Asus TUF Gaming GeForce RTX 4070 Ti Super Review: AD103 mid-ranger that challenges RX 7900 XT and displaces RTX 3090 Ti for US$300 less

Nvidia launched the RTX 4070 Ti Super alongside the RTX 4070 Super and the RTX 4080 Super back during CES 2024. With this refresh, the RTX 4070 Ti Super has now become an AD103 GPU, which brings with it a substantial memory subsystem upgrade along with the customary increases in CUDA core counts.
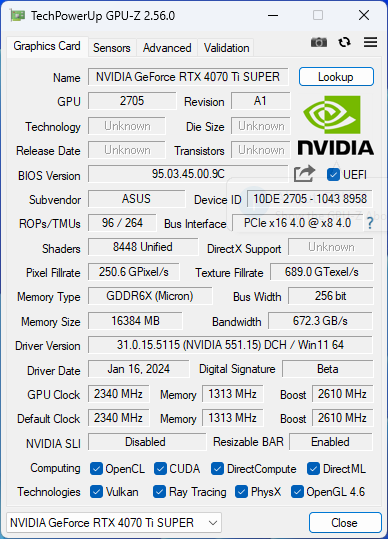
The RTX 4070 Ti Super now boasts 8,448 CUDA cores, which is a 10% increase over the 7,680 shaders in the original RTX 4070 Ti. The transition to AD103 silicon provides the card with a 16 GB GDDR6X 256-bit memory bus that yields a 672 GB/s bandwidth.
Nvidia has once again chosen not to offer a Founders Edition for the RTX 4070 Ti Super, but there are plenty of options to choose from among add-in-board (AiB) partner offerings. Most AiBs have cards targeting the US$799 MSRP while also offering SKUs with added niceties for a markup.
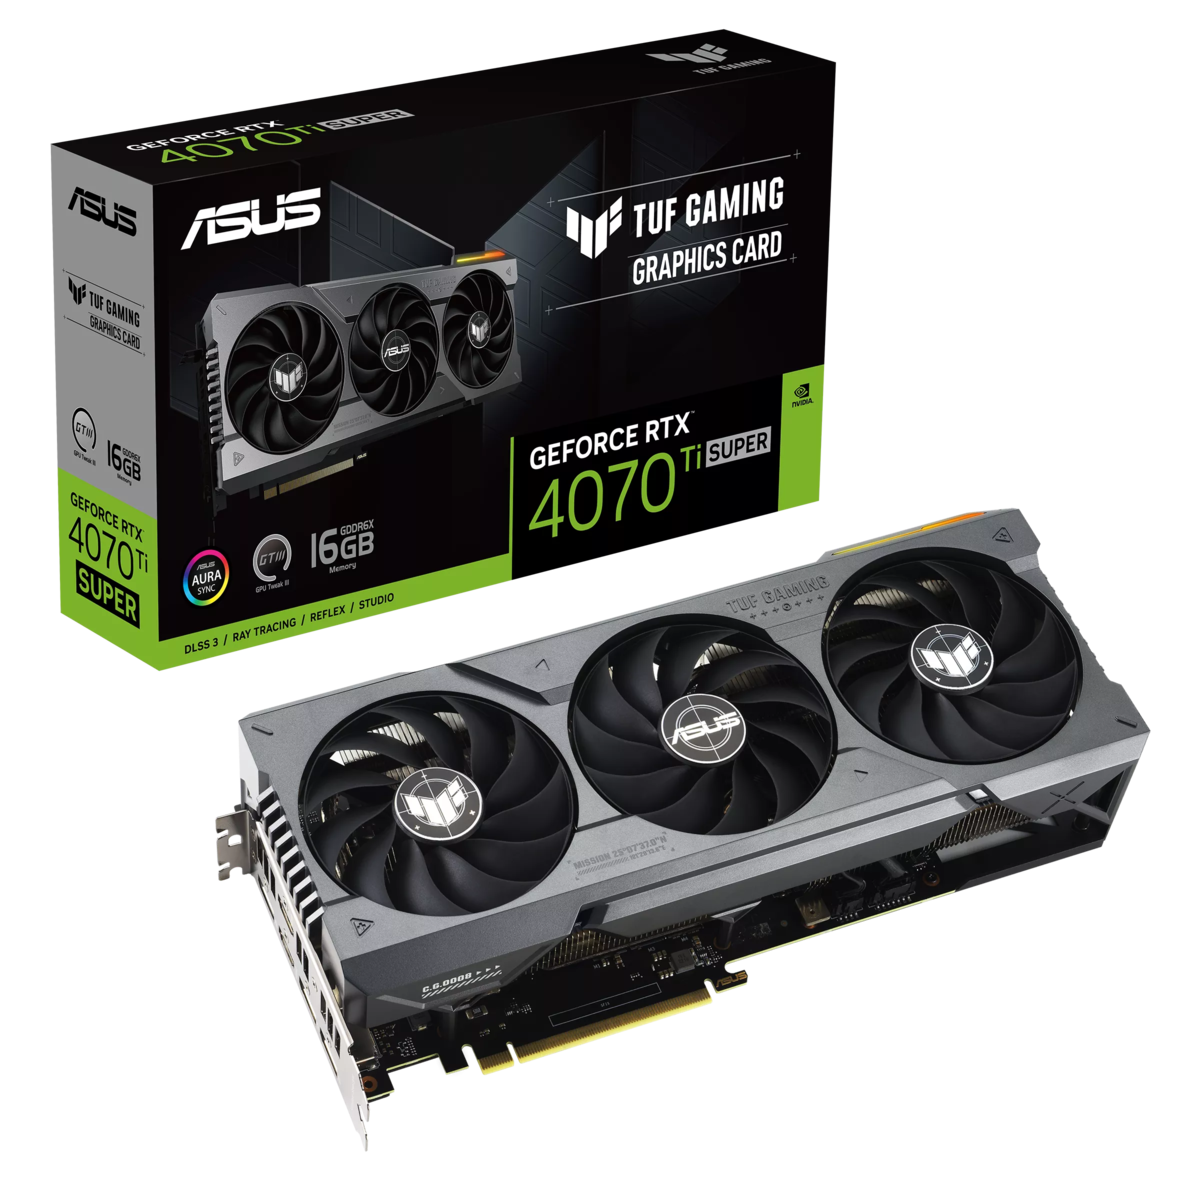
Apposite to this, we now have with us the new Asus TUF Gaming GeForce RTX 4070 Ti Super. This card retails for US$799 or ₹95,000 in India and comes with a three-year warranty. Asus is also offering an OC variant of this card that fully supplants the original TUF Gaming GeForce RTX 4070 Ti OC that we reviewed last year.
In this review, we put the Asus TUF Gaming GeForce RTX 4070 Ti Super through its paces and see if these hardware improvements amount to any tangible gains in synthetic benchmarks and gaming.
Comparison of the Asus TUF Gaming RTX 4070 Ti Super with other Nvidia GPUs
| Specification | RTX 4090 FE | RTX 4080 Super FE | RTX 4080 FE | Asus TUF RTX 4070 Ti Super | Asus TUF RTX 4070 Ti | RTX 4070 Super | Zotac RTX 4070 AMP Airo | KFA2 RTX 4060 Ti EX | RTX 3090 Ti FE | RTX 3090 FE | RTX 3080 Ti FE | RTX 3070 Ti FE | RTX 3070 FE | Titan RTX |
|---|---|---|---|---|---|---|---|---|---|---|---|---|---|---|
| Chip | AD102 | AD103 | AD103 | AD103 | AD104 | AD104 | AD104 | AD106 | GA102 | GA102 | GA102 | GA104 | GA104 | TU102 |
| FinFET Process | Custom 4N | Custom 4N | Custom 4N | Custom 4N | Custom 4N | Custom 4N | Custom 4N | Custom 4N | 8 nm | 8 nm | 8 nm | 8 nm | 8 nm | 12 nm |
| CUDA Cores | 16,384 | 10,240 | 9,728 | 8,448 | 7,680 | 7,168 | 5,888 | 4,352 | 10,752 | 10,496 | 10,240 | 6,144 | 5,888 | 4,608 |
| Texture Units | 512 | 320 | 304 | 264 | 240 | 224 | 184 | 136 | 336 | 328 | 320 | 192 | 184 | 288 |
| Tensor Cores | 512 4th Gen. | 320 4th Gen. | 304 4th Gen. | 264 4th Gen. | 240 4th Gen. | 224 4th Gen. | 184 4th Gen. | 136 4th Gen. | 336 3rd Gen. | 328 3rd Gen. | 320 3rd Gen. | 192 3rd Gen. | 184 3rd Gen. | 576 2nd Gen. |
| RT Cores | 128 3rd Gen. | 80 3rd Gen. | 76 3rd Gen. | 66 3rd Gen. | 60 3rd Gen. | 56 3rd Gen. | 46 3rd Gen. | 34 3rd Gen. | 84 2nd Gen. | 82 2nd Gen. | 80 2nd Gen. | 48 2nd Gen. | 46 2nd Gen. | 72 |
| GPU Base Clock | 2,235 MHz | 2,295 MHz | 2,205 MHz | 2,340 MHz | 2,310 MHz | 1,980 MHz | 1,920 MHz | 2,310 MHz | 1,560 MHz | 1,395 MHz | 1,365 MHz | 1,575 MHz | 1,500 MHz | 1,350 MHz |
| GPU Boost Clock | 2,520 MHz | 2,550 MHz | 2,505 MHz | 2,610 MHz | 2,760 MHz | 2,565 MHz | 2,535 MHz | 2,535 MHz | 1,860 MHz | 1,695 MHz | 1,665 MHz | 1,770 MHz | 1,750 MHz | 1,770 MHz |
| Memory Bus | 384-bit | 256-bit | 256-bit | 256-bit | 192-bit | 192-bit | 192-bit | 128-bit | 384-bit | 384-bit | 384-bit | 256-bit | 256-bit | 384-bit |
| Memory Bandwidth | 1,008 GB/s | 736.3 GB/s | 716.8 GB/s | 672 GB/s | 504 GB/s | 504 GB/s | 504 GB/s | 288 GB/s | 1,008 GB/s | 936 GB/s | 912 GB/s | 608 GB/s | 448 GB/s | 672 GB/s |
| Video Memory | 24 GB GDDR6X | 16 GB GDDR6X | 16 GB GDDR6X | 16 GB GDDR6X | 12 GB GDDR6X | 12 GB GDDR6X | 12 GB GDDR6X | 8 GB GDDR6 | 24 GB GDDR6X | 24 GB GDDR6X | 12 GB GDDR6X | 8 GB GDDR6X | 8 GB GDDR6 | 24 GB GDDR6 |
| Power Consumption | 450 W | 320 W | 320 W | 285 W | 285 W | 220 W | 215 W | 160 W | 450 W | 350 W | 350 W | 290 W | 220 W | 280 W |
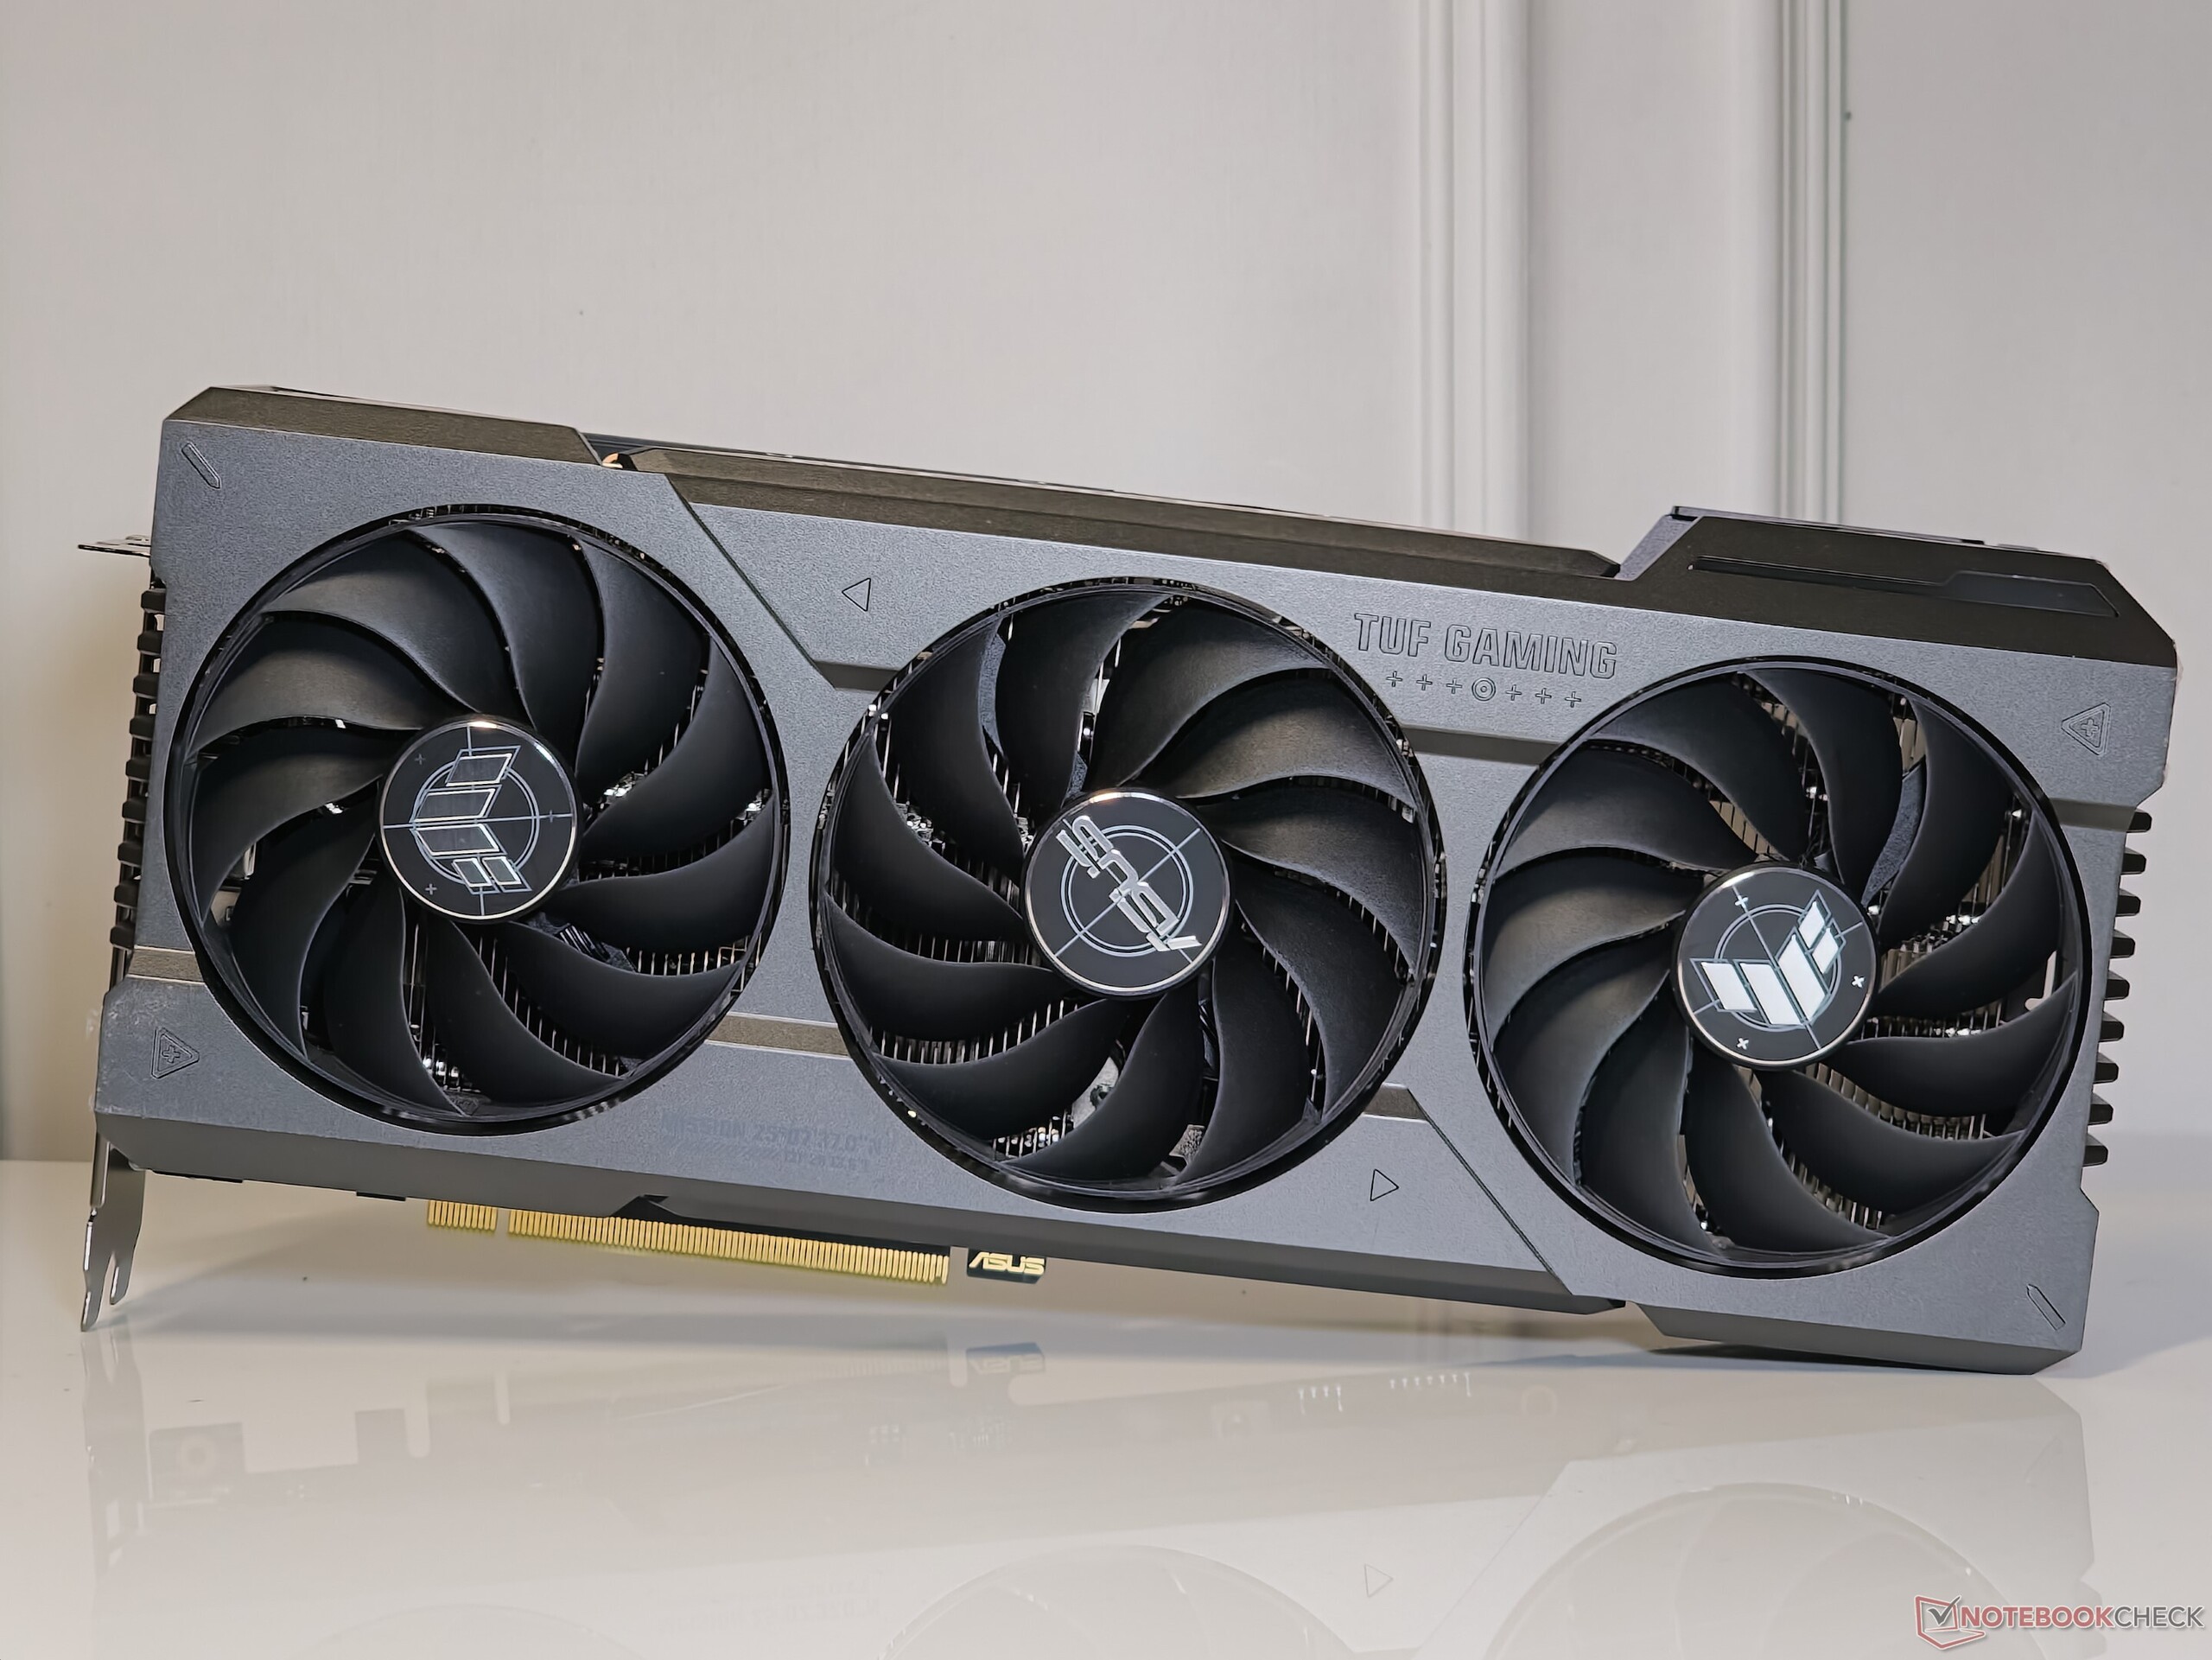
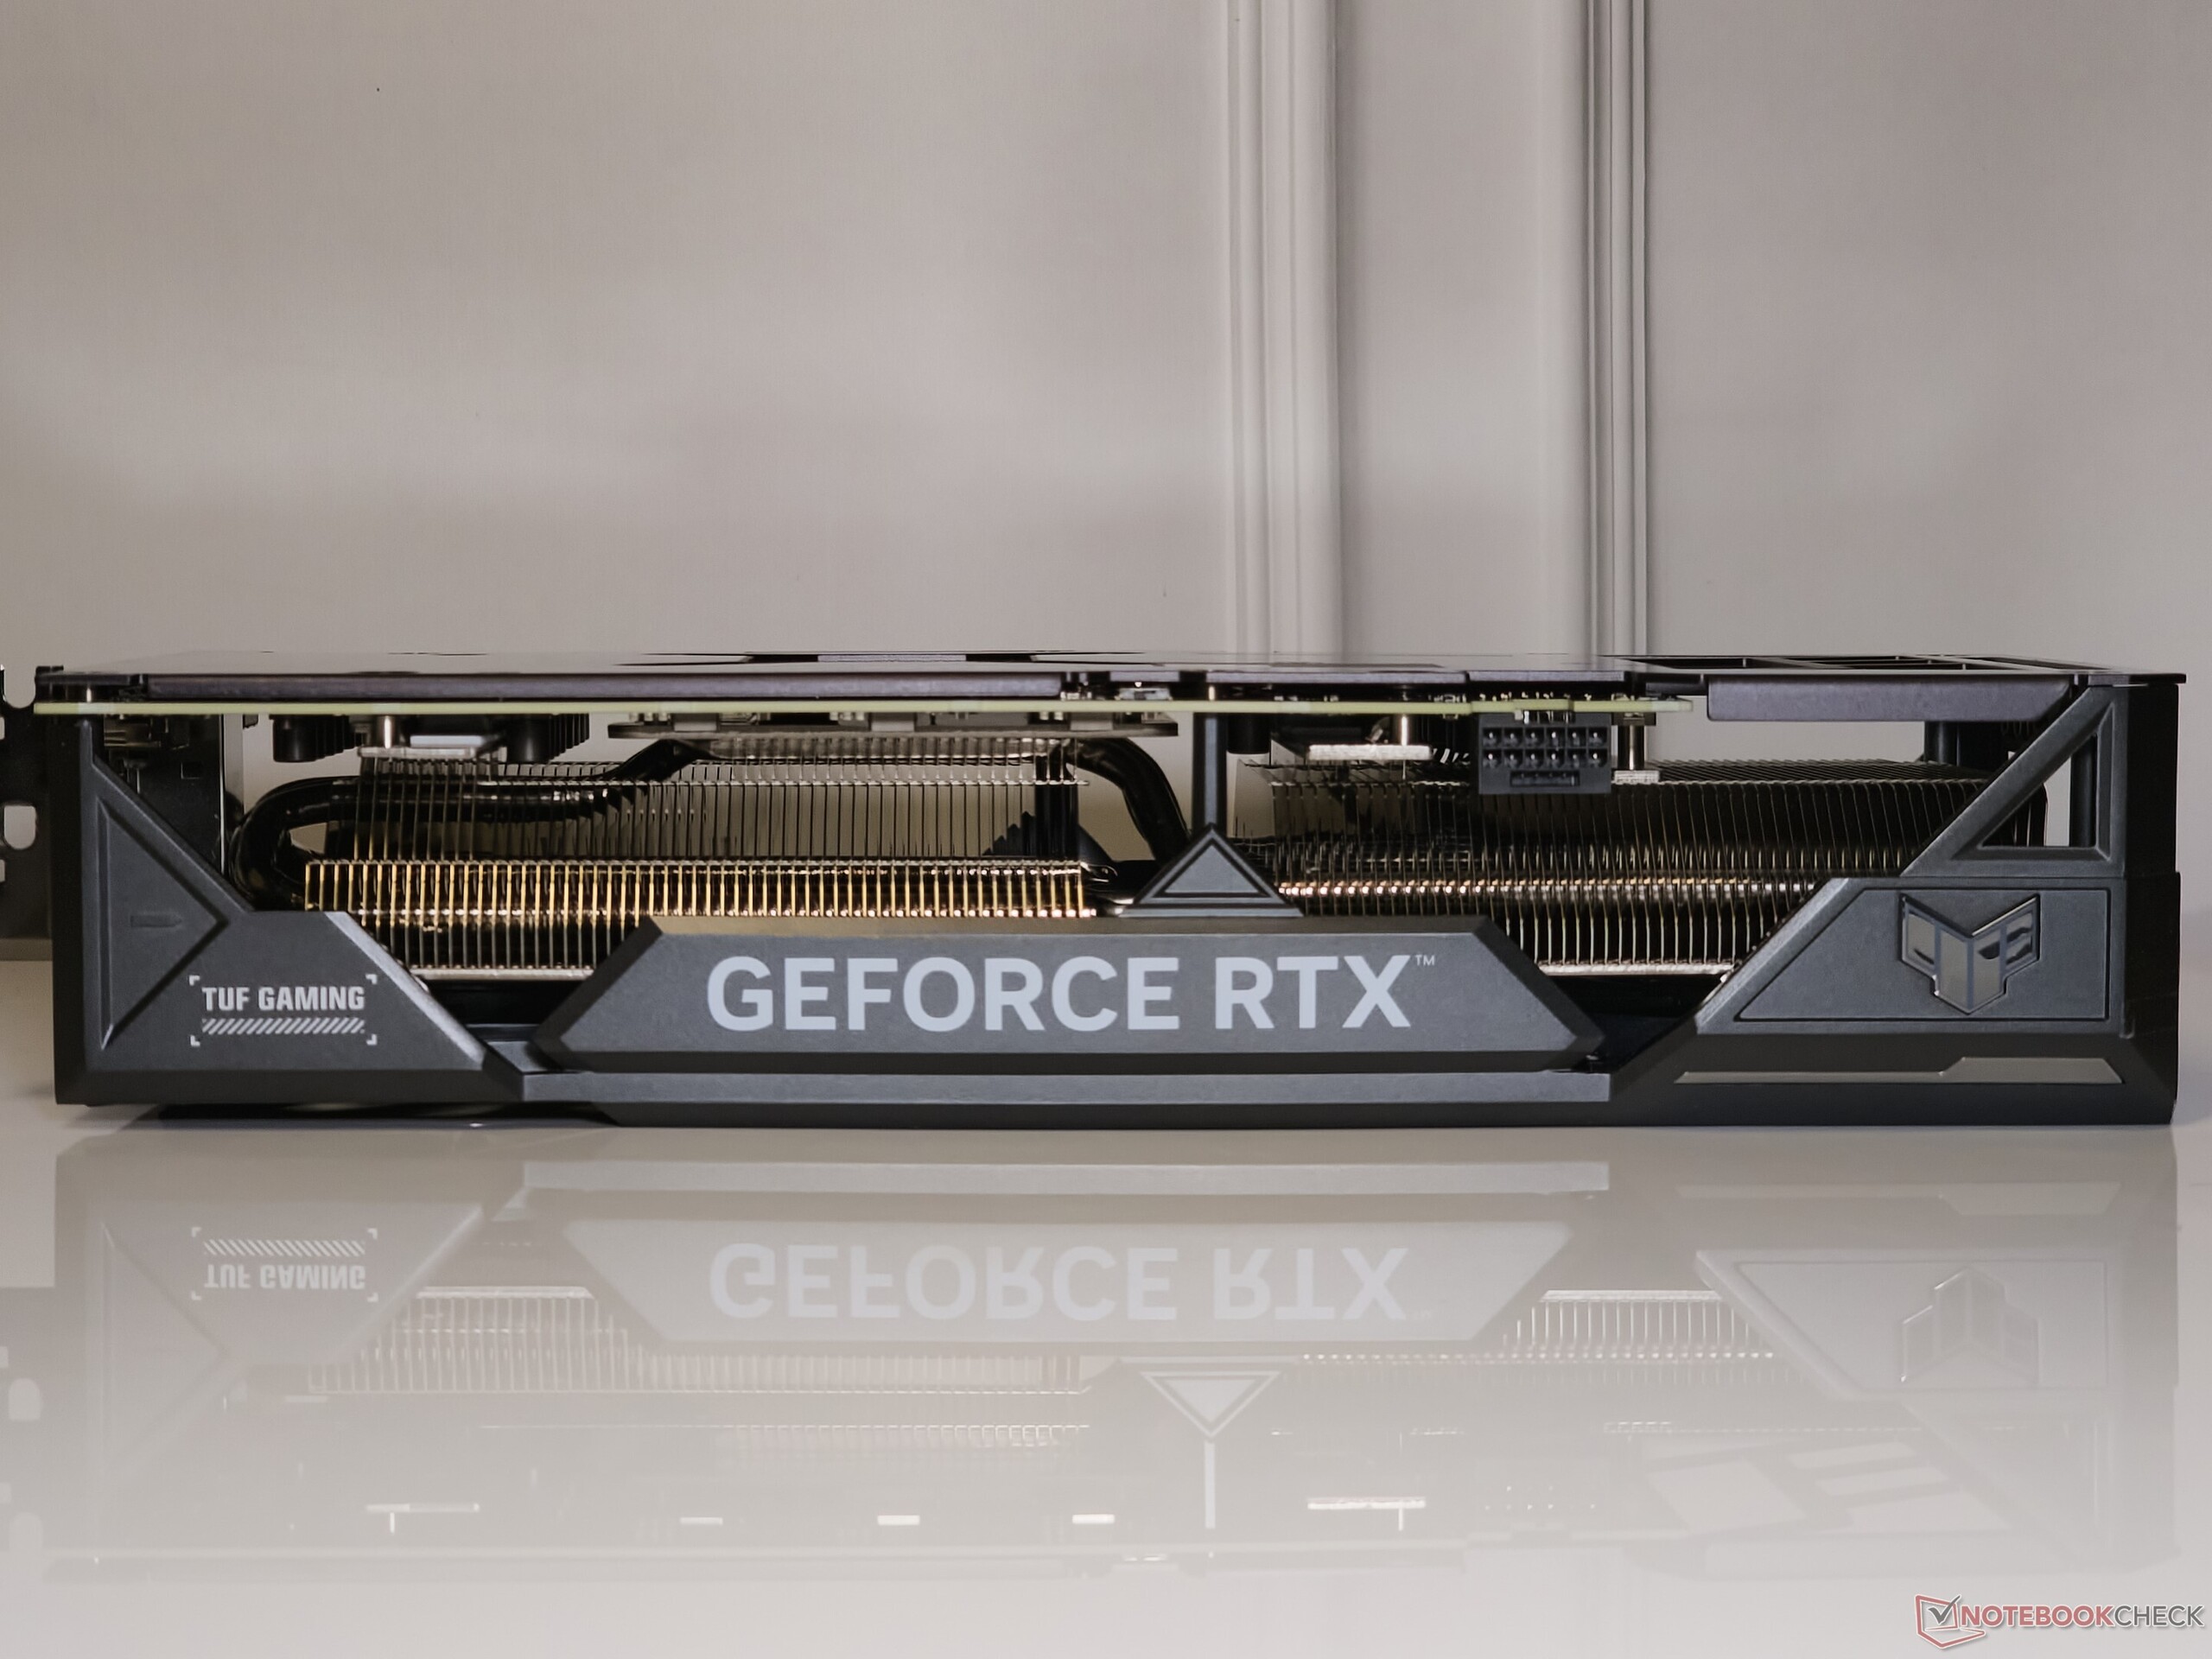
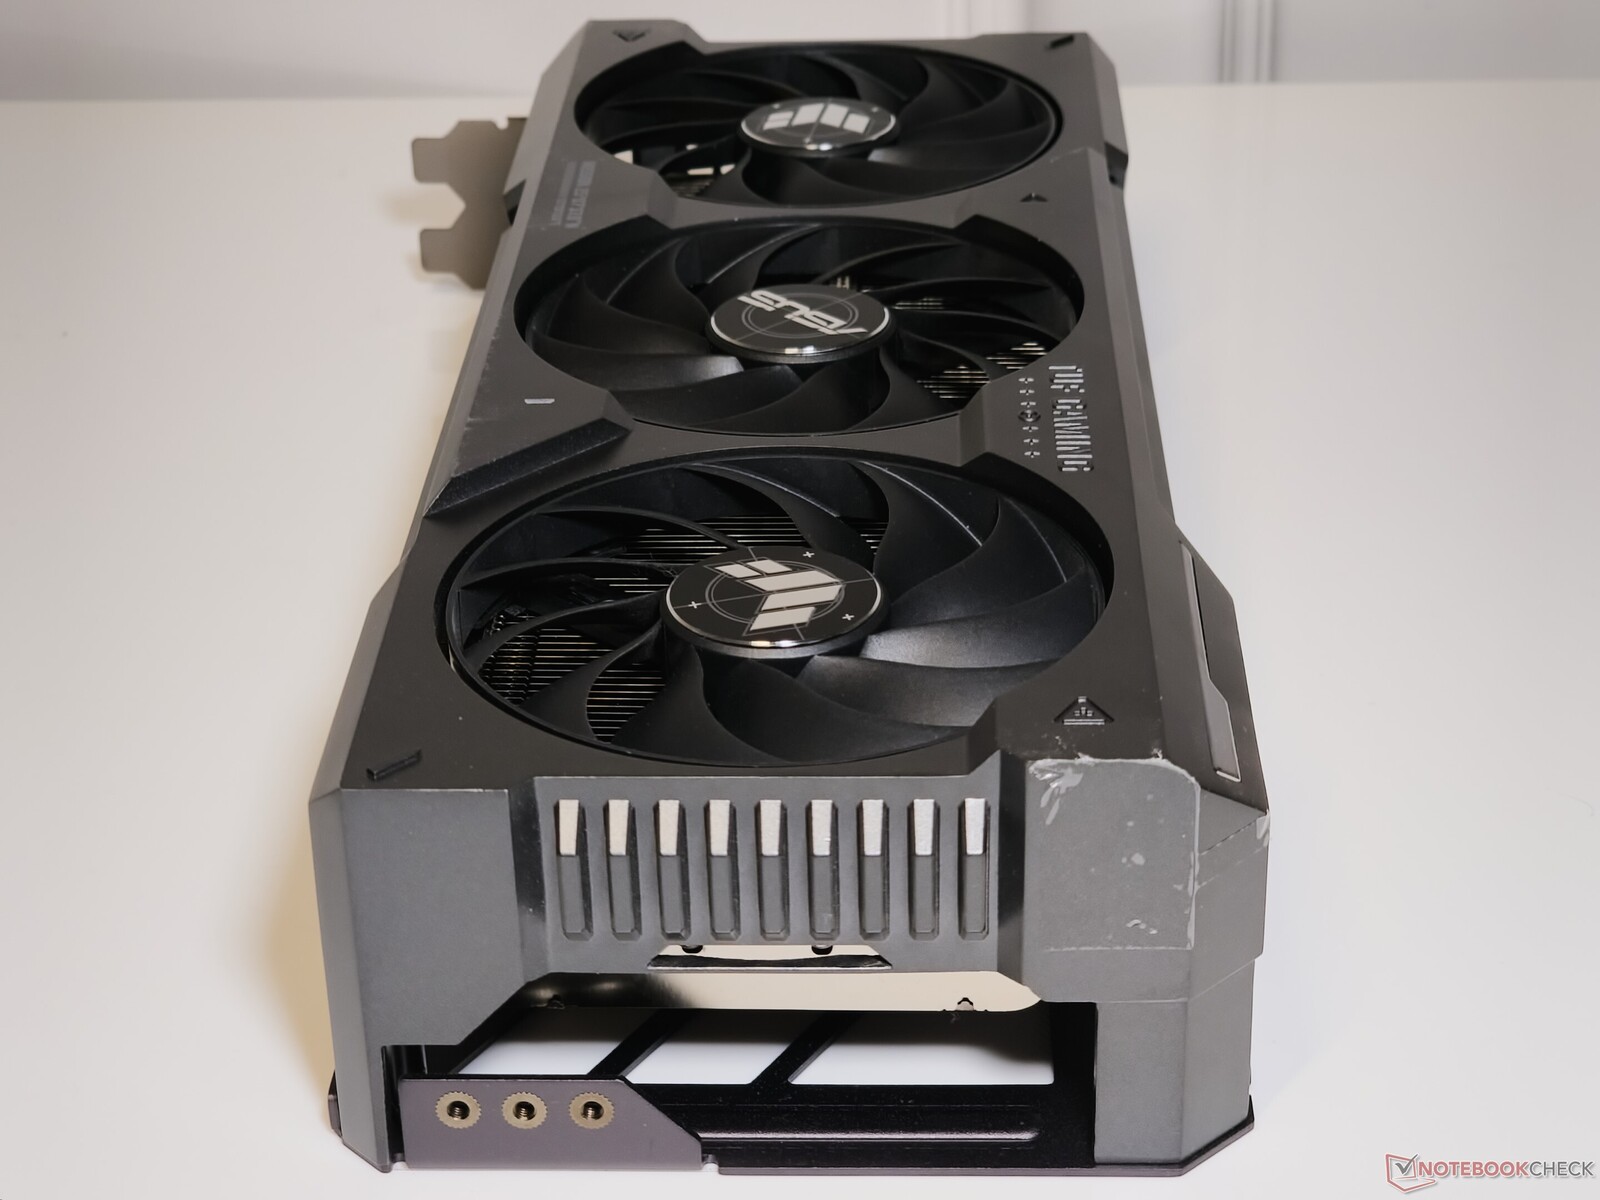
The Asus TUF Gaming GeForce RTX 4070 Ti Super up close
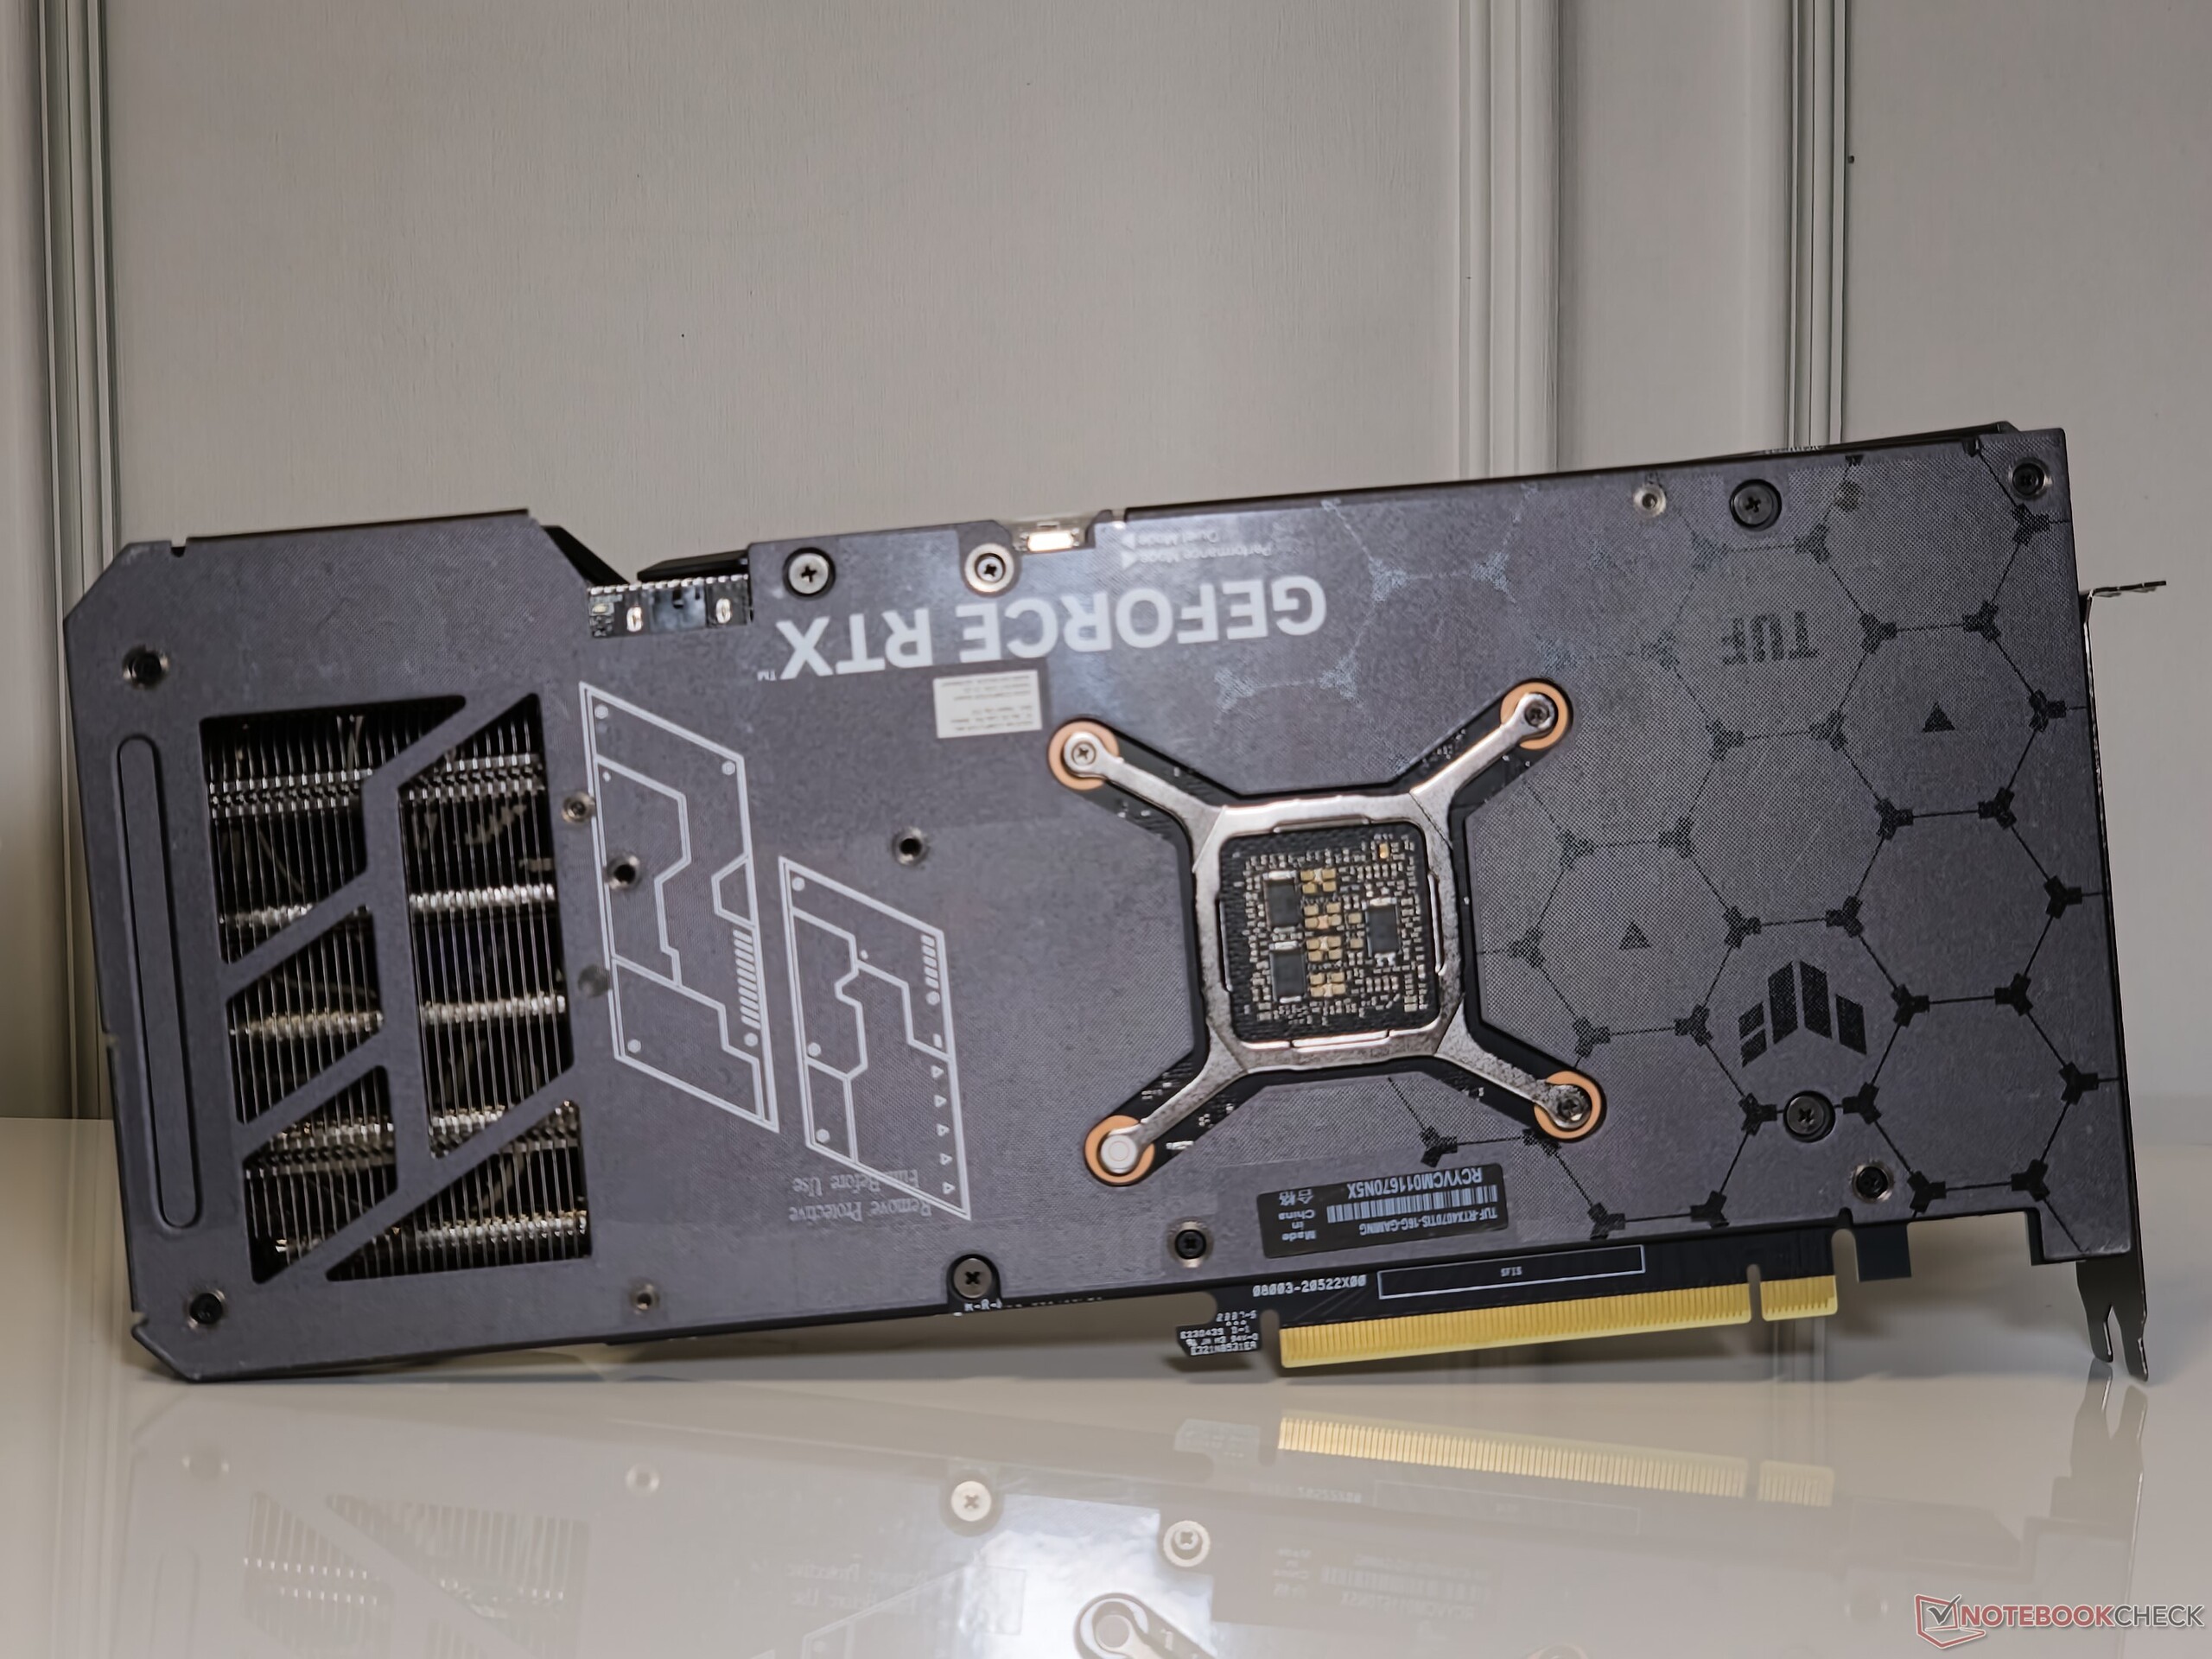
The TUF card may be Asus's entry-level offering for the RTX 4070 Ti Super, but it is built like a tank. The card features a metallic shroud, a rarity in non-premium offerings. The metal backplate adds to the reassuring heft and features cutouts for ventilation.
At 305 x 138 x 65 mm, the TUF Gaming GeForce RTX 4070 Ti Super does not shy away from occupying nearly 3.5 slots on the board. This is something to bear in mind if you are planning on adding other expansion cards and you have an ATX or smaller board with closely spaced PCIe slots.
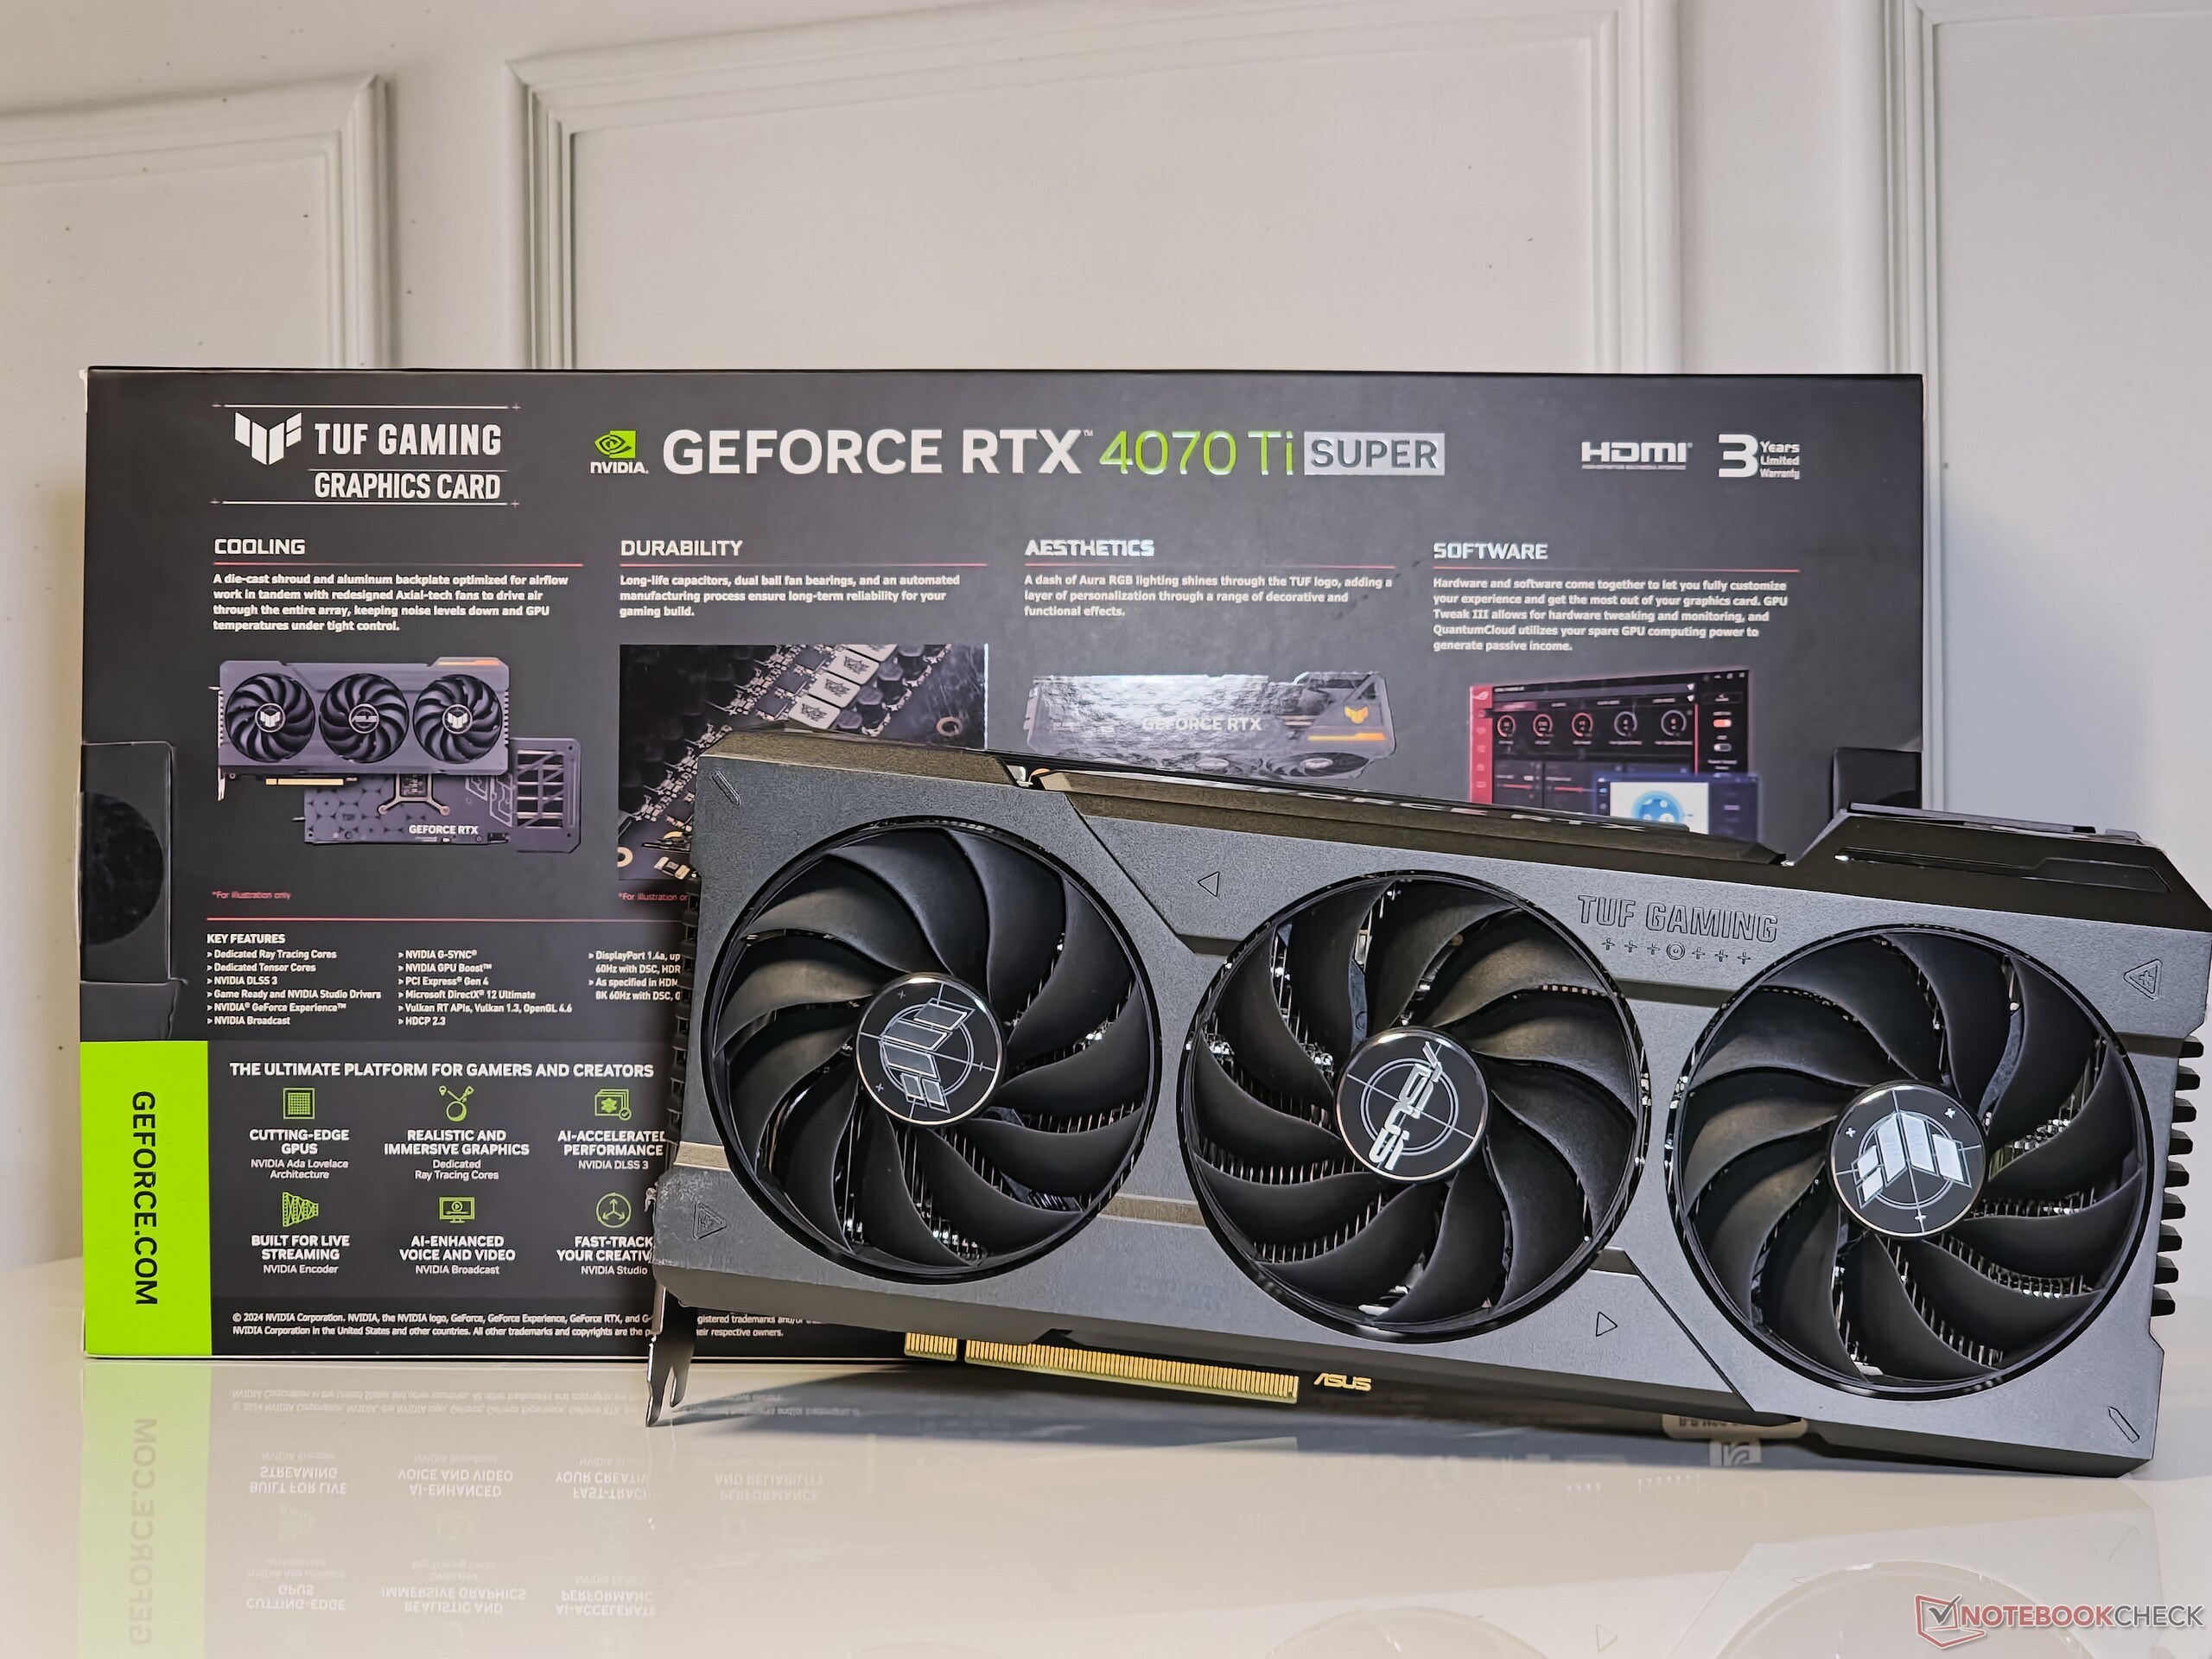
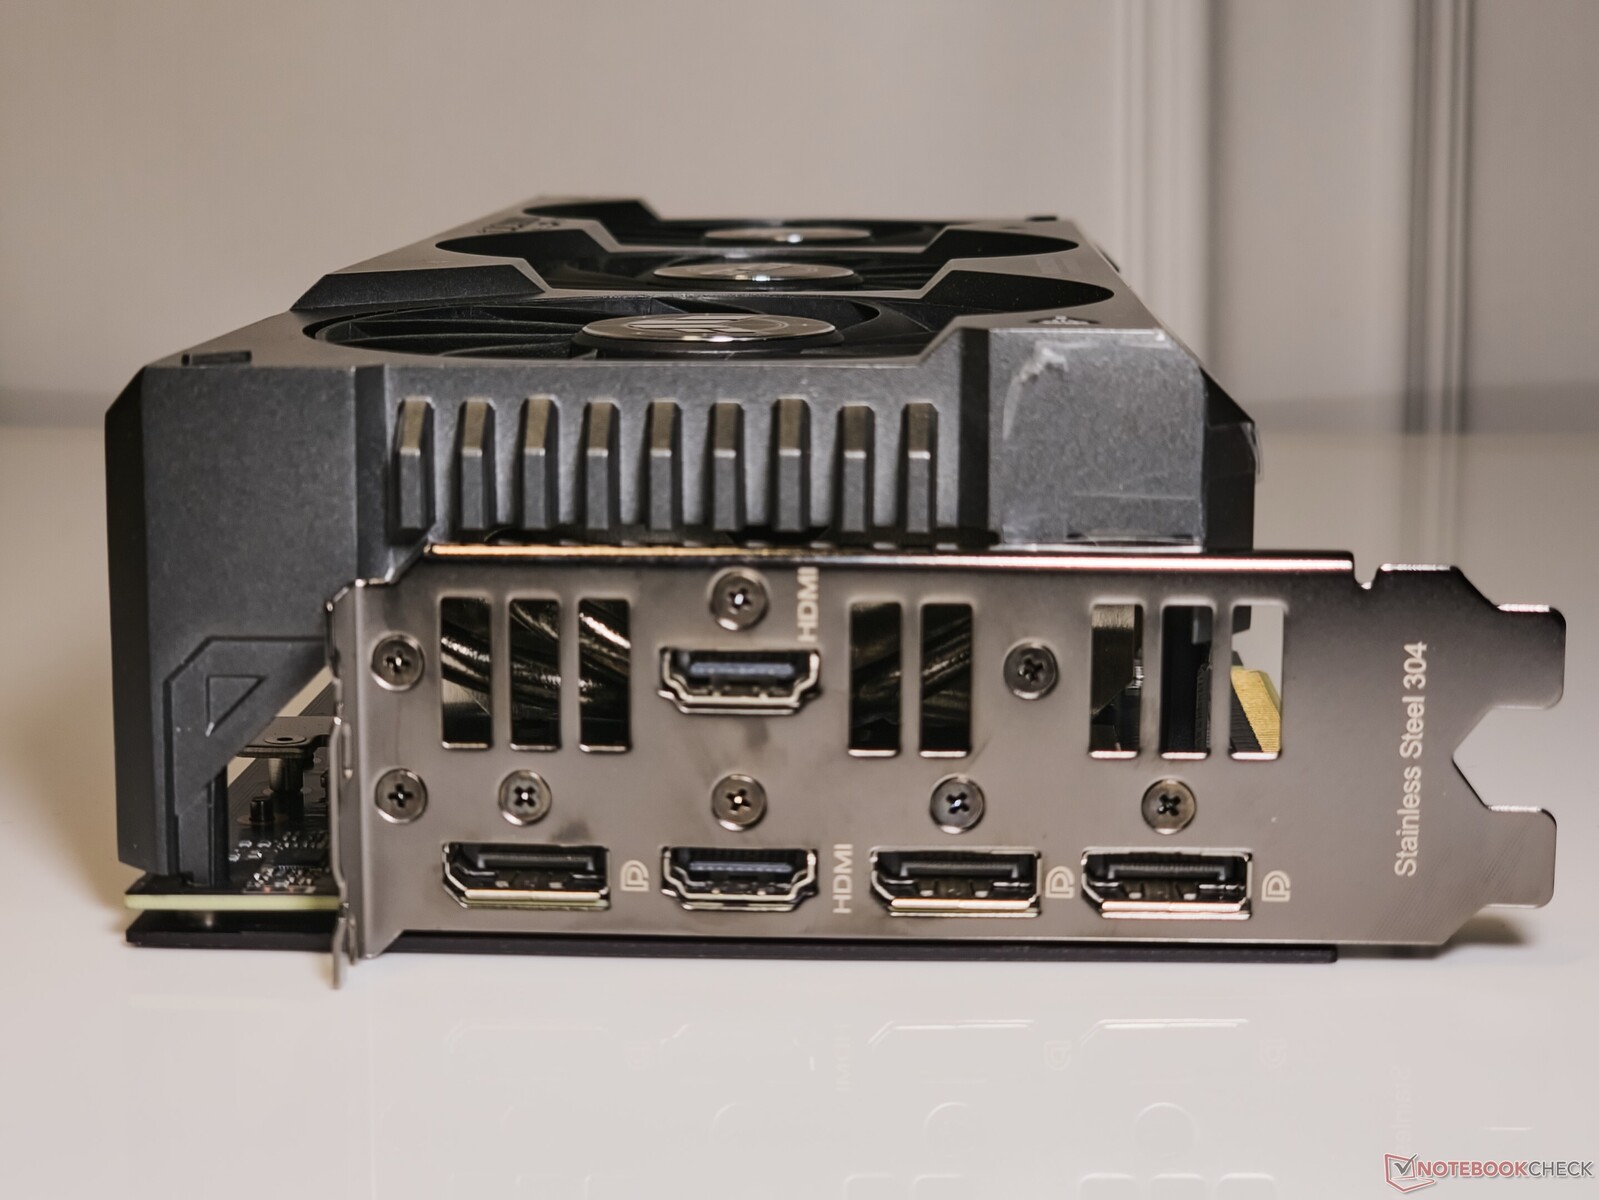
Like most other Asus cards, the TUF Gaming GeForce RTX 4070 Ti Super also comes with five ports, which is not often the case with a vast majority of the cards out there.
Alongside the usual 3x DisplayPort-1.4-outs and the HDMI 2.1a-out, Asus is also offering an additional HDMI 2.1a-out port that can come in handy for hooking up a TV or displays that don't feature a DisplayPort.
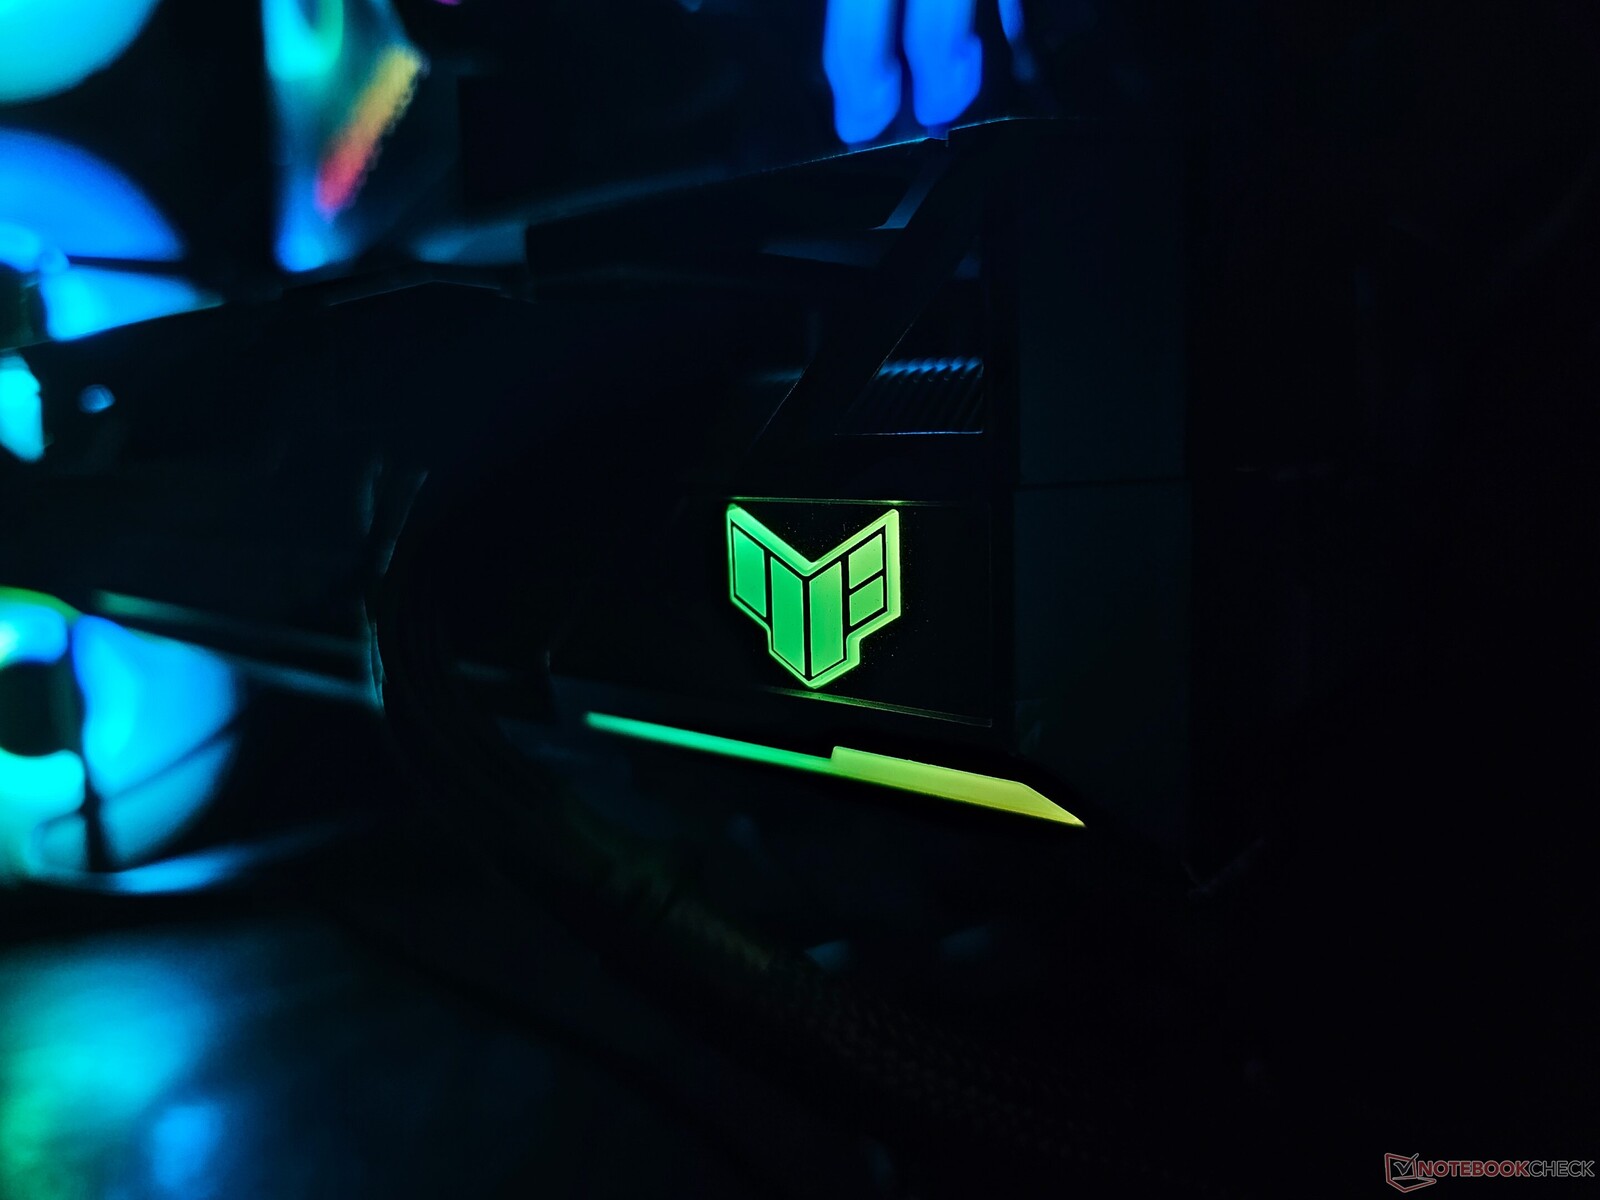
Unlike their Strix counterparts, TUF cards have a more subdued RGB lighting. The only areas that get lit up are the TUF logo and a short light bar beneath it. Still, the lighting in effective and can be customized via Asus's GPU Tweak III software or any Aura Sync-compatible utility.
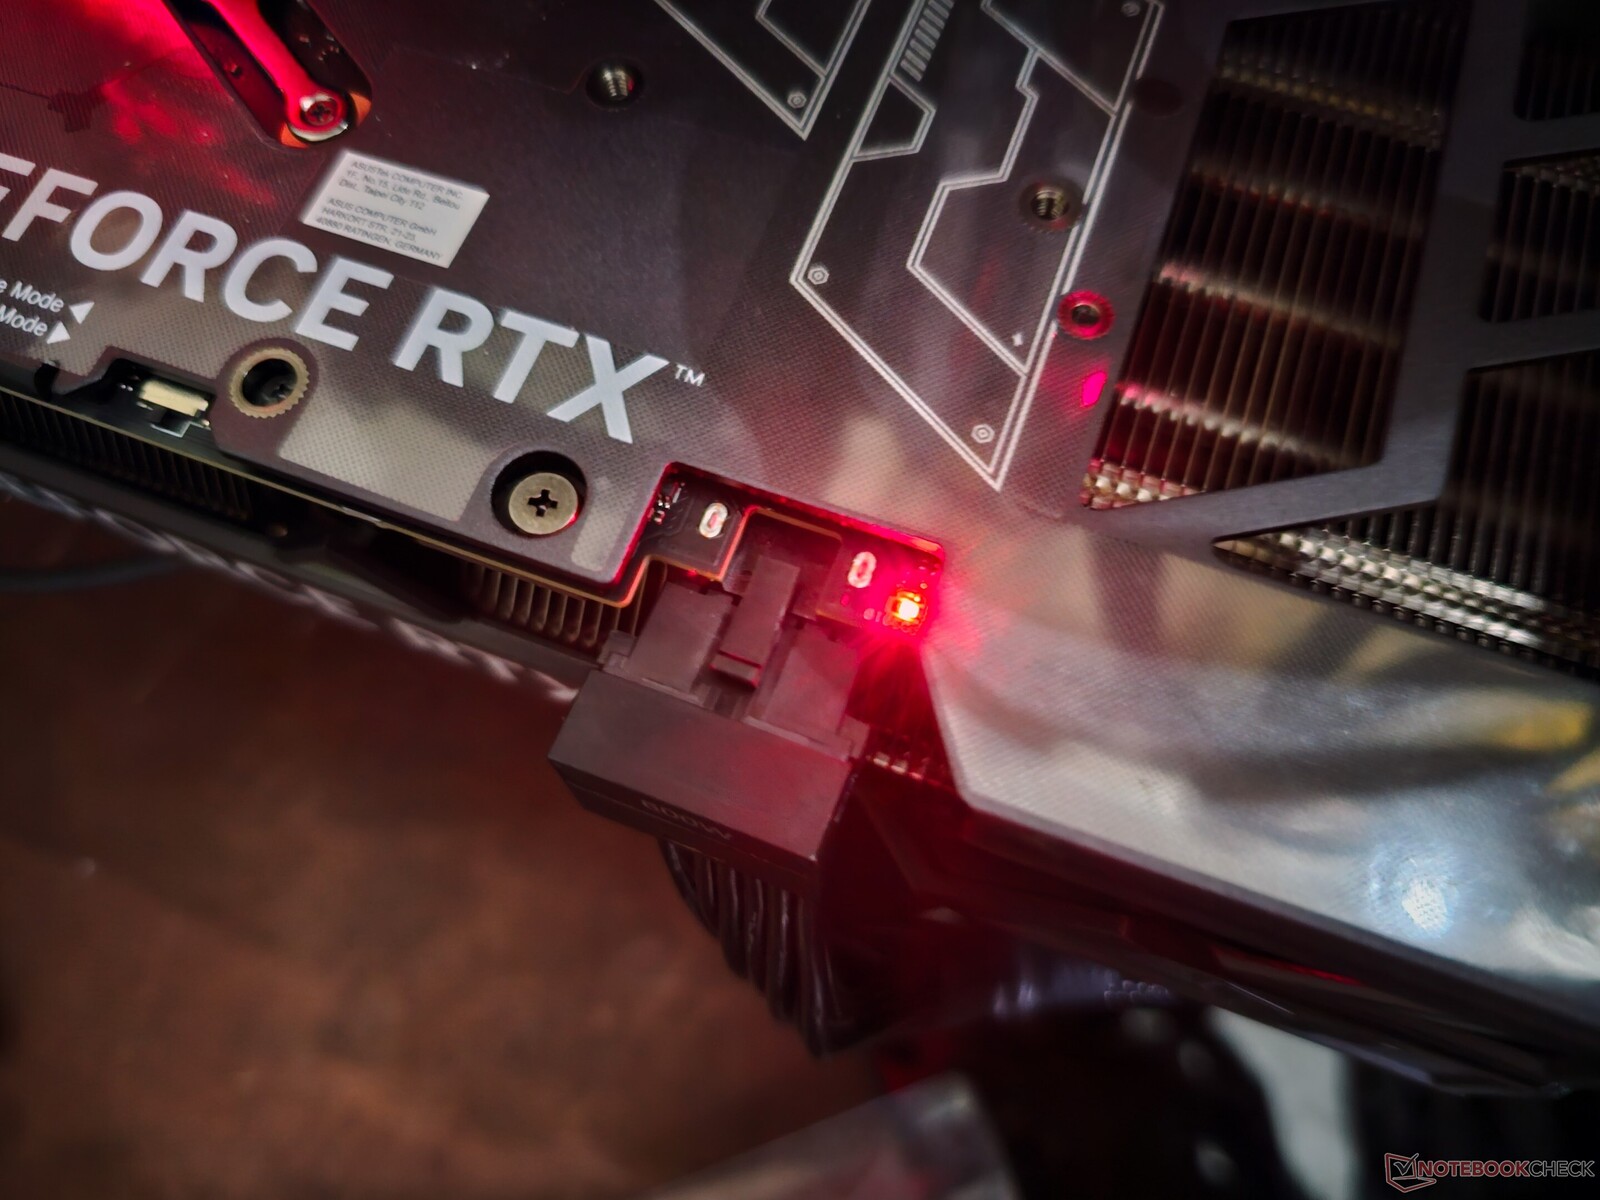
Power supply is handled by the standard 12VHPWR connector. Asus supplies a 12VHPWR to 2x 8-pin adapter in the box that fits snugly into the connector.
The power connector also sports a useful red LED indicator that glows to indicate an improper connection or inadequate power supply. Unfortunately, the indicator glows even during system power off which can potentially confuse to users.
Asus offers a dual-BIOS system that can be toggled between Performance and Quiet modes. We performed all testing in the Performance mode and used the Quiet mode to compare fan noise levels.

The TUF cards also come with a decent accessory set, which includes:
- TUF collection card
- 12VHPWR to 2x 8-pin power adapter
- Thank You card
- TUF Gaming Certificate
- Quick Start guide
- Warranty information
- TUF Velcro hook and loop
- TUF GPU holder with built-in screwdriver
The TUF Gaming GeForce RTX 4070 Ti Super has a rated boost up to 2,610 MHz, which is the Nvidia reference spec for this GPU. This is 150 MHz lower than what was offered with the original RTX 4070 Ti non-Super, but the base clock now gets a 30 MHz increase to 2,340 MHz.
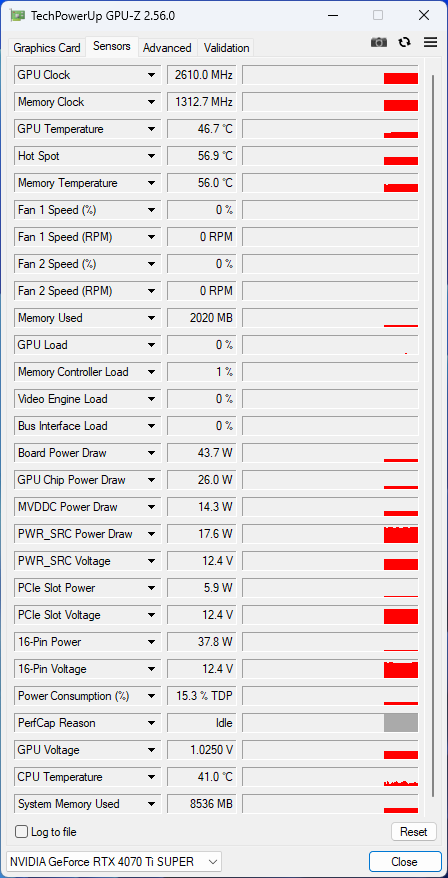
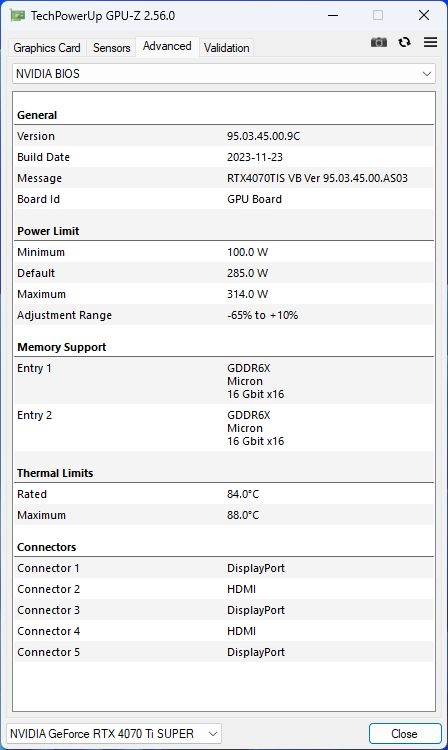
Despite increases in memory bandwidth and shader counts, the TUF Gaming GeForce RTX 4070 Ti Super operates at a 285 W TGP similar to the RTX 4070 Ti.
There is limited potential to crank up power utilization by 10% for an increased TGP of 314 W.
The test bench: RTX 4070 Ti Super and the Core i9-13900K make a great pair
Our test system is based on the Intel Core i9-13900K and Z790 platform. This includes the following components:
- Cooler MasterFrame 700 test bench
- Intel Core i9-13900K with PL1=PL2
- Gigabyte Z790 Aorus Master motherboard
- Gigabyte Aorus Gen4 2 TB NVMe SSD
- Sabrent Rocket 4 Plus Gen4 2 TB NVMe SSD
- 2x 16 GB Kingston Fury Renegade DDR5-6400 RAM with timings 32-39-39-80 at 1.40 V
- Gigabyte M28U 4K 144 Hz monitor
- Gigabyte Aorus Waterforce X II 360 AiO cooler
- Cooler Master MVE Gold V2 1250 ATX 3.0 fully modular PSU
Windows 11 23H2 with the latest patches, together with Nvidia Game Ready Driver version 551.15 was used.
We would like to thank Cooler Master for supplying the test bench and PSU, Gigabyte for the motherboard, CPU, SSD, AiO cooler, and monitor, Sabrent for the SSD, and Kingston for the memory.
Synthetic benchmarks: Firmly cements its gains against the RTX 3090 Ti
In cumulative synthetic tests, we only see a 3% improvement overall with the TUF Gaming GeForce RTX 4070 Ti Super compared to the RTX 4070 Ti and up to 12% compared to the RTX 4070 Super Founders Edition.
Individually, the best gains stem from benchmarks at higher resolutions. For instance, 3DMark Fire Strike Ultra shows a 4% gain compared to the RTX 4070 Ti average while Unigine Superposition 4K and 8K Optimized tests increase this delta to 11%.
The RTX 4070 Ti Super further inches ahead of the Ampere flagship RTX 3090 Ti by 5% while trailing behind the AMD Radeon RX 7900 XT by the same margin.
3DMark 11: 1280x720 Performance GPU
3DMark: 1920x1080 Fire Strike Graphics | 3840x2160 Fire Strike Ultra Graphics | Fire Strike Extreme Graphics | 2560x1440 Time Spy Graphics
Unigine Heaven 4.0: Extreme Preset DX11 | Extreme Preset OpenGL
Unigine Valley 1.0: 1920x1080 Extreme HD DirectX AA:x8 | 1920x1080 Extreme HD Preset OpenGL AA:x8
Unigine Superposition: 1280x720 720p Low | 1920x1080 1080p Extreme | 3840x2160 4k Optimized | 7680x4320 8k Optimized
| Performance rating | |
| NVIDIA GeForce RTX 4090 Founders Edition | |
| AMD Radeon RX 7900 XTX | |
| NVIDIA GeForce RTX 4080 Founders Edition | |
| Average of class Desktop | |
| AMD Radeon RX 7900 XT | |
| Asus TUF Gaming GeForce RTX 4070 Ti Super | |
| Gigabyte Aorus GeForce RTX 4070 Ti Master | |
| Asus TUF Gaming GeForce RTX 4070 Ti | |
| Average NVIDIA GeForce RTX 4070 Ti | |
| Zotac Gaming GeForce RTX 3090 Ti AMP Extreme Holo | |
| Sapphire AMD Radeon RX 6950 XT Nitro+ Pure | |
| Gigabyte GeForce RTX 4070 Super Gaming OC 12G | |
| Average NVIDIA GeForce RTX 3090 | |
| Average NVIDIA GeForce RTX 3080 Ti | |
| NVIDIA GeForce RTX 4070 Super Founders Edition | |
| AMD Radeon RX 7800 XT | |
| AMD Radeon RX 6900 XT | |
| Zotac Gaming GeForce RTX 4070 AMP Airo | |
| AMD Radeon RX 6800 XT | |
| Average NVIDIA GeForce RTX 3080 | |
| KFA2 GeForce RTX 3070 Ti SG | |
| Sapphire Pulse Radeon RX 7700 XT | |
| Average NVIDIA Titan RTX | |
| Average NVIDIA GeForce RTX 3070 | |
| Average NVIDIA GeForce RTX 4060 Ti 8G | |
| KFA2 GeForce RTX 4060 Ti EX, 16GB GDDR6 | |
| XFX Speedster QICK 308 Radeon RX 7600 Black Edition | |
| KFA2 GeForce RTX 4060 1-Click-OC 2X | |
3DMark 11: 1280x720 Performance GPU
3DMark: 1920x1080 Fire Strike Graphics | 3840x2160 Fire Strike Ultra Graphics | Fire Strike Extreme Graphics | 2560x1440 Time Spy Graphics
Unigine Heaven 4.0: Extreme Preset DX11 | Extreme Preset OpenGL
Unigine Valley 1.0: 1920x1080 Extreme HD DirectX AA:x8 | 1920x1080 Extreme HD Preset OpenGL AA:x8
Unigine Superposition: 1280x720 720p Low | 1920x1080 1080p Extreme | 3840x2160 4k Optimized | 7680x4320 8k Optimized
| 3DMark 11 Performance | 54278 points | |
| 3DMark Ice Storm Standard Score | 287297 points | |
| 3DMark Cloud Gate Standard Score | 79438 points | |
| 3DMark Fire Strike Score | 42631 points | |
| 3DMark Fire Strike Extreme Score | 27105 points | |
| 3DMark Time Spy Score | 23540 points | |
Help | ||
Compute performance: Scales corresponding to increased CUDA core counts
The impact of increased CUDA core counts is more visibly seen in compute tests such as V-Ray and Blender. In V-Ray 5, the TUF Gaming GeForce RTX 4070 Ti Super musters an impressive 11% and 14% leads in CUDA and RTX benchmarks compared to the RTX 4070 Ti average. AMD cards are at an obvious disadvantage in these tests.
Where they do shine, however, is in LuxMark Sala GPU tests with even the RX 6950 XT showing good leads over the RTX 4090 Founders Edition. That being said, the RTX 4070 Ti Super shows a decent 11% uplift over both the TUF Gaming GeForce RTX 4070 Ti OC and the Aorus GeForce RTX 4070 Ti Master in LuxMark Room GPU.
The TUF Gaming GeForce RTX 4070 Ti Super is also able to complete Blender 3.3 Classroom CUDA and Optix rendering 1.5 seconds faster than the RTX 4070 Ti average.
V-Ray Benchmark Next 4.10: GPU
Blender: v3.3 Classroom CUDA | v3.3 Classroom OPTIX/RTX
LuxMark v2.0 64Bit: Room GPUs-only | Sala GPUs-only
ComputeMark v2.1: 1024x600 Normal, Score | 1024x600 Normal, QJuliaRayTrace | 1024x600 Normal, Mandel Scalar | 1024x600 Normal, Mandel Vector | 1024x600 Normal, Fluid 2DTexArr | 1024x600 Normal, Fluid 3DTex
| Blender / v3.3 Classroom CUDA | |
| KFA2 GeForce RTX 4060 1-Click-OC 2X (3.3.3) | |
| Average NVIDIA GeForce RTX 3070 (n=1) | |
| KFA2 GeForce RTX 3070 Ti SG (3.3.0) | |
| Average NVIDIA Titan RTX (n=1) | |
| Average NVIDIA GeForce RTX 4060 Ti 8G (n=1) | |
| Zotac Gaming GeForce RTX 4070 AMP Airo (3.3.3) | |
| Average NVIDIA GeForce RTX 3080 Ti (21 - 22, n=2) | |
| Average NVIDIA GeForce RTX 3090 (20 - 22, n=13) | |
| NVIDIA GeForce RTX 4070 Super Founders Edition (3.3.3) | |
| Gigabyte GeForce RTX 4070 Super Gaming OC 12G (3.3.3) | |
| Average NVIDIA GeForce RTX 4070 Ti (18 - 19, n=3) | |
| Average of class Desktop (8 - 54, n=31, last 2 years) | |
| Gigabyte Aorus GeForce RTX 4070 Ti Master (3.3.2) | |
| Asus TUF Gaming GeForce RTX 4070 Ti Super (3.3.3) | |
| Blender / v3.3 Classroom OPTIX/RTX | |
| Average NVIDIA GeForce RTX 3070 (n=1) | |
| KFA2 GeForce RTX 4060 1-Click-OC 2X (3.3.3) | |
| Average NVIDIA Titan RTX (n=1) | |
| KFA2 GeForce RTX 3070 Ti SG (3.3.0) | |
| KFA2 GeForce RTX 4060 Ti EX, 16GB GDDR6 (3.3.3) | |
| Average NVIDIA GeForce RTX 4060 Ti 8G (17 - 18, n=3) | |
| Average NVIDIA GeForce RTX 3080 Ti (14 - 15, n=2) | |
| Zotac Gaming GeForce RTX 4070 AMP Airo (3.3.3) | |
| Average NVIDIA GeForce RTX 3090 (13 - 14, n=13) | |
| Asus TUF Gaming GeForce RTX 4070 Ti (3.3.2) | |
| Average NVIDIA GeForce RTX 4070 Ti (11 - 12, n=5) | |
| Gigabyte Aorus GeForce RTX 4070 Ti Master (3.3.2) | |
| NVIDIA GeForce RTX 4070 Super Founders Edition (3.3.3) | |
| Gigabyte GeForce RTX 4070 Super Gaming OC 12G (3.3.3) | |
| Average of class Desktop (5 - 19, n=30, last 2 years) | |
| NVIDIA GeForce RTX 4080 Founders Edition (3.3.0) | |
| Asus TUF Gaming GeForce RTX 4070 Ti Super (3.3.3) | |
| NVIDIA GeForce RTX 4090 Founders Edition (3.3.0) | |
V-Ray Benchmark Next 4.10: GPU
Blender: v3.3 Classroom CUDA | v3.3 Classroom OPTIX/RTX
LuxMark v2.0 64Bit: Room GPUs-only | Sala GPUs-only
ComputeMark v2.1: 1024x600 Normal, Score | 1024x600 Normal, QJuliaRayTrace | 1024x600 Normal, Mandel Scalar | 1024x600 Normal, Mandel Vector | 1024x600 Normal, Fluid 2DTexArr | 1024x600 Normal, Fluid 3DTex
* ... smaller is better
Gaming performance: On par with RTX 3090 Ti and RX 7900 XT in QHD and 4K Ultra
Unlike synthetic tests, not all games scale in accordance with increases in shader counts. Accordingly, we see only a 4% uplift from the average RTX 4070 Ti non-Super in cumulative QHD and 4K gaming performance.
Games such as The Witcher 3 and Shadow of the Tomb Raider show up to 5% gains in 4K Ultra with the RTX 4070 Ti Super compared to the average RTX 4070 Ti non-Super. The deltas widen to 8% with Borderlands 3 and up to 11% with Final Fantasy XV at 4K Ultra.
This places the RTX 4070 Ti Super in the same league as the RTX 3090 Ti and the Radeon RX 7900 XT when it comes to gaming, particularly in QHD and 4K Ultra settings.
Like the RTX 4070 Super, Nvidia continues to pitch the RTX 4070 Ti Super for QHD gamers. While this card certainly benefits those with high refresh rate QHD displays, the RTX 4070 Ti Super can comfortably run a good number of modern and slightly older AAA titles at 4K 60 or above.
However, some of the particularly texture-heavy ones such as Cyberpunk 2077 Phantom Liberty, Alan Wake 2, Avatar: Frontiers of Pandora and the like will require some upscaling assistance for a smoother gaming experience at 4K Ultra.
Native ray tracing performance
Ray tracing performance at 1080p Ultra is either on par with or only marginally better than the RTX 4070 Ti, with The Callisto Protocol showing a decent 9% gain.
The RTX 4070 Ti Super does have an advantage at 4K Ultra ray tracing, evidenced by a 4% uplift in Cyberpunk 2077 1.6 and 10% gains in Control.
The difference becomes more pronounced when compared with the RTX 4070 Super Founders Edition. Here, the RTX 4070 Ti Super shows a significant 22% benefit in Alan Wake 2 1080p and Cyberpunk 2077 Phantom Liberty 4K ray tracing.
| low | med. | high | ultra | QHD | 4K DLSS | 4K | |
|---|---|---|---|---|---|---|---|
| GTA V (2015) | 187.6 | 187.6 | 187.4 | 160.1 | 155.3 | 182.1 | |
| The Witcher 3 (2015) | 558 | 430 | 210 | 159.3 | |||
| Dota 2 Reborn (2015) | 245 | 228 | 226 | 202 | 203 | ||
| Final Fantasy XV Benchmark (2018) | 235 | 235 | 209 | 168.8 | 98.9 | ||
| X-Plane 11.11 (2018) | 224 | 196.7 | 150 | 127.8 | |||
| Far Cry 5 (2018) | 203 | 197 | 188 | 187 | 119 | ||
| Strange Brigade (2018) | 568 | 467 | 442 | 407 | 306 | 161.9 | |
| Shadow of the Tomb Raider (2018) | 273 | 269 | 256 | 205 | 109.5 | ||
| Metro Exodus (2019) | 236 | 193.5 | 158.3 | 130.9 | 84.4 | ||
| Control (2019) | 226 | 196.9 | 130.3 | 78.9 | 66.4 | ||
| Borderlands 3 (2019) | 192.1 | 176.8 | 169.6 | 143.6 | 79.4 | ||
| Mafia Definitive Edition (2020) | 239 | 231 | 181 | 96.6 | |||
| Watch Dogs Legion (2020) | 171.2 | 159.3 | 144.2 | 115.9 | 68.6 | ||
| Far Cry 6 (2021) | 209 | 191 | 169 | 154 | 91 | ||
| Dying Light 2 (2022) | 213 | 162.2 | 121.5 | 63.7 | |||
| Cyberpunk 2077 1.6 (2022) | 196.9 | 195.9 | 172.3 | 157.5 | 103.6 | 49.7 | |
| Ghostwire Tokyo (2022) | 278 | 282 | 283 | 217 | 99.2 | ||
| F1 22 (2022) | 371 | 384 | 336 | 144.9 | 95.1 | 48.9 | |
| The Callisto Protocol (2022) | 210.62 | 202.94 | 149.39 | 114.82 | 70.04 | ||
| F1 23 (2023) | 385 | 402 | 363 | 138.2 | 90 | 77.4 | 45.1 |
| Baldur's Gate 3 (2023) | 246 | 223 | 218 | 157.8 | 133.9 | 117.2 | |
| Cyberpunk 2077 (2023) | 188.5 | 188.5 | 170.8 | 150.3 | 94.9 | 42.3 | |
| Assassin's Creed Mirage (2023) | 221 | 206 | 170 | 136 | 112 | 84 | |
| Alan Wake 2 (2023) | 124.7 | 114.4 | 82.5 | 63.7 | 44.7 | ||
| Call of Duty Modern Warfare 3 2023 (2023) | 227 | 184 | 179 | 133 | 112 | 84 | |
| Avatar Frontiers of Pandora (2023) | 163 | 141.8 | 113.2 | 76.6 | 68.9 | 39.8 |
Emissions: Low fan noise but higher surface temperatures under load
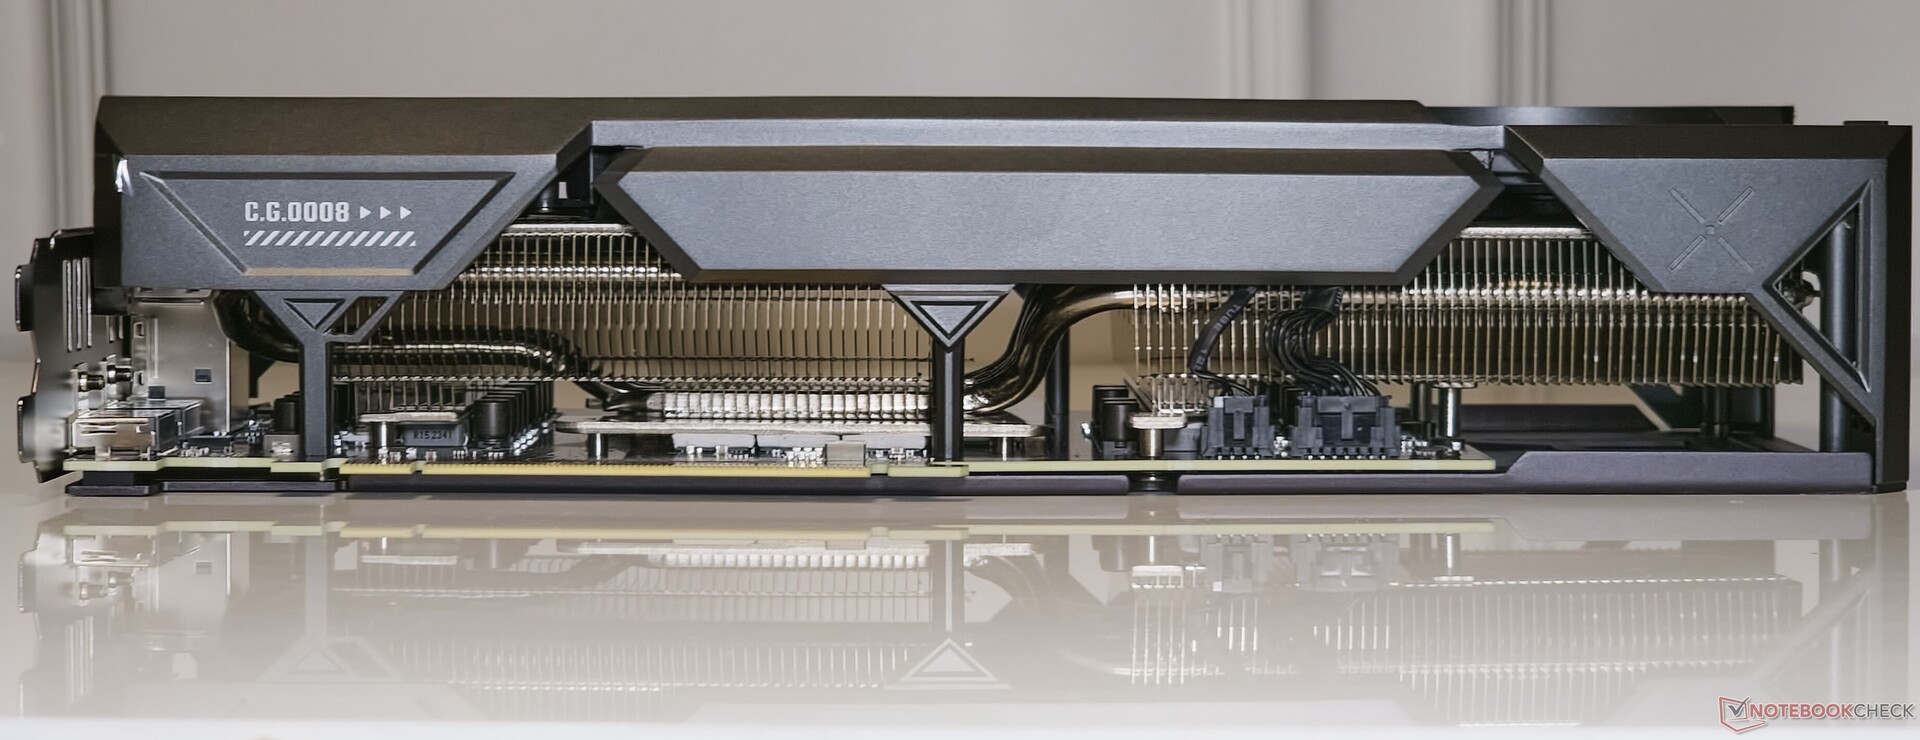
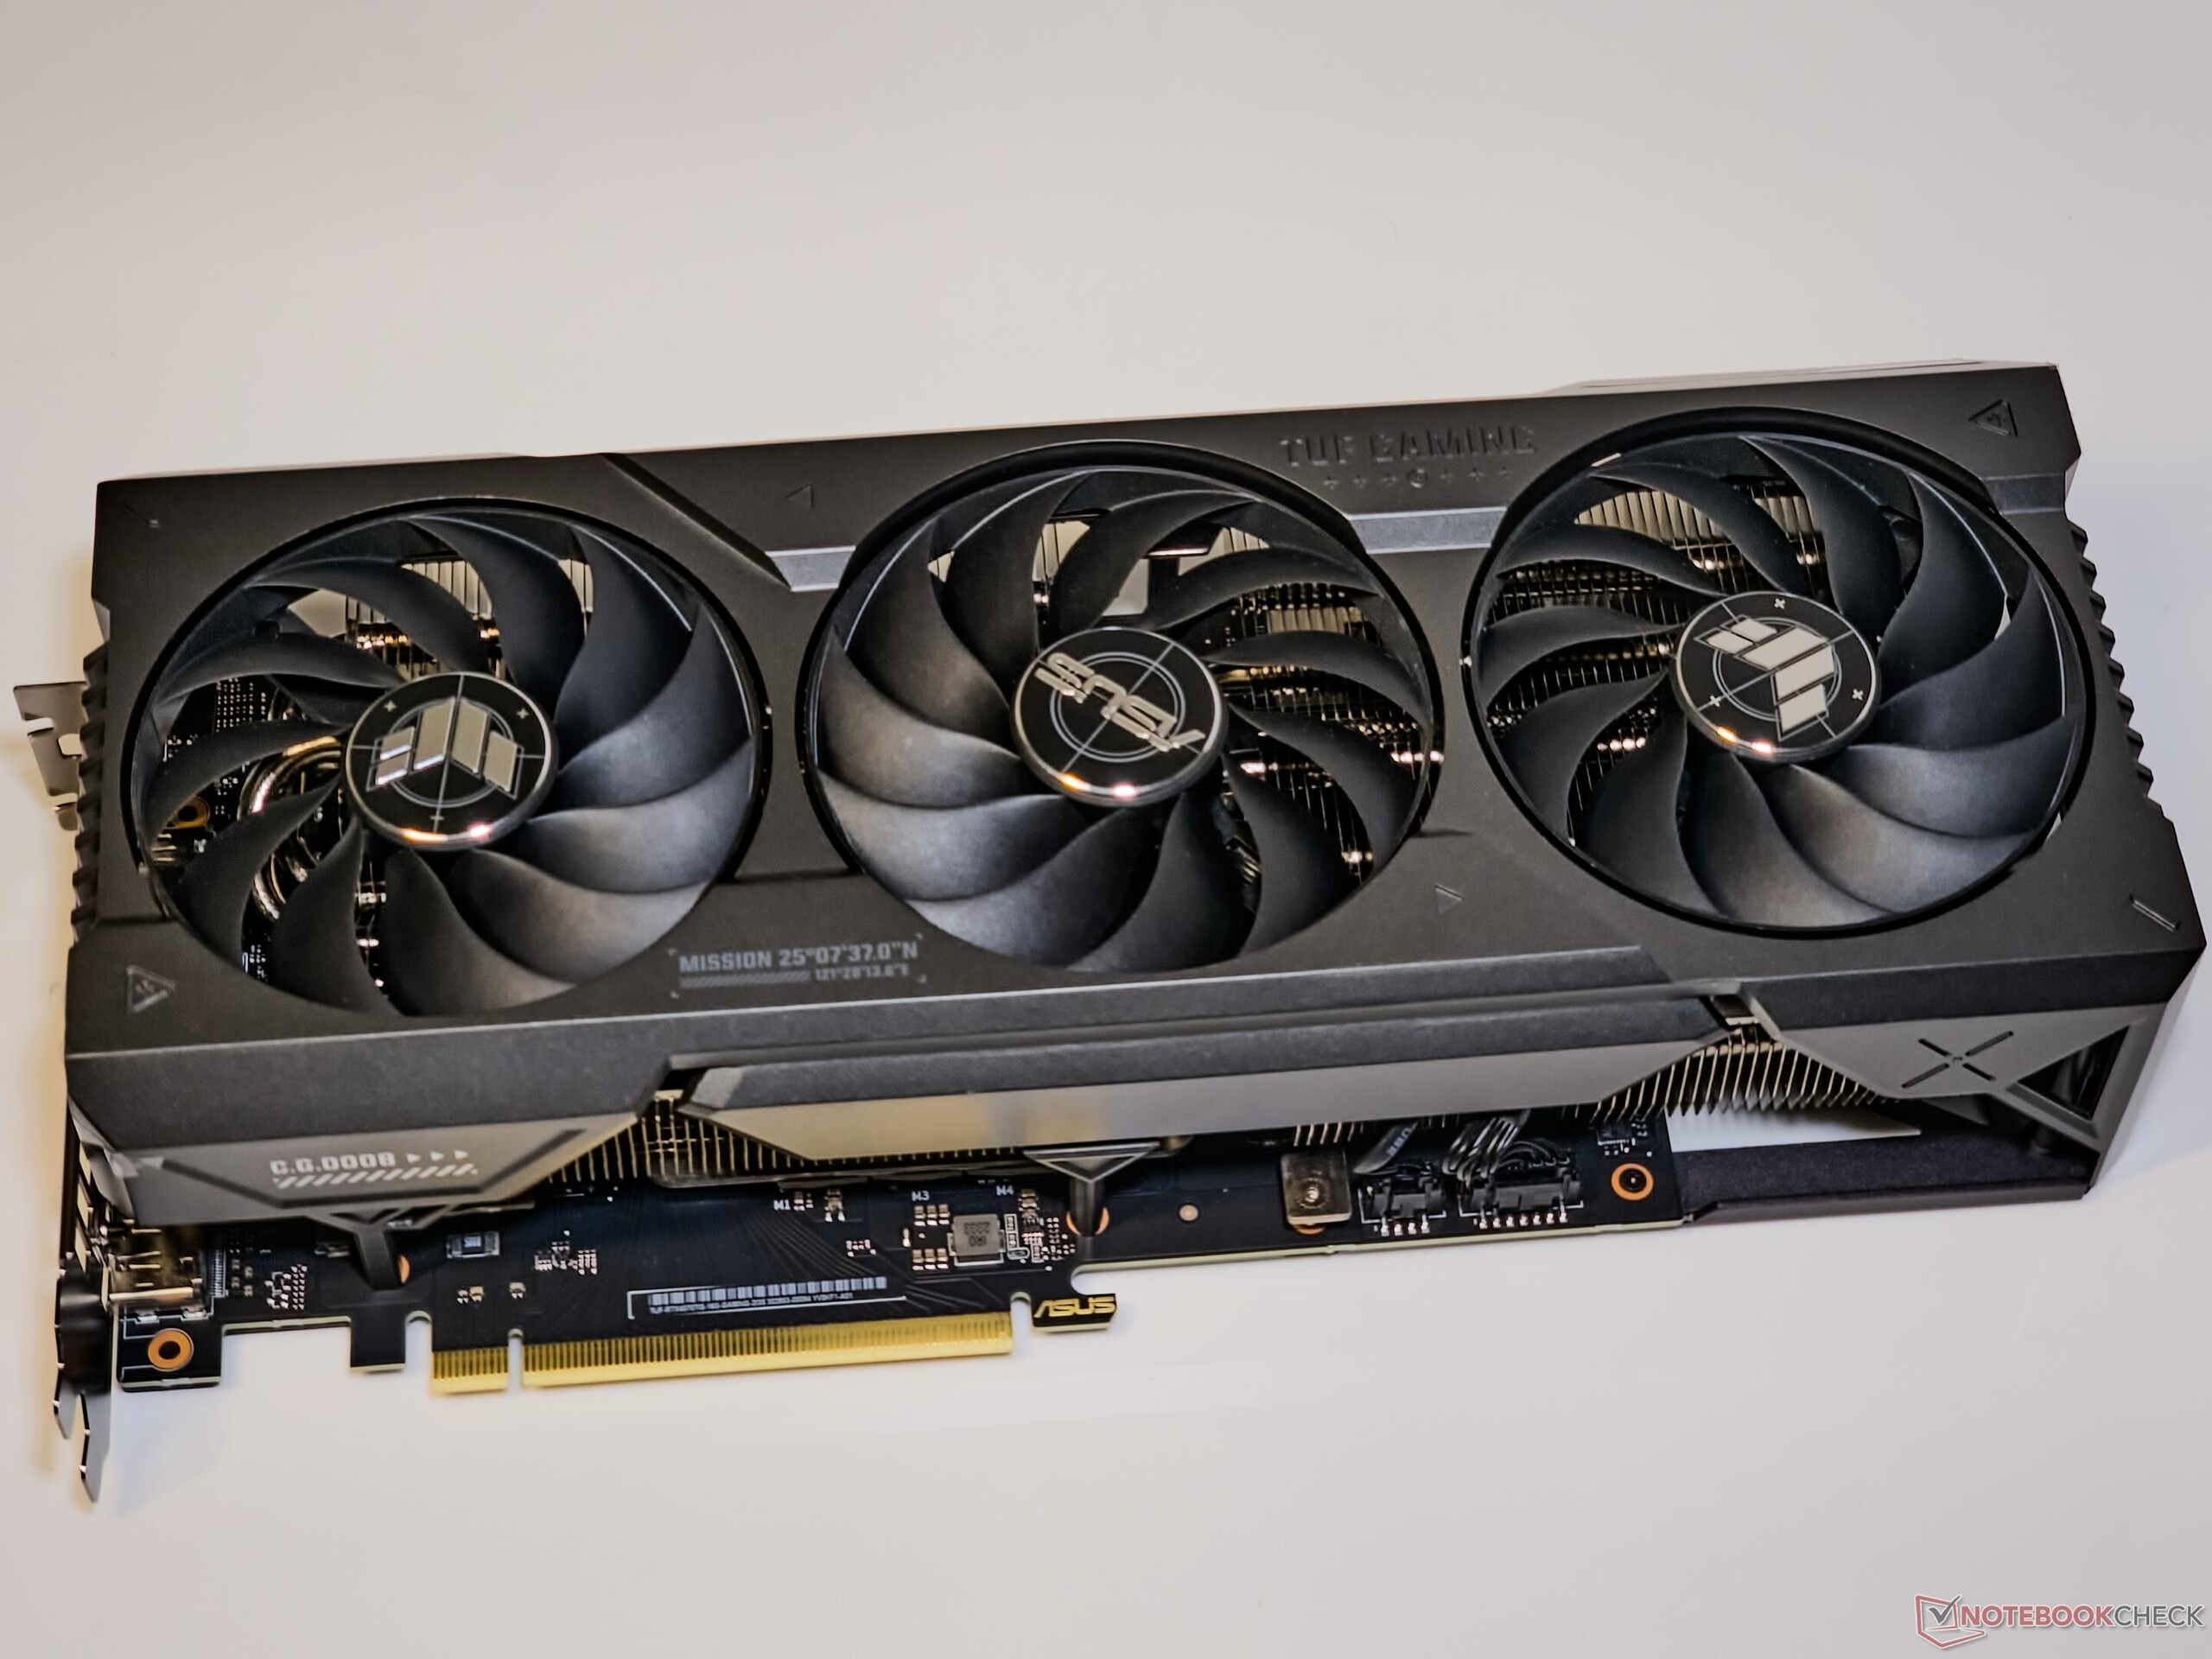
The Asus TUF Gaming GeForce RTX 4070 Ti Super features what the company refers to as axial-tech fans with dual ball bearings that are slated to reduce noise and last longer.
A nice touch is the ability to remove the metal shroud to clean the fans if needed without having to disassemble the card itself.
The TUF Gaming GeForce RTX 4070 Ti Super employs a total of six heatpipes for efficient heat transfer from the GPU, VRM, and memory.
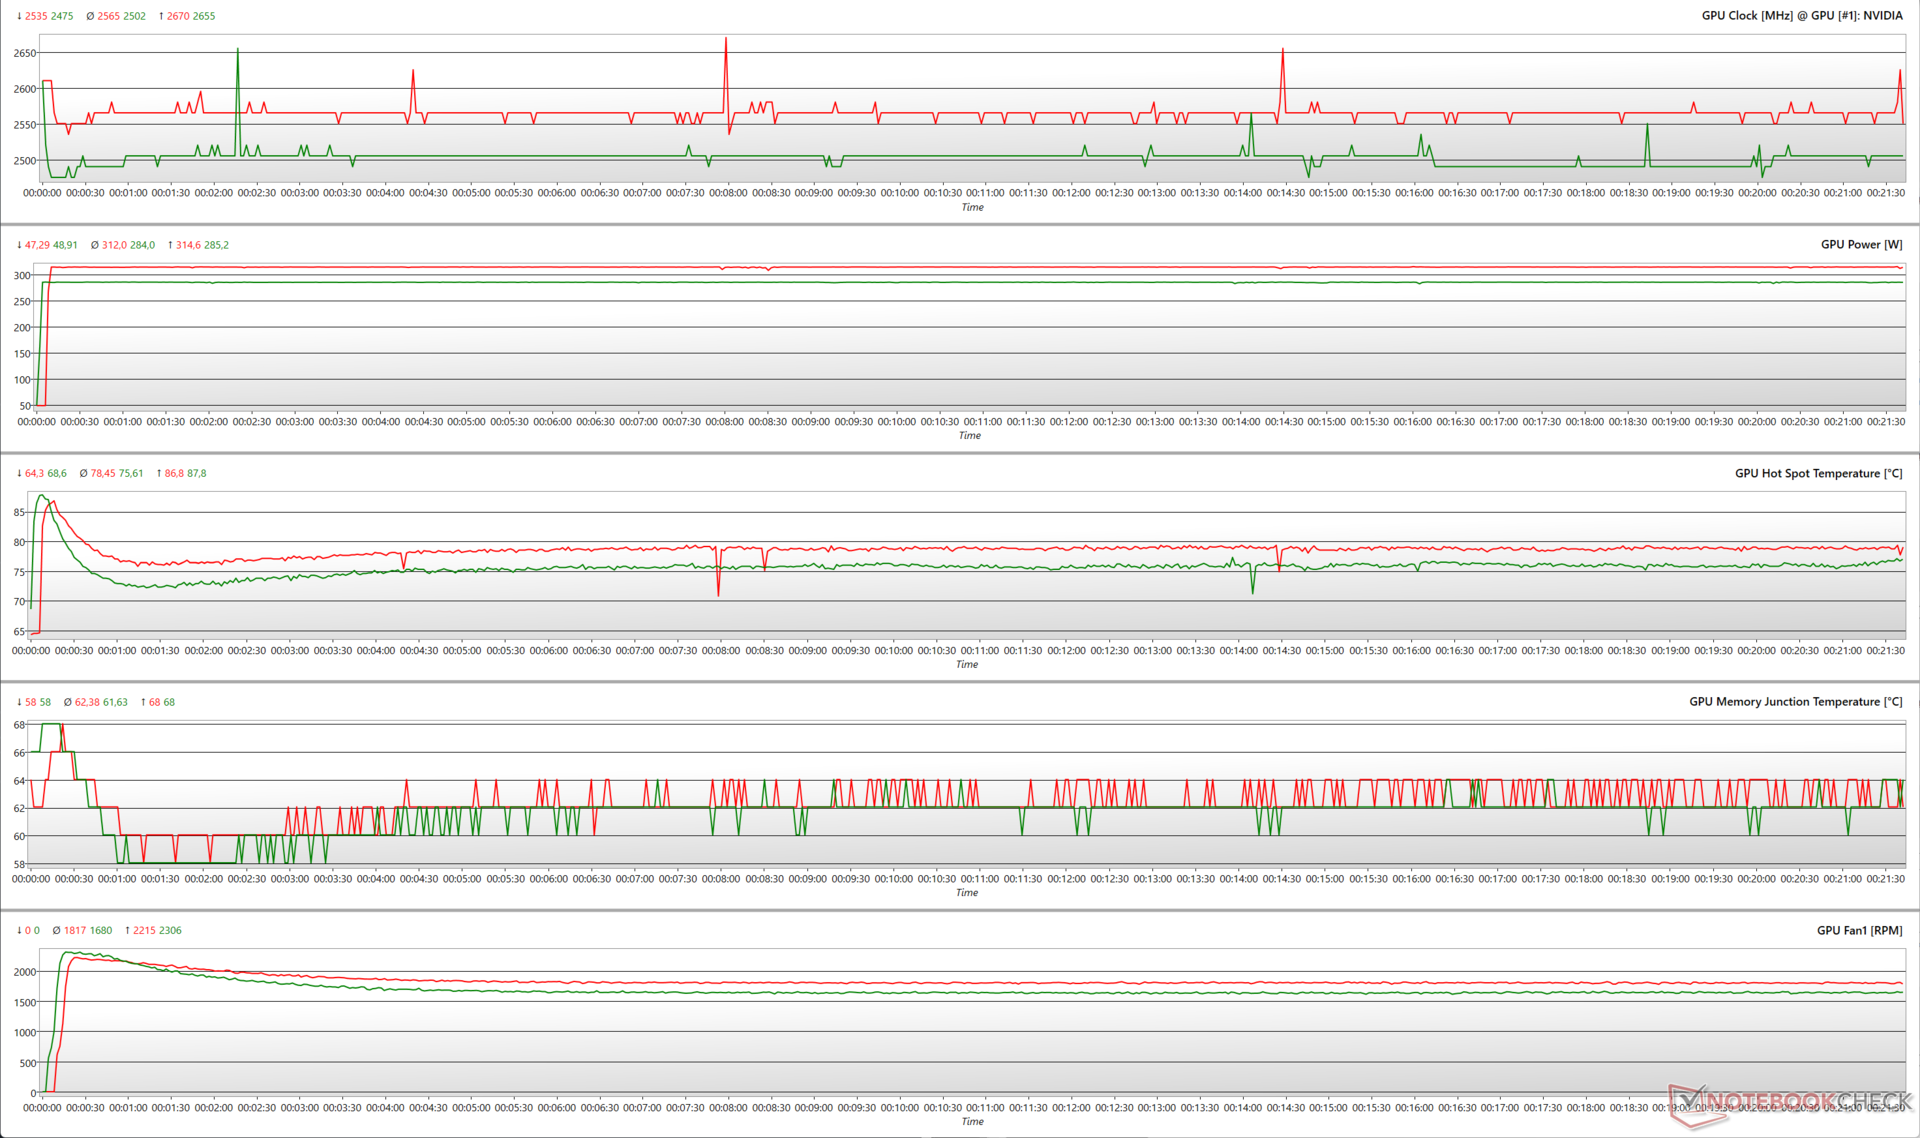
Stress tests
At a 100% power target (PT), the TUF Gaming GeForce RTX 4070 Ti Super can boost up to 2,655 MHz during a FurMark stress at 1280 x 720 with no AA while utilizing a 285 W TGP.
Increasing the power target to 110% sees the card hitting boosts up to 2,670 MHz while consuming nearly 315 W. This also results in a slightly higher average hot spot temperature of ~78.5 °C and a higher average fan speed of 1,817 RPM.
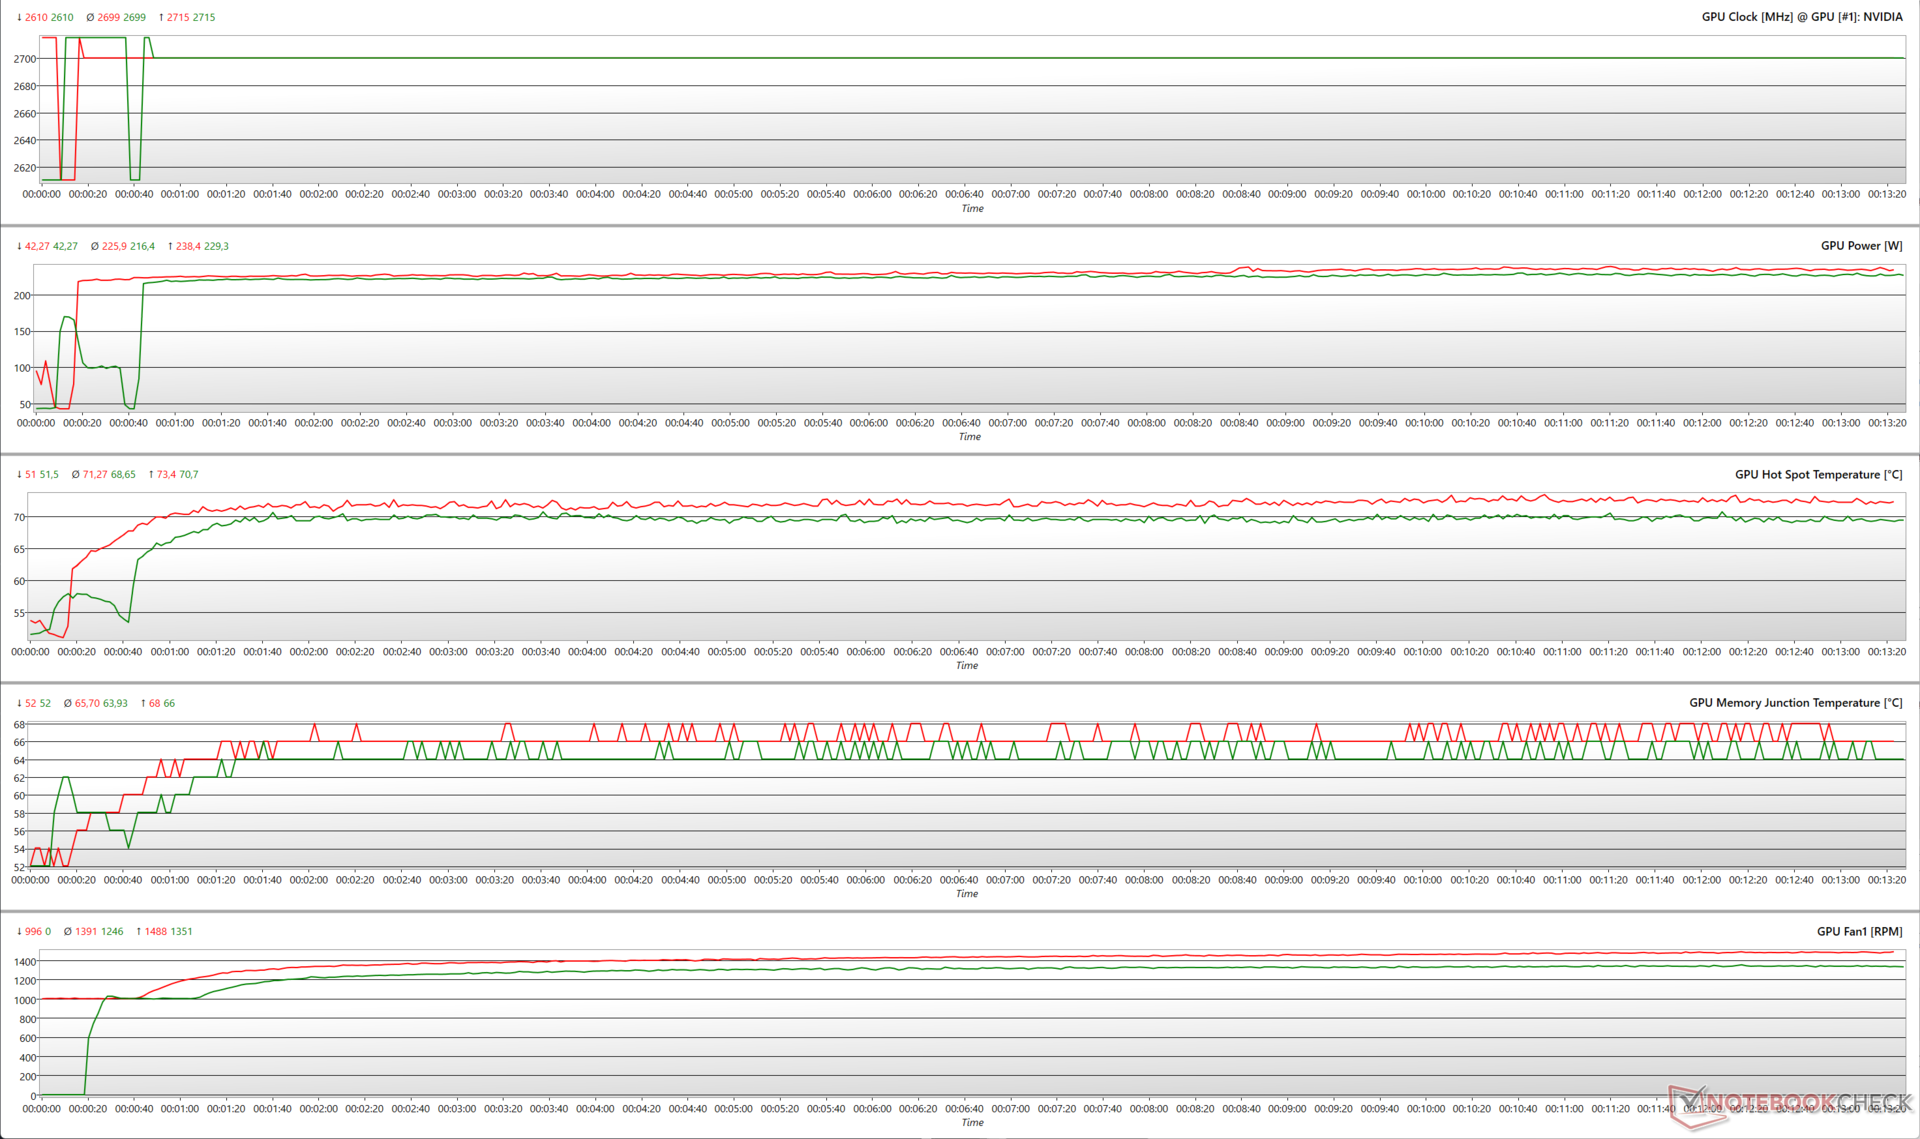
Stressing with The Witcher 3 at 1080p Ultra shows a similar clock profile at both 100% PT and 110% PT with max boosts at 2,715 MHz. The RTX 4070 Ti Super does not need to utilize all the available 315 W headroom to attain this clock — a behavior that is consistent with other Ada GPUs we've reviewed so far.
The average GPU hot spot temperature and average fan speeds see only nominal increases of 3.8% and 11%, respectively at 110% PT.
The Witcher 3 FPS Chart
Asus's cooling system appears to be doing a good job in helping the TUF Gaming GeForce RTX 4070 Ti Super maintain steady frame rates in The Witcher 3 at both 1080p Ultra and 4K Ultra.
4K Ultra shows an initial dip from 109 to 101 fps, but the card manages a fairly consistent frame rate thereafter.
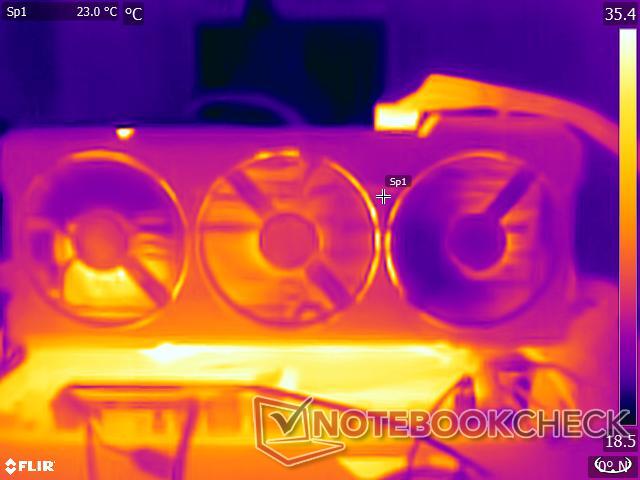
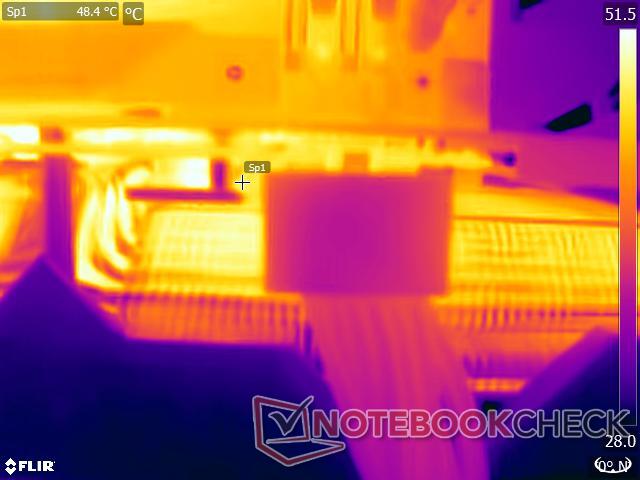
Surface temperatures
While the cooling system is able to ensure a throttle-free performance for the GPU itself, we find that the TUF Gaming GeForce RTX 4070 Ti Super shows relatively high surface temperatures.
At an ambient temperature of 22 °C, the metal front shroud does not get very warm, but the backplate heats up to ~56 °C while the GPU area can hit 76 °C. The area around the 12VHPWR connector stays relatively cool at 48.4 °C.


Noise levels
Asus's triple-fan implementation generally has tolerable fan noise emissions, which we've seen before with the TUF Gaming GeForce RTX 4070 Ti OC as well.
Among the three fans in the TUF RTX 4070 Ti Super, two rotate counterclockwise while the center fan balances with a clockwise spin. Asus implements a complete fan stop when in idle, with 55 °C being the core temperature threshold before the fans start up.
The TUF Gaming RTX 4070 Ti Super allows toggling between the Performance and Quiet VBIOS modes. The Quiet mode allows for tighter fan curves, and all other parameters are unaffected. That being said, there is no discernable difference between these VBIOS modes for all practical purposes.
The card remained under 35 dB(A) across all FurMark loads and under 30 dB(A) during The Witcher 3 1080p Ultra stress. The maximum sound pressure level (SPL) we recorded was 35.88 dB(A) in the Performance VBIOS at a 110% PT.
This is a good improvement over the earlier TUF RTX 4070 Ti OC, which had emissions nearing 46 dB(A) in FurMark load. Also note that our SPL measurements were taken with an open test bench setup, which means that the fans should be practically inaudible in a typical ATX case.
| Stress Test | VBIOS Mode / Power Target | Fan Noise dB(A) |
|---|---|---|
| FurMark 1280 x 720, no AA | Performance / 100% | 33.71 |
| FurMark 1280 x 720, no AA | Quiet / 100% | 33.05 |
| FurMark 1280 x 720, no AA | Performance / 110% | 35.88 |
| FurMark 1280 x 720, no AA | Quiet / 110% | 35.55 |
| The Witcher 3 1080p Ultra | Performance / 100% | 28.40 |
| The Witcher 3 1080p Ultra | Quiet / 100% | 27.77 |
| The Witcher 3 1080p Ultra | Performance / 110% | 29.51 |
| The Witcher 3 1080p Ultra | Quiet / 110% | 28.55 |
Energy Management: Frugal power draws than the RTX 4070 Ti
Despite a spec bump, the TUF RTX 4070 Ti Super is quite thrifty when it comes to power consumption and is even more economical than the RTX 4070 Ti average in both FurMark and The Witcher 3 power consumption tests. In terms of power efficiency, the TUF RTX 4070 Ti Super is right on the heels of the RTX 4090 Founders Edition.
As is the norm with Nvidia Ada Lovelace cards, the RTX 4070 Ti Super shows similar total system power draws from the wall at both 100% and 110% power targets in The Witcher 3 at 1080p Ultra. This is in line with our observations in the stress test above.
Power Consumption: External monitor
| 1280x720 FurMark 1.19 GPU Stress Test (external Monitor) | |
| 1920x1080 The Witcher 3 ultra (external Monitor) | |
* ... smaller is better
Pros
Cons
Verdict: What the original RTX 4070 Ti should have been

The RTX 4070 Ti Super supplants the original RTX 4070 Ti at the same US$799 MSRP. Unlike the RTX 4070 Super, which sees a substantial 21% increase in shaders from the RTX 4070, the RTX 4070 Ti Super offers only a 10% increase in CUDA cores compared to the RTX 4070 Ti, which may not always offer tangible gains in real-world gaming scenarios.
However, the transition to AD103 silicon means that the RTX 4070 Ti Super is now a more "complete mid-range GPU" of sorts that shares the dinner table with the likes of the RTX 4080 and the RTX 4080 Super. A consequential benefit is a faster 256-bit memory subsystem and 16 GB GDDR6X VRAM that AD104 simply cannot support.
On its part, the Asus TUF Gaming GeForce RTX 4070 Ti Super offers superb build quality, added ports, and excellent performance based on reference specifications. While there's an OC SKU as well, the tested US$799 base SKU provides everything that you need to make the most of the latest AD103 entrant.
The new AD103-based Asus TUF Gaming GeForce RTX 4070 Ti Super does 1440p Ultra high frame rate gaming with elan while also offering decent 4K Ultra and compute capabilities, thus meriting serious consideration at the US$799 asking price.
Asus has equipped the TUF Gaming GeForce RTX 4070 Ti Super with a robust cooling system. Although surface temperatures appear to be on the higher side, the triple-fan six-heatpipe cooling allows the AD103 GPU to perform without throttling concerns with highly tolerable fan noise levels.
The RTX 4070 Ti Super works wonders for 1440p Ultra gaming, but it's frankly an overkill for this resolution. If you are primarily a 1440p gamer who doesn't dabble much with compute workloads, you can save a good US$200 by opting for the RTX 4070 Super instead.
AMD Radeon RX 7900 XT cards such as the XFX Speedster MERC310 (US$740 on Amazon) or the Asus TUF Gaming RX 7900 XT OC (US$880 on Amazon) are viable options too, especially if you prioritize raster performance alone and are happy with FSR upscaling.
That being said, the TUF Gaming RTX 4070 Ti Super offers a better overall proposition given its superior ray tracing prowess and support for DLSS 3 frame generation and DLSS 3.5 ray reconstruction.
Interesting, considering that the RTX 3090 Ti, which this card handsomely displaces, costed 2.5x at MSRP back in the day.
Price and Availability
The Asus TUF Gaming GeForce RTX 4070 Ti Super can be had from Best Buy US for US$800 for the base variant while the OC SKU retails for US$850.
In India, the TUF Gaming GeForce RTX 4070 Ti Super is officially priced at ₹95,000 with the actual price depending on the distributor. Amazon India is currently offering the OC edition of this card for ₹1,08,499.
Transparency
The selection of devices to be reviewed is made by our editorial team. The test sample was provided to the author as a loan by the manufacturer or retailer for the purpose of this review. The lender had no influence on this review, nor did the manufacturer receive a copy of this review before publication. There was no obligation to publish this review. As an independent media company, Notebookcheck is not subjected to the authority of manufacturers, retailers or publishers.
This is how Notebookcheck is testing
Every year, Notebookcheck independently reviews hundreds of laptops and smartphones using standardized procedures to ensure that all results are comparable. We have continuously developed our test methods for around 20 years and set industry standards in the process. In our test labs, high-quality measuring equipment is utilized by experienced technicians and editors. These tests involve a multi-stage validation process. Our complex rating system is based on hundreds of well-founded measurements and benchmarks, which maintains objectivity. Further information on our test methods can be found here.
Price comparison
