Gigabyte Aorus GeForce RTX 4070 Ti Master 12G Review: RTX 3090 Ti challenger with added bling for US$1,000
Nvidia released the AD104-based RTX 4070 Ti in early January with boisterous performance claims at a US$799 MSRP. Unlike the RTX 4080 FE and the RTX 4090 FE, there are no Founders Edition cards this time around, but a bevy of add-in board (AiB) partner cards are in the offing.
We've previously reviewed the Asus TUF Gaming GeForce RTX 4070 Ti OC Edition and now we have with us the Gigabyte Aorus GeForce RTX 4070 Ti Master 12G, which is the company's premium offering in the Aorus sub-brand for the RTX 4070 Ti.
The Gigabyte Aorus RTX 4070 Ti Master 12G retails in India for ₹94,127 and is available in the US for US$1,000. The card comes with a three-year warranty with an additional year offered on registering the product with Gigabyte.
In this review, we will look into what differentiates the flagship Aorus RTX 4070 Ti card from the competition and compare its performance to reviewed GPUs so far.
Comparison of the Aorus RTX 4070 Ti Master with other Nvidia GPUs
| Specification | RTX 4090 FE | RTX 4080 FE | Aorus RTX 4070 Ti Master | RTX 3090 Ti FE | RTX 3090 FE | RTX 3080 Ti FE | RTX 3080 FE | RTX 3070 FE | Titan RTX | Titan X Pascal |
| Chip | AD102 | AD103 | AD104 | GA102 | GA102 | GA102 | GA102 | GA104 | TU102 | GP102 |
| FinFET Process | Custom 4N | Custom 4N | Custom 4N | 8 nm | 8 nm | 8 nm | 8 nm | 8 nm | 12 nm | 16 nm |
| CUDA Cores | 16,384 | 9,728 | 7,680 | 10,752 | 10,496 | 10,240 | 8,704 | 5,888 | 4,608 | 3,584 |
| Texture Units | 512 | 304 | 240 | 336 | 328 | 320 | 272 | 184 | 288 | 224 |
| Tensor Cores | 512 4th Gen. | 304 4th Gen. | 240 4th Gen. | 336 3rd Gen. | 328 3rd Gen. | 320 3rd Gen. | 272 3rd Gen. | 184 3rd Gen. | 576 2nd Gen. | — |
| RT Cores | 128 3rd Gen. | 76 3rd Gen. | 60 3rd Gen. | 84 2nd Gen. | 82 2nd Gen. | 80 2nd Gen. | 68 2nd Gen. | 46 2nd Gen. | 72 | — |
| GPU Base Clock | 2,235 MHz | 2,205 MHz | 2,310 MHz | 1,560 MHz | 1,395 MHz | 1,365 MHz | 1,440 MHz | 1,500 MHz | 1,350 MHz | 1,417 MHz |
| GPU Boost Clock | 2,520 MHz | 2,505 MHz | 2,670 MHz | 1,860 MHz | 1,695 MHz | 1,665 MHz | 1,710 MHz | 1,750 MHz | 1,770 MHz | 1,531 MHz |
| Memory Bus | 384-bit | 256-bit | 192-bit | 384-bit | 384-bit | 384-bit | 320-bit | 256-bit | 384-bit | 384-bit |
| Memory Bandwidth | 1,008 GB/s | 716.8 GB/s | 504 GB/s | 1,008 GB/s | 936 GB/s | 912 GB/s | 760 GB/s | 448 GB/s | 672 GB/s | 480.4 GB/s |
| Video Memory | 24 GB GDDR6X | 16 GB GDDR6X | 12 GB GDDR6X | 24 GB GDDR6X | 24 GB GDDR6X | 12 GB GDDR6X | 10 GB GDDR6X | 8 GB GDDR6 | 24 GB GDDR6 | 12 GB GDDR5X |
| Power Consumption | 450 W | 320 W | 285 W | 450 W | 350 W | 350 W | 320 W | 220 W | 280 W | 250 W |
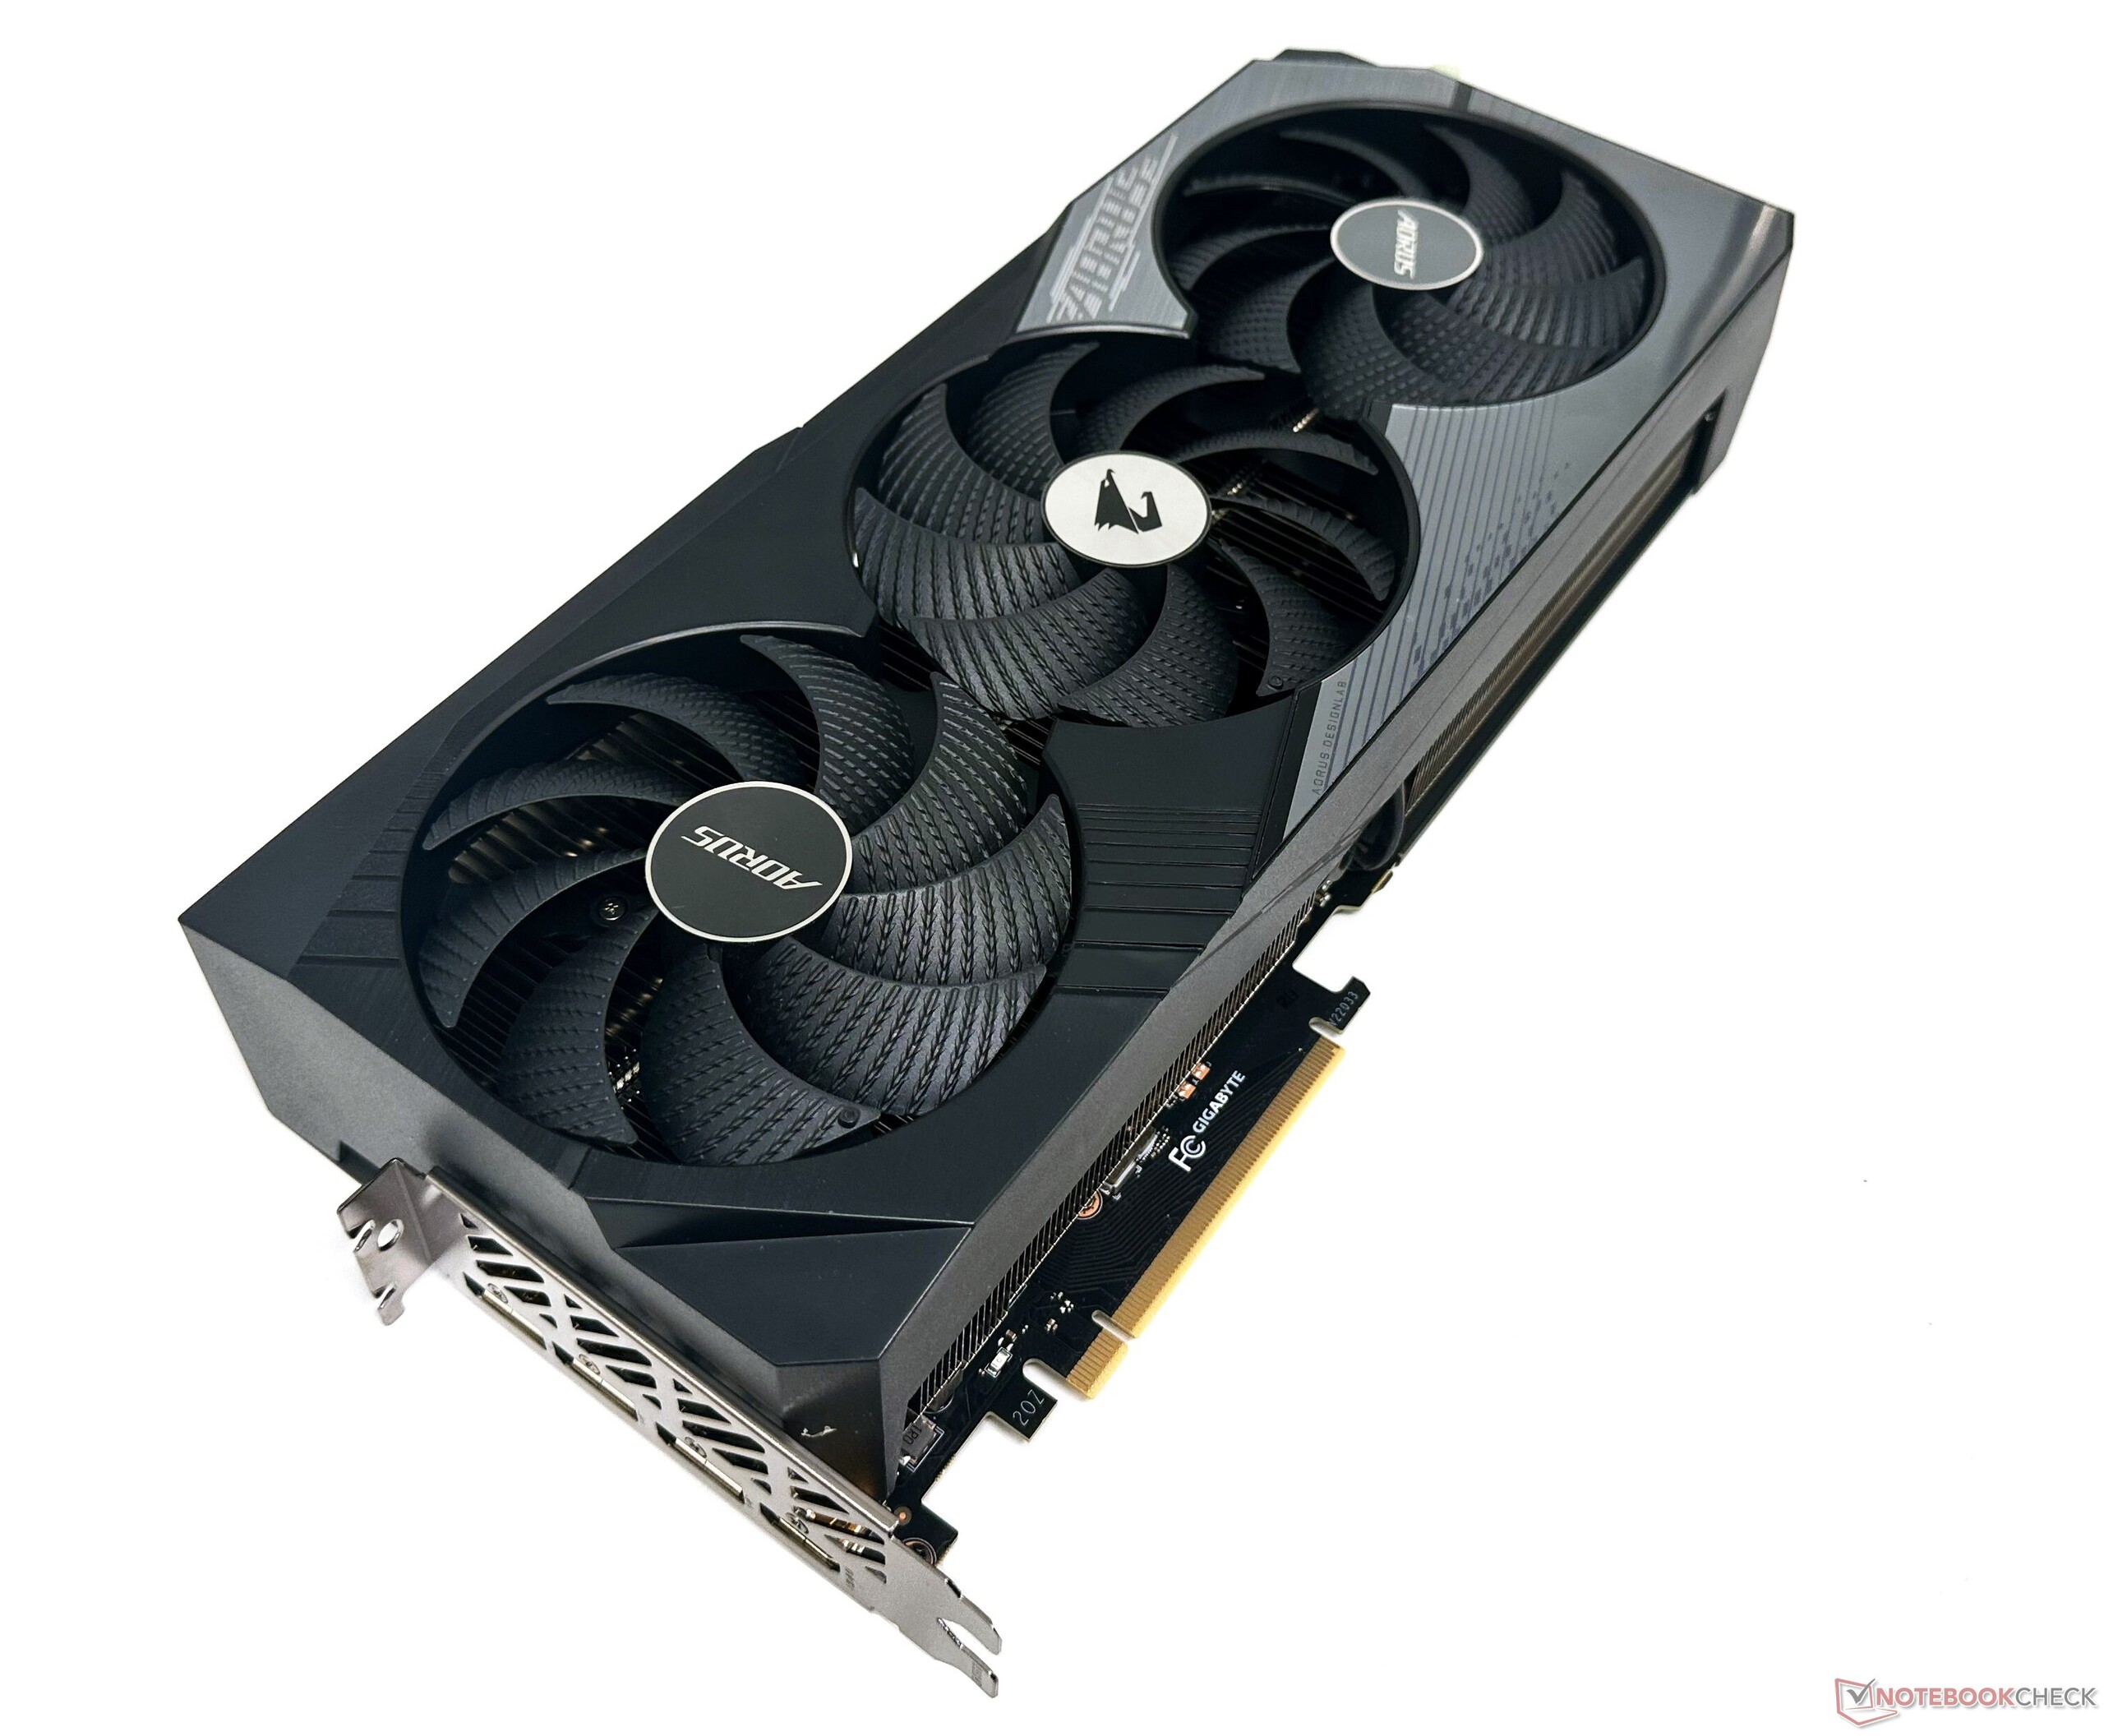
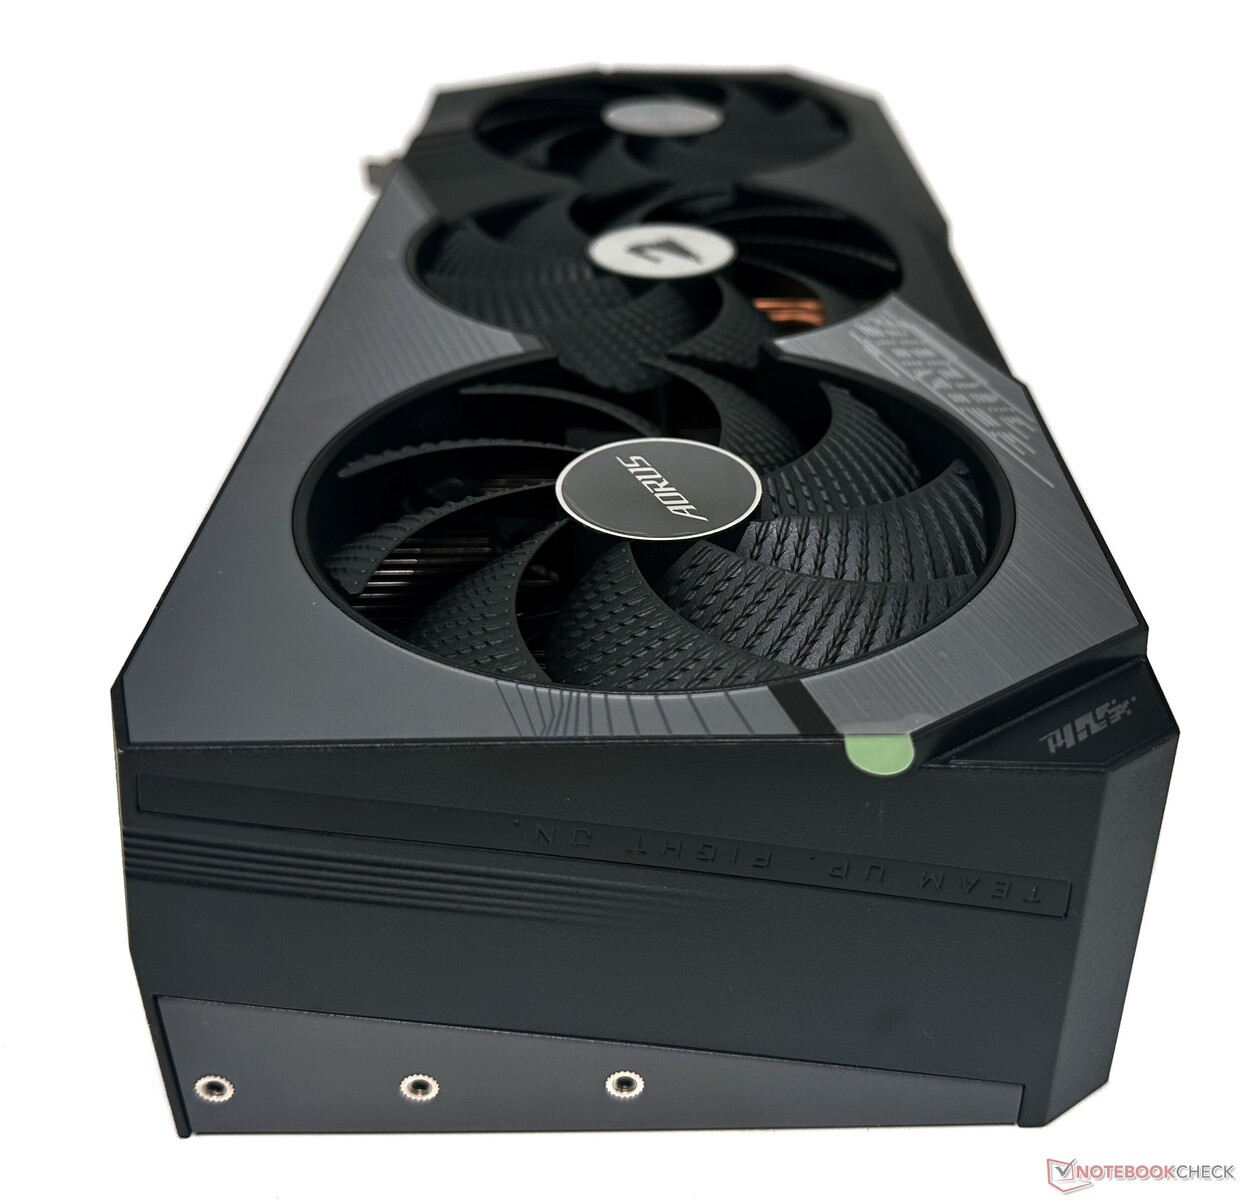
The Aorus GeForce RTX 4070 Ti Master up close
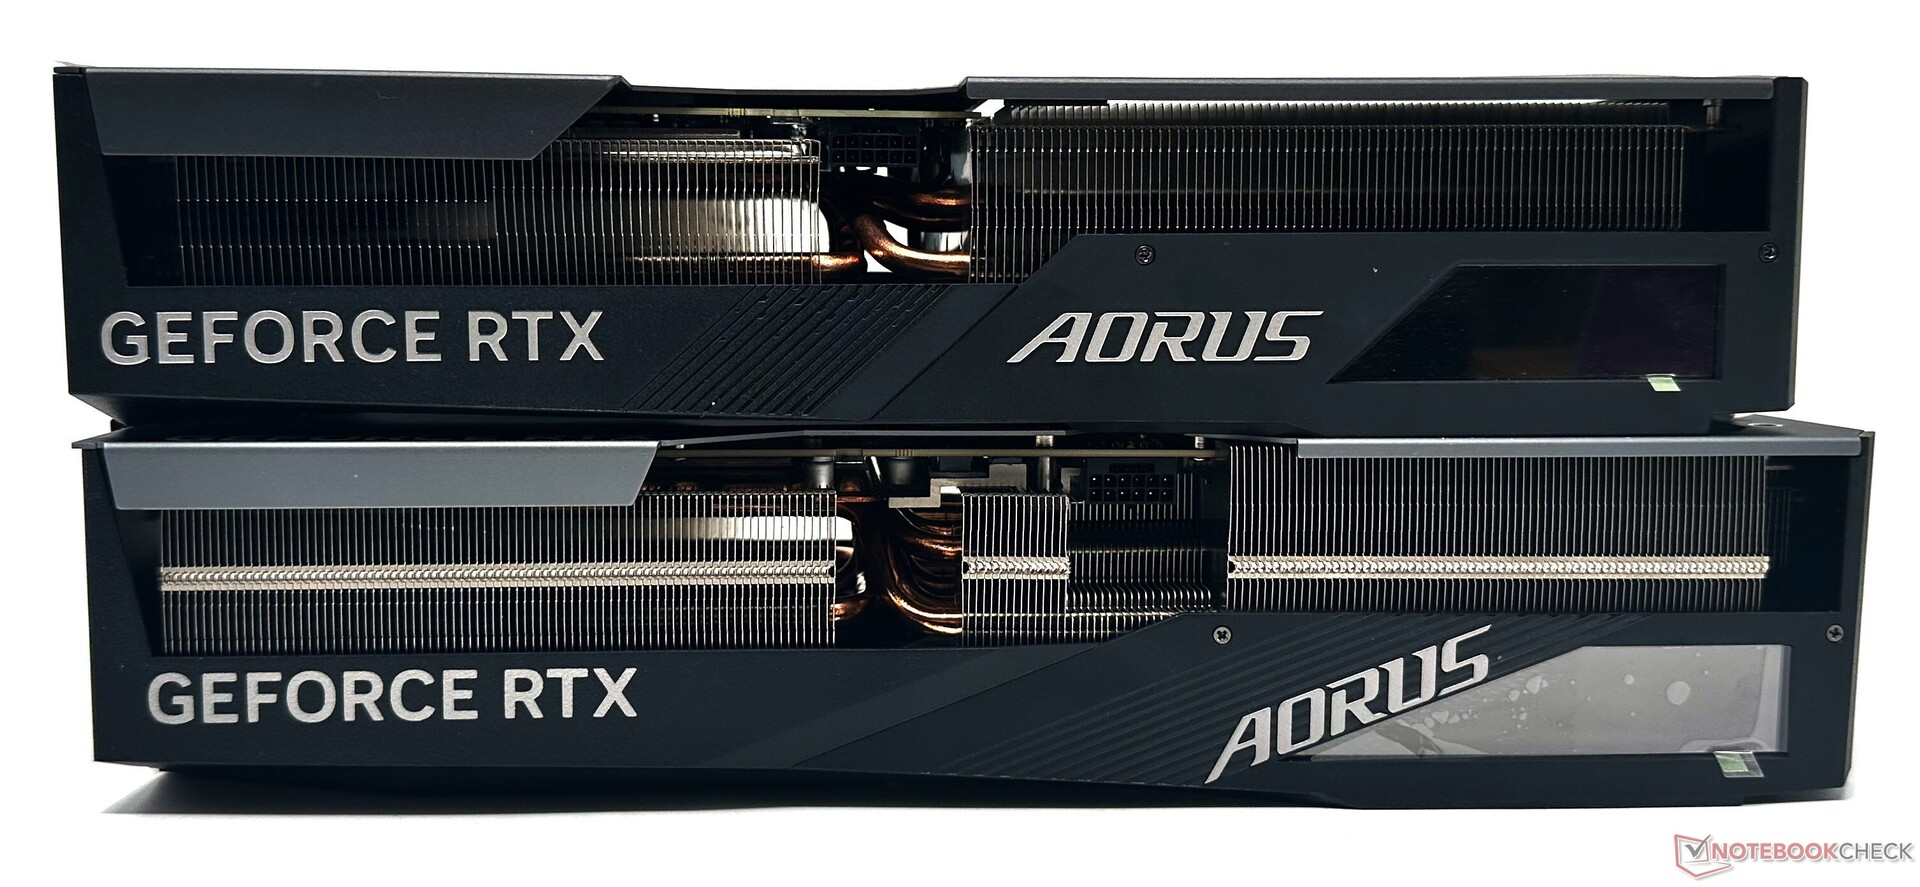
The Aorus GeForce RTX 4070 Ti Master looks pretty similar to the Aorus GeForce RTX 4080 Master at first glance but has comparatively smaller dimensions at 342 x 153 x 70.6 mm.
The length should pose no problems fitting inside a typical ATX case.
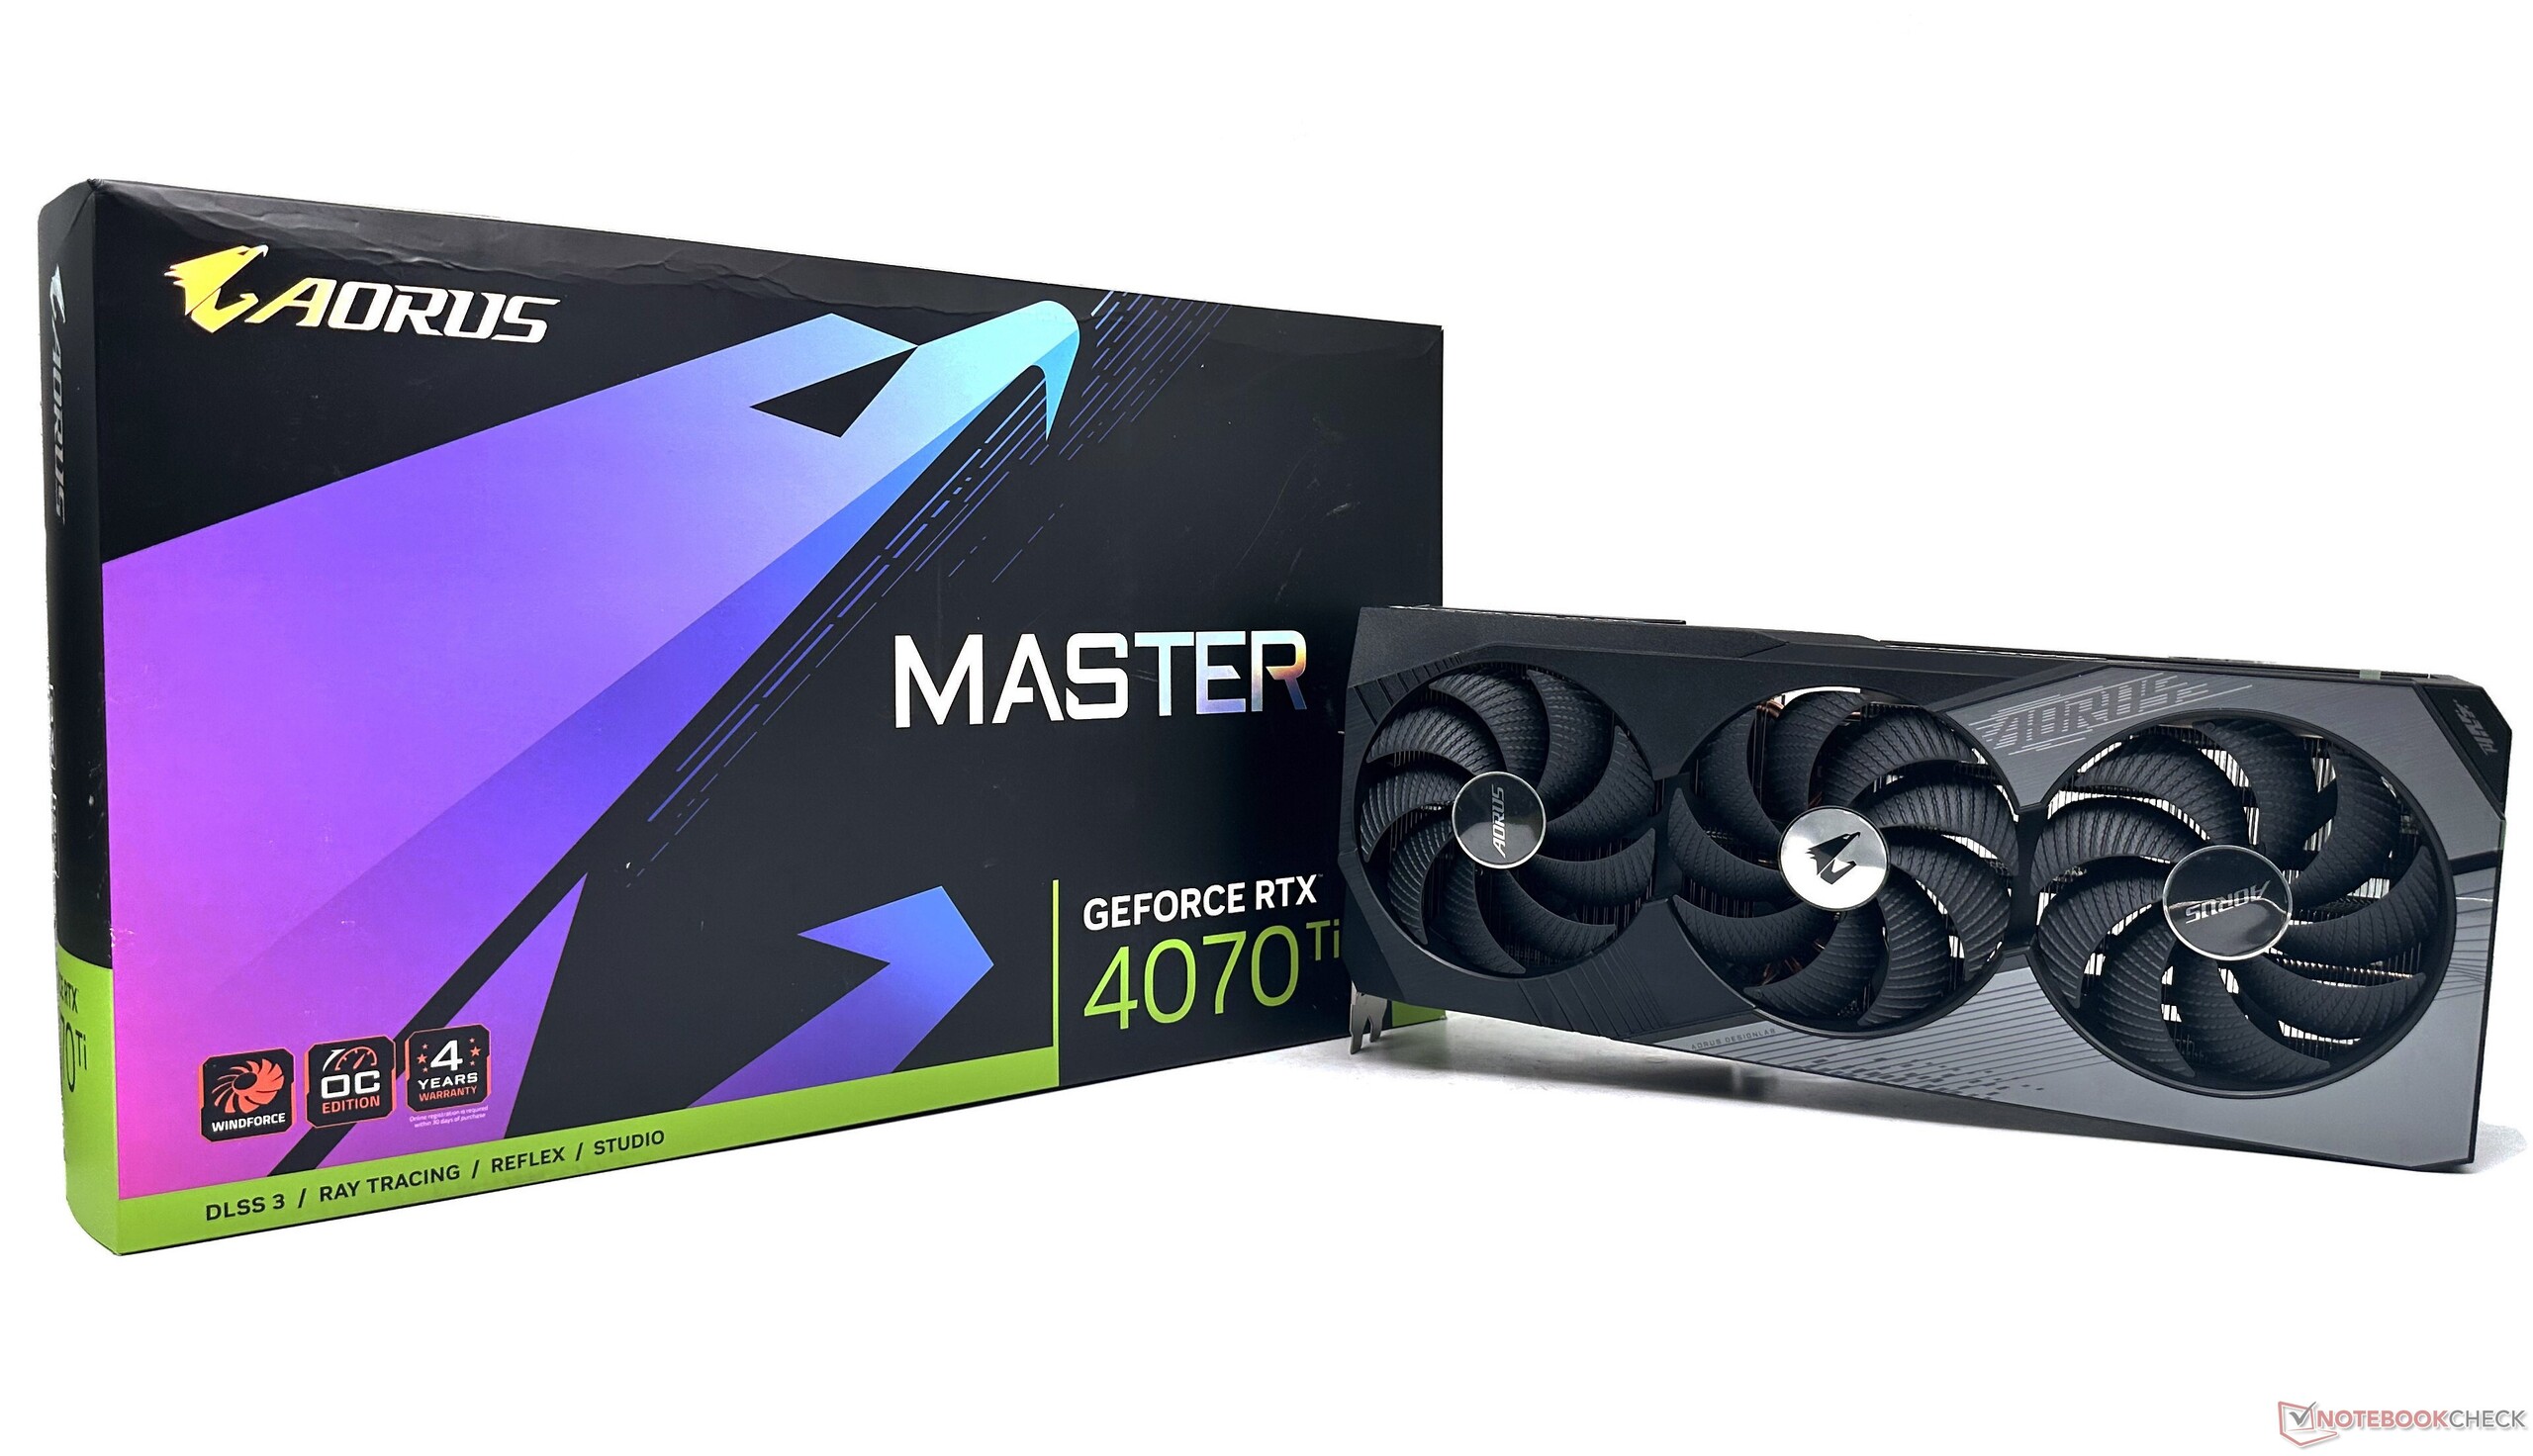
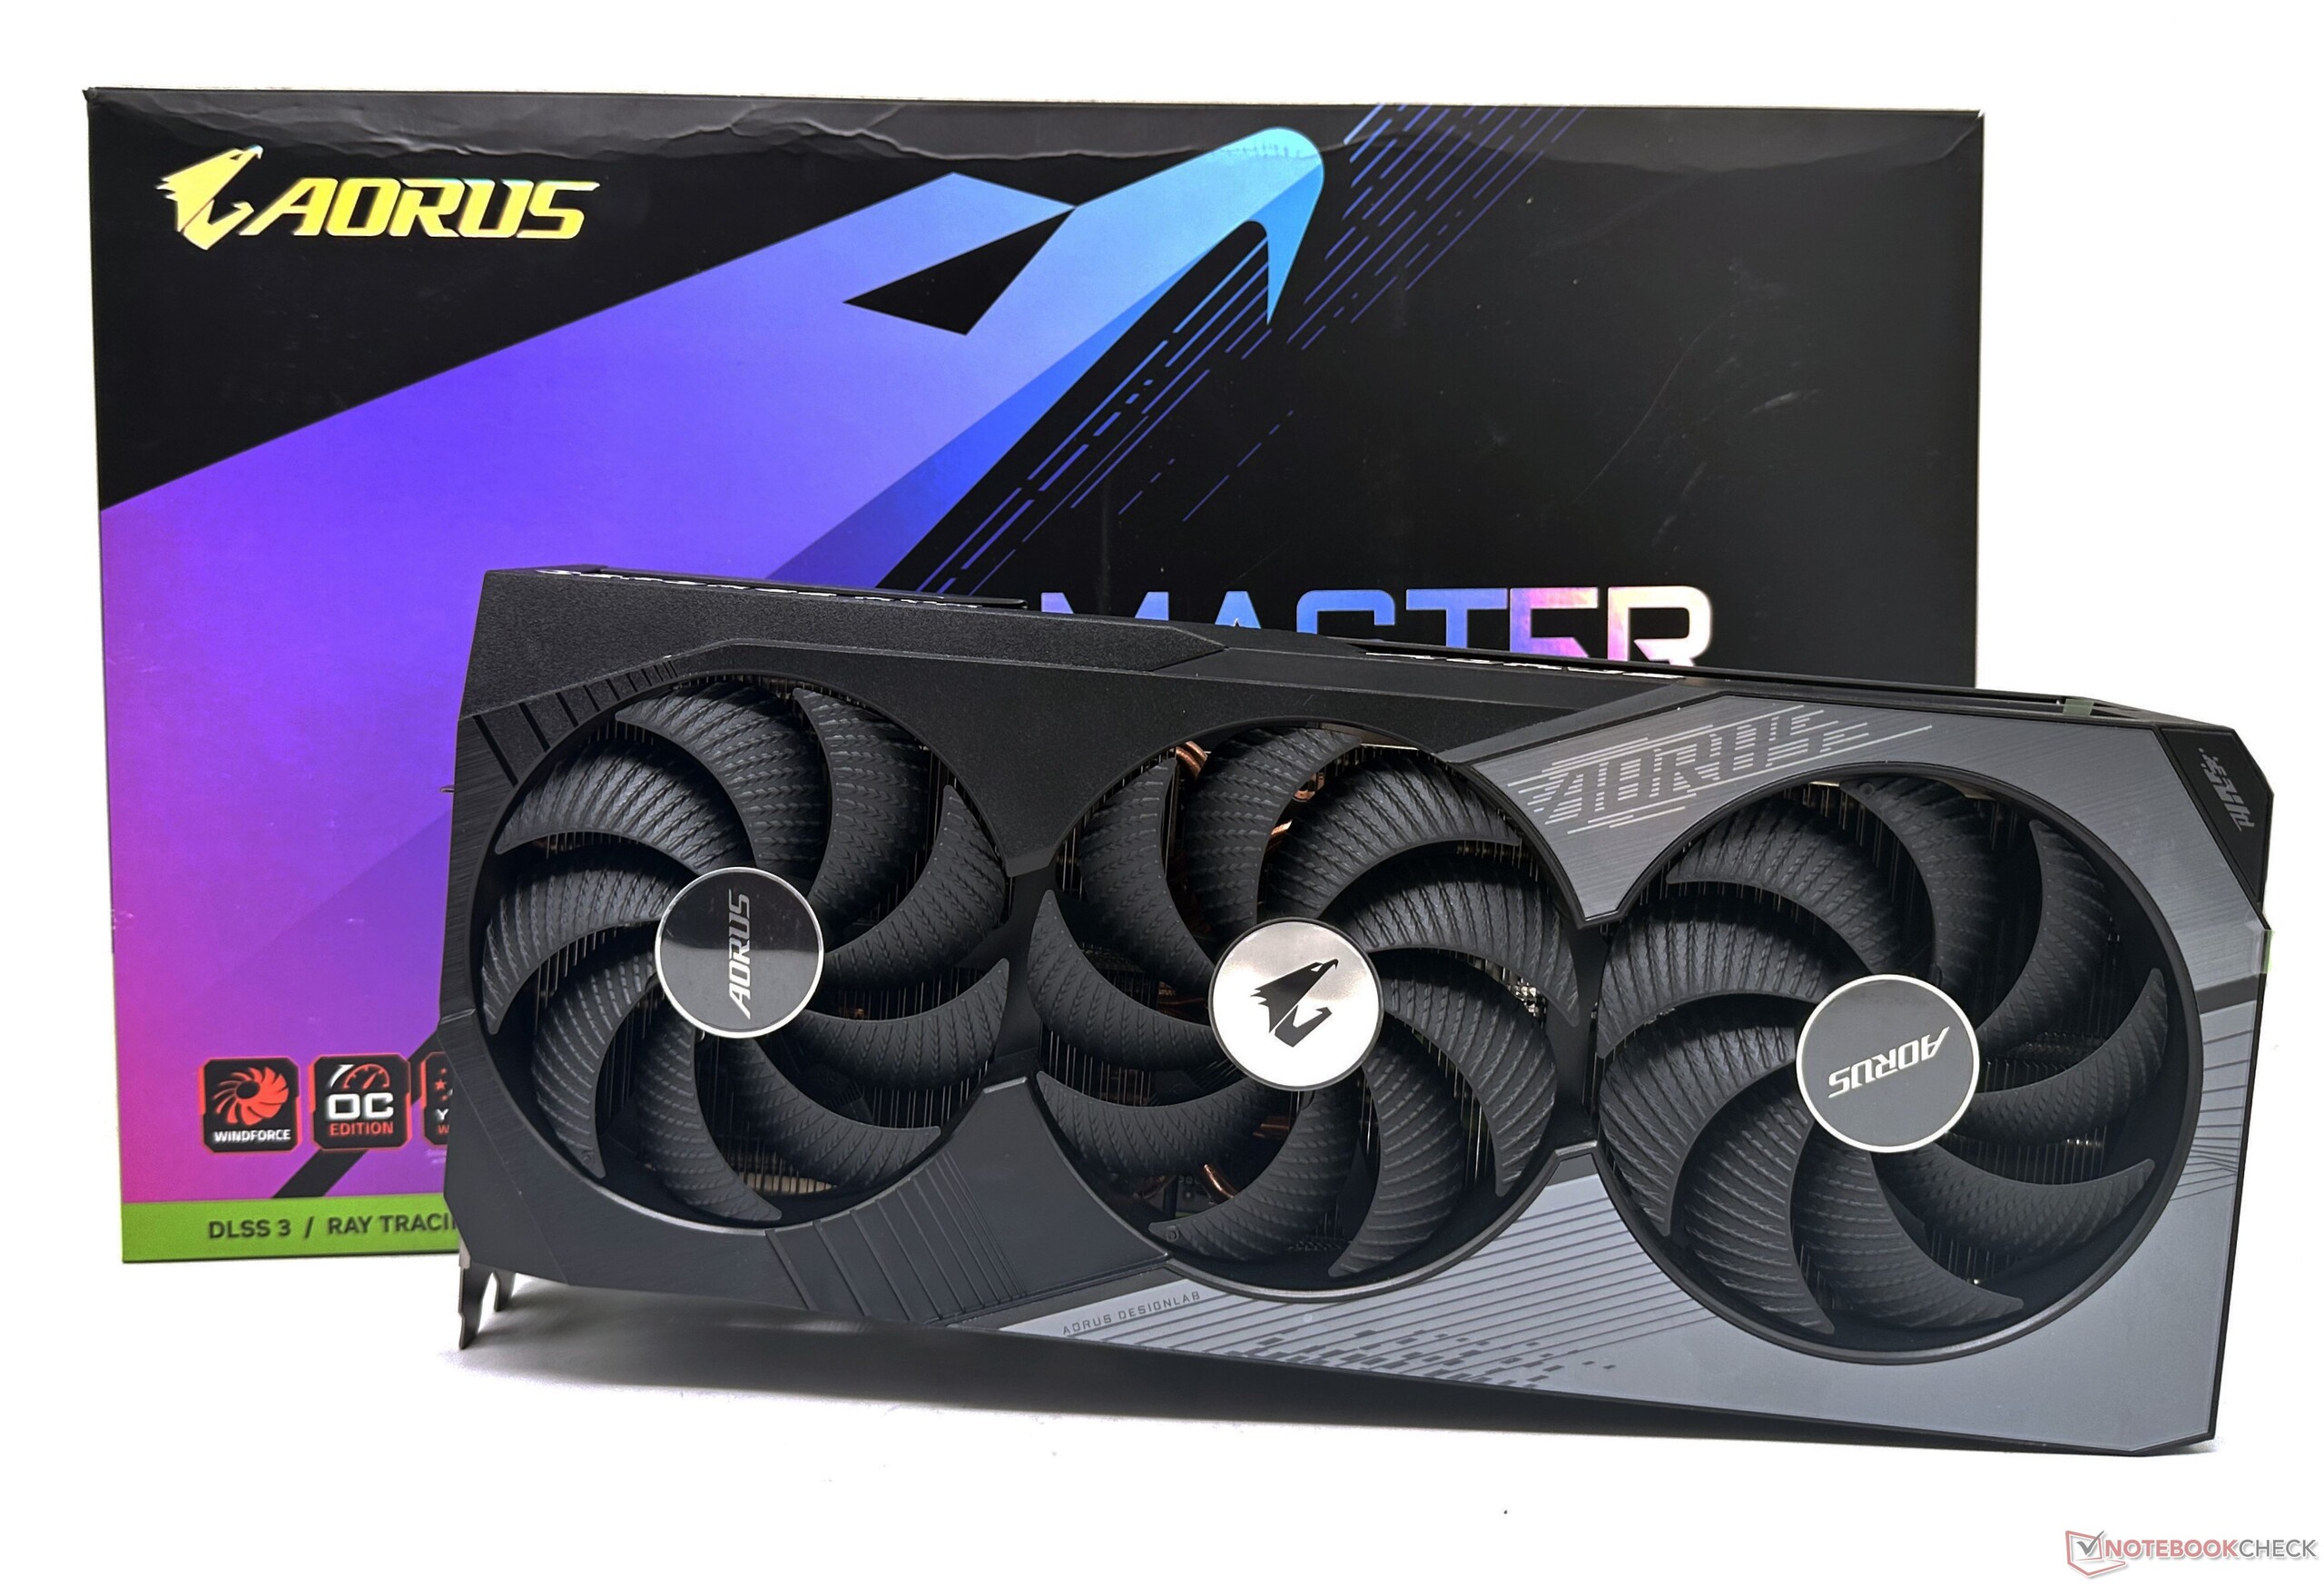
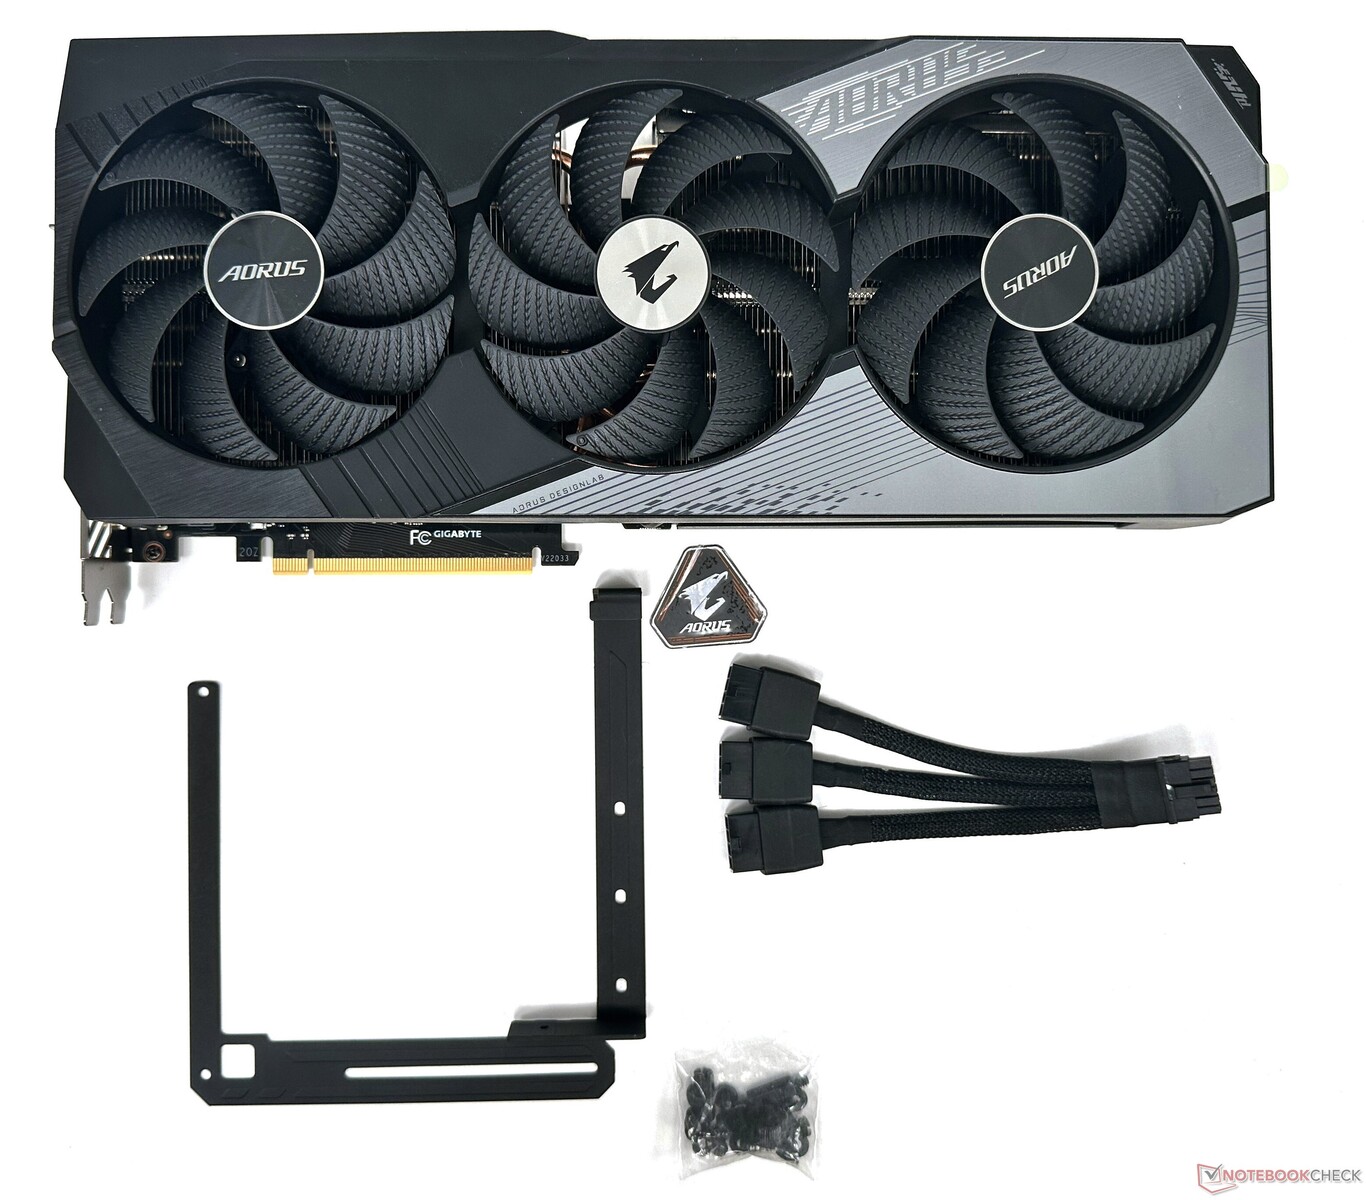
In the box, we find the following:
- Quick start guide
- Warranty info
- Anti-sag bracket, screws, and installation guide
- 12VHPWR to 3x 8-pin power cable
- Aorus metal sticker
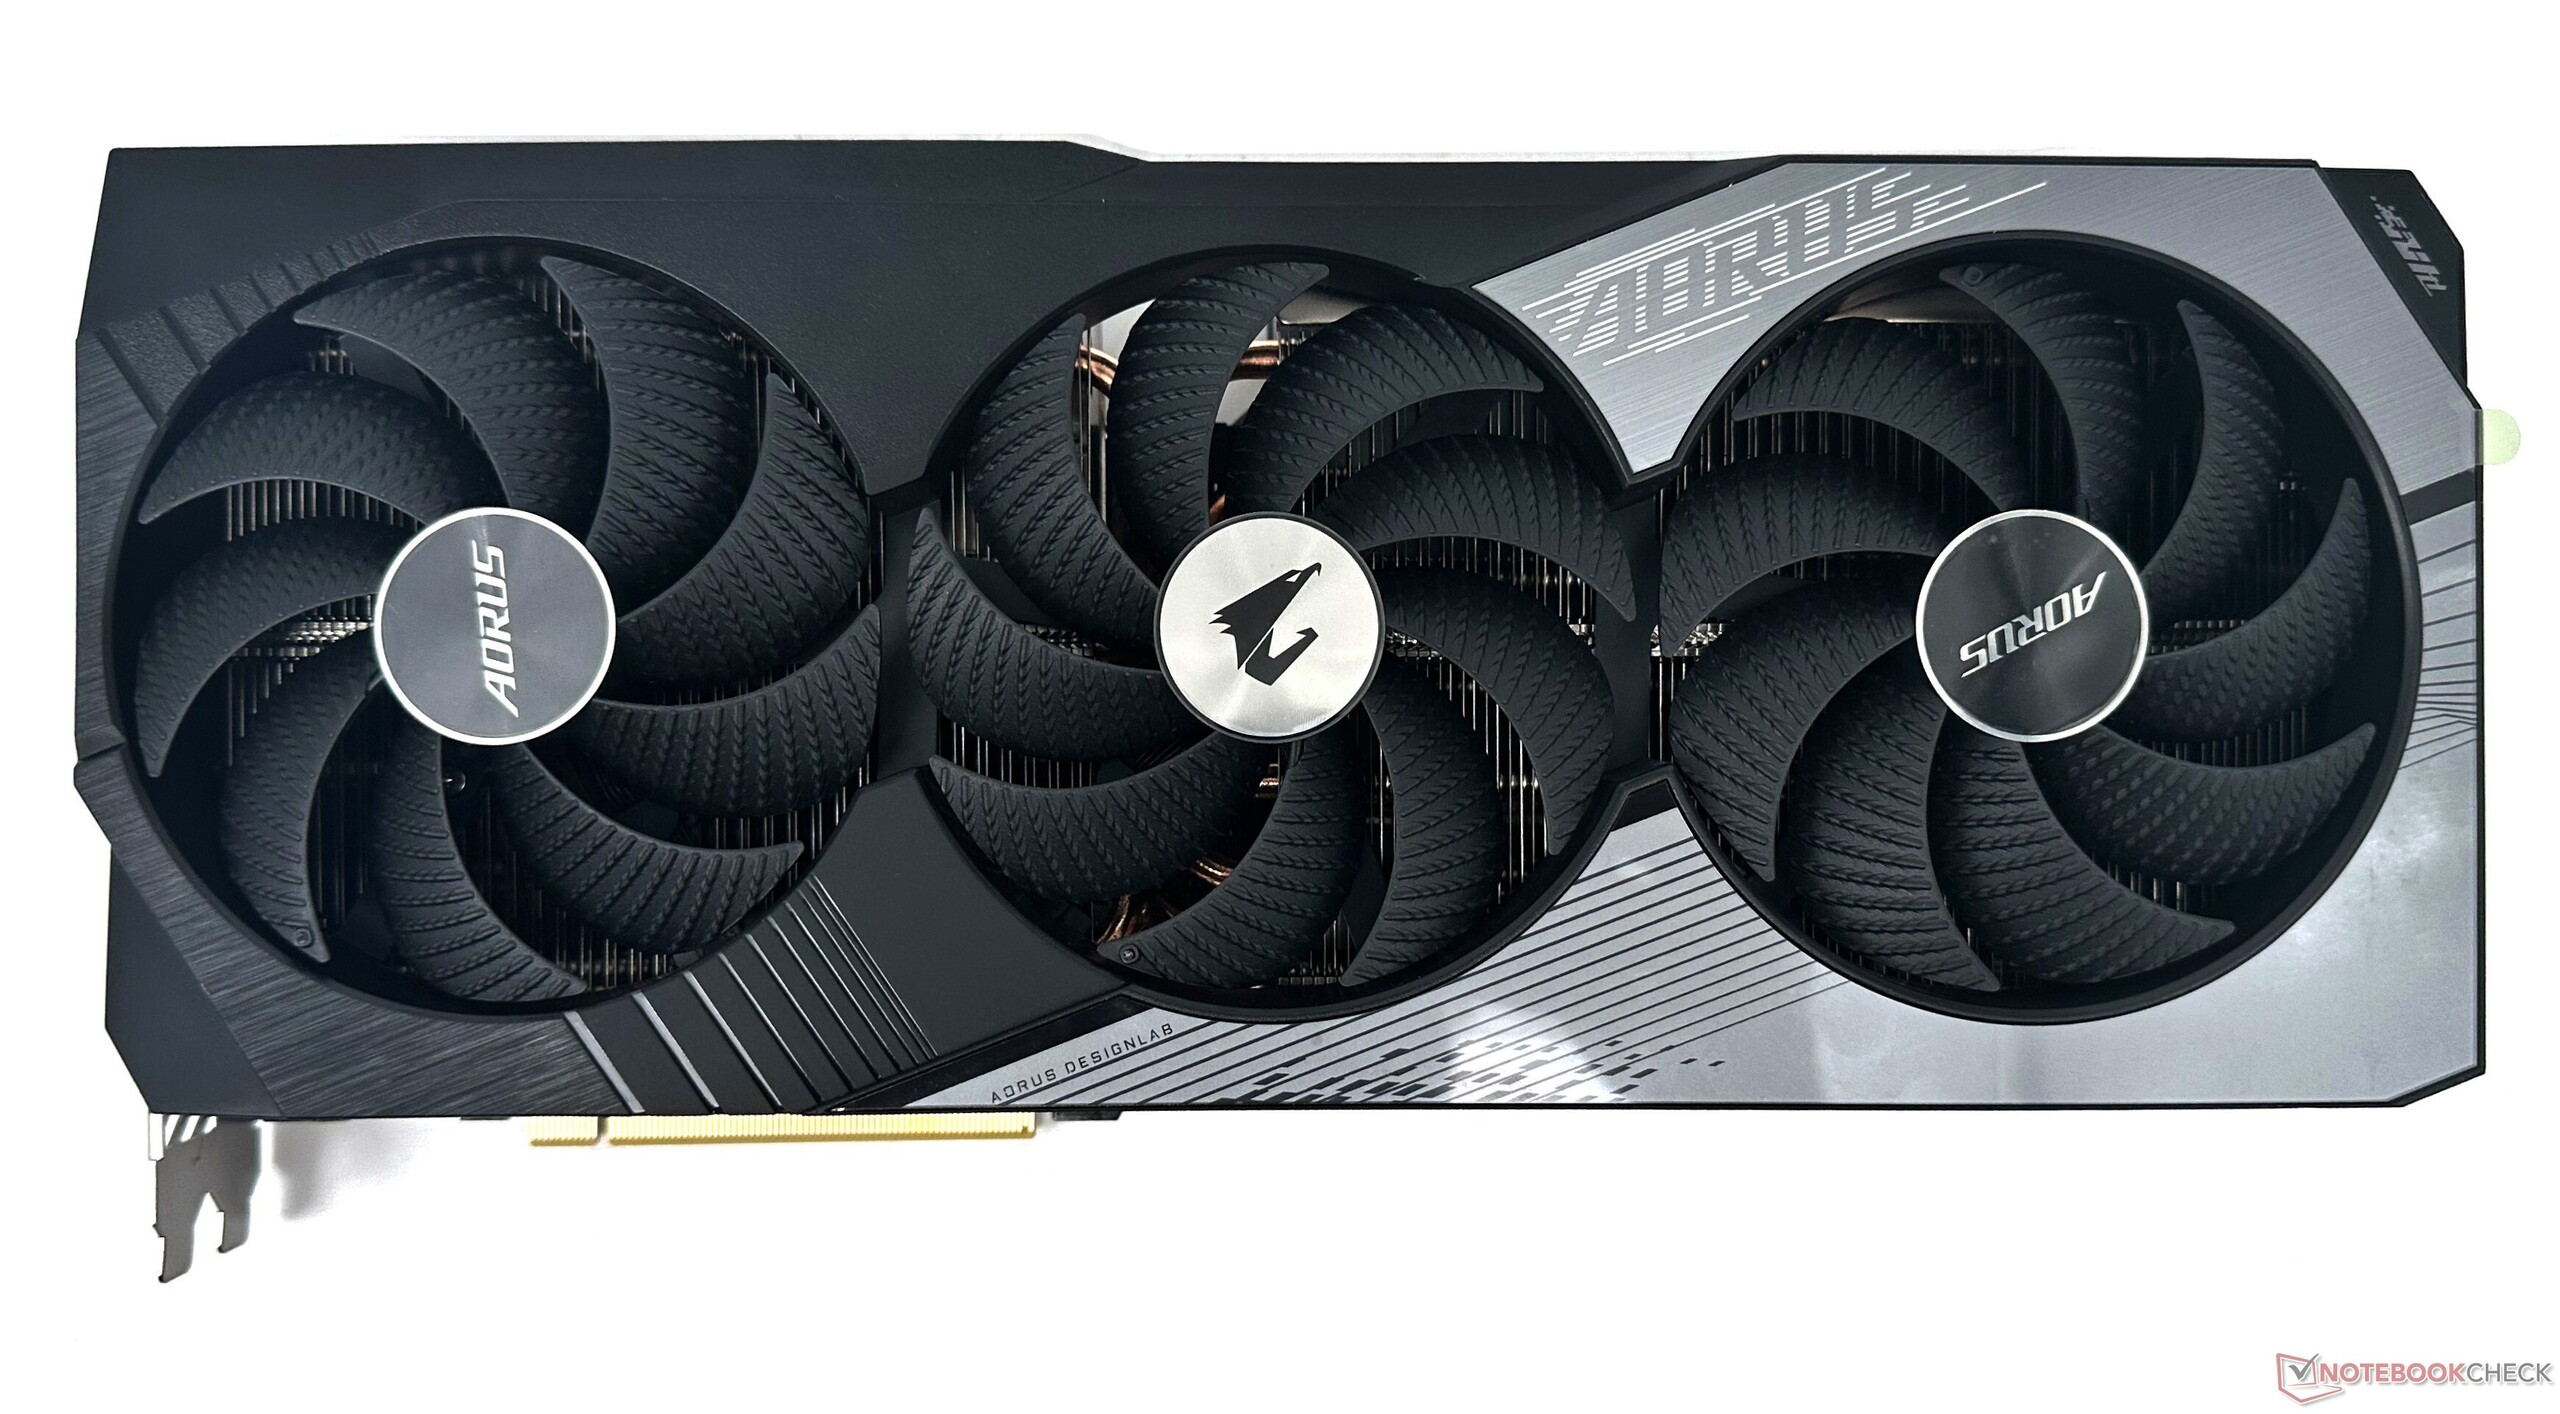
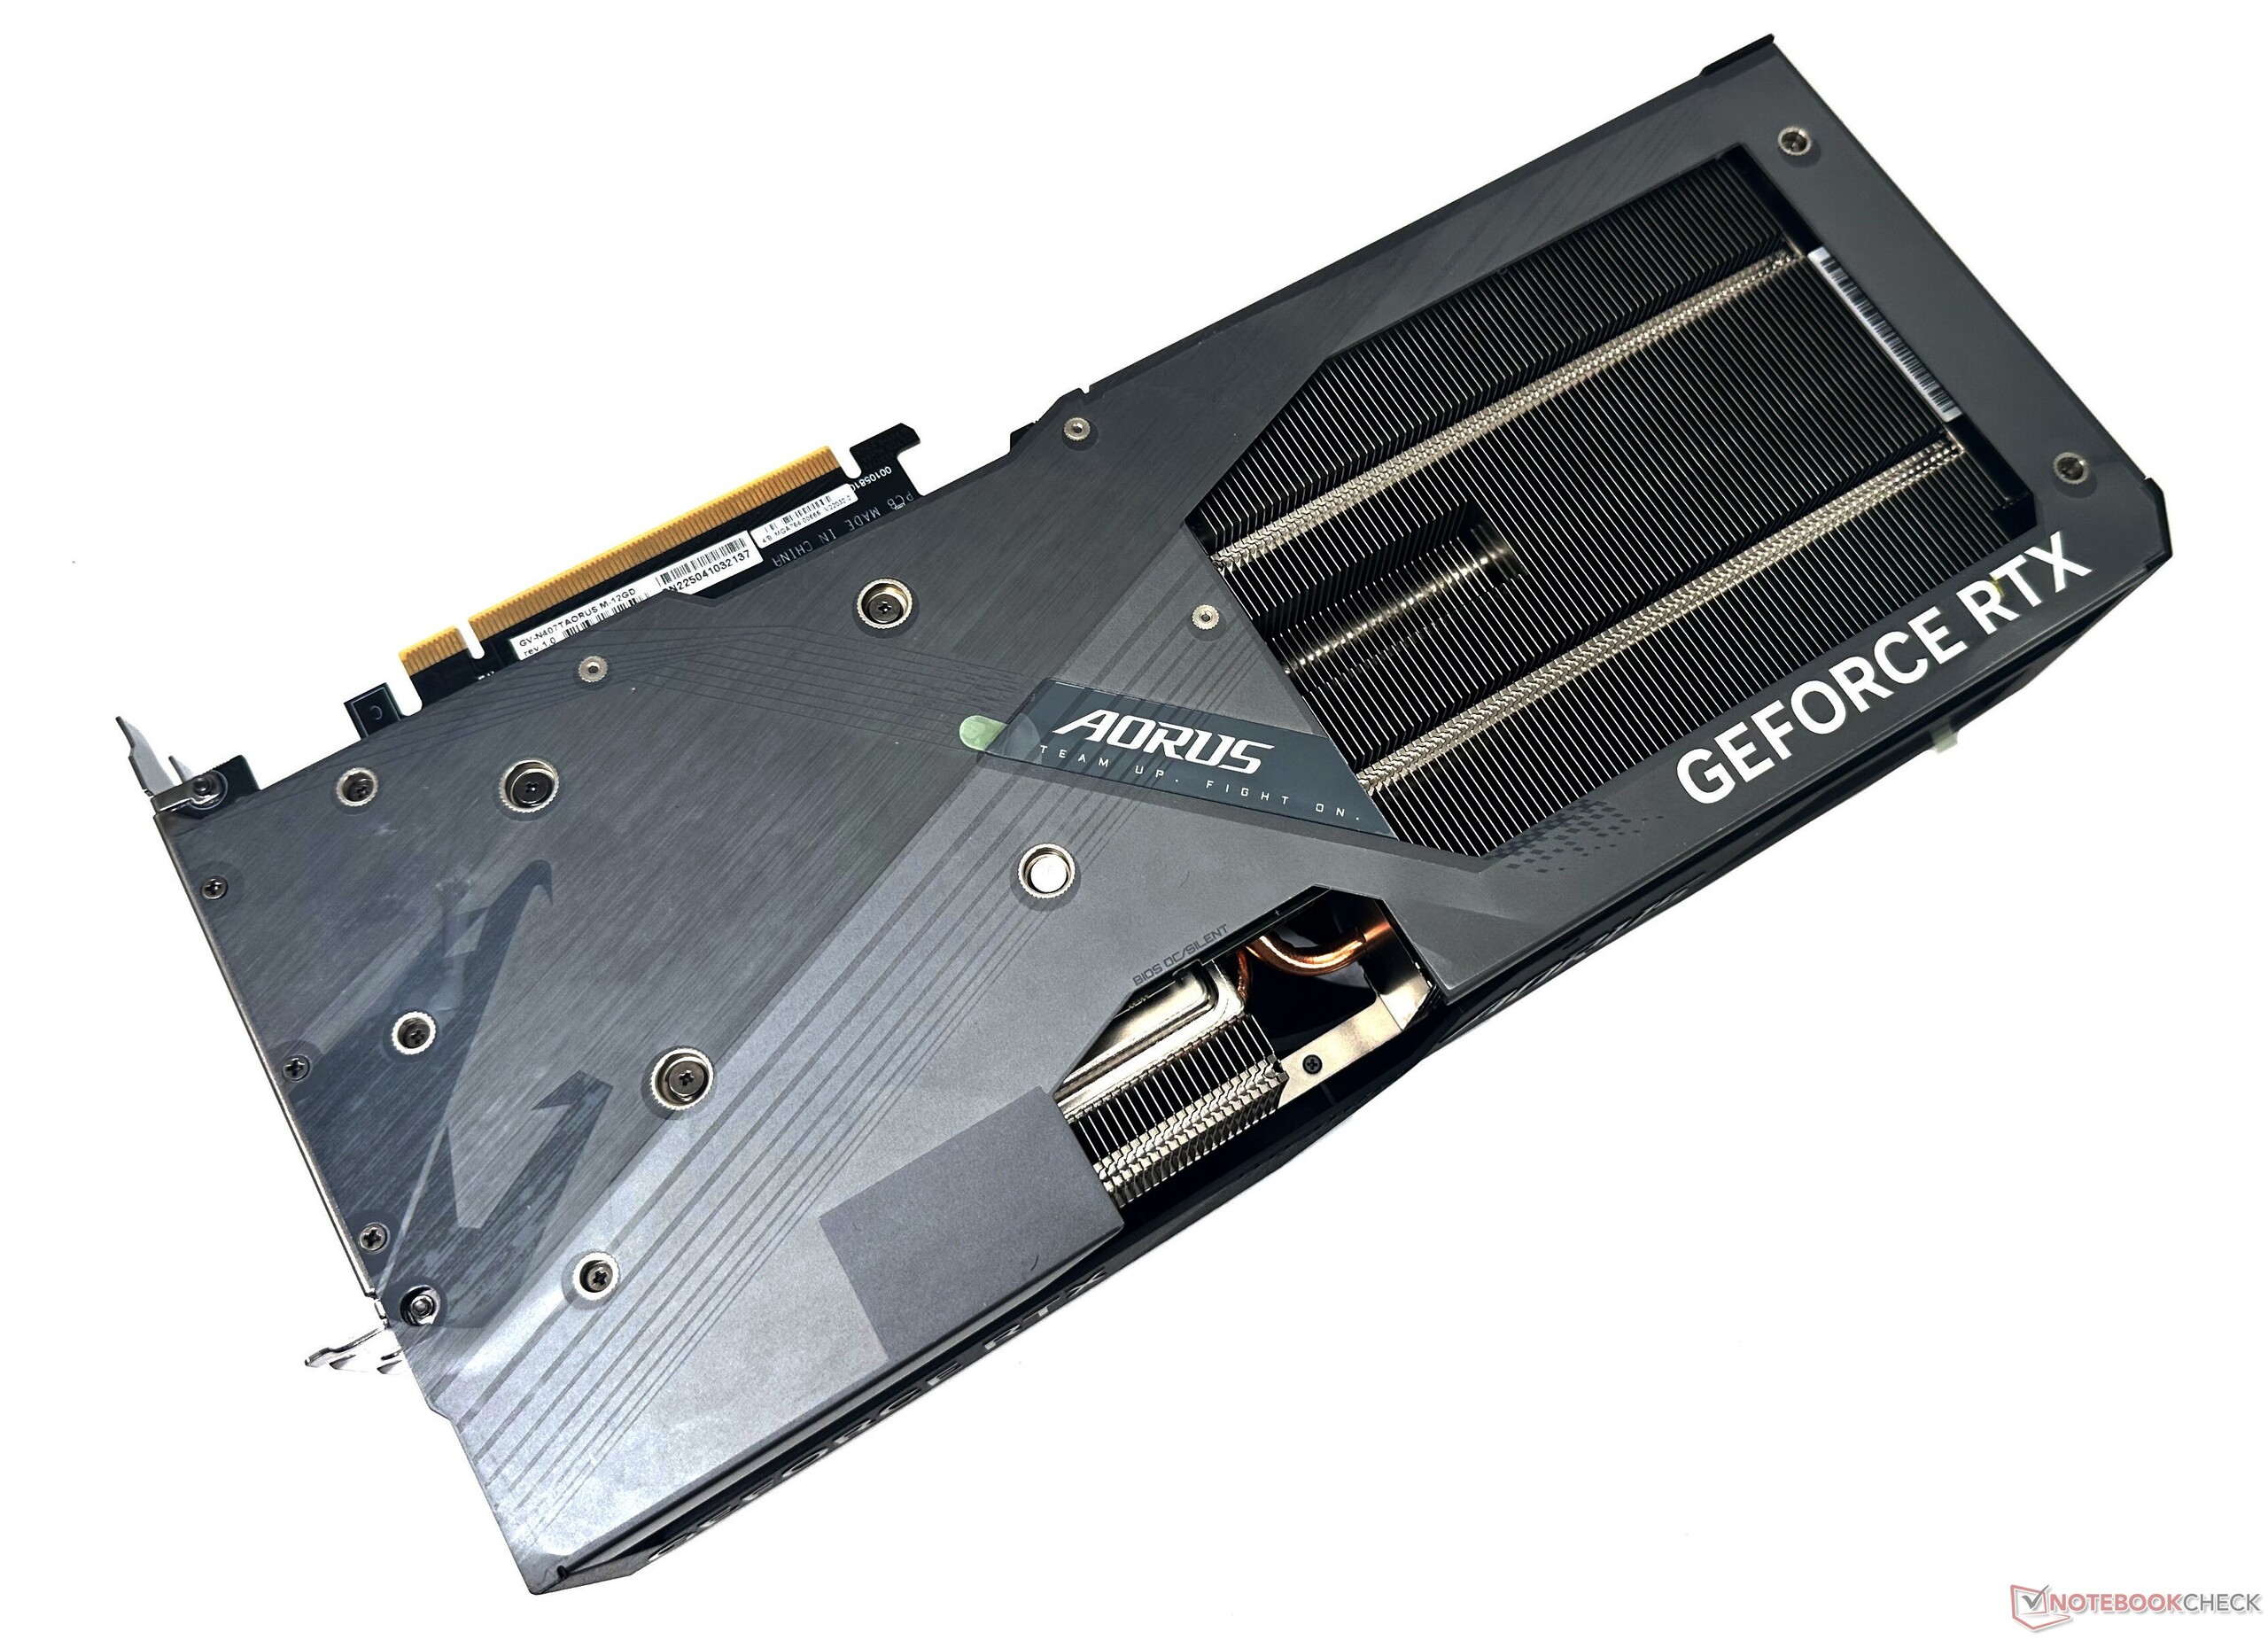
The GPU uses a plastic shroud but comes with a metal backplate with a large cutout for the ventilation fins. The metal backplate together with the provided anti-sag bracket help reinforce the 1.6 kg card firmly on the PCIe slot while preventing any sag.
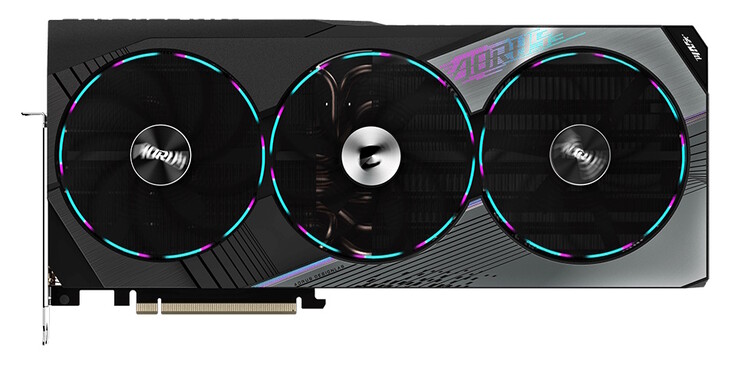
Unlike the Asus TUF Gaming RTX 4070 Ti, the Aorus RTX 4070 Ti Master does not shy from showing off its RGB bling.
Gigabyte takes a unique approach in this aspect. Instead of an RGB ring around the fans, each fan has a single LED on one of its fins that only lights up when the fans are active. This gives a sort of a broken halo ring lighting, which may or may not appeal to all — the ring appears contiguous when the fans spin at full speed, though.
There is RGB lighting on the Aorus logo at the front and on the back, but there's no RGB on the top logos. Gigabyte, in fact, recommends installing the card on a PCIe riser cable for the best light show.
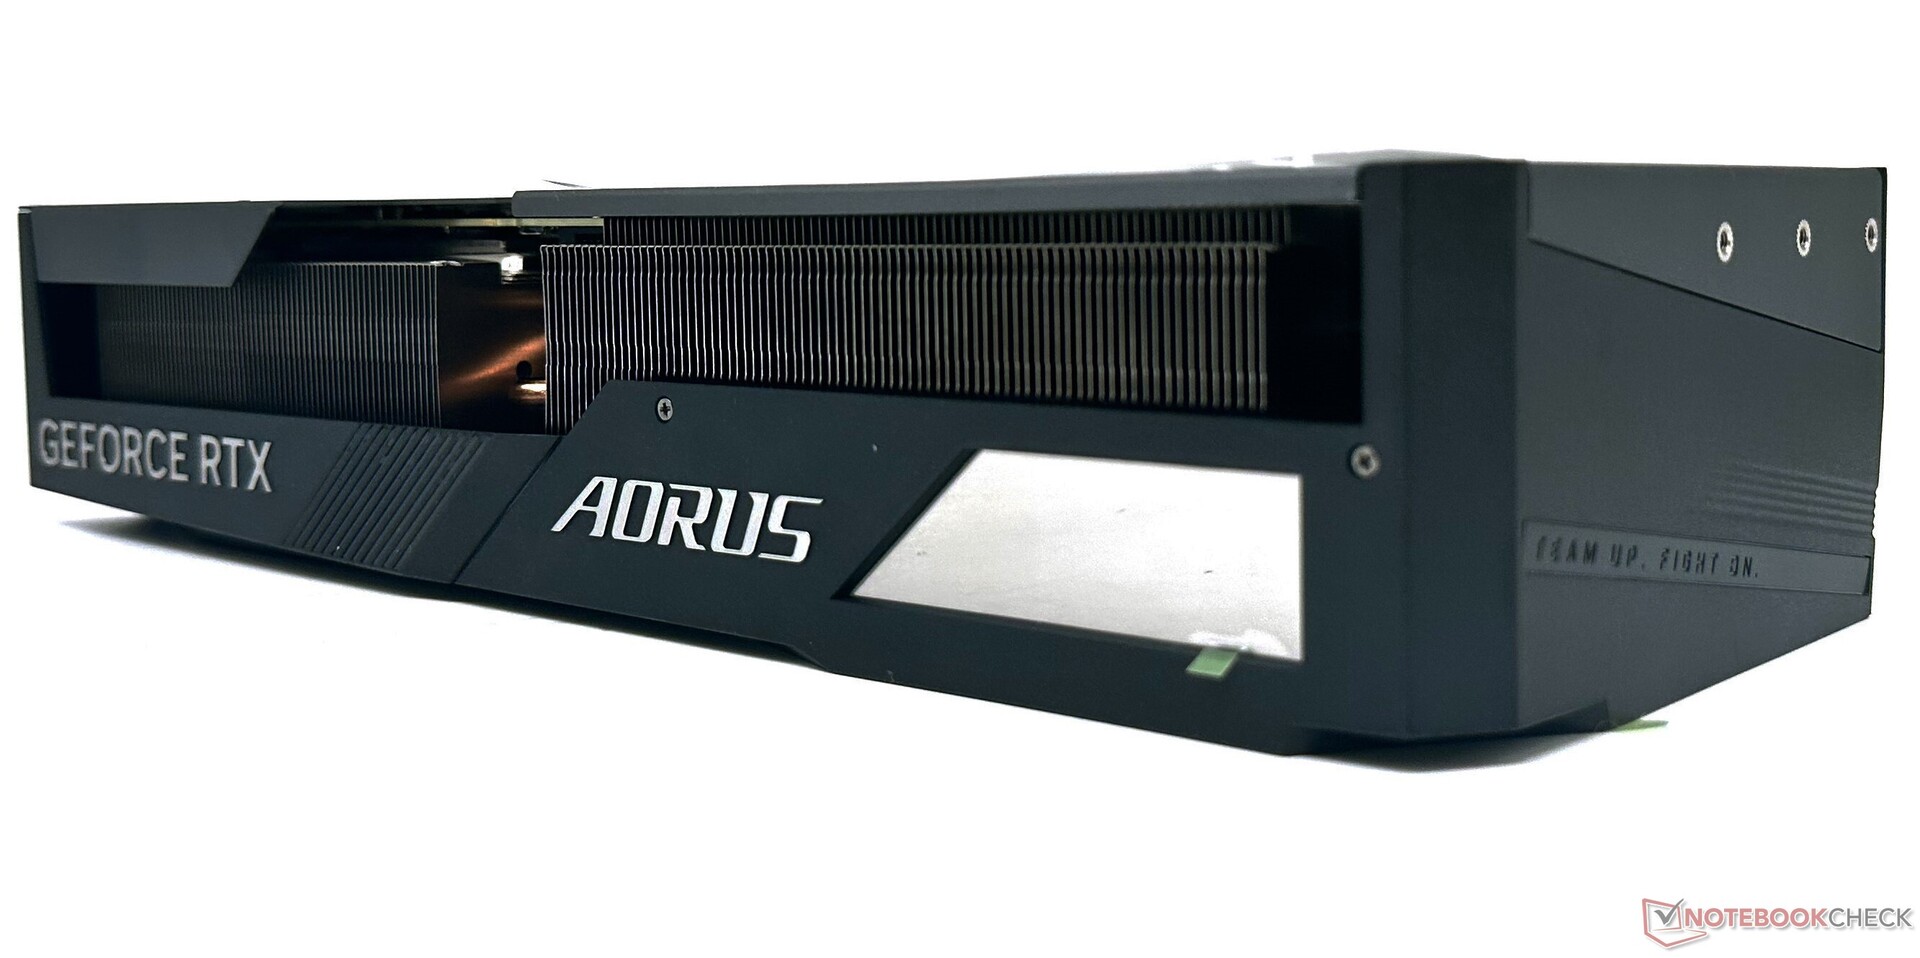
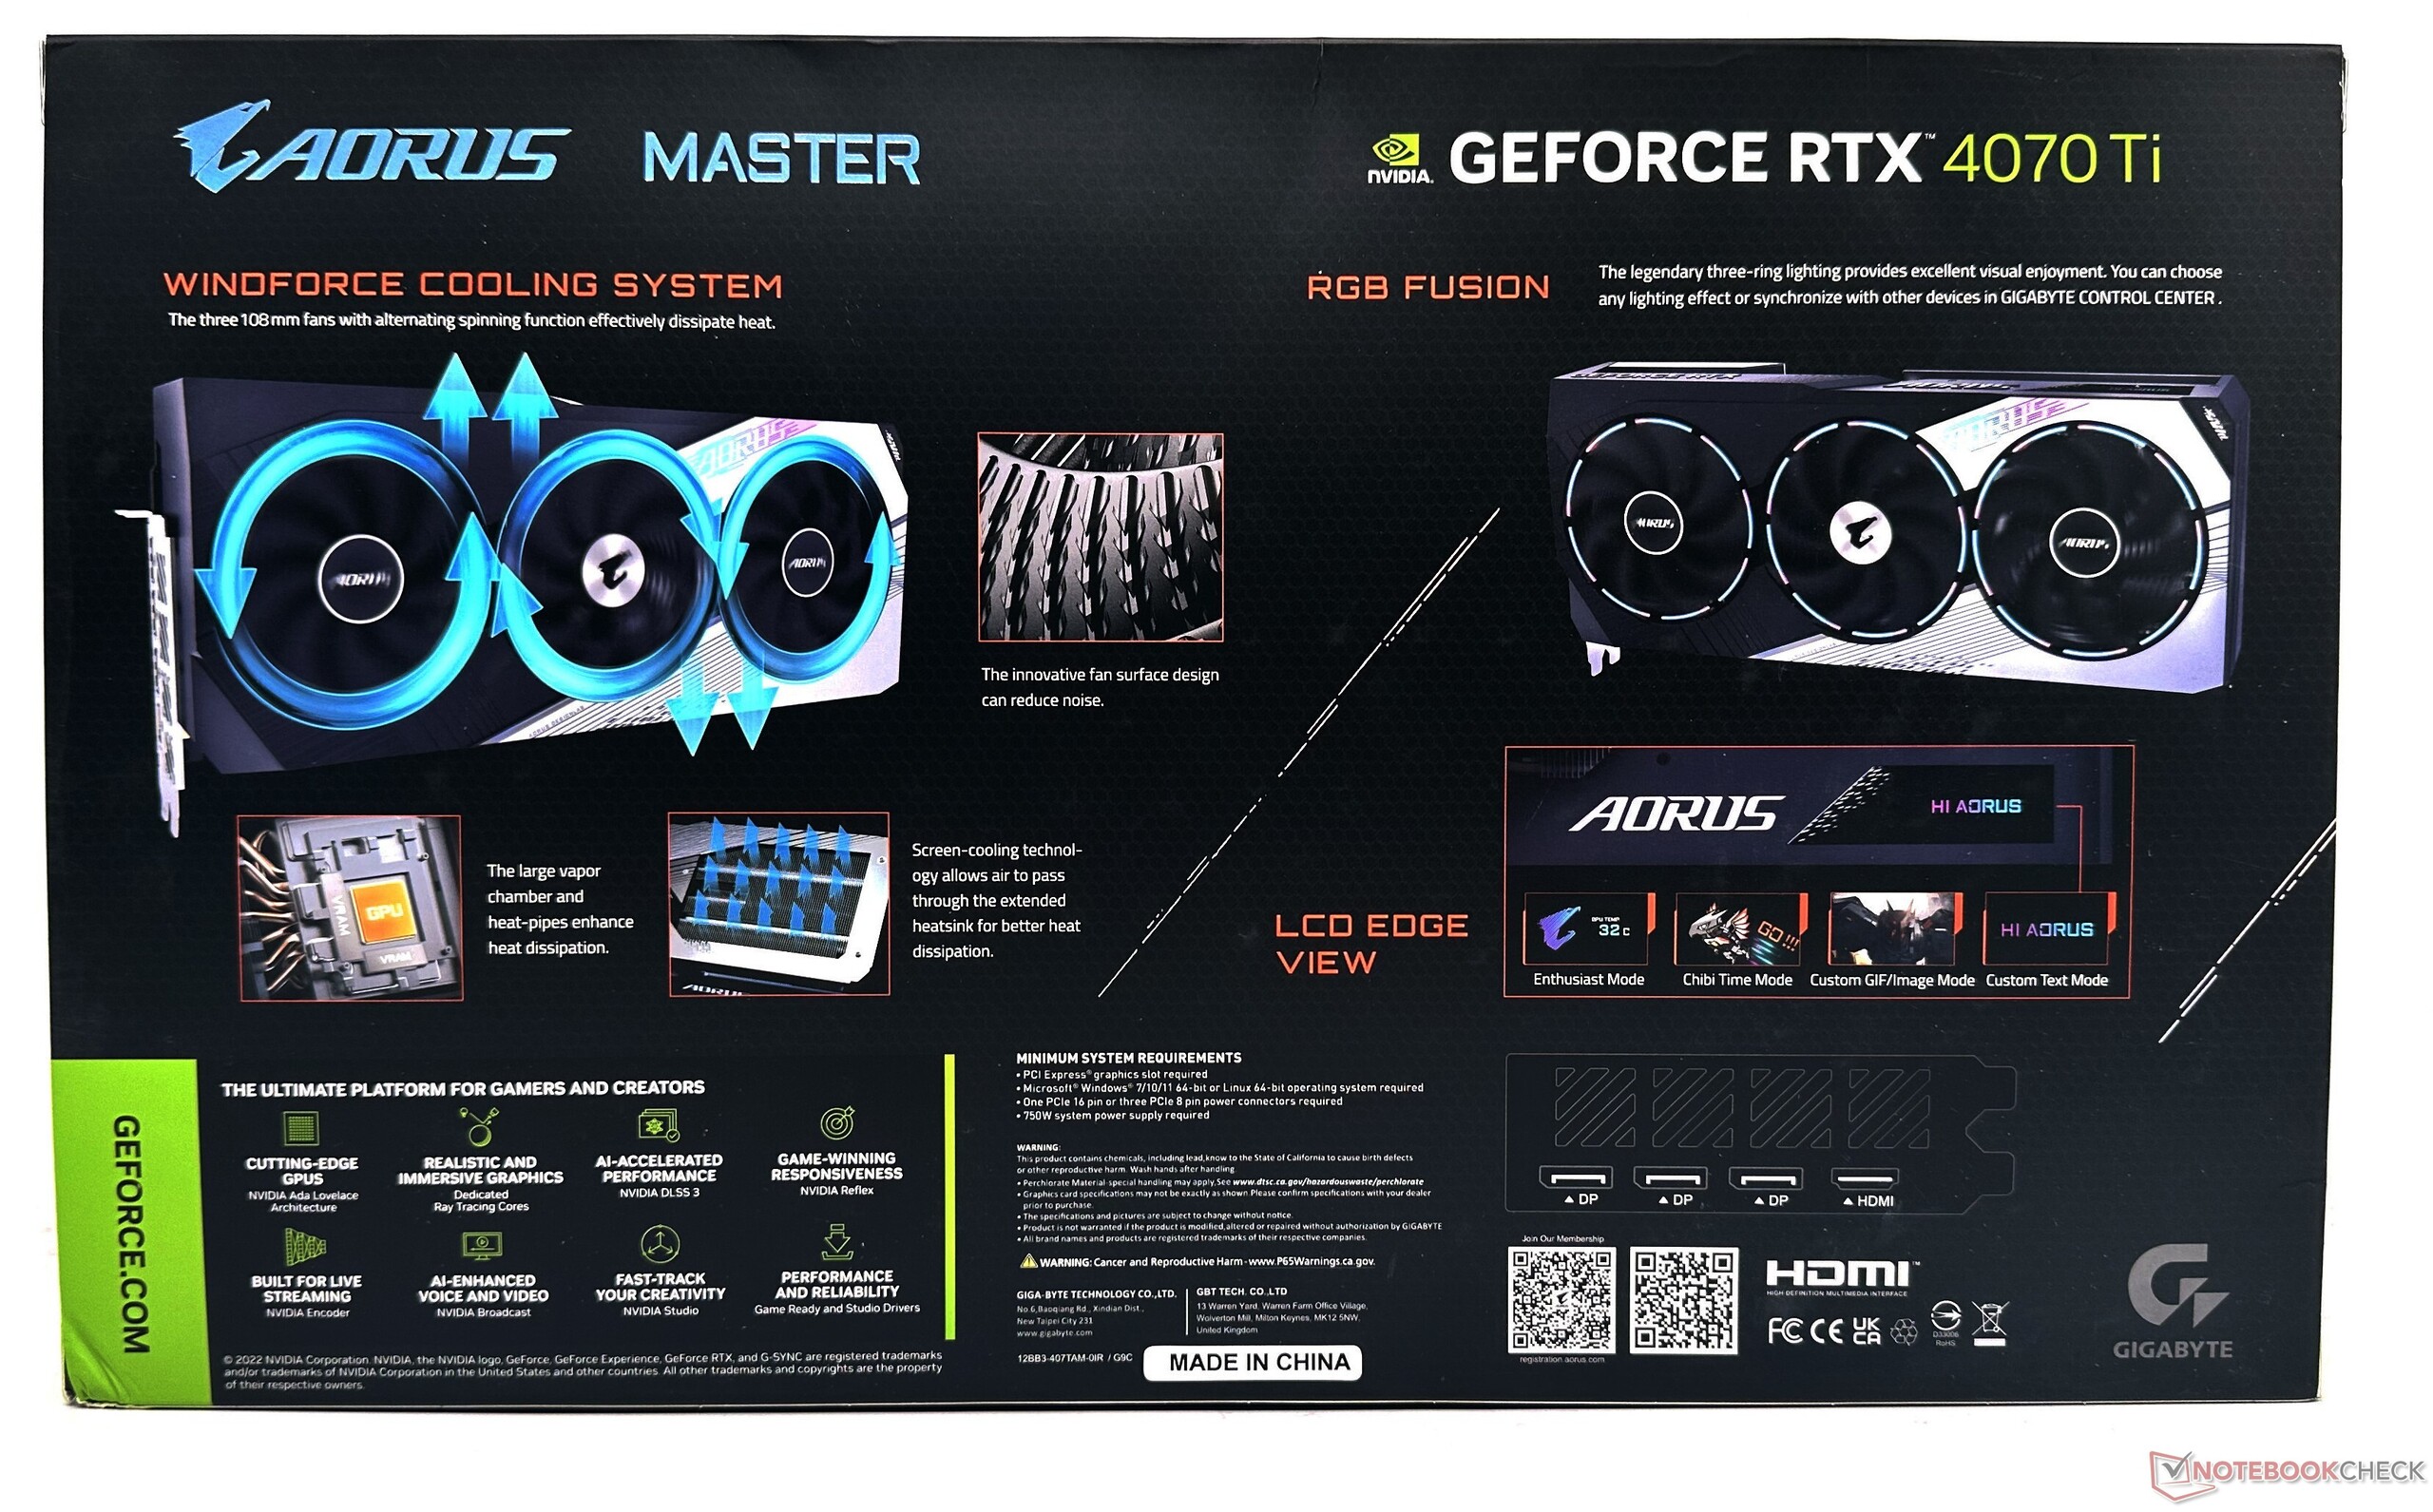
The Aorus RTX 4070 Ti Master also comes with an LCD View monitor on the top.
Users can customize the functionality of this panel via Gigabyte Control Center to display all kinds of system stats, GIFs, and custom texts.
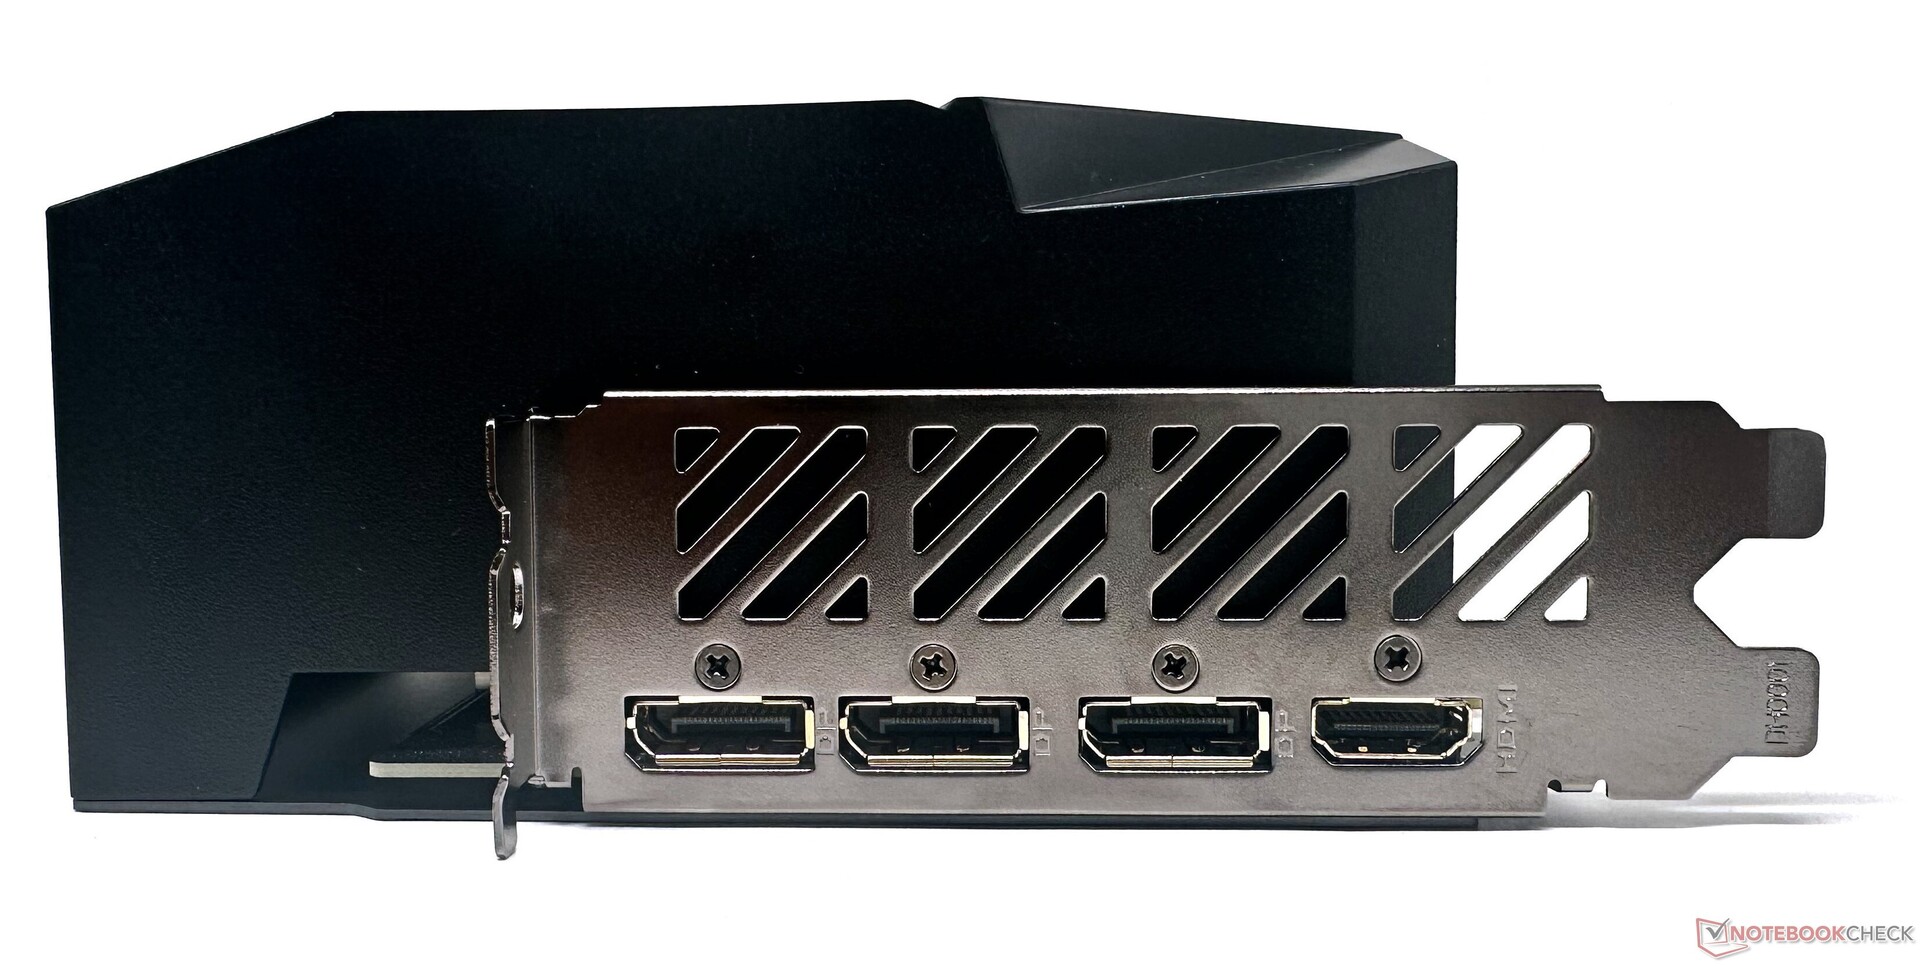
As is the case with most modern GPUs, the Aorus GeForce RTX 4070 Ti Master also offers three DisplayPort 1.4 ports and one HDMI 2.1-out. The convenience of an additional HDMI 2.1-out as seen in the TUF Gaming RTX 4070 Ti is missing here.
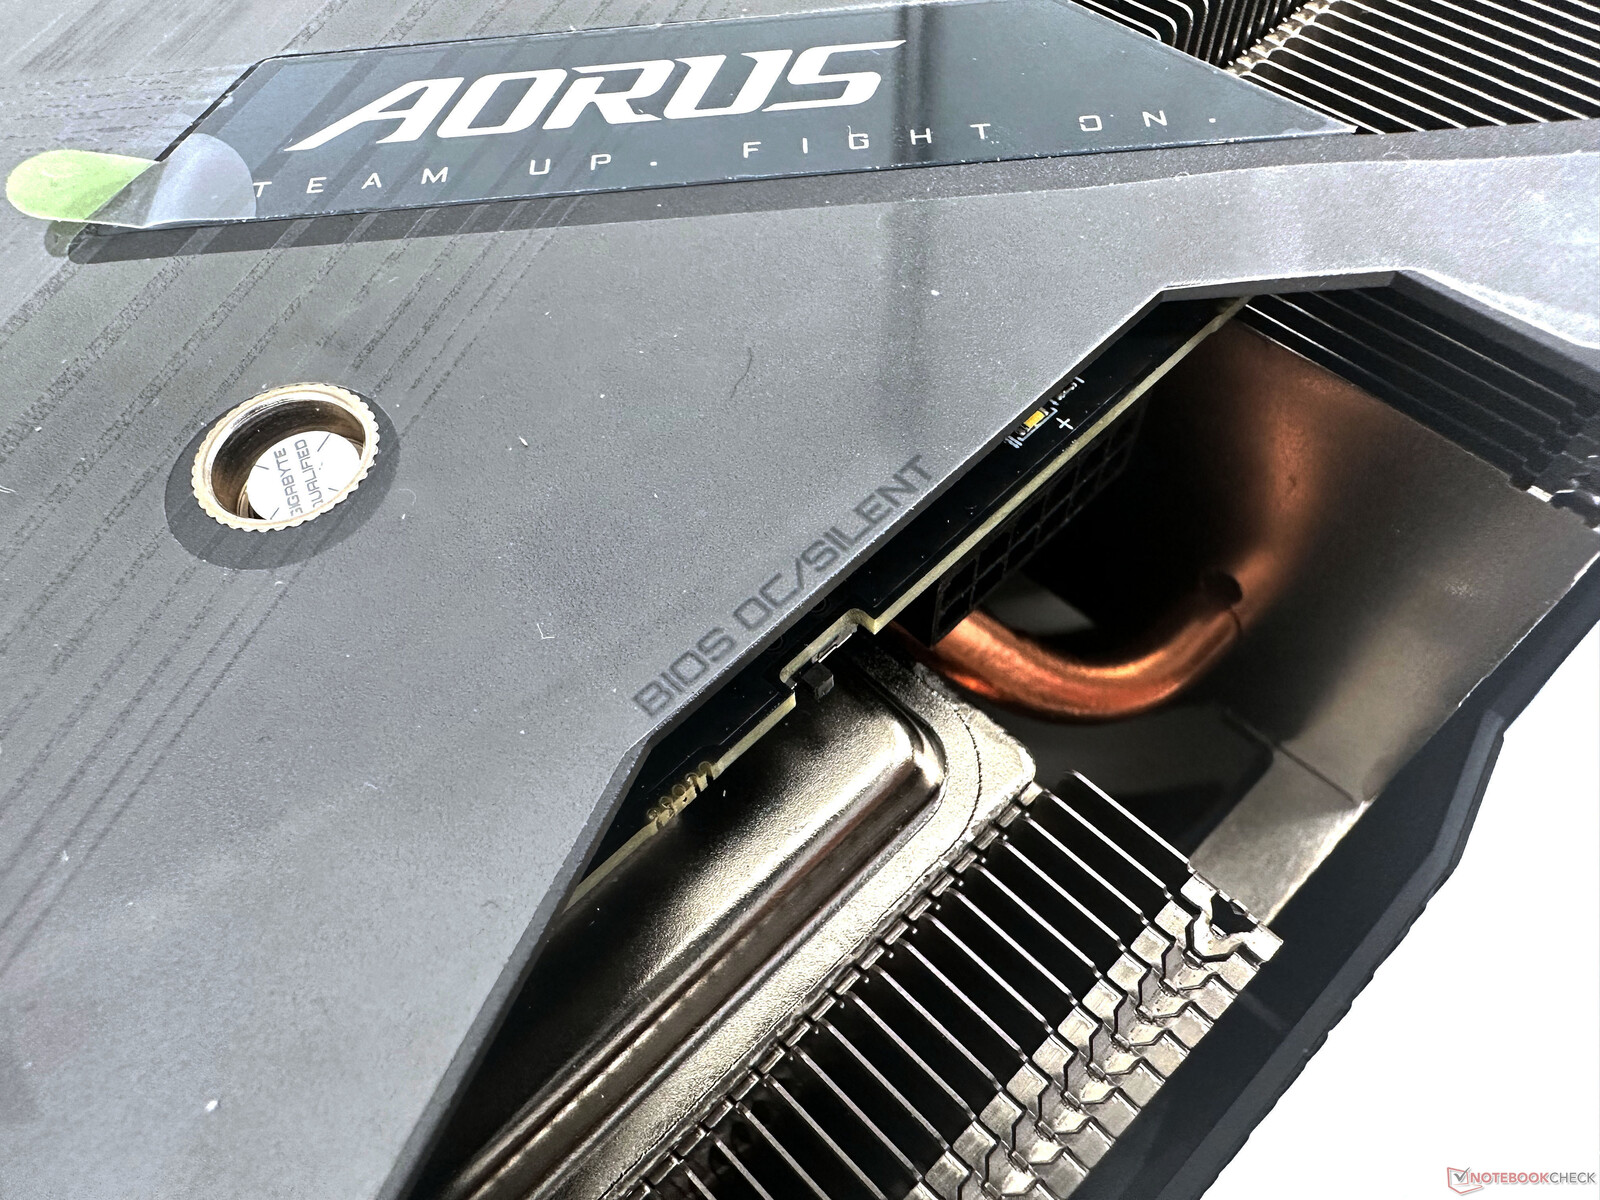
Similar to most AiB cards, the Aorus GeForce RTX 4070 Ti Master comes with a dual BIOS switch that can be toggled between BIOS OC and Silent modes.
The card uses the new 12VHPWR connector with three 8-pin outs. An LED near the power connector serves to indicate the power supply status. The light comes on if the power supply is disconnected and goes off when the supply is stable. A blinking LED indicates an abnormal power supply or a wrongly seated cable.
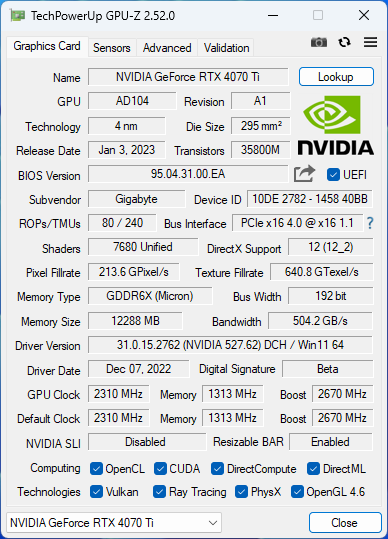
The Aorus GeForce RTX 4070 Ti Master can boost up to 2,670 MHz at a 285 W TGP, which is slightly higher than the reference 2,610 MHz boost.
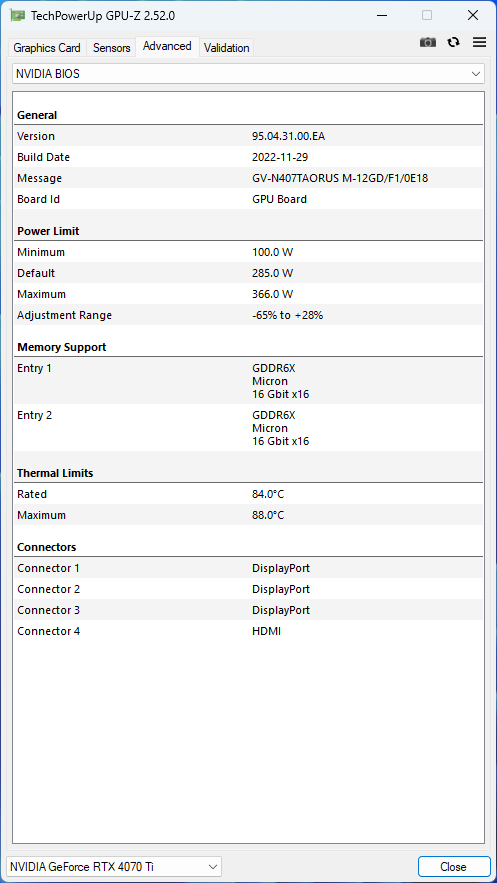
However, the Aorus card is clocked 90 MHz lower than the TUF Gaming OC's 2,760 MHz. It is possible to increase the TGP by 28% to up to 366 W.
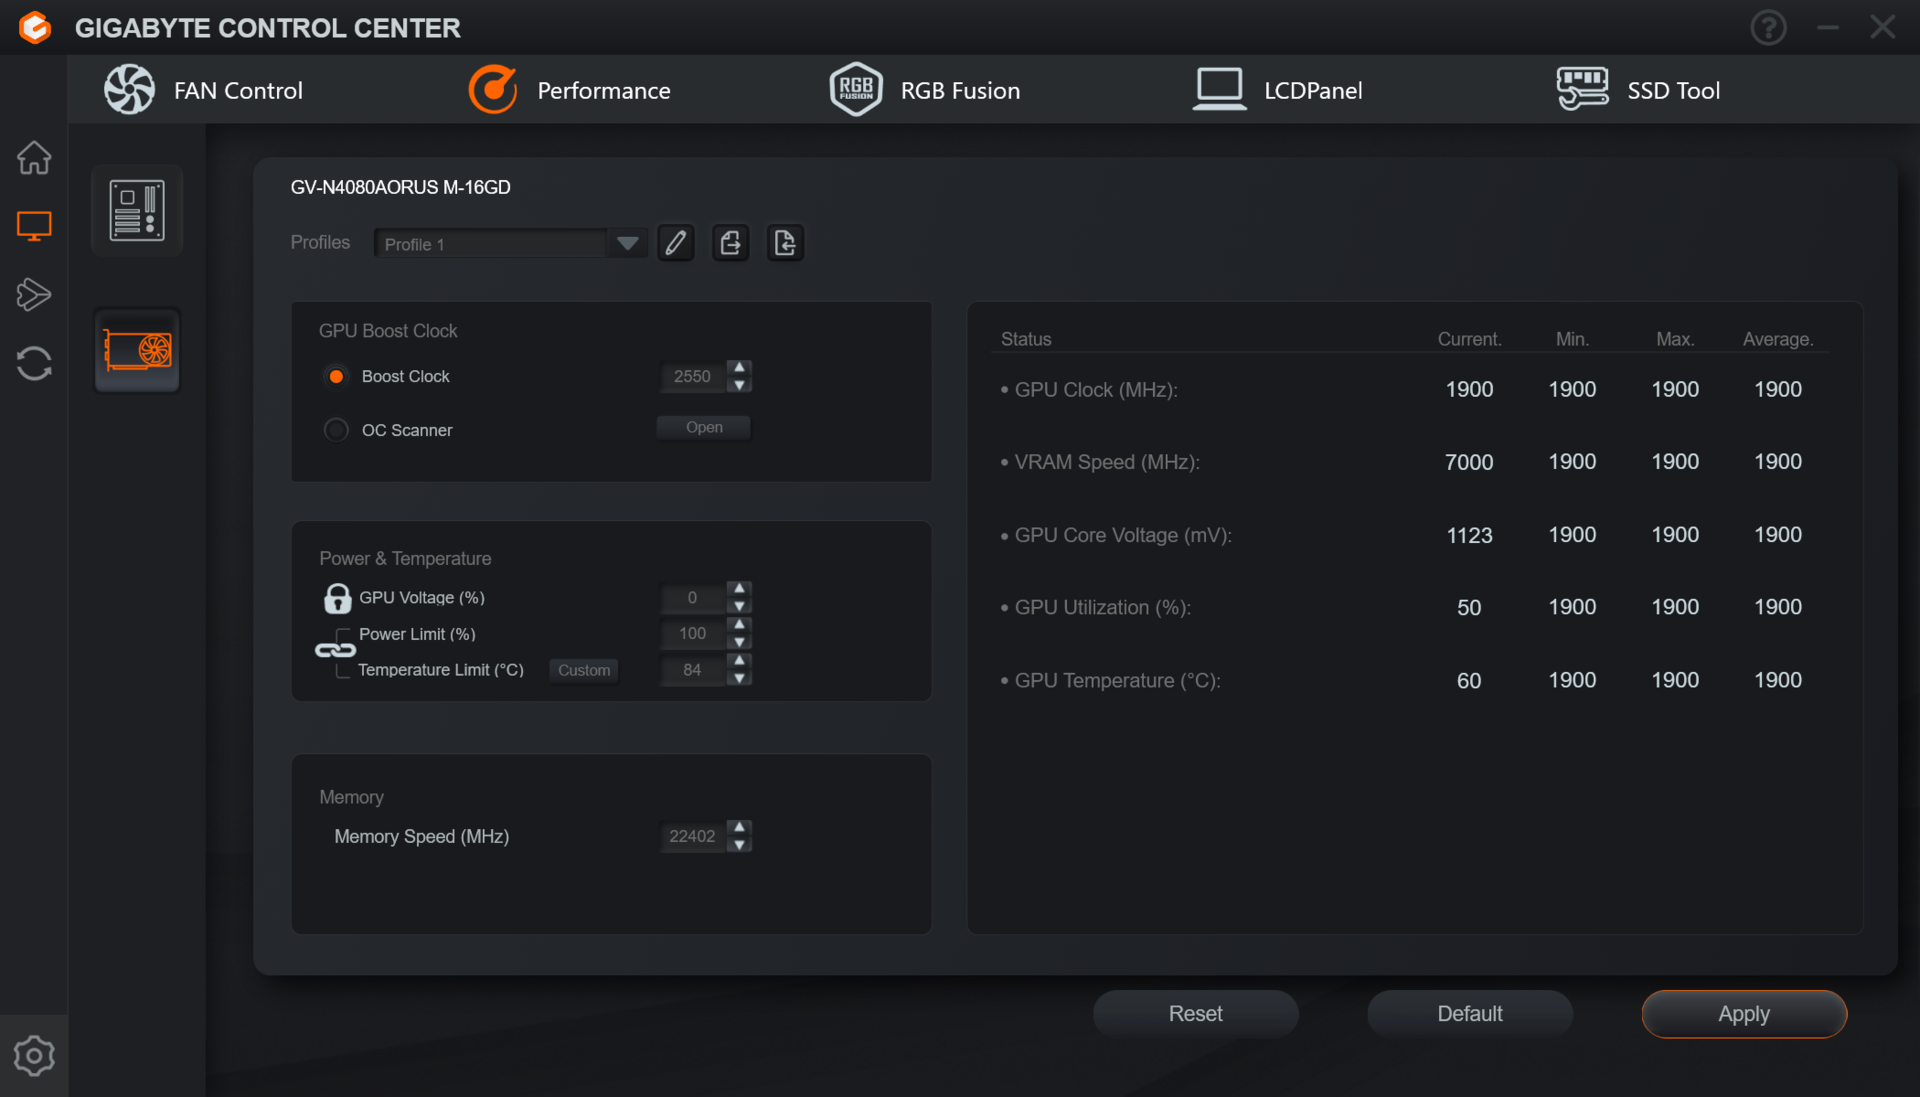
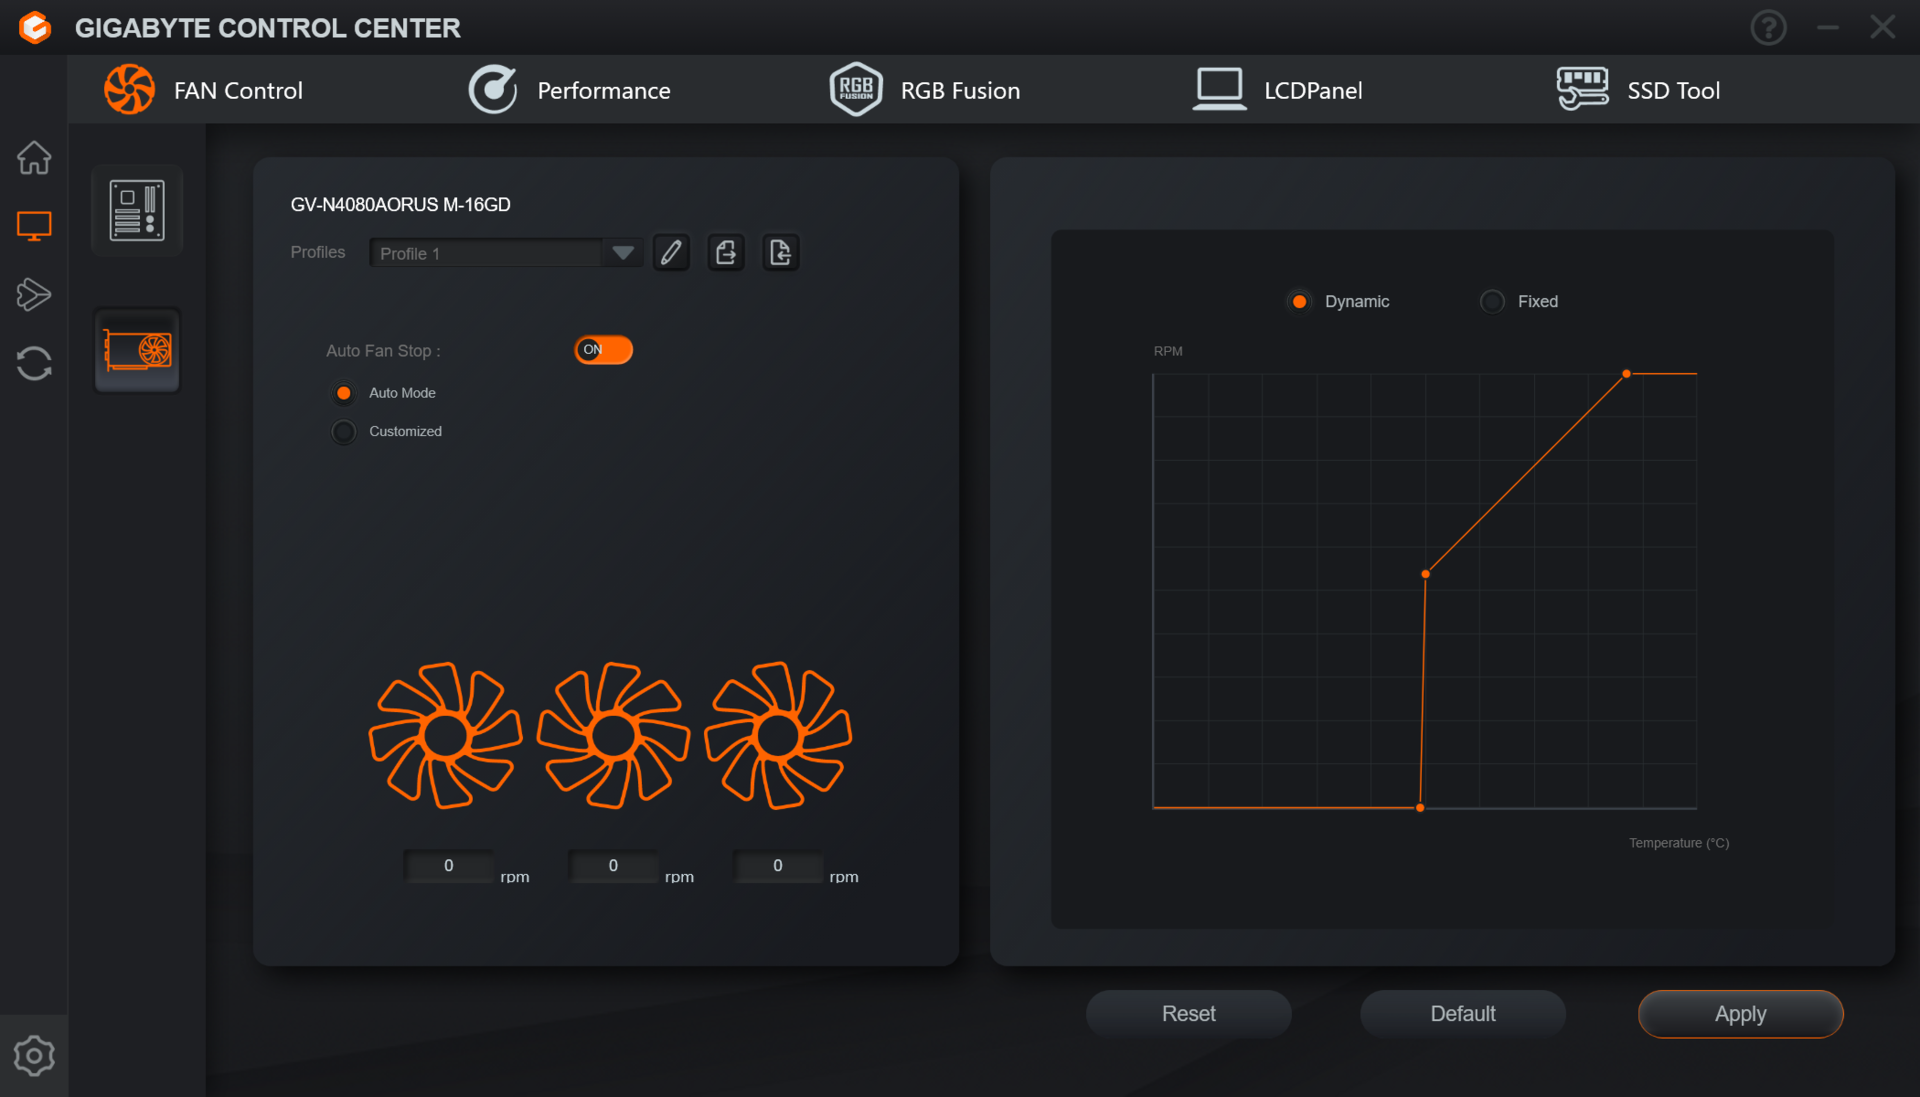
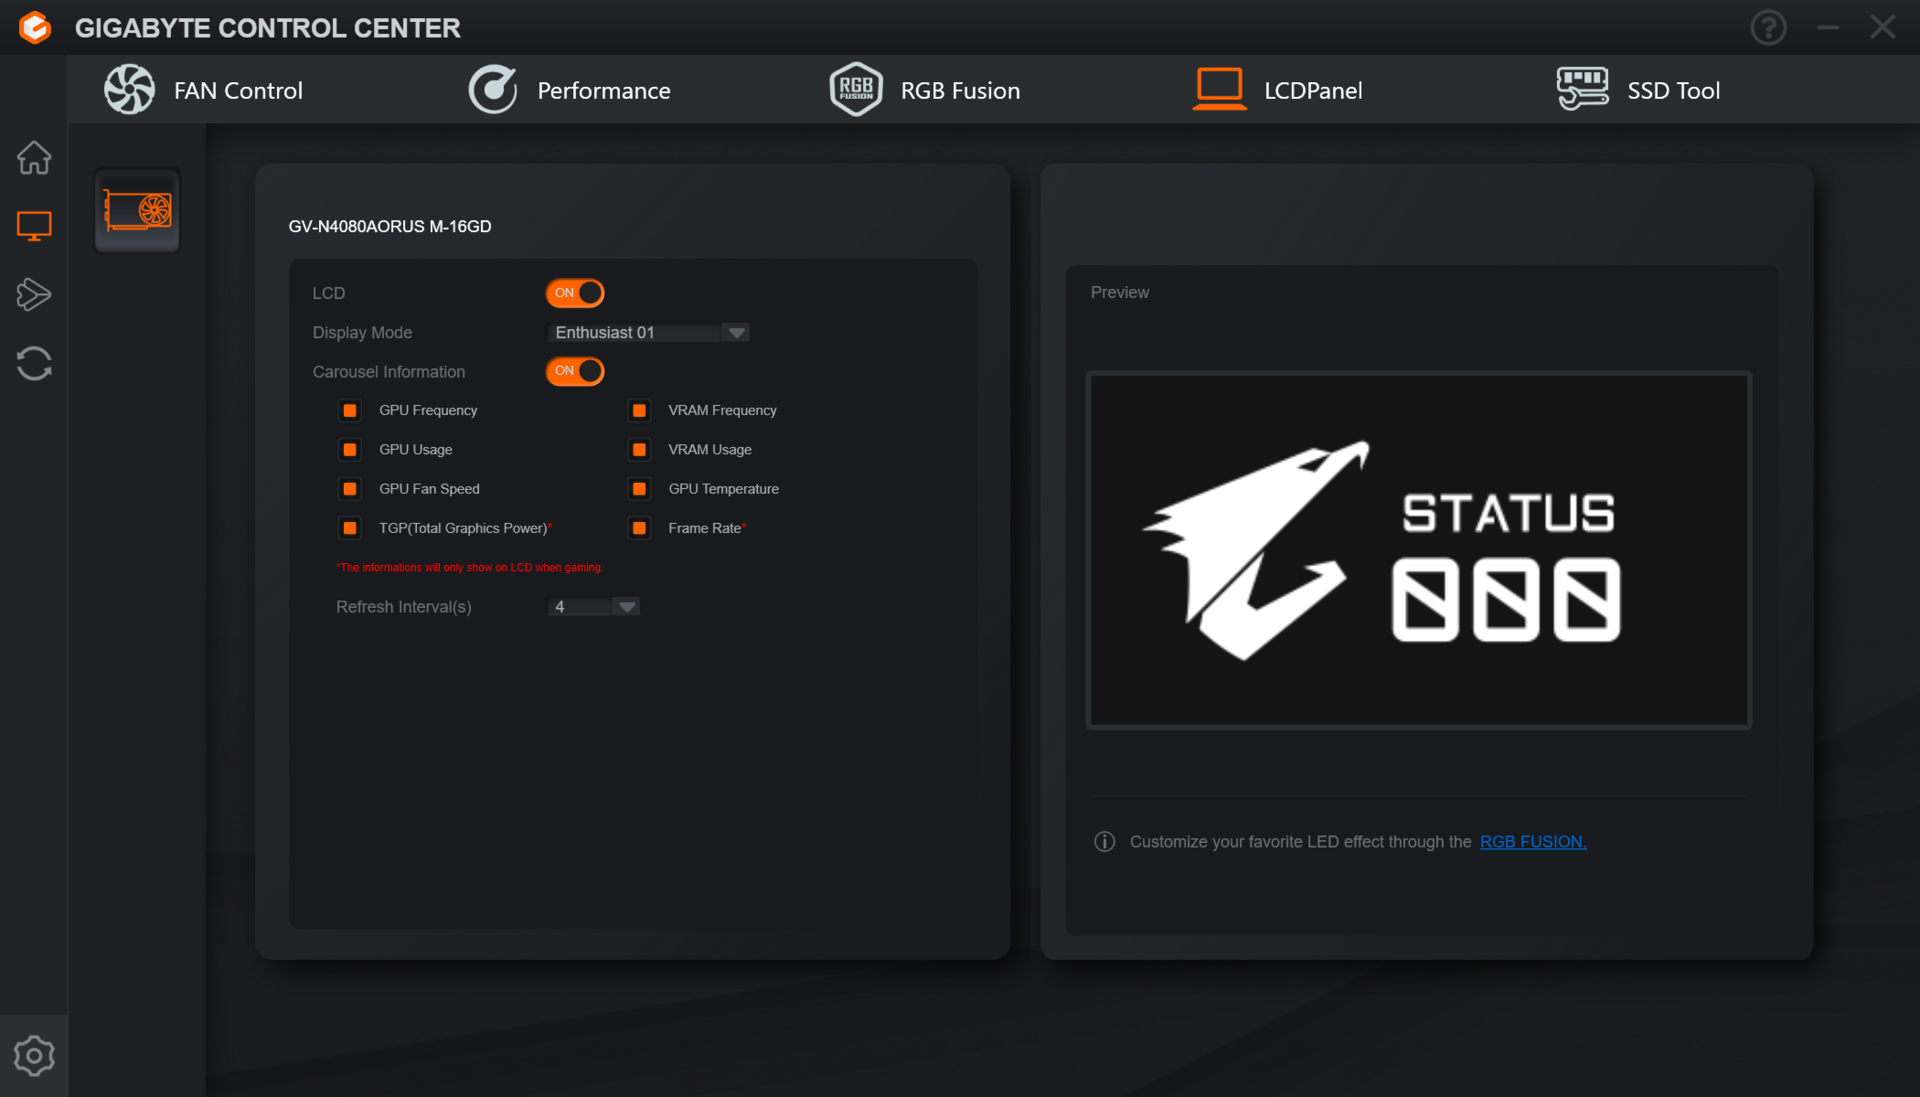
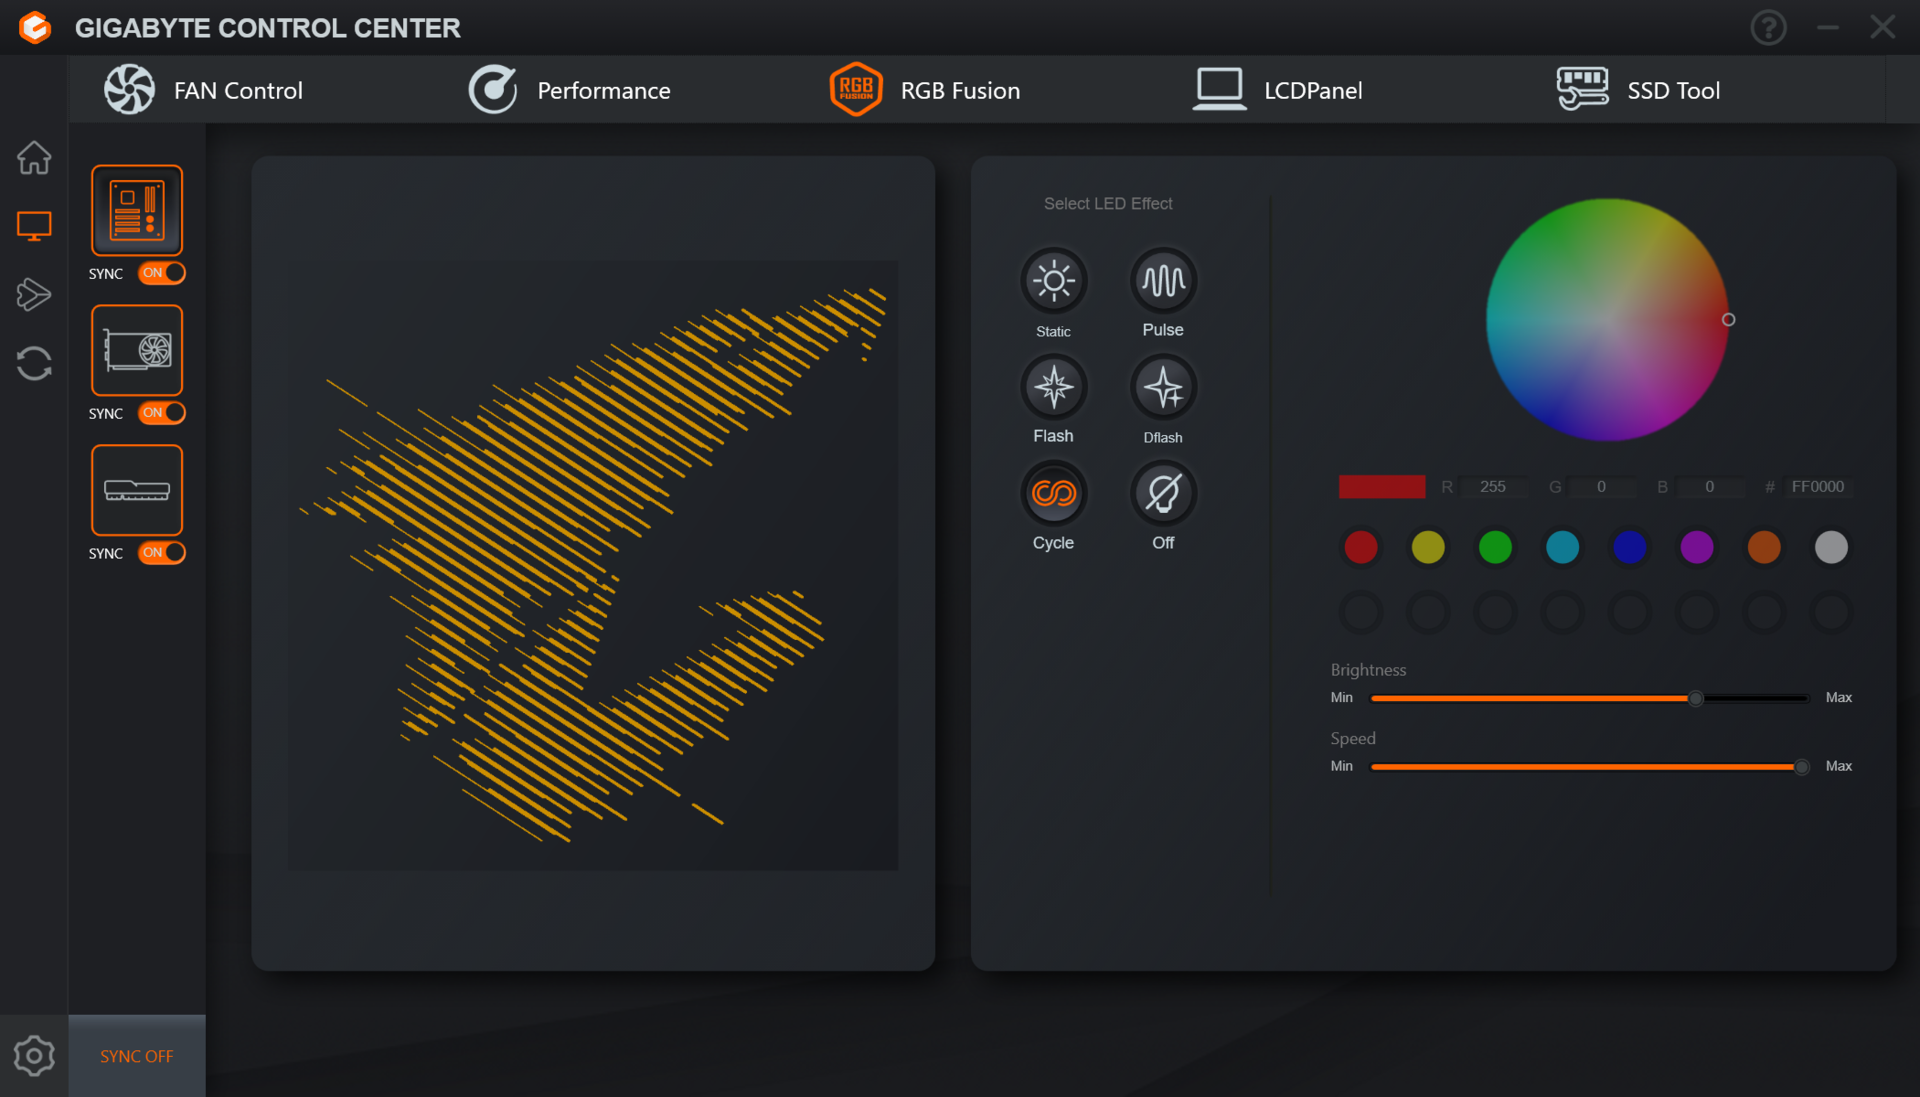
Gigabyte Control Center needs a lot of work
Gigabyte traditionally offers a smorgasbord of motherboard, SSD, and GPU utilities, but all of them are now consolidated under a unified interface called Gigabyte Control Center (GCC).
The idea is great, but the execution seems rather poor at the moment. The app is extremely buggy, hangs often, and can take ages to apply a setting. This seems to be the case even with the latest version of the app at the time of testing.
While third-party utilities such as MSI Afterburner and EVGA Precision X1 continue to work with Ada cards, their development status is currently in a limbo. We hope Gigabyte makes the app usable with ensuing updates, so users can have a proper first-party GPU tweaking solution.
The screens below depict GCC with an Aorus RTX 4080 Master, but the functionality is the same with the RTX 4070 Ti Master as well.
The test bench: Aorus GeForce RTX 4070 Ti Master gets paired with the Intel Core i9-13900K
Our test bench remains similar to the one we have used previously for the TUF Gaming RTX 4070 Ti OC and several other GPUs. The build is comprised of the following components:
- Cooler MasterFrame 700 test bench
- Intel Core i9-13900K
- Gigabyte Z790 Aorus Master motherboard
- Gigabyte Aorus Gen 4 2 TB NVMe SSD for benchmarks and games
- 2x 16 GB Kingston Fury Renegade DDR5-6400 RAM with timings 32-39-39-80 at 1.40 V
- Gigabyte M28U 4K 144 Hz monitor
- Cooler Master MasterLiquid ML360L V2 ARGB AIO cooler
- Thermaltake ToughPower Grand RGB 850 W
We used a fresh installation of Windows 11 22H2 with the latest patches together with Game Ready driver version 527.62.
We would like to thank Cooler Master for supplying the test bench and AIO, Gigabyte for the Core i9-13900K, Z790 motherboard, M28U monitor, and NVMe SSD, and Kingston for the DDR5 memory kit.
Synthetic benchmarks: Faster than the RTX 3090 Ti, ties in well with other RTX 4070 Ti cards
The Aorus GeForce RTX 4070 Ti Master does not throw any surprises and ties up exactly with the TUF Gaming RTX 4070 Ti OC in overall synthetic benchmark performance. The differences with its Asus competition are extremely minor and can be considered to be within the margin or error.
That being said, benchmarks like Unigine Valley 1.0 DirectX show the TUF Gaming OC card to have a 11% lead, but we see a reversal of roles with the Aorus RTX 4070 Ti Master leading by 12% in the OpenGL version of the test.
The KFA2 GeForce RTX 4070 Ti SG also ties with the other two RTX 4070 Tis in 3DMark and Unigine tests for the most part and is only about 3% behind the Aorus and the Asus.
Both the Asus and Aorus have a slight advantage in Unigine Superposition 720p low compared to the KFA2, possibly due to the Intel Core i9-13900K being more favorable at lower resolutions compared to the AMD Ryzen 9 7950X.
Overall, the Aorus GeForce RTX 4070 Ti Master is perceivable faster than the RTX 3090 while edging out the RTX 3090 Ti and is within striking distance of the AMD Radeon RX 7900 XT in cumulative synthetic performance.
| 3DMark 11 Performance | 56489 points | |
| 3DMark Ice Storm Standard Score | 274632 points | |
| 3DMark Cloud Gate Standard Score | 82725 points | |
| 3DMark Fire Strike Score | 41391 points | |
| 3DMark Fire Strike Extreme Score | 26501 points | |
| 3DMark Time Spy Score | 22611 points | |
Help | ||
Compute benchmarks: Matches Ampere flagships for the most part
A similar performance is seen in compute tests as well. All tested RTX 4070 Ti cards are more or less vying for the same leads. The Aorus GeForce RTX 4070 Ti Master has a miniscule advantage in V-Ray 5 tests while it's the turn of Asus and KFA2 in V-Ray 4.0 benchmark.
LuxMark Room GPU sees the Aorus and Asus cards calling it a draw while the KFA2 is 8% behind. AMD cards are known to perform well in LuxMark Sala GPU, and we see that here once again. The Radeon RX 6900 XT and RX 6800 XT are 55% and 38% faster than the Aorus RTX 4070 Ti, respectively.
Overall ComputeMark scores are tied between these three RTX 4070 Ti cards, with the Aorus being a smidgen of a second faster in Blender 3.3 Classroom Optix.
| V-Ray Benchmark Next 4.10 - GPU | |
| NVIDIA GeForce RTX 4090 Founders Edition (v4.10.07 ) | |
| NVIDIA GeForce RTX 4080 Founders Edition (v4.10.07 ) | |
| Average of class Desktop (122 - 2392, n=43, last 2 years) | |
| KFA2 GeForce RTX 4070 Ti SG (v4.10.07 ) | |
| Asus TUF Gaming GeForce RTX 4070 Ti (v4.10.07 ) | |
| Aorus GeForce RTX 4070 Ti Master (v4.10.07 ) | |
| Zotac Gaming GeForce RTX 3090 Ti AMP Extreme Holo (v4.10.07 ) | |
| Intel Core i9-13900K (v4.10.07 ) | |
| Average NVIDIA GeForce RTX 3090 (781 - 883, n=18) | |
| Average NVIDIA GeForce RTX 3080 Ti (854 - 855, n=3) | |
| Average NVIDIA GeForce RTX 3080 (636 - 643, n=2) | |
| Average NVIDIA Titan RTX (386 - 439, n=16) | |
| AMD Radeon RX 6800 XT (v4.10.07 ) | |
| Sapphire AMD Radeon RX 6950 XT Nitro+ Pure (v4.10.07 ) | |
| Blender - v3.3 Classroom OPTIX/RTX | |
| Average NVIDIA Titan RTX (n=1) | |
| Average NVIDIA GeForce RTX 3080 Ti (14 - 15, n=2) | |
| Average NVIDIA GeForce RTX 3090 (13 - 14, n=13) | |
| Intel Core i9-13900K (3.3.0) | |
| Asus TUF Gaming GeForce RTX 4070 Ti (3.3.2) | |
| KFA2 GeForce RTX 4070 Ti SG (3.3.2) | |
| Aorus GeForce RTX 4070 Ti Master (3.3.2) | |
| Average of class Desktop (5 - 19, n=27, last 2 years) | |
| NVIDIA GeForce RTX 4080 Founders Edition (3.3.0) | |
| NVIDIA GeForce RTX 4090 Founders Edition (3.3.0) | |
* ... smaller is better
Gaming performance: Easy 60 fps in 4K Ultra but QHD is the sweet spot
The Aorus GeForce RTX 4070 Ti Master comes across a very capable 4K gaming GPU for the price. Most modern titles can easily hit 60 fps+ in 4K Ultra settings. Cumulative performance in tested games is the same as that of the Asus TUF Gaming 4070 Ti. The KFA2 only loses out by an ever-so-slight margin cumulatively.
The Aorus RTX 4070 Ti Master is capable of utilizing DLSS 3.0, so it is possible to get significant fps boosts at 4K in supported titles. That being said, QHD is the sweet spot for AD104 cards.
The Aorus 4070 Ti card is about 11% faster than the RTX 3090 overall and more or less ties with the RTX 3090 Ti. The Radeon RX 7900 XT only gets a 4% advantage compared to the Aorus.
While 4K gaming shouldn't be a hassle with the RTX 4070 Ti, the lower memory and bandwidth might pose a bottleneck while playing texture-heavy titles.
Ray tracing performance
Ray tracing combined with DLSS 3.0 is a major USP for Nvidia RTX 40 cards over their AMD RDNA 3 rivals. The Aorus GeForce RTX 4070 Ti Master generally leads the 4070 Ti crowd in most ray tracing tests albeit only by a tiny margin.
We see particularly good gains with Cyberpunk 2077 4K Ultra ray tracing wherein the Aorus card is 15% faster than the Radeon RX 7900 XTX and about 11% faster than the KFA2 RTX 4070 Ti SG.
Dying Light 2, which can get demanding at max ray tracing settings, sees the Aorus RTX 4070 Ti gaining a nice 8% lead over the RTX 3090 Ti.
Interestingly, the RTX 4090 Founders Edition is only 5% ahead of the Aorus RTX 4070 Ti in Metro Exodus (non-Enhanced Edition) and Far Cry 6 1080p Ultra ray tracing. It is possible that there are other bottlenecks at play here, or that these games are simply unable to take full advantage of the new architecture.
| Watch Dogs Legion - 1920x1080 Ultra Preset + Ultra Ray Tracing (DX12) | |
| NVIDIA GeForce RTX 4090 Founders Edition | |
| NVIDIA GeForce RTX 4080 Founders Edition | |
| Aorus GeForce RTX 4070 Ti Master | |
| Asus TUF Gaming GeForce RTX 4070 Ti | |
| Zotac Gaming GeForce RTX 3090 Ti AMP Extreme Holo | |
| Average NVIDIA GeForce RTX 3090 (75.7 - 110, n=3) | |
| Average NVIDIA GeForce RTX 3080 Ti (n=1) | |
| AMD Radeon RX 6800 XT | |
| Average NVIDIA GeForce RTX 3080 (70.9 - 71.3, n=2) | |
| Sapphire AMD Radeon RX 6950 XT Nitro+ Pure | |
| AMD Radeon RX 6900 XT | |
| AMD Radeon RX 6900 XT (SAM ENABLED) | |
| Average NVIDIA Titan RTX (n=1) | |
| The Callisto Protocol - 1920x1080 Ultra Preset (without FSR Upscaling) + Full Ray-Tracing | |
| Average of class Desktop (138.8 - 145.2, n=2, last 2 years) | |
| Average NVIDIA GeForce RTX 3090 (n=1) | |
| AMD Radeon RX 7900 XTX | |
| AMD Radeon RX 7900 XT | |
| Asus TUF Gaming GeForce RTX 4070 Ti | |
| Aorus GeForce RTX 4070 Ti Master | |
| KFA2 GeForce RTX 4070 Ti SG | |
| Average NVIDIA GeForce RTX 3080 Ti (n=1) | |
| Average NVIDIA GeForce RTX 3080 (n=1) | |
| Average NVIDIA Titan RTX (n=1) | |
| low | med. | high | ultra | QHD | 4K | |
|---|---|---|---|---|---|---|
| GTA V (2015) | 188.1 | 187.9 | 187.4 | 172 | 158.4 | 172.4 |
| The Witcher 3 (2015) | 445 | 220 | 148.7 | |||
| Dota 2 Reborn (2015) | 302.5 | 267.6 | 258.8 | 243.4 | 225.9 | |
| Final Fantasy XV Benchmark (2018) | 237 | 237 | 212 | 169.2 | 90.9 | |
| X-Plane 11.11 (2018) | 254 | 222 | 166.8 | 141.7 | ||
| Shadow of the Tomb Raider (2018) | 299 | 280 | 204 | 104.9 | ||
| Metro Exodus (2019) | 194.9 | 161.2 | 132.3 | 85 | ||
| Control (2019) | 201 | 130.6 | 64.9 | |||
| Borderlands 3 (2019) | 212 | 185.3 | 142 | 74.9 | ||
| Mafia Definitive Edition (2020) | 249 | 175.5 | 88.2 | |||
| Watch Dogs Legion (2020) | 177.5 | 151.8 | 121 | 68.4 | ||
| F1 2021 (2021) | 704 | 606 | 491 | 262 | 201 | 114.9 |
| Far Cry 6 (2021) | 192.7 | 171.7 | 157 | 88.7 | ||
| Dying Light 2 (2022) | 176.9 | 120 | 58.2 | |||
| Cyberpunk 2077 1.6 (2022) | 184.9 | 167.1 | 107.1 | 50.7 | ||
| Ghostwire Tokyo (2022) | 332 | 321 | 217 | 101.1 | ||
| F1 22 (2022) | 423 | 416 | 342 | 142.5 | 94.4 | 47.3 |
| Uncharted Legacy of Thieves Collection (2022) | 140.8 | 133.8 | 108.4 | 63.9 | ||
| Call of Duty Modern Warfare 2 2022 (2022) | 188 | 180 | 132 | 82 | ||
| The Callisto Protocol (2022) | 155 | 155 | 117 | 69 |
Emissions: No practical difference between OC and Silent BIOS modes
Gigabyte uses a triple-fan cooler with alternate spinning fans in the Aorus GeForce RTX 4070 Ti Master. The company places great emphasis on improvements to its Windforce cooling system with 108 mm alternate spinning fans.
According to Gigabyte, the Aorus card makes use of vapor chamber cooling with nine copper heatpipes for effective heat dissipation. The card also sports an extended heatsink with large venting in the rear to allow for more efficient heat dissipation.
Overclocking potential is decent with the ability to increase the power target by 28% to 366 W.
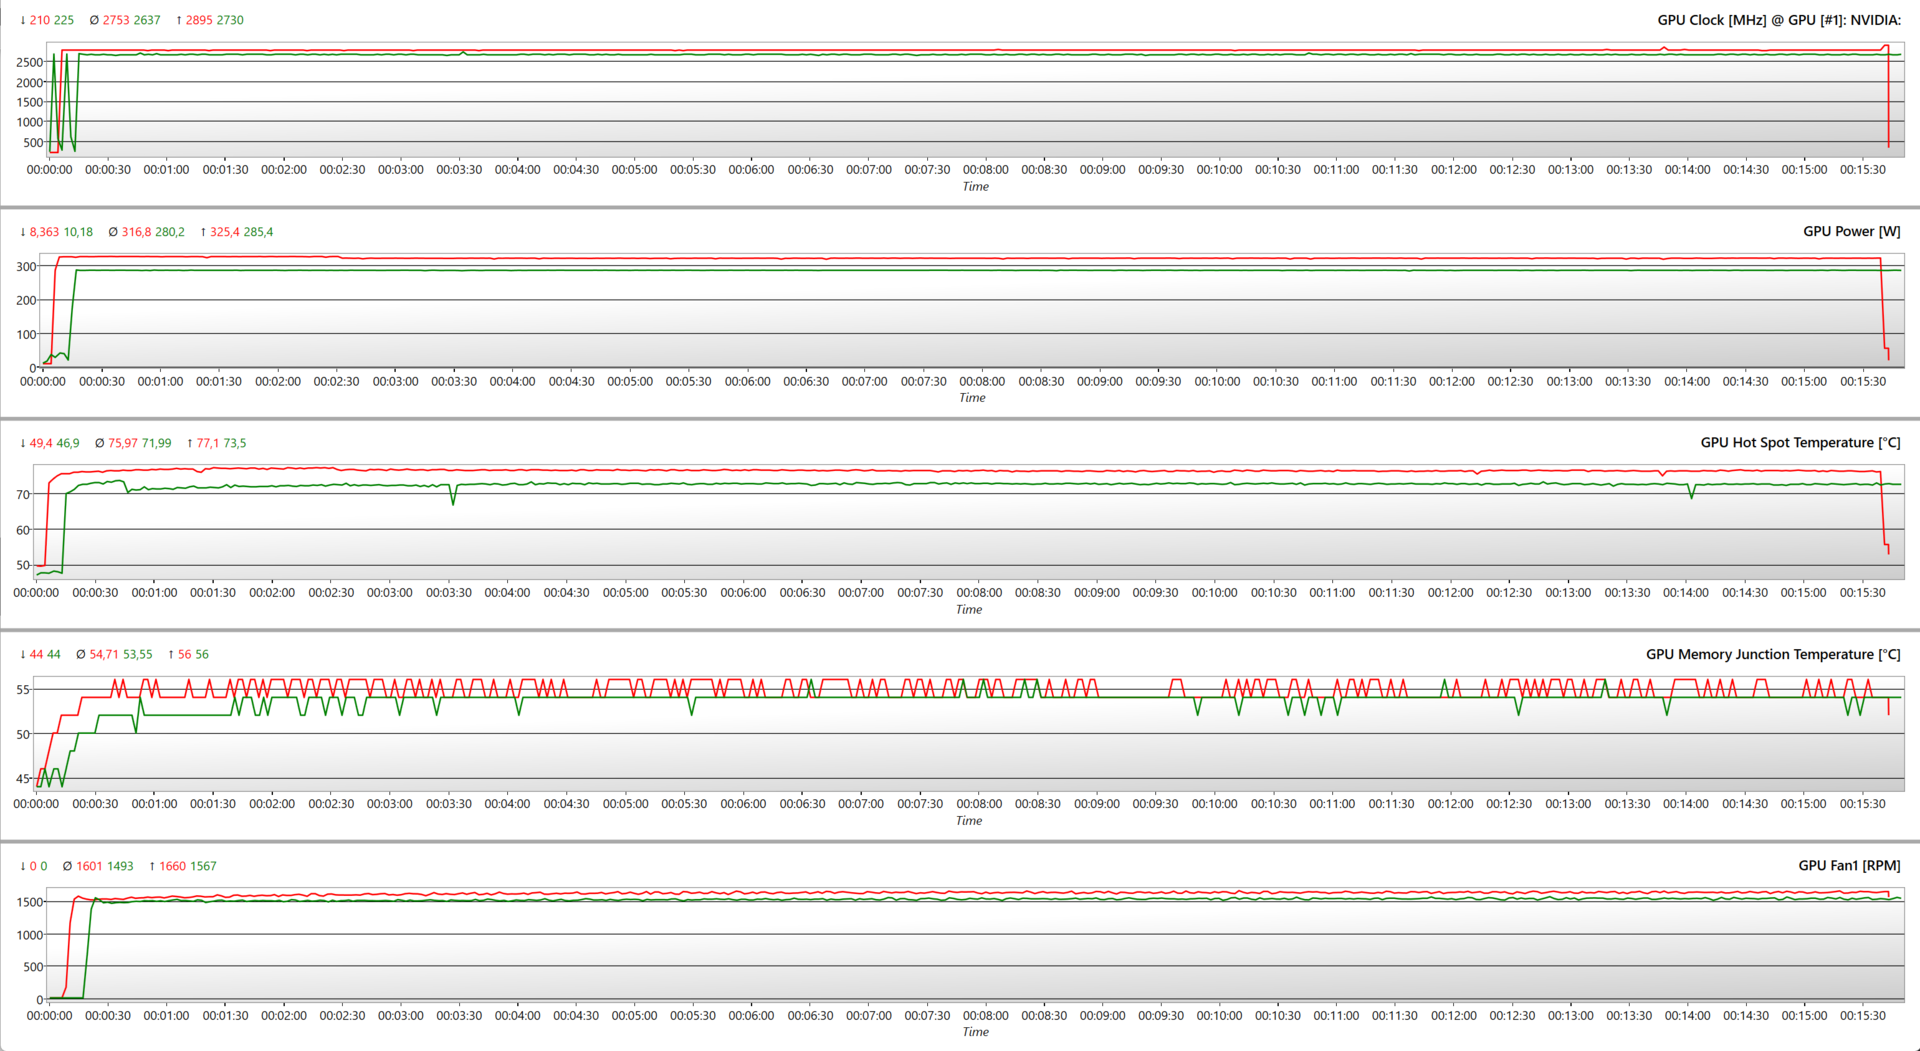
Stress tests
Running FurMark at 1280 x 720 with no AA in the OC BIOS mode sees the Aorus GeForce RTX 4070 Ti Master maximizing its rated TGP at both 100% and 128 power targets. The increase in power target enables a 6% increase in clocks from 2,730 MHz to 2,895 MHz. The GPU is able to sustain these boosts very well without any visible signs of throttling with a hot spot average of 72 °C and 76 °C, at 100% and 128% power targets, respectively.
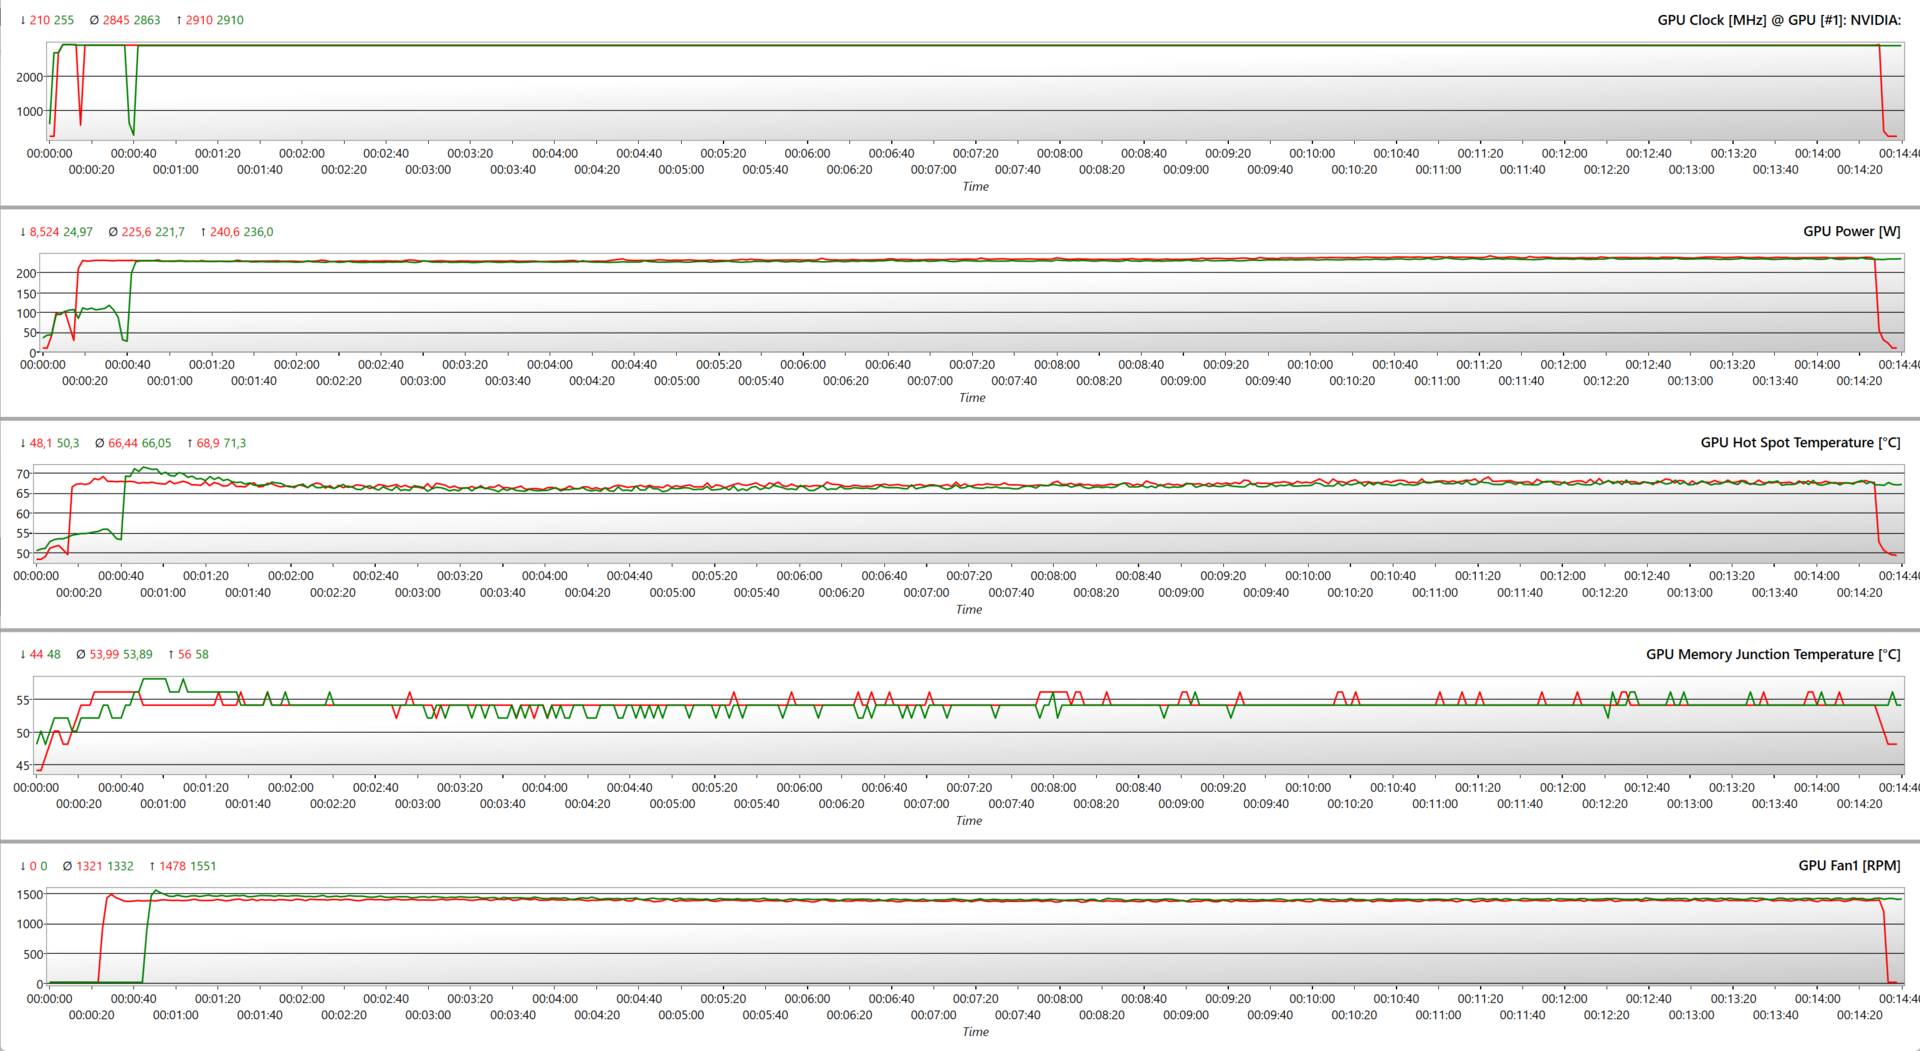
The Witcher 3 at 1080p Ultra sees a similar pattern, but the clocks here are maximized at 2,910 MHz at a lower 236 W TGP at 100% power target. The increase in power target to 128% does not seem to have any tangible benefit in terms of clocks or average hot spot temperatures. Running the game at 4K Ultra at 100% power also resulted in a 2,910 MHz boost but with an increased 246 W TGP.
Switching the BIOS mode to Silent has practically no effect on power draws in FurMark. Interestingly, the Silent mode can even afford a slight increase in boost clocks as seen before without having to increase the power target.
GPU parameters in The Witcher 3 stress using the Silent BIOS are more or less similar to what we see with the OC BIOS at a 100% power target.


The Witcher 3 FPS Chart
Gigabyte seems to have a done a good job in the cooling department. We see practically no fps drops in The Witcher 3 at 1080p Ultra and 4K Ultra.
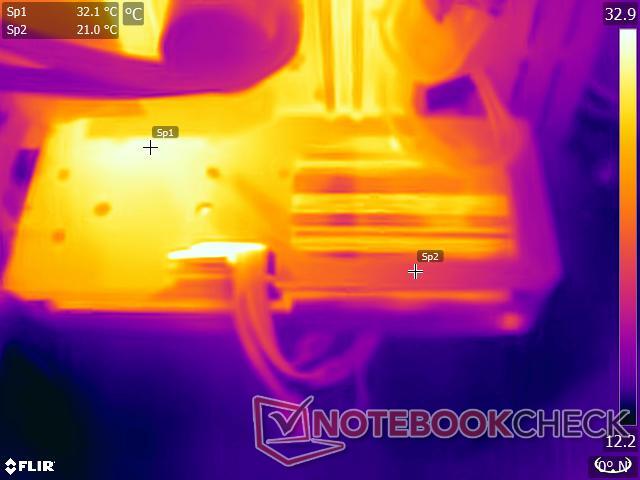
Surface temperatures
The good cooling also translates to lower surface temperatures. The plastic front shroud of the card remains close to the ambient room temperature of 22 °C.
Since the Aorus card does not expose the GPU mount, the metal backplate helps radiate way the temperatures quite effectively.
We recorded about 41 °C in the area near the 12VHPWR connector, which is normal.


Noise levels
Gigabyte touts a lot about its improved Windforce cooling system in the Aorus lineup. The new fan blades feature what the company calls a Bionic Shark design that mimics the scales on a shark's skin.
Apparently, the new fan blade design and its shark skin-like texture should help in increasing static pressure by 30% while resulting in a 3 dB reduced noise compared to conventional fans at 1,800 RPM.
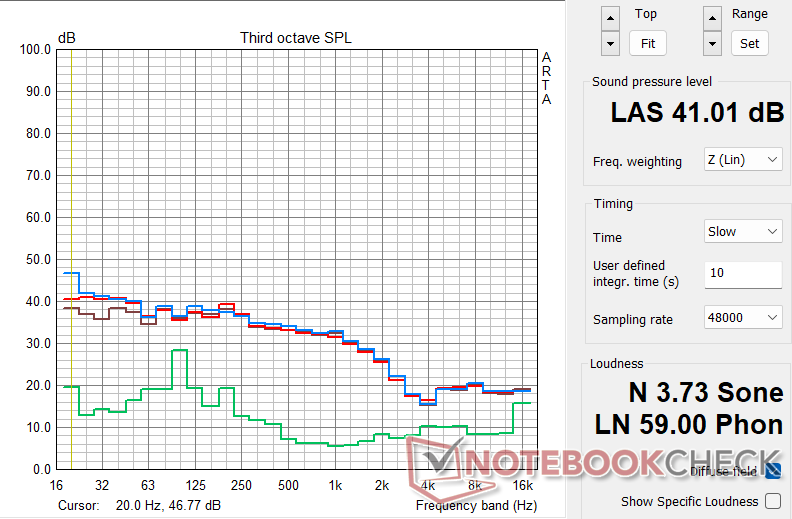
Gigabyte provided us with updated BIOS versions that seemingly help with tighter fan curves and reduced noise. We observed that the new BIOS versions indeed helped in reducing fan noise to a perceivable extent. For instance, fan noise in FurMark at 100% power target in OC BIOS mode reduced from 44.10 dB(A) in the old BIOS to 41.01 in the new version.
Retail samples should be available with the new BIOSs pre-flashed.
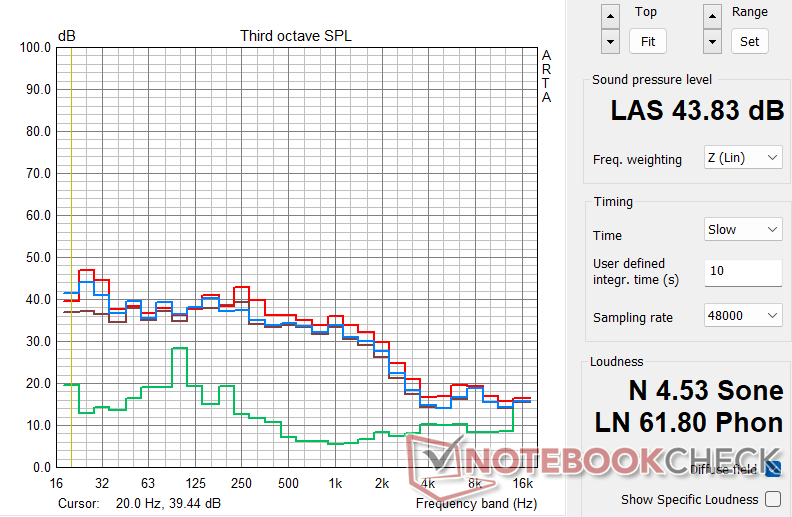
That being said, we did not observe any particular benefit of choosing either BIOS mode just like the Asus TUF Gaming RTX 4070 Ti OC. As illustrated in the table below, there is not much of a difference in measured sound pressure levels (SPL) during stress tests performed at a 100% power target in either BIOS mode.
Increasing the power target to 128% does have an impact on fan speed, and consequently the SPL, in FurMark. However, the fans actually spin at a 4% lower RPM during The Witcher 3 stress at a 128% power target as the GPU is already able to sustain maximum clocks for prolonged periods without throttling.
| Stress Test | VBIOS Mode / Power Target | Max. Fan Speed (RPM) | Fan Noise dB(A) |
|---|---|---|---|
| FurMark 1280 x 720, no AA | OC BIOS / 100% | 1,567 | 41.01 |
| FurMark 1280 x 720, no AA | OC BIOS / 128% | 1,660 | 43.83 |
| FurMark 1280 x 720, no AA | Silent / 100% | 1,517 | 41.40 |
| The Witcher 3 1080p Ultra | OC BIOS / 100% | 1,551 | 40.55 |
| The Witcher 3 1080p Ultra | OC BIOS / 128% | 1,478 | 40.41 |
| The Witcher 3 1080p Ultra | Silent / 100% | 1,559 | 41.01 |
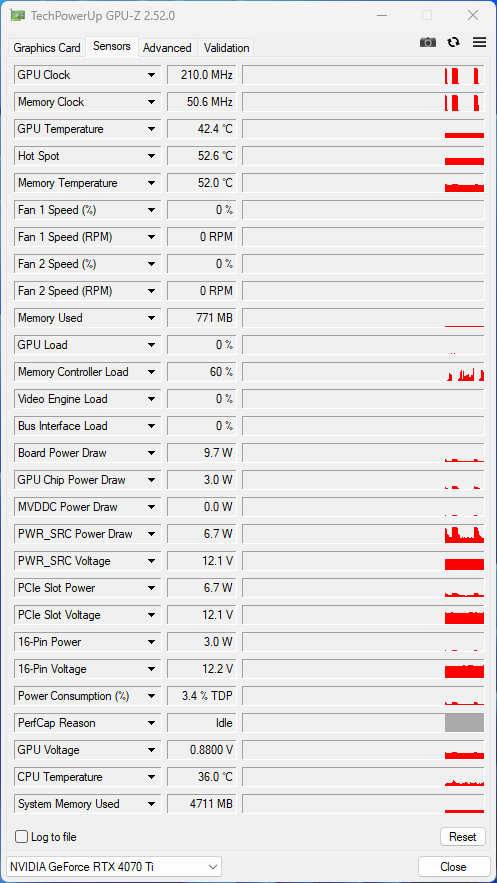
The fans completely stop in idle and only start revving once the GPU core temperature crosses 52 °C. Overall, the Aorus GeForce RTX 4070 Ti Master's fan noise is manageable in a closed case.
Users can further fine-tune the fan curves via Gigabyte Control Center or a compatible third-party utility.
Energy management: Sips 32% less power than an RTX 3090 Ti
Power consumption from the wall is on expected lines for an AD104 card. The Aorus GeForce RTX 4070 Ti Master consumes 32% less power compared to the Zotac Gaming GeForce RTX 3090 Ti AMP Extreme Holo in FurMark and 28% in The Witcher 3 at 1080p Ultra at a 100% power target.
There's not much difference between the three RTX 4070 Ti cards themselves in terms of energy consumption. At a 100% power target, the TUF Gaming RTX 4070 Ti OC consumes about 4% higher power than the Aorus while running The Witcher 3.
Power Consumption: External Monitor
* ... smaller is better
Pros
Cons
Verdict: Excellent performance with callous pricing

With Nvidia not opting to launch an RTX 4070 Ti Founders Edition, the Aorus GeForce RTX 4070 Ti Master 12G joins the list of a few dozen AiB cards based on the new AD104 GPU. However, Aorus has a few tricks of its own to make RTX 4070 Ti Master 12G stand apart from the crowd.
The Aorus GeForce RTX 4070 Ti Master 12G does not throw up any particular surprises on the performance front — it performs exactly like the Asus TUF Gaming GeForce RTX 4070 Ti OC and the KFA2 GeForce RTX 4070 Ti SG in almost every benchmark and game we've tested.
This means that the card performs on par or even better than the RTX 3090 Ti and is often significantly ahead of the RTX 3090. Support for new architectural improvements including DLSS 3.0 frame generation and new ray tracing pipelines mean that the RTX 4070 Ti will last for quite some time to come and will be able to make merry with a good number of current and upcoming titles at QHD Ultra and even at 4K without much trouble.
Aorus tries to differentiate itself from the competition in terms of aesthetics. The build is primarily plastic, but the metal backplate adds both form and function helping in effective heat dissipation.
The Aorus RTX 4070 Ti Master features prominent RGB logos on the front and the back, has a triple-ring RGB Halo on the fans, and even offers an LCD panel for displaying system stats and custom info. While these features work great out-of-the-box, Gigabyte's Control Center app is a royal pain in the rear in its current condition.
The Aorus GeForce RTX 4070 Ti Master 12G makes for an excellent QHD Ultra triple-digit fps and 4K gaming card that can edge out the RTX 3090 Ti. However, the asking price of US$1,000 for a 70-series card will raise a few eyebrows.
Gigabyte has equipped the card with an outstanding cooling solution, the effectiveness of which is evident in our stress tests. With the latest BIOSs, the Aorus RTX 4070 Ti Master tries to keep the volume down. However, the TUF Gaming RTX 4070 Ti and the KFA2 RTX 4070 Ti SG are still a tad bit quieter under stress.
The performance and emissions of the card should not differ much irrespective of the BIOS you use. Power consumption at a 100% power target is similar to the other RTX 4070 Ti cards we've tested so far.
So, should the Aorus GeForce RTX 4070 Ti Master 12G feature high on your gaming shopping list? If you are talking in pure performance terms, then the answer is a yes. However, there's more to it than meets the eye.
Sure, you're getting RTX 3090 Ti-class performance but that is purely an architectural advantage. The RTX 3090 Ti, or even the RTX 3090, still offer a superior memory subsystem that can come in handy in not just texture-heavy games but in demanding creative workflows as well.
And the RTX 3090 Ti, which was once a collosal expenditure for no reason, has now dropped to US$1,099 (good luck finding stocks at this price, though).
On the AMD side of things, the Radeon RX 7900 XT is Team Red's 4070 Ti equivalent dud in terms of pricing. It is priced higher solely because Nvidia has inflated theirs, sensing that customers will eventually pay up.
Remember that you are also paying extra for the Aorus branding and things like fancy LCD screens. There are Gigabyte RTX 4070 Tis around the US$850 mark and they perform just as good.
However, the Radeon RX 7900 XTX Made by AMD (MBA) card at an MSRP of US$999 is a much better deal overall than the Aorus RTX 4070 Ti Master if you don't mind losing out on DLSS 3 and any CUDA-dependent workflows.
On its own, the Aorus GeForce RTX 4070 Ti Master 12G is a great gaming GPU that looks great, is reasonably quiet, power efficient, and offers Ampere's flagship performance without much trouble.
If you have the time, we suggest waiting for prices to drop down further and keeping a close watch on good deals on the RTX 4080 and RX 7900 XTX.
Else, just opt for an RTX 4070 Ti around the US$799 mark.
Price and Availability
The Aorus GeForce RTX 4070 Ti Master 12G is available from Amazon US and Best Buy for US$999.99.
In India, the Aorus GeForce RTX 4070 Ti Master 12G is priced at an official MRP of ₹94,127 with slight variations across retailers. This makes it cheaper than the Asus TUF Gaming RTX 4070 Ti OC that retails for ₹101,999 MRP.
Price comparison
