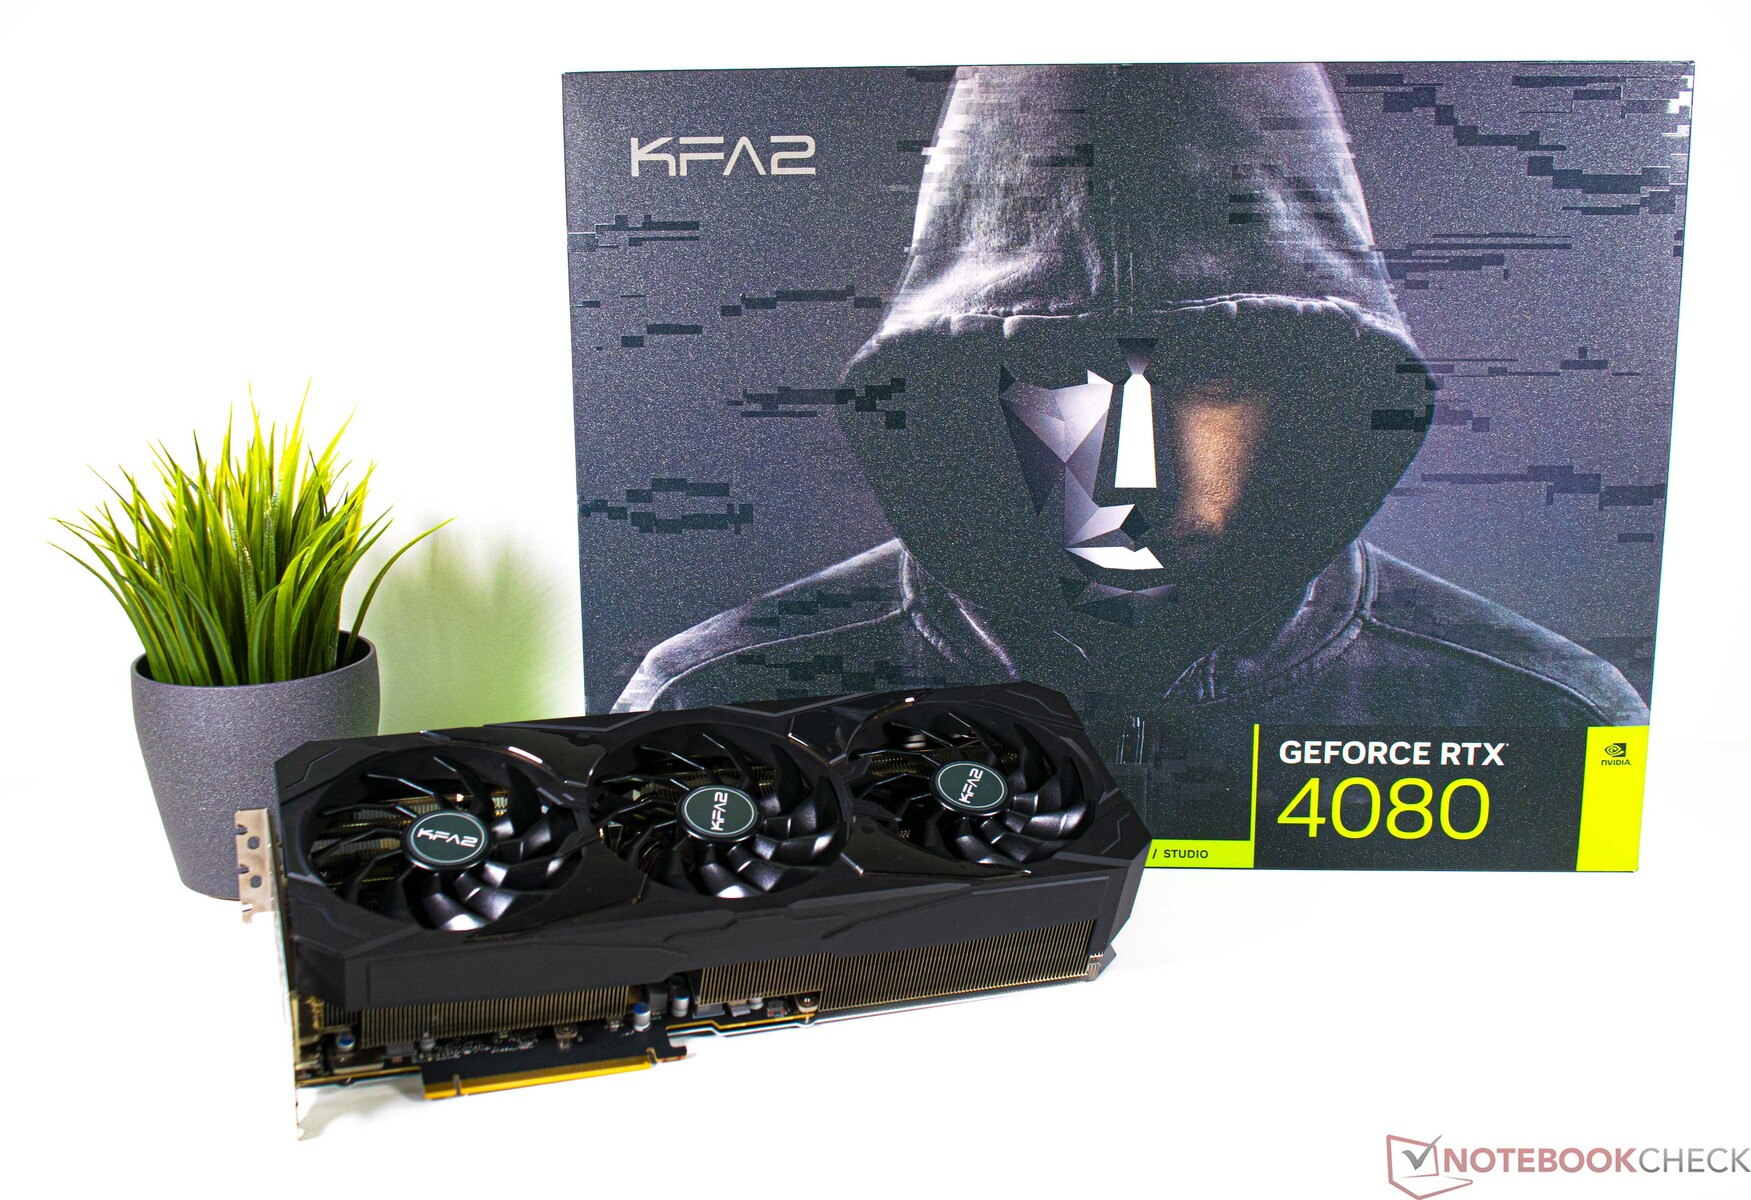
KFA2 GeForce RTX 4080 SG desktop GPU review: Great performance meets questionable pricing

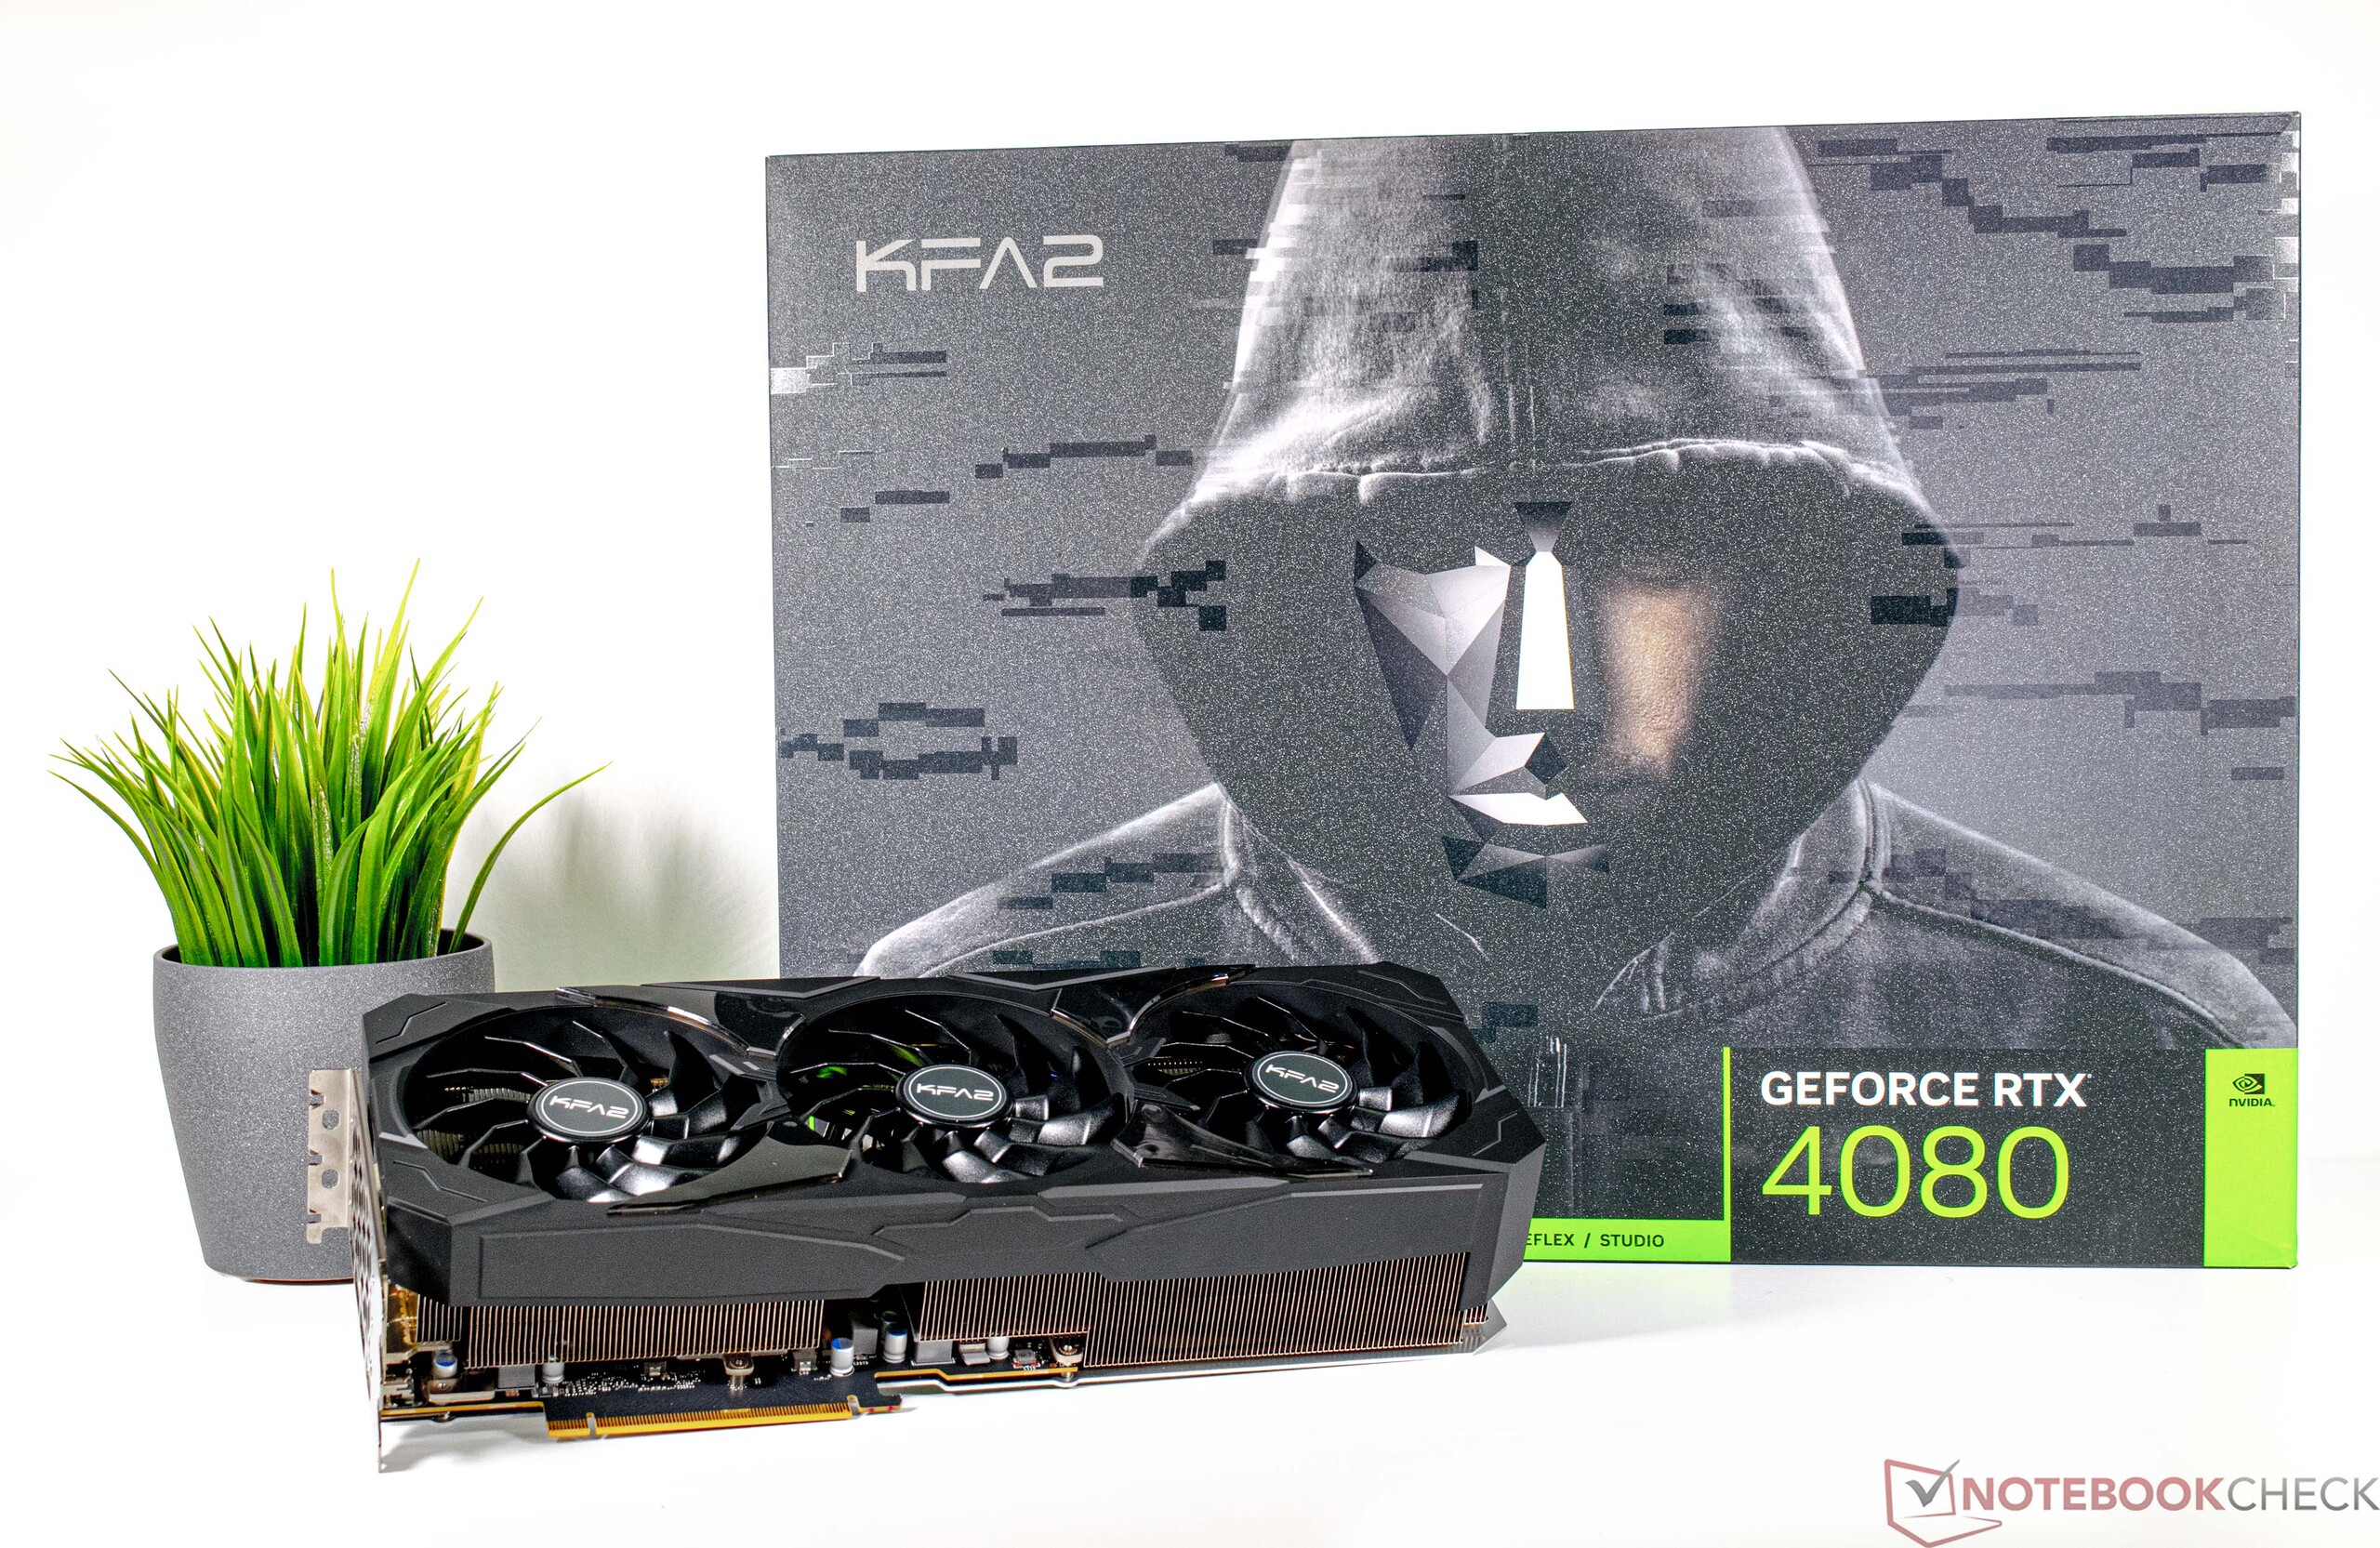
After we recently reviewed the KFA2 GeForce RTX 4090 SG, it is now time for the smaller KFA2 GeForce RTX 4080 SG to showcase what it has got under the hood. Speaking of under the hood, unlike the Ampere lineup, the second fastest model of the current generation is based on a different graphics chip from the one on the top-end model. It uses the AD103 GPU, which is substantially smaller and thus cheaper to produce than the AD102. However, the lower production cost isn't fully reflected in the current pricing. This is a widely discussed issue, and we too believe that prices must be reduced significantly so that the latest graphics cards don't end up becoming shelf warmers. The RRP of the GeForce RTX 4080 has more than doubled compared with its predecessor (GeForce RTX 3080). We are going to leave our criticism of the pricing here for the time being. From this point on, we want to instead focus on the performance and features of the KFA2 GeForce RTX 4080 SG and discuss how well this model stacks up particularly against AMD's RDNA3 GPUs.
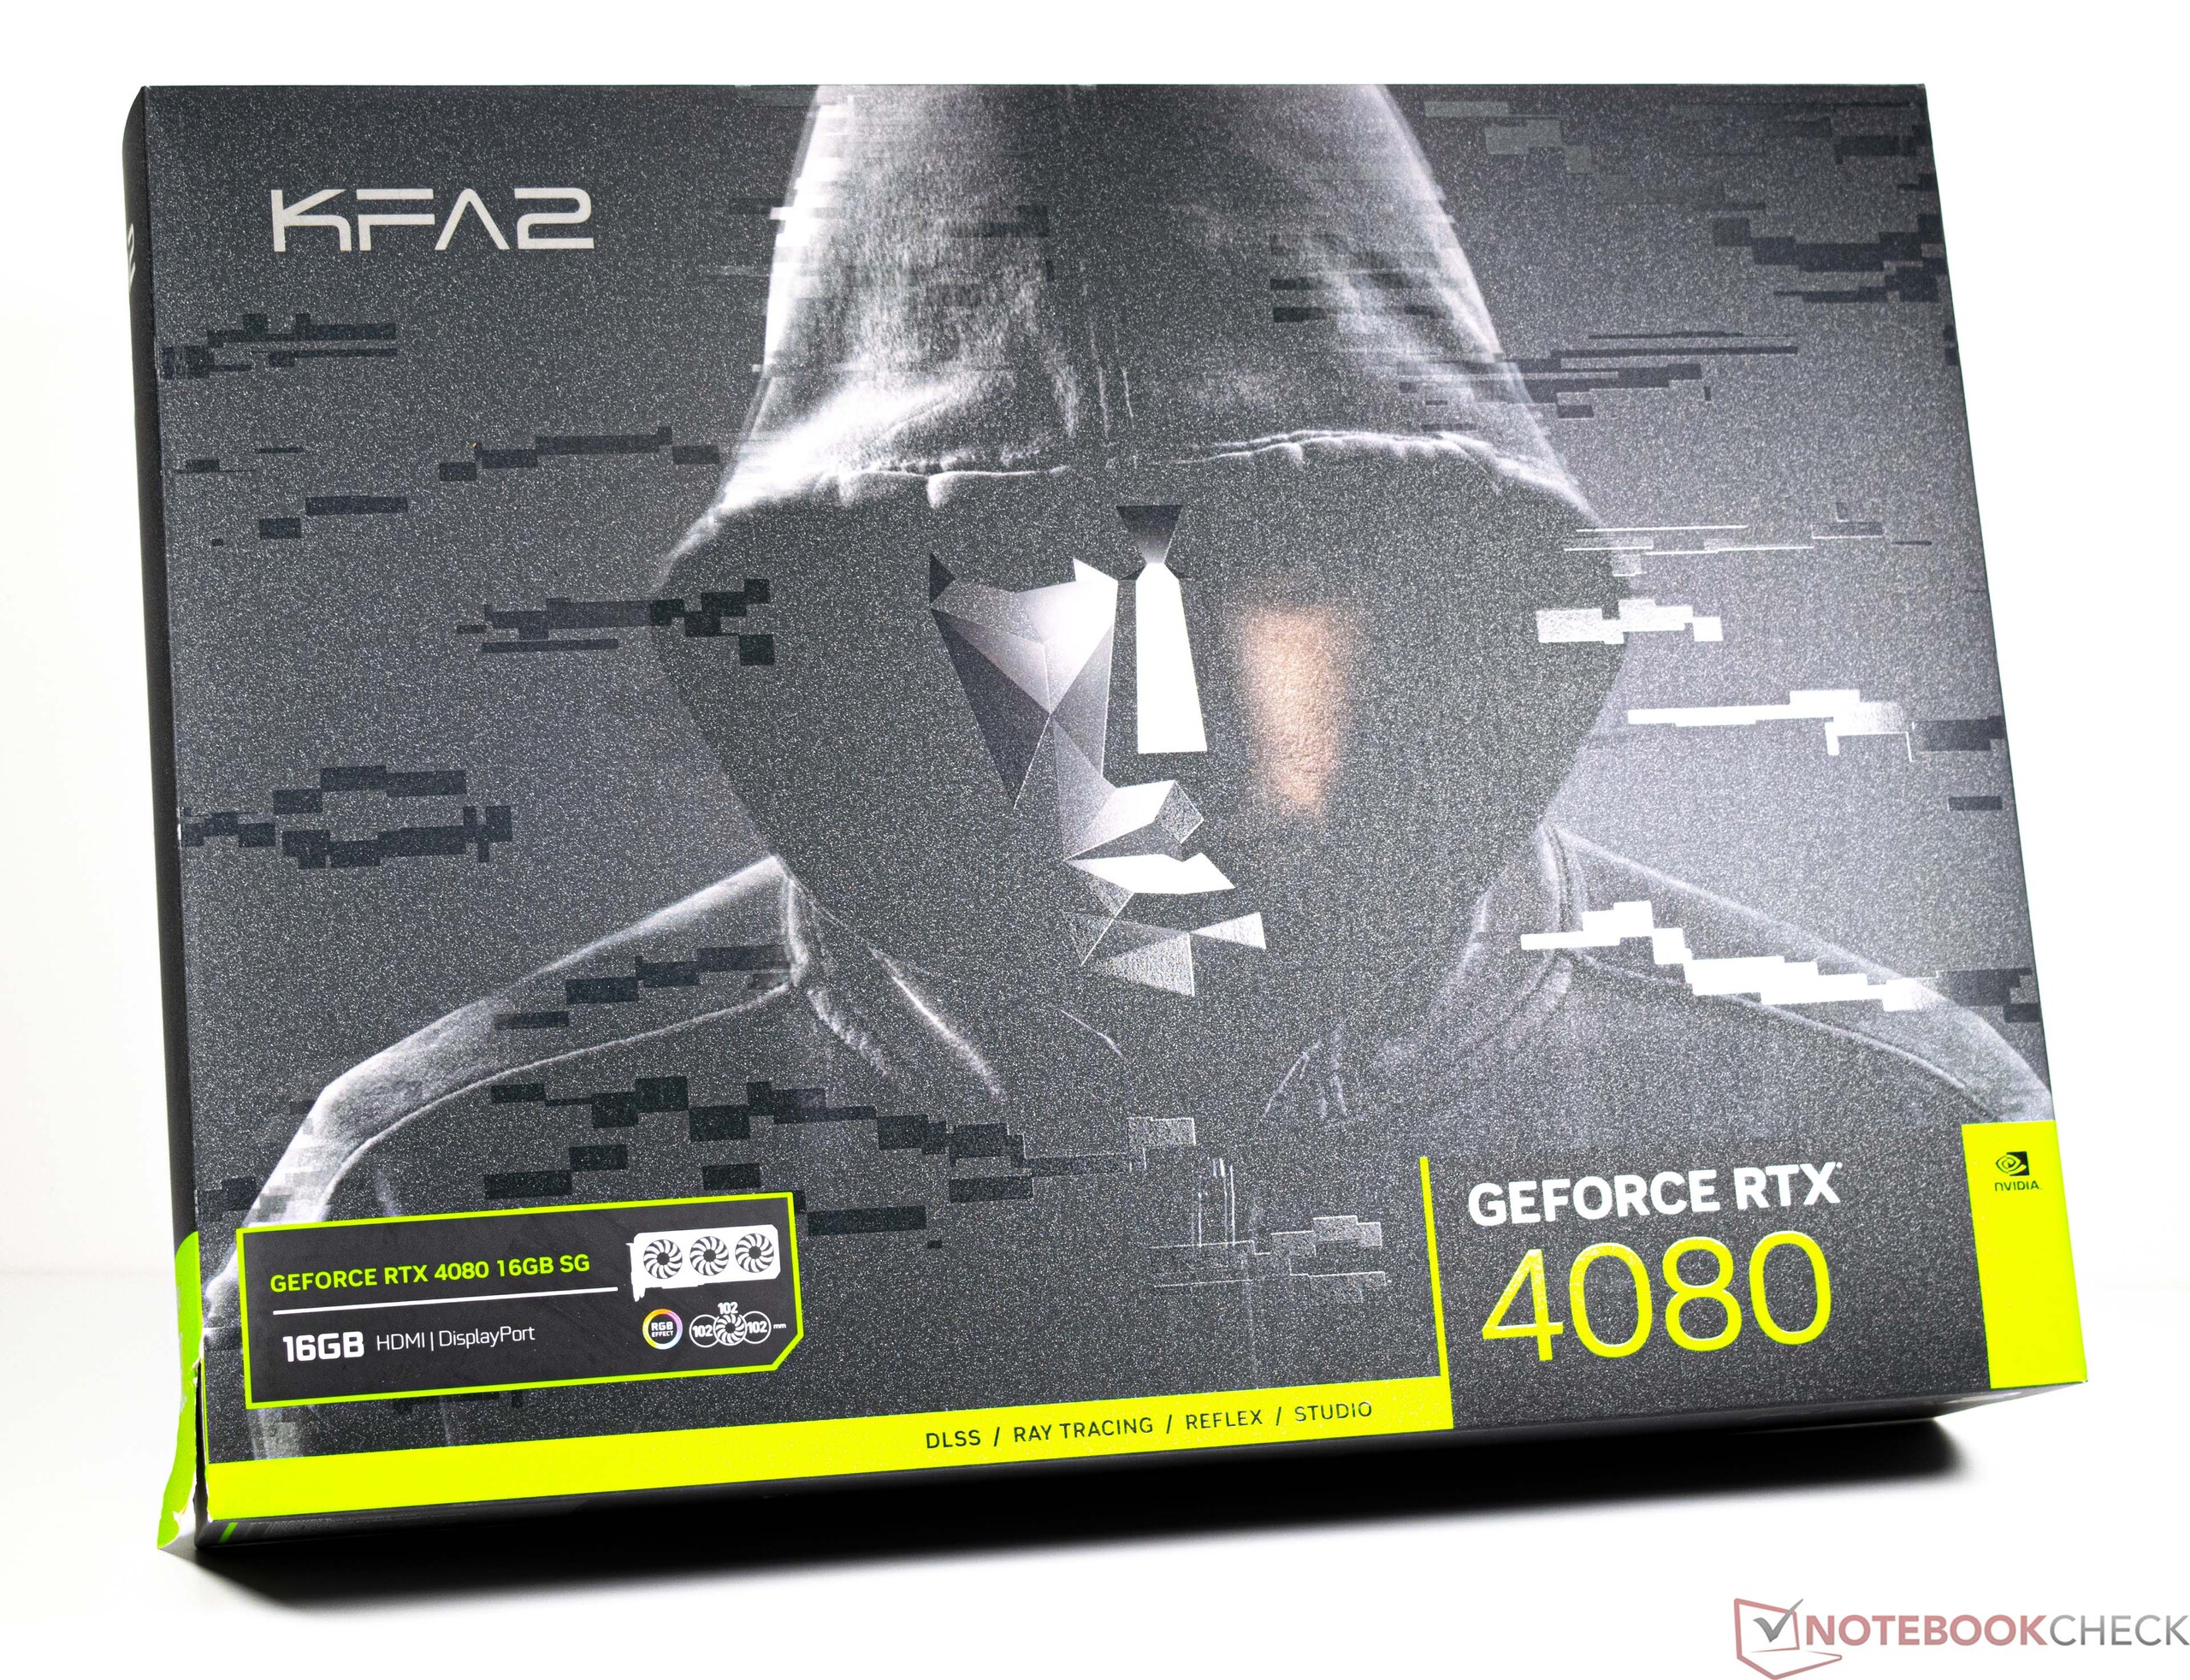
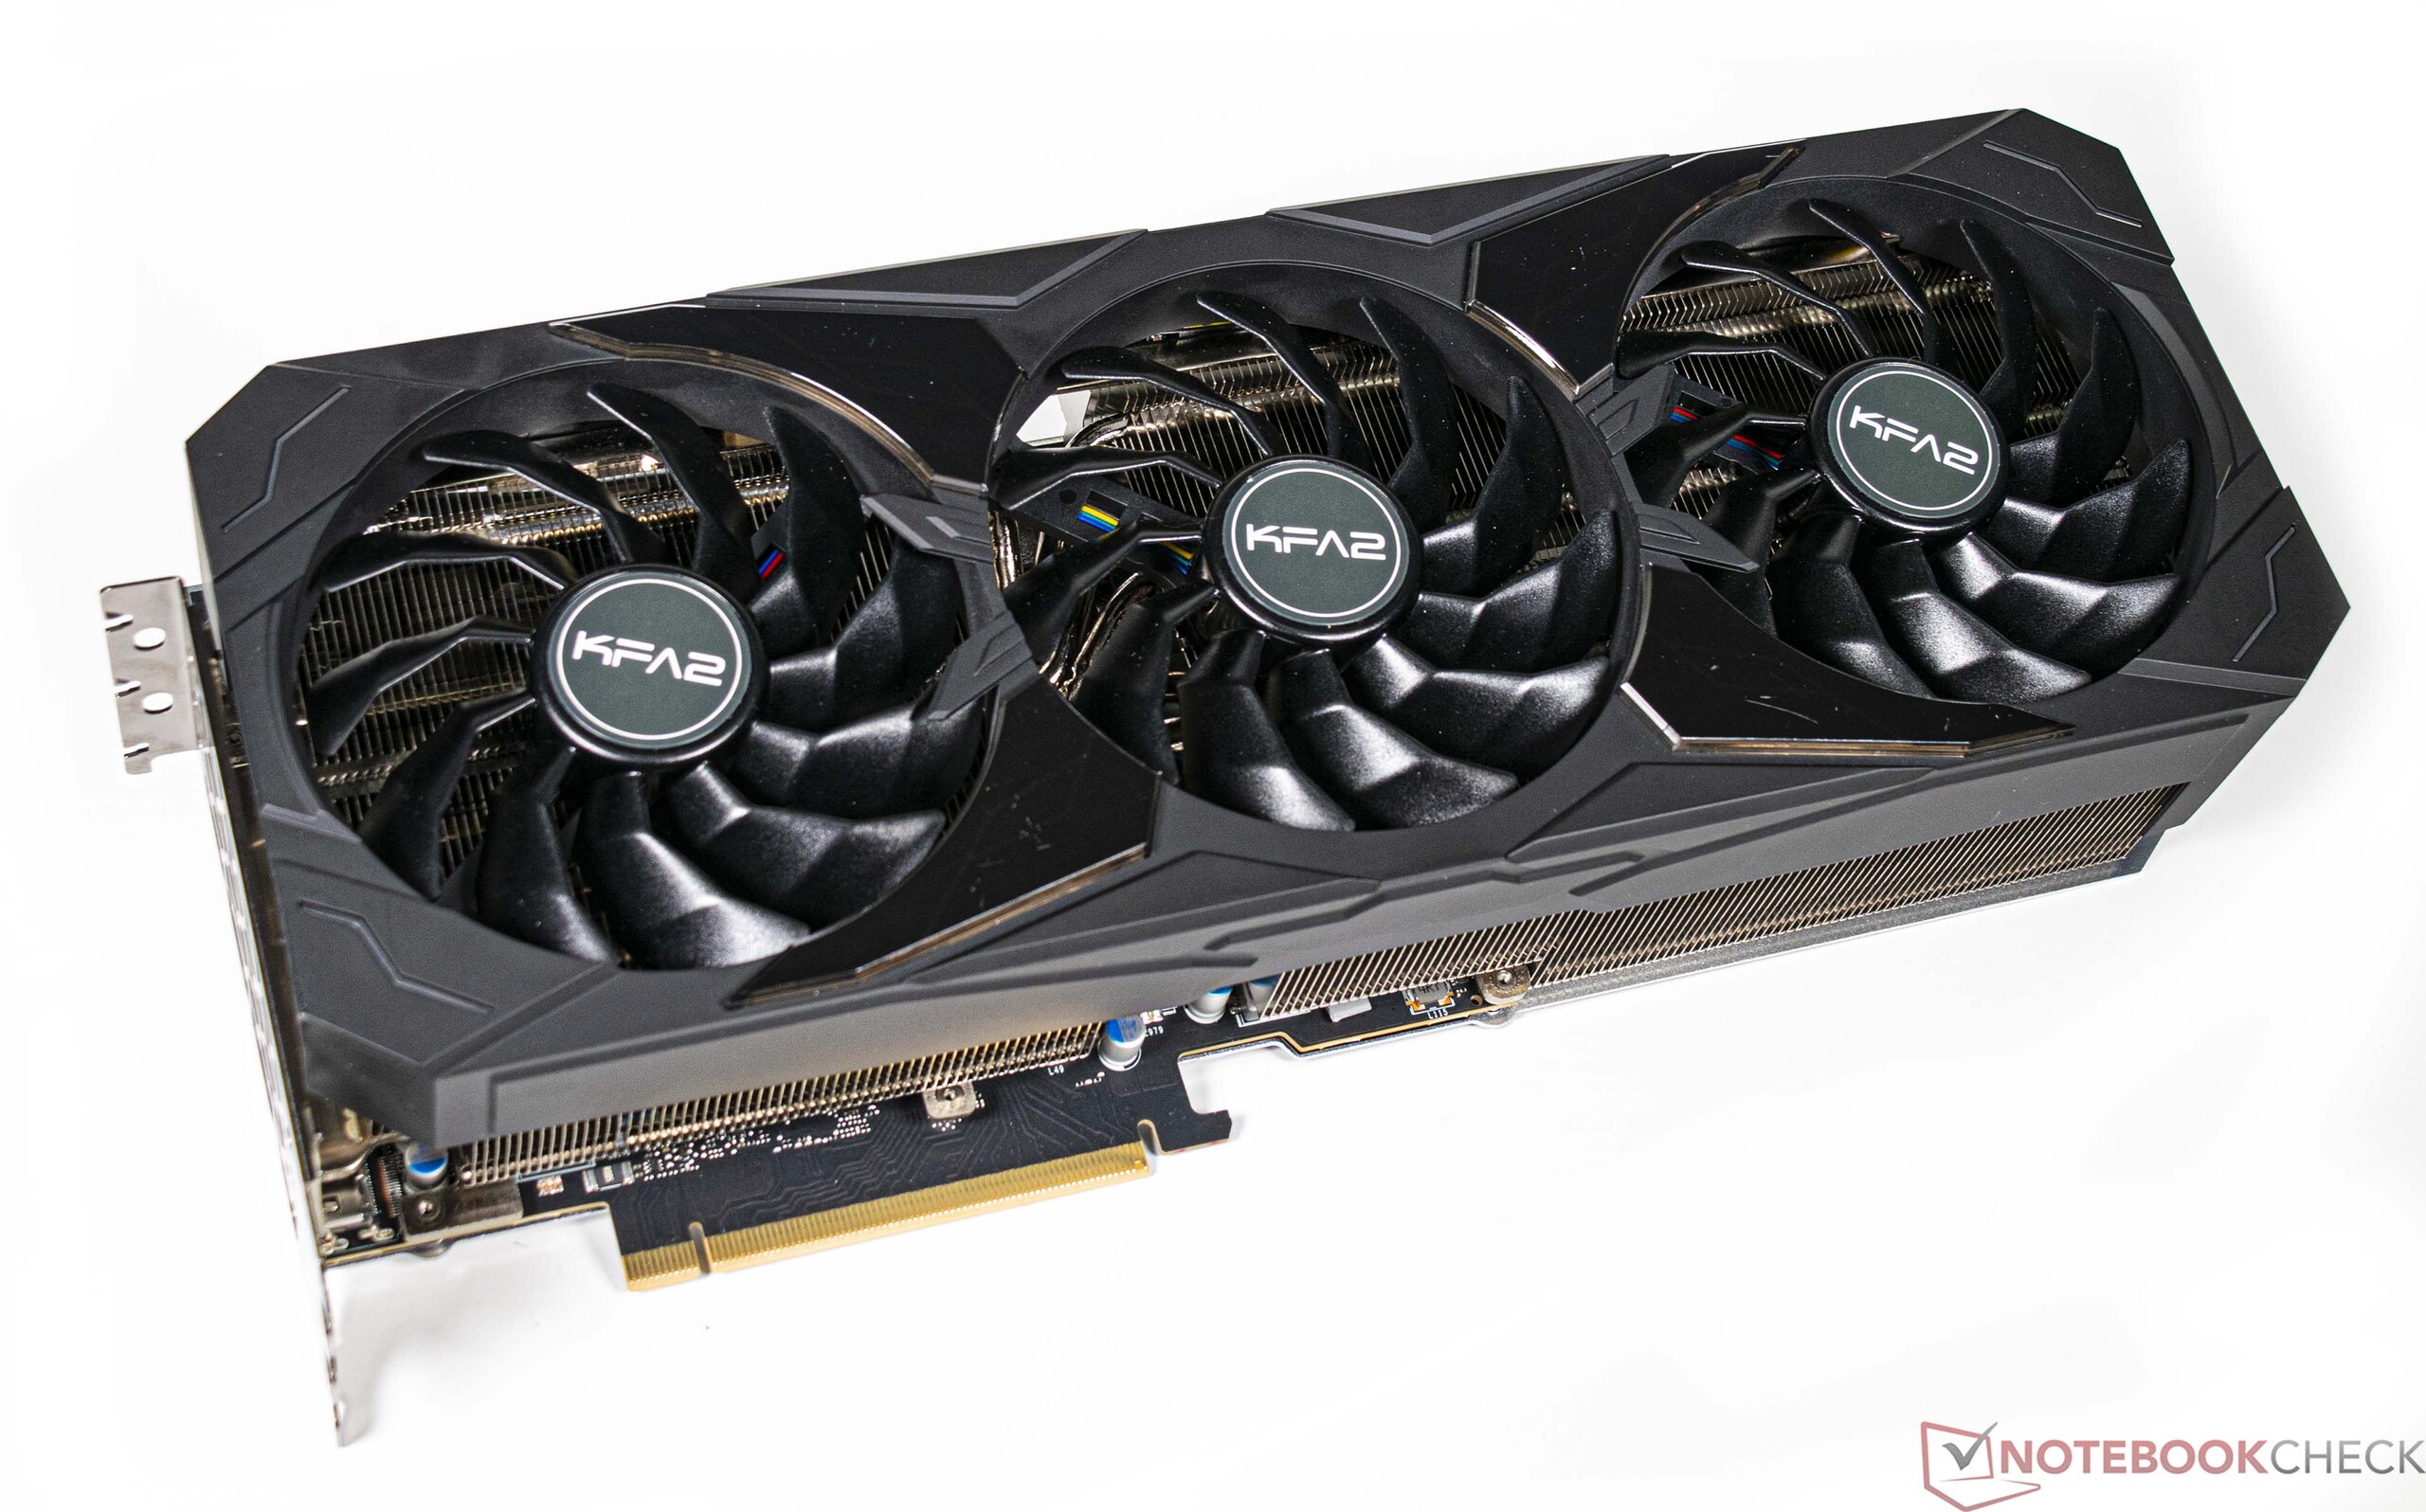
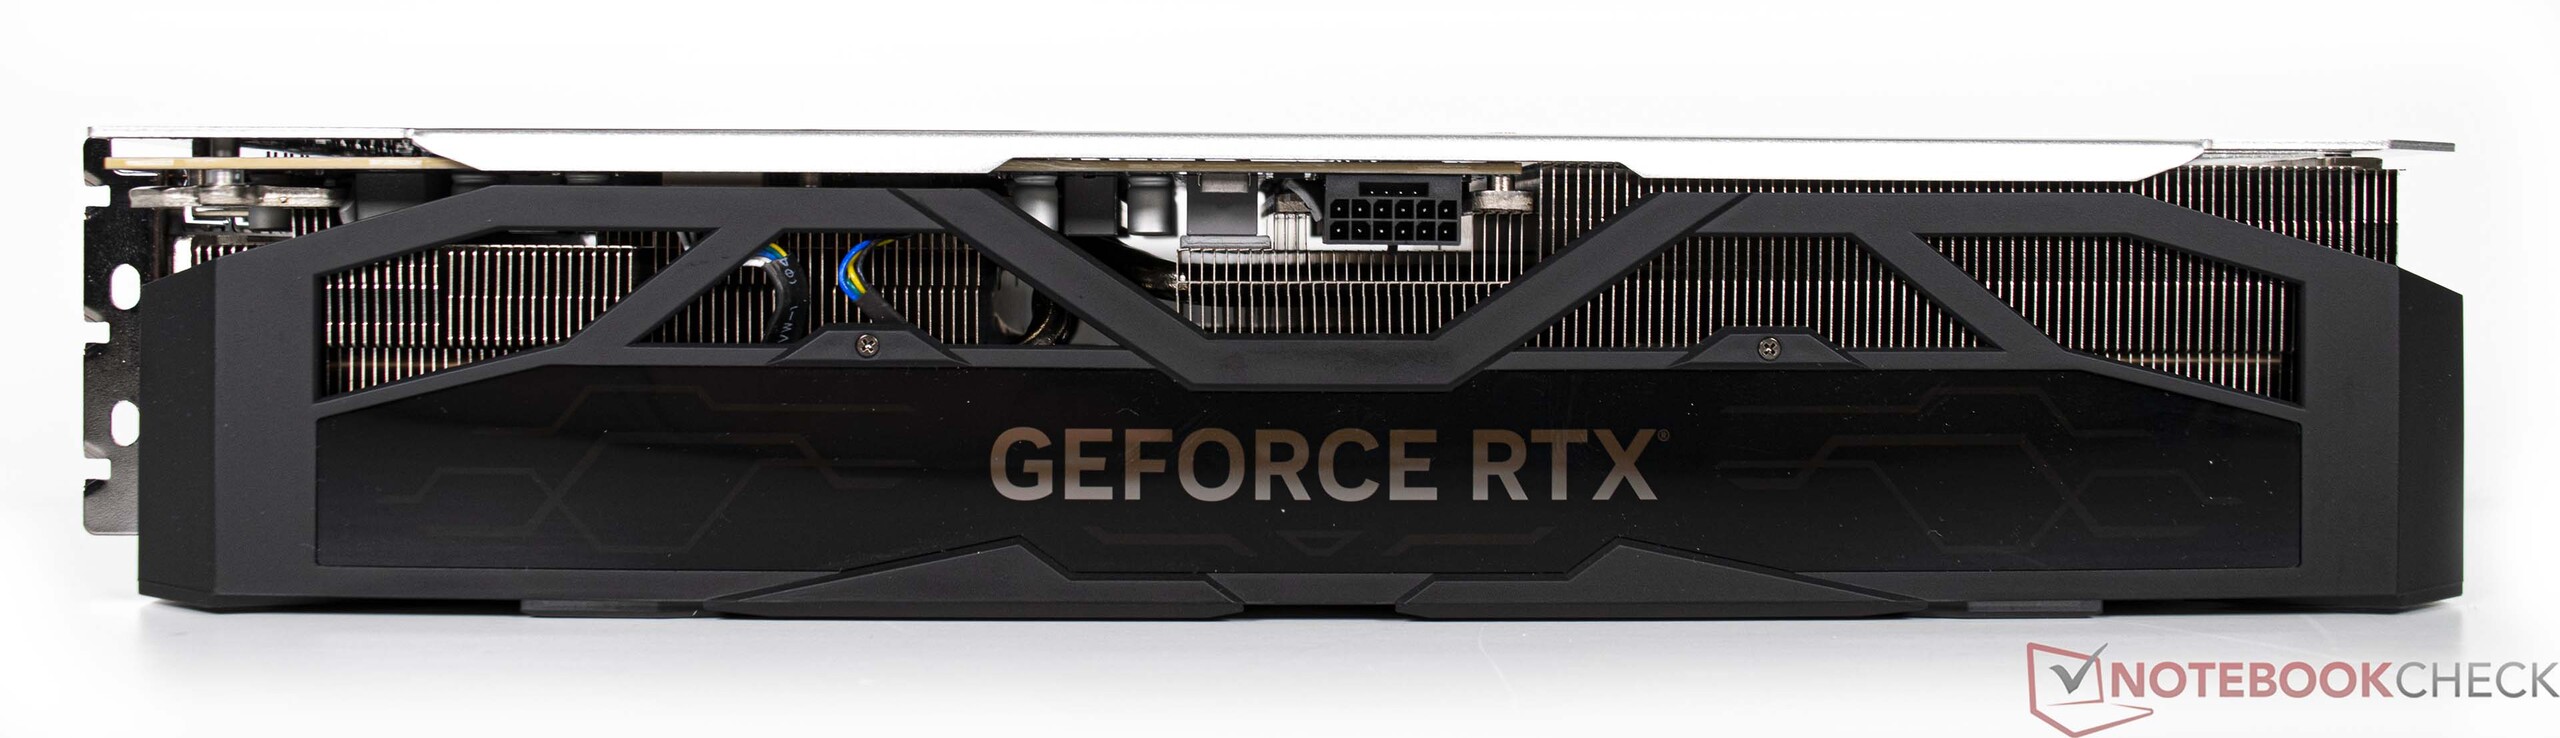
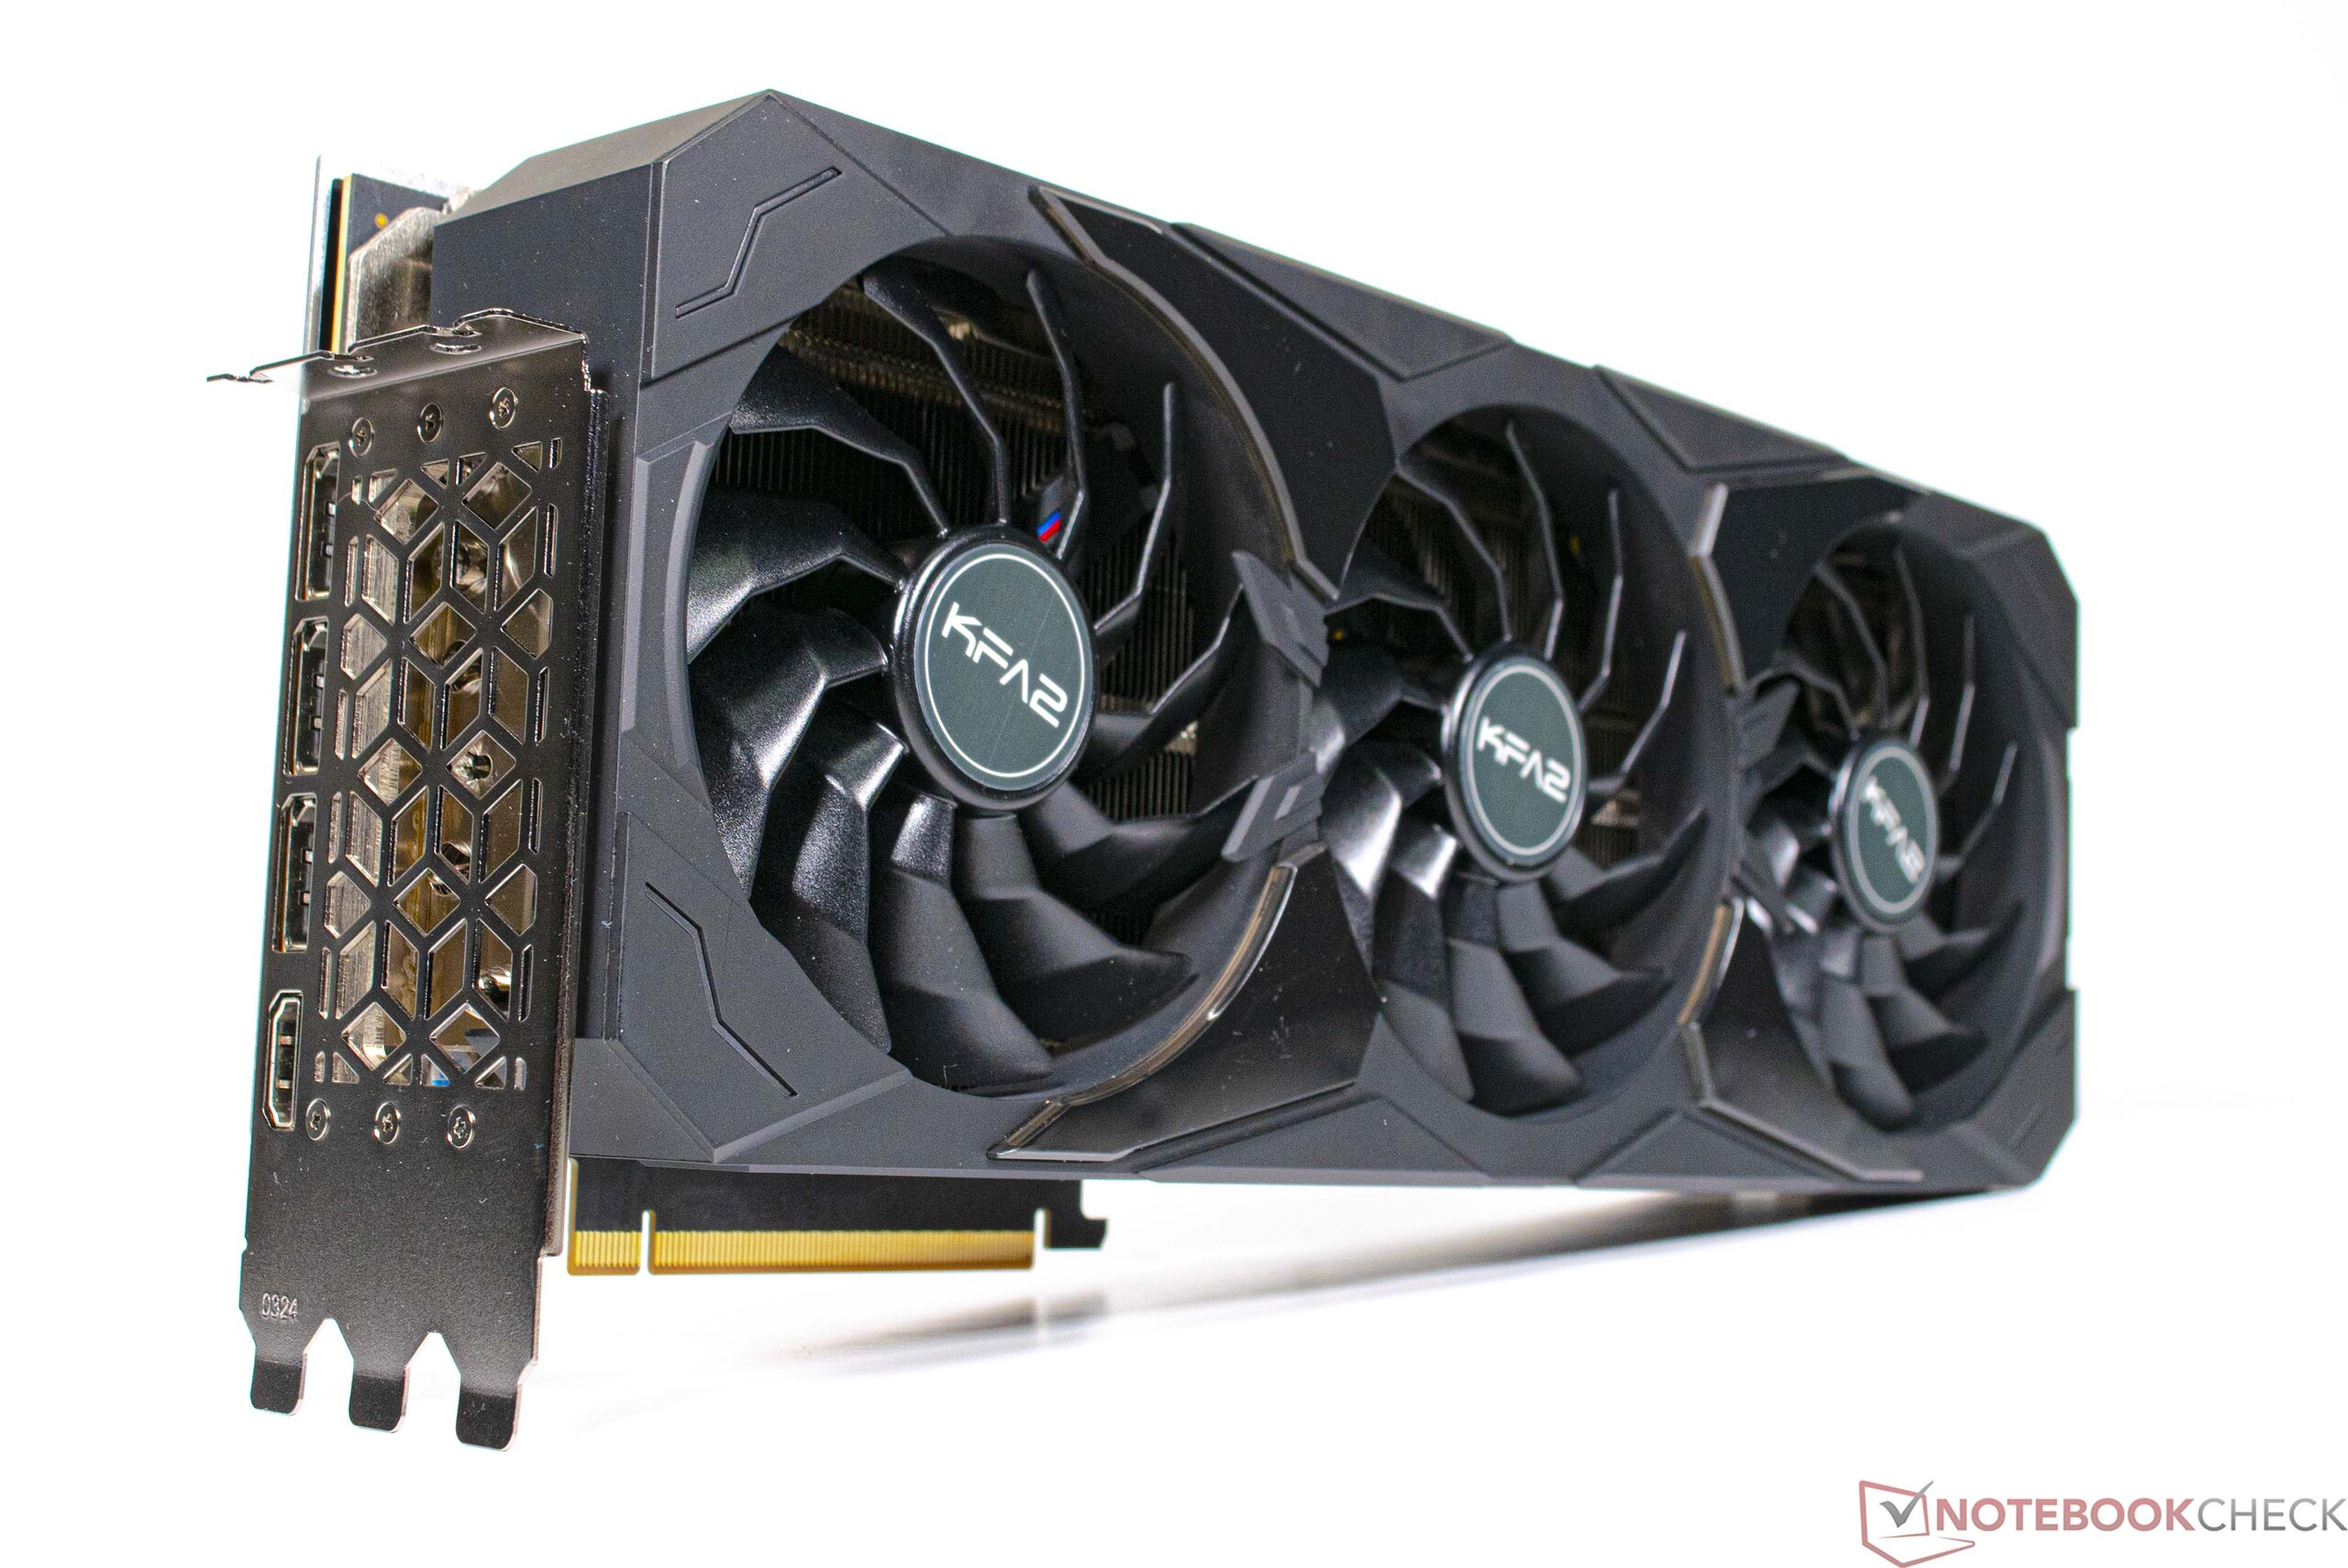
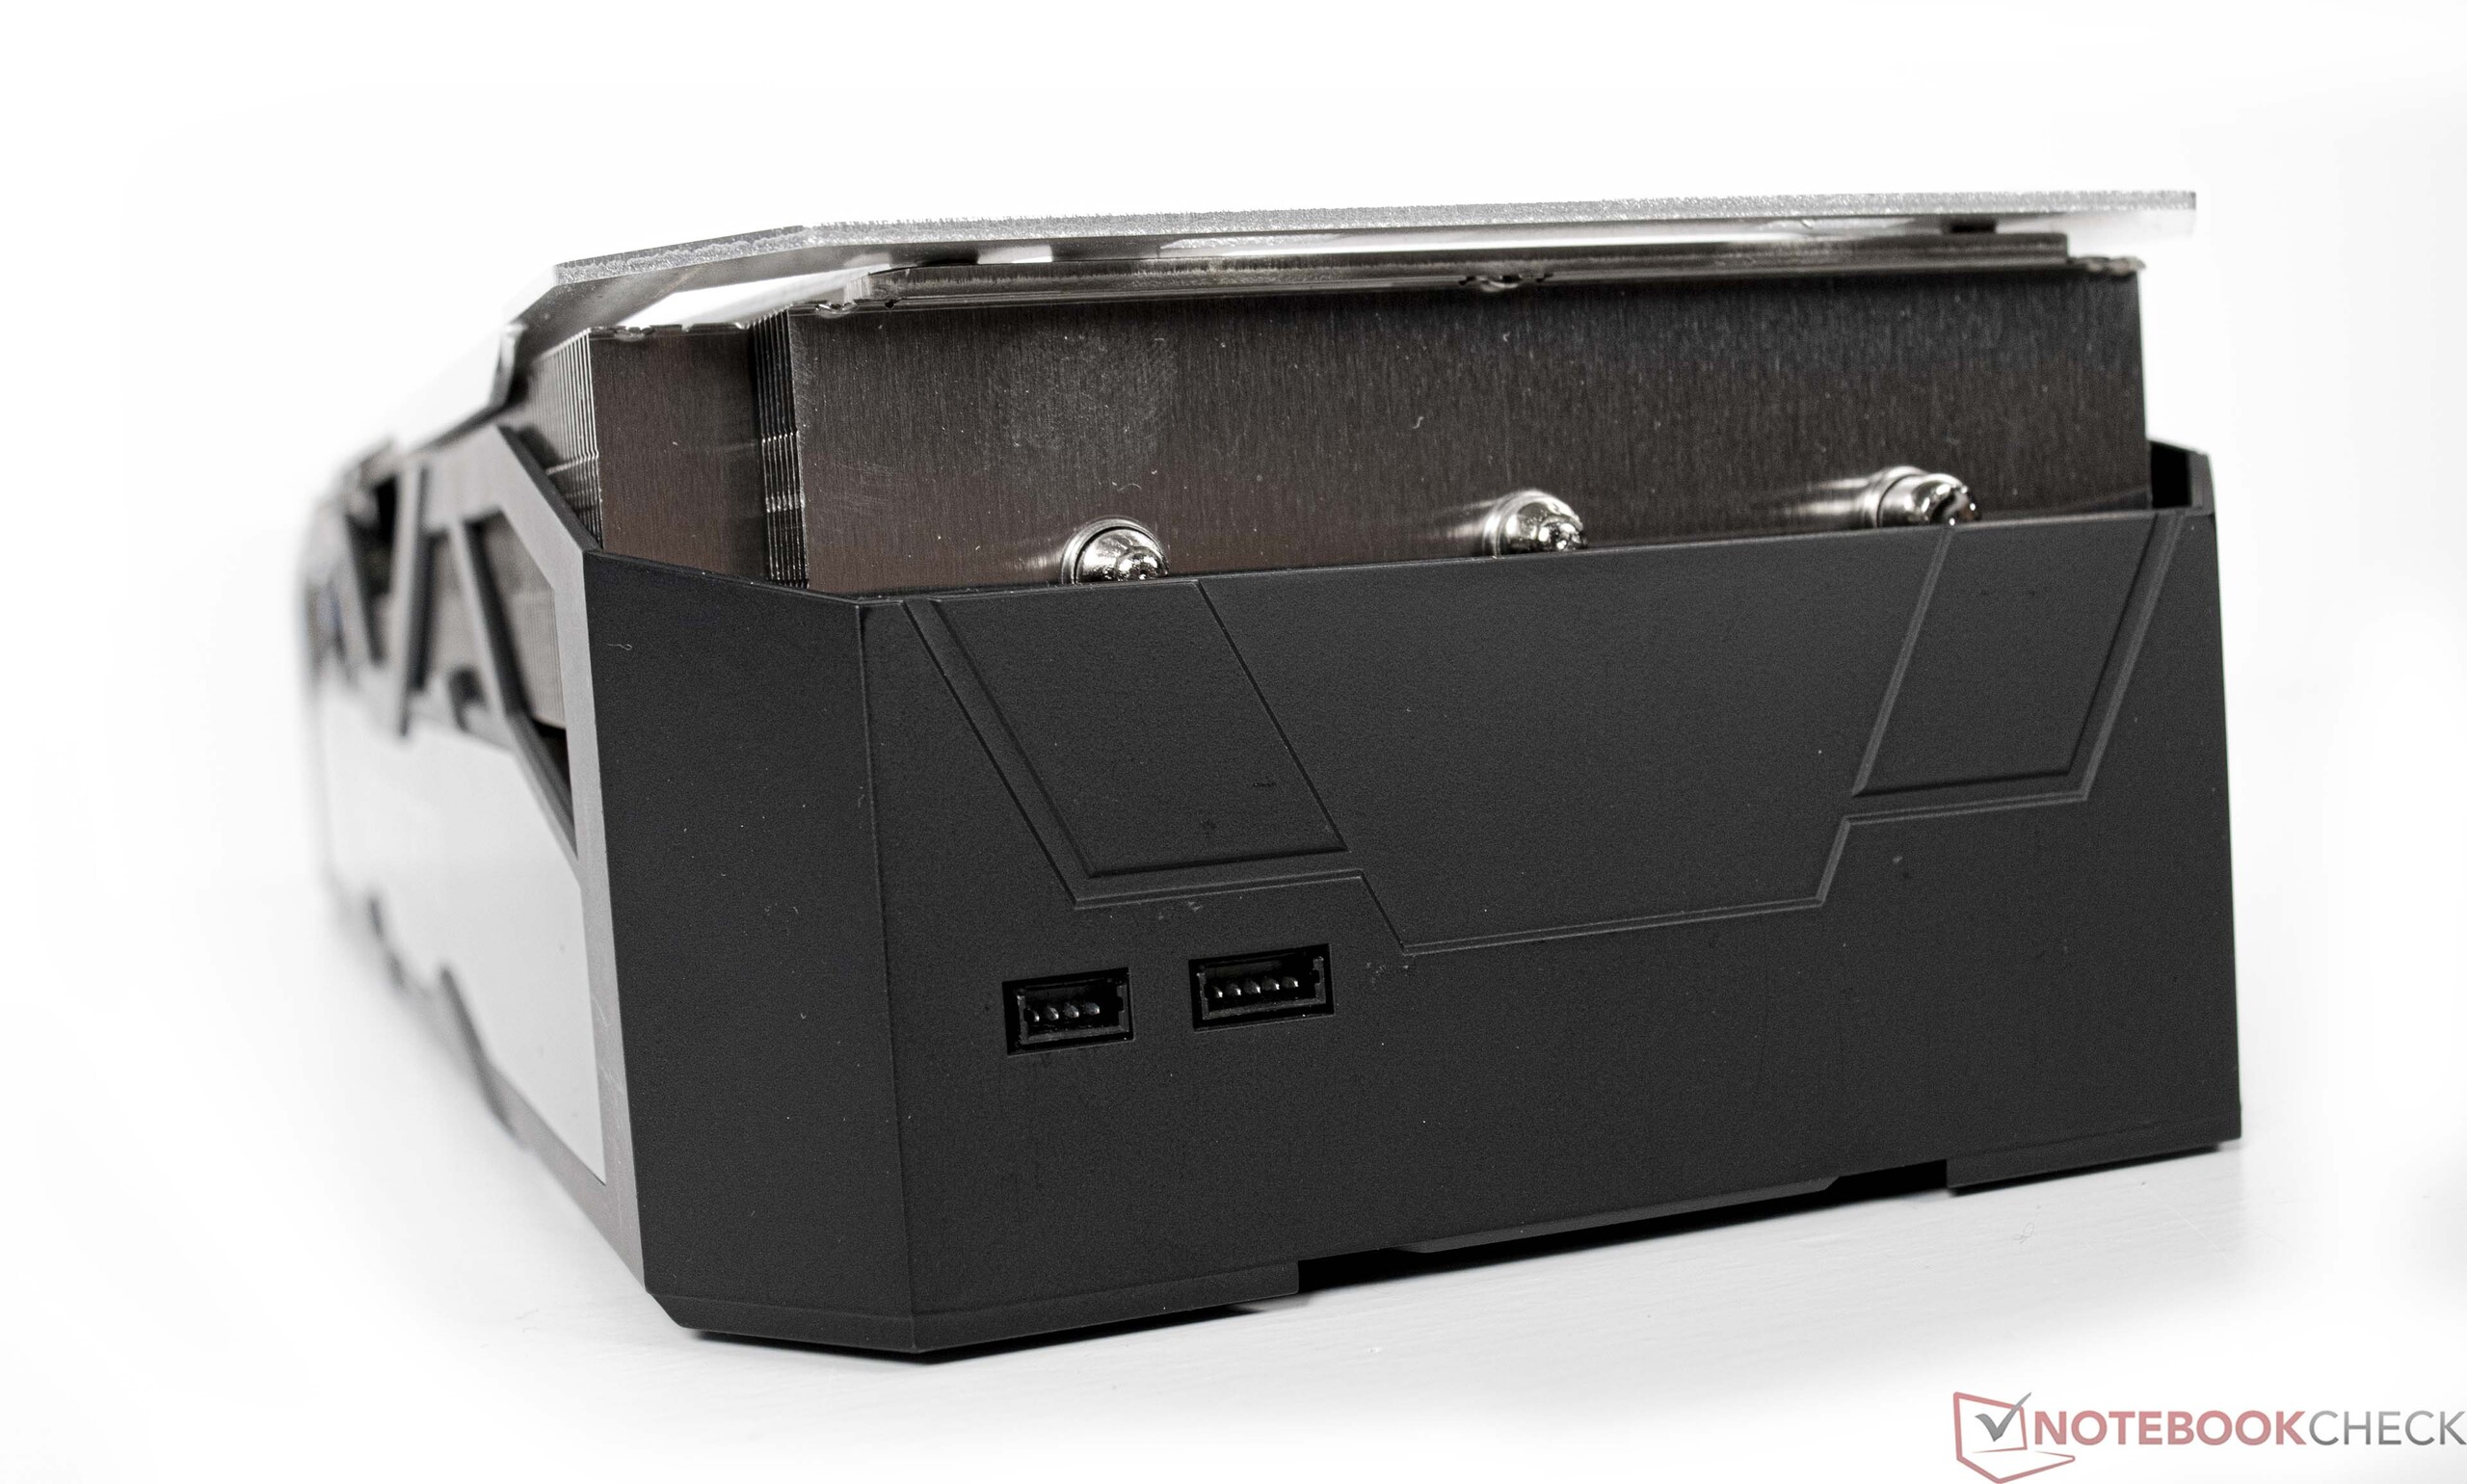
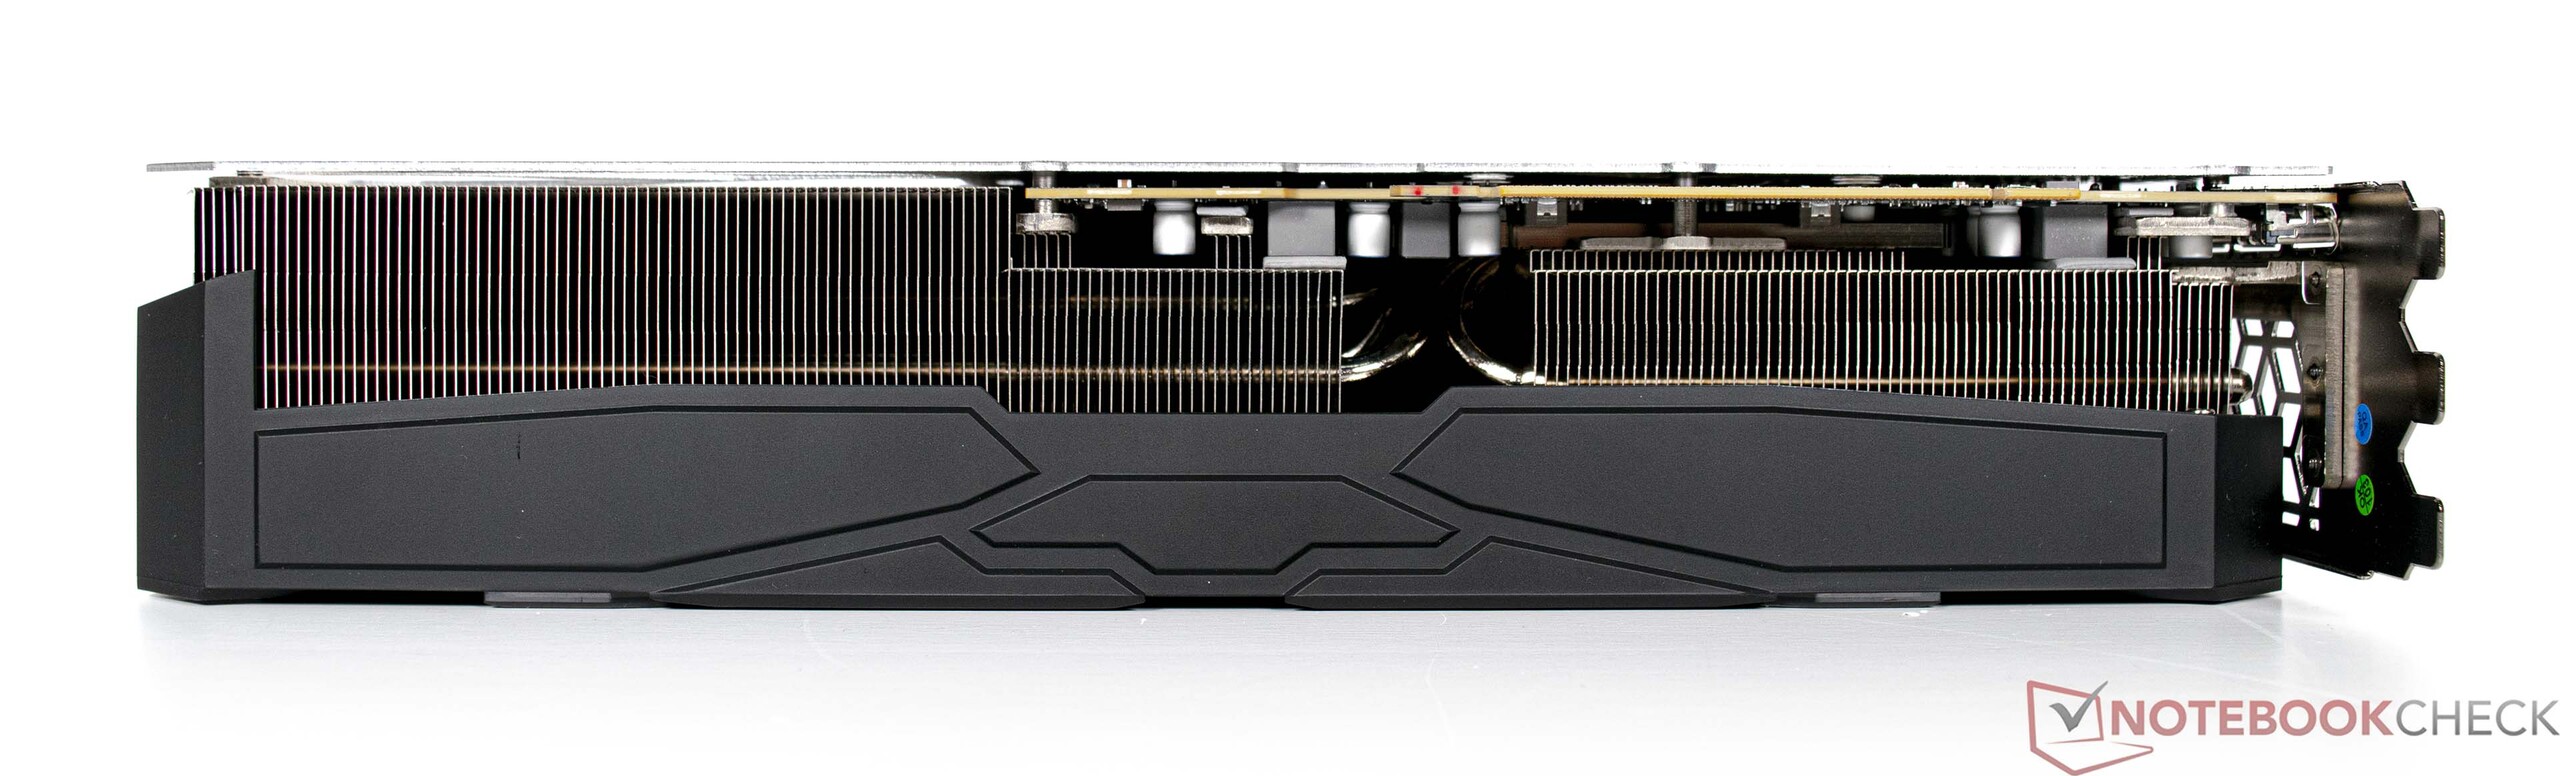
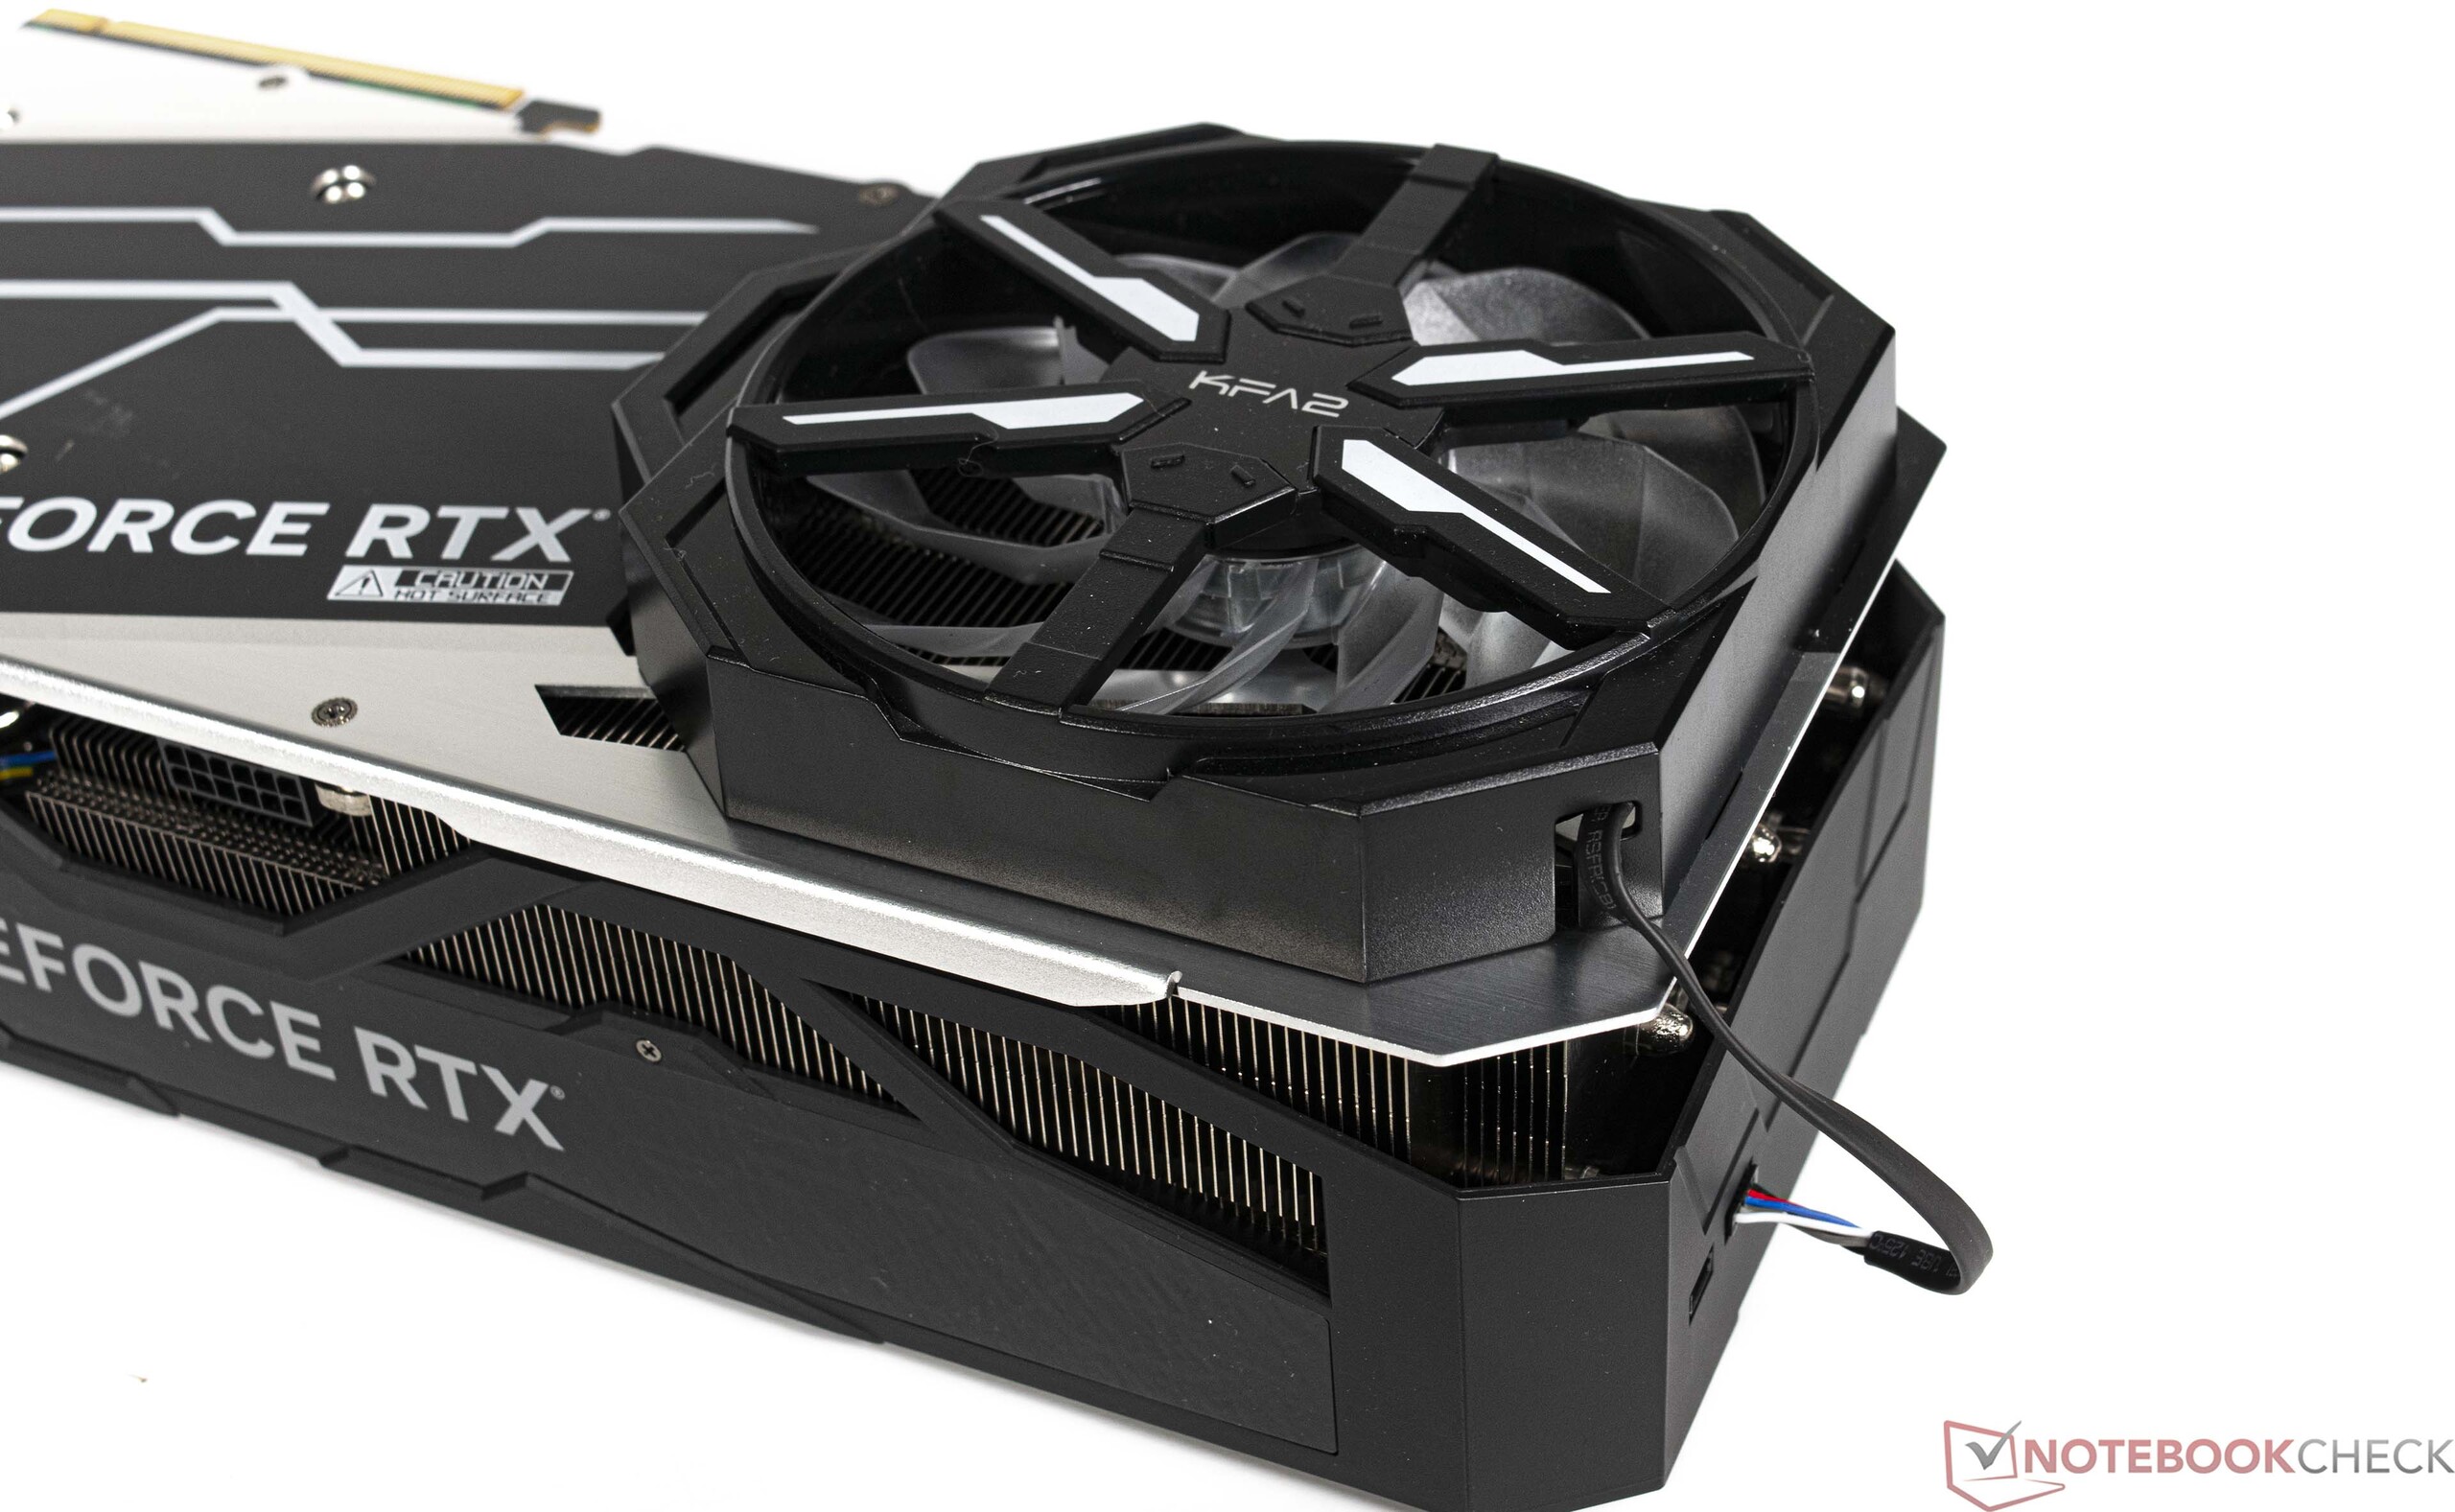
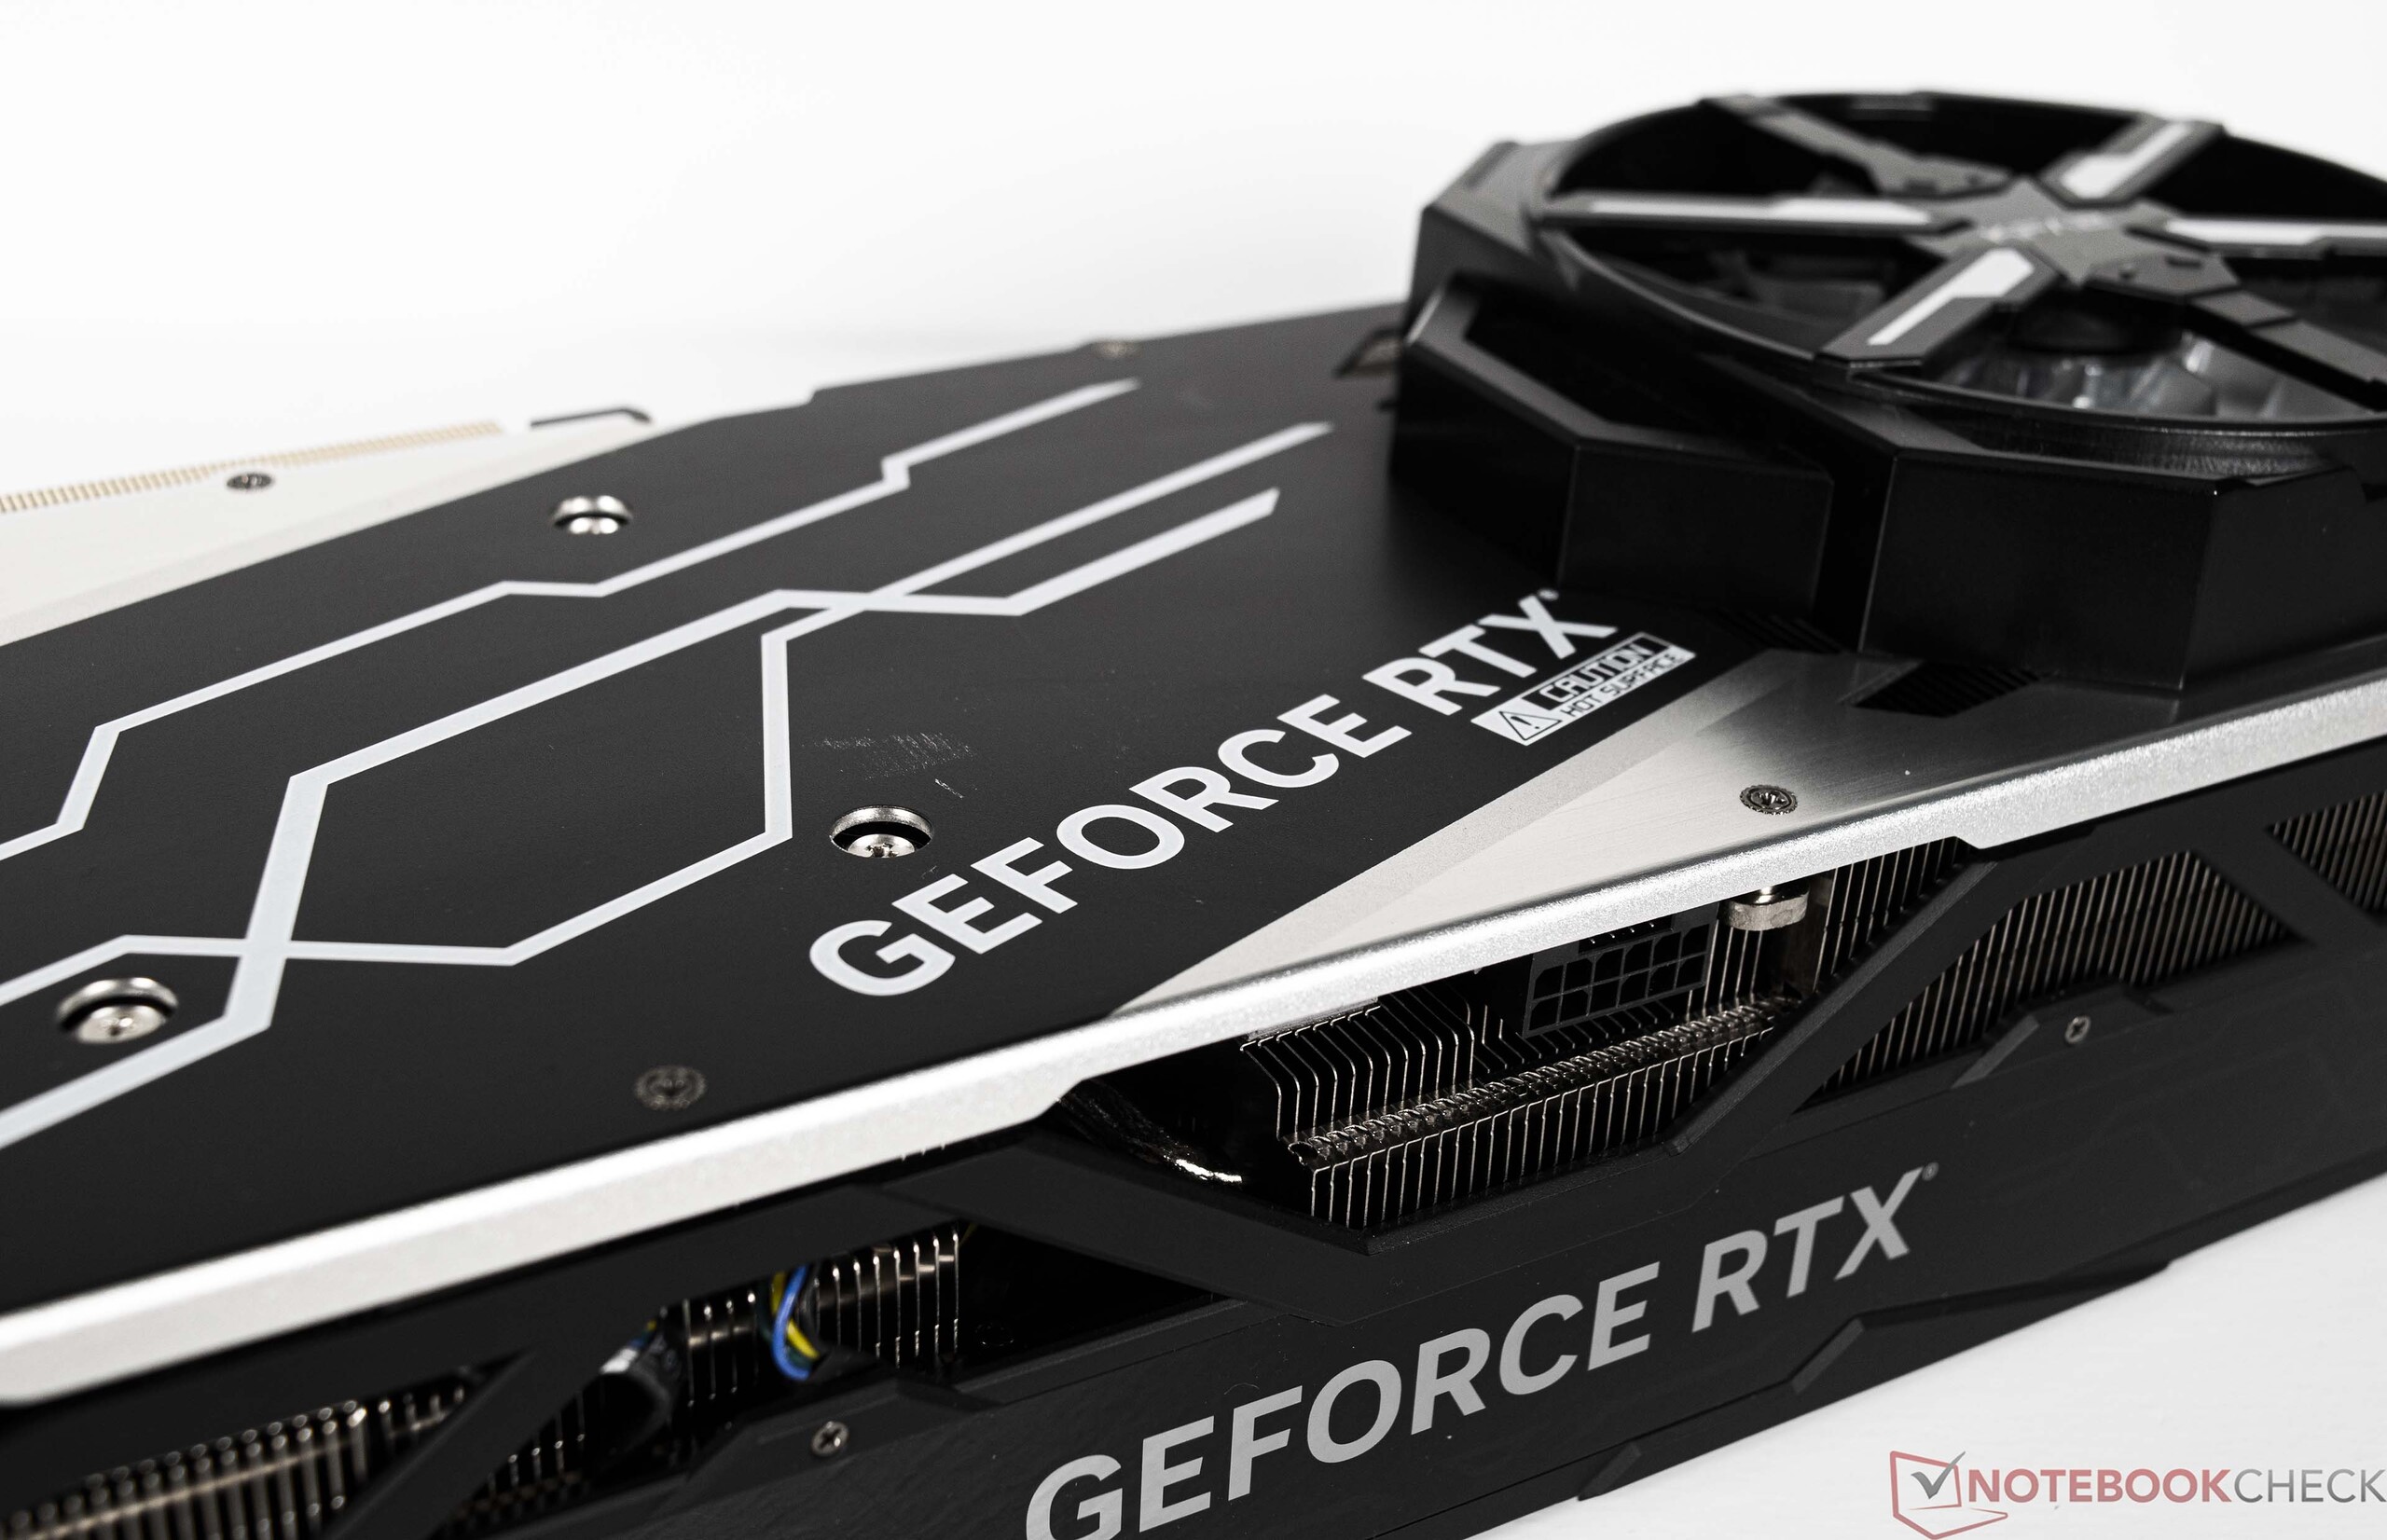
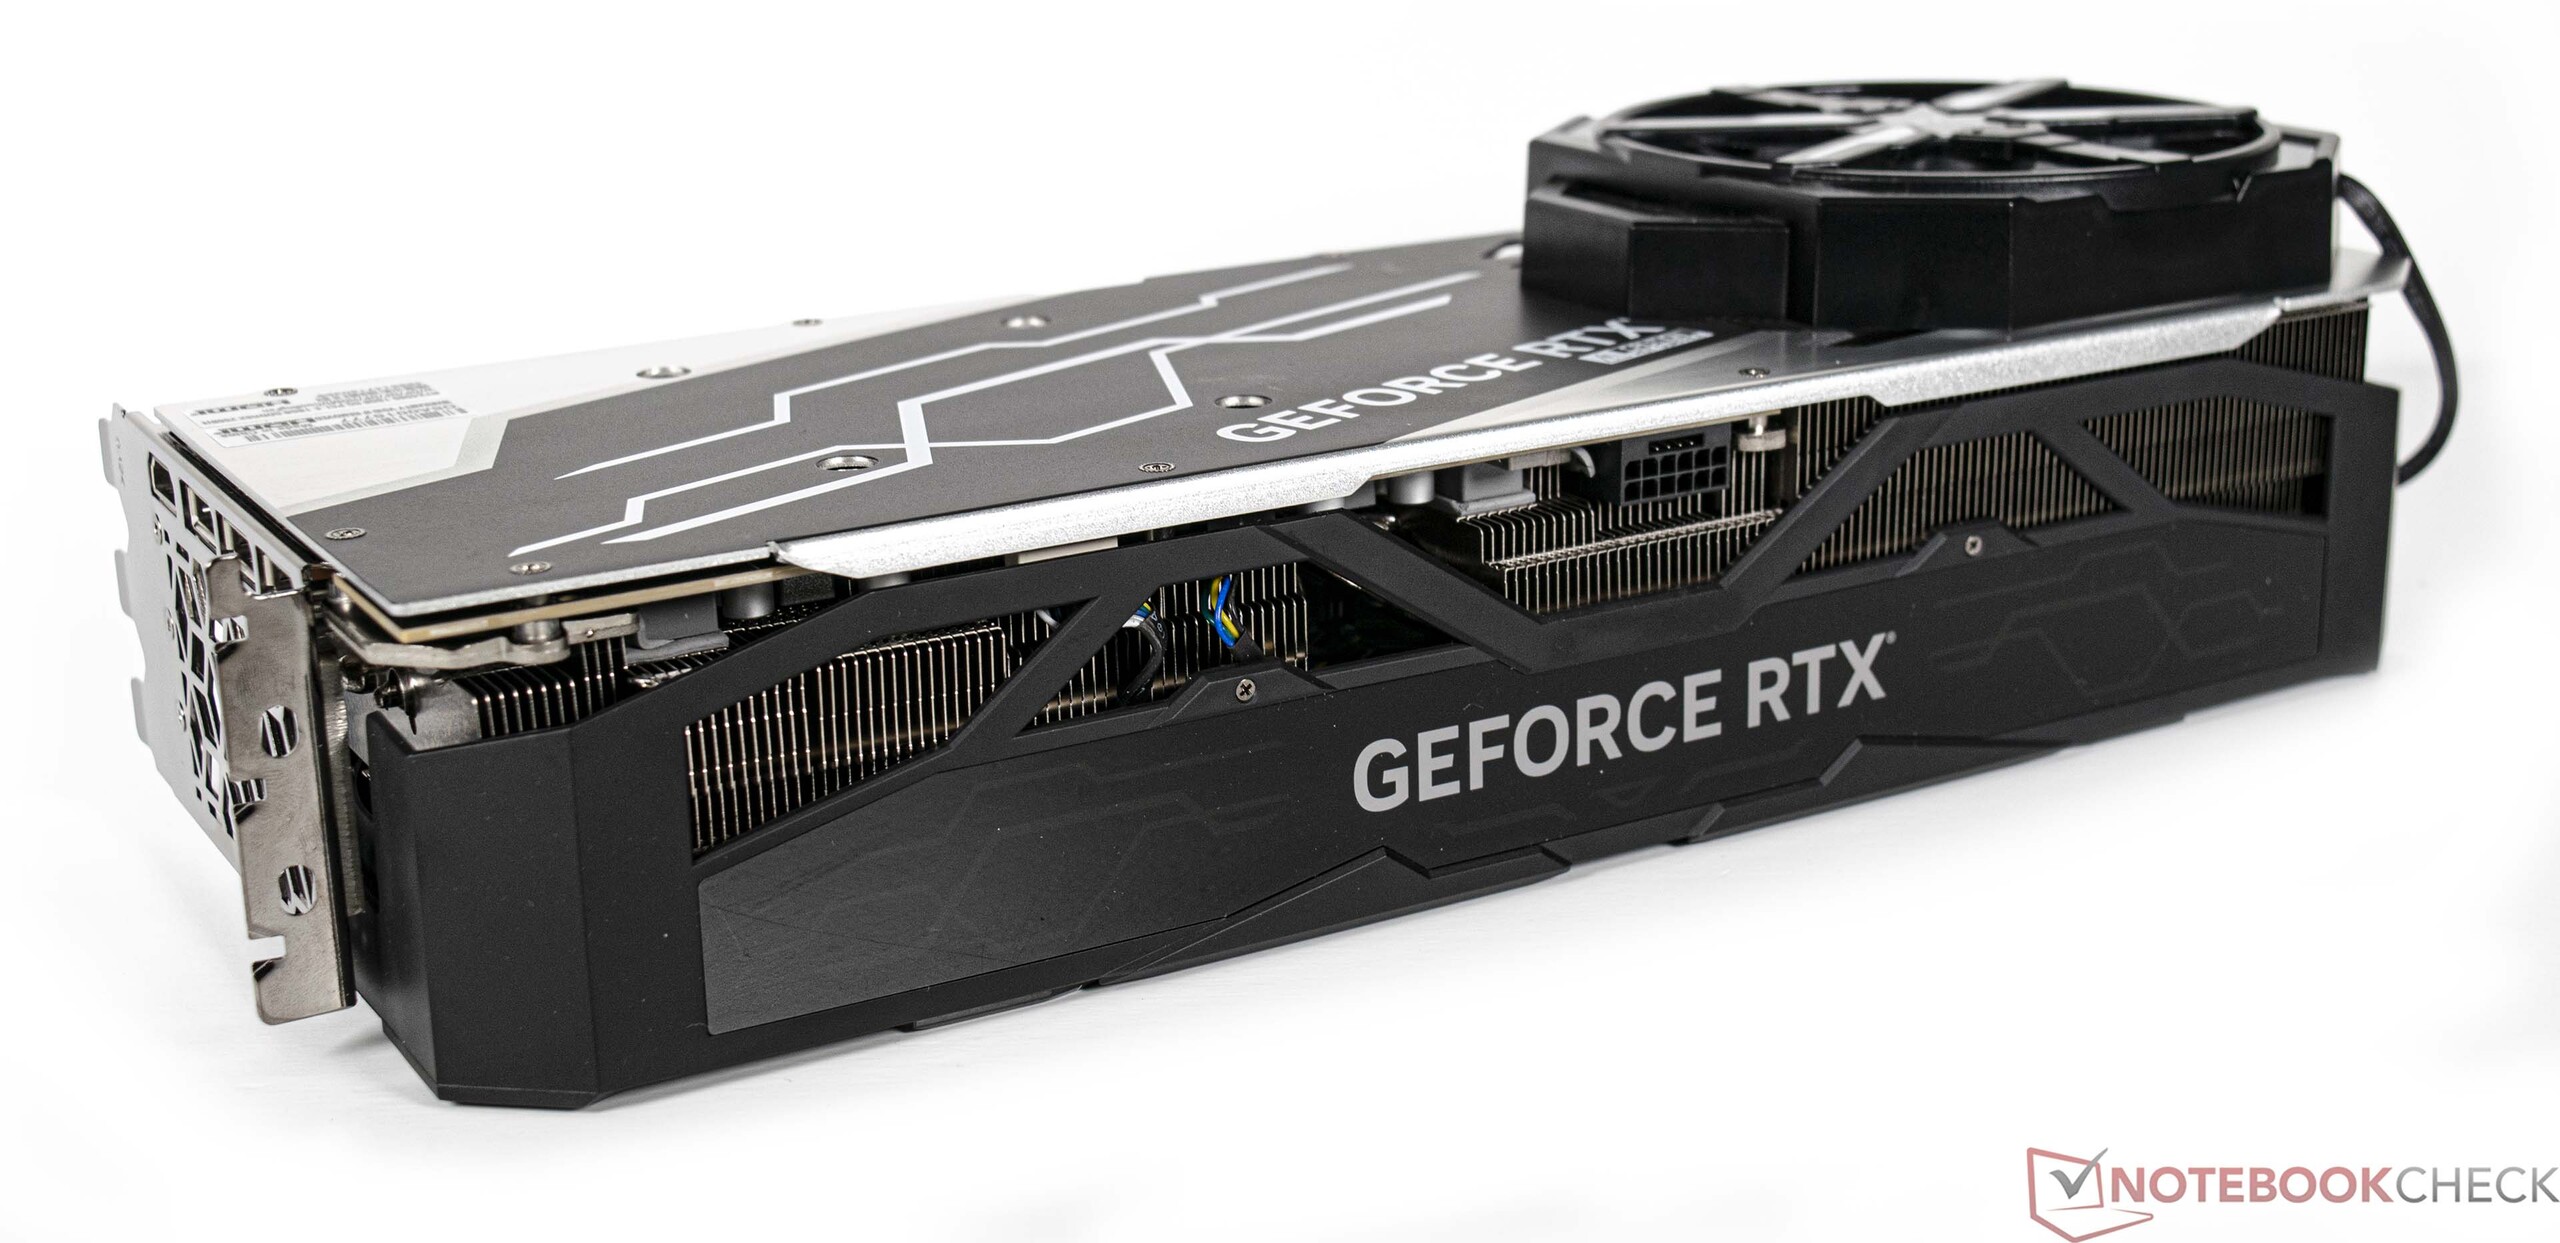
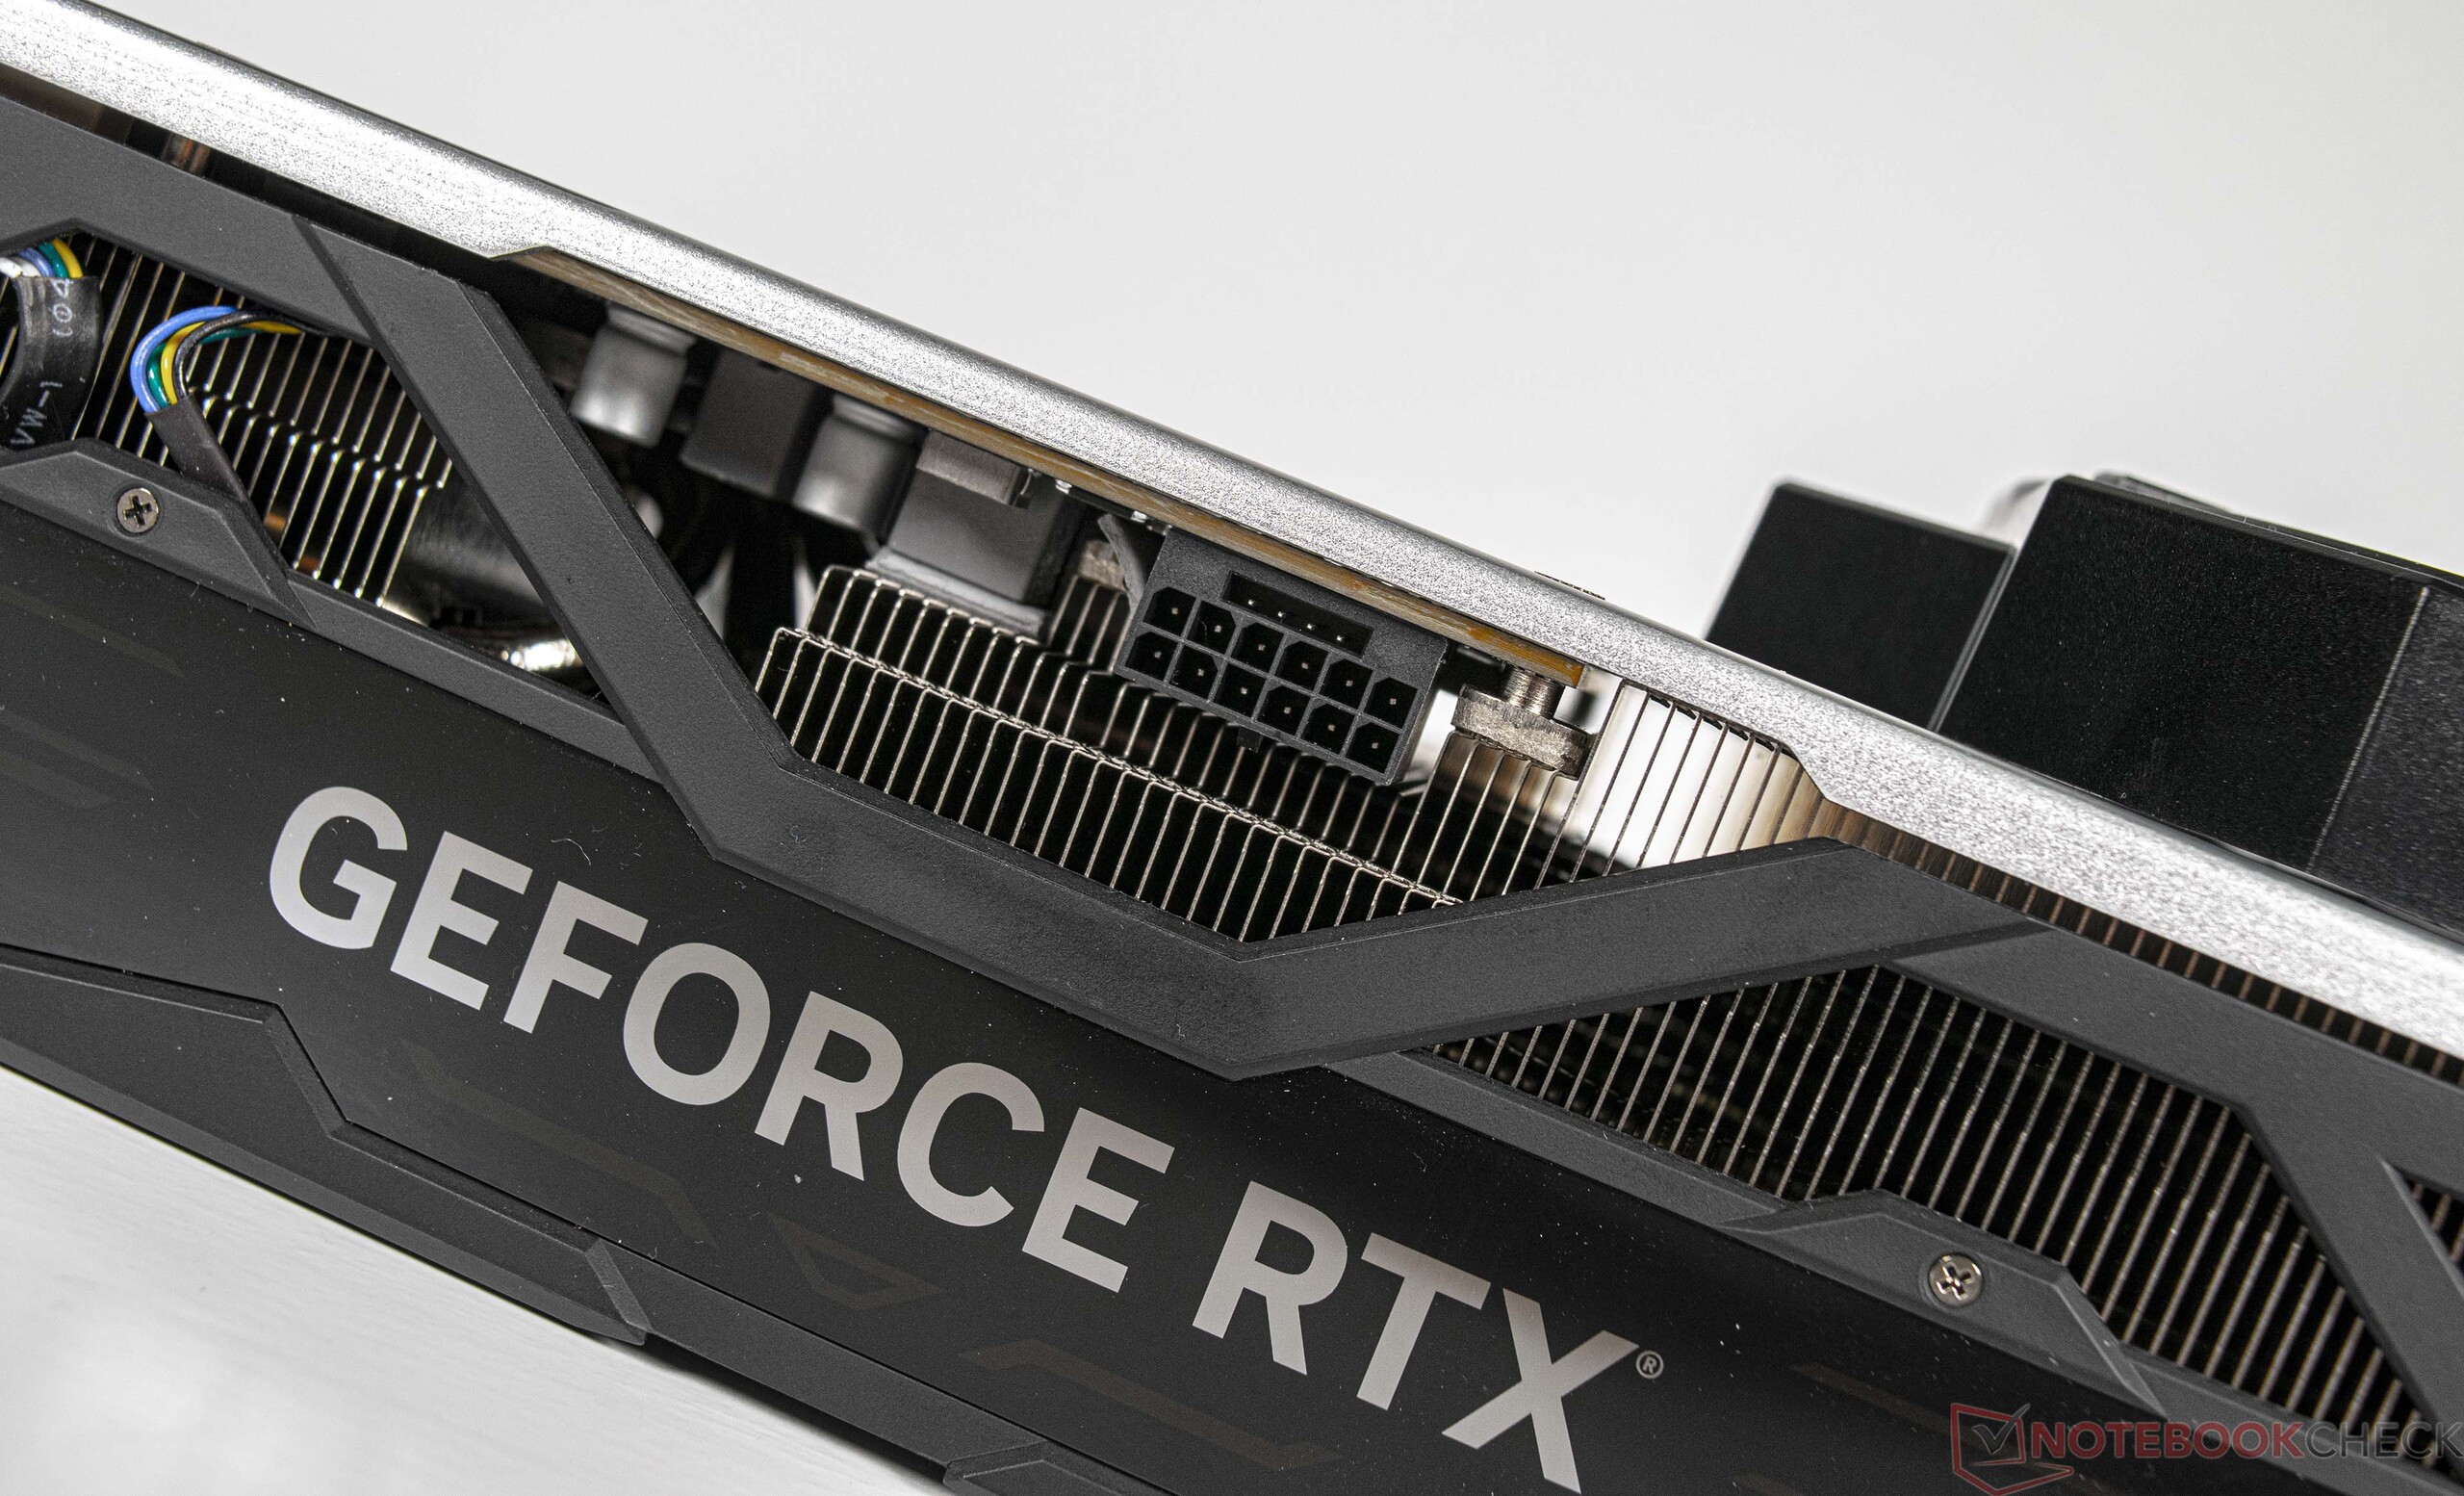
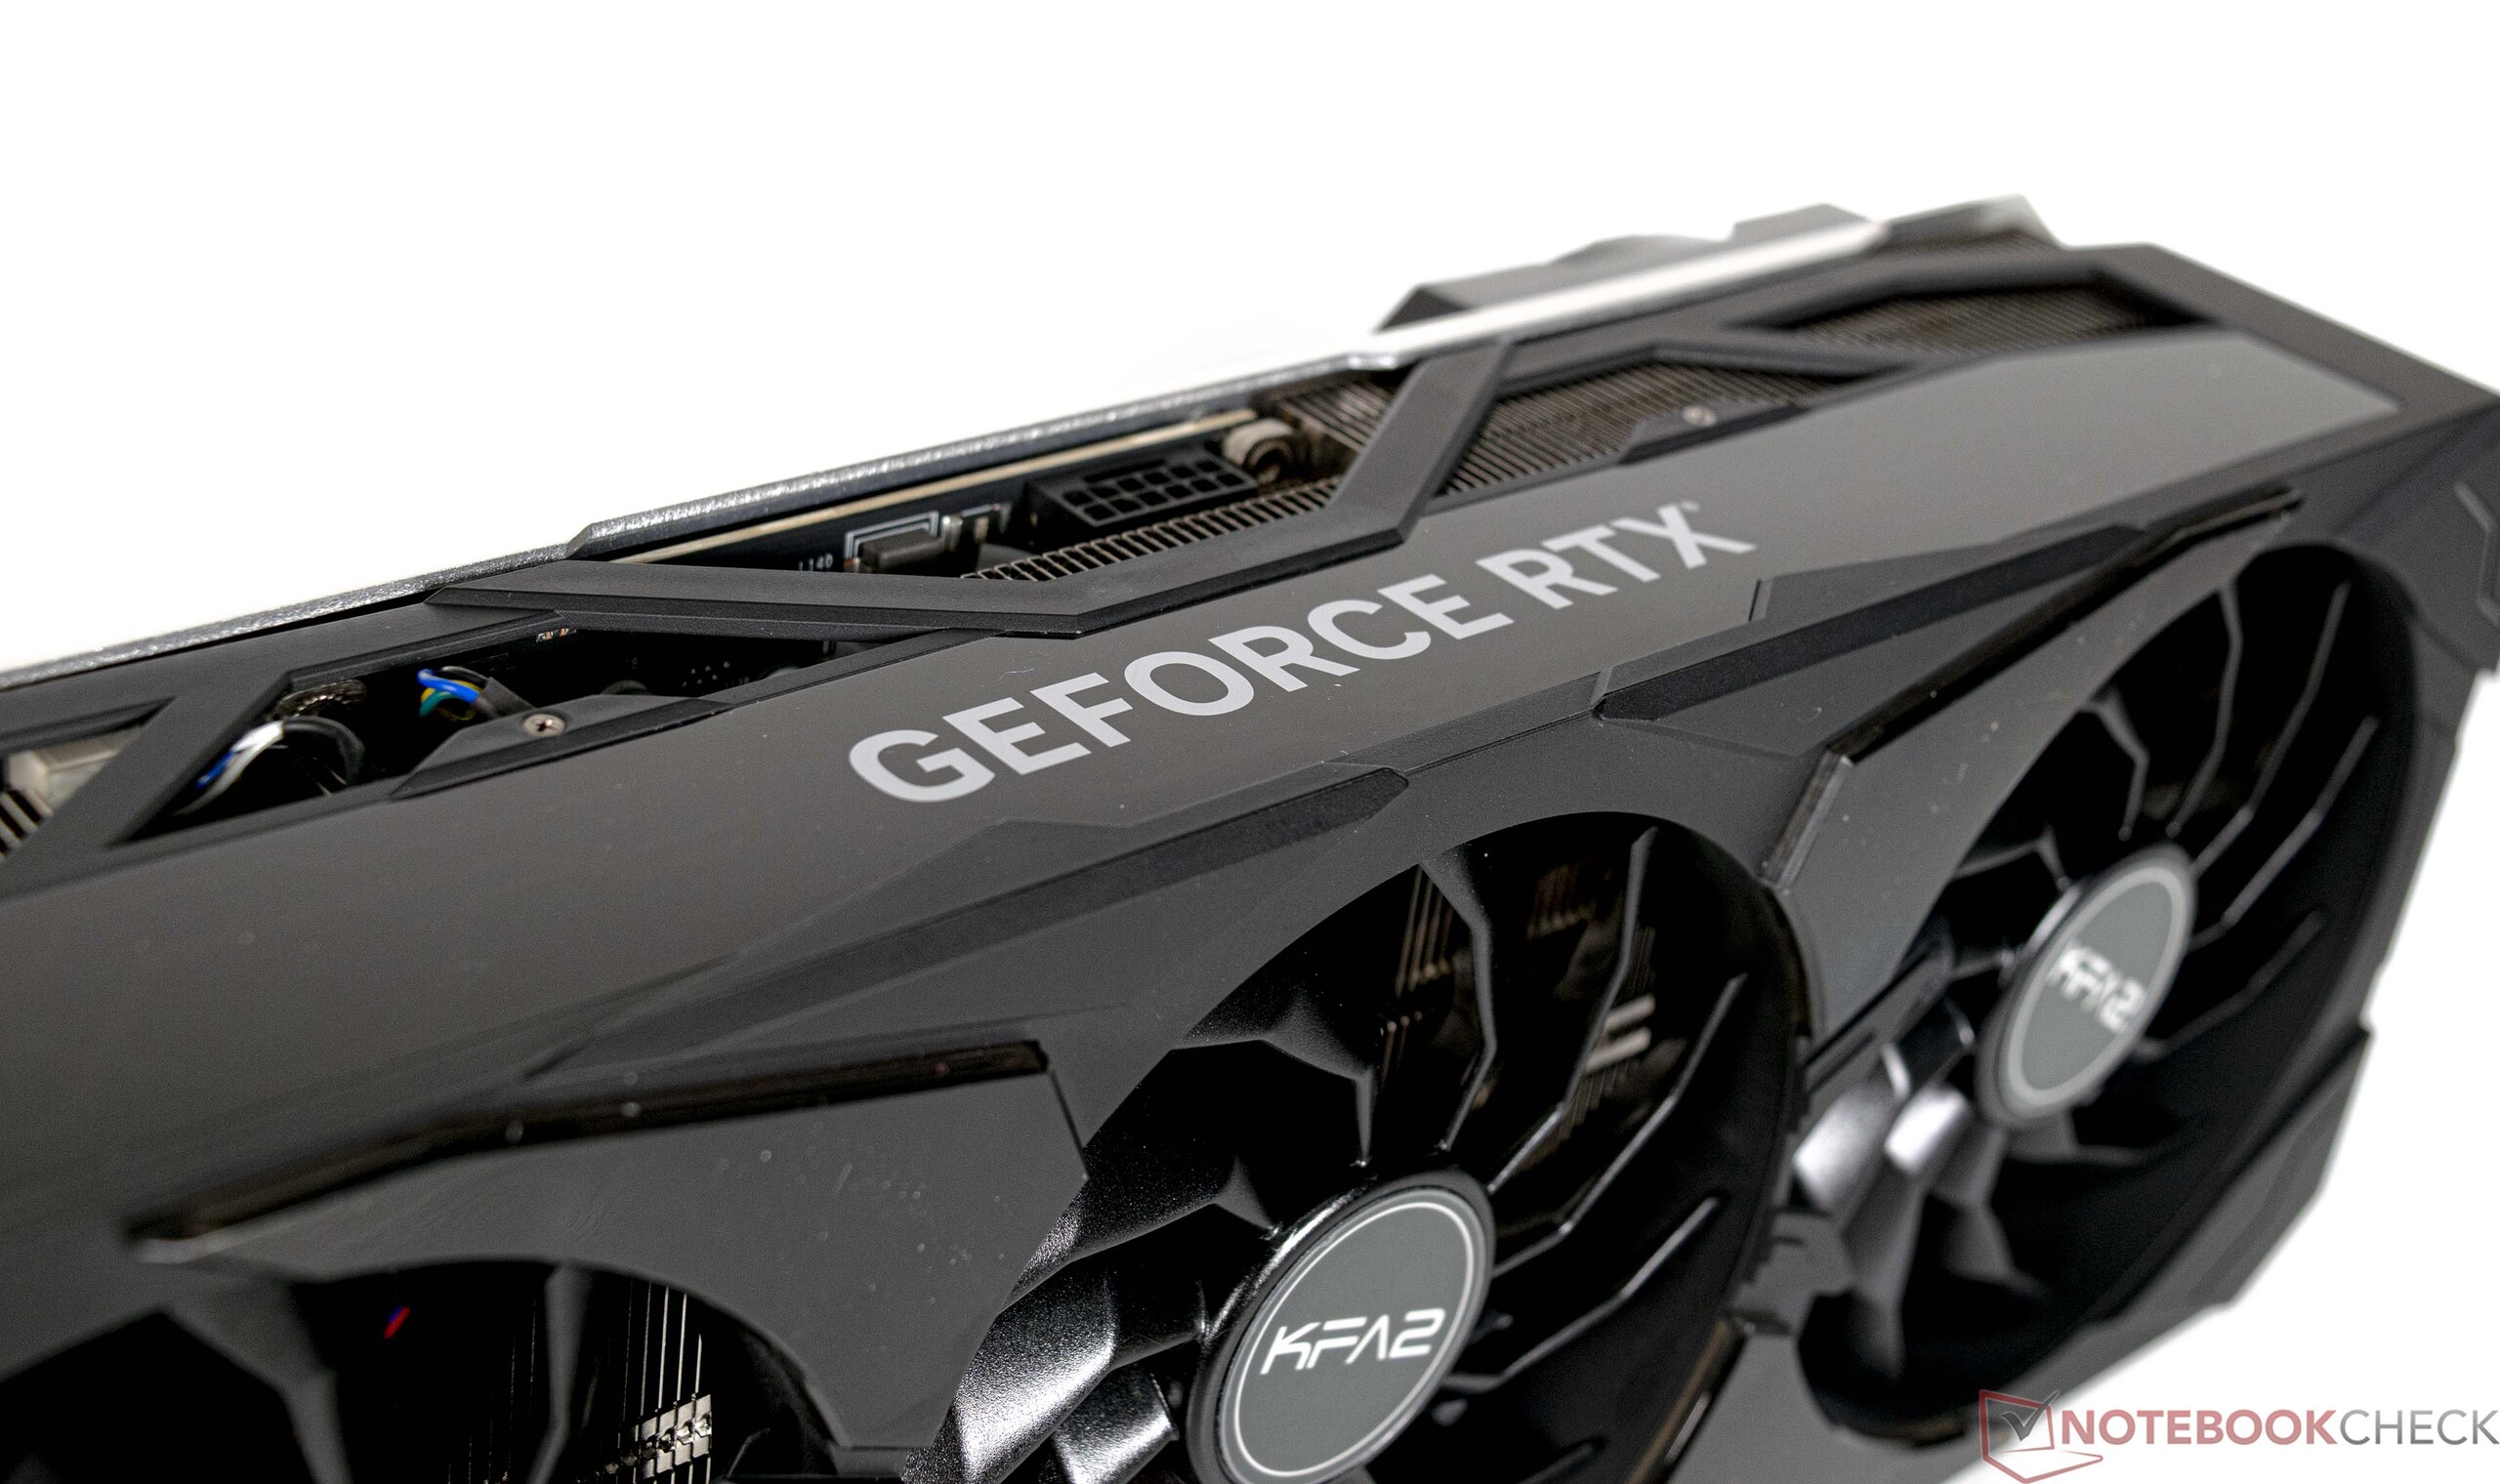
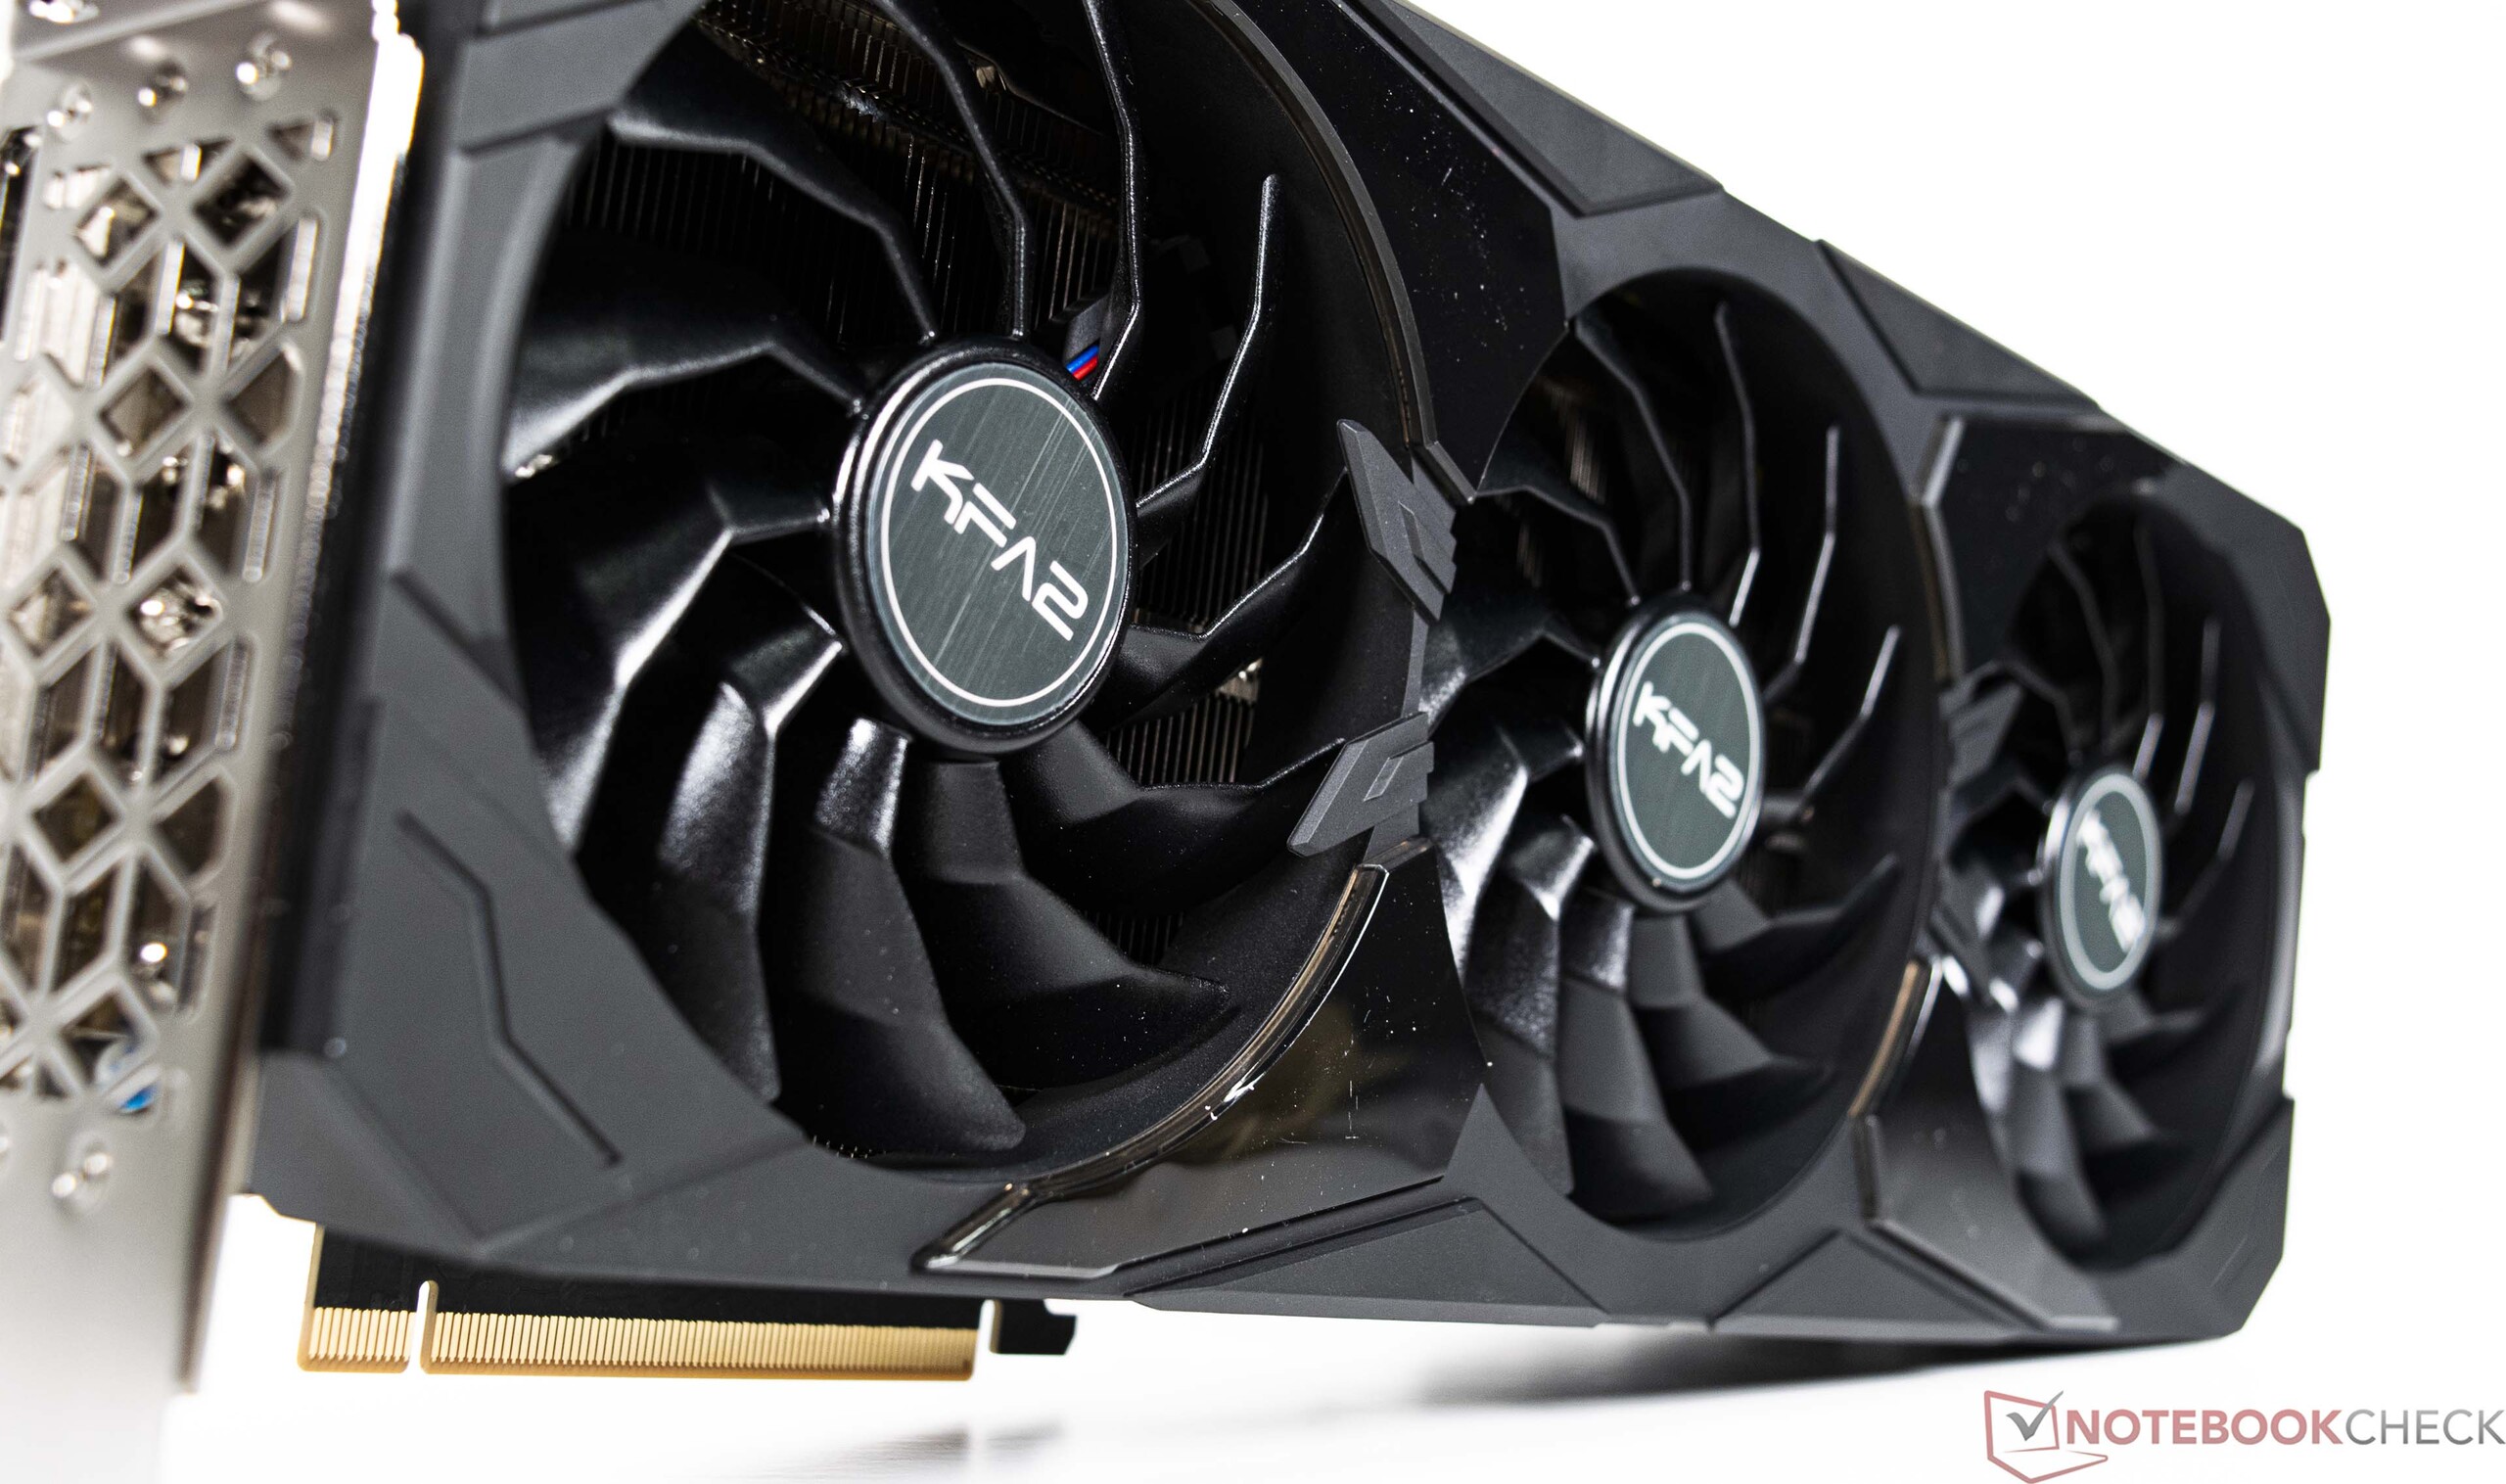
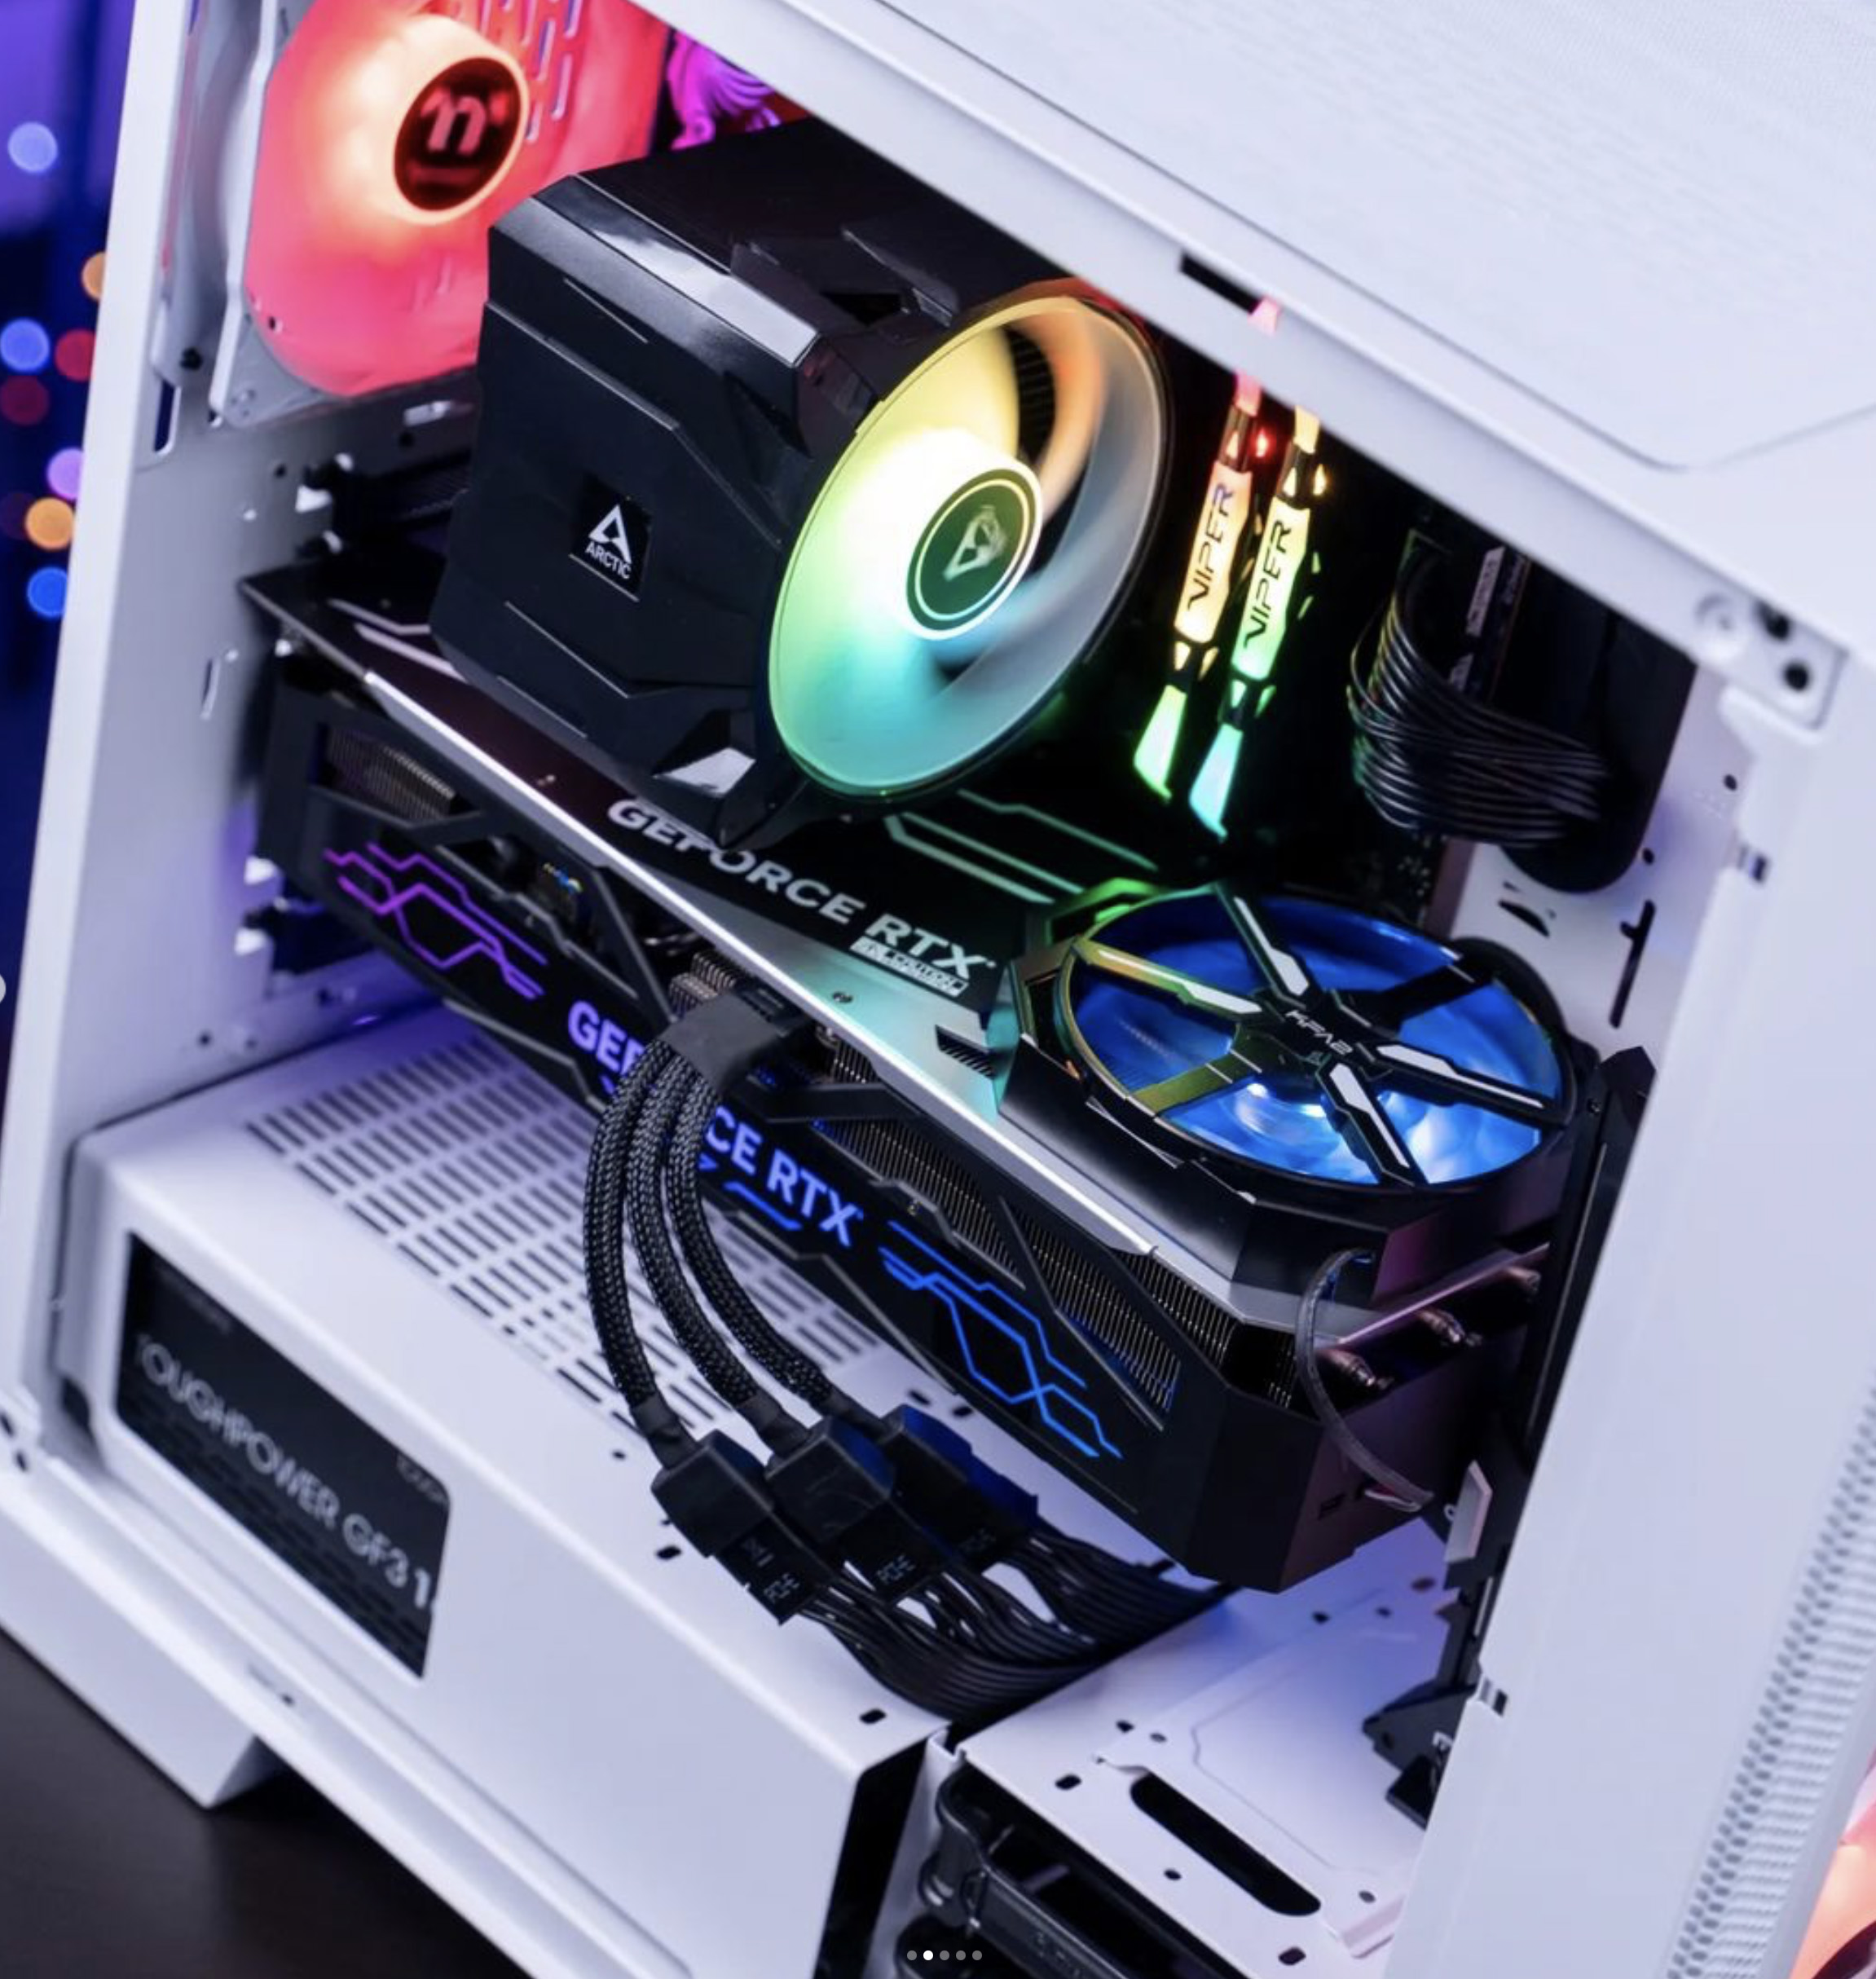
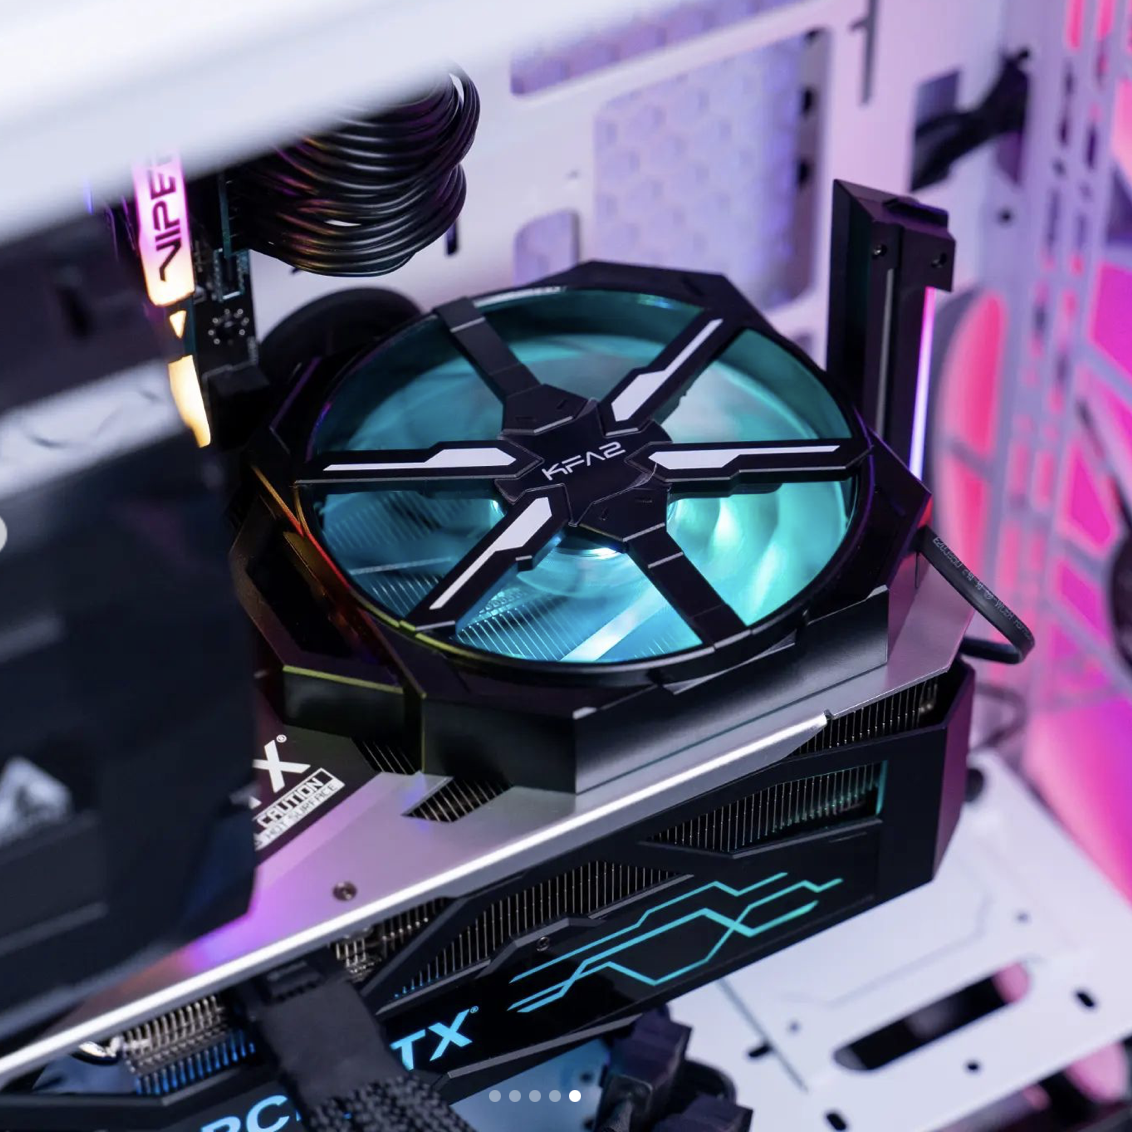
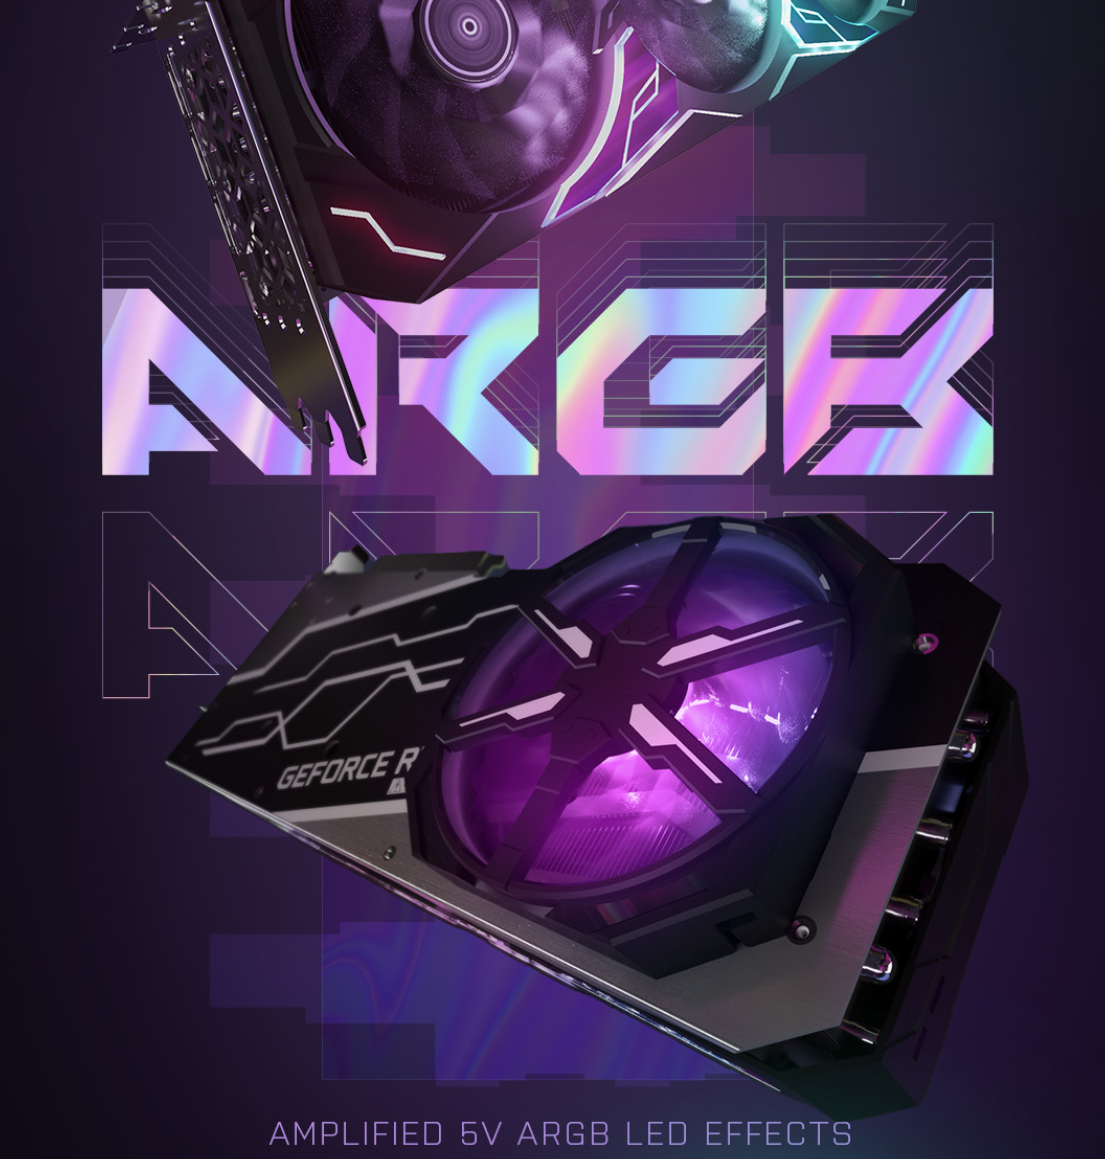
Although KFA2 is often one of the manufacturers with the lowest prices, the company considers itself a competitor of other manufacturers offering more expensive cards, such as Asus with its Strix series and MSI with its Suprim-X models. Unfortunately, we weren't able to compare the different cards head-to-head because we have yet to get our hands on any Asus or MSI models. Nevertheless, we can say that the KFA2 GeForce RTX 4080 SG has the same level of workmanship as the KFA2 GeForce RTX 4090 SG. Despite having a much lower rated power usage than the top model, the KFA2 GeForce RTX 4080 SG is fitted with an enormous quad-slot cooler. There is also a ton of RGB lighting that draws attention to the card. As with all the current RTX 40 Series models, the RTX 4080 is powered via the new 12VHPWR connector. KFA2 hasn't done anything differently here and has included an appropriate 3x6+2 pin PCIe to 12VHPWR adapter.
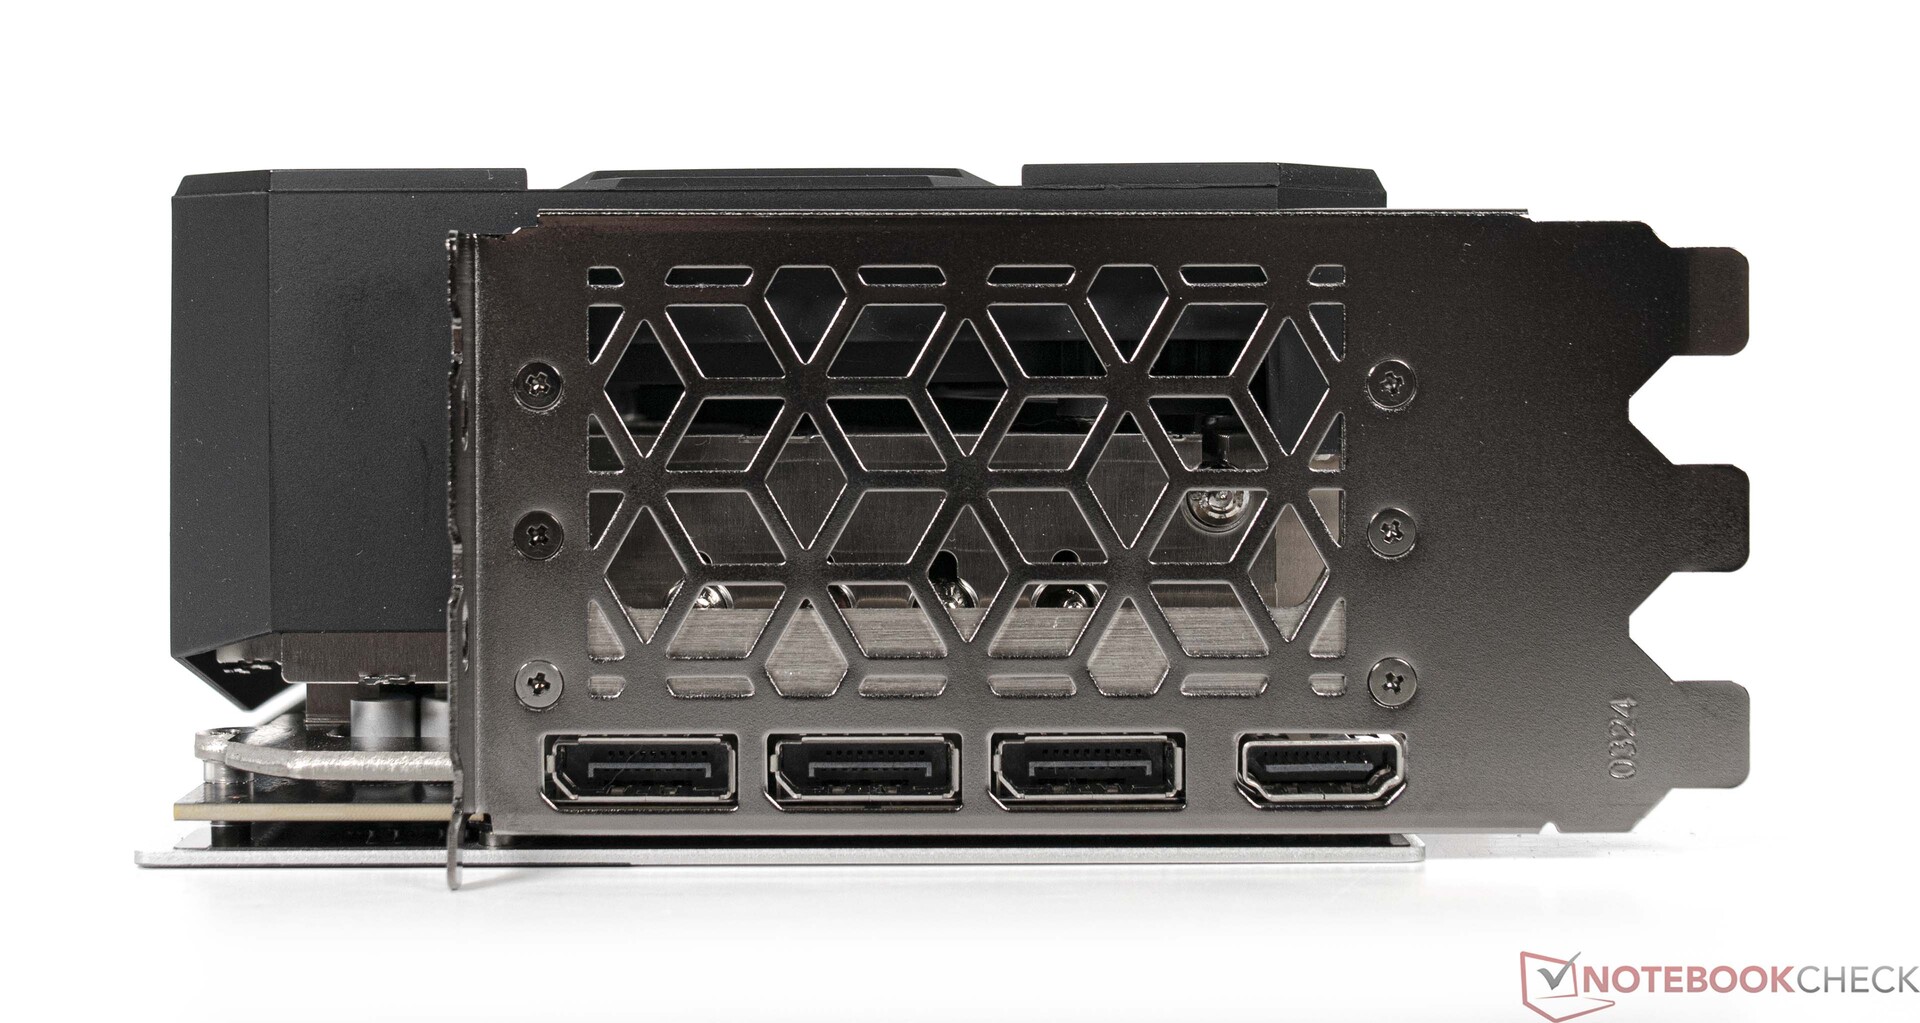
On the outside, the KFA2 GeForce RTX 4080 SG features 1x HDMI 2.1a port and 3x DisplayPort 1.4a.

GPU specs comparison
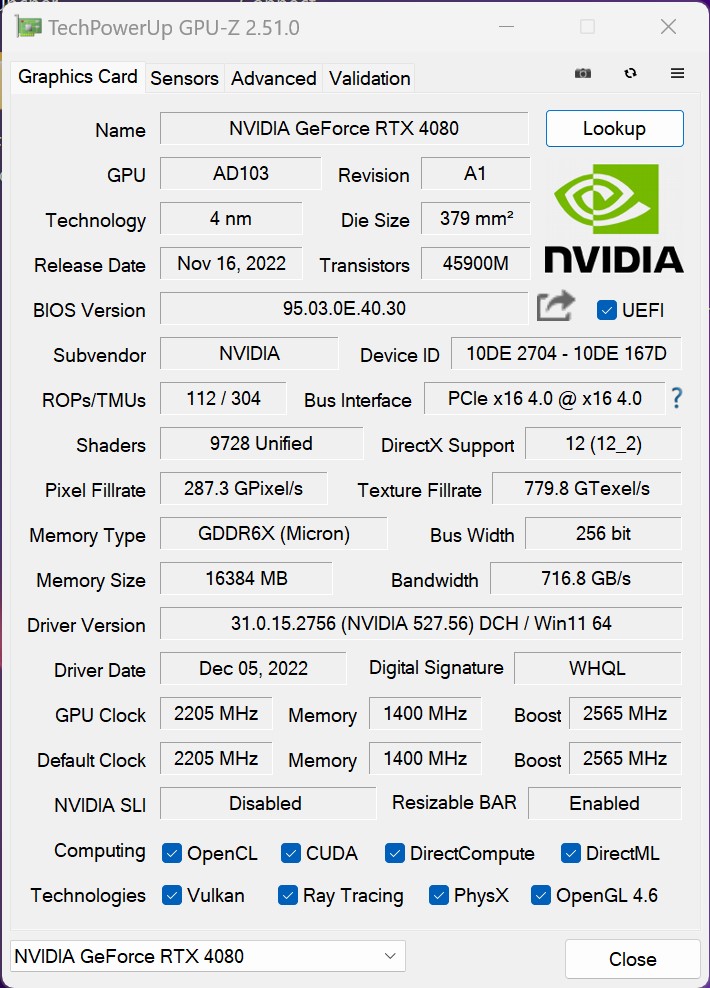
| Specification | RTX 4090 (FE) | RTX 4080 | KFA2 RTX 4080 | RTX 3090 Ti | RTX 3090 (FE) | RTX 3080 Ti (FE) | RTX 3080 (FE) | Titan RTX |
| Chip | AD102 | AD103 | AD103 | GA102 | GA102 | GA102 | GA102 | TU102 |
| FinFET process | 4 nm | 4 nm | 4 nm | 8 nm | 8 nm | 8 nm | 8 nm | 12 nm |
| CUDA cores | 16.384 | 9.728 | 9.728 | 10.752 | 10.496 | 10.240 | 8.704 | 4.608 |
| Texture units | 512 | 304 | 304 | 336 | 328 | 320 | 272 | 288 |
| Tensor cores | 512 4. Gen. | 304 4. Gen. | 304 4. Gen. | 336 3. Gen. | 328 3. Gen. | 320 3. Gen. | 272 3. Gen. | 576 2. Gen. |
| RT cores | 128 | 76 | 76 | 84 | 82 | 80 | 68 | 72 |
| GPU base clock | 2,235 MHz | 2,205 MHz | 2,205 MHz | 1,560 MHz | 1,395 MHz | 1,365 MHz | 1,440 MHz | 1,350 MHz |
| GPU boost clock | 2,520 MHz | 2,505 MHz | 2,565 MHz | 1,860 MHz | 1,695 MHz | 1,665 MHz | 1,710 MHz | 1,770 MHz |
| Memory bus | 384 bit | 256 bit | 256 bit | 384 bit | 384 bit | 384 bit | 320 bit | 384 bit |
| Memory bandwidth | 1,008 GB/s | 716.8 GB/s | 716.8 GB/s | 1,008 GB/s | 936 GB/s | 912.4 GB/s | 760 GB/s | 672 GB/s |
| Video memory | 24 GB GDDR6X | 16 GB GDDR6X | 16 GB GDDR6X | 24 GB GDDR6X | 24 GB GDDR6X | 12 GB GDDR6X | 10 GB GDDR6X | 24 GB GDDR6 |
| Power consumption | 450 W | 320 W | 320 W | 450 W | 350 W | 350 W | 320 W | 280 W |
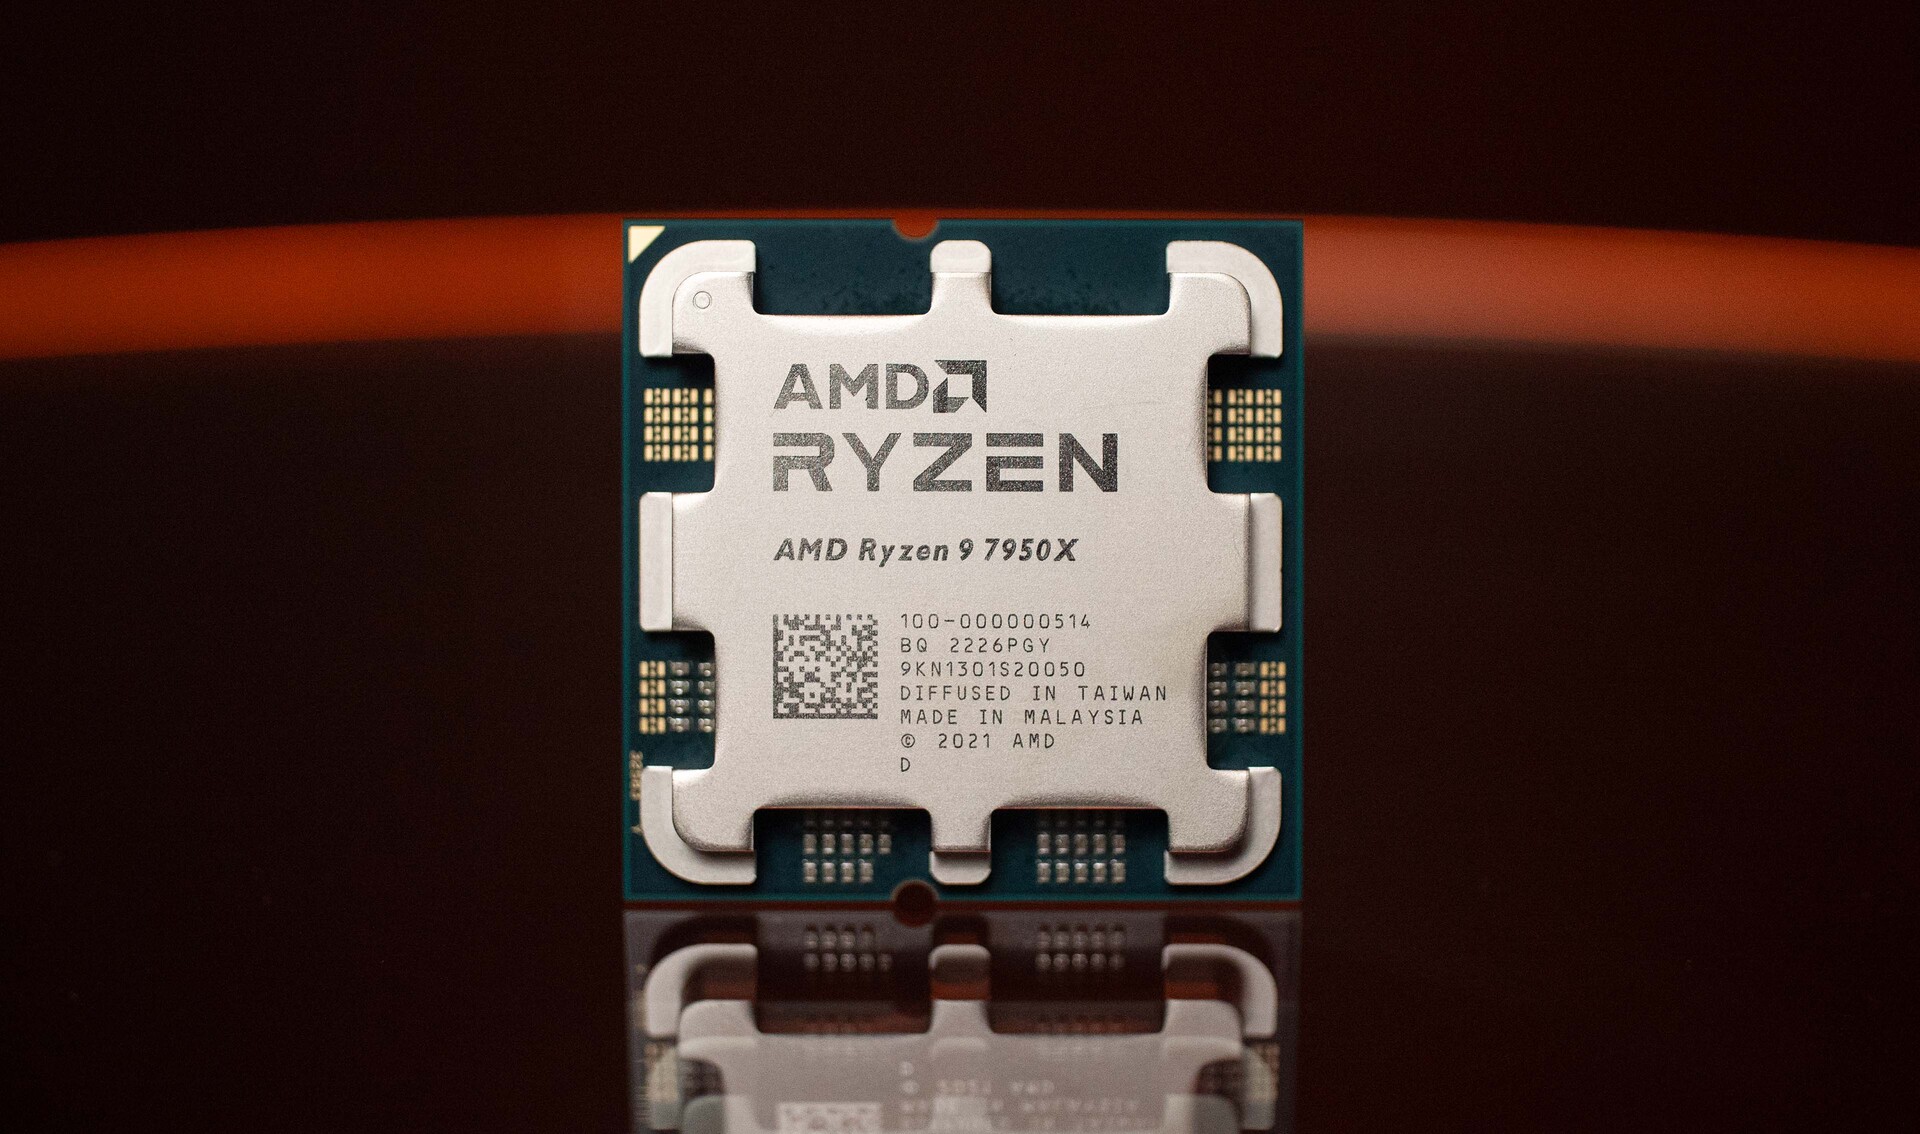
Our test system is based on AMD Ryzen 9 7950X
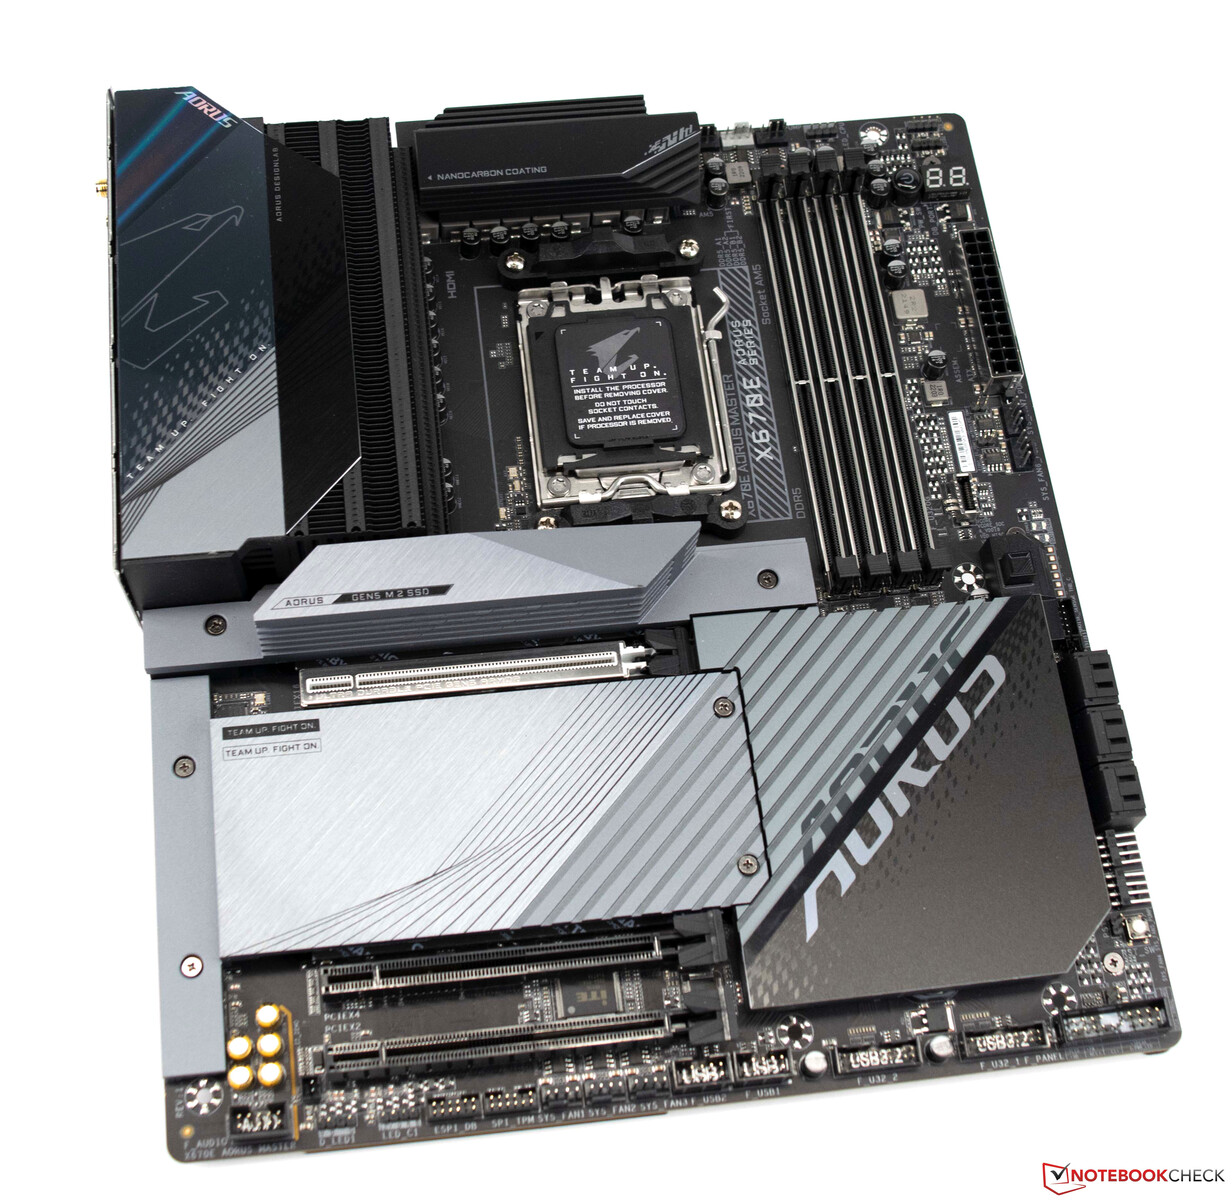
Our test system features a Gigabyte X670E Aorus Master motherboard paired with a high-performance AMD CPU (Ryzen 9 7950X), which is cooled by an Alphacool AIO solution (Alphacool Eisbaer Aurora 360 mm). The system has 32 GB of G.Skill memory running on an appropriate EXPO profile and is connected to a Gigabyte M32U monitor.
Detailed specs of the test system
We used the following system for the benchmarks and tests in this review:
- Lian-Li O11 Dynamic
- AMD Ryzen 9 7950X
- Gigabyte X670E Aorus Master, BIOS: F8a
- Alphacool Eisbear 360 AIO
- Corsair RM 1000x power supply
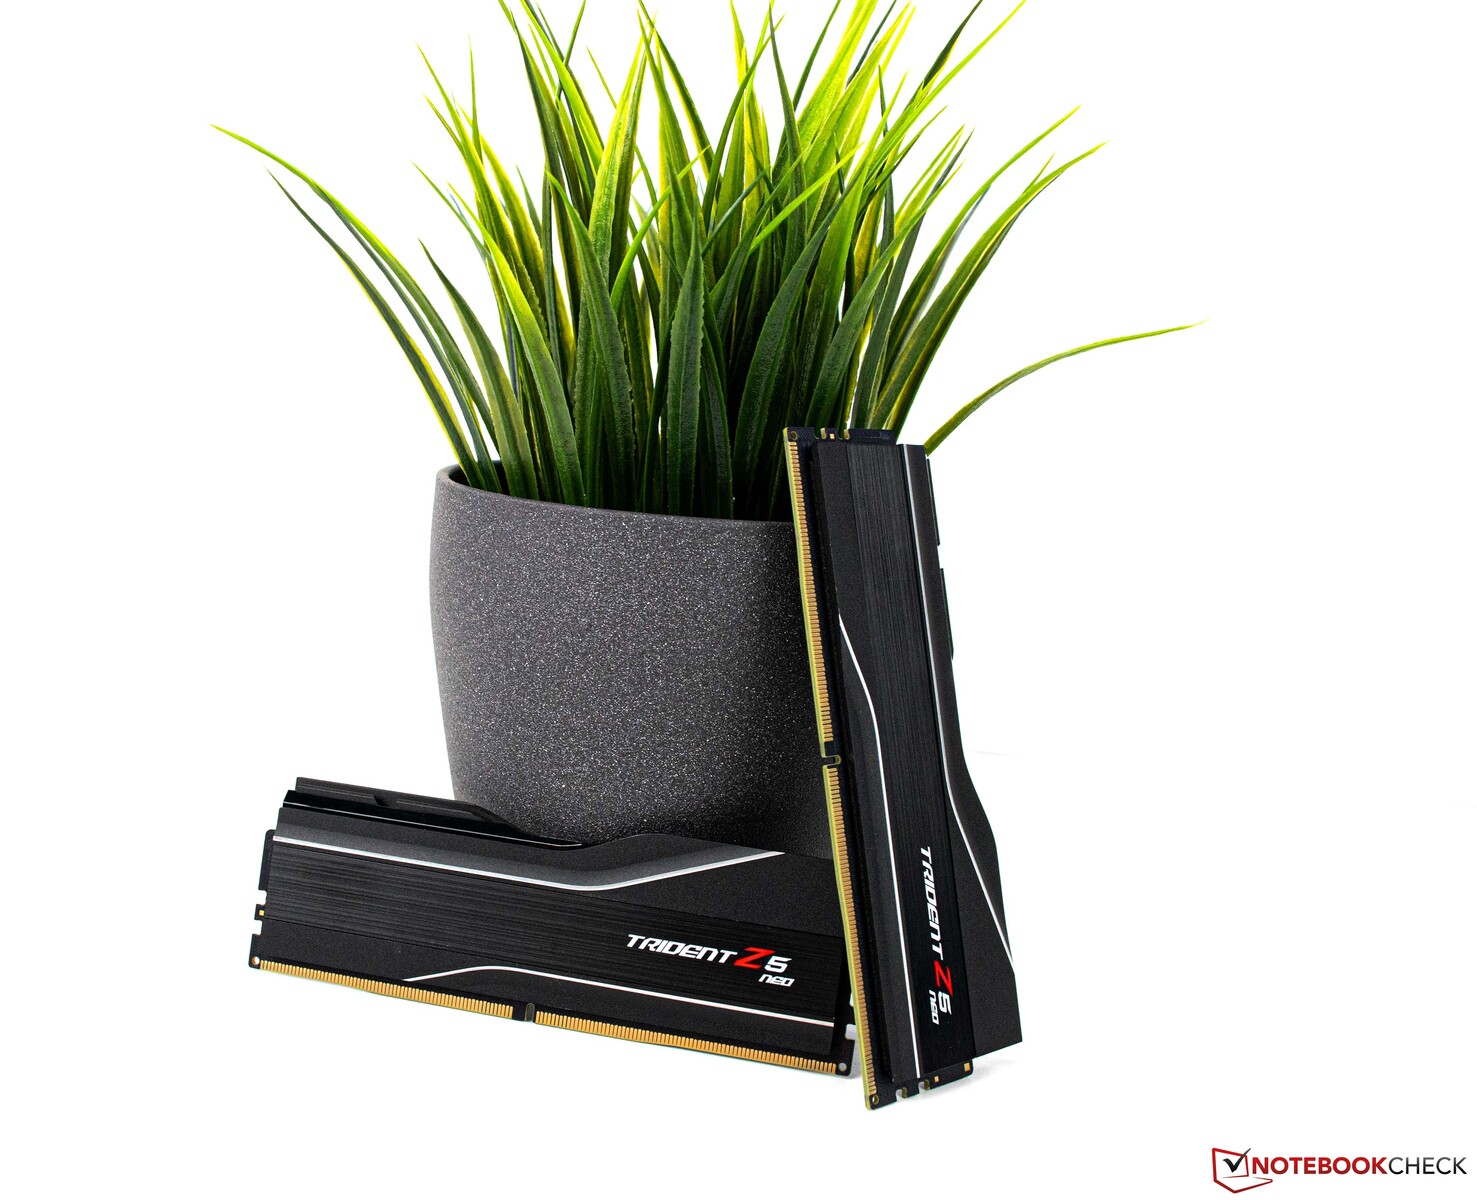
- G.Skill Trident Z5 Neo DDR5-6000 2x 16 GB, EXPO (DDR5-6000 CL30-38-38-96)
- Corsair MP600 2 TB
- Crucial MX500 2 TB
- Microsoft Windows 11 Professional 64-Bit (Version 22H2)
Details on the KFA2 GeForce RTX 4080 SG
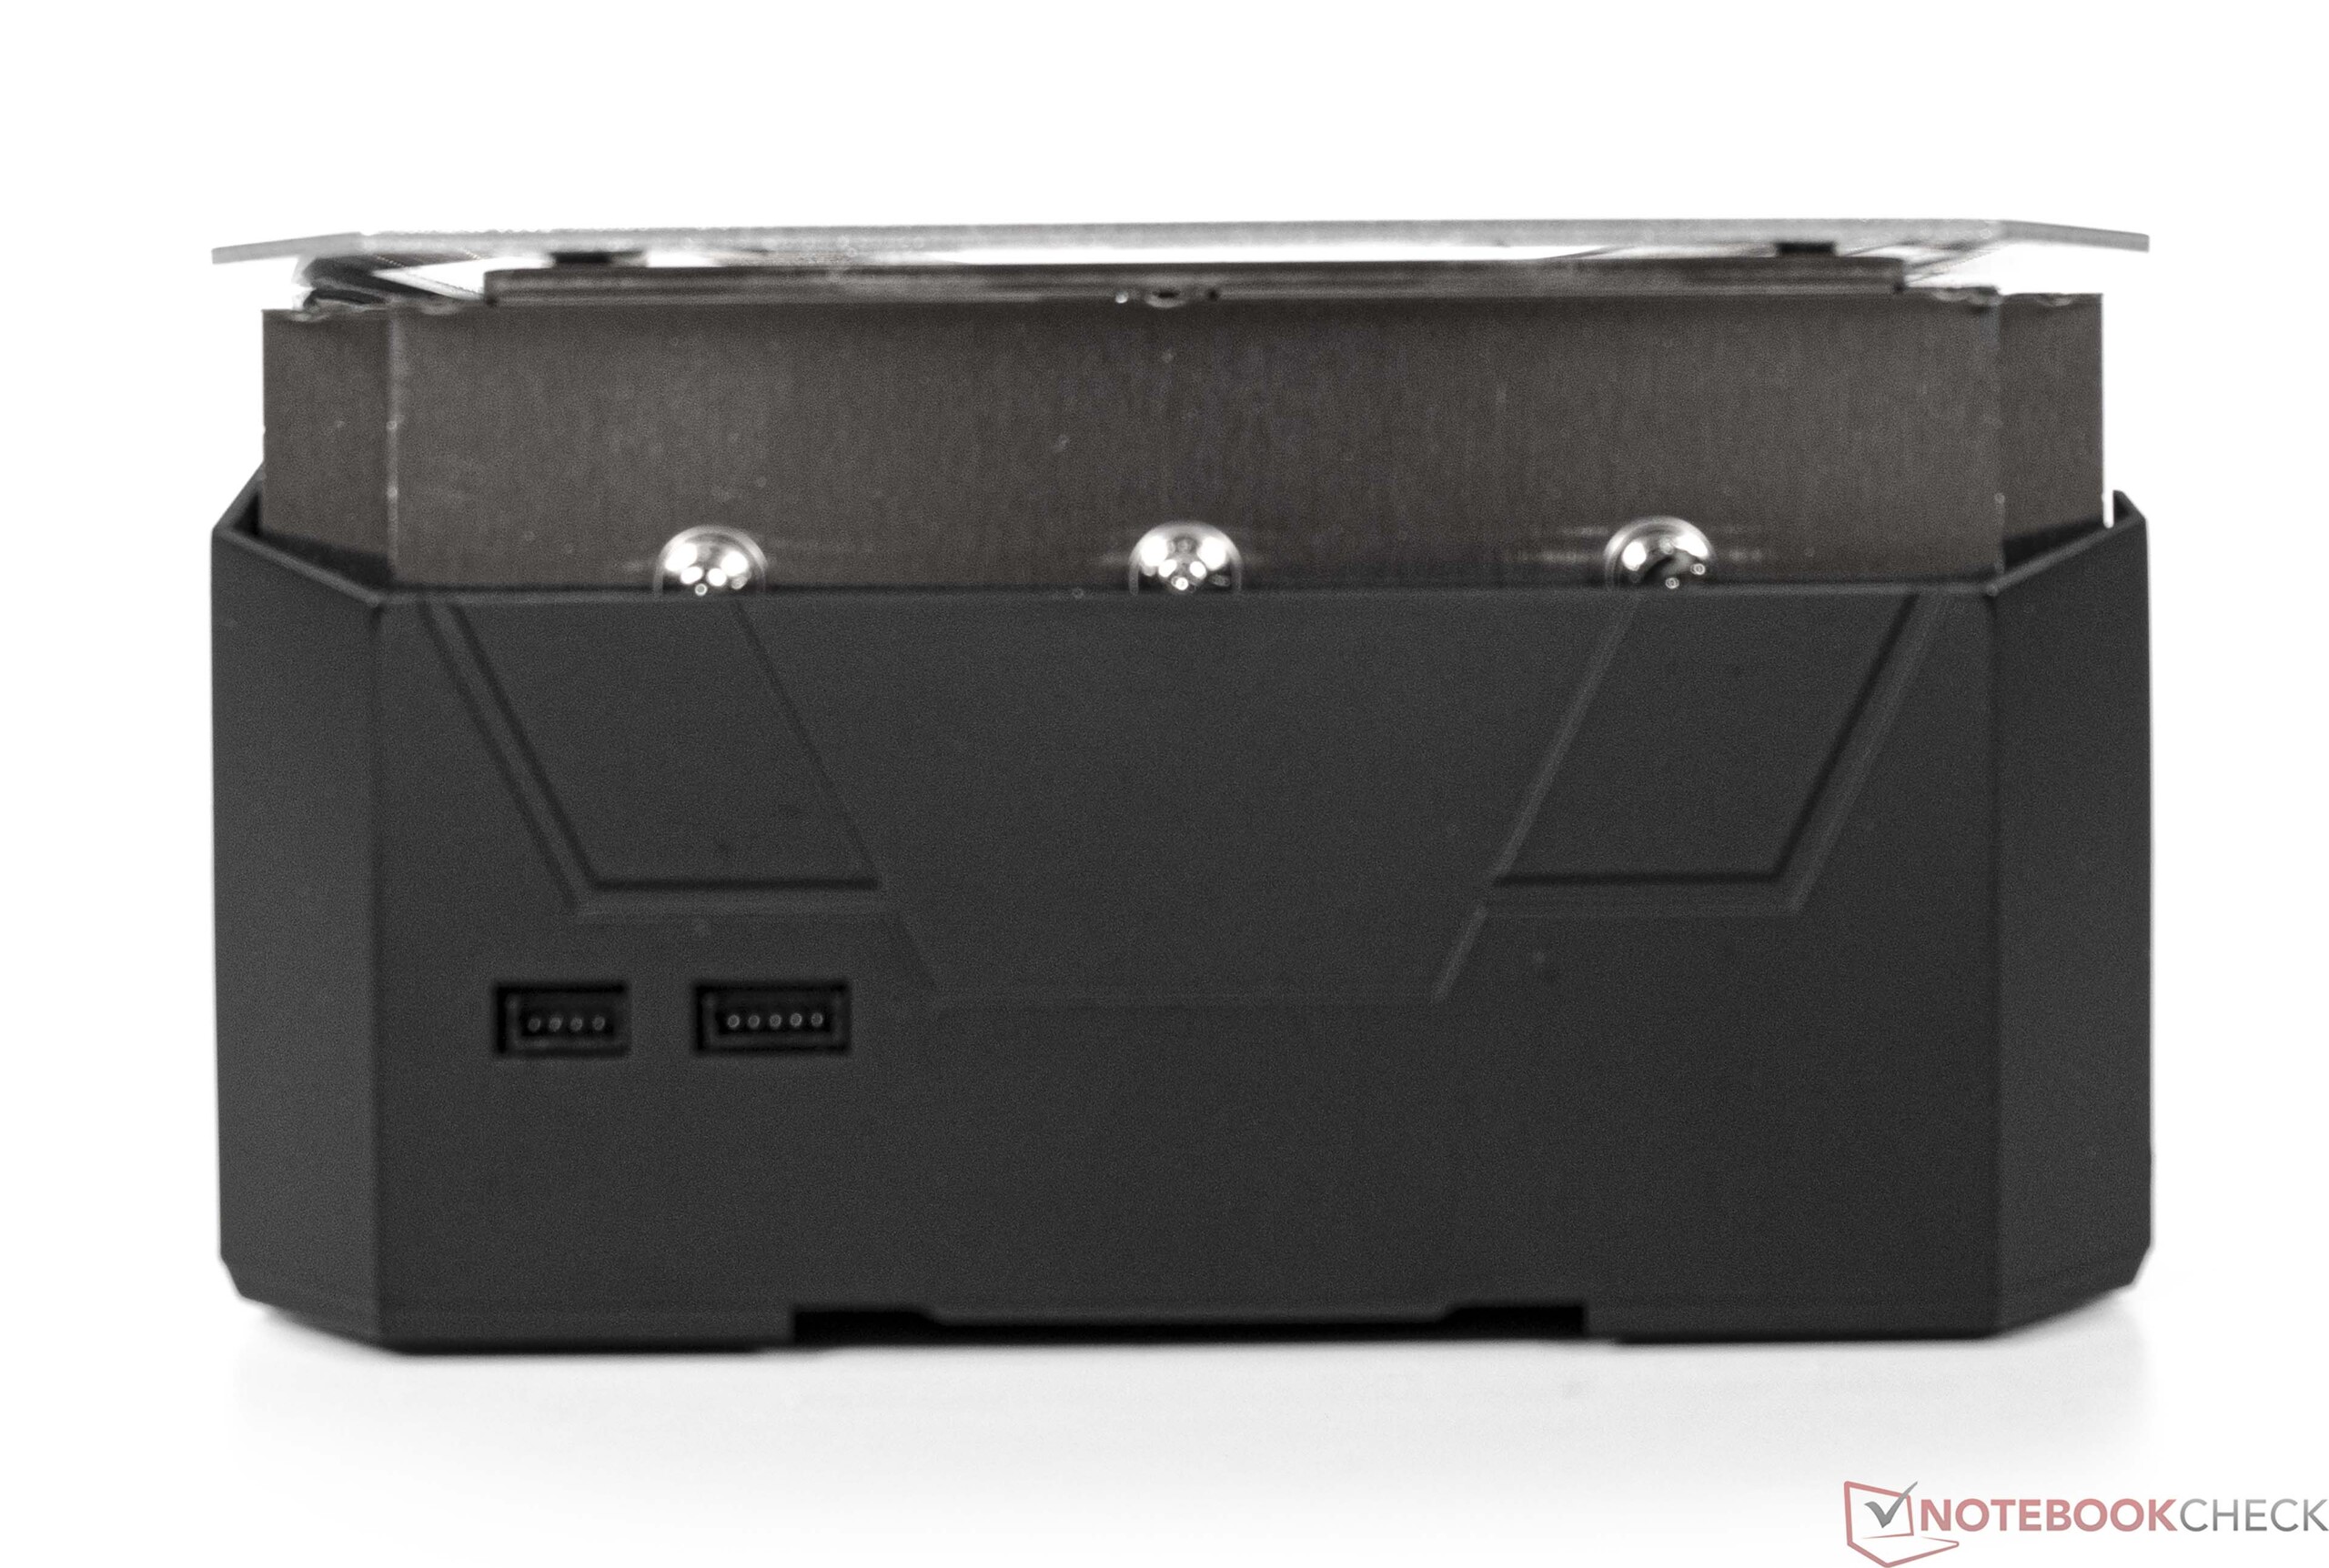
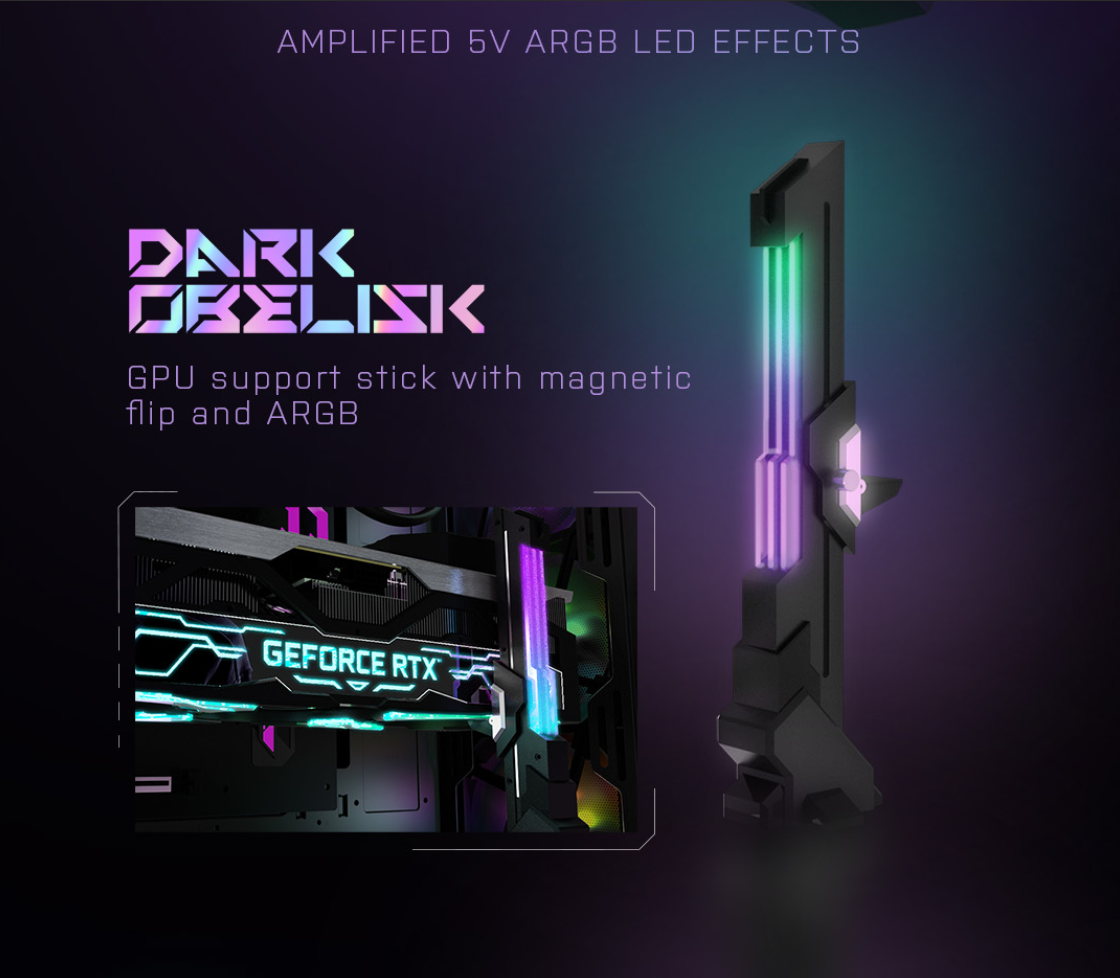
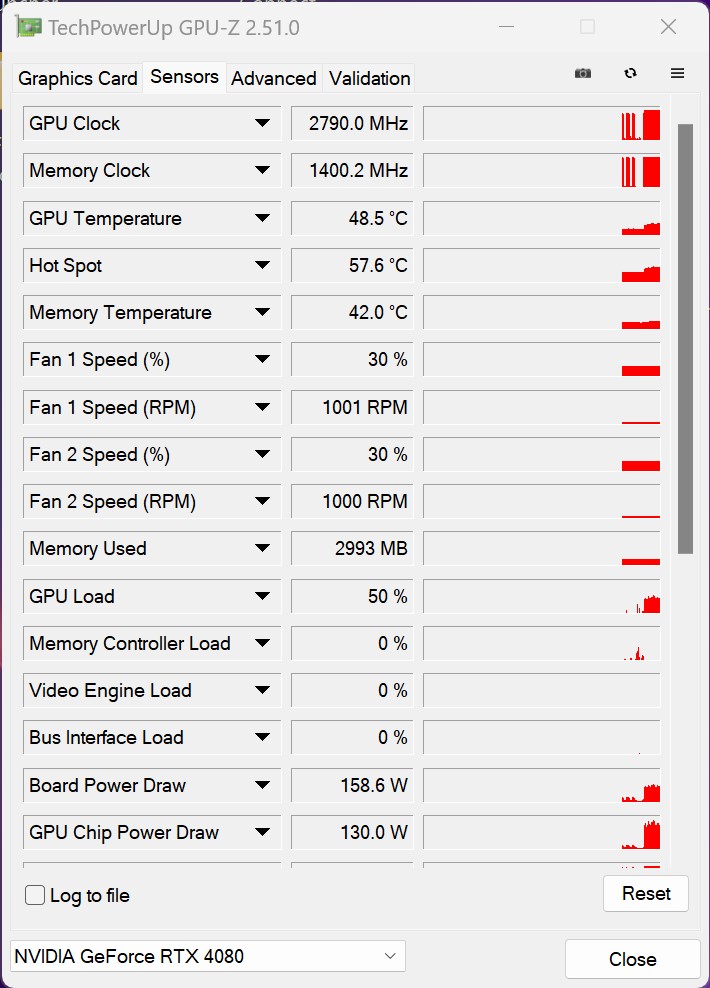
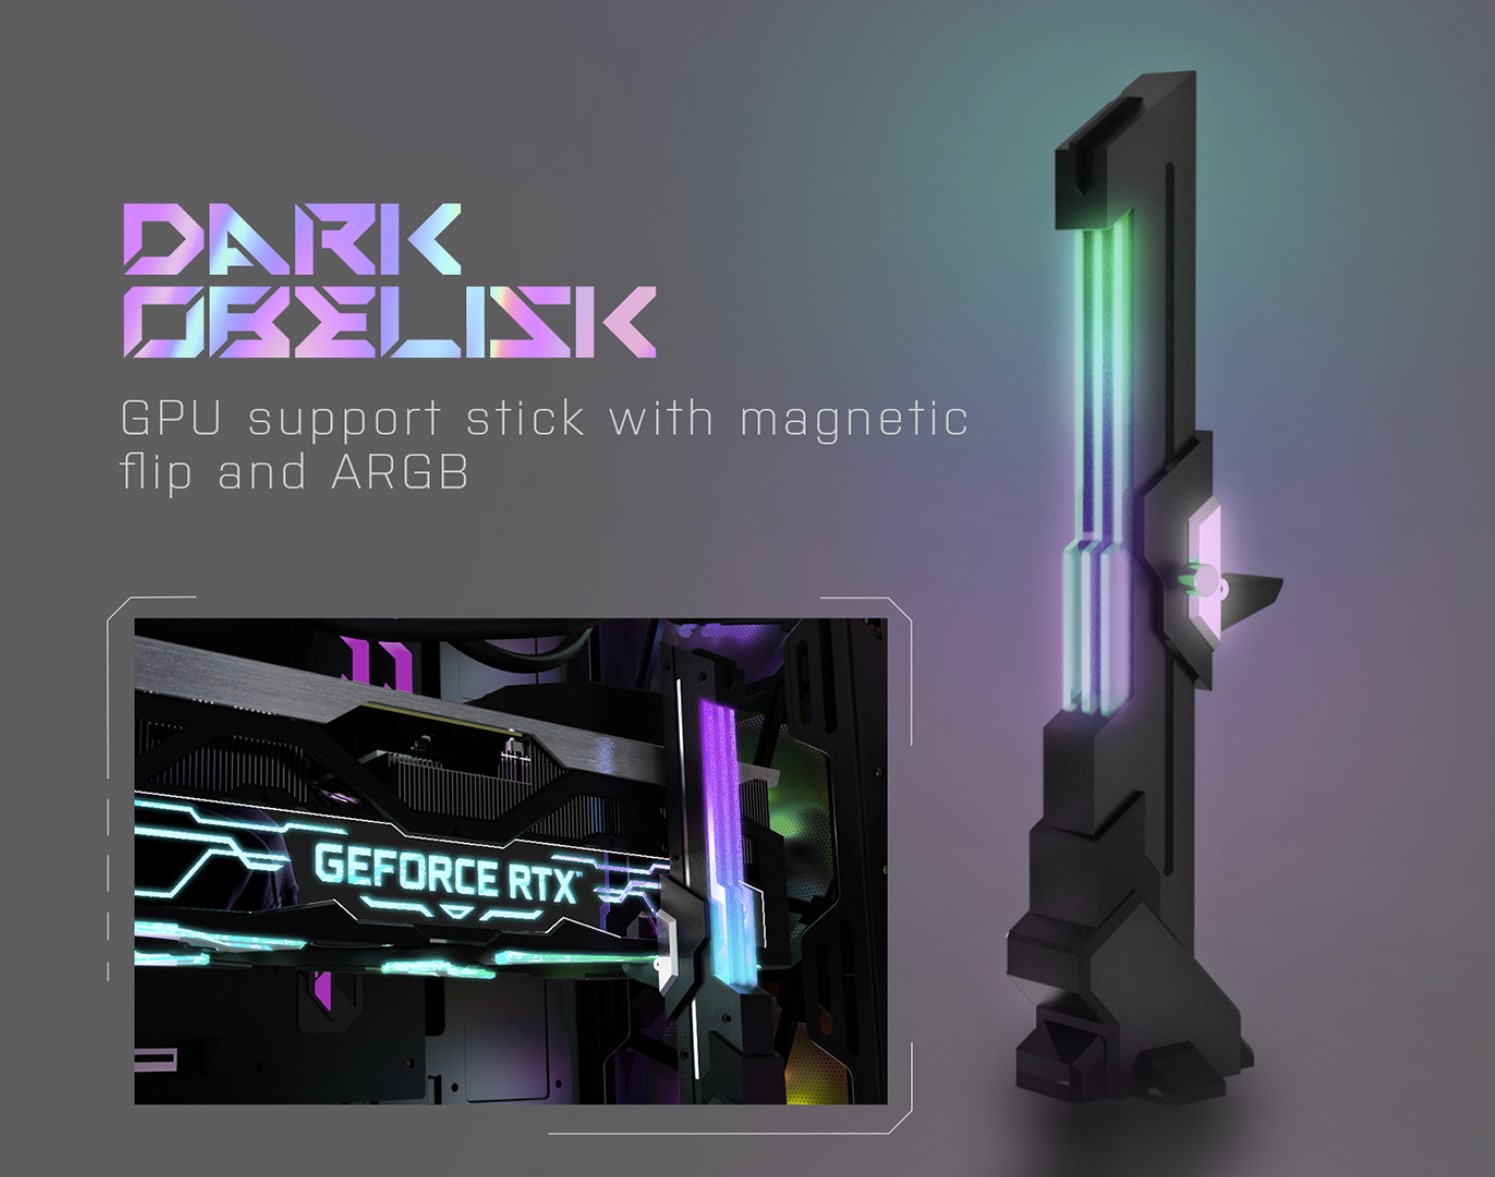
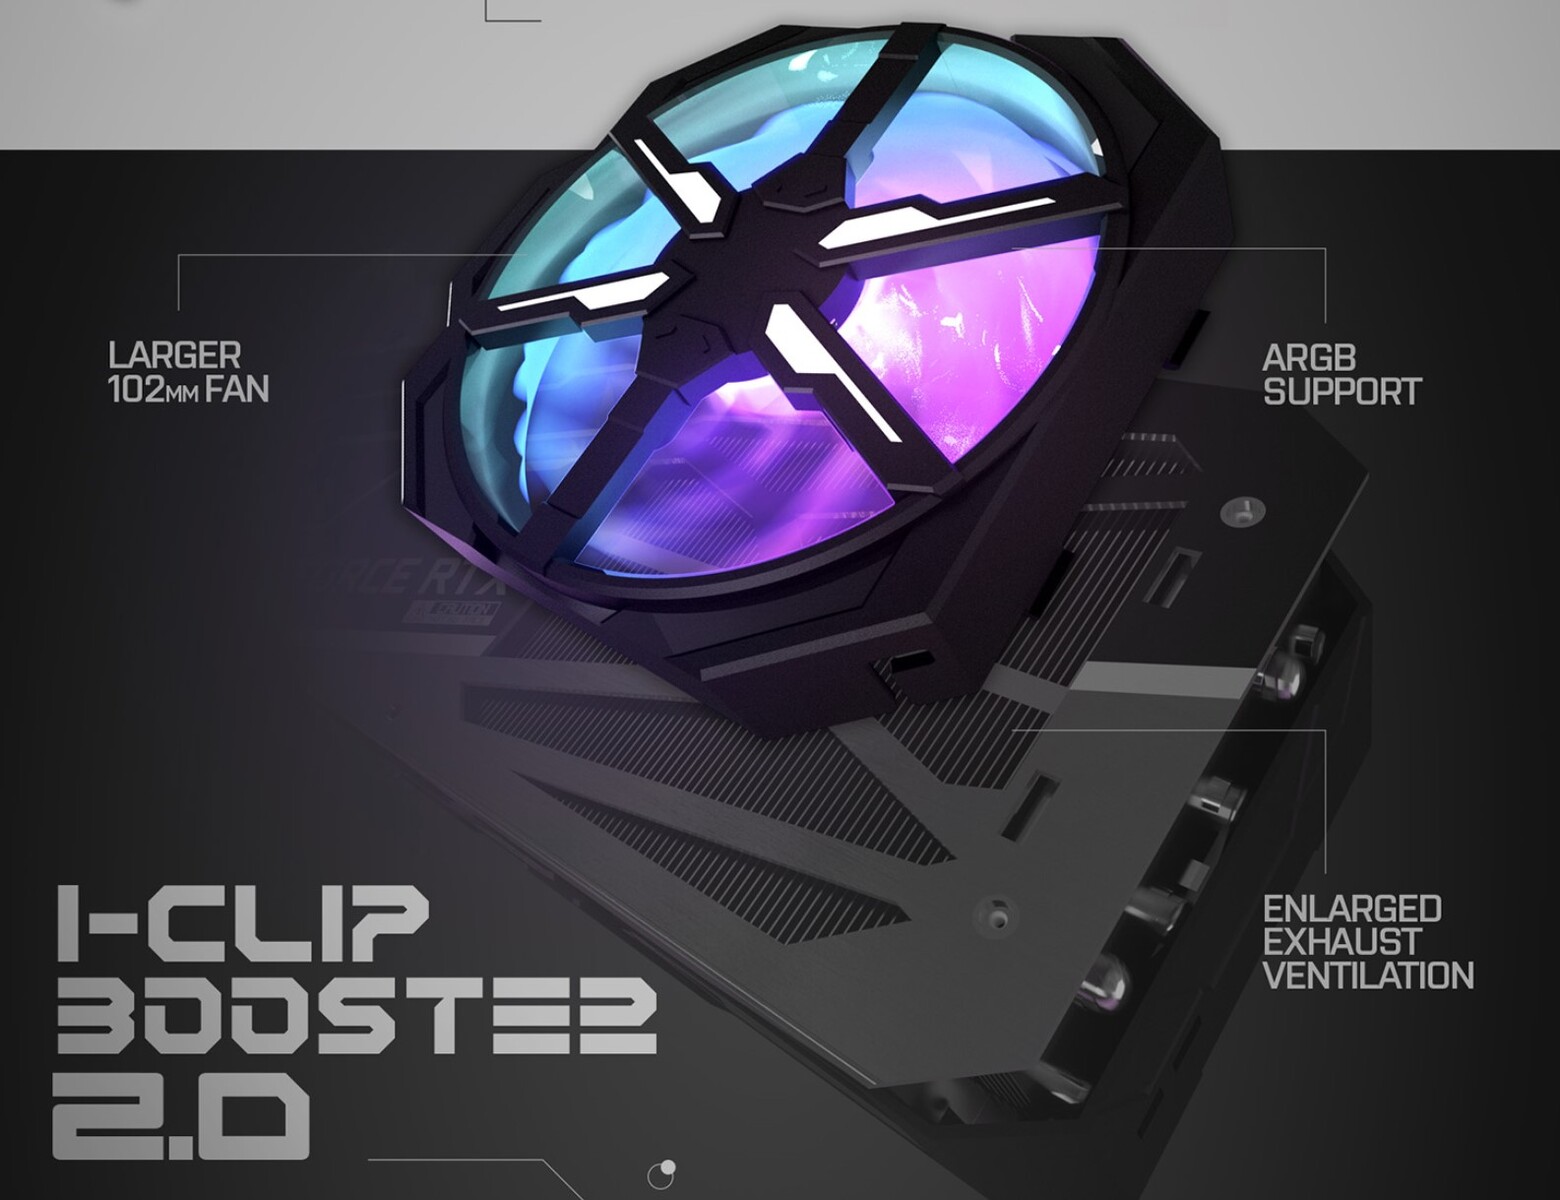
KFA2 has given the GeForce RTX 4080 SG slightly higher clock speeds than specified by Nvidia – the max boost clock has been increased by 60 MHz to be exact. But this is irrelevant in practice because we consistently managed to achieve higher speeds during our testing. On average, we saw GPU clock rates of roughly 2.8 GHz during gaming. The lightweight Xtreme Tuner tool allows users to control the fans and lighting on the graphics card. For our tests, however, we didn’t make any changes to the default settings. The 1-Click OC feature often found on KFA2 models is more just for show. In real-life applications, raising GPU speeds by just 15 MHz hardly makes any difference. We hope that this feature will bring significantly more to the table in future. Apart from the graphics card itself, in the box you’ll also find an optional fan designed to be mounted on the back of the card. Too bad the fan is incompatible with our motherboard, thus preventing us from using it in our review. The company has also included a GPU bracket (ARGB Dark Obelisk). This item is equipped with integrated RGB lighting and therefore goes well with the overall design of the KFA2 GeForce RTX 4080 SG.
Synthetic benchmarks
In synthetic tests, the KFA2 GeForce RTX 4080 SG delivered exactly the same level of performance as the Founders Edition by Nvidia. The KFA2 card was able to outperformed an AMD Radeon RX 7900 XT by eleven per cent. AMD’s flagship GPU, the Radeon RX 7900 XTX, is within the same performance range and only negligibly faster than our review unit. After seeing a huge performance jump from the GeForce RTX 3090 to the RTX 4090, we observed a similar gain in performance when comparing the RTX 4080 with the RTX 3080 Ti. Overall, Nvidia’s Ada Lovelace architecture delivers a whopping 26 per cent more performance than Ampere.
In terms of compute performance, Nvidia clearly has the upper hand sometimes, whilst AMD is decidedly better in other instances. So those who are primarily looking for high compute performance should carefully consider what software programs they intend to use and which graphics card has an edge in those particular applications. As such, we can’t definitively recommend a particular product in this regard.
| Performance rating - Percent | |
| Palit GeForce RTX 4090 GameRock OC | |
| KFA2 GeForce RTX 4090 SG | |
| AMD Radeon RX 7900 XTX | |
| NVIDIA GeForce RTX 4080 Founders Edition | |
| KFA2 GeForce RTX 4080 SG | |
| AMD Radeon RX 7900 XT | |
| MSI Radeon RX 6950 XT Gaming X Trio | |
| ASUS TUF Gaming GeForce RTX 3080 Ti OC | |
| NVIDIA GeForce RTX 3090 Founders Edition | |
| Sapphire AMD Radeon RX 6950 XT Nitro+ Pure | |
| KFA2 GeForce RTX 3080 SG | |
| Nvidia Titan RTX | |
| Unigine Heaven 4.0 | |
| Extreme Preset DX11 | |
| Palit GeForce RTX 4090 GameRock OC | |
| KFA2 GeForce RTX 4090 SG | |
| KFA2 GeForce RTX 4080 SG | |
| NVIDIA GeForce RTX 4080 Founders Edition | |
| AMD Radeon RX 7900 XTX | |
| AMD Radeon RX 7900 XT | |
| MSI Radeon RX 6950 XT Gaming X Trio | |
| ASUS TUF Gaming GeForce RTX 3080 Ti OC | |
| NVIDIA GeForce RTX 3090 Founders Edition | |
| Sapphire AMD Radeon RX 6950 XT Nitro+ Pure | |
| KFA2 GeForce RTX 3080 SG | |
| Nvidia Titan RTX | |
| Extreme Preset OpenGL | |
| Palit GeForce RTX 4090 GameRock OC | |
| KFA2 GeForce RTX 4090 SG | |
| KFA2 GeForce RTX 4080 SG | |
| AMD Radeon RX 7900 XTX | |
| NVIDIA GeForce RTX 4080 Founders Edition | |
| AMD Radeon RX 7900 XT | |
| ASUS TUF Gaming GeForce RTX 3080 Ti OC | |
| NVIDIA GeForce RTX 3090 Founders Edition | |
| MSI Radeon RX 6950 XT Gaming X Trio | |
| KFA2 GeForce RTX 3080 SG | |
| Sapphire AMD Radeon RX 6950 XT Nitro+ Pure | |
| Nvidia Titan RTX | |
| Unigine Valley 1.0 | |
| 1920x1080 Extreme HD DirectX AA:x8 | |
| NVIDIA GeForce RTX 4080 Founders Edition | |
| KFA2 GeForce RTX 4090 SG | |
| Palit GeForce RTX 4090 GameRock OC | |
| AMD Radeon RX 7900 XTX | |
| KFA2 GeForce RTX 4080 SG | |
| AMD Radeon RX 7900 XT | |
| MSI Radeon RX 6950 XT Gaming X Trio | |
| ASUS TUF Gaming GeForce RTX 3080 Ti OC | |
| NVIDIA GeForce RTX 3090 Founders Edition | |
| Sapphire AMD Radeon RX 6950 XT Nitro+ Pure | |
| KFA2 GeForce RTX 3080 SG | |
| Nvidia Titan RTX | |
| 1920x1080 Extreme HD Preset OpenGL AA:x8 | |
| Palit GeForce RTX 4090 GameRock OC | |
| KFA2 GeForce RTX 4090 SG | |
| NVIDIA GeForce RTX 4080 Founders Edition | |
| AMD Radeon RX 7900 XTX | |
| KFA2 GeForce RTX 4080 SG | |
| AMD Radeon RX 7900 XT | |
| ASUS TUF Gaming GeForce RTX 3080 Ti OC | |
| NVIDIA GeForce RTX 3090 Founders Edition | |
| MSI Radeon RX 6950 XT Gaming X Trio | |
| KFA2 GeForce RTX 3080 SG | |
| Sapphire AMD Radeon RX 6950 XT Nitro+ Pure | |
| Nvidia Titan RTX | |
| 3DMark 11 | |
| 1280x720 Performance GPU | |
| Palit GeForce RTX 4090 GameRock OC | |
| KFA2 GeForce RTX 4090 SG | |
| KFA2 GeForce RTX 4080 SG | |
| NVIDIA GeForce RTX 4080 Founders Edition | |
| AMD Radeon RX 7900 XTX | |
| AMD Radeon RX 7900 XT | |
| MSI Radeon RX 6950 XT Gaming X Trio | |
| Sapphire AMD Radeon RX 6950 XT Nitro+ Pure | |
| NVIDIA GeForce RTX 3090 Founders Edition | |
| ASUS TUF Gaming GeForce RTX 3080 Ti OC | |
| KFA2 GeForce RTX 3080 SG | |
| Nvidia Titan RTX | |
| 1280x720 Performance | |
| Palit GeForce RTX 4090 GameRock OC | |
| KFA2 GeForce RTX 4090 SG | |
| KFA2 GeForce RTX 4080 SG | |
| NVIDIA GeForce RTX 4080 Founders Edition | |
| AMD Radeon RX 7900 XTX | |
| AMD Radeon RX 7900 XT | |
| MSI Radeon RX 6950 XT Gaming X Trio | |
| ASUS TUF Gaming GeForce RTX 3080 Ti OC | |
| NVIDIA GeForce RTX 3090 Founders Edition | |
| Nvidia Titan RTX | |
| Sapphire AMD Radeon RX 6950 XT Nitro+ Pure | |
| KFA2 GeForce RTX 3080 SG | |
Compute benchmarks and professional applications
| LuxMark v2.0 64Bit | |
| Sala GPUs-only | |
| AMD Radeon RX 6950 XT | |
| NVIDIA GeForce RTX 4090 | |
| NVIDIA GeForce RTX 4090 | |
| NVIDIA GeForce RTX 4080 | |
| KFA2 GeForce RTX 4080 SG | |
| NVIDIA GeForce RTX 3080 Ti | |
| AMD Radeon RX 7900 XTX | |
| NVIDIA GeForce RTX 3090 | |
| NVIDIA GeForce RTX 3080 12 GB | |
| AMD Radeon RX 7900 XT | |
| AMD Radeon RX 6950 XT | |
| NVIDIA Titan RTX | |
| Room GPUs-only | |
| NVIDIA GeForce RTX 4090 | |
| NVIDIA GeForce RTX 4090 | |
| NVIDIA GeForce RTX 4080 | |
| KFA2 GeForce RTX 4080 SG | |
| NVIDIA GeForce RTX 3090 | |
| NVIDIA GeForce RTX 3080 Ti | |
| NVIDIA GeForce RTX 3080 12 GB | |
| AMD Radeon RX 7900 XTX | |
| AMD Radeon RX 6950 XT | |
| NVIDIA Titan RTX | |
| AMD Radeon RX 7900 XT | |
| AMD Radeon RX 6950 XT | |
| Blender - v3.3 Classroom CUDA | |
| NVIDIA Titan RTX | |
| NVIDIA GeForce RTX 3080 Ti | |
| Geekbench 5.5 | |
| OpenCL Score | |
| NVIDIA GeForce RTX 4090 | |
| NVIDIA GeForce RTX 4090 | |
| KFA2 GeForce RTX 4080 SG | |
| NVIDIA GeForce RTX 4080 | |
| NVIDIA GeForce RTX 3090 | |
| NVIDIA GeForce RTX 3080 12 GB | |
| AMD Radeon RX 6950 XT | |
| NVIDIA Titan RTX | |
| Vulkan Score 5.5 | |
| NVIDIA GeForce RTX 4090 | |
| NVIDIA GeForce RTX 4090 | |
| NVIDIA Titan RTX | |
| NVIDIA GeForce RTX 3090 | |
| AMD Radeon RX 6950 XT | |
| NVIDIA GeForce RTX 3080 12 GB | |
| V-Ray 5 Benchmark | |
| GPU CUDA | |
| NVIDIA GeForce RTX 4090 | |
| NVIDIA GeForce RTX 4090 | |
| KFA2 GeForce RTX 4080 SG | |
| NVIDIA GeForce RTX 4080 | |
| NVIDIA GeForce RTX 3090 | |
| NVIDIA GeForce RTX 3080 Ti | |
| NVIDIA GeForce RTX 3080 12 GB | |
| AMD Radeon RX 6950 XT | |
| GPU RTX | |
| NVIDIA GeForce RTX 4090 | |
| NVIDIA GeForce RTX 4090 | |
| KFA2 GeForce RTX 4080 SG | |
| NVIDIA GeForce RTX 4080 | |
| NVIDIA GeForce RTX 3090 | |
| NVIDIA GeForce RTX 3080 Ti | |
| Affinity Photo 2 - Combined (Single / Multi GPU) | |
| NVIDIA GeForce RTX 4090 | |
| KFA2 GeForce RTX 4080 SG | |
| NVIDIA GeForce RTX 3080 Ti | |
| NVIDIA Titan RTX | |
| AMD Radeon RX 6950 XT | |
| AMD Radeon RX 7900 XTX | |
| AMD Radeon RX 7900 XT | |
* ... smaller is better
Gaming benchmarks
Like the KFA2 GeForce RTX 4090 SG, the KFA2 GeForce RTX 4080 SG offers immensely high gaming performance that only properly flexes its muscles at 2160p. Needless to say, the model can handle 1440p very comfortably, and the CPU is less of a limiting factor as with the faster RTX 4090. The AMD competitors don't put up much of a fight against the KFA2 GeForce RTX 4080 SG, despite the fact that a few games run better on AMD graphics cards. On the other hand, there are also games that perform far better on Nvidia GPUs. Once ray tracing features are enabled, Nvidia cards pull even further ahead of the new RDNA3 graphics cards. Without DLSS, though, even the fastest Nvidia GPUs right now struggle with ray tracing at higher resolutions. As shown by Cyberpunk 2077, you'll have to settle for 1080p when DLSS is disabled.
In any case, it should be noted that DLSS 3.0 is available exclusively on the new GeForce RTX 40 Series GPUs. AMD has a similar feature at the ready in the form of the open standard FSR, which can also be used with Nvidia GPUs. Ultimately, it is up to game developers to integrate these features into their games. You can click here to find a list of games that support DLSS 3.0 right now or are going to so in future.
| GTA V - 3840x2160 High/On (Advanced Graphics Off) AA:FX AF:8x | |
| Palit GeForce RTX 4090 GameRock OC | |
| NVIDIA GeForce RTX 4080 Founders Edition | |
| AMD Radeon RX 7900 XTX | |
| KFA2 GeForce RTX 4080 SG | |
| ASUS TUF Gaming GeForce RTX 3080 Ti OC | |
| NVIDIA GeForce RTX 3090 Founders Edition | |
| MSI Radeon RX 6950 XT Gaming X Trio | |
| AMD Radeon RX 7900 XT | |
| Sapphire AMD Radeon RX 6950 XT Nitro+ Pure | |
| KFA2 GeForce RTX 3080 SG | |
| Nvidia Titan RTX | |
| The Witcher 3 - 3840x2160 High Graphics & Postprocessing (Nvidia HairWorks Off) | |
| Palit GeForce RTX 4090 GameRock OC | |
| NVIDIA GeForce RTX 4080 Founders Edition | |
| KFA2 GeForce RTX 4080 SG | |
| AMD Radeon RX 7900 XTX | |
| AMD Radeon RX 7900 XT | |
| NVIDIA GeForce RTX 3090 Founders Edition | |
| ASUS TUF Gaming GeForce RTX 3080 Ti OC | |
| MSI Radeon RX 6950 XT Gaming X Trio | |
| Sapphire AMD Radeon RX 6950 XT Nitro+ Pure | |
| KFA2 GeForce RTX 3080 SG | |
| AMD Radeon RX 6900 XT | |
| Nvidia Titan RTX | |
| Final Fantasy XV Benchmark - 3840x2160 High Quality | |
| Palit GeForce RTX 4090 GameRock OC | |
| KFA2 GeForce RTX 4080 SG | |
| NVIDIA GeForce RTX 4080 Founders Edition | |
| AMD Radeon RX 7900 XTX | |
| NVIDIA GeForce RTX 3090 Founders Edition | |
| ASUS TUF Gaming GeForce RTX 3080 Ti OC | |
| Sapphire AMD Radeon RX 6950 XT Nitro+ Pure | |
| MSI Radeon RX 6950 XT Gaming X Trio | |
| AMD Radeon RX 7900 XT | |
| KFA2 GeForce RTX 3080 SG | |
| Nvidia Titan RTX | |
| Strange Brigade - 3840x2160 ultra AA:ultra AF:16 | |
| Palit GeForce RTX 4090 GameRock OC | |
| KFA2 GeForce RTX 4080 SG | |
| MSI Radeon RX 6950 XT Gaming X Trio | |
| AMD Radeon RX 7900 XT | |
| AMD Radeon RX 7900 XTX | |
| Sapphire AMD Radeon RX 6950 XT Nitro+ Pure | |
| NVIDIA GeForce RTX 3090 Founders Edition | |
| ASUS TUF Gaming GeForce RTX 3080 Ti OC | |
| KFA2 GeForce RTX 3080 SG | |
| Nvidia Titan RTX | |
| Far Cry 5 - 3840x2160 Ultra Preset AA:T | |
| Palit GeForce RTX 4090 GameRock OC | |
| AMD Radeon RX 7900 XTX | |
| NVIDIA GeForce RTX 4080 Founders Edition | |
| KFA2 GeForce RTX 4080 SG | |
| AMD Radeon RX 7900 XT | |
| MSI Radeon RX 6950 XT Gaming X Trio | |
| Sapphire AMD Radeon RX 6950 XT Nitro+ Pure | |
| ASUS TUF Gaming GeForce RTX 3080 Ti OC | |
| NVIDIA GeForce RTX 3090 Founders Edition | |
| KFA2 GeForce RTX 3080 SG | |
| Nvidia Titan RTX | |
| Far Cry New Dawn - 3840x2160 Ultra Preset | |
| Palit GeForce RTX 4090 GameRock OC | |
| AMD Radeon RX 7900 XTX | |
| KFA2 GeForce RTX 4080 SG | |
| AMD Radeon RX 7900 XT | |
| MSI Radeon RX 6950 XT Gaming X Trio | |
| Sapphire AMD Radeon RX 6950 XT Nitro+ Pure | |
| ASUS TUF Gaming GeForce RTX 3080 Ti OC | |
| NVIDIA GeForce RTX 3090 Founders Edition | |
| AMD Radeon RX 6900 XT | |
| KFA2 GeForce RTX 3080 SG | |
| Nvidia Titan RTX | |
| Far Cry 6 - 3840x2160 Ultra Graphics Quality + HD Textures AA:T | |
| Palit GeForce RTX 4090 GameRock OC | |
| AMD Radeon RX 7900 XTX | |
| NVIDIA GeForce RTX 4080 Founders Edition | |
| KFA2 GeForce RTX 4080 SG | |
| AMD Radeon RX 7900 XT | |
| MSI Radeon RX 6950 XT Gaming X Trio | |
| Sapphire AMD Radeon RX 6950 XT Nitro+ Pure | |
| ASUS TUF Gaming GeForce RTX 3080 Ti OC | |
| NVIDIA GeForce RTX 3090 Founders Edition | |
| Nvidia Titan RTX | |
| KFA2 GeForce RTX 3080 SG | |
| Metro Exodus - 3840x2160 Ultra Quality AF:16x | |
| Palit GeForce RTX 4090 GameRock OC | |
| NVIDIA GeForce RTX 4080 Founders Edition | |
| KFA2 GeForce RTX 4080 SG | |
| AMD Radeon RX 7900 XTX | |
| AMD Radeon RX 7900 XT | |
| MSI Radeon RX 6950 XT Gaming X Trio | |
| ASUS TUF Gaming GeForce RTX 3080 Ti OC | |
| NVIDIA GeForce RTX 3090 Founders Edition | |
| Sapphire AMD Radeon RX 6950 XT Nitro+ Pure | |
| AMD Radeon RX 6900 XT | |
| KFA2 GeForce RTX 3080 SG | |
| Nvidia Titan RTX | |
| F1 2020 - 3840x2160 Ultra High Preset AA:T AF:16x | |
| Palit GeForce RTX 4090 GameRock OC | |
| KFA2 GeForce RTX 4080 SG | |
| AMD Radeon RX 7900 XTX | |
| AMD Radeon RX 7900 XT | |
| MSI Radeon RX 6950 XT Gaming X Trio | |
| Sapphire AMD Radeon RX 6950 XT Nitro+ Pure | |
| ASUS TUF Gaming GeForce RTX 3080 Ti OC | |
| NVIDIA GeForce RTX 3090 Founders Edition | |
| AMD Radeon RX 6900 XT | |
| AMD Radeon RX 6900 XT | |
| KFA2 GeForce RTX 3080 SG | |
| Nvidia Titan RTX | |
| F1 2021 - 3840x2160 Ultra High Preset + Raytracing AA:T AF:16x | |
| Palit GeForce RTX 4090 GameRock OC | |
| KFA2 GeForce RTX 4080 SG | |
| NVIDIA GeForce RTX 4080 Founders Edition | |
| AMD Radeon RX 7900 XTX | |
| AMD Radeon RX 7900 XT | |
| ASUS TUF Gaming GeForce RTX 3080 Ti OC | |
| NVIDIA GeForce RTX 3090 Founders Edition | |
| MSI Radeon RX 6950 XT Gaming X Trio | |
| Sapphire AMD Radeon RX 6950 XT Nitro+ Pure | |
| KFA2 GeForce RTX 3080 SG | |
| Nvidia Titan RTX | |
| F1 22 - 3840x2160 Ultra High Preset AA:T AF:16x | |
| Palit GeForce RTX 4090 GameRock OC | |
| NVIDIA GeForce RTX 4080 Founders Edition | |
| KFA2 GeForce RTX 4080 SG | |
| AMD Radeon RX 7900 XTX | |
| AMD Radeon RX 7900 XT | |
| ASUS TUF Gaming GeForce RTX 3080 Ti OC | |
| NVIDIA GeForce RTX 3090 Founders Edition | |
| MSI Radeon RX 6950 XT Gaming X Trio | |
| Sapphire AMD Radeon RX 6950 XT Nitro+ Pure | |
| Nvidia Titan RTX | |
| Borderlands 3 - 3840x2160 Badass Overall Quality (DX11) | |
| Palit GeForce RTX 4090 GameRock OC | |
| NVIDIA GeForce RTX 4080 Founders Edition | |
| KFA2 GeForce RTX 4080 SG | |
| AMD Radeon RX 7900 XTX | |
| AMD Radeon RX 7900 XT | |
| ASUS TUF Gaming GeForce RTX 3080 Ti OC | |
| NVIDIA GeForce RTX 3090 Founders Edition | |
| MSI Radeon RX 6950 XT Gaming X Trio | |
| KFA2 GeForce RTX 3080 SG | |
| Sapphire AMD Radeon RX 6950 XT Nitro+ Pure | |
| AMD Radeon RX 6900 XT | |
| AMD Radeon RX 6900 XT | |
| Nvidia Titan RTX | |
| Metro Exodus - 1920x1080 Ultra Quality DXR AF:16x | |
| NVIDIA GeForce RTX 4090 | |
| NVIDIA GeForce RTX 4080 | |
| AMD Radeon RX 7900 XTX | |
| NVIDIA GeForce RTX 4080 | |
| AMD Radeon RX 7900 XT | |
| NVIDIA GeForce RTX 3080 Ti | |
| NVIDIA GeForce RTX 3090 | |
| AMD Radeon RX 6950 XT | |
| Far Cry 6 - 1920x1080 Ultra Graphics Quality + HD Textures + DXR AA:T | |
| NVIDIA GeForce RTX 4080 | |
| AMD Radeon RX 7900 XTX | |
| AMD Radeon RX 7900 XT | |
| NVIDIA GeForce RTX 4090 | |
| AMD Radeon RX 6950 XT | |
| NVIDIA GeForce RTX 3080 Ti | |
| NVIDIA GeForce RTX 4080 | |
| NVIDIA GeForce RTX 3090 | |
| AMD Radeon RX 6800 | |
| AMD Radeon RX 6950 XT | |
| Cyberpunk 2077 1.6 | |
| 3840x2160 Ray Tracing Ultra Preset (DLSS off) | |
| NVIDIA GeForce RTX 4090 (1.6) | |
| NVIDIA GeForce RTX 4080 (1.6) | |
| NVIDIA GeForce RTX 4080 (1.61) | |
| NVIDIA GeForce RTX 3090 (1.6) | |
| AMD Radeon RX 7900 XTX (1.61) | |
| NVIDIA GeForce RTX 3080 Ti (1.61) | |
| AMD Radeon RX 7900 XT (1.61) | |
| AMD Radeon RX 6950 XT (1.61) | |
| AMD Radeon RX 6800 (1.61) | |
| 1920x1080 Ray Tracing Ultra Preset (DLSS off) | |
| NVIDIA GeForce RTX 4090 (1.6) | |
| NVIDIA GeForce RTX 4080 (1.6) | |
| NVIDIA GeForce RTX 4080 (1.61) | |
| NVIDIA GeForce RTX 3080 Ti (1.61) | |
| NVIDIA GeForce RTX 3090 (1.6) | |
| AMD Radeon RX 7900 XTX (1.61) | |
| AMD Radeon RX 7900 XT (1.61) | |
| AMD Radeon RX 6950 XT (1.61) | |
| AMD Radeon RX 6800 (1.61) | |
| Control - 1920x1080 High Quality Preset & High Ray Tracing Preset (DX12) | |
| NVIDIA GeForce RTX 4090 | |
| NVIDIA GeForce RTX 4080 | |
| NVIDIA GeForce RTX 4080 | |
| AMD Radeon RX 7900 XTX | |
| NVIDIA GeForce RTX 3080 Ti | |
| AMD Radeon RX 7900 XT | |
| AMD Radeon RX 6950 XT | |
| AMD Radeon RX 6950 XT | |
| Ghostwire Tokyo - 1920x1080 Highest Settings + Maximum Ray Tracing | |
| NVIDIA GeForce RTX 4090 | |
| NVIDIA GeForce RTX 4080 | |
| NVIDIA GeForce RTX 4080 | |
| AMD Radeon RX 7900 XTX | |
| NVIDIA GeForce RTX 3080 Ti | |
| AMD Radeon RX 7900 XT | |
| AMD Radeon RX 6950 XT | |
| The Callisto Protocol - 1920x1080 Ultra Preset (without FSR Upscaling) + Full Ray-Tracing | |
| AMD Radeon RX 7900 XTX | |
| NVIDIA GeForce RTX 4090 | |
| AMD Radeon RX 7900 XT | |
| NVIDIA GeForce RTX 4080 | |
| AMD Radeon RX 6950 XT | |
| NVIDIA GeForce RTX 3080 Ti | |
| AMD Radeon RX 6800 | |
| Spider-Man Miles Morales - 1920x0180 Very High Preset + Ray-Tracing AA:T | |
| NVIDIA GeForce RTX 4090 | |
| NVIDIA GeForce RTX 4080 | |
| AMD Radeon RX 7900 XTX | |
| NVIDIA GeForce RTX 3080 Ti | |
| AMD Radeon RX 7900 XT | |
| AMD Radeon RX 6950 XT | |
| AMD Radeon RX 6800 | |
| low | med. | high | ultra | QHD | 4K DLSS | 4K | |
|---|---|---|---|---|---|---|---|
| GTA V (2015) | 188.1 | 188 | 187.7 | 164.3 | 159.2 | 183.9 | |
| The Witcher 3 (2015) | 811 | 719 | 549 | 268 | 202 | ||
| Dota 2 Reborn (2015) | 287.8 | 256.8 | 247.1 | 228.6 | 221.7 | ||
| Final Fantasy XV Benchmark (2018) | 236 | 235 | 225 | 195.7 | 116.9 | ||
| X-Plane 11.11 (2018) | 219 | 193.6 | 149.4 | 124.9 | |||
| Far Cry 5 (2018) | 239 | 209 | 203 | 188 | 185 | 139 | |
| Strange Brigade (2018) | 681 | 548 | 531 | 482 | 390 | 195.1 | |
| Shadow of the Tomb Raider (2018) | 334 | 299 | 304 | 288 | 241 | 132.2 | |
| Far Cry New Dawn (2019) | 196 | 173 | 166 | 150 | 149 | 130 | |
| Metro Exodus (2019) | 300 | 256 | 212 | 177.7 | 153.7 | 103.9 | |
| Control (2019) | 240 | 240 | 235 | 162 | 82.4 | ||
| Borderlands 3 (2019) | 239 | 203 | 189.9 | 187.2 | 163.2 | 95.2 | |
| F1 2020 (2020) | 552 | 478 | 463 | 396 | 332 | 201 | |
| F1 2021 (2021) | 656 | 606 | 514 | 256 | 240 | 144.3 | |
| Far Cry 6 (2021) | 205 | 177.3 | 161.6 | 155 | 150.6 | 107 | |
| Forza Horizon 5 (2021) | 302 | 242 | 238 | 177 | 164 | 124 | |
| God of War (2022) | 274 | 271 | 229 | 164.9 | 136.3 | 95.3 | |
| GRID Legends (2022) | 318 | 287 | 254 | 237 | 233 | 163.3 | |
| Cyberpunk 2077 1.6 (2022) | 216 | 213 | 201 | 190.1 | 129.1 | 63.4 | |
| Ghostwire Tokyo (2022) | 294 | 283 | 252 | 124.6 | |||
| Tiny Tina's Wonderlands (2022) | 385 | 320 | 269 | 226 | 165.8 | 89 | |
| F1 22 (2022) | 423 | 411 | 384 | 172.8 | 113.8 | 57.9 | |
| The Quarry (2022) | 376 | 291 | 249 | 207 | 149 | 79.2 | |
| FIFA 23 (2022) | 278 | 274 | 274 | 274 | 272 | 218 | |
| A Plague Tale Requiem (2022) | 174.1 | 172.5 | 153.9 | 127 | 95.4 | 54.4 | |
| Uncharted Legacy of Thieves Collection (2022) | 145.5 | 144.7 | 142.1 | 140.4 | 125.6 | 77.7 | |
| Call of Duty Modern Warfare 2 2022 (2022) | 317 | 286 | 230 | 219 | 170 | 158 | 112 |
| Spider-Man Miles Morales (2022) | 198.6 | 180.3 | 178.2 | 157.3 | 202 | 103.9 | |
| The Callisto Protocol (2022) | 231 | 213 | 172 | 171 | 138 | 85 | |
| Need for Speed Unbound (2022) | 177.8 | 171.4 | 160.4 | 140.3 | 137.8 | 104.5 |
Emissions from the KFA2 GeForce RTX 4080 SG
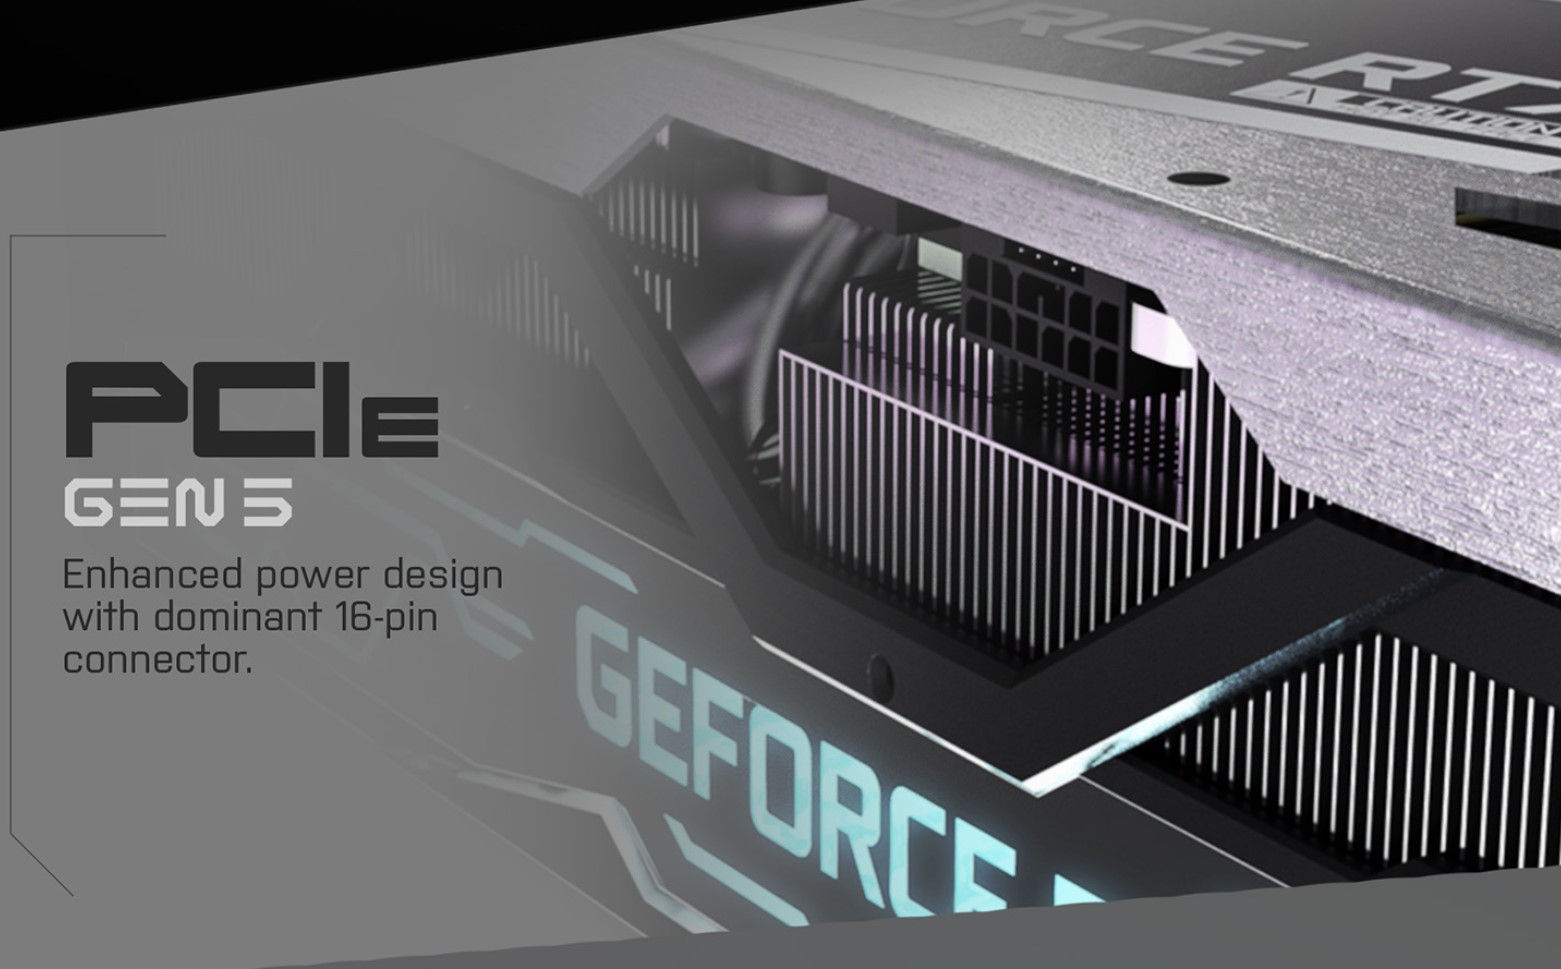
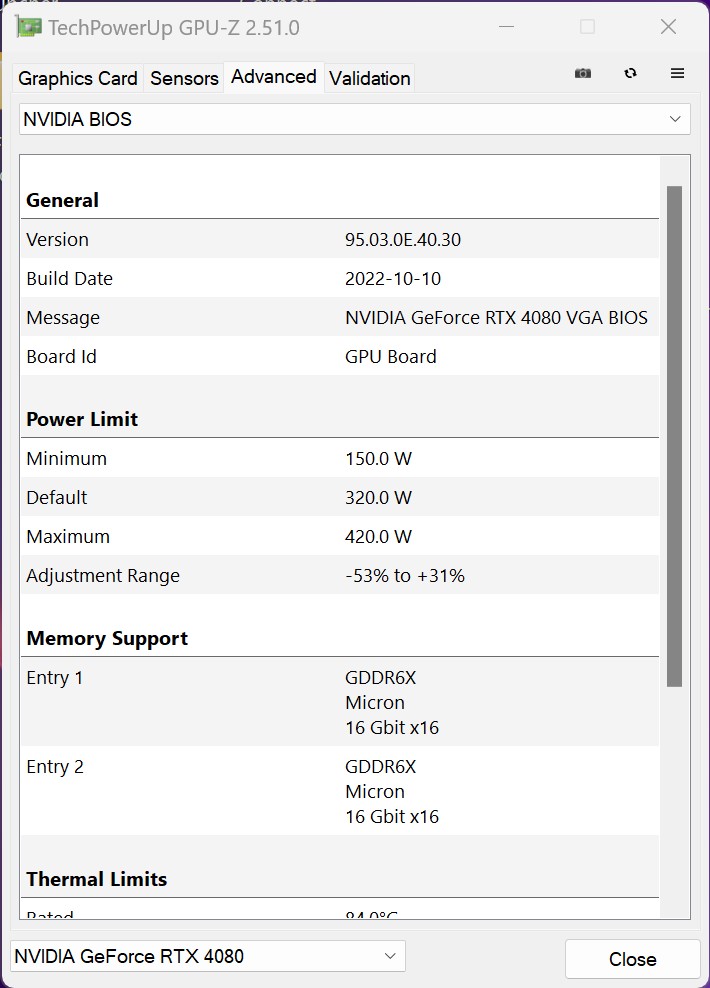
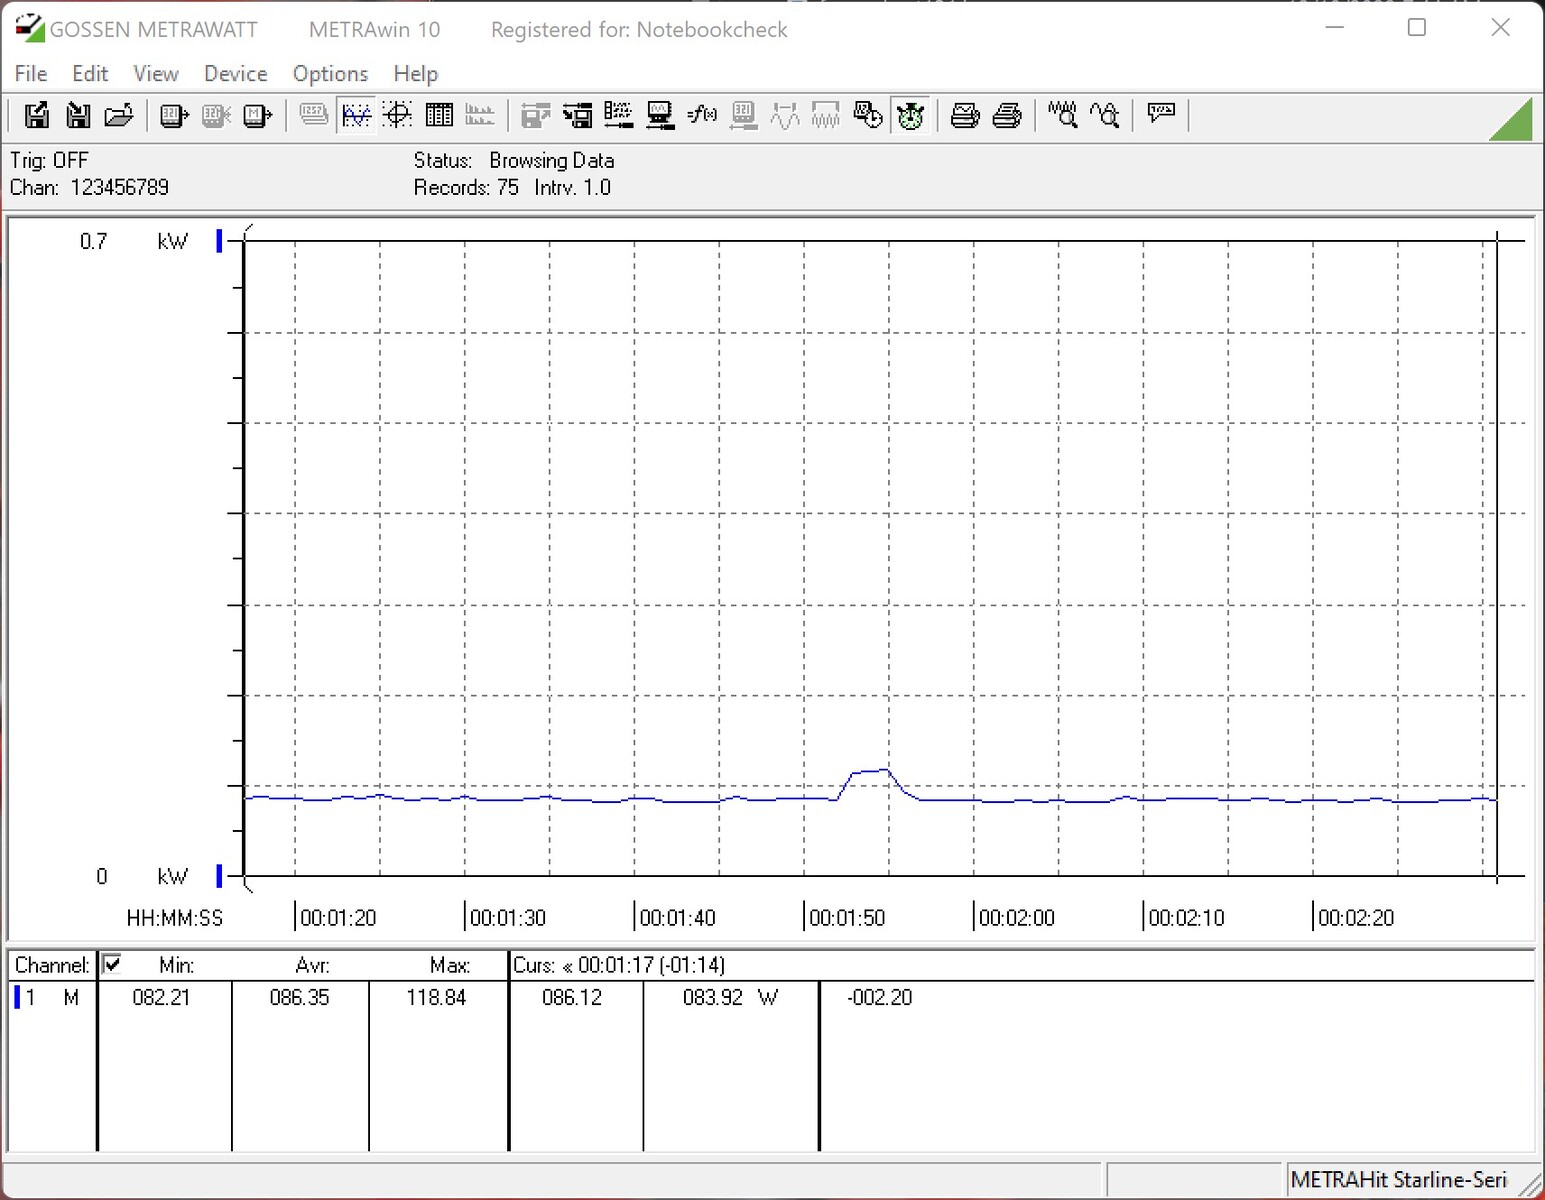
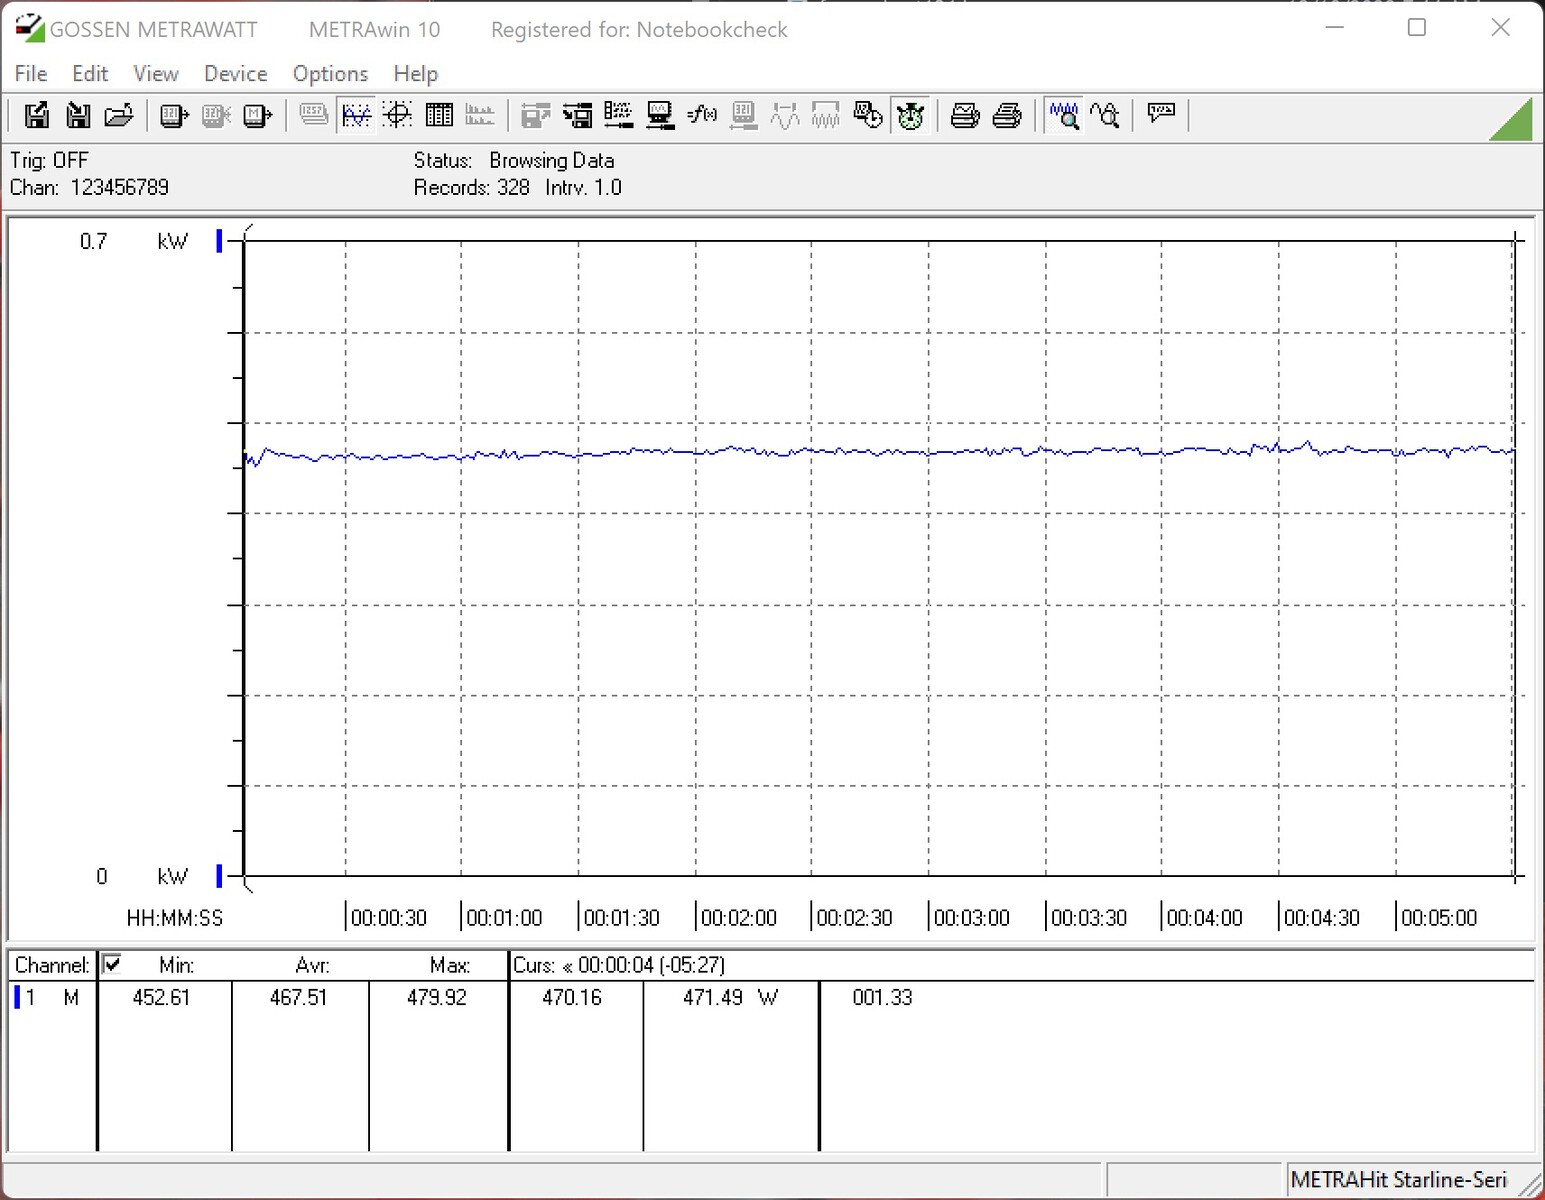
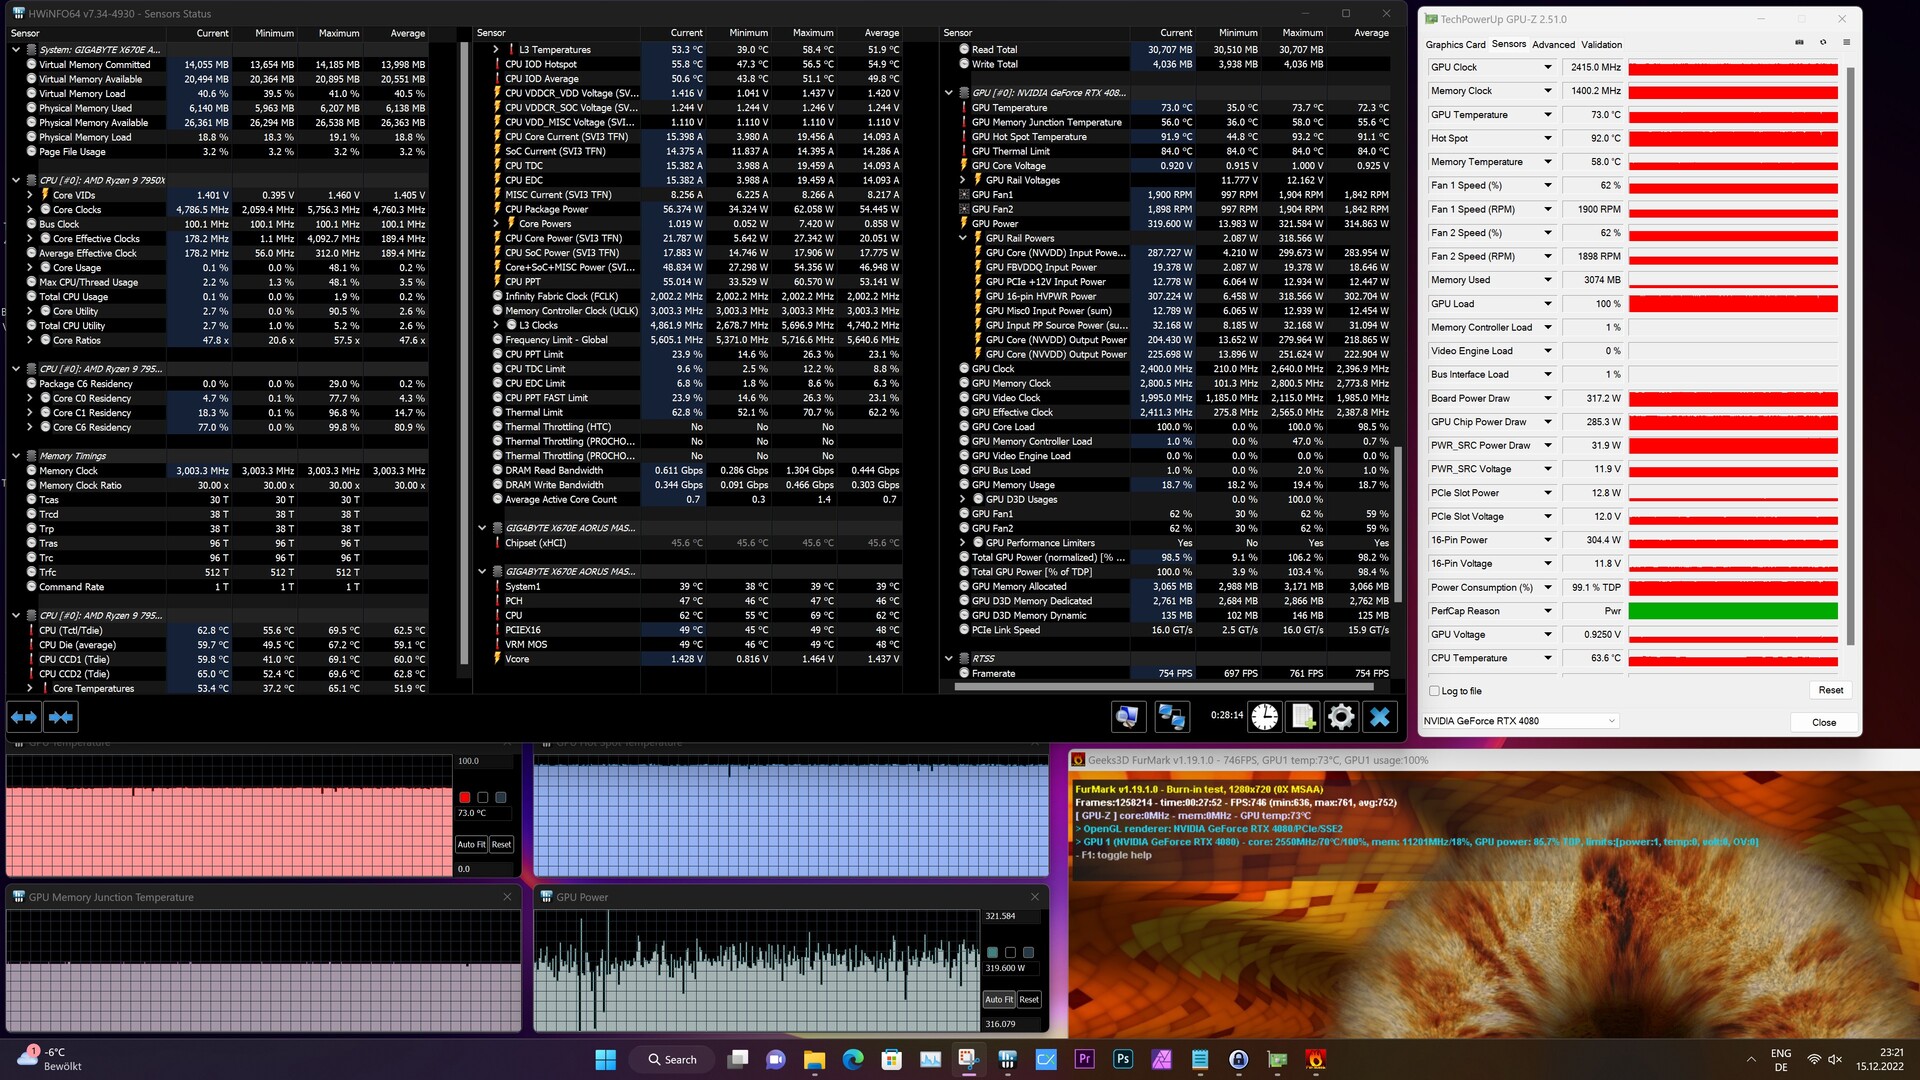
The KFA2 GeForce RTX 4080 SG has a power draw rated at 320 watts – which is on the same level as a Founders Edition card from Nvidia. Even though its power usage has remained unchanged compared with a GeForce RTX 3080, the RTX 4080 outperformed its predecessor considerably in our tests. Power efficiency has been improved by an impressive margin with Ada Lovelace and the 4 nm node. The power target of the KFA2 GeForce RTX 4080 SG can be increased by up to 31 per cent, allowing the graphics card alone to consume as much as 420 watts of power. Using the 12VHPWR connector (included in the box as an adapter with 3x6+2 pin PCIe connectors), the GPU’s power draw is still within permissible limits. In order to avoid problems with power supply, we recommend using three separate cables to connect the card to the PSU.
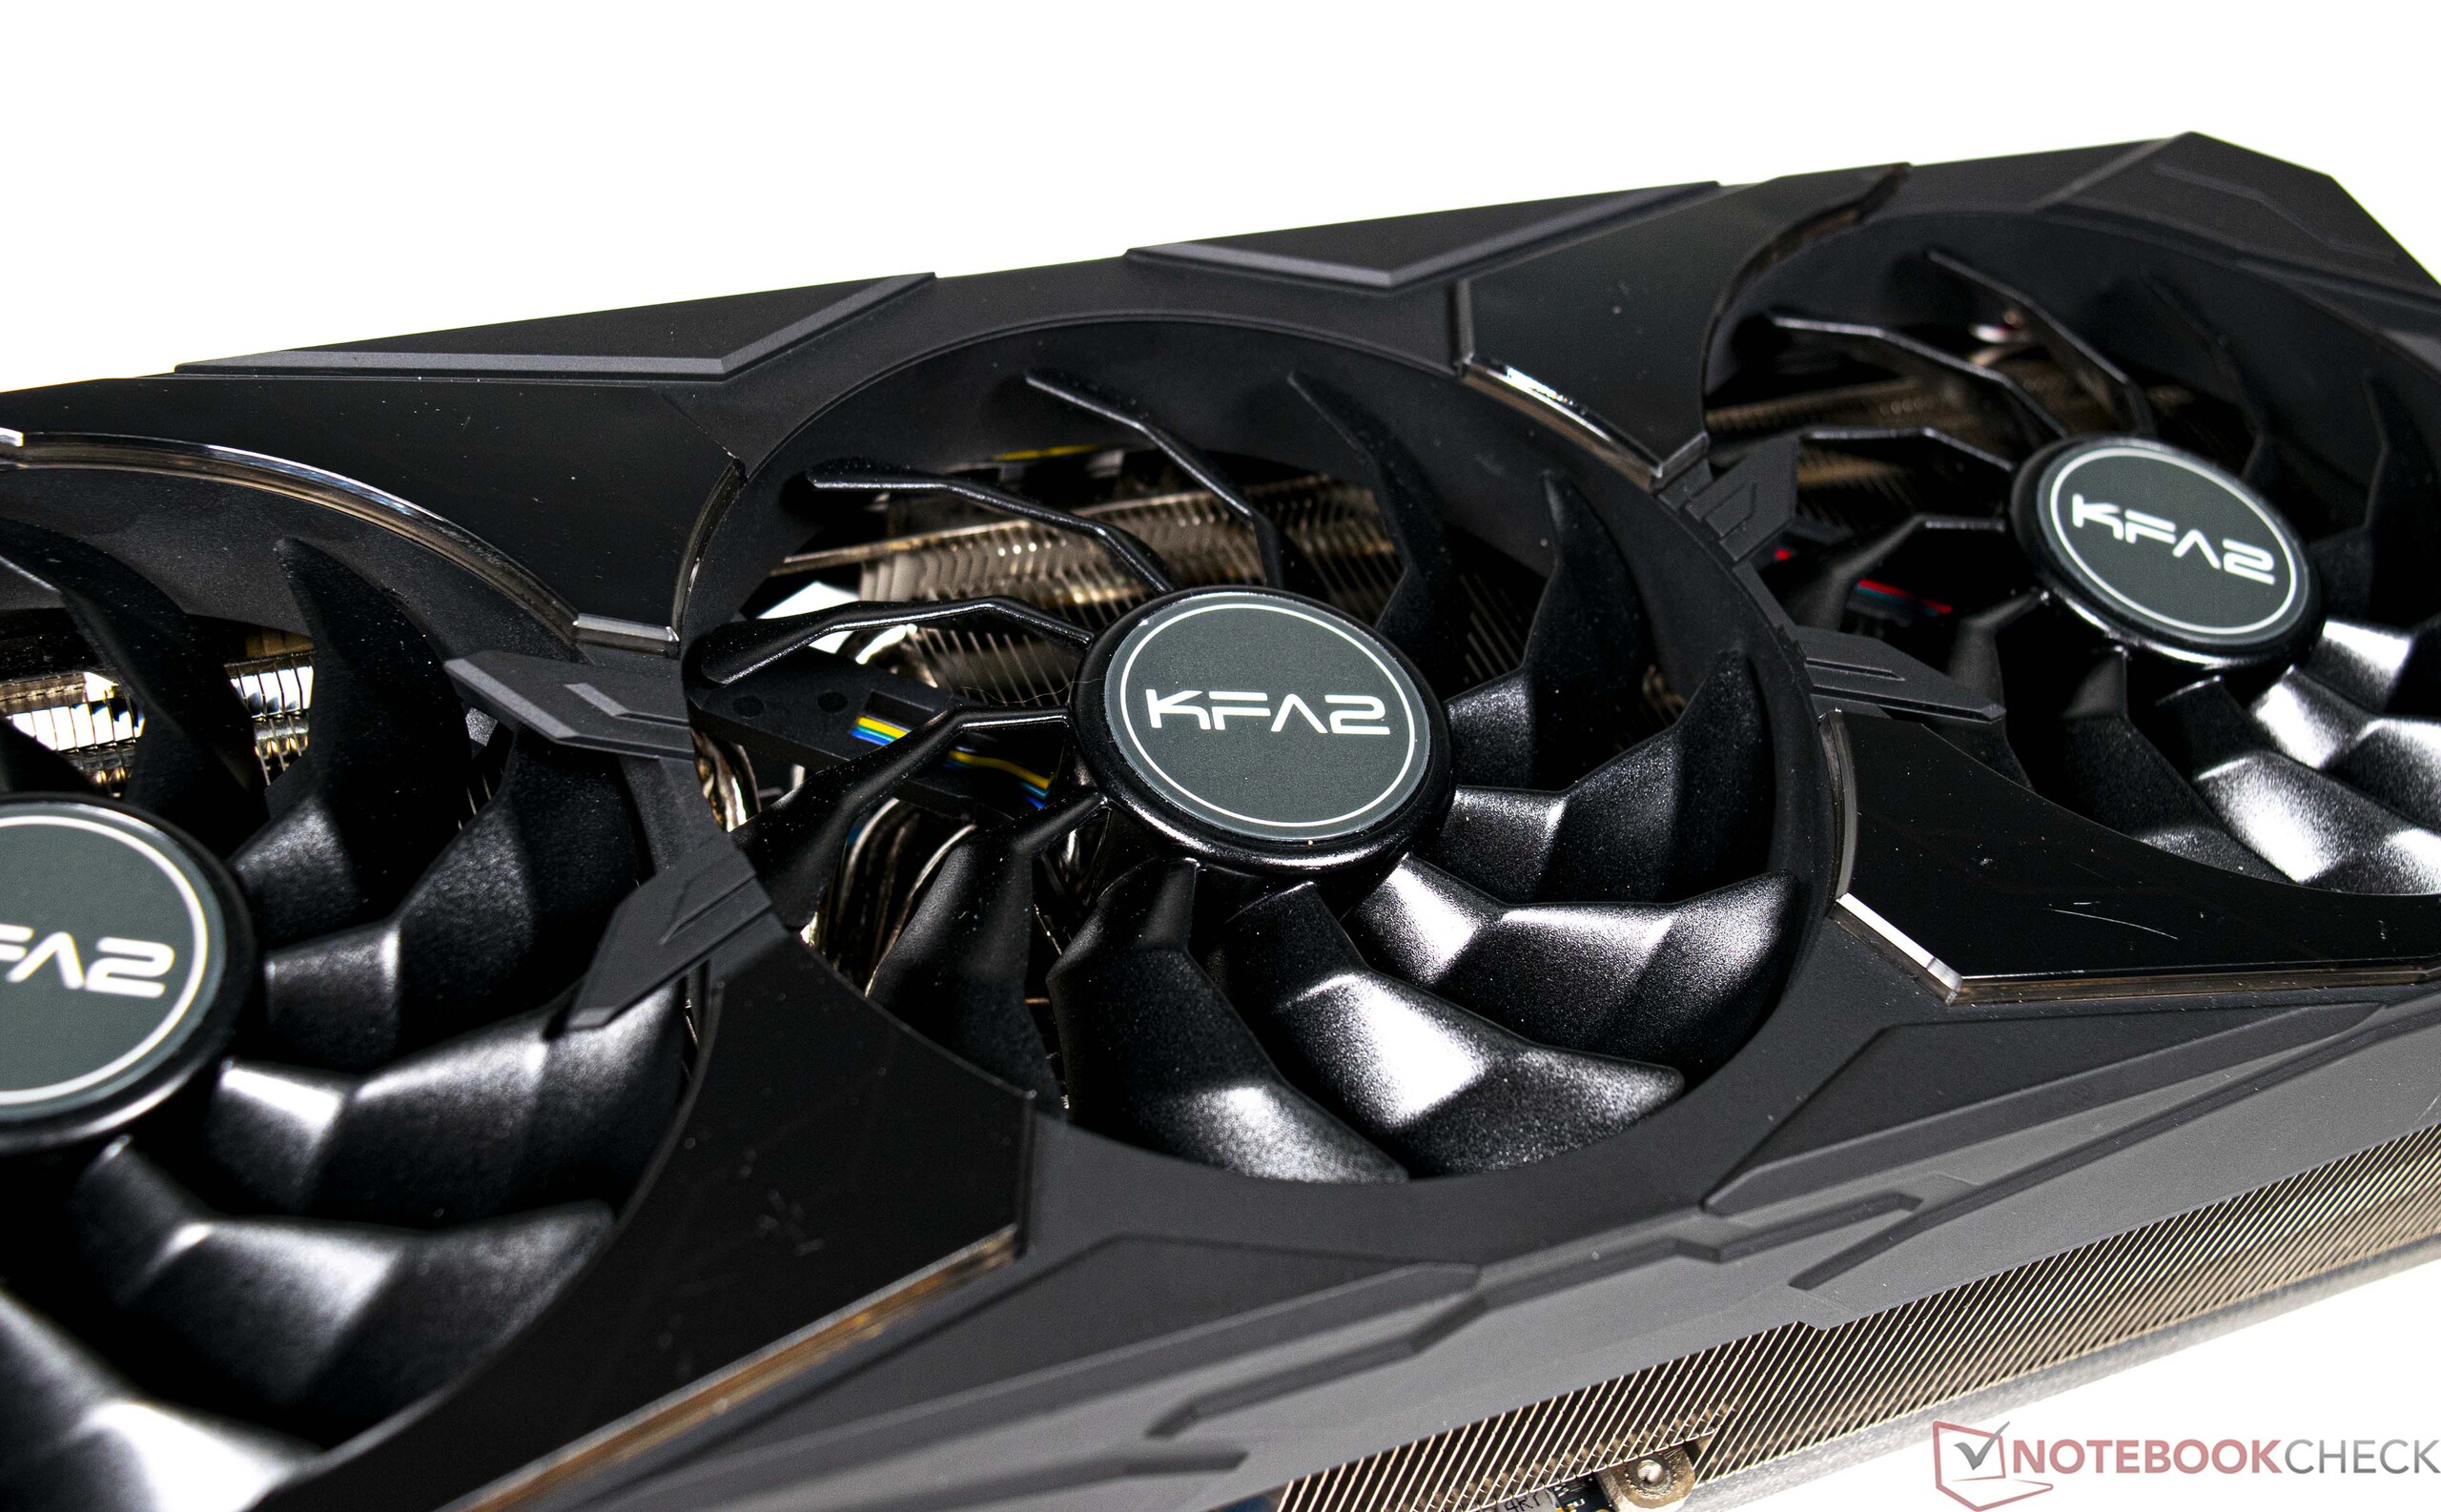
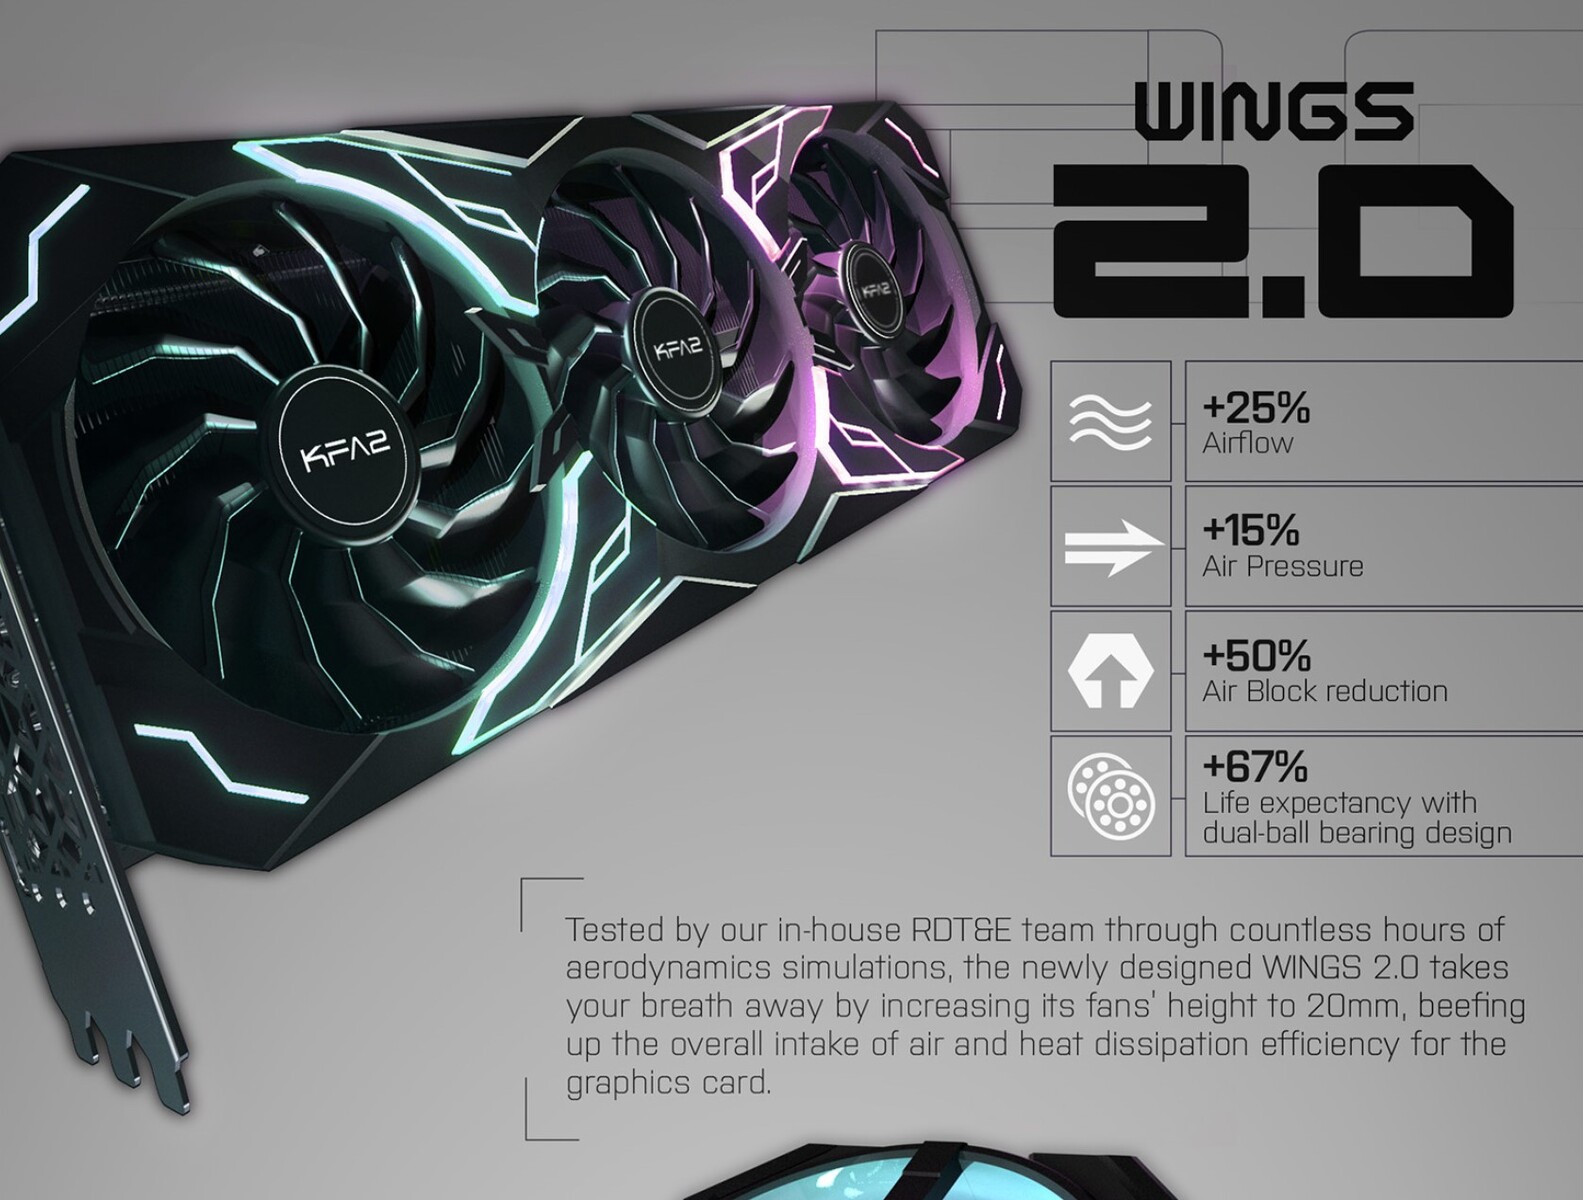
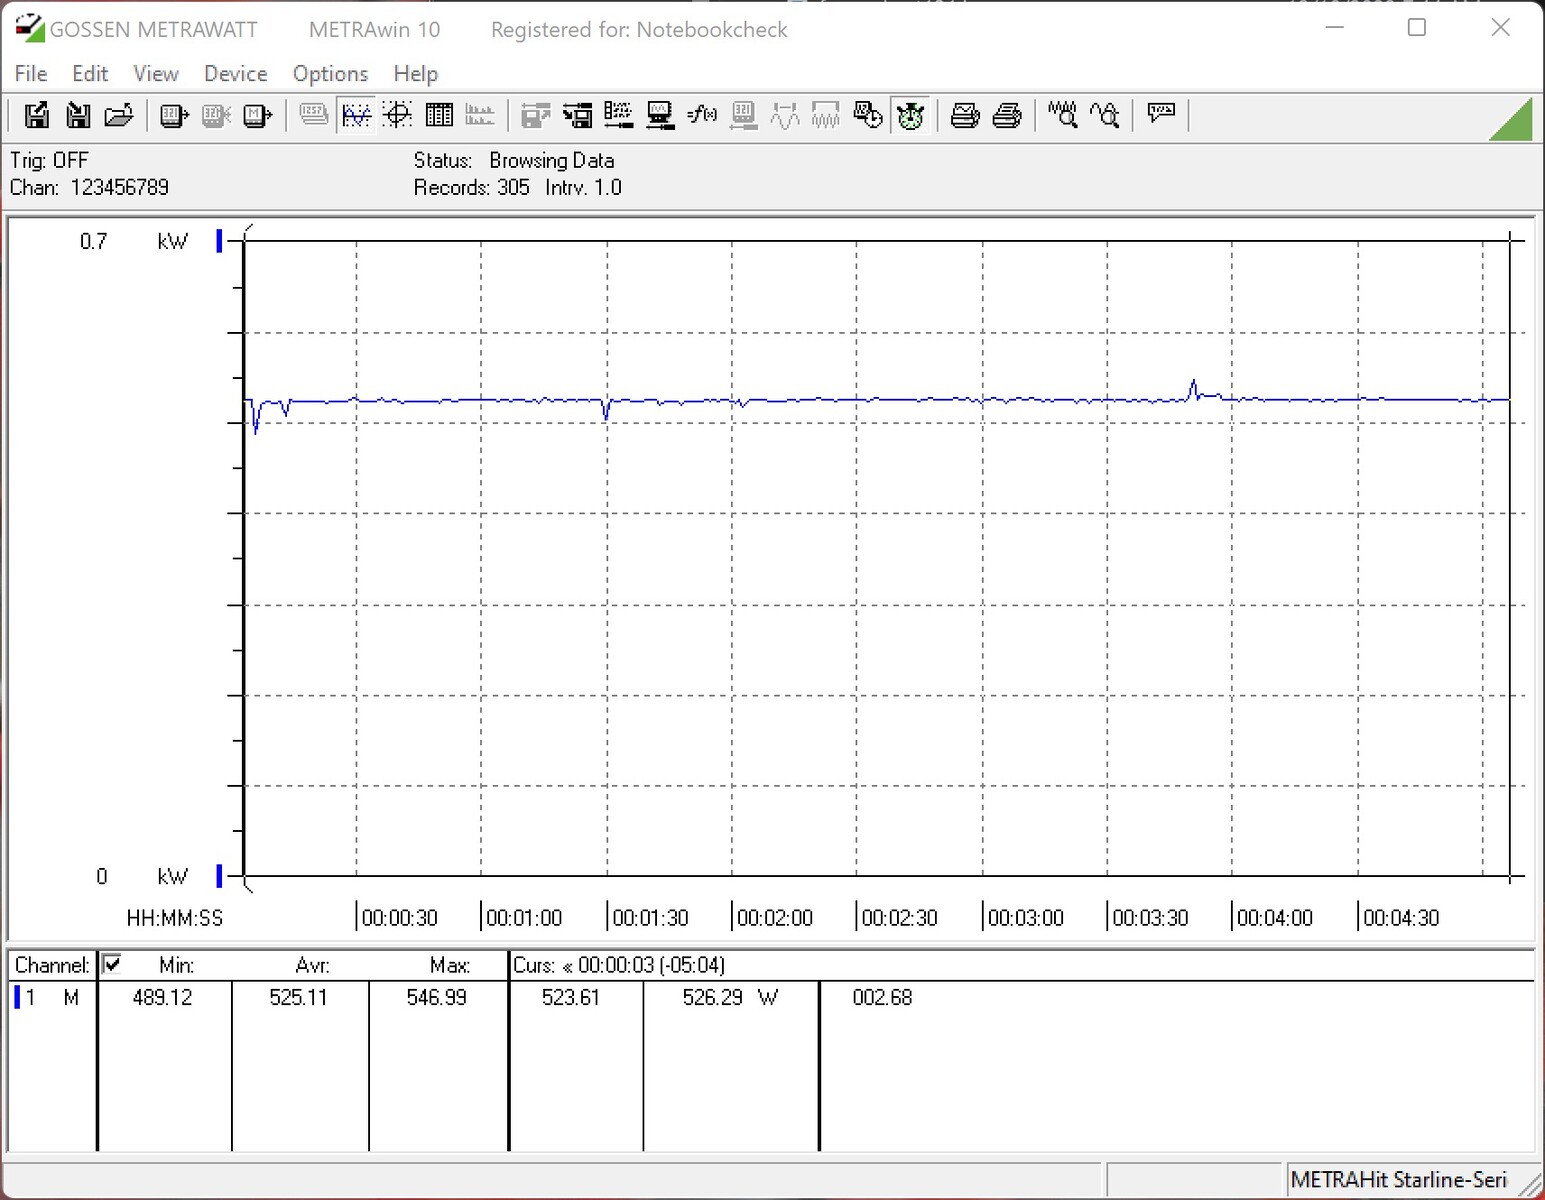
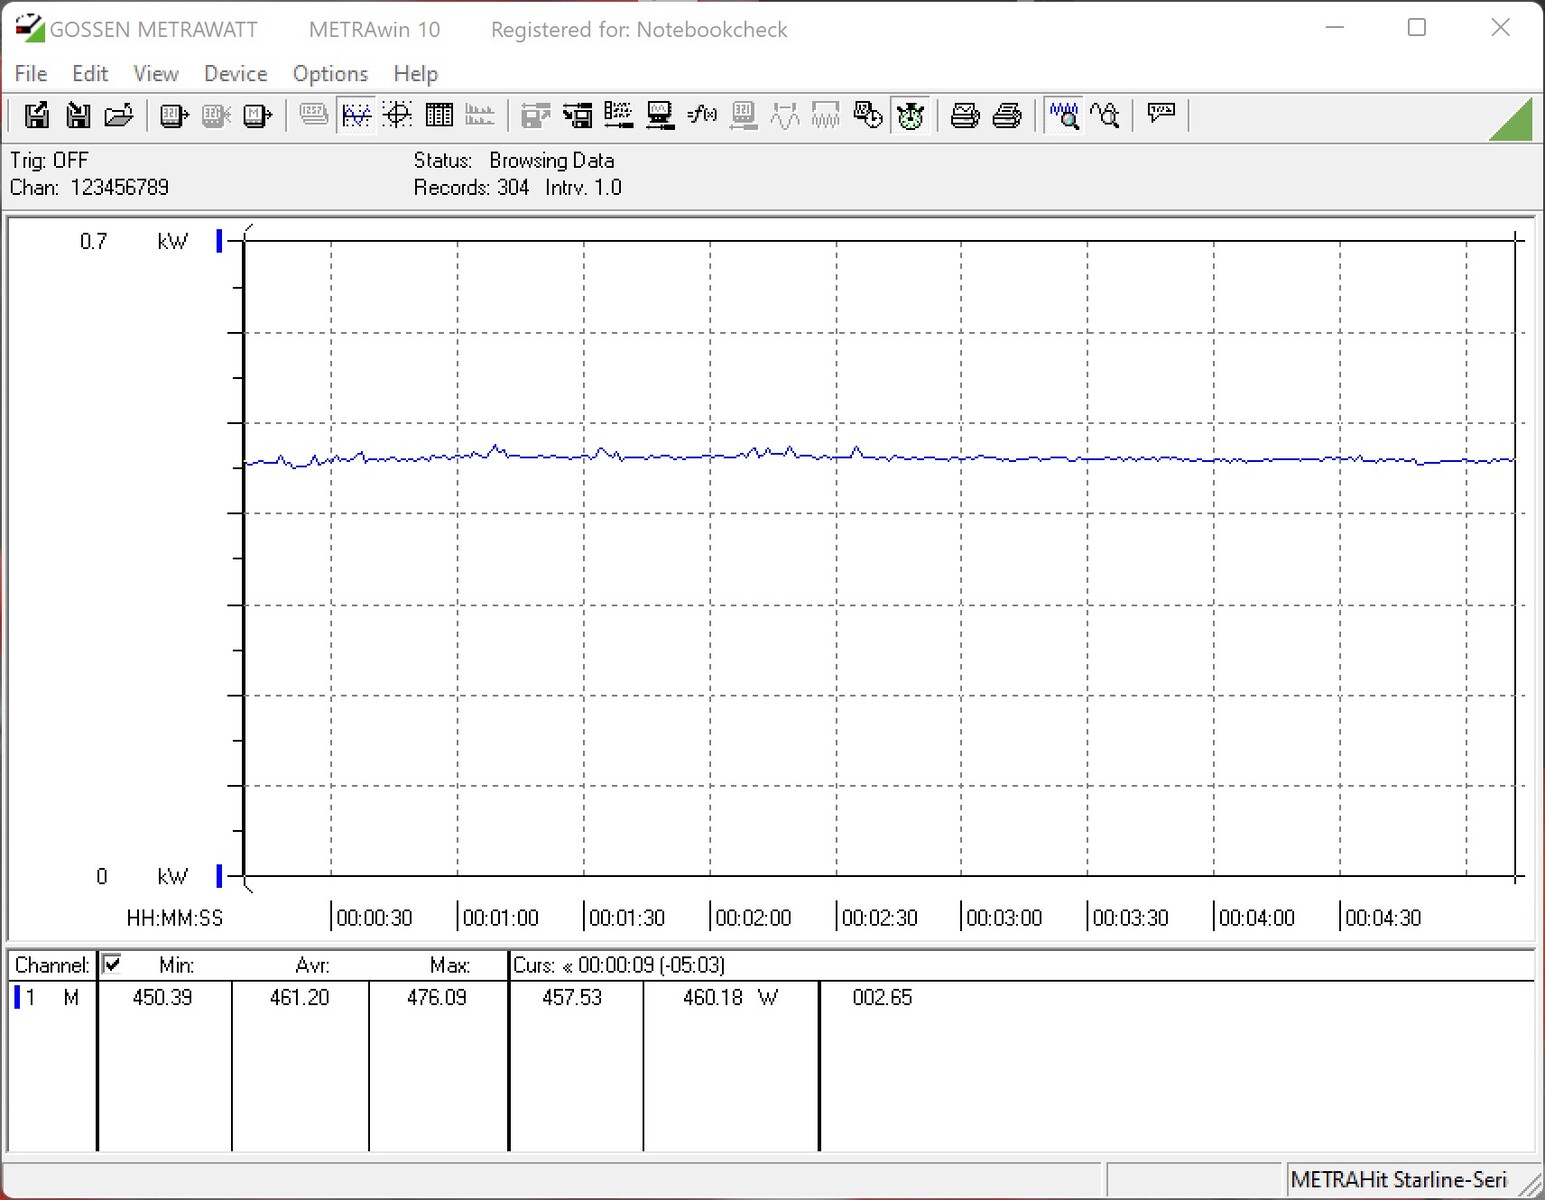
During the stress test, the KFA2 GeForce RTX 4080 SG reached 320 watts effortlessly, and we recorded GPU temperature of around 74°C (165°F). However, GPU hotspot temperature was as high as 93°C (199°F) under load. The VRAM remained astoundingly cool at 58°C (136°F). The KFA2 card relies on one massive heatsink with three 102 mm axial fans to dissipate heat. Optionally, another 102 mm fan can be installed on the back of the card. Unfortunately, we weren’t unable to test it out due to incompatibility with our motherboard. The fans generated a quiet whirring sound that could still be heard with the computer case closed (42 dB(A) of noise based on our measurement). When we increased the power limit, noise levels from the GPU rose to 43 dB(A). During gaming (The Witcher 3, 1080p, Ultra preset), our setup produced a pleasant 36 dB(A) of noise. We also didn’t notice any annoying coil whine.
In terms of power consumption, the KFA2 GeForce RTX 4080 SG leaves a good impression and is neck and neck with the AMD Radeon RX 7900 XT – a card that delivers significantly less performance. The KFA GeForce RTX 3080 SG, which we previously reviewed, required more power under load. Compared with the KFA2 GeForce RTX 4090 SG, the smaller Ada Lovelace graphics card uses 30 per cent less power under load. Nonetheless, it bears mentioning that the RTX 4090 is rated at 450 watts and offers substantially higher performance.
The manufacturer recommends using a 750-watt PSU. This recommendation is based on a system with an AMD Ryzen 9 5900X. But if your system has a Ryzen 9 7000 Series processor or an Intel Raptor Lake processor, you should take into consideration the higher power usage of these CPUs under load. Therefore, we recommend pairing the graphics card with an 850-watt PSU.
Noise level
| Idle |
| 30.9 / 30.9 / 30.9 dB(A) |
| Load |
| 31 / 42.1 dB(A) |
 | ||
30 dB silent 40 dB(A) audible 50 dB(A) loud |
||
min: | ||
| Power Consumption / The Witcher 3 ultra (external Monitor) | |
| MSI Radeon RX 6950 XT Gaming X Trio (Idle: 79.6 W) | |
| Sapphire AMD Radeon RX 6950 XT Nitro+ Pure | |
| AMD Ryzen 7 5800X3D (Idle: 102 W) | |
| KFA2 GeForce RTX 4090 SG | |
| AMD Radeon RX 7900 XTX (Idle: 86.5 W) | |
| NVIDIA GeForce RTX 3090 Founders Edition | |
| ASUS TUF Gaming GeForce RTX 3080 Ti OC (Idle: 78.2 W) | |
| KFA2 GeForce RTX 3080 SG | |
| AMD Radeon RX 6900 XT (Idle: 99.15 W) | |
| KFA2 GeForce RTX 4080 SG (Idle: 86.4 W) | |
| AMD Radeon RX 7900 XT (Idle: 84.6 W) | |
| Power Consumption / FurMark 1.19 GPU Stress Test (external Monitor) | |
| KFA2 GeForce RTX 4090 SG | |
| MSI Radeon RX 6950 XT Gaming X Trio (Idle: 79.6 W) | |
| Sapphire AMD Radeon RX 6950 XT Nitro+ Pure | |
| AMD Radeon RX 7900 XTX (Idle: 86.5 W) | |
| NVIDIA GeForce RTX 3090 Founders Edition | |
| ASUS TUF Gaming GeForce RTX 3080 Ti OC (Idle: 78.2 W) | |
| AMD Radeon RX 7900 XT (Idle: 84.6 W) | |
| KFA2 GeForce RTX 3080 SG | |
| KFA2 GeForce RTX 4080 SG (Idle: 86.4 W) | |
| AMD Radeon RX 6900 XT (Idle: 99.15 W) | |
* ... smaller is better
Power consumption with external monitor
Pros
Cons
Verdict - Great performance and lots of RGB

The KFA2 GeForce RTX 4080 SG is in every way an extremely fast graphics card and is suitable for running demanding games without compromise. Compared with the GeForce RTX 3080, the card is able to deliver substantially more performance at the same power consumption. The advantages of the new GPU generation is particularly apparent when ray tracing is enabled. Together with DLSS 3.0 (including Frame Generation), even new games can run smoothly at 2160p with ray tracing effects turned on. Unfortunately, though, you’ll need either a GeForce RTX 4080 or RTX 4090 to reach this level of performance. Users of older Nvidia GPUs are left out of the action.
The KFA2 model in this review features a specially developed design and a massive cooler that performed stupendously well during our review. It is even able too cool the card silently in 2D applications thanks to its fan stop mode. The GPU requires a lot of power and is rated at 320 watts, but this power usage still falls within a reasonable range. In our opinion, constantly increasing power consumption is not the right way forward.
The KFA2 GeForce RTX 4080 SG is a great graphics card and utterly impressed us with its high gaming performance. The wide array of RGB lighting draws attention to the massive cooler.
The graphics card is powered via a 12VHPWR connector. Opinions may be divided about this connector, but we still haven’t encountered any problems with it yet. The only issue is that we think the 12VHPWR connector is placed in a less-than-optimal spot. Due to how much the graphics card sticks out above the PCIe slot, enough space must be allocated to the large adapter cable so it doesn’t get kinked right beside the GPU. This could cause space issues in many computer cases.
The KFA2 GeForce RTX 4080 SG is competing with AMD's latest Radeon RX 7900 graphics cards when we are talking about pure gaming performance without ray tracing. Our review unit often falls exactly between the performance of a Radeon RX 7900 XTX and Radeon RX 7900 XT. But as always, it depends on whether a specific game performs better on AMD or Nvidia cards. When ray tracing features are turned on, the KFA2 GeForce RTX 4080 SG clearly outperforms the Radeon RX 7900 XTX. This means you’ll have to settle for an Nvidia card if you don’t want to forego these features.
The KFA2 GeForce RTX 4080 SG is currently going for €1,379 (US$1,473), making the model actually much less expensive than a GeForce RTX 3090 Ti (approx. €1,600, or US$1,068), which offers worse performance. AMD’s Radeon RX 7900 XTX costs around €1,350 (US$1,442), but the slightly slower model (Radeon RX 7900 XT) will set you back €1,020 (US$1,090). With some luck, you might be able to grab the top-end model on AMD Shop for €1,120 (US$1,196). Right now, we are very critical of these prices because many users are unwilling to cough up such amounts of money for a graphics card.

