Notebookcheck Logo

AMD Radeon RX 6900 XT Review: Near-RTX 3090 performance for US$500 less but only marginally better than RX 6800 XT

Radeon has re-entered the chat. The Radeon RX 6900 XT signals AMD's re-entry into the flagship GPU space since the R9 Fury X's outing in 2015. The RX 6900 XT offers excellent raster performance that puts it firmly within reach of the NVIDIA GeForce RTX 3090 despite some inadequacies in ray tracing and lack of AI-based super sampling. We take the AMD Radeon RX 6900 XT for a test drive and see how well Team Red has progressed with RDNA 2 so far.

AMD has been going strong against Intel in the CPU space with Ryzen, but the Radeon unit has lagged significantly behind the competition so far. The last time we saw an AMD flagship graphics card being mentioned in the same breath as that of NVIDIA's was the Fiji-based Radeon R9 Fury X that competed with the NVIDIA Maxwell GeForce 980 Ti back in 2015.

For a long time, NVIDIA's flagship Turing parts remained unchallenged. AMD's Vega 56, Vega 64, and the Radeon VII did little to give NVIDIA sleepless nights. It was only in July 2019 that AMD tasted moderate success with the Navi 10-based Radeon RX 5700 XT, but that was at best comparable to the GeForce RTX 2070 Super.

All that is history now. Last October, AMD officially unveiled the Radeon RX 6000 series cards, comprised of the RX 6800, RX 6800 XT, the RX 6900 XT and more recently, the RX 6700 XT, with the promise of taking on NVIDIA's high-end Ampere offerings such as the RTX 3070, RTX 3080, and RTX 3090 for 1440p and 4K gaming.

The RX 6900 XT is being pegged as an RTX 3090 competitor, at least in terms of pure raster performance (with caveats, of course). NVIDIA cards currently have the upper hand when it comes to features such as ray tracing and AI-based super sampling. However, the RX 6900 XT has a few tricks up its sleeve too.

In this review, we put the top dog Navi 21 XTX card through its paces and see whether it has the guts to take on NVIDIA's Ampere Goliath.

Comparison of the Radeon RX 6900 XT with other AMD GPUs

Specifications Radeon RX 6900 XT Radeon RX 6800 XT Radeon RX 6800 Radeon RX 6700 XT Radeon RX 5700 XT Radeon RX 5700 Radeon VII
GPU Navi 21 XTX Navi 21 XT Navi 21 XL Navi 22 Navi 10 XT Navi 10 XL Vega 20 XT
Manufacturing Process 7 nm 7 nm 7 nm 7 nm 7 nm 7 nm 7 nm
Compute Units 80 72 60 40 40 36 60
Shading Units 5,120 4,608 3,840 2,560 2,560 2,304 3,840
Texture Mapping Units 320 288 240 160 160 144 240
Ray Accelerators 80 72 60 40 -- -- --
Base Clock 1,825 MHz 1,825 MHz 1,700 MHz 2,321 MHz 1,605 MHz 1,465 MHz 1,400 MHz
Game Clock 2,015 MHz 2,015 MHz 1,815 MHz 2,424 MHz 1,755 MHz 1,625 MHz 1,750 MHz
Boost Clock 2,250 MHz 2,250 MHz 2,105 MHz 2,581 MHz 1,905 MHz 1,725 MHz 1,802 MHz
Infinity Cache 128 MB 128 MB 128 MB 96 MB -- -- --
Memory Bus Width 256-bit 256-bit 256-bit 192-bit 256-bit 256-bit 4096-bit
Memory Bandwidth 512 GB/s 512 GB/s 512 GB/s 384 GB/s 448 GB/s 448 GB/s 1,024 GB/s
Memory Size 16 GB GDDR6 16 GB GDDR6 16 GB GDDR6 12 GB GDDR6 8 GB GDDR6 8 GB GDDR6 16 GB HBM2
TBP 300 W 300 W 250 W 230 W 225 W 180 W 295 W

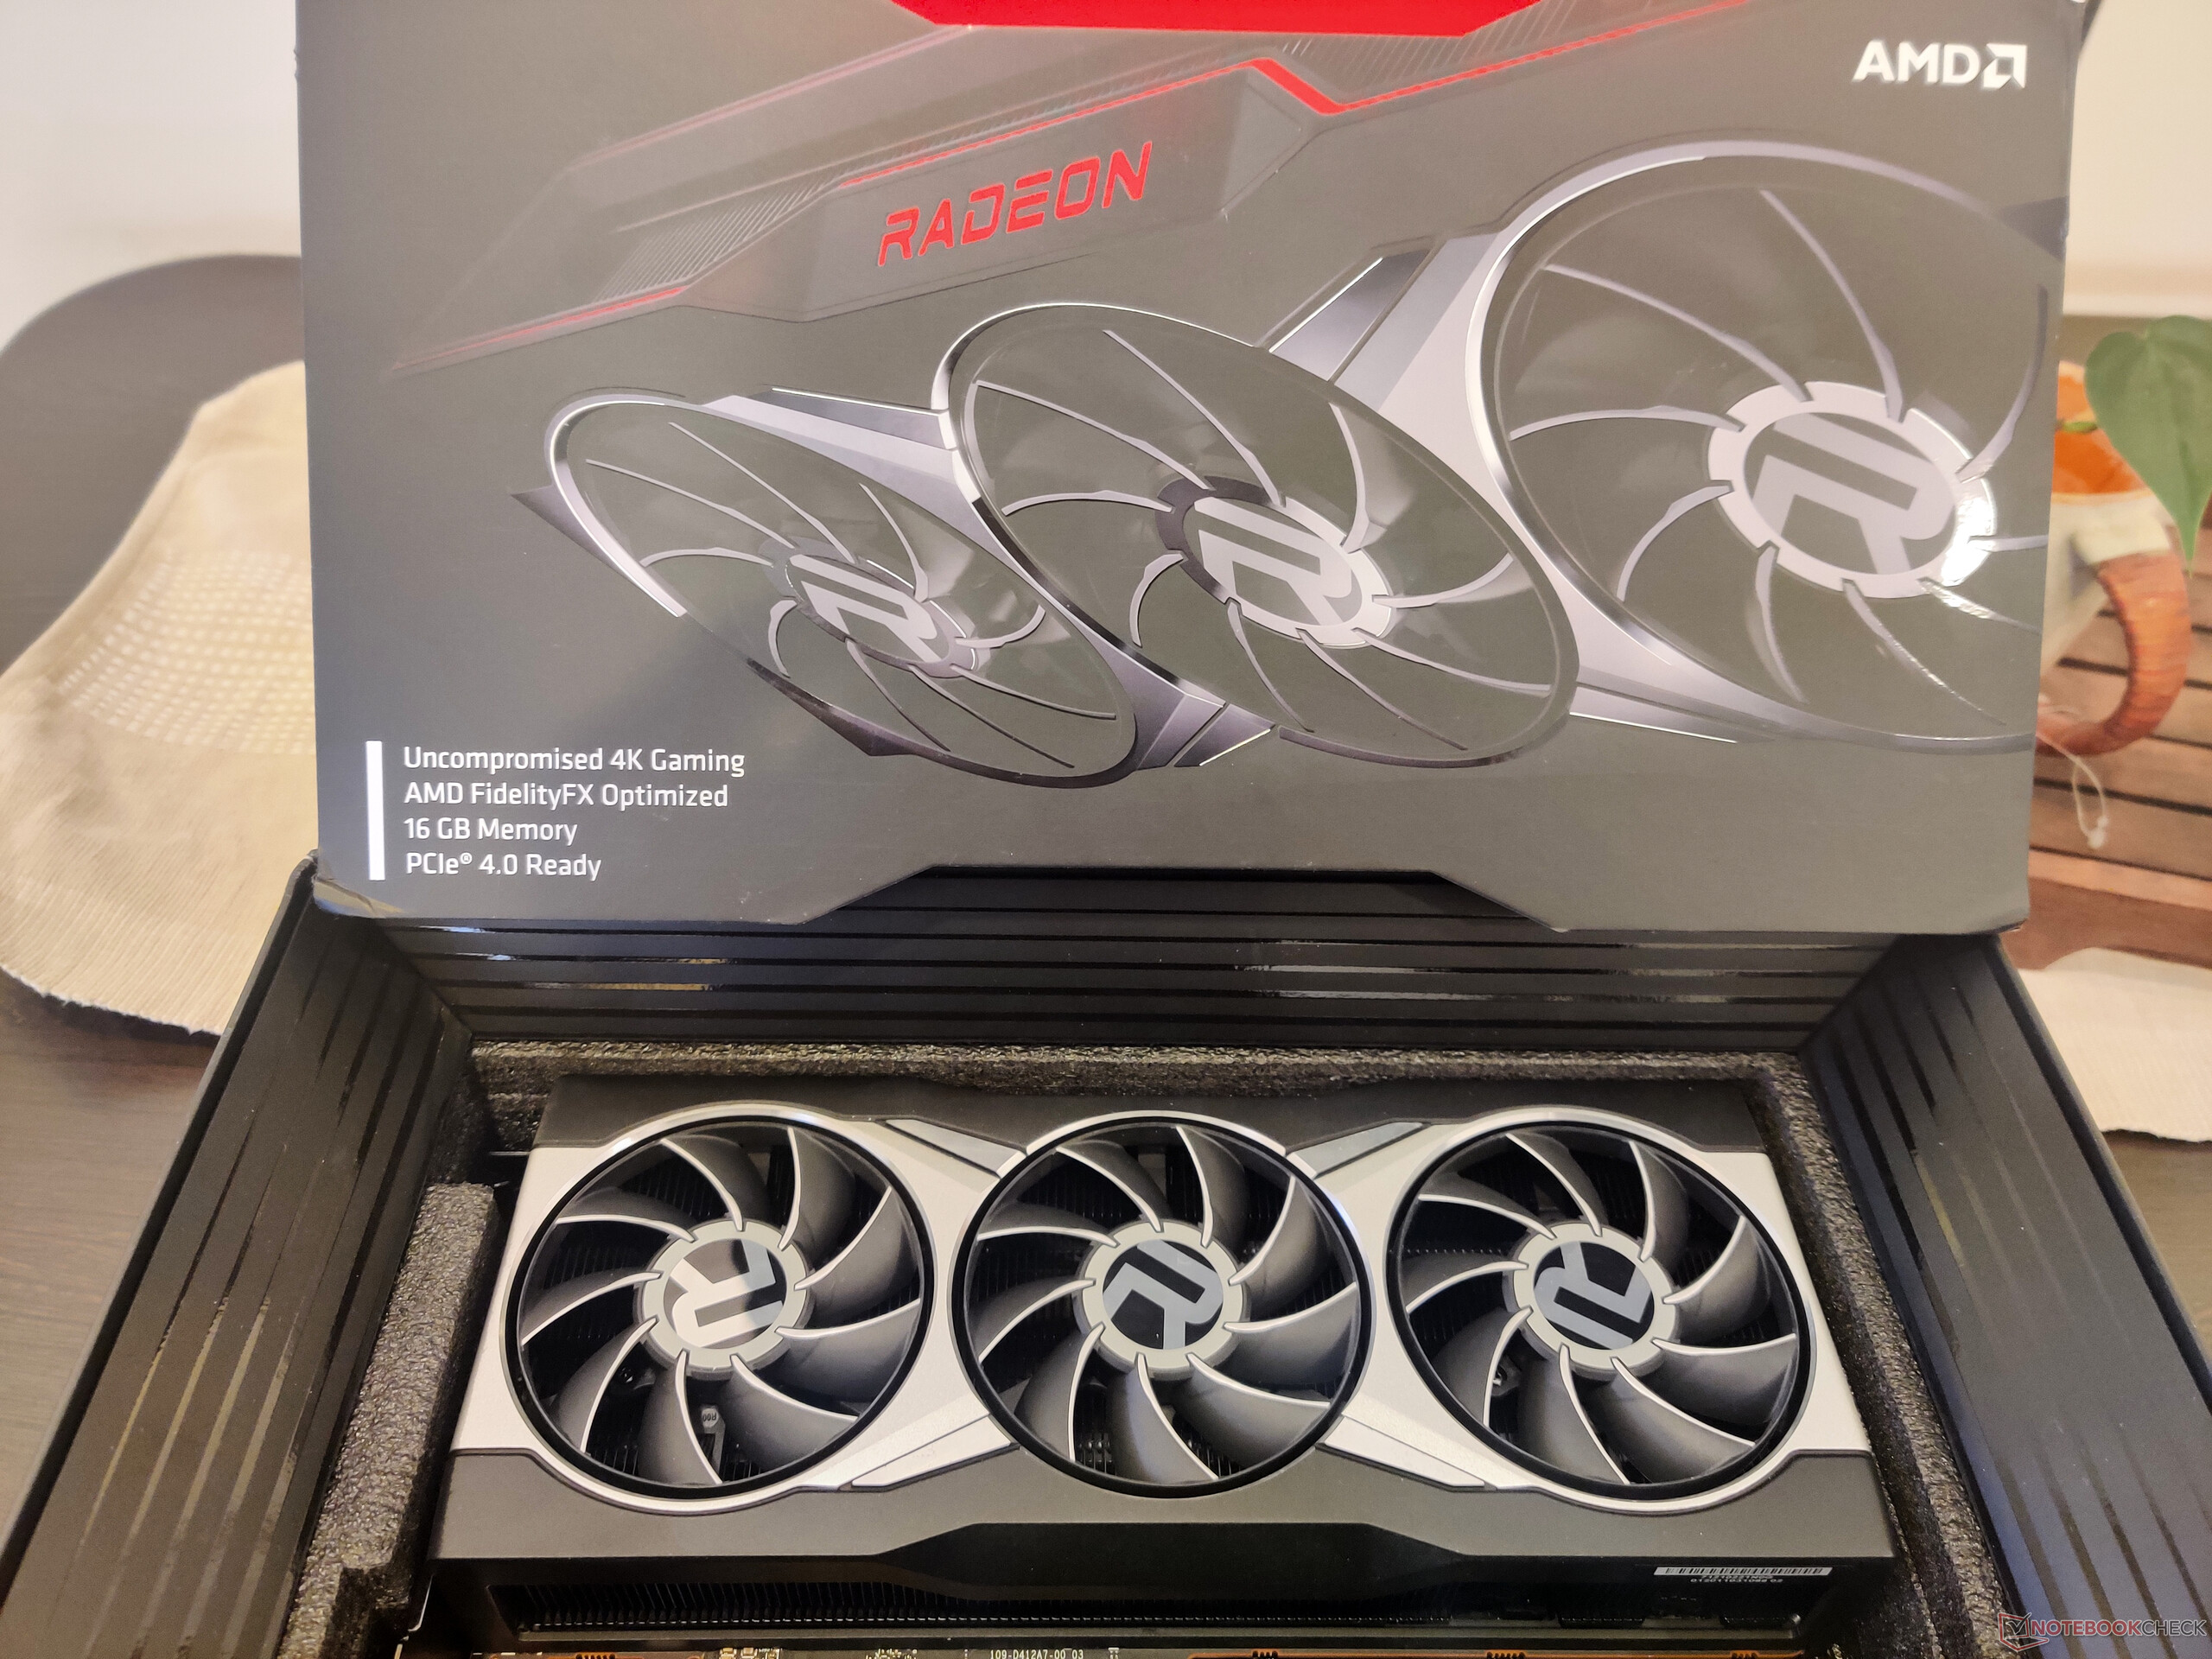
A tour of the AMD Radeon RX 6900 XT

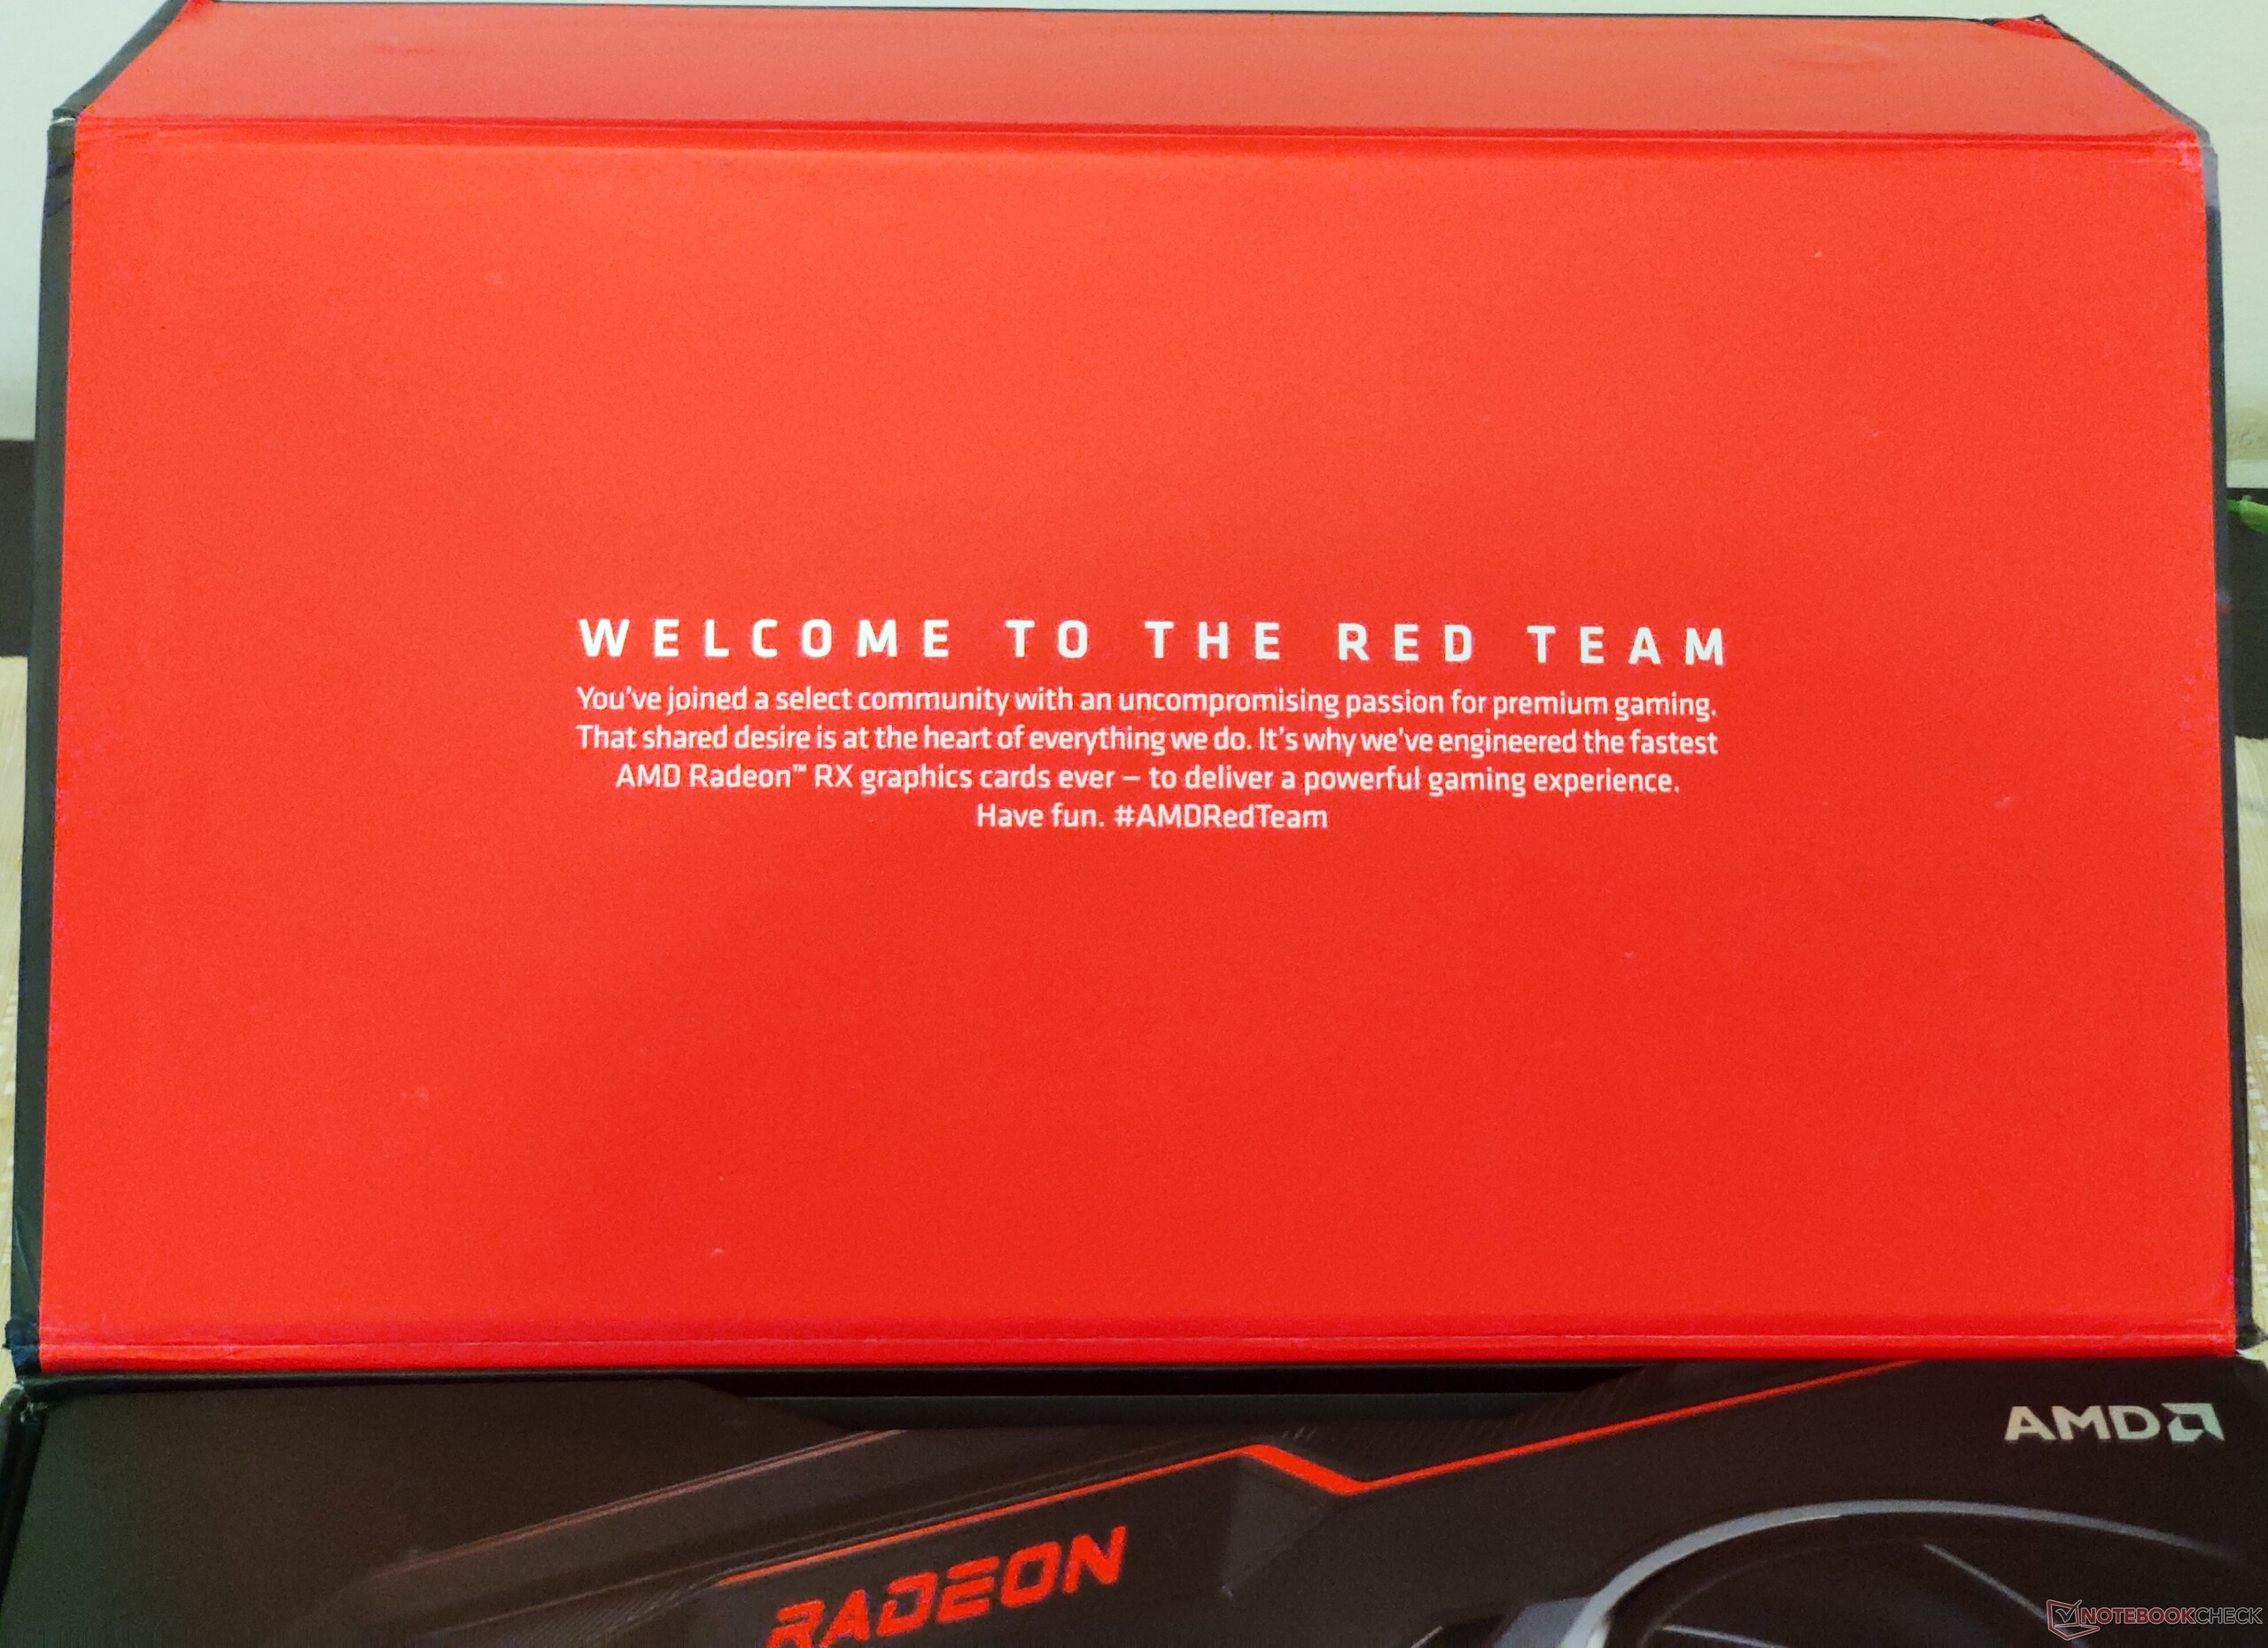
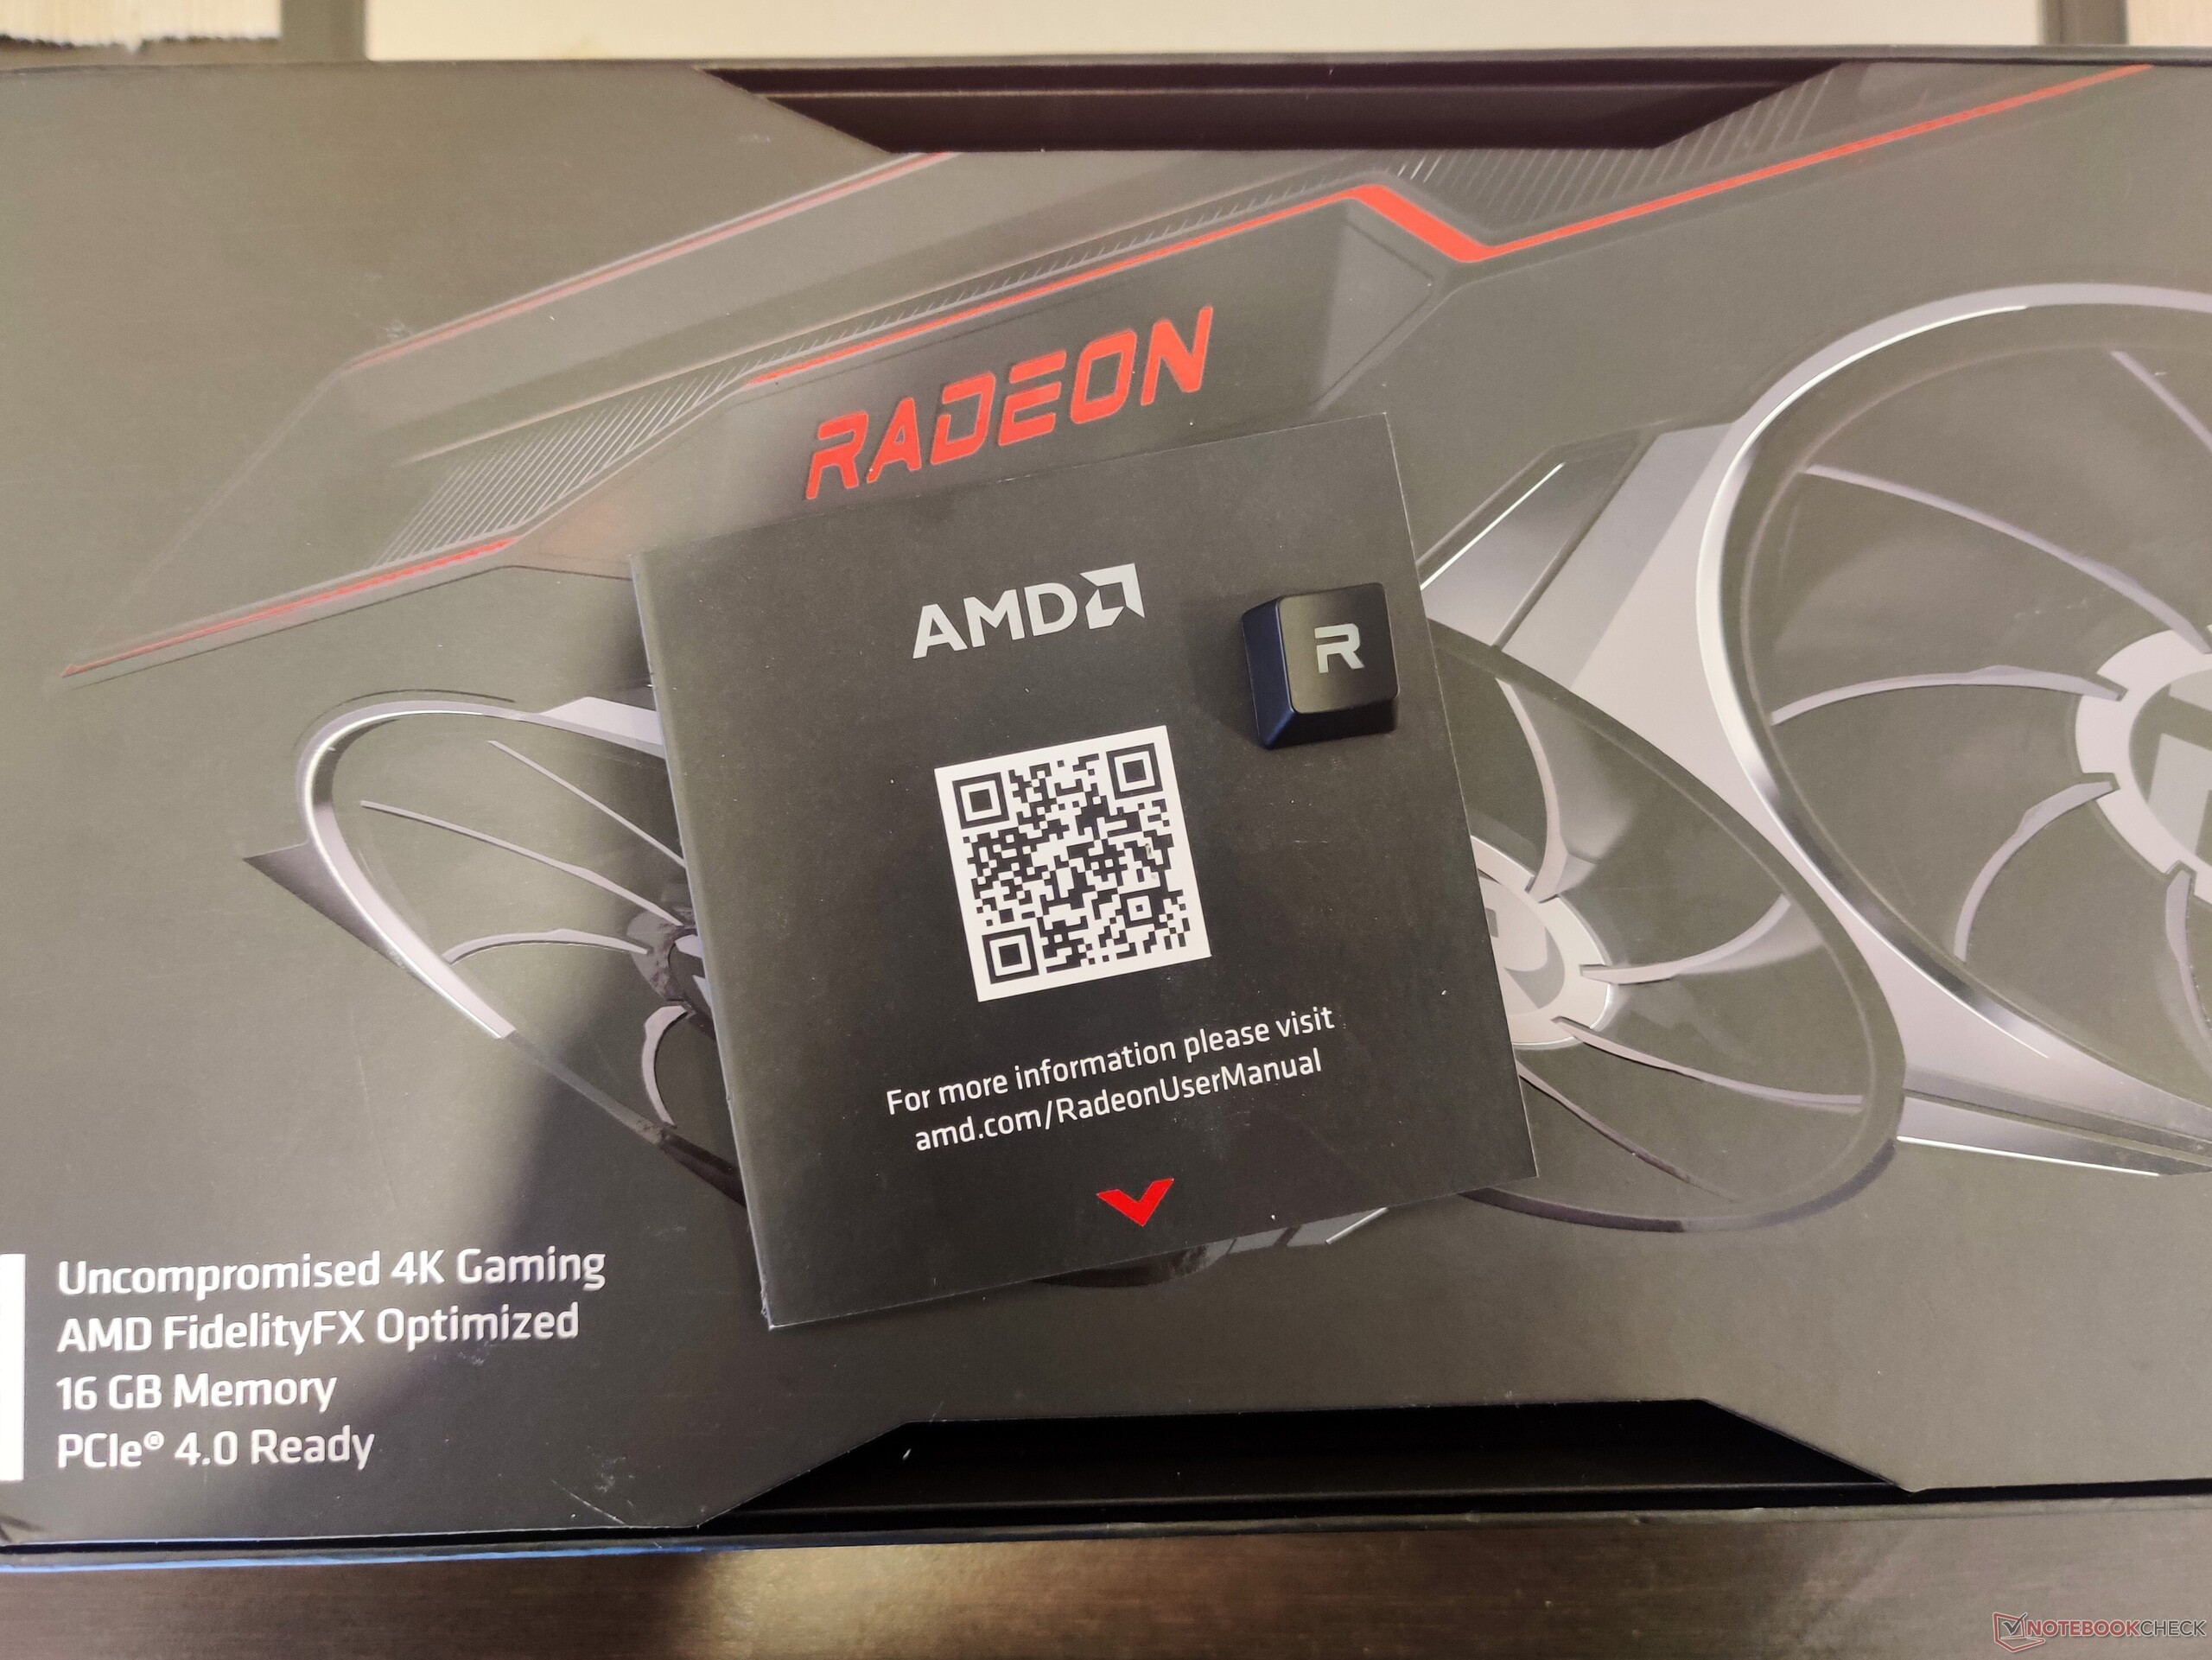
Upon opening the box, we were greeted by a "Welcome to the Red Team" message. The packaging includes a Radeon cardboard in which a quick start guide and an "R" keyboard key are enclosed. The "R" key is fashioned in typical Radeon font and allows RGB light to pass through. Unfortunately, our package didn't come with an AMD-branded mouse pad included, which should, however, be there in the retail box. 

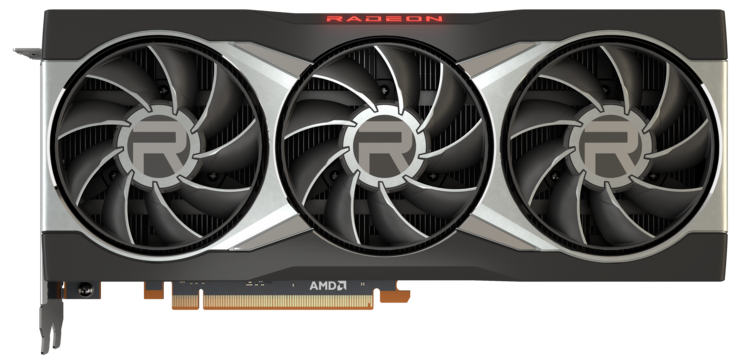
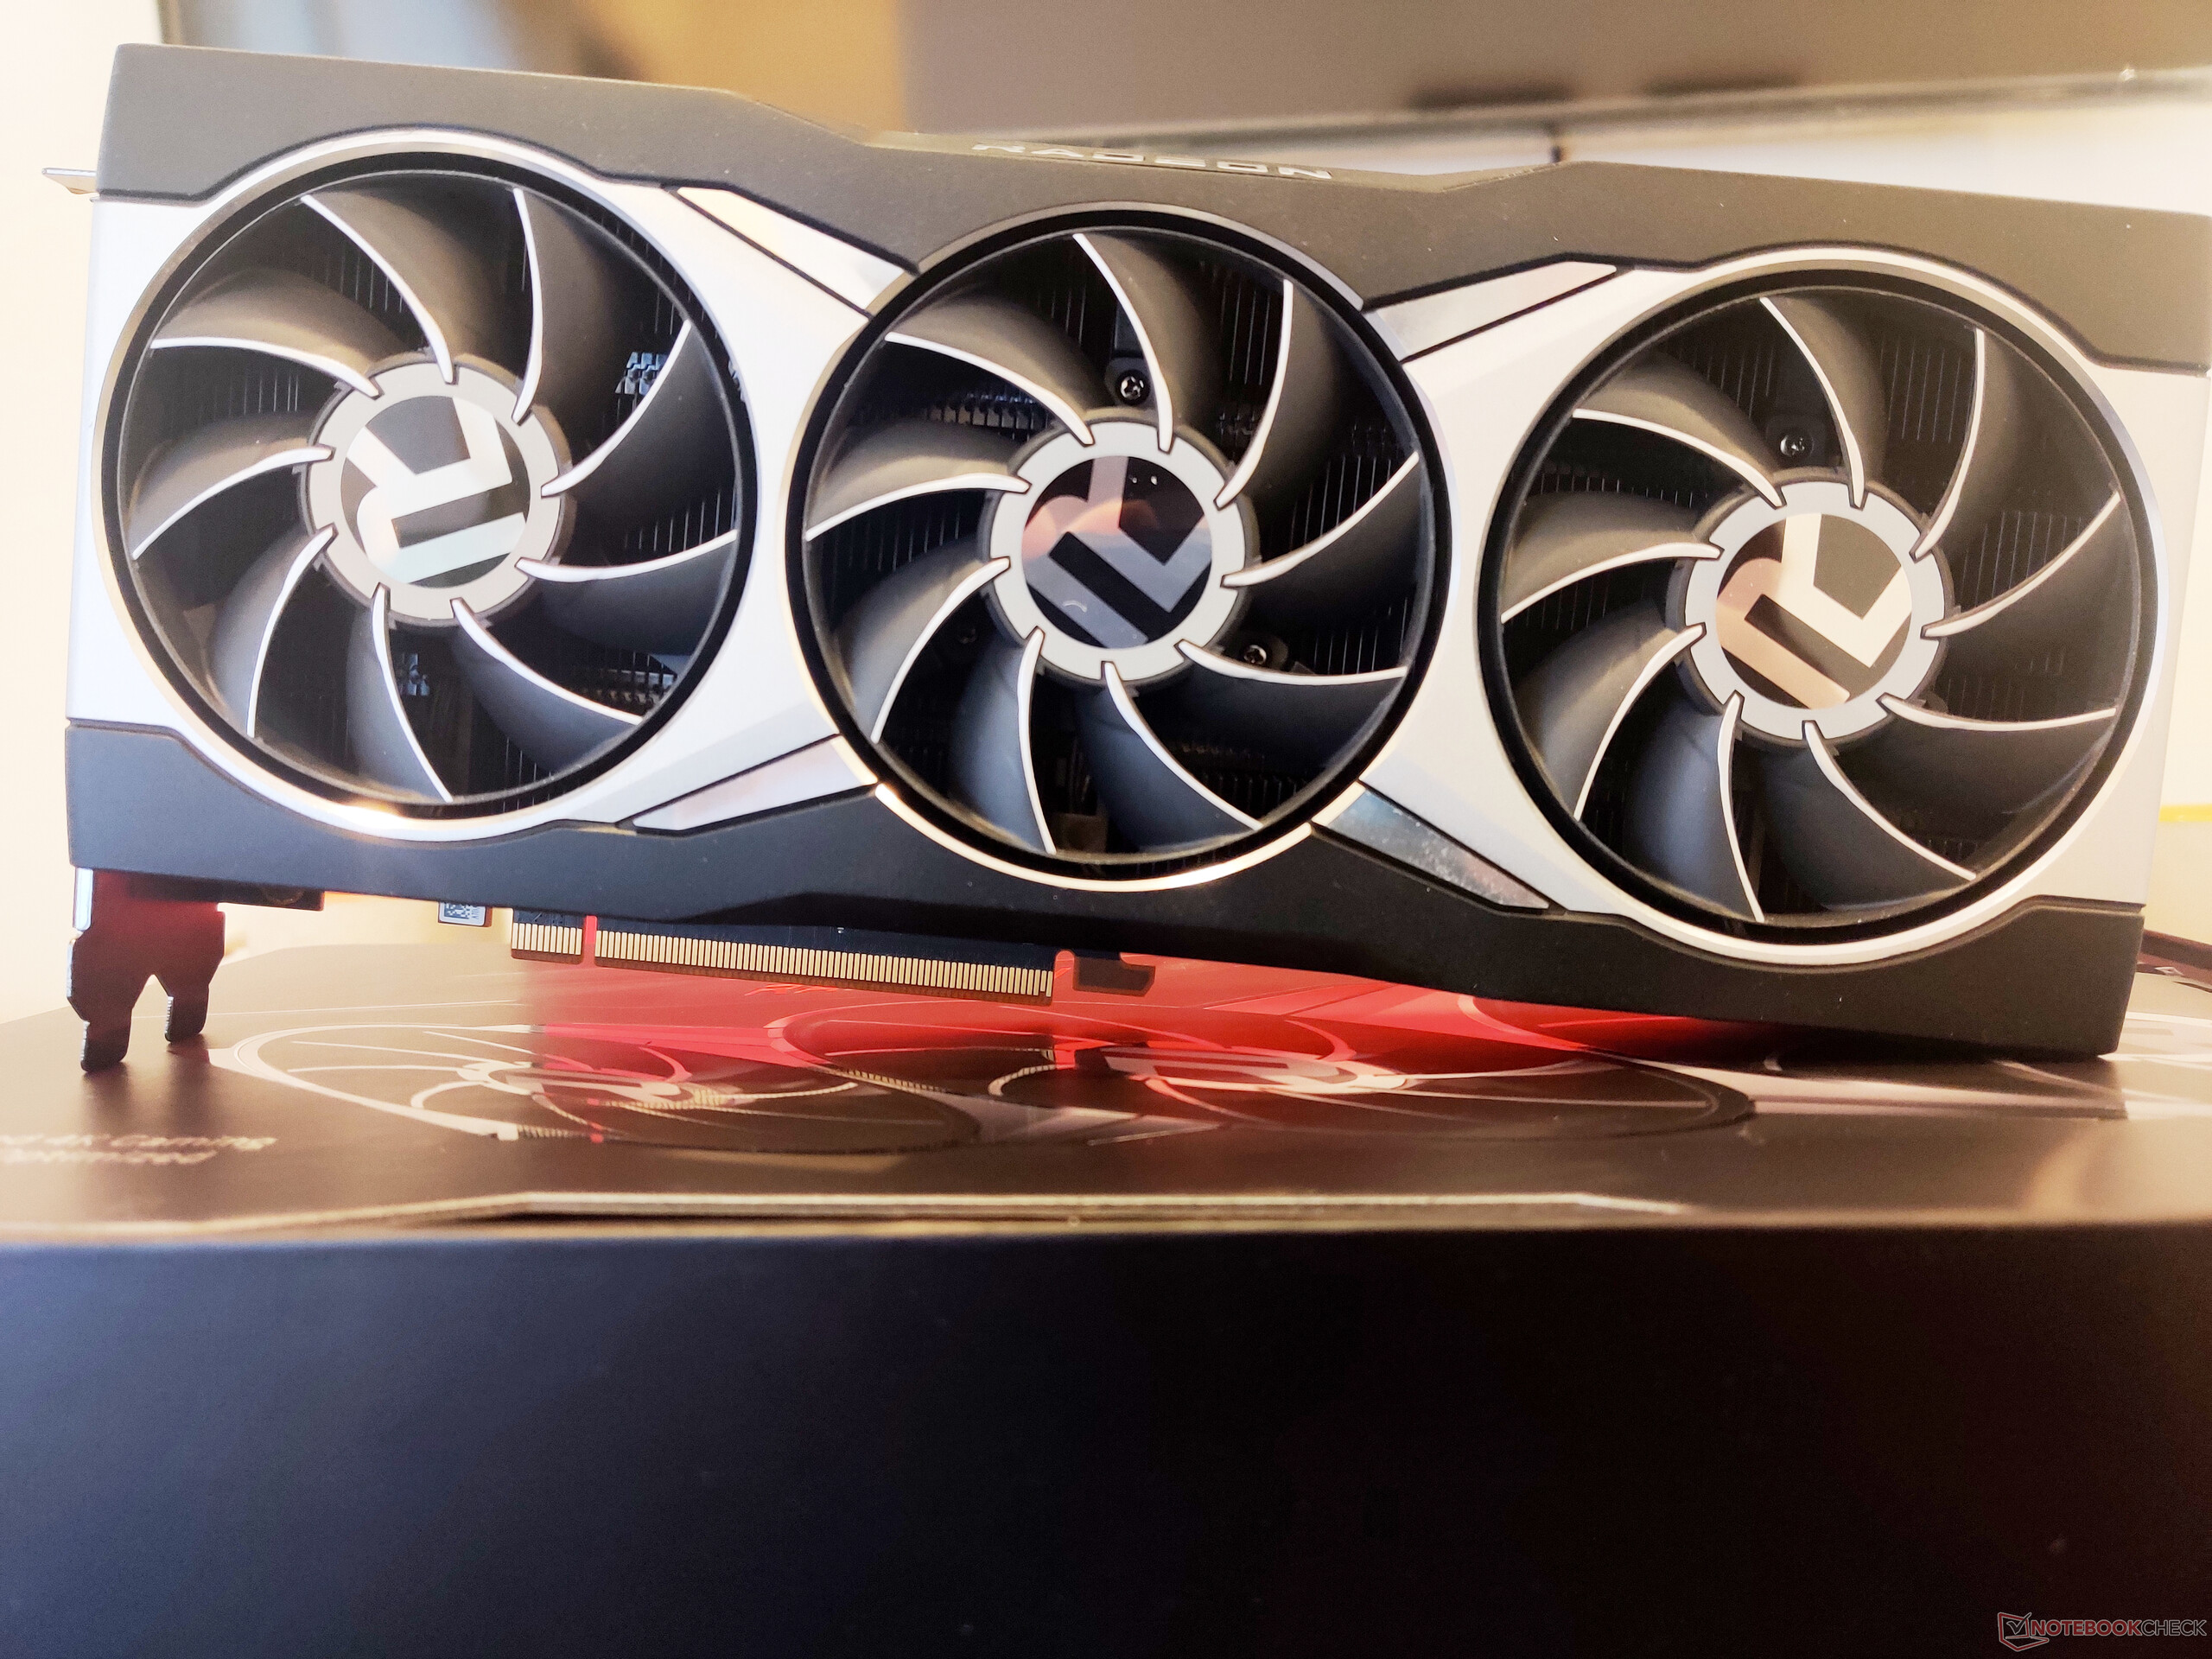
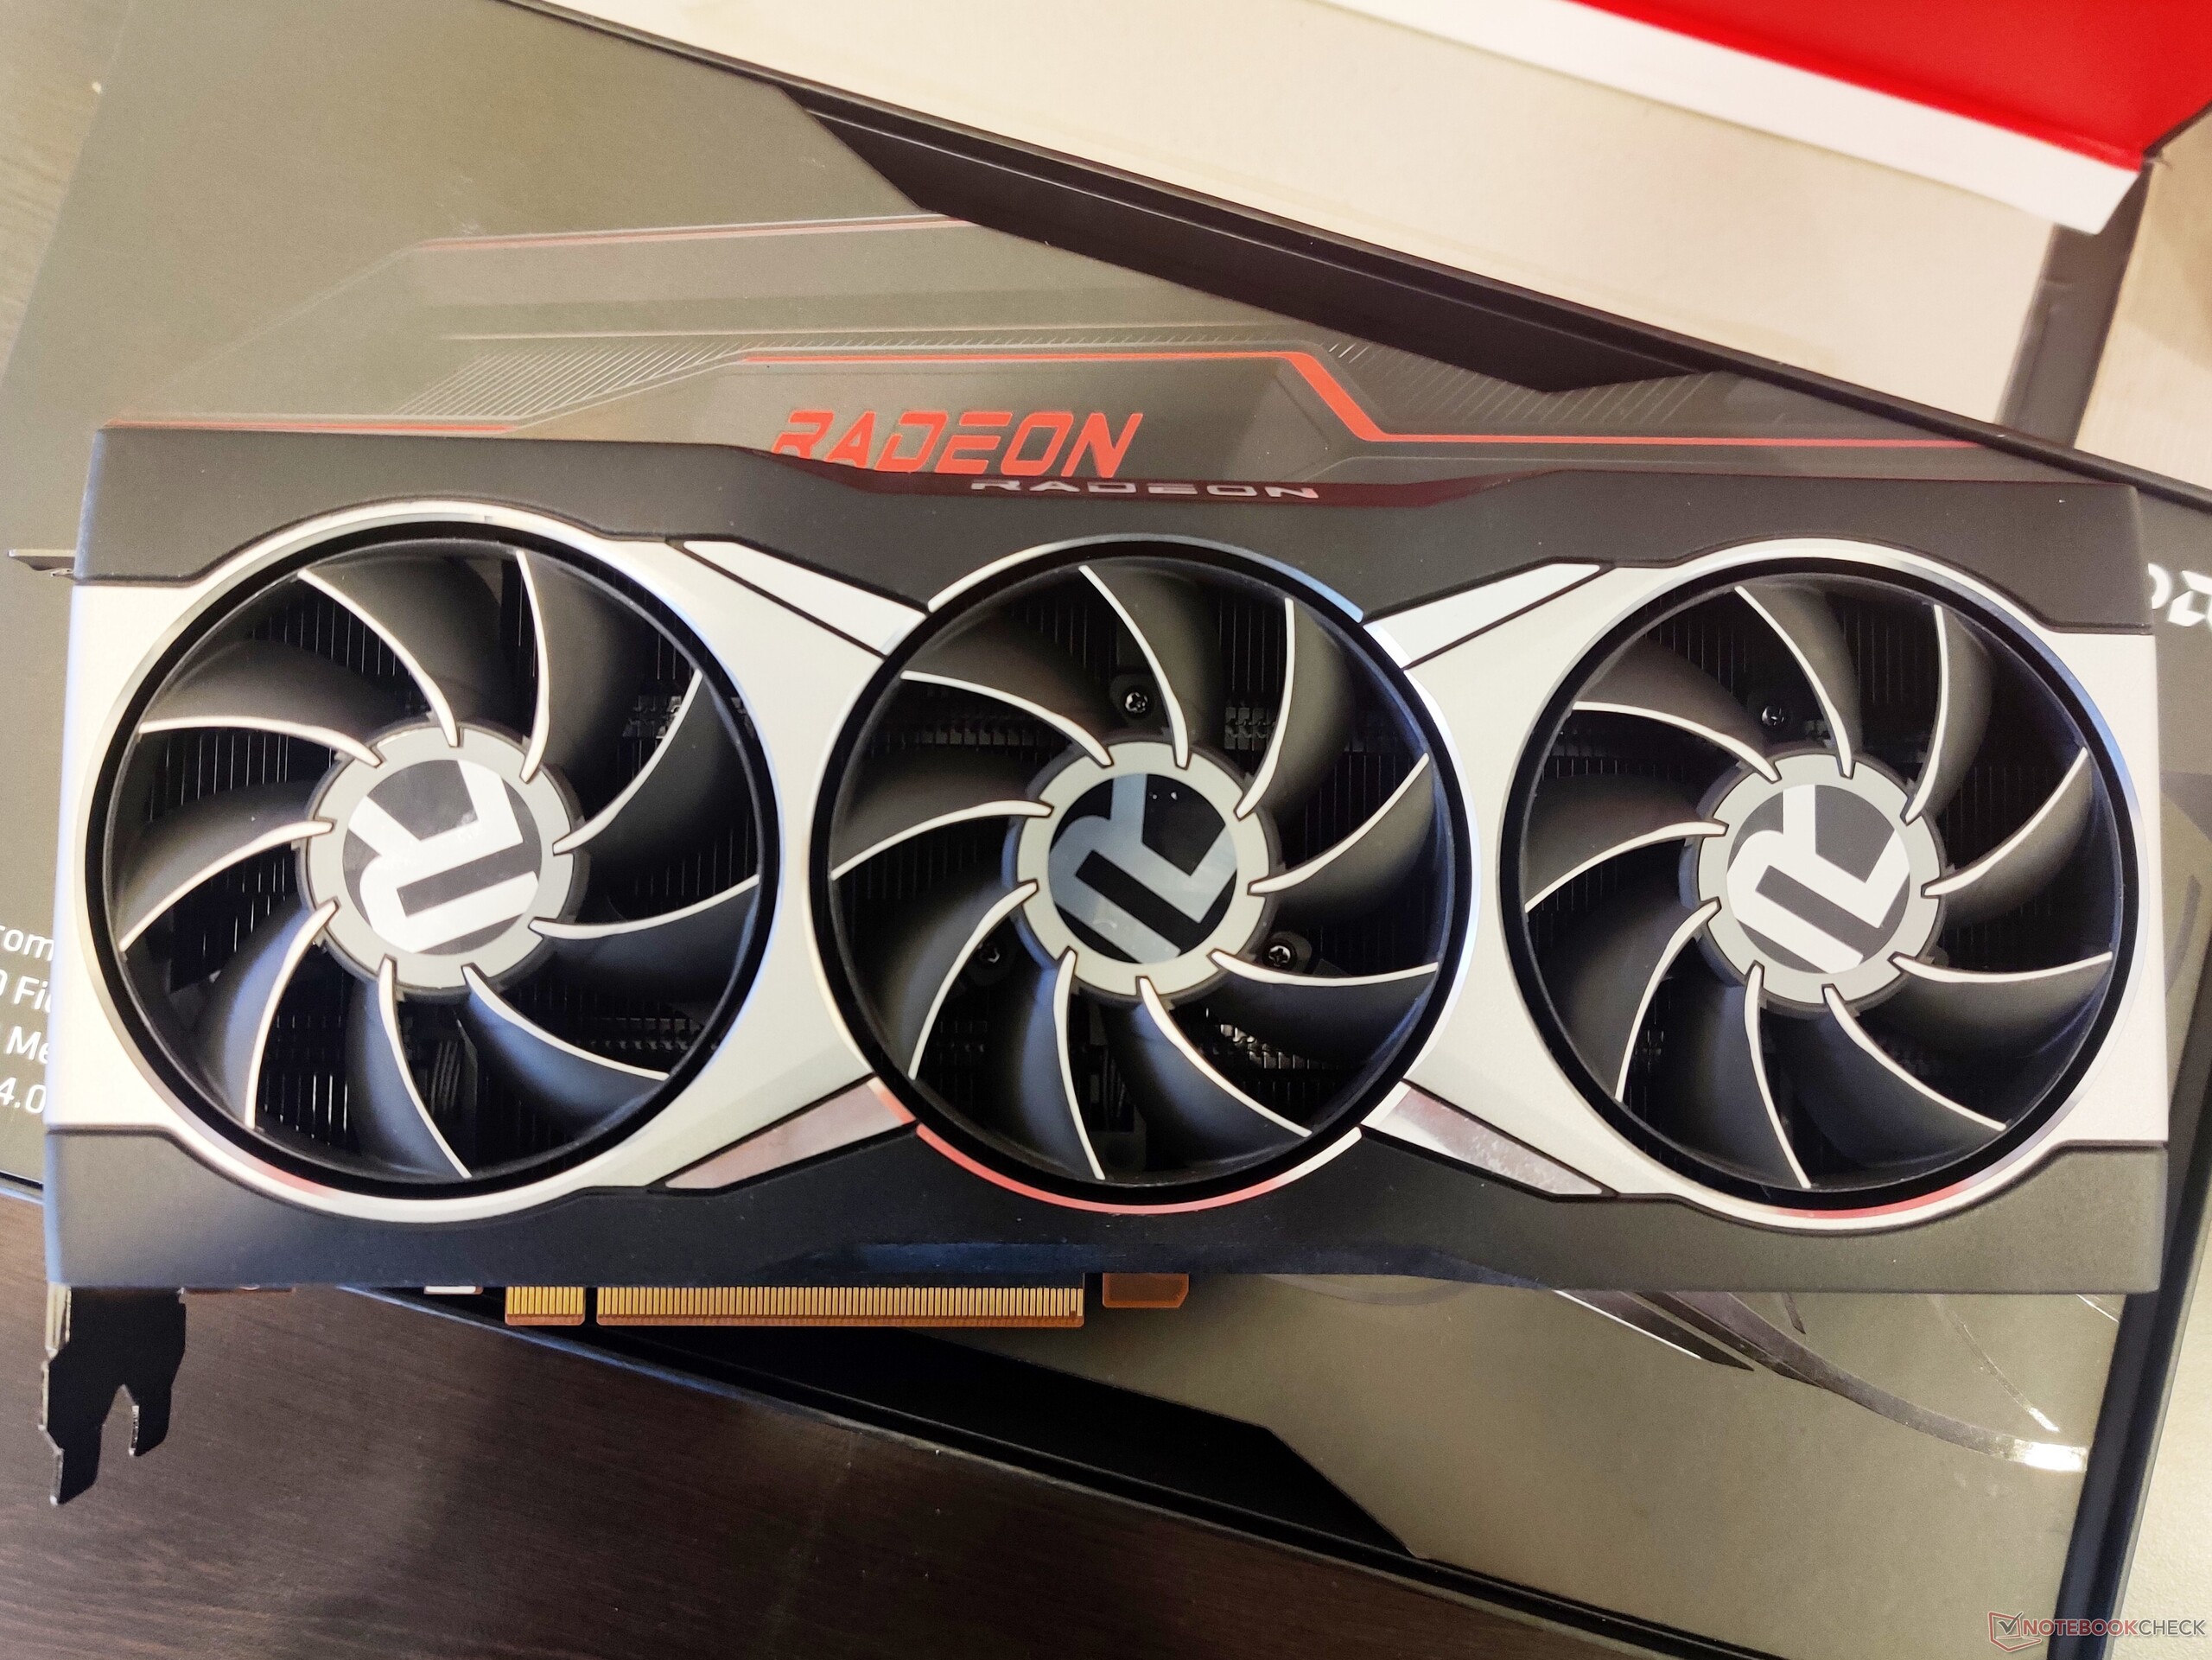
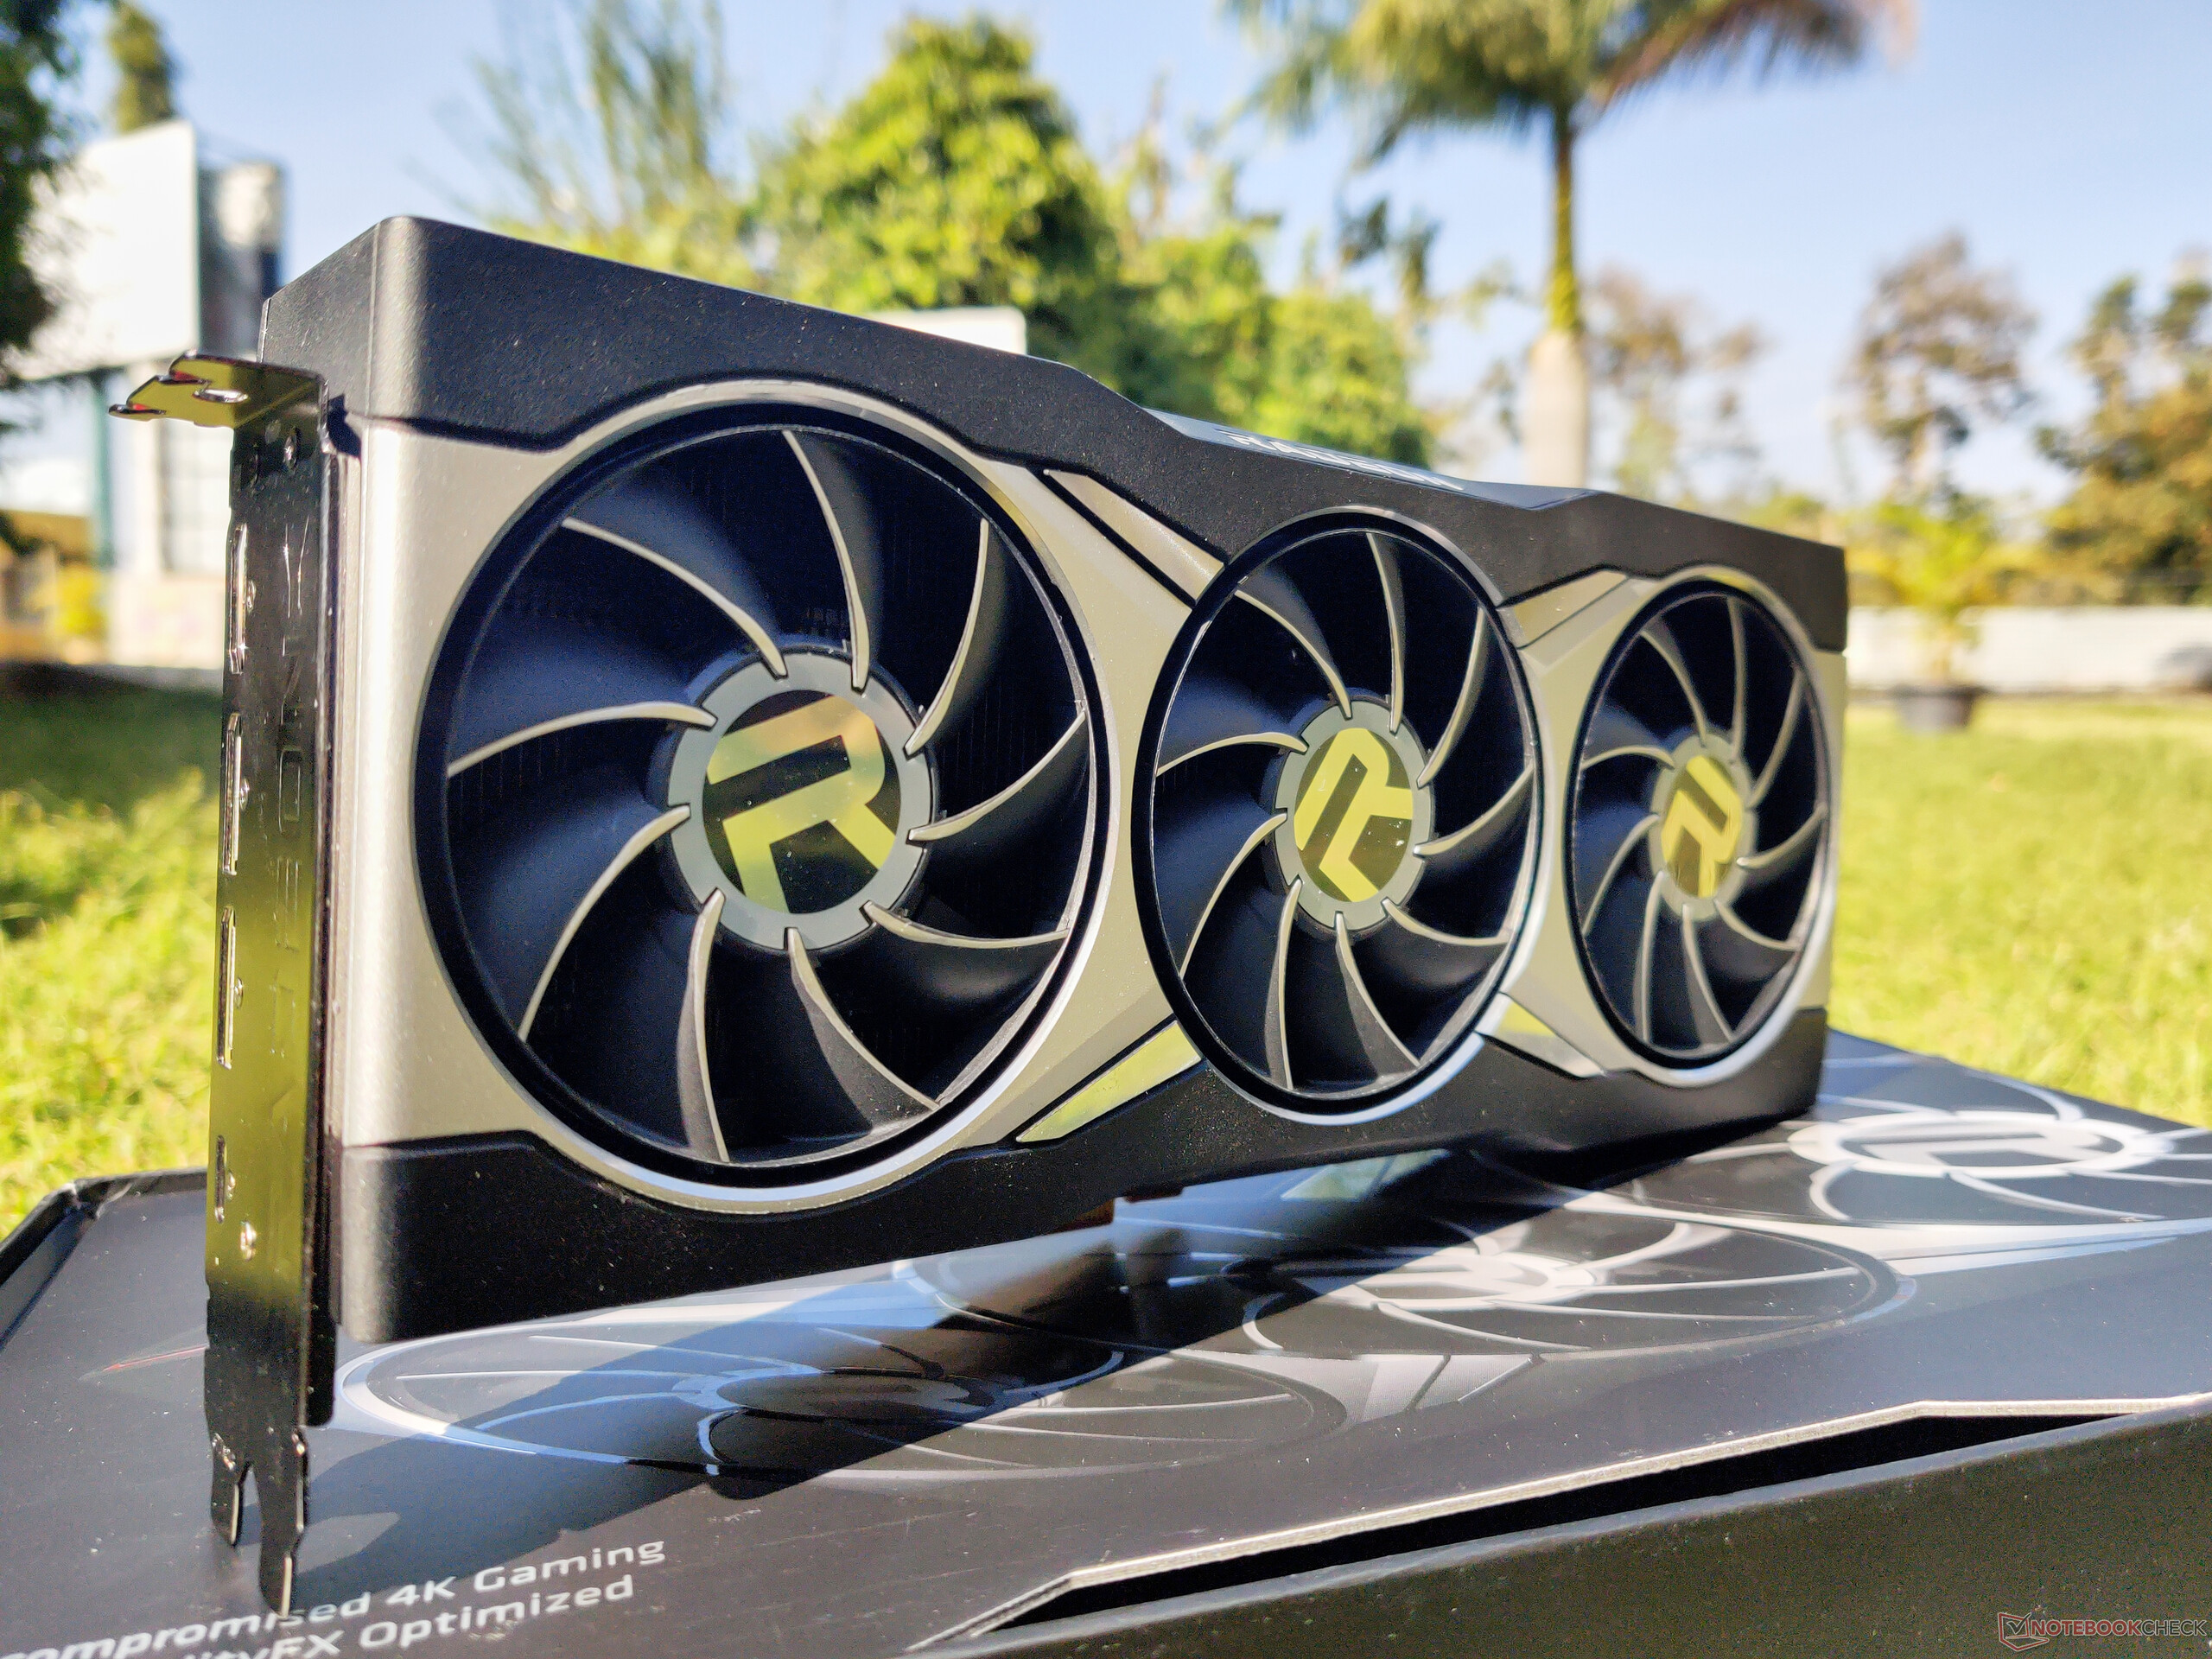
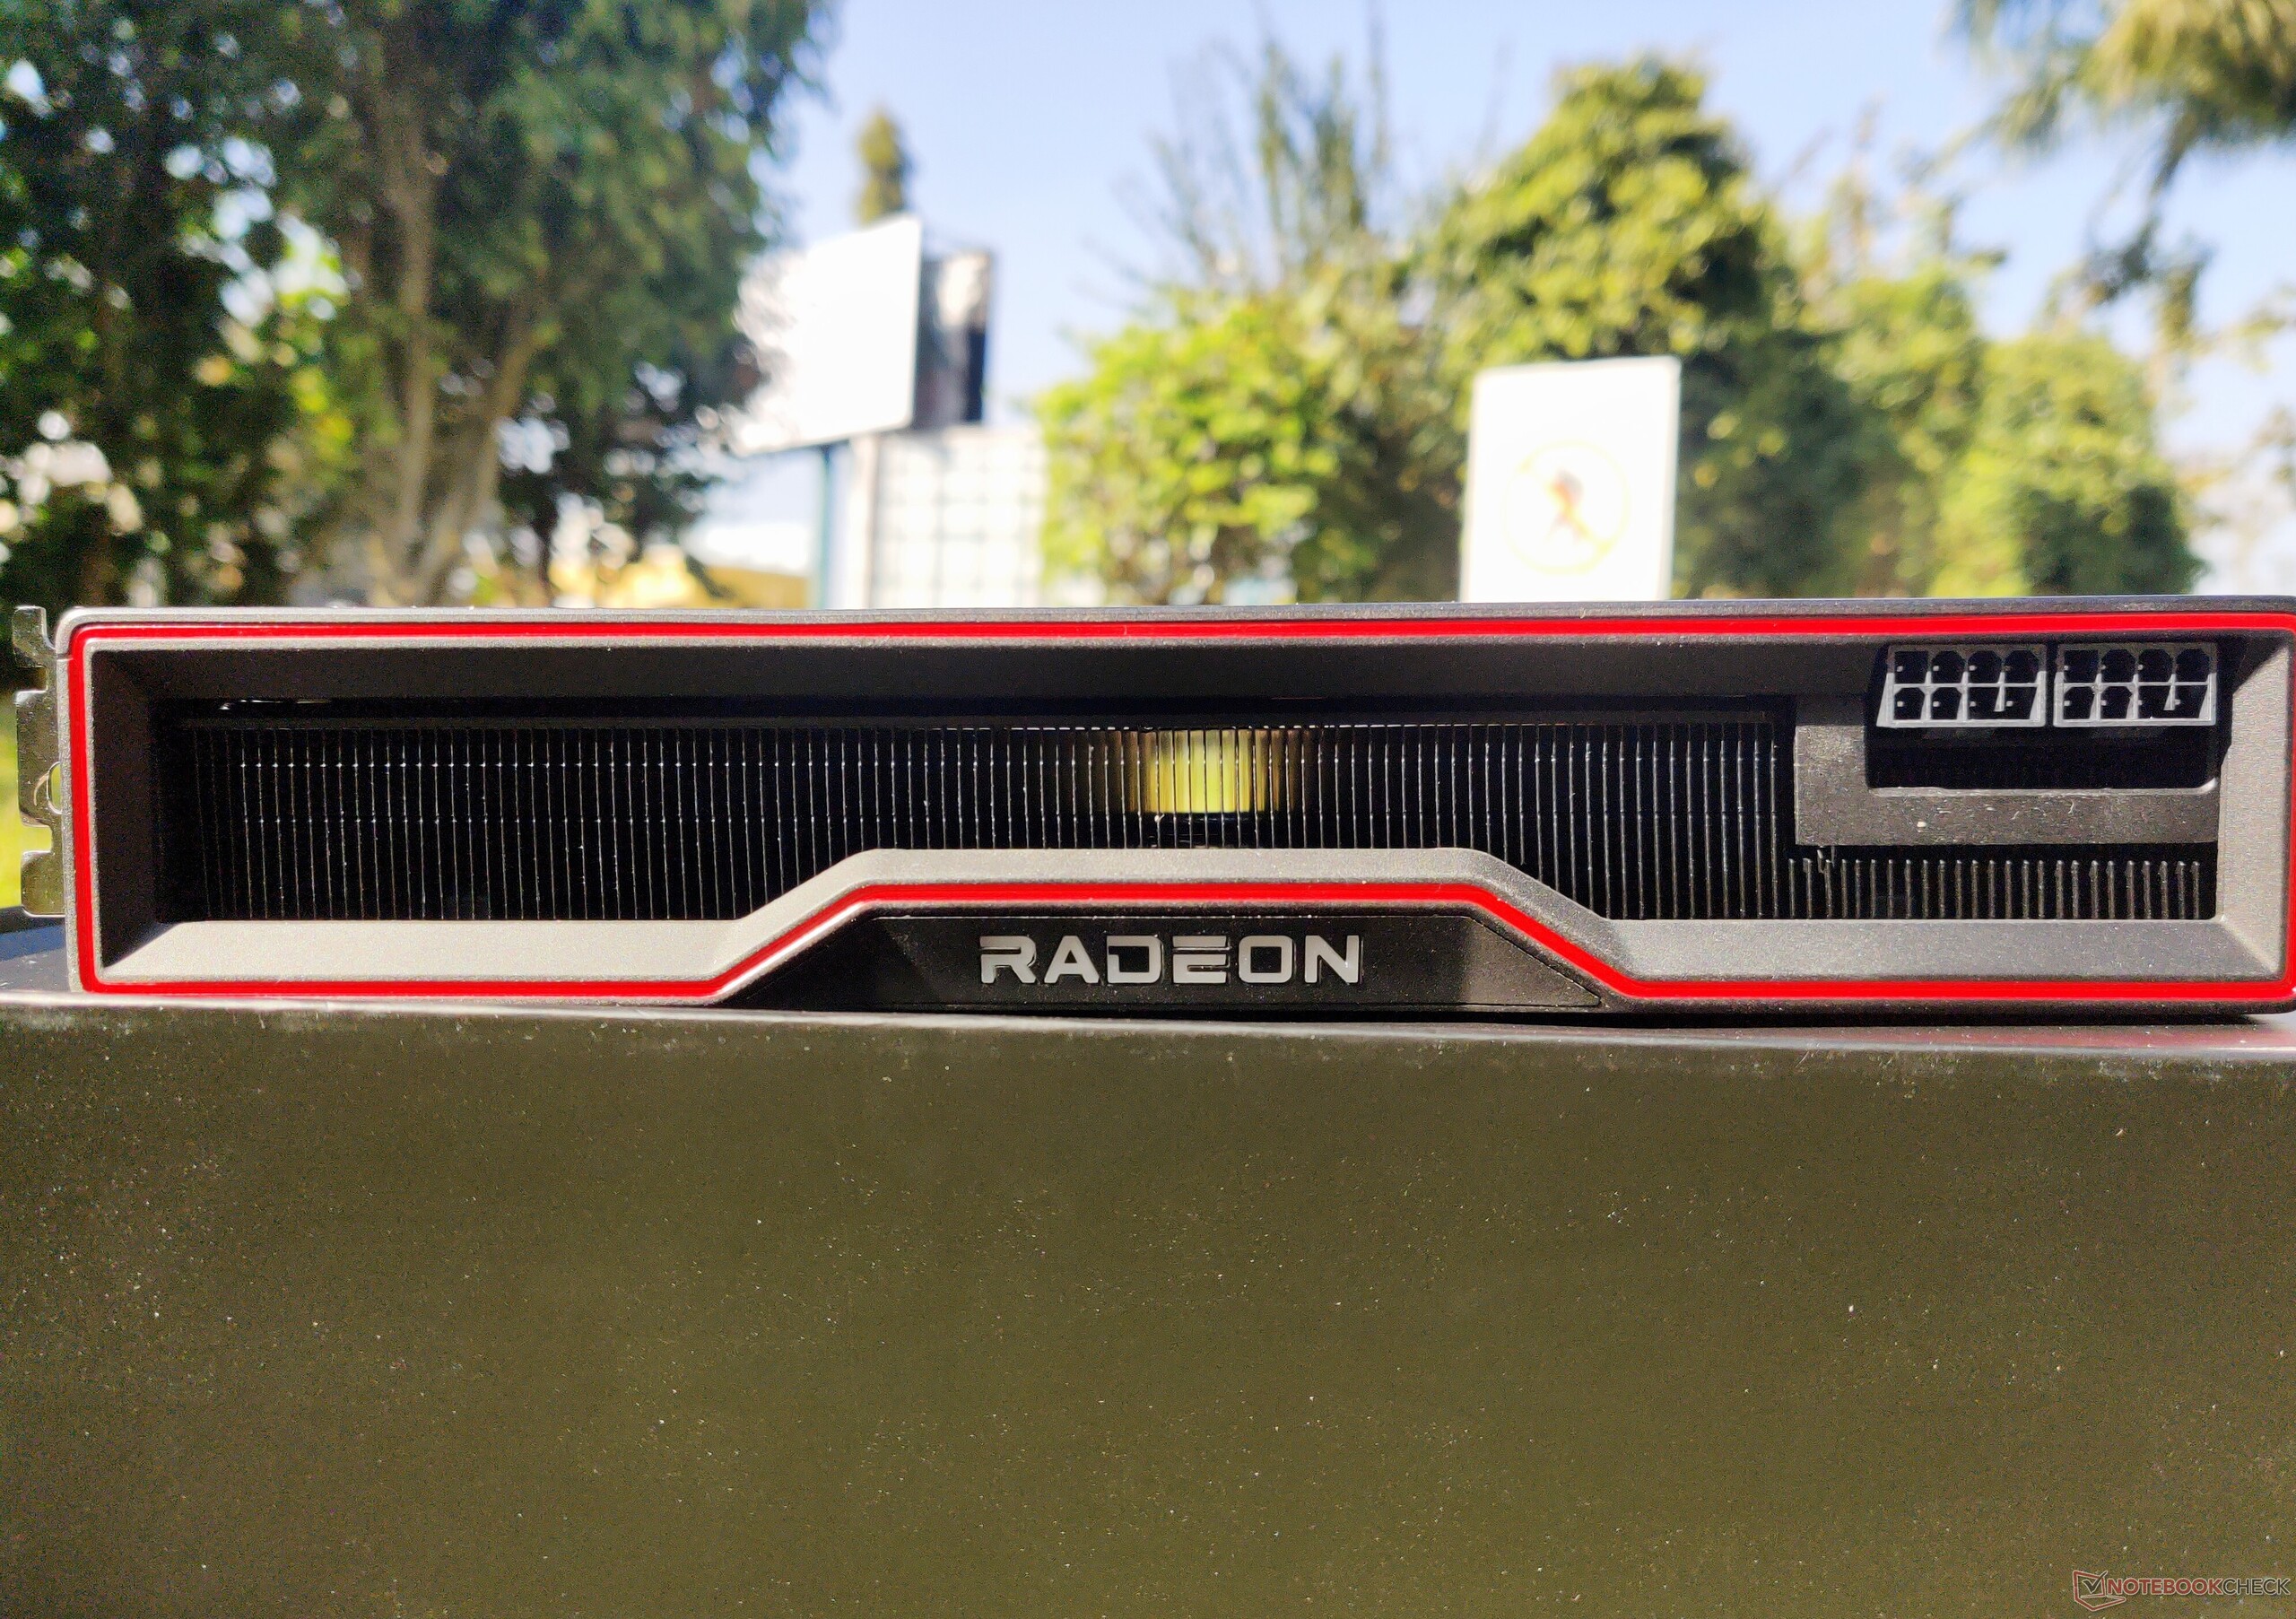
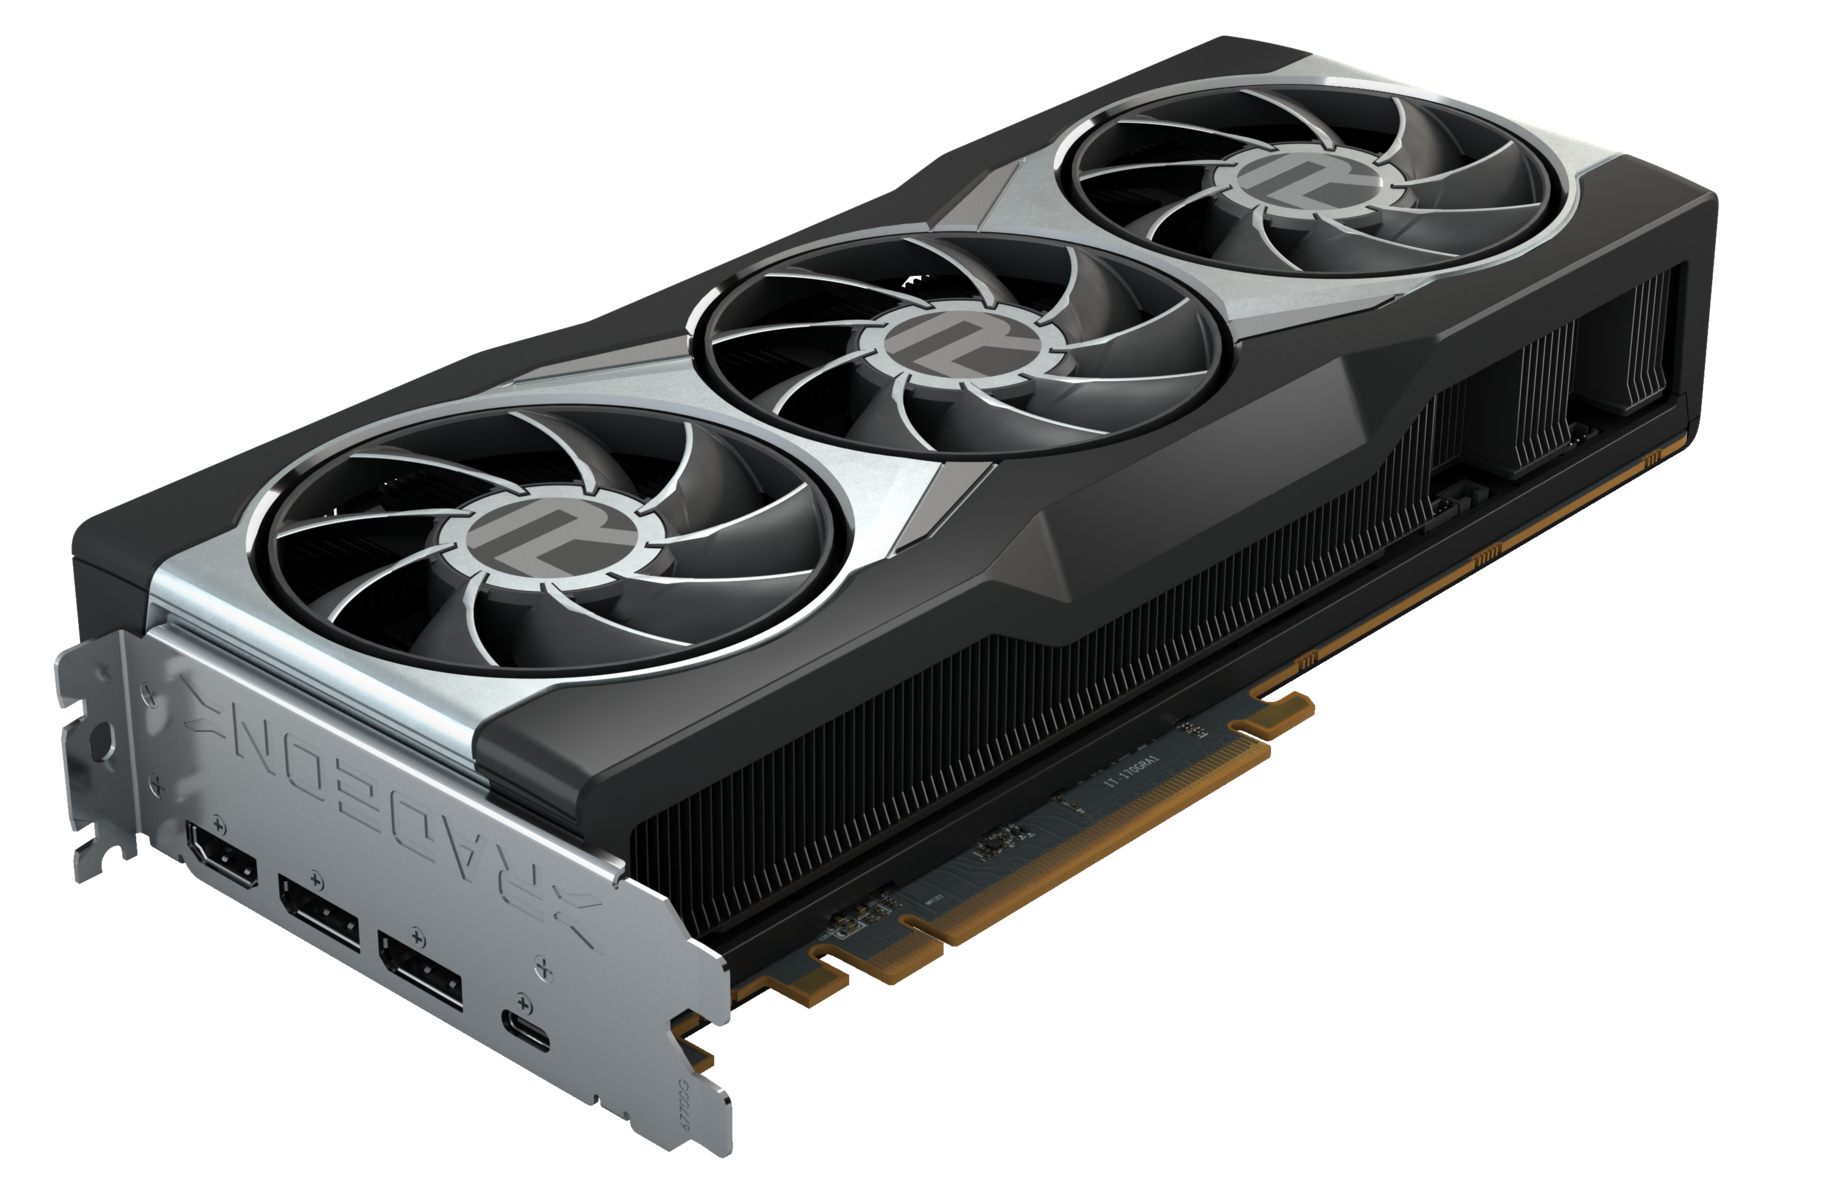
Coming to the card itself, we see that AMD has ditched the blower-style cooler found on the RX 5700 XT reference card and has instead opted for a triple-fan cooler. The fans have the distinct "R" logo on them and are built into a bright silver metal frame. On the top, we find a red trim that runs along the length of the card and also an RGB Radeon logo. 

The Radeon logo glows in red by default, but you can download a CoolerMaster RGB LED tool for cycling between the colors. We would hazard a guess that CoolerMaster has something to do with the reference design's cooling system going by what we've seen before with Ryzen's Wraith Prism stock cooler.

Staying on the top, we see two 8-pin power connectors that are placed towards the right edge — no 12-pin fancy alien antenna stuff like NVIDIA, which can be good or bad depending on your preference.

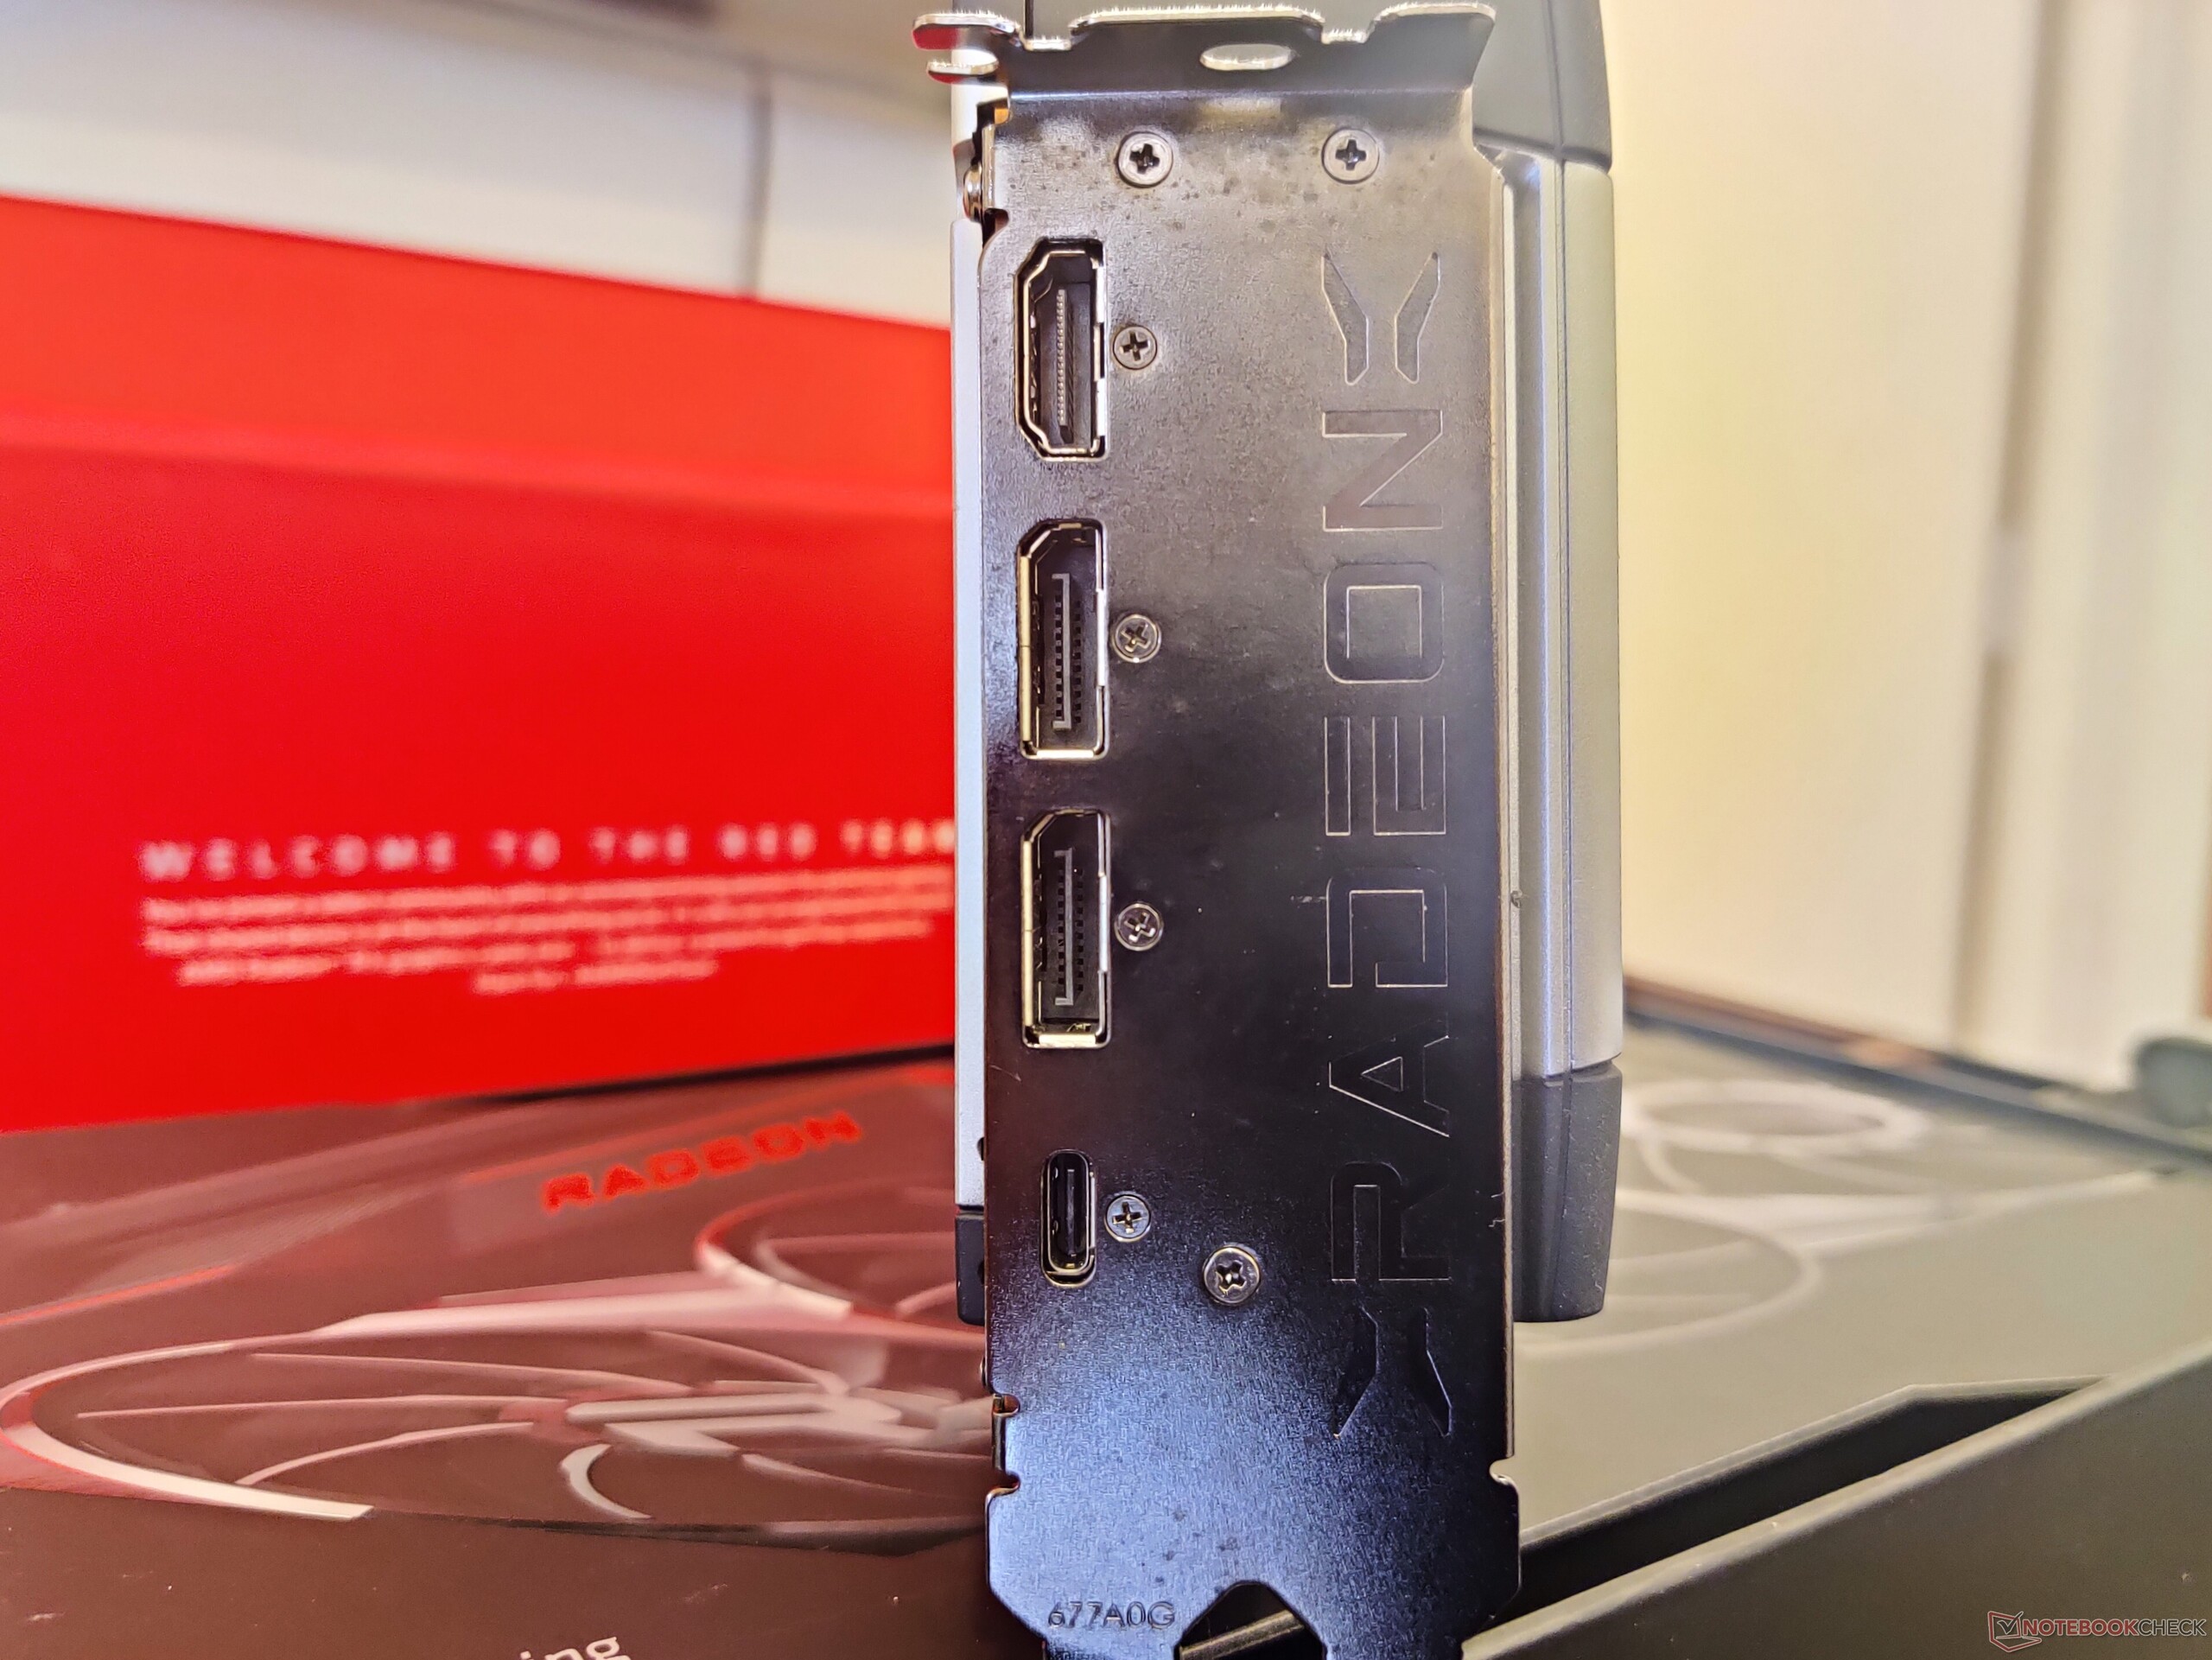
On the rear, we have two DisplayPort 1.4 outs, one HDMI 2.1 out, and a USB Type-C with DisplayPort. It is good to see AMD offering a USB Type-C port at a time when NVIDIA ditched it apparently to save some power on the Ampere cards.

It's not exactly news, but it's been some time since AMD has waved goodbye to CrossFire support so there's no CrossFire Bridge port available. NVIDIA, on the other hand, still offers an NVLink connector on the RTX 3090. 

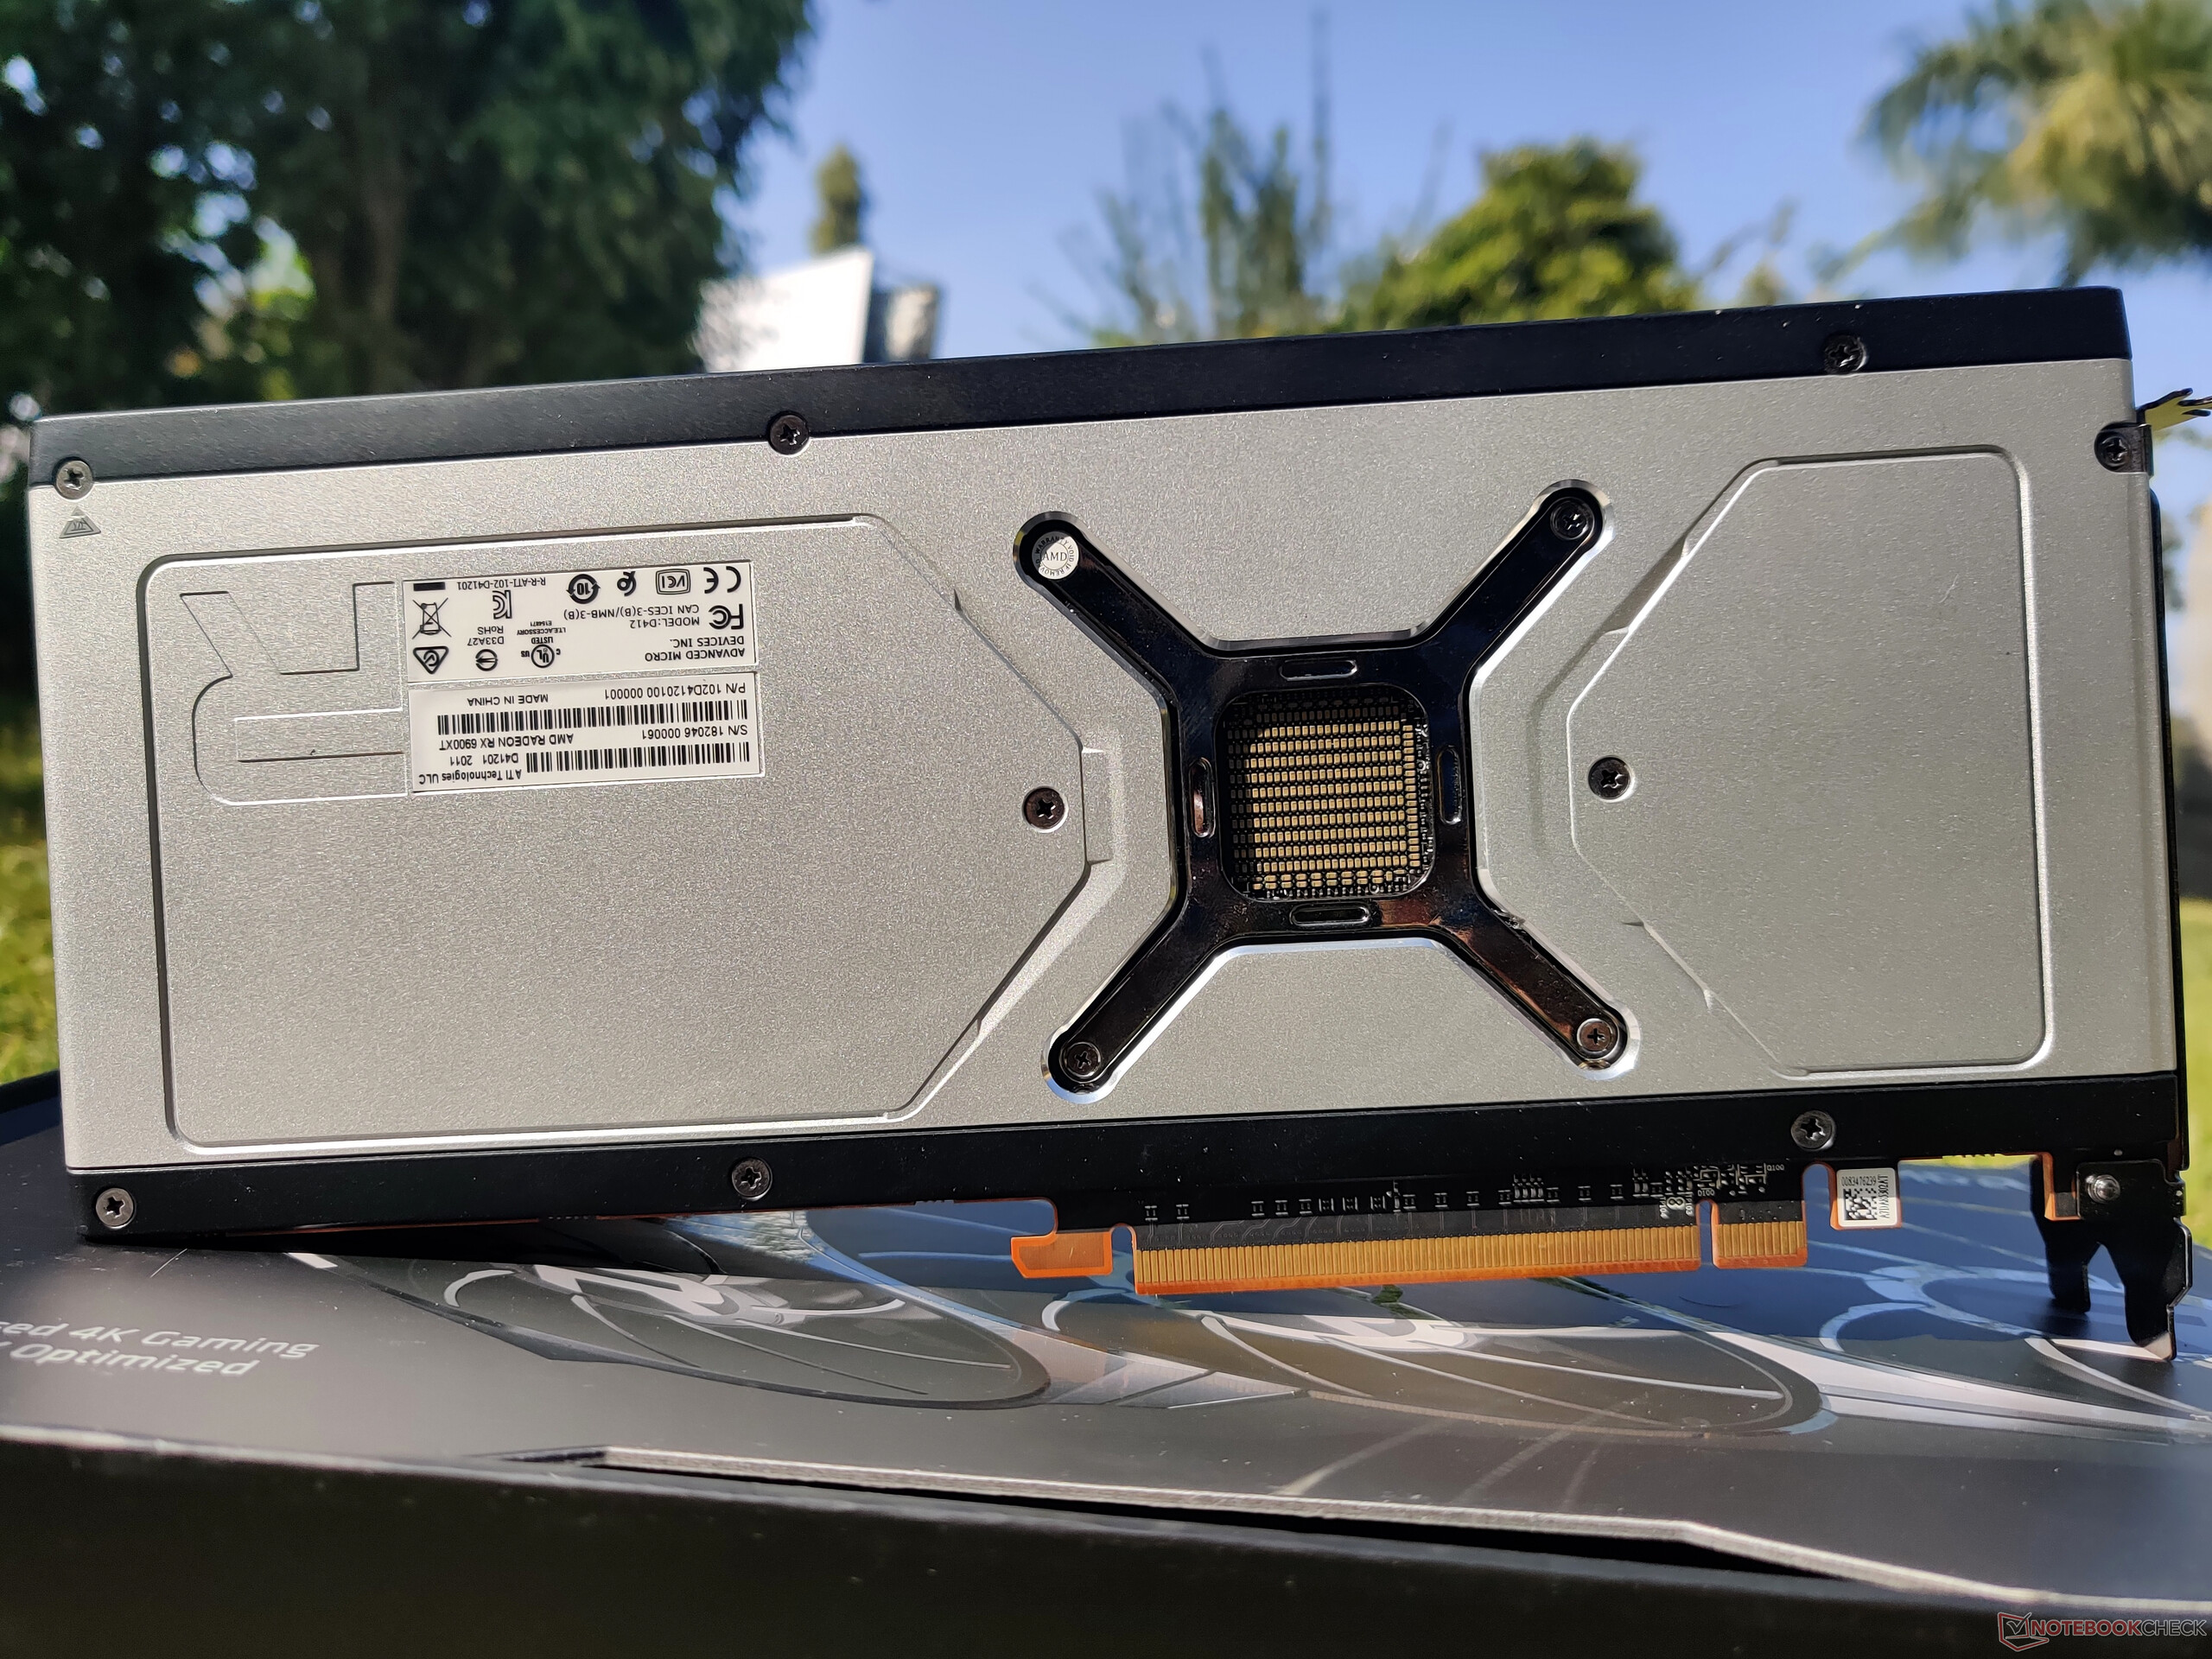
Overall, the RX 6900 XT sports a neat 2.7-slot reference design, which should have near-universal appeal.

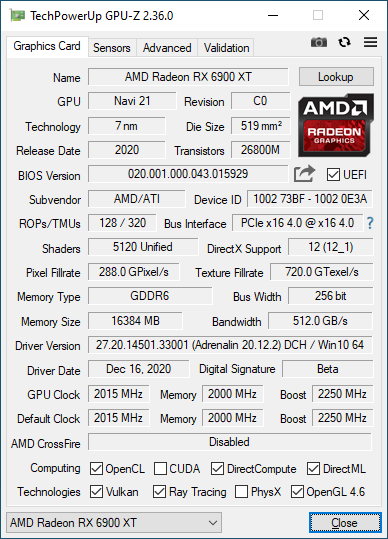
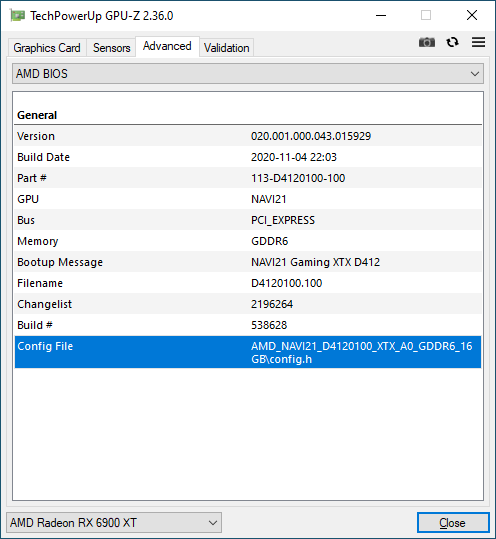
The Radeon RX 6900 XT is based on the RDNA 2 Navi 21 XTX GPU — a 7 nm part that offers 80 compute units (CUs) i.e. 5,120 shading units. The card has a base clock of 1,825 MHz. For most applications, the GPU runs at 2,015 MHz, which AMD advertises as the Game Clock, while boosting up to 2,250 MHz. Depending on the workload and available thermal headroom, even higher boosts are possible as well.  

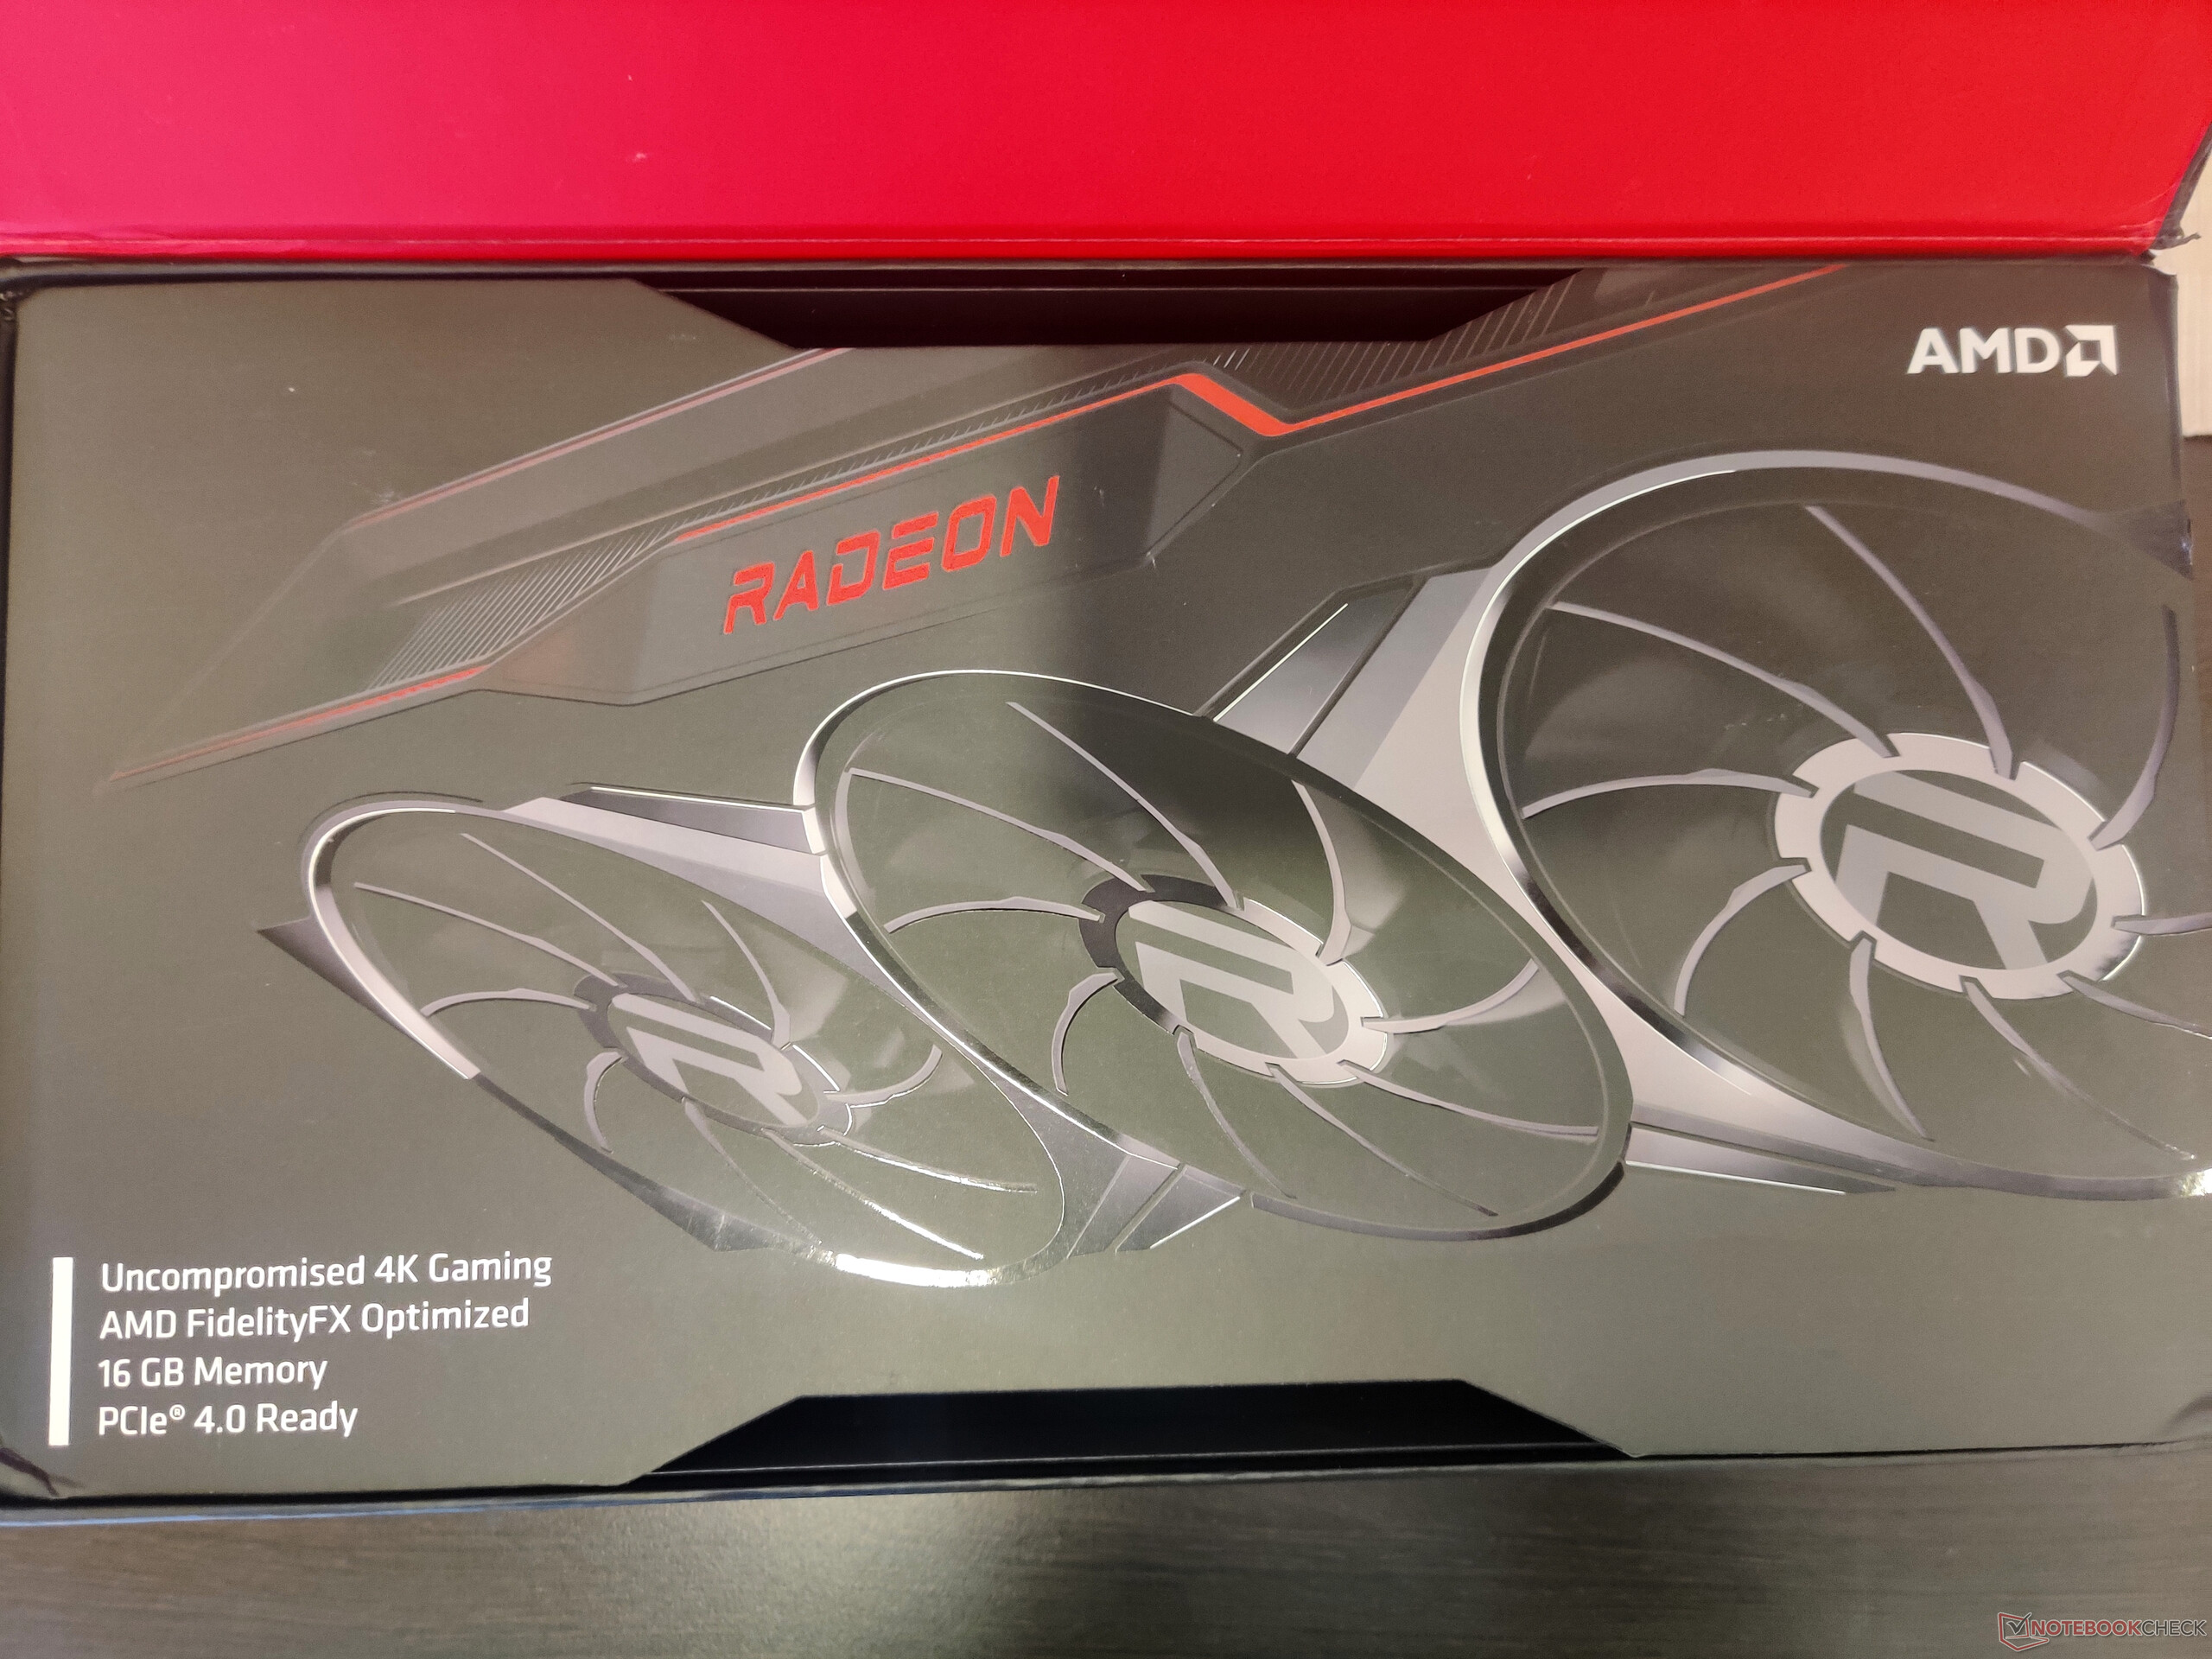
Like the RX 6800 XT, the RX 6900 XT also offers 16 GB GDDR6 VRAM on a 256-bit bus yielding a memory bandwidth of up to 512 GB/s. AMD has equipped the Radeon RX 6900 XT with a 128 MB Infinity Cache that sort of covers up for the slower (but more easily available) GDDR6 VRAM and the smaller 256-bit memory bus to achieve performance levels similar to what NVIDIA can with a bigger bus, more expensive GDDR6X VRAM, and higher memory bandwidth.

The Radeon RX 6900 XT is rated for a total board power of 300 W. During stress testing, we observed that the core alone can draw up to 255 W.

The test bench

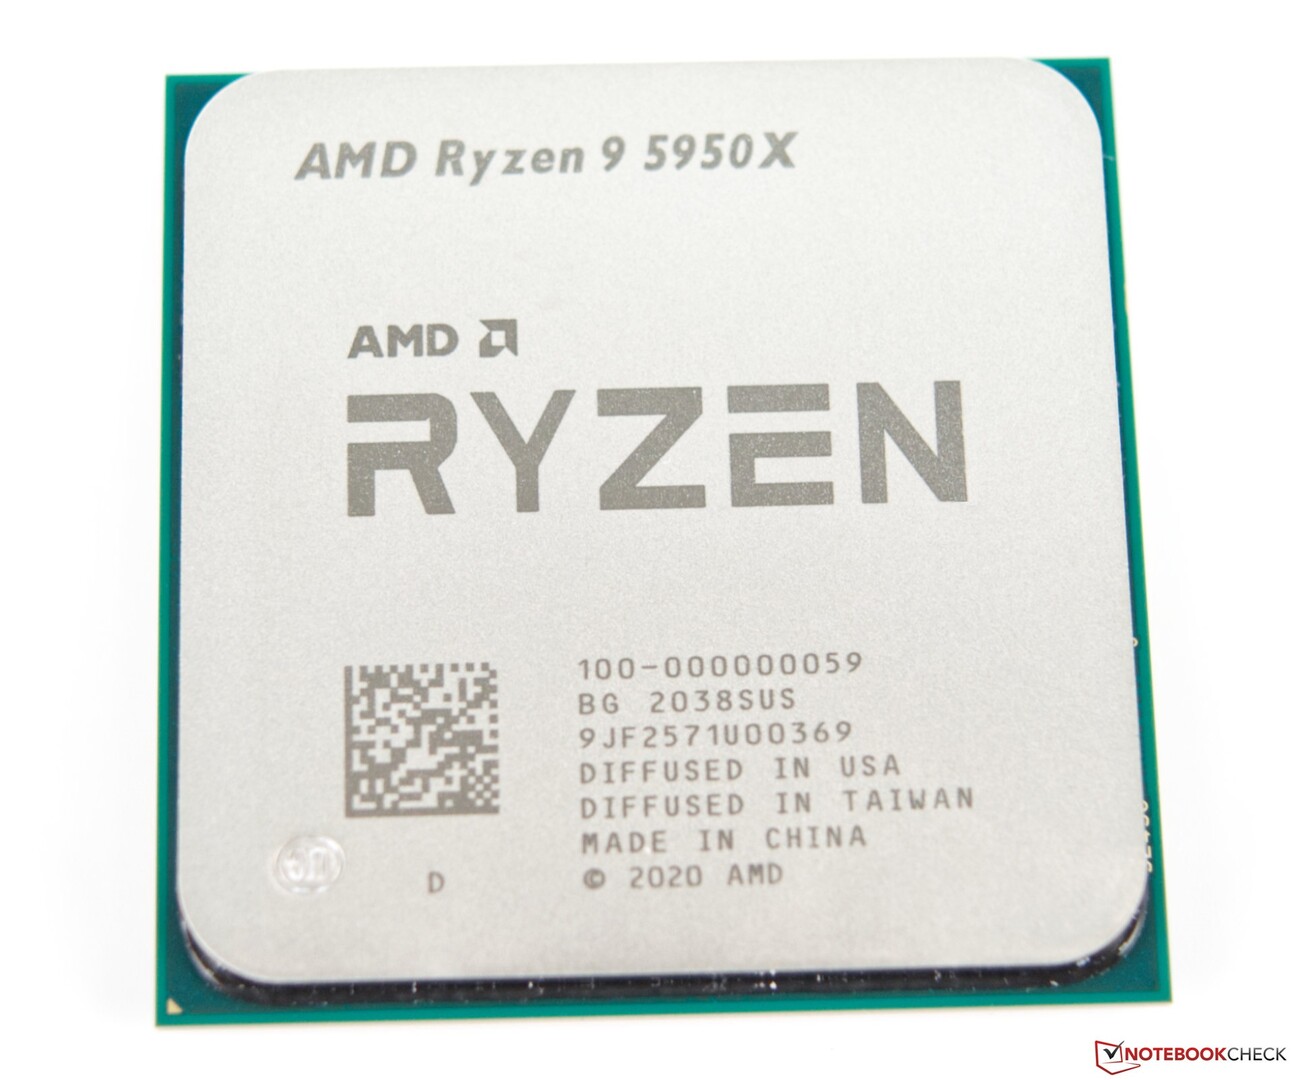
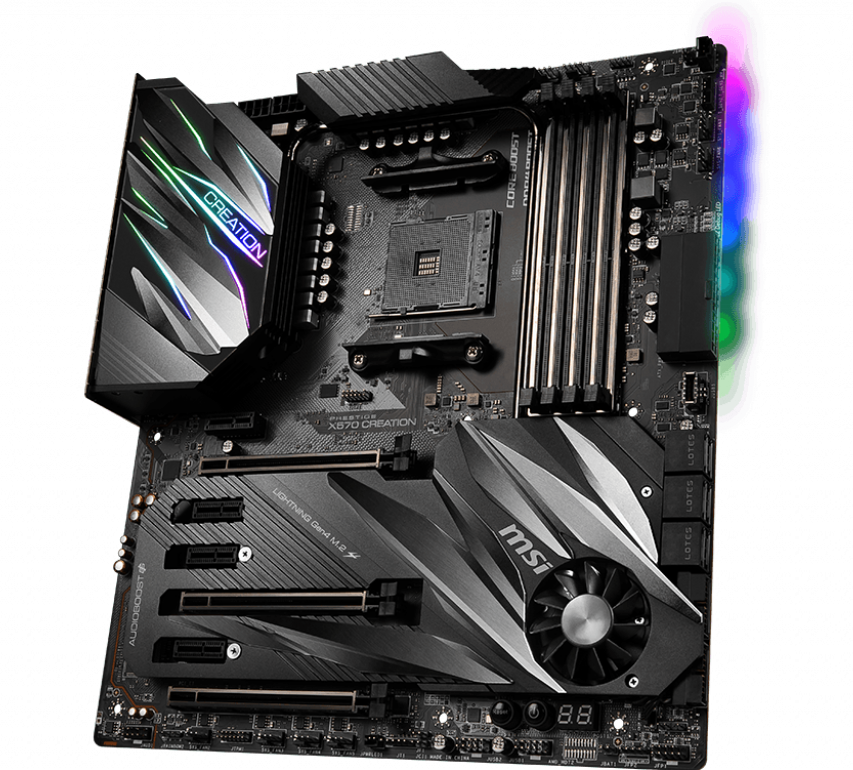
We used an AMD X570 platform as the test bench for evaluating the RX 6900 XT. Our setup includes an AMD Ryzen 9 5950X processor paired with 32 GB (16 GB x) of G.SKILL Trident Z Neo DDR4-3600 RAM (timings 16-19-19-39) on an MSI Prestige X570 Creation motherboard.

A Gigabyte Aorus NVMe Gen4 1 TB SSD was used to run Windows 10 20H2 with the latest cumulative patches while benchmarks and games were installed on two 1 TB Crucial MX500 SATA SSDs.

Keeping the 16C/32T Ryzen 9 5950X cool was a Corsair iCUE H115i Capellix AIO cooler. The setup was housed in a Corsair iCUE 4000X RGB case with a Thermaltake Toughpower 850 W 80 Plus Gold as the power supply. 

The RX 6900 XT was paired with a OnePlus U Series 55U1 smart TV running at 4K 60 Hz. Color output was set to Full RGB 4:4:4 pixel format in Radeon software and Windows desktop scaling was set to 100%.

We would like to thank AMD for providing the RX 6900 XT and the Ryzen 9 5950X, Corsair for the iCUE Elite Capellix AIO cooler and iCUE 4000X case, and OnePlus for the U series 55U1 4K TV.

AMD Ryzen 9 5950X CPU
MSI Prestige X570 Creation motherboard. (Image Source: MSI)
Gigabyte Aorus NVMe Gen4 SSD. (Image Source: Gigabyte)
G.SKILL Trident Z Neo DDR4-3600 RAM. (Image Source: G.SKILL)

Synthetic Benchmarks

In the majority of the 3DMark tests, the RX 6900 XT is on par or even better than the NVIDIA RTX 3090. The maximum leads are seen in 3DMark Fire Strike at up to 1440p. In the 4K Fire Strike Ultra, the lead reduces to about 11% over the average RTX 3090. Time Spy, though, shows the AMD and NVIDIA flagships to be more or less on par with each other.

The capabilities of the RDNA2 architecture when it comes to ray tracing aren't poor per se, but the shortcomings become quite evident in the Port Royal test wherein the RX 6900 XT perceivably lags behind the RTX 3080 by 15% and significantly behind the RTX 3090 by 24%. That being said, we do see the RX 6900 XT performing about 9% better than the average RTX 2080 Ti in this benchmark.

Unigine benchmarks show better scores in DirectX tests compared to OpenGL ones, especially in the Valley and Heaven benchmarks. In Superposition, the RX 6900 XT takes a beating in the 8K Optimized test trailing the RTX 3090 by 20%. This gap narrows significantly at lower resolutions, and we see the GPU trailing only by about 8% in the 4K Optimized benchmark.

3DMark
2560x1440 Time Spy Graphics
Average NVIDIA GeForce RTX 3090
  (18685 - 20433, n=16)
19254 Points +6%
Nvidia GeForce RTX 3090 Founders Edition
NVIDIA GeForce RTX 3090, R9 5900X
18685 Points +3%
AMD Radeon RX 6900 XT
AMD Radeon RX 6900 XT, R9 5950X
18210 Points
AMD Radeon RX 6800 XT
AMD Radeon RX 6800 XT, R9 5950X
17603 Points -3%
Average NVIDIA GeForce RTX 3080
  (17467 - 17604, n=2)
17536 Points -4%
ASUS GeForce RTX 3080 ROG STRIX OC GAMING
NVIDIA GeForce RTX 3080, R9 5900X
17467 Points -4%
AMD Ryzen 9 5900X
NVIDIA Titan RTX, R9 5900X
15283 Points -16%
Average NVIDIA Titan RTX
  (14216 - 15283, n=29)
14884 Points -18%
Average NVIDIA GeForce RTX 2080 Ti (Desktop)
  (13744 - 14645, n=4)
14283 Points -22%
KFA2 GeForce RTX 2080 Ti EX
NVIDIA GeForce RTX 2080 Ti (Desktop), R9 3900X
13744 Points -25%
MSI GeForce RTX 3070 Gaming X Trio
NVIDIA GeForce RTX 3070, R9 5900X
13579 Points -25%
Average NVIDIA GeForce RTX 3070
  (11043 - 13579, n=7)
12616 Points -31%
Nvidia GeForce RTX 2080 Super
NVIDIA GeForce RTX 2080 Super (Desktop), R7 2700X
11477 Points -37%
Average NVIDIA GeForce RTX 2080 Super (Desktop)
  (11313 - 11542, n=4)
11439 Points -37%
Nvidia GeForce RTX 2070 Super
NVIDIA GeForce RTX 2070 Super (Desktop), R7 2700X
10094 Points -45%
Average NVIDIA GeForce RTX 2070 Super (Desktop)
  (9564 - 10094, n=8)
9846 Points -46%
AMD Radeon RX 5700 XT
AMD Radeon RX 5700 XT (Desktop), R7 2700X
8673 Points -52%
Average AMD Radeon RX 5700 XT (Desktop)
  (6050 - 9371, n=7)
8574 Points -53%
AMD Radeon RX 5700
AMD Radeon RX 5700 (Desktop), R7 2700X
7675 Points -58%
1920x1080 Fire Strike Graphics
AMD Radeon RX 6900 XT
AMD Radeon RX 6900 XT, R9 5950X
50587 Points
AMD Radeon RX 6800 XT
AMD Radeon RX 6800 XT, R9 5950X
49735 Points -2%
Average NVIDIA GeForce RTX 3090
  (41298 - 49282, n=16)
46854 Points -7%
Nvidia GeForce RTX 3090 Founders Edition
NVIDIA GeForce RTX 3090, R9 5900X
41298 Points -18%
ASUS GeForce RTX 3080 ROG STRIX OC GAMING
NVIDIA GeForce RTX 3080, R9 5900X
40910 Points -19%
Average NVIDIA GeForce RTX 3080
  (37604 - 40910, n=2)
39257 Points -22%
Average NVIDIA Titan RTX
  (33377 - 40910, n=30)
36062 Points -29%
AMD Ryzen 9 5900X
NVIDIA Titan RTX, R9 5900X
34722 Points -31%
Average NVIDIA GeForce RTX 2080 Ti (Desktop)
  (32081 - 35851, n=4)
34141 Points -33%
KFA2 GeForce RTX 2080 Ti EX
NVIDIA GeForce RTX 2080 Ti (Desktop), R9 3900X
32081 Points -37%
MSI GeForce RTX 3070 Gaming X Trio
NVIDIA GeForce RTX 3070, R9 5900X
31096 Points -39%
Average NVIDIA GeForce RTX 3070
  (20357 - 33270, n=7)
28949 Points -43%
Average NVIDIA GeForce RTX 2080 Super (Desktop)
  (26824 - 28968, n=4)
27647 Points -45%
Nvidia GeForce RTX 2080 Super
NVIDIA GeForce RTX 2080 Super (Desktop), R7 2700X
27075 Points -46%
AMD Radeon RX 5700 XT
AMD Radeon RX 5700 XT (Desktop), R7 2700X
25383 Points -50%
Average AMD Radeon RX 5700 XT (Desktop)
  (19850 - 27164, n=7)
25322 Points -50%
Average NVIDIA GeForce RTX 2070 Super (Desktop)
  (22819 - 25799, n=8)
24645 Points -51%
Nvidia GeForce RTX 2070 Super
NVIDIA GeForce RTX 2070 Super (Desktop), R7 2700X
24151 Points -52%
AMD Radeon RX 5700
AMD Radeon RX 5700 (Desktop), R7 2700X
22457 Points -56%
3840x2160 Fire Strike Ultra Graphics
AMD Radeon RX 6900 XT
AMD Radeon RX 6900 XT, R9 5950X
13370 Points
AMD Radeon RX 6800 XT
AMD Radeon RX 6800 XT, R9 5950X
12626 Points -6%
Average NVIDIA GeForce RTX 3090
  (11613 - 12587, n=13)
12305 Points -8%
Nvidia GeForce RTX 3090 Founders Edition
NVIDIA GeForce RTX 3090, R9 5900X
11613 Points -13%
ASUS GeForce RTX 3080 ROG STRIX OC GAMING
NVIDIA GeForce RTX 3080, R9 5900X
10793 Points -19%
Average NVIDIA GeForce RTX 3080
  (10645 - 10793, n=2)
10719 Points -20%
Average NVIDIA Titan RTX
  (8461 - 10793, n=29)
8868 Points -34%
AMD Ryzen 9 5900X
NVIDIA Titan RTX, R9 5900X
8649 Points -35%
MSI GeForce RTX 3070 Gaming X Trio
NVIDIA GeForce RTX 3070, R9 5900X
8483 Points -37%
Average NVIDIA GeForce RTX 3070
  (8043 - 8483, n=5)
8250 Points -38%
Average NVIDIA GeForce RTX 2080 Ti (Desktop)
  (7925 - 8504, n=4)
8226 Points -38%
KFA2 GeForce RTX 2080 Ti EX
NVIDIA GeForce RTX 2080 Ti (Desktop), R9 3900X
7925 Points -41%
Average NVIDIA GeForce RTX 2080 Super (Desktop)
  (6500 - 6700, n=3)
6585 Points -51%
Nvidia GeForce RTX 2080 Super
NVIDIA GeForce RTX 2080 Super (Desktop), R7 2700X
6500 Points -51%
Average AMD Radeon RX 5700 XT (Desktop)
  (4989 - 6500, n=7)
6119 Points -54%
AMD Radeon RX 5700 XT
AMD Radeon RX 5700 XT (Desktop), R7 2700X
5955 Points -55%
Nvidia GeForce RTX 2070 Super
NVIDIA GeForce RTX 2070 Super (Desktop), R7 2700X
5786 Points -57%
Average NVIDIA GeForce RTX 2070 Super (Desktop)
  (2290 - 5882, n=7)
5313 Points -60%
AMD Radeon RX 5700
AMD Radeon RX 5700 (Desktop), R7 2700X
5292 Points -60%
Fire Strike Extreme Graphics
AMD Radeon RX 6900 XT
AMD Radeon RX 6900 XT, R9 5950X
26650 Points
AMD Radeon RX 6800 XT
AMD Radeon RX 6800 XT, R9 5950X
25015 Points -6%
Average NVIDIA GeForce RTX 3090
  (22075 - 24730, n=13)
23822 Points -11%
Nvidia GeForce RTX 3090 Founders Edition
NVIDIA GeForce RTX 3090, R9 5900X
22075 Points -17%
ASUS GeForce RTX 3080 ROG STRIX OC GAMING
NVIDIA GeForce RTX 3080, R9 5900X
20861 Points -22%
Average NVIDIA GeForce RTX 3080
  (20007 - 20861, n=2)
20434 Points -23%
Average NVIDIA Titan RTX
  (16484 - 20861, n=29)
17649 Points -34%
AMD Ryzen 9 5900X
NVIDIA Titan RTX, R9 5900X
17176 Points -36%
Average NVIDIA GeForce RTX 2080 Ti (Desktop)
  (15603 - 16856, n=3)
16416 Points -38%
MSI GeForce RTX 3070 Gaming X Trio
NVIDIA GeForce RTX 3070, R9 5900X
16196 Points -39%
Average NVIDIA GeForce RTX 3070
  (15503 - 16276, n=5)
15859 Points -40%
KFA2 GeForce RTX 2080 Ti EX
NVIDIA GeForce RTX 2080 Ti (Desktop), R9 3900X
15603 Points -41%
Average NVIDIA GeForce RTX 2080 Super (Desktop)
  (12968 - 13551, n=3)
13172 Points -51%
Nvidia GeForce RTX 2080 Super
NVIDIA GeForce RTX 2080 Super (Desktop), R7 2700X
12968 Points -51%
Average AMD Radeon RX 5700 XT (Desktop)
  (12178 - 12921, n=6)
12611 Points -53%
AMD Radeon RX 5700 XT
AMD Radeon RX 5700 XT (Desktop), R7 2700X
12209 Points -54%
Average NVIDIA GeForce RTX 2070 Super (Desktop)
  (11382 - 12044, n=7)
11850 Points -56%
Nvidia GeForce RTX 2070 Super
NVIDIA GeForce RTX 2070 Super (Desktop), R7 2700X
11634 Points -56%
AMD Radeon RX 5700
AMD Radeon RX 5700 (Desktop), R7 2700X
10876 Points -59%
2560x1440 Port Royal Graphics
Average NVIDIA GeForce RTX 3090
  (12255 - 13075, n=5)
12728 Points +33%
Nvidia GeForce RTX 3090 Founders Edition
NVIDIA GeForce RTX 3090, R9 5900X
12384 Points +29%
Average NVIDIA GeForce RTX 3080
  (11238 - 11433, n=2)
11336 Points +18%
ASUS GeForce RTX 3080 ROG STRIX OC GAMING
NVIDIA GeForce RTX 3080, R9 5900X
11238 Points +17%
AMD Radeon RX 6900 XT
AMD Radeon RX 6900 XT, R9 5950X
9585 Points
AMD Ryzen 9 5900X
NVIDIA Titan RTX, R9 5900X
9335 Points -3%
AMD Ryzen 9 5900X
NVIDIA Titan RTX, R9 5900X
9239 Points -4%
Average NVIDIA Titan RTX
  (8945 - 9528, n=24)
9303 Points -3%
Average NVIDIA GeForce RTX 2080 Ti (Desktop)
  (8537 - 9021, n=2)
8779 Points -8%
KFA2 GeForce RTX 2080 Ti EX
NVIDIA GeForce RTX 2080 Ti (Desktop), R9 3900X
8537 Points -11%
MSI GeForce RTX 3070 Gaming X Trio
NVIDIA GeForce RTX 3070, R9 5900X
8191 Points -15%
Average NVIDIA GeForce RTX 3070
  (7796 - 8191, n=5)
7941 Points -17%
Average NVIDIA GeForce RTX 2080 Super (Desktop)
  (6745 - 6947, n=3)
6873 Points -28%
Nvidia GeForce RTX 2080 Super
NVIDIA GeForce RTX 2080 Super (Desktop), R7 2700X
6745 Points -30%
Nvidia GeForce RTX 2070 Super
NVIDIA GeForce RTX 2070 Super (Desktop), R7 2700X
5840 Points -39%
Average NVIDIA GeForce RTX 2070 Super (Desktop)
  (5725 - 5988, n=5)
5838 Points -39%
Unigine Heaven 4.0
Extreme Preset DX11
Average NVIDIA GeForce RTX 3090
  (272 - 315, n=10)
299 fps +15%
Nvidia GeForce RTX 3090 Founders Edition
NVIDIA GeForce RTX 3090, R9 5900X
274 fps +6%
AMD Radeon RX 6900 XT
AMD Radeon RX 6900 XT, R9 5950X
259.5 (49.3min - 537.2max) fps
AMD Radeon RX 6800 XT
AMD Radeon RX 6800 XT, R9 5950X
247.9 fps -4%
Average NVIDIA GeForce RTX 3080
  (233 - 253, n=2)
243 fps -6%
AMD Ryzen 9 5900X
NVIDIA Titan RTX, R9 5900X
237.1 fps -9%
Average NVIDIA Titan RTX
  (207 - 248, n=12)
236 fps -9%
ASUS GeForce RTX 3080 ROG STRIX OC GAMING
NVIDIA GeForce RTX 3080, R9 5900X
232.6 fps -10%
Average NVIDIA GeForce RTX 2080 Ti (Desktop)
  (215 - 226, n=3)
222 fps -14%
KFA2 GeForce RTX 2080 Ti EX
NVIDIA GeForce RTX 2080 Ti (Desktop), R9 3900X
215.2 fps -17%
Average NVIDIA GeForce RTX 3070
  (196.4 - 214, n=5)
206 fps -21%
MSI GeForce RTX 3070 Gaming X Trio
NVIDIA GeForce RTX 3070, R9 5900X
202.5 fps -22%
Nvidia GeForce RTX 2080 Super
NVIDIA GeForce RTX 2080 Super (Desktop), R7 2700X
175.2 fps -32%
Average NVIDIA GeForce RTX 2080 Super (Desktop)
 
175.2 fps -32%
Average NVIDIA GeForce RTX 2070 Super (Desktop)
  (160.1 - 172.3, n=4)
167.1 fps -36%
Nvidia GeForce RTX 2070 Super
NVIDIA GeForce RTX 2070 Super (Desktop), R7 2700X
160.1 fps -38%
Average AMD Radeon RX 5700 XT (Desktop)
  (132.5 - 144.7, n=5)
136.8 fps -47%
AMD Radeon RX 5700 XT
AMD Radeon RX 5700 XT (Desktop), R7 2700X
132.5 fps -49%
AMD Radeon RX 5700
AMD Radeon RX 5700 (Desktop), R7 2700X
119.9 fps -54%
Extreme Preset OpenGL
Average NVIDIA GeForce RTX 3090
  (188.2 - 284, n=9)
268 fps +30%
Average NVIDIA GeForce RTX 3080
  (232 - 243, n=2)
238 fps +15%
ASUS GeForce RTX 3080 ROG STRIX OC GAMING
NVIDIA GeForce RTX 3080, R9 5900X
232.4 fps +13%
Average NVIDIA Titan RTX
  (203 - 299, n=12)
223 fps +8%
AMD Ryzen 9 5900X
NVIDIA Titan RTX, R9 5900X
215.1 fps +4%
AMD Radeon RX 6900 XT
AMD Radeon RX 6900 XT, R9 5950X
206.5 (8.2min - 453.7max) fps
Average NVIDIA GeForce RTX 2080 Ti (Desktop)
  (202 - 213, n=3)
206 fps 0%
KFA2 GeForce RTX 2080 Ti EX
NVIDIA GeForce RTX 2080 Ti (Desktop), R9 3900X
204.4 fps -1%
AMD Radeon RX 6800 XT
AMD Radeon RX 6800 XT, R9 5950X
204 fps -1%
MSI GeForce RTX 3070 Gaming X Trio
NVIDIA GeForce RTX 3070, R9 5900X
196.1 fps -5%
Average NVIDIA GeForce RTX 3070
  (187.5 - 196.1, n=4)
192.5 fps -7%
Nvidia GeForce RTX 3090 Founders Edition
NVIDIA GeForce RTX 3090, R9 5900X
188.2 fps -9%
Nvidia GeForce RTX 2080 Super
NVIDIA GeForce RTX 2080 Super (Desktop), R7 2700X
167.5 fps -19%
Average NVIDIA GeForce RTX 2080 Super (Desktop)
 
167.5 fps -19%
Average NVIDIA GeForce RTX 2070 Super (Desktop)
  (153.5 - 157.1, n=4)
155.4 fps -25%
Nvidia GeForce RTX 2070 Super
NVIDIA GeForce RTX 2070 Super (Desktop), R7 2700X
153.5 fps -26%
Average AMD Radeon RX 5700 XT (Desktop)
  (97.8 - 161.9, n=6)
124.7 fps -40%
AMD Radeon RX 5700 XT
AMD Radeon RX 5700 XT (Desktop), R7 2700X
110.2 fps -47%
AMD Radeon RX 5700
AMD Radeon RX 5700 (Desktop), R7 2700X
100.7 fps -51%
Unigine Valley 1.0
1920x1080 Extreme HD DirectX AA:x8
Average NVIDIA GeForce RTX 3090
  (184.2 - 245, n=10)
223 fps +11%
AMD Radeon RX 6900 XT
AMD Radeon RX 6900 XT, R9 5950X
200.8 (53.4min - 359.1max) fps
Nvidia GeForce RTX 3090 Founders Edition
NVIDIA GeForce RTX 3090, R9 5900X
192.4 fps -4%
AMD Radeon RX 6800 XT
AMD Radeon RX 6800 XT, R9 5950X
190.6 fps -5%
AMD Ryzen 9 5900X
NVIDIA Titan RTX, R9 5900X
180.1 fps -10%
Average NVIDIA GeForce RTX 3080
  (176.2 - 181.8, n=2)
179 fps -11%
ASUS GeForce RTX 3080 ROG STRIX OC GAMING
NVIDIA GeForce RTX 3080, R9 5900X
176.2 fps -12%
Average NVIDIA Titan RTX
  (135 - 191.4, n=12)
173.3 fps -14%
Average NVIDIA GeForce RTX 2080 Ti (Desktop)
  (159.4 - 164.1, n=3)
162.2 fps -19%
Average NVIDIA GeForce RTX 3070
  (155.1 - 168.5, n=5)
161.2 fps -20%
KFA2 GeForce RTX 2080 Ti EX
NVIDIA GeForce RTX 2080 Ti (Desktop), R9 3900X
159.4 fps -21%
MSI GeForce RTX 3070 Gaming X Trio
NVIDIA GeForce RTX 3070, R9 5900X
155.1 fps -23%
Average NVIDIA GeForce RTX 2070 Super (Desktop)
  (113.7 - 127.4, n=4)
122.5 fps -39%
Nvidia GeForce RTX 2080 Super
NVIDIA GeForce RTX 2080 Super (Desktop), R7 2700X
120.2 fps -40%
Average NVIDIA GeForce RTX 2080 Super (Desktop)
 
120.2 fps -40%
Nvidia GeForce RTX 2070 Super
NVIDIA GeForce RTX 2070 Super (Desktop), R7 2700X
113.7 fps -43%
Average AMD Radeon RX 5700 XT (Desktop)
  (106.3 - 116, n=4)
111.5 fps -44%
AMD Radeon RX 5700 XT
AMD Radeon RX 5700 XT (Desktop), R7 2700X
106.3 fps -47%
AMD Radeon RX 5700
AMD Radeon RX 5700 (Desktop), R7 2700X
99.3 fps -51%
1920x1080 Extreme HD Preset OpenGL AA:x8
Average NVIDIA GeForce RTX 3090
  (158.8 - 211, n=9)
201 fps +20%
Average NVIDIA GeForce RTX 3080
  (163.8 - 172, n=2)
167.9 fps 0%
AMD Radeon RX 6900 XT
AMD Radeon RX 6900 XT, R9 5950X
167.4 (56.7min - 375.7max) fps
ASUS GeForce RTX 3080 ROG STRIX OC GAMING
NVIDIA GeForce RTX 3080, R9 5900X
163.8 fps -2%
Nvidia GeForce RTX 3090 Founders Edition
NVIDIA GeForce RTX 3090, R9 5900X
158.8 fps -5%
AMD Ryzen 9 5900X
NVIDIA Titan RTX, R9 5900X
158.5 fps -5%
AMD Radeon RX 6800 XT
AMD Radeon RX 6800 XT, R9 5950X
158.2 fps -5%
Average NVIDIA Titan RTX
  (139.2 - 181.2, n=12)
158.1 fps -6%
Average NVIDIA GeForce RTX 2080 Ti (Desktop)
  (144.5 - 147.8, n=3)
145.8 fps -13%
KFA2 GeForce RTX 2080 Ti EX
NVIDIA GeForce RTX 2080 Ti (Desktop), R9 3900X
145.1 fps -13%
MSI GeForce RTX 3070 Gaming X Trio
NVIDIA GeForce RTX 3070, R9 5900X
142.9 fps -15%
Average NVIDIA GeForce RTX 3070
  (140.2 - 144.9, n=4)
142.7 fps -15%
Nvidia GeForce RTX 2080 Super
NVIDIA GeForce RTX 2080 Super (Desktop), R7 2700X
114.5 fps -32%
Average NVIDIA GeForce RTX 2080 Super (Desktop)
 
114.5 fps -32%
Average NVIDIA GeForce RTX 2070 Super (Desktop)
  (105.6 - 112, n=4)
109.5 fps -35%
Nvidia GeForce RTX 2070 Super
NVIDIA GeForce RTX 2070 Super (Desktop), R7 2700X
105.6 fps -37%
Average AMD Radeon RX 5700 XT (Desktop)
  (88.5 - 108.5, n=5)
92.8 fps -45%
AMD Radeon RX 5700 XT
AMD Radeon RX 5700 XT (Desktop), R7 2700X
89.1 fps -47%
AMD Radeon RX 5700
AMD Radeon RX 5700 (Desktop), R7 2700X
82.7 fps -51%
Unigine Superposition
1280x720 720p Low
Average NVIDIA GeForce RTX 3090
  (33329 - 54879, n=9)
45093 Points +22%
AMD Ryzen 9 5900X
NVIDIA Titan RTX, R9 5900X
40994 Points +11%
Average NVIDIA Titan RTX
  (25622 - 50876, n=9)
40891 Points +10%
Average NVIDIA GeForce RTX 2070 Super (Desktop)
  (26742 - 45424, n=3)
38495 Points +4%
Average AMD Radeon RX 5700 XT (Desktop)
  (28674 - 42884, n=3)
37187 Points 0%
AMD Radeon RX 6900 XT
AMD Radeon RX 6900 XT, R9 5950X
37023 Points
AMD Radeon RX 6800 XT
AMD Radeon RX 6800 XT, R9 5950X
36452 Points -2%
Nvidia GeForce RTX 3090 Founders Edition
NVIDIA GeForce RTX 3090, R9 5900X
34649 Points -6%
Average NVIDIA GeForce RTX 3070
  (27330 - 40007, n=5)
34576 Points -7%
MSI GeForce RTX 3070 Gaming X Trio
NVIDIA GeForce RTX 3070, R9 5900X
31666 Points -14%
Average NVIDIA GeForce RTX 3080
  (30851 - 32183, n=2)
31517 Points -15%
ASUS GeForce RTX 3080 ROG STRIX OC GAMING
NVIDIA GeForce RTX 3080, R9 5900X
30851 Points -17%
Average NVIDIA GeForce RTX 2080 Super (Desktop)
 
26907 Points -27%
1920x1080 1080p High
Average NVIDIA GeForce RTX 3090
  (23626 - 27207, n=10)
25978 Points +4%
AMD Radeon RX 6900 XT
AMD Radeon RX 6900 XT, R9 5950X
25029 Points
Nvidia GeForce RTX 3090 Founders Edition
NVIDIA GeForce RTX 3090, R9 5900X
23853 Points -5%
AMD Radeon RX 6800 XT
AMD Radeon RX 6800 XT, R9 5950X
22265 Points -11%
Average NVIDIA GeForce RTX 3080
  (21333 - 21912, n=2)
21623 Points -14%
ASUS GeForce RTX 3080 ROG STRIX OC GAMING
NVIDIA GeForce RTX 3080, R9 5900X
21333 Points -15%
AMD Ryzen 9 5900X
NVIDIA Titan RTX, R9 5900X
20315 Points -19%
Average NVIDIA Titan RTX
  (19460 - 20658, n=9)
20301 Points -19%
MSI GeForce RTX 3070 Gaming X Trio
NVIDIA GeForce RTX 3070, R9 5900X
17346 Points -31%
Average NVIDIA GeForce RTX 3070
  (17054 - 17491, n=5)
17312 Points -31%
Average NVIDIA GeForce RTX 2080 Super (Desktop)
 
15558 Points -38%
Average NVIDIA GeForce RTX 2070 Super (Desktop)
  (13655 - 13832, n=3)
13765 Points -45%
Average AMD Radeon RX 5700 XT (Desktop)
  (11874 - 11902, n=3)
11886 Points -53%
1920x1080 1080p Extreme
Average NVIDIA GeForce RTX 3090
  (11806 - 12694, n=10)
12227 Points +14%
Nvidia GeForce RTX 3090 Founders Edition
NVIDIA GeForce RTX 3090, R9 5900X
11806 Points +11%
Average NVIDIA GeForce RTX 3080
  (10572 - 10822, n=2)
10697 Points 0%
AMD Radeon RX 6900 XT
AMD Radeon RX 6900 XT, R9 5950X
10683 Points
ASUS GeForce RTX 3080 ROG STRIX OC GAMING
NVIDIA GeForce RTX 3080, R9 5900X
10572 Points -1%
AMD Radeon RX 6800 XT
AMD Radeon RX 6800 XT, R9 5950X
10046 Points -6%
AMD Ryzen 9 5900X
NVIDIA Titan RTX, R9 5900X
9056 Points -15%
Average NVIDIA Titan RTX
  (8916 - 9285, n=9)
9051 Points -15%
MSI GeForce RTX 3070 Gaming X Trio
NVIDIA GeForce RTX 3070, R9 5900X
8507 Points -20%
Average NVIDIA GeForce RTX 3070
  (8276 - 8507, n=5)
8354 Points -22%
Average NVIDIA GeForce RTX 2080 Super (Desktop)
 
7080 Points -34%
Average NVIDIA GeForce RTX 2070 Super (Desktop)
  (6161 - 6178, n=3)
6169 Points -42%
Average AMD Radeon RX 5700 XT (Desktop)
  (4901 - 4967, n=3)
4927 Points -54%
3840x2160 4k Optimized
Average NVIDIA GeForce RTX 3090
  (15794 - 16868, n=10)
16352 Points +9%
Nvidia GeForce RTX 3090 Founders Edition
NVIDIA GeForce RTX 3090, R9 5900X
15794 Points +6%
AMD Radeon RX 6900 XT
AMD Radeon RX 6900 XT, R9 5950X
14955 Points
Average NVIDIA GeForce RTX 3080
  (13984 - 14243, n=2)
14114 Points -6%
ASUS GeForce RTX 3080 ROG STRIX OC GAMING
NVIDIA GeForce RTX 3080, R9 5900X
13984 Points -6%
AMD Radeon RX 6800 XT
AMD Radeon RX 6800 XT, R9 5950X
13471 Points -10%
Average NVIDIA Titan RTX
  (11937 - 12644, n=9)
12203 Points -18%
AMD Ryzen 9 5900X
NVIDIA Titan RTX, R9 5900X
12186 Points -19%
MSI GeForce RTX 3070 Gaming X Trio
NVIDIA GeForce RTX 3070, R9 5900X
10755 Points -28%
Average NVIDIA GeForce RTX 3070
  (10544 - 10755, n=5)
10667 Points -29%
Average NVIDIA GeForce RTX 2080 Super (Desktop)
 
9338 Points -38%
Average NVIDIA GeForce RTX 2070 Super (Desktop)
  (8096 - 8111, n=3)
8101 Points -46%
Average AMD Radeon RX 5700 XT (Desktop)
  (6885 - 7034, n=3)
6973 Points -53%
7680x4320 8k Optimized
Average NVIDIA GeForce RTX 3090
  (6969 - 7521, n=10)
7160 Points +24%
Nvidia GeForce RTX 3090 Founders Edition
NVIDIA GeForce RTX 3090, R9 5900X
7002 Points +21%
Average NVIDIA GeForce RTX 3080
  (6243 - 6346, n=2)
6295 Points +9%
ASUS GeForce RTX 3080 ROG STRIX OC GAMING
NVIDIA GeForce RTX 3080, R9 5900X
6243 Points +8%
AMD Radeon RX 6900 XT
AMD Radeon RX 6900 XT, R9 5950X
5764 Points
AMD Ryzen 9 5900X
NVIDIA Titan RTX, R9 5900X
5402 Points -6%
Average NVIDIA Titan RTX
  (5255 - 5571, n=9)
5393 Points -6%
AMD Radeon RX 6800 XT
AMD Radeon RX 6800 XT, R9 5950X
5256 Points -9%
MSI GeForce RTX 3070 Gaming X Trio
NVIDIA GeForce RTX 3070, R9 5900X
4695 Points -19%
Average NVIDIA GeForce RTX 3070
  (4587 - 4695, n=5)
4624 Points -20%
Average NVIDIA GeForce RTX 2080 Super (Desktop)
 
3989 Points -31%
Average NVIDIA GeForce RTX 2070 Super (Desktop)
  (3419 - 3435, n=3)
3429 Points -41%
Average AMD Radeon RX 5700 XT (Desktop)
  (2867 - 2887, n=3)
2877 Points -50%
3DMark 11 Performance
42418 points
3DMark Fire Strike Score
39057 points
3DMark Fire Strike Extreme Score
25197 points
3DMark Time Spy Score
17549 points
Help

Compute Benchmarks

The RX 6900 XT puts up a decent show against the RTX 3090 in compute benchmarks. In ComputeMark, we see AMD's top offering trailing between 3% and 26% behind the RTX 3090 depending on the test. Interestingly, LuxMark seems to showcase the full might of RDNA 2's compute prowess with the RX 6900 XT showing a whopping 114% lead over the RTX 3090 in the Sala GPU-only test, though the card does take a hit by about 12% in the Room GPUs-only benchmark.  

Performance in Geekbench 5.3 compute using OpenCL and Vulkan does not seem to be impressive with even the RTX 3080 offering marginally better performance than the RX 6900 XT in OpenCL. Though fortunes reverse in the Vulkan part of the test when compared with the RTX 3080, the RTX 3090 Founders Edition here still manages a comfortable 67% lead over the RX 6900 XT.

ComputeMark v2.1
1024x600 Normal, QJuliaRayTrace
Average NVIDIA GeForce RTX 3090
  (16403 - 18223, n=9)
17439 Points +42%
Nvidia GeForce RTX 3090 Founders Edition
NVIDIA GeForce RTX 3090, R9 5900X
16543 Points +35%
Average NVIDIA GeForce RTX 3080
  (14718 - 15508, n=2)
15113 Points +23%
ASUS GeForce RTX 3080 ROG STRIX OC GAMING
NVIDIA GeForce RTX 3080, R9 5900X
14718 Points +20%
AMD Radeon RX 6900 XT
AMD Radeon RX 6900 XT, R9 5950X
12255 Points
MSI GeForce RTX 3070 Gaming X Trio
NVIDIA GeForce RTX 3070, R9 5900X
11816 Points -4%
Average NVIDIA GeForce RTX 3070
  (11510 - 11816, n=3)
11665 Points -5%
AMD Radeon RX 6800 XT
AMD Radeon RX 6800 XT, R9 5950X
11304 Points -8%
Average NVIDIA Titan RTX
  (9418 - 10129, n=3)
9748 Points -20%
Average NVIDIA GeForce RTX 2080 Ti (Desktop)
  (9104 - 9690, n=3)
9492 Points -23%
KFA2 GeForce RTX 2080 Ti EX
NVIDIA GeForce RTX 2080 Ti (Desktop), R9 3900X
9104 Points -26%
Nvidia GeForce RTX 2080 Super
NVIDIA GeForce RTX 2080 Super (Desktop), R7 2700X
7258 Points -41%
Average NVIDIA GeForce RTX 2080 Super (Desktop)
 
7258 Points -41%
Average NVIDIA GeForce RTX 2070 Super (Desktop)
  (6155 - 6158, n=2)
6157 Points -50%
Nvidia GeForce RTX 2070 Super
NVIDIA GeForce RTX 2070 Super (Desktop), R7 2700X
6155 Points -50%
AMD Radeon RX 5700 XT
AMD Radeon RX 5700 XT (Desktop), R7 2700X
5761 Points -53%
Average AMD Radeon RX 5700 XT (Desktop)
  (5677 - 5761, n=2)
5719 Points -53%
AMD Radeon RX 5700
AMD Radeon RX 5700 (Desktop), R7 2700X
4703 Points -62%
1024x600 Normal, Mandel Scalar
Average NVIDIA GeForce RTX 3090
  (10650 - 11564, n=9)
11171 Points +3%
AMD Radeon RX 6900 XT
AMD Radeon RX 6900 XT, R9 5950X
10834 Points
Nvidia GeForce RTX 3090 Founders Edition
NVIDIA GeForce RTX 3090, R9 5900X
10650 Points -2%
AMD Radeon RX 6800 XT
AMD Radeon RX 6800 XT, R9 5950X
10018 Points -8%
Average NVIDIA GeForce RTX 3080
  (9554 - 9938, n=2)
9746 Points -10%
ASUS GeForce RTX 3080 ROG STRIX OC GAMING
NVIDIA GeForce RTX 3080, R9 5900X
9554 Points -12%
MSI GeForce RTX 3070 Gaming X Trio
NVIDIA GeForce RTX 3070, R9 5900X
7314 Points -32%
Average NVIDIA GeForce RTX 3070
  (7042 - 7314, n=3)
7169 Points -34%
Average NVIDIA Titan RTX
  (5977 - 6406, n=3)
6184 Points -43%
Average NVIDIA GeForce RTX 2080 Ti (Desktop)
  (5679 - 6226, n=3)
6010 Points -45%
KFA2 GeForce RTX 2080 Ti EX
NVIDIA GeForce RTX 2080 Ti (Desktop), R9 3900X
5679 Points -48%
AMD Radeon RX 5700 XT
AMD Radeon RX 5700 XT (Desktop), R7 2700X
4869 Points -55%
Average AMD Radeon RX 5700 XT (Desktop)
  (4846 - 4869, n=2)
4858 Points -55%
Nvidia GeForce RTX 2080 Super
NVIDIA GeForce RTX 2080 Super (Desktop), R7 2700X
4525 Points -58%
Average NVIDIA GeForce RTX 2080 Super (Desktop)
 
4525 Points -58%
AMD Radeon RX 5700
AMD Radeon RX 5700 (Desktop), R7 2700X
4043 Points -63%
Nvidia GeForce RTX 2070 Super
NVIDIA GeForce RTX 2070 Super (Desktop), R7 2700X
3782 Points -65%
Average NVIDIA GeForce RTX 2070 Super (Desktop)
  (3748 - 3782, n=2)
3765 Points -65%
1024x600 Normal, Mandel Vector
Average NVIDIA GeForce RTX 3090
  (8038 - 10097, n=9)
9437 Points +9%
Nvidia GeForce RTX 3090 Founders Edition
NVIDIA GeForce RTX 3090, R9 5900X
9236 Points +6%
AMD Radeon RX 6900 XT
AMD Radeon RX 6900 XT, R9 5950X
8690 Points
AMD Radeon RX 6800 XT
AMD Radeon RX 6800 XT, R9 5950X
8399 Points -3%
Average NVIDIA GeForce RTX 3080
  (7148 - 7540, n=2)
7344 Points -15%
ASUS GeForce RTX 3080 ROG STRIX OC GAMING
NVIDIA GeForce RTX 3080, R9 5900X
7148 Points -18%
Average NVIDIA GeForce RTX 3070
  (5364 - 6266, n=3)
5707 Points -34%
MSI GeForce RTX 3070 Gaming X Trio
NVIDIA GeForce RTX 3070, R9 5900X
5490 Points -37%
Average NVIDIA Titan RTX
  (4944 - 5440, n=3)
5158 Points -41%
Average NVIDIA GeForce RTX 2080 Ti (Desktop)
  (4695 - 5092, n=3)
4941 Points -43%
KFA2 GeForce RTX 2080 Ti EX
NVIDIA GeForce RTX 2080 Ti (Desktop), R9 3900X
4695 Points -46%
Average AMD Radeon RX 5700 XT (Desktop)
  (4246 - 4371, n=2)
4309 Points -50%
AMD Radeon RX 5700 XT
AMD Radeon RX 5700 XT (Desktop), R7 2700X
4246 Points -51%
Nvidia GeForce RTX 2080 Super
NVIDIA GeForce RTX 2080 Super (Desktop), R7 2700X
3835 Points -56%
Average NVIDIA GeForce RTX 2080 Super (Desktop)
 
3835 Points -56%
AMD Radeon RX 5700
AMD Radeon RX 5700 (Desktop), R7 2700X
3532 Points -59%
Nvidia GeForce RTX 2070 Super
NVIDIA GeForce RTX 2070 Super (Desktop), R7 2700X
3358 Points -61%
Average NVIDIA GeForce RTX 2070 Super (Desktop)
  (3348 - 3358, n=2)
3353 Points -61%
1024x600 Normal, Fluid 2DTexArr
Average NVIDIA GeForce RTX 3090
  (4344 - 4608, n=9)
4497 Points +15%
Nvidia GeForce RTX 3090 Founders Edition
NVIDIA GeForce RTX 3090, R9 5900X
4344 Points +11%
Average NVIDIA GeForce RTX 3080
  (4087 - 4159, n=2)
4123 Points +5%
ASUS GeForce RTX 3080 ROG STRIX OC GAMING
NVIDIA GeForce RTX 3080, R9 5900X
4087 Points +4%
AMD Radeon RX 6800 XT
AMD Radeon RX 6800 XT, R9 5950X
3947 Points +1%
AMD Radeon RX 6900 XT
AMD Radeon RX 6900 XT, R9 5950X
3924 Points
Average NVIDIA Titan RTX
  (3691 - 3828, n=3)
3757 Points -4%
Average NVIDIA GeForce RTX 2080 Ti (Desktop)
  (3444 - 3539, n=3)
3499 Points -11%
KFA2 GeForce RTX 2080 Ti EX
NVIDIA GeForce RTX 2080 Ti (Desktop), R9 3900X
3444 Points -12%
MSI GeForce RTX 3070 Gaming X Trio
NVIDIA GeForce RTX 3070, R9 5900X
2704 Points -31%
Average NVIDIA GeForce RTX 3070
  (2666 - 2706, n=3)
2692 Points -31%
Nvidia GeForce RTX 2080 Super
NVIDIA GeForce RTX 2080 Super (Desktop), R7 2700X
2655 Points -32%
Average NVIDIA GeForce RTX 2080 Super (Desktop)
 
2655 Points -32%
Average NVIDIA GeForce RTX 2070 Super (Desktop)
  (2331 - 2354, n=2)
2343 Points -40%
Nvidia GeForce RTX 2070 Super
NVIDIA GeForce RTX 2070 Super (Desktop), R7 2700X
2331 Points -41%
Average AMD Radeon RX 5700 XT (Desktop)
  (1960 - 2005, n=2)
1983 Points -49%
AMD Radeon RX 5700 XT
AMD Radeon RX 5700 XT (Desktop), R7 2700X
1960 Points -50%
AMD Radeon RX 5700
AMD Radeon RX 5700 (Desktop), R7 2700X
1810 Points -54%
1024x600 Normal, Fluid 3DTex
Average NVIDIA GeForce RTX 3090
  (5246 - 5520, n=9)
5444 Points +6%
Nvidia GeForce RTX 3090 Founders Edition
NVIDIA GeForce RTX 3090, R9 5900X
5246 Points +2%
AMD Radeon RX 6800 XT
AMD Radeon RX 6800 XT, R9 5950X
5154 Points 0%
AMD Radeon RX 6900 XT
AMD Radeon RX 6900 XT, R9 5950X
5154 Points
Average NVIDIA GeForce RTX 3080
  (4417 - 4450, n=2)
4434 Points -14%
ASUS GeForce RTX 3080 ROG STRIX OC GAMING
NVIDIA GeForce RTX 3080, R9 5900X
4417 Points -14%
Average NVIDIA Titan RTX
  (3877 - 4027, n=3)
3955 Points -23%
Average NVIDIA GeForce RTX 2080 Ti (Desktop)
  (3589 - 3653, n=3)
3625 Points -30%
KFA2 GeForce RTX 2080 Ti EX
NVIDIA GeForce RTX 2080 Ti (Desktop), R9 3900X
3589 Points -30%
MSI GeForce RTX 3070 Gaming X Trio
NVIDIA GeForce RTX 3070, R9 5900X
2776 Points -46%
Average NVIDIA GeForce RTX 3070
  (2749 - 2791, n=3)
2772 Points -46%
Nvidia GeForce RTX 2080 Super
NVIDIA GeForce RTX 2080 Super (Desktop), R7 2700X
2736 Points -47%
Average NVIDIA GeForce RTX 2080 Super (Desktop)
 
2736 Points -47%
Average NVIDIA GeForce RTX 2070 Super (Desktop)
  (2456 - 2486, n=2)
2471 Points -52%
Nvidia GeForce RTX 2070 Super
NVIDIA GeForce RTX 2070 Super (Desktop), R7 2700X
2456 Points -52%
Average AMD Radeon RX 5700 XT (Desktop)
  (2349 - 2376, n=2)
2363 Points -54%
AMD Radeon RX 5700 XT
AMD Radeon RX 5700 XT (Desktop), R7 2700X
2349 Points -54%
AMD Radeon RX 5700
AMD Radeon RX 5700 (Desktop), R7 2700X
2294 Points -55%
1024x600 Normal, Score
Average NVIDIA GeForce RTX 3090
  (44948 - 49118, n=8)
47736 Points +17%
Nvidia GeForce RTX 3090 Founders Edition
NVIDIA GeForce RTX 3090, R9 5900X
46018 Points +13%
AMD Radeon RX 6900 XT
AMD Radeon RX 6900 XT, R9 5950X
40857 Points
Average NVIDIA GeForce RTX 3080
  (39924 - 41594, n=2)
40759 Points 0%
ASUS GeForce RTX 3080 ROG STRIX OC GAMING
NVIDIA GeForce RTX 3080, R9 5900X
39924 Points -2%
AMD Radeon RX 6800 XT
AMD Radeon RX 6800 XT, R9 5950X
38823 Points -5%
MSI GeForce RTX 3070 Gaming X Trio
NVIDIA GeForce RTX 3070, R9 5900X
30100 Points -26%
Average NVIDIA GeForce RTX 3070
  (29330 - 30581, n=3)
30004 Points -27%
Average NVIDIA Titan RTX
  (27907 - 29830, n=3)
28802 Points -30%
Average NVIDIA GeForce RTX 2080 Ti (Desktop)
  (26510 - 28145, n=3)
27567 Points -33%
KFA2 GeForce RTX 2080 Ti EX
NVIDIA GeForce RTX 2080 Ti (Desktop), R9 3900X
26510 Points -35%
Nvidia GeForce RTX 2080 Super
NVIDIA GeForce RTX 2080 Super (Desktop), R7 2700X
21009 Points -49%
Average NVIDIA GeForce RTX 2080 Super (Desktop)
 
21009 Points -49%
Average AMD Radeon RX 5700 XT (Desktop)
  (19184 - 19274, n=2)
19229 Points -53%
AMD Radeon RX 5700 XT
AMD Radeon RX 5700 XT (Desktop), R7 2700X
19184 Points -53%
Average NVIDIA GeForce RTX 2070 Super (Desktop)
  (18083 - 18095, n=2)
18089 Points -56%
Nvidia GeForce RTX 2070 Super
NVIDIA GeForce RTX 2070 Super (Desktop), R7 2700X
18083 Points -56%
AMD Radeon RX 5700
AMD Radeon RX 5700 (Desktop), R7 2700X
16383 Points -60%
LuxMark v2.0 64Bit
Room GPUs-only
Average NVIDIA GeForce RTX 3090
  (5727 - 5974, n=8)
5881 Samples/s +16%
Nvidia GeForce RTX 3090 Founders Edition
NVIDIA GeForce RTX 3090, R9 5900X
5808 Samples/s +14%
Average NVIDIA GeForce RTX 3080
  (5112 - 5198, n=2)
5155 Samples/s +1%
ASUS GeForce RTX 3080 ROG STRIX OC GAMING
NVIDIA GeForce RTX 3080, R9 5900X
5112 Samples/s +1%
AMD Radeon RX 6900 XT
AMD Radeon RX 6900 XT, R9 5950X
5084 Samples/s
AMD Radeon RX 6800 XT
AMD Radeon RX 6800 XT, R9 5950X
5057 Samples/s -1%
Average NVIDIA Titan RTX
  (4643 - 4703, n=2)
4673 Samples/s -8%
Average NVIDIA GeForce RTX 2080 Ti (Desktop)
  (4425 - 4494, n=3)
4449 Samples/s -12%
KFA2 GeForce RTX 2080 Ti EX
NVIDIA GeForce RTX 2080 Ti (Desktop), R9 3900X
4429 Samples/s -13%
MSI GeForce RTX 3070 Gaming X Trio
NVIDIA GeForce RTX 3070, R9 5900X
4293 Samples/s -16%
Average NVIDIA GeForce RTX 3070
  (2187 - 4293, n=3)
3588 Samples/s -29%
Nvidia GeForce RTX 2080 Super
NVIDIA GeForce RTX 2080 Super (Desktop), R7 2700X
3430 Samples/s -33%
Average NVIDIA GeForce RTX 2080 Super (Desktop)
 
3430 Samples/s -33%
Nvidia GeForce RTX 2070 Super
NVIDIA GeForce RTX 2070 Super (Desktop), R7 2700X
3404 Samples/s -33%
Average NVIDIA GeForce RTX 2070 Super (Desktop)
 
3404 Samples/s -33%
AMD Radeon RX 5700 XT
AMD Radeon RX 5700 XT (Desktop), R7 2700X
2104 Samples/s -59%
Average AMD Radeon RX 5700 XT (Desktop)
  (1915 - 2104, n=2)
2010 Samples/s -60%
AMD Radeon RX 5700
AMD Radeon RX 5700 (Desktop), R7 2700X
1856 Samples/s -63%
Sala GPUs-only
AMD Radeon RX 6900 XT
AMD Radeon RX 6900 XT, R9 5950X
31400 Samples/s
AMD Radeon RX 6800 XT
AMD Radeon RX 6800 XT, R9 5950X
28023 Samples/s -11%
Average NVIDIA GeForce RTX 3090
  (14590 - 15088, n=8)
14908 Samples/s -53%
Nvidia GeForce RTX 3090 Founders Edition
NVIDIA GeForce RTX 3090, R9 5900X
14670 Samples/s -53%
Average NVIDIA GeForce RTX 3080
  (12797 - 12980, n=2)
12889 Samples/s -59%
ASUS GeForce RTX 3080 ROG STRIX OC GAMING
NVIDIA GeForce RTX 3080, R9 5900X
12797 Samples/s -59%
Average NVIDIA Titan RTX
  (10799 - 10996, n=2)
10898 Samples/s -65%
Average NVIDIA GeForce RTX 2080 Ti (Desktop)
  (9999 - 10291, n=3)
10156 Samples/s -68%
MSI GeForce RTX 3070 Gaming X Trio
NVIDIA GeForce RTX 3070, R9 5900X
10115 Samples/s -68%
Average NVIDIA GeForce RTX 3070
  (10096 - 10115, n=3)
10107 Samples/s -68%
KFA2 GeForce RTX 2080 Ti EX
NVIDIA GeForce RTX 2080 Ti (Desktop), R9 3900X
9999 Samples/s -68%
Nvidia GeForce RTX 2080 Super
NVIDIA GeForce RTX 2080 Super (Desktop), R7 2700X
7878 Samples/s -75%
Average NVIDIA GeForce RTX 2080 Super (Desktop)
 
7878 Samples/s -75%
Nvidia GeForce RTX 2070 Super
NVIDIA GeForce RTX 2070 Super (Desktop), R7 2700X
7594 Samples/s -76%
Average NVIDIA GeForce RTX 2070 Super (Desktop)
 
7594 Samples/s -76%
AMD Radeon RX 5700 XT
AMD Radeon RX 5700 XT (Desktop), R7 2700X
6188 Samples/s -80%
Average AMD Radeon RX 5700 XT (Desktop)
  (4650 - 6188, n=2)
5419 Samples/s -83%
AMD Radeon RX 5700
AMD Radeon RX 5700 (Desktop), R7 2700X
5312 Samples/s -83%
Geekbench 5.5
OpenCL Score
Average NVIDIA GeForce RTX 3090
  (199930 - 224611, n=19)
214008 Points +24%
Nvidia GeForce RTX 3090 Founders Edition
NVIDIA GeForce RTX 3090, R9 5900X
199930 Points +16%
ASUS GeForce RTX 3080 ROG STRIX OC GAMING
NVIDIA GeForce RTX 3080, R9 5900X
192091 Points +11%
Average NVIDIA GeForce RTX 3080
  (164477 - 192091, n=2)
178284 Points +3%
AMD Radeon RX 6900 XT
AMD Radeon RX 6900 XT, R9 5950X
172661 Points
AMD Radeon RX 6800 XT
AMD Radeon RX 6800 XT, R9 5950X
159072 Points -8%
AMD Ryzen 9 5900X
NVIDIA Titan RTX, R9 5900X
149070 Points -14%
Average NVIDIA Titan RTX
  (132850 - 153940, n=20)
140450 Points -19%
Average NVIDIA GeForce RTX 3070
  (134961 - 138625, n=4)
136574 Points -21%
MSI GeForce RTX 3070 Gaming X Trio
NVIDIA GeForce RTX 3070, R9 5900X
136521 Points -21%
Average NVIDIA GeForce RTX 2080 Super (Desktop)
  (118695 - 127035, n=3)
122884 Points -29%
Average NVIDIA GeForce RTX 2070 Super (Desktop)
  (102914 - 132850, n=2)
117882 Points -32%
Average AMD Radeon RX 5700 XT (Desktop)
  (56327 - 84682, n=2)
70505 Points -59%
Vulkan Score
Nvidia GeForce RTX 3090 Founders Edition
NVIDIA GeForce RTX 3090, R9 5900X
147831 Points +67%
Average NVIDIA GeForce RTX 3090
  (62516 - 168974, n=19)
128422 Points +45%
Average NVIDIA Titan RTX
  (70085 - 138172, n=20)
92754 Points +5%
AMD Radeon RX 6900 XT
AMD Radeon RX 6900 XT, R9 5950X
88587 Points
AMD Radeon RX 6800 XT
AMD Radeon RX 6800 XT, R9 5950X
81098 Points -8%
Average NVIDIA GeForce RTX 3080
  (76596 - 83486, n=2)
80041 Points -10%
Average NVIDIA GeForce RTX 2080 Super (Desktop)
  (62324 - 91321, n=3)
78667 Points -11%
Average NVIDIA GeForce RTX 2070 Super (Desktop)
  (76596 - 80530, n=2)
78563 Points -11%
AMD Ryzen 9 5900X
NVIDIA Titan RTX, R9 5900X
76596 Points -14%
ASUS GeForce RTX 3080 ROG STRIX OC GAMING
NVIDIA GeForce RTX 3080, R9 5900X
76596 Points -14%
Average NVIDIA GeForce RTX 3070
  (27460 - 107958, n=4)
71908 Points -19%
MSI GeForce RTX 3070 Gaming X Trio
NVIDIA GeForce RTX 3070, R9 5900X
62516 Points -29%
Average AMD Radeon RX 5700 XT (Desktop)
  (14776 - 57117, n=2)
35947 Points -59%

Professional applications

Navi 2x seems to show good performance gains in pro apps over the Navi 1x parts, and even the best of Ampere consumer offerings from NVIDIA. Although the Titan RTX and Quadro RTX 5000 are better choices overall when it comes to CAD/CAM, energy, automobile, and medical applications, individual component scores in the SPECviewperf tests show that the RX 6900 XT is no slouch, at least when it comes to specific 3D authoring and CAD workflows.

AMD Radeon RX 6900 XT
AMD Radeon RX 6900 XT, R9 5950X
AMD Radeon RX 6800 XT
AMD Radeon RX 6800 XT, R9 5950X
AMD Radeon RX 5700 XT
AMD Radeon RX 5700 XT (Desktop), R7 2700X
Nvidia GeForce RTX 3090 Founders Edition
NVIDIA GeForce RTX 3090, R9 5900X
ASUS GeForce RTX 3080 ROG STRIX OC GAMING
NVIDIA GeForce RTX 3080, R9 5900X
AMD Ryzen 9 5900X
NVIDIA Titan RTX, R9 5900X
Acer ConceptD 9 Pro
NVIDIA Quadro RTX 5000 (Laptop), i9-9980HK
SPECviewperf 12
-15%
-45%
-31%
-35%
55%
49%
1900x1060 Solidworks (sw-03)
167
150
-10%
89.6
-46%
71.4
-57%
71.1
-57%
174.9
5%
230.1
38%
1900x1060 Siemens NX (snx-02)
47.7
45.07
-6%
35.27
-26%
14.8
-69%
13.27
-72%
273.2
473%
258.1
441%
1900x1060 Showcase (showcase-01)
241
223
-7%
137.8
-43%
239
-1%
199.9
-17%
191.1
-21%
126.4
-48%
1900x1060 Medical (medical-01)
88.4
77.3
-13%
46.9
-47%
47.2
-47%
50.8
-43%
90.7
3%
109.3
24%
1900x1060 Maya (maya-04)
151
118
-22%
86.5
-43%
190
26%
184.6
22%
188.3
25%
179
19%
1900x1060 Energy (energy-01)
30.8
28.39
-8%
12.72
-59%
20.6
-33%
18.47
-40%
28.31
-8%
26
-16%
1900x1060 Creo (creo-01)
127
119
-6%
66.9
-47%
74.8
-41%
74.2
-42%
173
36%
172.1
36%
1900x1060 Catia (catia-04)
292
238
-18%
158.8
-46%
127
-57%
126.1
-57%
262.7
-10%
220
-25%
1900x1060 3ds Max (3dsmax-05)
318
167
-47%
173.8
-45%
320
1%
275.6
-13%
292.6
-8%
235.8
-26%
SPECviewperf 13
-8%
-45%
-57%
-38%
44%
35%
Solidworks (sw-04)
214
193
-10%
114.4
-47%
82.9
-61%
92.4
-57%
196.4
-8%
203.8
-5%
Siemens NX (snx-03)
85.8
81.4
-5%
61.3
-29%
15.6
-82%
23.22
-73%
493.4
475%
465.3
442%
Showcase (showcase-02)
241
232
-4%
137.6
-43%
114
-53%
190.5
-21%
127.1
-47%
Medical (medical-02)
148
130
-12%
82.8
-44%
49.3
-67%
91.8
-38%
90.8
-39%
133.4
-10%
Maya (maya-05)
395
348
-12%
220.3
-44%
253
-36%
360.2
-9%
458
16%
340.8
-14%
Energy (energy-02)
60.6
58.4
-4%
26.82
-56%
26.6
-56%
36.08
-40%
52
-14%
57.3
-5%
Creo (creo-02)
292
276
-5%
157
-46%
176
-40%
281.2
-4%
346.5
19%
319.8
10%
Catia (catia-05)
468
412
-12%
242.8
-48%
111
-76%
190.4
-59%
374.8
-20%
338.9
-28%
3ds Max (3dsmax-06)
317
284
-10%
175.6
-45%
180
-43%
238.2
-25%
291.3
-8%
232.2
-27%
SPECviewperf 2020
5%
-37%
64%
3840x2160 Solidworks (solidworks-05)
112
108
-4%
93.1
-17%
153
37%
3840x2160 Siemens NX (snx-04)
85
81.7
-4%
13.2
-84%
347
308%
3840x2160 Medical (medical-03)
30.4
27.84
-8%
9.95
-67%
16.42
-46%
3840x2160 Maya (maya-06)
266
224
-16%
181
-32%
257
-3%
3840x2160 Energy (energy-03)
32.6
60.8
87%
22.3
-32%
58.2
79%
3840x2160 Creo (creo-03)
65.4
65
-1%
68.1
4%
113
73%
3840x2160 CATIA (catia-06)
44.6
42.4
-5%
32.3
-28%
78.2
75%
3840x2160 3ds Max (3dsmax-07)
121
114
-6%
70.2
-42%
108
-11%
Total Average (Program / Settings)
-6% / -6%
-45% / -45%
-42% / -42%
-37% / -37%
54% / 54%
42% / 42%

Game benchmarks

In the vast majority of games tested, the RX 6900 XT performs on expected lines at 4K Ultra settings. The RX 6900 XT does seem to have an advantage over the NVIDIA cards in titles optimized for AMD hardware such as Assassin's Creed Odyssey and Assassin's Creed Valhalla. AMD's flagship card led the charts in Battlefield V, Hitman 3, F1 2020, and Forza Horizon 4 as well.

That being said, the RTX 3090 showed anywhere between 9% and 20% advantage in most titles we tested, sometimes going as high as 30% at 4K Ultra in Mafia Definitive Edition. The presence of eight additional compute units (CUs) in the RX 6900 XT does not seem to confer a significant advantage over the RX 6800 XT in gaming.

Ray tracing, though available, pales in comparison to the current generation Ampere cards. However, AMD still needs to be commended for achieving ray tracing performance that is mostly on par or at times somewhat better than the RTX 2080 Ti

In The Witcher 3 stress test at 1080p Ultra settings, the RX 6900 XT offers a fairly good sustained performance close to 172 fps for the most part. However, we do see occasional throttling, which does drop the fps significantly. This can probably be attributed to a dip in clocks when the card comes closer to the hot spot or junction temperature of 110 °C.

0102030405060708090100110120130140150160170Tooltip
AMD Radeon RX 6900 XT Radeon RX 6900 XT, R9 5950X: Ø171.1 (125-176)
The Witcher 3
3840x2160 High Graphics & Postprocessing (Nvidia HairWorks Off)
Average NVIDIA GeForce RTX 3090
  (128 - 160.2, n=12)
151.5 fps +24%
Nvidia GeForce RTX 3090 Founders Edition
NVIDIA GeForce RTX 3090, R9 5900X
148 fps +21%
AMD Radeon RX 6900 XT
AMD Radeon RX 6900 XT, R9 5950X
122 (105min, 105P1 - 134max) fps
ASUS GeForce RTX 3080 ROG STRIX OC GAMING
NVIDIA GeForce RTX 3080, R9 5900X
115 (107min - 124max) fps -6%
Average NVIDIA GeForce RTX 3080
  (114 - 115, n=2)
114.5 fps -6%
AMD Radeon RX 6800 XT
AMD Radeon RX 6800 XT, R9 5950X
110 (97min - 117max) fps -10%
AMD Ryzen 9 5900X
NVIDIA Titan RTX, R9 5900X
104 (97min - 112max) fps -15%
Average NVIDIA Titan RTX
  (94 - 107.1, n=28)
102.4 fps -16%
Average NVIDIA GeForce RTX 2080 Ti (Desktop)
  (96 - 101, n=3)
98.3 fps -19%
KFA2 GeForce RTX 2080 Ti EX
NVIDIA GeForce RTX 2080 Ti (Desktop), R9 3900X
96 (87min - 109max) fps -21%
Average NVIDIA GeForce RTX 3070
  (84 - 93.9, n=5)
89.3 fps -27%
MSI GeForce RTX 3070 Gaming X Trio
NVIDIA GeForce RTX 3070, R9 5900X
88.2 (82min - 97max) fps -28%
Nvidia GeForce RTX 2080 Super
NVIDIA GeForce RTX 2080 Super (Desktop), R7 2700X
79 (71min - 87max) fps -35%
Average NVIDIA GeForce RTX 2080 Super (Desktop)
 
79 fps -35%
Nvidia GeForce RTX 2070 Super
NVIDIA GeForce RTX 2070 Super (Desktop), R7 2700X
68 (61min - 74max) fps -44%
Average NVIDIA GeForce RTX 2070 Super (Desktop)
  (65.5 - 71, n=5)
68 fps -44%
AMD Radeon RX 5700 XT
AMD Radeon RX 5700 XT (Desktop), R7 2700X
52.1 (47min - 57max) fps -57%
Average AMD Radeon RX 5700 XT (Desktop)
  (44 - 55.9, n=5)
52.1 fps -57%
AMD Radeon RX 5700
AMD Radeon RX 5700 (Desktop), R7 2700X
46.8 (42min - 51max) fps -62%
3840x2160 Ultra Graphics & Postprocessing (HBAO+)
Average NVIDIA GeForce RTX 3090
  (85.4 - 98.5, n=8)
93.4 fps +22%
Nvidia GeForce RTX 3090 Founders Edition
NVIDIA GeForce RTX 3090, R9 5900X
91.8 fps +20%
Average NVIDIA GeForce RTX 3080
  (78 - 85.7, n=2)
81.9 fps +7%
ASUS GeForce RTX 3080 ROG STRIX OC GAMING
NVIDIA GeForce RTX 3080, R9 5900X
78 (72min - 83max) fps +2%
AMD Radeon RX 6900 XT
AMD Radeon RX 6900 XT, R9 5950X
76.6 (70min, 70P1 - 84max) fps
Average NVIDIA Titan RTX
 
71.8 fps -6%
Average NVIDIA GeForce RTX 2080 Ti (Desktop)
  (65 - 67, n=3)
65.7 fps -14%
KFA2 GeForce RTX 2080 Ti EX
NVIDIA GeForce RTX 2080 Ti (Desktop), R9 3900X
65 (59min - 71max) fps -15%
Average NVIDIA GeForce RTX 3070
  (59 - 60.3, n=2)
59.7 fps -22%
Nvidia GeForce RTX 2080 Super
NVIDIA GeForce RTX 2080 Super (Desktop), R7 2700X
55.2 (49min - 61max) fps -28%
Average NVIDIA GeForce RTX 2080 Super (Desktop)
  (55.2 - 55.2, n=2)
55.2 fps -28%
Average NVIDIA GeForce RTX 2070 Super (Desktop)
  (46.3 - 49.3, n=4)
47.4 fps -38%
Nvidia GeForce RTX 2070 Super
NVIDIA GeForce RTX 2070 Super (Desktop), R7 2700X
46.3 (41min - 50max) fps -40%
AMD Radeon RX 5700 XT
AMD Radeon RX 5700 XT (Desktop), R7 2700X
39.7 (35min - 43max) fps -48%
Average AMD Radeon RX 5700 XT (Desktop)
  (38.9 - 40.4, n=3)
39.7 fps -48%
AMD Radeon RX 5700
AMD Radeon RX 5700 (Desktop), R7 2700X
35.6 (32min - 40max) fps -54%
1920x1080 Ultra Graphics & Postprocessing (HBAO+)
Average NVIDIA GeForce RTX 3090
  (160 - 192.6, n=16)
179.9 fps +10%
Nvidia GeForce RTX 3090 Founders Edition
NVIDIA GeForce RTX 3090, R9 5900X
171.5 fps +5%
AMD Radeon RX 6900 XT
AMD Radeon RX 6900 XT, R9 5950X
163.6 (139min - 179max) fps
AMD Radeon RX 6800 XT
AMD Radeon RX 6800 XT, R9 5950X
160 (138min - 179max) fps -2%
ASUS GeForce RTX 3080 ROG STRIX OC GAMING
NVIDIA GeForce RTX 3080, R9 5900X
152 (138min - 171max) fps -7%
Average NVIDIA GeForce RTX 3080
  (145 - 152, n=2)
148.5 fps -9%
AMD Ryzen 9 5900X
NVIDIA Titan RTX, R9 5900X
141 (127min - 154max) fps -14%
Average NVIDIA Titan RTX
  (124 - 150, n=28)
137.7 fps -16%
KFA2 GeForce RTX 2080 Ti EX
NVIDIA GeForce RTX 2080 Ti (Desktop), R9 3900X
135 (118min - 158max) fps -17%
Average NVIDIA GeForce RTX 2080 Ti (Desktop)
  (131 - 136, n=3)
134 fps -18%
MSI GeForce RTX 3070 Gaming X Trio
NVIDIA GeForce RTX 3070, R9 5900X
122 (110min - 138max) fps -25%
Nvidia GeForce RTX 2080 Super
NVIDIA GeForce RTX 2080 Super (Desktop), R7 2700X
109 (81min - 123max) fps -33%
Average NVIDIA GeForce RTX 2080 Super (Desktop)
 
109 fps -33%
Average NVIDIA GeForce RTX 3070
  (52.8 - 132.2, n=7)
106.1 fps -35%
Average NVIDIA GeForce RTX 2070 Super (Desktop)
  (95.6 - 109.6, n=6)
100.9 fps -38%
Nvidia GeForce RTX 2070 Super
NVIDIA GeForce RTX 2070 Super (Desktop), R7 2700X
97 (83min - 109max) fps -41%
AMD Radeon RX 5700 XT
AMD Radeon RX 5700 XT (Desktop), R7 2700X
92 (79min - 99max) fps -44%
Average AMD Radeon RX 5700 XT (Desktop)
  (71.6 - 102.4, n=6)
92 fps -44%
AMD Radeon RX 5700
AMD Radeon RX 5700 (Desktop), R7 2700X
80 (70min - 87max) fps -51%
Assassin´s Creed Odyssey
3840x2160 Ultra High Preset
AMD Radeon RX 6900 XT
AMD Radeon RX 6900 XT, R9 5950X
68 (14min - 149max) fps
Average NVIDIA GeForce RTX 3090
 
65 fps -4%
Average NVIDIA Titan RTX
 
52 fps -24%
Average NVIDIA GeForce RTX 2080 Ti (Desktop)
  (46 - 53, n=2)
49.5 fps -27%
Average NVIDIA GeForce RTX 3070
 
48 fps -29%
KFA2 GeForce RTX 2080 Ti EX
NVIDIA GeForce RTX 2080 Ti (Desktop), R9 3900X
46 fps -32%
Nvidia GeForce RTX 2080 Super
NVIDIA GeForce RTX 2080 Super (Desktop), R7 2700X
41 fps -40%
Average NVIDIA GeForce RTX 2080 Super (Desktop)
 
41 fps -40%
Nvidia GeForce RTX 2070 Super
NVIDIA GeForce RTX 2070 Super (Desktop), R7 2700X
39 fps -43%
Average NVIDIA GeForce RTX 2070 Super (Desktop)
  (38 - 39, n=2)
38.5 fps -43%
AMD Radeon RX 5700 XT
AMD Radeon RX 5700 XT (Desktop), R7 2700X
35 fps -49%
Average AMD Radeon RX 5700 XT (Desktop)
 
35 fps -49%
AMD Radeon RX 5700
AMD Radeon RX 5700 (Desktop), R7 2700X
31 fps -54%
2560x1440 Ultra High Preset
AMD Radeon RX 6900 XT
AMD Radeon RX 6900 XT, R9 5950X
99 (37min - 156max) fps
Average NVIDIA GeForce RTX 3090
 
82 fps -17%
Average NVIDIA GeForce RTX 2080 Ti (Desktop)
  (71 - 72, n=2)
71.5 fps -28%
KFA2 GeForce RTX 2080 Ti EX
NVIDIA GeForce RTX 2080 Ti (Desktop), R9 3900X
71 fps -28%
Average NVIDIA GeForce RTX 3070
 
68 fps -31%
Nvidia GeForce RTX 2080 Super
NVIDIA GeForce RTX 2080 Super (Desktop), R7 2700X
58 fps -41%
Average NVIDIA GeForce RTX 2080 Super (Desktop)
 
58 fps -41%
Average NVIDIA GeForce RTX 2070 Super (Desktop)
  (56 - 57, n=2)
56.5 fps -43%
Nvidia GeForce RTX 2070 Super
NVIDIA GeForce RTX 2070 Super (Desktop), R7 2700X
56 fps -43%
AMD Radeon RX 5700 XT
AMD Radeon RX 5700 XT (Desktop), R7 2700X
53 fps -46%
Average AMD Radeon RX 5700 XT (Desktop)
 
53 fps -46%
AMD Radeon RX 5700
AMD Radeon RX 5700 (Desktop), R7 2700X
51 fps -48%
1920x1080 Ultra High Preset
AMD Radeon RX 6900 XT
AMD Radeon RX 6900 XT, R9 5950X
98 (37min - 162max) fps
Average NVIDIA GeForce RTX 3090
 
92 fps -6%
Average NVIDIA GeForce RTX 2080 Ti (Desktop)
  (80 - 83, n=2)
81.5 fps -17%
Average NVIDIA GeForce RTX 3070
 
81 fps -17%
KFA2 GeForce RTX 2080 Ti EX
NVIDIA GeForce RTX 2080 Ti (Desktop), R9 3900X
80 fps -18%
Average NVIDIA Titan RTX
 
79 fps -19%
Nvidia GeForce RTX 2080 Super
NVIDIA GeForce RTX 2080 Super (Desktop), R7 2700X
68 fps -31%
Average NVIDIA GeForce RTX 2080 Super (Desktop)
 
68 fps -31%
Average NVIDIA GeForce RTX 2070 Super (Desktop)
  (64 - 66, n=2)
65 fps -34%
Nvidia GeForce RTX 2070 Super
NVIDIA GeForce RTX 2070 Super (Desktop), R7 2700X
64 fps -35%
AMD Radeon RX 5700 XT
AMD Radeon RX 5700 XT (Desktop), R7 2700X
62 fps -37%
Average AMD Radeon RX 5700 XT (Desktop)
 
62 fps -37%
AMD Radeon RX 5700
AMD Radeon RX 5700 (Desktop), R7 2700X
60 fps -39%
Battlefield V
1920x1080 Ultra Preset DXR
ASUS GeForce RTX 3080 ROG STRIX OC GAMING
NVIDIA GeForce RTX 3080, R9 5900X
128 (95min - 161max) fps +27%
Average NVIDIA GeForce RTX 3080
  (122.1 - 128, n=2)
125.1 fps +24%
Nvidia GeForce RTX 3090 Founders Edition
NVIDIA GeForce RTX 3090, R9 5900X
124.8 fps +24%
Average NVIDIA GeForce RTX 3090
  (106 - 128, n=3)
119.6 fps +18%
AMD Radeon RX 6900 XT
AMD Radeon RX 6900 XT, R9 5950X
101 (18.7min, 50.6P0.1, 65.1P1 - 290max) fps
Average NVIDIA GeForce RTX 3070
  (87.7 - 104.5, n=2)
96.1 fps -5%
Average NVIDIA GeForce RTX 2080 Ti (Desktop)
  (94 - 96, n=2)
95 fps -6%
AMD Radeon RX 6800 XT
AMD Radeon RX 6800 XT, R9 5950X
94.5 fps -6%
KFA2 GeForce RTX 2080 Ti EX
NVIDIA GeForce RTX 2080 Ti (Desktop), R9 3900X
94 (74min - 129max) fps -7%
MSI GeForce RTX 3070 Gaming X Trio
NVIDIA GeForce RTX 3070, R9 5900X
87.7 fps -13%
Nvidia GeForce RTX 2070 Super
NVIDIA GeForce RTX 2070 Super (Desktop), R7 2700X
80 (57min - 103max) fps -21%
Nvidia GeForce RTX 2080 Super
NVIDIA GeForce RTX 2080 Super (Desktop), R7 2700X
80 (47min - 111max) fps -21%
Average NVIDIA GeForce RTX 2080 Super (Desktop)
 
80 fps -21%
Average NVIDIA GeForce RTX 2070 Super (Desktop)
  (70.8 - 80, n=3)
75.6 fps -25%
3840x2160 Ultra Preset
AMD Radeon RX 6900 XT
AMD Radeon RX 6900 XT, R9 5950X
134 (28.5min, 44.9P0.1, 89P1 - 463max) fps
Average NVIDIA GeForce RTX 3090
  (94 - 130, n=4)
112.5 fps -16%
AMD Radeon RX 6800 XT
AMD Radeon RX 6800 XT, R9 5950X
102.5 fps -24%
Average NVIDIA Titan RTX
 
97.3 fps -27%
Nvidia GeForce RTX 3090 Founders Edition
NVIDIA GeForce RTX 3090, R9 5900X
95.8 fps -29%
ASUS GeForce RTX 3080 ROG STRIX OC GAMING
NVIDIA GeForce RTX 3080, R9 5900X
94.2 (78min - 135max) fps -30%
Average NVIDIA GeForce RTX 3080
  (87.2 - 94.2, n=2)
90.7 fps -32%
Average NVIDIA GeForce RTX 2080 Ti (Desktop)
  (73 - 99, n=2)
86 fps -36%
KFA2 GeForce RTX 2080 Ti EX
NVIDIA GeForce RTX 2080 Ti (Desktop), R9 3900X
73 (61min - 110max) fps -46%
Average NVIDIA GeForce RTX 3070
  (69 - 70.9, n=2)
70 fps -48%
MSI GeForce RTX 3070 Gaming X Trio
NVIDIA GeForce RTX 3070, R9 5900X
69 fps -49%
Average NVIDIA GeForce RTX 2080 Super (Desktop)
  (55.7 - 80, n=2)
67.9 fps -49%
AMD Radeon RX 5700 XT
AMD Radeon RX 5700 XT (Desktop), R7 2700X
59.5 (49min - 92max) fps -56%
Average AMD Radeon RX 5700 XT (Desktop)
 
59.5 fps -56%
Nvidia GeForce RTX 2080 Super
NVIDIA GeForce RTX 2080 Super (Desktop), R7 2700X
55.7 (33min - 81max) fps -58%
AMD Radeon RX 5700
AMD Radeon RX 5700 (Desktop), R7 2700X
53.5 (44min - 83max) fps -60%
Average NVIDIA GeForce RTX 2070 Super (Desktop)
  (50.9 - 54.4, n=3)
52.7 fps -61%
Nvidia GeForce RTX 2070 Super
NVIDIA GeForce RTX 2070 Super (Desktop), R7 2700X
50.9 (41min - 73max) fps -62%
2560x1440 Ultra Preset
AMD Radeon RX 6900 XT
AMD Radeon RX 6900 XT, R9 5950X
196 (24.2min, 63.2P0.1, 120P1 - 512max) fps
AMD Radeon RX 6800 XT
AMD Radeon RX 6800 XT, R9 5950X
153.7 fps -22%
Average NVIDIA GeForce RTX 3090
  (124 - 178, n=3)
143.8 fps -27%
Average NVIDIA GeForce RTX 2080 Ti (Desktop)
  (108 - 159, n=2)
133.5 fps -32%
ASUS GeForce RTX 3080 ROG STRIX OC GAMING
NVIDIA GeForce RTX 3080, R9 5900X
132 (109min - 179max) fps -33%
Nvidia GeForce RTX 3090 Founders Edition
NVIDIA GeForce RTX 3090, R9 5900X
129.5 fps -34%
Average NVIDIA GeForce RTX 3080
  (116.1 - 132, n=2)
124.1 fps -37%
KFA2 GeForce RTX 2080 Ti EX
NVIDIA GeForce RTX 2080 Ti (Desktop), R9 3900X
108 (87min - 153max) fps -45%
Average NVIDIA GeForce RTX 2080 Super (Desktop)
  (85 - 131, n=2)
108 fps -45%
Average NVIDIA GeForce RTX 3070
  (98.8 - 106.8, n=2)
102.8 fps -48%
MSI GeForce RTX 3070 Gaming X Trio
NVIDIA GeForce RTX 3070, R9 5900X
98.8 fps -50%
AMD Radeon RX 5700 XT
AMD Radeon RX 5700 XT (Desktop), R7 2700X
89 (70min - 130max) fps -55%
Average AMD Radeon RX 5700 XT (Desktop)
 
89 fps -55%
Nvidia GeForce RTX 2080 Super
NVIDIA GeForce RTX 2080 Super (Desktop), R7 2700X
85 (43min - 122max) fps -57%
Average NVIDIA GeForce RTX 2070 Super (Desktop)
  (78 - 94, n=3)
85 fps -57%
AMD Radeon RX 5700
AMD Radeon RX 5700 (Desktop), R7 2700X
81 (64min - 122max) fps -59%
Nvidia GeForce RTX 2070 Super
NVIDIA GeForce RTX 2070 Super (Desktop), R7 2700X
78 (65min - 110max) fps -60%
1920x1080 Ultra Preset
AMD Radeon RX 6900 XT
AMD Radeon RX 6900 XT, R9 5950X
197 (46.7min, 68.3P0.1, 114P1 - 501max) fps
AMD Radeon RX 6800 XT
AMD Radeon RX 6800 XT, R9 5950X
175.4 fps -11%
Average NVIDIA Titan RTX
 
160.4 fps -19%
Average NVIDIA GeForce RTX 2080 Ti (Desktop)
  (127 - 190, n=2)
158.5 fps -20%
Average NVIDIA GeForce RTX 3090
  (141 - 187, n=3)
157.9 fps -20%
ASUS GeForce RTX 3080 ROG STRIX OC GAMING
NVIDIA GeForce RTX 3080, R9 5900X
152 (126min - 199max) fps -23%
Nvidia GeForce RTX 3090 Founders Edition
NVIDIA GeForce RTX 3090, R9 5900X
145.8 fps -26%
Average NVIDIA GeForce RTX 3080
  (137.9 - 152, n=2)
145 fps -26%
Average NVIDIA GeForce RTX 2080 Super (Desktop)
  (101 - 160, n=2)
130.5 fps -34%
KFA2 GeForce RTX 2080 Ti EX
NVIDIA GeForce RTX 2080 Ti (Desktop), R9 3900X
127 (102min - 175max) fps -36%
Average NVIDIA GeForce RTX 3070
  (113.6 - 125.2, n=2)
119.4 fps -39%
MSI GeForce RTX 3070 Gaming X Trio
NVIDIA GeForce RTX 3070, R9 5900X
113.6 fps -42%
AMD Radeon RX 5700 XT
AMD Radeon RX 5700 XT (Desktop), R7 2700X
105 (81min - 150max) fps -47%
Average AMD Radeon RX 5700 XT (Desktop)
 
105 fps -47%
Average NVIDIA GeForce RTX 2070 Super (Desktop)
  (93.2 - 123, n=3)
103.7 fps -47%
Nvidia GeForce RTX 2080 Super
NVIDIA GeForce RTX 2080 Super (Desktop), R7 2700X
101 (63min - 139max) fps -49%
AMD Radeon RX 5700
AMD Radeon RX 5700 (Desktop), R7 2700X
97 (76min - 140max) fps -51%
Nvidia GeForce RTX 2070 Super
NVIDIA GeForce RTX 2070 Super (Desktop), R7 2700X
95 (77min - 133max) fps -52%
The Division 2
3840x2160 Ultra Preset
Average NVIDIA GeForce RTX 3090
  (71.9 - 77.5, n=3)
73.8 fps +11%
Nvidia GeForce RTX 3090 Founders Edition
NVIDIA GeForce RTX 3090, R9 5900X
72 fps +8%
AMD Radeon RX 6900 XT
AMD Radeon RX 6900 XT, R9 5950X
66.6 (40.2min, 54.6P1) fps
ASUS GeForce RTX 3080 ROG STRIX OC GAMING
NVIDIA GeForce RTX 3080, R9 5900X
65 fps -2%
Average NVIDIA GeForce RTX 3080
 
65 fps -2%
AMD Radeon RX 6800 XT
AMD Radeon RX 6800 XT, R9 5950X
63.2 (34.5min, 54.1P1) fps -5%
Average NVIDIA Titan RTX
 
62 fps -7%
Average NVIDIA GeForce RTX 2080 Ti (Desktop)
  (53 - 57, n=3)
55.3 fps -17%
KFA2 GeForce RTX 2080 Ti EX
NVIDIA GeForce RTX 2080 Ti (Desktop), R9 3900X
53 fps -20%
MSI GeForce RTX 3070 Gaming X Trio
NVIDIA GeForce RTX 3070, R9 5900X
49 fps -26%
Average NVIDIA GeForce RTX 3070
 
49 fps -26%
Nvidia GeForce RTX 2080 Super
NVIDIA GeForce RTX 2080 Super (Desktop), R7 2700X
45 fps -32%
Average NVIDIA GeForce RTX 2080 Super (Desktop)
  (43 - 45, n=2)
44 fps -34%
Nvidia GeForce RTX 2070 Super
NVIDIA GeForce RTX 2070 Super (Desktop), R7 2700X
39 fps -41%
Average NVIDIA GeForce RTX 2070 Super (Desktop)
  (37 - 39, n=2)
38 fps -43%
AMD Radeon RX 5700 XT
AMD Radeon RX 5700 XT (Desktop), R7 2700X
34.1 (16.9min, 21.4P1) fps -49%
Average AMD Radeon RX 5700 XT (Desktop)
  (26 - 34.1, n=2)
30.1 fps -55%
AMD Radeon RX 5700
AMD Radeon RX 5700 (Desktop), R7 2700X
30 (2.5min, 24.3P1) fps -55%
2560x1440 Ultra Preset
Average NVIDIA GeForce RTX 3090
  (120 - 128, n=3)
123 fps +4%
Nvidia GeForce RTX 3090 Founders Edition
NVIDIA GeForce RTX 3090, R9 5900X
121 fps +3%
AMD Radeon RX 6900 XT
AMD Radeon RX 6900 XT, R9 5950X
118 (51.3min, 70.9P1) fps
AMD Radeon RX 6800 XT
AMD Radeon RX 6800 XT, R9 5950X
114 (52.4min, 73P1) fps -3%
ASUS GeForce RTX 3080 ROG STRIX OC GAMING
NVIDIA GeForce RTX 3080, R9 5900X
107 fps -9%
Average NVIDIA GeForce RTX 3080
 
107 fps -9%
Average NVIDIA Titan RTX
 
102 fps -14%
Average NVIDIA GeForce RTX 2080 Ti (Desktop)
  (92 - 100, n=3)
96.3 fps -18%
KFA2 GeForce RTX 2080 Ti EX
NVIDIA GeForce RTX 2080 Ti (Desktop), R9 3900X
92 fps -22%
MSI GeForce RTX 3070 Gaming X Trio
NVIDIA GeForce RTX 3070, R9 5900X
82 fps -31%
Average NVIDIA GeForce RTX 3070
 
82 fps -31%
Nvidia GeForce RTX 2080 Super
NVIDIA GeForce RTX 2080 Super (Desktop), R7 2700X
79 fps -33%
Average NVIDIA GeForce RTX 2080 Super (Desktop)
 
79 fps -33%
Nvidia GeForce RTX 2070 Super
NVIDIA GeForce RTX 2070 Super (Desktop), R7 2700X
69 fps -42%
Average NVIDIA GeForce RTX 2070 Super (Desktop)
  (67 - 69, n=2)
68 fps -42%
AMD Radeon RX 5700 XT
AMD Radeon RX 5700 XT (Desktop), R7 2700X
64 (33.2min, 45.2P1) fps -46%
AMD Radeon RX 5700
AMD Radeon RX 5700 (Desktop), R7 2700X
56.9 (22.8min, 39.8P1) fps -52%
Average AMD Radeon RX 5700 XT (Desktop)
  (49 - 64, n=2)
56.5 fps -52%
1920x1080 Ultra Preset
Nvidia GeForce RTX 3090 Founders Edition
NVIDIA GeForce RTX 3090, R9 5900X
152 fps +10%
Average NVIDIA GeForce RTX 3090
  (140 - 160, n=3)
150.7 fps +9%
ASUS GeForce RTX 3080 ROG STRIX OC GAMING
NVIDIA GeForce RTX 3080, R9 5900X
140 fps +1%
Average NVIDIA GeForce RTX 3080
 
140 fps +1%
AMD Radeon RX 6800 XT
AMD Radeon RX 6800 XT, R9 5950X
138 (45.5min, 74.1P1) fps 0%
AMD Radeon RX 6900 XT
AMD Radeon RX 6900 XT, R9 5950X
138 (54.9min, 75.2P1) fps
Average NVIDIA GeForce RTX 2080 Ti (Desktop)
  (123 - 133, n=3)
127 fps -8%
KFA2 GeForce RTX 2080 Ti EX
NVIDIA GeForce RTX 2080 Ti (Desktop), R9 3900X
123 fps -11%
Average NVIDIA Titan RTX
 
113 fps -18%
MSI GeForce RTX 3070 Gaming X Trio
NVIDIA GeForce RTX 3070, R9 5900X
112 fps -19%
Average NVIDIA GeForce RTX 3070
 
112 fps -19%
Nvidia GeForce RTX 2080 Super
NVIDIA GeForce RTX 2080 Super (Desktop), R7 2700X
106 fps -23%
Average NVIDIA GeForce RTX 2080 Super (Desktop)
 
106 fps -23%
Average NVIDIA GeForce RTX 2070 Super (Desktop)
  (90 - 96, n=2)
93 fps -33%
Nvidia GeForce RTX 2070 Super
NVIDIA GeForce RTX 2070 Super (Desktop), R7 2700X
90 fps -35%
AMD Radeon RX 5700 XT
AMD Radeon RX 5700 XT (Desktop), R7 2700X
88 (30.2min, 50P1) fps -36%
Average AMD Radeon RX 5700 XT (Desktop)
  (69 - 88, n=2)
78.5 fps -43%
AMD Radeon RX 5700
AMD Radeon RX 5700 (Desktop), R7 2700X
78 (14.6min, 42.2P1) fps -43%
Red Dead Redemption 2
3840x2160 Maximum Settings
Average NVIDIA GeForce RTX 3090
  (61.9 - 67, n=3)
64.1 fps +17%
Nvidia GeForce RTX 3090 Founders Edition
NVIDIA GeForce RTX 3090, R9 5900X
63.5 (29min - 85max) fps +16%
Average NVIDIA GeForce RTX 3080
  (56 - 56.4, n=2)
56.2 fps +3%
ASUS GeForce RTX 3080 ROG STRIX OC GAMING
NVIDIA GeForce RTX 3080, R9 5900X
56 fps +3%
AMD Radeon RX 6900 XT
AMD Radeon RX 6900 XT, R9 5950X
54.6 (36.2min, 47.6P1 - 67max) fps
AMD Radeon RX 6800 XT
AMD Radeon RX 6800 XT, R9 5950X
52.9 (41min, 45.5P1 - 65.3max) fps -3%
MSI GeForce RTX 3070 Gaming X Trio
NVIDIA GeForce RTX 3070, R9 5900X
44 (32min - 55max) fps -19%
Average NVIDIA GeForce RTX 3070
  (42.1 - 44, n=3)
42.9 fps -21%
Average NVIDIA GeForce RTX 2080 Ti (Desktop)
 
42.3 fps -23%
Average NVIDIA Titan RTX
 
41 fps -25%
Average NVIDIA GeForce RTX 2080 Super (Desktop)
 
33 fps -40%
Average NVIDIA GeForce RTX 2070 Super (Desktop)
  (28 - 28.7, n=2)
28.4 fps -48%
Average AMD Radeon RX 5700 XT (Desktop)
 
27 fps -51%
2560x1440 Maximum Settings
Average NVIDIA GeForce RTX 3090
  (91.9 - 96, n=3)
93.4 fps +14%
Nvidia GeForce RTX 3090 Founders Edition
NVIDIA GeForce RTX 3090, R9 5900X
92.3 (33min - 132max) fps +12%
Average NVIDIA GeForce RTX 3080
  (81 - 86.4, n=2)
83.7 fps +2%
AMD Radeon RX 6800 XT
AMD Radeon RX 6800 XT, R9 5950X
82.7 (59min, 66.7P1 - 103max) fps +1%
AMD Radeon RX 6900 XT
AMD Radeon RX 6900 XT, R9 5950X
82.1 (34min, 66.7P1 - 104max) fps
ASUS GeForce RTX 3080 ROG STRIX OC GAMING
NVIDIA GeForce RTX 3080, R9 5900X
81 fps -1%
MSI GeForce RTX 3070 Gaming X Trio
NVIDIA GeForce RTX 3070, R9 5900X
65 (33min - 100max) fps -21%
Average NVIDIA GeForce RTX 3070
  (63.2 - 65, n=3)
63.9 fps -22%
Average NVIDIA GeForce RTX 2080 Ti (Desktop)
 
63 fps -23%
Average NVIDIA Titan RTX
 
63 fps -23%
Average NVIDIA GeForce RTX 2080 Super (Desktop)
 
50.6 fps -38%
Average NVIDIA GeForce RTX 2070 Super (Desktop)
  (43.3 - 44, n=2)
43.7 fps -47%
Average AMD Radeon RX 5700 XT (Desktop)
 
41.8 fps -49%
1920x1080 Maximum Settings
Average NVIDIA GeForce RTX 3090
  (109.9 - 115, n=3)
111.6 fps +14%
Nvidia GeForce RTX 3090 Founders Edition
NVIDIA GeForce RTX 3090, R9 5900X
109.9 (37min - 148max) fps +12%
AMD Radeon RX 6800 XT
AMD Radeon RX 6800 XT, R9 5950X
102 (68.7min, 76.9P1 - 129max) fps +4%
Average NVIDIA GeForce RTX 3080
  (96 - 103, n=2)
99.5 fps +2%
AMD Radeon RX 6900 XT
AMD Radeon RX 6900 XT, R9 5950X
98 (34.2min, 76.9P1 - 125max) fps
ASUS GeForce RTX 3080 ROG STRIX OC GAMING
NVIDIA GeForce RTX 3080, R9 5900X
96 fps -2%
MSI GeForce RTX 3070 Gaming X Trio
NVIDIA GeForce RTX 3070, R9 5900X
78 (38min - 126max) fps -20%
Average NVIDIA GeForce RTX 3070
  (76.2 - 78, n=3)
77.4 fps -21%
Average NVIDIA GeForce RTX 2080 Ti (Desktop)
 
76 fps -22%
Average NVIDIA Titan RTX
 
76 fps -22%
Average NVIDIA GeForce RTX 2080 Super (Desktop)
 
61 fps -38%
Average NVIDIA GeForce RTX 2070 Super (Desktop)
  (53 - 54.6, n=2)
53.8 fps -45%
Average AMD Radeon RX 5700 XT (Desktop)
 
51.5 fps -47%
Mafia Definitive Edition
3840x2160 High Preset
Average NVIDIA GeForce RTX 3090
  (84.5 - 89.1, n=2)
86.8 fps +30%
Nvidia GeForce RTX 3090 Founders Edition
NVIDIA GeForce RTX 3090, R9 5900X
84.5 fps +26%
ASUS GeForce RTX 3080 ROG STRIX OC GAMING
NVIDIA GeForce RTX 3080, R9 5900X
78.2 (17.9min, 31P0.1, 59.3P1 - 292max) fps +17%
Average NVIDIA GeForce RTX 3080
  (78.1 - 78.2, n=2)
78.2 fps +17%
AMD Radeon RX 6900 XT
AMD Radeon RX 6900 XT, R9 5950X
67 (32.3min, 41.7P0.1, 44.7P1 - 211max) fps
Average NVIDIA Titan RTX
 
63.4 fps -5%
AMD Radeon RX 6800 XT
AMD Radeon RX 6800 XT, R9 5950X
62.6 (28min, 37.6P0.1, 49.2P1 - 87.3max) fps -7%
Average NVIDIA GeForce RTX 2080 Ti (Desktop)
 
62.4 fps -7%
MSI GeForce RTX 3070 Gaming X Trio
NVIDIA GeForce RTX 3070, R9 5900X
56.6 (34.7min, 37.9P0.1, 44.2P1 - 177max) fps -16%
Average NVIDIA GeForce RTX 3070
  (55.2 - 56.6, n=2)
55.9 fps -17%
Average NVIDIA GeForce RTX 2080 Super (Desktop)
 
48.5 fps -28%
Average NVIDIA GeForce RTX 2070 Super (Desktop)
 
41.8 fps -38%
Average AMD Radeon RX 5700 XT (Desktop)
 
36.4 fps -46%
2560x1440 High Preset
Average NVIDIA GeForce RTX 3090
  (142.3 - 149, n=2)
145.7 fps +21%
Nvidia GeForce RTX 3090 Founders Edition
NVIDIA GeForce RTX 3090, R9 5900X
142.3 fps +19%
ASUS GeForce RTX 3080 ROG STRIX OC GAMING
NVIDIA GeForce RTX 3080, R9 5900X
137 (26.5min, 66.2P0.1, 95.7P1 - 265max) fps +14%
Average NVIDIA GeForce RTX 3080
  (127 - 137, n=2)
132 fps +10%
AMD Radeon RX 6900 XT
AMD Radeon RX 6900 XT, R9 5950X
120 (17.6min, 61.2P0.1, 83.1P1 - 238max) fps
AMD Radeon RX 6800 XT
AMD Radeon RX 6800 XT, R9 5950X
112 (23.5min, 64P0.1, 80.8P1 - 169max) fps -7%
Average NVIDIA Titan RTX
 
109 fps -9%
Average NVIDIA GeForce RTX 2080 Ti (Desktop)
 
105 fps -12%
MSI GeForce RTX 3070 Gaming X Trio
NVIDIA GeForce RTX 3070, R9 5900X
98.7 (45.2min, 55.9P0.1, 69.4P1 - 191max) fps -18%
Average NVIDIA GeForce RTX 3070
  (98.1 - 98.7, n=2)
98.4 fps -18%
Average NVIDIA GeForce RTX 2080 Super (Desktop)
 
88.8 fps -26%
Average NVIDIA GeForce RTX 2070 Super (Desktop)
 
78.1 fps -35%
Average AMD Radeon RX 5700 XT (Desktop)
 
67.7 fps -44%
1920x1080 High Preset
ASUS GeForce RTX 3080 ROG STRIX OC GAMING
NVIDIA GeForce RTX 3080, R9 5900X
169 (32.7min, 75.7P0.1, 112P1 - 361max) fps +22%
Nvidia GeForce RTX 3090 Founders Edition
NVIDIA GeForce RTX 3090, R9 5900X
158.8 fps +15%
Average NVIDIA GeForce RTX 3090
  (157 - 158.8, n=2)
157.9 fps +14%
Average NVIDIA GeForce RTX 3080
  (144 - 169, n=2)
156.5 fps +13%
AMD Radeon RX 6900 XT
AMD Radeon RX 6900 XT, R9 5950X
138 (32.8min, 68.1P0.1, 90.2P1 - 334max) fps
Average NVIDIA GeForce RTX 3070
  (124 - 132, n=2)
128 fps -7%
MSI GeForce RTX 3070 Gaming X Trio
NVIDIA GeForce RTX 3070, R9 5900X
124 (57.4min, 62.8P0.1, 82P1 - 251max) fps -10%
Average NVIDIA Titan RTX
 
123.7 fps -10%
AMD Radeon RX 6800 XT
AMD Radeon RX 6800 XT, R9 5950X
121 (23.7min, 68P0.1, 83.3P1 - 223max) fps -12%
Average NVIDIA GeForce RTX 2080 Super (Desktop)
 
118.1 fps -14%
Average NVIDIA GeForce RTX 2080 Ti (Desktop)
 
117 fps -15%
Average NVIDIA GeForce RTX 2070 Super (Desktop)
 
111.6 fps -19%
Average AMD Radeon RX 5700 XT (Desktop)
 
92.3 fps -33%
Cyberpunk 2077 1.0
3840x2160 Ultra Preset
Average NVIDIA GeForce RTX 3090
  (41.5 - 45.3, n=2)
43.4 fps +25%
Nvidia GeForce RTX 3090 Founders Edition
NVIDIA GeForce RTX 3090, R9 5900X
41.5 fps +19%
Average NVIDIA GeForce RTX 3080
 
38.9 fps +12%
AMD Radeon RX 6900 XT
AMD Radeon RX 6900 XT, R9 5950X
34.8 (19.4min, 22.8P0.1, 29.7P1 - 177max) fps
Average NVIDIA GeForce RTX 2080 Ti (Desktop)
 
32.2 fps -7%
AMD Ryzen 9 5900X
NVIDIA Titan RTX, R9 5900X
30.9 fps -11%
Average NVIDIA Titan RTX
 
30.9 fps -11%
Average NVIDIA GeForce RTX 3070
  (26.6 - 27.9, n=2)
27.3 fps -22%
Average NVIDIA GeForce RTX 2080 Super (Desktop)
 
24.1 fps -31%
Average NVIDIA GeForce RTX 2070 Super (Desktop)
 
21.5 fps -38%
Average AMD Radeon RX 5700 XT (Desktop)
 
16.5 fps -53%
2560x1440 Ultra Preset
Average NVIDIA GeForce RTX 3090
  (78.1 - 85.3, n=2)
81.7 fps +13%
Nvidia GeForce RTX 3090 Founders Edition
NVIDIA GeForce RTX 3090, R9 5900X
78.1 fps +8%
Average NVIDIA GeForce RTX 3080
 
72.5 fps 0%
AMD Radeon RX 6900 XT
AMD Radeon RX 6900 XT, R9 5950X
72.3 (21min, 36.7P0.1, 58.6P1 - 231max) fps
Average NVIDIA GeForce RTX 2080 Ti (Desktop)
 
64 fps -11%
AMD Ryzen 9 5900X
NVIDIA Titan RTX, R9 5900X
58.4 fps -19%
Average NVIDIA Titan RTX
 
58.4 fps -19%
Average NVIDIA GeForce RTX 3070
  (53.7 - 54.8, n=2)
54.3 fps -25%
Average NVIDIA GeForce RTX 2080 Super (Desktop)
 
49.1 fps -32%
Average NVIDIA GeForce RTX 2070 Super (Desktop)
 
43.7 fps -40%
Average AMD Radeon RX 5700 XT (Desktop)
 
36.9 fps -49%
1920x1080 Ultra Preset
Nvidia GeForce RTX 3090 Founders Edition
NVIDIA GeForce RTX 3090, R9 5900X
109.7 fps +3%
Average NVIDIA GeForce RTX 3090
  (108 - 109.7, n=2)
108.9 fps +3%
AMD Radeon RX 6900 XT
AMD Radeon RX 6900 XT, R9 5950X
106 (23.2min, 48.3P0.1, 76.1P1 - 189max) fps
Average NVIDIA GeForce RTX 3080
 
103 fps -3%
Average NVIDIA GeForce RTX 2080 Ti (Desktop)
 
95.4 fps -10%
AMD Ryzen 9 5900X
NVIDIA Titan RTX, R9 5900X
82.3 fps -22%
Average NVIDIA Titan RTX
 
82.3 fps -22%
Average NVIDIA GeForce RTX 3070
  (80.6 - 81, n=2)
80.8 fps -24%
Average NVIDIA GeForce RTX 2080 Super (Desktop)
 
72.1 fps -32%
Average NVIDIA GeForce RTX 2070 Super (Desktop)
 
65.4 fps -38%
Average AMD Radeon RX 5700 XT (Desktop)
 
58.9 fps -44%
Call of Duty Black Ops Cold War
1920x1080 Highest Settings + Ultra Ray Tracing
AMD Ryzen 9 5900X
NVIDIA Titan RTX, R9 5900X
119 fps +71%
Average NVIDIA Titan RTX
 
119 fps +71%
Nvidia GeForce RTX 3090 Founders Edition
NVIDIA GeForce RTX 3090, R9 5900X
89 fps +28%
Average NVIDIA GeForce RTX 3090
  (88.3 - 89, n=2)
88.7 fps +28%
Average NVIDIA GeForce RTX 3080
 
81.9 fps +18%
Average NVIDIA GeForce RTX 2080 Ti (Desktop)
 
77.2 fps +11%
AMD Radeon RX 6900 XT
AMD Radeon RX 6900 XT, R9 5950X
69.5 (40.4min, 48.2P0.1, 54.5P1 - 302max) fps
MSI GeForce RTX 3070 Gaming X Trio
NVIDIA GeForce RTX 3070, R9 5900X
68.5 (19.1min, 22.3P0.1, 30.4P1 - 229max) fps -1%
Average NVIDIA GeForce RTX 3070
  (49.8 - 70.1, n=3)
62.8 fps -10%
Average NVIDIA GeForce RTX 2080 Super (Desktop)
 
59 fps -15%
Average NVIDIA GeForce RTX 2070 Super (Desktop)
 
55.6 fps -20%
AMD Radeon RX 6800 XT
AMD Radeon RX 6800 XT, R9 5950X
21.8 (8.8min, 9.61P0.1, 16.2P1 - 49.5max) fps -69%
3840x2160 Highest Settings
Average NVIDIA GeForce RTX 3090
  (74.6 - 76.1, n=2)
75.4 fps +11%
Nvidia GeForce RTX 3090 Founders Edition
NVIDIA GeForce RTX 3090, R9 5900X
74.6 fps +10%
MSI GeForce RTX 3070 Gaming X Trio
NVIDIA GeForce RTX 3070, R9 5900X
74 (32.6min, 43.5P0.1, 50.6P1 - 270max) fps +9%
AMD Radeon RX 6900 XT
AMD Radeon RX 6900 XT, R9 5950X
68.1 (42.2min, 50.7P0.1, 56.8P1 - 172max) fps
Average NVIDIA GeForce RTX 3080
 
65.6 fps -4%
AMD Radeon RX 6800 XT
AMD Radeon RX 6800 XT, R9 5950X
64 (10.8min, 11.6P0.1, 50.8P1 - 159max) fps -6%
Average NVIDIA GeForce RTX 3070
  (43.8 - 74, n=3)
56 fps -18%
Average NVIDIA GeForce RTX 2080 Ti (Desktop)
 
54.4 fps -20%
AMD Ryzen 9 5900X
NVIDIA Titan RTX, R9 5900X
52.9 fps -22%
Average NVIDIA Titan RTX
 
52.9 fps -22%
Average NVIDIA GeForce RTX 2080 Super (Desktop)
  (38 - 44.5, n=2)
41.3 fps -39%
Average NVIDIA GeForce RTX 2070 Super (Desktop)
 
37.6 fps -45%
Average AMD Radeon RX 5700 XT (Desktop)
 
33.3 fps -51%
2560x1440 Highest Settings
Nvidia GeForce RTX 3090 Founders Edition
NVIDIA GeForce RTX 3090, R9 5900X
124.7 fps +8%
Average NVIDIA GeForce RTX 3090
  (122 - 124.7, n=2)
123.4 fps +7%
AMD Radeon RX 6900 XT
AMD Radeon RX 6900 XT, R9 5950X
115 (54.9min, 82.8P0.1, 92.3P1 - 314max) fps
MSI GeForce RTX 3070 Gaming X Trio
NVIDIA GeForce RTX 3070, R9 5900X
107 (43.6min, 54P0.1, 62.7P1 - 272max) fps -7%
Average NVIDIA GeForce RTX 3080
 
104 fps -10%
Average NVIDIA GeForce RTX 3070
  (83 - 107, n=3)
93.2 fps -19%
Average NVIDIA GeForce RTX 2080 Ti (Desktop)
 
89.2 fps -22%
AMD Ryzen 9 5900X
NVIDIA Titan RTX, R9 5900X
87.6 fps -24%
Average NVIDIA Titan RTX
 
87.6 fps -24%
AMD Radeon RX 6800 XT
AMD Radeon RX 6800 XT, R9 5950X
80.4 (16.5min, 31.8P0.1, 64.3P1 - 285max) fps -30%
Average NVIDIA GeForce RTX 2070 Super (Desktop)
 
67.7 fps -41%
Average NVIDIA GeForce RTX 2080 Super (Desktop)
  (51 - 77.6, n=2)
64.3 fps -44%
Average AMD Radeon RX 5700 XT (Desktop)
 
59.6 fps -48%
1920x1080 Highest Settings
Nvidia GeForce RTX 3090 Founders Edition
NVIDIA GeForce RTX 3090, R9 5900X
161.1 fps +5%
Average NVIDIA GeForce RTX 3090
  (161 - 161.1, n=2)
161.1 fps +5%
AMD Radeon RX 6900 XT
AMD Radeon RX 6900 XT, R9 5950X
153 (60.9min, 98.1P0.1, 117P1 - 437max) fps
AMD Ryzen 9 5900X
NVIDIA Titan RTX, R9 5900X
144 fps -6%
AMD Radeon RX 6800 XT
AMD Radeon RX 6800 XT, R9 5950X
144 (58.7min, 90.7P0.1, 105P1 - 365max) fps -6%
Average NVIDIA Titan RTX
 
144 fps -6%
Average NVIDIA GeForce RTX 3080
 
127 fps -17%
MSI GeForce RTX 3070 Gaming X Trio
NVIDIA GeForce RTX 3070, R9 5900X
122 (45min, 57.3P0.1, 67.9P1 - 301max) fps -20%
Average NVIDIA GeForce RTX 2080 Ti (Desktop)
 
118 fps -23%
Average NVIDIA GeForce RTX 3070
  (95.7 - 122, n=3)
112.6 fps -26%
Average NVIDIA GeForce RTX 2070 Super (Desktop)
 
92.7 fps -39%
Average NVIDIA GeForce RTX 2080 Super (Desktop)
  (59 - 106, n=2)
82.5 fps -46%
Average AMD Radeon RX 5700 XT (Desktop)
 
81.3 fps -47%
Metro Exodus
1920x1080 Ultra Quality DXR AF:16x
Average NVIDIA GeForce RTX 3090
  (68.6 - 122.2, n=12)
111.4 fps +23%
Average NVIDIA GeForce RTX 3080
  (91.5 - 102, n=2)
96.8 fps +7%
ASUS GeForce RTX 3080 ROG STRIX OC GAMING
NVIDIA GeForce RTX 3080, R9 5900X
91.5 (51.03min - 134.52max) fps +1%
AMD Radeon RX 6900 XT
AMD Radeon RX 6900 XT, R9 5950X
90.5 (55.53min - 126.79max) fps
AMD Ryzen 9 5900X
NVIDIA Titan RTX, R9 5900X
87.9 (49.32min - 136.76max) fps -3%
Average NVIDIA Titan RTX
  (69 - 95.5, n=23)
86.1 fps -5%
AMD Radeon RX 6800 XT
AMD Radeon RX 6800 XT, R9 5950X
85.5 (52.71min - 120.38max) fps -6%
Average NVIDIA GeForce RTX 2080 Ti (Desktop)
  (78.6 - 84.9, n=3)
81.8 fps -10%
Average NVIDIA GeForce RTX 3070
  (80.4 - 83, n=5)
81.6 fps -10%
MSI GeForce RTX 3070 Gaming X Trio
NVIDIA GeForce RTX 3070, R9 5900X
80.4 (43.5min - 124.3max) fps -11%
KFA2 GeForce RTX 2080 Ti EX
NVIDIA GeForce RTX 2080 Ti (Desktop), R9 3900X
78.6 (43min - 115max) fps -13%
Nvidia GeForce RTX 3090 Founders Edition
NVIDIA GeForce RTX 3090, R9 5900X
68.6 (37.68min - 117.88max) fps -24%
Nvidia GeForce RTX 2080 Super
NVIDIA GeForce RTX 2080 Super (Desktop), R7 2700X
65 (37.62min - 97.62max) fps -28%
Average NVIDIA GeForce RTX 2080 Super (Desktop)
 
65 fps -28%
Average NVIDIA GeForce RTX 2070 Super (Desktop)
  (56.3 - 62.1, n=4)
58.5 fps -35%
Nvidia GeForce RTX 2070 Super
NVIDIA GeForce RTX 2070 Super (Desktop), R7 2700X
57.5 (34min - 85max) fps -36%
3840x2160 Ultra Quality AF:16x
Average NVIDIA GeForce RTX 3090
  (70.6 - 77.3, n=12)
75 fps +12%
Nvidia GeForce RTX 3090 Founders Edition
NVIDIA GeForce RTX 3090, R9 5900X
70.6 (41.43min - 118.98max) fps +6%
AMD Radeon RX 6900 XT
AMD Radeon RX 6900 XT, R9 5950X
66.7 (42.71min - 92.25max) fps
Average NVIDIA GeForce RTX 3080
  (64.1 - 65.9, n=2)
65 fps -3%
ASUS GeForce RTX 3080 ROG STRIX OC GAMING
NVIDIA GeForce RTX 3080, R9 5900X
64.1 (36.54min - 108.57max) fps -4%
AMD Radeon RX 6800 XT
AMD Radeon RX 6800 XT, R9 5950X
56.3 (40.14min - 64.28max) fps -16%
AMD Ryzen 9 5900X
NVIDIA Titan RTX, R9 5900X
54.9 (34.88min - 89.73max) fps -18%
Average NVIDIA Titan RTX
  (51.3 - 57.9, n=27)
54.9 fps -18%
Average NVIDIA GeForce RTX 2080 Ti (Desktop)
  (47.5 - 51, n=3)
49.7 fps -25%
MSI GeForce RTX 3070 Gaming X Trio
NVIDIA GeForce RTX 3070, R9 5900X
49.1 (30.24min - 89.89max) fps -26%
Average NVIDIA GeForce RTX 3070
  (48.3 - 49.7, n=5)
48.9 fps -27%
KFA2 GeForce RTX 2080 Ti EX
NVIDIA GeForce RTX 2080 Ti (Desktop), R9 3900X
47.5 (31min - 69max) fps -29%
Average NVIDIA GeForce RTX 2080 Super (Desktop)
  (40 - 40.4, n=2)
40.2 fps -40%
Nvidia GeForce RTX 2080 Super
NVIDIA GeForce RTX 2080 Super (Desktop), R7 2700X
40 (25.84min - 59.35max) fps -40%
Average NVIDIA GeForce RTX 2070 Super (Desktop)
  (35 - 38.1, n=5)
36.8 fps -45%
Nvidia GeForce RTX 2070 Super
NVIDIA GeForce RTX 2070 Super (Desktop), R7 2700X
35 (23min - 51max) fps -48%
Average AMD Radeon RX 5700 XT (Desktop)
  (29.6 - 35.7, n=3)
33.6 fps -50%
AMD Radeon RX 5700 XT
AMD Radeon RX 5700 XT (Desktop), R7 2700X
29.6 (20.7min - 36.64max) fps -56%
AMD Radeon RX 5700
AMD Radeon RX 5700 (Desktop), R7 2700X
28.6 (19.67min - 36.24max) fps -57%
2560x1440 Ultra Quality AF:16x
Average NVIDIA GeForce RTX 3090
  (102 - 118.2, n=12)
113.2 fps +11%
Nvidia GeForce RTX 3090 Founders Edition
NVIDIA GeForce RTX 3090, R9 5900X
106 (54.88min - 173.25max) fps +4%
AMD Radeon RX 6900 XT
AMD Radeon RX 6900 XT, R9 5950X
102 (59.52min - 156.84max) fps
Average NVIDIA GeForce RTX 3080
  (92.2 - 97.4, n=2)
94.8 fps -7%
AMD Radeon RX 6800 XT
AMD Radeon RX 6800 XT, R9 5950X
94.6 (55.44min - 143.68max) fps -7%
ASUS GeForce RTX 3080 ROG STRIX OC GAMING
NVIDIA GeForce RTX 3080, R9 5900X
92.2 (46.62min - 155.93max) fps -10%
AMD Ryzen 9 5900X
NVIDIA Titan RTX, R9 5900X
84.9 (46.03min - 152.65max) fps -17%
Average NVIDIA Titan RTX
  (69 - 92.9, n=26)
84 fps -18%
Average NVIDIA GeForce RTX 3070
  (74.4 - 78.3, n=5)
75.8 fps -26%
Average NVIDIA GeForce RTX 2080 Ti (Desktop)
  (71.9 - 77.9, n=3)
75.3 fps -26%
MSI GeForce RTX 3070 Gaming X Trio
NVIDIA GeForce RTX 3070, R9 5900X
74.4 (38.95min - 129.85max) fps -27%
KFA2 GeForce RTX 2080 Ti EX
NVIDIA GeForce RTX 2080 Ti (Desktop), R9 3900X
71.9 (40min - 108max) fps -30%
Average NVIDIA GeForce RTX 2080 Super (Desktop)
  (61 - 65, n=2)
63 fps -38%
Nvidia GeForce RTX 2080 Super
NVIDIA GeForce RTX 2080 Super (Desktop), R7 2700X
61 (35.51min - 95.82max) fps -40%
Average NVIDIA GeForce RTX 2070 Super (Desktop)
  (54.3 - 61.9, n=5)
57.6 fps -44%
Average AMD Radeon RX 5700 XT (Desktop)
  (54.5 - 57.7, n=3)
56.4 fps -45%
AMD Radeon RX 5700 XT
AMD Radeon RX 5700 XT (Desktop), R7 2700X
54.5 (31.85min - 78.06max) fps -47%
Nvidia GeForce RTX 2070 Super
NVIDIA GeForce RTX 2070 Super (Desktop), R7 2700X
54.3 (32min - 83max) fps -47%
AMD Radeon RX 5700
AMD Radeon RX 5700 (Desktop), R7 2700X
48.4 (28.7min - 68.51max) fps -53%
1920x1080 Ultra Quality AF:16x
Average NVIDIA GeForce RTX 3090
  (108 - 145, n=12)
135.3 fps +10%
Nvidia GeForce RTX 3090 Founders Edition
NVIDIA GeForce RTX 3090, R9 5900X
124 (65.58min - 188.71max) fps +1%
AMD Radeon RX 6900 XT
AMD Radeon RX 6900 XT, R9 5950X
123 (67.67min - 199.52max) fps
AMD Radeon RX 6800 XT
AMD Radeon RX 6800 XT, R9 5950X
115 (64.52min - 181.92max) fps -7%
Average NVIDIA GeForce RTX 3080
  (111 - 116, n=2)
113.5 fps -8%
ASUS GeForce RTX 3080 ROG STRIX OC GAMING
NVIDIA GeForce RTX 3080, R9 5900X
111 (57.16min - 183.25max) fps -10%
AMD Ryzen 9 5900X
NVIDIA Titan RTX, R9 5900X
106 (52.66min - 176.55max) fps -14%
Average NVIDIA Titan RTX
  (73 - 116, n=27)
102.2 fps -17%
Average NVIDIA GeForce RTX 3070
  (91.3 - 97.7, n=5)
93.9 fps -24%
Average NVIDIA GeForce RTX 2080 Ti (Desktop)
  (89.7 - 98.6, n=3)
93.8 fps -24%
MSI GeForce RTX 3070 Gaming X Trio
NVIDIA GeForce RTX 3070, R9 5900X
91.3 (46.36min - 152.74max) fps -26%
KFA2 GeForce RTX 2080 Ti EX
NVIDIA GeForce RTX 2080 Ti (Desktop), R9 3900X
89.7 (46min - 140max) fps -27%
Average NVIDIA GeForce RTX 2080 Super (Desktop)
  (76 - 82, n=2)
79 fps -36%
Nvidia GeForce RTX 2080 Super
NVIDIA GeForce RTX 2080 Super (Desktop), R7 2700X
76 (38.54min - 122.4max) fps -38%
Average NVIDIA GeForce RTX 2070 Super (Desktop)
  (67.8 - 79.1, n=5)
72.3 fps -41%
Average AMD Radeon RX 5700 XT (Desktop)
  (61 - 73.8, n=3)
69.3 fps -44%
Nvidia GeForce RTX 2070 Super
NVIDIA GeForce RTX 2070 Super (Desktop), R7 2700X
67.8 (36min - 110max) fps -45%
AMD Radeon RX 5700 XT
AMD Radeon RX 5700 XT (Desktop), R7 2700X
61 (36.09min - 86.1max) fps -50%
AMD Radeon RX 5700
AMD Radeon RX 5700 (Desktop), R7 2700X
58.6 (32.67min - 85.8max) fps -52%

AMD Smart Access Memory

Resizable BAR settings on the MSI Prestige X570 Creation motherboard.

Smart access memory (SAM) is AMD's fancy term for resizable base address register (BAR), a PCIe specification that allows the CPU to access the full GPU VRAM at all times (originally limited to 256 MB of GPU memory for 32-bit OS compatibility). Though all RDNA 2 GPUs support SAM out-of-the-box, they need to be paired with a Ryzen 5000 series CPU and a motherboard with a B550 or an X570 chipset (Ryzen 3000 CPUs on these motherboards are now supported as well). You may also have to look out for BIOS updates (AGESA 1.1.0.0 or newer) from your motherboard vendor that enable this feature. 

In order to enable SAM, you need to navigate to the BIOS and enable both "Above 4G Memory/Crypto Currency Mining" and "Re-Size BAR Support" under PCIe Subsystem Settings. Unfortunately, there is no way to check SAM status via the driver.

While AMD seemed pretty excited about SAM during its Big Navi launch keynote, the real-world performance gains, if any, are seen only in a handful of games at the moment. In our testing, we found SAM to offer marginal fps increases in Borderlands 3 and Shadow of the Tomb Raider at QHD Ultra and 4K Ultra settings.

However, enabling SAM showed showed +18% at 1080p Ultra, +13% at 1440p Ultra, and +8% gains at 4K Ultra settings in Assassin's Creed Valhalla. SAM didn't seem to be of any benefit at 1080p Ultra in Forza Horizon 4, but we do see +11% and +13% benefits at 1440p Ultra and 4K Ultra, respectively. F1 2020 showed only minor gains at 1080p Ultra. Games such as Control, Hitman 3, and Watch Dogs Legion did not show any performance improvement or regression with SAM turned on.

With all new GPUs and motherboards now supporting resizable BAR, we expect more games to take advantage of this feature in the days to come.

Borderlands 3
3840x2160 Badass Overall Quality (DX11)
Average NVIDIA GeForce RTX 3090
  (68 - 75.3, n=12)
72.8 fps +22%
Nvidia GeForce RTX 3090 Founders Edition
NVIDIA GeForce RTX 3090, R9 5900X
68 fps +14%
Average NVIDIA GeForce RTX 3080
  (61.5 - 61.9, n=2)
61.7 fps +3%
ASUS GeForce RTX 3080 ROG STRIX OC GAMING
NVIDIA GeForce RTX 3080, R9 5900X
61.5 fps +3%
AMD Radeon RX 6900 XT
AMD Radeon RX 6900 XT, R9 5950X (SAM ENABLED)
59.8 fps
AMD Radeon RX 6900 XT
AMD Radeon RX 6900 XT, R9 5950X
57.1 fps -5%
AMD Radeon RX 6800 XT
AMD Radeon RX 6800 XT, R9 5950X
53.6 fps -10%
Average NVIDIA Titan RTX
  (46 - 52.8, n=29)
47.3 fps -21%
AMD Ryzen 9 5900X
NVIDIA Titan RTX, R9 5900X
46.7 fps -22%
Average NVIDIA GeForce RTX 2080 Ti (Desktop)
  (43.6 - 47, n=2)
45.3 fps -24%
Average NVIDIA GeForce RTX 3070
  (42.7 - 46.3, n=5)
44.3 fps -26%
MSI GeForce RTX 3070 Gaming X Trio
NVIDIA GeForce RTX 3070, R9 5900X
44.2 fps -26%
KFA2 GeForce RTX 2080 Ti EX
NVIDIA GeForce RTX 2080 Ti (Desktop), R9 3900X
43.6 fps -27%
Average NVIDIA GeForce RTX 2080 Super (Desktop)
 
35.9 fps -40%
Average NVIDIA GeForce RTX 2070 Super (Desktop)
  (29.5 - 32.7, n=5)
31.3 fps -48%
Average AMD Radeon RX 5700 XT (Desktop)
  (28.1 - 30.5, n=3)
29.6 fps -51%
2560x1440 Badass Overall Quality (DX11)
Average NVIDIA GeForce RTX 3090
  (105 - 131.6, n=12)
123.2 fps +15%
AMD Radeon RX 6900 XT
AMD Radeon RX 6900 XT, R9 5950X (SAM ENABLED)
107 fps
AMD Radeon RX 6900 XT
AMD Radeon RX 6900 XT, R9 5950X
105 fps -2%
Nvidia GeForce RTX 3090 Founders Edition
NVIDIA GeForce RTX 3090, R9 5900X
105 fps -2%
ASUS GeForce RTX 3080 ROG STRIX OC GAMING
NVIDIA GeForce RTX 3080, R9 5900X
103 fps -4%
Average NVIDIA GeForce RTX 3080
  (95.7 - 103, n=2)
99.4 fps -7%
AMD Radeon RX 6800 XT
AMD Radeon RX 6800 XT, R9 5950X
93.6 fps -13%
AMD Ryzen 9 5900X
NVIDIA Titan RTX, R9 5900X
84.7 fps -21%
Average NVIDIA Titan RTX
  (74 - 93.1, n=29)
84.7 fps -21%
Average NVIDIA GeForce RTX 2080 Ti (Desktop)
  (78 - 83, n=2)
80.5 fps -25%
KFA2 GeForce RTX 2080 Ti EX
NVIDIA GeForce RTX 2080 Ti (Desktop), R9 3900X
78 fps -27%
Average NVIDIA GeForce RTX 3070
  (75.1 - 82.9, n=5)
77.7 fps -27%
MSI GeForce RTX 3070 Gaming X Trio
NVIDIA GeForce RTX 3070, R9 5900X
75.9 fps -29%
Average NVIDIA GeForce RTX 2080 Super (Desktop)
 
65.5 fps -39%
Average NVIDIA GeForce RTX 2070 Super (Desktop)
  (53.7 - 60.3, n=5)
57.3 fps -46%
Average AMD Radeon RX 5700 XT (Desktop)
  (51.1 - 56.1, n=3)
54.3 fps -49%
1920x1080 Badass Overall Quality (DX11)
Average NVIDIA GeForce RTX 3090
  (117 - 165, n=12)
149.1 fps +14%
AMD Radeon RX 6900 XT
AMD Radeon RX 6900 XT, R9 5950X (SAM ENABLED)
131 fps
AMD Radeon RX 6900 XT
AMD Radeon RX 6900 XT, R9 5950X
130 fps -1%
ASUS GeForce RTX 3080 ROG STRIX OC GAMING
NVIDIA GeForce RTX 3080, R9 5900X
128 fps -2%
Average NVIDIA GeForce RTX 3080
  (117 - 128, n=2)
122.5 fps -6%
AMD Radeon RX 6800 XT
AMD Radeon RX 6800 XT, R9 5950X
120 fps -8%
Nvidia GeForce RTX 3090 Founders Edition
NVIDIA GeForce RTX 3090, R9 5900X
119 fps -9%
AMD Ryzen 9 5900X
NVIDIA Titan RTX, R9 5900X
118 fps -10%
Average NVIDIA Titan RTX
  (77.2 - 128.7, n=29)
112 fps -15%
Average NVIDIA GeForce RTX 2080 Ti (Desktop)
  (101.3 - 109, n=2)
105.2 fps -20%
KFA2 GeForce RTX 2080 Ti EX
NVIDIA GeForce RTX 2080 Ti (Desktop), R9 3900X
101.3 fps -23%
Average NVIDIA GeForce RTX 3070
  (95.3 - 108.9, n=5)
100.6 fps -23%
MSI GeForce RTX 3070 Gaming X Trio
NVIDIA GeForce RTX 3070, R9 5900X
95.8 fps -27%
Average NVIDIA GeForce RTX 2080 Super (Desktop)
 
91 fps -31%
Average NVIDIA GeForce RTX 2070 Super (Desktop)
  (74.3 - 86, n=5)
80.9 fps -38%
Average AMD Radeon RX 5700 XT (Desktop)
  (71.7 - 79.1, n=3)
76.6 fps -42%
Control
1920x1080 High Quality Preset & High Ray Tracing Preset (DX12)
Average NVIDIA GeForce RTX 3090
  (91.4 - 120.4, n=4)
108.2 fps +42%
Nvidia GeForce RTX 3090 Founders Edition
NVIDIA GeForce RTX 3090, R9 5900X
106.9 fps +40%
ASUS GeForce RTX 3080 ROG STRIX OC GAMING
NVIDIA GeForce RTX 3080, R9 5900X
103 (94min - 116max) fps +35%
Average NVIDIA GeForce RTX 3080
  (98.1 - 103, n=2)
100.6 fps +32%
Average NVIDIA Titan RTX
  (63 - 120, n=3)
88.1 fps +16%
AMD Radeon RX 6900 XT
AMD Radeon RX 6900 XT, R9 5950X (SAM ENABLED)
76.2 (38.7min, 43.3P0.1, 62.8P1 - 142max) fps
AMD Radeon RX 6900 XT
AMD Radeon RX 6900 XT, R9 5950X
73.1 (31.6min, 40.9P0.1, 62.6P1 - 149max) fps -4%
Average NVIDIA GeForce RTX 2080 Ti (Desktop)
  (72 - 76, n=2)
74 fps -3%
KFA2 GeForce RTX 2080 Ti EX
NVIDIA GeForce RTX 2080 Ti (Desktop), R9 3900X
72 (67min - 80max) fps -6%
Average NVIDIA GeForce RTX 3070
  (57.9 - 75.1, n=3)
68.5 fps -10%
AMD Radeon RX 6800 XT
AMD Radeon RX 6800 XT, R9 5950X
66.9 (60min - 75max) fps -12%
MSI GeForce RTX 3070 Gaming X Trio
NVIDIA GeForce RTX 3070, R9 5900X
57.9 (29min - 79max) fps -24%
Average NVIDIA GeForce RTX 2080 Super (Desktop)
 
53.2 fps -30%
Average NVIDIA GeForce RTX 2070 Super (Desktop)
  (51.1 - 54.2, n=4)
52.7 fps -31%
3840x2160 High Quality Preset (DX11)
Average NVIDIA GeForce RTX 3090
  (61.3 - 66, n=4)
63 fps +15%
Nvidia GeForce RTX 3090 Founders Edition
NVIDIA GeForce RTX 3090, R9 5900X
61.3 fps +12%
Average NVIDIA GeForce RTX 3080
  (56.2 - 56.7, n=2)
56.5 fps +3%
ASUS GeForce RTX 3080 ROG STRIX OC GAMING
NVIDIA GeForce RTX 3080, R9 5900X
56.2 (49min - 64max) fps +3%
AMD Radeon RX 6900 XT
AMD Radeon RX 6900 XT, R9 5950X
54.7 (39.8min, 41.7P0.1, 44.9P1 - 65.8max) fps
AMD Radeon RX 6900 XT
AMD Radeon RX 6900 XT, R9 5950X (SAM ENABLED)
53.9 (36.6min, 41.7P0.1, 43.5P1 - 64.9max) fps -1%
AMD Radeon RX 6800 XT
AMD Radeon RX 6800 XT, R9 5950X
51.6 (46min - 58max) fps -6%
Average NVIDIA Titan RTX
  (45.2 - 47.3, n=3)
46.5 fps -15%
Average NVIDIA GeForce RTX 2080 Ti (Desktop)
  (42.6 - 45.8, n=2)
44.2 fps -19%
KFA2 GeForce RTX 2080 Ti EX
NVIDIA GeForce RTX 2080 Ti (Desktop), R9 3900X
42.6 (37min - 49max) fps -22%
MSI GeForce RTX 3070 Gaming X Trio
NVIDIA GeForce RTX 3070, R9 5900X
42.3 (37min - 49max) fps -23%
Average NVIDIA GeForce RTX 3070
  (40.6 - 42.3, n=3)
41.3 fps -24%
Average AMD Radeon RX 5700 XT (Desktop)
  (26.3 - 55.2, n=2)
40.8 fps -25%
Average NVIDIA GeForce RTX 2080 Super (Desktop)
 
30.4 fps -44%
Average NVIDIA GeForce RTX 2070 Super (Desktop)
  (29.2 - 30.7, n=4)
30.1 fps -45%
2560x1440 High Quality Preset (DX11)
Average NVIDIA GeForce RTX 3090
  (115.8 - 123.7, n=4)
120.1 fps +6%
Nvidia GeForce RTX 3090 Founders Edition
NVIDIA GeForce RTX 3090, R9 5900X
115.8 fps +2%
AMD Radeon RX 6900 XT
AMD Radeon RX 6900 XT, R9 5950X
113 (71.5min, 73.2P0.1, 79.6P1 - 164max) fps
AMD Radeon RX 6900 XT
AMD Radeon RX 6900 XT, R9 5950X (SAM ENABLED)
113 (68min, 71.3P0.1, 81.1P1 - 193max) fps 0%
AMD Radeon RX 6800 XT
AMD Radeon RX 6800 XT, R9 5950X
108 (93min - 123max) fps -4%
ASUS GeForce RTX 3080 ROG STRIX OC GAMING
NVIDIA GeForce RTX 3080, R9 5900X
106 (92min - 123max) fps -6%
Average NVIDIA GeForce RTX 3080
  (105 - 106, n=2)
105.5 fps -7%
Average NVIDIA Titan RTX
  (89 - 93.6, n=3)
91.5 fps -19%
Average NVIDIA GeForce RTX 2080 Ti (Desktop)
  (84 - 89, n=2)
86.5 fps -23%
KFA2 GeForce RTX 2080 Ti EX
NVIDIA GeForce RTX 2080 Ti (Desktop), R9 3900X
84 (75min - 95max) fps -26%
MSI GeForce RTX 3070 Gaming X Trio
NVIDIA GeForce RTX 3070, R9 5900X
82.5 (72min - 96max) fps -27%
Average NVIDIA GeForce RTX 3070
  (79.8 - 82.5, n=3)
81.2 fps -28%
Average AMD Radeon RX 5700 XT (Desktop)
  (53.4 - 91, n=2)
72.2 fps -36%
Average NVIDIA GeForce RTX 2080 Super (Desktop)
 
62 fps -45%
Average NVIDIA GeForce RTX 2070 Super (Desktop)
  (56.9 - 62.6, n=4)
60.6 fps -46%
1920x1080 High Quality Preset (DX11)
Average NVIDIA GeForce RTX 3090
  (172.2 - 189.2, n=4)
178.1 fps +2%
AMD Radeon RX 6900 XT
AMD Radeon RX 6900 XT, R9 5950X
175 (56.8min, 96P0.1, 112P1 - 314max) fps
AMD Radeon RX 6900 XT
AMD Radeon RX 6900 XT, R9 5950X (SAM ENABLED)
174 (54min, 99P0.1, 112P1 - 335max) fps -1%
Nvidia GeForce RTX 3090 Founders Edition
NVIDIA GeForce RTX 3090, R9 5900X
172.2 fps -2%
AMD Radeon RX 6800 XT
AMD Radeon RX 6800 XT, R9 5950X
168 (145min - 194max) fps -4%
ASUS GeForce RTX 3080 ROG STRIX OC GAMING
NVIDIA GeForce RTX 3080, R9 5900X
155 (133min - 178max) fps -11%
Average NVIDIA GeForce RTX 3080
  (151 - 155, n=2)
153 fps -13%
Average NVIDIA Titan RTX
  (135 - 141.9, n=3)
137.3 fps -22%
Average NVIDIA GeForce RTX 2080 Ti (Desktop)
  (126 - 132, n=2)
129 fps -26%
KFA2 GeForce RTX 2080 Ti EX
NVIDIA GeForce RTX 2080 Ti (Desktop), R9 3900X
126 (111min - 143max) fps -28%
MSI GeForce RTX 3070 Gaming X Trio
NVIDIA GeForce RTX 3070, R9 5900X
122 (103min - 138max) fps -30%
Average NVIDIA GeForce RTX 3070
  (117 - 124.9, n=3)
121.3 fps -31%
Average AMD Radeon RX 5700 XT (Desktop)
  (83 - 121.9, n=2)
102.5 fps -41%
Average NVIDIA GeForce RTX 2080 Super (Desktop)
 
95 fps -46%
Average NVIDIA GeForce RTX 2070 Super (Desktop)
  (88 - 97.3, n=4)
93.3 fps -47%
Assassin´s Creed Valhalla
3840x2160 Ultra High Preset
AMD Radeon RX 6900 XT
AMD Radeon RX 6900 XT, R9 5950X (SAM ENABLED)
68 (33min - 230max) fps
AMD Radeon RX 6900 XT
AMD Radeon RX 6900 XT, R9 5950X
63 (32min - 219max) fps -7%
AMD Radeon RX 6800 XT
AMD Radeon RX 6800 XT, R9 5950X
65 (33min - 179max) fps -4%
Nvidia GeForce RTX 3090 Founders Edition
NVIDIA GeForce RTX 3090, R9 5900X
57 (36min - 113max) fps -16%
Average NVIDIA GeForce RTX 3090
  (55 - 57, n=2)
56 fps -18%
Average NVIDIA GeForce RTX 3080
 
52 fps -24%
MSI GeForce RTX 3070 Gaming X Trio
NVIDIA GeForce RTX 3070, R9 5900X
47 (31min - 92max) fps -31%
Average NVIDIA GeForce RTX 2080 Ti (Desktop)
 
46 fps -32%
Average NVIDIA GeForce RTX 3070
  (42 - 47, n=3)
44 fps -35%
AMD Ryzen 9 5900X
NVIDIA Titan RTX, R9 5900X
43 fps -37%
Average NVIDIA Titan RTX
 
43 fps -37%
Average NVIDIA GeForce RTX 2080 Super (Desktop)
 
36 fps -47%
Average AMD Radeon RX 5700 XT (Desktop)
 
33 fps -51%
Average NVIDIA GeForce RTX 2070 Super (Desktop)
 
32 fps -53%
2560x1440 Ultra High Preset
AMD Radeon RX 6900 XT
AMD Radeon RX 6900 XT, R9 5950X (SAM ENABLED)
115 (41min - 242max) fps
AMD Radeon RX 6900 XT
AMD Radeon RX 6900 XT, R9 5950X
102 (40min - 239max) fps -11%
AMD Radeon RX 6800 XT
AMD Radeon RX 6800 XT, R9 5950X
98 (25min - 211max) fps -15%
Nvidia GeForce RTX 3090 Founders Edition
NVIDIA GeForce RTX 3090, R9 5900X
79 (44min - 135max) fps -31%
Average NVIDIA GeForce RTX 3090
  (76 - 79, n=2)
77.5 fps -33%
Average NVIDIA GeForce RTX 3080
 
76 fps -34%
MSI GeForce RTX 3070 Gaming X Trio
NVIDIA GeForce RTX 3070, R9 5900X
67 (39min - 124max) fps -42%
Average NVIDIA GeForce RTX 2080 Ti (Desktop)
 
67 fps -42%
AMD Ryzen 9 5900X
NVIDIA Titan RTX, R9 5900X
66 fps -43%
Average NVIDIA Titan RTX
 
66 fps -43%
Average NVIDIA GeForce RTX 3070
  (65 - 67, n=3)
65.7 fps -43%
Average AMD Radeon RX 5700 XT (Desktop)
 
59 fps -49%
Average NVIDIA GeForce RTX 2080 Super (Desktop)
 
57 fps -50%
Average NVIDIA GeForce RTX 2070 Super (Desktop)
 
53 fps -54%
1920x1080 Ultra High Preset
AMD Radeon RX 6900 XT
AMD Radeon RX 6900 XT, R9 5950X (SAM ENABLED)
148 (44min - 248max) fps
AMD Radeon RX 6900 XT
AMD Radeon RX 6900 XT, R9 5950X
125 (43min - 252max) fps -16%
AMD Radeon RX 6800 XT
AMD Radeon RX 6800 XT, R9 5950X
118 (29min - 255max) fps -20%
Nvidia GeForce RTX 3090 Founders Edition
NVIDIA GeForce RTX 3090, R9 5900X
91 (48min - 158max) fps -39%
Average NVIDIA GeForce RTX 3090
  (88 - 91, n=2)
89.5 fps -40%
Average NVIDIA GeForce RTX 3080
 
88 fps -41%
AMD Ryzen 9 5900X
NVIDIA Titan RTX, R9 5900X
80 fps -46%
Average NVIDIA GeForce RTX 2080 Ti (Desktop)
 
80 fps -46%
Average NVIDIA Titan RTX
 
80 fps -46%
Average NVIDIA GeForce RTX 3070
  (77 - 80, n=3)
78.3 fps -47%
MSI GeForce RTX 3070 Gaming X Trio
NVIDIA GeForce RTX 3070, R9 5900X
78 (15min - 139max) fps -47%
Average AMD Radeon RX 5700 XT (Desktop)
 
78 fps -47%
Average NVIDIA GeForce RTX 2080 Super (Desktop)
 
70 fps -53%
Average NVIDIA GeForce RTX 2070 Super (Desktop)
 
66 fps -55%
Shadow of the Tomb Raider
3840x2160 Highest Preset AA:T
Average NVIDIA GeForce RTX 3090
  (89.3 - 99.7, n=12)
96.4 fps +12%
Nvidia GeForce RTX 3090 Founders Edition
NVIDIA GeForce RTX 3090, R9 5900X
94 fps +9%
AMD Radeon RX 6900 XT
AMD Radeon RX 6900 XT, R9 5950X (SAM ENABLED)
86 fps
AMD Radeon RX 6900 XT
AMD Radeon RX 6900 XT, R9 5950X
84 fps -2%
Average NVIDIA GeForce RTX 3080
  (83.9 - 87.9, n=2)
85.9 fps 0%
ASUS GeForce RTX 3080 ROG STRIX OC GAMING
NVIDIA GeForce RTX 3080, R9 5900X
83.9 fps -2%
AMD Radeon RX 6800 XT
AMD Radeon RX 6800 XT, R9 5950X
79.6 fps -7%
Average NVIDIA Titan RTX
  (59 - 71.1, n=24)
66.9 fps -22%
AMD Ryzen 9 5900X
NVIDIA Titan RTX, R9 5900X
66.3 fps -23%
Average NVIDIA GeForce RTX 3070
  (61 - 63.5, n=4)
62.3 fps -28%
MSI GeForce RTX 3070 Gaming X Trio
NVIDIA GeForce RTX 3070, R9 5900X
61 fps -29%
Average NVIDIA GeForce RTX 2080 Ti (Desktop)
  (60 - 61, n=2)
60.5 fps -30%
KFA2 GeForce RTX 2080 Ti EX
NVIDIA GeForce RTX 2080 Ti (Desktop), R9 3900X
60 fps -30%
Nvidia GeForce RTX 2080 Super
NVIDIA GeForce RTX 2080 Super (Desktop), R7 2700X
49 fps -43%
Average NVIDIA GeForce RTX 2080 Super (Desktop)
  (49 - 49, n=2)
49 fps -43%
Average NVIDIA GeForce RTX 2070 Super (Desktop)
  (43 - 47.9, n=5)
45.5 fps -47%
Nvidia GeForce RTX 2070 Super
NVIDIA GeForce RTX 2070 Super (Desktop), R7 2700X
43 fps -50%
AMD Radeon RX 5700 XT
AMD Radeon RX 5700 XT (Desktop), R7 2700X
38 fps -56%
Average AMD Radeon RX 5700 XT (Desktop)
  (32 - 40.9, n=4)
37.9 fps -56%
AMD Radeon RX 5700
AMD Radeon RX 5700 (Desktop), R7 2700X
34 fps -60%
2560x1440 Highest Preset AA:T
Average NVIDIA GeForce RTX 3090
  (137 - 172.3, n=12)
165.6 fps +2%
AMD Radeon RX 6900 XT
AMD Radeon RX 6900 XT, R9 5950X (SAM ENABLED)
163 fps
AMD Radeon RX 6900 XT
AMD Radeon RX 6900 XT, R9 5950X
155 fps -5%
Nvidia GeForce RTX 3090 Founders Edition
NVIDIA GeForce RTX 3090, R9 5900X
159 fps -2%
Average NVIDIA GeForce RTX 3080
  (147 - 152, n=2)
149.5 fps -8%
AMD Radeon RX 6800 XT
AMD Radeon RX 6800 XT, R9 5950X
148 fps -9%
ASUS GeForce RTX 3080 ROG STRIX OC GAMING
NVIDIA GeForce RTX 3080, R9 5900X
147 fps -10%
AMD Ryzen 9 5900X
NVIDIA Titan RTX, R9 5900X
120 fps -26%
Average NVIDIA Titan RTX
  (98 - 128, n=23)
117.8 fps -28%
Average NVIDIA GeForce RTX 3070
  (108 - 116, n=4)
113.2 fps -31%
Average NVIDIA GeForce RTX 2080 Ti (Desktop)
  (108 - 112, n=2)
110 fps -33%
KFA2 GeForce RTX 2080 Ti EX
NVIDIA GeForce RTX 2080 Ti (Desktop), R9 3900X
108 fps -34%
MSI GeForce RTX 3070 Gaming X Trio
NVIDIA GeForce RTX 3070, R9 5900X
108 fps -34%
Average NVIDIA GeForce RTX 2080 Super (Desktop)
  (91 - 92, n=2)
91.5 fps -44%
Nvidia GeForce RTX 2080 Super
NVIDIA GeForce RTX 2080 Super (Desktop), R7 2700X
91 fps -44%
Average NVIDIA GeForce RTX 2070 Super (Desktop)
  (81 - 89.6, n=5)
85.4 fps -48%
Nvidia GeForce RTX 2070 Super
NVIDIA GeForce RTX 2070 Super (Desktop), R7 2700X
81 fps -50%
AMD Radeon RX 5700 XT
AMD Radeon RX 5700 XT (Desktop), R7 2700X
76 fps -53%
Average AMD Radeon RX 5700 XT (Desktop)
  (61 - 79.2, n=4)
73.8 fps -55%
AMD Radeon RX 5700
AMD Radeon RX 5700 (Desktop), R7 2700X
68 fps -58%
1920x1080 Highest Preset AA:T
Average NVIDIA GeForce RTX 3090
  (145 - 240, n=14)
204 fps +1%
AMD Radeon RX 6900 XT
AMD Radeon RX 6900 XT, R9 5950X
202 fps
AMD Radeon RX 6900 XT
AMD Radeon RX 6900 XT, R9 5950X (SAM ENABLED)
199 fps -1%
AMD Radeon RX 6800 XT
AMD Radeon RX 6800 XT, R9 5950X
194 fps -4%
Nvidia GeForce RTX 3090 Founders Edition
NVIDIA GeForce RTX 3090, R9 5900X
187 fps -7%
ASUS GeForce RTX 3080 ROG STRIX OC GAMING
NVIDIA GeForce RTX 3080, R9 5900X
185 fps -8%
Average NVIDIA GeForce RTX 3080
  (177 - 185, n=2)
181 fps -10%
AMD Ryzen 9 5900X
NVIDIA Titan RTX, R9 5900X
166 fps -18%
Average NVIDIA GeForce RTX 3070
  (138 - 160, n=4)
151.3 fps -25%
Average NVIDIA Titan RTX
  (106 - 178.8, n=24)
149.5 fps -26%
MSI GeForce RTX 3070 Gaming X Trio
NVIDIA GeForce RTX 3070, R9 5900X
138 fps -32%
Average NVIDIA GeForce RTX 2080 Ti (Desktop)
  (130 - 142, n=2)
136 fps -33%
KFA2 GeForce RTX 2080 Ti EX
NVIDIA GeForce RTX 2080 Ti (Desktop), R9 3900X
130 fps -36%
Average NVIDIA GeForce RTX 2070 Super (Desktop)
  (104 - 131.1, n=5)
119.7 fps -41%
Average NVIDIA GeForce RTX 2080 Super (Desktop)
  (110 - 118, n=2)
114 fps -44%
Average AMD Radeon RX 5700 XT (Desktop)
  (89 - 119, n=6)
110.8 fps -45%
Nvidia GeForce RTX 2080 Super
NVIDIA GeForce RTX 2080 Super (Desktop), R7 2700X
110 fps -46%
AMD Radeon RX 5700 XT
AMD Radeon RX 5700 XT (Desktop), R7 2700X
110 fps -46%
Nvidia GeForce RTX 2070 Super
NVIDIA GeForce RTX 2070 Super (Desktop), R7 2700X
104 fps -49%
AMD Radeon RX 5700
AMD Radeon RX 5700 (Desktop), R7 2700X
90 fps -55%
Forza Horizon 4
3840x2160 Ultra Preset AA:2xMS
AMD Radeon RX 6900 XT
AMD Radeon RX 6900 XT, R9 5950X (SAM ENABLED)
172 fps
AMD Radeon RX 6900 XT
AMD Radeon RX 6900 XT, R9 5950X
152 fps -12%
Average NVIDIA GeForce RTX 3090
 
147 fps -15%
Average NVIDIA Titan RTX
  (90 - 121, n=17)
112.9 fps -34%
KFA2 GeForce RTX 2080 Ti EX
NVIDIA GeForce RTX 2080 Ti (Desktop), R9 3900X
107 fps -38%
Average NVIDIA GeForce RTX 2080 Ti (Desktop)
  (98 - 111, n=3)
105.3 fps -39%
Average NVIDIA GeForce RTX 2070 Super (Desktop)
  (76 - 85, n=3)
81.7 fps -52%
Nvidia GeForce RTX 2080 Super
NVIDIA GeForce RTX 2080 Super (Desktop), R7 2700X
81 fps -53%
Average NVIDIA GeForce RTX 2080 Super (Desktop)
 
81 fps -53%
AMD Radeon RX 5700 XT
AMD Radeon RX 5700 XT (Desktop), R7 2700X
79 fps -54%
Average AMD Radeon RX 5700 XT (Desktop)
 
79 fps -54%
Nvidia GeForce RTX 2070 Super
NVIDIA GeForce RTX 2070 Super (Desktop), R7 2700X
76 fps -56%
AMD Radeon RX 5700
AMD Radeon RX 5700 (Desktop), R7 2700X
70 fps -59%
2560x1440 Ultra Preset AA:2xMS
AMD Radeon RX 6900 XT
AMD Radeon RX 6900 XT, R9 5950X (SAM ENABLED)
243 fps
AMD Radeon RX 6900 XT
AMD Radeon RX 6900 XT, R9 5950X
218 fps -10%
Average NVIDIA GeForce RTX 3090
 
164 fps -33%
Average NVIDIA Titan RTX
  (127 - 171, n=16)
154.8 fps -36%
KFA2 GeForce RTX 2080 Ti EX
NVIDIA GeForce RTX 2080 Ti (Desktop), R9 3900X
147 fps -40%
Average NVIDIA GeForce RTX 2080 Ti (Desktop)
  (131 - 150, n=3)
142.7 fps -41%
Average NVIDIA GeForce RTX 2070 Super (Desktop)
  (108 - 125, n=3)
119.3 fps -51%
AMD Radeon RX 5700 XT
AMD Radeon RX 5700 XT (Desktop), R7 2700X
119 fps -51%
Average AMD Radeon RX 5700 XT (Desktop)
 
119 fps -51%
Nvidia GeForce RTX 2080 Super
NVIDIA GeForce RTX 2080 Super (Desktop), R7 2700X
117 fps -52%
Average NVIDIA GeForce RTX 2080 Super (Desktop)
 
117 fps -52%
Nvidia GeForce RTX 2070 Super
NVIDIA GeForce RTX 2070 Super (Desktop), R7 2700X
108 fps -56%
AMD Radeon RX 5700
AMD Radeon RX 5700 (Desktop), R7 2700X
103 fps -58%
1920x1080 Ultra Preset AA:2xMS
AMD Radeon RX 6900 XT
AMD Radeon RX 6900 XT, R9 5950X
248 fps
AMD Radeon RX 6900 XT
AMD Radeon RX 6900 XT, R9 5950X (SAM ENABLED)
247 fps 0%
Average NVIDIA Titan RTX
  (129 - 196, n=17)
169.8 fps -32%
KFA2 GeForce RTX 2080 Ti EX
NVIDIA GeForce RTX 2080 Ti (Desktop), R9 3900X
168 fps -32%
Average NVIDIA GeForce RTX 3090
 
166 fps -33%
Average NVIDIA GeForce RTX 2080 Ti (Desktop)
  (153 - 169, n=3)
163.3 fps -34%
Average AMD Radeon RX 5700 XT (Desktop)
  (138 - 149, n=3)
145 fps -42%
Average NVIDIA GeForce RTX 2070 Super (Desktop)
  (129 - 153, n=3)
145 fps -42%
AMD Radeon RX 5700 XT
AMD Radeon RX 5700 XT (Desktop), R7 2700X
138 fps -44%
Nvidia GeForce RTX 2080 Super
NVIDIA GeForce RTX 2080 Super (Desktop), R7 2700X
133 fps -46%
Average NVIDIA GeForce RTX 2080 Super (Desktop)
 
133 fps -46%
Nvidia GeForce RTX 2070 Super
NVIDIA GeForce RTX 2070 Super (Desktop), R7 2700X
129 fps -48%
AMD Radeon RX 5700
AMD Radeon RX 5700 (Desktop), R7 2700X
118 fps -52%
Hitman 3
3840x2160 Maximum Settings AF:16x
AMD Radeon RX 6900 XT
AMD Radeon RX 6900 XT, R9 5950X
128.4 fps
AMD Radeon RX 6900 XT
AMD Radeon RX 6900 XT, R9 5950X (SAM ENABLED)
127.8 fps 0%
Average NVIDIA GeForce RTX 3090
  (115 - 122, n=2)
118.5 fps -8%
Nvidia GeForce RTX 3090 Founders Edition
NVIDIA GeForce RTX 3090, R9 5900X
115 fps -10%
Average NVIDIA GeForce RTX 3080
 
109 fps -15%
Average NVIDIA GeForce RTX 2080 Ti (Desktop)
 
85.2 fps -34%
AMD Ryzen 9 5900X
NVIDIA Titan RTX, R9 5900X
82 fps -36%
Average NVIDIA Titan RTX
 
82 fps -36%
Average NVIDIA GeForce RTX 3070
 
77.5 fps -40%
Average NVIDIA GeForce RTX 2080 Super (Desktop)
 
64 fps -50%
Average NVIDIA GeForce RTX 2070 Super (Desktop)
 
55 fps -57%
Average AMD Radeon RX 5700 XT (Desktop)
 
53 fps -59%
2560x1440 Maximum Settings AF:16x
AMD Radeon RX 6900 XT
AMD Radeon RX 6900 XT, R9 5950X
213.1 fps
AMD Radeon RX 6900 XT
AMD Radeon RX 6900 XT, R9 5950X (SAM ENABLED)
213.1 fps 0%
Nvidia GeForce RTX 3090 Founders Edition
NVIDIA GeForce RTX 3090, R9 5900X
190 fps -11%
Average NVIDIA GeForce RTX 3090
  (166 - 190, n=2)
178 fps -16%
Average NVIDIA GeForce RTX 3080
 
164 fps -23%
Average NVIDIA GeForce RTX 2080 Ti (Desktop)
 
147 fps -31%
AMD Ryzen 9 5900X
NVIDIA Titan RTX, R9 5900X
145 fps -32%
Average NVIDIA Titan RTX
 
145 fps -32%
Average NVIDIA GeForce RTX 3070
 
140 fps -34%
Average NVIDIA GeForce RTX 2080 Super (Desktop)
 
115 fps -46%
Average NVIDIA GeForce RTX 2070 Super (Desktop)
 
101 fps -53%
Average AMD Radeon RX 5700 XT (Desktop)
 
95 fps -55%
1920x1080 Maximum Settings AF:16x
AMD Radeon RX 6900 XT
AMD Radeon RX 6900 XT, R9 5950X
276.2 fps
AMD Radeon RX 6900 XT
AMD Radeon RX 6900 XT, R9 5950X (SAM ENABLED)
269.4 fps -2%
Nvidia GeForce RTX 3090 Founders Edition
NVIDIA GeForce RTX 3090, R9 5900X
223 fps -19%
AMD Ryzen 9 5900X
NVIDIA Titan RTX, R9 5900X
202 fps -27%
Average NVIDIA Titan RTX
 
202 fps -27%
Average NVIDIA GeForce RTX 3090
  (167 - 223, n=2)
195 fps -29%
Average NVIDIA GeForce RTX 3080
 
166 fps -40%
Average NVIDIA GeForce RTX 2080 Super (Desktop)
 
166 fps -40%
Average NVIDIA GeForce RTX 3070
 
165 fps -40%
Average NVIDIA GeForce RTX 2080 Ti (Desktop)
 
162 fps -41%
Average NVIDIA GeForce RTX 2070 Super (Desktop)
 
148 fps -46%
Average AMD Radeon RX 5700 XT (Desktop)
 
141 fps -49%
Watch Dogs Legion
1920x1080 Ultra Preset + Ultra Ray Tracing (DX12)
Average NVIDIA GeForce RTX 3090
  (75.7 - 78.2, n=2)
77 fps +38%
Nvidia GeForce RTX 3090 Founders Edition
NVIDIA GeForce RTX 3090, R9 5900X
75.7 (33.41min, 58.92P1 - 126.05max) fps +36%
AMD Radeon RX 6800 XT
AMD Radeon RX 6800 XT, R9 5950X
71.4 (47.71min, 55.63P1 - 113.42max) fps +28%
Average NVIDIA GeForce RTX 3080
  (70.9 - 71.3, n=2)
71.1 fps +28%
ASUS GeForce RTX 3080 ROG STRIX OC GAMING
NVIDIA GeForce RTX 3080, R9 5900X
70.9 (37.64min, 58.05P1 - 113.63max) fps +28%
Average NVIDIA GeForce RTX 2080 Ti (Desktop)
 
55.8 fps 0%
AMD Radeon RX 6900 XT
AMD Radeon RX 6900 XT, R9 5950X
55.6 (35.81min, 41.86P1 - 76.28max) fps
AMD Radeon RX 6900 XT
AMD Radeon RX 6900 XT, R9 5950X (SAM ENABLED)
55.5 (36.48min, 43.27P1 - 76.42max) fps 0%
Average NVIDIA Titan RTX
 
55.4 fps 0%
Average NVIDIA GeForce RTX 3070
  (51.7 - 61, n=4)
55.1 fps -1%
MSI GeForce RTX 3070 Gaming X Trio
NVIDIA GeForce RTX 3070, R9 5900X
54.3 (18.74min, 40.53P1 - 81.06max) fps -2%
Average NVIDIA GeForce RTX 2080 Super (Desktop)
 
45.4 fps -18%
Average NVIDIA GeForce RTX 2070 Super (Desktop)
 
39.2 fps -29%
3840x2160 Ultra Preset (DX12)
Average NVIDIA GeForce RTX 3090
  (57.6 - 60.3, n=2)
59 fps +10%
Nvidia GeForce RTX 3090 Founders Edition
NVIDIA GeForce RTX 3090, R9 5900X
57.6 (24.58min, 45.93P1 - 114.36max) fps +7%
ASUS GeForce RTX 3080 ROG STRIX OC GAMING
NVIDIA GeForce RTX 3080, R9 5900X
54.1 (24.72min, 44.97P1 - 114.7max) fps +1%
Average NVIDIA GeForce RTX 3080
  (53.5 - 54.1, n=2)
53.8 fps 0%
AMD Radeon RX 6900 XT
AMD Radeon RX 6900 XT, R9 5950X (SAM ENABLED)
53.6 (34.78min, 44.93P1 - 72.47max) fps
AMD Radeon RX 6900 XT
AMD Radeon RX 6900 XT, R9 5950X
53.5 (33.75min, 44.2P1 - 82.3max) fps 0%
AMD Radeon RX 6800 XT
AMD Radeon RX 6800 XT, R9 5950X
49.3 (32.85min, 41.54P1 - 76.12max) fps -8%
Average NVIDIA GeForce RTX 2080 Ti (Desktop)
 
44 fps -18%
Average NVIDIA Titan RTX
 
43.4 fps -19%
Average NVIDIA GeForce RTX 3070
  (37 - 39.2, n=4)
38 fps -29%
MSI GeForce RTX 3070 Gaming X Trio
NVIDIA GeForce RTX 3070, R9 5900X
37 (17.44min, 25.32P1 - 81.3max) fps -31%
Average NVIDIA GeForce RTX 2080 Super (Desktop)
 
34.4 fps -36%
Average NVIDIA GeForce RTX 2070 Super (Desktop)
 
29.2 fps -46%
Average AMD Radeon RX 5700 XT (Desktop)
 
12.7 fps -76%
2560x1440 Ultra Preset (DX12)
AMD Radeon RX 6900 XT
AMD Radeon RX 6900 XT, R9 5950X (SAM ENABLED)
91.4 (38.16min, 73.25P1 - 135.95max) fps
AMD Radeon RX 6900 XT
AMD Radeon RX 6900 XT, R9 5950X
91.1 (31.59min, 72.21P1 - 151.03max) fps 0%
Average NVIDIA GeForce RTX 3090
  (88.3 - 89.7, n=2)
89 fps -3%
Nvidia GeForce RTX 3090 Founders Edition
NVIDIA GeForce RTX 3090, R9 5900X
88.3 (48.36min, 68.18P1 - 160.5max) fps -3%
AMD Radeon RX 6800 XT
AMD Radeon RX 6800 XT, R9 5950X
84.5 (58.88min, 69.45P1 - 137.16max) fps -8%
ASUS GeForce RTX 3080 ROG STRIX OC GAMING
NVIDIA GeForce RTX 3080, R9 5900X
81.6 (44.31min, 65.35P1 - 139.28max) fps -11%
Average NVIDIA GeForce RTX 3080
  (81.1 - 81.6, n=2)
81.4 fps -11%
Average NVIDIA GeForce RTX 2080 Ti (Desktop)
 
72.9 fps -20%
Average NVIDIA Titan RTX
 
69.9 fps -24%
Average NVIDIA GeForce RTX 3070
  (65.3 - 67, n=4)
66.1 fps -28%
MSI GeForce RTX 3070 Gaming X Trio
NVIDIA GeForce RTX 3070, R9 5900X
65.7 (25.01min, 51.86P1 - 96.9max) fps -28%
Average NVIDIA GeForce RTX 2080 Super (Desktop)
 
57.3 fps -37%
Average NVIDIA GeForce RTX 2070 Super (Desktop)
 
51.4 fps -44%
Average AMD Radeon RX 5700 XT (Desktop)
 
46.4 fps -49%
1920x1080 Ultra Preset (DX12)
AMD Radeon RX 6900 XT
AMD Radeon RX 6900 XT, R9 5950X (SAM ENABLED)
121 (67.26min, 95.56P1 - 184.97max) fps
AMD Radeon RX 6900 XT
AMD Radeon RX 6900 XT, R9 5950X
120 (81.32min, 93.02P1 - 209.32max) fps -1%
AMD Radeon RX 6800 XT
AMD Radeon RX 6800 XT, R9 5950X
112 (75.12min, 87.97P1 - 181.69max) fps -7%
Nvidia GeForce RTX 3090 Founders Edition
NVIDIA GeForce RTX 3090, R9 5900X
107 (24.35min, 77.46P1 - 174.03max) fps -12%
Average NVIDIA GeForce RTX 3090
  (103 - 107, n=2)
105 fps -13%
ASUS GeForce RTX 3080 ROG STRIX OC GAMING
NVIDIA GeForce RTX 3080, R9 5900X
103 (55.63min, 83.65P1 - 156.57max) fps -15%
Average NVIDIA GeForce RTX 3080
  (99.3 - 103, n=2)
101.2 fps -16%
Average NVIDIA GeForce RTX 2080 Ti (Desktop)
 
89.6 fps -26%
Average NVIDIA Titan RTX
 
85.5 fps -29%
Average NVIDIA GeForce RTX 3070
  (79 - 89, n=4)
84.7 fps -30%
MSI GeForce RTX 3070 Gaming X Trio
NVIDIA GeForce RTX 3070, R9 5900X
79 (42.91min, 56.59P1 - 121.27max) fps -35%
Average NVIDIA GeForce RTX 2080 Super (Desktop)
 
75.4 fps -38%
Average NVIDIA GeForce RTX 2070 Super (Desktop)
 
68.3 fps -44%
Average AMD Radeon RX 5700 XT (Desktop)
 
66.8 fps -45%
F1 2020
3840x2160 Ultra High Preset AA:T AF:16x
Average NVIDIA GeForce RTX 3090
  (133 - 149.6, n=10)
141.8 fps +4%
AMD Radeon RX 6900 XT
AMD Radeon RX 6900 XT, R9 5950X (SAM ENABLED)
137 (109min - 165max) fps
AMD Radeon RX 6900 XT
AMD Radeon RX 6900 XT, R9 5950X
136 (110min - 161max) fps -1%
Nvidia GeForce RTX 3090 Founders Edition
NVIDIA GeForce RTX 3090, R9 5900X
135 (116min - 157max) fps -1%
AMD Radeon RX 6800 XT
AMD Radeon RX 6800 XT, R9 5950X (704326)
128 (106min - 152max) fps -7%
ASUS GeForce RTX 3080 ROG STRIX OC GAMING
NVIDIA GeForce RTX 3080, R9 5900X (692646)
118 (102min - 137max) fps -14%
Average NVIDIA GeForce RTX 3080
  (114 - 118, n=2)
116 fps -15%
Average NVIDIA Titan RTX
  (97.4 - 103.4, n=6)
101.5 fps -26%
Average NVIDIA GeForce RTX 2080 Ti (Desktop)
 
100 fps -27%
Average NVIDIA GeForce RTX 3070
  (88.7 - 92.7, n=3)
90.2 fps -34%
MSI GeForce RTX 3070 Gaming X Trio
NVIDIA GeForce RTX 3070, R9 5900X (692646)
89.2 (73min - 104max) fps -35%
Average NVIDIA GeForce RTX 2080 Super (Desktop)
 
77.2 fps -44%
Average NVIDIA GeForce RTX 2070 Super (Desktop)
  (67.6 - 71.4, n=3)
69.2 fps -49%
Average AMD Radeon RX 5700 XT (Desktop)
  (47 - 65, n=4)
59.3 fps -57%
2560x1440 Ultra High Preset AA:T AF:16x
AMD Radeon RX 6900 XT
AMD Radeon RX 6900 XT, R9 5950X (SAM ENABLED)
228 (178min - 275max) fps
AMD Radeon RX 6900 XT
AMD Radeon RX 6900 XT, R9 5950X
220 (173min - 264max) fps -4%
Average NVIDIA GeForce RTX 3090
  (204 - 240, n=10)
226 fps -1%
AMD Radeon RX 6800 XT
AMD Radeon RX 6800 XT, R9 5950X (704326)
215 (166min - 264max) fps -6%
Nvidia GeForce RTX 3090 Founders Edition
NVIDIA GeForce RTX 3090, R9 5900X
207 (171min - 241max) fps -9%
Average NVIDIA Titan RTX
  (153 - 175.8, n=6)
167.4 fps -27%
Average NVIDIA GeForce RTX 2080 Ti (Desktop)
 
162 fps -29%
ASUS GeForce RTX 3080 ROG STRIX OC GAMING
NVIDIA GeForce RTX 3080, R9 5900X (692646)
155 (128min - 184max) fps -32%
Average NVIDIA GeForce RTX 3080
  (146 - 155, n=2)
150.5 fps -34%
Average NVIDIA GeForce RTX 3070
  (143 - 162.2, n=3)
150.4 fps -34%
MSI GeForce RTX 3070 Gaming X Trio
NVIDIA GeForce RTX 3070, R9 5900X (692646)
146 (121min - 168max) fps -36%
Average NVIDIA GeForce RTX 2080 Super (Desktop)
 
127 fps -44%
Average NVIDIA GeForce RTX 2070 Super (Desktop)
  (117.6 - 121.1, n=3)
118.9 fps -48%
Average AMD Radeon RX 5700 XT (Desktop)
  (80 - 109, n=4)
99.3 fps -56%
1920x1080 Ultra High Preset AA:T AF:16x
AMD Radeon RX 6900 XT
AMD Radeon RX 6900 XT, R9 5950X (SAM ENABLED)
291 (222min - 355max) fps
AMD Radeon RX 6900 XT
AMD Radeon RX 6900 XT, R9 5950X
275 (213min - 338max) fps -5%
AMD Radeon RX 6800 XT
AMD Radeon RX 6800 XT, R9 5950X (704326)
279 (211min - 345max) fps -4%
Average NVIDIA GeForce RTX 3090
  (227 - 311, n=10)
279 fps -4%
Nvidia GeForce RTX 3090 Founders Edition
NVIDIA GeForce RTX 3090, R9 5900X
250 (214min - 304max) fps -14%
Average NVIDIA Titan RTX
  (194 - 231, n=7)
216 fps -26%
Average NVIDIA GeForce RTX 2080 Ti (Desktop)
 
202 fps -31%
Average NVIDIA GeForce RTX 3070
  (179 - 215, n=3)
191.7 fps -34%
ASUS GeForce RTX 3080 ROG STRIX OC GAMING
NVIDIA GeForce RTX 3080, R9 5900X (692646)
185 (158min - 218max) fps -36%
Average NVIDIA GeForce RTX 3080
  (179 - 185, n=2)
182 fps -37%
MSI GeForce RTX 3070 Gaming X Trio
NVIDIA GeForce RTX 3070, R9 5900X (692646)
179 (153min - 213max) fps -38%
Average NVIDIA GeForce RTX 2080 Super (Desktop)
 
162 fps -44%
Average NVIDIA GeForce RTX 2070 Super (Desktop)
  (153 - 163, n=3)
157.4 fps -46%
Average AMD Radeon RX 5700 XT (Desktop)
  (108 - 149, n=4)
131.9 fps -55%
low med. high ultraQHD4K
The Witcher 3 (2015) 589 375 323 163.6 122
Shadow of the Tomb Raider (2018) 248 222 213 199 163 86
Forza Horizon 4 (2018) 350 283 279 247 243 172
Assassin´s Creed Odyssey (2018) 124 117 106 98 99 68
Battlefield V (2018) 196 195 196 197 196 134
Far Cry New Dawn (2019) 141 126 123 118 117 101
Metro Exodus (2019) 274 214 154 123 102 66.7
The Division 2 (2019) 217 190 157 138 118 66.6
Anno 1800 (2019) 223 162 139 87.1 70.7 52
Total War: Three Kingdoms (2019) 429.7 263 180.3 141.3 92.9 44.9
Control (2019) 240 234 174 113 53.9
Borderlands 3 (2019) 197 169 152 131 107 59.8
Red Dead Redemption 2 (2019) 208 196 150 98 82.1 54.6
Doom Eternal (2020) 624 480 416 411 328 185
Gears Tactics (2020) 495.8 338.1 249 175.1 136.4 74.1
F1 2020 (2020) 520 442 395 291 228 137
Horizon Zero Dawn (2020) 245 205 184 164 136 76
Mafia Definitive Edition (2020) 160 142 138 120 67
Watch Dogs Legion (2020) 191 190 170 121 91.4 53.6
Assassin´s Creed Valhalla (2020) 227 169 142 148 115 68
Call of Duty Black Ops Cold War (2020) 298 198 169 153 115 68.1
Immortals Fenyx Rising (2020) 139 126 127 122 121 83
Cyberpunk 2077 1.0 (2020) 160 152 127 106 72.3 34.8
Hitman 3 (2021) 352.8 283.2 279.9 269.4 213.1 127.8

Emissions

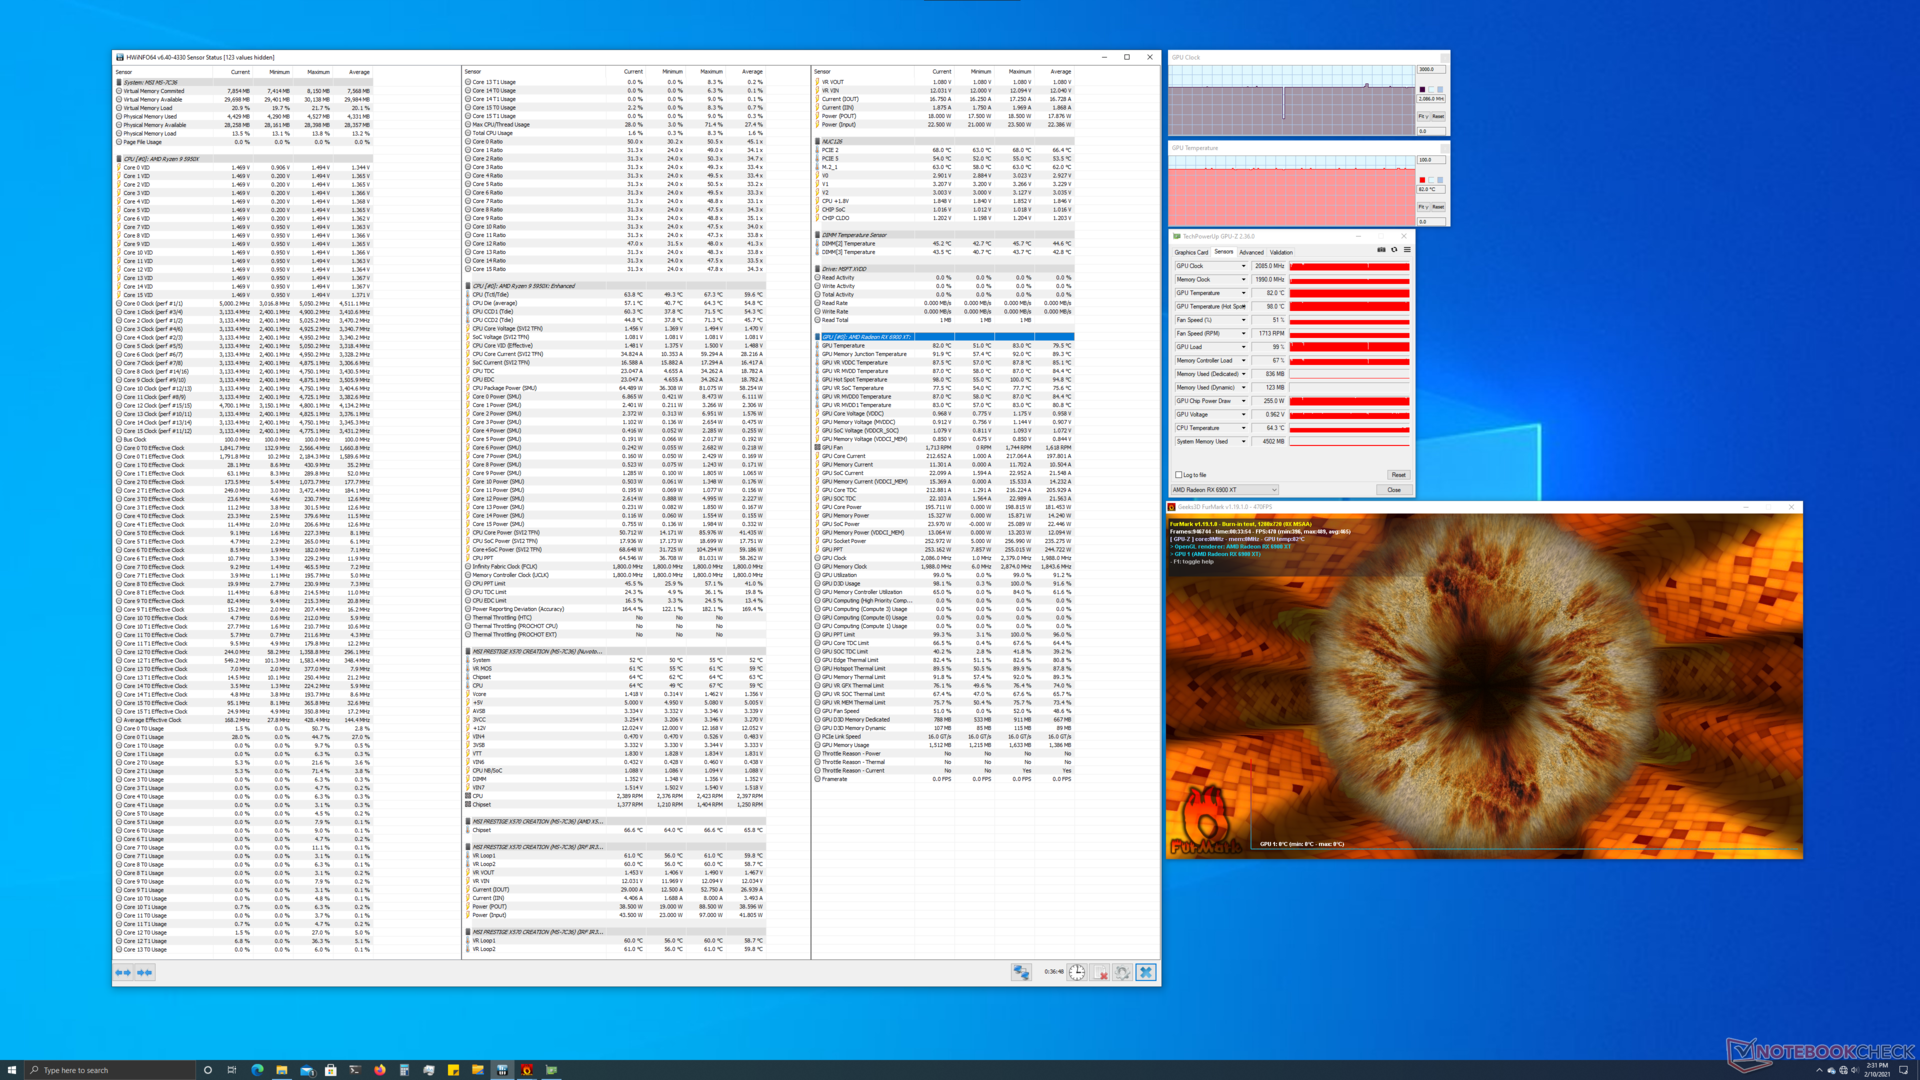
With the RX 6000 series, AMD has ditched its traditional blower style cooler for a more capable triple-fan cooling system. While this new cooler definitely enables better sustained clocks, we find the card reaching nearer to the 100 °C hot spot temperature often under FurMark stress. The core also runs quite hot at 82 °C.

For the most part, the RX 6900 XT can offer a fairly sustained 2,086 MHz boost and can at times even hit 2,379 MHz. However, we do see occasional throttling when the hot spot temperature hits the 100 °C mark, though the clocks do recover back fairly quickly.

We used FurMark stress to determine the noise and temperature levels. FuMark and The Witcher 3 at 1080p Ultra preset were used to measure power consumption.

FurMark stress
FurMark stress
Core clocks, temperatures (GPU hot spot temp. - red, GPU temp. - green, GDDR6 junction temp. - blue), and fan speed graphs during FurMark stress

Temperature

AMD Radeon RX 6900 XT heat map.

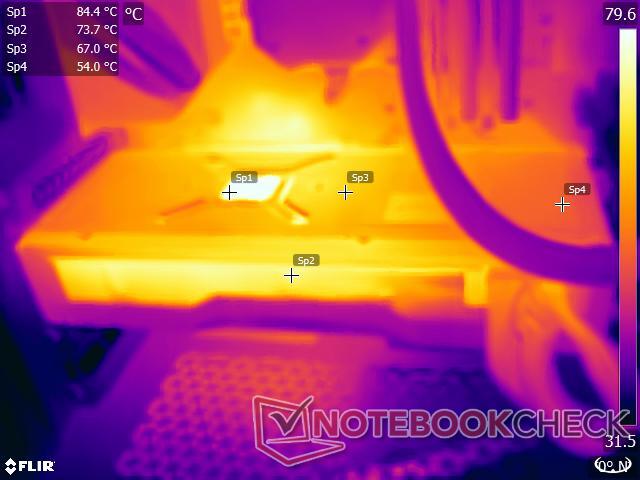
The surface temperatures seem to be on the higher side as well. We logged nearly 85 °C near the GPU area and 67 °C near the power supply VRM section while running the FurMark stress test.

The air exhaust vents on the top of the card can reach up to nearly 74 °C. Therefore, we recommend using a good exhaust fan to avoid heat buildup inside the case, especially if the case has a tempered glass side panel. Power users may find it worthwhile to undervolt the card and set a lower power limit. This can potentially reduce the hot spot temperature and prevent some of the clock dips we've seen earlier.

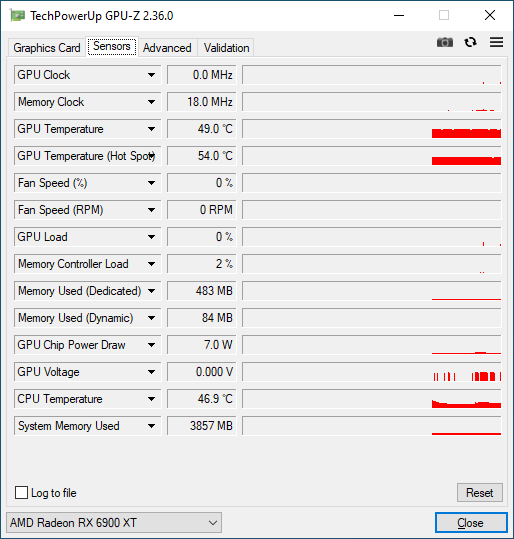
We recorded 49 °C and 54 °C as GPU and hot spot temperatures, respectively during idle. Unlike the Radeon RX 5700 XT reference card, the RX 6900 XT now features idle-fan-stop, which means the fans turn off completely when there's no load.
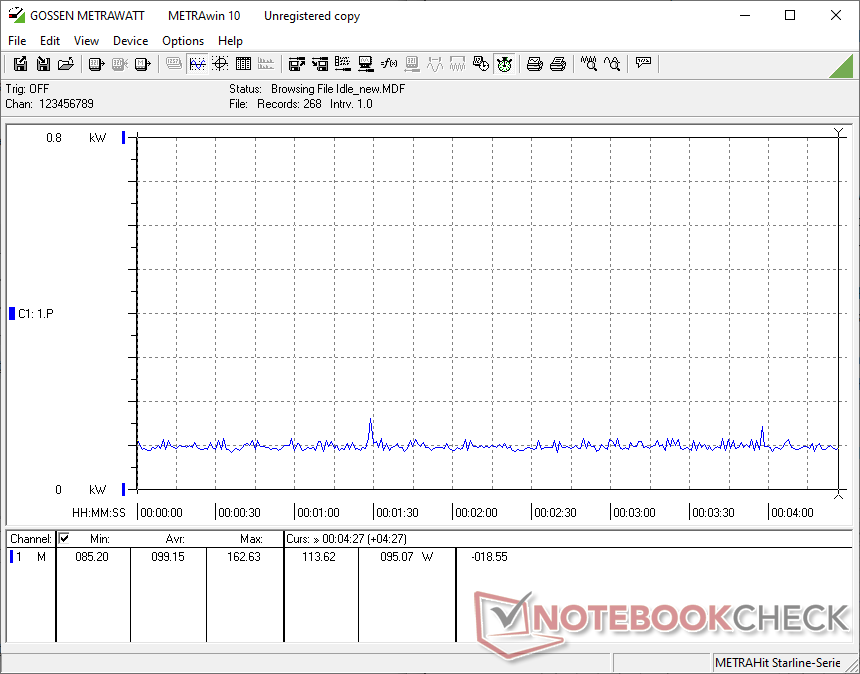
Power consumption

Our test bench consumes an average of 99 W power in idle with all RGB lighting turned off and a total of five fans (three Corsair SP 120 mm case fans and two Corsair ML 120 mm radiator fans) and the Elite Capellix AIO pump running in a Balanced profile.

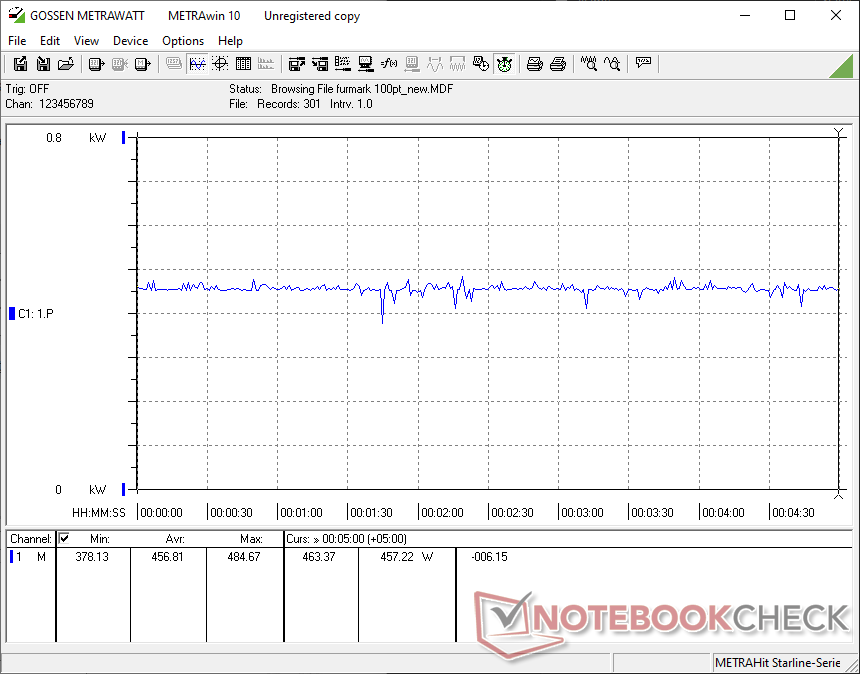
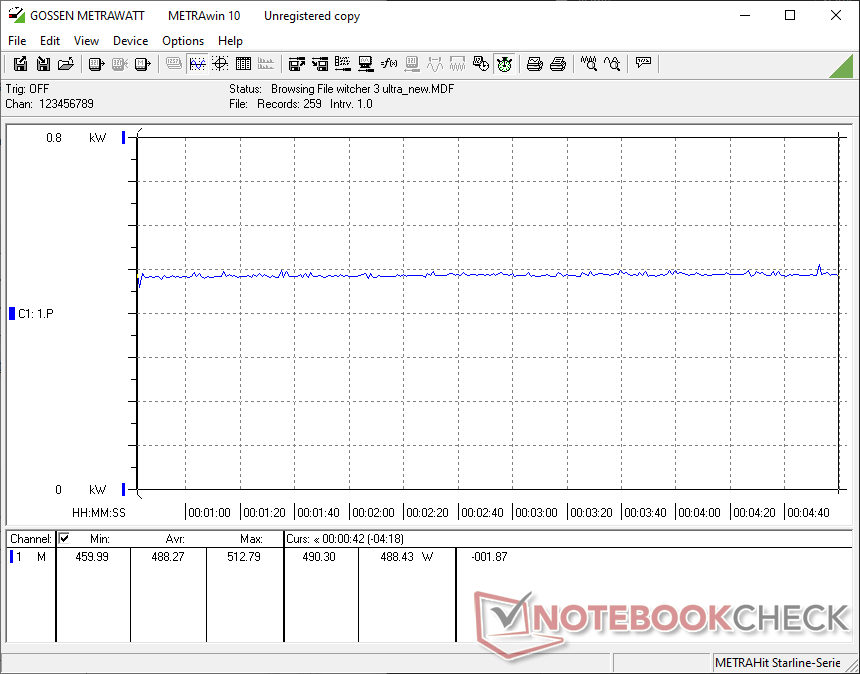
We recorded an average of 456.8 W and 488 W total system power consumption during FurMark and The Witcher 3 Ultra stress tests, respectively. Power consumption during FurMark stress shows the occasional drop consistent with the clock speed drops we described before.

While the new RDNA 2 cards definitely show increased power consumption over the RX 5700 XT, it is interesting to note that there isn't much of a difference between the RX 6800 XT and the RX 6900 XT in this regard. The RTX 3090 Founders Edition, on the other hand, consumes 10% higher power than the RX 6900 XT in FurMark stress also while being 5% more economical in The Witcher 3 Ultra.

System power consumption - Idle
System power consumption - FurMark stress
System power consumption - The Witcher 3 1080p Ultra preset
Power Consumption
1280x720 FurMark 1.19 GPU Stress Test (external Monitor)
ASUS GeForce RTX 3080 ROG STRIX OC GAMING
NVIDIA GeForce RTX 3080, R9 5900X (Idle: 88.3 W)
505 (493min - 541max) Watt * -11%
Nvidia GeForce RTX 3090 Founders Edition
NVIDIA GeForce RTX 3090, R9 5900X (Idle: 91.1 W)
502 (425min - 525max) Watt * -10%
Average NVIDIA GeForce RTX 3080
  (Idle: 492 - 505, n=2 W)
499 Watt * -9%
Average NVIDIA GeForce RTX 3090
  (Idle: 281 - 551, n=7 W)
466 Watt * -2%
AMD Radeon RX 6900 XT
AMD Radeon RX 6900 XT, R9 5950X (Idle: 99.15 W)
456.8 (378.13min - 484.67max) Watt *
AMD Radeon RX 6800 XT
AMD Radeon RX 6800 XT, R9 5950X (Idle: 99.5 W)
447.9 (413min - 484max) Watt * +2%
KFA2 GeForce RTX 2080 Ti EX
NVIDIA GeForce RTX 2080 Ti (Desktop), R9 3900X (Idle: 100.5 W)
400.8 (354min - 432max) Watt * +12%
Average NVIDIA GeForce RTX 2080 Ti (Desktop)
  (Idle: 330 - 439, n=3 W)
390 Watt * +15%
MSI GeForce RTX 3070 Gaming X Trio
NVIDIA GeForce RTX 3070, R9 5900X (Idle: 95.1 W)
376.9 (369min - 433max) Watt * +17%
Nvidia GeForce RTX 2080 Super
NVIDIA GeForce RTX 2080 Super (Desktop), R7 2700X (Idle: 78.87 W)
376.8 (331min - 409max) Watt * +18%
Average NVIDIA GeForce RTX 2080 Super (Desktop)
  (Idle: 328 - 414, n=4 W)
362 Watt * +21%
Average NVIDIA GeForce RTX 3070
  (Idle: 281 - 393, n=6 W)
348 Watt * +24%
Average AMD Radeon RX 5700 XT (Desktop)
  (Idle: 327 - 352, n=2 W)
339 Watt * +26%
Average NVIDIA GeForce RTX 2070 Super (Desktop)
  (Idle: 280 - 358, n=5 W)
327 Watt * +28%
AMD Radeon RX 5700 XT
AMD Radeon RX 5700 XT (Desktop), R7 2700X (239 fps, Idle: 69.8 W)
326.6 (313min - 351max) Watt * +29%
Nvidia GeForce RTX 2070 Super
NVIDIA GeForce RTX 2070 Super (Desktop), R7 2700X (283 fps, Idle: 80.5 W)
326 (315min - 348max) Watt * +29%
AMD Radeon RX 5700
AMD Radeon RX 5700 (Desktop), R7 2700X (207 fps, Idle: 64.5 W)
280.5 (271min - 312max) Watt * +39%
1920x1080 The Witcher 3 ultra (external Monitor)
Average NVIDIA GeForce RTX 3090
  (Idle: 464 - 597, n=16 W)
523 Watt * -7%
ASUS GeForce RTX 3080 ROG STRIX OC GAMING
NVIDIA GeForce RTX 3080, R9 5900X (Idle: 88.3 W)
505 (389min - 543max) Watt * -3%
AMD Radeon RX 6800 XT
AMD Radeon RX 6800 XT, R9 5950X (Idle: 99.5 W)
505 (389min - 543max) Watt * -3%
Average NVIDIA GeForce RTX 3080
  (Idle: 498 - 505, n=2 W)
502 Watt * -3%
AMD Radeon RX 6900 XT
AMD Radeon RX 6900 XT, R9 5950X (Idle: 99.15 W)
488.3 (459.99min - 512.79max) Watt *
Nvidia GeForce RTX 3090 Founders Edition
NVIDIA GeForce RTX 3090, R9 5900X (Idle: 91.1 W)
463.7 (450min - 487max) Watt * +5%
AMD Ryzen 9 5900X
NVIDIA Titan RTX, R9 5900X (Idle: 78.1 W)
439.6 (419min - 497max) Watt * +10%
KFA2 GeForce RTX 2080 Ti EX
NVIDIA GeForce RTX 2080 Ti (Desktop), R9 3900X (Idle: 100.5 W)
438.8 (431min - 463max) Watt * +10%
Average NVIDIA GeForce RTX 2080 Ti (Desktop)
  (Idle: 359 - 467, n=3 W)
422 Watt * +14%
Average NVIDIA Titan RTX
  (Idle: 371 - 463, n=26 W)
407 Watt * +17%
Average NVIDIA GeForce RTX 3070
  (Idle: 317 - 550, n=5 W)
401 Watt * +18%
MSI GeForce RTX 3070 Gaming X Trio
NVIDIA GeForce RTX 3070, R9 5900X (Idle: 95.1 W)
394.5 (381min - 430max) Watt * +19%
Nvidia GeForce RTX 2080 Super
NVIDIA GeForce RTX 2080 Super (Desktop), R7 2700X (Idle: 78.87 W)
382.8 (360min - 410max) Watt * +22%
Average AMD Radeon RX 5700 XT (Desktop)
  (Idle: 349 - 376, n=2 W)
363 Watt * +26%
Average NVIDIA GeForce RTX 2080 Super (Desktop)
  (Idle: 336 - 416, n=5 W)
363 Watt * +26%
AMD Radeon RX 5700 XT
AMD Radeon RX 5700 XT (Desktop), R7 2700X (Idle: 69.8 W)
348.7 (341min - 359max) Watt * +29%
Nvidia GeForce RTX 2070 Super
NVIDIA GeForce RTX 2070 Super (Desktop), R7 2700X (96.8 fps, Idle: 80.5 W)
344.7 (335min - 370max) Watt * +29%
Average NVIDIA GeForce RTX 2070 Super (Desktop)
  (Idle: 296 - 377, n=5 W)
340 Watt * +30%
AMD Radeon RX 5700
AMD Radeon RX 5700 (Desktop), R7 2700X (84.2 fps, Idle: 64.5 W)
295.9 (284min - 304max) Watt * +39%

* ... smaller is better

Noise levels

AMD's new triple-fan cooling system looks to operate with decent noise levels. With availability of a complete fan-stop mode, the sound pressure level (SPL) is almost the same as the ambient levels at 28.70 db(A) at a distance of 20 cm from the closed case.

During FurMark stress testing, the SPL rose to 44.13 db(A), which is quite tolerable when the case is closed. Users may be able to further optimize temperatures and fan curves using Radeon Software Adrenalin Edition or via third-party tools such as MSI Afterburner.

Noise levels - Idle with case fans off
Noise levels - FurMark stress with case fans off

Pros

+ Good build quality
+ Aluminum backplate
+ Triple-fan cooler
+ USB Type-C port
+ Performance between an RTX 3080 and RTX 3090 in most synthetic and 4K gaming benchmarks
+ Good show in professional 3D applications
+ Power consumption on par with an RX 6800 XT and less than RTX 3090
+ Complete fan-stop in idle
+ Tolerable noise levels under stress
+ US$500 cheaper at MSRP compared to an RTX 3090

Cons

- Compute performance can be better
- Ray tracing significantly behind RTX 3080 and RTX 3090
- No AI-based super sampling support yet
- Smart access memory of little consequence in most games
- High core and surface temperatures under load
- Sporadic throttling under load
- Overall performance only marginally better than RX 6800 XT
- Very limited stocks

Verdict

AMD Radeon RX 6900 XT. Review unit courtesy of AMD India.

AMD's days of being the underdogs in the GPU market are officially over with the Radeon RX 6900 XT. The RX 6900 XT has the mettle to truly take on NVIDIA's flagship offerings, and we see that being reflected in most tests. With the latest Navi 2x cards, AMD seems to have adopted a more striking design complete with an RGB Radeon logo and a triple-fan cooler for improved thermal performance compared to the blower-style coolers we've been seeing so far.

The RX 6900 XT does hold its fort pretty well, even beating the RTX 3090 in select synthetic benchmarks. Considering the US$999 MSRP of the RX 6900 XT vs. the US$1,499 MSRP of the RTX 3090, the slight performance deficit is well-offset by the US$500 price difference. Moreover, we see excellent numbers in professional applications as well making the RX 6900 XT a good choice if your workflow isn't CUDA-dependent.

Gamers who have been wanting to get a flagship AMD card that can be a viable alternative to that of NVIDIA's will find the RX 6900 XT worthwhile, especially so if the games are optimized for AMD hardware. Radeon Software Adrenalin drivers have come a long way in terms of offering a stable experience, and the inclusion of both Ryzen and Radeon tuning in the latest version is definitely a step in the right direction. Smart access memory, while good to have, is currently of little consequence in the vast majority of today's games.

AMD, however, currently lags behind NVIDIA in two technologies, which are now being fast-embraced by game developers — ray tracing and AI-based super sampling. The RX 6900 XT's ray tracing performance is definitely RTX 2080 Ti-class, but it is not really competitive with what the RTX 3080 and RTX 3090 can offer. Also, AMD is yet to come up with a super sampling solution on the lines of NVIDIA's Deep Learning Super Sampling (DLSS).

The eight additional CUs in the RX 6900 XT do not seem to offer a significant performance gain over the 72-CU RX 6800 XT. Therefore, if you are primarily looking for a gaming-only card, the RX 6800 XT at US$649 MSRP would probably be a better investment.

The AMD Radeon RX 6900 XT is just what Team Red's fans have been clamoring for since a long time in order to keep the competition in check. While the RX 6900 XT does not wholly beat the NVIDIA GeForce RTX 3090, it is within striking distance and at times can beat NVIDIA's top dog by a fair margin making it a good choice if next generation technologies such as ray tracing and AI-based super sampling aren't primary concerns."

The RX 6900 XT does not exactly help in saving on your electricity bills. However, it is still comparatively more economical in power guzzling when compared to the RTX 3080 and the RTX 3090. While noise levels under load are tolerable, the temperatures seem to be on the higher side leading to sporadic throttling in our stress tests.

With RDNA 2 becoming the staple graphics hardware in next-gen consoles such as the Xbox Series X/S and the PlayStation 5, there's a lot of potential cross-platform advantage that developers can leverage. Hopefully, AMD would also improve whatever it can on the ray tracing front and offer a viable DLSS alternative in the months to come. 

Price and availability

AMD is currently running short on reference Radeon RX 6900 XT cards but has promised to continue offering the reference design. While reference card stocks are expected to replenish soon, add-in board (AiB) partner cards from the likes of MSI, Sapphire, XFX, and PowerColor can be availed online depending on the stock situation.

At the time of this writing, the Sapphire RX 6900 XT is available on Amazon for US$2,388 while the XFX Speedster MERC 319 Radeon RX 6900 XT is available for US$2,661.99 on Walmart, both of which are quite significant markups. AiB cards on Best Buy and Newegg continue to be out of stock at the time of publication.

We recommend keeping a tab on availability of AMD reference cards and wait for prices of the AiB versions to drop in the coming weeks before taking the plunge.

Pricecompare

Read all 3 comments / answer
static version load dynamic
Loading Comments
Comment on this article
Please share our article, every link counts!
> Expert Reviews and News on Laptops, Smartphones and Tech Innovations > Reviews > AMD Radeon RX 6900 XT Review: Near-RTX 3090 performance for US$500 less but only marginally better than RX 6800 XT
Vaidyanathan Subramaniam, 2021-05- 4 (Update: 2021-05-31)