Asus TUF GeForce RTX 3080 Ti OC gaming graphics card review: How well does Ampere perform in 2022?

Although it's now one and a half years old, the GeForce RTX 3080 Ti shouldn't be considered over the hill, in spite of the recent release of successor models. In our review, we take a closer look to see how well this Asus model fares against the competition. Using current games and drivers, we put the TUF GeForce RTX 3080 Ti OC through its paces.
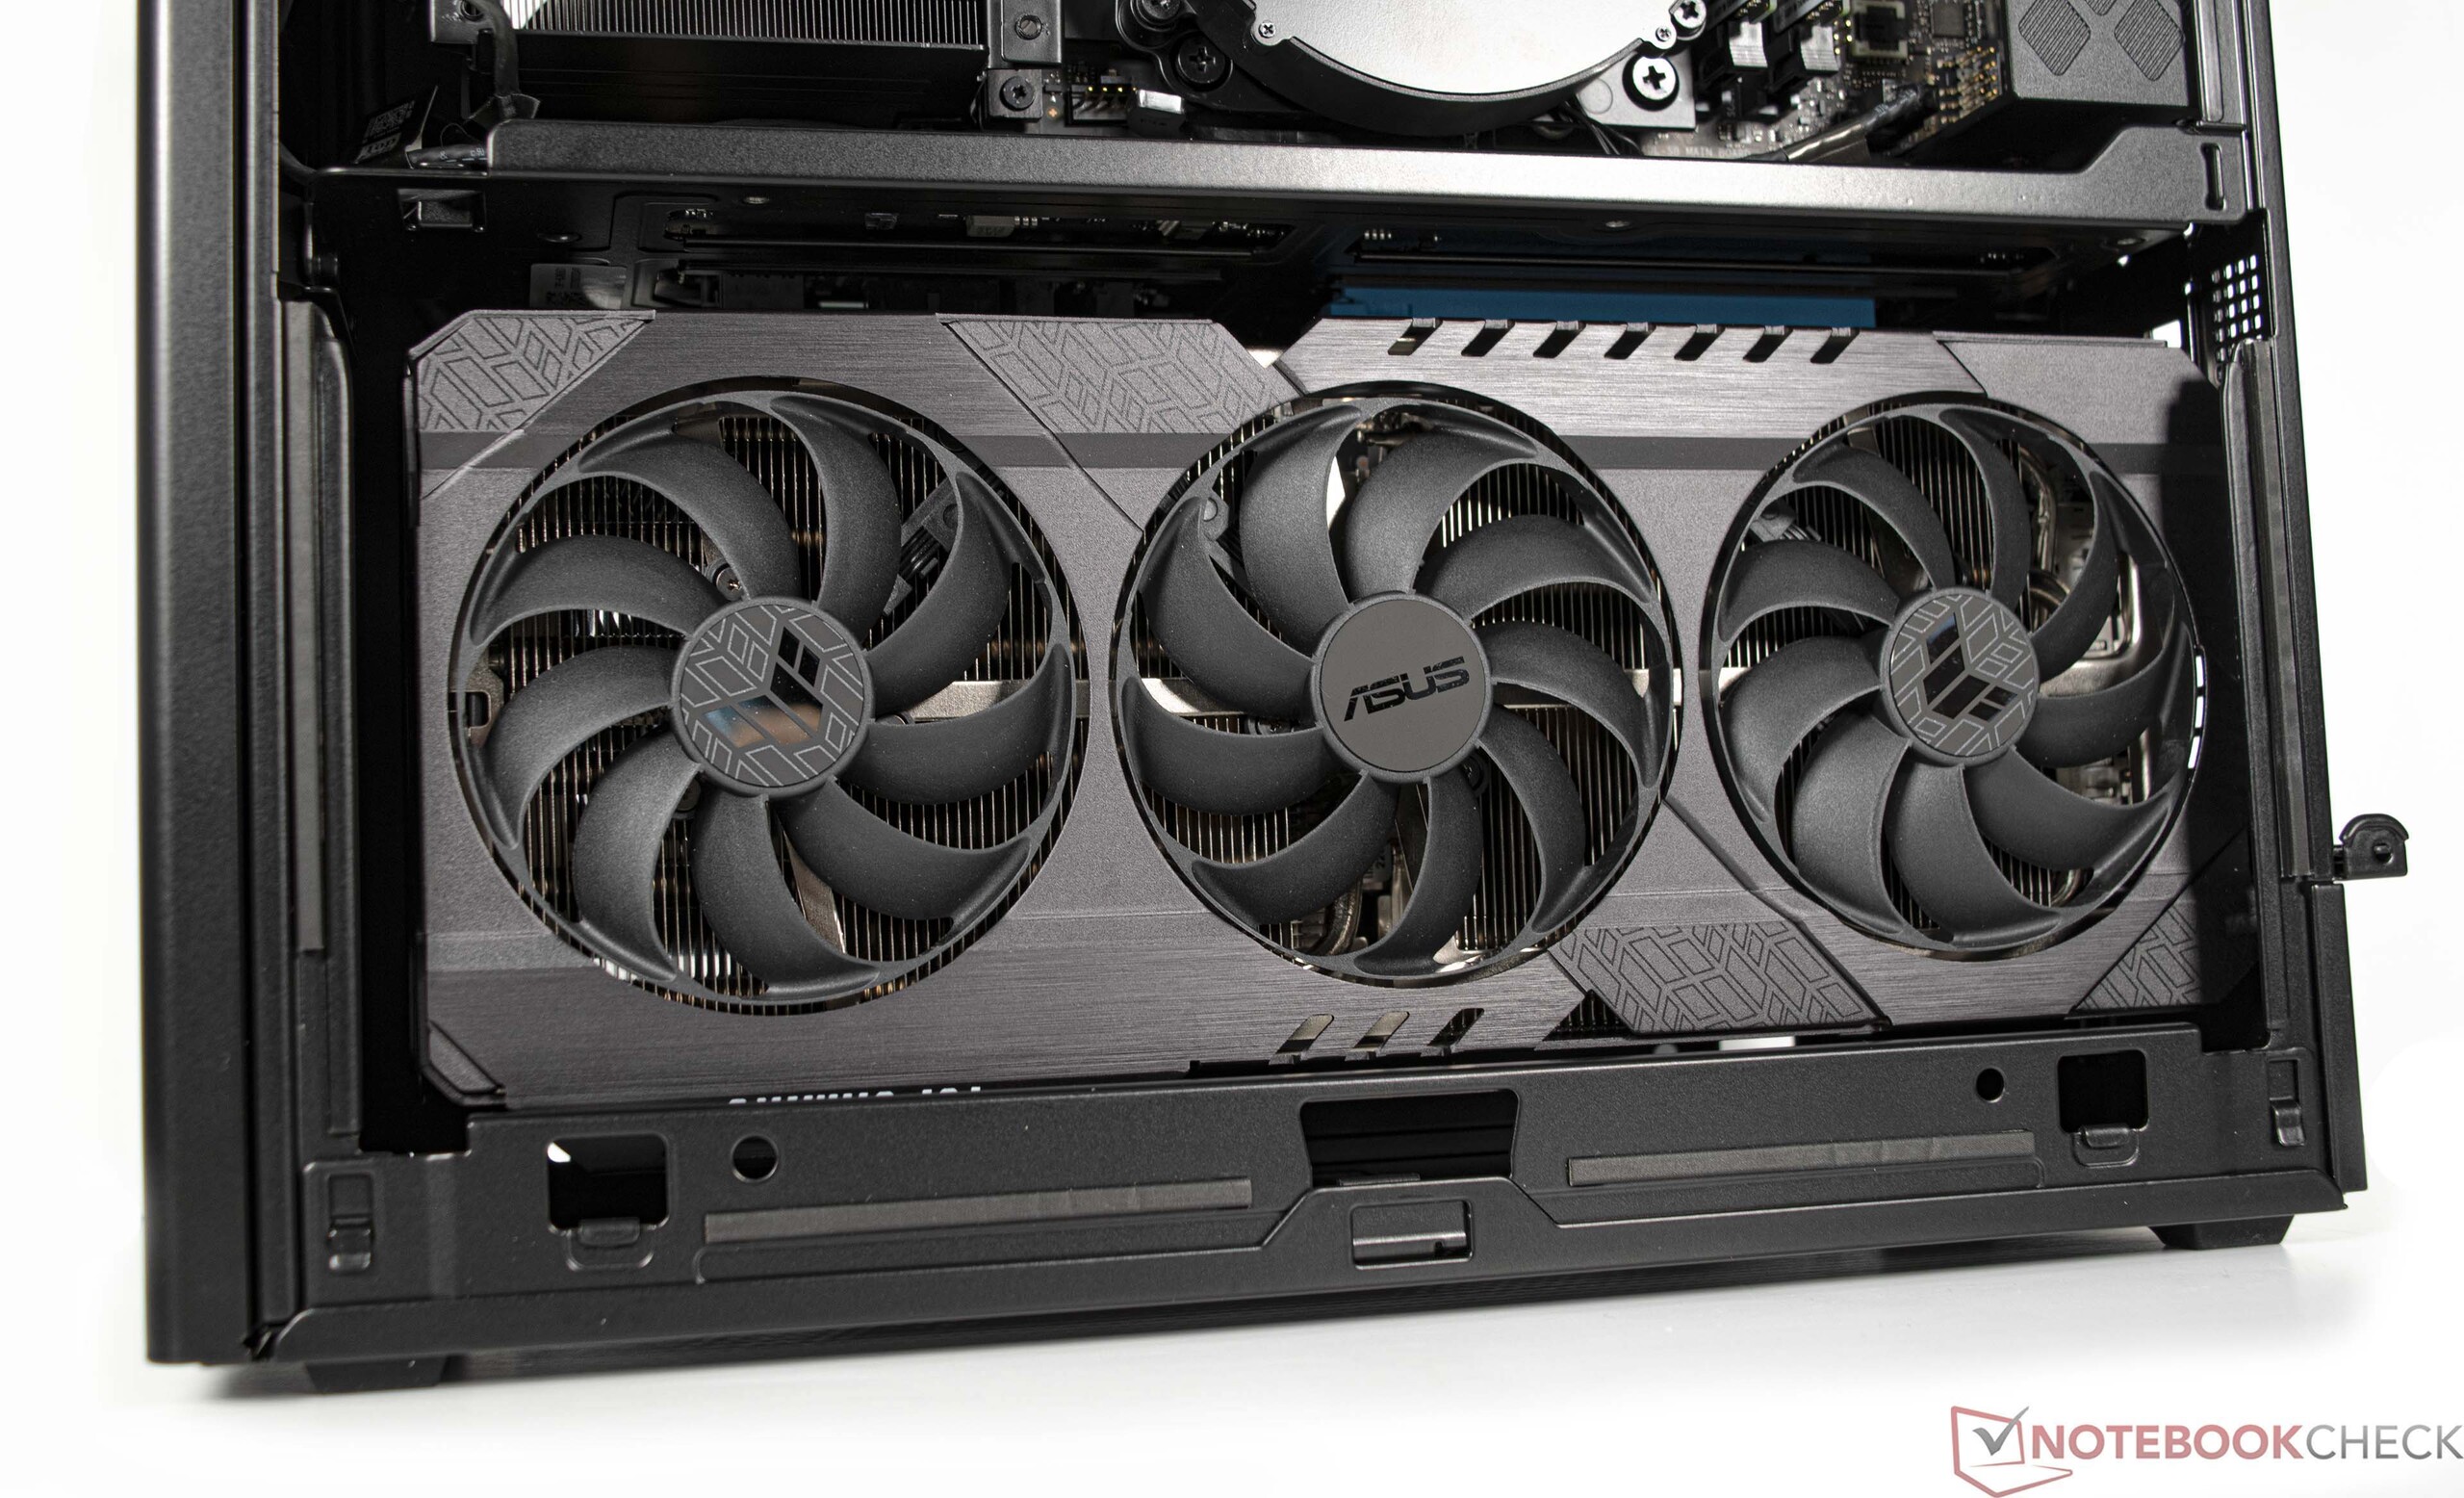
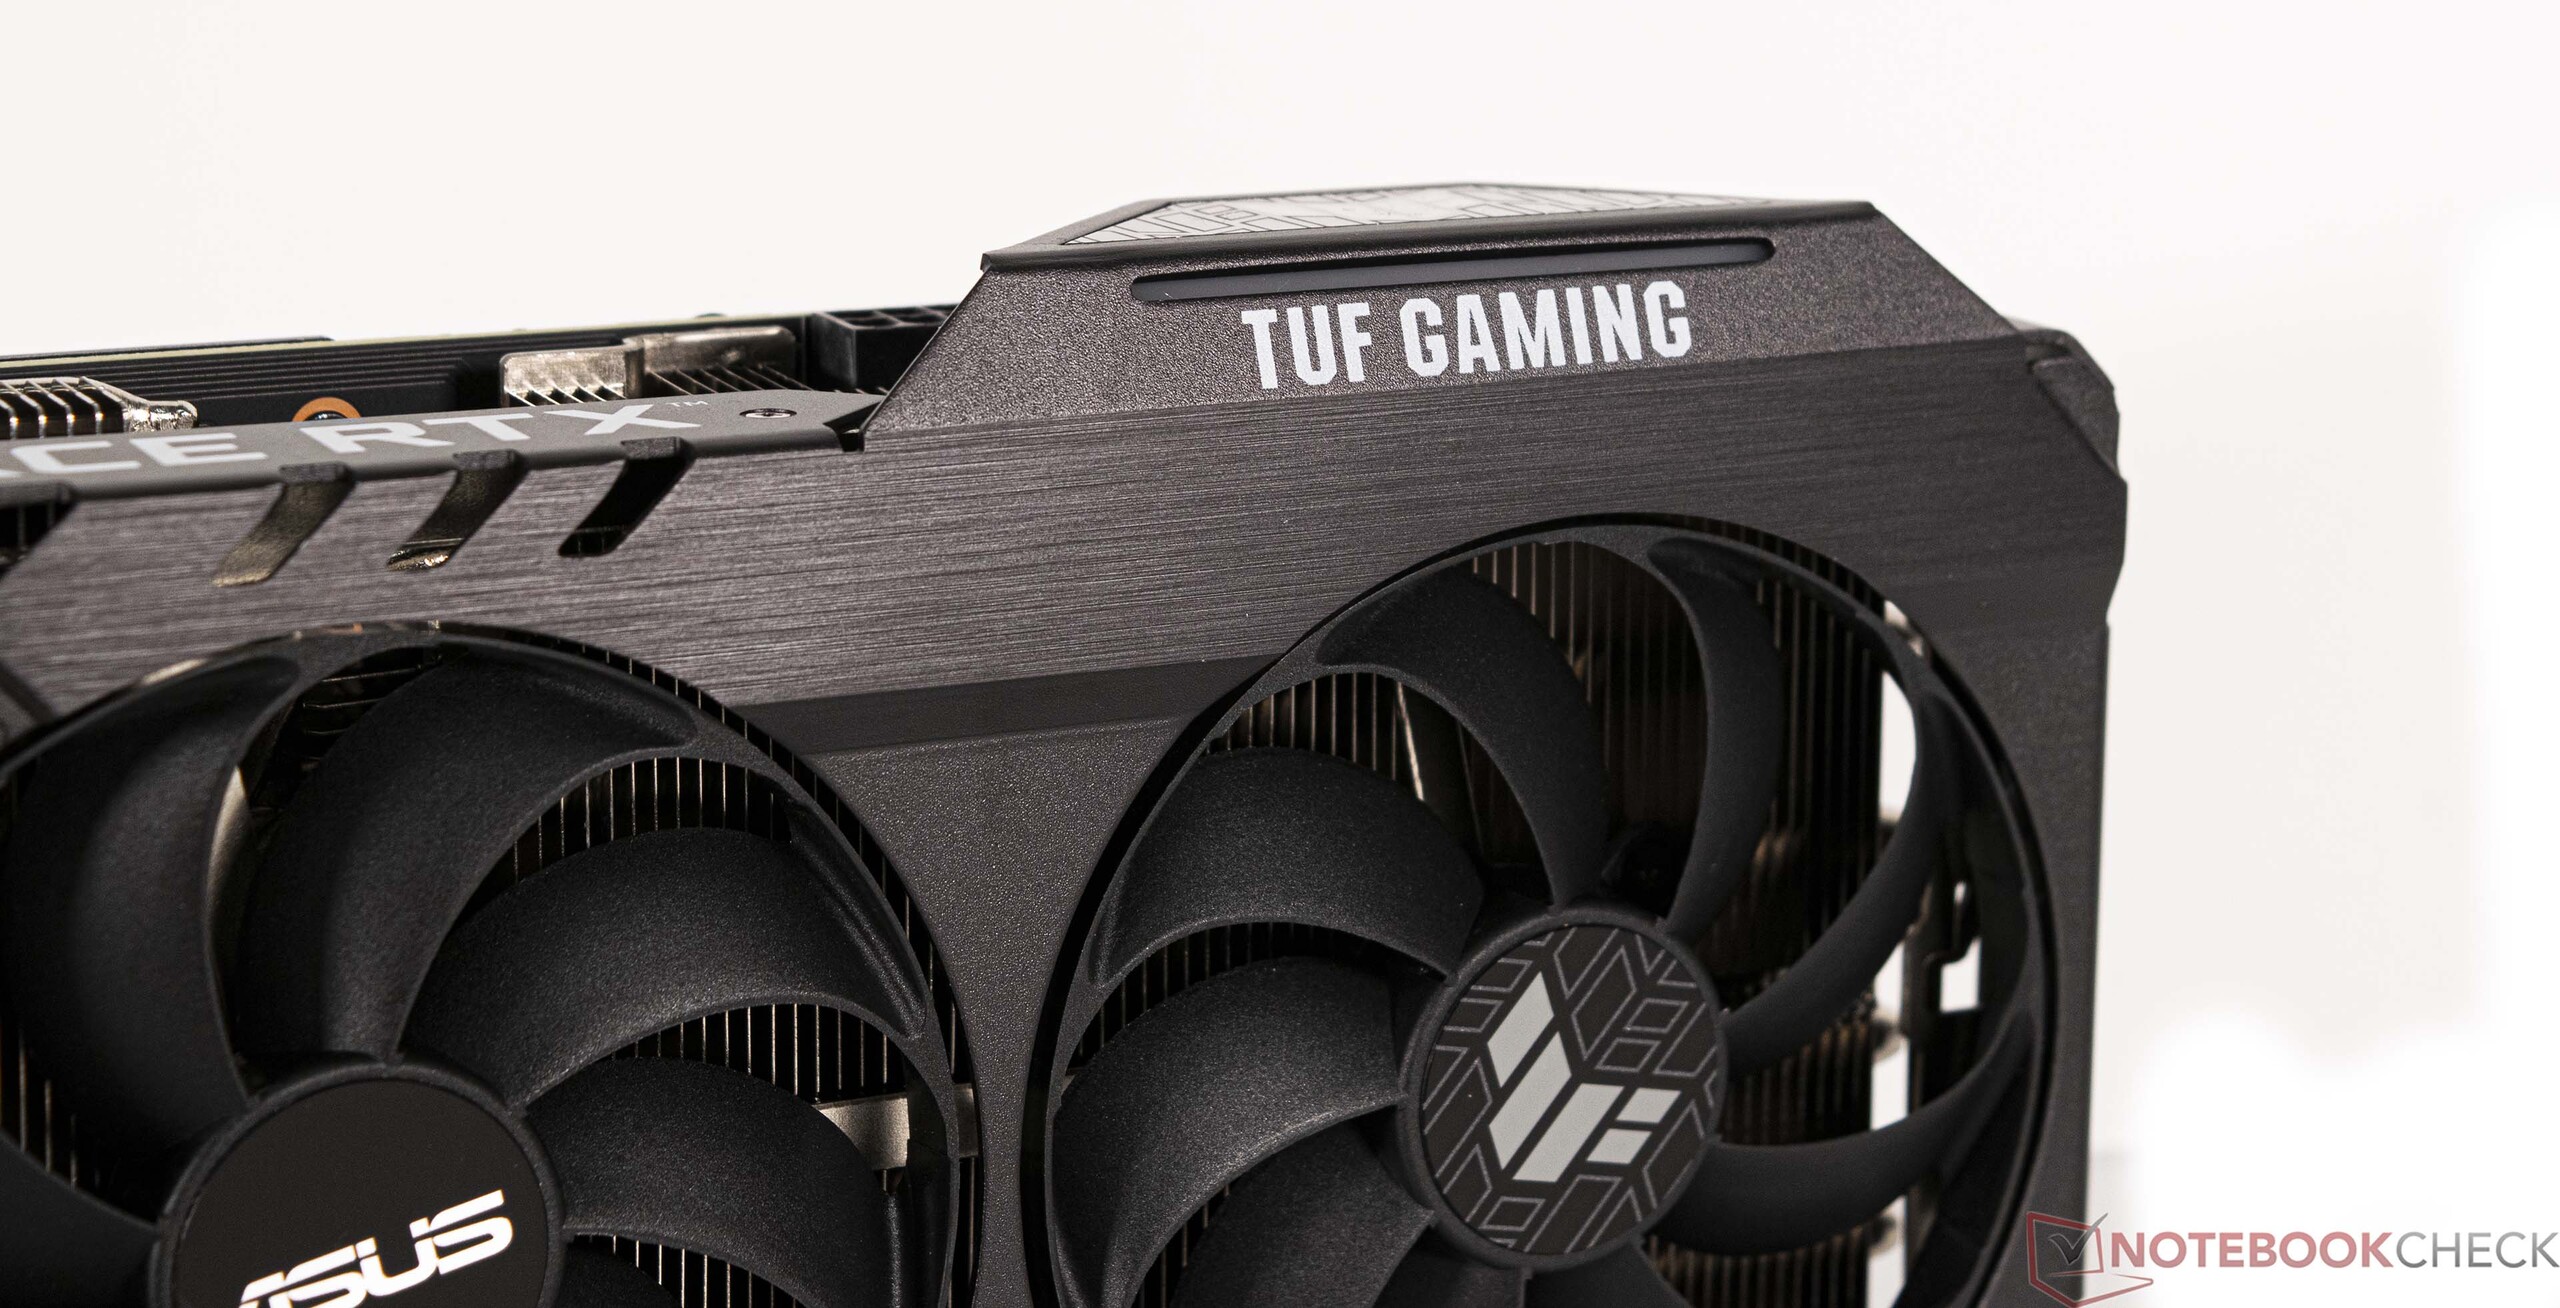
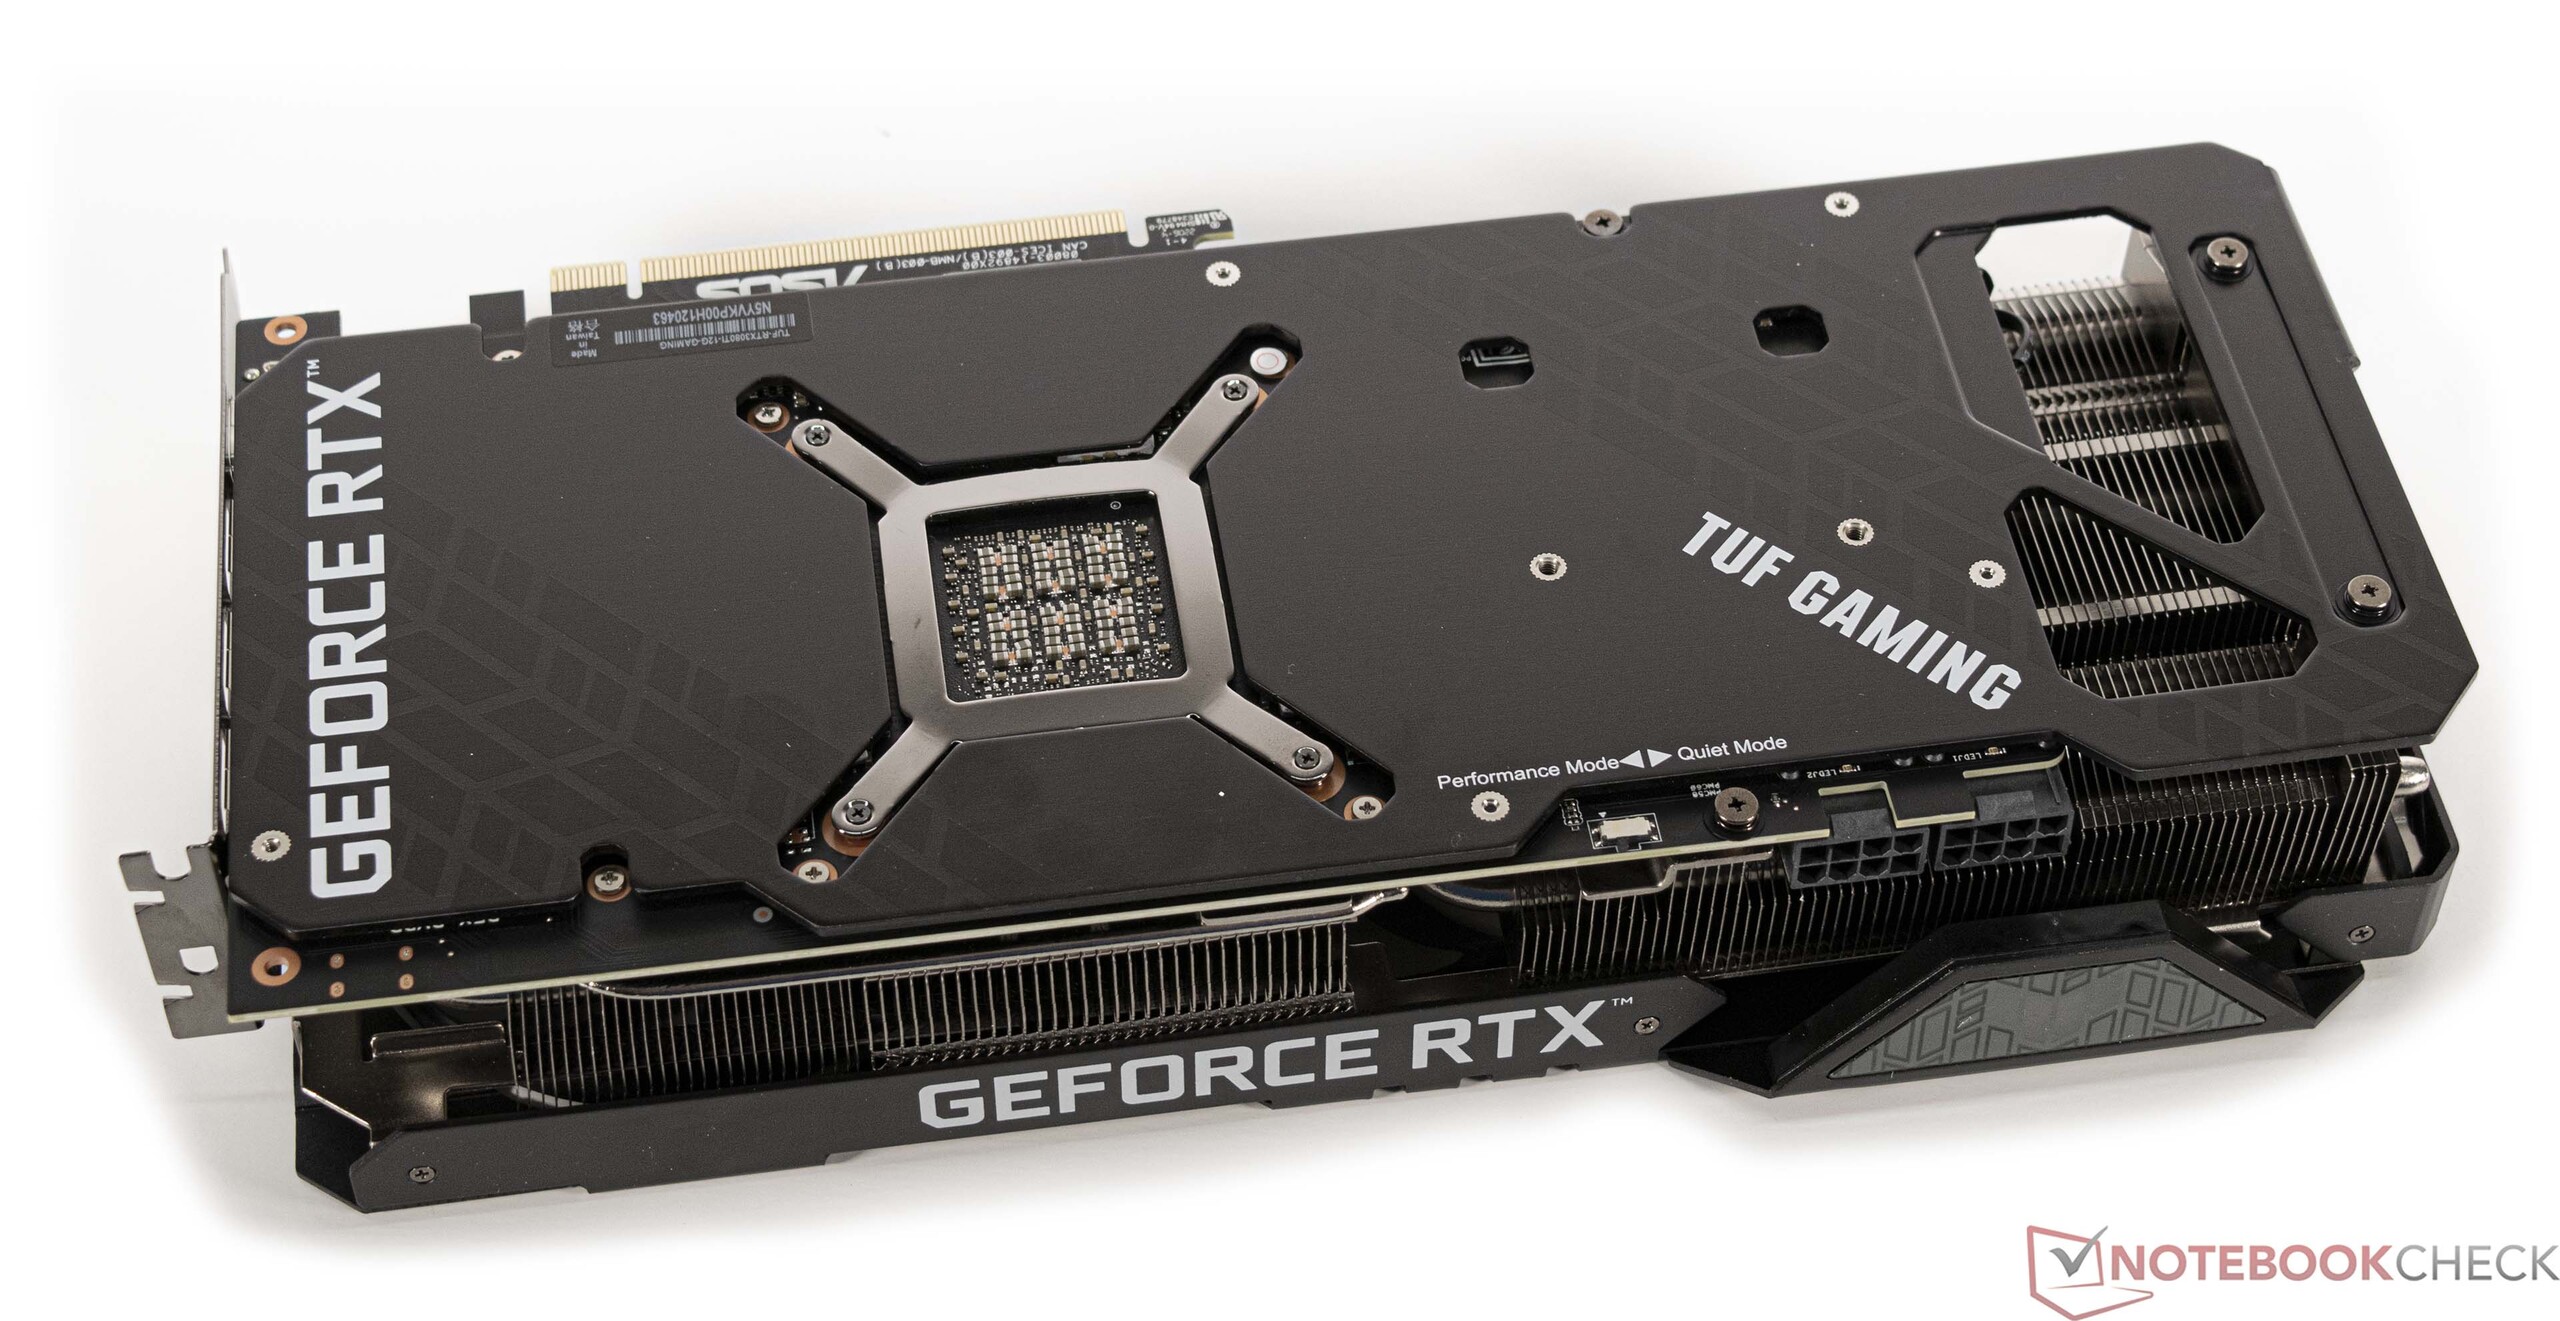
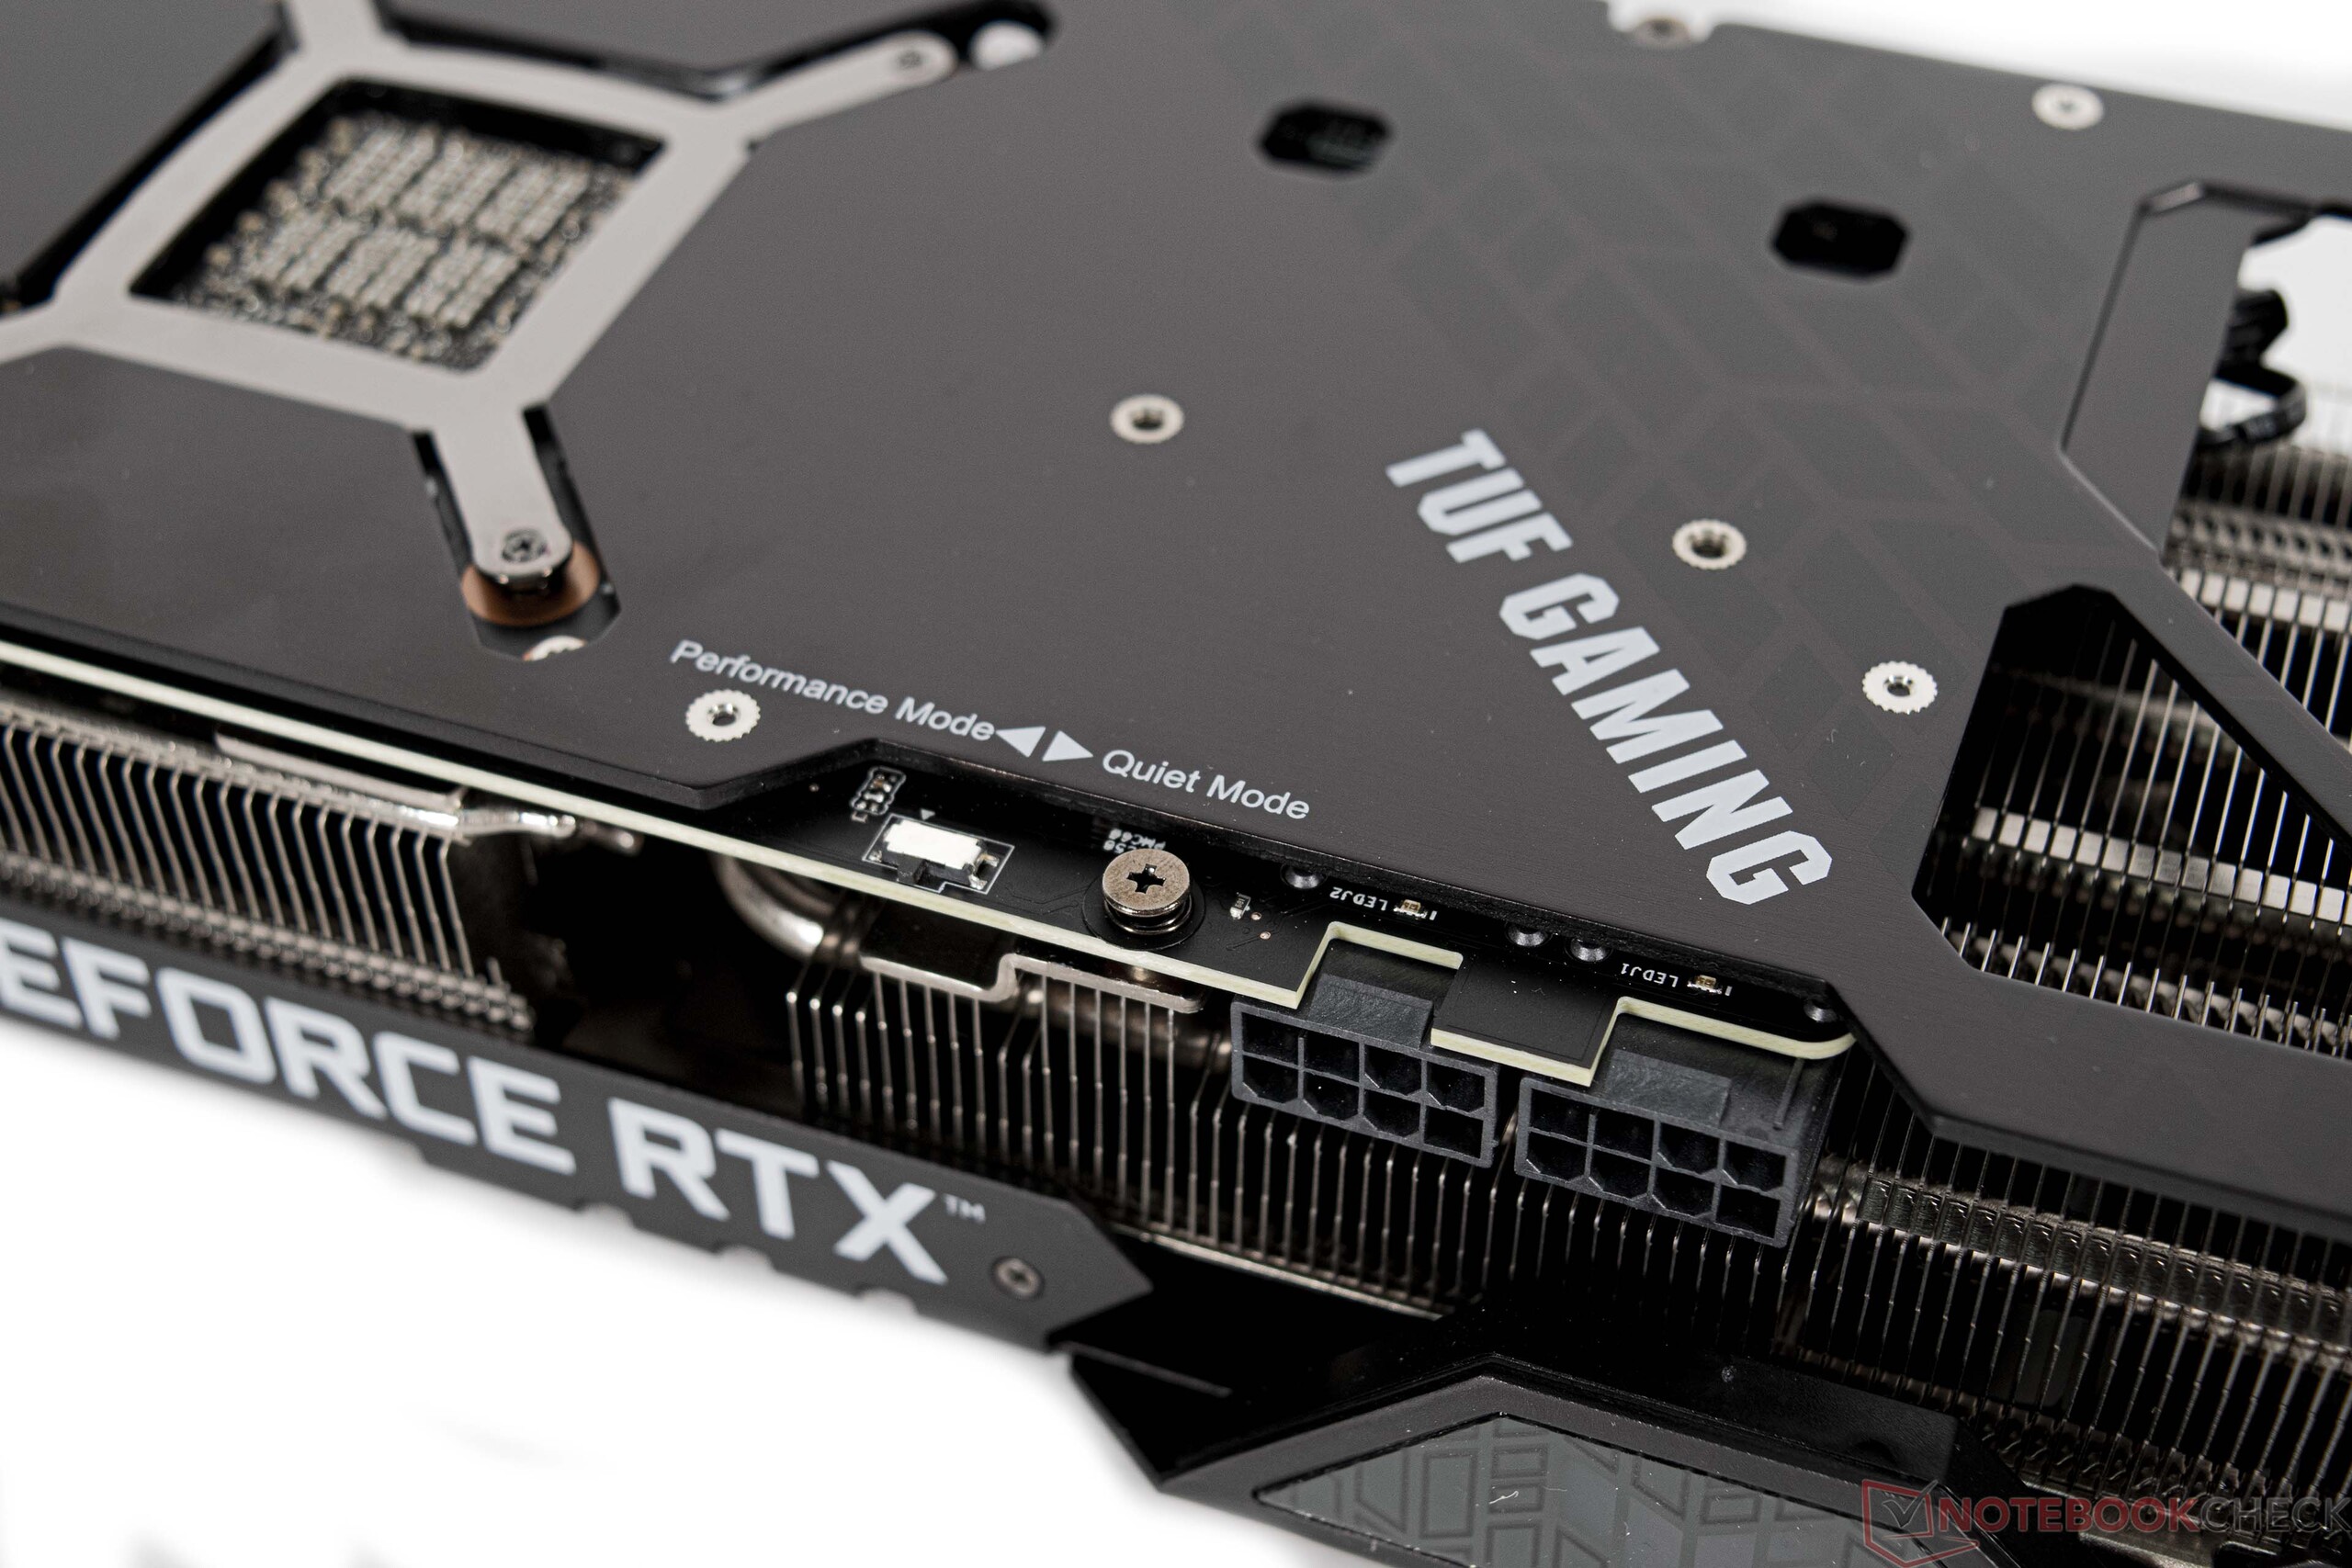
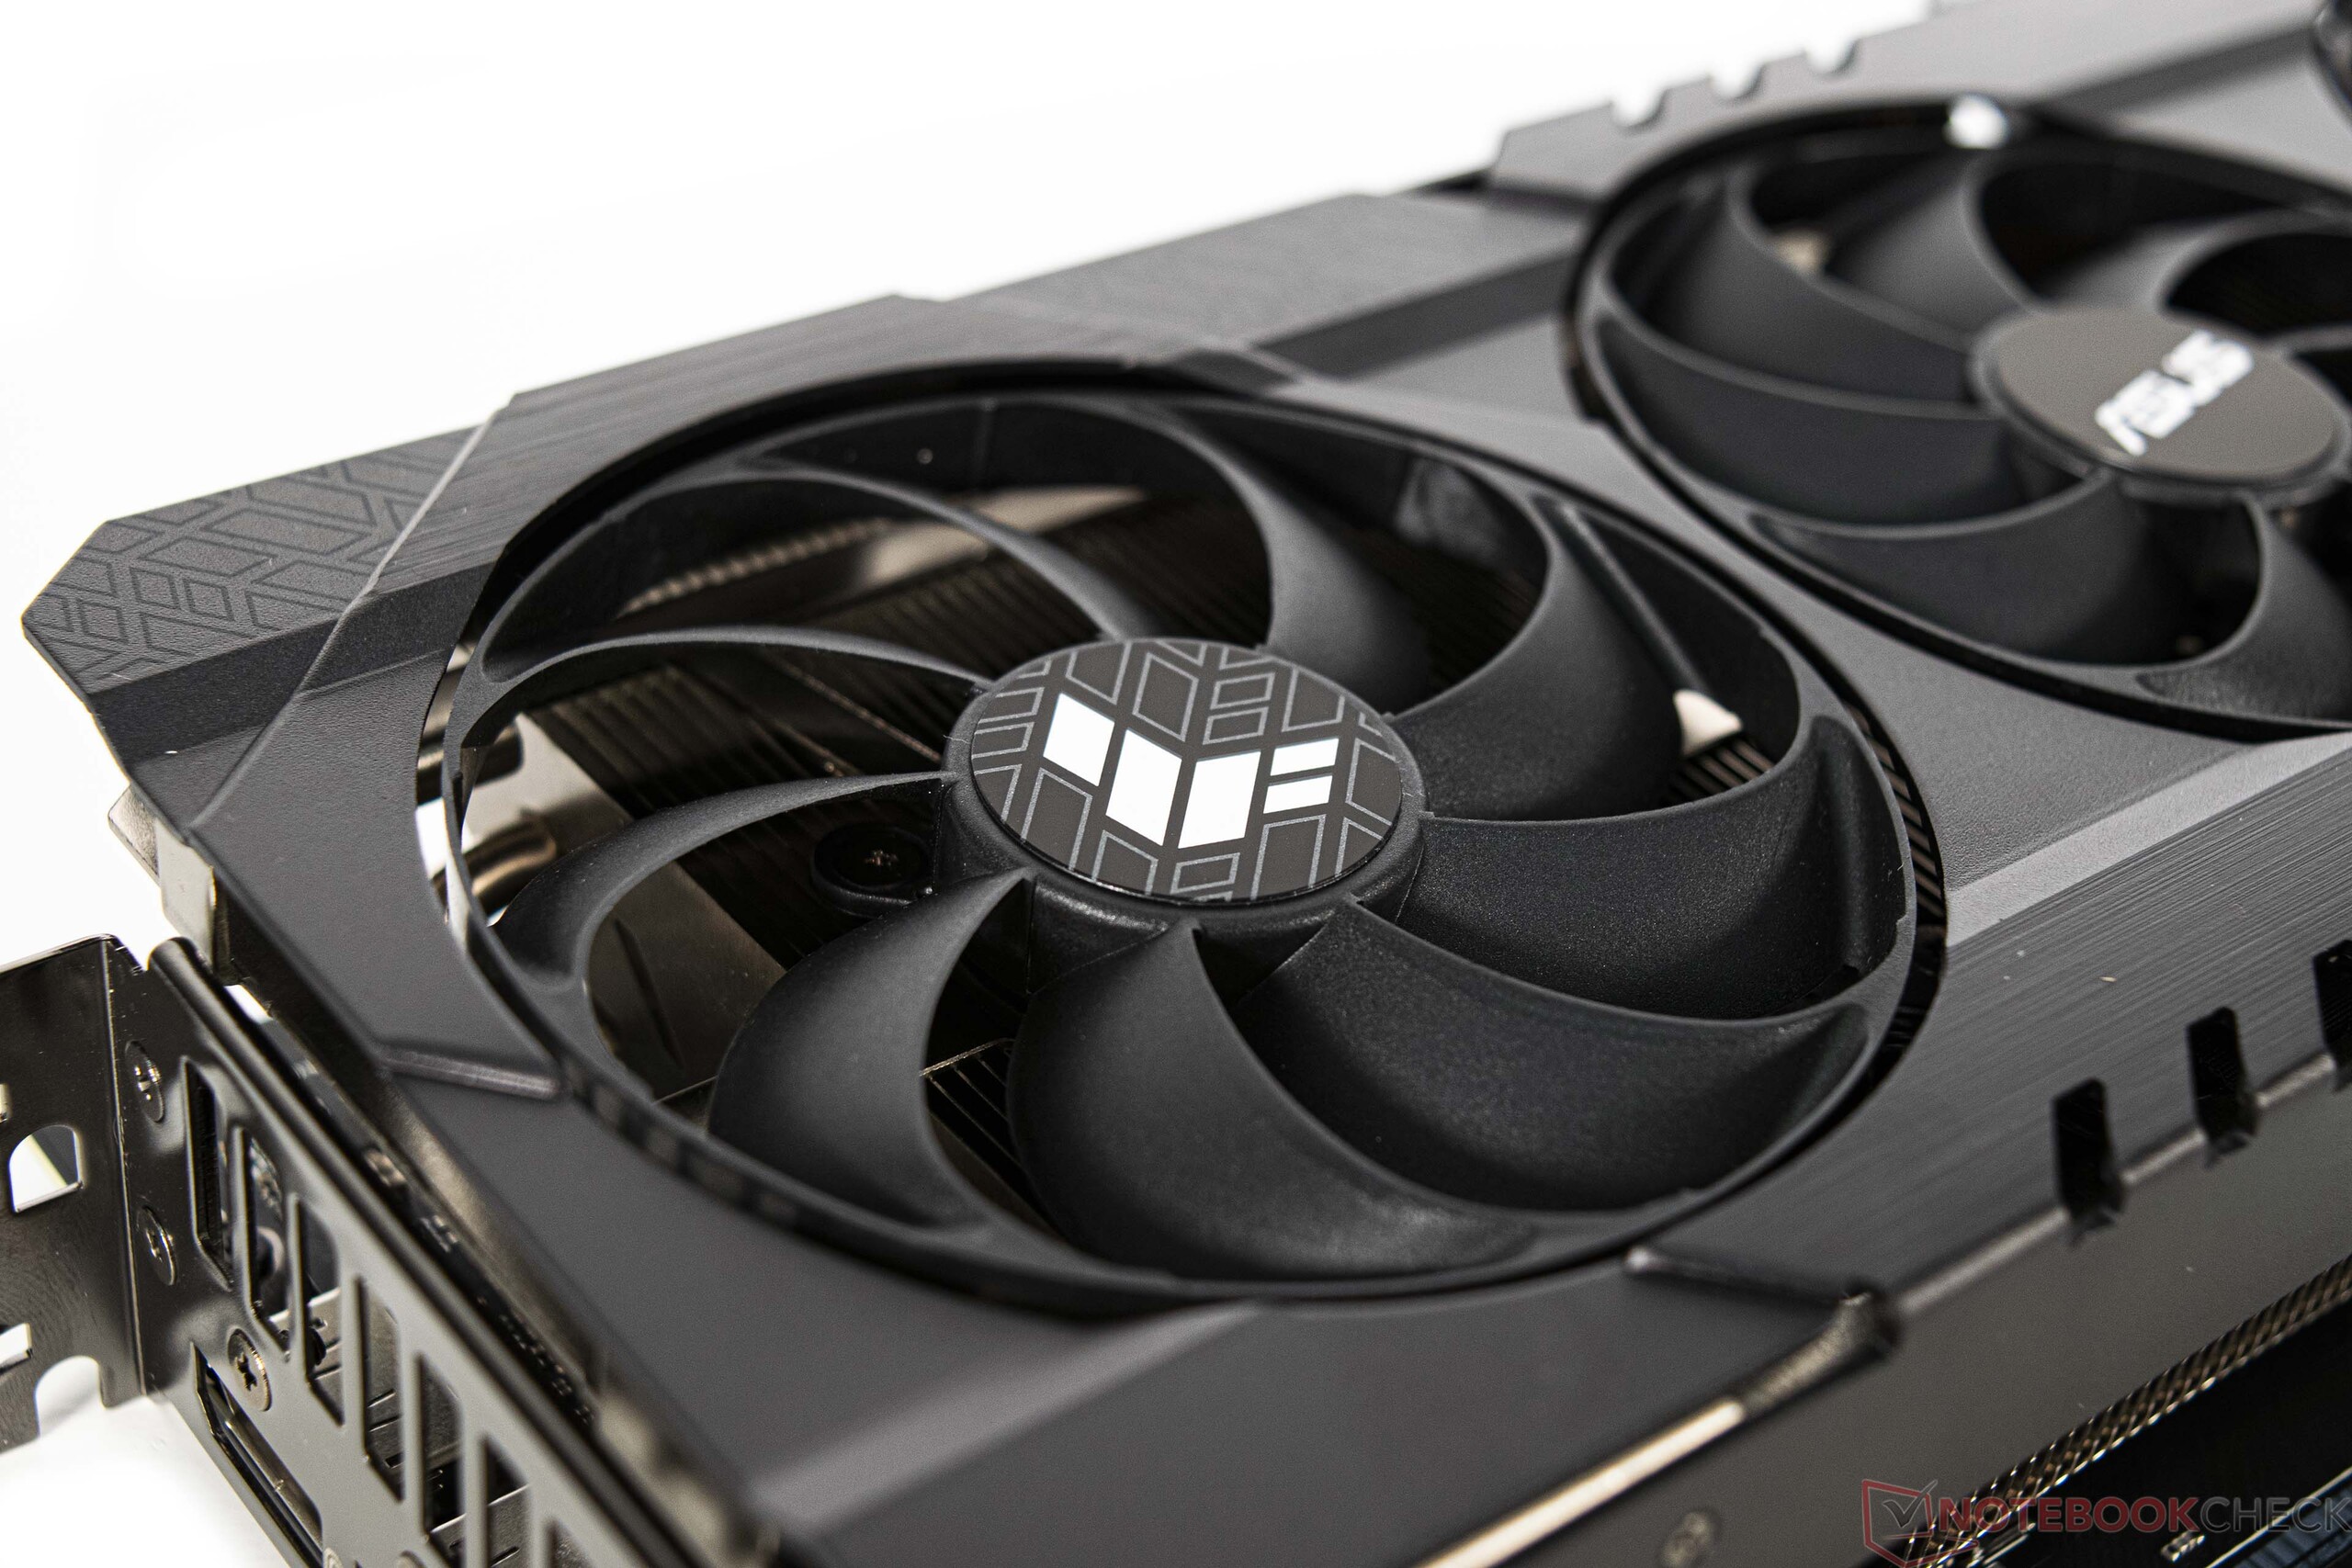
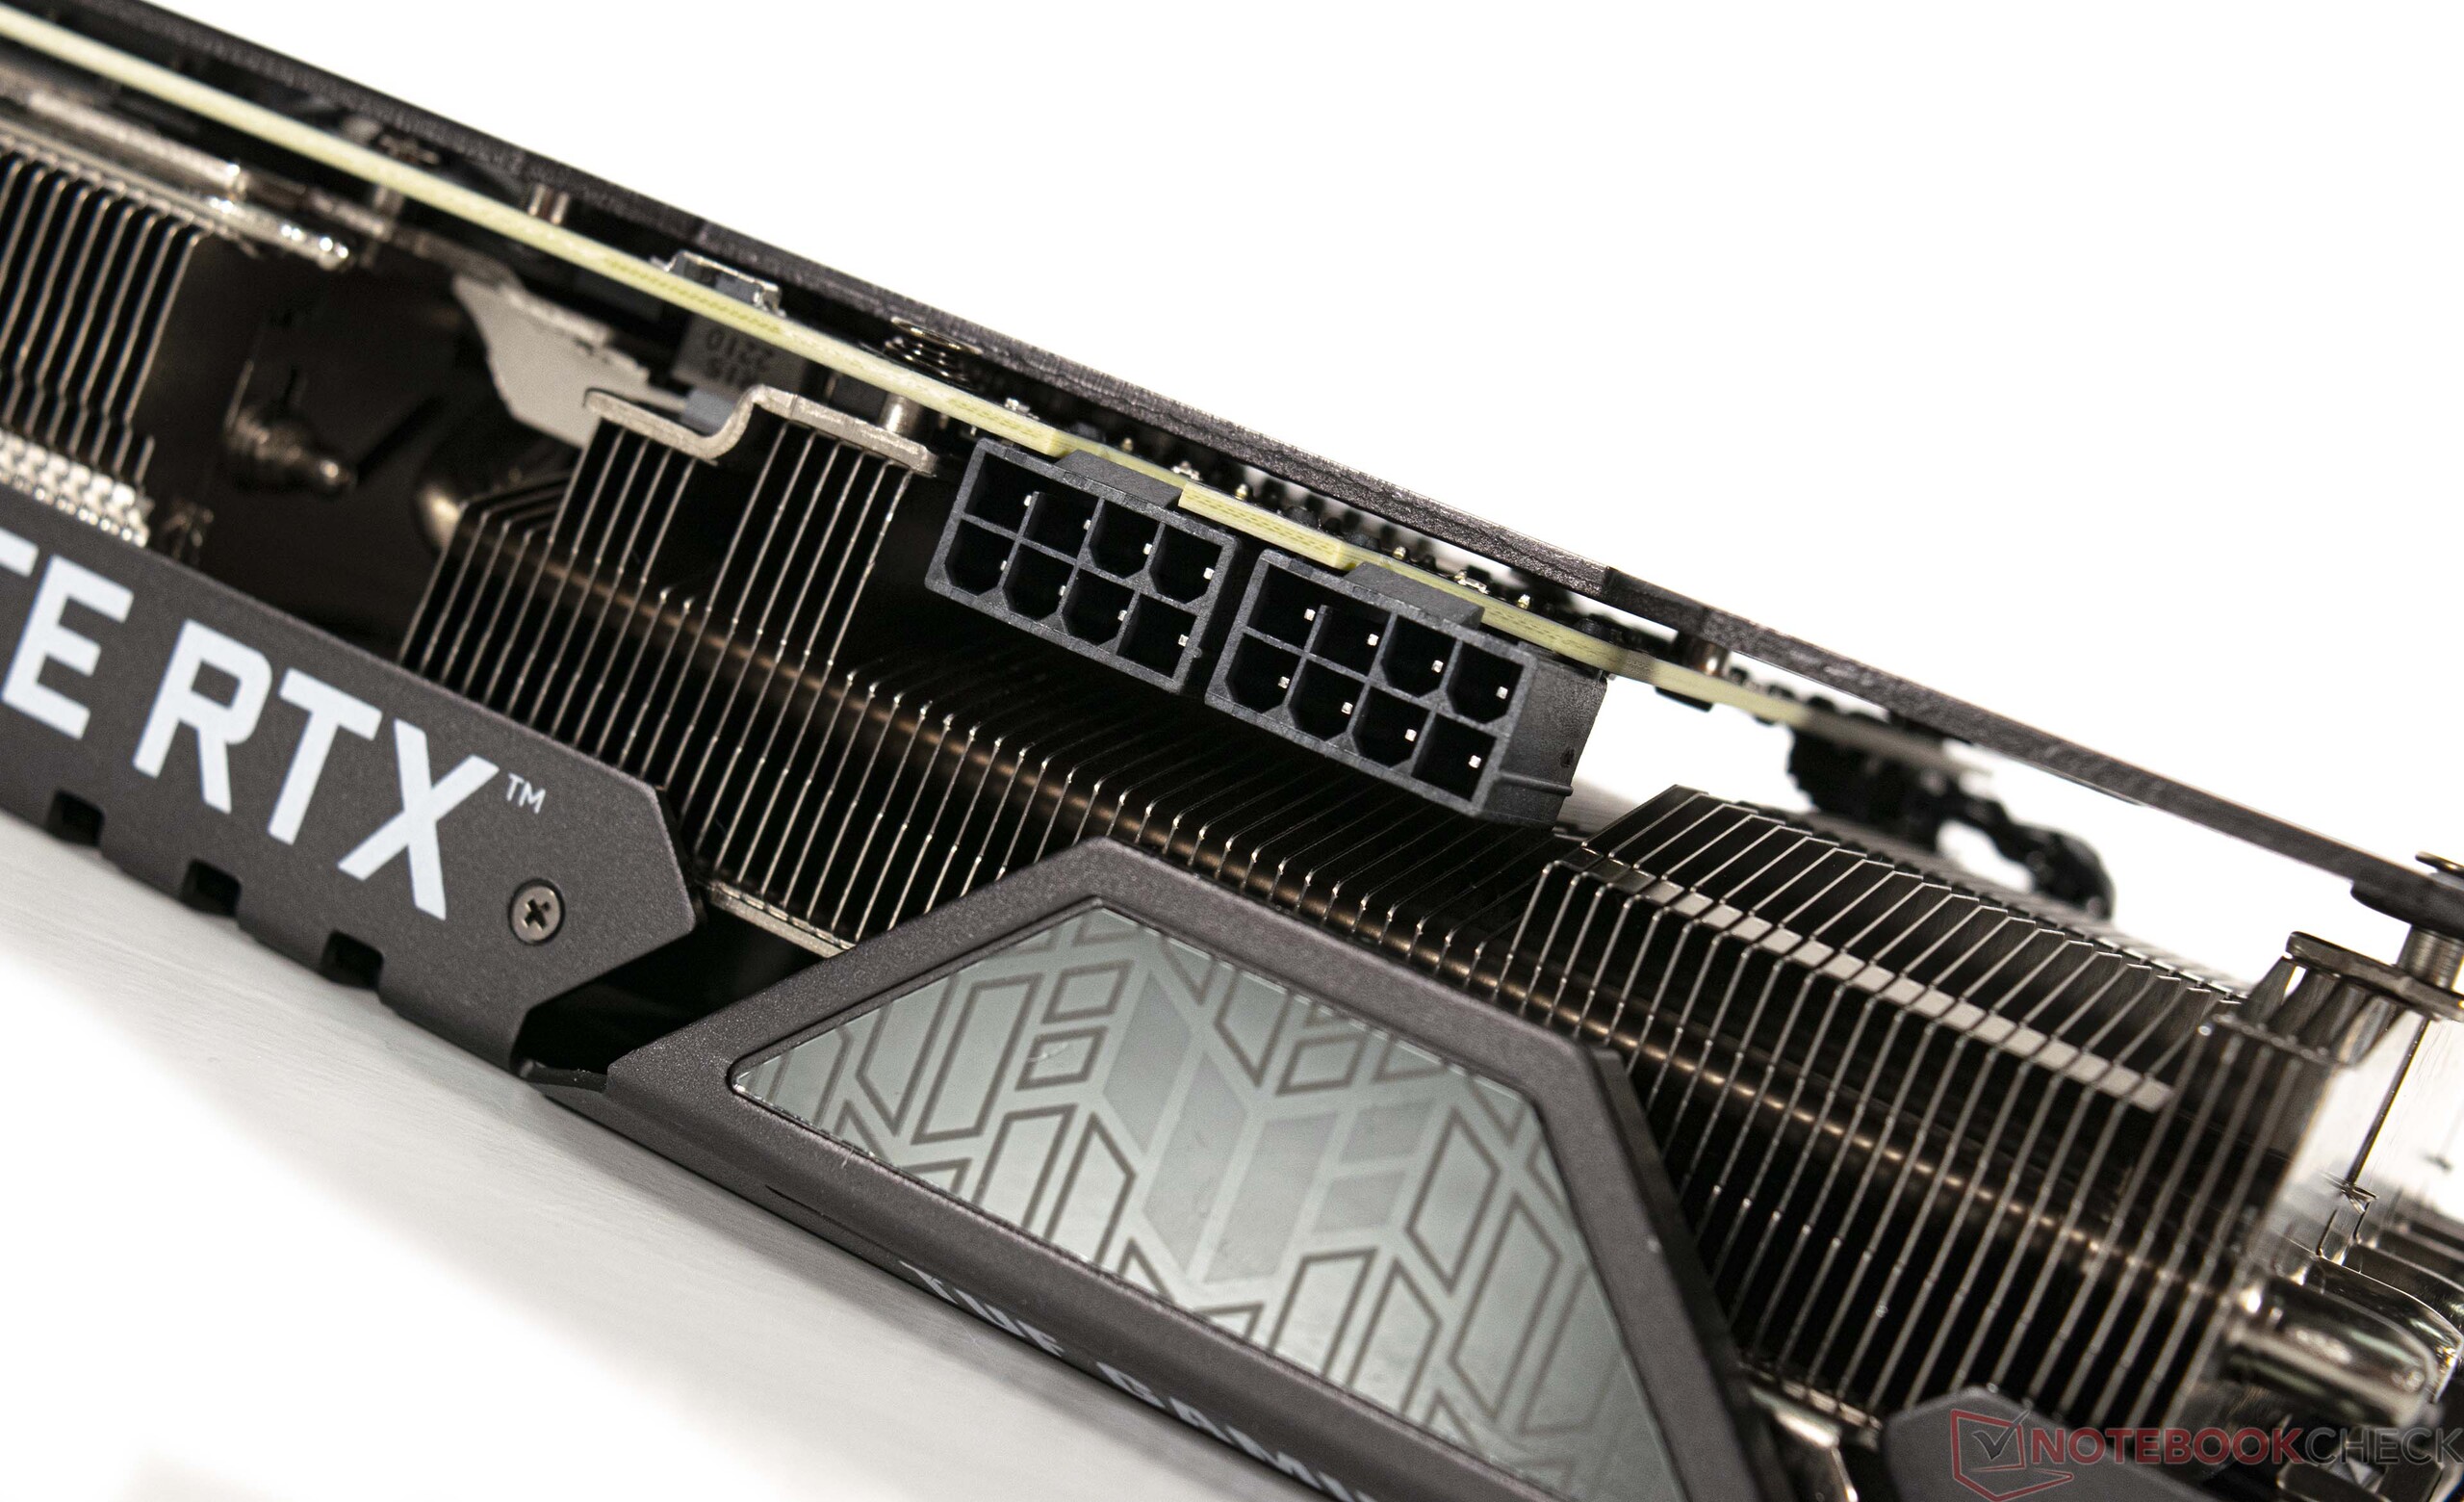
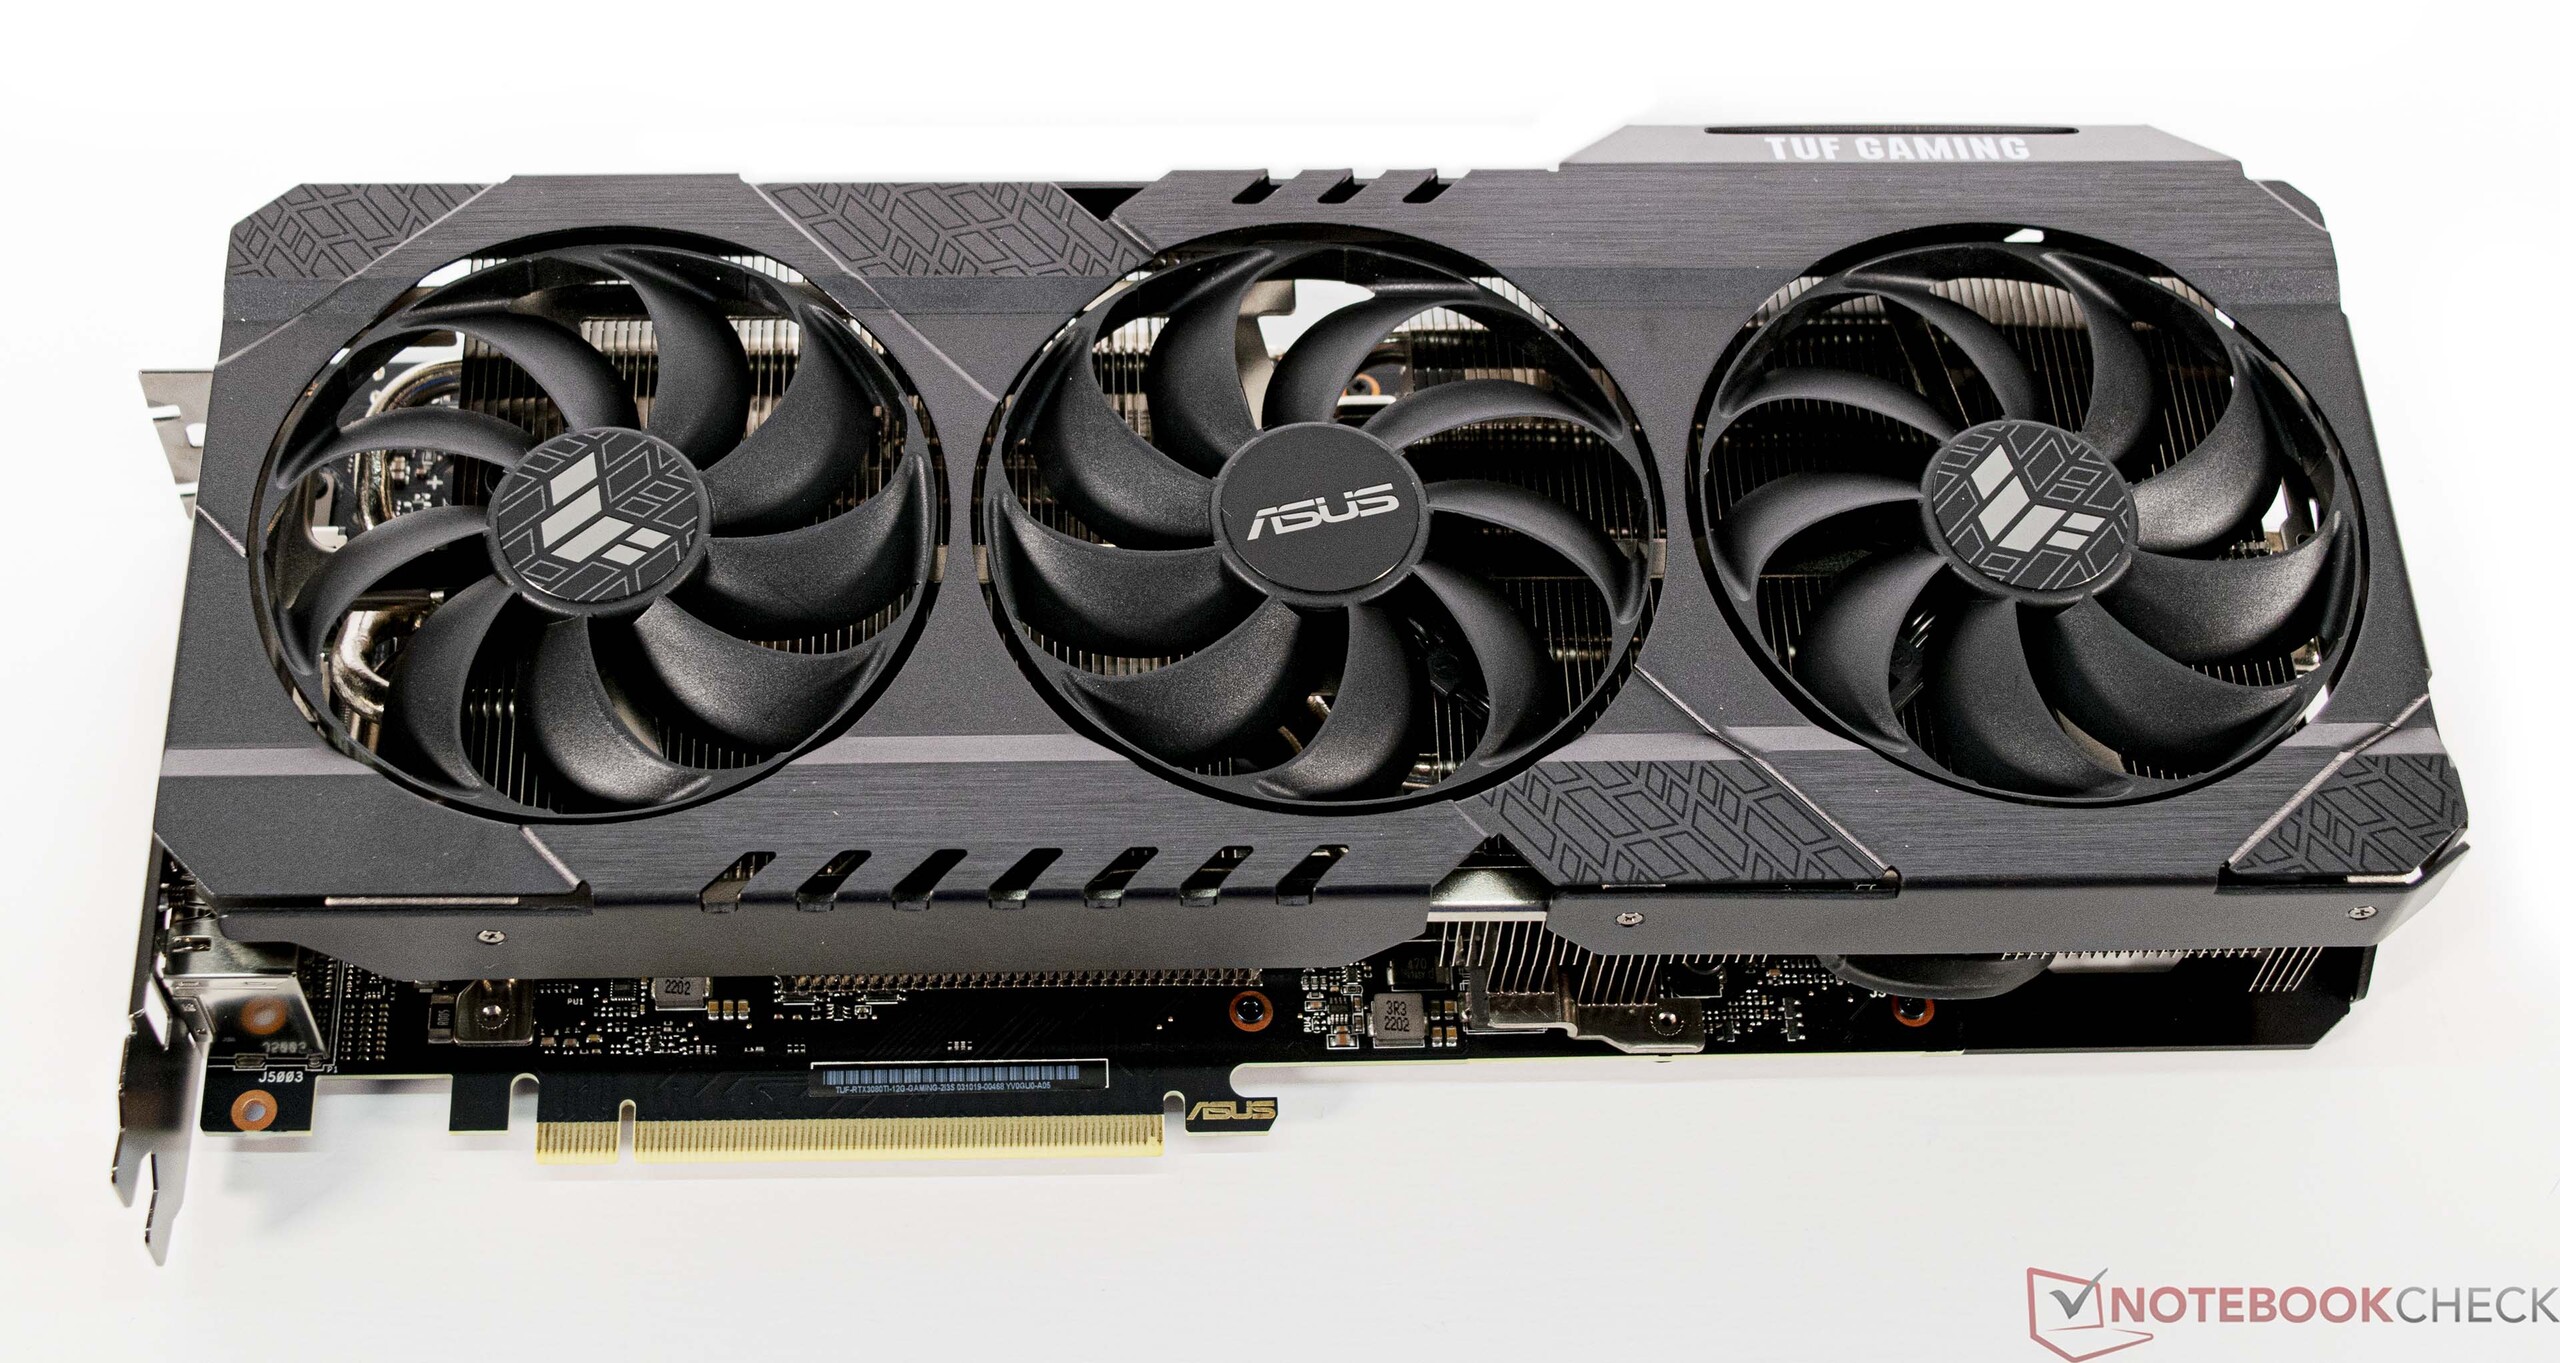
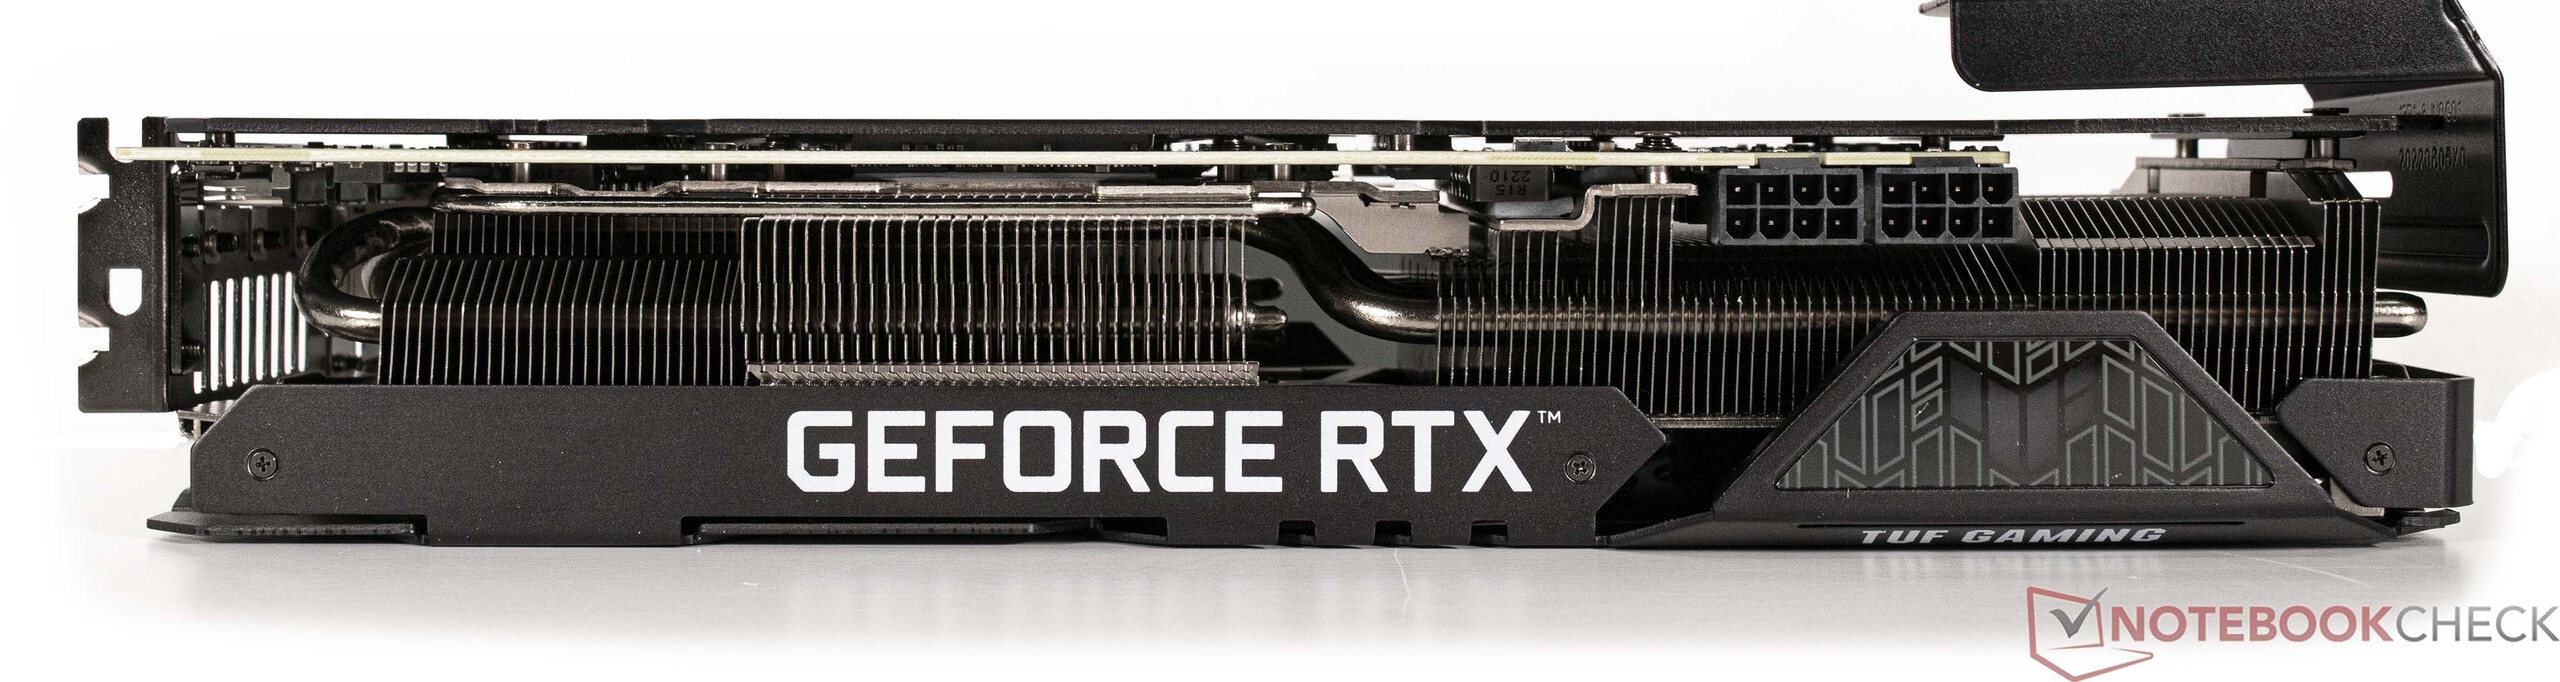
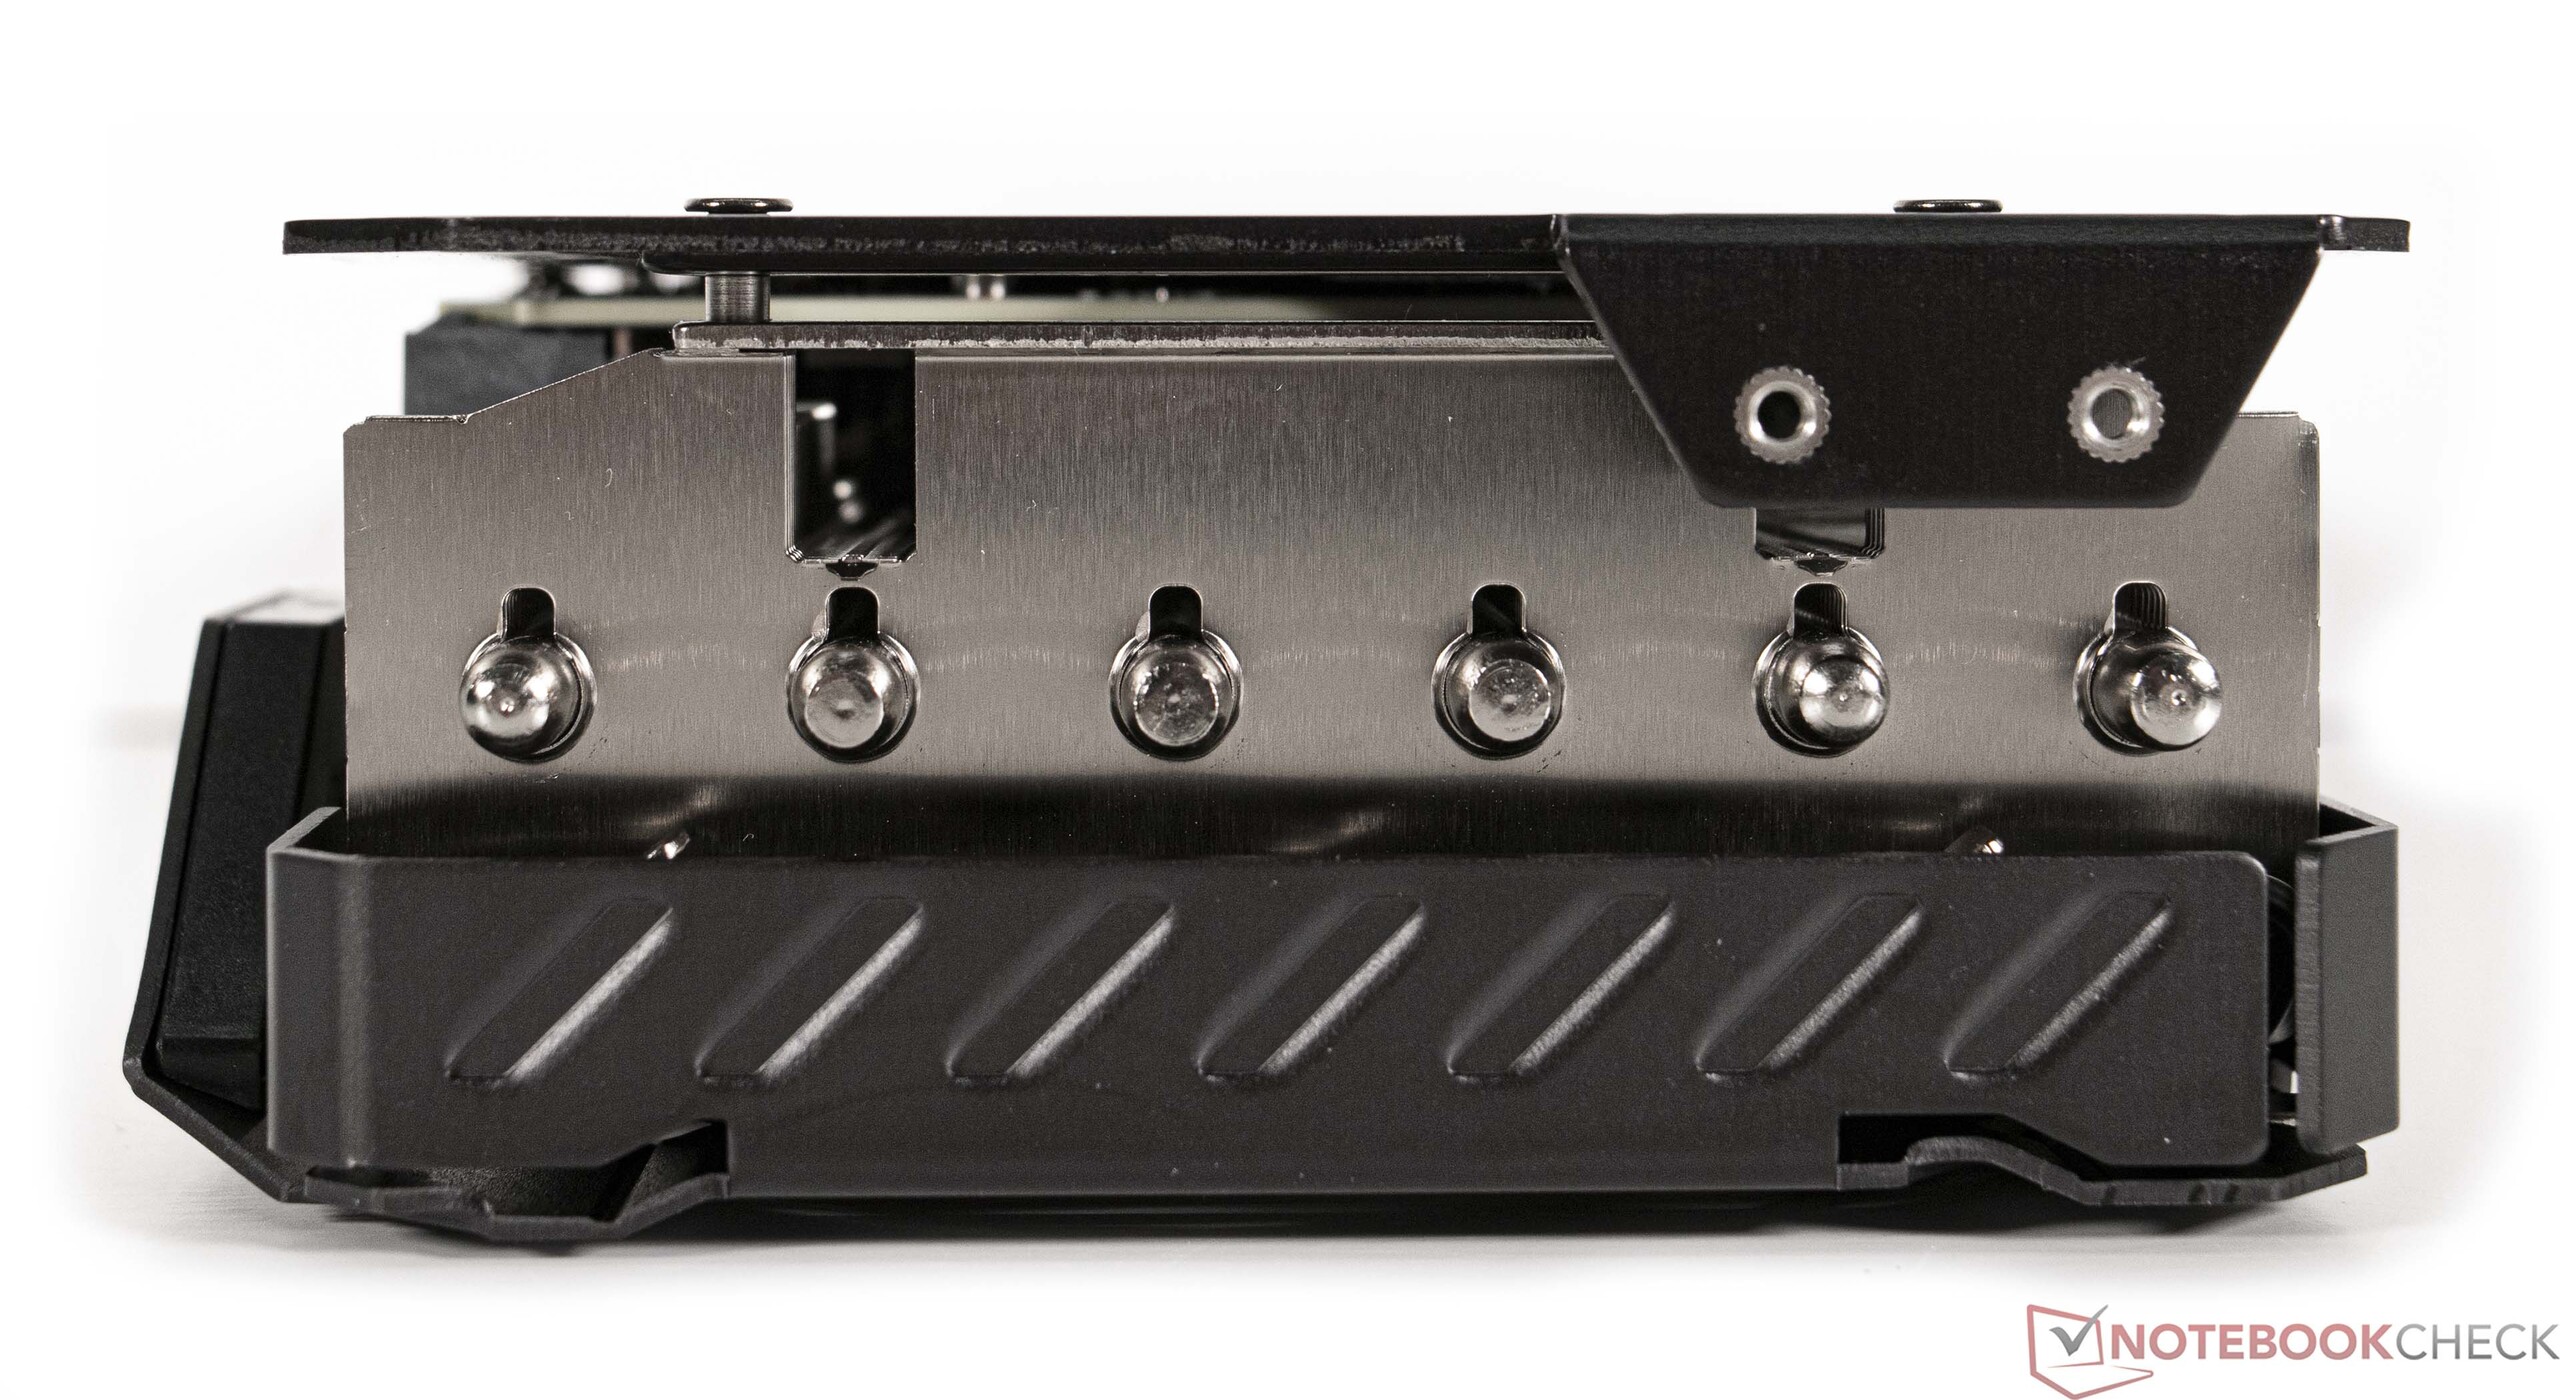
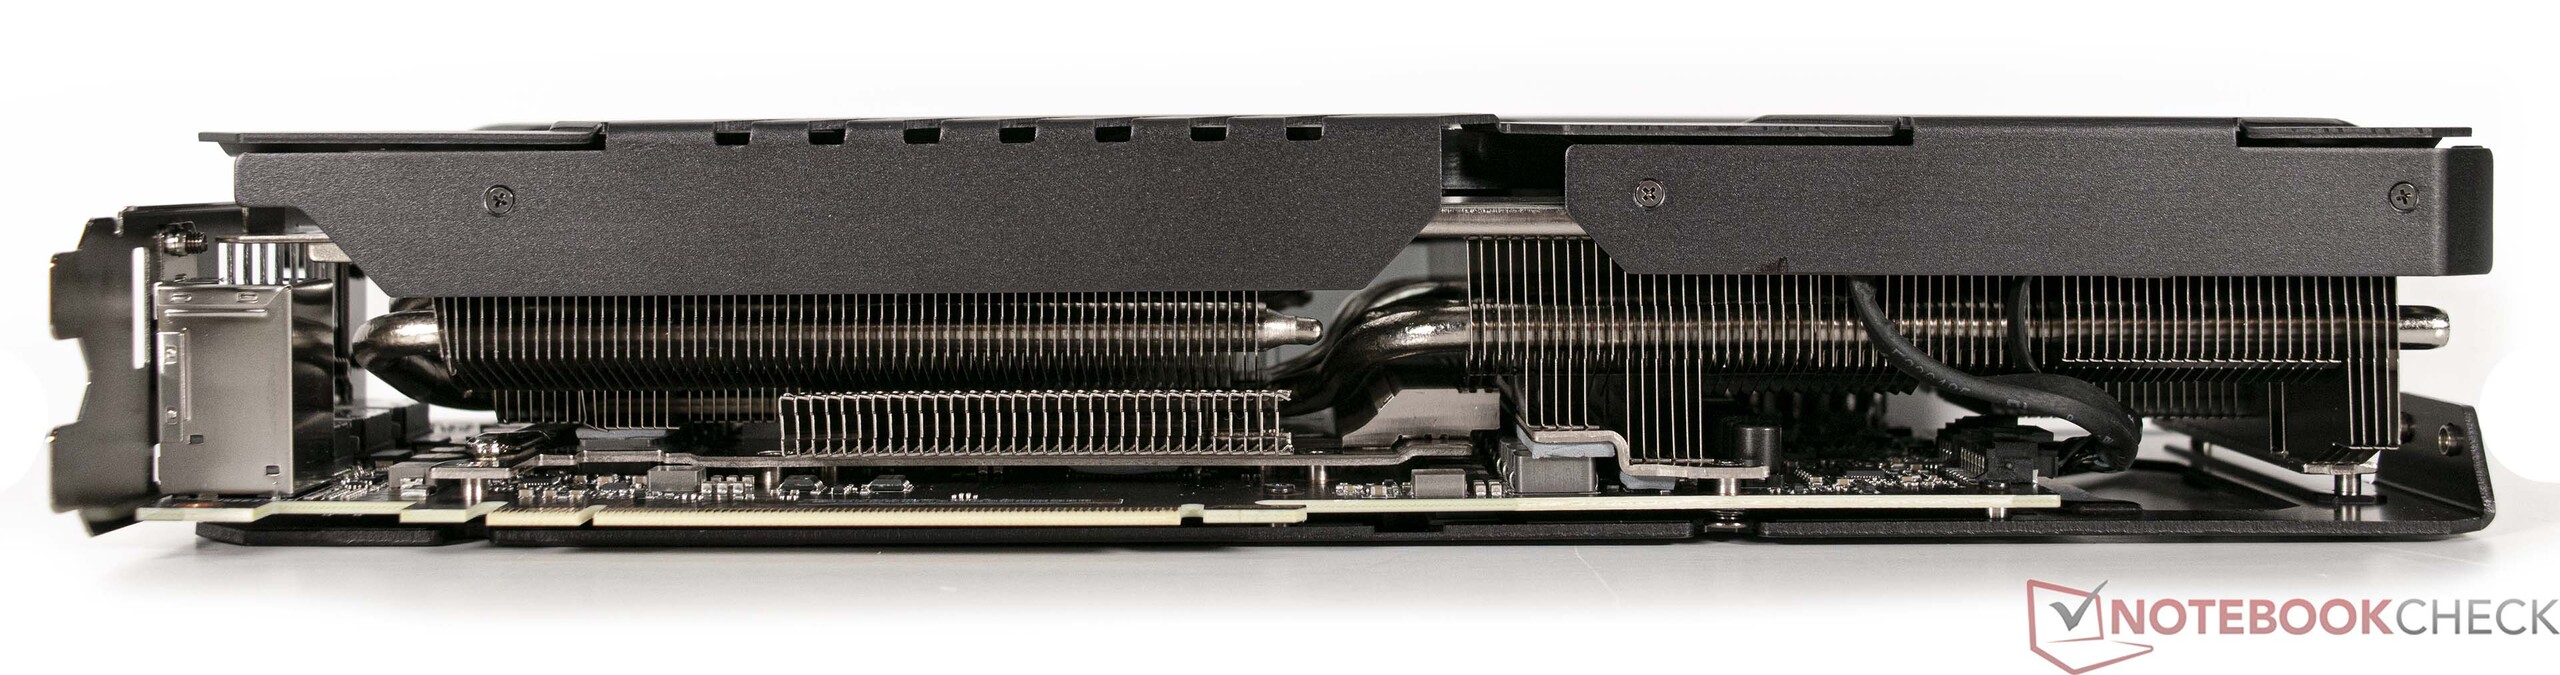
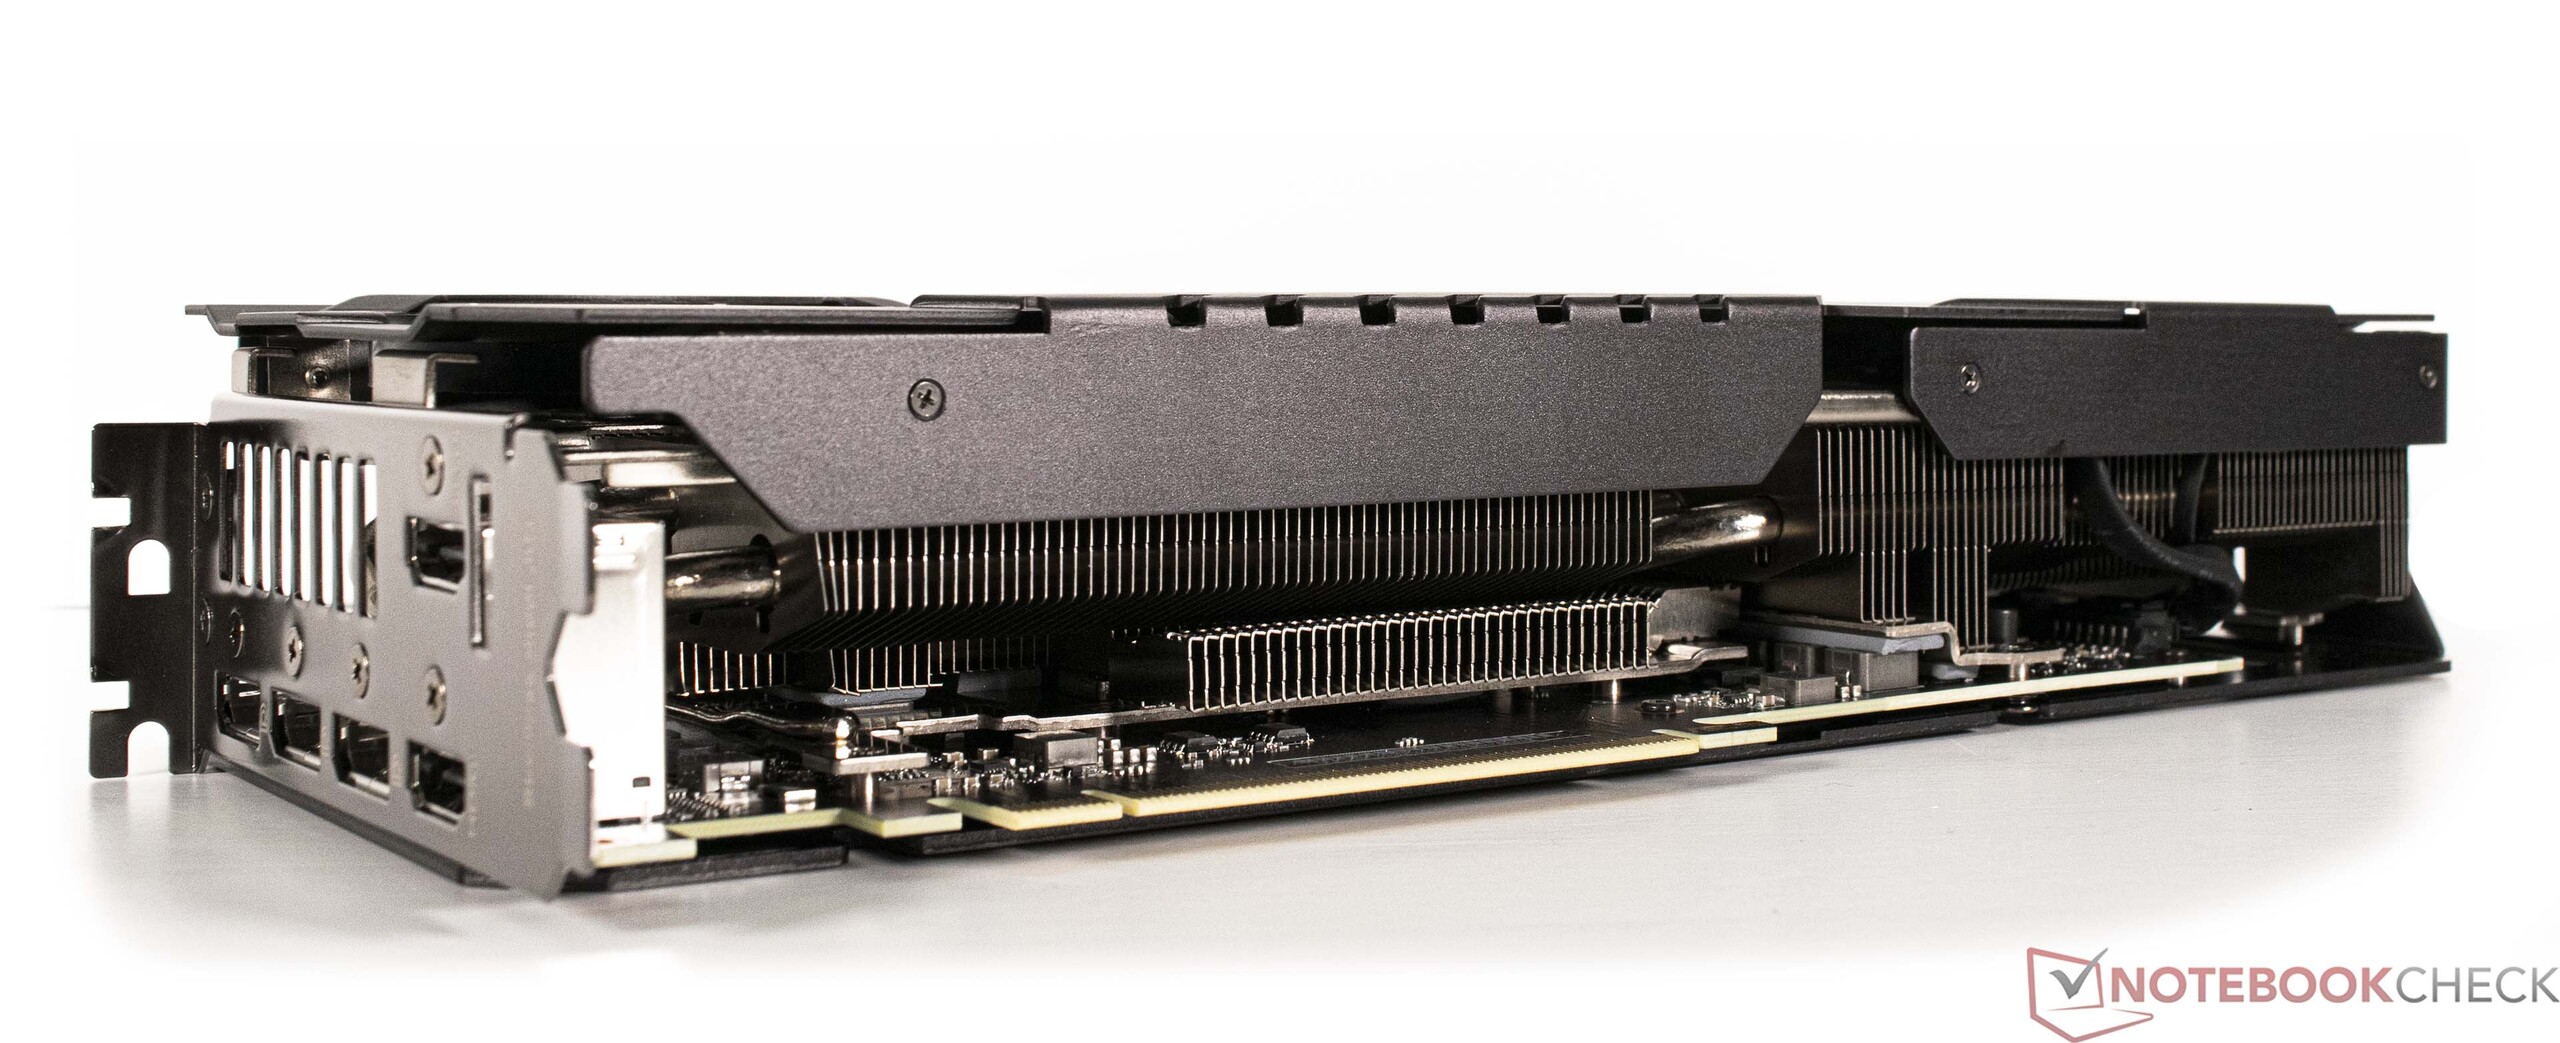
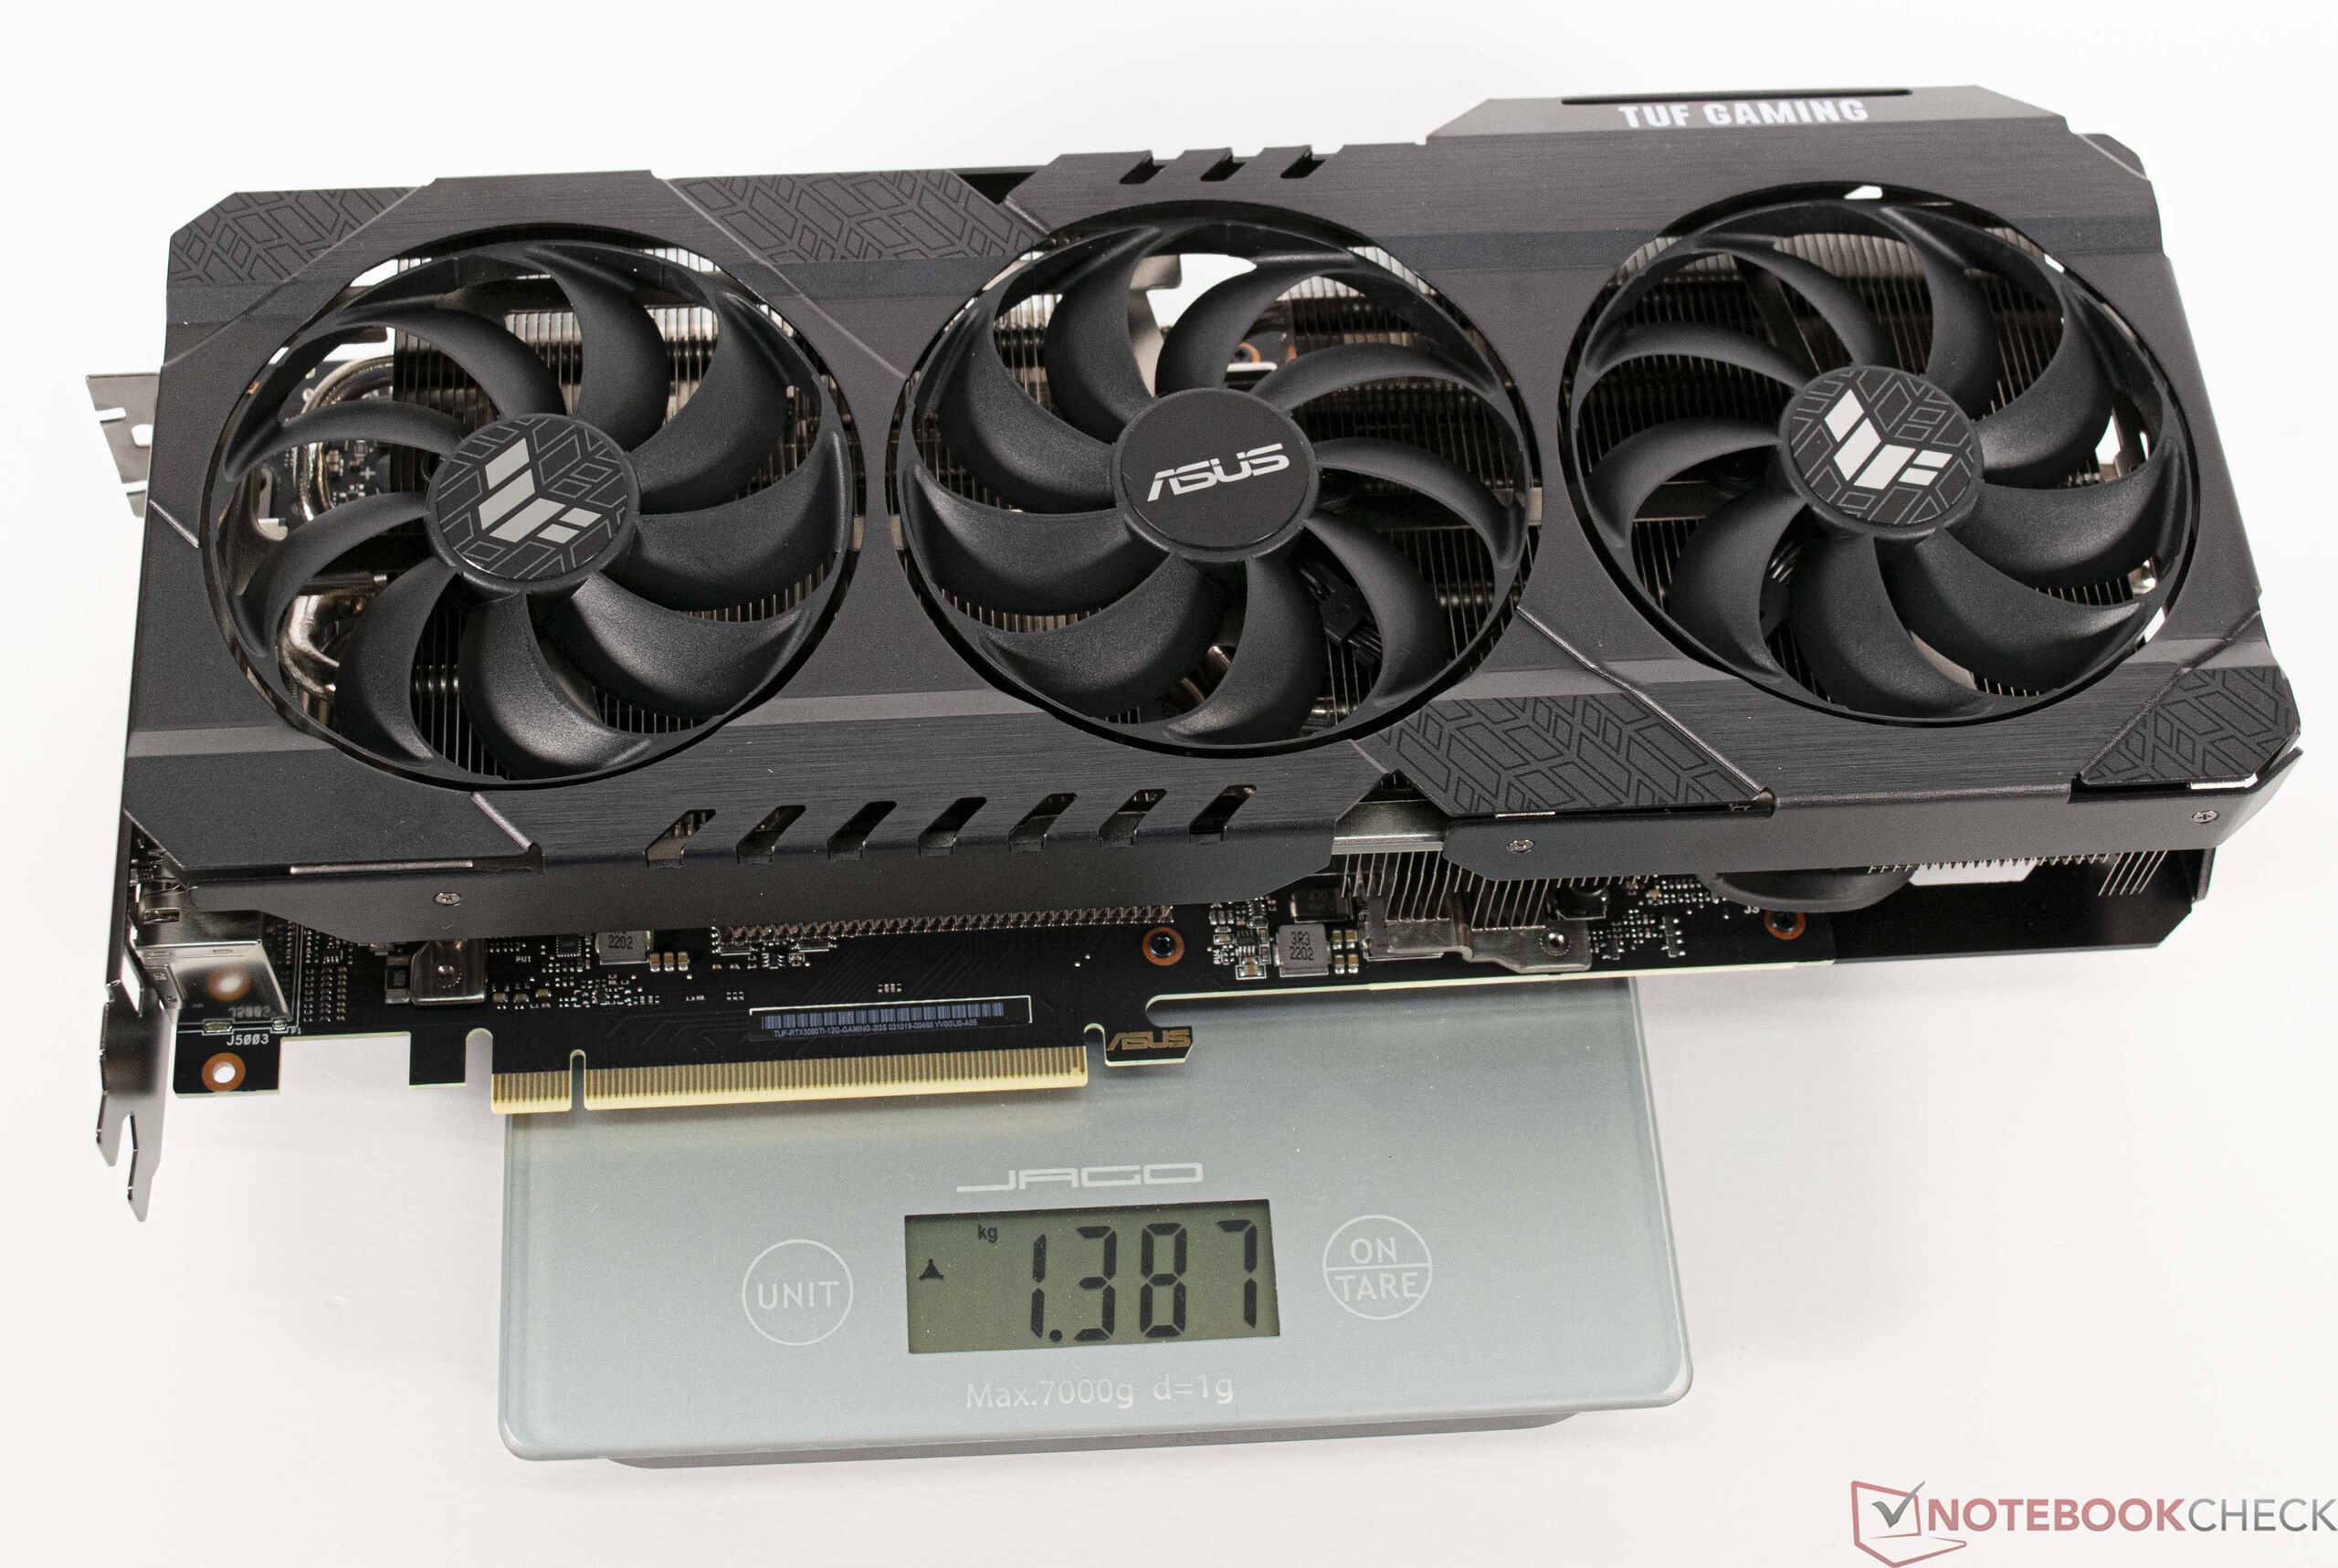
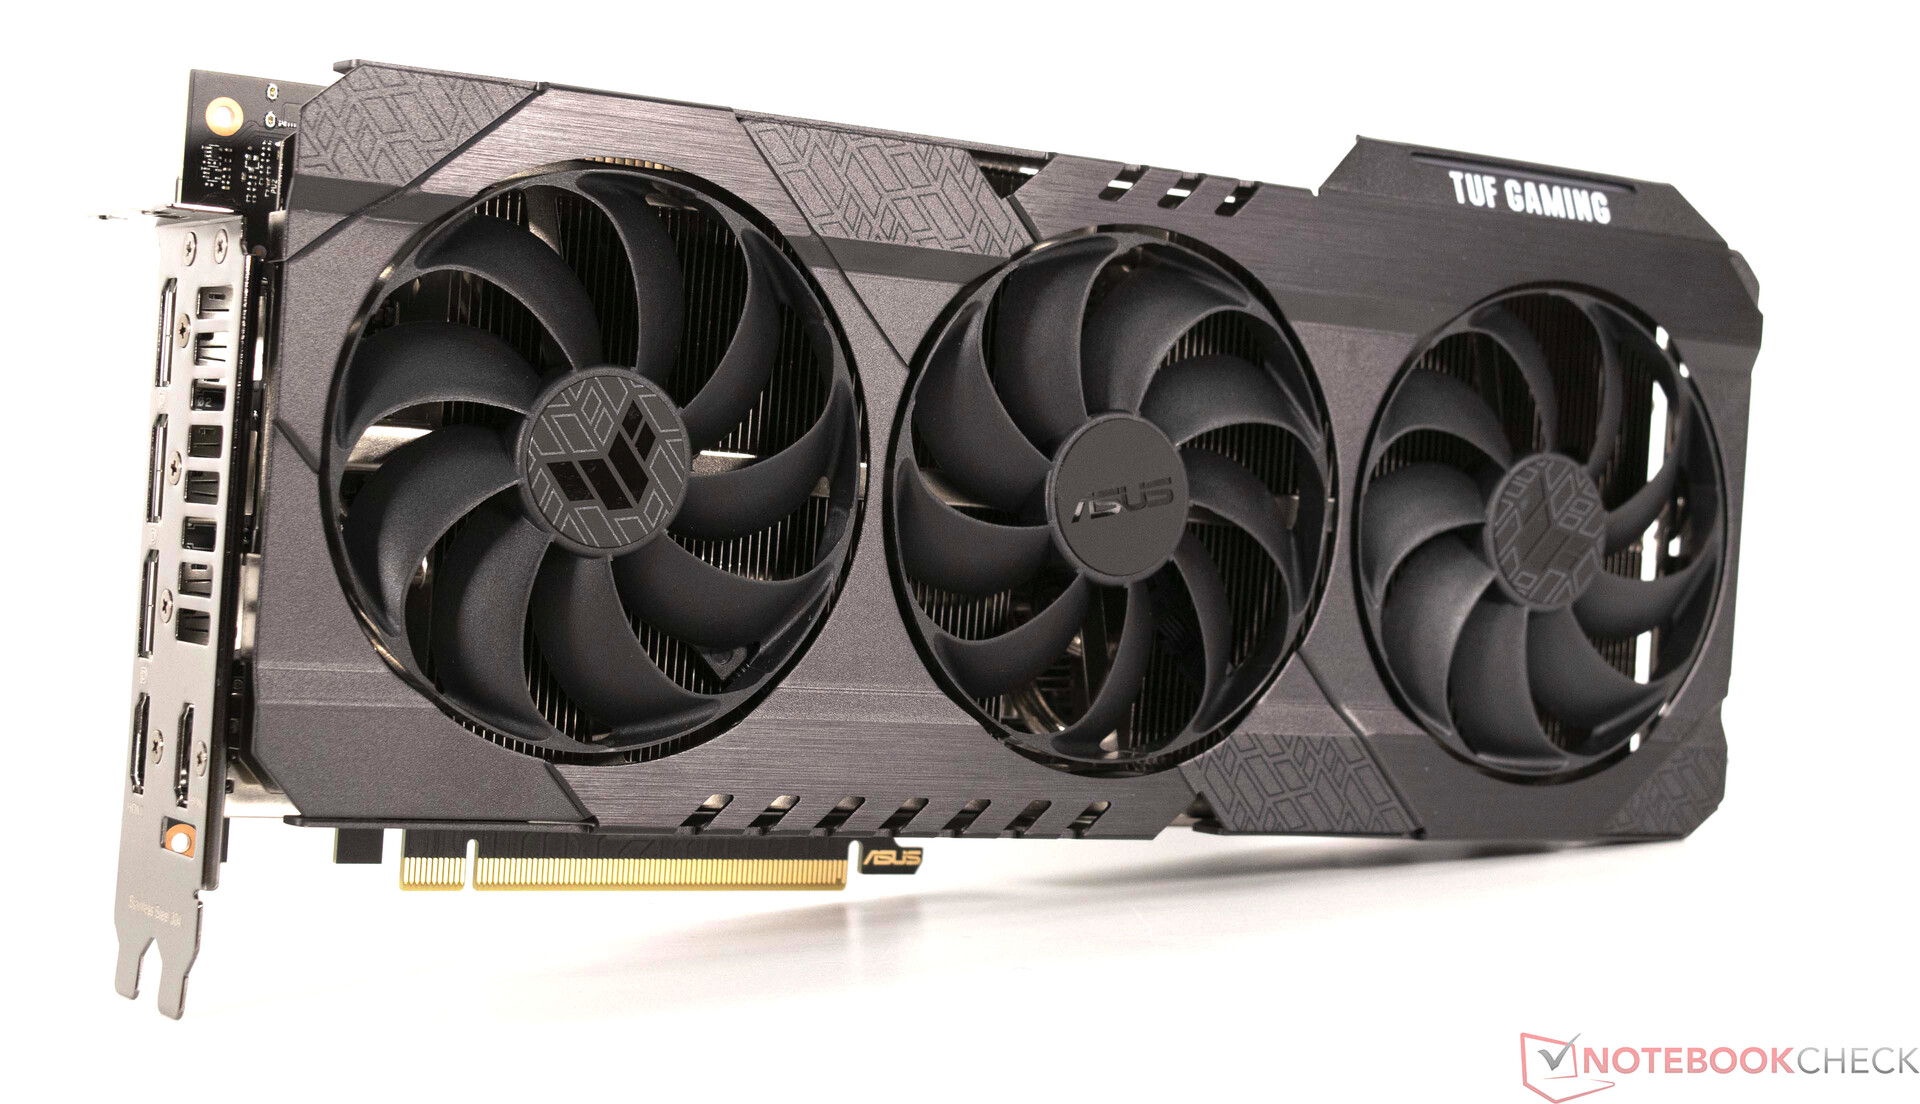
The graphics card is finished to a very high level with the surface consisting mainly of metal. We can already reveal the fan has no difficulties in dispersing heat under load. However, it's worth checking case compatibility due to the card's size. Primarily, the height could be an issue. At 12.6 centimeters, space can quickly be at a premium with the side wall. Additionally, space has also to be made for the two 6+2 pin power connectors. Length-wise, at just under 30 centimeters, the graphics card is nothing out of the ordinary. This card was used in our recently reviewed Intel NUC 13 Extreme Raptor Canyon and fit well inside the case.
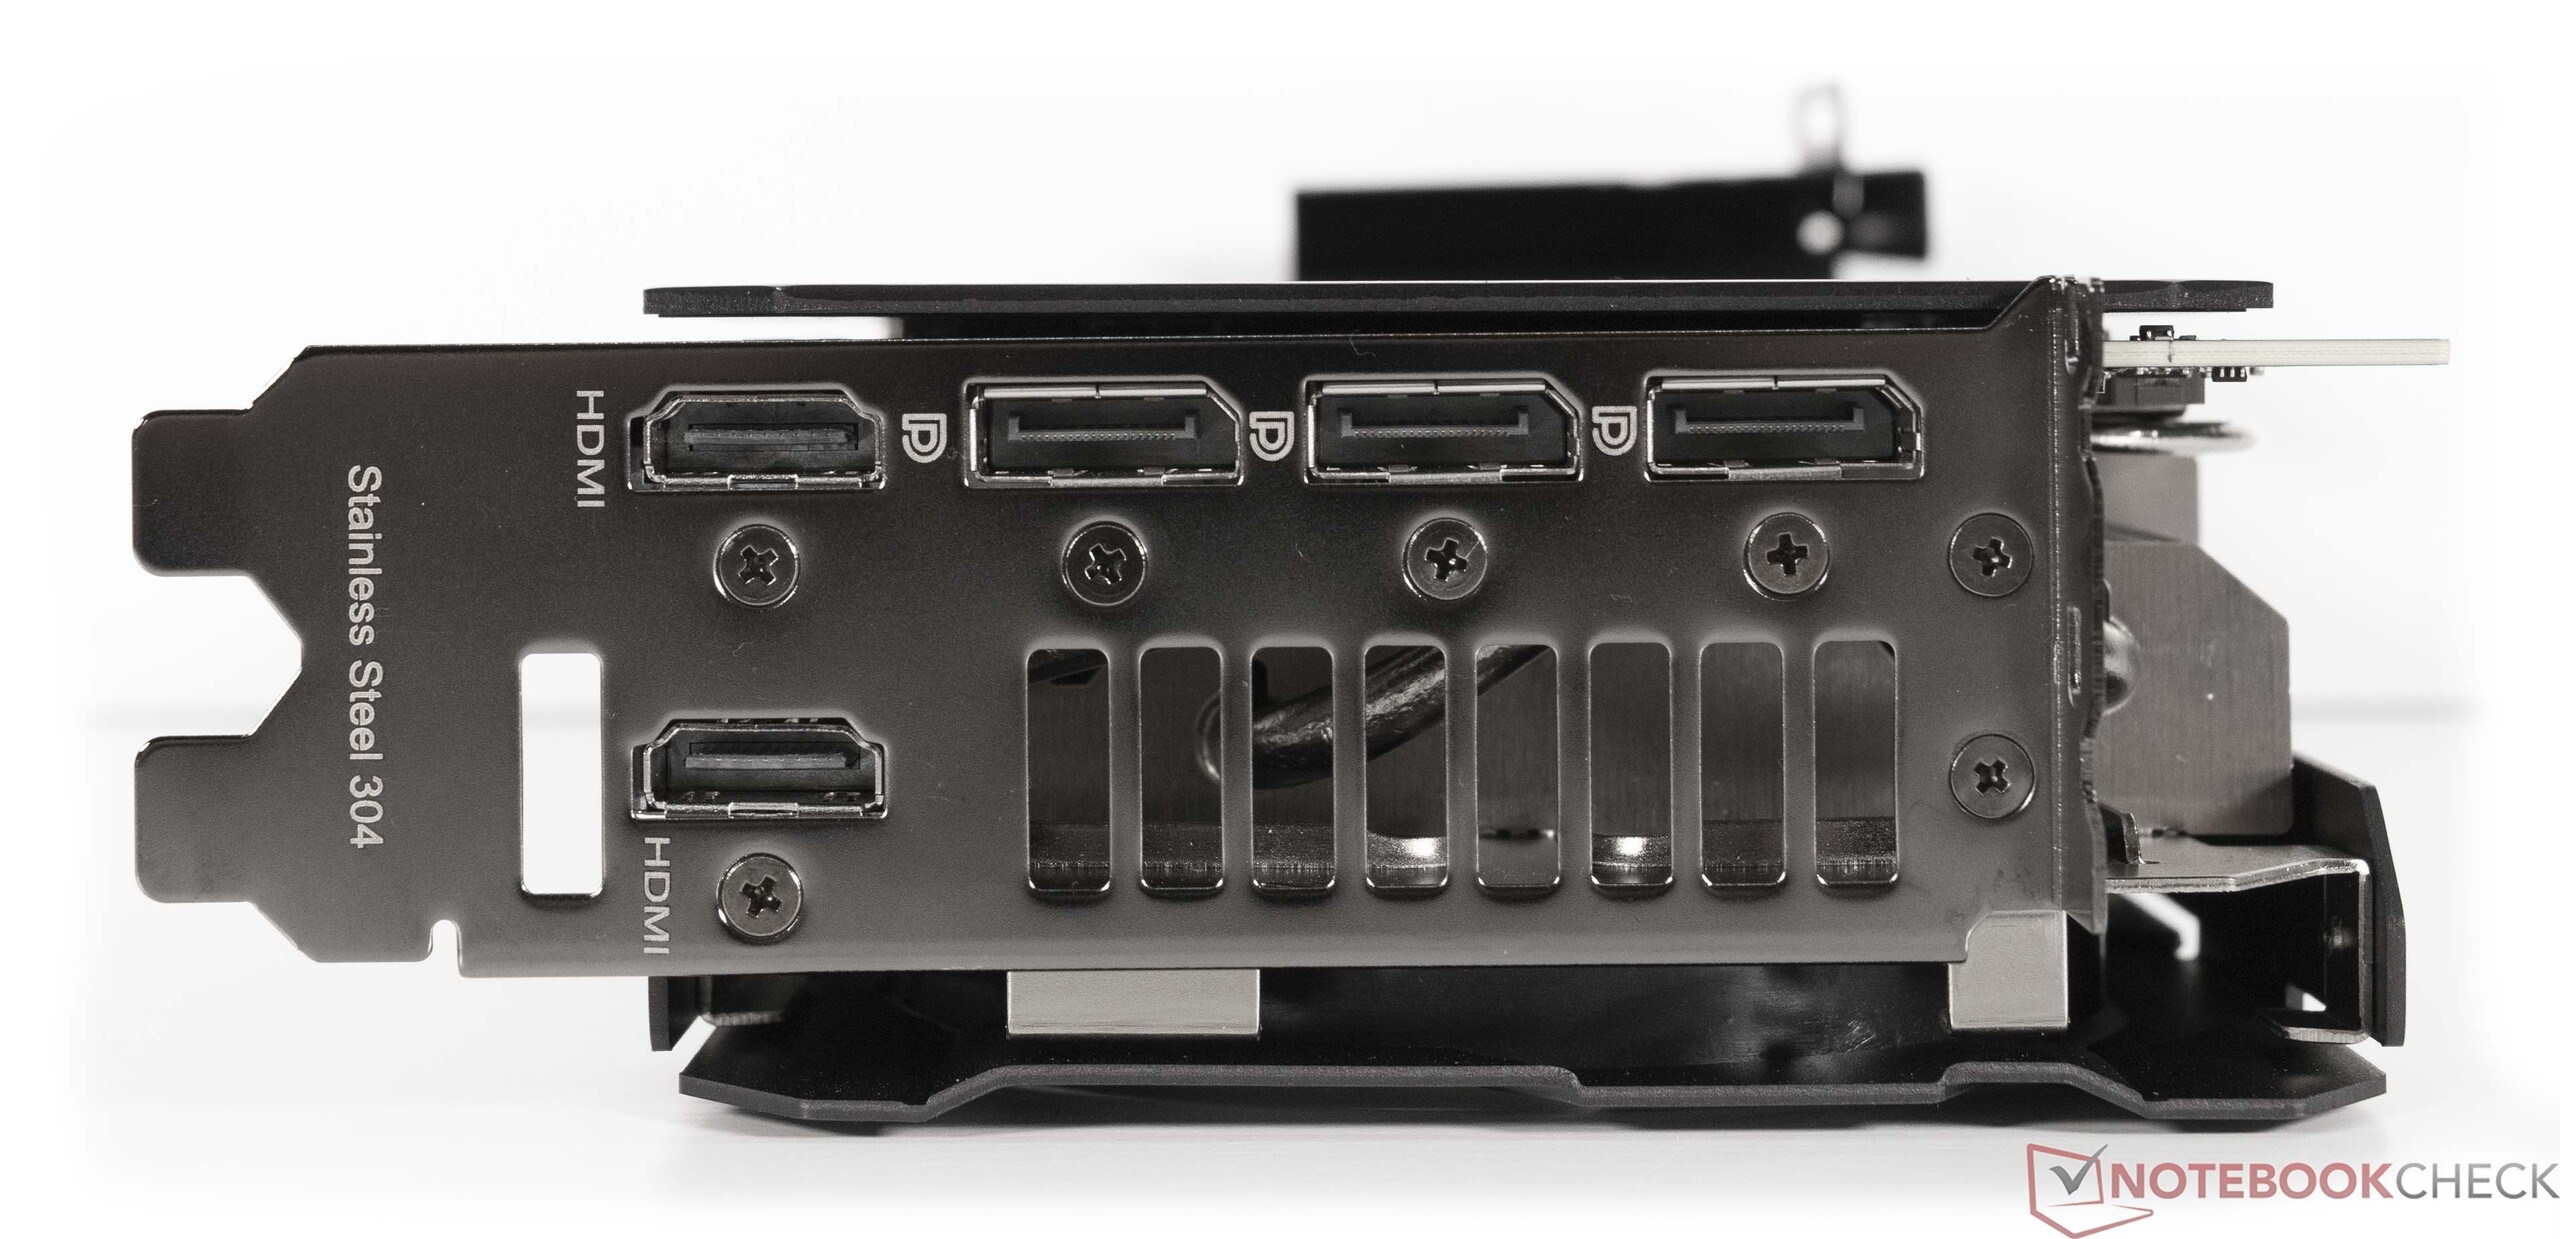
The Asus TUF GeForce RTX 3080 Ti OC's power consumption sits at 350 watts which is also in line with the Founders Edition's specifications and is, therefore, higher than the newly announced graphics cards such as the Nvidia GeForce RTX 4080 or the AMD Radeon RX 7900 XT. Externally, the graphics card offers two HDMI v2.1 and 3x DisplayPort 1.4a ports, helping the Asus TUF GeForce RTX 3080 Ti OC output 8K at 60 Hz or 4K at 120 Hz. Our tests were able to confirm this.

Graphics card specifications compared
| Model | RTX 4090 (FE) | RTX 4080 | RTX 3090 Ti | RTX 3090 (FE) | RTX 3080 Ti (FE) | Asus TUF RTX 3080 Ti | RTX 3080 (FE) | AMD Radeon RX 7900 XT |
| Chip | AD102 | AD103 | GA102 | GA102 | GA102 | GA102 | GA102 | Navi 31 XT |
| FinFET process | 4 nm | 4 nm | 8 nm | 8 nm | 8 nm | 8 nm | 8 nm | 5/6 nm |
| CUDA cores | 16,384 | 9,728 | 10,752 | 10,496 | 10,240 | 10,240 | 8,704 | 5,376 |
| Texture units | 512 | 304 | 336 | 328 | 320 | 320 | 272 | 336 |
| Tensor cores | 512 4th gen. | 304 4th gen. | 336 3rd gen. | 328 3rd gen. | 320 3rd gen. | 320 3rd gen. | 272 3rd gen. | - |
| RT cores | 128 | 76 | 84 | 82 | 80 | 80 | 68 | 84 |
| GPU base clock | 2,235 MHz | 2,205 MHz | 1,560 MHz | 1,395 MHz | 1,365 MHz | 1,365 MHz | 1,440 MHz | 2,000 MHz |
| GPU boost clock | 2,520 MHz | 2,505 MHz | 1,860 MHz | 1,695 MHz | 1,665 MHz | 1,785 MHz | 1,710 MHz | 2,400 MHz |
| Memory bus | 384 bit | 256 Bit | 384 bit | 384 bit | 384 bit | 384 bit | 320 bit | 320-bit |
| Memory bandwidth | 1,008 GB/s | 735.7 GB/s | 1,008 GB/s | 936 GB/s | 912.4 GB/s | 912.4 GB/s | 760 GB/s | 800 GB/s |
| Video memory | 24 GB GDDR6X | 16 GB GDDR6X | 24 GB GDDR6X | 24 GB GDDR6X | 12 GB GDDR6X | 12 GB GDDR6X | 10 GB GDDR6X | 20 GB GDDR6 |
| Power consumption | 450 W | 320 W | 450 W | 350 W | 350 W | 350 W | 320 W | 315 W |
The test system in detail
For the benchmarks and tests we used the following system:
- Lian Li O11 Dynamic
- AMD Ryzen 9 7950X
- Gigabyte X670E Aorus Master, BIOS: F8a
- Alphacool Eisbaer 360 AiO
- Corsair RM 1000x PSU
- G.Skill Trident Z5 Neo DDR5-6000 2x 16 GB, EXPO (DDR5-6000 CL30-38-38-96)
- Corsair MP600 2 TB
- Crucial MX500 2 TB
- Microsoft Windows 11 Professional 64 Bit (Version 22H2)
Synthetic benchmarks and compute performance
In synthetic tests, the Asus TUF GeForce RTX 3080 Ti OC can achieve the same performance as an Nvidia GeForce RTX 3090. These results run like a red thread through most tests as the difference between the number of both models' CUDA cores is negligibly small. In addition, the benchmarks don't profit from the Nvidia GeForce RTX 3090's larger VRAM. However, the difference in performance is much higher when compared to the current Radeon RX 7900 and GeForce RTX 4000 series cards. In synthetic tests, AMD's second-fastest model finds itself roughly 15 percent ahead of the GeForce RTX 3080 Ti. However, Nvidia consistently lags behind AMD when it comes to professional rendering tests. Regarding photo editing, things look much different with Affinity Photo 2. In this area, the Asus TUF GeForce RTX 3080 Ti OC is able to compete with Nvidia's GeForce RTX 4090. AMD is unable to keep up with its new RX 7900 graphics card.
As a small interim conclusion, it is definitely a question of the user's individual case and for which purpose the graphics card should serve.
| 3DMark 11 - 1280x720 Performance GPU | |
| NVIDIA GeForce RTX 4090 | |
| NVIDIA GeForce RTX 4080 | |
| AMD Radeon RX 7900 XTX | |
| AMD Radeon RX 7900 XT | |
| AMD Radeon RX 6950 XT | |
| NVIDIA GeForce RTX 3090 Ti | |
| NVIDIA GeForce RTX 3080 Ti | |
| NVIDIA GeForce RTX 3090 | |
| AMD Radeon RX 6900 XT | |
| AMD Radeon RX 6800 XT | |
| Unigine Valley 1.0 | |
| 1920x1080 Extreme HD DirectX AA:x8 | |
| NVIDIA GeForce RTX 4090 | |
| NVIDIA GeForce RTX 4080 | |
| AMD Radeon RX 7900 XTX | |
| NVIDIA GeForce RTX 3090 | |
| AMD Radeon RX 7900 XT | |
| NVIDIA GeForce RTX 3080 Ti | |
| AMD Radeon RX 6950 XT | |
| NVIDIA GeForce RTX 3090 Ti | |
| AMD Radeon RX 6900 XT | |
| AMD Radeon RX 6800 XT | |
| 1920x1080 Extreme HD Preset OpenGL AA:x8 | |
| NVIDIA GeForce RTX 4090 | |
| NVIDIA GeForce RTX 4080 | |
| AMD Radeon RX 7900 XTX | |
| AMD Radeon RX 7900 XT | |
| NVIDIA GeForce RTX 3090 | |
| NVIDIA GeForce RTX 3080 Ti | |
| NVIDIA GeForce RTX 3090 Ti | |
| AMD Radeon RX 6950 XT | |
| AMD Radeon RX 6900 XT | |
| AMD Radeon RX 6800 XT | |
| Photoshop PugetBench | |
| GPU Score | |
| AMD Radeon RX 7900 XT | |
| AMD Radeon RX 7900 XTX | |
| NVIDIA GeForce RTX 4090 | |
| NVIDIA GeForce RTX 3080 Ti | |
| NVIDIA GeForce RTX 3090 | |
| AMD Radeon RX 6950 XT | |
| AMD Radeon RX 6800 XT | |
| Overall Score | |
| AMD Radeon RX 7900 XT | |
| AMD Radeon RX 7900 XTX | |
| NVIDIA GeForce RTX 4090 | |
| NVIDIA GeForce RTX 3080 Ti | |
| NVIDIA GeForce RTX 3090 | |
| AMD Radeon RX 6800 XT | |
| AMD Radeon RX 6950 XT | |
| Affinity Photo 2 - Combined (Single / Multi GPU) | |
| NVIDIA GeForce RTX 4090 | |
| NVIDIA GeForce RTX 3080 Ti | |
| AMD Radeon RX 7900 XTX | |
| AMD Radeon RX 7900 XT | |
| Blender | |
| v3.3 Classroom HIP/AMD | |
| AMD Radeon RX 7900 XT | |
| AMD Radeon RX 7900 XTX | |
| v3.3 Classroom CUDA | |
| NVIDIA GeForce RTX 3090 | |
| NVIDIA GeForce RTX 3080 Ti | |
* ... smaller is better
Professional applications
| NVIDIA GeForce RTX 3080 Ti R9 7950X | NVIDIA GeForce RTX 4090 i9-13900K | NVIDIA GeForce RTX 3090 Ti R7 5800X3D | AMD Radeon RX 6950 XT R9 5900X | AMD Radeon RX 6800 XT R9 5950X | NVIDIA GeForce RTX 3090 i9-13900K | NVIDIA RTX A6000 TR Pro 3975WX | NVIDIA Titan RTX R9 7950X | AMD Radeon RX 7900 XT R9 7950X | AMD Radeon RX 7900 XTX R9 7950X | NVIDIA GeForce RTX 4080 i9-13900K | Average of class | |
|---|---|---|---|---|---|---|---|---|---|---|---|---|
| SPECviewperf 12 | 63% | -14% | 21% | 12% | -3% | 244% | 203% | 329% | 367% | 37% | -8% | |
| 1900x1060 Solidworks (sw-03) (fps) | 106 | 119 12% | 85.7 -19% | 157 48% | 150 42% | 106 0% | 225 112% | 207 95% | 342 223% | 360 240% | 127 20% | 89.4 ? -16% |
| 1900x1060 Siemens NX (snx-02) (fps) | 16.6 | 28.8 73% | 15.6 -6% | 49.4 198% | 45.07 172% | 17.1 3% | 351 2014% | 283 1605% | 373 2147% | 400 2310% | 23.4 41% | 60.9 ? 267% |
| 1900x1060 Showcase (showcase-01) (fps) | 252 | 410 63% | 265 5% | 308 22% | 223 -12% | 263 4% | 255 1% | 197 -22% | 278 10% | 322 28% | 304 21% | 103.7 ? -59% |
| 1900x1060 Medical (medical-01) (fps) | 142 | 288 103% | 87.1 -39% | 58.3 -59% | 77.3 -46% | 90 -37% | 159 12% | 101 -29% | 288 103% | 347 144% | 227 60% | 59.2 ? -58% |
| 1900x1060 Maya (maya-04) (fps) | 302 | 324 7% | 197 -35% | 90.7 -70% | 118 -61% | 306 1% | 144 -52% | 260 -14% | 347 15% | 367 22% | 310 3% | 117.7 ? -61% |
| 1900x1060 Energy (energy-01) (fps) | 27.6 | 82.6 199% | 27.6 0% | 23 -17% | 28.39 3% | 26 -6% | 39.8 44% | 28.8 4% | 72.4 162% | 85.2 209% | 57.5 108% | 16.9 ? -39% |
| 1900x1060 Creo (creo-01) (fps) | 94.7 | 122 29% | 76.4 -19% | 115 21% | 119 26% | 101 7% | 136 44% | 197 108% | 176 86% | 187 97% | 118 25% | 66.6 ? -30% |
| 1900x1060 Catia (catia-04) (fps) | 171 | 274 60% | 150 -12% | 199 16% | 238 39% | 177 4% | 229 34% | 332 94% | 481 181% | 536 213% | 229 34% | 113.6 ? -34% |
| 1900x1060 3ds Max (3dsmax-05) (fps) | 385 | 473 23% | 371 -4% | 484 26% | 167 -57% | 369 -4% | 336 -13% | 315 -18% | 502 30% | 553 44% | 477 24% | 206 ? -46% |
| SPECviewperf 13 | 63% | -5% | 43% | 23% | 1% | 259% | 190% | 322% | 365% | 38% | 11% | |
| Solidworks (sw-04) (fps) | 153 | 190 24% | 118 -23% | 210 37% | 193 26% | 154 1% | 192 25% | 218 42% | 307 101% | 323 111% | 183 20% | 124.1 ? -19% |
| Siemens NX (snx-03) (fps) | 29.9 | 51.4 72% | 28 -6% | 89.7 200% | 81.4 172% | 30.7 3% | 638 2034% | 512 1612% | 675 2158% | 725 2325% | 42.1 41% | 136.6 ? 357% |
| Showcase (showcase-02) (fps) | 252 | 412 63% | 265 5% | 312 24% | 232 -8% | 262 4% | 255 1% | 198 -21% | 279 11% | 323 28% | 305 21% | 126.2 ? -50% |
| Medical (medical-02) (fps) | 107 | 182 70% | 113 6% | 157 47% | 130 21% | 107 0% | 184 72% | 92 -14% | 237 121% | 263 146% | 148 38% | 88.4 ? -17% |
| Maya (maya-05) (fps) | 569 | 838 47% | 493 -13% | 372 -35% | 348 -39% | 580 2% | 415 -27% | 499 -12% | 670 18% | 735 29% | 726 28% | 278 ? -51% |
| Energy (energy-02) (fps) | 44.1 | 119 170% | 48.4 10% | 60.3 37% | 58.4 32% | 45.1 2% | 132 199% | 51.8 17% | 147 233% | 187 324% | 91.7 108% | 39.7 ? -10% |
| Creo (creo-02) (fps) | 402 | 580 44% | 353 -12% | 323 -20% | 276 -31% | 397 -1% | 366 -9% | 386 -4% | 567 41% | 613 52% | 544 35% | 216 ? -46% |
| Catia (catia-05) (fps) | 258 | 406 57% | 230 -11% | 450 74% | 412 60% | 252 -2% | 371 44% | 534 107% | 728 182% | 825 220% | 333 29% | 211 ? -18% |
| 3ds Max (3dsmax-06) (fps) | 382 | 474 24% | 373 -2% | 483 26% | 284 -26% | 369 -3% | 338 -12% | 321 -16% | 506 32% | 564 48% | 478 25% | 196.9 ? -48% |
| SPECviewperf 2020 | 49% | -12% | 32% | 18% | 10% | 276% | 210% | 311% | 355% | 18% | 17% | |
| 3840x2160 Solidworks (solidworks-05) (fps) | 305 | 197 | 125 | 108 | 192 | 169 | 158 | 226 | 117.6 ? | |||
| 3840x2160 Siemens NX (snx-04) (fps) | 24.9 | 44 77% | 23.7 -5% | 88.6 256% | 81.7 228% | 25.6 3% | 481 1832% | 375 1406% | 476 1812% | 514 1964% | 34.1 37% | 88.3 ? 255% |
| 3840x2160 Medical (medical-03) (fps) | 22.9 | 39.3 72% | 22.2 -3% | 34.4 50% | 27.84 22% | 20.3 -11% | 37.9 66% | 16.5 -28% | 53.9 135% | 62.3 172% | 28.3 24% | 24 ? 5% |
| 3840x2160 Maya (maya-06) (fps) | 366 | 508 39% | 353 -4% | 296 -19% | 224 -39% | 356 -3% | 329 -10% | 274 -25% | 401 10% | 481 31% | 426 16% | 221 ? -40% |
| 3840x2160 Energy (energy-03) (fps) | 57.5 | 65.3 14% | 31.6 -45% | 47.6 -17% | 60.8 6% | 101 76% | 63 10% | 93.9 63% | 99.6 73% | 129 124% | 45.6 -21% | 50 ? -13% |
| 3840x2160 Creo (creo-03) (fps) | 114 | 142 25% | 84.5 -26% | 73.1 -36% | 65 -43% | 118 4% | 111 -3% | 135 18% | 173 52% | 187 64% | 136 19% | 78.3 ? -31% |
| 3840x2160 CATIA (catia-06) (fps) | 59.9 | 95.6 60% | 58.6 -2% | 53 -12% | 42.4 -29% | 60.4 1% | 82.4 38% | 90.9 52% | 113 89% | 127 112% | 76.5 28% | 48.9 ? -18% |
| 3840x2160 3ds Max (3dsmax-07) (fps) | 139 | 213 53% | 145 4% | 144 4% | 114 -18% | 143 3% | 137 -1% | 118 -15% | 143 3% | 167 20% | 172 24% | 85 ? -39% |
| Total Average (Program / Settings) | 58% /
59% | -10% /
-10% | 32% /
32% | 18% /
18% | 3% /
2% | 260% /
258% | 201% /
200% | 321% /
321% | 362% /
363% | 31% /
32% | 7% /
6% |
Gaming benchmarks
Our gaming tests show the Asus TUF GeForce RTX 3080 Ti OC to be an excellent performer. Even though one and a half years have passed since its release, the graphics card can play nearly all current games smoothly at 2160p. However, the GeForce RTX 3080 Ti struggles to manage just over 40 FPS with two games - A Plague Tale Requiem and Cyberpunk 2077. We have excluded F1 22 as the ray tracing option is activated in the 4K preset. Without ray tracing, substantially higher frame rates can, of course, be expected. Compared to the RTX 4090 or the Radeon RX 7900, the Asus TUF GeForce RTX 3080 Ti OC has to admit defeat when it comes to higher resolutions. Nevertheless, the lead the current models enjoy is put into perspective when playing at 1080p as processor bottlenecks prevent full performance levels from being achieved. Consequently, it would be advantageous to take a closer look at the RTX 3000 series to properly compare and prioritize certain games. You can find an excellent overview of various graphics cards' performance in our GPU comparison table.
| The Witcher 3 | |
| 3840x2160 High Graphics & Postprocessing (Nvidia HairWorks Off) | |
| NVIDIA GeForce RTX 4090 | |
| NVIDIA GeForce RTX 4080 | |
| NVIDIA GeForce RTX 3090 Ti | |
| AMD Radeon RX 7900 XTX | |
| AMD Radeon RX 7900 XT | |
| NVIDIA GeForce RTX 3080 Ti | |
| NVIDIA GeForce RTX 3090 | |
| AMD Radeon RX 6950 XT | |
| AMD Radeon RX 6900 XT | |
| AMD Radeon RX 6800 XT | |
| 1920x1080 Ultra Graphics & Postprocessing (HBAO+) | |
| NVIDIA GeForce RTX 4090 | |
| AMD Radeon RX 7900 XTX | |
| AMD Radeon RX 7900 XT | |
| NVIDIA GeForce RTX 4080 | |
| AMD Radeon RX 6950 XT | |
| NVIDIA GeForce RTX 3090 Ti (110% PT) | |
| NVIDIA GeForce RTX 3090 Ti (100% PT) | |
| NVIDIA GeForce RTX 3080 Ti | |
| NVIDIA GeForce RTX 3090 | |
| AMD Radeon RX 6900 XT | |
| AMD Radeon RX 6800 XT | |
| Metro Exodus | |
| 3840x2160 Ultra Quality AF:16x | |
| NVIDIA GeForce RTX 4090 | |
| NVIDIA GeForce RTX 4080 | |
| AMD Radeon RX 7900 XTX | |
| AMD Radeon RX 7900 XT | |
| NVIDIA GeForce RTX 3090 Ti | |
| NVIDIA GeForce RTX 3080 Ti | |
| NVIDIA GeForce RTX 3090 | |
| AMD Radeon RX 6950 XT | |
| AMD Radeon RX 6900 XT | |
| AMD Radeon RX 6800 XT | |
| 2560x1440 Ultra Quality AF:16x | |
| NVIDIA GeForce RTX 4090 | |
| NVIDIA GeForce RTX 4080 | |
| AMD Radeon RX 7900 XTX | |
| AMD Radeon RX 7900 XT | |
| NVIDIA GeForce RTX 3090 Ti | |
| NVIDIA GeForce RTX 3080 Ti | |
| NVIDIA GeForce RTX 3090 | |
| AMD Radeon RX 6950 XT | |
| AMD Radeon RX 6900 XT | |
| AMD Radeon RX 6800 XT | |
| 1920x1080 Ultra Quality AF:16x | |
| NVIDIA GeForce RTX 4090 | |
| AMD Radeon RX 7900 XTX | |
| NVIDIA GeForce RTX 4080 | |
| AMD Radeon RX 7900 XT | |
| NVIDIA GeForce RTX 3090 Ti | |
| NVIDIA GeForce RTX 3080 Ti | |
| NVIDIA GeForce RTX 3090 | |
| AMD Radeon RX 6950 XT | |
| AMD Radeon RX 6900 XT | |
| AMD Radeon RX 6800 XT | |
| Far Cry 5 | |
| 3840x2160 Ultra Preset AA:T | |
| NVIDIA GeForce RTX 4090 | |
| AMD Radeon RX 7900 XTX | |
| NVIDIA GeForce RTX 4080 | |
| AMD Radeon RX 7900 XT | |
| AMD Radeon RX 6950 XT | |
| NVIDIA GeForce RTX 3090 | |
| NVIDIA GeForce RTX 3080 Ti | |
| AMD Radeon RX 6800 XT | |
| 2560x1440 Ultra Preset AA:T | |
| NVIDIA GeForce RTX 4080 | |
| NVIDIA GeForce RTX 4090 | |
| NVIDIA GeForce RTX 3090 | |
| NVIDIA GeForce RTX 3080 Ti | |
| AMD Radeon RX 7900 XTX | |
| AMD Radeon RX 7900 XT | |
| AMD Radeon RX 6950 XT | |
| AMD Radeon RX 6800 XT | |
| 1920x1080 Ultra Preset AA:T | |
| NVIDIA GeForce RTX 4080 | |
| NVIDIA GeForce RTX 3090 | |
| NVIDIA GeForce RTX 4090 | |
| NVIDIA GeForce RTX 3080 Ti | |
| AMD Radeon RX 7900 XTX | |
| AMD Radeon RX 7900 XT | |
| AMD Radeon RX 6950 XT | |
| AMD Radeon RX 6800 XT | |
| Far Cry 6 | |
| 3840x2160 Ultra Graphics Quality + HD Textures AA:T | |
| NVIDIA GeForce RTX 4090 | |
| AMD Radeon RX 7900 XTX | |
| NVIDIA GeForce RTX 4080 | |
| AMD Radeon RX 7900 XT | |
| NVIDIA GeForce RTX 3090 Ti | |
| AMD Radeon RX 6950 XT | |
| NVIDIA GeForce RTX 3080 Ti | |
| NVIDIA GeForce RTX 3090 | |
| 2560x1440 Ultra Graphics Quality + HD Textures AA:T | |
| NVIDIA GeForce RTX 4080 | |
| AMD Radeon RX 7900 XTX | |
| NVIDIA GeForce RTX 4090 | |
| AMD Radeon RX 7900 XT | |
| NVIDIA GeForce RTX 3080 Ti | |
| NVIDIA GeForce RTX 3090 | |
| NVIDIA GeForce RTX 3090 Ti | |
| AMD Radeon RX 6950 XT | |
| 1920x1080 Ultra Graphics Quality + HD Textures AA:T | |
| AMD Radeon RX 7900 XTX | |
| NVIDIA GeForce RTX 4090 | |
| AMD Radeon RX 7900 XT | |
| NVIDIA GeForce RTX 4080 | |
| NVIDIA GeForce RTX 3080 Ti | |
| NVIDIA GeForce RTX 3090 | |
| NVIDIA GeForce RTX 3090 Ti | |
| AMD Radeon RX 6950 XT | |
| F1 2021 | |
| 3840x2160 Ultra High Preset + Raytracing AA:T AF:16x | |
| NVIDIA GeForce RTX 4090 (874931) | |
| NVIDIA GeForce RTX 4080 (874931) | |
| AMD Radeon RX 7900 XTX (874931) | |
| NVIDIA GeForce RTX 3090 Ti | |
| AMD Radeon RX 7900 XT (874931) | |
| NVIDIA GeForce RTX 3080 Ti (874931) | |
| NVIDIA GeForce RTX 3090 (874931) | |
| AMD Radeon RX 6950 XT (874931) | |
| 2560x1440 Ultra High Preset + Raytracing AA:T AF:16x | |
| NVIDIA GeForce RTX 4090 (874931) | |
| NVIDIA GeForce RTX 4080 (874931) | |
| AMD Radeon RX 7900 XTX (874931) | |
| AMD Radeon RX 7900 XT (874931) | |
| NVIDIA GeForce RTX 3090 Ti | |
| NVIDIA GeForce RTX 3080 Ti (874931) | |
| AMD Radeon RX 6950 XT (874931) | |
| NVIDIA GeForce RTX 3090 (874931) | |
| 1920x1080 Ultra High Preset + Raytracing AA:T AF:16x | |
| NVIDIA GeForce RTX 4090 (874931) | |
| NVIDIA GeForce RTX 4080 (874931) | |
| AMD Radeon RX 7900 XTX (874931) | |
| AMD Radeon RX 7900 XT (874931) | |
| NVIDIA GeForce RTX 3090 Ti | |
| NVIDIA GeForce RTX 3080 Ti (874931) | |
| NVIDIA GeForce RTX 3090 (874931) | |
| AMD Radeon RX 6950 XT (874931) | |
| F1 22 | |
| 3840x2160 Ultra High Preset AA:T AF:16x | |
| NVIDIA GeForce RTX 4090 (928484) | |
| NVIDIA GeForce RTX 4080 (928484) | |
| AMD Radeon RX 7900 XTX (939134) | |
| AMD Radeon RX 7900 XT (939134) | |
| NVIDIA GeForce RTX 3080 Ti (939134) | |
| NVIDIA GeForce RTX 3090 (918016) | |
| AMD Radeon RX 6950 XT (905427) | |
| 2560x1440 Ultra High Preset AA:T AF:16x | |
| NVIDIA GeForce RTX 4090 (928484) | |
| NVIDIA GeForce RTX 4080 (928484) | |
| AMD Radeon RX 7900 XTX (939134) | |
| AMD Radeon RX 7900 XT (939134) | |
| NVIDIA GeForce RTX 3080 Ti (939134) | |
| NVIDIA GeForce RTX 3090 (918016) | |
| AMD Radeon RX 6950 XT (905427) | |
| 1920x1080 Ultra High Preset AA:T AF:16x | |
| NVIDIA GeForce RTX 4090 (928484) | |
| NVIDIA GeForce RTX 4080 (928484) | |
| AMD Radeon RX 7900 XTX (939134) | |
| NVIDIA GeForce RTX 3080 Ti (939134) | |
| AMD Radeon RX 7900 XT (939134) | |
| NVIDIA GeForce RTX 3090 (918016) | |
| AMD Radeon RX 6950 XT (905427) | |
| Cyberpunk 2077 1.6 | |
| 3840x2160 Ultra Preset | |
| NVIDIA GeForce RTX 4090 (1.6) | |
| AMD Radeon RX 7900 XTX (1.61) | |
| NVIDIA GeForce RTX 4080 (1.6) | |
| AMD Radeon RX 7900 XT (1.61) | |
| NVIDIA GeForce RTX 3090 Ti (1.52) | |
| NVIDIA GeForce RTX 3080 Ti (1.61) | |
| AMD Radeon RX 6950 XT | |
| 2560x1440 Ultra Preset | |
| NVIDIA GeForce RTX 4090 (1.6) | |
| AMD Radeon RX 7900 XTX (1.61) | |
| NVIDIA GeForce RTX 4080 (1.6) | |
| AMD Radeon RX 7900 XT (1.61) | |
| NVIDIA GeForce RTX 3090 Ti (1.52) | |
| NVIDIA GeForce RTX 3080 Ti (1.61) | |
| AMD Radeon RX 6950 XT | |
| 1920x1080 Ultra Preset | |
| NVIDIA GeForce RTX 4090 (1.6) | |
| AMD Radeon RX 7900 XTX (1.61) | |
| NVIDIA GeForce RTX 4080 (1.6) | |
| AMD Radeon RX 7900 XT (1.61) | |
| NVIDIA GeForce RTX 3090 Ti (1.52) | |
| NVIDIA GeForce RTX 3080 Ti (1.61) | |
| AMD Radeon RX 6950 XT | |
| Metro Exodus - 1920x1080 Ultra Quality DXR AF:16x | |
| NVIDIA GeForce RTX 4090 | |
| AMD Radeon RX 7900 XTX | |
| NVIDIA GeForce RTX 4080 | |
| AMD Radeon RX 7900 XT | |
| NVIDIA GeForce RTX 3080 Ti | |
| NVIDIA GeForce RTX 3090 | |
| Far Cry 6 - 1920x1080 Ultra Graphics Quality + HD Textures + DXR AA:T | |
| NVIDIA GeForce RTX 4080 | |
| AMD Radeon RX 7900 XTX | |
| AMD Radeon RX 7900 XT | |
| NVIDIA GeForce RTX 4090 | |
| NVIDIA GeForce RTX 3080 Ti | |
| NVIDIA GeForce RTX 3090 | |
| AMD Radeon RX 6800 | |
| AMD Radeon RX 6950 XT | |
| Cyberpunk 2077 1.6 | |
| 3840x2160 Ray Tracing Ultra Preset (DLSS off) | |
| NVIDIA GeForce RTX 4090 (1.6) | |
| NVIDIA GeForce RTX 4080 (1.6) | |
| NVIDIA GeForce RTX 3090 (1.6) | |
| AMD Radeon RX 7900 XTX (1.61) | |
| NVIDIA GeForce RTX 3080 Ti (1.61) | |
| AMD Radeon RX 7900 XT (1.61) | |
| AMD Radeon RX 6800 (1.61) | |
| 1920x1080 Ray Tracing Ultra Preset (DLSS off) | |
| NVIDIA GeForce RTX 4090 (1.6) | |
| NVIDIA GeForce RTX 4080 (1.6) | |
| NVIDIA GeForce RTX 3080 Ti (1.61) | |
| NVIDIA GeForce RTX 3090 (1.6) | |
| AMD Radeon RX 7900 XTX (1.61) | |
| AMD Radeon RX 7900 XT (1.61) | |
| AMD Radeon RX 6800 (1.61) | |
| Control - 1920x1080 High Quality Preset & High Ray Tracing Preset (DX12) | |
| NVIDIA GeForce RTX 4090 | |
| NVIDIA GeForce RTX 4080 | |
| AMD Radeon RX 7900 XTX | |
| NVIDIA GeForce RTX 3080 Ti | |
| AMD Radeon RX 7900 XT | |
| AMD Radeon RX 6950 XT | |
| Ghostwire Tokyo - 1920x1080 Highest Settings + Maximum Ray Tracing | |
| NVIDIA GeForce RTX 4090 | |
| NVIDIA GeForce RTX 4080 | |
| AMD Radeon RX 7900 XTX | |
| NVIDIA GeForce RTX 3080 Ti | |
| AMD Radeon RX 7900 XT | |
| The Callisto Protocol - 1920x1080 Ultra Preset (without FSR Upscaling) + Full Ray-Tracing | |
| AMD Radeon RX 7900 XTX | |
| NVIDIA GeForce RTX 4090 | |
| AMD Radeon RX 7900 XT | |
| NVIDIA GeForce RTX 3080 Ti | |
| AMD Radeon RX 6800 | |
| low | med. | high | ultra | QHD | 4K DLSS | 4K | |
|---|---|---|---|---|---|---|---|
| GTA V (2015) | 188 | 187.9 | 187.1 | 163.6 | 157 | 182.6 | |
| The Witcher 3 (2015) | 783 | 586 | 372 | 184.6 | 154.9 | ||
| Dota 2 Reborn (2015) | 305 | 266 | 259 | 235 | 220 | ||
| Rise of the Tomb Raider (2016) | 488 | 388 | 282 | 243 | 118.8 | ||
| Final Fantasy XV Benchmark (2018) | 235 | 232 | 186.4 | 142 | 86.4 | ||
| X-Plane 11.11 (2018) | 216 | 182.8 | 140.1 | 118 | |||
| Far Cry 5 (2018) | 242 | 212 | 204 | 188 | 177 | 109 | |
| Strange Brigade (2018) | 692 | 523 | 415 | 360 | 270 | 161.8 | |
| Shadow of the Tomb Raider (2018) | 336 | 267 | 254 | 238 | 173.3 | 98.6 | |
| Far Cry New Dawn (2019) | 199 | 175 | 169 | 153 | 146 | 110 | |
| Metro Exodus (2019) | 303 | 227 | 179.8 | 144.2 | 118 | 77.1 | |
| Control (2019) | 240 | 238 | 190.7 | 125.5 | 64 | ||
| Borderlands 3 (2019) | 241 | 213 | 189.7 | 164.9 | 130.2 | 73.8 | |
| F1 2020 (2020) | 553 | 463 | 432 | 313 | 242 | 145.9 | |
| F1 2021 (2021) | 643 | 569 | 460 | 234 | 180.2 | 105.6 | |
| Far Cry 6 (2021) | 216 | 188 | 167.6 | 159.6 | 136.9 | 86.2 | |
| Forza Horizon 5 (2021) | 291 | 215 | 204 | 141 | 124 | 90 | |
| God of War (2022) | 212 | 184 | 173.6 | 124.4 | 108.1 | 77.8 | |
| GRID Legends (2022) | 317 | 289 | 254 | 223 | 185.1 | 130.3 | |
| Cyberpunk 2077 1.6 (2022) | 219 | 184.4 | 160.4 | 146.4 | 99.1 | 49.7 | |
| Ghostwire Tokyo (2022) | 290 | 288 | 279 | 278 | 211 | 108.4 | |
| Tiny Tina's Wonderlands (2022) | 370 | 299 | 215 | 171.3 | 124.7 | 70.6 | |
| Vampire Bloodhunt (2022) | 496 | 384 | 362 | 349 | 249 | 138.1 | |
| F1 22 (2022) | 433 | 430 | 365 | 131.6 | 86.6 | 43.4 | |
| The Quarry (2022) | 285 | 219 | 181.5 | 149.1 | 106.9 | 60.3 | |
| FIFA 23 (2022) | 250 | 247 | 243 | 242 | 234 | 165.1 | |
| A Plague Tale Requiem (2022) | 180 | 158.5 | 122.5 | 93.9 | 71.5 | 41.5 | |
| Uncharted Legacy of Thieves Collection (2022) | 121.8 | 118.4 | 113.4 | 109.7 | 92.7 | 61.3 | |
| Call of Duty Modern Warfare 2 2022 (2022) | 180 | 170 | 141 | 140 | 107 | 101 | 70 |
| Spider-Man Miles Morales (2022) | 203 | 186.1 | 174.8 | 168.9 | 134.6 | 82.1 | |
| The Callisto Protocol (2022) | 223 | 192 | 136 | 135 | 102 | 63 | |
| Need for Speed Unbound (2022) | 187.7 | 175.2 | 156.6 | 139.9 | 132.4 | 77.8 |
Asus TUF GeForce RTX 3080 Ti OC emissions
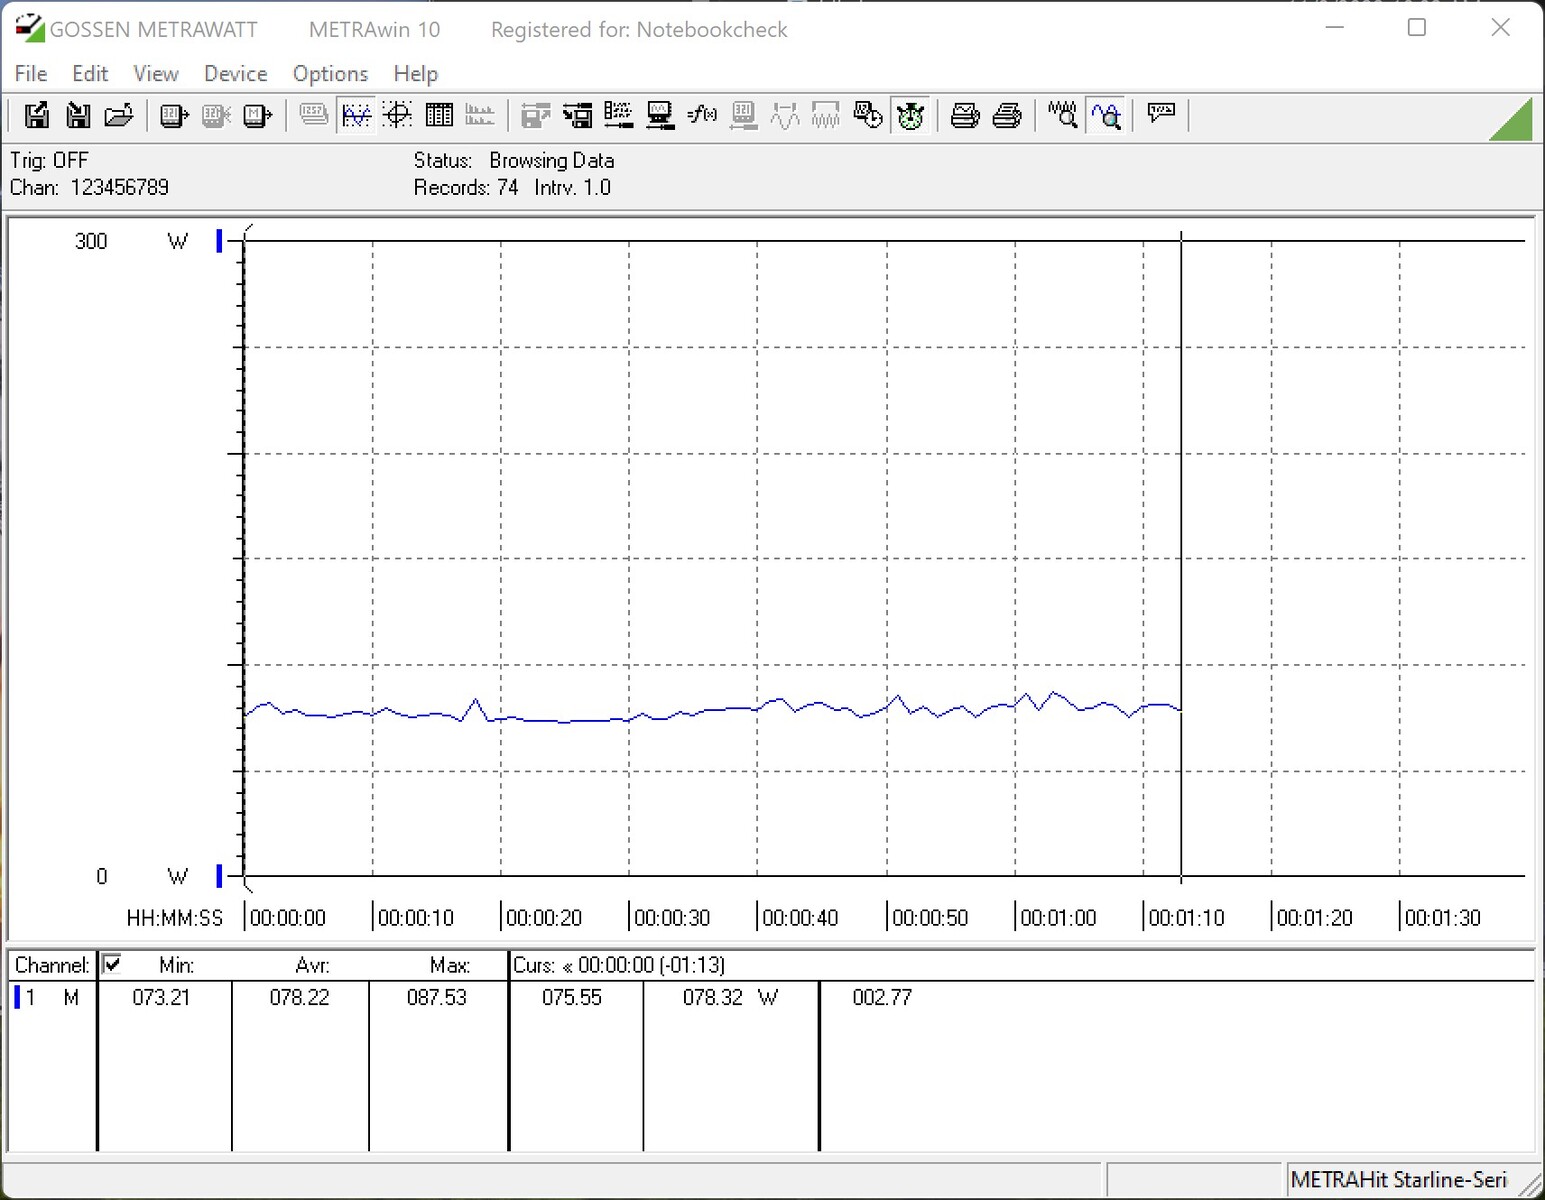
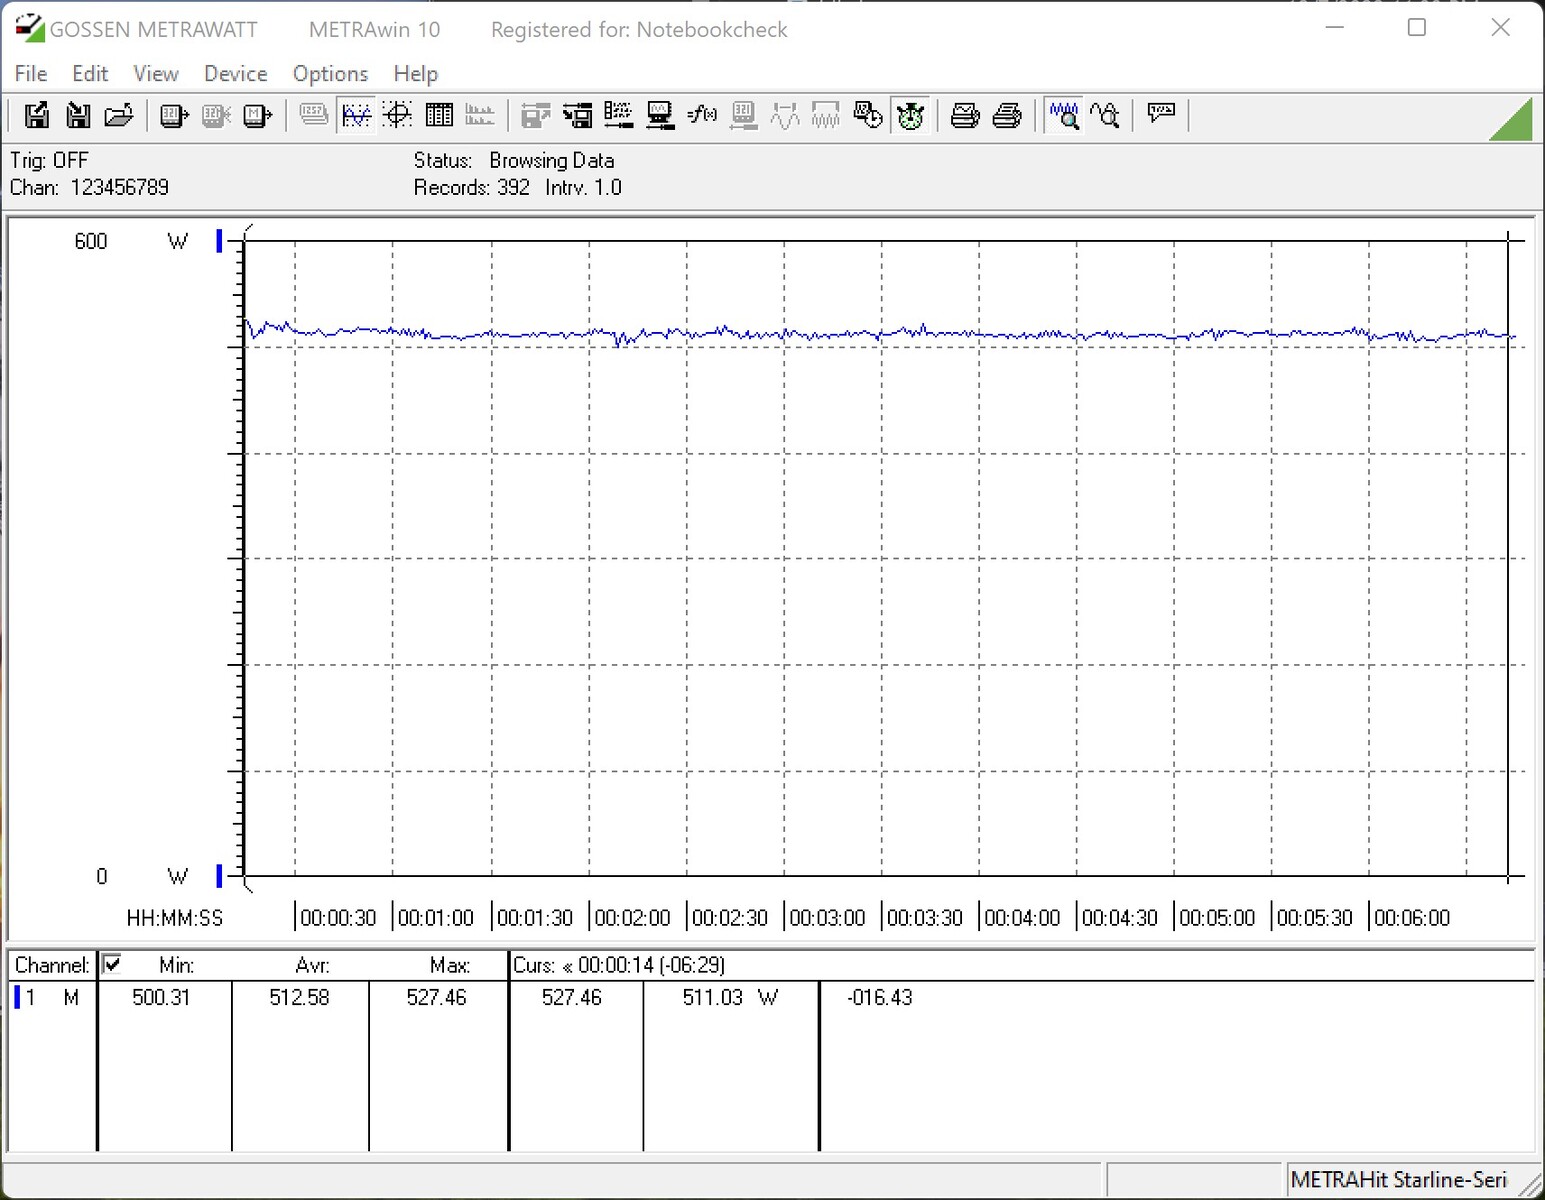
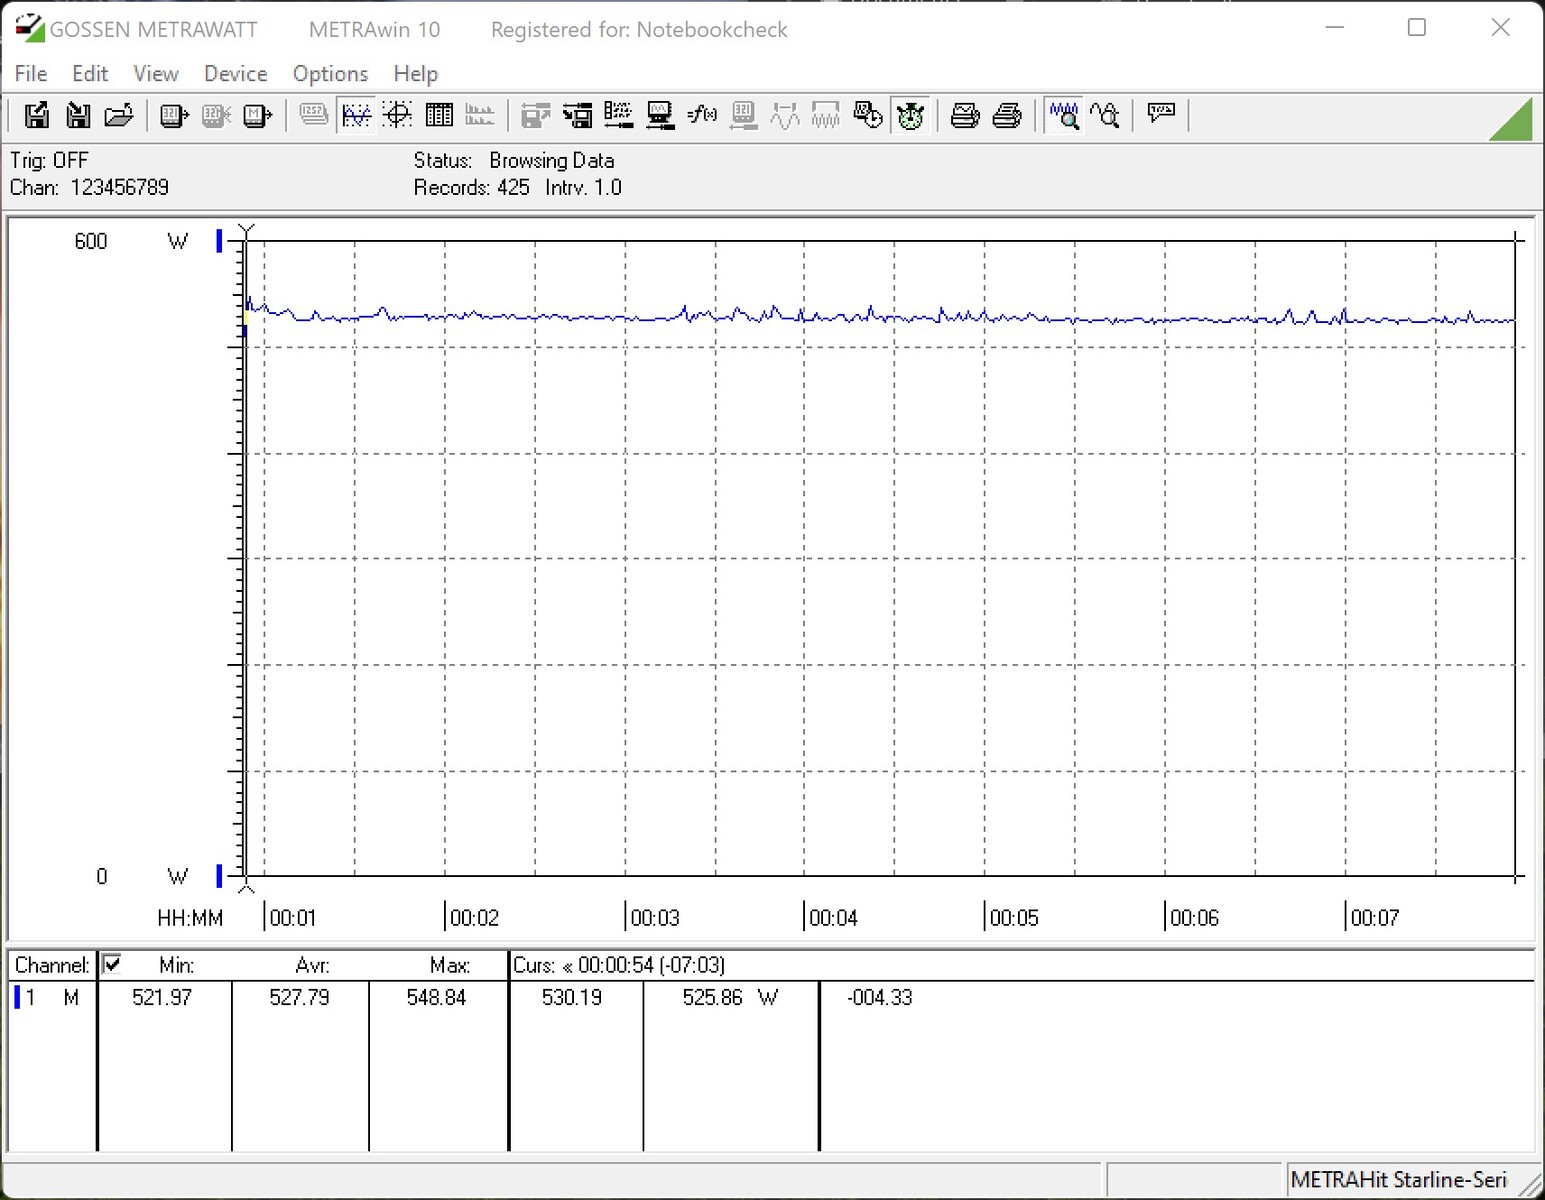
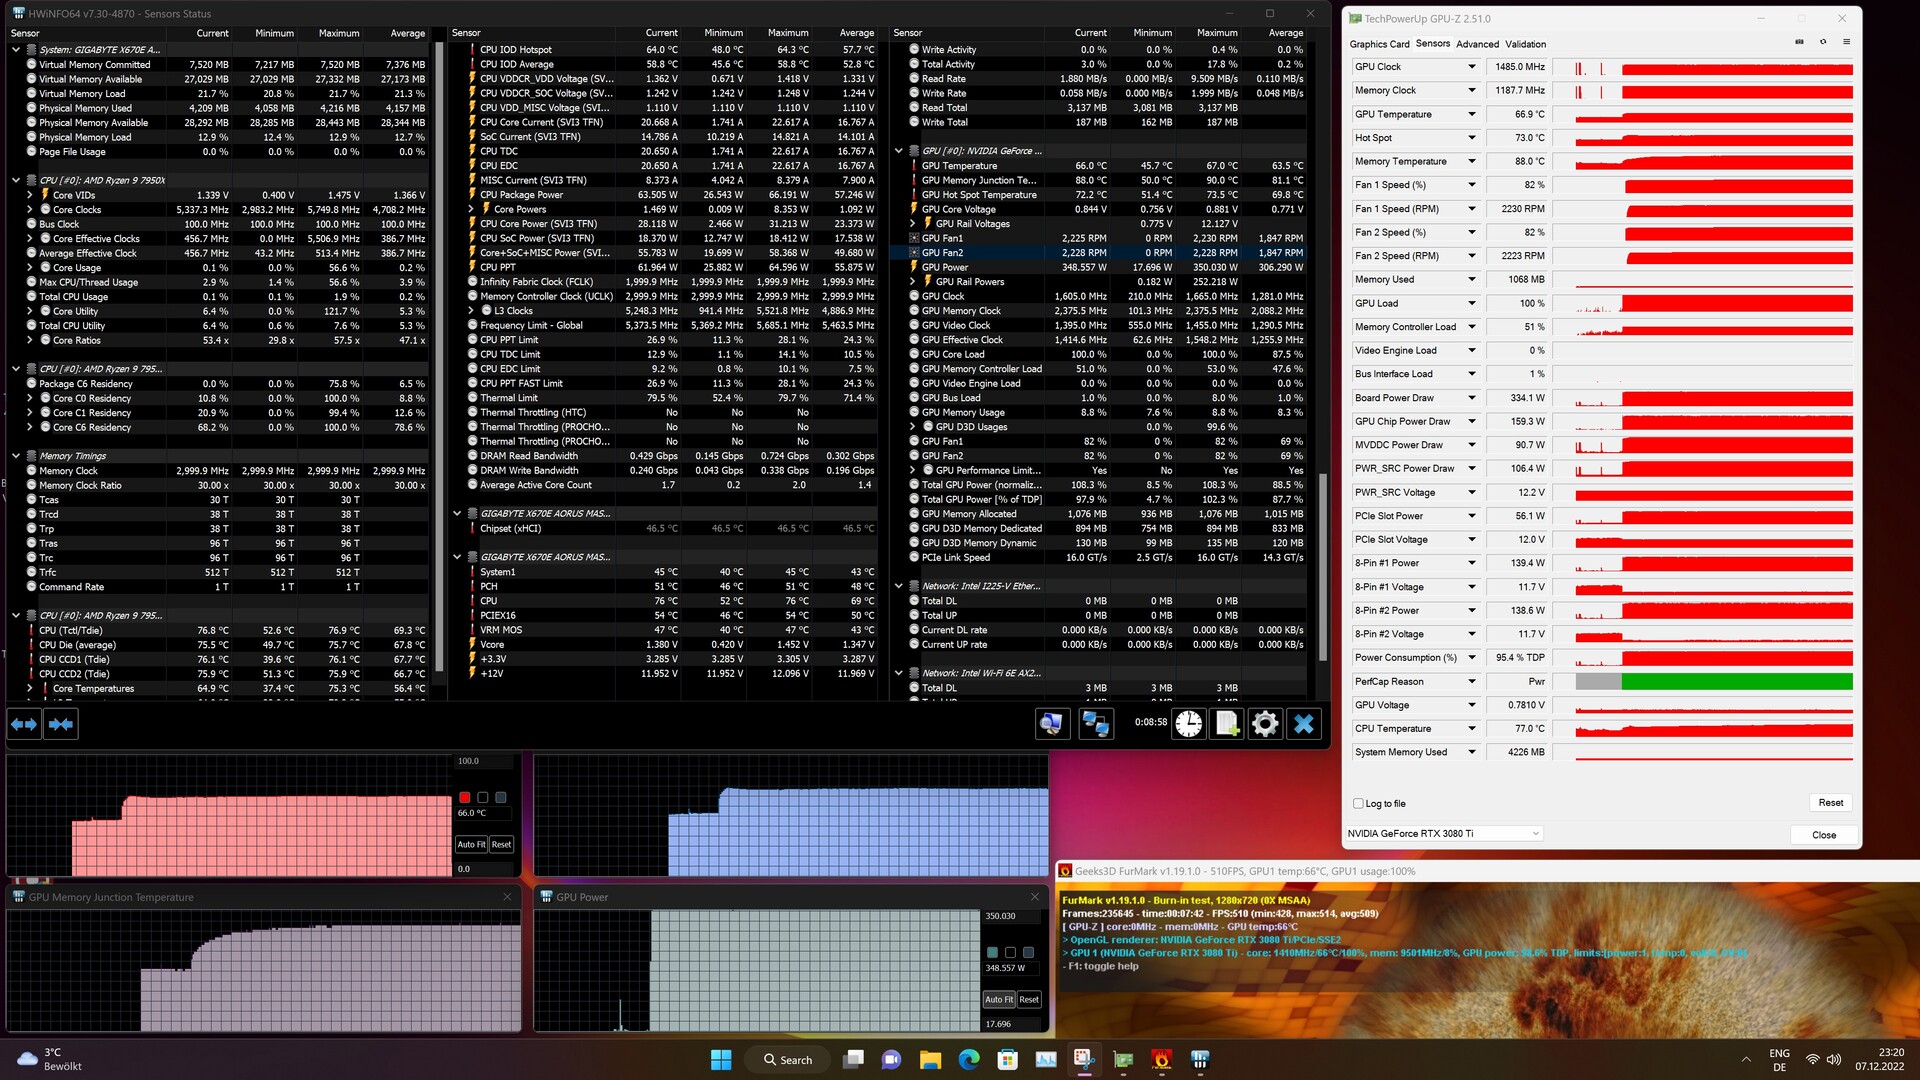
New GPU architecture technical advances can clearly be seen in the jump from Ampere to Ada Lovelace. At 1080p our test system's Asus TUF GeForce RTX 3080 Ti OC power consumption is on par with an Nvidia GeForce RTX 4090. In this case, we measured almost 530 watts at the socket. In the stress test, the 100-watt higher power target is the GeForce RTX 4090's undoing. In this area, our test device is much more economical. However, with regard to the Nvidia GeForce RTX 4080, the Asus TUF GeForce RTX 3080 Ti OC consumed 10 % more power in our test system. Concerning energy efficiency, both of the new AMD models (Radeon RX 7900 XTX, Radeon RX 7900 XT) are not where we would have expected these cards to be prior to our review. Nevertheless, future driver updates should ensure improvements follow. Currently, the AMD Radeon RX 7900 XT is more economical than a GeForce RTX 3080 Ti during gaming, even if both models were on an equal footing in our stress test. Regarding performance per watt, you are currently better served by the smaller RDNA 3 GPU.
In terms of noise, the Asus TUF GeForce RTX 3080 Ti OC behaves inconspicuously. Although, due to the huge fan, this is something we had expected. The three axial fans only kick in when the GPU temperature reaches 55 °C. We registered 37.5 dB(A) in the stress test, although a slightly higher sound pressure level of just over 38 dB(A) was measured during gaming.
| Power Consumption / The Witcher 3 ultra (external Monitor) | |
| AMD Radeon RX 6950 XT | |
| AMD Radeon RX 7900 XTX (Idle: 86.5 W) | |
| NVIDIA GeForce RTX 3090 (Idle: 95.2 W) | |
| NVIDIA GeForce RTX 4090 | |
| NVIDIA GeForce RTX 3080 Ti (Idle: 78.2 W) | |
| NVIDIA GeForce RTX 4080 (Idle: 78.45 W) | |
| NVIDIA GeForce RTX 4080 (Idle: 78.45 W) | |
| AMD Radeon RX 7900 XT (Idle: 84.6 W) | |
| Power Consumption / FurMark 1.19 GPU Stress Test (external Monitor) | |
| NVIDIA GeForce RTX 4090 | |
| AMD Radeon RX 6950 XT | |
| AMD Radeon RX 7900 XTX (Idle: 86.5 W) | |
| NVIDIA GeForce RTX 3080 Ti (Idle: 78.2 W) | |
| AMD Radeon RX 7900 XT (Idle: 84.6 W) | |
| NVIDIA GeForce RTX 4080 (Idle: 78.45 W) | |
| NVIDIA GeForce RTX 4080 (Idle: 78.45 W) | |
* ... smaller is better
Noise level
| Idle |
| 30.7 / 30.7 / 30.7 dB(A) |
| Load |
| 31.1 / 37.5 dB(A) |
 | ||
30 dB silent 40 dB(A) audible 50 dB(A) loud |
||
min: | ||
Pros
Cons
Verdict - A poor price to performance ratio

The Asus TUF GeForce RTX 3080 Ti OC is certainly not a poor graphics card if we only focus on the graphics card's benchmark performance. Here you have a model with which almost all games can currently be played flawlessly. With 12 GB of VRAM, the graphics card was well-equipped when it was released in the middle of 2021, but, it's worth keeping in mind, high-end models now come with 20 and 24 GB of VRAM. However, the added value is manageable when making a direct comparison between the GeForce RTX 3080 Ti and the Nvidia GeForce RTX 3090.
Features such as ray tracing and DLSS help the GeForce RTX 3080 Ti fare well against the competition. This isn't really an area in which AMD's Radeon RX 7900 XT is faster. However, when it purely comes to rasterization performance without upscaling functions, AMD with RDNA3 manages to outmuscle Ampere. Unfortunately, Nvidia offers the current version of DLSS, including frame generation, only for the RTX 4000 series, with customers from the previous generation left wanting.
The Asus TUF GeForce RTX 3080 Ti OC is without a doubt a good, fast graphics card. However, the high price will put off customers, making the card an unattractive proposition.
The Asus review model used here offers a much larger fan compared to the Founders Edition, and at no time did it encounter problems cooling the graphics card during testing. Fans stop completely if processing load is low, ensuring silent operation in 2D mode. This particular model also remains relatively silent when gaming and can hardly be heard from within the closed case.
In addition to the performance on offer, a graphics card's attractiveness is also always closely tied to the purchase price. This is where the Nvidia GeForce RTX 3080 Ti currently finds the going tough as the current models are listed at around 949 US dollars. Available models are often priced even higher. This makes the price considerably higher than the RRP of the recently unveiled AMD Radeon RX 7900 models both of which offer more performance at a lower purchase price. For an extra 70 euros, Nvidia's GeForce RTX 4080 is a better option and well worth considering.
