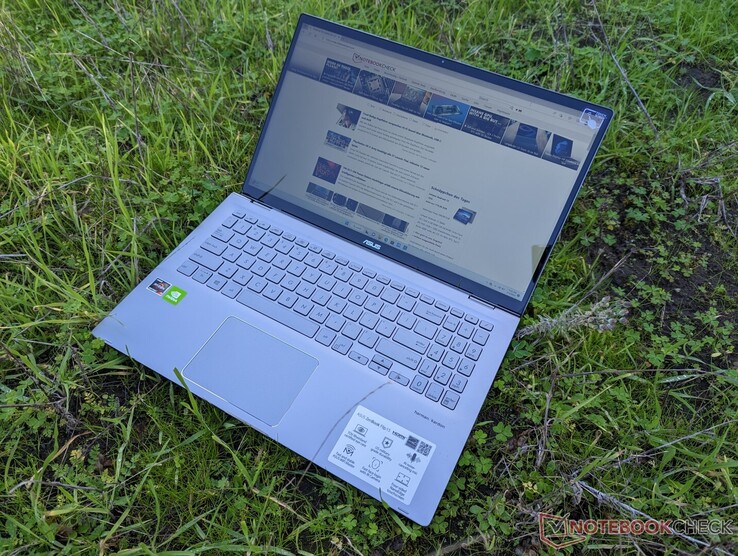
The GeForce MX450 is falling behind: Asus ZenBook Flip 15 Q508U convertible review
The Asus Zenbook series is home to the manufacturer's higher-end consumer laptop models in contrast to the lower-end to midrange Vivobook series. The maker was one of the first to make available the Intel Arc A370M GPU through its ZenBook Flip 15 Q539ZD last year, for example.
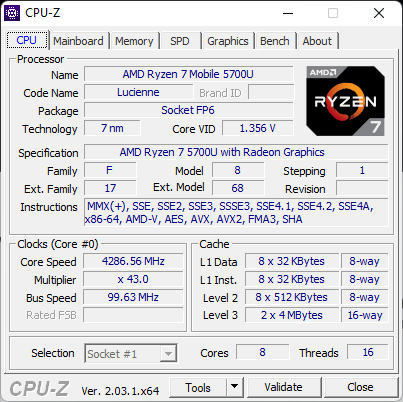
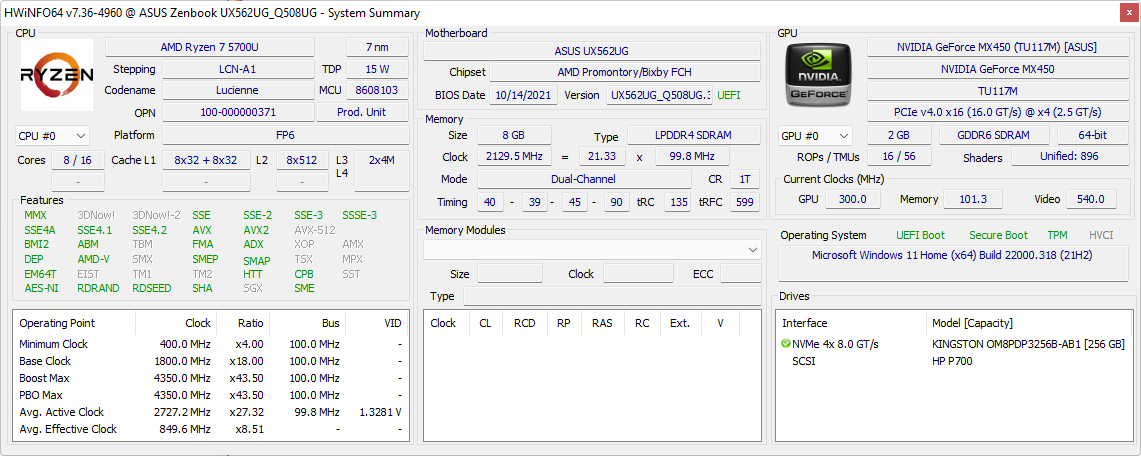
Our review unit here is the 2022 ZenBook Flip 15 Q508U which is a completely different model from the aforementioned 2022 ZenBook Flip 15 Q539ZD. There are only one or two SKUs available with our specific configuration sporting the Zen 2 AMD Ryzen 7 5700U CPU, GeForce MX450 GPU, 8 GB RAM, and 1080p IPS display for approximately $850 USD retail. It is notable for being one of the few 15.6-inch convertible laptops powered by AMD + Nvidia hardware.
Competitors in this space include other upper midrange to high-end 15.6-inch convertibles like the Samsung Galaxy Book Pro 360 15, HP Envy x360 15 or Spectre x360 15 series, or the Dell Inspiron 15 7506 2-in-1.
More Asus reviews:
Potential Competitors in Comparison
Rating | Date | Model | Weight | Height | Size | Resolution | Price |
|---|---|---|---|---|---|---|---|
| 81.1 % v7 (old) | 01 / 2023 | Asus ZenBook Flip 15 Q508U R7 5700U, GeForce MX450 | 1.9 kg | 19.9 mm | 15.60" | 1920x1080 | |
| 88 % v7 (old) | 06 / 2022 | Asus ZenBook Flip 15 Q539ZD i7-12700H, A370M | 1.8 kg | 18.9 mm | 15.60" | 2880x1620 | |
| 86.8 % v7 (old) | 09 / 2022 | HP Envy x360 15-ey0023dx R7 5825U, Vega 8 | 1.9 kg | 18.6 mm | 15.60" | 1920x1080 | |
| 86.6 % v7 (old) | 03 / 2022 | Samsung Galaxy Book Pro 360 15 NP950QDB-KC3DE i5-1135G7, Iris Xe G7 80EUs | 1.4 kg | 11 mm | 15.60" | 1920x1080 | |
| 81.2 % v7 (old) | 12 / 2020 | Dell Inspiron 15 7506 2-in-1 P97F i5-1135G7, Iris Xe G7 80EUs | 1.8 kg | 17.94 mm | 15.60" | 1920x1080 | |
| 83.5 % v7 (old) | 08 / 2021 | Lenovo IdeaPad 5 15ALC05 R5 5500U, Vega 7 | 1.7 kg | 19.1 mm | 15.60" | 1920x1080 |
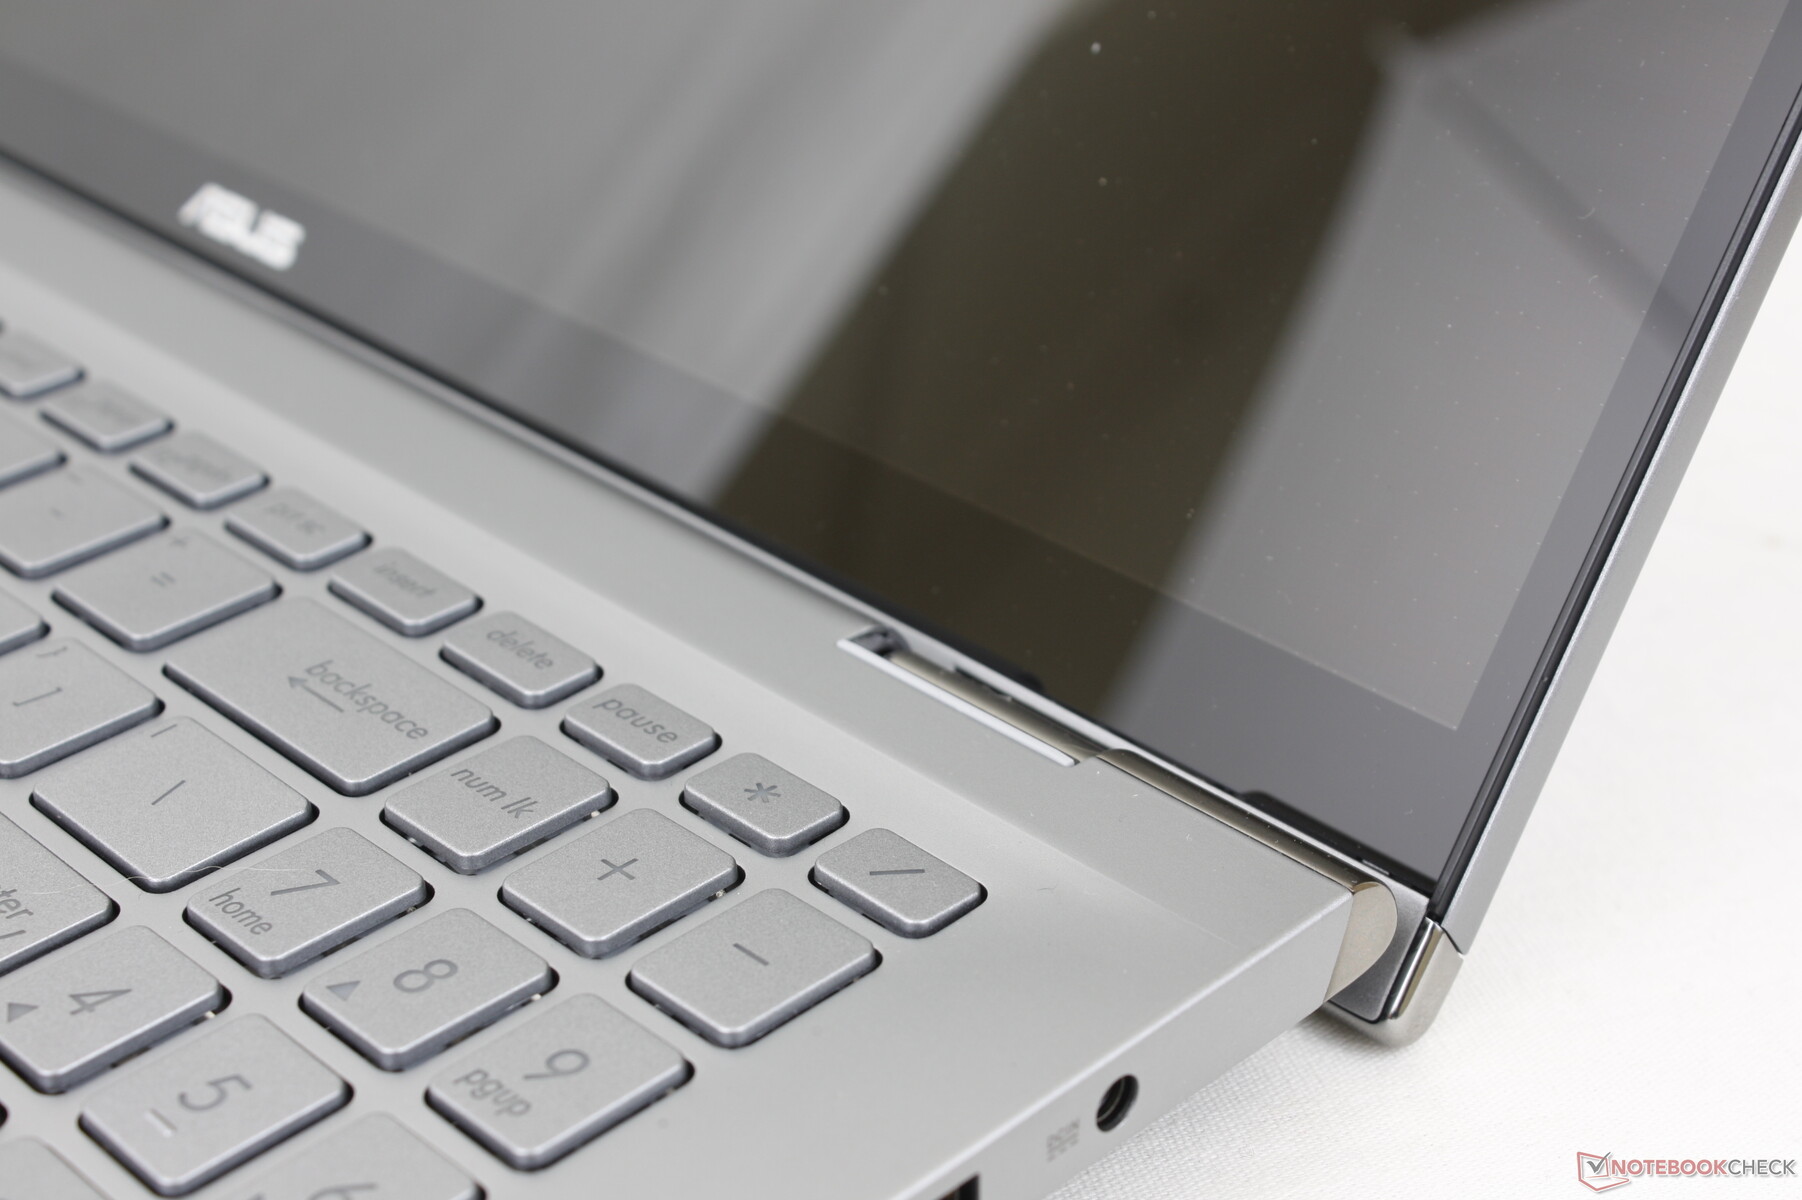
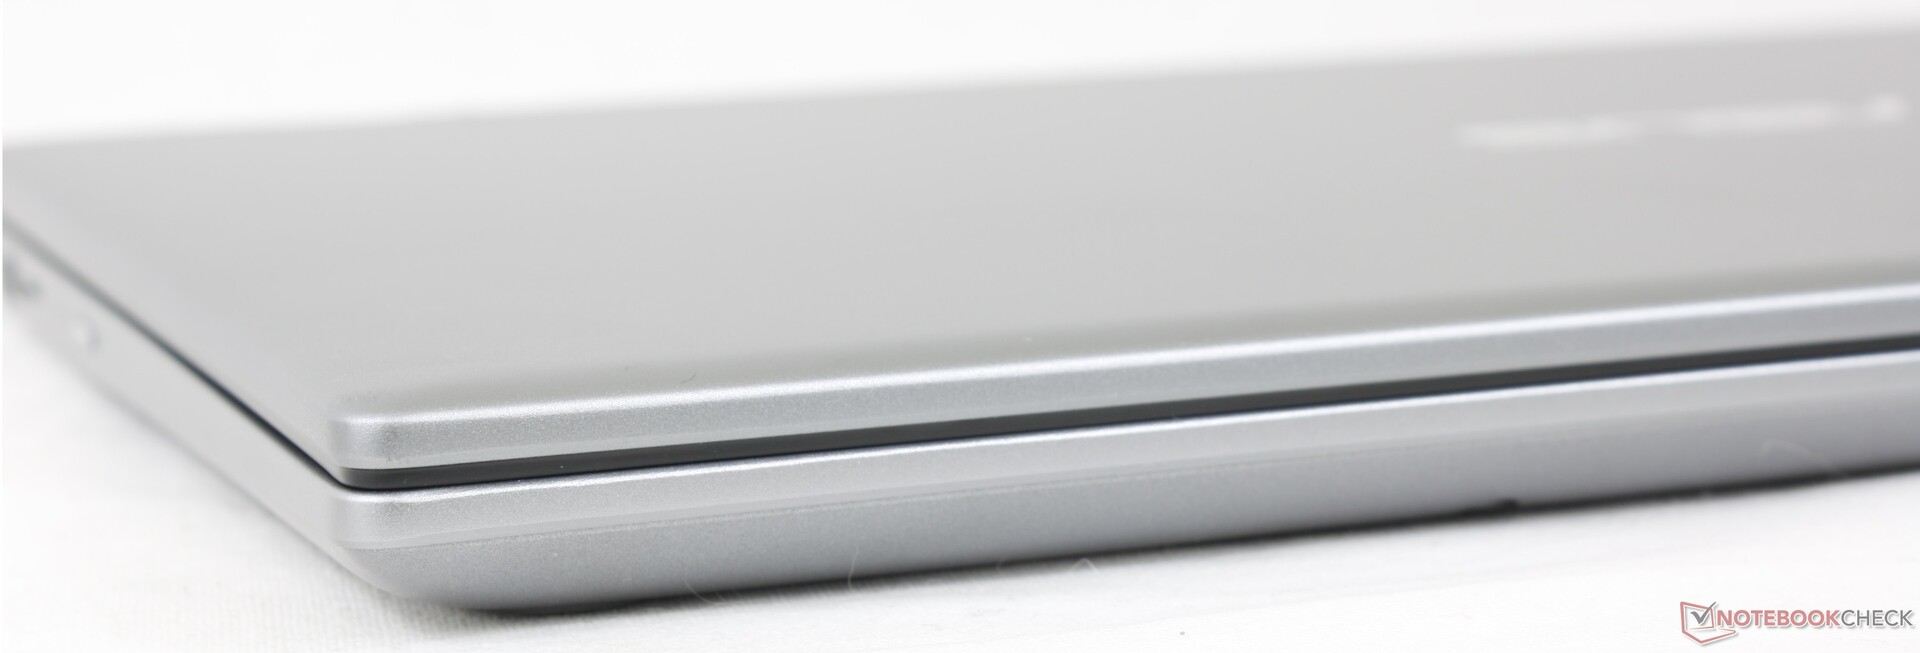
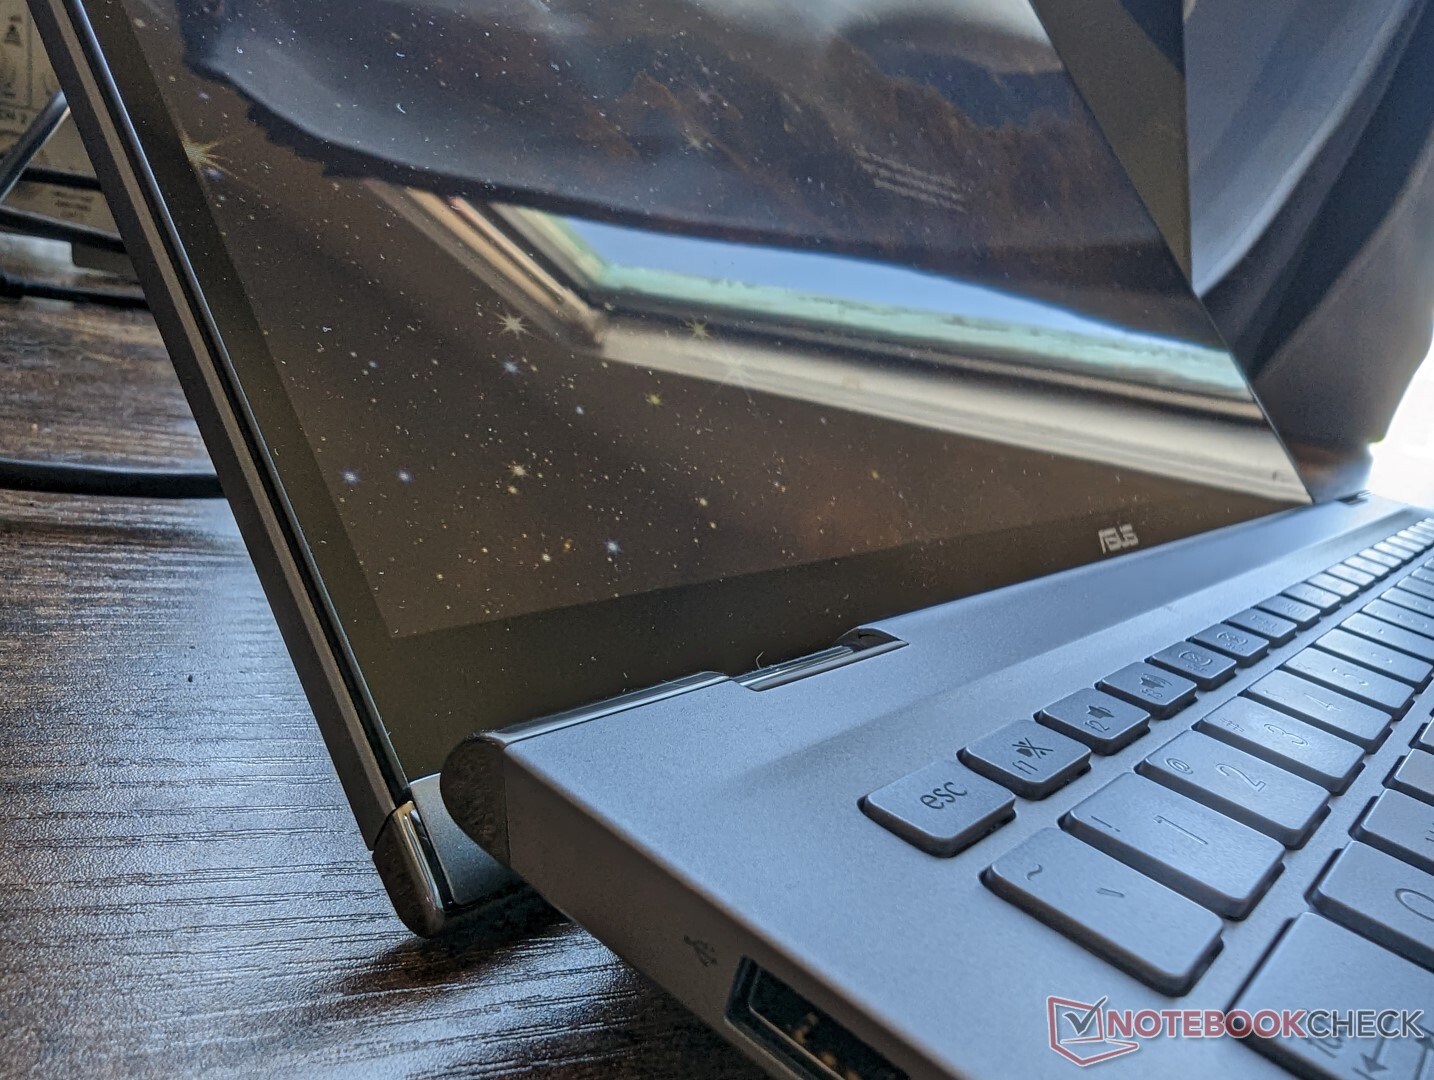
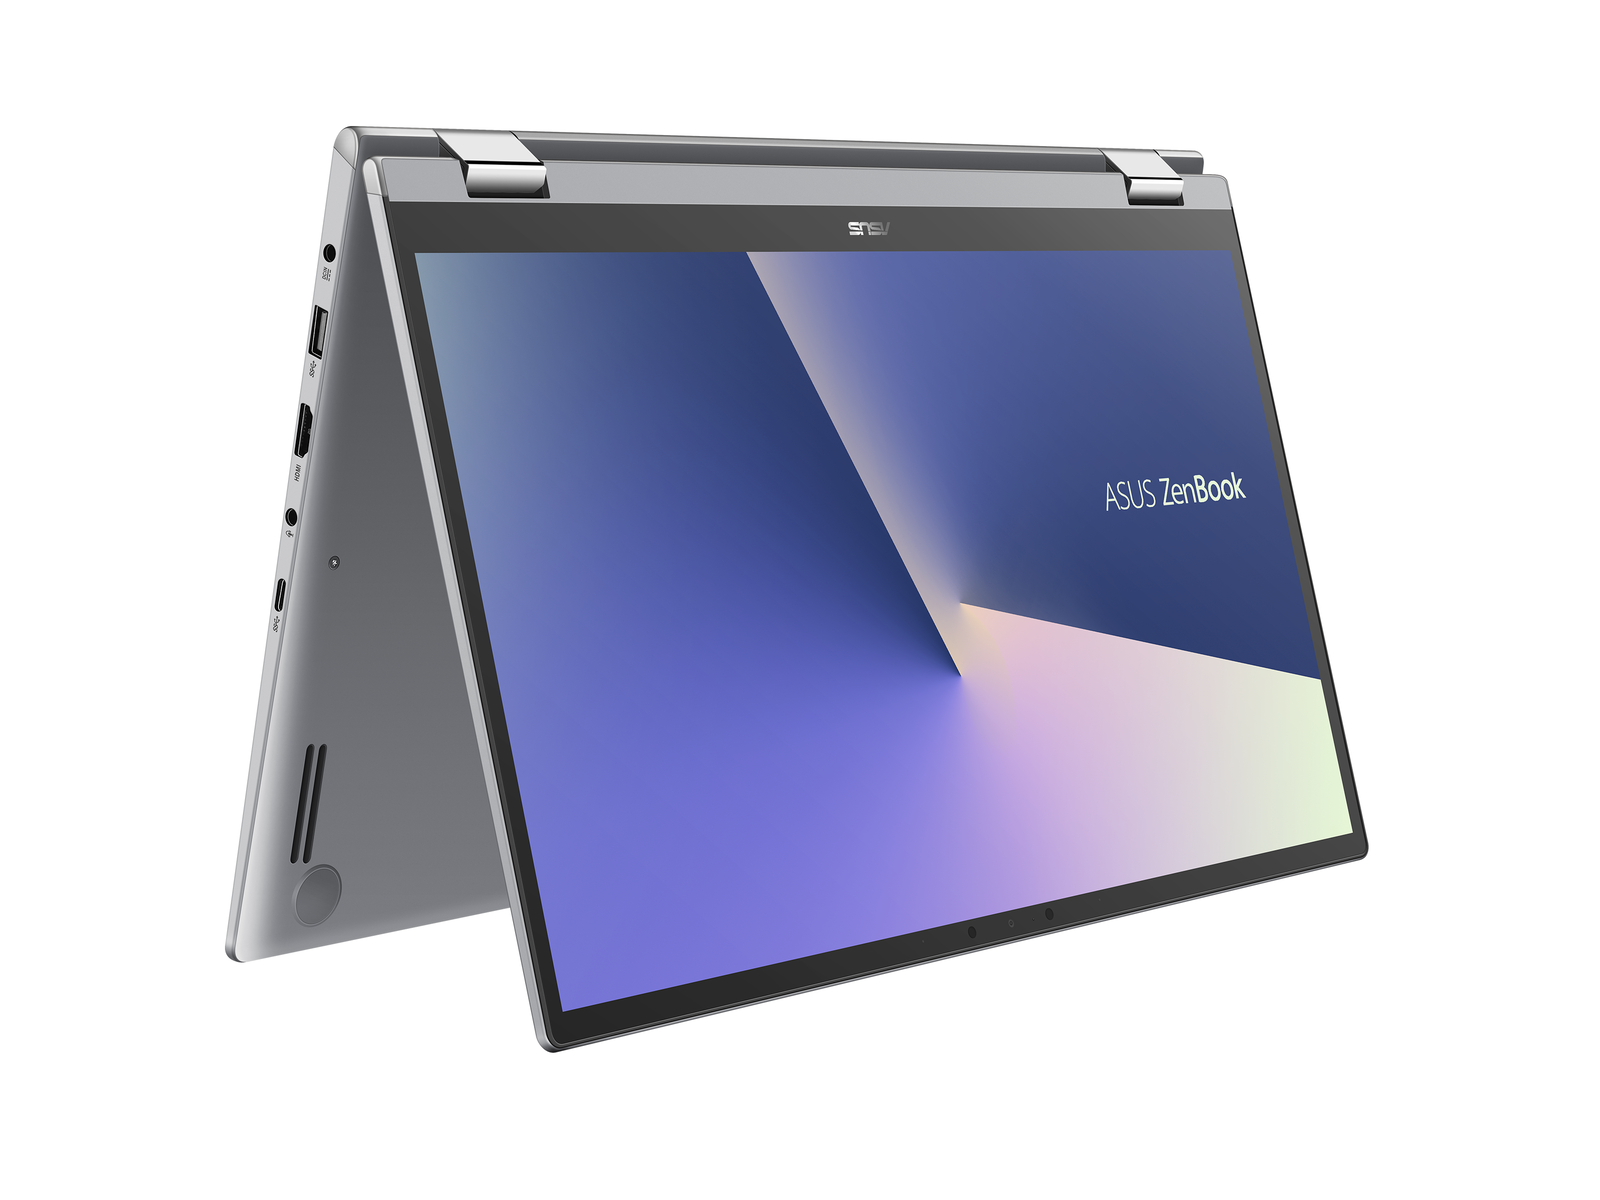
Case — Dull For A ZenBook
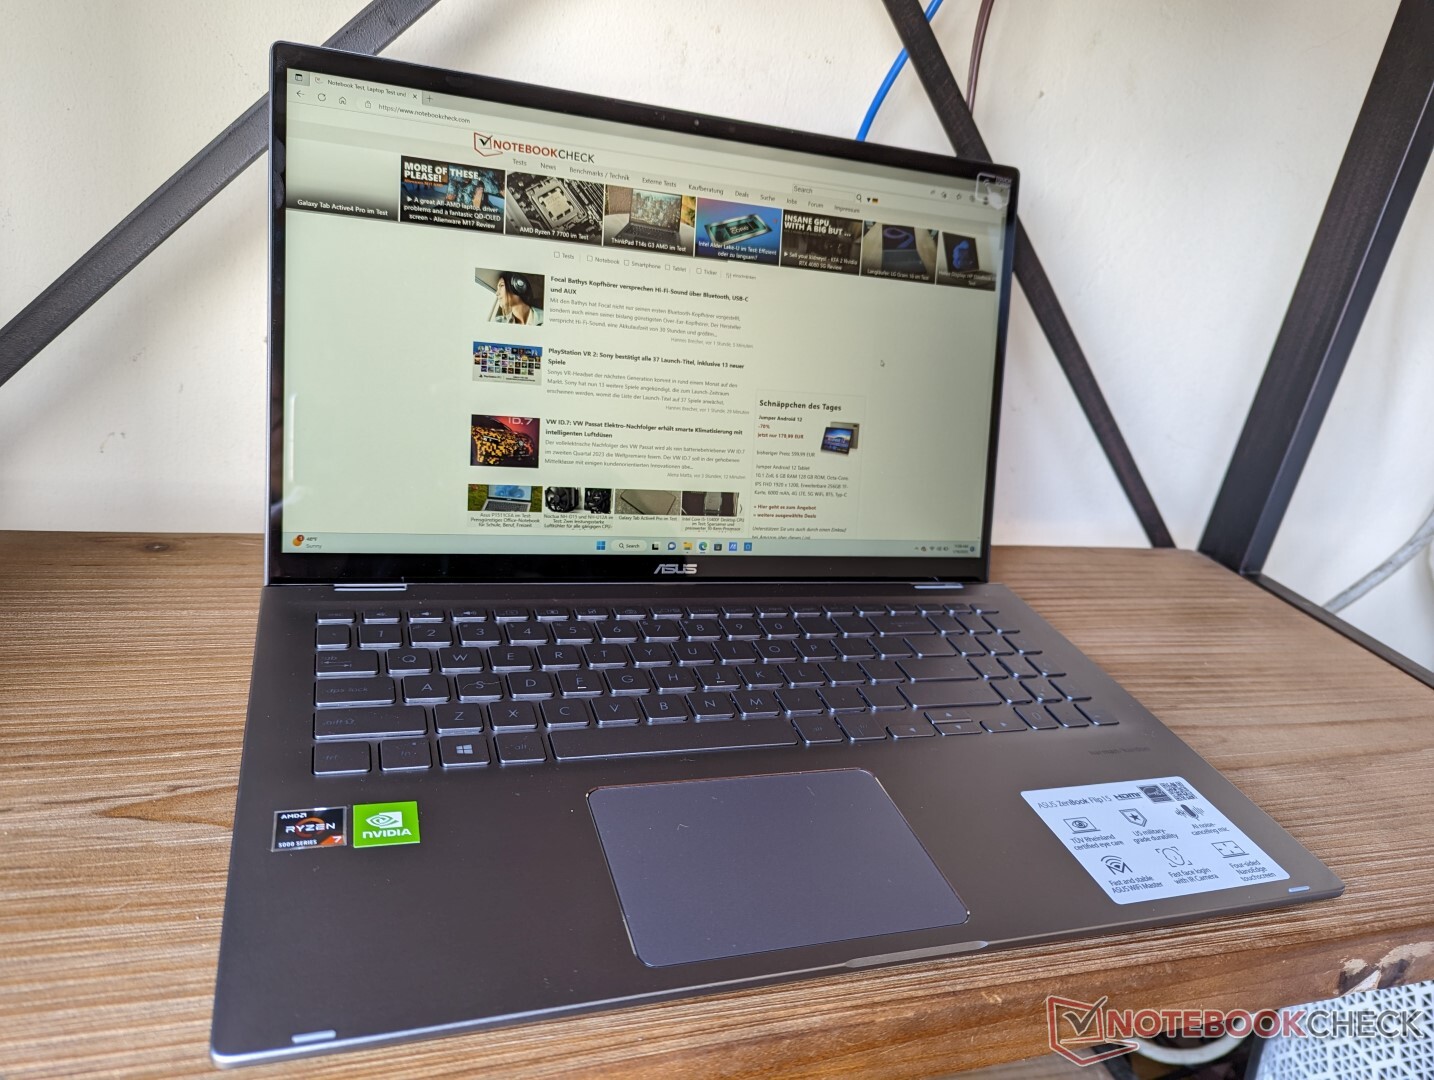
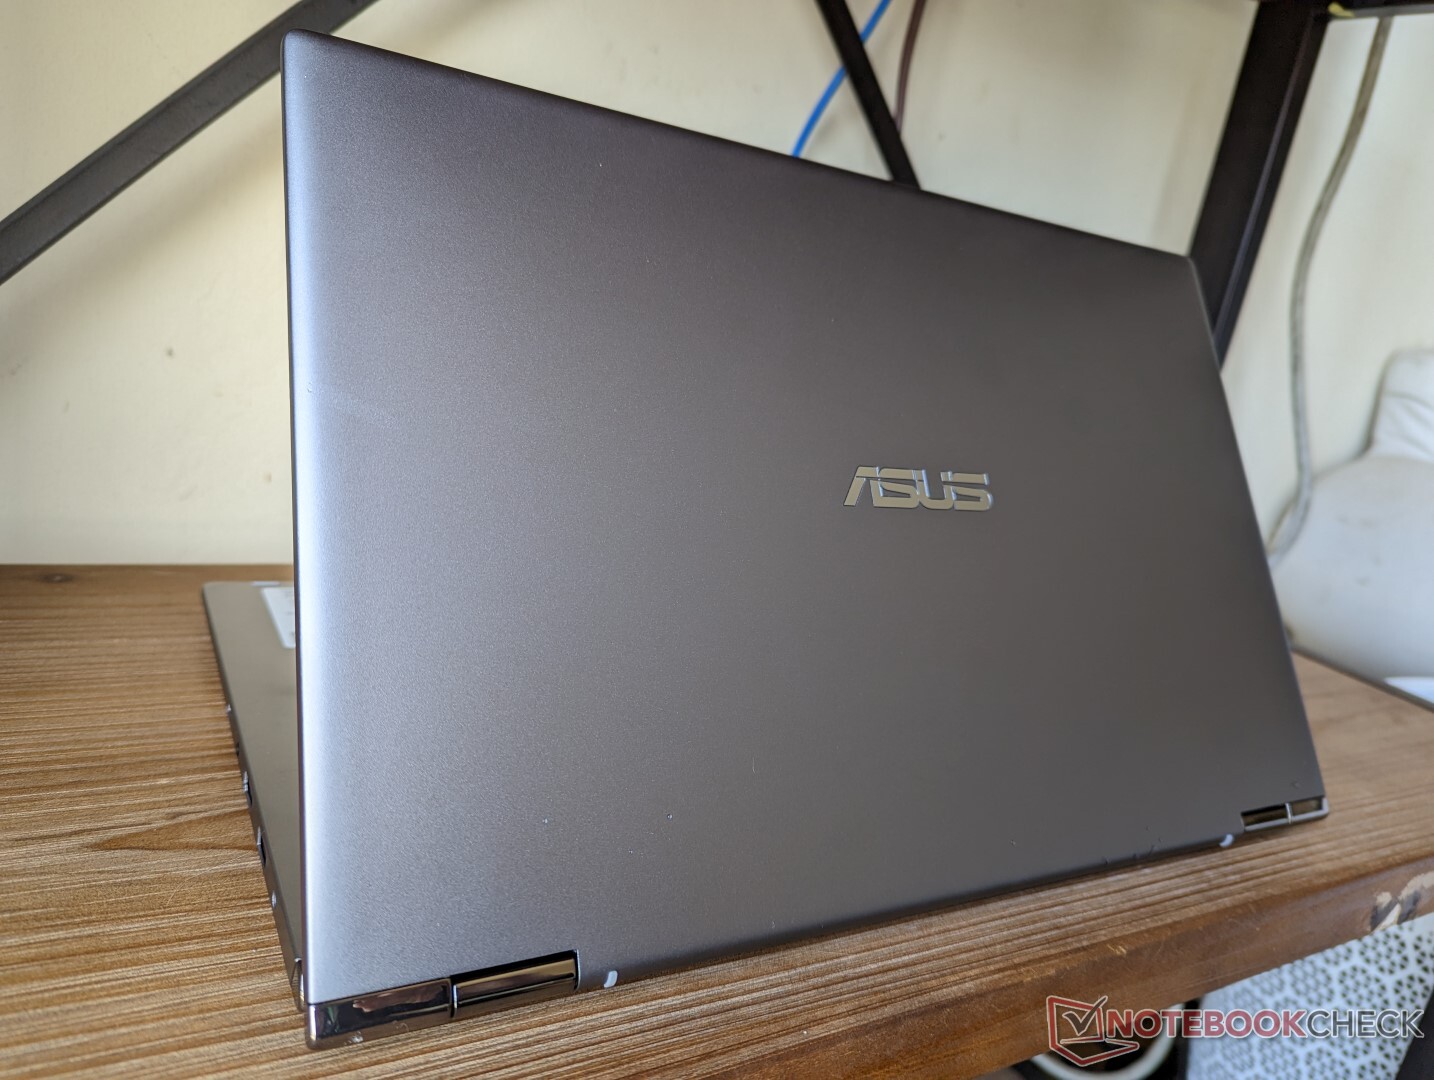
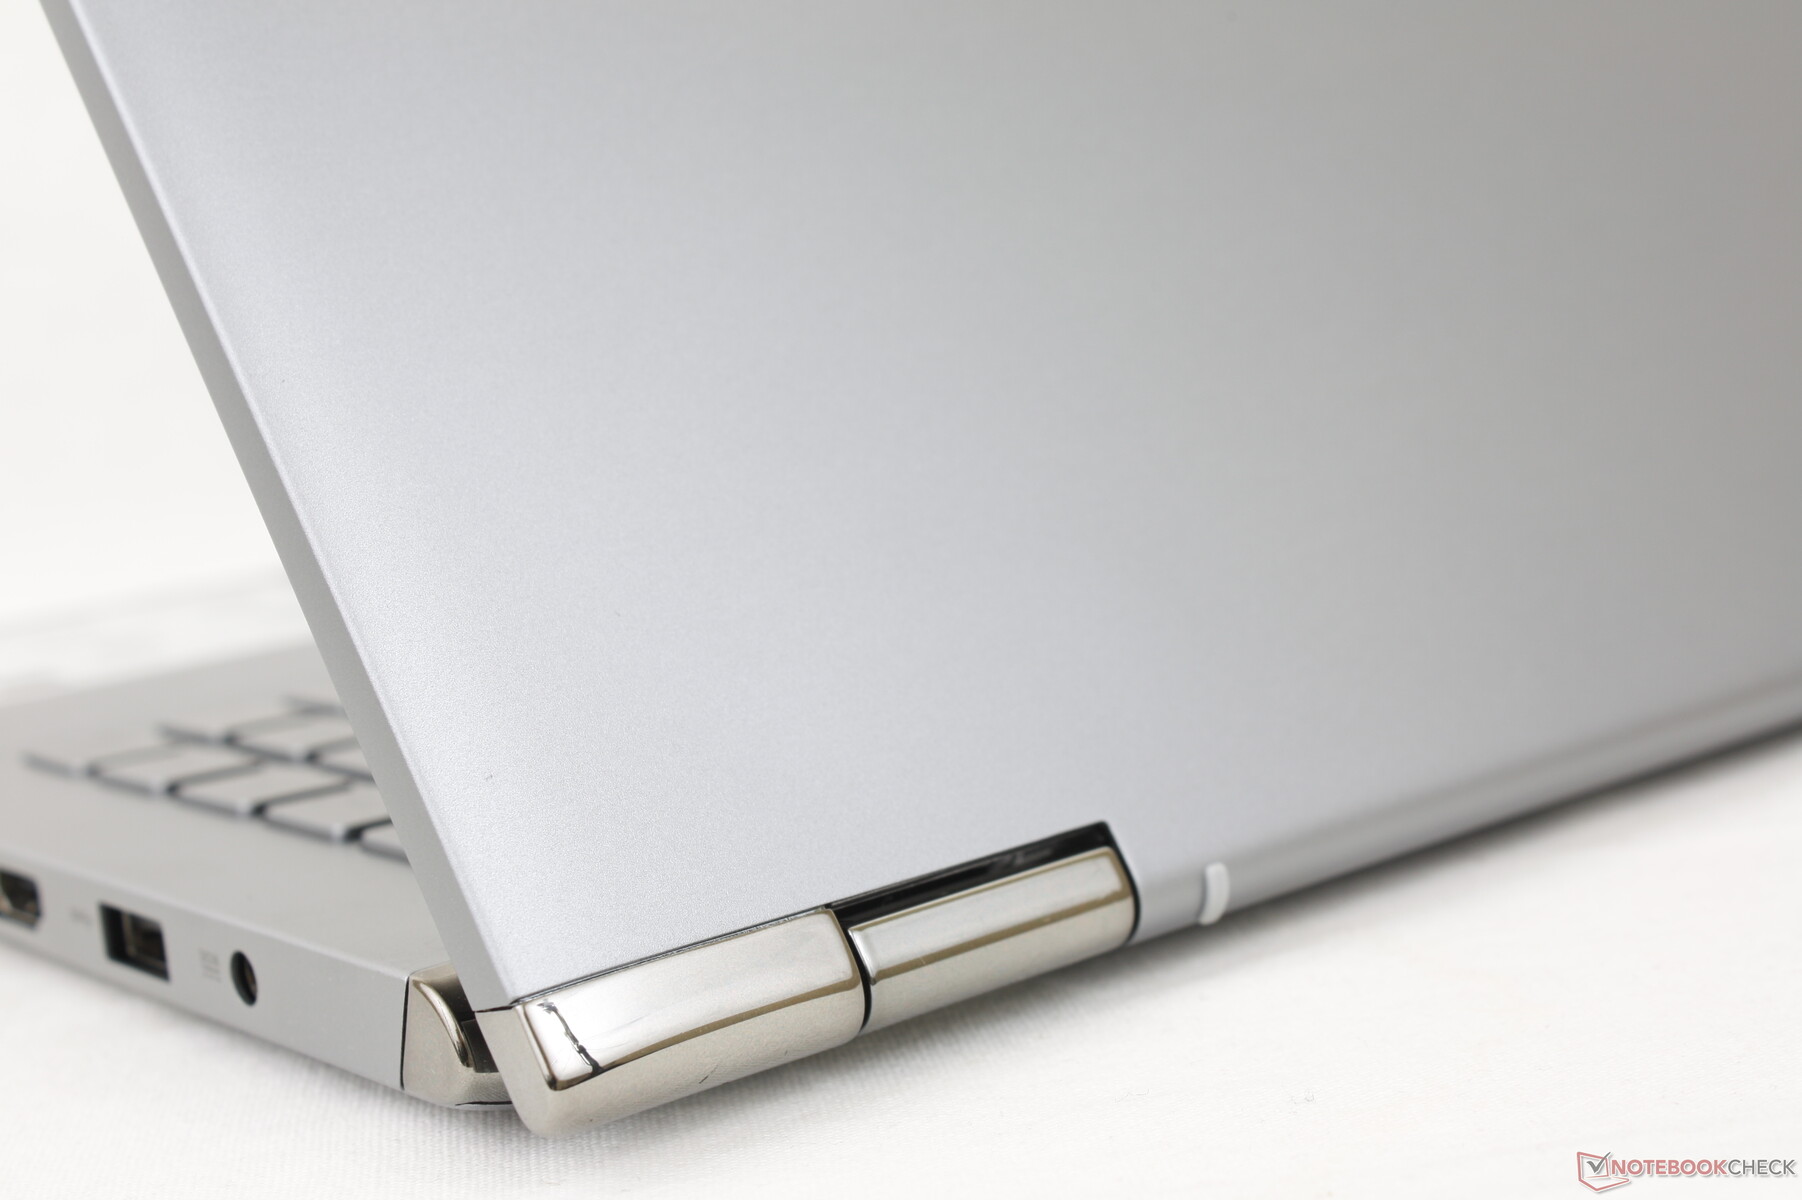
The matte gray design is uninspiring when compared to the chrome-cut blue design of the recent ZenBook Flip 15 Q539ZD, but chassis rigidity remains excellent from top to bottom. Both the lid and base exhibit minimal twisting and bending and the hinges feel stiff at all angles as well. There is a bit of warping when applying pressure down the center of the keyboard or outer lid, but it is of no major concern.
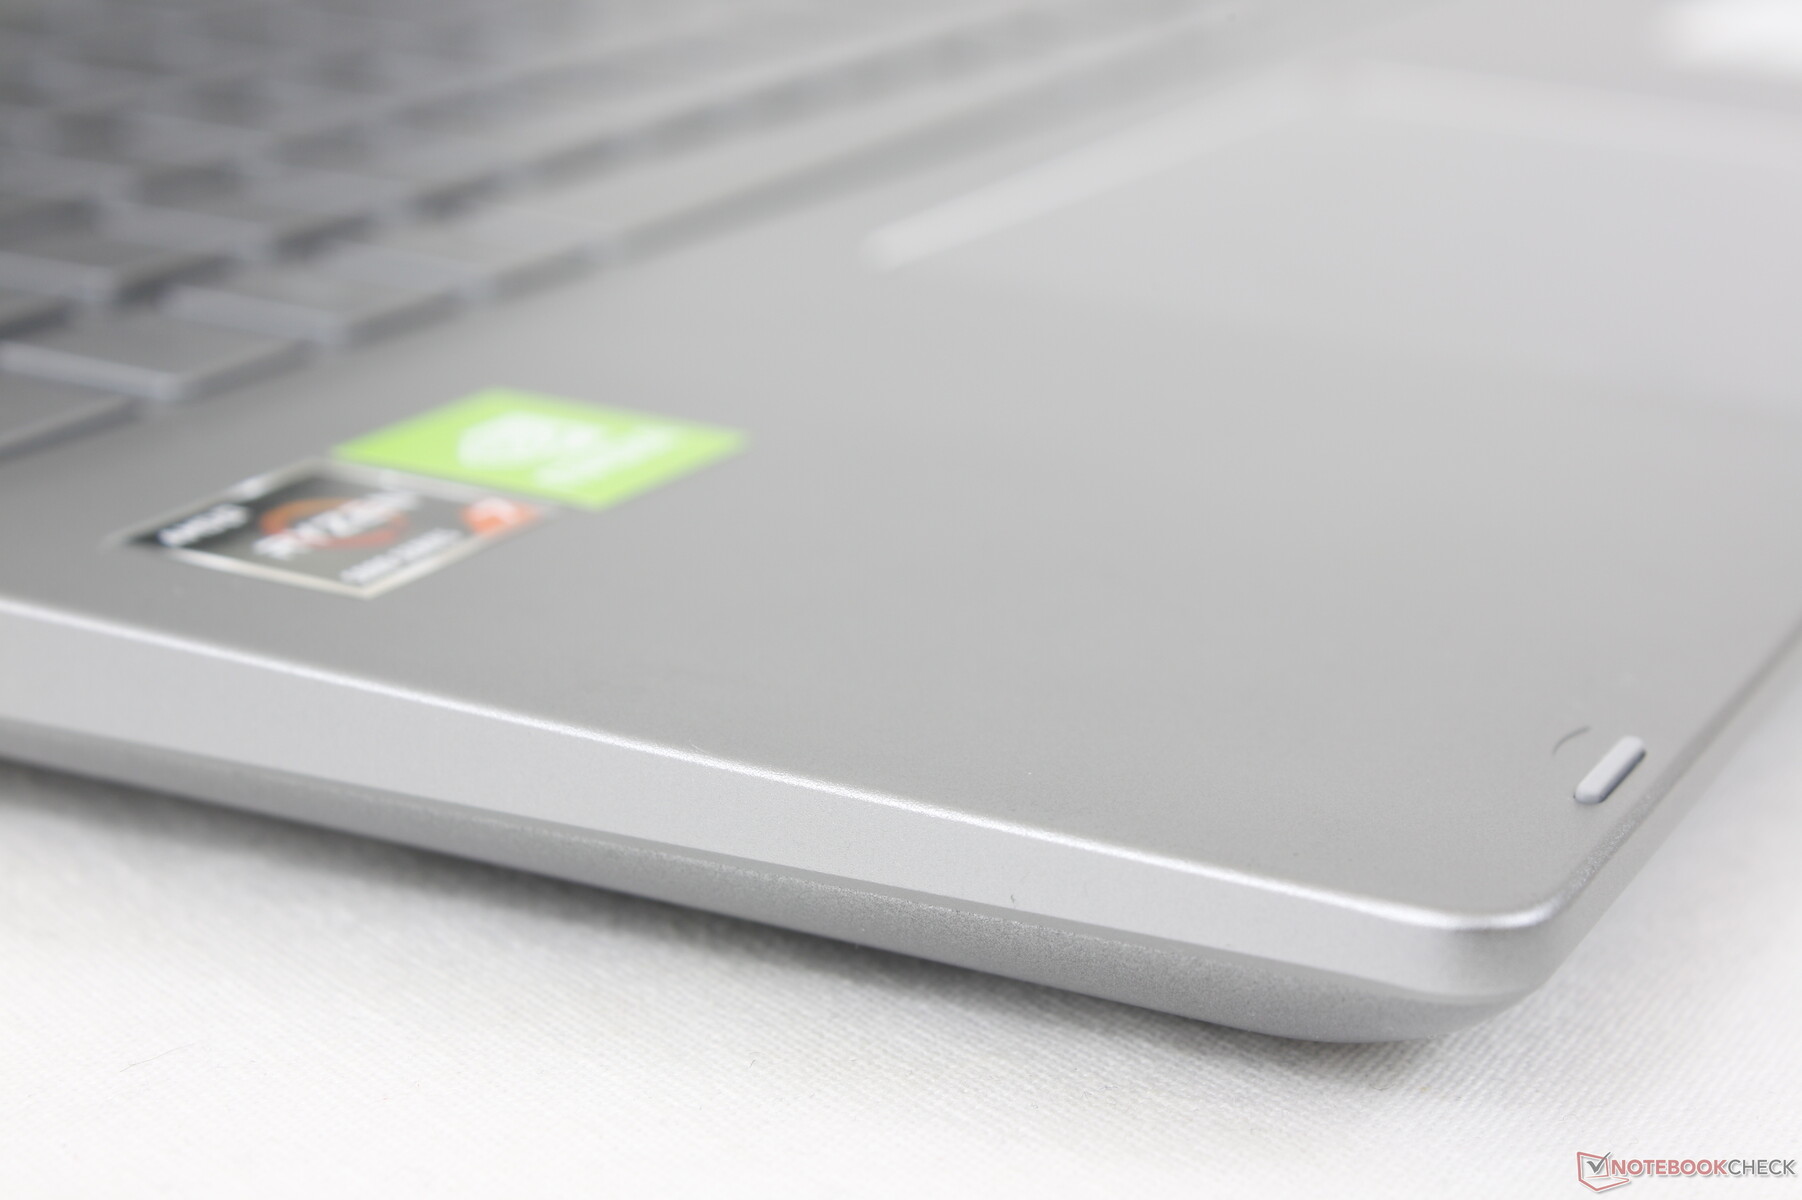
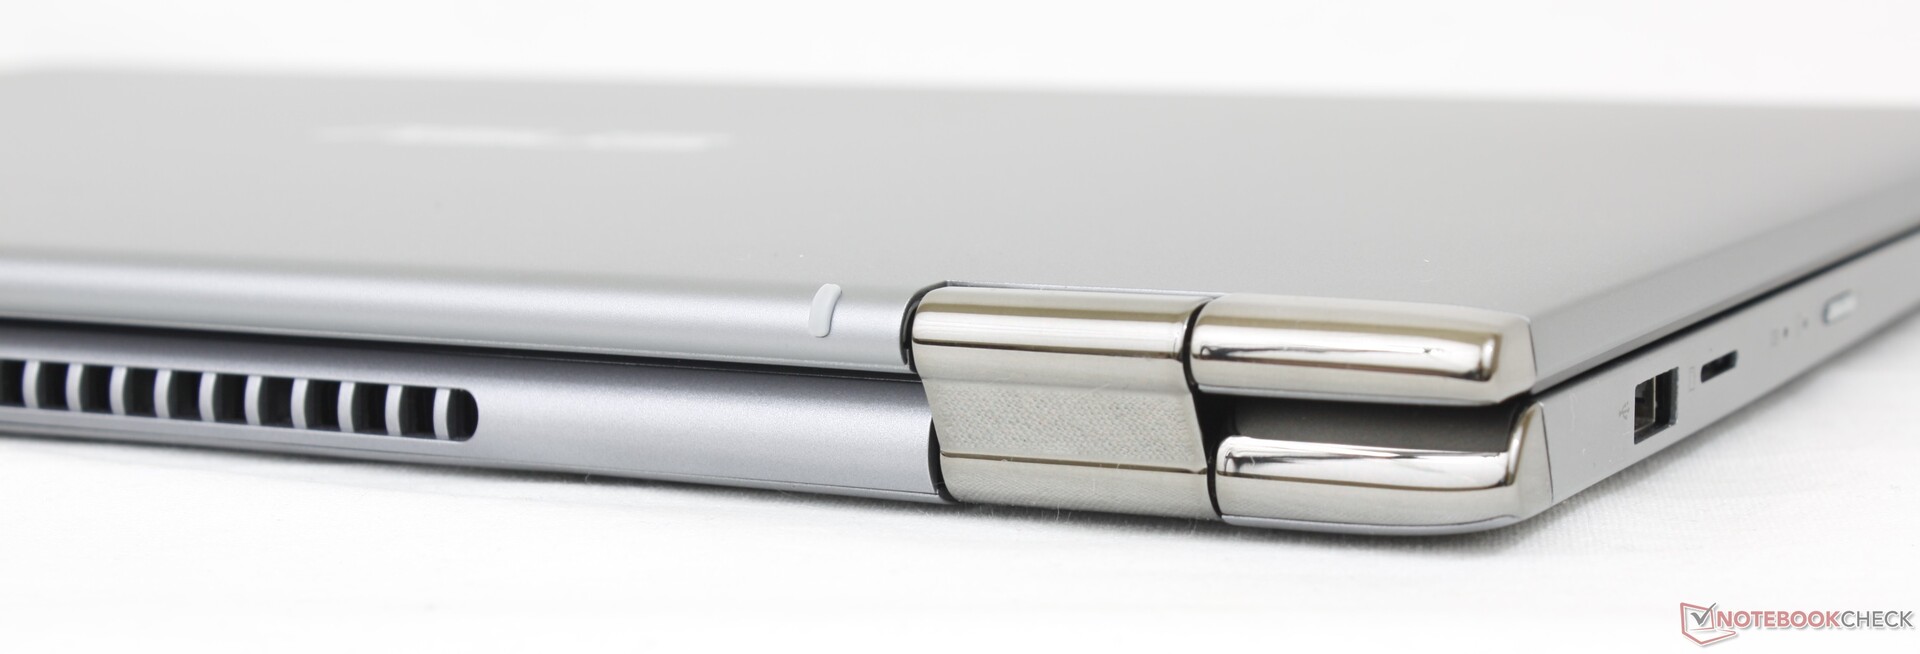
Perhaps our biggest criticism about the chassis relates to the shiny chrome hinges and rear corners. They look nice at first because they contrast the matte look of the rest of the skeleton, but they scratch and scuff very easily against most surfaces especially since they make contact with the table whenever the lid is opened.
The system is slightly heavier and thicker than most other 15.6-inch convertibles in the market due in part to its discrete Nvidia GPU. An extreme case is the Samsung Galaxy Book Pro 360 15 which is half a kilogram lighter and 9 mm thinner to be significantly more portable. Even Asus' own ZenBook Flip 15 Q539, which comes with faster CPU and GPU options, is still lighter and thinner than our Q508U.
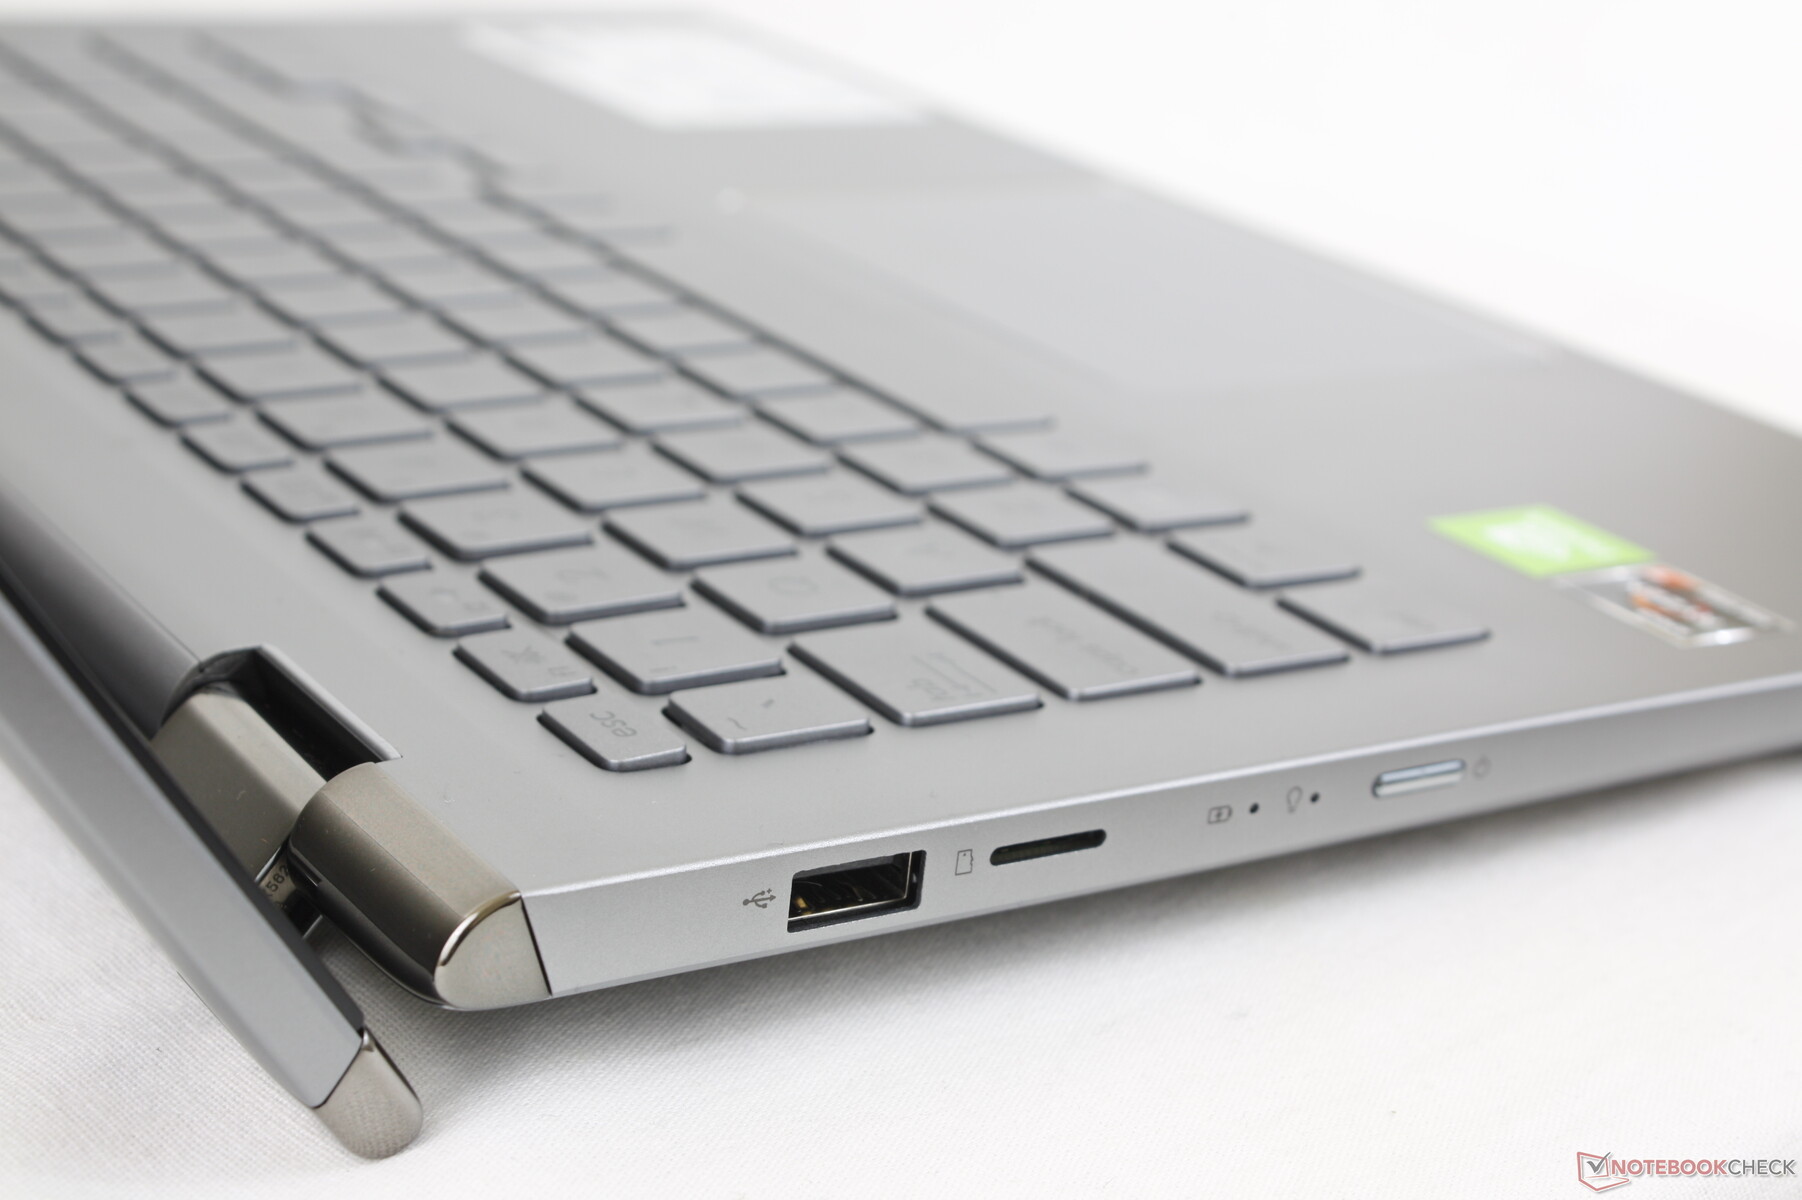
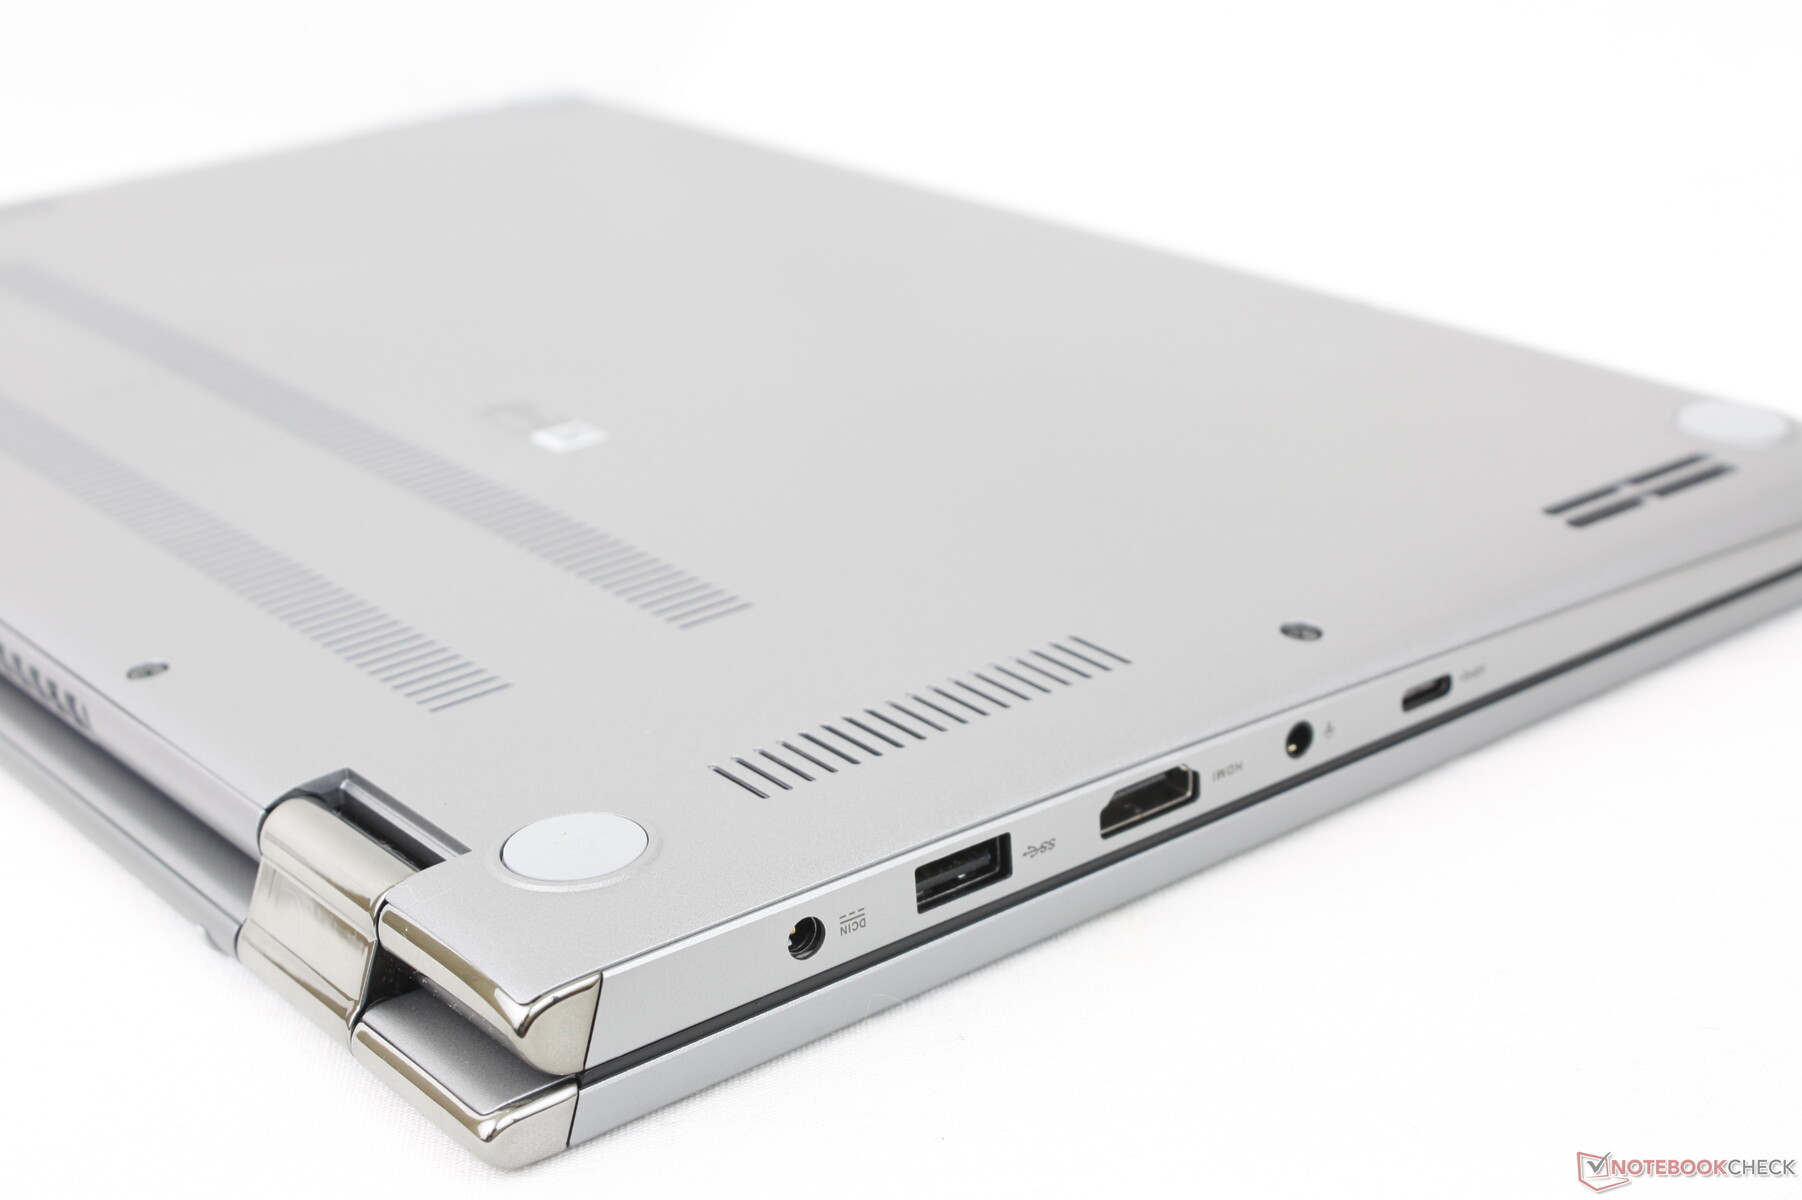
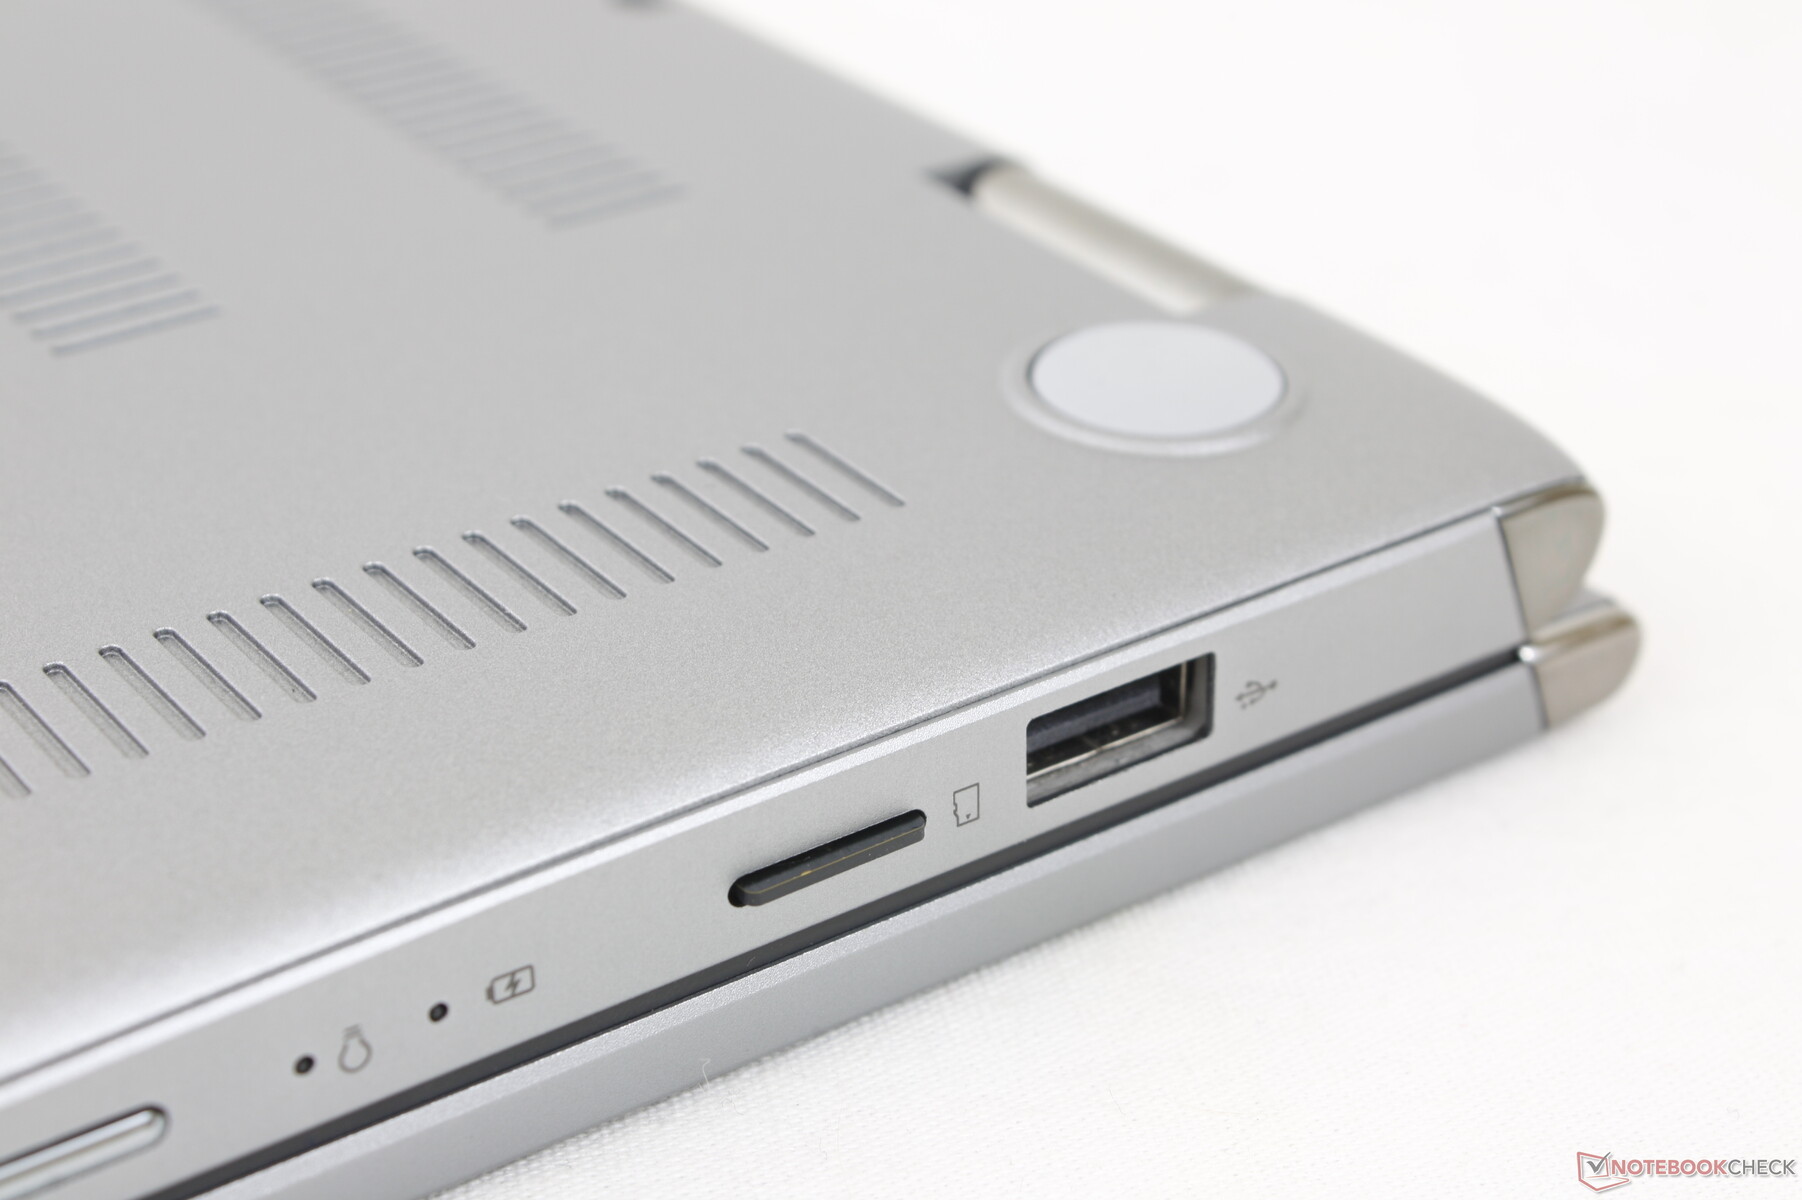
Connectivity — No DisplayPort or Power Delivery
Port options are similar to the Dell Inspiron 15 7506 2-in-1 but with a few caveats that don't favor our Asus. Firstly, its USB-C port does not support Thunderbolt, Power Delivery, or even DisplayPort. Secondly, the HDMI port is 1.4 only meaning there is no support for 4K external monitors at 60 Hz. Most budget to midrange convertibles support DP over USB in comparison.

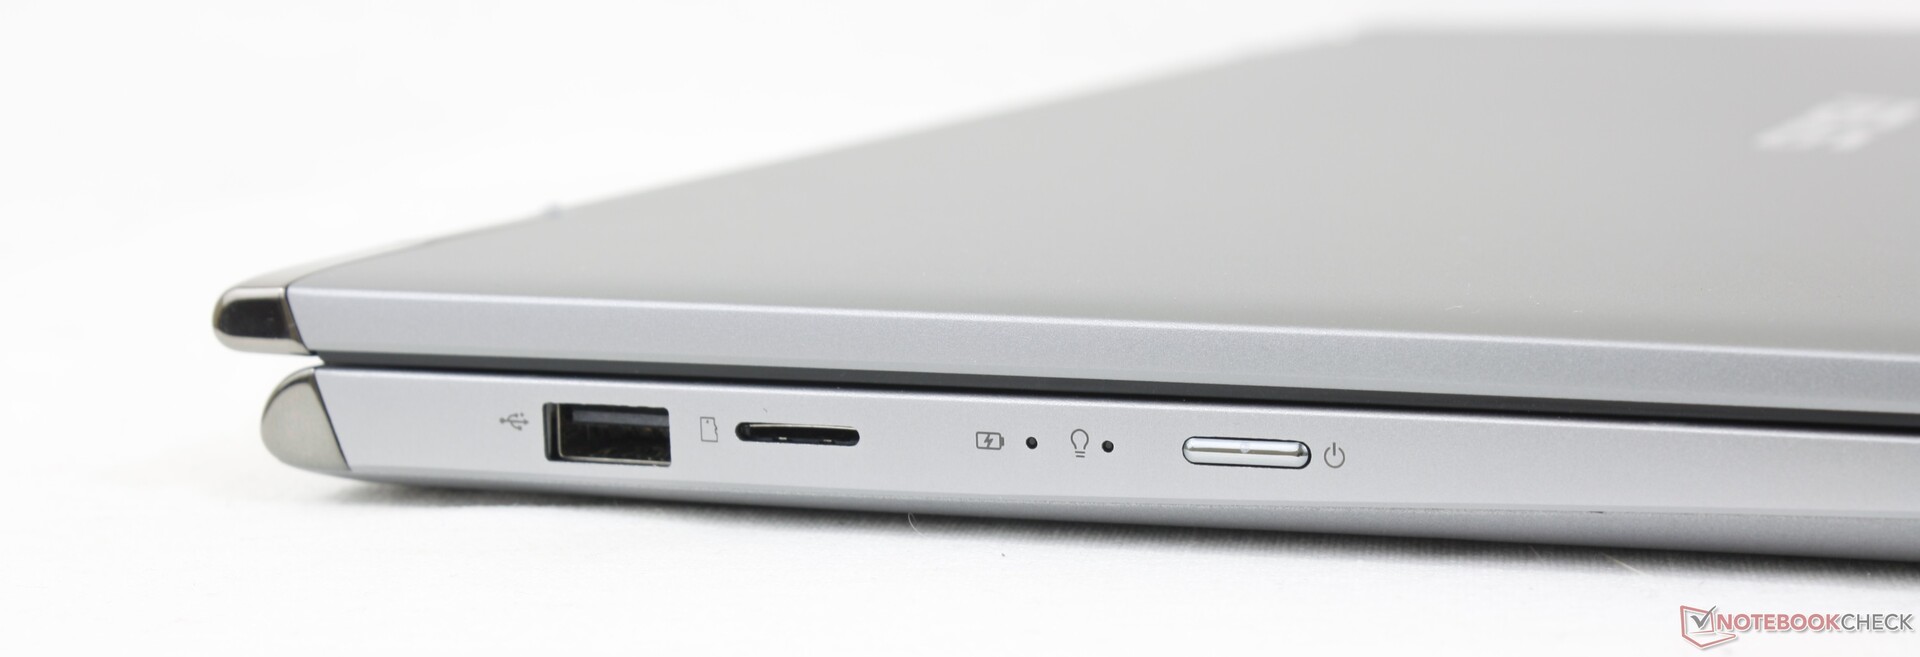
SD Card Reader
The integrated MicroSD card reader is much slower than the one on the ZenBook Flip 15 Q539Z. Moving 1 GB of pictures from our UHS-II test card to desktop takes over 30 seconds compared to less than half that on the Q539 model.
| SD Card Reader | |
| average JPG Copy Test (av. of 3 runs) | |
| HP Envy x360 15-ey0023dx (AV Pro SD microSD 128 GB V60) | |
| Asus ZenBook Flip 15 Q539ZD (AV Pro SD microSD 128 GB V60) | |
| Asus ZenBook Flip 15 Q508U (AV Pro SD microSD 128 GB V60) | |
| Lenovo IdeaPad 5 15ALC05 (Toshiba Exceria Pro SDXC 64 GB UHS-II) | |
| Samsung Galaxy Book Pro 360 15 NP950QDB-KC3DE (AV Pro SD microSD 128 GB V60) | |
| Dell Inspiron 15 7506 2-in-1 P97F (Toshiba Exceria Pro SDXC 64 GB UHS-II) | |
| maximum AS SSD Seq Read Test (1GB) | |
| Asus ZenBook Flip 15 Q539ZD (AV Pro SD microSD 128 GB V60) | |
| HP Envy x360 15-ey0023dx (AV Pro SD microSD 128 GB V60) | |
| Asus ZenBook Flip 15 Q508U (AV Pro SD microSD 128 GB V60) | |
| Lenovo IdeaPad 5 15ALC05 (Toshiba Exceria Pro SDXC 64 GB UHS-II) | |
| Dell Inspiron 15 7506 2-in-1 P97F (Toshiba Exceria Pro SDXC 64 GB UHS-II) | |
| Samsung Galaxy Book Pro 360 15 NP950QDB-KC3DE (AV Pro SD microSD 128 GB V60) | |
Communication
There is no support for Wi-Fi 6E likely to save on costs. Performance on Wi-Fi 6 could have been faster as average transmit rates are slower than expected at 618 Mb/s compared to almost twice that on the Dell Inspiron 15 7506 2-in-1.
| Networking | |
| iperf3 transmit AX12 | |
| Dell Inspiron 15 7506 2-in-1 P97F | |
| Samsung Galaxy Book Pro 360 15 NP950QDB-KC3DE | |
| Lenovo IdeaPad 5 15ALC05 | |
| iperf3 receive AX12 | |
| Dell Inspiron 15 7506 2-in-1 P97F | |
| Samsung Galaxy Book Pro 360 15 NP950QDB-KC3DE | |
| Lenovo IdeaPad 5 15ALC05 | |
| iperf3 receive AXE11000 6GHz | |
| Asus ZenBook Flip 15 Q539ZD | |
| HP Envy x360 15-ey0023dx | |
| iperf3 receive AXE11000 | |
| Asus ZenBook Flip 15 Q508U | |
| iperf3 transmit AXE11000 | |
| Asus ZenBook Flip 15 Q508U | |
| iperf3 transmit AXE11000 6GHz | |
| Asus ZenBook Flip 15 Q539ZD | |
| HP Envy x360 15-ey0023dx | |
Webcam
The webcam is the typical low-end 1 MP or 720p sensor commonly found on many budget to midrange laptops. There is unfortunately no camera shutter, but IR is present for Hello support.


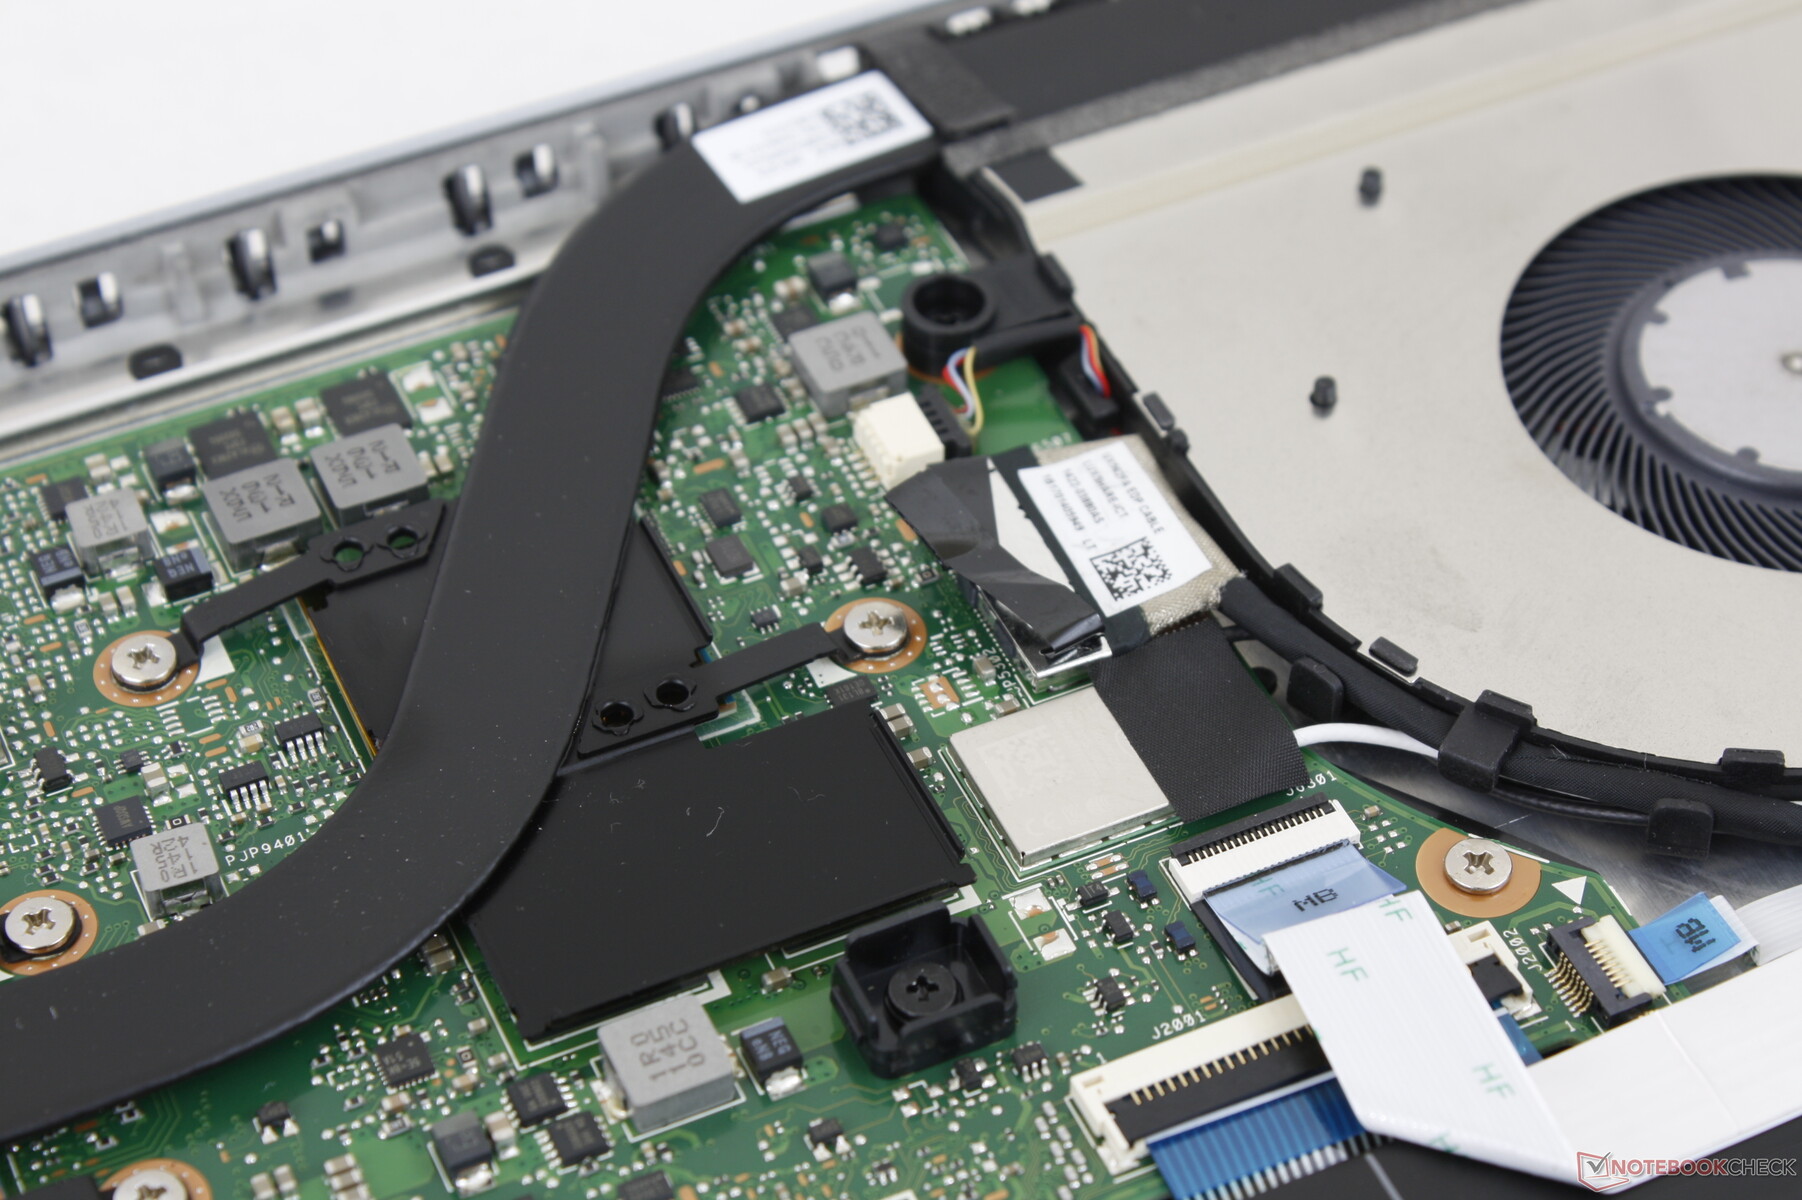
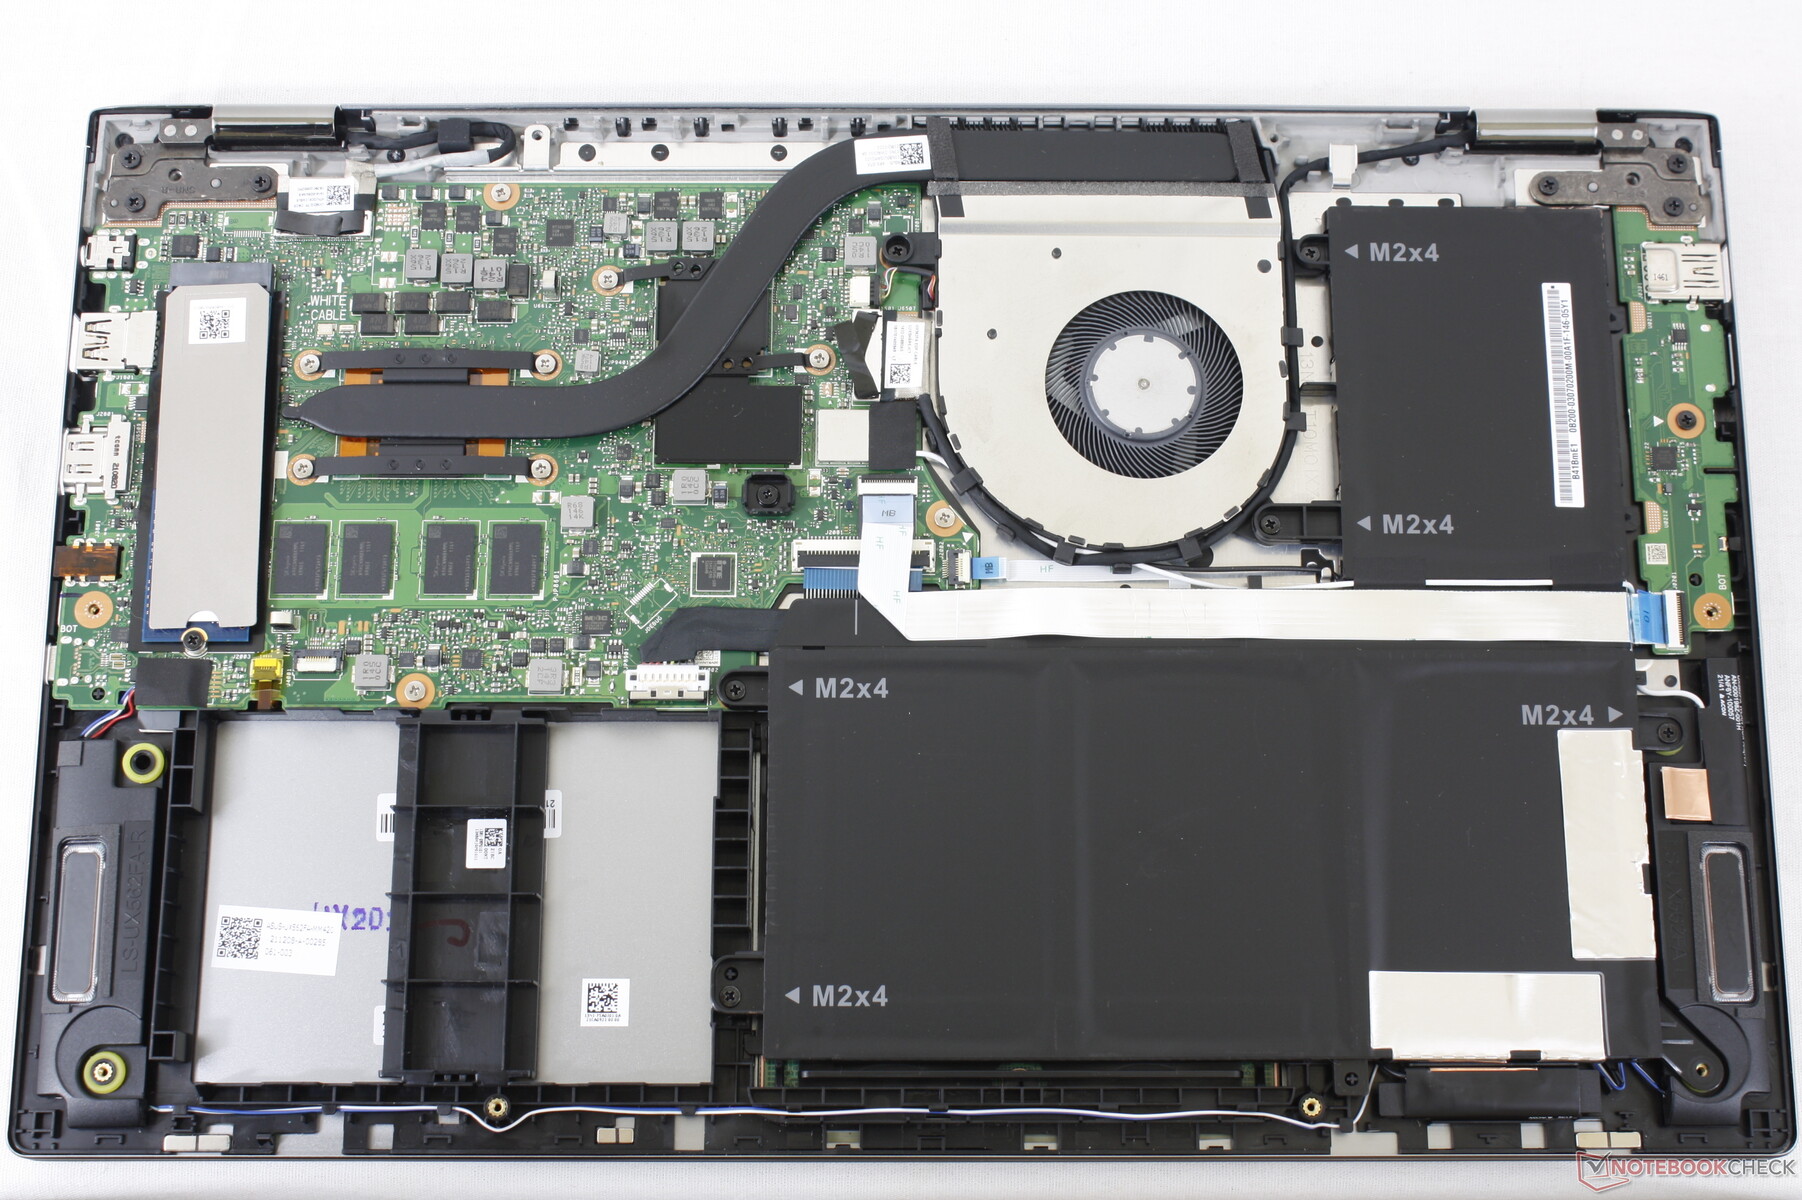
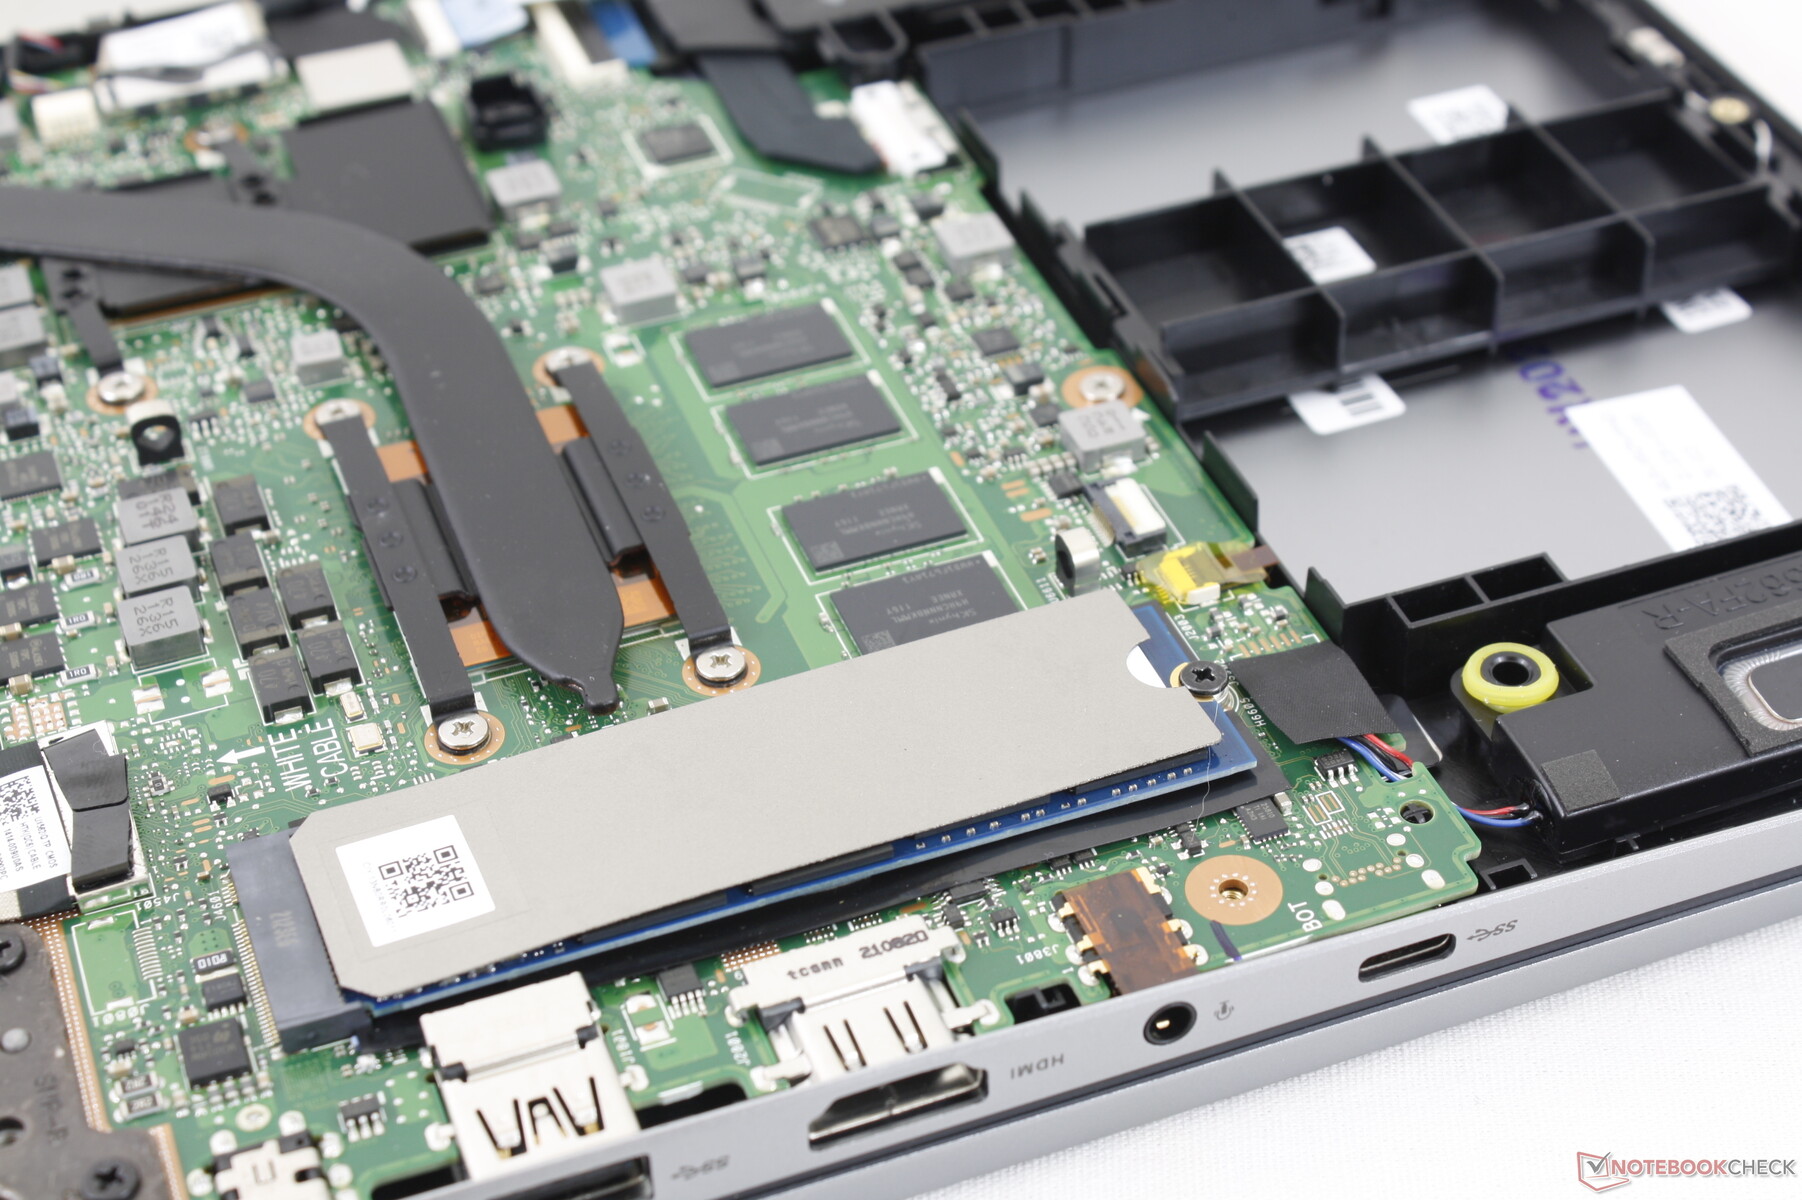
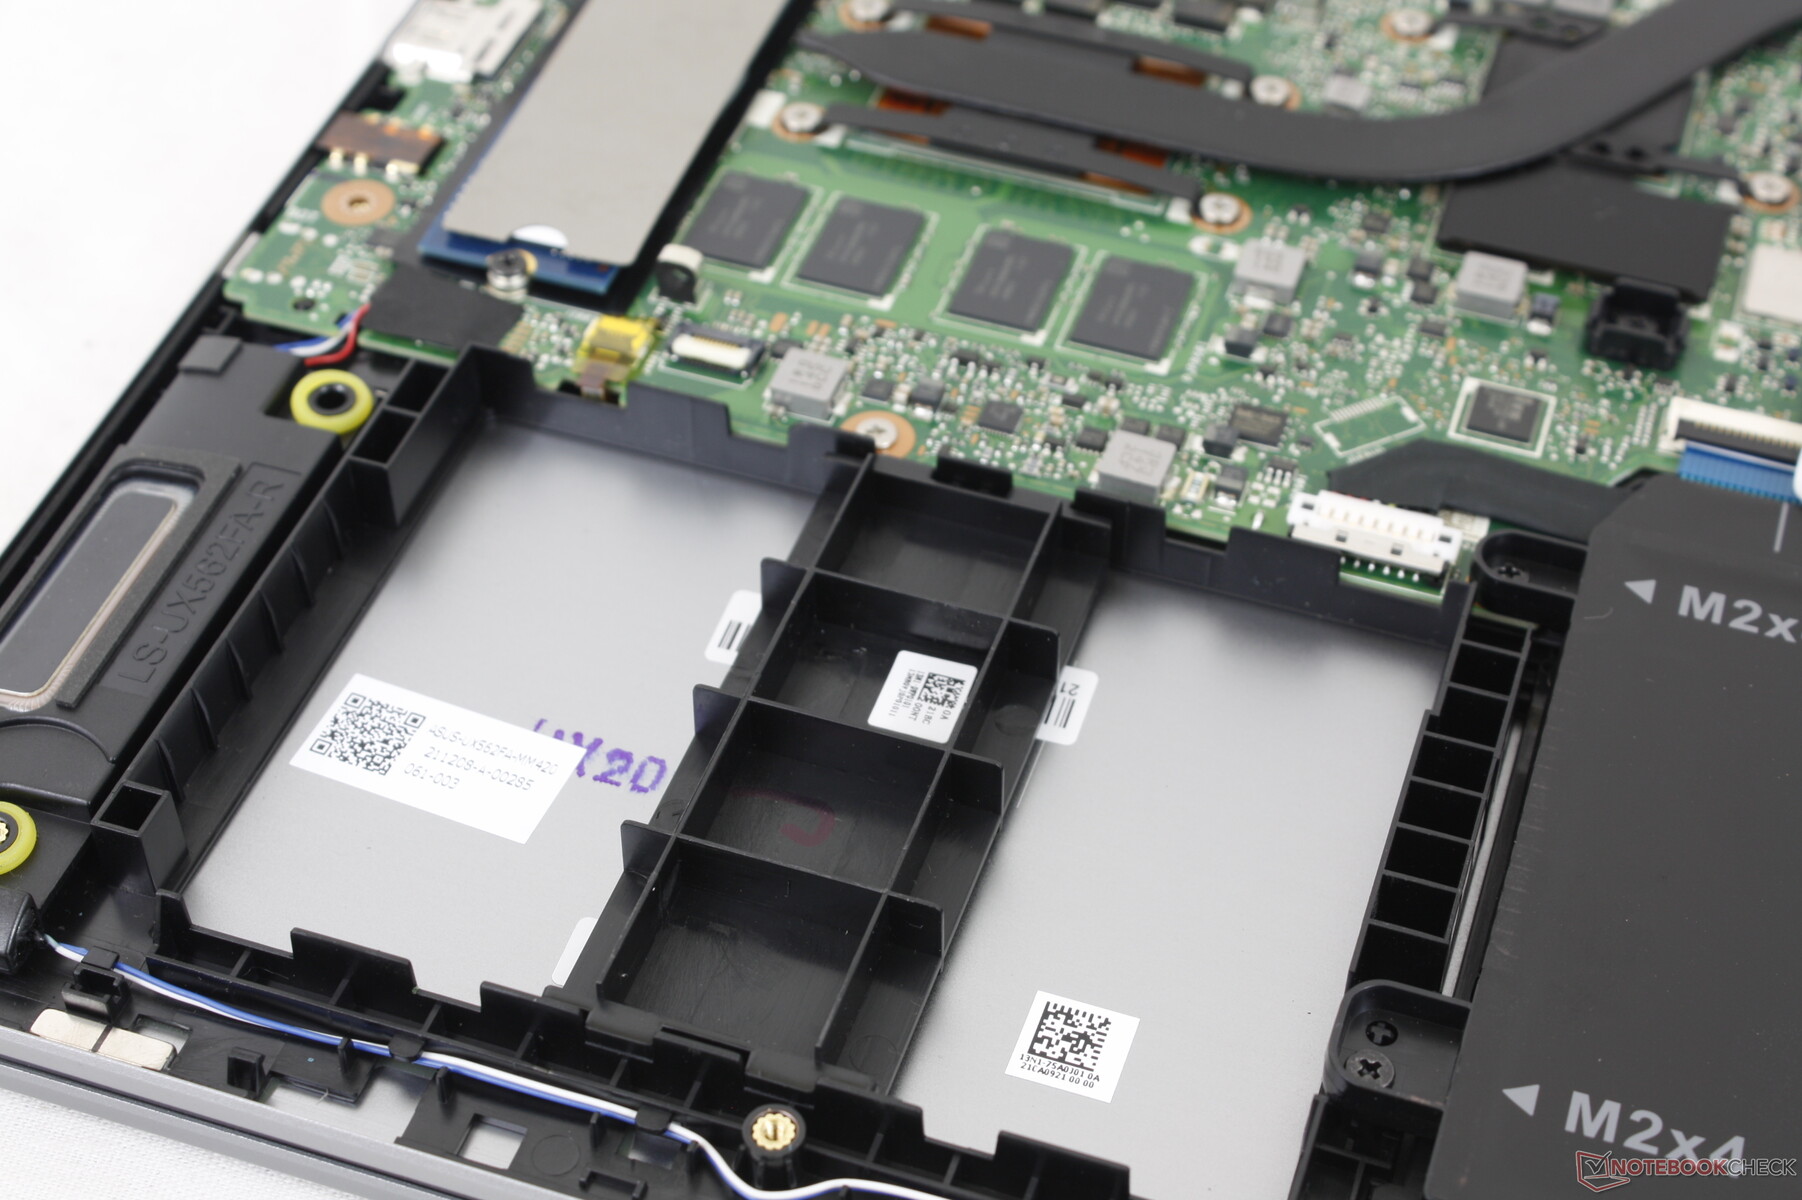
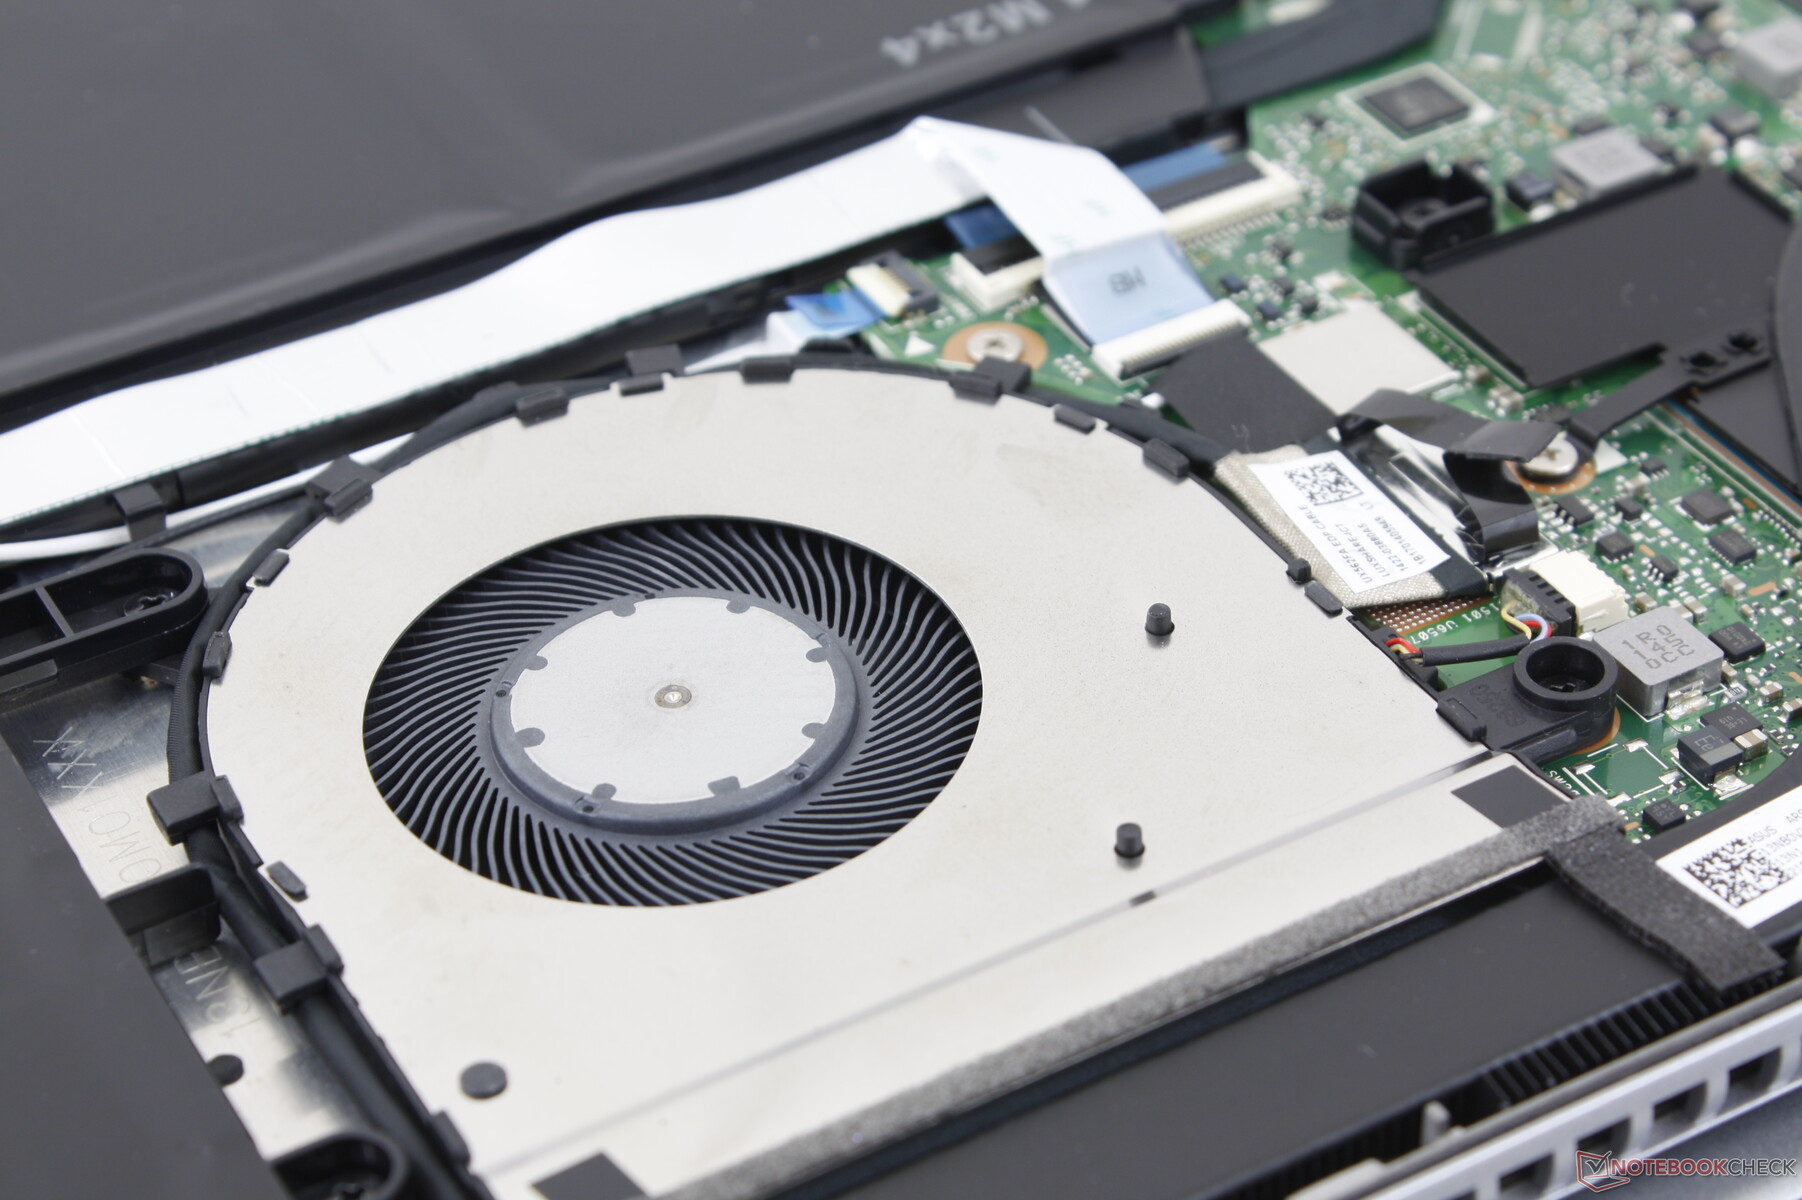
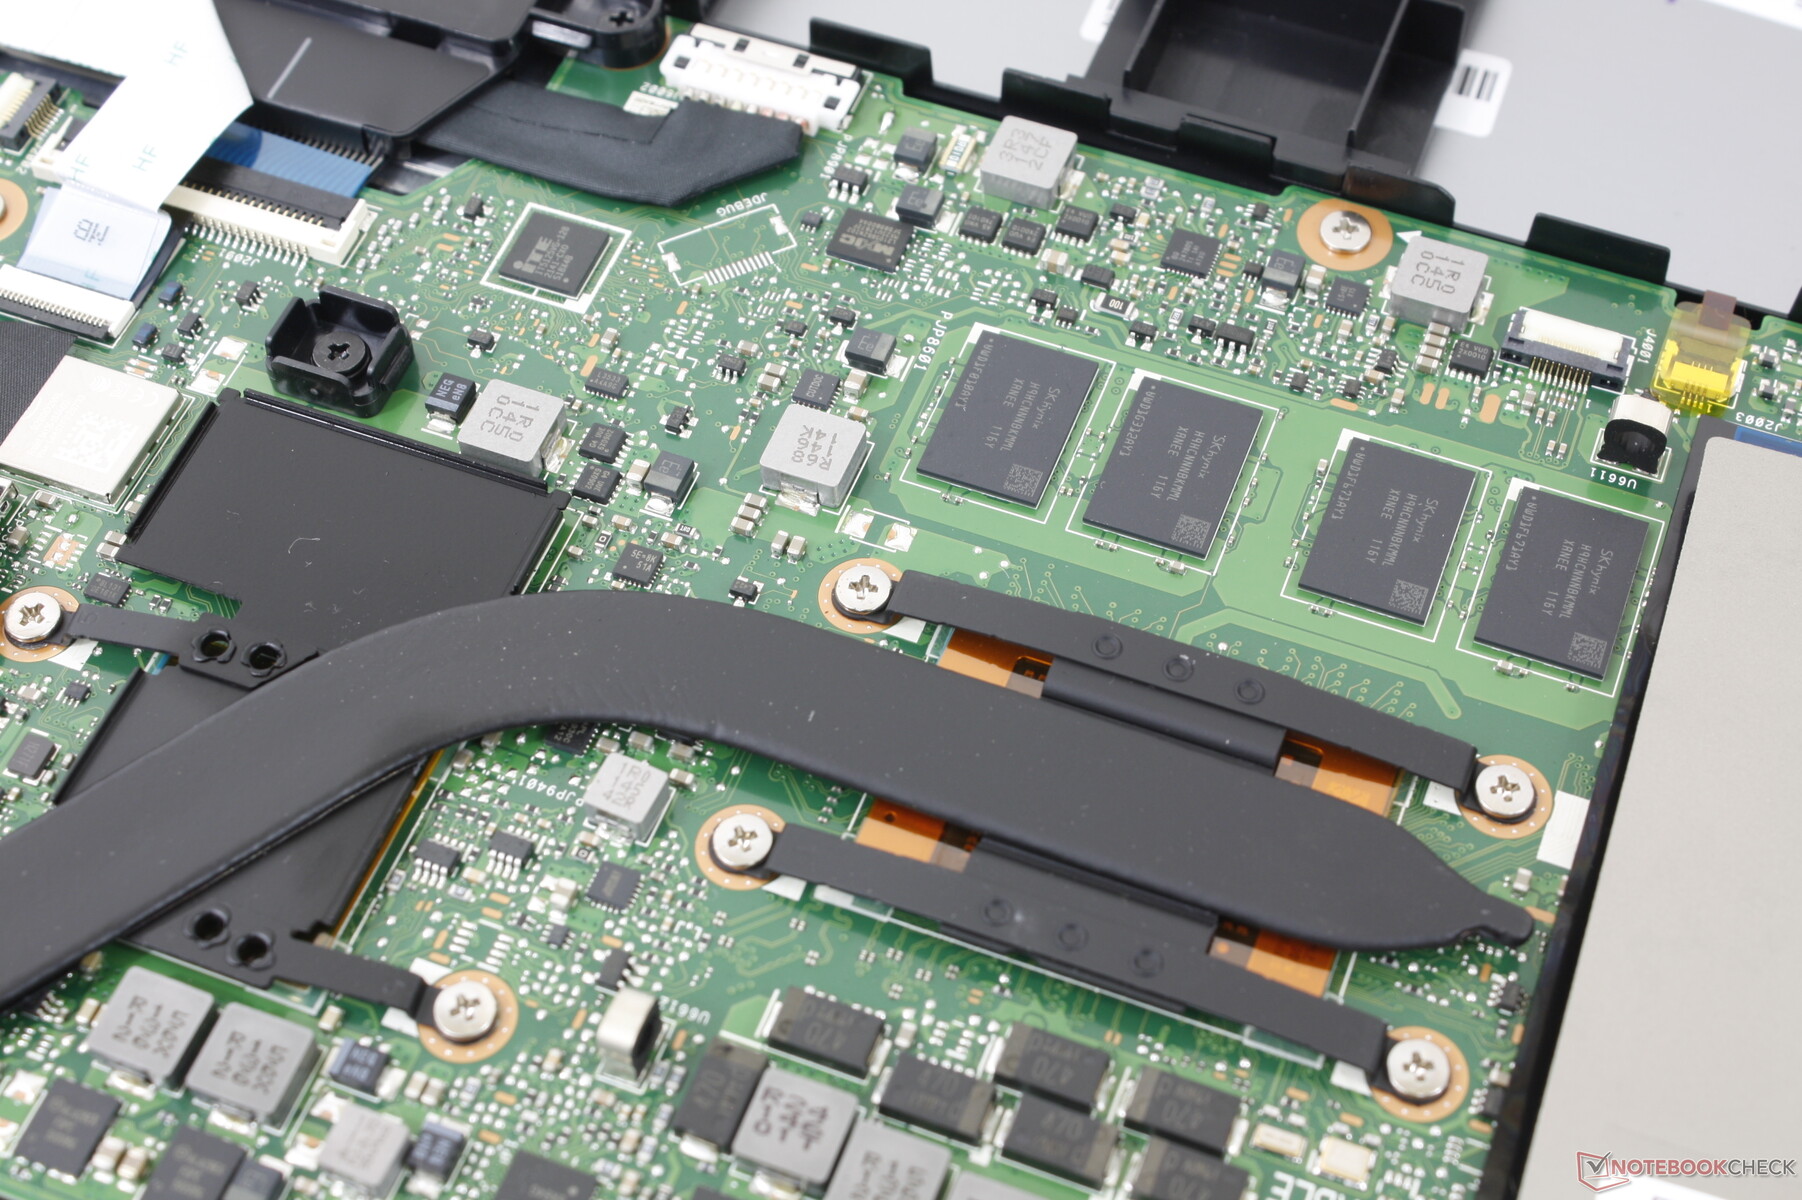
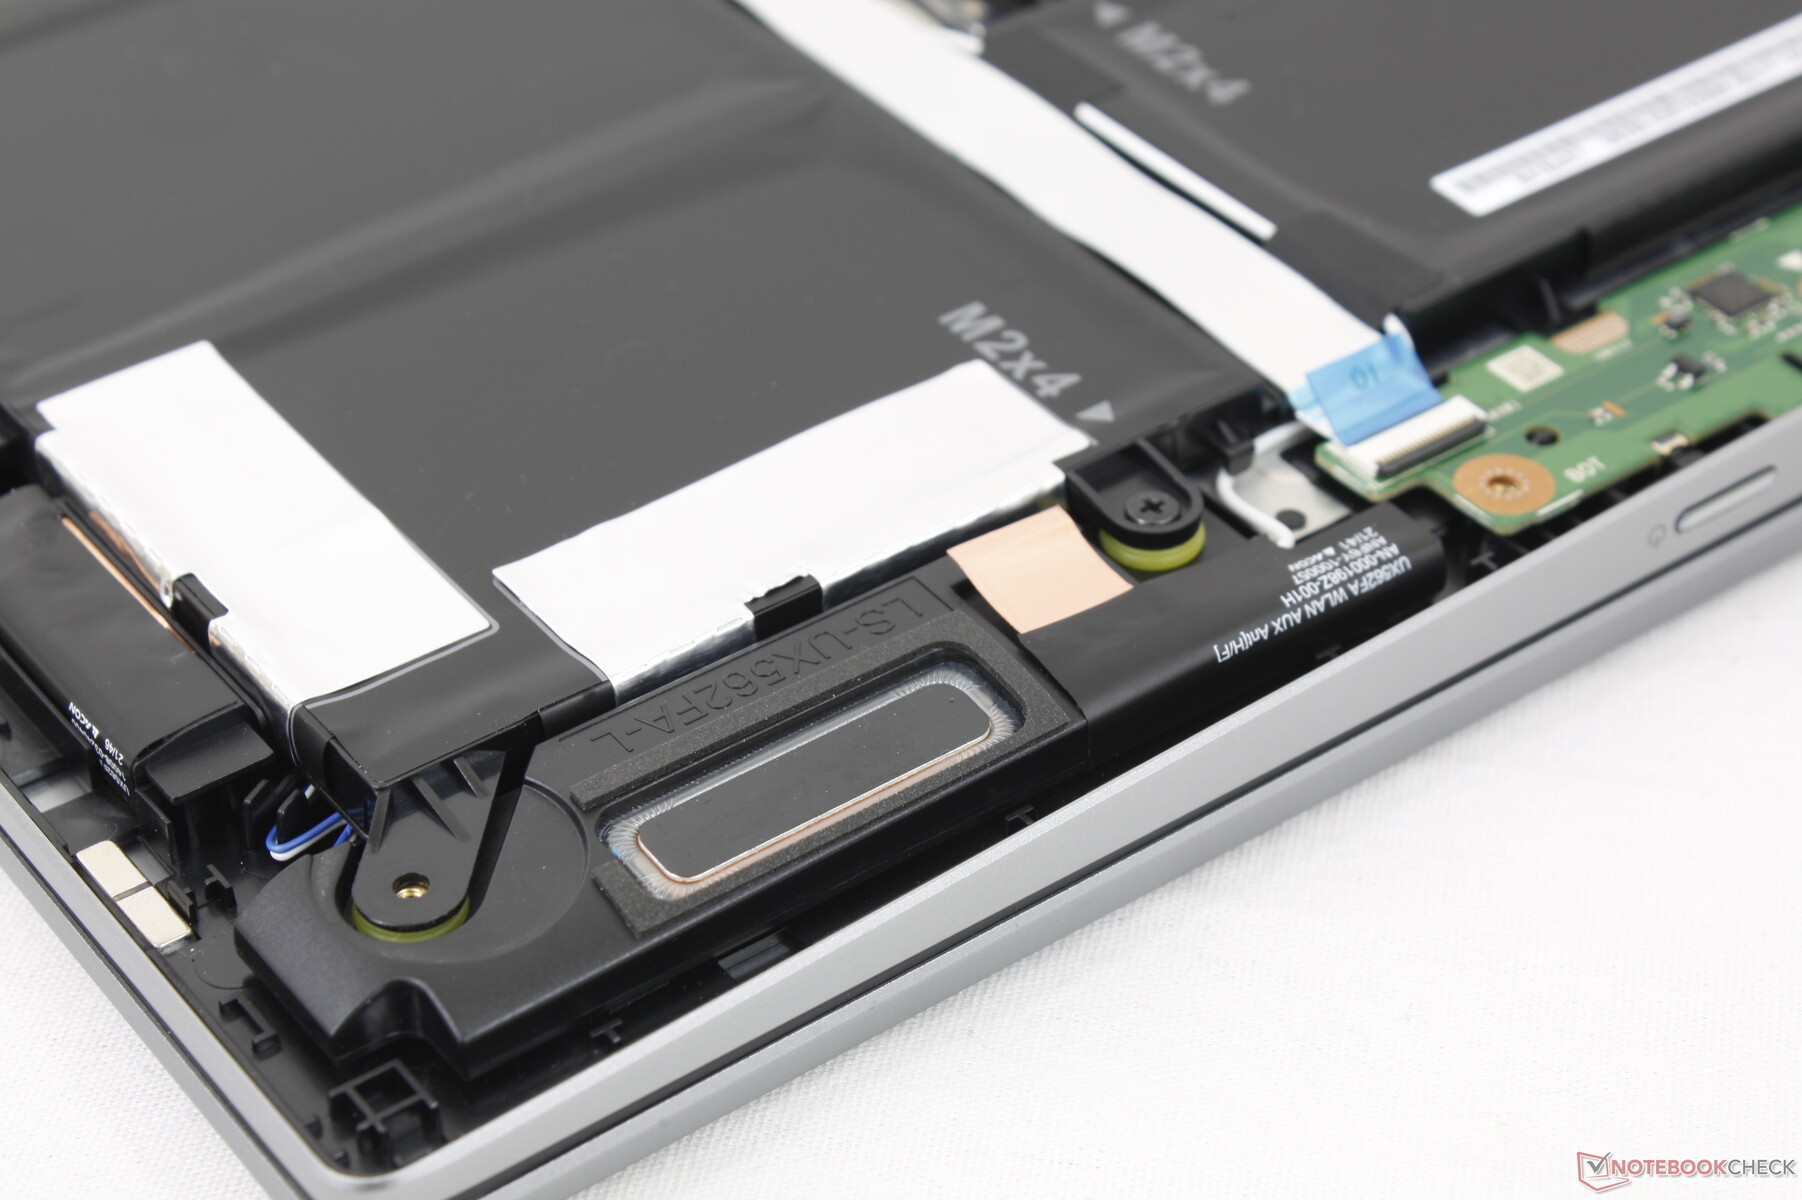
Maintenance
The bottom panel is secured by ten Philips screws with four of them hidden underneath the rubber feet. Other makers like HP have been moving away from hidden screws to make servicing easier and so it's frustrating to see Asus stick to such a user-unfriendly design.
Once inside, users can only upgrade the M.2 2280 PCIe SSD as the RAM and WLAN modules are soldered. In comparison, both the Dell Inspiron 15 7506 2-in-1 and HP Envy x360 15 have removable RAM.
Accessories and Warranty
There are no extras in the retail box other than the AC adapter and paperwork. The usual one-year limited manufacturer warranty applies if purchased in the US.
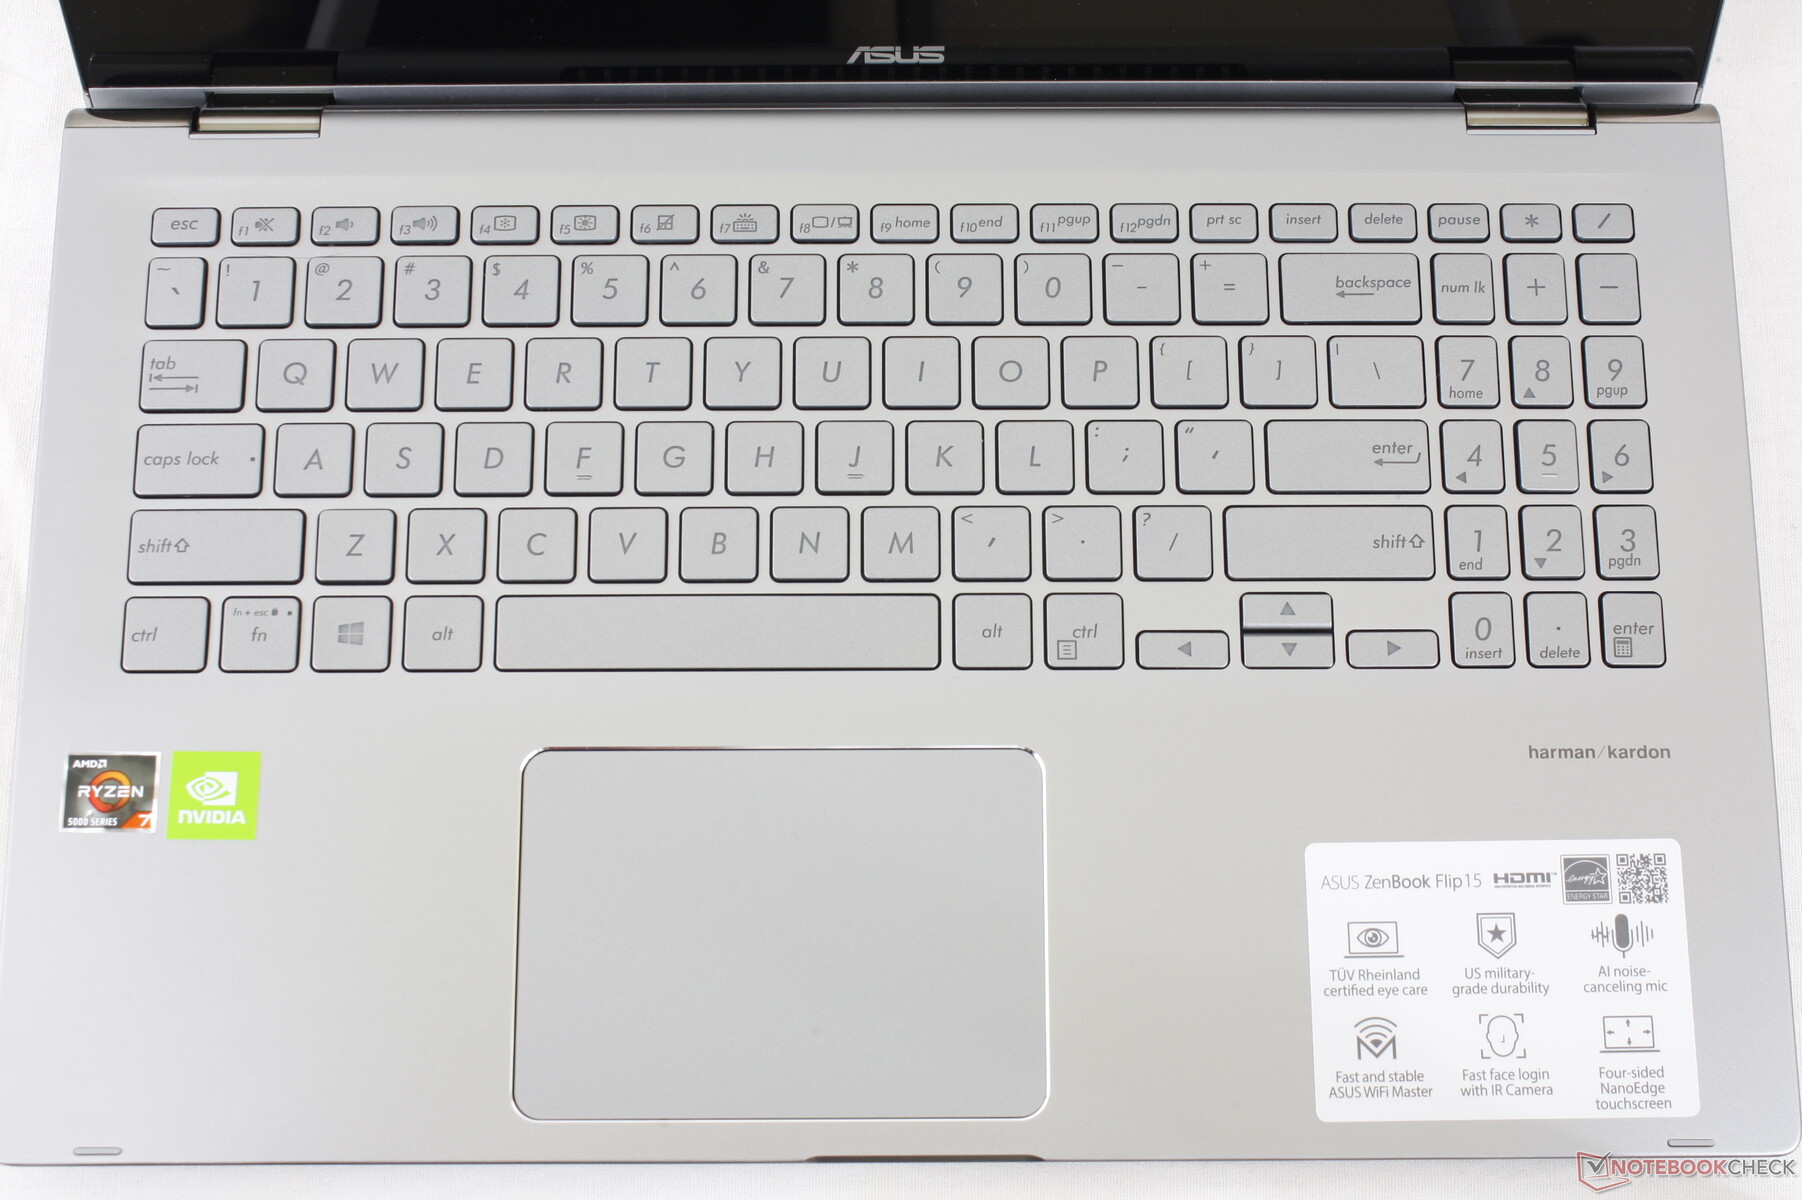
Input Devices — Decent Keyboard, Spongy Clickpad
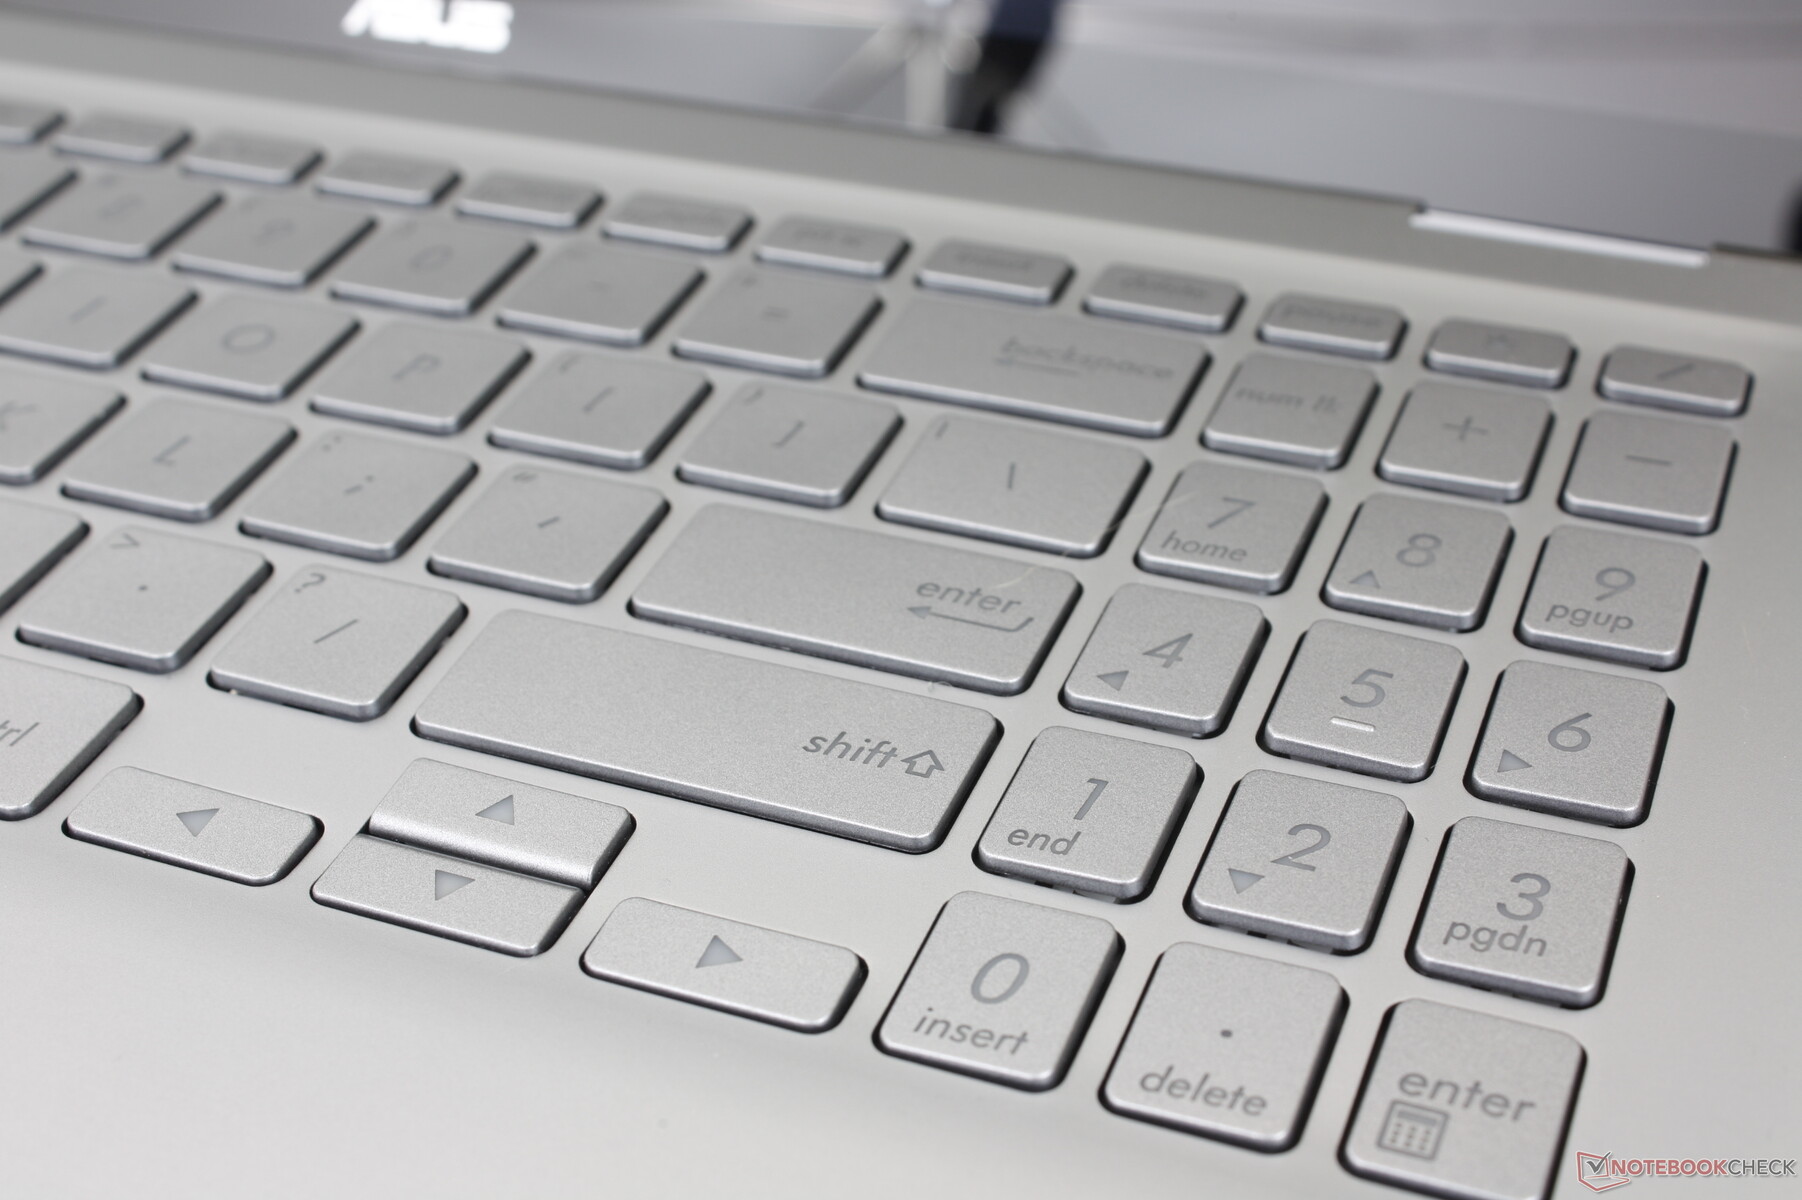
Keyboard
QWERTY key feedback is almost as sharp as on a Spectre x360 16 for a satisfying typing experience. Clatter is consequently loud, however, especially on the Space key. Key layout is otherwise identical to the ZenBook Flip 15 Q539ZD with just minor differences in labeling.
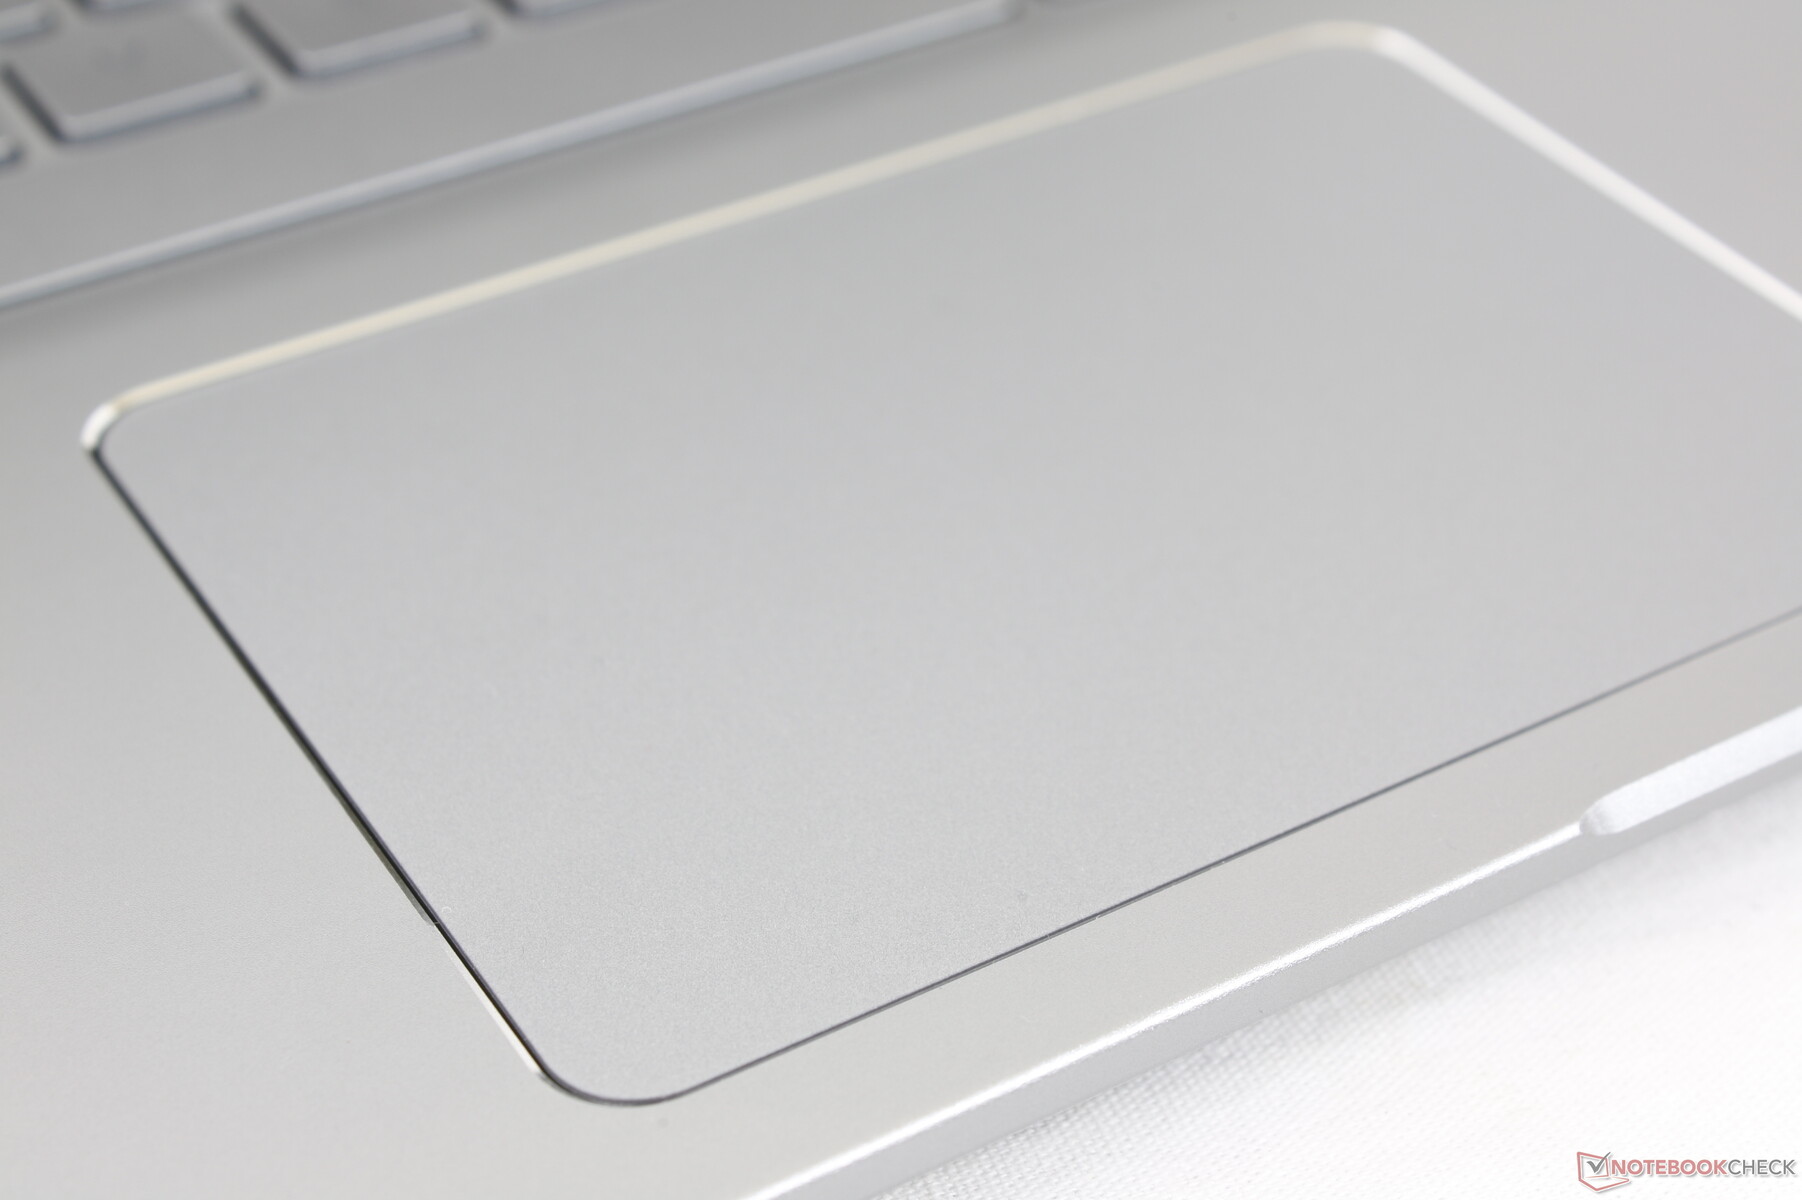
Touchpad
The clickpad is smaller than the one on the Dell Inspiron 15 7506 2-in-1 (10.5 x 7.5 cm vs. 11.5 x 8 cm). Gliding is smooth and reliable with only a bit of sticking at slower speeds for more accurate clicks and drag-and-drop actions. Feedback when clicking, however, is shallow and spongy for an unsatisfying feel. This trait is unfortunately shared between the Inspiron 15 7506 2-in-1 and Envy x360 15 and so it is not unique to Asus.

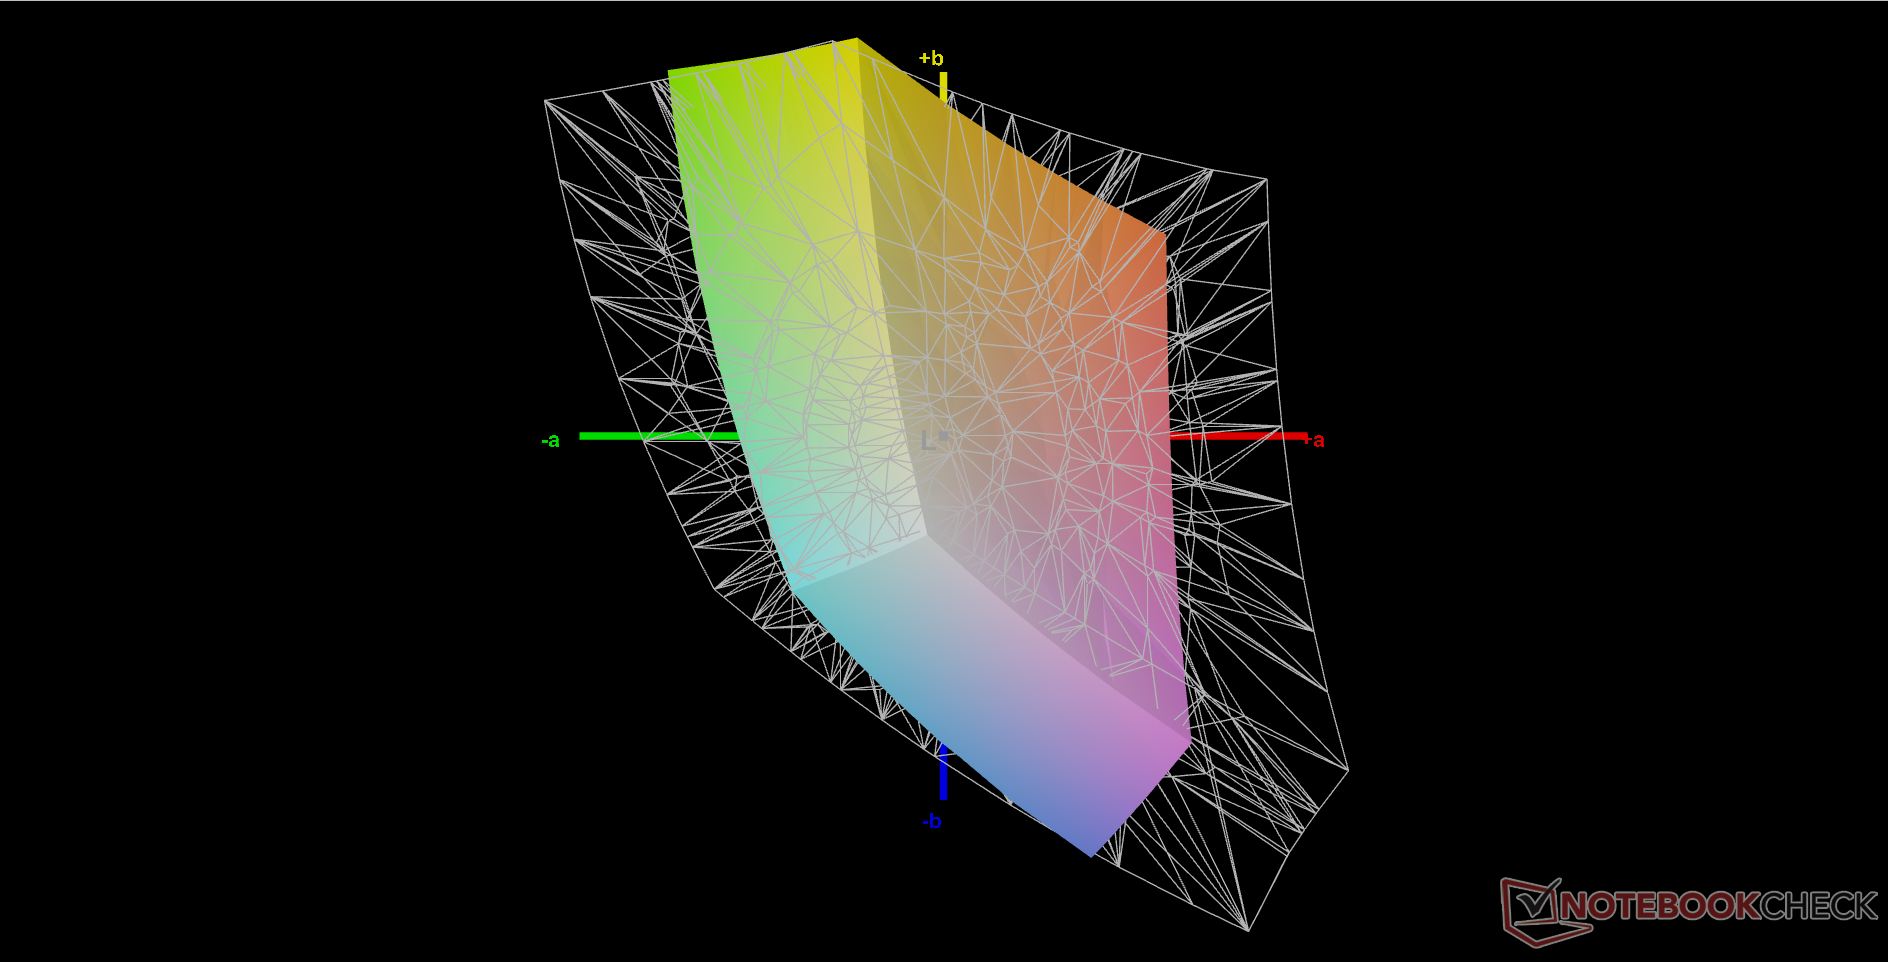
Display — Budget IPS Only
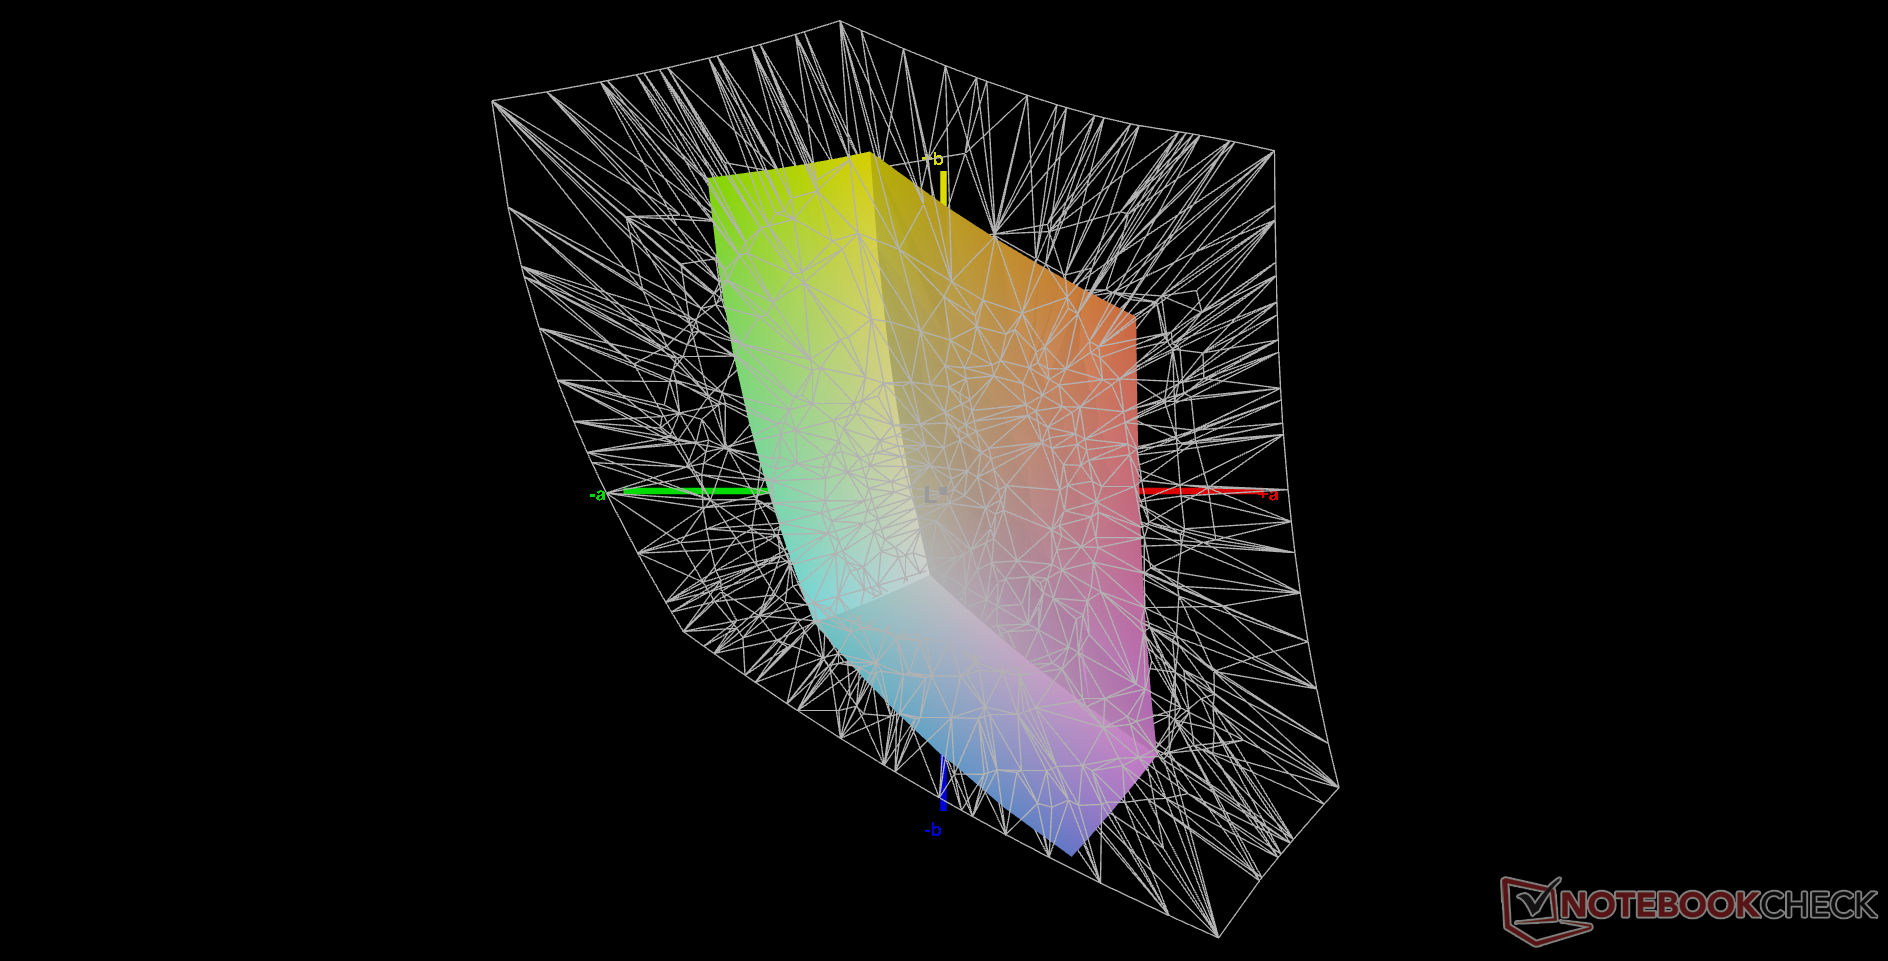
The model utilizes a budget-grade BOE IPS panel with no other options to choose from. The dead giveaway that this is not a high-end panel is its narrow color space of just 59 percent of sRGB. In comparison, the displays on the Inspiron 15 7506 2-in-1 or HP Spectre x360 15 series target full sRGB coverage or greater.
Aside from the disappointing colors, other attributes like response times, refresh rate, and brightness are average at best and nothing special for the category. We would love to see a 90 Hz option in the future for a smoother user experience. Asus already offers them on certain Vivobook models, after all.


| |||||||||||||||||||||||||
Brightness Distribution: 85 %
Center on Battery: 328.4 cd/m²
Contrast: 1095:1 (Black: 0.3 cd/m²)
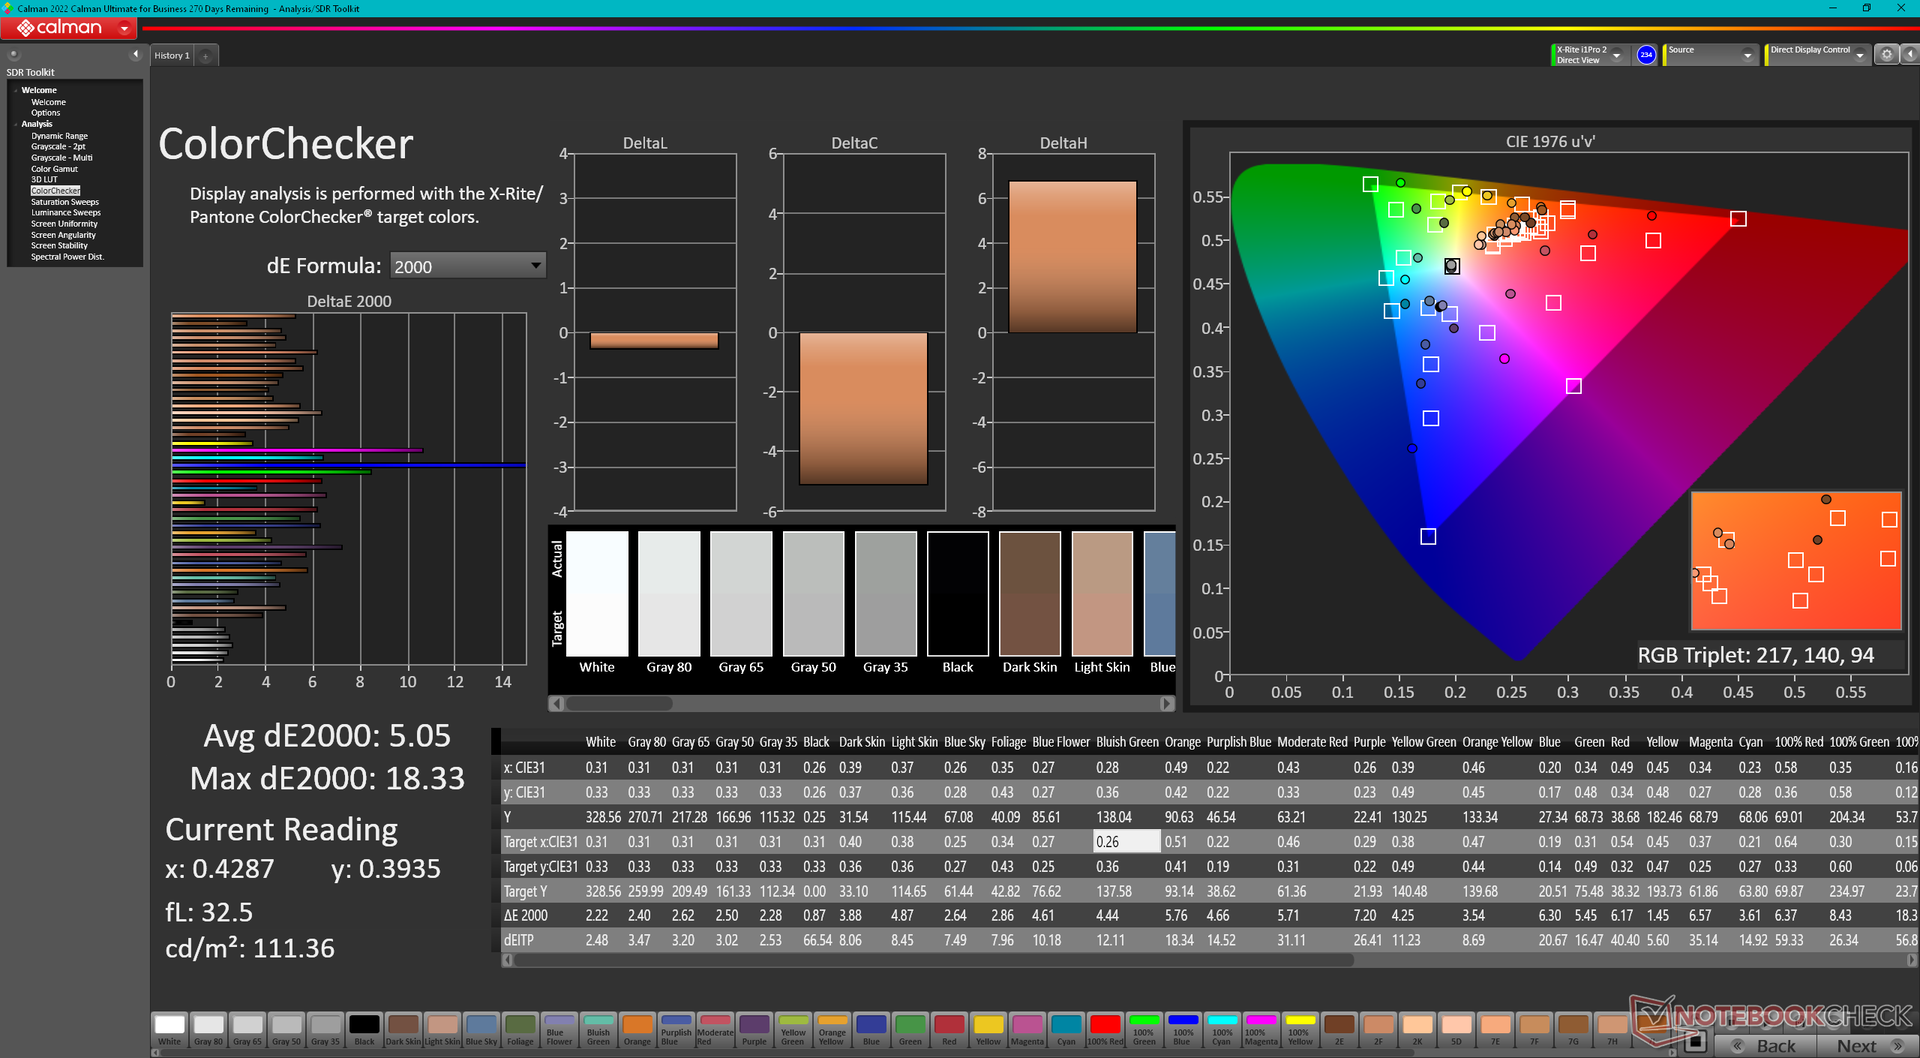
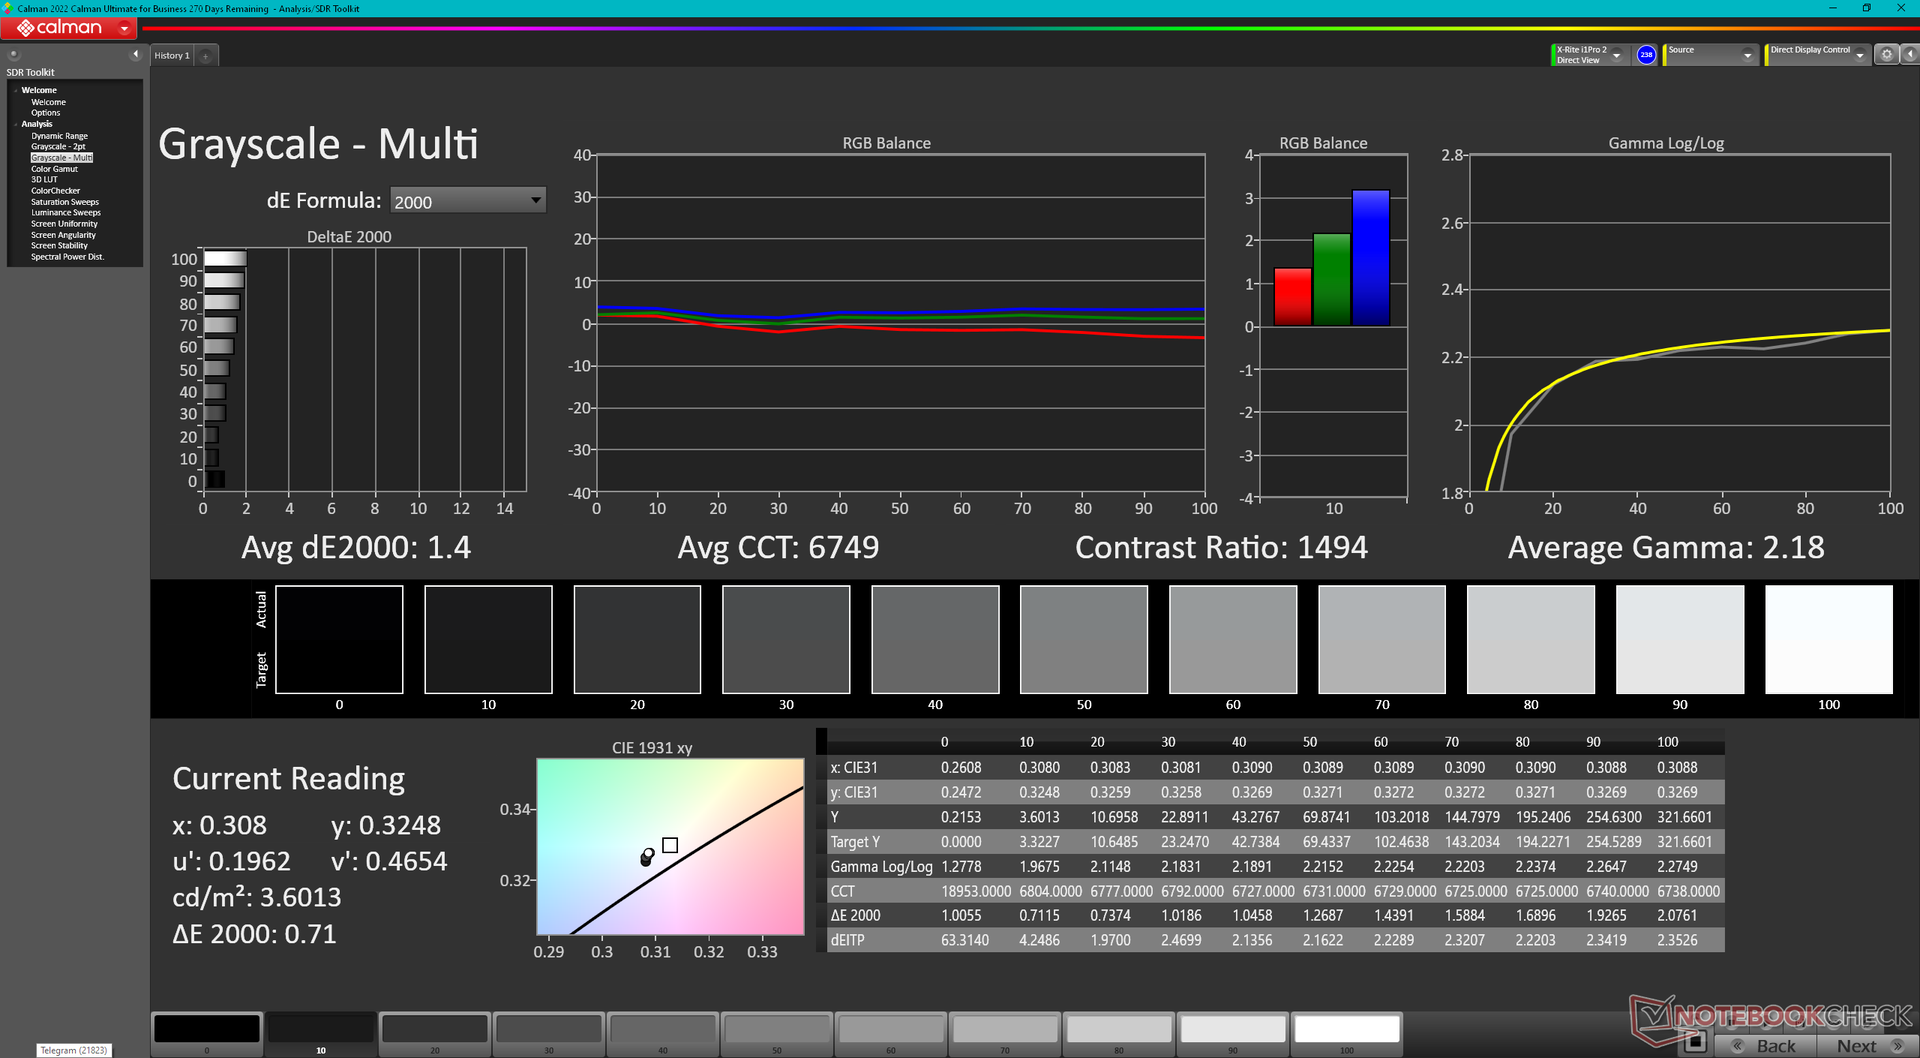
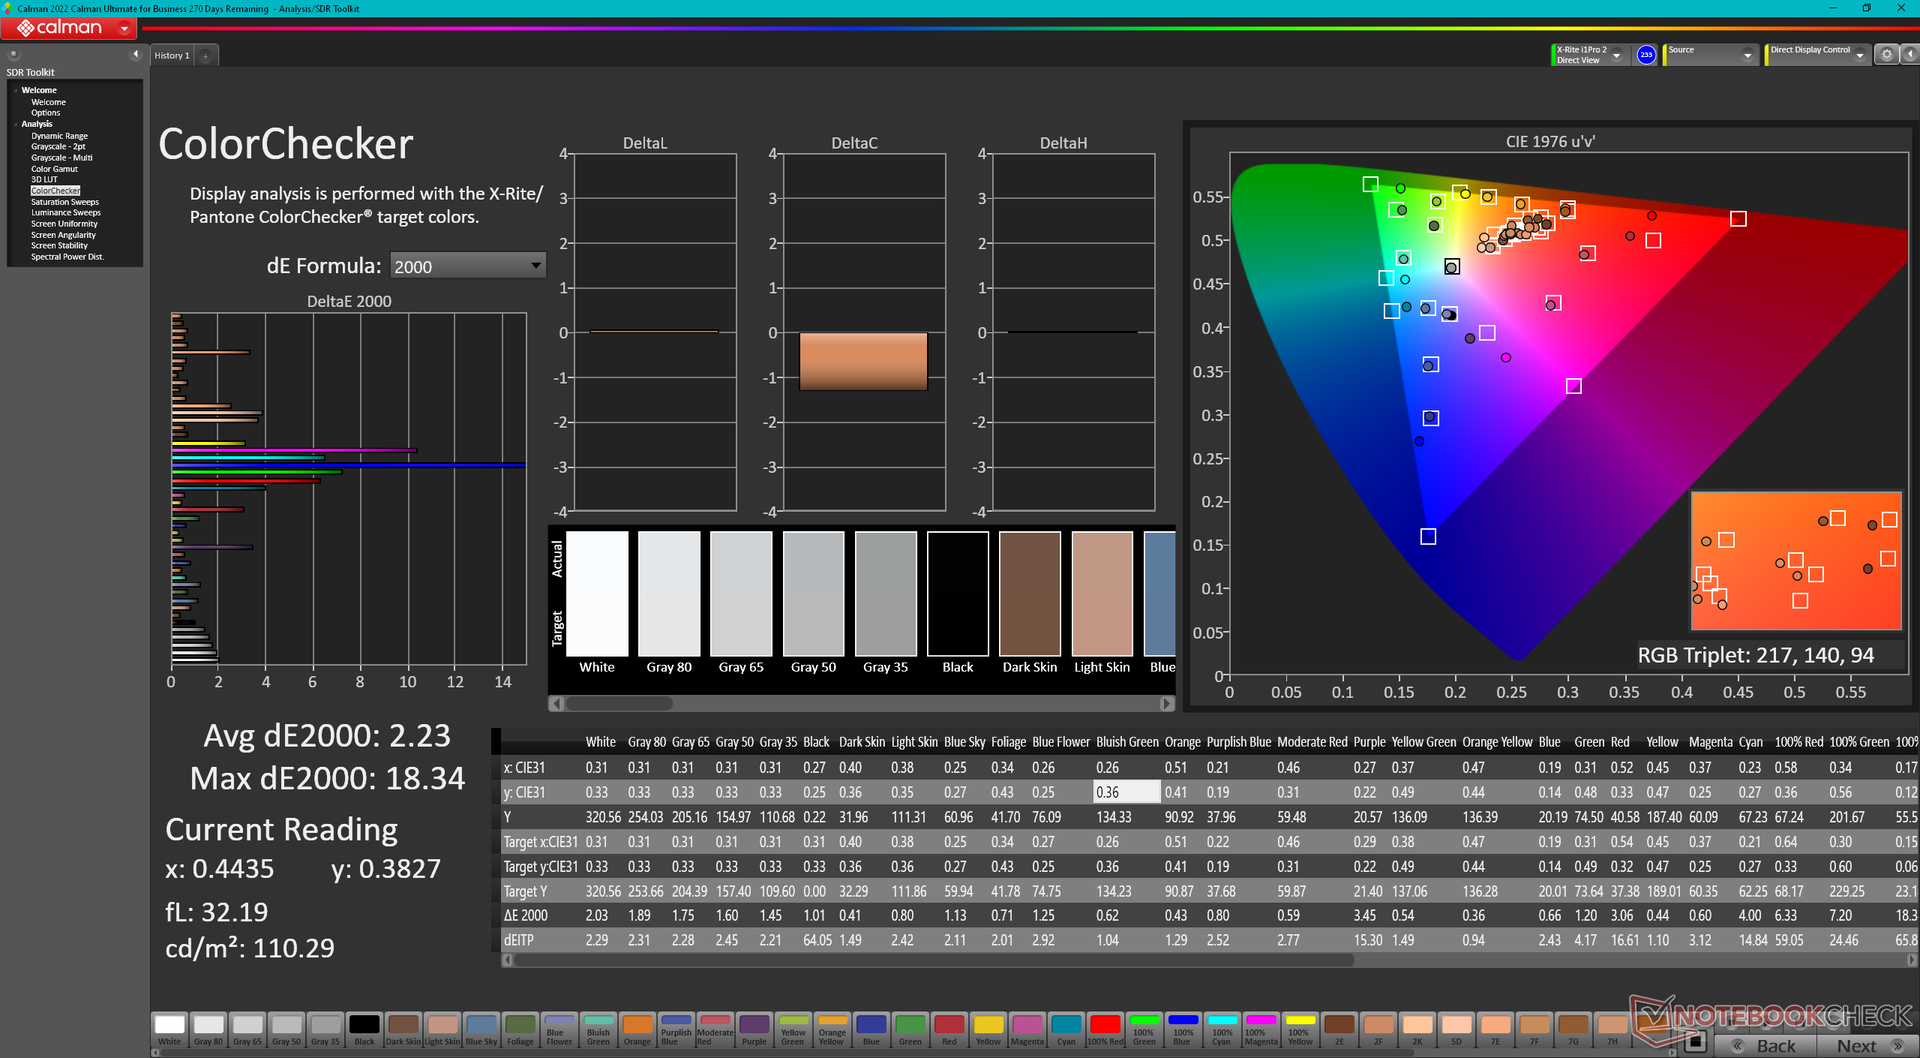
ΔE ColorChecker Calman: 5.05 | ∀{0.5-29.43 Ø4.72}
calibrated: 2.23
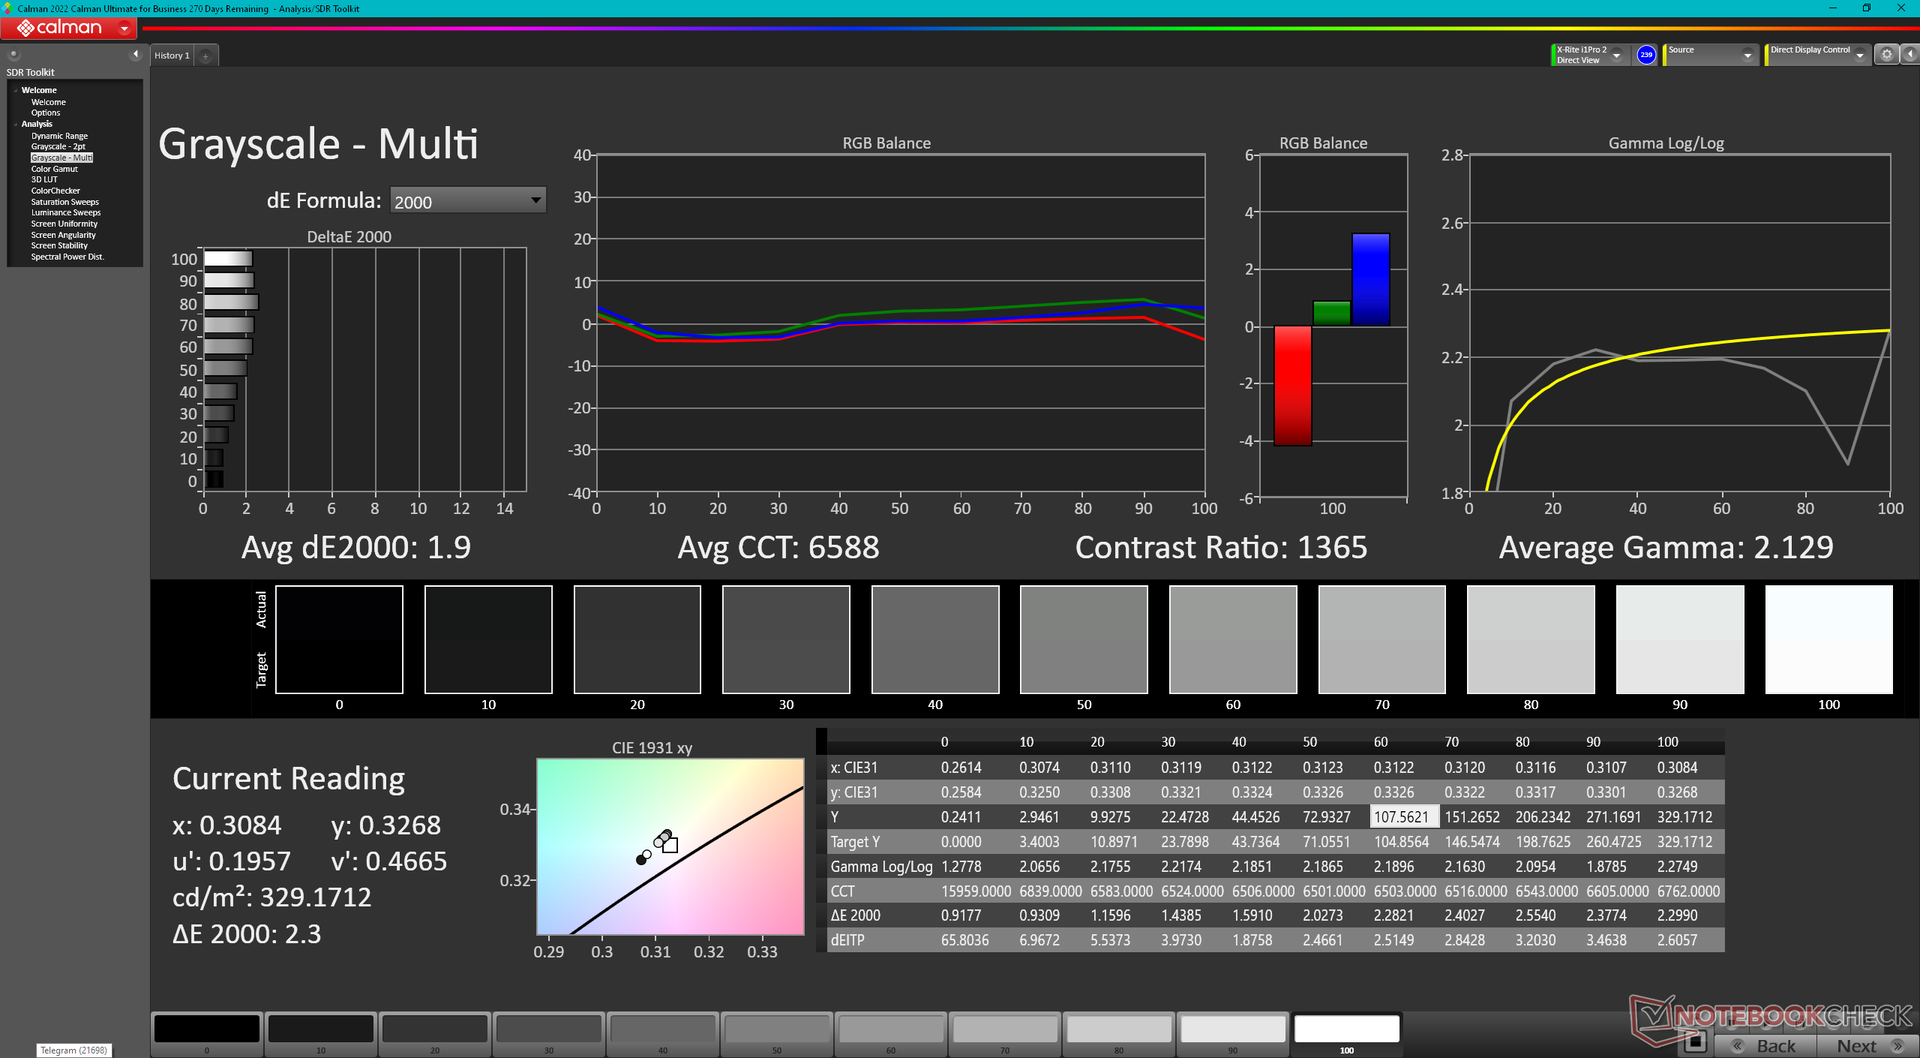
ΔE Greyscale Calman: 1.9 | ∀{0.09-98 Ø4.97}
41.3% AdobeRGB 1998 (Argyll 3D)
58.5% sRGB (Argyll 3D)
40.1% Display P3 (Argyll 3D)
Gamma: 2.13
CCT: 6588 K
| Asus ZenBook Flip 15 Q508U BOE CQ NV156FHM-N4L, IPS, 1920x1080, 15.6" | Asus ZenBook Flip 15 Q539ZD Samsung ATNA56AC01-0, OLED, 2880x1620, 15.6" | HP Envy x360 15-ey0023dx BOE08A8, IPS, 1920x1080, 15.6" | Samsung Galaxy Book Pro 360 15 NP950QDB-KC3DE SDC4159, OLED, 1920x1080, 15.6" | Dell Inspiron 15 7506 2-in-1 P97F LG Philips 156WFF, IPS, 1920x1080, 15.6" | Lenovo IdeaPad 5 15ALC05 Lenovo LEN156FHD, IPS, 1920x1080, 15.6" | |
|---|---|---|---|---|---|---|
| Display | 119% | -1% | 119% | 67% | -4% | |
| Display P3 Coverage (%) | 40.1 | 99.8 149% | 39.6 -1% | 99.9 149% | 67.4 68% | |
| sRGB Coverage (%) | 58.5 | 100 71% | 58.5 0% | 100 71% | 97.2 66% | 59 1% |
| AdobeRGB 1998 Coverage (%) | 41.3 | 97.5 136% | 40.9 -1% | 97.6 136% | 68.7 66% | 38 -8% |
| Response Times | 98% | 19% | 96% | -5% | 45% | |
| Response Time Grey 50% / Grey 80% * (ms) | 45.2 ? | 0.8 ? 98% | 43.6 ? 4% | 2 ? 96% | 52.4 ? -16% | 29 ? 36% |
| Response Time Black / White * (ms) | 38.4 ? | 1.1 ? 97% | 25.2 ? 34% | 2 ? 95% | 36 ? 6% | 18 ? 53% |
| PWM Frequency (Hz) | 240.4 ? | 60 | ||||
| Screen | 26% | -10% | 74% | -10% | -42% | |
| Brightness middle (cd/m²) | 328.4 | 340.1 4% | 297.8 -9% | 290 -12% | 289.8 -12% | 376 14% |
| Brightness (cd/m²) | 307 | 344 12% | 271 -12% | 290 -6% | 274 -11% | 341 11% |
| Brightness Distribution (%) | 85 | 97 14% | 81 -5% | 99 16% | 92 8% | 78 -8% |
| Black Level * (cd/m²) | 0.3 | 0.35 -17% | 0.05 83% | 0.31 -3% | 0.66 -120% | |
| Contrast (:1) | 1095 | 851 -22% | 5800 430% | 935 -15% | 570 -48% | |
| Colorchecker dE 2000 * | 5.05 | 2.47 51% | 5.16 -2% | 1.84 64% | 3.75 26% | 6.4 -27% |
| Colorchecker dE 2000 max. * | 18.33 | 5.96 67% | 19.76 -8% | 3.83 79% | 7.01 62% | 20.45 -12% |
| Colorchecker dE 2000 calibrated * | 2.23 | 2.28 -2% | 2.69 -21% | 1.52 32% | ||
| Greyscale dE 2000 * | 1.9 | 1.8 5% | 2.2 -16% | 1.24 35% | 5.3 -179% | 4.59 -142% |
| Gamma | 2.13 103% | 2.2 100% | 2.27 97% | 2.2 100% | 2.35 94% | 2.26 97% |
| CCT | 6588 99% | 6346 102% | 6678 97% | 6686 97% | 5810 112% | 6819 95% |
| Color Space (Percent of AdobeRGB 1998) (%) | 62.9 | 38 | ||||
| Color Space (Percent of sRGB) (%) | 97 | 59 | ||||
| Total Average (Program / Settings) | 81% /
64% | 3% /
-4% | 96% /
87% | 17% /
7% | -0% /
-21% |
* ... smaller is better
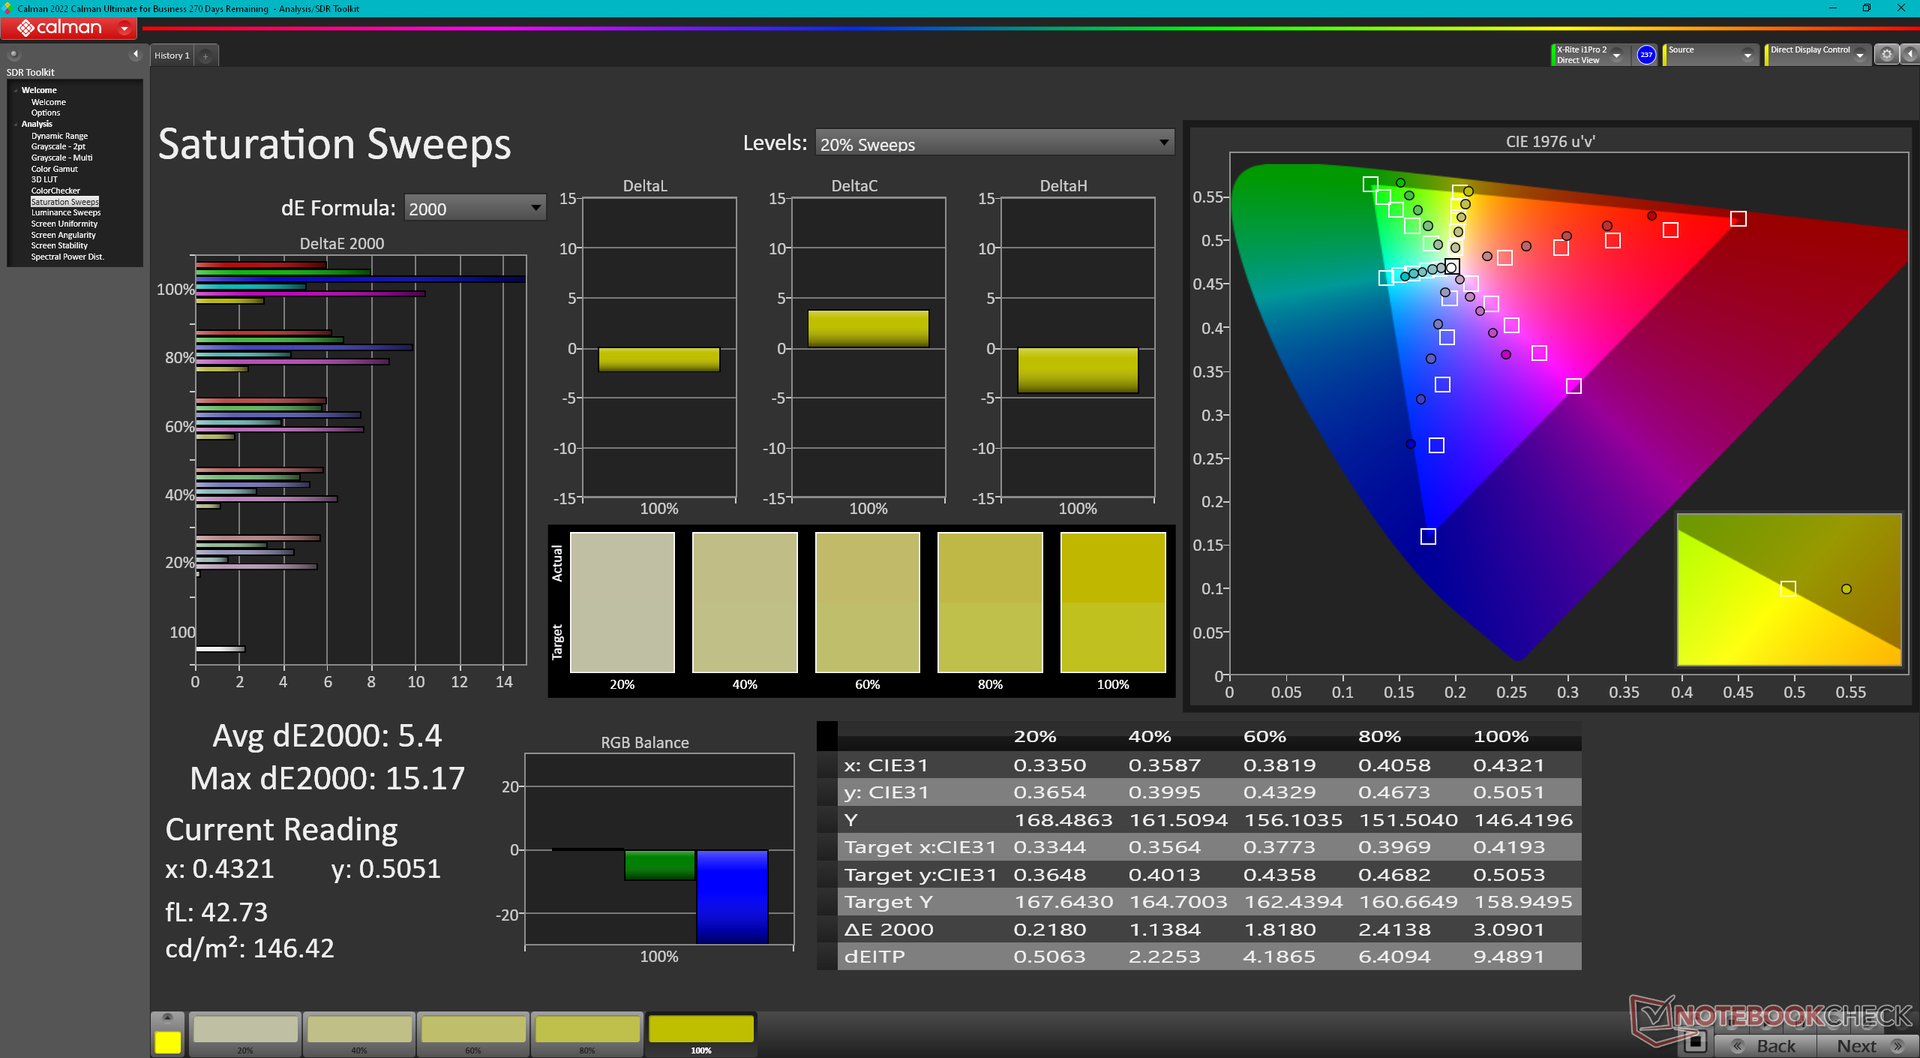
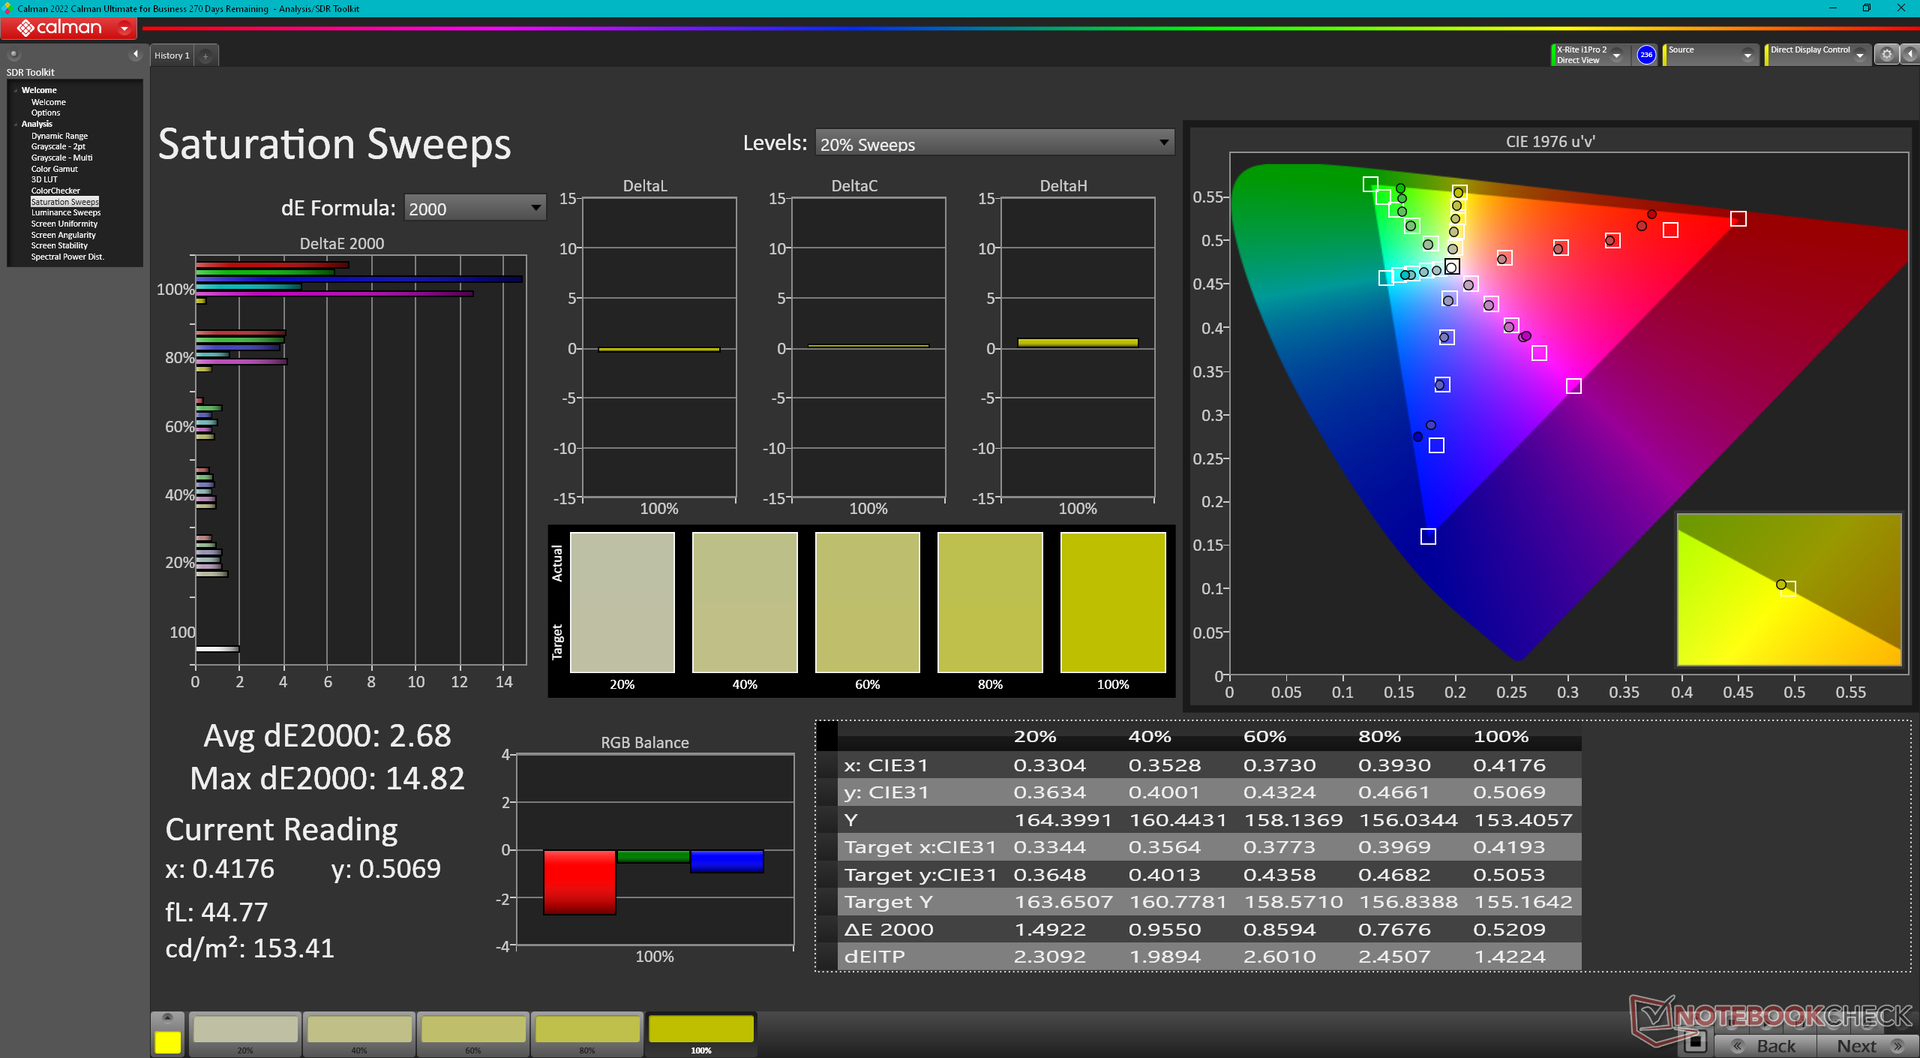
Grayscale and color temperature are actually pretty good out of the box while the colors themselves are inaccurate. Calibrating with our X-Rite colorimeter would improve colors at lower saturation levels as shown by our CalMAN results below, but the limited color space mentioned above means that colors are higher saturation levels must remain inaccurate. Blue in particular is the least accurate color tested as it appears closer to blue-green instead of true blue.
We recommend applying our calibrated ICM profile above for a more color accurate display.
Display Response Times
| ↔ Response Time Black to White | ||
|---|---|---|
| 38.4 ms ... rise ↗ and fall ↘ combined | ↗ 21.2 ms rise | 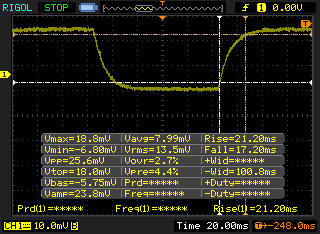 |
| ↘ 17.2 ms fall | ||
| The screen shows slow response rates in our tests and will be unsatisfactory for gamers. In comparison, all tested devices range from 0.1 (minimum) to 240 (maximum) ms. » 96 % of all devices are better. This means that the measured response time is worse than the average of all tested devices (19.8 ms). | ||
| ↔ Response Time 50% Grey to 80% Grey | ||
| 45.2 ms ... rise ↗ and fall ↘ combined | ↗ 22.4 ms rise | 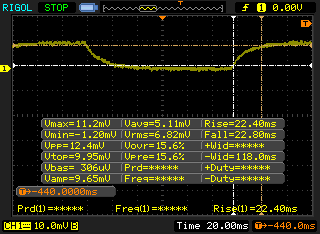 |
| ↘ 22.8 ms fall | ||
| The screen shows slow response rates in our tests and will be unsatisfactory for gamers. In comparison, all tested devices range from 0.165 (minimum) to 636 (maximum) ms. » 78 % of all devices are better. This means that the measured response time is worse than the average of all tested devices (31 ms). | ||
Screen Flickering / PWM (Pulse-Width Modulation)
| Screen flickering / PWM not detected | 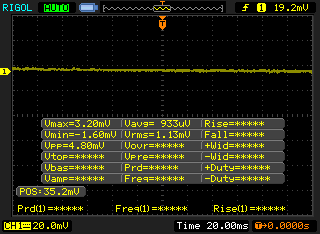 | ||
In comparison: 52 % of all tested devices do not use PWM to dim the display. If PWM was detected, an average of 7747 (minimum: 5 - maximum: 343500) Hz was measured. | |||
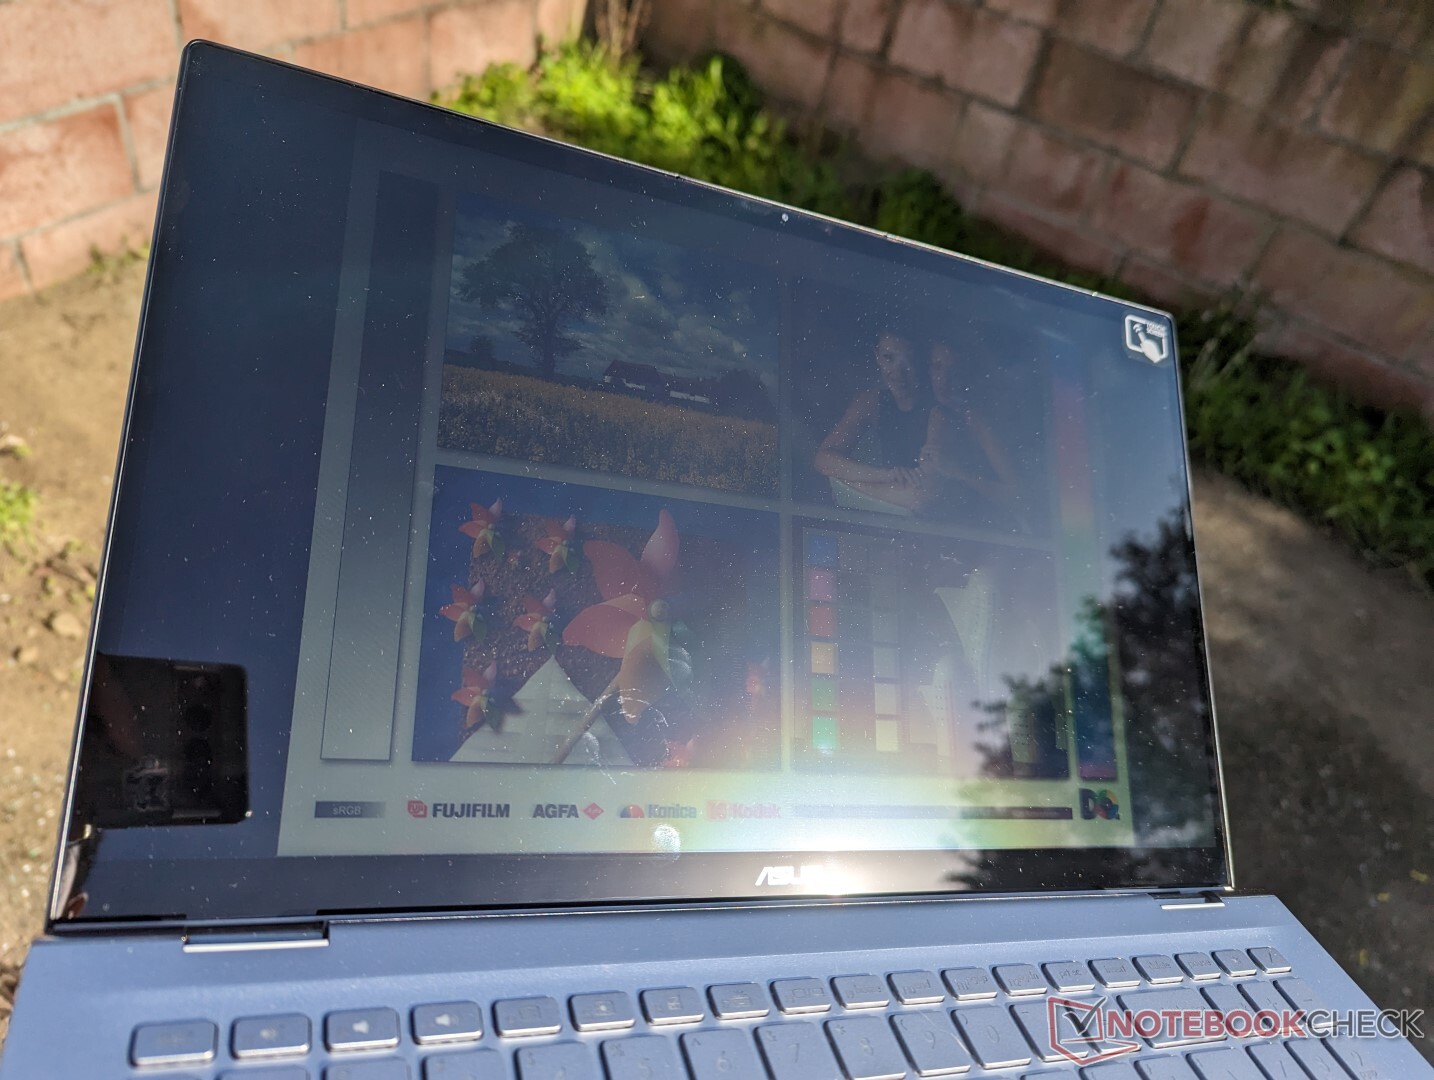
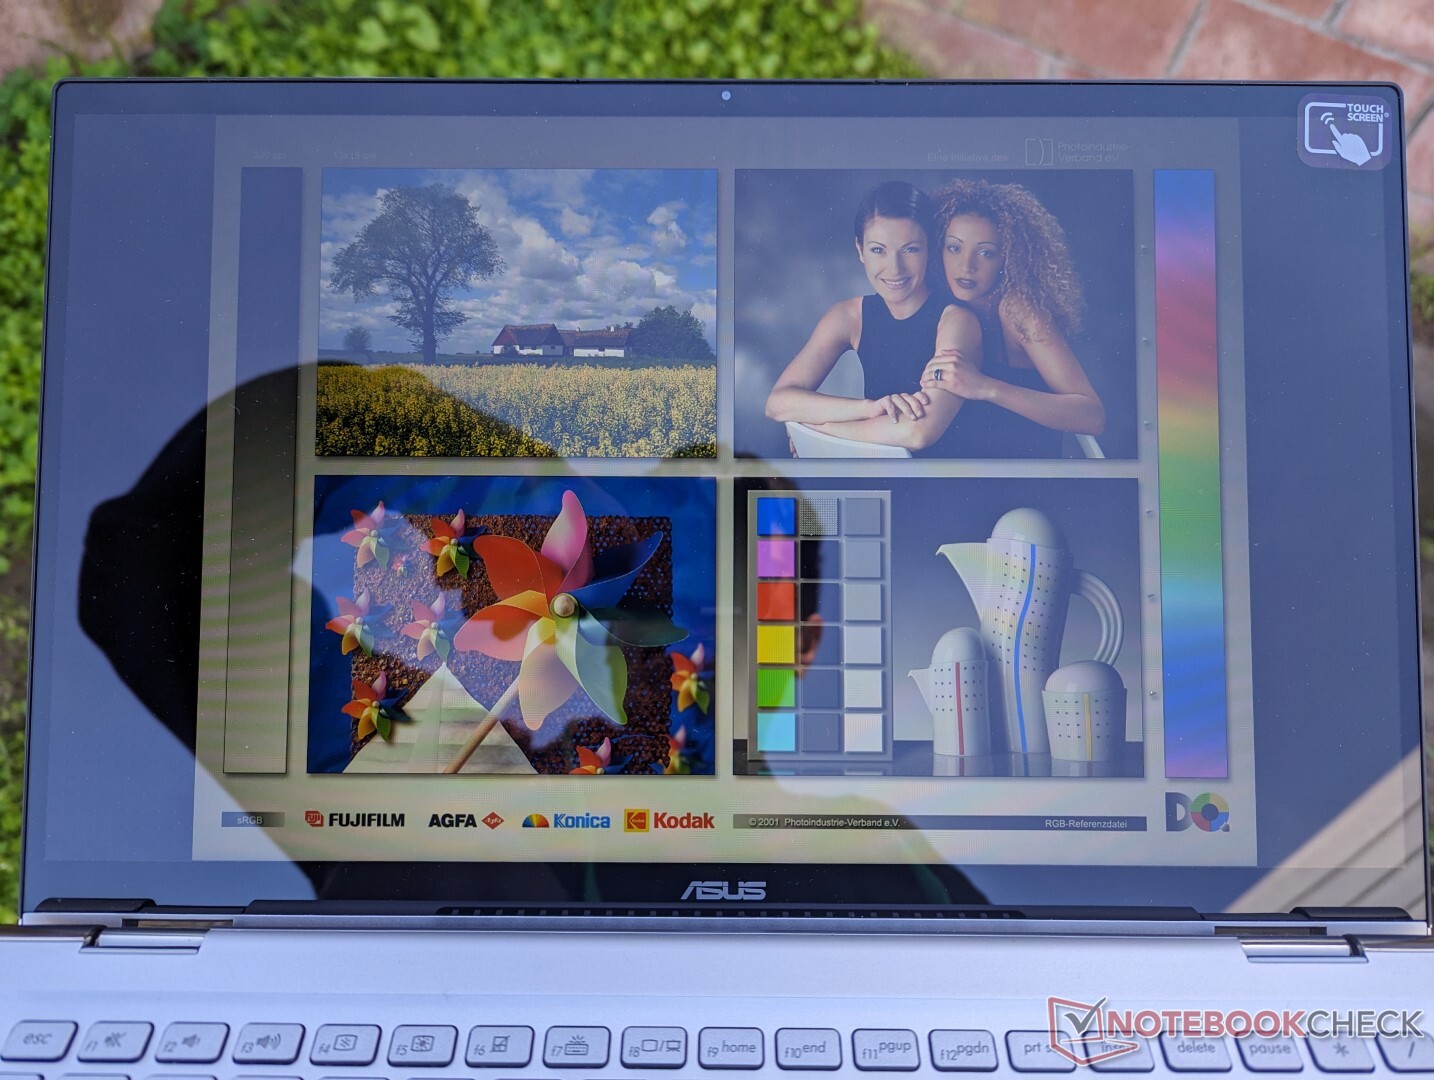
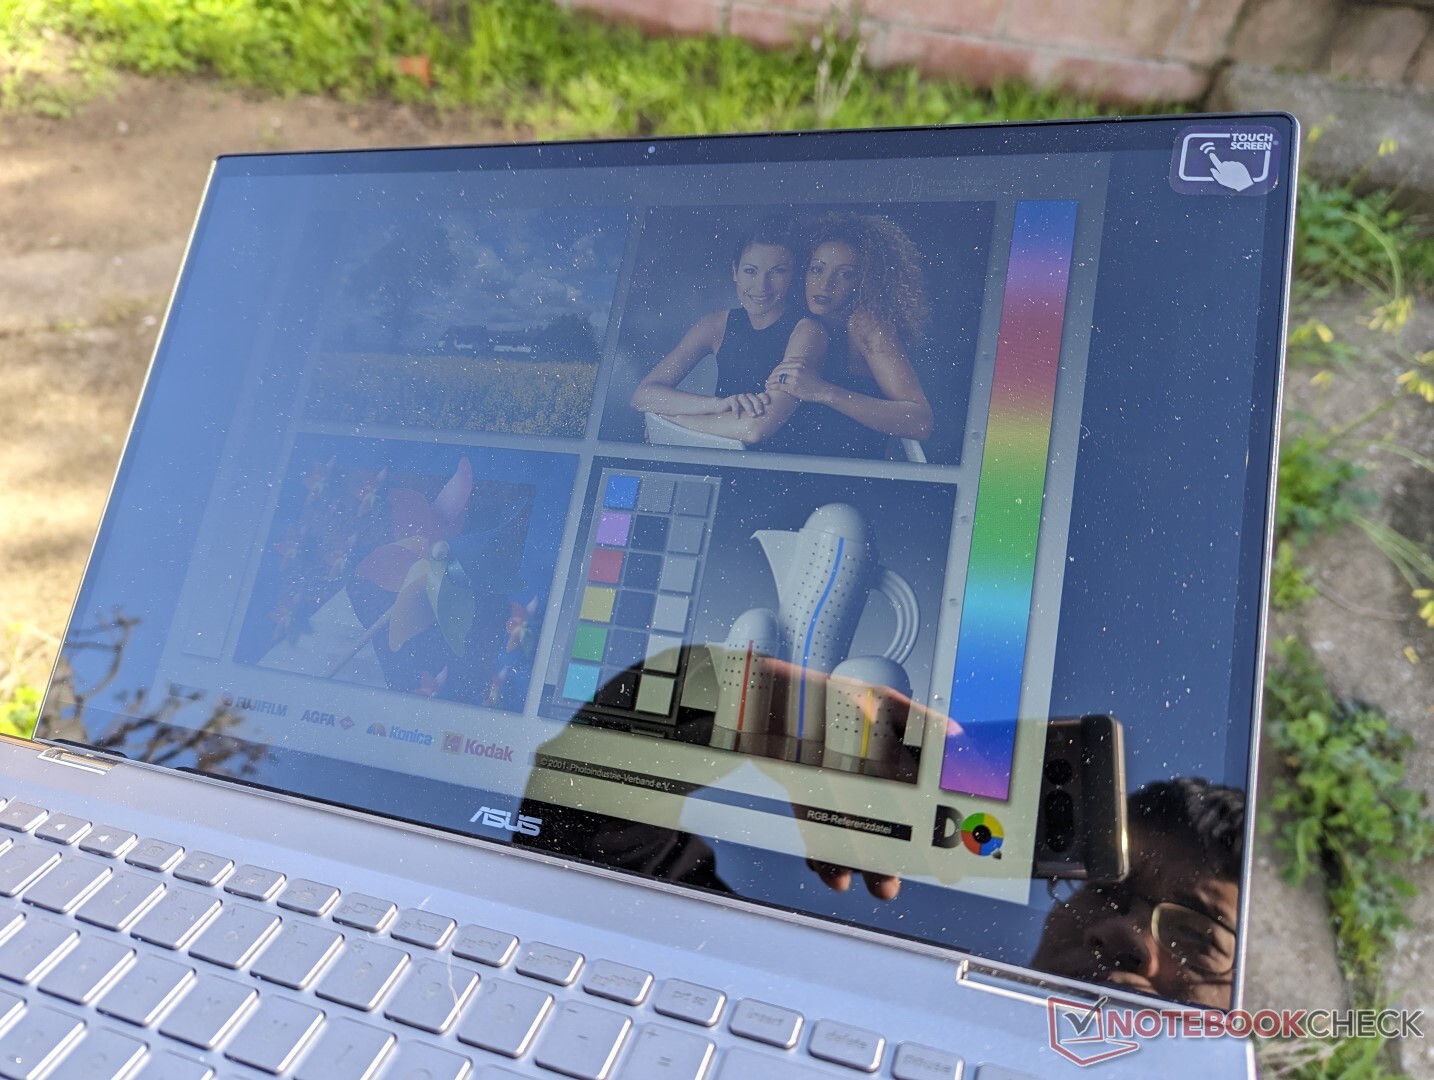
The 300-nit display is not bright enough for comfortable viewing in most daytime outdoor conditions. Glare is prevalent and colors look washed out as a result. Most 15.6-inch laptops share this same disadvantage including the pricier LG Gram 15 series or the Samsung Galaxy Book Pro 360 15.
Performance — AMD Zen 2 With GeForce MX
Testing Conditions
We set our test unit to Performance mode via Windows and the MyAsus software prior to running the benchmarks below. We also made sure to set the GPU to the GeForce MX450 via the Nvidia Control Panel. It's recommended to become accustomed to the pre-installed MyAsus app as it is the hub for toggling specific features like blue light intensity, battery health charging, fan profile, colors, and more.
Processor
The Ryzen 7 5700U in our Asus unit is performing 5 to 10 percent faster than the average laptop in our database equipped with the same processor. Multi-thread performance is significantly faster than any Intel 12th gen or older Core U-series CPU while being on par with the 12th gen Core P-series. As is tradition for AMD, however, single-core performance is lacking.
Performance sustainability is good could but could have been better. When running CineBench R15 xT in a loop, for example, the initial score of 1613 points would drop by roughly 20 percent over time.
Cinebench R15 Multi Loop
Cinebench R23: Multi Core | Single Core
Cinebench R15: CPU Multi 64Bit | CPU Single 64Bit
Blender: v2.79 BMW27 CPU
7-Zip 18.03: 7z b 4 | 7z b 4 -mmt1
Geekbench 5.5: Multi-Core | Single-Core
HWBOT x265 Benchmark v2.2: 4k Preset
LibreOffice : 20 Documents To PDF
R Benchmark 2.5: Overall mean
| HWBOT x265 Benchmark v2.2 / 4k Preset | |
| Asus ZenBook Flip 15 Q539ZD | |
| HP Envy x360 15-ey0023dx | |
| Samsung Galaxy Book2 15 | |
| Average AMD Ryzen 7 5700U (6.08 - 12.1, n=20) | |
| Asus ZenBook Flip 15 Q508U | |
| Dynabook Satellite Pro C50D-B-115 | |
| Dell Inspiron 15 7506 2-in-1 P97F | |
| HP ProBook 450 G9 6A180EA | |
| Samsung Galaxy Book Pro 360 15 NP950QDB-KC3DE | |
* ... smaller is better
AIDA64: FP32 Ray-Trace | FPU Julia | CPU SHA3 | CPU Queen | FPU SinJulia | FPU Mandel | CPU AES | CPU ZLib | FP64 Ray-Trace | CPU PhotoWorxx
System Performance
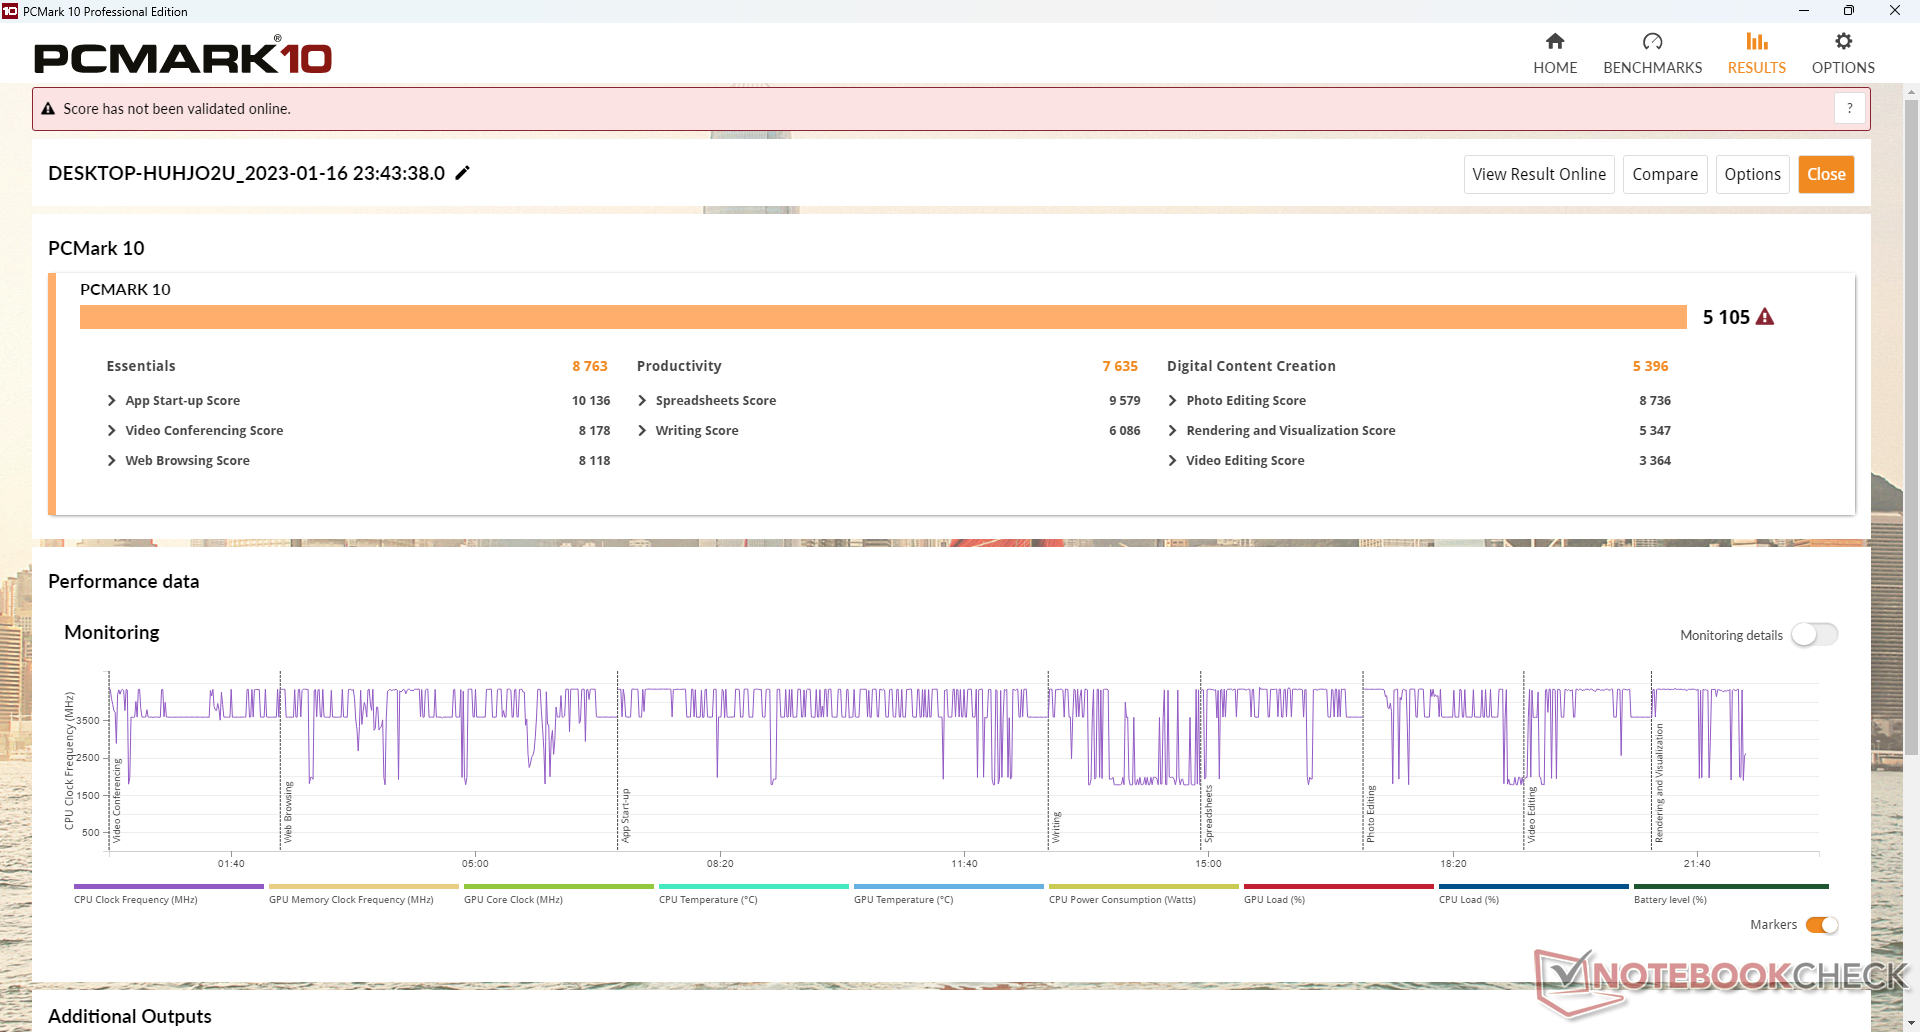
PCMark results are comparable to systems running on 11th gen Intel Core U-series CPUs like the Samsung Galaxy Book Pro 360 15 or Dell Inspiron 15 7506 2-in-1 while being far behind the Asus ZenBook Flip 15 Q539ZD and its Arc A370M GPU. Its PCMark 10 Essentials subscore is particularly low likely due to its slow SSD write speeds and single-core performance.
CrossMark: Overall | Productivity | Creativity | Responsiveness
| PCMark 10 / Essentials | |
| Asus ZenBook Flip 15 Q539ZD | |
| HP Envy x360 15-ey0023dx | |
| Samsung Galaxy Book Pro 360 15 NP950QDB-KC3DE | |
| Dell Inspiron 15 7506 2-in-1 P97F | |
| Lenovo IdeaPad 5 15ALC05 | |
| Average AMD Ryzen 7 5700U (8025 - 10091, n=16) | |
| Asus ZenBook Flip 15 Q508U | |
| PCMark 10 / Productivity | |
| HP Envy x360 15-ey0023dx | |
| Lenovo IdeaPad 5 15ALC05 | |
| Average AMD Ryzen 7 5700U (7001 - 8457, n=16) | |
| Asus ZenBook Flip 15 Q508U | |
| Asus ZenBook Flip 15 Q539ZD | |
| Dell Inspiron 15 7506 2-in-1 P97F | |
| Samsung Galaxy Book Pro 360 15 NP950QDB-KC3DE | |
| PCMark 10 / Digital Content Creation | |
| Asus ZenBook Flip 15 Q539ZD | |
| HP Envy x360 15-ey0023dx | |
| Asus ZenBook Flip 15 Q508U | |
| Lenovo IdeaPad 5 15ALC05 | |
| Average AMD Ryzen 7 5700U (3738 - 5964, n=16) | |
| Samsung Galaxy Book Pro 360 15 NP950QDB-KC3DE | |
| Dell Inspiron 15 7506 2-in-1 P97F | |
| CrossMark / Overall | |
| Asus ZenBook Flip 15 Q539ZD | |
| HP Envy x360 15-ey0023dx | |
| Asus ZenBook Flip 15 Q508U | |
| Average AMD Ryzen 7 5700U (866 - 1183, n=9) | |
| CrossMark / Productivity | |
| Asus ZenBook Flip 15 Q539ZD | |
| HP Envy x360 15-ey0023dx | |
| Asus ZenBook Flip 15 Q508U | |
| Average AMD Ryzen 7 5700U (931 - 1191, n=9) | |
| CrossMark / Creativity | |
| Asus ZenBook Flip 15 Q539ZD | |
| HP Envy x360 15-ey0023dx | |
| Asus ZenBook Flip 15 Q508U | |
| Average AMD Ryzen 7 5700U (907 - 1197, n=9) | |
| CrossMark / Responsiveness | |
| Asus ZenBook Flip 15 Q539ZD | |
| HP Envy x360 15-ey0023dx | |
| Asus ZenBook Flip 15 Q508U | |
| Average AMD Ryzen 7 5700U (605 - 1159, n=9) | |
| PCMark 10 Score | 5105 points | |
Help | ||
| AIDA64 / Memory Copy | |
| Asus ZenBook Flip 15 Q539ZD | |
| Samsung Galaxy Book Pro 360 15 NP950QDB-KC3DE | |
| Asus ZenBook Flip 15 Q508U | |
| HP Envy x360 15-ey0023dx | |
| Lenovo IdeaPad 5 15ALC05 | |
| Average AMD Ryzen 7 5700U (15867 - 39326, n=20) | |
| AIDA64 / Memory Read | |
| Asus ZenBook Flip 15 Q539ZD | |
| Samsung Galaxy Book Pro 360 15 NP950QDB-KC3DE | |
| Asus ZenBook Flip 15 Q508U | |
| Lenovo IdeaPad 5 15ALC05 | |
| HP Envy x360 15-ey0023dx | |
| Average AMD Ryzen 7 5700U (17632 - 47190, n=20) | |
| AIDA64 / Memory Write | |
| Samsung Galaxy Book Pro 360 15 NP950QDB-KC3DE | |
| Asus ZenBook Flip 15 Q539ZD | |
| Asus ZenBook Flip 15 Q508U | |
| Average AMD Ryzen 7 5700U (11554 - 47048, n=20) | |
| HP Envy x360 15-ey0023dx | |
| Lenovo IdeaPad 5 15ALC05 | |
| AIDA64 / Memory Latency | |
| Asus ZenBook Flip 15 Q508U | |
| Lenovo IdeaPad 5 15ALC05 | |
| Average AMD Ryzen 7 5700U (84.9 - 113, n=20) | |
| HP Envy x360 15-ey0023dx | |
| Samsung Galaxy Book Pro 360 15 NP950QDB-KC3DE | |
| Asus ZenBook Flip 15 Q539ZD | |
* ... smaller is better
DPC Latency
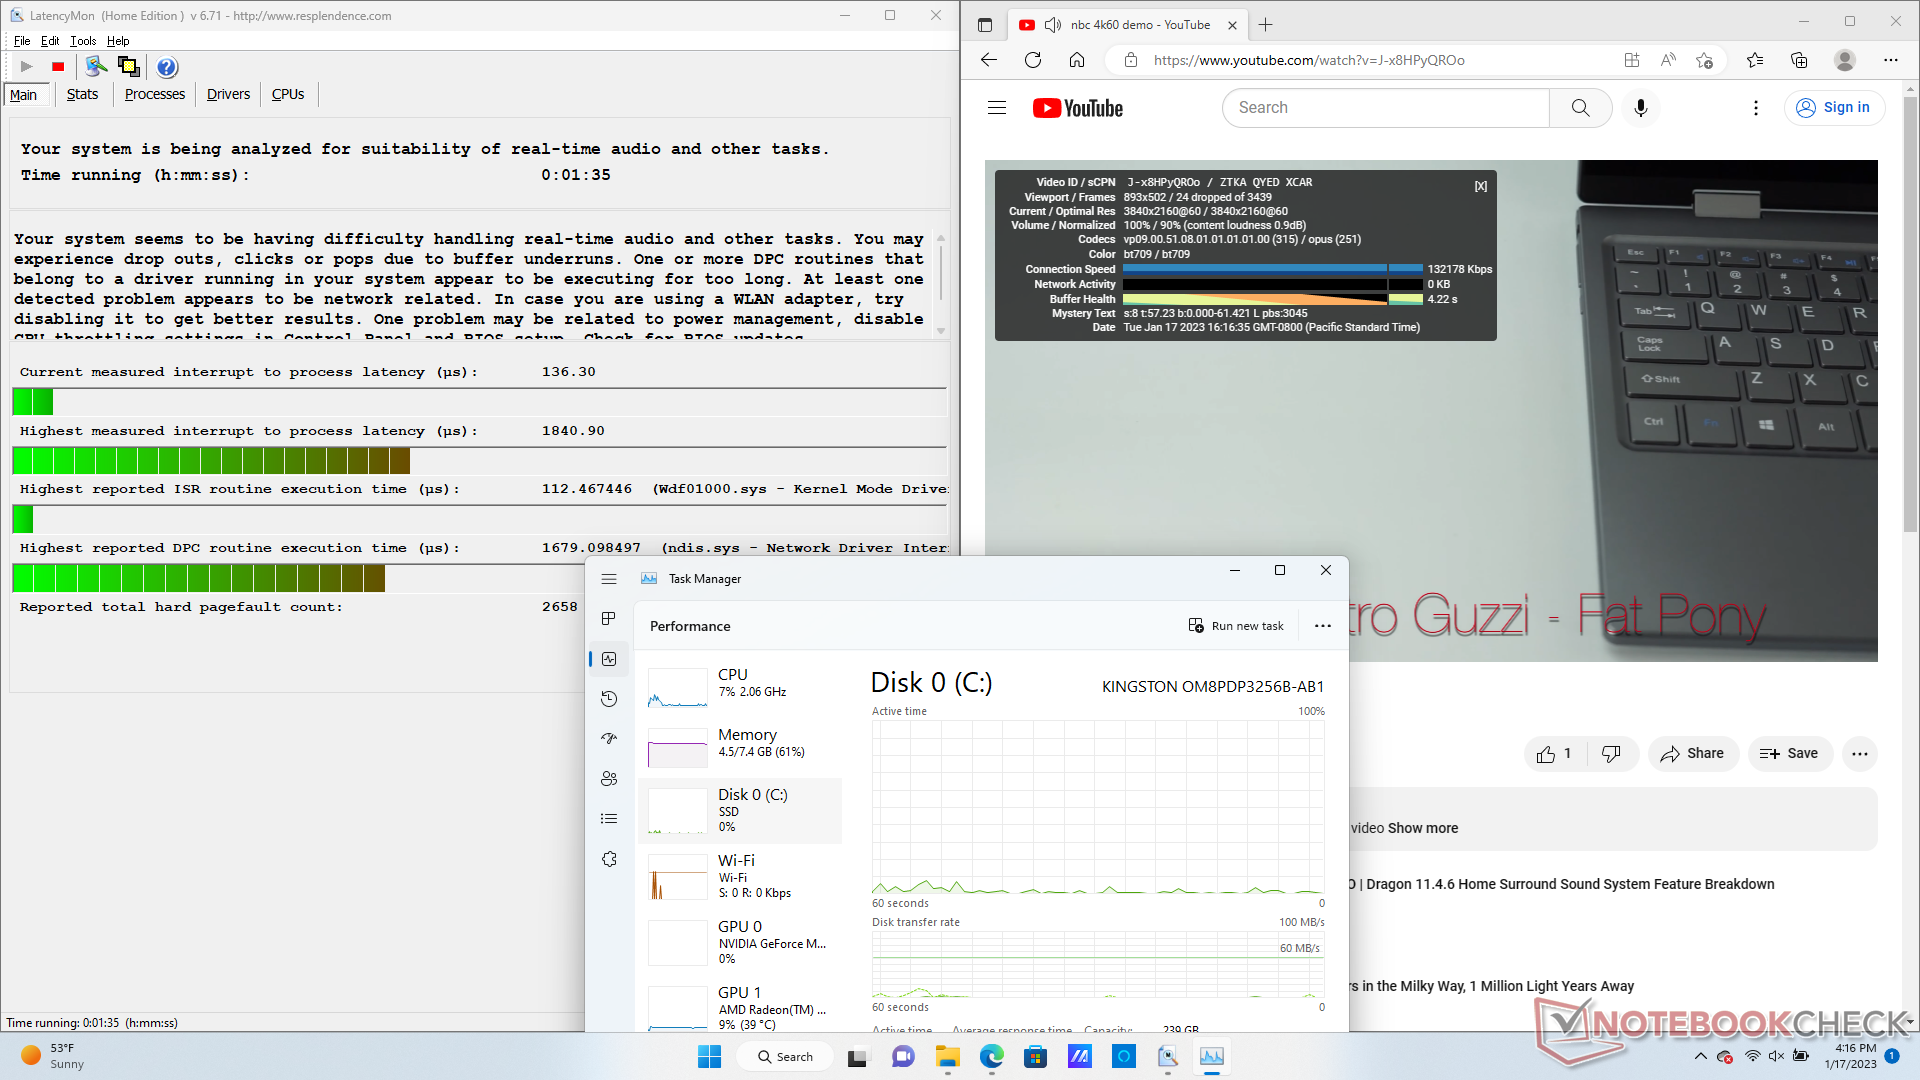
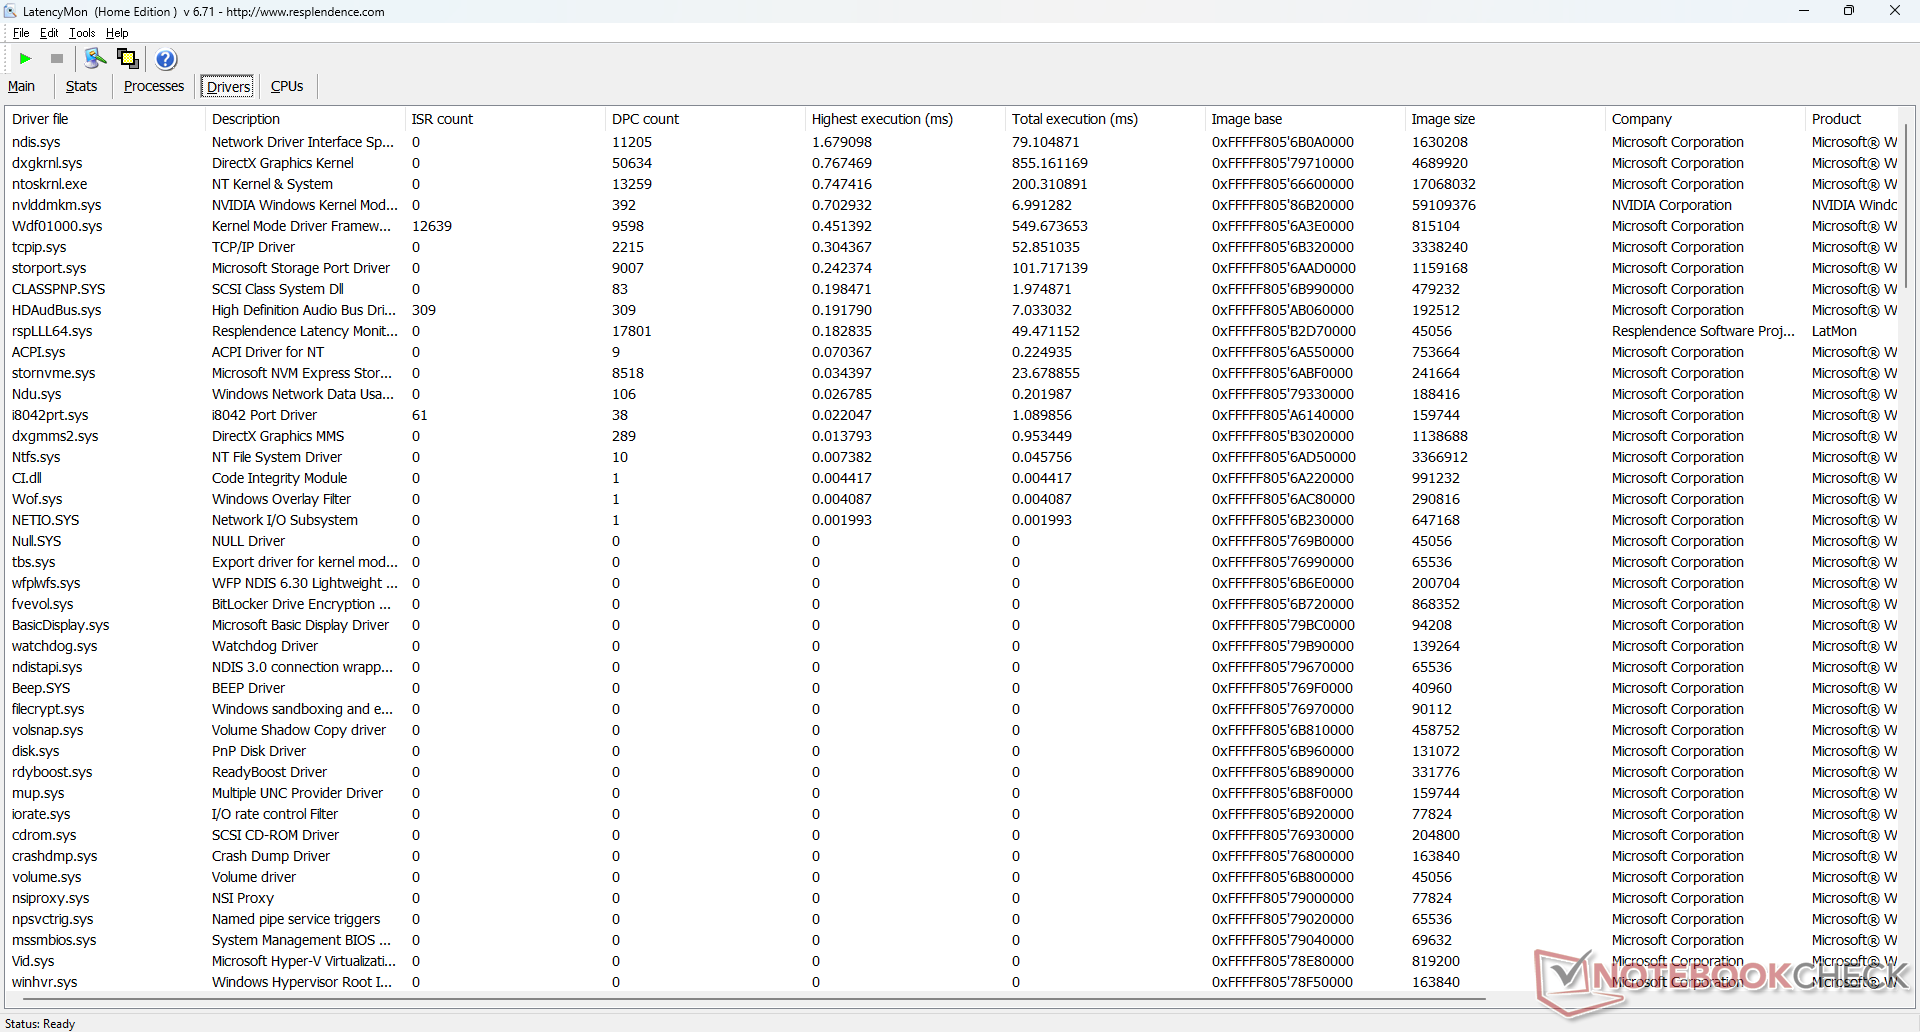
LatencyMon reveals DPC issues when opening multiple browser tabs of our homepage. Furthermore, we're able to record 24 frame skips during our minute-long 4k 60 FPS test video to suggest poor hardware acceleration and optimization.
| DPC Latencies / LatencyMon - interrupt to process latency (max), Web, Youtube, Prime95 | |
| Samsung Galaxy Book Pro 360 15 NP950QDB-KC3DE | |
| Dell Inspiron 15 7506 2-in-1 P97F | |
| Asus ZenBook Flip 15 Q508U | |
| HP Envy x360 15-ey0023dx | |
| Lenovo IdeaPad 5 15ALC05 | |
| Asus ZenBook Flip 15 Q539ZD | |
* ... smaller is better
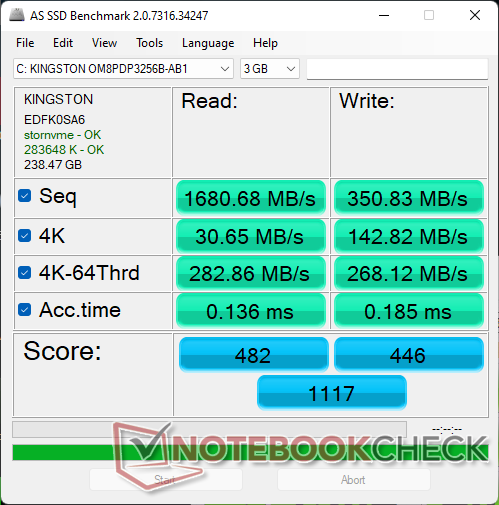
Storage Devices — Up To One Drive Only
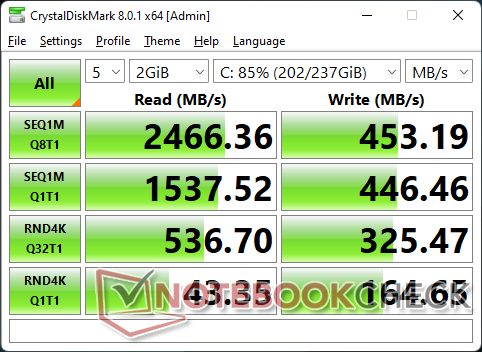
Our test unit ships with the uncommon 256 GB Kingston OM8PDP3256B M.2 NVMe SSD whereas most other laptops commonly come with Samsung, Micron, or Toshiba drives. The Kingston model here is unfortunately a budget drive with slow write rates of just ~450 MB/s compared to 2x or faster on most PCIe3 drives. Higher capacity SKUs will likely ship with faster drives, however.

* ... smaller is better
Disk Throttling: DiskSpd Read Loop, Queue Depth 8
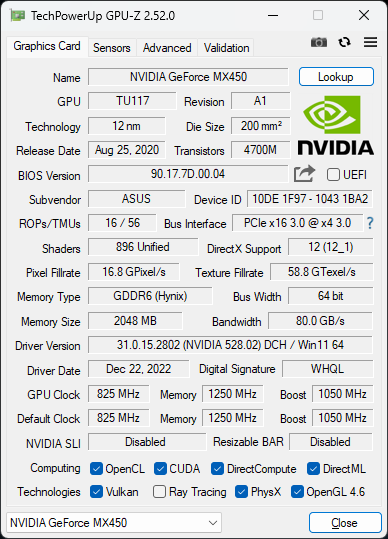
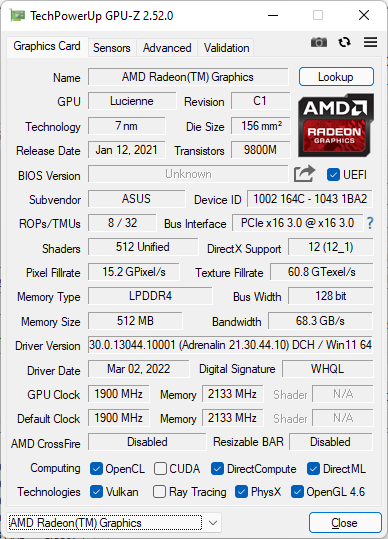
GPU Performance — Losing Ground To Integrated Intel and AMD Options
Graphics performance can be up to 30 percent faster than the Intel Iris Xe 96 EUs depending on the game. Though the advantages between GeForce MX and integrated options are not insignificant, they have been growing increasingly narrow now that the integrated GPUs from Intel and AMD have had time to mature. The latest integrated Radeon 680M, for example, can match the discrete GeForce MX450 or even outperform it in many titles. The Nvidia GPU is still a significant boost over the old integrated Radeon RX Vega series in the Ryzen 7 5700U CPU nonetheless.
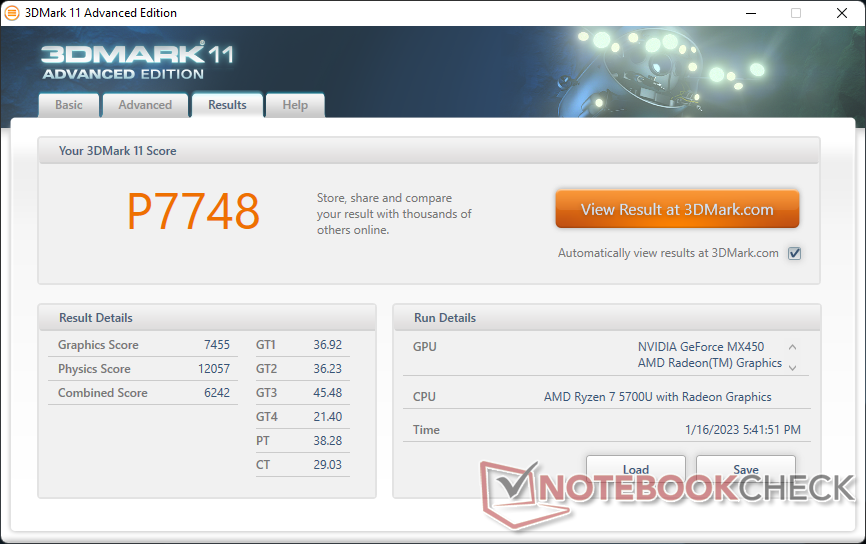
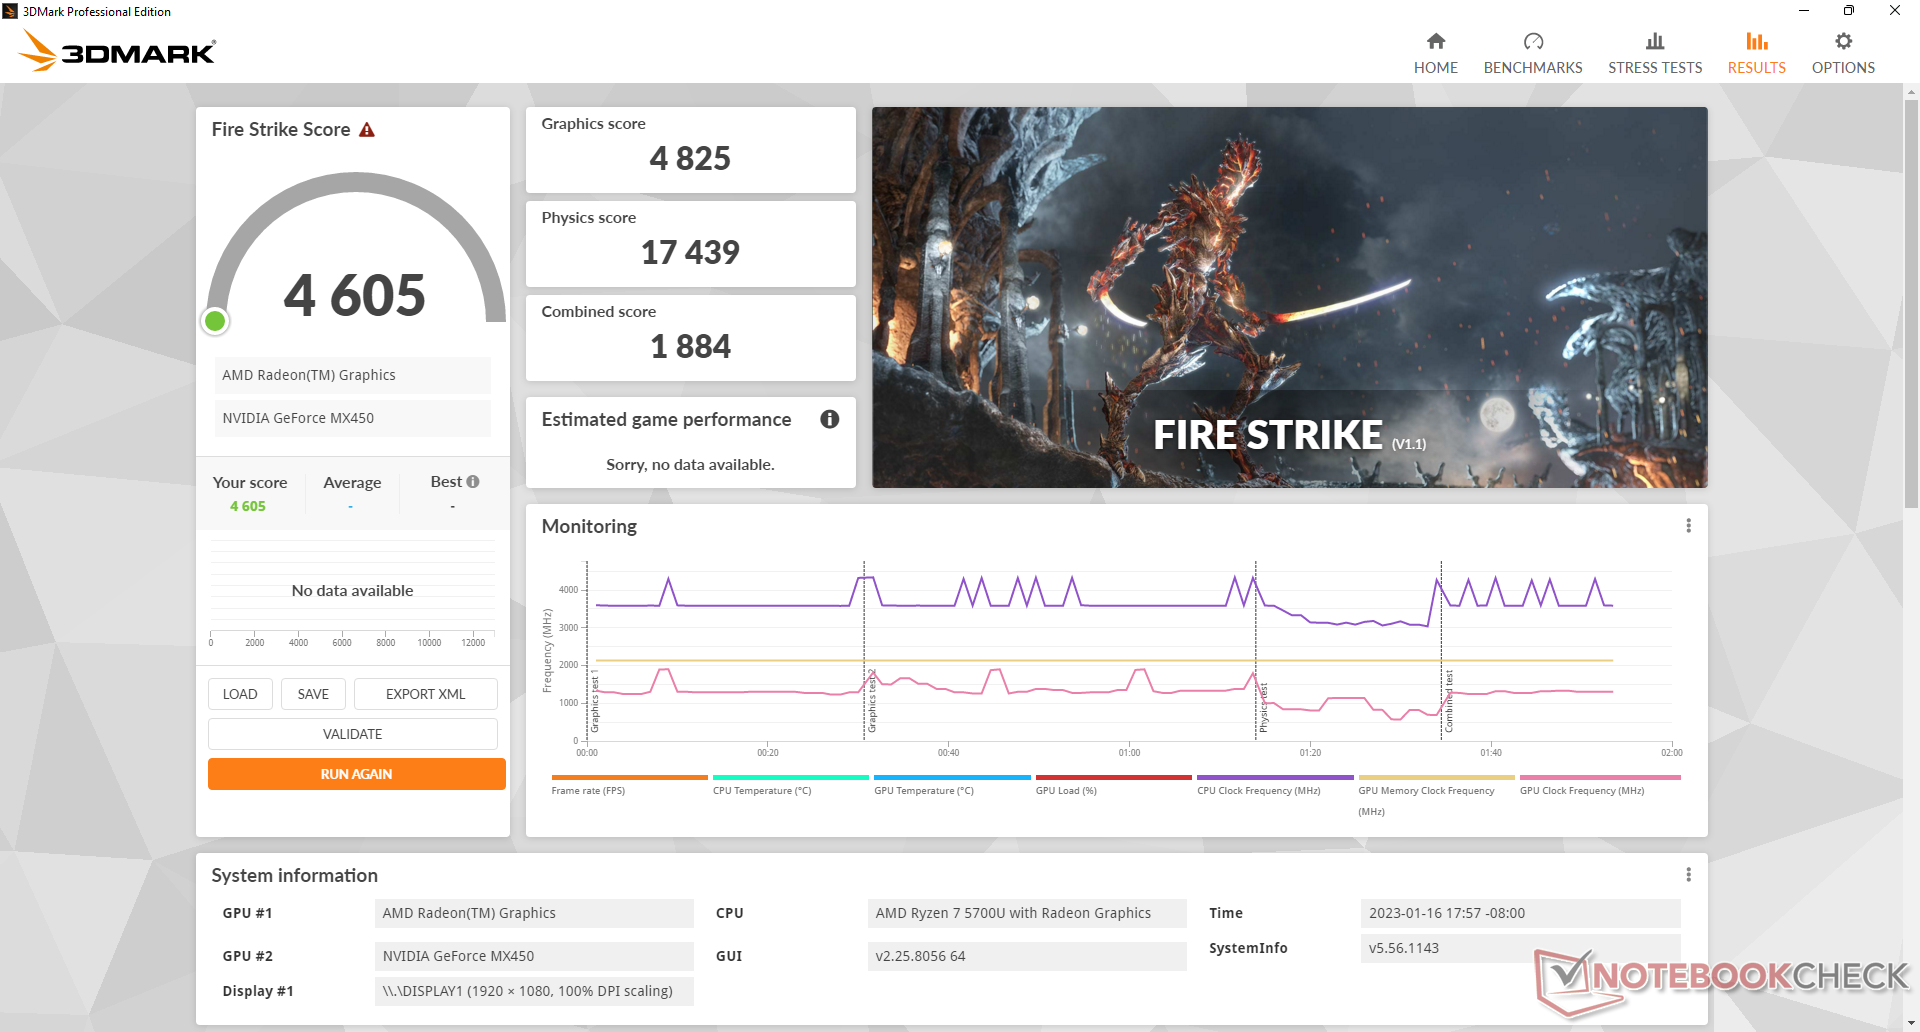
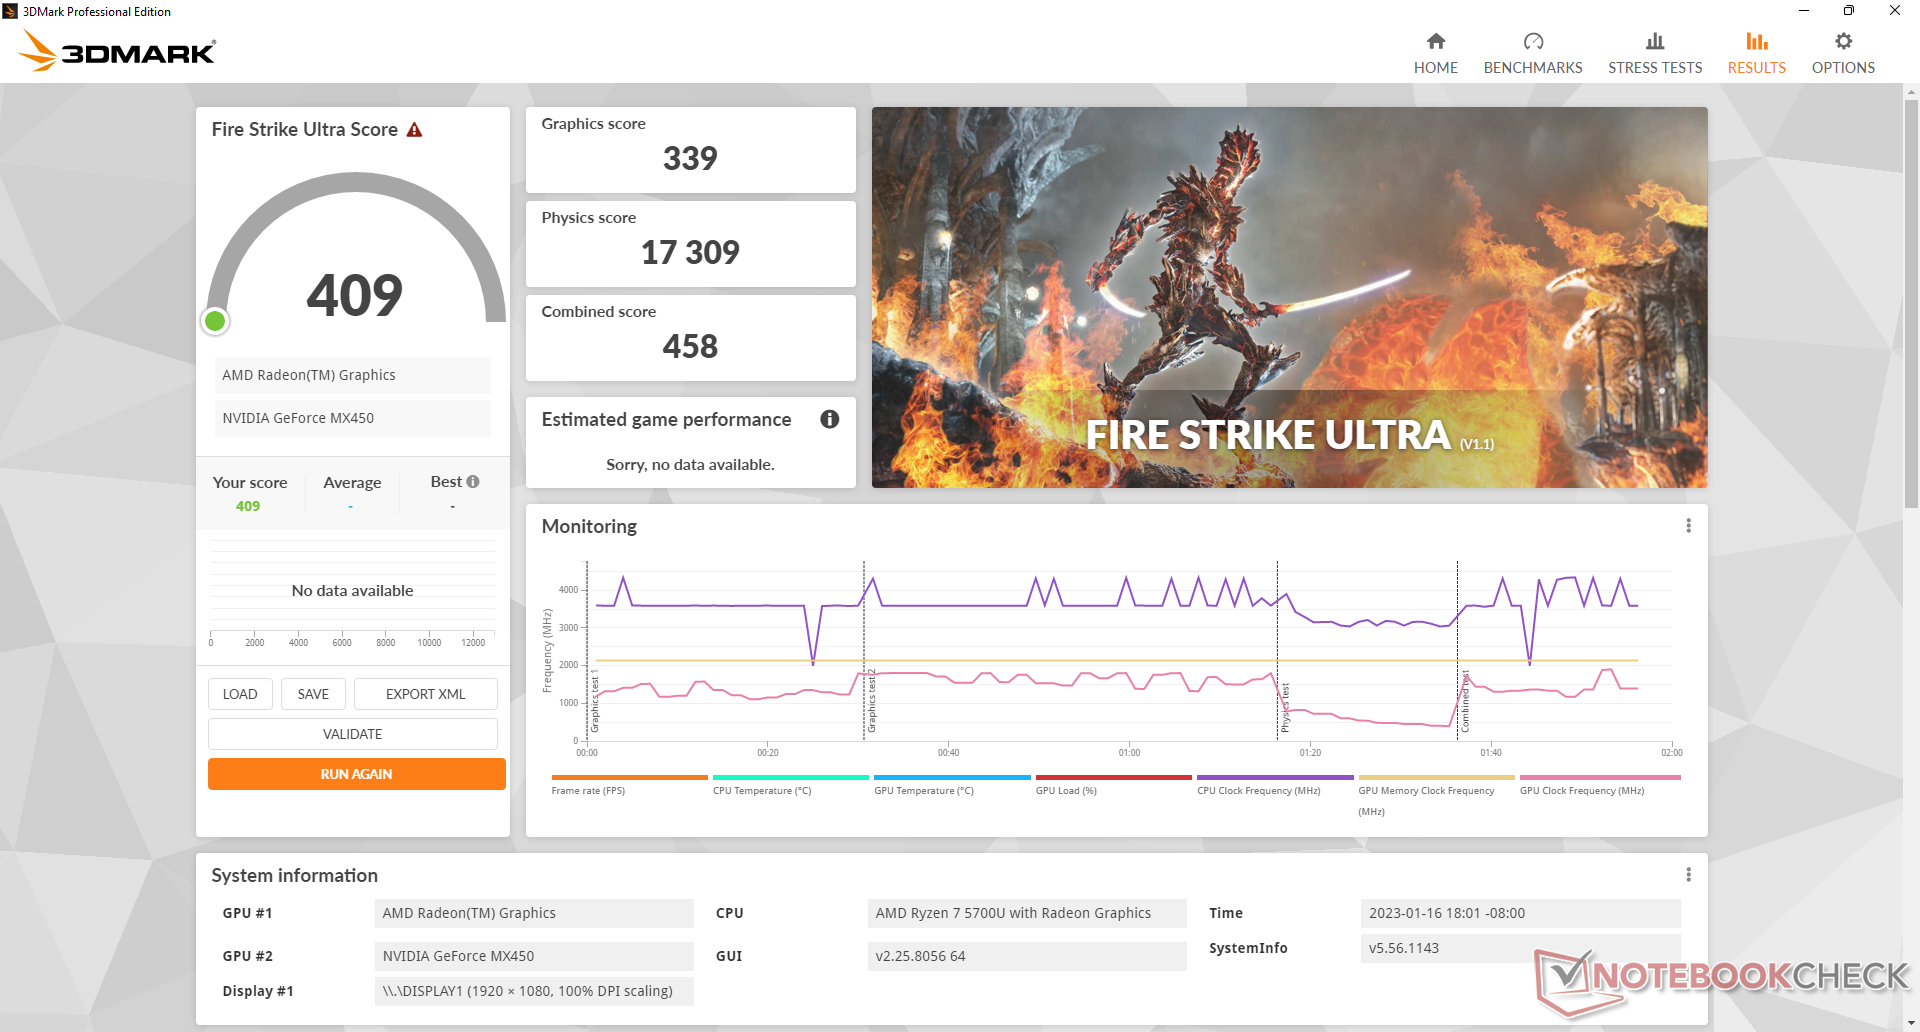
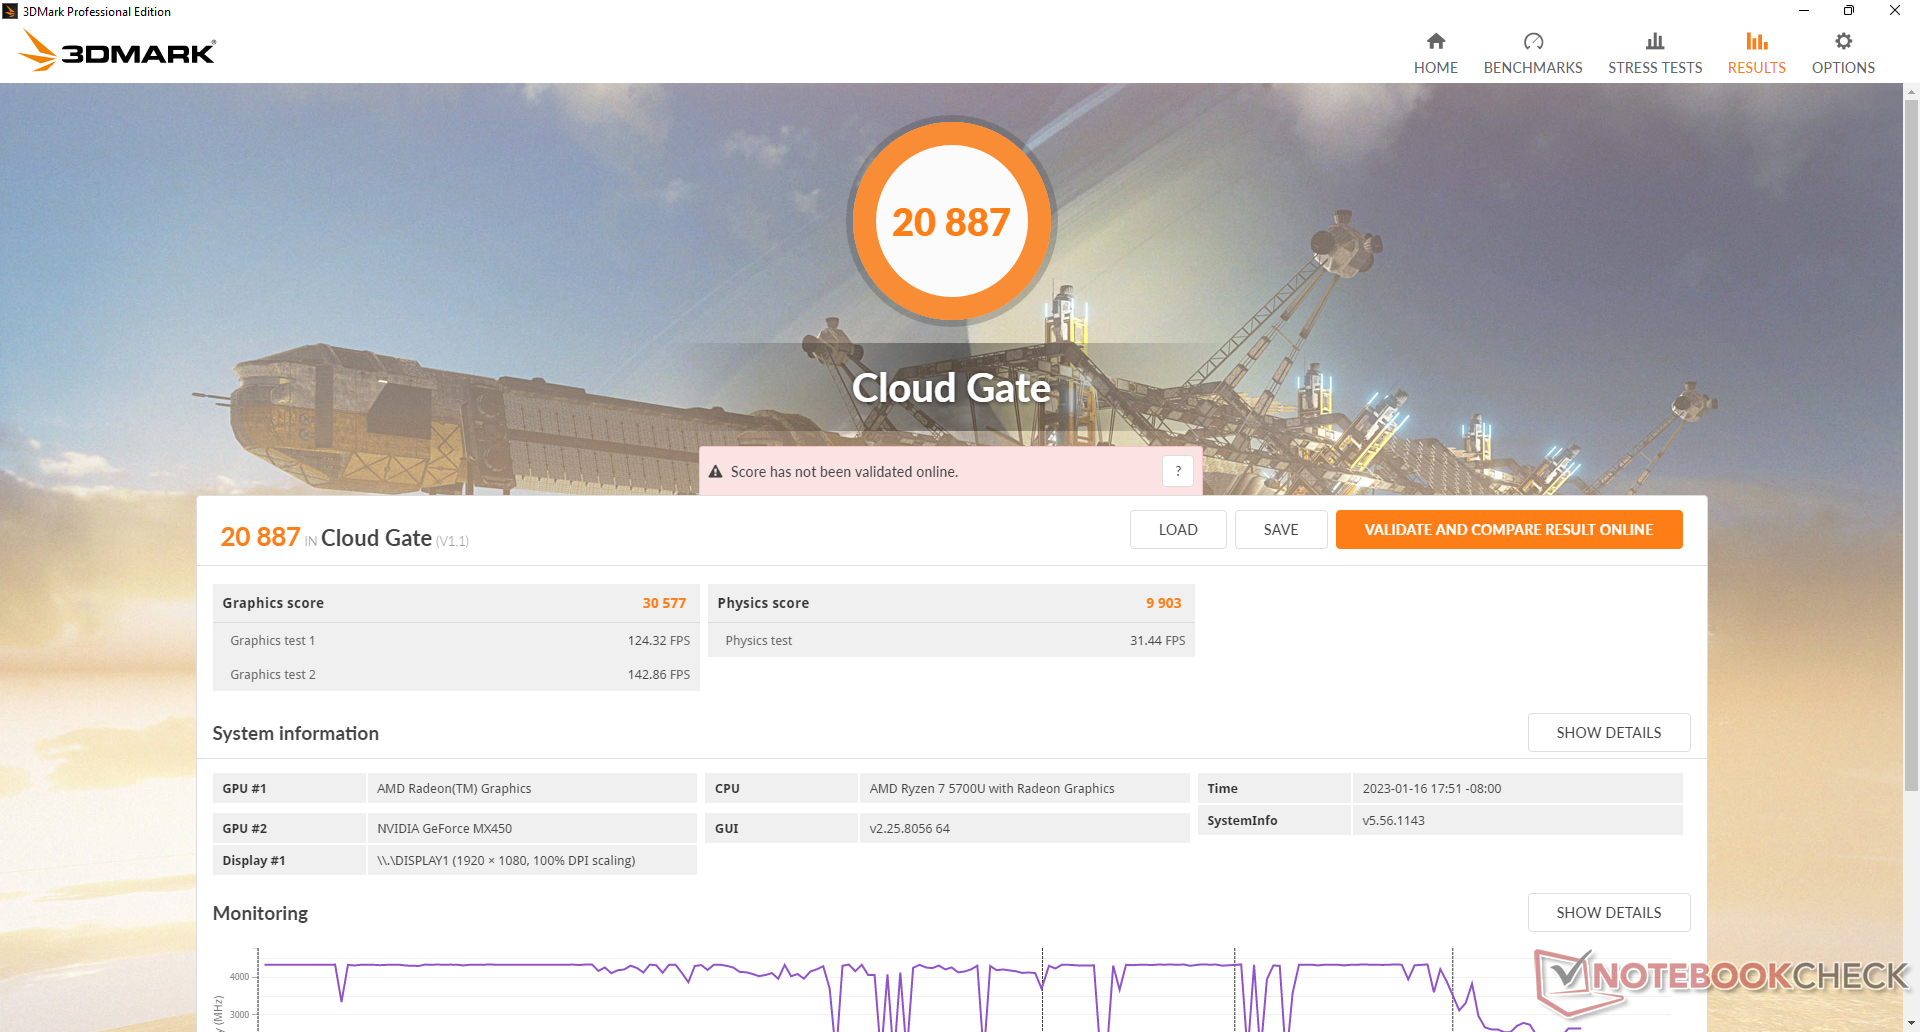
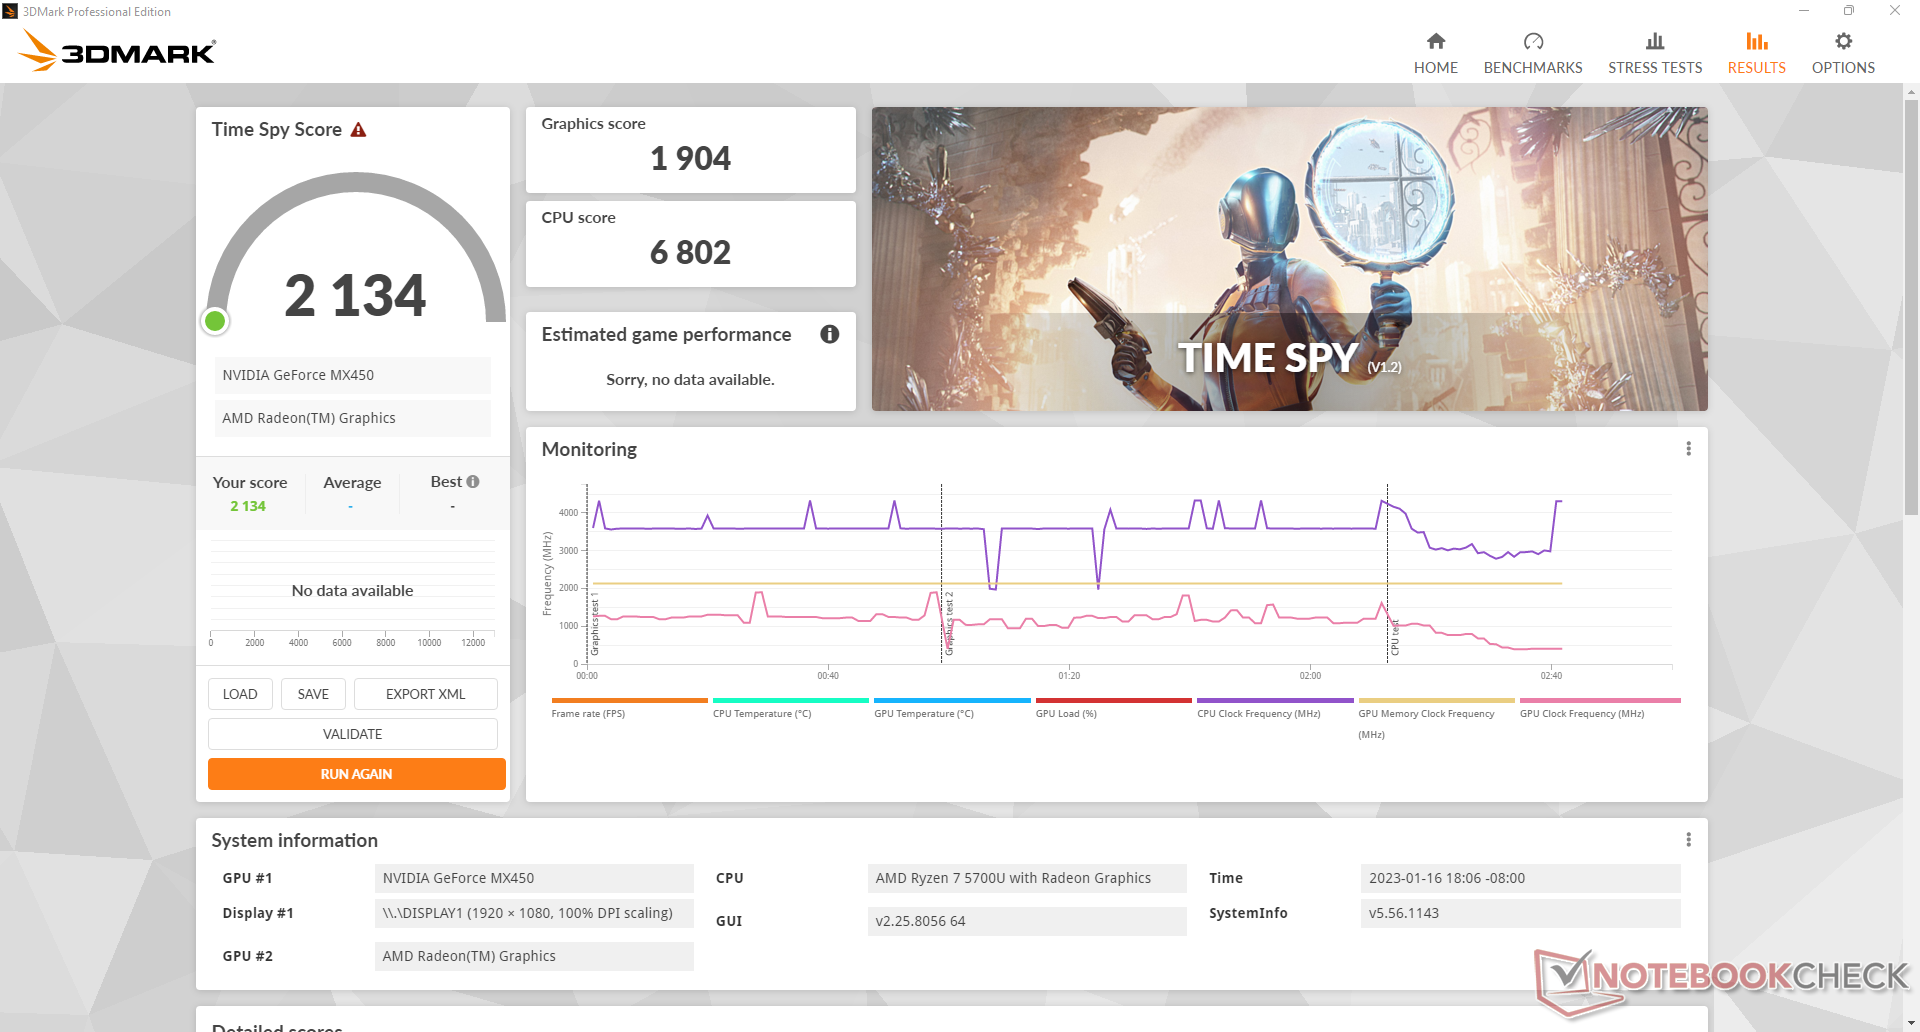
| 3DMark 11 Performance | 7748 points | |
| 3DMark Cloud Gate Standard Score | 20887 points | |
| 3DMark Fire Strike Score | 4605 points | |
| 3DMark Time Spy Score | 2134 points | |
Help | ||
| Blender | |
| v3.3 Classroom HIP/AMD | |
| HP Envy x360 15-ey0023dx | |
| v3.3 Classroom OPTIX/RTX | |
| MSI Prestige 15 A12UD-093 | |
| v3.3 Classroom CUDA | |
| MSI Prestige 15 A12UD-093 | |
| v3.3 Classroom CPU | |
| HP ProBook 450 G9 6A180EA | |
| Samsung Galaxy Book2 15 | |
| Asus ZenBook Flip 15 Q508U | |
| Average NVIDIA GeForce MX450 (n=1) | |
| MSI Prestige 15 A12UD-093 | |
| HP Envy x360 15-ey0023dx | |
* ... smaller is better
Witcher 3 FPS Chart
| low | med. | high | ultra | |
|---|---|---|---|---|
| The Witcher 3 (2015) | 124.9 | 76.8 | 42.2 | 23.1 |
| Dota 2 Reborn (2015) | 100.9 | 92.8 | 75.3 | 79.3 |
| Final Fantasy XV Benchmark (2018) | 60.3 | 27.7 | 18 | |
| X-Plane 11.11 (2018) | 49.9 | 60.6 | 50.9 | |
| Strange Brigade (2018) | 124.8 | 47.7 | 36.9 | 26 |
| Borderlands 3 (2019) | 70.8 | 28.6 | 18.3 | 13.2 |
| Cyberpunk 2077 1.6 (2022) | 30.1 | 21.9 | 11.7 | 7.6 |
Emissions
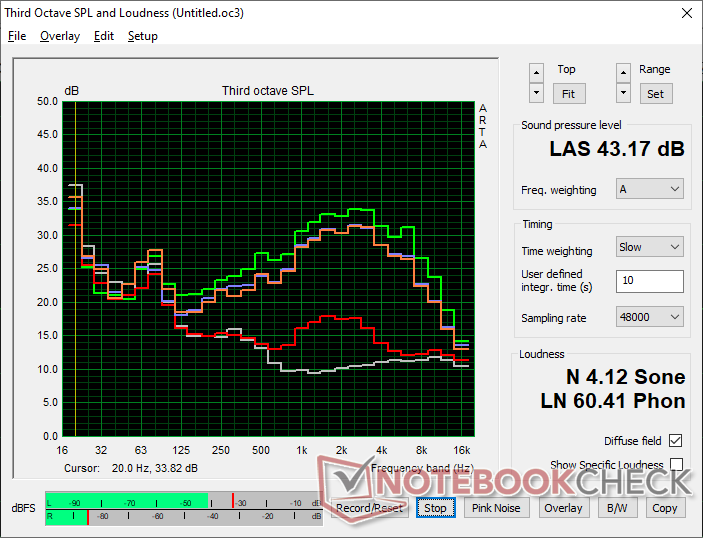
System Noise — Very Active Fan
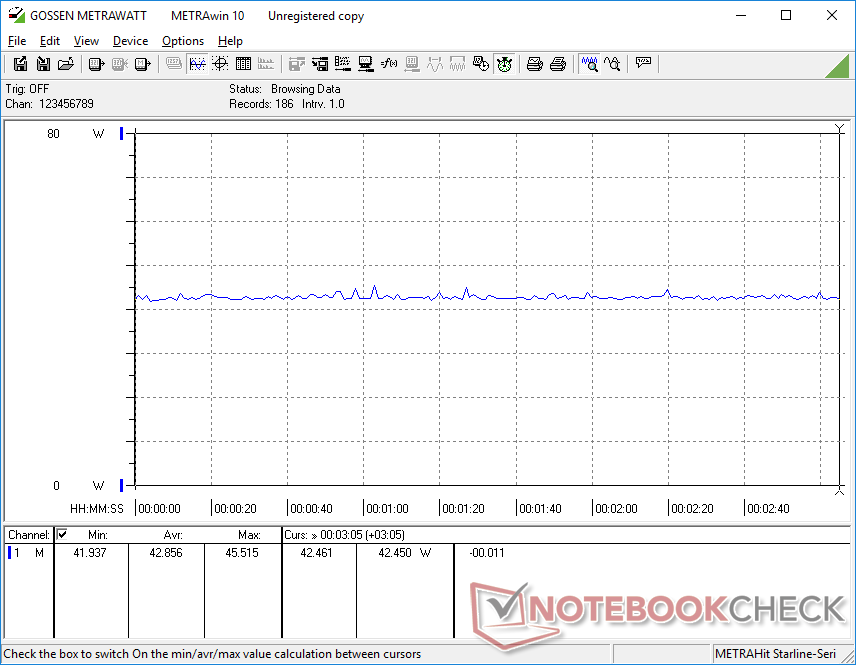
Fan noise typically hovers around 27.6 dB(A) against a silent background of 23.3 dB(A) when browsing or video streaming even when set to Whisper mode via the MyAsus software. We find that the fan tends to idle more often when on battery power for a "truer" Whisper mode. Fan pulsing is infrequent as changes to fan RPM are gradual rather than sharp.
Speaking of RPM, it doesn't take much for the fan to reach its top speed. When running the first benchmark scene of 3DMark 06, for example, fan noise would steadily ramp up before stabilizing at just under 41 dB(A) midway into the test. This result is significantly louder than many competing 15.6-inch convertibles like the HP Envy x360 15 or Galaxy Book Pro 360 15 which can run quieter for longer periods. The high fan RPM sensitivity in our Asus is directly attributed to the dGPU whereas most convertibles typically ship with integrated graphics only where less cooling is required.
Noise level
| Idle |
| 23.3 / 27.6 / 27.6 dB(A) |
| Load |
| 40.6 / 43.2 dB(A) |
 | ||
30 dB silent 40 dB(A) audible 50 dB(A) loud |
||
min: | ||
| Asus ZenBook Flip 15 Q508U GeForce MX450, R7 5700U, Kingston OM8PDP3256B | Asus ZenBook Flip 15 Q539ZD A370M, i7-12700H, SK Hynix HFM001TD3JX013N | HP Envy x360 15-ey0023dx Vega 8, R7 5825U, Samsung PM991 MZVLQ512HBLU | Samsung Galaxy Book Pro 360 15 NP950QDB-KC3DE Iris Xe G7 80EUs, i5-1135G7, Samsung PM991 MZVLQ256HAJD | Dell Inspiron 15 7506 2-in-1 P97F Iris Xe G7 80EUs, i5-1135G7, Toshiba KBG40ZNS256G NVMe | Lenovo IdeaPad 5 15ALC05 Vega 7, R5 5500U | |
|---|---|---|---|---|---|---|
| Noise | 5% | 11% | 4% | -1% | -1% | |
| off / environment * (dB) | 23.3 | 23 1% | 22.7 3% | 25 -7% | 27.1 -16% | 26 -12% |
| Idle Minimum * (dB) | 23.3 | 23 1% | 22.7 3% | 25 -7% | 27.1 -16% | 26 -12% |
| Idle Average * (dB) | 27.6 | 23 17% | 22.7 18% | 25 9% | 27.1 2% | 26 6% |
| Idle Maximum * (dB) | 27.6 | 24.7 11% | 22.7 18% | 25 9% | 27.1 2% | 26 6% |
| Load Average * (dB) | 40.6 | 31.7 22% | 23.3 43% | 32.7 19% | 31.5 22% | 42.6 -5% |
| Witcher 3 ultra * (dB) | 40.5 | 45.2 -12% | 43.4 -7% | 37.4 8% | ||
| Load Maximum * (dB) | 43.2 | 45.2 -5% | 43.4 -0% | 42 3% | 47.2 -9% | 37.4 13% |
* ... smaller is better
Temperature
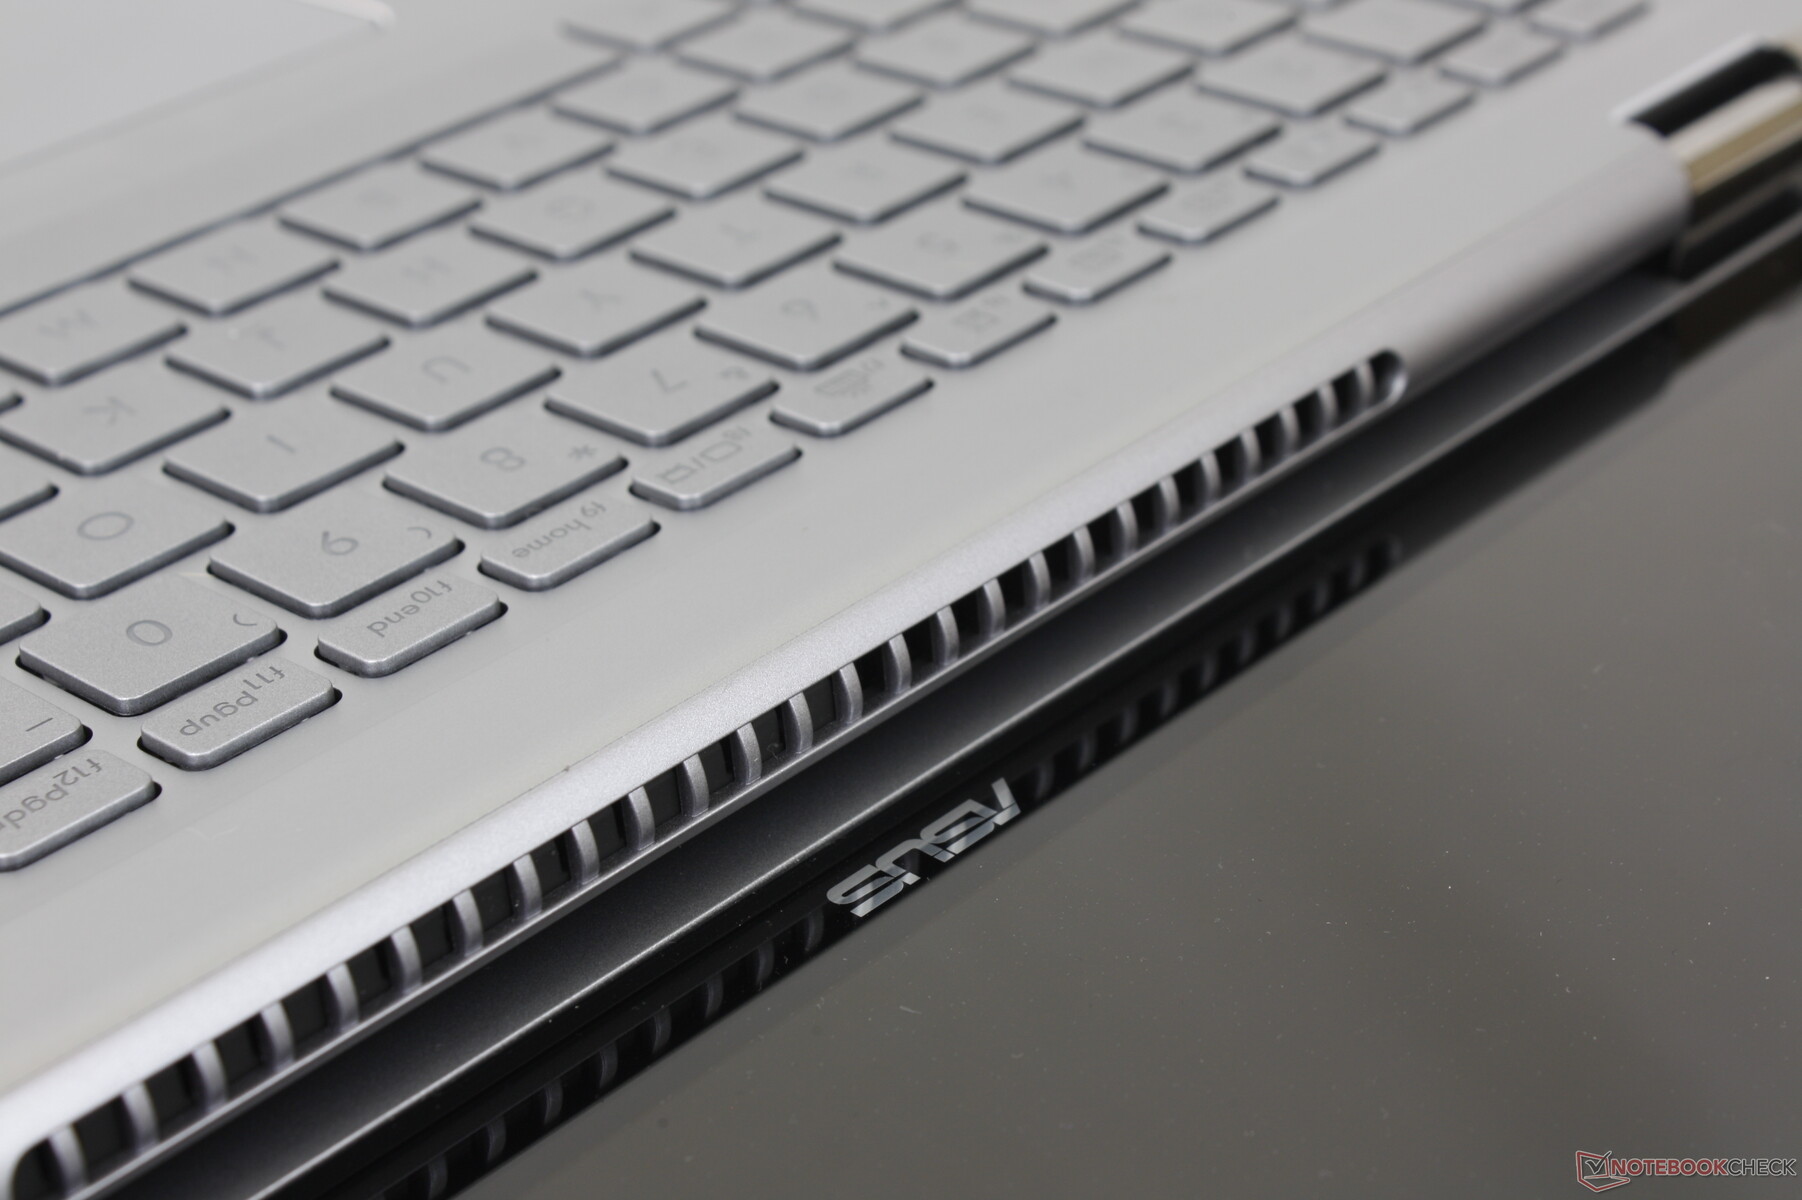
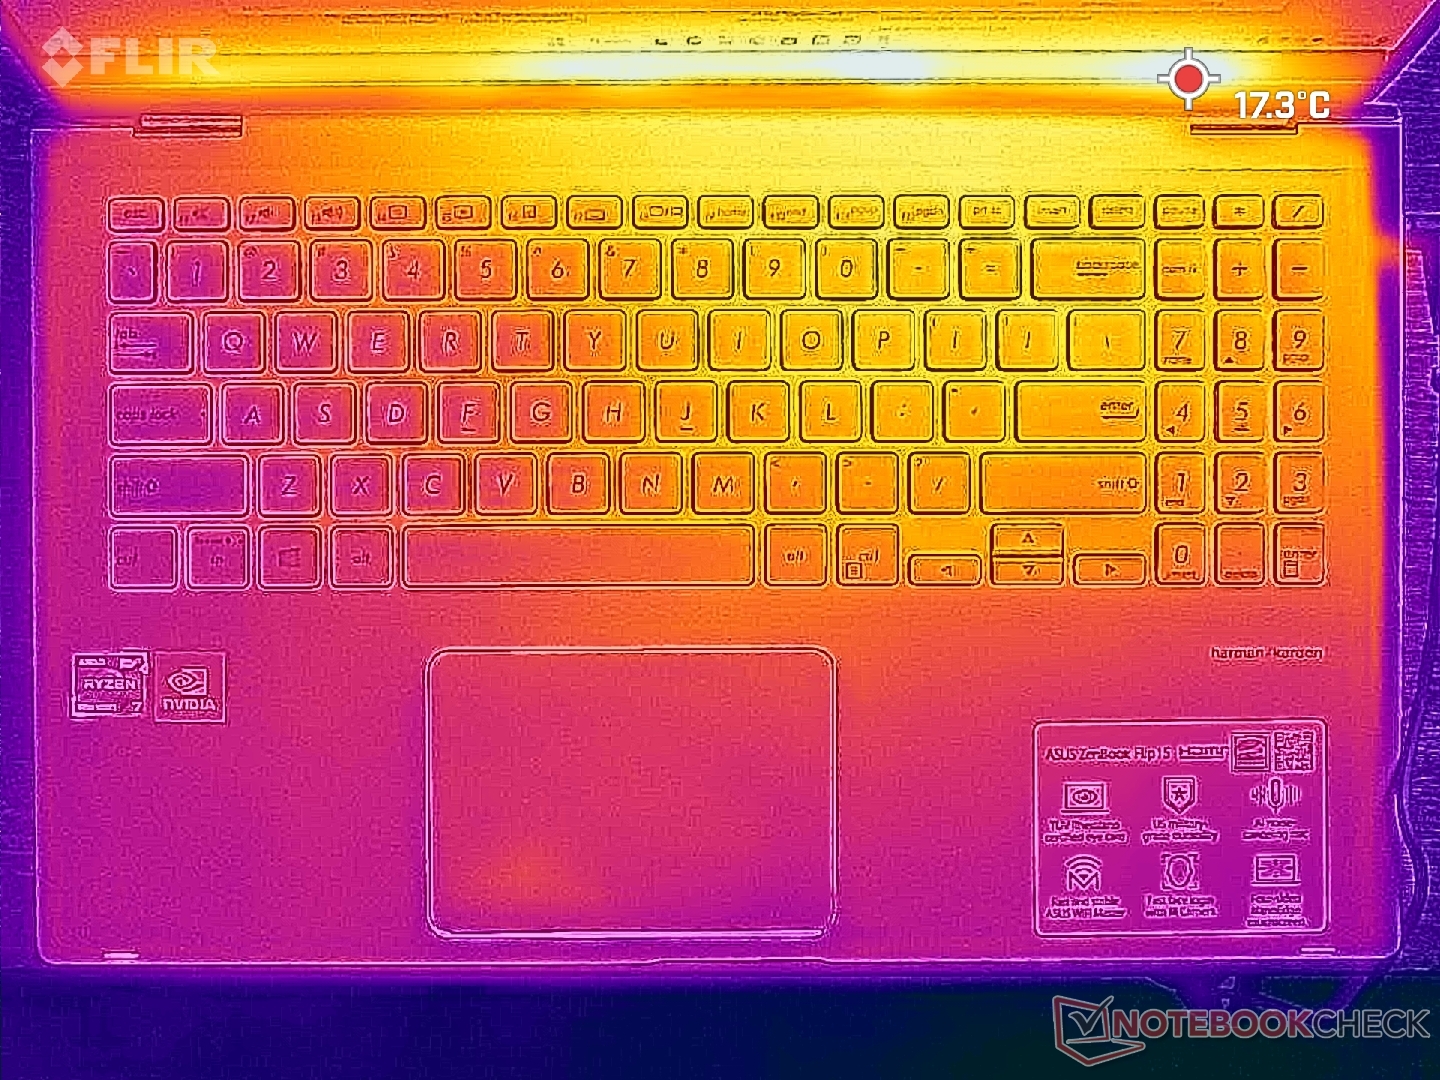
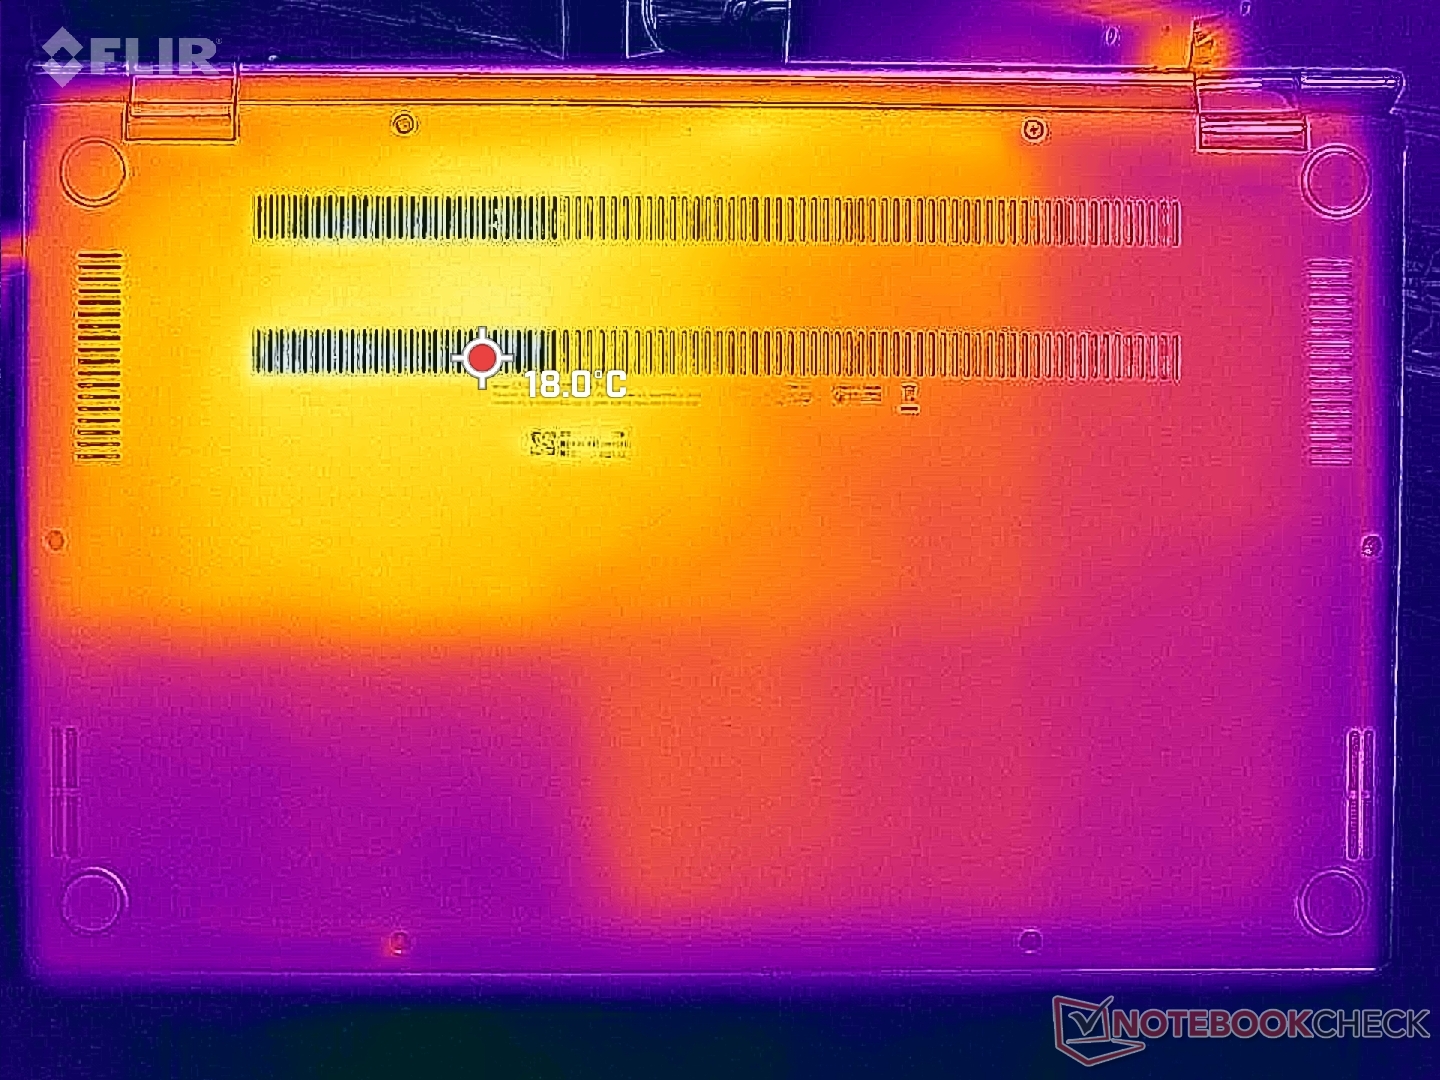
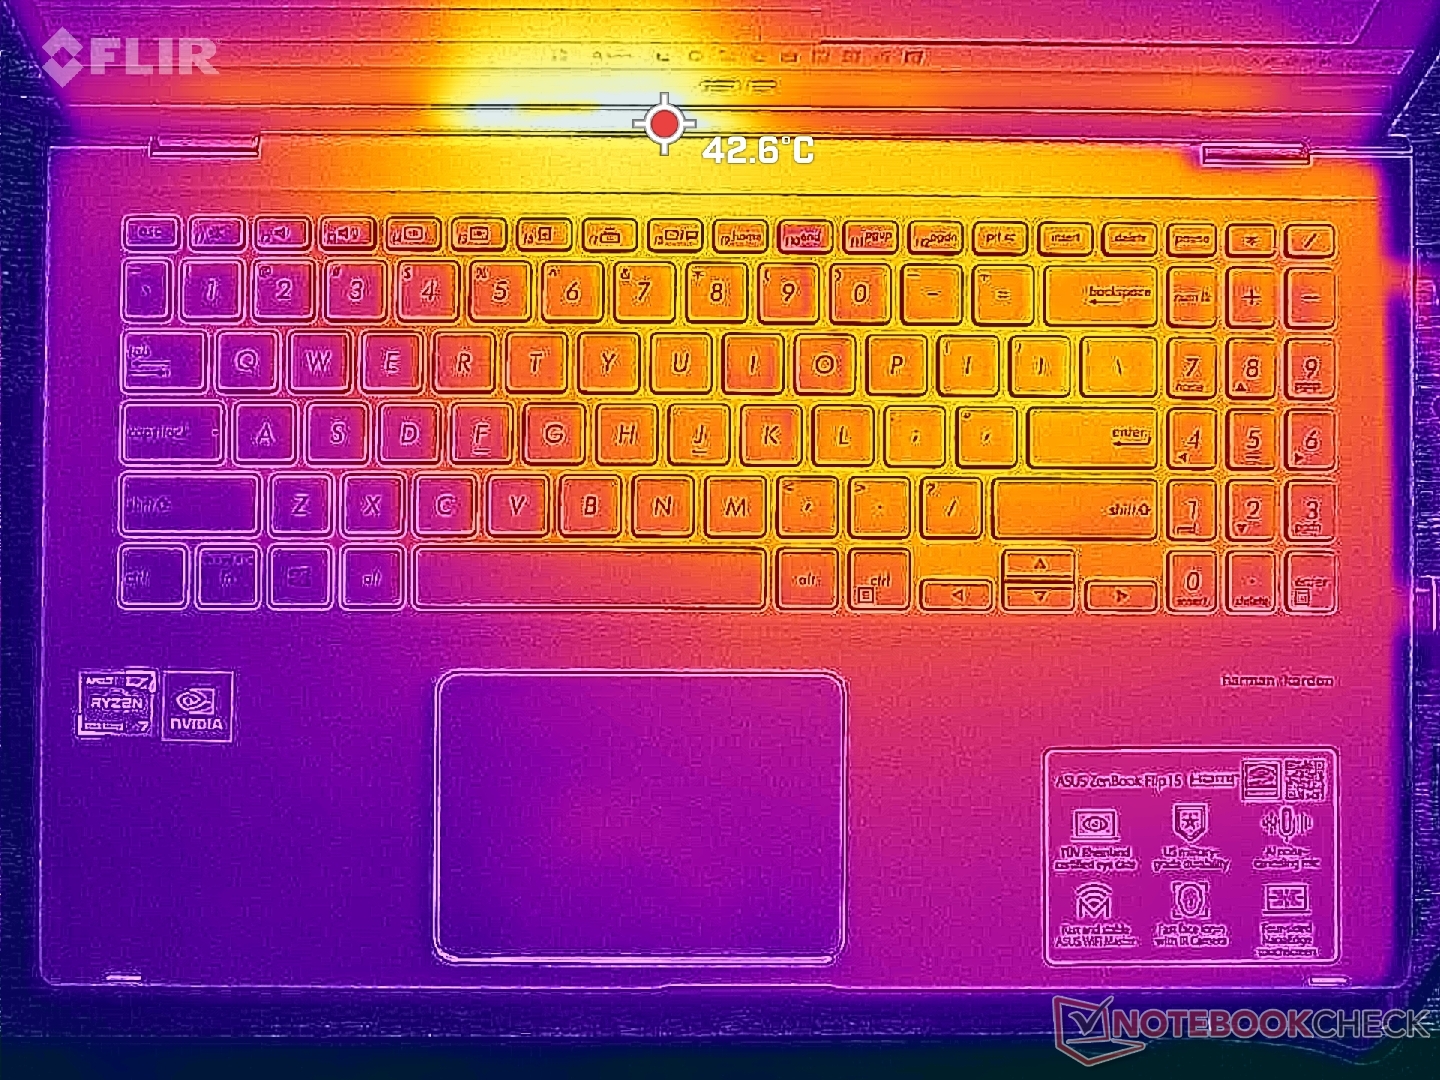
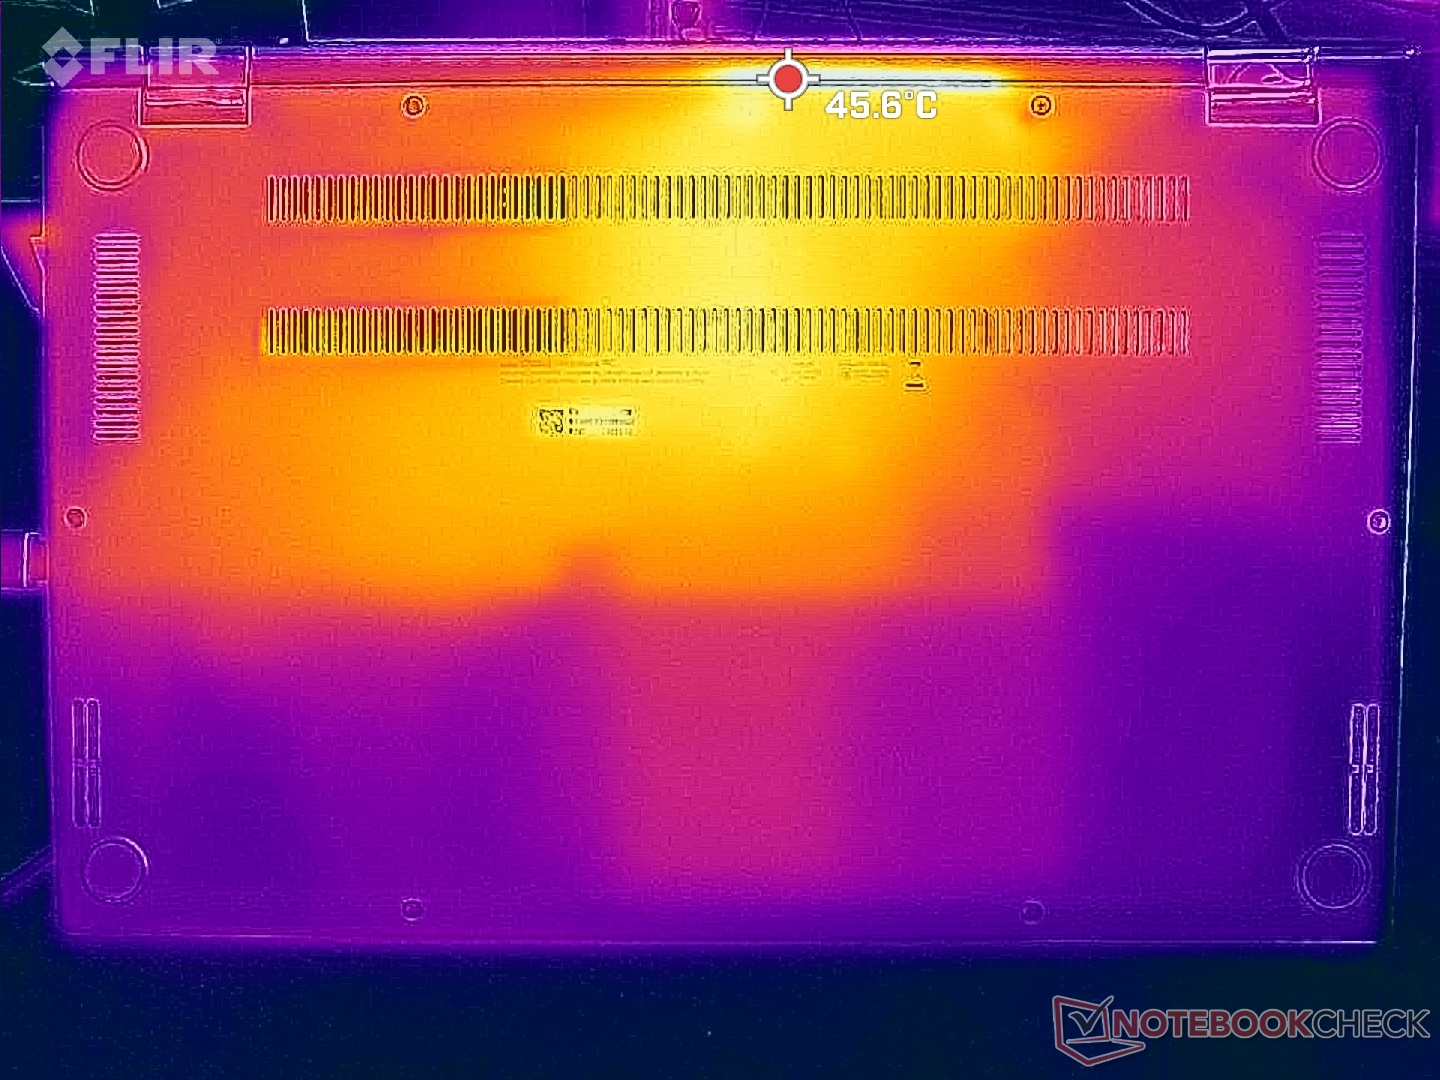
Surface temperatures are never uncomfortably warm on the palm rests or keyboard keys as hot spots are toward the rear of the chassis where skin is unlikely to touch. The warmest areas reach about 40 C as shown by the temperature maps below when running demanding loads for extended periods. In comparison, the hot spot on the bottom of the Dell Inspiron 15 7506 2-in-1 can reach over 46 C.
The ventilation grilles on the bottom of the laptop are very narrow. Perhaps larger grilles could have improved cooling even further.
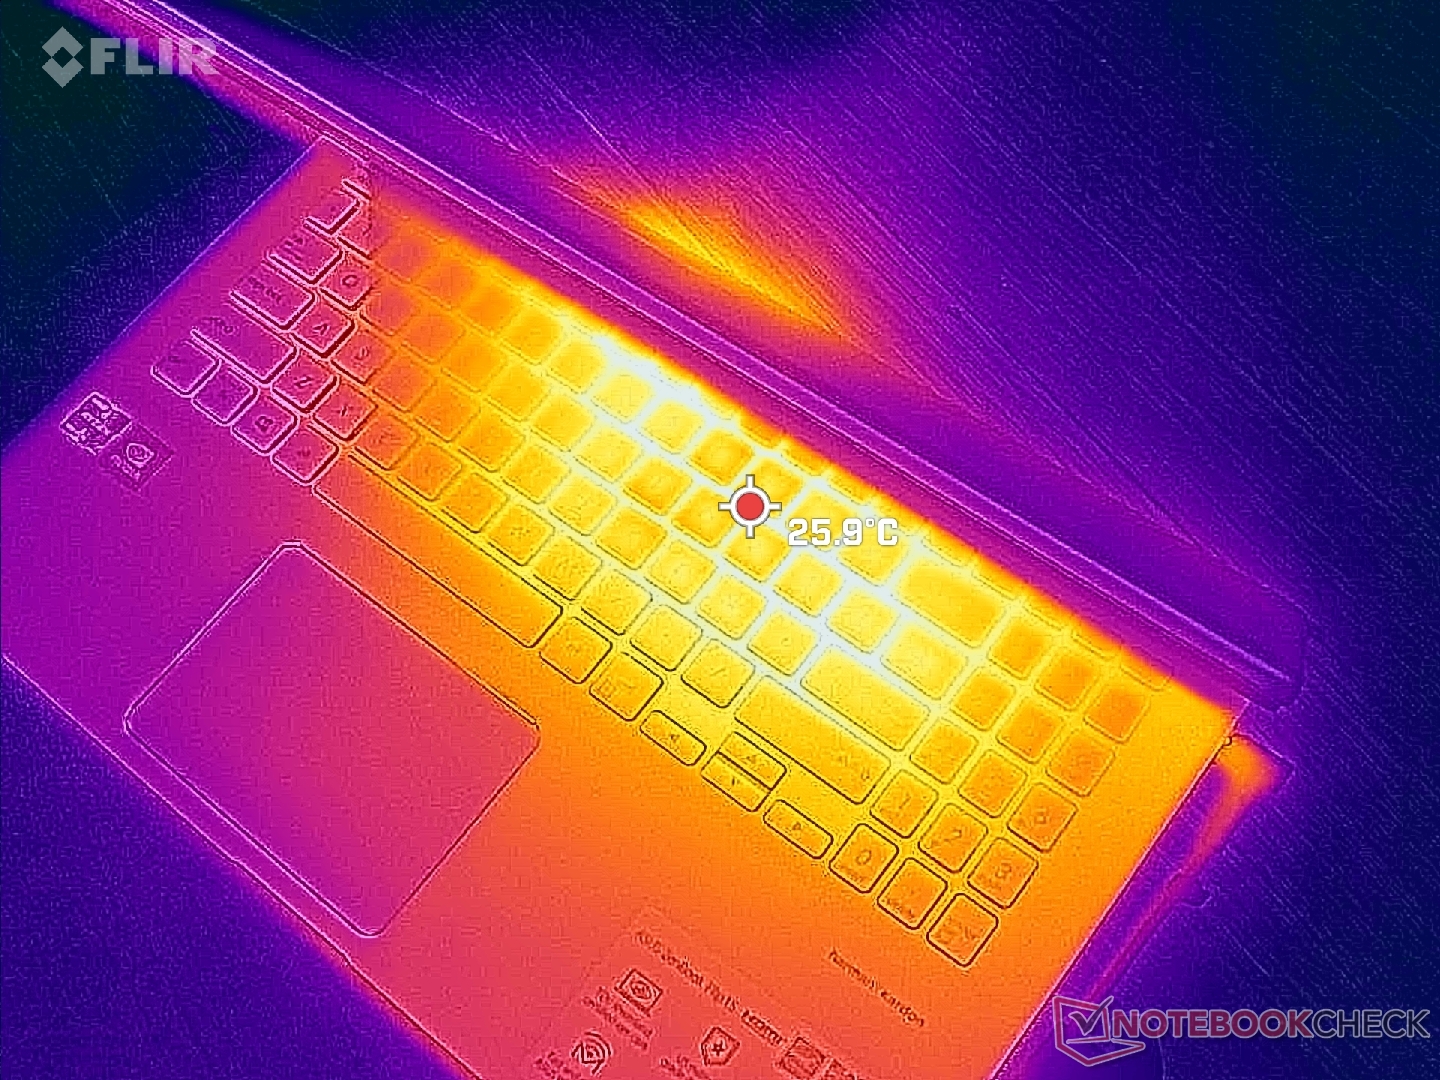
(+) The maximum temperature on the upper side is 39.6 °C / 103 F, compared to the average of 35.4 °C / 96 F, ranging from 19.6 to 60 °C for the class Convertible.
(+) The bottom heats up to a maximum of 37.8 °C / 100 F, compared to the average of 36.9 °C / 98 F
(+) In idle usage, the average temperature for the upper side is 23.4 °C / 74 F, compared to the device average of 30.3 °C / 87 F.
(+) The palmrests and touchpad are cooler than skin temperature with a maximum of 27.6 °C / 81.7 F and are therefore cool to the touch.
(±) The average temperature of the palmrest area of similar devices was 28 °C / 82.4 F (+0.4 °C / 0.7 F).
| Asus ZenBook Flip 15 Q508U AMD Ryzen 7 5700U, NVIDIA GeForce MX450 | Asus ZenBook Flip 15 Q539ZD Intel Core i7-12700H, Intel Arc A370M | HP Envy x360 15-ey0023dx AMD Ryzen 7 5825U, AMD Radeon RX Vega 8 (Ryzen 4000/5000) | Samsung Galaxy Book Pro 360 15 NP950QDB-KC3DE Intel Core i5-1135G7, Intel Iris Xe Graphics G7 80EUs | Dell Inspiron 15 7506 2-in-1 P97F Intel Core i5-1135G7, Intel Iris Xe Graphics G7 80EUs | Lenovo IdeaPad 5 15ALC05 AMD Ryzen 5 5500U, AMD Radeon RX Vega 7 | |
|---|---|---|---|---|---|---|
| Heat | -2% | 4% | -3% | -2% | -5% | |
| Maximum Upper Side * (°C) | 39.6 | 36.4 8% | 36.2 9% | 42.6 -8% | 35.6 10% | 40.5 -2% |
| Maximum Bottom * (°C) | 37.8 | 40.4 -7% | 37.8 -0% | 40.8 -8% | 46.8 -24% | 42 -11% |
| Idle Upper Side * (°C) | 26.4 | 26.2 1% | 25.4 4% | 25.9 2% | 23.6 11% | 26.5 -0% |
| Idle Bottom * (°C) | 26.8 | 29.2 -9% | 26.6 1% | 26.1 3% | 28 -4% | 29 -8% |
* ... smaller is better
Stress Test
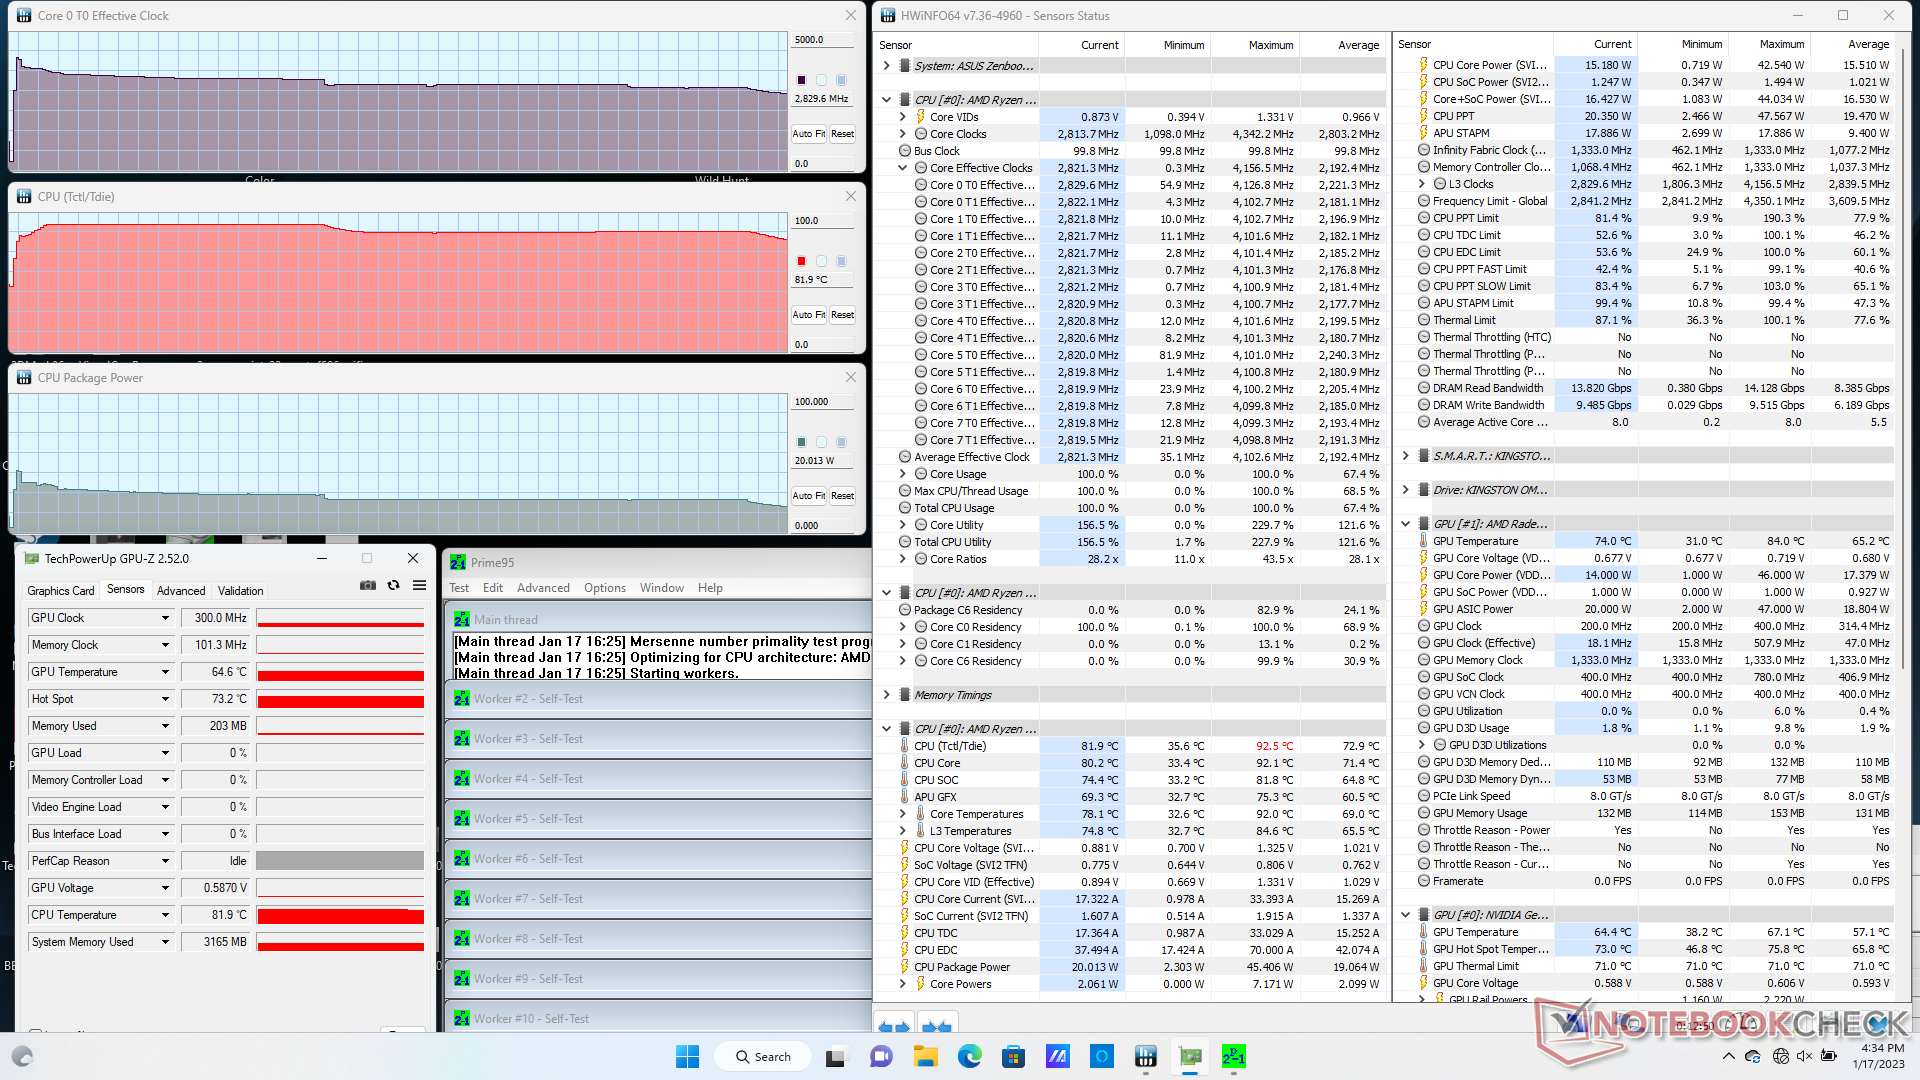
CPU clock rates, temperature, and board power draw would boost to 4.1 GHz, 93 C, and 45 W, respectively, when launching Prime95 stress. After just a couple of seconds, however, clock rates and power draw would begin to fall before eventually stabilizing at 2.8 GHz and 20 W, respectively, in order to maintain a cooler core temperature in the low 80 C range as shown by our screenshots below. Repeating this test on the HP Envy x360 15 with the Ryzen 7 5825U would result in a higher stable clock rate and cooler core temperature of 3.5 GHz and 77 C, respectively.
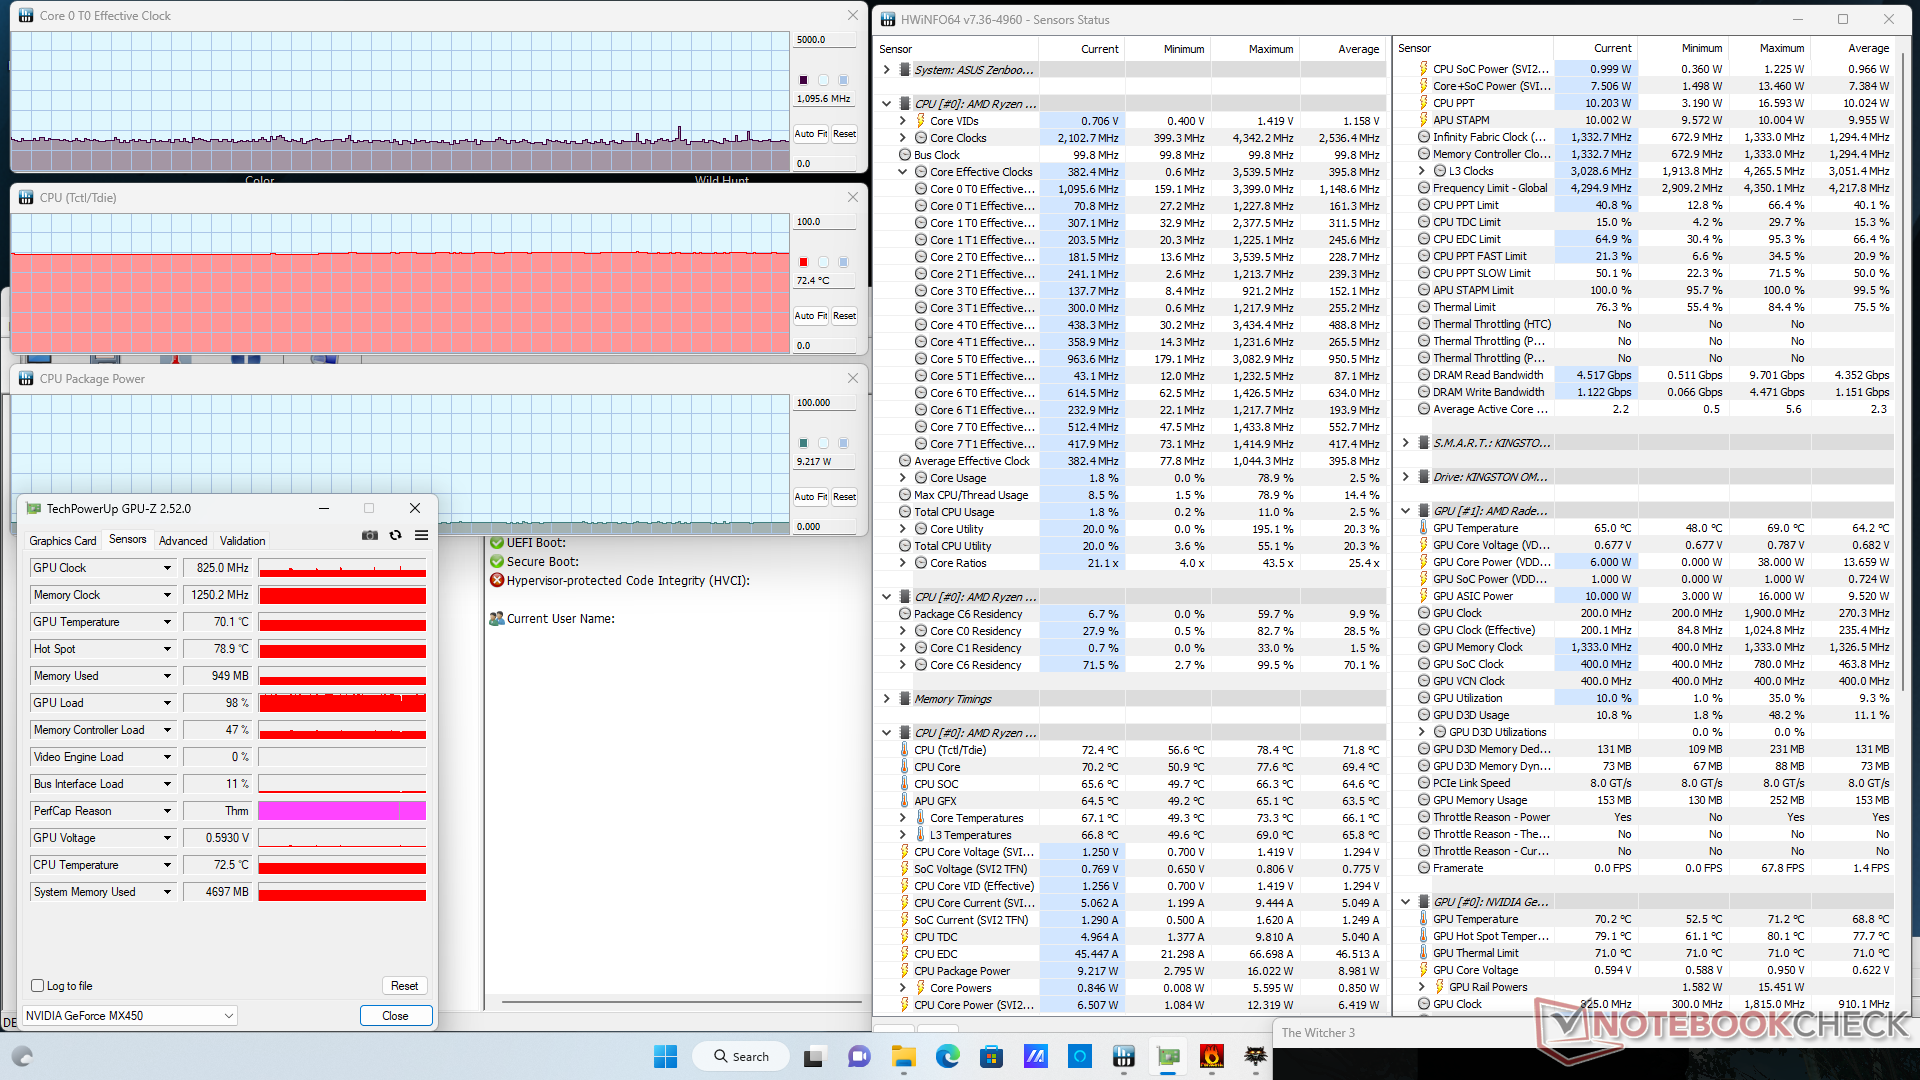
When running Witcher 3 to represent typical gaming loads, the Nvidia GPU would stabilize at 825 MHz and 70 C. Its power draw would range between 10 W and 20 W according to HWiNFO which is common for the GeForce MX series.
Running on battery power impacts CPU performance. A 3DMark 11 test on batteries would return Physics and Graphics scores of 7325 and 7434 points, respectively, compared to 12057 and 7455 points when on mains.
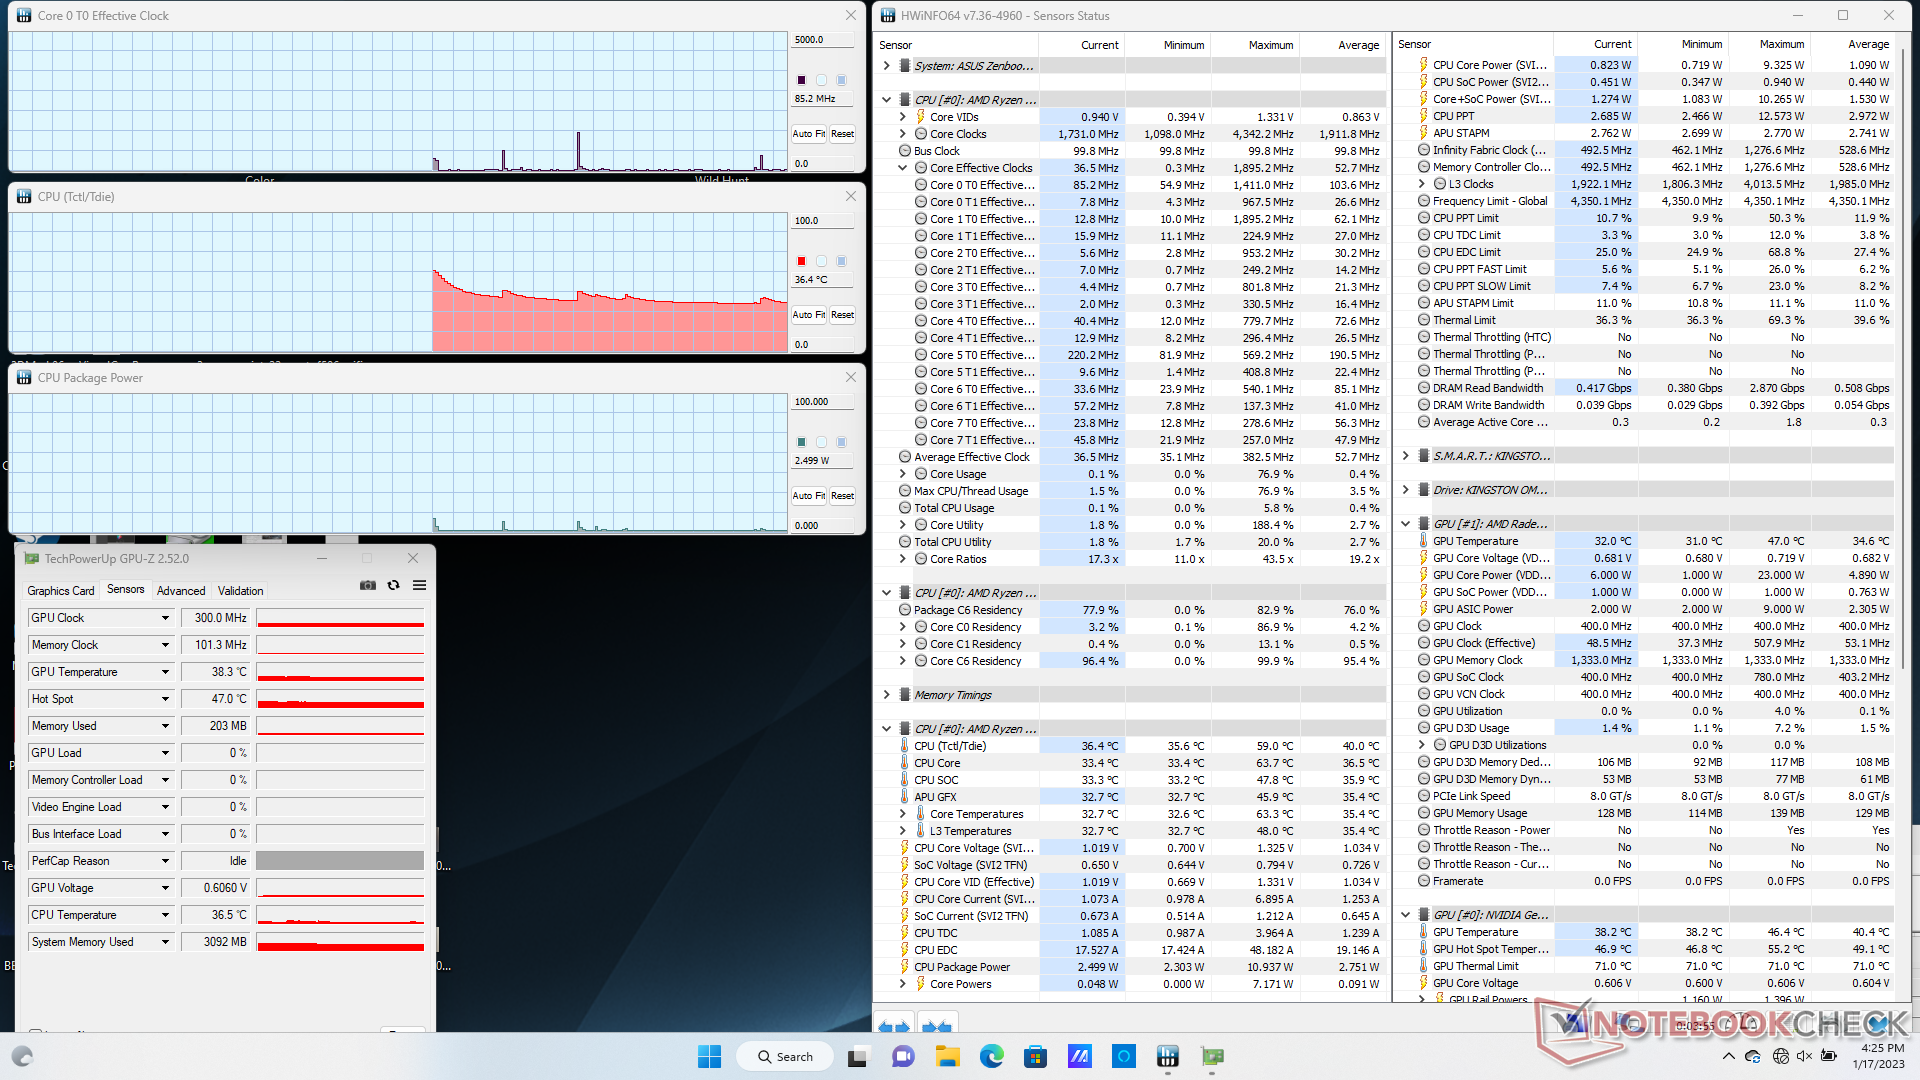
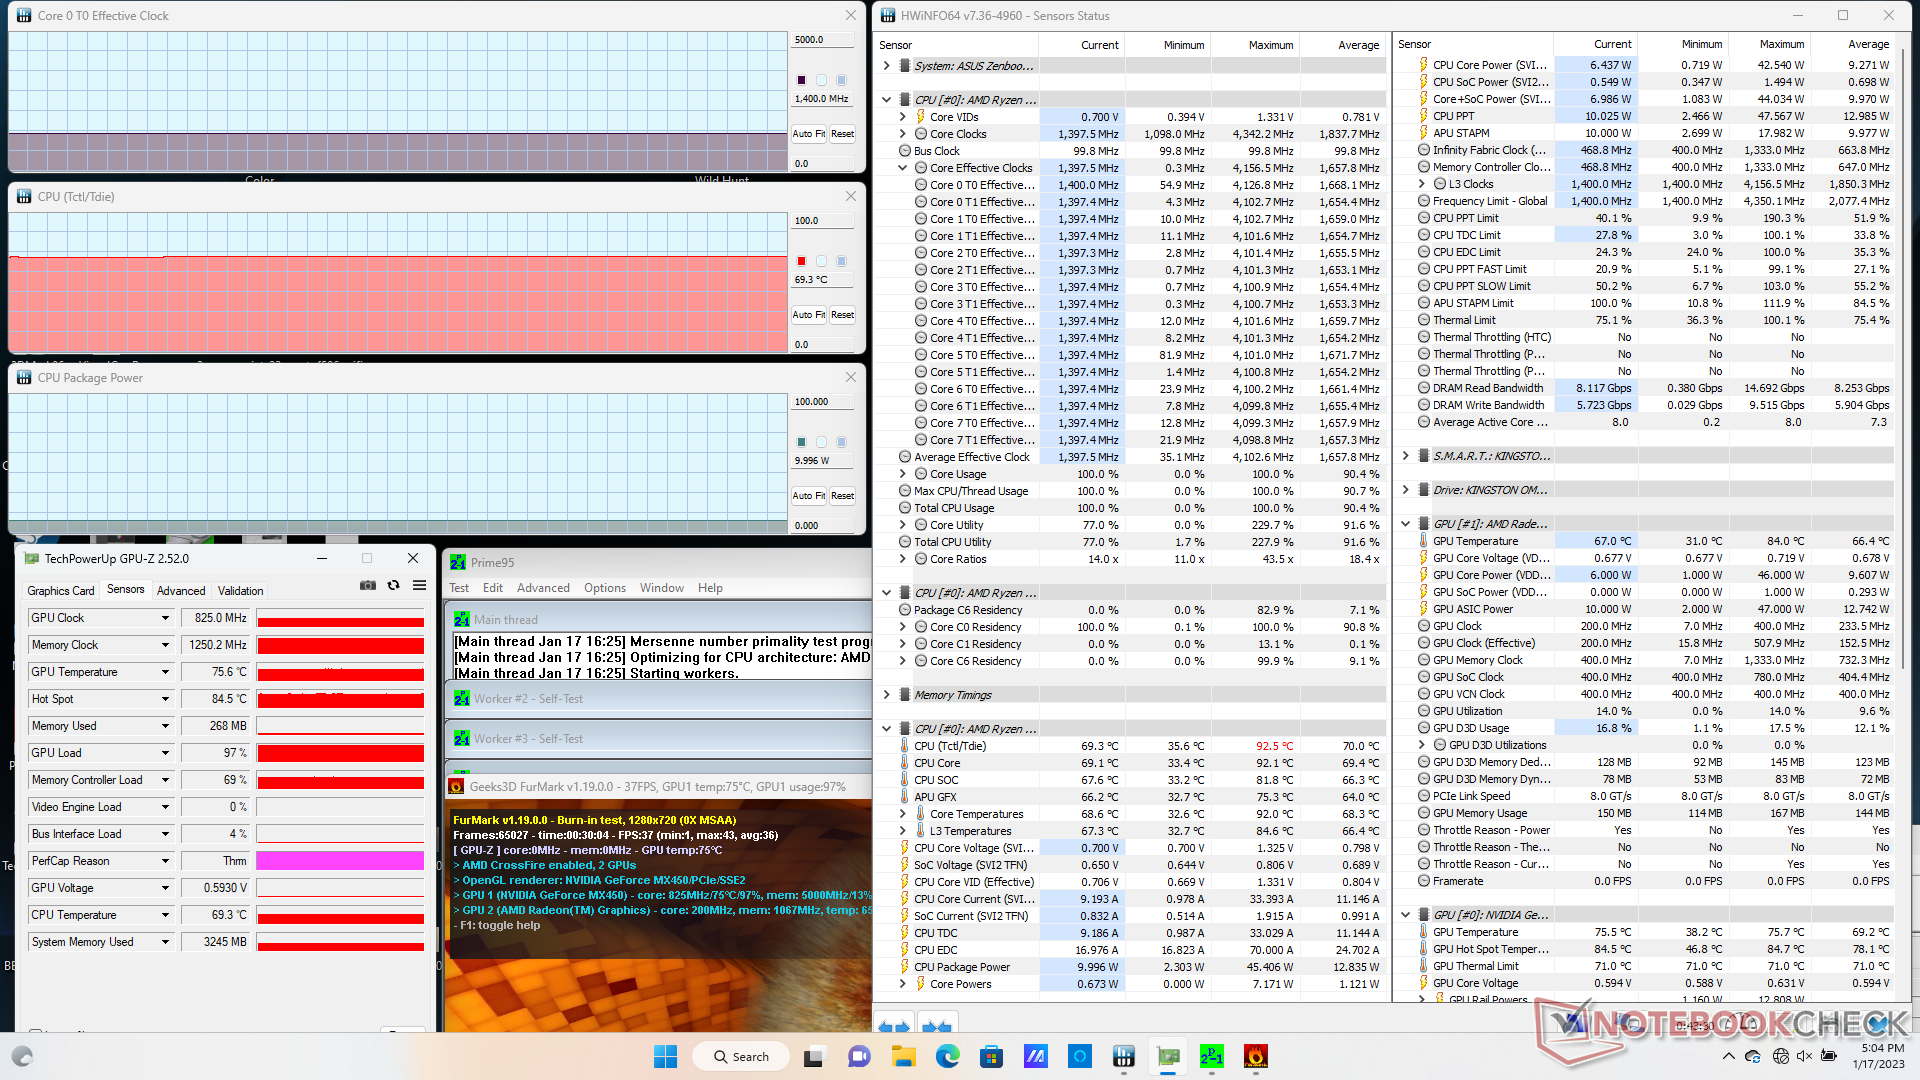
| CPU Clock (GHz) | GPU Clock (MHz) | Average CPU Temperature (°C) | Average GPU Temperature (°C) | |
| System Idle | -- | -- | 37 | 38 |
| Prime95 Stress | 2.8 | -- | 82 | 65 |
| Prime95 + FurMark Stress | 1.4 | 825 | 69 | 76 |
| Witcher 3 Stress | ~1.1 | 825 | 72 | 71 |
Speakers
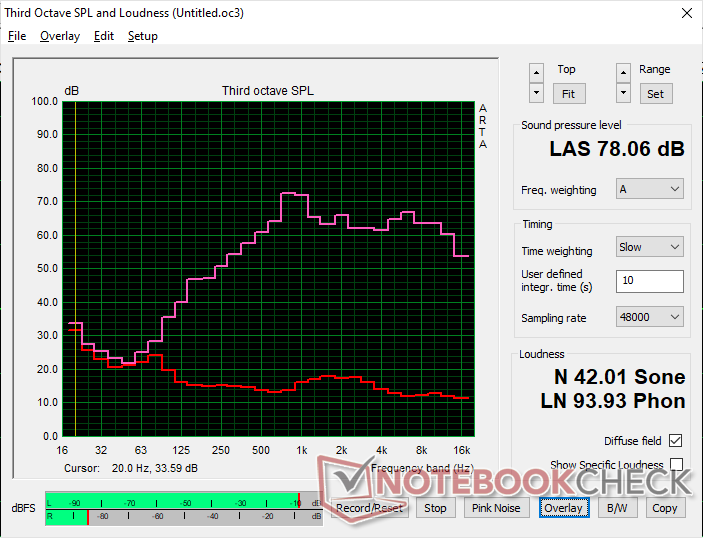
Asus ZenBook Flip 15 Q508U audio analysis
(±) | speaker loudness is average but good (78.1 dB)
Bass 100 - 315 Hz
(-) | nearly no bass - on average 16.2% lower than median
(±) | linearity of bass is average (9.3% delta to prev. frequency)
Mids 400 - 2000 Hz
(+) | balanced mids - only 4.6% away from median
(±) | linearity of mids is average (8.1% delta to prev. frequency)
Highs 2 - 16 kHz
(+) | balanced highs - only 1.7% away from median
(+) | highs are linear (4% delta to prev. frequency)
Overall 100 - 16.000 Hz
(±) | linearity of overall sound is average (16.3% difference to median)
Compared to same class
» 30% of all tested devices in this class were better, 3% similar, 67% worse
» The best had a delta of 6%, average was 20%, worst was 57%
Compared to all devices tested
» 27% of all tested devices were better, 6% similar, 68% worse
» The best had a delta of 4%, average was 23%, worst was 134%
Apple MacBook Pro 16 2021 M1 Pro audio analysis
(+) | speakers can play relatively loud (84.7 dB)
Bass 100 - 315 Hz
(+) | good bass - only 3.8% away from median
(+) | bass is linear (5.2% delta to prev. frequency)
Mids 400 - 2000 Hz
(+) | balanced mids - only 1.3% away from median
(+) | mids are linear (2.1% delta to prev. frequency)
Highs 2 - 16 kHz
(+) | balanced highs - only 1.9% away from median
(+) | highs are linear (2.7% delta to prev. frequency)
Overall 100 - 16.000 Hz
(+) | overall sound is linear (4.6% difference to median)
Compared to same class
» 0% of all tested devices in this class were better, 0% similar, 100% worse
» The best had a delta of 5%, average was 17%, worst was 45%
Compared to all devices tested
» 0% of all tested devices were better, 0% similar, 100% worse
» The best had a delta of 4%, average was 23%, worst was 134%
Energy Management
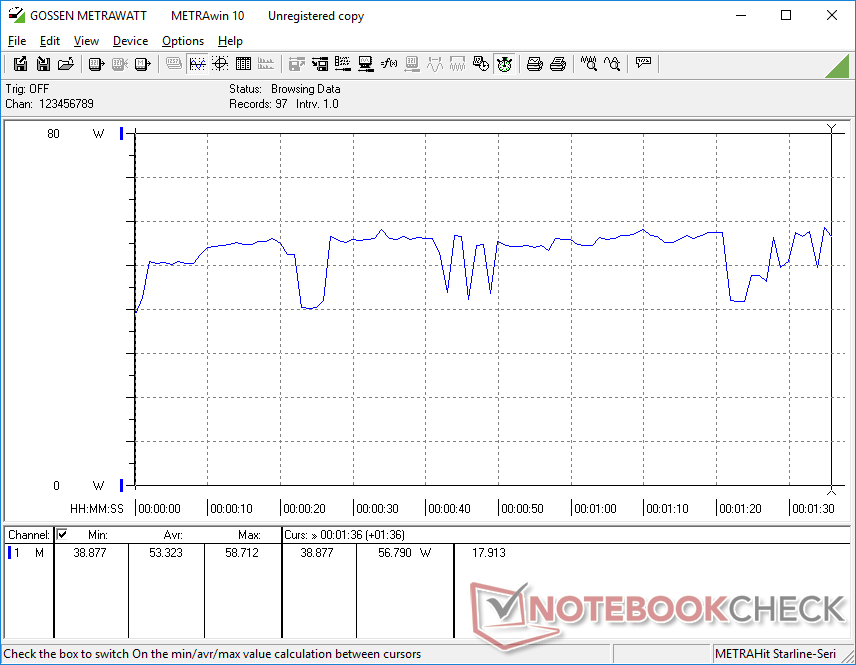
Power Consumption — Losing Ground To The Integrated Radeon 680M
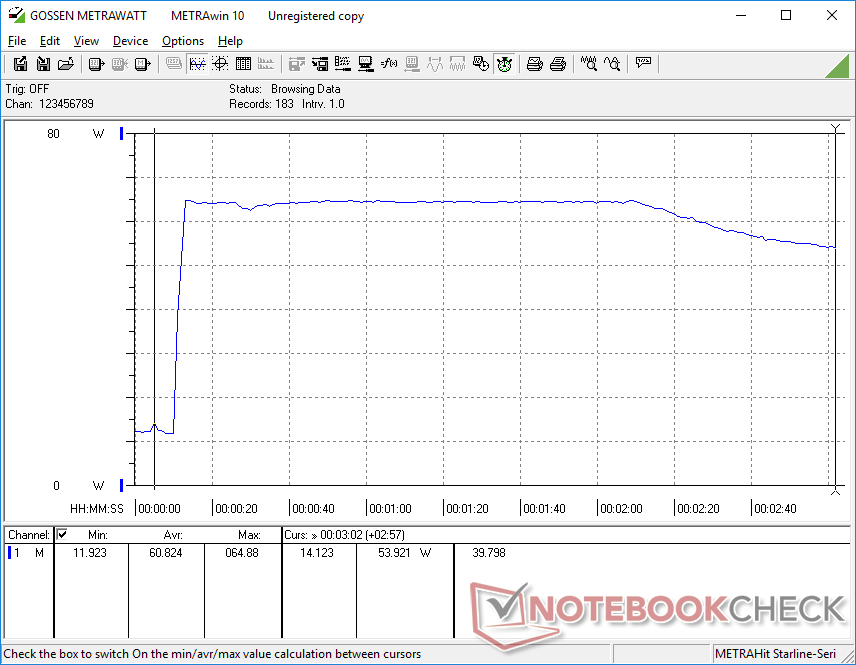
If gaming, consumption would range between 42 W and 54 W compared to 46 W and 52 W on the Lenovo Yoga 7 14 powered by the faster Ryzen 7 6800U and integrated Radeon 680M. Performance-per-watt is therefore noticeably poorer on our Asus especially since the Nvidia MX GPU generally underperforms when compared to the competing Radeon 680M. A key advantage of sporting a discrete GPU is its potential for faster performance than an integrated alternative even if it means higher power consumption, but the MX450 can only barely keep up with the latest integrated solution from AMD.
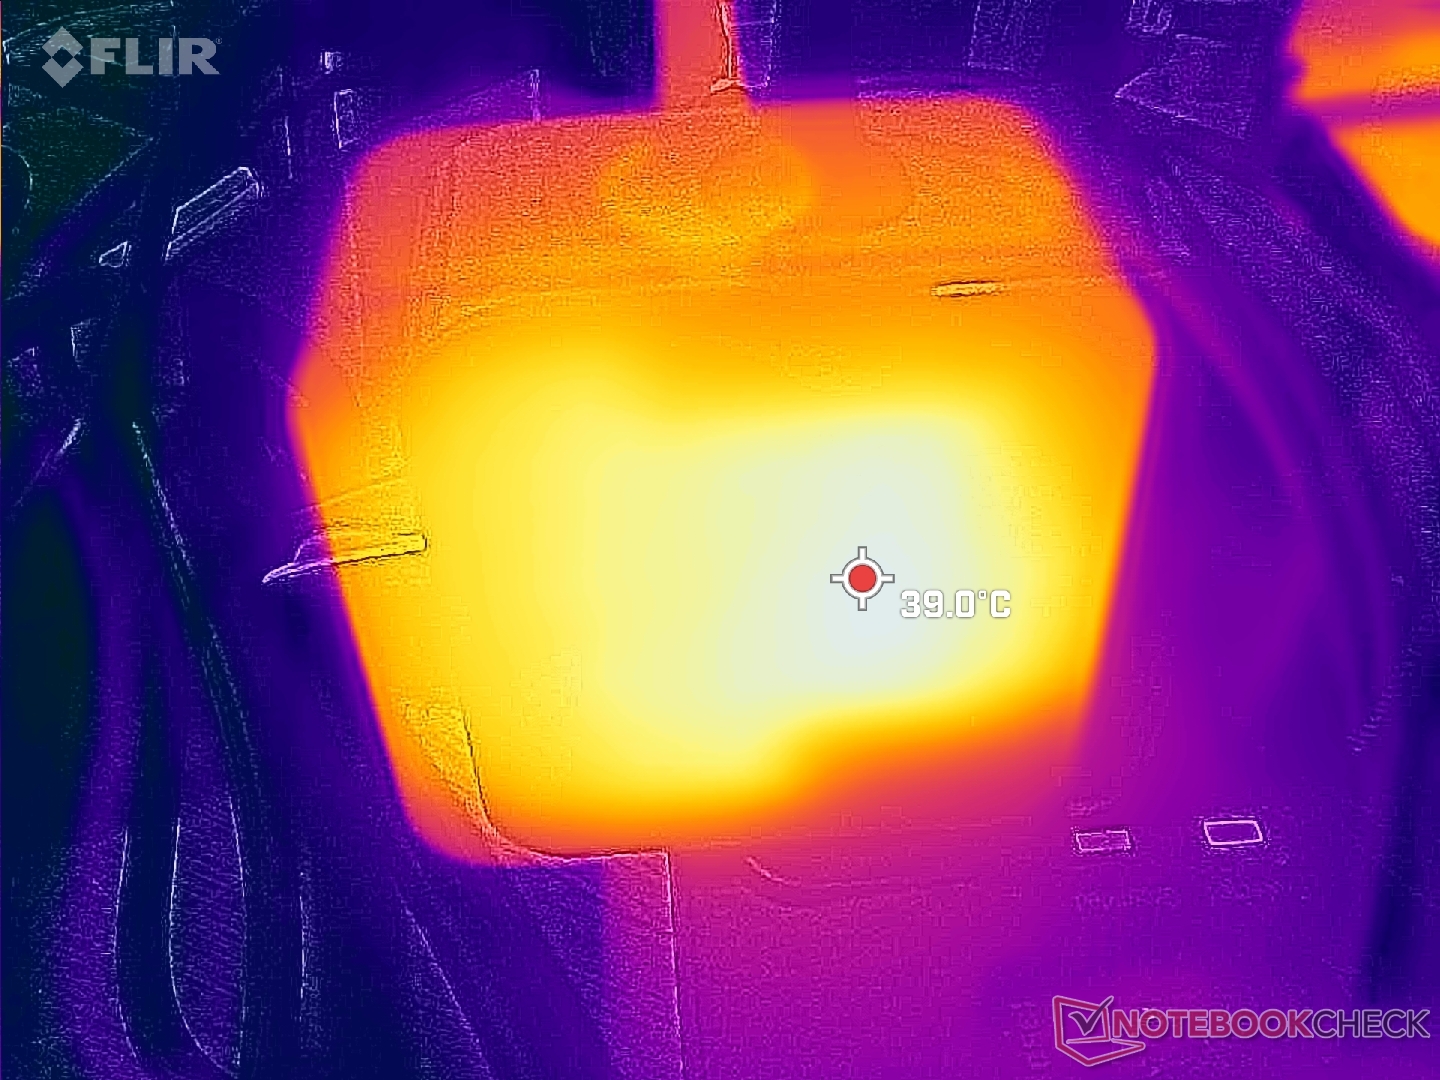
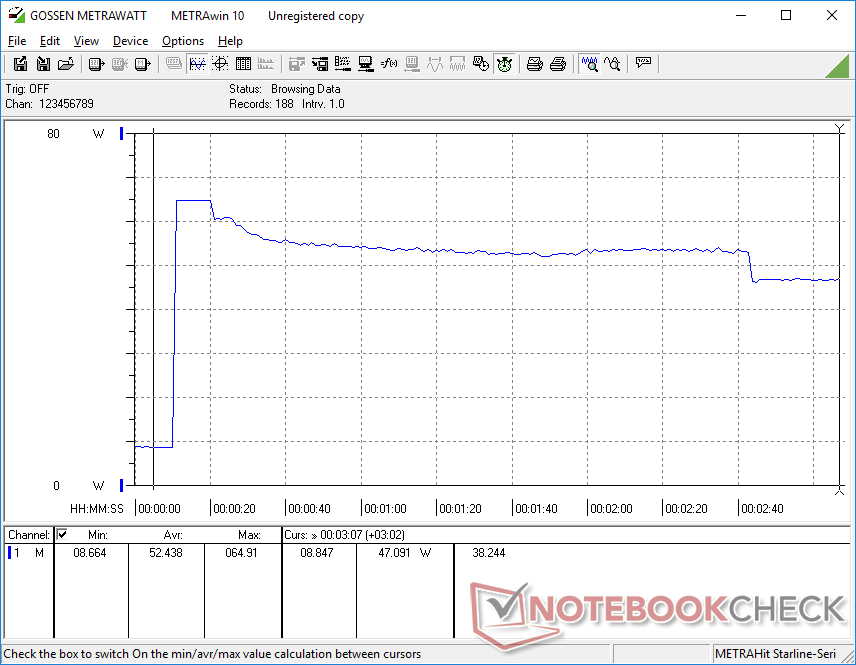
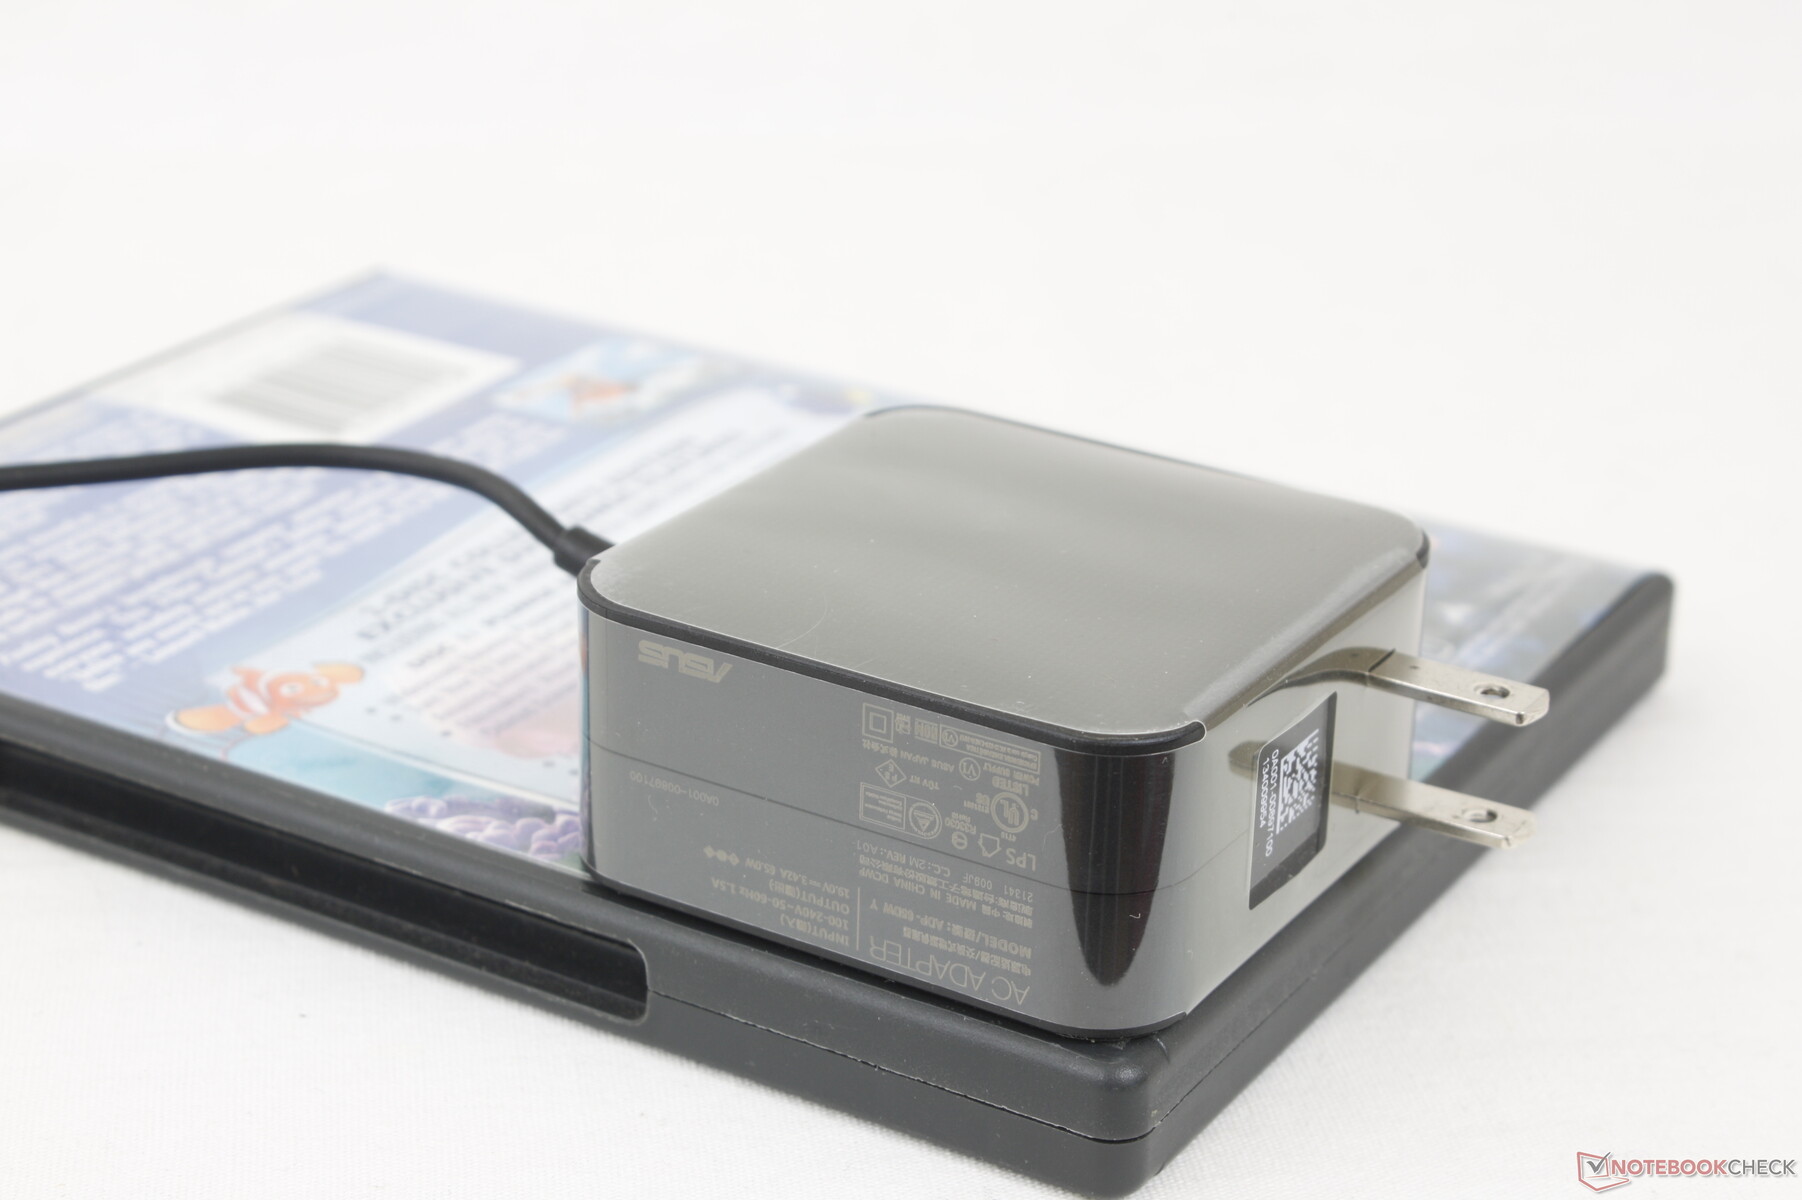
We're able to record a temporary maximum consumption of 65 W from the small (6.4 x 6.4 x 2.8 cm) 65 W wall wart AC adapter when both the CPU and GPU are at 100 percent utilization. This rate would quickly fall as maximum Boost speeds are unsustainable on the model as shown by the screenshots below.
| Off / Standby | |
| Idle | |
| Load |
|
Key:
min: | |
| Asus ZenBook Flip 15 Q508U R7 5700U, GeForce MX450, Kingston OM8PDP3256B, IPS, 1920x1080, 15.6" | Asus ZenBook Flip 15 Q539ZD i7-12700H, A370M, SK Hynix HFM001TD3JX013N, OLED, 2880x1620, 15.6" | HP Envy x360 15-ey0023dx R7 5825U, Vega 8, Samsung PM991 MZVLQ512HBLU, IPS, 1920x1080, 15.6" | Samsung Galaxy Book Pro 360 15 NP950QDB-KC3DE i5-1135G7, Iris Xe G7 80EUs, Samsung PM991 MZVLQ256HAJD, OLED, 1920x1080, 15.6" | Lenovo IdeaPad 5 15ALC05 R5 5500U, Vega 7, , IPS, 1920x1080, 15.6" | Lenovo Yoga 7-14ARB G7 R7 6800U, Radeon 680M, Kioxia BG5 KBG50ZNT1T02, OLED, 2880x1800, 14" | |
|---|---|---|---|---|---|---|
| Power Consumption | -89% | 9% | 15% | 11% | -4% | |
| Idle Minimum * (Watt) | 3.9 | 9.1 -133% | 3.9 -0% | 4 -3% | 3.7 5% | 5.1 -31% |
| Idle Average * (Watt) | 7.6 | 11.9 -57% | 7.2 5% | 5.6 26% | 7.9 -4% | 8.2 -8% |
| Idle Maximum * (Watt) | 11 | 12.4 -13% | 7.3 34% | 10.1 8% | 9.3 15% | 8.7 21% |
| Load Average * (Watt) | 53.3 | 101.3 -90% | 46.7 12% | 34.7 35% | 41 23% | 51.4 4% |
| Witcher 3 ultra * (Watt) | 42.8 | 85.6 -100% | 41.1 4% | 34.7 19% | 41 4% | 46.3 -8% |
| Load Maximum * (Watt) | 64.9 | 155.7 -140% | 64.8 -0% | 63 3% | 52.2 20% | 64.8 -0% |
* ... smaller is better
Power Consumption Witcher 3 / Stresstest
Power Consumption external Monitor
Battery Life — Actually Not Bad
At just 56 Wh, battery capacity is significantly smaller than the 96 Wh battery in the ZenBook Flip 15 Q539. Even so, battery life isn't shorter due to the less demanding U-series CPU and MX series GPU in our ZenBook Flip 15 Q508 configuration. We're able to record a real-world WLAN runtime of just over 11 hours compared to 9 hours on the ZenBook Flip 15 Q539.
Charging from empty to full capacity takes about 2 hours. The system cannot be recharged via USB-C.
| Asus ZenBook Flip 15 Q508U R7 5700U, GeForce MX450, 56 Wh | Asus ZenBook Flip 15 Q539ZD i7-12700H, A370M, 96 Wh | HP Envy x360 15-ey0023dx R7 5825U, Vega 8, 51 Wh | Samsung Galaxy Book Pro 360 15 NP950QDB-KC3DE i5-1135G7, Iris Xe G7 80EUs, 67 Wh | Dell Inspiron 15 7506 2-in-1 P97F i5-1135G7, Iris Xe G7 80EUs, 53 Wh | Lenovo IdeaPad 5 15ALC05 R5 5500U, Vega 7, 70 Wh | |
|---|---|---|---|---|---|---|
| Battery runtime | 2% | 0% | 26% | -15% | 21% | |
| Reader / Idle (h) | 16.8 | 13.2 -21% | 20 19% | 27.6 64% | 18.8 12% | |
| WiFi v1.3 (h) | 11.1 | 9.4 -15% | 10.2 -8% | 11.3 2% | 8.3 -25% | 14 26% |
| Load (h) | 1.9 | 2.7 42% | 1.7 -11% | 2.1 11% | 1.3 -32% | 2.2 16% |
| H.264 (h) | 15.4 | |||||
| Witcher 3 ultra (h) | 1.8 |
Pros
Cons
Verdict — More Like a VivoBook Than A ZenBook
Some of Asus' best consumer laptops carry the Zenbook name. The ZenBook Flip 15 Q508UG, however, cuts far too many corners to be one of the worst Zenbook models we've tested thus far. It carries a thick and heavy drab chassis design with no support for DisplayPort, Power Delivery, Wi-Fi 6E, or full sRGB options. Its clickpad is small and servicing is difficult because of hidden screws. The dropped frames during 4K60 video playback is unacceptable and the high-pitched fan noise is difficult to ignore when running demanding loads. The slow NVMe SSD and soldered RAM limit the versatility of the system even further.
The Zenbook Flip 15 Q508UG is unique for its combination Ryzen 7 5700U CPU and GeForce MX450 graphics. Unfortunately, it's all wrapped in a thick chassis that's lacking in features common on most other midrange or higher laptops.
There are a few positive aspects of the model, but they are overshadowed by the longer list of disappointments. CPU and GPU performance is good, for example, but the newer Zen 3+ and Radeon 680M options from AMD can do it better and more efficiently without needing a dedicated GeForce MX graphics chip. At least the hinges and keyboard are of decent quality despite the fragile chrome coating and poor contrast between the keycap and labels.
If you're going to spend $900 USD on a 15.6-inch convertible, then it would be best to consider the HP Envy x360 15 or Dell Inspiron 15 7506 2-in-1 instead. These alternatives are leaner, more configurable, and carry more RAM and features without needing to sacrifice screen size.
Price and Availability
The Asus Zenbook 15 Q508UG convertible is now shipping at Best Buy for $869 USD.
Asus ZenBook Flip 15 Q508U
- 01/20/2023 v7 (old)
Allen Ngo
Transparency
The selection of devices to be reviewed is made by our editorial team. The test sample was freely purchased by the author at his/her own expense. The lender had no influence on this review, nor did the manufacturer receive a copy of this review before publication. There was no obligation to publish this review. As an independent media company, Notebookcheck is not subjected to the authority of manufacturers, retailers or publishers.
This is how Notebookcheck is testing
Every year, Notebookcheck independently reviews hundreds of laptops and smartphones using standardized procedures to ensure that all results are comparable. We have continuously developed our test methods for around 20 years and set industry standards in the process. In our test labs, high-quality measuring equipment is utilized by experienced technicians and editors. These tests involve a multi-stage validation process. Our complex rating system is based on hundreds of well-founded measurements and benchmarks, which maintains objectivity. Further information on our test methods can be found here.
Price comparison
