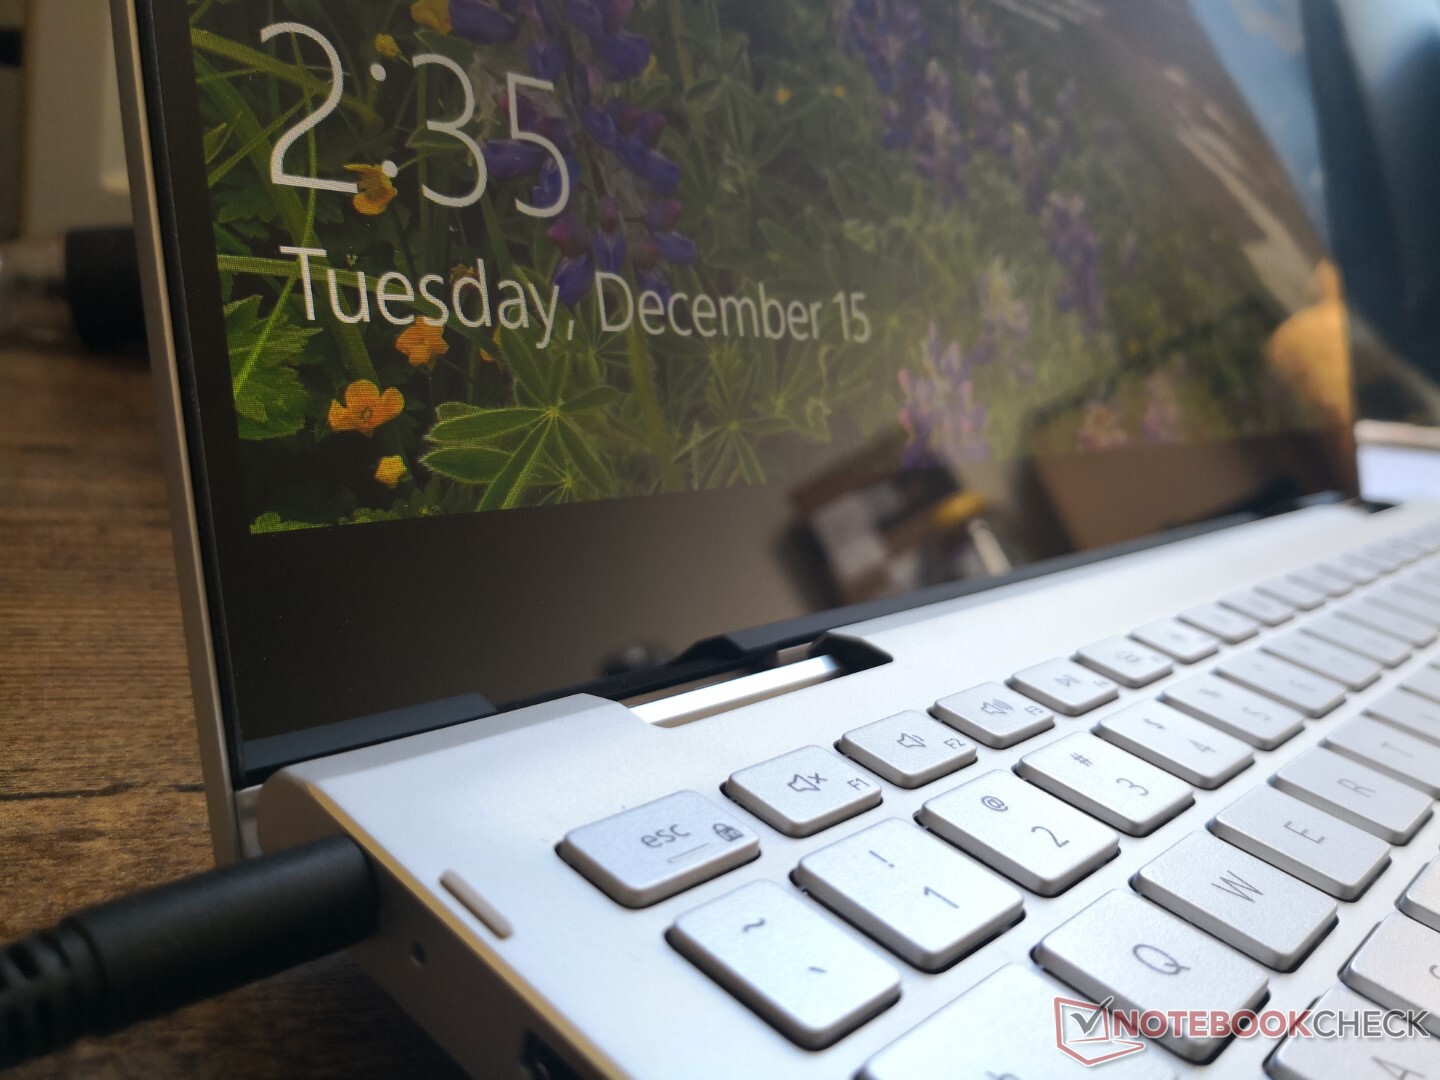
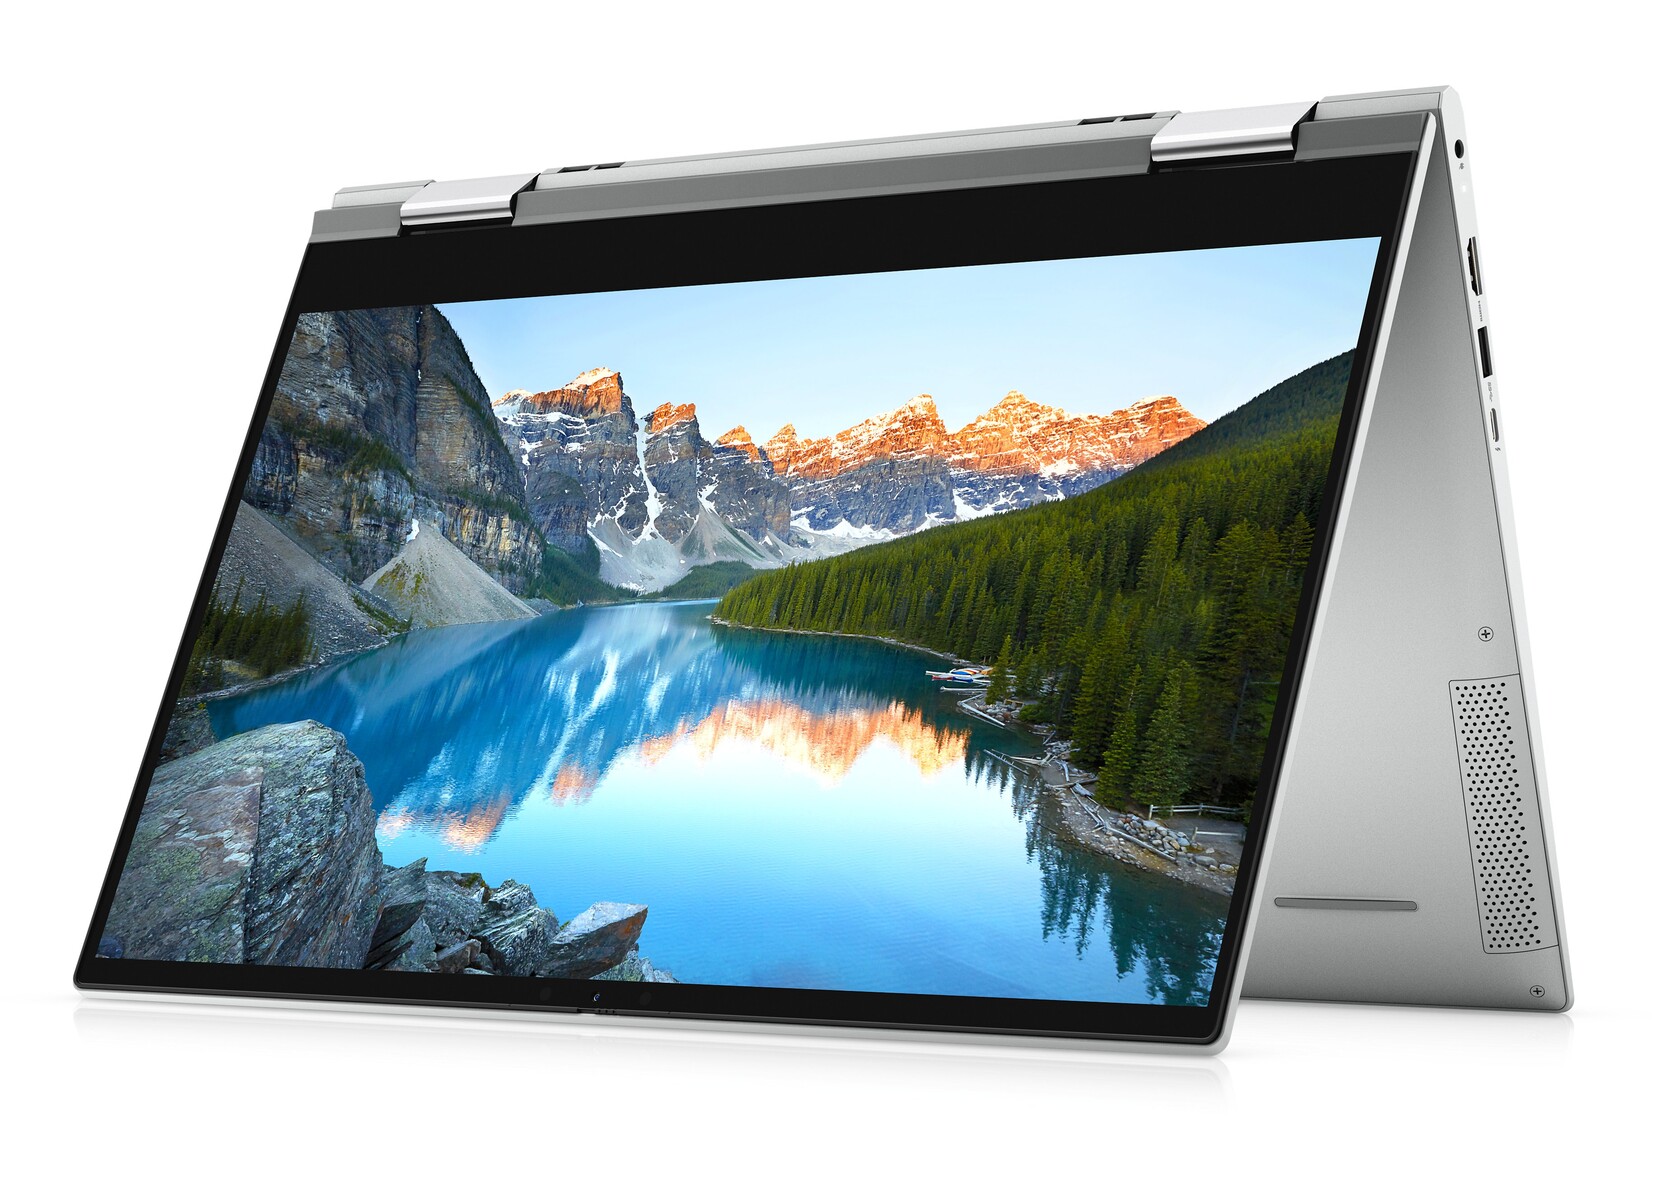
Dell Inspiron 15 7506 2-in-1 Convertible Review: Easy to Use, Easy to Own
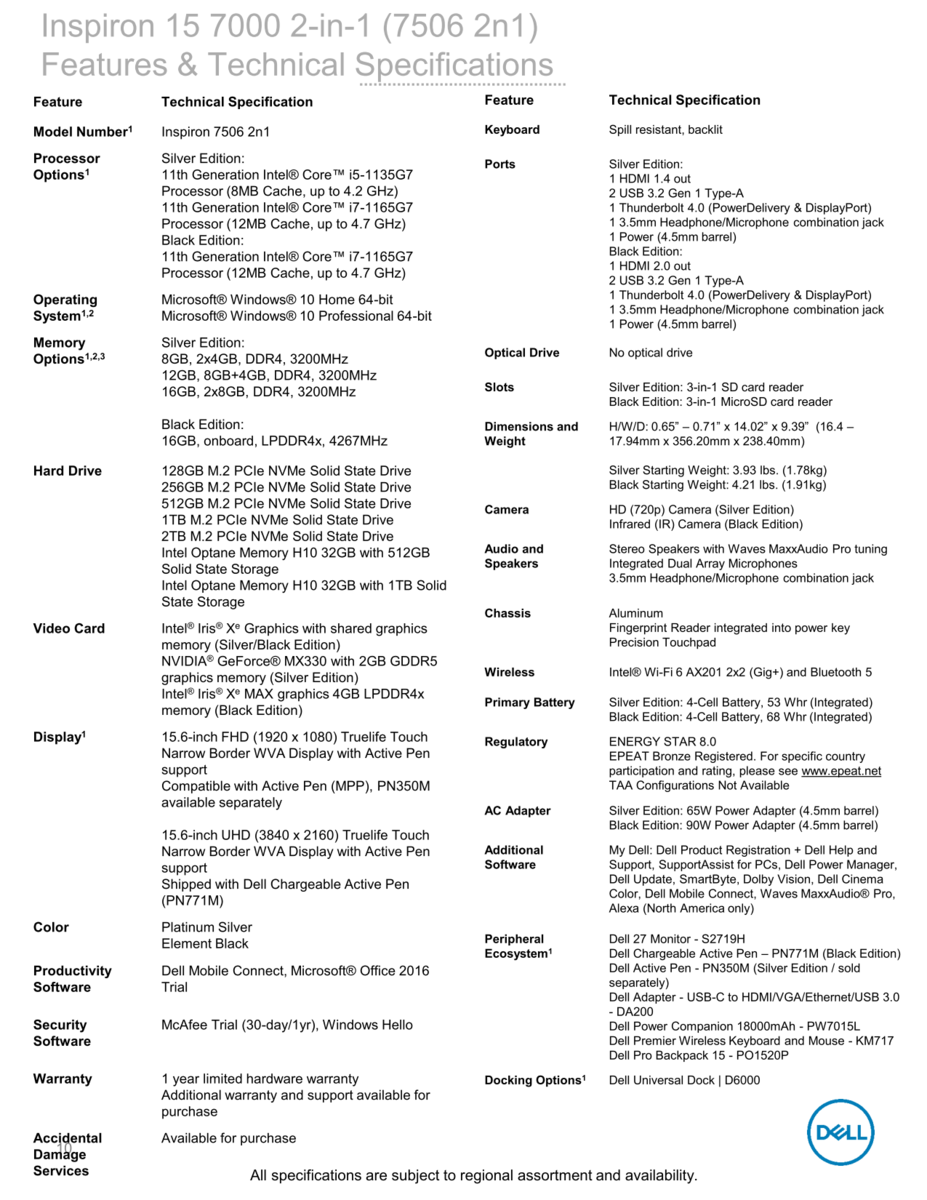
The Inspiron 7000 series is home to Dell's upper mid-range laptops in contrast to the budget Inspiron 3000 series or mid-range Inspiron 5000 series. The Inspiron 15 7506 is a 15.6-inch convertible in the Inspiron 7000 family to directly succeed the older 2018 Inspiron 15 7000 2-in-1. Two distinct Inspiron 15 7506 2-in-1 models are available: the more affordable Silver Edition and the full-fledged Black Edition which comes with additional features not found on the former including Intel Xe Max graphics, a pen garage, and a 4K UHD option.
Our review here will focus on the Silver Edition while the Black Edition review will come at a later date. Silver Edition SKUs range from $750 USD with the Core i5-1135G7 CPU, 8 GB of RAM, and 256 GB NVMe SSD up to $1100 USD for the Core i7-1165G7 CPU, 16 GB of RAM, and 512 GB NVMe SSD. All Silver Edition configurations come with the same 1080p touchscreen while a GeForce MX330 GPU option is in the works.
Alternatives to the Inspiron 15 7506 2-in-1 include other 15.6-inch convertibles like the Asus VivoBook Flip 15, HP Envy x360 15, or Lenovo Yoga C740-15.
More Dell reviews:

potential competitors in comparison
Rating | Date | Model | Weight | Height | Size | Resolution | Price |
|---|---|---|---|---|---|---|---|
| 81.2 % v7 (old) | 12 / 2020 | Dell Inspiron 15 7506 2-in-1 P97F i5-1135G7, Iris Xe G7 80EUs | 1.8 kg | 17.94 mm | 15.60" | 1920x1080 | |
| 86.5 % v7 (old) | 03 / 2020 | Asus ZenBook Flip 15 UX563FD-A1027T i7-10510U, GeForce GTX 1050 Max-Q | 1.9 kg | 19.9 mm | 15.60" | 3840x2160 | |
| 82.8 % v6 (old) | 12 / 2018 | Dell Inspiron 15 7000 2-in-1 Black Edition i7-8565U, GeForce MX150 | 2.1 kg | 17 mm | 15.60" | 3840x2160 | |
| 82.8 % v7 (old) | 09 / 2020 | HP Envy x360 15-ee0257ng R5 4500U, Vega 6 | 2 kg | 18.9 mm | 15.60" | 1920x1080 | |
| 84.8 % v7 (old) | 01 / 2020 | Lenovo Yoga C740-15IML i7-10510U, UHD Graphics 620 | 1.9 kg | 17.25 mm | 15.60" | 1920x1080 | |
| 78.9 % v6 (old) | 02 / 2018 | Asus VivoBook Flip 15 TP510UA-E8073T i5-8250U, UHD Graphics 620 | 2.3 kg | 18 mm | 15.60" | 1920x1080 |
Case
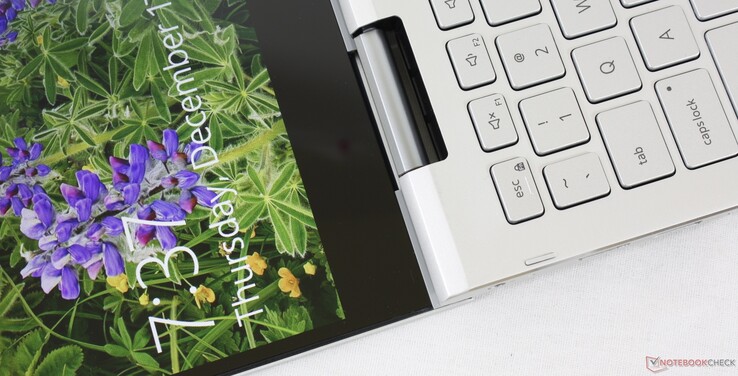
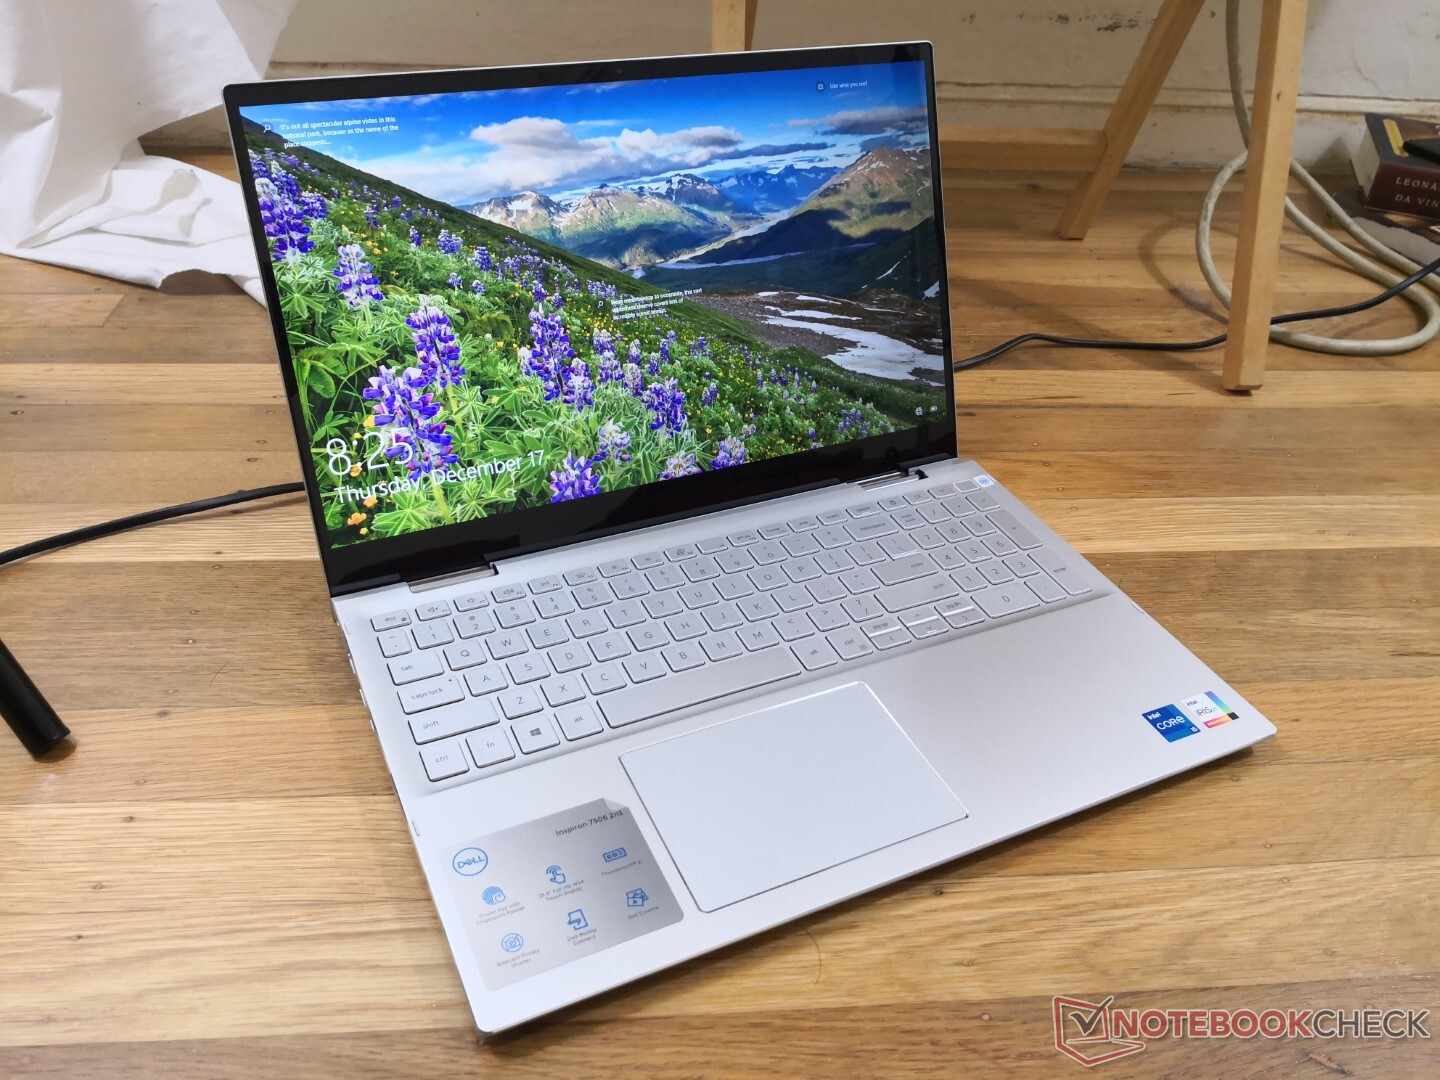
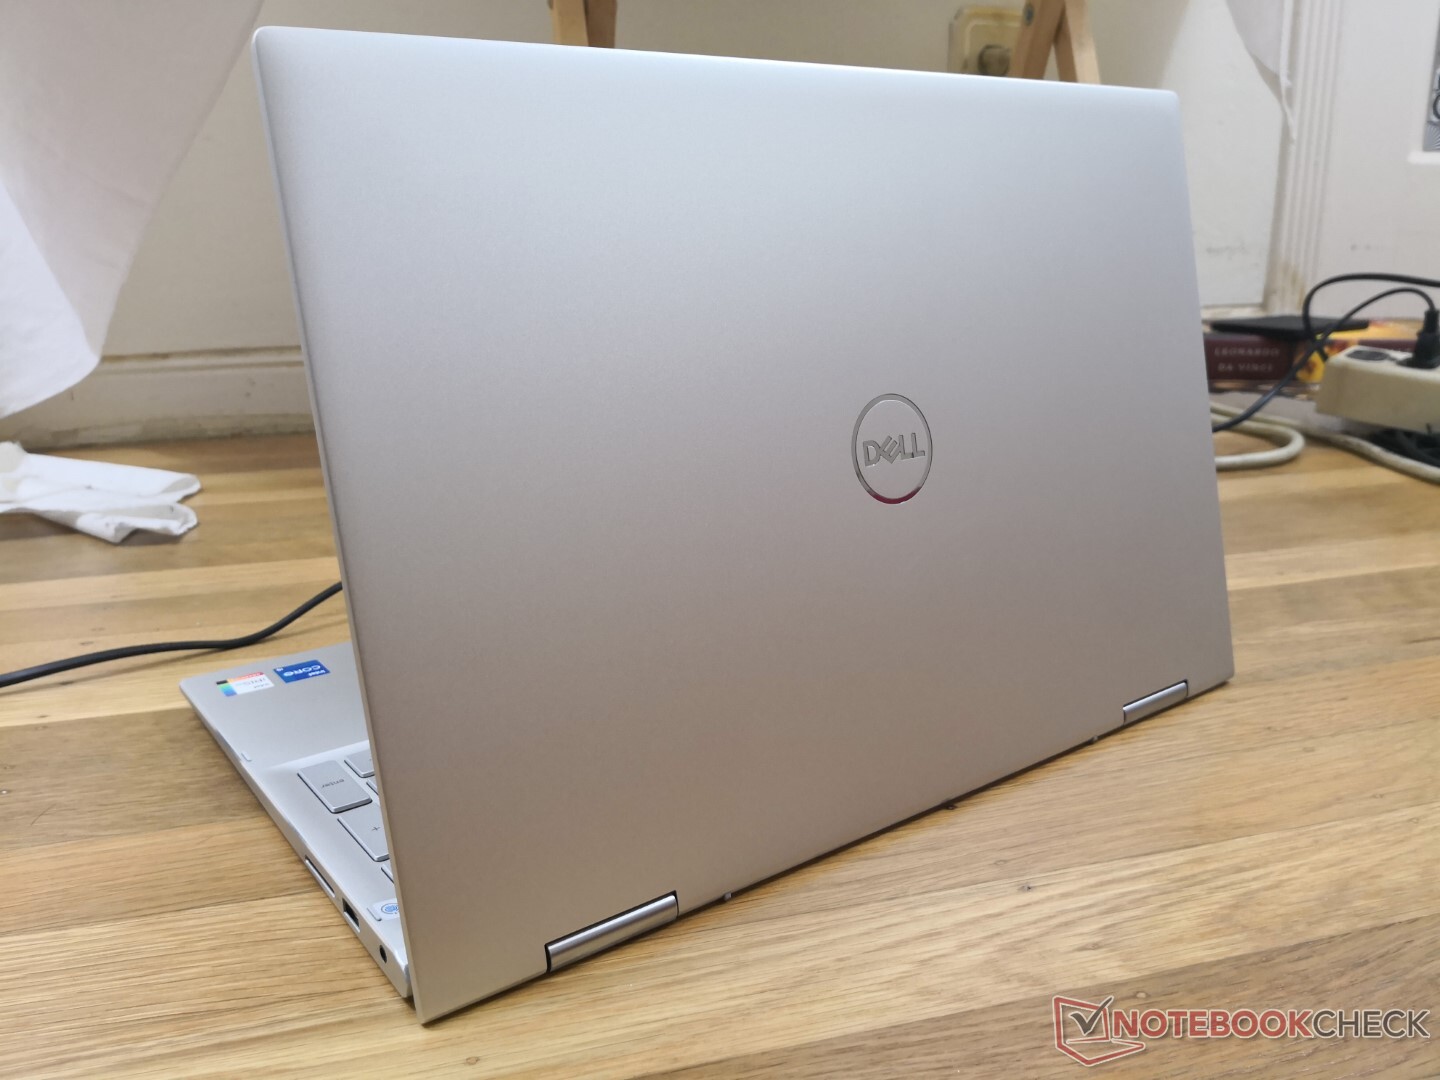
The chassis is distinctly mid-range to reflect its mid-range price point. It lacks the luxurious metal materials of the XPS series while avoiding the overly plastic feel of cheaper Inspiron 3000 or HP Pavilion systems. The lid and hinges, for example, feel stiff which gives a good sense of longevity when alternating between tablet mode and laptop mode. Nonetheless, the base and outer lid flex more than on the HP Spectre and we can still hear some creaking when opening or closing the lid.
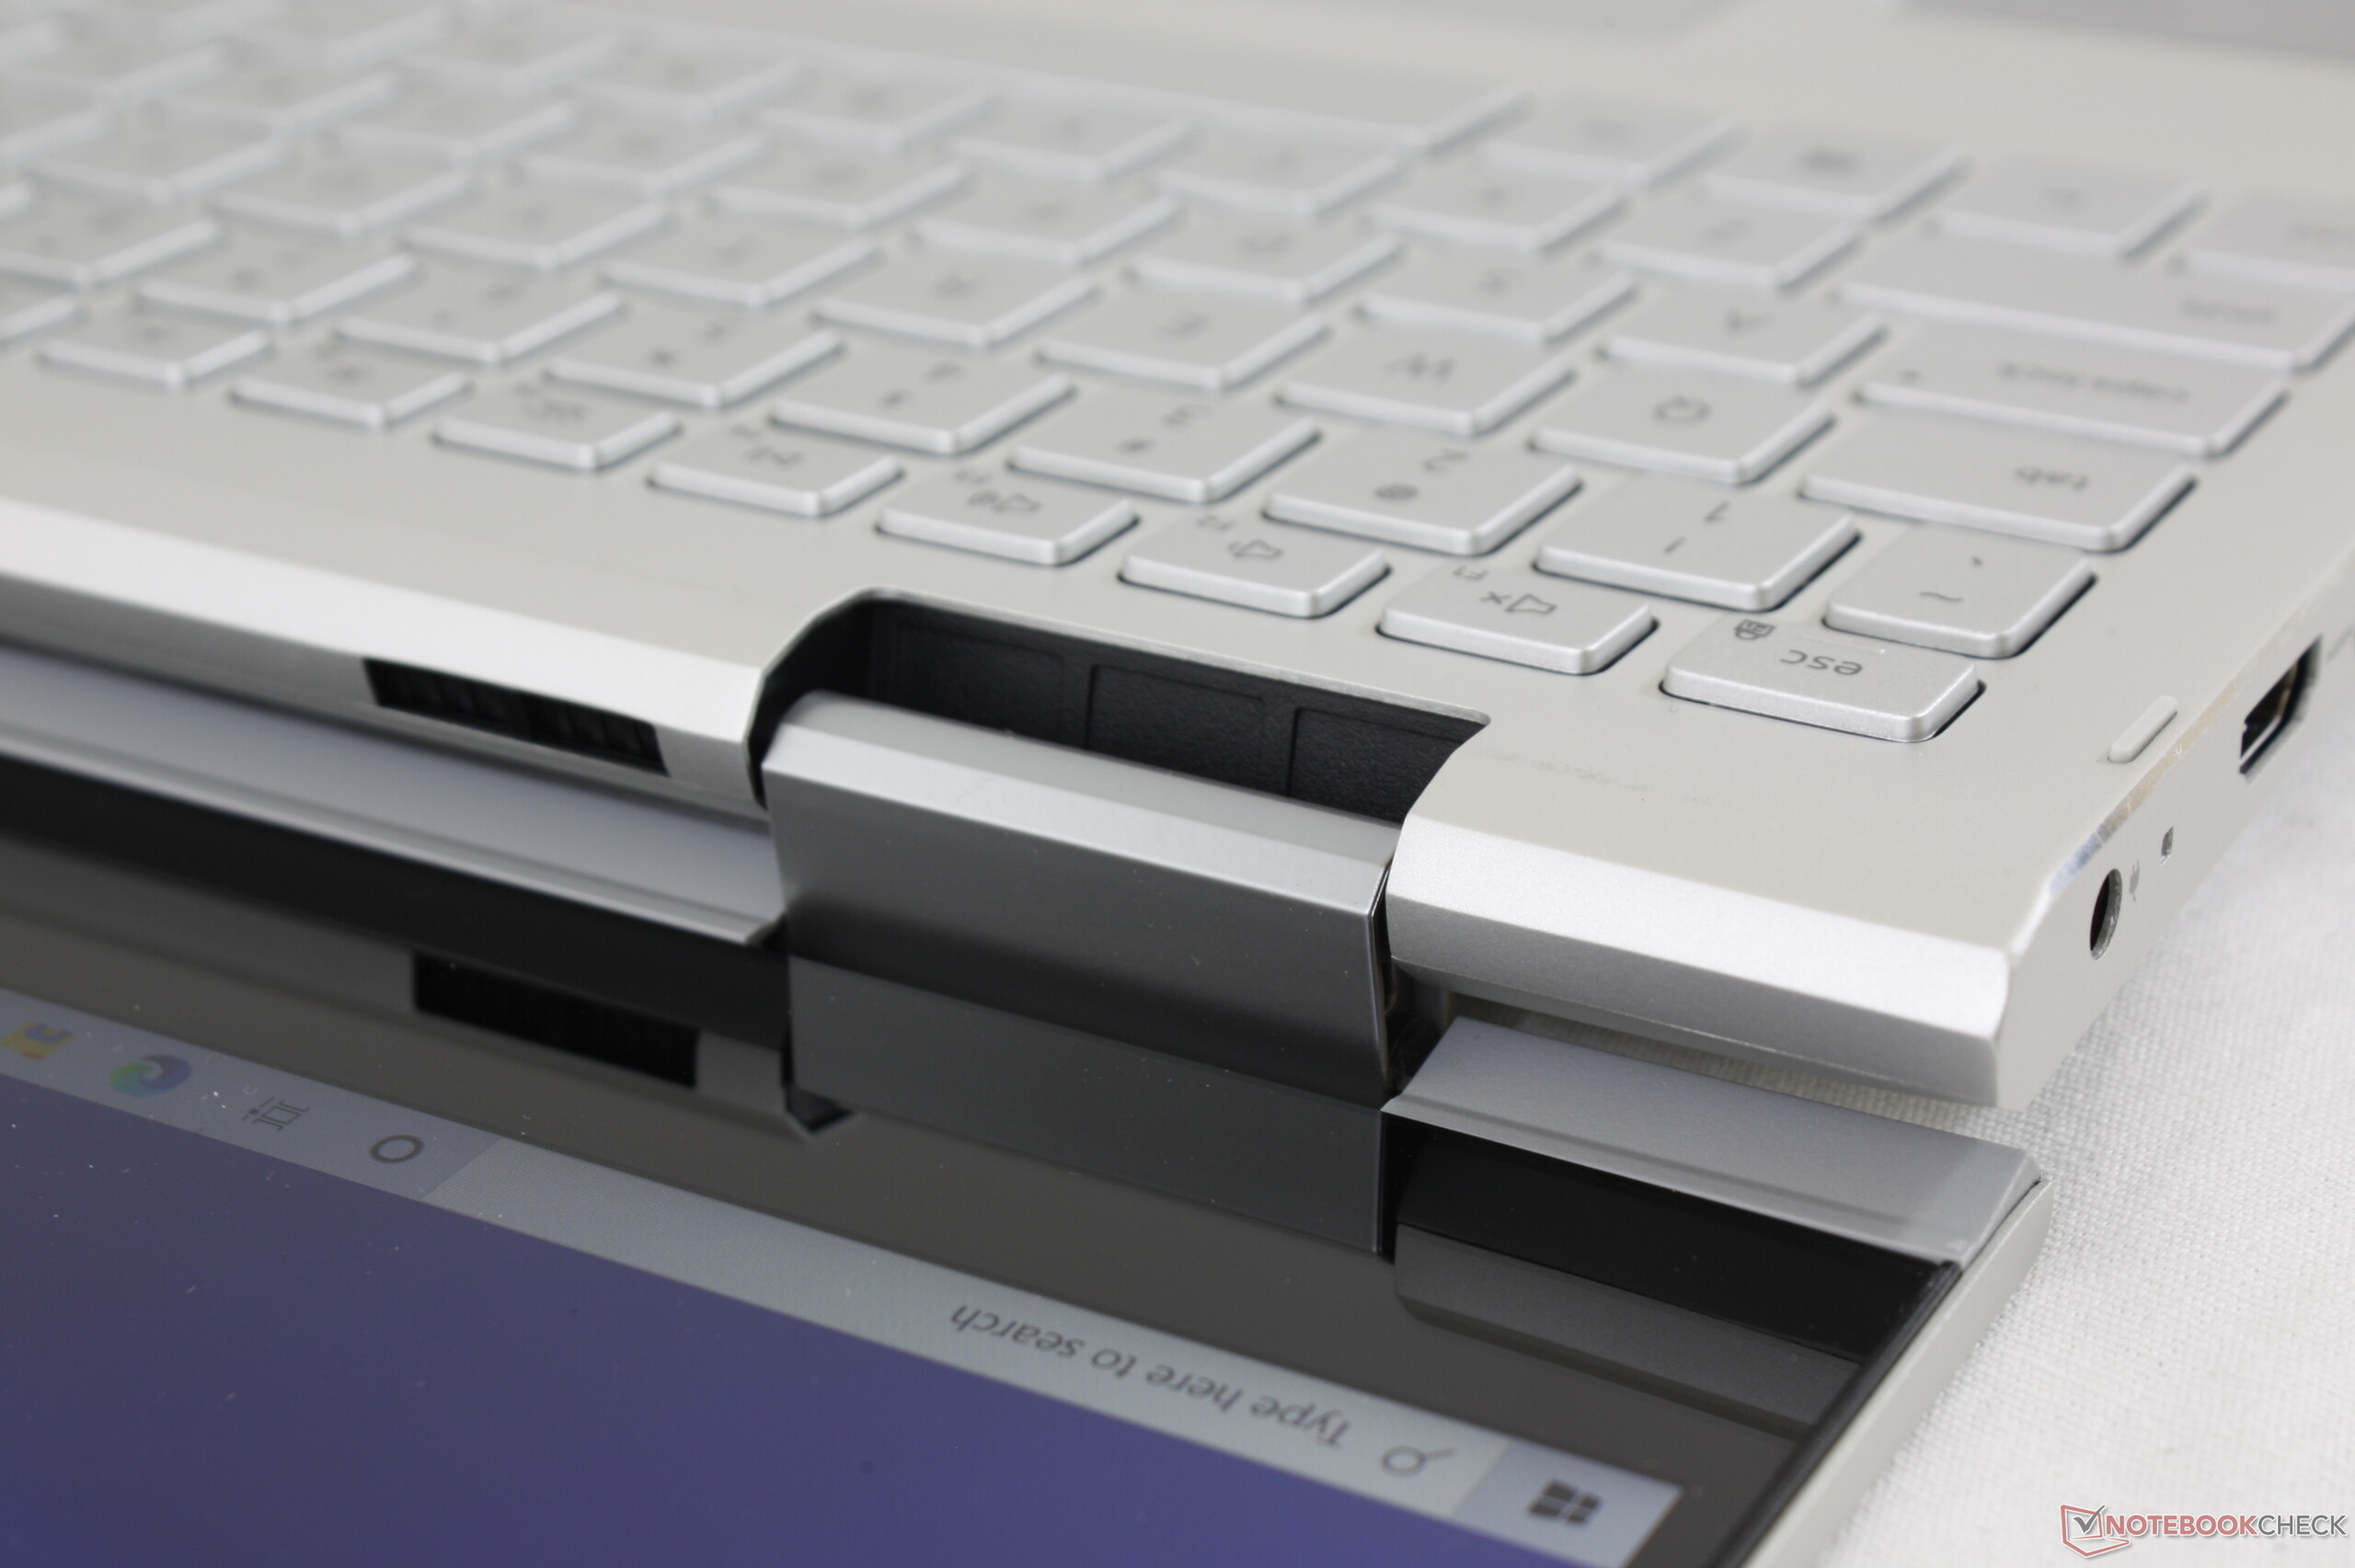
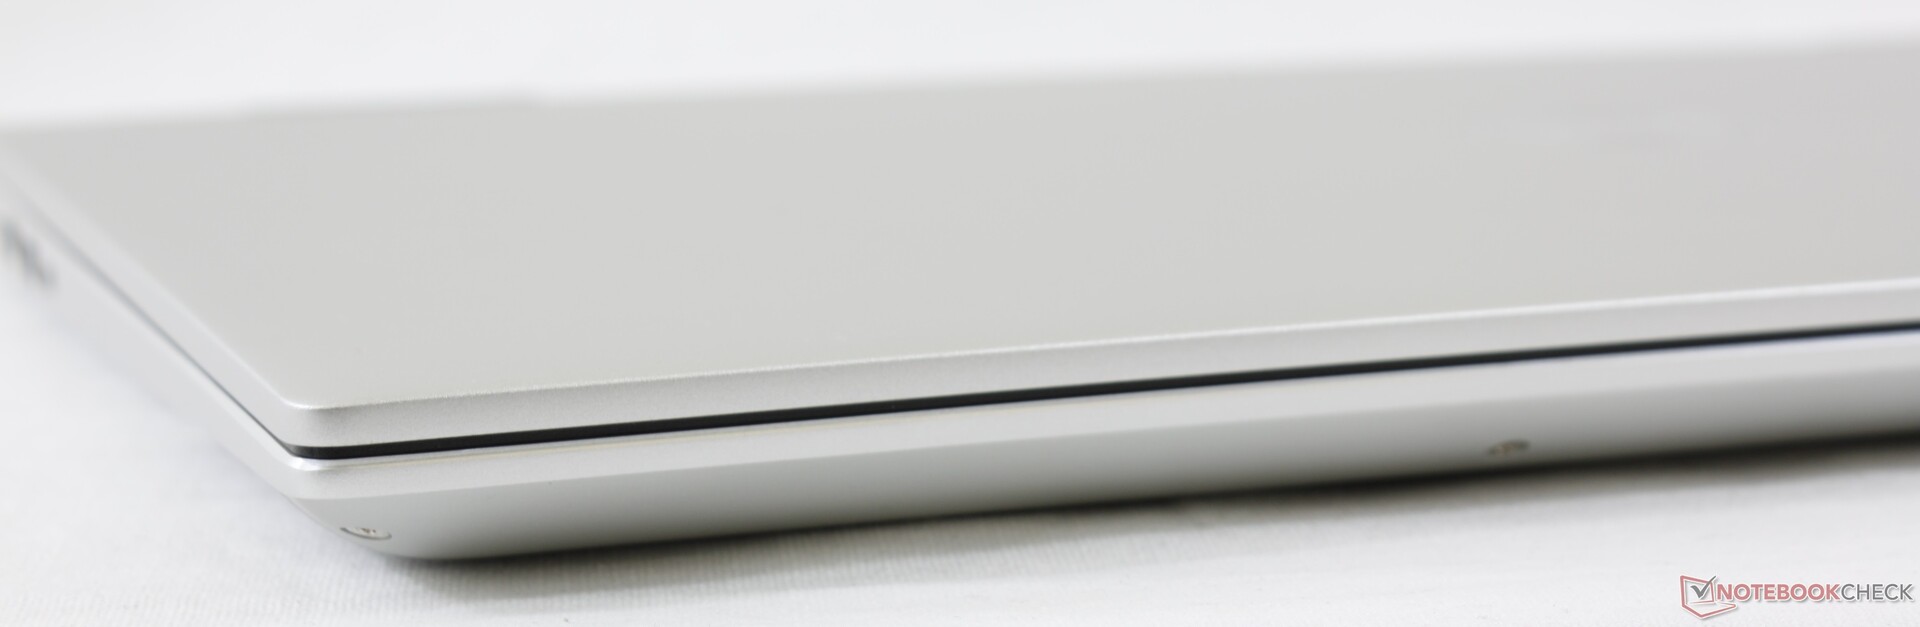
When compared to the 2018 Inspiron 7000 2-in-1, our newer Inspiron 7506 2-in-1 is slightly smaller in length and width while being slightly thicker by almost a millimeter. However, the most notable improvement is weight as the newer model is about 300 g lighter to make tablet mode more ergonomic.
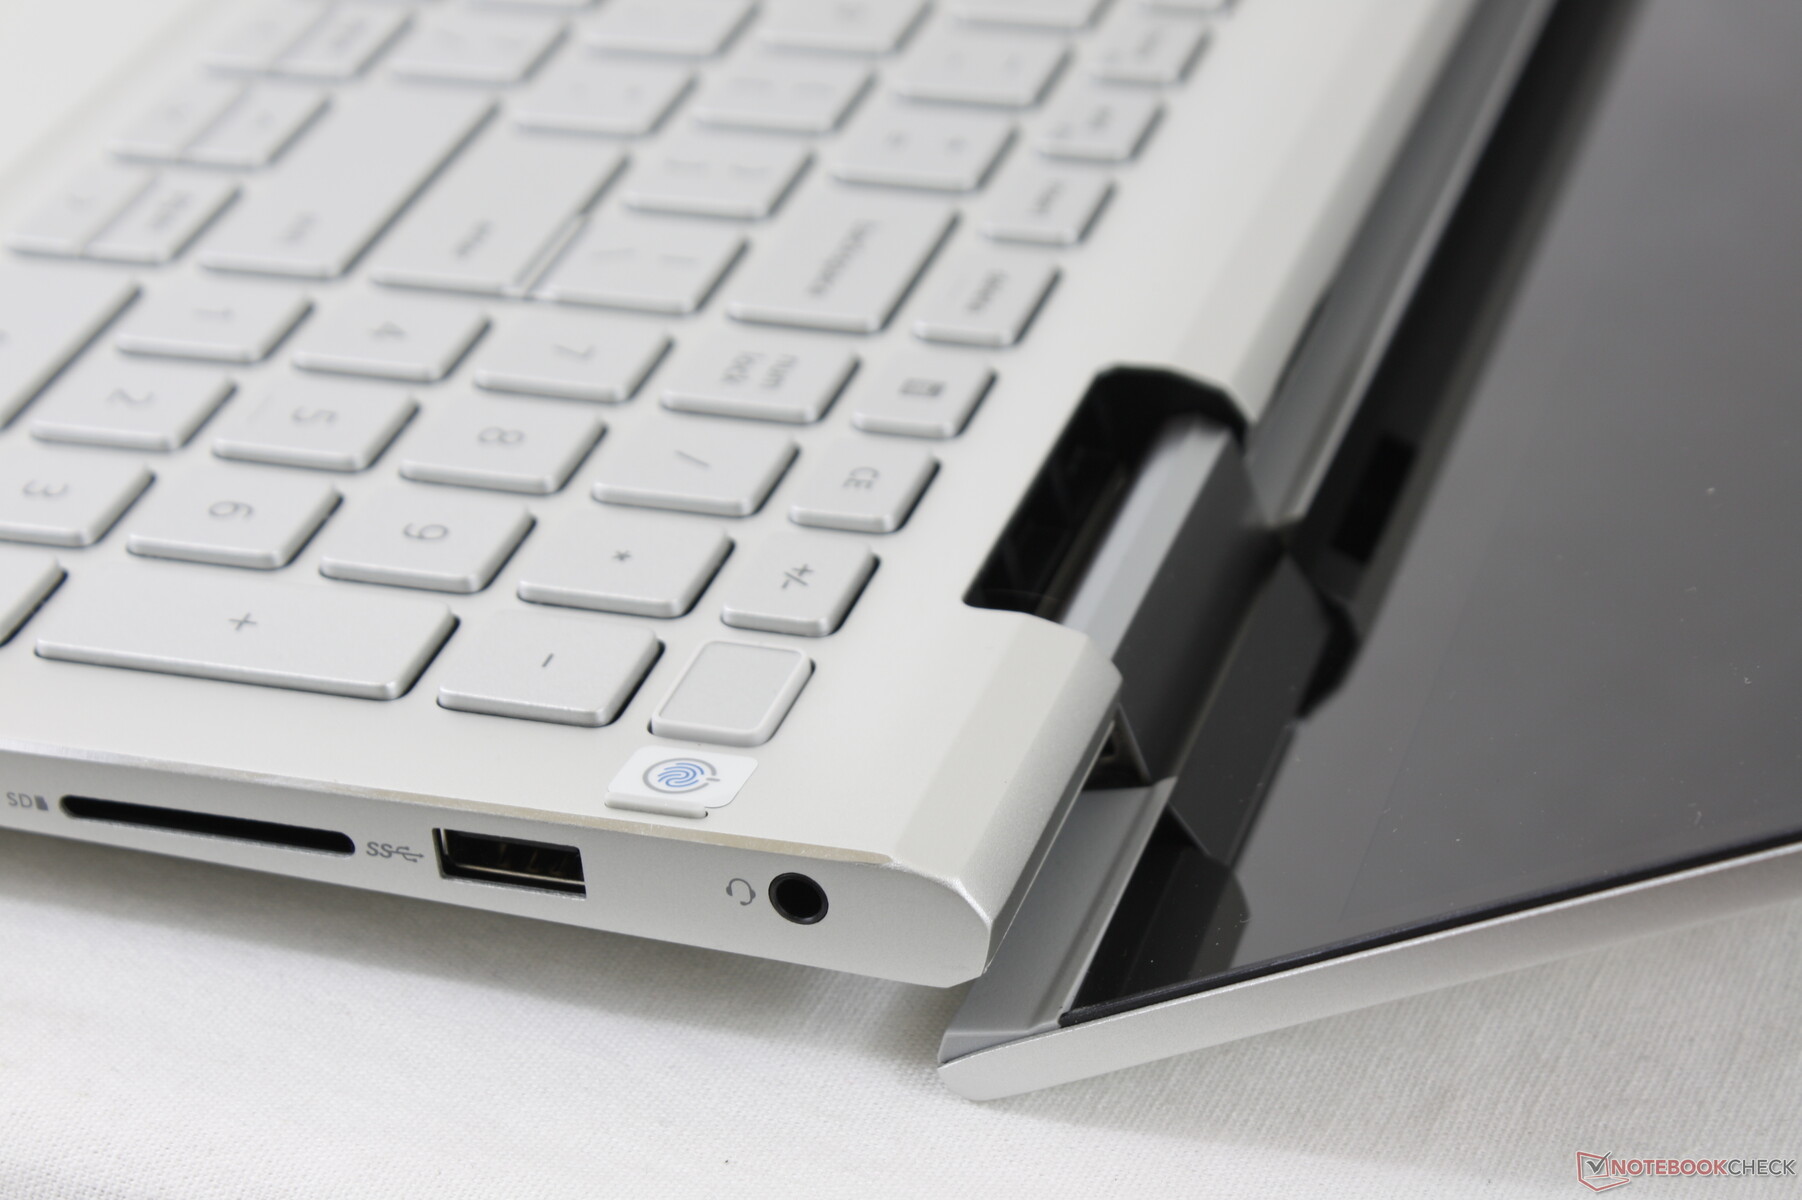
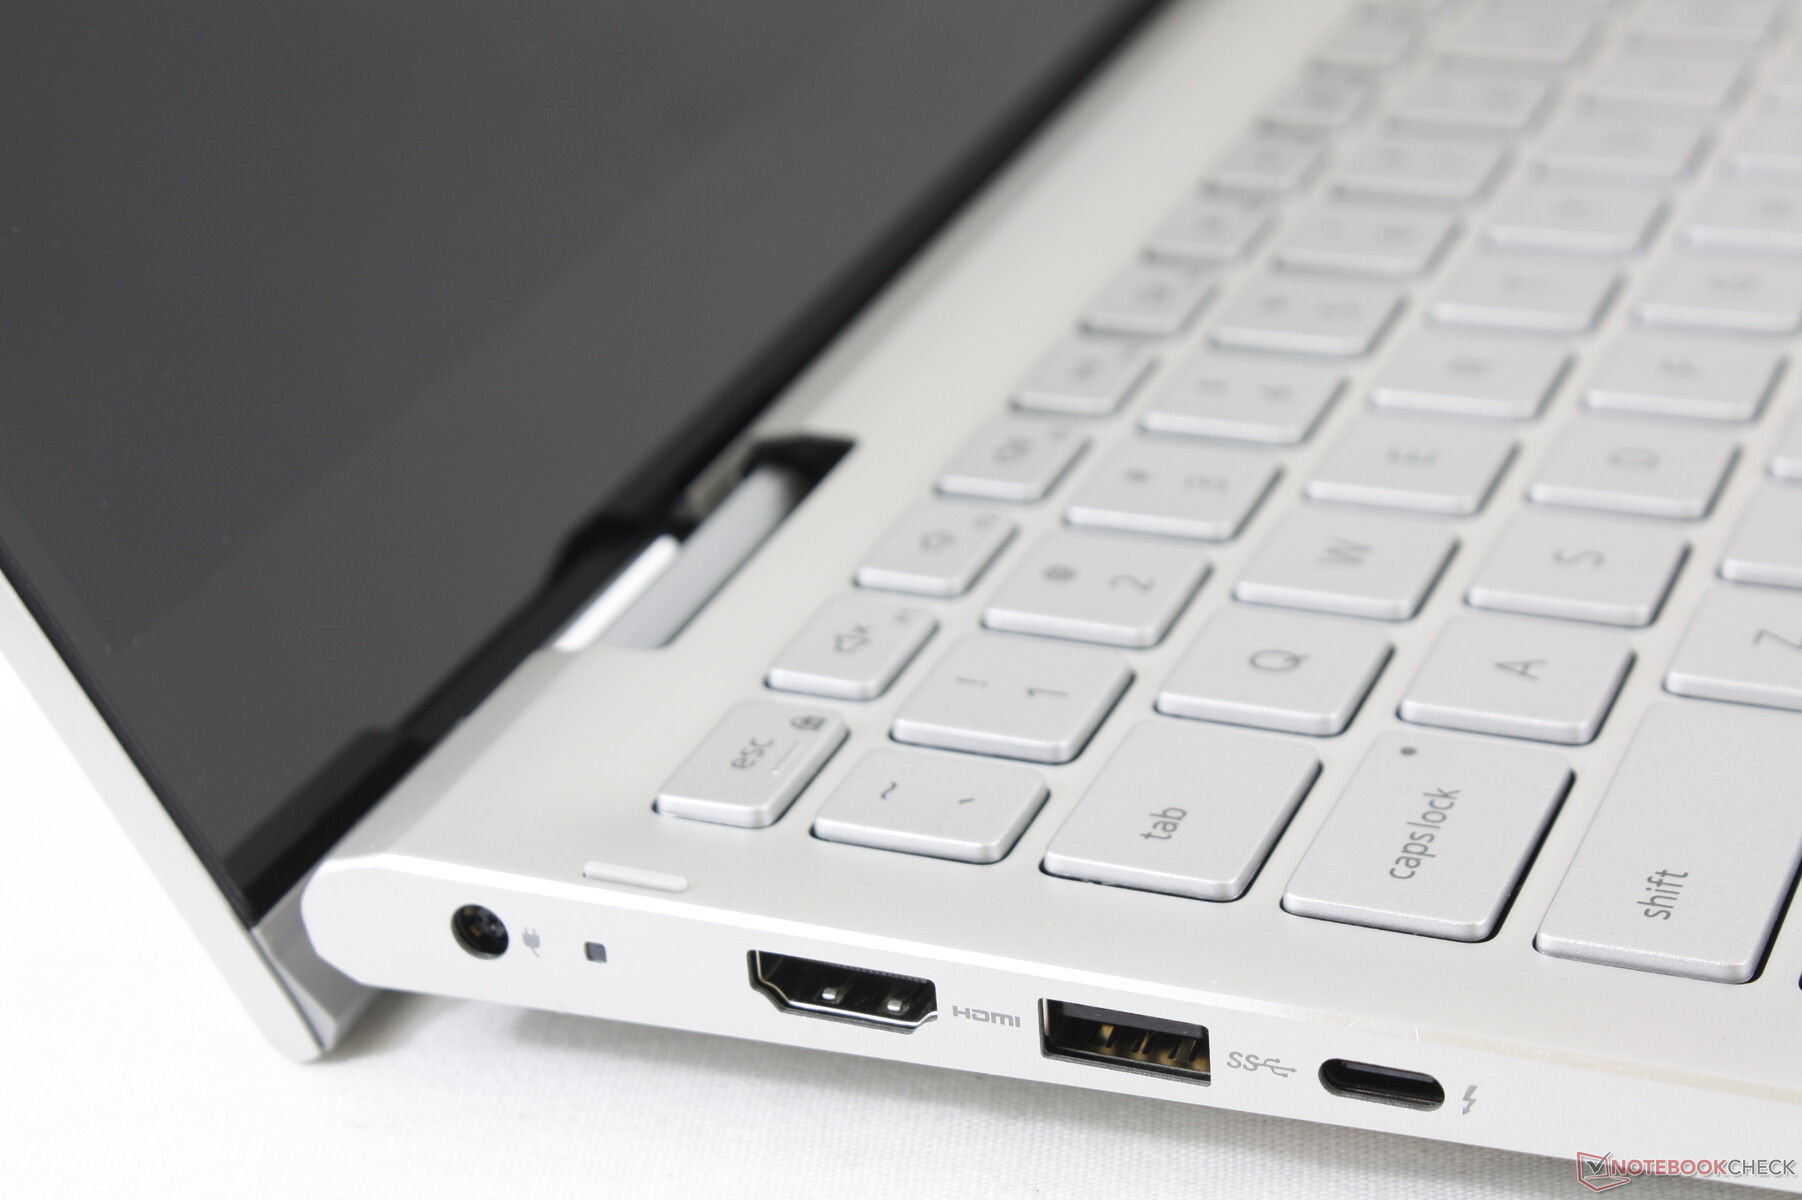

Connectivity
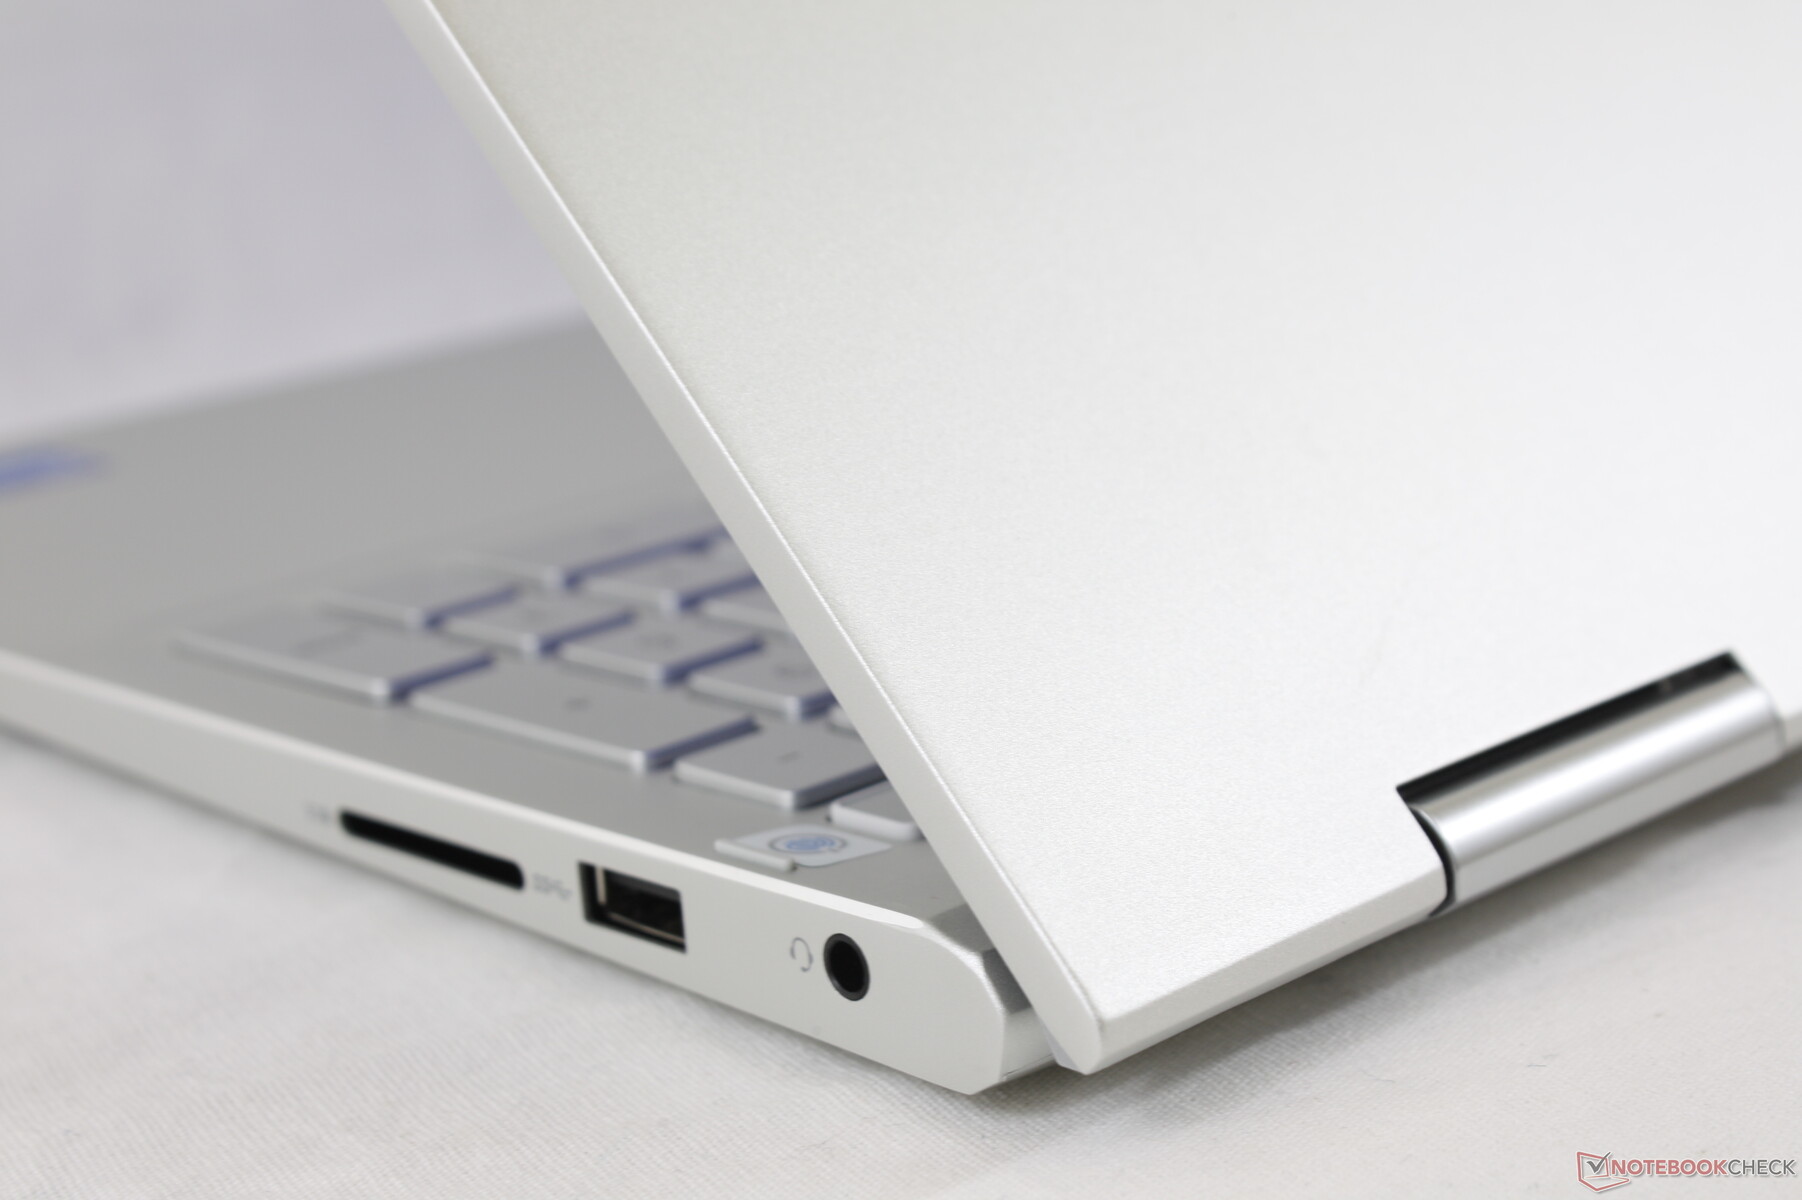
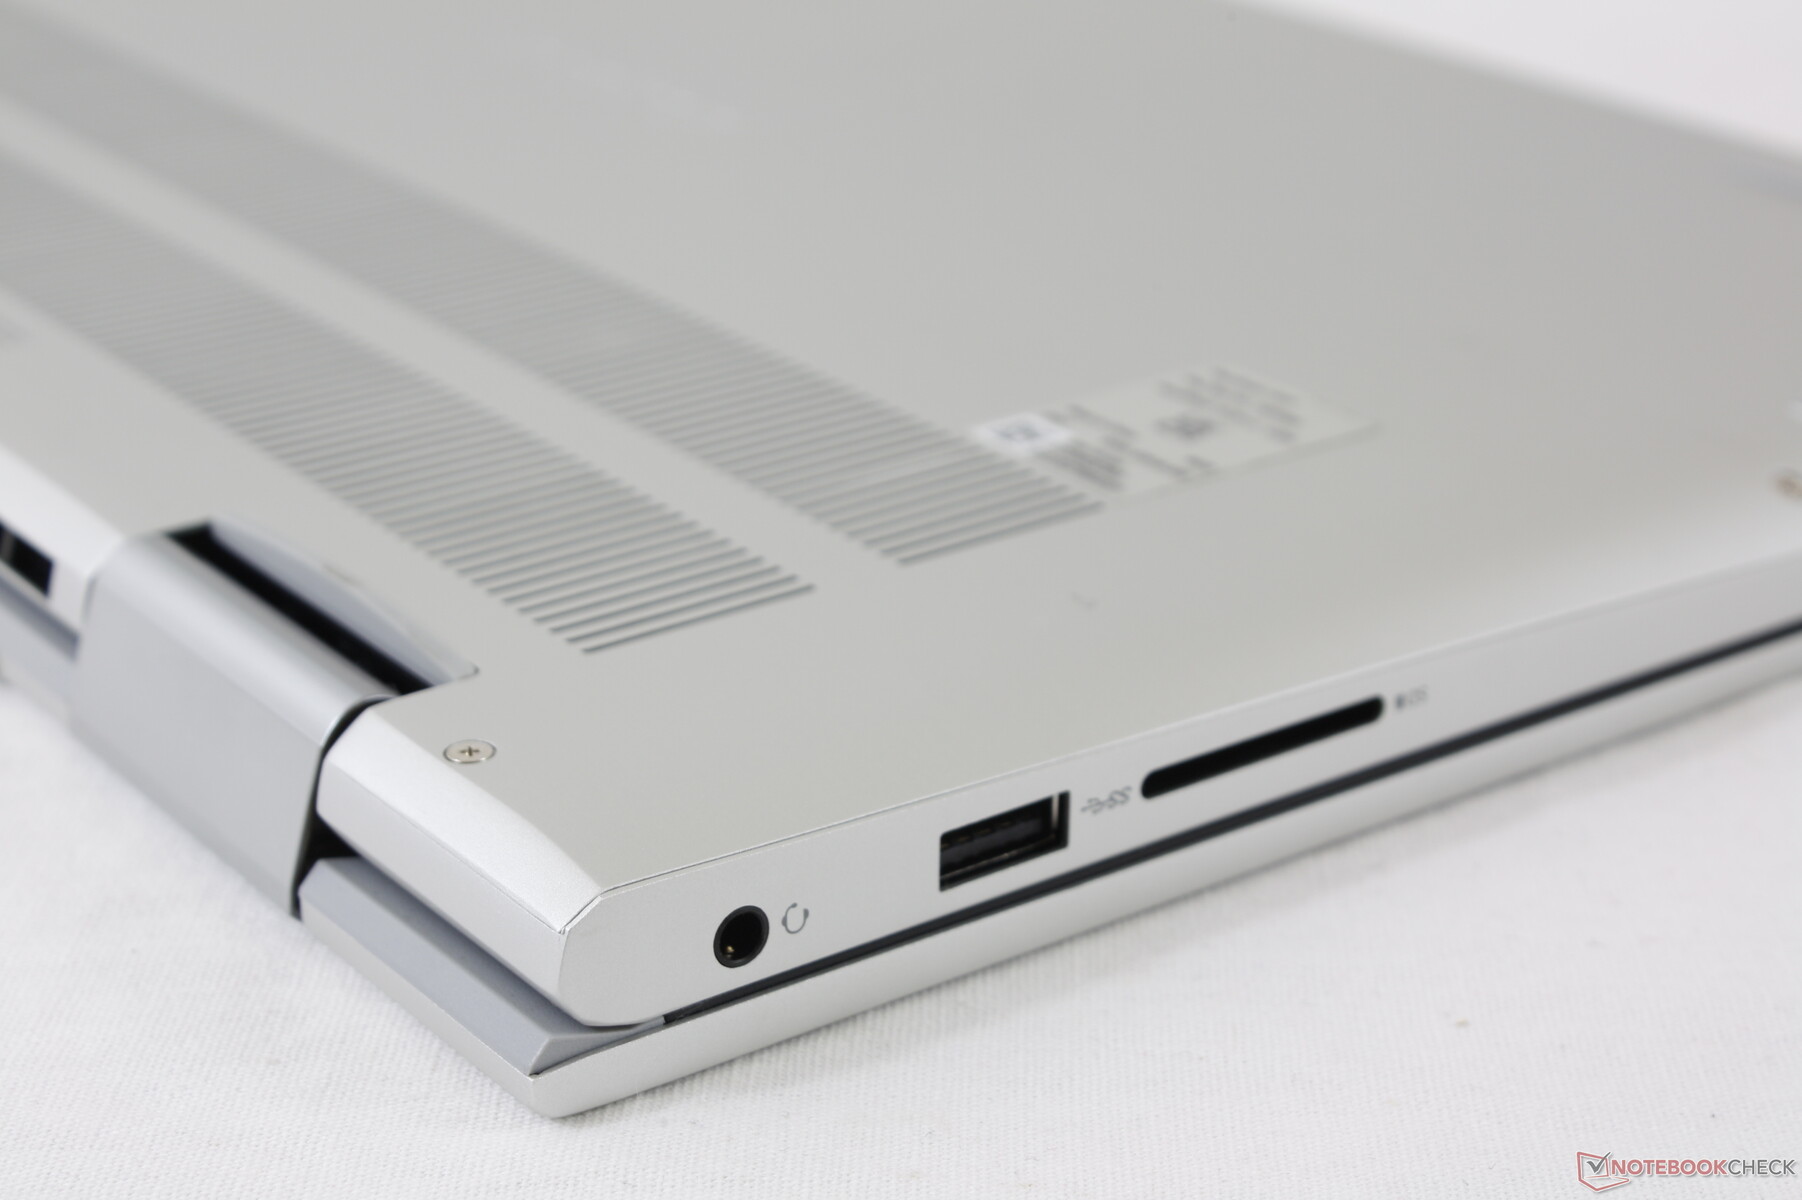
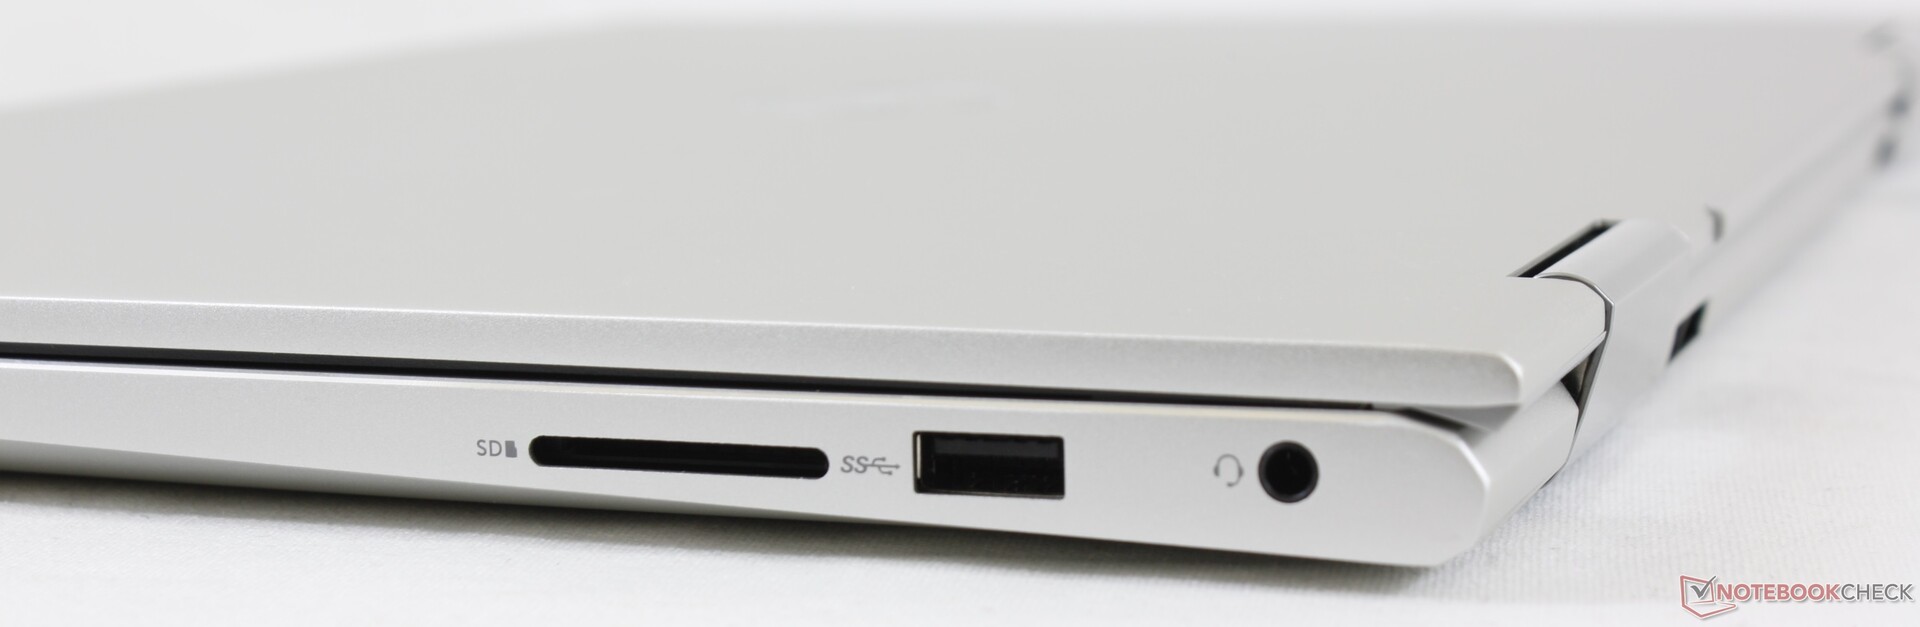
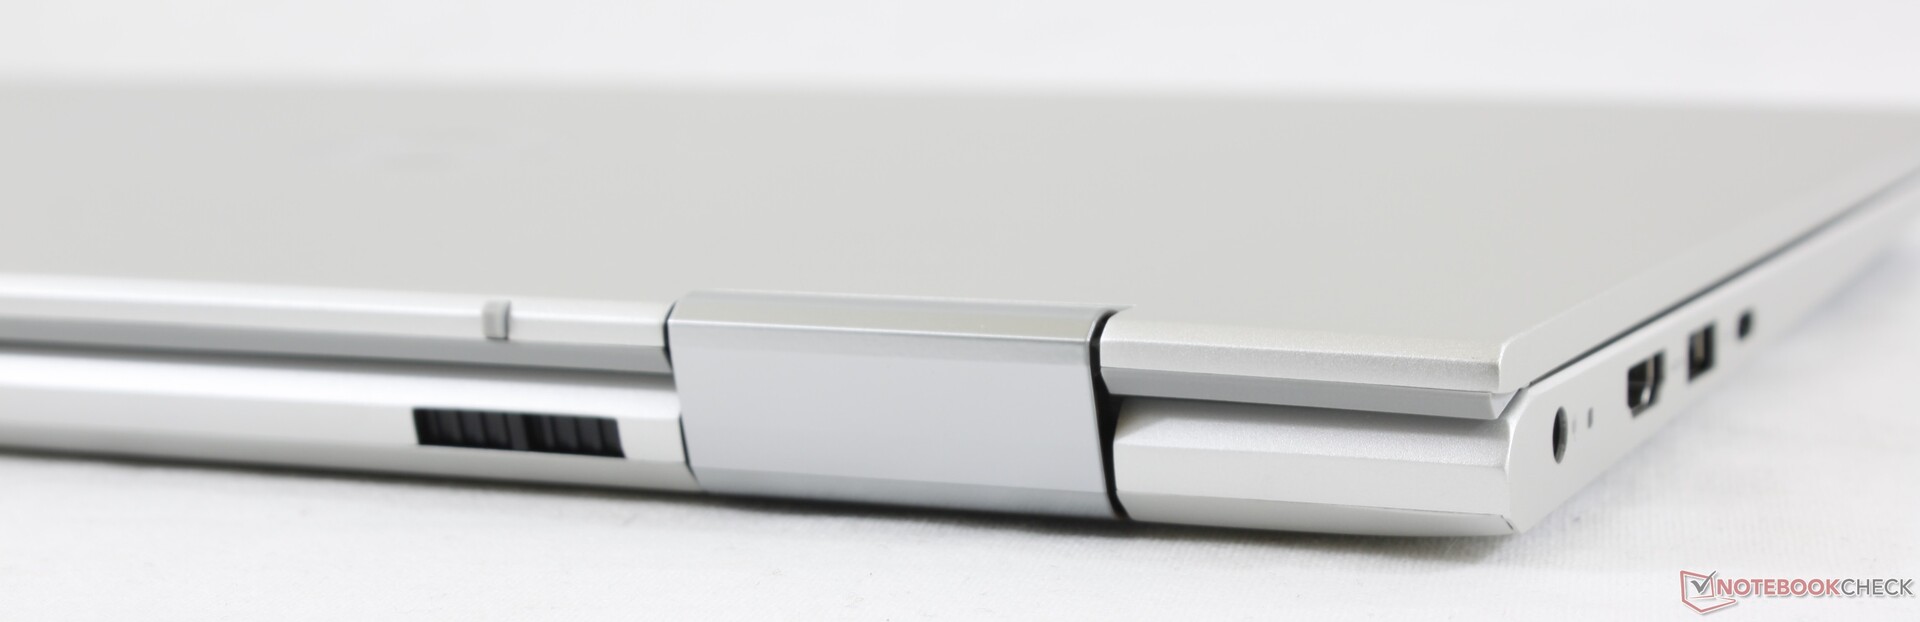
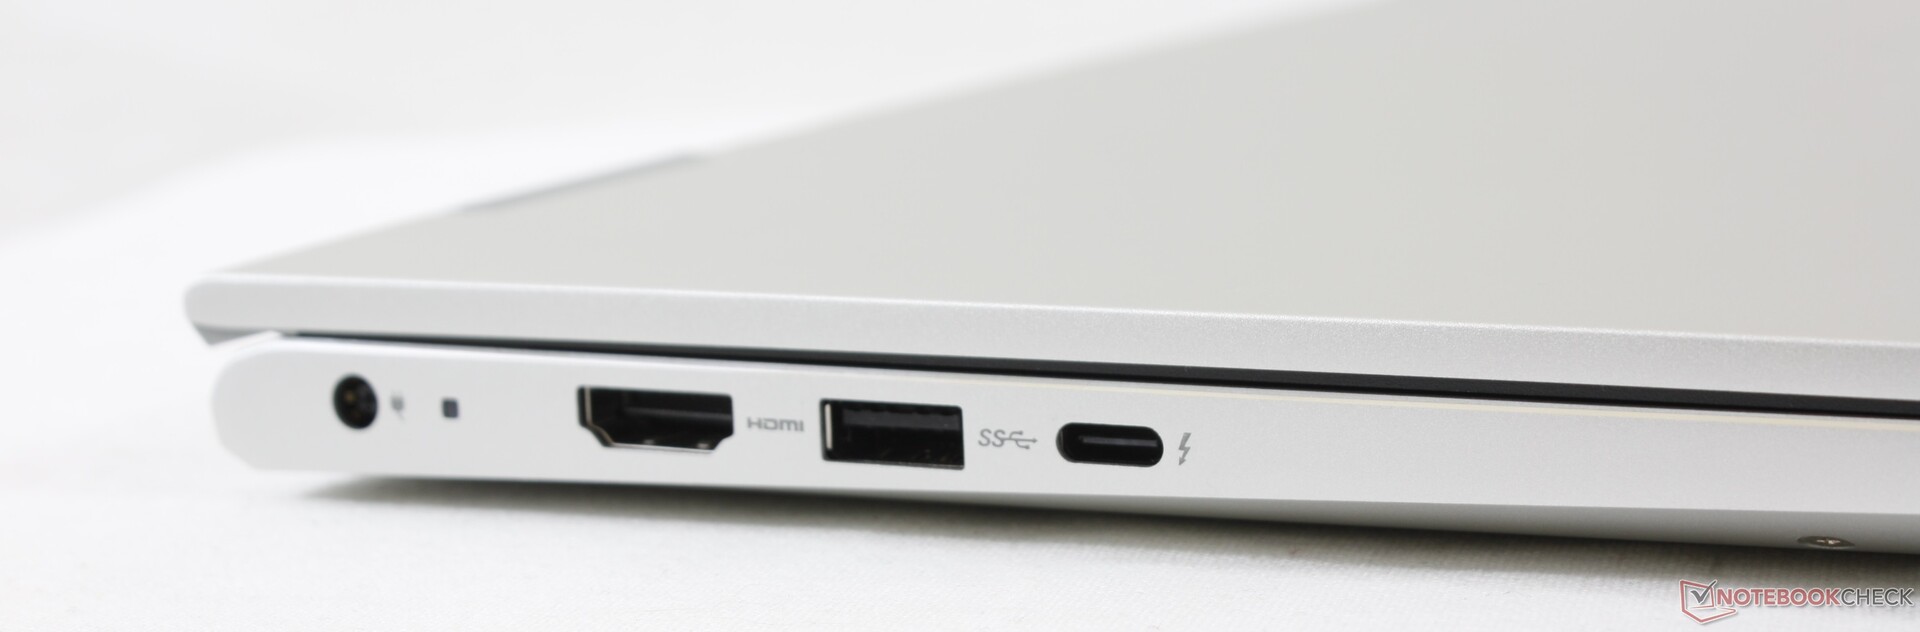
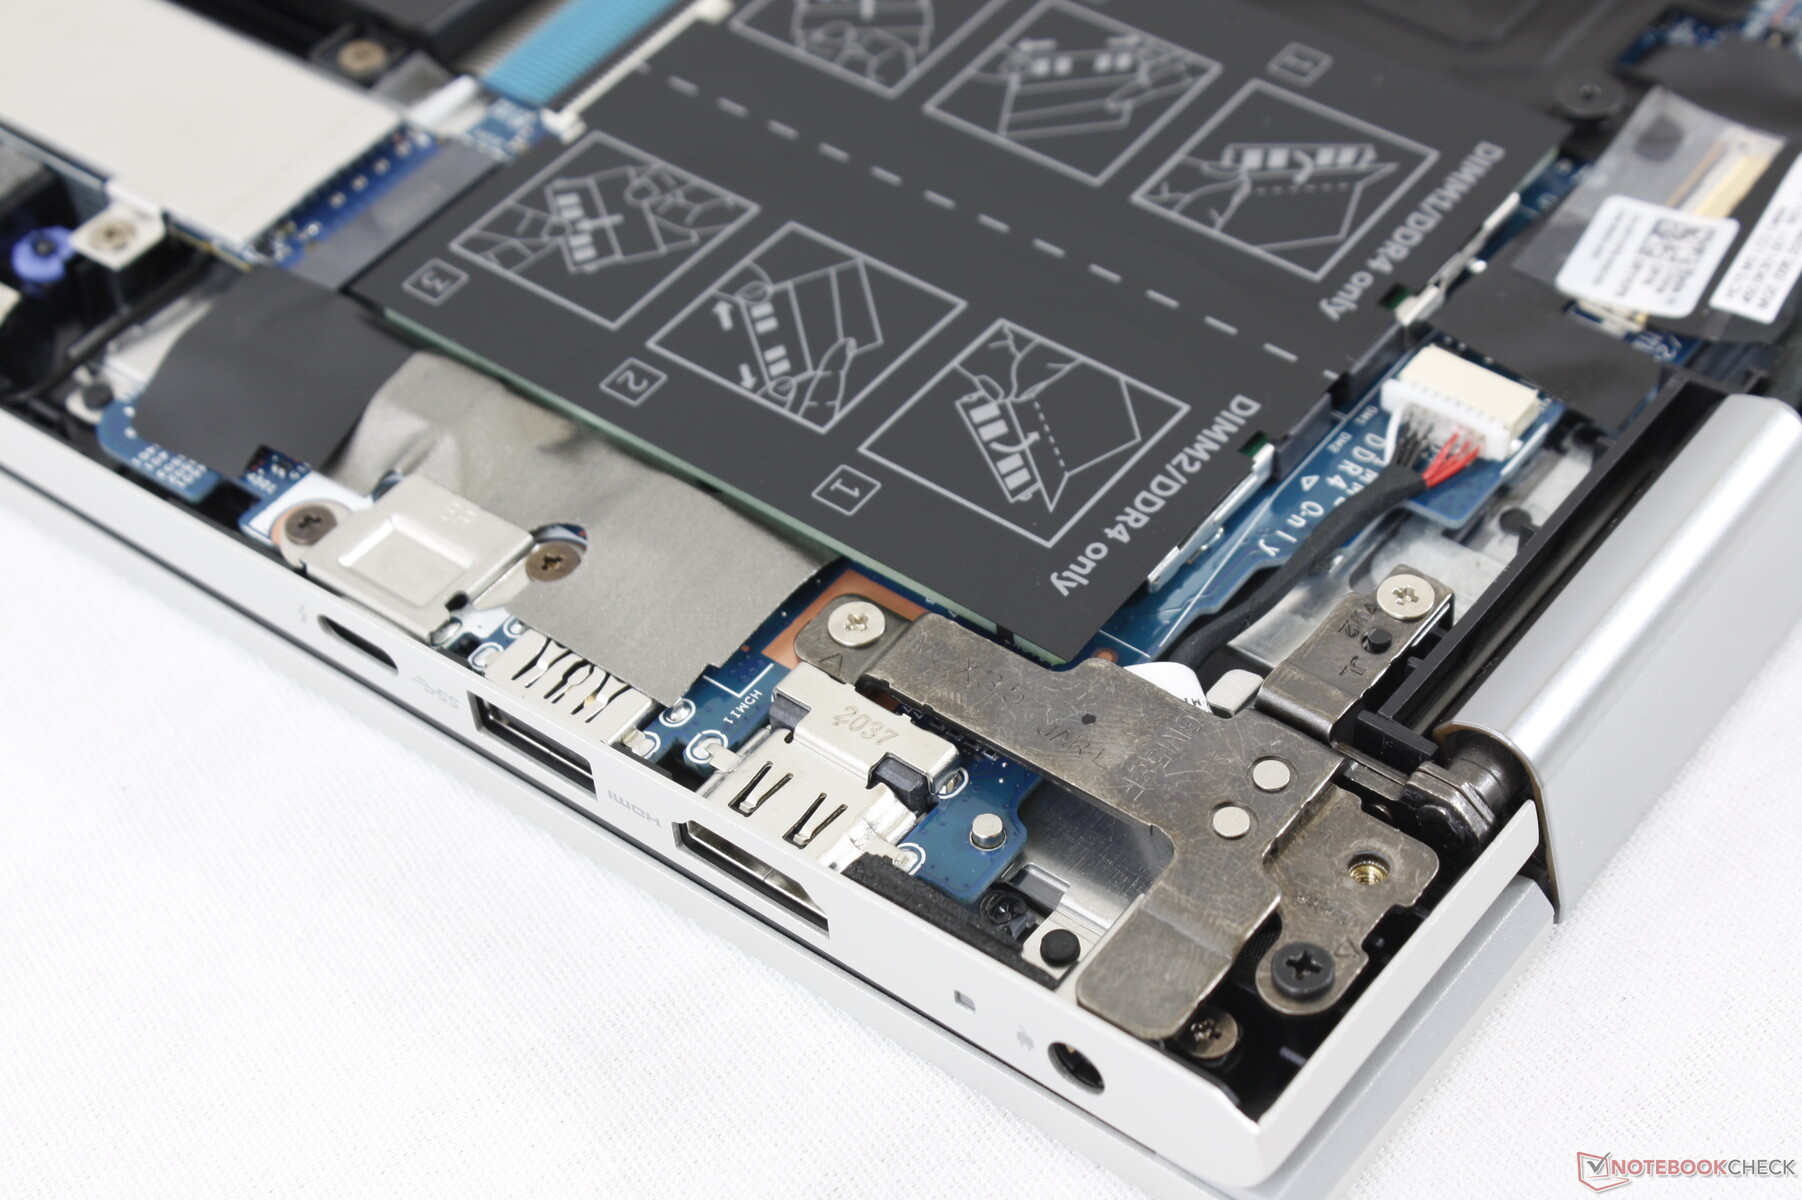
Port options are respectable and evenly spaced along the left and right edges. Of particular note is the inclusion of Thunderbolt 4 to essentially future-proof the system in terms of docking capabilities.
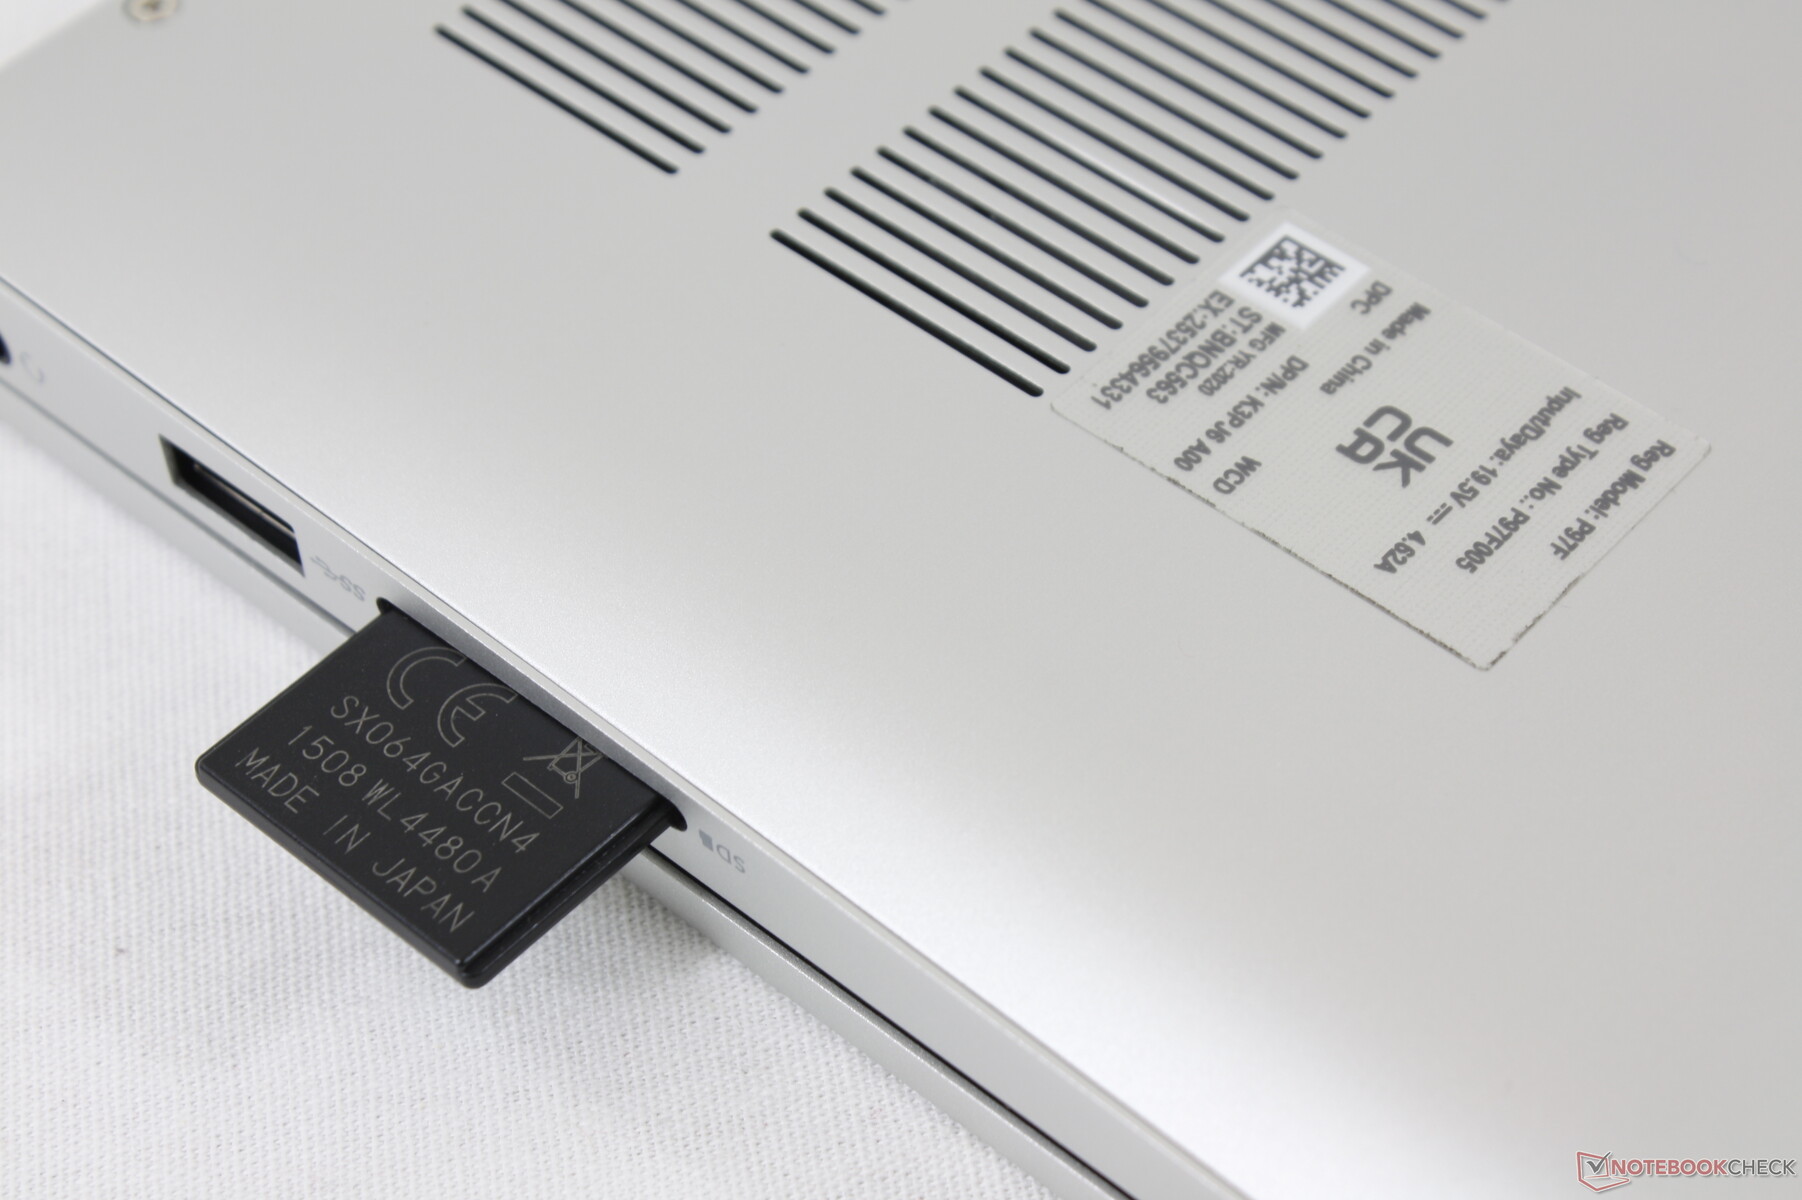
SD Card Reader
Transfer rates from the SD card reader is slow. Moving 1 GB of pictures from our UHS-II test card to desktop takes about 48 seconds compared to under 8 seconds on the XPS 15.
| SD Card Reader | |
| average JPG Copy Test (av. of 3 runs) | |
| HP Envy x360 15-ee0257ng (Toshiba Exceria Pro SDXC 64 GB UHS-II) | |
| Asus ZenBook Flip 15 UX563FD-A1027T (Toshiba Exceria Pro SDXC 64 GB UHS-II) | |
| Dell Inspiron 15 7000 2-in-1 Black Edition (Toshiba Exceria Pro SDXC 64 GB UHS-II) | |
| Asus VivoBook Flip 15 TP510UA-E8073T (Toshiba Exceria Pro SDXC 64 GB UHS-II) | |
| Dell Inspiron 15 7506 2-in-1 P97F (Toshiba Exceria Pro SDXC 64 GB UHS-II) | |
| maximum AS SSD Seq Read Test (1GB) | |
| HP Envy x360 15-ee0257ng (Toshiba Exceria Pro SDXC 64 GB UHS-II) | |
| Dell Inspiron 15 7000 2-in-1 Black Edition (Toshiba Exceria Pro SDXC 64 GB UHS-II) | |
| Dell Inspiron 15 7506 2-in-1 P97F (Toshiba Exceria Pro SDXC 64 GB UHS-II) | |
| Asus VivoBook Flip 15 TP510UA-E8073T (Toshiba Exceria Pro SDXC 64 GB UHS-II) | |
Communication
Webcam


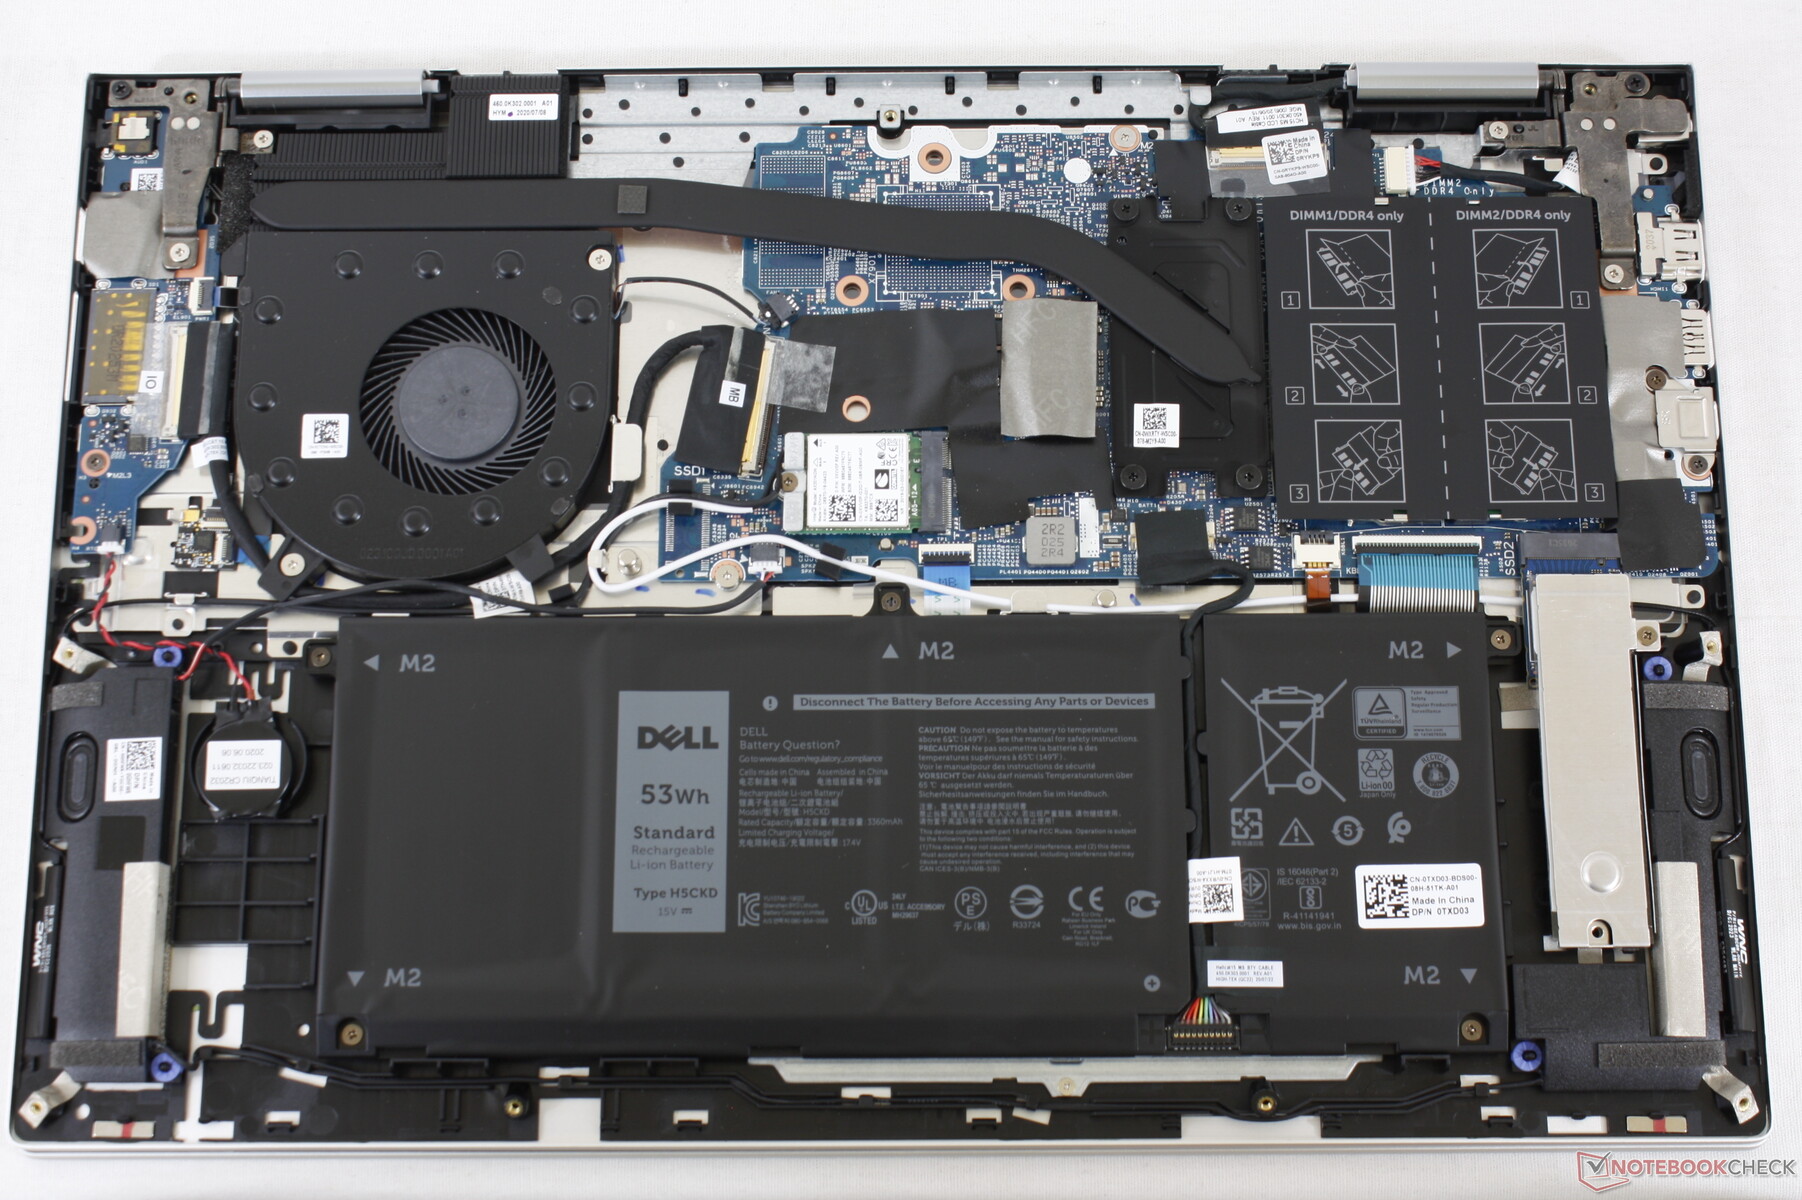
Maintenance
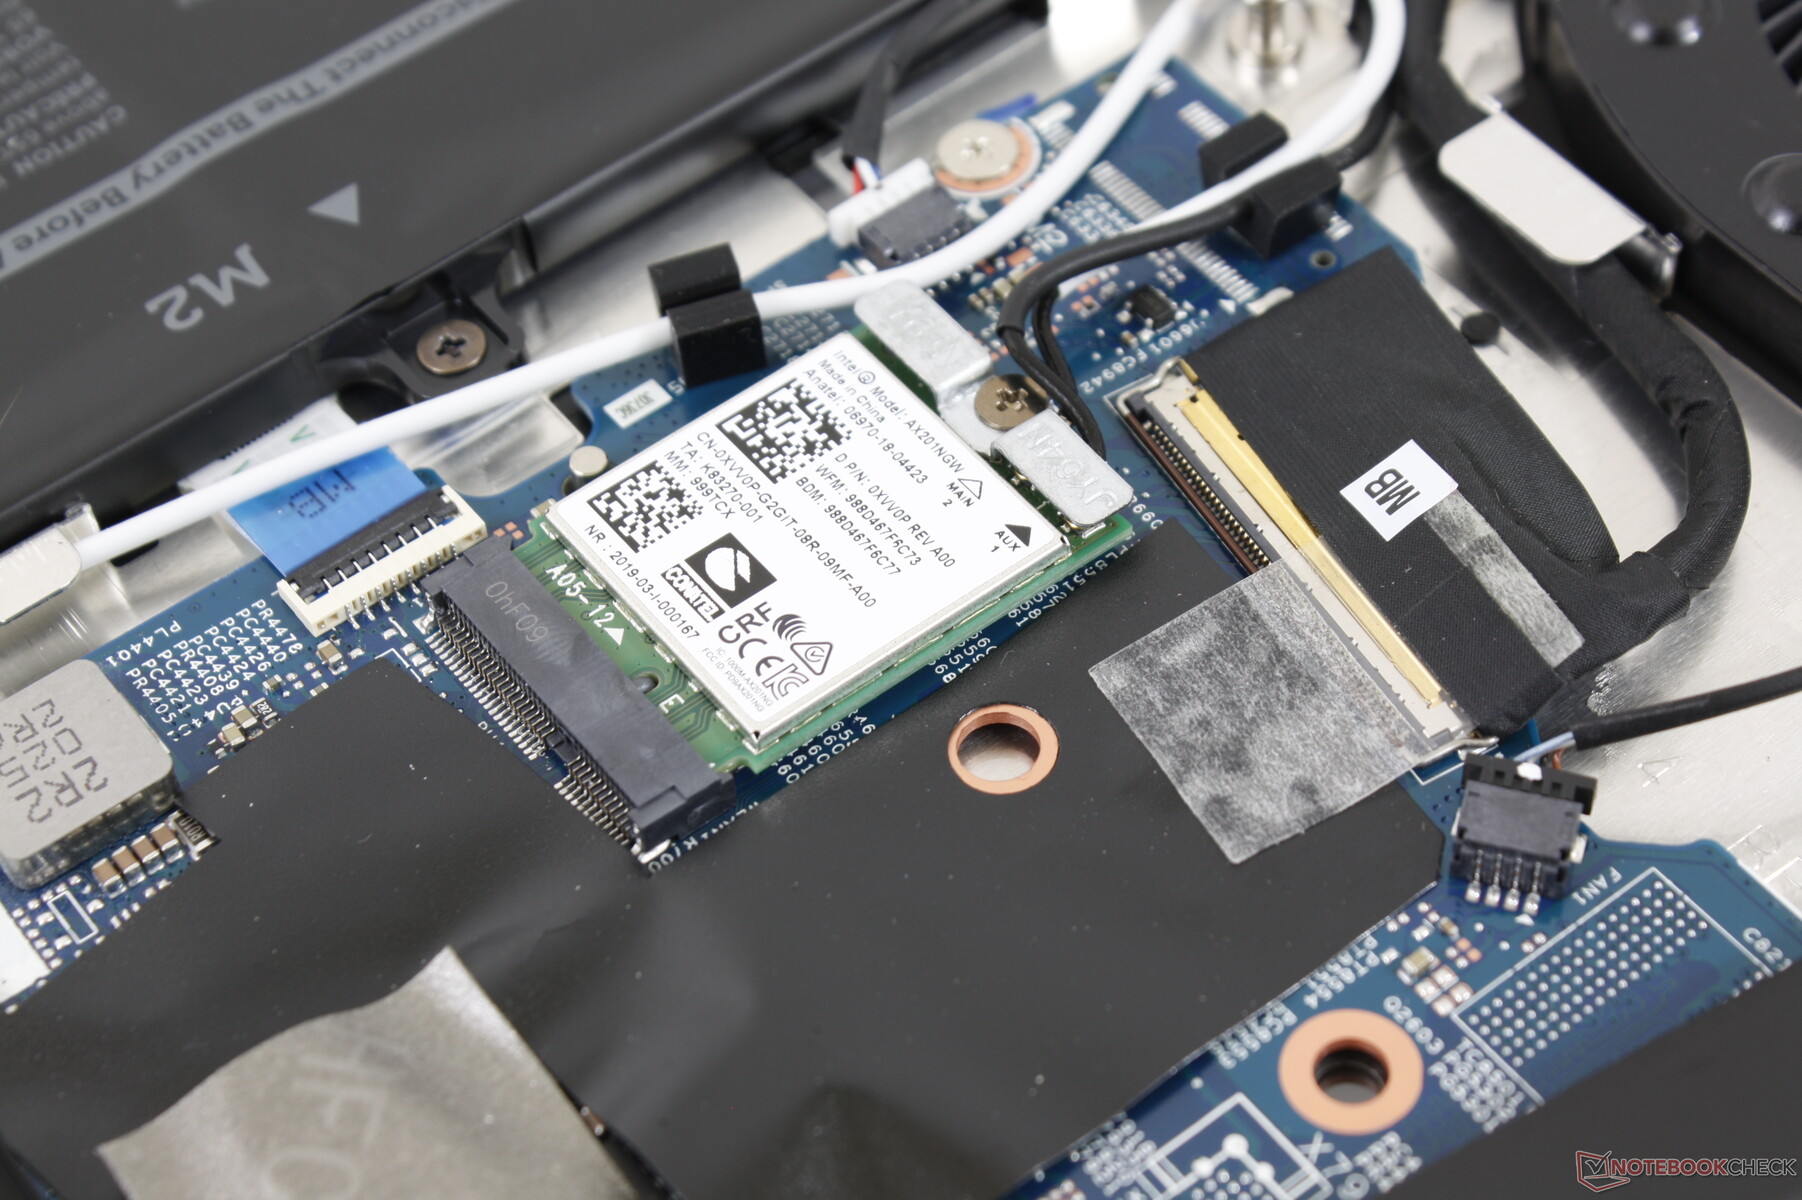
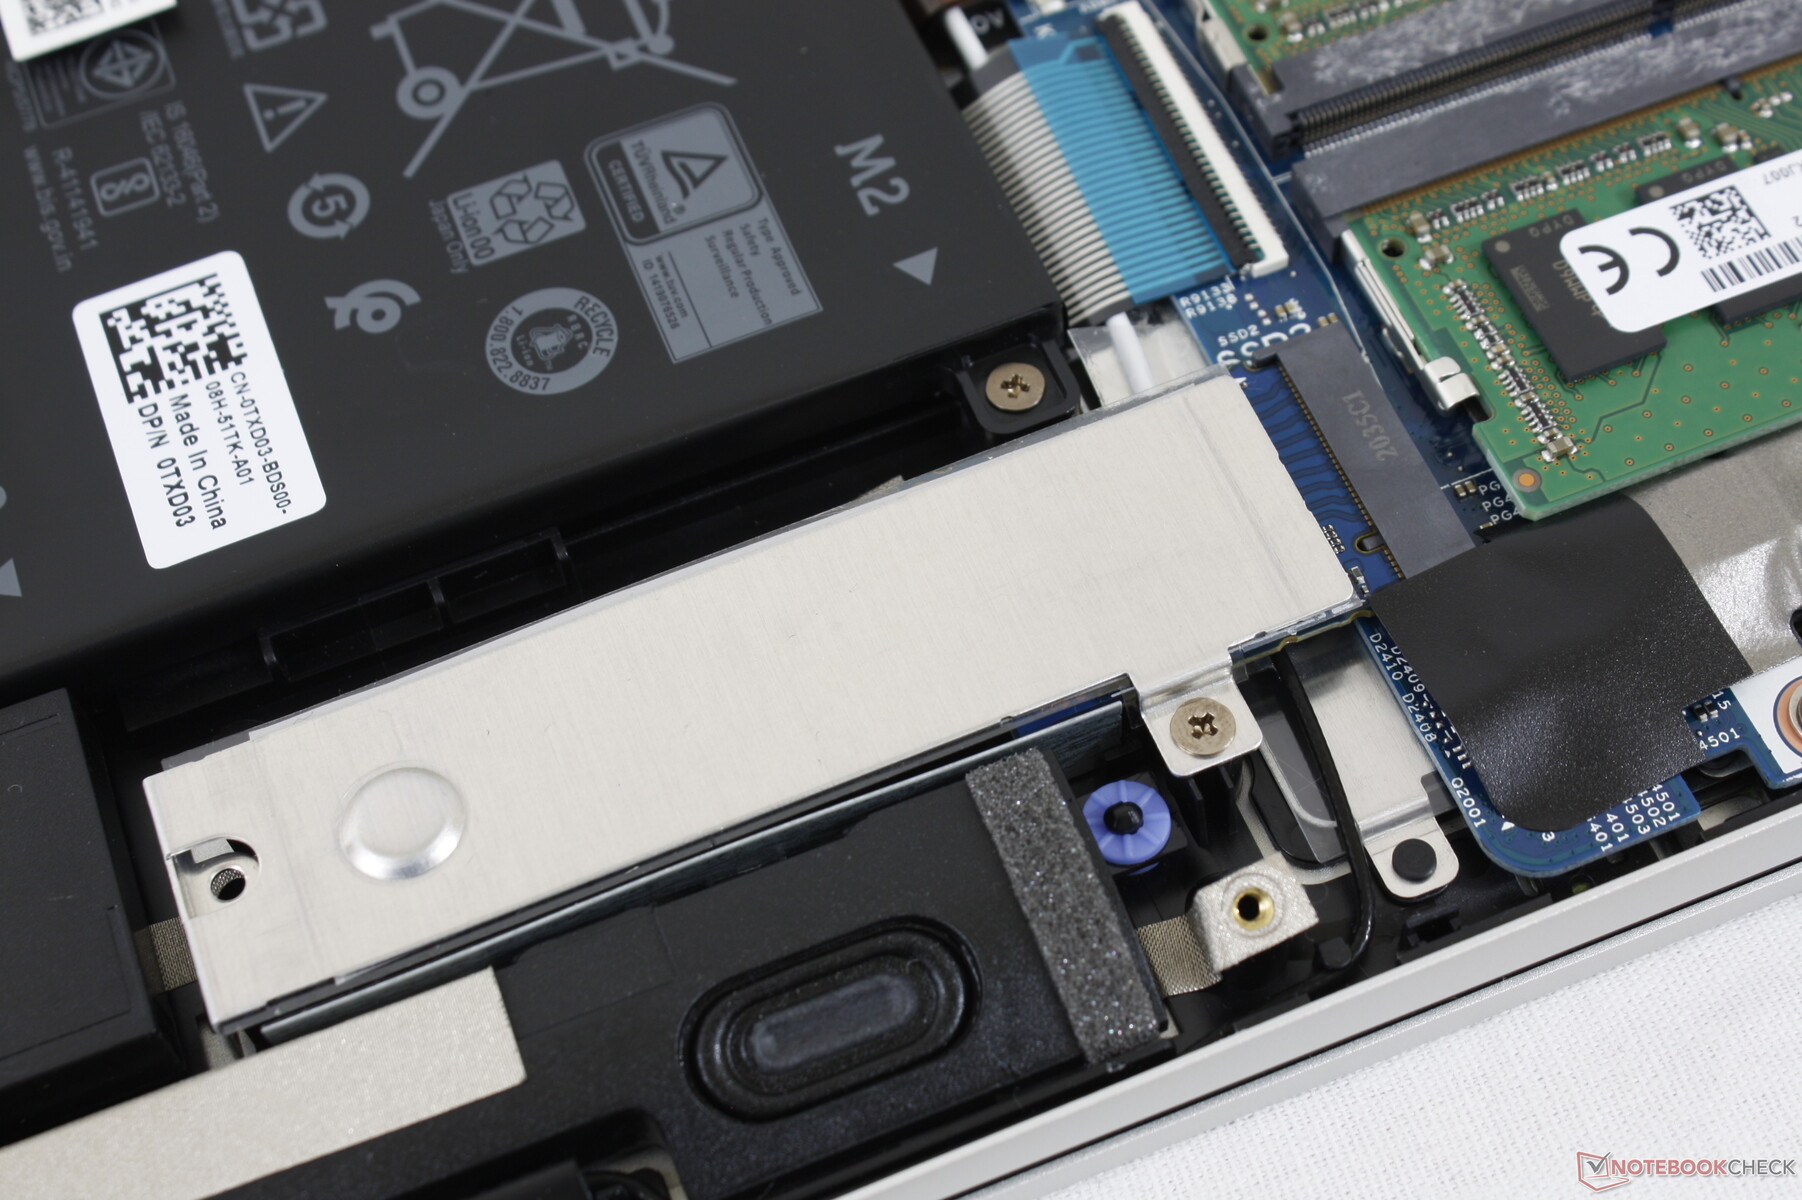
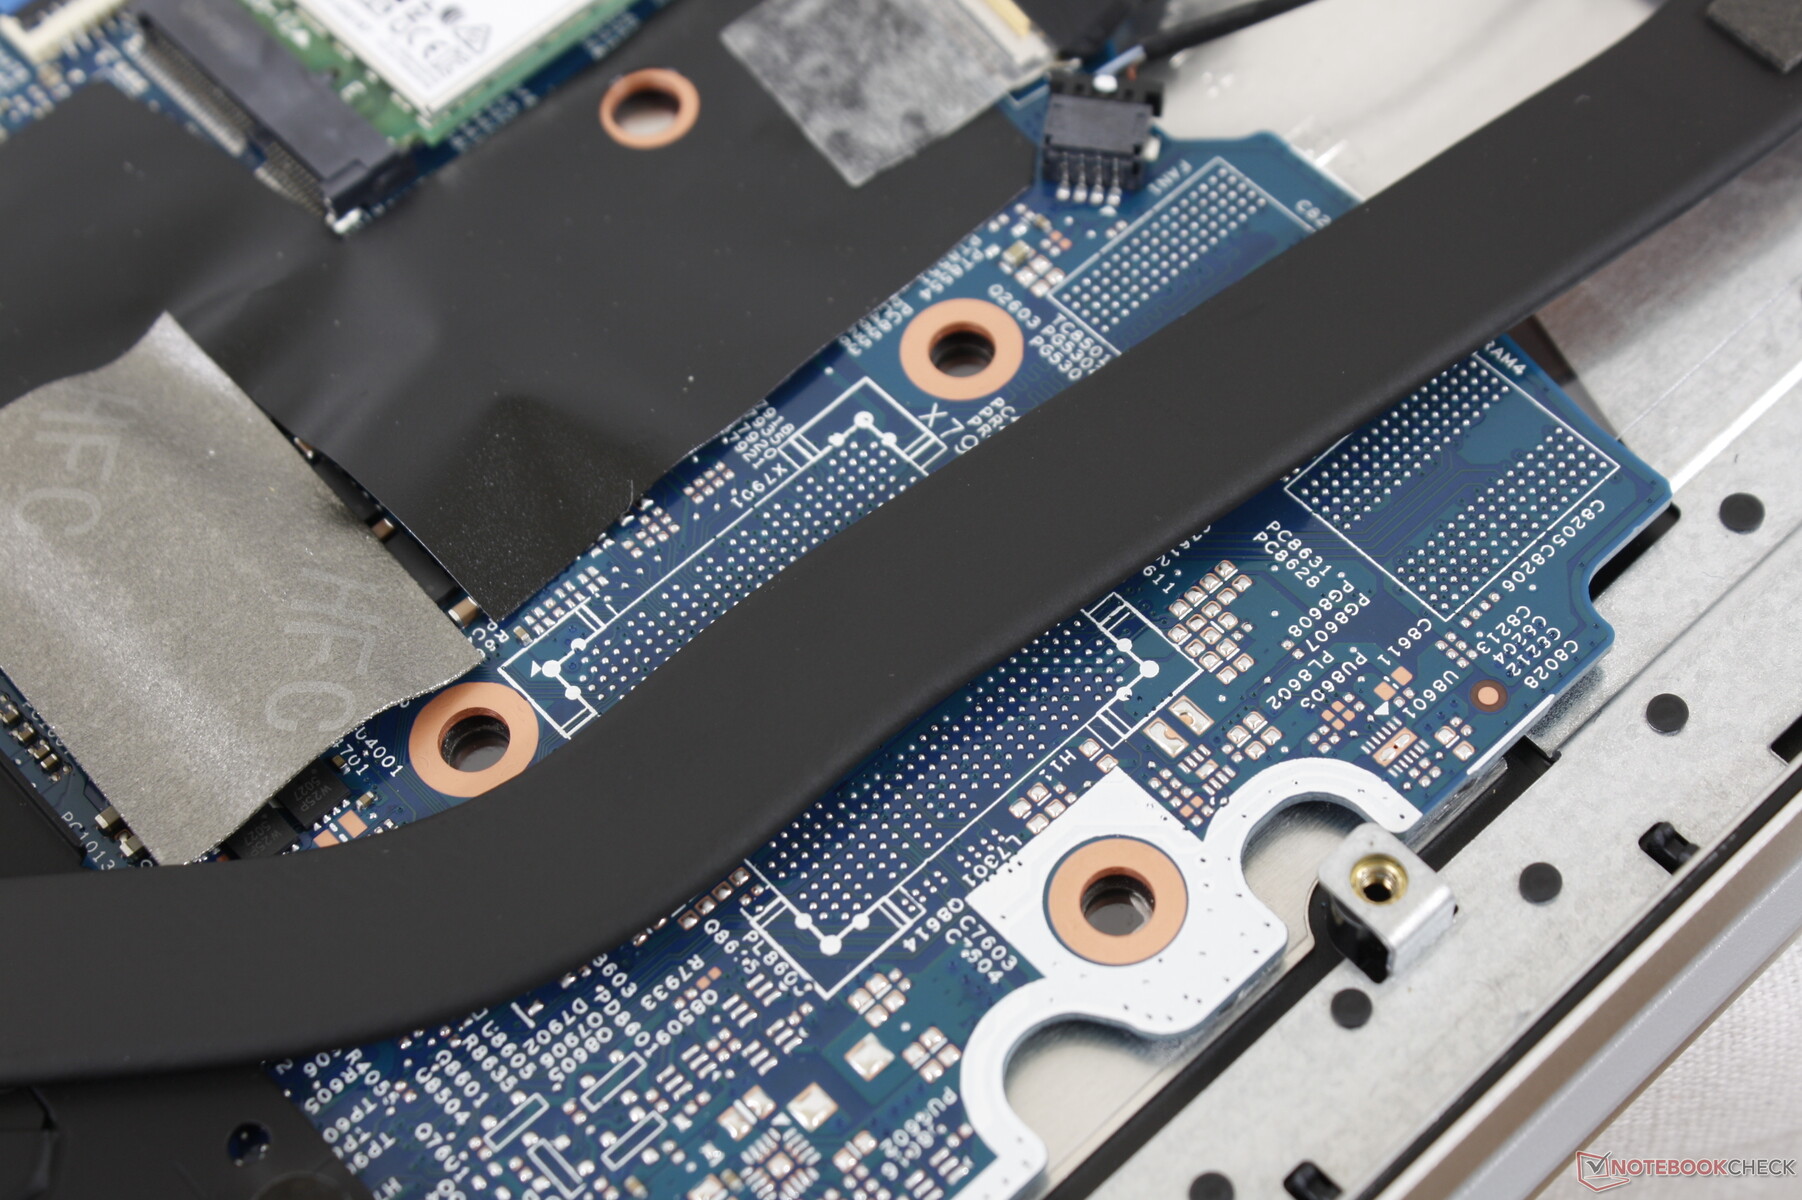
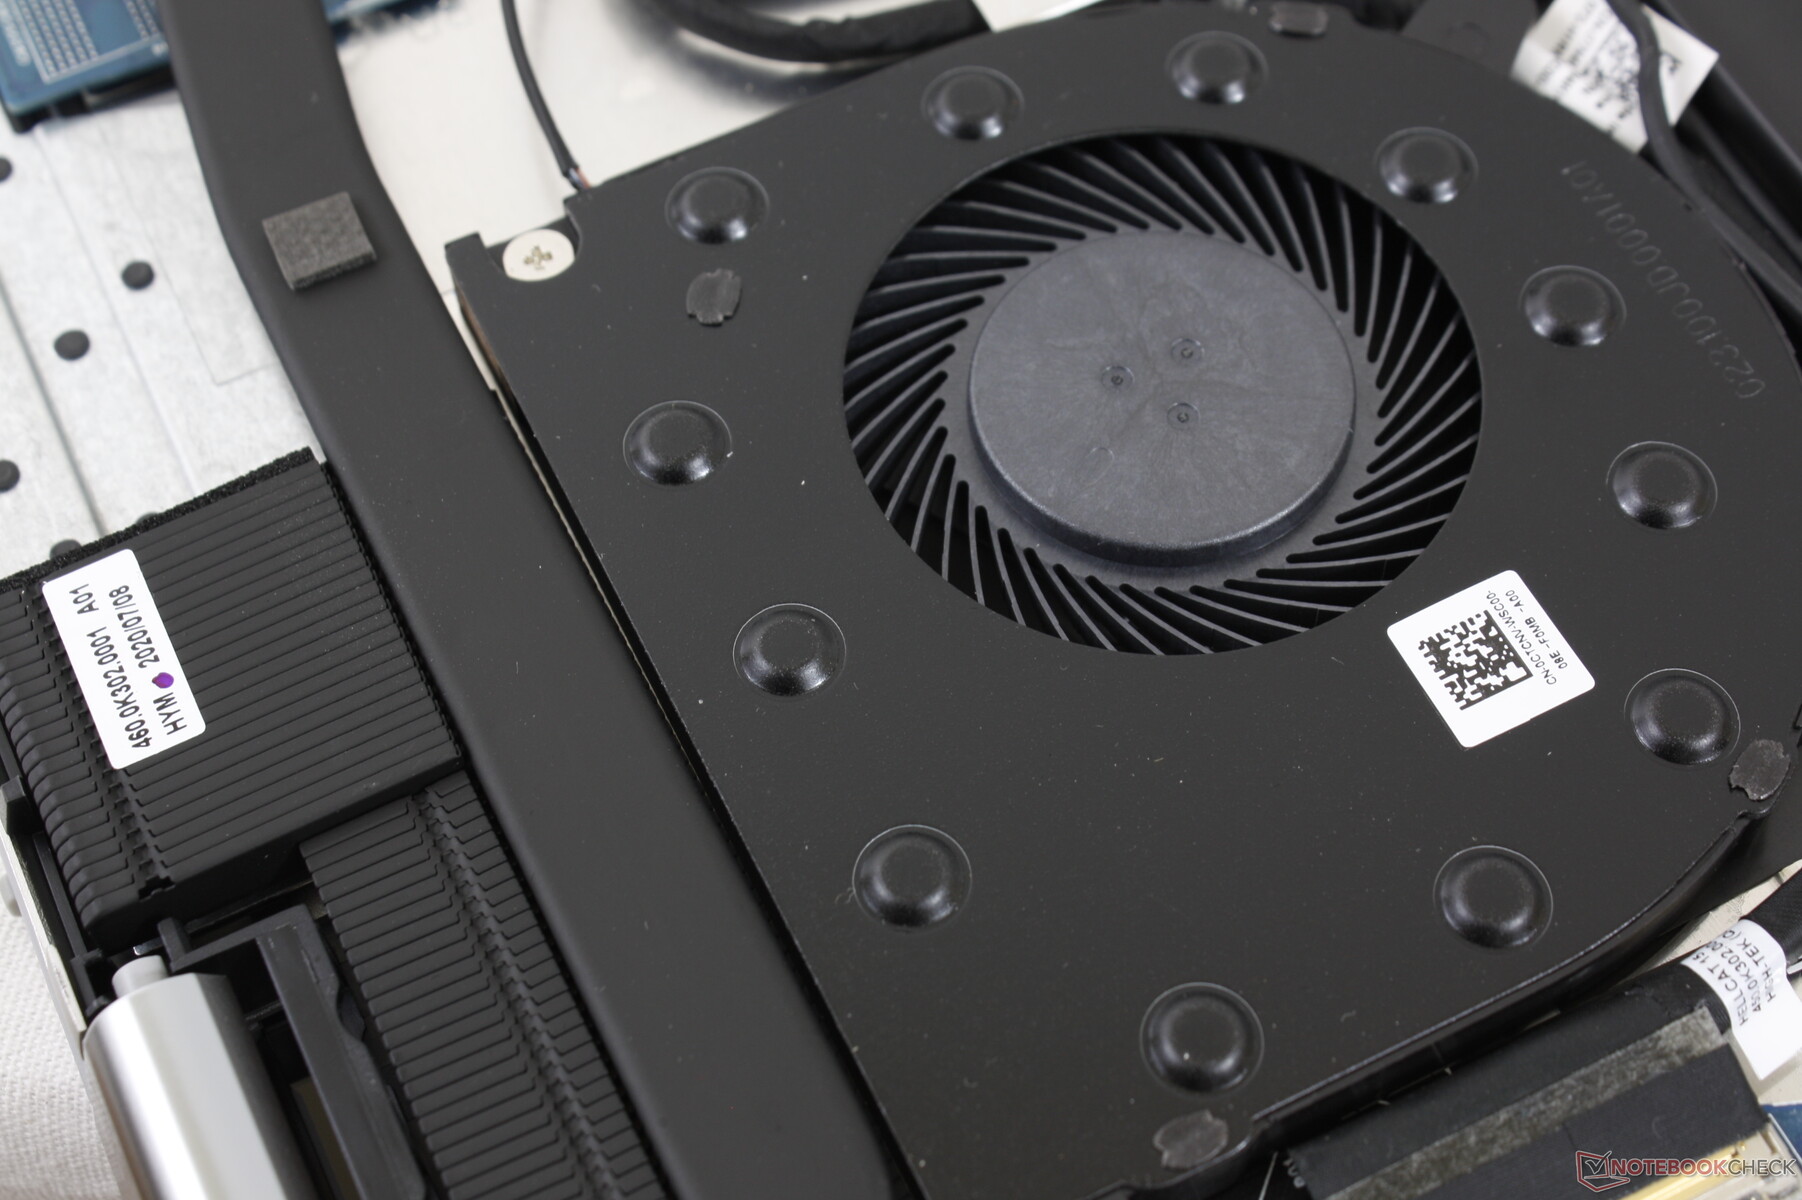
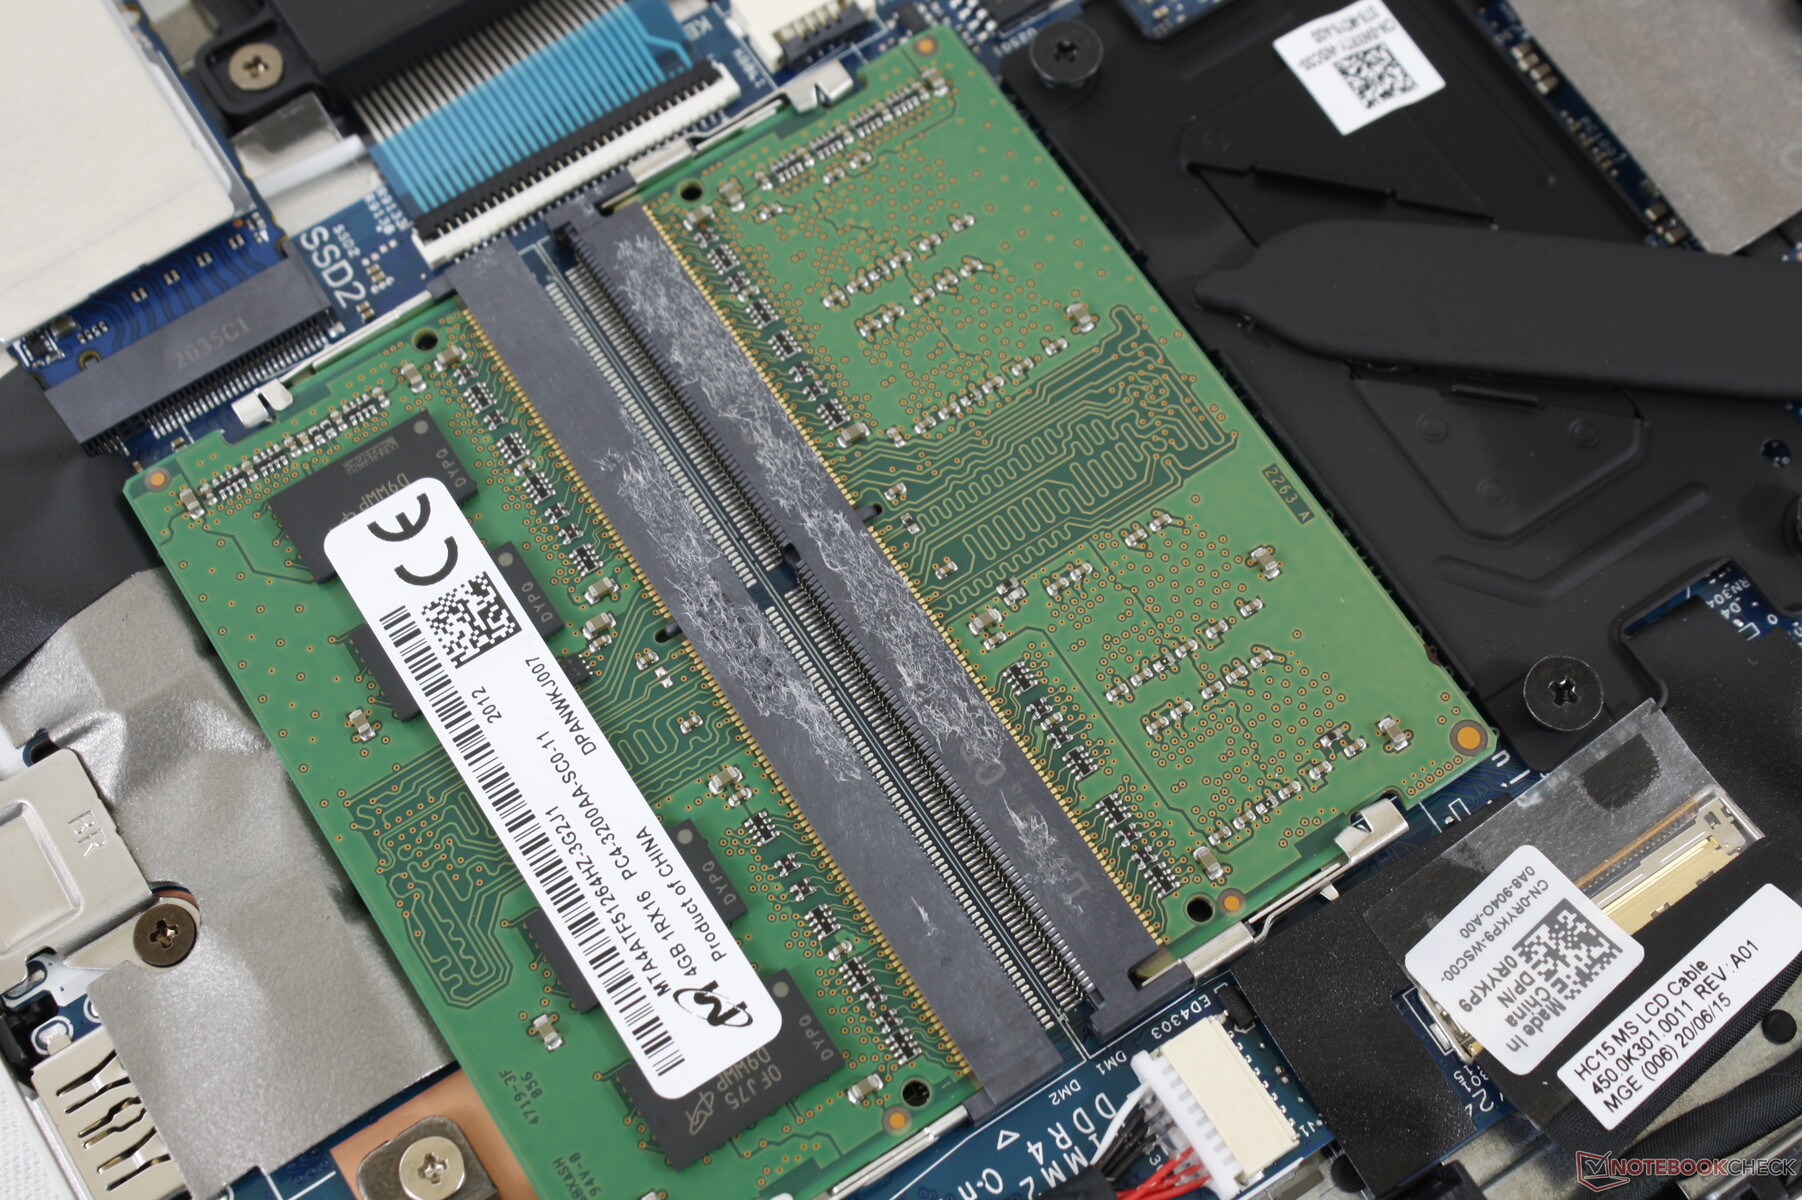
The bottom panel comes off easily with just a Philips screwdriver. RAM (2x SODIMM), storage, and WLAN are all removable.
Accessories and Warranty
There are no extras in the box outside of the AC adapter and paperwork. The Dell Active Pen is optional.
The standard one-year limited warranty applies with extension options of up to four years.
Input Devices
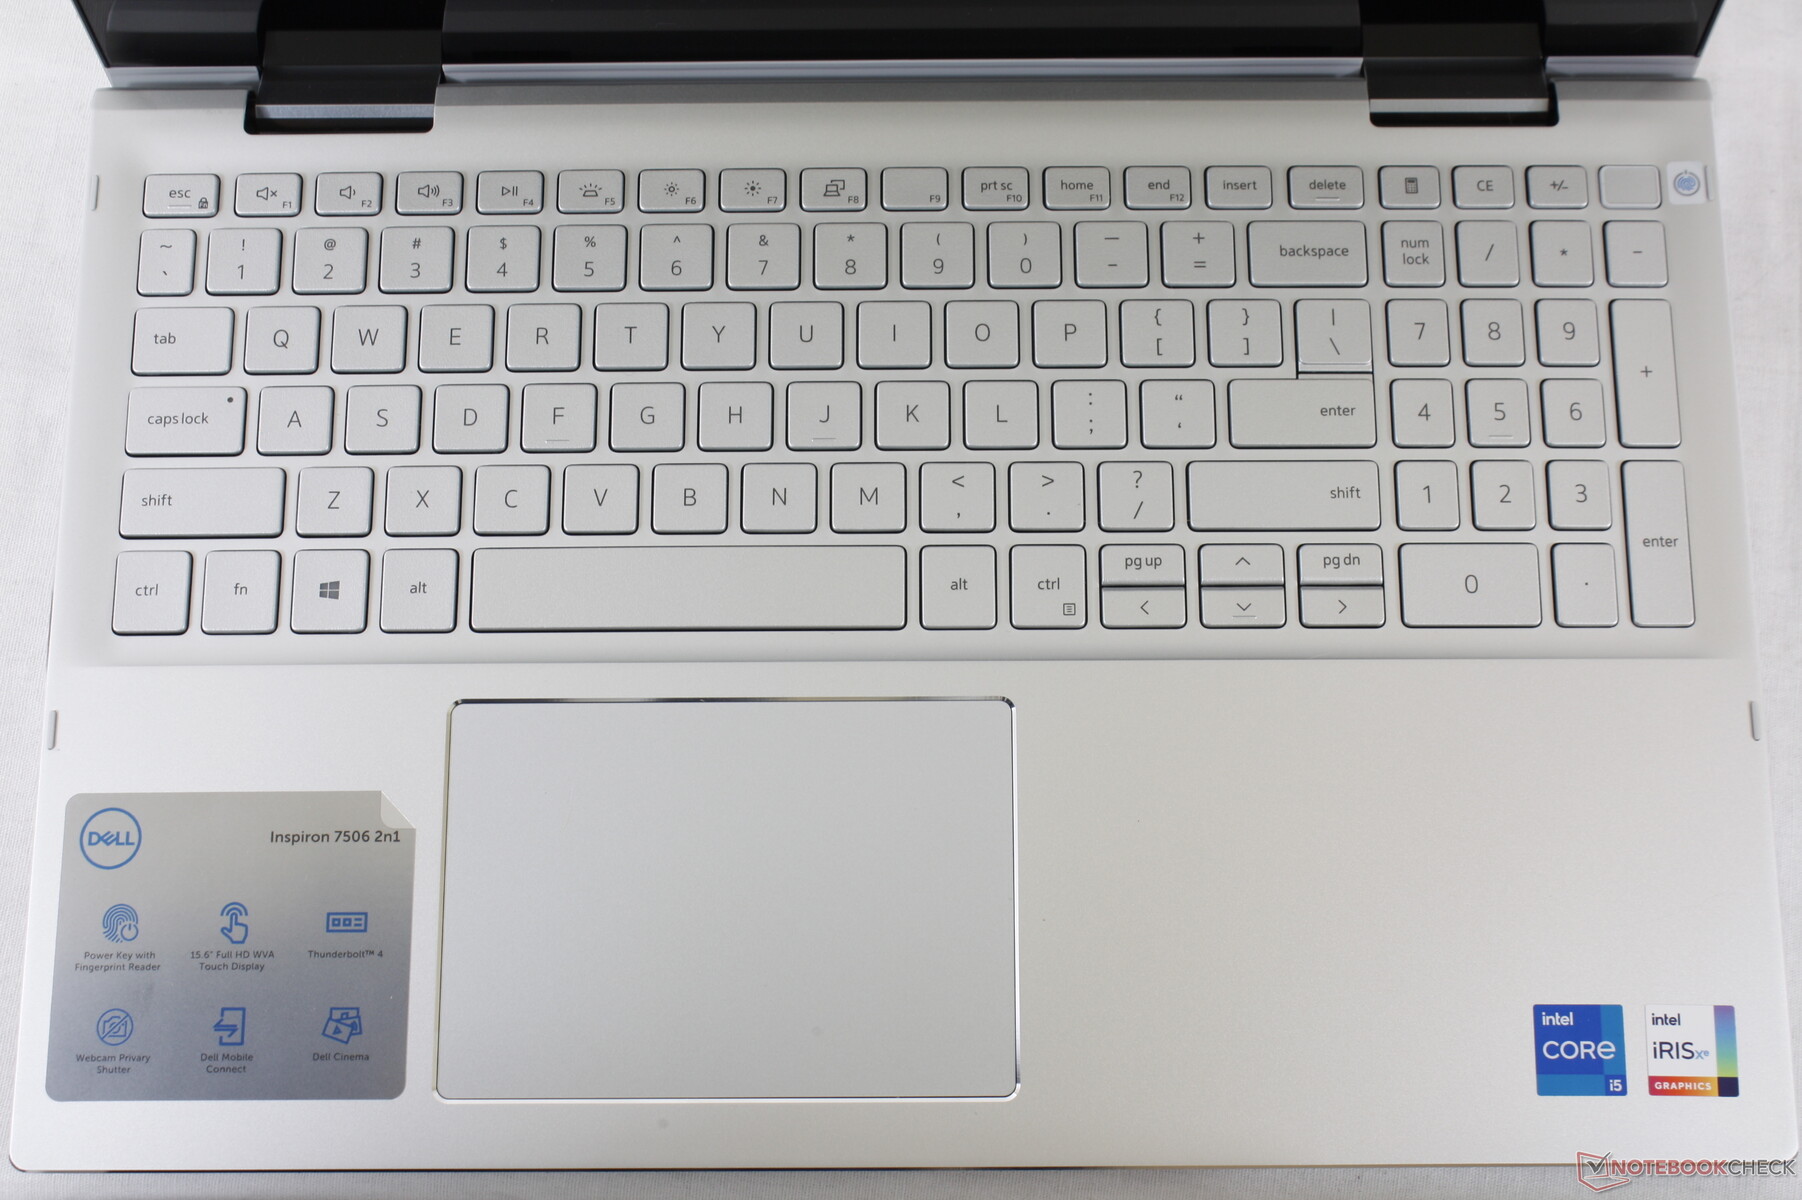
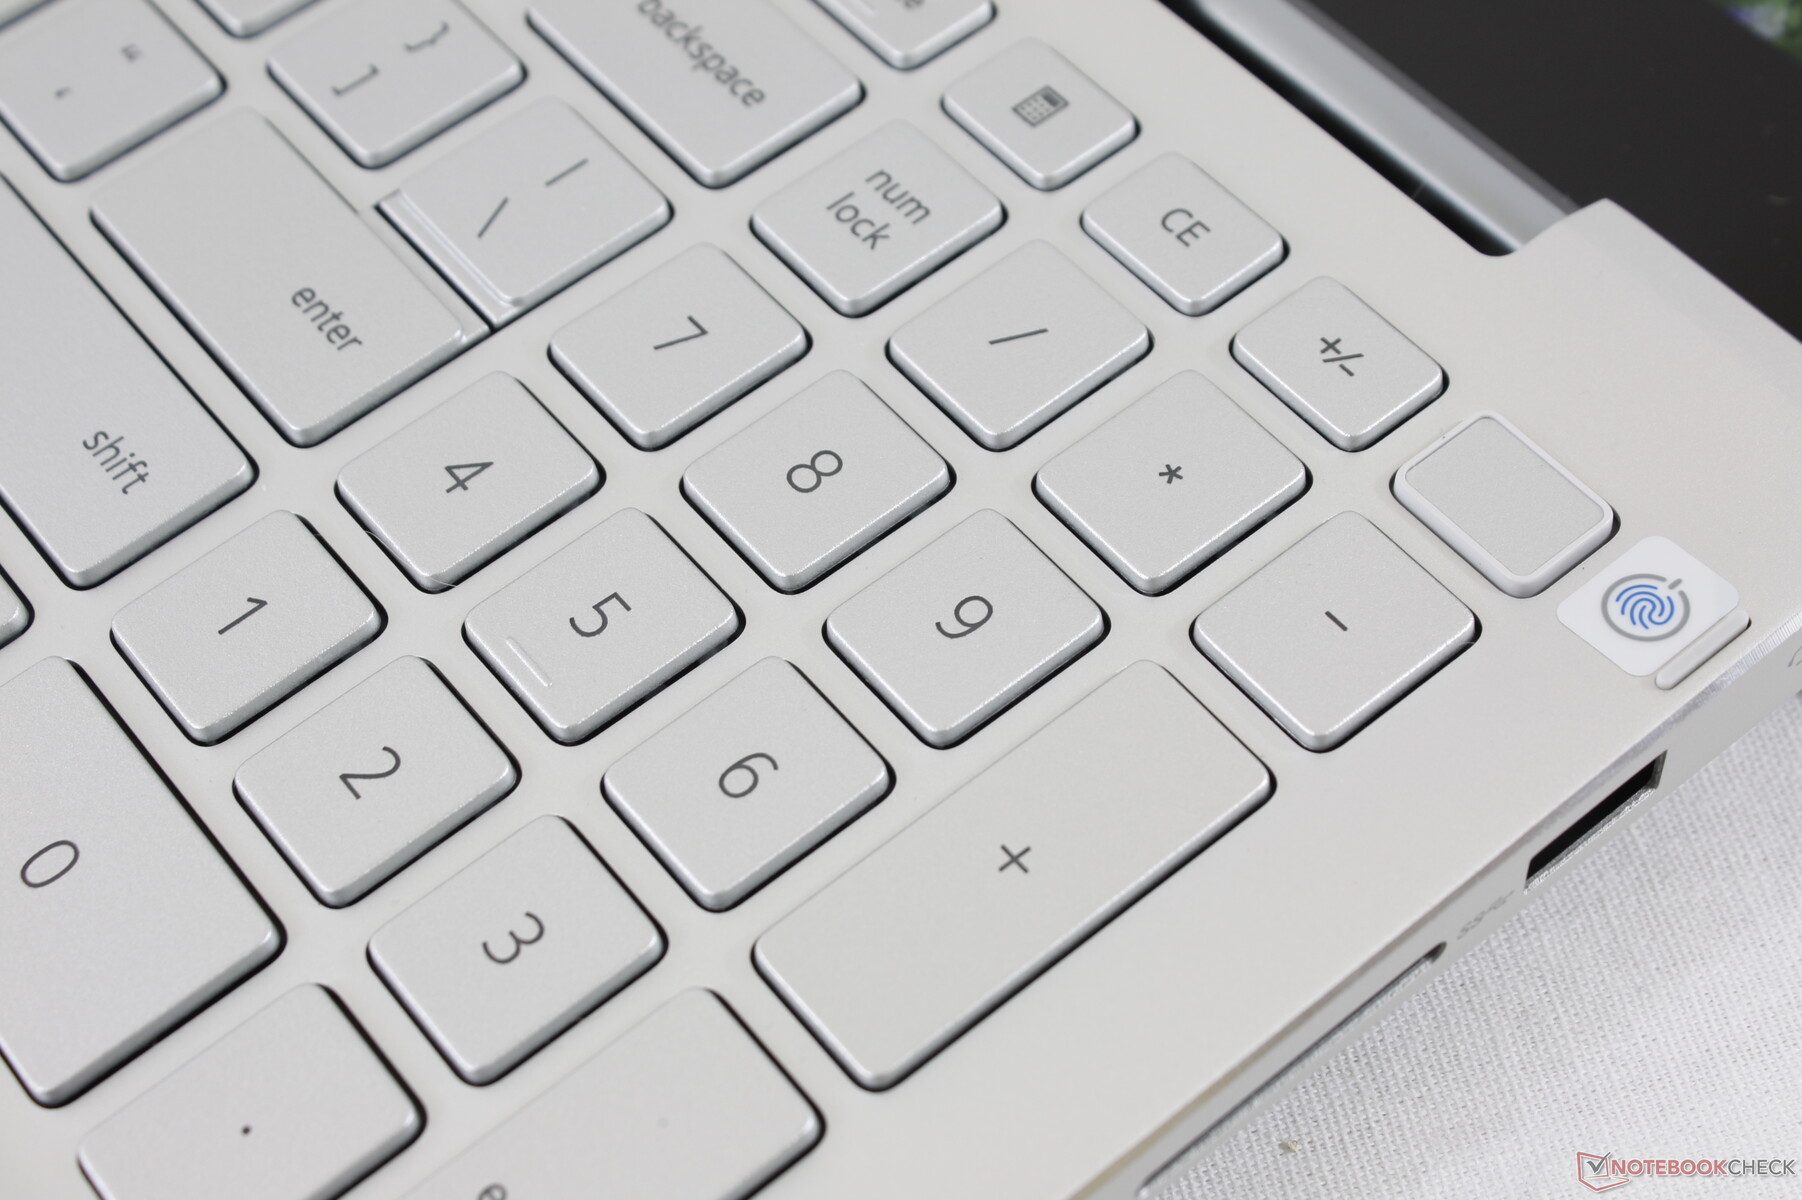
Keyboard
Key feedback is average and could be firmer or with deeper travel. Part of the problem is the overlying base which flexes more easily down the center of the keyboard as opposed to the left- or right-hand sides. The typing experience is not as crisp as on the Dell XPS or HP Spectre.
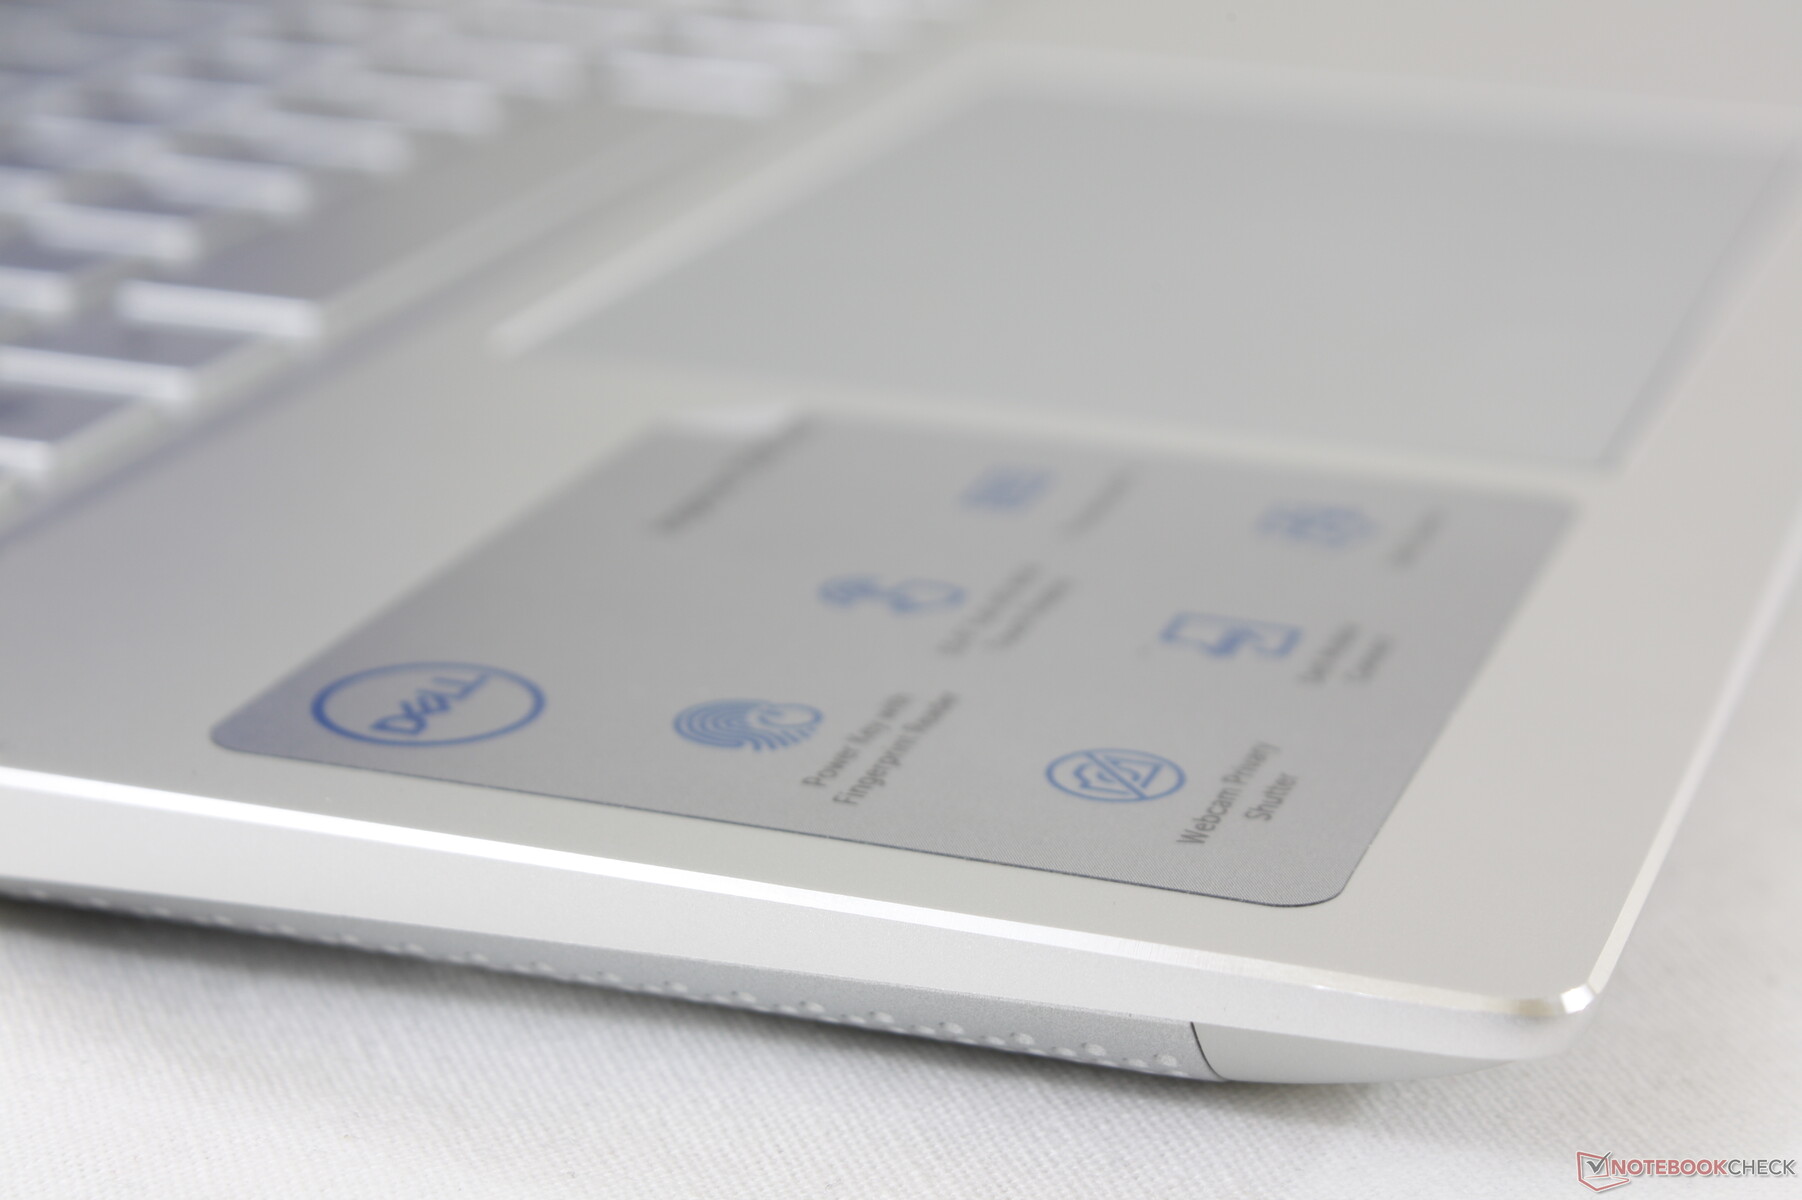
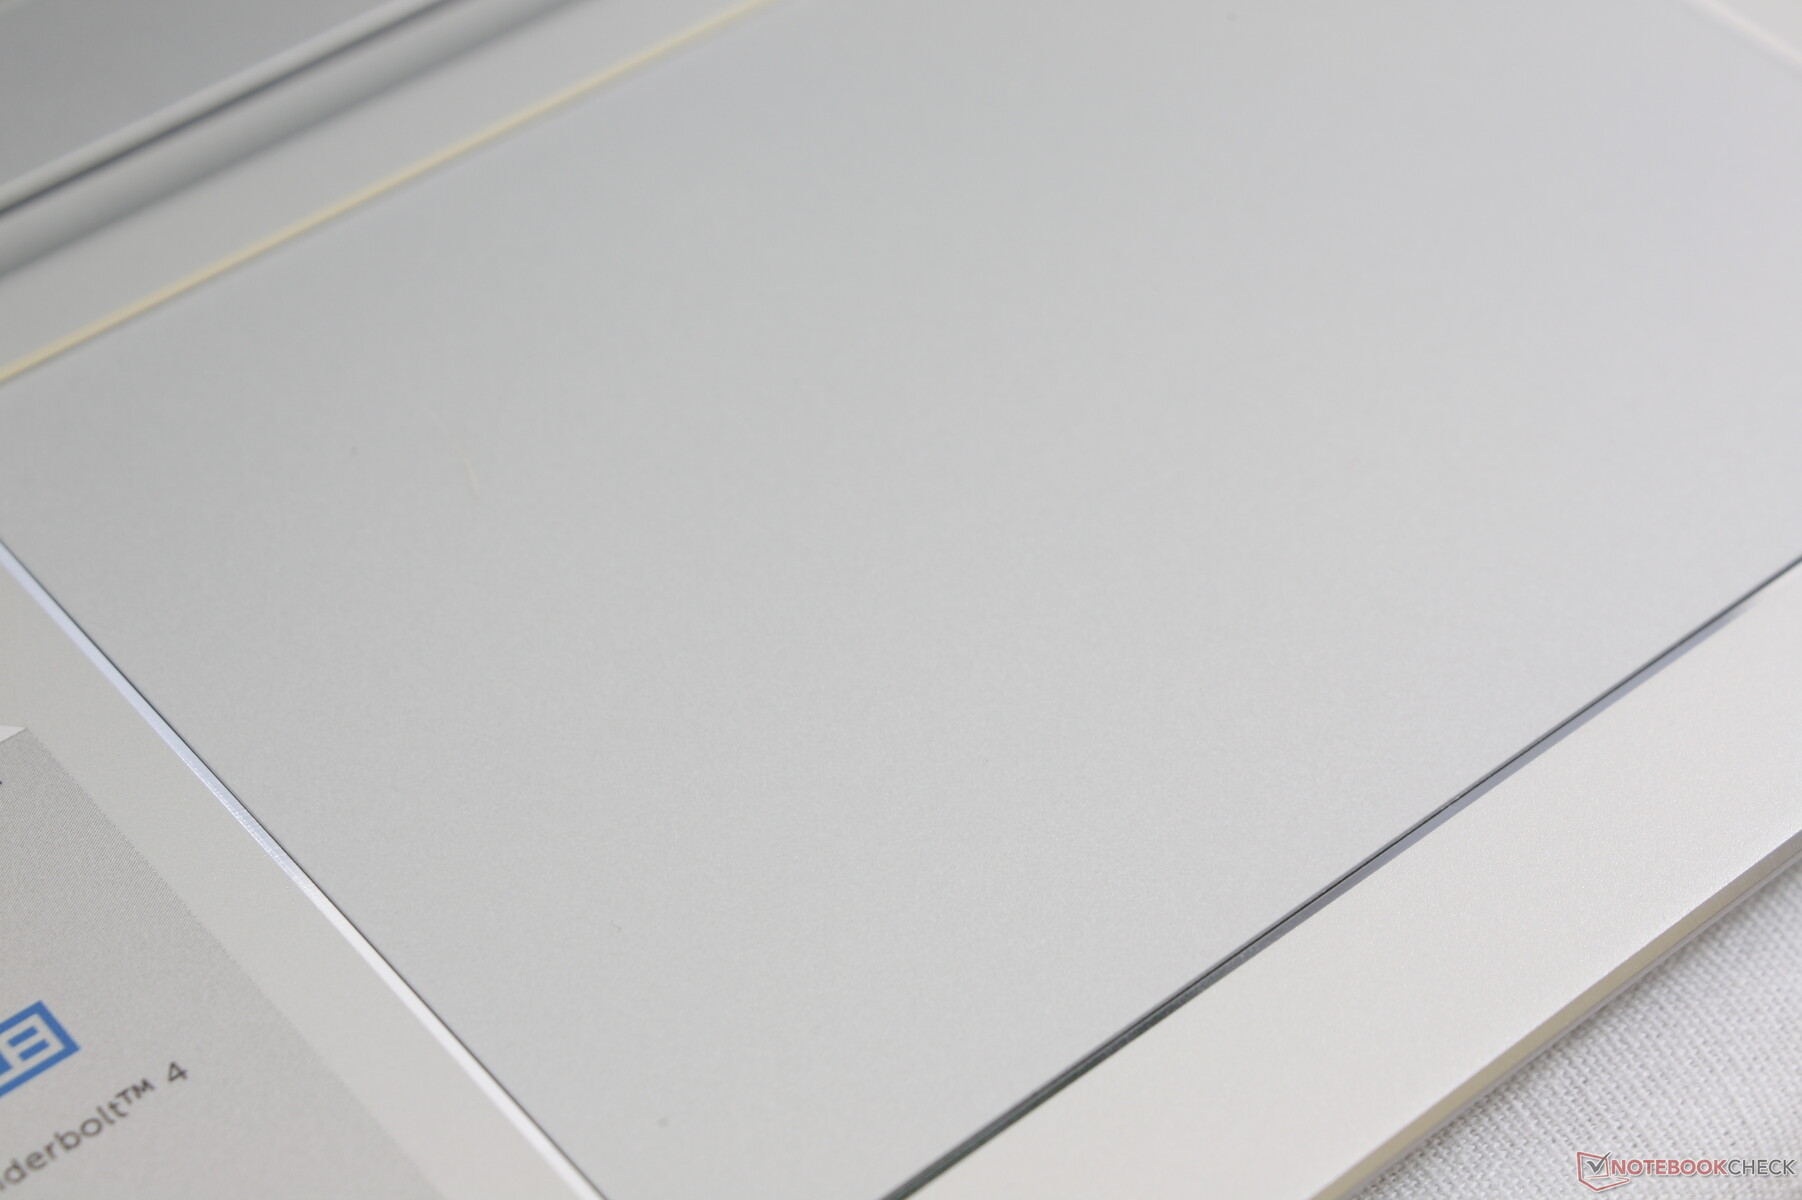
Touchpad
The large clickpad (11.5 x 8 cm) is smooth and with a bit of sticking when gliding at slow speeds for accurate cursor control. Unfortunately, its integrated mouse clicks are way too shallow and spongy. The unsatisfying feedback makes the laptop more difficult to use without an external mouse or stylus for inputs.

Display
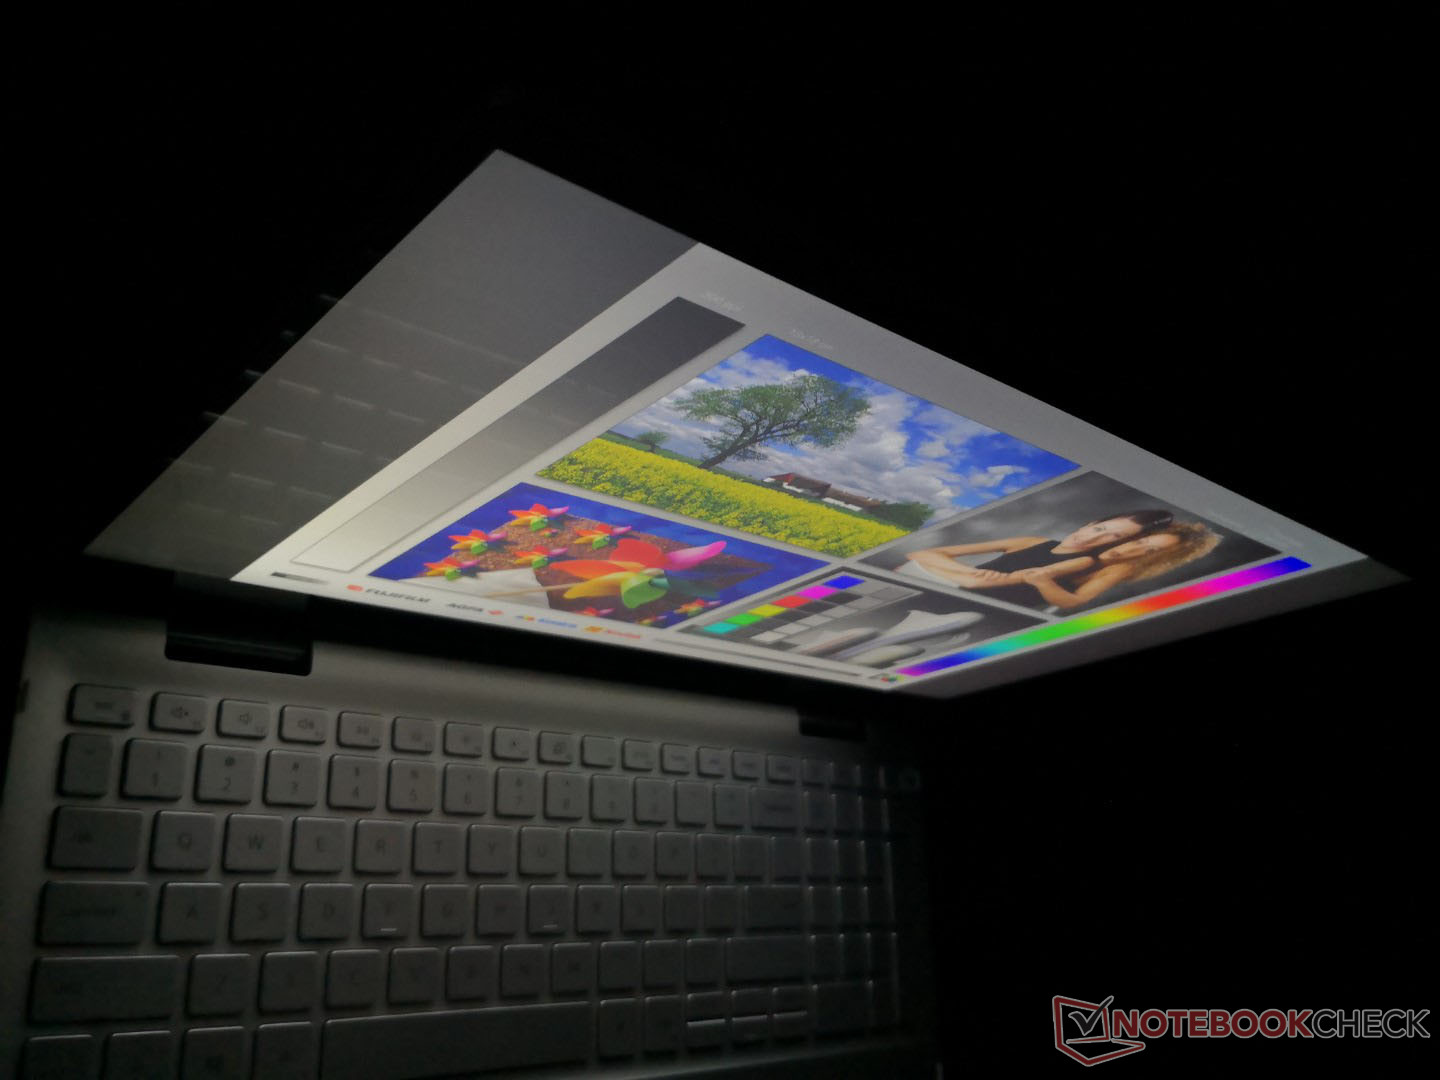
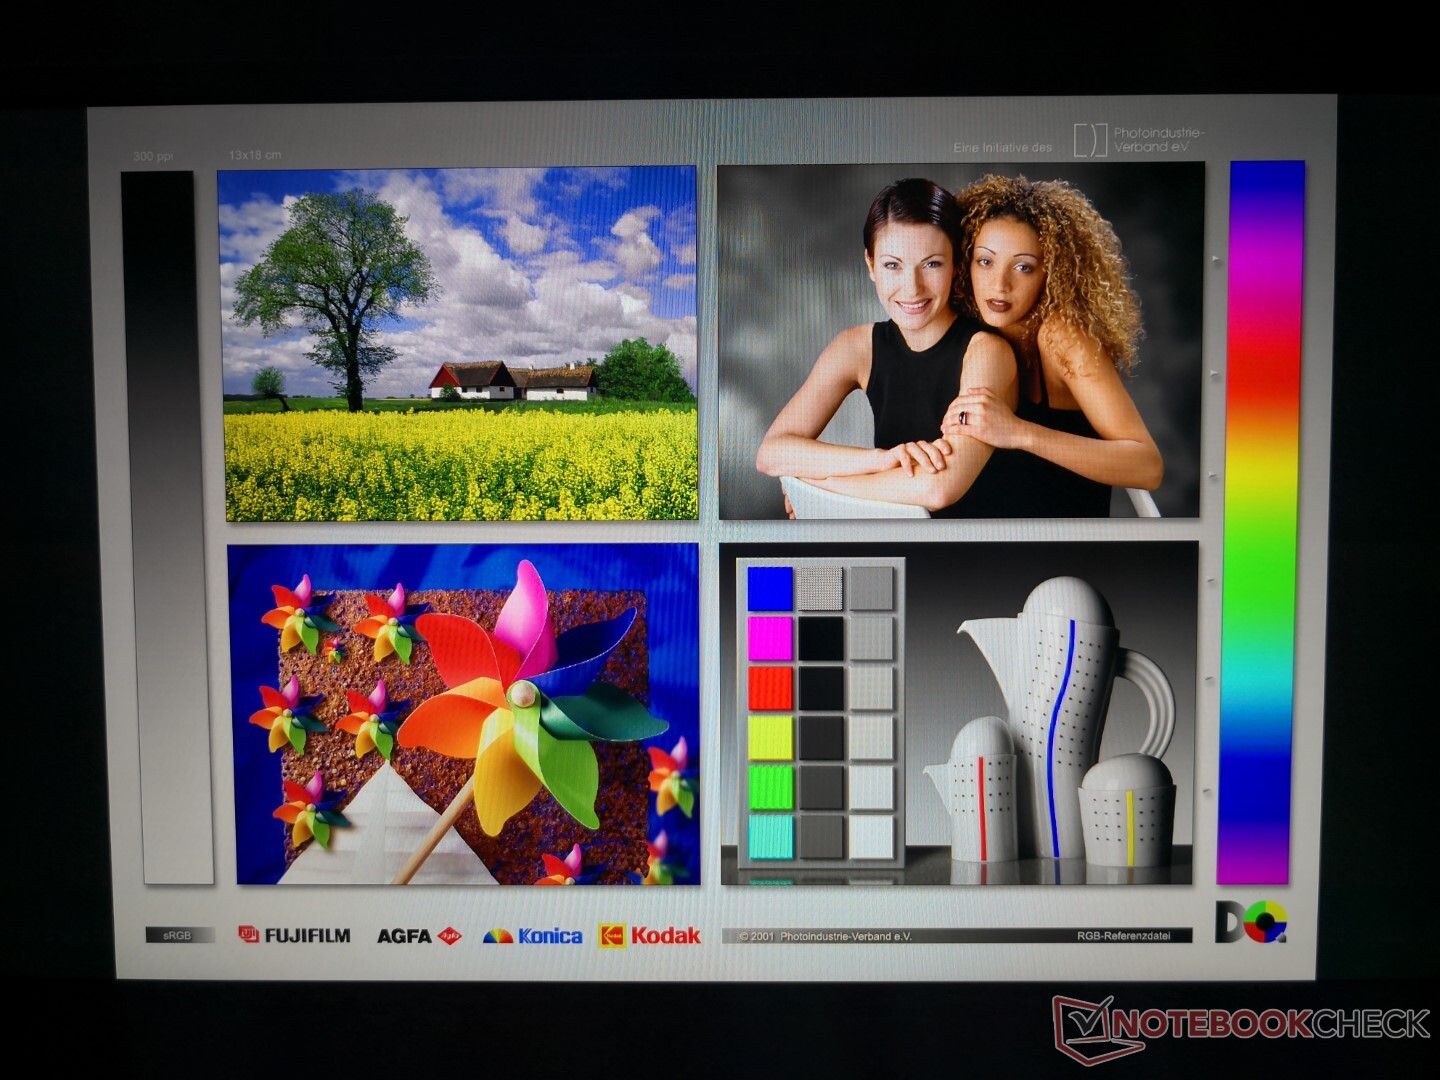
The Dell system is a first in our database to use an LG Philips 156WFF IPS panel. Nonetheless, its properties are similar to what we observed on the older 2018 Inspiron 7000 2-in-1 with its 4K AU Optronics panel save for the resolution difference. Contrast is high and colors are deep to represent a quality panel. Its main drawbacks are the slow black-white response times and average display brightness.


| |||||||||||||||||||||||||
Brightness Distribution: 92 %
Center on Battery: 289.8 cd/m²
Contrast: 935:1 (Black: 0.31 cd/m²)
ΔE ColorChecker Calman: 3.75 | ∀{0.5-29.43 Ø4.72}
calibrated: 1.52
ΔE Greyscale Calman: 5.3 | ∀{0.09-98 Ø4.97}
97% sRGB (Argyll 1.6.3 3D)
62.9% AdobeRGB 1998 (Argyll 1.6.3 3D)
68.7% AdobeRGB 1998 (Argyll 3D)
97.2% sRGB (Argyll 3D)
67.4% Display P3 (Argyll 3D)
Gamma: 2.35
CCT: 5810 K
| Dell Inspiron 15 7506 2-in-1 P97F LG Philips 156WFF, IPS, 15.6", 1920x1080 | Asus ZenBook Flip 15 UX563FD-A1027T BOE HF NE156QUM-N64, IPS, 15.6", 3840x2160 | Dell Inspiron 15 7000 2-in-1 Black Edition AUO34EB, IPS, 15.6", 3840x2160 | HP Envy x360 15-ee0257ng BOE NV156FHM-N4T, IPS, 15.6", 1920x1080 | Lenovo Yoga C740-15IML B156HAN02.5, IPS LED, 15.6", 1920x1080 | Asus VivoBook Flip 15 TP510UA-E8073T AU Optronics B156HAN02.1, IPS, 15.6", 1920x1080 | |
|---|---|---|---|---|---|---|
| Display | -1% | 8% | -39% | -41% | -41% | |
| Display P3 Coverage (%) | 67.4 | 66.2 -2% | 75.7 12% | 40.43 -40% | 39.04 -42% | 39.19 -42% |
| sRGB Coverage (%) | 97.2 | 97.2 0% | 99.3 2% | 59.6 -39% | 57.9 -40% | 58.9 -39% |
| AdobeRGB 1998 Coverage (%) | 68.7 | 68.3 -1% | 75.7 10% | 41.77 -39% | 40.33 -41% | 40.49 -41% |
| Response Times | -6% | 15% | 39% | 7% | 18% | |
| Response Time Grey 50% / Grey 80% * (ms) | 52.4 ? | 60 ? -15% | 48 ? 8% | 34 ? 35% | 50.8 ? 3% | 44 ? 16% |
| Response Time Black / White * (ms) | 36 ? | 35 ? 3% | 28.4 ? 21% | 21 ? 42% | 32.4 ? 10% | 29 ? 19% |
| PWM Frequency (Hz) | ||||||
| Screen | 23% | -18% | -47% | -53% | -9% | |
| Brightness middle (cd/m²) | 289.8 | 351 21% | 321.1 11% | 314 8% | 286 -1% | 229 -21% |
| Brightness (cd/m²) | 274 | 335 22% | 315 15% | 280 2% | 268 -2% | 221 -19% |
| Brightness Distribution (%) | 92 | 87 -5% | 95 3% | 72 -22% | 83 -10% | 76 -17% |
| Black Level * (cd/m²) | 0.31 | 0.31 -0% | 0.36 -16% | 0.275 11% | 0.2 35% | 0.15 52% |
| Contrast (:1) | 935 | 1132 21% | 892 -5% | 1142 22% | 1430 53% | 1527 63% |
| Colorchecker dE 2000 * | 3.75 | 1.74 54% | 5.45 -45% | 5.94 -58% | 7.3 -95% | 5.03 -34% |
| Colorchecker dE 2000 max. * | 7.01 | 2.76 61% | 12.6 -80% | 21.71 -210% | 21.7 -210% | 8.89 -27% |
| Colorchecker dE 2000 calibrated * | 1.52 | 2.08 -37% | 5.15 -239% | 5.1 -236% | ||
| Greyscale dE 2000 * | 5.3 | 2.22 58% | 8.1 -53% | 2.97 44% | 7 -32% | 5.56 -5% |
| Gamma | 2.35 94% | 2.35 94% | 2.207 100% | 2.4 92% | 2.35 94% | 2.64 83% |
| CCT | 5810 112% | 6667 97% | 6845 95% | 6581 99% | 5847 111% | 7015 93% |
| Color Space (Percent of AdobeRGB 1998) (%) | 62.9 | 62 -1% | 67.3 7% | 38.1 -39% | 36.9 -41% | 37 -41% |
| Color Space (Percent of sRGB) (%) | 97 | 97 0% | 99.3 2% | 59.1 -39% | 57.5 -41% | 59 -39% |
| Total Average (Program / Settings) | 5% /
14% | 2% /
-9% | -16% /
-35% | -29% /
-43% | -11% /
-12% |
* ... smaller is better
Color space covers all of sRGB and approximately 63 percent of AdobeRGB not unlike most high-end Ultrabooks. We appreciate that there is no lesser baseline 1080p option with just 60 percent sRGB coverage. The HP Envy 15, Lenovo Yoga C740, and Asus VivoBook Flip 15, for example, all come with panels with inferior color reproduction.
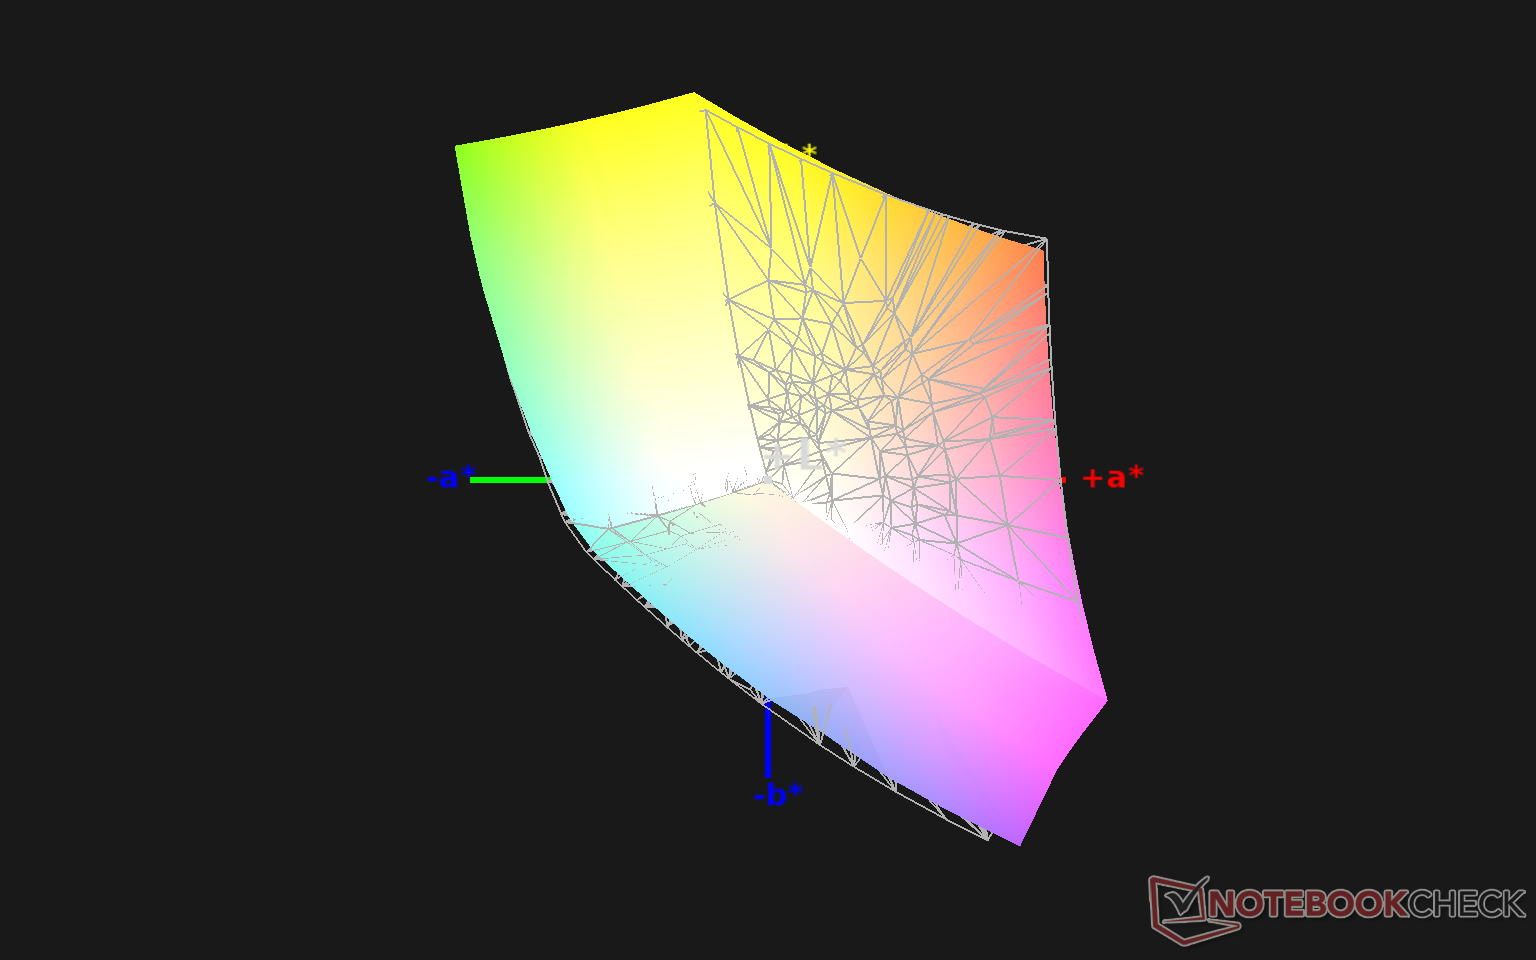
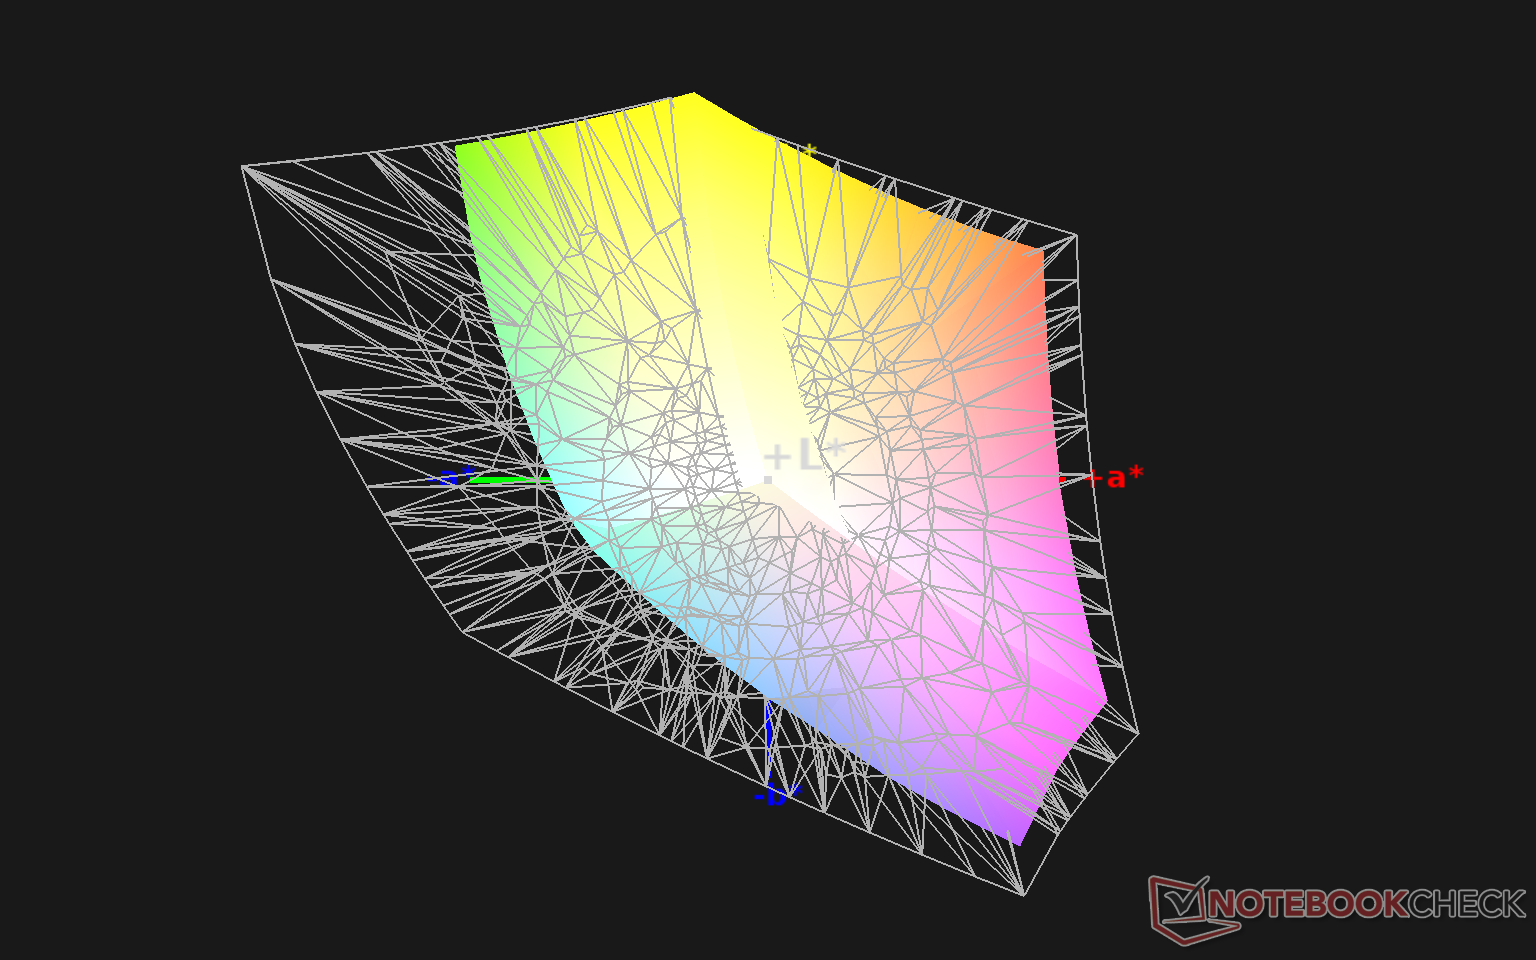
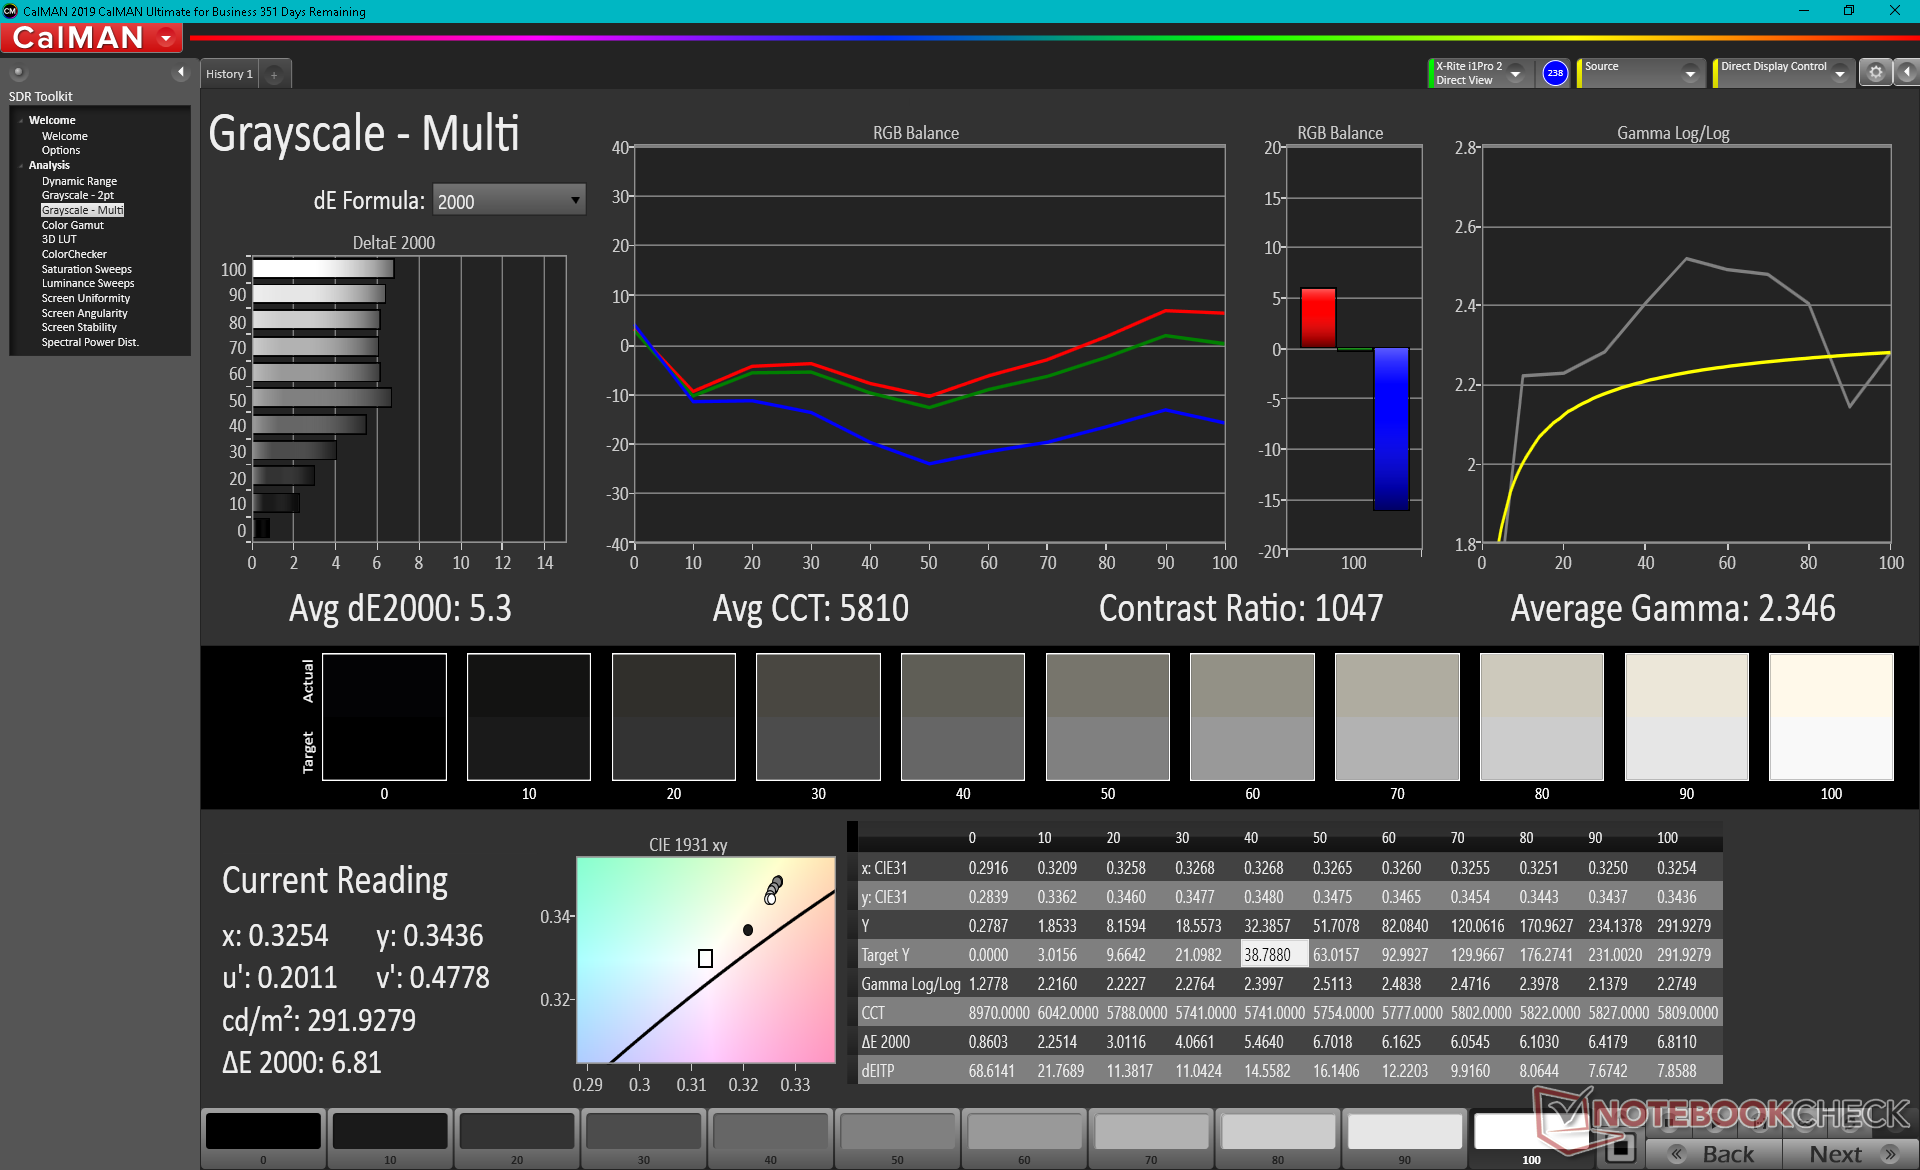
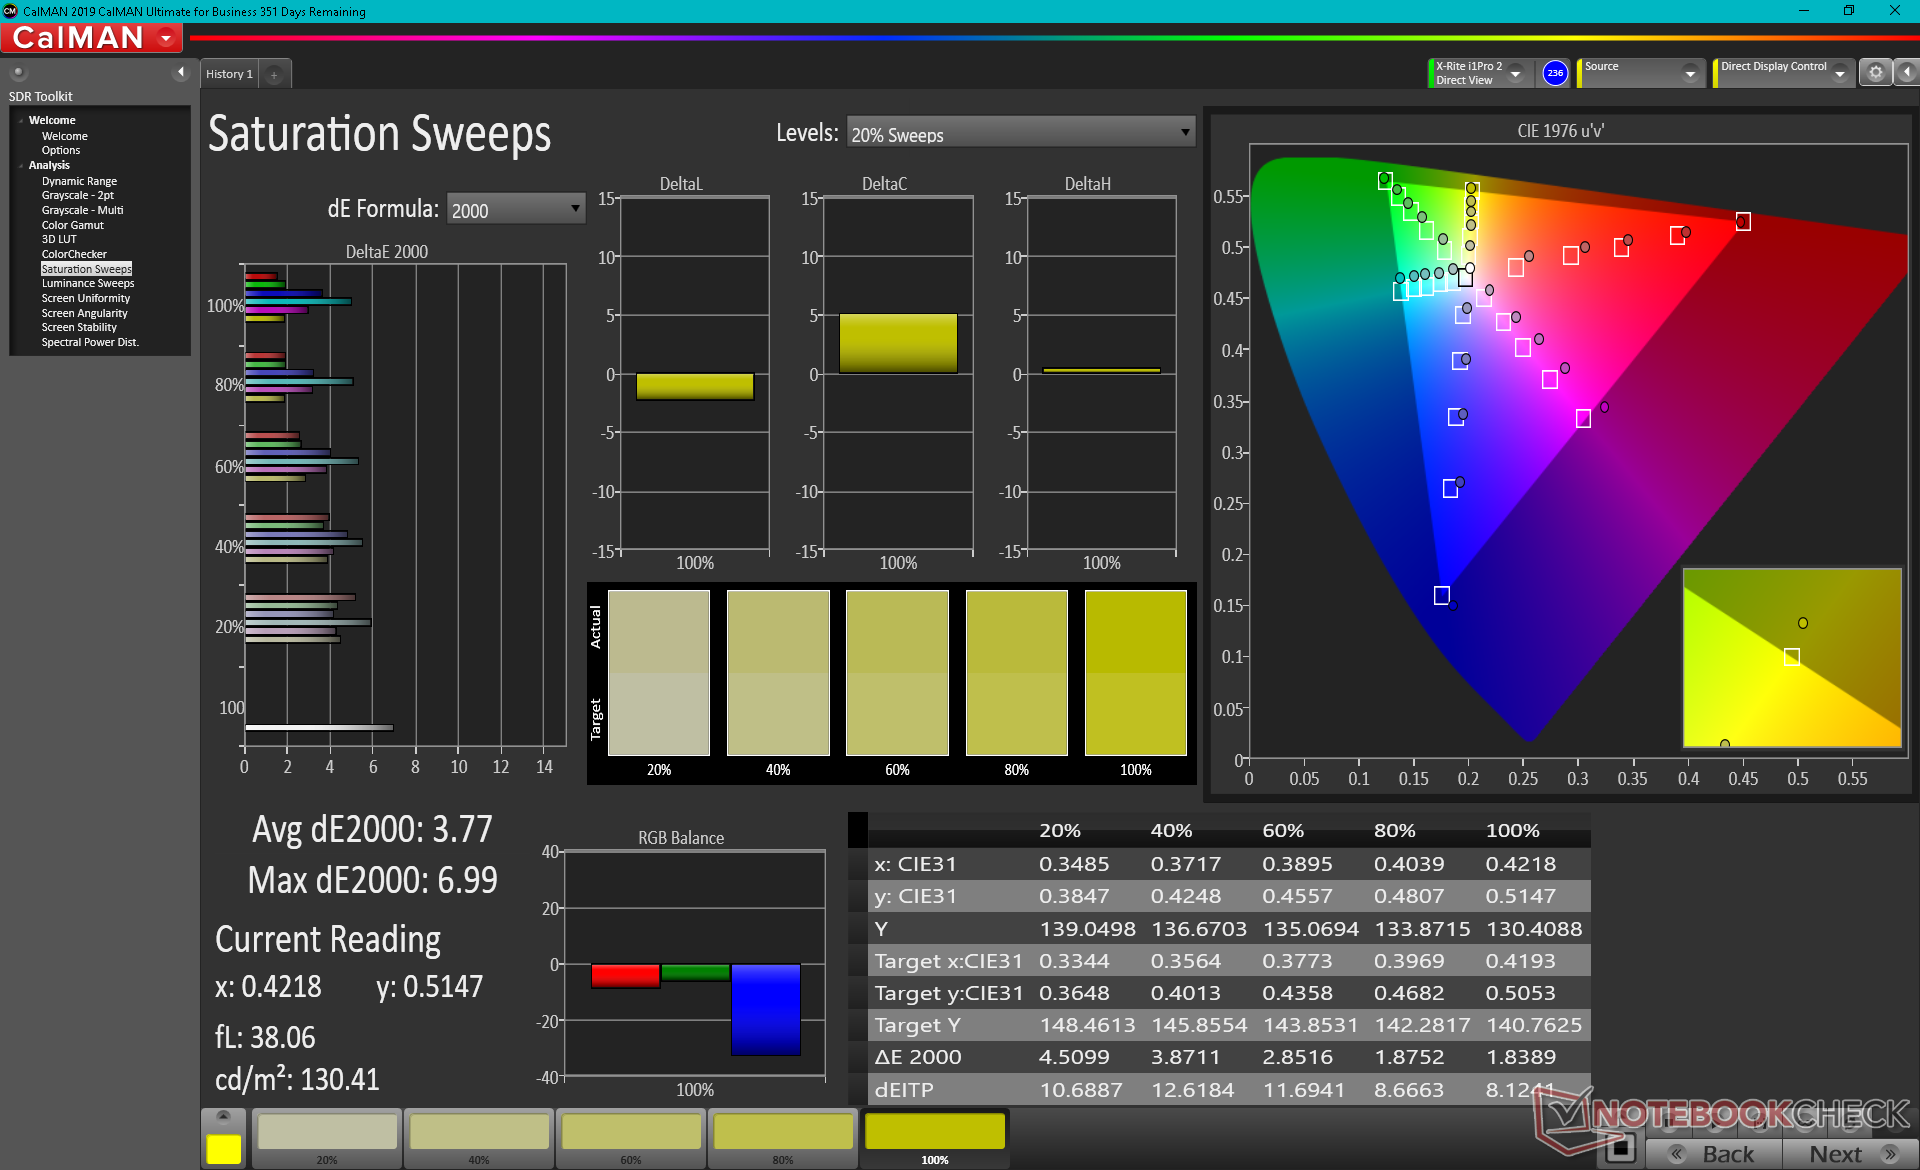
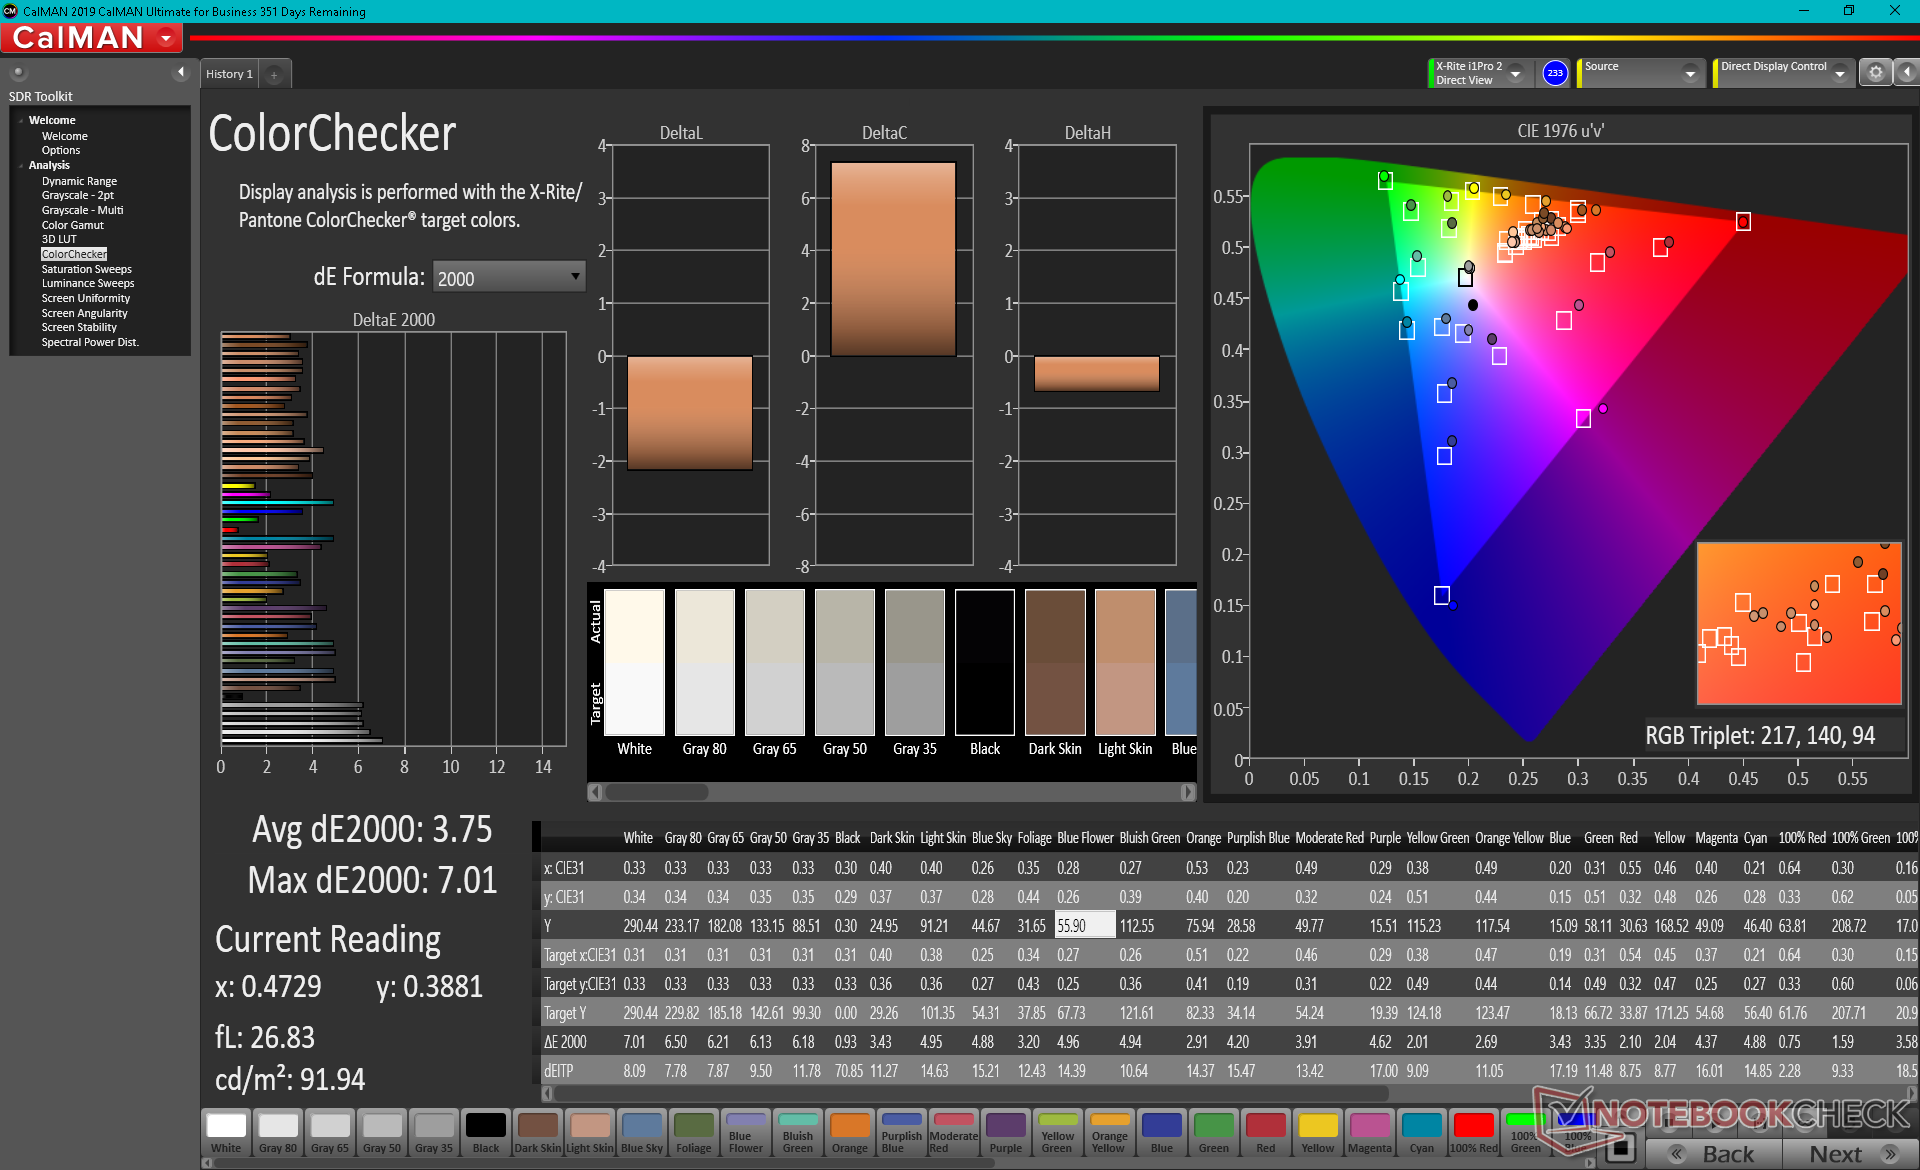
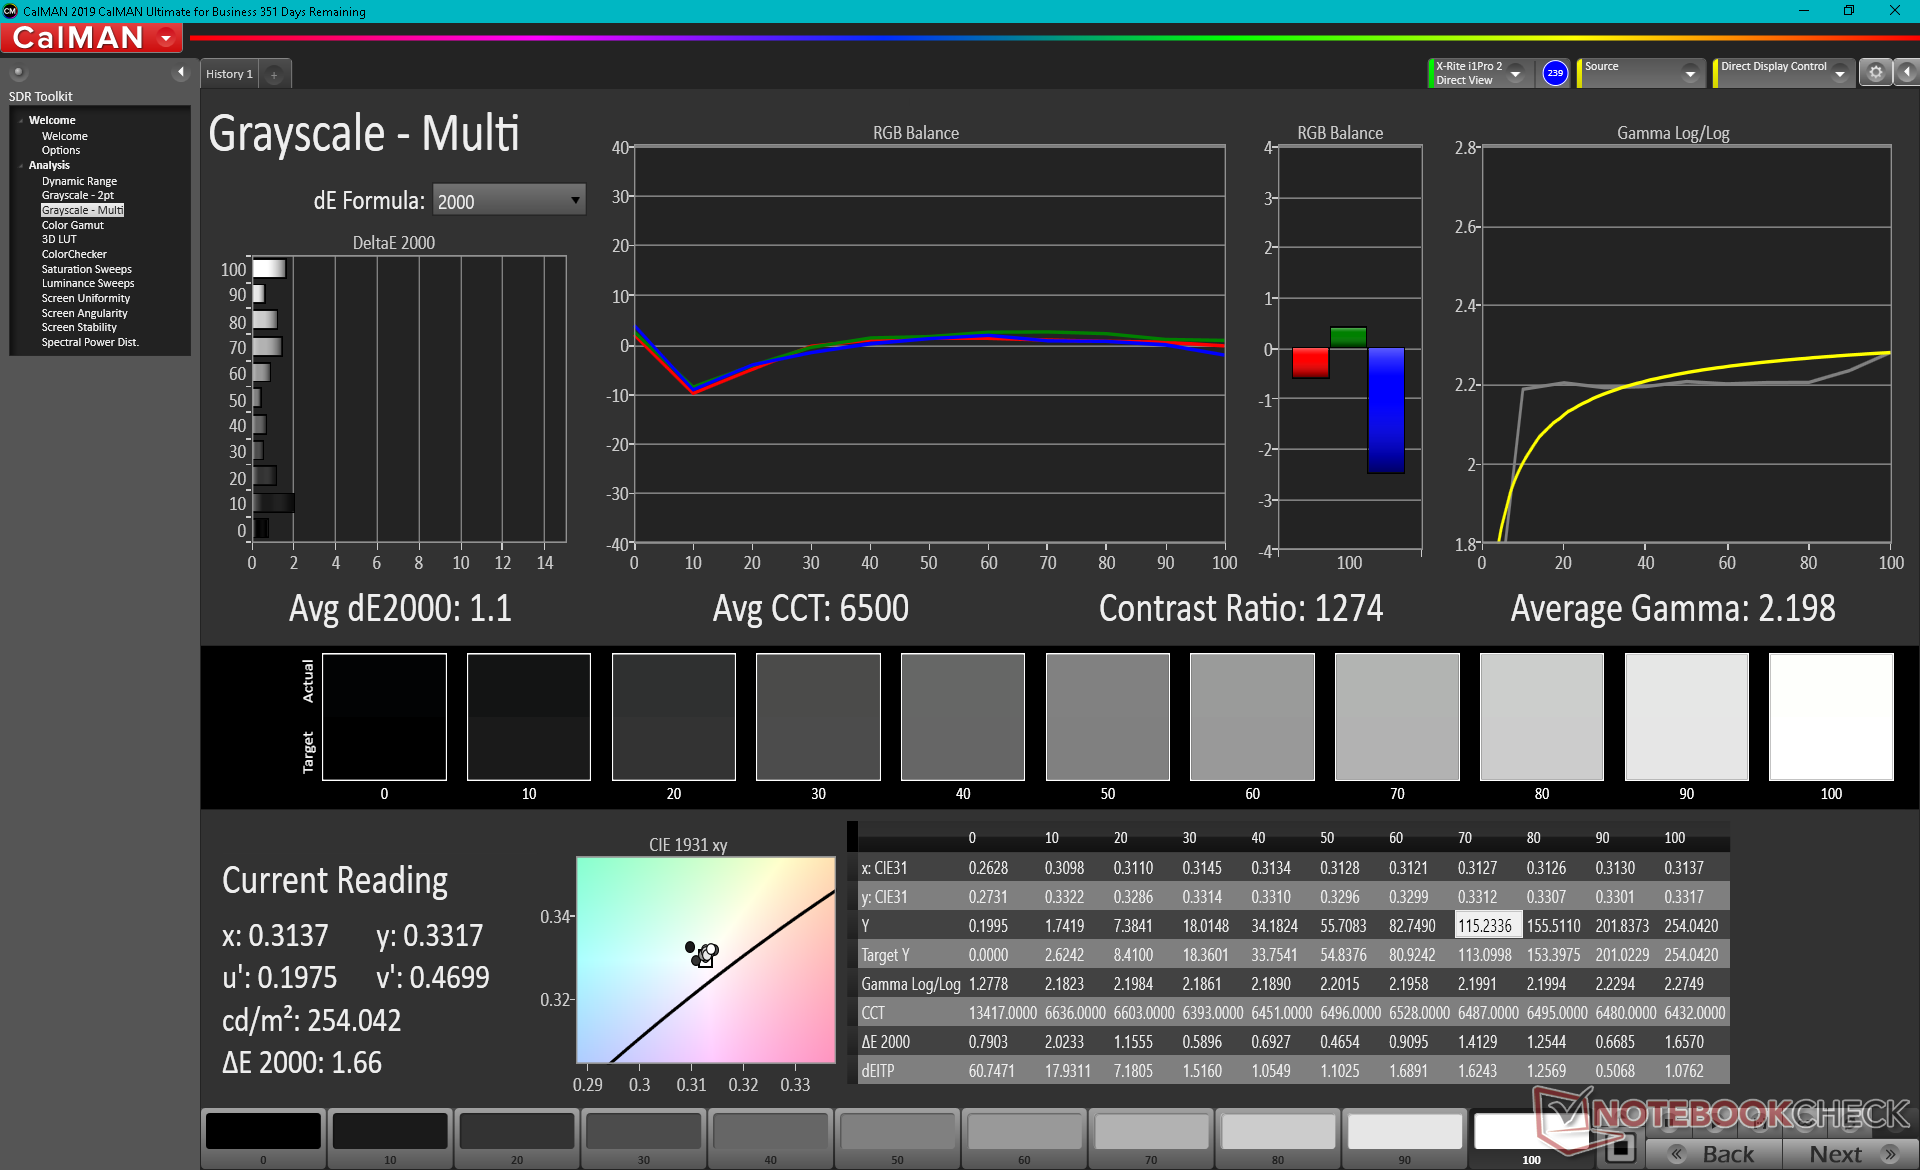
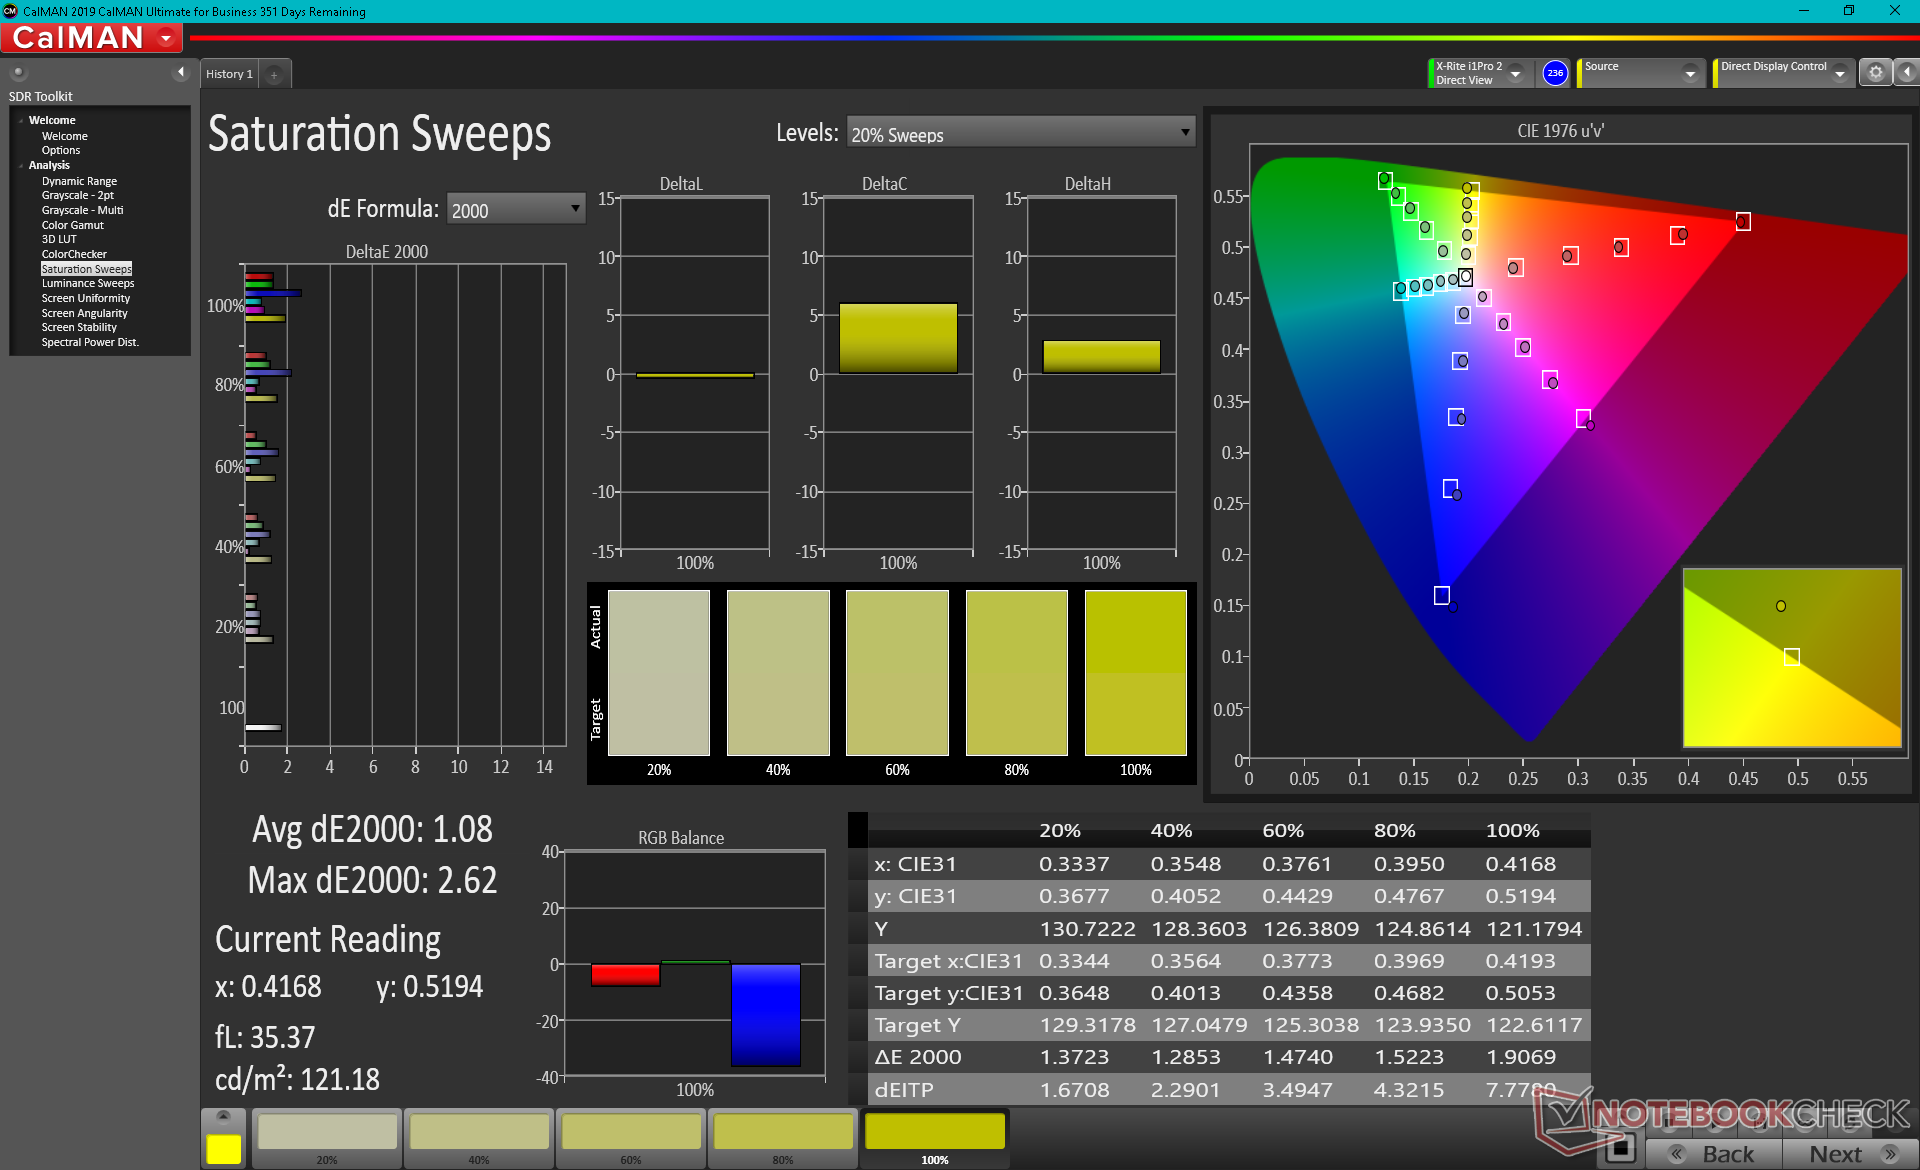
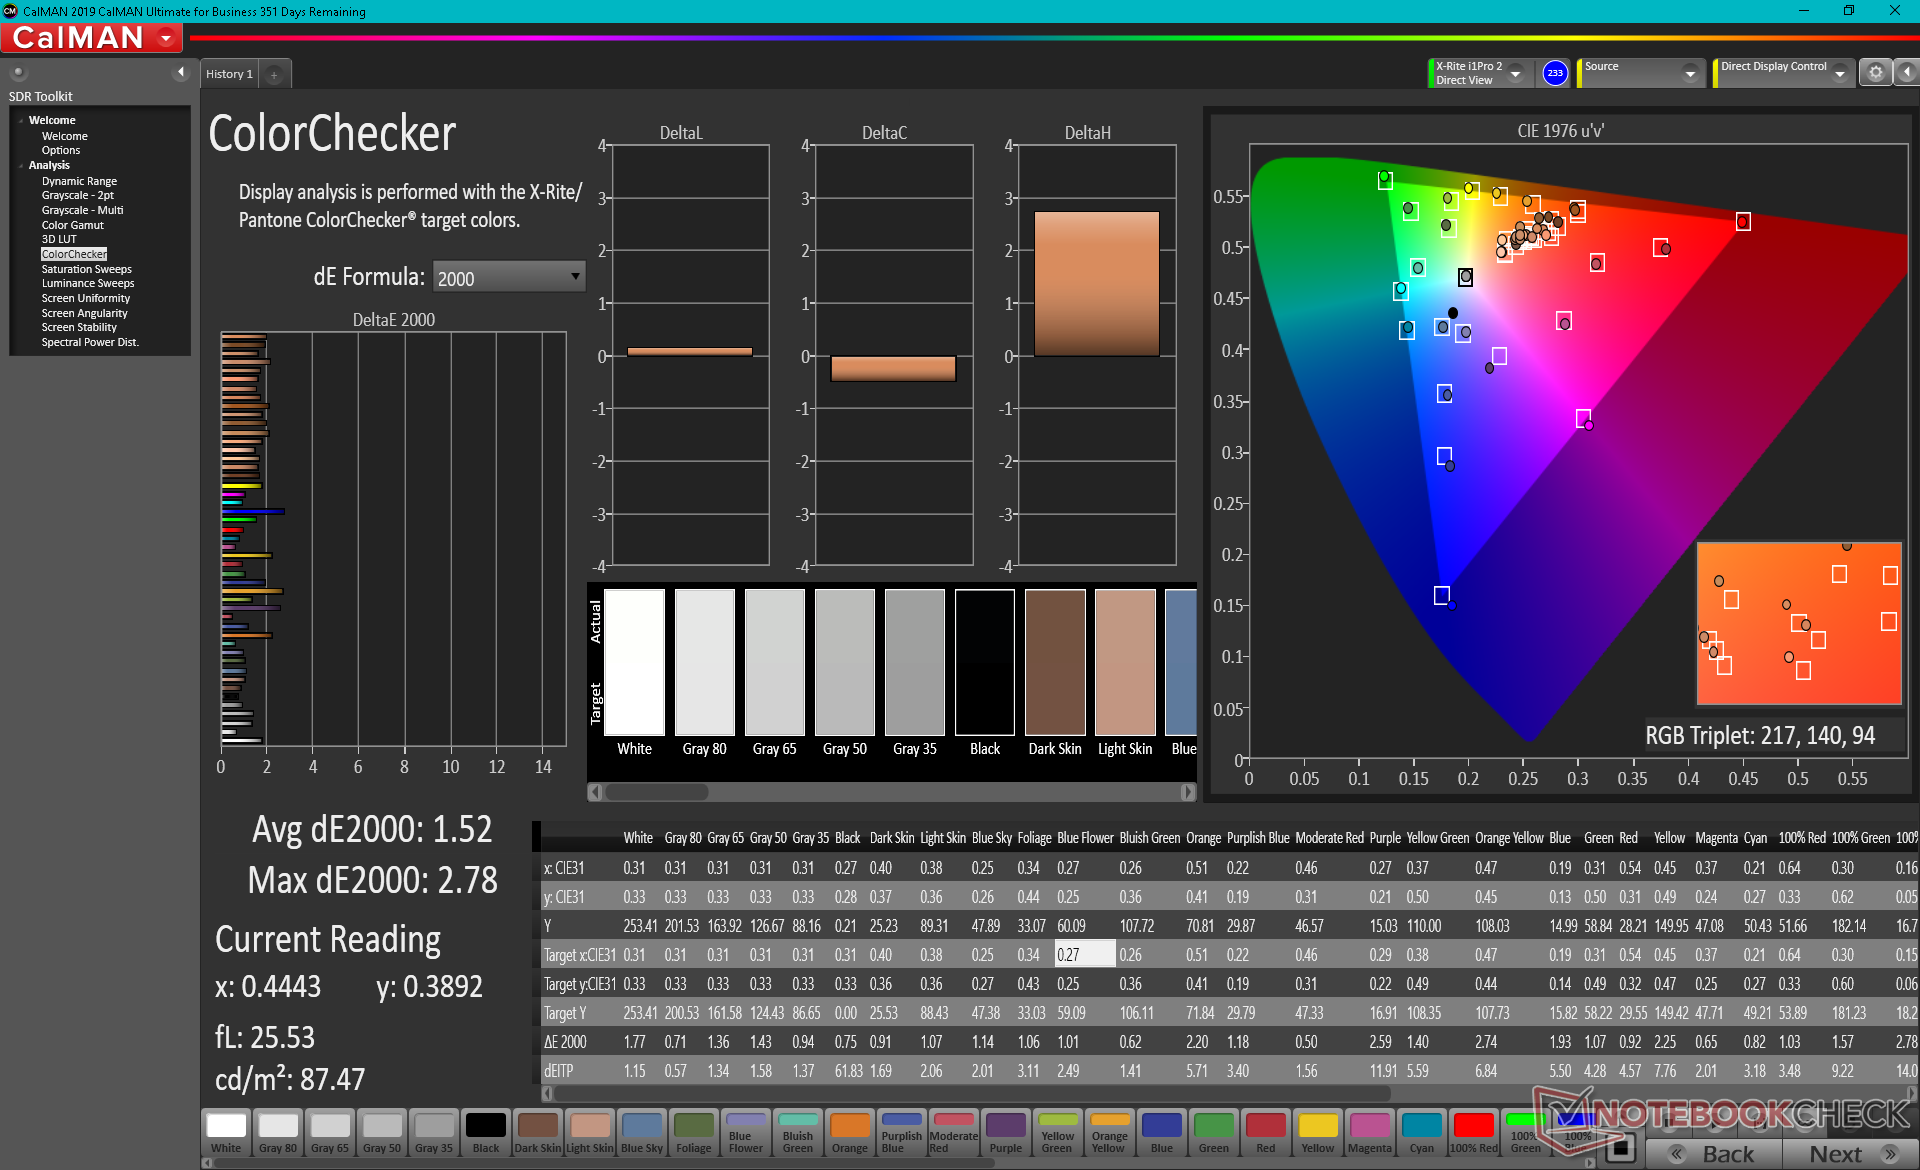
Grayscale and colors are not well calibrated out of the box which is to be expected for a laptop in this price range. Color temperature in particular is way too warm at 5810 with relatively high average grayscale and color DeltaE values of 5.3 and 3.75, respectively. We recommend an end-user calibration to get the most out of the display as colors improve noticeably as shown by our CalMan measurements below.
Display Response Times
| ↔ Response Time Black to White | ||
|---|---|---|
| 36 ms ... rise ↗ and fall ↘ combined | ↗ 22.8 ms rise | 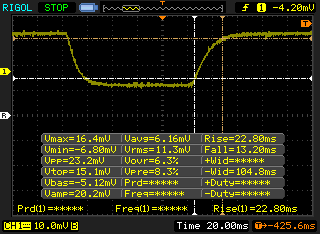 |
| ↘ 13.2 ms fall | ||
| The screen shows slow response rates in our tests and will be unsatisfactory for gamers. In comparison, all tested devices range from 0.1 (minimum) to 240 (maximum) ms. » 94 % of all devices are better. This means that the measured response time is worse than the average of all tested devices (19.8 ms). | ||
| ↔ Response Time 50% Grey to 80% Grey | ||
| 52.4 ms ... rise ↗ and fall ↘ combined | ↗ 29.2 ms rise | 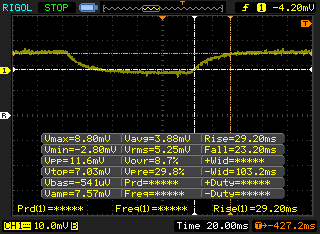 |
| ↘ 23.2 ms fall | ||
| The screen shows slow response rates in our tests and will be unsatisfactory for gamers. In comparison, all tested devices range from 0.165 (minimum) to 636 (maximum) ms. » 89 % of all devices are better. This means that the measured response time is worse than the average of all tested devices (31 ms). | ||
Screen Flickering / PWM (Pulse-Width Modulation)
| Screen flickering / PWM not detected |  | ||
In comparison: 52 % of all tested devices do not use PWM to dim the display. If PWM was detected, an average of 7747 (minimum: 5 - maximum: 343500) Hz was measured. | |||
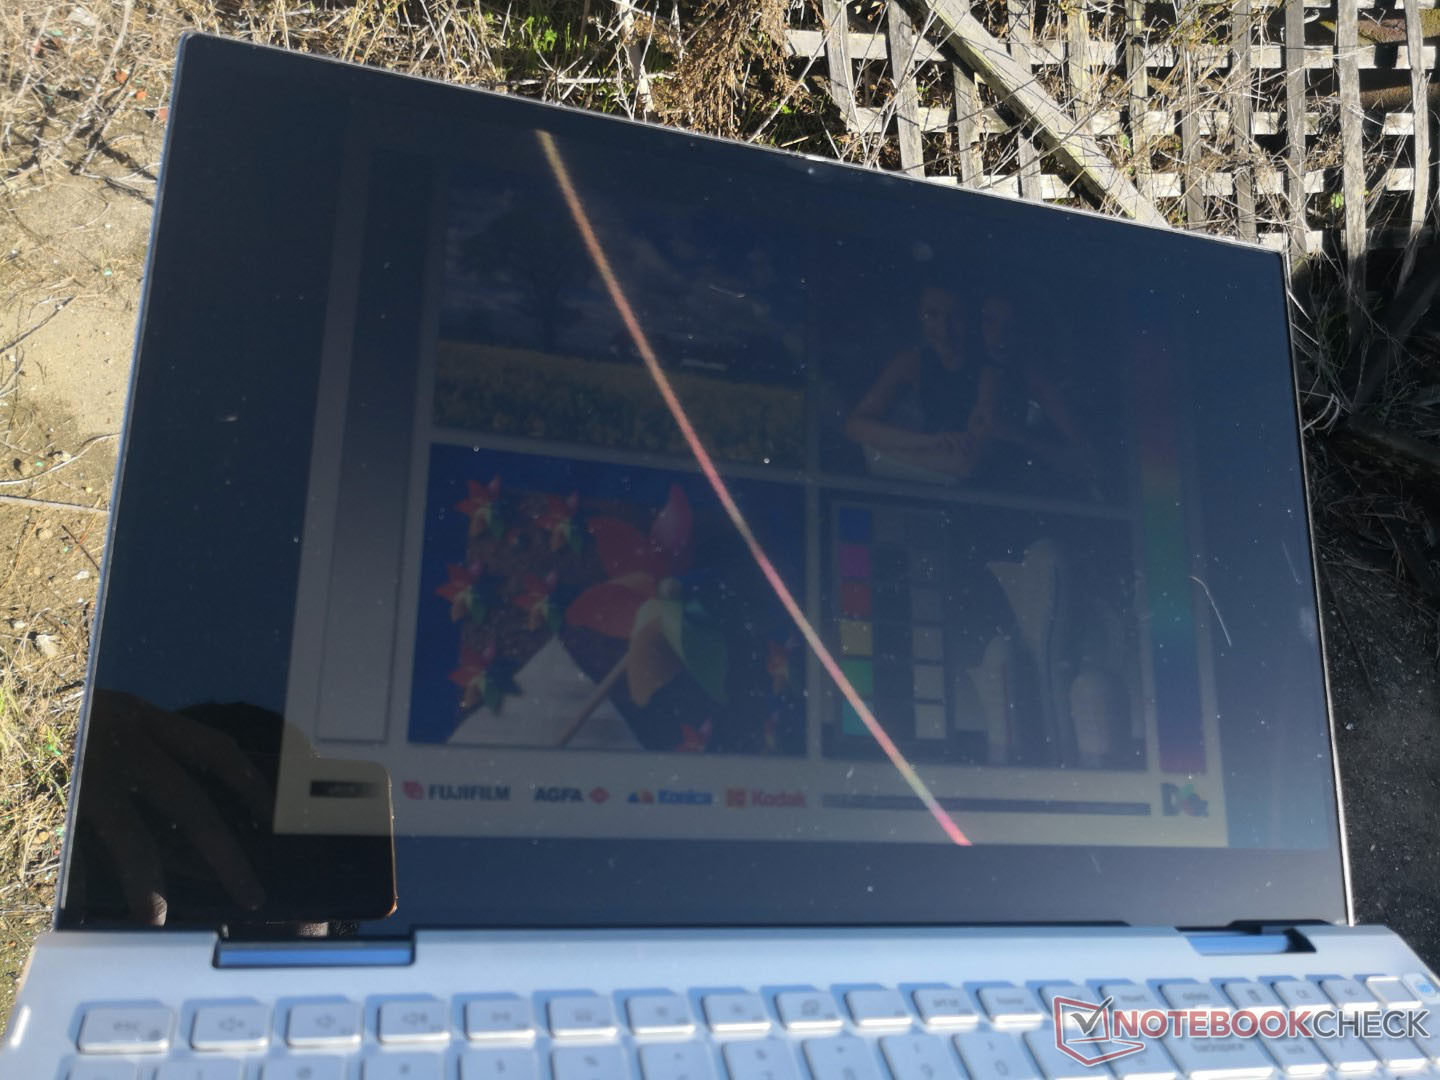
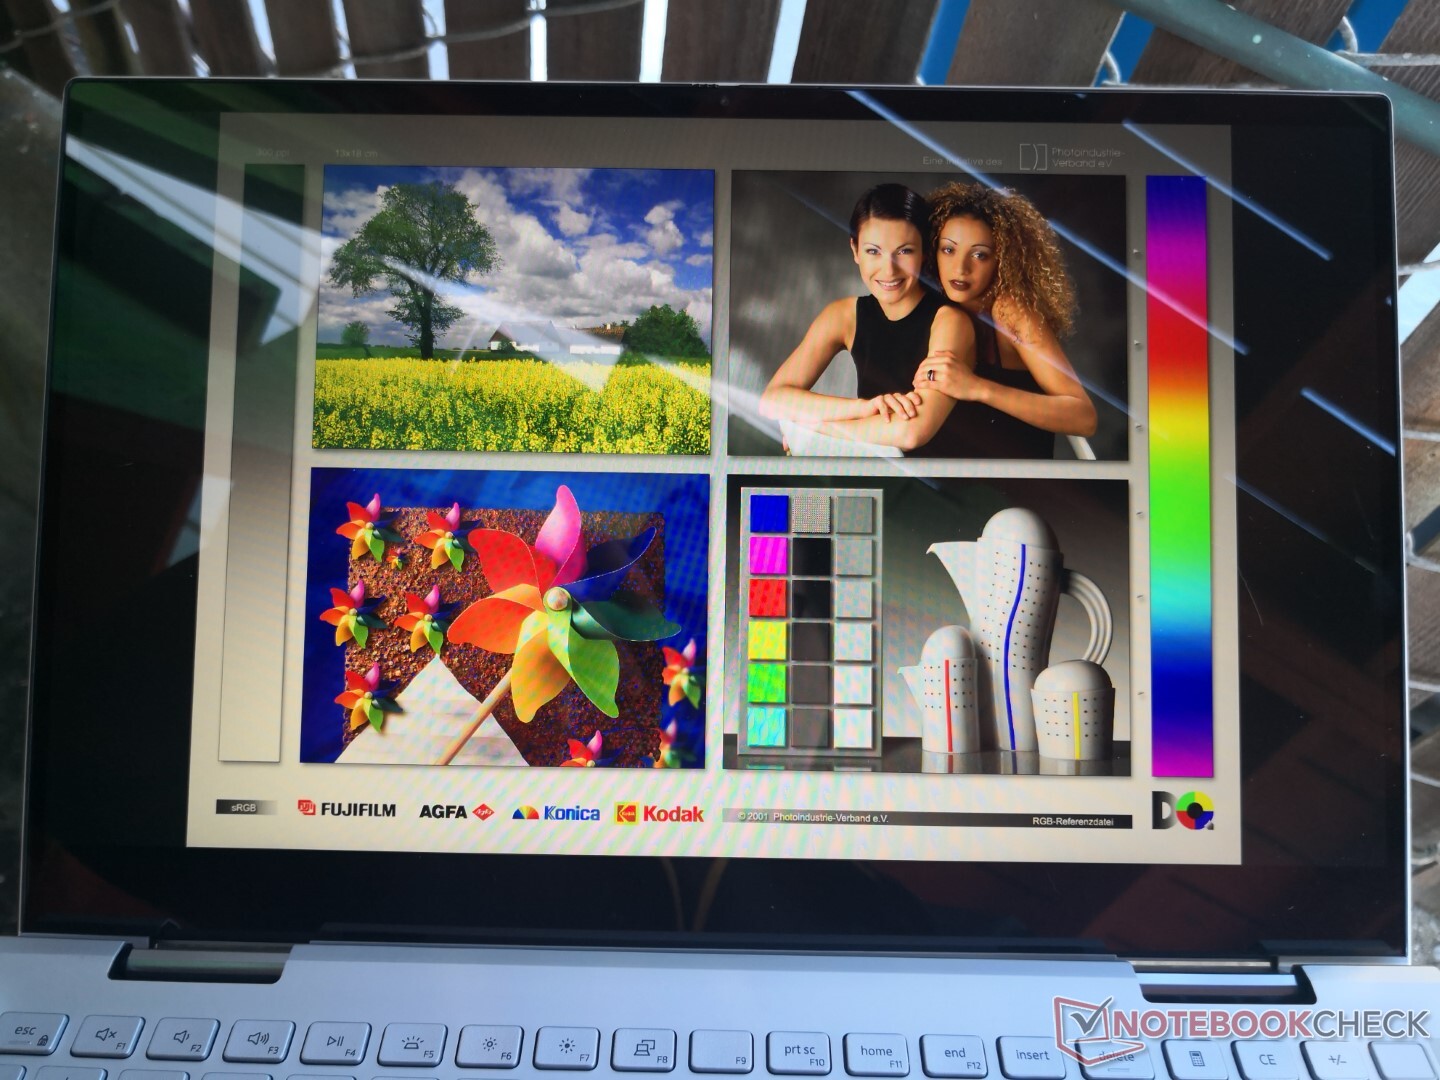
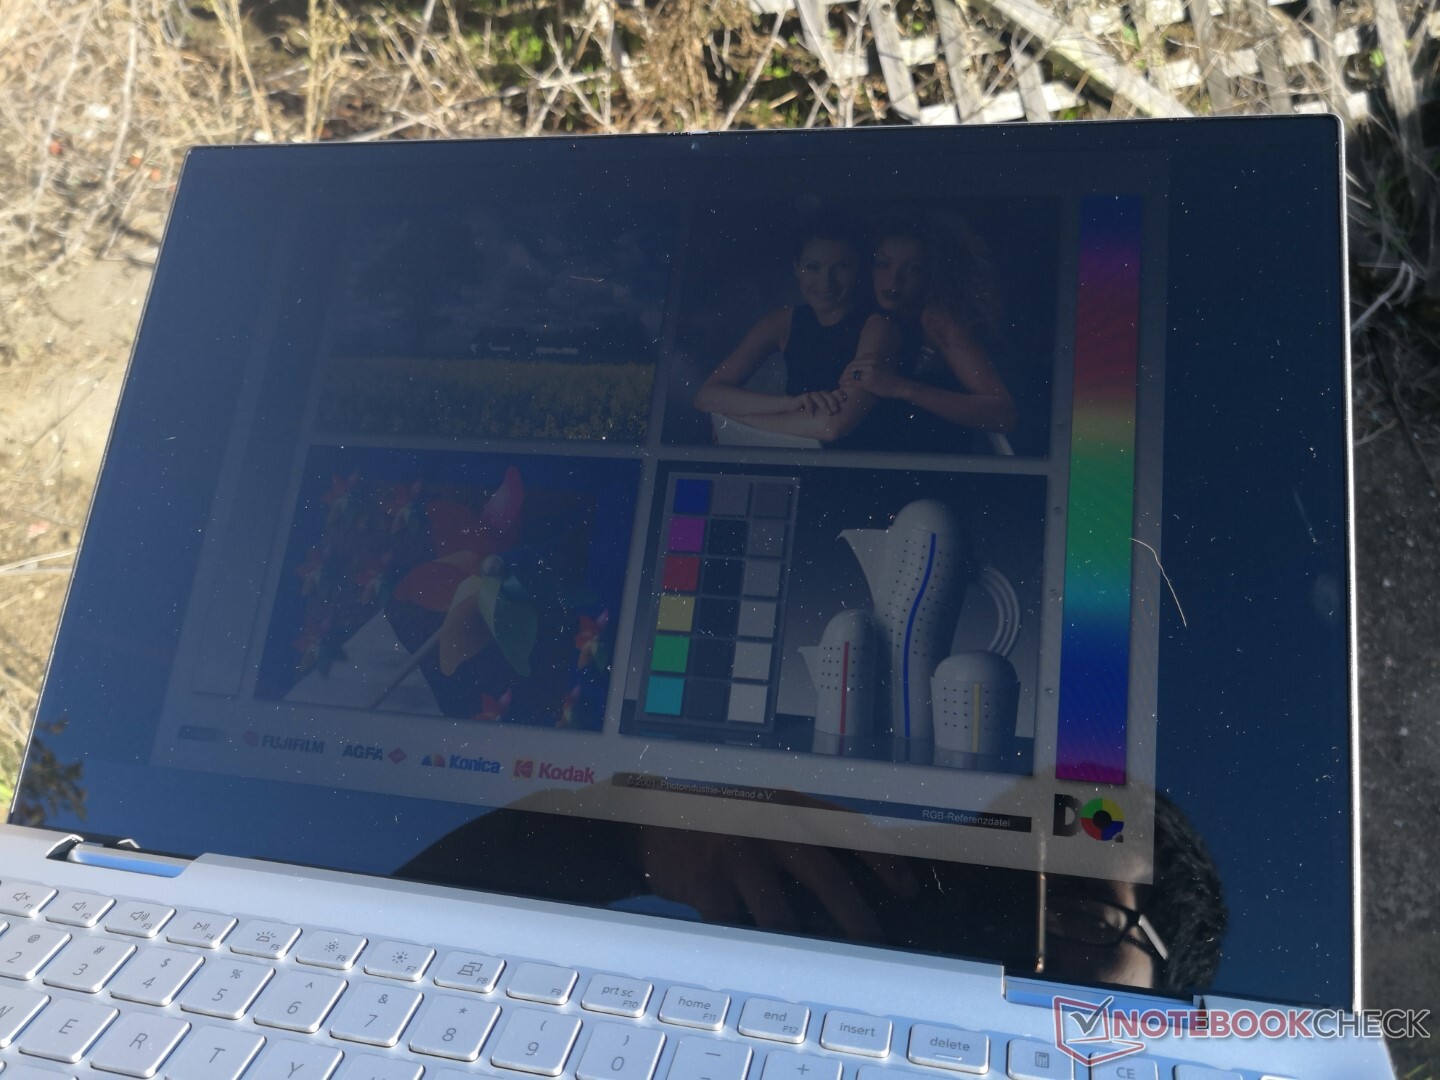
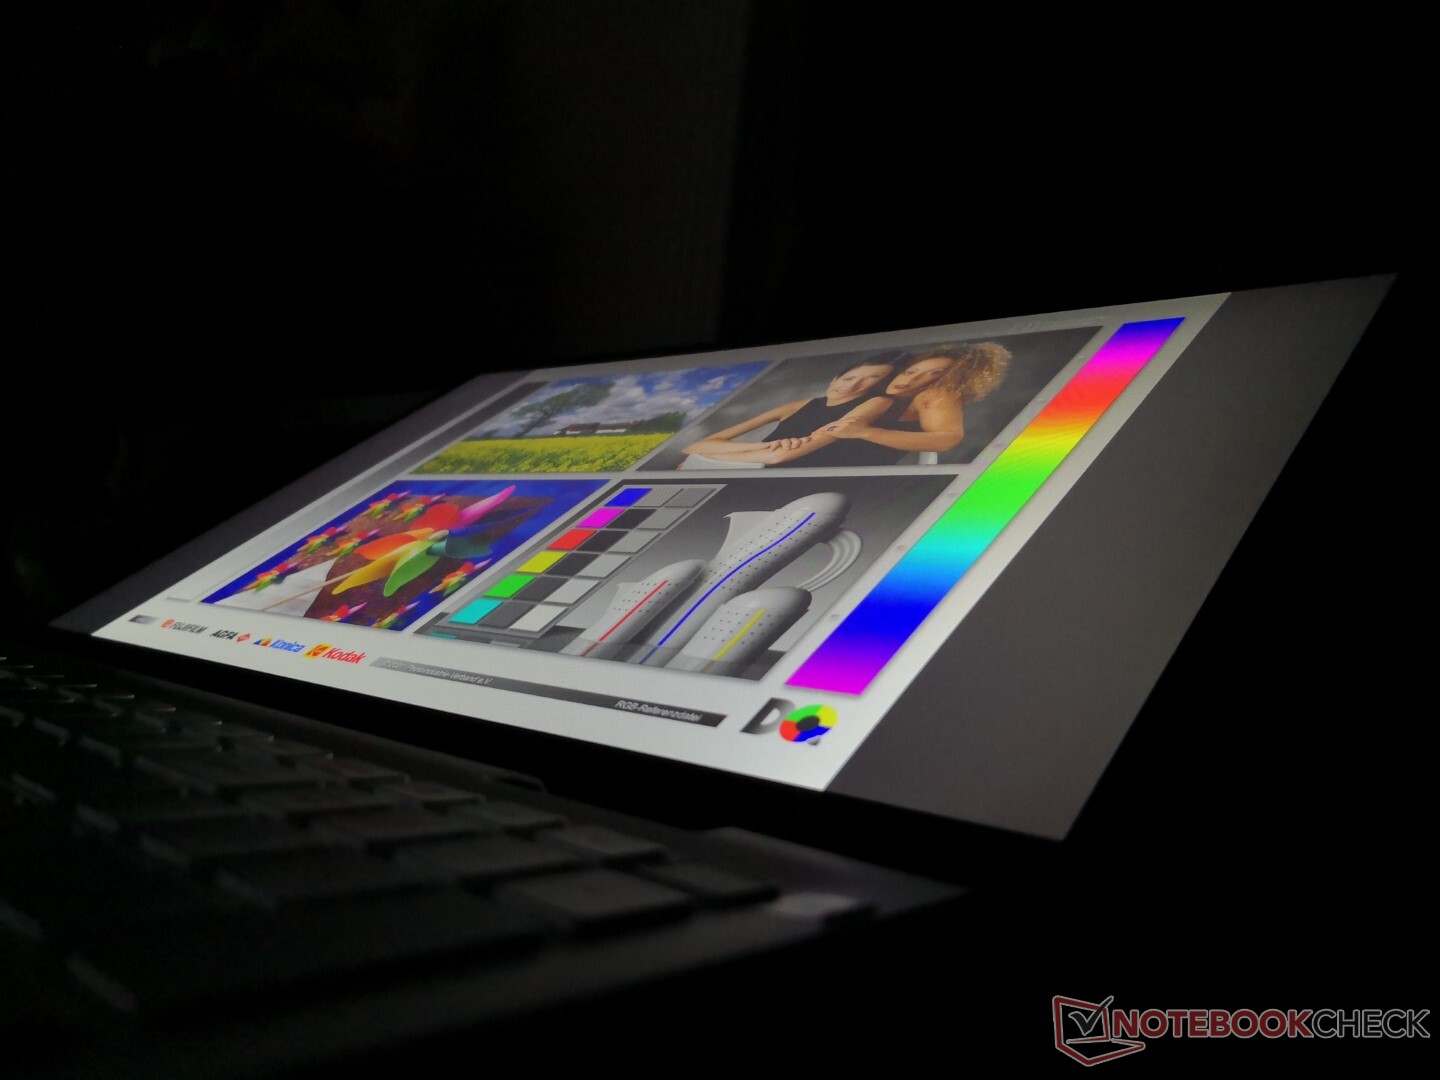
Outdoor visibility is worse than on the XPS 15 but otherwise similar to the HP Envy x360 15 or Lenovo Yoga C740. Colors appear washed out if under sunlight while glare is inevitable even if under shade. This is a convertible you'll mostly want to use indoors.
Performance
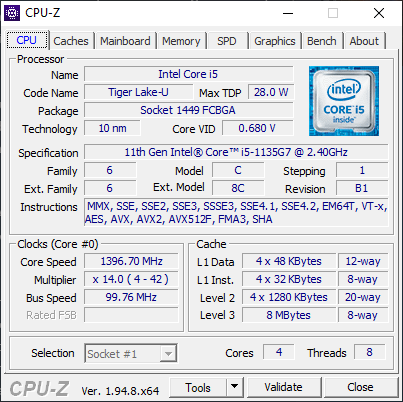
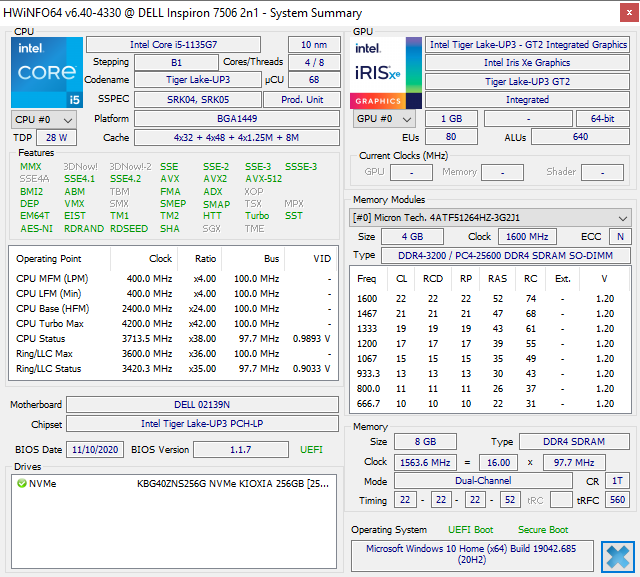
Processor options include either the 11th gen Core i5-1135G7 or Core i7-1165G7 to replace the older 10th gen Core i5-1035G7 and i7-1065G7, respectively. There are no i7-1185G7 or AMD Ryzen options at the moment. Upgrading to the Black Edition grants the optional Iris Xe Max for extra graphics horsepower.
We set our system to Ultra Performance mode via the Dell Power Manager software prior to running all performance benchmarks below. Users should become familiar with the software since it includes options not found on the standard Windows power profile menu.
Processor
Multi-thread performance is about 10 percent faster than the average Core i5-1135G7 laptop in our database. In fact, the system has better performance sustainability than some laptops with the pricier Core i7-1165G7 CPU like the Asus VivoBook S15 S533EQ. Users can expect up to 30 percent faster multi-thread CPU performance or 8 percent faster single-thread performance over the Core i7-8565U in the 2018 Inspiron 7000 2-in-1.
The competing Ryzen 5 4500U is able to outperform our Core i5-1135G7 just slightly in multi-thread benchmarks while falling behind in single-thread benchmarks.
Cinebench R15: CPU Multi 64Bit | CPU Single 64Bit
Blender: v2.79 BMW27 CPU
7-Zip 18.03: 7z b 4 -mmt1 | 7z b 4
Geekbench 5.5: Single-Core | Multi-Core
HWBOT x265 Benchmark v2.2: 4k Preset
LibreOffice : 20 Documents To PDF
R Benchmark 2.5: Overall mean
| Blender / v2.79 BMW27 CPU | |
| HP Envy x360 15-ee0257ng | |
| HP Envy x360 15-dr1679cl | |
| Samsung Galaxy Book Flex 15-NP950 | |
| Average Intel Core i5-1135G7 (499 - 1044, n=60) | |
| Lenovo IdeaPad 5 15IIL05 | |
| Dell Inspiron 15 7506 2-in-1 P97F | |
| HP ProBook 455 G7-175W8EA | |
| Schenker Vision 15 | |
| 7-Zip 18.03 / 7z b 4 -mmt1 | |
| Schenker Vision 15 | |
| Dell Inspiron 15 7506 2-in-1 P97F | |
| Average Intel Core i5-1135G7 (3924 - 4921, n=62) | |
| HP Envy x360 15-dr1679cl | |
| Samsung Galaxy Book Flex 15-NP950 | |
| HP Envy x360 15-ee0257ng | |
| Lenovo IdeaPad 5 15IIL05 | |
| HP ProBook 455 G7-175W8EA | |
| 7-Zip 18.03 / 7z b 4 | |
| HP ProBook 455 G7-175W8EA | |
| Schenker Vision 15 | |
| HP Envy x360 15-ee0257ng | |
| Dell Inspiron 15 7506 2-in-1 P97F | |
| Samsung Galaxy Book Flex 15-NP950 | |
| Average Intel Core i5-1135G7 (14745 - 24873, n=62) | |
| Lenovo IdeaPad 5 15IIL05 | |
| HP Envy x360 15-dr1679cl | |
| Geekbench 5.5 / Single-Core | |
| Schenker Vision 15 | |
| Dell Inspiron 15 7506 2-in-1 P97F | |
| Average Intel Core i5-1135G7 (1147 - 1428, n=58) | |
| Samsung Galaxy Book Flex 15-NP950 | |
| Lenovo IdeaPad 5 15IIL05 | |
| HP ProBook 455 G7-175W8EA | |
| HP Envy x360 15-ee0257ng | |
| HP Envy x360 15-dr1679cl | |
| Geekbench 5.5 / Multi-Core | |
| Schenker Vision 15 | |
| HP Envy x360 15-ee0257ng | |
| HP ProBook 455 G7-175W8EA | |
| Samsung Galaxy Book Flex 15-NP950 | |
| Average Intel Core i5-1135G7 (3475 - 5472, n=58) | |
| Dell Inspiron 15 7506 2-in-1 P97F | |
| Lenovo IdeaPad 5 15IIL05 | |
| HP Envy x360 15-dr1679cl | |
| HWBOT x265 Benchmark v2.2 / 4k Preset | |
| Schenker Vision 15 | |
| Dell Inspiron 15 7506 2-in-1 P97F | |
| HP ProBook 455 G7-175W8EA | |
| Lenovo IdeaPad 5 15IIL05 | |
| Average Intel Core i5-1135G7 (3.57 - 7.6, n=57) | |
| Samsung Galaxy Book Flex 15-NP950 | |
| HP Envy x360 15-ee0257ng | |
| HP Envy x360 15-dr1679cl | |
| LibreOffice / 20 Documents To PDF | |
| HP ProBook 455 G7-175W8EA | |
| HP Envy x360 15-ee0257ng | |
| HP Envy x360 15-dr1679cl | |
| Samsung Galaxy Book Flex 15-NP950 | |
| Lenovo IdeaPad 5 15IIL05 | |
| Average Intel Core i5-1135G7 (44.2 - 62.9, n=60) | |
| Dell Inspiron 15 7506 2-in-1 P97F | |
| Schenker Vision 15 | |
| R Benchmark 2.5 / Overall mean | |
| HP Envy x360 15-dr1679cl | |
| Lenovo IdeaPad 5 15IIL05 | |
| Samsung Galaxy Book Flex 15-NP950 | |
| HP ProBook 455 G7-175W8EA | |
| Average Intel Core i5-1135G7 (0.619 - 0.727, n=59) | |
| Dell Inspiron 15 7506 2-in-1 P97F | |
| HP Envy x360 15-ee0257ng | |
| Schenker Vision 15 | |
* ... smaller is better
System Performance
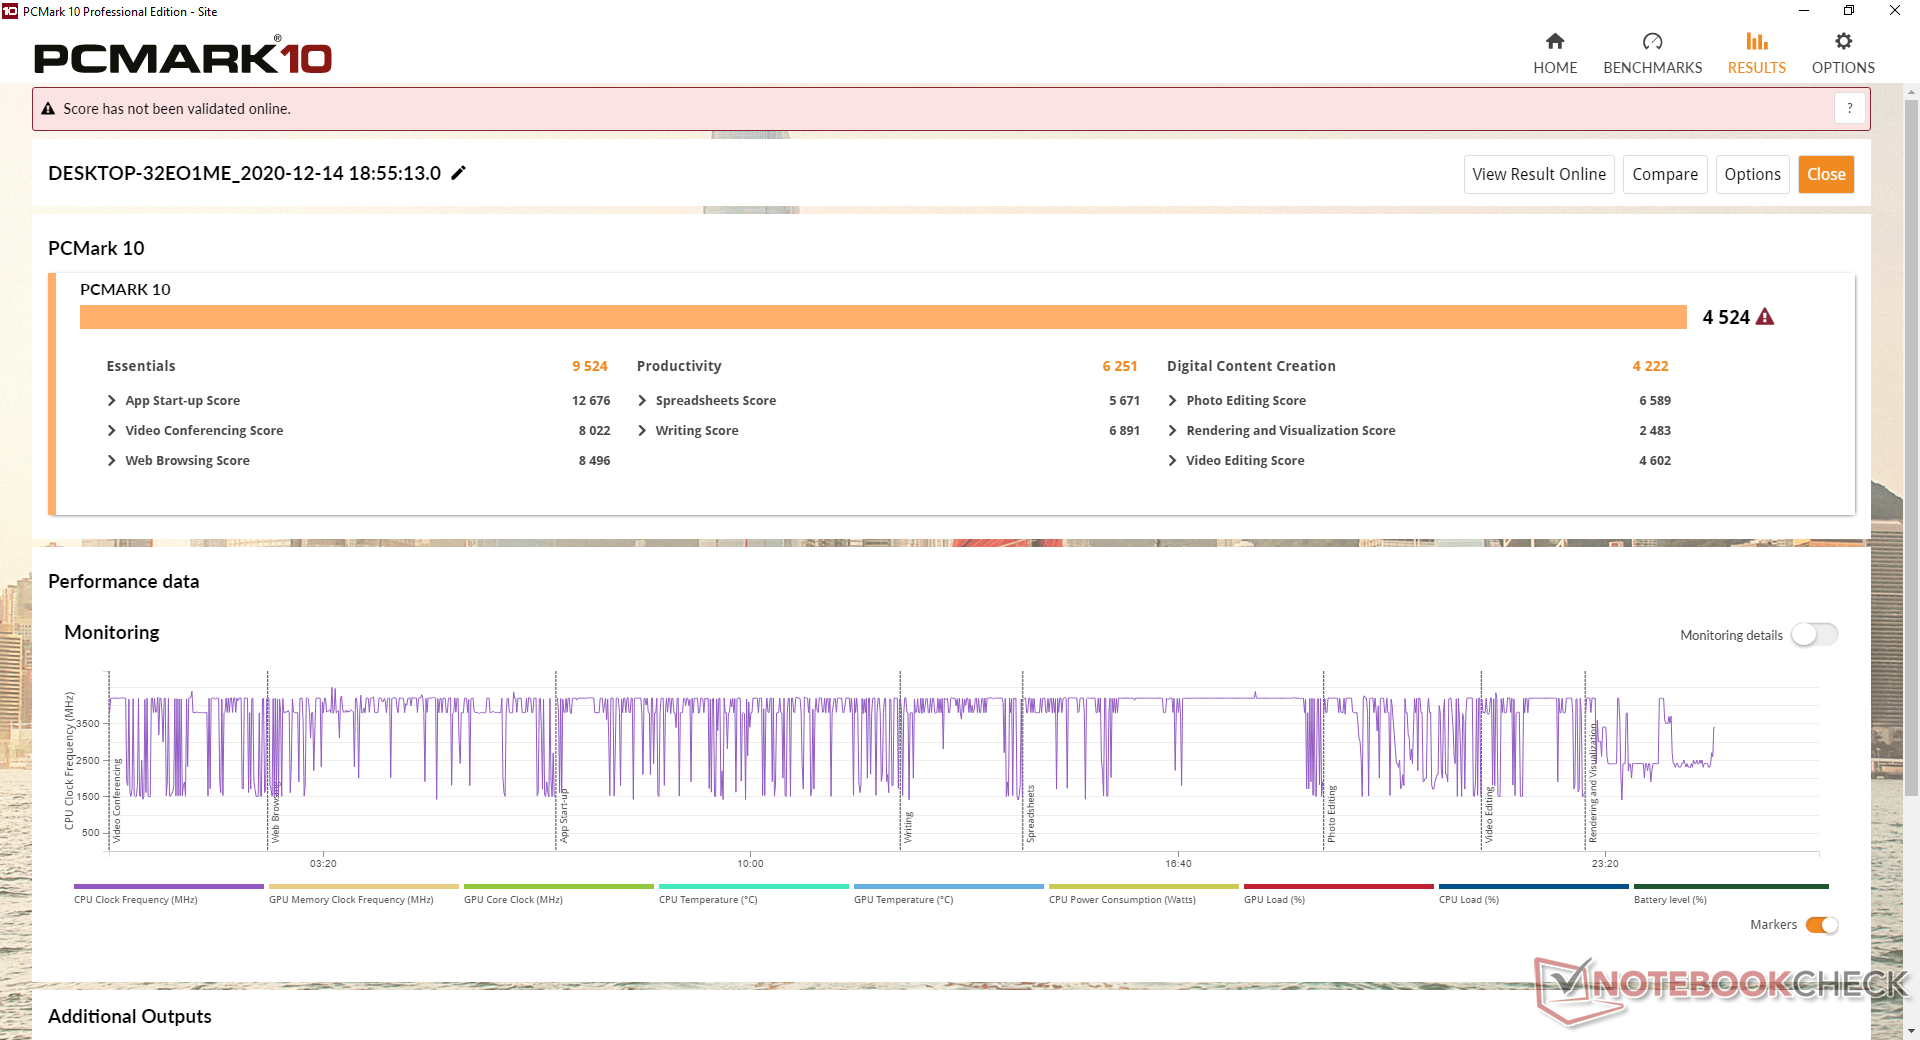
PCMark benchmarks are consistently higher than the 2018 model especially in Digital Content Creation and Essentials. When compared to other laptops in our database with the same Core i5-1135G7 CPU, results are almost exactly where we expect them to be. We experienced no software or hardware issues during our time with the unit.
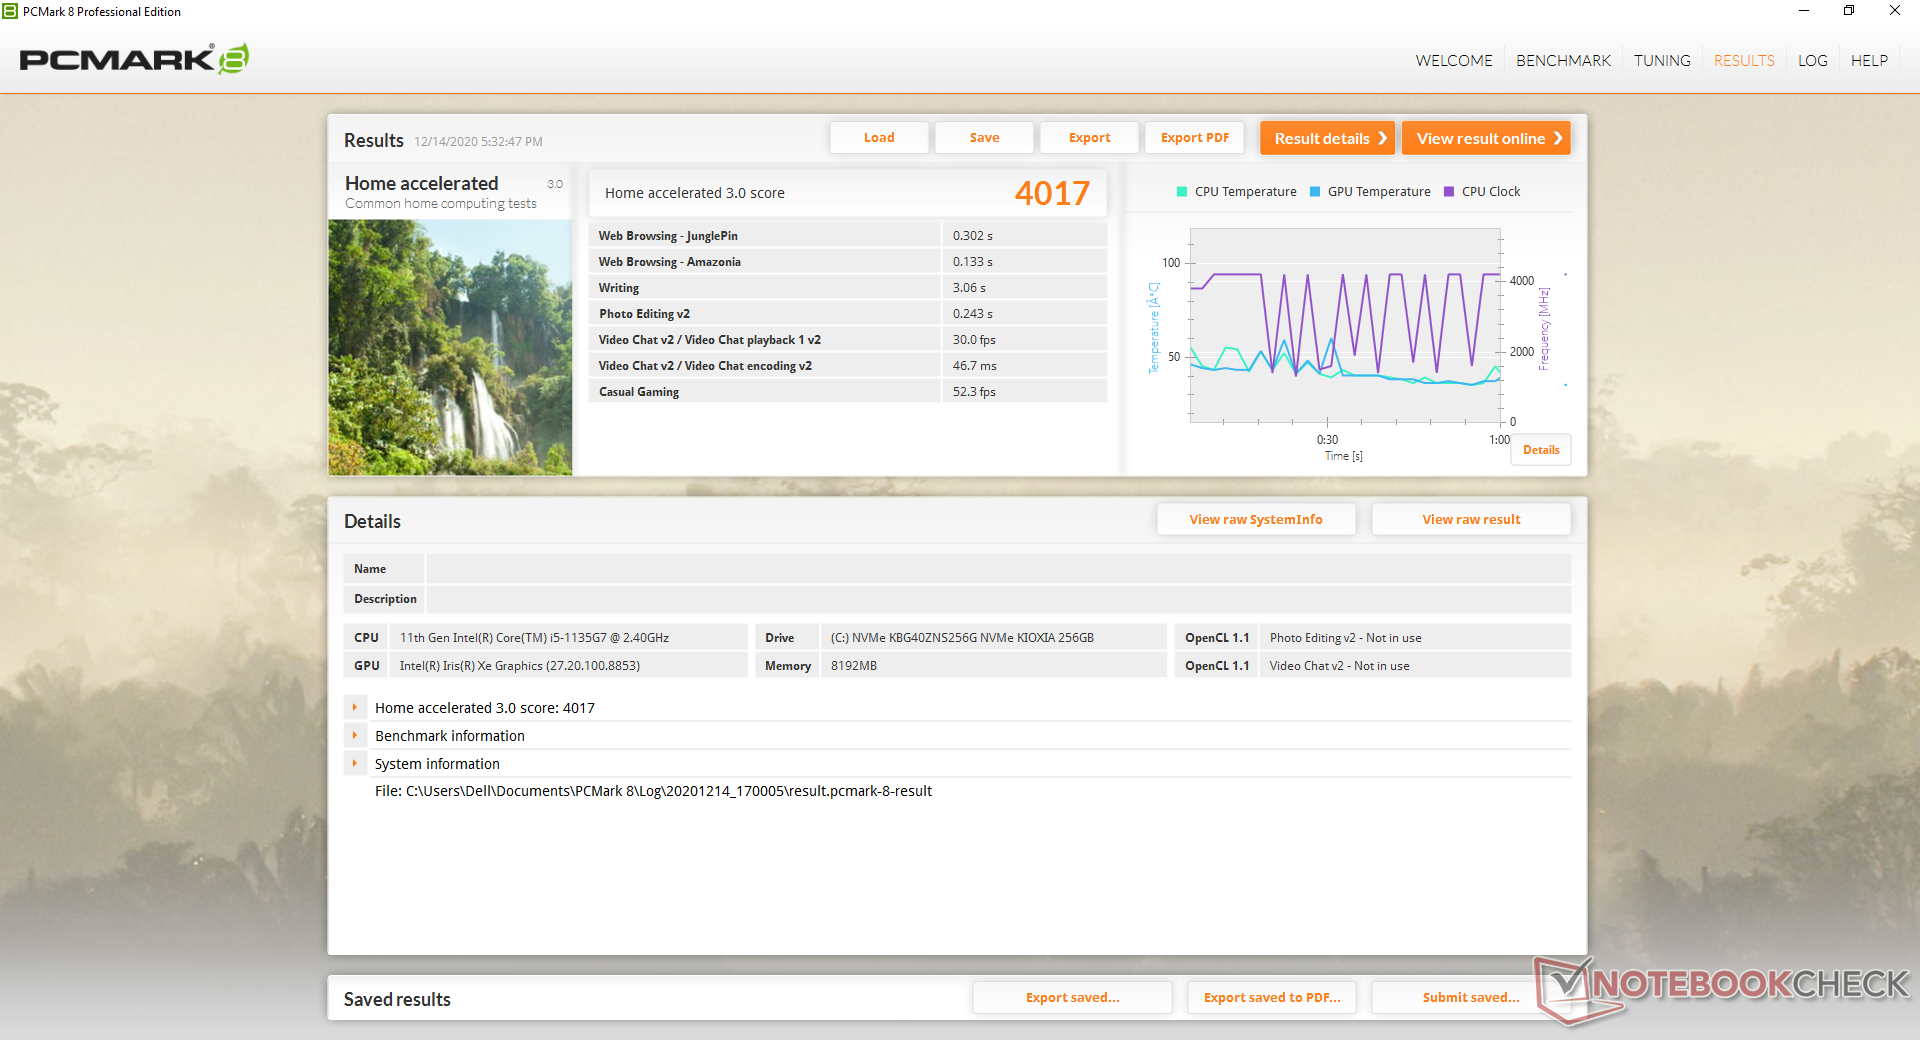
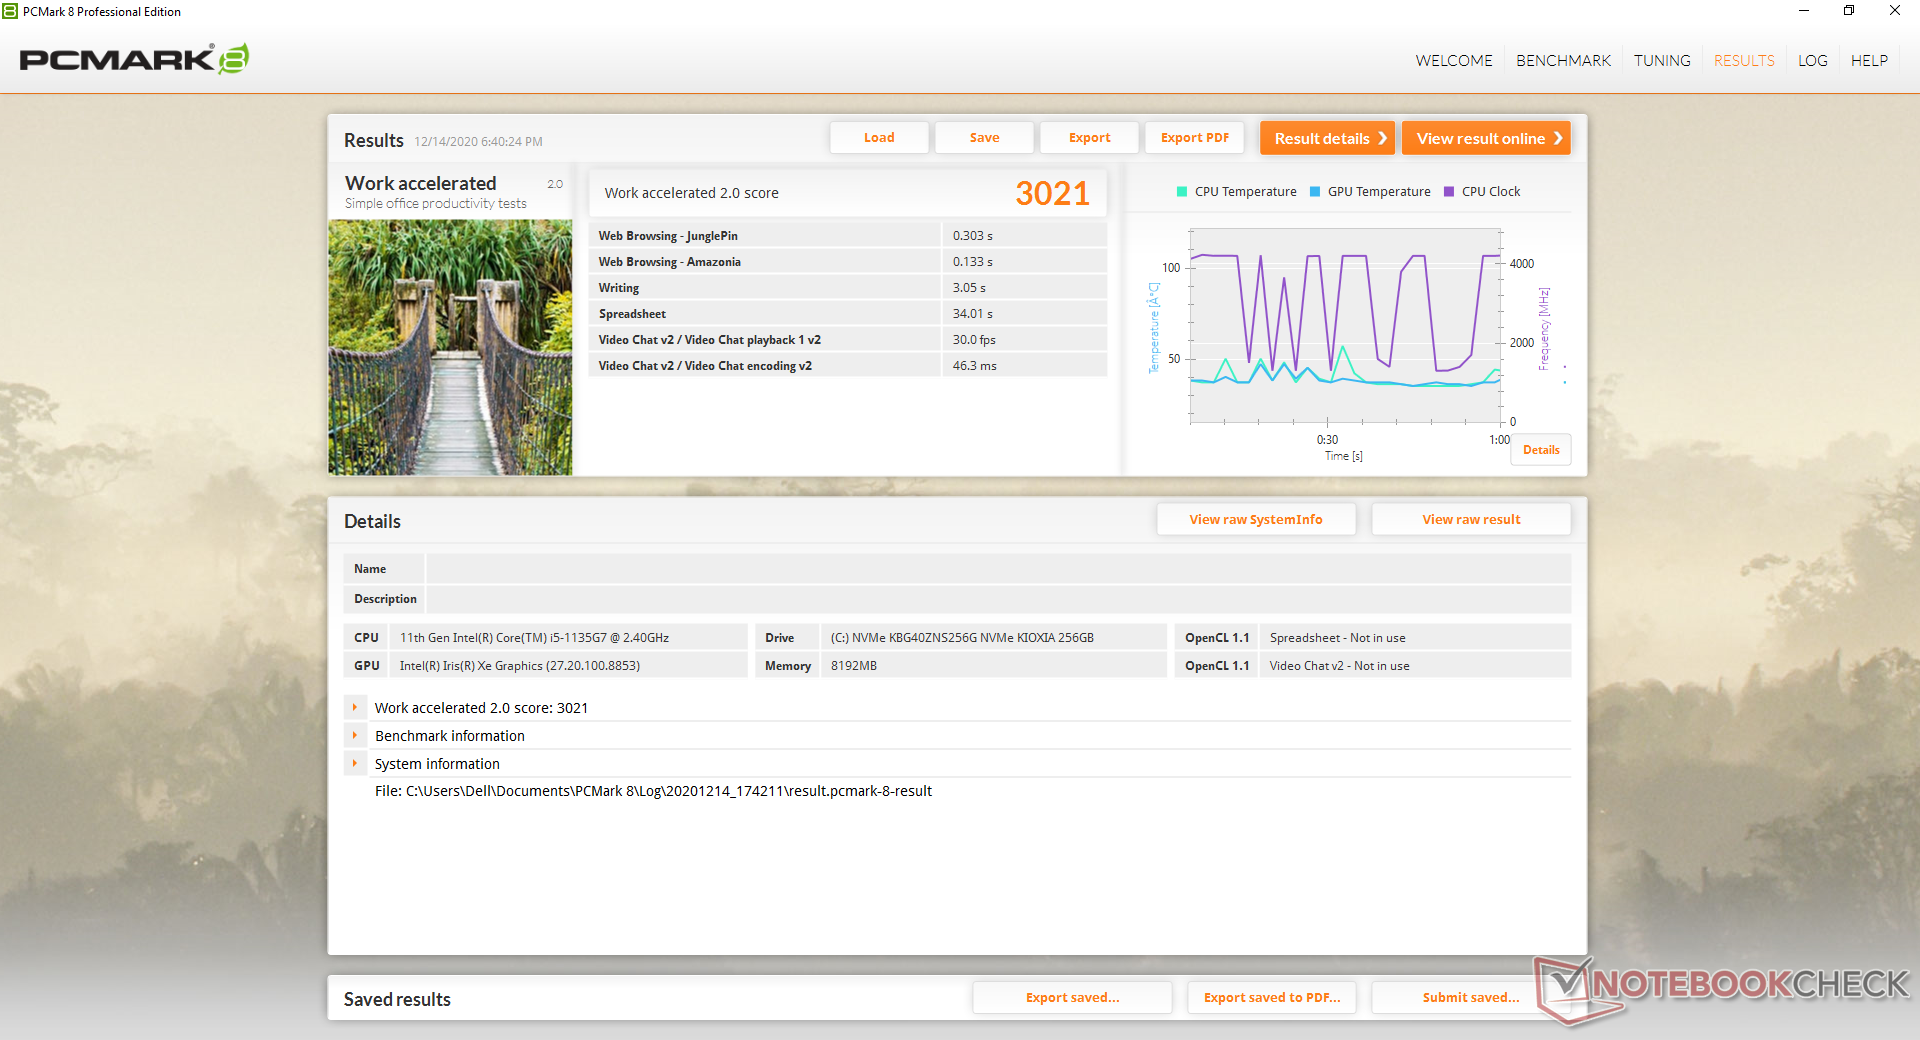
| PCMark 8 Home Score Accelerated v2 | 4017 points | |
| PCMark 8 Work Score Accelerated v2 | 3021 points | |
| PCMark 10 Score | 4524 points | |
Help | ||
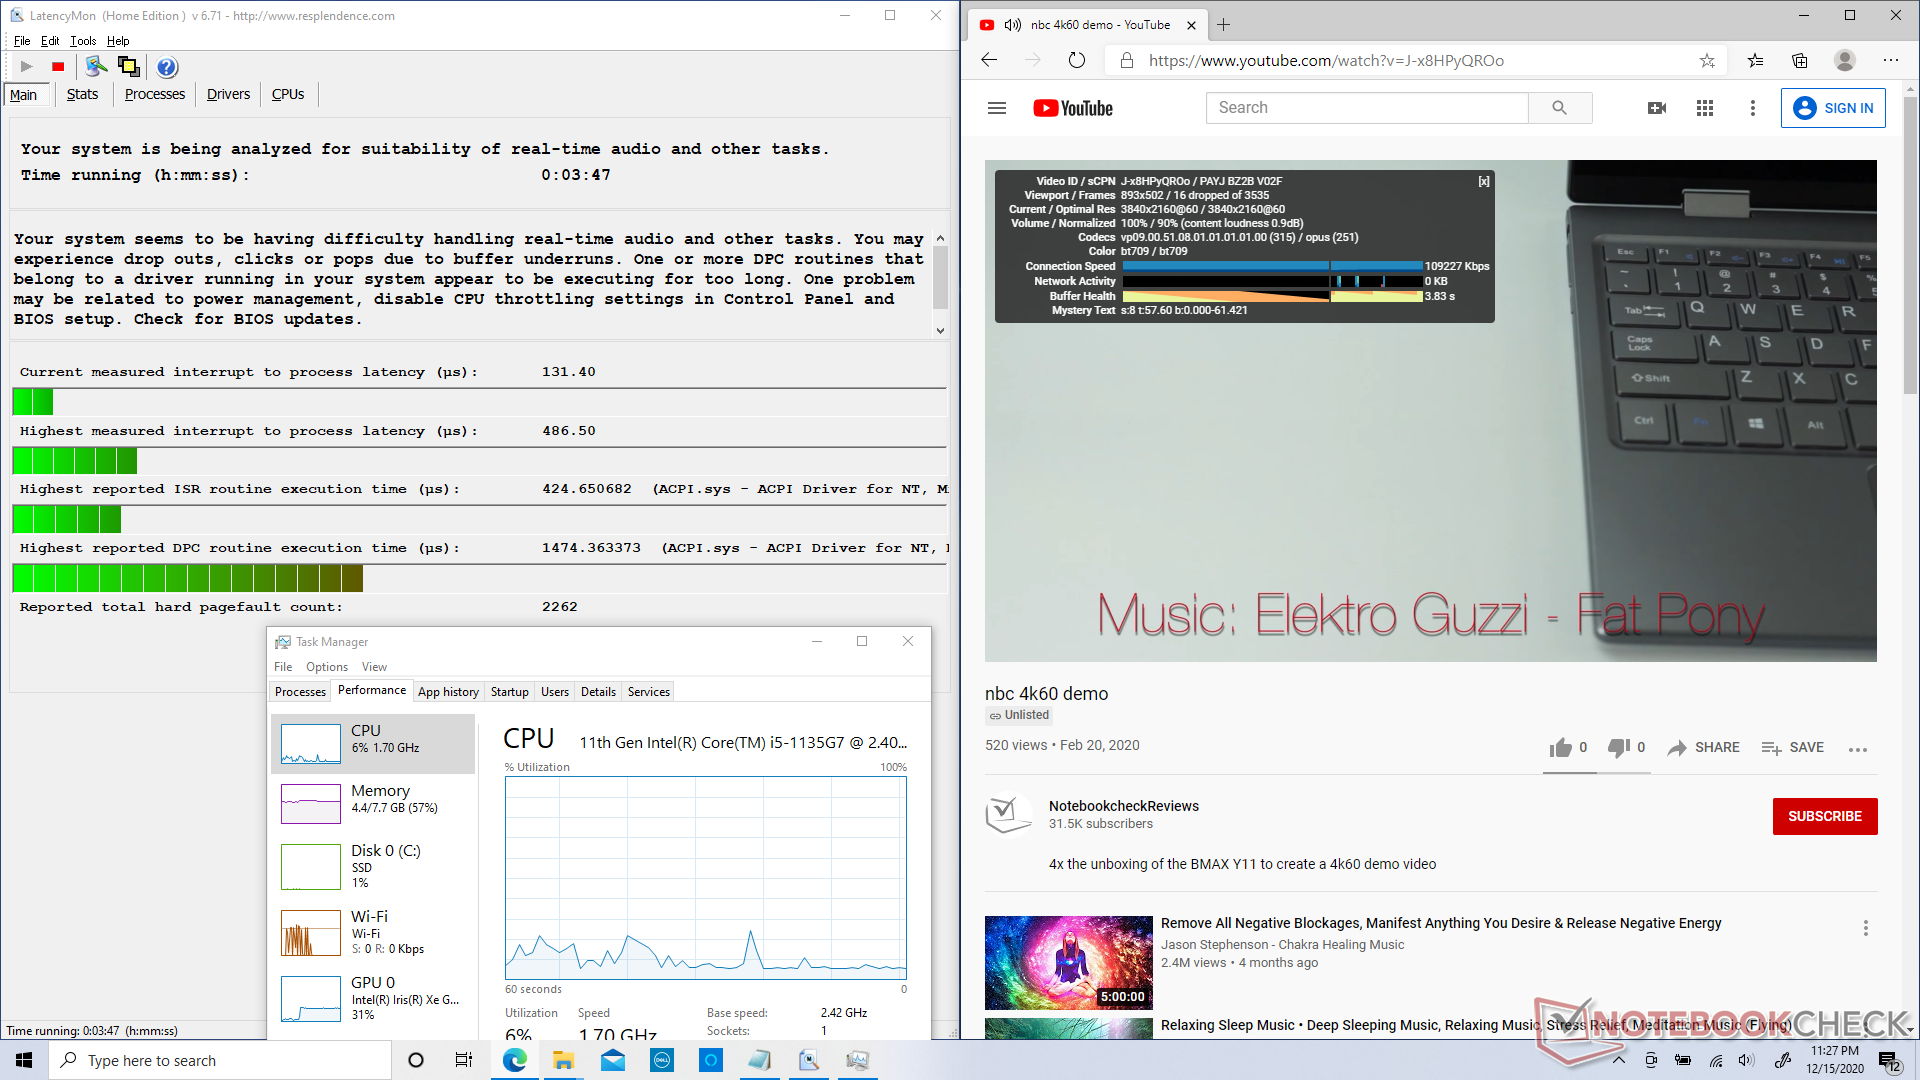
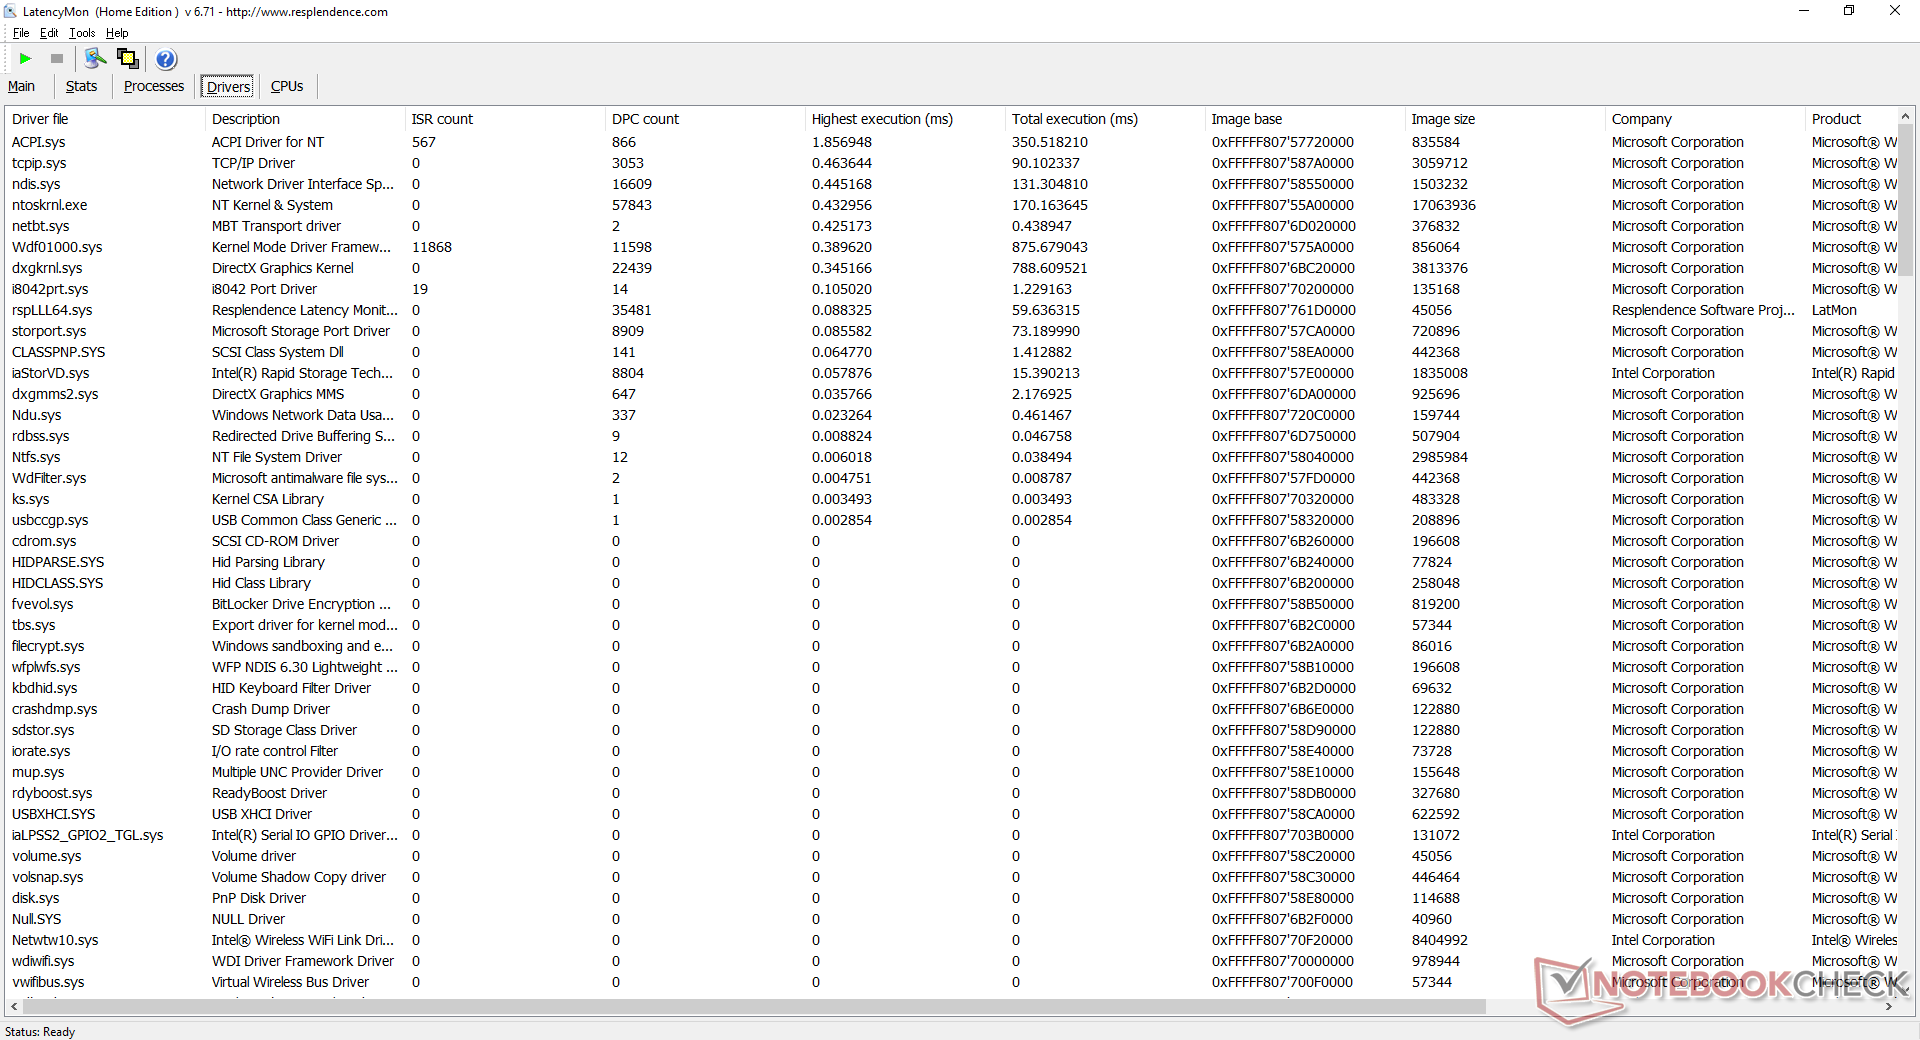
DPC Latency
LatencyMon shows DPC latency issues related to ACPI.sys when opening multiple browser tabs on our homepage. 4K UHD video playback at 60 FPS is otherwise smooth albeit imperfect with 16 dropped frames during our minute-long test.
| DPC Latencies / LatencyMon - interrupt to process latency (max), Web, Youtube, Prime95 | |
| Schenker Vision 15 | |
| HP Envy x360 15-dr1679cl | |
| Dell Inspiron 15 7506 2-in-1 P97F | |
| Lenovo Yoga 9i 14ITL5 | |
| HP ProBook 455 G7-175W8EA | |
| Lenovo IdeaPad 5 15IIL05 | |
| Samsung Galaxy Book Flex 15-NP950 | |
| HP Envy x360 15-ee0257ng | |
* ... smaller is better
Storage Devices
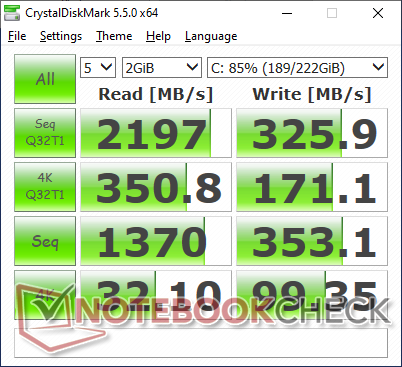
Our unit comes with a Toshiba BG4 NVMe SSD as opposed to the BG3 NVMe SSD on our 2018 Inspiron 7000 2-in-1. Transfer rates are slightly faster overall even though sequential write rates are still slow at just 350 MB/s. The XPS 15 9500 comes with this same Toshiba SSD but is able to run it much faster.
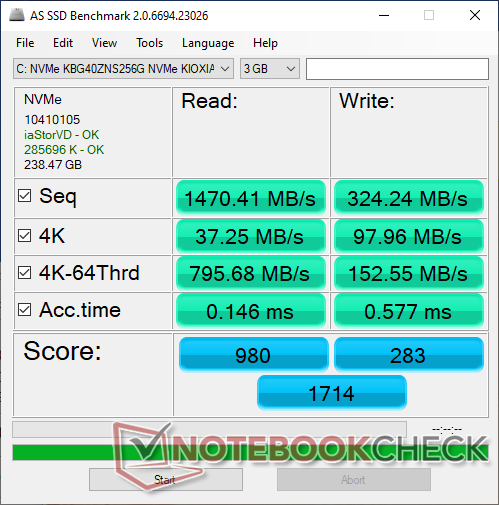
| Dell Inspiron 15 7506 2-in-1 P97F Toshiba KBG40ZNS256G NVMe | Asus ZenBook Flip 15 UX563FD-A1027T Samsung SSD PM981 MZVLB1T0HALR | Dell Inspiron 15 7000 2-in-1 Black Edition Toshiba BG3 KBG30ZMS256G | HP Envy x360 15-ee0257ng Intel SSD 660p SSDPEKNW512G8 | Lenovo Yoga C740-15IML Samsung SSD PM981 MZVLB512HAJQ | Dell XPS 15 9500 Core i5 Toshiba KBG40ZNS256G NVMe | |
|---|---|---|---|---|---|---|
| AS SSD | 217% | -32% | 104% | 250% | 62% | |
| Seq Read (MB/s) | 1470 | 2739 86% | 1123 -24% | 1587 8% | 2732 86% | 1423 -3% |
| Seq Write (MB/s) | 324.2 | 1307 303% | 208.9 -36% | 864 167% | 1477 356% | 766 136% |
| 4K Read (MB/s) | 37.25 | 47.43 27% | 27.36 -27% | 51.6 39% | 57.7 55% | 42.21 13% |
| 4K Write (MB/s) | 98 | 126 29% | 65 -34% | 125.1 28% | 136.3 39% | 74.8 -24% |
| 4K-64 Read (MB/s) | 796 | 1013 27% | 313.2 -61% | 323.1 -59% | 1021 28% | 973 22% |
| 4K-64 Write (MB/s) | 152.6 | 1371 798% | 111.2 -27% | 724 374% | 1651 982% | 218.8 43% |
| Access Time Read * (ms) | 0.146 | 0.082 44% | 0.684 -368% | 0.101 31% | 0.062 58% | 0.125 14% |
| Access Time Write * (ms) | 0.577 | 0.029 95% | 0.344 40% | 0.046 92% | 0.028 95% | 0.552 4% |
| Score Read (Points) | 980 | 1335 36% | 453 -54% | 533 -46% | 1352 38% | 1157 18% |
| Score Write (Points) | 283 | 1628 475% | 197 -30% | 935 230% | 1935 584% | 370 31% |
| Score Total (Points) | 1714 | 3582 109% | 844 -51% | 1725 1% | 3929 129% | 2094 22% |
| Copy ISO MB/s (MB/s) | 353.5 | 1931 446% | 927 162% | 1323 274% | 1972 458% | 1151 226% |
| Copy Program MB/s (MB/s) | 194.1 | 457.9 136% | 206.4 6% | 340.8 76% | 642 231% | 499.4 157% |
| Copy Game MB/s (MB/s) | 239 | 1242 420% | 360.4 51% | 823 244% | 1090 356% | 733 207% |
| CrystalDiskMark 5.2 / 6 | 181% | -24% | 69% | 221% | 79% | |
| Write 4K (MB/s) | 99.3 | 137.8 39% | 83.4 -16% | 104.5 5% | 142.3 43% | 93.3 -6% |
| Read 4K (MB/s) | 32.1 | 44.15 38% | 32.22 0% | 49.7 55% | 47.56 48% | 45.9 43% |
| Write Seq (MB/s) | 353.1 | 2073 487% | 171.7 -51% | 981 178% | 2185 519% | 1211 243% |
| Read Seq (MB/s) | 1370 | 2165 58% | 924 -33% | 1517 11% | 2235 63% | 1633 19% |
| Write 4K Q32T1 (MB/s) | 171.1 | 431.9 152% | 161.5 -6% | 398.8 133% | 515 201% | 273.1 60% |
| Read 4K Q32T1 (MB/s) | 350.8 | 427.7 22% | 301.1 -14% | 338.4 -4% | 413.4 18% | 356 1% |
| Write Seq Q32T1 (MB/s) | 325.9 | 2253 591% | 222.3 -32% | 982 201% | 2981 815% | 1198 268% |
| Read Seq Q32T1 (MB/s) | 2197 | 3480 58% | 1300 -41% | 1650 -25% | 3565 62% | 2269 3% |
| Total Average (Program / Settings) | 199% /
203% | -28% /
-29% | 87% /
92% | 236% /
239% | 71% /
68% |
* ... smaller is better

Disk Throttling: DiskSpd Read Loop, Queue Depth 8
GPU Performance
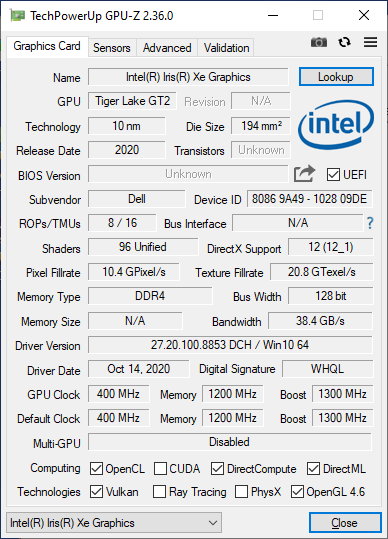
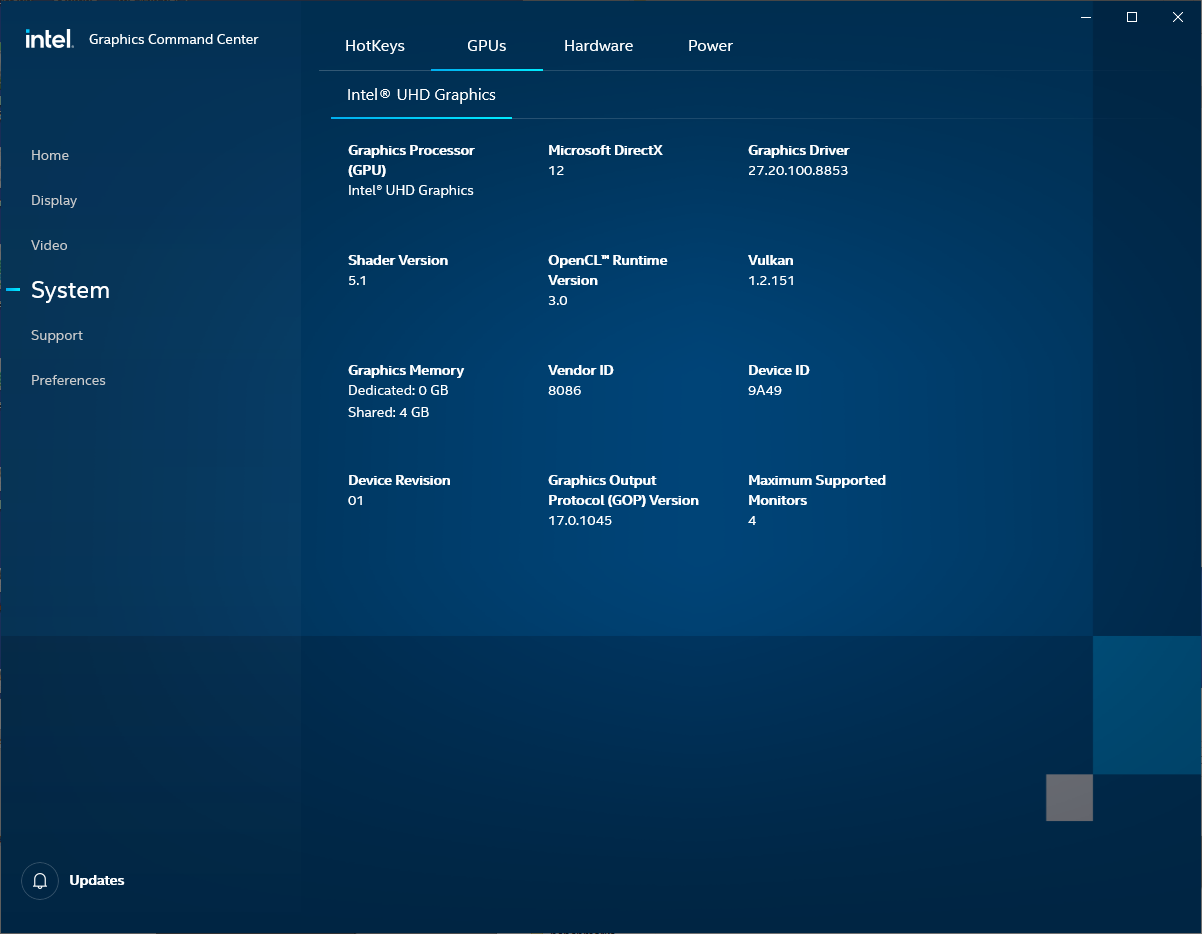
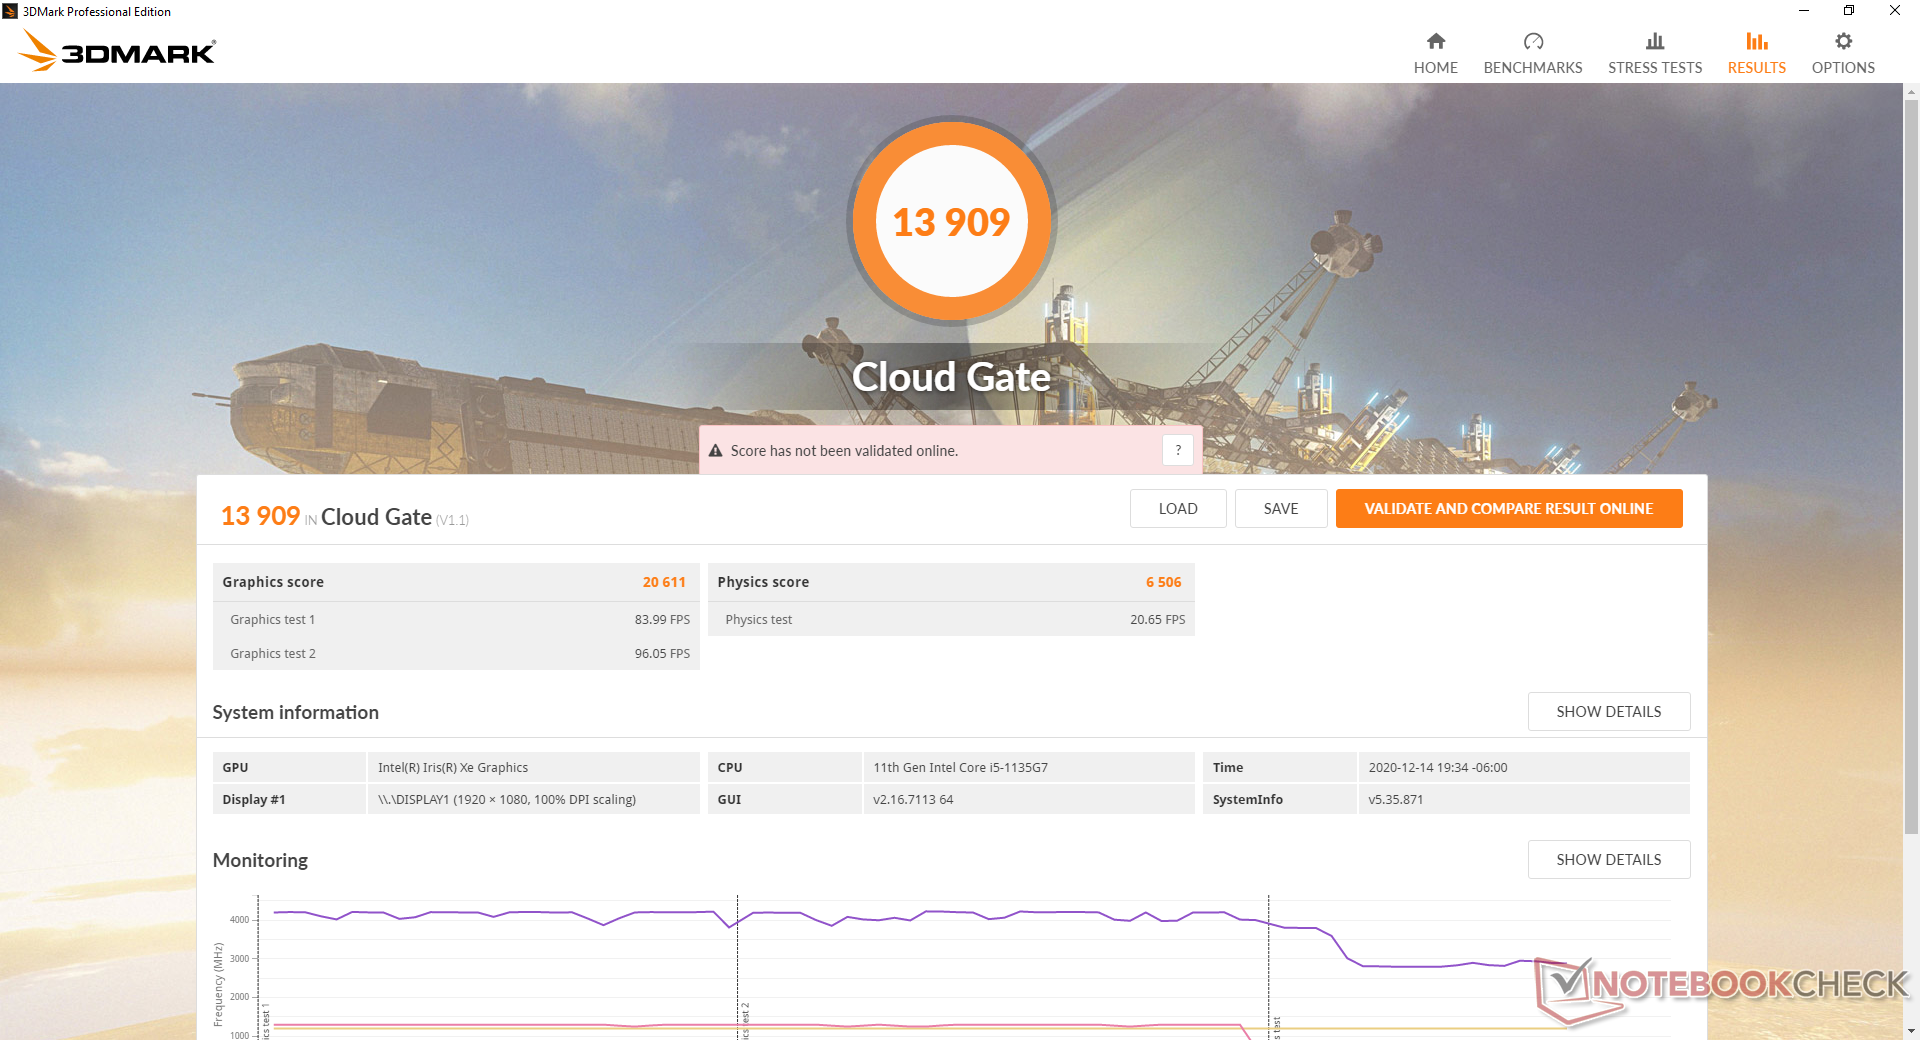
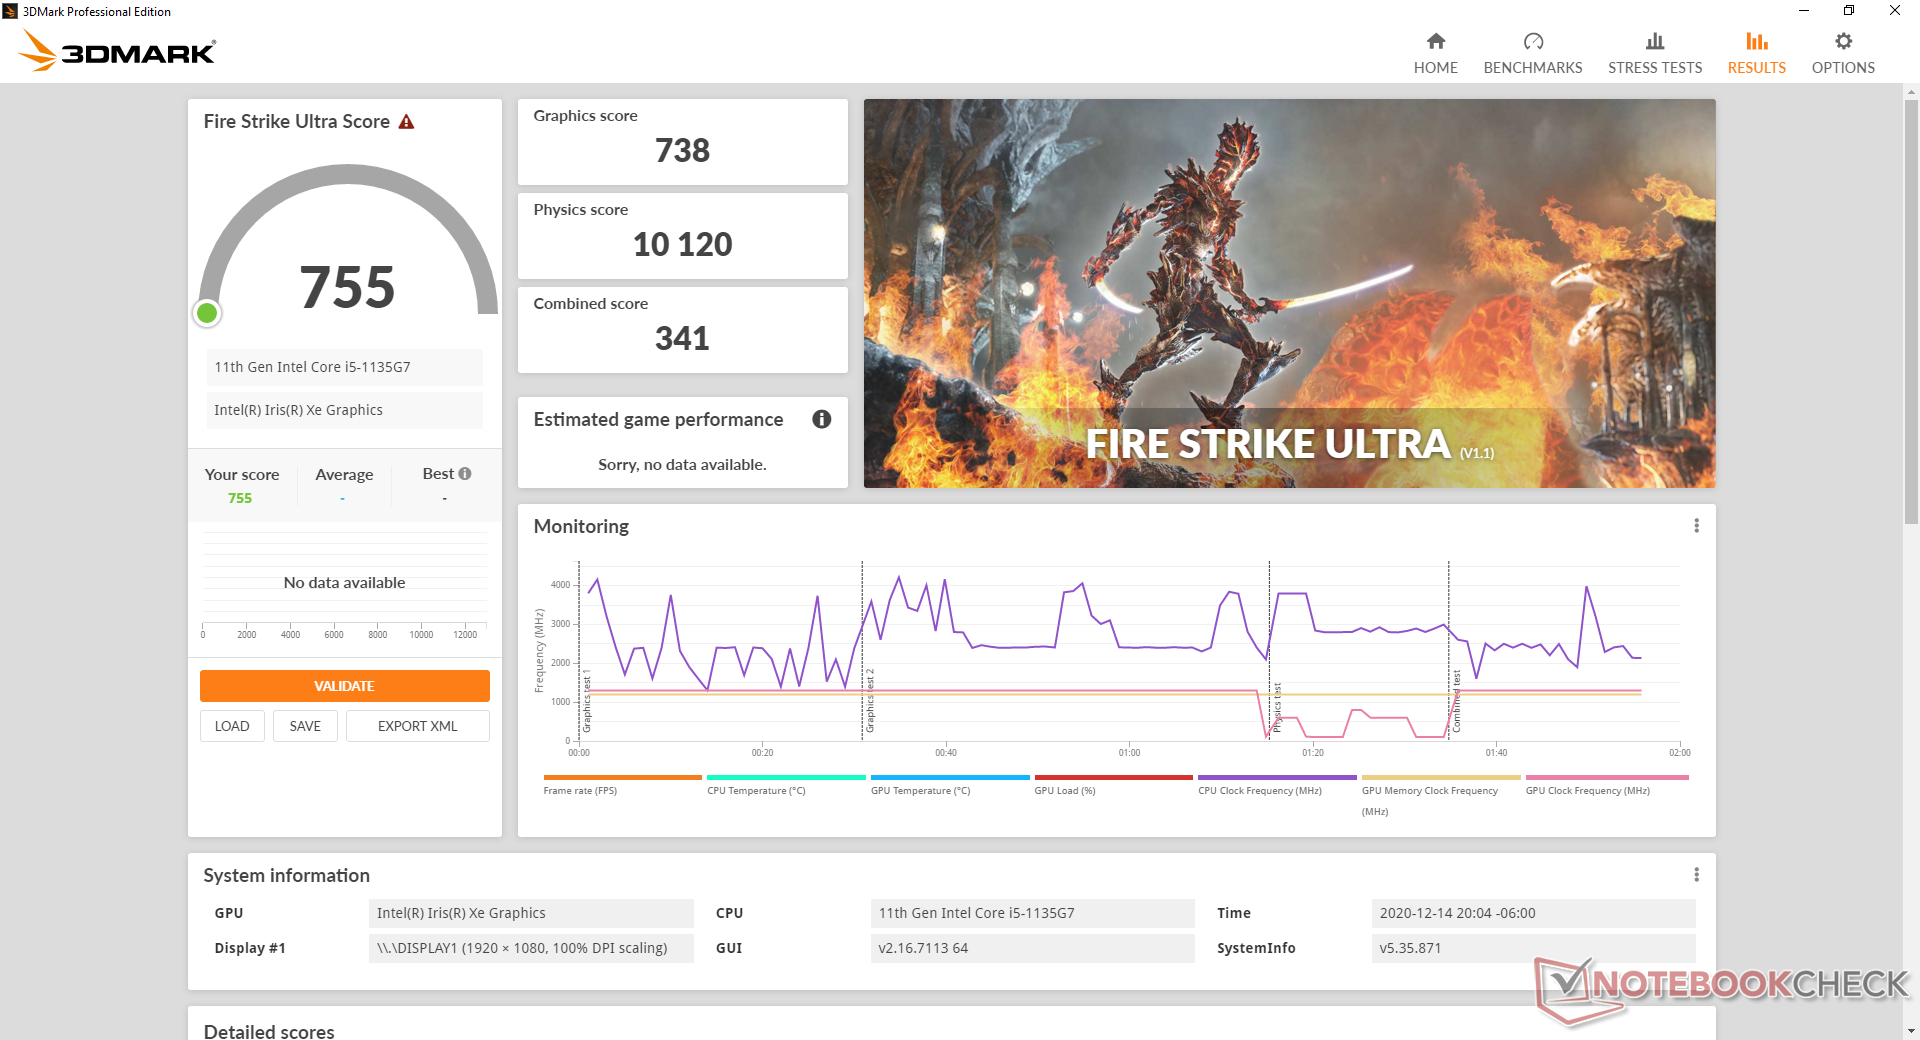
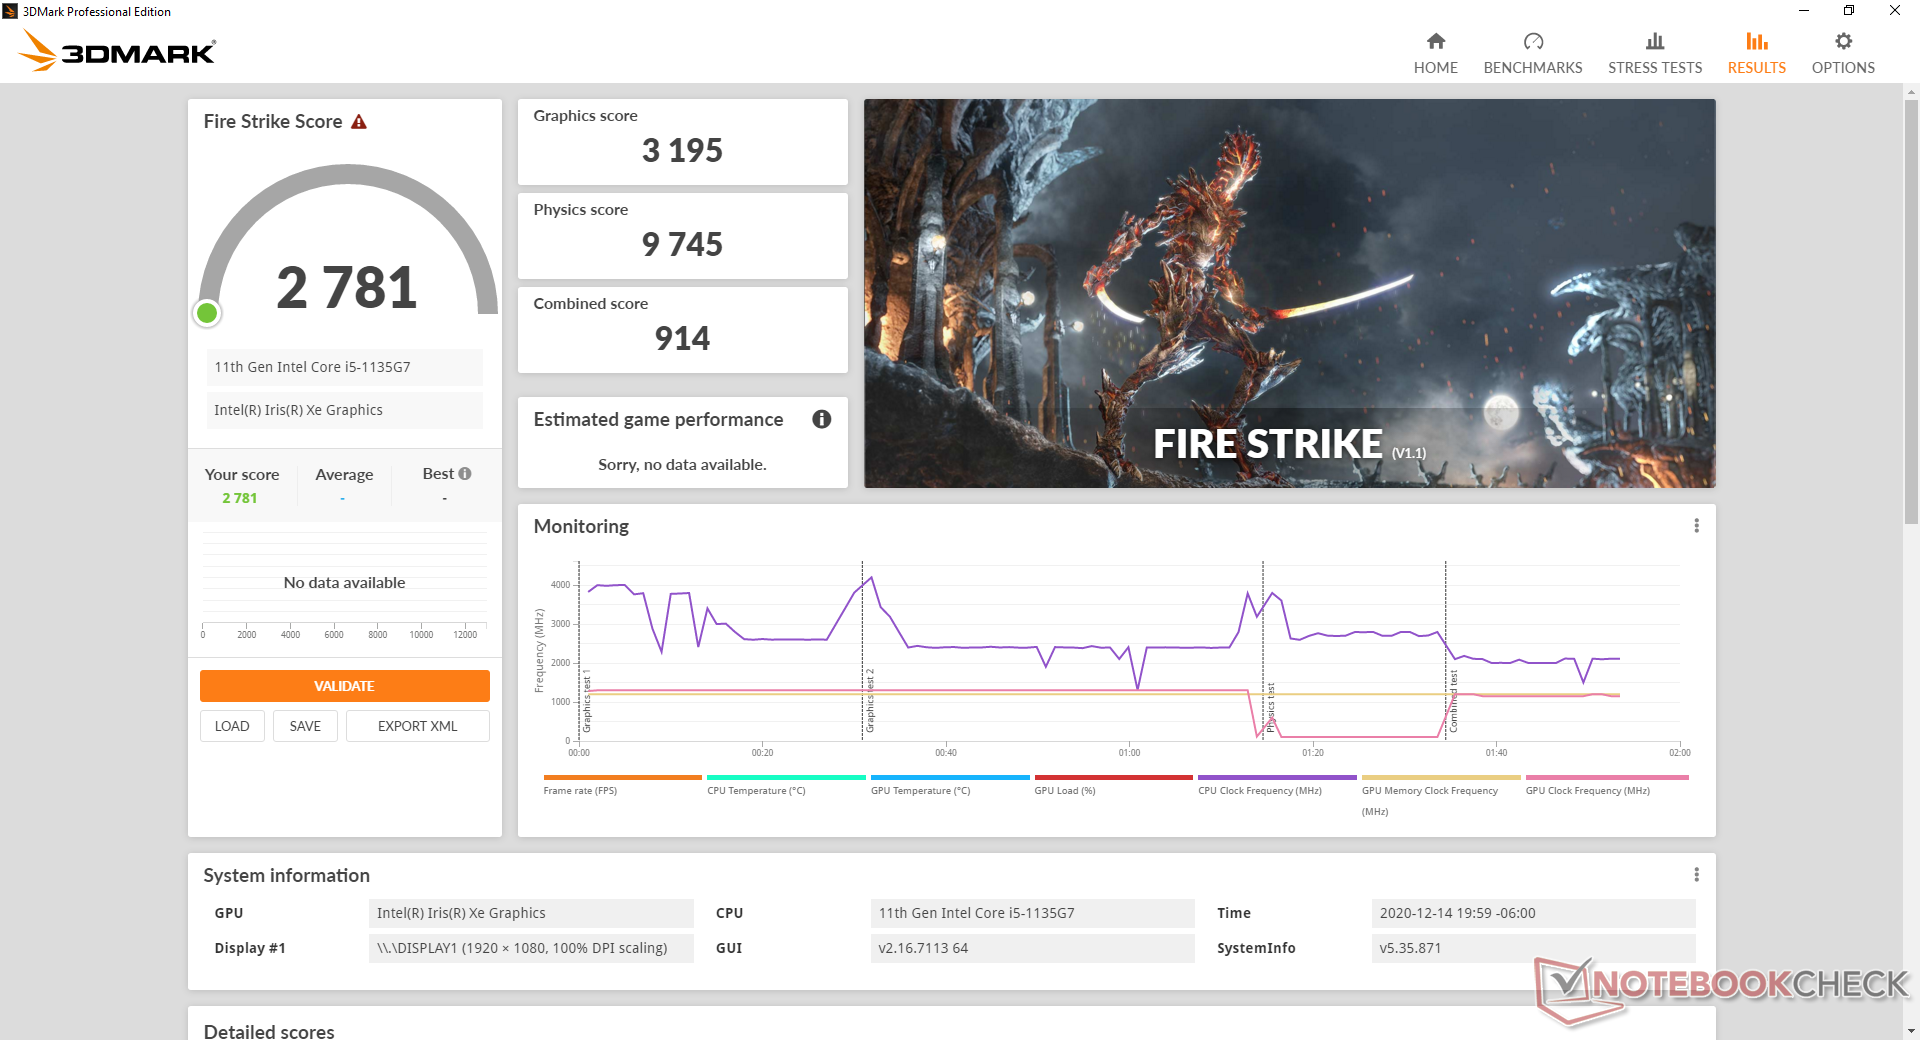
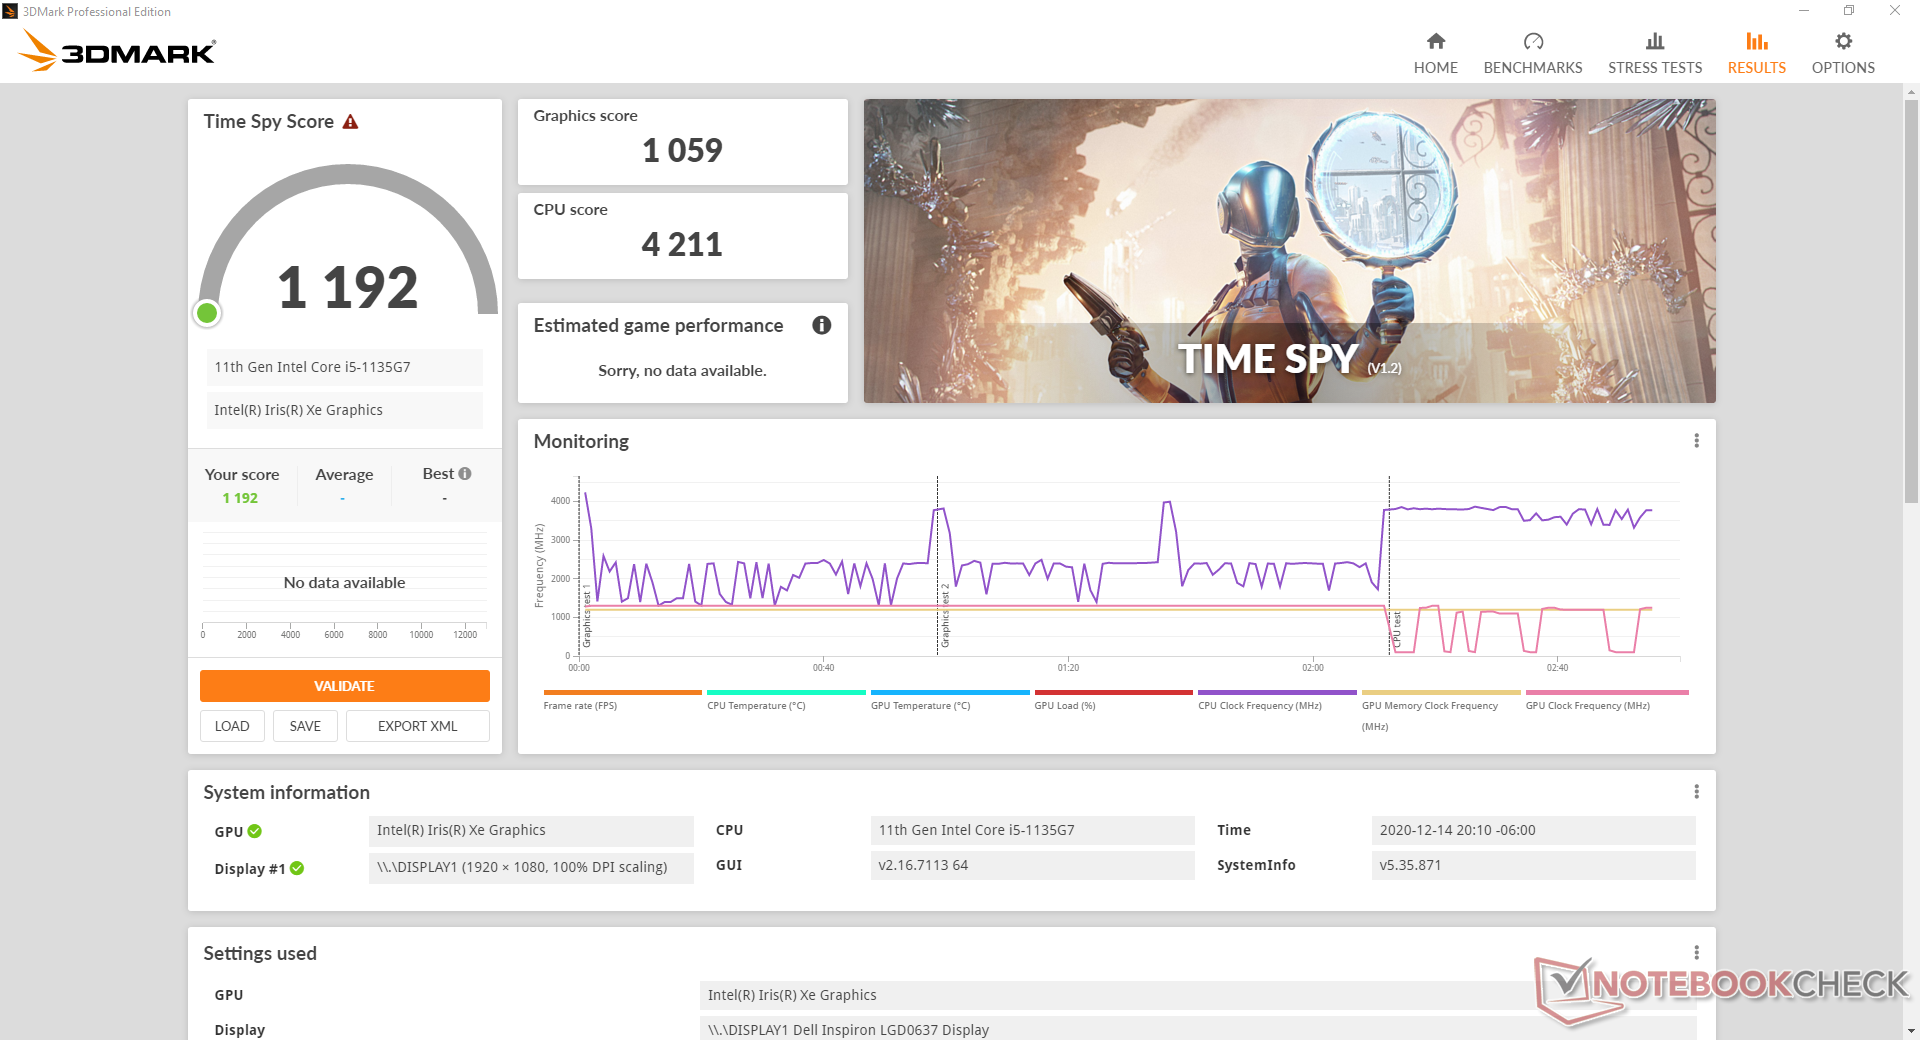
Graphics performance is slower than the Iris Xe 96 EUs by about 30 to 35 percent according to 3DMark benchmarks to be roughly comparable to the GeForce MX150 or MX250. Nonetheless, performance is still faster than last year's Iris Plus G7 and especially the older UHD Graphics 620. For light gaming or editing, the boost in graphics over previous generations is welcomed.
See our dedicated page on the Iris Xe 80 EUs for more technical information and benchmarks.
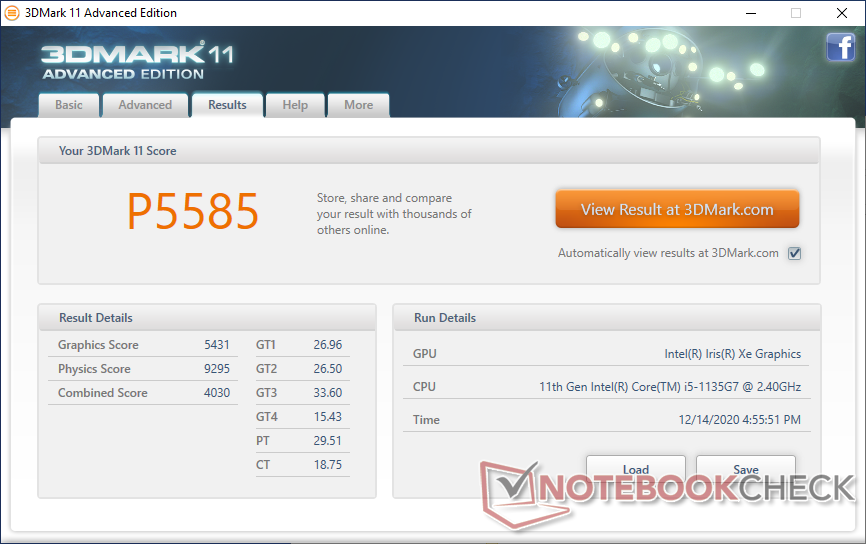
| 3DMark 11 Performance | 5585 points | |
| 3DMark Cloud Gate Standard Score | 13909 points | |
| 3DMark Fire Strike Score | 2781 points | |
| 3DMark Time Spy Score | 1192 points | |
Help | ||
| Final Fantasy XV Benchmark | |
| 1280x720 Lite Quality | |
| Lenovo Yoga 9i 14ITL5 | |
| Average Intel Iris Xe Graphics G7 80EUs (8.32 - 45.6, n=107) | |
| Dell Inspiron 15 7506 2-in-1 P97F | |
| 1920x1080 Standard Quality | |
| Lenovo Yoga 9i 14ITL5 | |
| Average Intel Iris Xe Graphics G7 80EUs (4.47 - 25.4, n=100) | |
| Dell Inspiron 15 7506 2-in-1 P97F | |
| 1920x1080 High Quality | |
| Lenovo Yoga 9i 14ITL5 | |
| Average Intel Iris Xe Graphics G7 80EUs (4.01 - 22, n=92) | |
| Dell Inspiron 15 7506 2-in-1 P97F | |
| low | med. | high | ultra | |
|---|---|---|---|---|
| The Witcher 3 (2015) | 66.1 | 36.5 | 19.8 | 10 |
| Dota 2 Reborn (2015) | 78.2 | 54.4 | 36.3 | 34.1 |
| Final Fantasy XV Benchmark (2018) | 29.2 | 15 | 10.8 | |
| X-Plane 11.11 (2018) | 23.6 | 31.3 | 32.8 |
Emissions
System Noise
Fan noise is quiet under most conditions. When browsing or streaming, fan noise would occasionally jump to 30.5 or 31.5 dB(A) for short periods against a silent background of 27.1 dB(A). Higher loads for extended periods like gaming may induce a fan noise ranging from 37 dB(A) to 47 dB(A) to be louder than many other 15.6-inch convertibles, but you'll have to really stress the laptop to reach levels.
We noticed no electronic noise or coil whine from our test unit.
| Dell Inspiron 15 7506 2-in-1 P97F Iris Xe G7 80EUs, i5-1135G7, Toshiba KBG40ZNS256G NVMe | Asus ZenBook Flip 15 UX563FD-A1027T GeForce GTX 1050 Max-Q, i7-10510U, Samsung SSD PM981 MZVLB1T0HALR | Dell Inspiron 15 7000 2-in-1 Black Edition GeForce MX150, i7-8565U, Toshiba BG3 KBG30ZMS256G | HP Envy x360 15-ee0257ng Vega 6, R5 4500U, Intel SSD 660p SSDPEKNW512G8 | Lenovo Yoga C740-15IML UHD Graphics 620, i7-10510U, Samsung SSD PM981 MZVLB512HAJQ | Asus VivoBook Flip 15 TP510UA-E8073T UHD Graphics 620, i5-8250U, SanDisk SD8SN8U128G1002 | |
|---|---|---|---|---|---|---|
| Noise | -5% | -14% | -5% | -1% | -6% | |
| off / environment * (dB) | 27.1 | 30.3 -12% | 28 -3% | 27 -0% | 29.3 -8% | 30.2 -11% |
| Idle Minimum * (dB) | 27.1 | 30.3 -12% | 28 -3% | 27 -0% | 29.3 -8% | 30.9 -14% |
| Idle Average * (dB) | 27.1 | 30.3 -12% | 28 -3% | 27 -0% | 29.3 -8% | 30.9 -14% |
| Idle Maximum * (dB) | 27.1 | 30.3 -12% | 28.4 -5% | 27 -0% | 29.6 -9% | 30.9 -14% |
| Load Average * (dB) | 31.5 | 33.7 -7% | 48.6 -54% | 43.2 -37% | 32.4 -3% | 34.2 -9% |
| Witcher 3 ultra * (dB) | 37.4 | 37.4 -0% | 47.9 -28% | |||
| Load Maximum * (dB) | 47.2 | 38.9 18% | 49.2 -4% | 43.2 8% | 33.3 29% | 34.2 28% |
* ... smaller is better
Noise level
| Idle |
| 27.1 / 27.1 / 27.1 dB(A) |
| Load |
| 31.5 / 47.2 dB(A) |
 | ||
30 dB silent 40 dB(A) audible 50 dB(A) loud |
||
min: | ||
Temperature
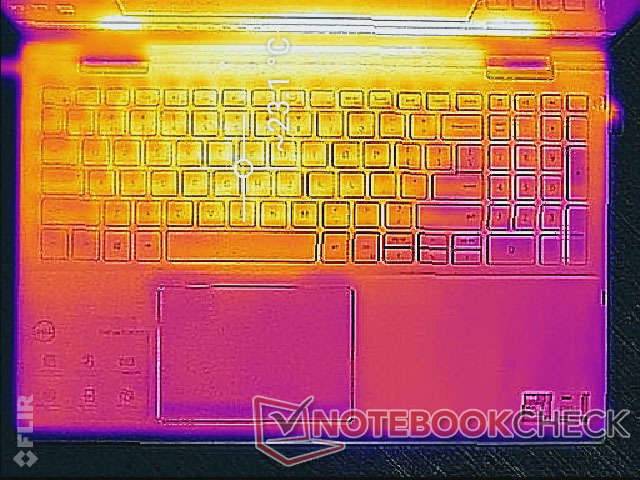
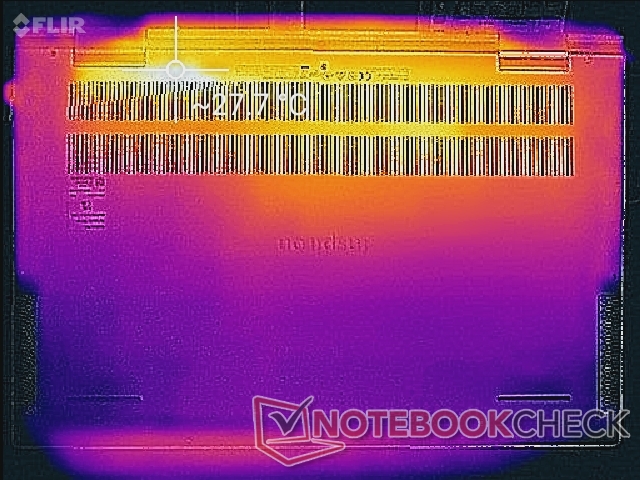
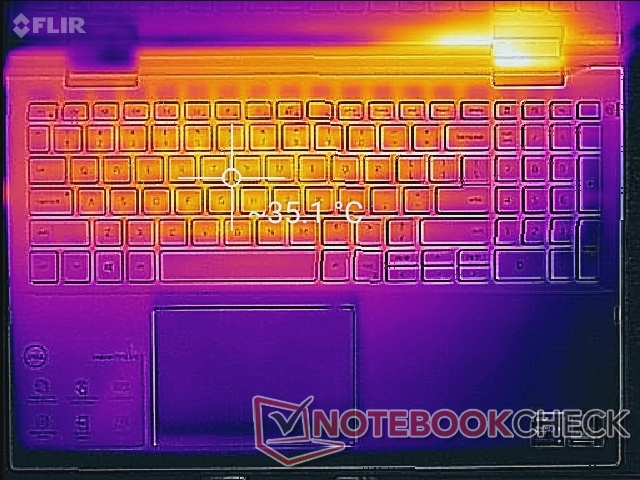
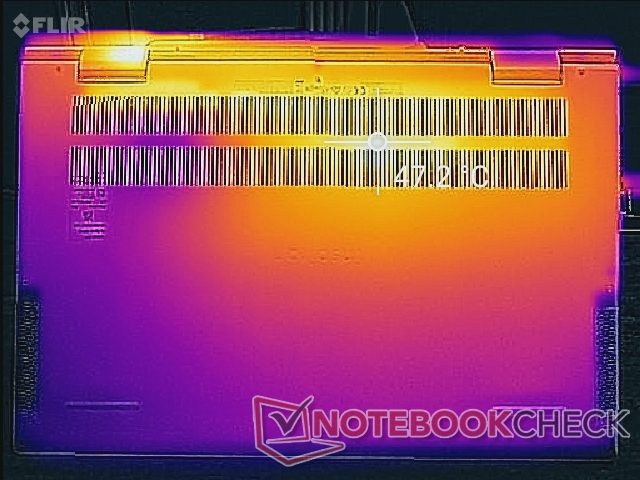
Surface temperatures are much warmer on the bottom surface than the top. When under high processing stress, the bottom can be as warm as 48 C compared to only 35 C on the keyboard hot spot. The laptop is never uncomfortable to type on as a result, but be sure to not obstruct the ventilation grilles underneath especially since core temperatures can be very warm as our Stress Test section below will illustrate.
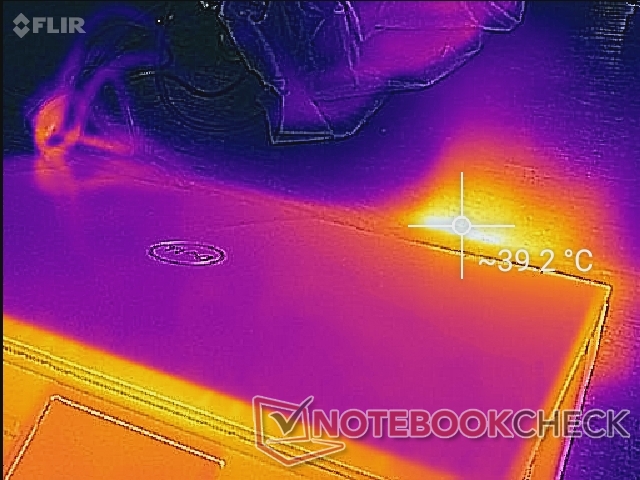

(+) The maximum temperature on the upper side is 35.6 °C / 96 F, compared to the average of 36.8 °C / 98 F, ranging from 21 to 71 °C for the class Multimedia.
(-) The bottom heats up to a maximum of 46.8 °C / 116 F, compared to the average of 39.1 °C / 102 F
(+) In idle usage, the average temperature for the upper side is 21.9 °C / 71 F, compared to the device average of 31.3 °C / 88 F.
(+) The palmrests and touchpad are cooler than skin temperature with a maximum of 25 °C / 77 F and are therefore cool to the touch.
(+) The average temperature of the palmrest area of similar devices was 28.7 °C / 83.7 F (+3.7 °C / 6.7 F).
Stress Test
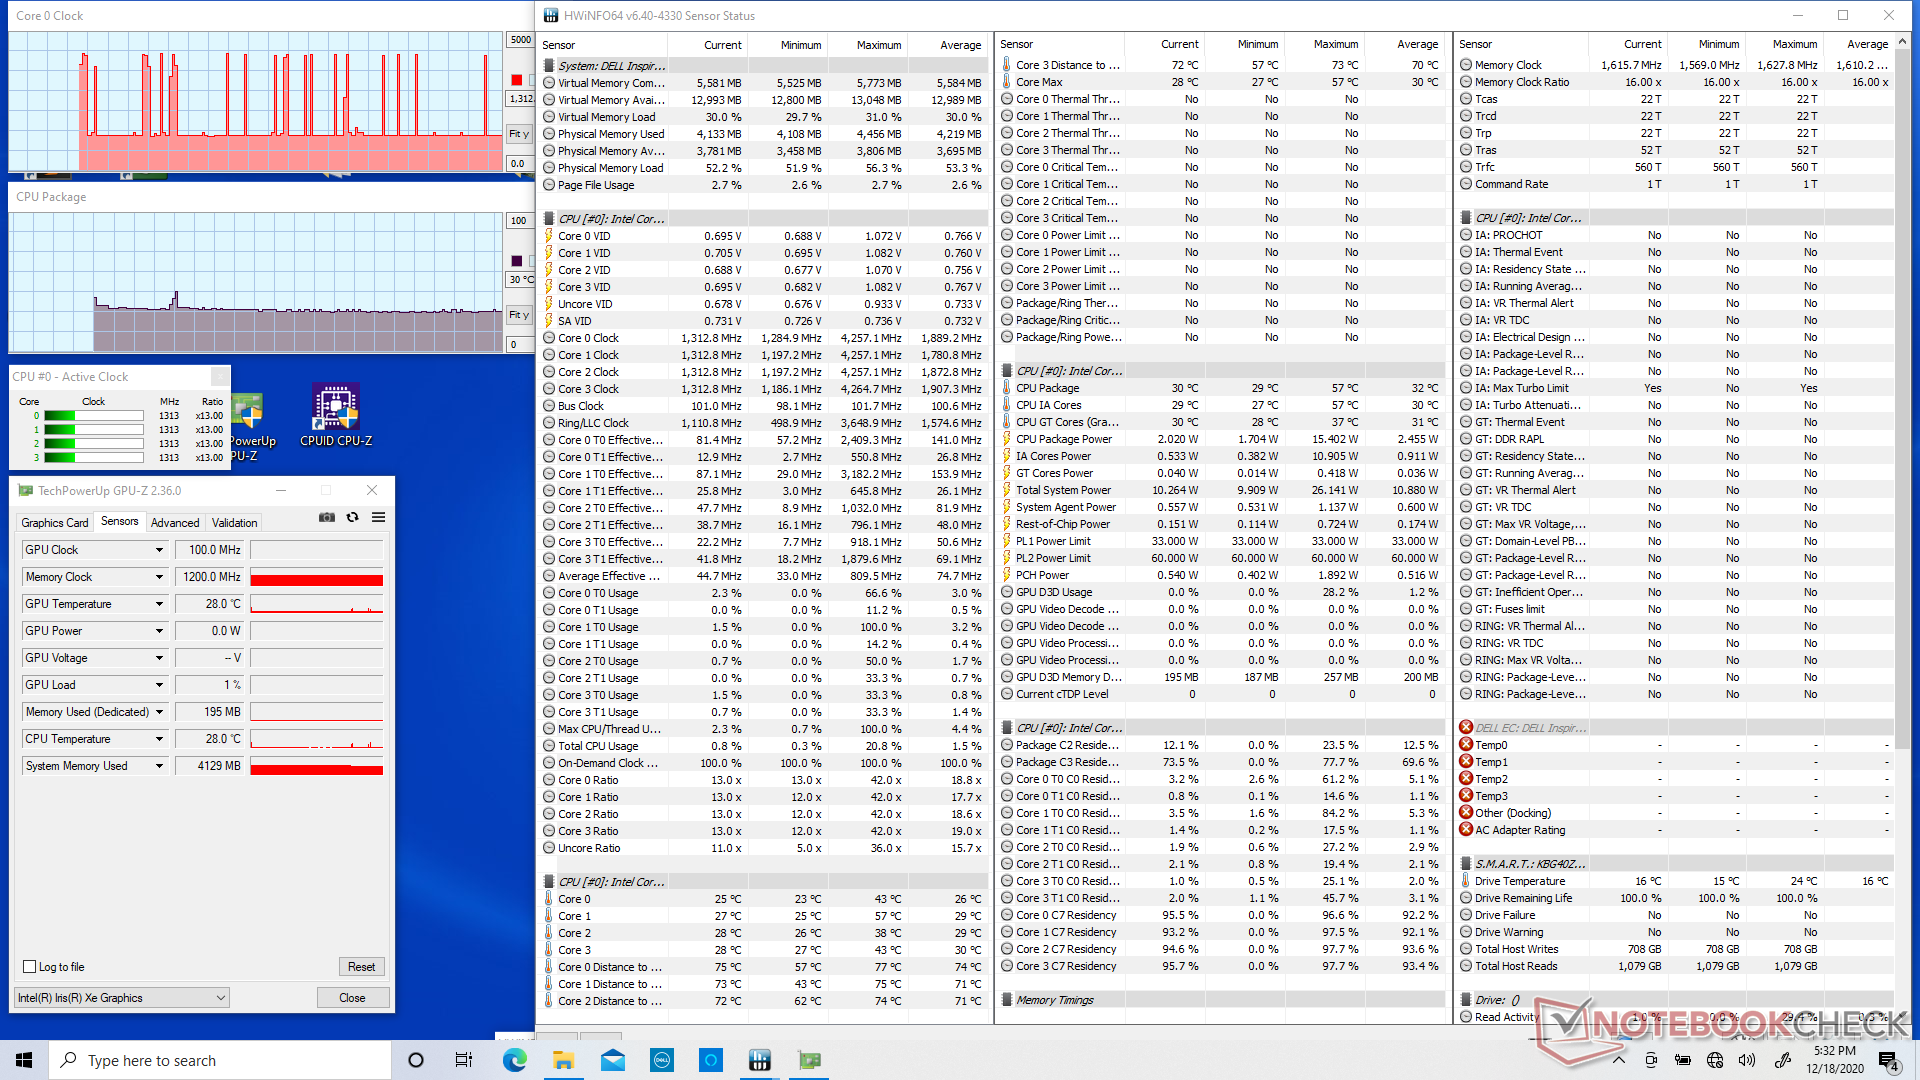
When running Prime95, CPU clock rates would boost to 4.0 GHz for just the first couple of seconds until hitting a core temperature of 100 C. Clock rates would then stabilize at about 3.2 GHz and at a very warm CPU temperature of 99 C to be much warmer than essentially all other 15.6-inch convertibles when subjected to similar conditions. Users who prefer cooler core temperatures can select the slower Cool or Optimized power profiles in Dell Power Manager instead.
Running on battery power will slightly impact GPU performance. A 3DMark 11 test on batteries would return Physics and Graphics scores of 9902 and 5089 points, respectively, compared to 9295 and 5431 points when on mains.
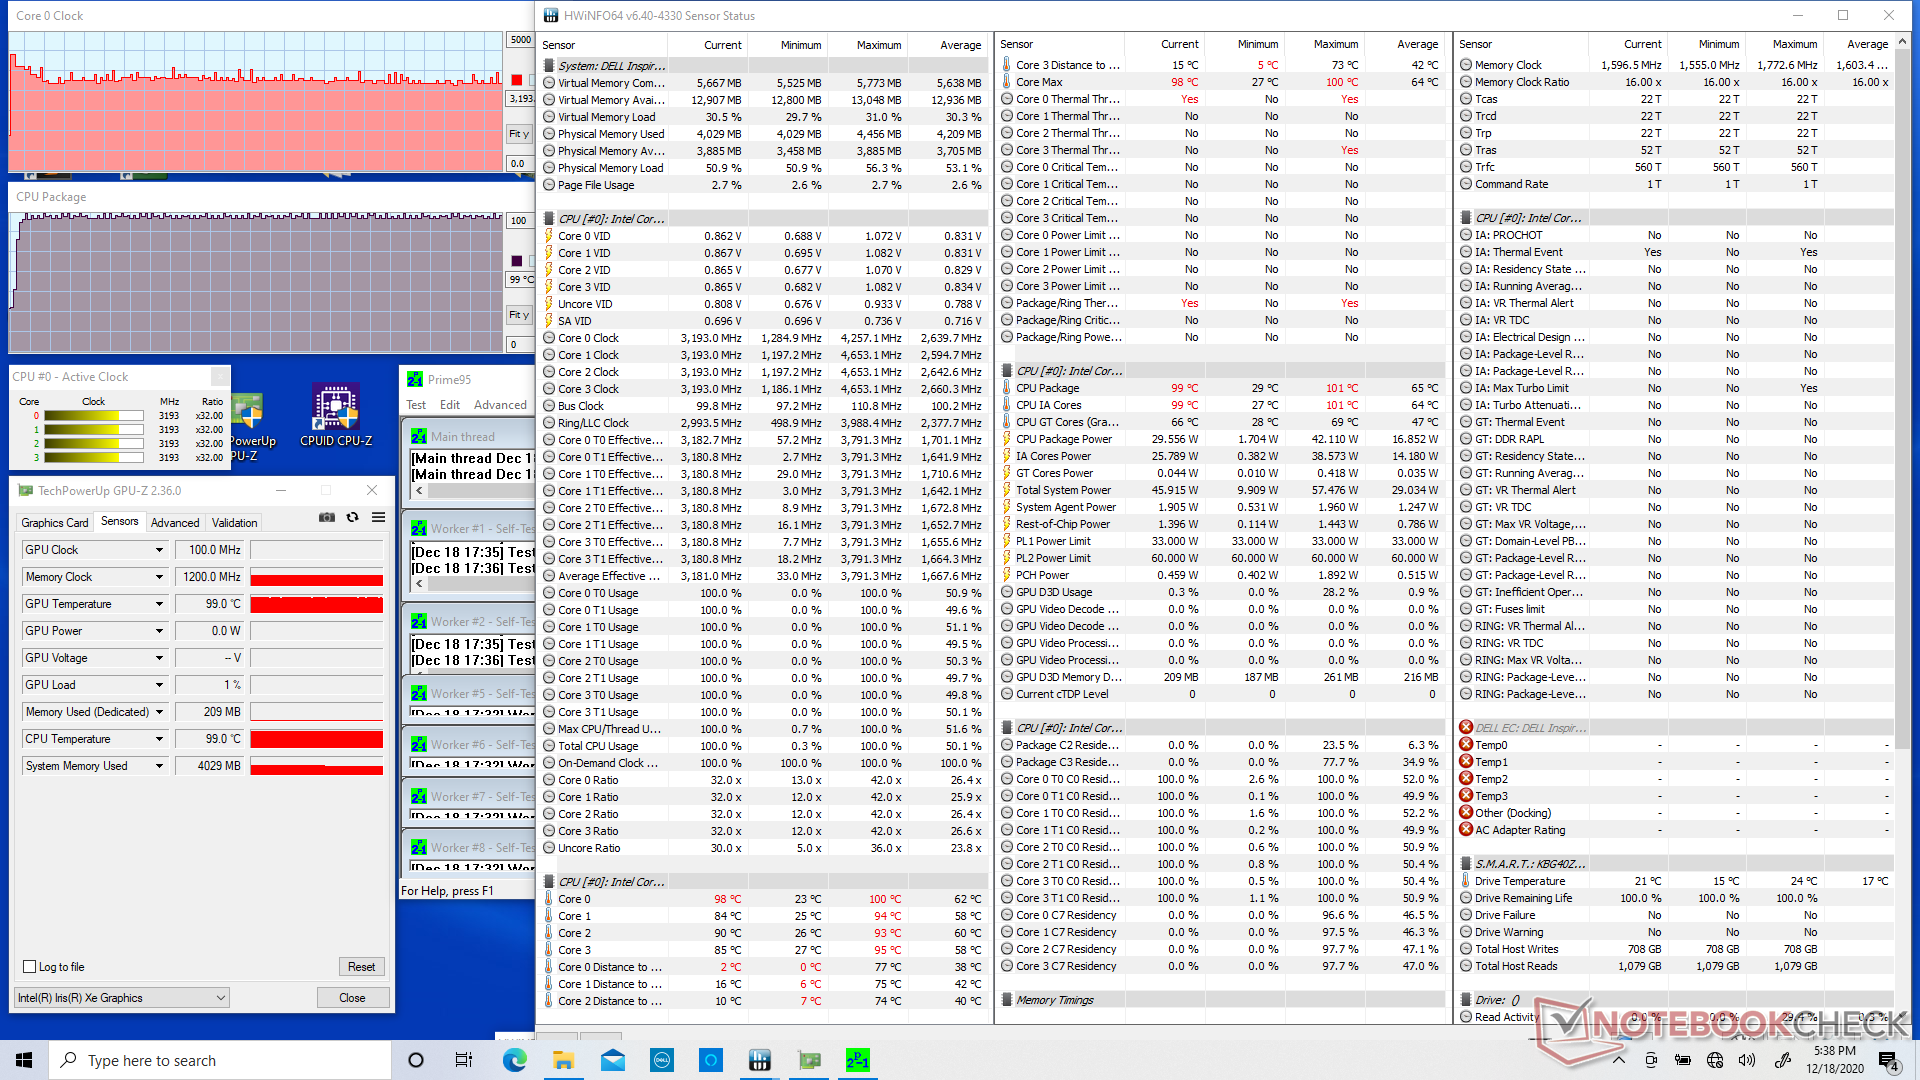
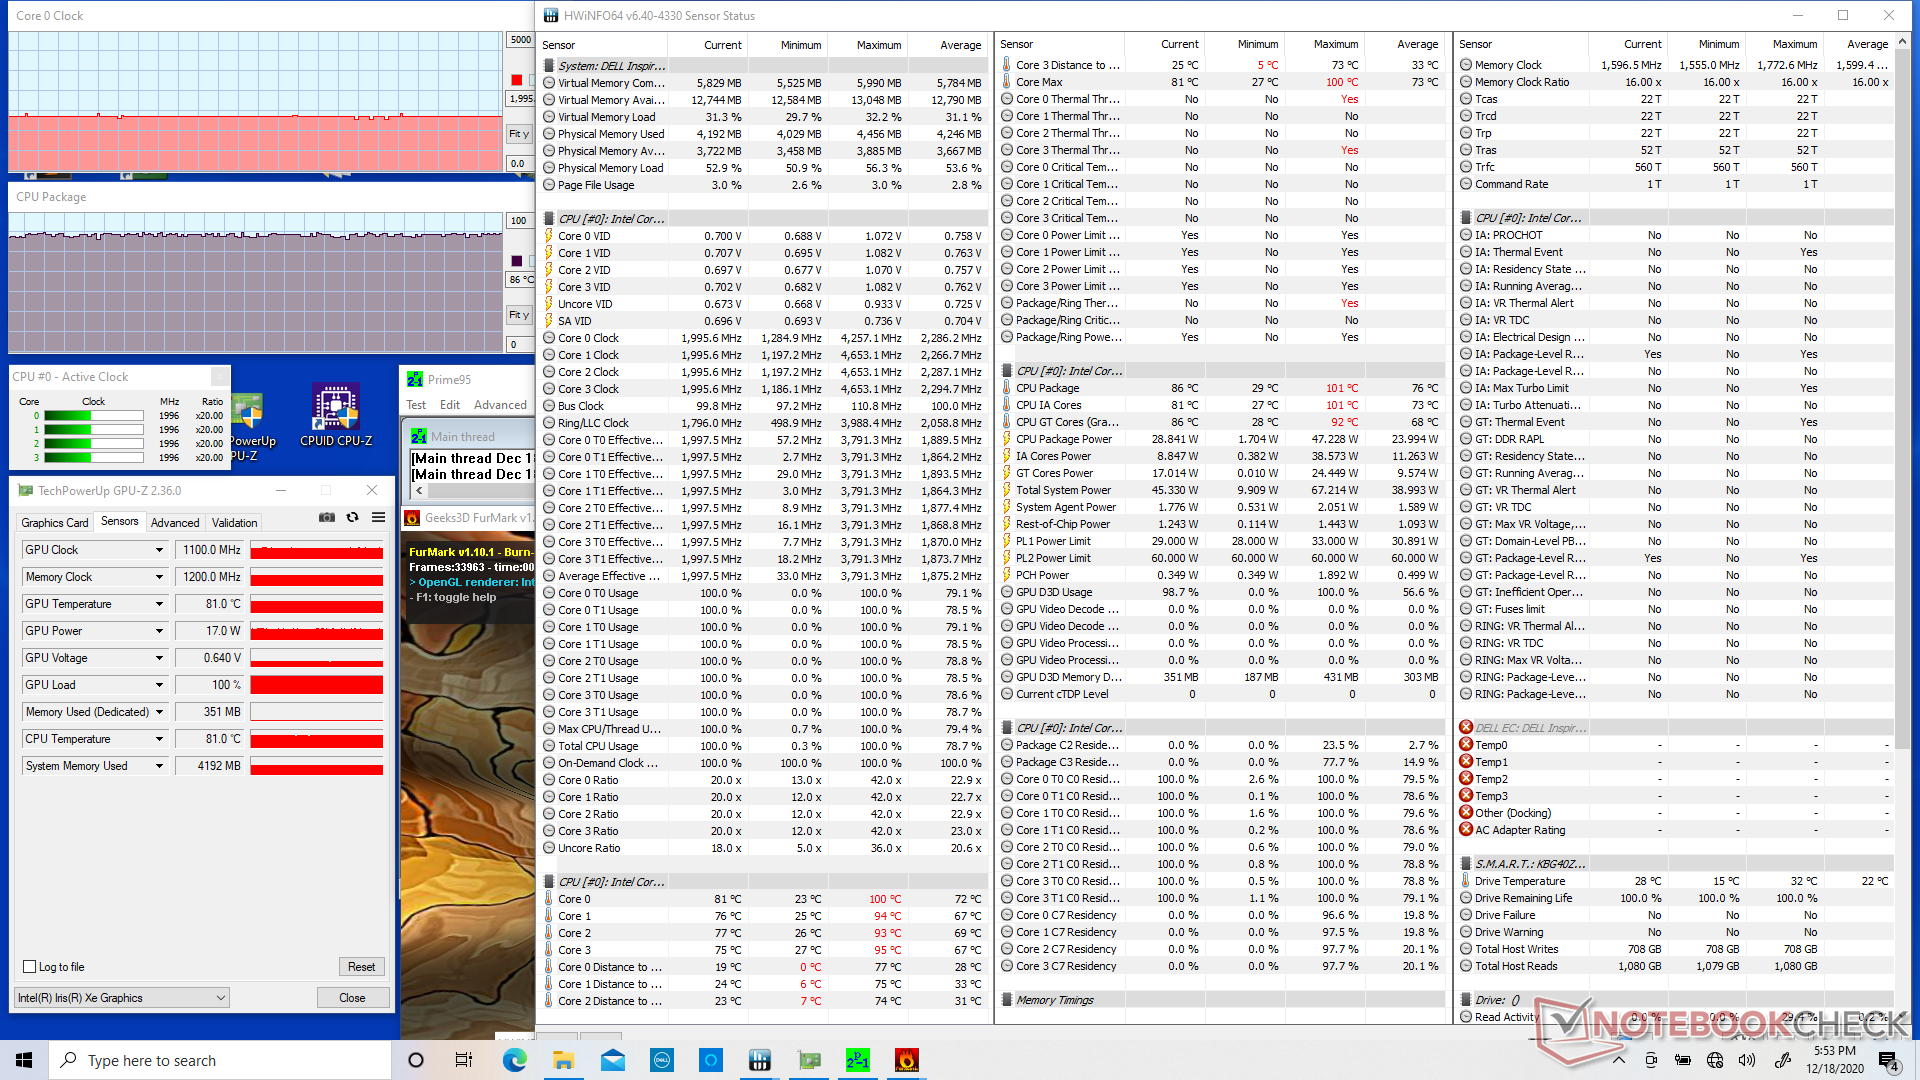
| CPU Clock (GHz) | GPU Clock (MHz) | Average CPU Temperature (°C) | |
| System Idle | -- | -- | 30 |
| Prime95 Stress | ~3.2 | -- | 99 |
| Prime95 + FurMark Stress | 2.0 | 1100 | 86 |
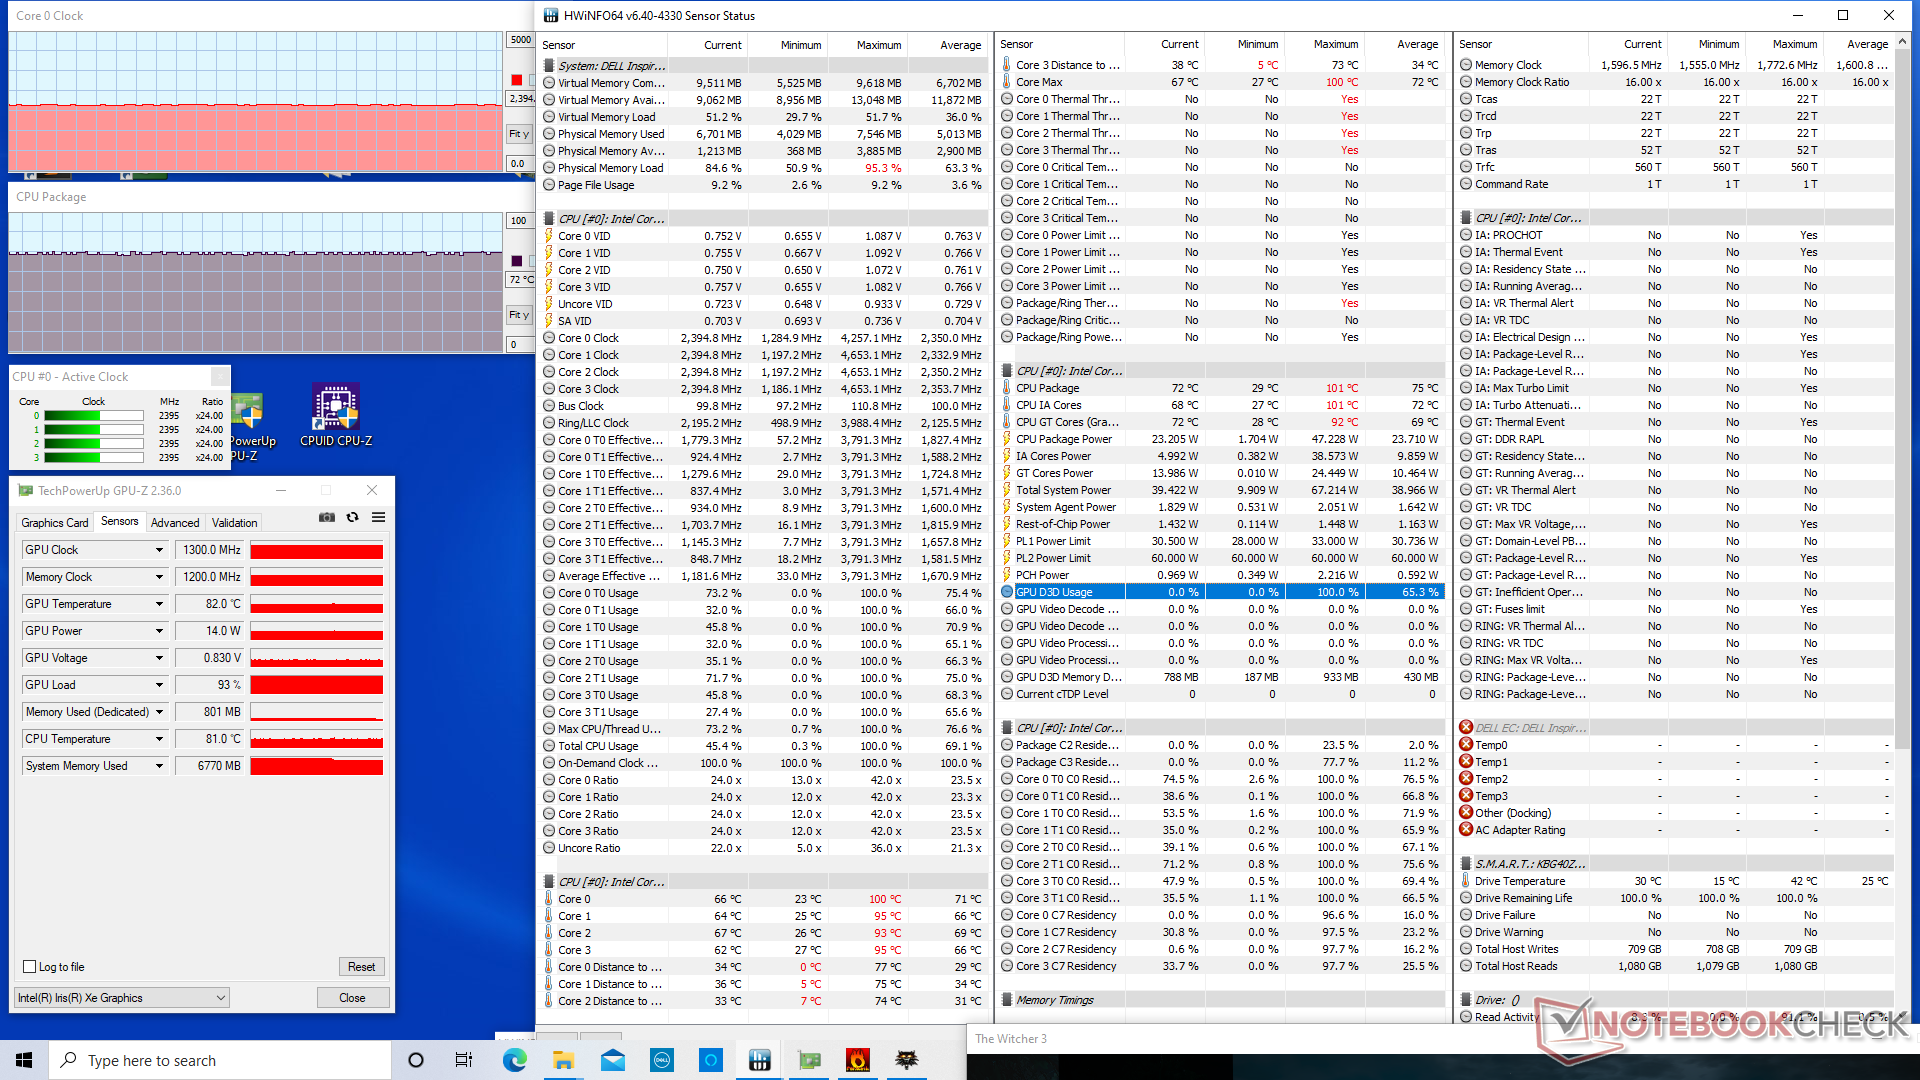
| Witcher 3 Stress | 2.4 | 1300 | 72 |
Speakers


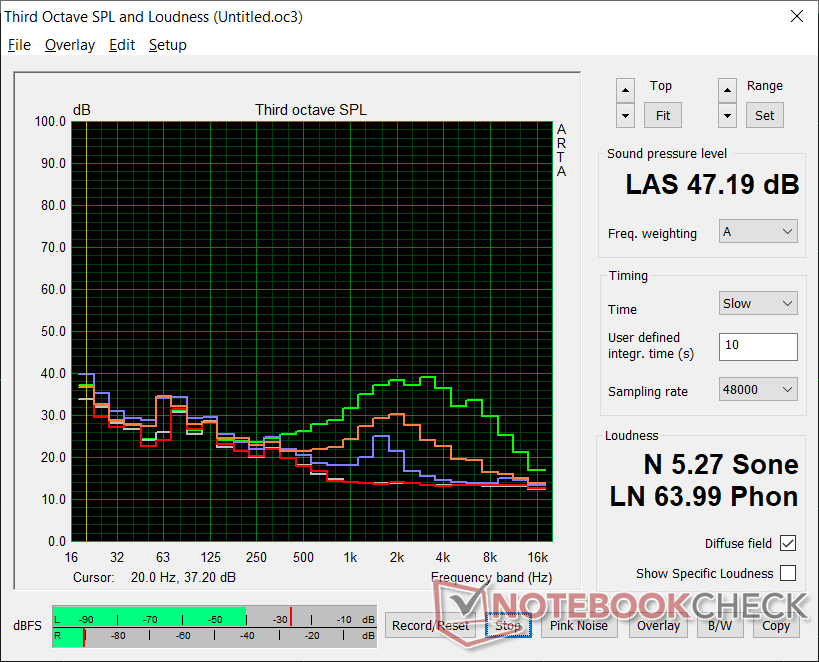
Dell Inspiron 15 7506 2-in-1 P97F audio analysis
(±) | speaker loudness is average but good (81.6 dB)
Bass 100 - 315 Hz
(-) | nearly no bass - on average 22.7% lower than median
(±) | linearity of bass is average (11% delta to prev. frequency)
Mids 400 - 2000 Hz
(±) | higher mids - on average 8.4% higher than median
(±) | linearity of mids is average (8.6% delta to prev. frequency)
Highs 2 - 16 kHz
(+) | balanced highs - only 3.4% away from median
(+) | highs are linear (6.2% delta to prev. frequency)
Overall 100 - 16.000 Hz
(±) | linearity of overall sound is average (21.2% difference to median)
Compared to same class
» 73% of all tested devices in this class were better, 7% similar, 20% worse
» The best had a delta of 5%, average was 17%, worst was 45%
Compared to all devices tested
» 59% of all tested devices were better, 7% similar, 34% worse
» The best had a delta of 4%, average was 23%, worst was 134%
Apple MacBook 12 (Early 2016) 1.1 GHz audio analysis
(+) | speakers can play relatively loud (83.6 dB)
Bass 100 - 315 Hz
(±) | reduced bass - on average 11.3% lower than median
(±) | linearity of bass is average (14.2% delta to prev. frequency)
Mids 400 - 2000 Hz
(+) | balanced mids - only 2.4% away from median
(+) | mids are linear (5.5% delta to prev. frequency)
Highs 2 - 16 kHz
(+) | balanced highs - only 2% away from median
(+) | highs are linear (4.5% delta to prev. frequency)
Overall 100 - 16.000 Hz
(+) | overall sound is linear (10.2% difference to median)
Compared to same class
» 7% of all tested devices in this class were better, 2% similar, 90% worse
» The best had a delta of 5%, average was 18%, worst was 53%
Compared to all devices tested
» 5% of all tested devices were better, 1% similar, 94% worse
» The best had a delta of 4%, average was 23%, worst was 134%
Energy Management
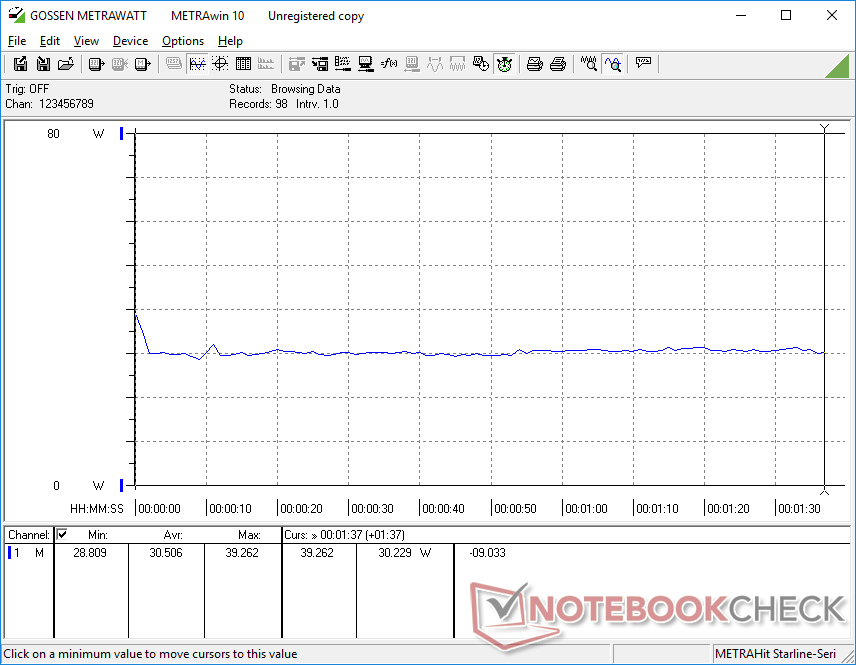
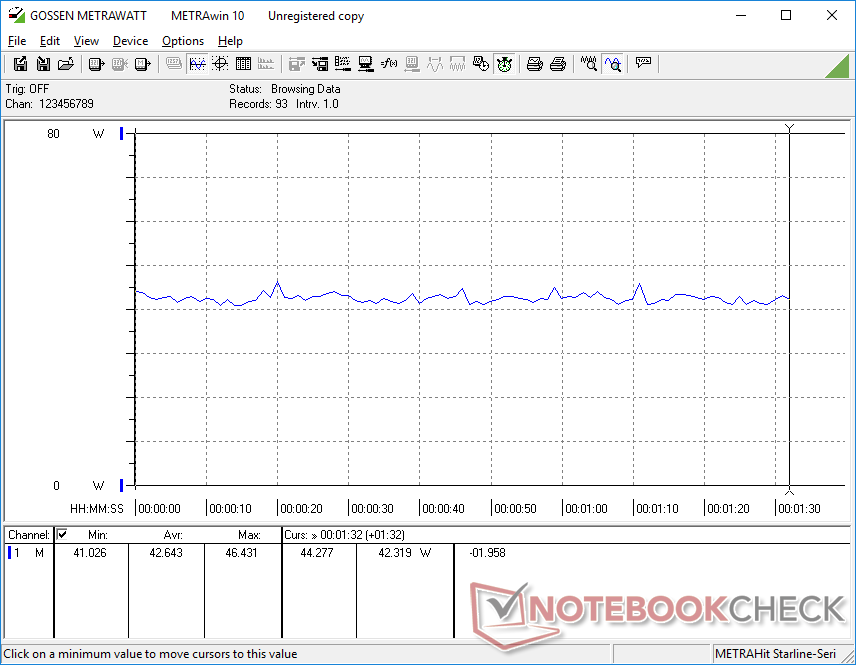
Power Consumption
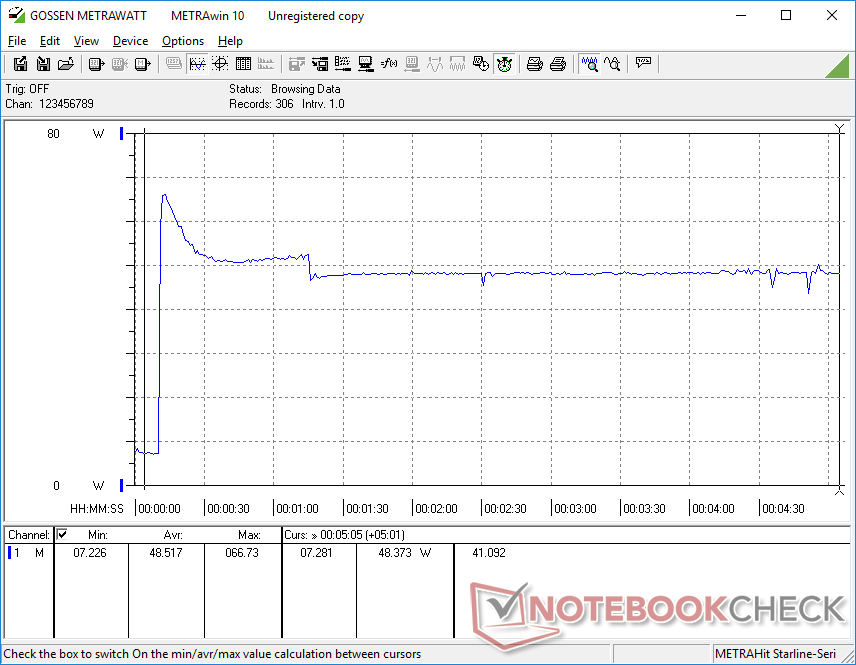
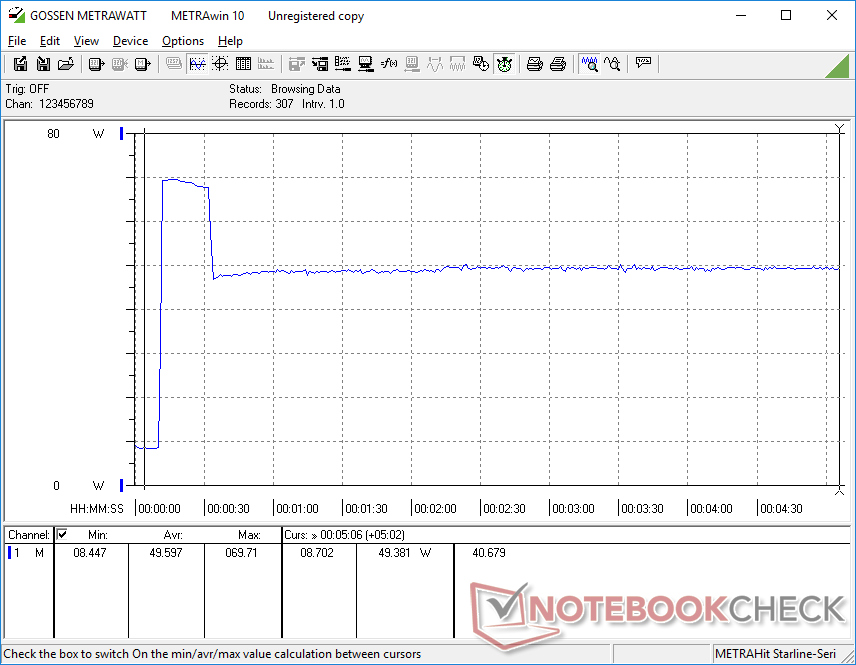
Running medium to high loads like games will demand between 30 W 43 W compared to 57 W on the 2018 model powered by the discrete GeForce MX150. The new Tiger Lake model is definitely more power efficient without needing to sacrifice raw graphics performance, but many games are still expected to run better on MX150 systems simply due to superior drivers and compatibility from Nvidia.
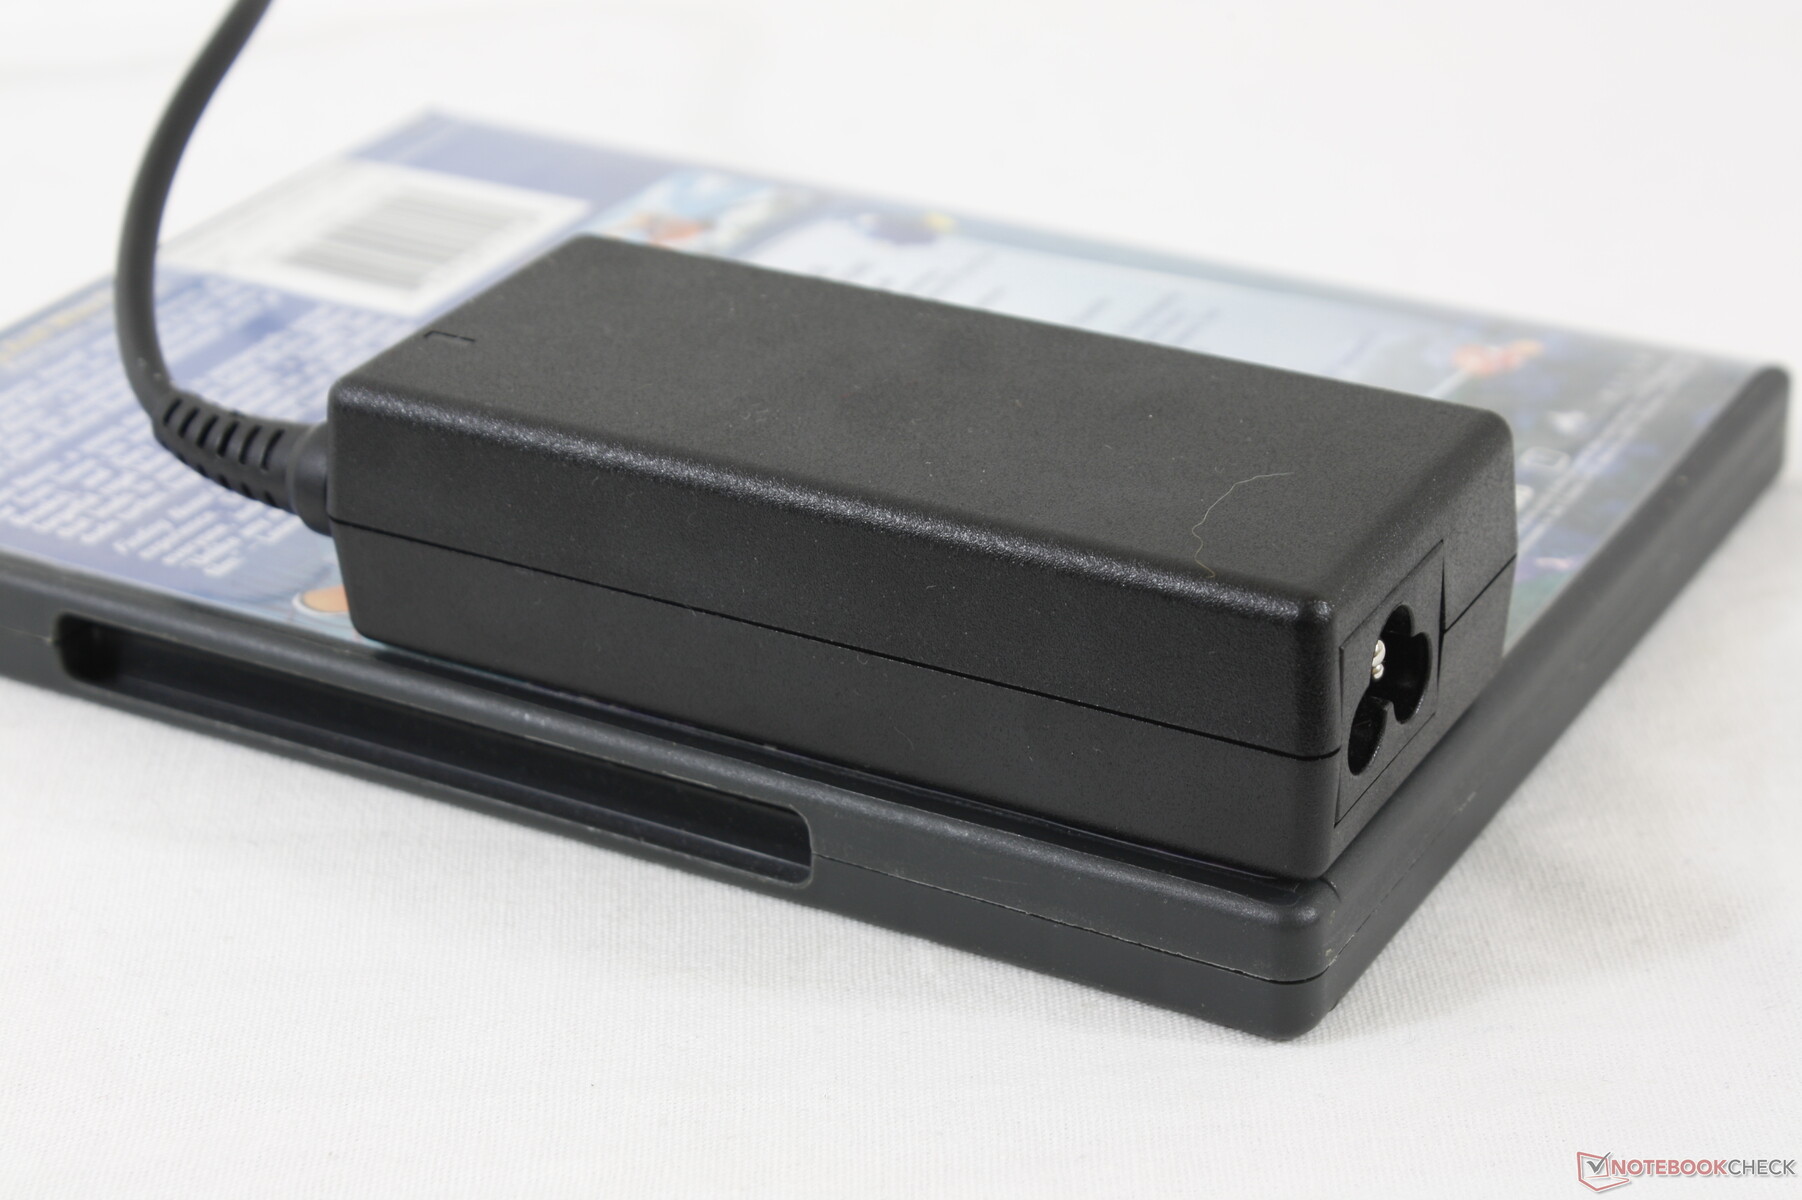
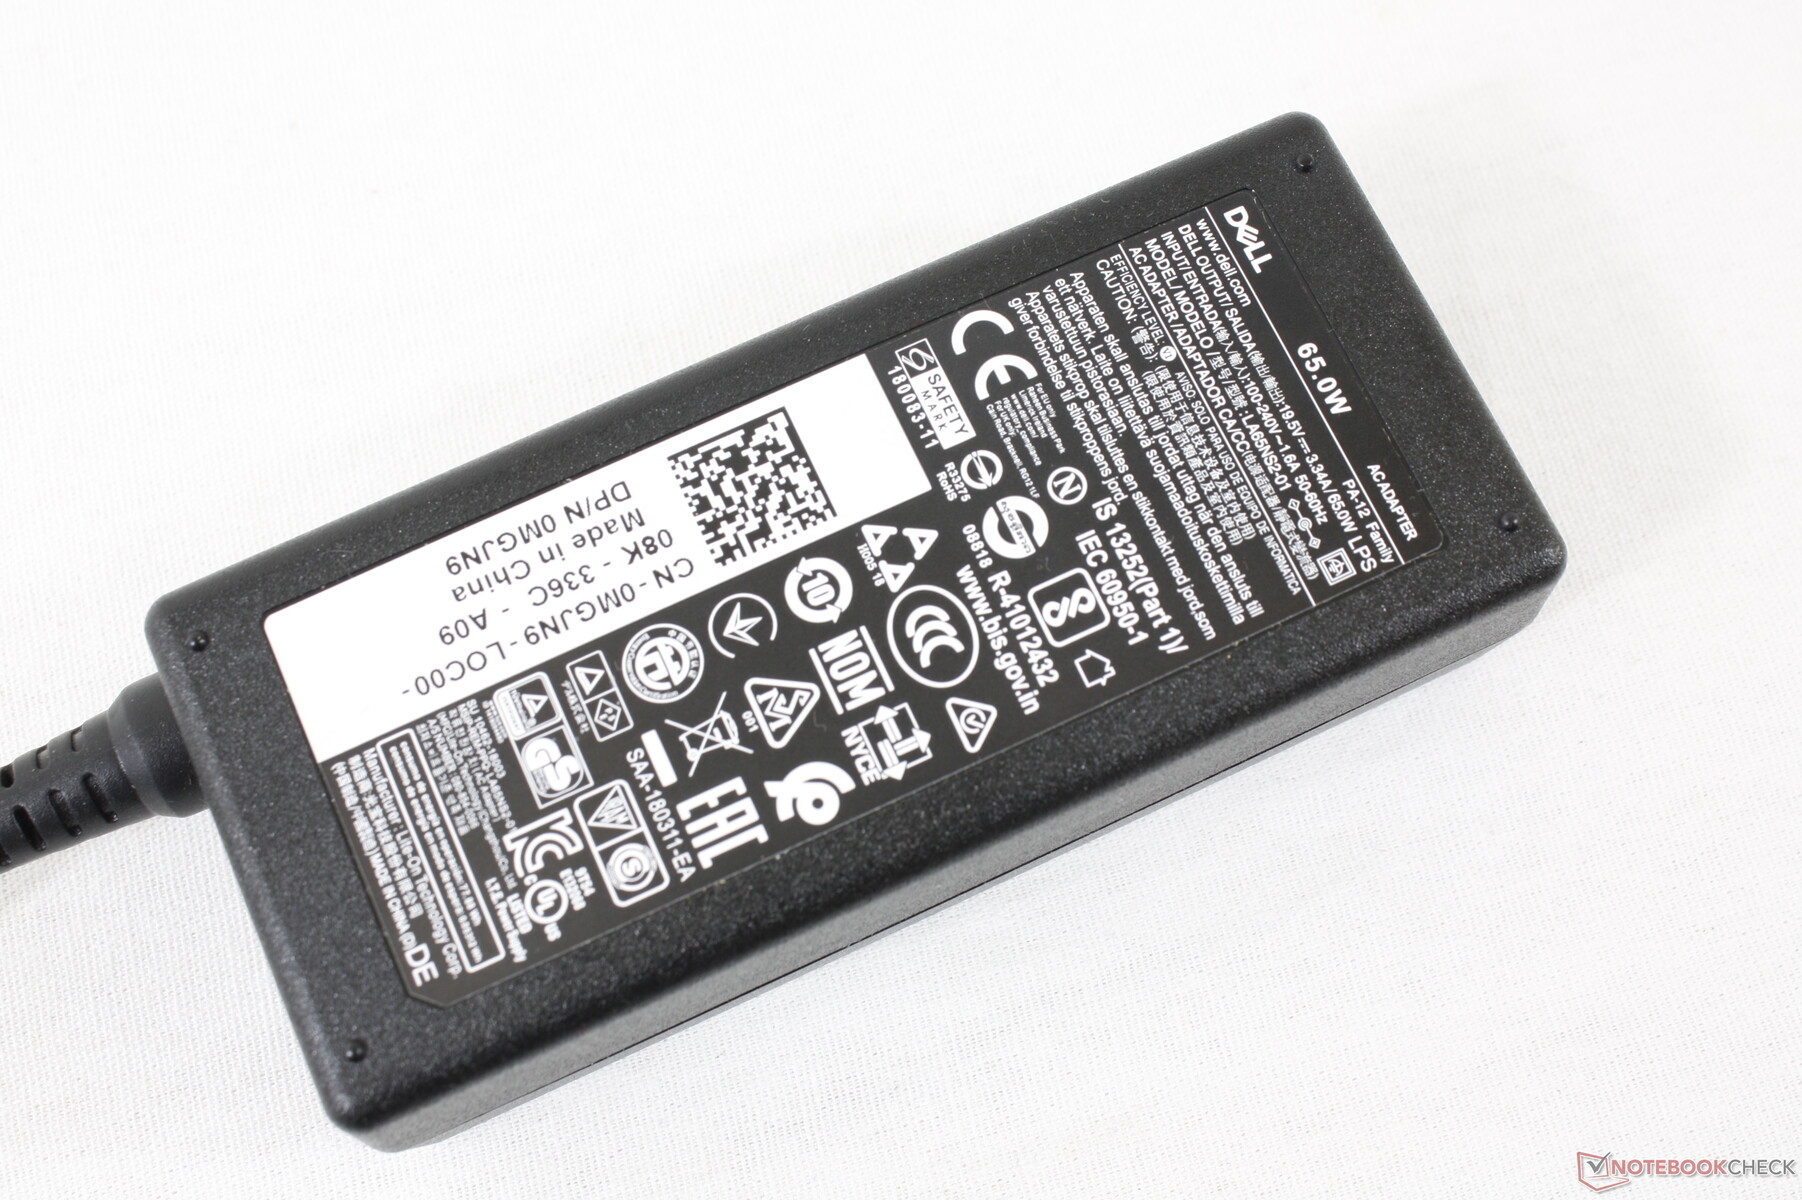
We're able to record a maximum consumption of 69.7 W from the small (~10.4 x 4.5 x 2.8) 65 W AC adapter when running extreme loads. However, this rate only lasts for just a few seconds as shown by the graphs below due to thermal limitations.
| Off / Standby | |
| Idle | |
| Load |
|
Key:
min: | |
| Dell Inspiron 15 7506 2-in-1 P97F i5-1135G7, Iris Xe G7 80EUs, Toshiba KBG40ZNS256G NVMe, IPS, 1920x1080, 15.6" | Asus ZenBook Flip 15 UX563FD-A1027T i7-10510U, GeForce GTX 1050 Max-Q, Samsung SSD PM981 MZVLB1T0HALR, IPS, 3840x2160, 15.6" | Dell Inspiron 15 7000 2-in-1 Black Edition i7-8565U, GeForce MX150, Toshiba BG3 KBG30ZMS256G, IPS, 3840x2160, 15.6" | HP Envy x360 15-ee0257ng R5 4500U, Vega 6, Intel SSD 660p SSDPEKNW512G8, IPS, 1920x1080, 15.6" | Lenovo Yoga C740-15IML i7-10510U, UHD Graphics 620, Samsung SSD PM981 MZVLB512HAJQ, IPS LED, 1920x1080, 15.6" | Asus VivoBook Flip 15 TP510UA-E8073T i5-8250U, UHD Graphics 620, SanDisk SD8SN8U128G1002, IPS, 1920x1080, 15.6" | |
|---|---|---|---|---|---|---|
| Power Consumption | -53% | -24% | -15% | -5% | 3% | |
| Idle Minimum * (Watt) | 3.9 | 2.3 41% | 4.2 -8% | 3.9 -0% | 2.97 24% | 3.9 -0% |
| Idle Average * (Watt) | 6.9 | 10.3 -49% | 7.8 -13% | 7 -1% | 7.2 -4% | 7.2 -4% |
| Idle Maximum * (Watt) | 8.5 | 11 -29% | 8.5 -0% | 10.5 -24% | 9.9 -16% | 9.5 -12% |
| Load Average * (Watt) | 30.5 | 77 -152% | 57 -87% | 48 -57% | 40.8 -34% | 36.8 -21% |
| Witcher 3 ultra * (Watt) | 42.6 | 68 -60% | 57.3 -35% | |||
| Load Maximum * (Watt) | 69.7 | 118 -69% | 68 2% | 65 7% | 64.7 7% | 33.1 53% |
* ... smaller is better
Battery Life
Battery capacity is slightly smaller than on the older 2018 model (53 Wh vs. 56 Wh), but WLAN runtimes are 90 minutes longer likely due to design improvements and the newer and more efficient processor.
Charging from empty to full capacity takes about 2 hours. It's possible to recharge the system via USB-C as well.
| Dell Inspiron 15 7506 2-in-1 P97F i5-1135G7, Iris Xe G7 80EUs, 53 Wh | Asus ZenBook Flip 15 UX563FD-A1027T i7-10510U, GeForce GTX 1050 Max-Q, 71 Wh | Dell Inspiron 15 7000 2-in-1 Black Edition i7-8565U, GeForce MX150, 56 Wh | HP Envy x360 15-ee0257ng R5 4500U, Vega 6, 51 Wh | Lenovo Yoga C740-15IML i7-10510U, UHD Graphics 620, 60.3 Wh | Asus VivoBook Flip 15 TP510UA-E8073T i5-8250U, UHD Graphics 620, 42 Wh | |
|---|---|---|---|---|---|---|
| Battery runtime | 36% | -20% | 13% | 40% | -28% | |
| Reader / Idle (h) | 18.8 | 19.5 4% | ||||
| WiFi v1.3 (h) | 8.3 | 9.4 13% | 6.6 -20% | 9.4 13% | 10.4 25% | 6 -28% |
| Load (h) | 1.3 | 2.5 92% | 2 54% |
Pros
Cons
Verdict
The main differentiating factor between the Inspiron 15 7506 2-in-1 Silver Edition and other 15.6-inch convertibles with older CPUs is its support for Thunderbolt 4. Laptops like the Asus ZenBook Flip 15, VivoBook Flip 15, or HP Envy x360 15 do not support Thunderbolt at all which limit their docking capabilities. If you plan to exploit this feature with eGPUs and multiple 4K monitors, then the Dell convertible will offer a ton of value.
Other notable features are the fast processor performance and readily accessible RAM and SSD. Owning a convertible laptop doesn't mean you'll have to sacrifice performance or serviceability with this Dell system.
As for the negatives, the soft clickpad and keyboard feedback could use more attention. Its keys are nowhere near as firm or satisfying to type on when compared to the HP Envy x360 15 and its gray font can also be difficult to see against the gray key caps. If you can get used to the mediocre keyboard and clickpad, then the Inspiron 15 7506 2-in-1 will prove itself to be a versatile solution with its form factor, steady performance, and wide connectivity options.
A balanced convertible with great performance, serviceability, and Thunderbolt 4 support. However, there's still a lot of room for improvement in regards to the clickpad and display brightness.
Dell Inspiron 15 7506 2-in-1 P97F
- 12/20/2020 v7 (old)
Allen Ngo
Price comparison
