Dell Inspiron 15 5502 Laptop Review: Intel 11th Gen For The Masses
The Dell Inspiron series consists of budget to mid-range laptops to contrast the higher-end and more well-known XPS series. These models typically lack the luxurious metal and carbon fiber skeletons in favor of more down-to-earth designs and features. Unsurprisingly, Inspiron laptops often retail for half the price or even less than the typical XPS laptop.
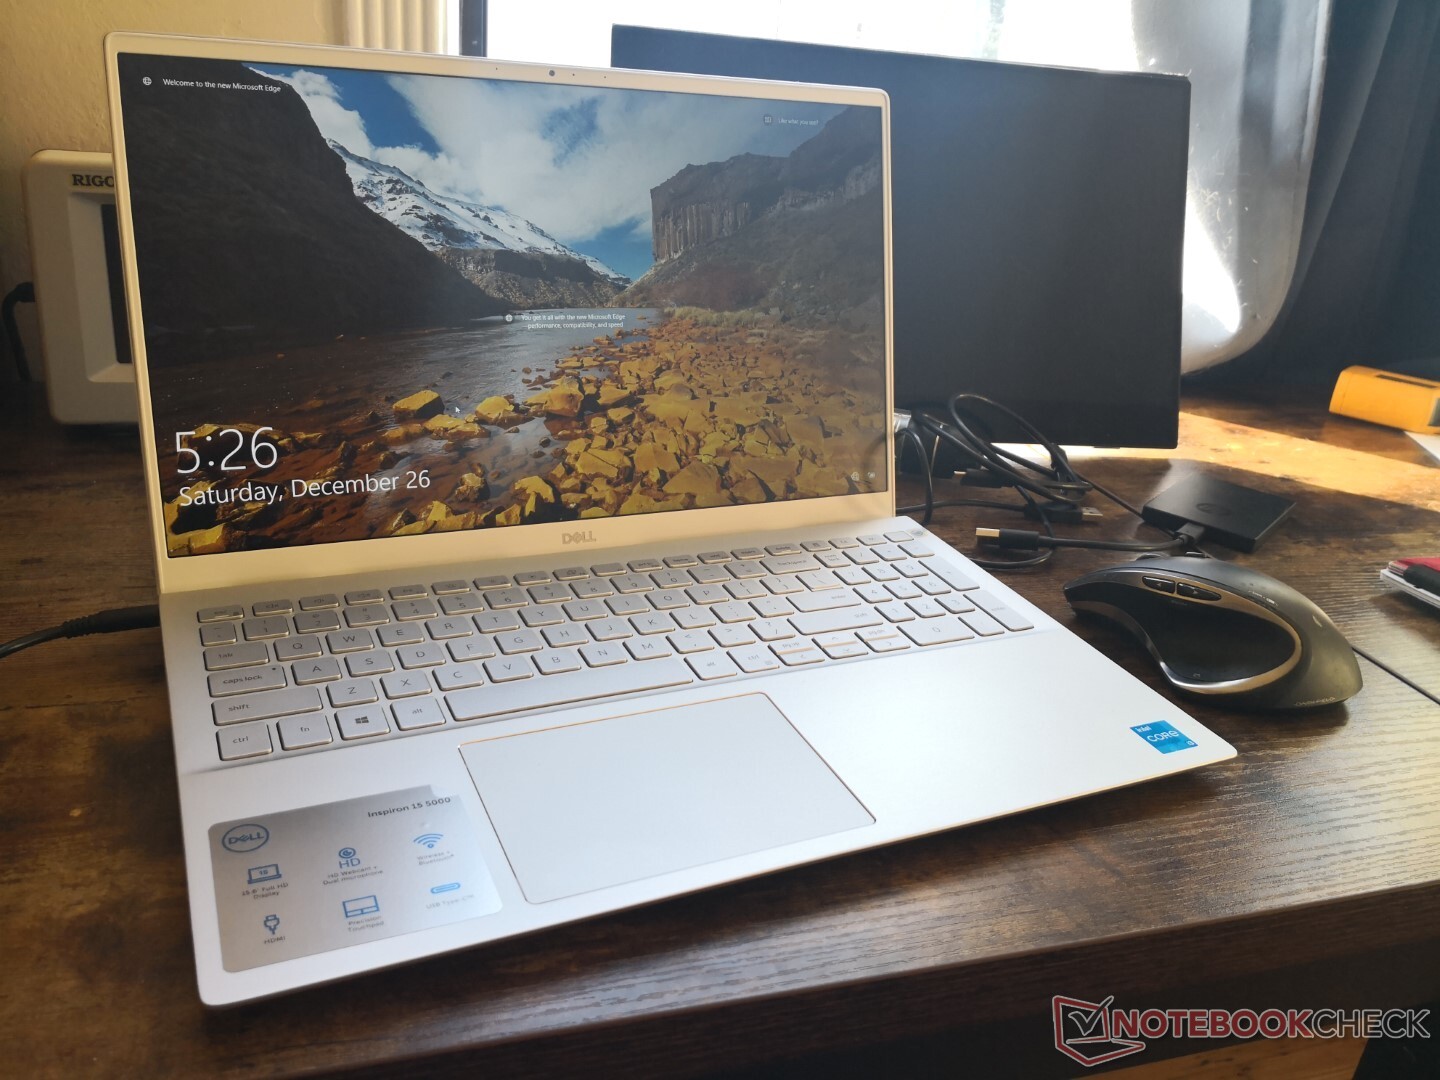
Our unit for this review is the baseline Inspiron 15 5502 which succeeds last year's Inspiron 5584. The 5502 introduces a new chassis design alongside Intel's latest 11th gen Tiger Lake options. SKUs range from the Core i3-1105G4 CPU with 8 GB of RAM, 256 GB SSD, and 1080p non-touchscreen for about $500 USD up to the Core i7-1165G7 with 12 GB of RAM, 512 GB SSD, and 1080p touchscreen for $850 USD.
Competitors in this space include other inexpensive or budget 15.6-inch multimedia laptops like the Asus VivoBook S15, Honor MagicBook 15, Lenovo IdeaPad 3 or IdeaPad 5 series, or the HP Pavilion 15 series.
More Dell reviews:
potential competitors in comparison
Rating | Date | Model | Weight | Height | Size | Resolution | Price |
|---|---|---|---|---|---|---|---|
| 78.2 % v7 (old) | 12 / 2020 | Dell Inspiron 15 5000 5502 i3-1115G4, UHD Graphics Xe G4 48EUs | 1.6 kg | 17.9 mm | 15.60" | 1920x1080 | |
| 81.2 % v7 (old) | 12 / 2020 | Dell Inspiron 15 7506 2-in-1 P97F i5-1135G7, Iris Xe G7 80EUs | 1.8 kg | 17.94 mm | 15.60" | 1920x1080 | |
| 83.4 % v7 (old) | 12 / 2020 | Asus VivoBook S15 S533EQ-BQ002T i7-1165G7, GeForce MX350 | 1.8 kg | 16.1 mm | 15.60" | 1920x1080 | |
| 82.8 % v7 (old) | 07 / 2020 | Honor MagicBook 15 R5 3500U, Vega 8 | 1.5 kg | 16.9 mm | 15.60" | 1920x1080 | |
| 83 % v7 (old) | 07 / 2020 | Lenovo IdeaPad 5 15IIL05 i5-1035G1, GeForce MX350 | 1.7 kg | 17.9 mm | 15.60" | 1920x1080 | |
| 79.4 % v7 (old) | 03 / 2020 | Lenovo Ideapad S340-15IIL i7-1065G7, Iris Plus Graphics G7 (Ice Lake 64 EU) | 1.8 kg | 17.9 mm | 15.60" | 1920x1080 |
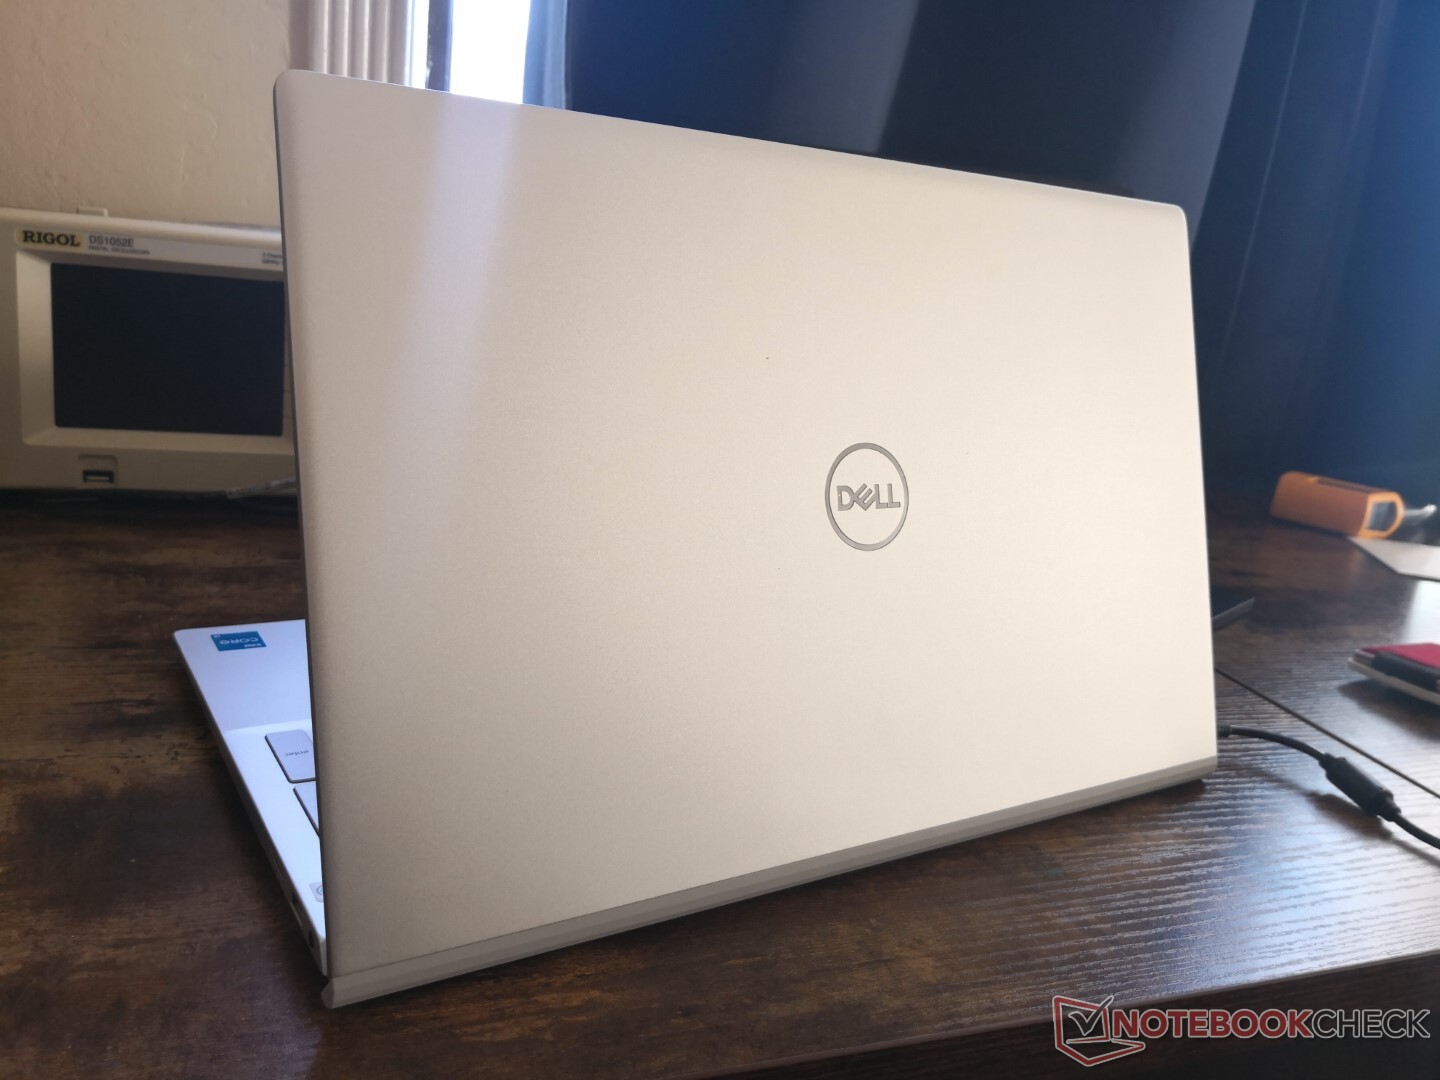
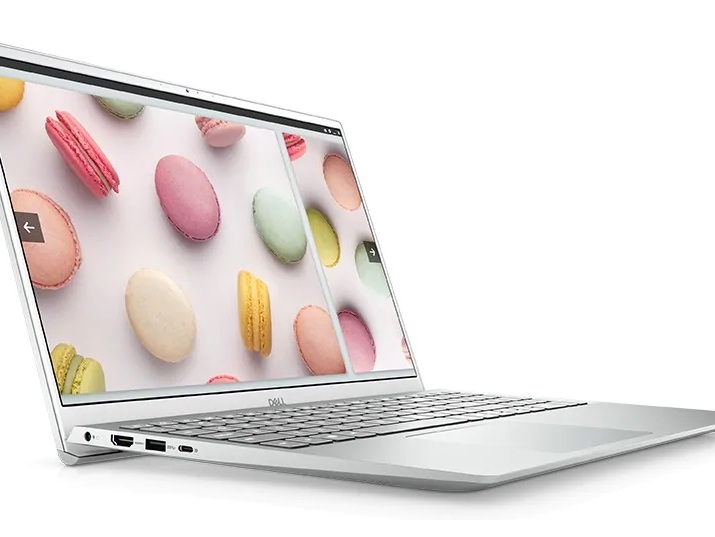
Case
The chassis is plastic and more prone to flexing down the keyboard center and outer lid than say the pricier HP Envy or Lenovo Yoga. When compared to the similarly priced Lenovo IdeaPad 3 or older HP Pavilion 15, however, chassis rigidity is comparable and not all that much better or worse.
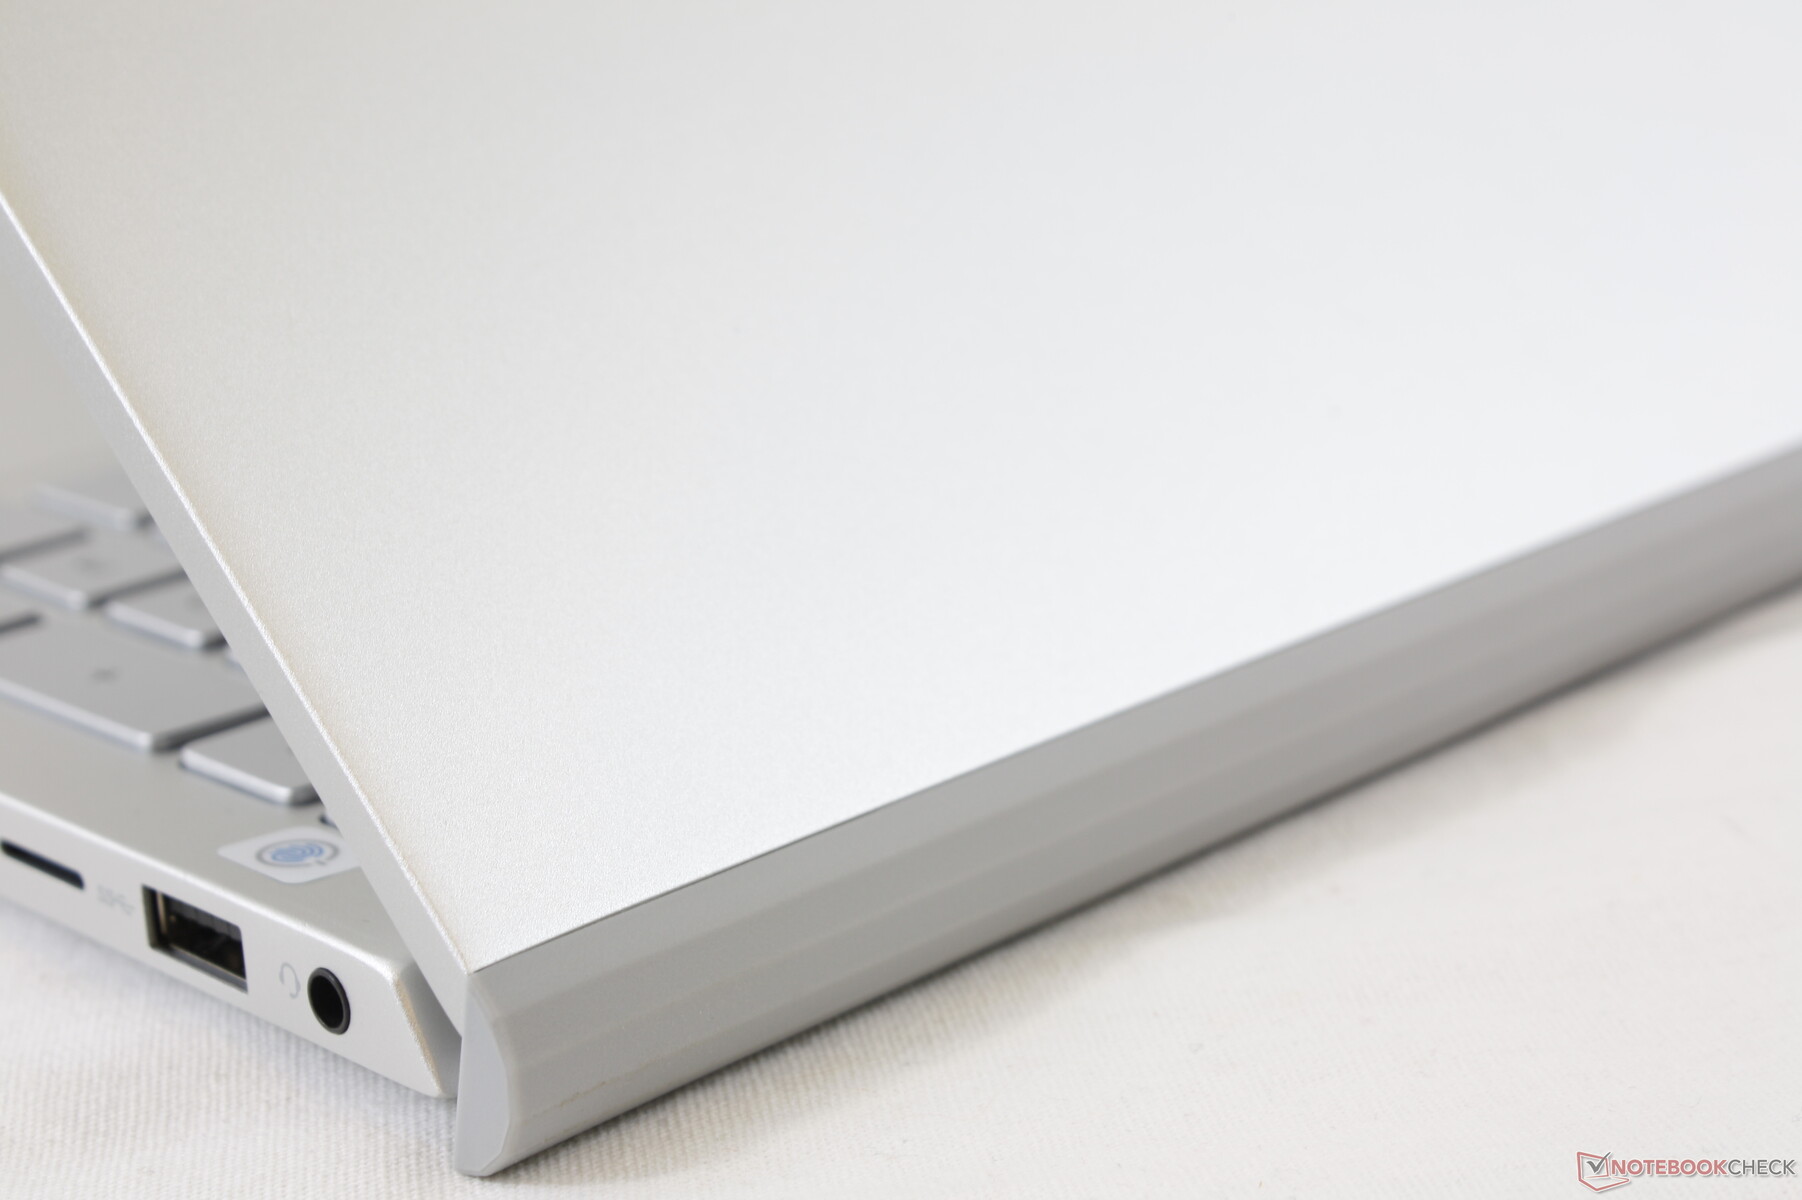
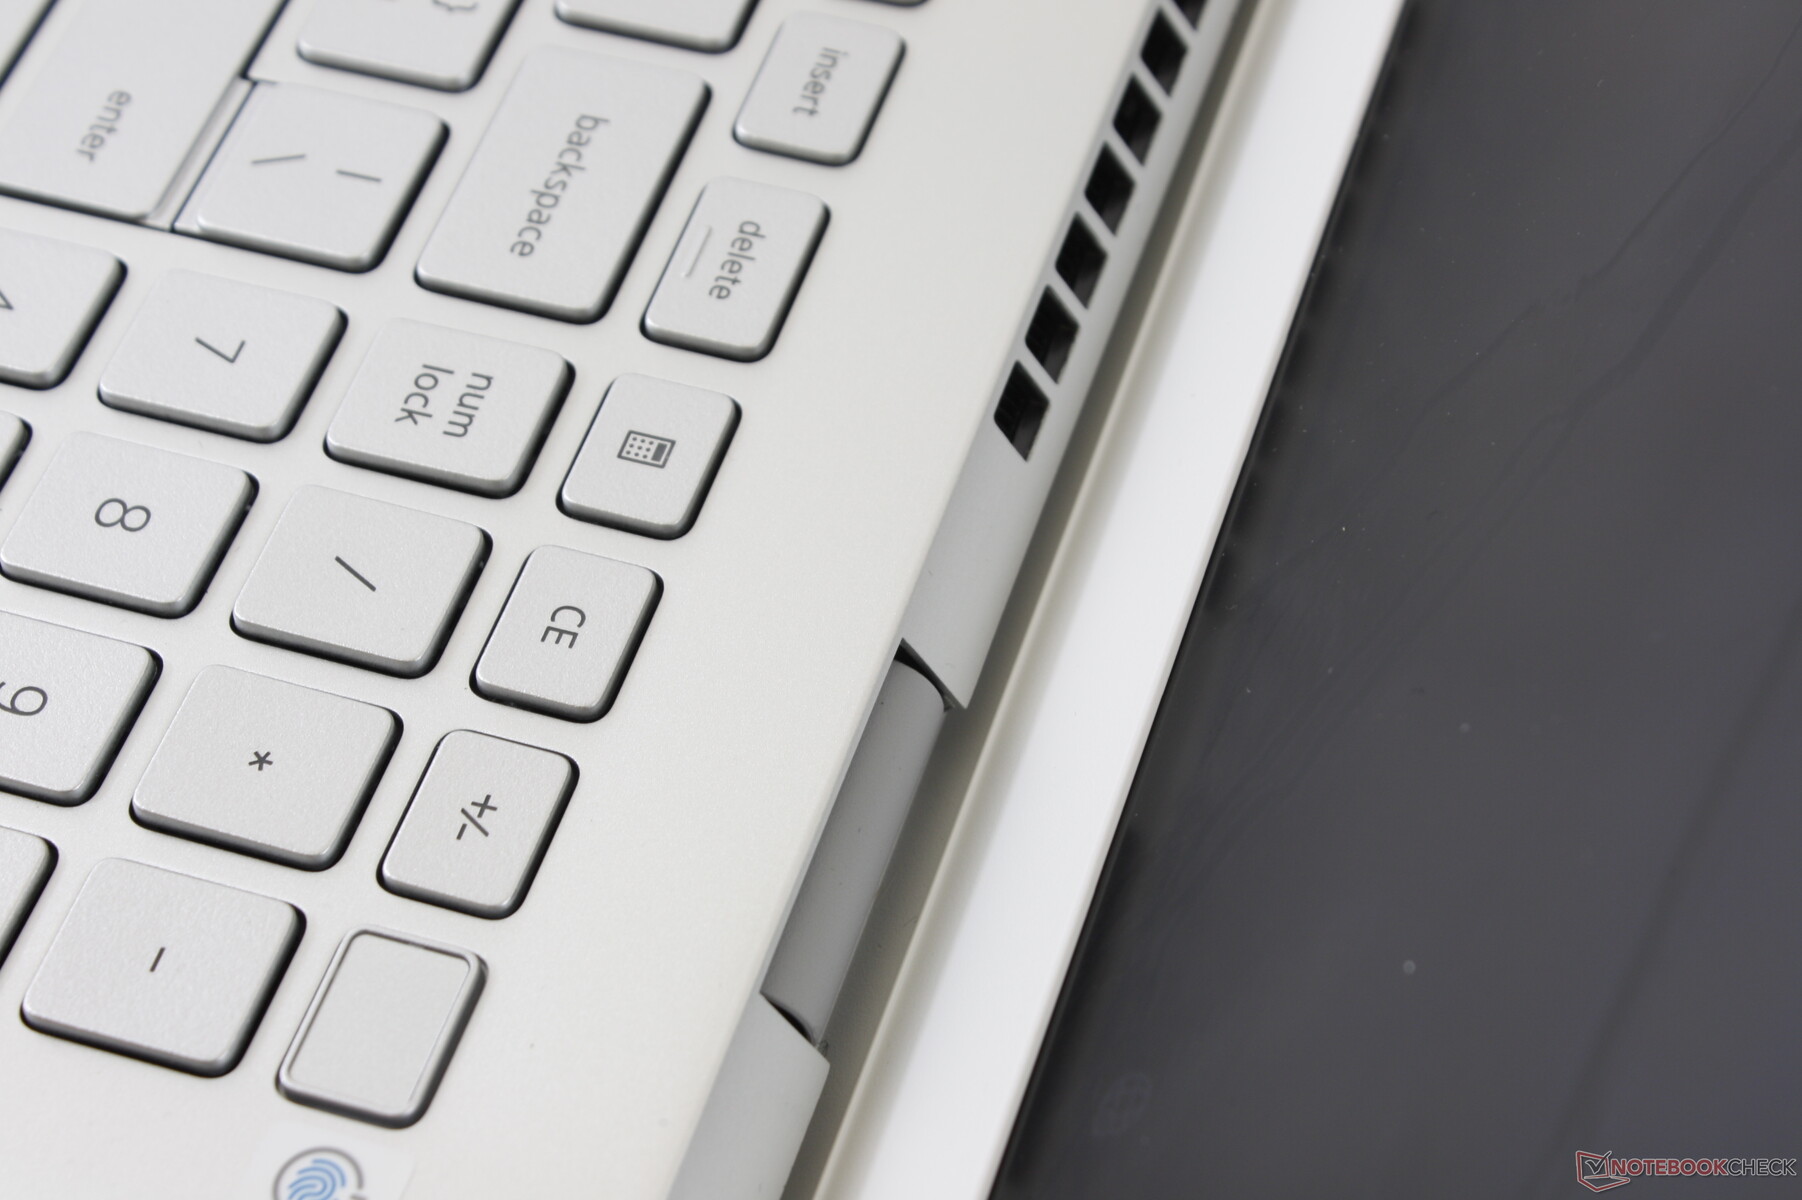
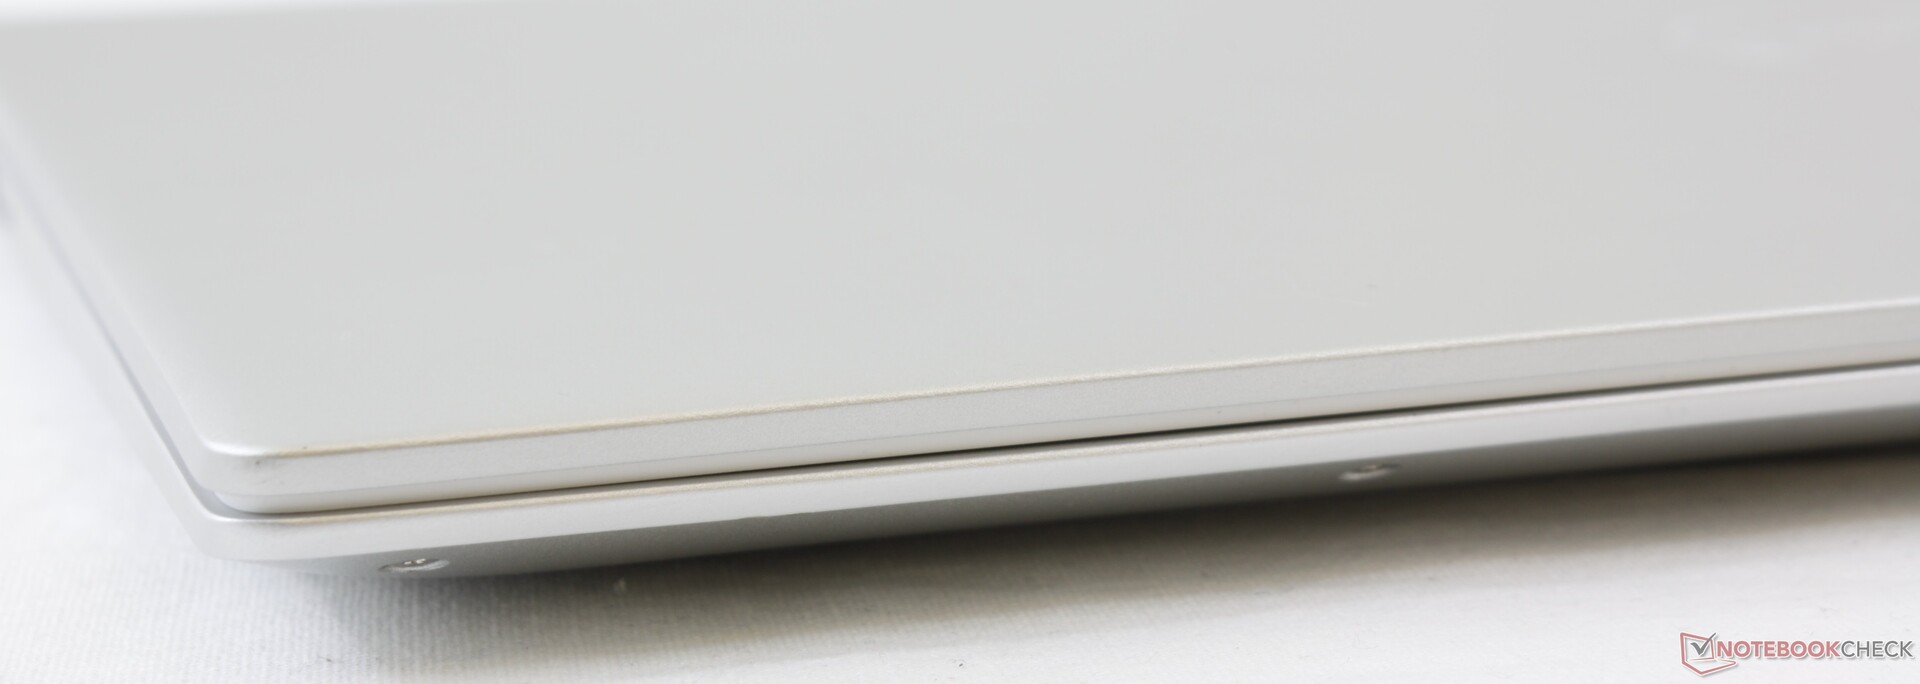
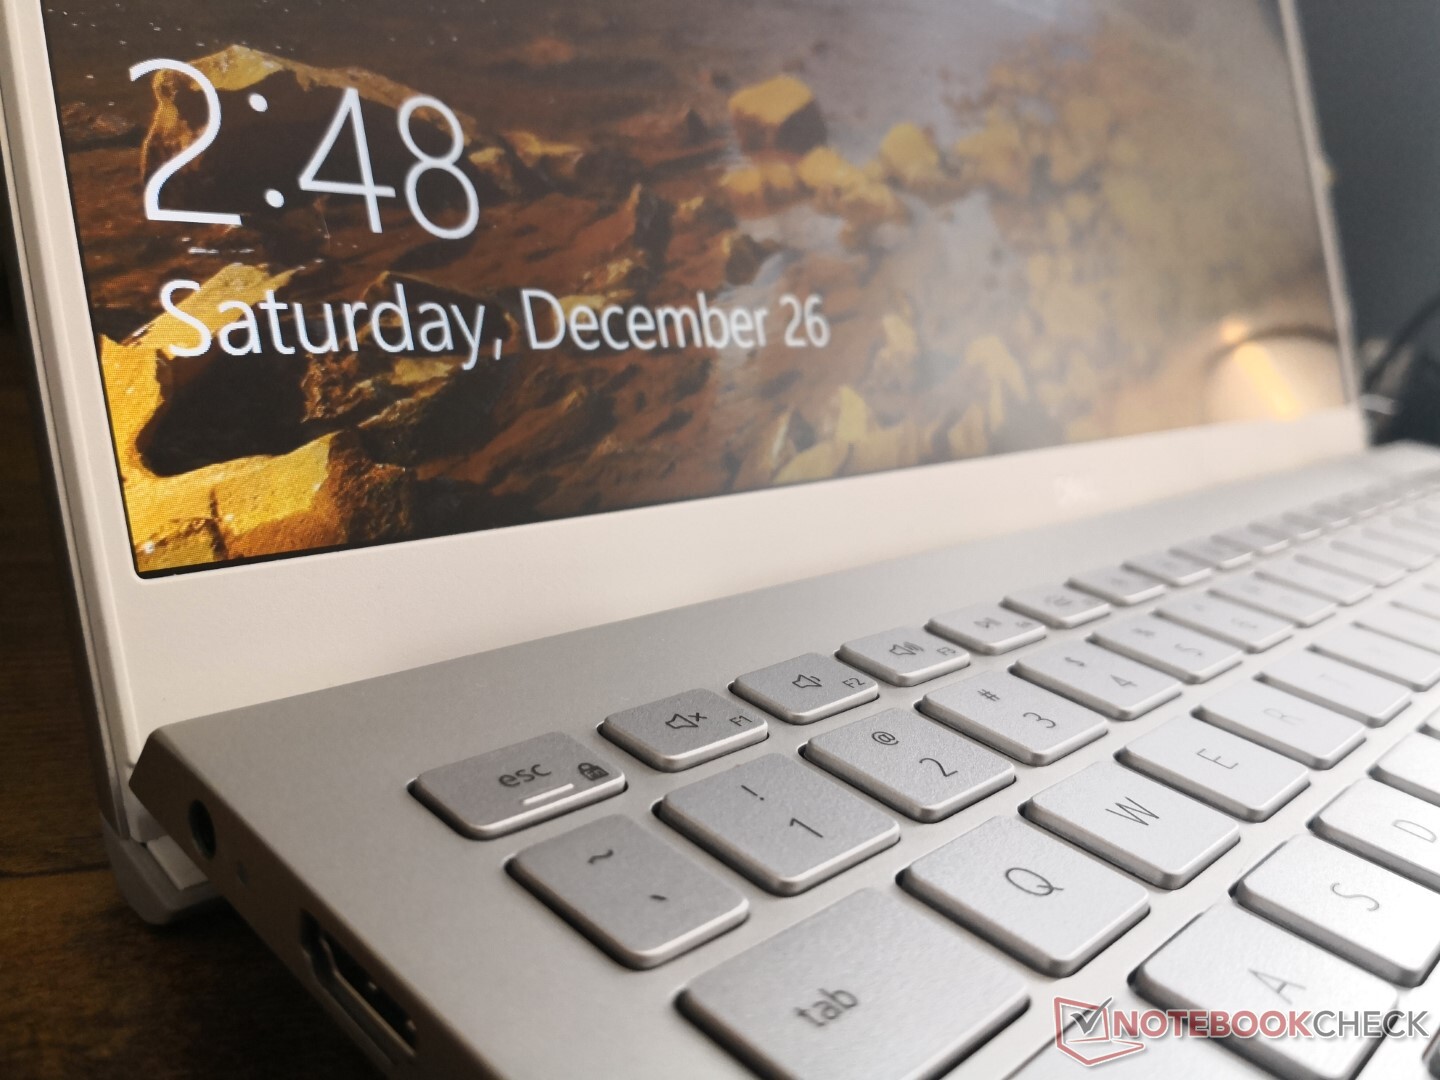
The hinges are the biggest difference between the 2020 Inspiron 15 and previous generation models. Dell has implemented what Asus calls "ErgoLift" hinges where the base will rise at a slight angle when the lid is opened. The rear is lined with rubber since this section of the lid will always slide against the table.
Hinge rigidity feels taut and uniform at all angles. Teetering remains when changing angles but it's minimal enough to not be of any concern.
Overall dimensions are very close to competing models like the Asus VivoBook 15, Lenovo IdeaPad 5 or Honor MagicBook 15 by just a few millimeters each. However, our Dell system has the slight advantage in weight as it's about 100 g to 200 g lighter than the aforementioned alternatives.

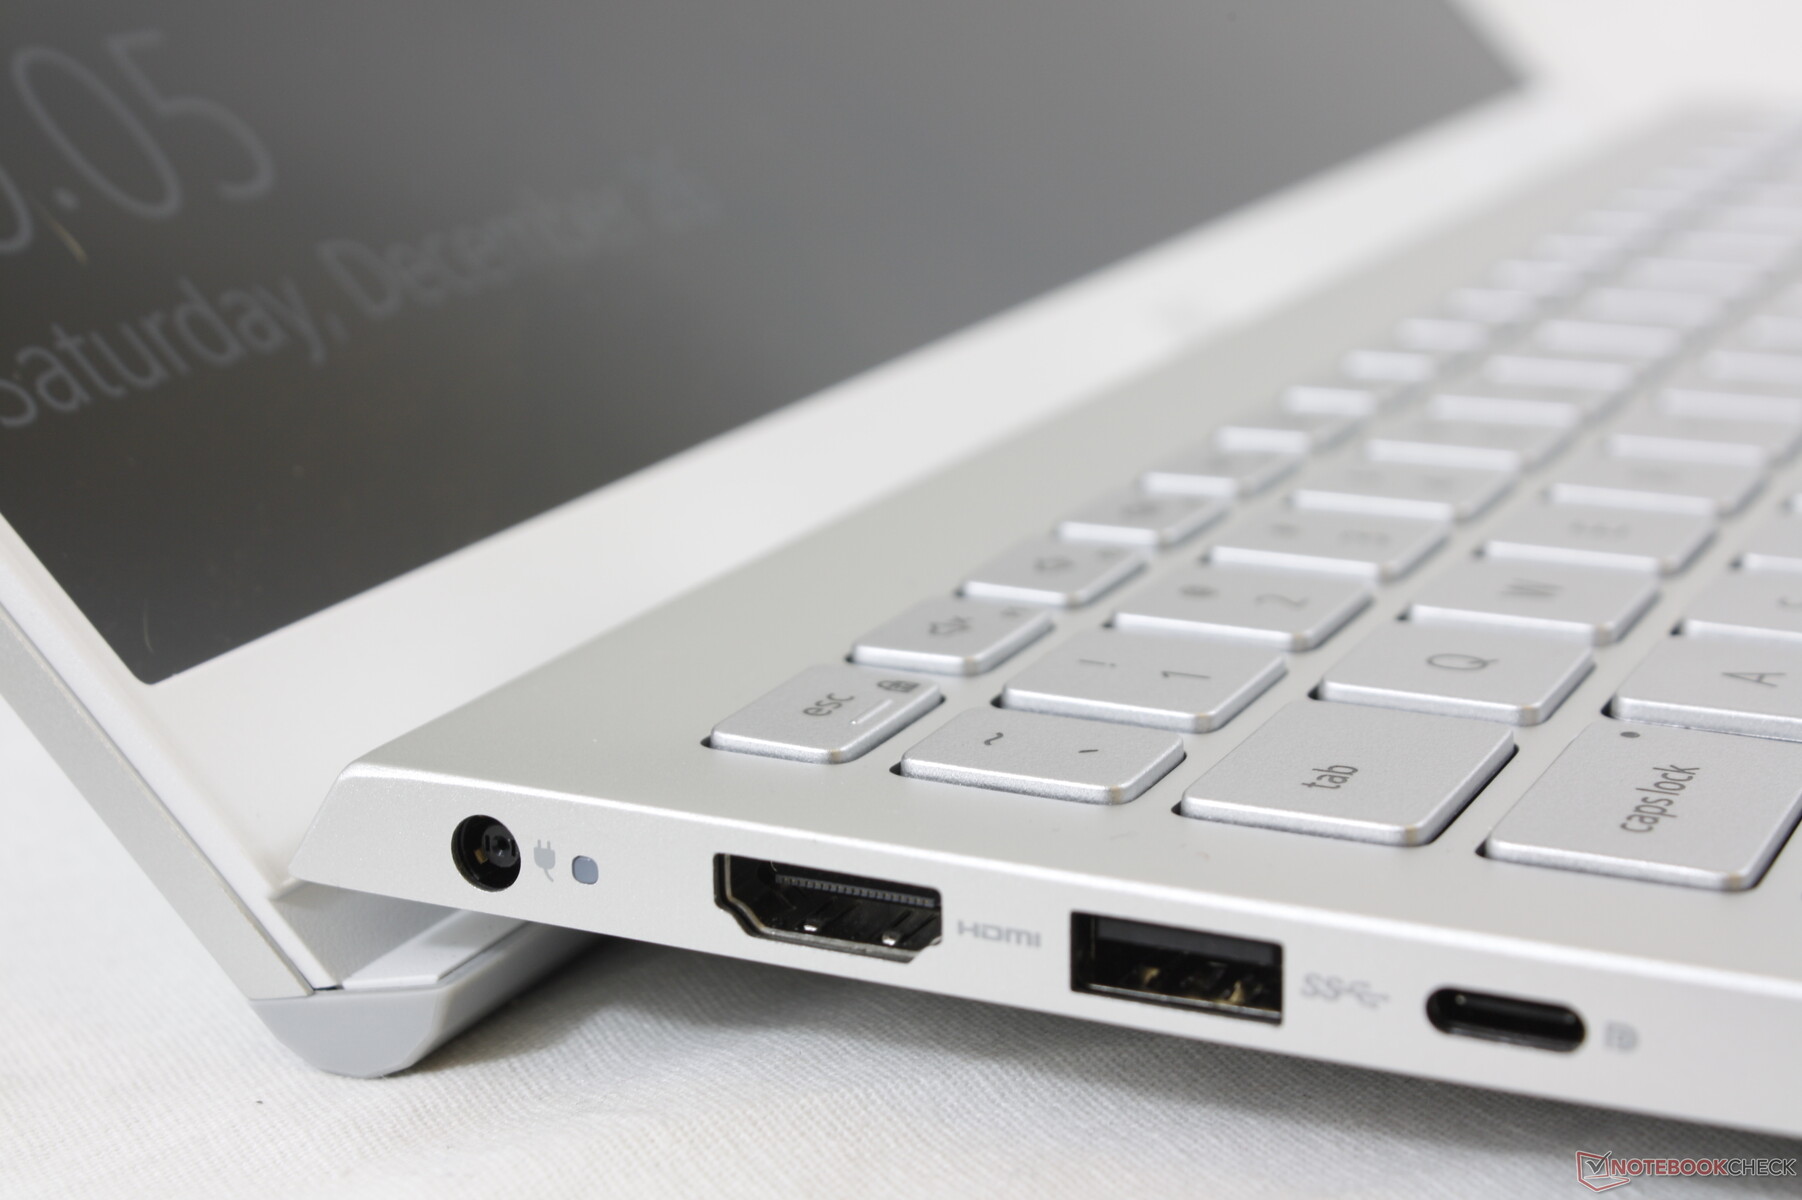
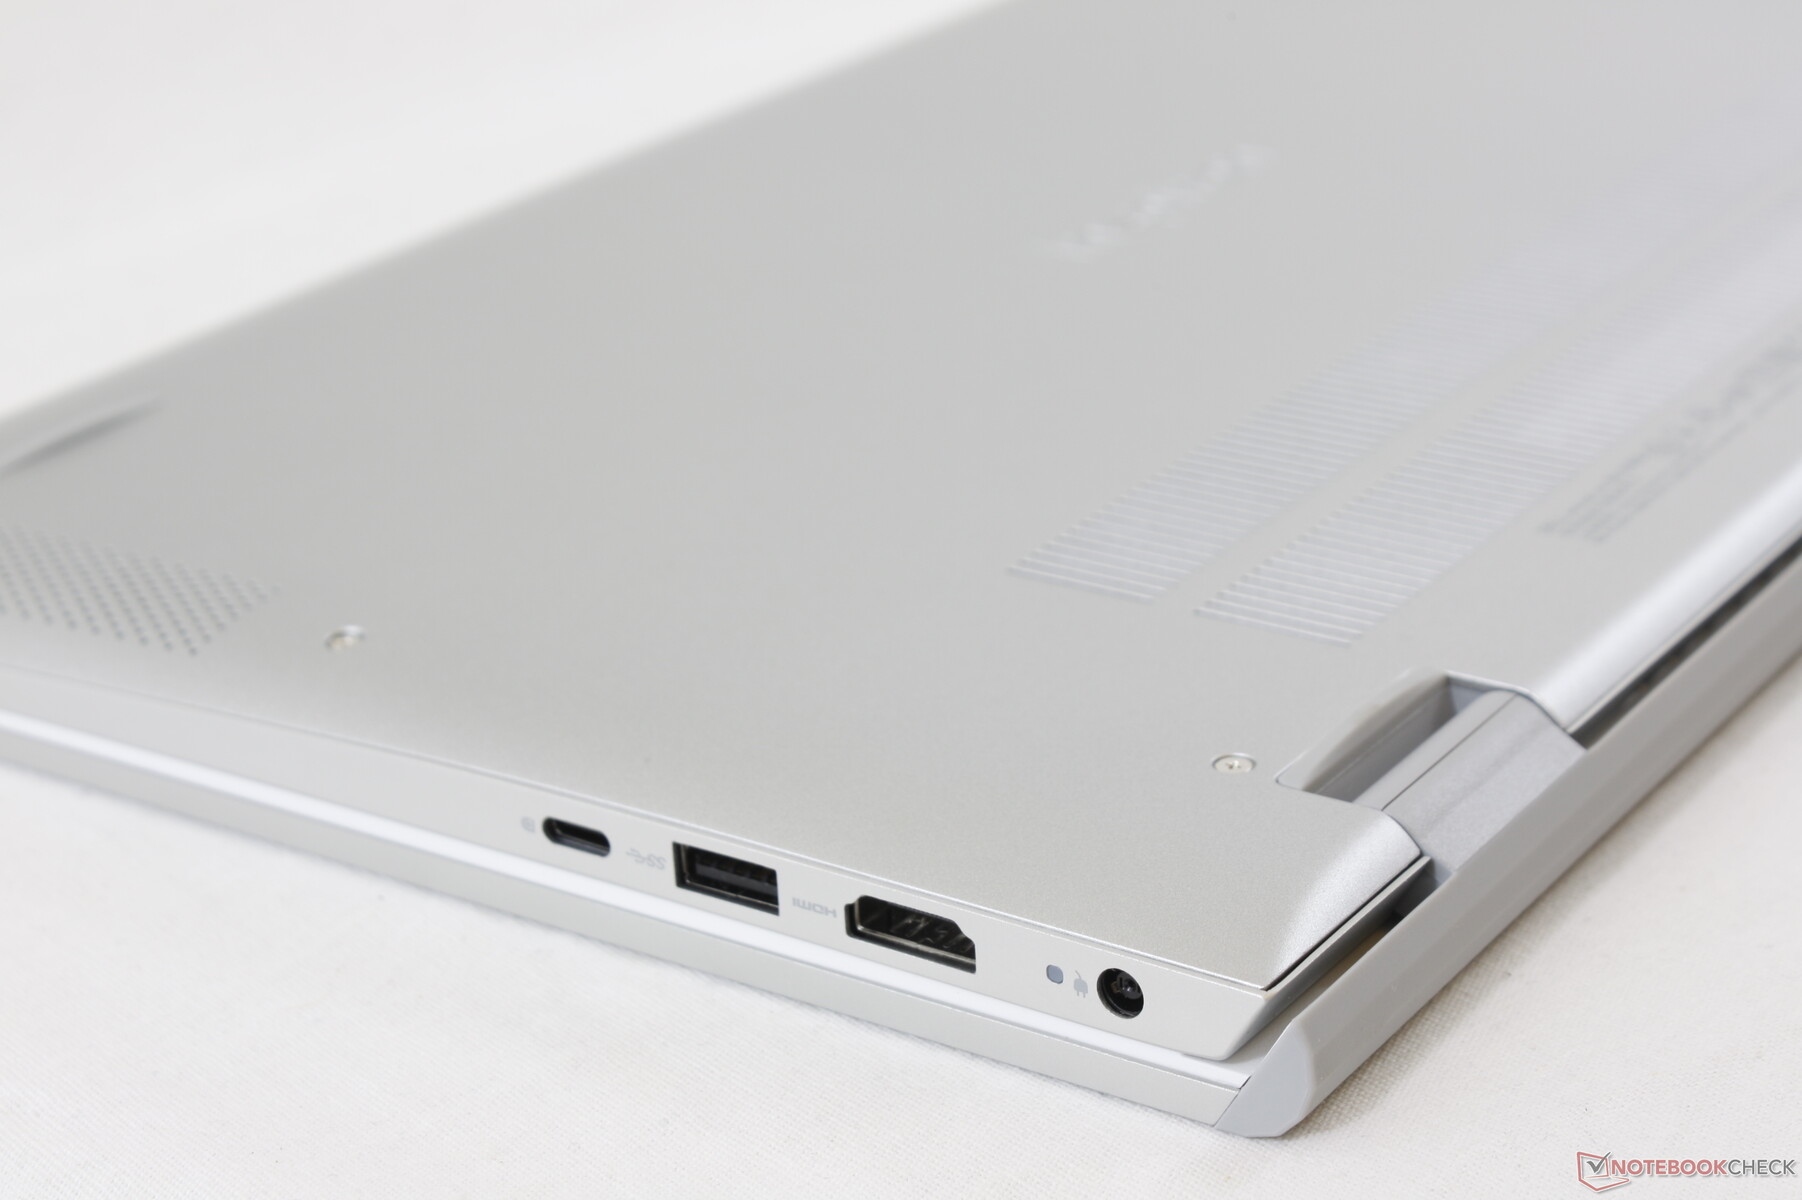
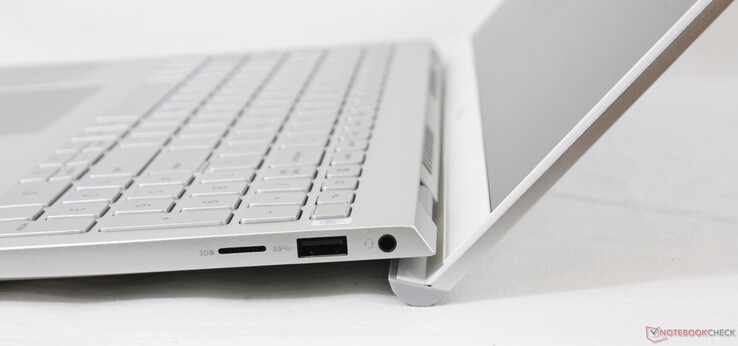
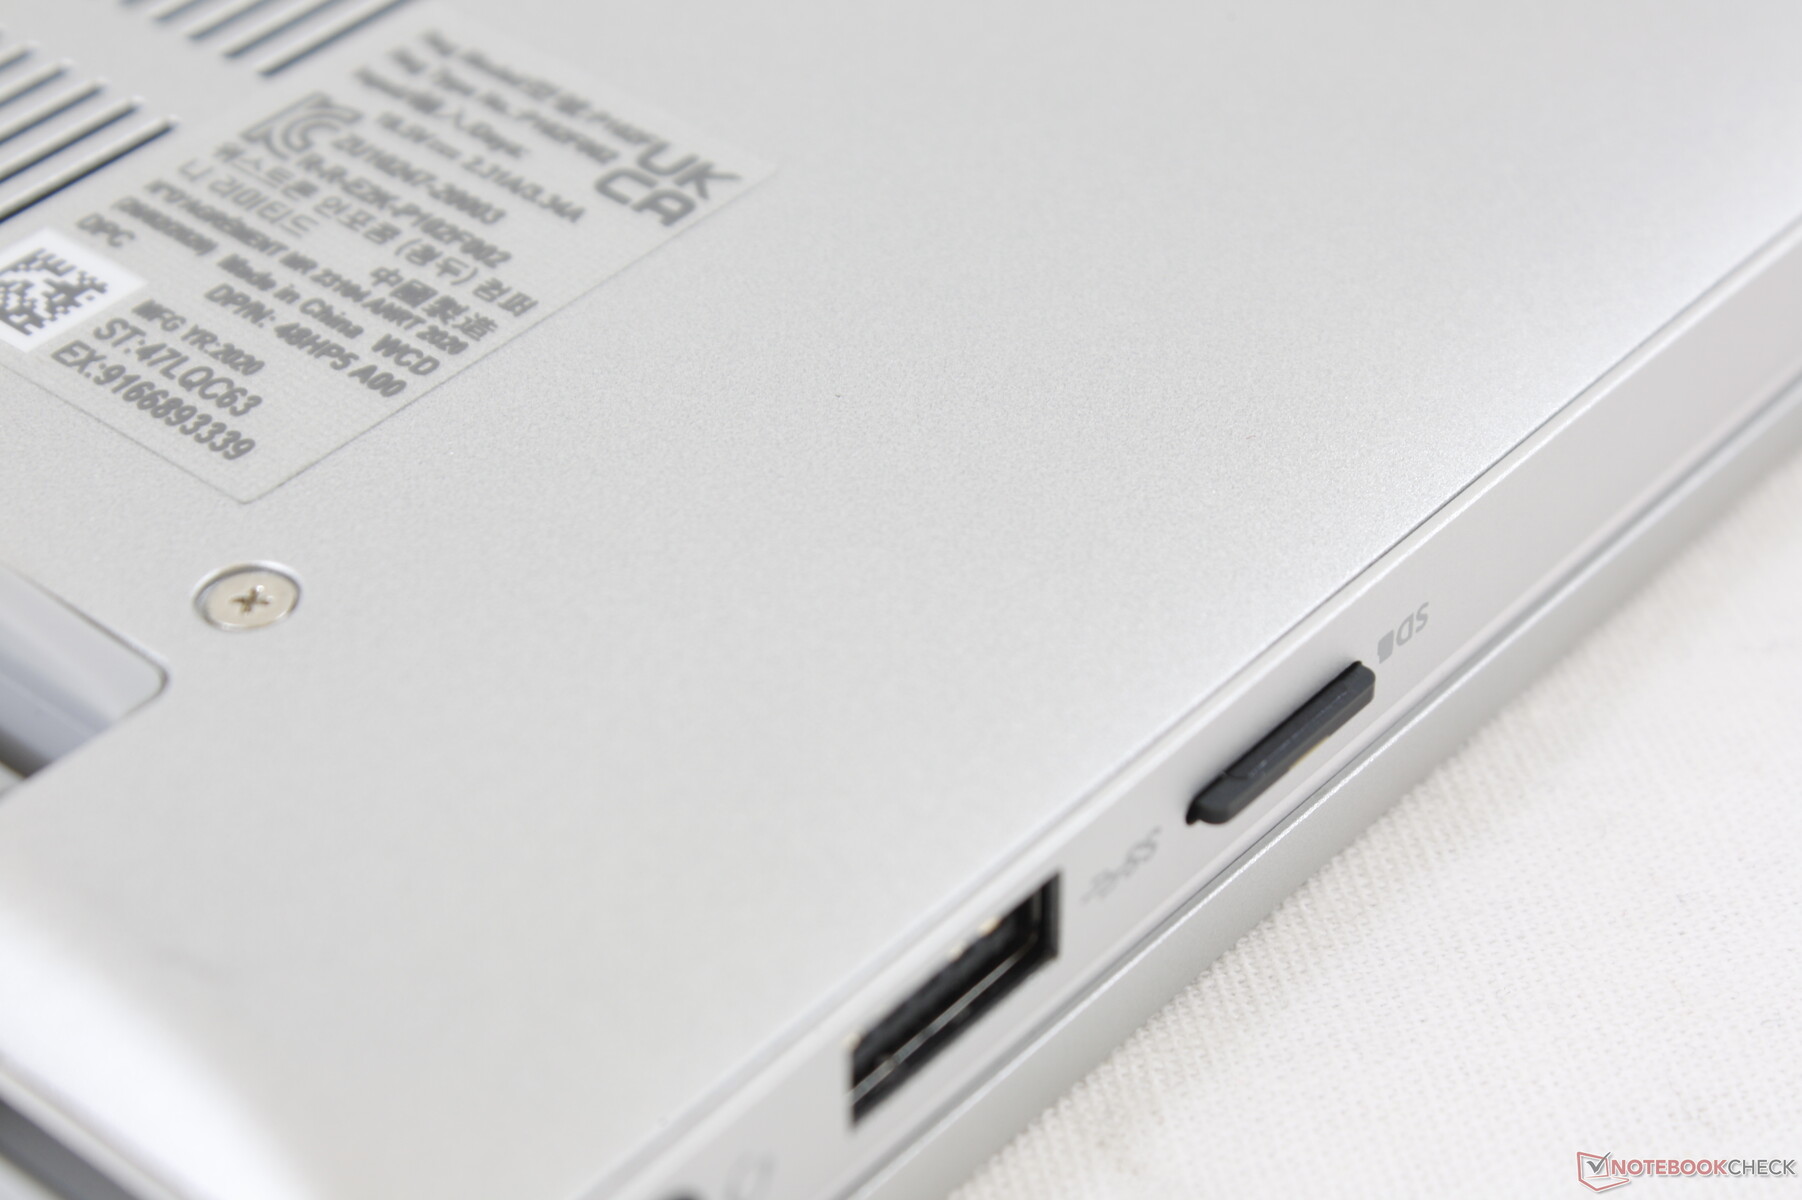
Connectivity
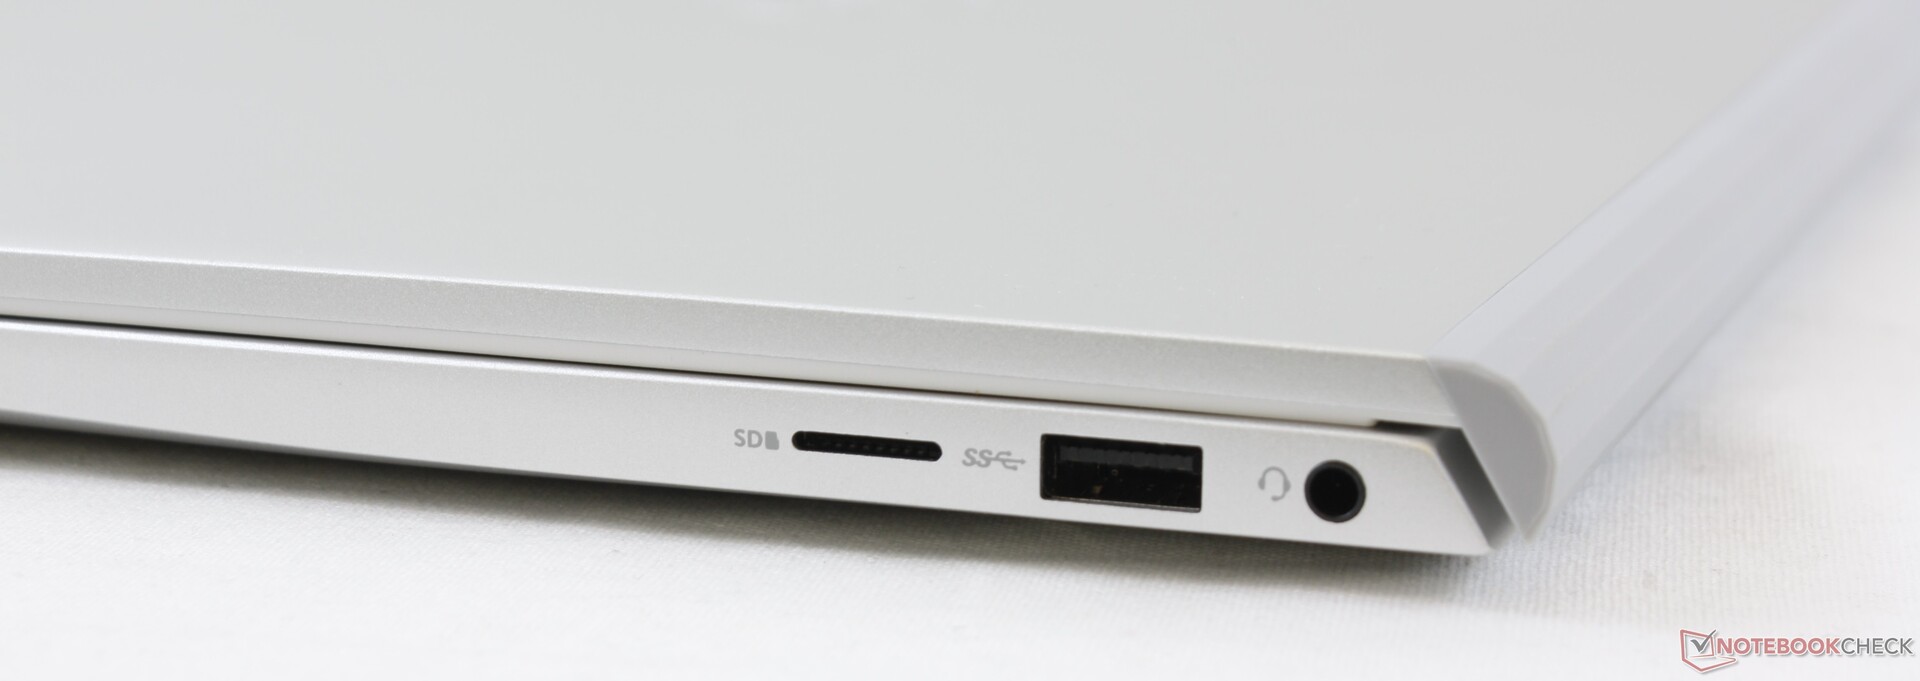
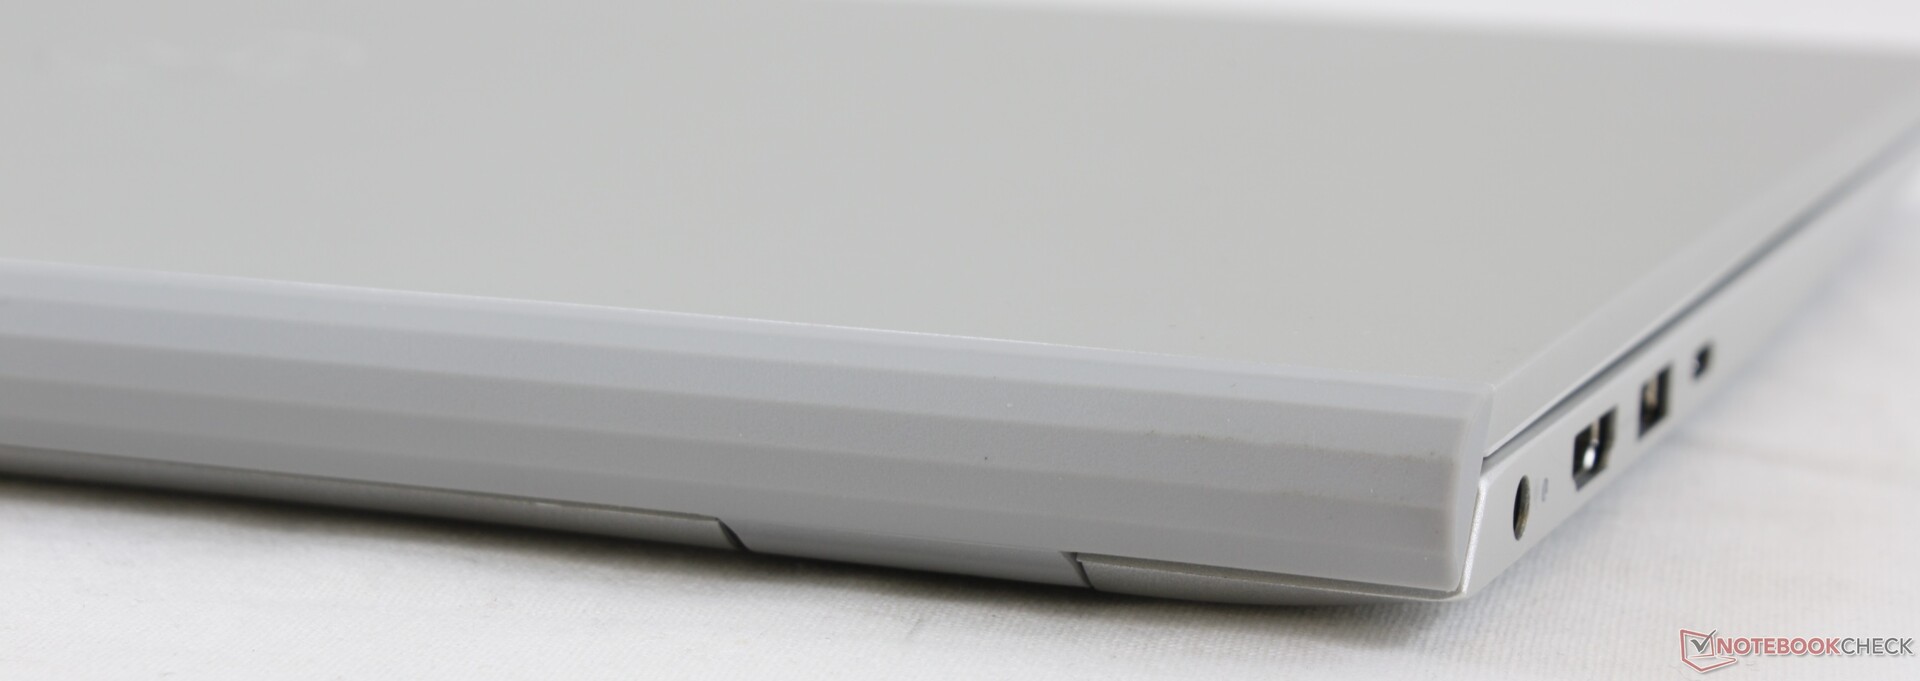
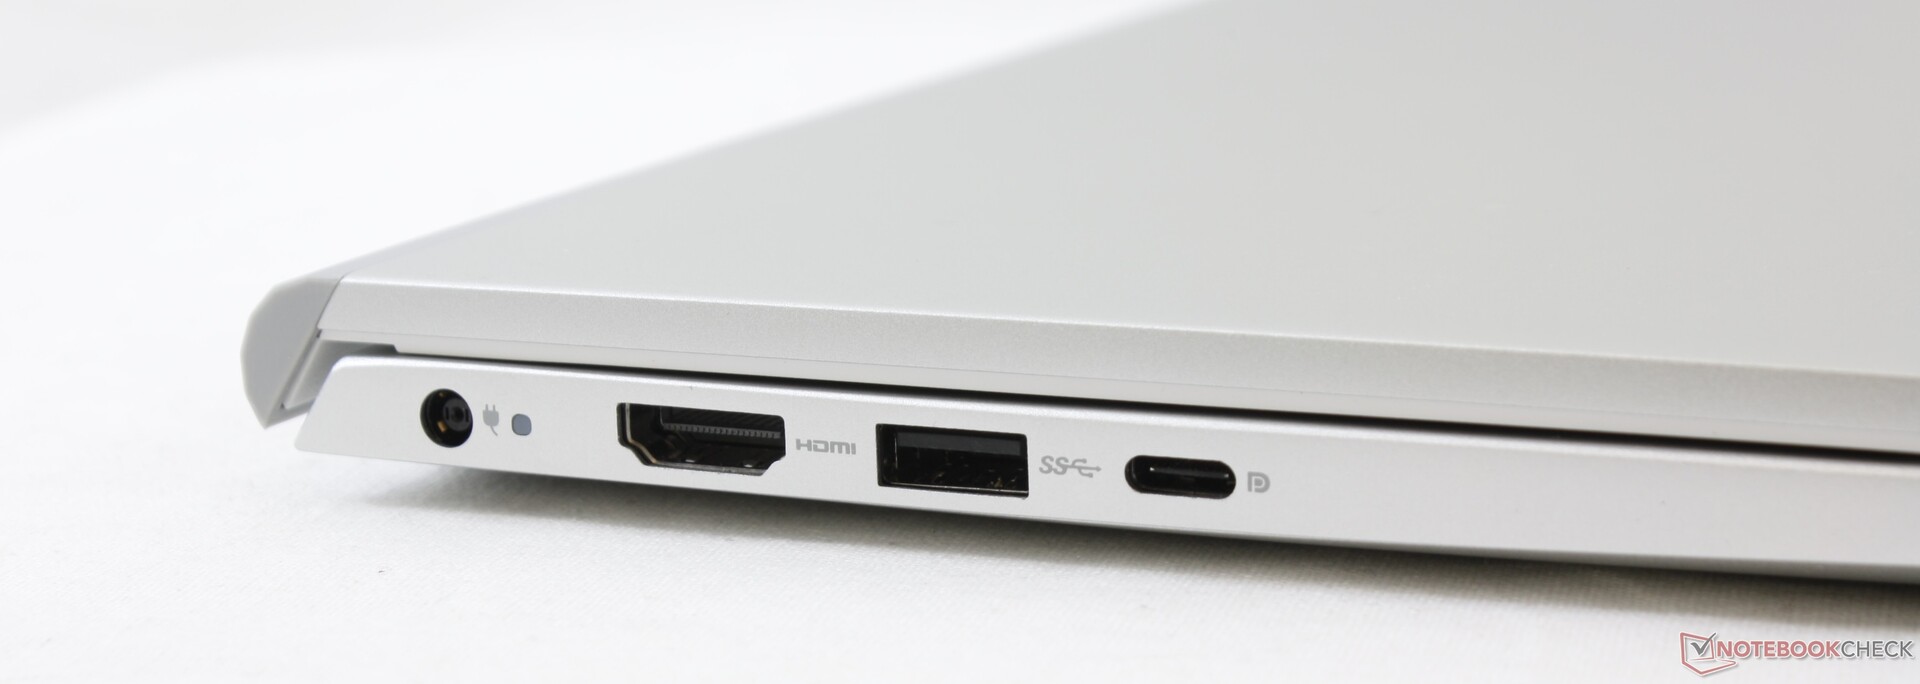
Port options are similar to the Lenovo IdeaPad S340 except that the SD reader on our Dell is a MicroSD reader instead. Keep in mind that the USB-C port here does not support Thunderbolt at all unlike on the pricier Inspiron 15 7506.
SD Card Reader
| SD Card Reader | |
| average JPG Copy Test (av. of 3 runs) | |
| Lenovo Ideapad S340-15IIL (Toshiba Exceria Pro SDXC 64 GB UHS-II) | |
| Asus VivoBook S15 S533EQ-BQ002T (Toshiba Exceria Pro M501 microSDXC 64GB) | |
| Dell Inspiron 15 7506 2-in-1 P97F (Toshiba Exceria Pro SDXC 64 GB UHS-II) | |
| Lenovo IdeaPad 5 15IIL05 (Toshiba Exceria Pro SDXC 64 GB UHS-II) | |
| Dell Inspiron 15 5000 5502 (Toshiba Exceria Pro M501 microSDXC 32GB) | |
| maximum AS SSD Seq Read Test (1GB) | |
| Lenovo Ideapad S340-15IIL (Toshiba Exceria Pro SDXC 64 GB UHS-II) | |
| Lenovo IdeaPad 5 15IIL05 (Toshiba Exceria Pro SDXC 64 GB UHS-II) | |
| Dell Inspiron 15 7506 2-in-1 P97F (Toshiba Exceria Pro SDXC 64 GB UHS-II) | |
| Dell Inspiron 15 5000 5502 (Toshiba Exceria Pro M501 microSDXC 32GB) | |
| Asus VivoBook S15 S533EQ-BQ002T (Toshiba Exceria Pro M501 microSDXC 64GB) | |
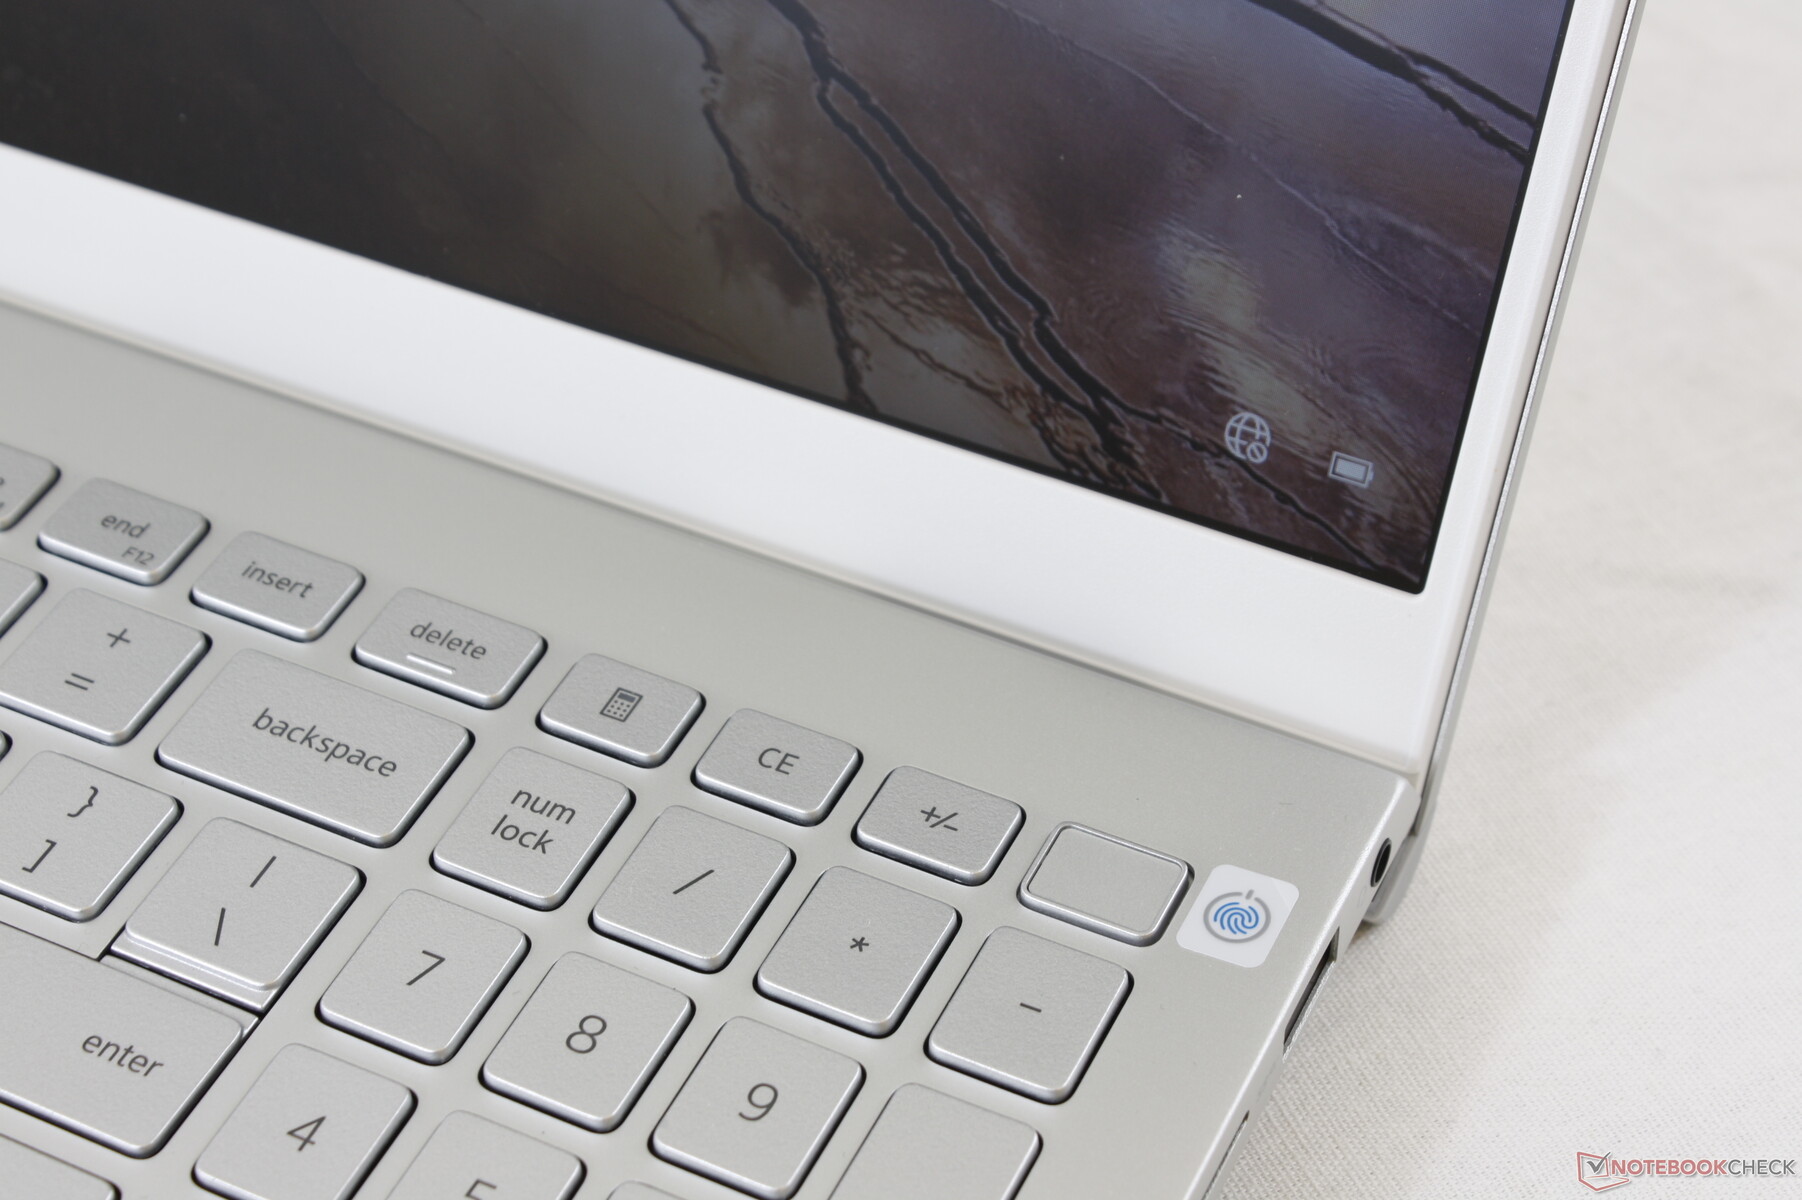
Communication
Webcam


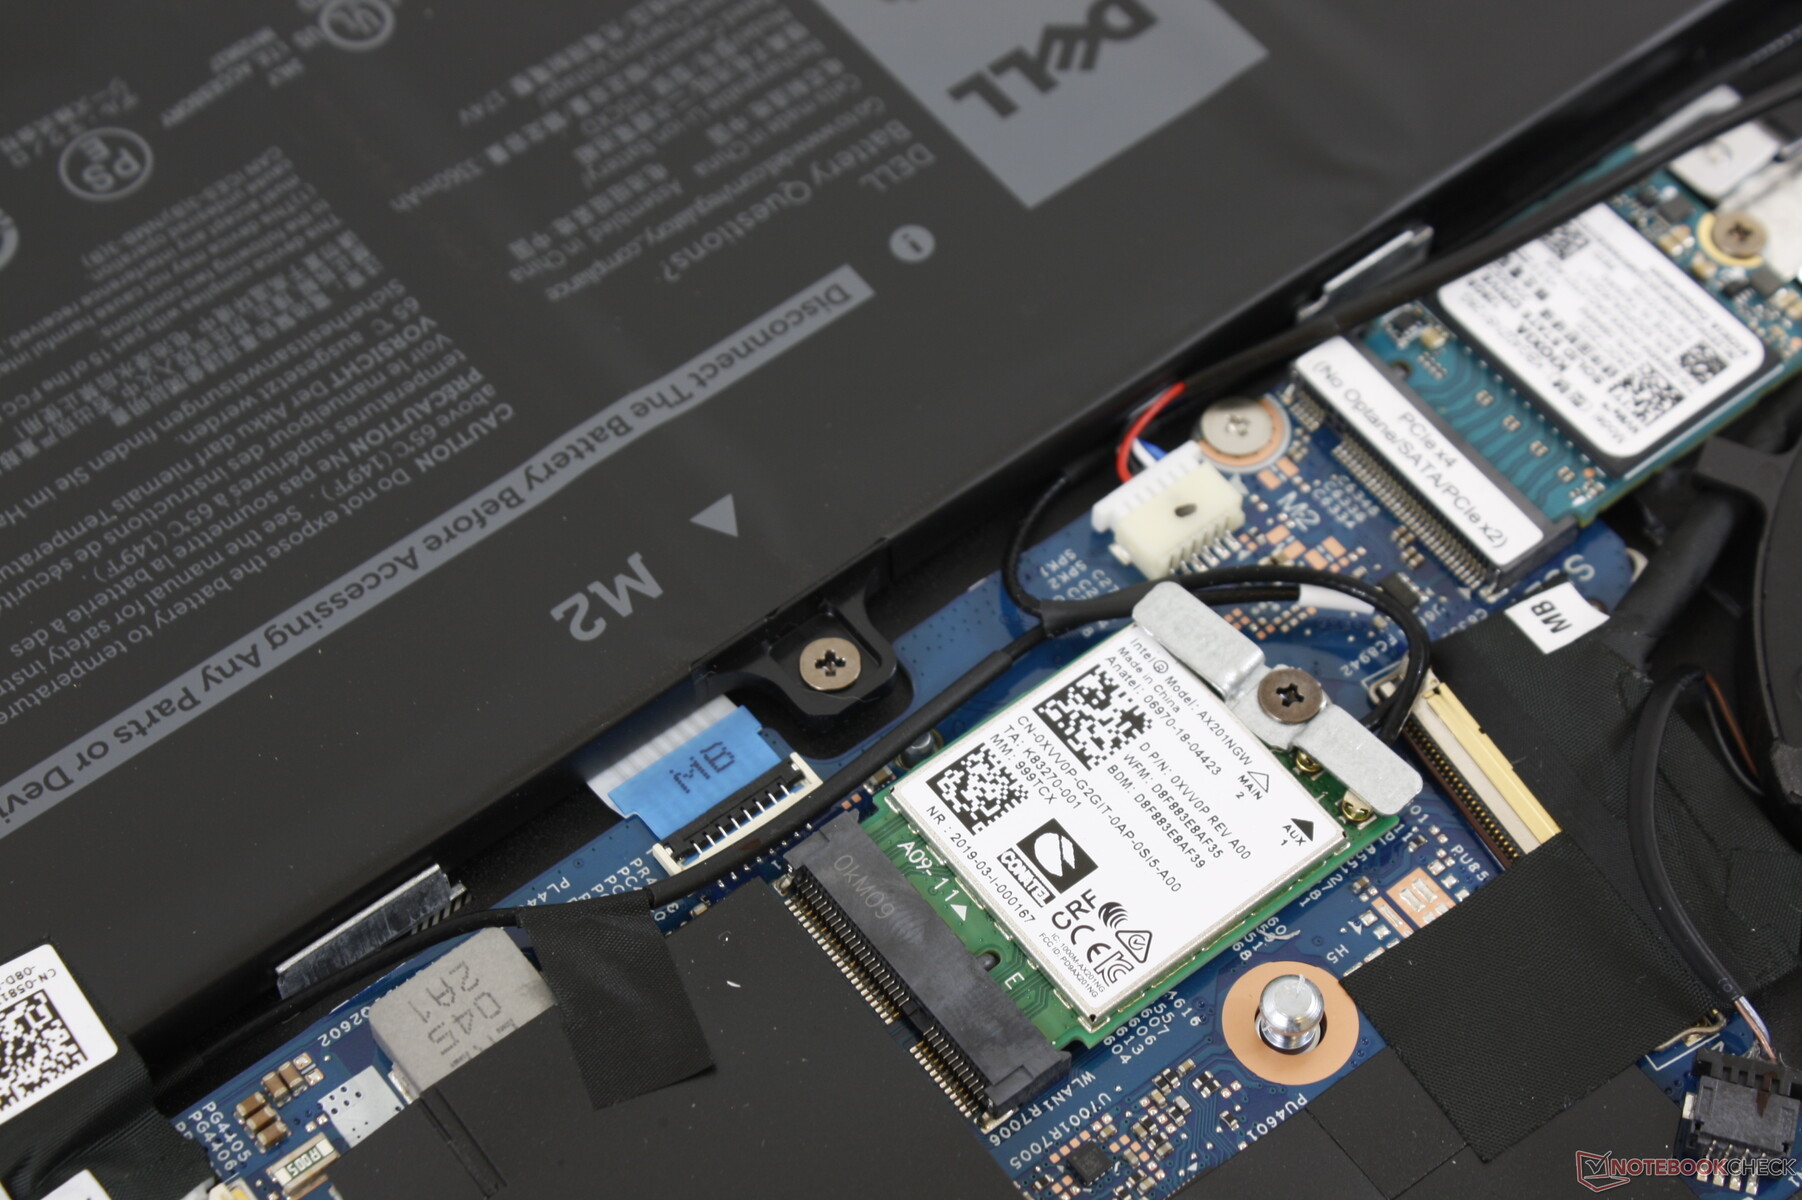
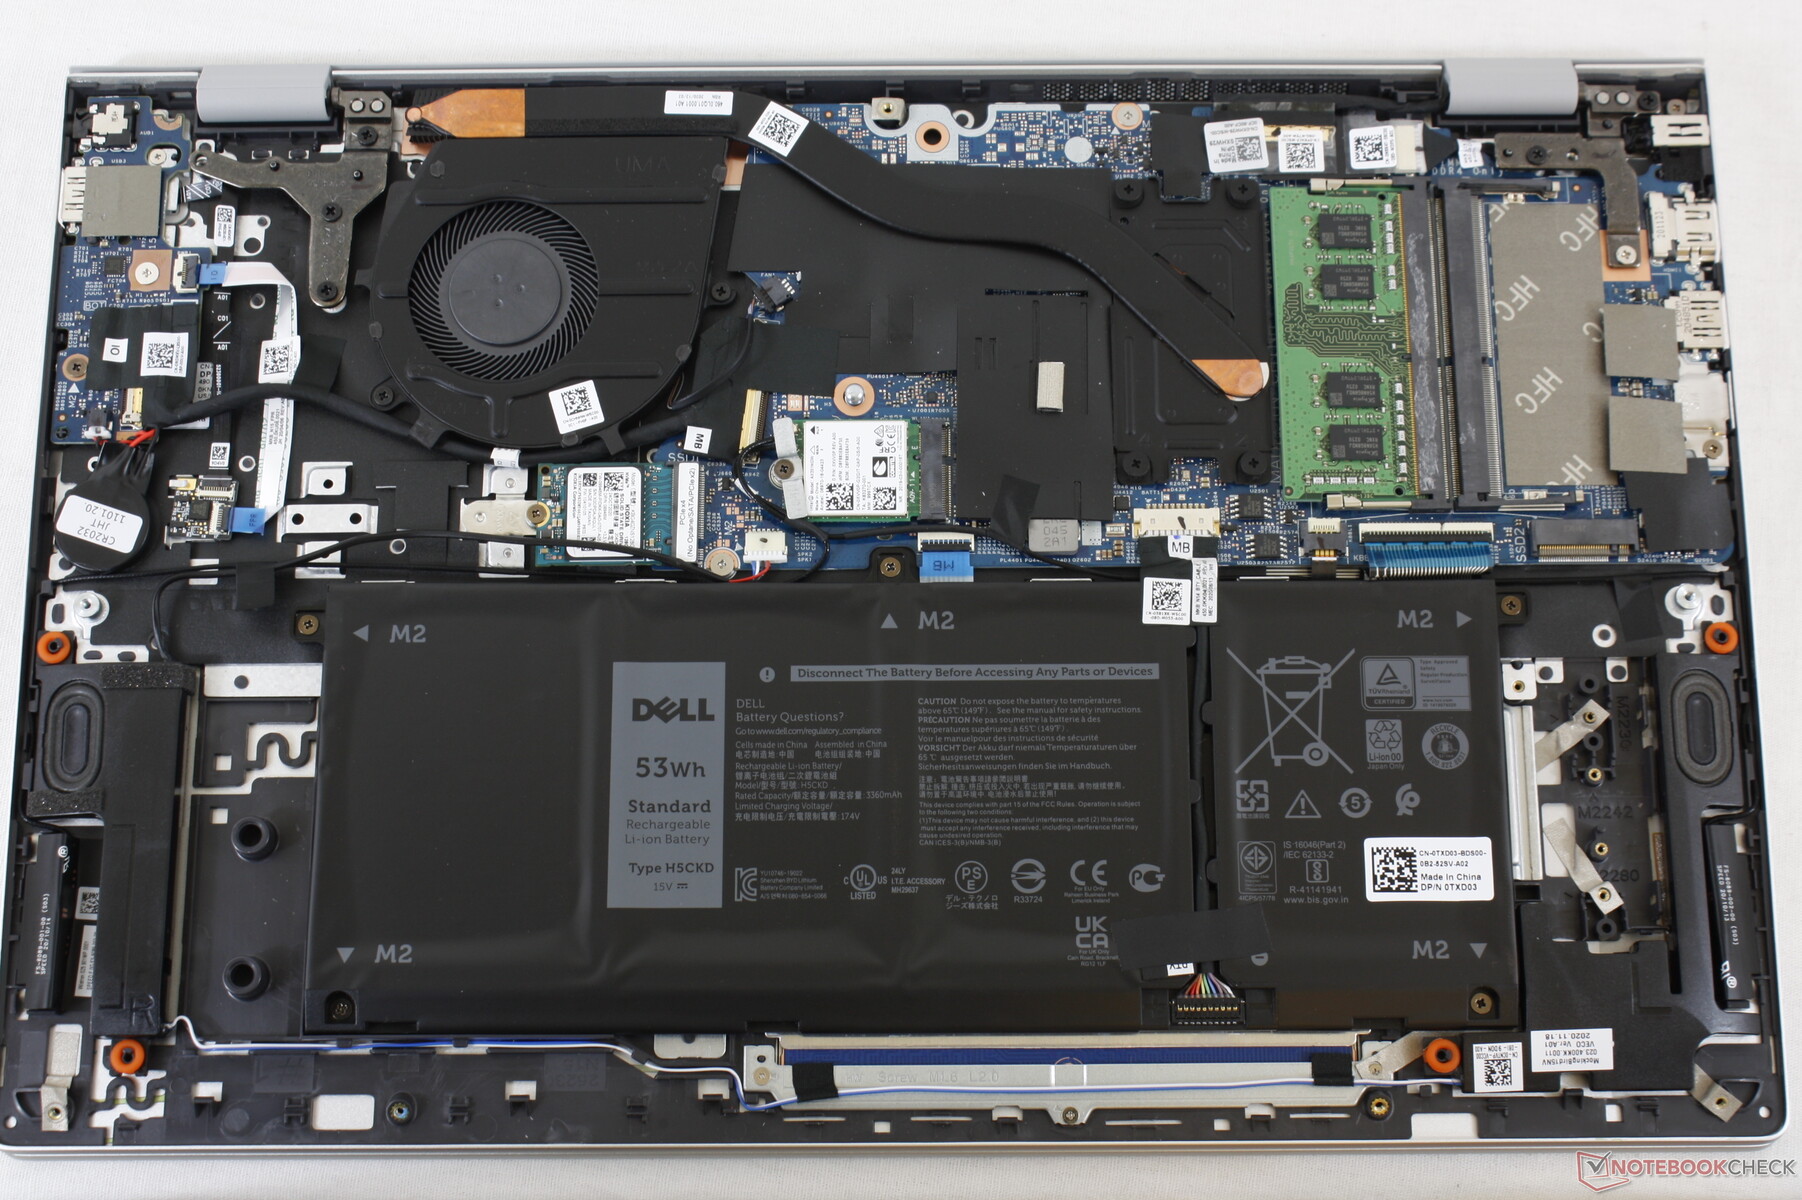
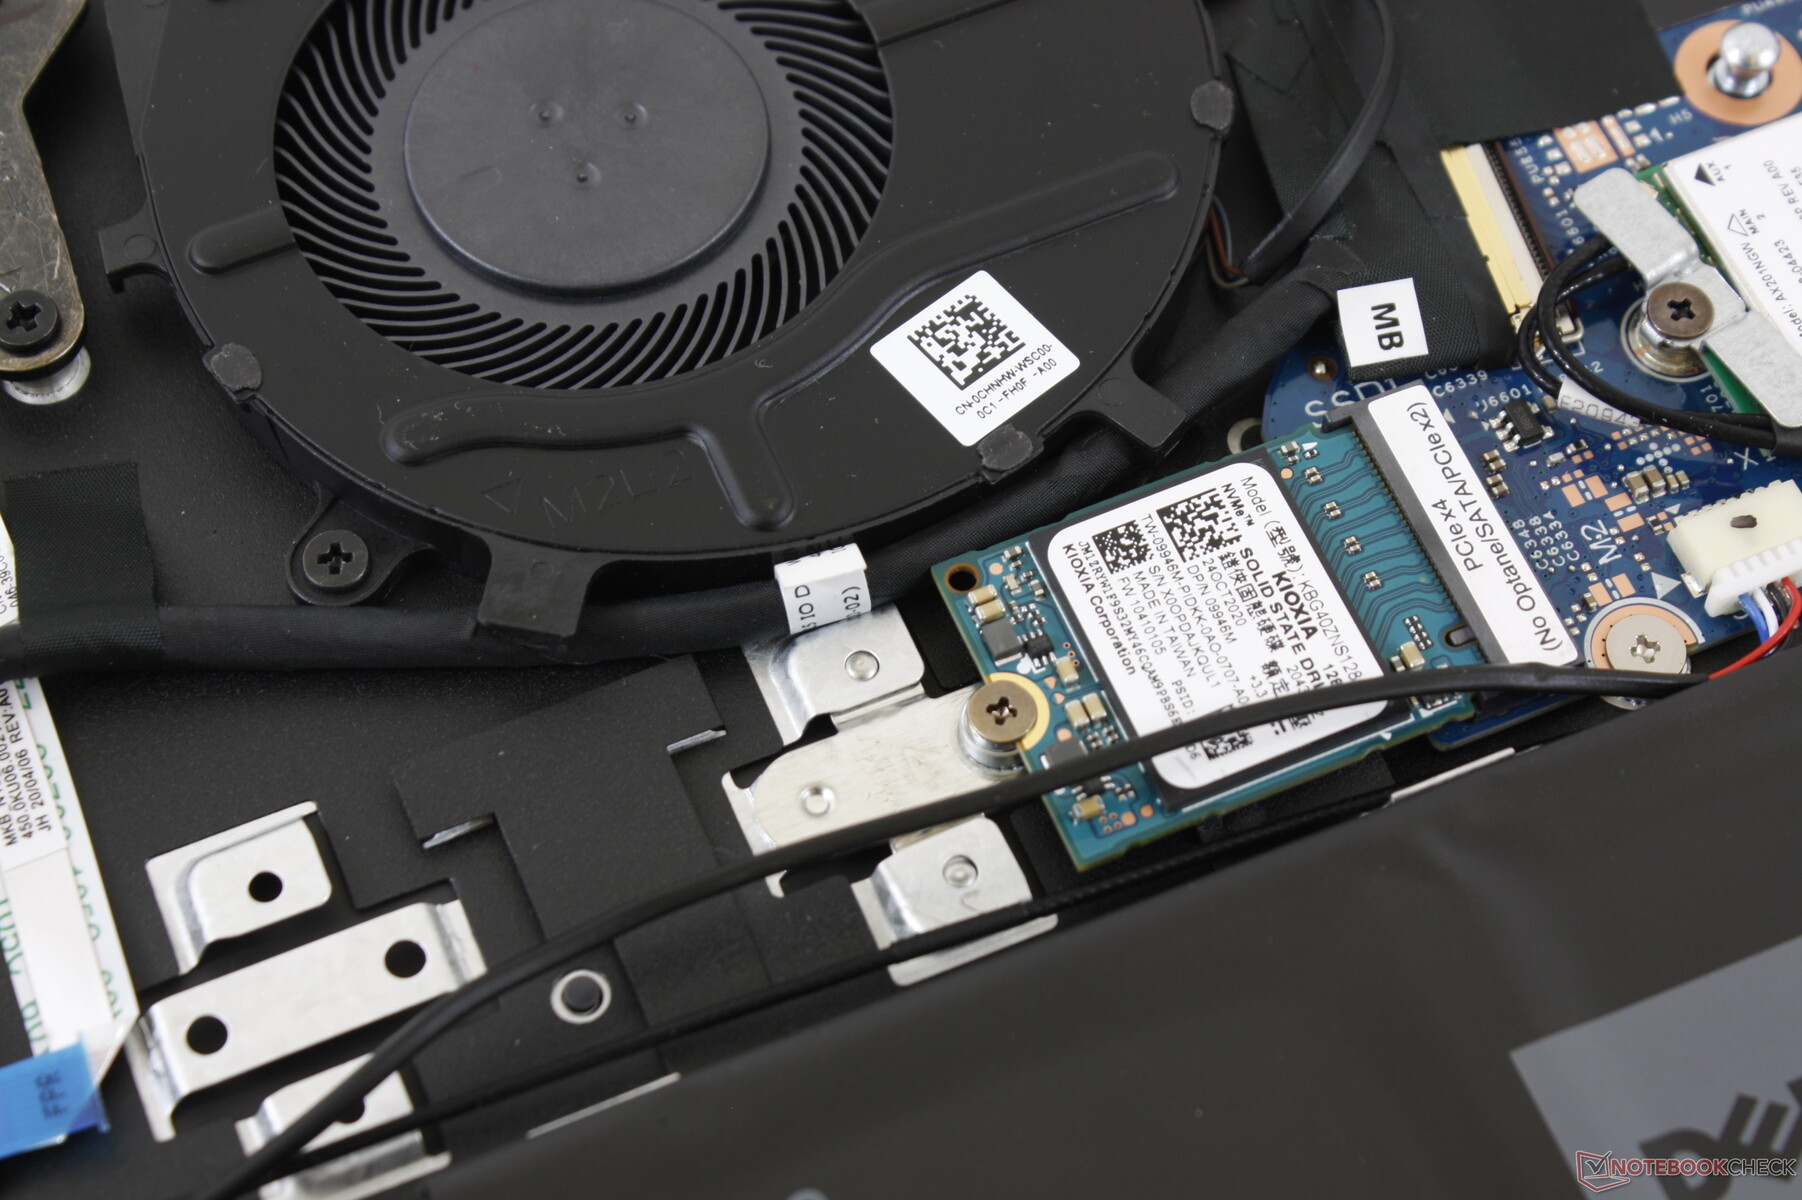
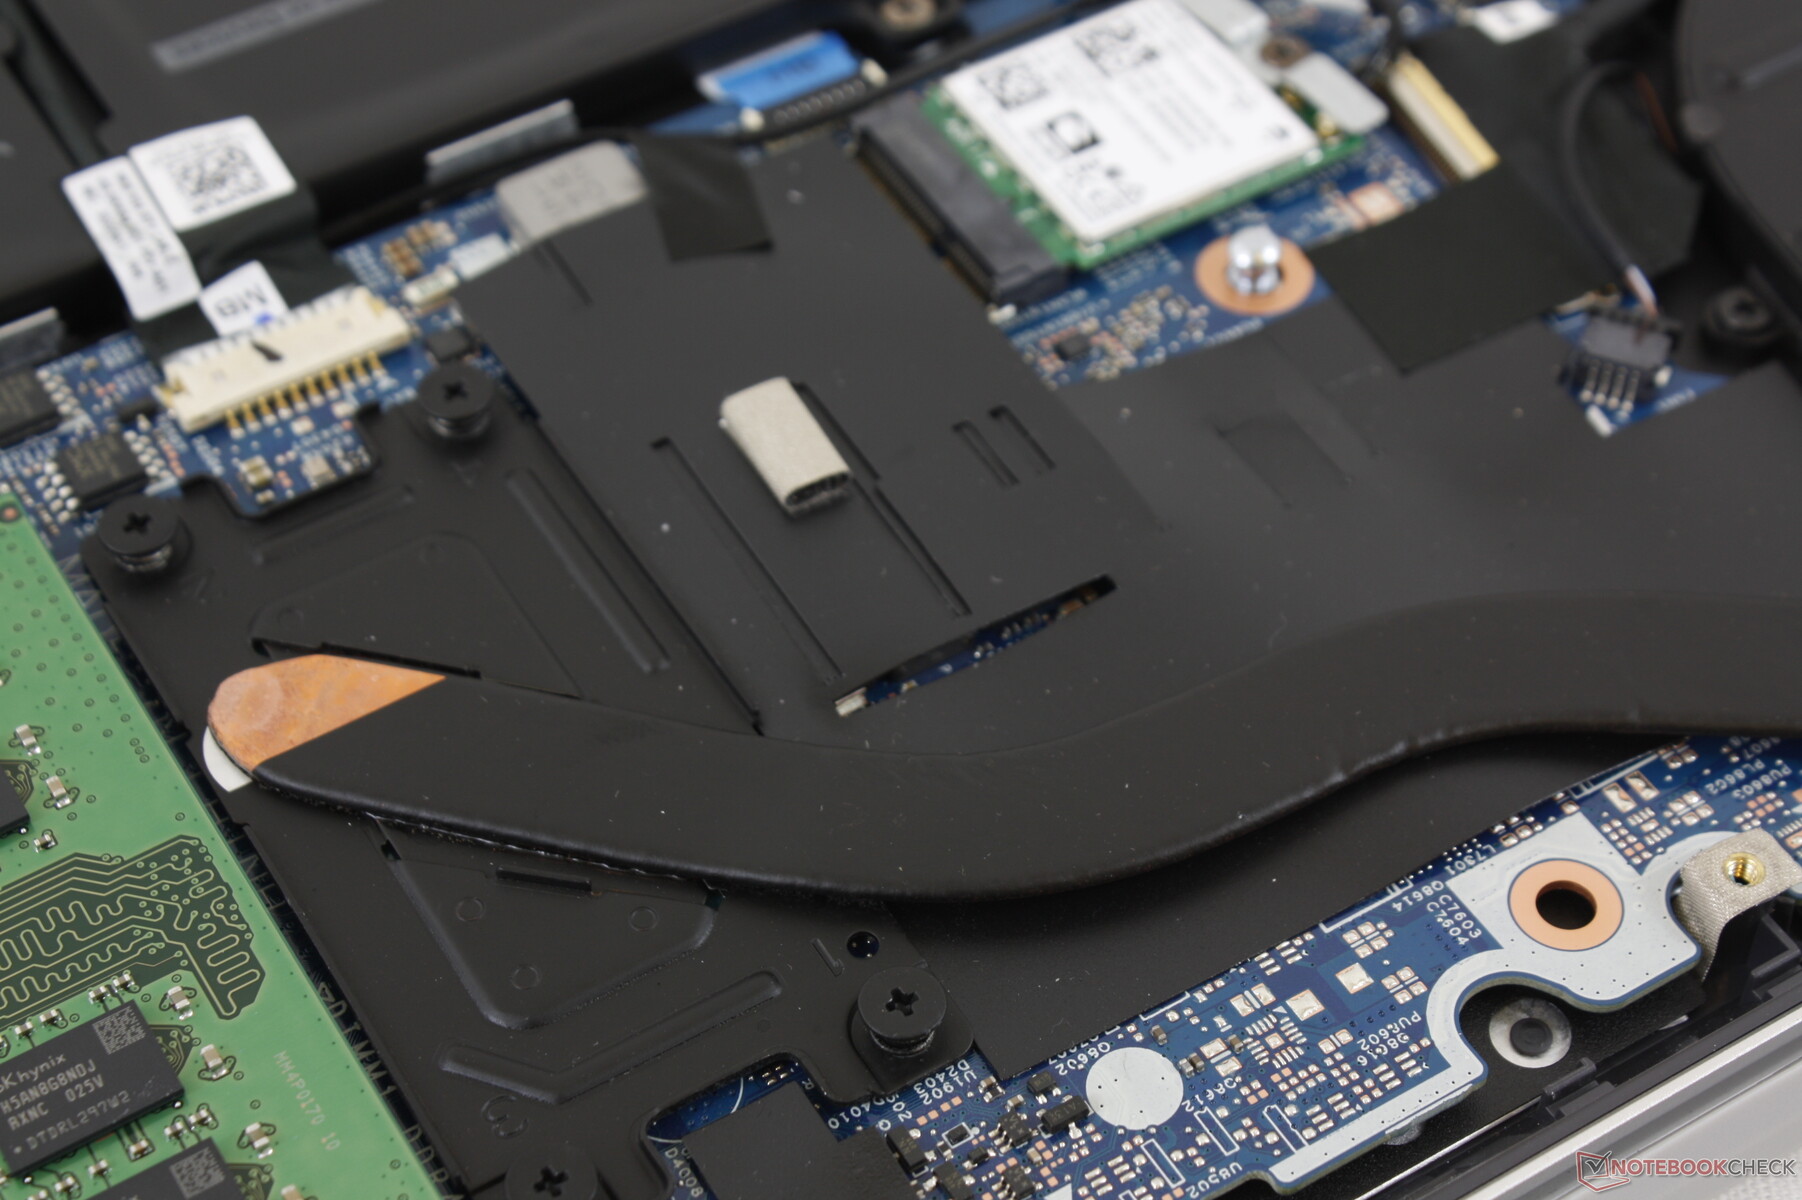
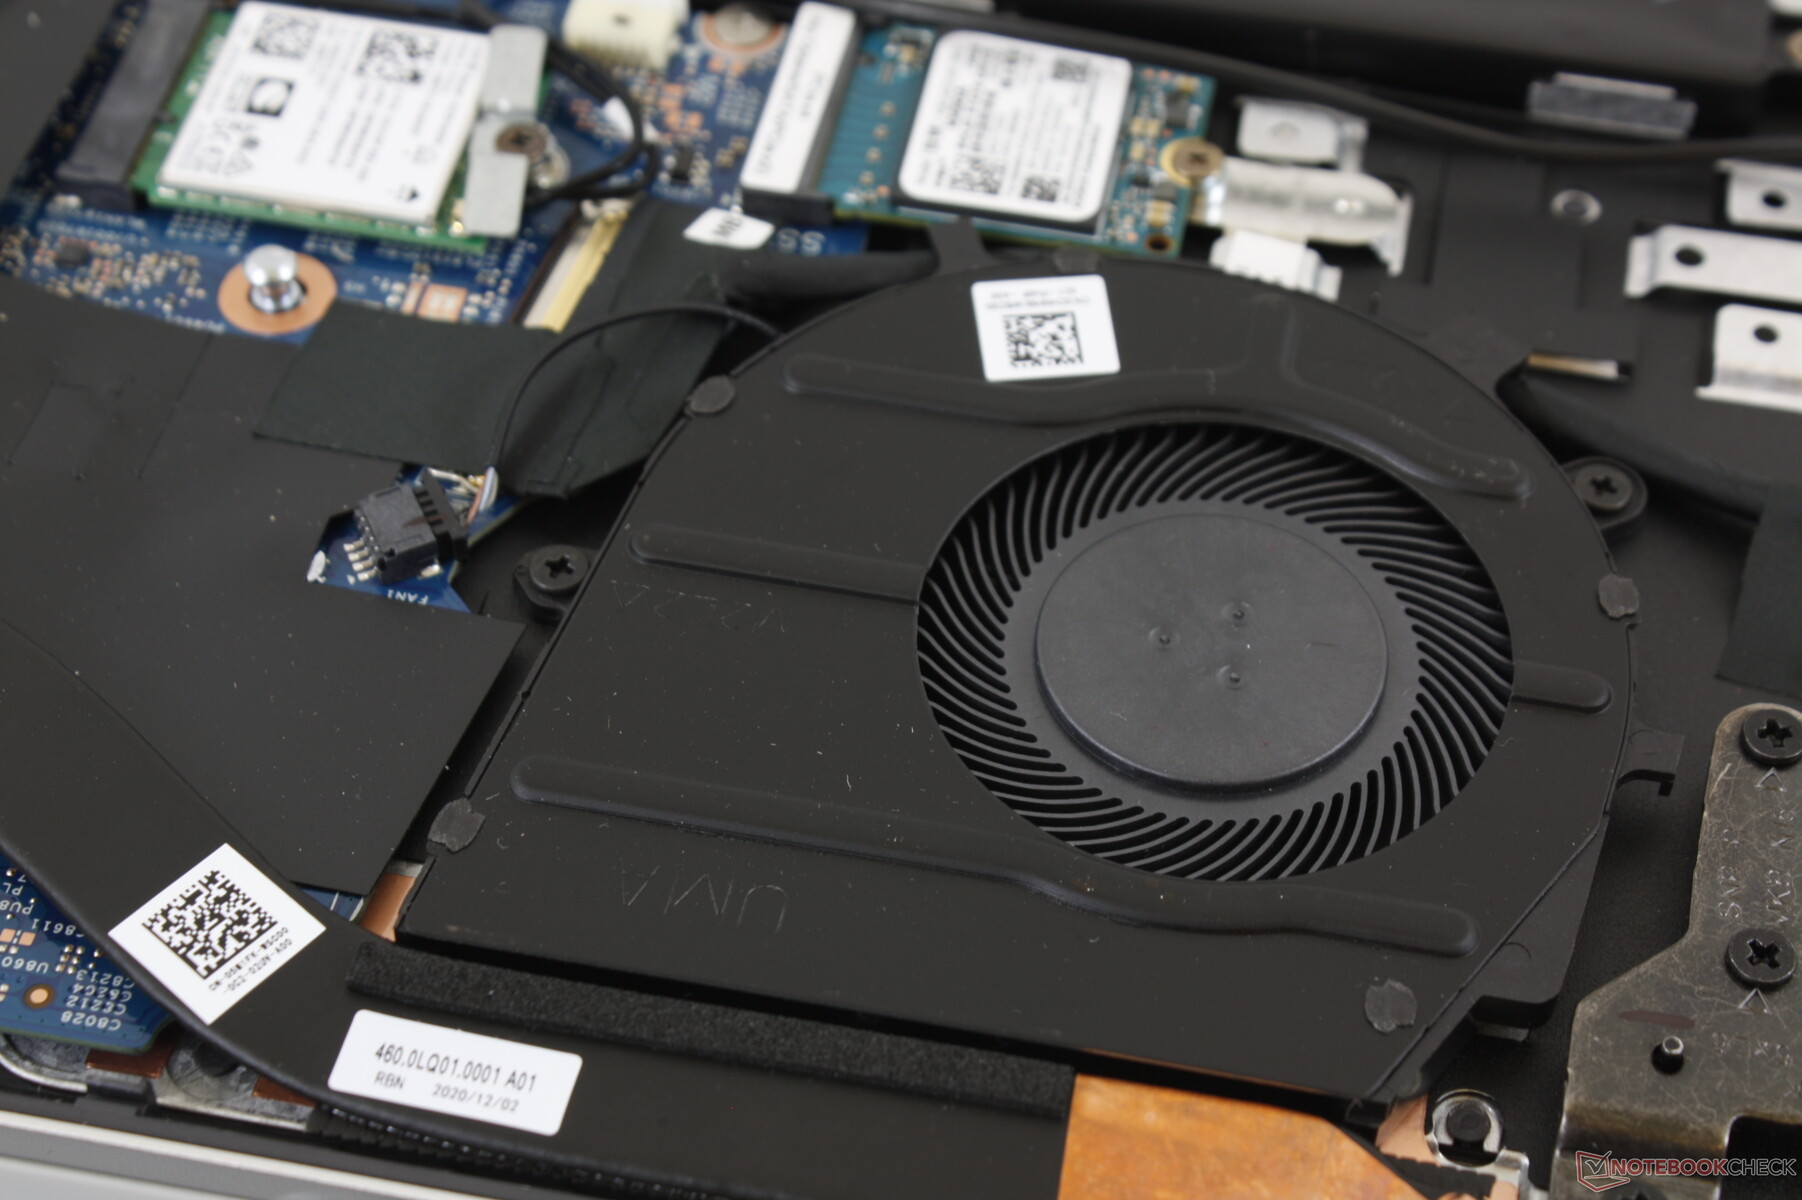
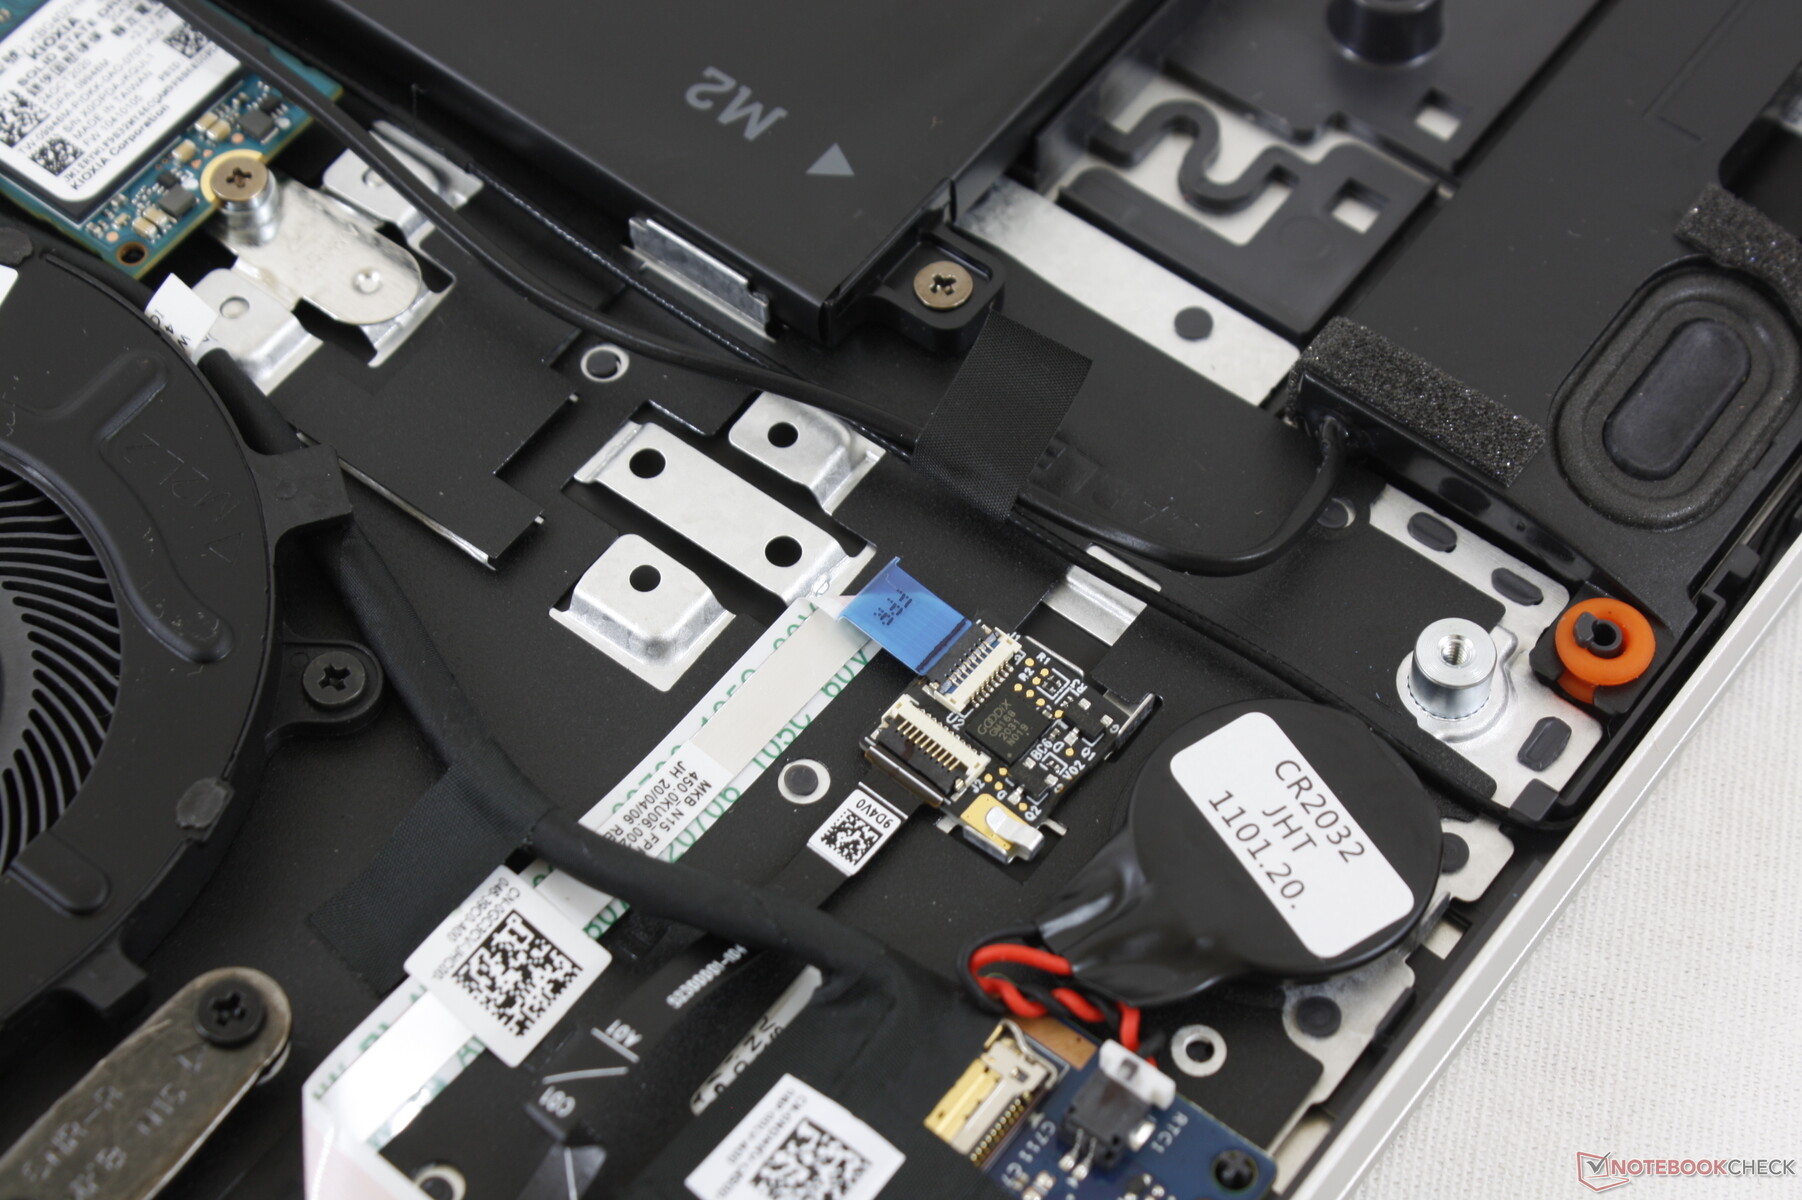
Maintenance
Accessories and Warranty
The retail box includes no extras other than the AC adapter and paperwork. Dell offers a wide variety of warranty extensions if purchased directly from its website.
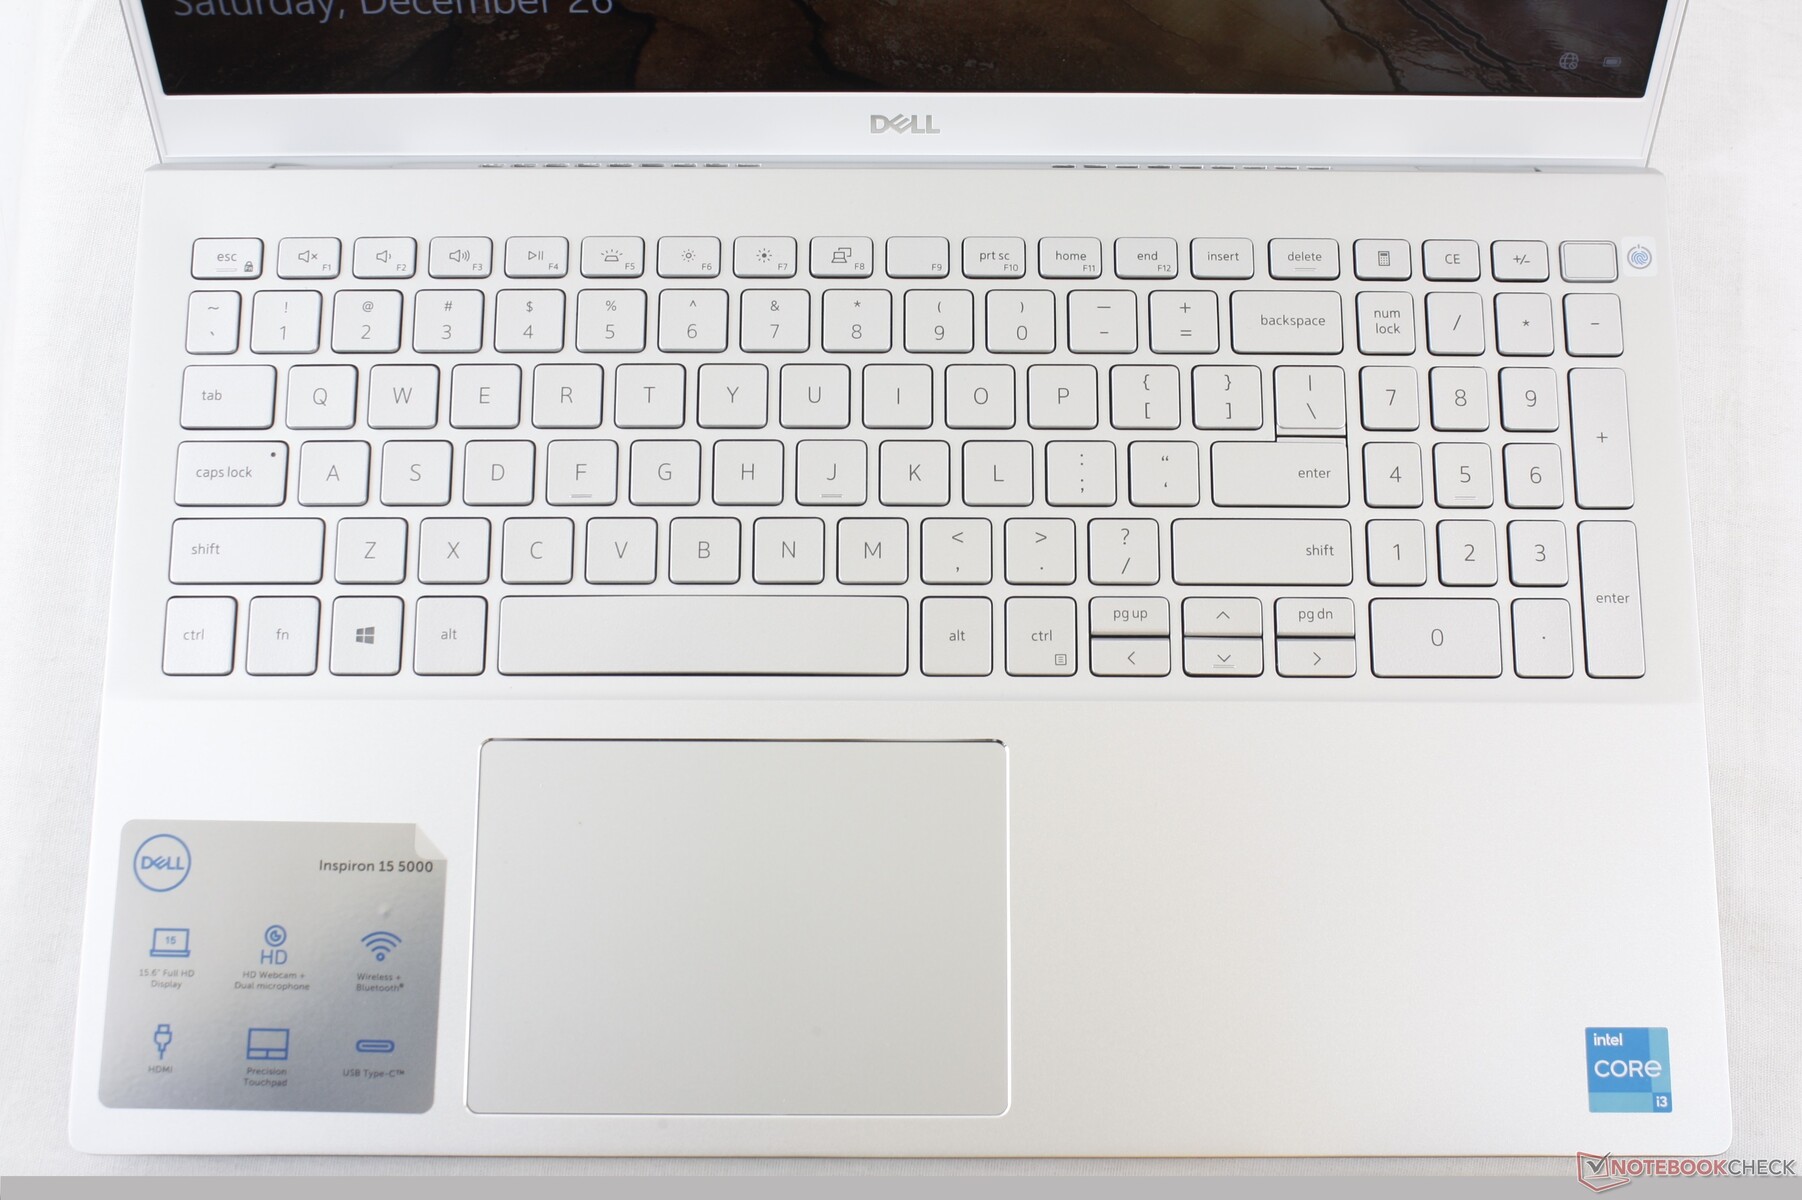
Input Devices
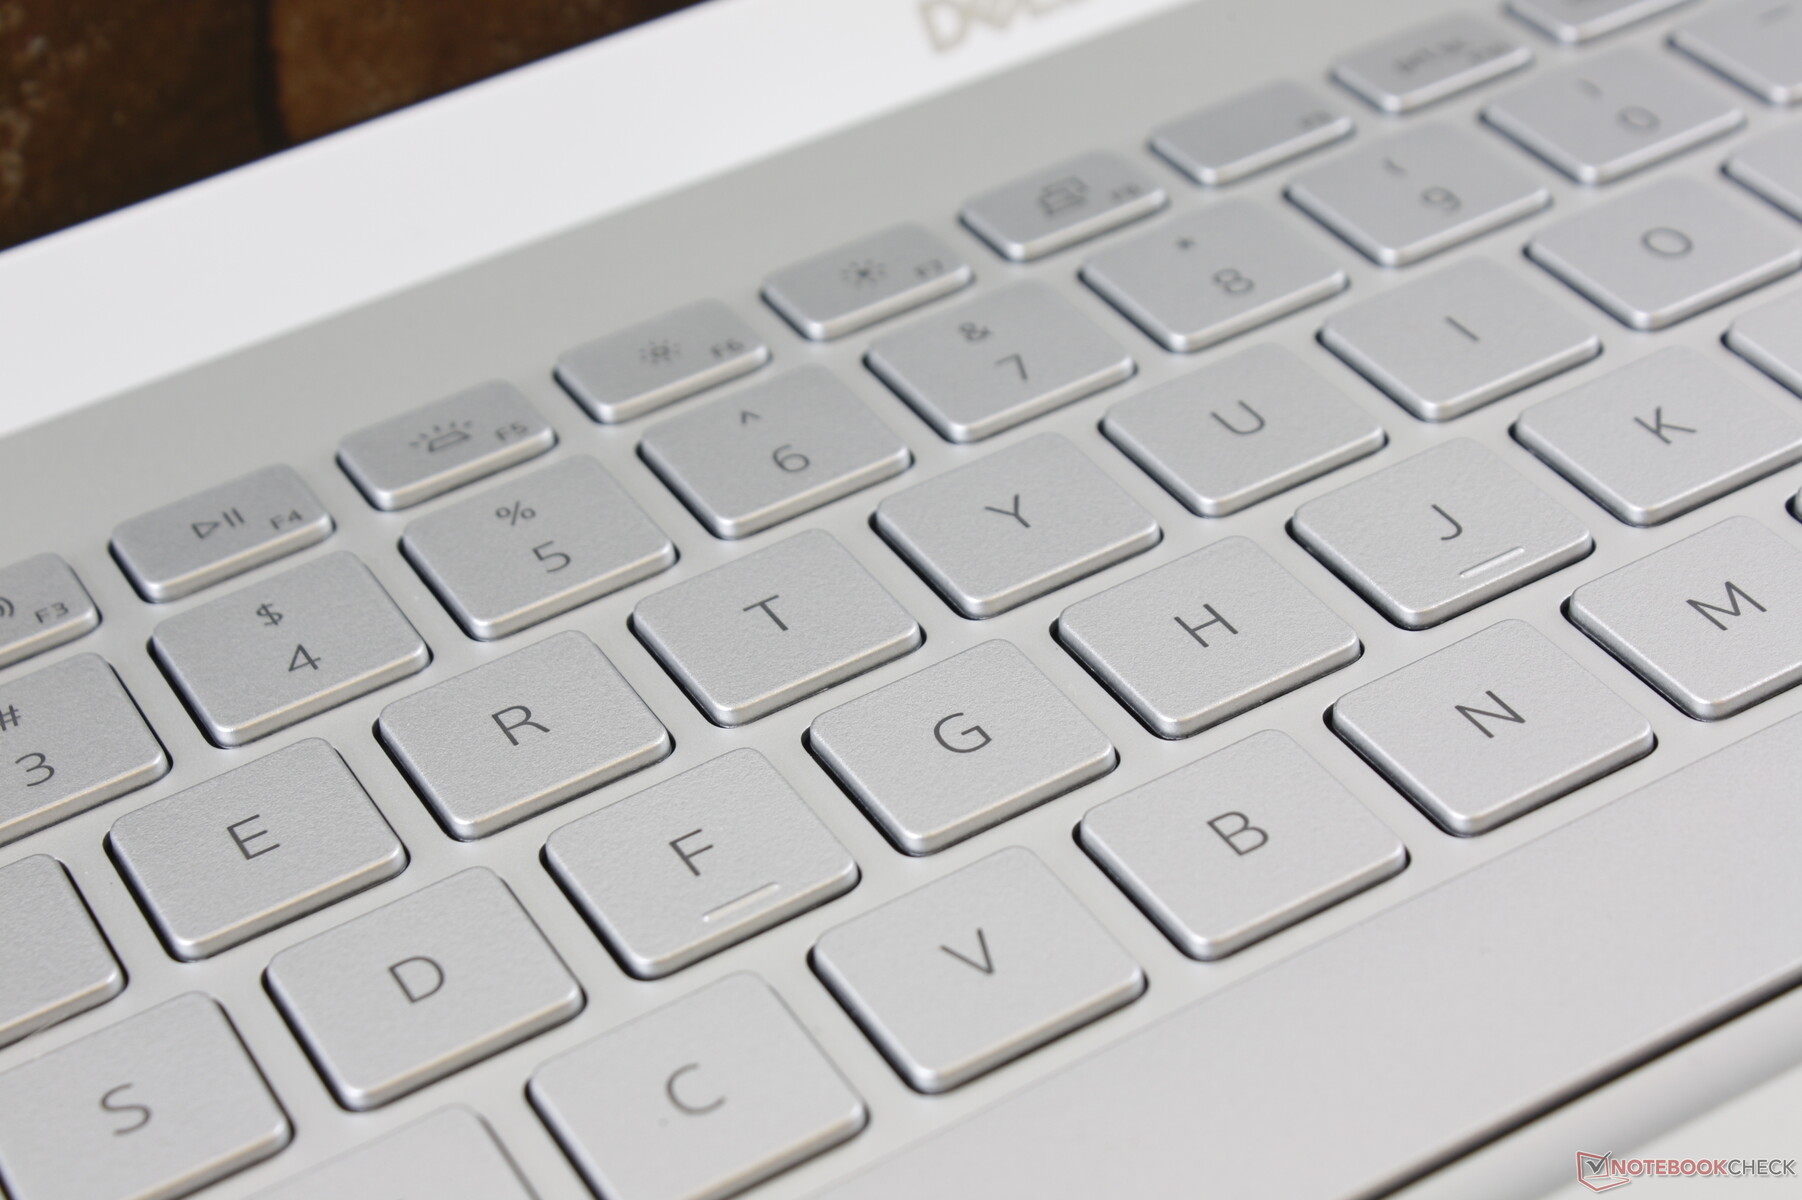
Keyboard
Though Inspiron laptops have changed in design over the past year, their keyboards have remained the same. Our Inspiron 5502 keyboard is exactly the same as the ones on the Inspiron 15 7506 and Inspiron 5584 for similar typing experiences between them. On one hand, this consistency is appreciated as it makes jumping between different Inspiron laptops easier to manage such as in offices or large public workspaces. On the other hand, key feedback remains shallow and somewhat soft especially when compared to the keyboards on the HP Envy series or Dell Latitude series.
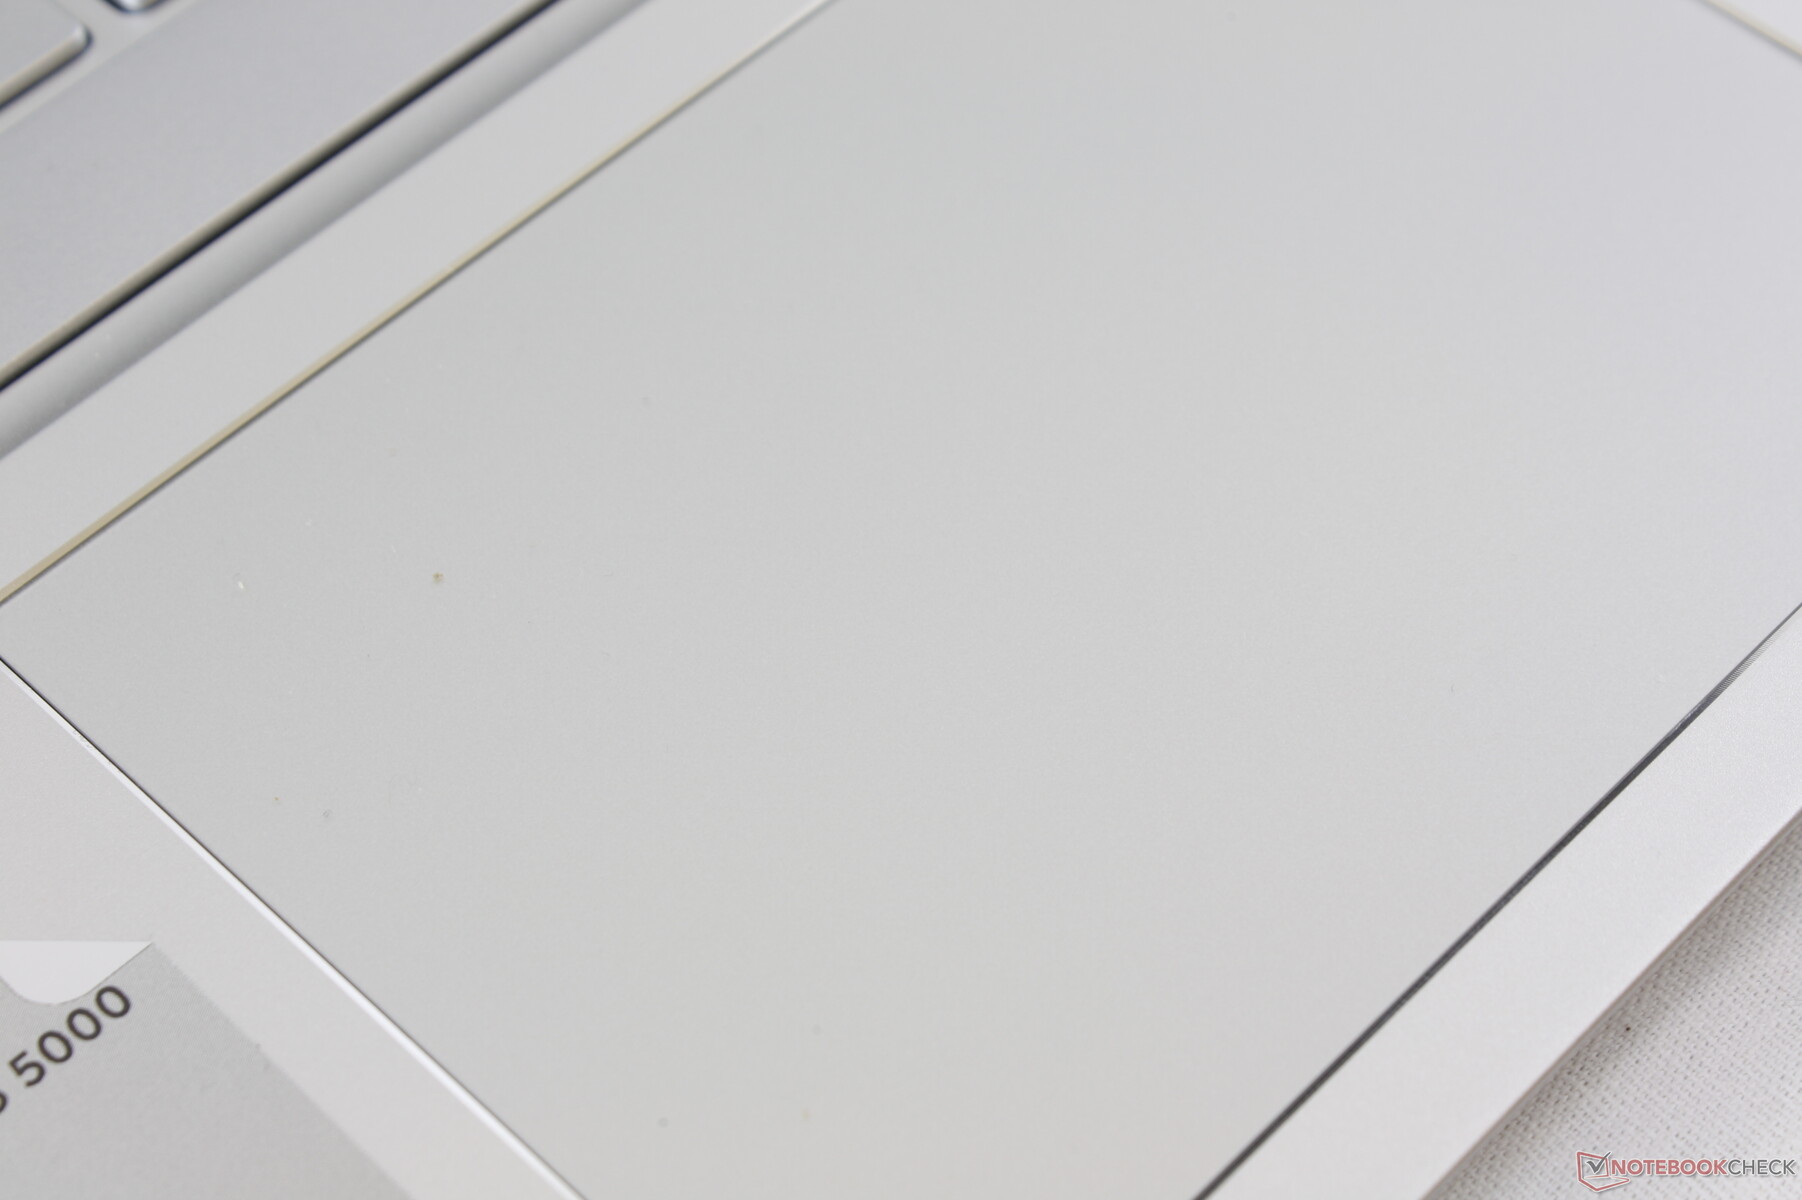
Touchpad
The Precision clickpad (11.5 x 8 cm) is smooth and with a little bit of sticking when gliding at slow speeds for accurate clicks. Its integrated mouse buttons, however, are horrendously spongy and shallow for an unsatisfying experience. Even simple actions like double-clicking are difficult because of how soft the feedback is. We recommend using an external mouse whenever possible.

Display
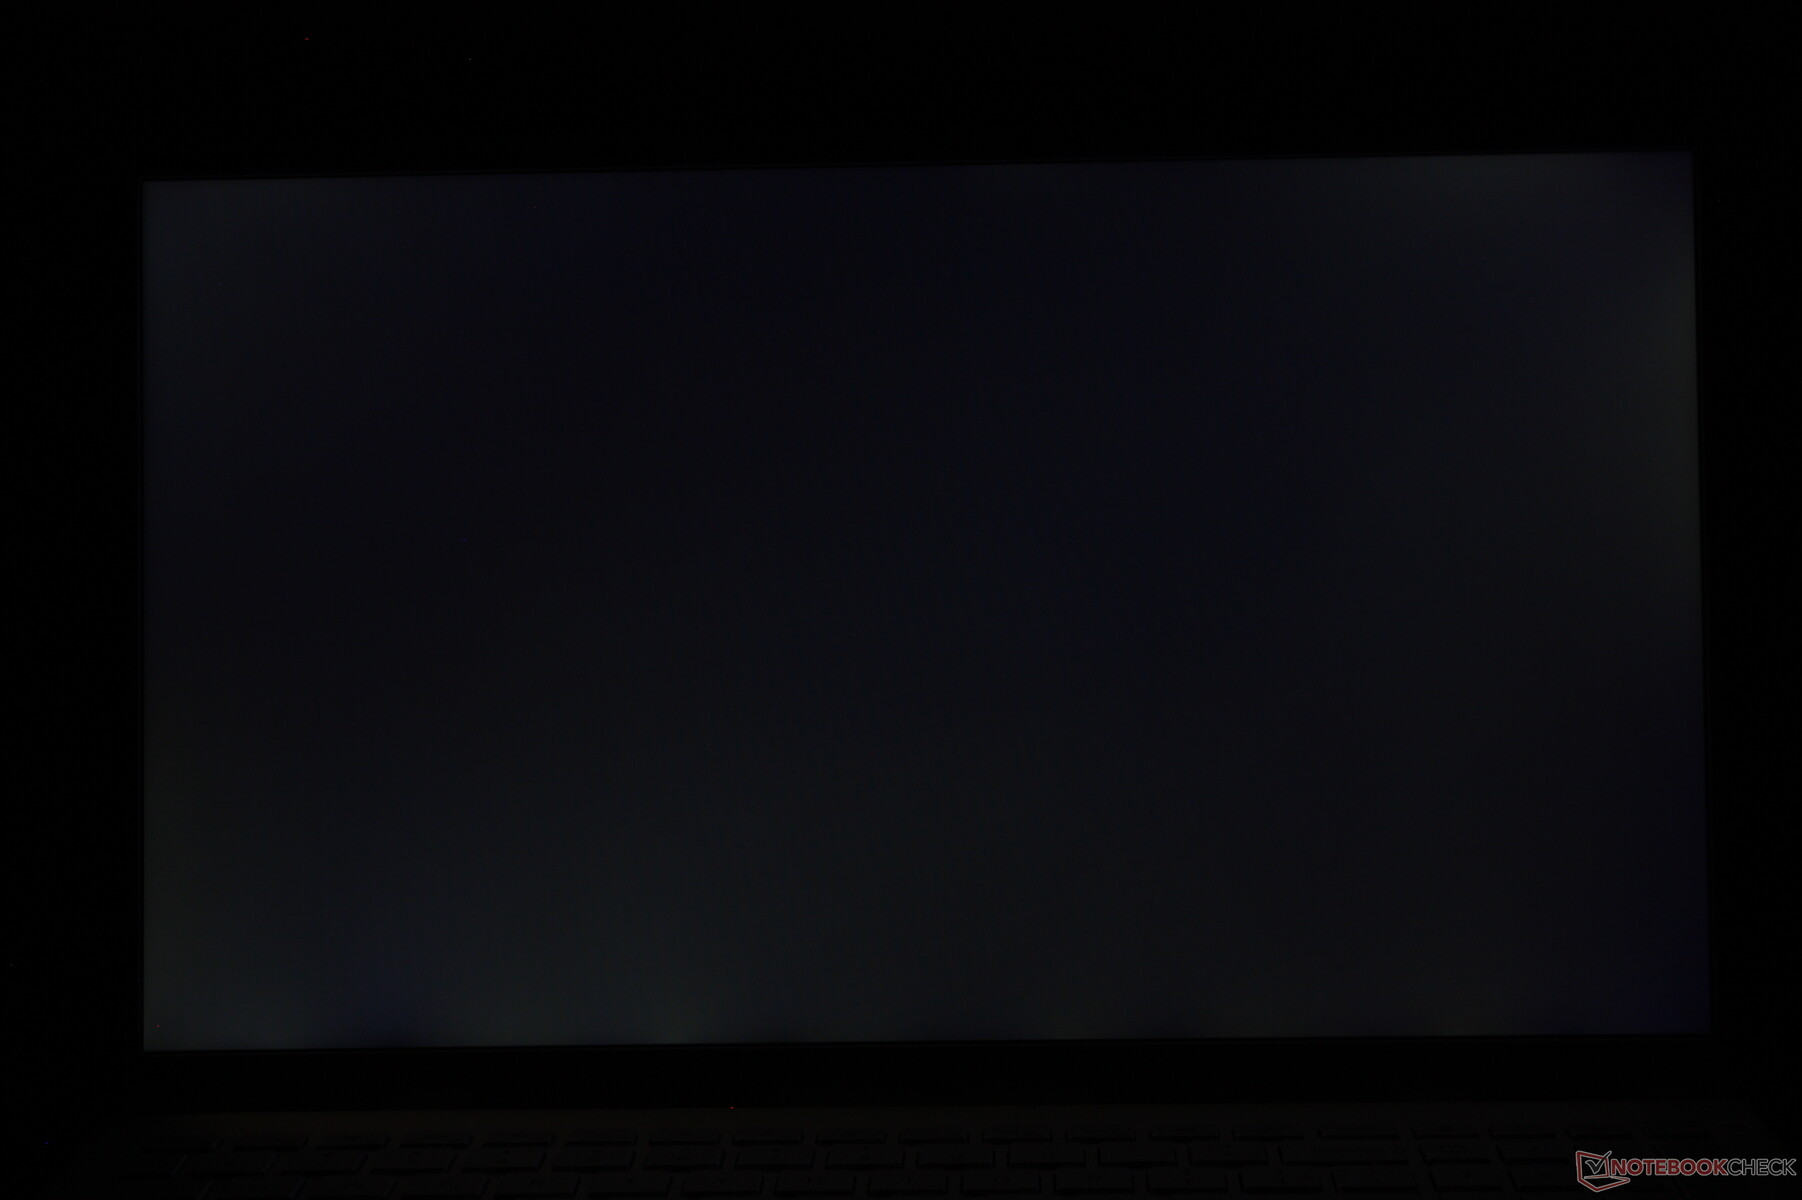
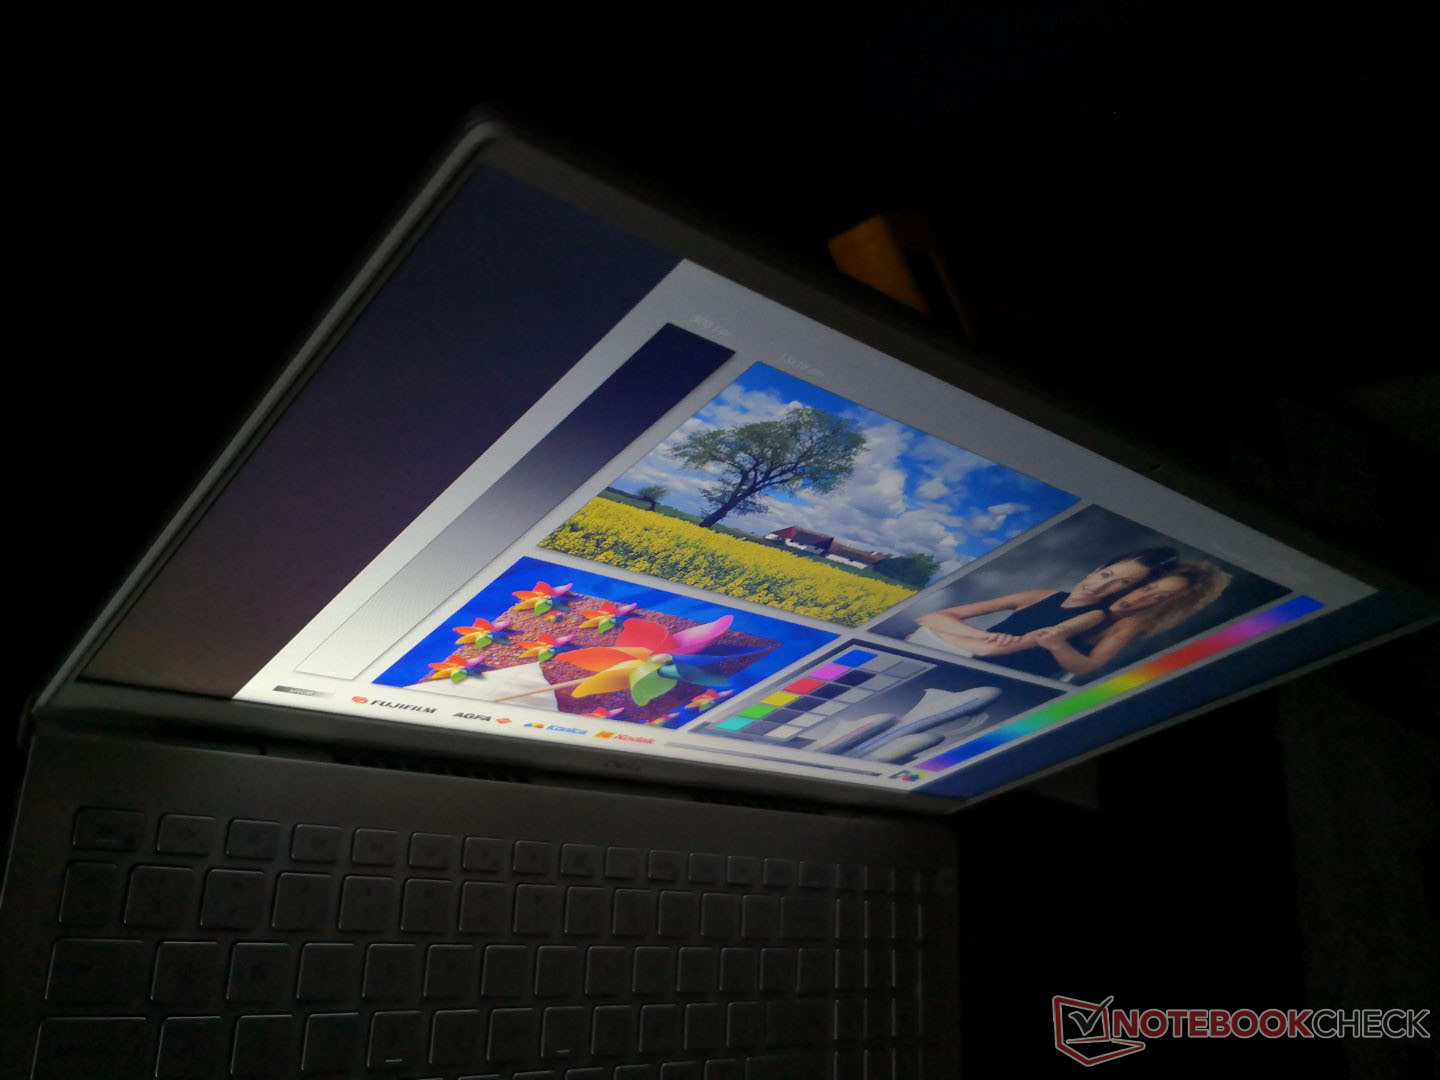
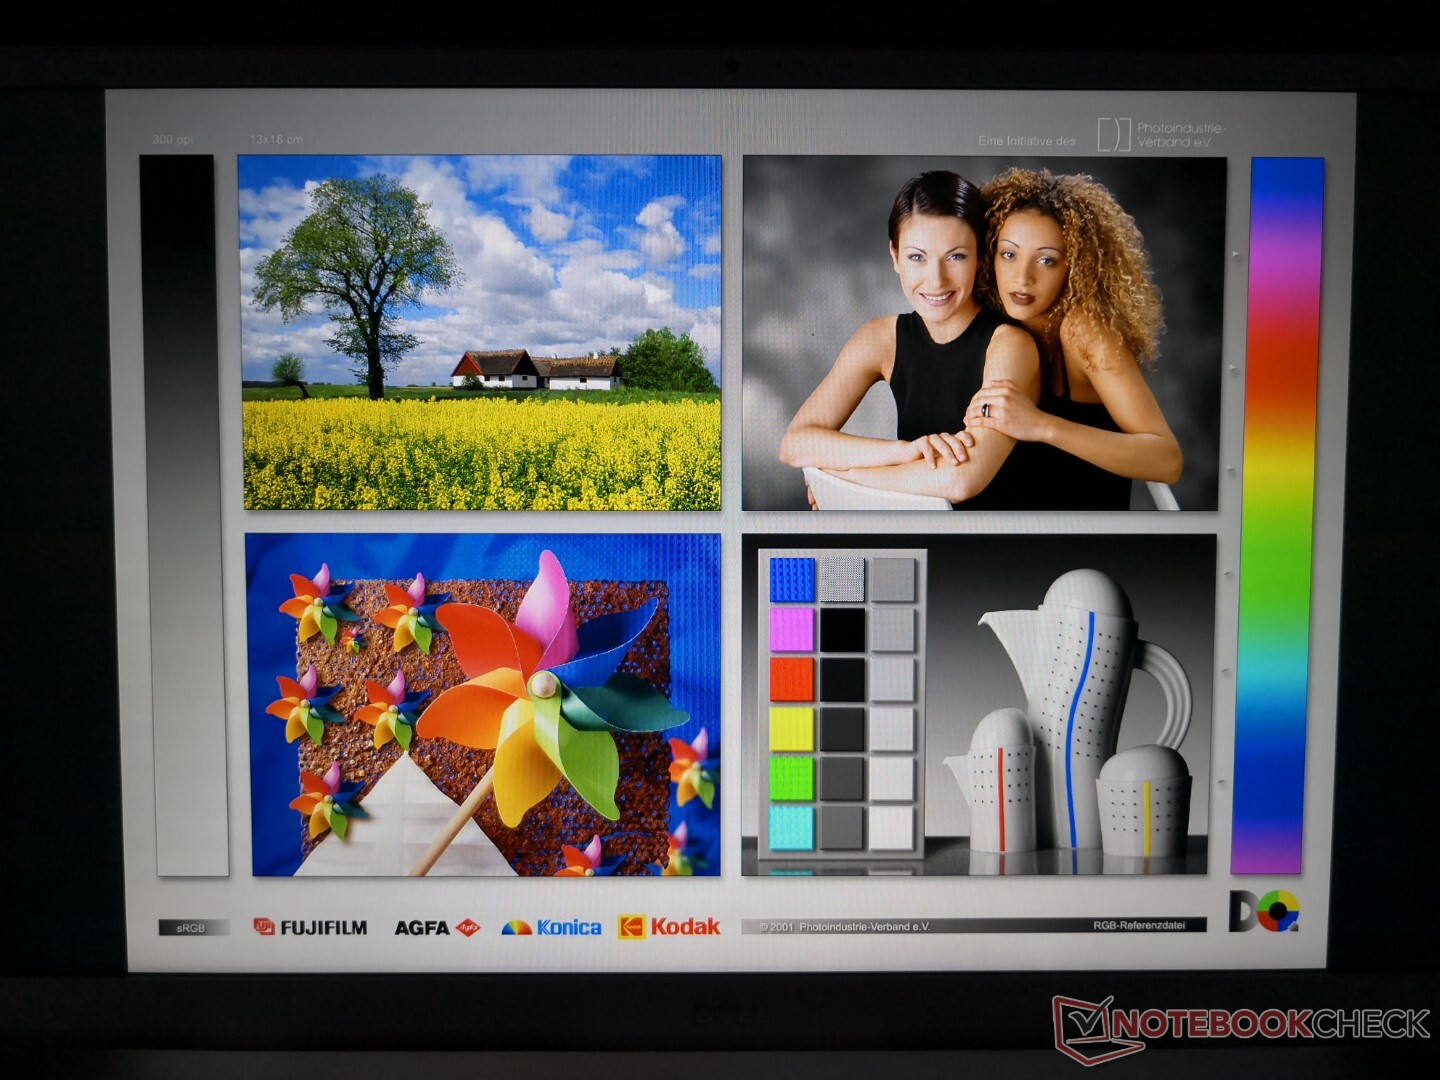
Dell uses the same BOE NV15N3D panel for both the budget G3 15 3590 gaming laptop and our Inspiron 5502. This panel exhibits almost all the characteristics of a cheap display including the shallow color space, slow black-white response times, low maximum brightness, and a slightly cool color temperature. Contrast ratio, however, is actually respectable at just over 1000:1. Nonetheless, don't expect videos or images to pop or be as colorful as they would be on the XPS 15.
Note that pulse-width modulation is present on all brightness levels up to 98 percent. If your eyes are sensitive to flickering, then you may want to avoid using this laptop for long periods.


| |||||||||||||||||||||||||
Brightness Distribution: 90 %
Center on Battery: 210.4 cd/m²
Contrast: 1110:1 (Black: 0.21 cd/m²)
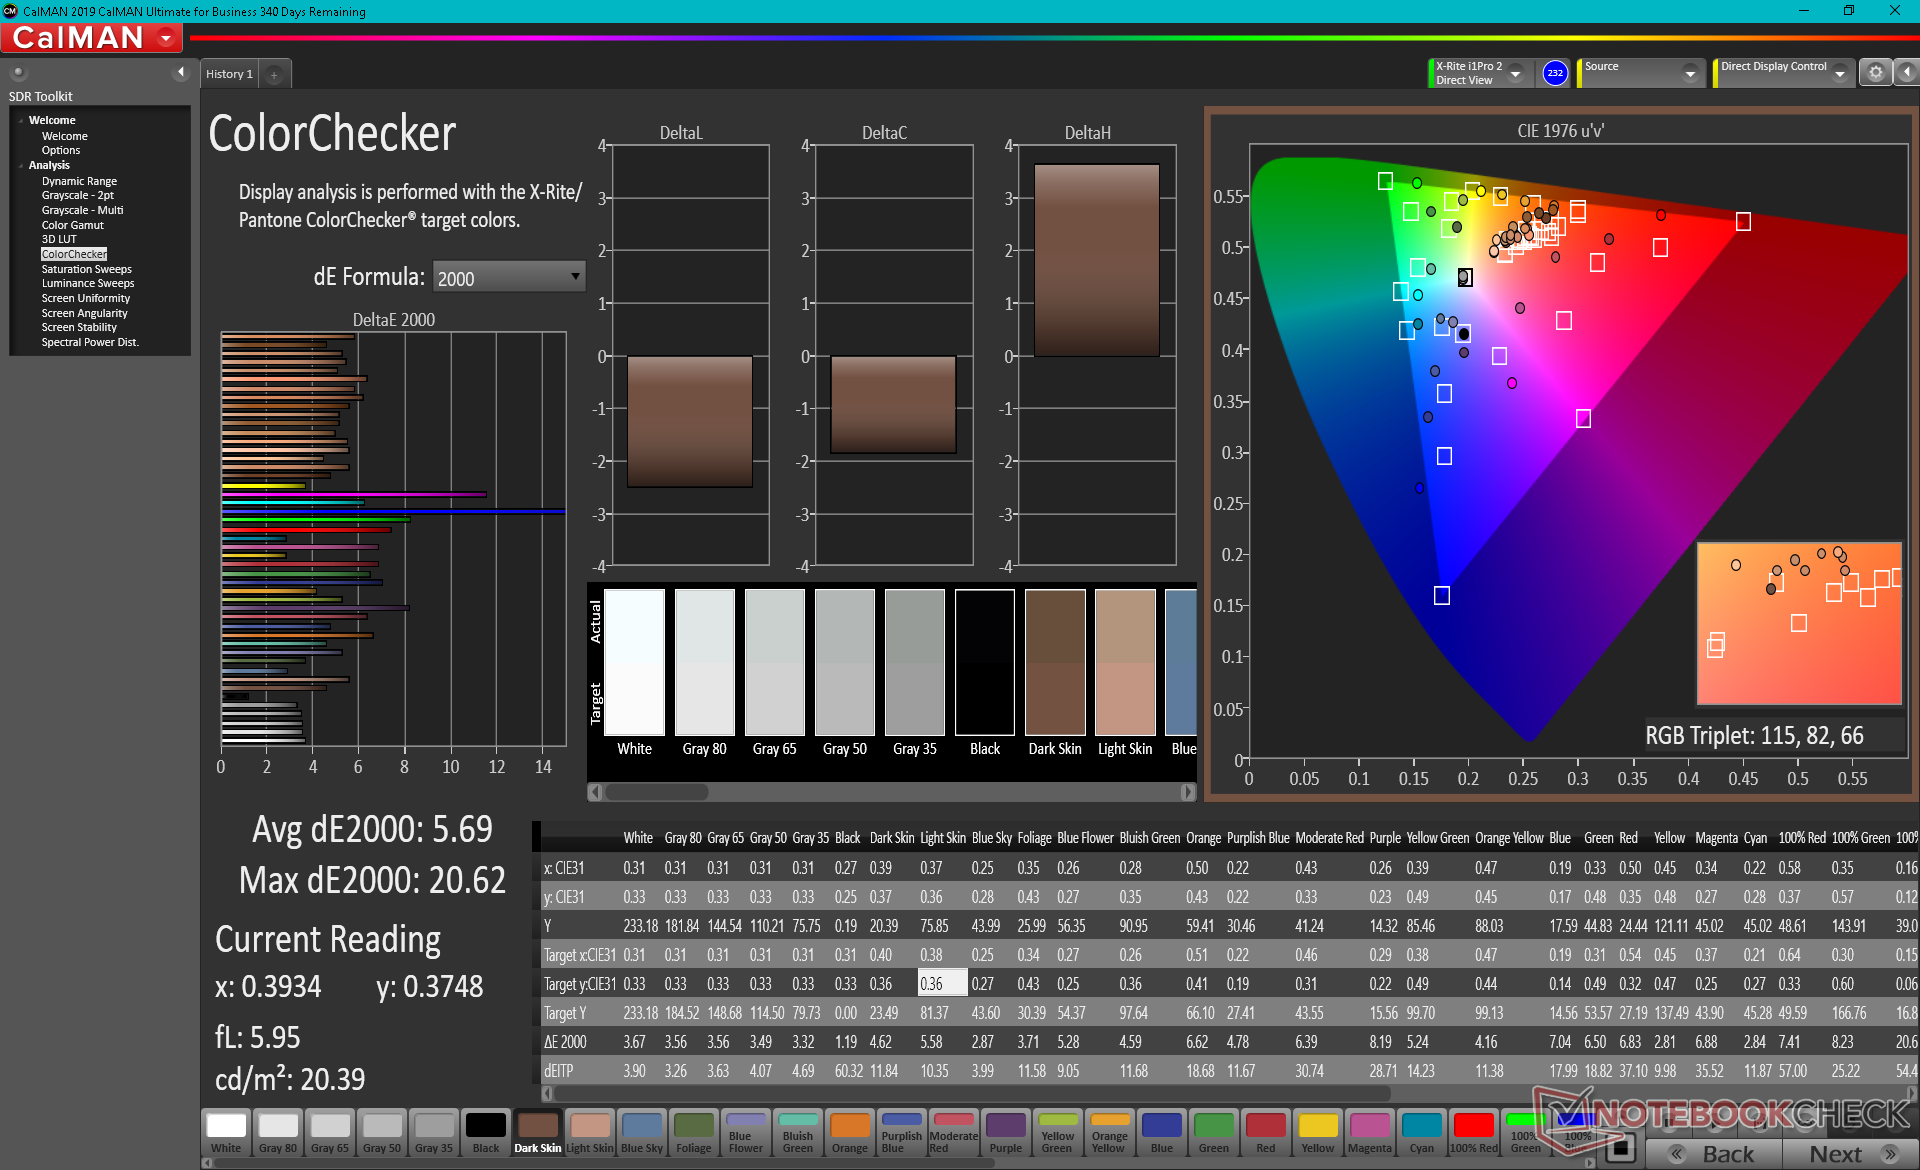
ΔE ColorChecker Calman: 5.69 | ∀{0.5-29.43 Ø4.71}
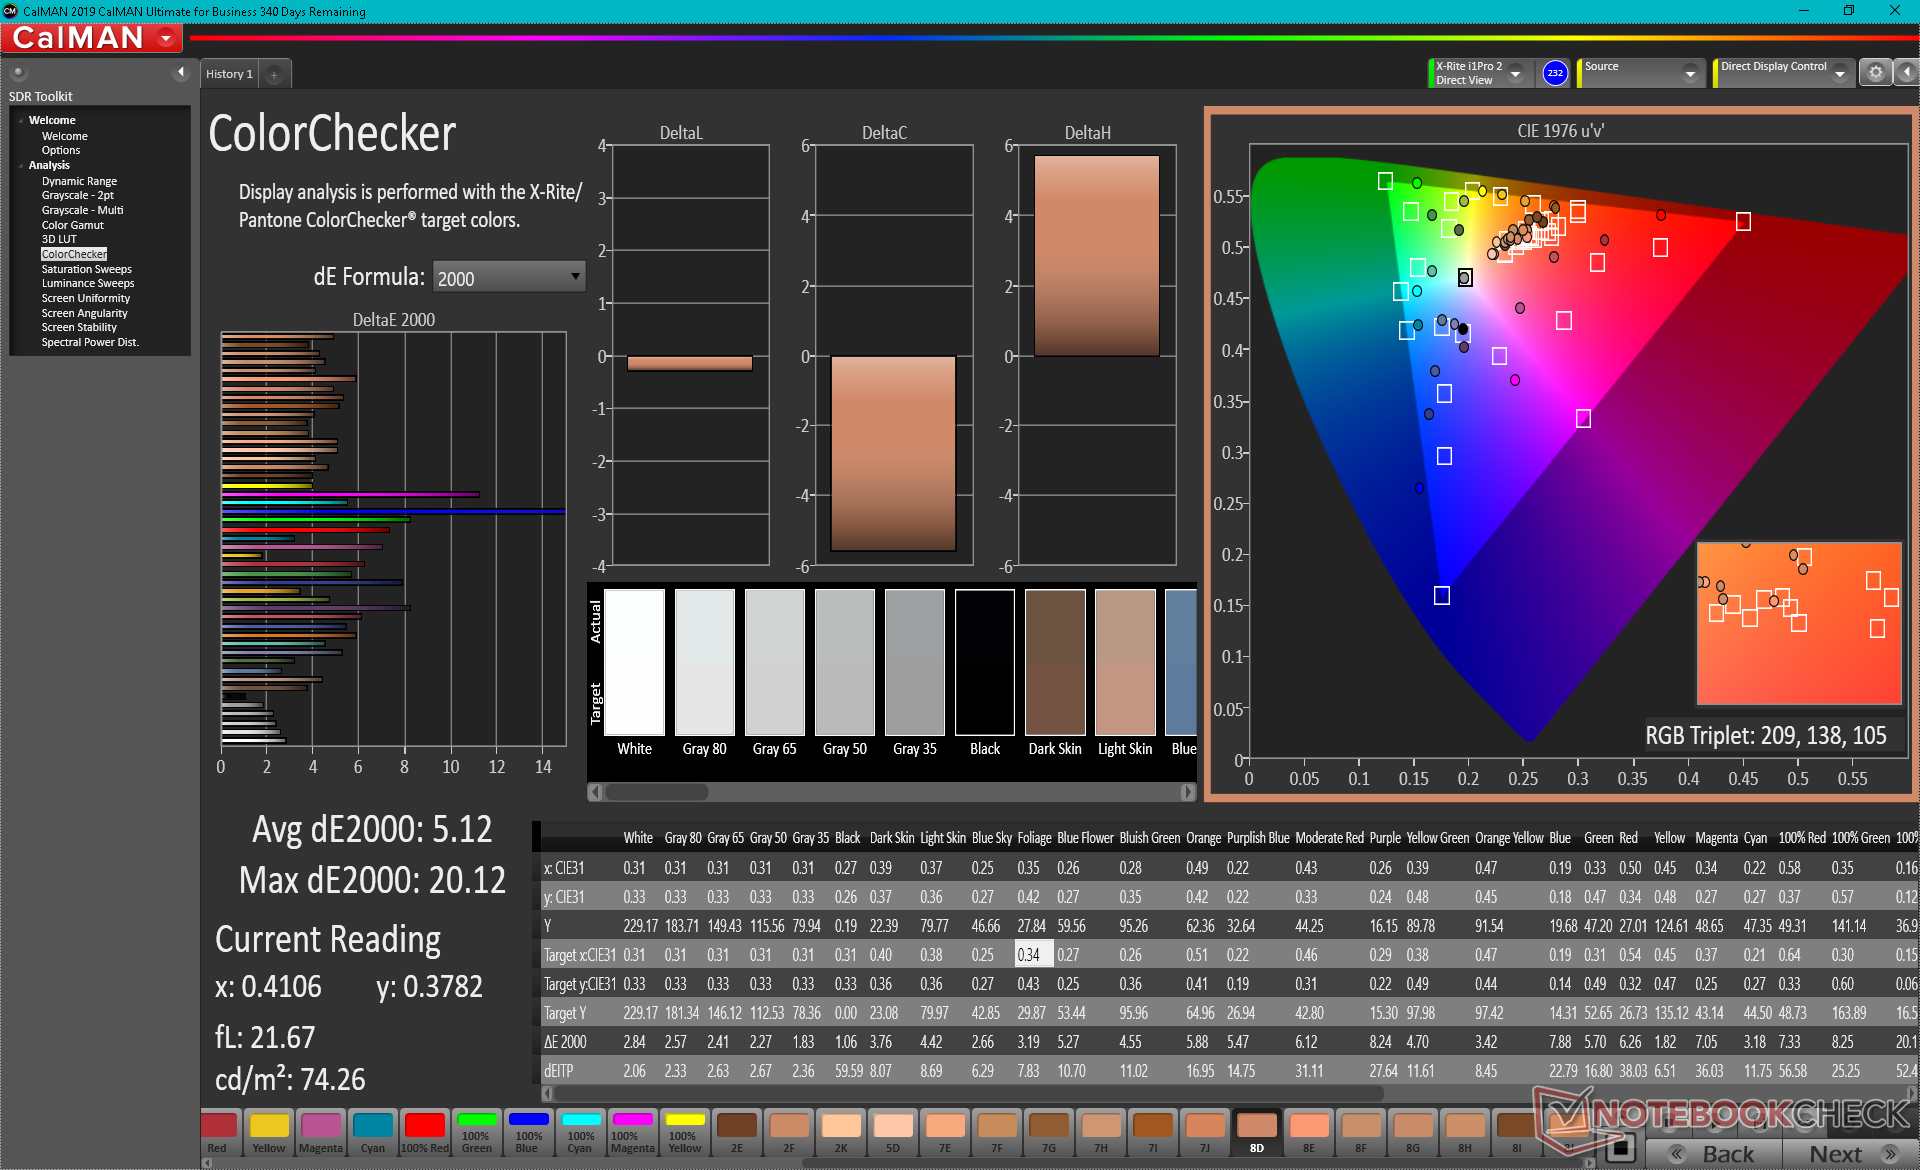
calibrated: 5.12
ΔE Greyscale Calman: 3.3 | ∀{0.09-98 Ø4.96}
58% sRGB (Argyll 1.6.3 3D)
37.1% AdobeRGB 1998 (Argyll 1.6.3 3D)
40.73% AdobeRGB 1998 (Argyll 3D)
58.7% sRGB (Argyll 3D)
39.42% Display P3 (Argyll 3D)
Gamma: 2.35
CCT: 6749 K
| Dell Inspiron 15 5000 5502 BOE NV15N3D, IPS, 15.6", 1920x1080 | Dell Inspiron 15 7506 2-in-1 P97F LG Philips 156WFF, IPS, 15.6", 1920x1080 | Asus VivoBook S15 S533EQ-BQ002T Panda LM156LF-5L04, IPS, 15.6", 1920x1080 | Honor MagicBook 15 AU Optronics B156HAN02.8, IPS, 15.6", 1920x1080 | Lenovo IdeaPad 5 15IIL05 AU Optronics B156HAN02.1, IPS, 15.6", 1920x1080 | Lenovo Ideapad S340-15IIL BOE CQ NV156FHM-T03, IPS, 15.6", 1920x1080 | |
|---|---|---|---|---|---|---|
| Display | 69% | -1% | 1% | -5% | 2% | |
| Display P3 Coverage (%) | 39.42 | 67.4 71% | 39.01 -1% | 39.96 1% | 37.63 -5% | 40.43 3% |
| sRGB Coverage (%) | 58.7 | 97.2 66% | 58.5 0% | 59.7 2% | 56.5 -4% | 58.8 0% |
| AdobeRGB 1998 Coverage (%) | 40.73 | 68.7 69% | 40.33 -1% | 41.29 1% | 38.88 -5% | 41.77 3% |
| Response Times | -7% | 22% | 26% | 17% | 1% | |
| Response Time Grey 50% / Grey 80% * (ms) | 45.6 ? | 52.4 ? -15% | 38 ? 17% | 36 ? 21% | 42 ? 8% | 46.4 ? -2% |
| Response Time Black / White * (ms) | 36.4 ? | 36 ? 1% | 27 ? 26% | 25 ? 31% | 27 ? 26% | 35.2 ? 3% |
| PWM Frequency (Hz) | 1020 ? | |||||
| Screen | 21% | -6% | 14% | 1% | -9% | |
| Brightness middle (cd/m²) | 233.1 | 289.8 24% | 287 23% | 251 8% | 340 46% | 320.8 38% |
| Brightness (cd/m²) | 226 | 274 21% | 261 15% | 247 9% | 325 44% | 309 37% |
| Brightness Distribution (%) | 90 | 92 2% | 84 -7% | 85 -6% | 88 -2% | 87 -3% |
| Black Level * (cd/m²) | 0.21 | 0.31 -48% | 0.51 -143% | 0.205 2% | 0.27 -29% | 0.27 -29% |
| Contrast (:1) | 1110 | 935 -16% | 563 -49% | 1224 10% | 1259 13% | 1188 7% |
| Colorchecker dE 2000 * | 5.69 | 3.75 34% | 4.72 17% | 3.94 31% | 6.62 -16% | 7.68 -35% |
| Colorchecker dE 2000 max. * | 20.62 | 7.01 66% | 17.94 13% | 7.87 62% | 21.05 -2% | 21.97 -7% |
| Colorchecker dE 2000 calibrated * | 5.12 | 1.52 70% | 3.74 27% | 3.42 33% | 4.71 8% | 4.65 9% |
| Greyscale dE 2000 * | 3.3 | 5.3 -61% | 2.2 33% | 3.42 -4% | 4.61 -40% | 7.3 -121% |
| Gamma | 2.35 94% | 2.35 94% | 2.51 88% | 2.44 90% | 2.74 80% | 2.12 104% |
| CCT | 6749 96% | 5810 112% | 6758 96% | 6319 103% | 6262 104% | 6213 105% |
| Color Space (Percent of AdobeRGB 1998) (%) | 37.1 | 62.9 70% | 37 0% | 38 2% | 36 -3% | 37.8 2% |
| Color Space (Percent of sRGB) (%) | 58 | 97 67% | 58 0% | 59 2% | 56 -3% | 58.3 1% |
| Total Average (Program / Settings) | 28% /
26% | 5% /
-2% | 14% /
13% | 4% /
2% | -2% /
-6% |
* ... smaller is better
Color space covers just 58 percent of sRGB. Though not uncommon on other budget laptops like the Lenovo IdeaPad 5 or Asus VivoBook S15, mid-range laptops and up tend to cover at least 90 percent of sRGB for deeper and more accurate colors. This is definitely not the laptop to be using for any sort of graphics editing.
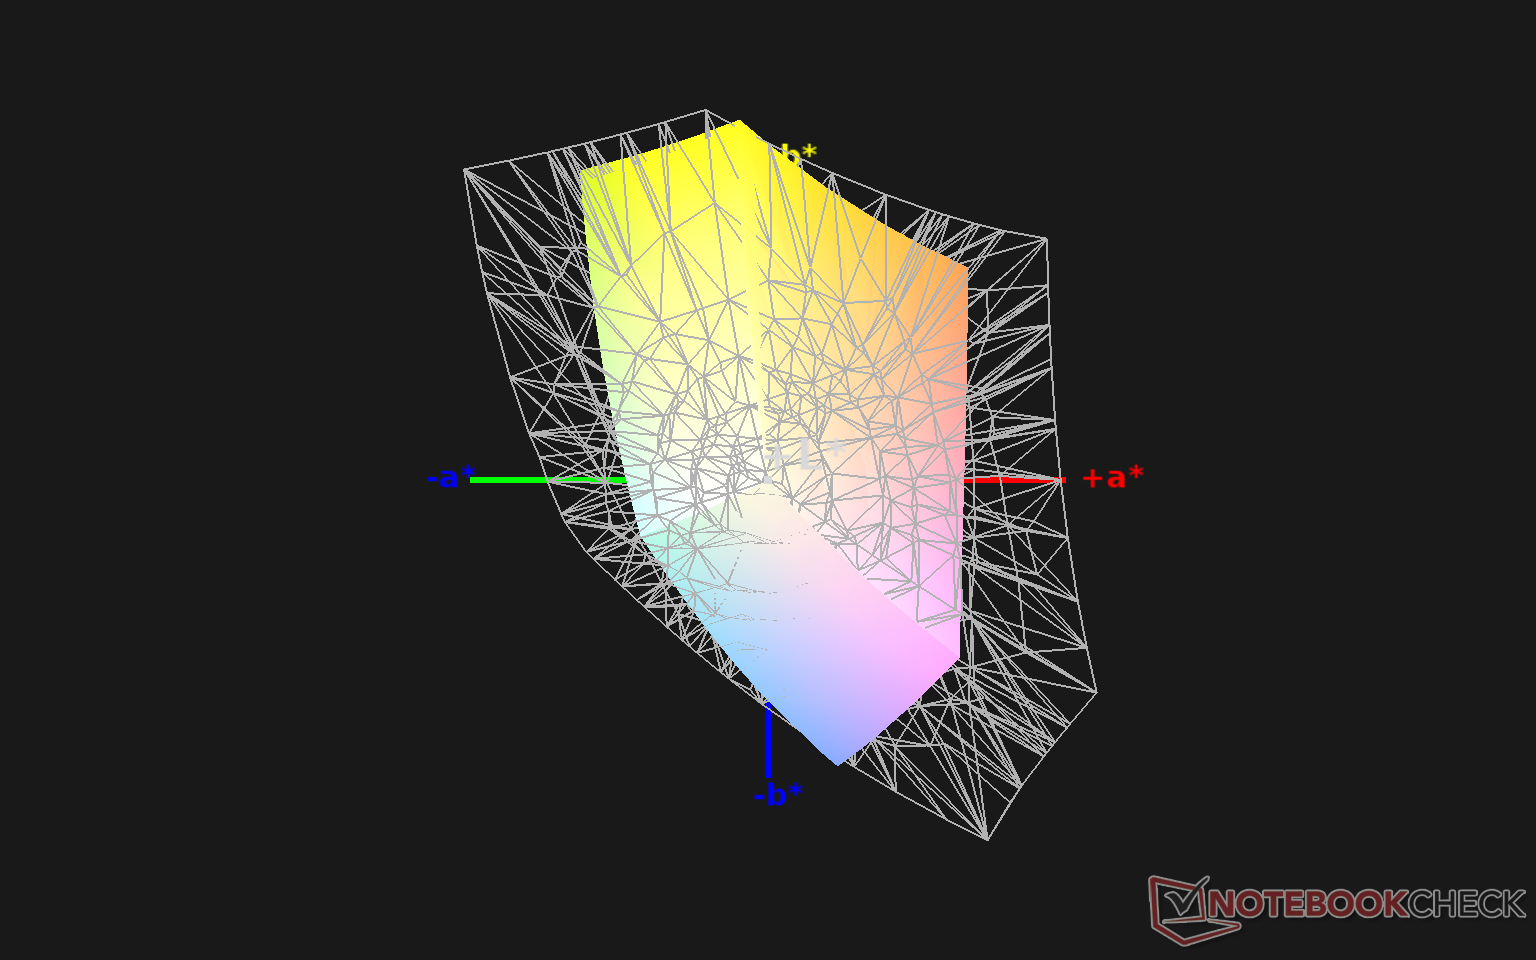
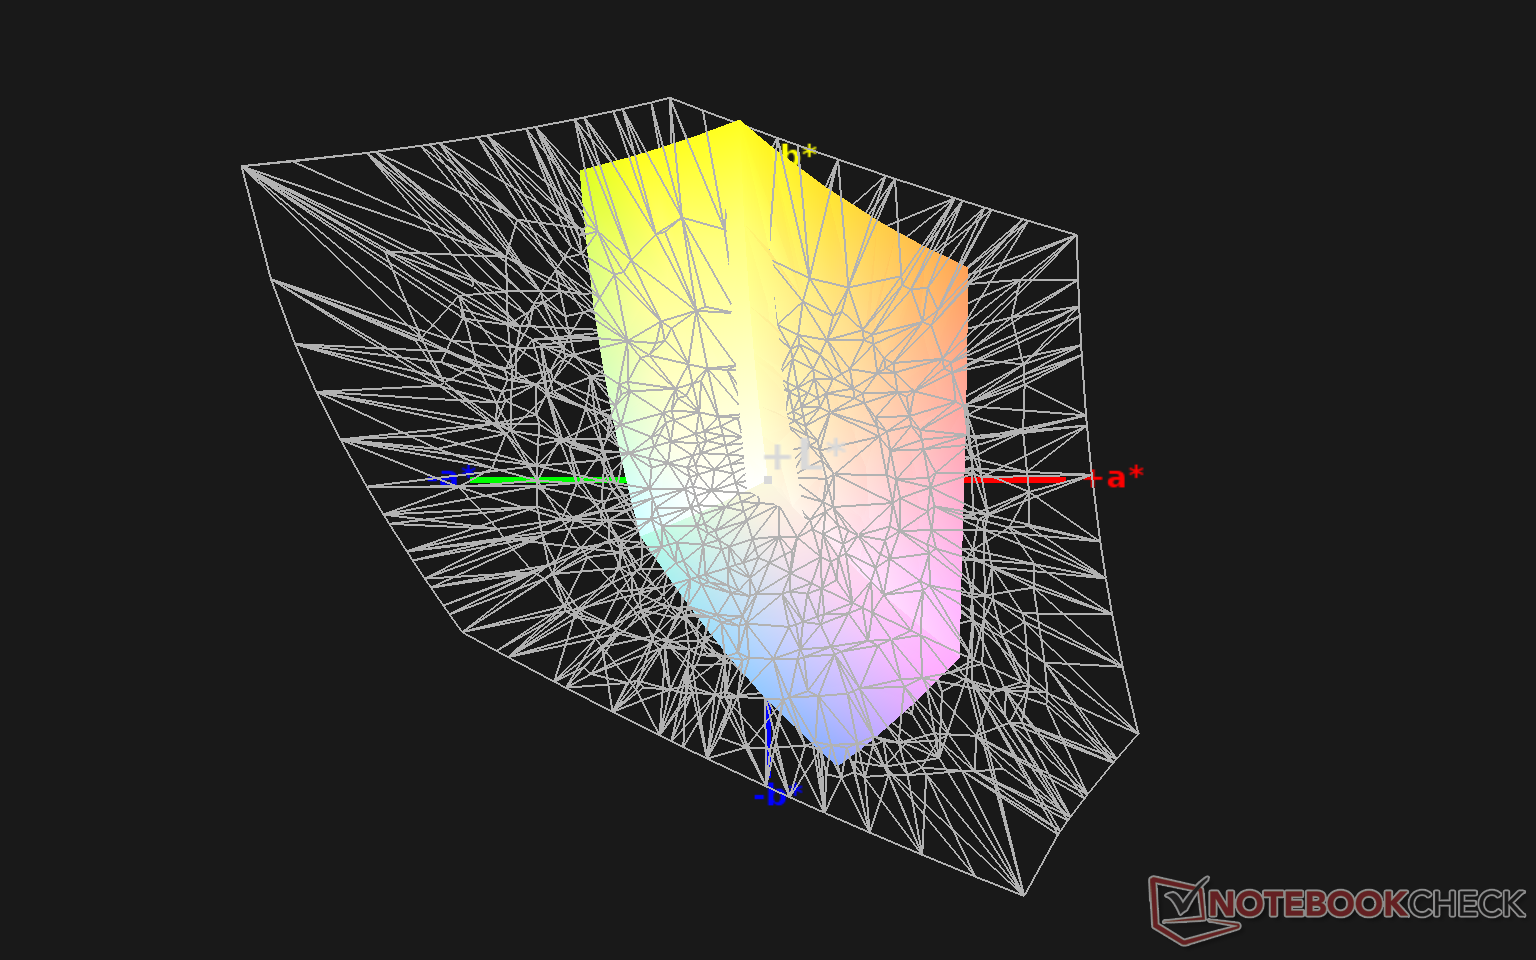
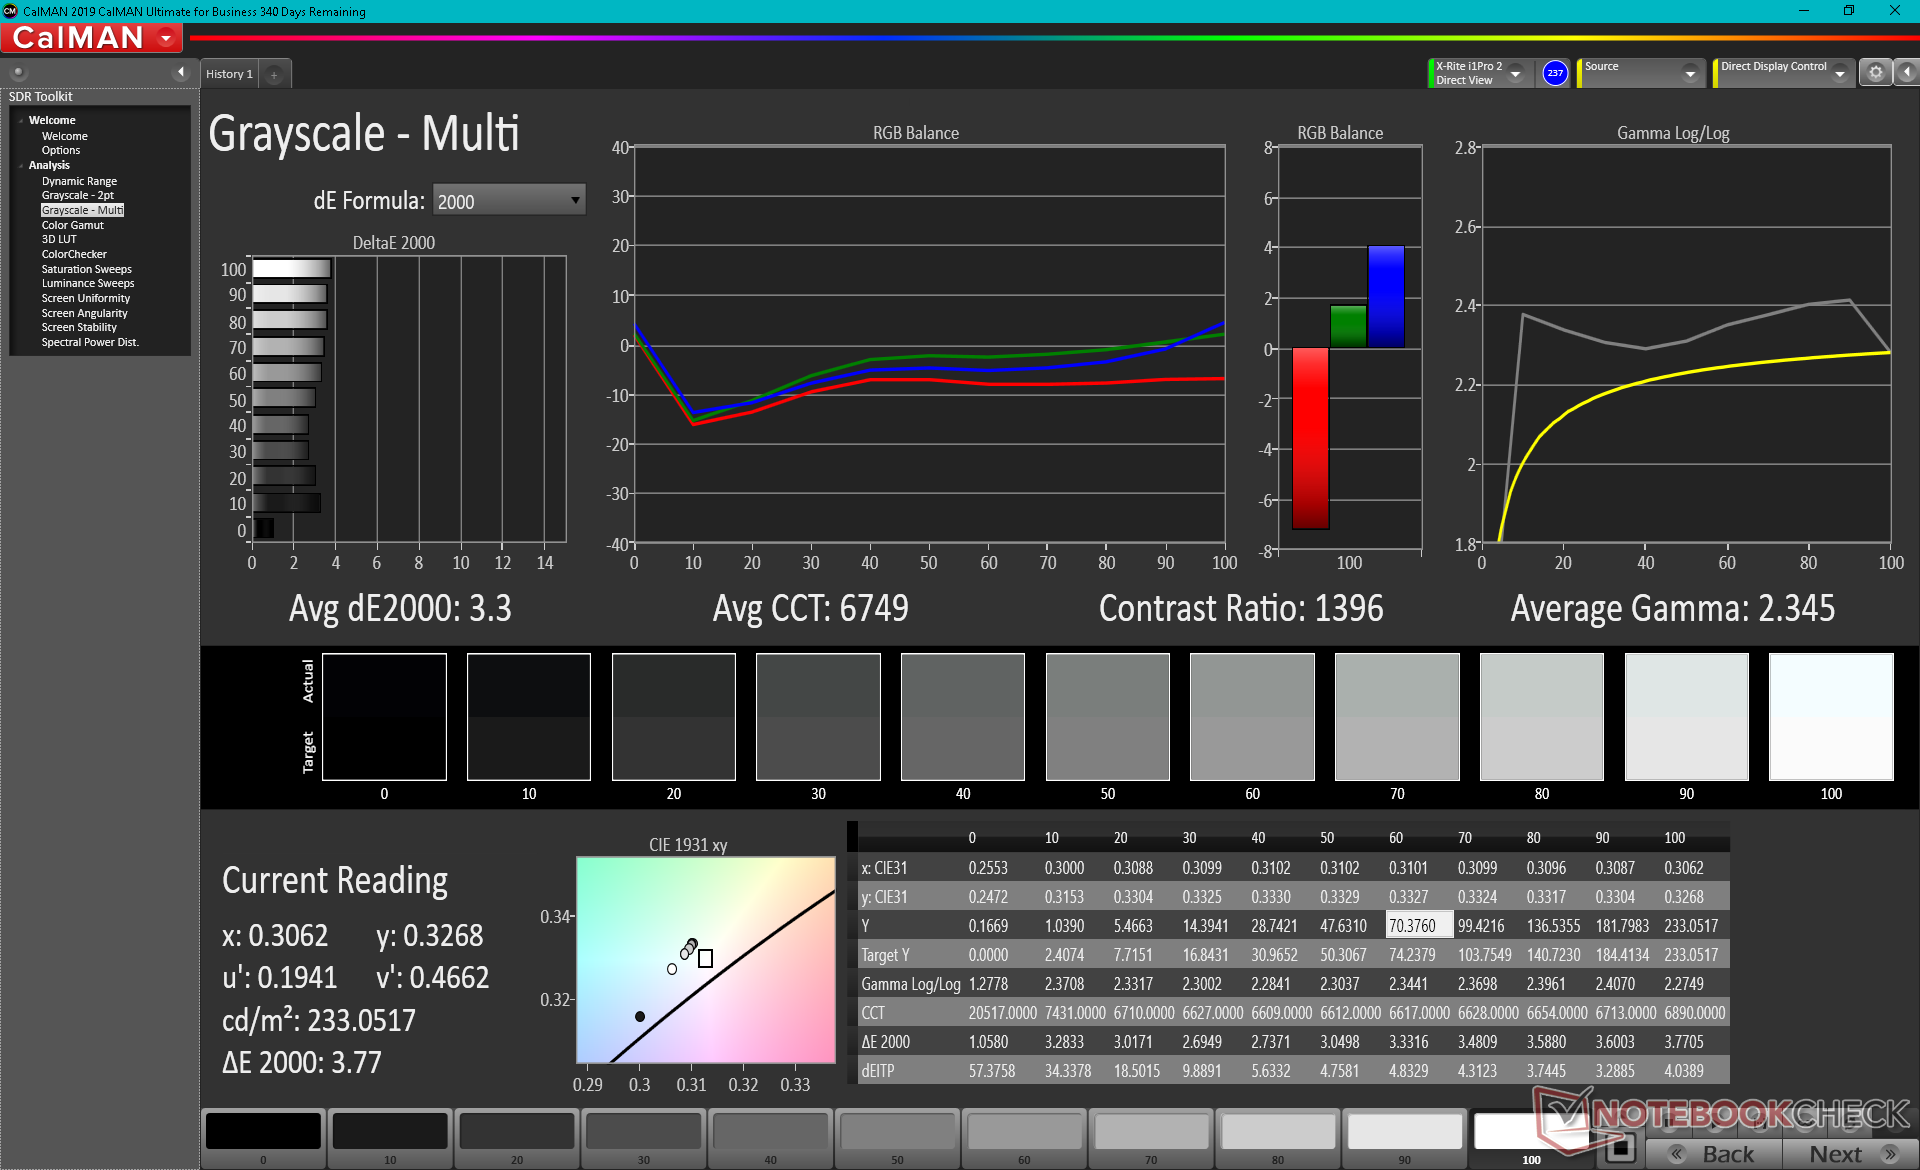
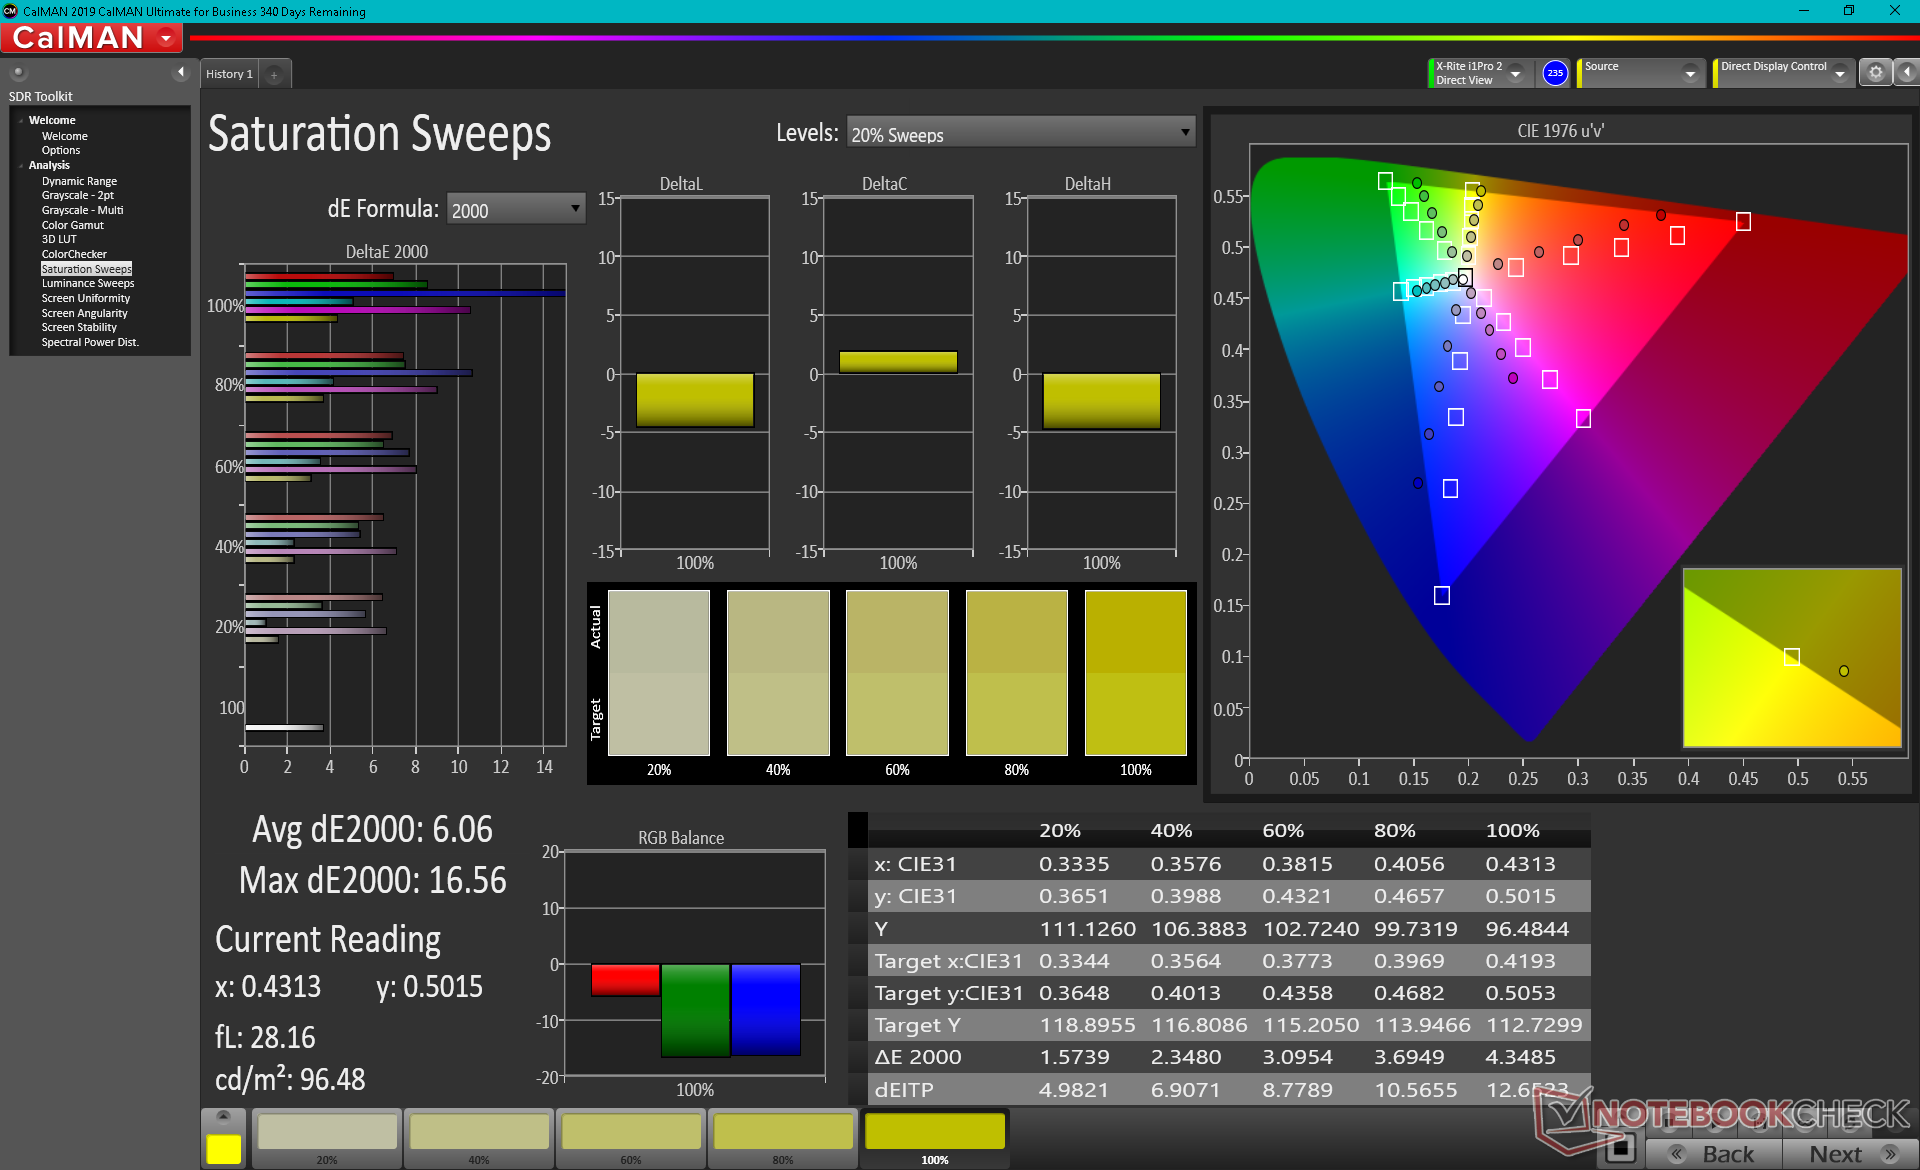
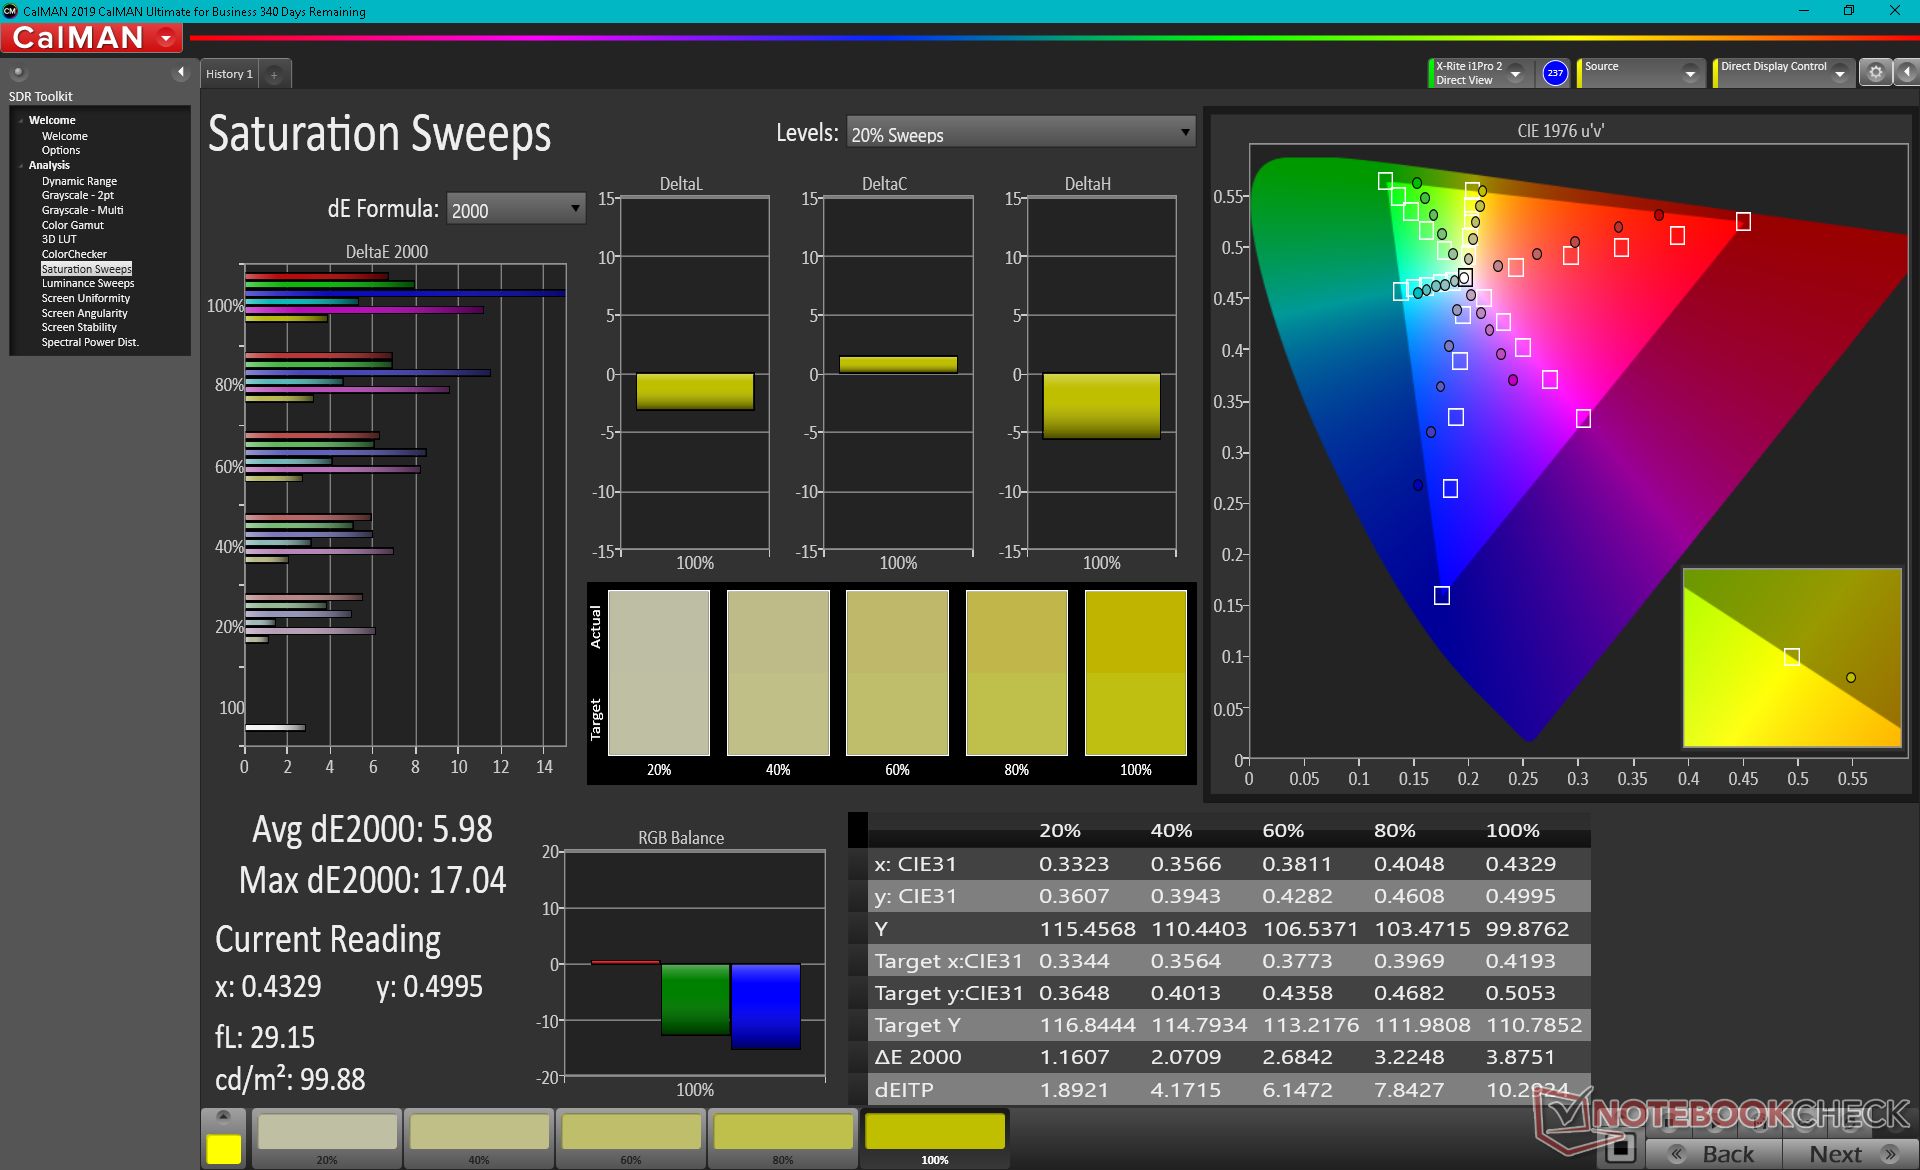
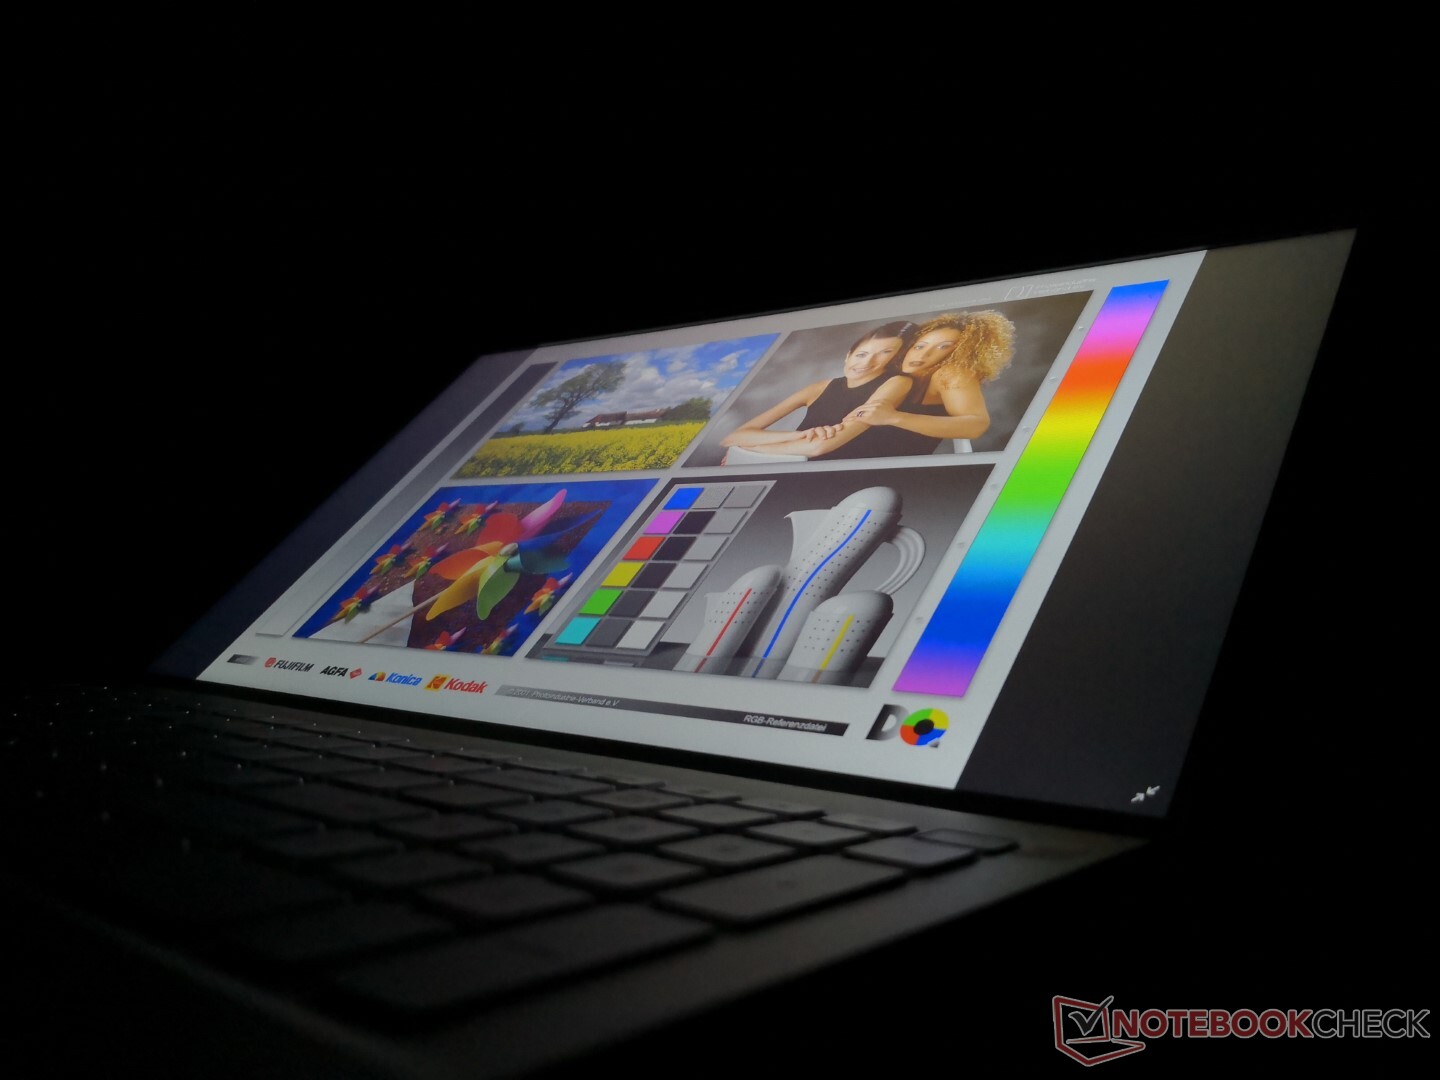
Grayscale is actually not bad out of the box with a low average DeltaE value of just 3.3. Colors, however, are relatively inaccurate especially at higher saturations due to the narrow color space mentioned above. Calibrating the panel will not significantly improve these drawbacks.

Display Response Times
| ↔ Response Time Black to White | ||
|---|---|---|
| 36.4 ms ... rise ↗ and fall ↘ combined | ↗ 20.4 ms rise | 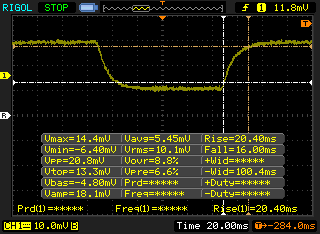 |
| ↘ 16 ms fall | ||
| The screen shows slow response rates in our tests and will be unsatisfactory for gamers. In comparison, all tested devices range from 0.1 (minimum) to 240 (maximum) ms. » 95 % of all devices are better. This means that the measured response time is worse than the average of all tested devices (19.8 ms). | ||
| ↔ Response Time 50% Grey to 80% Grey | ||
| 45.6 ms ... rise ↗ and fall ↘ combined | ↗ 23.6 ms rise | 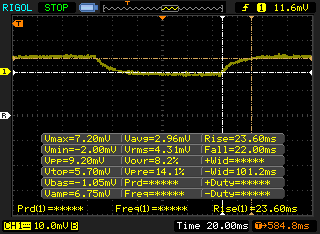 |
| ↘ 22 ms fall | ||
| The screen shows slow response rates in our tests and will be unsatisfactory for gamers. In comparison, all tested devices range from 0.165 (minimum) to 636 (maximum) ms. » 78 % of all devices are better. This means that the measured response time is worse than the average of all tested devices (30.9 ms). | ||
Screen Flickering / PWM (Pulse-Width Modulation)
| Screen flickering / PWM detected | 1020 Hz | ≤ 98 % brightness setting | 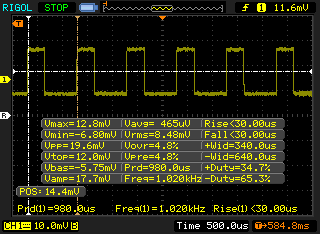 |
The display backlight flickers at 1020 Hz (worst case, e.g., utilizing PWM) Flickering detected at a brightness setting of 98 % and below. There should be no flickering or PWM above this brightness setting. The frequency of 1020 Hz is quite high, so most users sensitive to PWM should not notice any flickering. In comparison: 52 % of all tested devices do not use PWM to dim the display. If PWM was detected, an average of 7744 (minimum: 5 - maximum: 343500) Hz was measured. | |||
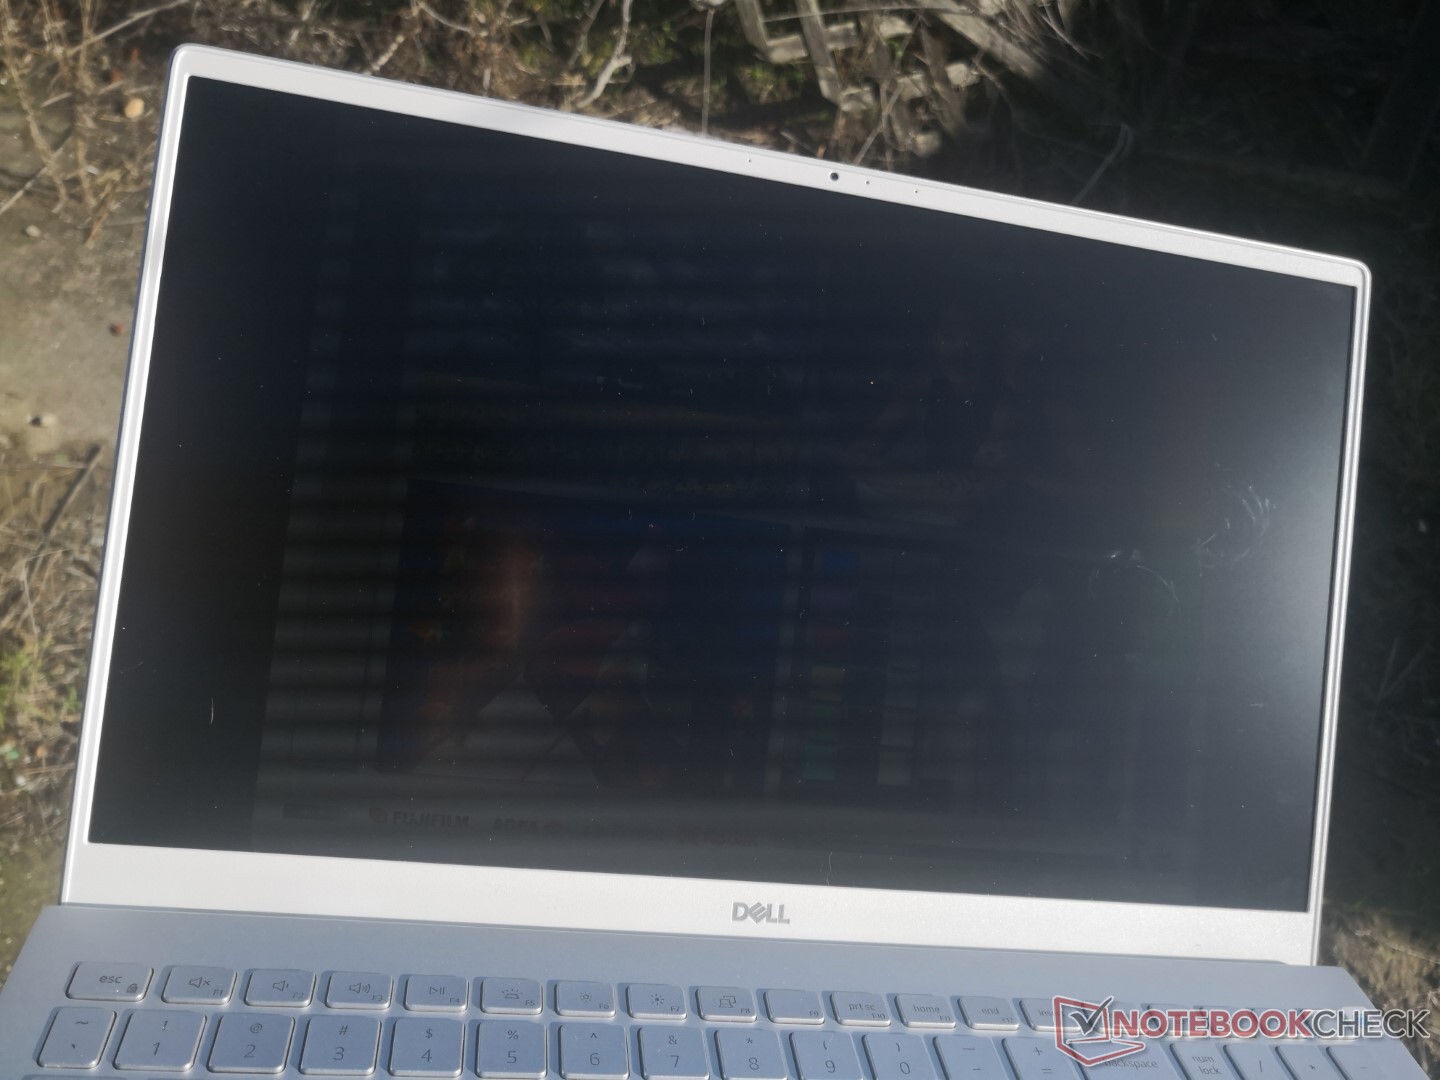
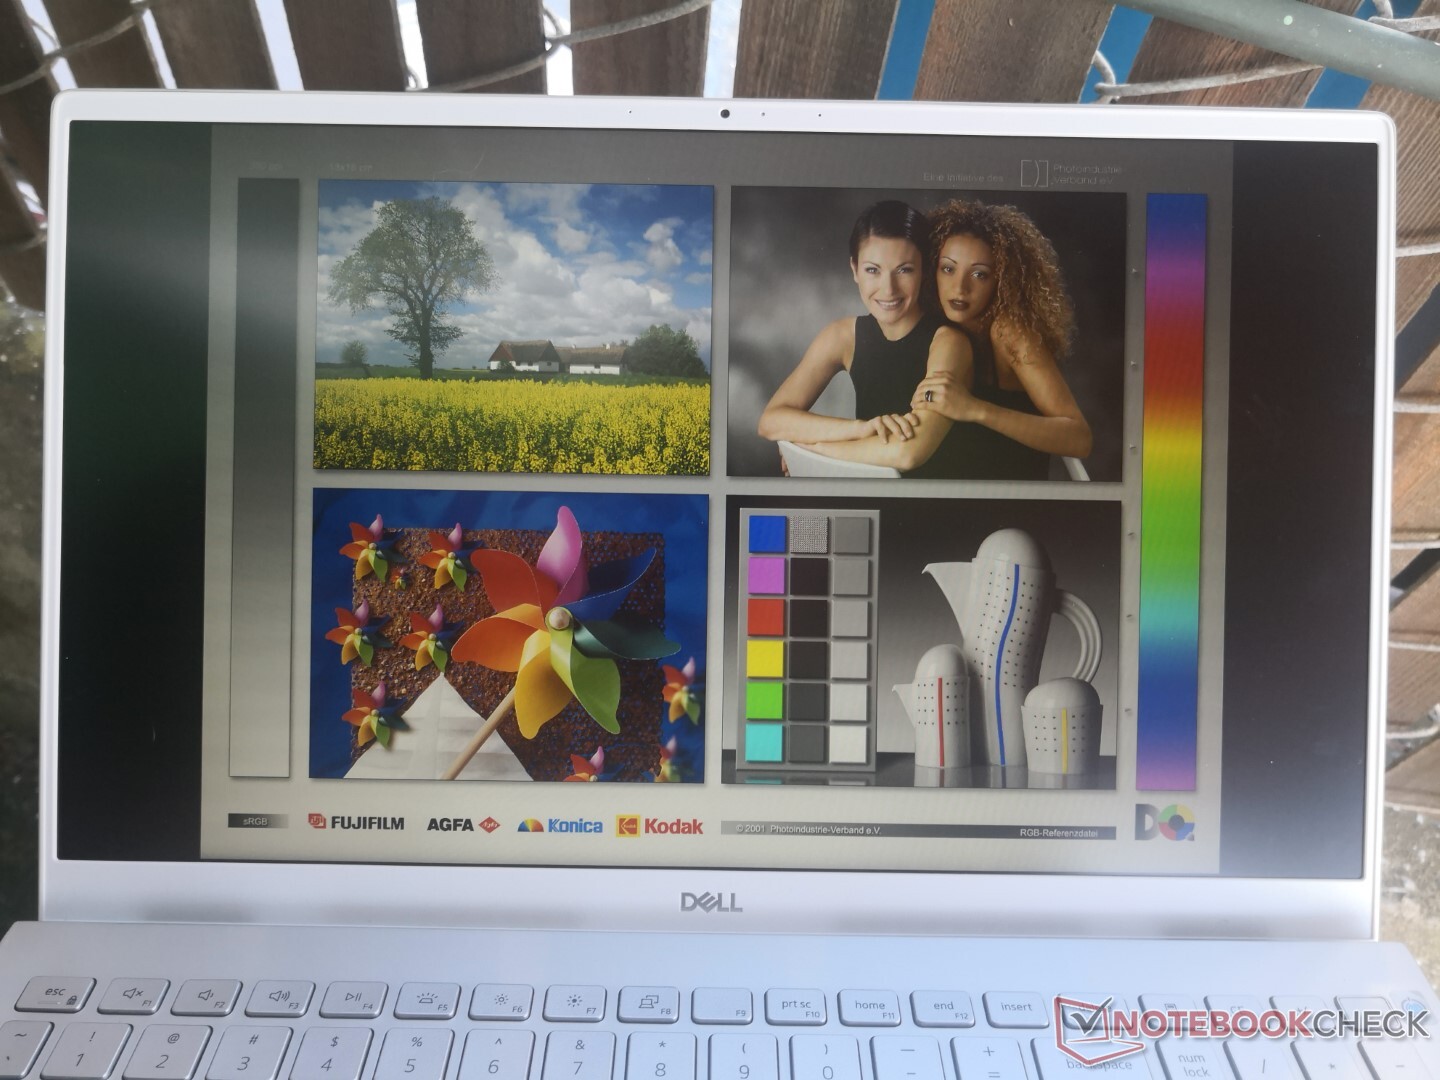
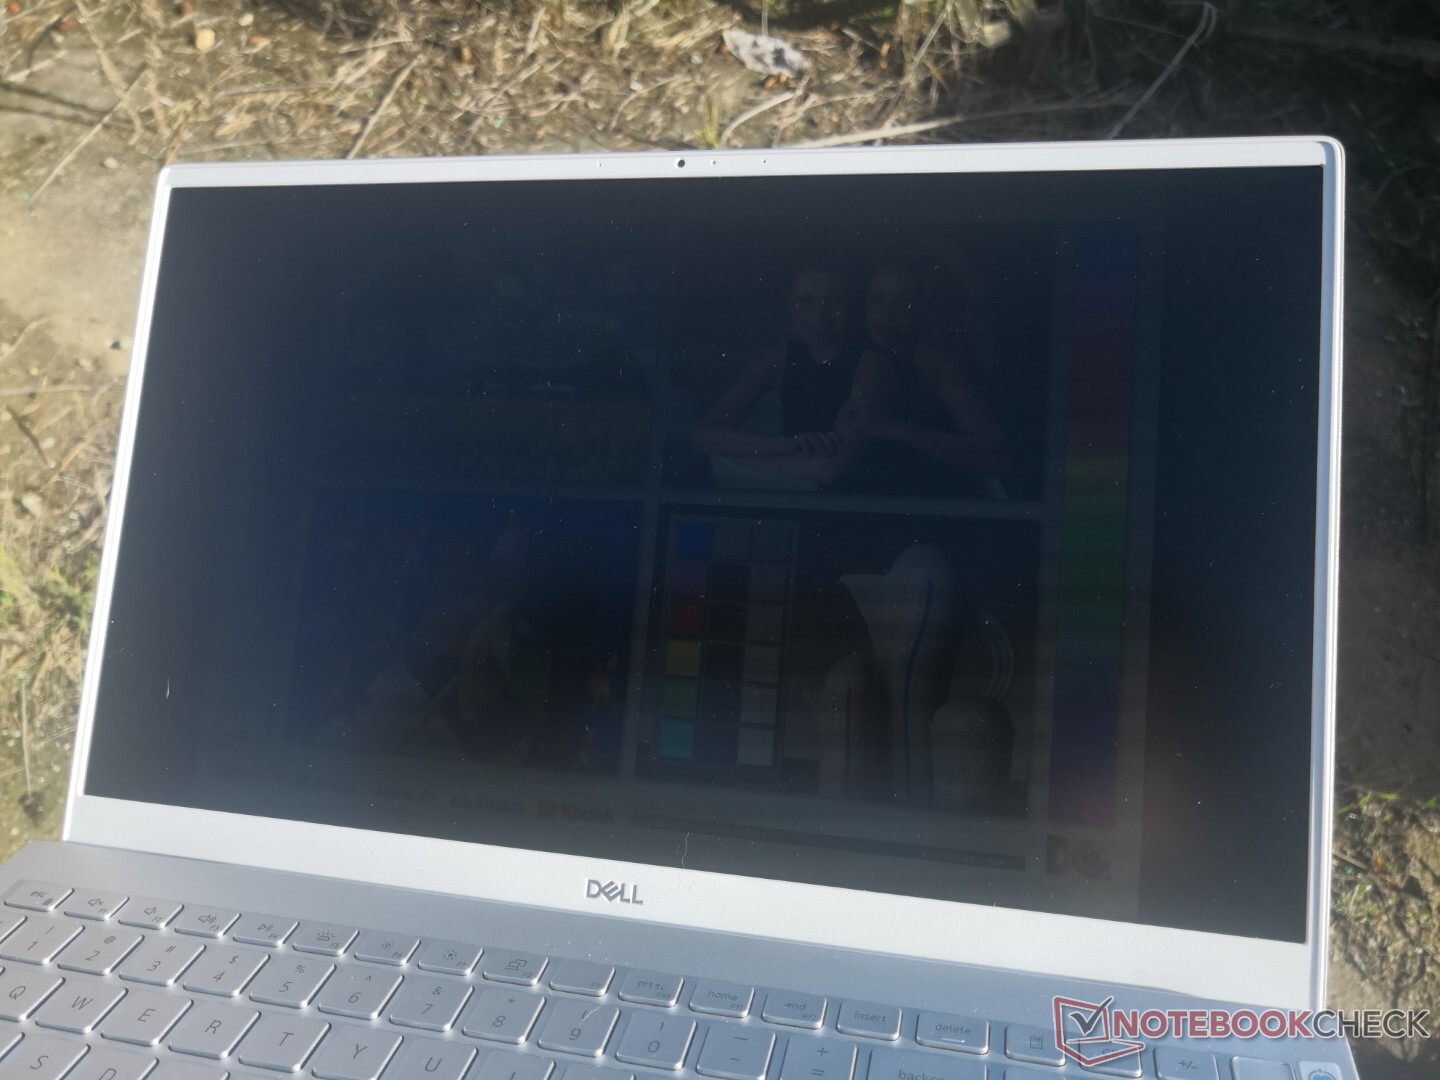
Outdoor visibility is poor as the backlight is relatively dim for anything other than indoor use. Furthermore, maximum brightness dips slightly when running on battery power (233 nits to 210 nits) with no option to disable this in Intel Graphics Command Center. Users must enter BIOS and disable EcoPower to prevent the automatic dip in brightness.
Performance
The Inspiron 15 5502 offers only 11th gen Intel options ranging from the Core i3-1115G1 to the Core i5-1135G7 and Core i7-1165G7. Upgrading to the Core i5 or Core i7 from our Core i3 configuration will bring significant gains in performance as our benchmarks below will show. The lack of any discrete GPU options is understandable since Iris Xe is more power efficient and appropriate for the price range, but it would have been nice to see some AMD Ryzen options.
Our test unit was set to Best performance via Windows prior to running any performance benchmarks below for the best possible scores.
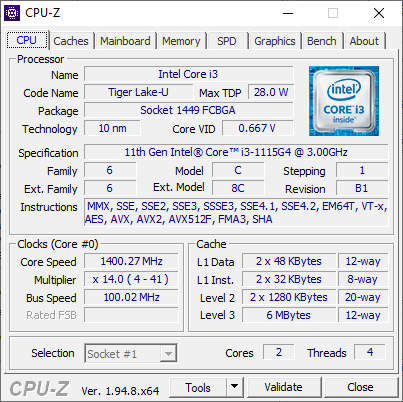
Processor
Multi-thread performance is about neck-to-neck with the last generation Core i3-1005G1 while single-thread performance can be up to 25 percent faster according to CineBench benchmarks. Owners of older Whiskey Lake-U Core i3 laptops aren't going to see much of a CPU performance difference if upgrading to the Core i3-1115G4. Performance hunters on a budget may want to consider the competing Ryzen 3 4300U which can outperform our i3-111G5G4 by about 50 percent in multi-threaded loads with only a 15 percent deficit in single-threaded loads.
Upgrading to the Core i5-1135G7 option can bring a massive boost to CPU performance by about 2x.
See our dedicated page on the Core i3-1115G4 for more technical information and benchmark comparisons.
Cinebench R15: CPU Multi 64Bit | CPU Single 64Bit
Blender: v2.79 BMW27 CPU
7-Zip 18.03: 7z b 4 -mmt1 | 7z b 4
Geekbench 5.5: Single-Core | Multi-Core
HWBOT x265 Benchmark v2.2: 4k Preset
LibreOffice : 20 Documents To PDF
R Benchmark 2.5: Overall mean
| HWBOT x265 Benchmark v2.2 / 4k Preset | |
| Schenker Vision 15 | |
| Dell Inspiron 15 7506 2-in-1 P97F | |
| HP Envy x360 15-ee0257ng | |
| Acer Swift 3 SF314-42-R27B | |
| Honor MagicBook 15 | |
| Average Intel Core i3-1115G4 (3.25 - 4.1, n=6) | |
| Lenovo IdeaPad 3 14IIL05 | |
| Dell Inspiron 15 5000 5502 | |
| Dell Latitude 15 3510 NK2MC | |
| Apple MacBook Air 2020 i3 | |
| Asus Vivobook 15 F512DA-SH31 | |
Cinebench R15: CPU Multi 64Bit | CPU Single 64Bit
Blender: v2.79 BMW27 CPU
7-Zip 18.03: 7z b 4 -mmt1 | 7z b 4
Geekbench 5.5: Single-Core | Multi-Core
HWBOT x265 Benchmark v2.2: 4k Preset
LibreOffice : 20 Documents To PDF
R Benchmark 2.5: Overall mean
* ... smaller is better
System Performance
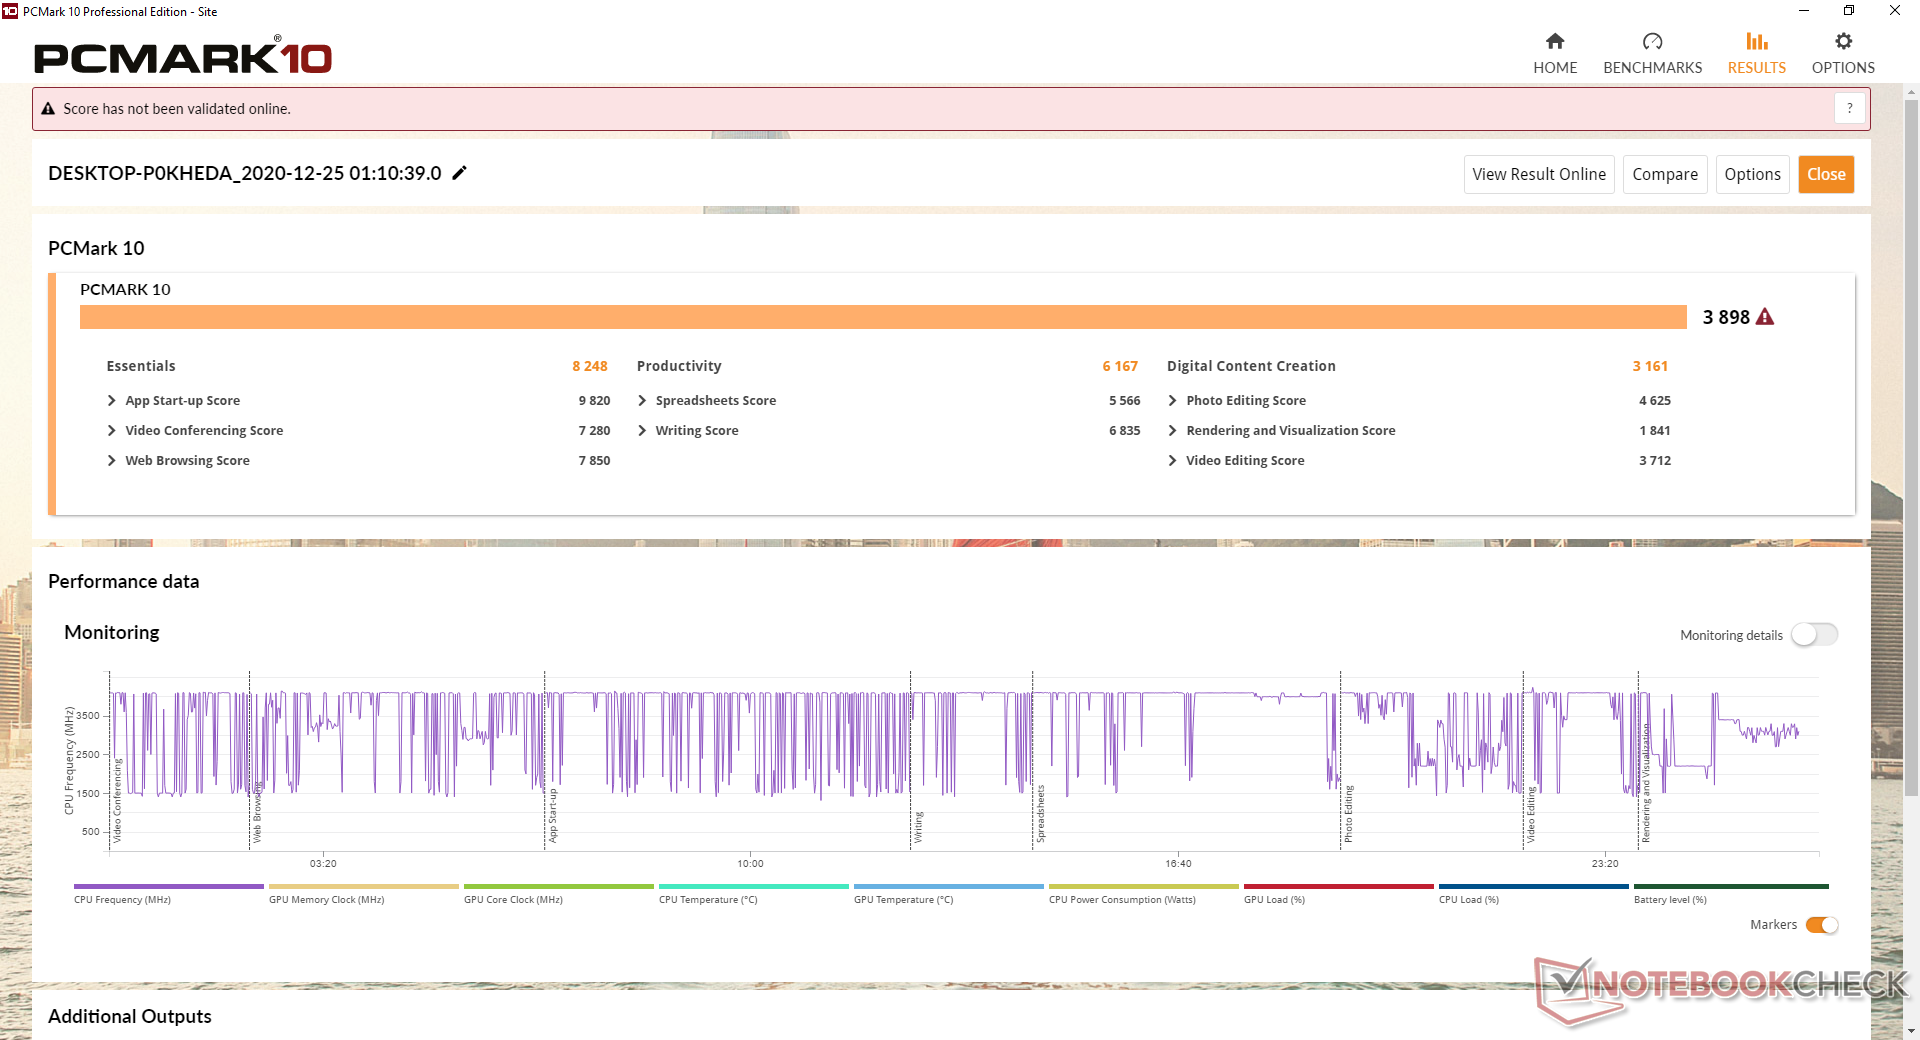
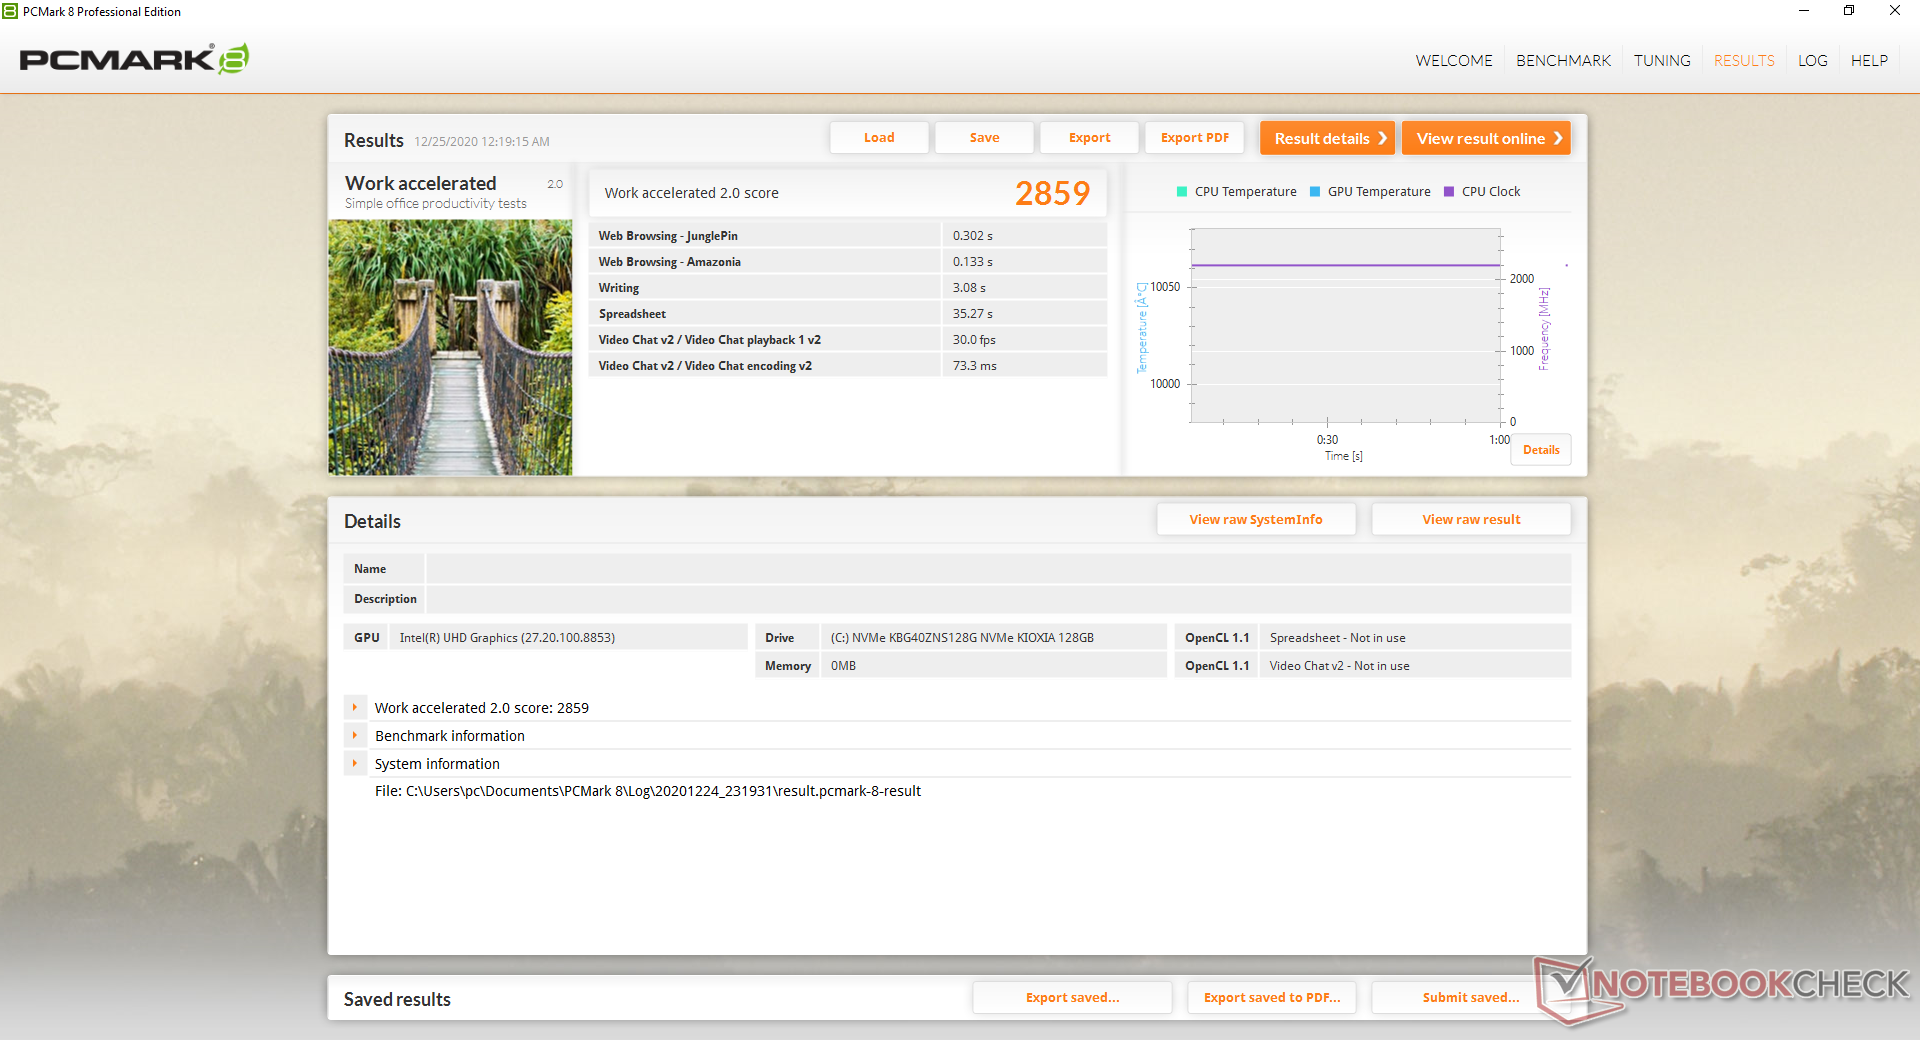
PCMark results are slower than the usual Core i5 and Core i7 laptops while being faster than the last generation Core i3-10110U. Our integrated Xe GPU in particular gets a big boost in Digital Content Creation over the older UHD Graphics 620.
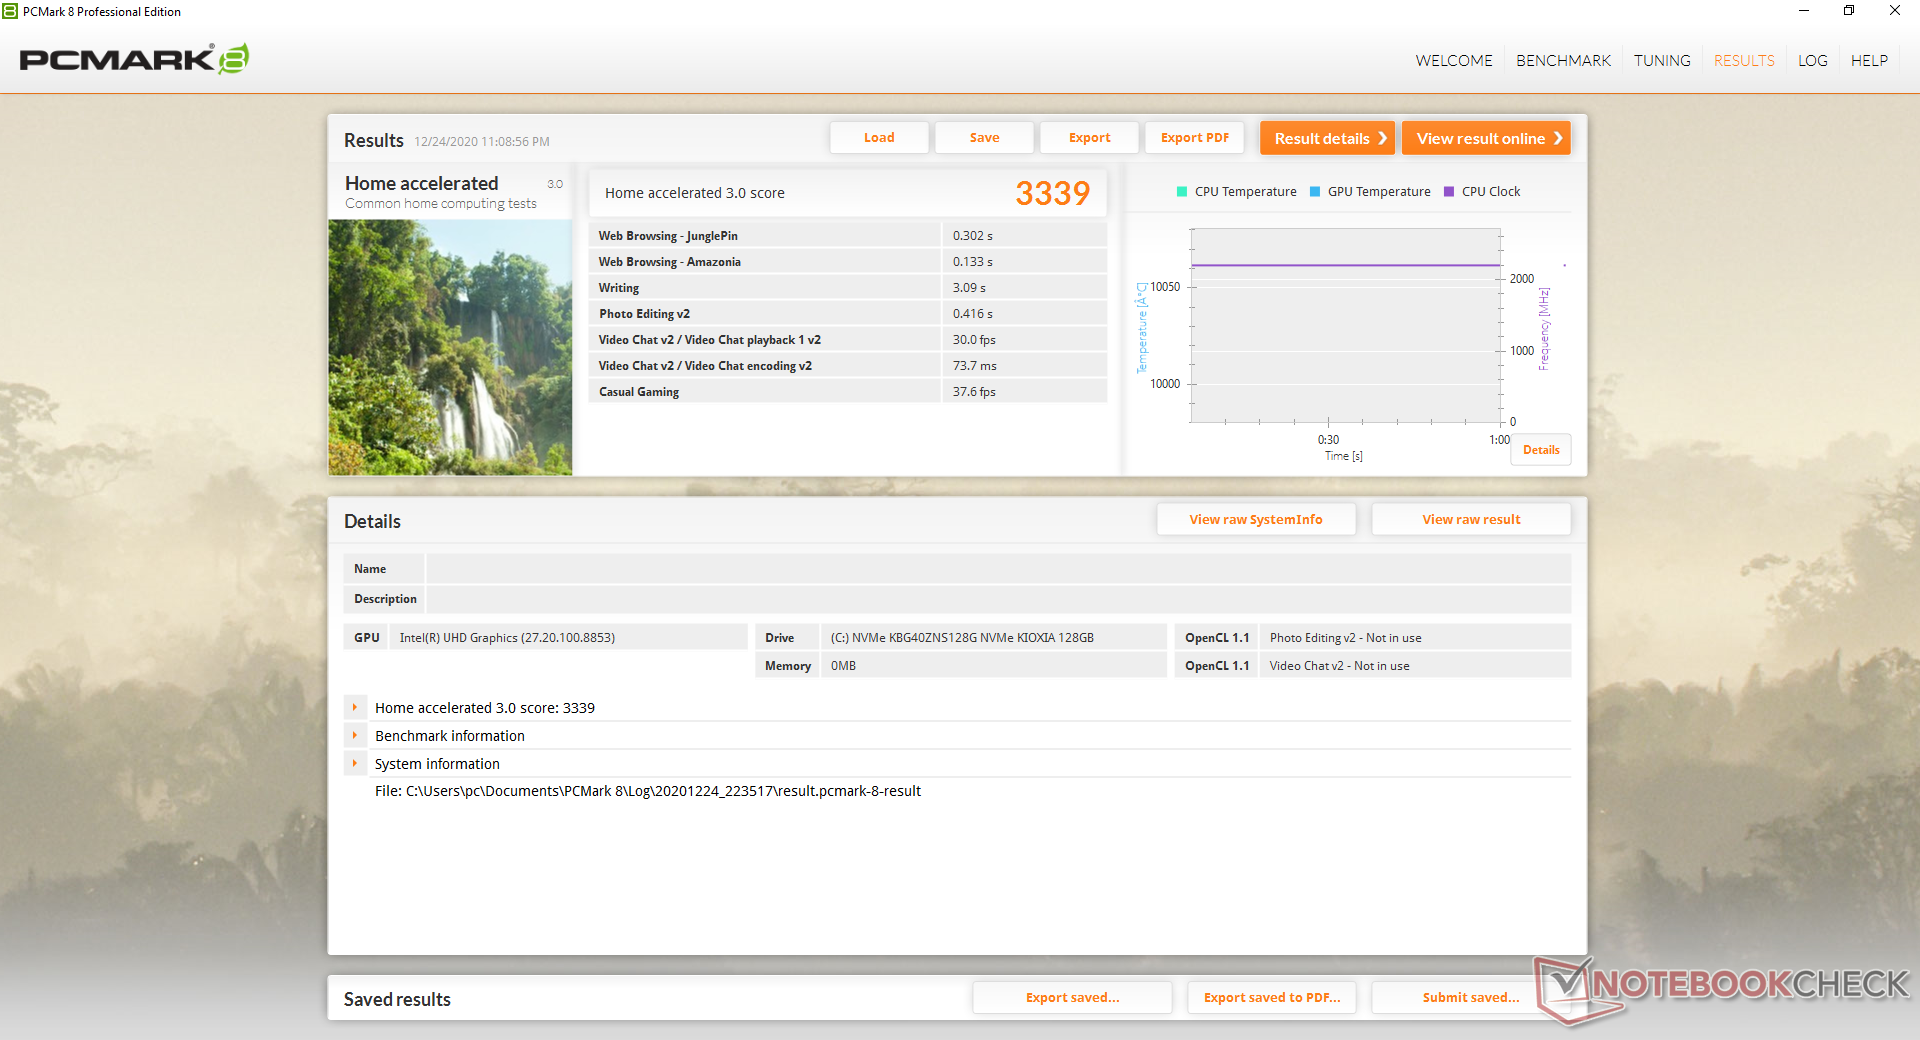
| PCMark 8 Home Score Accelerated v2 | 3339 points | |
| PCMark 8 Work Score Accelerated v2 | 2859 points | |
| PCMark 10 Score | 3898 points | |
Help | ||
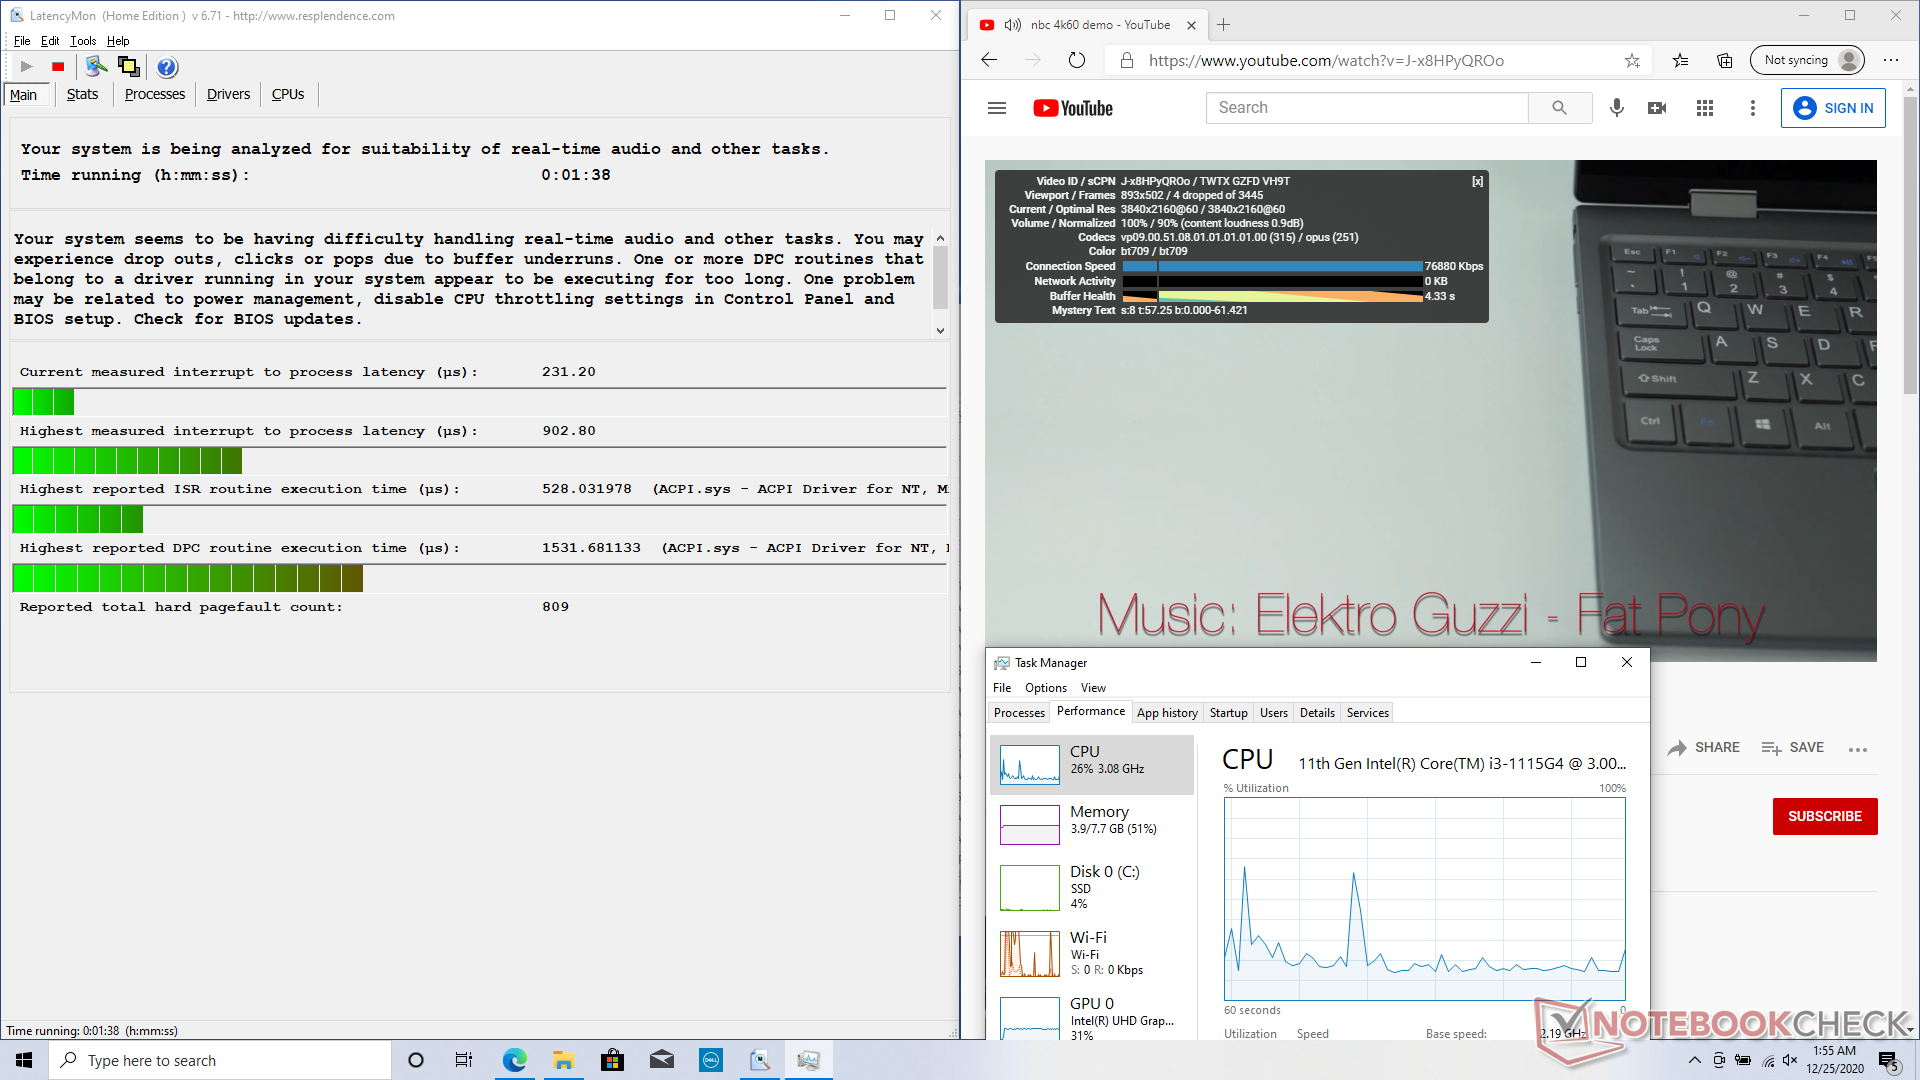
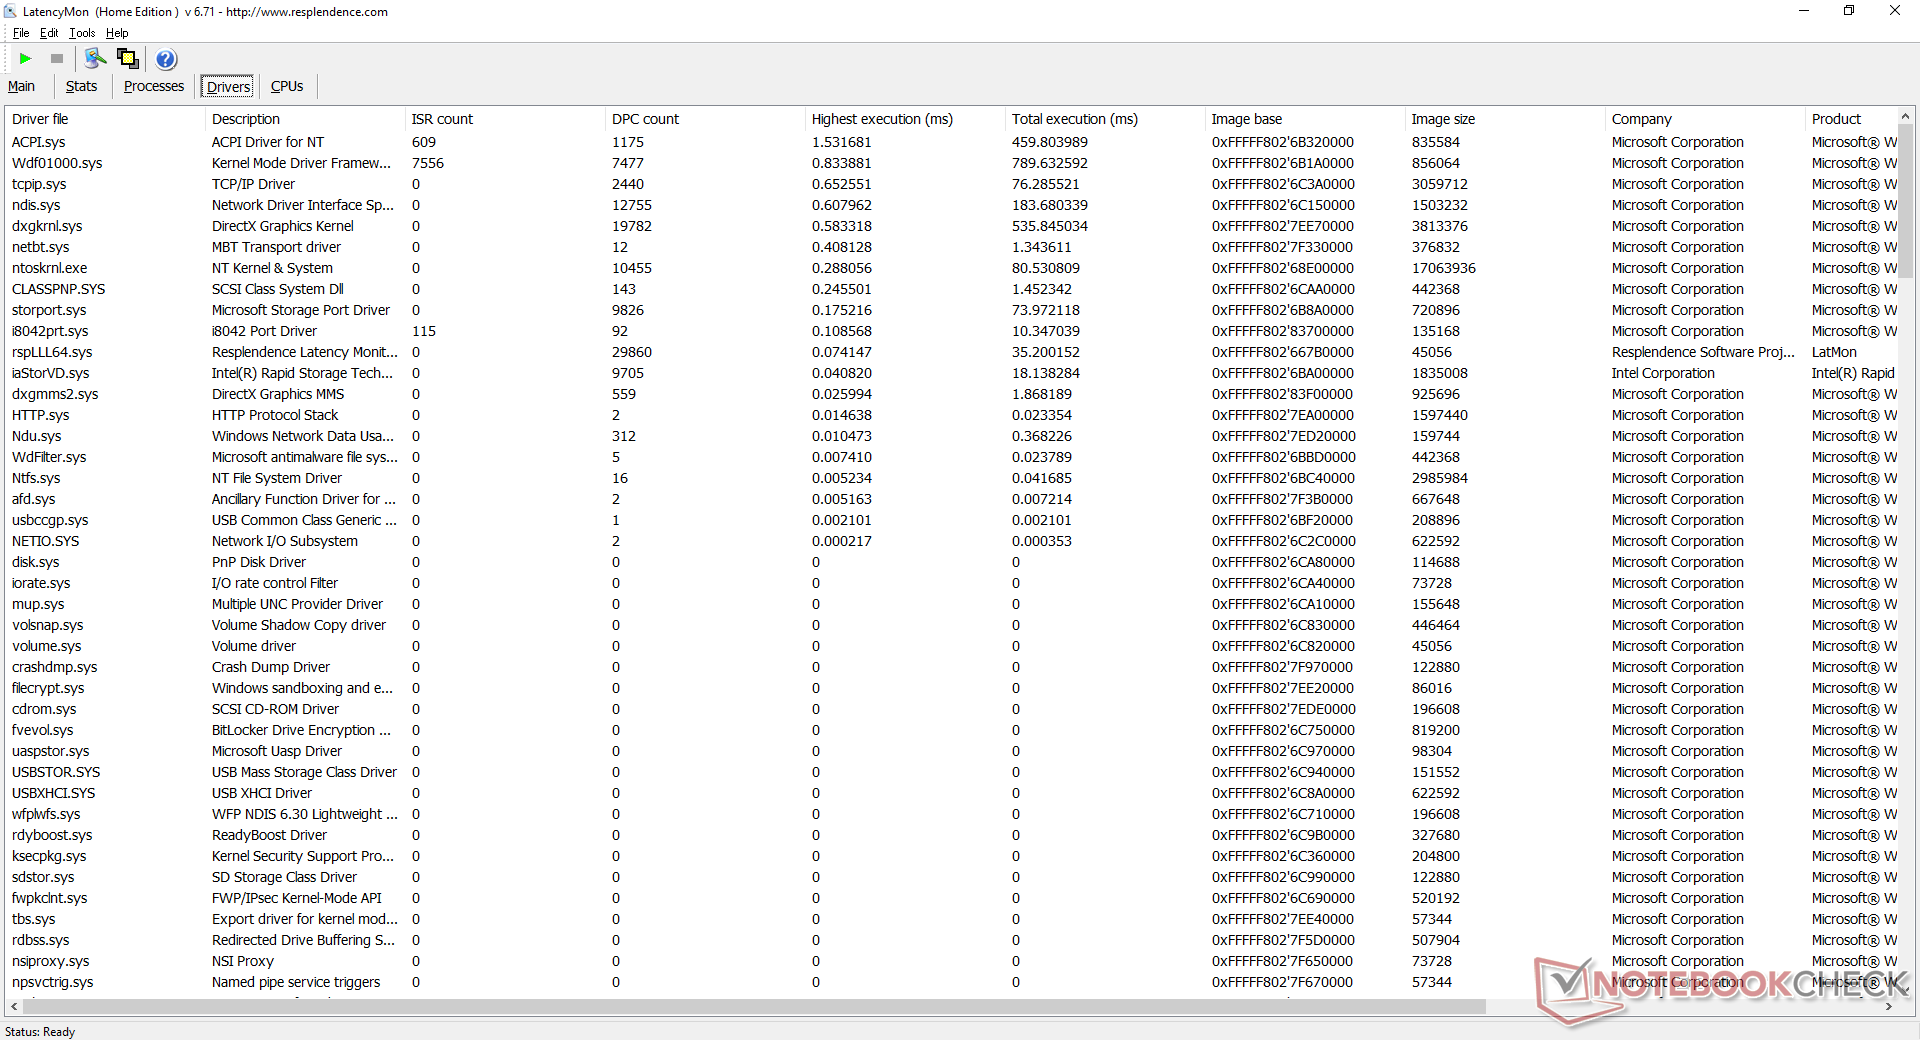
DPC Latency
LatencyMon shows DPC latency issues related to ACPI.sys. 4K video playback at 60 FPS is otherwise smooth with just four dropped frames during our minute-long YouTube test.
| DPC Latencies / LatencyMon - interrupt to process latency (max), Web, Youtube, Prime95 | |
| Dell Inspiron 15 7506 2-in-1 P97F | |
| Dell Inspiron 15 5000 5502 | |
| Honor MagicBook 15 | |
| Lenovo IdeaPad 5 15IIL05 | |
| Asus VivoBook S15 S533EQ-BQ002T | |
* ... smaller is better
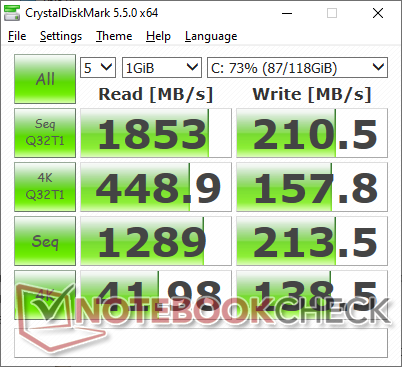
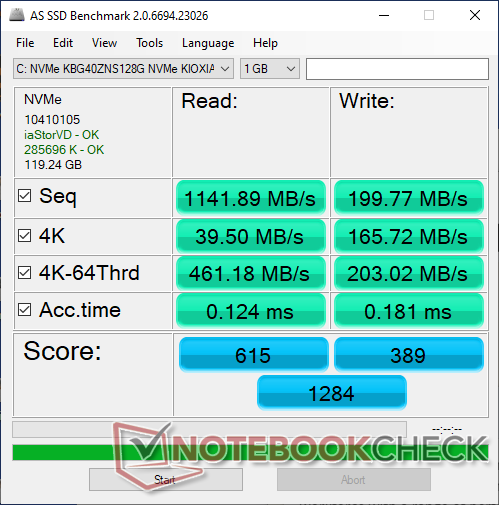
Storage Devices
Our unit comes with a budget 128 GB Toshiba BG4 NVMe SSD. Though sequential read rates are decent at over 1900 MB/s, sequential write rates are significantly slower at just 200 MB/s according to AS SSD. Toshiba's official specifications sheet claims a write rate of up to 800 MB/s. Users can configure with higher capacity drives or install their own.
More SSD and HDD comparisons can be found on our table here.
| Dell Inspiron 15 5000 5502 Toshiba BG4 KBG40ZNS128G | Dell Inspiron 15 7506 2-in-1 P97F Toshiba KBG40ZNS256G NVMe | Asus VivoBook S15 S533EQ-BQ002T Intel SSD 660p 1TB SSDPEKNW010T8 | Honor MagicBook 15 Samsung SSD PM981a MZVLB256HBHQ | Lenovo IdeaPad 5 15IIL05 SK hynix BC511 HFM512GDHTNI-87A0B | Lenovo Ideapad S340-15IIL Intel SSD 660p SSDPEKNW512G8 | |
|---|---|---|---|---|---|---|
| AS SSD | 3% | 189% | 217% | 118% | 131% | |
| Seq Read (MB/s) | 1142 | 1470 29% | 1754 54% | 2830 148% | 1625 42% | 1447 27% |
| Seq Write (MB/s) | 199.8 | 324.2 62% | 1567 684% | 2187 995% | 860 330% | 926 363% |
| 4K Read (MB/s) | 39.5 | 37.25 -6% | 53 34% | 45.36 15% | 52.1 32% | 40.06 1% |
| 4K Write (MB/s) | 165.7 | 98 -41% | 167.9 1% | 88.6 -47% | 131.3 -21% | 97.9 -41% |
| 4K-64 Read (MB/s) | 461.2 | 796 73% | 586 27% | 732 59% | 797 73% | 323.7 -30% |
| 4K-64 Write (MB/s) | 203 | 152.6 -25% | 858 323% | 1199 491% | 769 279% | 791 290% |
| Access Time Read * (ms) | 0.124 | 0.146 -18% | 0.097 22% | 0.055 56% | 0.063 49% | 0.06 52% |
| Access Time Write * (ms) | 0.181 | 0.577 -219% | 0.038 79% | 0.037 80% | 0.032 82% | 0.144 20% |
| Score Read (Points) | 615 | 980 59% | 815 33% | 1060 72% | 1012 65% | 508 -17% |
| Score Write (Points) | 389 | 283 -27% | 1182 204% | 1506 287% | 986 153% | 982 152% |
| Score Total (Points) | 1284 | 1714 33% | 2421 89% | 3087 140% | 2492 94% | 1738 35% |
| Copy ISO MB/s (MB/s) | 216.8 | 353.5 63% | 1477 581% | 1151 431% | 638 194% | 943 335% |
| Copy Program MB/s (MB/s) | 163 | 194.1 19% | 495.3 204% | 239.3 47% | 290.2 78% | 612 275% |
| Copy Game MB/s (MB/s) | 176 | 239 36% | 719 309% | 635 261% | 525 198% | 826 369% |
| CrystalDiskMark 5.2 / 6 | 10% | 236% | 276% | 131% | 117% | |
| Write 4K (MB/s) | 138.5 | 99.3 -28% | 214.4 55% | 136.1 -2% | 159.7 15% | 130.8 -6% |
| Read 4K (MB/s) | 41.98 | 32.1 -24% | 58.5 39% | 42.88 2% | 48.31 15% | 54.8 31% |
| Write Seq (MB/s) | 213.5 | 353.1 65% | 1678 686% | 2335 994% | 1038 386% | 978 358% |
| Read Seq (MB/s) | 1289 | 1370 6% | 1648 28% | 2183 69% | 1158 -10% | 1627 26% |
| Write 4K Q32T1 (MB/s) | 157.8 | 171.1 8% | 644 308% | 261.2 66% | 493.9 213% | 450.1 185% |
| Read 4K Q32T1 (MB/s) | 448.9 | 350.8 -22% | 600 34% | 328.1 -27% | 522 16% | 345.9 -23% |
| Write Seq Q32T1 (MB/s) | 210.5 | 325.9 55% | 1760 736% | 2348 1015% | 1028 388% | 982 367% |
| Read Seq Q32T1 (MB/s) | 1853 | 2197 19% | 1853 0% | 3564 92% | 2280 23% | 1842 -1% |
| Total Average (Program / Settings) | 7% /
5% | 213% /
206% | 247% /
238% | 125% /
122% | 124% /
126% |
* ... smaller is better

Disk Throttling: DiskSpd Read Loop, Queue Depth 8
GPU Performance
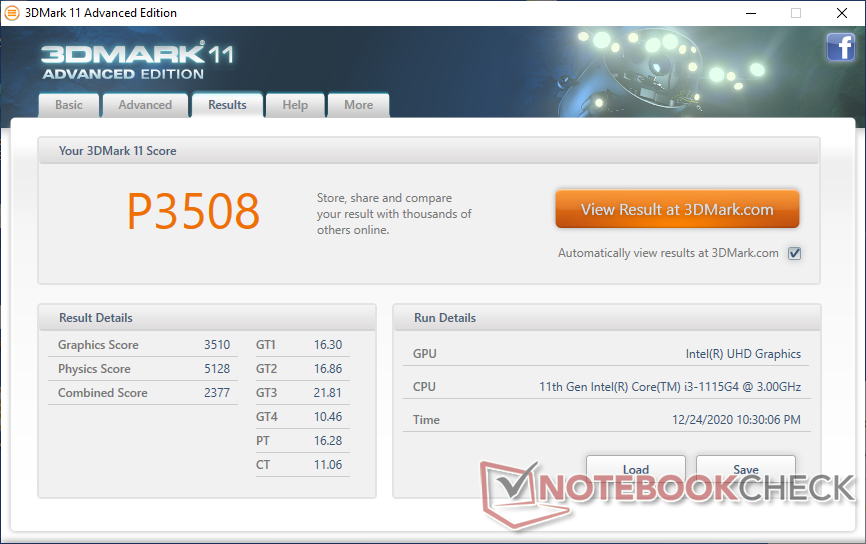
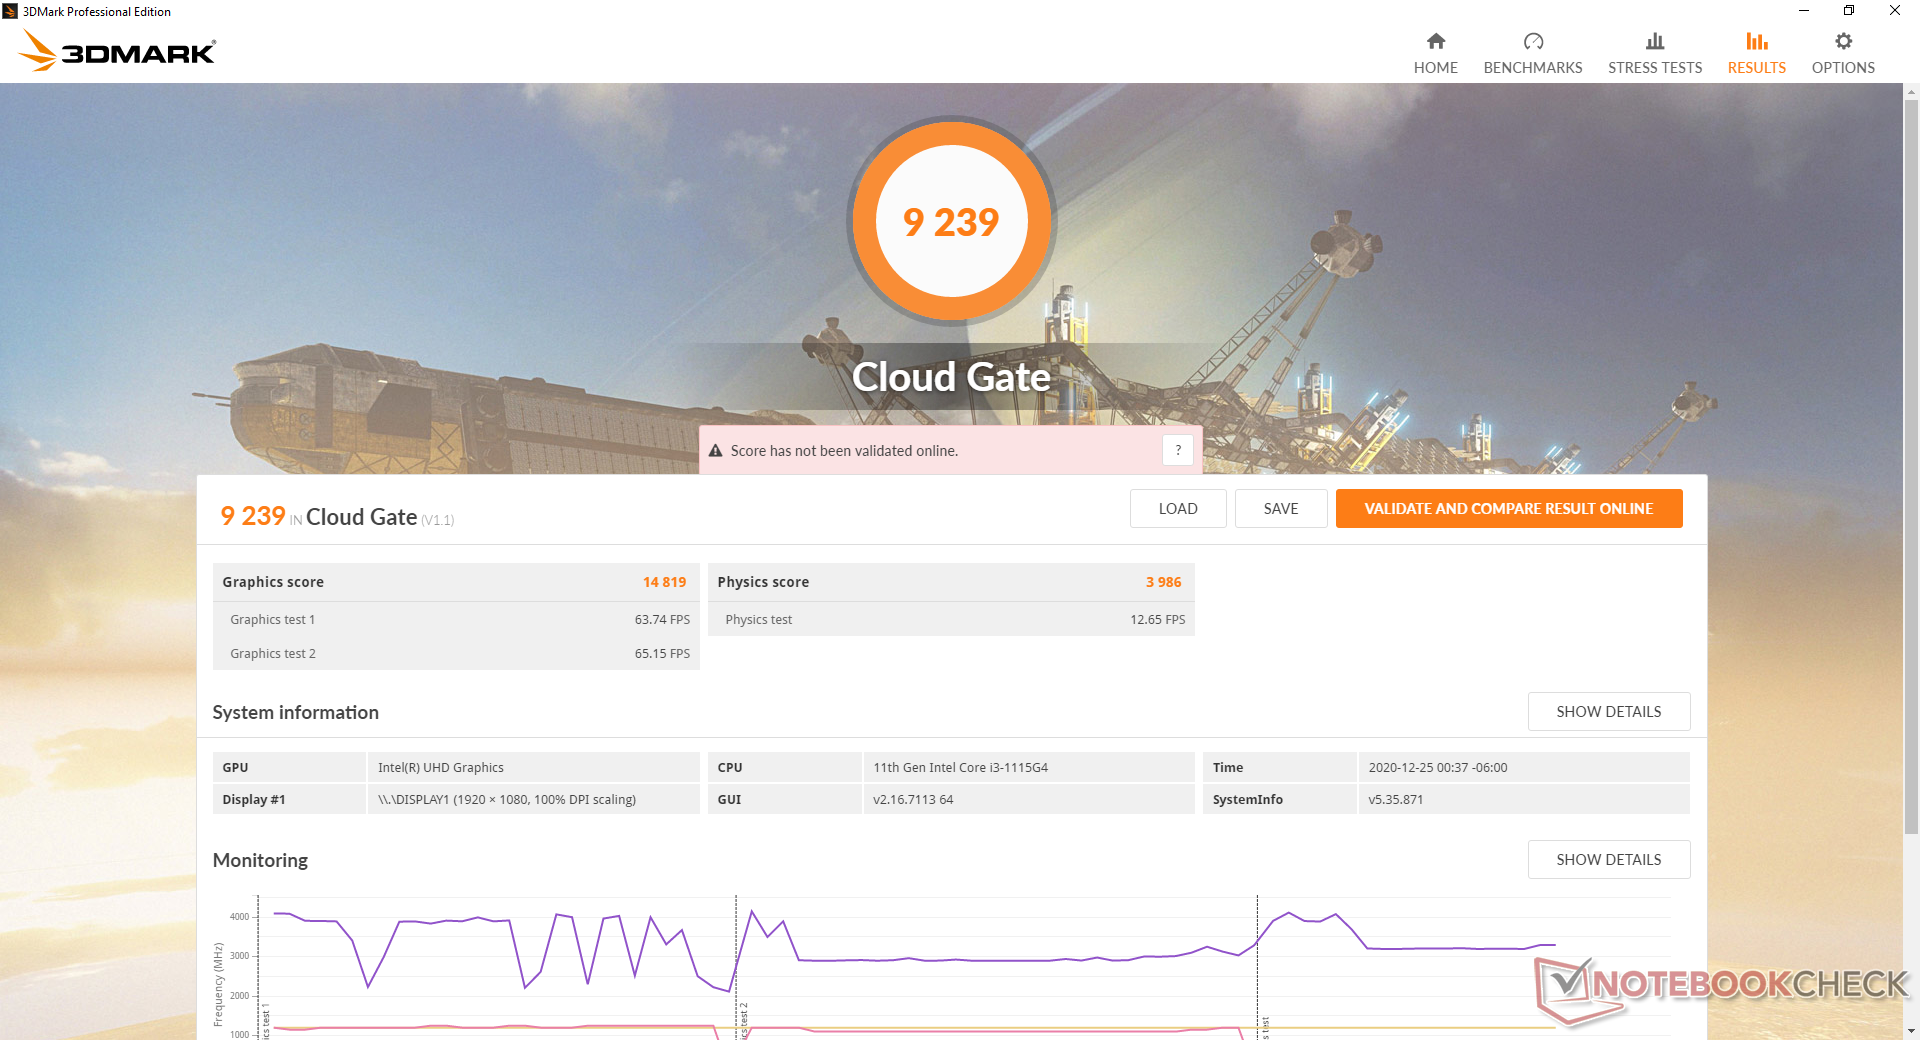
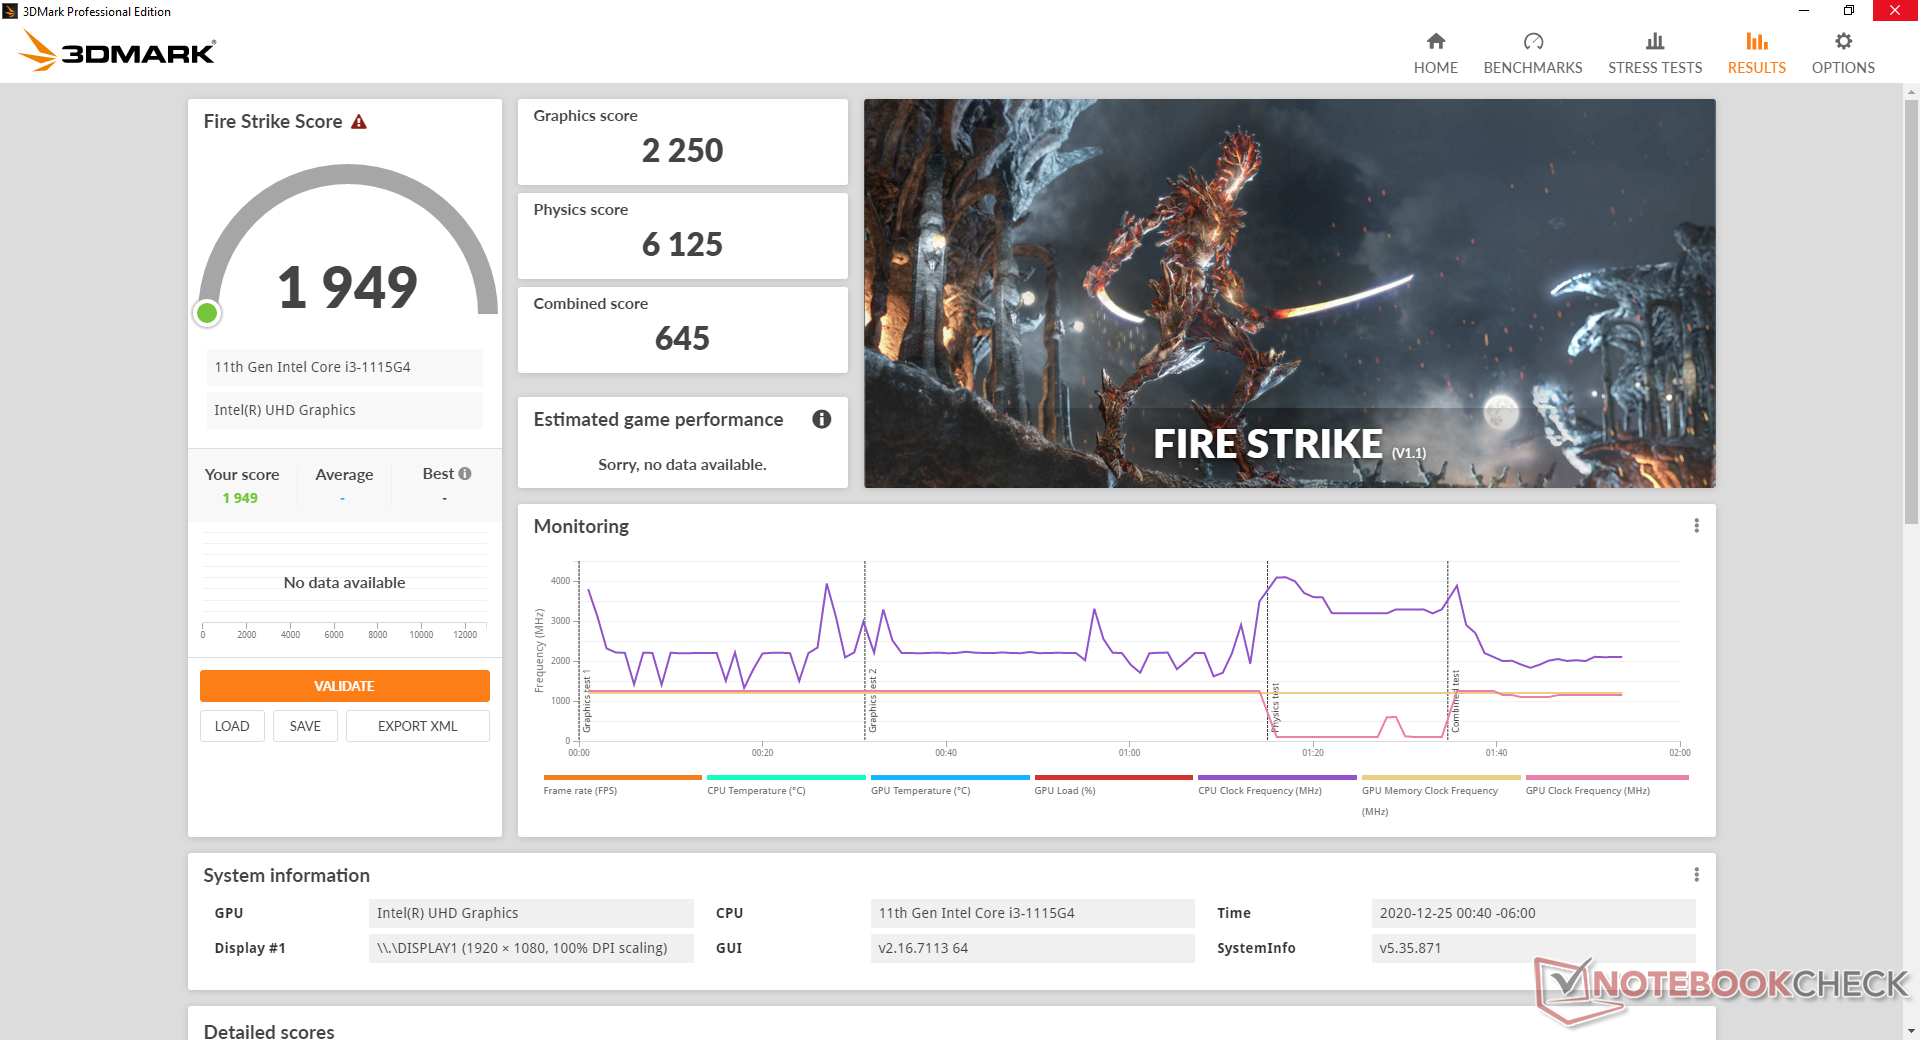
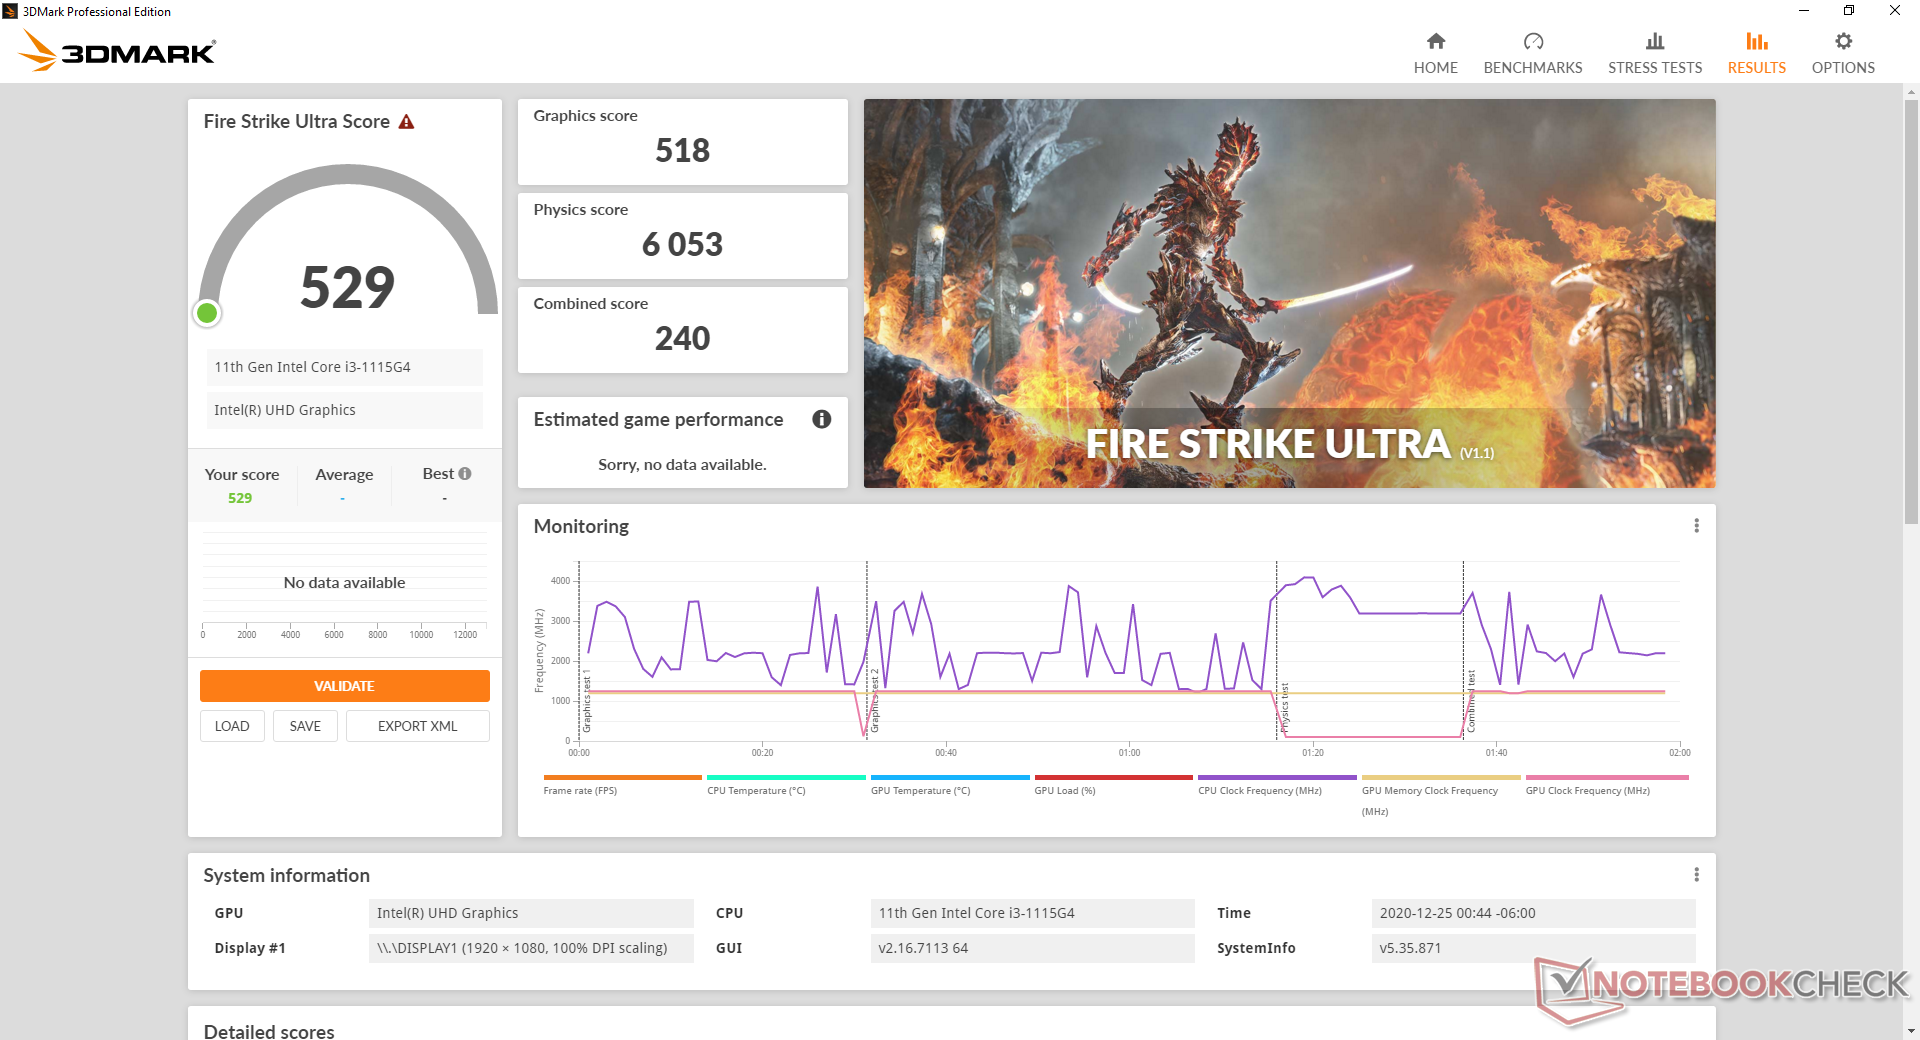
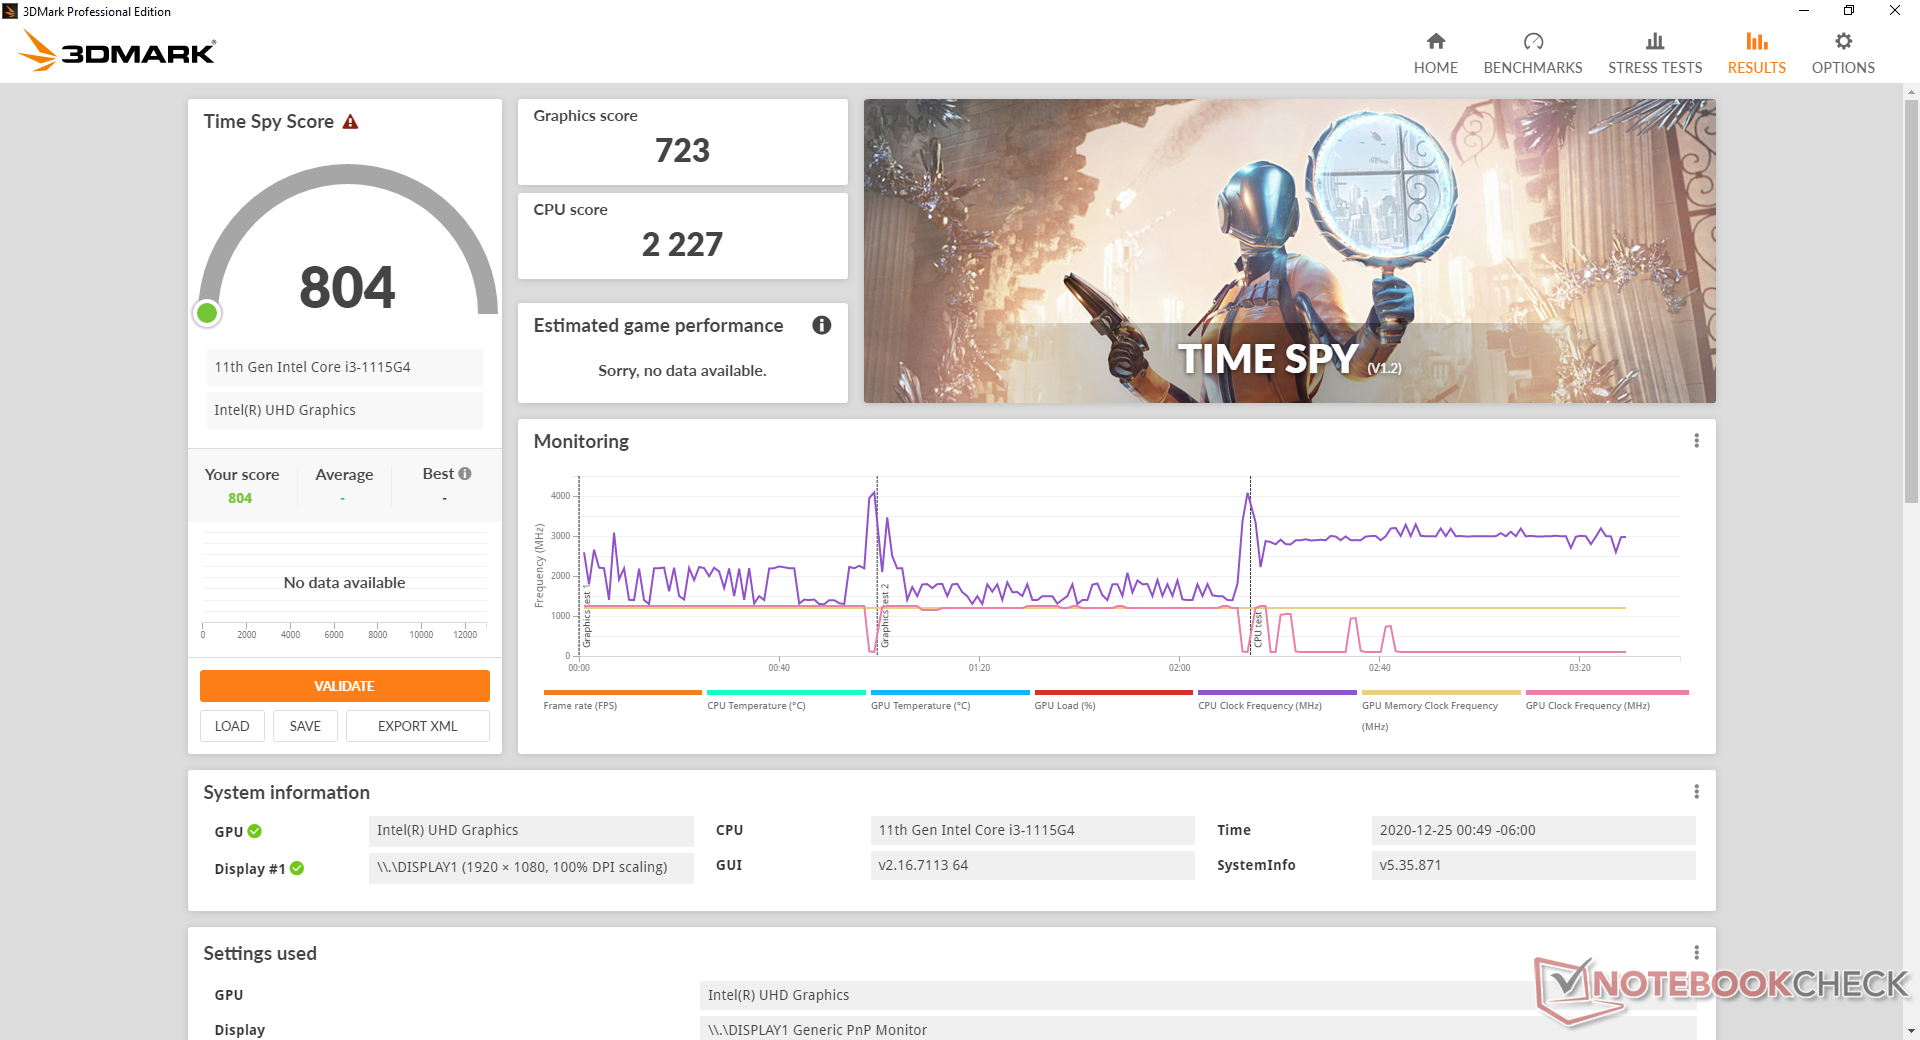
Our Iris Xe G4 is about 50 to 60 percent slower than the Iris Xe G7 as found on laptops with the Core i7-1165G7 according to 3DMark benchmarks. Even so, users who may be upgrading from the UHD Graphics 620 will still see a massive leap in graphics performance by at least 2x. Gaming potential is still very limited, however, as even DOTA 2 can barely maintain 30 FPS at medium settings.
See our dedicated page on the Iris Xe G4 for more technical information and benchmark comparisons.
| 3DMark 06 Standard Score | 11040 points | |
| 3DMark Vantage P Result | 10650 points | |
| 3DMark 11 Performance | 3508 points | |
| 3DMark Cloud Gate Standard Score | 9239 points | |
| 3DMark Fire Strike Score | 1949 points | |
| 3DMark Time Spy Score | 804 points | |
Help | ||
| The Witcher 3 | |
| 1024x768 Low Graphics & Postprocessing | |
| Schenker Vision 15 | |
| Dell Inspiron 15 7506 2-in-1 P97F | |
| HP Envy x360 15-ee0257ng | |
| Dell Inspiron 15 5000 5502 | |
| Acer Swift 3 SF314-42-R27B | |
| Average Intel UHD Graphics Xe G4 48EUs (20.6 - 62.3, n=11) | |
| Apple MacBook Air 2020 i3 | |
| 1366x768 Medium Graphics & Postprocessing | |
| Schenker Vision 15 | |
| HP Envy x360 15-ee0257ng | |
| Dell Inspiron 15 7506 2-in-1 P97F | |
| Acer Swift 3 SF314-42-R27B | |
| Average Intel UHD Graphics Xe G4 48EUs (15.6 - 39.3, n=10) | |
| Dell Inspiron 15 5000 5502 | |
| 1920x1080 High Graphics & Postprocessing (Nvidia HairWorks Off) | |
| Schenker Vision 15 | |
| Dell Inspiron 15 7506 2-in-1 P97F | |
| HP Envy x360 15-ee0257ng | |
| Dell Inspiron 15 5000 5502 | |
| Average Intel UHD Graphics Xe G4 48EUs (8.37 - 20.7, n=10) | |
| Acer Swift 3 SF314-42-R27B | |
| 1920x1080 Ultra Graphics & Postprocessing (HBAO+) | |
| Schenker Vision 15 | |
| HP Envy x360 15-ee0257ng | |
| Dell Inspiron 15 7506 2-in-1 P97F | |
| Acer Swift 3 SF314-42-R27B | |
| Average Intel UHD Graphics Xe G4 48EUs (5.61 - 10.3, n=8) | |
| Dell Inspiron 15 5000 5502 | |
| low | med. | high | ultra | |
|---|---|---|---|---|
| The Witcher 3 (2015) | 46.2 | 27.8 | 14.7 | 7.7 |
| Dota 2 Reborn (2015) | 73 | 33.3 | 22 | 20 |
| Final Fantasy XV Benchmark (2018) | 19.2 | 11.5 | 7.99 | |
| X-Plane 11.11 (2018) | 33.7 | 24.2 | 22.3 |
Emissions
System Noise
Fan noise is almost always quiet. After all, the chassis is capable of housing a Core i7 CPU whereas our configuration uses only a Core i3 with more limited Turbo Boost potential. We had to run the first benchmark scene of 3DMark 06 twice in a row to get the internal fan kicking.
At worst, we're only able to record a fan noise just shy of 35 dB(A) only when running extreme loads like Prime95 which is still quieter than many other Ultrabooks under the same conditions.
| Dell Inspiron 15 5000 5502 UHD Graphics Xe G4 48EUs, i3-1115G4, Toshiba BG4 KBG40ZNS128G | Dell Inspiron 15 7506 2-in-1 P97F Iris Xe G7 80EUs, i5-1135G7, Toshiba KBG40ZNS256G NVMe | Asus VivoBook S15 S533EQ-BQ002T GeForce MX350, i7-1165G7, Intel SSD 660p 1TB SSDPEKNW010T8 | Honor MagicBook 15 Vega 8, R5 3500U, Samsung SSD PM981a MZVLB256HBHQ | Lenovo IdeaPad 5 15IIL05 GeForce MX350, i5-1035G1, SK hynix BC511 HFM512GDHTNI-87A0B | Lenovo Ideapad S340-15IIL Iris Plus Graphics G7 (Ice Lake 64 EU), i7-1065G7, Intel SSD 660p SSDPEKNW512G8 | |
|---|---|---|---|---|---|---|
| Noise | -6% | -4% | -11% | -20% | -3% | |
| off / environment * (dB) | 27.5 | 27.1 1% | 25 9% | 30.7 -12% | 30.7 -12% | 28.5 -4% |
| Idle Minimum * (dB) | 27.9 | 27.1 3% | 25 10% | 30.7 -10% | 30.7 -10% | 28.5 -2% |
| Idle Average * (dB) | 27.9 | 27.1 3% | 25 10% | 30.7 -10% | 30.7 -10% | 28.5 -2% |
| Idle Maximum * (dB) | 27.9 | 27.1 3% | 25 10% | 30.7 -10% | 30.7 -10% | 28.5 -2% |
| Load Average * (dB) | 28.1 | 31.5 -12% | 39.5 -41% | 32.7 -16% | 43.4 -54% | 30.3 -8% |
| Load Maximum * (dB) | 34.8 | 47.2 -36% | 41.6 -20% | 38.4 -10% | 43.7 -26% | 35.5 -2% |
| Witcher 3 ultra * (dB) | 37.4 | 39.3 | 43.2 |
* ... smaller is better
Noise level
| Idle |
| 27.9 / 27.9 / 27.9 dB(A) |
| Load |
| 28.1 / 34.8 dB(A) |
 | ||
30 dB silent 40 dB(A) audible 50 dB(A) loud |
||
min: | ||
Temperature
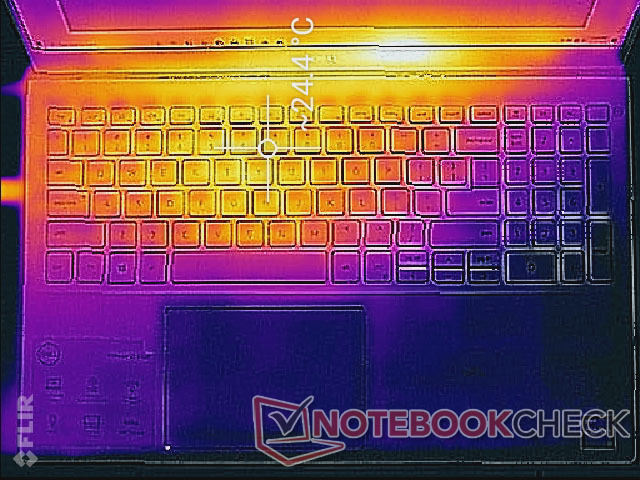
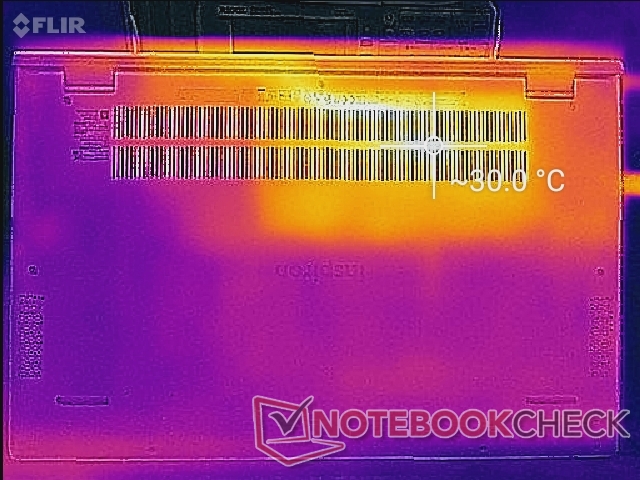
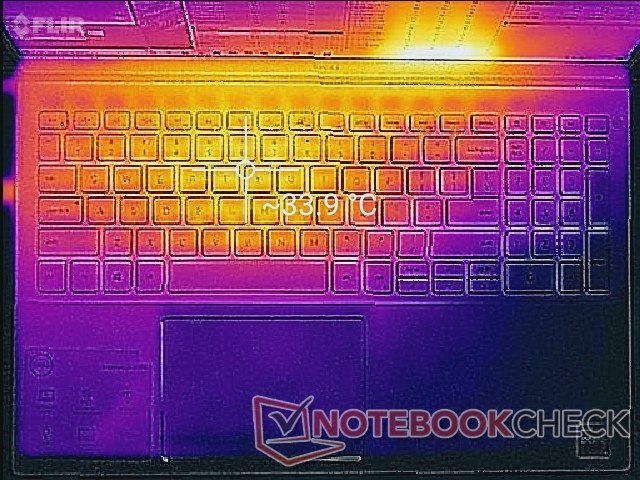
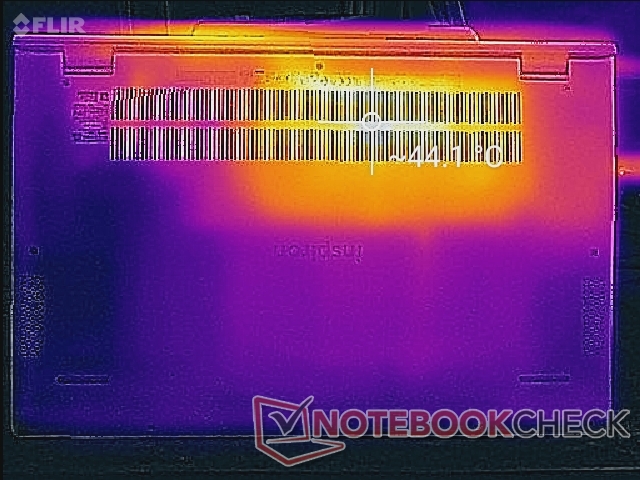
Surface temperatures are warmest near the center of the keyboard. Nonetheless, this hot spot will only be about 35 C when running demanding loads and so it's never uncomfortable to the touch. Be sure to not block the ventilation grilles on the bottom side which can be much warmer at over 44 C.
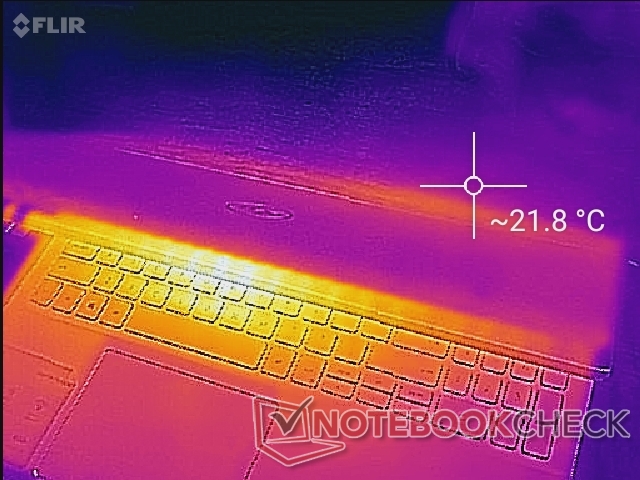
(+) The maximum temperature on the upper side is 33.6 °C / 92 F, compared to the average of 36.8 °C / 98 F, ranging from 21 to 71 °C for the class Multimedia.
(±) The bottom heats up to a maximum of 44.2 °C / 112 F, compared to the average of 39.1 °C / 102 F
(+) In idle usage, the average temperature for the upper side is 22 °C / 72 F, compared to the device average of 31.3 °C / 88 F.
(+) The palmrests and touchpad are cooler than skin temperature with a maximum of 23.8 °C / 74.8 F and are therefore cool to the touch.
(+) The average temperature of the palmrest area of similar devices was 28.7 °C / 83.7 F (+4.9 °C / 8.9 F).
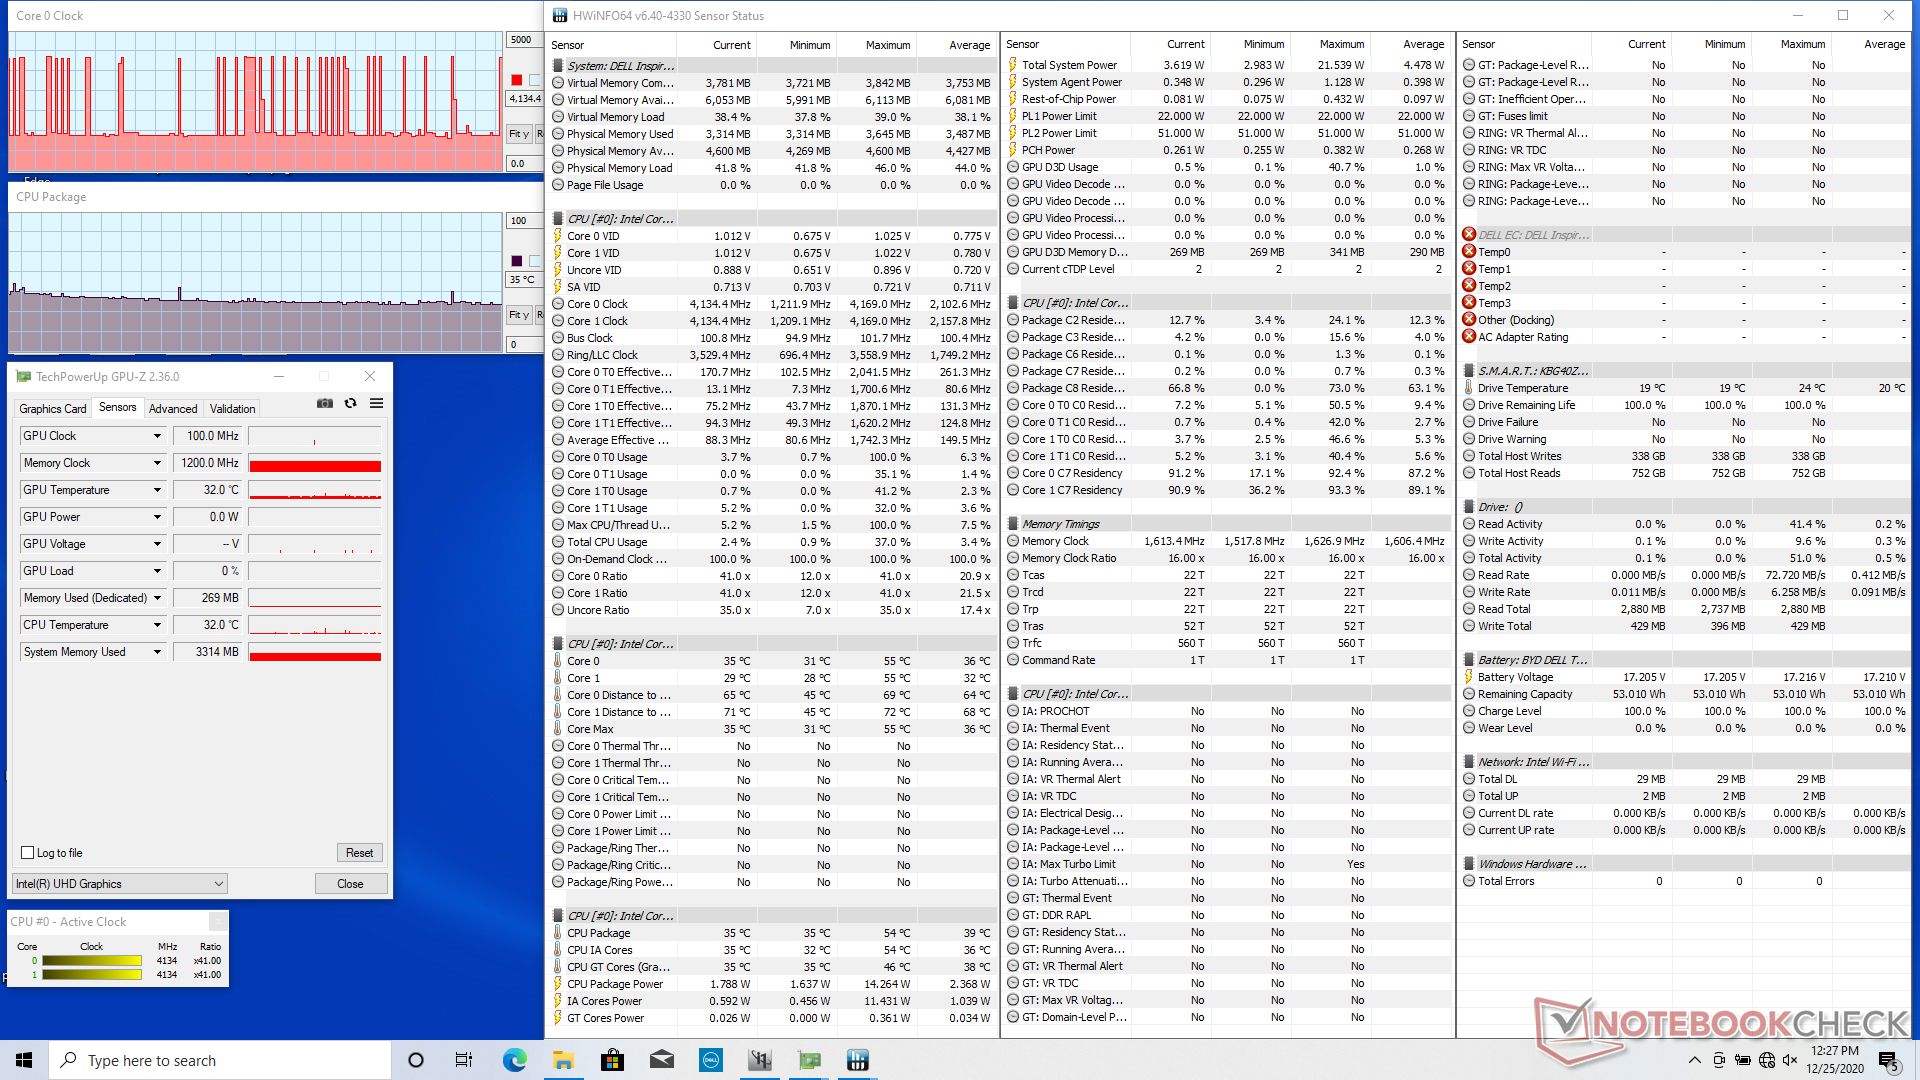
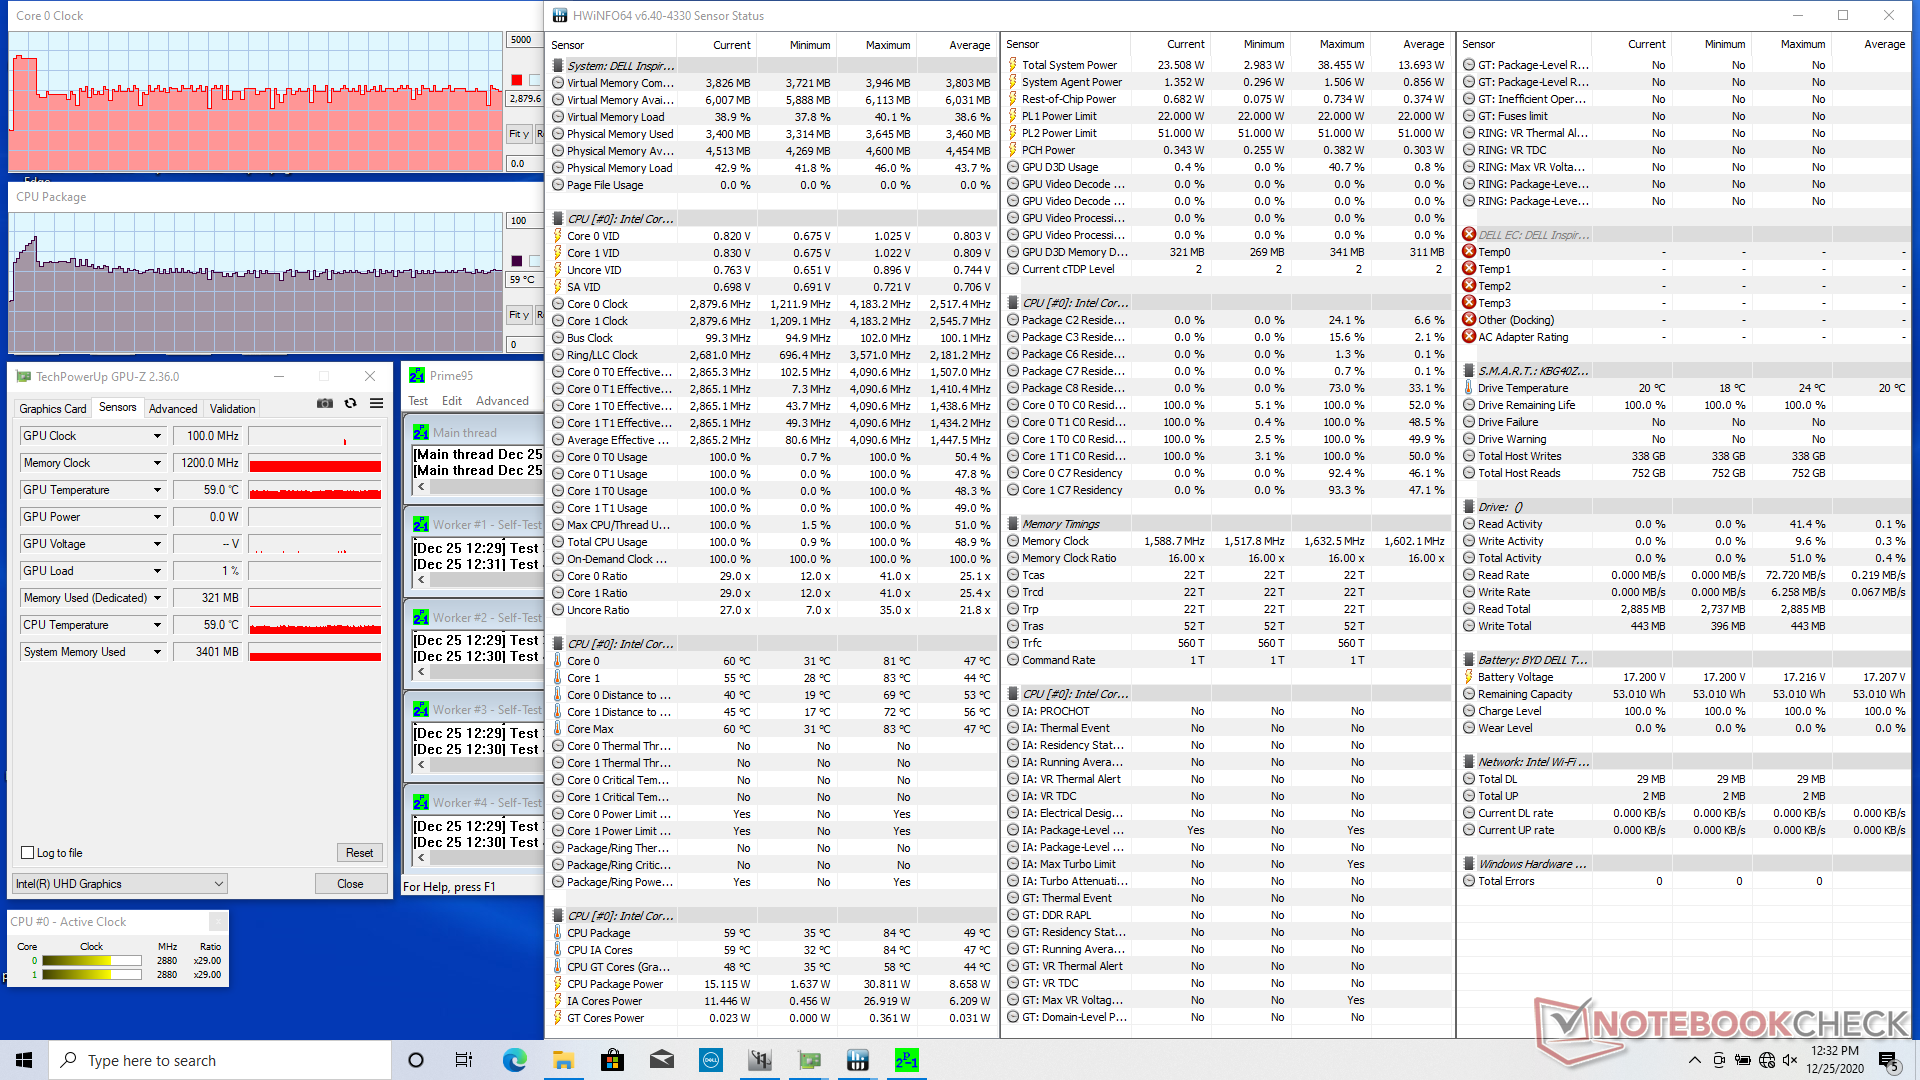
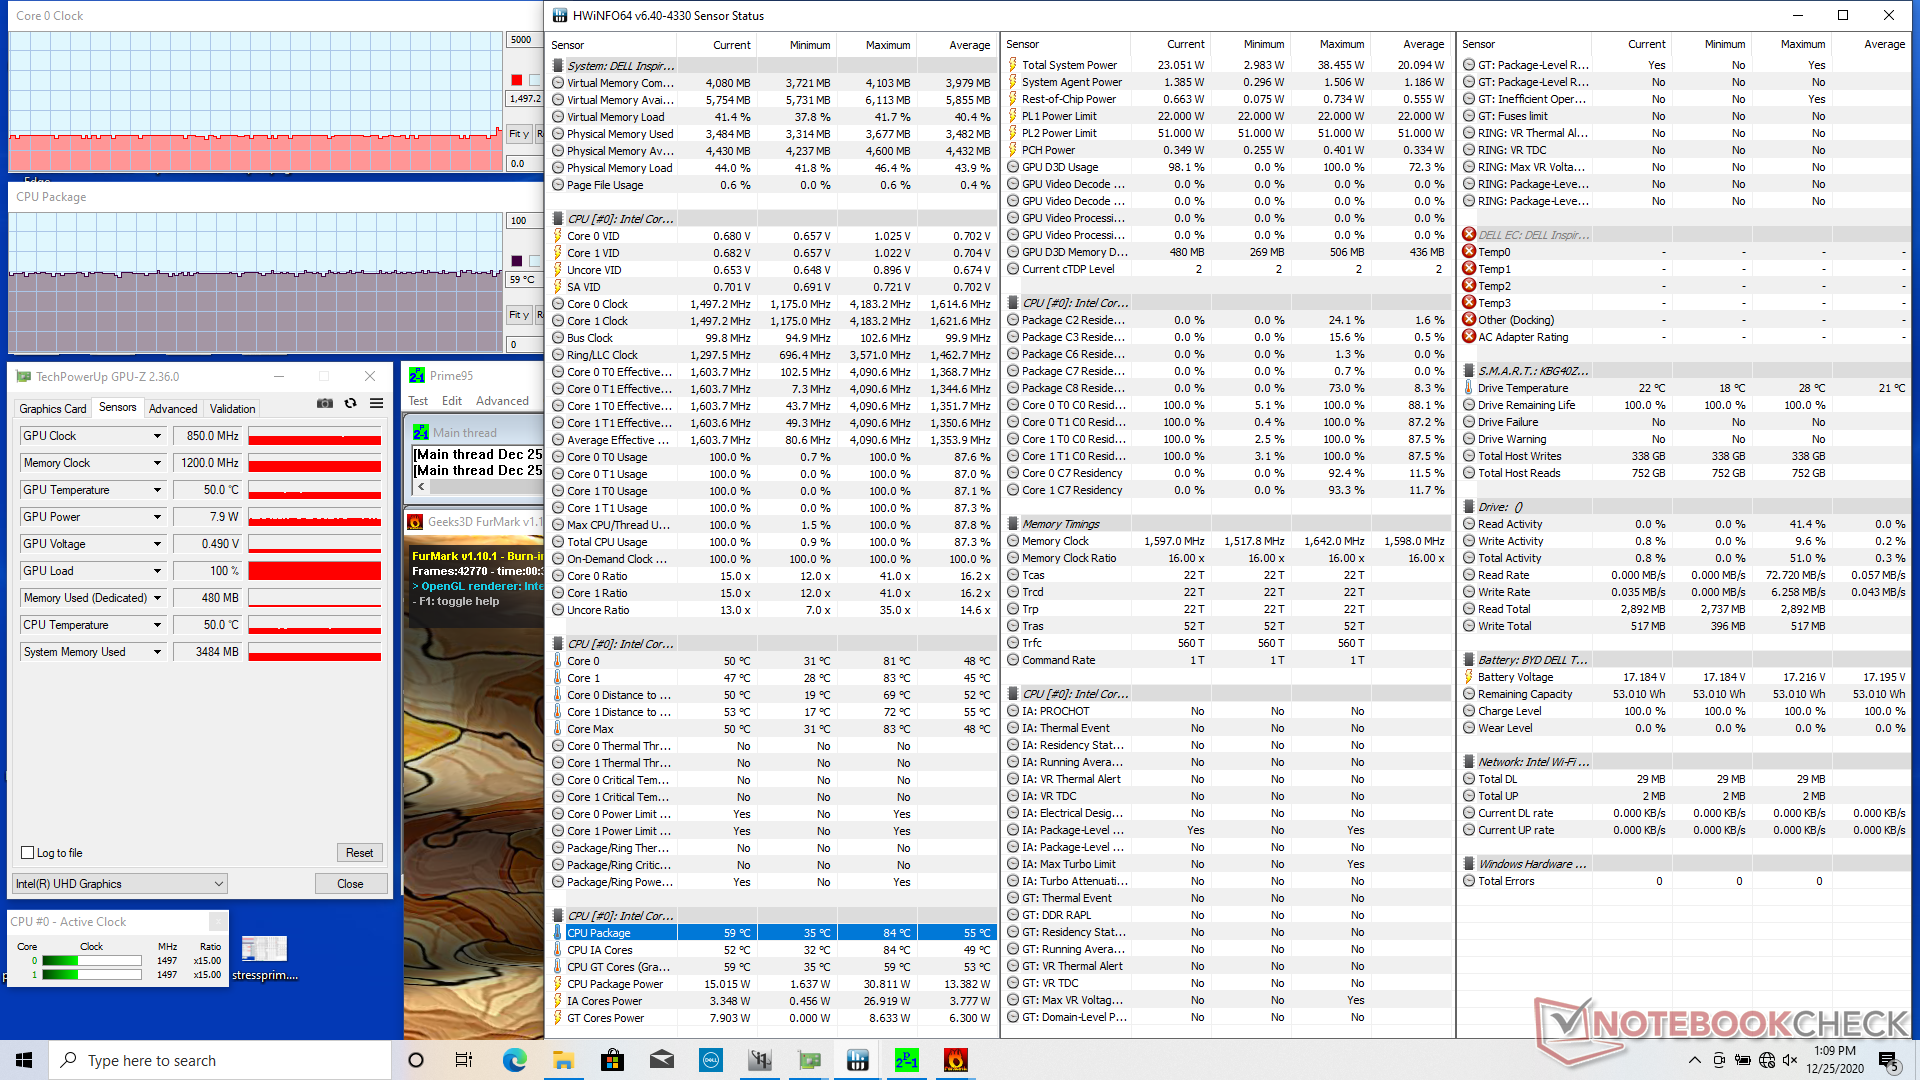
Stress Test
When stressed with Prime95, the CPU would boost to 4.1 GHz for about 30 seconds until hitting an apparent 84 C temperature ceiling. Thereafter, clock rates and temperature would drop and stabilize at 2.9 GHz and 59 C, respectively. Clock rates fall further to about 1.4 GHz when both the CPU and GPU are under 100 percent utilization.
Running on battery power will not limit performance. A 3DMark 11 test on batteries returned Physics and Graphics scores of 3533 and 5233 points, respectively, compared to 3510 and 5128 points when on mains.
| CPU Clock (GHz) | GPU Clock (MHz) | Average CPU Temperature (°C) | |
| System Idle | -- | -- | 35 |
| Prime95 Stress | 2.9 | -- | 59 |
| Prime95 + FurMark Stress | 1.4 | 850 | 59 |
Speakers


Dell Inspiron 15 5000 5502 audio analysis
(±) | speaker loudness is average but good (80.3 dB)
Bass 100 - 315 Hz
(-) | nearly no bass - on average 17.6% lower than median
(±) | linearity of bass is average (9.4% delta to prev. frequency)
Mids 400 - 2000 Hz
(+) | balanced mids - only 3.7% away from median
(+) | mids are linear (5.9% delta to prev. frequency)
Highs 2 - 16 kHz
(+) | balanced highs - only 2% away from median
(+) | highs are linear (4.8% delta to prev. frequency)
Overall 100 - 16.000 Hz
(+) | overall sound is linear (14.6% difference to median)
Compared to same class
» 35% of all tested devices in this class were better, 4% similar, 61% worse
» The best had a delta of 5%, average was 17%, worst was 45%
Compared to all devices tested
» 19% of all tested devices were better, 4% similar, 77% worse
» The best had a delta of 4%, average was 23%, worst was 134%
Apple MacBook 12 (Early 2016) 1.1 GHz audio analysis
(+) | speakers can play relatively loud (83.6 dB)
Bass 100 - 315 Hz
(±) | reduced bass - on average 11.3% lower than median
(±) | linearity of bass is average (14.2% delta to prev. frequency)
Mids 400 - 2000 Hz
(+) | balanced mids - only 2.4% away from median
(+) | mids are linear (5.5% delta to prev. frequency)
Highs 2 - 16 kHz
(+) | balanced highs - only 2% away from median
(+) | highs are linear (4.5% delta to prev. frequency)
Overall 100 - 16.000 Hz
(+) | overall sound is linear (10.2% difference to median)
Compared to same class
» 7% of all tested devices in this class were better, 2% similar, 90% worse
» The best had a delta of 5%, average was 18%, worst was 53%
Compared to all devices tested
» 5% of all tested devices were better, 1% similar, 94% worse
» The best had a delta of 4%, average was 23%, worst was 134%
Energy Management
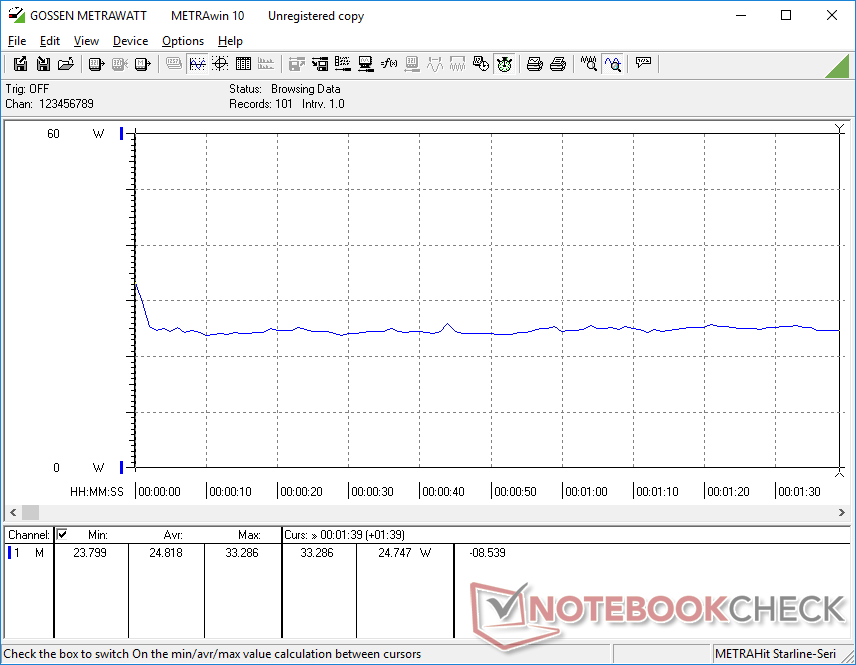
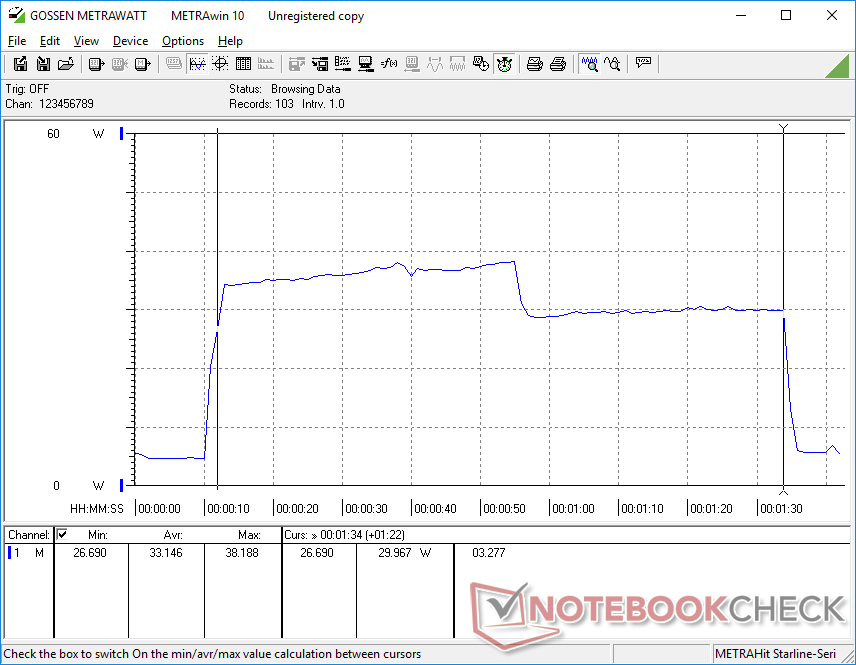
Power Consumption
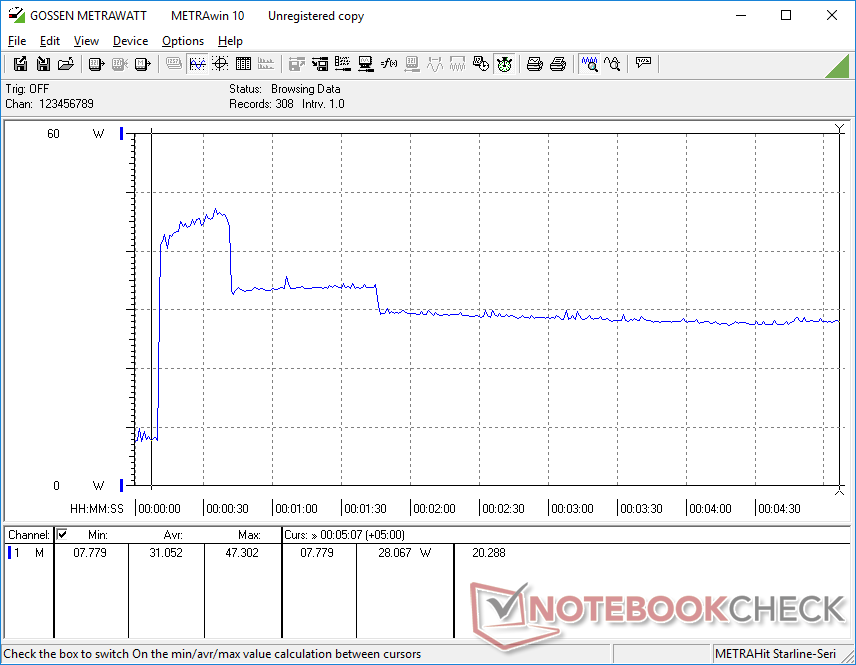
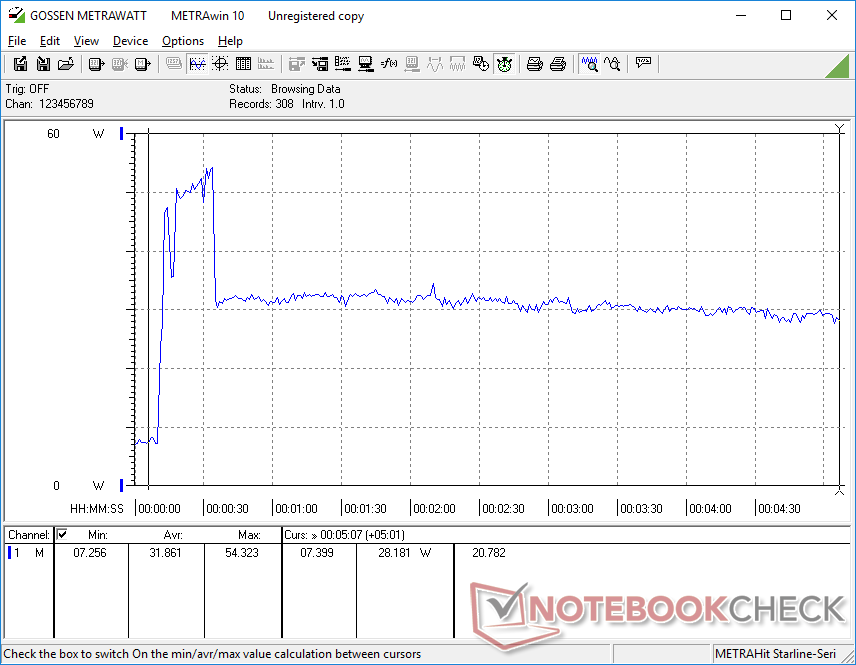
Our Dell consumes less power than its Core i5 or Core i7 peers especially when under heavier loads. Running 3DMark 06, for example, would only consume about 25 W compared to 31 W or 43 W on the Inspiron 15 7506 or Lenovo Ideapad S340 15, respectively. The results are reasonable based on the significantly slower graphics performance of our integrated Xe G4 with 48 EUs when compared to the Xe G7 with 80 EUs or 96 EUs.
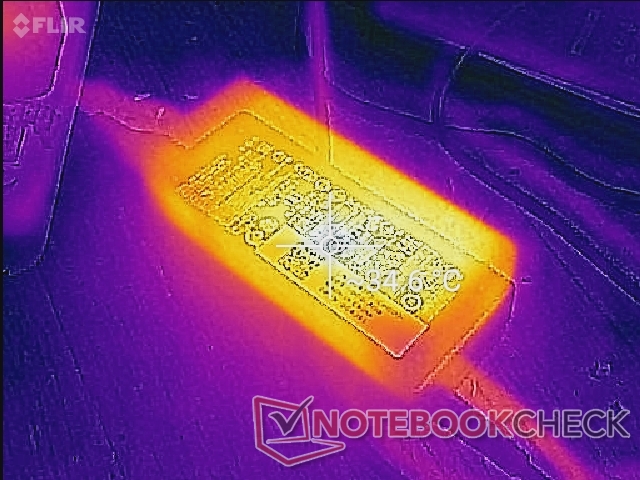
We're able to record a temporary maximum draw of 54.3 W from the small (~10.6 x 4.6 x 2.7 cm) 65 W AC adapter before thermal limitations start to kick in as shown by the graphs below.
| Off / Standby | |
| Idle | |
| Load |
|
Key:
min: | |
| Dell Inspiron 15 5000 5502 i3-1115G4, UHD Graphics Xe G4 48EUs, Toshiba BG4 KBG40ZNS128G, IPS, 1920x1080, 15.6" | Dell Inspiron 15 7506 2-in-1 P97F i5-1135G7, Iris Xe G7 80EUs, Toshiba KBG40ZNS256G NVMe, IPS, 1920x1080, 15.6" | Asus VivoBook S15 S533EQ-BQ002T i7-1165G7, GeForce MX350, Intel SSD 660p 1TB SSDPEKNW010T8, IPS, 1920x1080, 15.6" | Honor MagicBook 15 R5 3500U, Vega 8, Samsung SSD PM981a MZVLB256HBHQ, IPS, 1920x1080, 15.6" | Lenovo IdeaPad 5 15IIL05 i5-1035G1, GeForce MX350, SK hynix BC511 HFM512GDHTNI-87A0B, IPS, 1920x1080, 15.6" | Lenovo Ideapad S340-15IIL i7-1065G7, Iris Plus Graphics G7 (Ice Lake 64 EU), Intel SSD 660p SSDPEKNW512G8, IPS, 1920x1080, 15.6" | |
|---|---|---|---|---|---|---|
| Power Consumption | -11% | -27% | -17% | -57% | -11% | |
| Idle Minimum * (Watt) | 4.3 | 3.9 9% | 3 30% | 4.6 -7% | 4.9 -14% | 3.8 12% |
| Idle Average * (Watt) | 7.1 | 6.9 3% | 6.4 10% | 8.5 -20% | 9.1 -28% | 6.9 3% |
| Idle Maximum * (Watt) | 7.2 | 8.5 -18% | 7.9 -10% | 9.1 -26% | 11.6 -61% | 7.7 -7% |
| Load Average * (Watt) | 24.8 | 30.5 -23% | 59 -138% | 38 -53% | 65 -162% | 43.3 -75% |
| Load Maximum * (Watt) | 54.3 | 69.7 -28% | 68 -25% | 44 19% | 65.3 -20% | 47.5 13% |
| Witcher 3 ultra * (Watt) | 42.6 | 48 | 59 | 40.4 |
* ... smaller is better
Battery Life
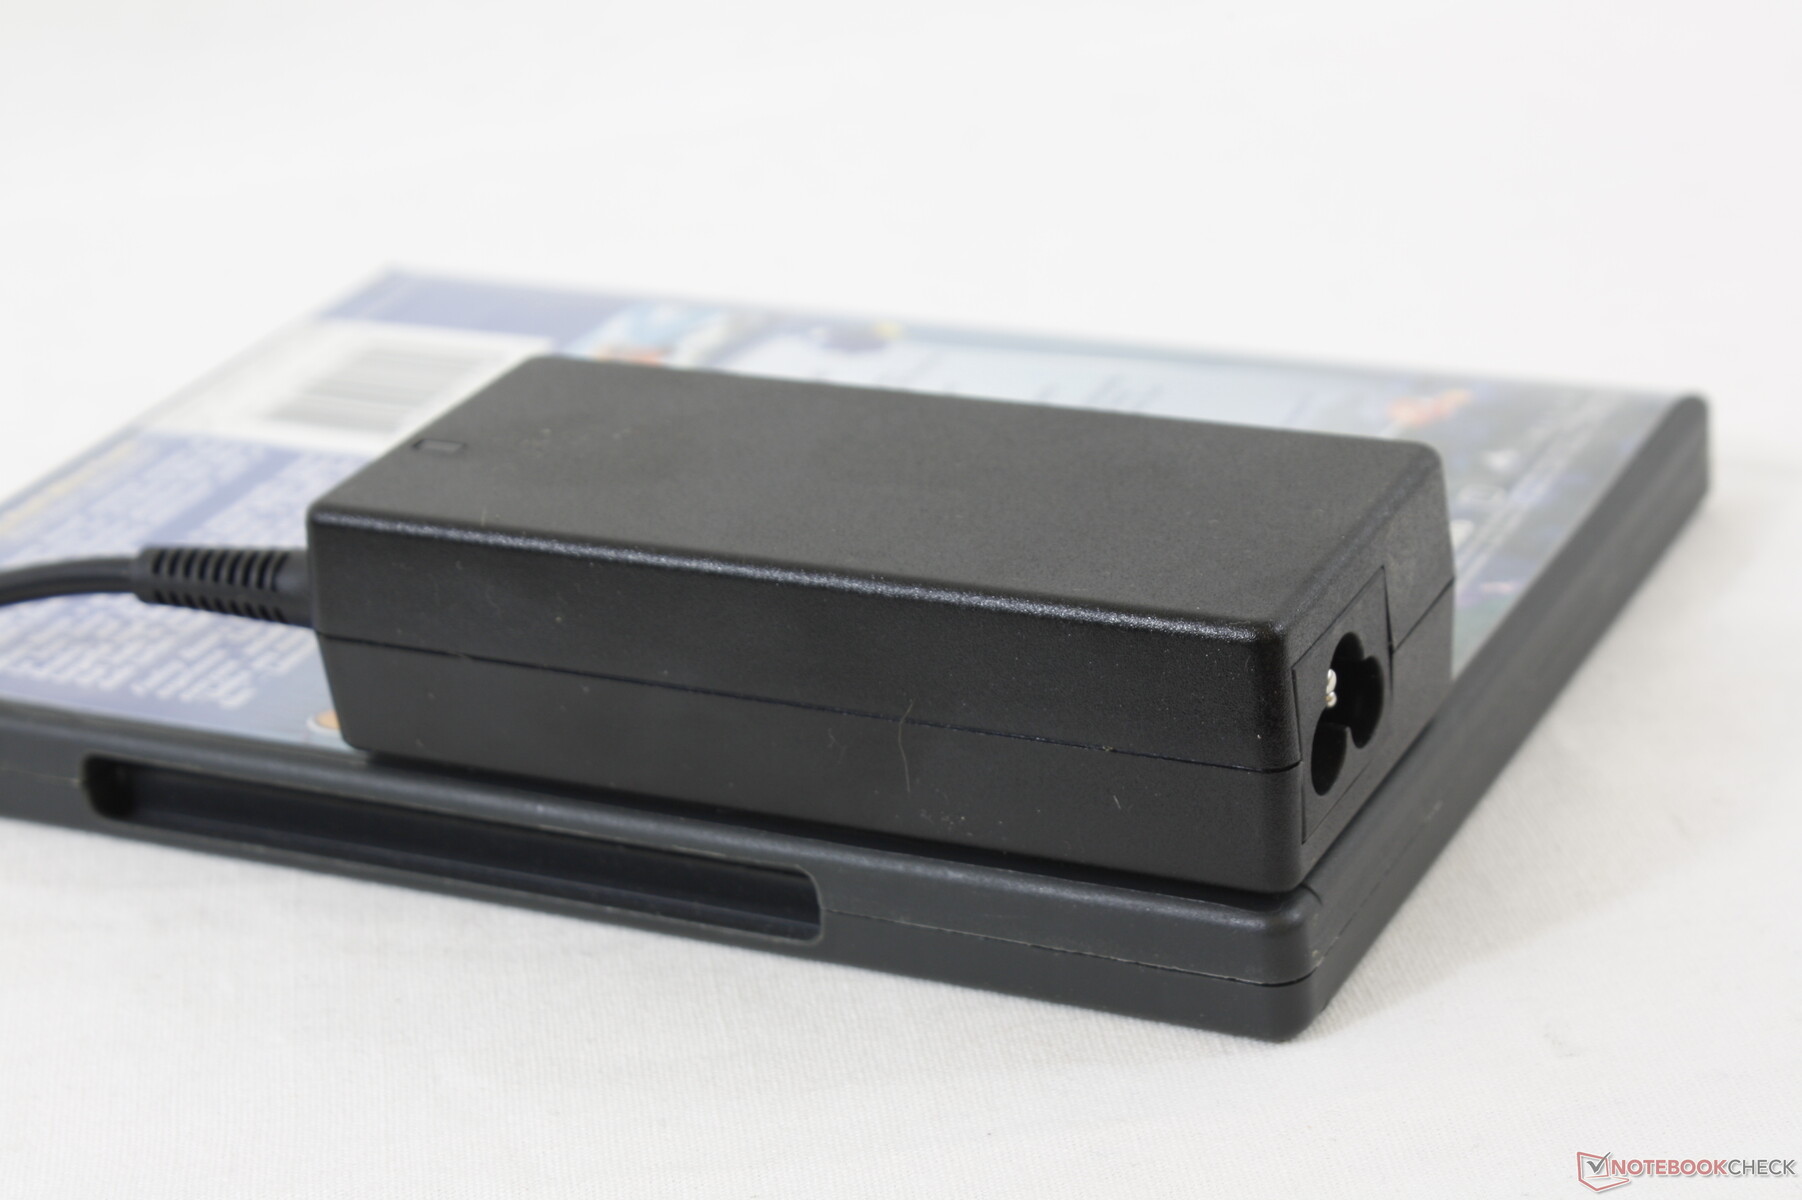
Battery capacity is identical to the pricier Dell Inspiron 15 7506 2-in-1 at 53 Wh. Nonetheless, runtimes are longer on our Inspiron 5502 at almost 9 hours of real-world WLAN use.
Charging from empty to full capacity takes about 2 hours with the included AC adapter. The system supports charging with generic USB-C chargers as well.
| Dell Inspiron 15 5000 5502 i3-1115G4, UHD Graphics Xe G4 48EUs, 53 Wh | Dell Inspiron 15 7506 2-in-1 P97F i5-1135G7, Iris Xe G7 80EUs, 53 Wh | Asus VivoBook S15 S533EQ-BQ002T i7-1165G7, GeForce MX350, 50 Wh | Honor MagicBook 15 R5 3500U, Vega 8, 42 Wh | Lenovo IdeaPad 5 15IIL05 i5-1035G1, GeForce MX350, 70 Wh | Lenovo Ideapad S340-15IIL i7-1065G7, Iris Plus Graphics G7 (Ice Lake 64 EU), 36 Wh | |
|---|---|---|---|---|---|---|
| Battery runtime | -33% | -7% | -33% | -5% | -61% | |
| Reader / Idle (h) | 26.7 | 18.8 -30% | 23.2 -13% | 10 -63% | ||
| WiFi v1.3 (h) | 9 | 8.3 -8% | 8.4 -7% | 6 -33% | 11.4 27% | 4.3 -52% |
| Load (h) | 3.3 | 1.3 -61% | 2.3 -30% | 1.1 -67% |
Pros
Cons
Verdict
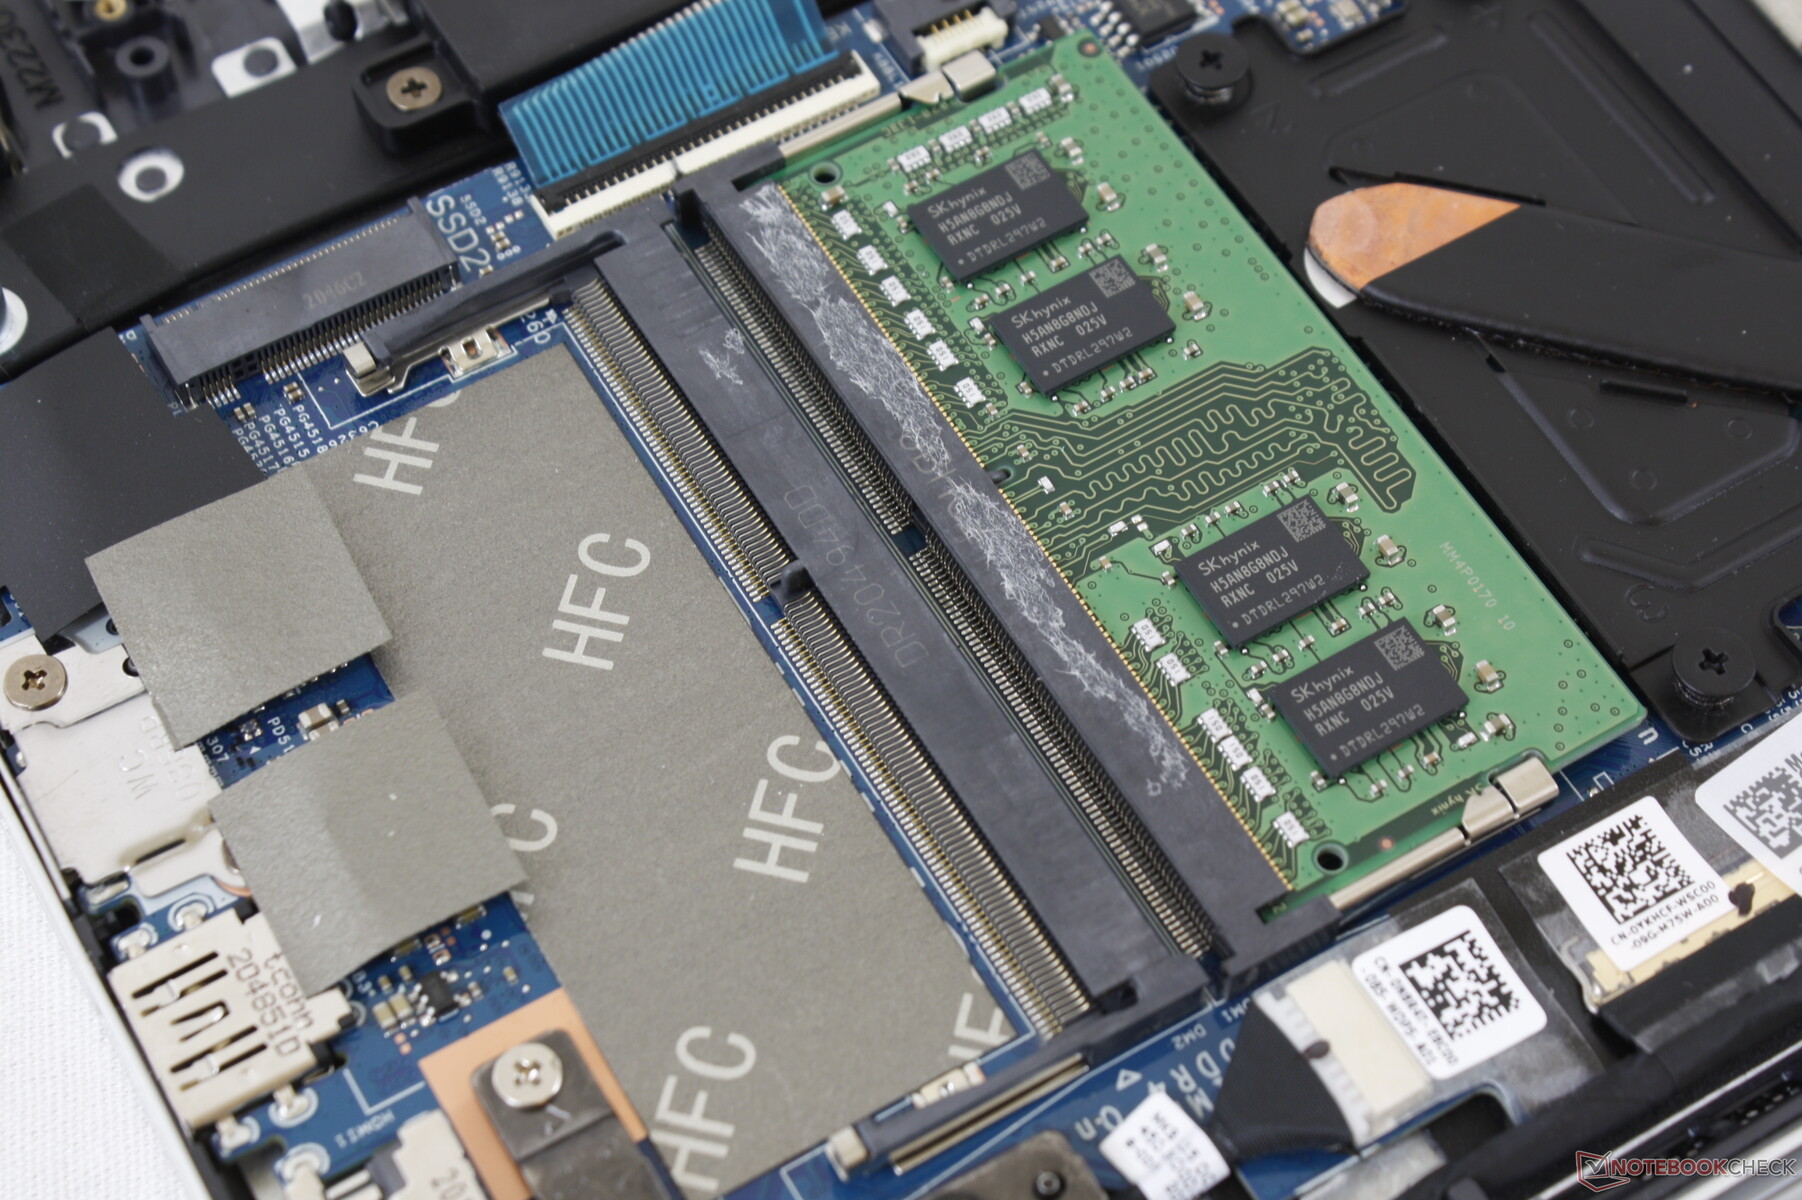
The Inspiron 15 5502 excels in serviceability and expandability with its 2x SODIMM and 2x storage bays. Users should exploit these features to make the most of the Dell as many other laptops in this price range are either more difficult to service or lacking in storage options. The long battery life and decent CPU performance will be more than sufficient for day-to-day browsing and office use.
Upgrading to the Core i5-1135G7 is recommended especially since you can skimp on RAM or storage and then upgrade those components yourself to save some cash. The quad-core Core i5 option the potential to offer 100 percent faster CPU performance and 50 percent faster graphics performance than our baseline dual-core Core i3. Even if you mostly web browse or email, the extra horsepower can give the laptop longer legs down the line.
A good "starter" laptop for students and indoor use because of its affordability and upgrade options. However, amateur graphics editors or outdoor users are going to want something with a better display and a firmer clickpad.
The worst aspects of the Inspiron 15 5502 are its poor colors, dim display, and spongy clickpad. The former makes this model a bad option for any sort of video or photo editing while the latter just makes it a pain to use without an external mouse. You might want to check out the similarly-priced Lenovo IdeaPad 5 if you plan on using the laptop outdoors frequently because of its brighter display.
Price and availability
Amazon product page with similar Core i3 specifications for $579 USD
Mid-range Core i5 options can be found on Best Buy for $759 USD
Higher-end Core i7 options can be found on Walmart for $899 USD
The prices reflect the date of publishing and they will likely change over time.
Dell Inspiron 15 5000 5502
- 12/29/2020 v7 (old)
Allen Ngo
Price comparison
