Asus VivoBook S15 S533EQ in review: Elegant all-rounder with equipment weaknesses

The VivoBook S15 S533EQ is a stylish, slim all-rounder in the 15.6-inch format. The test device provided to us is powered by a Core i7-1165G7 processor and a GeForce MX350 graphics core. Competitors include devices like the Lenovo IdeaPad 5 15IIL05, the Samsung Galaxy Book Ion Aura, and the Schenker Vision 15.
Possible competitors compared
Rating | Date | Model | Weight | Height | Size | Resolution | Price |
|---|---|---|---|---|---|---|---|
| 83.4 % v7 (old) | 12 / 2020 | Asus VivoBook S15 S533EQ-BQ002T i7-1165G7, GeForce MX350 | 1.8 kg | 16.1 mm | 15.60" | 1920x1080 | |
| 83 % v7 (old) | 07 / 2020 | Lenovo IdeaPad 5 15IIL05 i5-1035G1, GeForce MX350 | 1.7 kg | 17.9 mm | 15.60" | 1920x1080 | |
| 87.7 % v7 (old) | 12 / 2020 | Schenker Vision 15 i7-1165G7, Iris Xe G7 96EUs | 1.7 kg | 15 mm | 15.60" | 1920x1080 | |
| 81.7 % v7 (old) | 10 / 2020 | Samsung Galaxy Book Ion Aura Silver i7-10510U, GeForce MX250 | 1.3 kg | 15 mm | 15.60" | 1920x1080 |
Case and connectivity - S15 provides Thunderbolt 4
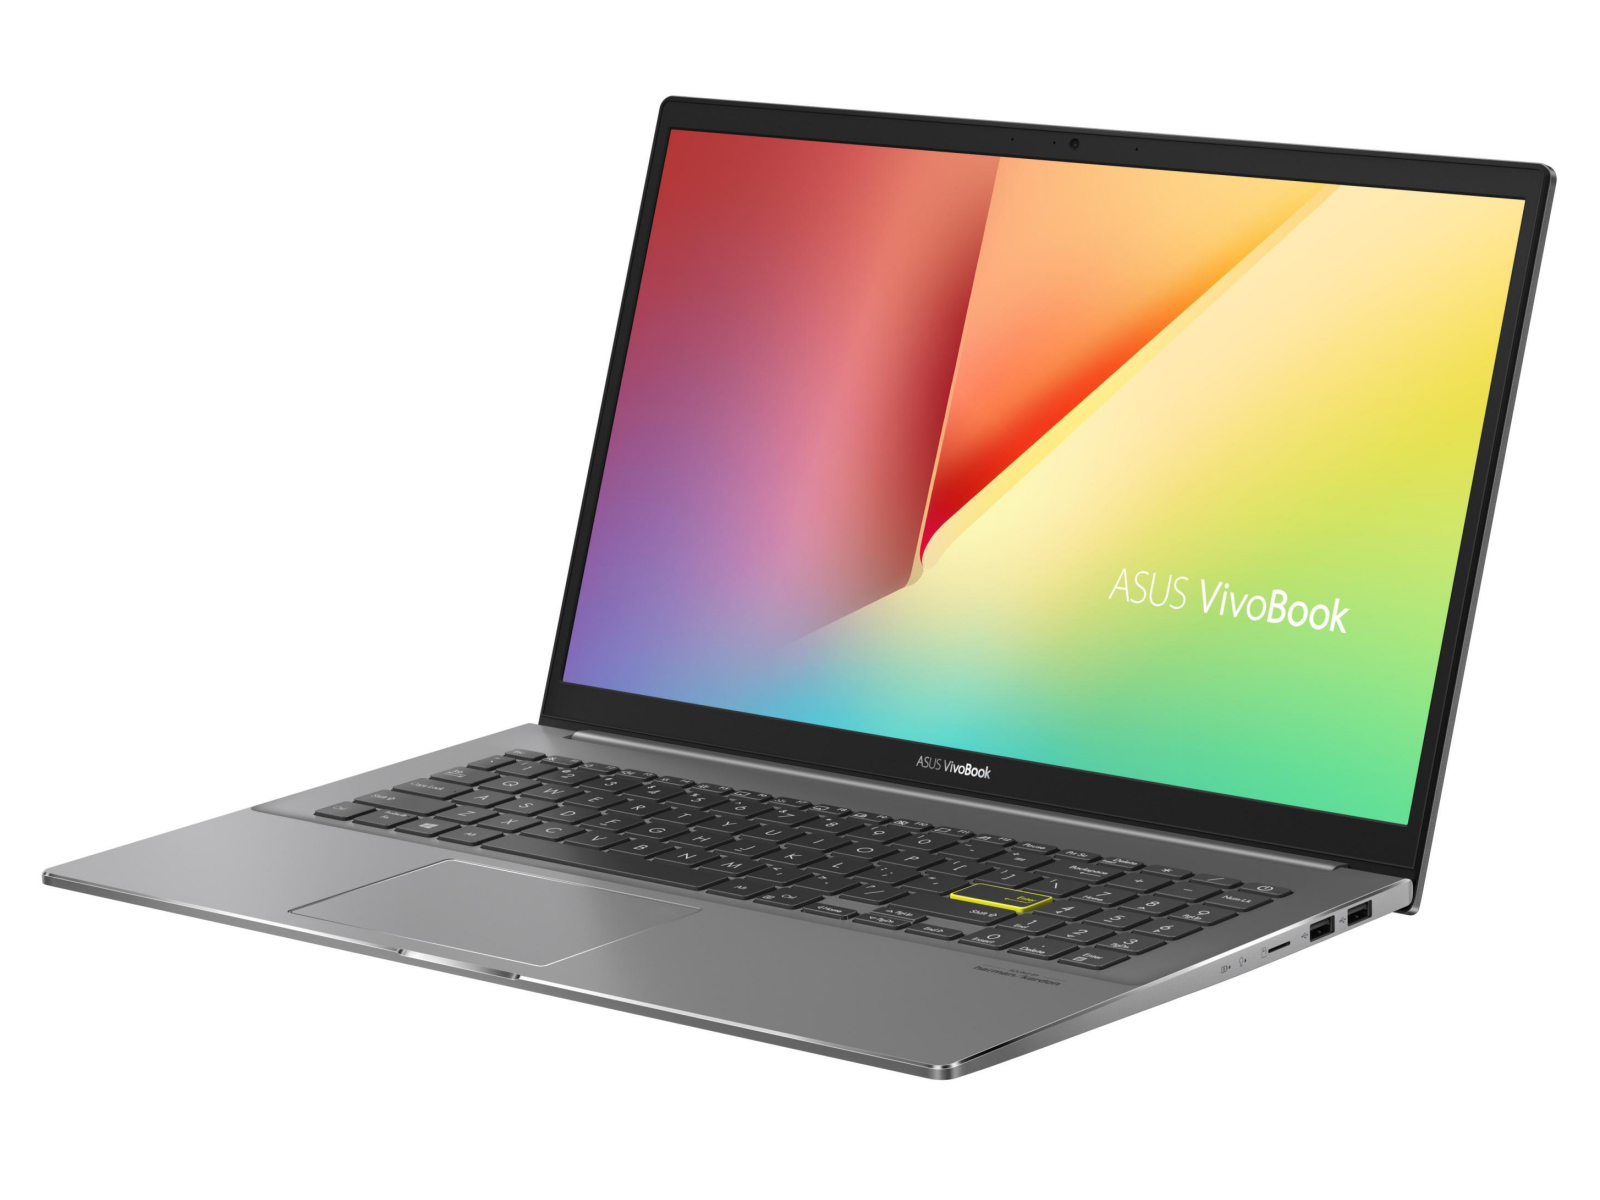
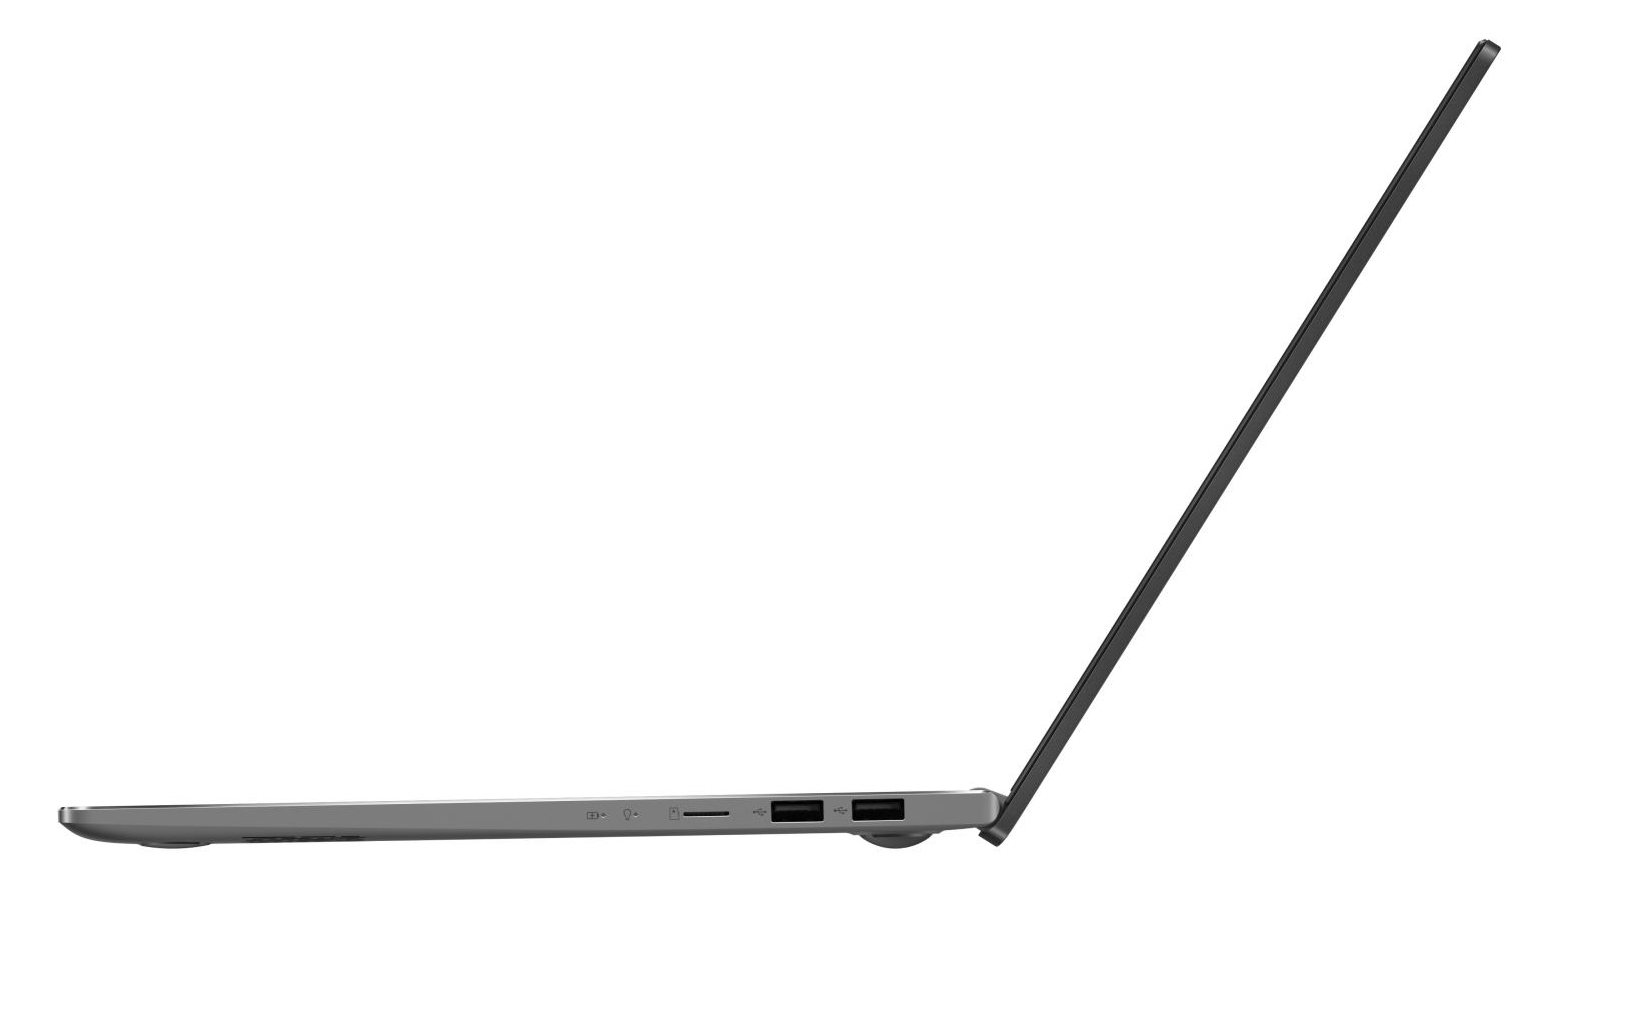
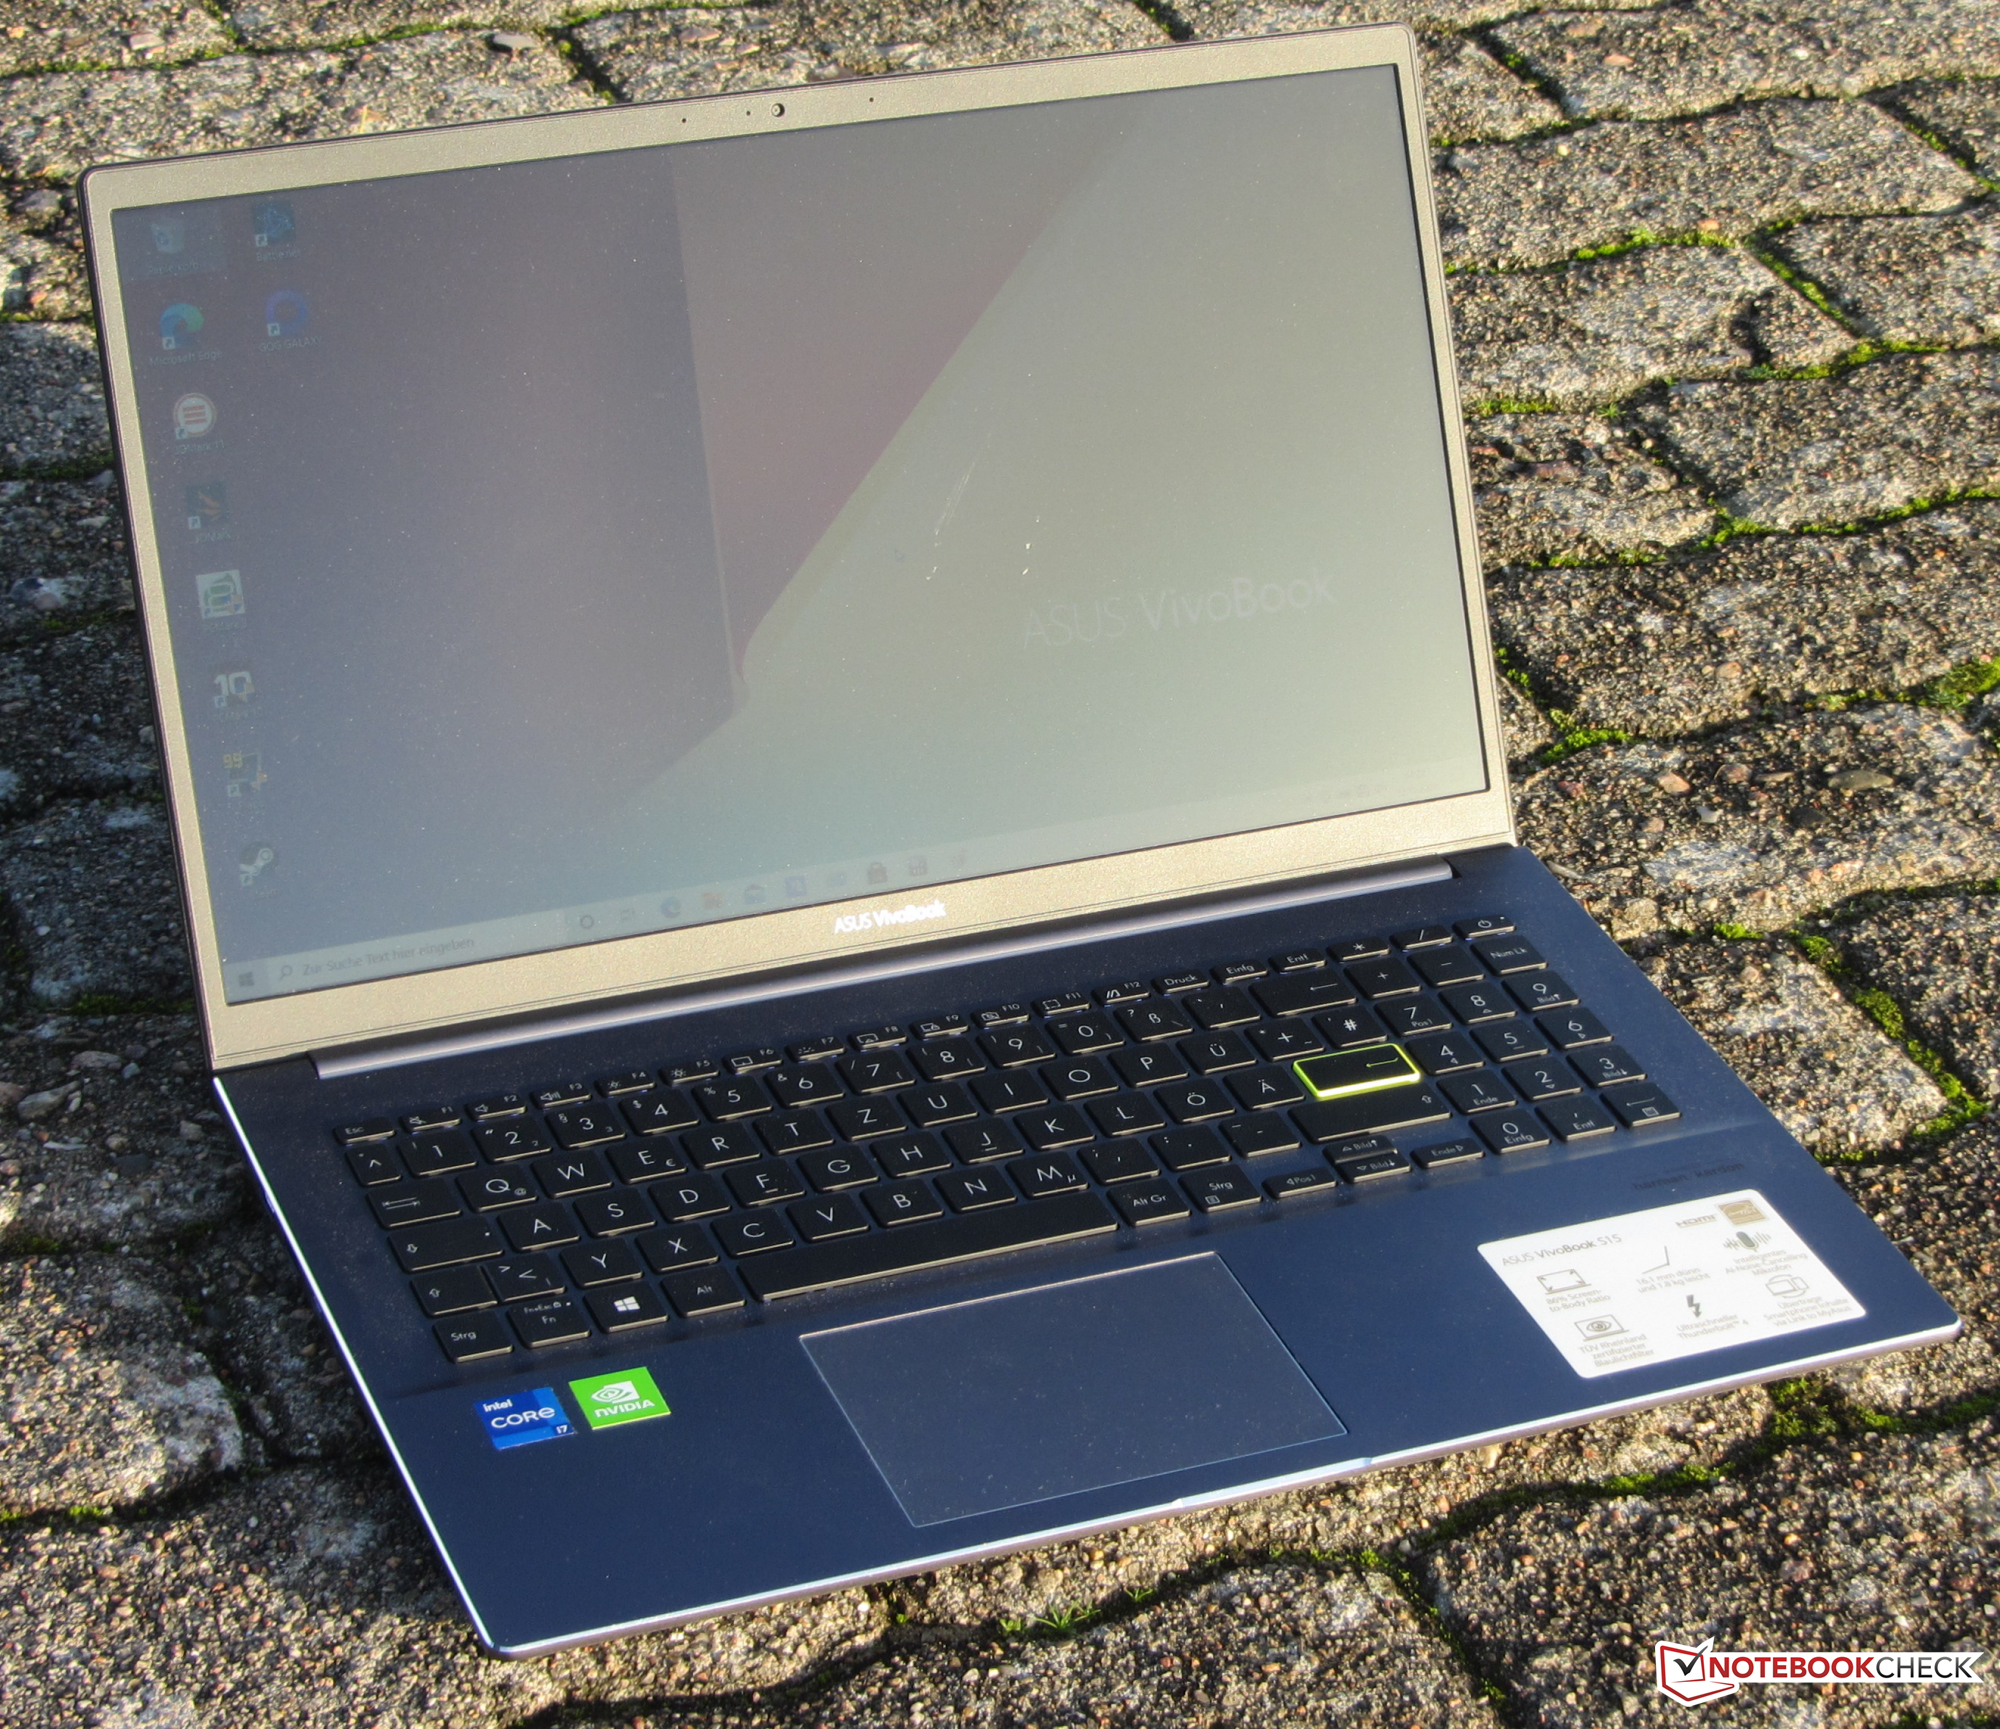
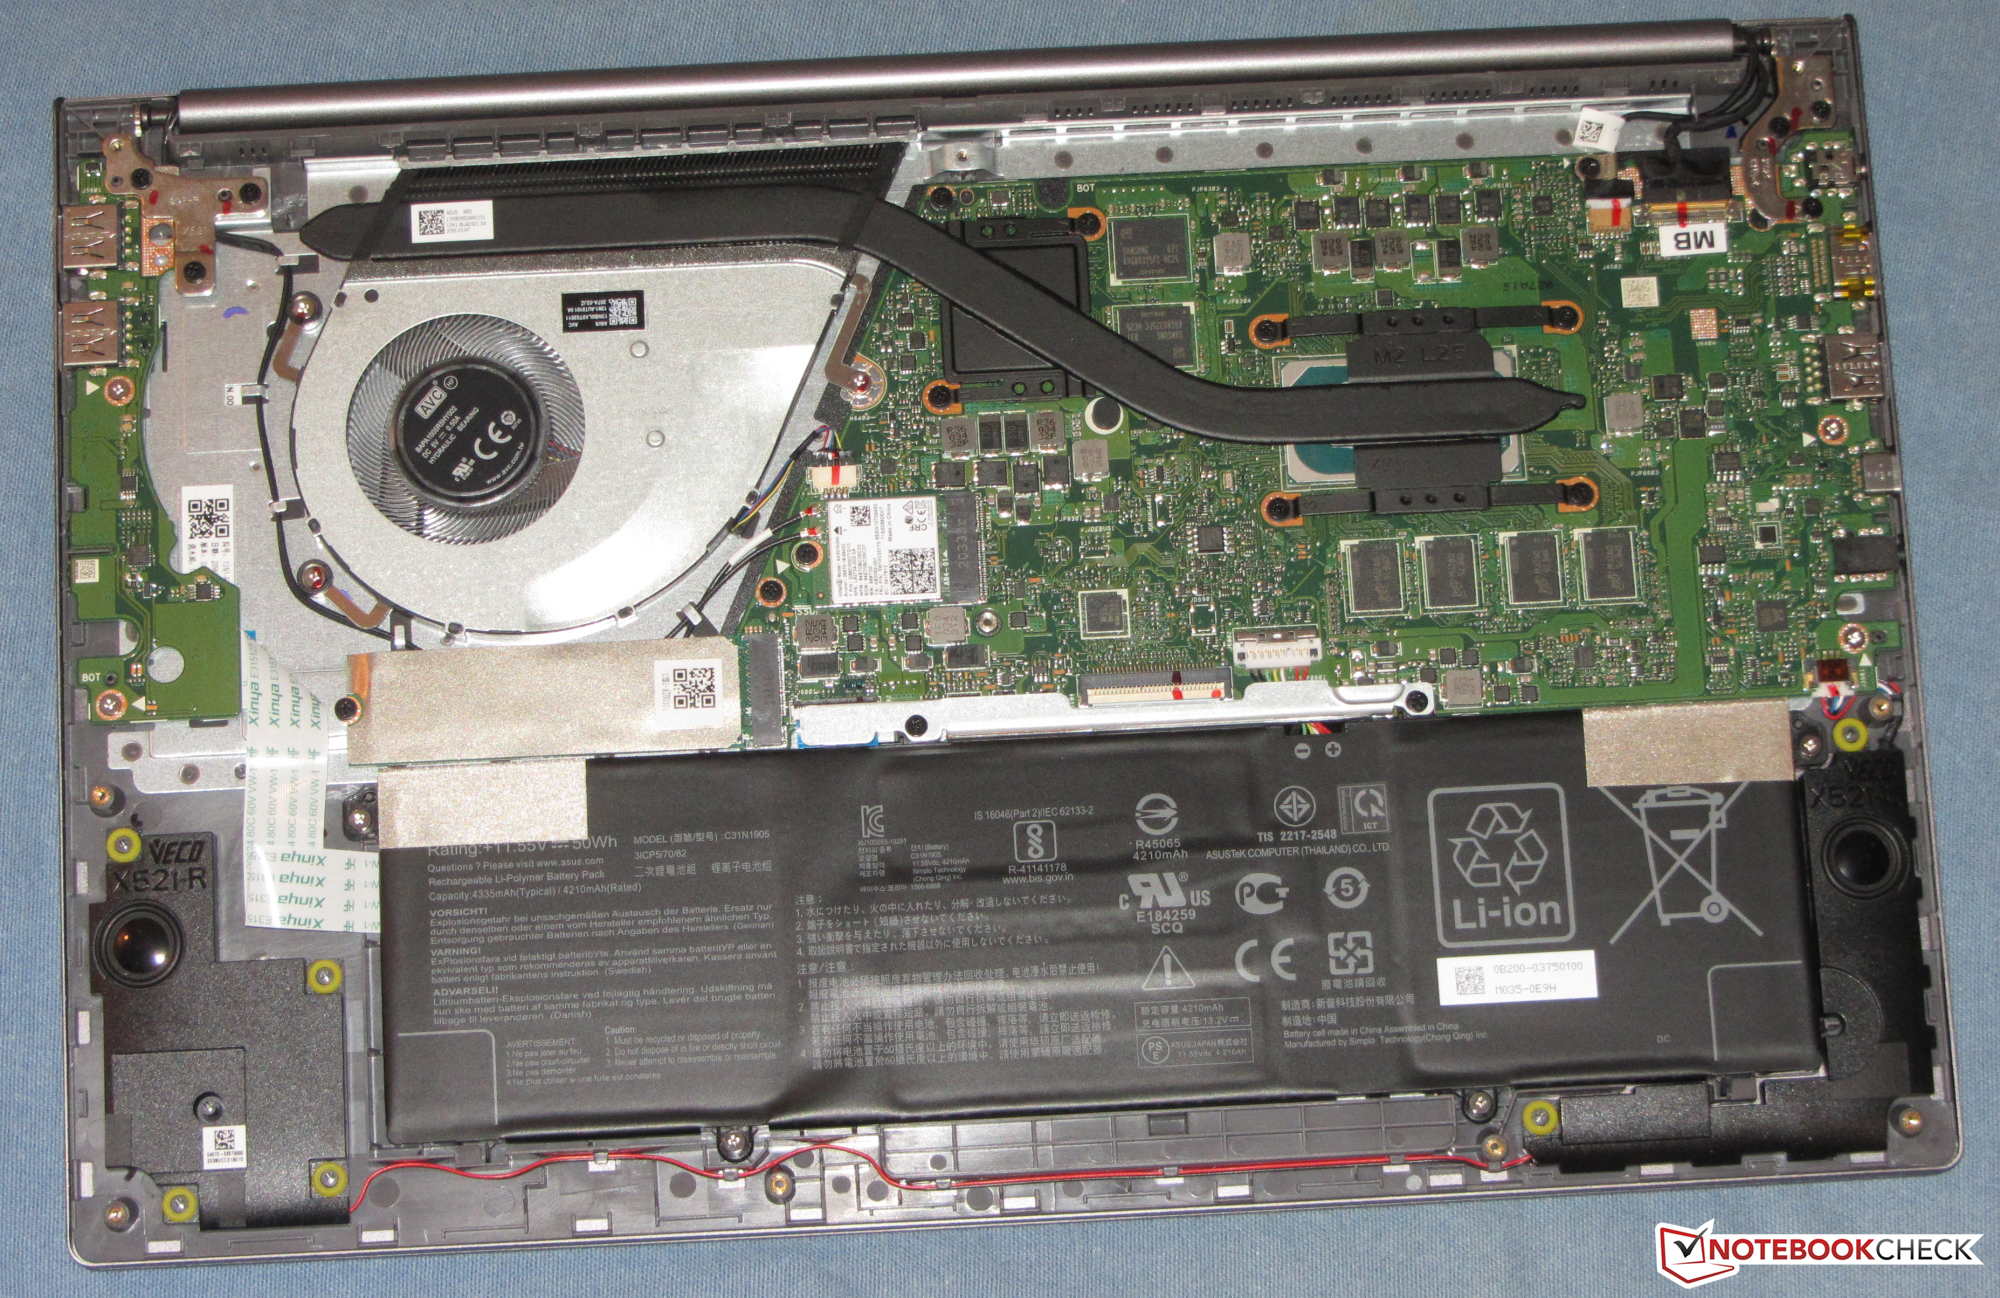
The VivoBook's technology is housed in a stylish, slim metal case that is finished in a darker silver-gray color (base unit) and in black (lid). The S533 doesn't have any manufacturing flaws, and stability and rigidity are within the limits. The lid's maximum aperture angle is about 130 degrees. Moreover, the battery is firmly installed. The interior can be accessed after removing the bottom cover.
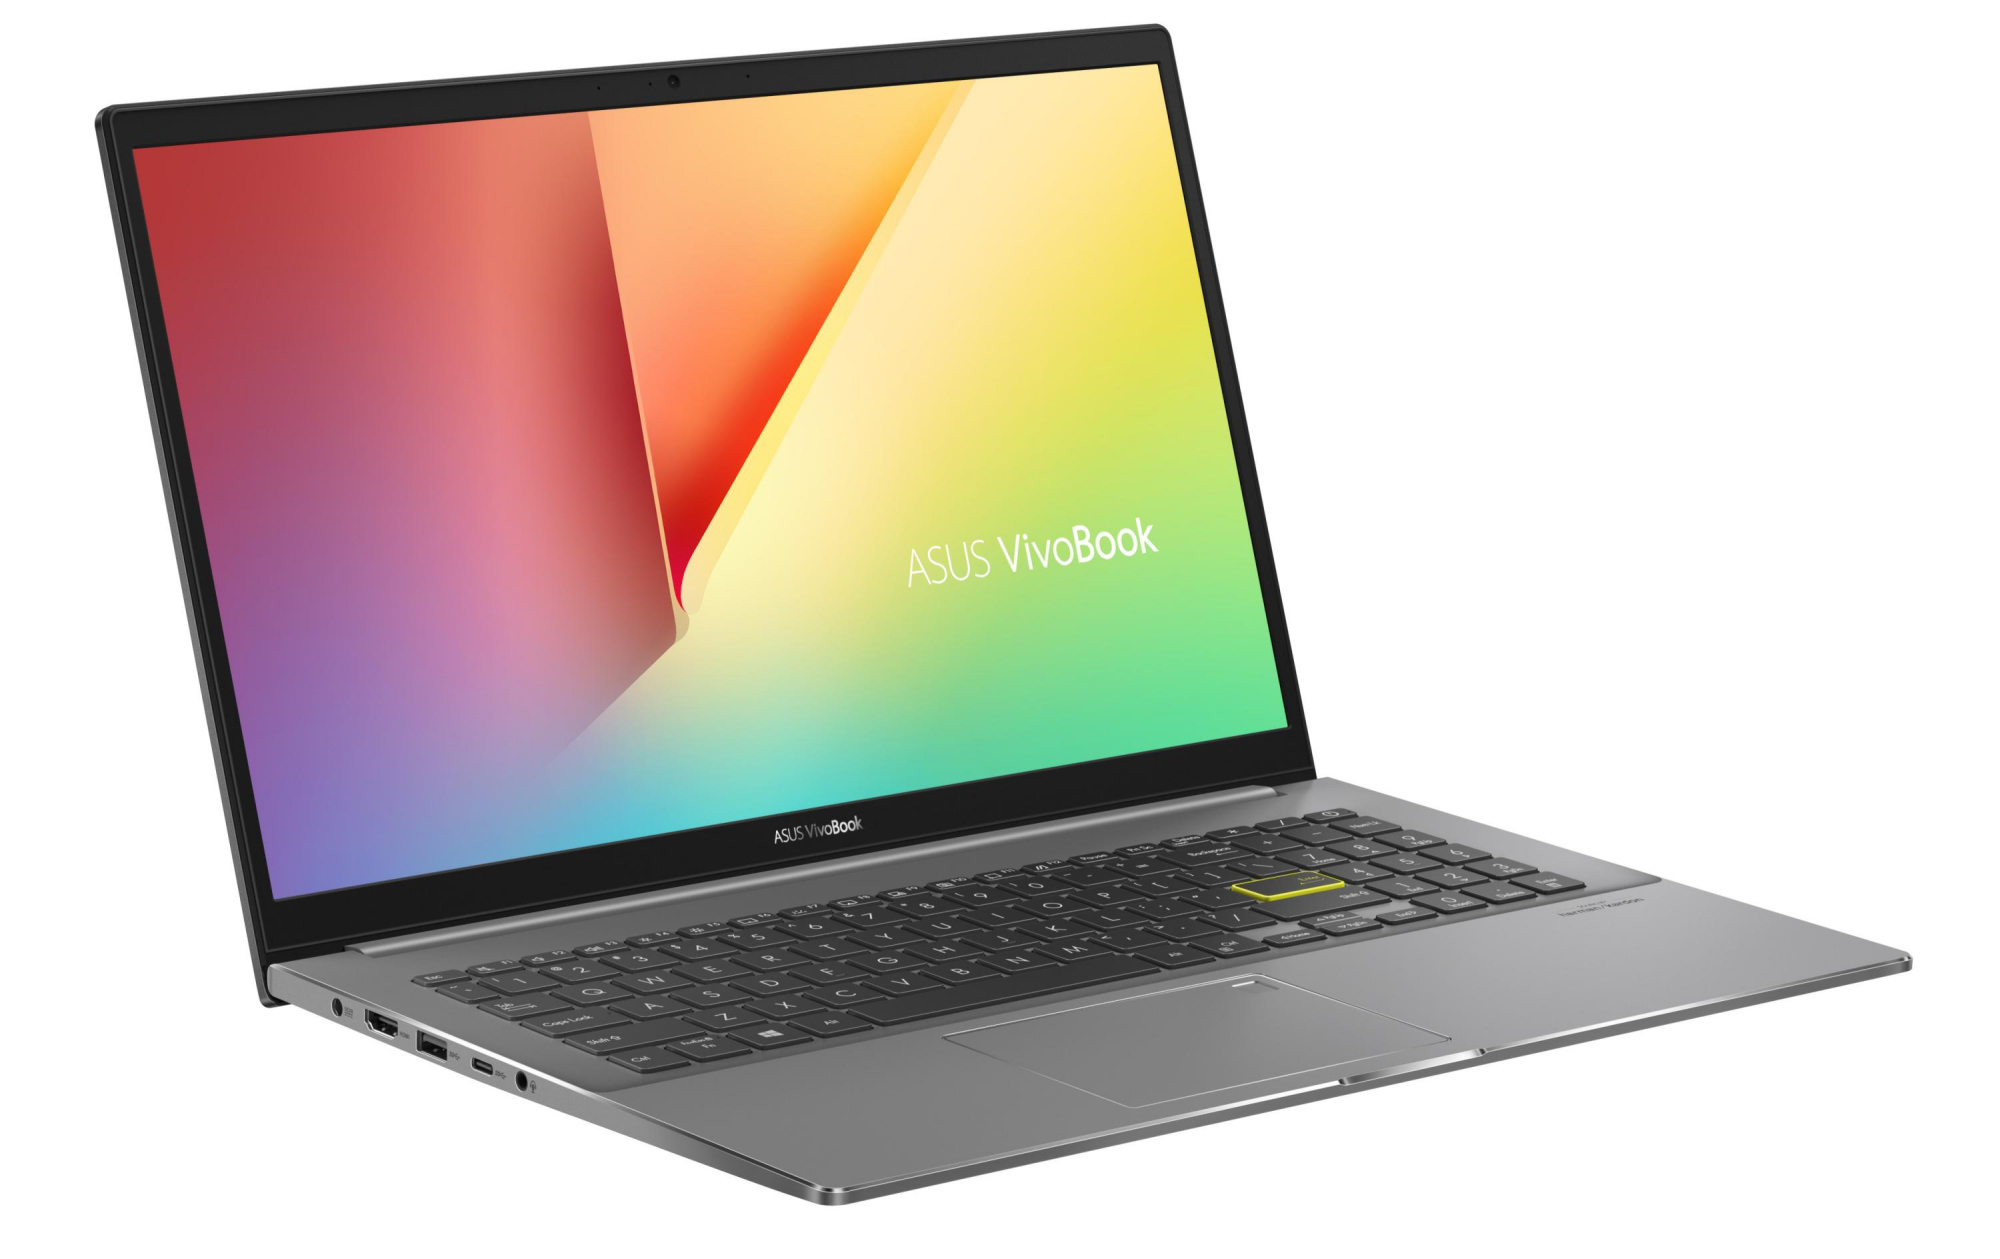
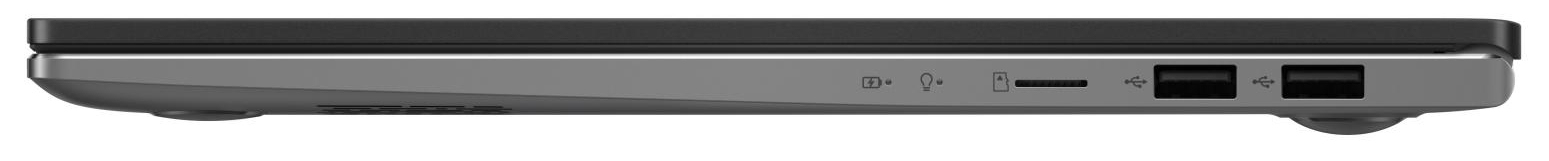
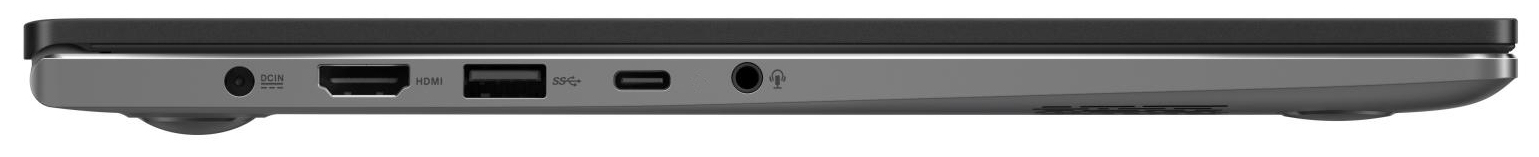
The laptop has three USB Type-A ports (2x USB 2.0, 1x USB 3.2 Gen 1) and a USB Type-C port (Thunderbolt 4). The latter supports Power Delivery and DisplayPort via USB-C. Consequently, two video outputs are available together with the HDMI port. The microSD memory card reader (reference card: Toshiba Exceria Pro M501 microSDXC 64 GB) is one of the slowest representatives of its kind.
The WLAN chip (Intel AX201) supports the 802.11a/b/g/n/ac/ax standards and offers Bluetooth 5 functionality. The data rates determined under optimal conditions (no other WLAN devices nearby, short distance between laptop and server PC; router: Netgear Nighthawk AX12) are excellent.

Port configuration
| SD Card Reader | |
| average JPG Copy Test (av. of 3 runs) | |
| Average of class Multimedia (23 - 531, n=37, last 2 years) | |
| Samsung Galaxy Book Ion Aura Silver (Toshiba Exceria Pro M501 microSDXC 64GB) | |
| Asus VivoBook S15 S533EQ-BQ002T (Toshiba Exceria Pro M501 microSDXC 64GB) | |
| Lenovo IdeaPad 5 15IIL05 (Toshiba Exceria Pro SDXC 64 GB UHS-II) | |
| maximum AS SSD Seq Read Test (1GB) | |
| Average of class Multimedia (37.3 - 1455, n=36, last 2 years) | |
| Samsung Galaxy Book Ion Aura Silver (Toshiba Exceria Pro M501 microSDXC 64GB) | |
| Lenovo IdeaPad 5 15IIL05 (Toshiba Exceria Pro SDXC 64 GB UHS-II) | |
| Asus VivoBook S15 S533EQ-BQ002T (Toshiba Exceria Pro M501 microSDXC 64GB) | |


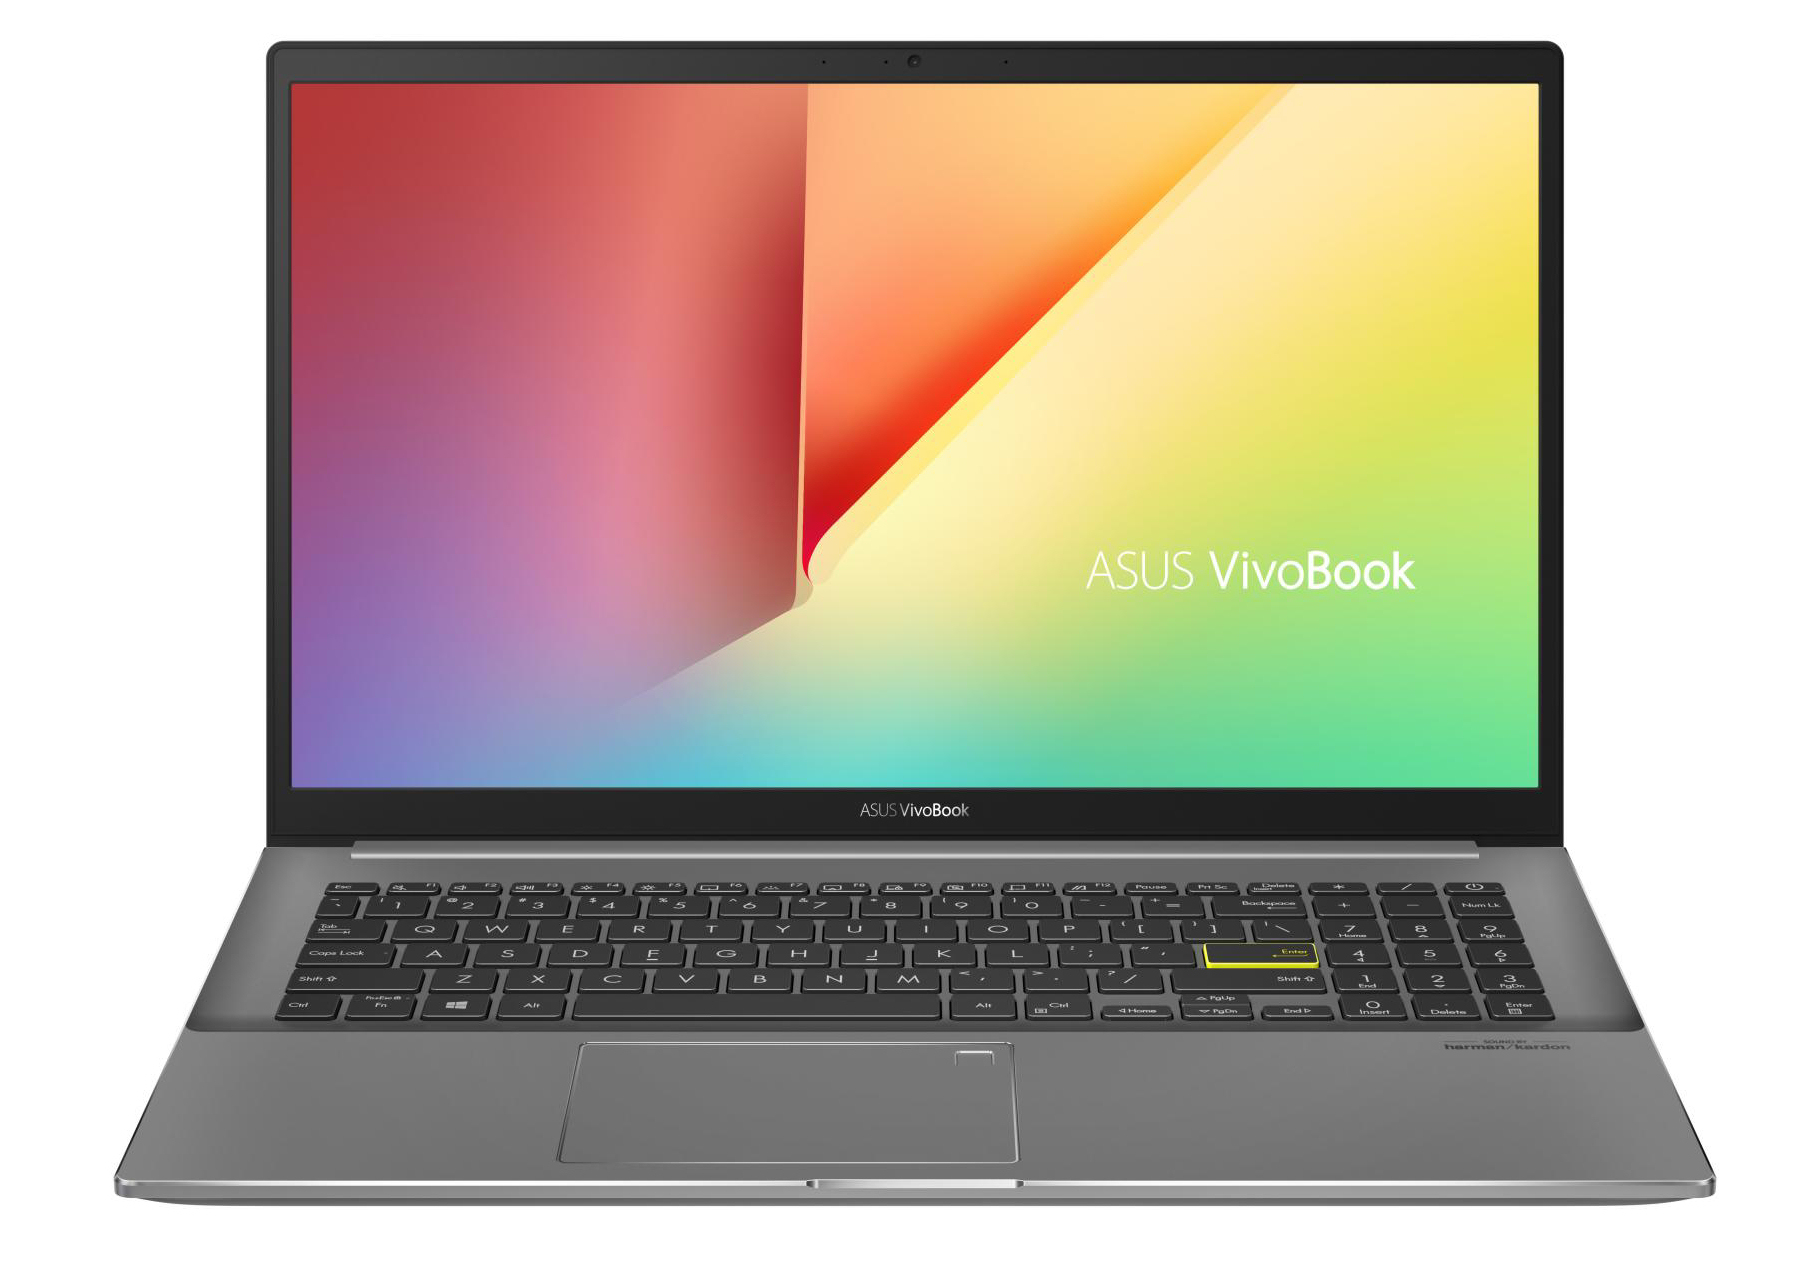
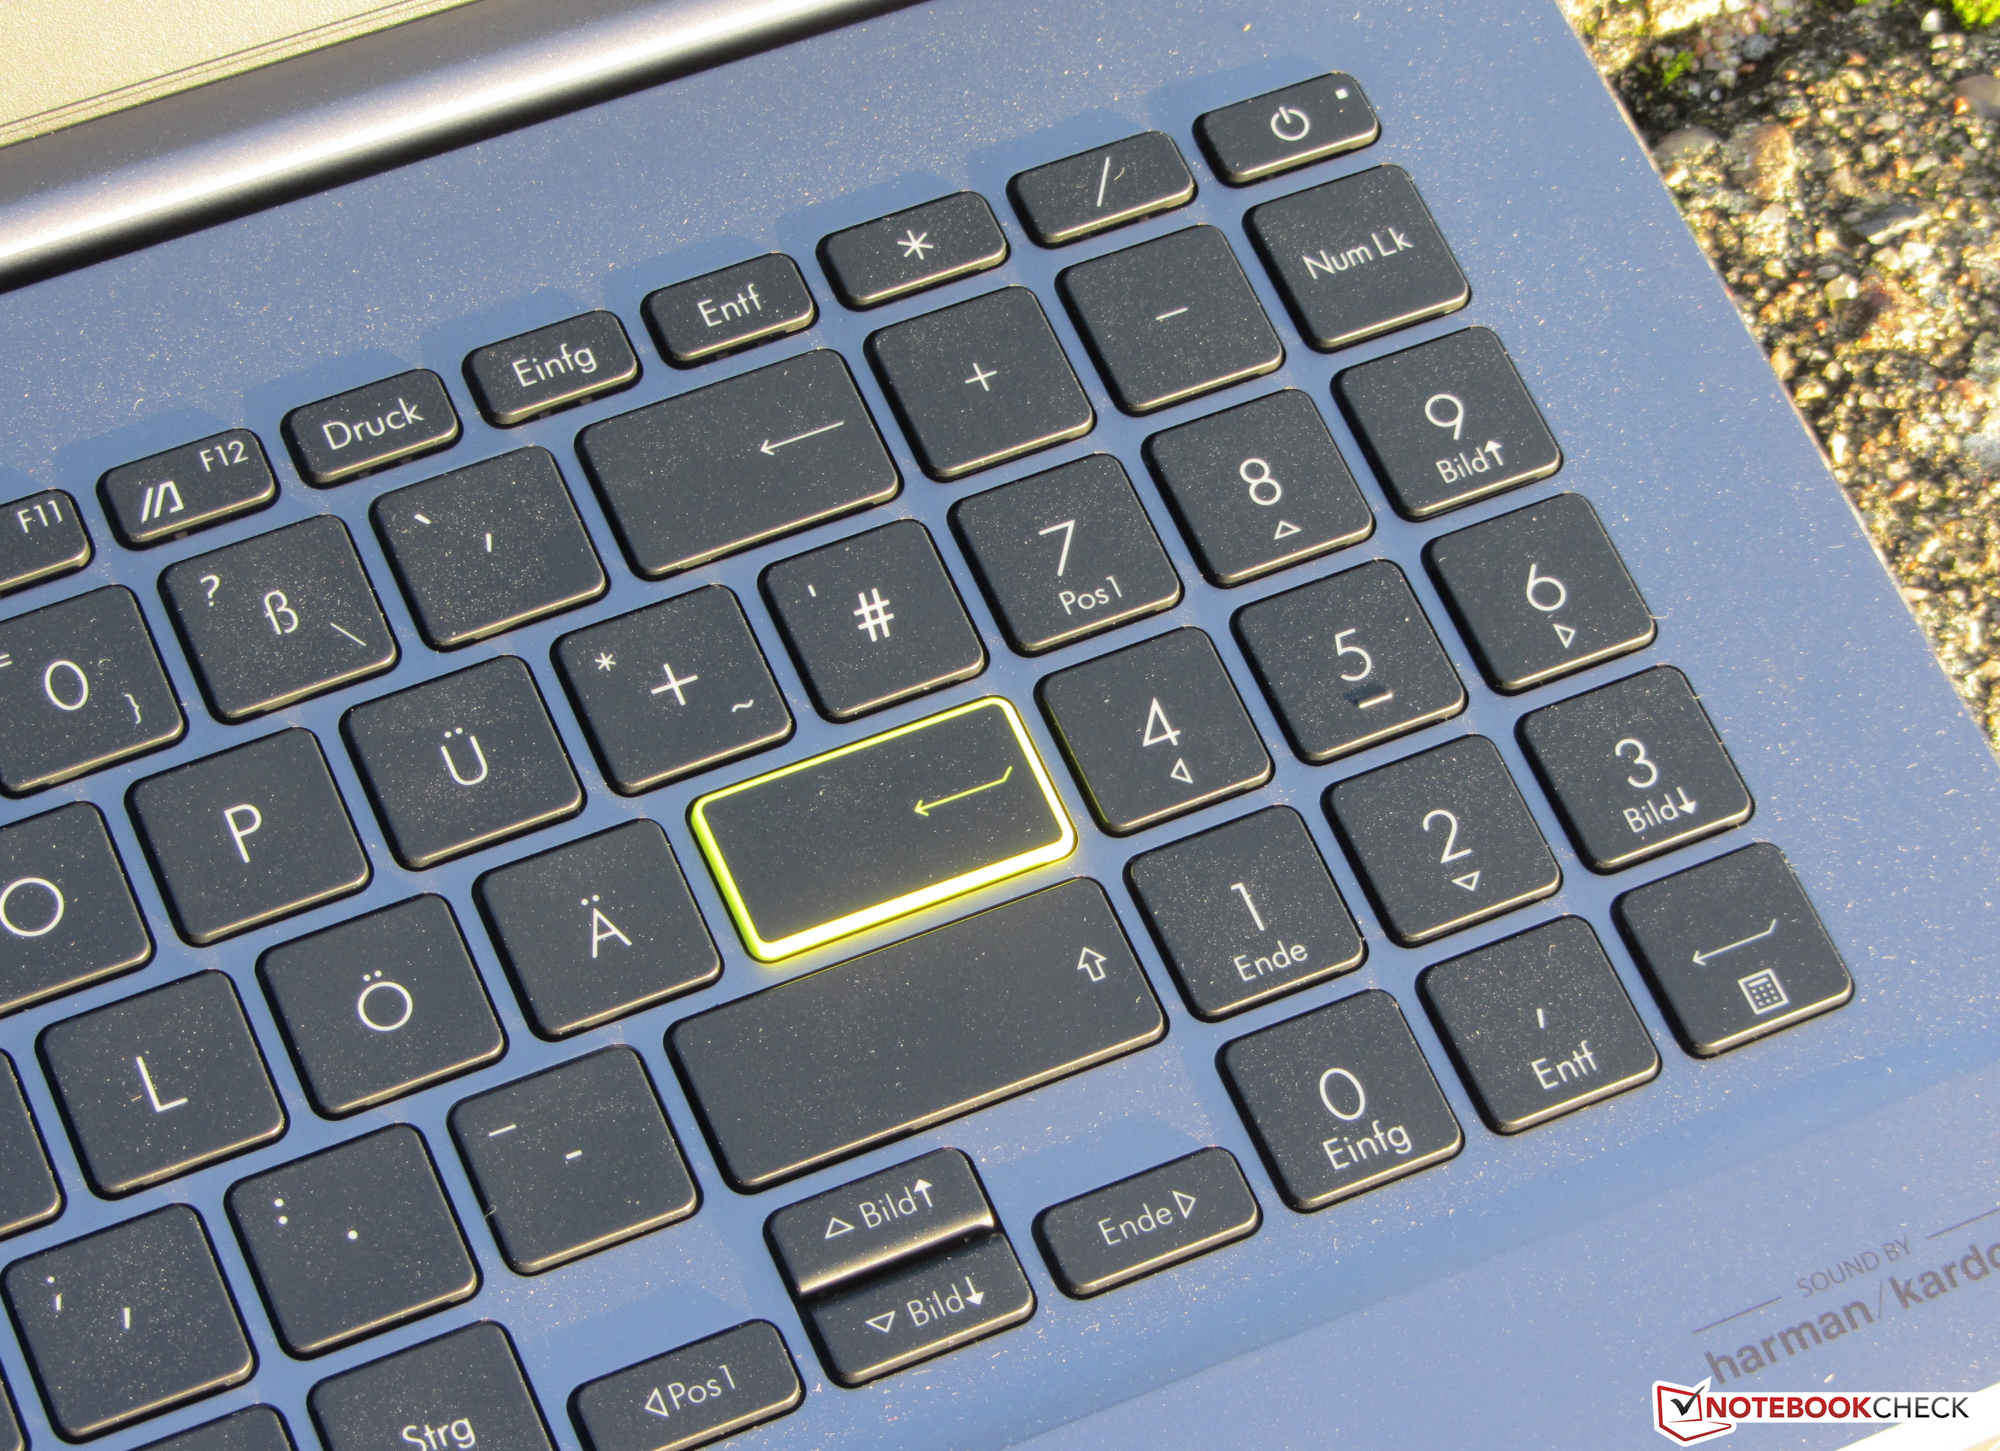
Input devices - Asus laptop with backlit keyboard
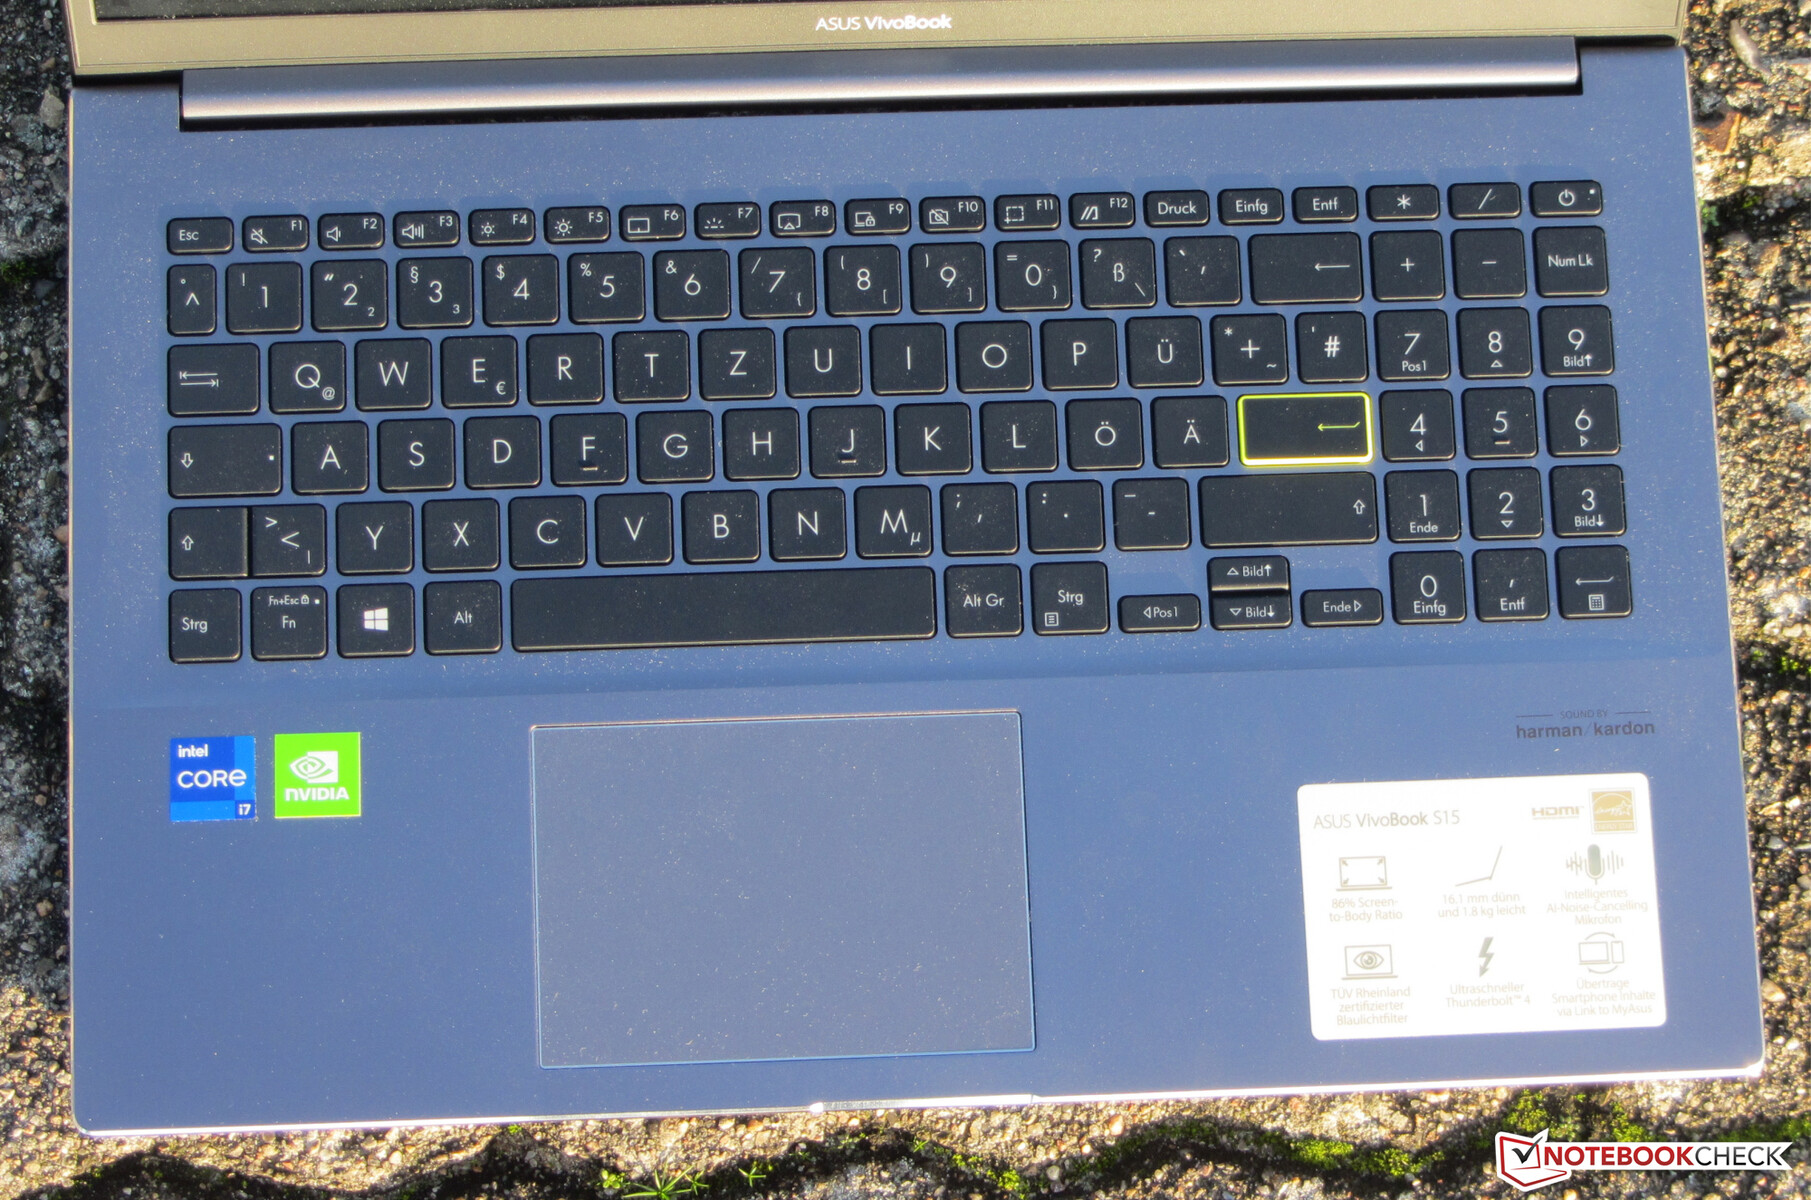
The flat, smooth keys of the backlit chiclet keyboard offer a short travel and a clear pressure point. The keyboard yields minimally during typing. This didn't prove to be annoying. All in all, Asus delivers a keyboard that is suitable for everyday use here. Furthermore, the smooth surface of the multi-touch capable ClickPad (10.5 x 7.3 cm) makes it easy for fingers to glide on it. It also responds to inputs in the corners. The pad has a short travel and a clear pressure point.
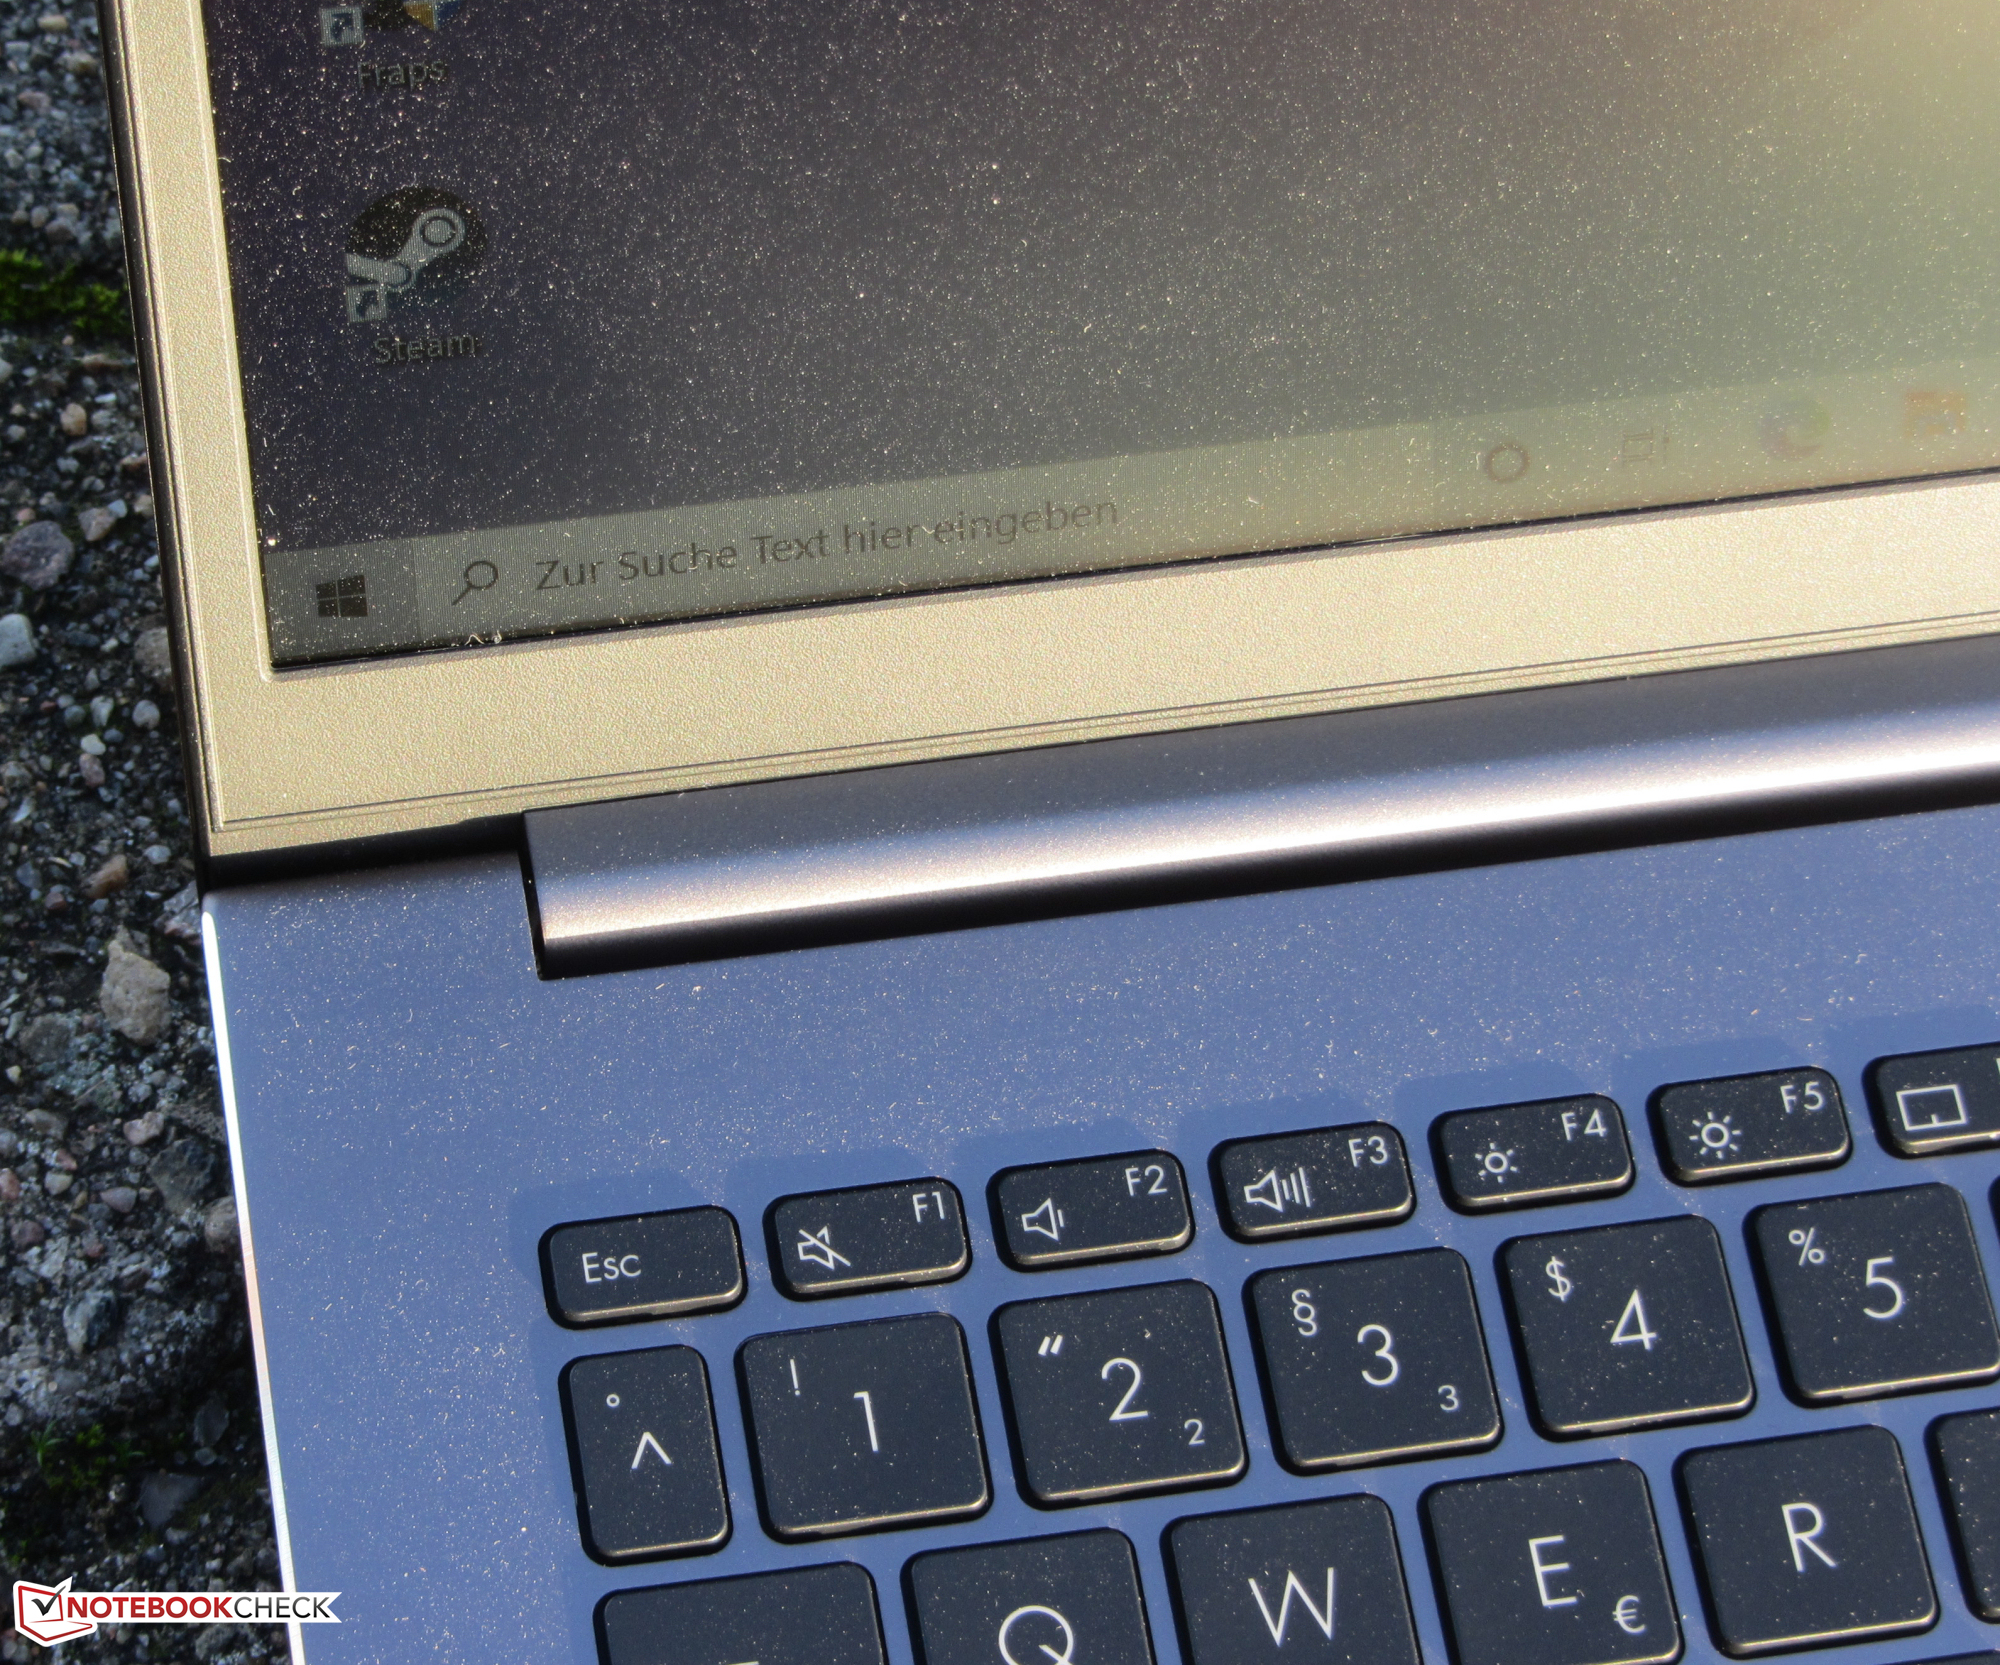
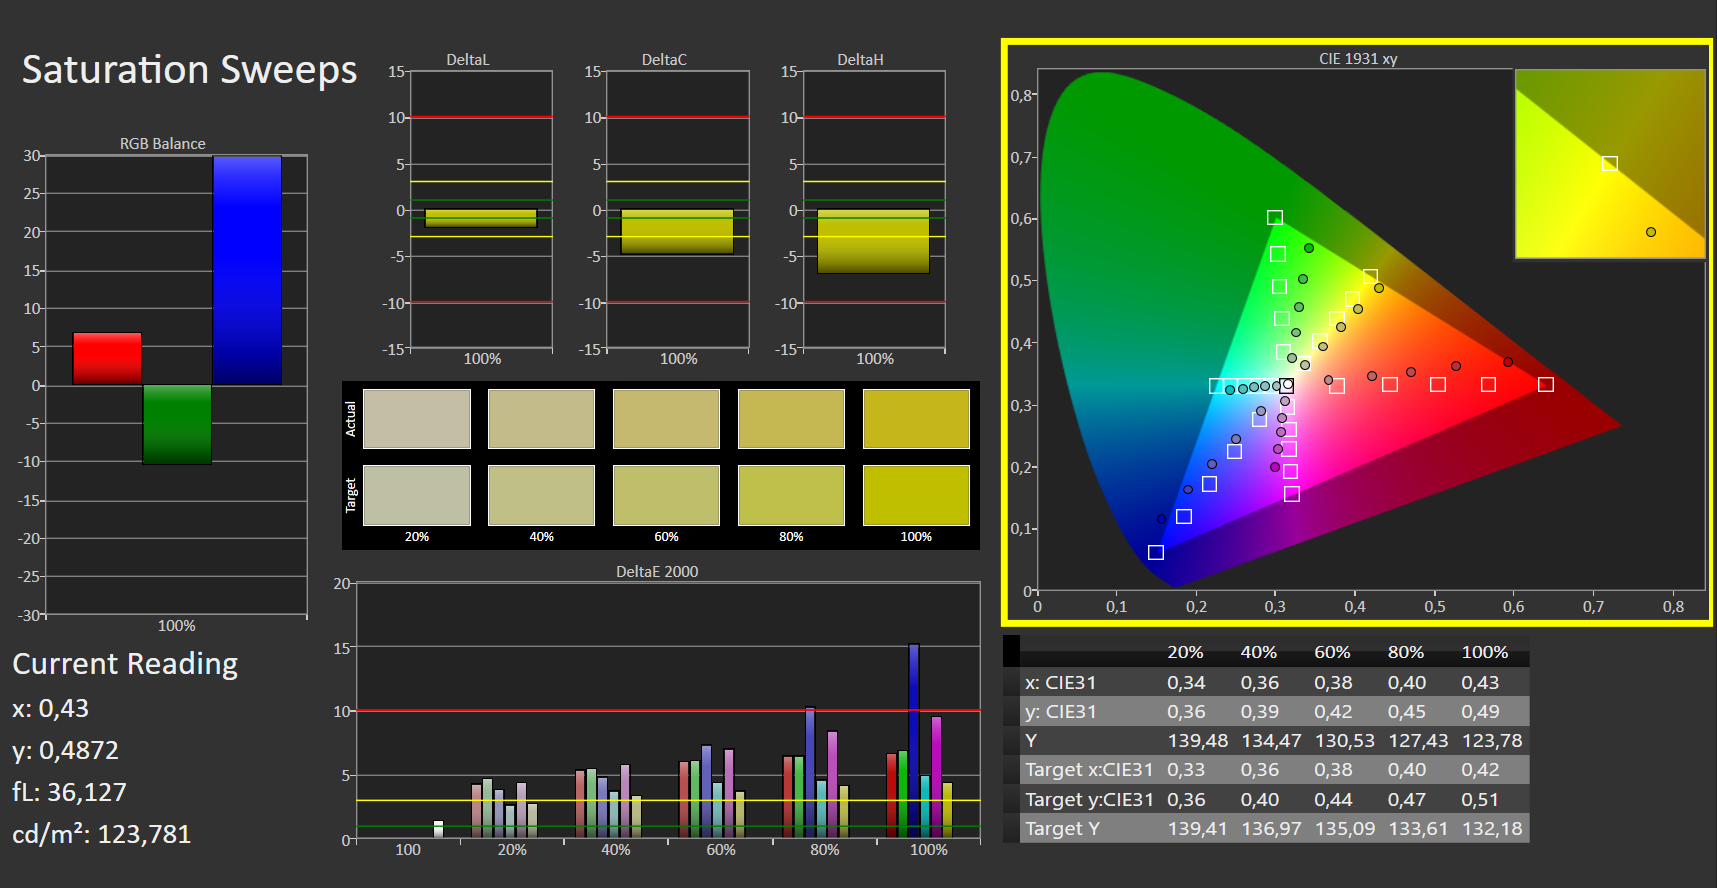
Display - Dim and low-contrast

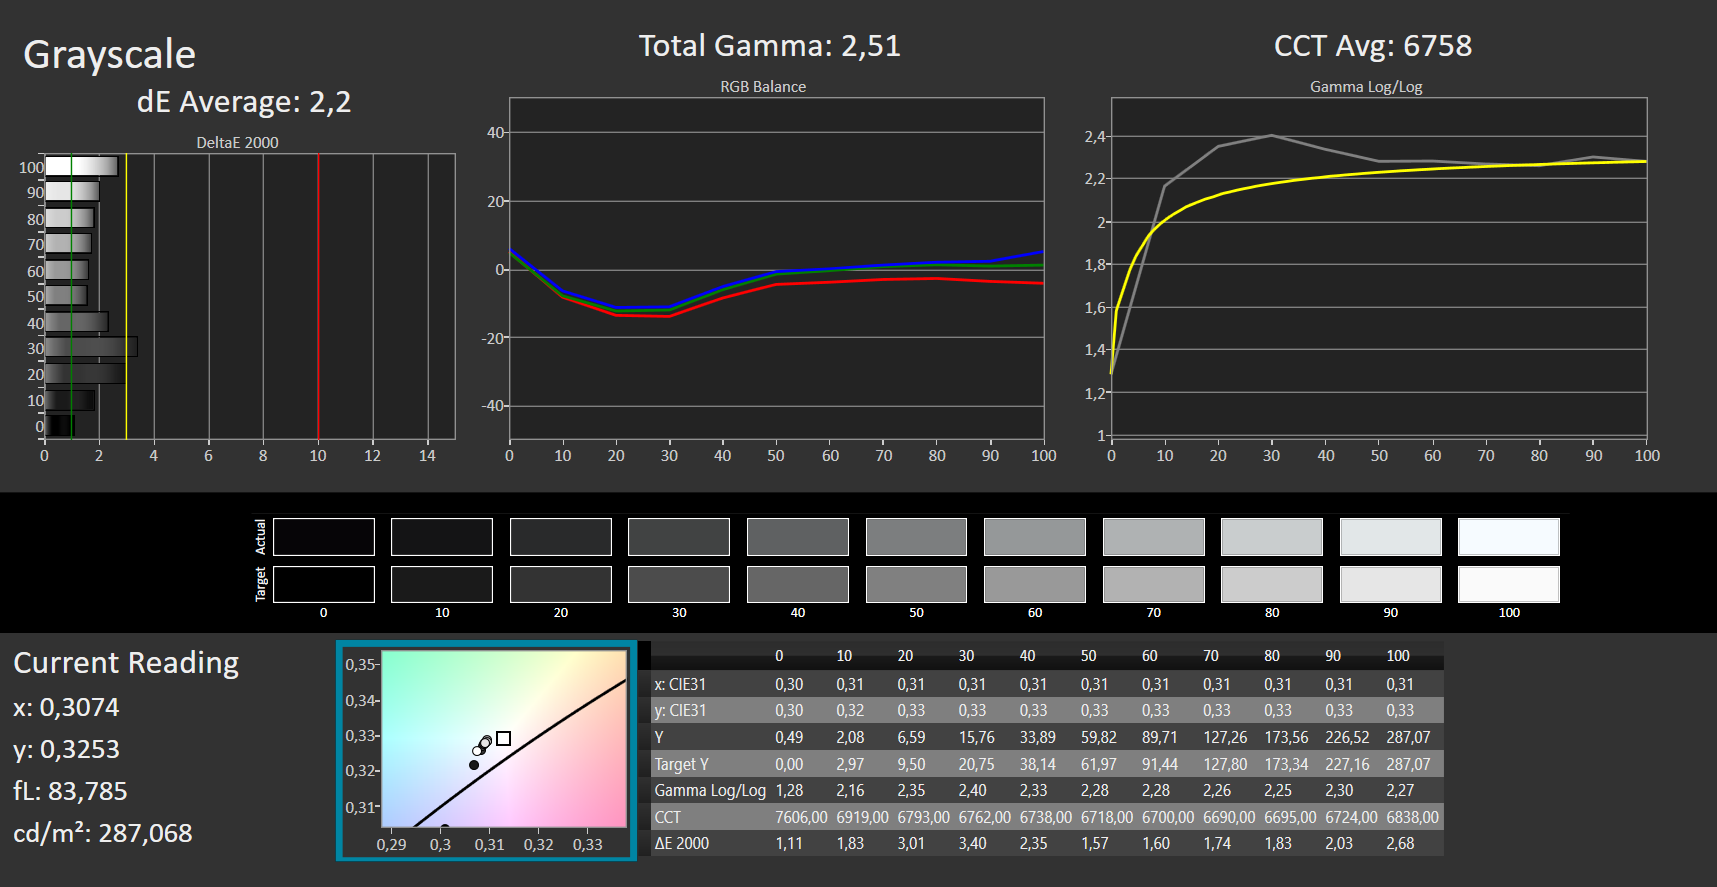
The brightness (261.1 cd/m²) and contrast (563:1) of the matte 15.6-inch display (1920x1080 pixels) are too low. We consider values beyond 300 cd/m² and 1,000:1, respectively, to be good. The competition consistently delivers better values.
| |||||||||||||||||||||||||
Brightness Distribution: 84 %
Center on Battery: 291 cd/m²
Contrast: 563:1 (Black: 0.51 cd/m²)
ΔE ColorChecker Calman: 4.72 | ∀{0.5-29.43 Ø4.71}
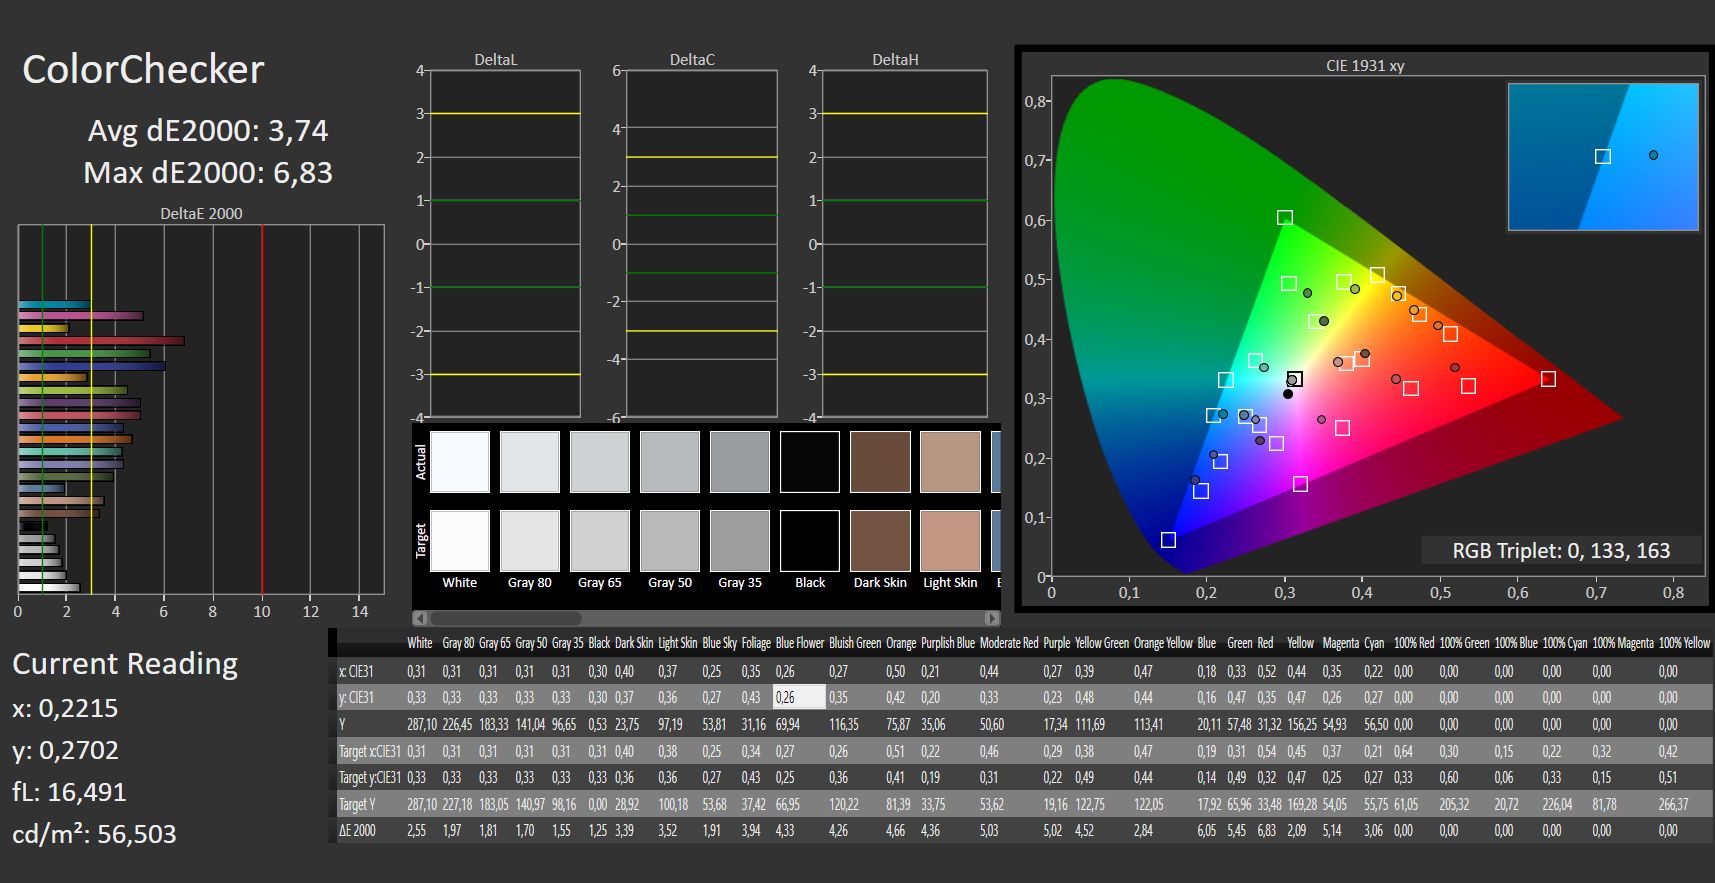
calibrated: 3.74
ΔE Greyscale Calman: 2.2 | ∀{0.09-98 Ø4.96}
58% sRGB (Argyll 1.6.3 3D)
37% AdobeRGB 1998 (Argyll 1.6.3 3D)
40.33% AdobeRGB 1998 (Argyll 3D)
58.5% sRGB (Argyll 3D)
39.01% Display P3 (Argyll 3D)
Gamma: 2.51
CCT: 6758 K
| Asus VivoBook S15 S533EQ-BQ002T Panda LM156LF-5L04, IPS, 1920x1080, 15.6" | Lenovo IdeaPad 5 15IIL05 AU Optronics B156HAN02.1, IPS, 1920x1080, 15.6" | Schenker Vision 15 BOE08F5, IPS, 1920x1080, 15.6" | Samsung Galaxy Book Ion Aura Silver BOE0889, QLED, 1920x1080, 15.6" | |
|---|---|---|---|---|
| Display | -4% | 72% | 114% | |
| Display P3 Coverage (%) | 39.01 | 37.63 -4% | 69.3 78% | 99.1 154% |
| sRGB Coverage (%) | 58.5 | 56.5 -3% | 94 61% | 99.9 71% |
| AdobeRGB 1998 Coverage (%) | 40.33 | 38.88 -4% | 70.8 76% | 87.3 116% |
| Response Times | -6% | -51% | -18% | |
| Response Time Grey 50% / Grey 80% * (ms) | 38 ? | 42 ? -11% | 60 ? -58% | 49 ? -29% |
| Response Time Black / White * (ms) | 27 ? | 27 ? -0% | 39 ? -44% | 29 ? -7% |
| PWM Frequency (Hz) | ||||
| Screen | 2% | 52% | 67% | |
| Brightness middle (cd/m²) | 287 | 340 18% | 478 67% | 467 63% |
| Brightness (cd/m²) | 261 | 325 25% | 462 77% | 437 67% |
| Brightness Distribution (%) | 84 | 88 5% | 94 12% | 91 8% |
| Black Level * (cd/m²) | 0.51 | 0.27 47% | 0.27 47% | 0.27 47% |
| Contrast (:1) | 563 | 1259 124% | 1770 214% | 1730 207% |
| Colorchecker dE 2000 * | 4.72 | 6.62 -40% | 3.2 32% | 3.39 28% |
| Colorchecker dE 2000 max. * | 17.94 | 21.05 -17% | 8.4 53% | 6.27 65% |
| Colorchecker dE 2000 calibrated * | 3.74 | 4.71 -26% | 2 47% | |
| Greyscale dE 2000 * | 2.2 | 4.61 -110% | 4.5 -105% | 2.17 1% |
| Gamma | 2.51 88% | 2.74 80% | 2.16 102% | 2.45 90% |
| CCT | 6758 96% | 6262 104% | 6788 96% | 6488 100% |
| Color Space (Percent of AdobeRGB 1998) (%) | 37 | 36 -3% | 63.1 71% | 78 111% |
| Color Space (Percent of sRGB) (%) | 58 | 56 -3% | 93.6 61% | 100 72% |
| Total Average (Program / Settings) | -3% /
-0% | 24% /
43% | 54% /
65% |
* ... smaller is better
Display Response Times
| ↔ Response Time Black to White | ||
|---|---|---|
| 27 ms ... rise ↗ and fall ↘ combined | ↗ 15 ms rise | 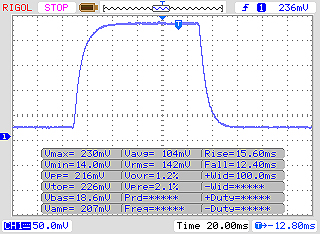 |
| ↘ 12 ms fall | ||
| The screen shows relatively slow response rates in our tests and may be too slow for gamers. In comparison, all tested devices range from 0.1 (minimum) to 240 (maximum) ms. » 67 % of all devices are better. This means that the measured response time is worse than the average of all tested devices (19.8 ms). | ||
| ↔ Response Time 50% Grey to 80% Grey | ||
| 38 ms ... rise ↗ and fall ↘ combined | ↗ 19 ms rise | 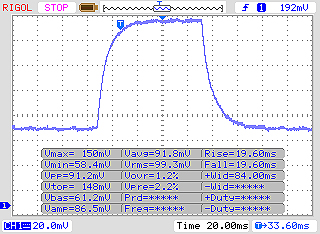 |
| ↘ 19 ms fall | ||
| The screen shows slow response rates in our tests and will be unsatisfactory for gamers. In comparison, all tested devices range from 0.165 (minimum) to 636 (maximum) ms. » 55 % of all devices are better. This means that the measured response time is worse than the average of all tested devices (31 ms). | ||
Screen Flickering / PWM (Pulse-Width Modulation)
| Screen flickering / PWM not detected | 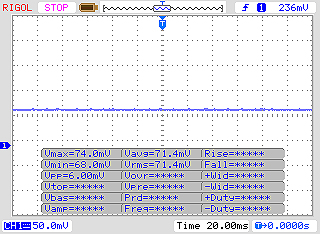 | ||
In comparison: 52 % of all tested devices do not use PWM to dim the display. If PWM was detected, an average of 7754 (minimum: 5 - maximum: 343500) Hz was measured. | |||
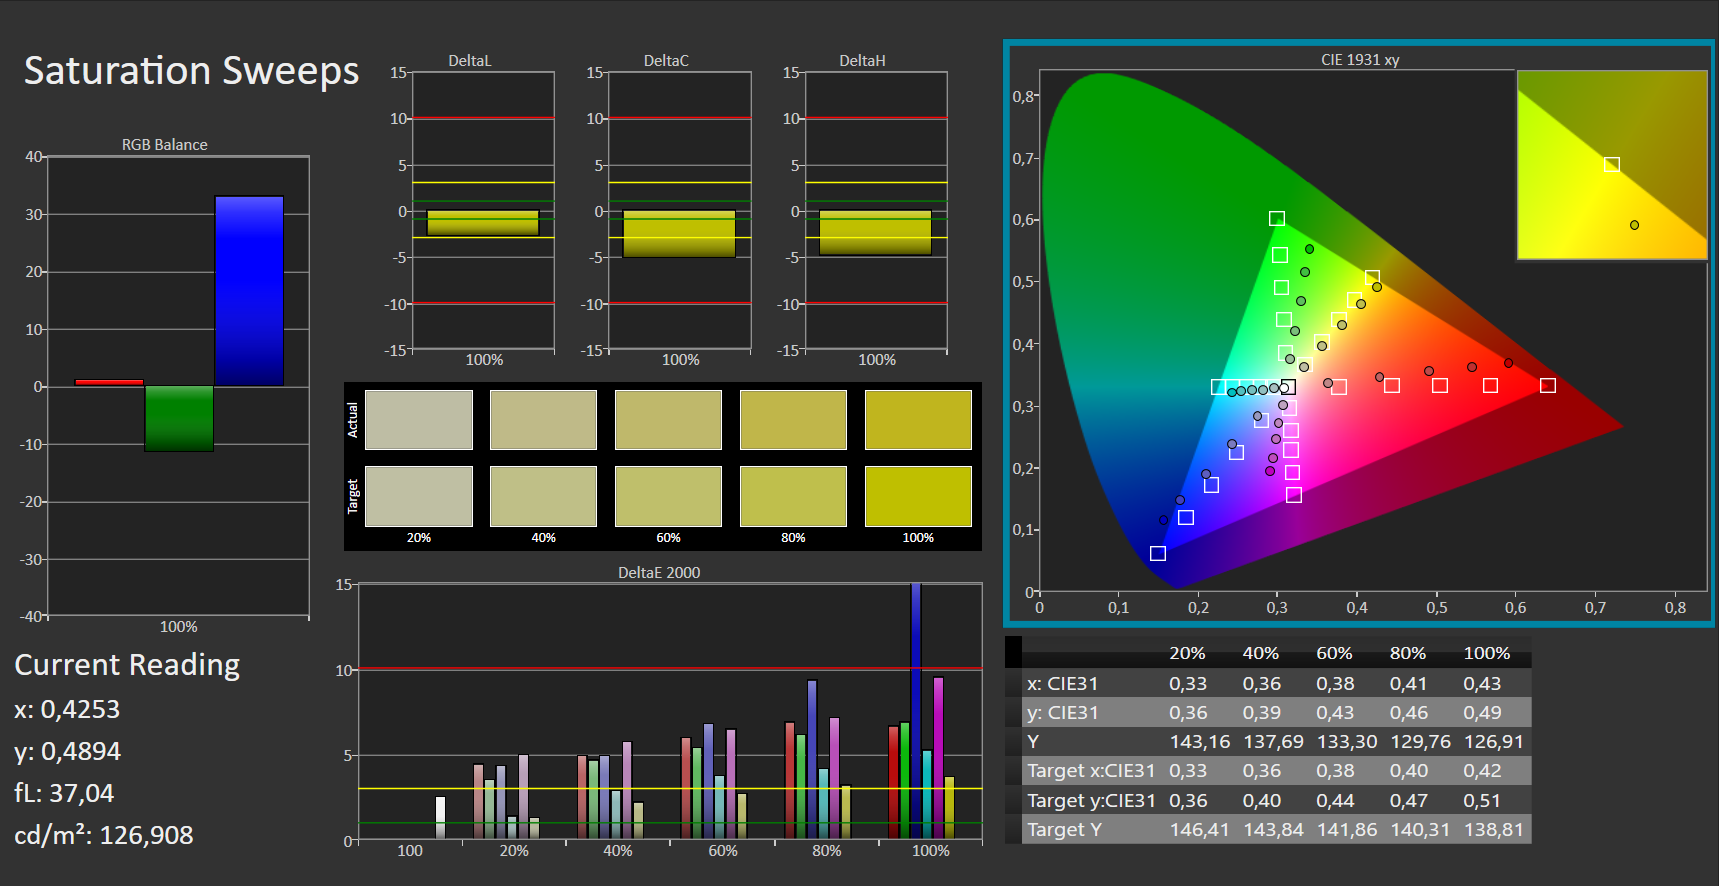
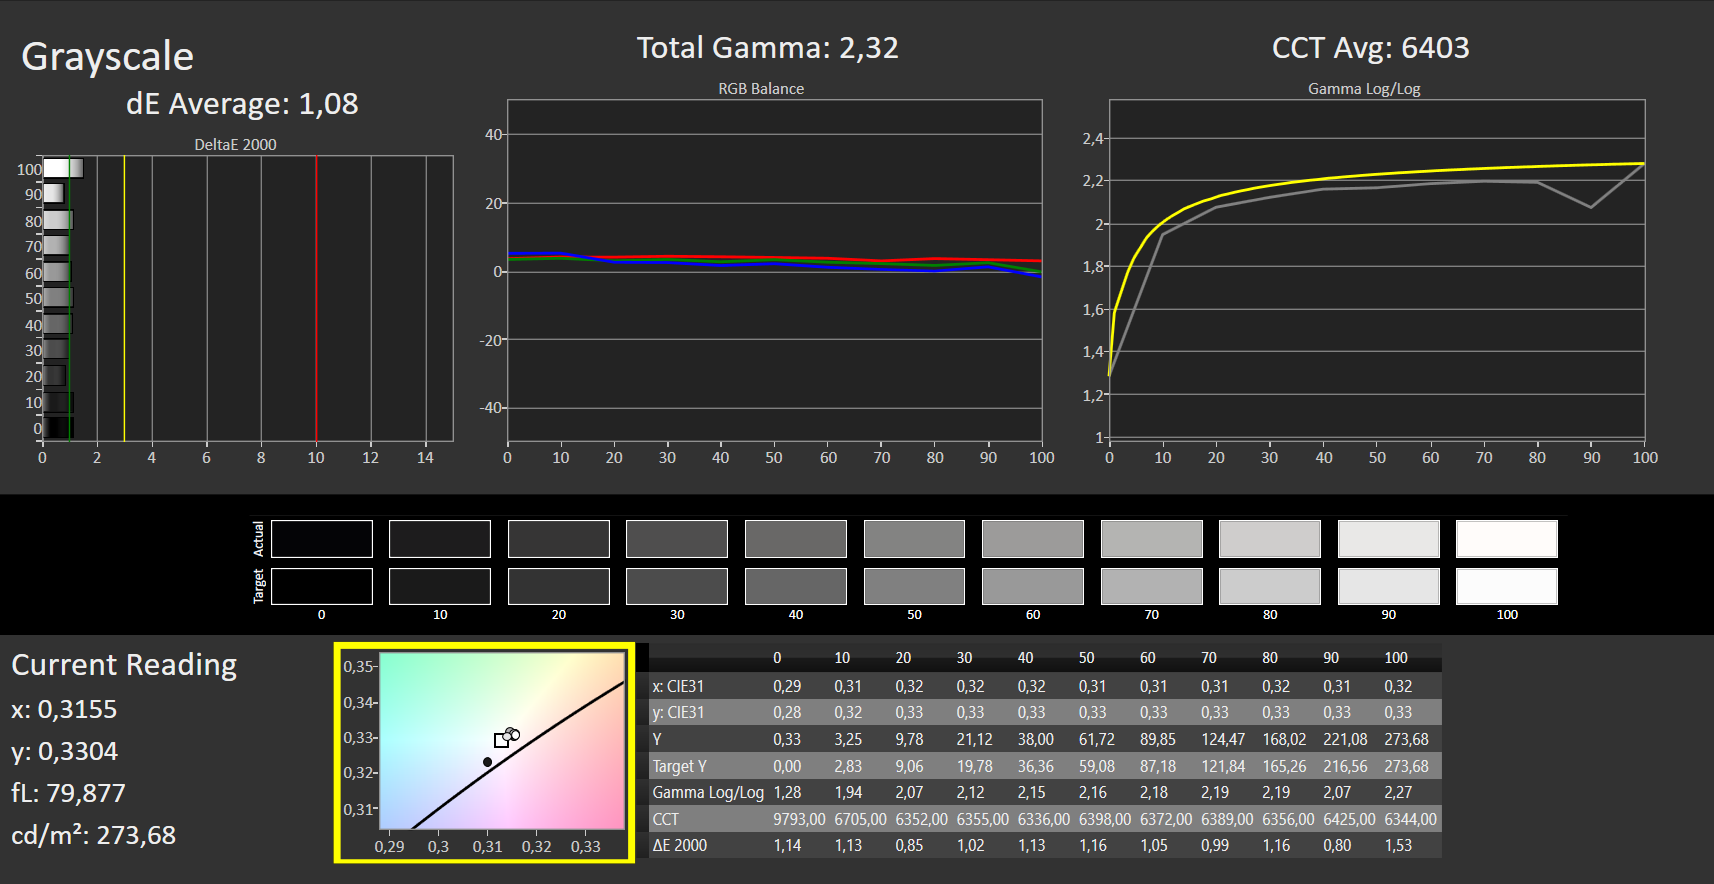
Out of the box, the display shows a decent color reproduction. However, with a deviation of 4.72, the target (Delta E less than 3) is not met. Moreover, the display doesn't suffer from a blue tint, and calibration provides improvements. In addition, the AdobeRGB (37%) and sRGB (58%) color spaces are not completely reproduced.
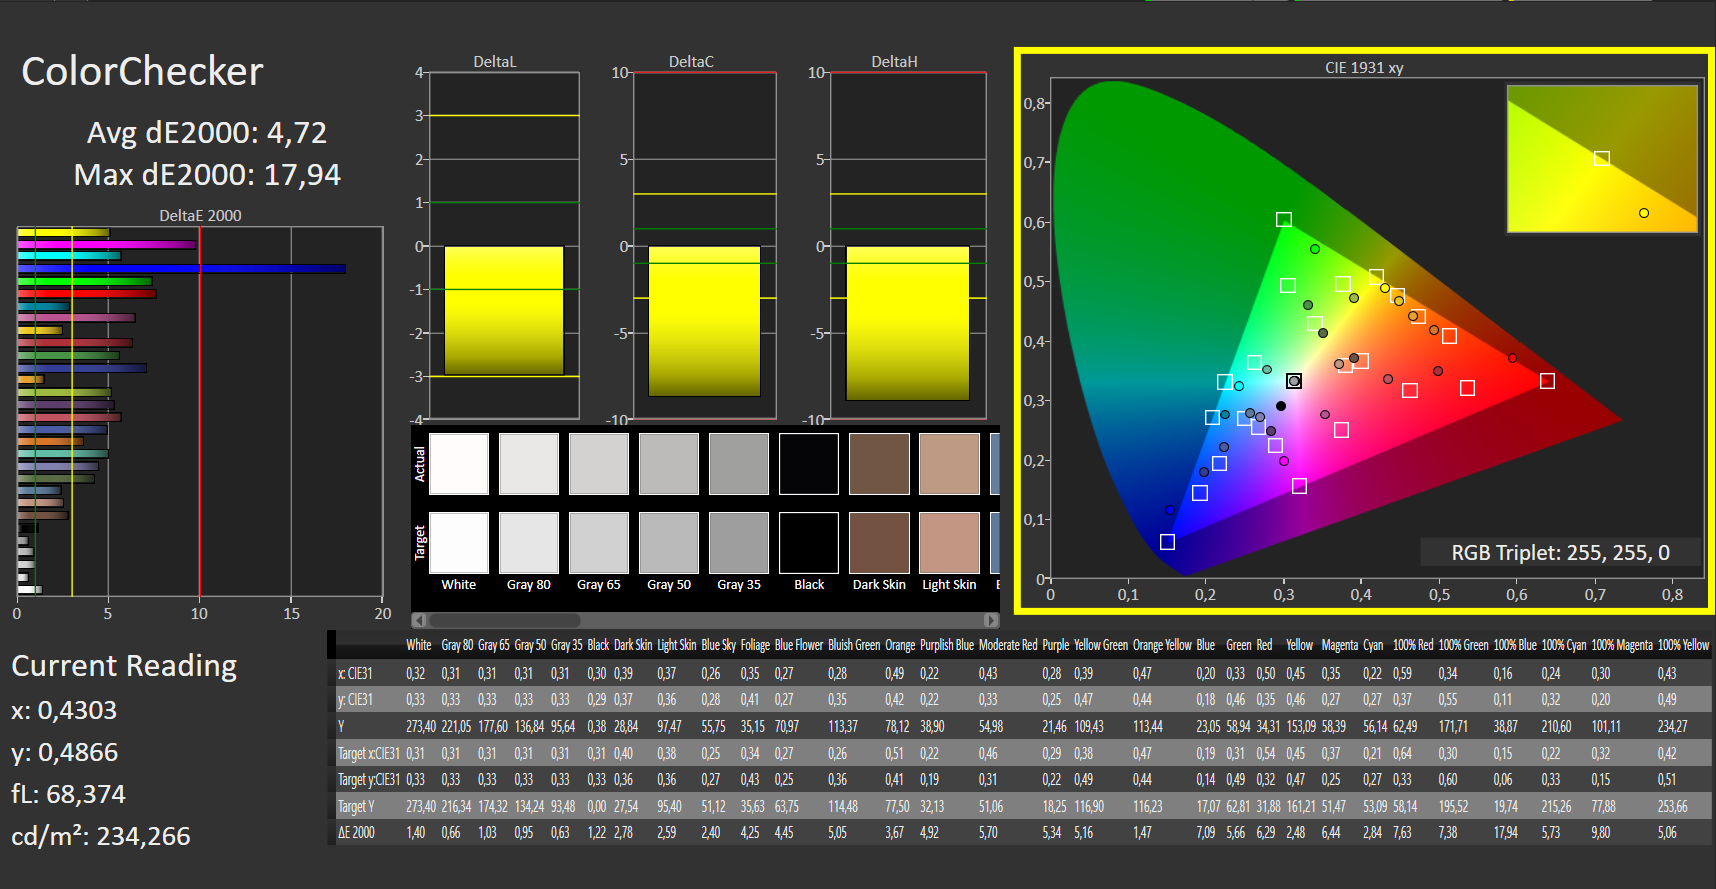
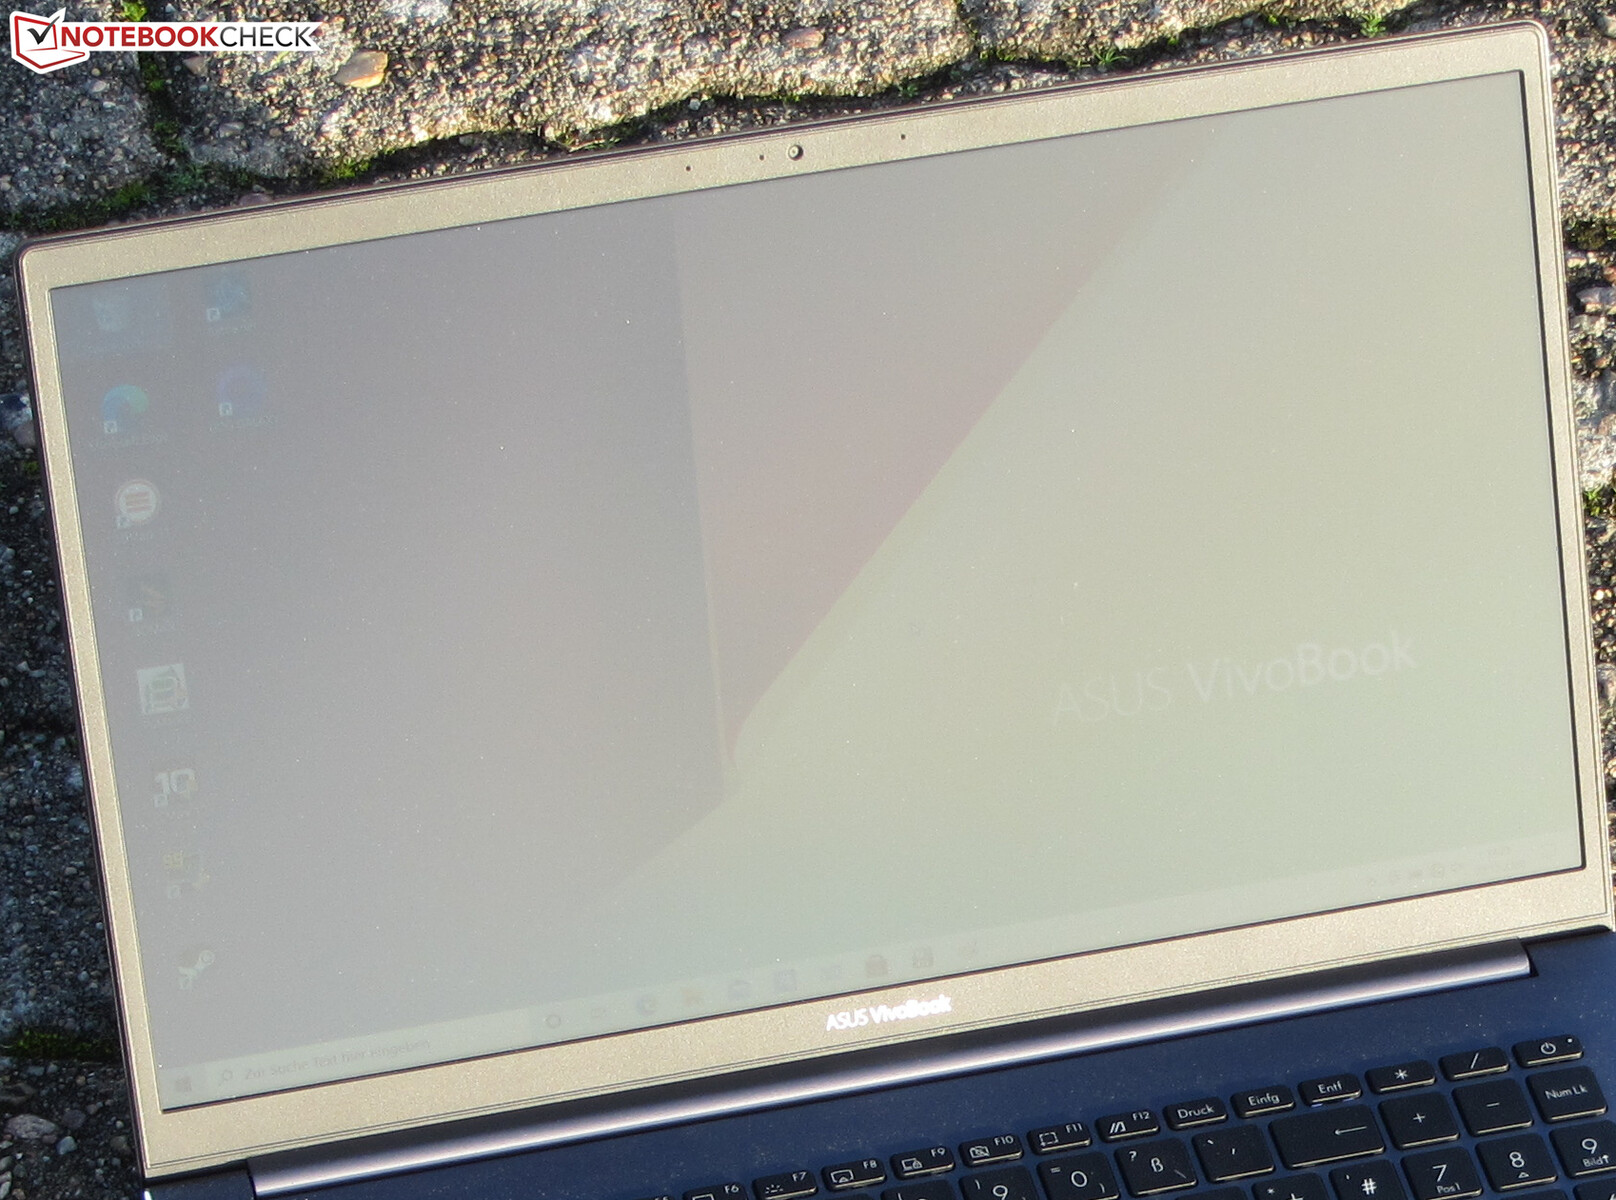
The viewing-angle stable IPS panel can be read from any position. Outdoors, reading the display is possible under cloudy skies or in the shade.
Performance - Gaming is possible to a limited extent
With the VivoBook S15 S533EQ, Asus has a 15.6-inch all-rounder in its lineup that provides enough performance for office and Internet applications. The installed hardware can also handle computer games.
Test conditions
Asus provides the three energy profiles "Performance Mode", "Balanced Mode", and "Whisper Mode"; you can switch between them via the key combination "Fn" + "F". We performed our test with the "Balanced Mode" profile active. We also ran some benchmarks under the "Performance Mode" profile. The results can be found in the comparison graphs.
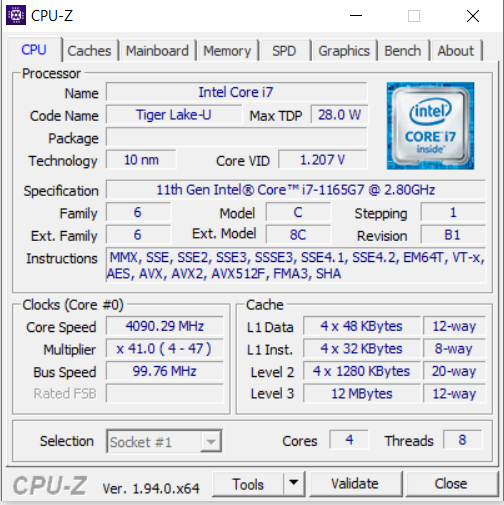
Processor
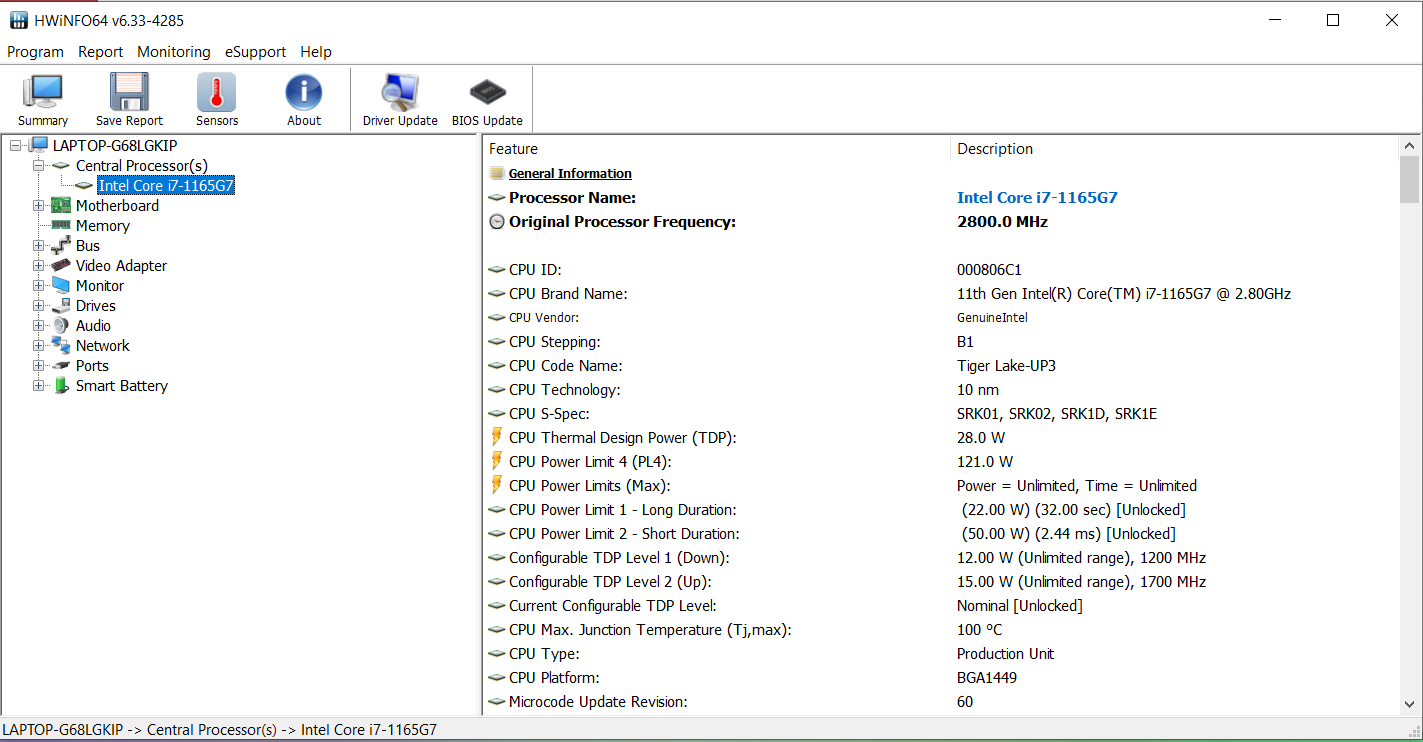
The Core i7-1165G7 quad-core processor (Tiger Lake) runs at a base clock speed of 2.8 GHz. An increase to 4.1 GHz (all four cores) and 4.7 GHz (one core) is possible via Turbo. Hyper-Threading (two threads per core) is supported.
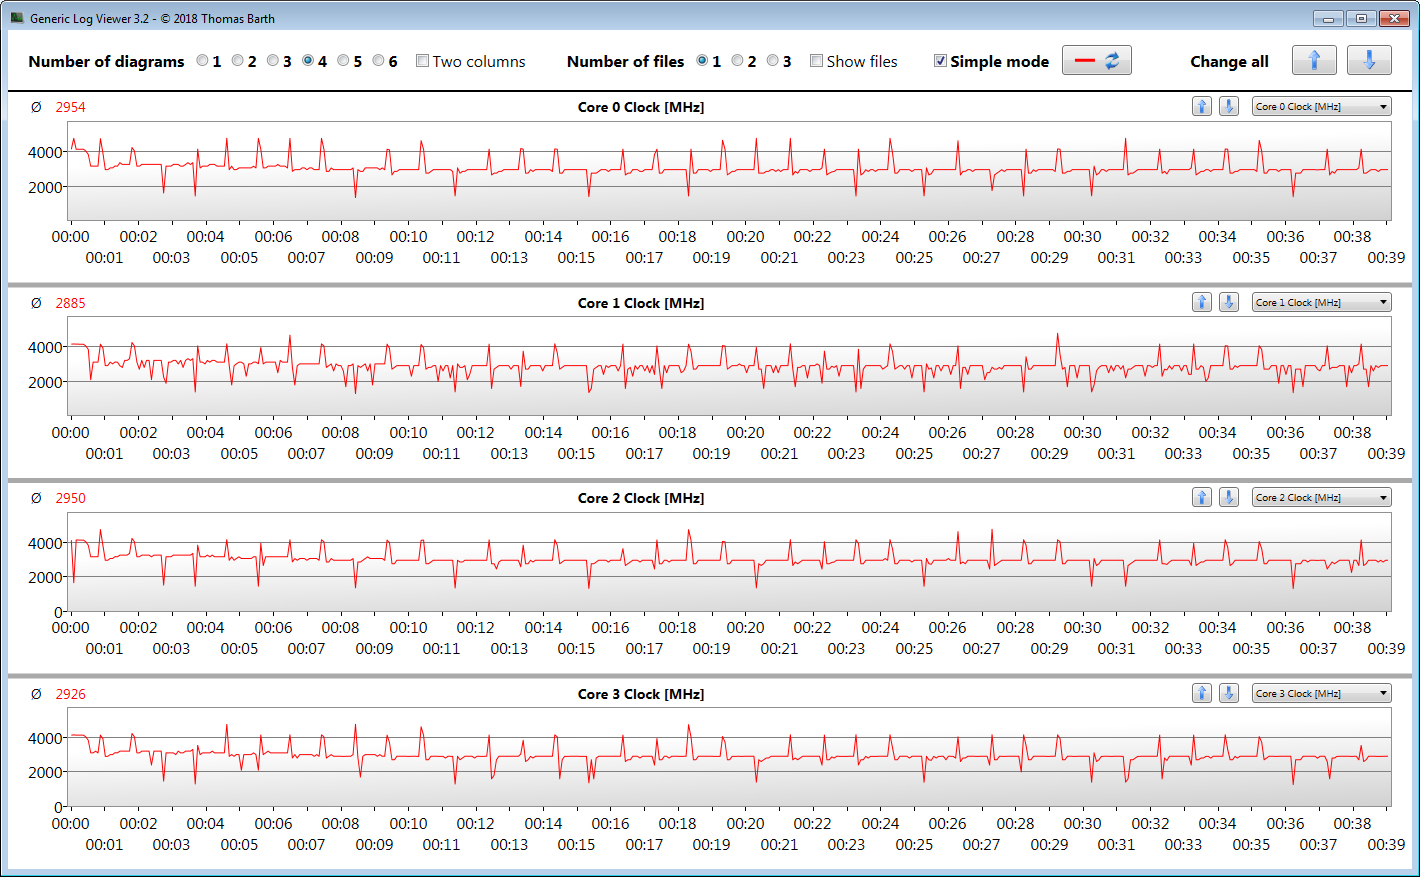
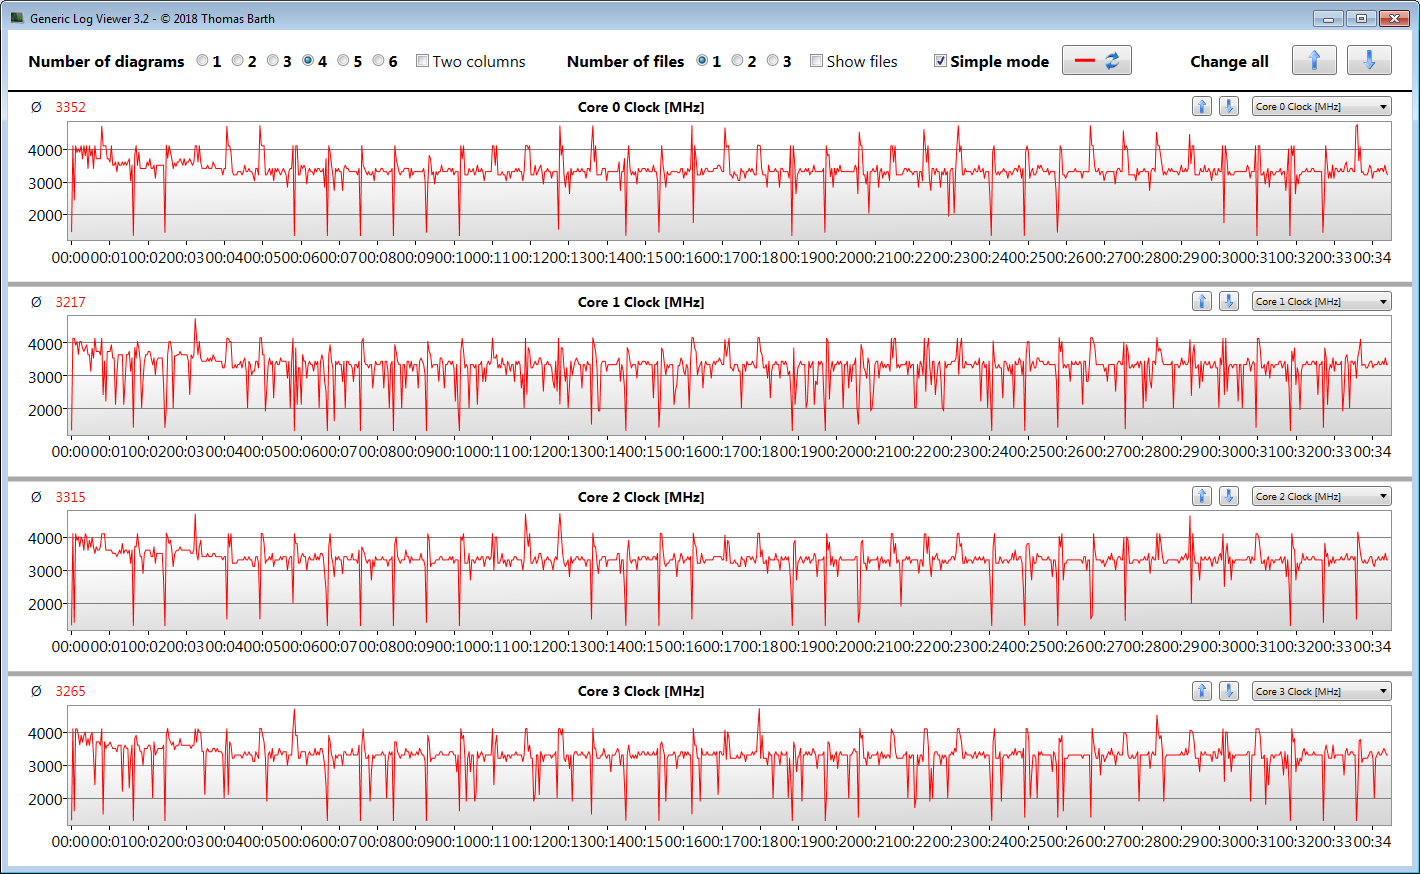
The multithread tests of the Cinebench benchmarks are briefly processed at 4.1 GHz. The clock speed then drops to 3.1 to 3.2 GHz. The single-thread tests are run at 1.8 to 4.7 GHz. On battery power, the clock rates are 2.7 to 3.4 GHz (multithread) and 1.6 to 2.8 GHz (single-thread), respectively.
We verify if the CPU Turbo is consistently used when plugged in by running the Cinebench R15 benchmark's multithread test in a continuous loop for at least 30 minutes. High Turbo clock speeds are only achieved in the first few minutes of the test. In the further course, the speed drops to values just above the base clock speed. The "Performance Mode" profile allows a steady increase of the Turbo clock rates. In any case, the VivoBook lags behind the Schenker Vision 15 that is equipped with the same CPU, since Schenker grants the CPU more generous power limits.
| Cinebench R15 | |
| CPU Single 64Bit | |
| Average of class Multimedia (184.8 - 326, n=59, last 2 years) | |
| Schenker Vision 15 | |
| Asus VivoBook S15 S533EQ-BQ002T | |
| Average Intel Core i7-1165G7 (115 - 230, n=78) | |
| Samsung Galaxy Book Ion Aura Silver | |
| Lenovo IdeaPad 5 15IIL05 | |
| CPU Multi 64Bit | |
| Average of class Multimedia (856 - 5224, n=61, last 2 years) | |
| Schenker Vision 15 | |
| Asus VivoBook S15 S533EQ-BQ002T (Leistungsmodus) | |
| Asus VivoBook S15 S533EQ-BQ002T | |
| Average Intel Core i7-1165G7 (553 - 1027, n=86) | |
| Lenovo IdeaPad 5 15IIL05 | |
| Samsung Galaxy Book Ion Aura Silver | |
| Blender - v2.79 BMW27 CPU | |
| Samsung Galaxy Book Ion Aura Silver | |
| Average Intel Core i7-1165G7 (468 - 1138, n=80) | |
| Lenovo IdeaPad 5 15IIL05 | |
| Asus VivoBook S15 S533EQ-BQ002T | |
| Schenker Vision 15 | |
| Asus VivoBook S15 S533EQ-BQ002T (Leistungsmodus) | |
| Average of class Multimedia (100 - 557, n=58, last 2 years) | |
| 7-Zip 18.03 | |
| 7z b 4 -mmt1 | |
| Average of class Multimedia (3666 - 7545, n=56, last 2 years) | |
| Asus VivoBook S15 S533EQ-BQ002T (Leistungsmodus) | |
| Asus VivoBook S15 S533EQ-BQ002T | |
| Average Intel Core i7-1165G7 (4478 - 5507, n=80) | |
| Schenker Vision 15 | |
| Samsung Galaxy Book Ion Aura Silver | |
| Lenovo IdeaPad 5 15IIL05 | |
| 7z b 4 | |
| Average of class Multimedia (26062 - 130368, n=55, last 2 years) | |
| Schenker Vision 15 | |
| Asus VivoBook S15 S533EQ-BQ002T (Leistungsmodus) | |
| Asus VivoBook S15 S533EQ-BQ002T | |
| Average Intel Core i7-1165G7 (15347 - 27405, n=80) | |
| Lenovo IdeaPad 5 15IIL05 | |
| Samsung Galaxy Book Ion Aura Silver | |
| Cinebench R20 | |
| CPU (Single Core) | |
| Average of class Multimedia (425 - 853, n=57, last 2 years) | |
| Asus VivoBook S15 S533EQ-BQ002T | |
| Asus VivoBook S15 S533EQ-BQ002T (Leistungsmodus) | |
| Average Intel Core i7-1165G7 (442 - 589, n=81) | |
| Schenker Vision 15 | |
| Samsung Galaxy Book Ion Aura Silver | |
| Lenovo IdeaPad 5 15IIL05 | |
| CPU (Multi Core) | |
| Average of class Multimedia (1887 - 12912, n=57, last 2 years) | |
| Asus VivoBook S15 S533EQ-BQ002T (Leistungsmodus) | |
| Asus VivoBook S15 S533EQ-BQ002T | |
| Schenker Vision 15 | |
| Average Intel Core i7-1165G7 (1060 - 2657, n=81) | |
| Lenovo IdeaPad 5 15IIL05 | |
| Samsung Galaxy Book Ion Aura Silver | |
| Geekbench 5.5 | |
| Single-Core | |
| Average of class Multimedia (805 - 2974, n=56, last 2 years) | |
| Schenker Vision 15 | |
| Asus VivoBook S15 S533EQ-BQ002T | |
| Asus VivoBook S15 S533EQ-BQ002T | |
| Average Intel Core i7-1165G7 (1302 - 1595, n=77) | |
| Samsung Galaxy Book Ion Aura Silver | |
| Lenovo IdeaPad 5 15IIL05 | |
| Multi-Core | |
| Average of class Multimedia (4652 - 20422, n=56, last 2 years) | |
| Schenker Vision 15 | |
| Average Intel Core i7-1165G7 (3078 - 5926, n=77) | |
| Asus VivoBook S15 S533EQ-BQ002T | |
| Asus VivoBook S15 S533EQ-BQ002T | |
| Lenovo IdeaPad 5 15IIL05 | |
| Samsung Galaxy Book Ion Aura Silver | |
| HWBOT x265 Benchmark v2.2 - 4k Preset | |
| Average of class Multimedia (5.26 - 36.1, n=56, last 2 years) | |
| Schenker Vision 15 | |
| Asus VivoBook S15 S533EQ-BQ002T (Leistungsmodus) | |
| Lenovo IdeaPad 5 15IIL05 | |
| Average Intel Core i7-1165G7 (1.39 - 8.47, n=80) | |
| Asus VivoBook S15 S533EQ-BQ002T | |
| Samsung Galaxy Book Ion Aura Silver | |
| LibreOffice - 20 Documents To PDF | |
| Samsung Galaxy Book Ion Aura Silver | |
| Lenovo IdeaPad 5 15IIL05 | |
| Average of class Multimedia (23.9 - 146.7, n=57, last 2 years) | |
| Average Intel Core i7-1165G7 (21.5 - 88.1, n=78) | |
| Schenker Vision 15 | |
| Asus VivoBook S15 S533EQ-BQ002T | |
| Asus VivoBook S15 S533EQ-BQ002T (Leistungsmodus) | |
| R Benchmark 2.5 - Overall mean | |
| Lenovo IdeaPad 5 15IIL05 | |
| Samsung Galaxy Book Ion Aura Silver | |
| Average Intel Core i7-1165G7 (0.552 - 1.002, n=80) | |
| Asus VivoBook S15 S533EQ-BQ002T (Leistungsmodus) | |
| Schenker Vision 15 | |
| Asus VivoBook S15 S533EQ-BQ002T | |
| Average of class Multimedia (0.3604 - 0.947, n=56, last 2 years) | |
* ... smaller is better
System performance
The fast and smooth S533 provides more than enough computing power for office and Internet applications. The dedicated graphics core allows playing computer games to a limited extent. This is complemented by good PCMark results.
| PCMark 8 Home Score Accelerated v2 | 4141 points | |
| PCMark 8 Creative Score Accelerated v2 | 4792 points | |
| PCMark 8 Work Score Accelerated v2 | 5681 points | |
| PCMark 10 Score | 5306 points | |
Help | ||
DPC latencies
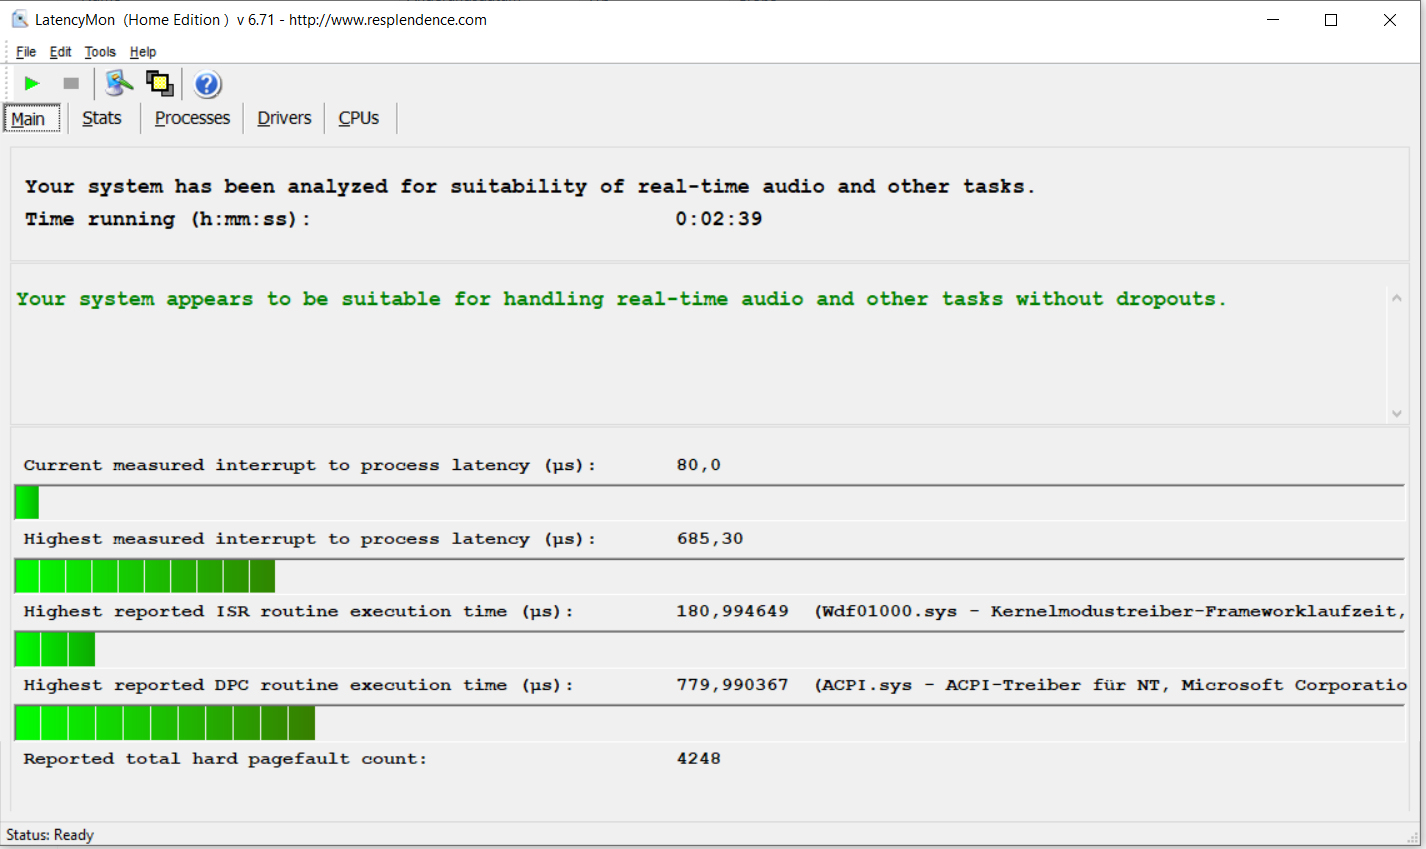
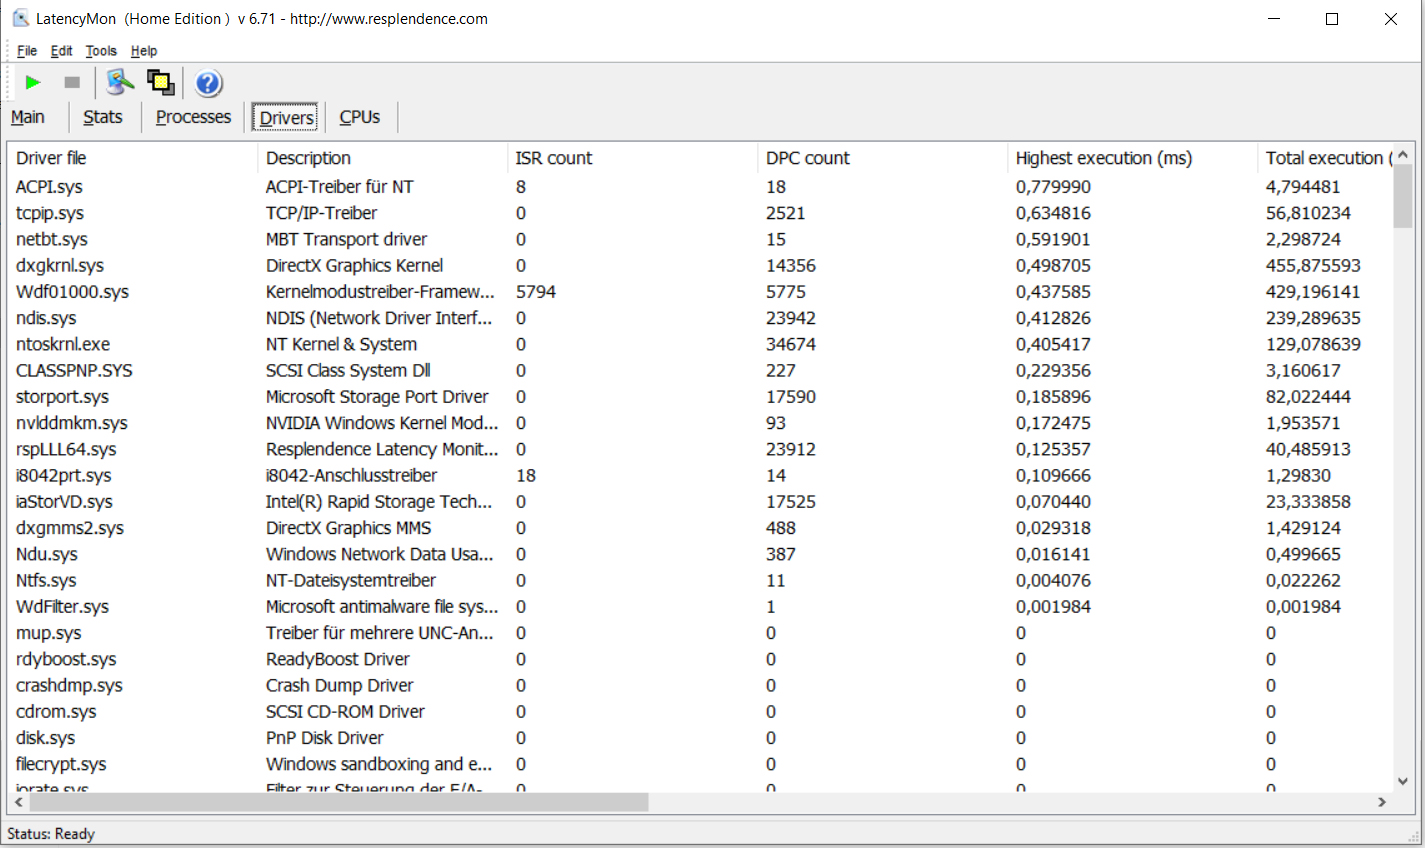
| DPC Latencies / LatencyMon - interrupt to process latency (max), Web, Youtube, Prime95 | |
| Schenker Vision 15 | |
| Samsung Galaxy Book Ion Aura Silver | |
| Lenovo IdeaPad 5 15IIL05 | |
| Asus VivoBook S15 S533EQ-BQ002T | |
* ... smaller is better
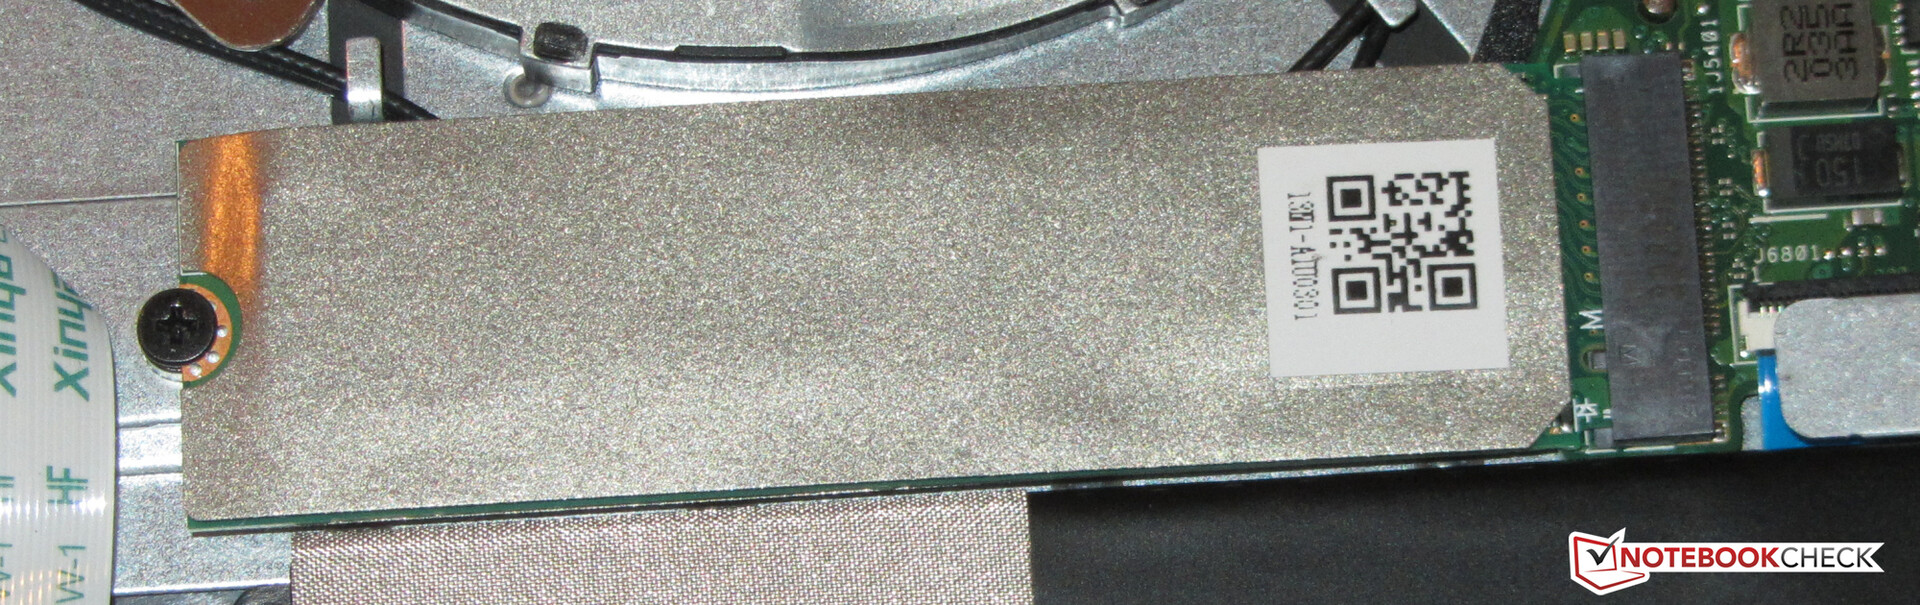
Storage
A 1 TB NVMe SSD (M.2 2280) from Intel serves as system drive and delivers good transfer rates. It's not one of the top SSD models, though.

| Asus VivoBook S15 S533EQ-BQ002T Intel SSD 660p 1TB SSDPEKNW010T8 | Lenovo IdeaPad 5 15IIL05 SK hynix BC511 HFM512GDHTNI-87A0B | Schenker Vision 15 Samsung SSD 980 Pro 1TB MZ-V8P1T0BW | Samsung Galaxy Book Ion Aura Silver WDC PC SN730 SDBQNTY-512GB | Average Intel SSD 660p 1TB SSDPEKNW010T8 | Average of class Multimedia | |
|---|---|---|---|---|---|---|
| CrystalDiskMark 5.2 / 6 | -21% | 107% | 20% | -17% | 62% | |
| Write 4K (MB/s) | 214.4 | 159.7 -26% | 238.1 11% | 196.3 -8% | 144.5 ? -33% | 164.4 ? -23% |
| Read 4K (MB/s) | 58.5 | 48.31 -17% | 79.2 35% | 54.2 -7% | 54.1 ? -8% | 68 ? 16% |
| Write Seq (MB/s) | 1678 | 1038 -38% | 4139 147% | 2194 31% | 1445 ? -14% | 2667 ? 59% |
| Read Seq (MB/s) | 1648 | 1158 -30% | 4133 151% | 2508 52% | 1446 ? -12% | 3134 ? 90% |
| Write 4K Q32T1 (MB/s) | 644 | 493.9 -23% | 697 8% | 423.8 -34% | 427 ? -34% | 463 ? -28% |
| Read 4K Q32T1 (MB/s) | 600 | 522 -13% | 758 26% | 547 -9% | 456 ? -24% | 584 ? -3% |
| Write Seq Q32T1 (MB/s) | 1760 | 1028 -42% | 5187 195% | 2705 54% | 1650 ? -6% | 4640 ? 164% |
| Read Seq Q32T1 (MB/s) | 1853 | 2280 23% | 7117 284% | 3405 84% | 1728 ? -7% | 5867 ? 217% |
| AS SSD | -8% | 130% | 20% | -9% | 78% | |
| Seq Read (MB/s) | 1754 | 1625 -7% | 5427 209% | 2901 65% | 1456 ? -17% | 4493 ? 156% |
| Seq Write (MB/s) | 1567 | 860 -45% | 3886 148% | 2289 46% | 1404 ? -10% | 3037 ? 94% |
| 4K Read (MB/s) | 53 | 52.1 -2% | 72.9 38% | 46.57 -12% | 48.7 ? -8% | 61.5 ? 16% |
| 4K Write (MB/s) | 167.9 | 131.3 -22% | 219.3 31% | 137.1 -18% | 131.6 ? -22% | 184.5 ? 10% |
| 4K-64 Read (MB/s) | 586 | 797 36% | 2209 277% | 772 32% | 586 ? 0% | 1084 ? 85% |
| 4K-64 Write (MB/s) | 858 | 769 -10% | 2265 164% | 1245 45% | 788 ? -8% | 2215 ? 158% |
| Access Time Read * (ms) | 0.097 | 0.063 35% | 0.033 66% | 0.142 -46% | 0.07236 ? 25% | 0.06171 ? 36% |
| Access Time Write * (ms) | 0.038 | 0.032 16% | 0.02 47% | 0.028 26% | 0.07731 ? -103% | 0.07475 ? -97% |
| Score Read (Points) | 815 | 1012 24% | 2825 247% | 1108 36% | 780 ? -4% | 1595 ? 96% |
| Score Write (Points) | 1182 | 986 -17% | 2873 143% | 1611 36% | 1060 ? -10% | 2703 ? 129% |
| Score Total (Points) | 2421 | 2492 3% | 7069 192% | 3266 35% | 2252 ? -7% | 5053 ? 109% |
| Copy ISO MB/s (MB/s) | 1477 | 638 -57% | 2775 88% | 1597 8% | 1469 ? -1% | 2844 ? 93% |
| Copy Program MB/s (MB/s) | 495.3 | 290.2 -41% | 662 34% | 494.8 0% | 484 ? -2% | 842 ? 70% |
| Copy Game MB/s (MB/s) | 719 | 525 -27% | 1655 130% | 879 22% | 997 ? 39% | 1678 ? 133% |
| Total Average (Program / Settings) | -15% /
-13% | 119% /
121% | 20% /
20% | -13% /
-12% | 70% /
72% |
* ... smaller is better
Continuous load read: DiskSpd Read Loop, Queue Depth 8
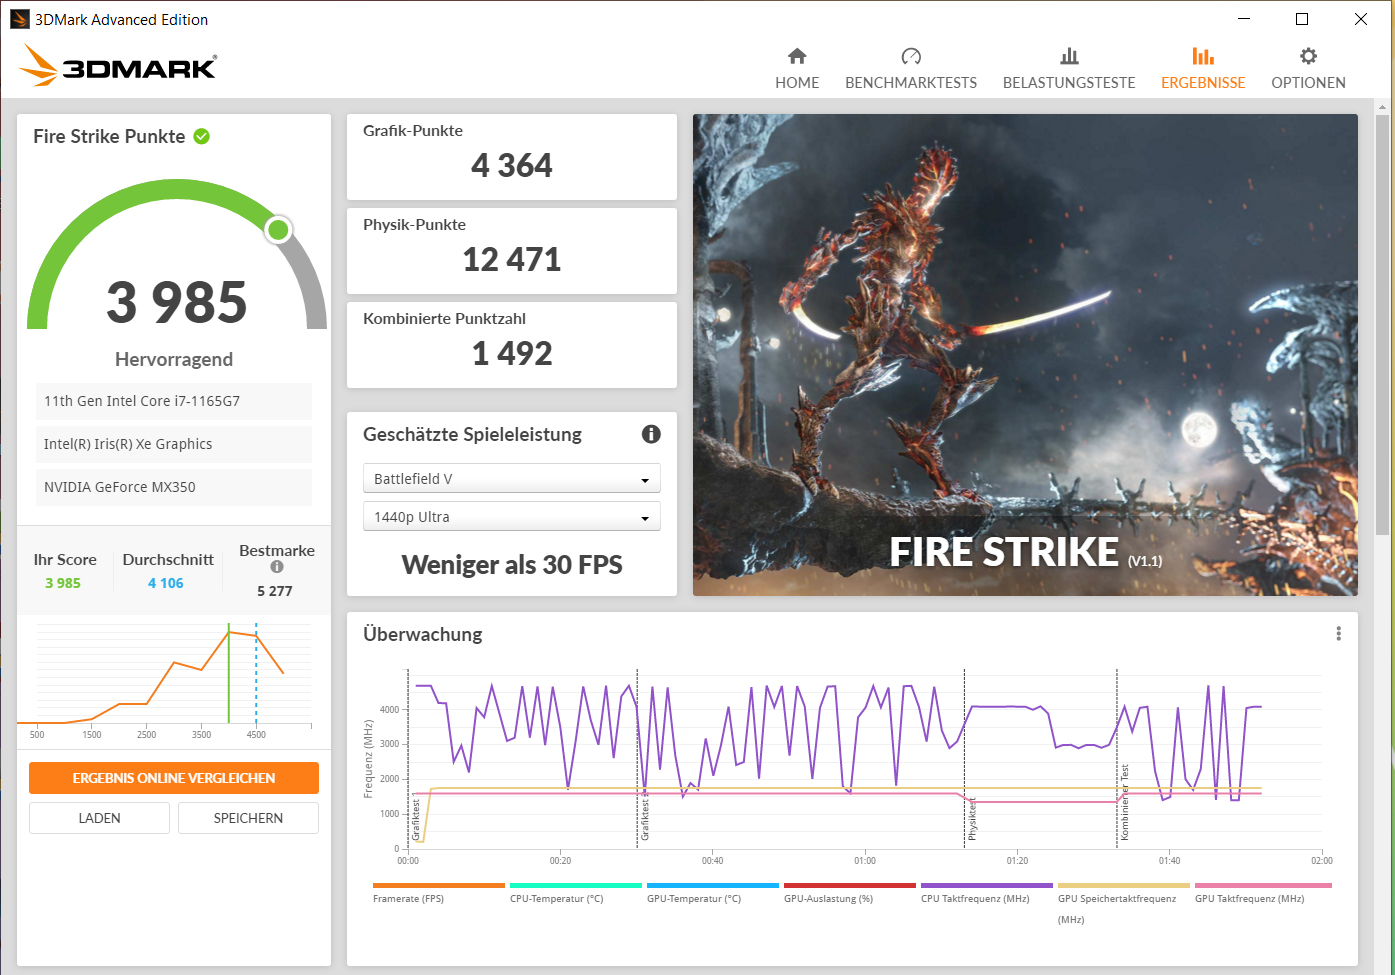
Graphics card
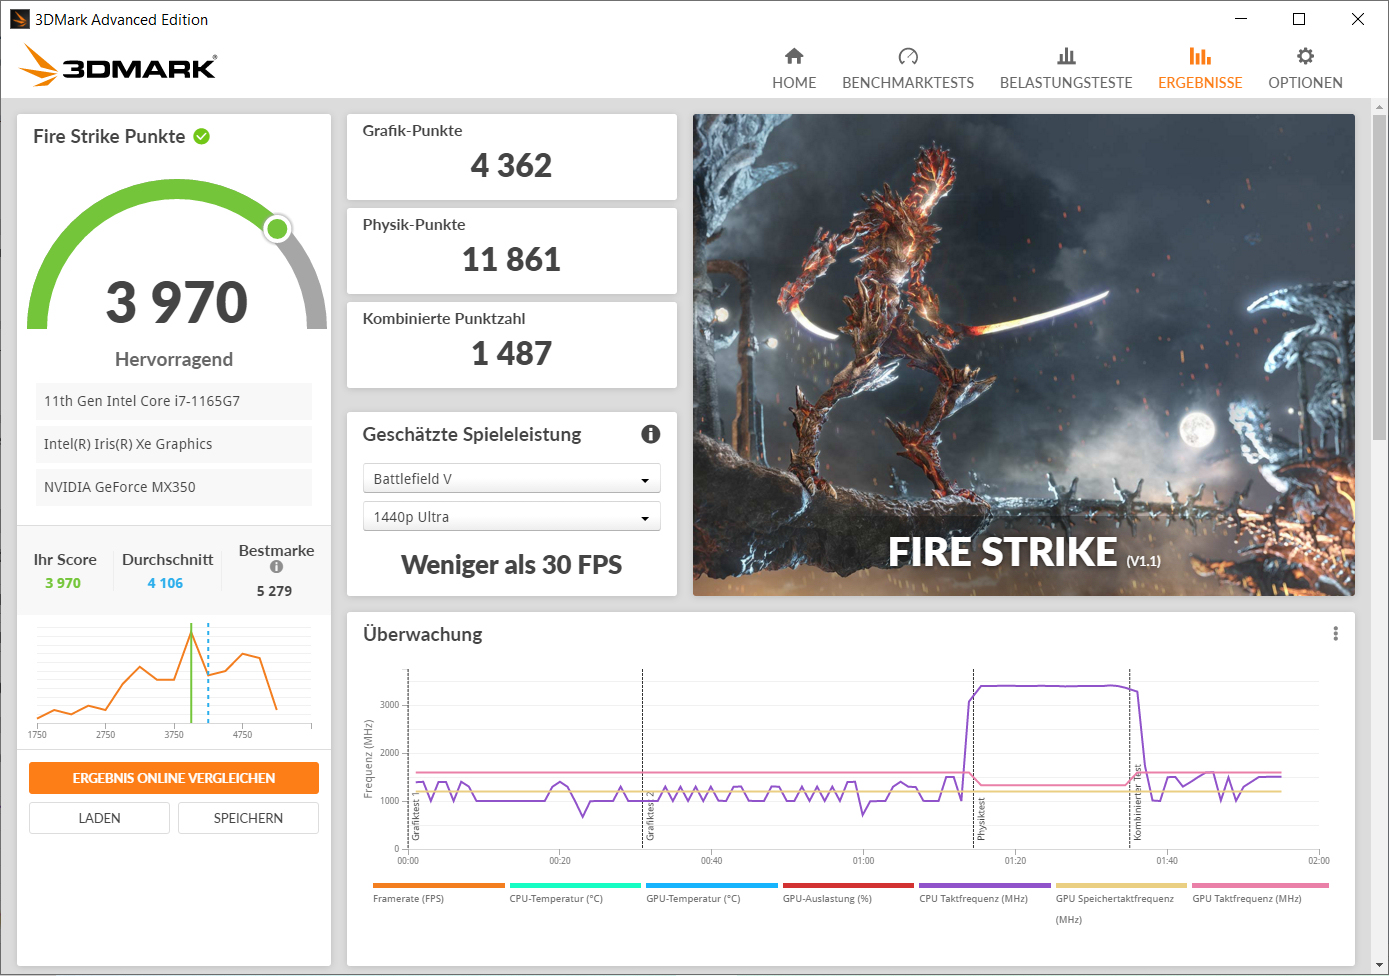
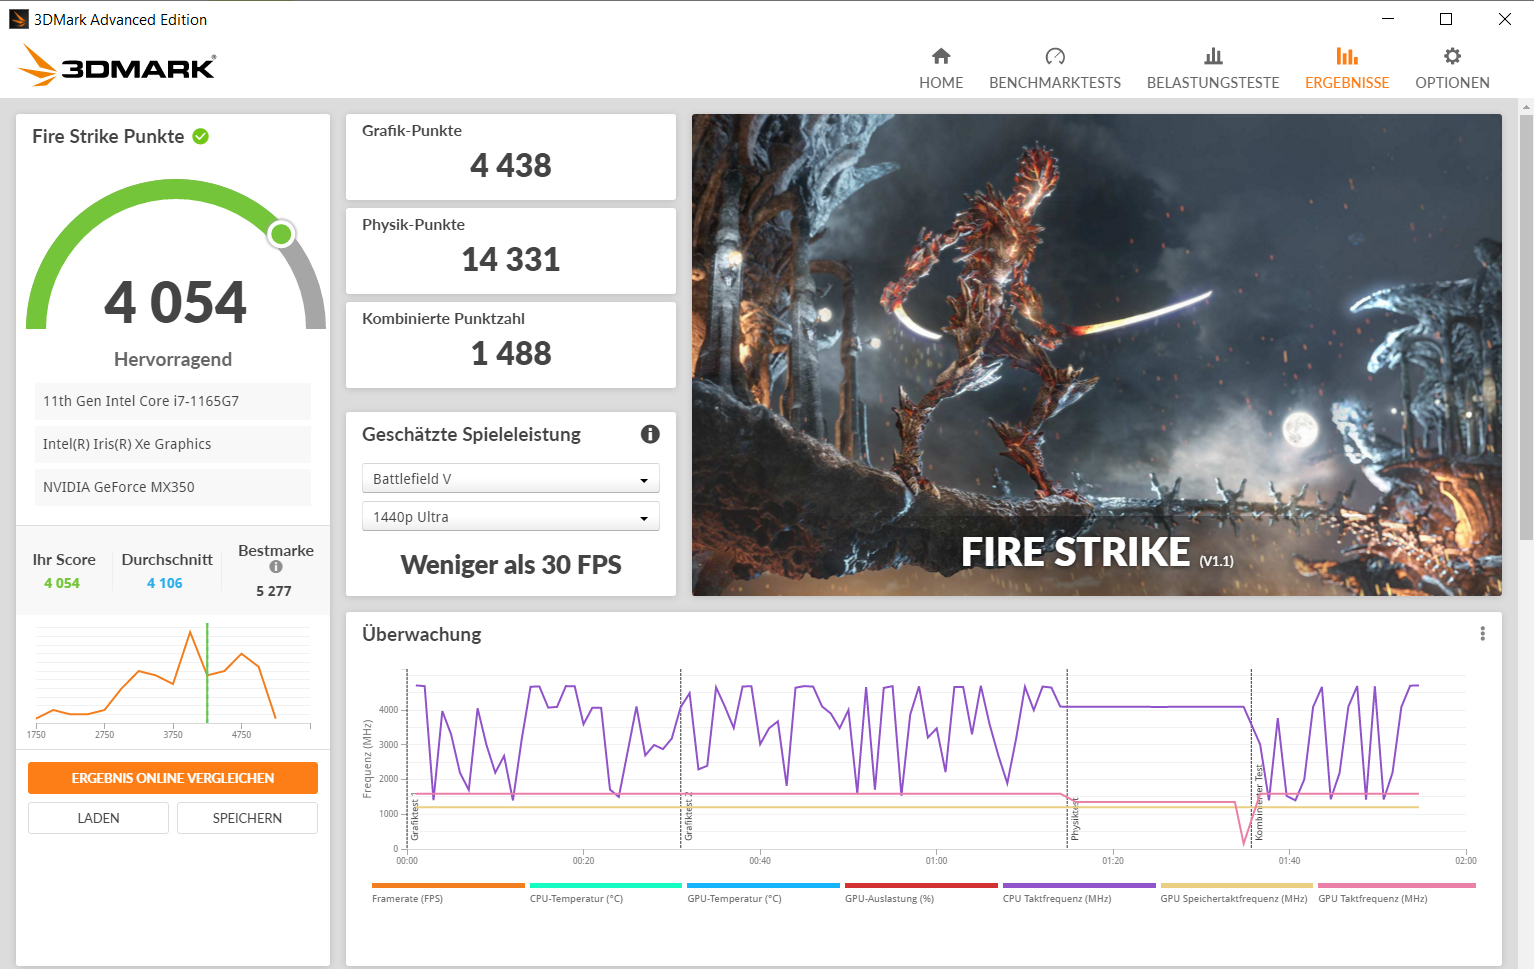
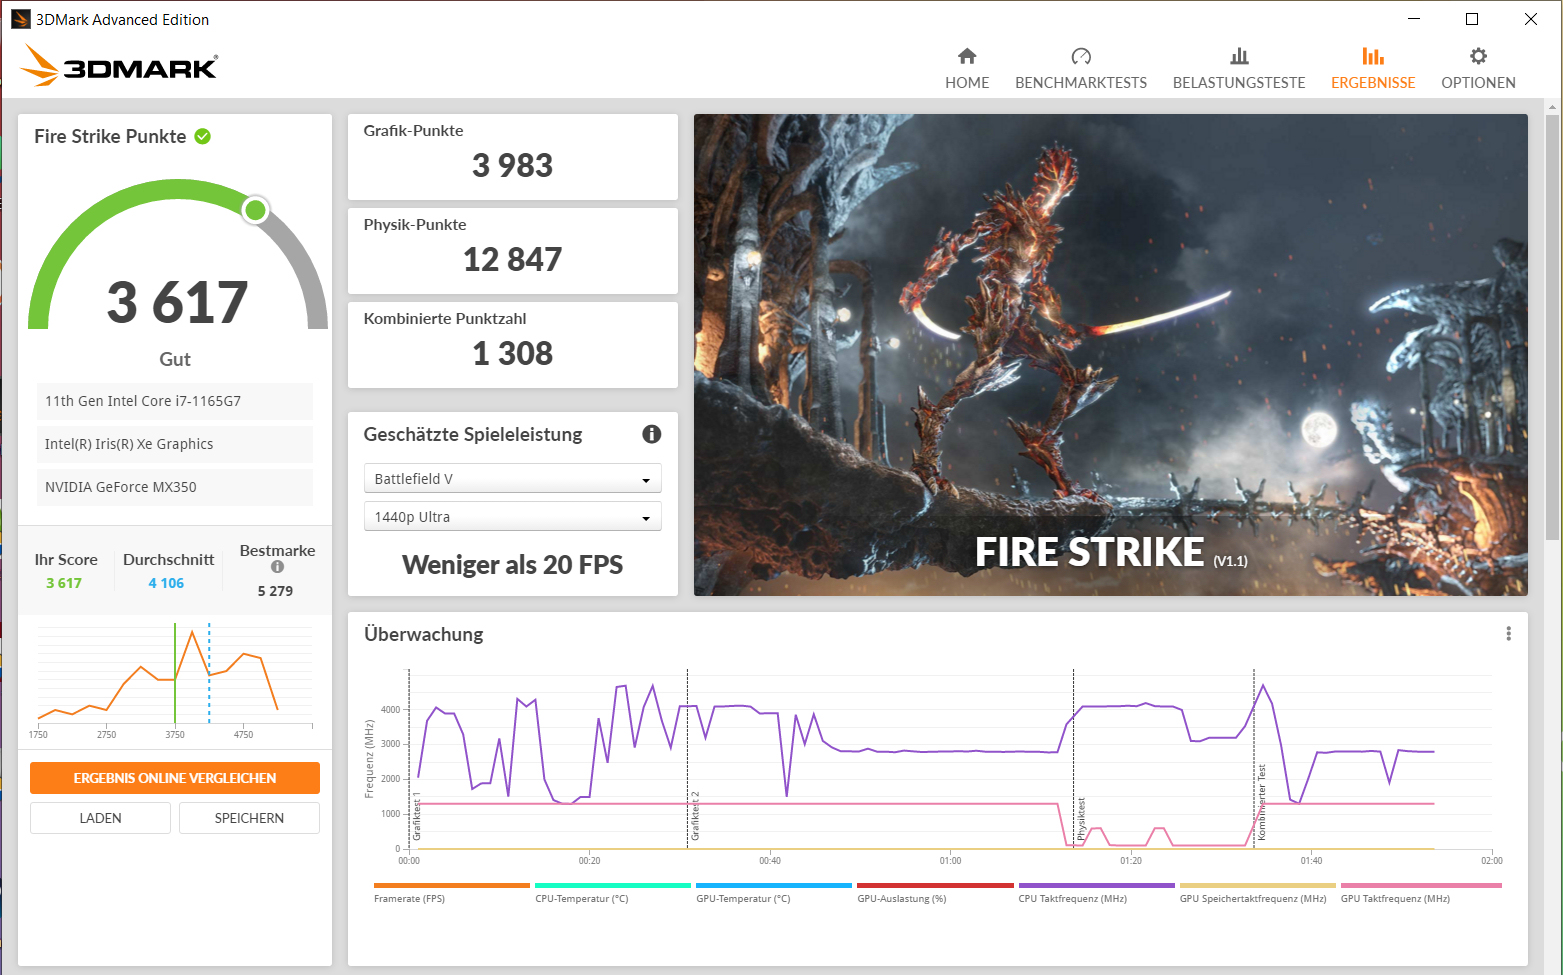
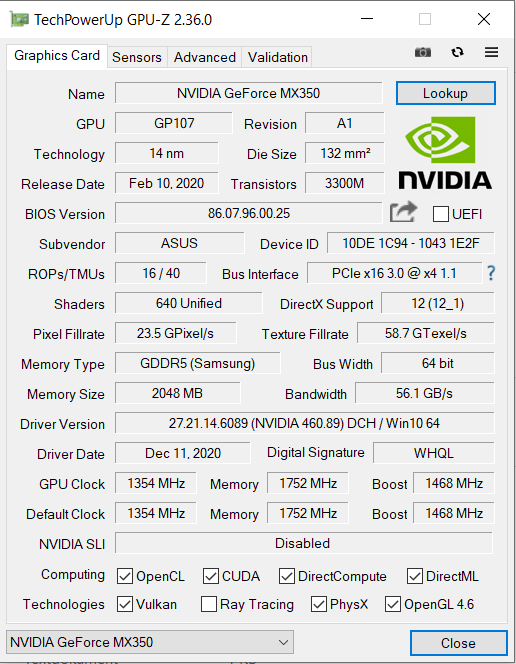
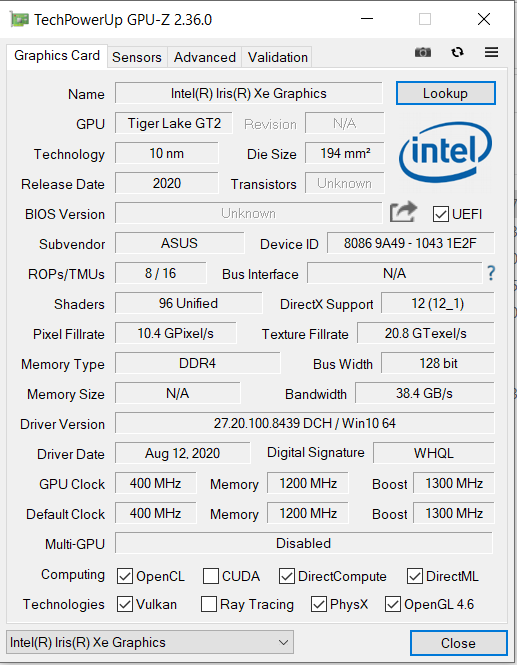
The GeForce MX350 mid-range graphics core is a slimmed-down version of the GeForce GTX 1050 GPU. The memory interface width (GDDR5, 2,048 MB) has been halved from 128 bits to 64 bits. The results in the 3DMark benchmarks are at a normal level for the GPU installed here. Moreover, the "Performance Mode" profile causes a minimal increase in graphics performance. The integrated Intel Iris Xe Graphics G7 96EU GPU is active, and the laptop works with Nvidia's Optimus graphics-switching solution.
| 3DMark 11 Performance | 6645 points | |
| 3DMark Ice Storm Standard Score | 74675 points | |
| 3DMark Cloud Gate Standard Score | 17289 points | |
| 3DMark Fire Strike Score | 3985 points | |
| 3DMark Time Spy Score | 1485 points | |
Help | ||
| 3DMark | |
| 1920x1080 Fire Strike Graphics | |
| Average of class Multimedia (2328 - 48907, n=58, last 2 years) | |
| Schenker Vision 15 | |
| Lenovo IdeaPad 5 15IIL05 | |
| Asus VivoBook S15 S533EQ-BQ002T (Leistungsmodus) | |
| Average NVIDIA GeForce MX350 (3999 - 4656, n=14) | |
| Asus VivoBook S15 S533EQ-BQ002T | |
| Samsung Galaxy Book Ion Aura Silver | |
| 1280x720 Cloud Gate Standard Graphics | |
| Average of class Multimedia (16765 - 143501, n=32, last 2 years) | |
| Asus VivoBook S15 S533EQ-BQ002T | |
| Average NVIDIA GeForce MX350 (23194 - 26239, n=9) | |
| Lenovo IdeaPad 5 15IIL05 | |
| Samsung Galaxy Book Ion Aura Silver | |
| 2560x1440 Time Spy Graphics | |
| Average of class Multimedia (696 - 19403, n=59, last 2 years) | |
| Schenker Vision 15 | |
| Lenovo IdeaPad 5 15IIL05 | |
| Asus VivoBook S15 S533EQ-BQ002T (Leistungsmodus) | |
| Asus VivoBook S15 S533EQ-BQ002T | |
| Average NVIDIA GeForce MX350 (1123 - 1595, n=12) | |
| Samsung Galaxy Book Ion Aura Silver | |
Gaming performance
The S533 brings most games in our database smoothly onto the screen - at low resolutions and low to medium quality levels. Titles with moderate hardware requirements allow more. A performance-hungry hit like Cyberpunk 2077 is not playable, though. Some games achieve slightly higher frame rates when the "Performance Mode" profile is active.
| The Witcher 3 - 1366x768 Medium Graphics & Postprocessing | |
| Schenker Vision 15 | |
| Average of class Multimedia (41 - 73, n=2, last 2 years) | |
| Asus VivoBook S15 S533EQ-BQ002T | |
| Asus VivoBook S15 S533EQ-BQ002T (Leistungsmodus) | |
| Lenovo IdeaPad 5 15IIL05 | |
| Average NVIDIA GeForce MX350 (35.2 - 51.9, n=13) | |
| Samsung Galaxy Book Ion Aura Silver | |
| Dota 2 Reborn - 1920x1080 ultra (3/3) best looking | |
| Average of class Multimedia (29 - 179.9, n=59, last 2 years) | |
| Lenovo IdeaPad 5 15IIL05 | |
| Asus VivoBook S15 S533EQ-BQ002T | |
| Asus VivoBook S15 S533EQ-BQ002T (Leistungsmodus) | |
| Average NVIDIA GeForce MX350 (52.3 - 80.6, n=14) | |
| Samsung Galaxy Book Ion Aura Silver | |
| Schenker Vision 15 | |
| X-Plane 11.11 - 1920x1080 med (fps_test=2) | |
| Average of class Multimedia (18.7 - 177.4, n=55, last 2 years) | |
| Asus VivoBook S15 S533EQ-BQ002T (Leistungsmodus) | |
| Average NVIDIA GeForce MX350 (35.5 - 72.3, n=14) | |
| Asus VivoBook S15 S533EQ-BQ002T | |
| Lenovo IdeaPad 5 15IIL05 | |
| Samsung Galaxy Book Ion Aura Silver | |
| Schenker Vision 15 | |
| F1 2020 - 1920x1080 Medium Preset AF:16x | |
| Schenker Vision 15 | |
| Average NVIDIA GeForce MX350 (48.3 - 49, n=2) | |
| Asus VivoBook S15 S533EQ-BQ002T (712959) | |
| Serious Sam 4 - 1280x720 Lowest (DX12) | |
| Average NVIDIA GeForce MX350 (67.4 - 107, n=4) | |
| Asus VivoBook S15 S533EQ-BQ002T (Leistungsmodus) | |
| Asus VivoBook S15 S533EQ-BQ002T | |
| Immortals Fenyx Rising - 1280x720 Very Low Preset | |
| Average NVIDIA GeForce MX350 (38 - 47, n=4) | |
| Asus VivoBook S15 S533EQ-BQ002T | |
| Asus VivoBook S15 S533EQ-BQ002T (Leistungsmodus) | |
| Crysis Remastered - 1280x720 Low Preset | |
| Asus VivoBook S15 S533EQ-BQ002T | |
| Average NVIDIA GeForce MX350 (76.2 - 81.5, n=2) | |
| Star Wars Squadrons - 1920x1080 High Preset | |
| Asus VivoBook S15 S533EQ-BQ002T | |
| Average NVIDIA GeForce MX350 (49.5 - 52.9, n=2) | |
| Mafia Definitive Edition - 1280x720 Low Preset | |
| Average NVIDIA GeForce MX350 (45.3 - 49.6, n=2) | |
| Asus VivoBook S15 S533EQ-BQ002T | |
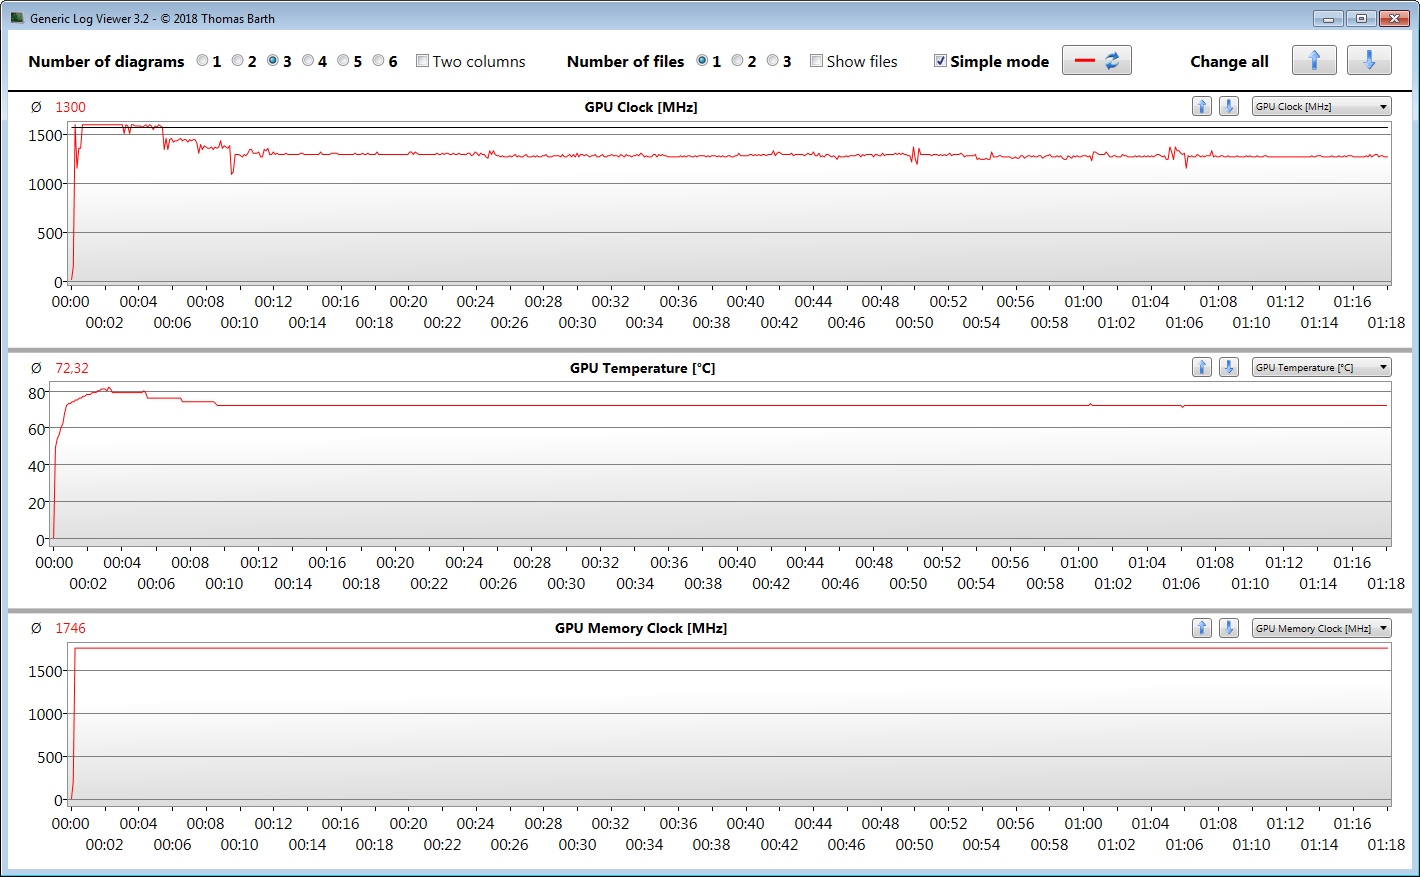
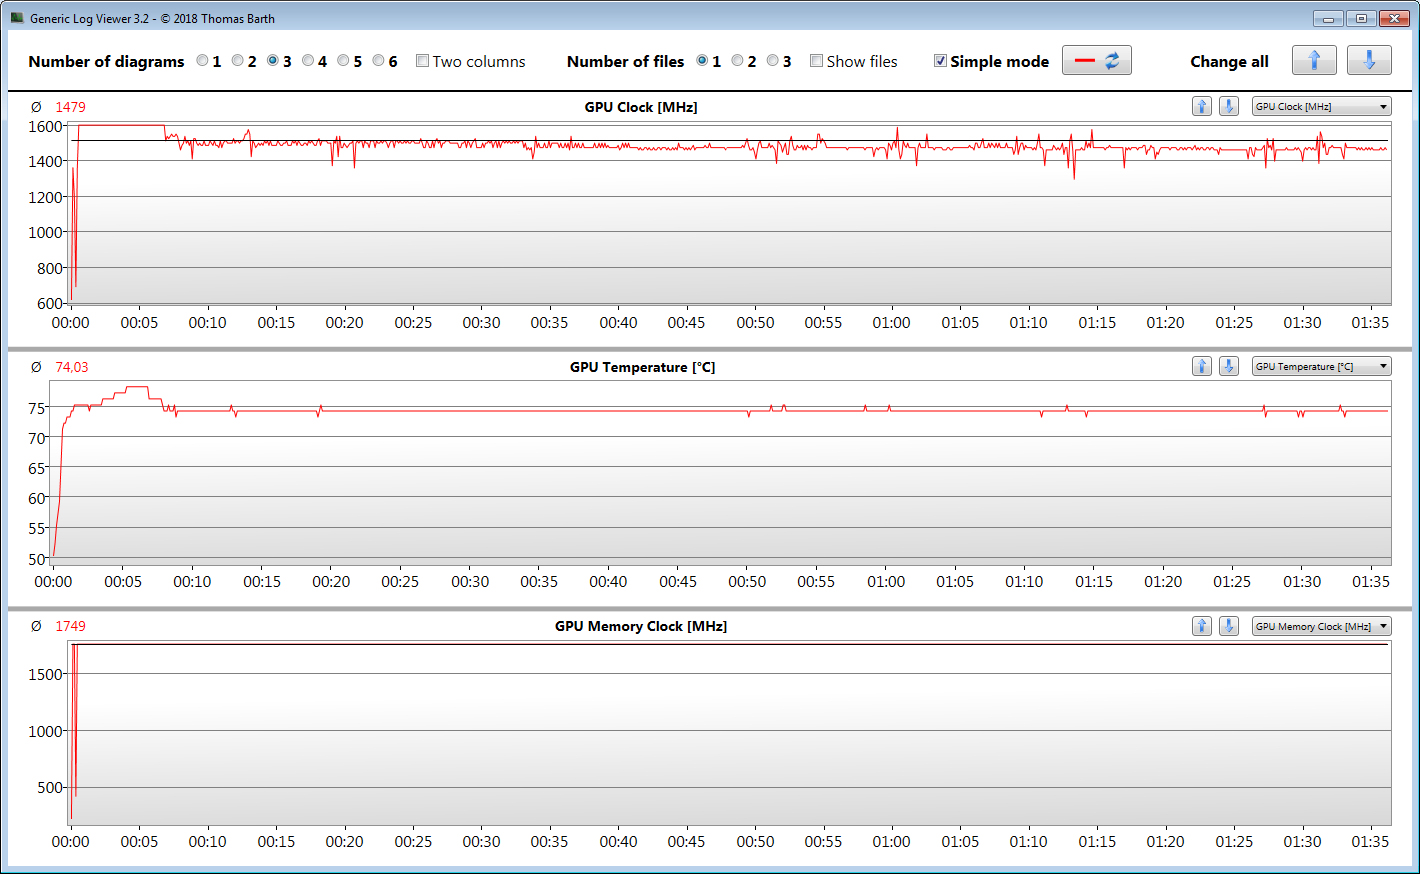
In order to verify whether the frame rates remain largely constant over a prolonged period of time, we let the game The Witcher 3 run for about 60 minutes at Full HD resolution and maximum quality settings. The character is not moved.
After about six minutes, the GPU clock rate is slightly throttled - less under the "Performance Mode" profile than under the "Balanced Mode" profile. As a result, the frame rates drop a bit.
| low | med. | high | ultra | |
|---|---|---|---|---|
| The Witcher 3 (2015) | 79.6 | 46.9 | 27 | 15.6 |
| Dota 2 Reborn (2015) | 138 | 120 | 84.1 | 76.3 |
| X-Plane 11.11 (2018) | 74.5 | 52 | 36.5 | |
| F1 2020 (2020) | 98.7 | 48.3 | 33 | 20.3 |
| Death Stranding (2020) | 40.3 | 20.5 | 18.7 | 18.1 |
| Horizon Zero Dawn (2020) | 33 | 18 | 14 | 11 |
| Flight Simulator 2020 (2020) | 36.3 | 14.6 | 8.89 | |
| Crysis Remastered (2020) | 81.5 | 30.4 | 9.22 | |
| Serious Sam 4 (2020) | 67.4 | 12.8 | 8.05 | |
| Mafia Definitive Edition (2020) | 45.3 | 21.1 | 18.9 | |
| Star Wars Squadrons (2020) | 103 | 60 | 52.9 | 25.2 |
| Watch Dogs Legion (2020) | 36 | 20 | 15 | |
| Assassin´s Creed Valhalla (2020) | 17 | 13 | 6 | |
| Call of Duty Black Ops Cold War (2020) | 43 | 14.4 | 13.4 | |
| Yakuza Like a Dragon (2020) | 62.7 | 20.7 | 20.5 | 18 |
| Immortals Fenyx Rising (2020) | 38 | 14 | 10 | |
| Cyberpunk 2077 1.0 (2020) | 19 | 10.5 | 6.93 |
Emissions and energy - In the green area
Noise emissions
The fan often stands still in idle usage and there is silence. Under load, it turns up. As a result, we register maximum sound pressure levels of 41.6 dB(A) (stress test) and 39.3 dB(A) (The Witcher 3 test). The "Whisper Mode" profile needs to be used for a lower noise level - at the expense of performance.
Noise level
| Idle |
| 25 / 25 / 25 dB(A) |
| Load |
| 39.5 / 41.6 dB(A) |
 | ||
30 dB silent 40 dB(A) audible 50 dB(A) loud |
||
min: | ||
Temperature
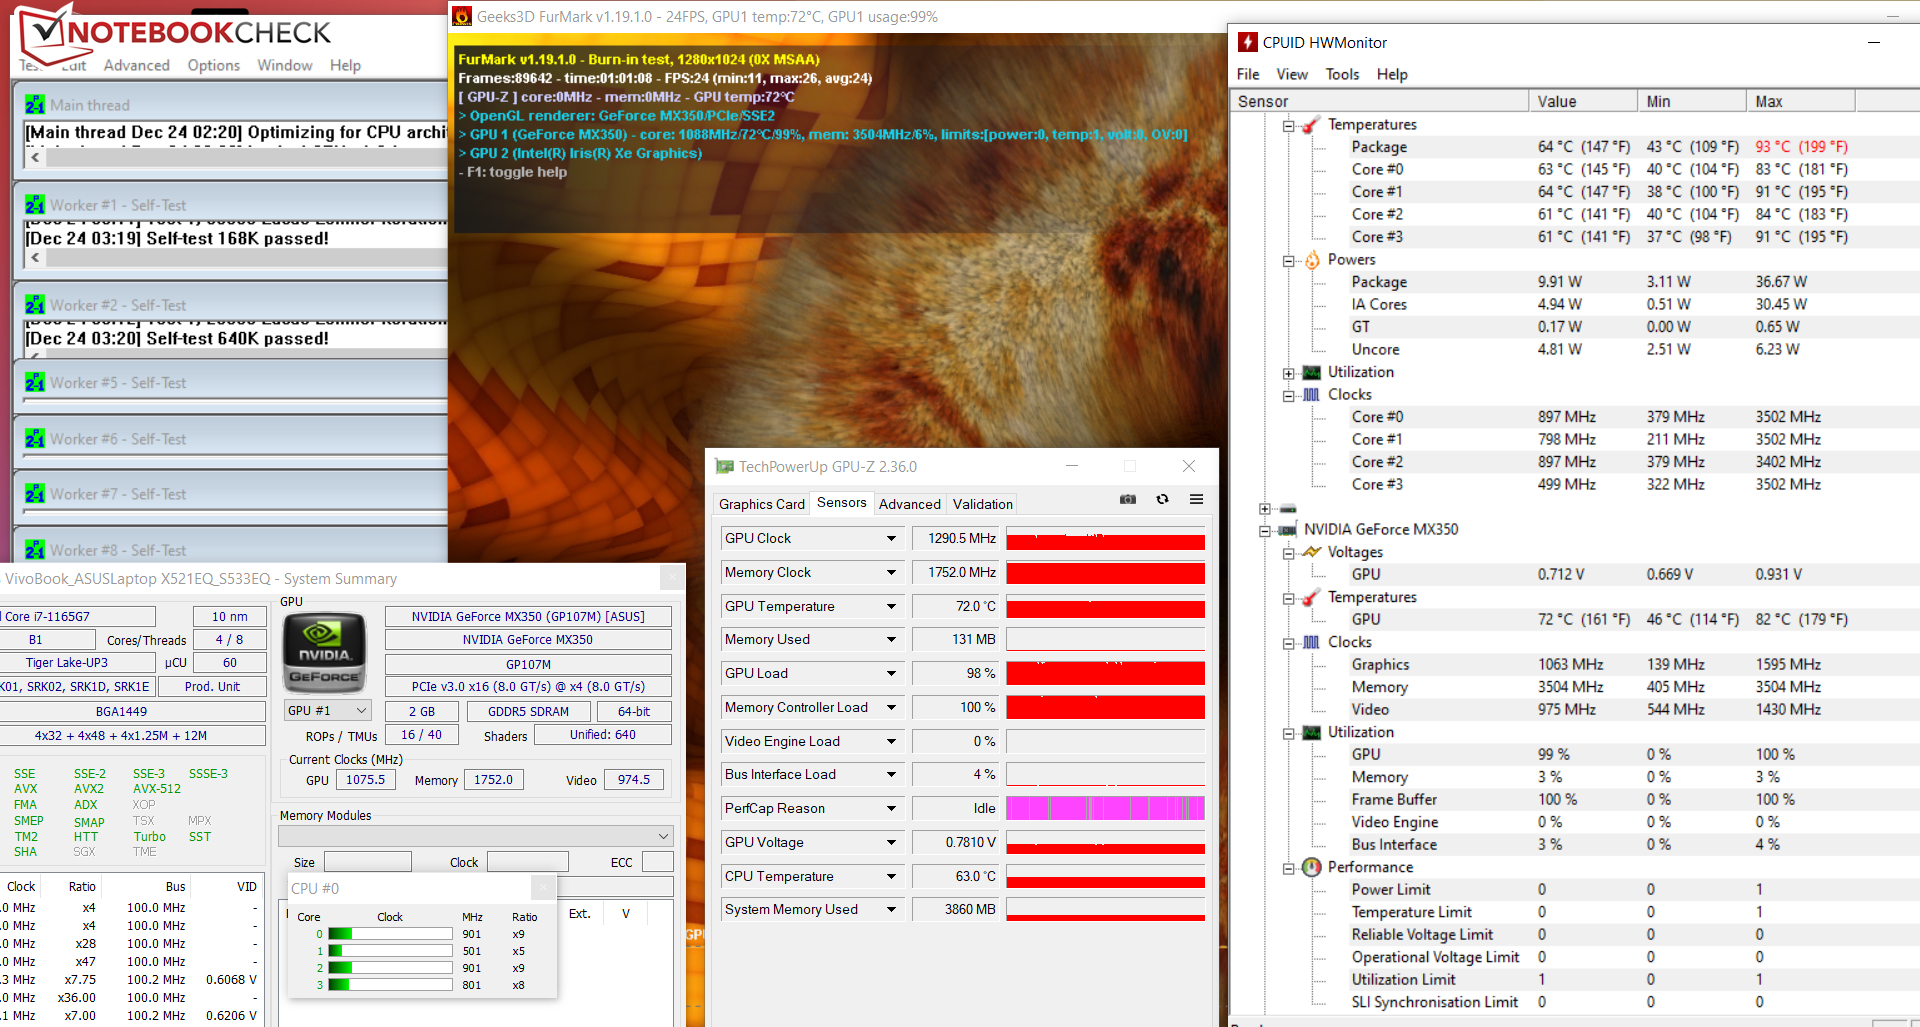
Our stress test (Prime95 and FurMark run for at least an hour) is processed by the CPU and GPU at 500 to 1,000 MHz and at about 1,300 MHz, respectively. The stress test represents an extreme scenario, though. We use this test to check whether the system remains stable even under full load.
The Asus laptop doesn't heat up excessively. During the stress test and our The Witcher 3 test, respectively, we register temperatures just above 40 °C (~104 °F) at two and three measuring points, accordingly. The values are within the green area in everyday use.
(+) The maximum temperature on the upper side is 38.1 °C / 101 F, compared to the average of 36.8 °C / 98 F, ranging from 21 to 71 °C for the class Multimedia.
(±) The bottom heats up to a maximum of 41.3 °C / 106 F, compared to the average of 39.1 °C / 102 F
(+) In idle usage, the average temperature for the upper side is 23.9 °C / 75 F, compared to the device average of 31.3 °C / 88 F.
(±) Playing The Witcher 3, the average temperature for the upper side is 34.6 °C / 94 F, compared to the device average of 31.3 °C / 88 F.
(+) The palmrests and touchpad are reaching skin temperature as a maximum (32 °C / 89.6 F) and are therefore not hot.
(-) The average temperature of the palmrest area of similar devices was 28.7 °C / 83.7 F (-3.3 °C / -5.9 F).


Speakers
The stereo speakers produce a very decent sound that lacks bass, though.
Asus VivoBook S15 S533EQ-BQ002T audio analysis
(±) | speaker loudness is average but good (79.8 dB)
Bass 100 - 315 Hz
(-) | nearly no bass - on average 21.6% lower than median
(±) | linearity of bass is average (11.9% delta to prev. frequency)
Mids 400 - 2000 Hz
(±) | higher mids - on average 8.3% higher than median
(±) | linearity of mids is average (7.5% delta to prev. frequency)
Highs 2 - 16 kHz
(+) | balanced highs - only 3.5% away from median
(±) | linearity of highs is average (7.4% delta to prev. frequency)
Overall 100 - 16.000 Hz
(±) | linearity of overall sound is average (20% difference to median)
Compared to same class
» 66% of all tested devices in this class were better, 8% similar, 26% worse
» The best had a delta of 5%, average was 17%, worst was 45%
Compared to all devices tested
» 51% of all tested devices were better, 8% similar, 41% worse
» The best had a delta of 4%, average was 23%, worst was 134%
Energy consumption
The laptop doesn't show any problems in terms of energy consumption. We measure a maximum power consumption of 7.9 watts in idle usage. Under load, the demand increases to up to 68 watts (stress test) and to an average of 48 watts (42 to 53 watts; The Witcher 3 test), respectively. The power adapter's output is 65 watts.
| Off / Standby | |
| Idle | |
| Load |
|
Key:
min: | |
Battery life
Our WLAN test uses a script to simulate the load caused by accessing websites. The laptop's power-saving features are disabled, and the display brightness is set to about 150 cd/m². The S15 achieves a runtime of 8:24 hours - a very good rate. The Lenovo IdeaPad 5 15IIL05 (70 Wh) and the Schenker Vision 15 (73 Wh) score better because they have a higher battery capacity than the S533 (50 Wh).
Pros
Cons
Verdict
Thanks to the Core i7-1165G7 CPU and the GeForce MX350 GPU, the VivoBook offers enough performance for all common usage scenarios. Graphics-intensive applications benefit from the MX350. If maximum graphics performance is not a requirement, it can be resorted to a cheaper VivoBook model without a dGPU. The performance difference between the MX350 and the Intel iGPU is not too big.
With the VivoBook S15 S533EQ, Asus has a stylish, elegant 15.6-inch all-rounder in its lineup that has been equipped with an unsatisfactory display.
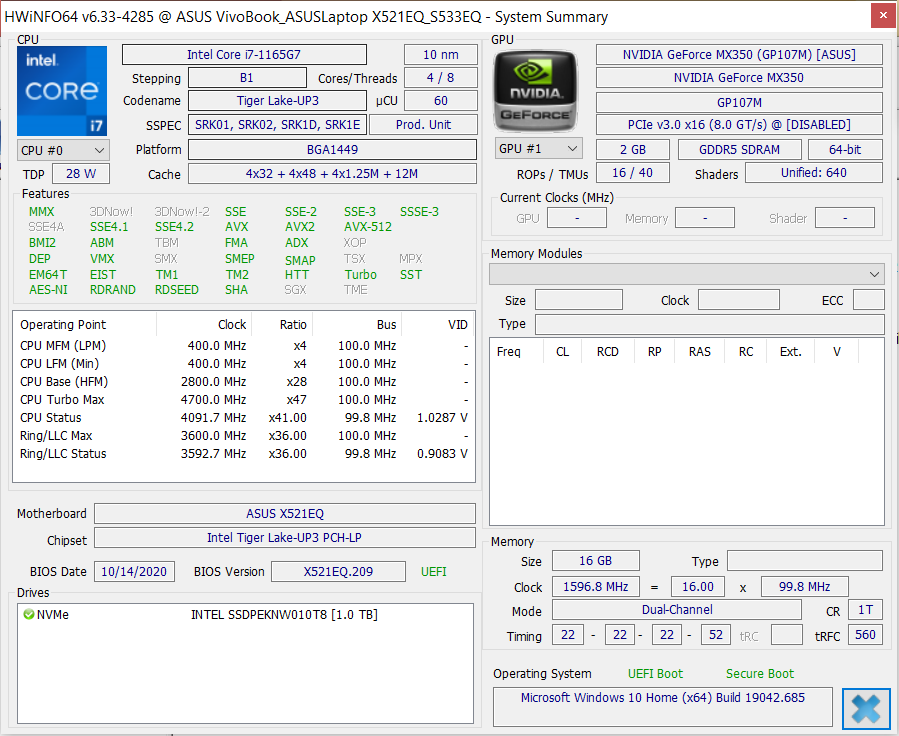
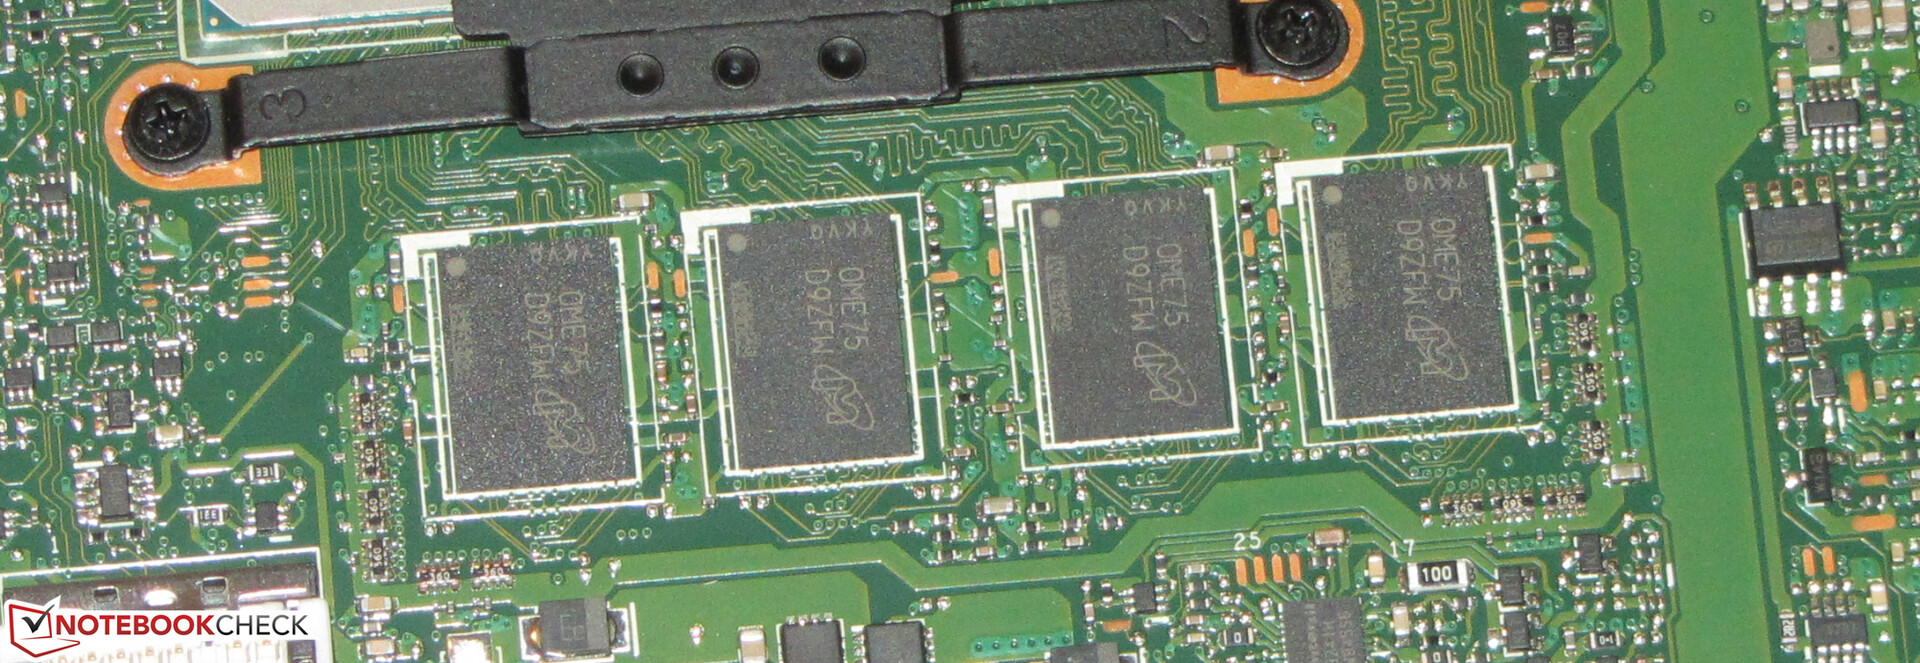
The hardware is supported by 16 GB of memory (dual-channel mode) and a 1 TB NVMe SSD. An expansion of the soldered RAM wouldn't be possible, but the SSD could be replaced with a larger-capacity/faster model if necessary. The latter could be of interest since Asus has installed a relatively slow model.
The display (Full HD, IPS) scores points with stable viewing angles, a matte surface, and decent color reproduction. Brightness, contrast, and color-space coverage are disappointing, though. A 1,300-Euro laptop (~$1,587) needs to offer much more here. The backlit keyboard proved to be suitable for everyday use. The battery life is very good.
The laptop can be powered via the included proprietary power adapter as well as via a USB charger. The USB Type-C port (Thunderbolt 4; DisplayPort via USB-C, Power Delivery) makes this possible. The latter also allows the connection of an extensive docking solution or an external GPU.
Price and availability
The Asus VivoBook S15 S533 is currently available in the S533EQ-BQ002T configuration (Core i7-1165G7, GeForce MX350, 8 GB of RAM, 1 TB SSD) for a price of 1,266 Euros (~$1,545) at Notebooksbilliger.de and Cyberport.de.
Asus VivoBook S15 S533EQ-BQ002T
- 12/26/2020 v7 (old)
Sascha Mölck
Price comparison

