Asus VivoBook 15 Pro OLED review: Affordable multimedia laptop with a high performance

With the new VivoBook Pro models, Asus offers multimedia laptops with a good price-performance ratio and now optionally also with a 1080p OLED display. The user has the choice between AMD and Intel CPUs, as well as between integrated GPUs or dedicated graphics cards from Nvidia. Our test unit combines a current Ryzen 5 5600H processor from AMD with the dedicated Nvidia GeForce RTX 3050 GPU and 16 GB of RAM. In addition, there is also a 512 GB PCIe SSD and the optional 1080p OLED display. Our specific configuration is a Campus model without Windows for 999 Euros (~$1155), but regular customers will pay 1199 Euros (~$1387) for this model (incl. Windows).
Possible Competitors in Comparison
Rating | Date | Model | Weight | Height | Size | Resolution | Price |
|---|---|---|---|---|---|---|---|
| 85.9 % v7 (old) | 11 / 2021 | Asus VivoBook 15 Pro M3500QC-L1062 R5 5600H, GeForce RTX 3050 4GB Laptop GPU | 1.7 kg | 19.9 mm | 15.60" | 1920x1080 | |
| 82.7 % v7 (old) | 10 / 2021 | Dell G15 5515 R7 5800H, GeForce RTX 3050 Ti Laptop GPU | 2.4 kg | 24.9 mm | 15.60" | 1920x1080 | |
| 83.2 % v7 (old) | 09 / 2021 | Schenker XMG Focus 15 i7-11800H, GeForce RTX 3050 Ti Laptop GPU | 1.9 kg | 22 mm | 15.60" | 1920x1080 | |
| 81.2 % v7 (old) | 06 / 2021 | HP Pavilion 15-eg i7-1165G7, GeForce MX450 | 1.7 kg | 17.9 mm | 15.60" | 1920x1080 | |
| 86.1 % v7 (old) | 09 / 2021 | Lenovo IdeaPad 5 Pro 16ACH R7 5800H, GeForce GTX 1650 Mobile | 2 kg | 17.5 mm | 16.00" | 2560x1600 | |
| 88.4 % v7 (old) | 08 / 2021 | Dell XPS 15 9510 11800H RTX 3050 Ti OLED i7-11800H, GeForce RTX 3050 Ti Laptop GPU | 1.9 kg | 18 mm | 15.60" | 3456x2160 |
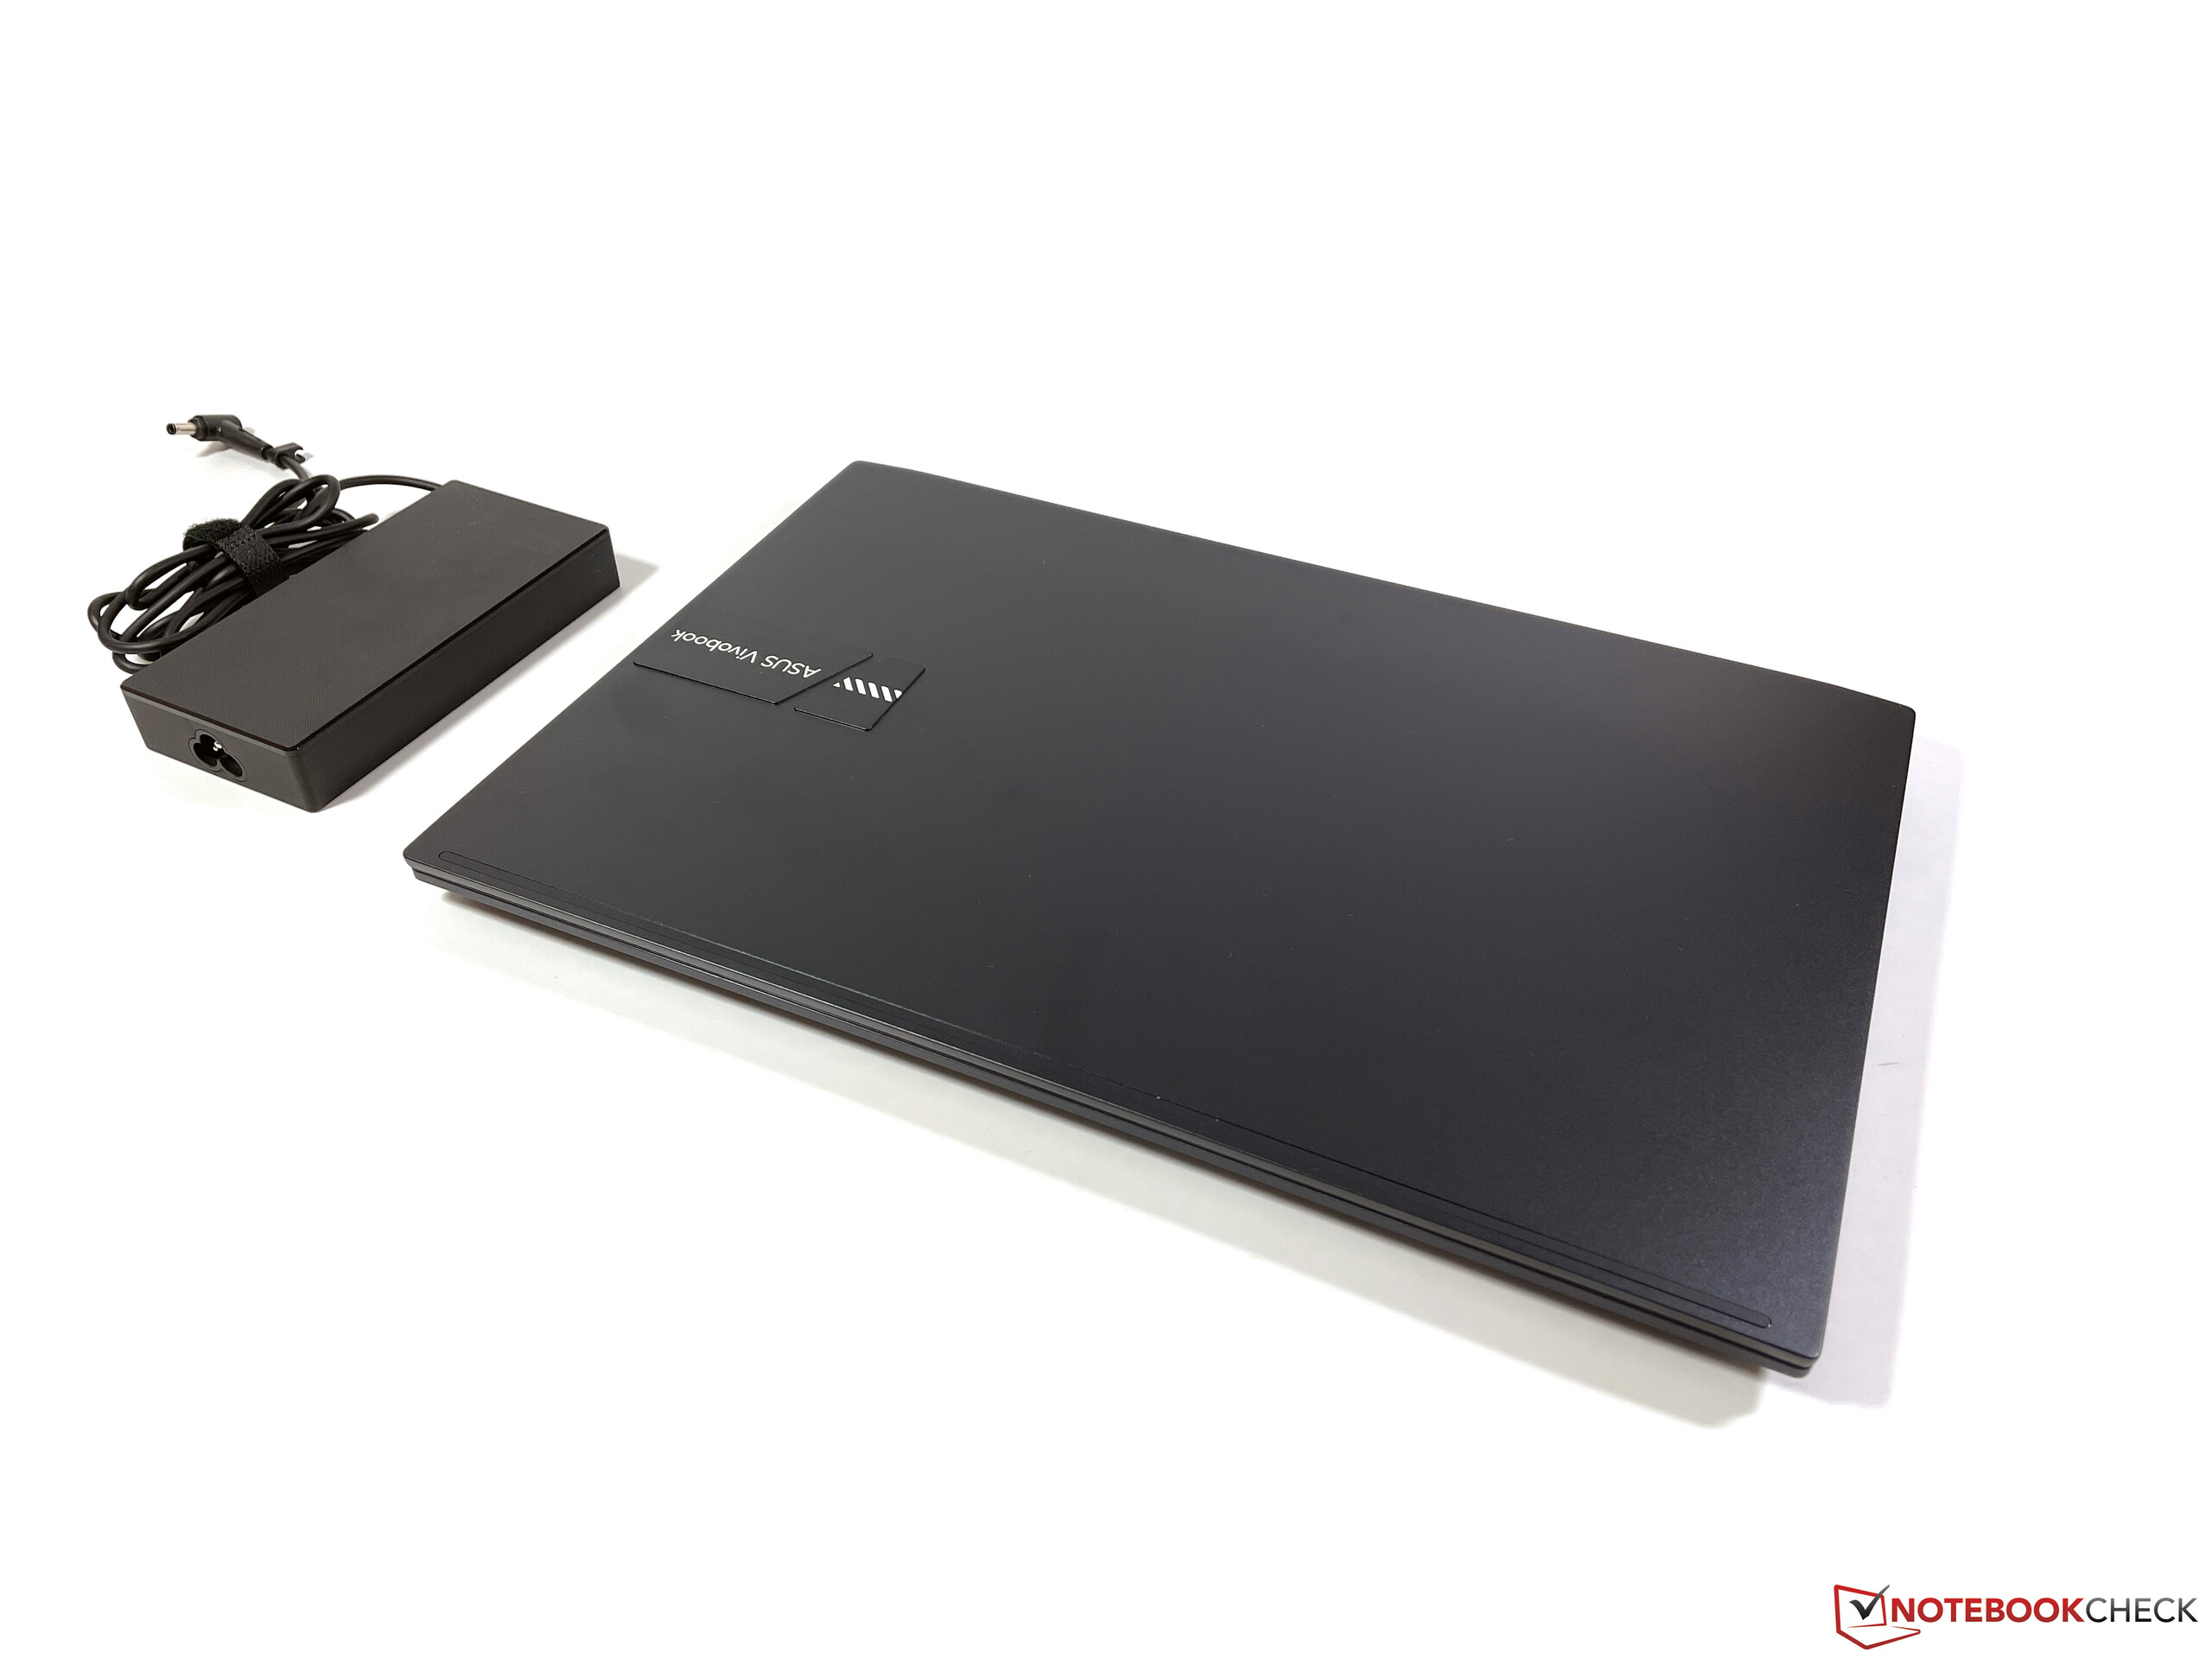
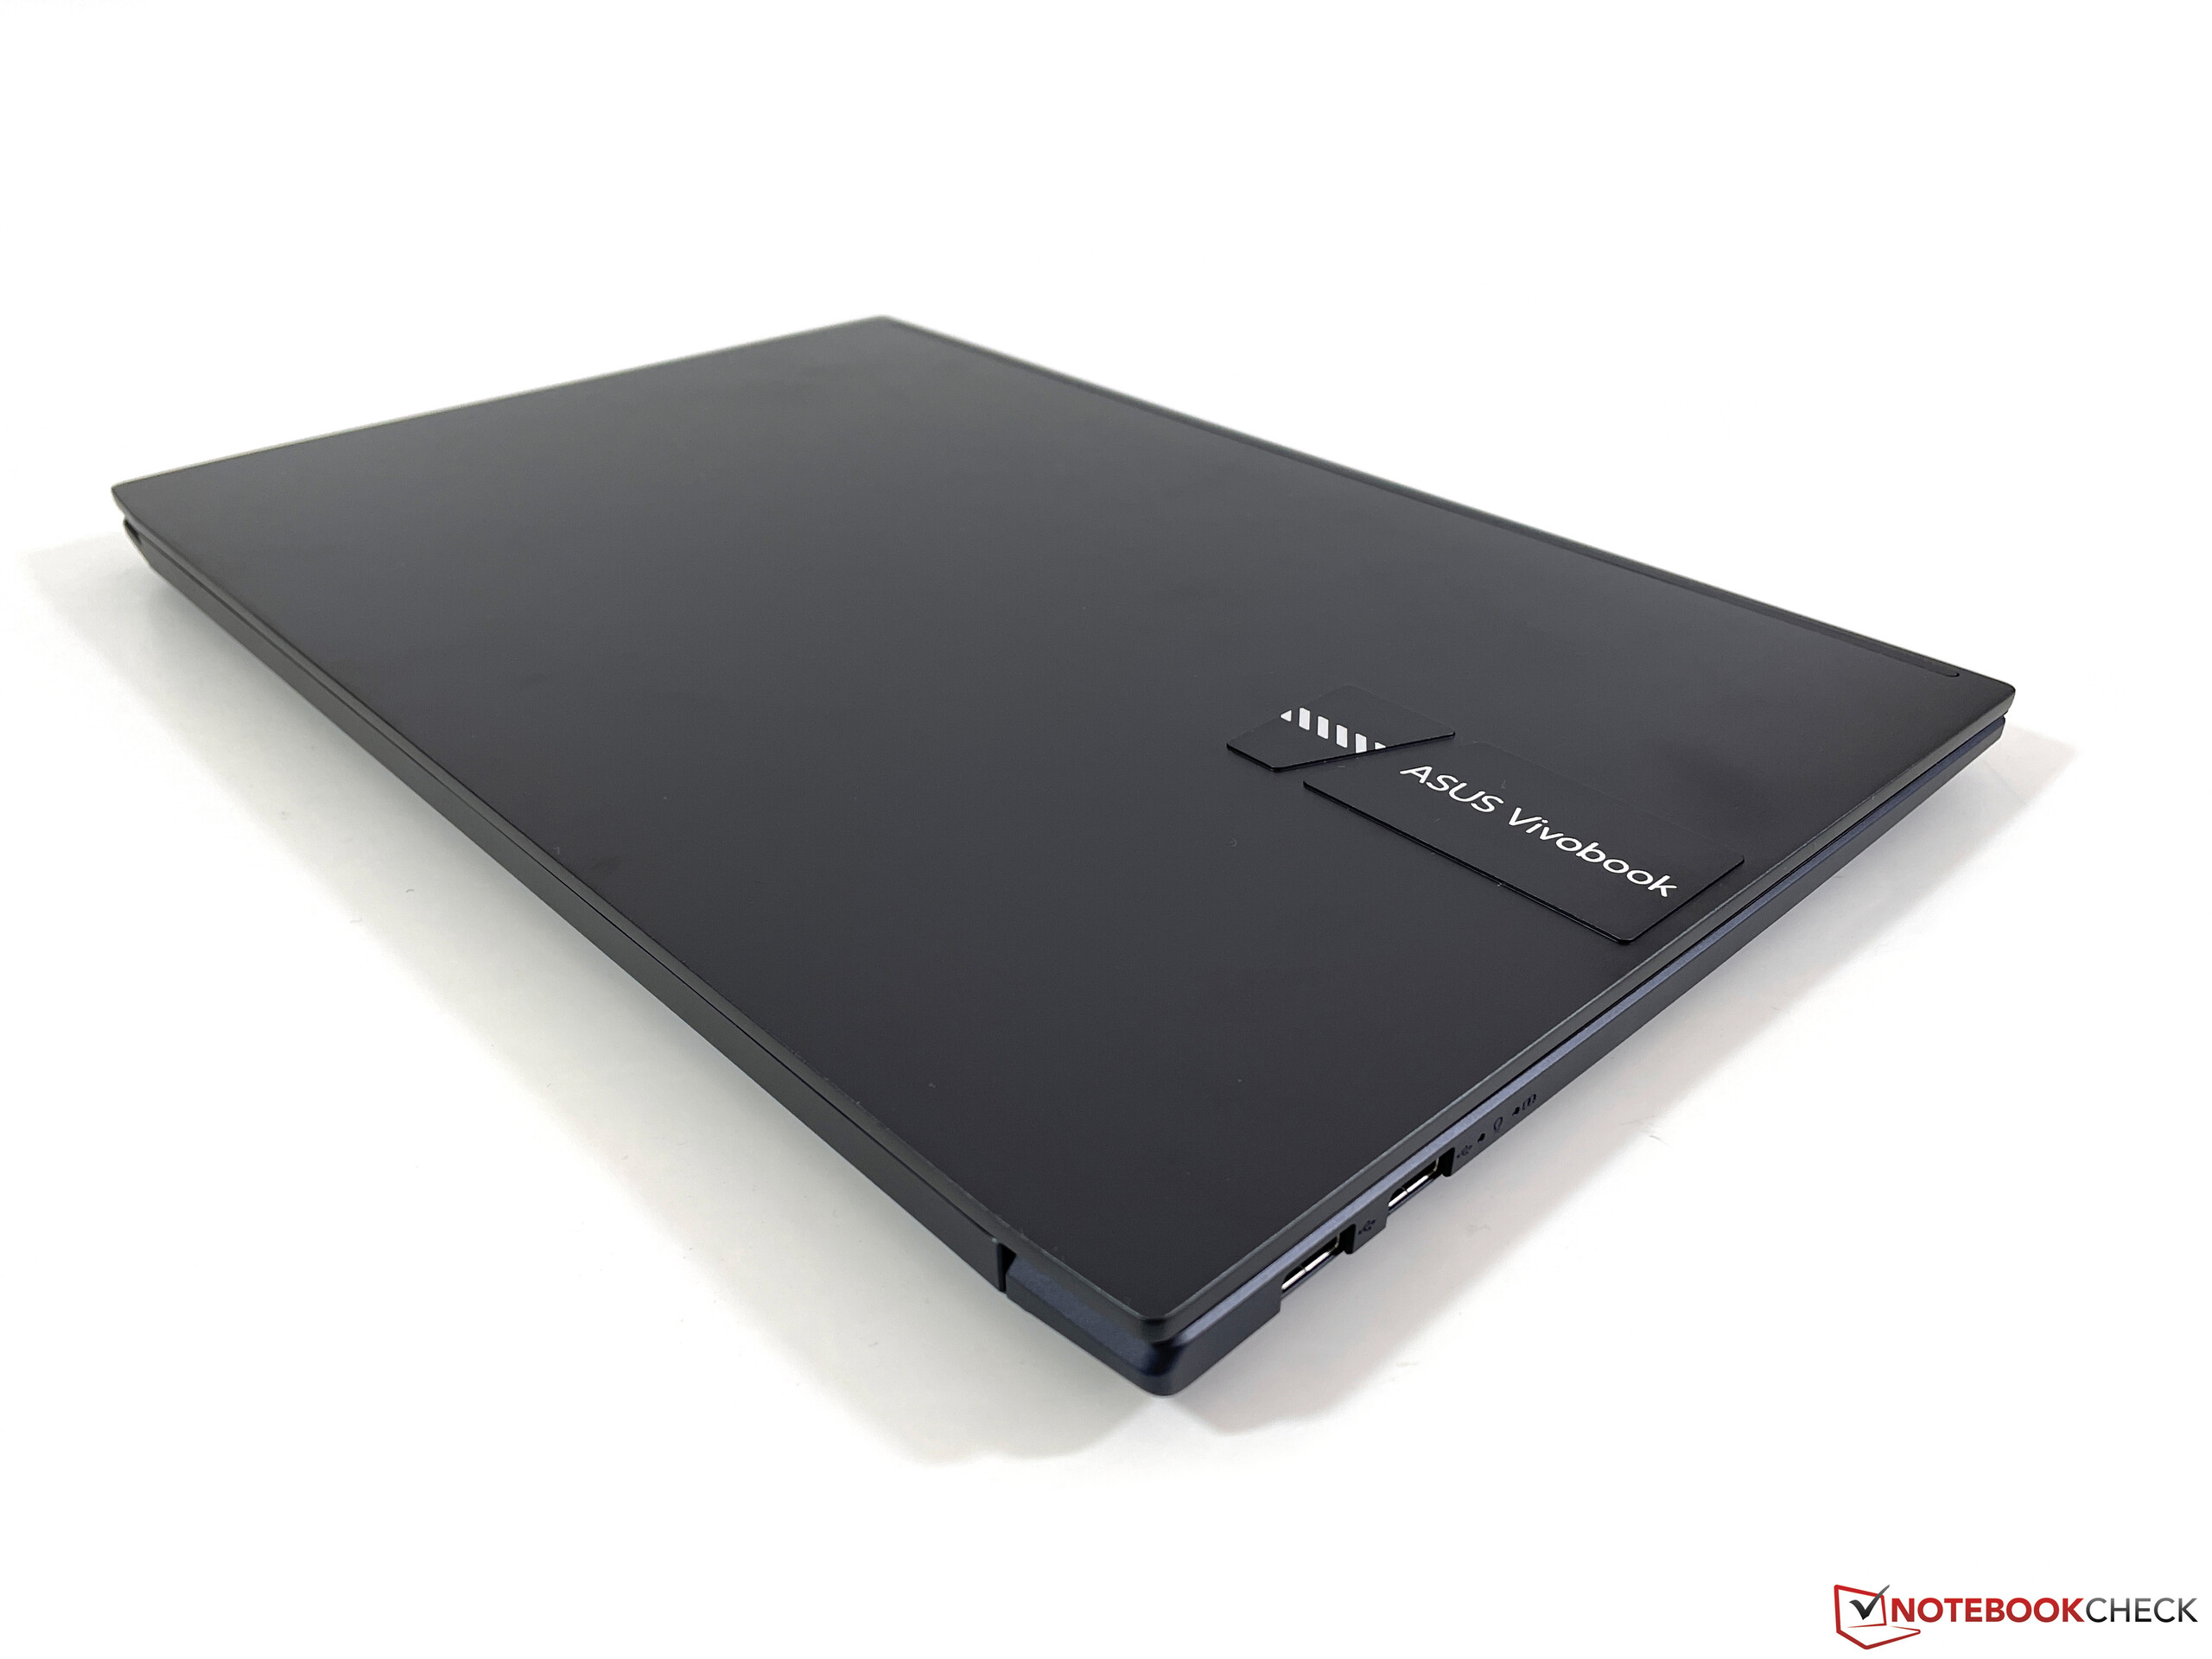
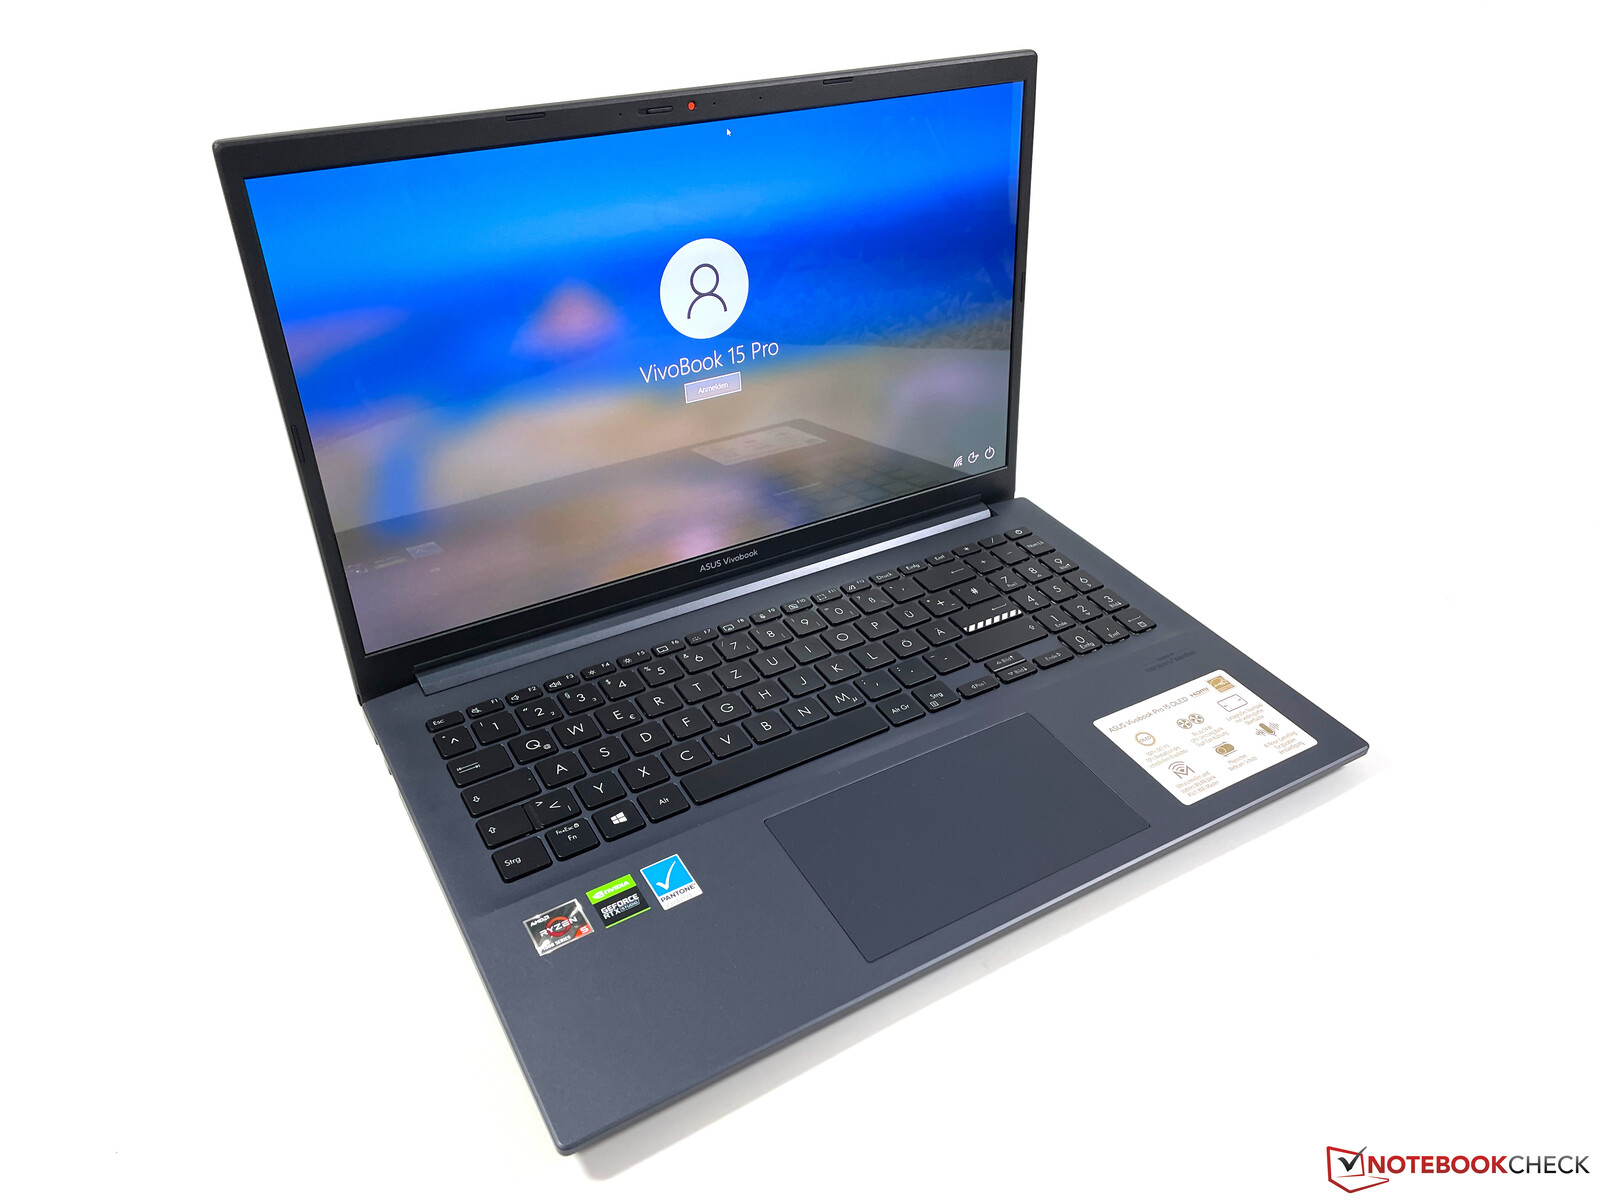
Case - The VivoBook Pro uses plastic
The relatively low entry-level price of the VivoBook 15 Pro becomes easily apparent in the plastic case. While it looks good visually and we also like the color of our test unit (Quiet Blue), you can notice the differences to metal cases such as that of the (significantly more expensive) Dell XPS 15 in terms of the stability and haptics. The palm rests can be pressed down a bit, and when opening the display lid there are usually some creaking noises. The lid itself leaves a better impression. Even though it can still be warped slightly, there are no creaking noises and we are unable to provoke image errors by pressing down in some spots. On the other hand, the hinge, which has a maximum opening angle of about 135 degrees, could be better adjusted, since some bouncing of the display cannot be avoided, for example when changing the opening angle.
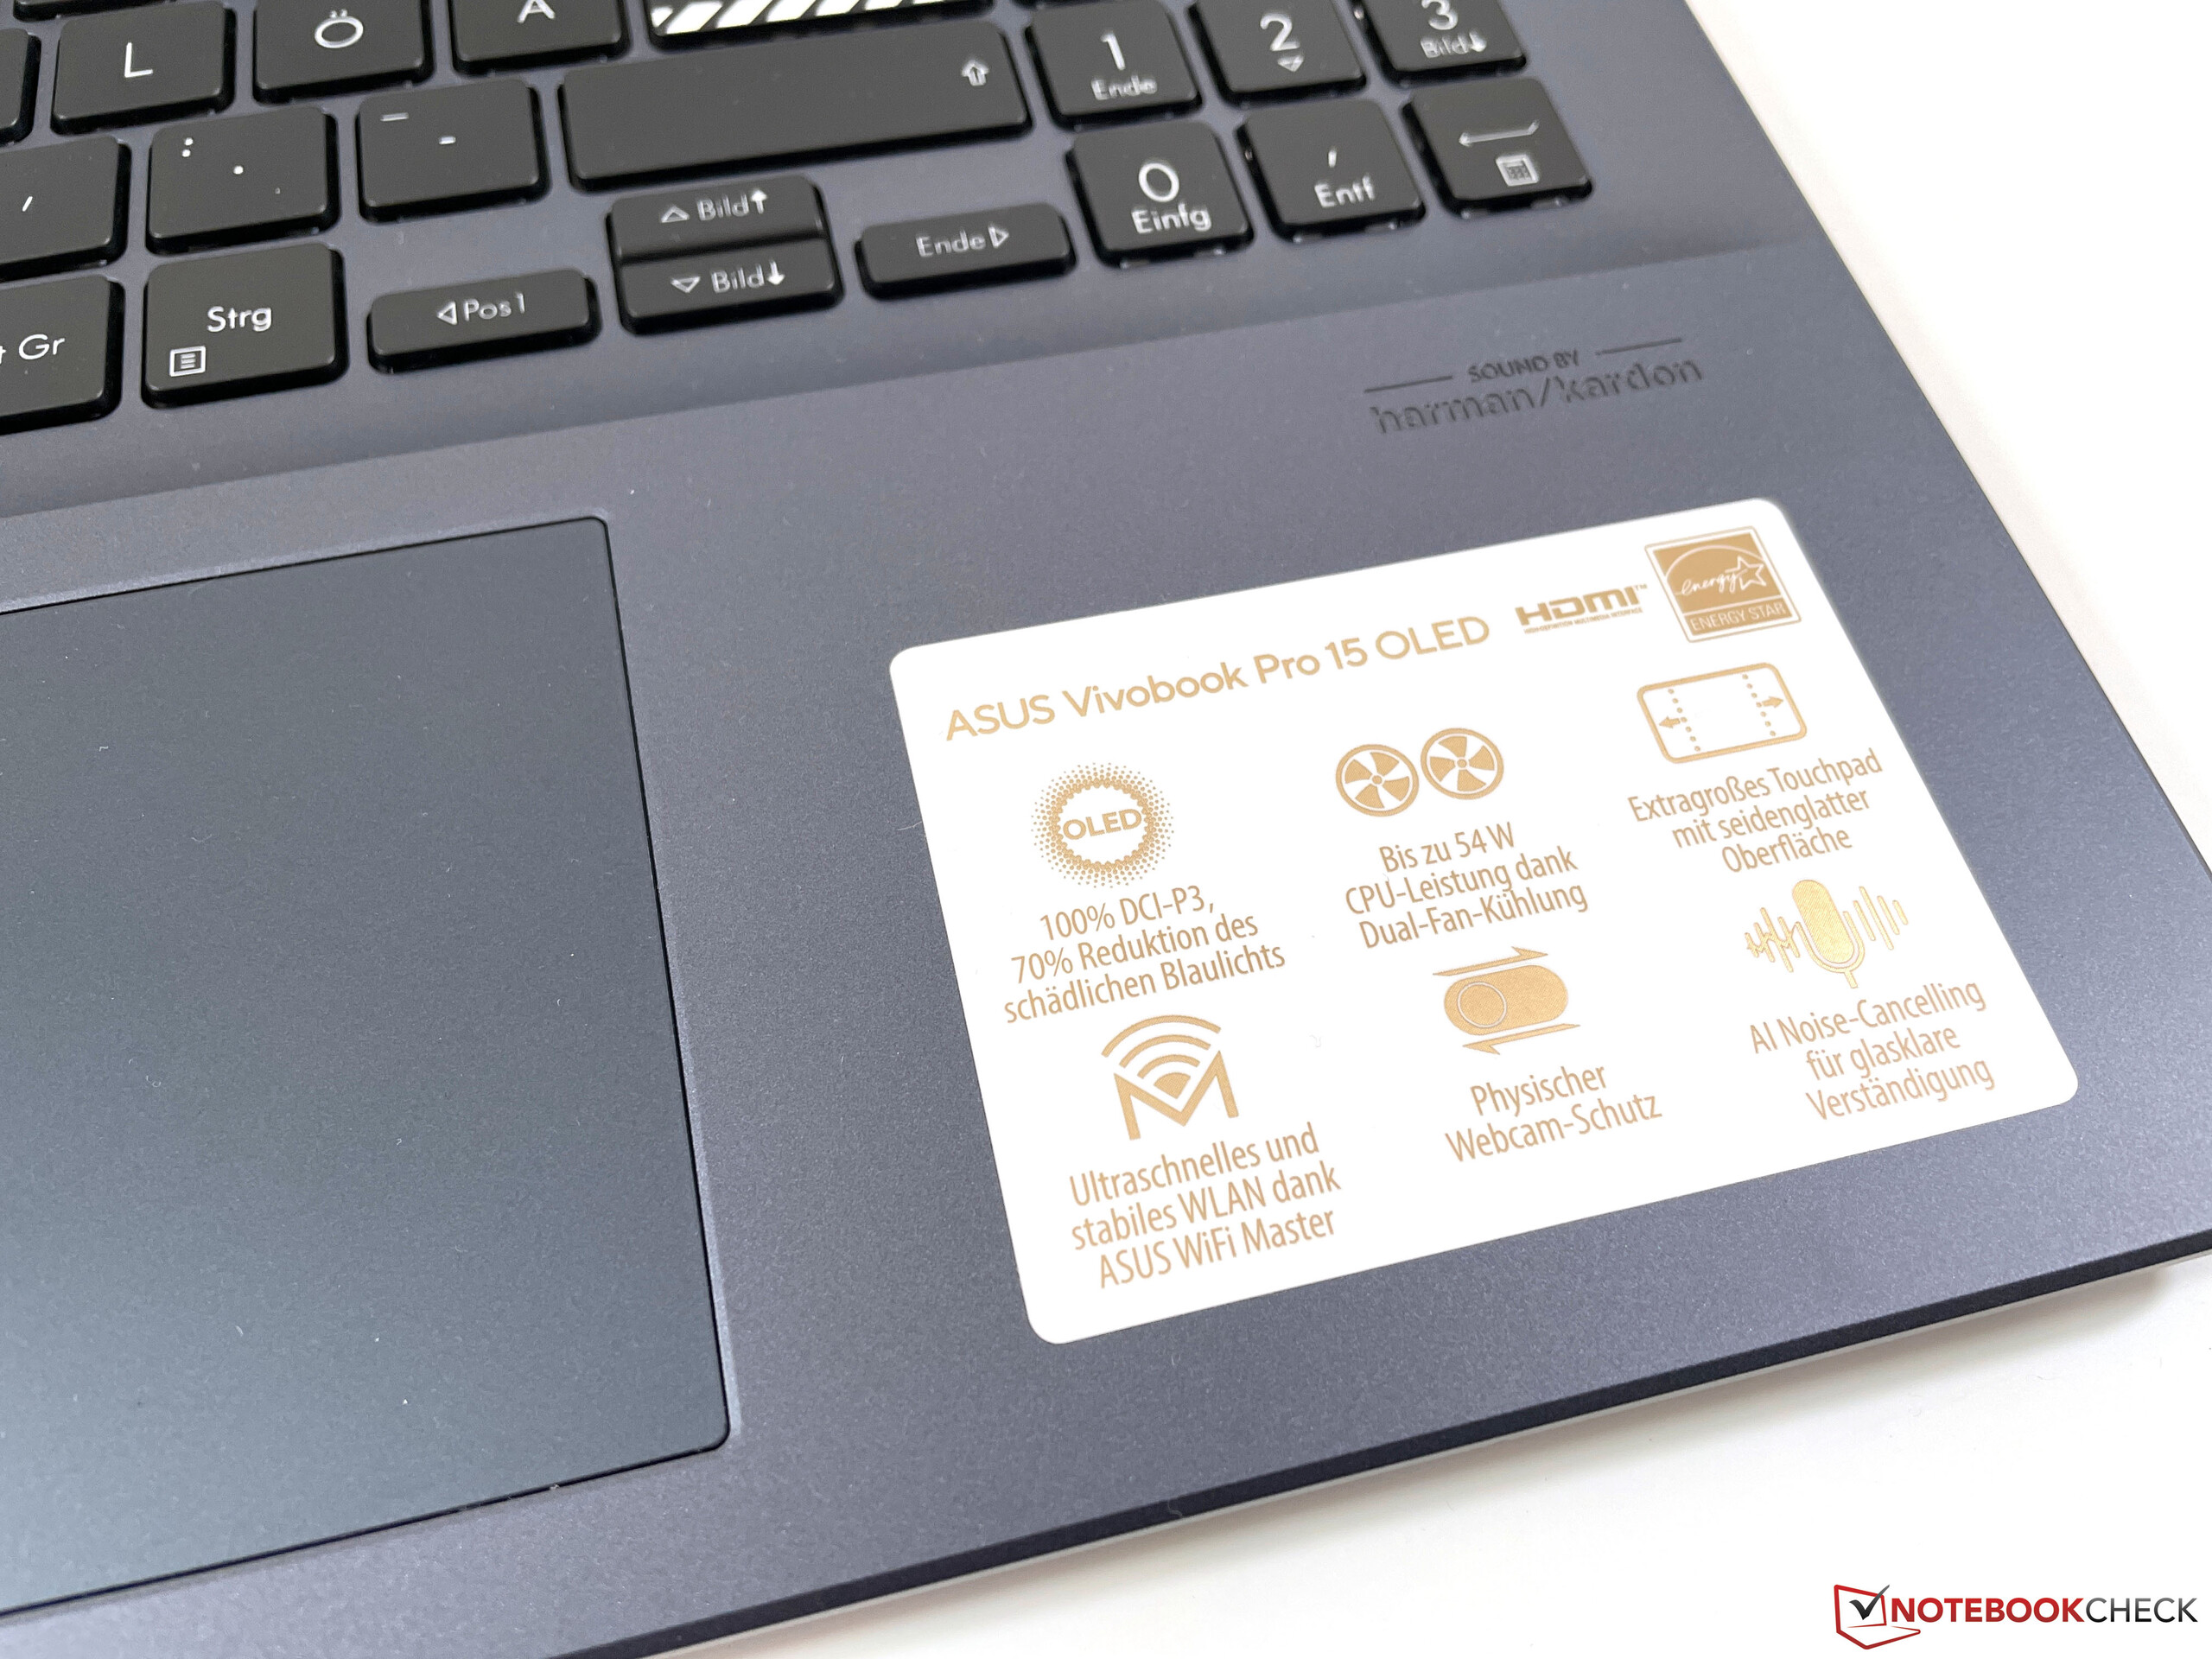
The two side bezels are very small and help in presenting a modern appearance. Asus also uses other design elements such as the raised 3D logo on the lid and the striped pattern on the Enter key. The base unit is not very susceptible to fingerprints, and only the lid has to be cleaned more often.
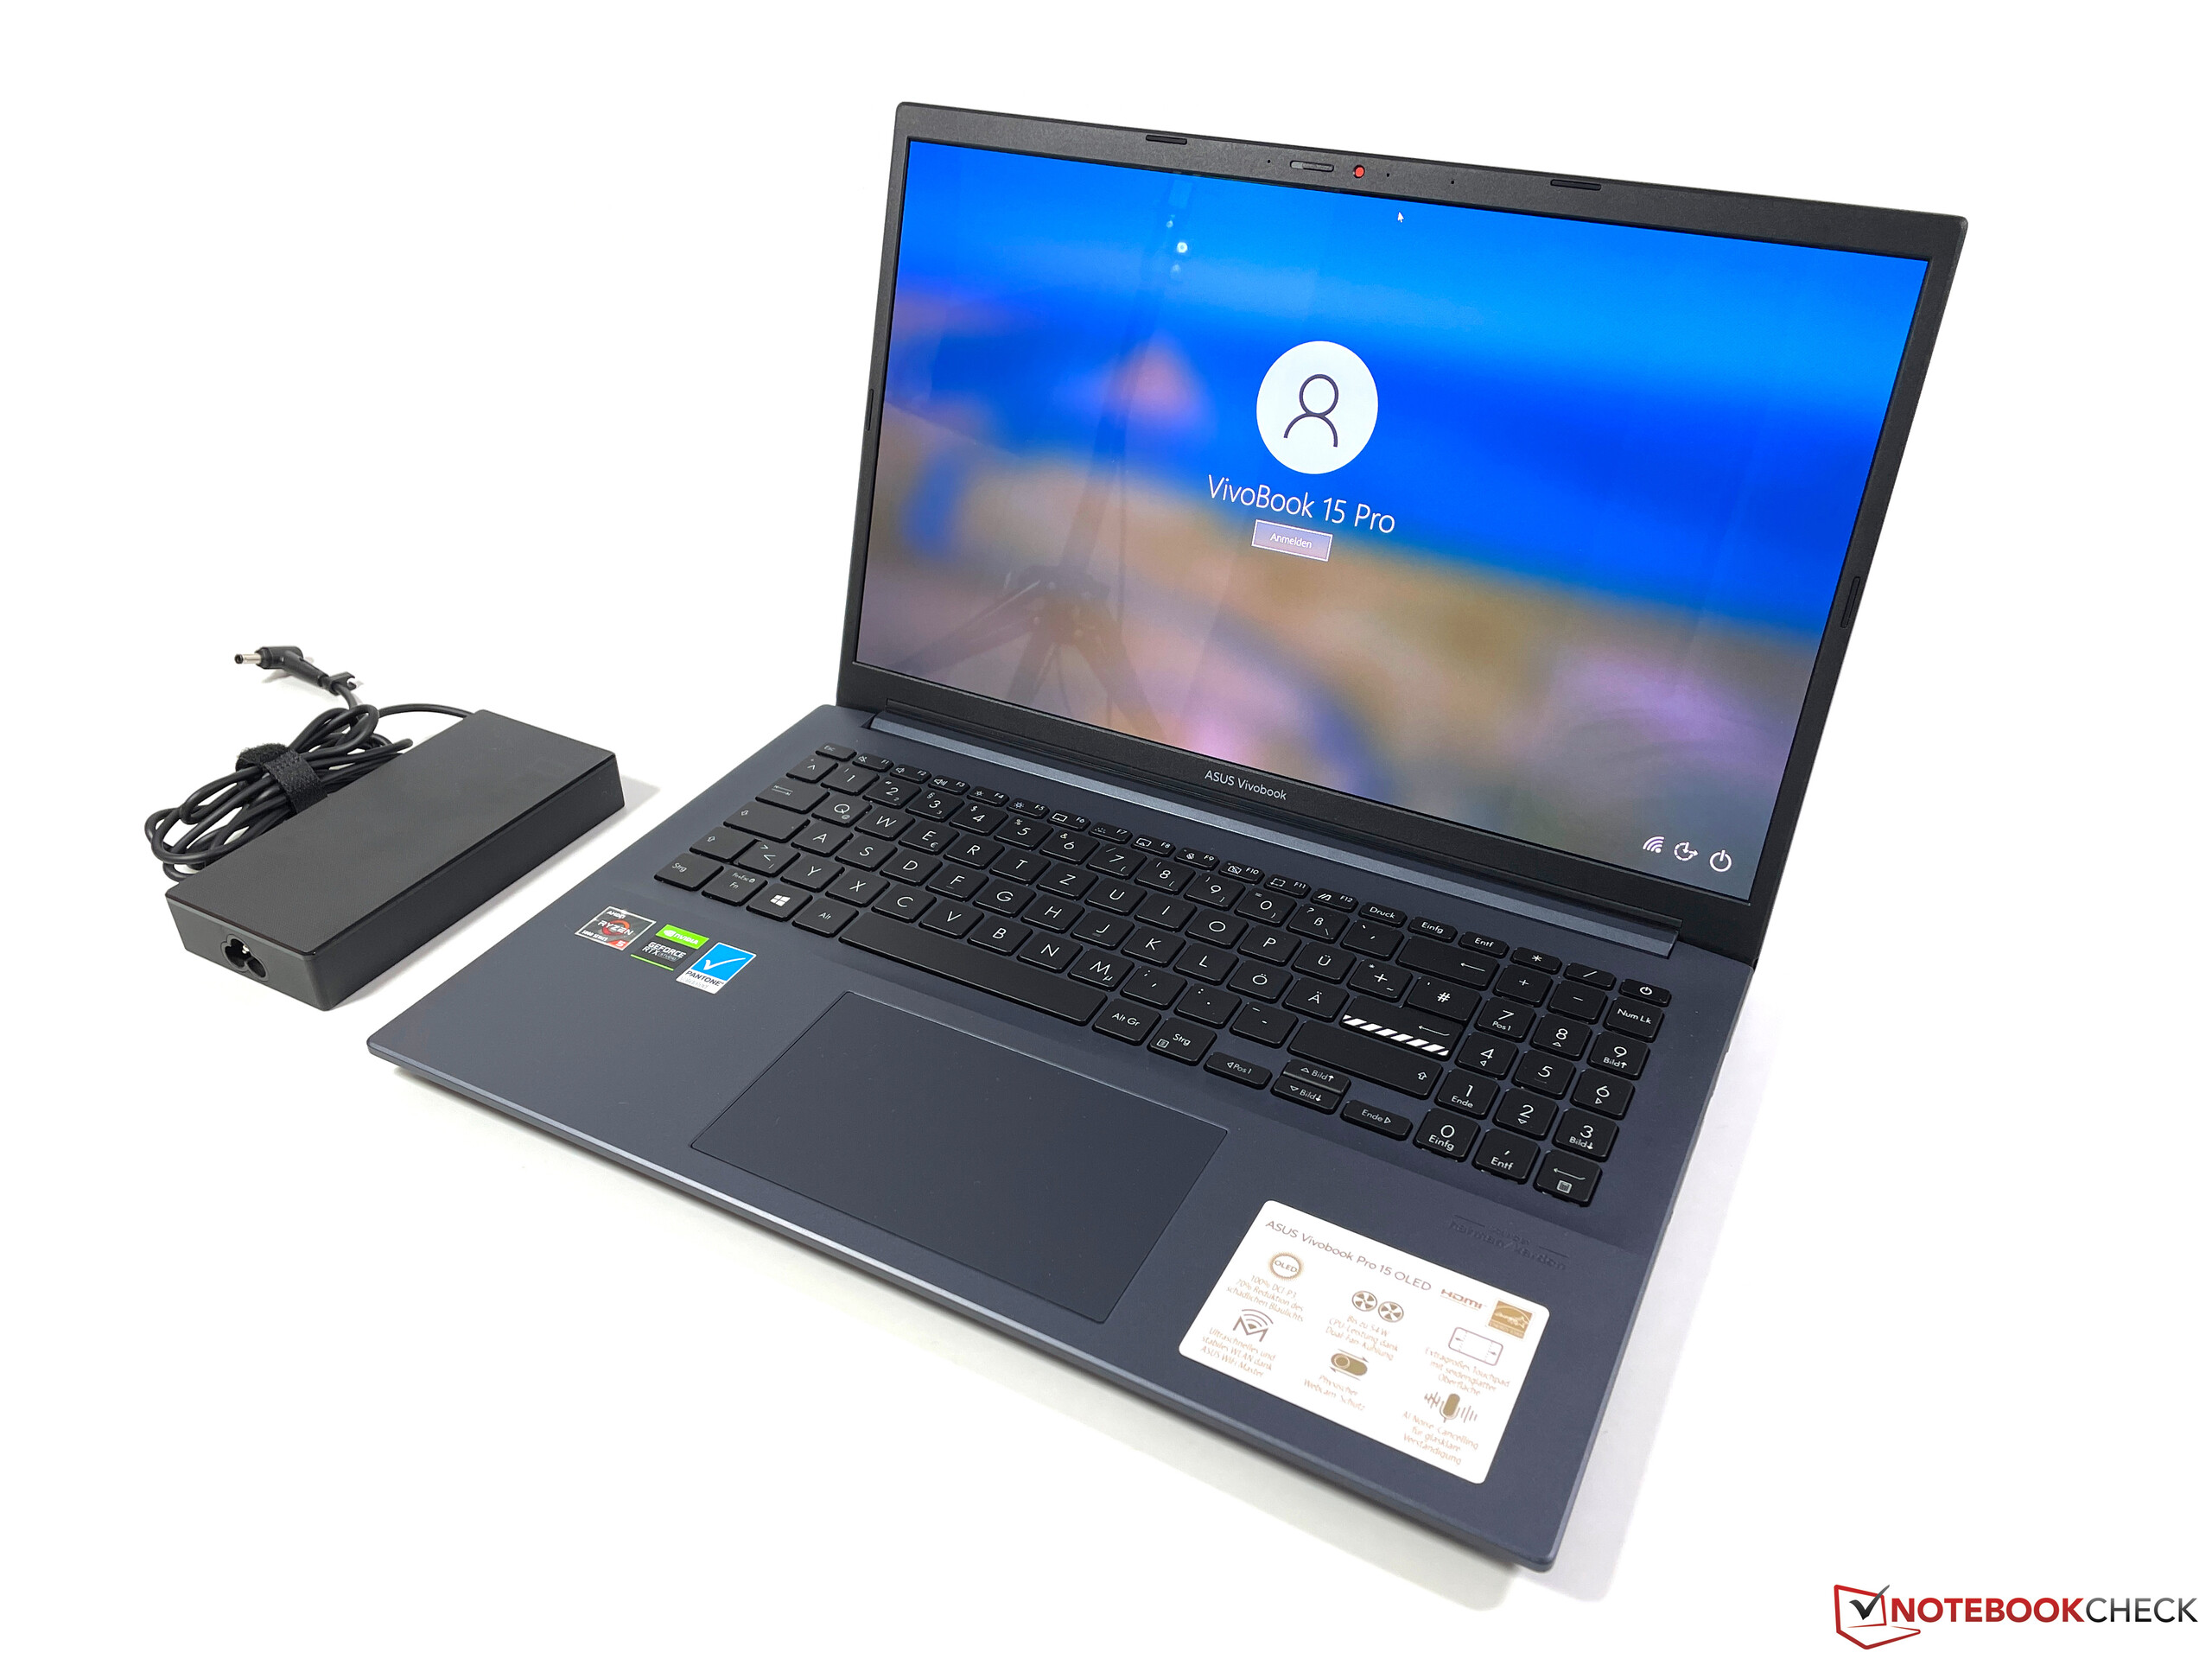
The test unit is one of the most compact and at barely 1.7 kg (~3.75 lb) also lightest laptops in our comparison group. You also have to add almost another 450 grams (~1 lb) for the charger.
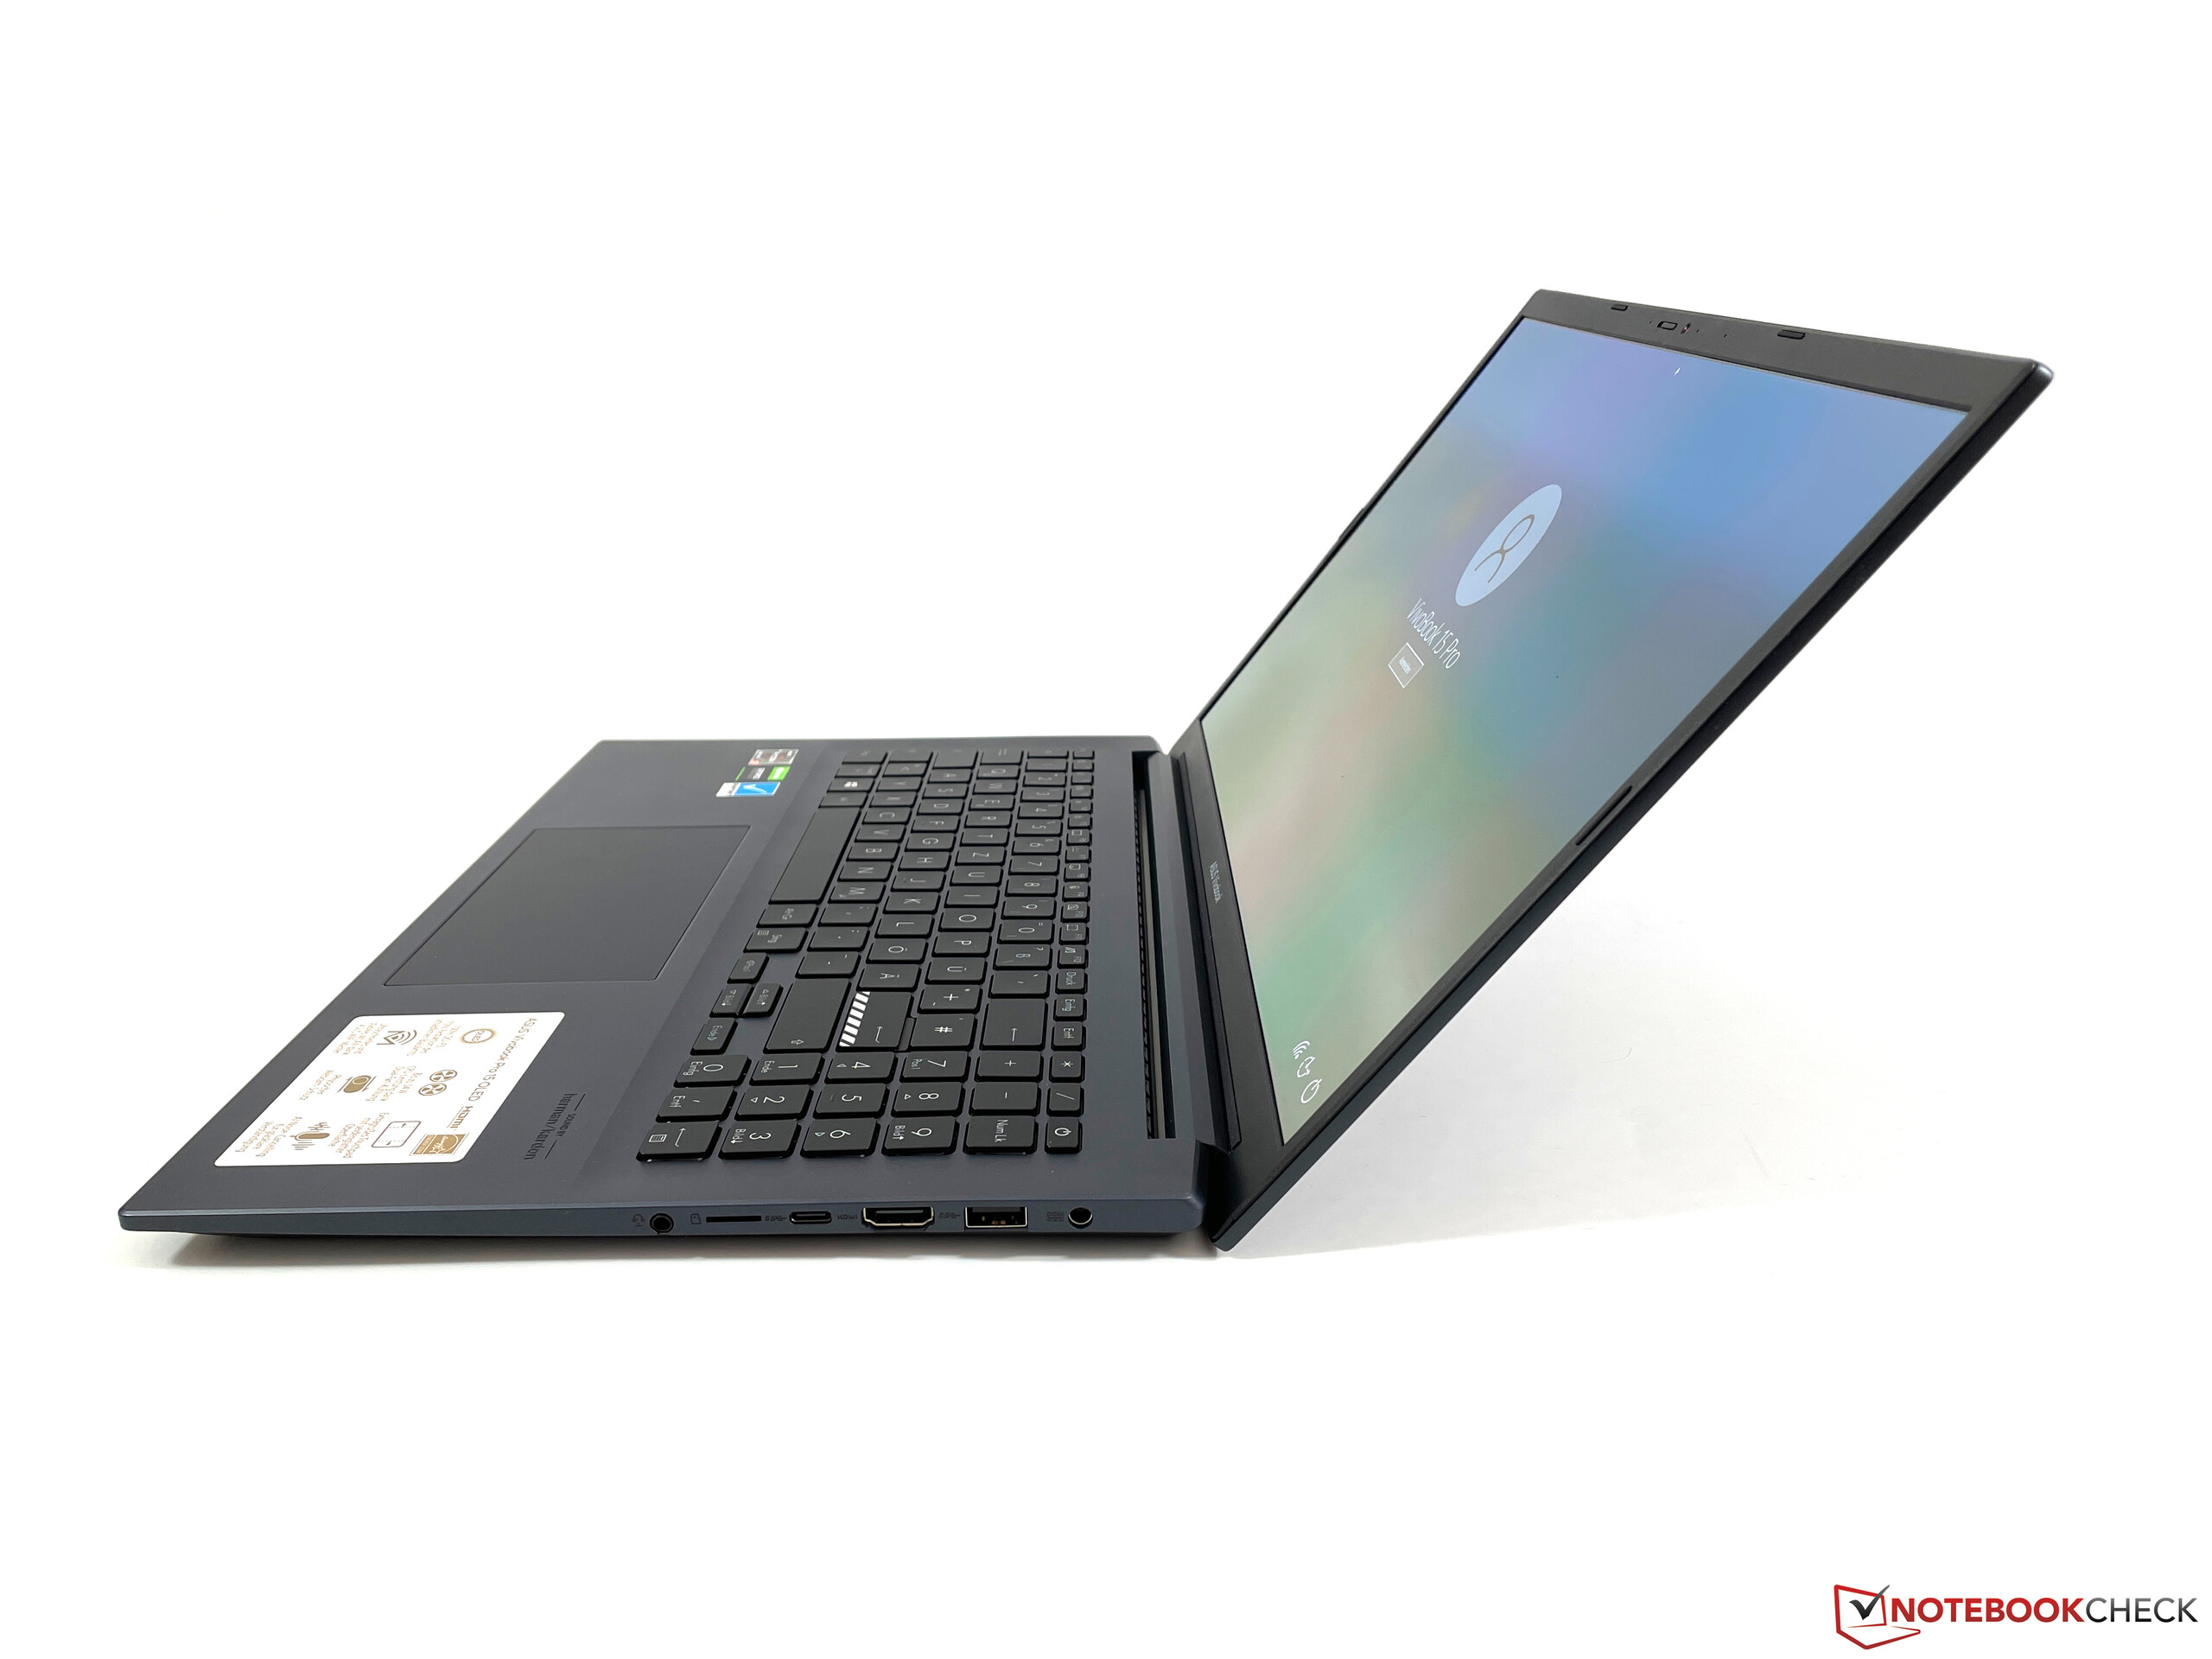
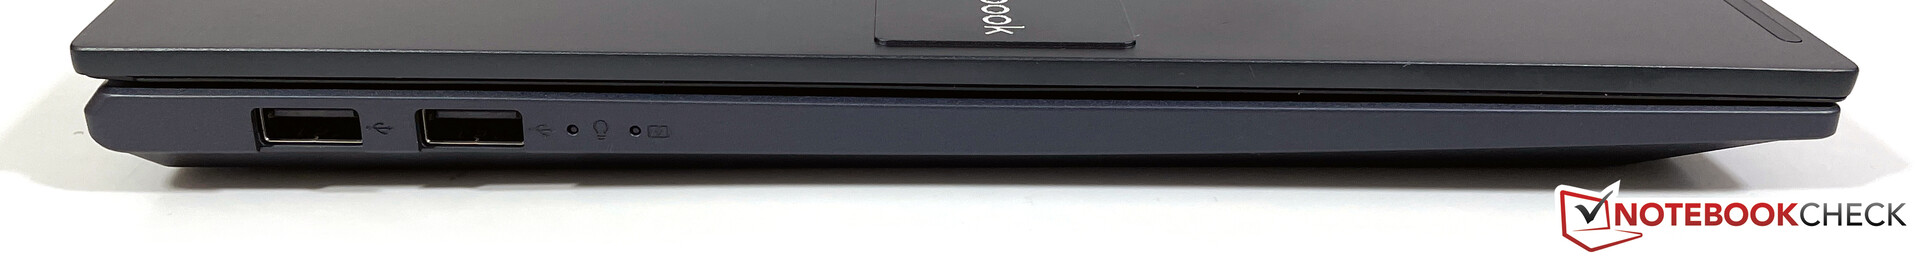
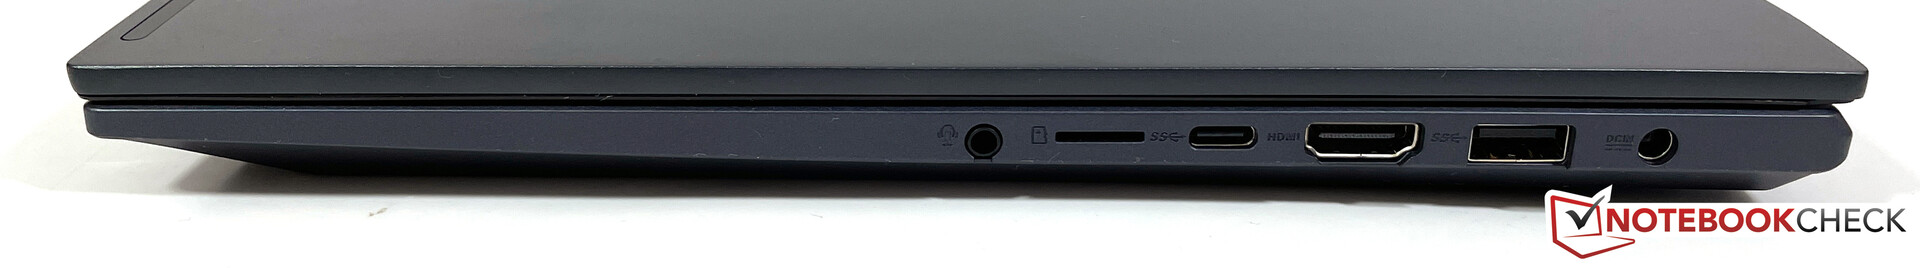
Equipment - Asus made some cuts in the connections
While at first glance all the important connections including USB-A, USB-C, and HDMI are available, their standards are outdated. The USB-C connection only supports the 3.2 Gen 1 standard and also cannot be used for video output or charging, and two of the three USB-A connections only support the old 2.0 standard. HDMI is also outdated at 1.4b, so it cannot drive an external 4k monitor with 60 Hz. Even though some models offer a fingerprint sensor in the Power button, our test unit does not include it.
SD Card Reader
The VivoBook offers a microSD card reader, but it is not particularly fast. With our AV Pro V60 UHS-II reference card, the transfer rates are lower than 40 MB/s, which is significantly lower than the usual 70-80 MB/s that were achieved by the competitors.
| SD Card Reader | |
| average JPG Copy Test (av. of 3 runs) | |
| Dell XPS 15 9510 11800H RTX 3050 Ti OLED (AV Pro V60) | |
| Average of class Multimedia (23 - 531, n=43, last 2 years) | |
| Schenker XMG Focus 15 (AV PRO microSD 128 GB V60) | |
| Lenovo IdeaPad 5 Pro 16ACH (AV PRO V60) | |
| HP Pavilion 15-eg (AV PRO microSD 128 GB V60) | |
| Asus VivoBook 15 Pro M3500QC-L1062 (AV Pro V60) | |
| maximum AS SSD Seq Read Test (1GB) | |
| Dell XPS 15 9510 11800H RTX 3050 Ti OLED (AV Pro V60) | |
| Average of class Multimedia (27.9 - 1455, n=42, last 2 years) | |
| Schenker XMG Focus 15 (AV PRO microSD 128 GB V60) | |
| Lenovo IdeaPad 5 Pro 16ACH (AV PRO V60) | |
| HP Pavilion 15-eg (AV PRO microSD 128 GB V60) | |
| Asus VivoBook 15 Pro M3500QC-L1062 (AV Pro V60) | |
Communication
Asus uses a MediaTek WLAN module (MT7921, 2x2) that would theoretically support the fast WLAN 6 standard (802.11ax). However, in our tests with the Netgear Nighthawk RAX120 reference router, the laptop simply refused to connect via WLAN 6, using only WLAN 5 (802.11ac), which is also the reason why the transfer rates remained below what should be possible. On the other hand, the WLAN signal was stable and inconspicuous.
Webcam
The webcam of the VivoBook includes a mechanical cover, with a red spot showing that the camera is locked. As expected, the image quality of the 720p sensors is not good, and even in good light conditions the colors appear quite pale and the contents aren't really sharp either.


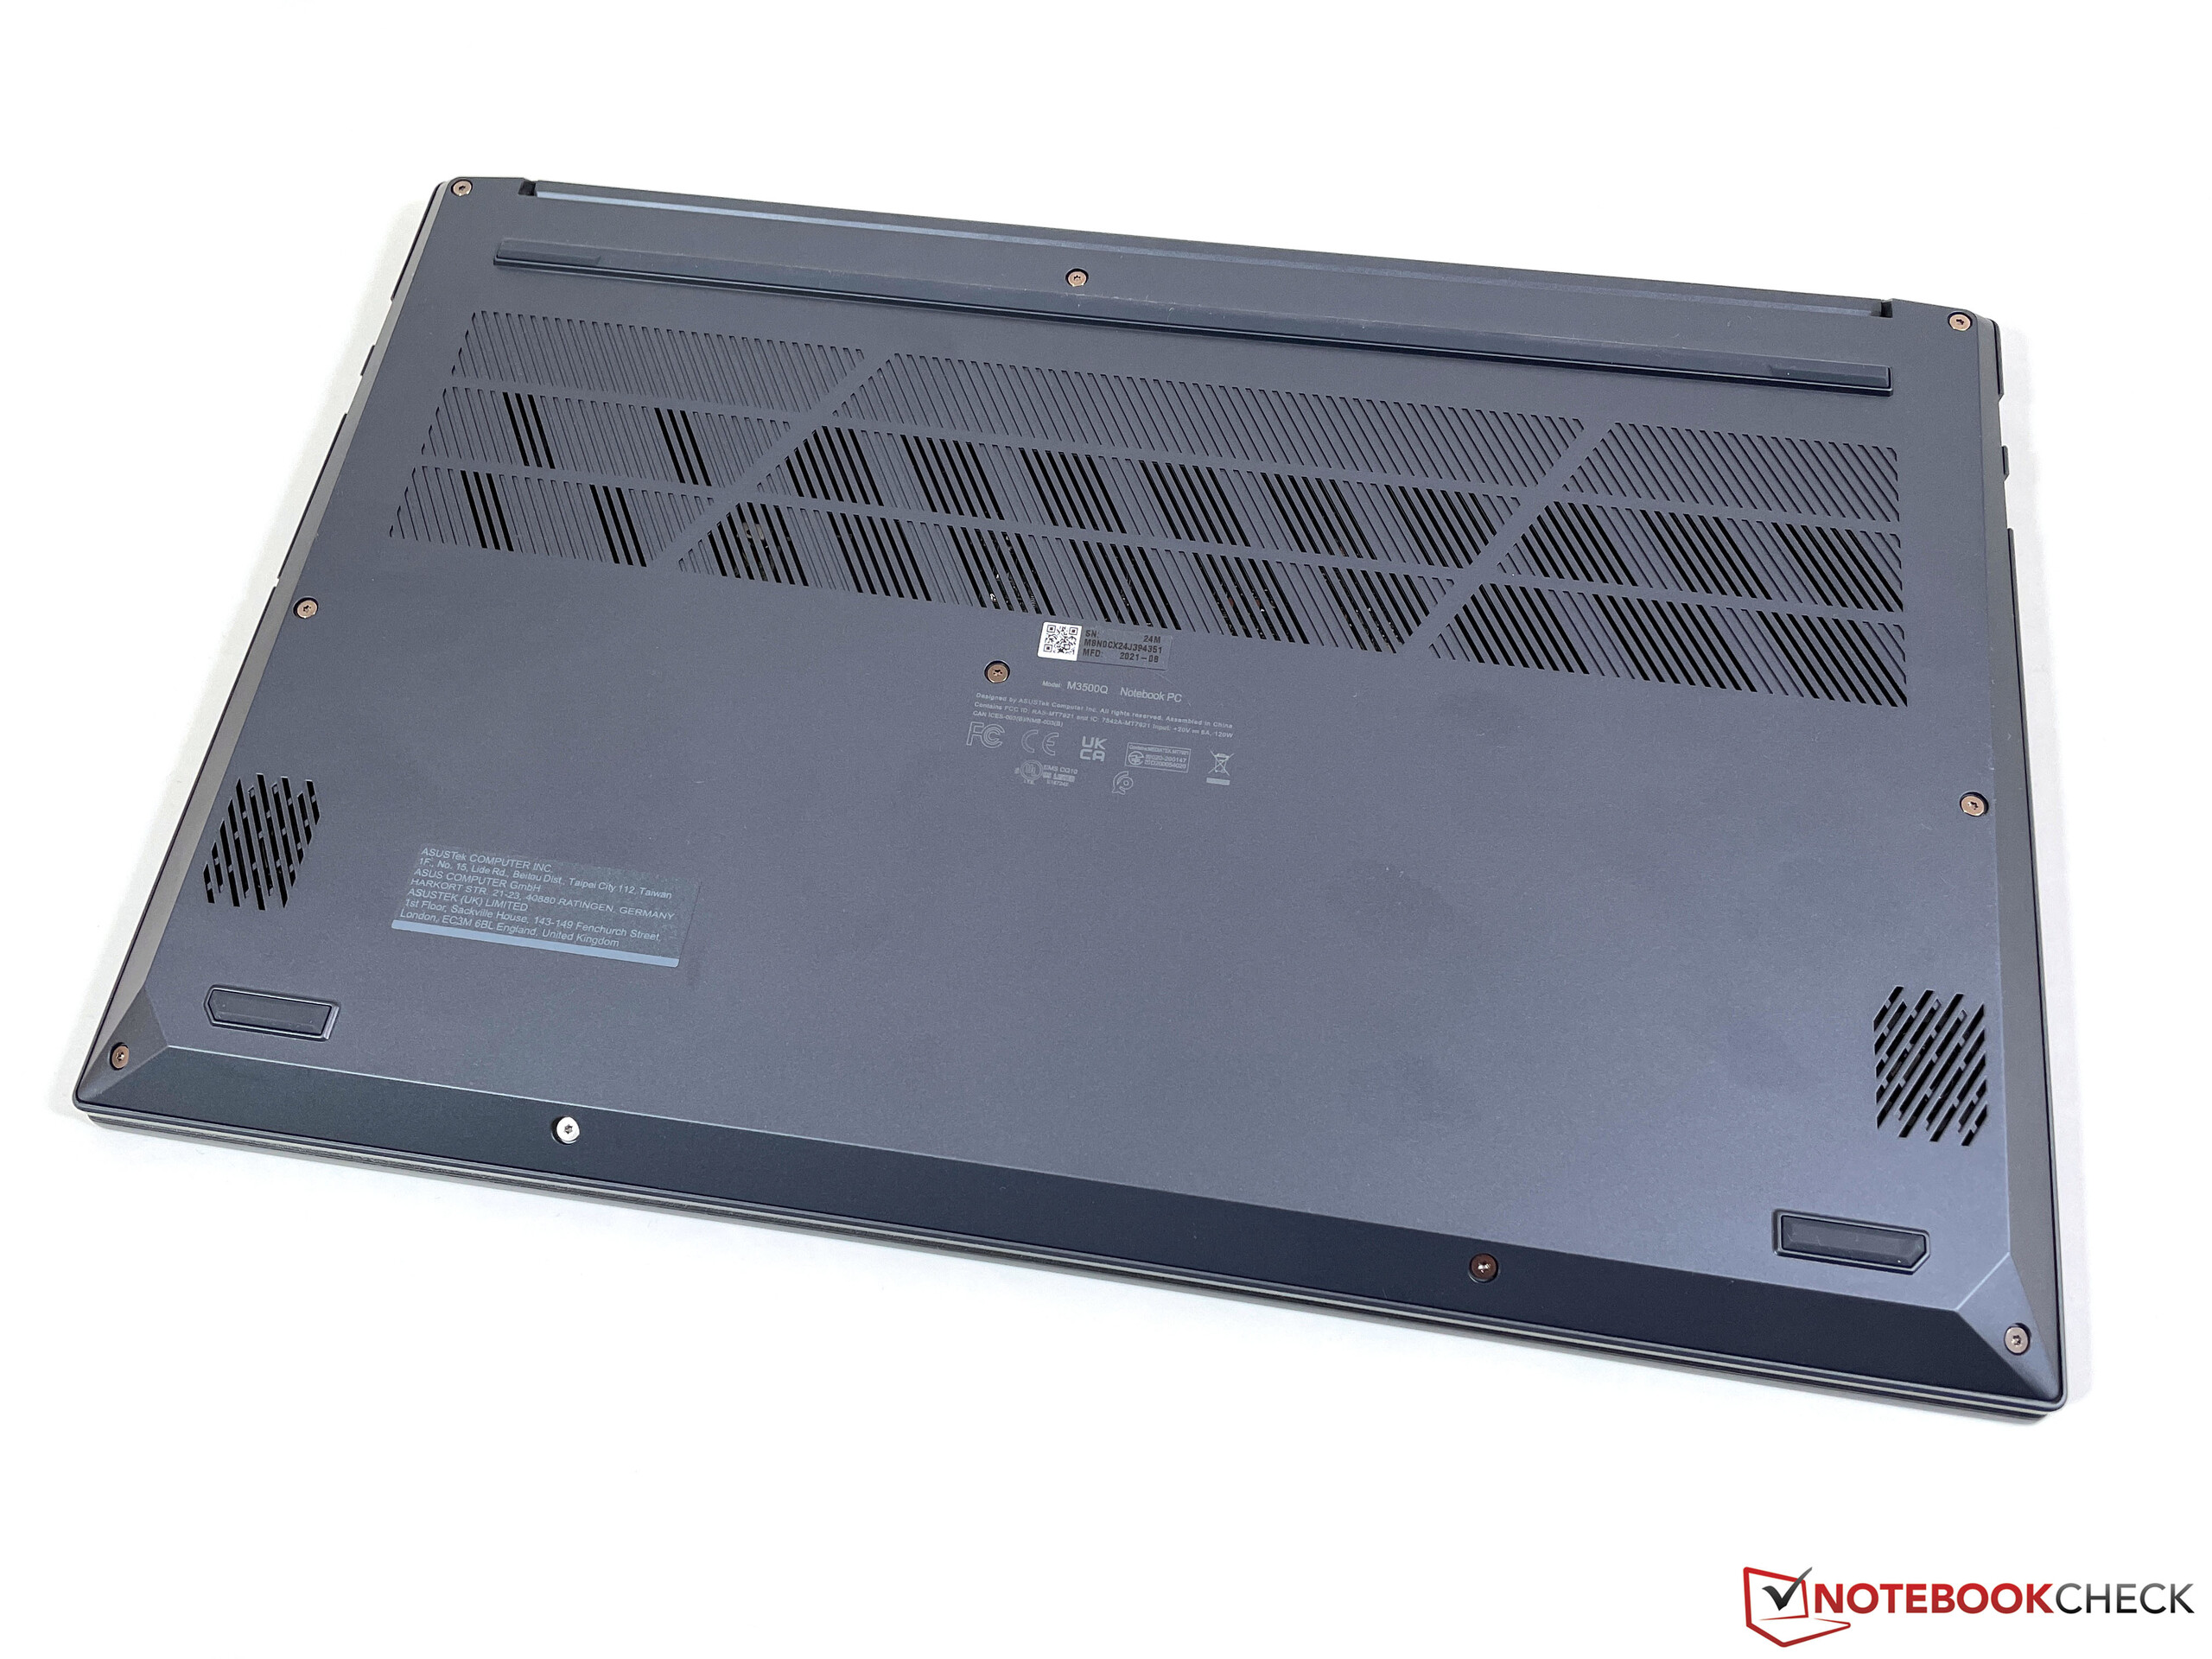
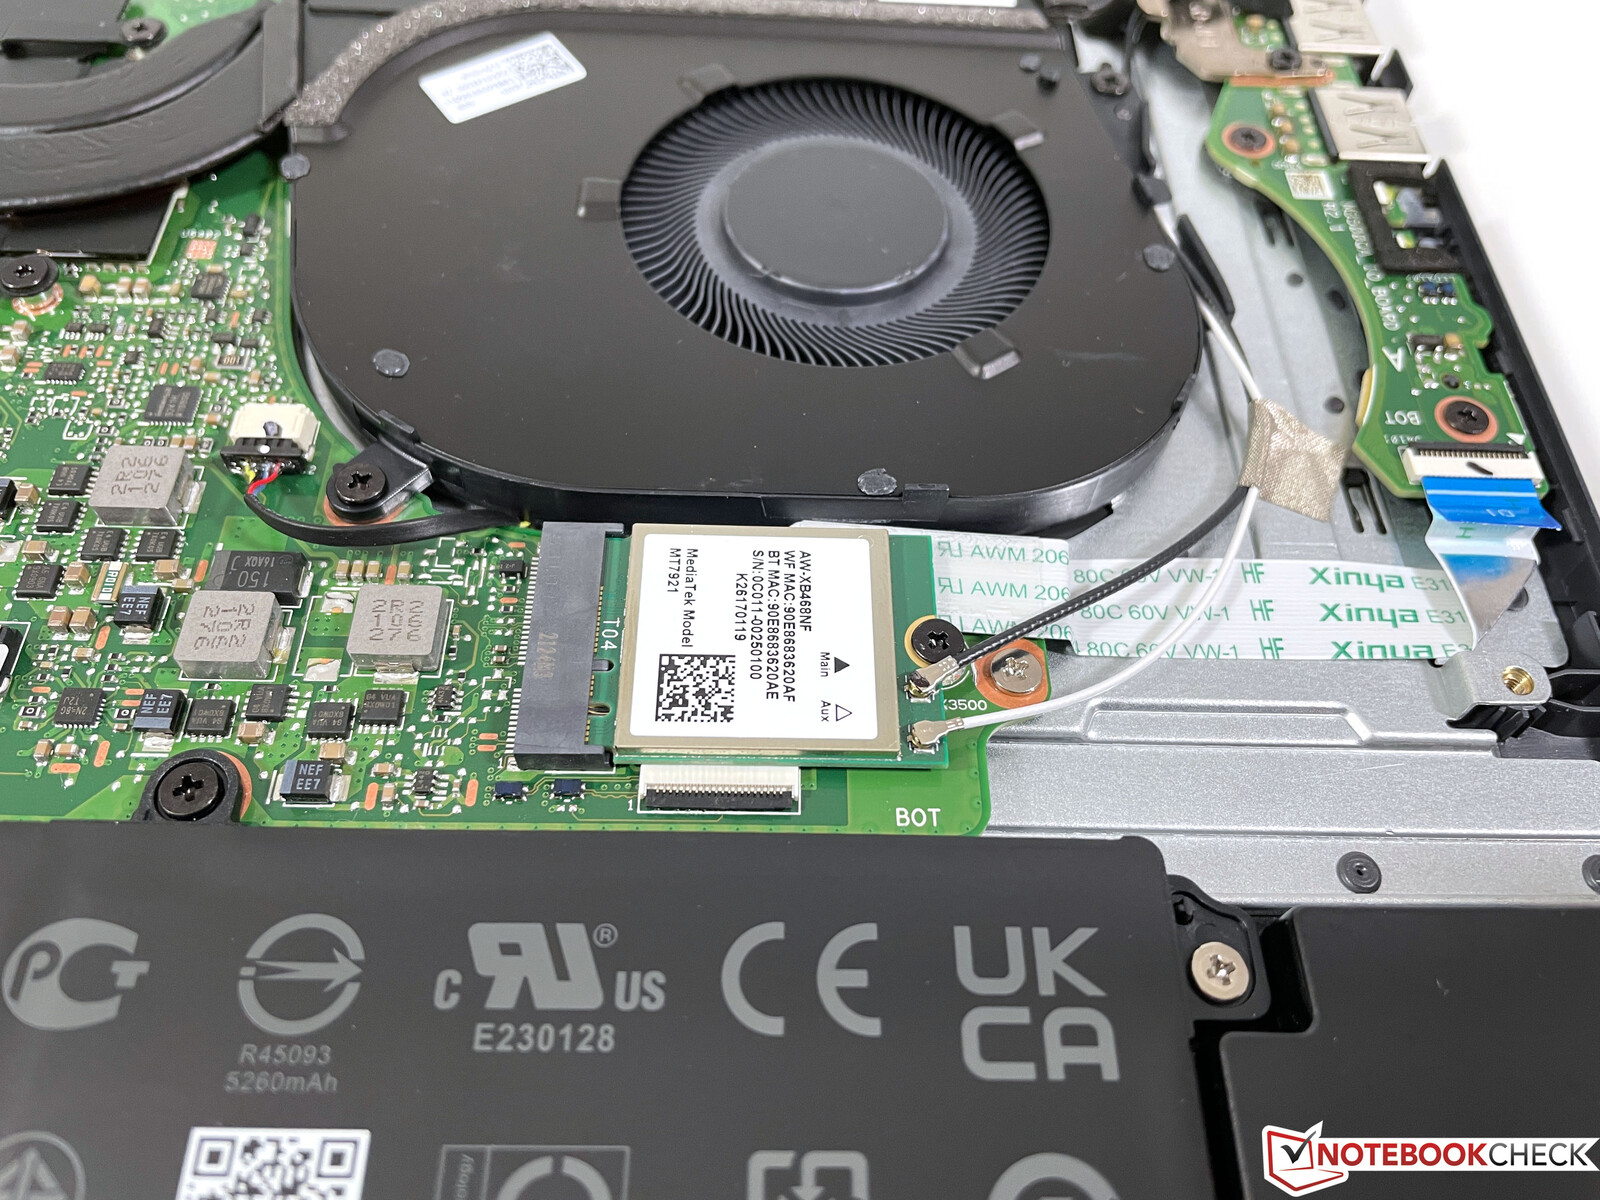
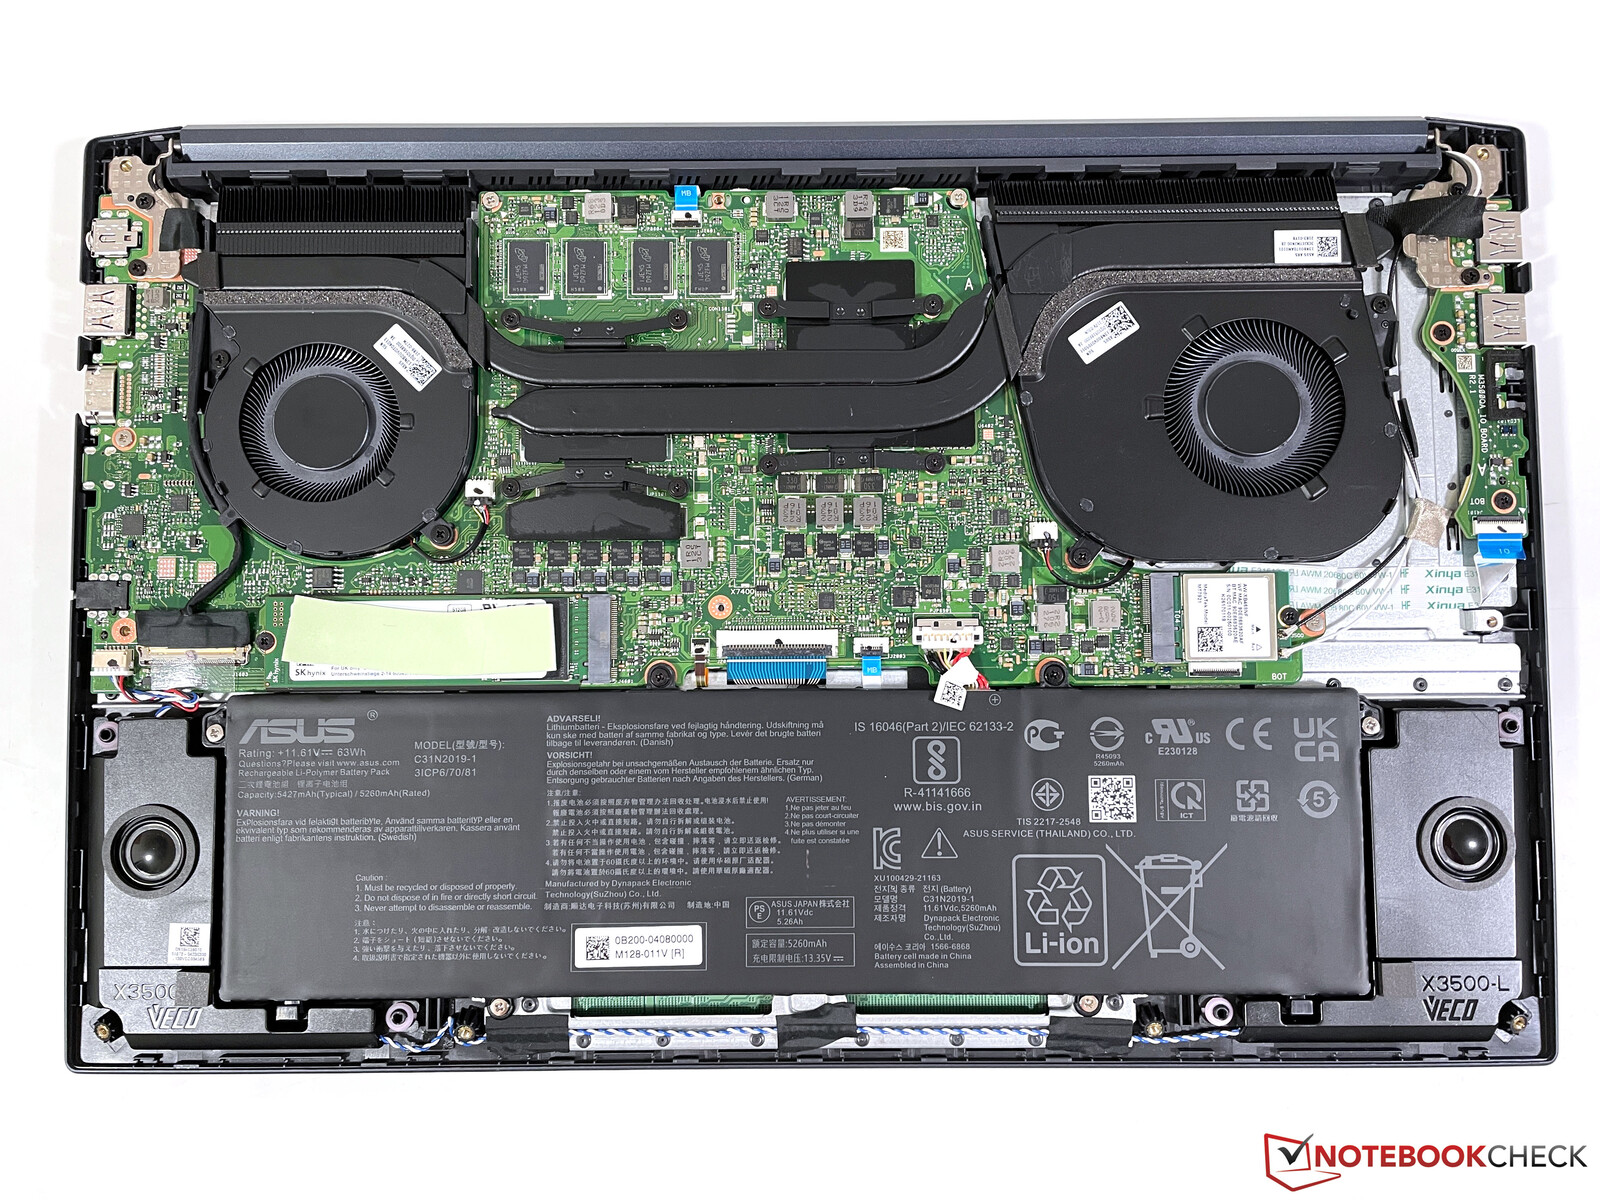
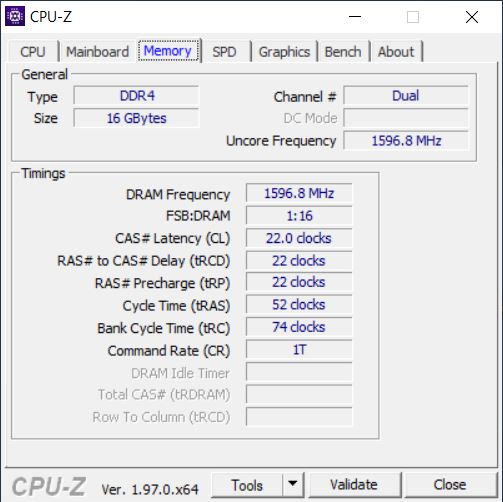
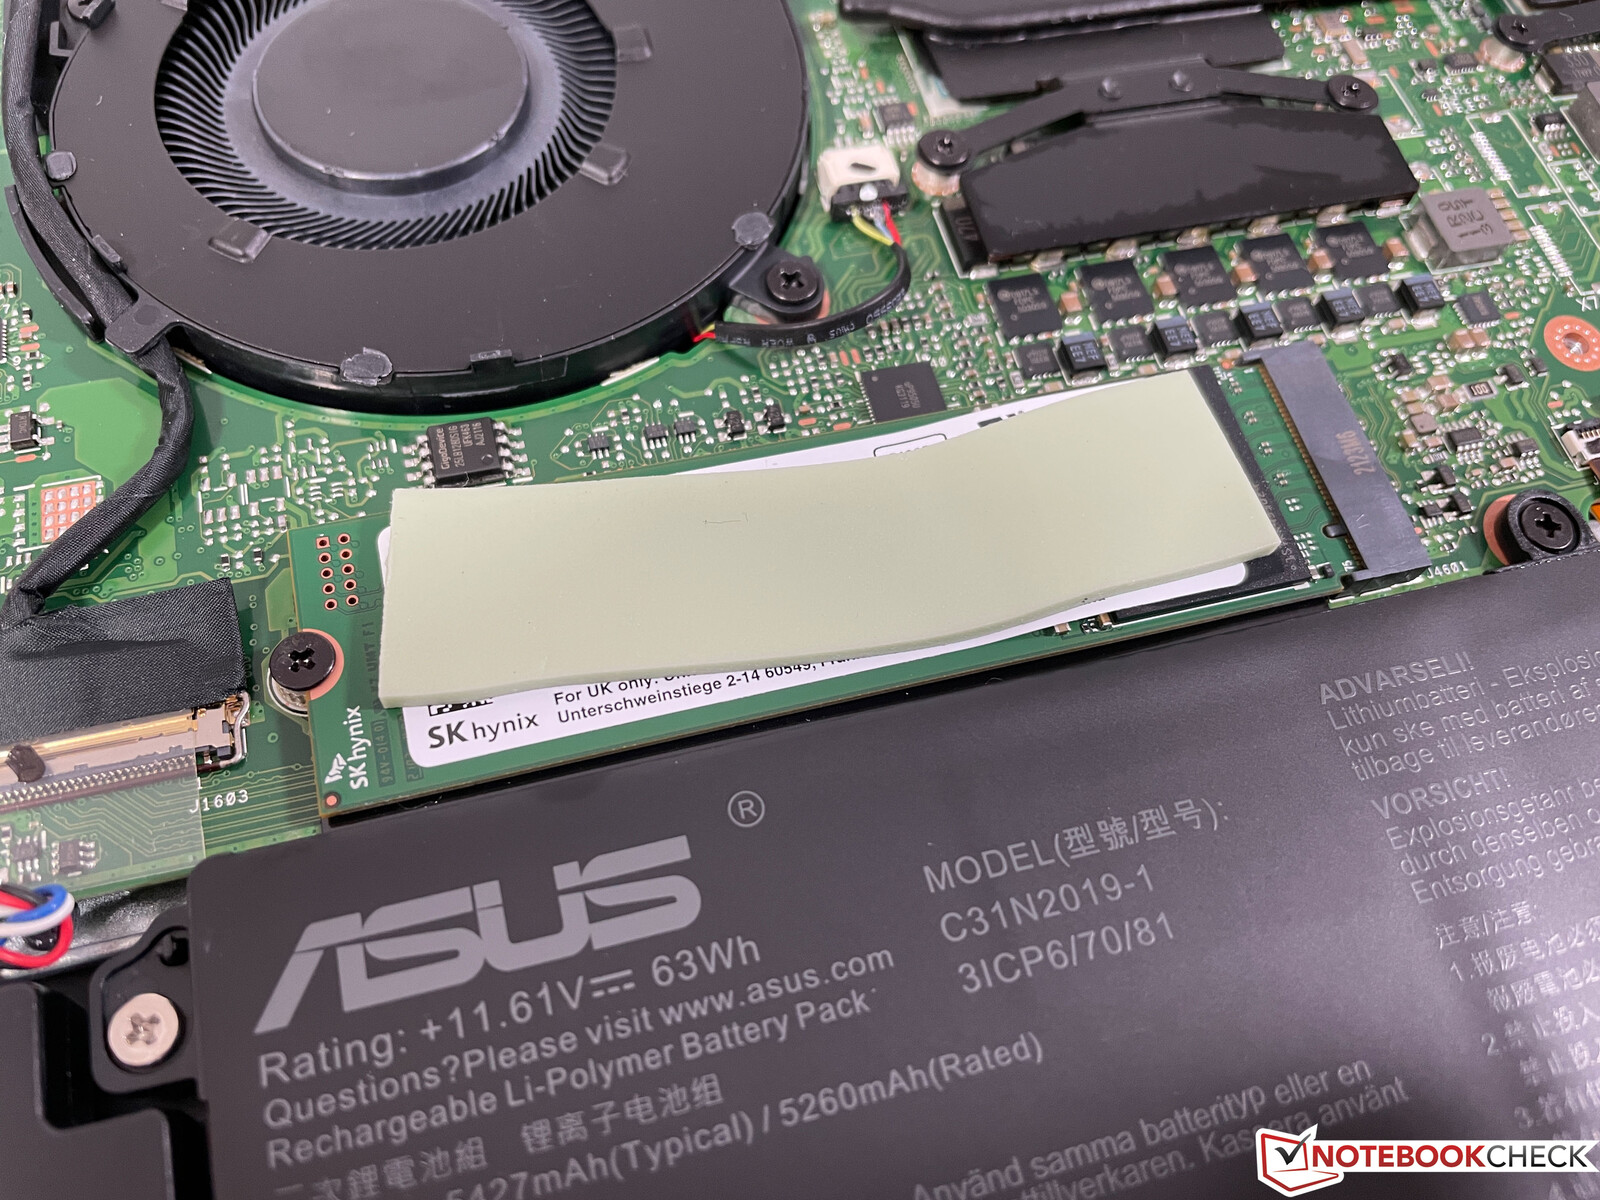
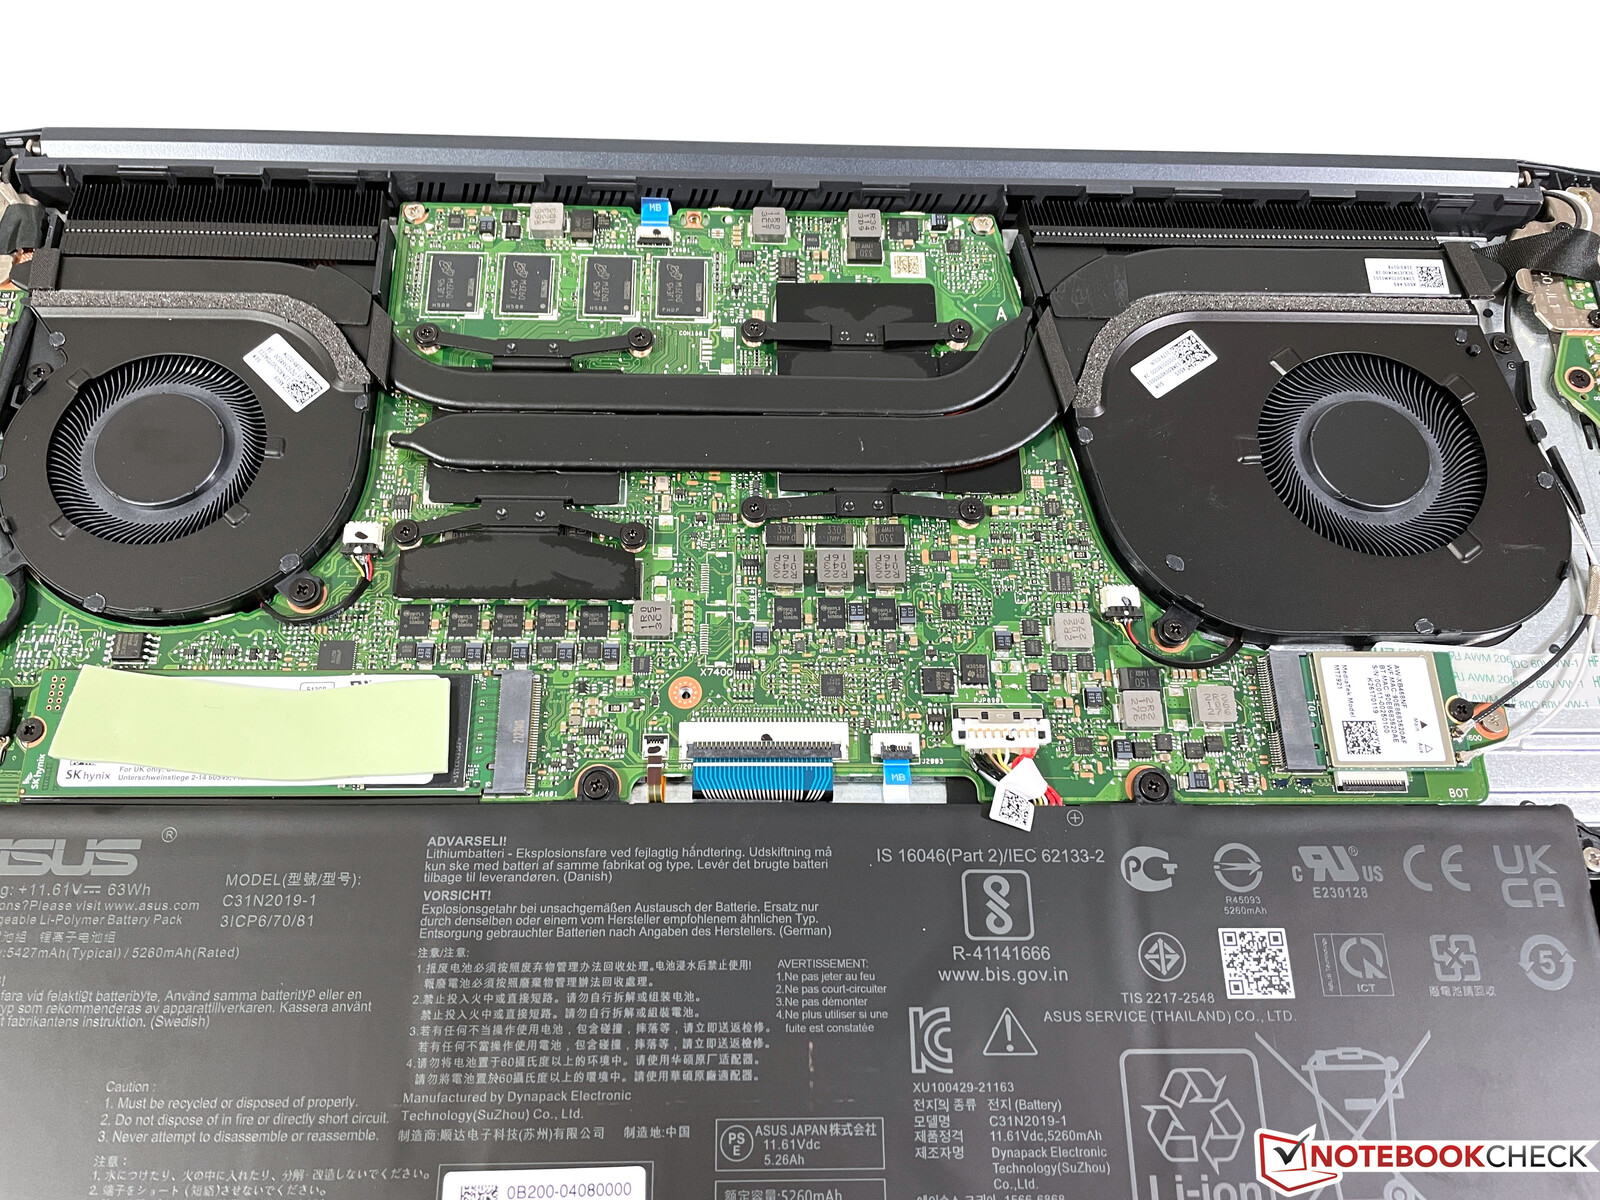
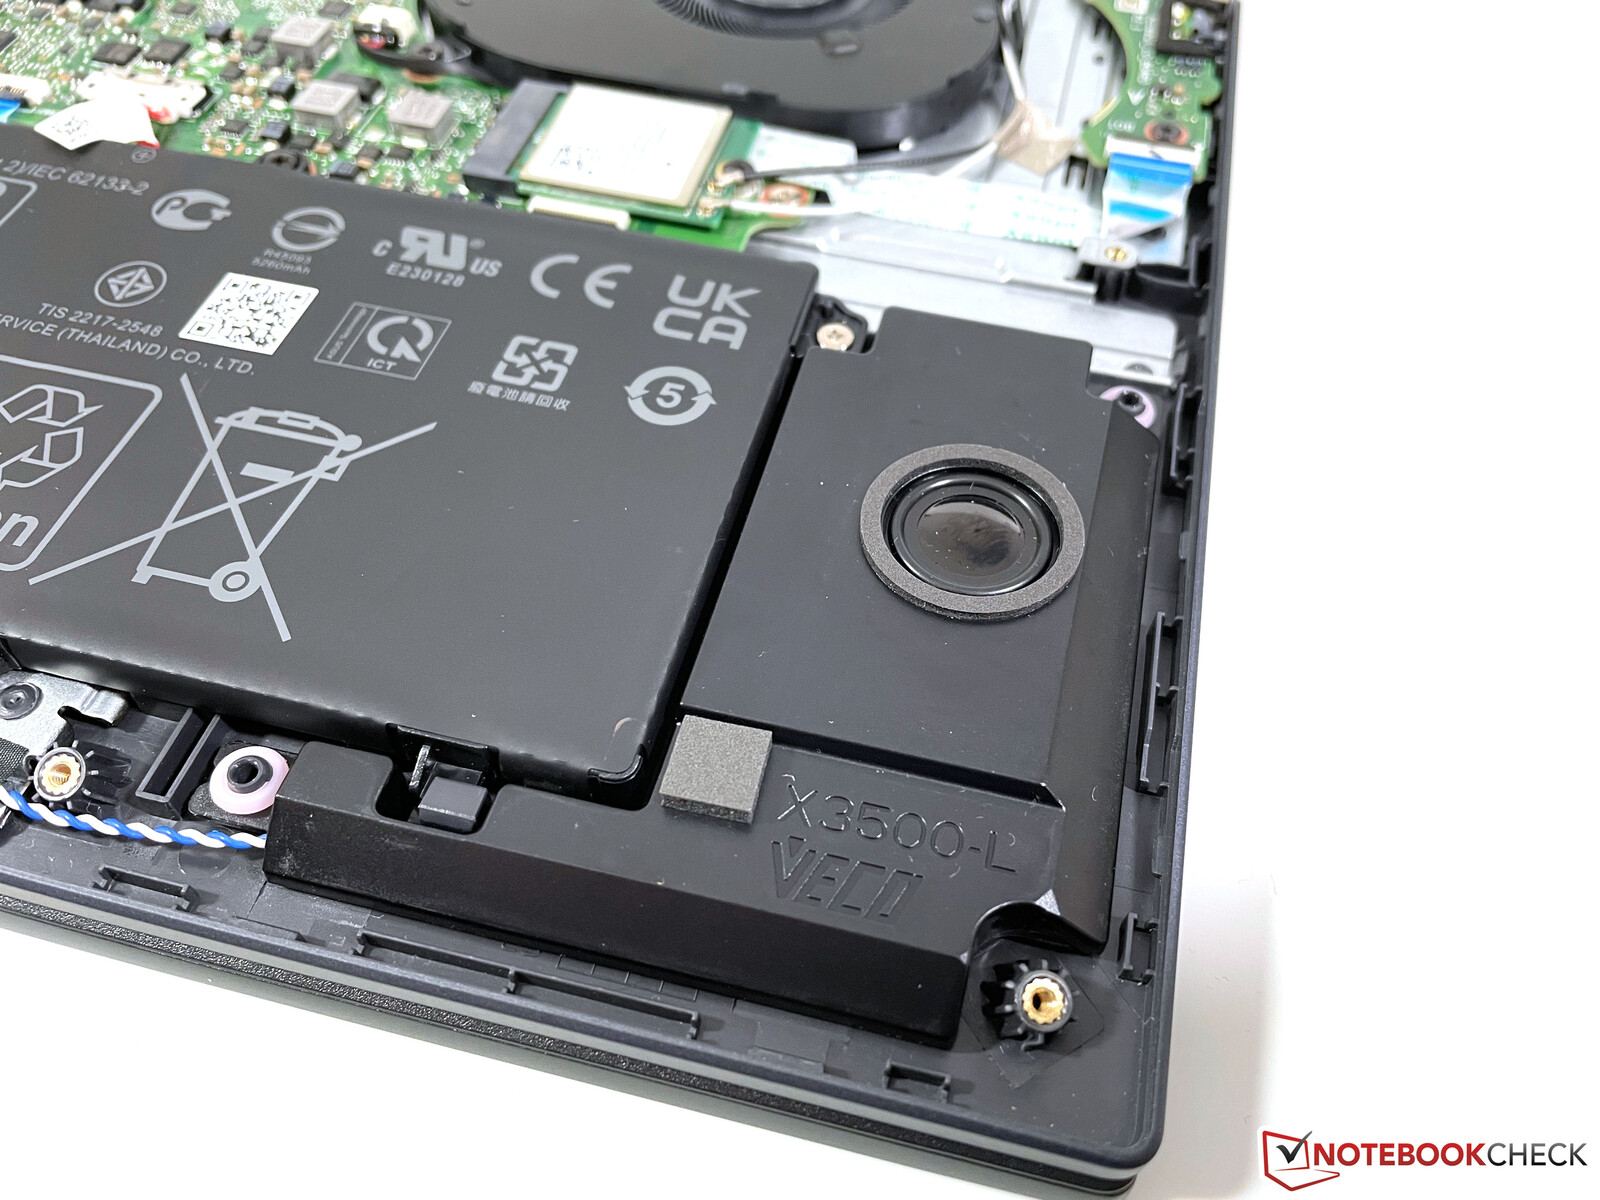
Maintenance
The bottom of the case is secured with Torx screws (T6) and can be removed easily. But since the working memory of the VivoBook 15 Pro is soldered in, the maintenance options are limited to the M.2-2280 slot of the SSD and the WLAN module. You can also clean the fans.
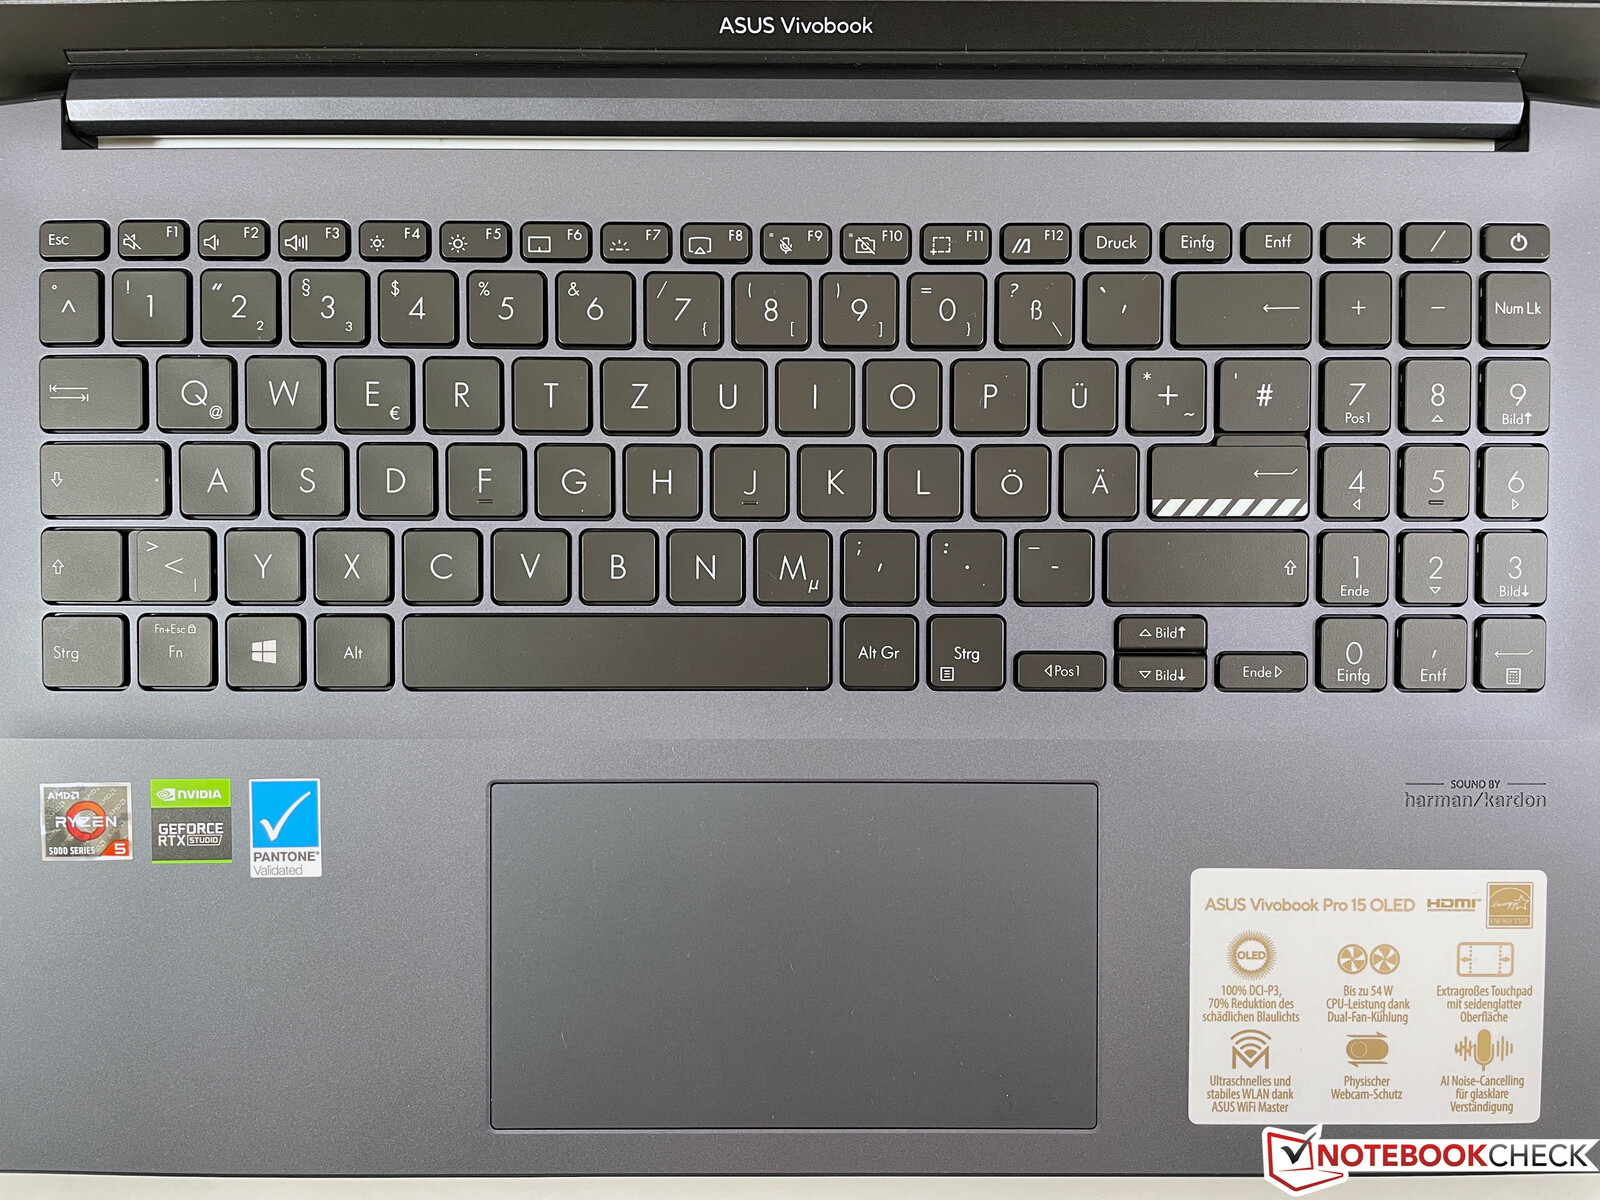
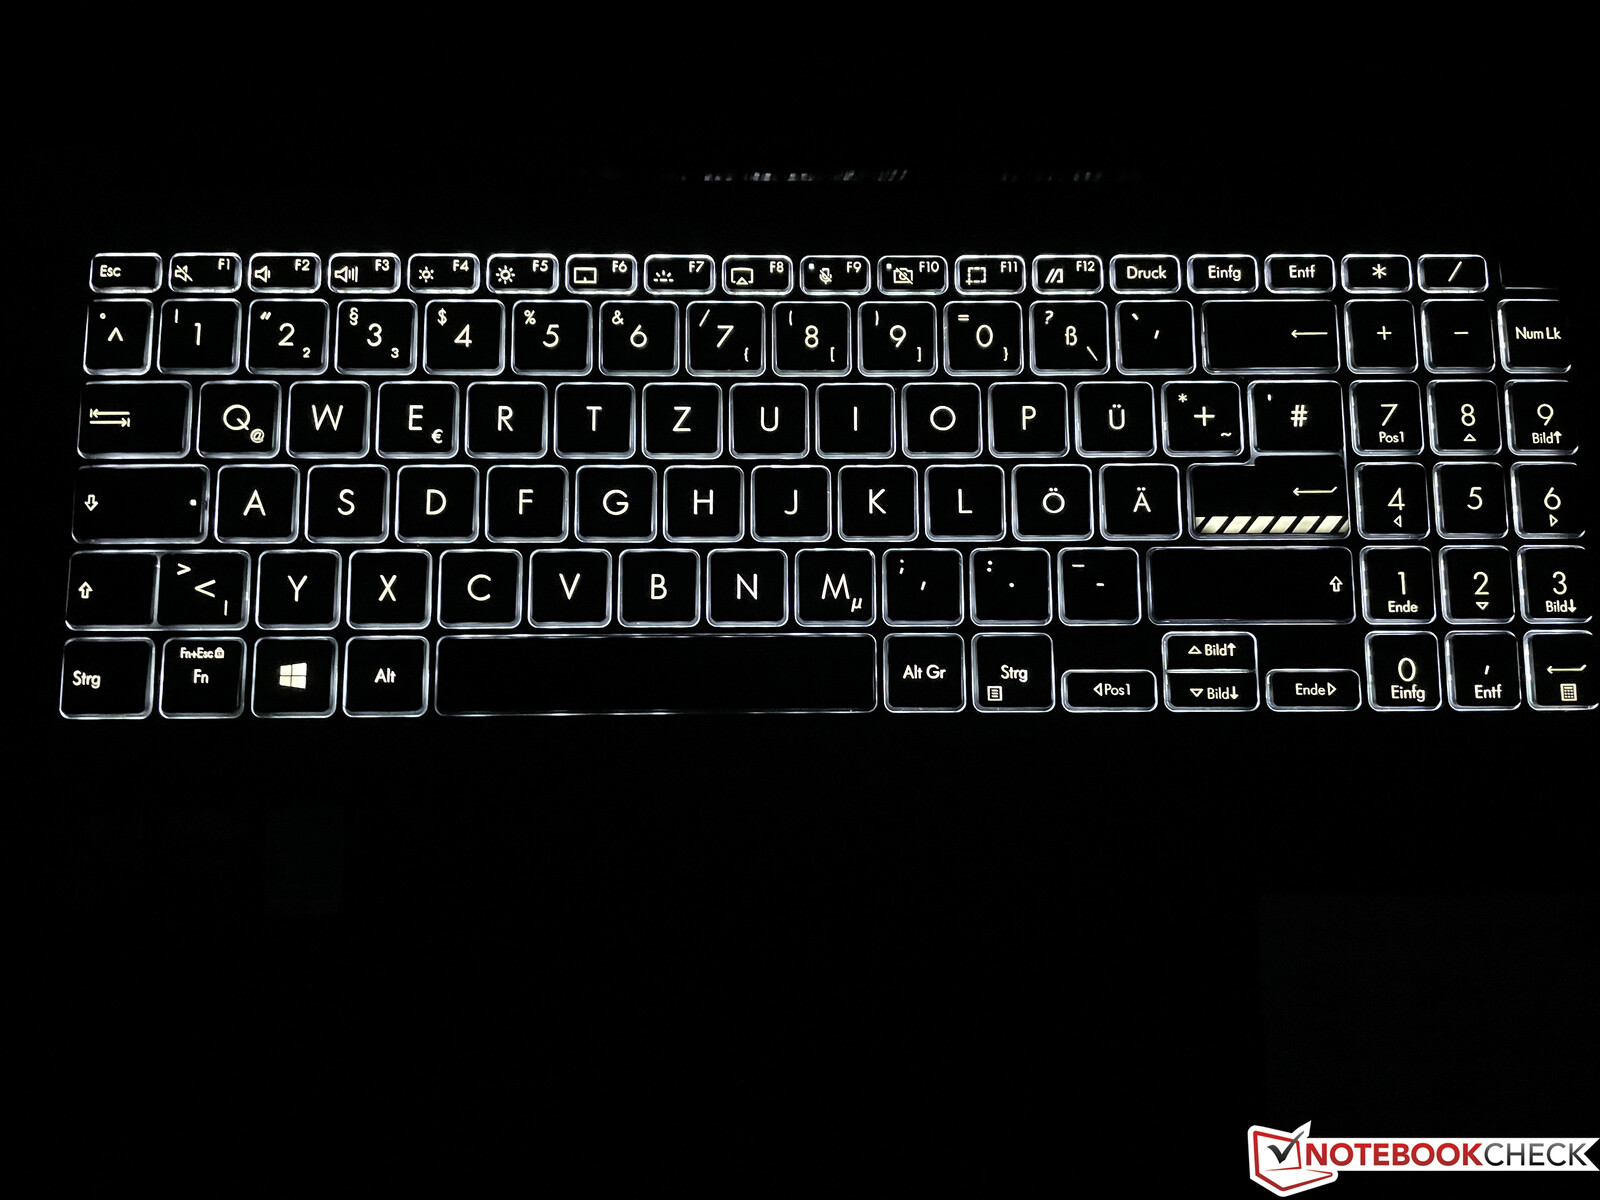
Input Devices - A keyboard with a number pad
Asus uses a keyboard with a 1.35-mm key stroke and dedicated number block on the right side in the VivoBook 15 Pro. The typing experience is decent, and the typing on the letter keys is also comfortably quiet. Only the larger keys such as the Enter and Space keys clatter a bit. The Enter key, which unfortunately only occupies a single row, continues the grooved pattern of the display lid, which makes it easy to feel. For dark surroundings, there is also a white background illumination that can be adjusted in three steps.
The ClickPad offers good sliding characteristics, and at 13 x 7.5 cm (~5.1 x 3 in) is very wide. We did not encounter any problems during our testing, and the mouse control worked flawlessly. As in other laptops of this price range, only the clicking noises were fairly loud.
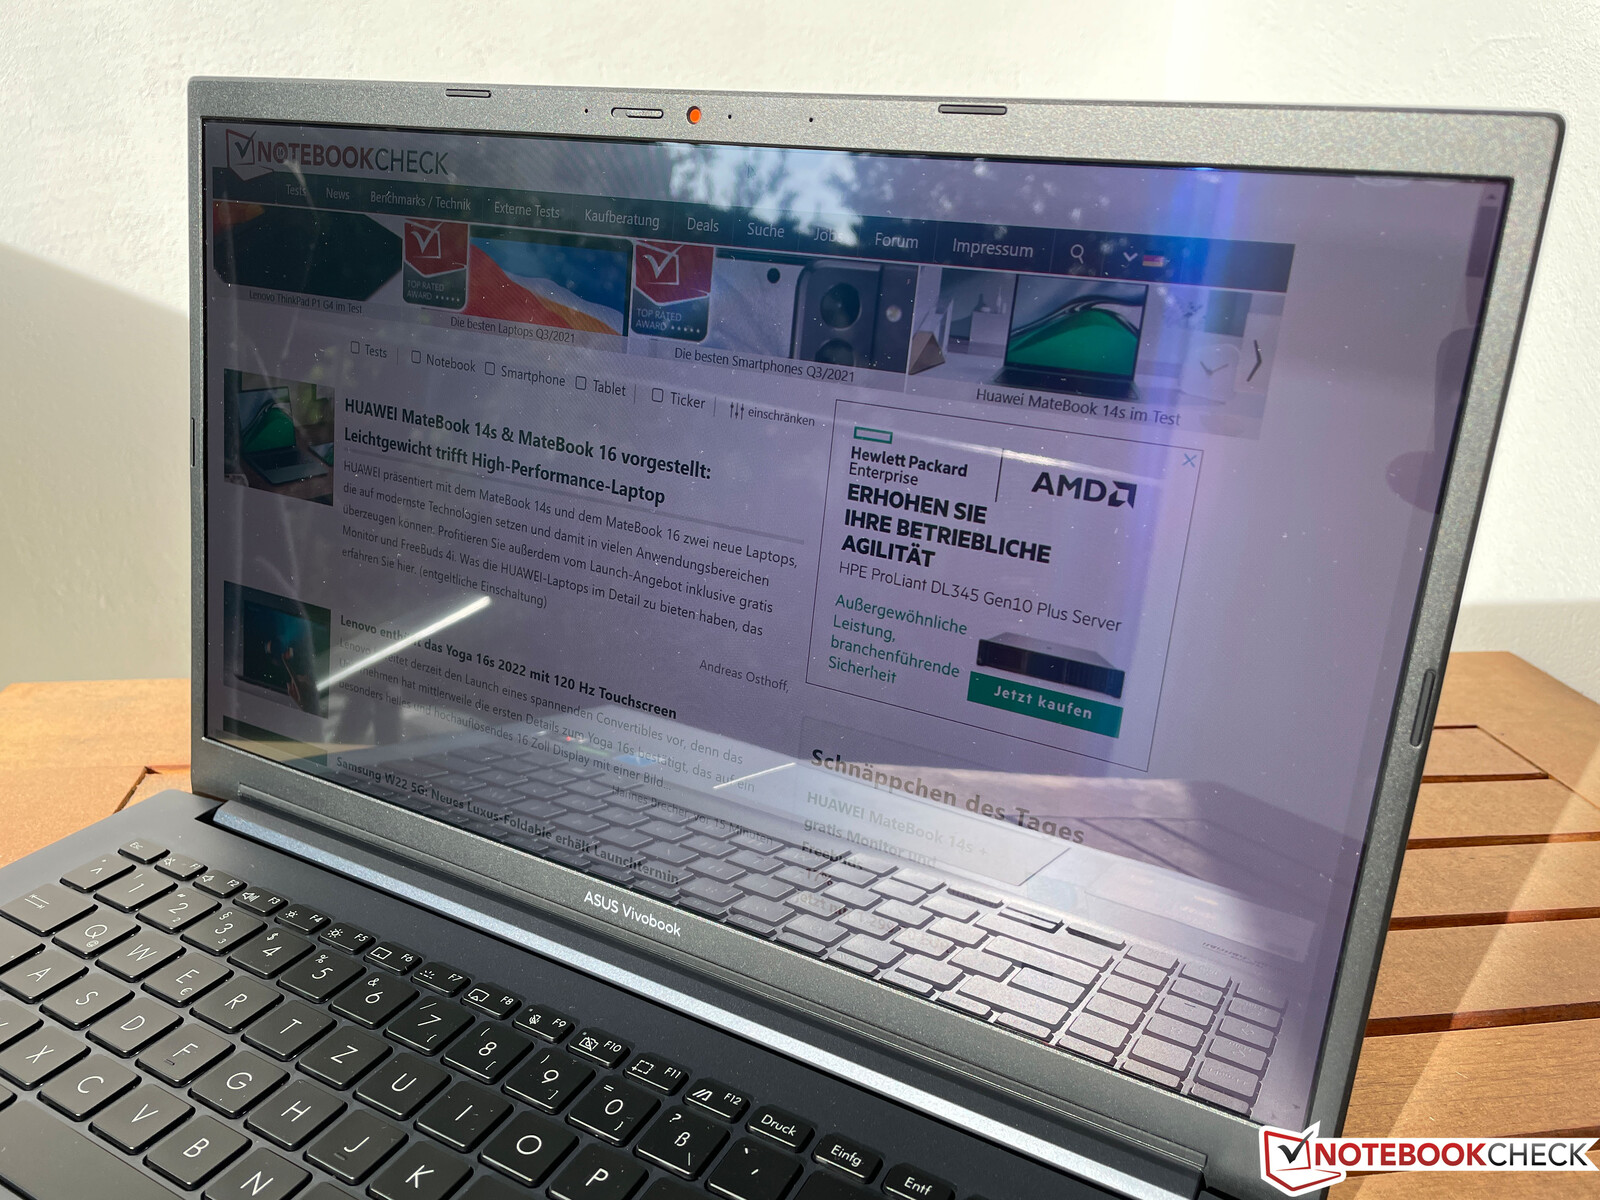
Display - 1080p AMOLED from Samsung

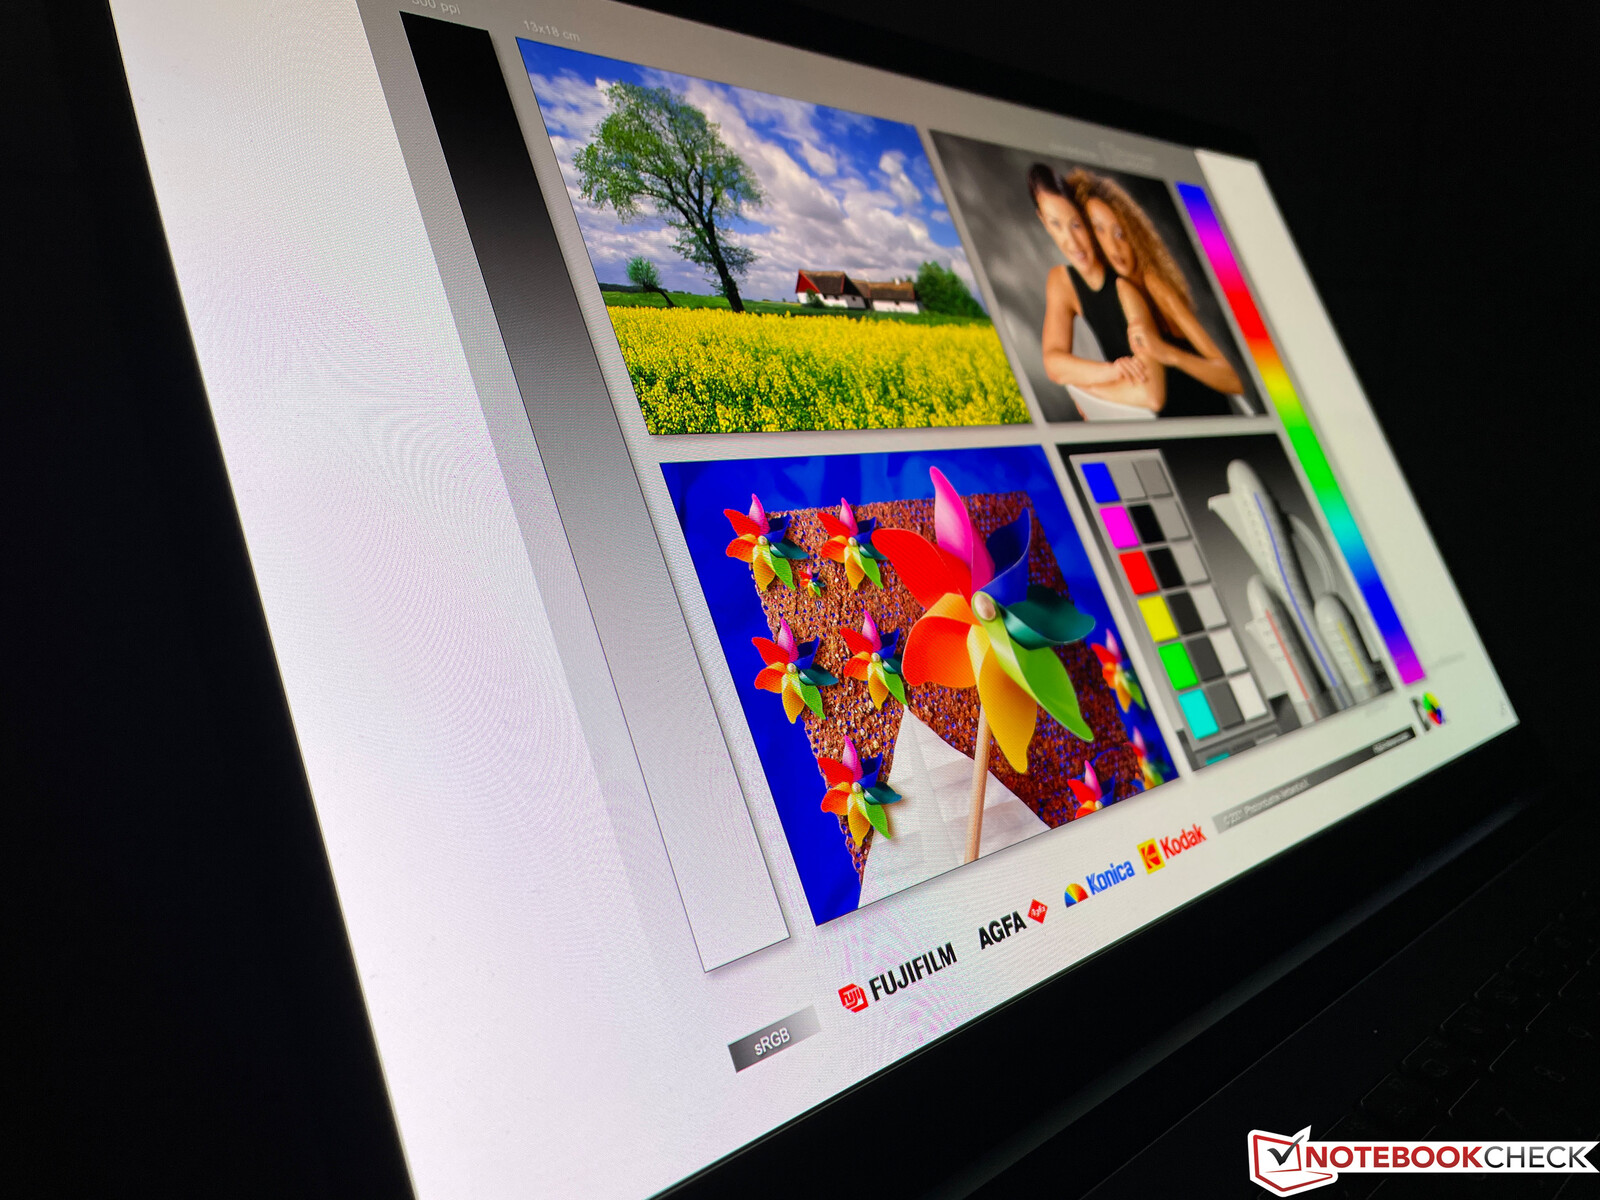
Asus uses a 15.6-inch Samsung AMOLED display with a resolution of 1920 x 1080 pixels (Full HD) in our test unit, but a regular IPS panel is also offered. Thanks to the low black value and its resulting extremely high contrast ratio, the subjective image quality of the OLED panel is very good. Compared to the regular IPS panels, black color appears really black and the colors are also very vibrant. The VivoBook 15 Pro has a real advantage compared to the competitors with IPS displays here.
In our analysis with the CalMAN software and X-Rite i1 Pro 2, the panel with the label "SDC4161" achieves a brightness of almost 400 cd/m² throughout, with only very low variations. At 99%, the brightness distribution is almost perfect. These values are even above those of the OLED panel in the XPS 15. The viewing angle stability is also excellent. Although you can see a slightly blue tint from some specific angles, this is normal for OLED panels.
Another advantage of the OLED display are the extremely fast response times, which also makes it very well-suited for gaming. However, even this panel is not completely without its problems, since we are able to measure PWM at a frequency of only 60 Hz starting from a brightness of 60% or less. This could lead to problems for some users.
To prevent burning in of image content, Asus offers several functions, such as pixel shifting, which is not apparent in practice. The task bar can be hidden automatically, and the screen saver is activated after 30 minutes by default. All these settings can be deactivated in the preinstalled MyAsus app.
| |||||||||||||||||||||||||
Brightness Distribution: 99 %
Center on Battery: 396 cd/m²
Contrast: ∞:1 (Black: 0 cd/m²)
ΔE ColorChecker Calman: 2 | ∀{0.5-29.43 Ø4.73}
calibrated: 1.8
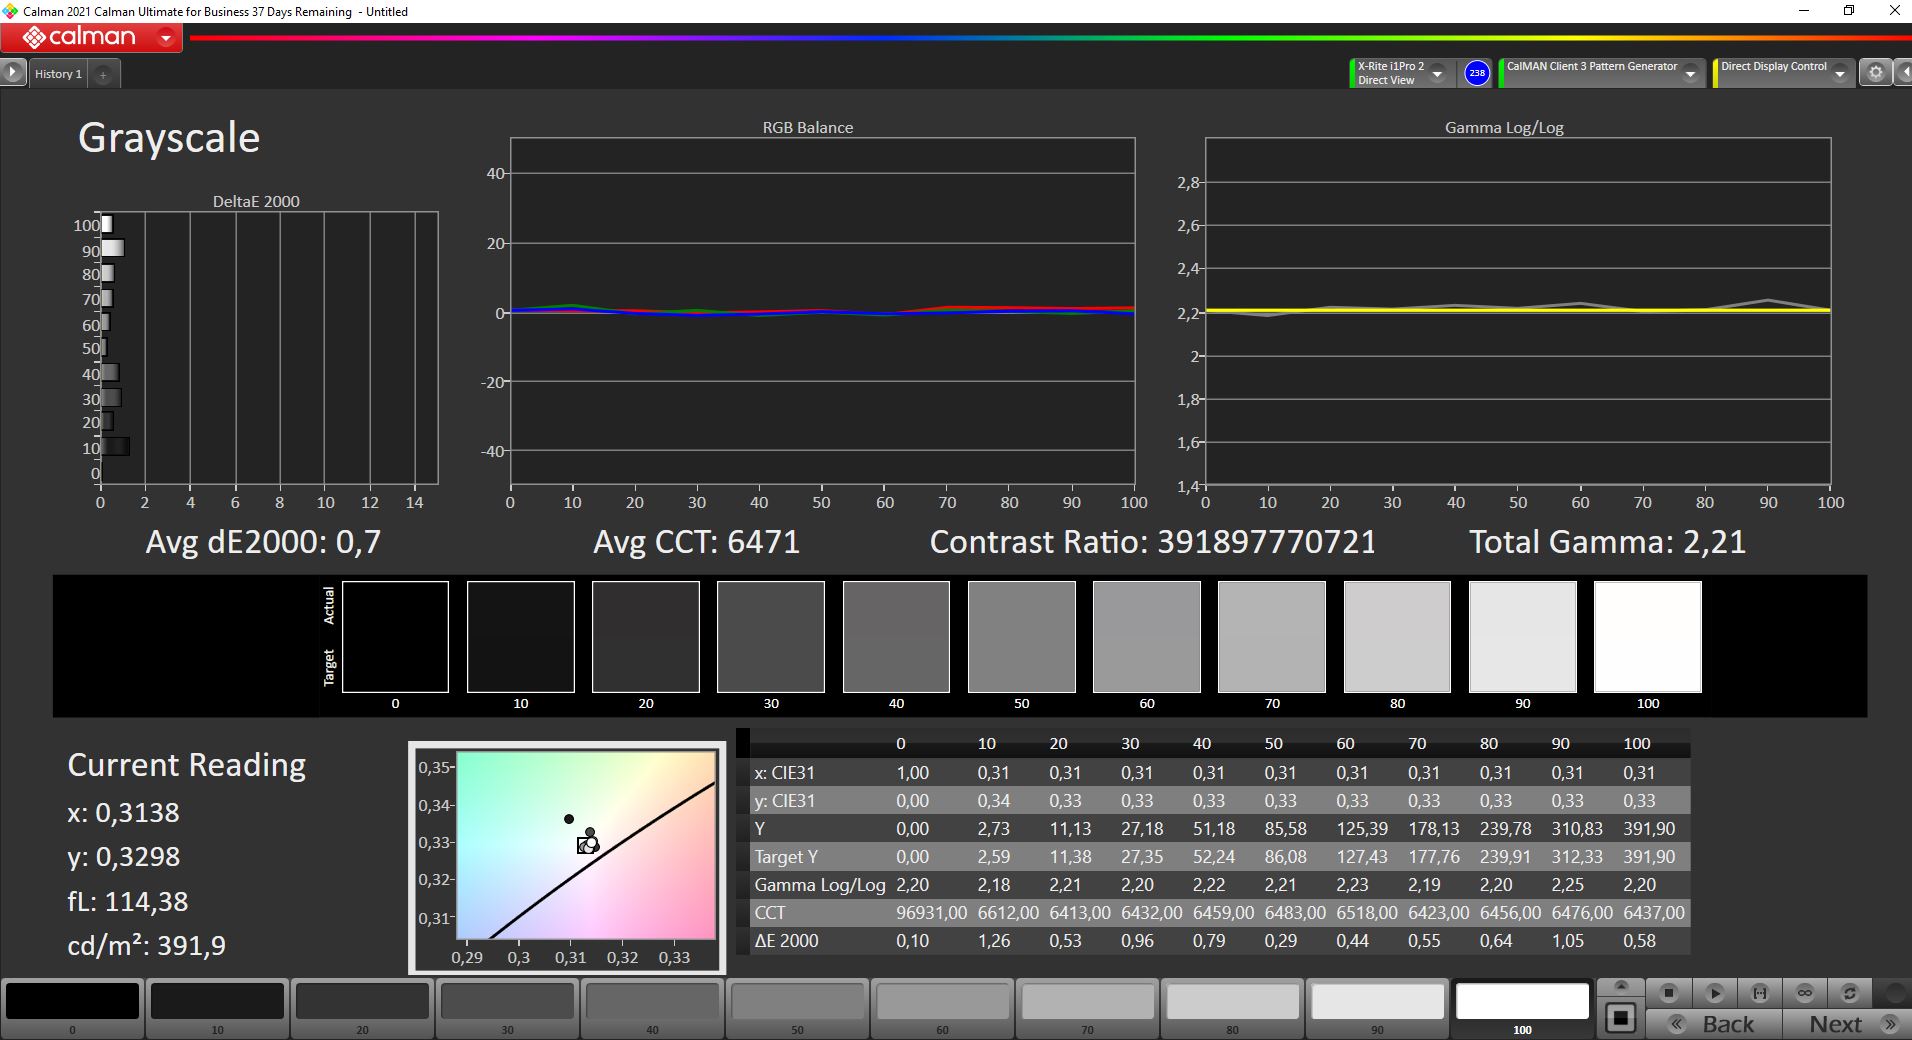
ΔE Greyscale Calman: 1 | ∀{0.09-98 Ø4.97}
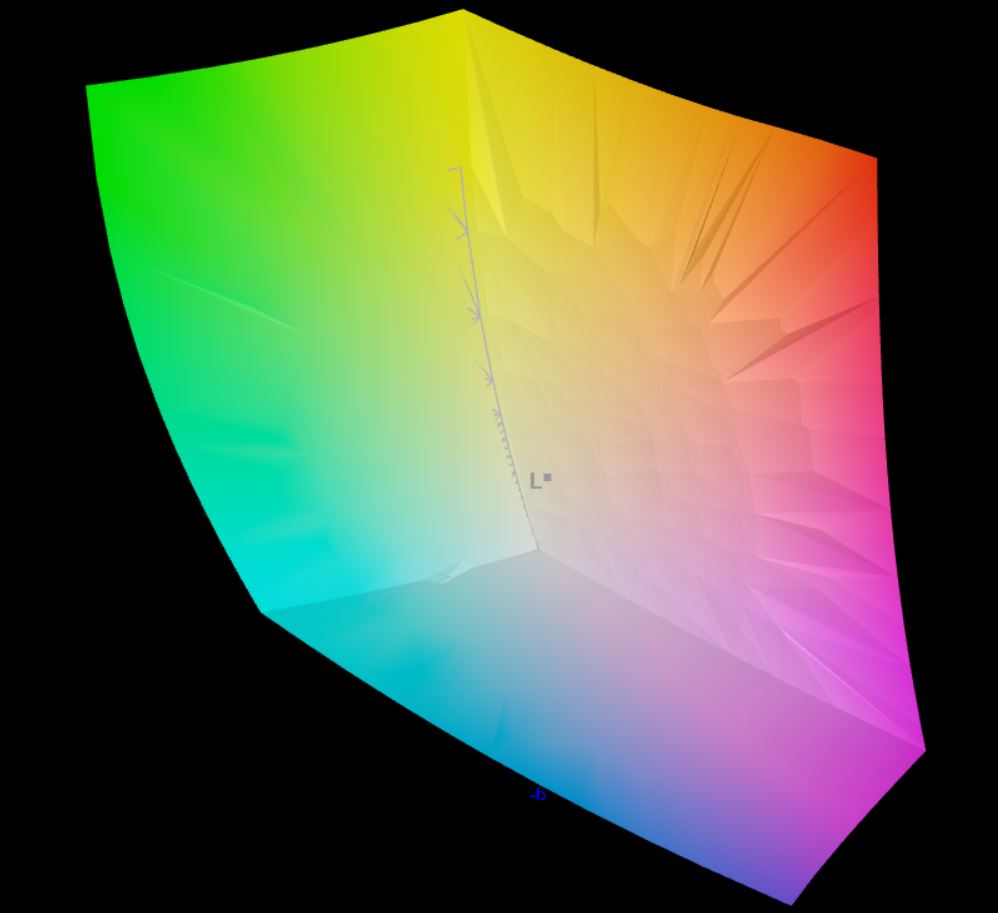
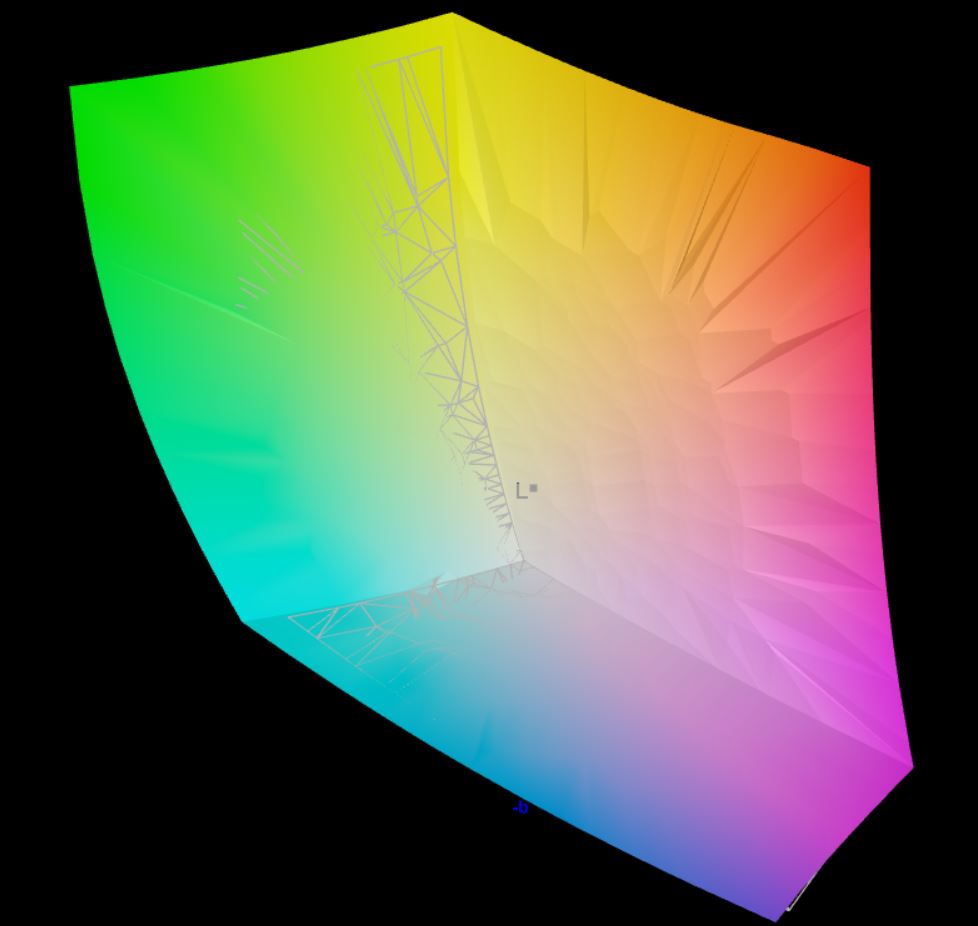
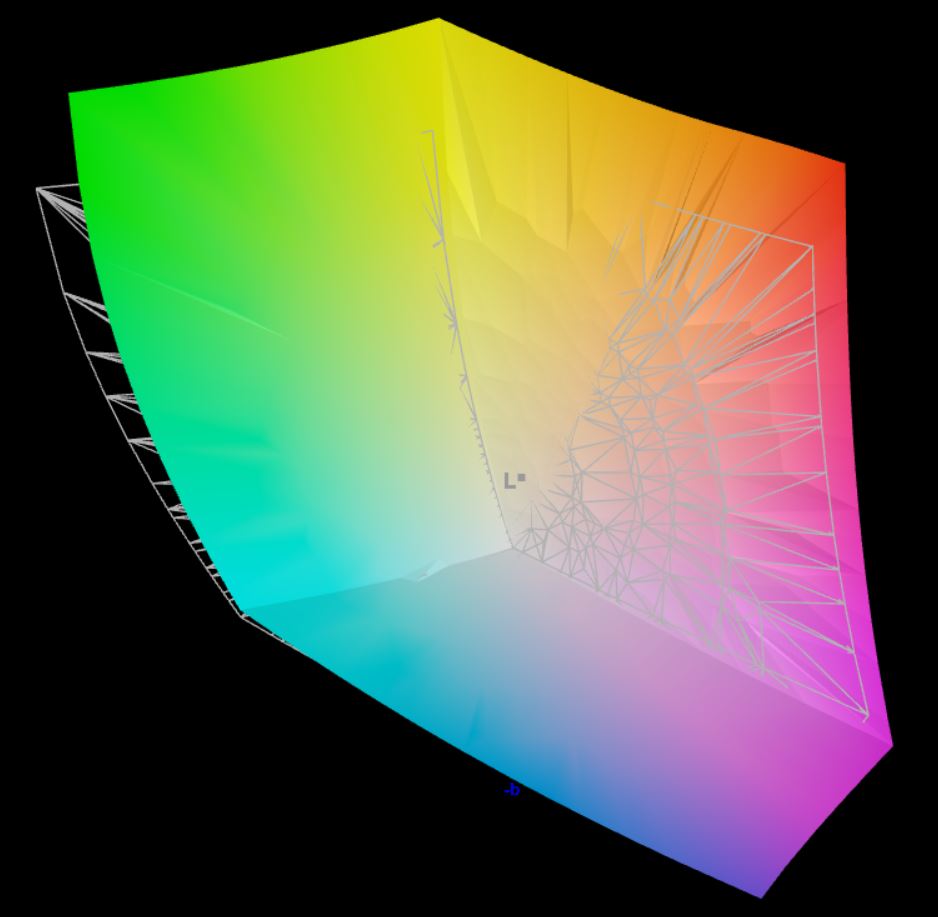
95.8% AdobeRGB 1998 (Argyll 3D)
99.9% sRGB (Argyll 3D)
99.9% Display P3 (Argyll 3D)
Gamma: 2.17
CCT: 6608 K
| Asus VivoBook 15 Pro M3500QC-L1062 ATNA56YX03-0, AMOLED, 1920x1080, 15.6" | Dell G15 5515 BOE092A, IPS, 1920x1080, 15.6" | Schenker XMG Focus 15 LG Philips LP156WFG-SPB5, IPS, 1920x1080, 15.6" | HP Pavilion 15-eg Chi Mei CMN1523, IPS, 1920x1080, 15.6" | Lenovo IdeaPad 5 Pro 16ACH IPS LED, 2560x1600, 16" | Dell XPS 15 9510 11800H RTX 3050 Ti OLED SDC414D, OLED, 3456x2160, 15.6" | |
|---|---|---|---|---|---|---|
| Display | -54% | -24% | -49% | -18% | 1% | |
| Display P3 Coverage (%) | 99.9 | 39.1 -61% | 64.6 -35% | 42.9 -57% | 71 -29% | 99.9 0% |
| sRGB Coverage (%) | 99.9 | 56.9 -43% | 95.3 -5% | 64 -36% | 99 -1% | 100 0% |
| AdobeRGB 1998 Coverage (%) | 95.8 | 40.4 -58% | 66.5 -31% | 44.4 -54% | 73.3 -23% | 98.1 2% |
| Response Times | -556% | -319% | -626% | -294% | 0% | |
| Response Time Grey 50% / Grey 80% * (ms) | 3.2 ? | 25.2 ? -687% | 18 ? -463% | 22.8 ? -613% | 16.4 ? -412% | 3.6 ? -13% |
| Response Time Black / White * (ms) | 3.2 ? | 16.8 ? -425% | 8.8 ? -175% | 23.6 ? -638% | 8.8 ? -175% | 2.8 ? 13% |
| PWM Frequency (Hz) | 60.2 ? | 200 ? | 26320 ? | 24940 ? | 59.5 ? | |
| Screen | -135% | -18% | -115% | -37% | -13% | |
| Brightness middle (cd/m²) | 396 | 278 -30% | 418 6% | 294.3 -26% | 395 0% | 362 -9% |
| Brightness (cd/m²) | 397 | 262 -34% | 376 -5% | 251 -37% | 375 -6% | 367 -8% |
| Brightness Distribution (%) | 99 | 83 -16% | 83 -16% | 76 -23% | 90 -9% | 97 -2% |
| Black Level * (cd/m²) | 0.36 | 0.41 | 0.26 | 0.32 | 0.06 | |
| Colorchecker dE 2000 * | 2 | 5.74 -187% | 1.67 16% | 4.08 -104% | 2.6 -30% | 2.1 -5% |
| Colorchecker dE 2000 max. * | 4.8 | 19.63 -309% | 3.88 19% | 19.49 -306% | 5.4 -13% | 4.1 15% |
| Colorchecker dE 2000 calibrated * | 1.8 | 4.7 -161% | 0.98 46% | 3.7 -106% | 1.1 39% | 2.5 -39% |
| Greyscale dE 2000 * | 1 | 3.1 -210% | 2.9 -190% | 3 -200% | 3.4 -240% | 1.4 -40% |
| Gamma | 2.17 101% | 2.011 109% | 2.26 97% | 2.21 100% | 2.12 104% | 2.18 101% |
| CCT | 6608 98% | 6207 105% | 6209 105% | 6616 98% | 6140 106% | 6608 98% |
| Contrast (:1) | 772 | 1020 | 1132 | 1234 | 6033 | |
| Total Average (Program / Settings) | -248% /
-185% | -120% /
-69% | -263% /
-183% | -116% /
-75% | -4% /
-7% |
* ... smaller is better

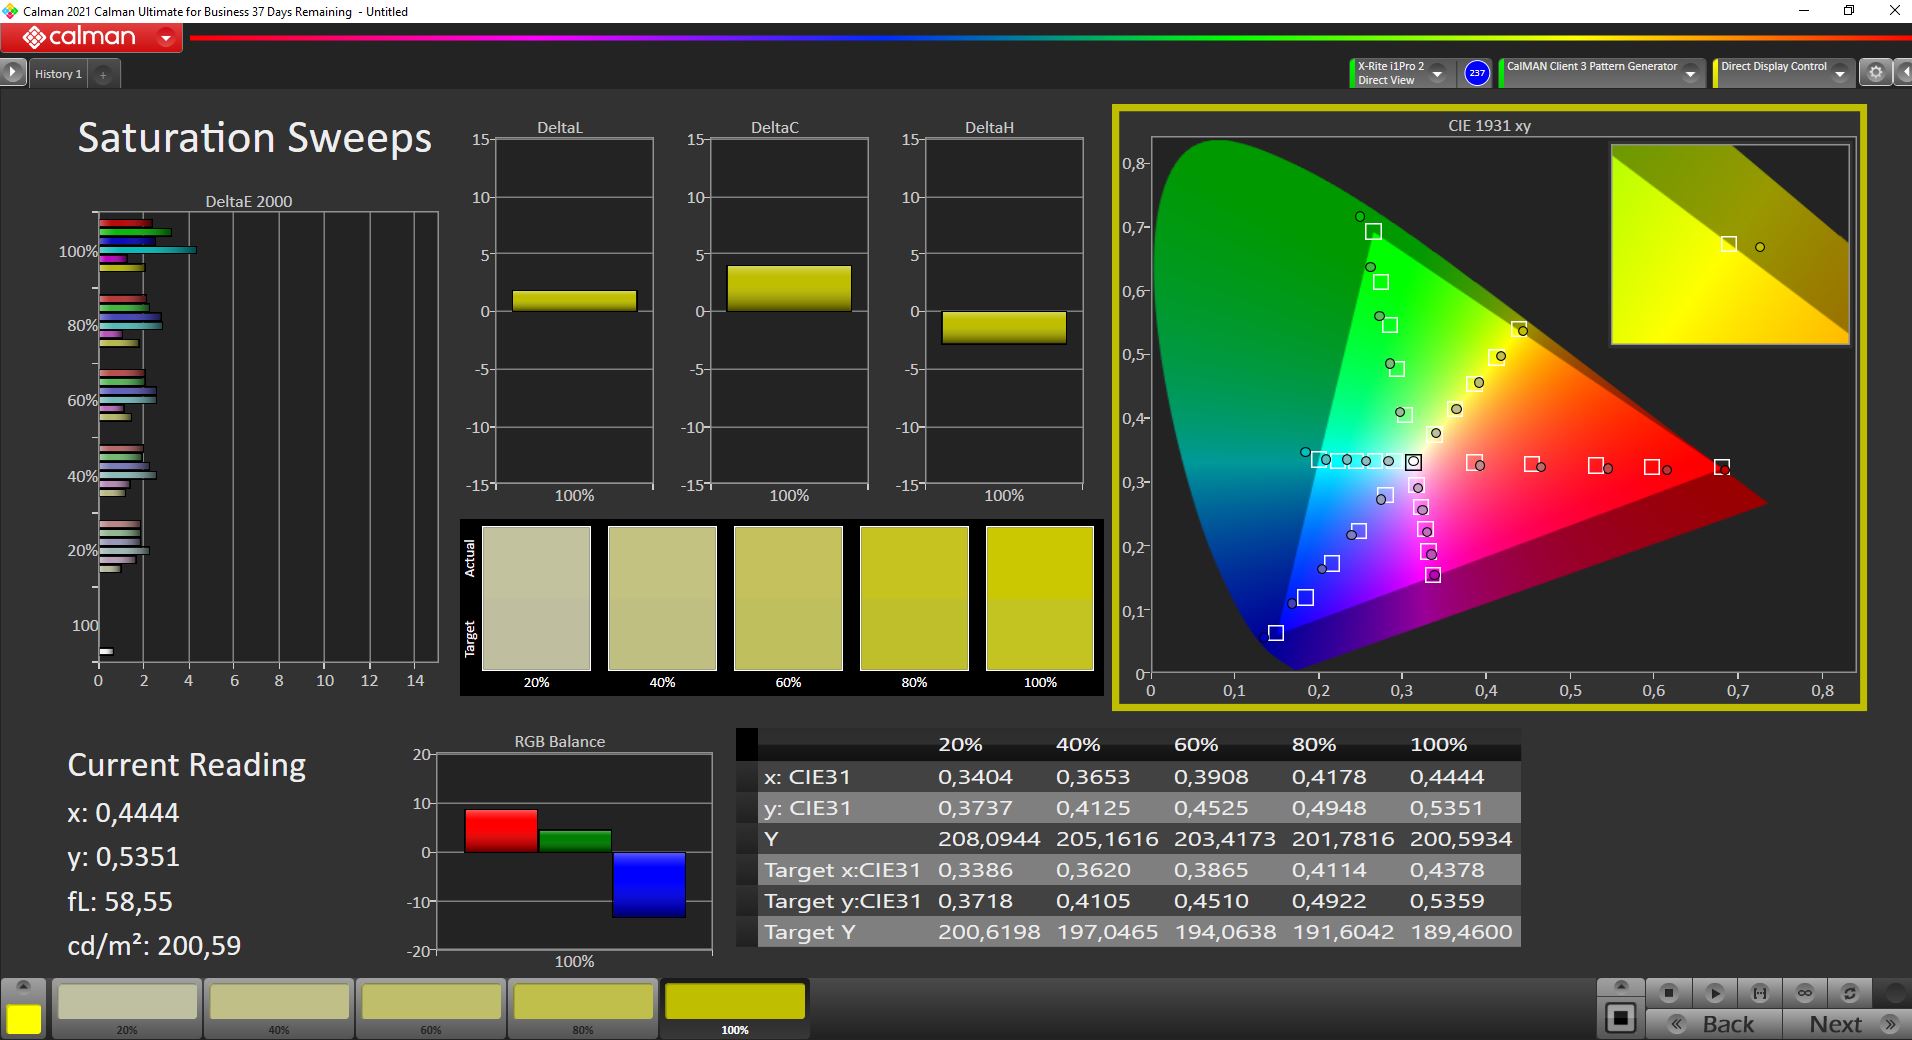
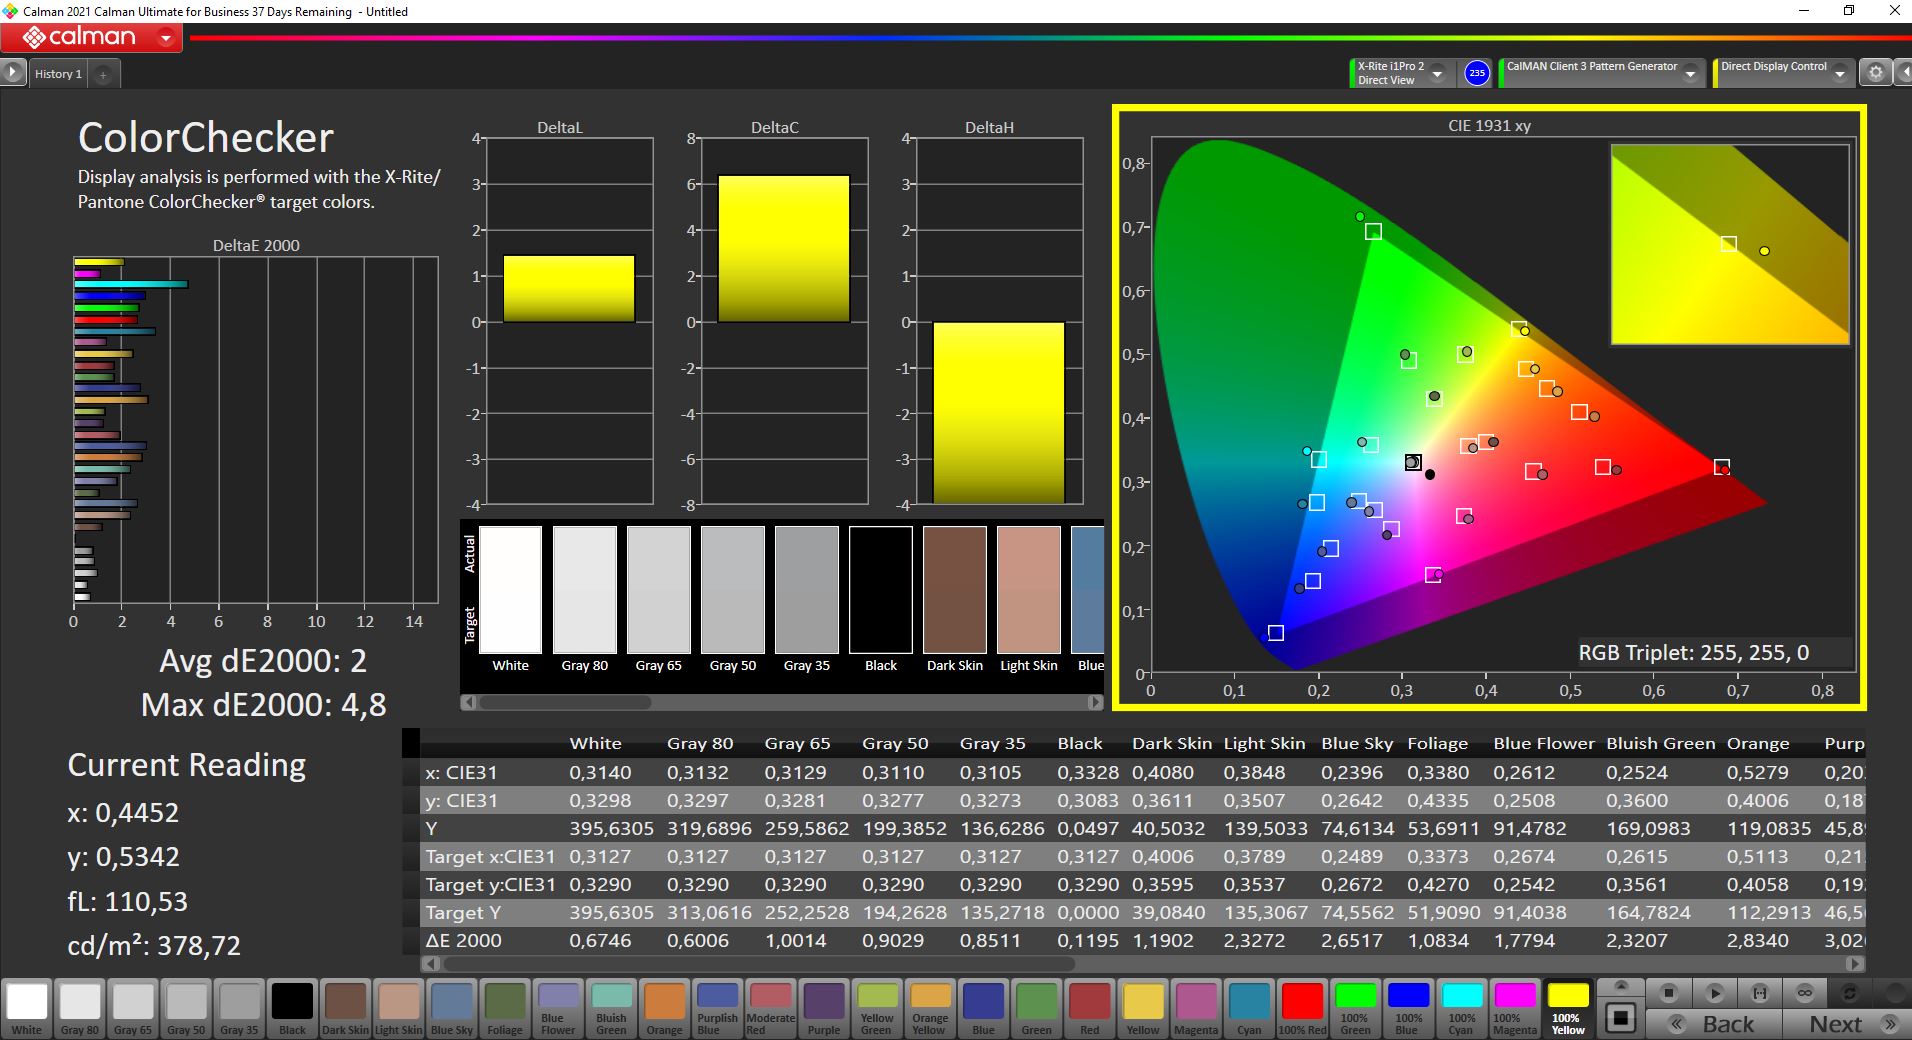
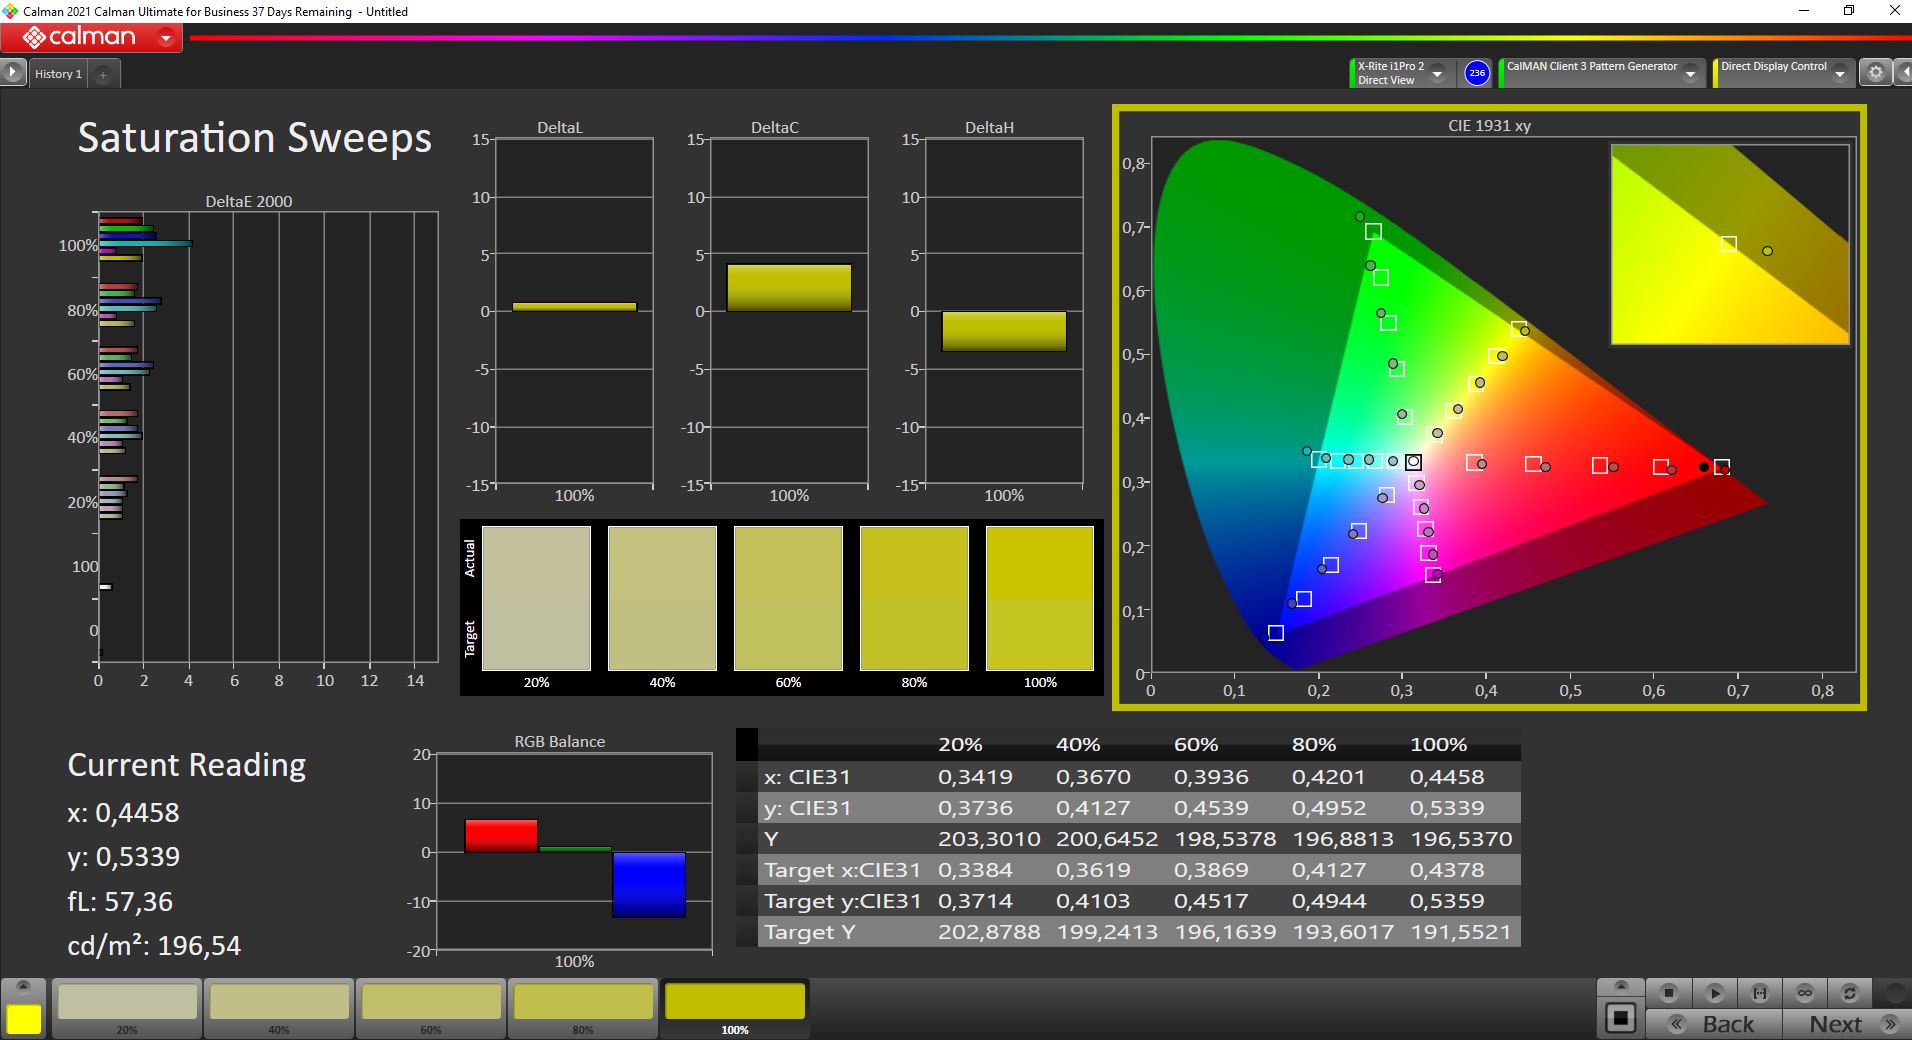

In the state of delivery, the panel is already adjusted well and there is no colored tint. The color deviations compared to the DCI P3 reference color space are very low. Only the deviation of cyan color is still above the important target of 3. With a calibration (the profile is available for free download above), we are able to further improve the DeltaE 2000 deviations slightly (although the cyan outlier remains), but this isn't really necessary. Thanks to the complete coverage of the DCI P3 color space, video and image processing is also possible on this device.
Display Response Times
| ↔ Response Time Black to White | ||
|---|---|---|
| 3.2 ms ... rise ↗ and fall ↘ combined | ↗ 1.6 ms rise | 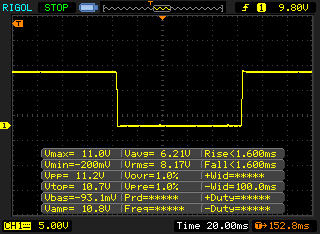 |
| ↘ 1.6 ms fall | ||
| The screen shows very fast response rates in our tests and should be very well suited for fast-paced gaming. In comparison, all tested devices range from 0.1 (minimum) to 240 (maximum) ms. » 15 % of all devices are better. This means that the measured response time is better than the average of all tested devices (19.9 ms). | ||
| ↔ Response Time 50% Grey to 80% Grey | ||
| 3.2 ms ... rise ↗ and fall ↘ combined | ↗ 1.6 ms rise | 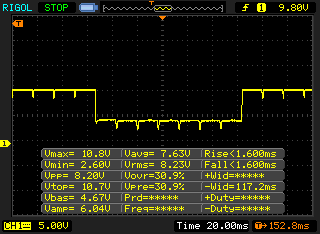 |
| ↘ 1.6 ms fall | ||
| The screen shows very fast response rates in our tests and should be very well suited for fast-paced gaming. In comparison, all tested devices range from 0.165 (minimum) to 636 (maximum) ms. » 13 % of all devices are better. This means that the measured response time is better than the average of all tested devices (31.1 ms). | ||
Screen Flickering / PWM (Pulse-Width Modulation)
| Screen flickering / PWM detected | 60.2 Hz | ≤ 60 % brightness setting | 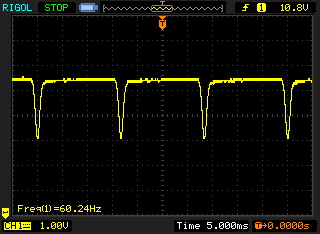 |
The display backlight flickers at 60.2 Hz (worst case, e.g., utilizing PWM) Flickering detected at a brightness setting of 60 % and below. There should be no flickering or PWM above this brightness setting. The frequency of 60.2 Hz is very low, so the flickering may cause eyestrain and headaches after extended use. In comparison: 52 % of all tested devices do not use PWM to dim the display. If PWM was detected, an average of 7798 (minimum: 5 - maximum: 343500) Hz was measured. | |||
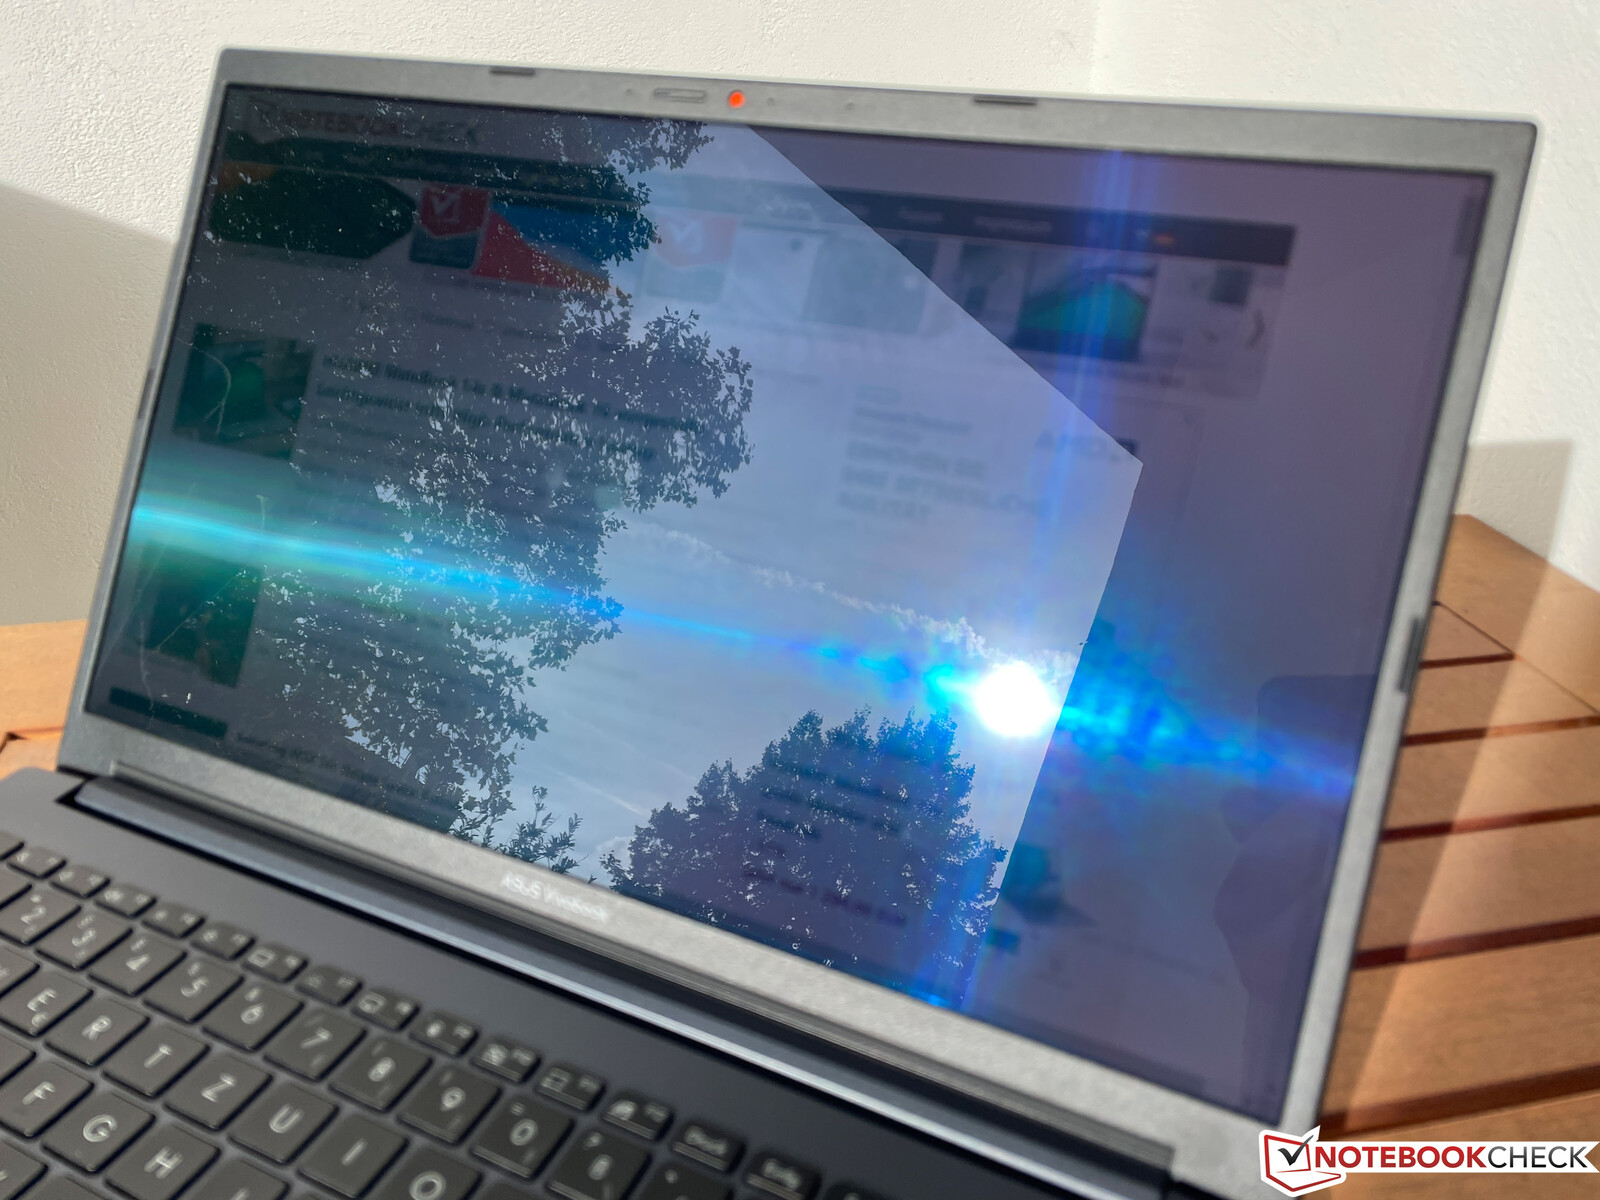
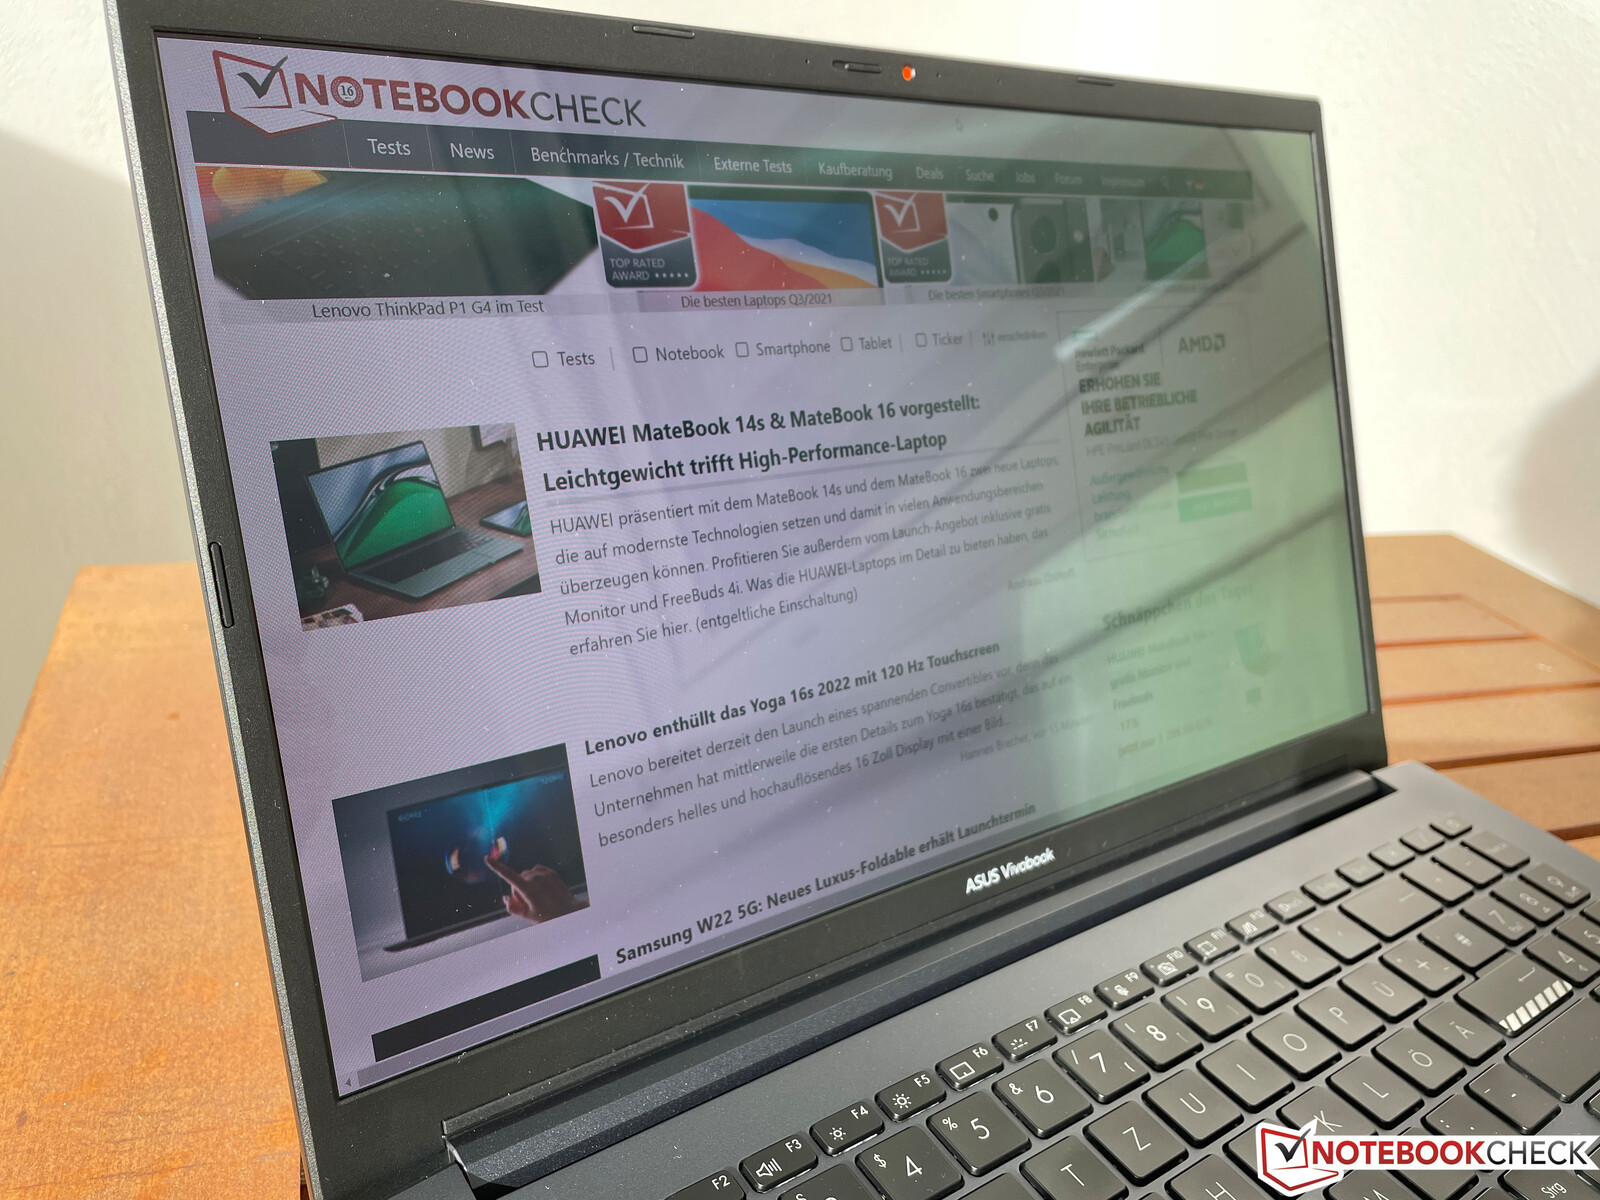
The display surface is highly reflective, which also impacts using the device in bright surroundings. On a bright and sunny day, you can hardly use the device outdoors, since constant reflections become a hindrance.
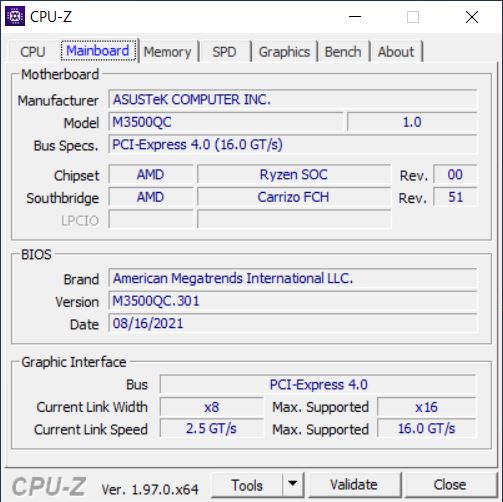
Performance - AMD Ryzen meets GeForce RTX
Our VivoBook 15 Pro test unit uses a current AMD Ryzen 5000 processor (45-Watt class) in combination with a dedicated GeForce RTX-3050 graphics card from Nvidia. The MyAsus app offers various performance profiles that have an impact on the performance of both the processor and the graphics card.
| Performance mode | CPU load | GPU load | combined CPU/GPU load |
|---|---|---|---|
| Whisper Mode | 65W -> 45W | 35W | CPU: 15W, GPU: 35W |
| Standard Mode | 65W -> 54W | 40W | CPU: 25W, GPU: 40W |
| Performance Mode | 65W -> 54W | 50W | CPU: 35W, GPU: 50W |
In general, we ran the following benchmarks and measurements using the preset Standard Mode. However, in some categories we also look at the effect of the other two modes. Particularly the Whisper Mode might be really interesting for everyday tasks and even gaming, but more on this later.
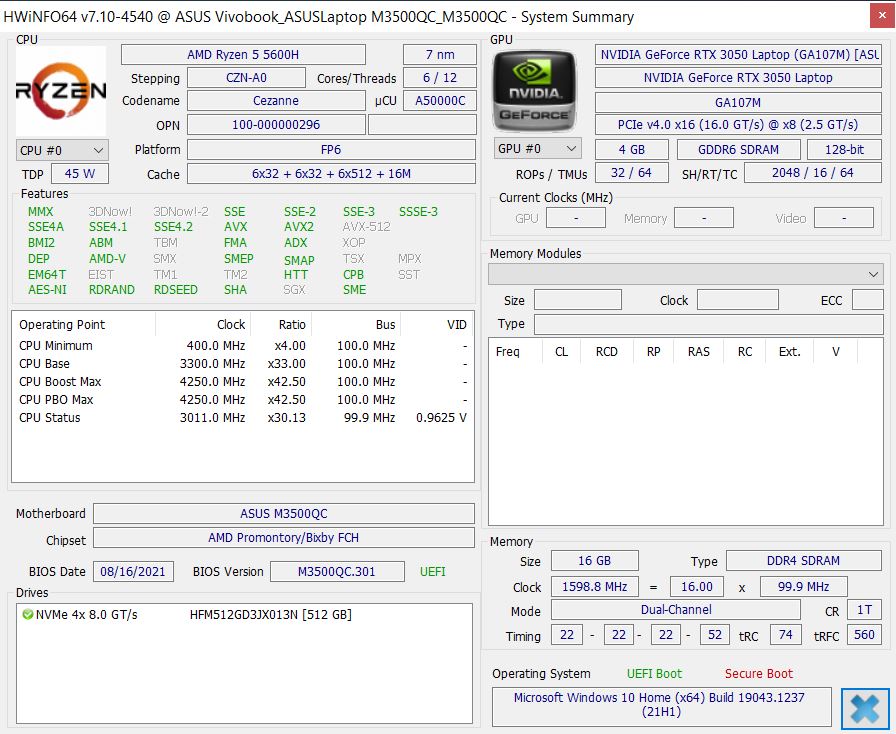
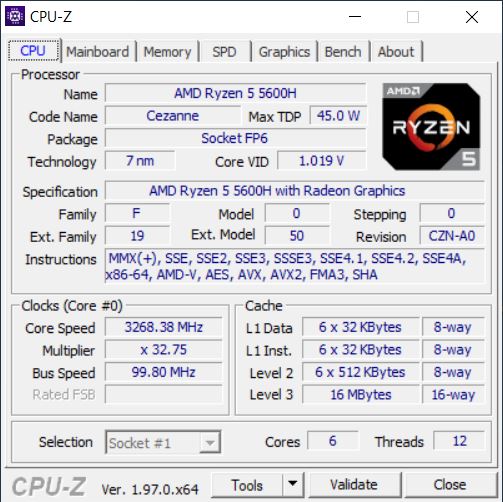
Processor - Ryzen 5 5600H (Zen 3)
Asus uses the current AMD Ryzen 5 5600H processor with 6 cores (12 threads). Thanks to the high TDP values, it delivers a very good performance and in the Standard as well as the Performance Mode, the performance also remains stable even under constant load. As expected, the competitors with 8-core CPUs have an advantage, but due to its bad performance development under longer load, the XPS 15 isn't even that far ahead. Overall, the performance of the Ryzen 5 is completely sufficient in most cases, even for more demanding tasks.
The Intel model of the VivoBook 15 Pro uses the Core i7-11370H with 4 cores (8 threads), which we already tested with similar TDP values in the MateBook 14s. In the multi-core tests, the i7 ends up behind the Ryzen 5 by about 30%, but in the single-core tests it has an advantage of slightly more than 10%. Since the Ryzen processor is more efficient due to its modern 7-nm manufacturing process, it is the better choice overall.
In battery operation, the CPU performance is limited to about 30 watts (even in the optional Performance Mode), but this only becomes noticeable in the multi-core tests with a decrease of about 15%. You can find additional CPU benchmarks here.
Cinebench R15 Multi Constant Load Test
Cinebench R23: Multi Core | Single Core
Cinebench R20: CPU (Multi Core) | CPU (Single Core)
Cinebench R15: CPU Multi 64Bit | CPU Single 64Bit
Blender: v2.79 BMW27 CPU
7-Zip 18.03: 7z b 4 | 7z b 4 -mmt1
Geekbench 5.5: Multi-Core | Single-Core
HWBOT x265 Benchmark v2.2: 4k Preset
LibreOffice : 20 Documents To PDF
R Benchmark 2.5: Overall mean
| CPU Performance rating | |
| Average of class Multimedia | |
| Lenovo IdeaPad 5 Pro 16ACH | |
| Dell XPS 15 9510 11800H RTX 3050 Ti OLED | |
| Schenker XMG Focus 15 | |
| Dell G15 5515 | |
| Average AMD Ryzen 5 5600H | |
| Asus VivoBook 15 Pro M3500QC-L1062 | |
| Huawei MateBook 14s i7 | |
| HP Pavilion 15-eg -2! | |
| Cinebench R23 / Multi Core | |
| Average of class Multimedia (4861 - 33362, n=81, last 2 years) | |
| Dell G15 5515 | |
| Lenovo IdeaPad 5 Pro 16ACH | |
| Schenker XMG Focus 15 | |
| Dell XPS 15 9510 11800H RTX 3050 Ti OLED | |
| Average AMD Ryzen 5 5600H (7945 - 10416, n=13) | |
| Asus VivoBook 15 Pro M3500QC-L1062 | |
| Huawei MateBook 14s i7 | |
| HP Pavilion 15-eg | |
| Cinebench R23 / Single Core | |
| Average of class Multimedia (1128 - 2459, n=73, last 2 years) | |
| Huawei MateBook 14s i7 | |
| Dell XPS 15 9510 11800H RTX 3050 Ti OLED | |
| HP Pavilion 15-eg | |
| Dell G15 5515 | |
| Schenker XMG Focus 15 | |
| Lenovo IdeaPad 5 Pro 16ACH | |
| Average AMD Ryzen 5 5600H (1316 - 1381, n=13) | |
| Asus VivoBook 15 Pro M3500QC-L1062 | |
| Cinebench R20 / CPU (Multi Core) | |
| Average of class Multimedia (1887 - 12912, n=64, last 2 years) | |
| Dell G15 5515 | |
| Lenovo IdeaPad 5 Pro 16ACH | |
| Schenker XMG Focus 15 | |
| Dell XPS 15 9510 11800H RTX 3050 Ti OLED | |
| Average AMD Ryzen 5 5600H (3074 - 4059, n=16) | |
| Asus VivoBook 15 Pro M3500QC-L1062 | |
| Huawei MateBook 14s i7 | |
| HP Pavilion 15-eg | |
| Cinebench R20 / CPU (Single Core) | |
| Average of class Multimedia (425 - 853, n=64, last 2 years) | |
| Huawei MateBook 14s i7 | |
| Dell XPS 15 9510 11800H RTX 3050 Ti OLED | |
| HP Pavilion 15-eg | |
| Dell G15 5515 | |
| Lenovo IdeaPad 5 Pro 16ACH | |
| Schenker XMG Focus 15 | |
| Average AMD Ryzen 5 5600H (527 - 538, n=15) | |
| Asus VivoBook 15 Pro M3500QC-L1062 | |
| Cinebench R15 / CPU Multi 64Bit | |
| Average of class Multimedia (856 - 5224, n=68, last 2 years) | |
| Dell XPS 15 9510 11800H RTX 3050 Ti OLED (Ultra Performance) | |
| Dell XPS 15 9510 11800H RTX 3050 Ti OLED | |
| Lenovo IdeaPad 5 Pro 16ACH | |
| Dell G15 5515 | |
| Schenker XMG Focus 15 | |
| Average AMD Ryzen 5 5600H (1319 - 1723, n=16) | |
| Asus VivoBook 15 Pro M3500QC-L1062 (Performance Mode) | |
| Asus VivoBook 15 Pro M3500QC-L1062 (Standard) | |
| Asus VivoBook 15 Pro M3500QC-L1062 (Quiet Mode) | |
| Huawei MateBook 14s i7 | |
| HP Pavilion 15-eg | |
| Cinebench R15 / CPU Single 64Bit | |
| Average of class Multimedia (184.8 - 326, n=66, last 2 years) | |
| Huawei MateBook 14s i7 | |
| Dell G15 5515 | |
| Dell XPS 15 9510 11800H RTX 3050 Ti OLED | |
| Lenovo IdeaPad 5 Pro 16ACH | |
| Asus VivoBook 15 Pro M3500QC-L1062 | |
| Average AMD Ryzen 5 5600H (218 - 225, n=14) | |
| HP Pavilion 15-eg | |
| Schenker XMG Focus 15 | |
| Blender / v2.79 BMW27 CPU | |
| HP Pavilion 15-eg | |
| Huawei MateBook 14s i7 | |
| Asus VivoBook 15 Pro M3500QC-L1062 | |
| Average AMD Ryzen 5 5600H (300 - 384, n=14) | |
| Dell XPS 15 9510 11800H RTX 3050 Ti OLED | |
| Schenker XMG Focus 15 | |
| Lenovo IdeaPad 5 Pro 16ACH | |
| Dell G15 5515 | |
| Average of class Multimedia (100 - 557, n=65, last 2 years) | |
| 7-Zip 18.03 / 7z b 4 | |
| Average of class Multimedia (29095 - 130368, n=62, last 2 years) | |
| Dell G15 5515 | |
| Lenovo IdeaPad 5 Pro 16ACH | |
| Schenker XMG Focus 15 | |
| Average AMD Ryzen 5 5600H (36315 - 46562, n=14) | |
| Asus VivoBook 15 Pro M3500QC-L1062 | |
| Dell XPS 15 9510 11800H RTX 3050 Ti OLED | |
| Huawei MateBook 14s i7 | |
| HP Pavilion 15-eg | |
| 7-Zip 18.03 / 7z b 4 -mmt1 | |
| Average of class Multimedia (3666 - 7545, n=63, last 2 years) | |
| Dell G15 5515 | |
| Asus VivoBook 15 Pro M3500QC-L1062 | |
| Dell XPS 15 9510 11800H RTX 3050 Ti OLED | |
| HP Pavilion 15-eg | |
| Huawei MateBook 14s i7 | |
| Average AMD Ryzen 5 5600H (5213 - 5446, n=14) | |
| Lenovo IdeaPad 5 Pro 16ACH | |
| Schenker XMG Focus 15 | |
| Geekbench 5.5 / Multi-Core | |
| Average of class Multimedia (4652 - 20422, n=62, last 2 years) | |
| Schenker XMG Focus 15 | |
| Dell XPS 15 9510 11800H RTX 3050 Ti OLED | |
| Dell G15 5515 | |
| Lenovo IdeaPad 5 Pro 16ACH | |
| Average AMD Ryzen 5 5600H (4990 - 7253, n=14) | |
| Asus VivoBook 15 Pro M3500QC-L1062 | |
| Huawei MateBook 14s i7 | |
| Geekbench 5.5 / Single-Core | |
| Average of class Multimedia (805 - 2974, n=62, last 2 years) | |
| Huawei MateBook 14s i7 | |
| Dell XPS 15 9510 11800H RTX 3050 Ti OLED | |
| Schenker XMG Focus 15 | |
| Dell G15 5515 | |
| Lenovo IdeaPad 5 Pro 16ACH | |
| Asus VivoBook 15 Pro M3500QC-L1062 | |
| Average AMD Ryzen 5 5600H (1365 - 1445, n=14) | |
| HWBOT x265 Benchmark v2.2 / 4k Preset | |
| Average of class Multimedia (5.26 - 36.1, n=63, last 2 years) | |
| Dell G15 5515 | |
| Lenovo IdeaPad 5 Pro 16ACH | |
| Schenker XMG Focus 15 | |
| Dell XPS 15 9510 11800H RTX 3050 Ti OLED | |
| Average AMD Ryzen 5 5600H (9.92 - 13.3, n=14) | |
| Asus VivoBook 15 Pro M3500QC-L1062 | |
| Huawei MateBook 14s i7 | |
| HP Pavilion 15-eg | |
| LibreOffice / 20 Documents To PDF | |
| Dell G15 5515 | |
| Average AMD Ryzen 5 5600H (52.2 - 81.5, n=14) | |
| Asus VivoBook 15 Pro M3500QC-L1062 | |
| Average of class Multimedia (23.9 - 146.7, n=64, last 2 years) | |
| Dell XPS 15 9510 11800H RTX 3050 Ti OLED | |
| Lenovo IdeaPad 5 Pro 16ACH | |
| Schenker XMG Focus 15 | |
| HP Pavilion 15-eg | |
| Huawei MateBook 14s i7 | |
| R Benchmark 2.5 / Overall mean | |
| Schenker XMG Focus 15 | |
| Dell XPS 15 9510 11800H RTX 3050 Ti OLED | |
| HP Pavilion 15-eg | |
| Huawei MateBook 14s i7 | |
| Lenovo IdeaPad 5 Pro 16ACH | |
| Average AMD Ryzen 5 5600H (0.526 - 0.596, n=14) | |
| Asus VivoBook 15 Pro M3500QC-L1062 | |
| Dell G15 5515 | |
| Average of class Multimedia (0.3604 - 0.947, n=63, last 2 years) | |
* ... smaller is better
AIDA64: FP32 Ray-Trace | FPU Julia | CPU SHA3 | CPU Queen | FPU SinJulia | FPU Mandel | CPU AES | CPU ZLib | FP64 Ray-Trace | CPU PhotoWorxx
| Performance rating | |
| Average of class Multimedia | |
| Dell G15 5515 | |
| Lenovo IdeaPad 5 Pro 16ACH | |
| Asus VivoBook 15 Pro M3500QC-L1062 | |
| Average AMD Ryzen 5 5600H | |
| HP Pavilion 15-eg | |
| AIDA64 / FP32 Ray-Trace | |
| Average of class Multimedia (2214 - 50388, n=60, last 2 years) | |
| Dell G15 5515 | |
| Lenovo IdeaPad 5 Pro 16ACH | |
| Average AMD Ryzen 5 5600H (9181 - 12636, n=14) | |
| Asus VivoBook 15 Pro M3500QC-L1062 | |
| HP Pavilion 15-eg | |
| AIDA64 / FPU Julia | |
| Dell G15 5515 | |
| Lenovo IdeaPad 5 Pro 16ACH | |
| Average of class Multimedia (12867 - 201874, n=61, last 2 years) | |
| Average AMD Ryzen 5 5600H (51994 - 78250, n=14) | |
| Asus VivoBook 15 Pro M3500QC-L1062 | |
| HP Pavilion 15-eg | |
| AIDA64 / CPU SHA3 | |
| Average of class Multimedia (653 - 8623, n=61, last 2 years) | |
| Dell G15 5515 | |
| Lenovo IdeaPad 5 Pro 16ACH | |
| Asus VivoBook 15 Pro M3500QC-L1062 | |
| Average AMD Ryzen 5 5600H (1587 - 2675, n=14) | |
| HP Pavilion 15-eg | |
| AIDA64 / CPU Queen | |
| Dell G15 5515 | |
| Lenovo IdeaPad 5 Pro 16ACH | |
| Average of class Multimedia (13483 - 181505, n=49, last 2 years) | |
| Average AMD Ryzen 5 5600H (66699 - 77213, n=14) | |
| Asus VivoBook 15 Pro M3500QC-L1062 | |
| HP Pavilion 15-eg | |
| AIDA64 / FPU SinJulia | |
| Dell G15 5515 | |
| Lenovo IdeaPad 5 Pro 16ACH | |
| Average of class Multimedia (1240 - 28794, n=61, last 2 years) | |
| Average AMD Ryzen 5 5600H (8340 - 9159, n=14) | |
| Asus VivoBook 15 Pro M3500QC-L1062 | |
| HP Pavilion 15-eg | |
| AIDA64 / FPU Mandel | |
| Dell G15 5515 | |
| Lenovo IdeaPad 5 Pro 16ACH | |
| Average of class Multimedia (6395 - 105740, n=60, last 2 years) | |
| Average AMD Ryzen 5 5600H (28268 - 43274, n=14) | |
| Asus VivoBook 15 Pro M3500QC-L1062 | |
| HP Pavilion 15-eg | |
| AIDA64 / CPU AES | |
| Lenovo IdeaPad 5 Pro 16ACH | |
| Dell G15 5515 | |
| Asus VivoBook 15 Pro M3500QC-L1062 | |
| Average AMD Ryzen 5 5600H (39852 - 98939, n=14) | |
| Average of class Multimedia (13243 - 126790, n=61, last 2 years) | |
| HP Pavilion 15-eg | |
| AIDA64 / CPU ZLib | |
| Average of class Multimedia (167.2 - 2022, n=61, last 2 years) | |
| Lenovo IdeaPad 5 Pro 16ACH | |
| Dell G15 5515 | |
| Average AMD Ryzen 5 5600H (507 - 649, n=14) | |
| Asus VivoBook 15 Pro M3500QC-L1062 | |
| HP Pavilion 15-eg | |
| AIDA64 / FP64 Ray-Trace | |
| Average of class Multimedia (1014 - 26875, n=61, last 2 years) | |
| Lenovo IdeaPad 5 Pro 16ACH | |
| Dell G15 5515 | |
| Average AMD Ryzen 5 5600H (4811 - 6652, n=14) | |
| Asus VivoBook 15 Pro M3500QC-L1062 | |
| HP Pavilion 15-eg | |
| AIDA64 / CPU PhotoWorxx | |
| Average of class Multimedia (12860 - 88154, n=61, last 2 years) | |
| HP Pavilion 15-eg | |
| Average AMD Ryzen 5 5600H (7419 - 24746, n=14) | |
| Asus VivoBook 15 Pro M3500QC-L1062 | |
| Lenovo IdeaPad 5 Pro 16ACH | |
| Dell G15 5515 | |
System Performance
As you can expect with its fast components, the VivoBook 15 Pro is a very responsive system, which is also confirmed by the synthetic benchmarks. There were also no problems or stutters with the automatic graphics switching from the AMD iGPU to the Nvidia GPU. The new Windows 11 can be installed on the VivoBook 15 Pro.
| PCMark 10 / Score | |
| Average of class Multimedia (4325 - 10386, n=58, last 2 years) | |
| Schenker XMG Focus 15 | |
| Dell G15 5515 | |
| Dell XPS 15 9510 11800H RTX 3050 Ti OLED | |
| Asus VivoBook 15 Pro M3500QC-L1062 | |
| Lenovo IdeaPad 5 Pro 16ACH | |
| Average AMD Ryzen 5 5600H, NVIDIA GeForce RTX 3050 4GB Laptop GPU (5748 - 5905, n=2) | |
| HP Pavilion 15-eg | |
| PCMark 10 / Essentials | |
| Average of class Multimedia (8025 - 11664, n=57, last 2 years) | |
| Schenker XMG Focus 15 | |
| Lenovo IdeaPad 5 Pro 16ACH | |
| Asus VivoBook 15 Pro M3500QC-L1062 | |
| HP Pavilion 15-eg | |
| Average AMD Ryzen 5 5600H, NVIDIA GeForce RTX 3050 4GB Laptop GPU (9372 - 9987, n=2) | |
| Dell G15 5515 | |
| Dell XPS 15 9510 11800H RTX 3050 Ti OLED | |
| PCMark 10 / Productivity | |
| Average of class Multimedia (7323 - 18233, n=57, last 2 years) | |
| HP Pavilion 15-eg | |
| Schenker XMG Focus 15 | |
| Asus VivoBook 15 Pro M3500QC-L1062 | |
| Dell G15 5515 | |
| Dell XPS 15 9510 11800H RTX 3050 Ti OLED | |
| Average AMD Ryzen 5 5600H, NVIDIA GeForce RTX 3050 4GB Laptop GPU (7975 - 8627, n=2) | |
| Lenovo IdeaPad 5 Pro 16ACH | |
| PCMark 10 / Digital Content Creation | |
| Average of class Multimedia (3651 - 16240, n=57, last 2 years) | |
| Schenker XMG Focus 15 | |
| Dell XPS 15 9510 11800H RTX 3050 Ti OLED | |
| Dell G15 5515 | |
| Average AMD Ryzen 5 5600H, NVIDIA GeForce RTX 3050 4GB Laptop GPU (6486 - 6897, n=2) | |
| Lenovo IdeaPad 5 Pro 16ACH | |
| Asus VivoBook 15 Pro M3500QC-L1062 | |
| HP Pavilion 15-eg | |
| PCMark 10 Score | 5905 points | |
Help | ||
| AIDA64 / Memory Copy | |
| Average of class Multimedia (21158 - 132135, n=61, last 2 years) | |
| HP Pavilion 15-eg | |
| Lenovo IdeaPad 5 Pro 16ACH | |
| Dell G15 5515 | |
| Asus VivoBook 15 Pro M3500QC-L1062 | |
| Average AMD Ryzen 5 5600H (20549 - 42141, n=14) | |
| AIDA64 / Memory Read | |
| Average of class Multimedia (19699 - 174586, n=61, last 2 years) | |
| HP Pavilion 15-eg | |
| Asus VivoBook 15 Pro M3500QC-L1062 | |
| Lenovo IdeaPad 5 Pro 16ACH | |
| Dell G15 5515 | |
| Average AMD Ryzen 5 5600H (22917 - 47595, n=14) | |
| AIDA64 / Memory Write | |
| Average of class Multimedia (17733 - 134998, n=61, last 2 years) | |
| HP Pavilion 15-eg | |
| Average AMD Ryzen 5 5600H (20226 - 44872, n=14) | |
| Asus VivoBook 15 Pro M3500QC-L1062 | |
| Lenovo IdeaPad 5 Pro 16ACH | |
| Dell G15 5515 | |
| AIDA64 / Memory Latency | |
| Average of class Multimedia (7 - 535, n=60, last 2 years) | |
| Lenovo IdeaPad 5 Pro 16ACH | |
| Average AMD Ryzen 5 5600H (75 - 89.1, n=14) | |
| Dell G15 5515 | |
| Asus VivoBook 15 Pro M3500QC-L1062 | |
| HP Pavilion 15-eg | |
| Dell XPS 15 9510 11800H RTX 3050 Ti OLED | |
* ... smaller is better
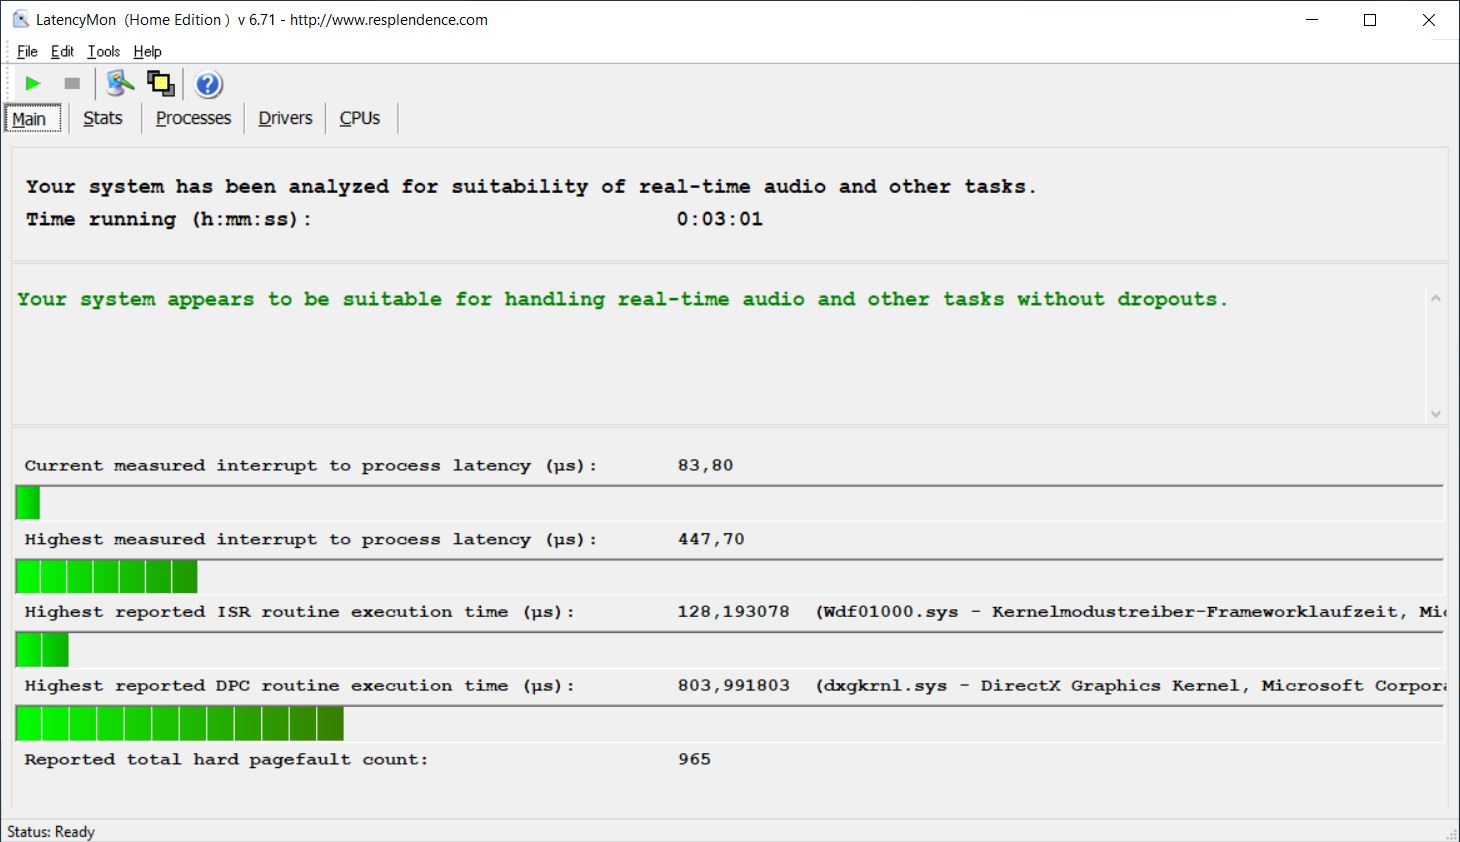
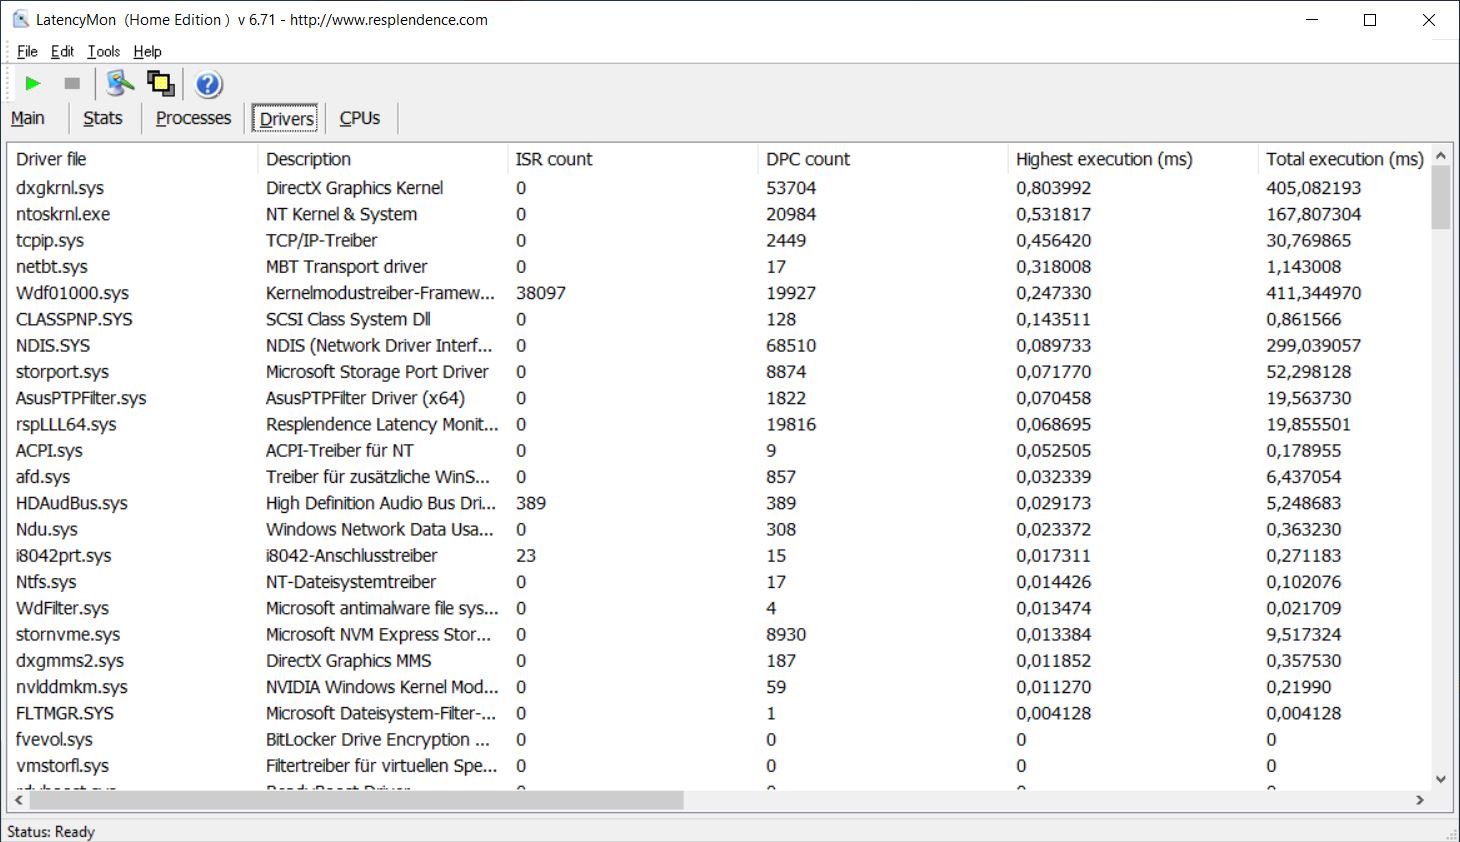
DPC Latencies
In our standardized latency test with surfing the Internet, YouTube 4K video reproduction, and CPU load, the VivoBook 15 Pro does not show any limitations, which makes it also suitable for real time audio applications.
| DPC Latencies / LatencyMon - interrupt to process latency (max), Web, Youtube, Prime95 | |
| HP Pavilion 15-eg | |
| Dell XPS 15 9510 11800H RTX 3050 Ti OLED | |
| Lenovo IdeaPad 5 Pro 16ACH | |
| Dell G15 5515 | |
| Schenker XMG Focus 15 | |
| Asus VivoBook 15 Pro M3500QC-L1062 | |
* ... smaller is better
Storage Solution
The VivoBook 15 Pro offers an M.2-2280 slot that is connected via PCIe 3.0 x4. Our test unit is equipped with an SK Hynik BC711. This offers a storage capacity of 512 GB, 446 GB of which are still available for the user after the first time starting the system. In the benchmarks, the storage performs very well and we don't expect any problems. You can find additional SSD benchmarks here.
* ... smaller is better

Constant Performance Reading: DiskSpd Read Loop, Queue Depth 8
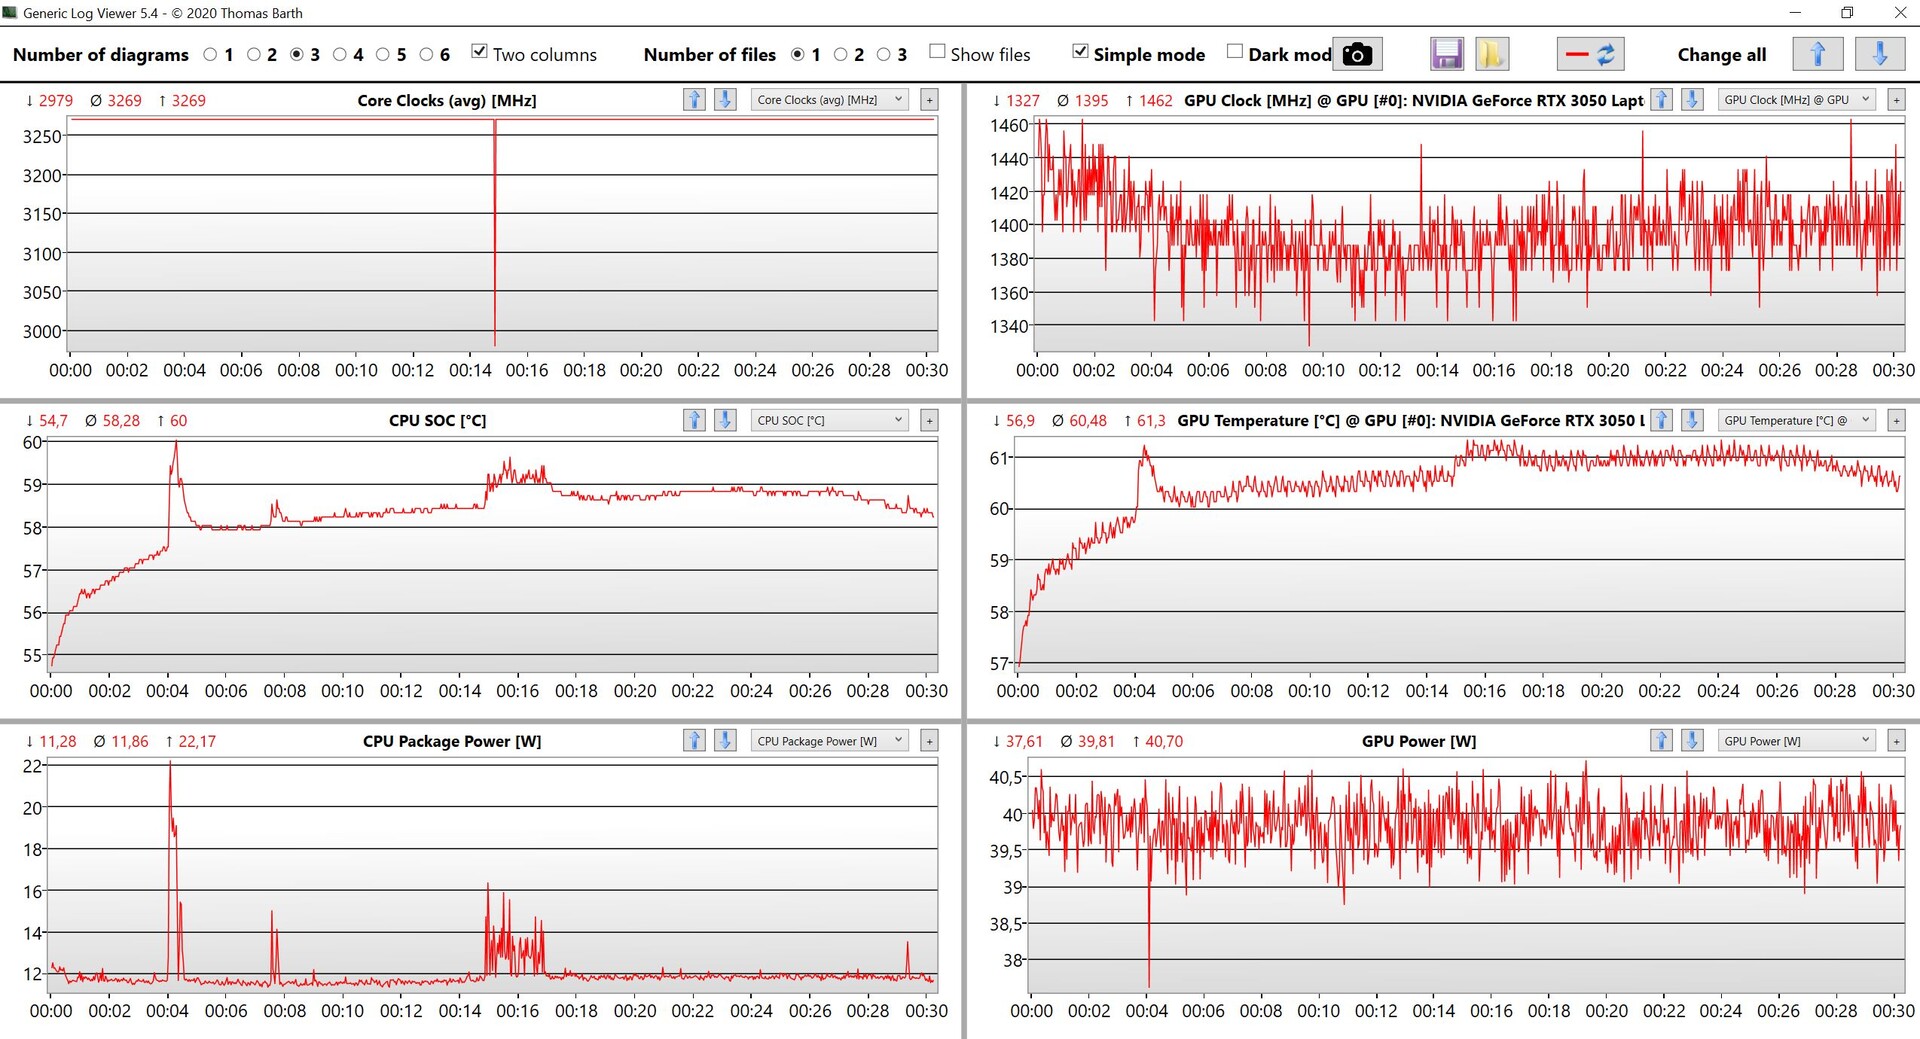
GPU Performance
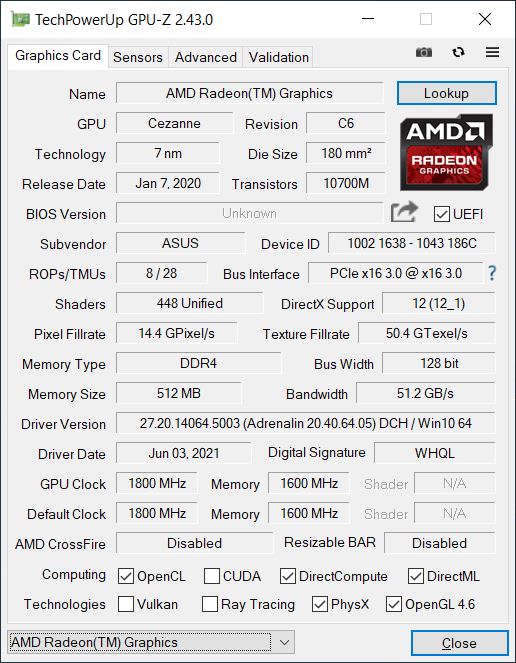
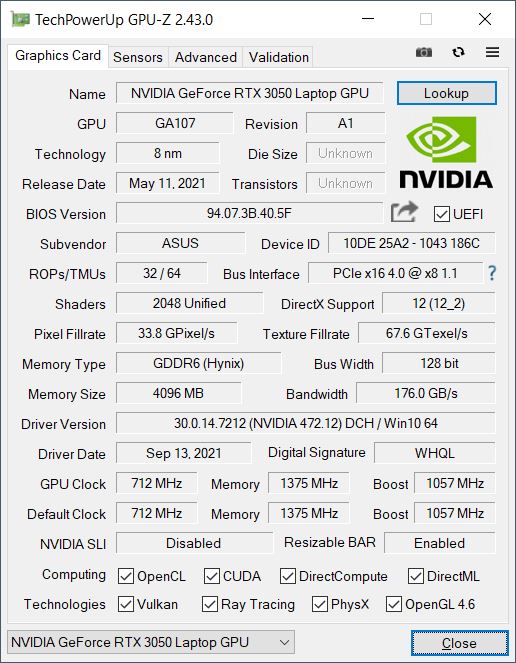
In everyday operation, the graphics output is often handled by the integrated Radeon RX Vega 6 of the processor, which is particularly able to score with a very efficient video decoder. As soon as you need more graphics performance (for gaming for example), it automatically switches over to the dedicated GeForce RTX 3050. Depending on the performance mode, the GPU runs using 35 watts up to a maximum of 50 watts, so overall the GPU is in the bottom to middle of the performance range for this GPU, which allows for a maximum of 80 watts. The performance difference between each of the various modes is about 10%.
| Whisper Mode | Standard | Performance Mode | |
|---|---|---|---|
| 3DMark Fire Strike GPU | 9,728 Points | 10,497 Points | 11,635 Points |
In the Performance Mode, the VivoBook 15 Pro comes very close to the RTX 3050 Ti of the XPS 15, which should really be faster. It is also significantly ahead of the old GeForce GTX 1650 in the IdeaPad 5 Pro 16. The graphics performance is stable in all three performance modes, even under constant load.
Like that of the processor, the graphics performance is limited to 30 watts in battery operation, even in the optional Performance Mode. This corresponds to a decrease of about 20% compared to the Standard Mode in mains operation. You can find additional GPU benchmarks here.
| 3DMark 11 Performance | 13203 points | |
| 3DMark Cloud Gate Standard Score | 30830 points | |
| 3DMark Fire Strike Score | 9485 points | |
| 3DMark Time Spy Score | 4118 points | |
Help | ||
Gaming Performance
The combination of the Ryzen CPU and RTX 3050 offers a decent gaming performance, and many games still run smoothly in the native Full HD resolution even at maximum detail settings. Only in very demanding games such as "Cyberpunk 2077," you have to reduce the details if you want to see a reasonably smooth game play.
| The Witcher 3 - 1920x1080 Ultra Graphics & Postprocessing (HBAO+) | |
| Dell G15 5515 | |
| Schenker XMG Focus 15 | |
| Average of class Multimedia (11 - 121, n=13, last 2 years) | |
| Average NVIDIA GeForce RTX 3050 4GB Laptop GPU (31.5 - 55.8, n=21) | |
| Dell XPS 15 9510 11800H RTX 3050 Ti OLED (BIOS 1.4 Ultra Performance) | |
| Dell XPS 15 9510 11800H RTX 3050 Ti OLED (BIOS 1.4) | |
| Dell XPS 15 9510 11800H RTX 3050 Ti OLED (BIOS 1.3.2 Ultra Performance) | |
| Dell XPS 15 9510 11800H RTX 3050 Ti OLED (BIOS 1.3.2) | |
| Asus VivoBook 15 Pro M3500QC-L1062 (Performance Mode) | |
| Asus VivoBook 15 Pro M3500QC-L1062 (Standard) | |
| Asus VivoBook 15 Pro M3500QC-L1062 (Quiet Mode) | |
| Lenovo IdeaPad 5 Pro 16ACH | |
| HP Pavilion 15-eg | |
| F1 2020 - 1920x1080 Ultra High Preset AA:T AF:16x | |
| Dell XPS 15 9510 11800H RTX 3050 Ti OLED (759689) | |
| Average NVIDIA GeForce RTX 3050 4GB Laptop GPU (66 - 81, n=2) | |
| Asus VivoBook 15 Pro M3500QC-L1062 | |
| Lenovo IdeaPad 5 Pro 16ACH (759689) | |
| Strange Brigade - 1920x1080 ultra AA:ultra AF:16 | |
| Dell G15 5515 (1.47.22.14 D3D12) | |
| Schenker XMG Focus 15 (1.47.22.14 D3D12) | |
| Average of class Multimedia (13.3 - 303, n=66, last 2 years) | |
| Dell XPS 15 9510 11800H RTX 3050 Ti OLED | |
| Average NVIDIA GeForce RTX 3050 4GB Laptop GPU (57.9 - 95.1, n=21) | |
| Asus VivoBook 15 Pro M3500QC-L1062 | |
| Lenovo IdeaPad 5 Pro 16ACH (1.47.22.14 D3D12) | |
| F1 2021 - 1920x1080 Ultra High Preset + Raytracing AA:T AF:16x | |
| Dell G15 5515 (807588) | |
| Dell XPS 15 9510 11800H RTX 3050 Ti OLED (797778) | |
| Average NVIDIA GeForce RTX 3050 4GB Laptop GPU (44.1 - 62, n=8) | |
| Asus VivoBook 15 Pro M3500QC-L1062 (815237) | |
The gaming performance remains stable in all three performance modes, which is easy to see in our "The Witcher 3" constant performance test. In battery operation, the performance is slightly reduced (32 vs. 38 FPS @Witcher 3 Ultra), but you can still play smoothly. The performance starts to really drop only at a battery level of 5%. You can find additional gaming benchmarks in our games section.
The Witcher 3 FPS Chart
| low | med. | high | ultra | |
|---|---|---|---|---|
| GTA V (2015) | 168 | 162 | 103 | 55.5 |
| The Witcher 3 (2015) | 199 | 76 | 41.7 | |
| Dota 2 Reborn (2015) | 139 | 130 | 116 | 109 |
| Final Fantasy XV Benchmark (2018) | 98.4 | 56.4 | 41.3 | |
| X-Plane 11.11 (2018) | 91.8 | 80.4 | 68 | |
| Strange Brigade (2018) | 192 | 104 | 84 | 72 |
| F1 2020 (2020) | 183 | 102 | 87 | 66 |
| Cyberpunk 2077 1.0 (2020) | 64 | 37 | 31 | 26 |
| F1 2021 (2021) | 196 | 112 | 93.4 | 47.1 |
| Far Cry 6 (2021) | 75 | 57 | 52 | 45 |
Emissions - The VivoBook with good cooling
Fan Noise
With simple or everyday tasks such as surfing the Internet or video reproduction, the two fans of the VivoBook 15 Pro usually remain completely deactivated, and at barely 27 dB(A), the first activation level of the fans is also only noticeable as a very quiet whirring. However, as soon as you put more load on the processor or graphics card, the fans quickly reach the maximum level depending on the performance mode as shown in the table below.
| Performance mode | The Witcher 3 | stress test |
|---|---|---|
| Whisper Mode | 33.9 dB(A) | 33.9 dB(A) |
| Standard | 42.8 dB(A) | 42.8 dB(A) |
| Performance Mode | 46.3 dB(A) | 48.3 dB(A) |
Particularly while gaming, the difference between the performance modes is very significant, and if you have sufficient performance to play smoothly, we would always recommend the Whisper Mode. This is the case with "The Witcher 3," for example. The noise volume in Standard Mode is still ok but might become annoying in quiet scenes, and you should only use the Performance Mode with headphones, since otherwise you won't hear much of the gaming sounds. We did not notice any other electronic noises such as coil whine.
| Asus VivoBook 15 Pro M3500QC-L1062 GeForce RTX 3050 4GB Laptop GPU, R5 5600H, SK Hynix HFM512GD3JX013N | Dell G15 5515 GeForce RTX 3050 Ti Laptop GPU, R7 5800H, Samsung PM991a MZ9LQ512HBLU-00BD1 | Schenker XMG Focus 15 GeForce RTX 3050 Ti Laptop GPU, i7-11800H, Samsung SSD 970 EVO Plus 1TB | HP Pavilion 15-eg GeForce MX450, i7-1165G7, Samsung PM991 MZVLQ1T0HALB | Lenovo IdeaPad 5 Pro 16ACH GeForce GTX 1650 Mobile, R7 5800H, Micron 2300 512GB MTFDHBA512TDV | Dell XPS 15 9510 11800H RTX 3050 Ti OLED GeForce RTX 3050 Ti Laptop GPU, i7-11800H, Micron 2300 512GB MTFDHBA512TDV | |
|---|---|---|---|---|---|---|
| Noise | -5% | -26% | 2% | -2% | 9% | |
| off / environment * (dB) | 24.8 | 24 3% | 24 3% | 25.4 -2% | 24.04 3% | 23.8 4% |
| Idle Minimum * (dB) | 24.8 | 25 -1% | 25 -1% | 25.6 -3% | 24.04 3% | 23.8 4% |
| Idle Average * (dB) | 24.8 | 26 -5% | 30 -21% | 25.6 -3% | 24.04 3% | 23.8 4% |
| Idle Maximum * (dB) | 26.4 | 30 -14% | 43 -63% | 25.6 3% | 24.04 9% | 23.8 10% |
| Load Average * (dB) | 42.8 | 44 -3% | 56 -31% | 39.2 8% | 41.3 4% | 36 16% |
| Witcher 3 ultra * (dB) | 42.8 | 44 -3% | 56 -31% | 39.1 9% | 49.21 -15% | 36 16% |
| Load Maximum * (dB) | 42.8 | 48 -12% | 58 -36% | 41.5 3% | 52.93 -24% | 38.2 11% |
* ... smaller is better
Noise level
| Idle |
| 24.8 / 24.8 / 26.4 dB(A) |
| Load |
| 42.8 / 42.8 dB(A) |
 | ||
30 dB silent 40 dB(A) audible 50 dB(A) loud |
||
min: | ||
Temperatures
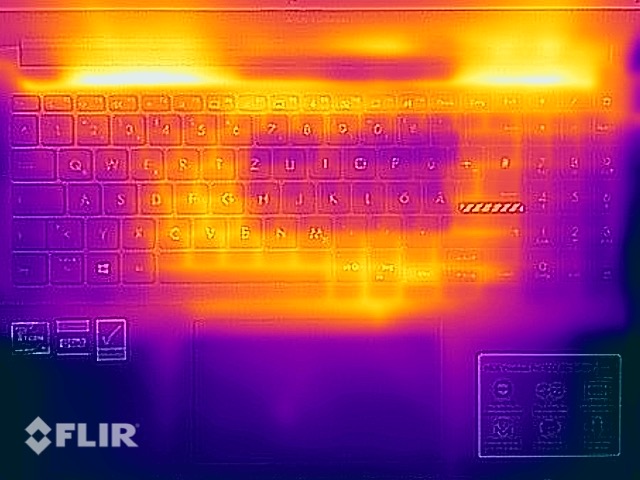
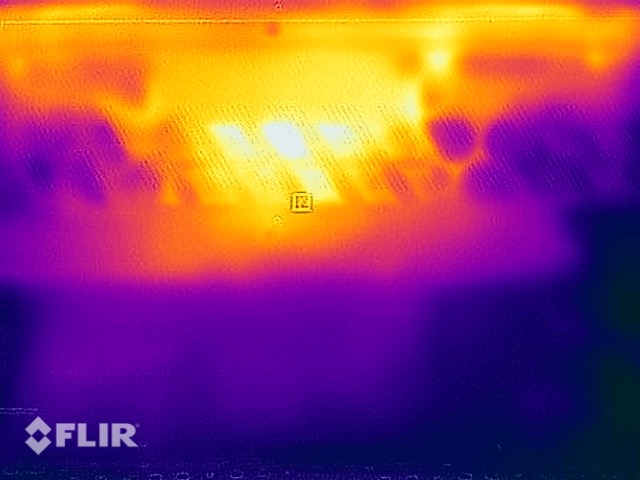
The surface temperatures of the VivoBook 15 Pro give no reason for concern at all. In everyday operation, the device hardly warms up, and even under load there is really only a single hotspot in the central area at the bottom towards the back. However, you can still use the device on your lap, and the keyboard remains at a comfortable temperature while gaming or under load.
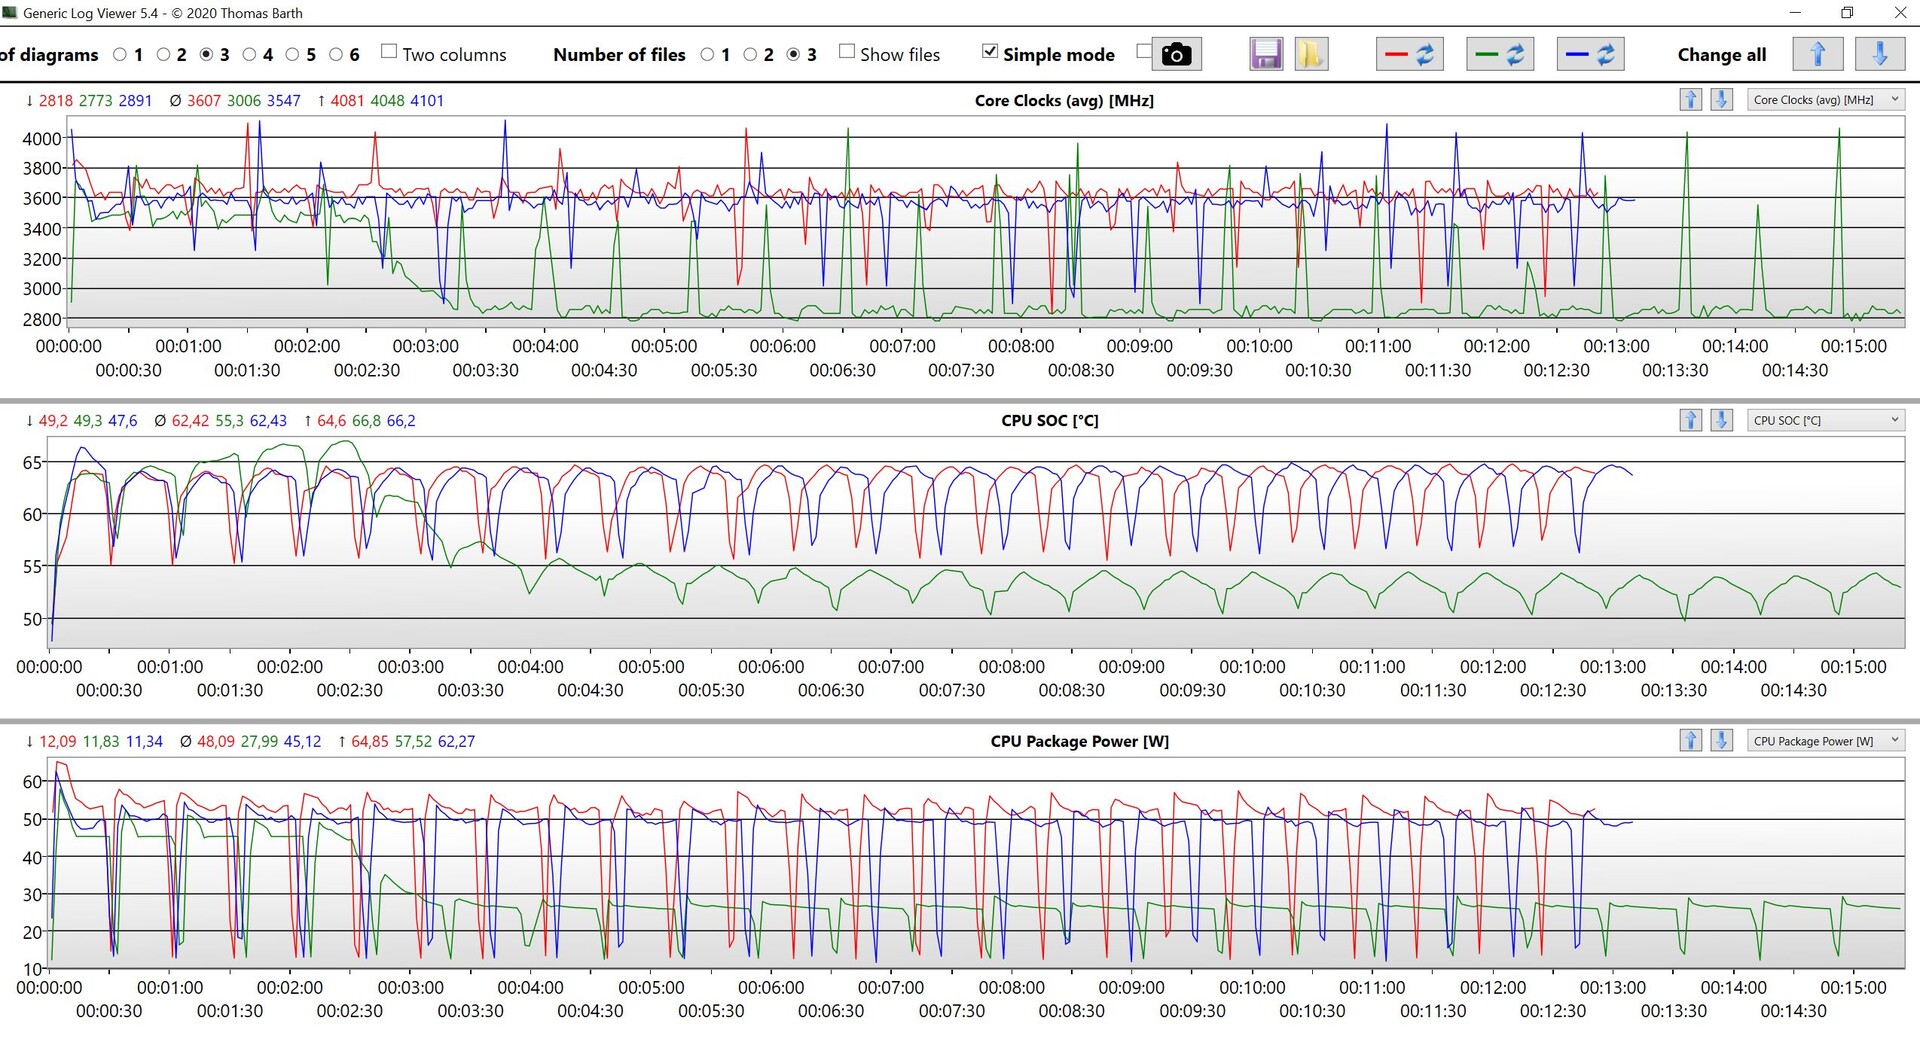
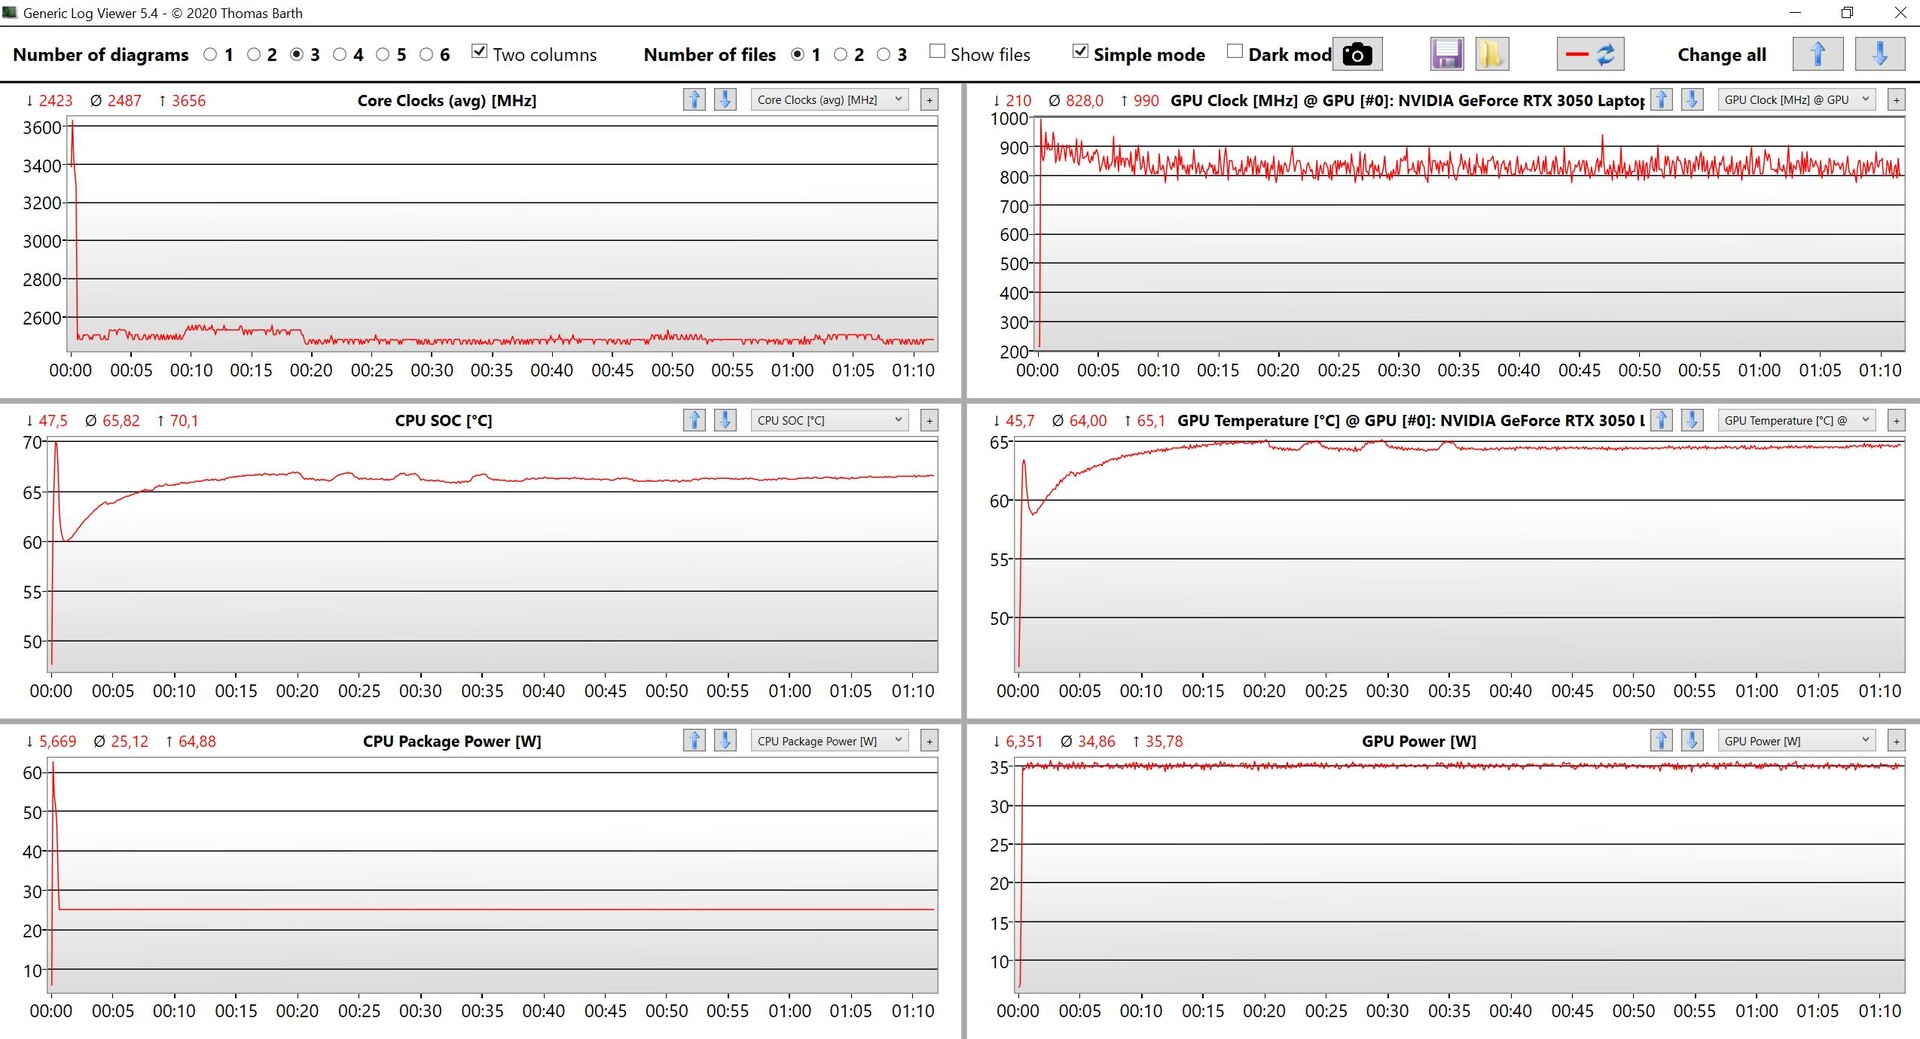
During the stress test, the performance is stable and the laptop is able to keep up the corresponding TDP/TGP values of the various performance modes without any trouble. This means that there is no limitation of the performance here even during longer periods under load.
(+) The maximum temperature on the upper side is 37.8 °C / 100 F, compared to the average of 36.8 °C / 98 F, ranging from 21 to 71 °C for the class Multimedia.
(-) The bottom heats up to a maximum of 48.4 °C / 119 F, compared to the average of 39.1 °C / 102 F
(+) In idle usage, the average temperature for the upper side is 23.2 °C / 74 F, compared to the device average of 31.3 °C / 88 F.
(+) Playing The Witcher 3, the average temperature for the upper side is 31.9 °C / 89 F, compared to the device average of 31.3 °C / 88 F.
(+) The palmrests and touchpad are cooler than skin temperature with a maximum of 24.3 °C / 75.7 F and are therefore cool to the touch.
(+) The average temperature of the palmrest area of similar devices was 28.7 °C / 83.7 F (+4.4 °C / 8 F).
Speakers
The two speakers in the frontal area of the bottom sound quite ok, but they lack some volume and sound pressure. They are definitely sufficient for watching some videos or playing background music, but for a good gaming sound or a movie, it would be better to use headphones or external speakers.
Asus VivoBook 15 Pro M3500QC-L1062 audio analysis
(±) | speaker loudness is average but good (79.3 dB)
Bass 100 - 315 Hz
(-) | nearly no bass - on average 21.5% lower than median
(±) | linearity of bass is average (9.5% delta to prev. frequency)
Mids 400 - 2000 Hz
(+) | balanced mids - only 2.9% away from median
(±) | linearity of mids is average (7.2% delta to prev. frequency)
Highs 2 - 16 kHz
(+) | balanced highs - only 3.7% away from median
(+) | highs are linear (5.6% delta to prev. frequency)
Overall 100 - 16.000 Hz
(±) | linearity of overall sound is average (17.2% difference to median)
Compared to same class
» 49% of all tested devices in this class were better, 7% similar, 44% worse
» The best had a delta of 5%, average was 17%, worst was 45%
Compared to all devices tested
» 32% of all tested devices were better, 8% similar, 60% worse
» The best had a delta of 4%, average was 24%, worst was 134%
Lenovo IdeaPad 5 Pro 16ACH audio analysis
(-) | not very loud speakers (68.8 dB)
Bass 100 - 315 Hz
(-) | nearly no bass - on average 24.4% lower than median
(±) | linearity of bass is average (13.3% delta to prev. frequency)
Mids 400 - 2000 Hz
(+) | balanced mids - only 3.2% away from median
(+) | mids are linear (4.1% delta to prev. frequency)
Highs 2 - 16 kHz
(+) | balanced highs - only 2% away from median
(+) | highs are linear (6.3% delta to prev. frequency)
Overall 100 - 16.000 Hz
(±) | linearity of overall sound is average (22.5% difference to median)
Compared to same class
» 80% of all tested devices in this class were better, 4% similar, 16% worse
» The best had a delta of 5%, average was 17%, worst was 45%
Compared to all devices tested
» 66% of all tested devices were better, 6% similar, 28% worse
» The best had a delta of 4%, average was 24%, worst was 134%
Dell XPS 15 9510 11800H RTX 3050 Ti OLED audio analysis
(+) | speakers can play relatively loud (88.8 dB)
Bass 100 - 315 Hz
(±) | reduced bass - on average 5.6% lower than median
(+) | bass is linear (4.3% delta to prev. frequency)
Mids 400 - 2000 Hz
(+) | balanced mids - only 3.9% away from median
(+) | mids are linear (4.1% delta to prev. frequency)
Highs 2 - 16 kHz
(+) | balanced highs - only 2.4% away from median
(+) | highs are linear (4.9% delta to prev. frequency)
Overall 100 - 16.000 Hz
(+) | overall sound is linear (8.4% difference to median)
Compared to same class
» 9% of all tested devices in this class were better, 2% similar, 89% worse
» The best had a delta of 5%, average was 17%, worst was 45%
Compared to all devices tested
» 2% of all tested devices were better, 1% similar, 97% worse
» The best had a delta of 4%, average was 24%, worst was 134%
Power Management - The battery life varies due to the OLED display
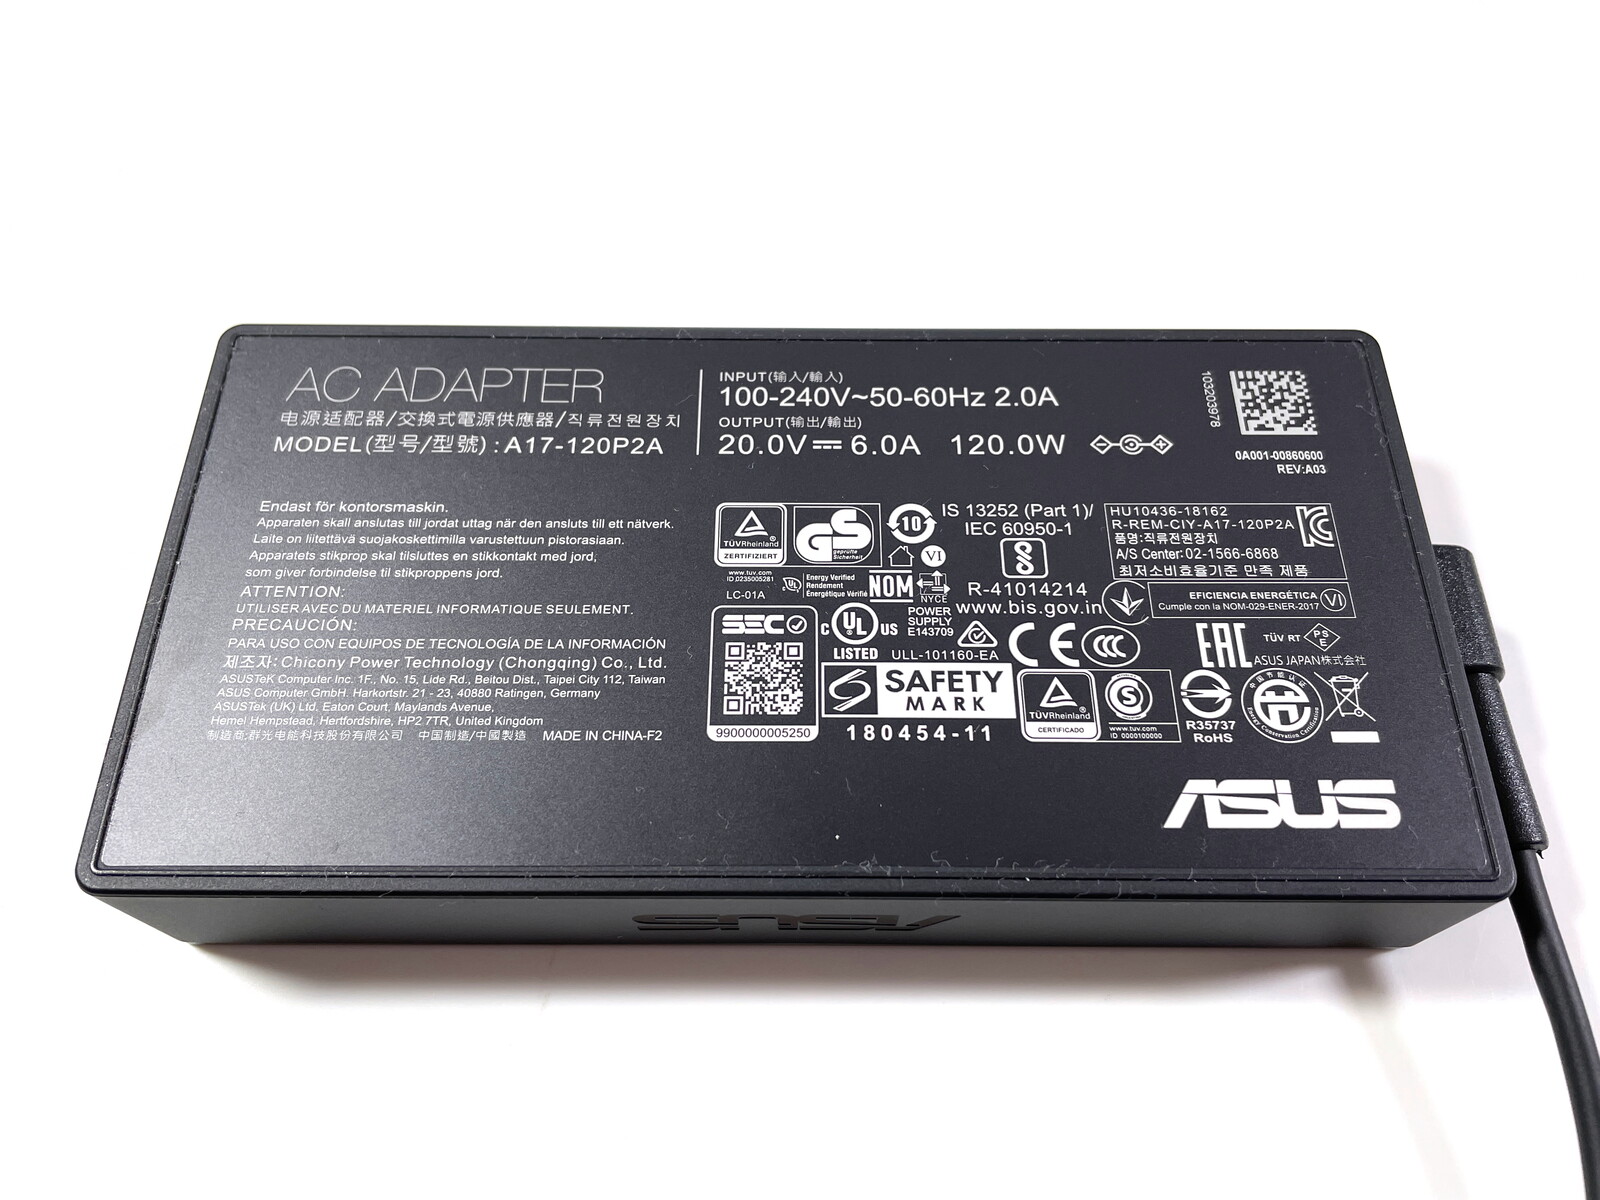
For OLED displays, the power consumption depends mostly on the contents, with brighter images leading to a higher consumption. However, the VivoBook 15 Pro fares quite well in the measurements during idle operation. Even under load, there are no surprises. While the maximum consumption during the stress test is 107 watts, it quickly levels out at a constant 76 watts. This means that the included 120-Watt power supply is completely sufficient.
| Off / Standby | |
| Idle | |
| Load |
|
Key:
min: | |
| Asus VivoBook 15 Pro M3500QC-L1062 R5 5600H, GeForce RTX 3050 4GB Laptop GPU, SK Hynix HFM512GD3JX013N, AMOLED, 1920x1080, 15.6" | Dell G15 5515 R7 5800H, GeForce RTX 3050 Ti Laptop GPU, Samsung PM991a MZ9LQ512HBLU-00BD1, IPS, 1920x1080, 15.6" | Schenker XMG Focus 15 i7-11800H, GeForce RTX 3050 Ti Laptop GPU, Samsung SSD 970 EVO Plus 1TB, IPS, 1920x1080, 15.6" | HP Pavilion 15-eg i7-1165G7, GeForce MX450, Samsung PM991 MZVLQ1T0HALB, IPS, 1920x1080, 15.6" | Lenovo IdeaPad 5 Pro 16ACH R7 5800H, GeForce GTX 1650 Mobile, Micron 2300 512GB MTFDHBA512TDV, IPS LED, 2560x1600, 16" | Dell XPS 15 9510 11800H RTX 3050 Ti OLED i7-11800H, GeForce RTX 3050 Ti Laptop GPU, Micron 2300 512GB MTFDHBA512TDV, OLED, 3456x2160, 15.6" | Average NVIDIA GeForce RTX 3050 4GB Laptop GPU | Average of class Multimedia | |
|---|---|---|---|---|---|---|---|---|
| Power Consumption | -45% | -154% | 7% | -17% | -20% | -30% | -9% | |
| Idle Minimum * (Watt) | 4.7 | 5 -6% | 23 -389% | 4.9 -4% | 5.7 -21% | 7.6 -62% | 7.17 ? -53% | 5.71 ? -21% |
| Idle Average * (Watt) | 9.4 | 9 4% | 25 -166% | 7.9 16% | 9.3 1% | 9.9 -5% | 10.4 ? -11% | 10.1 ? -7% |
| Idle Maximum * (Watt) | 10 | 20 -100% | 29 -190% | 14.2 -42% | 11 -10% | 10.8 -8% | 14.8 ? -48% | 12.4 ? -24% |
| Load Average * (Watt) | 74.3 | 94 -27% | 106 -43% | 64.3 13% | 83.4 -12% | 81 -9% | 89.7 ? -21% | 65 ? 13% |
| Witcher 3 ultra * (Watt) | 67.7 | 123 -82% | 128 -89% | 55.6 18% | 94.4 -39% | 76.2 -13% | ||
| Load Maximum * (Watt) | 106.9 | 172 -61% | 156 -46% | 65.4 39% | 128.7 -20% | 131 -23% | 124.8 ? -17% | 112.2 ? -5% |
* ... smaller is better
Power Consumption The Witcher 3 / Stress Test
Battery Life
Our WLAN test with many bright websites represents practically a worst-case scenario for the OLED display, but the battery life with the 63-Wh battery is still ok. At an adjusted brightness of 150 cd/m², it still lasts for almost 8.5 hours, and at full brightness it is 3 hours less. The video test at 150 cd/m², on the other hand, runs for more than 12 hours. Mobile gaming is also possible, but then it will only last a little longer than an hour.
It takes slightly more than 2 hours to completely recharge the laptop, but you will already have 50% available after barely 26 minutes and 80% after 52 minutes (while the laptop is turned on).
| Asus VivoBook 15 Pro M3500QC-L1062 R5 5600H, GeForce RTX 3050 4GB Laptop GPU, 63 Wh | Dell G15 5515 R7 5800H, GeForce RTX 3050 Ti Laptop GPU, 56 Wh | Schenker XMG Focus 15 i7-11800H, GeForce RTX 3050 Ti Laptop GPU, 49 Wh | HP Pavilion 15-eg i7-1165G7, GeForce MX450, 41 Wh | Lenovo IdeaPad 5 Pro 16ACH R7 5800H, GeForce GTX 1650 Mobile, 75 Wh | Dell XPS 15 9510 11800H RTX 3050 Ti OLED i7-11800H, GeForce RTX 3050 Ti Laptop GPU, 86 Wh | Average of class Multimedia | |
|---|---|---|---|---|---|---|---|
| Battery runtime | -5% | -42% | -14% | 23% | 3% | 37% | |
| H.264 (h) | 12.1 | 8.8 -27% | 10.4 -14% | 10.4 -14% | 16.4 ? 36% | ||
| WiFi v1.3 (h) | 8.3 | 8 -4% | 3.9 -53% | 6.6 -20% | 12.6 52% | 7 -16% | 12 ? 45% |
| Witcher 3 ultra (h) | 1.2 | ||||||
| Load (h) | 1.3 | 1.5 15% | 0.9 -31% | 1.2 -8% | 1.7 31% | 1.8 38% | 1.675 ? 29% |
| Reader / Idle (h) | 13.5 | 6.5 | 15 | 25.2 ? |
Pros
Cons
Verdict - The VivoBook 15 Pro impresses mainly with its performance and display
After our test, we are able to attest the new VivoBook 15 Pro mainly with a high performance development and good display quality. Using the available performance modes, the user can influence the performance and noise characteristics of the laptop. The combination of a current Ryzen processor and the RTX 3050 delivers a decent gaming performance for the 1080p panel.
The OLED display also impresses with great colors and an extremely high contrast, but there are also some disadvantages such as the highly reflective surface or the PWM flickering that could lead to problems for some users.
Asus clearly made some cuts in the connection equipment, and particularly the old connection standards stand out negatively here. At the end of 2021, two old USB 2.0 connections and one HDMI 1.4 port are really not up to date anymore. In addition, we would have preferred replaceable RAM modules in a 15-inch multimedia laptop.
The new VivoBook 15 Pro particularly offers a lot of performance and a great OLED panel, but there are some compromises in the connection equipment.
The VivoBook is practically the exact opposite of the significantly more expensive Dell XPS 15. While the OLED panels are almost comparable (except for the form factor), Dell uses a very high-quality case and modern connections (but USB-C only), but the XPS 15 mainly shows a weak performance development. Despite its significantly weaker components, the VivoBook 15 Pro isn't really noticeably slower in practice, neither in the CPU nor the gaming performance.
Those who need a higher performance should take a look at the Schenker XMG Focus 15, but you will also be confronted with more noisy fans there. The Dell G15 also offers a higher gaming performance but is significantly more bulky, and the IdeaPad 5 Pro 16 from Lenovo benefits from the faster Ryzen 7 processor.
Price and Availability
Asus VivoBook 15 Pro M3500QC-L1062
- 08/30/2022 v7 (old)
Andreas Osthoff
Price comparison

