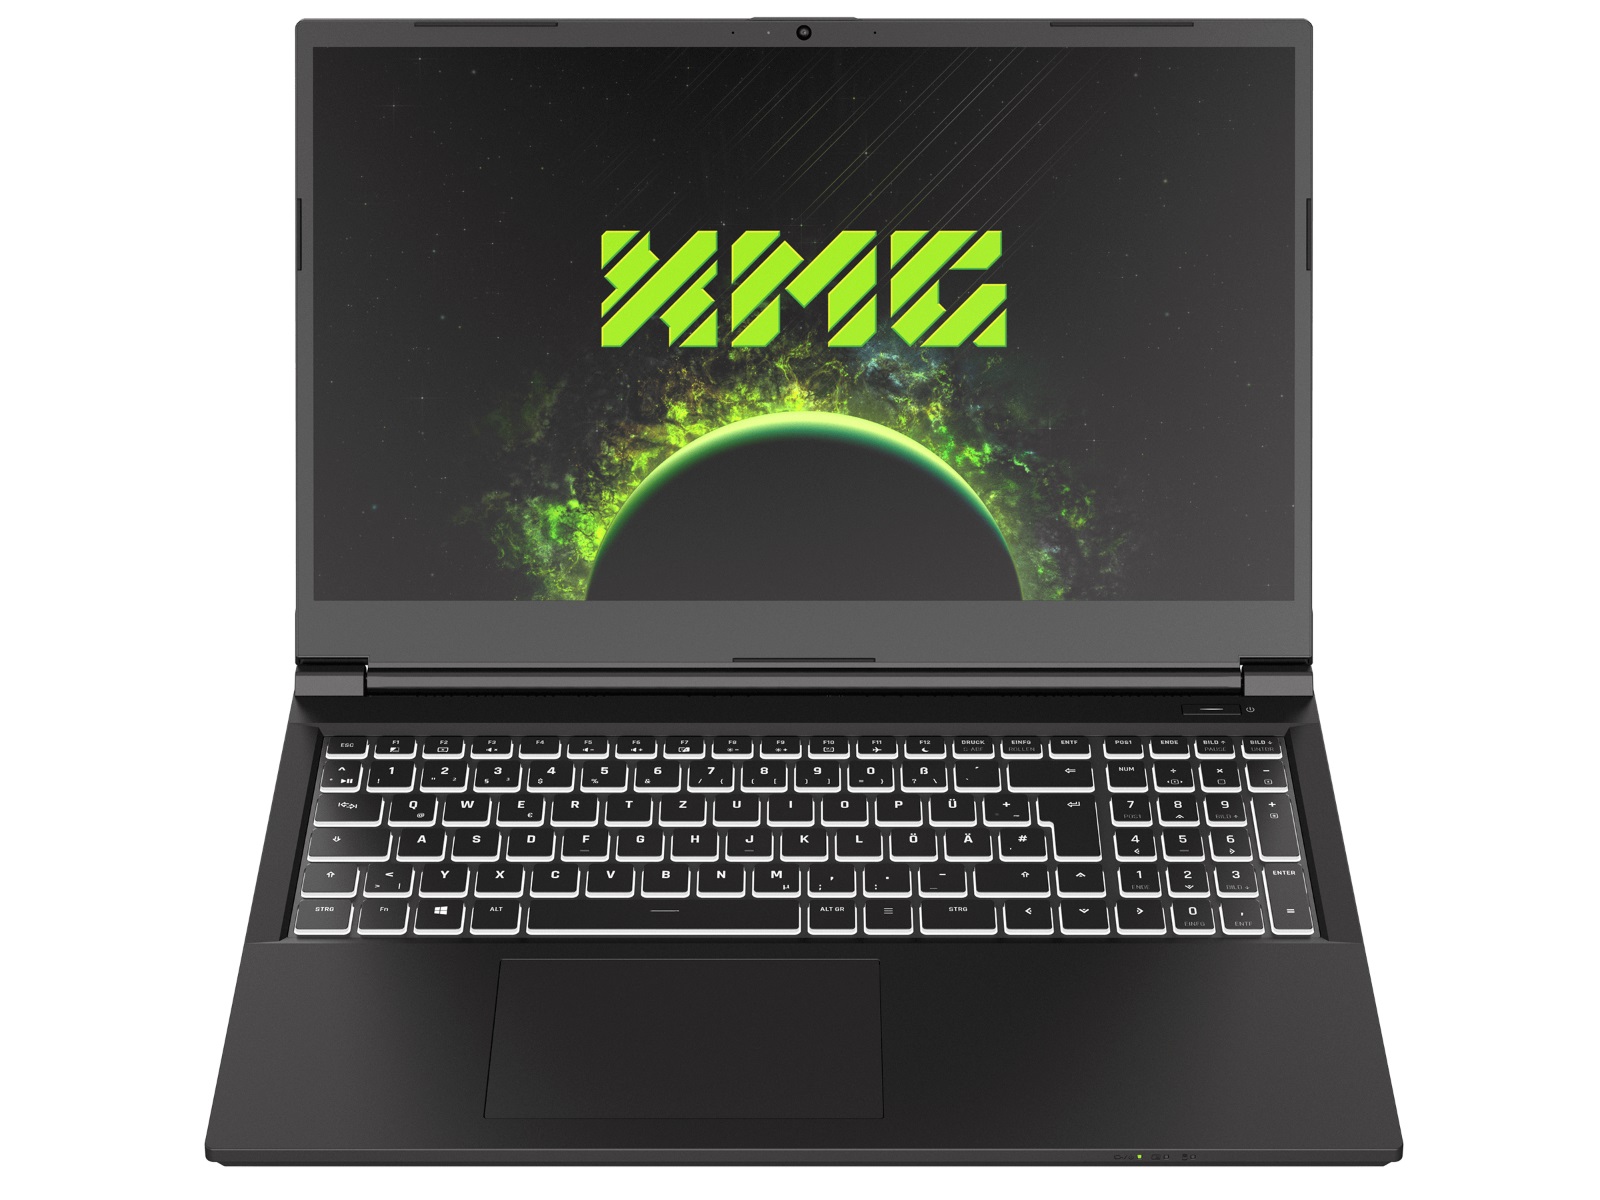
XMG Focus 15 (Clevo NP50HK) gaming laptop review: RTX 3050 Ti at its limits
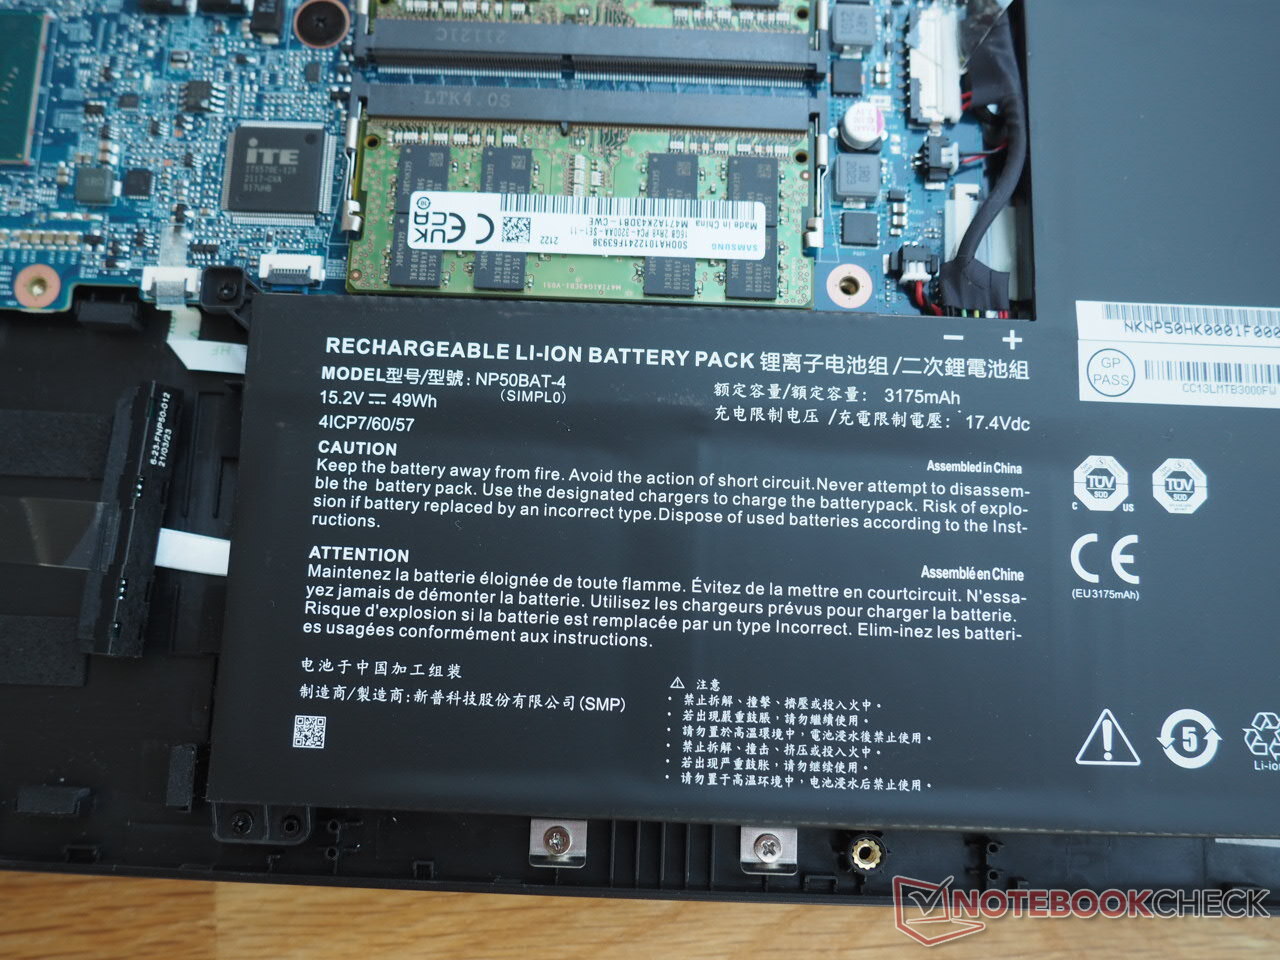
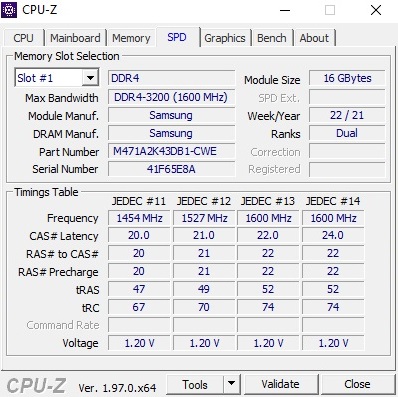
The XMG Focus 15 can be individually configured on the manufacturer's bestware.com homepage. However, in contrast to many other laptops from Schenker Technologies, the configuration options turn out quite meager. There is currently only a single option for the display (Full-HD IPS with 144 Hz), the graphics card (GeForce RTX 3050 Ti), and the processor (Core i7-11800H). You will find more choices for the working memory ranging from 8 to a maximum of 64 GB, and the storage, using either an M.2 SSD and/or a 2.5-inch hard drive. Primarily due to the 2.5-inch slot, the battery capacity is only 49 Wh. To allow for a longer battery life, we would have preferred to see two M.2 slots here. The customer also has a choice for the communication module, the keyboard language, and the operating system.
The price of the XMG Focus 15 starts from 1199 Euros (~$1401). Our tested configuration with 32 GB of dual-channel RAM and a 1-TB SSD ends up costing more than 1500 Euros (~$1753), which is quite a lot for an RTX 3050 Ti device.
The competitors include other 15-inch laptops with a graphics card of the upper mid-range or lower high-end such as the Dell XPS 15 9510, the Asus TUF F15 FX506HM, the Lenovo Legion 5 15ACH, and the Ryzen edition of the Alienware m15 R5. All these laptops are listed in our comparison charts.
Possible Competitors for Comparison
Rating | Date | Model | Weight | Height | Size | Resolution | Price |
|---|---|---|---|---|---|---|---|
| 83.2 % v7 (old) | 09 / 2021 | Schenker XMG Focus 15 i7-11800H, GeForce RTX 3050 Ti Laptop GPU | 1.9 kg | 22 mm | 15.60" | 1920x1080 | |
| 88.4 % v7 (old) | 08 / 2021 | Dell XPS 15 9510 11800H RTX 3050 Ti OLED i7-11800H, GeForce RTX 3050 Ti Laptop GPU | 1.9 kg | 18 mm | 15.60" | 3456x2160 | |
| 85.9 % v7 (old) | 06 / 2021 | Asus TUF Gaming F15 FX506HM i7-11800H, GeForce RTX 3060 Laptop GPU | 2.3 kg | 24.9 mm | 15.60" | 1920x1080 | |
| 83.4 % v7 (old) | 09 / 2021 | Lenovo Legion 5 15ACH-82JU00C6GE-FL R7 5800H, GeForce RTX 3060 Laptop GPU | 2.5 kg | 26 mm | 15.60" | 1920x1080 | |
| 84.7 % v7 (old) | 06 / 2021 | Alienware m15 R5 Ryzen Edition R7 5800H, GeForce RTX 3060 Laptop GPU | 2.5 kg | 22.85 mm | 15.60" | 1920x1080 |
Case
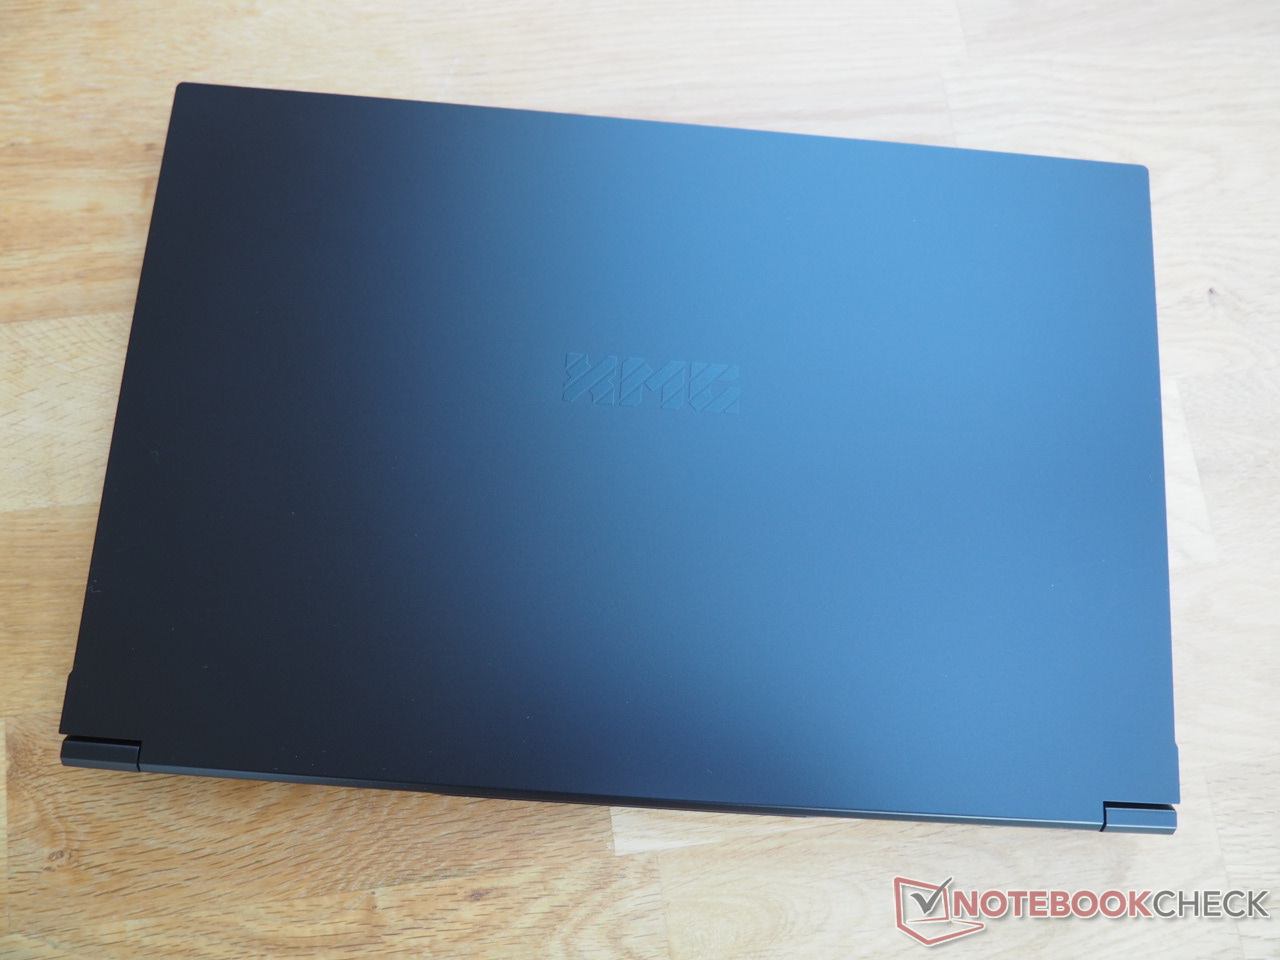
The case, which is based on a Barebone from Clevo (NP50HK case), appears inconspicuous in almost every regard. Besides the design, which is kept rather simple, the rest of the aspects are also unspectacular. The 15-inch laptop mostly shows clean workmanship and a good stability, even though in some places, the plastic surfaces can be pressed in with use of some force. However, this never becomes an annoyance in practical operation. The hinges are also solid. Although the base unit also lifts up slightly when opening the lid, the display can still be opened with a single hand.
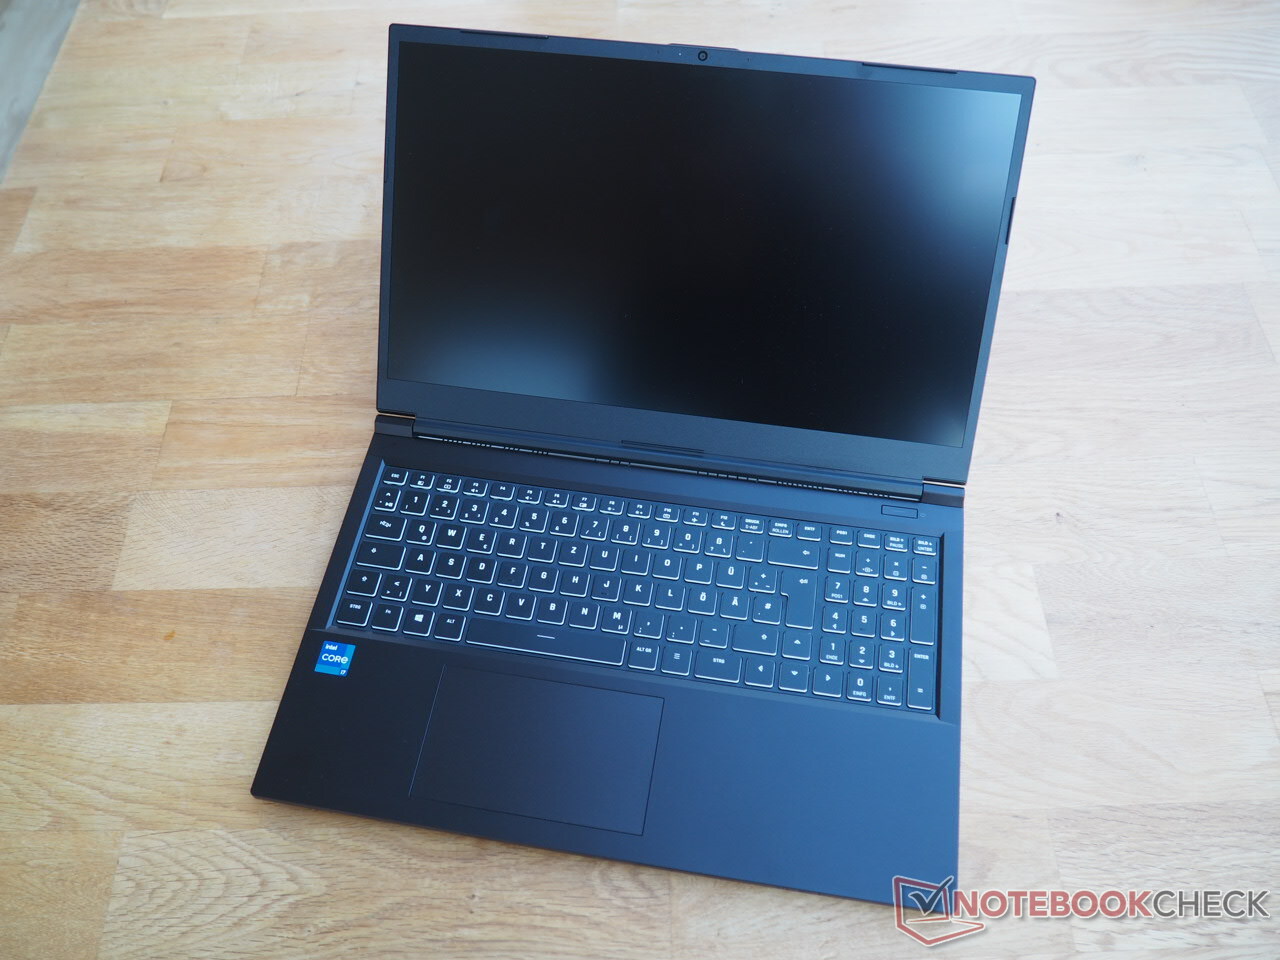

The highlight of the case is its low weight. 1.9 kg (~4.2 lb) is the lowest value in the test field, which is also shared by the Dell XPS 15. The RTX 3060 laptops bring between 2.3 and 2.5 kg (~5-5.5 lb) to the scale. The Focus 15 also scores with its slim build. The height of only 2.2 cm (~0.9 in) ensures a slim look and together with the moderate weight ensures good mobility.
Equipment
Connections
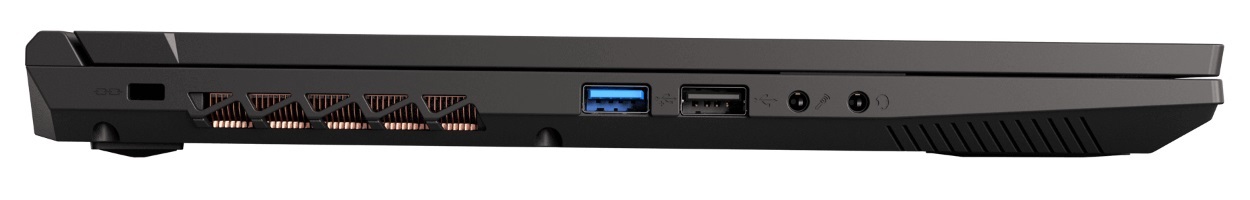
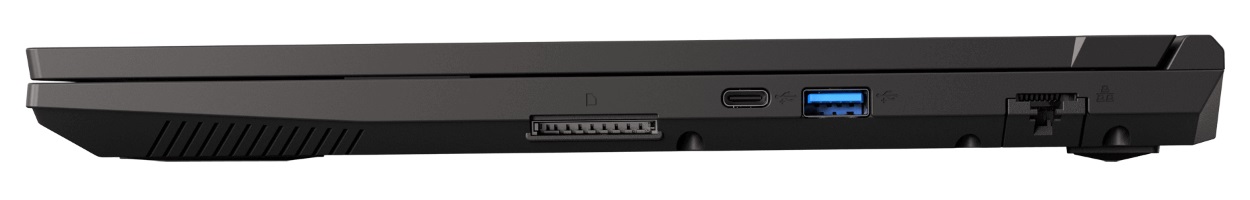
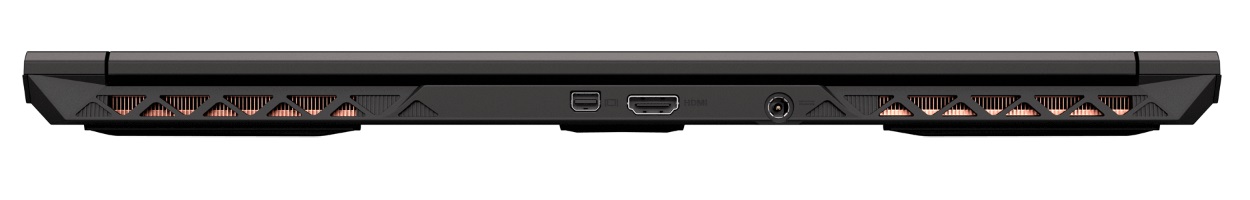
Those who can make do without Thunderbolt should be satisfied with the connection equipment of the Focus 15. While the left side offers an opening for the Kensington Lock, two USB-A ports (1x 2.0, 1x 3.0), and two audio outputs for a microphone and headset, the right side presents a full-size card reader, one USB-C port (3.2 Gen2), an additional USB-A-Port (3.0), and an RJ45 port with a folding mechanism. Finally the connections for power and the display output (HDMI 2.0, Mini-DisplayPort 1.4) are located in the back.
Since some of the connections are placed in the back and the USB ports are distributed well, there should be sufficient space for using an external mouse.
SD Card Reader
The built-in card reader supports the SD, SDHC, and SDXC card formats and offers a mediocre performance. During sequential reading and while transferring photos, you can expect around 80 to 90 MB/s. For comparison, the Dell XPS 15 cracks the 200-MB mark using our AV Pro 128 GB V60 reference card. All the other competitors do not offer a card reader.
| SD Card Reader | |
| average JPG Copy Test (av. of 3 runs) | |
| Dell XPS 15 9510 11800H RTX 3050 Ti OLED (AV Pro V60) | |
| Average of class Gaming (20.9 - 210, n=54, last 2 years) | |
| Schenker XMG Focus 15 (AV PRO microSD 128 GB V60) | |
| maximum AS SSD Seq Read Test (1GB) | |
| Dell XPS 15 9510 11800H RTX 3050 Ti OLED (AV Pro V60) | |
| Average of class Gaming (25.5 - 261, n=51, last 2 years) | |
| Schenker XMG Focus 15 (AV PRO microSD 128 GB V60) | |
Communication
Our test unit uses an Intel Wi-Fi 6 AX201 as the communication module. In addition to WLAN 802.11 a/b/g/n/ac/ax, it also supports Bluetooth 5.1. In our range test (1m distance to the Netgear Nighthawk AX12 reference router), the Focus 15 achieves very good results with 1500 Mbit/s when sending and more than 1300 Mbit/s when receiving data. With these values, it achieves the first and third place in our test field, respectively.
Webcam
As usual, you should not expect too much from the webcam. The image sharpness and color reproduction are rather limited.


Accessories
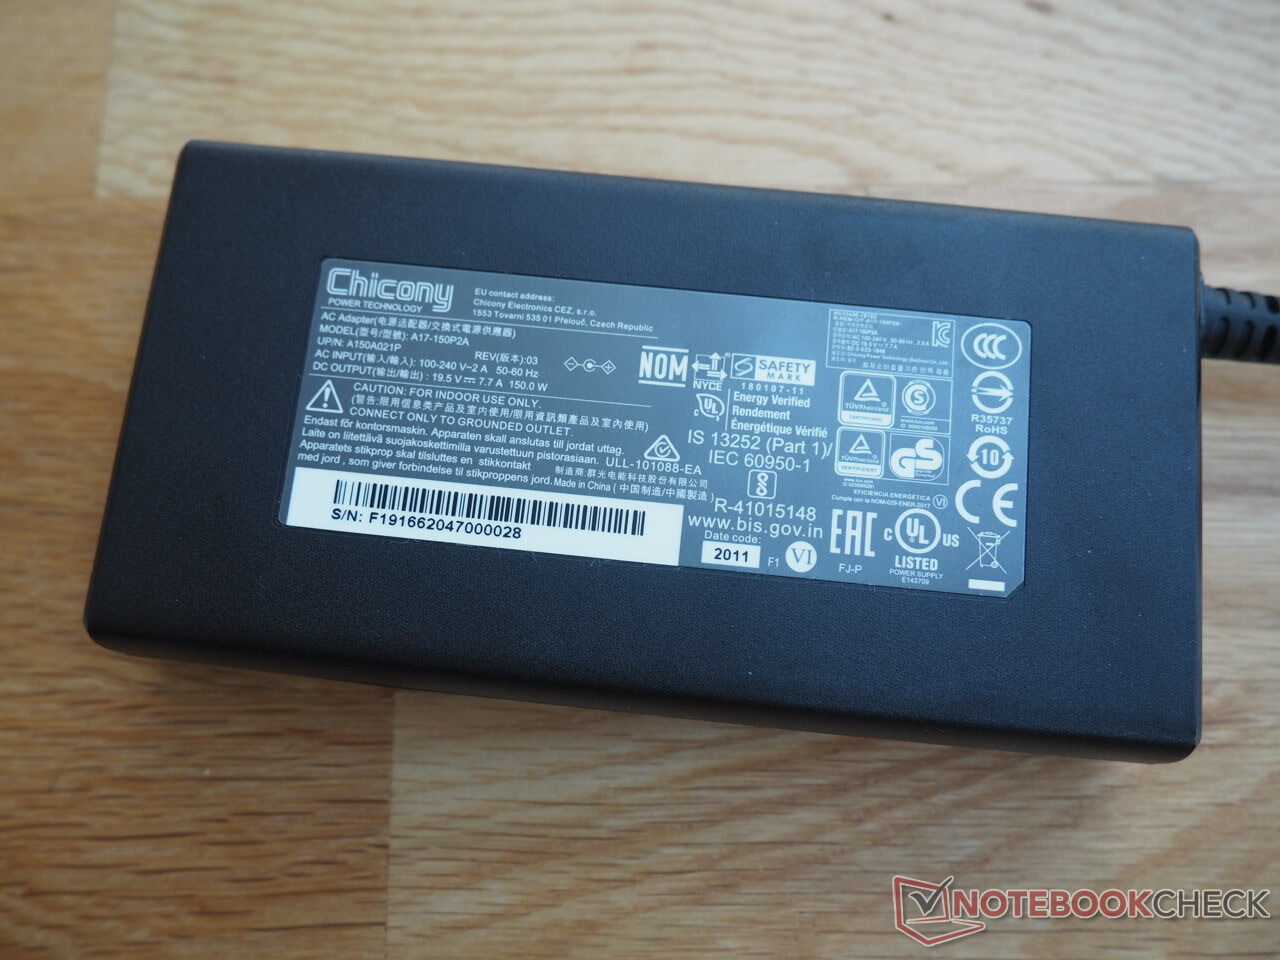
The box includes a quick start manual, a driver DVD, a USB stick with software, and screws for the 2.5-inch slot. The power supply of the Focus 15 is a pleasantly light and compact 150-Watt model.
Maintenance
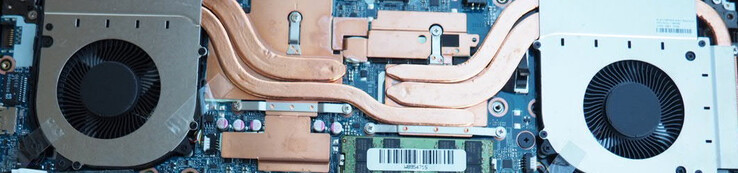
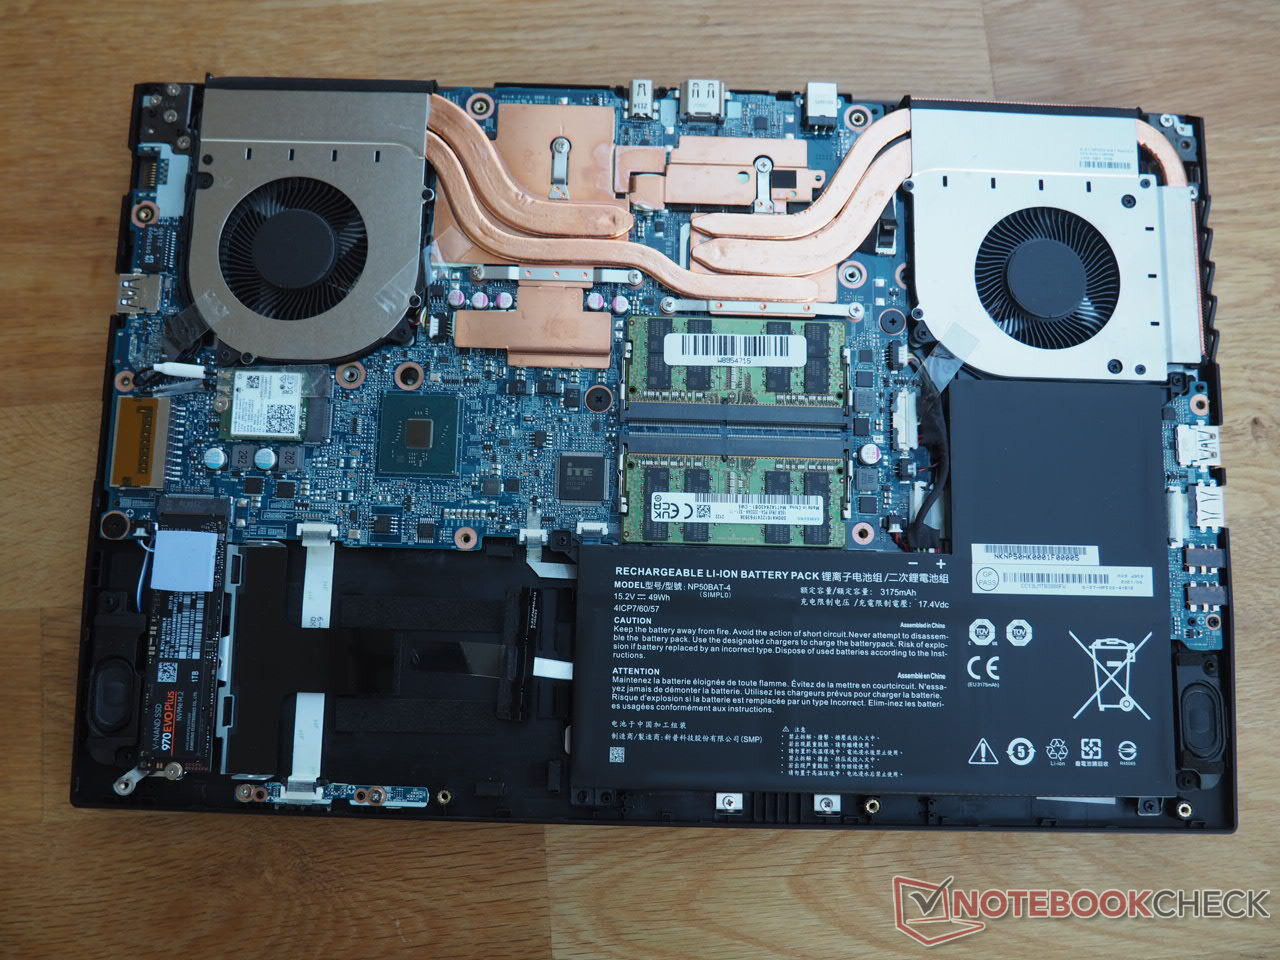
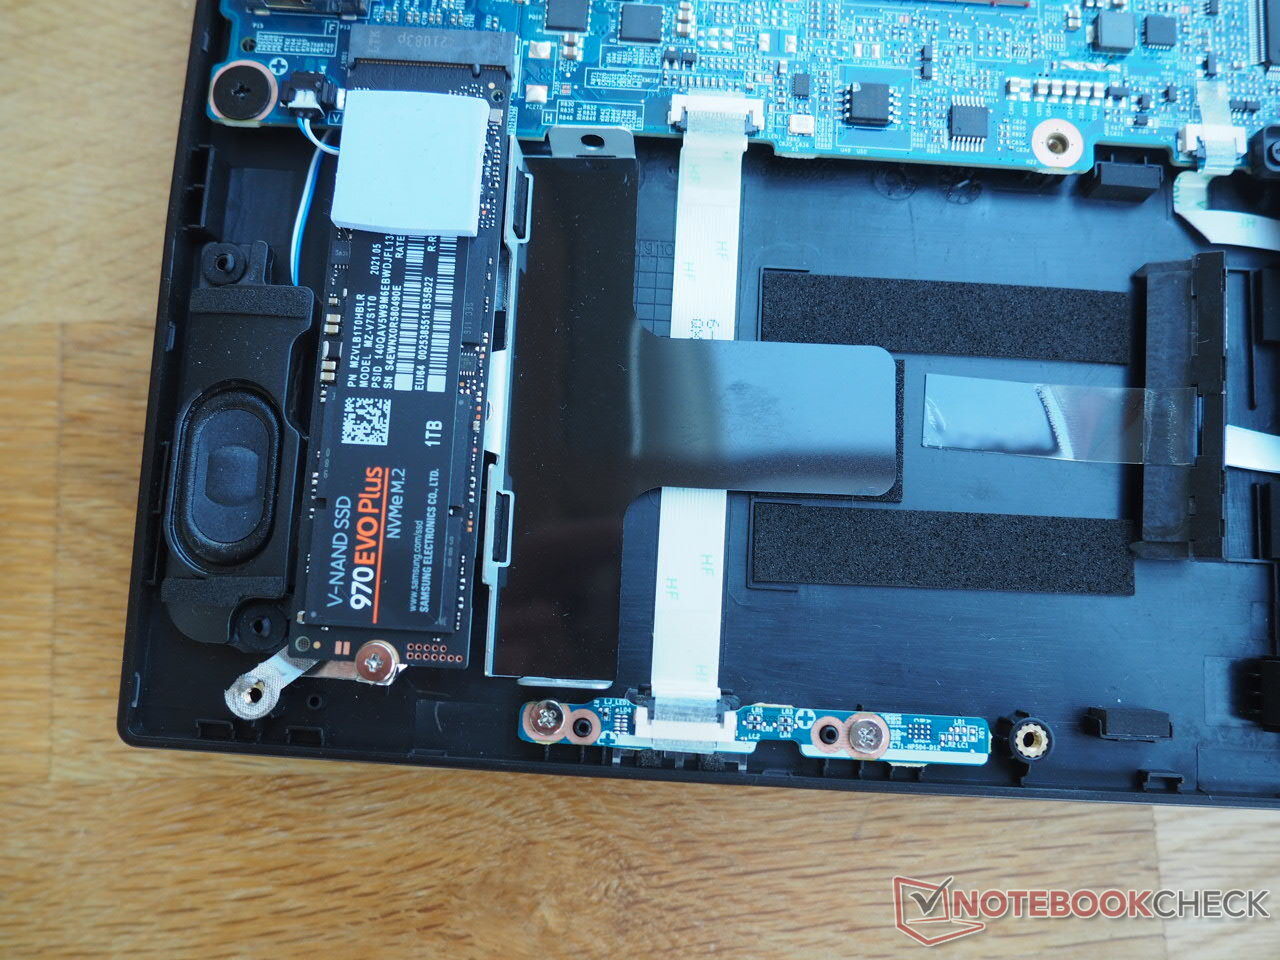
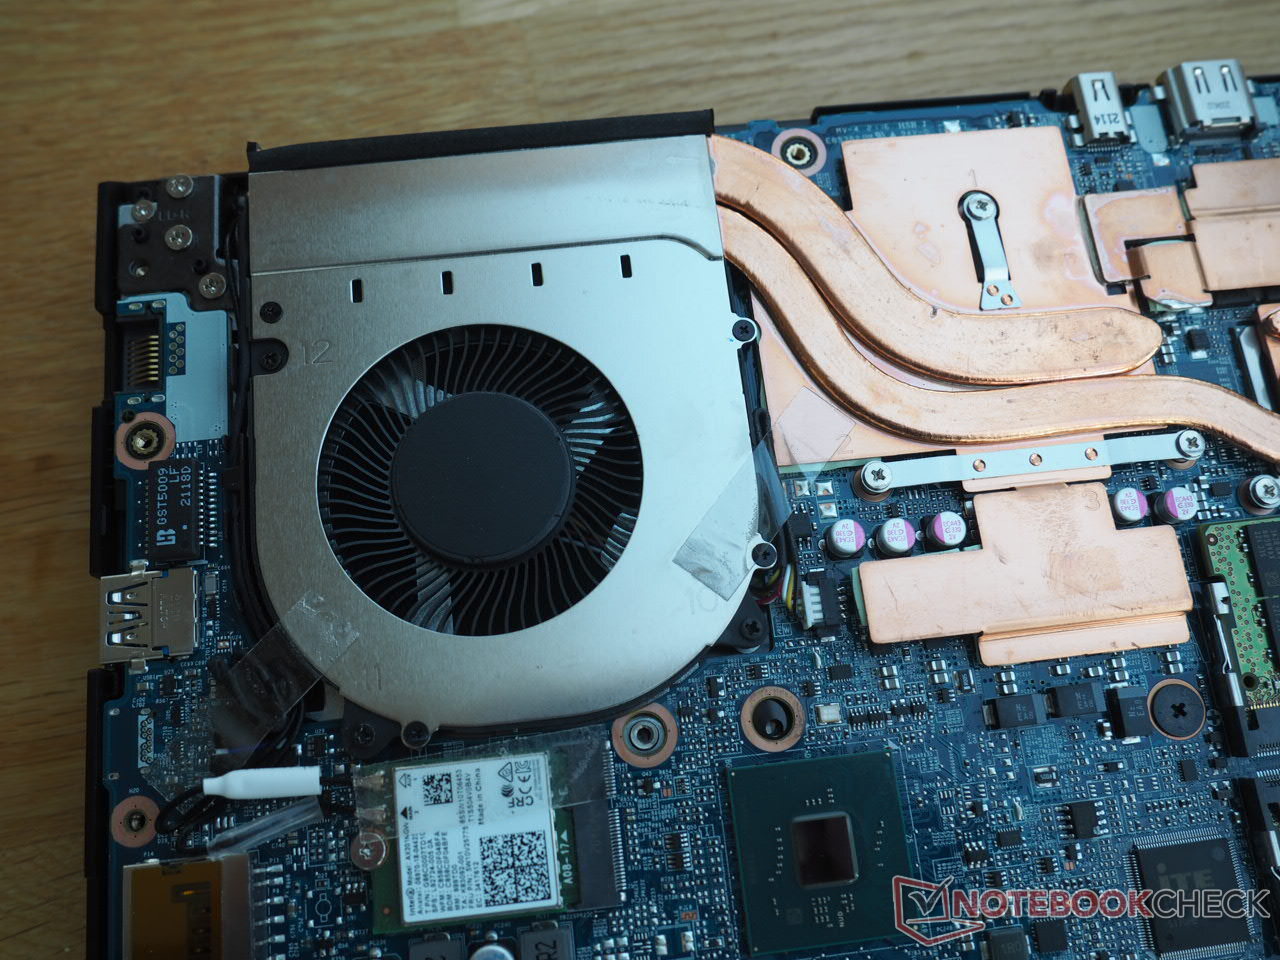
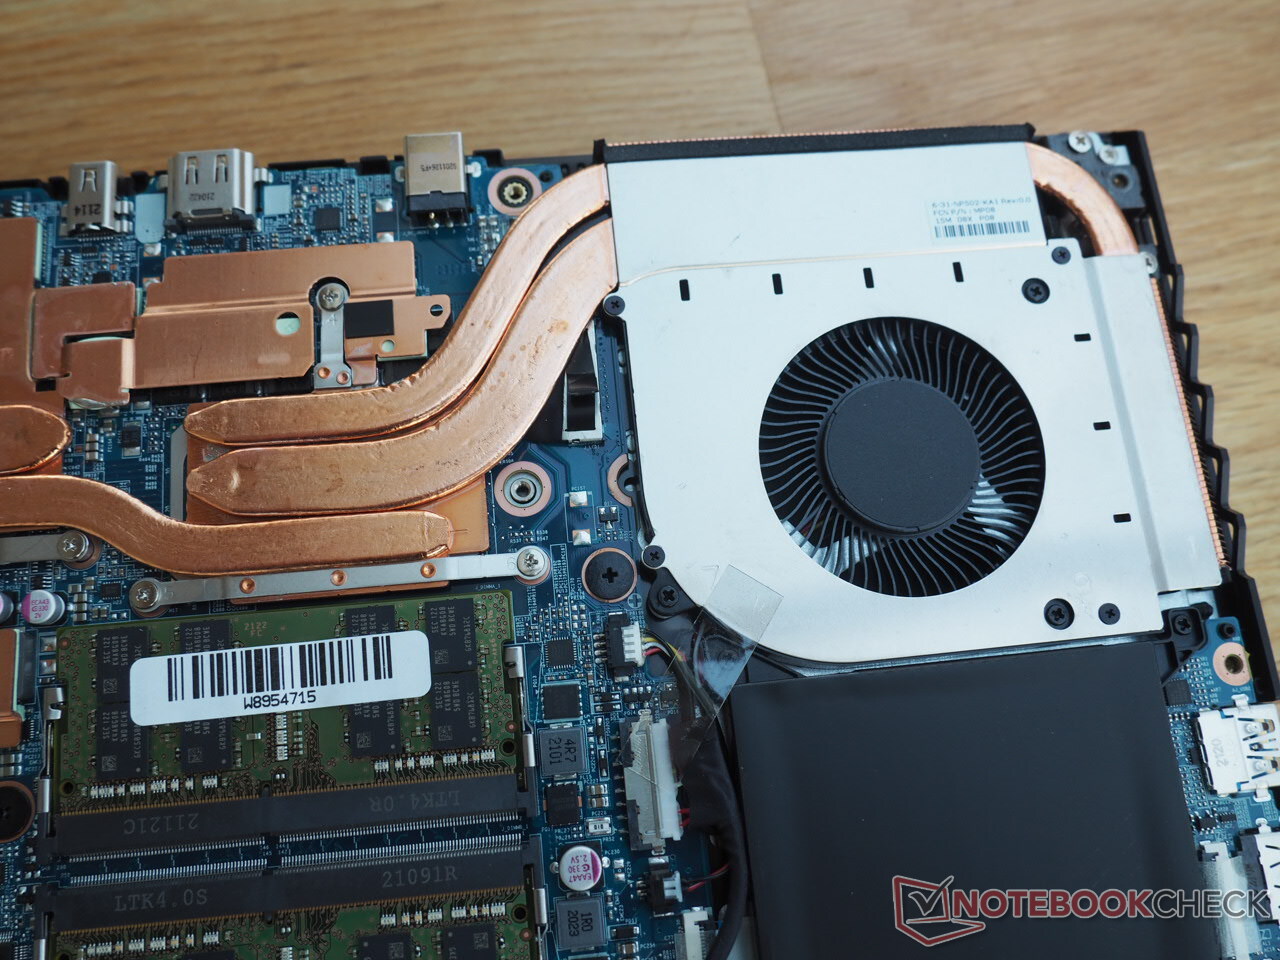
In order to access the insides, you have to first remove a total of 15 Philips screws from the bottom of the case. You can then lift off the bottom cover with only little use of force. As typical for Clevo cases, the maintenance options are very good. In addition to the battery, the WLAN module, and the working memory, you can also access the M.2 and the 2.5-inch slot. The cooling system consists of two fans, with several heat pipes running from each of them to the CPU and GPU (soldered in, so they cannot be replaced).
Warranty
The basic warranty lasts for 2 years (6 months quick repair). At an additional cost, up to 3 years of quick repair are also available for the whole warranty period.
Input Devices
Keyboard
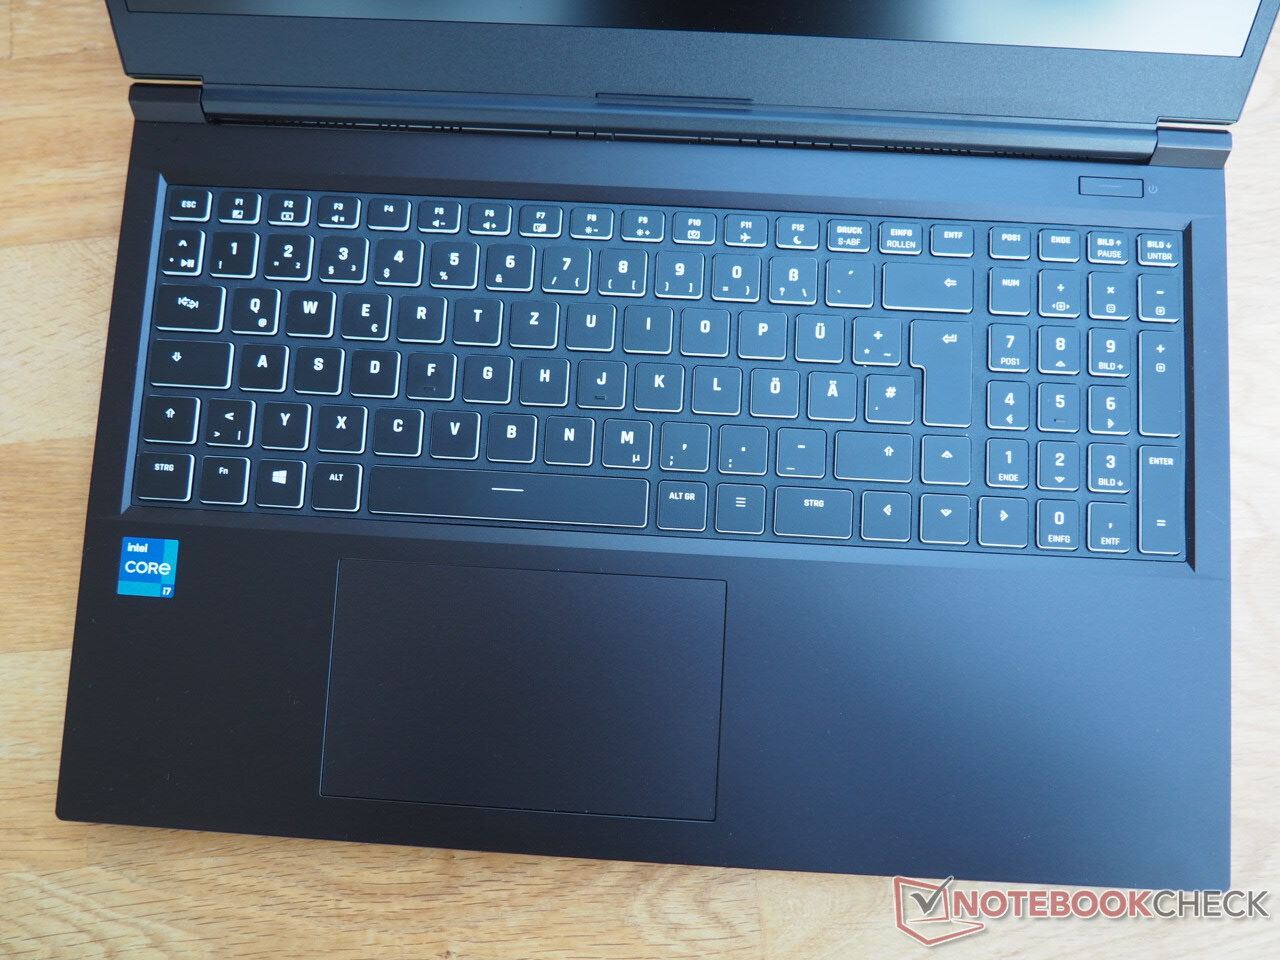
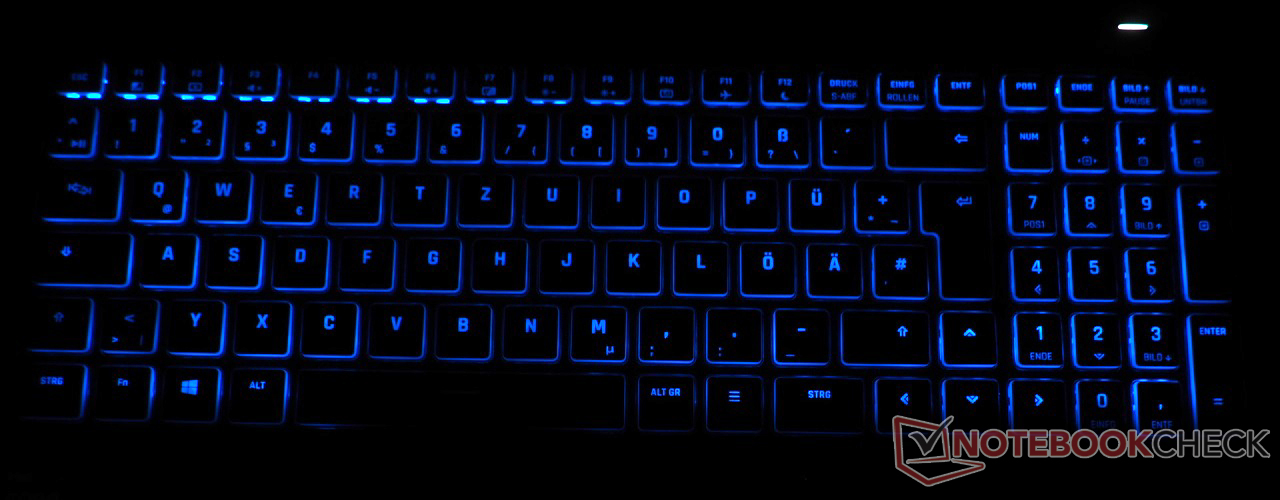
We already know the keyboard from other Clevo Barebones. The chicklet model that can be illuminated in several colors and levels offers a dedicated number block and a fairly good typing experience. Buyers should also be pleased with the comfortable key size. In addition to the WASD keys, the arrow keys also have a decent size. The typing noise is neither very quiet nor particularly loud, settling in the middle of the field. A positive point is the ample size of the palm rest due to the high positioning of the keyboard.
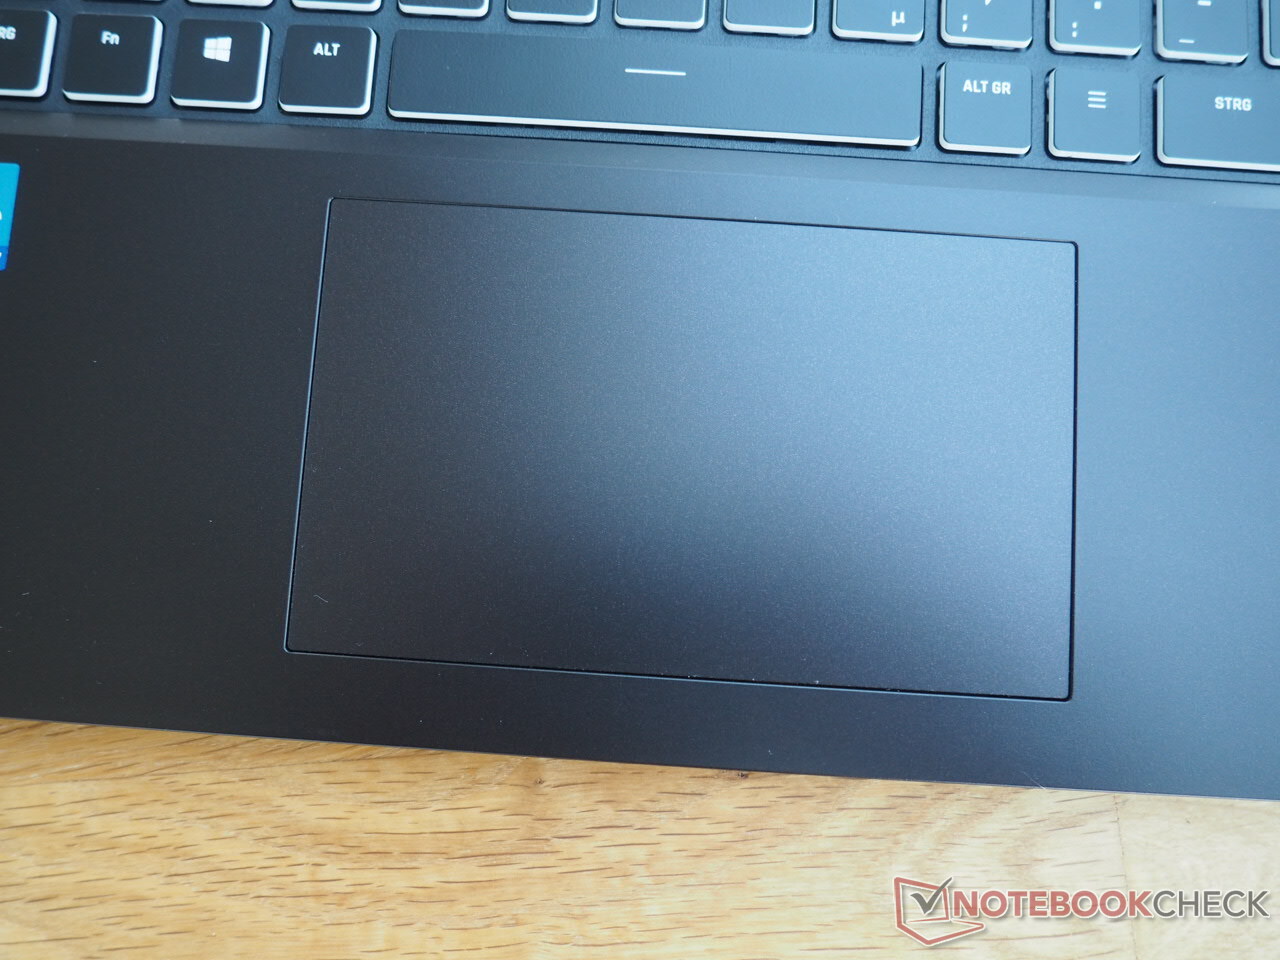
Touchpad
The touchpad is also impressive. About 12 x 7.3 cm (~4.7 x 2.9 in) are quite a lot for a 15-inch laptop. Following the current trend, this is a ClickPad without dedicated keys. With the smooth surface and good accuracy, mouse movements succeed very smoothly. However, the manufacturer should improve on the stability. Particularly the left and right edge of the pad can be pressed down more than usual. The same problem is also found in the 17-inch model, which will receive a review evaluation shortly.
Display
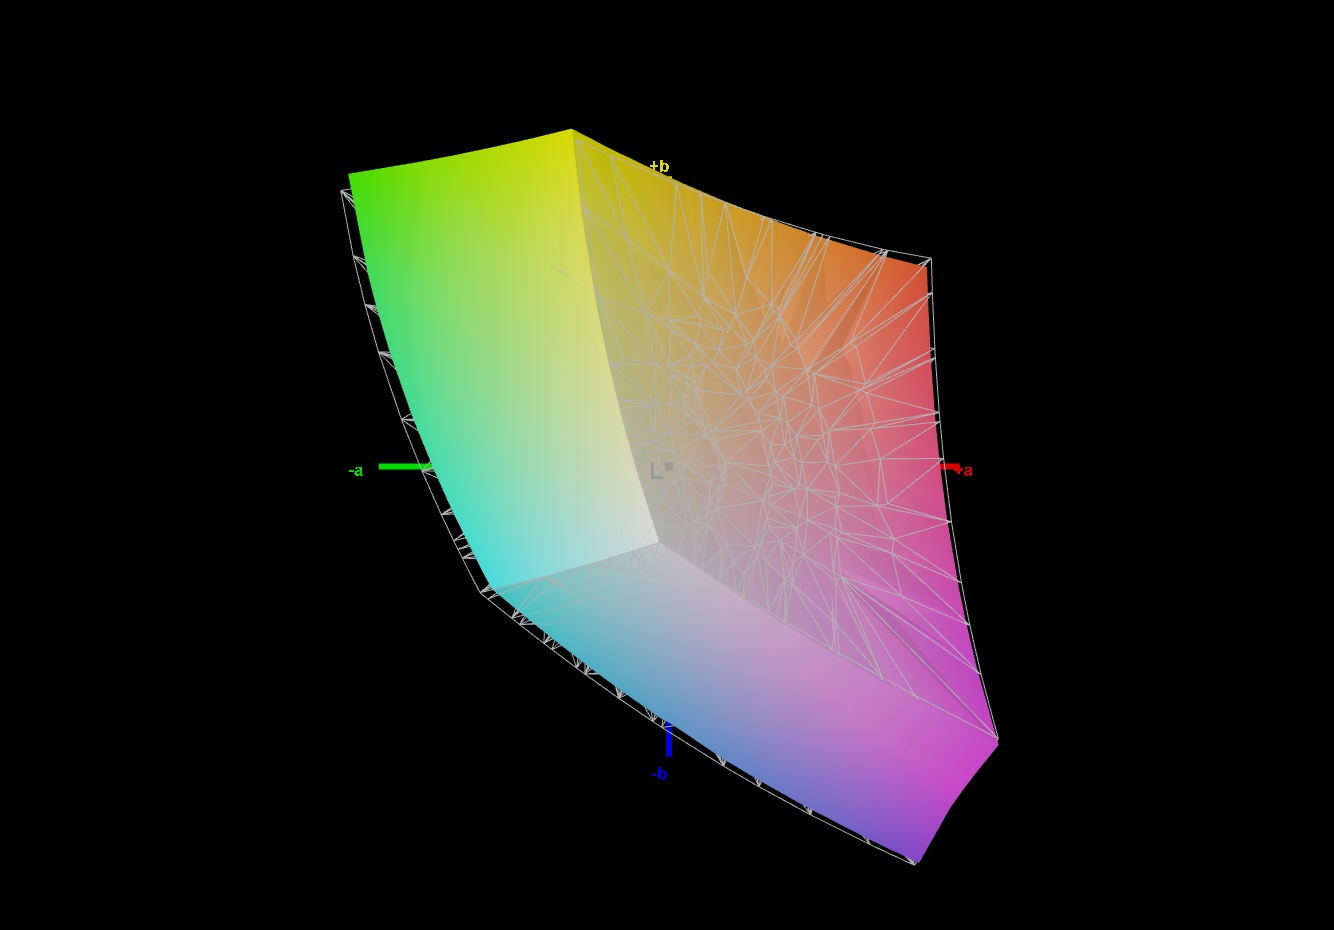
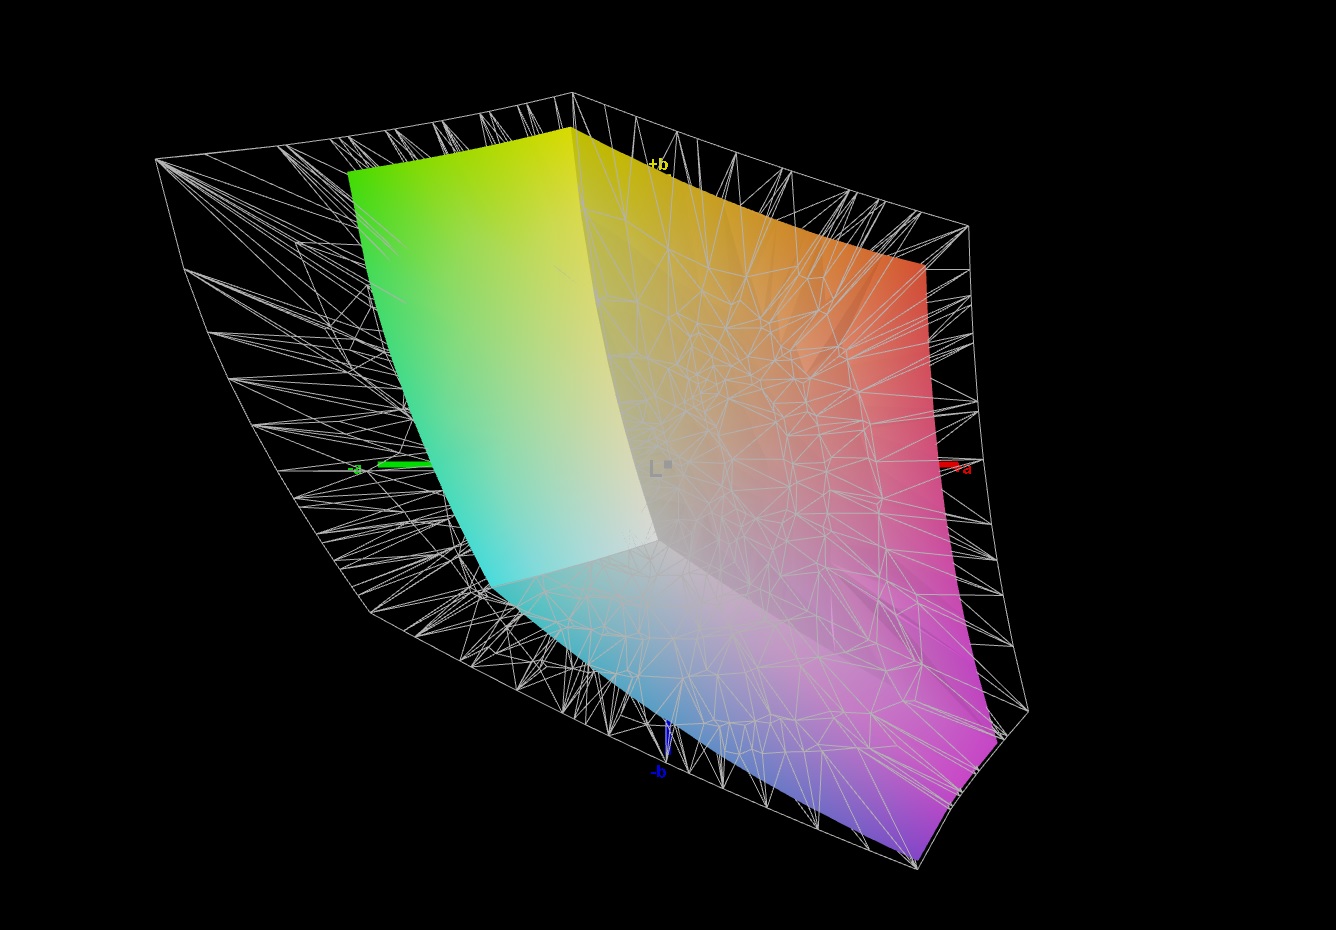
The display consists of a classic IPS panel with a 1920x1080 pixel resolution and refresh rate of 144 Hz.
| |||||||||||||||||||||||||
Brightness Distribution: 83 %
Center on Battery: 418 cd/m²
Contrast: 1020:1 (Black: 0.41 cd/m²)
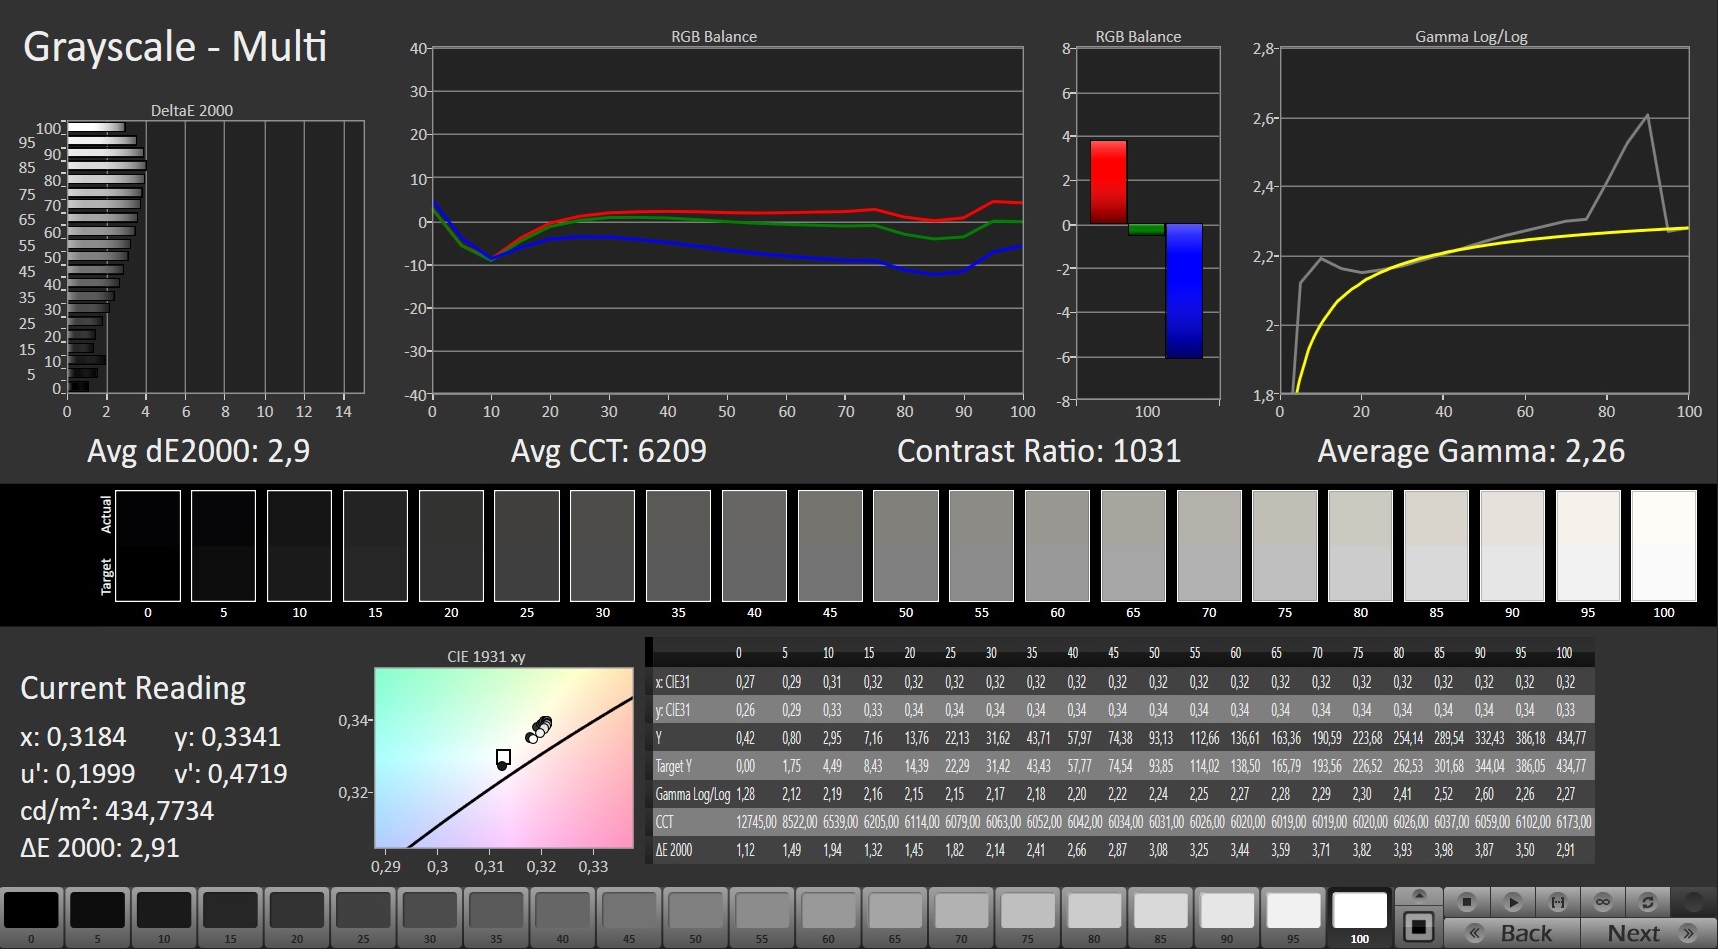
ΔE ColorChecker Calman: 1.67 | ∀{0.5-29.43 Ø4.71}
calibrated: 0.98
ΔE Greyscale Calman: 2.9 | ∀{0.09-98 Ø4.96}
66.5% AdobeRGB 1998 (Argyll 3D)
95.3% sRGB (Argyll 3D)
64.6% Display P3 (Argyll 3D)
Gamma: 2.26
CCT: 6209 K
| Schenker XMG Focus 15 LG Philips LP156WFG-SPB5, IPS, 1920x1080, 15.6" | Dell XPS 15 9510 11800H RTX 3050 Ti OLED SDC414D, OLED, 3456x2160, 15.6" | Asus TUF Gaming F15 FX506HM Chi Mei N156HRA-EA1, IPS, 1920x1080, 15.6" | Lenovo Legion 5 15ACH-82JU00C6GE-FL B156HAN12.H, , 1920x1080, 15.6" | Alienware m15 R5 Ryzen Edition B156HAN, IPS, 1920x1080, 15.6" | |
|---|---|---|---|---|---|
| Display | 36% | -35% | 1% | ||
| Display P3 Coverage (%) | 64.6 | 99.9 55% | 41.9 -35% | 65.4 1% | |
| sRGB Coverage (%) | 95.3 | 100 5% | 62.9 -34% | 96.3 1% | |
| AdobeRGB 1998 Coverage (%) | 66.5 | 98.1 48% | 43.3 -35% | 67.5 2% | |
| Response Times | 74% | -102% | 10% | 42% | |
| Response Time Grey 50% / Grey 80% * (ms) | 18 ? | 3.6 ? 80% | 28.4 ? -58% | 13.6 ? 24% | 4 ? 78% |
| Response Time Black / White * (ms) | 8.8 ? | 2.8 ? 68% | 21.6 ? -145% | 9.2 ? -5% | 8.4 ? 5% |
| PWM Frequency (Hz) | 59.5 ? | ||||
| Screen | 49% | -99% | -40% | -13% | |
| Brightness middle (cd/m²) | 418 | 362 -13% | 268.3 -36% | 350 -16% | 329 -21% |
| Brightness (cd/m²) | 376 | 367 -2% | 257 -32% | 350 -7% | 321 -15% |
| Brightness Distribution (%) | 83 | 97 17% | 84 1% | 96 16% | 92 11% |
| Black Level * (cd/m²) | 0.41 | 0.06 85% | 0.34 17% | 0.3 27% | 0.27 34% |
| Contrast (:1) | 1020 | 6033 491% | 789 -23% | 1167 14% | 1219 20% |
| Colorchecker dE 2000 * | 1.67 | 2.1 -26% | 5.05 -202% | 3.9 -134% | 2.78 -66% |
| Colorchecker dE 2000 max. * | 3.88 | 4.1 -6% | 15.43 -298% | 8.2 -111% | 4.88 -26% |
| Colorchecker dE 2000 calibrated * | 0.98 | 2.5 -155% | 3.21 -228% | 1.6 -63% | 1.63 -66% |
| Greyscale dE 2000 * | 2.9 | 1.4 52% | 5.5 -90% | 5.5 -90% | 2.5 14% |
| Gamma | 2.26 97% | 2.18 101% | 2.35 94% | 2.15 102% | 2.106 104% |
| CCT | 6209 105% | 6608 98% | 7392 88% | 7414 88% | 6201 105% |
| Color Space (Percent of AdobeRGB 1998) (%) | 76 | ||||
| Color Space (Percent of sRGB) (%) | 99 | ||||
| Total Average (Program / Settings) | 53% /
50% | -79% /
-86% | -10% /
-24% | 15% /
-3% |
* ... smaller is better
On the positive side, we have especially the good brightness. Almost 376 cd/m² at maximum brightness represent the best value in our test field, closely followed by the OLED panel of the Dell XPS 15 with 367 cd/m². This means that you can also use the 15-inch laptop easily outdoors.
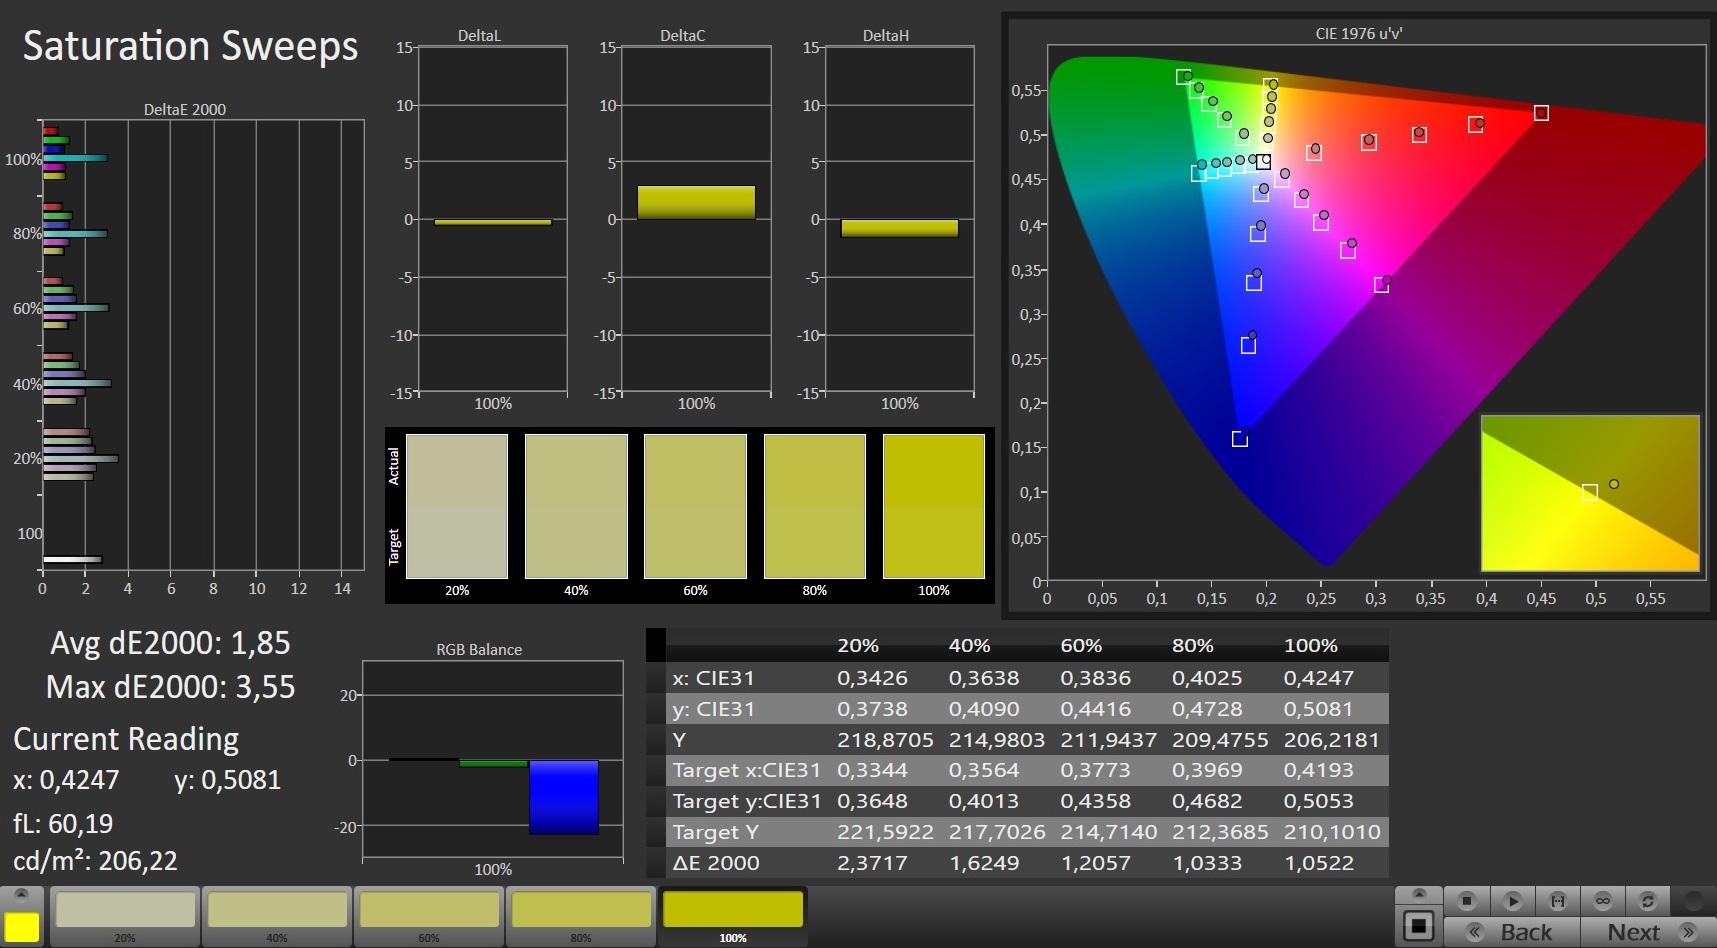
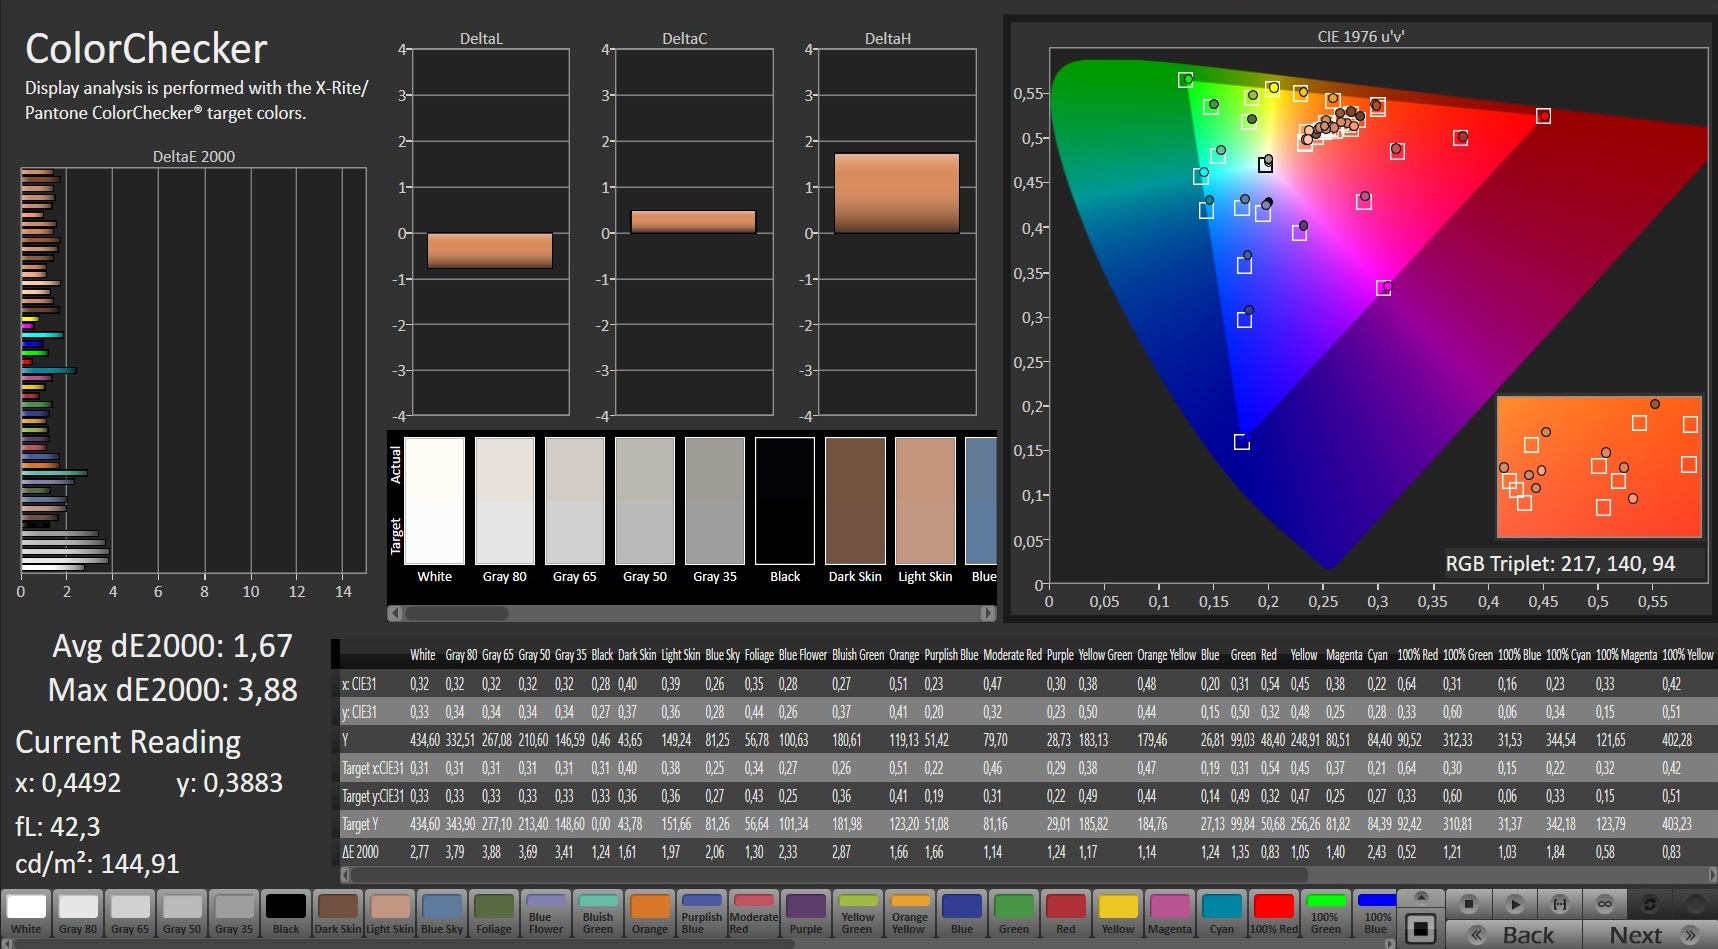
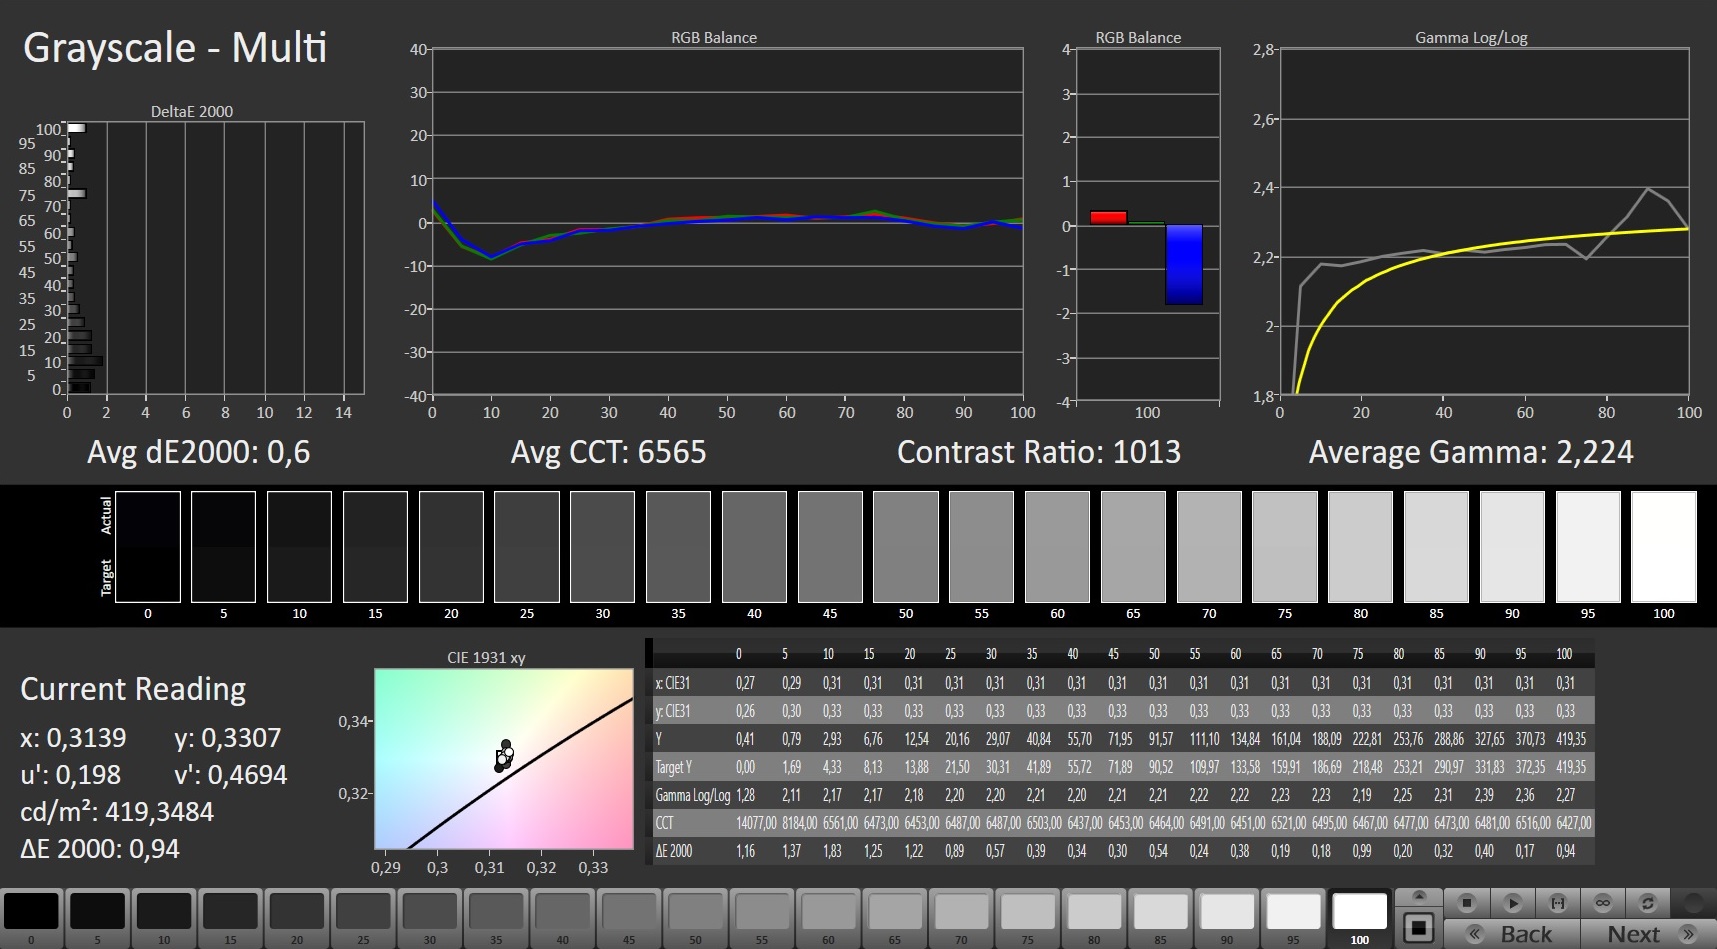
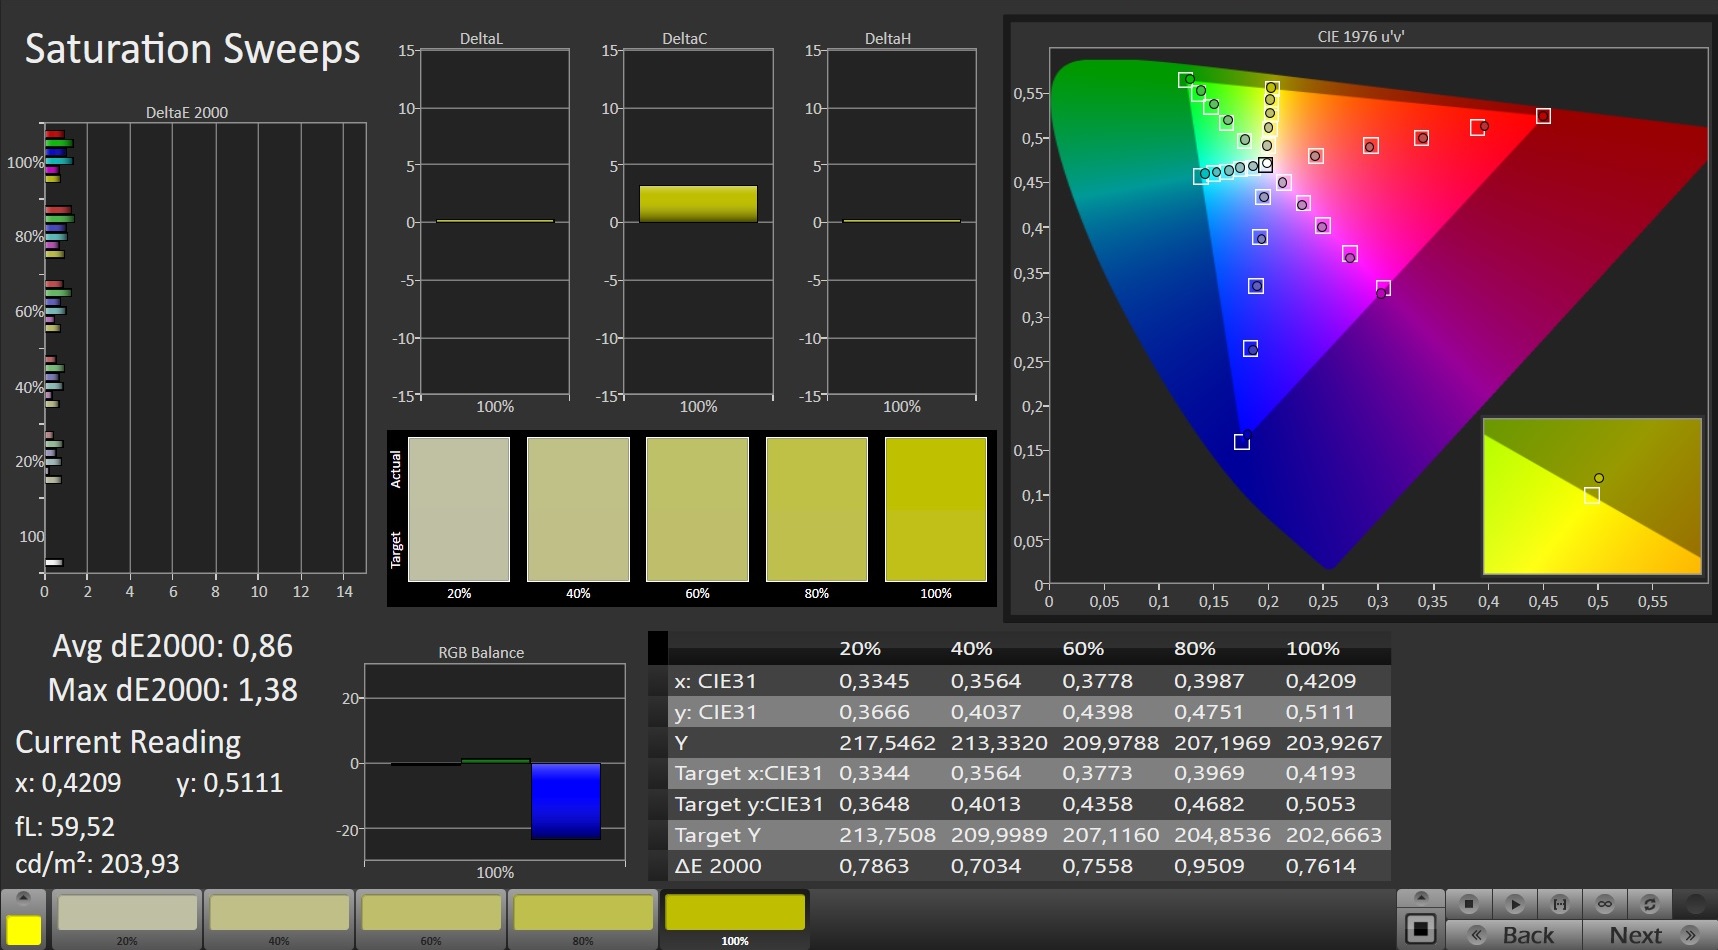
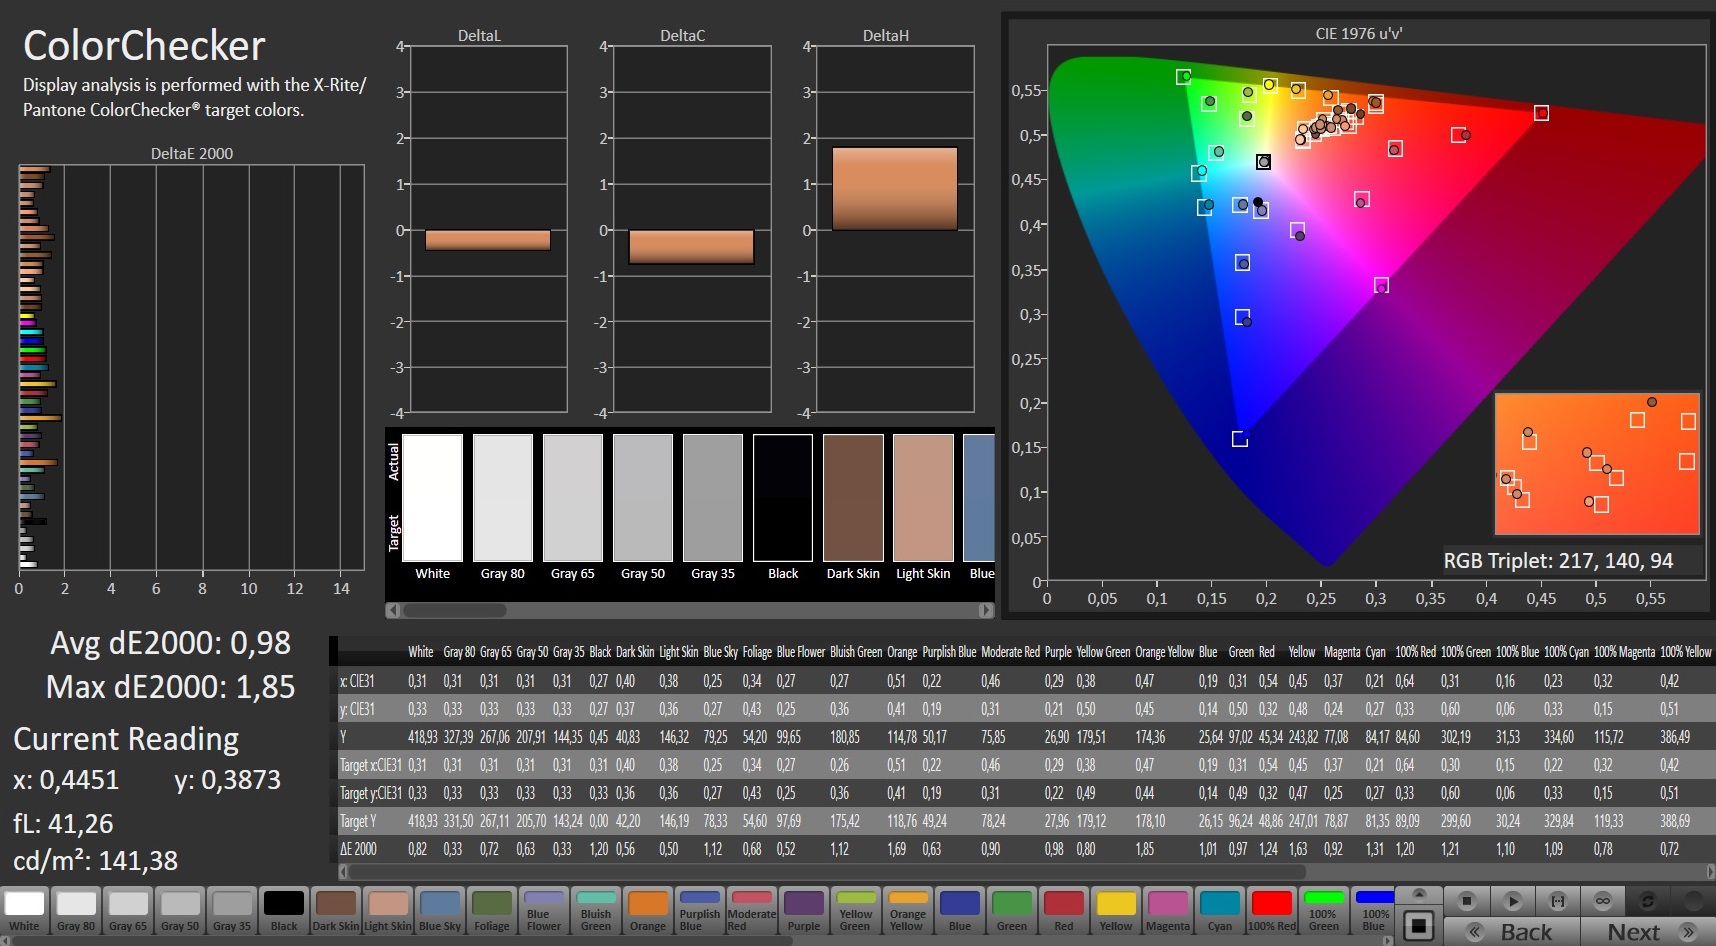
Due to the black value being less than optimal (0.41 cd/m²) the contrast value only places in the middle of the field. But about 1000:1 should be sufficient for most buyers. On the other hand, the good color reproduction deserves some positive points. The 15-inch screen offers a balanced image already in the state of delivery.
For the color space coverage, we measure 95% sRGB and 66% AdobeRGB. These are relative good values for a gaming laptop. The measured response times of 8.8 ms black-to-white and 18 ms grey-to-grey are similar to those of other IPS panels with 144 Hz.

Display Response Times
| ↔ Response Time Black to White | ||
|---|---|---|
| 8.8 ms ... rise ↗ and fall ↘ combined | ↗ 3.6 ms rise | 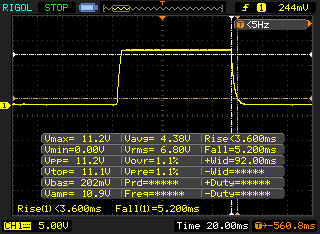 |
| ↘ 5.2 ms fall | ||
| The screen shows fast response rates in our tests and should be suited for gaming. In comparison, all tested devices range from 0.1 (minimum) to 240 (maximum) ms. » 25 % of all devices are better. This means that the measured response time is better than the average of all tested devices (19.8 ms). | ||
| ↔ Response Time 50% Grey to 80% Grey | ||
| 18 ms ... rise ↗ and fall ↘ combined | ↗ 9.2 ms rise | 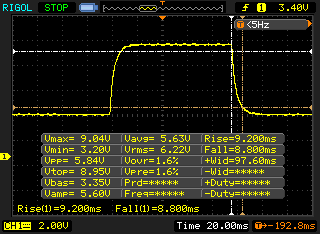 |
| ↘ 8.8 ms fall | ||
| The screen shows good response rates in our tests, but may be too slow for competitive gamers. In comparison, all tested devices range from 0.165 (minimum) to 636 (maximum) ms. » 32 % of all devices are better. This means that the measured response time is better than the average of all tested devices (30.9 ms). | ||
Screen Flickering / PWM (Pulse-Width Modulation)
| Screen flickering / PWM not detected | 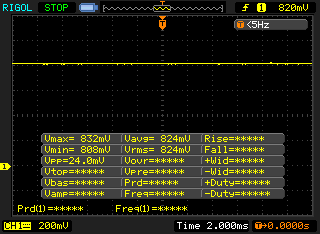 | ||
In comparison: 52 % of all tested devices do not use PWM to dim the display. If PWM was detected, an average of 7741 (minimum: 5 - maximum: 343500) Hz was measured. | |||
Test Conditions
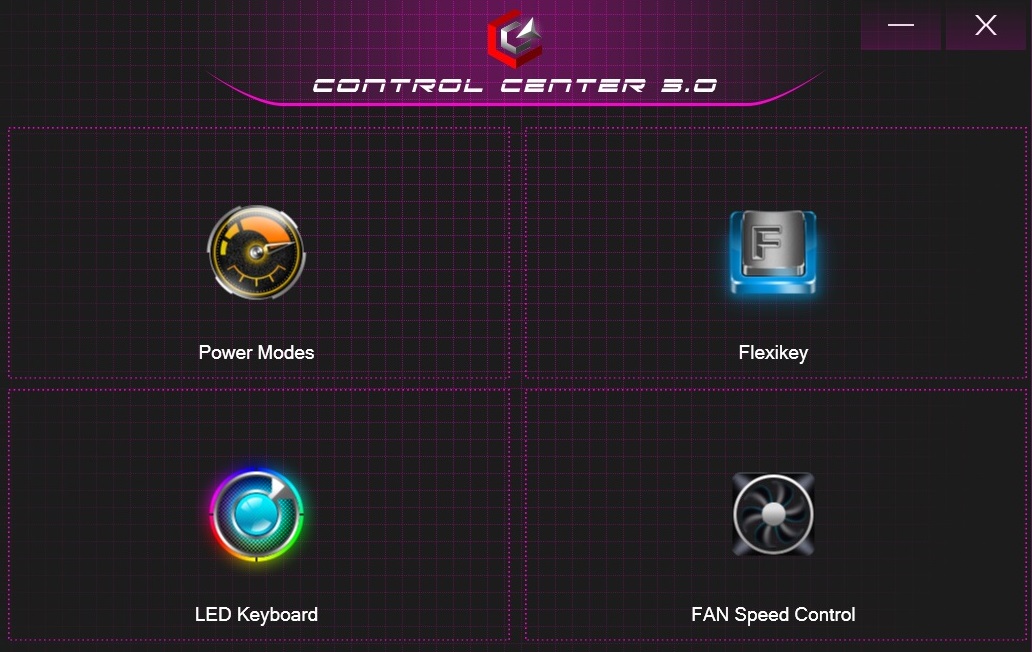
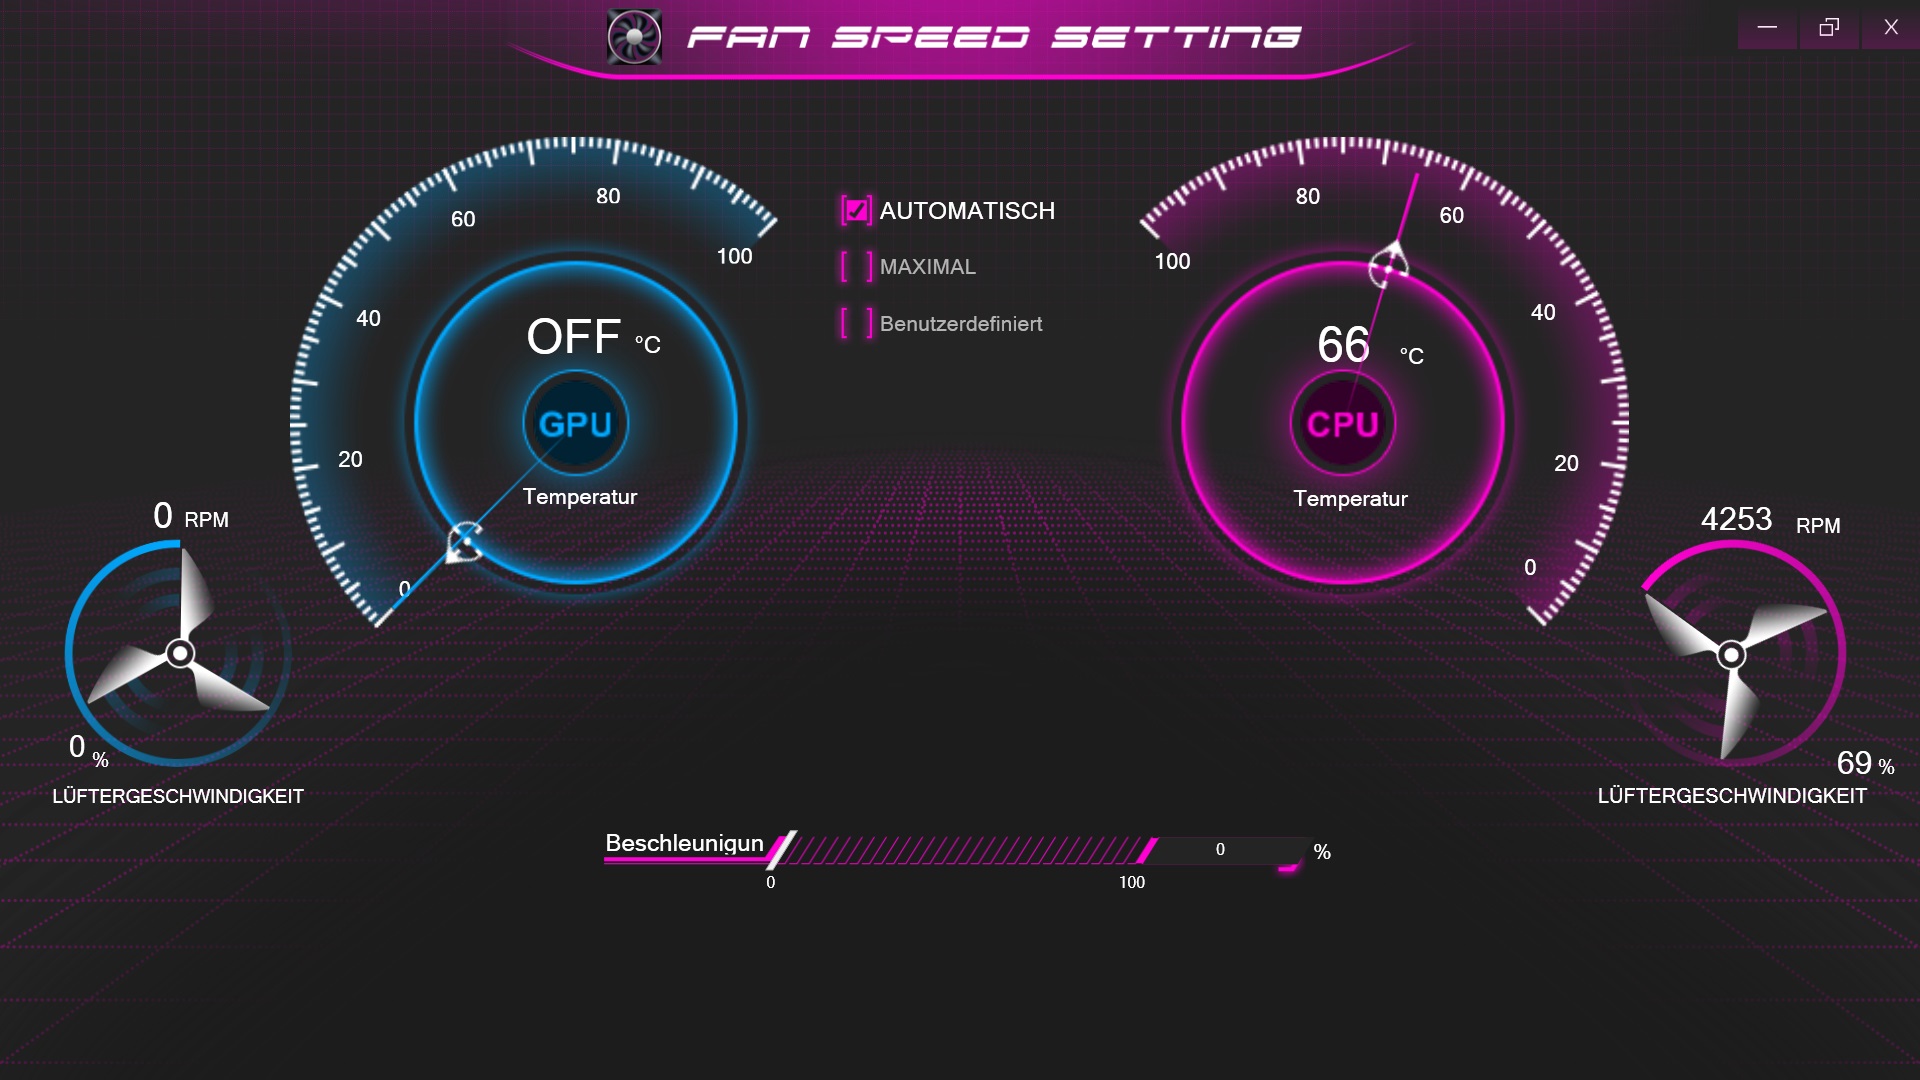
The preinstalled Control Center allows adjusting various system settings. Our tests were performed in the Performance mode using the automatic fan control.
Performance
Despite our test unit bringing an octa-core CPU, 32 GB of RAM, and a 1-TB SSD, the XMG Focus 15 "only" settles in the mid-range. The GeForce RTX 3050 Ti is meant more for the occasional gamer who doesn't need to play every new game at maximum details and who doesn't pose particularly high demands on getting a future-proof device.
Processor
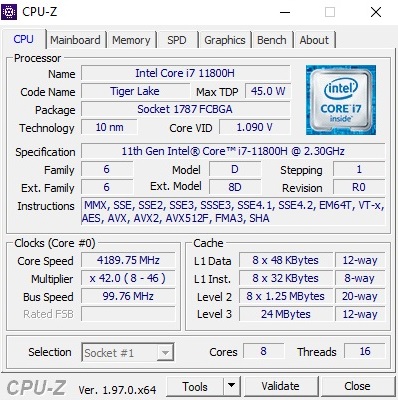
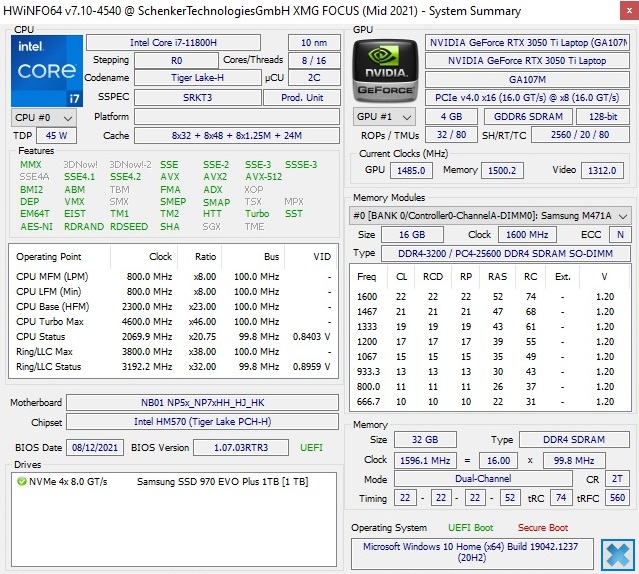
In the mobile gaming area, Intel's Core i7-11800H is currently one of the most successful processors. The 10-nm model contains 24 MB L3 cache and is able to operate on 16 threads simultaneously via Hyper Threading. Under load, the clock speed is between 2.3 and a maximum of 4.6 GHz.
In our Cinebench loop, the Focus 15 only turns out average. Even though the CPU performance remains fairly constant over a longer time period and ranges above that of the Dell XPS 15, the Core i7-11800H still achieves better benchmark results in other laptops (see the Asus TUF F15, for example). The Focus 15 also has a hard time in the comparison with laptops that are based on the Ryzen 7 5800H. However, since most 3D applications are limited by the GPU, gamers don't have to worry about any limitations when playing games.
Cinebench R15 Multi Constant Load Test
* ... smaller is better
System Performance
Not the least due to the fast SSD, the 15-inch laptop ends up in first place in the system tests. 6478 points in PCMark 10 result in third place, with the Schenker laptop performing at eye level with the test configuration of the Alienware m15 R5.
| PCMark 10 / Score | |
| Average of class Gaming (5828 - 12414, n=93, last 2 years) | |
| Asus TUF Gaming F15 FX506HM | |
| Lenovo Legion 5 15ACH-82JU00C6GE-FL | |
| Schenker XMG Focus 15 | |
| Alienware m15 R5 Ryzen Edition | |
| Average Intel Core i7-11800H, NVIDIA GeForce RTX 3050 Ti Laptop GPU (6019 - 6556, n=5) | |
| Dell XPS 15 9510 11800H RTX 3050 Ti OLED | |
| PCMark 10 / Essentials | |
| Average of class Gaming (8810 - 11935, n=97, last 2 years) | |
| Asus TUF Gaming F15 FX506HM | |
| Lenovo Legion 5 15ACH-82JU00C6GE-FL | |
| Schenker XMG Focus 15 | |
| Average Intel Core i7-11800H, NVIDIA GeForce RTX 3050 Ti Laptop GPU (9490 - 10846, n=5) | |
| Alienware m15 R5 Ryzen Edition | |
| Dell XPS 15 9510 11800H RTX 3050 Ti OLED | |
| PCMark 10 / Productivity | |
| Average of class Gaming (6845 - 25323, n=95, last 2 years) | |
| Lenovo Legion 5 15ACH-82JU00C6GE-FL | |
| Alienware m15 R5 Ryzen Edition | |
| Asus TUF Gaming F15 FX506HM | |
| Schenker XMG Focus 15 | |
| Average Intel Core i7-11800H, NVIDIA GeForce RTX 3050 Ti Laptop GPU (8176 - 8723, n=5) | |
| Dell XPS 15 9510 11800H RTX 3050 Ti OLED | |
| PCMark 10 / Digital Content Creation | |
| Average of class Gaming (7602 - 19954, n=95, last 2 years) | |
| Asus TUF Gaming F15 FX506HM | |
| Alienware m15 R5 Ryzen Edition | |
| Schenker XMG Focus 15 | |
| Average Intel Core i7-11800H, NVIDIA GeForce RTX 3050 Ti Laptop GPU (7475 - 8577, n=5) | |
| Lenovo Legion 5 15ACH-82JU00C6GE-FL | |
| Dell XPS 15 9510 11800H RTX 3050 Ti OLED | |
| PCMark 10 Score | 6478 points | |
Help | ||
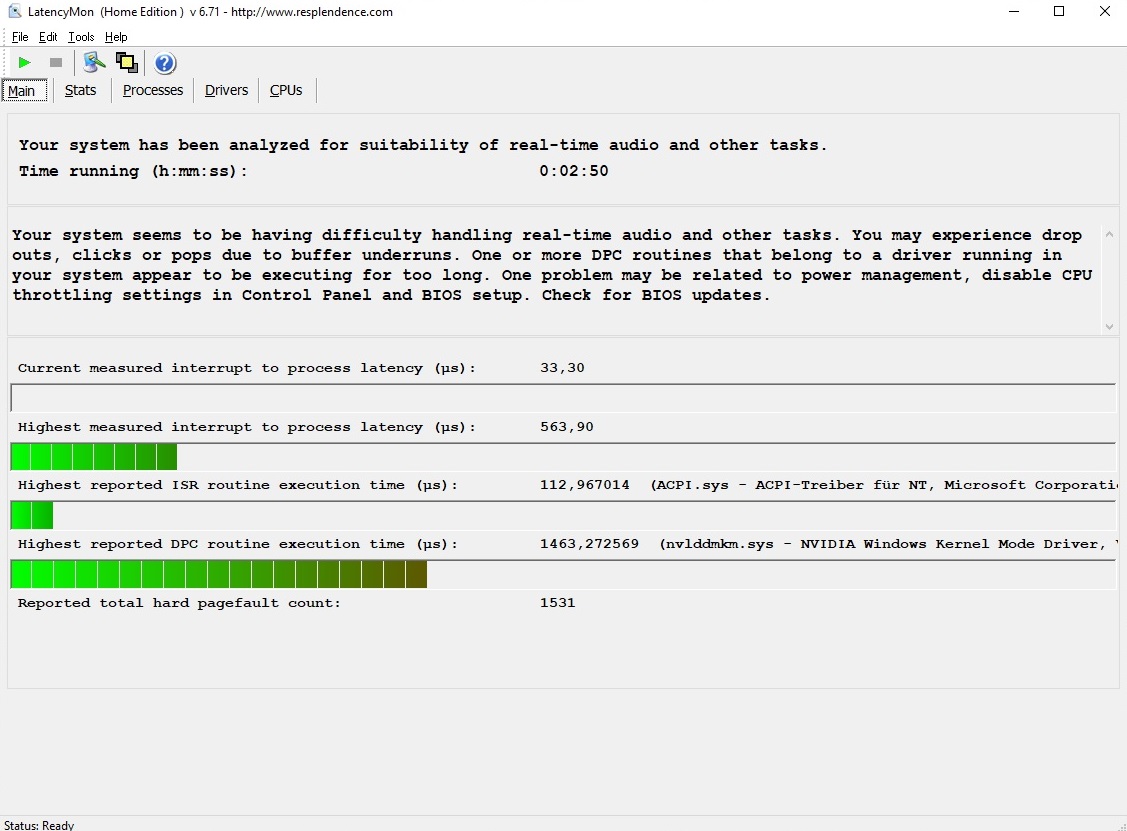
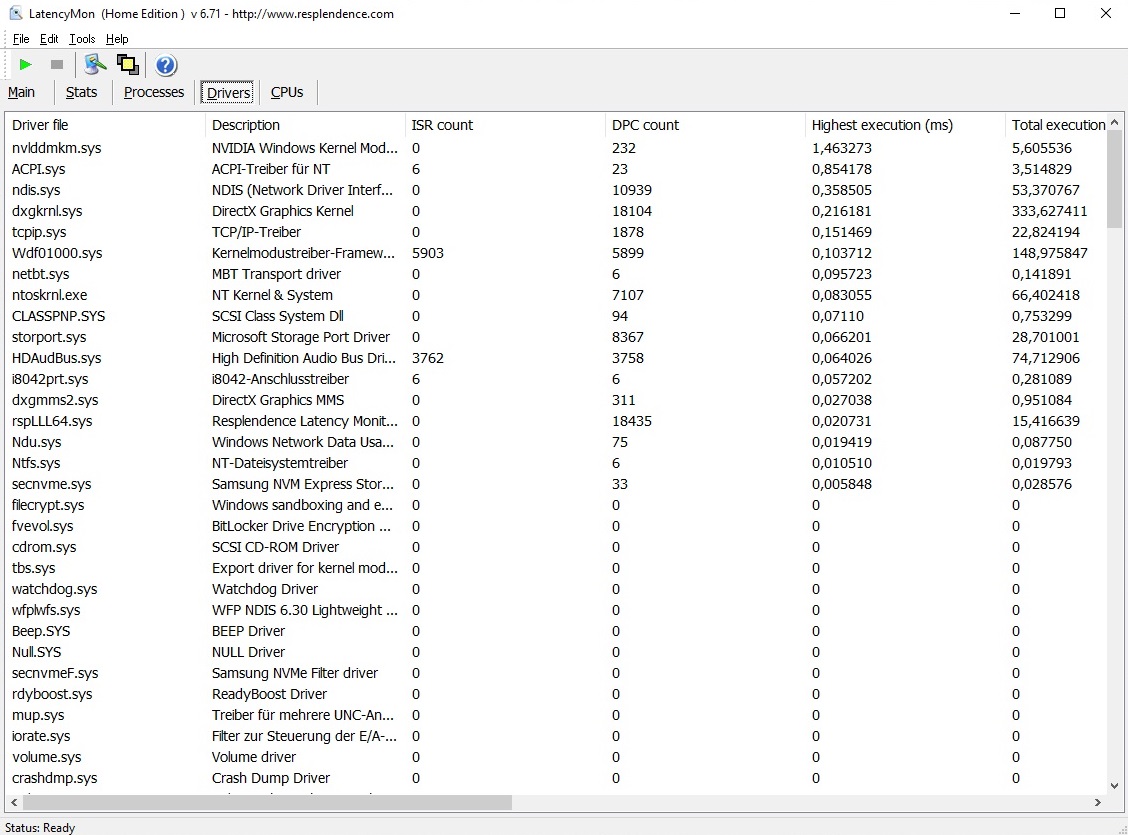
DPC Latencies
Even though the XMG Focus 15 shows relatively low latencies compared to the competitors, according to the LatencyMon tool, it is only suited to a limited extent for real-time audio and video processing. At least, that is the case in the state of delivery without any manual tuning.
| DPC Latencies / LatencyMon - interrupt to process latency (max), Web, Youtube, Prime95 | |
| Dell XPS 15 9510 11800H RTX 3050 Ti OLED | |
| Asus TUF Gaming F15 FX506HM | |
| Lenovo Legion 5 15ACH-82JU00C6GE-FL | |
| Schenker XMG Focus 15 | |
| Alienware m15 R5 Ryzen Edition | |
* ... smaller is better
Storage Solution
Our test unit is equipped with a powerful Samsung SSD. The 1-TB version of the 970 Evo Plus surpasses the Solid State Drives in all the competing devices, be they from Micron, SK Hynix, or Toshiba. The M.2 drive offers a first-rate performance while reading as well as writing data.
| Schenker XMG Focus 15 Samsung SSD 970 EVO Plus 1TB | Dell XPS 15 9510 11800H RTX 3050 Ti OLED Micron 2300 512GB MTFDHBA512TDV | Asus TUF Gaming F15 FX506HM SK Hynix HFM001TD3JX013N | Lenovo Legion 5 15ACH-82JU00C6GE-FL Micron 2300 512GB MTFDHBA512TDV | Alienware m15 R5 Ryzen Edition Toshiba KBG40ZNS512G NVMe | |
|---|---|---|---|---|---|
| CrystalDiskMark 5.2 / 6 | -26% | -17% | -16% | -38% | |
| Write 4K (MB/s) | 238.3 | 109.3 -54% | 168.1 -29% | 124.6 -48% | 116.9 -51% |
| Read 4K (MB/s) | 55.6 | 53.9 -3% | 65.1 17% | 54.2 -3% | 44.56 -20% |
| Write Seq (MB/s) | 3013 | 1991 -34% | 2124 -30% | 2706 -10% | 1552 -48% |
| Read Seq (MB/s) | 2879 | 1759 -39% | 2204 -23% | 2298 -20% | 1682 -42% |
| Write 4K Q32T1 (MB/s) | 569 | 499.8 -12% | 455.3 -20% | 499.7 -12% | 497.8 -13% |
| Read 4K Q32T1 (MB/s) | 715 | 438.8 -39% | 465.6 -35% | 570 -20% | 436.8 -39% |
| Write Seq Q32T1 (MB/s) | 3287 | 2835 -14% | 2911 -11% | 2999 -9% | 1461 -56% |
| Read Seq Q32T1 (MB/s) | 3561 | 3235 -9% | 3519 -1% | 3461 -3% | 2364 -34% |
| AS SSD | -53% | -9% | -23% | -64% | |
| Seq Read (MB/s) | 2988 | 1362 -54% | 2873 -4% | 2960 -1% | 2082 -30% |
| Seq Write (MB/s) | 2541 | 1440 -43% | 1619 -36% | 2586 2% | 825 -68% |
| 4K Read (MB/s) | 42.82 | 38.43 -10% | 57.5 34% | 46.84 9% | 42.41 -1% |
| 4K Write (MB/s) | 87 | 121.4 40% | 149.6 72% | 96.1 10% | 98.3 13% |
| 4K-64 Read (MB/s) | 2096 | 370.5 -82% | 1252 -40% | 854 -59% | 1255 -40% |
| 4K-64 Write (MB/s) | 2455 | 1054 -57% | 2196 -11% | 2015 -18% | 738 -70% |
| Access Time Read * (ms) | 0.068 | 0.042 38% | 0.04 41% | 0.048 29% | 0.109 -60% |
| Access Time Write * (ms) | 0.043 | 0.135 -214% | 0.082 -91% | 0.094 -119% | 0.17 -295% |
| Score Read (Points) | 2437 | 545 -78% | 1597 -34% | 1197 -51% | 1506 -38% |
| Score Write (Points) | 2797 | 1319 -53% | 2508 -10% | 2370 -15% | 918 -67% |
| Score Total (Points) | 6452 | 2160 -67% | 4869 -25% | 4170 -35% | 3136 -51% |
| Total Average (Program / Settings) | -40% /
-41% | -13% /
-12% | -20% /
-20% | -51% /
-53% |
* ... smaller is better

Constant Performance Reading: DiskSpd Read Loop, Queue Depth 8
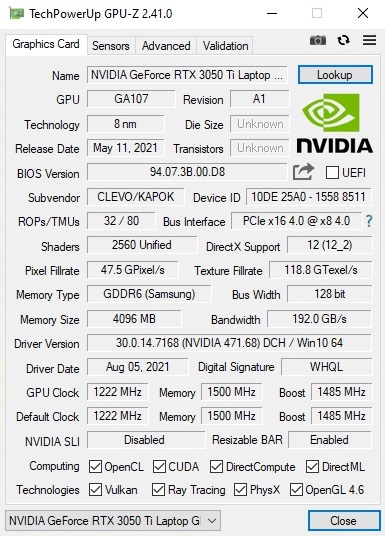
Graphics Card
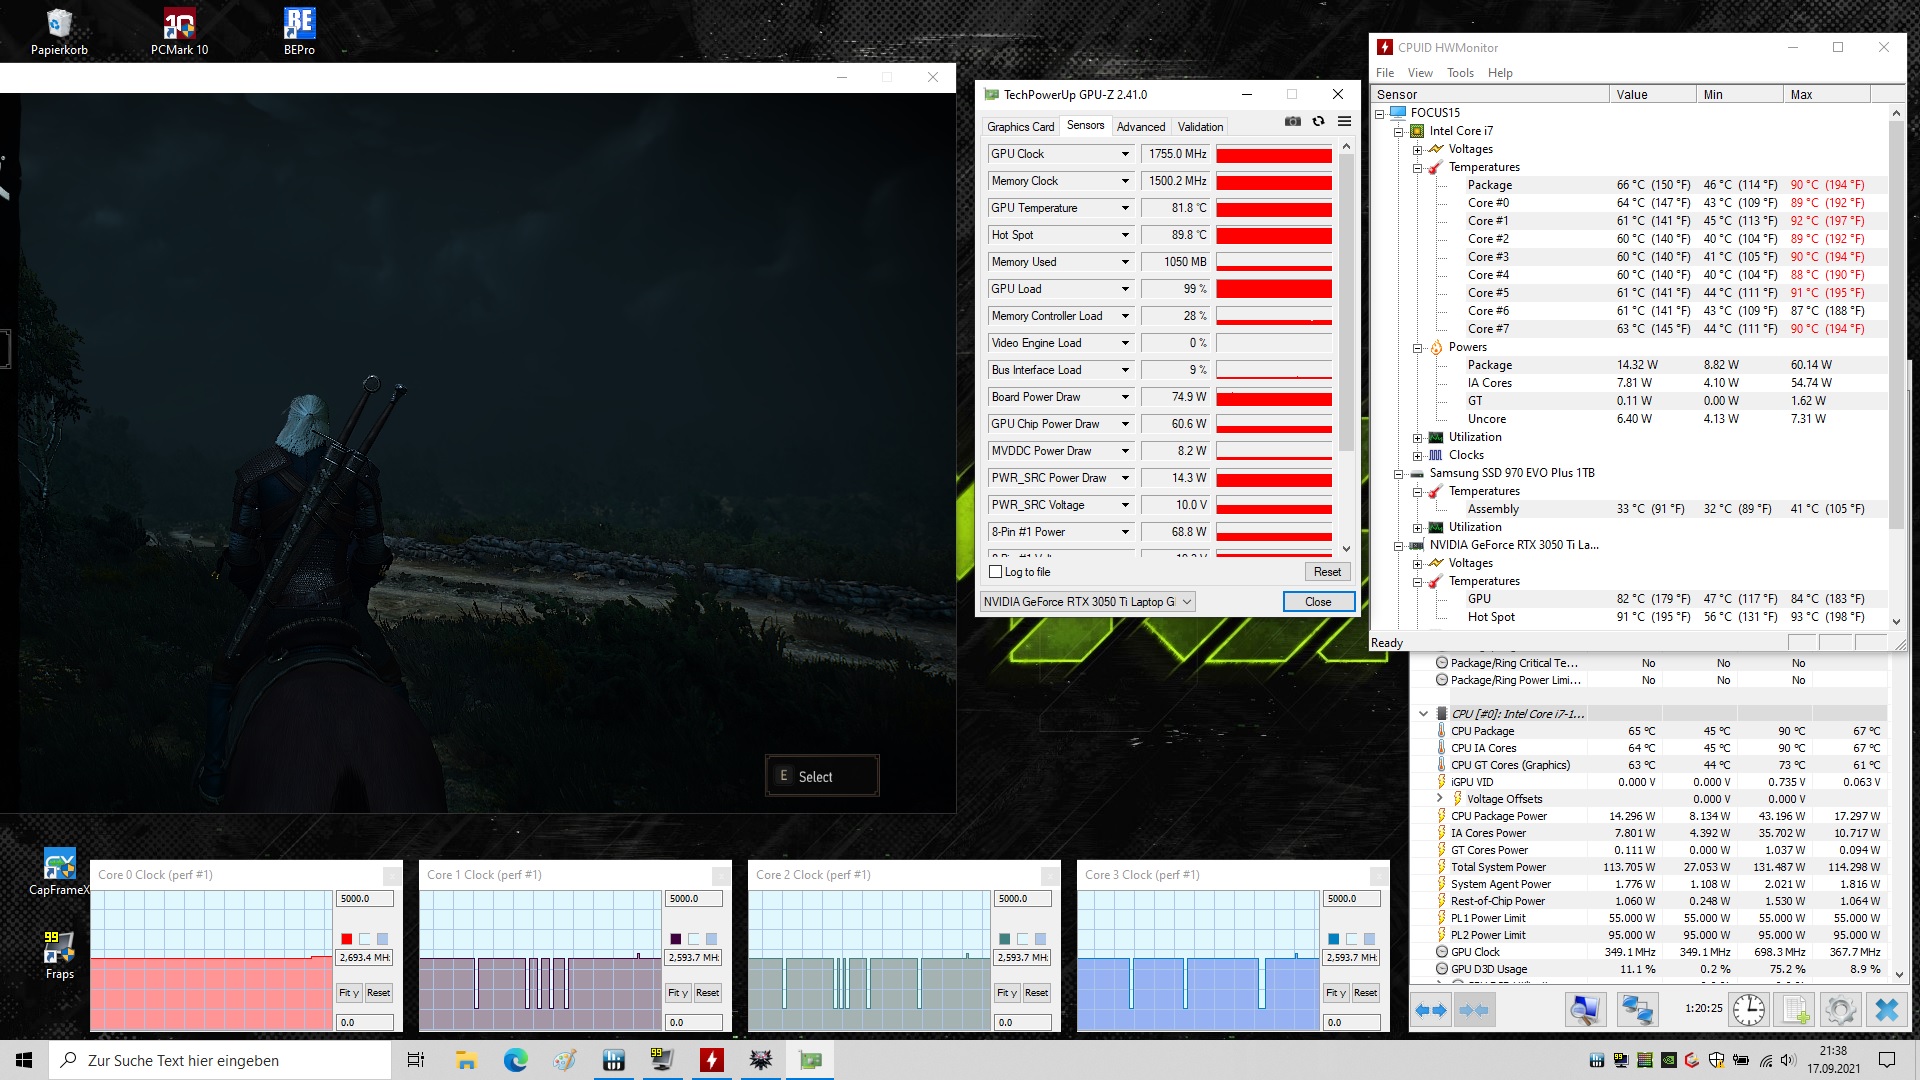
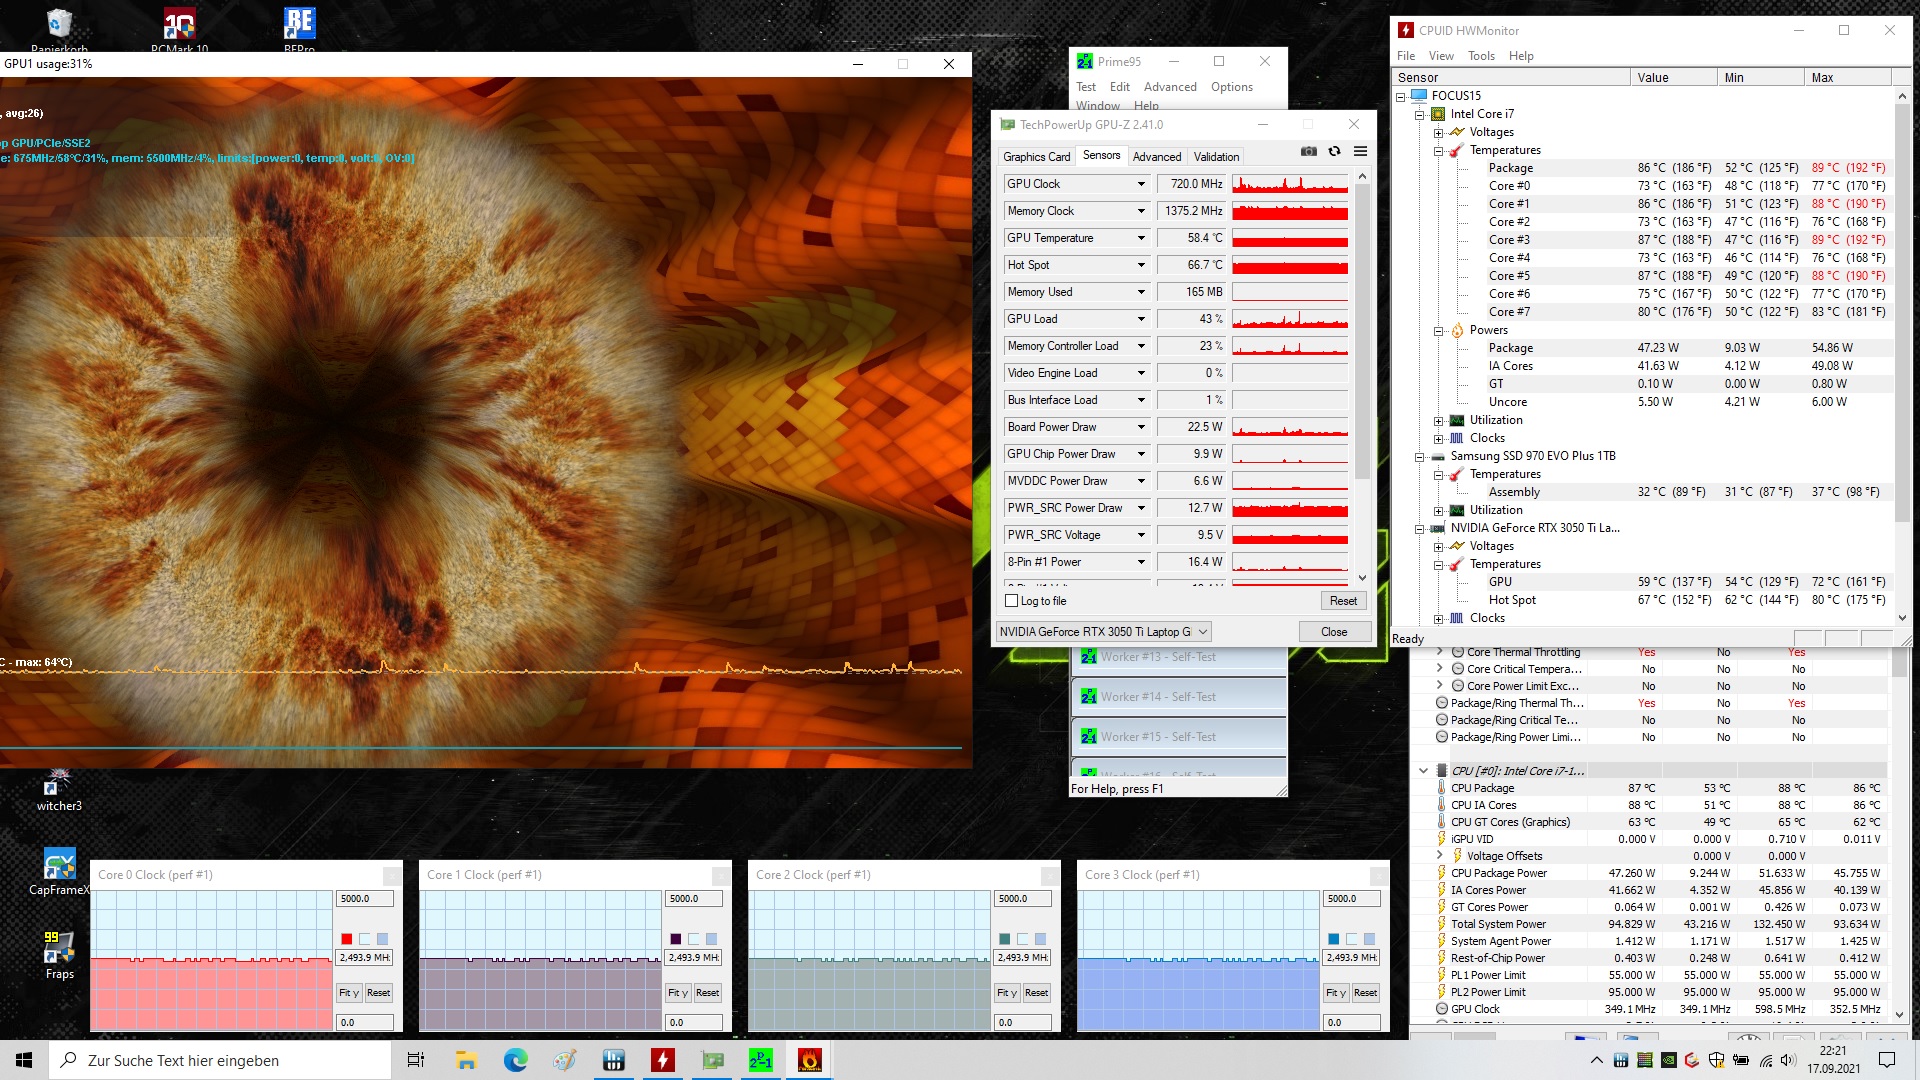
In order to get a maximum graphics performance from the GeForce RTX 3050 Ti, the manufacturer configured the Focus 15 with a TGP of 75 watts (incl. Dynamic Boost). With that, the 15-inch laptop moves significantly ahead of the Dell XPS 15, whose RTX 3050 Ti only gets 45 watts, which is only little more than half. This situation is also reflected in the benchmark runs, although the Focus 15 doesn't deliver twice the performance.
The biggest problem of the RTX 3050 Ti is the meager video storage. 4 GB are not up-to-date anymore for a mid-range GPU. It should be at least 6 GB VRAM in 2012. Current games such as "Deathloop" already demand more than 4 GB in Full-HD resolution, even at minimal settings. This means that Nvidia is too frugal here, unnecessarily limiting the future usefulness. You also shouldn't expect a high raytracing performance from the RTX 3050 Ti. In the Port Royal test of the 3DMark benchmark, for example, the result is miserable compared to the RTX 3060, which often runs in similarly priced laptops.
| 3DMark 11 Performance | 19072 points | |
| 3DMark Cloud Gate Standard Score | 42503 points | |
| 3DMark Fire Strike Score | 13179 points | |
| 3DMark Time Spy Score | 5963 points | |
Help | ||
Gaming Performance
Despite its meager storage, the RTX 3050 Ti is fast enough to run most games smoothly in the native Full-HD resolution at high to maximum detail settings. Only in badly programmed and/or extremely demanding games such as "Crysis Remastered" does the DirectX-12 chip begin to stumble. While the Focus 15 is still ahead of the Dell XPS 15 here, it finishes significantly behind laptops that use the RTX 3060, which runs around 40% faster.
| The Witcher 3 - 1920x1080 High Graphics & Postprocessing (Nvidia HairWorks Off) | |
| Average of class Gaming (341 - 404, n=2, last 2 years) | |
| Lenovo Legion 5 15ACH-82JU00C6GE-FL | |
| Asus TUF Gaming F15 FX506HM | |
| Alienware m15 R5 Ryzen Edition | |
| Schenker XMG Focus 15 | |
| Dell XPS 15 9510 11800H RTX 3050 Ti OLED | |
| Average NVIDIA GeForce RTX 3050 Ti Laptop GPU (30 - 110, n=26) | |
We evaluate how the graphics card behaves under longer 3D load, by running the role play "The Witcher 3" for about 60 minutes (FHD/Ultra). The result is that just like the CPU performance, that of the GPU also remains fairly constant.
The Witcher 3 FPS Chart
| low | med. | high | ultra | |
|---|---|---|---|---|
| GTA V (2015) | 180 | 147 | 74.5 | |
| The Witcher 3 (2015) | 181 | 102 | 56 | |
| Dota 2 Reborn (2015) | 175 | 163 | 154 | 145 |
| Final Fantasy XV Benchmark (2018) | 78.9 | 57.1 | ||
| X-Plane 11.11 (2018) | 133 | 115 | 91.3 | |
| Far Cry 5 (2018) | 101 | 93 | 86 | |
| Strange Brigade (2018) | 138 | 112 | 96.4 | |
| Hunt Showdown (2020) | 92.5 | 79.2 | ||
| Death Stranding (2020) | 98.1 | 89.3 | 85.8 | |
| Crysis Remastered (2020) | 90.4 | 46.6 | 31.3 | |
| Serious Sam 4 (2020) | 83.2 | 66.7 | 53.1 | |
| Mafia Definitive Edition (2020) | 74.1 | 68.3 | ||
| Star Wars Squadrons (2020) | 172 | 151 | 138 | |
| FIFA 21 (2020) | 237 | 205 | 192 | |
| Yakuza Like a Dragon (2020) | 79.1 | 76.2 | 67.4 | |
| Outriders (2021) | 76.2 | 69.5 | 57.2 | |
| Resident Evil Village (2021) | 102 | 101 | 76.4 | |
| Mass Effect Legendary Edition (2021) | 115 | |||
| Days Gone (2021) | 91.2 | 79.8 | 59 | |
| Monster Hunter Stories 2 (2021) | 144 | 143 | ||
| Deathloop (2021) | 72.4 | 57.4 | 51.2 |
Emissions
Noise Emissions
As we already know from other Clevo Barebones, the fan control turns out to be very unfortunate, at least in Performance mode. Instead of allowing the 15-inch laptop to run constantly at a low noise level during idle operation or less demanding scenarios, the fans are either completely quiet or rev up quickly to very noticeable levels. Things then get really annoying with the Focus 15 under load. Noise levels between 56 and 58 dB(A) are not even reached by some RTX 3070 and RTX 3080 laptops. Gaming without headphones is no fun this way. With the exception of the Lenovo Legion 5, which becomes similarly loud during 3D operation, the competitors remain noticeably quieter during the test.
Noise level
| Idle |
| 25 / 30 / 43 dB(A) |
| Load |
| 56 / 58 dB(A) |
 | ||
30 dB silent 40 dB(A) audible 50 dB(A) loud |
||
min: | ||
| Schenker XMG Focus 15 i7-11800H, GeForce RTX 3050 Ti Laptop GPU | Dell XPS 15 9510 11800H RTX 3050 Ti OLED i7-11800H, GeForce RTX 3050 Ti Laptop GPU | Asus TUF Gaming F15 FX506HM i7-11800H, GeForce RTX 3060 Laptop GPU | Lenovo Legion 5 15ACH-82JU00C6GE-FL R7 5800H, GeForce RTX 3060 Laptop GPU | Alienware m15 R5 Ryzen Edition R7 5800H, GeForce RTX 3060 Laptop GPU | |
|---|---|---|---|---|---|
| Noise | 25% | 20% | 5% | 13% | |
| off / environment * (dB) | 24 | 23.8 1% | 24.8 -3% | 24.2 -1% | 24 -0% |
| Idle Minimum * (dB) | 25 | 23.8 5% | 24.6 2% | 29 -16% | 24 4% |
| Idle Average * (dB) | 30 | 23.8 21% | 24.9 17% | 29 3% | 25 17% |
| Idle Maximum * (dB) | 43 | 23.8 45% | 24.9 42% | 29 33% | 35 19% |
| Load Average * (dB) | 56 | 36 36% | 27.1 52% | 53.5 4% | 44 21% |
| Witcher 3 ultra * (dB) | 56 | 36 36% | 46.4 17% | 53.5 4% | 48 14% |
| Load Maximum * (dB) | 58 | 38.2 34% | 49 16% | 53.5 8% | 50 14% |
* ... smaller is better
Temperature
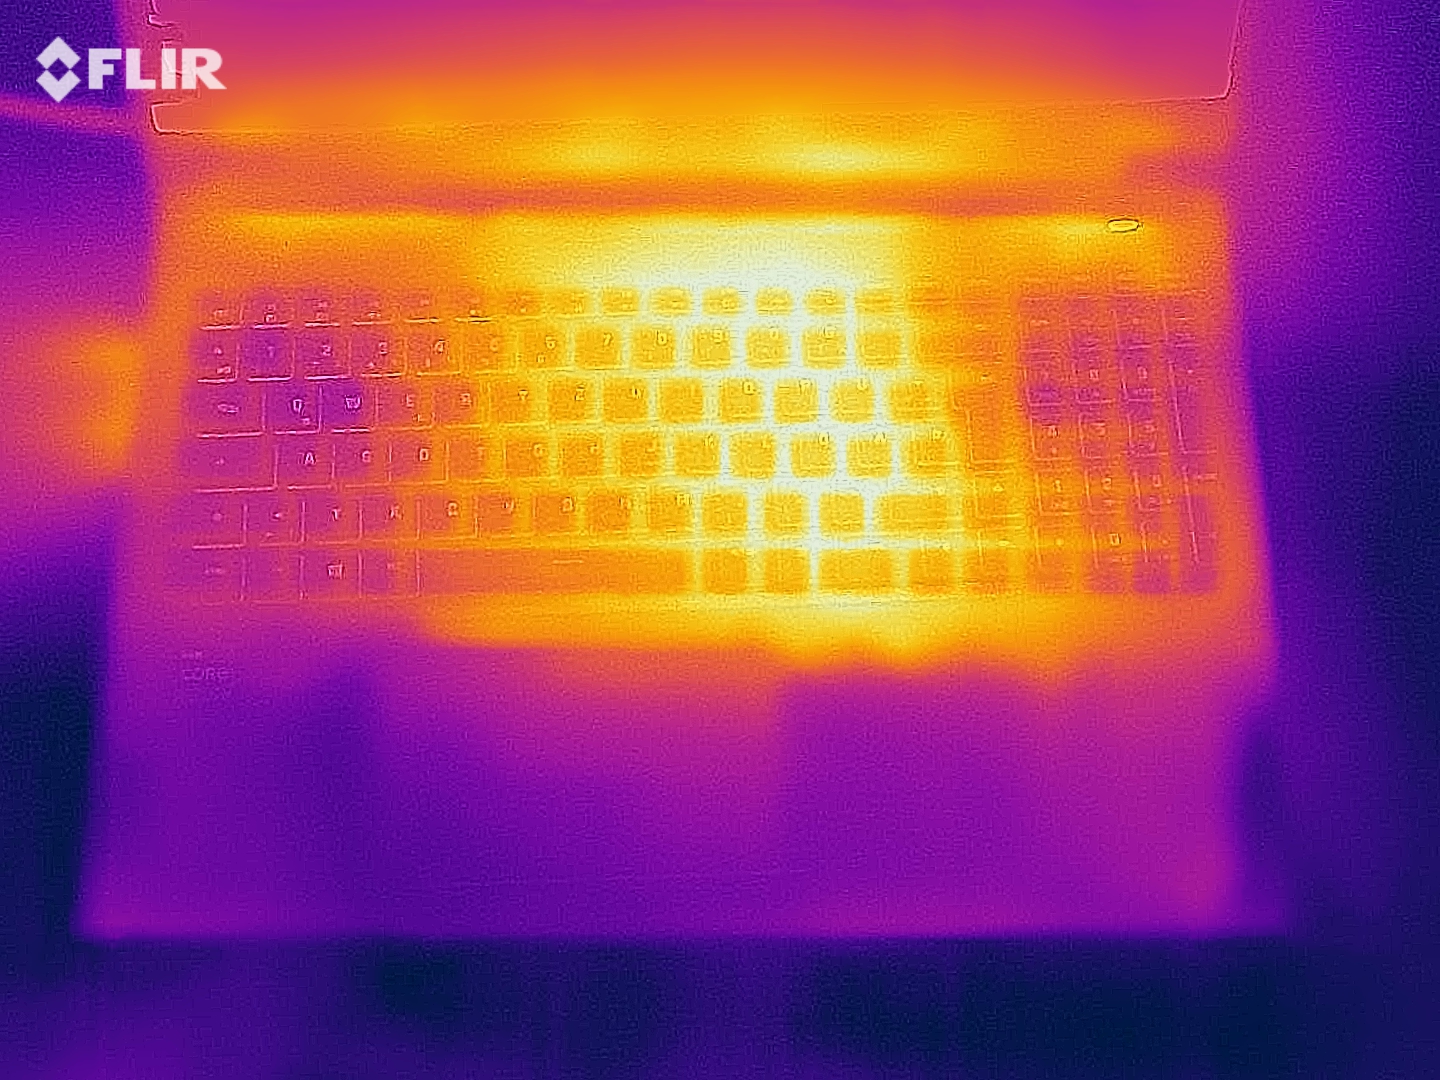
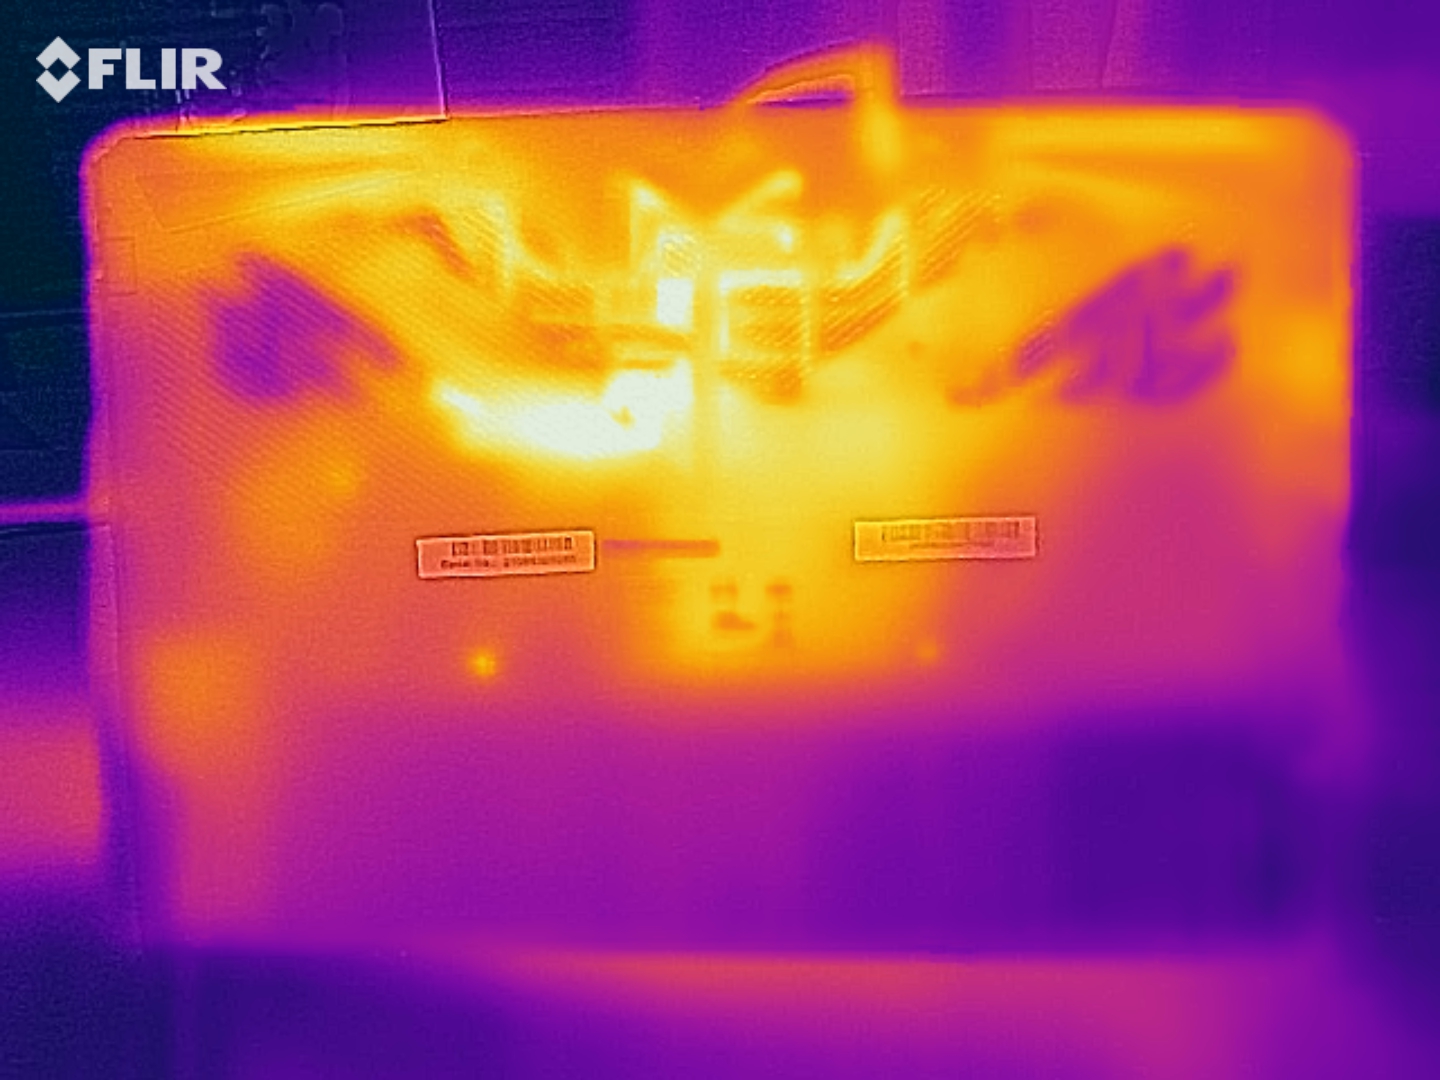
Since the graphics card was throttled during the stress test with the FurMark and Prime95 tools, it is best if we look at the temperature development during our test with "The Witcher 3." After about one hour, the case reaches temperatures of up to 50 °C (122 °F) on top and up to 56 °C (133 °F) on the bottom here. These are again fairly high values for an RTX 3050 Ti device. So the cooling system of the Focus 15 does not seem to be very effective. At almost 30 to 40 °C (86-104 °F) during idle operation, the case surfaces also becomes warmer than usual.
(±) The maximum temperature on the upper side is 43 °C / 109 F, compared to the average of 40.4 °C / 105 F, ranging from 21.2 to 68.8 °C for the class Gaming.
(-) The bottom heats up to a maximum of 46 °C / 115 F, compared to the average of 43.2 °C / 110 F
(±) In idle usage, the average temperature for the upper side is 34.6 °C / 94 F, compared to the device average of 33.9 °C / 93 F.
(-) Playing The Witcher 3, the average temperature for the upper side is 44 °C / 111 F, compared to the device average of 33.9 °C / 93 F.
(-) The palmrests and touchpad can get very hot to the touch with a maximum of 41 °C / 105.8 F.
(-) The average temperature of the palmrest area of similar devices was 28.8 °C / 83.8 F (-12.2 °C / -22 F).
| Schenker XMG Focus 15 i7-11800H, GeForce RTX 3050 Ti Laptop GPU | Dell XPS 15 9510 11800H RTX 3050 Ti OLED i7-11800H, GeForce RTX 3050 Ti Laptop GPU | Asus TUF Gaming F15 FX506HM i7-11800H, GeForce RTX 3060 Laptop GPU | Lenovo Legion 5 15ACH-82JU00C6GE-FL R7 5800H, GeForce RTX 3060 Laptop GPU | Alienware m15 R5 Ryzen Edition R7 5800H, GeForce RTX 3060 Laptop GPU | |
|---|---|---|---|---|---|
| Heat | 16% | 14% | 15% | -13% | |
| Maximum Upper Side * (°C) | 43 | 45.5 -6% | 46.4 -8% | 42.6 1% | 62 -44% |
| Maximum Bottom * (°C) | 46 | 44.2 4% | 45.4 1% | 52.2 -13% | 61 -33% |
| Idle Upper Side * (°C) | 39 | 27 31% | 26 33% | 24.9 36% | 36 8% |
| Idle Bottom * (°C) | 40 | 26.7 33% | 27.4 31% | 25.3 37% | 33 17% |
* ... smaller is better
Speakers
According to our audio analysis, the sound quality leaves something to be desired. In addition to the bass, the maximum volume could also be better. In terms of the sound, the Dell XPS 15 plays in a much higher league.
Schenker XMG Focus 15 audio analysis
(±) | speaker loudness is average but good (78 dB)
Bass 100 - 315 Hz
(-) | nearly no bass - on average 25.5% lower than median
(±) | linearity of bass is average (8.4% delta to prev. frequency)
Mids 400 - 2000 Hz
(+) | balanced mids - only 4.9% away from median
(+) | mids are linear (5.6% delta to prev. frequency)
Highs 2 - 16 kHz
(+) | balanced highs - only 1.7% away from median
(+) | highs are linear (4.1% delta to prev. frequency)
Overall 100 - 16.000 Hz
(±) | linearity of overall sound is average (20% difference to median)
Compared to same class
» 70% of all tested devices in this class were better, 7% similar, 23% worse
» The best had a delta of 6%, average was 18%, worst was 132%
Compared to all devices tested
» 51% of all tested devices were better, 8% similar, 40% worse
» The best had a delta of 4%, average was 23%, worst was 134%
Dell XPS 15 9510 11800H RTX 3050 Ti OLED audio analysis
(+) | speakers can play relatively loud (88.8 dB)
Bass 100 - 315 Hz
(±) | reduced bass - on average 5.6% lower than median
(+) | bass is linear (4.3% delta to prev. frequency)
Mids 400 - 2000 Hz
(+) | balanced mids - only 3.9% away from median
(+) | mids are linear (4.1% delta to prev. frequency)
Highs 2 - 16 kHz
(+) | balanced highs - only 2.4% away from median
(+) | highs are linear (4.9% delta to prev. frequency)
Overall 100 - 16.000 Hz
(+) | overall sound is linear (8.4% difference to median)
Compared to same class
» 9% of all tested devices in this class were better, 2% similar, 89% worse
» The best had a delta of 5%, average was 17%, worst was 45%
Compared to all devices tested
» 2% of all tested devices were better, 1% similar, 97% worse
» The best had a delta of 4%, average was 23%, worst was 134%
Power Management
Power Consumption
Even though the Focus 15 offers graphics switching (Nvidia Optimus), the consumption values in idle operation are quite high at 23 to 29 watts. Most of the competitors consume less than 20 watts. In 3D operation, the power consumption scales up fairly well with the TGP and graphics performance, as the following chart shows.
| Off / Standby | |
| Idle | |
| Load |
|
Key:
min: | |
| Schenker XMG Focus 15 i7-11800H, GeForce RTX 3050 Ti Laptop GPU | Dell XPS 15 9510 11800H RTX 3050 Ti OLED i7-11800H, GeForce RTX 3050 Ti Laptop GPU | Asus TUF Gaming F15 FX506HM i7-11800H, GeForce RTX 3060 Laptop GPU | Lenovo Legion 5 15ACH-82JU00C6GE-FL R7 5800H, GeForce RTX 3060 Laptop GPU | Alienware m15 R5 Ryzen Edition R7 5800H, GeForce RTX 3060 Laptop GPU | |
|---|---|---|---|---|---|
| Power Consumption | 45% | 18% | 15% | 2% | |
| Idle Minimum * (Watt) | 23 | 7.6 67% | 9.5 59% | 7.3 68% | 11 52% |
| Idle Average * (Watt) | 25 | 9.9 60% | 12.1 52% | 10.5 58% | 14 44% |
| Idle Maximum * (Watt) | 29 | 10.8 63% | 22.5 22% | 15.7 46% | 25 14% |
| Load Average * (Watt) | 106 | 81 24% | 99.5 6% | 108 -2% | 123 -16% |
| Witcher 3 ultra * (Watt) | 128 | 76.2 40% | 157 -23% | 175 -37% | 176 -38% |
| Load Maximum * (Watt) | 156 | 131 16% | 173.5 -11% | 228 -46% | 226 -45% |
* ... smaller is better
The Witcher 3 Power Consumption
Battery Life
For a change, we use the Entertainment mode instead of the Performance mode for the battery tests. When looking at the runtime values, it quickly becomes apparent that the small battery has a negative effect. 49 Wh pales in comparison to the 80 to 90 Wh offered by competitors. In the WLAN test at medium brightness, the Focus 15 only lasts for barely 4 hours, while the Dell XPS 15 manages about 7 hours here, and the Asus TUF F15 even almost 8 hours.
| Schenker XMG Focus 15 i7-11800H, GeForce RTX 3050 Ti Laptop GPU, 49 Wh | Dell XPS 15 9510 11800H RTX 3050 Ti OLED i7-11800H, GeForce RTX 3050 Ti Laptop GPU, 86 Wh | Asus TUF Gaming F15 FX506HM i7-11800H, GeForce RTX 3060 Laptop GPU, 90 Wh | Lenovo Legion 5 15ACH-82JU00C6GE-FL R7 5800H, GeForce RTX 3060 Laptop GPU, 80 Wh | Alienware m15 R5 Ryzen Edition R7 5800H, GeForce RTX 3060 Laptop GPU, 86 Wh | Average of class Gaming | |
|---|---|---|---|---|---|---|
| Battery runtime | 90% | 98% | 62% | 52% | 56% | |
| Reader / Idle (h) | 6.5 | 11 69% | 14.7 126% | 7.84 ? 21% | ||
| WiFi v1.3 (h) | 3.9 | 7 79% | 7.9 103% | 4.8 23% | 5.1 31% | 7.08 ? 82% |
| Load (h) | 0.9 | 1.8 100% | 2 122% | 1.8 100% | 0.9 0% | 1.496 ? 66% |
| H.264 (h) | 10.4 | 4.3 | 8.8 | 8.27 ? | ||
| Witcher 3 ultra (h) | 1.6 |
Pros
Cons
Verdict
Too expensive for what is offered: This is how you could summarize the XMG Focus 15 in a single sentence. While except for some smaller details, the case, input devices, and 144-Hz display are convincing, the 15-inch laptop falls behind the competitors in most of the other categories, be it in the battery life, cooling system, fan control, or the sound.
The high TGP of the GeForce RTX 3050 Ti is a curse and a blessing at the same time.
On one hand, the performance of the Focus 15 is able to leave many competitors with an RTX 3050 Ti behind (such as the Dell XPS 15 - however that is targeted more for multimedia users than gamers). On the other hand, the GeForce RTX 3060 is still a significantly better choice in the price range between 1000 and 1500 Euros (~$1169-1753), even if it is just because of the larger video storage (6 vs 4 GB GDDR6).
In summary, at a few hundred Euros less and with a lower noise level, the Focus 15 would have been an interesting option. But in its current form, we recommend that you buy an alternative laptop.
Price and Availability
The XMG Focus 15 is available in the manufacturer's bestware.com shop starting from 1199 Euros (~$1401).
Schenker XMG Focus 15
- 09/23/2021 v7 (old)
Florian Glaser
Price comparison

