Asus TUF Gaming F15 FX506HM Laptop Review: No Extras, Just Performance
Unveiled just this past May alongside the 11th gen Intel Tiger Lake-H series, The 15.6-inch TUF Gaming F15 FX506 and 17.3-inch TUF Gaming F17 FX706 directly succeed last year's FX505 and FX705 models, respectively, by introducing new aesthetics and new processors. The F15 and F17 should not be confused with the faster TUF Dash series or the A15/A17 series which utilize AMD processors instead.
Our unit in review is an upper mid-range configuration with the Core i7-11800H CPU, GeForce RTX 2060 GPU, and 144 Hz display for approximately 1500 USD retail. Other SKUs are available with the Core i5-11260H, i9-11900H, RTX 3050, or 60 Hz to 240 Hz panels. All options at the moment are limited to FHD and up to the RTX 3060 to better separate the TUF model from a pricier ROG model.
Competitors in this space include other budget to midrange 15.6-inch gaming laptops like the Lenovo Legion 5i, the MSI GF/GL series, Razer Blade 15 Base Model, or the HP Pavilion 15 Gaming.
More Asus reviews:
potential competitors in comparison
Rating | Date | Model | Weight | Height | Size | Resolution | Price |
|---|---|---|---|---|---|---|---|
| 85.9 % v7 (old) | 06 / 2021 | Asus TUF Gaming F15 FX506HM i7-11800H, GeForce RTX 3060 Laptop GPU | 2.3 kg | 24.9 mm | 15.60" | 1920x1080 | |
| 82.4 % v7 (old) | 02 / 2021 | Asus TUF Dash F15 FX516PR i7-11370H, GeForce RTX 3070 Laptop GPU | 2 kg | 20 mm | 15.60" | 1920x1080 | |
| 80.4 % v6 (old) | 07 / 2019 | Asus TUF FX505DT-EB73 R7 3750H, GeForce GTX 1650 Mobile | 2.2 kg | 26.8 mm | 15.60" | 1920x1080 | |
| 85.5 % v7 (old) | 03 / 2021 | Razer Blade 15 Base Edition 2021, i7-10750H RTX 3060 i7-10750H, GeForce RTX 3060 Laptop GPU | 2.1 kg | 19.9 mm | 15.60" | 1920x1080 | |
| 80.4 % v7 (old) | 03 / 2021 | MSI GF65 Thin 10UE i7-10750H, GeForce RTX 3060 Laptop GPU | 1.9 kg | 21.7 mm | 15.60" | 1920x1080 | |
| 83.3 % v7 (old) | 07 / 2020 | Lenovo Legion 5 15IMH05H i5-10300H, GeForce RTX 2060 Mobile | 2.5 kg | 26.1 mm | 15.60" | 1920x1080 |
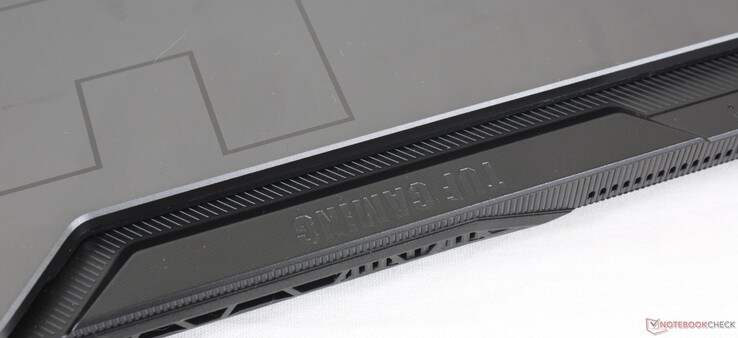
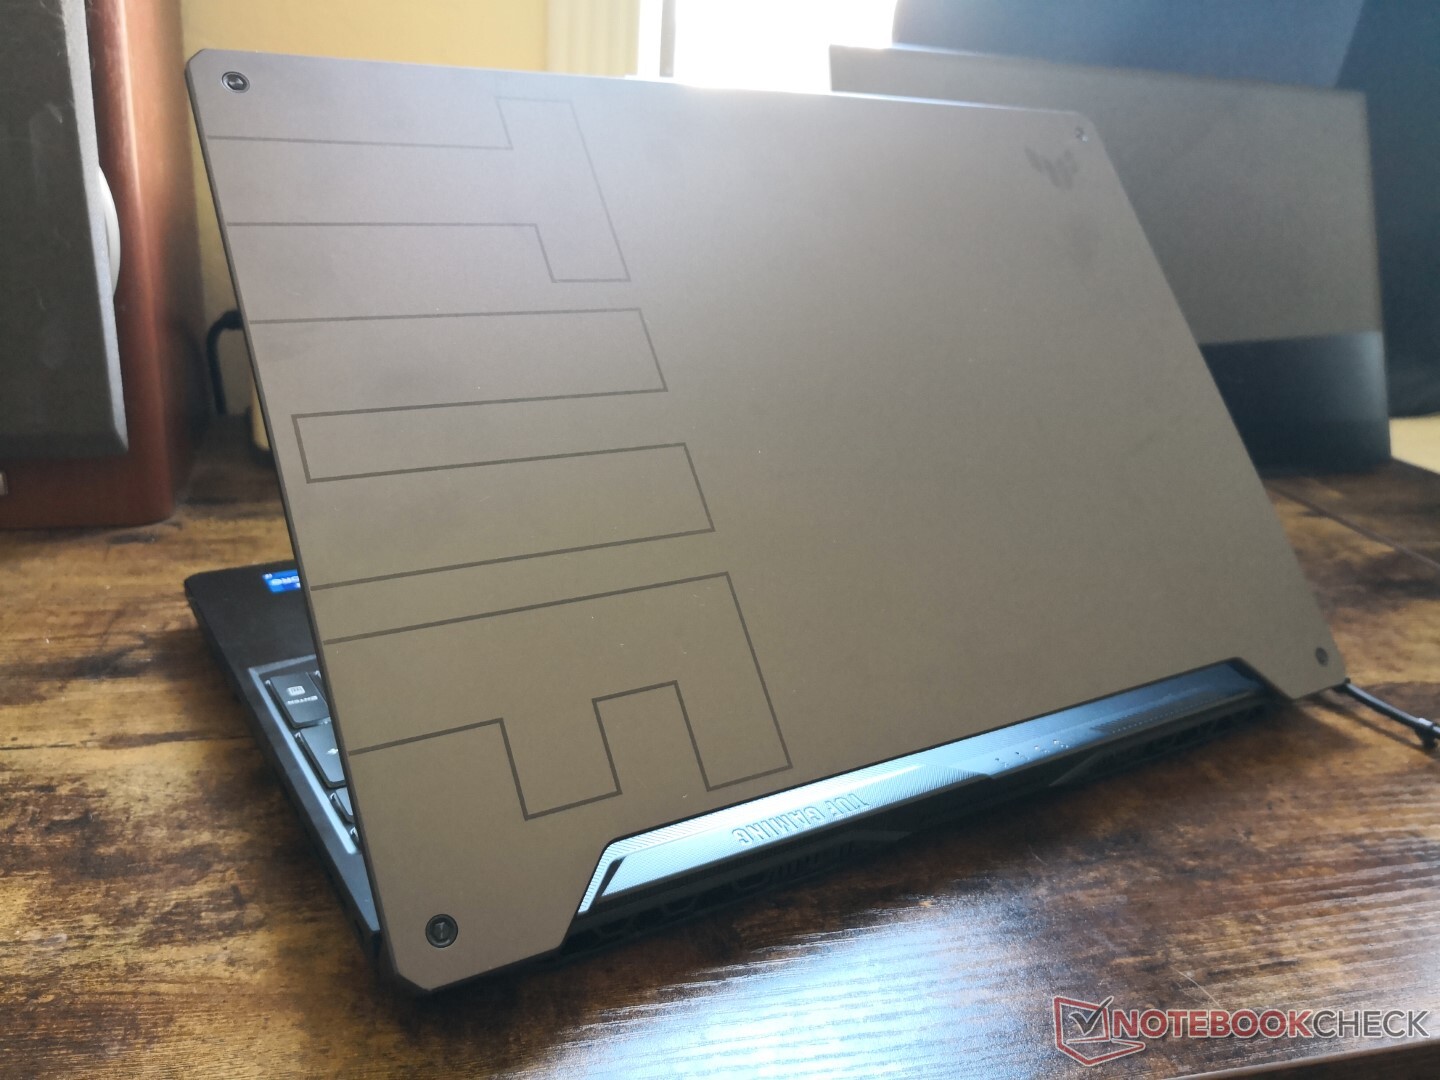
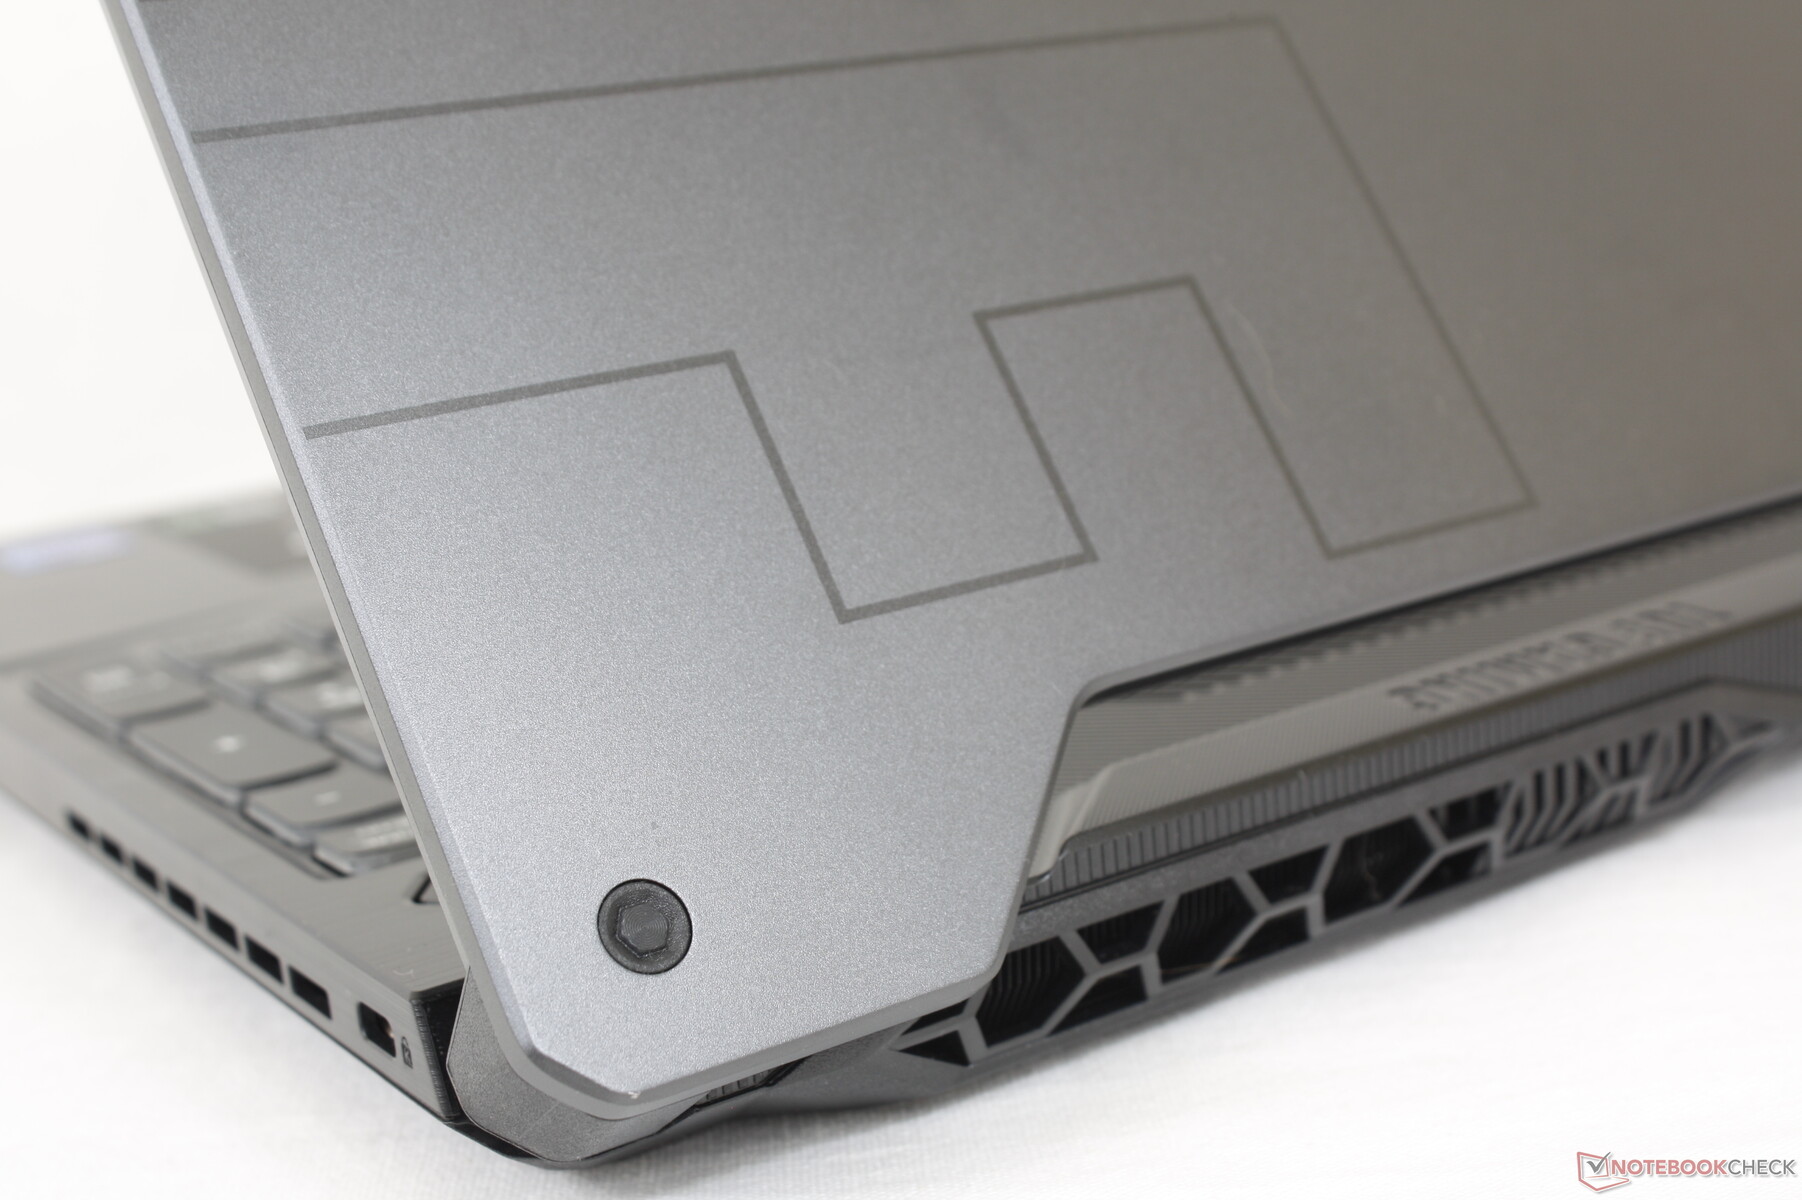
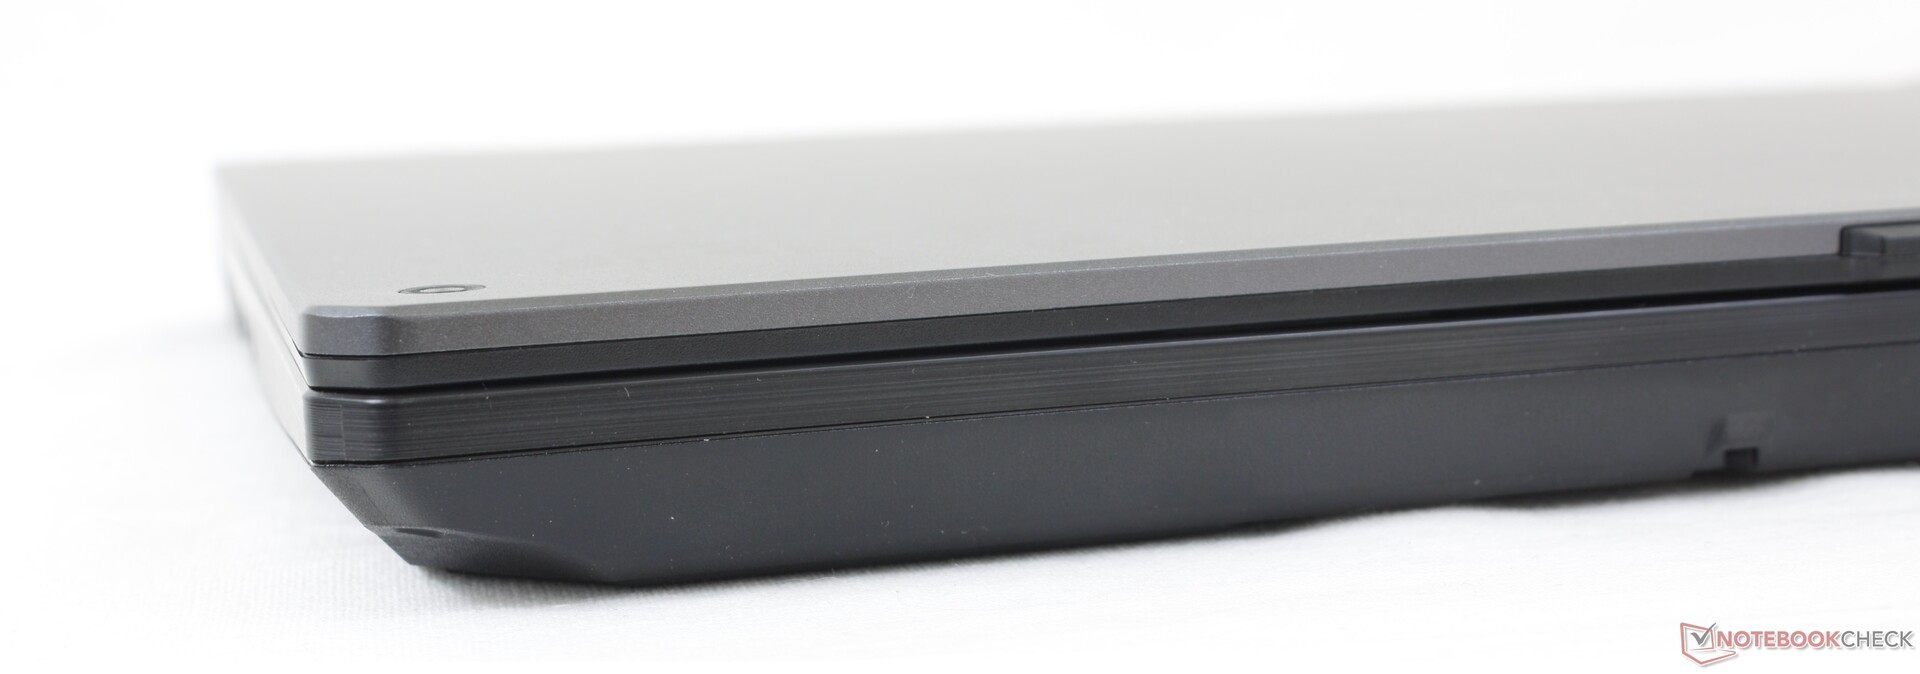
Case — Very Different From The FX516
The chassis is a combination of the older FX505 and newer TUF Dash F15 FX516. More specifically, it incorporates the metal-backed outer lid of the FX516 onto the base design features of the FX505. Other aspects have been updated as well including the touchpad and certain colors along the rear. The end result is a "tougher" and more visually appealing gaming laptop especially when the lid is closed.
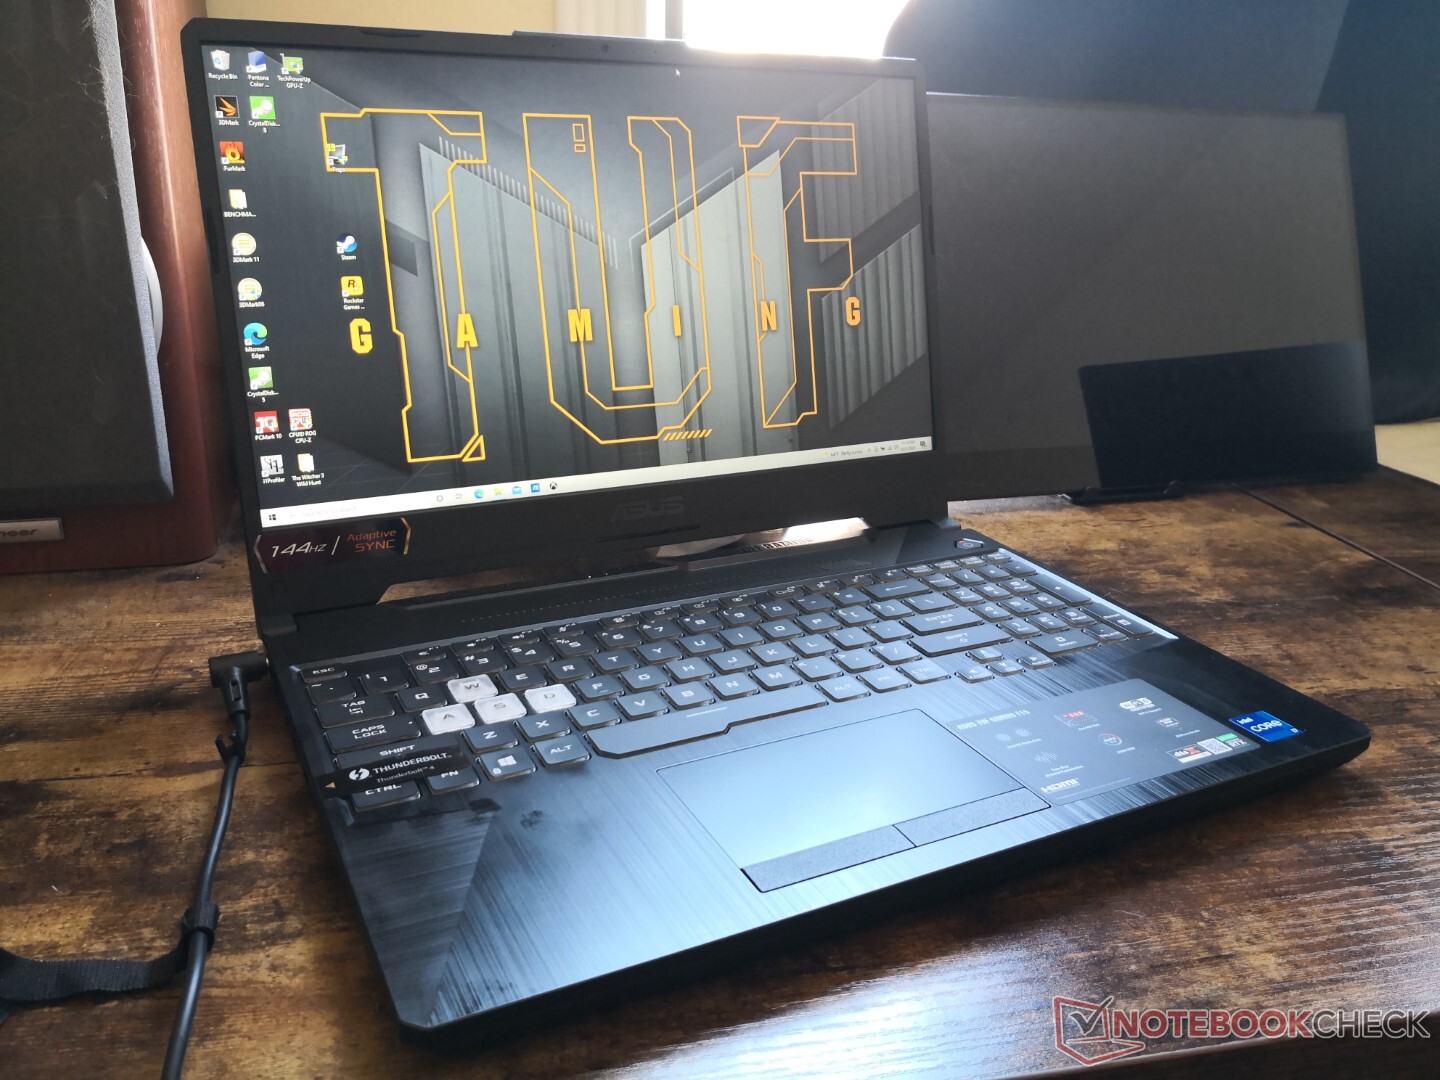
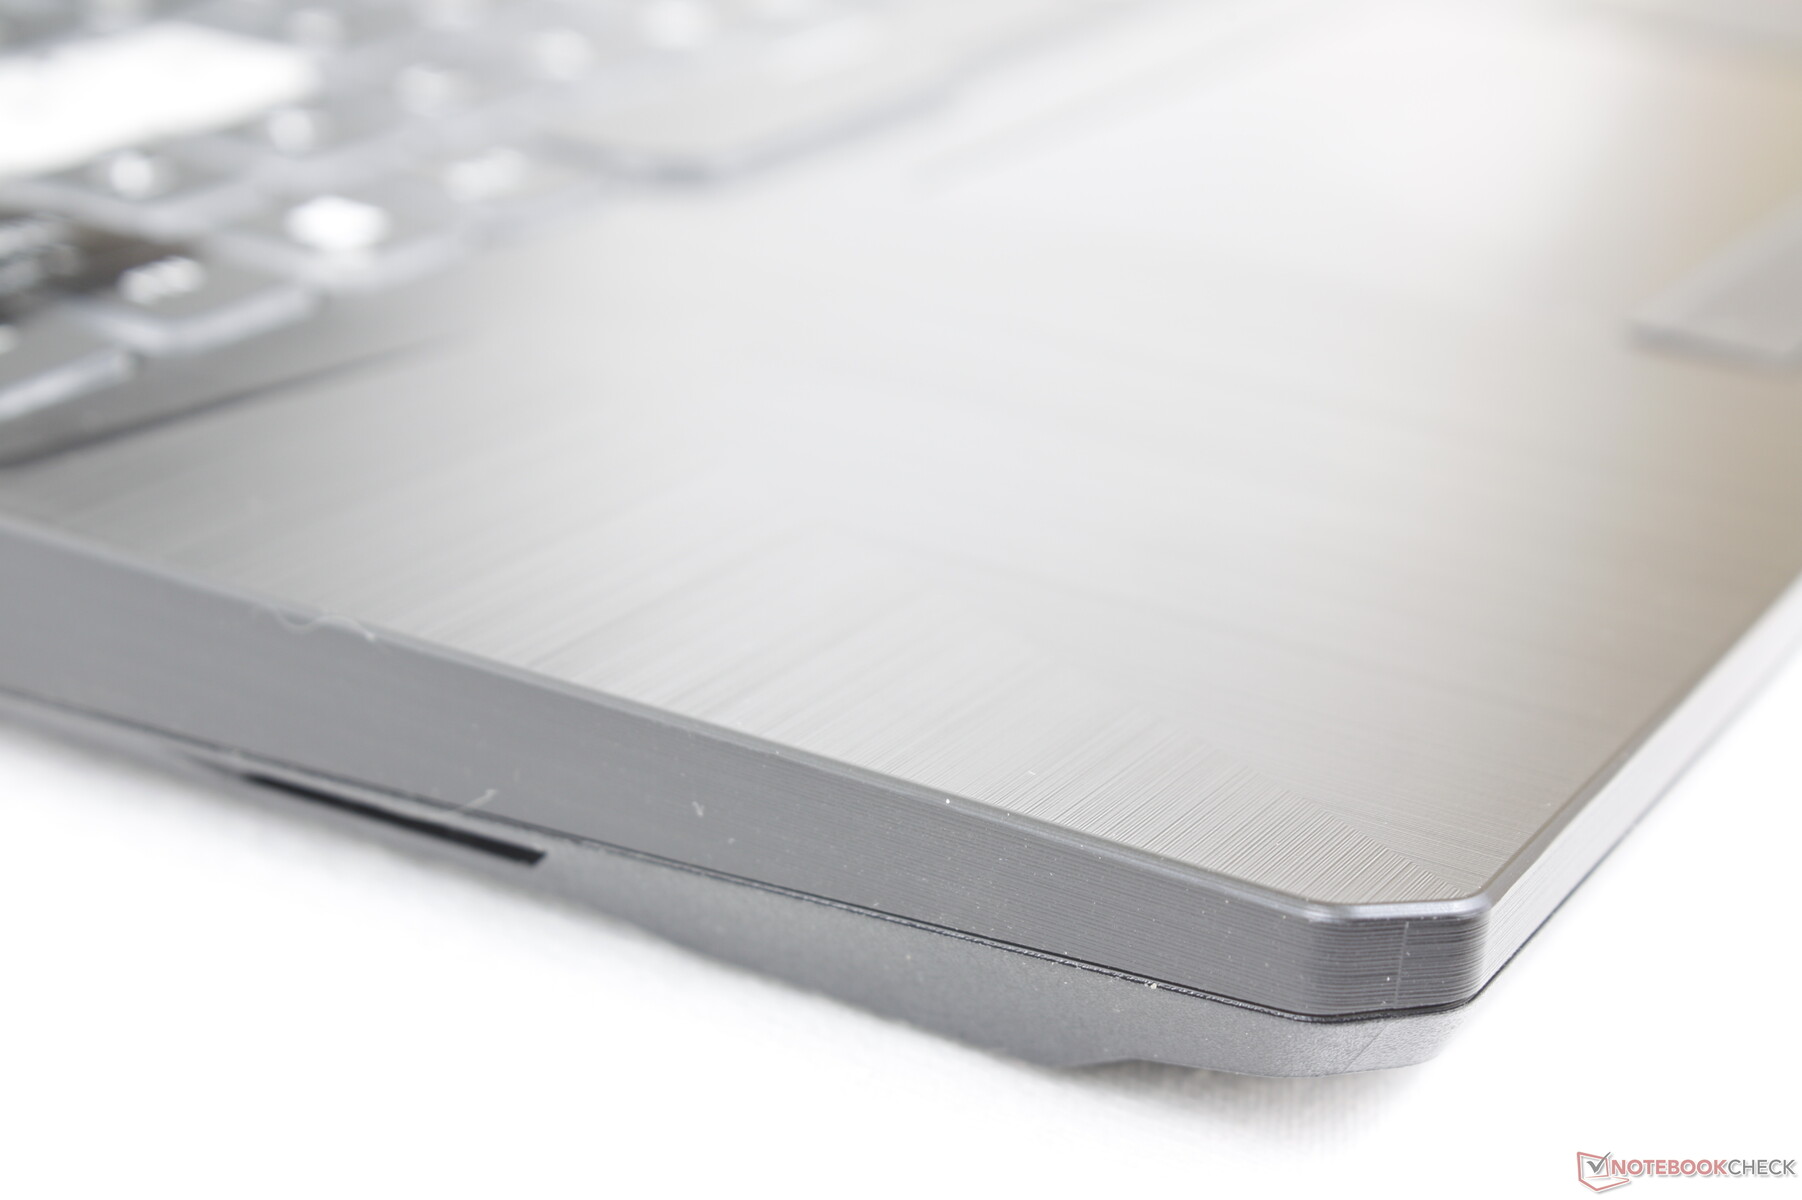
The FX506 is still an entry-level gaming laptop, however, and this becomes obvious when opening the lid to expose the plastic base. The palm rests and keyboard deck aren't nearly as luxurious as the stronger Zephyrus or ROG laptops. To hide this fact, the plastic surfaces are embellished with all kinds of textures and superficial bumps that users will either love or hate. MSI takes the opposite approach on its competing GF65 laptops with flatter and smoother plastic surfaces instead.
A notable benefit of the textured palm rests is their ability to detract fingerprint buildup. The smoother keyboard keys and touchpad, however, aren't as lucky.
Base rigidity feels stronger than on the MSI GF65. On the other hand, the lid and its two small hinges teeter a bit more than we would like and so they don't inspire much confidence in the long term.
Dimensions are in between that of the older TUF FX505DT and faster TUF Dash F15 FX516. It's slightly heavier than either by about 100 g to 200 g each for a denser first impression. The competing Blade 15 Base Model is still the smallest of the bunch especially in length because of the thicker chin bezel of the Asus TUF design.
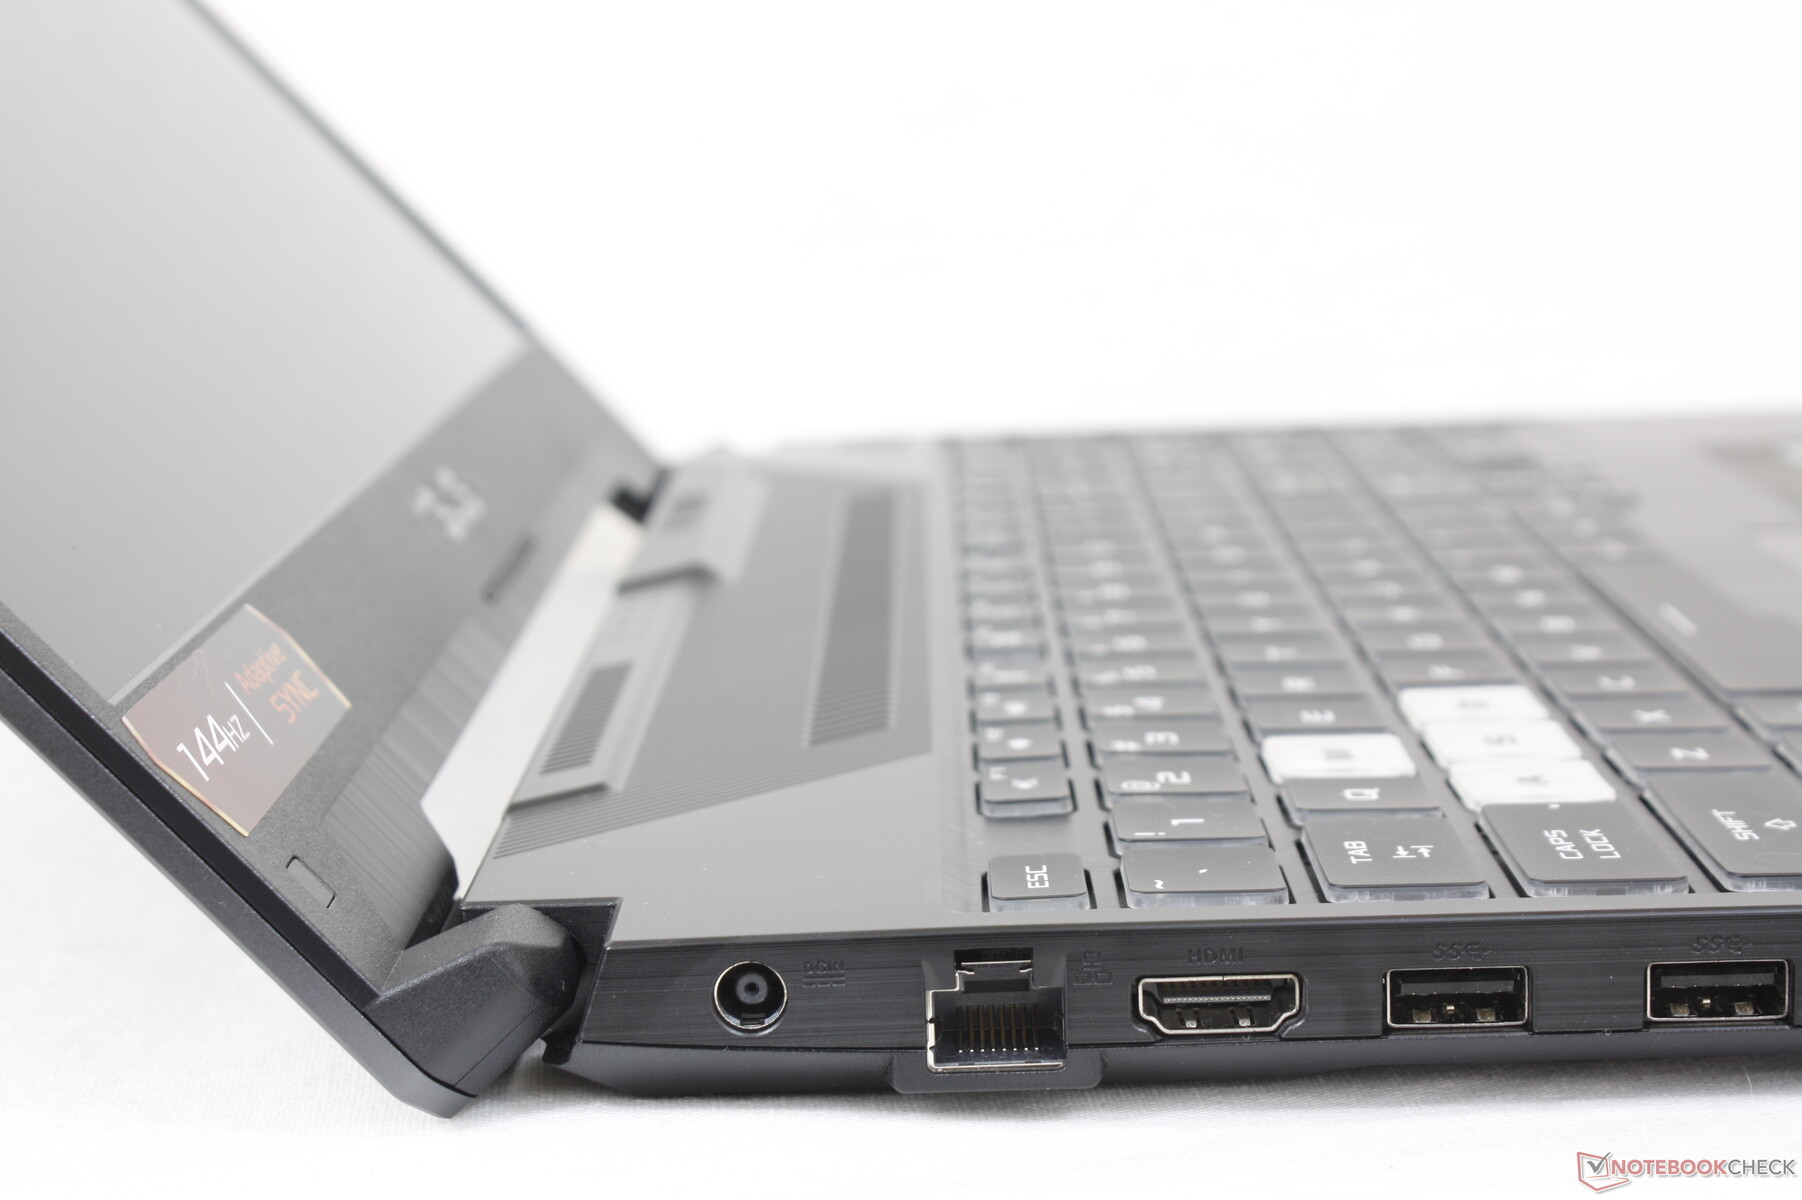
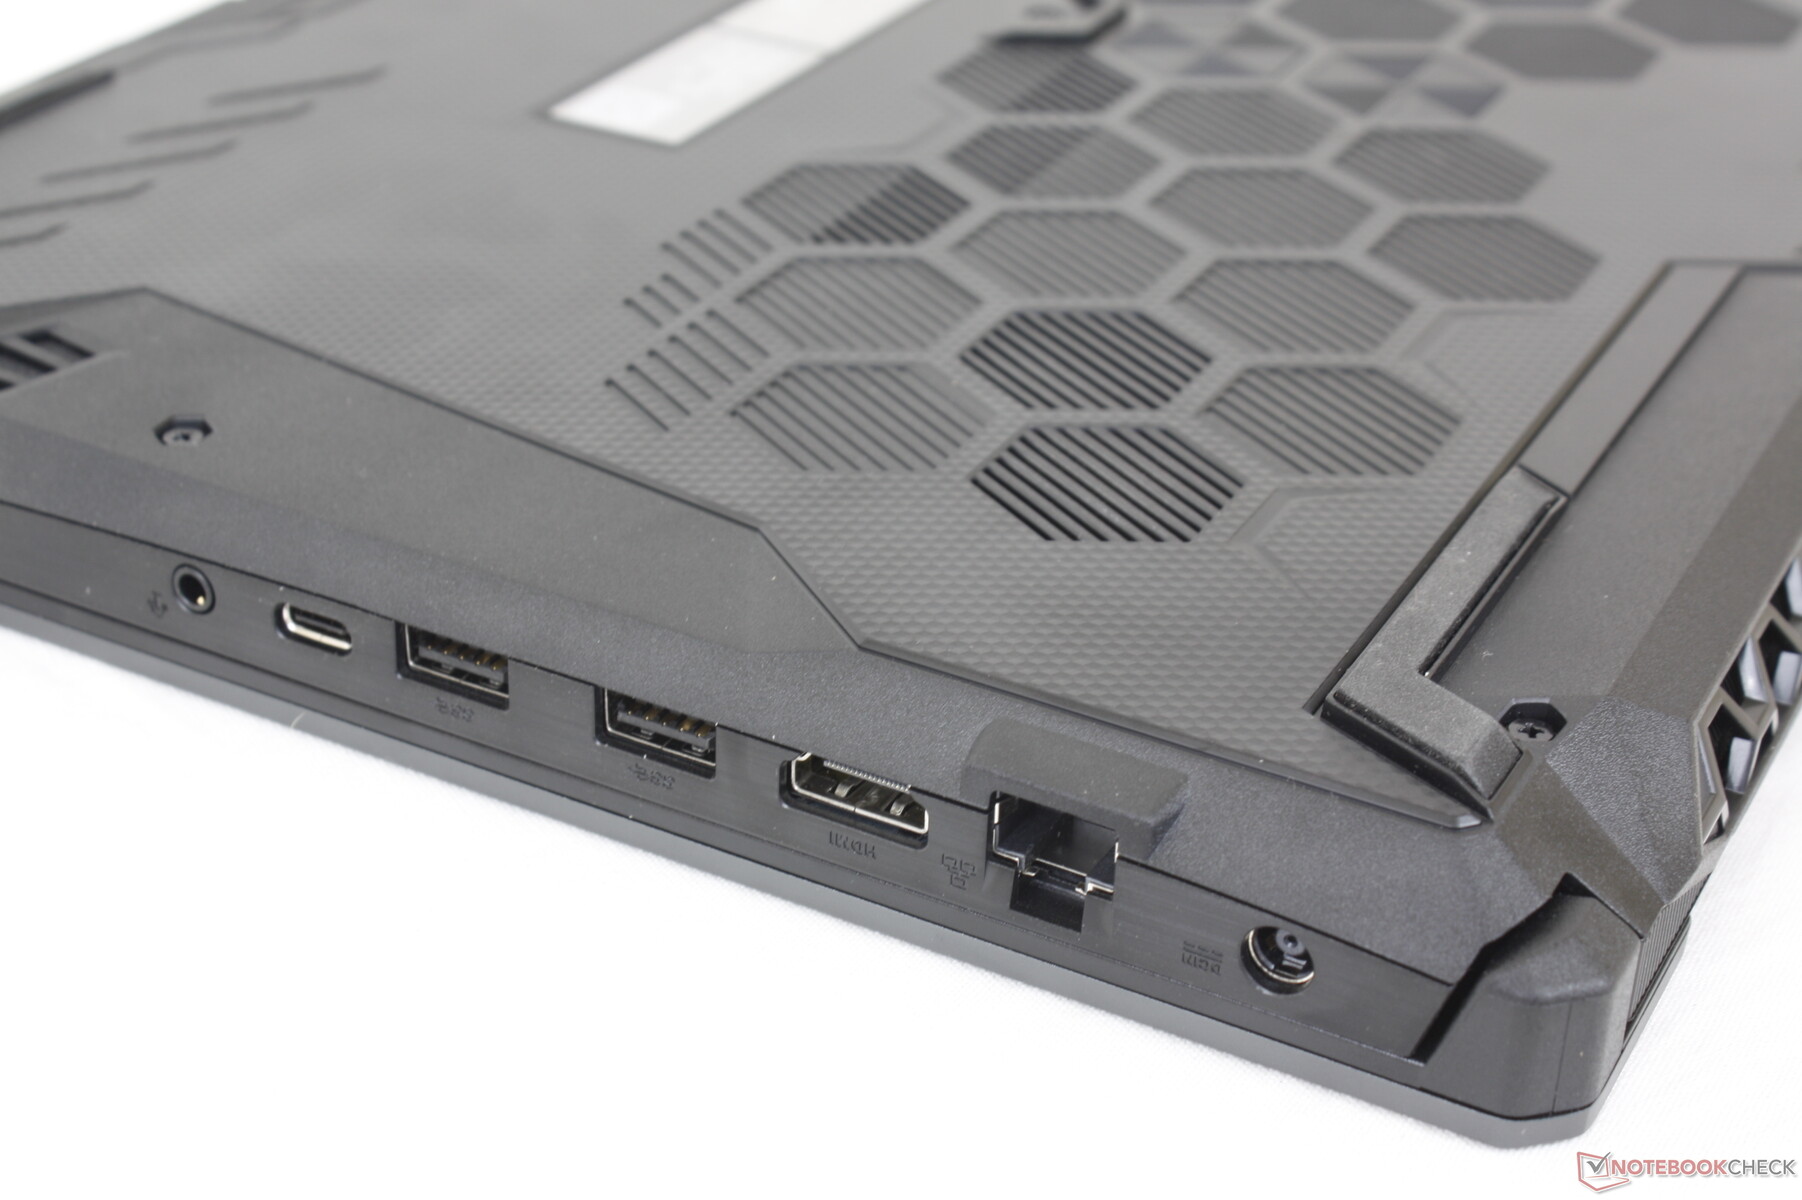
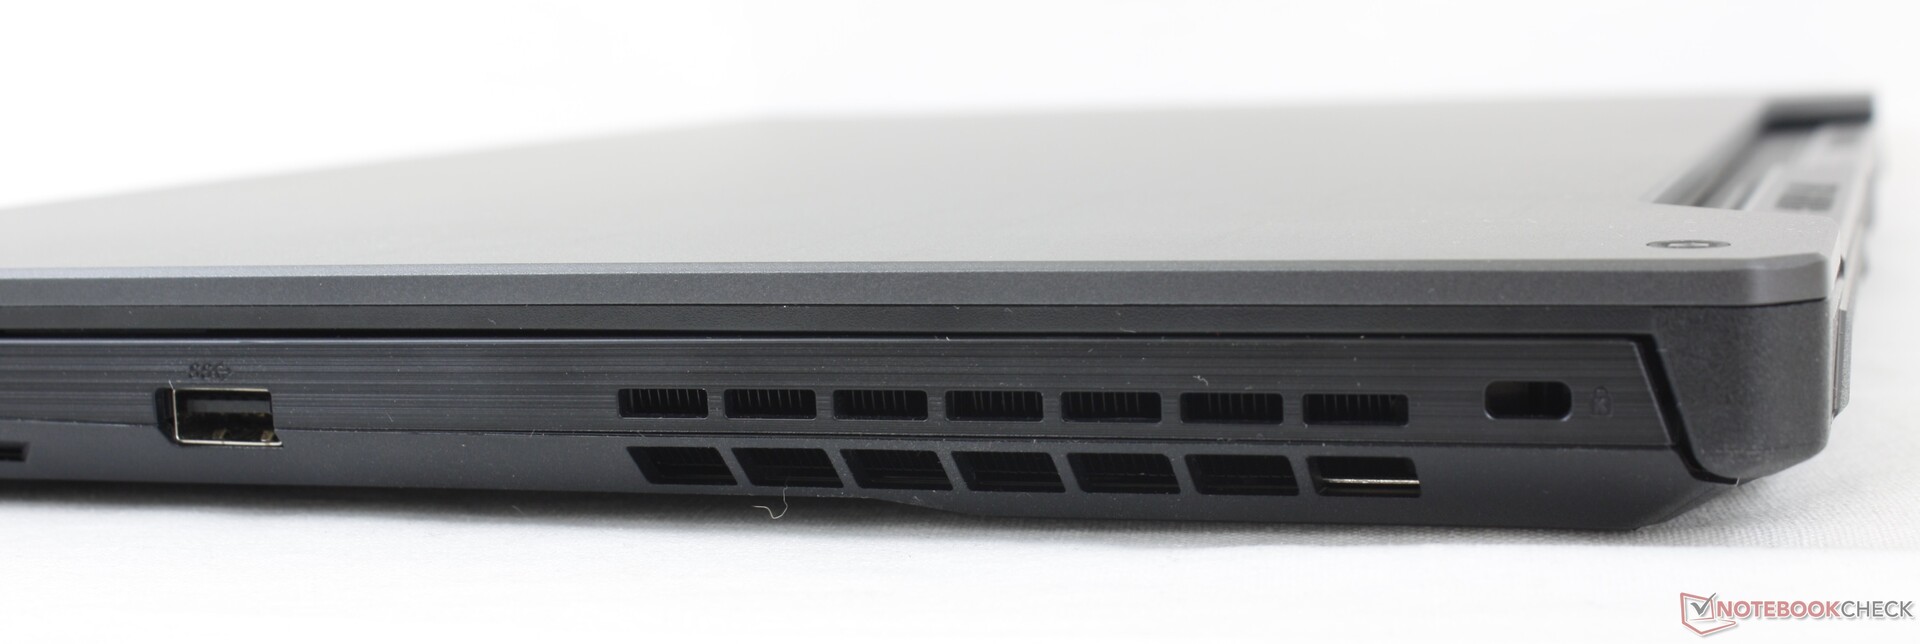
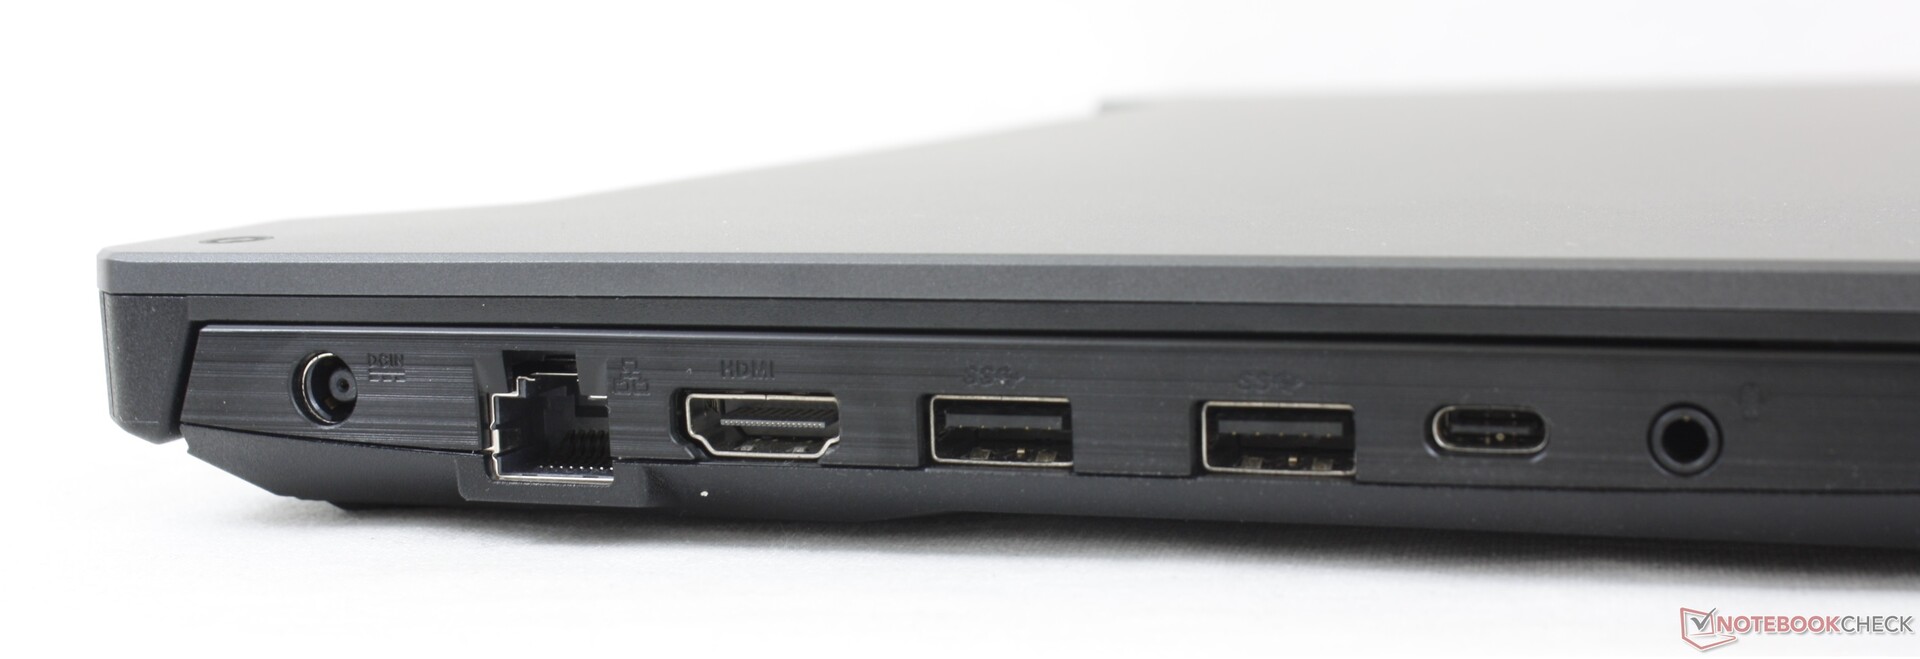
Connectivity — Thunderbolt 4 Comes Standard
Port options are the same as on the TUF Dash F15 but rearranged and with some notable upgrades. The right edge, for example, now houses just one USB port instead of two. Meanwhile, the USB-C port along the left edge now fully supports Thunderbolt 4 whereas earlier TUF laptops with AMD or 10th gen Intel CPUs or older would not.
Communication
Wi-FI 6 and Bluetooth 5.1 are provided by a MediaTek MT7921 which competes directly with the common Intel AX200/201. Though transfer rates are steady, they don't quite reach the same >1 Gbps maximums that we see on other laptops with the Intel wireless model.
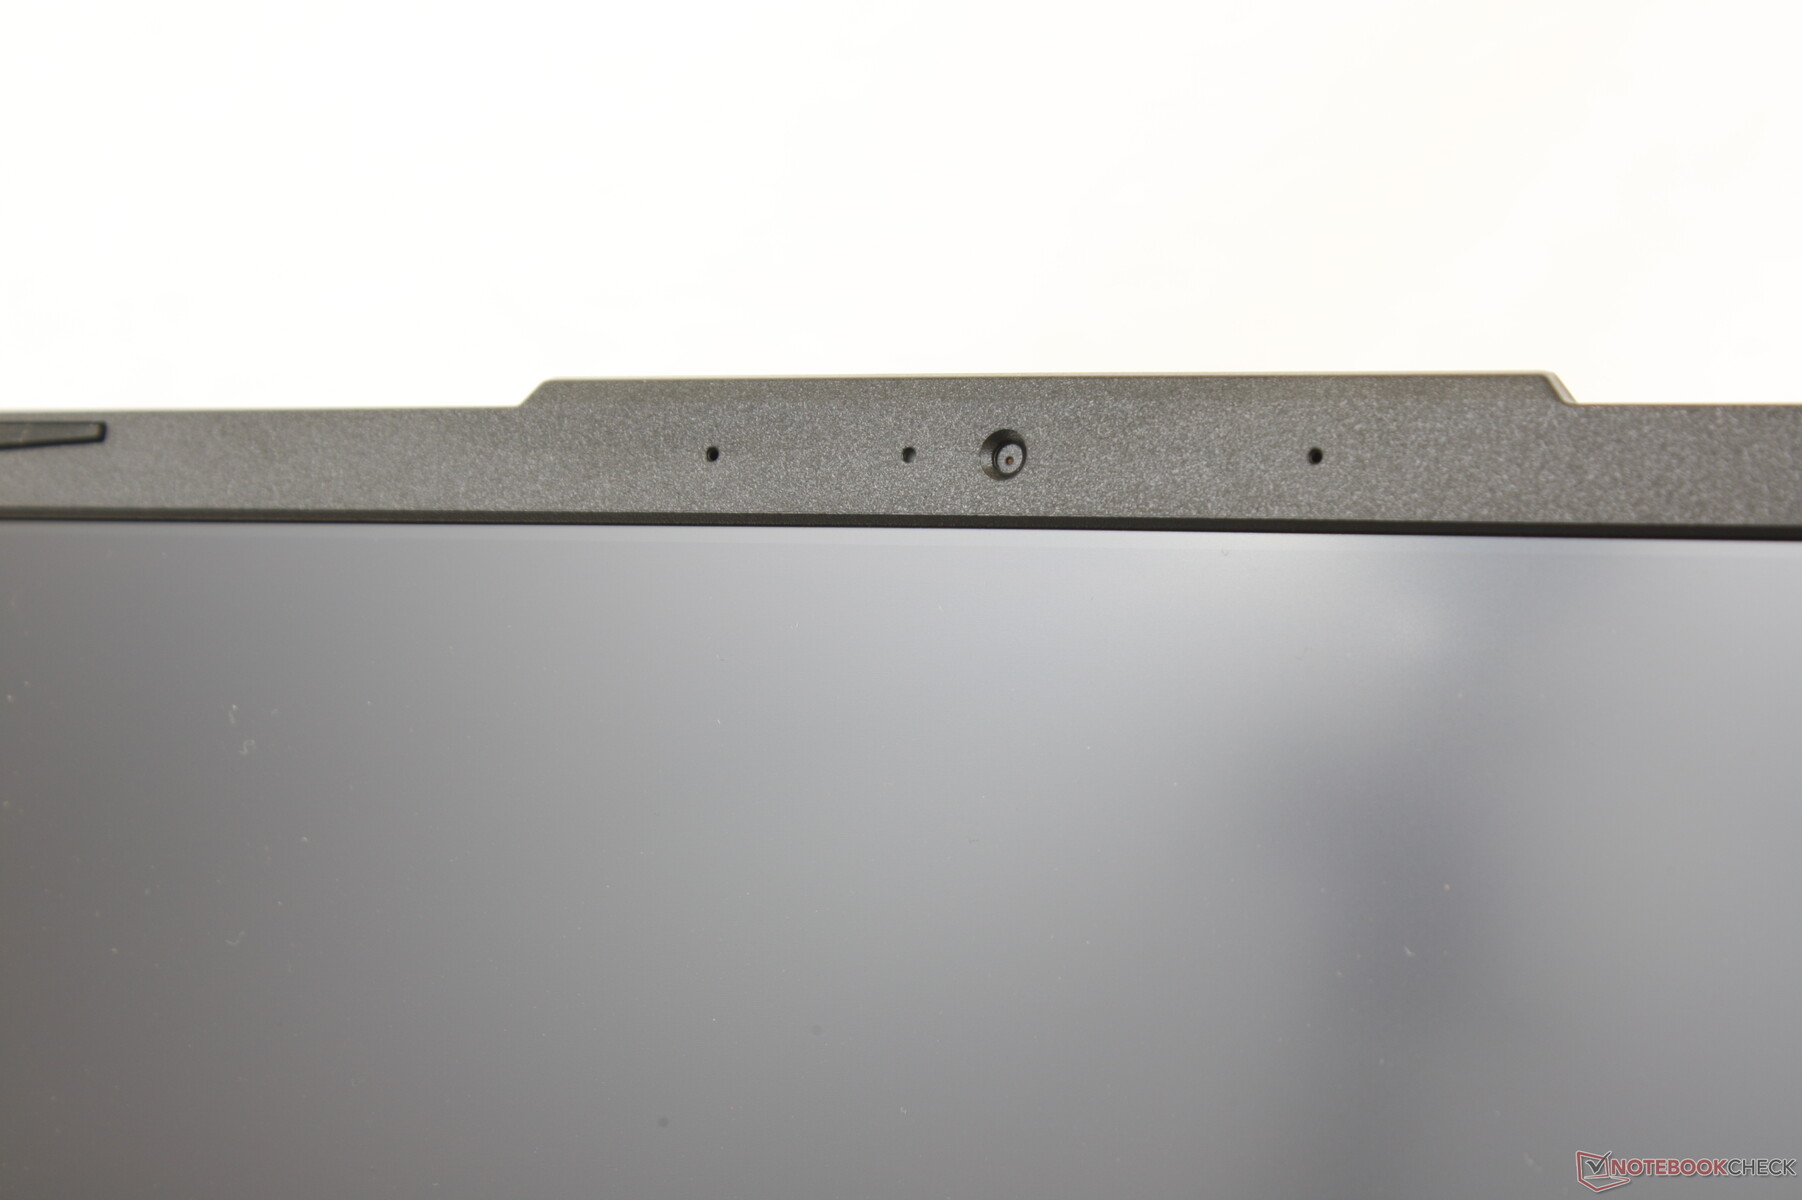
Webcam


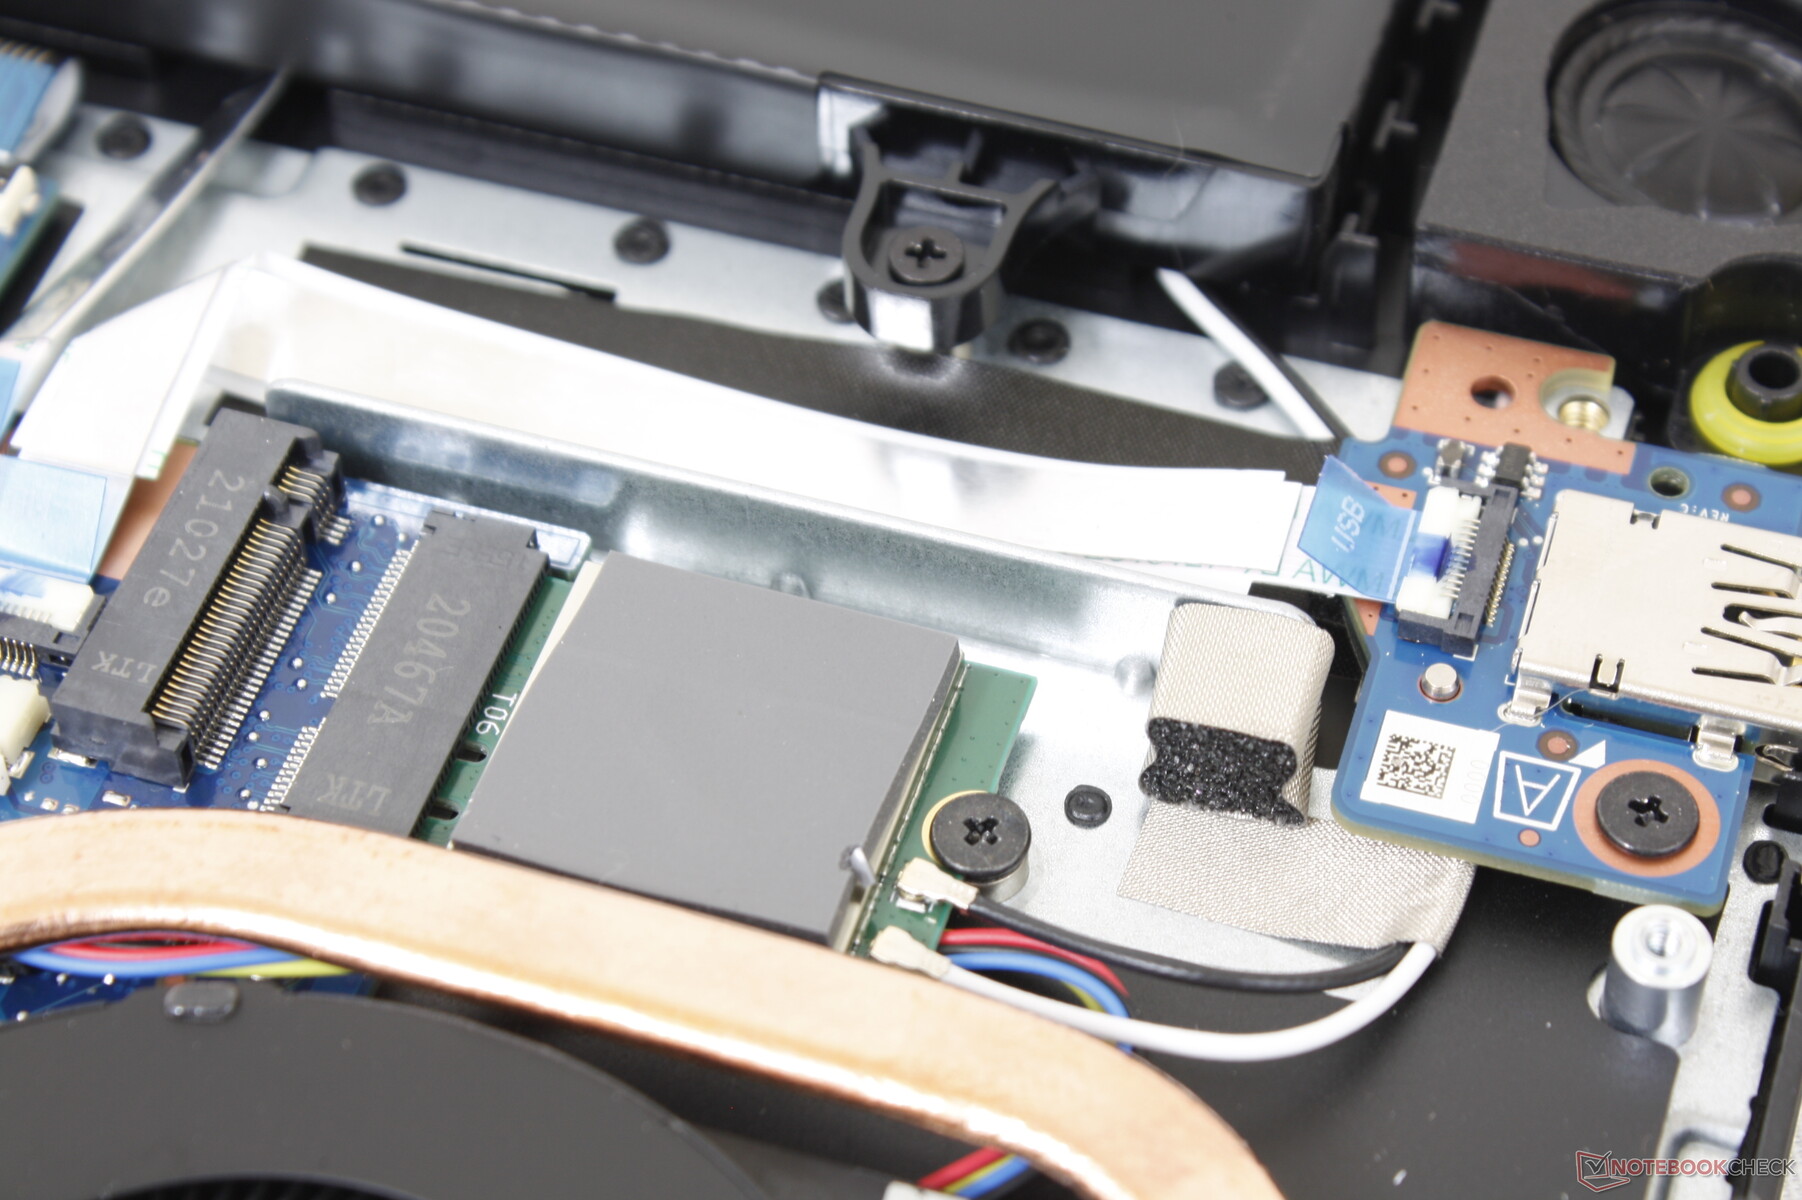
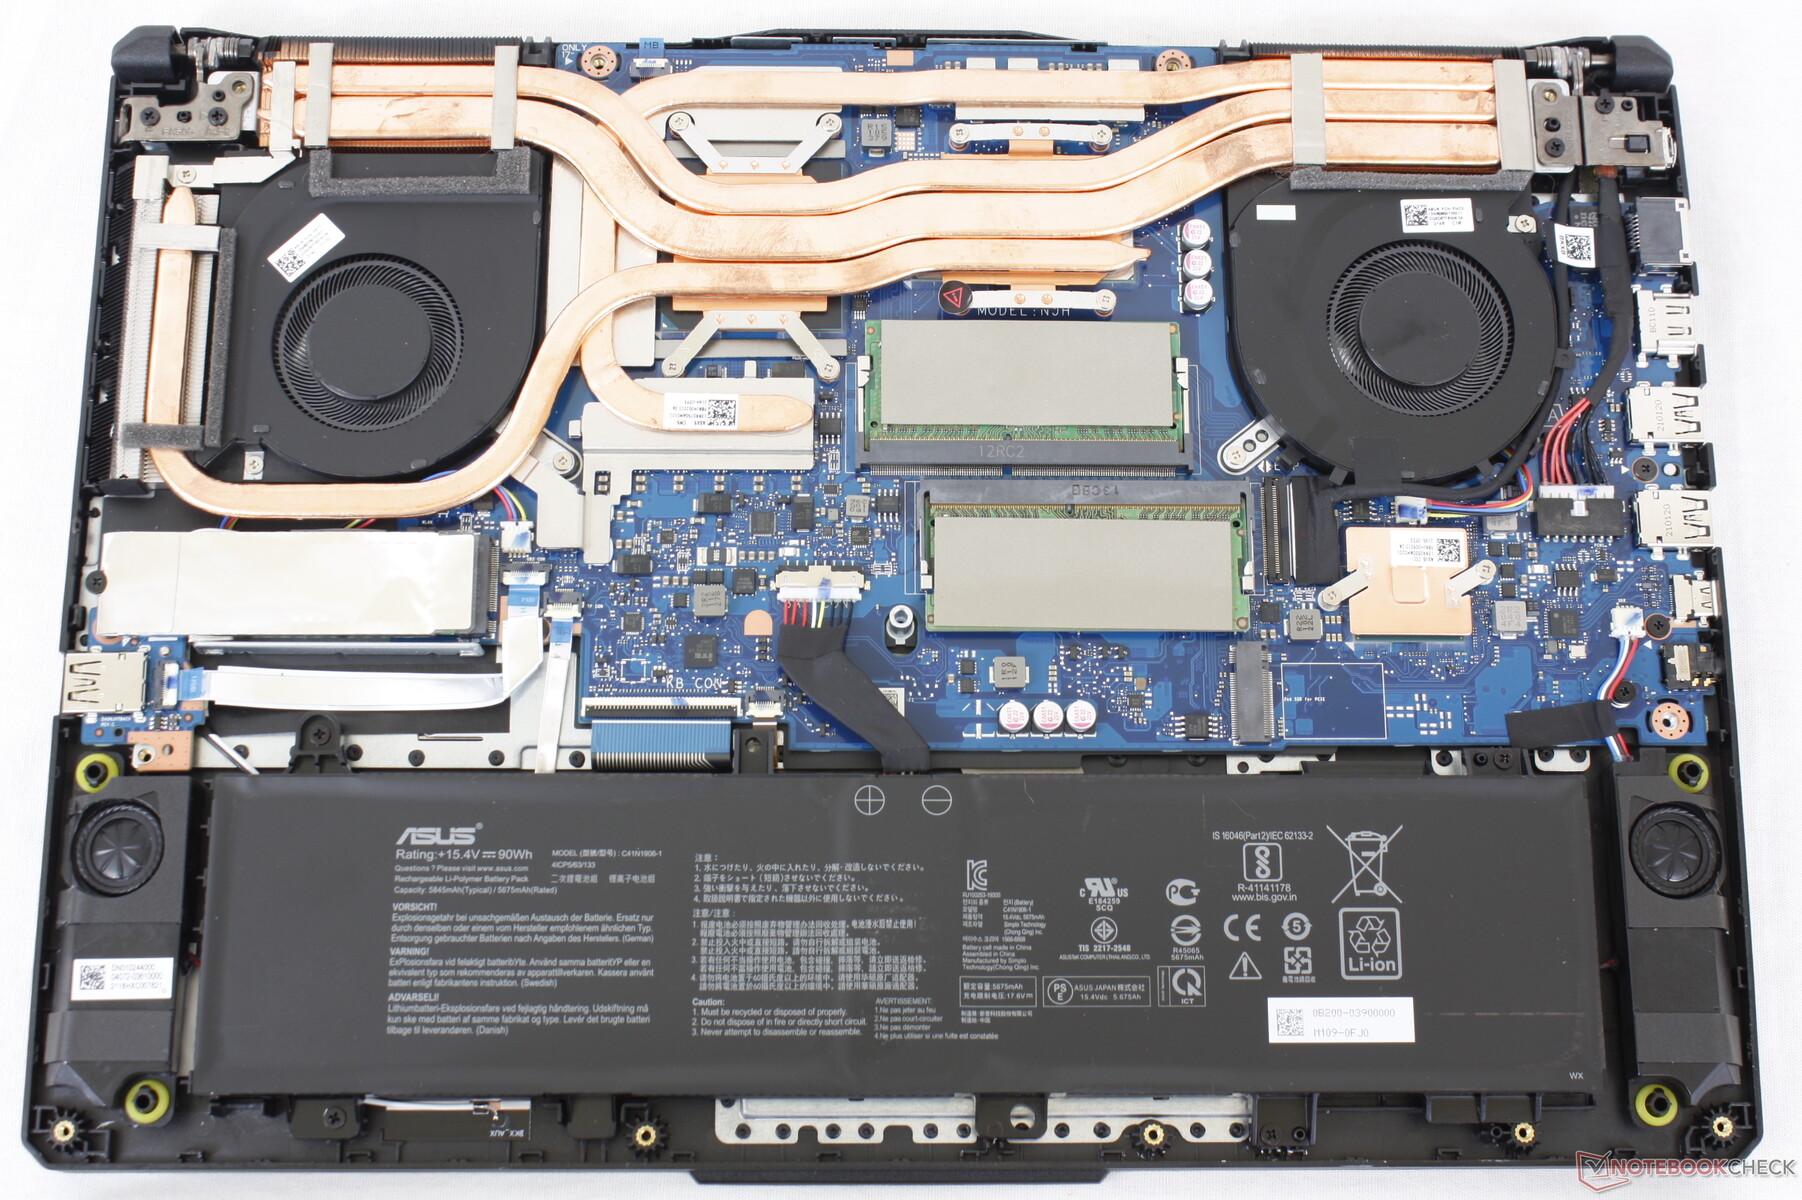
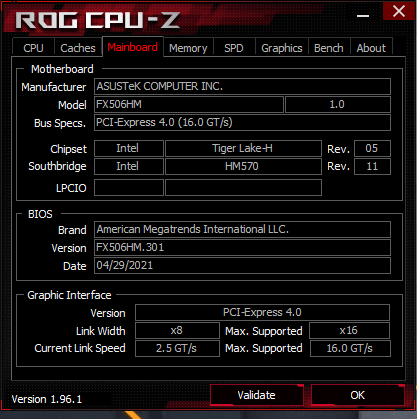
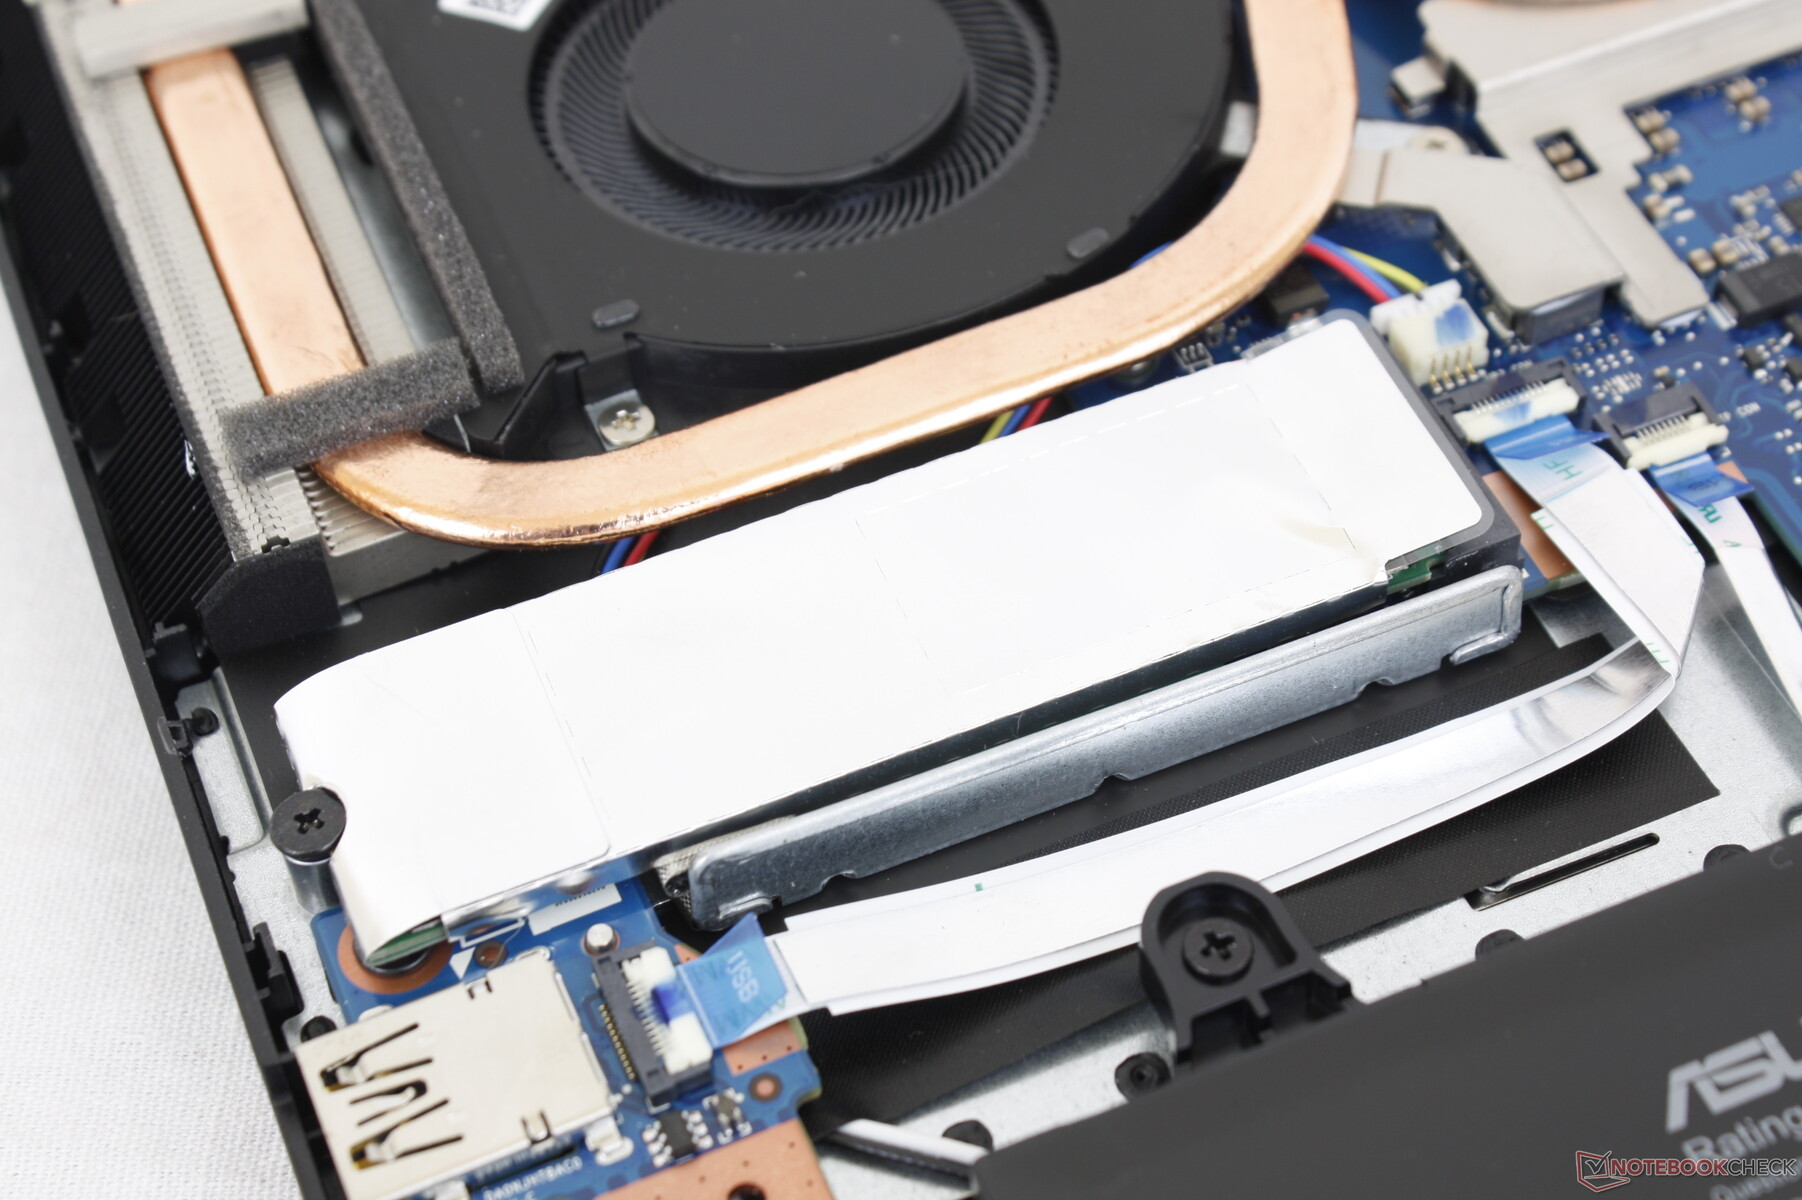
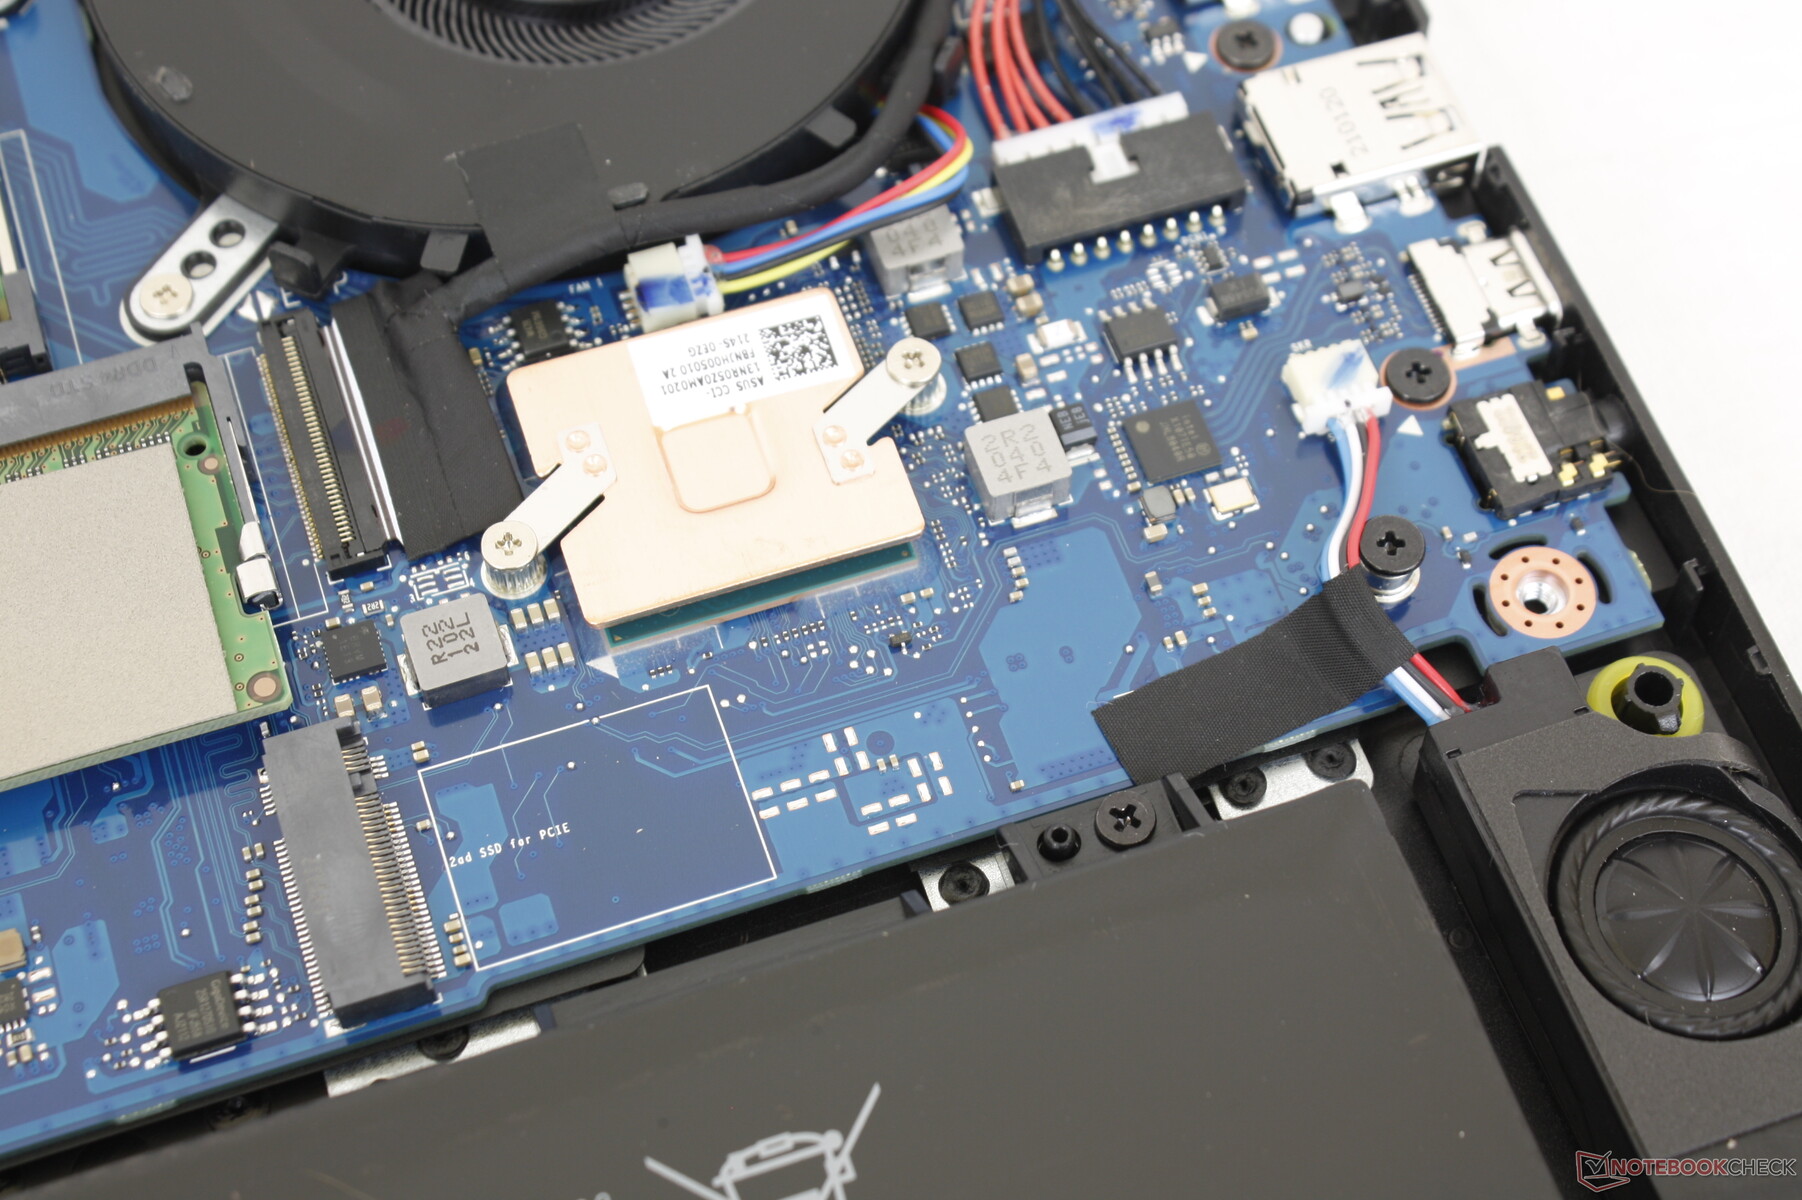
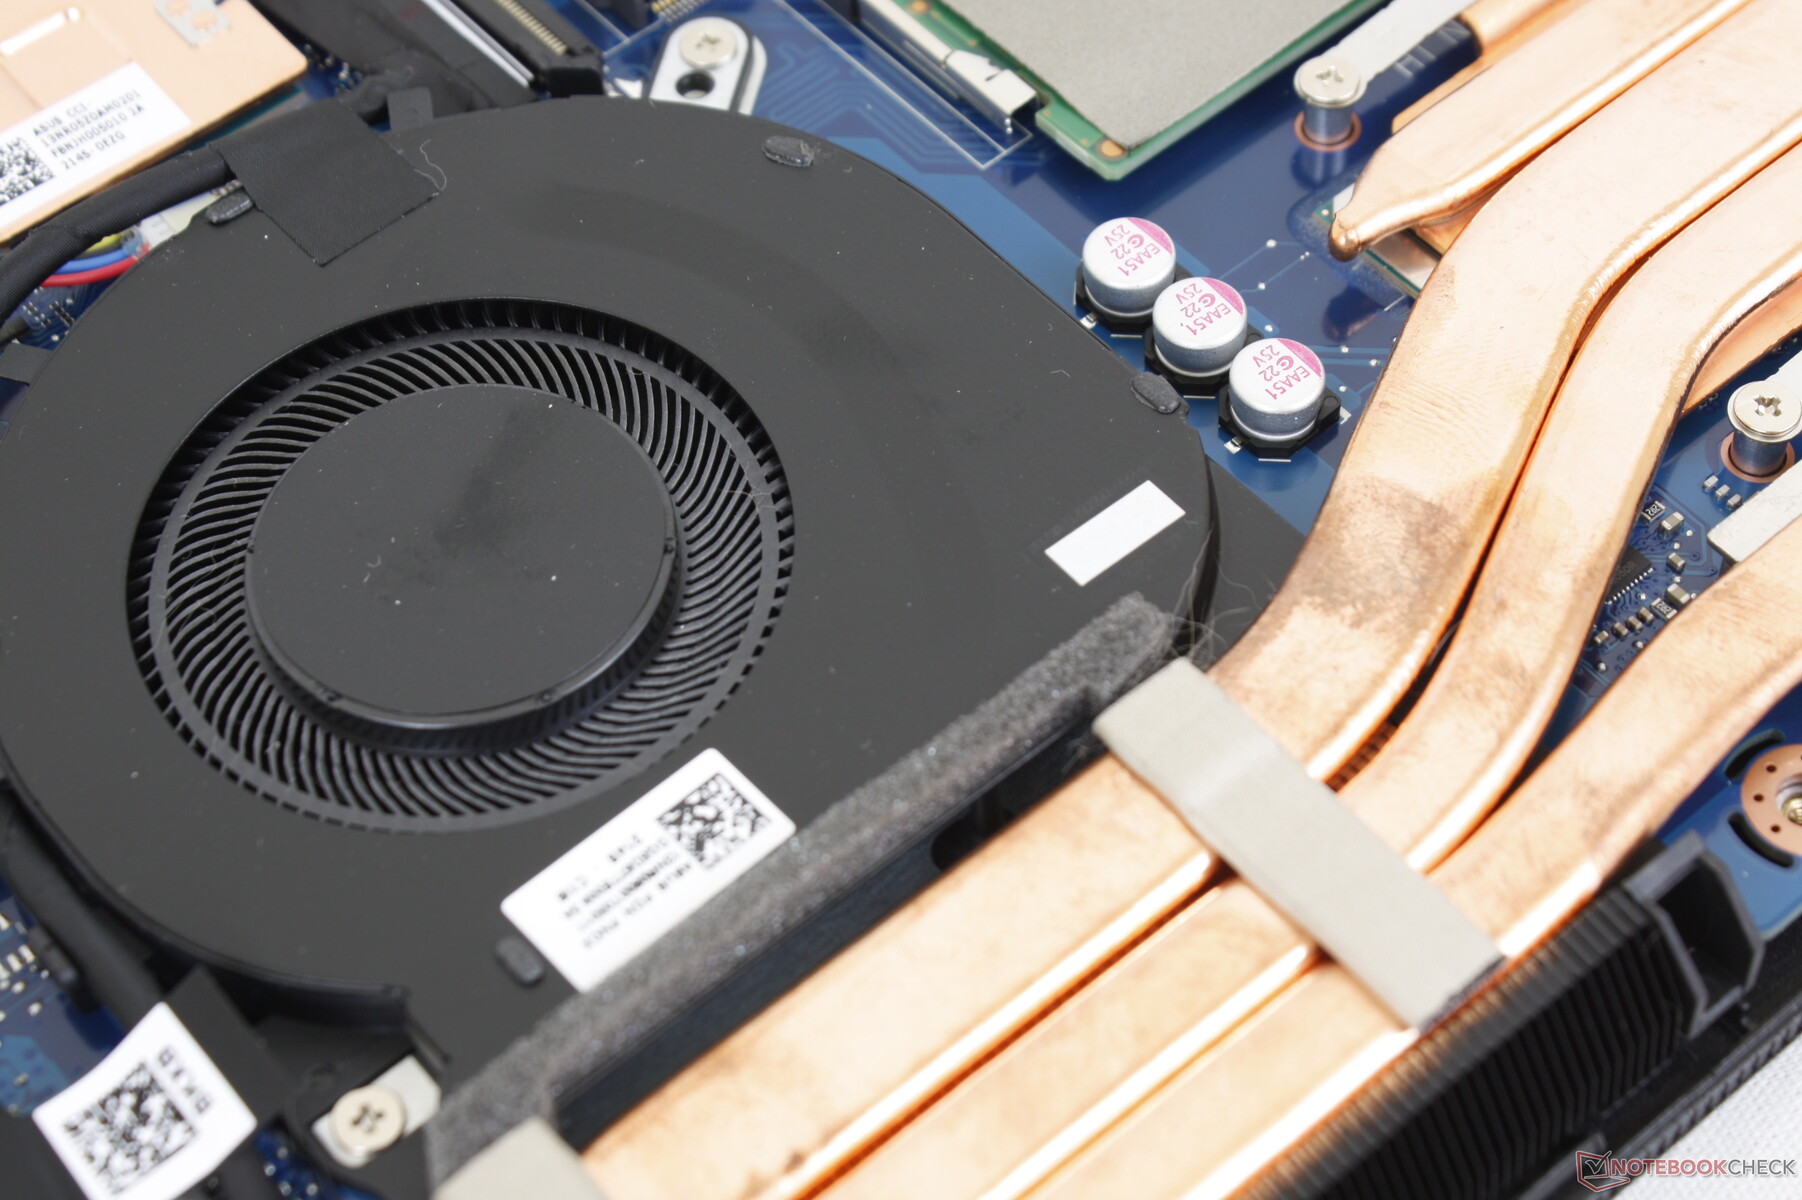
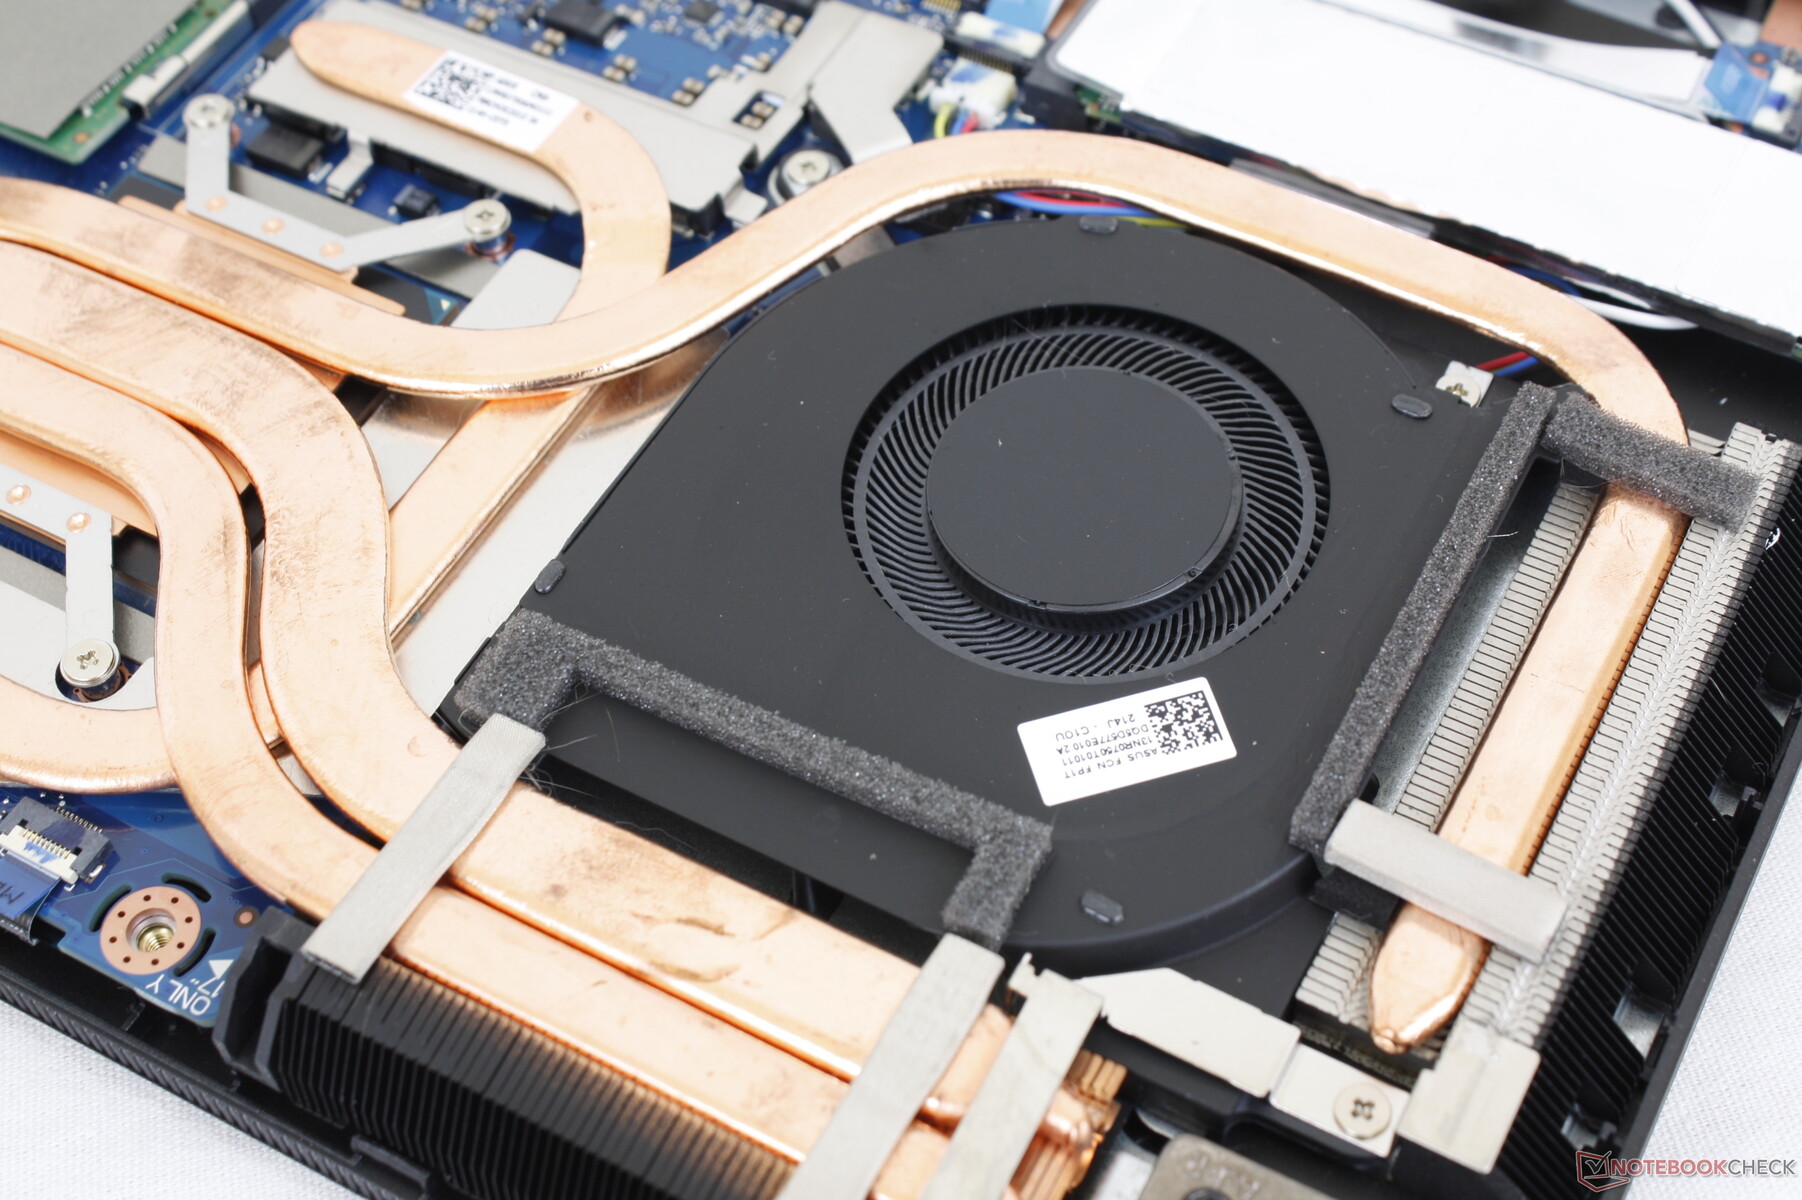
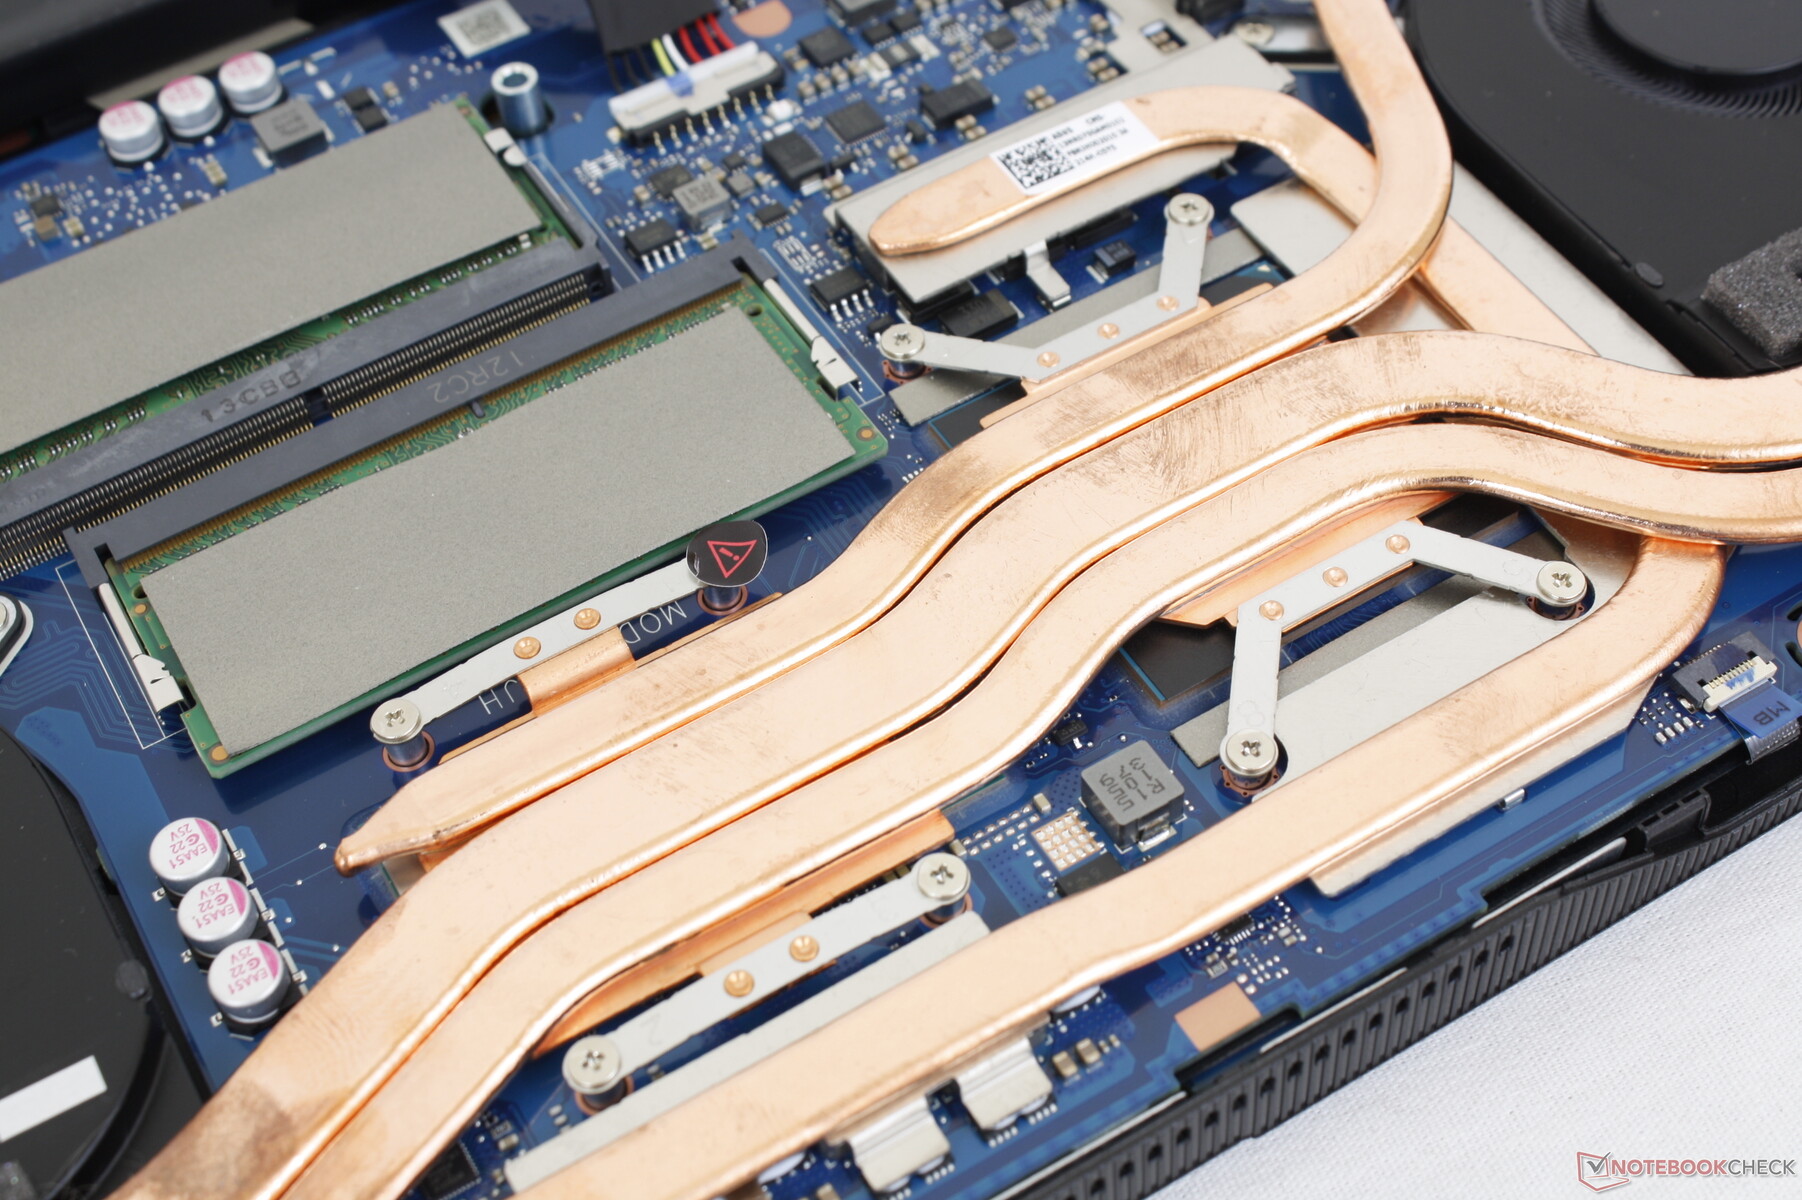
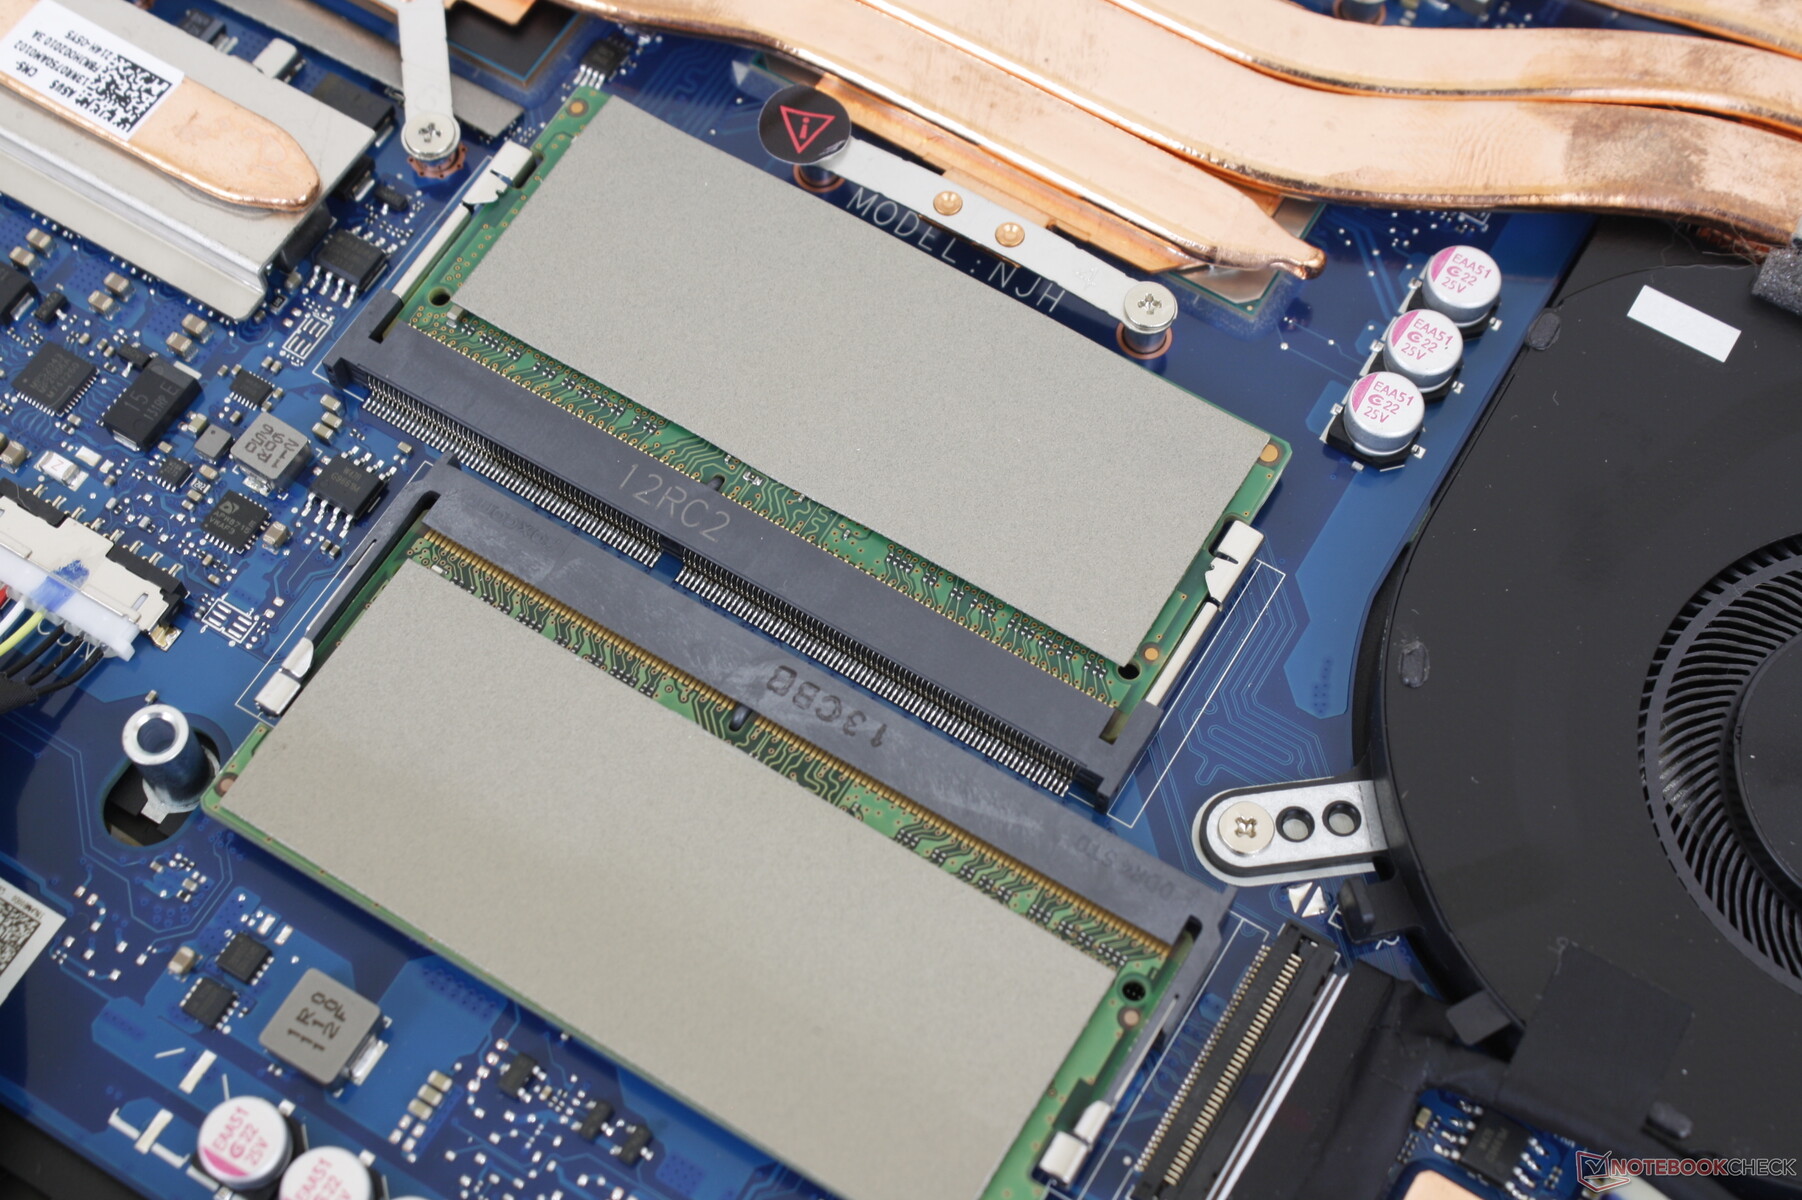
Maintenance — Easy Upgradeability
The bottom panel pops off fairly easily after removing its 11 Philips screws. The internal layout shares many similarities with the TUF Dash F15 despite their significant chassis differences.
Accessories and Warranty
The retail box includes a page of Asus stickers alongside the usual paperwork. A one-year limited warranty comes standard.
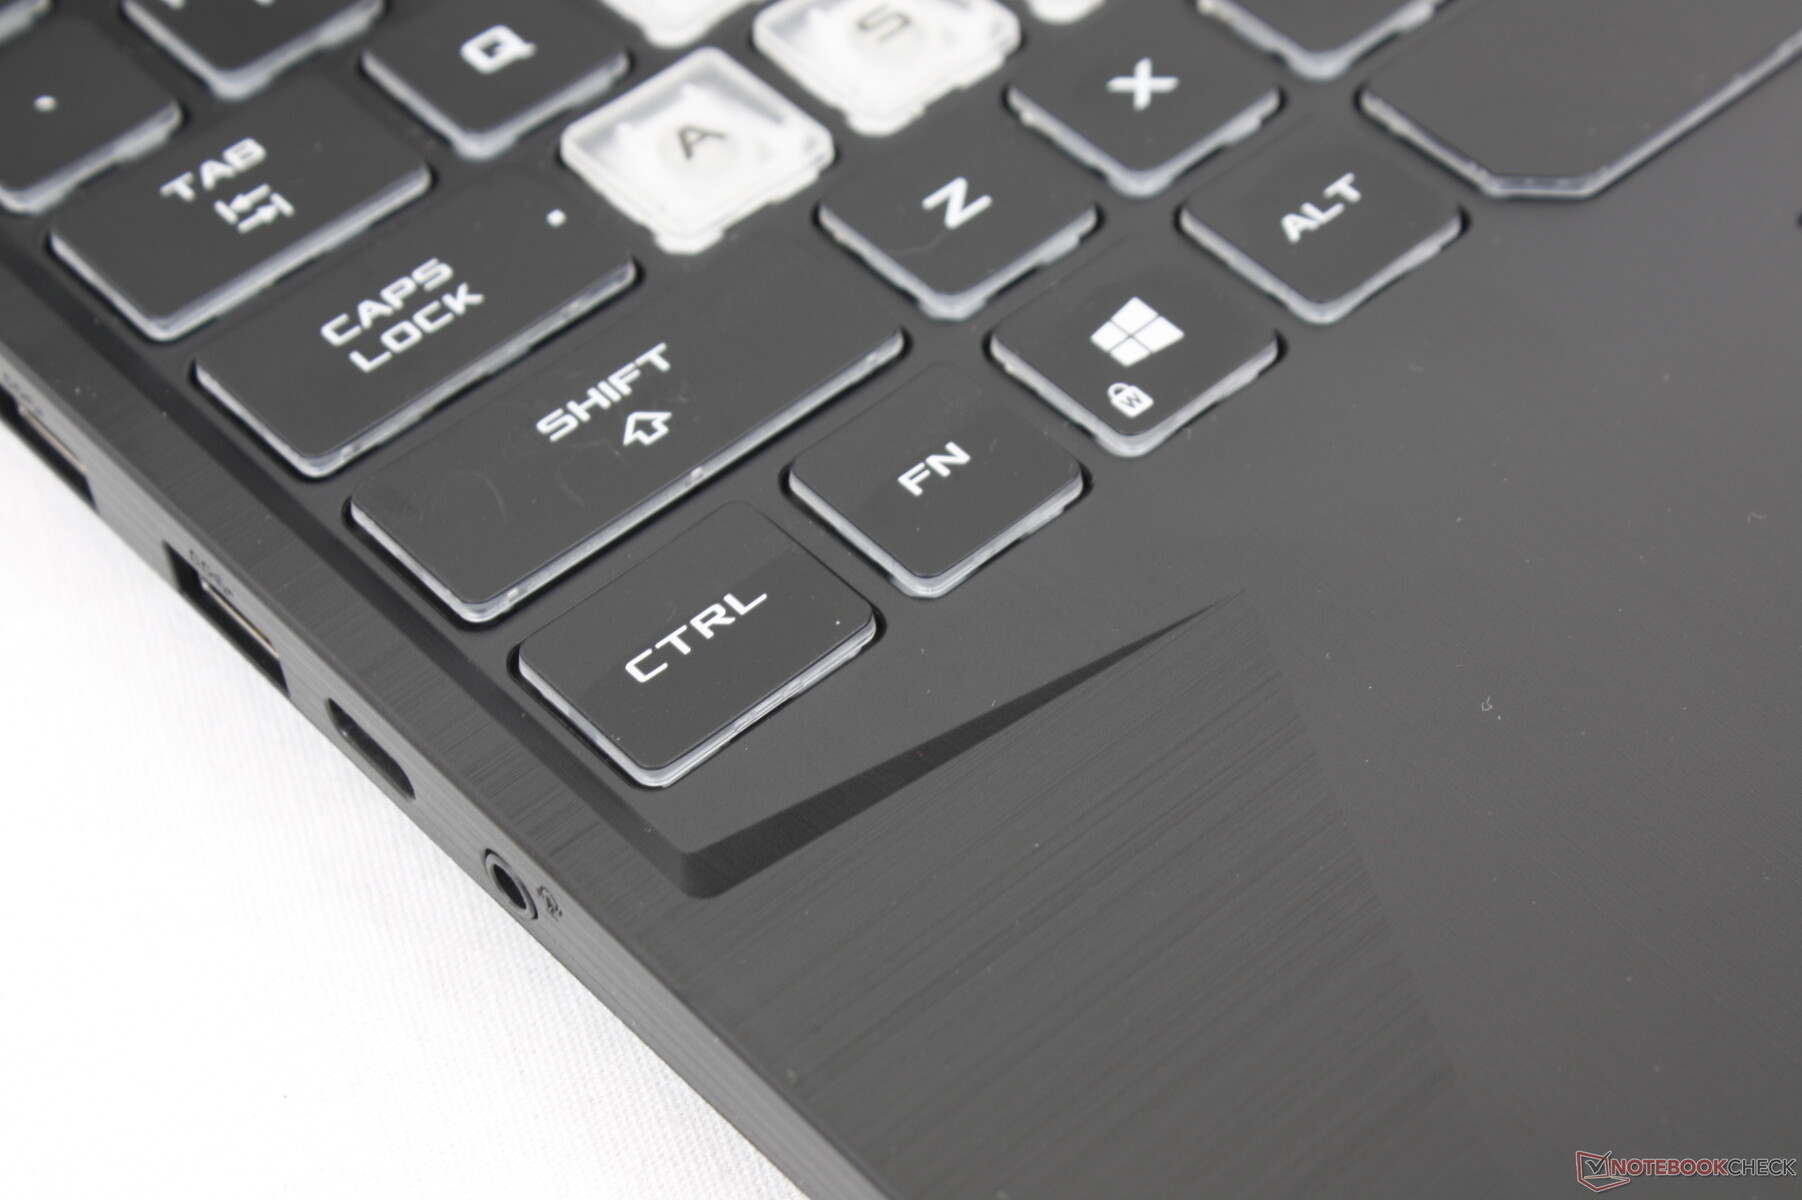
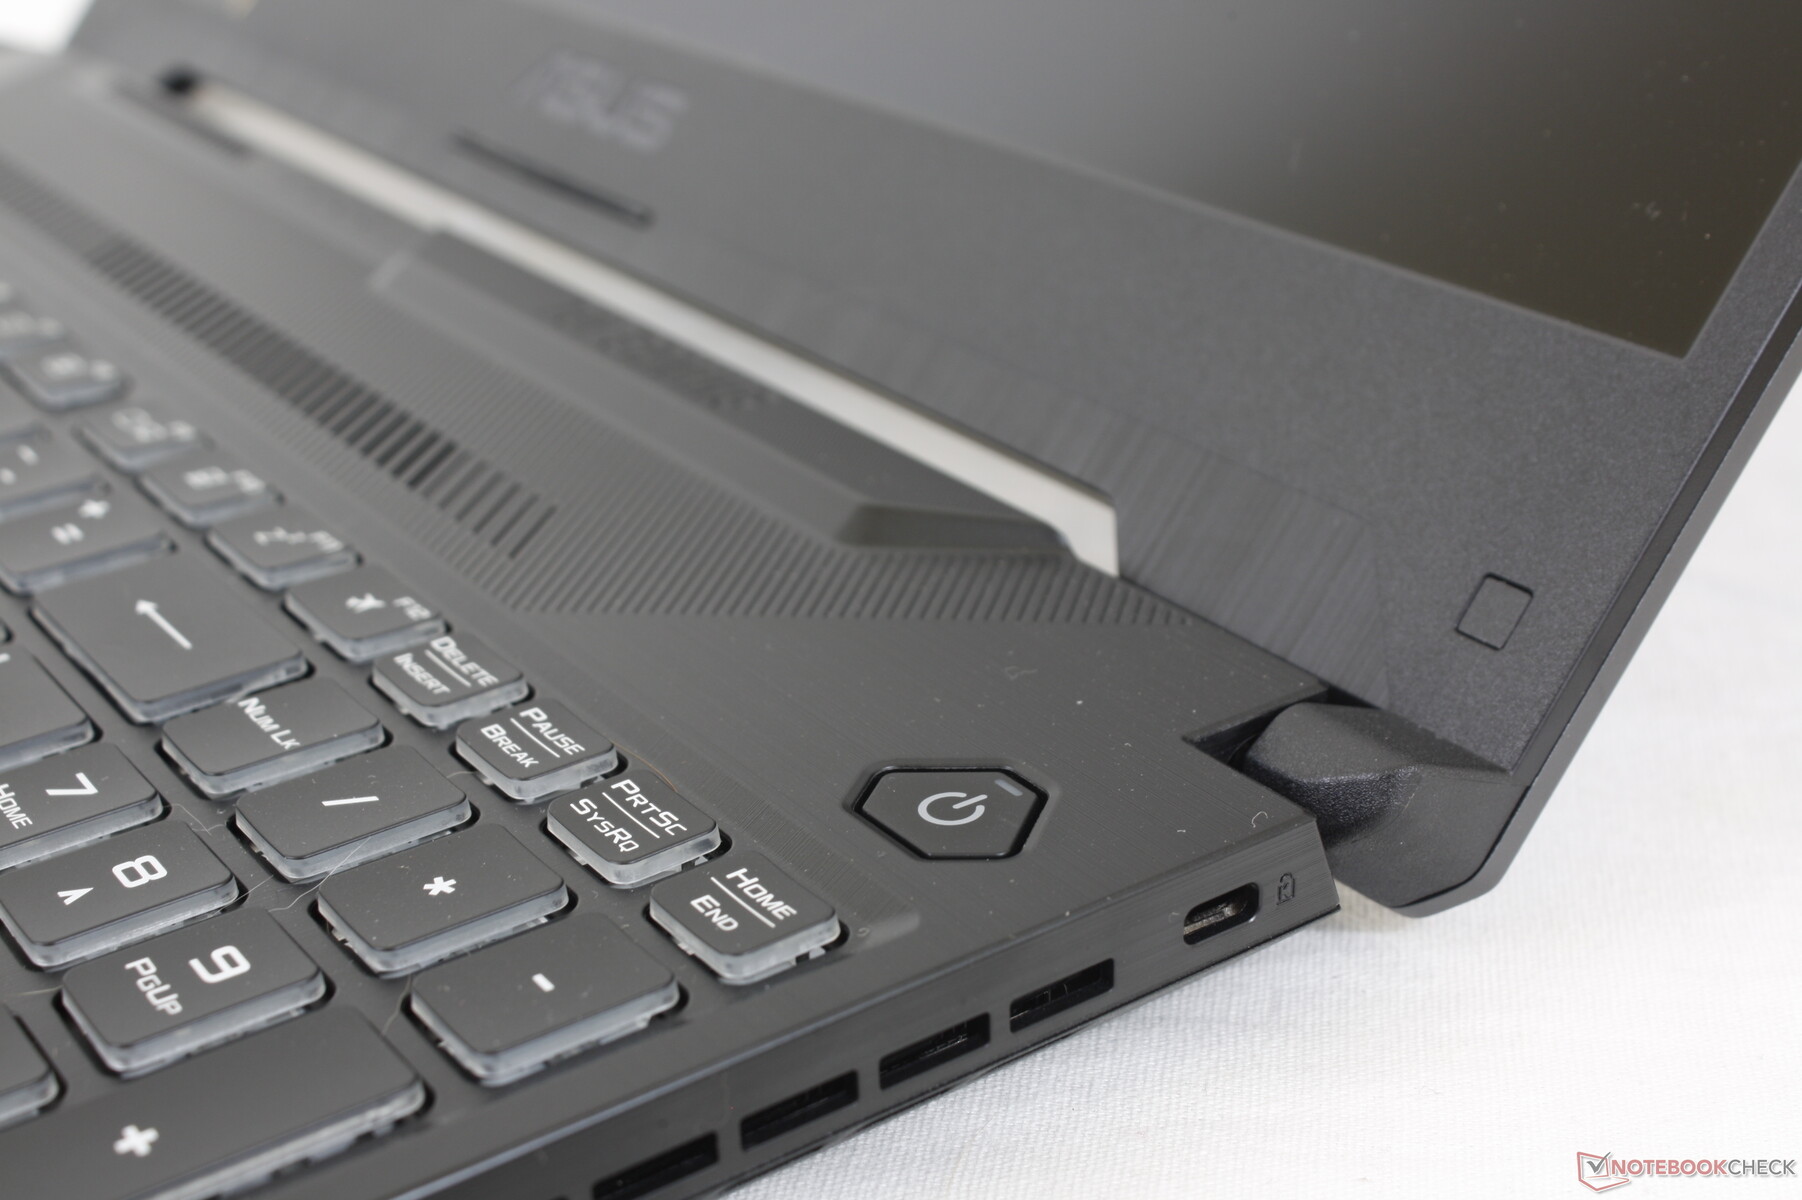
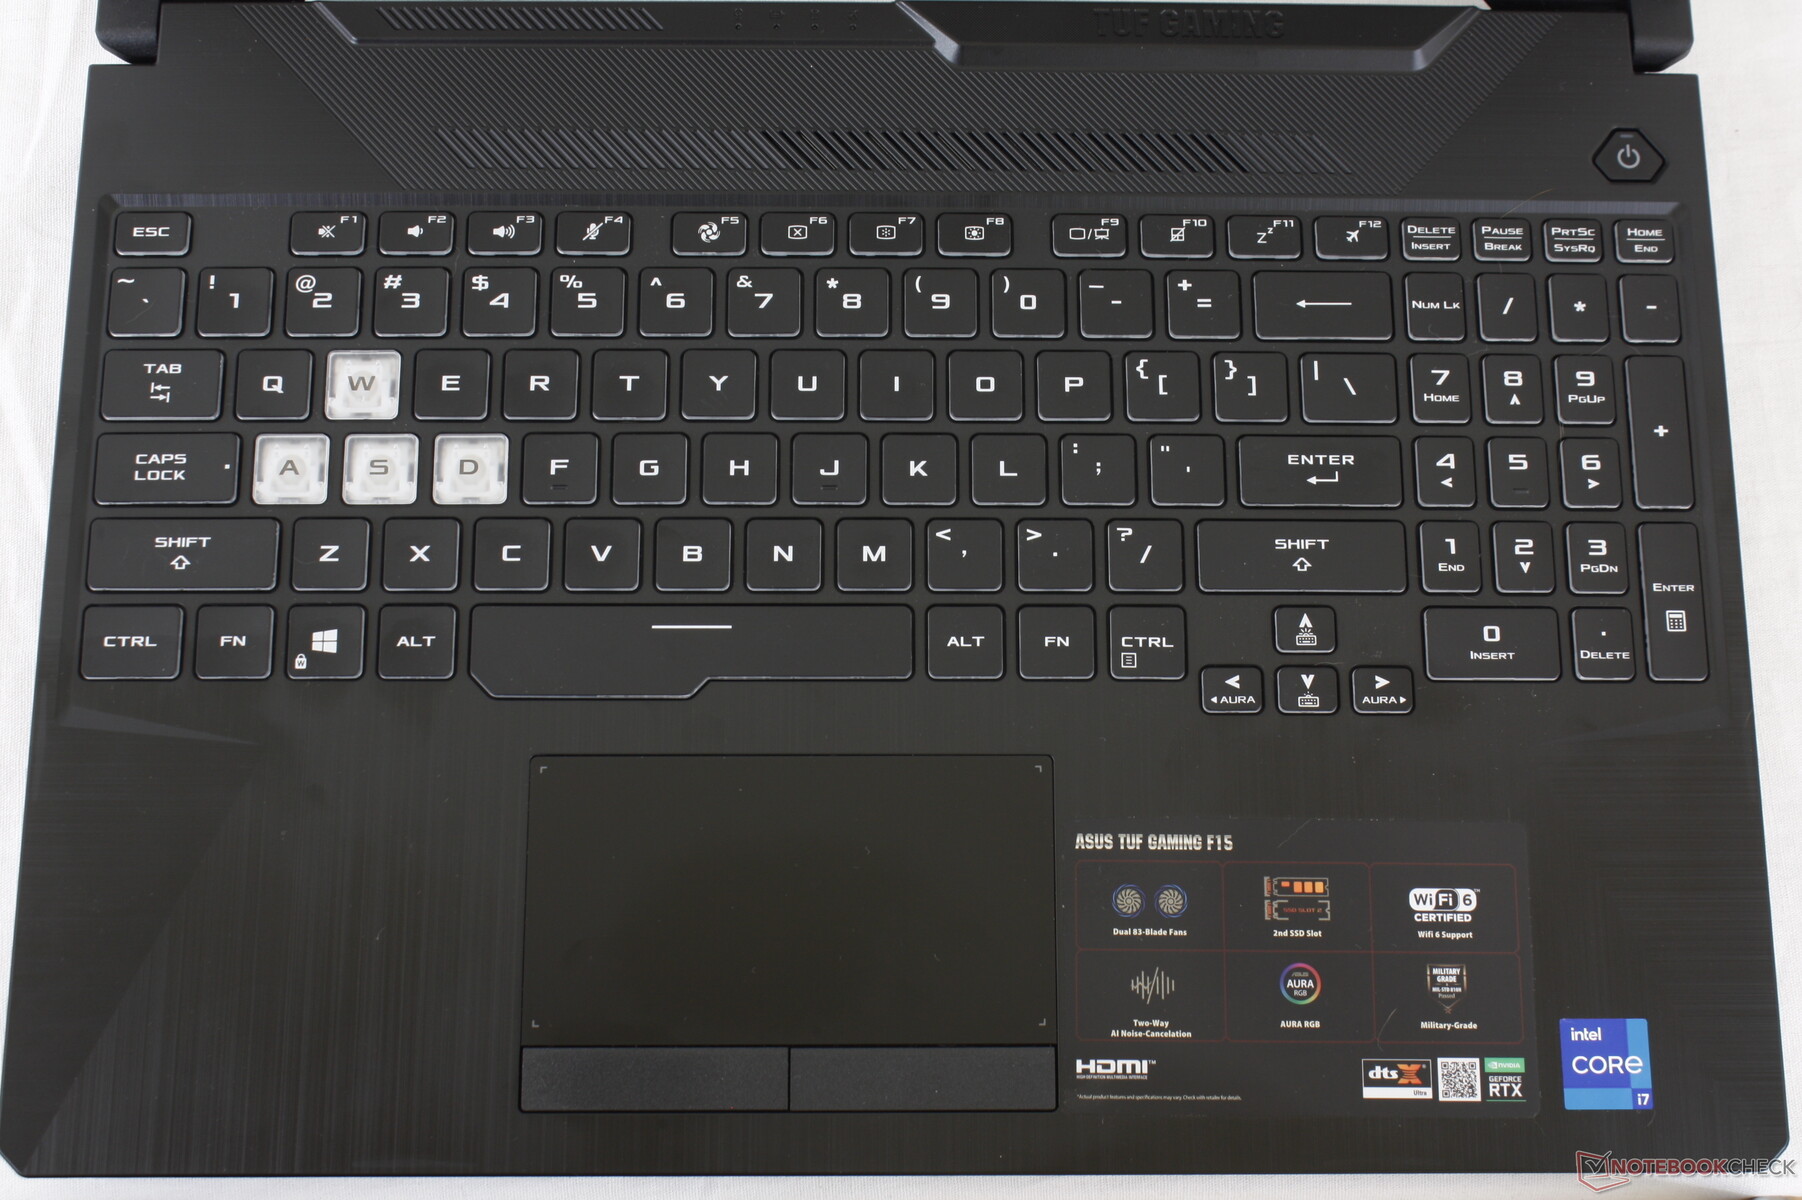
Input Devices — Great Typing Experience
Keyboard
While keyboard layout has changed from the FX505, the typing experience remains mostly the same. Feedback from the main QWERTY keys is still satisfactory with moderately loud clatter. Our main issue continues to be with the arrow keys which are now even smaller than the ones on the last generation model. Not only are they cramped, but feedback is spongy and unsatisfying. You're going to want an external keyboard or another gaming laptop if you plan on using the arrow keys frequently.
Single-zone RGB lighting is available with no per-key options. Users will have to upgrade to the pricier Asus ROG series for such luxury features.
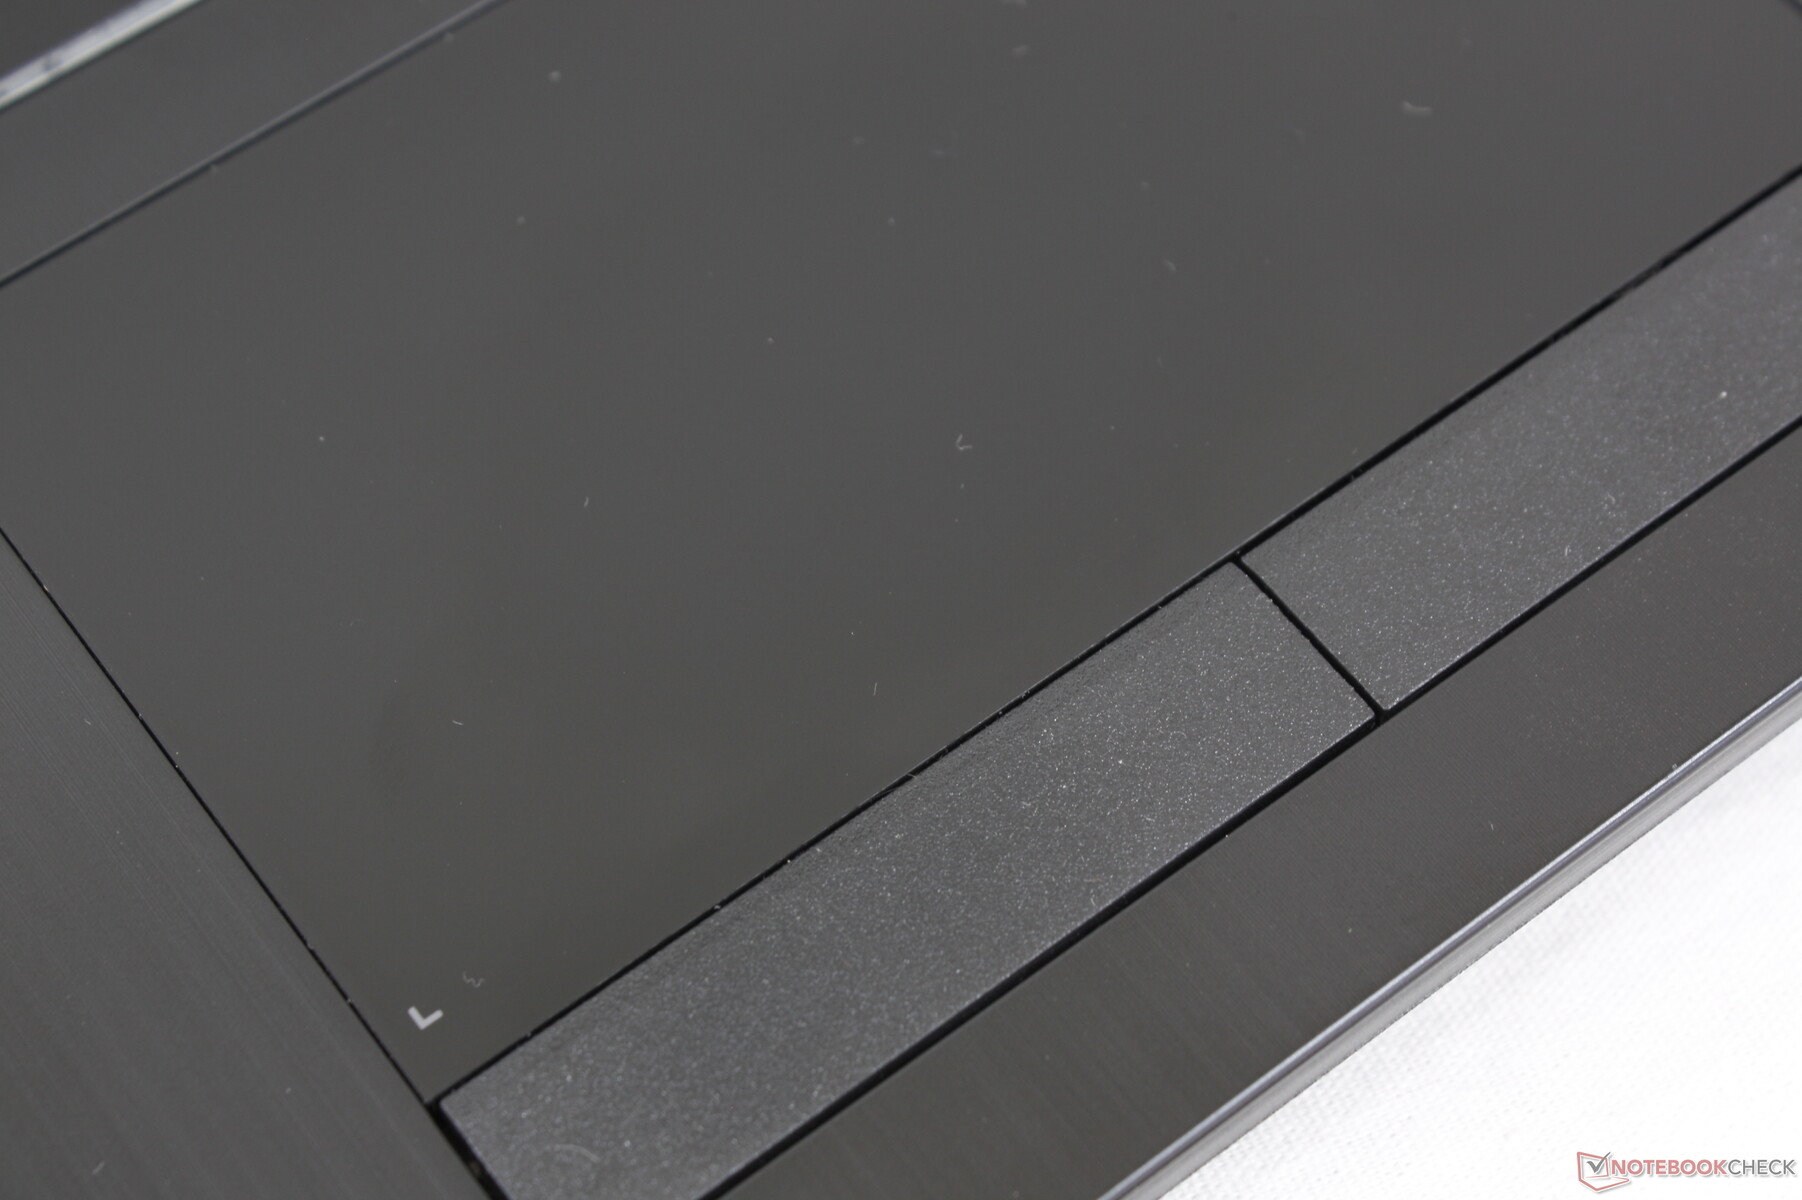
Touchpad
The touchpad is relatively small (~10.6 x 8.0 cm), but it's one of the few gaming laptops with dedicated mouse buttons for more accurate control and clicks. The buttons are very quiet when pressed with moderate but satisfactory feedback in contrast to the much louder buttons on the MSI GT series. The texture-less touchpad surface is unfortunately susceptible to unsightly fingerprint buildup, however.


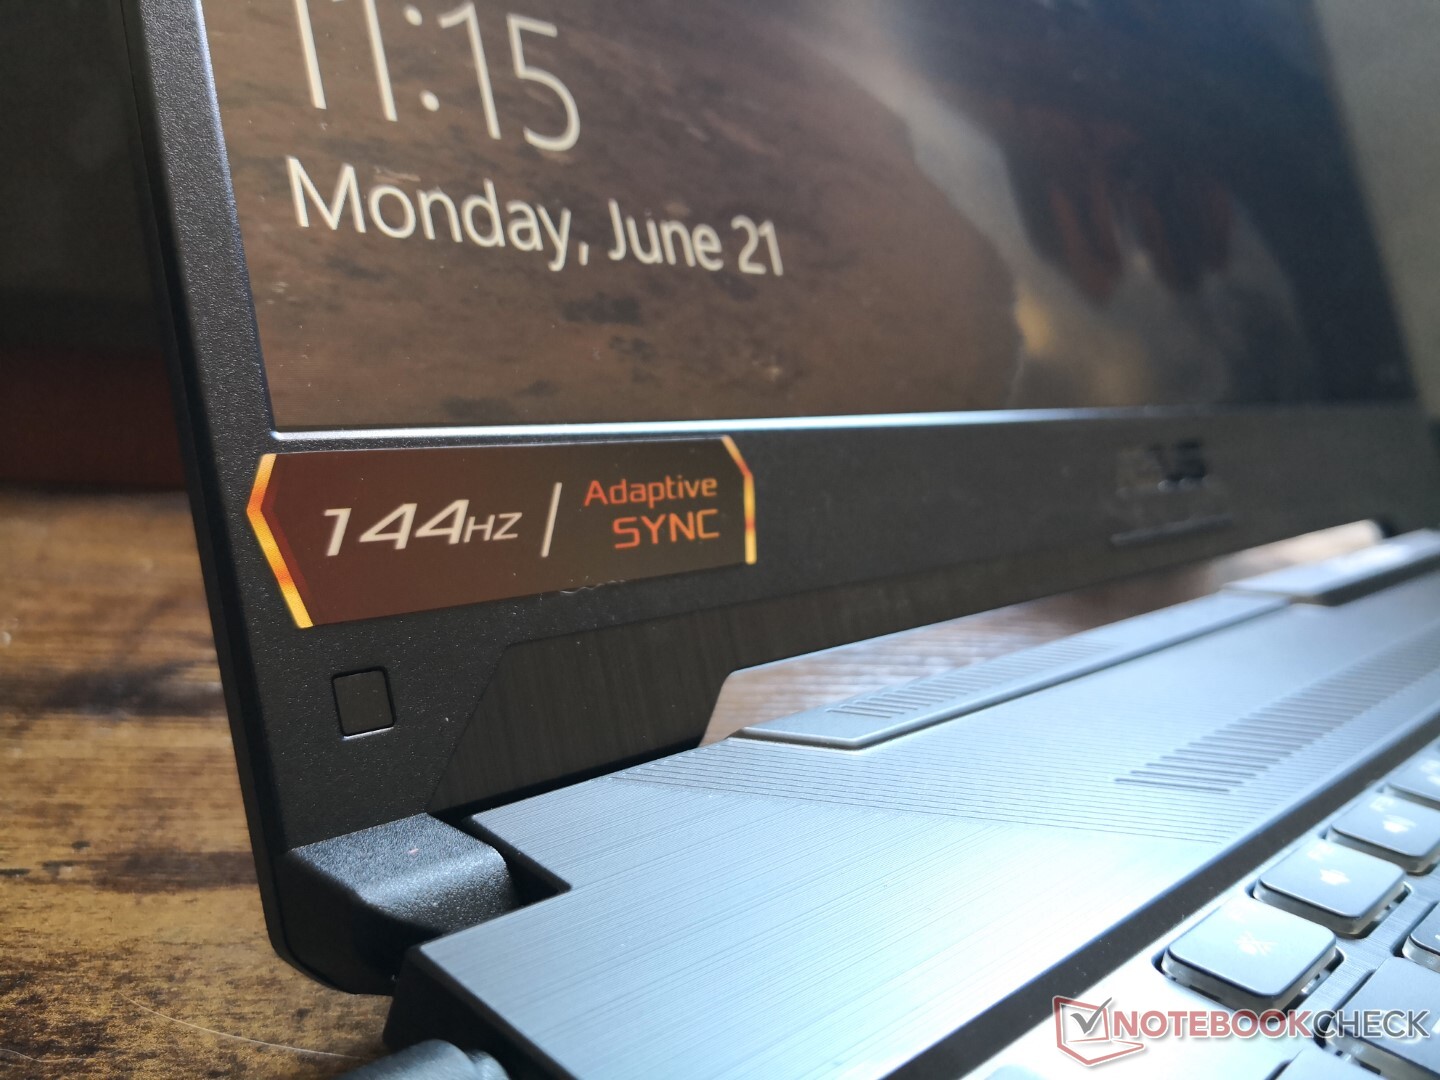
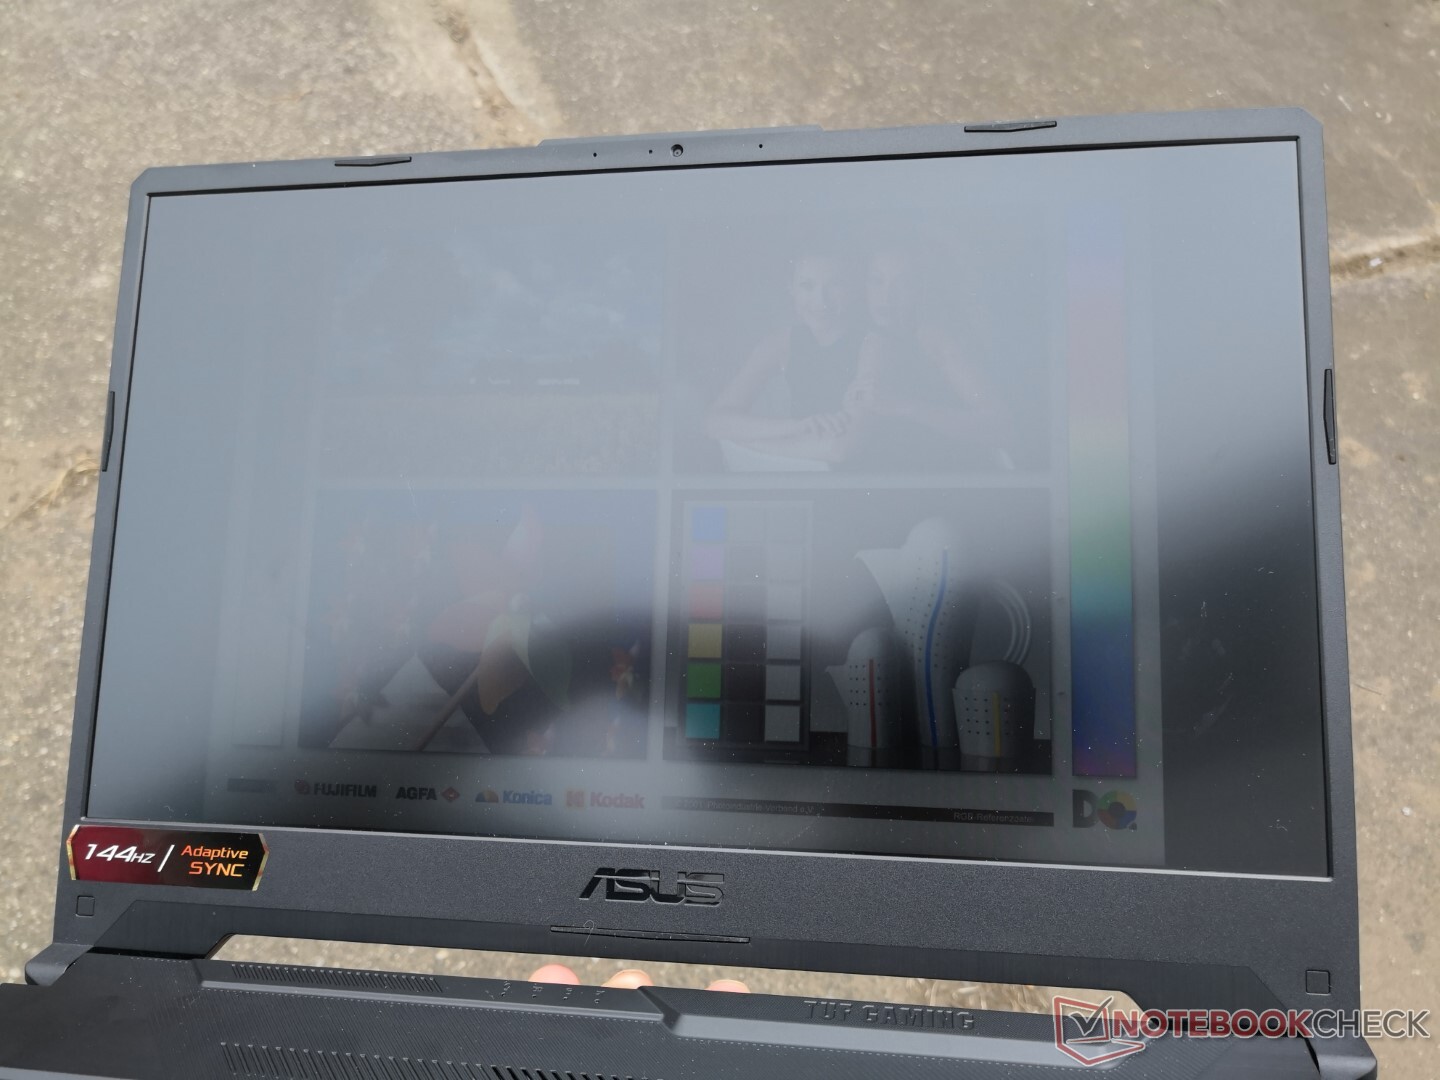
Display — High On Refresh Rate, Low On Colors
The 144 Hz Chi Mei N156HRA-EA1 IPS panel here can also be found on the recent Nitro 5 AN515-55 which is a competing budget gaming laptop from Acer. Aside from the fast native refresh rate, everything else about the panel is fairly mediocre to reflect the entry-level category. Response times, colors, and contrast aren't nearly as good as the panels on Asus' more expensive Zephyrus or ROG models. Nonetheless, the ultra-smooth motion is a noticeable upgrade over the cheaper 60 Hz panels out there.


| |||||||||||||||||||||||||
Brightness Distribution: 84 %
Center on Battery: 268.3 cd/m²
Contrast: 789:1 (Black: 0.34 cd/m²)
ΔE ColorChecker Calman: 5.05 | ∀{0.5-29.43 Ø4.73}
calibrated: 3.21
ΔE Greyscale Calman: 5.5 | ∀{0.09-98 Ø4.97}
43.3% AdobeRGB 1998 (Argyll 3D)
62.9% sRGB (Argyll 3D)
41.9% Display P3 (Argyll 3D)
Gamma: 2.35
CCT: 7392 K
| Asus TUF Gaming F15 FX506HM Chi Mei N156HRA-EA1, IPS, 15.6", 1920x1080 | Asus TUF Dash F15 FX516PR LQ156M1JW26 (SHP1532), IPS, 15.6", 1920x1080 | Asus TUF FX505DT-EB73 Panda LM156LF-GL, IPS, 15.6", 1920x1080 | Razer Blade 15 Base Edition 2021, i7-10750H RTX 3060 BOE NV156FHM-N4K, IPS, 15.6", 1920x1080 | MSI GF65 Thin 10UE AU Optronics B156HAN08.4, IPS, 15.6", 1920x1080 | Lenovo Legion 5 15IMH05H BOE CQ NV156FHM-NX1, IPS, 15.6", 1920x1080 | |
|---|---|---|---|---|---|---|
| Display | 58% | -6% | 50% | -10% | -7% | |
| Display P3 Coverage (%) | 41.9 | 66.9 60% | 39.56 -6% | 64.3 53% | 37.65 -10% | 38.8 -7% |
| sRGB Coverage (%) | 62.9 | 98.1 56% | 59.5 -5% | 91.8 46% | 56.3 -10% | 57.8 -8% |
| AdobeRGB 1998 Coverage (%) | 43.3 | 67.9 57% | 40.91 -6% | 65.5 51% | 38.9 -10% | 40.09 -7% |
| Response Times | 56% | -18% | 62% | -38% | 15% | |
| Response Time Grey 50% / Grey 80% * (ms) | 28.4 ? | 12 ? 58% | 30.4 ? -7% | 8.8 ? 69% | 36.8 ? -30% | 26 ? 8% |
| Response Time Black / White * (ms) | 21.6 ? | 10 ? 54% | 27.6 ? -28% | 10 ? 54% | 31.6 ? -46% | 17 ? 21% |
| PWM Frequency (Hz) | 23580 ? | 1000 ? | ||||
| Screen | 35% | -4% | 21% | 11% | 12% | |
| Brightness middle (cd/m²) | 268.3 | 286 7% | 286.2 7% | 317.2 18% | 266.5 -1% | 301 12% |
| Brightness (cd/m²) | 257 | 275 7% | 267 4% | 306 19% | 262 2% | 277 8% |
| Brightness Distribution (%) | 84 | 91 8% | 84 0% | 89 6% | 91 8% | 77 -8% |
| Black Level * (cd/m²) | 0.34 | 0.25 26% | 0.33 3% | 0.31 9% | 0.18 47% | 0.26 24% |
| Contrast (:1) | 789 | 1144 45% | 867 10% | 1023 30% | 1481 88% | 1158 47% |
| Colorchecker dE 2000 * | 5.05 | 2.43 52% | 5.45 -8% | 4.37 13% | 5.33 -6% | 5.12 -1% |
| Colorchecker dE 2000 max. * | 15.43 | 6.33 59% | 18.08 -17% | 6.62 57% | 18.28 -18% | 8.86 43% |
| Colorchecker dE 2000 calibrated * | 3.21 | 0.83 74% | 4.47 -39% | 2.67 17% | 4.36 -36% | 4.88 -52% |
| Greyscale dE 2000 * | 5.5 | 3.5 36% | 5.3 4% | 4.5 18% | 4.5 18% | 3.47 37% |
| Gamma | 2.35 94% | 2.32 95% | 2.1 105% | 2.4 92% | 2.35 94% | 2.37 93% |
| CCT | 7392 88% | 7145 91% | 7679 85% | 7418 88% | 6289 103% | 7062 92% |
| Color Space (Percent of AdobeRGB 1998) (%) | 68 | 37.6 | 59.2 | 35.6 | 37 | |
| Color Space (Percent of sRGB) (%) | 91 | 59.1 | 91.4 | 55.8 | 57 | |
| Total Average (Program / Settings) | 50% /
43% | -9% /
-6% | 44% /
33% | -12% /
-0% | 7% /
8% |
* ... smaller is better
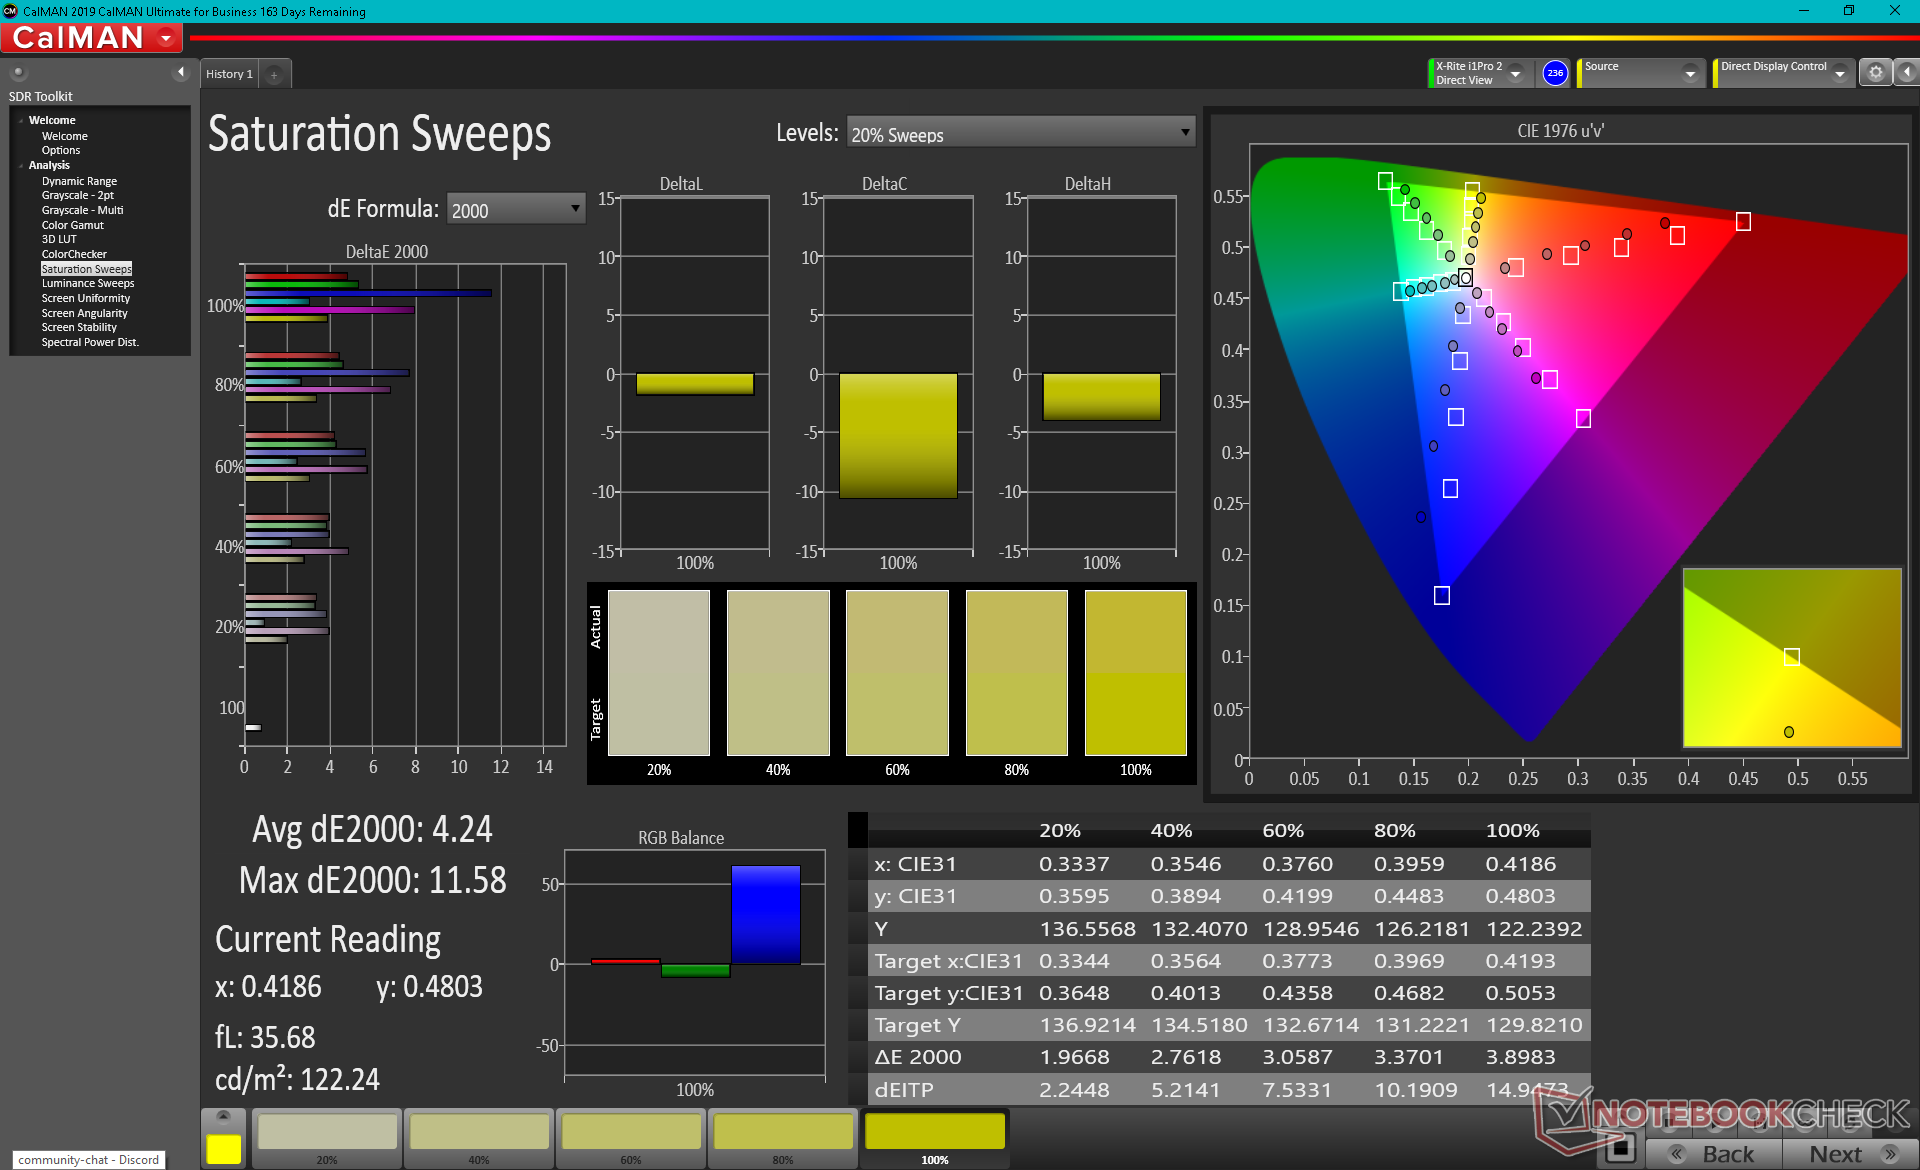
Color space is narrow at just 63 percent of sRGB to be indicative of a budget panel despite the 144 Hz native refresh rate. Most inexpensive gaming laptops like the Asus TUF tend to sacrifice color accuracy for faster response times and refresh rates. Uou may want to connect a more color accurate external monitor if you're a professional graphics editor.
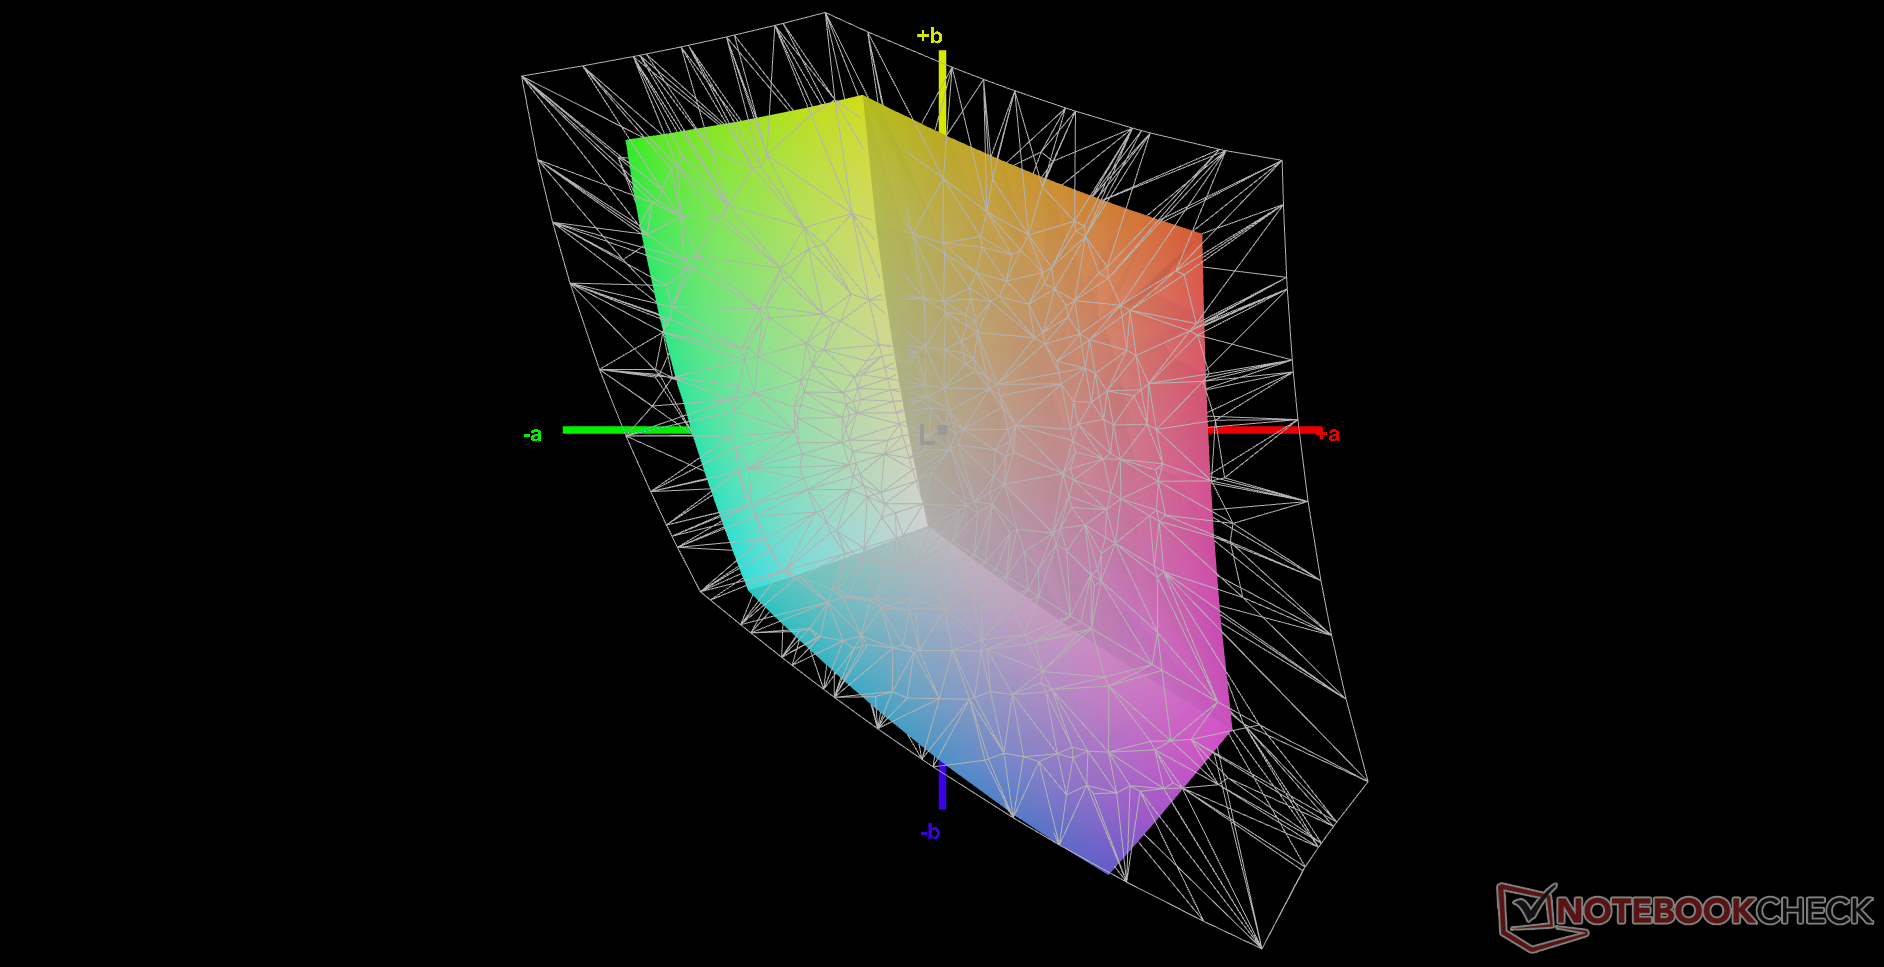
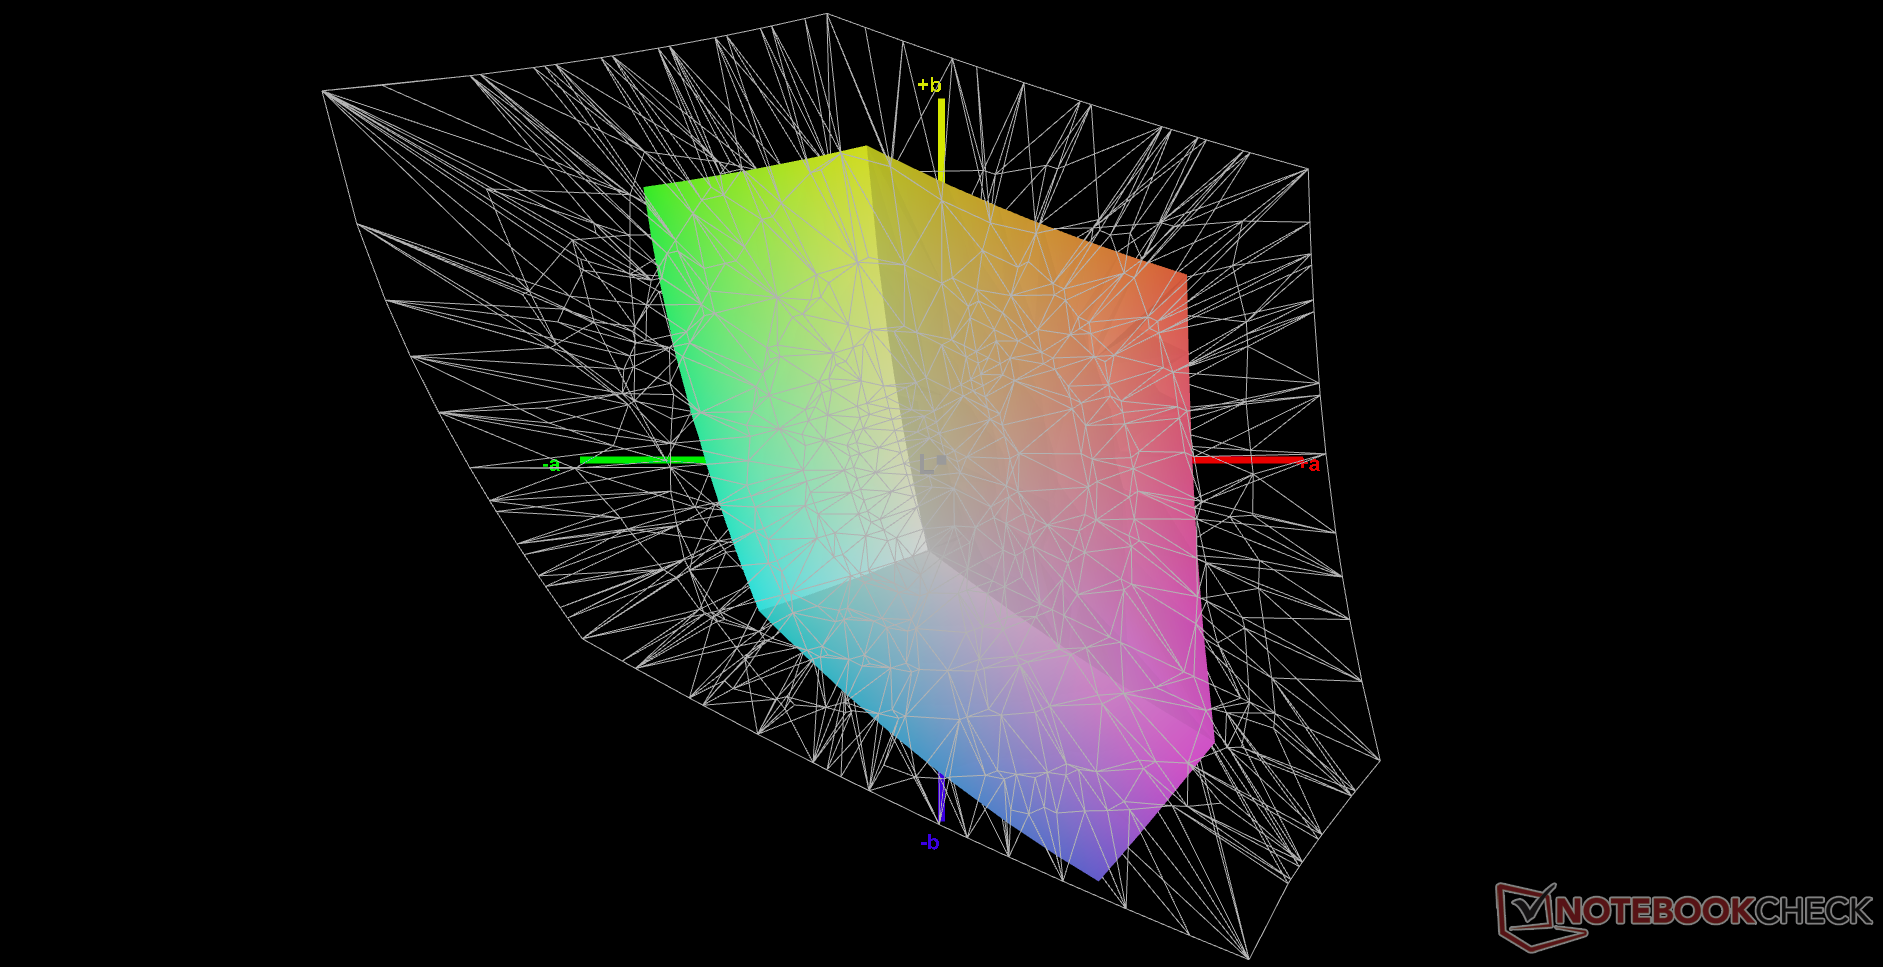
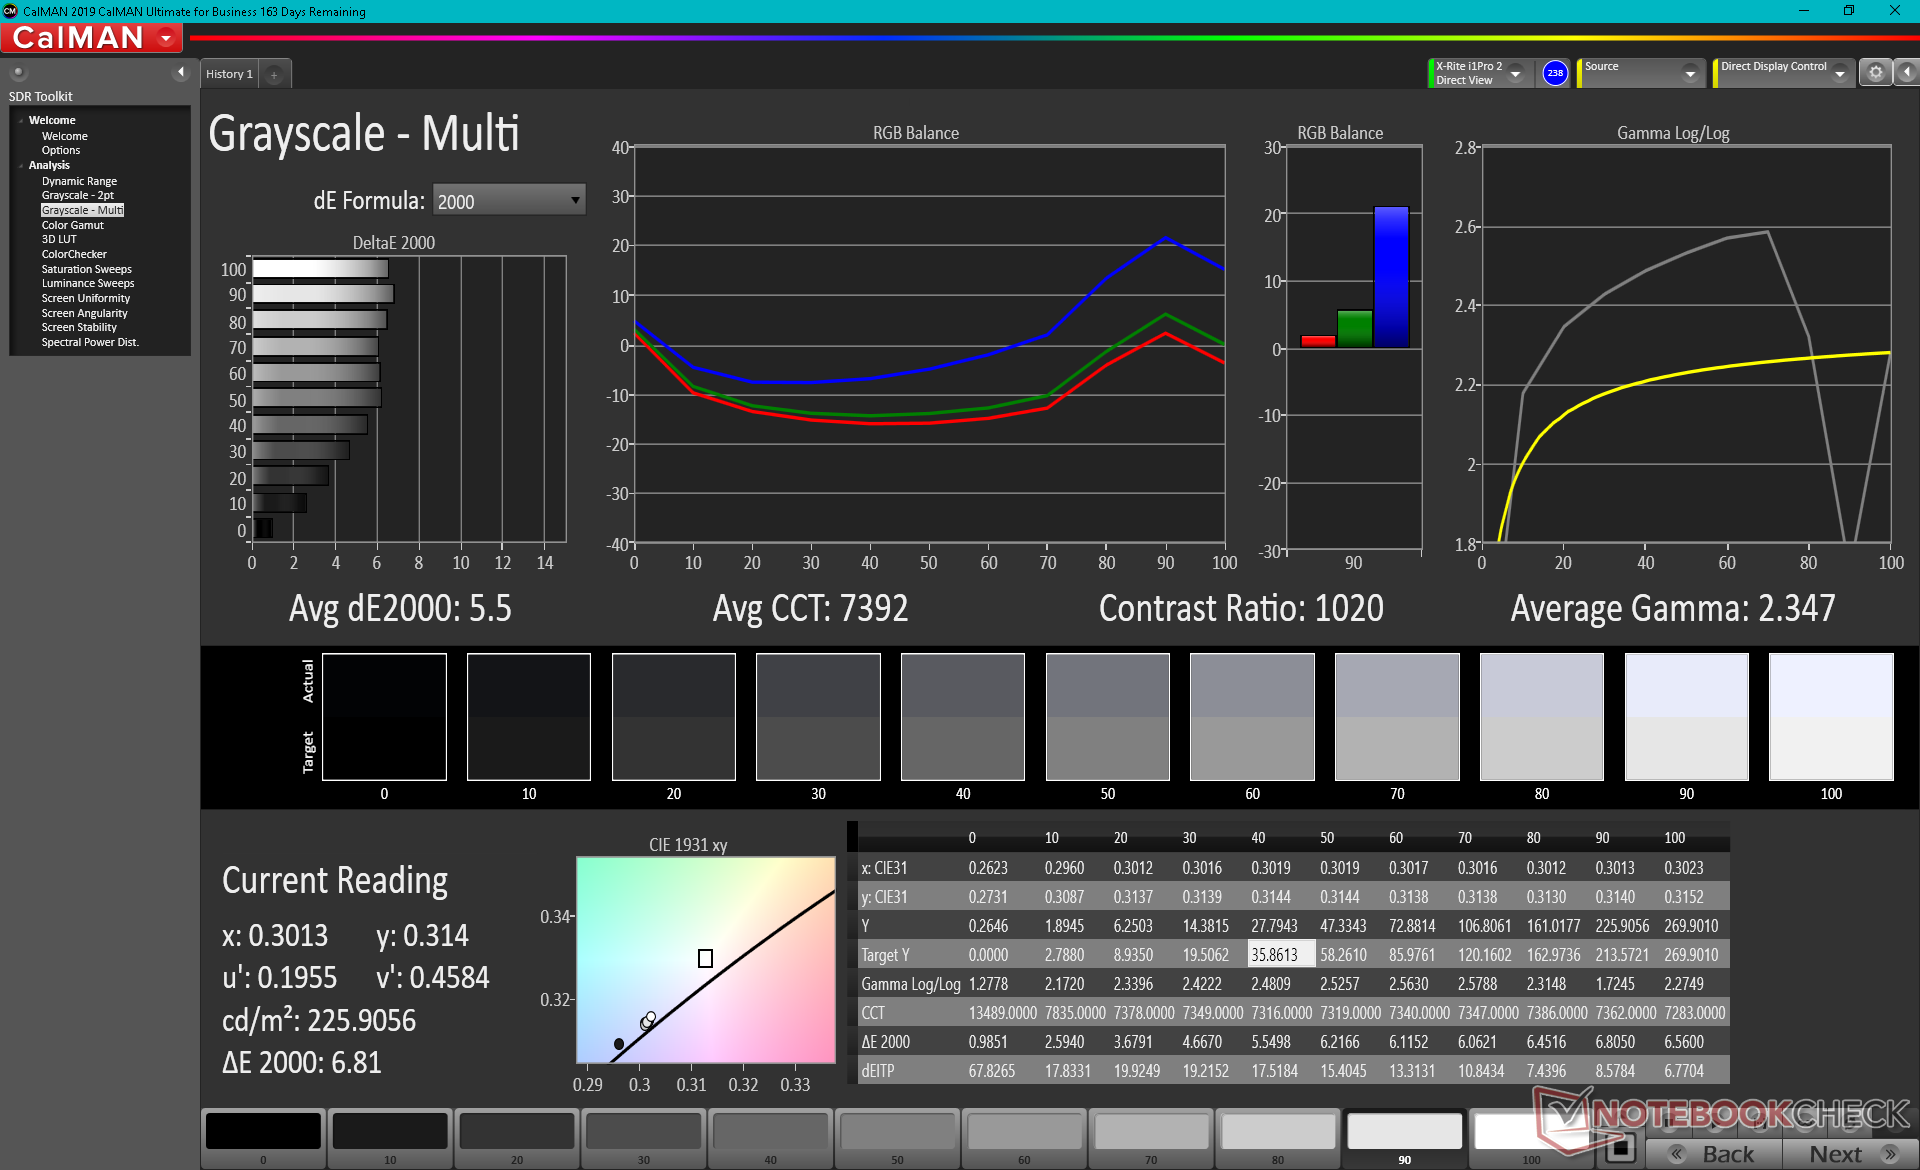
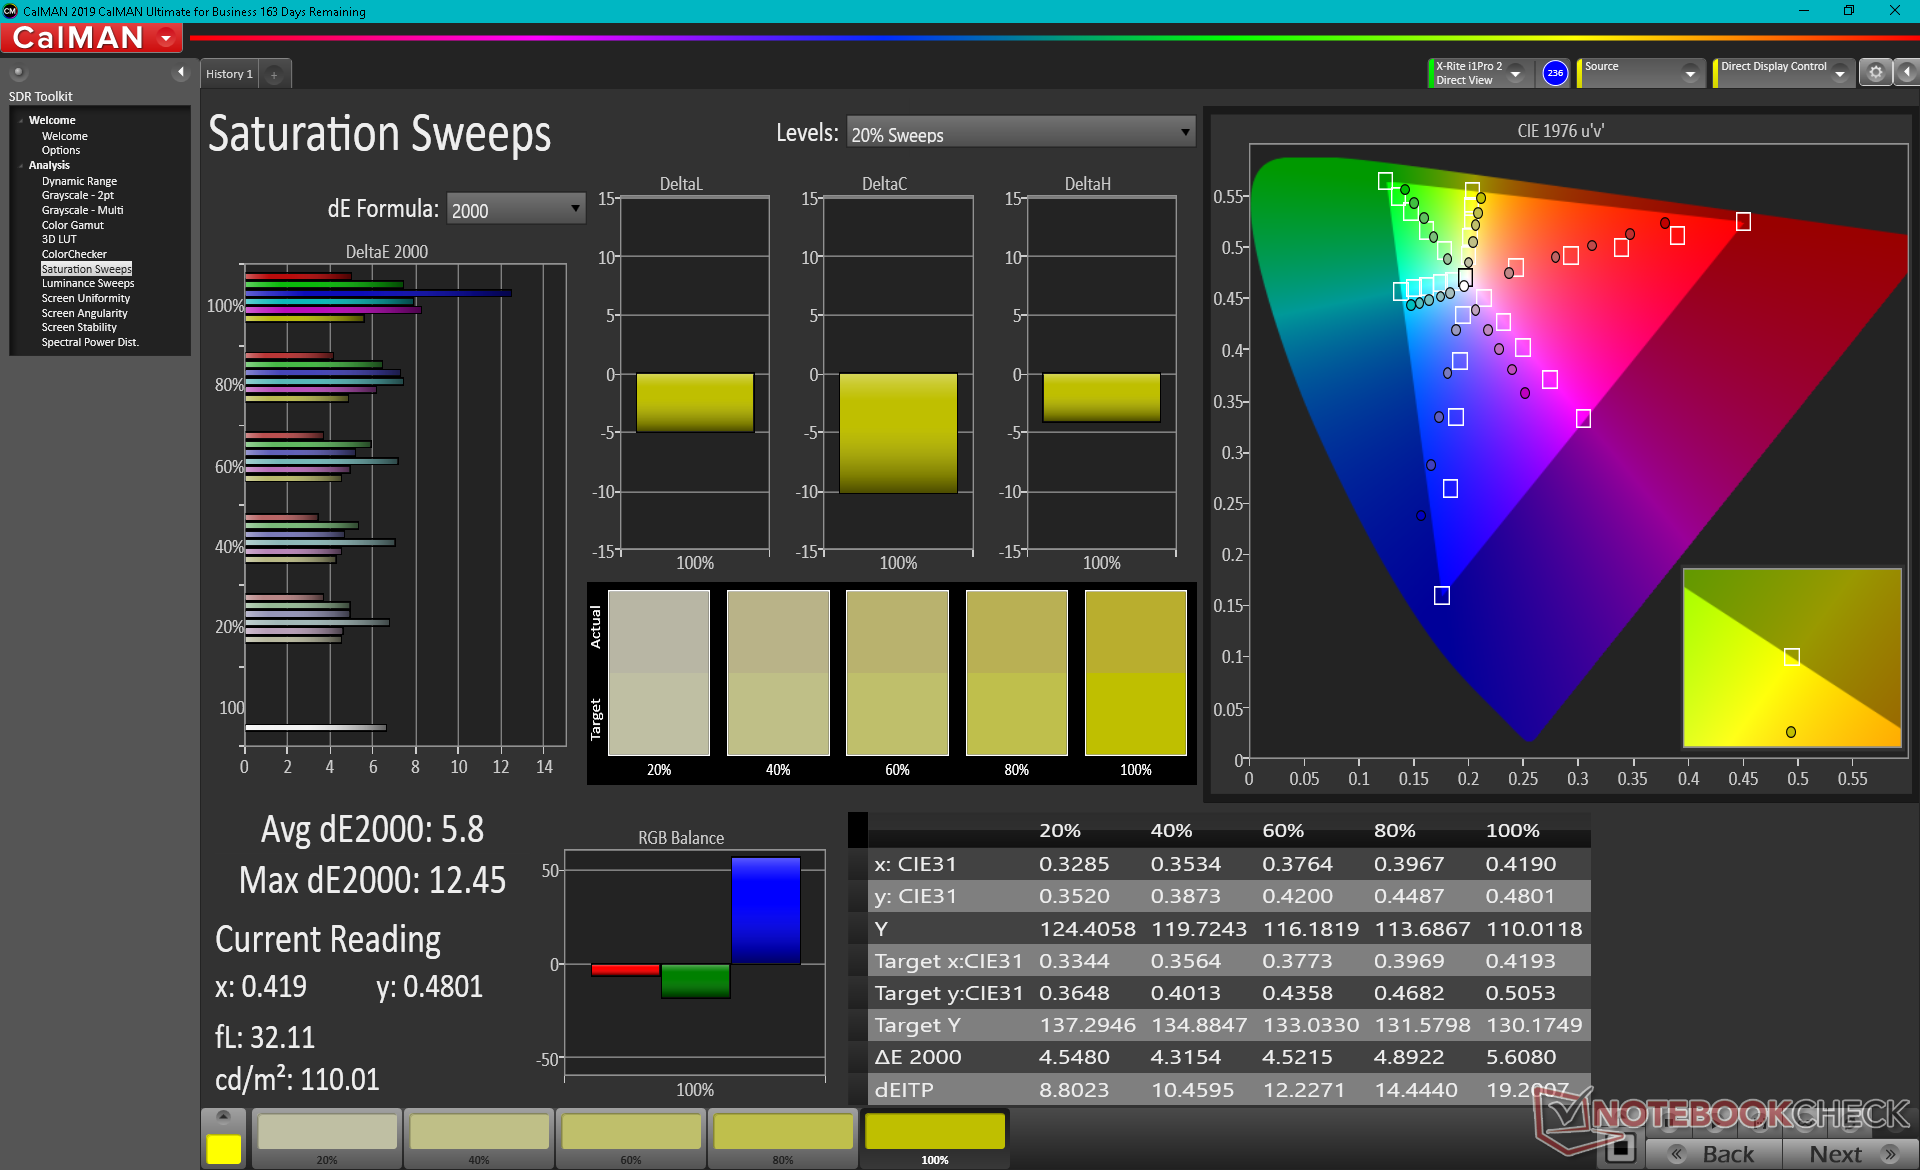
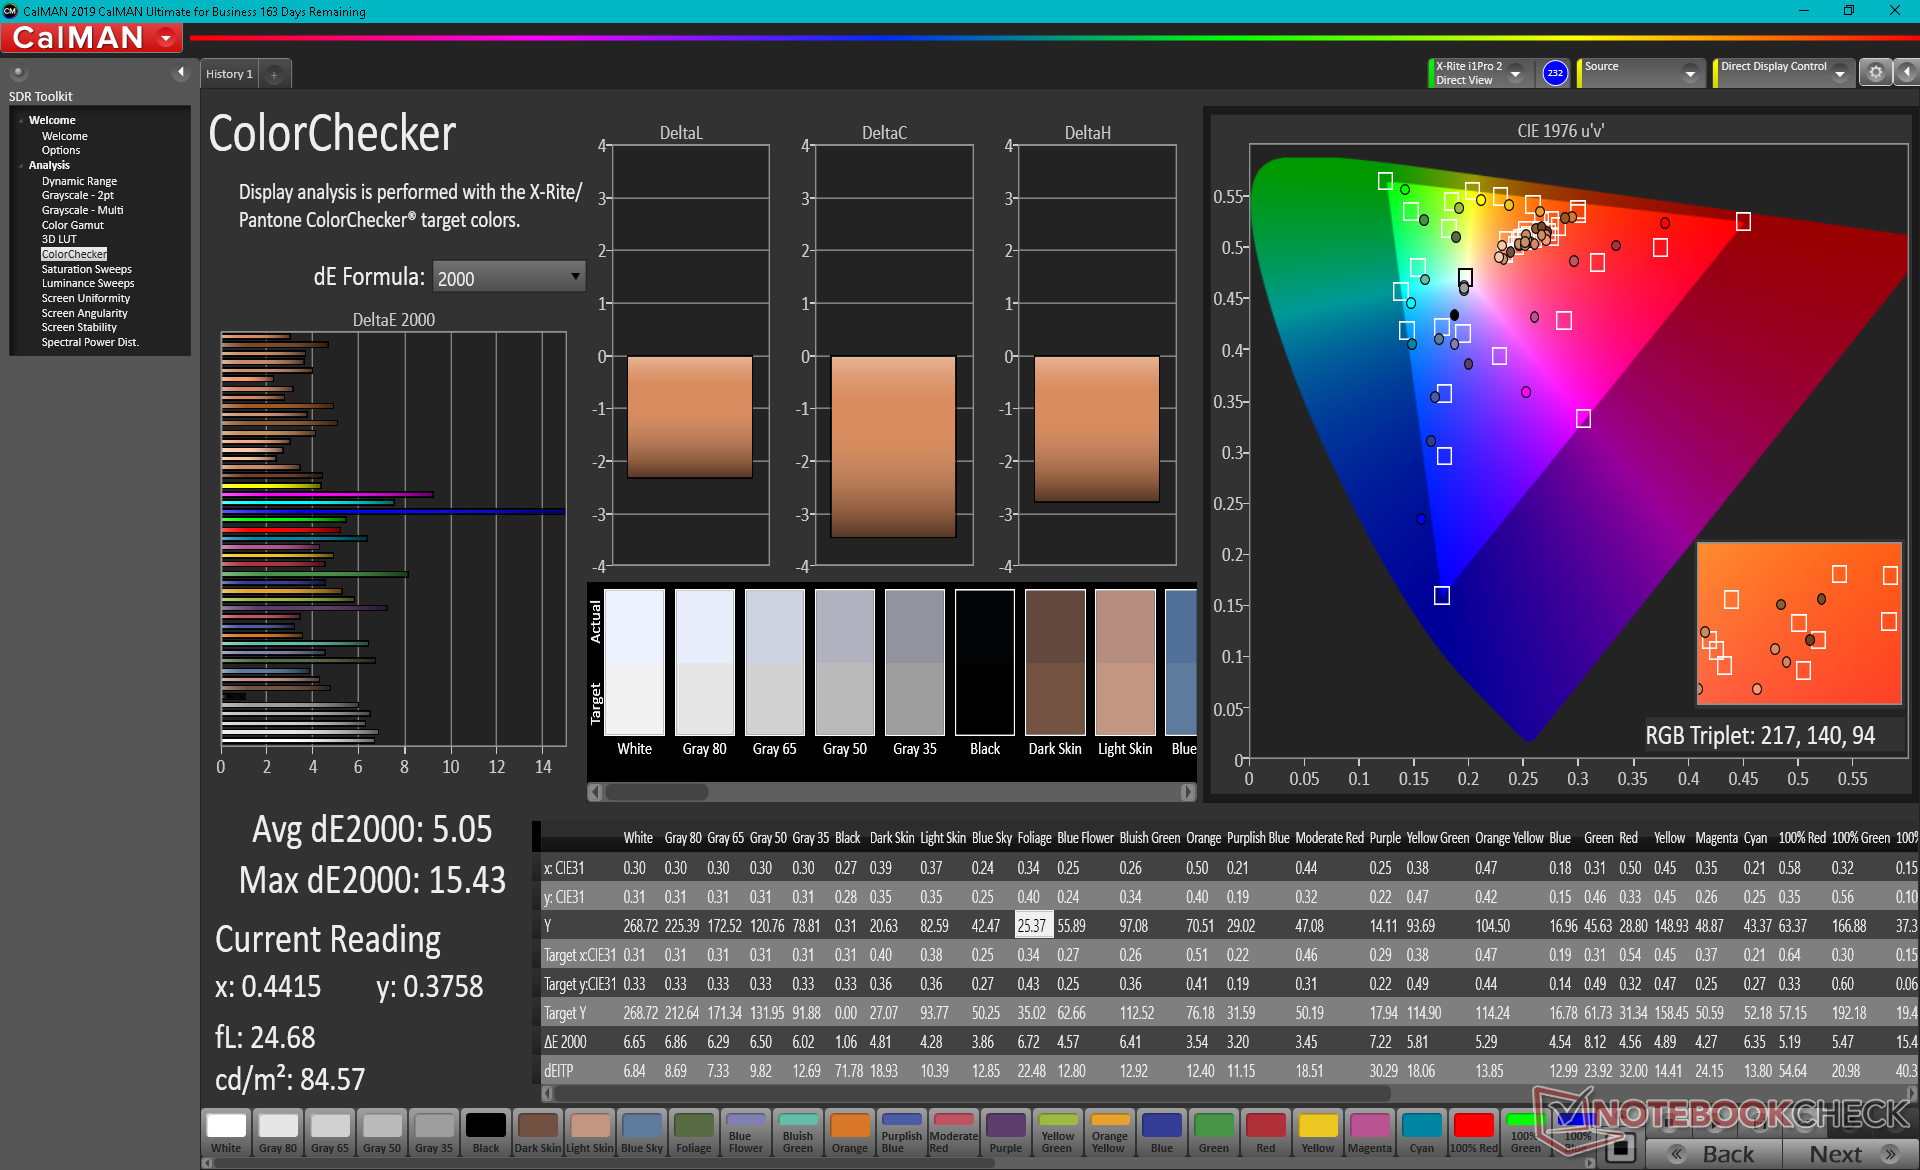
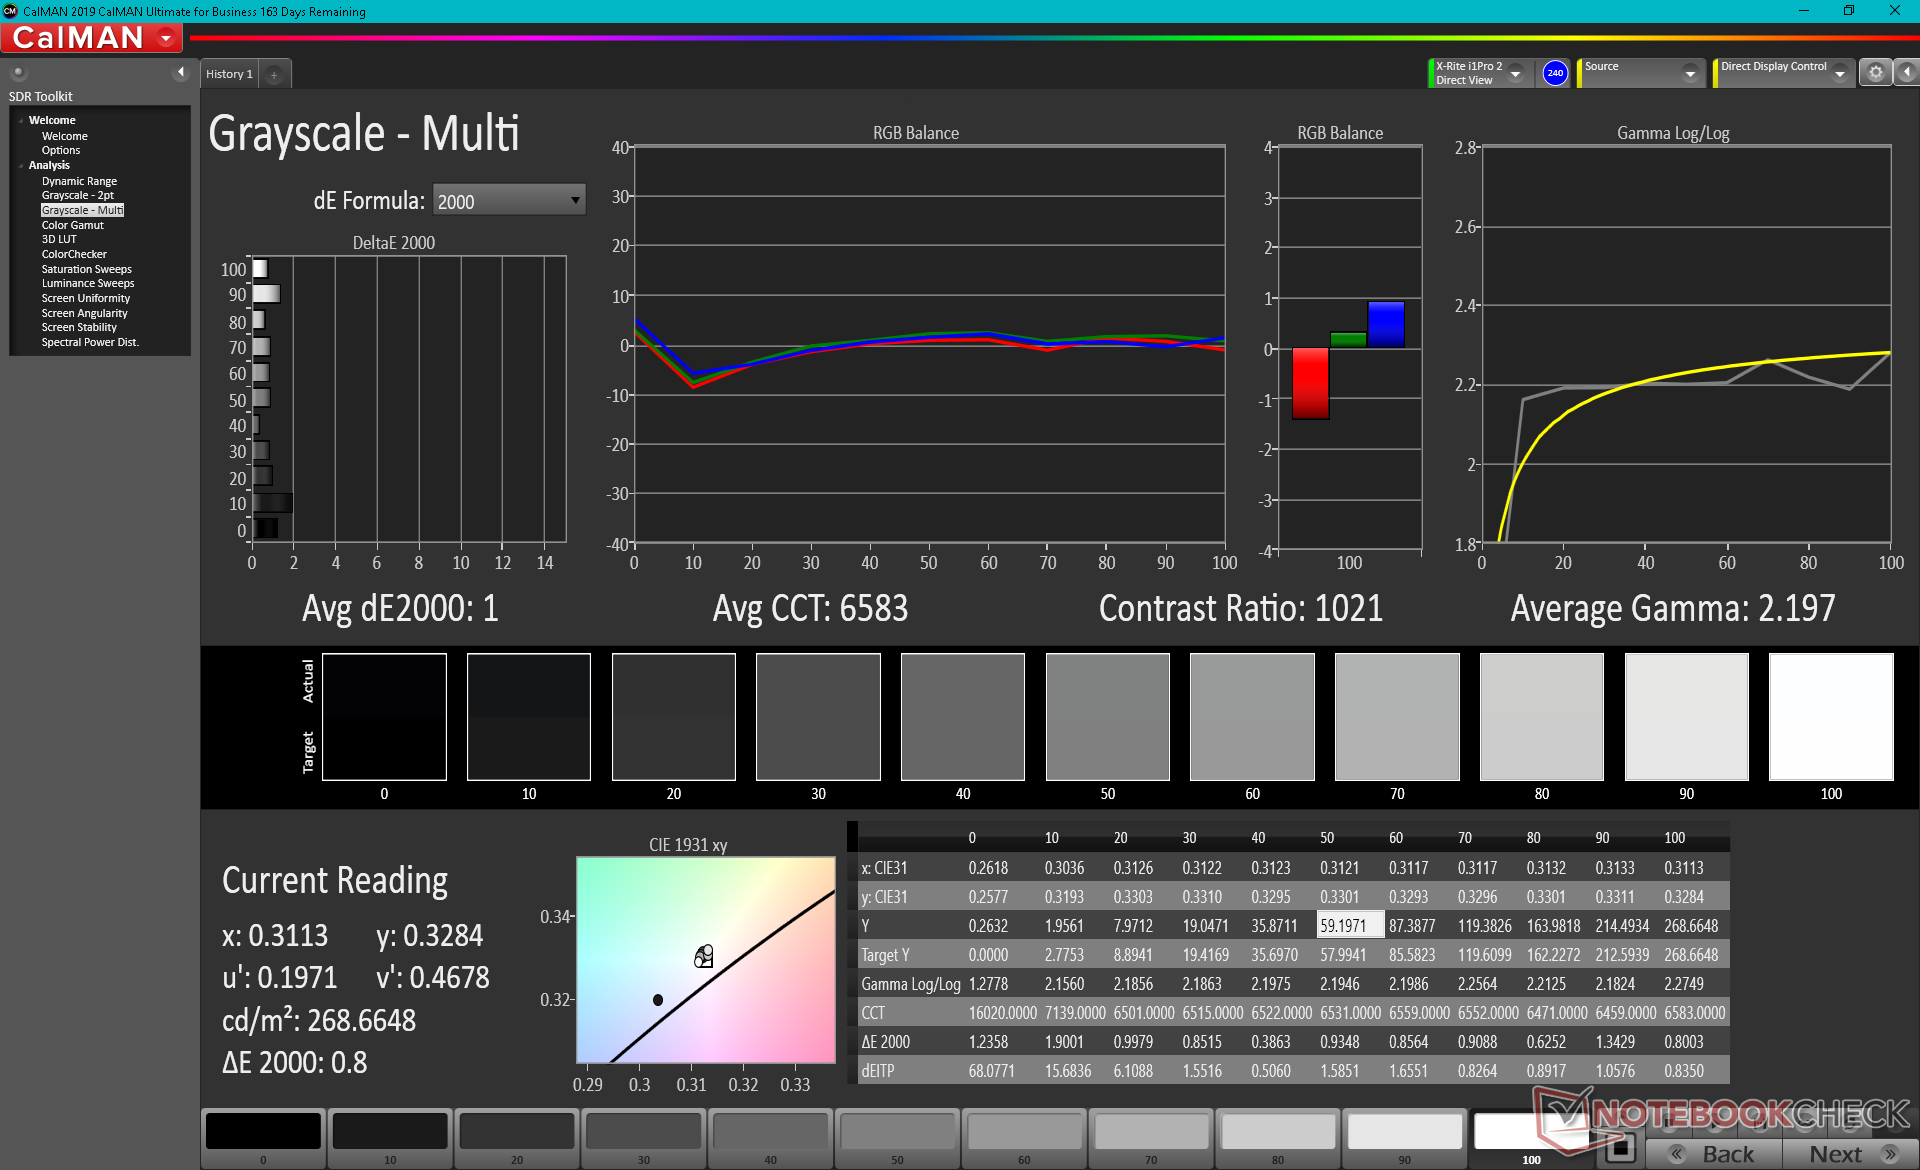
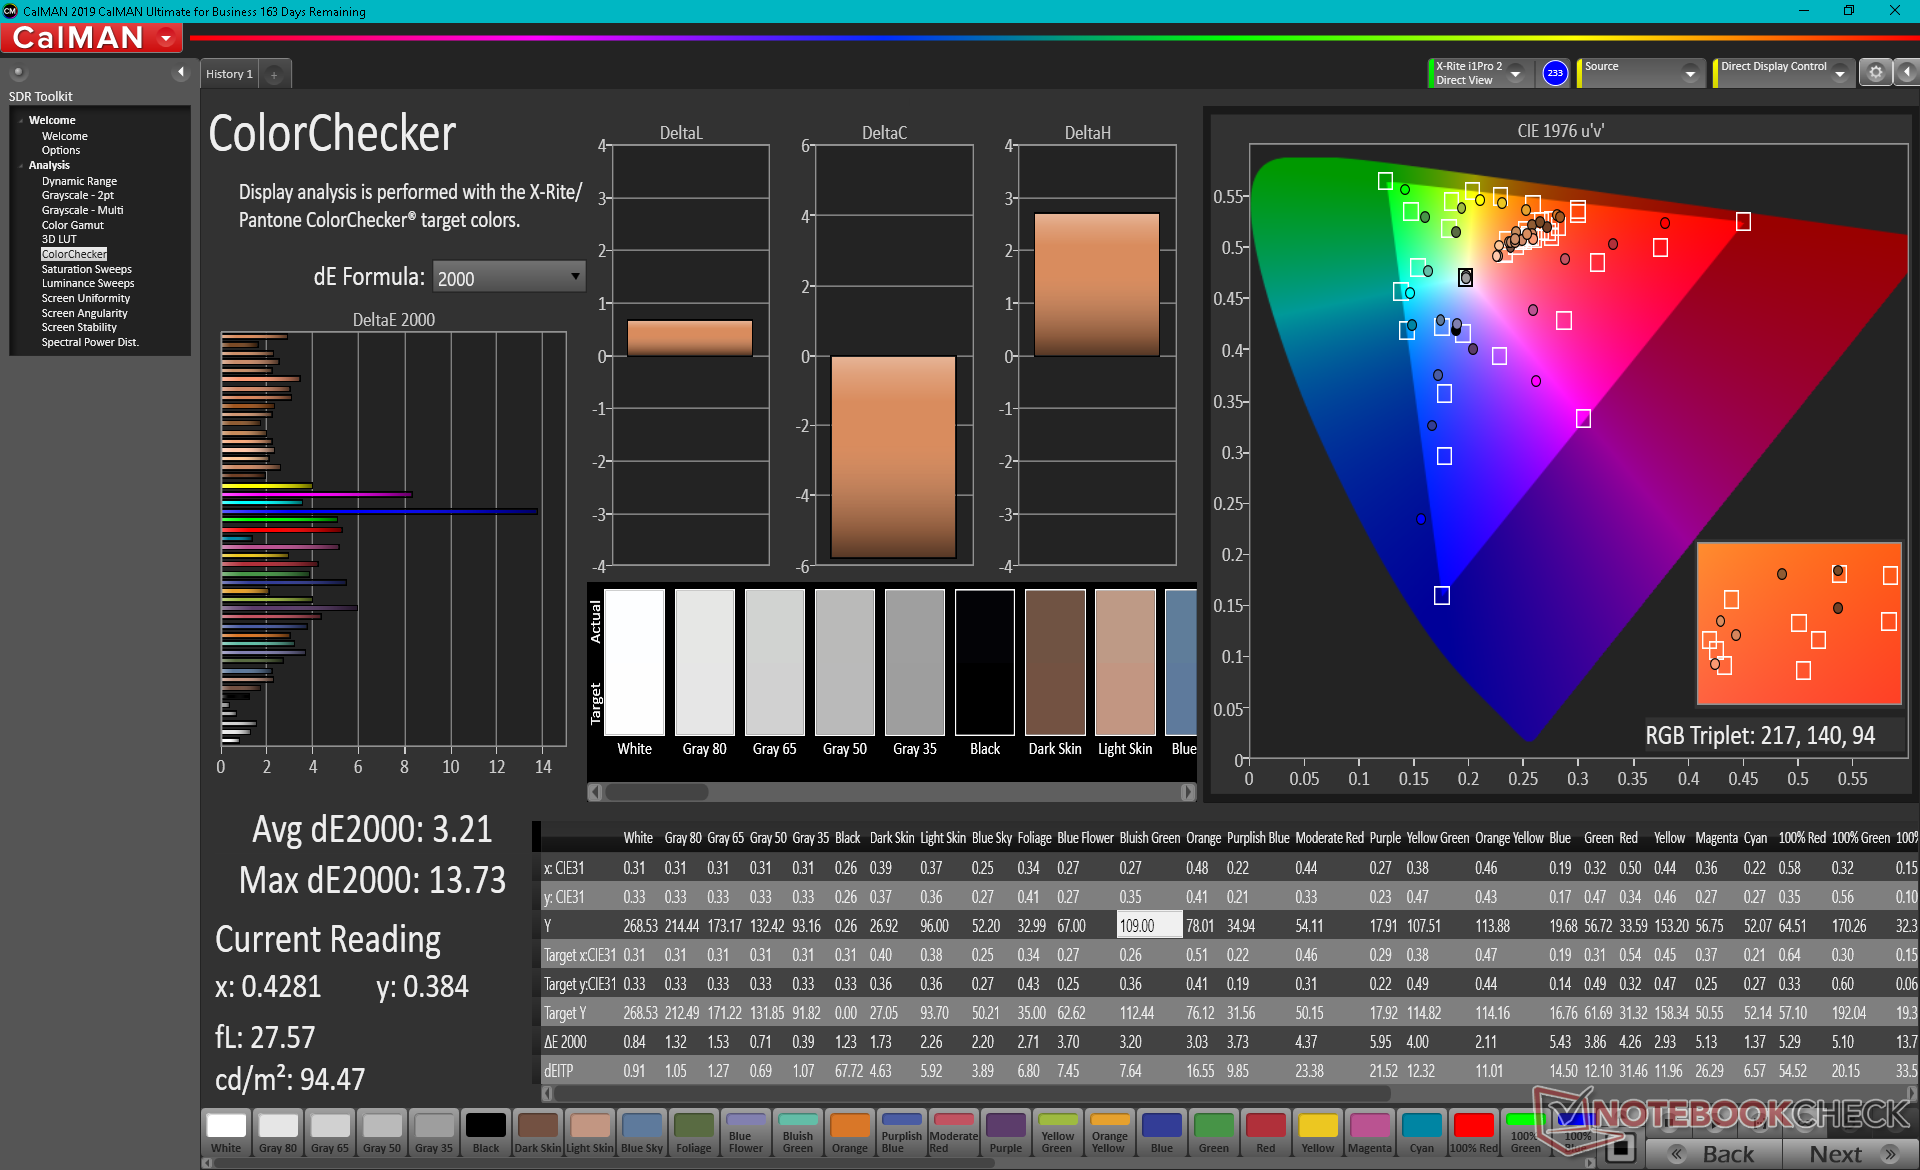
X-Rite colorimeter measurements show a display in need of calibration as the TUF series laptops are not pre-calibrated at factory. Color temperature in particular is too cool while blue is represented much more inaccurately than other colors. After calibrating the panel ourselves, grayscale and RGB balance would improve dramatically form an average DeltaE of 5.5 to just 1.0. However, colors are still relatively inaccurate at higher saturation levels due to the limited color space mentioned above.
Display Response Times
| ↔ Response Time Black to White | ||
|---|---|---|
| 21.6 ms ... rise ↗ and fall ↘ combined | ↗ 11.6 ms rise | 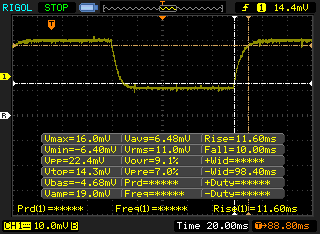 |
| ↘ 10 ms fall | ||
| The screen shows good response rates in our tests, but may be too slow for competitive gamers. In comparison, all tested devices range from 0.1 (minimum) to 240 (maximum) ms. » 48 % of all devices are better. This means that the measured response time is similar to the average of all tested devices (19.9 ms). | ||
| ↔ Response Time 50% Grey to 80% Grey | ||
| 28.4 ms ... rise ↗ and fall ↘ combined | ↗ 15.6 ms rise | 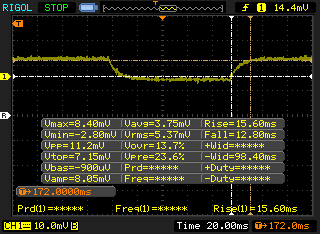 |
| ↘ 12.8 ms fall | ||
| The screen shows relatively slow response rates in our tests and may be too slow for gamers. In comparison, all tested devices range from 0.165 (minimum) to 636 (maximum) ms. » 38 % of all devices are better. This means that the measured response time is similar to the average of all tested devices (31.1 ms). | ||
Screen Flickering / PWM (Pulse-Width Modulation)
| Screen flickering / PWM not detected | 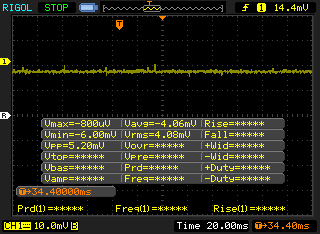 | ||
In comparison: 52 % of all tested devices do not use PWM to dim the display. If PWM was detected, an average of 7798 (minimum: 5 - maximum: 343500) Hz was measured. | |||
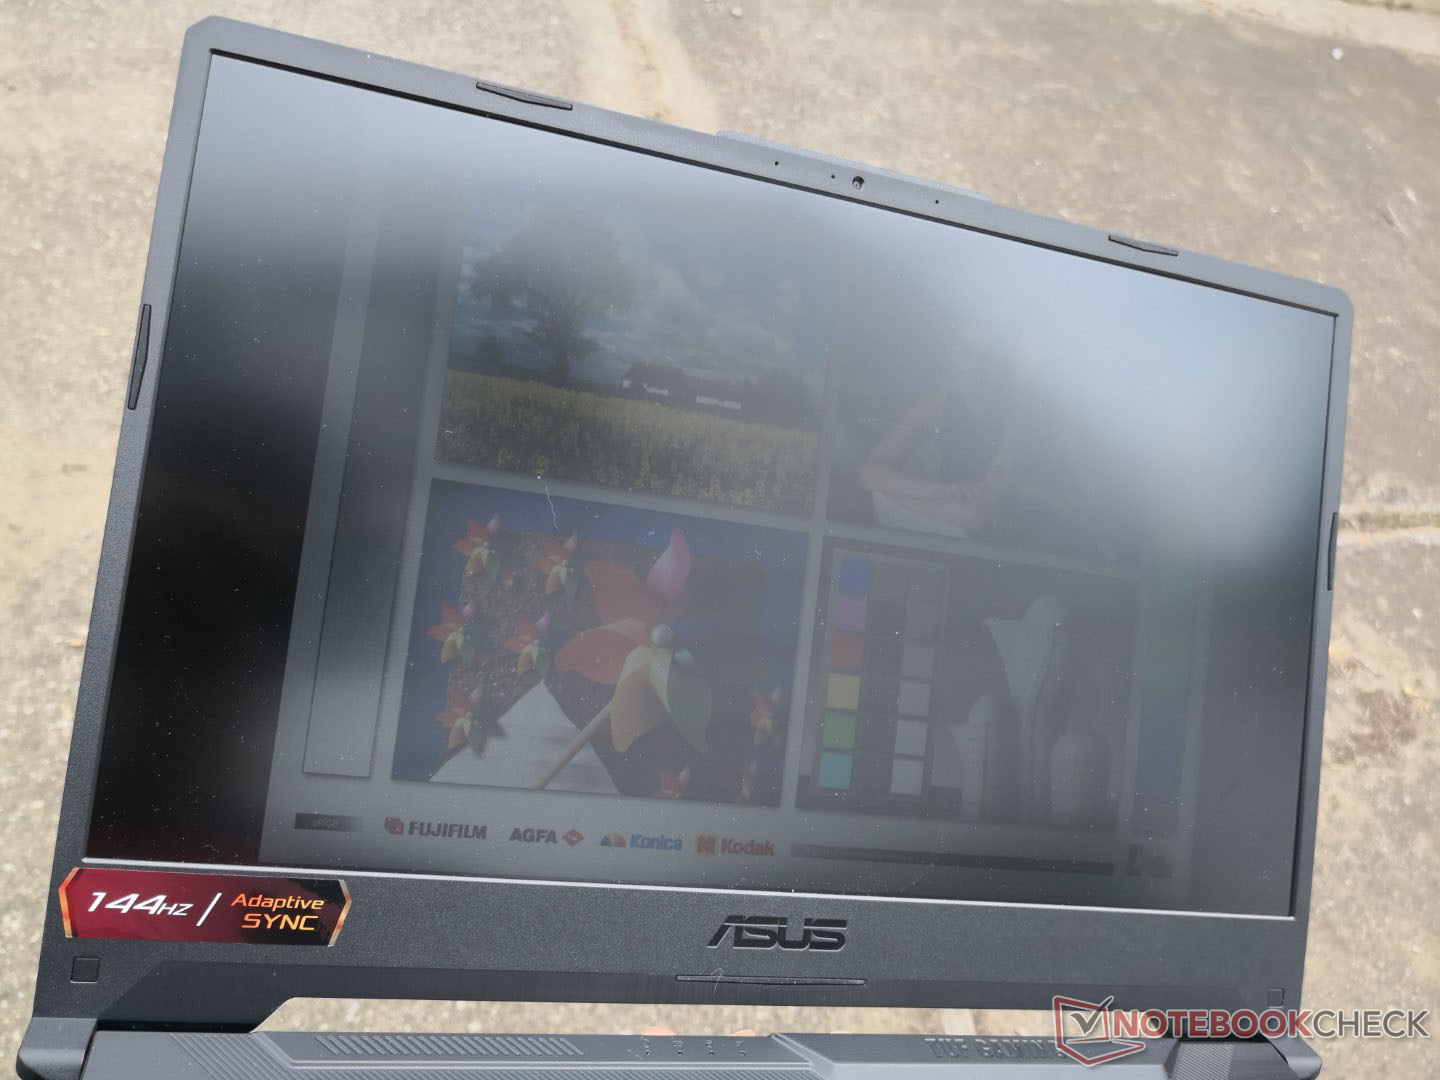
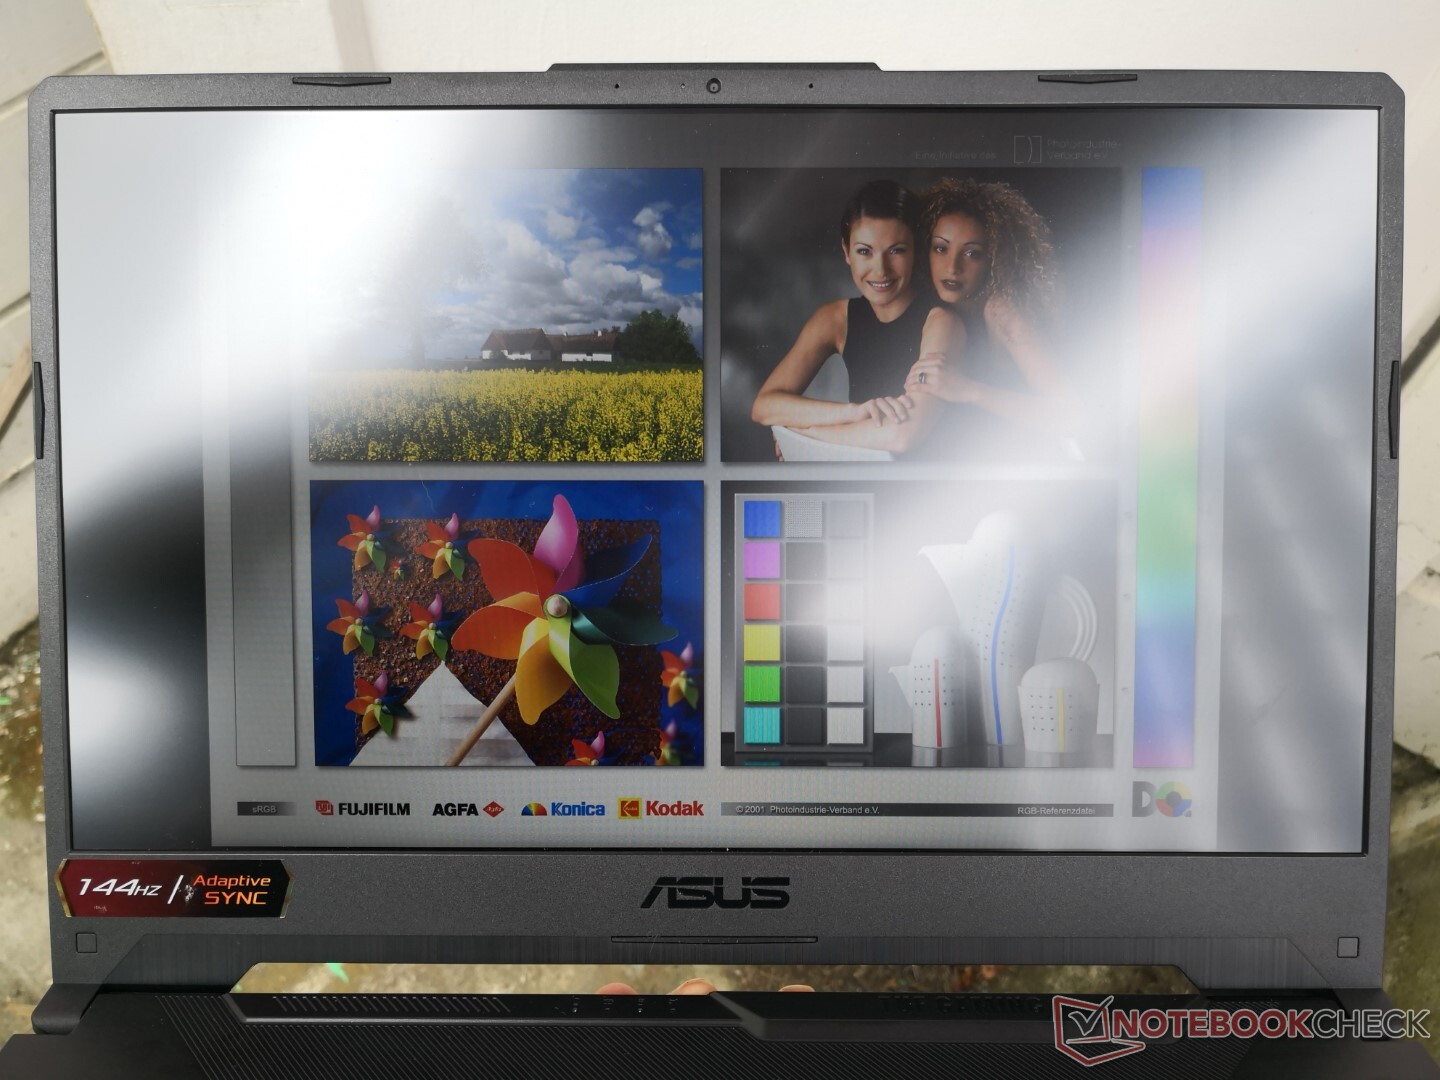
Outdoor visibility isn't better or worse than the last generation model or most other gaming laptops for that matter since the backlight is relatively dim. Colors look washed out and glare is noticeable despite the matte overlay. This isn't a system you'll want to be using outdoors on a frequent basis.
We recommend turning off Intel Display Power Saver mode or else maximum brightness may be even dimmer when running on battery power.

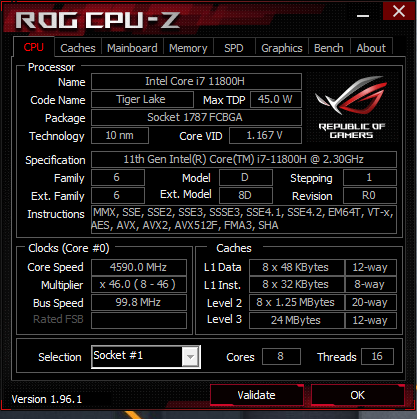
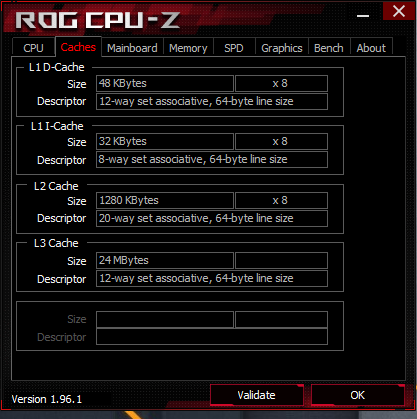
Performance — 11th Gen Core i7 Tiger Lake-H Debut
Asus offers a long list of 11th gen processor and Ampere graphics options for the TUF Gaming F15 including the Core i5-11260H, i5-11400H, i7-11800H, and the i9-11900H with either the GeForce RTX 3050 (60 W + 15 W DB) or RTX 3060 (90 W + 5 W DB) GPU. These options replace last year's 10th gen Comet Lake-H CPUs and GTX 1650 to 1660 Ti options. Resizable Bar, Dynamic Boost 2.0, and Whisper Mode 2.0, and standard Optimus 1.0 are all supported. AMD options are not yet available on this series.
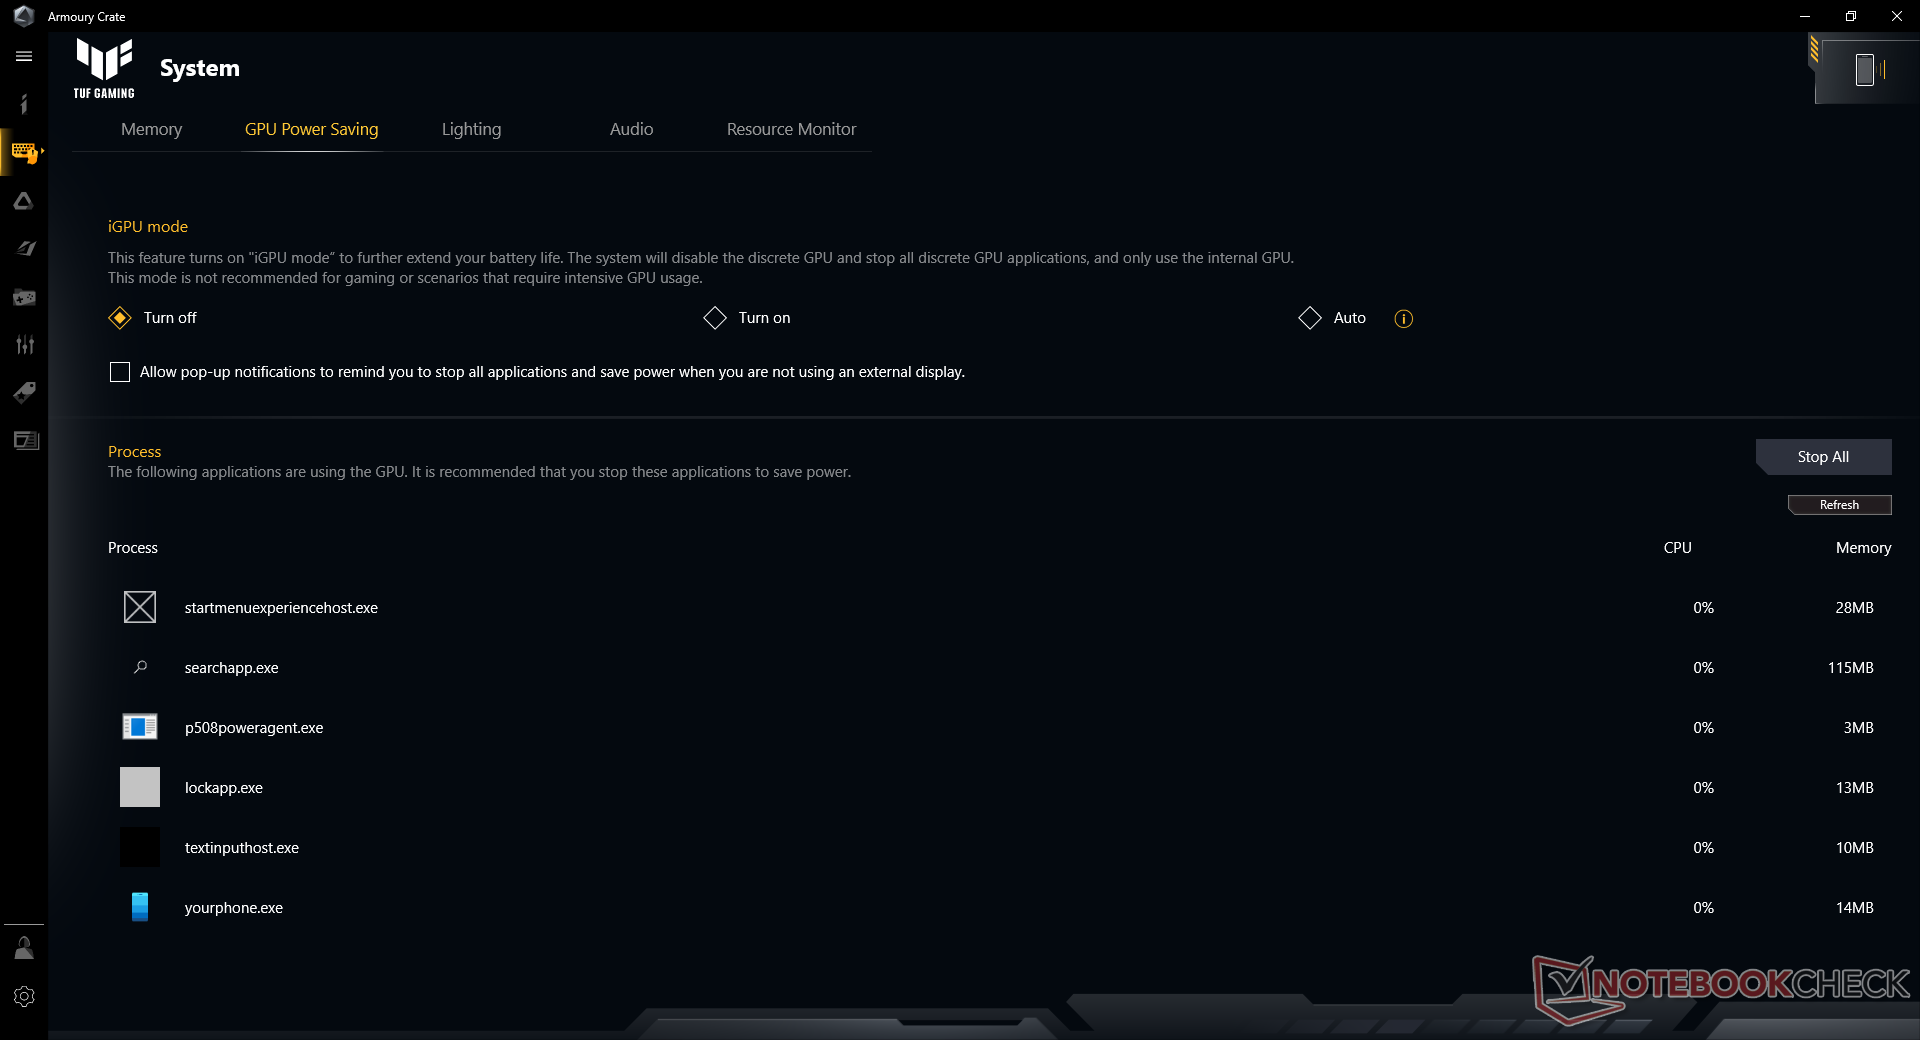
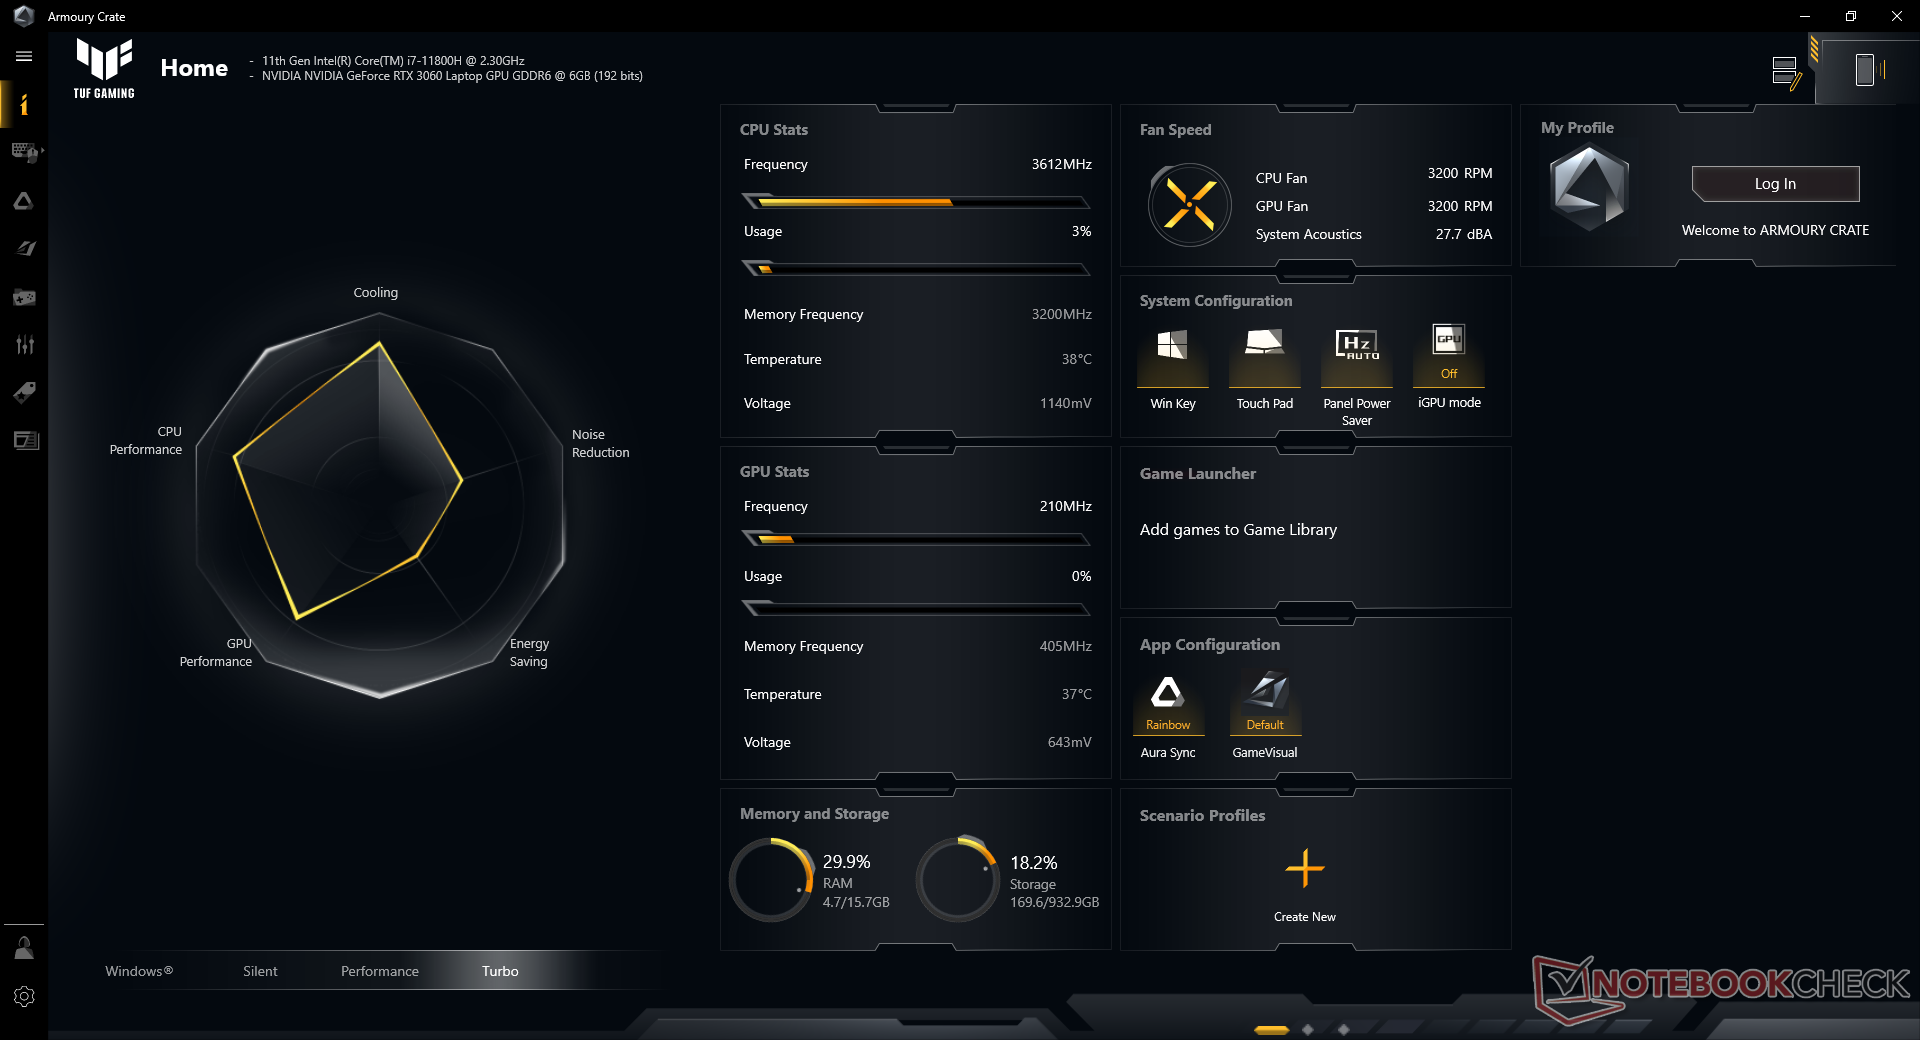
Our unit was set to Turbo mode via Asus Armoury Crate prior to running any performance benchmarks below for the highest possible scores. Owners should absolutely become familiar with the software as it serves as a command center for Asus-specific settings and features.
Processor
CPU performance is excellent and comparable to the competing Ryzen 9 5900HX or Ryzen 9 5980HS in both single-thread and multi-threaded workloads. The gen-to-gen performance uptick from last year's Core i7-10875H is sizeable at roughly 25 to 35 percent. If you have the option between an older Core i9-10980HK or newer Core i7-11800H, then the latter is looking to be the better and faster choice.
Cinebench R23: Multi Core | Single Core
Cinebench R15: CPU Multi 64Bit | CPU Single 64Bit
Blender: v2.79 BMW27 CPU
7-Zip 18.03: 7z b 4 -mmt1 | 7z b 4
Geekbench 5.5: Single-Core | Multi-Core
HWBOT x265 Benchmark v2.2: 4k Preset
LibreOffice : 20 Documents To PDF
R Benchmark 2.5: Overall mean
| Cinebench R23 / Multi Core | |
| Asus TUF Gaming F15 FX506HM | |
| Asus ROG Strix G15 G513QR | |
| Asus ROG Flow X13 GV301QH | |
| Average Intel Core i7-11800H (6508 - 14088, n=48) | |
| Aorus 15P XC | |
| Asus TUF Dash F15 FX516PR | |
| Cinebench R23 / Single Core | |
| Asus ROG Flow X13 GV301QH | |
| Asus TUF Gaming F15 FX506HM | |
| Asus TUF Dash F15 FX516PR | |
| Average Intel Core i7-11800H (1386 - 1522, n=45) | |
| Asus ROG Strix G15 G513QR | |
| Aorus 15P XC | |
* ... smaller is better
System Performance
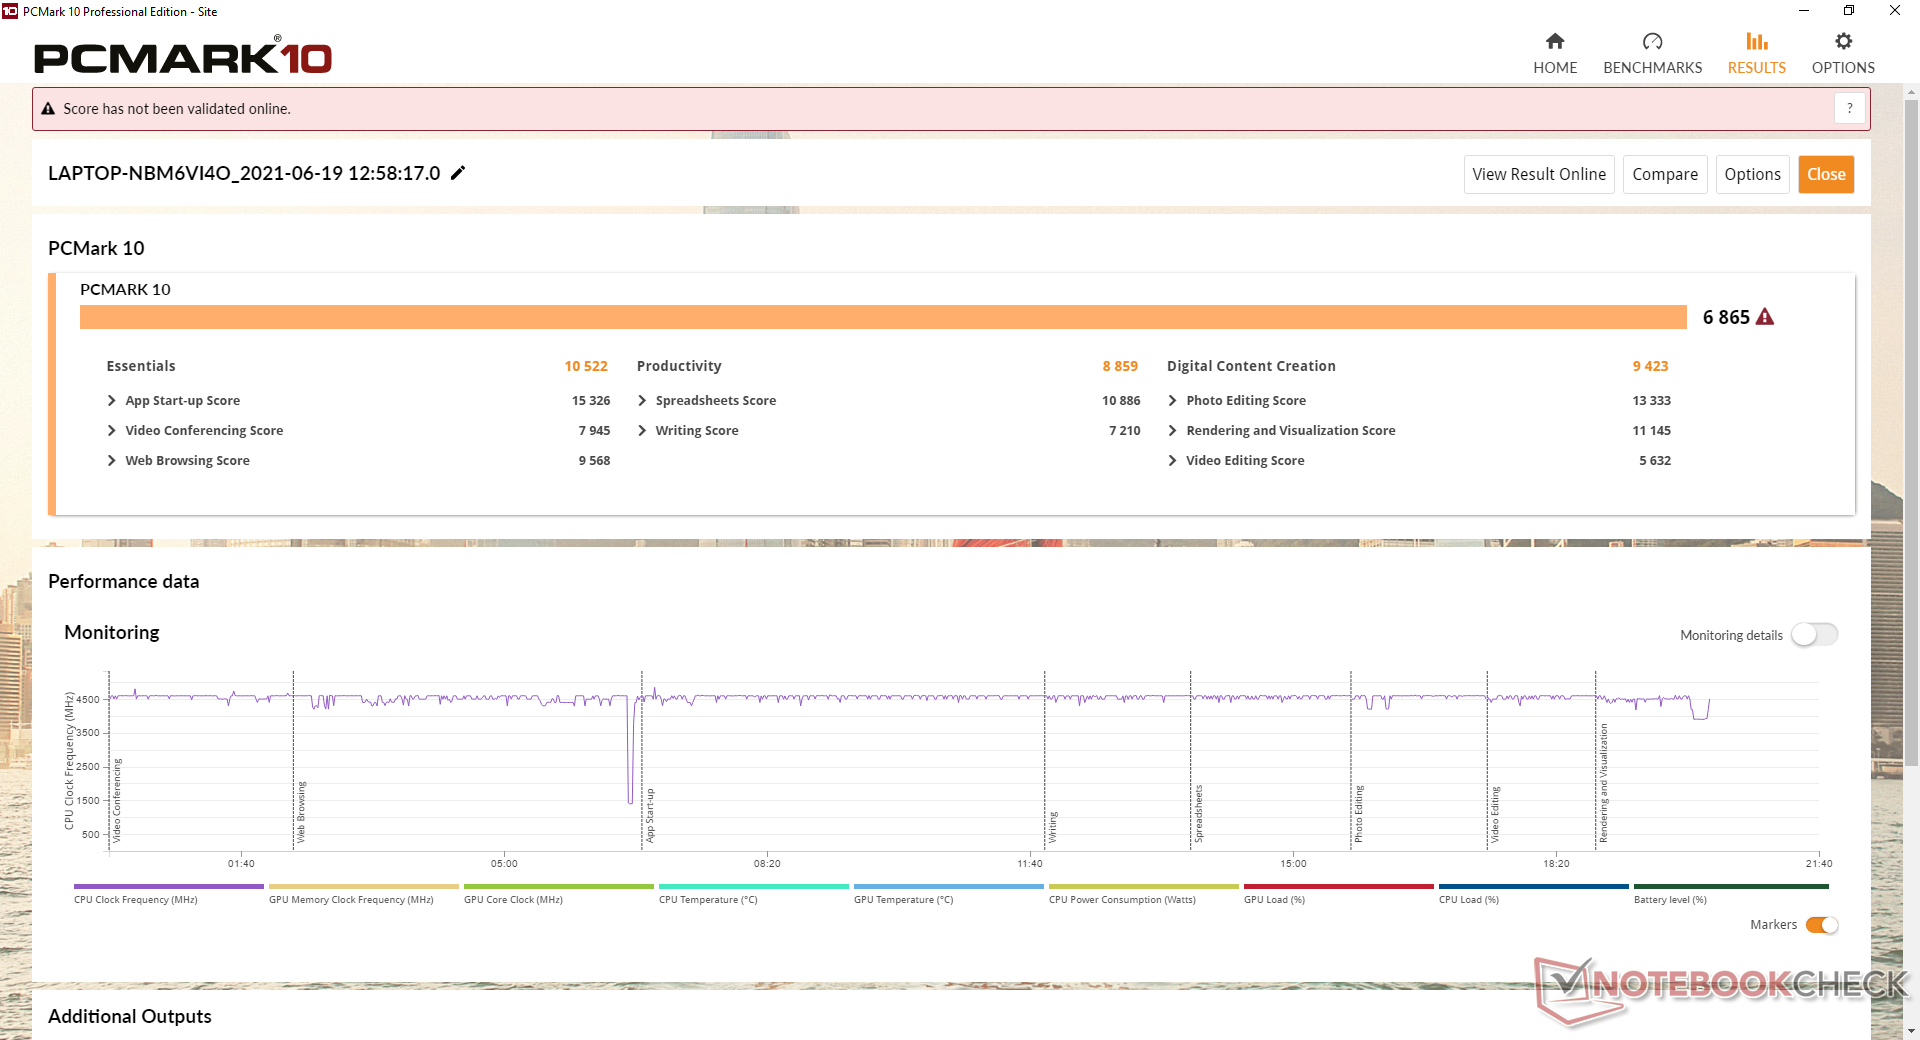
PCMark 10 scores are consistently higher than on last year's FX505 and also other laptops with 10th gen Core CPUs and the same RTX 3060 GPU. In fact, they're some of the highest in our database between all laptops with this particular GPU.
| PCMark 10 / Score | |
| Asus TUF Gaming F15 FX506HM | |
| Average NVIDIA GeForce RTX 3060 Laptop GPU (5117 - 8156, n=43) | |
| Razer Blade 15 Base Edition 2021, i7-10750H RTX 3060 | |
| Asus TUF Dash F15 FX516PR | |
| MSI GF65 Thin 10UE | |
| Lenovo Legion 5 15IMH05H | |
| Asus TUF FX505DT-EB73 | |
| PCMark 10 / Essentials | |
| Asus TUF Gaming F15 FX506HM | |
| Average NVIDIA GeForce RTX 3060 Laptop GPU (8945 - 12144, n=43) | |
| Razer Blade 15 Base Edition 2021, i7-10750H RTX 3060 | |
| Asus TUF Dash F15 FX516PR | |
| MSI GF65 Thin 10UE | |
| Lenovo Legion 5 15IMH05H | |
| Asus TUF FX505DT-EB73 | |
| PCMark 10 / Productivity | |
| Asus TUF Dash F15 FX516PR | |
| Average NVIDIA GeForce RTX 3060 Laptop GPU (6161 - 10486, n=43) | |
| Asus TUF Gaming F15 FX506HM | |
| Razer Blade 15 Base Edition 2021, i7-10750H RTX 3060 | |
| Lenovo Legion 5 15IMH05H | |
| MSI GF65 Thin 10UE | |
| Asus TUF FX505DT-EB73 | |
| PCMark 10 / Digital Content Creation | |
| Asus TUF Gaming F15 FX506HM | |
| Average NVIDIA GeForce RTX 3060 Laptop GPU (6003 - 12554, n=43) | |
| Razer Blade 15 Base Edition 2021, i7-10750H RTX 3060 | |
| Asus TUF Dash F15 FX516PR | |
| MSI GF65 Thin 10UE | |
| Asus TUF FX505DT-EB73 | |
| Lenovo Legion 5 15IMH05H | |
| PCMark 10 Score | 6865 points | |
Help | ||
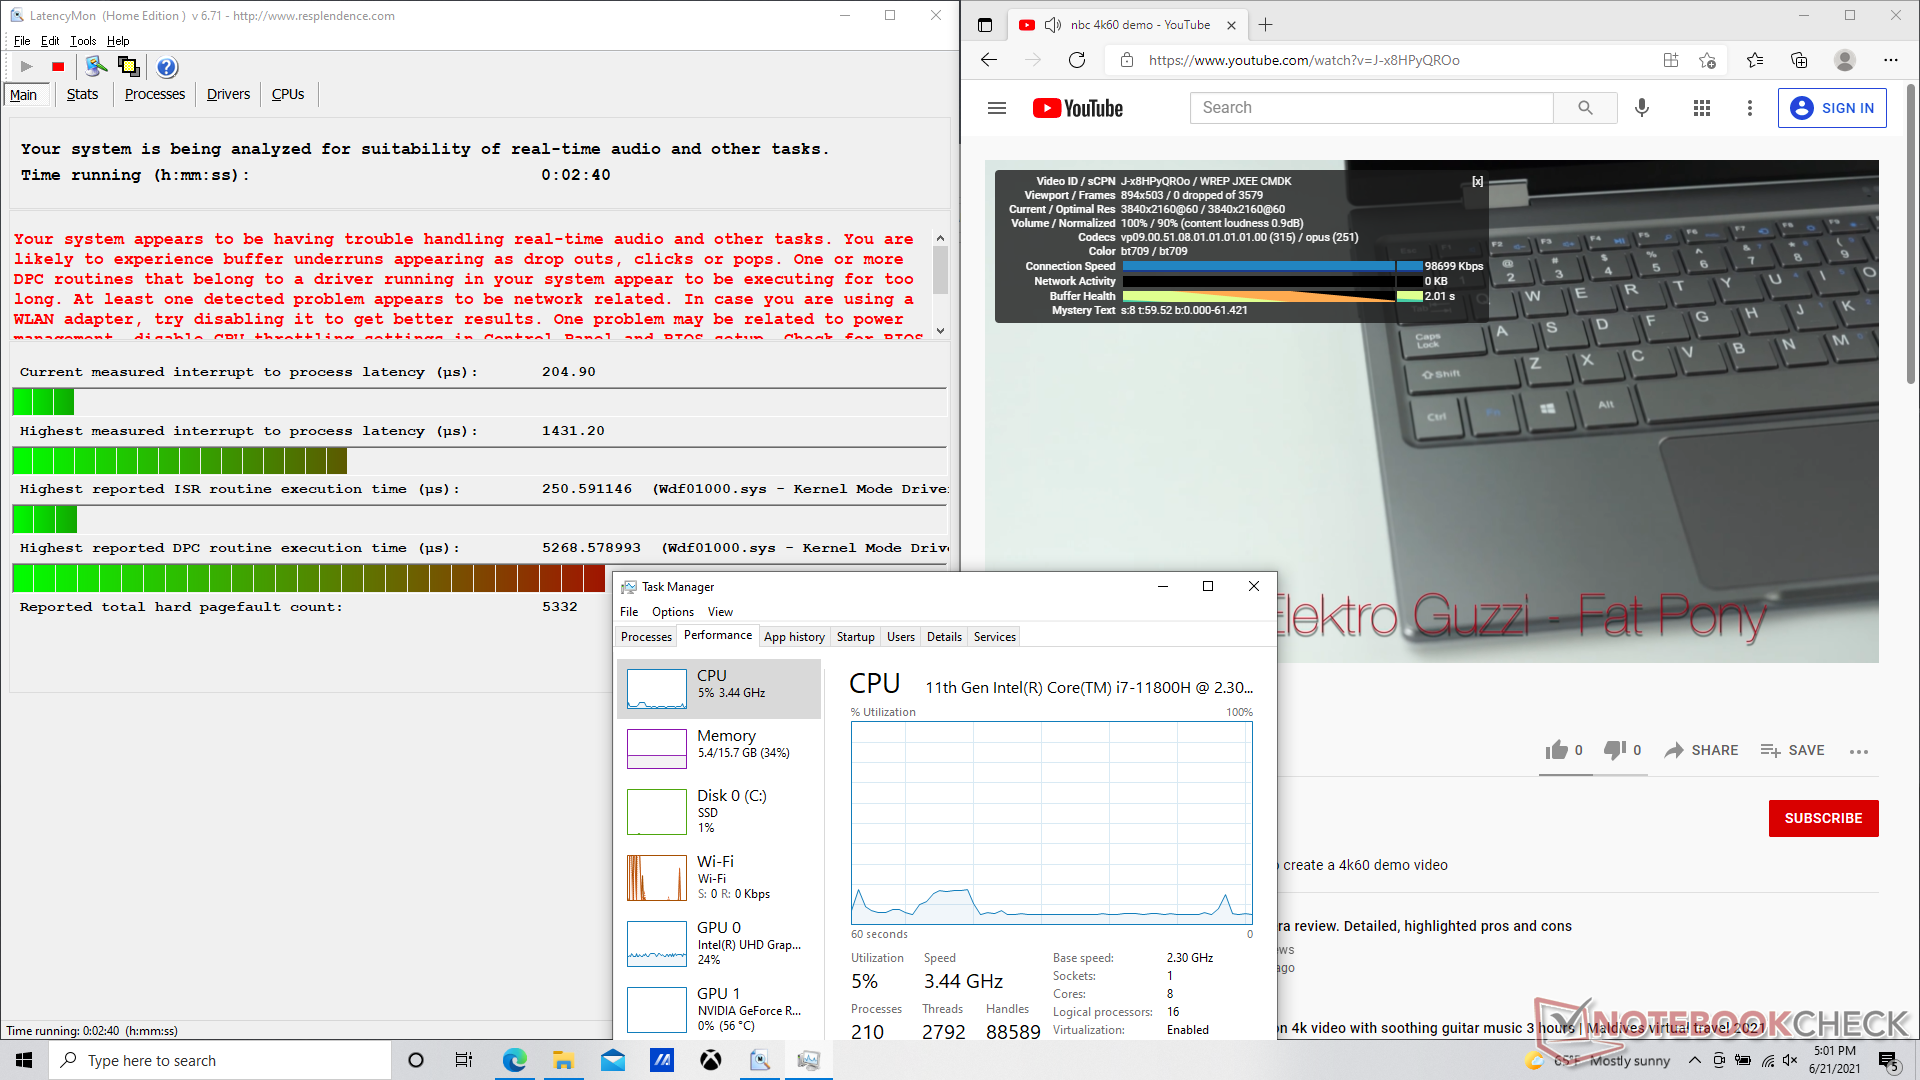
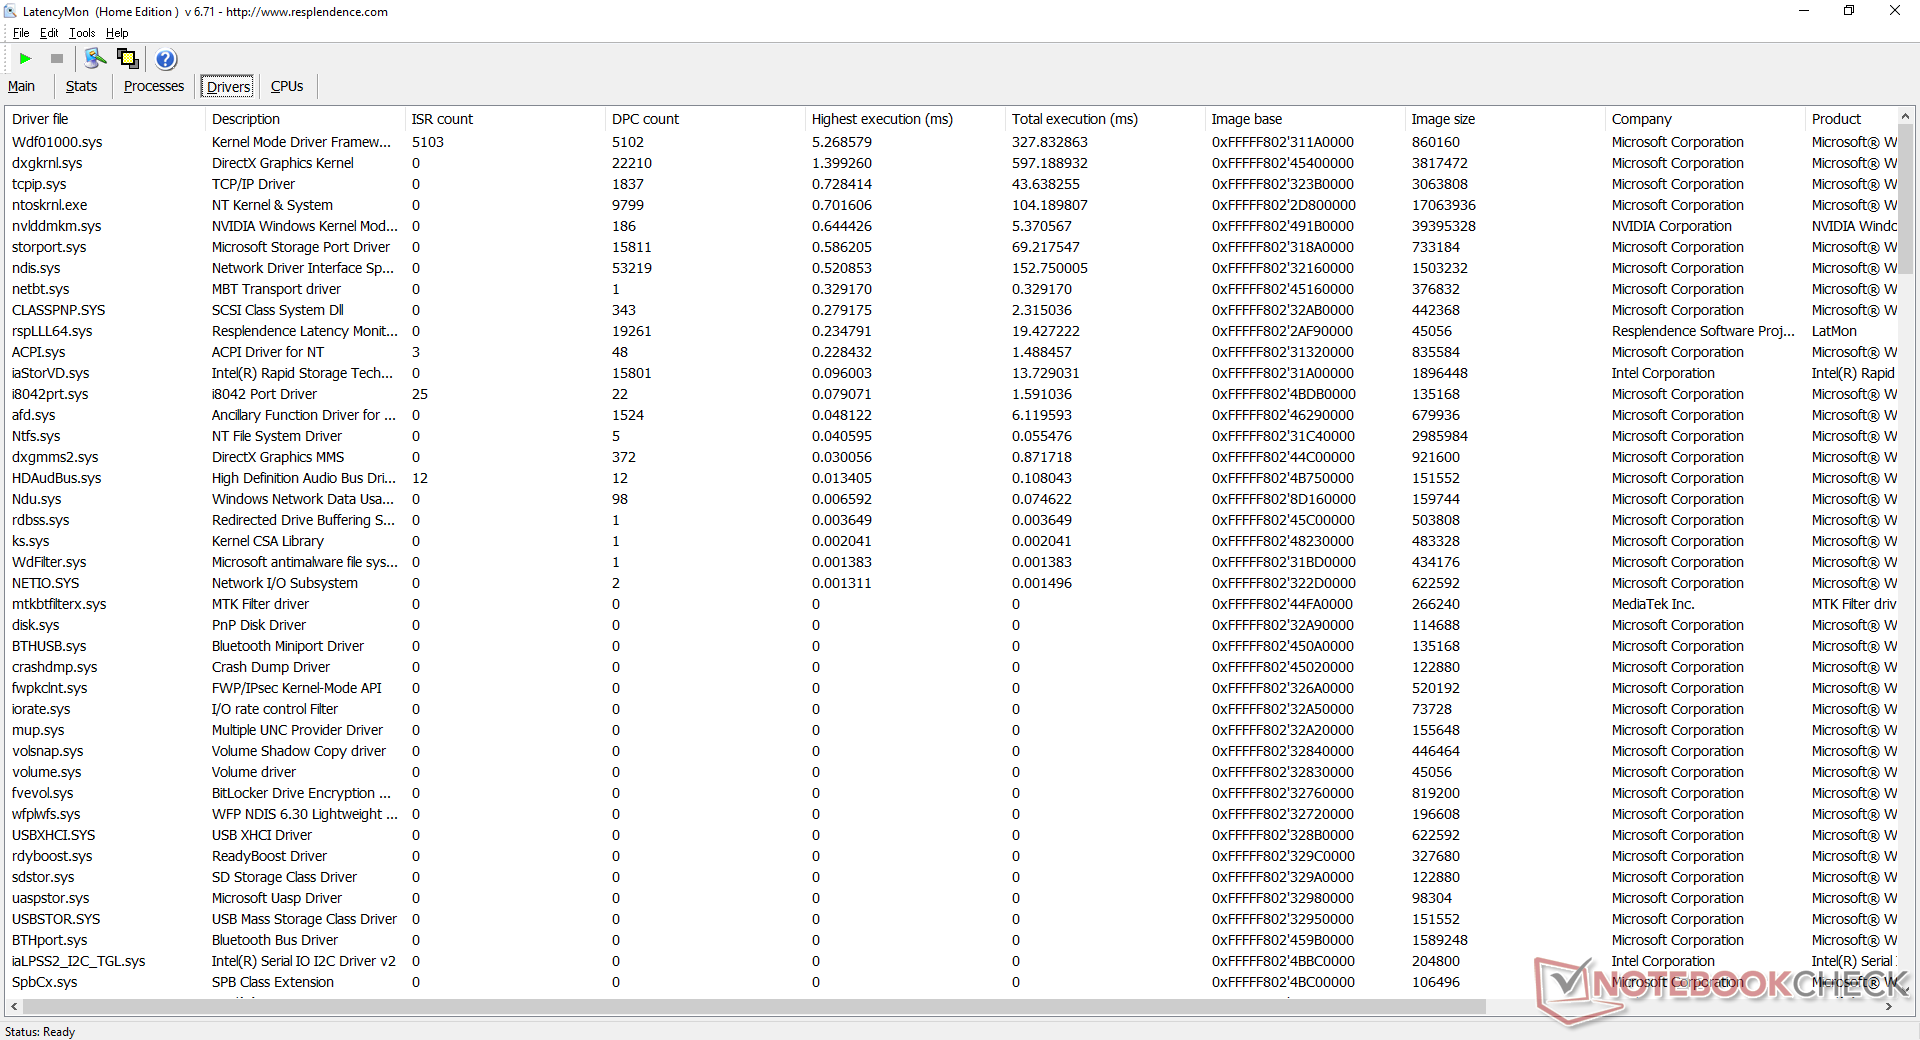
DPC Latency
LatencyMon shows DPC latency issues when opening multiple tabs on our homepage. 4K video playback at 60 FPS is otherwise smooth and without any dropped frames. CPU and iGPU utilization would be very low at just 5 percent and 24 percent, respectively.
| DPC Latencies / LatencyMon - interrupt to process latency (max), Web, Youtube, Prime95 | |
| Asus TUF Gaming F15 FX506HM | |
| Asus TUF Dash F15 FX516PR | |
| MSI GF65 Thin 10UE | |
| Lenovo Legion 5 15IMH05H | |
| Razer Blade 15 Base Edition 2021, i7-10750H RTX 3060 | |
* ... smaller is better
Storage Devices — Now With PCIe 4.0
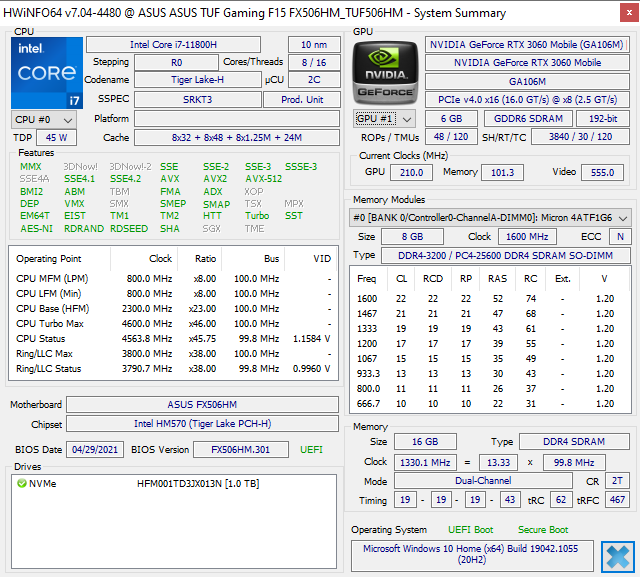
Our test unit comes with the same 1 TB SK Hynix HFM001TD3JX013N NVMe SSD as found on the TUF Dash F15. This doesn't guarantee that users will also get the same drive, however, as Asus sources drives from multiple providers including Intel and Samsung. Transfer rates are excellent on our drive with performance levels similar to the 1 TB Samsung PM981.
Asus also offers PCIe 4.0 NVMe SSD options for those who want to take advantage of the faster bandwidth that was previously unavailable on older Intel 10th gen laptops.
| Asus TUF Gaming F15 FX506HM SK Hynix HFM001TD3JX013N | Asus TUF Dash F15 FX516PR SK Hynix HFM001TD3JX013N | Asus TUF FX505DT-EB73 Intel SSD 660p SSDPEKNW512G8 | MSI GF65 Thin 10UE Samsung SSD PM981 MZVLB1T0HALR | Lenovo Legion 5 15IMH05H Samsung PM991 MZALQ512HALU | |
|---|---|---|---|---|---|
| AS SSD | -25% | -43% | 10% | -39% | |
| Seq Read (MB/s) | 2873 | 2671 -7% | 1019 -65% | 3002 4% | 2012 -30% |
| Seq Write (MB/s) | 1619 | 1501 -7% | 889 -45% | 2420 49% | 1261 -22% |
| 4K Read (MB/s) | 57.5 | 39.65 -31% | 48.22 -16% | 48.46 -16% | 43.66 -24% |
| 4K Write (MB/s) | 149.6 | 69 -54% | 115.5 -23% | 114.3 -24% | 109.3 -27% |
| 4K-64 Read (MB/s) | 1252 | 1209 -3% | 321.5 -74% | 1873 50% | 851 -32% |
| 4K-64 Write (MB/s) | 2196 | 1650 -25% | 787 -64% | 1882 -14% | 780 -64% |
| Access Time Read * (ms) | 0.04 | 0.093 -132% | 0.065 -63% | 0.045 -13% | 0.117 -193% |
| Access Time Write * (ms) | 0.082 | 0.055 33% | 0.047 43% | 0.101 -23% | 0.036 56% |
| Score Read (Points) | 1597 | 1516 -5% | 472 -70% | 2221 39% | 1096 -31% |
| Score Write (Points) | 2508 | 1869 -25% | 992 -60% | 2238 -11% | 1016 -59% |
| Score Total (Points) | 4869 | 4105 -16% | 1717 -65% | 5565 14% | 2643 -46% |
| Copy ISO MB/s (MB/s) | 1583 | 942 -40% | 2421 53% | 1481 -6% | |
| Copy Program MB/s (MB/s) | 964 | 444.5 -54% | 705 -27% | 467.5 -52% | |
| Copy Game MB/s (MB/s) | 943 | 867 -8% | 1490 58% | 734 -22% | |
| CrystalDiskMark 5.2 / 6 | -17% | -38% | -6% | -26% | |
| Write 4K (MB/s) | 168.1 | 129.6 -23% | 137.5 -18% | 157.3 -6% | 145.4 -14% |
| Read 4K (MB/s) | 65.1 | 44.71 -31% | 57 -12% | 46.69 -28% | 51.6 -21% |
| Write Seq (MB/s) | 2124 | 1929 -9% | 984 -54% | 2389 12% | 1007 -53% |
| Read Seq (MB/s) | 2204 | 2035 -8% | 1564 -29% | 2196 0% | 1145 -48% |
| Write 4K Q32T1 (MB/s) | 455.3 | 425.9 -6% | 237.4 -48% | 407.6 -10% | 468.4 3% |
| Read 4K Q32T1 (MB/s) | 465.6 | 433.4 -7% | 340.7 -27% | 519 11% | 528 13% |
| Write Seq Q32T1 (MB/s) | 2911 | 1390 -52% | 959 -67% | 2401 -18% | 1381 -53% |
| Read Seq Q32T1 (MB/s) | 3519 | 3505 0% | 1732 -51% | 3344 -5% | 2291 -35% |
| Total Average (Program / Settings) | -21% /
-21% | -41% /
-41% | 2% /
4% | -33% /
-35% |
* ... smaller is better

Disk Throttling: DiskSpd Read Loop, Queue Depth 8
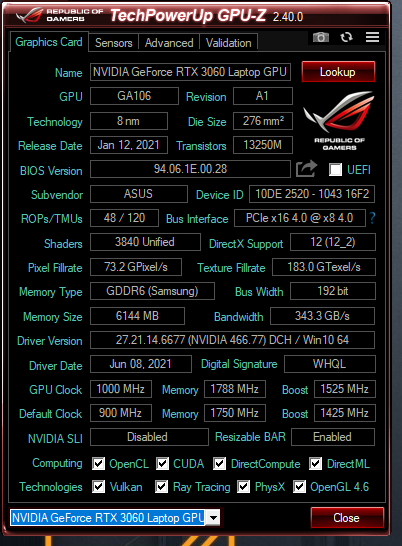
GPU Performance — 90 W TGP GeForce RTX 3060 Graphics
Graphics performance is exactly where we expect it to be relative to other laptops with the same mobile GeForce RTX 3060 GPU. Downgrading to the GTX 1660 Ti or GTX 1650 will net gamers a 20 percent and 50 percent drop in performance, respectively.
Performance in games is excellent with results that are nearly identical to the average RTX 2070 gaming laptop or RTX 2060 desktop.
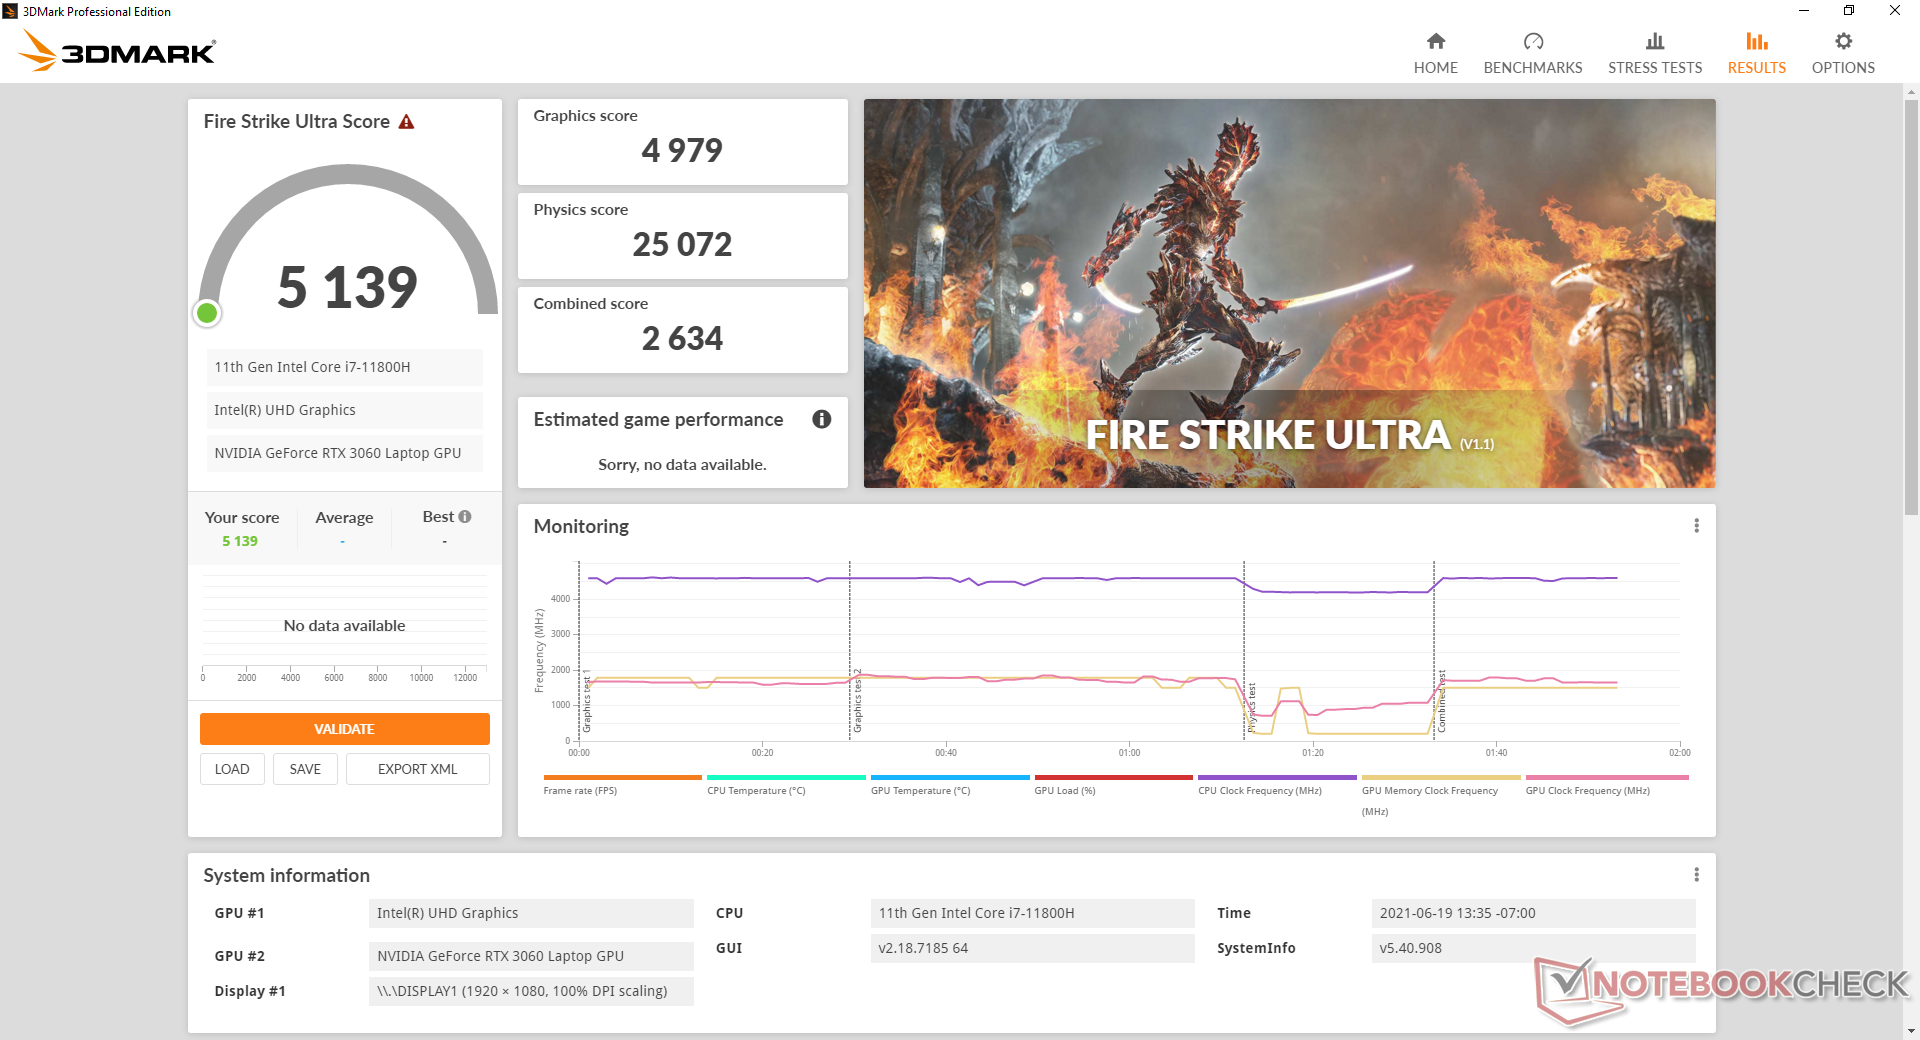
There is a slight performance gap between Performance mode and Turbo mode. Running Fire Strike on Turbo mode returns higher Physics and Graphics scores of about 2 percent and 5 percent, respectively, at the cost of louder fan noise.
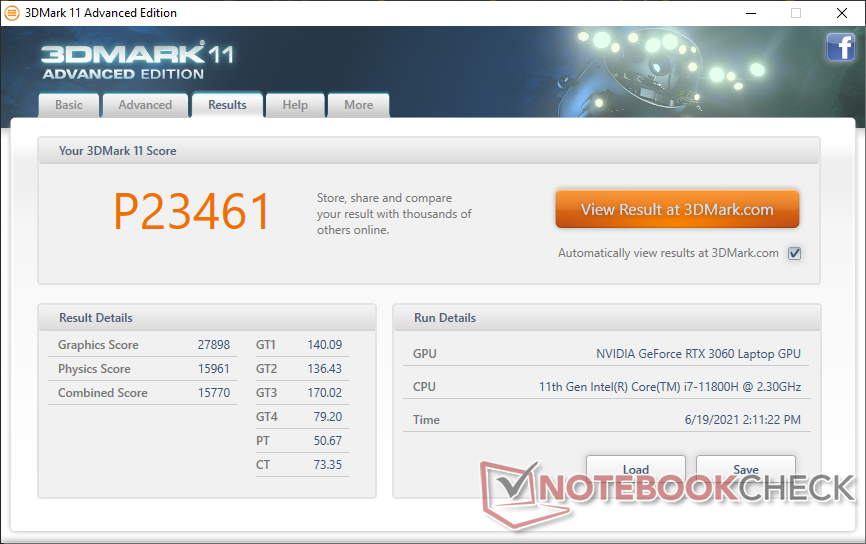
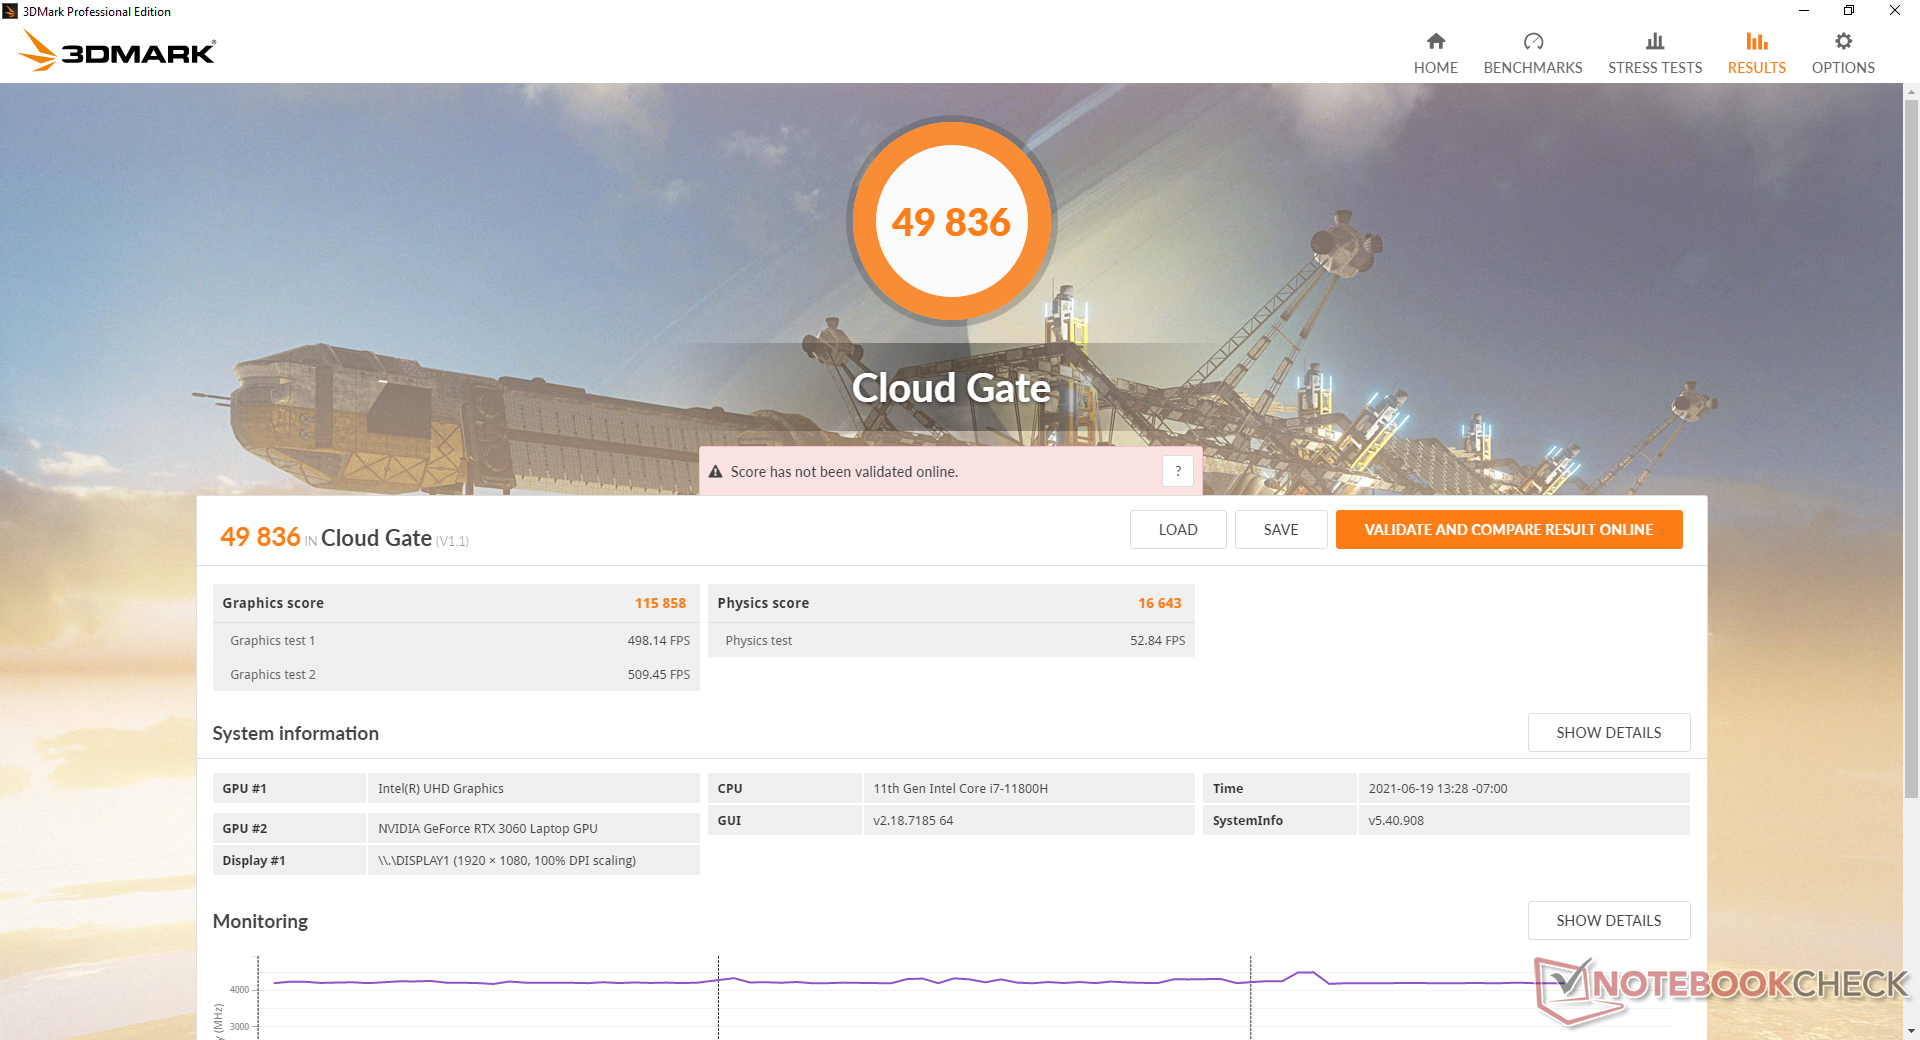
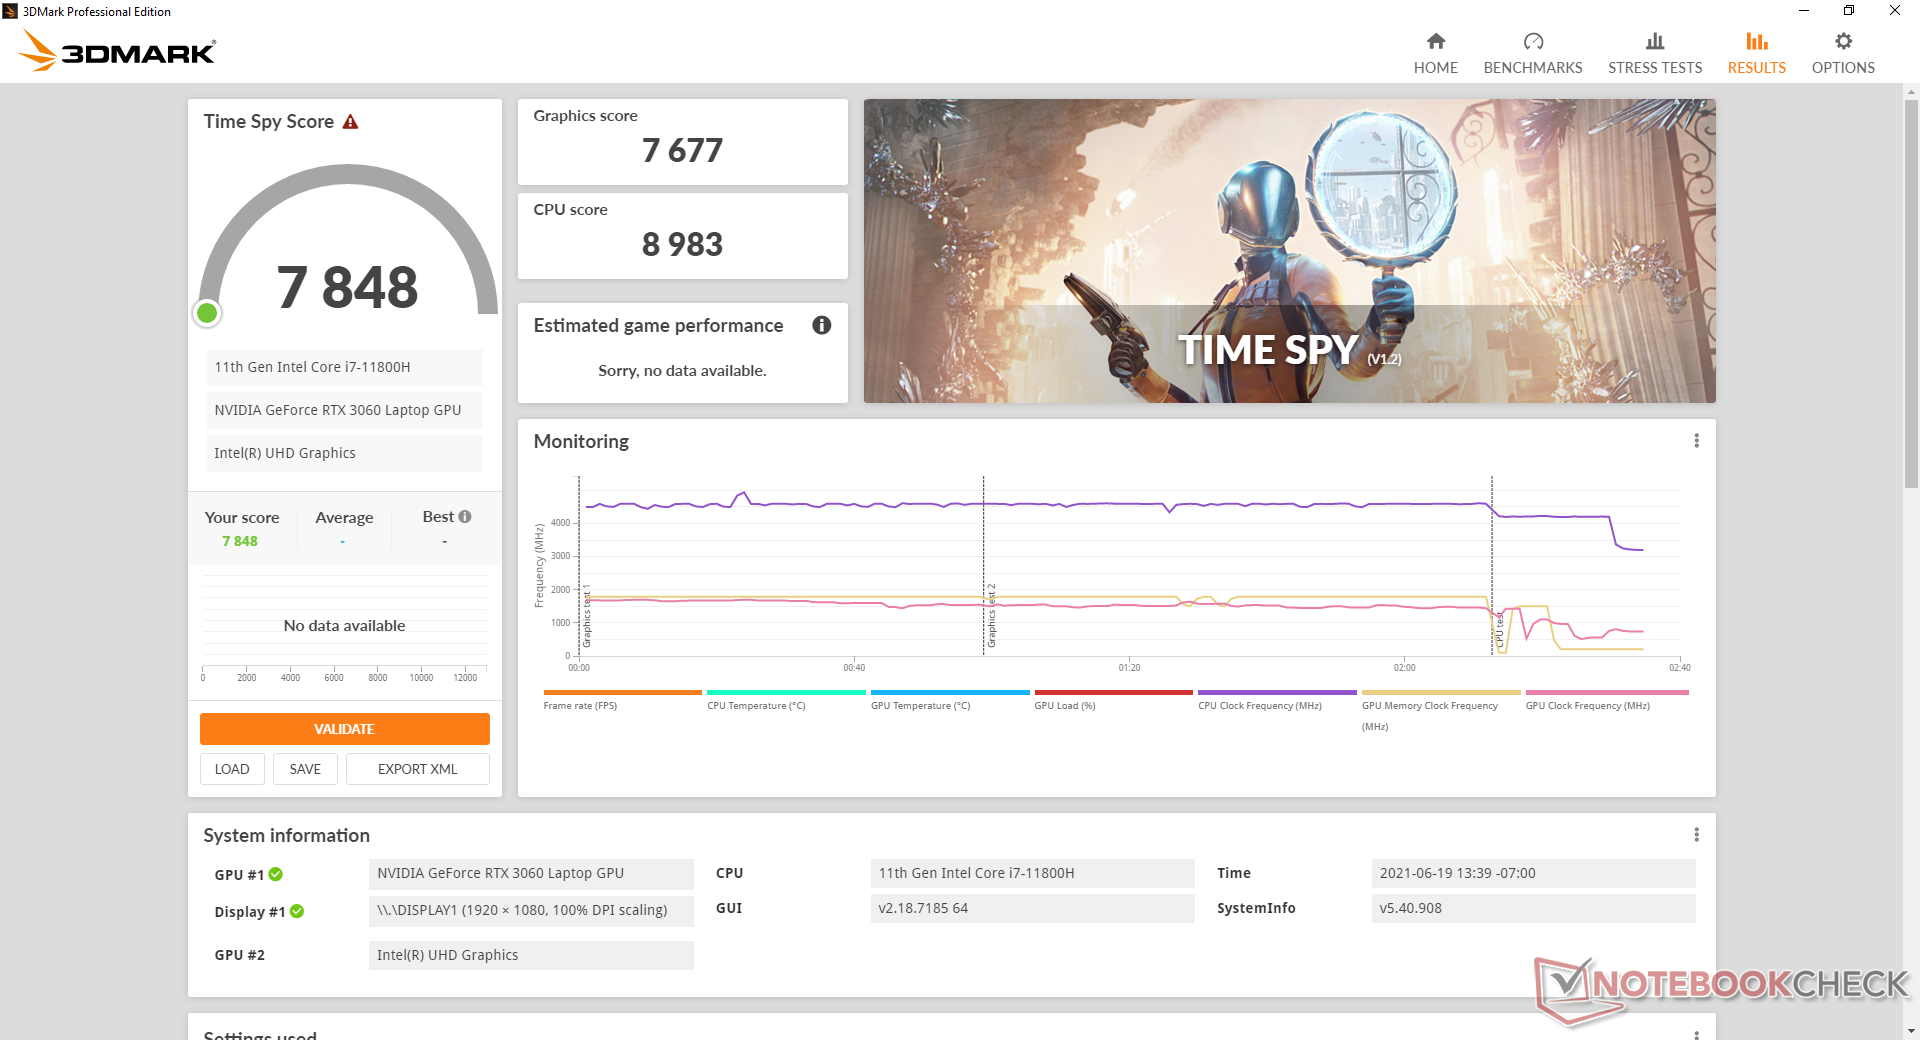
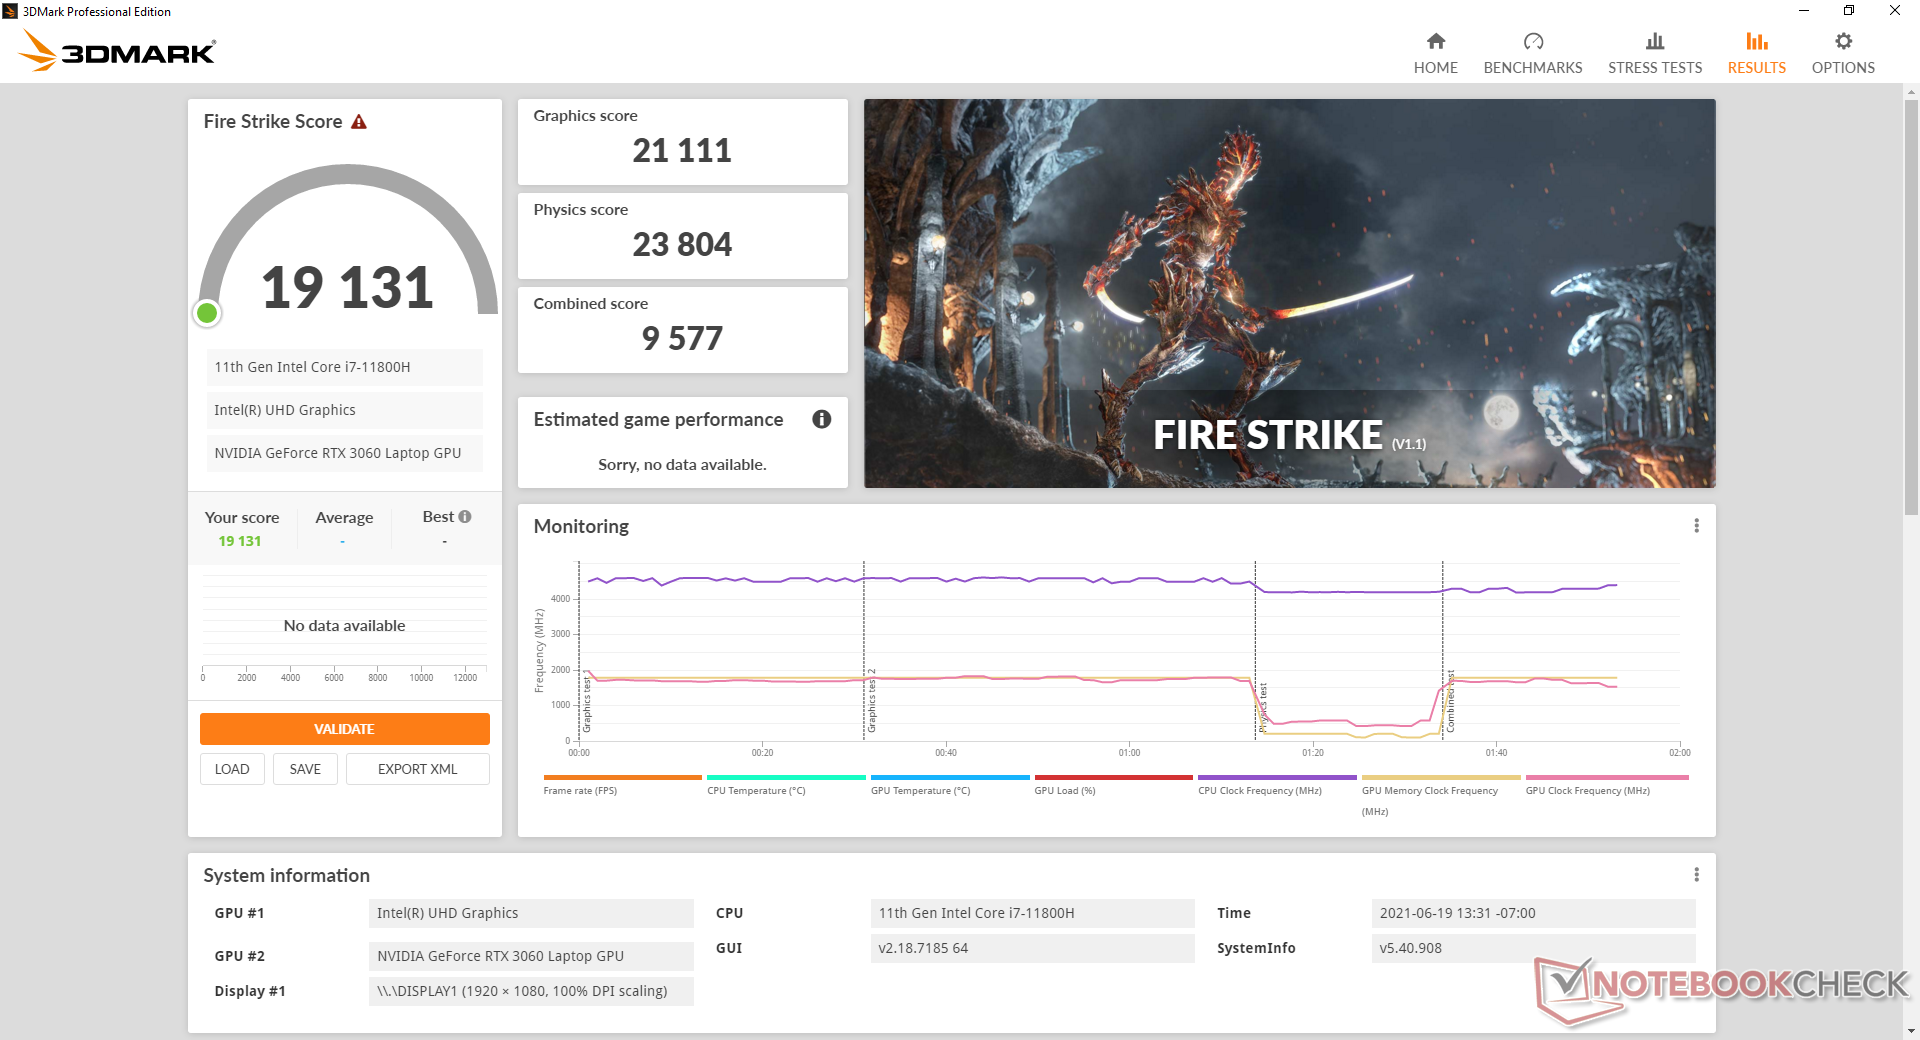

| 3DMark 11 Performance | 23461 points | |
| 3DMark Cloud Gate Standard Score | 49836 points | |
| 3DMark Fire Strike Score | 19131 points | |
| 3DMark Time Spy Score | 7848 points | |
Help | ||
Frame rates when idling on Witcher 3 are steady with no significant dips over time. There are fluctuations of a few frames every now and then likely due to the recurring Dynamic Boost.
Witcher 3 FPS Chart
| low | med. | high | ultra | |
|---|---|---|---|---|
| GTA V (2015) | 180 | 172 | 146 | 83.4 |
| The Witcher 3 (2015) | 362.3 | 246 | 143.9 | 75.3 |
| Dota 2 Reborn (2015) | 162 | 142 | 134 | 125 |
| Final Fantasy XV Benchmark (2018) | 153 | 104 | 78.1 | |
| X-Plane 11.11 (2018) | 122 | 102 | 83.3 | |
| Strange Brigade (2018) | 389 | 192 | 155 | 134 |
Emissions — Use Armoury Crate For Fan Control
System Noise
Fan noise can be either very quiet or very loud depending on the Armoury Crate profile. If set to Silent mode, the fans will typically remain at 26.7 dB(A) or quieter against a background of 24.8 dB(A) when streaming or web browsing. When set to Balanced or Performance mode, the system is able to remain quieter for longer than most other gaming laptops. Running the first benchmark scene of 3DMark 06, for example, would induce a fan noise of just 27 dB(A) compared to 53 dB(A) on the TUF Dash F15.
Running Witcher 3 on Performance mode would lead to a stable fan noise of 46.4 dB(A) while Turbo mode would boost this up even louder to 49 dB(A). As mentioned above, users will get slightly faster performance if gaming on Turbo mode.
| Asus TUF Gaming F15 FX506HM GeForce RTX 3060 Laptop GPU, i7-11800H, SK Hynix HFM001TD3JX013N | Asus TUF Dash F15 FX516PR GeForce RTX 3070 Laptop GPU, i7-11370H, SK Hynix HFM001TD3JX013N | Asus TUF FX505DT-EB73 GeForce GTX 1650 Mobile, R7 3750H, Intel SSD 660p SSDPEKNW512G8 | Razer Blade 15 Base Edition 2021, i7-10750H RTX 3060 GeForce RTX 3060 Laptop GPU, i7-10750H, Samsung SSD PM981a MZVLB512HBJQ | MSI GF65 Thin 10UE GeForce RTX 3060 Laptop GPU, i7-10750H, Samsung SSD PM981 MZVLB1T0HALR | Lenovo Legion 5 15IMH05H GeForce RTX 2060 Mobile, i5-10300H, Samsung PM991 MZALQ512HALU | |
|---|---|---|---|---|---|---|
| Noise | -24% | -17% | -9% | -24% | -19% | |
| off / environment * (dB) | 24.8 | 24 3% | 28.2 -14% | 25.3 -2% | 24.7 -0% | 30.7 -24% |
| Idle Minimum * (dB) | 24.6 | 25 -2% | 28.2 -15% | 25.4 -3% | 33.1 -35% | 30.7 -25% |
| Idle Average * (dB) | 24.9 | 30 -20% | 28.2 -13% | 25.4 -2% | 33.1 -33% | 30.7 -23% |
| Idle Maximum * (dB) | 24.9 | 35 -41% | 31.4 -26% | 25.4 -2% | 33.1 -33% | 30.7 -23% |
| Load Average * (dB) | 27.1 | 53 -96% | 39.8 -47% | 42.5 -57% | 42.7 -58% | 36.6 -35% |
| Witcher 3 ultra * (dB) | 46.4 | 48 -3% | 47 -1% | 42 9% | 40.6 12% | 47 -1% |
| Load Maximum * (dB) | 49 | 54 -10% | 50.2 -2% | 52.2 -7% | 59.4 -21% | 50.9 -4% |
* ... smaller is better
Noise level
| Idle |
| 24.6 / 24.9 / 24.9 dB(A) |
| HDD |
| 26.7 dB(A) |
| Load |
| 27.1 / 49 dB(A) |
 | ||
30 dB silent 40 dB(A) audible 50 dB(A) loud |
||
min: | ||
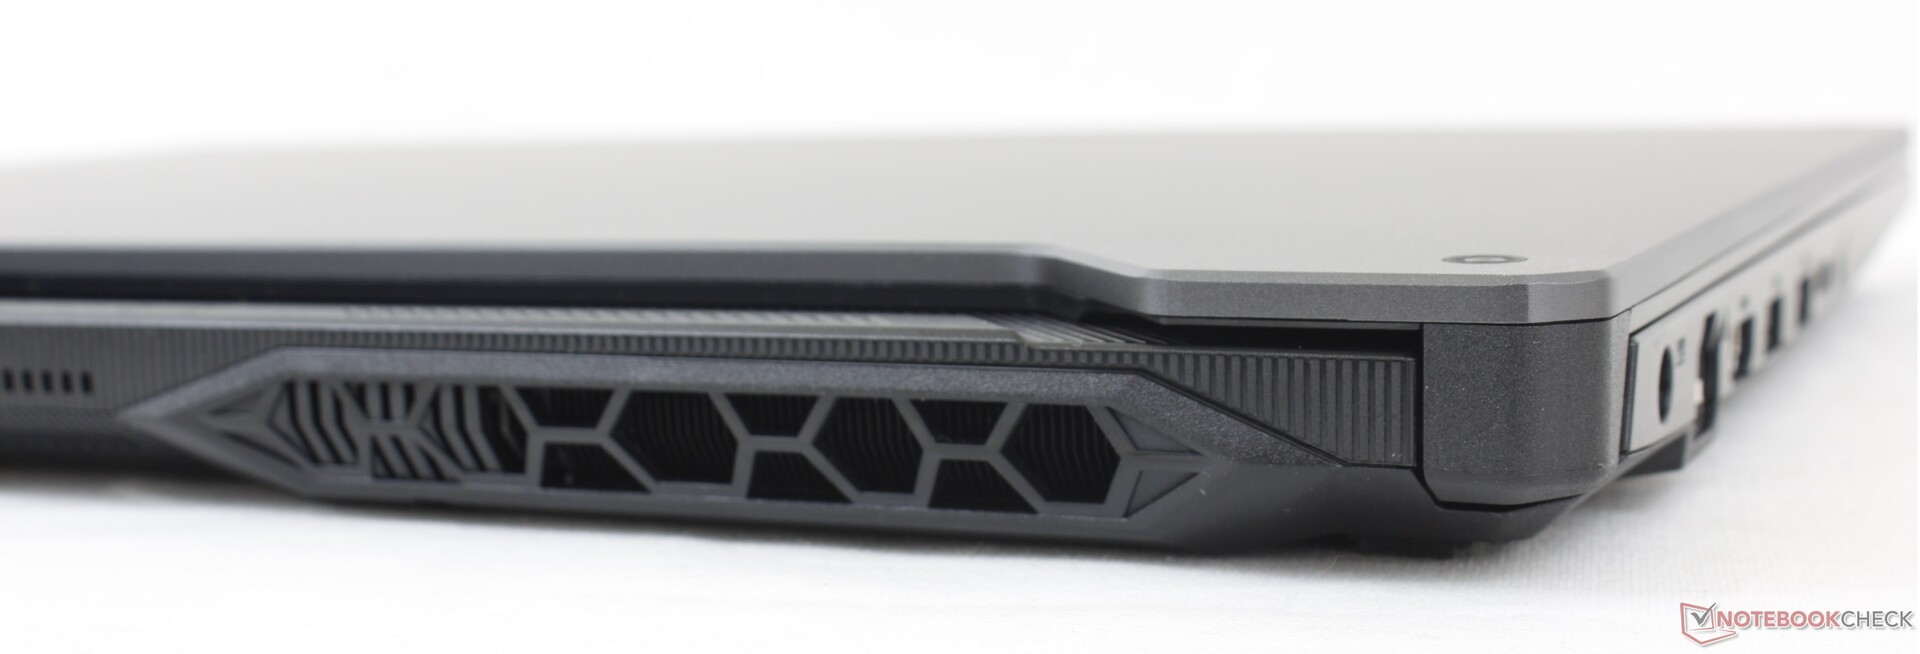
Temperature
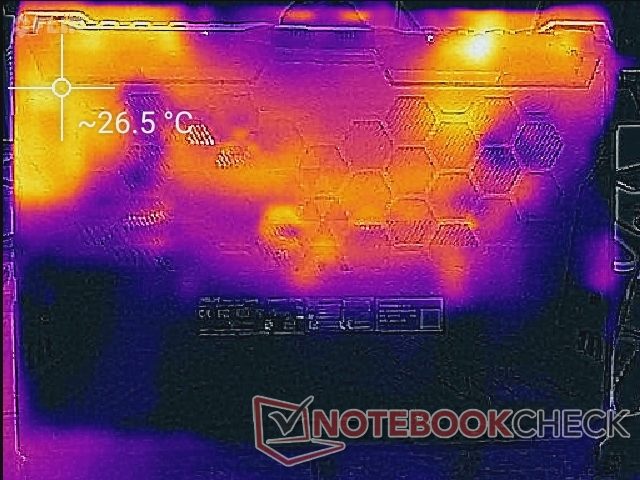
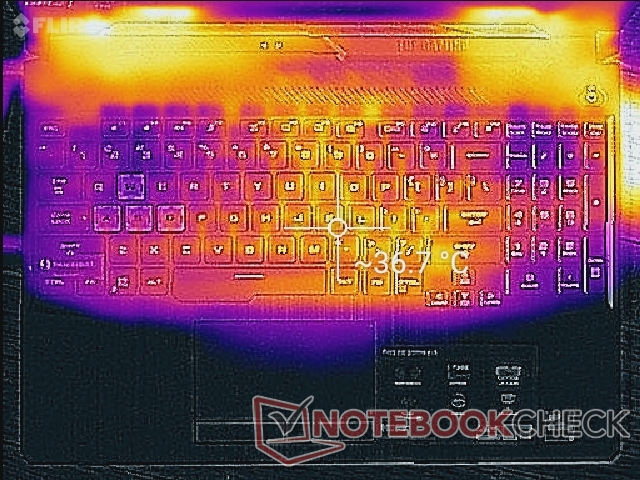
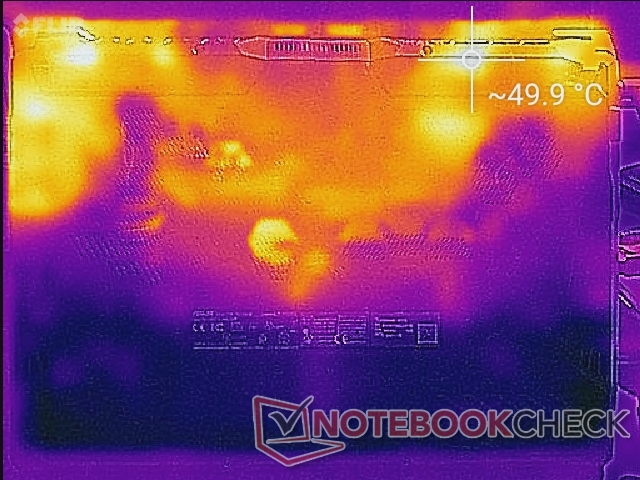
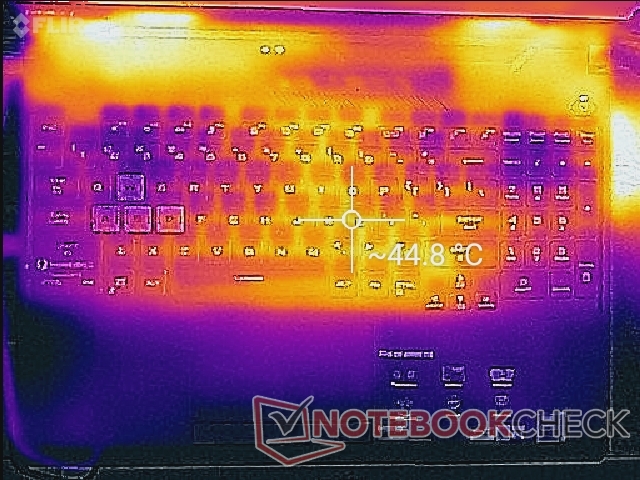
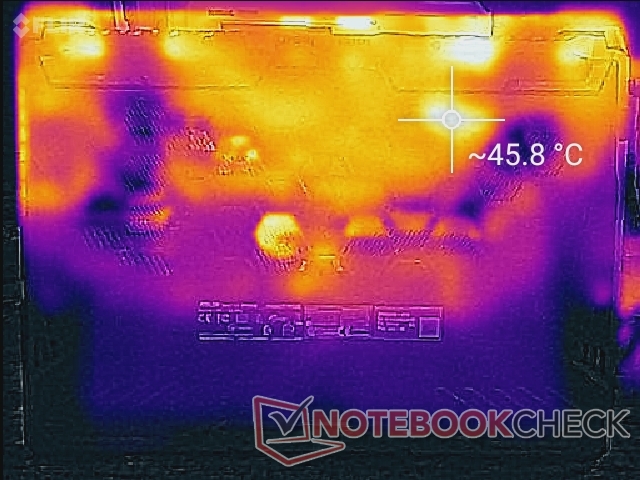
Surface temperatures are warmest toward the keyboard center and rear regions where they can be up to 45 C when running extreme loads. We observed similar temperature ranges on the MSI GF65 or Razer Blade 15 Base Model. The WASD and NumPad keys remain relatively cool when gaming since the two internal fans pull in fresh air through these keys. When compared to the TUF Dash F15 with the more powerful RTX 3070, however, surface temperatures are cooler here by several degrees C.
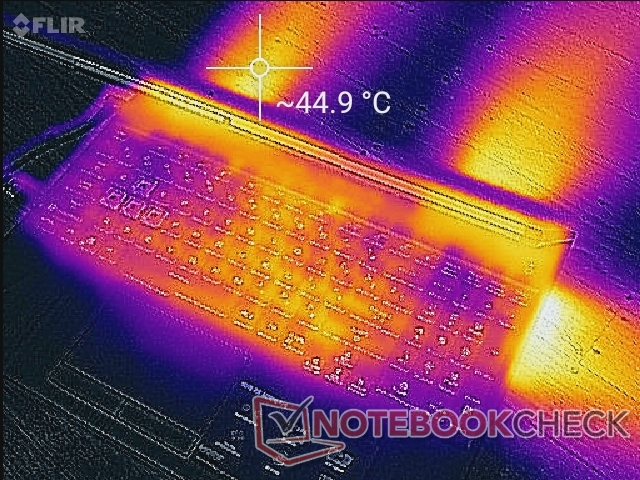
(-) The maximum temperature on the upper side is 46.4 °C / 116 F, compared to the average of 40.4 °C / 105 F, ranging from 21.2 to 68.8 °C for the class Gaming.
(-) The bottom heats up to a maximum of 45.4 °C / 114 F, compared to the average of 43.2 °C / 110 F
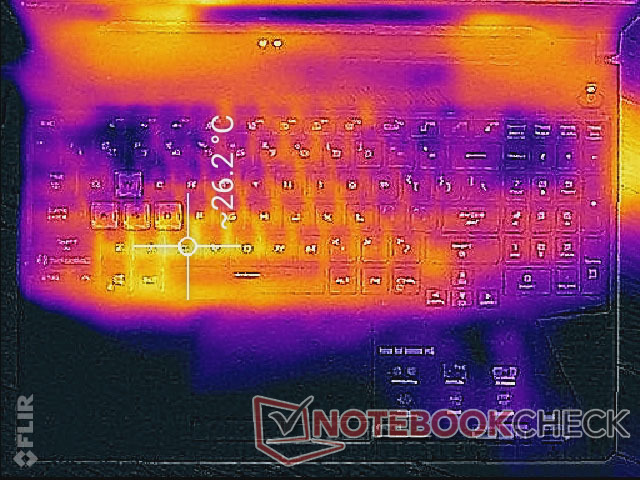
(+) In idle usage, the average temperature for the upper side is 24.1 °C / 75 F, compared to the device average of 33.9 °C / 93 F.
(±) Playing The Witcher 3, the average temperature for the upper side is 32.2 °C / 90 F, compared to the device average of 33.9 °C / 93 F.
(+) The palmrests and touchpad are cooler than skin temperature with a maximum of 26.4 °C / 79.5 F and are therefore cool to the touch.
(+) The average temperature of the palmrest area of similar devices was 28.8 °C / 83.8 F (+2.4 °C / 4.3 F).
Stress Test
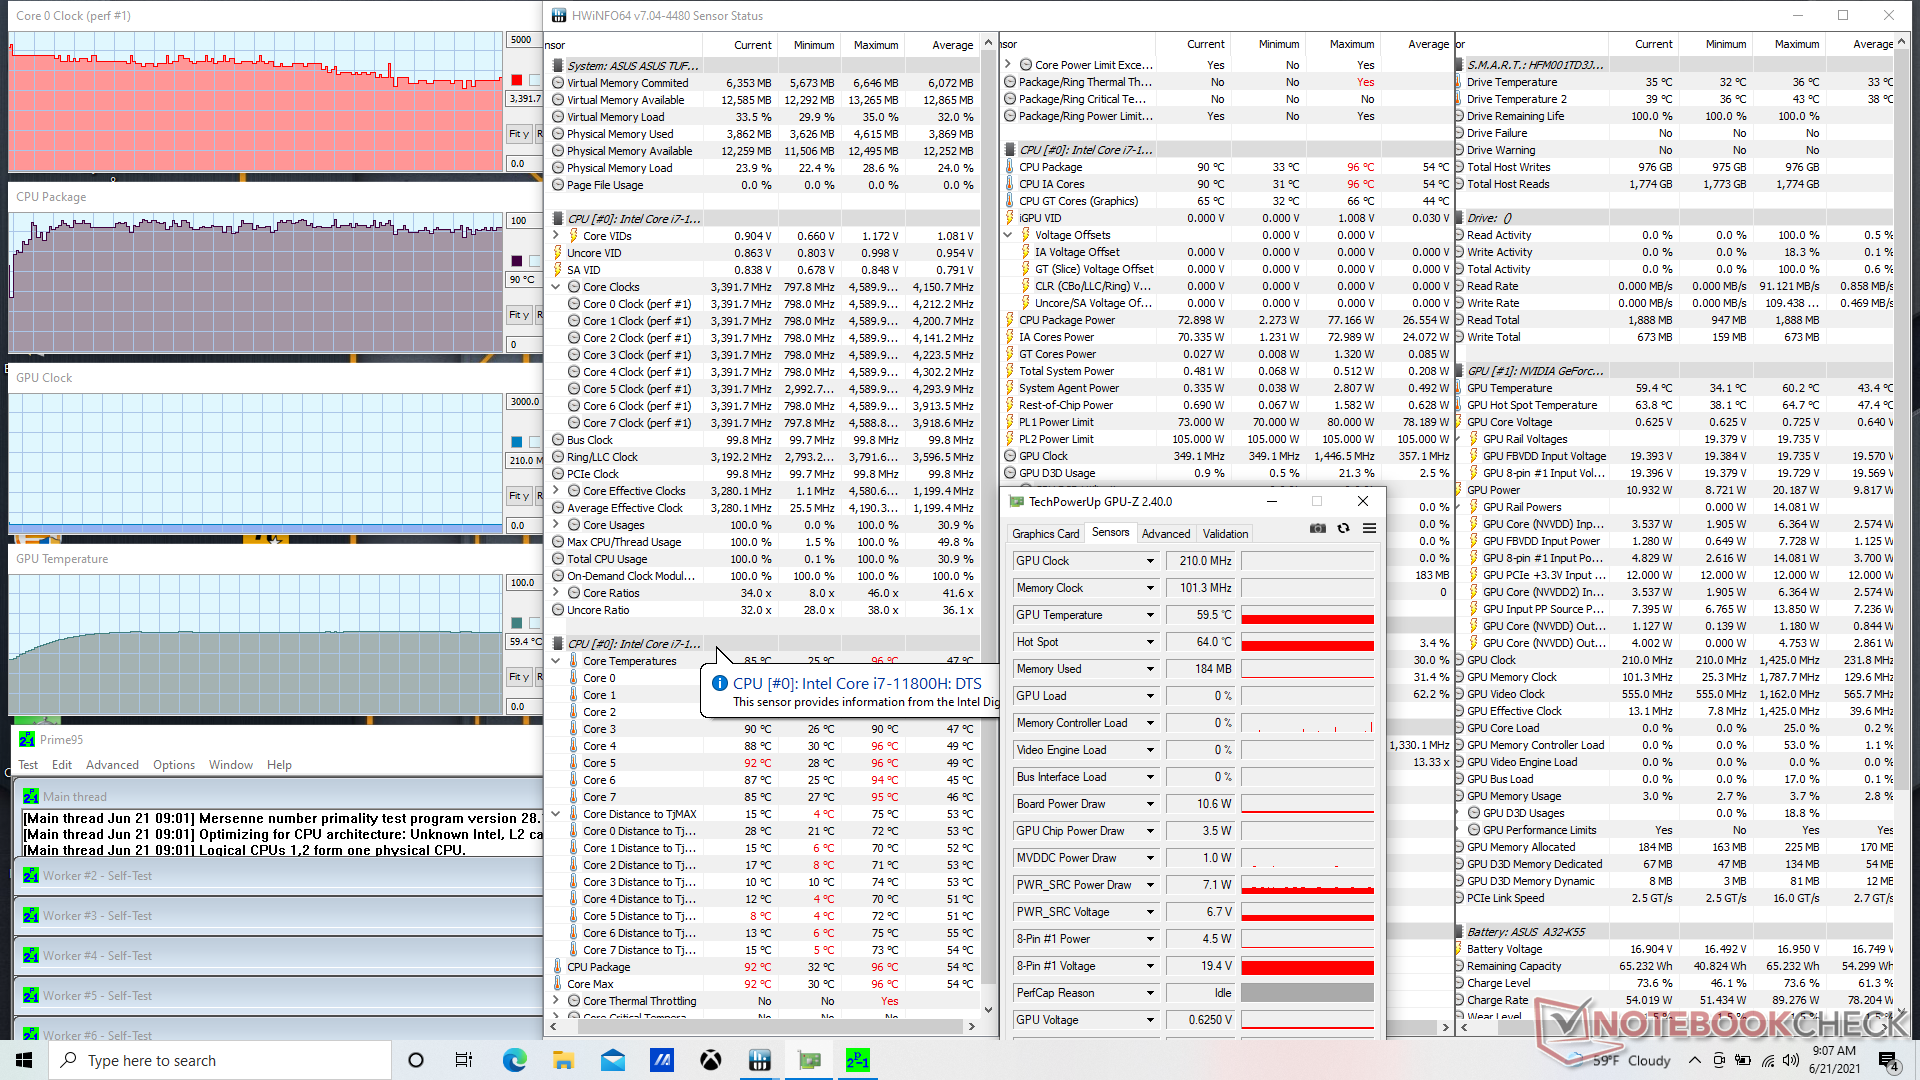
When running Prime95, the CPU would boost to 4.2 GHz for a couple of seconds before falling and eventually stabilizing at 3.2 GHz and 90 C. Core temperature may be high, but we prefer it over slower performance. Running this same test on the Razer Blade 15 with an older 10th gen Core i7-10750H, for example, would result in a stable CPU clock rate and temperature of just 2.7 GHz and 66 C.
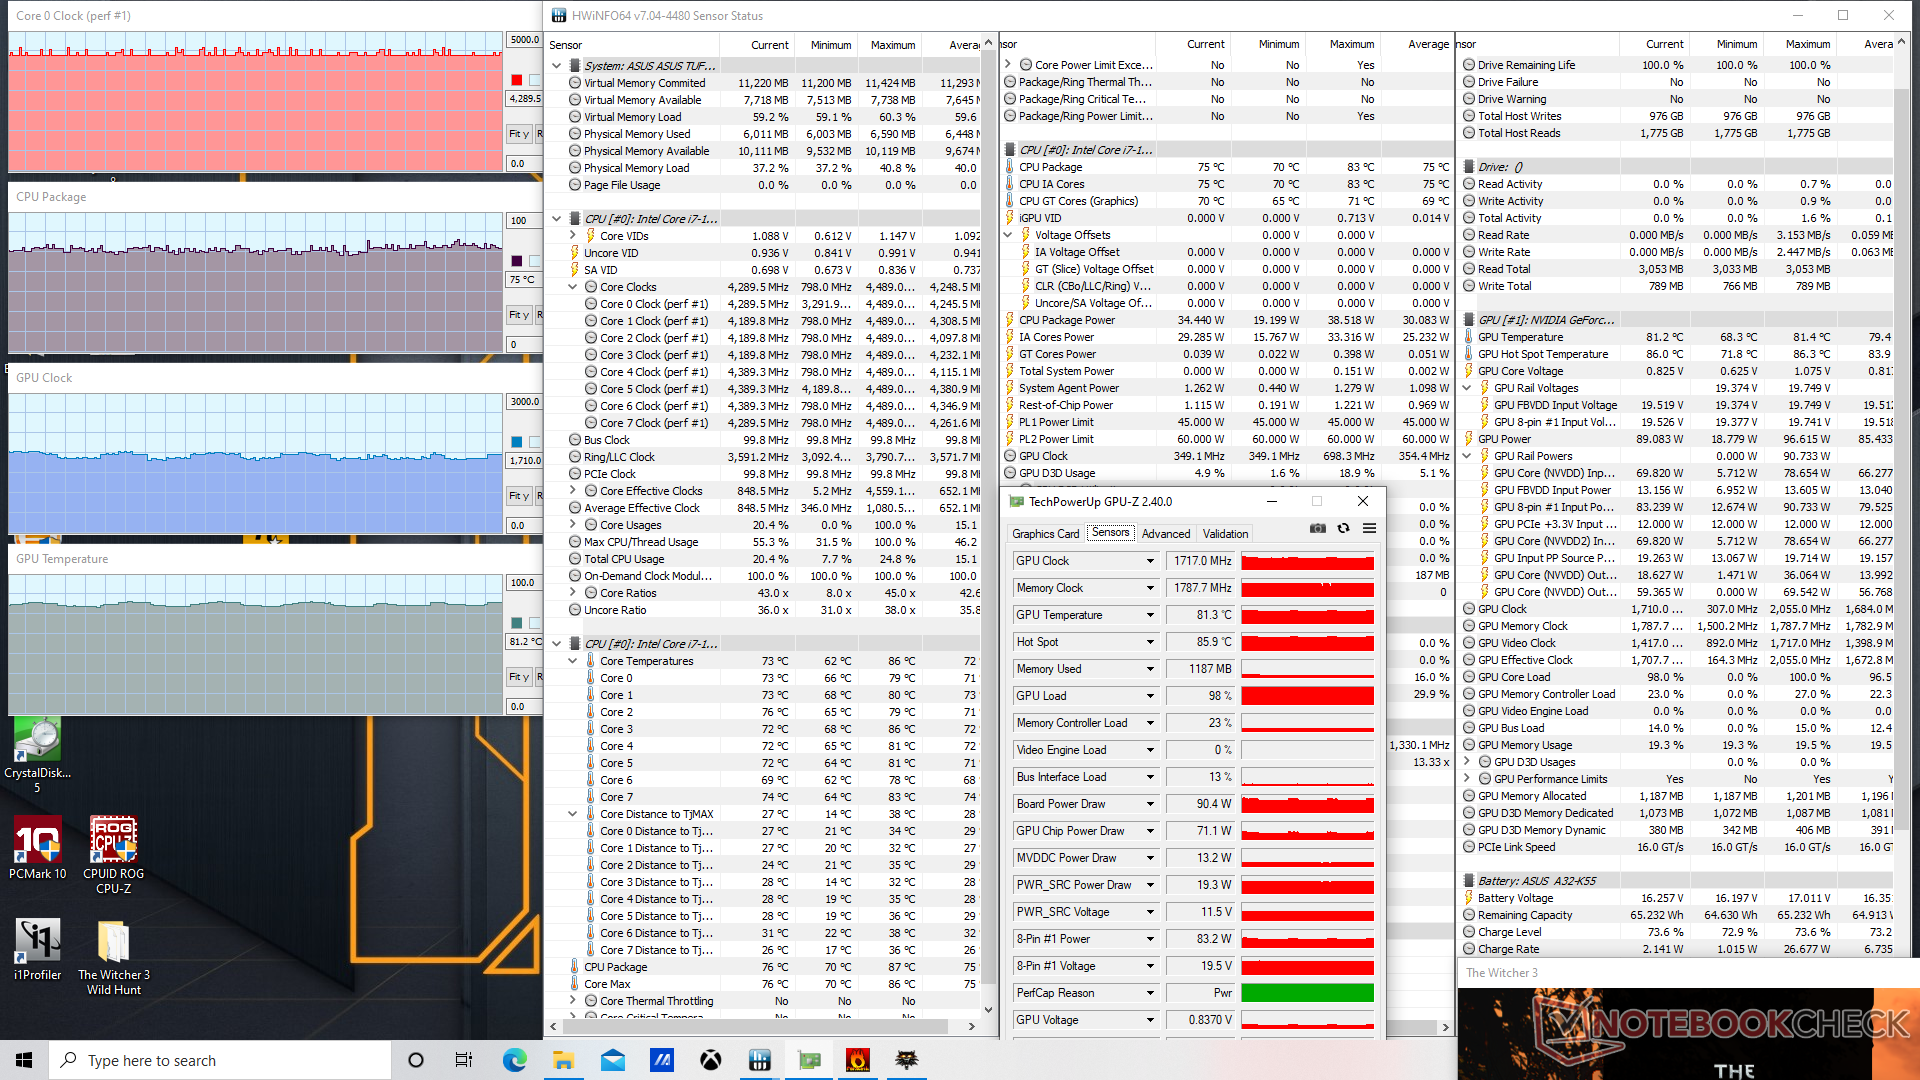
When running Witcher 3 on Turbo mode to represent real-world gaming loads, the CPU would stabilize at 75 C while the GPU would cycle slightly between 78 C and 81 C. GPU clock rates would subsequently cycle as well between 1600 MHz and 1717 MHz likely due to the small Dynamic Boost in effect. GPU-Z reports a real-time board power draw of up to 90 W to match what Asus is claiming on its specifications list.
Running on battery power will limit performance. A 3DMark 11 test on batteries would return Physics and Graphics scores of 10422 and 20531 points, respectively, compared to 15961 and 27898 points when on mains.
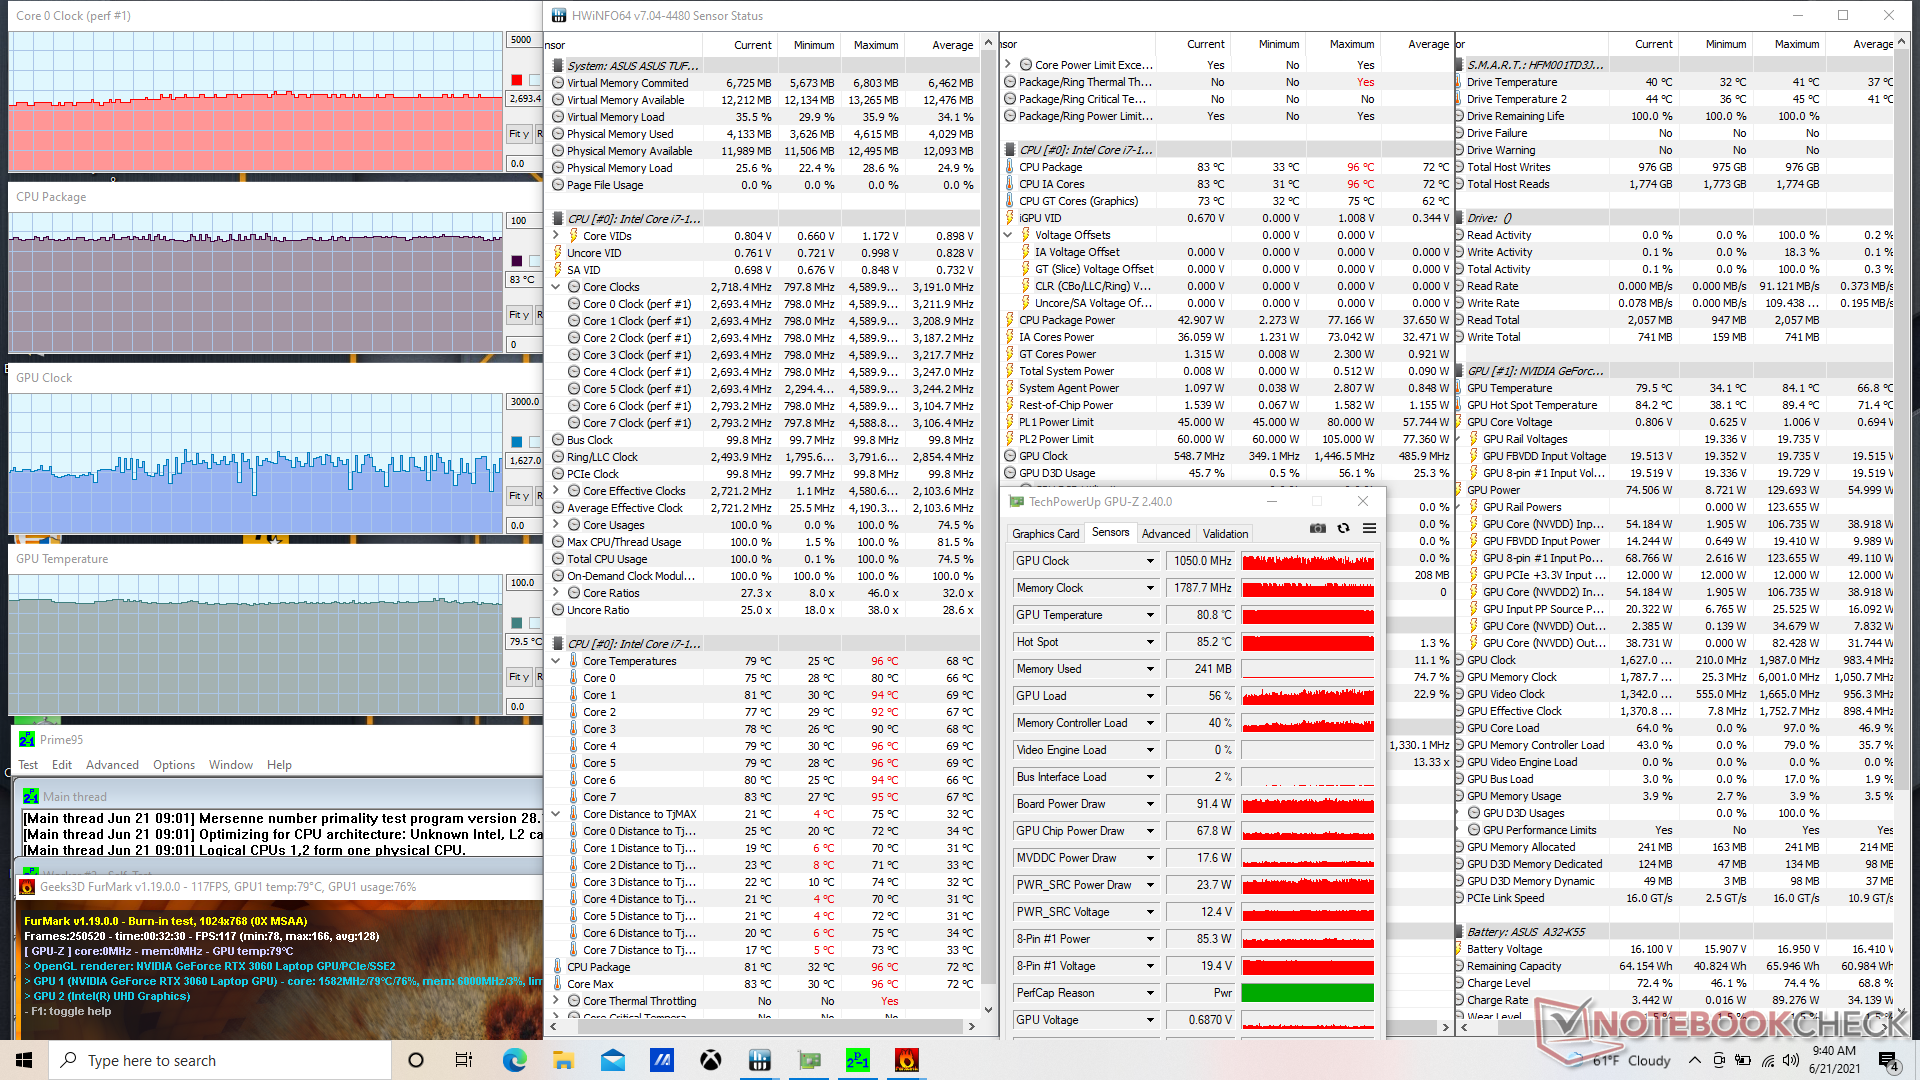
| CPU Clock (GHz) | GPU Clock (MHz) | Average CPU Temperature (°C) | Average GPU Temperature (°C) | |
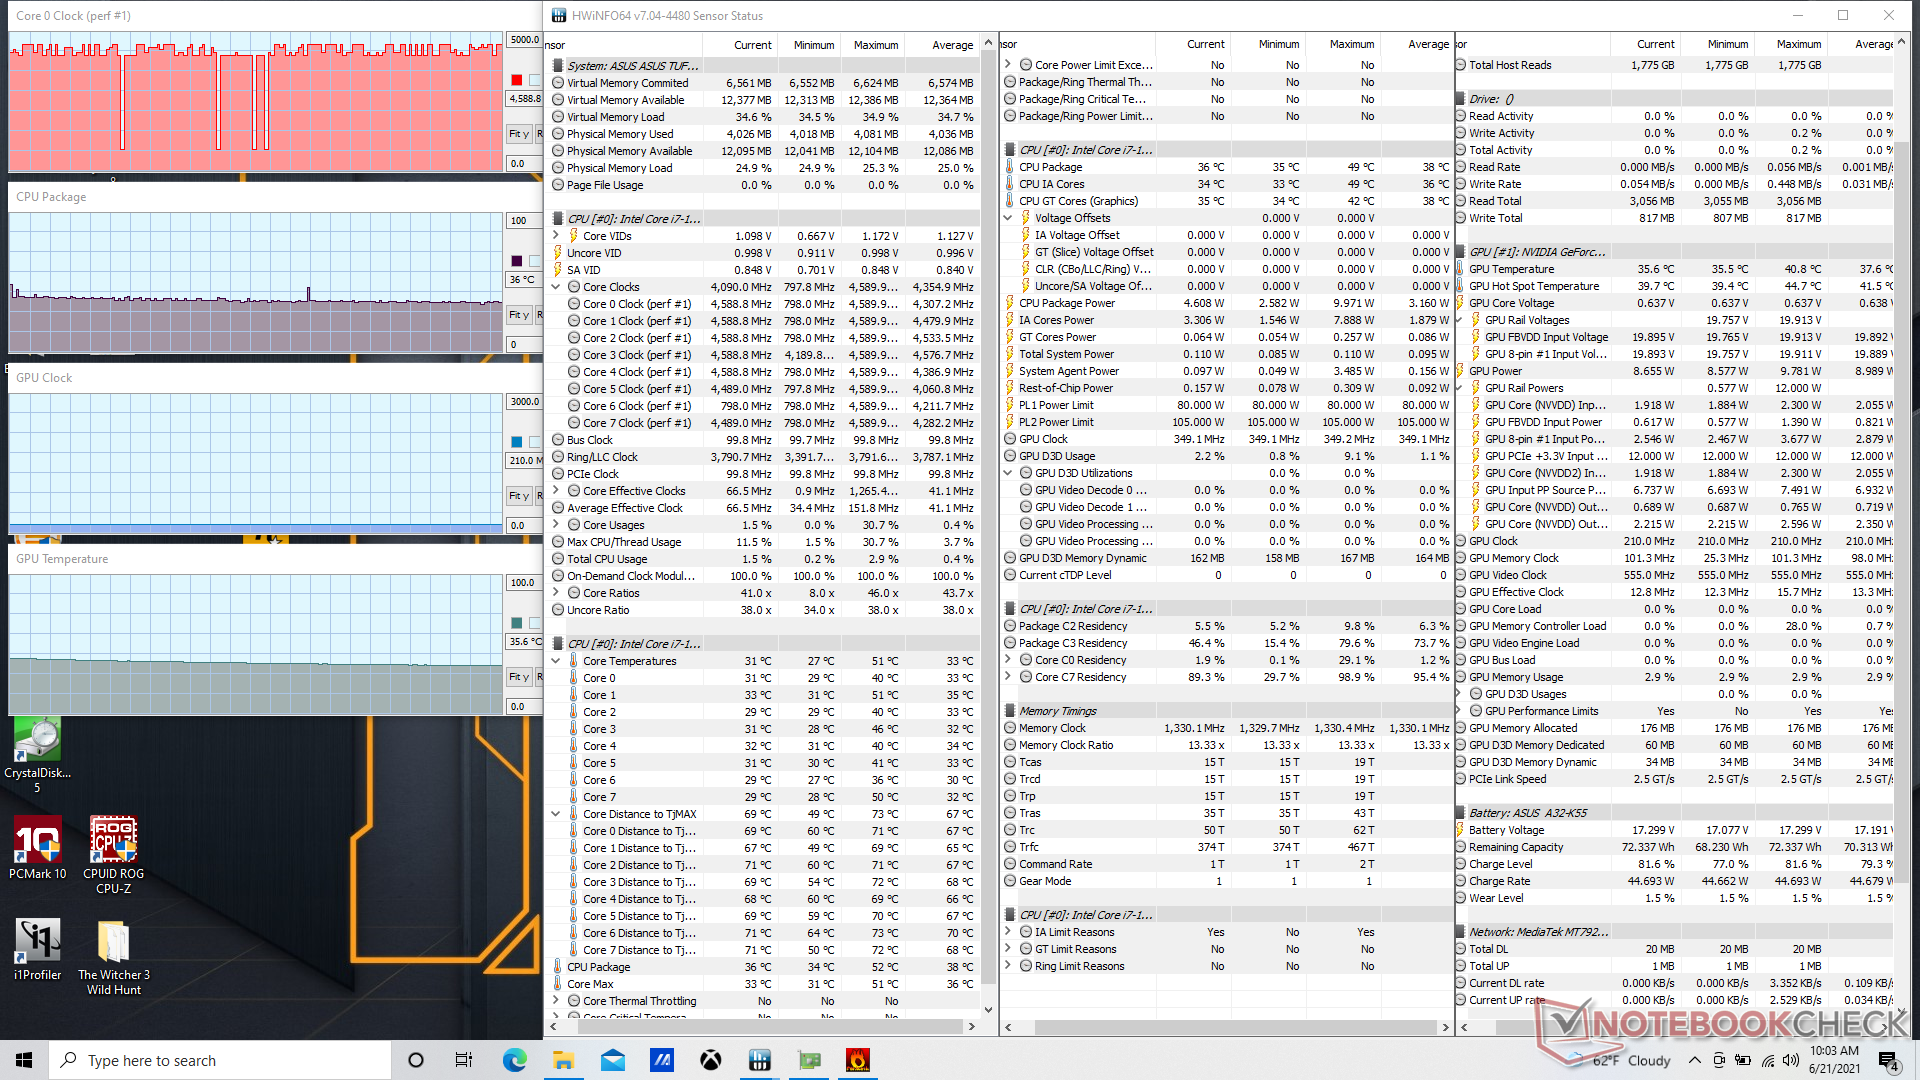
| System Idle | -- | -- | 36 | 36 |
| Prime95 Stress (Turbo mode) | 3.2 | -- | 90 | 60 |
| Prime95 + FurMark Stress (Turbo mode) | 2.7 - 2.8 | 930 - 2000 | 83 | 80 |
| Witcher 3 Stress (Turbo mode) | 4.2 - 4.3 | 1600 - 1717 | 75 | 78 - 81 |
Speakers

The two 2 W speakers have decent bass reproduction and balance as exemplified by their relatively smooth pink noise graph. Annoyingly, the palm rests will vibrate to the touch when on higher volumes since the speakers are located directly underneath.
Asus TUF Gaming F15 FX506HM audio analysis
(±) | speaker loudness is average but good (77.1 dB)
Bass 100 - 315 Hz
(±) | reduced bass - on average 13.8% lower than median
(±) | linearity of bass is average (7.9% delta to prev. frequency)
Mids 400 - 2000 Hz
(+) | balanced mids - only 2.9% away from median
(+) | mids are linear (5.9% delta to prev. frequency)
Highs 2 - 16 kHz
(+) | balanced highs - only 1.8% away from median
(+) | highs are linear (2.7% delta to prev. frequency)
Overall 100 - 16.000 Hz
(+) | overall sound is linear (13.1% difference to median)
Compared to same class
» 18% of all tested devices in this class were better, 4% similar, 78% worse
» The best had a delta of 6%, average was 18%, worst was 132%
Compared to all devices tested
» 13% of all tested devices were better, 3% similar, 84% worse
» The best had a delta of 4%, average was 24%, worst was 134%
Apple MacBook 12 (Early 2016) 1.1 GHz audio analysis
(+) | speakers can play relatively loud (83.6 dB)
Bass 100 - 315 Hz
(±) | reduced bass - on average 11.3% lower than median
(±) | linearity of bass is average (14.2% delta to prev. frequency)
Mids 400 - 2000 Hz
(+) | balanced mids - only 2.4% away from median
(+) | mids are linear (5.5% delta to prev. frequency)
Highs 2 - 16 kHz
(+) | balanced highs - only 2% away from median
(+) | highs are linear (4.5% delta to prev. frequency)
Overall 100 - 16.000 Hz
(+) | overall sound is linear (10.2% difference to median)
Compared to same class
» 7% of all tested devices in this class were better, 2% similar, 91% worse
» The best had a delta of 5%, average was 18%, worst was 53%
Compared to all devices tested
» 5% of all tested devices were better, 1% similar, 94% worse
» The best had a delta of 4%, average was 24%, worst was 134%
Energy Management
Power Consumption
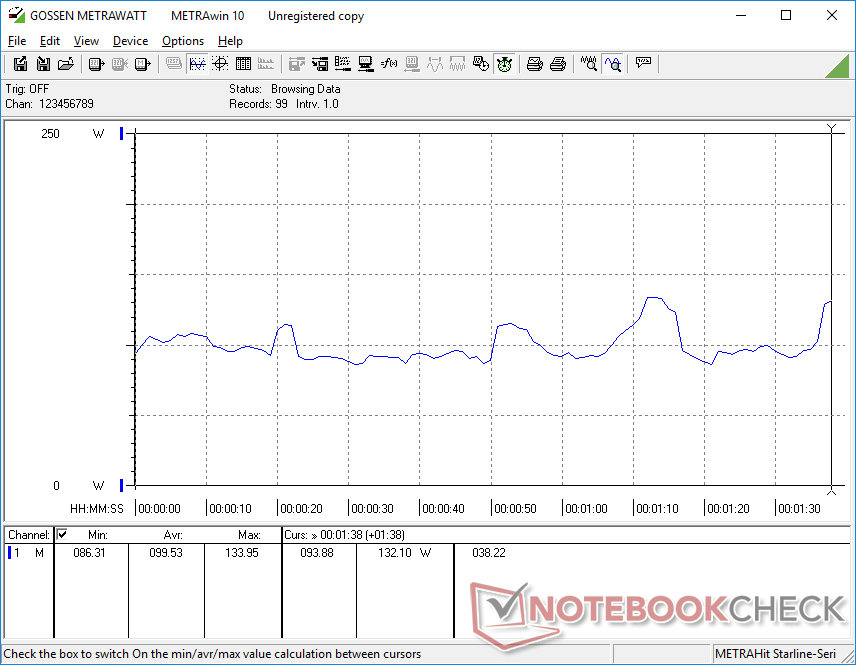
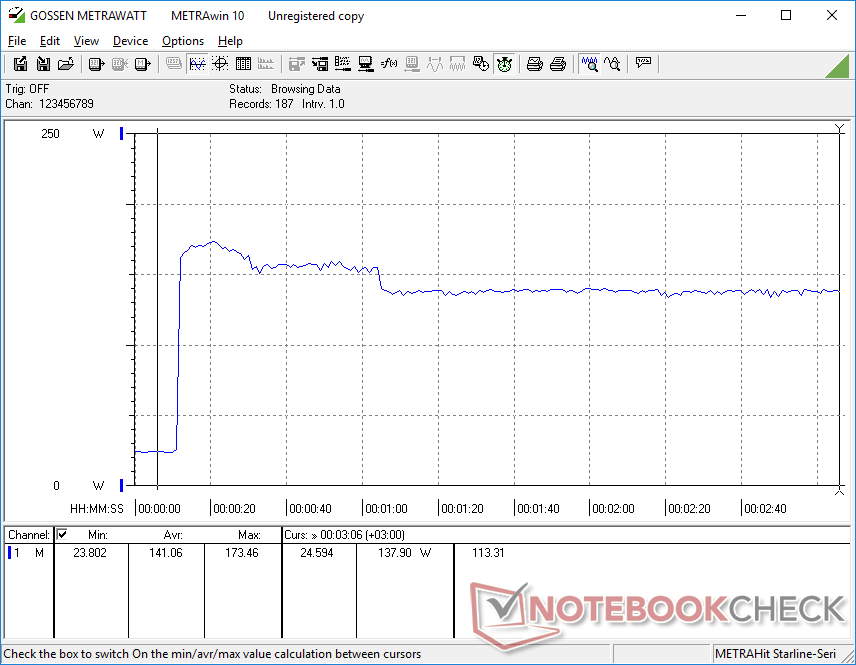
Overall power consumption is higher than what we recorded on the TUF Dash F15 FX516PR which may explain our shorter battery life in the next section. Running Witcher 3 would consume 157 W compared to just 141 W and 116 W on the Blade 15 and MSI GF65, respectively, each with older 10th gen Core i7 CPUs but the same RTX 3060 GPU.
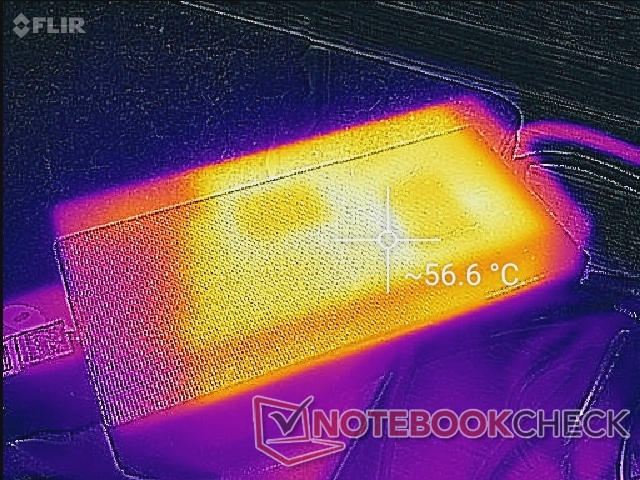
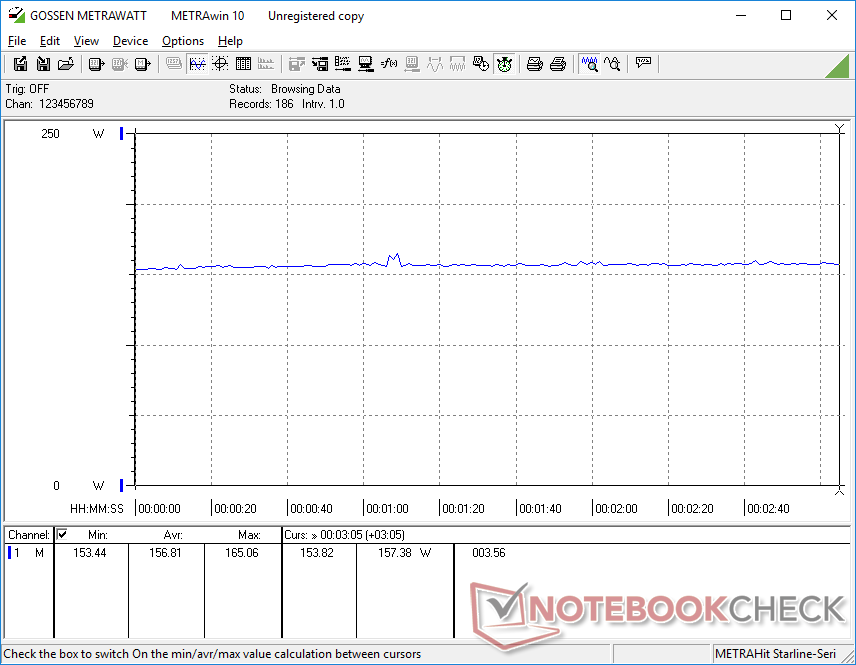
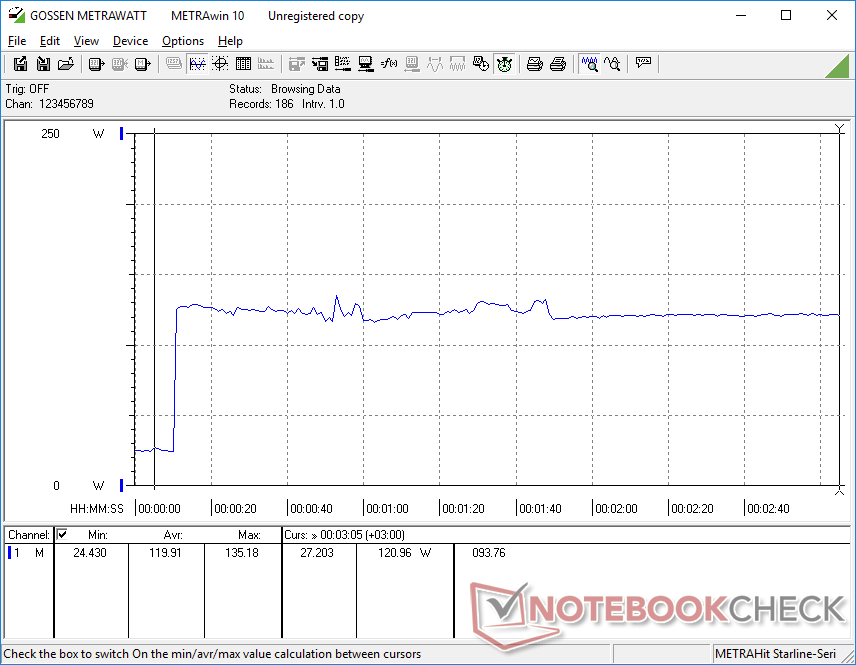
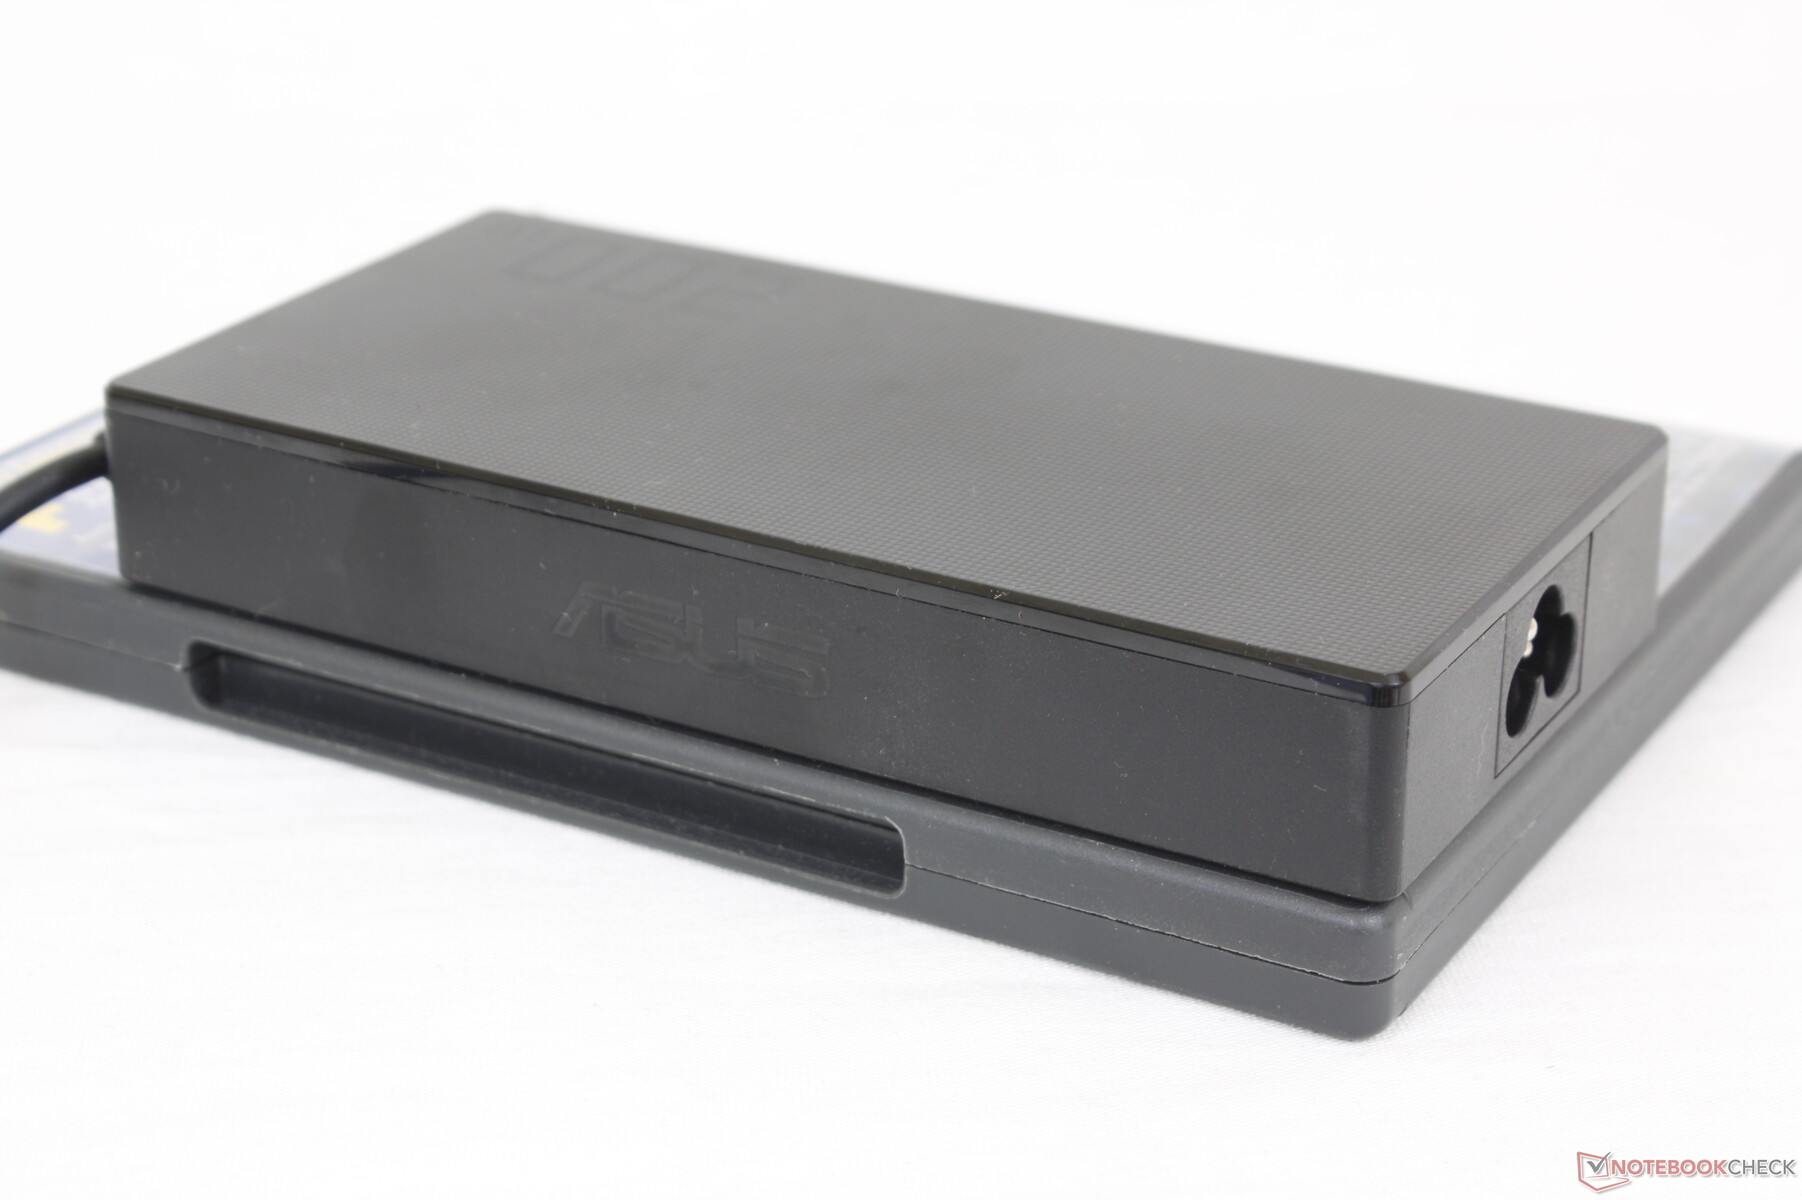
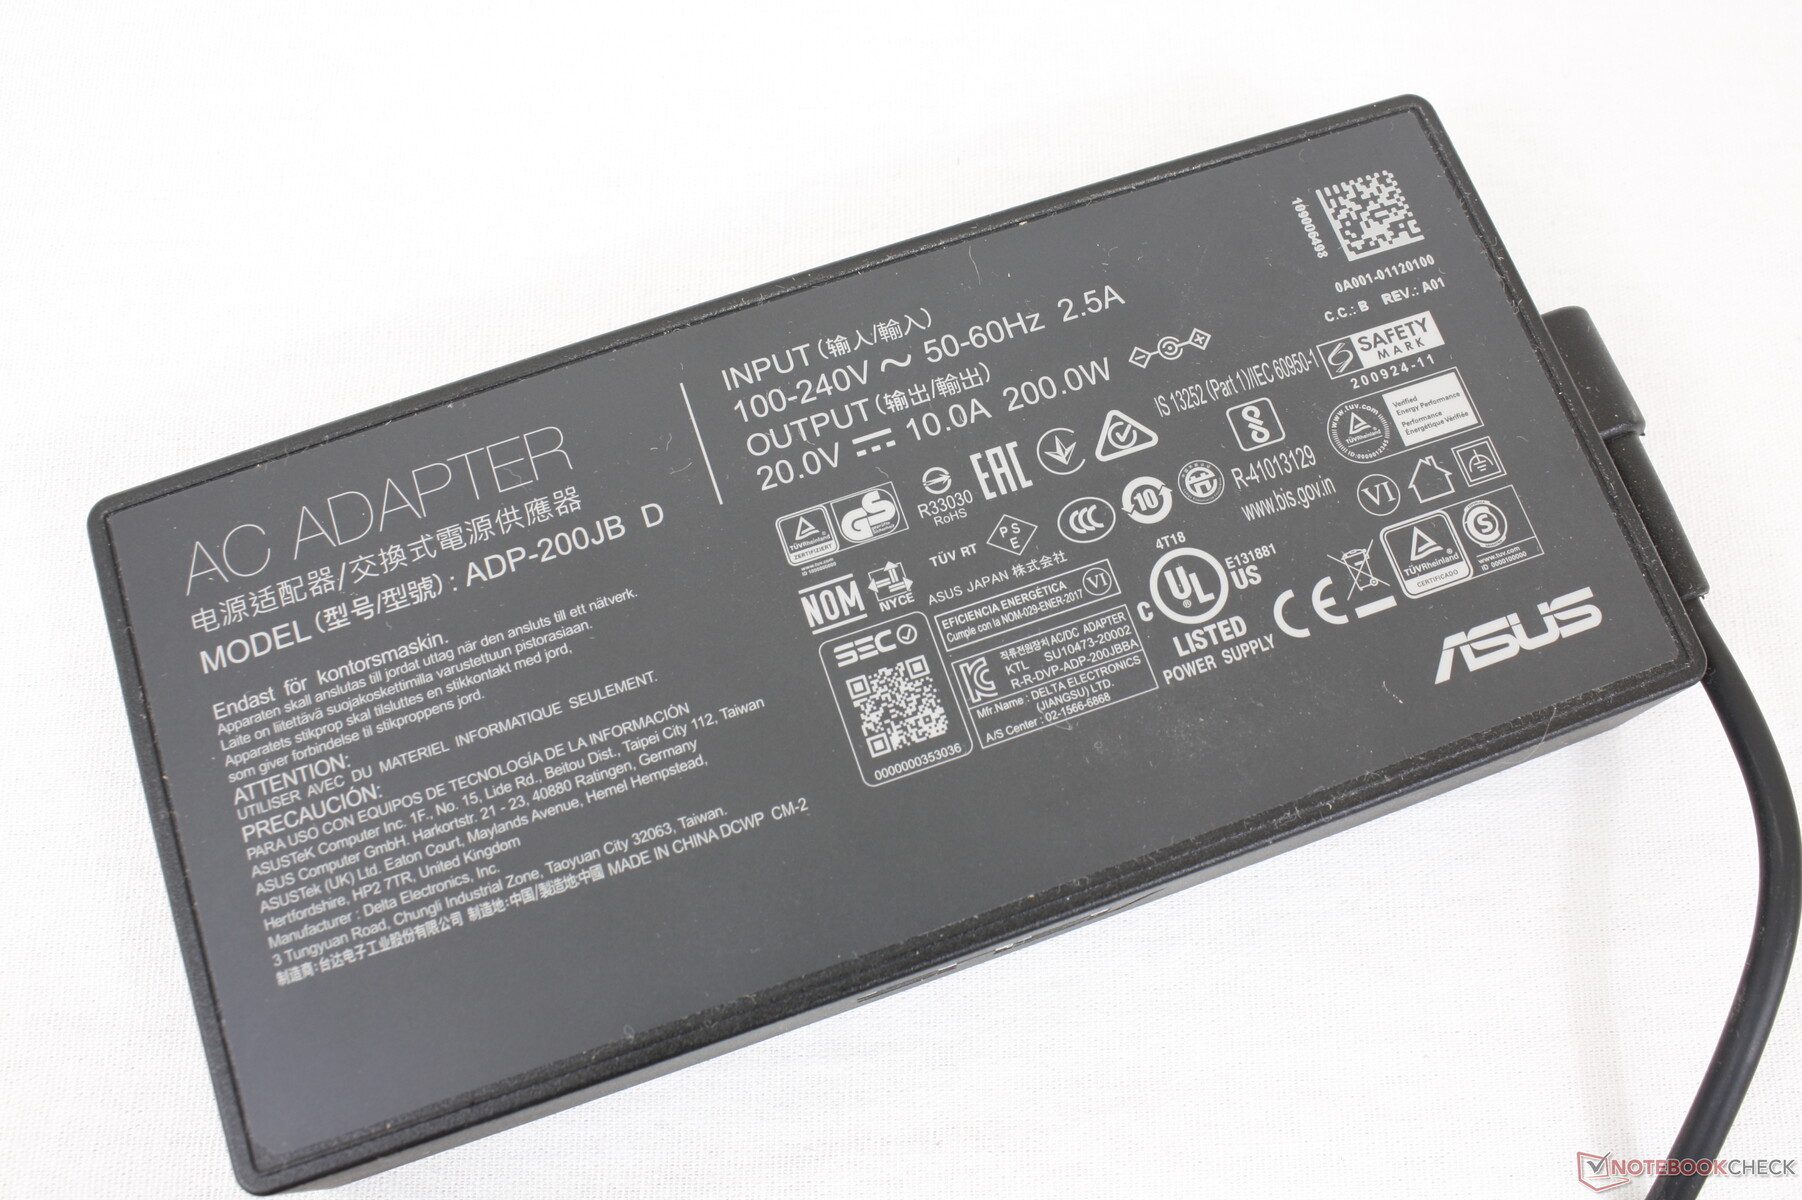
We're able to record a maximum draw of 173.5 W from the medium-sized (~15.1 x 7.2 x 2.3 cm) 180 W AC adapter. This rate is only temporary as it eventually falls to just 135 W after a couple of minutes as shown by the screenshot below. The charging rate slows when under such high loads as well, but it thankfully never discharges unlike on older XPS 17 models.
| Off / Standby | |
| Idle | |
| Load |
|
Key:
min: | |
| Asus TUF Gaming F15 FX506HM i7-11800H, GeForce RTX 3060 Laptop GPU, SK Hynix HFM001TD3JX013N, IPS, 1920x1080, 15.6" | Asus TUF Dash F15 FX516PR i7-11370H, GeForce RTX 3070 Laptop GPU, SK Hynix HFM001TD3JX013N, IPS, 1920x1080, 15.6" | Asus TUF FX505DT-EB73 R7 3750H, GeForce GTX 1650 Mobile, Intel SSD 660p SSDPEKNW512G8, IPS, 1920x1080, 15.6" | Razer Blade 15 Base Edition 2021, i7-10750H RTX 3060 i7-10750H, GeForce RTX 3060 Laptop GPU, Samsung SSD PM981a MZVLB512HBJQ, IPS, 1920x1080, 15.6" | MSI GF65 Thin 10UE i7-10750H, GeForce RTX 3060 Laptop GPU, Samsung SSD PM981 MZVLB1T0HALR, IPS, 1920x1080, 15.6" | Lenovo Legion 5 15IMH05H i5-10300H, GeForce RTX 2060 Mobile, Samsung PM991 MZALQ512HALU, IPS, 1920x1080, 15.6" | |
|---|---|---|---|---|---|---|
| Power Consumption | 11% | 31% | -14% | 15% | 28% | |
| Idle Minimum * (Watt) | 9.5 | 9 5% | 7 26% | 11.7 -23% | 5.4 43% | 3.2 66% |
| Idle Average * (Watt) | 12.1 | 11 9% | 9.9 18% | 16 -32% | 12.8 -6% | 8.3 31% |
| Idle Maximum * (Watt) | 22.5 | 16 29% | 12 47% | 29.3 -30% | 19.5 13% | 8.7 61% |
| Load Average * (Watt) | 99.5 | 107 -8% | 68.4 31% | 95.6 4% | 86.6 13% | 82 18% |
| Witcher 3 ultra * (Watt) | 157 | 121 23% | 94.9 40% | 141.3 10% | 115.7 26% | 151 4% |
| Load Maximum * (Watt) | 173.5 | 162 7% | 130.9 25% | 197 -14% | 175.2 -1% | 195 -12% |
* ... smaller is better
Battery Life — Good For A Gaming Laptop
We're able to squeeze almost 8 full hours of real-world WLAN use from our 90 Wh battery when set to Balanced mode with the iGPU active. Users who opt for the 48 Wh configuration can expect roughly half this runtime. Unusually, runtimes would be consistently shorter than what we recorded on the TUF Dash F15 even when idling on desktop on Power Saver mode with the display set to minimum brightness.
Charging from empty to full capacity is relatively fast at just under 1.5 hours. Users cannot recharge the laptop via USB-C.
| Asus TUF Gaming F15 FX506HM i7-11800H, GeForce RTX 3060 Laptop GPU, 90 Wh | Asus TUF Dash F15 FX516PR i7-11370H, GeForce RTX 3070 Laptop GPU, 76 Wh | Asus TUF FX505DT-EB73 R7 3750H, GeForce GTX 1650 Mobile, 48 Wh | Razer Blade 15 Base Edition 2021, i7-10750H RTX 3060 i7-10750H, GeForce RTX 3060 Laptop GPU, 65 Wh | MSI GF65 Thin 10UE i7-10750H, GeForce RTX 3060 Laptop GPU, 51 Wh | Lenovo Legion 5 15IMH05H i5-10300H, GeForce RTX 2060 Mobile, 60 Wh | |
|---|---|---|---|---|---|---|
| Battery runtime | 30% | -31% | -31% | -29% | -4% | |
| Reader / Idle (h) | 11 | 16 45% | 7.8 -29% | 7.8 -29% | 11.1 1% | 14.1 28% |
| WiFi v1.3 (h) | 7.9 | 9.1 15% | 4.8 -39% | 4.8 -39% | 4.6 -42% | 7.2 -9% |
| Load (h) | 2 | 1.5 -25% | 1.5 -25% | 1.1 -45% | 1.4 -30% |
Pros
Cons
Verdict — Great Performance, Meh Chassis
For an entry-level to midrange gaming laptop, the TUF FX506HM offers good value especially when compared to the competing MSI GF65 or GF66 series. Most notably, it carries Thunderbolt connectivity, RGB keyboard lighting, and a numpad which the aforementioned MSI models lack. We also prefer the firmer keyboard keys and easier-to-use touchpad on the Asus for an overall more satisfying user experience.
The high CPU and GPU performances allow the FX506HM to punch above its budget to midrange category. The plastic base and limited color reproduction, however, bring it back down to earth.
Processor performance from the new Intel 11th gen Core-H platform is also excellent with decent gains over the previous generation. Though it doesn't leapfrog over the latest Zen 3 AMD CPUs by significant margins, its on-die support for both Thunderbolt and PCIe 4.0 gives it a leg up for users who care about these high-end features.
Everything else about the FX506 is merely average for its category. The plastic base, for example, is on par with an inexpensive Lenovo IdeaPad Gaming 3i, HP Pavilion Gaming 15, or MSI GF65. Chassis quality doesn't feel any better or worse than on the previous generation FX505 as a result.
Price and availability
The Asus TUF FX506 series with 11th gen Intel CPUs is not yet widely available as of this writing.
Asus TUF Gaming F15 FX506HM
- 06/25/2021 v7 (old)
Allen Ngo
Price comparison
