NVIDIA GeForce RTX 3060 Ti Founders Edition Review: Flagship 1440p Ultra and austere 4K gaming for US$400
Back in December 2020, NVIDIA officially announced the GeForce RTX 3060 Ti targeting the vast majority of 1080p and 1440p gamers. The RTX 3060 Ti is based on the same 8 nm GA104 GPU as the RTX 3070 but enables only 4,864 CUDA cores.
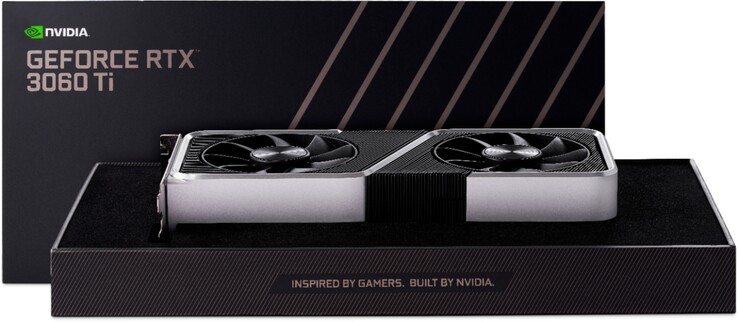
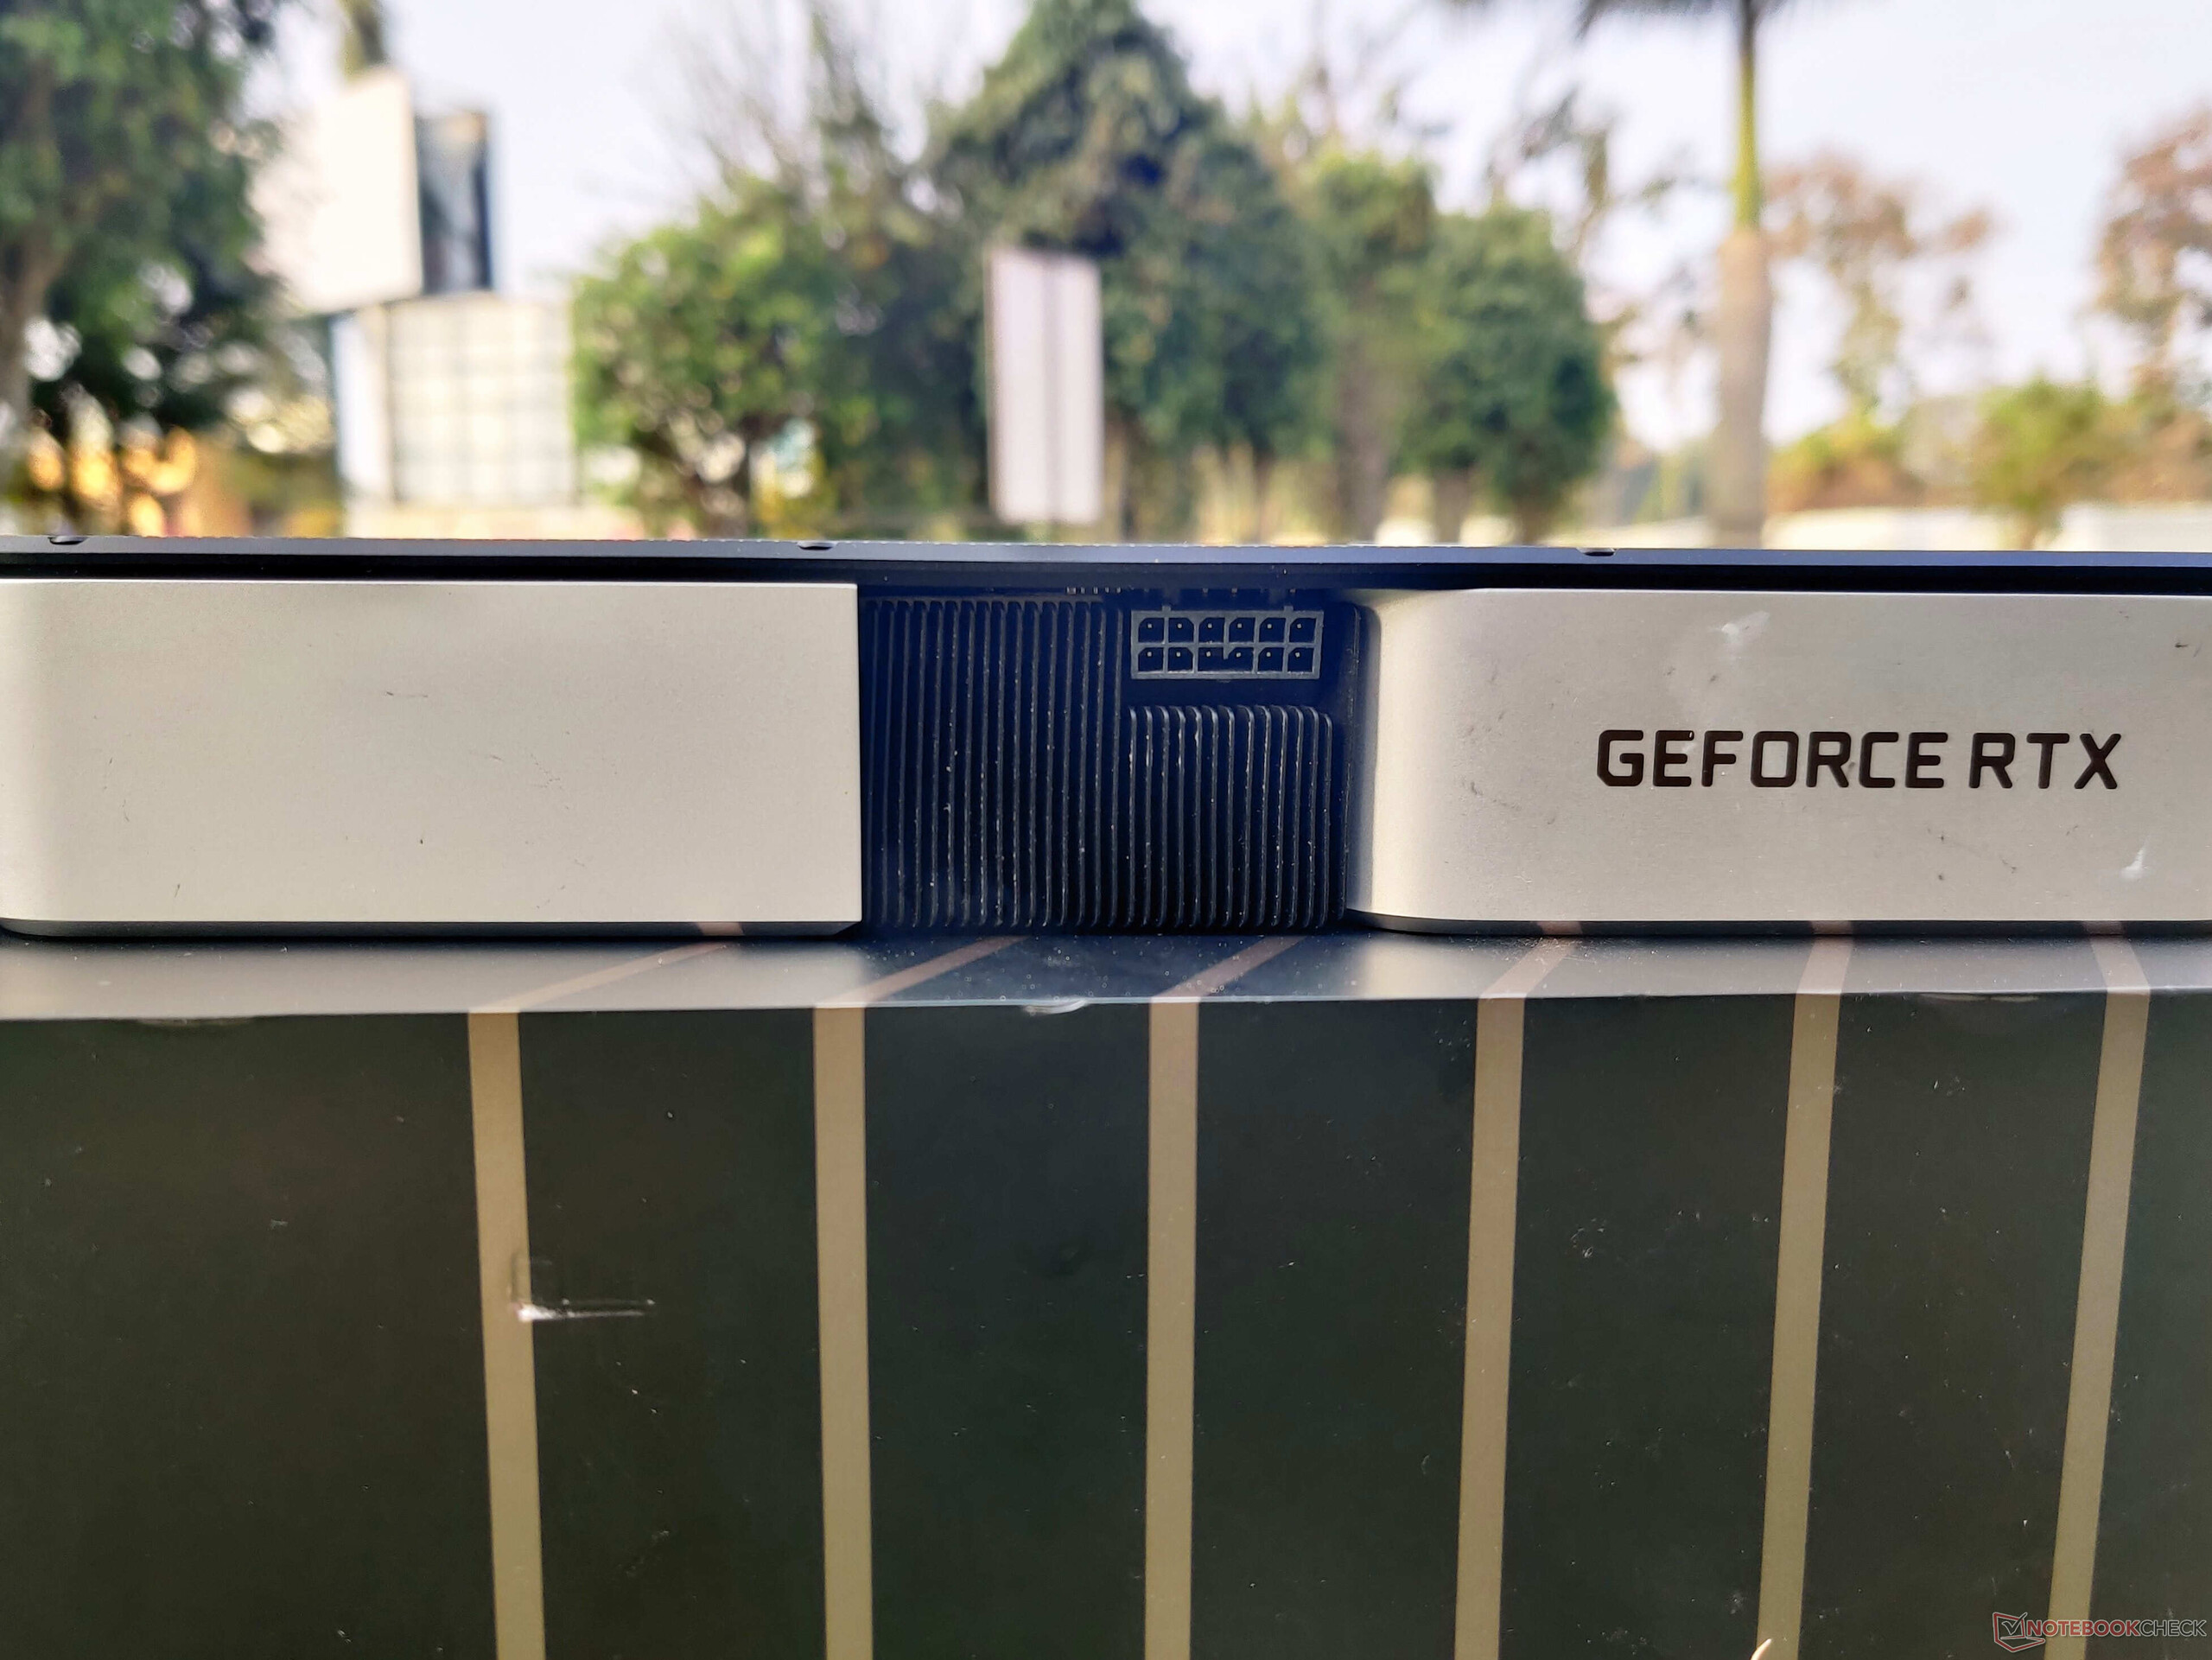
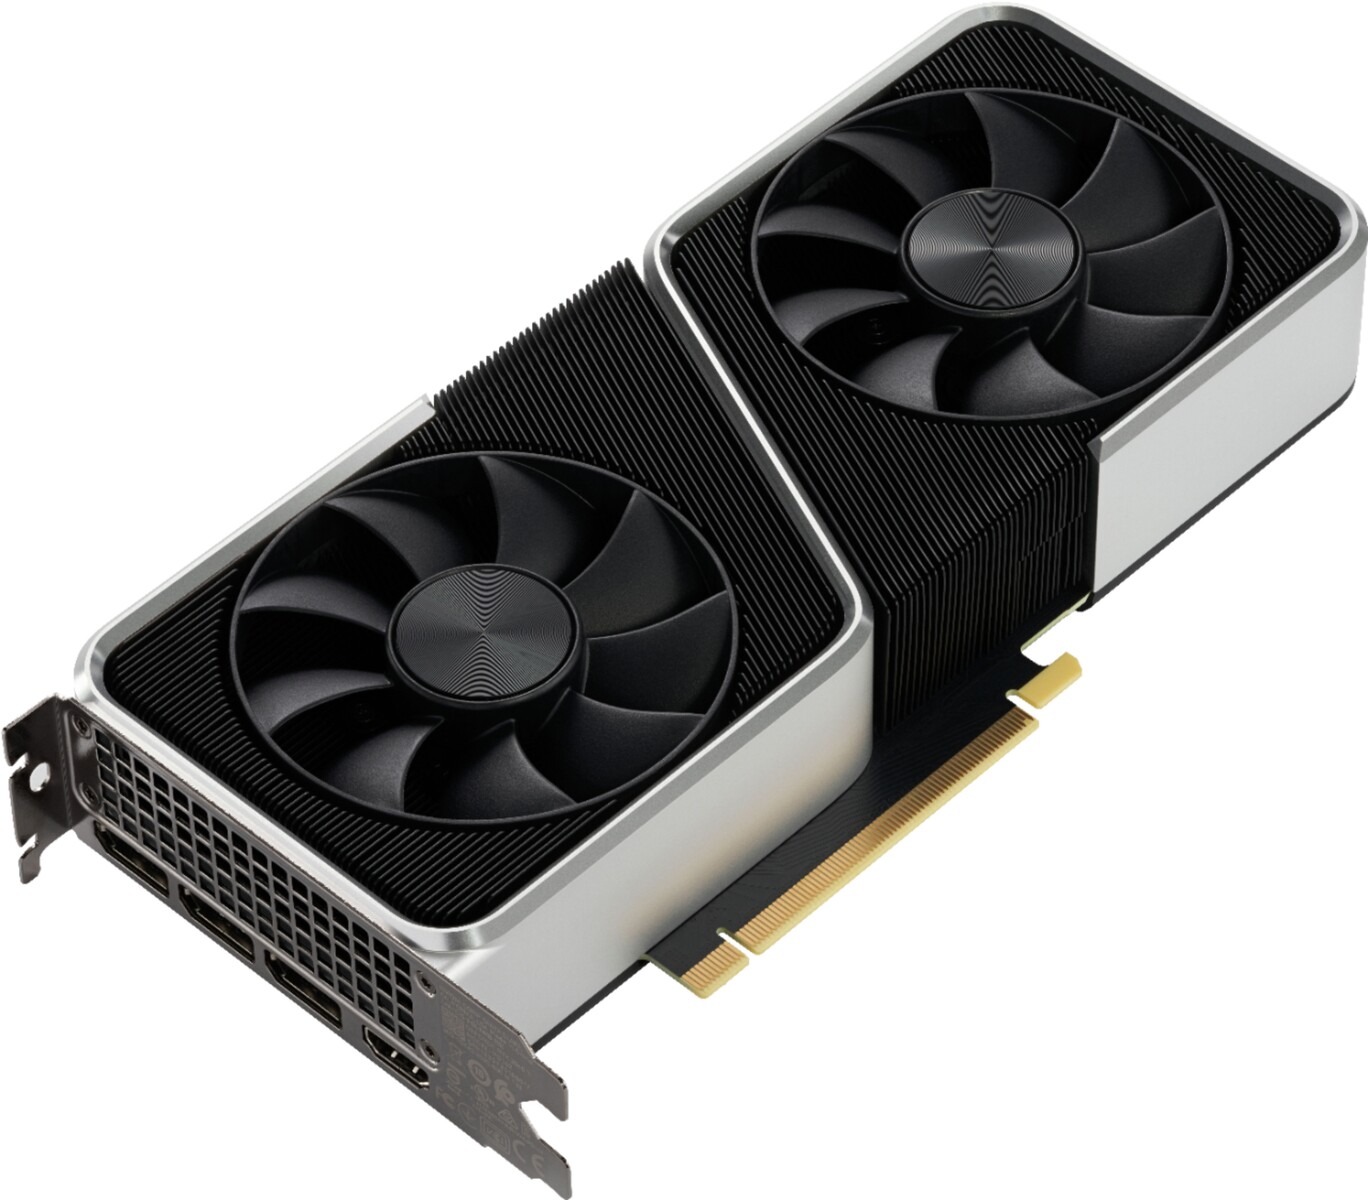
We have with us the RTX 3060 Ti Founders Edition (FE) card from NVIDIA for review. The RTX 3060 Ti FE sports a similar design as the rest of the Ampere FE cards including the use of a 12-pin Molex MicroFit 3.0 power connector. However, unlike the other Ampere FE cards so far, we get to see a bright silvery metallic finish that lends a premium look.
At an MSRP of US$400, the RTX 3060 Ti can be considered to be the RTX 2060 Super's spiritual successor. However, the card is slated to offer greater than RTX 2080 Super-level performance for US$300 less making it a potential bargain in more ways than one for 1440p Ultra and 1080p high refresh rate gamers.
In this review, we put the RTX 3060 Ti FE through its paces and evaluate whether it really offers the bang for the buck performance that NVIDIA claims it does.
Comparison of the RTX 3060 Ti with other NVIDIA GPUs
| Specification | RTX 3090 | RTX 3080 FE | RTX 3070 FE | RTX 3060 Ti FE | Titan RTX | RTX 2080 Ti | RTX 2080 Super | RTX 2070 Super | TITAN X Pascal |
| Chip | GA102 | GA102 | GA104 | GA104 | TU102 | TU102 | TU104 | TU104 | GP102 |
| FinFET process | 8 nm | 8 nm | 8 nm | 8 nm | 12 nm | 12 nm | 12 nm | 12 nm | 16 nm |
| CUDA cores | 10,496 | 8,704 | 5,888 | 4,864 | 4,608 | 4,352 | 3,072 | 2,560 | 3,584 |
| Texture units | 328 | 272 | 184 | 152 | 288 | 272 | 192 | 160 | 224 |
| Tensor cores | 328 3rd Gen. | 272 3rd Gen. | 184 3rd Gen. | 152 3rd Gen. | 576 2nd Gen. | 544 2nd Gen. | 384 2nd Gen. | 320 2nd Gen. | — |
| RT cores | 82 | 68 | 46 | 38 | 72 | 68 | 48 | 40 | — |
| GPU base clock | 1,395 MHz | 1,440 MHz | 1,500 MHz | 1,410 MHz | 1,350 MHz | 1,350 MHz | 1,650 MHz | 1,605 MHz | 1,417 MHz |
| GPU boost clock | 1,695 MHz | 1,710 MHz | 1,750 MHz | 1,665 MHz | 1,770 MHz | 1,545 MHz | 1,815 MHz | 1,770 MHz | 1,531 MHz |
| Memory bus | 384-bit | 320-bit | 256-bit | 256-bit | 384-bit | 352-bit | 256-bit | 256-bit | 384-bit |
| Memory bandwidth | 936 GB/s | 760 GB/s | 448 GB/s | 448 GB/s | 672 GB/s | 616 GB/s | 495.9 GB/s | 448 GB/s | 480.4 GB/s |
| Video memory | 24 GB GDDR6X | 10 GB GDDR6X | 8 GB GDDR6 | 8 GB GDDR6 | 24 GB GDDR6 | 11 GB GDDR6 | 8 GB GDDR6 | 8 GB GDDR6 | 12 GB GDDR5X |
| Power consumption | 350 W | 320 W | 220 W | 200 W | 280 W | 250 W | 250 W | 215 W | 250 W |
A tour of the NVIDIA GeForce RTX 3060 Ti Founders Edition
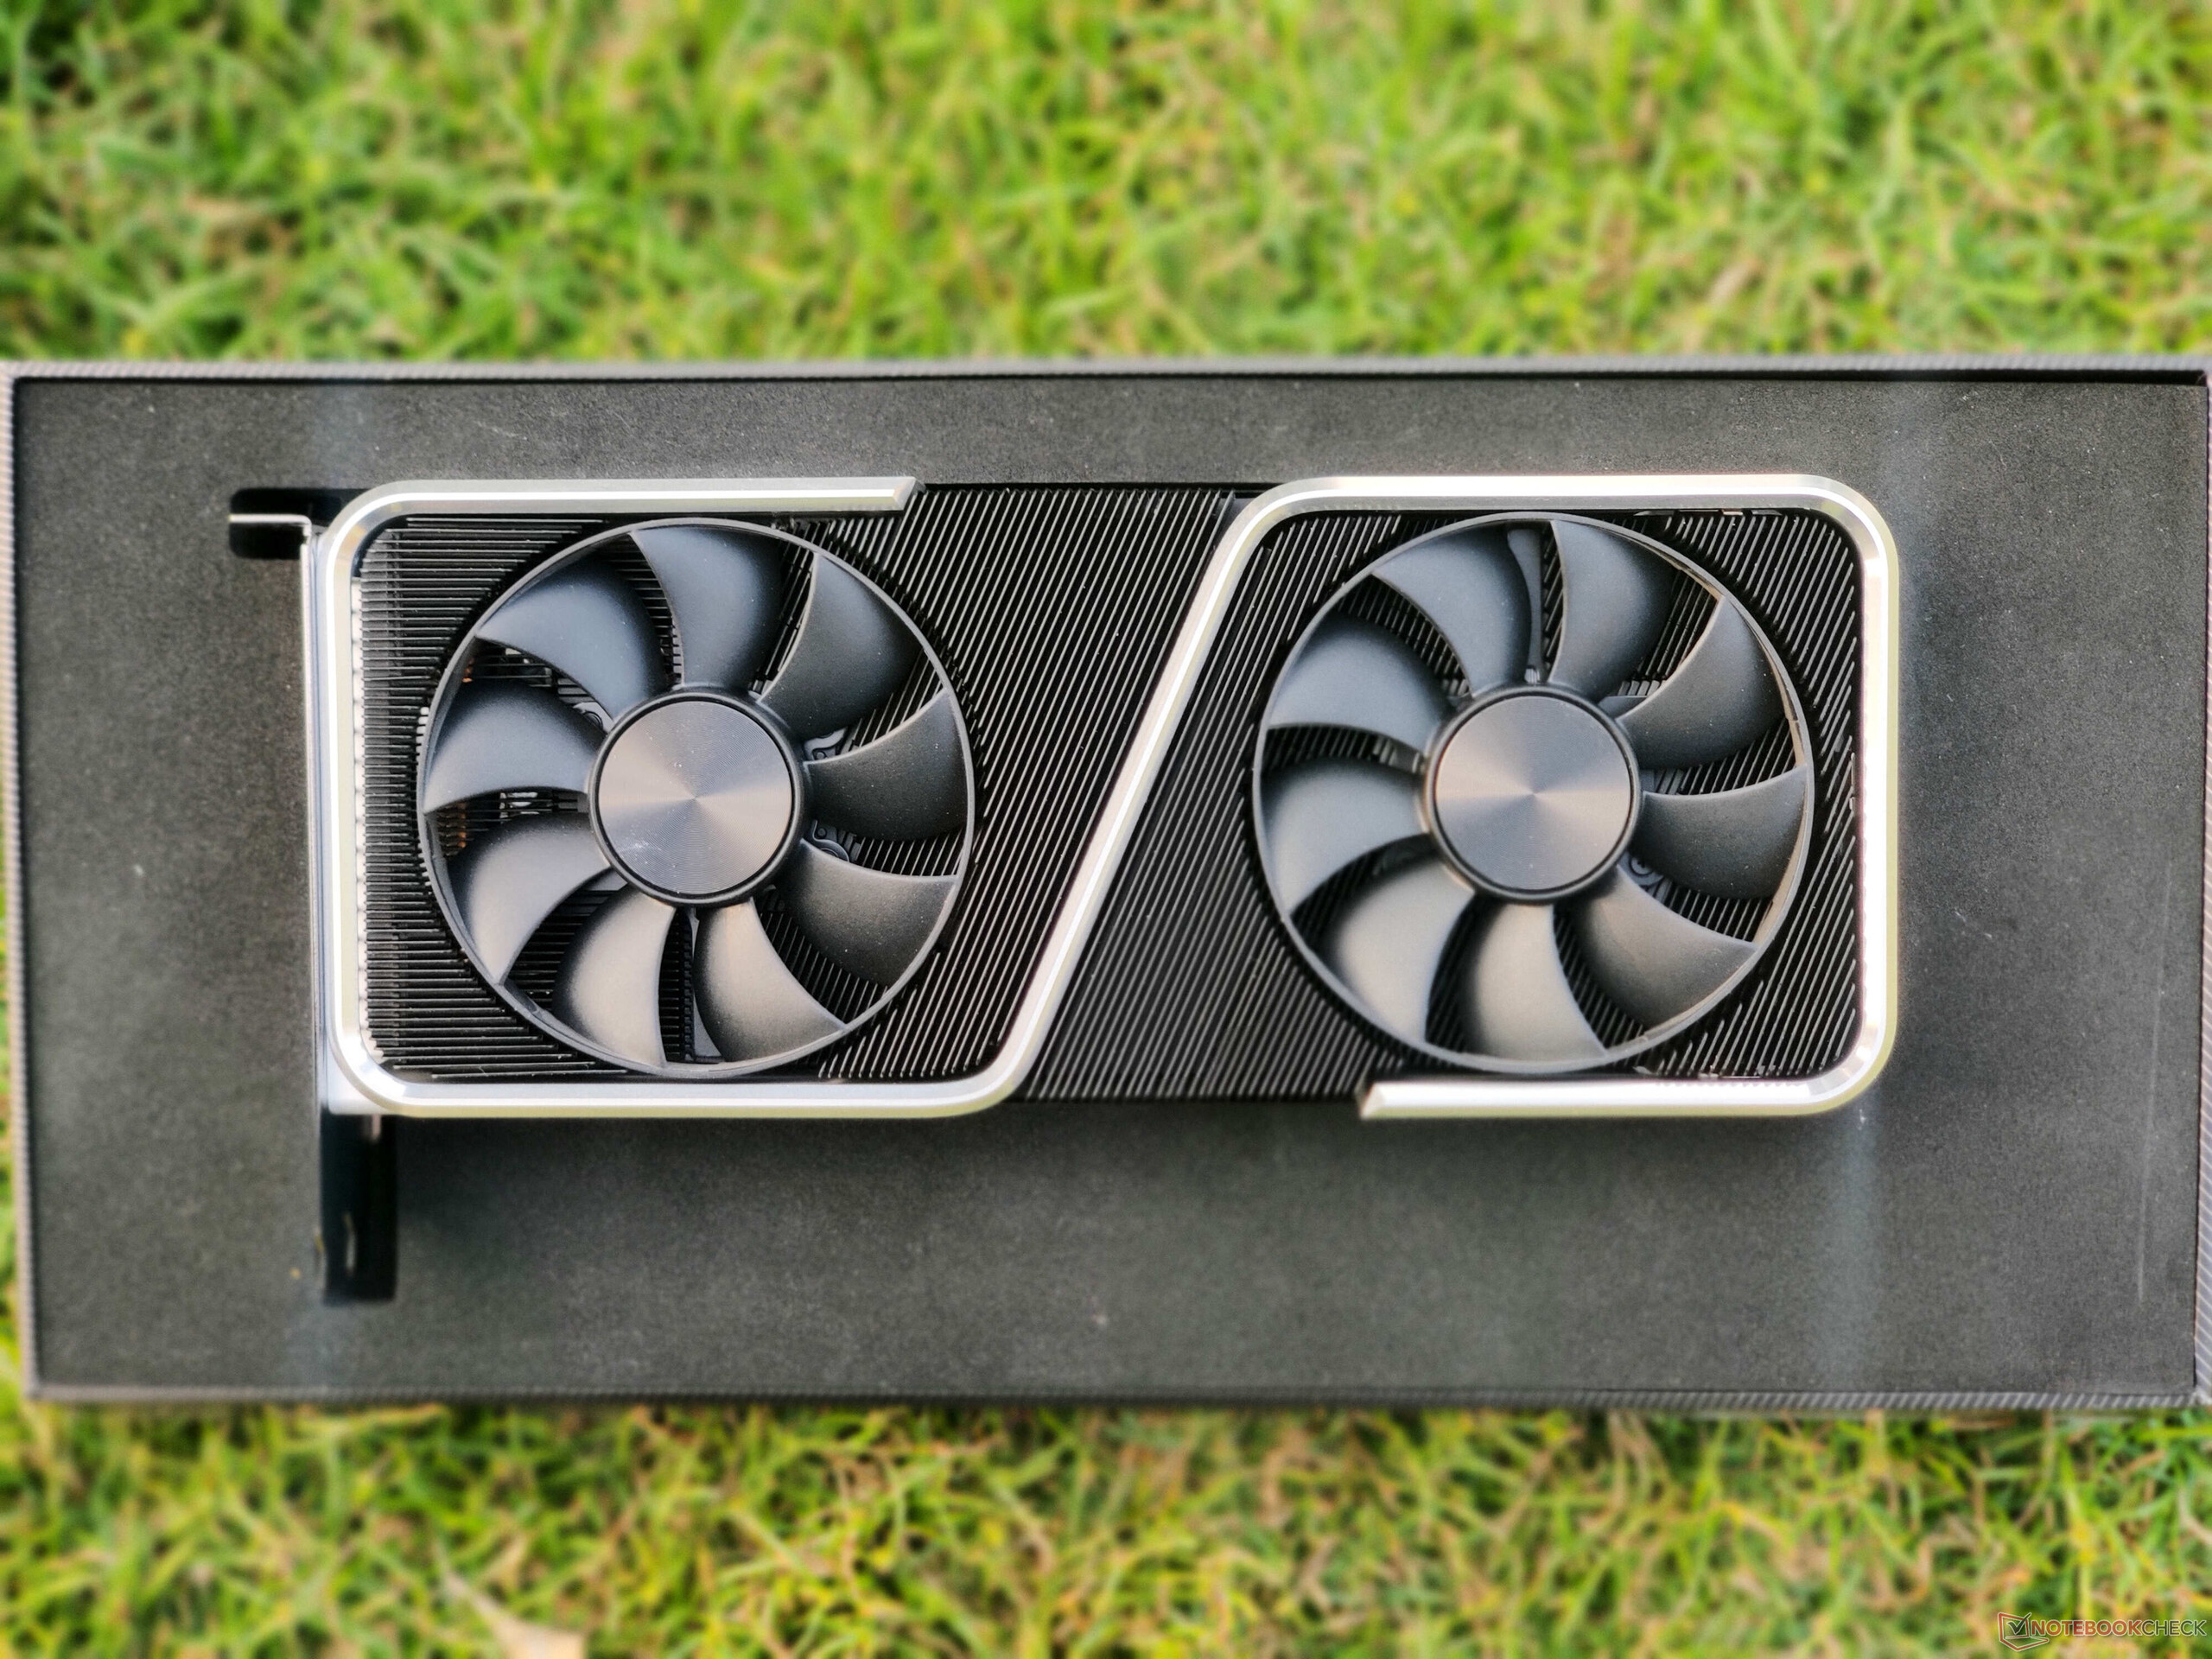
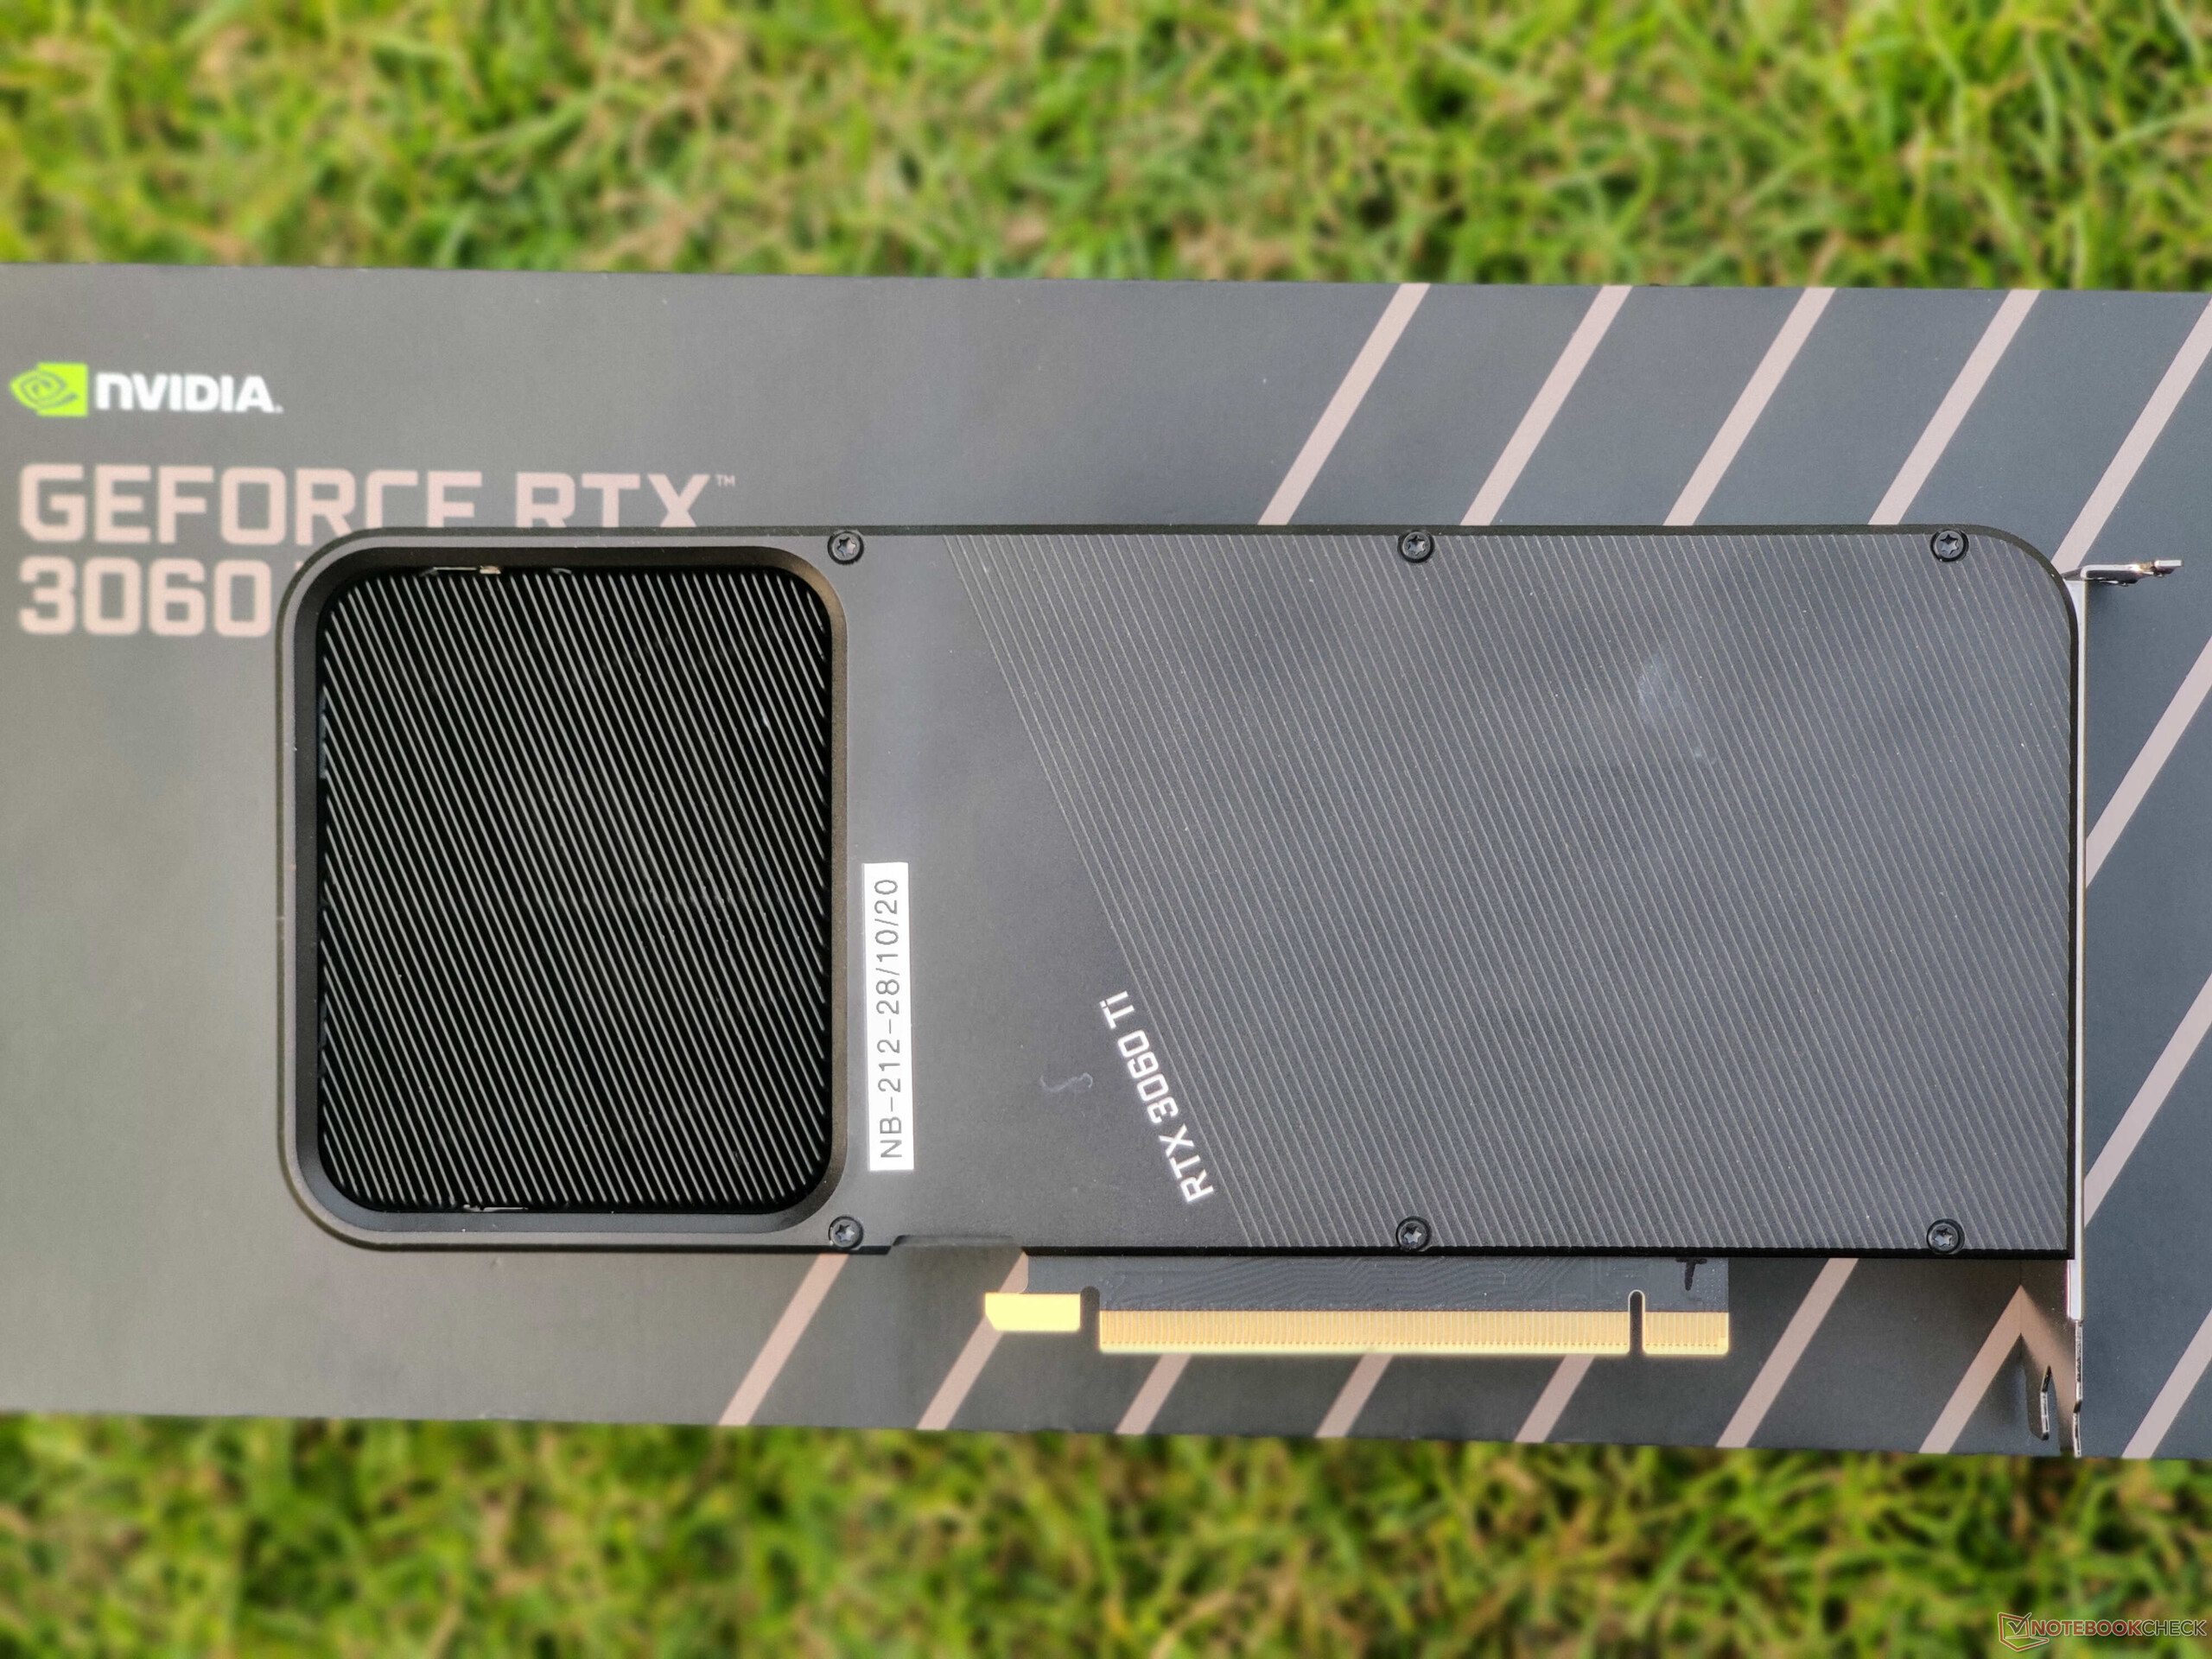
The RTX 3060 Ti Founders Edition embodies NVIDIA's new design language that helps with better heat dissipation and low noise levels, at least when compared to previous generation FE cards. The card looks quite unassuming, but the bright silver metal frame lends a premium look. It is well-built with no twists, creaks, or flimsy plastic shrouds.
Similar to the rest of the NVIDIA Ampere Founders Edition cards, the RTX 3060 Ti FE also comes with a 12-pin Molex MicroFit 3.0 power connector that is situated towards the middle. NVIDIA includes an 8-pin to 12-pin connector in the box.
The 12-pin connector seems somewhat redundant here and is a definite minus on the aesthetics front (not to mention cable management woes) as the RTX 3060 Ti consumes less than 300 W and can easily make do with just the standard 8-pin PSU connector.
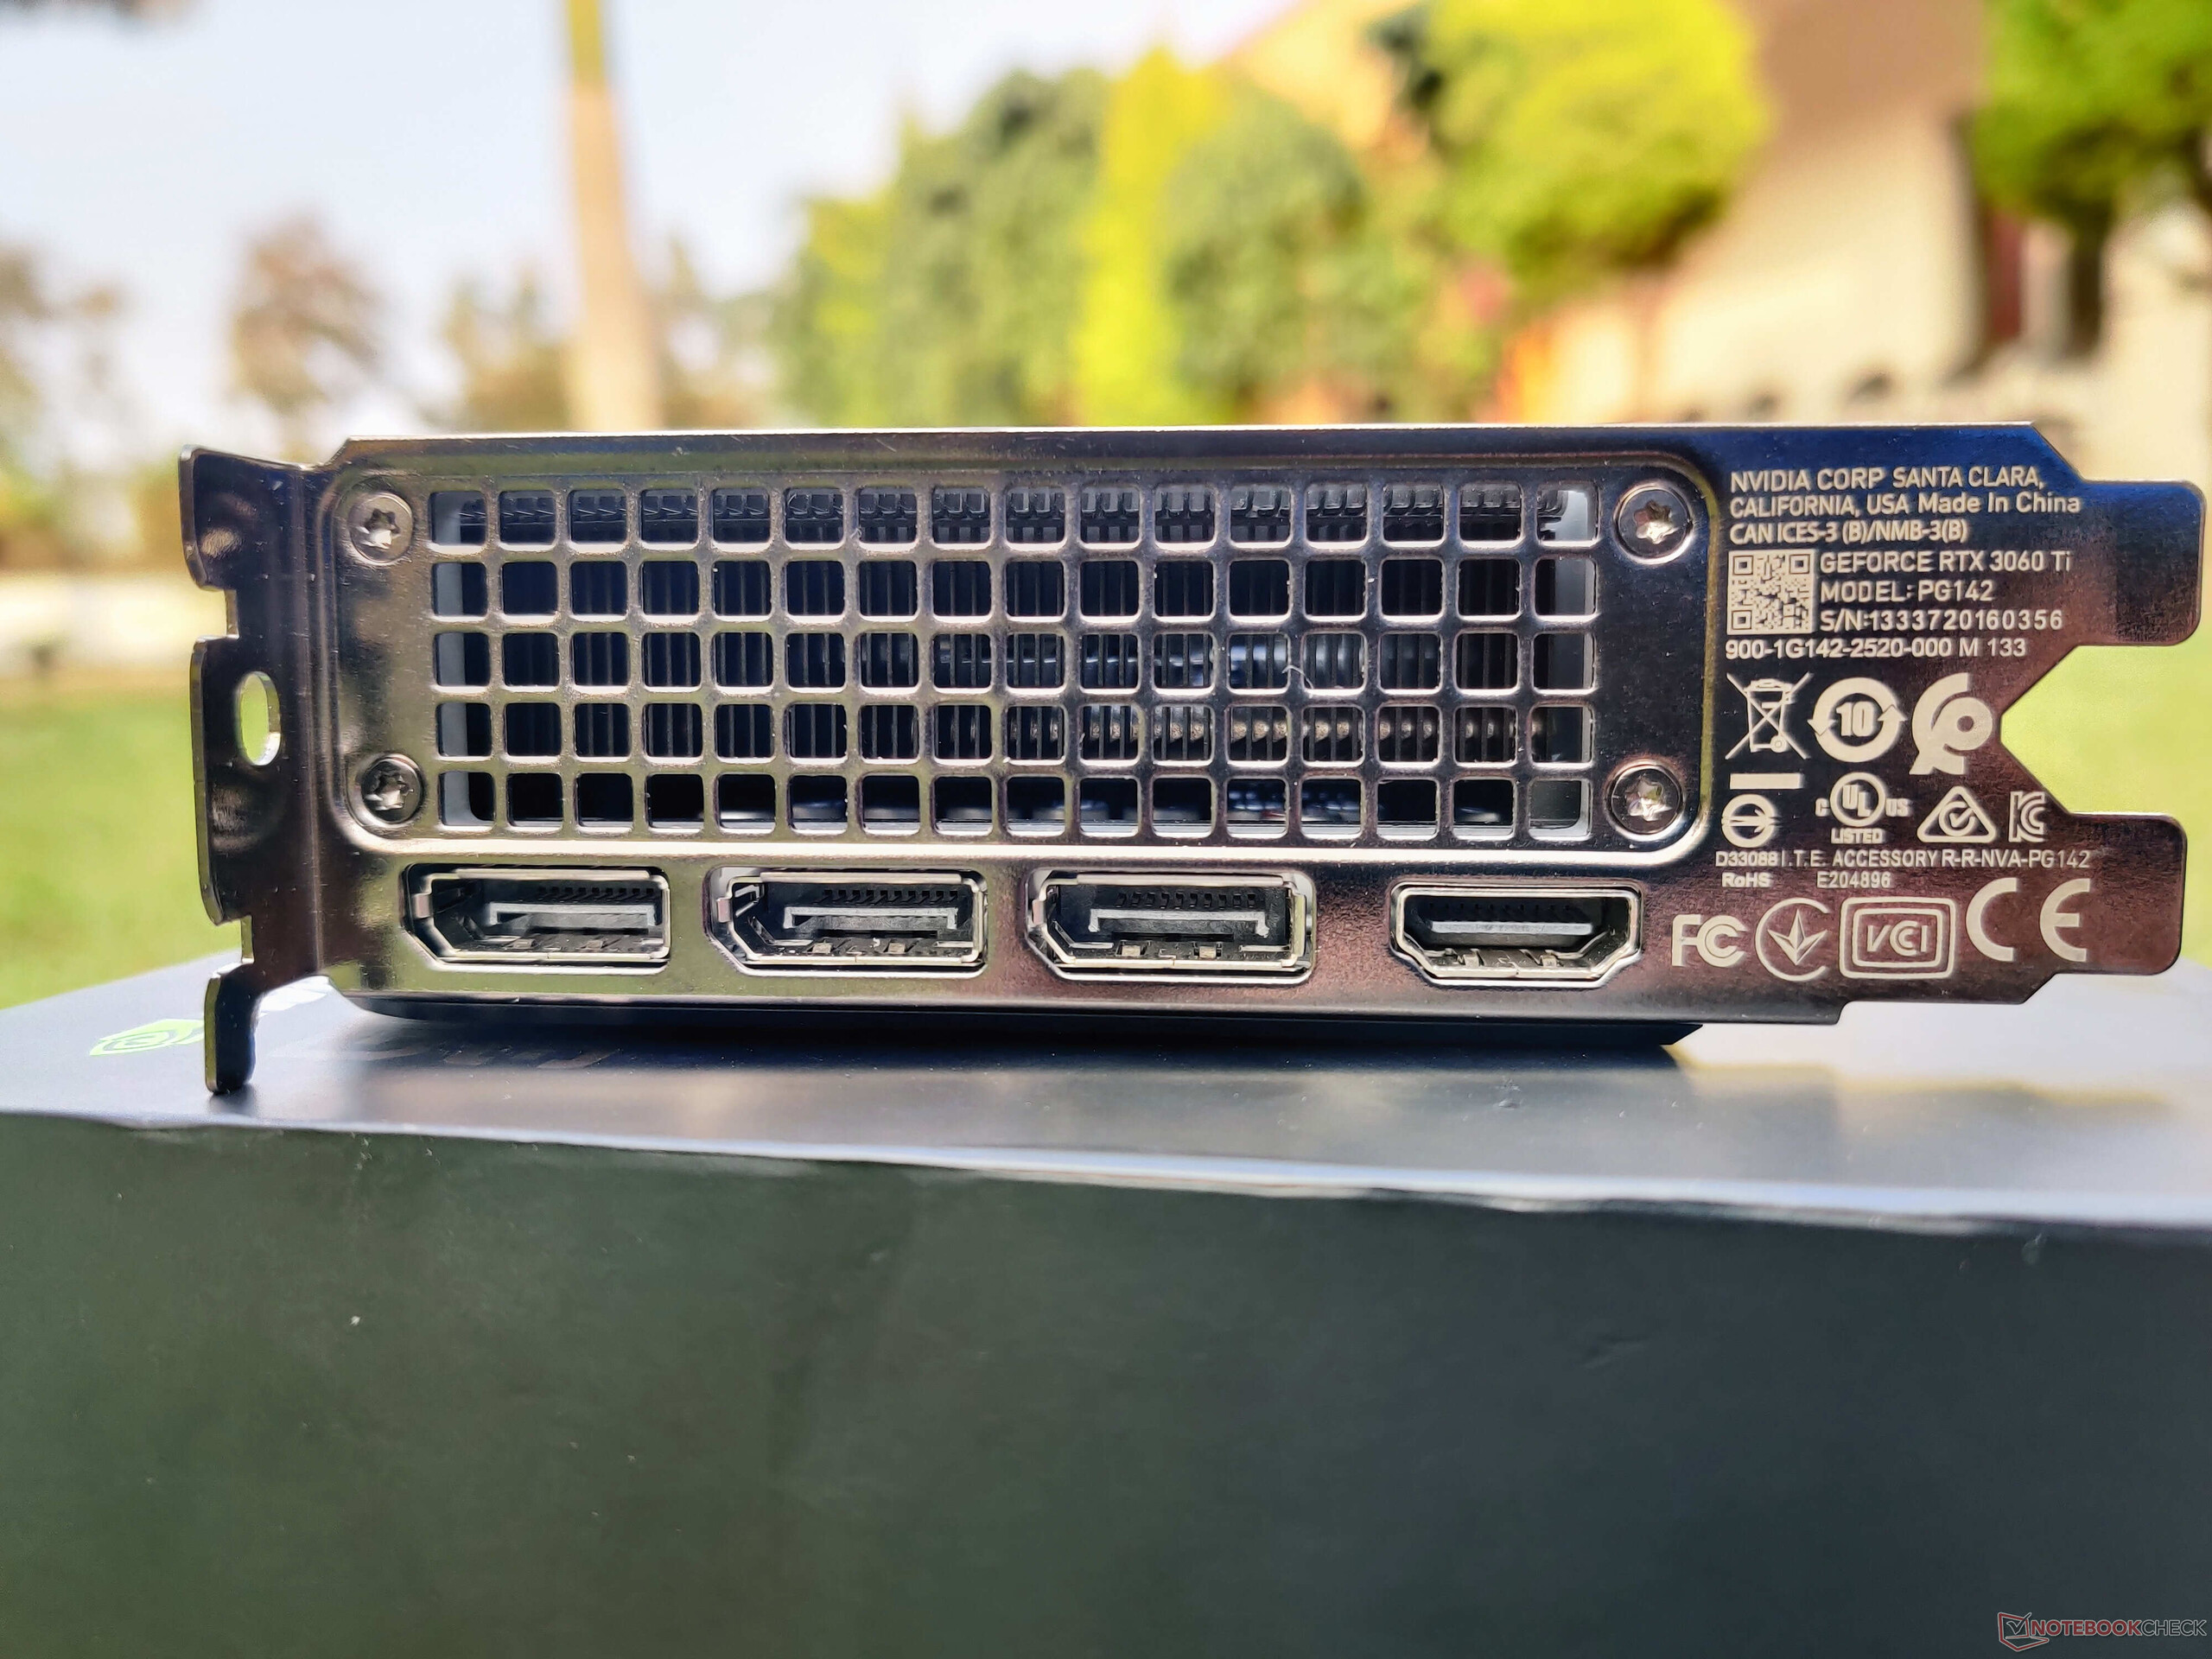
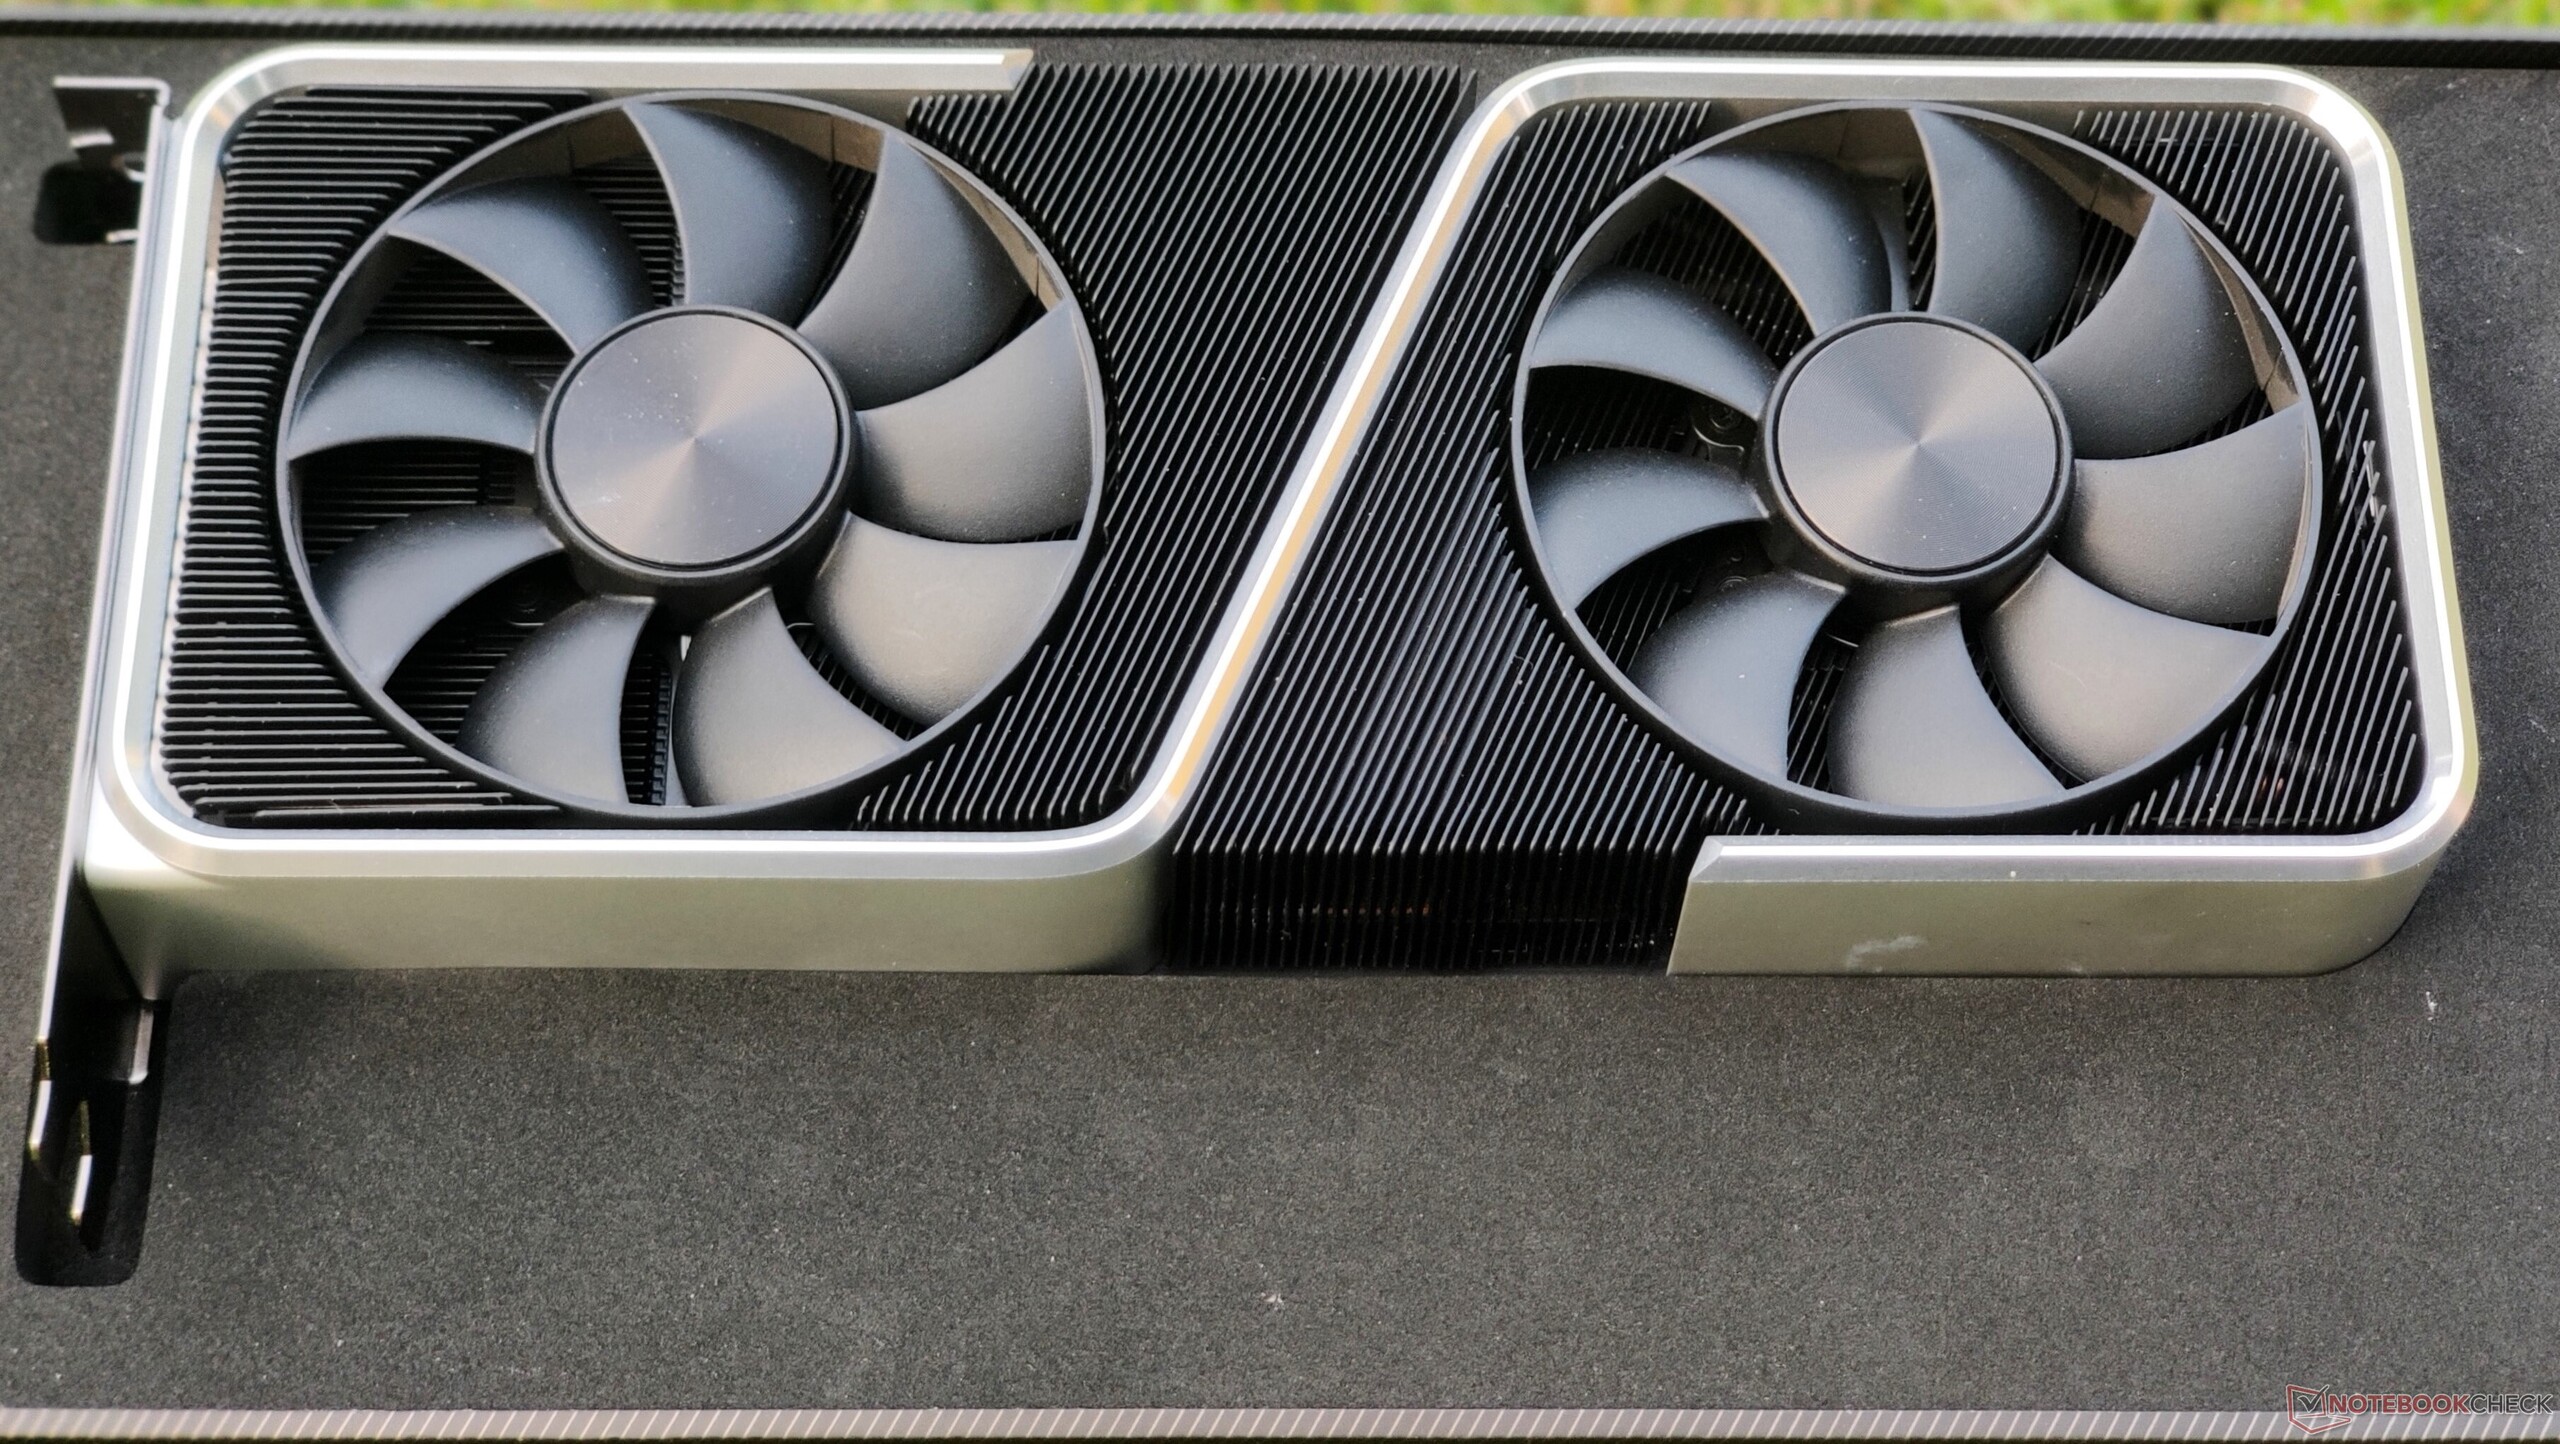
Connectivity options are standard and include three DisplayPort 1.4a ports and one HDMI 2.1. The dual 9-blade fans offer effective cooling and have a very good noise profile under load as we shall see later in the review. A metal backplate is provided that not only helps with protection but also features a couple of thermal pads underneath for dissipating heat away from the memory VRMs placed on the backside of the PCB.
The NVIDIA GeForce RTX 3060 Ti Founders Edition retails for US$399.99 (₹35,900) and comes with a three-year warranty.
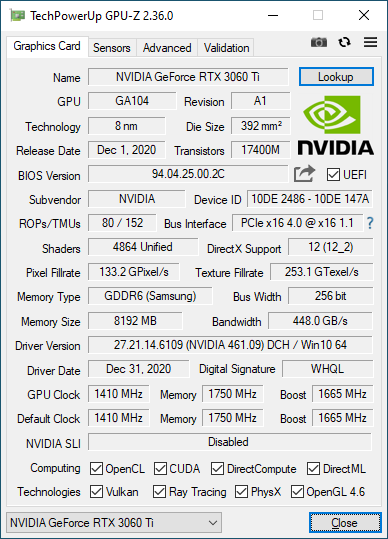
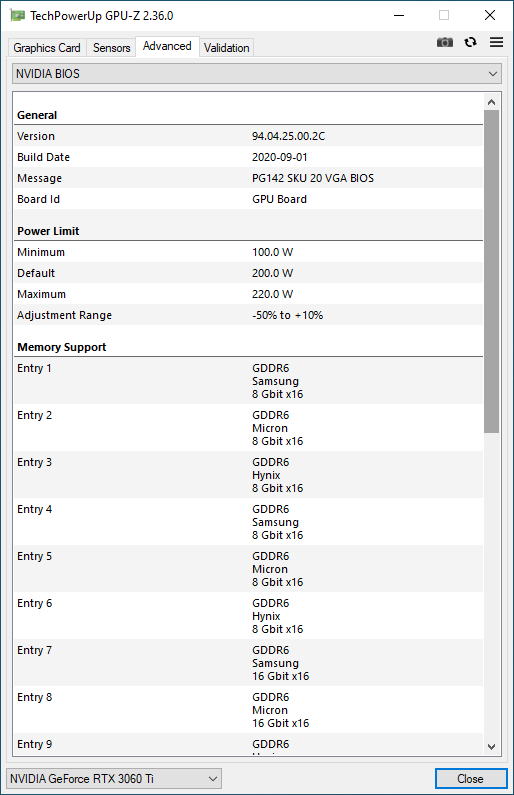
The RTX 3060 Ti FE offers a base clock of 1,410 MHz and can boost up to 1,665 MHz. It is possible to increase the 200 W power target by another 20 W. Since the card lacks any form of RGB bling, the additional power is mostly used by the GPU itself. That being said, the actual headroom for overclocking is not much.
The RTX 3060 Ti offers 8 GB of GDDR6 VRAM on a 256-bit memory bus with a maximum bandwidth of 448 GB/s. While this may seem low in comparison with high-end offerings from NVIDIA and all of AMD's Radeon RX 6000 cards so far, given the capabilities of the RTX 3060 Ti, the 8 GB VRAM should be adequate unless you are into pro apps or compute-heavy workloads that may require higher working video memory. We did not run into any memory limitation issues during the entirety of our testing.
The test bench
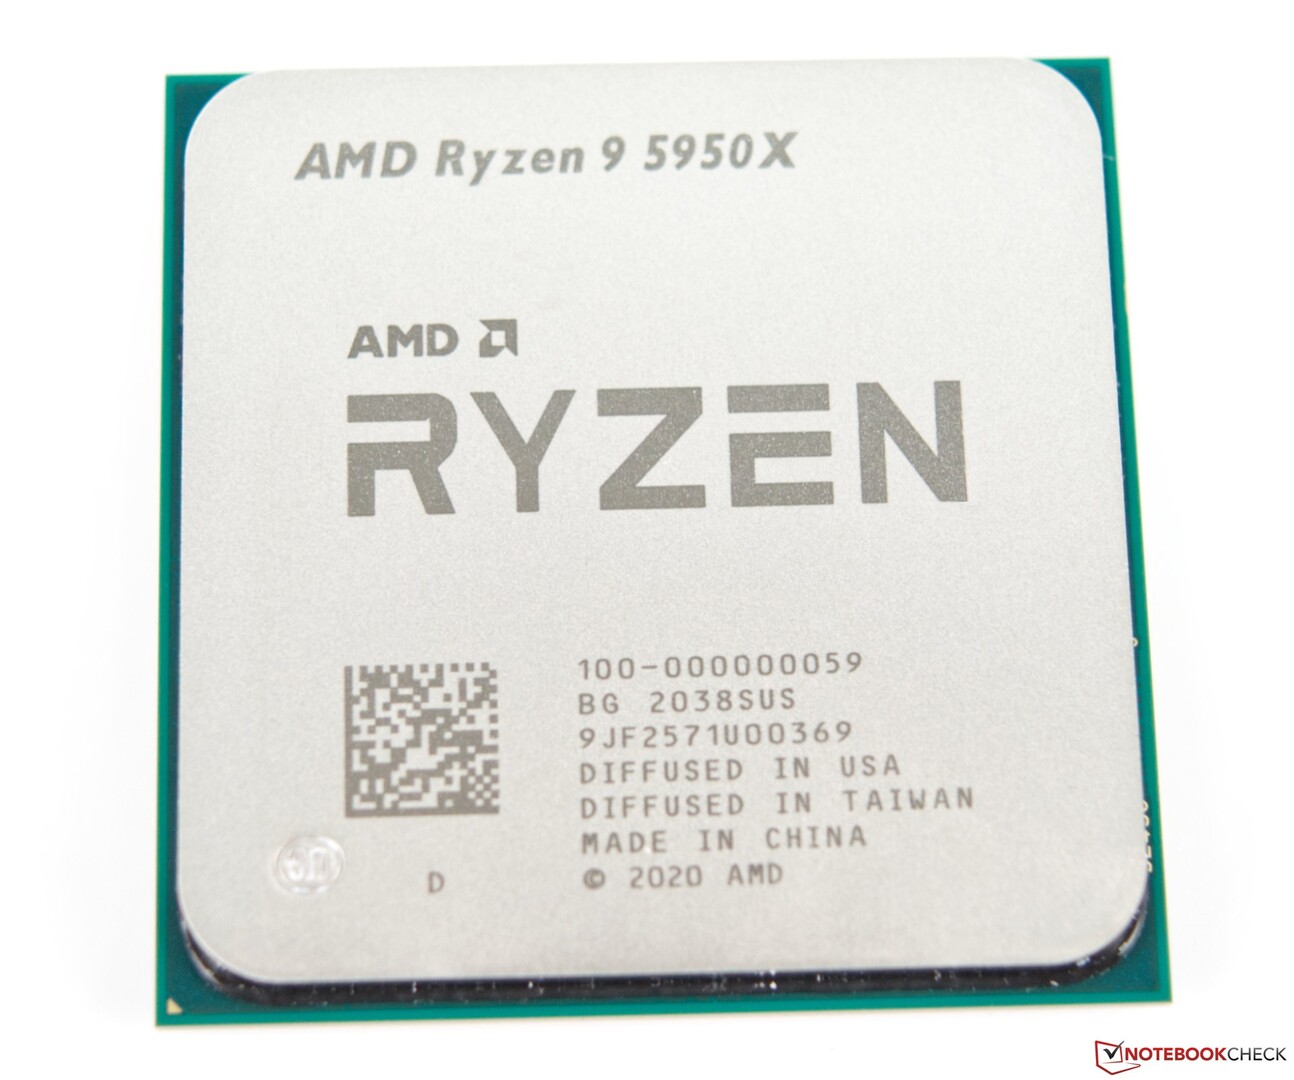
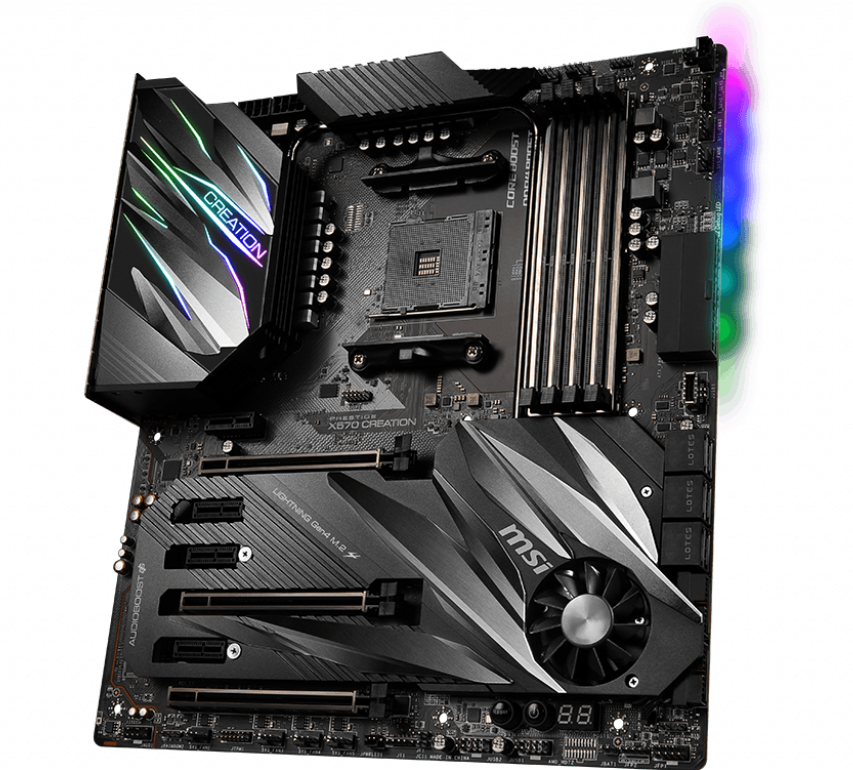
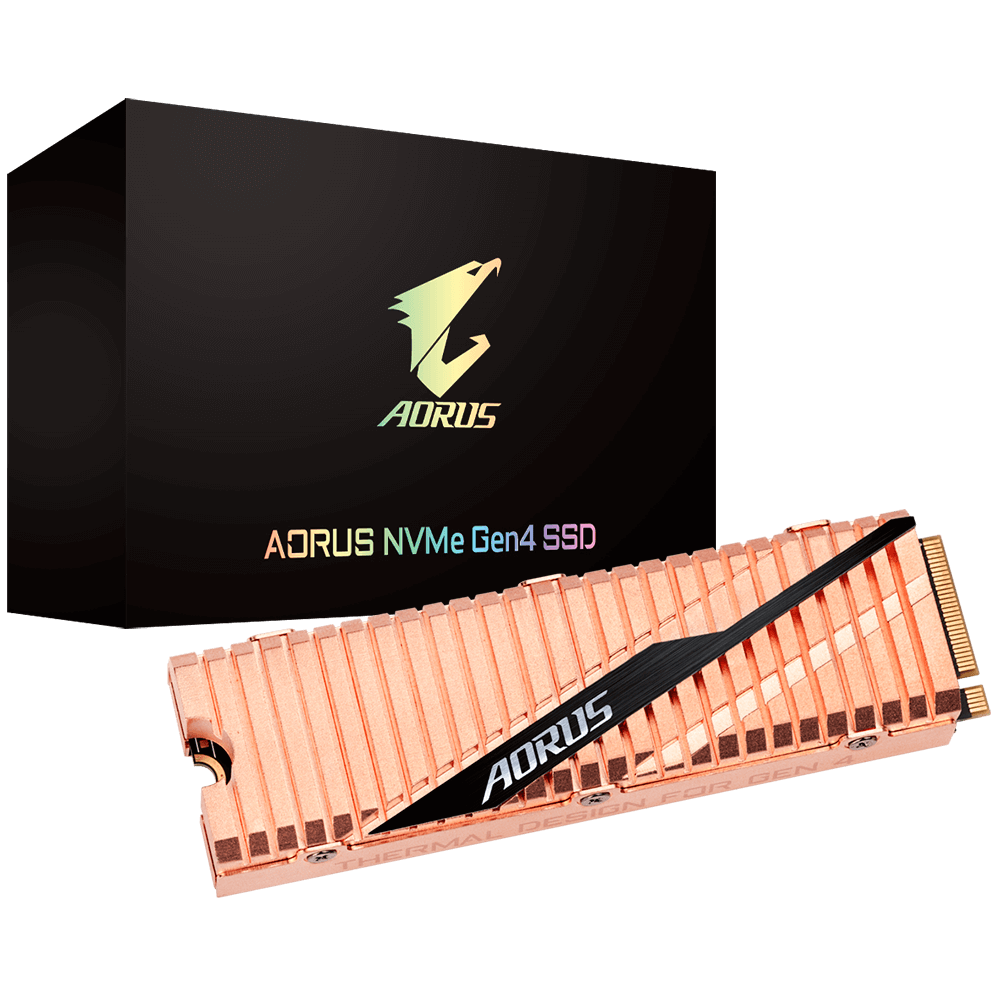
Our test bench is comprised of an AMD Ryzen 9 5950X 16-core 32-thread processor, MSI Prestige X570 Creation motherboard, 32 GB (16 GB x2) of G.SKILL Trident Z Neo DDR4-3200 RAM (timings 16-19-19-39), and a Gigabyte Aorus NVMe Gen4 1 TB SSD.
Windows 10 20H2 with the latest cumulative updates (Build 19041.746) was installed on the Aorus NVMe Gen4 PCIe SSD while two 1 TB Crucial MX500 SATA SSDs were used for running benchmarks and games.
A Corsair iCUE H115i Elite Capellix AIO cooler helped keep the mammoth Ryzen 9 5950X cool. The entire build was housed in a Corsair iCUE 4000X RGB case with a Thermaltake Toughpower 850 W 80 Plus Gold as the power supply of choice. We performed all testing with the case closed to represent typical usage.
The RTX 3060 Ti FE was paired with a OnePlus U Series 55U1 smart TV running at 4K 60 Hz. Color output was set to full 32-bit RGB in the NVIDIA control panel while Windows desktop scaling was set to 100%.
We would like to thank AMD for providing the Ryzen 9 5950X CPU, Corsair for the iCUE Elite Capellix AIO cooler and iCUE 4000X case, and OnePlus for the U series 55U1 4K TV.
Synthetic benchmarks
The RTX 3060 Ti's performance is in the same ballpark as an RTX 2080 Super and can be up to 32% faster than an RTX 2060 Super while trailing the RTX 3070 by about 10% in 3DMark tests.
A similar trend is also seen with Unigine Heaven and Valley benchmarks. We see that the performance delta between the cards is higher in DirectX tests than OpenGL ones. While the RTX 3060 Ti is only about 8% faster than the RTX 2080 Super in Heaven 4.0 DirectX, Valley 1.0 DirectX takes this difference to a significant 27%. Unigine Superposition shows that the RTX 3060 Ti is 12% to 14% slower than the RTX 3070 but virtually ties with the average RTX 2080 Super in all tests except 720p low.
| 3DMark 11 Performance | 33117 points | |
| 3DMark Cloud Gate Standard Score | 66922 points | |
| 3DMark Fire Strike Score | 27043 points | |
| 3DMark Fire Strike Extreme Score | 13790 points | |
| 3DMark Time Spy Score | 11520 points | |
Help | ||
Compute benchmarks
The RTX 3060 Ti FE offers decent compute performance with about 25% higher scores in ComputeMark compared to the average RTX 2080 Super. LuxMark also shows decent benefits with the RTX 3060 Ti FE being only about 6% slower than the average RTX 3070.
Professional applications
The GeForce cards aren't really aimed at professional workloads such as CAD/CAM, energy, automobile, or medical applications. This limitation primarily comes from the driver as NVIDIA would ideally want professionals in these fields to use the Quadro lineup. The Titan RTX, however, does manage to hold its own turf in SPECviewperf tests despite running on regular GeForce drivers.
Taking a look at SPECviewperf 12 and 13 benchmarks, we see that the RTX 3060 Ti lags significantly behind a Quadro RTX 5000 (laptop) in specialized professional workloads despite the latter essentially being an RTX 2080 TU104 chip. However, those working on 3D Studio Max and Maya projects will find the RTX 3060 Ti to be a decent performer.
SPECviewperf 2020 seemed somewhat taxing for the RTX 3060 Ti FE as it is a 4K benchmark. The RTX 3080 and RTX 3090 show obvious advantages, but the AMD Radeon RX 6800 XT is clearly the better-performing mainstream GPU when it comes to pro apps.
| NVIDIA GeForce RTX 3060 Ti Founders Edition GeForce RTX 3060 Ti, R9 5950X | MSI GeForce RTX 3080 Gaming X Trio GeForce RTX 3080, R9 5900X | MSI GeForce RTX 3090 Suprim X GeForce RTX 3090, R9 5900X | Nvidia GeForce RTX 2080 Super GeForce RTX 2080 Super (Desktop), R7 2700X | AMD Ryzen 9 5900X Titan RTX, R9 5900X | AMD Radeon RX 6800 XT Radeon RX 6800 XT, R9 5950X | Acer ConceptD 9 Pro Quadro RTX 5000 (Laptop), i9-9980HK | |
|---|---|---|---|---|---|---|---|
| SPECviewperf 12 | 1% | 20% | -9% | 312% | 80% | 296% | |
| 1900x1060 Solidworks (sw-03) (fps) | 71.1 | 66 -7% | 72.3 2% | 70.8 0% | 174.9 146% | 150 111% | 230.1 224% |
| 1900x1060 Siemens NX (snx-02) (fps) | 12.3 | 12.85 4% | 14.91 21% | 12.26 0% | 273.2 2121% | 45.07 266% | 258.1 1998% |
| 1900x1060 Showcase (showcase-01) (fps) | 144 | 180 25% | 236 64% | 143.6 0% | 191.1 33% | 223 55% | 126.4 -12% |
| 1900x1060 Medical (medical-01) (fps) | 59.4 | 36.93 -38% | 42.91 -28% | 45 -24% | 90.7 53% | 77.3 30% | 109.3 84% |
| 1900x1060 Maya (maya-04) (fps) | 197 | 146 -26% | 184 -7% | 134.8 -32% | 188.3 -4% | 118 -40% | 179 -9% |
| 1900x1060 Energy (energy-01) (fps) | 13.9 | 16.35 18% | 20.41 47% | 13.09 -6% | 28.31 104% | 28.39 104% | 26 87% |
| 1900x1060 Creo (creo-01) (fps) | 57.8 | 65.6 13% | 75.4 30% | 52.7 -9% | 173 199% | 119 106% | 172.1 198% |
| 1900x1060 Catia (catia-04) (fps) | 109 | 116 6% | 134 23% | 104.2 -4% | 262.7 141% | 238 118% | 220 102% |
| 1900x1060 3ds Max (3dsmax-05) (fps) | 252 | 276 10% | 322 28% | 225.8 -10% | 292.6 16% | 167 -34% | 235.8 -6% |
| SPECviewperf 13 | 25% | 36% | -3% | 290% | 91% | 270% | |
| Solidworks (sw-04) (fps) | 99.6 | 96.5 -3% | 95.3 -4% | 99.6 0% | 196.4 97% | 193 94% | 203.8 105% |
| Siemens NX (snx-03) (fps) | 22.3 | 24.26 9% | 27.03 21% | 21.94 -2% | 493.4 2113% | 81.4 265% | 465.3 1987% |
| Showcase (showcase-02) (fps) | 145 | 204 41% | 241 66% | 144.5 0% | 190.5 31% | 232 60% | 127.1 -12% |
| Medical (medical-02) (fps) | 72.2 | 99 37% | 105 45% | 71.6 -1% | 90.8 26% | 130 80% | 133.4 85% |
| Maya (maya-05) (fps) | 344 | 440 28% | 469 36% | 328.7 -4% | 458 33% | 348 1% | 340.8 -1% |
| Energy (energy-02) (fps) | 25.6 | 37.87 48% | 45.21 77% | 23.78 -7% | 52 103% | 58.4 128% | 57.3 124% |
| Creo (creo-02) (fps) | 225 | 295 31% | 316 40% | 220.1 -2% | 346.5 54% | 276 23% | 319.8 42% |
| Catia (catia-05) (fps) | 161 | 190 18% | 206 28% | 157.7 -2% | 374.8 133% | 412 156% | 338.9 110% |
| 3ds Max (3dsmax-06) (fps) | 252 | 294 17% | 298 18% | 227.8 -10% | 291.3 16% | 284 13% | 232.2 -8% |
| SPECviewperf 2020 | 58% | 85% | 300% | 107% | |||
| 3840x2160 Solidworks (solidworks-05) (fps) | 109 | 158 45% | 180 65% | 153 40% | 108 -1% | ||
| 3840x2160 Siemens NX (snx-04) (fps) | 18.2 | 19.8 9% | 22.6 24% | 347 1807% | 81.7 349% | ||
| 3840x2160 Medical (medical-03) (fps) | 11.4 | 18.47 62% | 21.19 86% | 16.42 44% | 27.84 144% | ||
| 3840x2160 Maya (maya-06) (fps) | 215 | 293 36% | 330 53% | 257 20% | 224 4% | ||
| 3840x2160 Energy (energy-03) (fps) | 14.5 | 51.7 257% | 61.1 321% | 58.2 301% | 60.8 319% | ||
| 3840x2160 Creo (creo-03) (fps) | 76.6 | 77.6 1% | 85.1 11% | 113 48% | 65 -15% | ||
| 3840x2160 CATIA (catia-06) (fps) | 37.9 | 50 32% | 56.6 49% | 78.2 106% | 42.4 12% | ||
| 3840x2160 3ds Max (3dsmax-07) (fps) | 80.1 | 100 25% | 135 69% | 108 35% | 114 42% | ||
| Total Average (Program / Settings) | 28% /
27% | 47% /
46% | -6% /
-6% | 301% /
301% | 93% /
92% | 283% /
283% |
Game benchmarks
Right off the bat, the RTX 3060 Ti FE performs great up to QHD Ultra resolution in most games. eSports players who prefer higher frame rates than resolution will also be able to make good use of this card at 1080p to drive monitors with high refresh rates. It is also possible to play at 60 fps+ in 4K Ultra in several titles such as Battlefield V, Far Cry New Dawn, Doom Eternal, and F1 2020. A good majority of the titles can also be brought up to 60 fps+ in 4K by tweaking the in-game settings without compromising much on visual fidelity.
Ray tracing (RT) performance is within 7% of an average RTX 3070 as long as the game does not use RT for global illumination as evidenced by results from Call of Duty: Black Ops Cold War and Watch Dogs: Legion 1080p Ultra ray tracing benchmarks. This performance delta doubles in games that extensively employ ray traced-global illumination such as Metro: Exodus and Cyberpunk 2077.
In The Witcher 3 Ultra stress test, the RTX 3060 Ti FE is seen to be quite stable overall. We do see the frames dropping down by about 5 fps past the halfway mark in the graph below, but the overall experience isn't affected much. This indicates that the cooling on the card is up to the task and is able to prevent thermal throttling.
| low | med. | high | ultra | QHD | 4K | |
|---|---|---|---|---|---|---|
| The Witcher 3 (2015) | 479 | 342 | 218 | 109 | 81.3 | |
| Shadow of the Tomb Raider (2018) | 185 | 157 | 153 | 145 | 103 | 56 |
| Forza Horizon 4 (2018) | 246 | 200 | 196 | 173 | 150 | 103 |
| Assassin´s Creed Odyssey (2018) | 142 | 121 | 104 | 75 | 65 | 45 |
| Battlefield V (2018) | 181 | 145 | 124 | 114 | 97.9 | 64.9 |
| Far Cry New Dawn (2019) | 123 | 111 | 108 | 99 | 94 | 65 |
| Metro Exodus (2019) | 193 | 139 | 105 | 84.9 | 66.2 | 42.7 |
| The Division 2 (2019) | 225 | 172 | 142 | 109 | 77.3 | 43.7 |
| Anno 1800 (2019) | 134 | 135 | 94.1 | 54.2 | 40.6 | 34.4 |
| Total War: Three Kingdoms (2019) | 367.4 | 195.6 | 127.3 | 92.8 | 59 | 28.8 |
| Control (2019) | 240 | 147 | 110 | 71.9 | 36.1 | |
| Borderlands 3 (2019) | 172 | 149 | 118 | 96 | 70.2 | 38.4 |
| Red Dead Redemption 2 (2019) | 170 | 154 | 108 | 69.9 | 57.3 | 37.5 |
| Doom Eternal (2020) | 508 | 320 | 283 | 274 | 219 | 122 |
| Gears Tactics (2020) | 332.3 | 208.8 | 162.4 | 128.9 | 91.9 | 49.4 |
| F1 2020 (2020) | 369 | 252 | 174 | 135 | 80 | |
| Horizon Zero Dawn (2020) | 181 | 139 | 122 | 109 | 92 | 53 |
| Mafia Definitive Edition (2020) | 159 | 130 | 124 | 90.1 | 49.7 | |
| FIFA 21 (2020) | 242 | 247 | 230 | |||
| Watch Dogs Legion (2020) | 124 | 122 | 109 | 76.6 | 59.1 | 33 |
| Assassin´s Creed Valhalla (2020) | 126 | 95 | 81 | 74 | 60 | 40 |
| Call of Duty Black Ops Cold War (2020) | 243 | 133 | 123 | 110 | 82.1 | 44.9 |
| Immortals Fenyx Rising (2020) | 166 | 119 | 110 | 101 | 84 | 57 |
| Cyberpunk 2077 1.0 (2020) | 122 | 101 | 85.2 | 73.6 | 48 | 24.1 |
Emissions
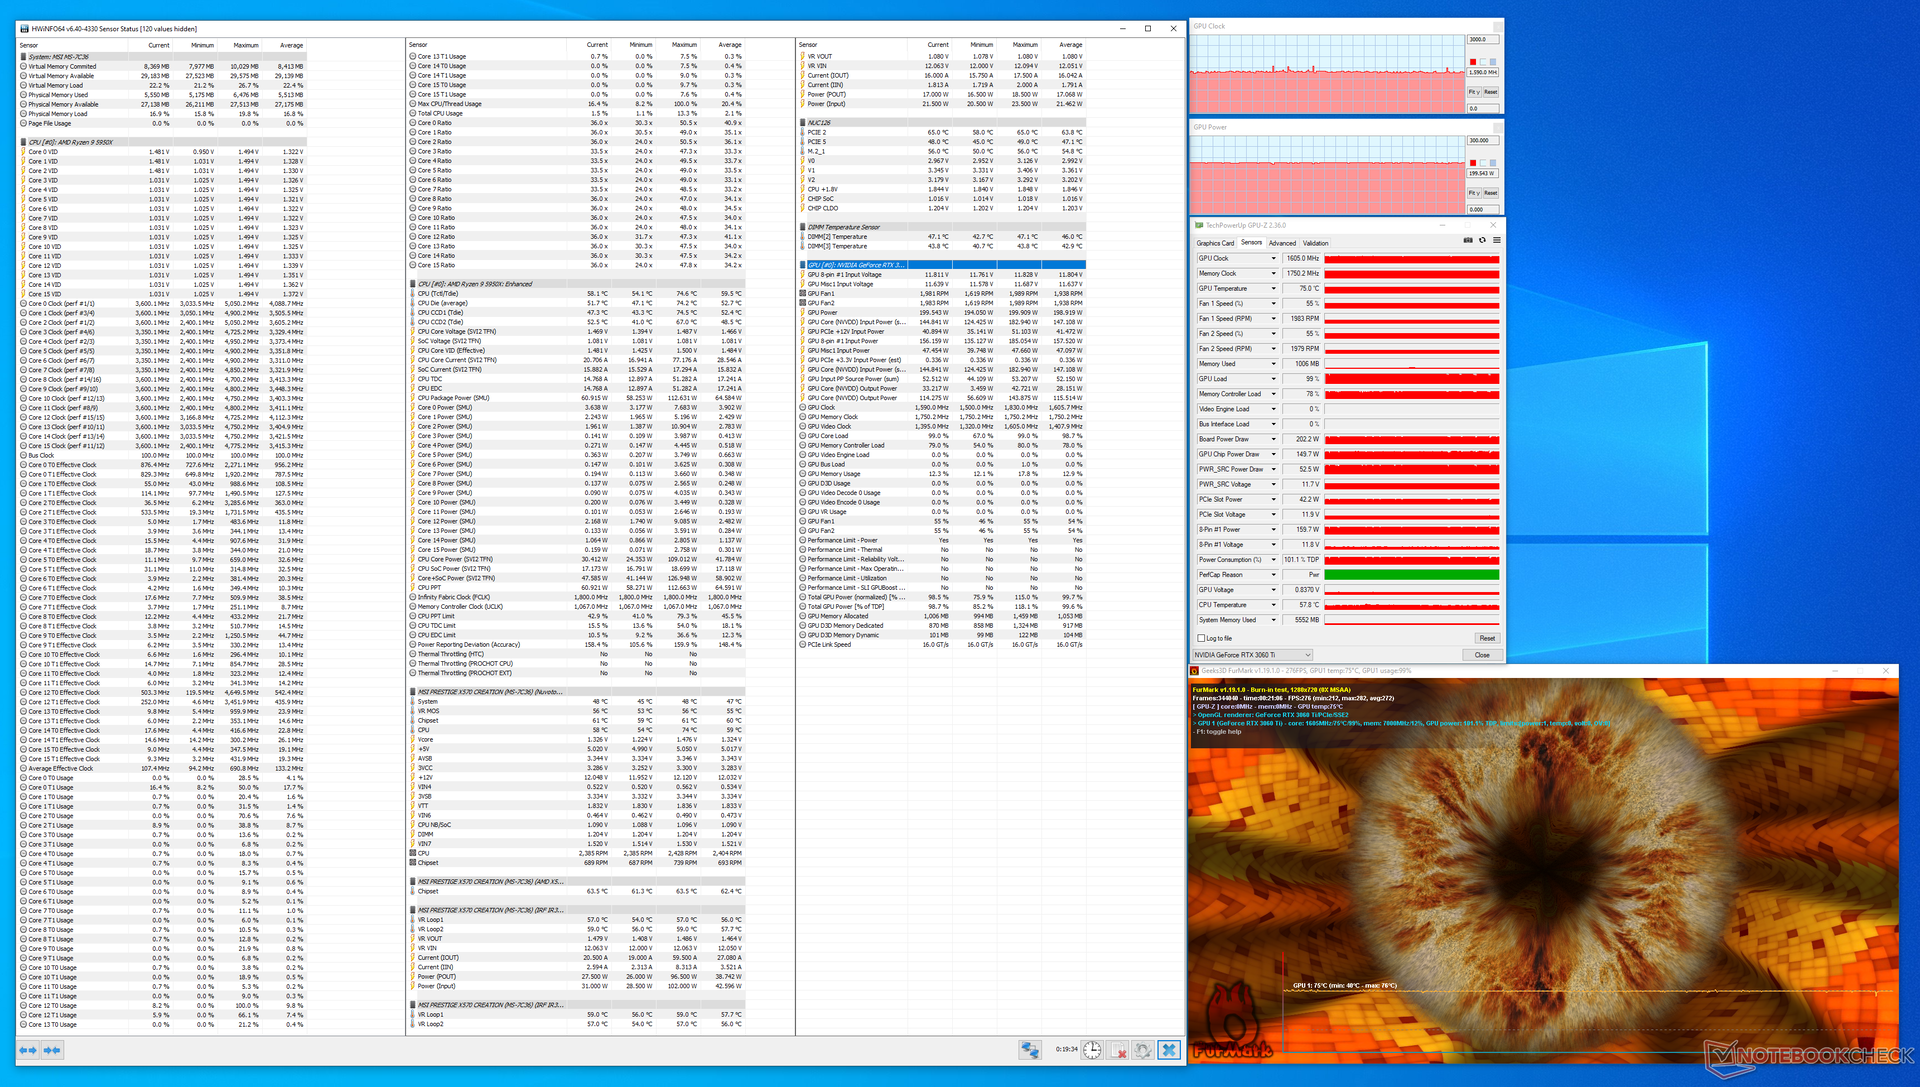
Thanks to NVIDIA's improved cooler design, the RTX 3060 Ti FE performs ably under stress. During the FurMark stress test, we observed that the GPU core maintained a consistent 75 °C and the board power draw was at the rated TGP of 200 W.
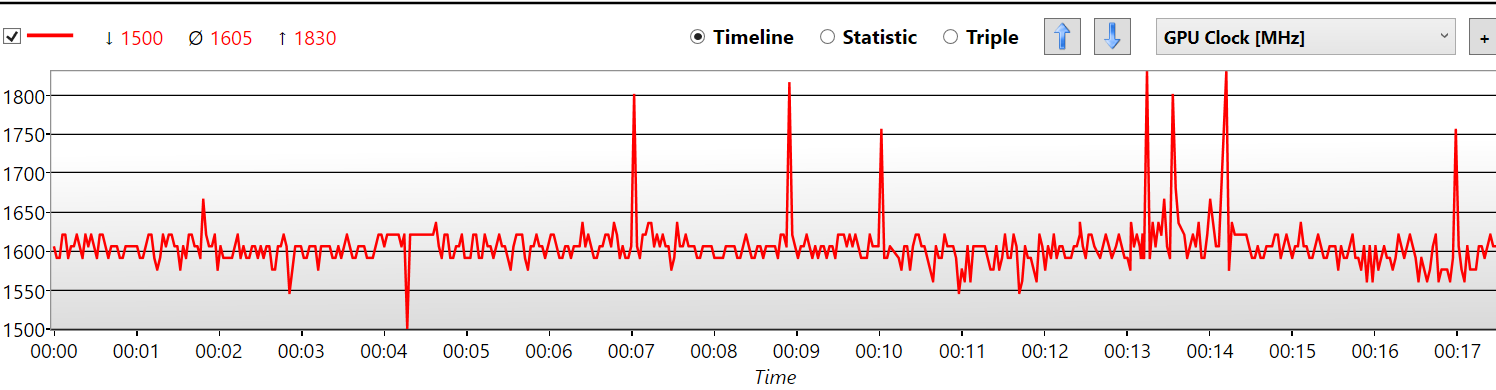
For the large part of the stress test, the RTX 3060 Ti FE operates near its rated boost clock of 1,665 MHz although we do observe occasional spikes up to 1,830 MHz.
We used FurMark stress to determine the temperature and noise levels. Total system power consumption was determined while stressing with FurMark and The Witcher 3 at 1080p Ultra preset.
Temperature
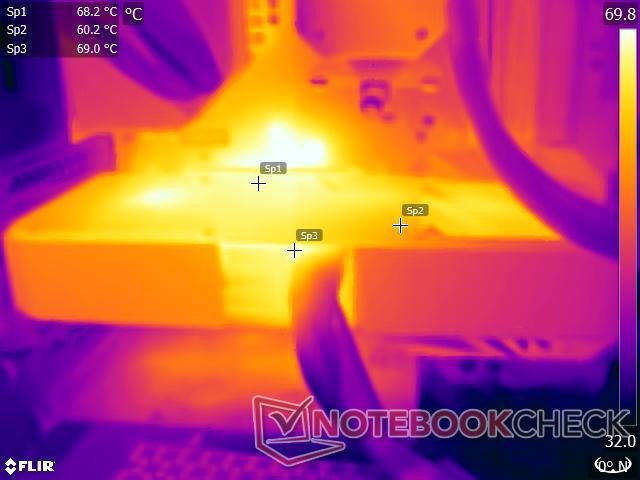
While NVIDIA's new cooling system offers adequate performance to keep the card from throttling, the card itself does tend to get significantly warm under load. During the FurMark stress test, we observed that surface temperatures near the GPU and power supply areas were close to the 70 °C mark.
This is to be expected as the GPU core itself can hit 75 °C under load and the metallic construction only serves to transmit a great deal of this heat to the surface.
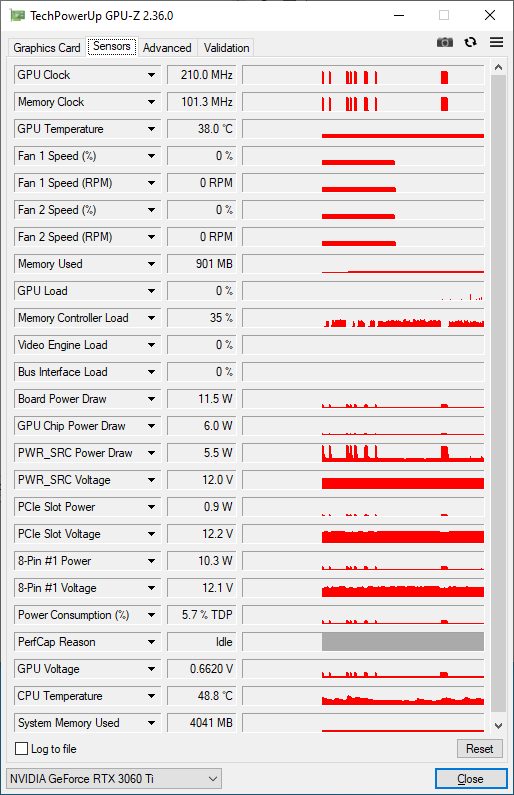
The area near the rear fan exhaust is also quite warm at 60 °C as you can see from the heat map. That being said, the GPU idles between 38 °C and 42 °C during which time the fans completely stop.
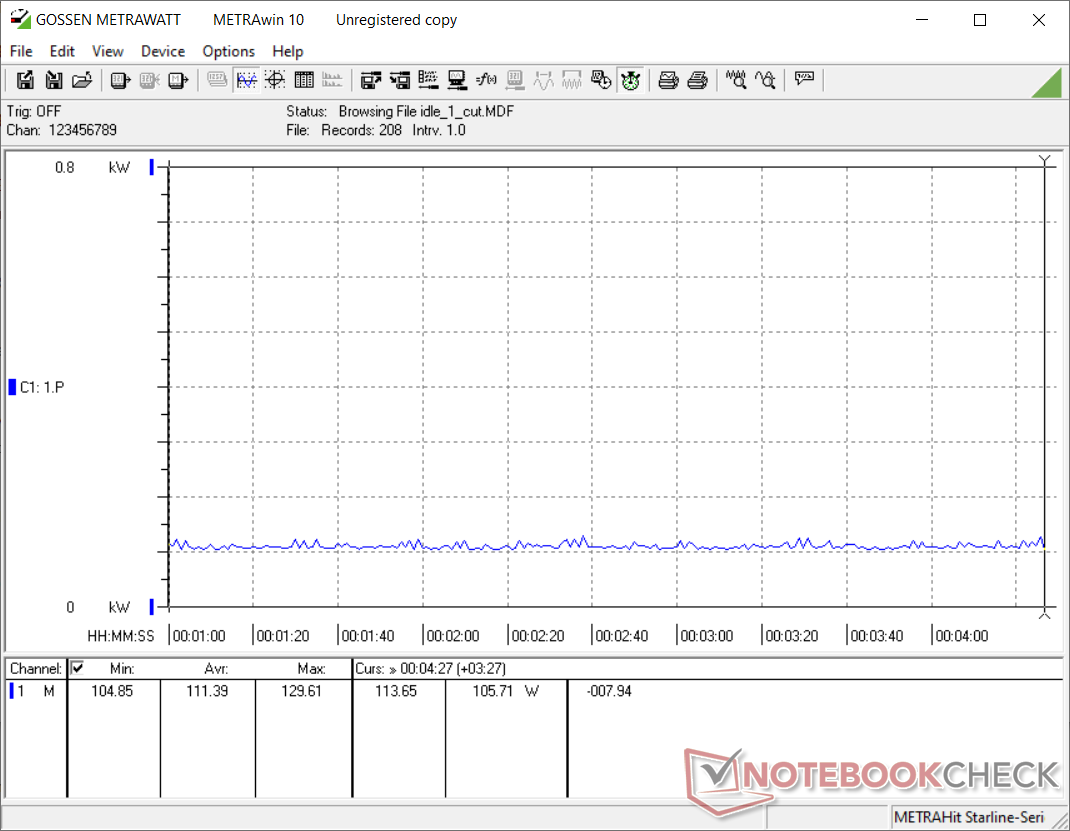
Power consumption
Our test bench consumes about 111 W in idle with all RGB lighting turned off and a total of five fans (three Corsair SP 120 mm case fans and two Corsair ML 120 mm radiator fans) and the Elite Capellix AIO pump running in a Balanced profile.
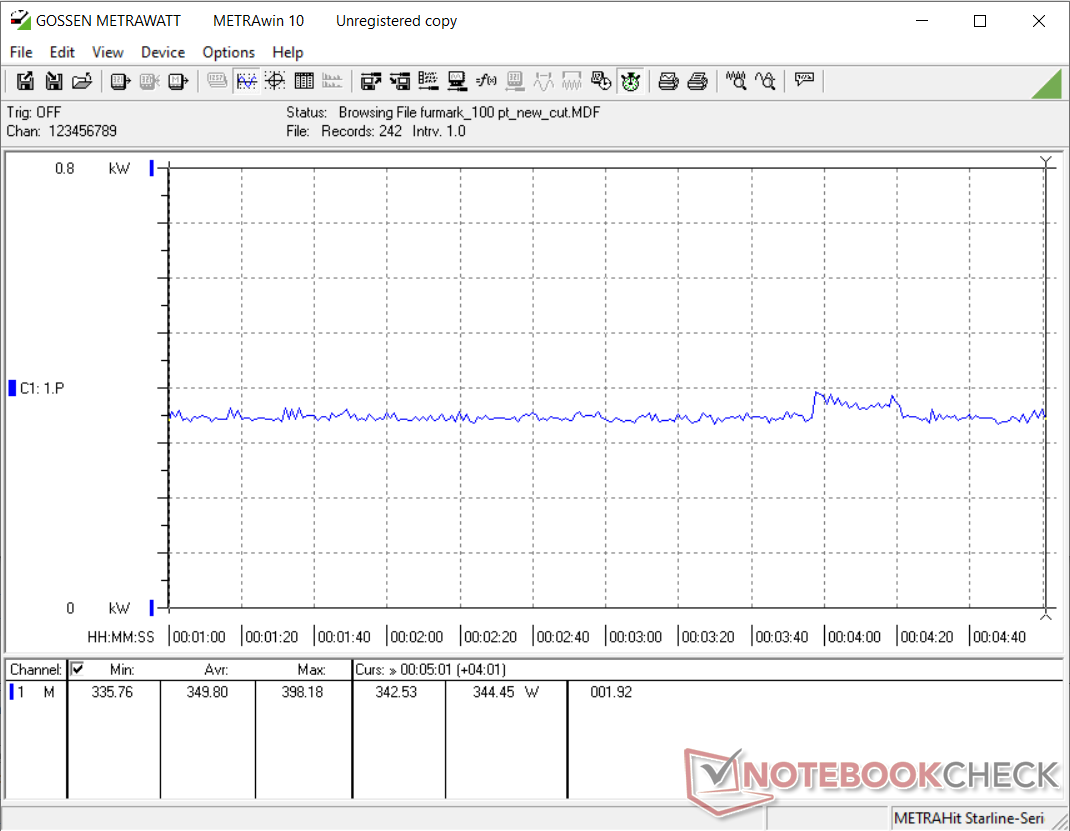
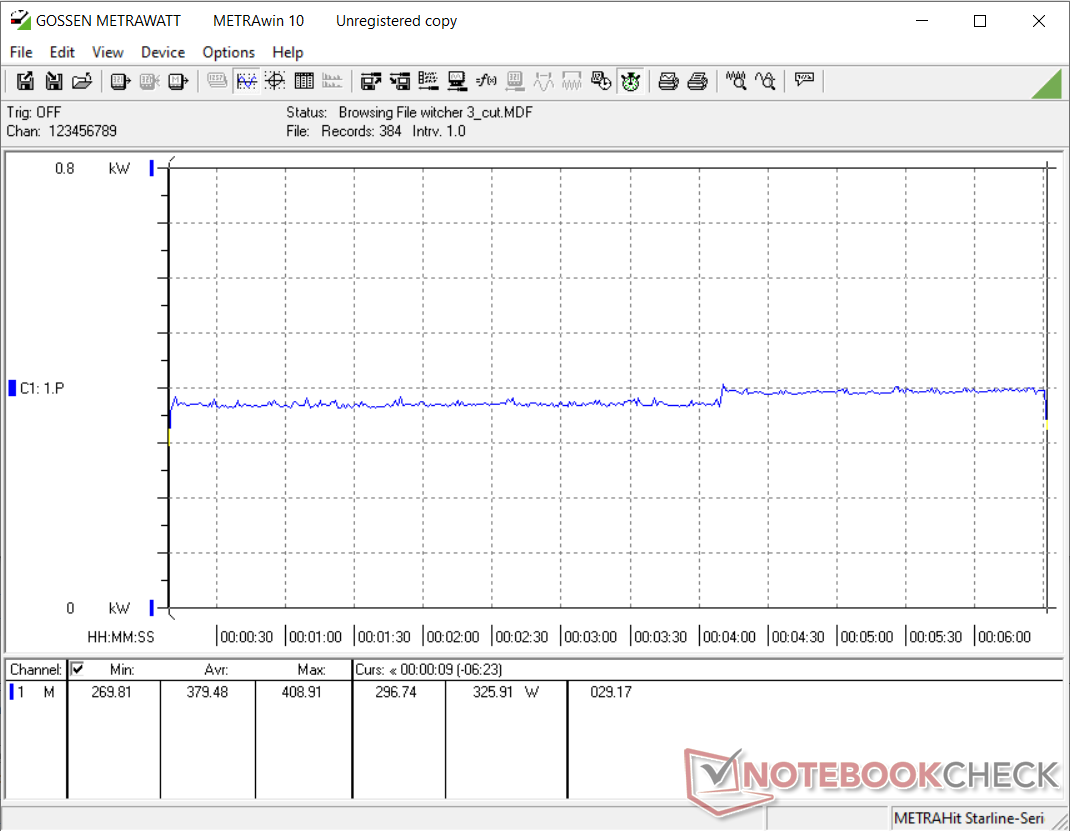
We observed an average total system power consumption of 350 W and 379 W during FurMark and The Witcher 3 Ultra stress, respectively.
As seen in the power consumption graphs below, a slight increase in power consumption is observed near the 4-minute mark. This could be due to the momentary boost clock increase that we described before.
Overall, the RTX 3060 Ti FE is more or less economical compared to the average RTX 2080 Super in terms of power consumption.
* ... smaller is better
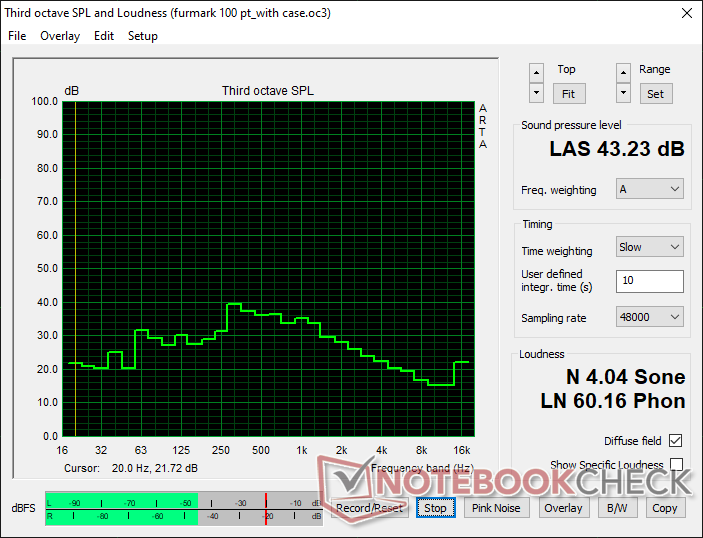
Noise levels
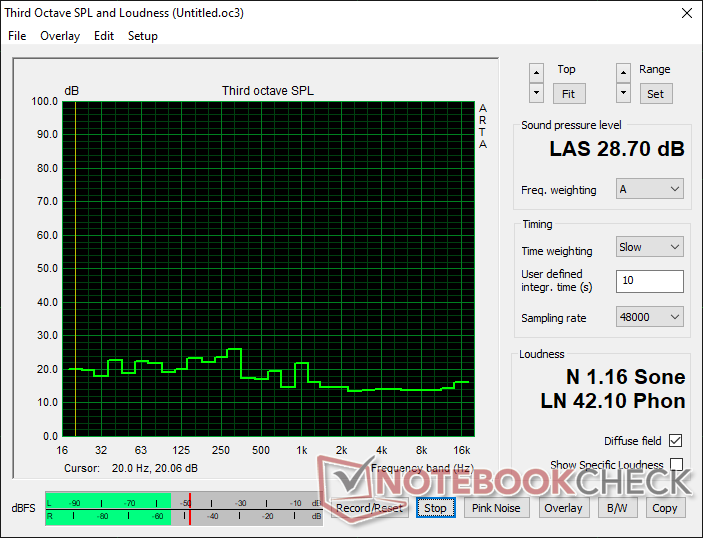
One of the niceties of NVIDIA's new cooling mechanism is that the fan noise levels are kept well-under control.
Since NVIDIA has implemented a complete fan-stop mode with Ampere FE cards, the sound pressure level (SPL) at idle is more or less the same as the ambient value of 28.70 db(A) at a distance of 20 cm from the closed case.
The SPL rose to 43.23 db(A) while during FurMark stress testing, which is very much tolerable particularly when the case is closed. Further fan-curve tuning may be possible by using third-party utilities such as MSI Afterburner.
Pros
Cons
Verdict
The NVIDIA GeForce RTX 3060 Ti Founders Edition gets a lot of things right. The card looks and feels premium, is well-built, and occupies a relatively compact 2-slot footprint. The only eyesore here is the centrally located 12-pin power connector, which does not add any functionality but actually makes cable management cumbersome.
NVIDIA's new cooling mechanism offers a clear advantage and with complete fan-stop, the Founders Edition can potentially be a better bargain compared to add-in board (AiB) variants. We observed reduced power consumption (though only marginal) compared to the RTX 2080 Super along with manageable noise levels under load, which are welcome developments.
The NVIDIA GeForce RTX 3060 Ti Founders Edition offers RTX 2080 Super performance for US$399.99 (₹35,900) and at a 50 W lower power envelope. It has the potential to be one of the most popular GPUs of this generation, but ongoing supply constraints continue to dampen the prospects of buying one at MSRP.
The RTX 3060 Ti FE should be your go-to card if you game primarily at 1080p Ultra and QHD Ultra resolutions. Smooth 4K gaming is definitely possible with a few visual tweaks. Ray tracing (RT) performance improvements over the RTX 2080 Super aren't very significant. That being said, DLSS 2.0 should be able to offer a shot in the arm in supported titles to get playable frames with RT enabled.
The card is also capable of decent compute and 3D modeling performance but is not really suitable for professional CAD/CAM, medical, automobile, or energy workflows.
NVIDIA has managed to offer RTX 2080 Super performance and a little more for US$300 less and at a 50 W lower TGP. Those coming from the likes of a GTX 1070 will find that the RTX 3060 Ti FE offers the best bargain at MSRP prices. However, buyers who can extend their budgets a little may also want to take a look at the RTX 3070 FE if it can be had for US$499 MSRP.
Price and availability
The NVIDIA GeForce RTX 3060 Ti Founders Edition availability, including those of partner cards, is uncertain at the time of writing this review. Currently, only Best Buy has this card listed at the US$399.99 MSRP. Unsurprisingly, it is completely sold out at the time of publication. We do recommend keeping a tab on the indicated link as stocks are expected to be replenished periodically.
Price comparison
