Acer ConceptD 9 Pro in Review: Workstation convertible for creative professionals

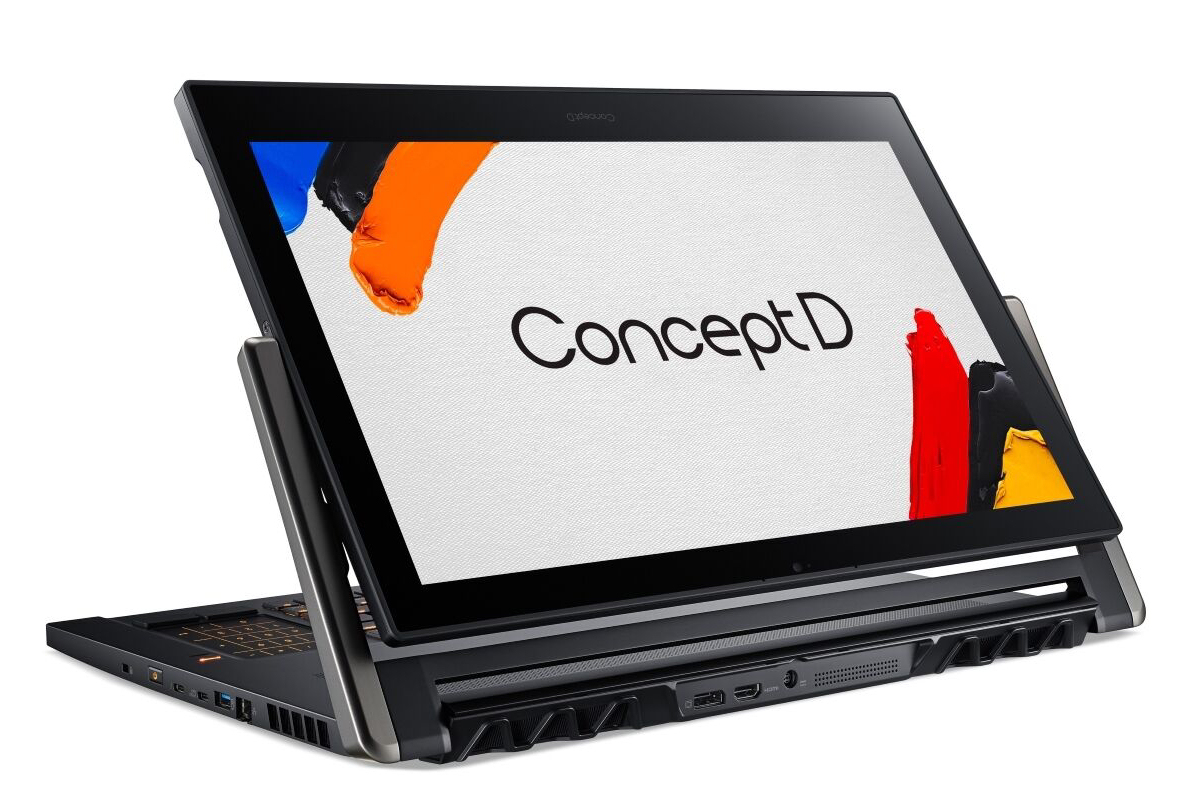
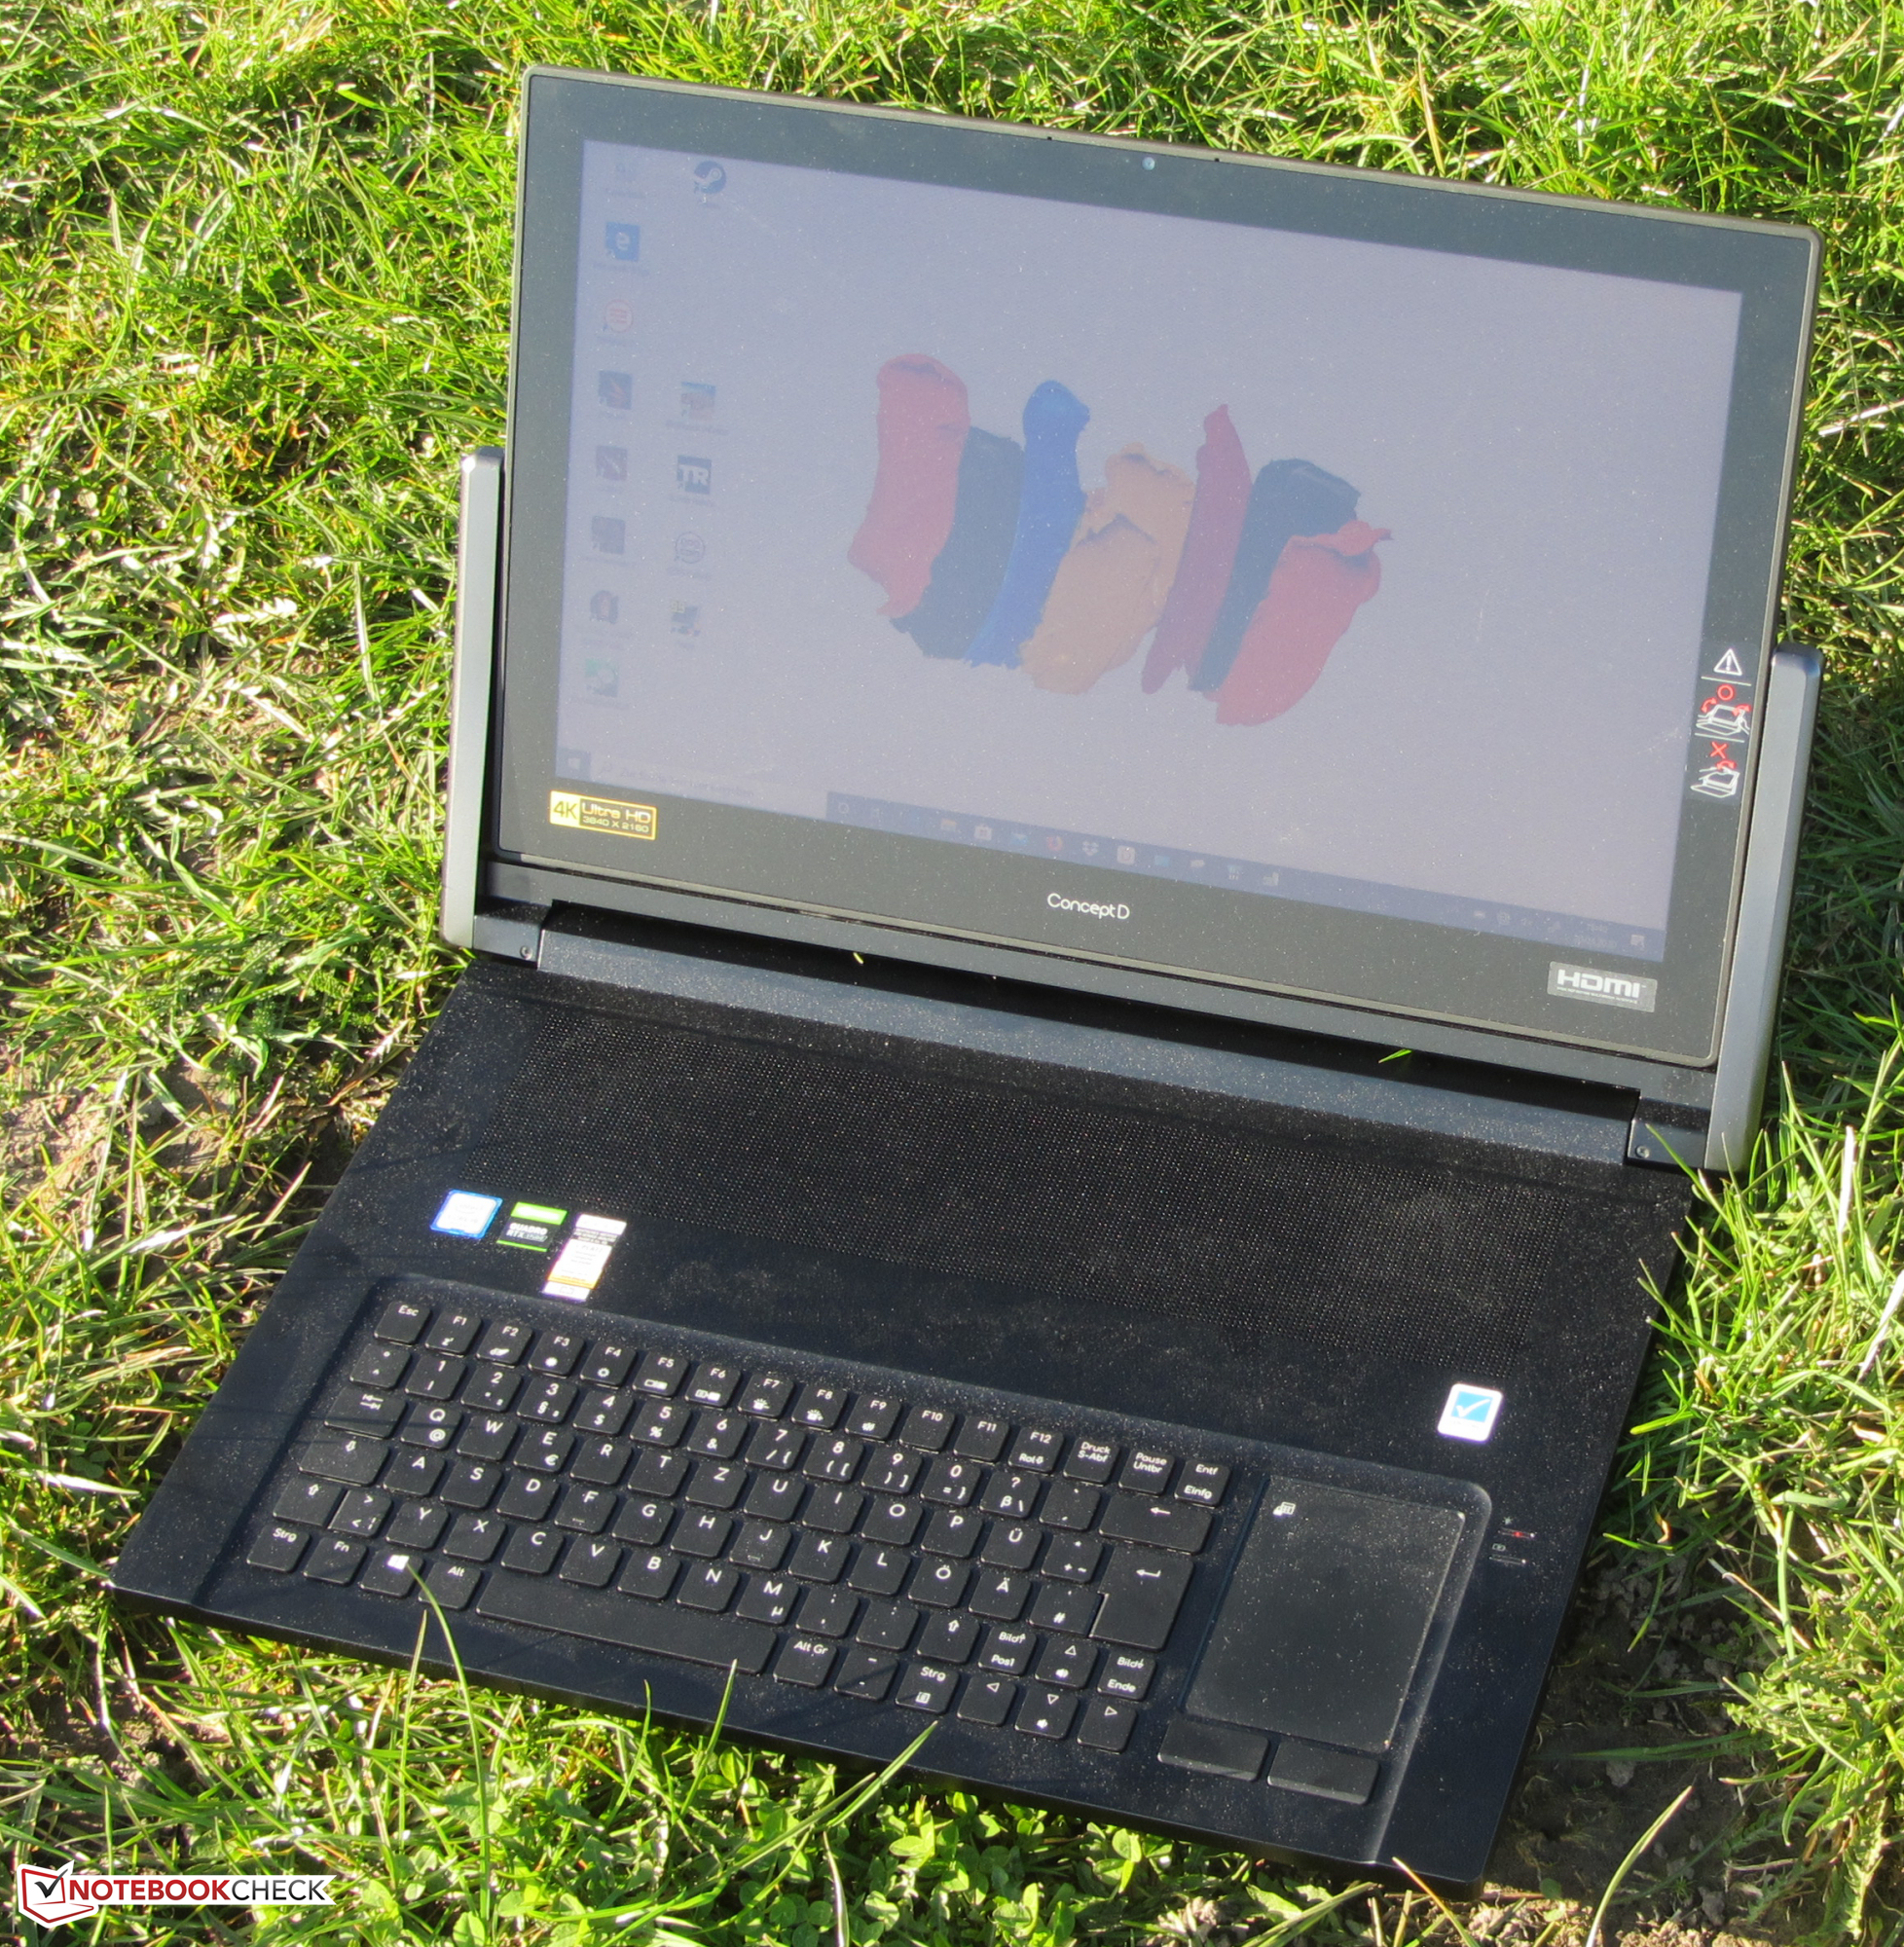
The Acer ConceptD 9 Pro is no ordinary 17.3-inch workstation. The rotating display can also be used as a graphics tablet. Sketches can be created with the help of the (included) Wacom digital stylus. The device is powered by a Core i9-9980HK CPU and a Quadro RTX 5000 GPU. There are no direct competitors in our database. Thus, we will use regular 17.3-inch workstations for comparison purposes. This includes devices such as the Lenovo ThinkPad P73, MSI WE75 9TK, Dell Precision 7730, Eurocom Tornado F7W and the Fujitsu Celsius H980.
Rating | Date | Model | Weight | Height | Size | Resolution | Price |
|---|---|---|---|---|---|---|---|
| 86.2 % v7 (old) | 03 / 2020 | Acer ConceptD 9 Pro i9-9980HK, Quadro RTX 5000 (Laptop) | 4.5 kg | 26.5 mm | 17.30" | 3840x2160 | |
| 86.6 % v7 (old) | 12 / 2019 | Lenovo ThinkPad P73-20QR002DGE i7-9850H, Quadro RTX 3000 (Laptop) | 3.5 kg | 31 mm | 17.30" | 1920x1080 | |
| 84.8 % v7 (old) | 11 / 2019 | MSI WE75 9TK i7-9750H, Quadro RTX 3000 (Laptop) | 2.6 kg | 27.5 mm | 17.30" | 1920x1080 | |
| 85.7 % v7 (old) | 05 / 2019 | Dell Precision 7730 i7-8850H, Quadro P3200 | 3.3 kg | 30 mm | 17.30" | 1920x1080 | |
| 86.3 % v6 (old) | 12 / 2018 | Eurocom Tornado F7W i9-9900K, Quadro P5200 | 4.2 kg | 51 mm | 17.30" | 3840x2160 | |
| 84.6 % v7 (old) | 02 / 2019 | Fujitsu Celsius H980 i7-8750H, Quadro P3200 | 3.5 kg | 30 mm | 17.30" | 1920x1080 |
Chassis - Heavy Workstation
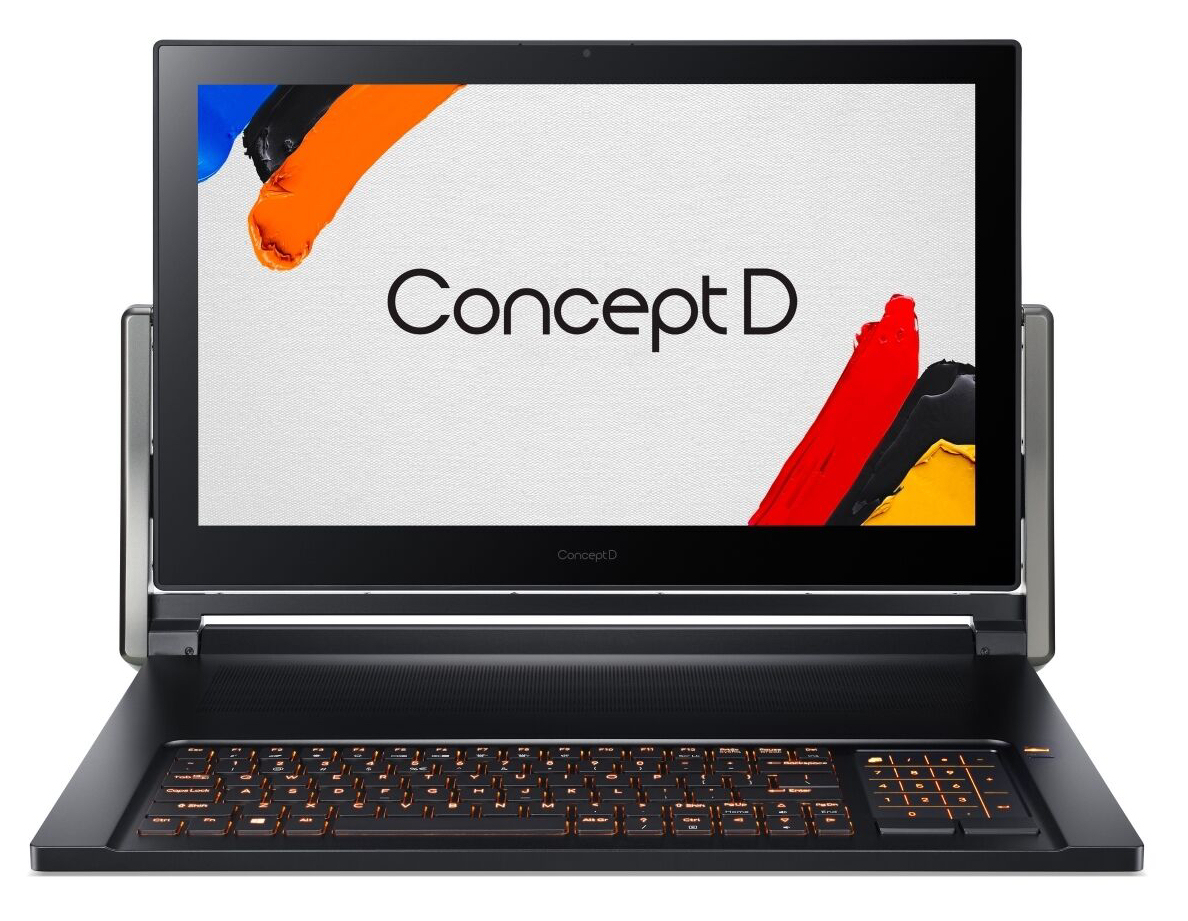
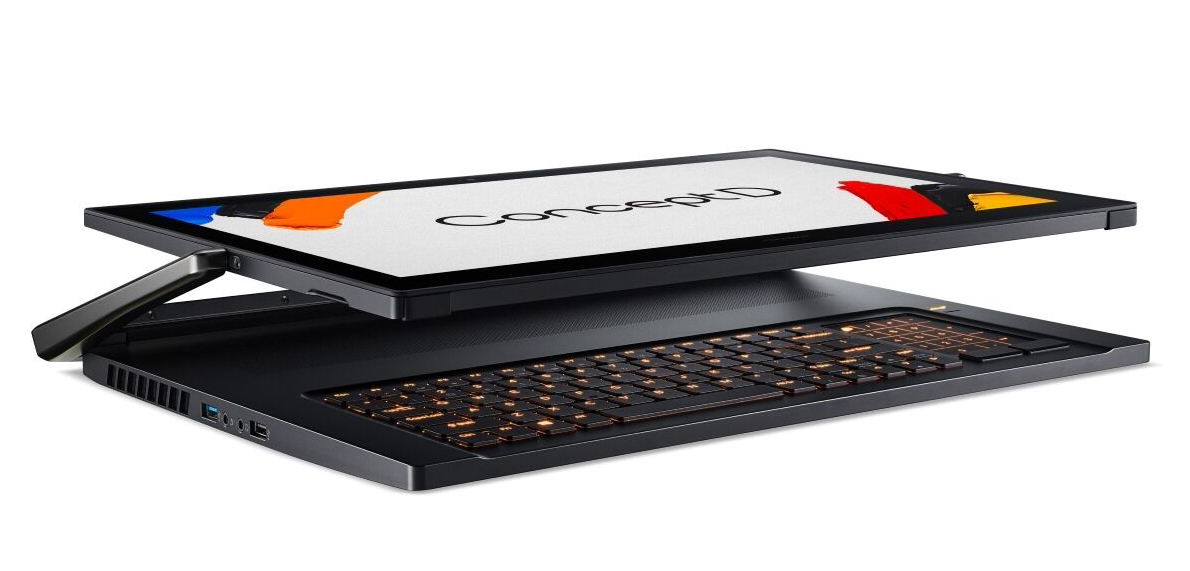
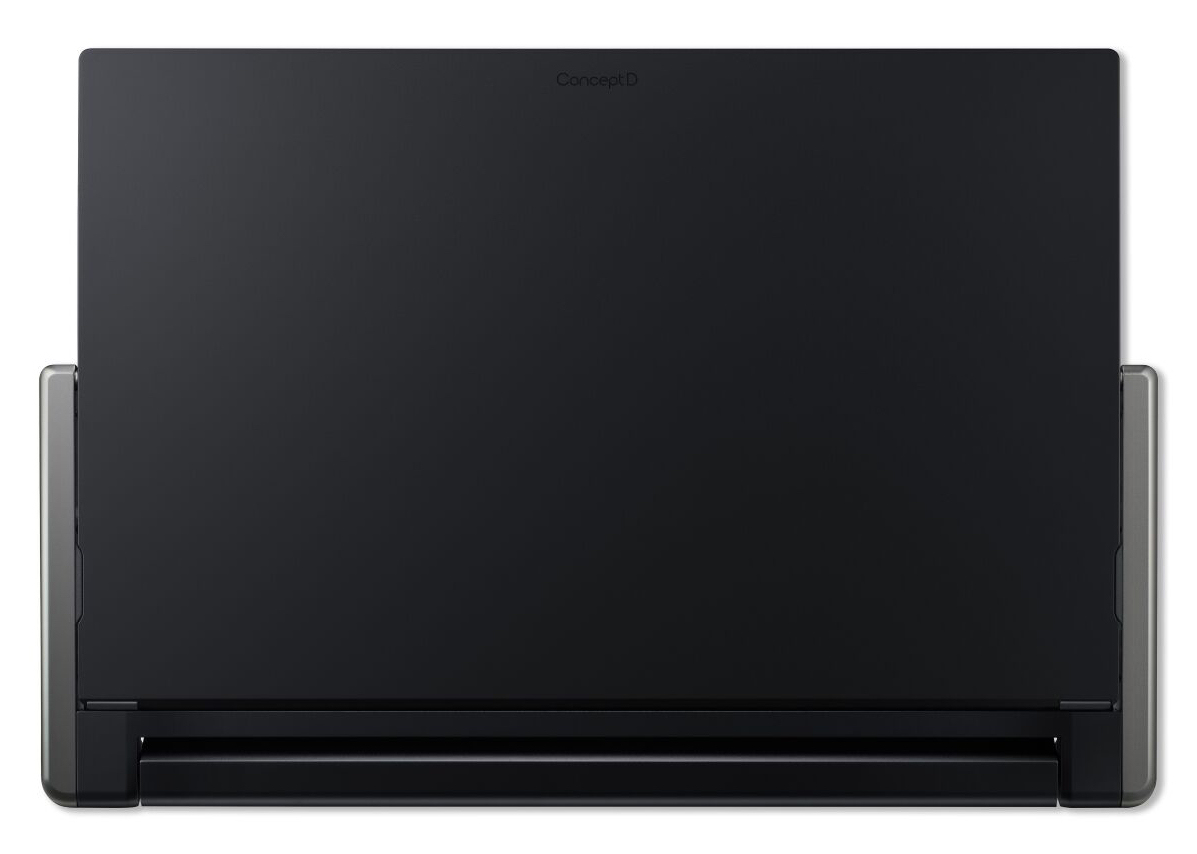
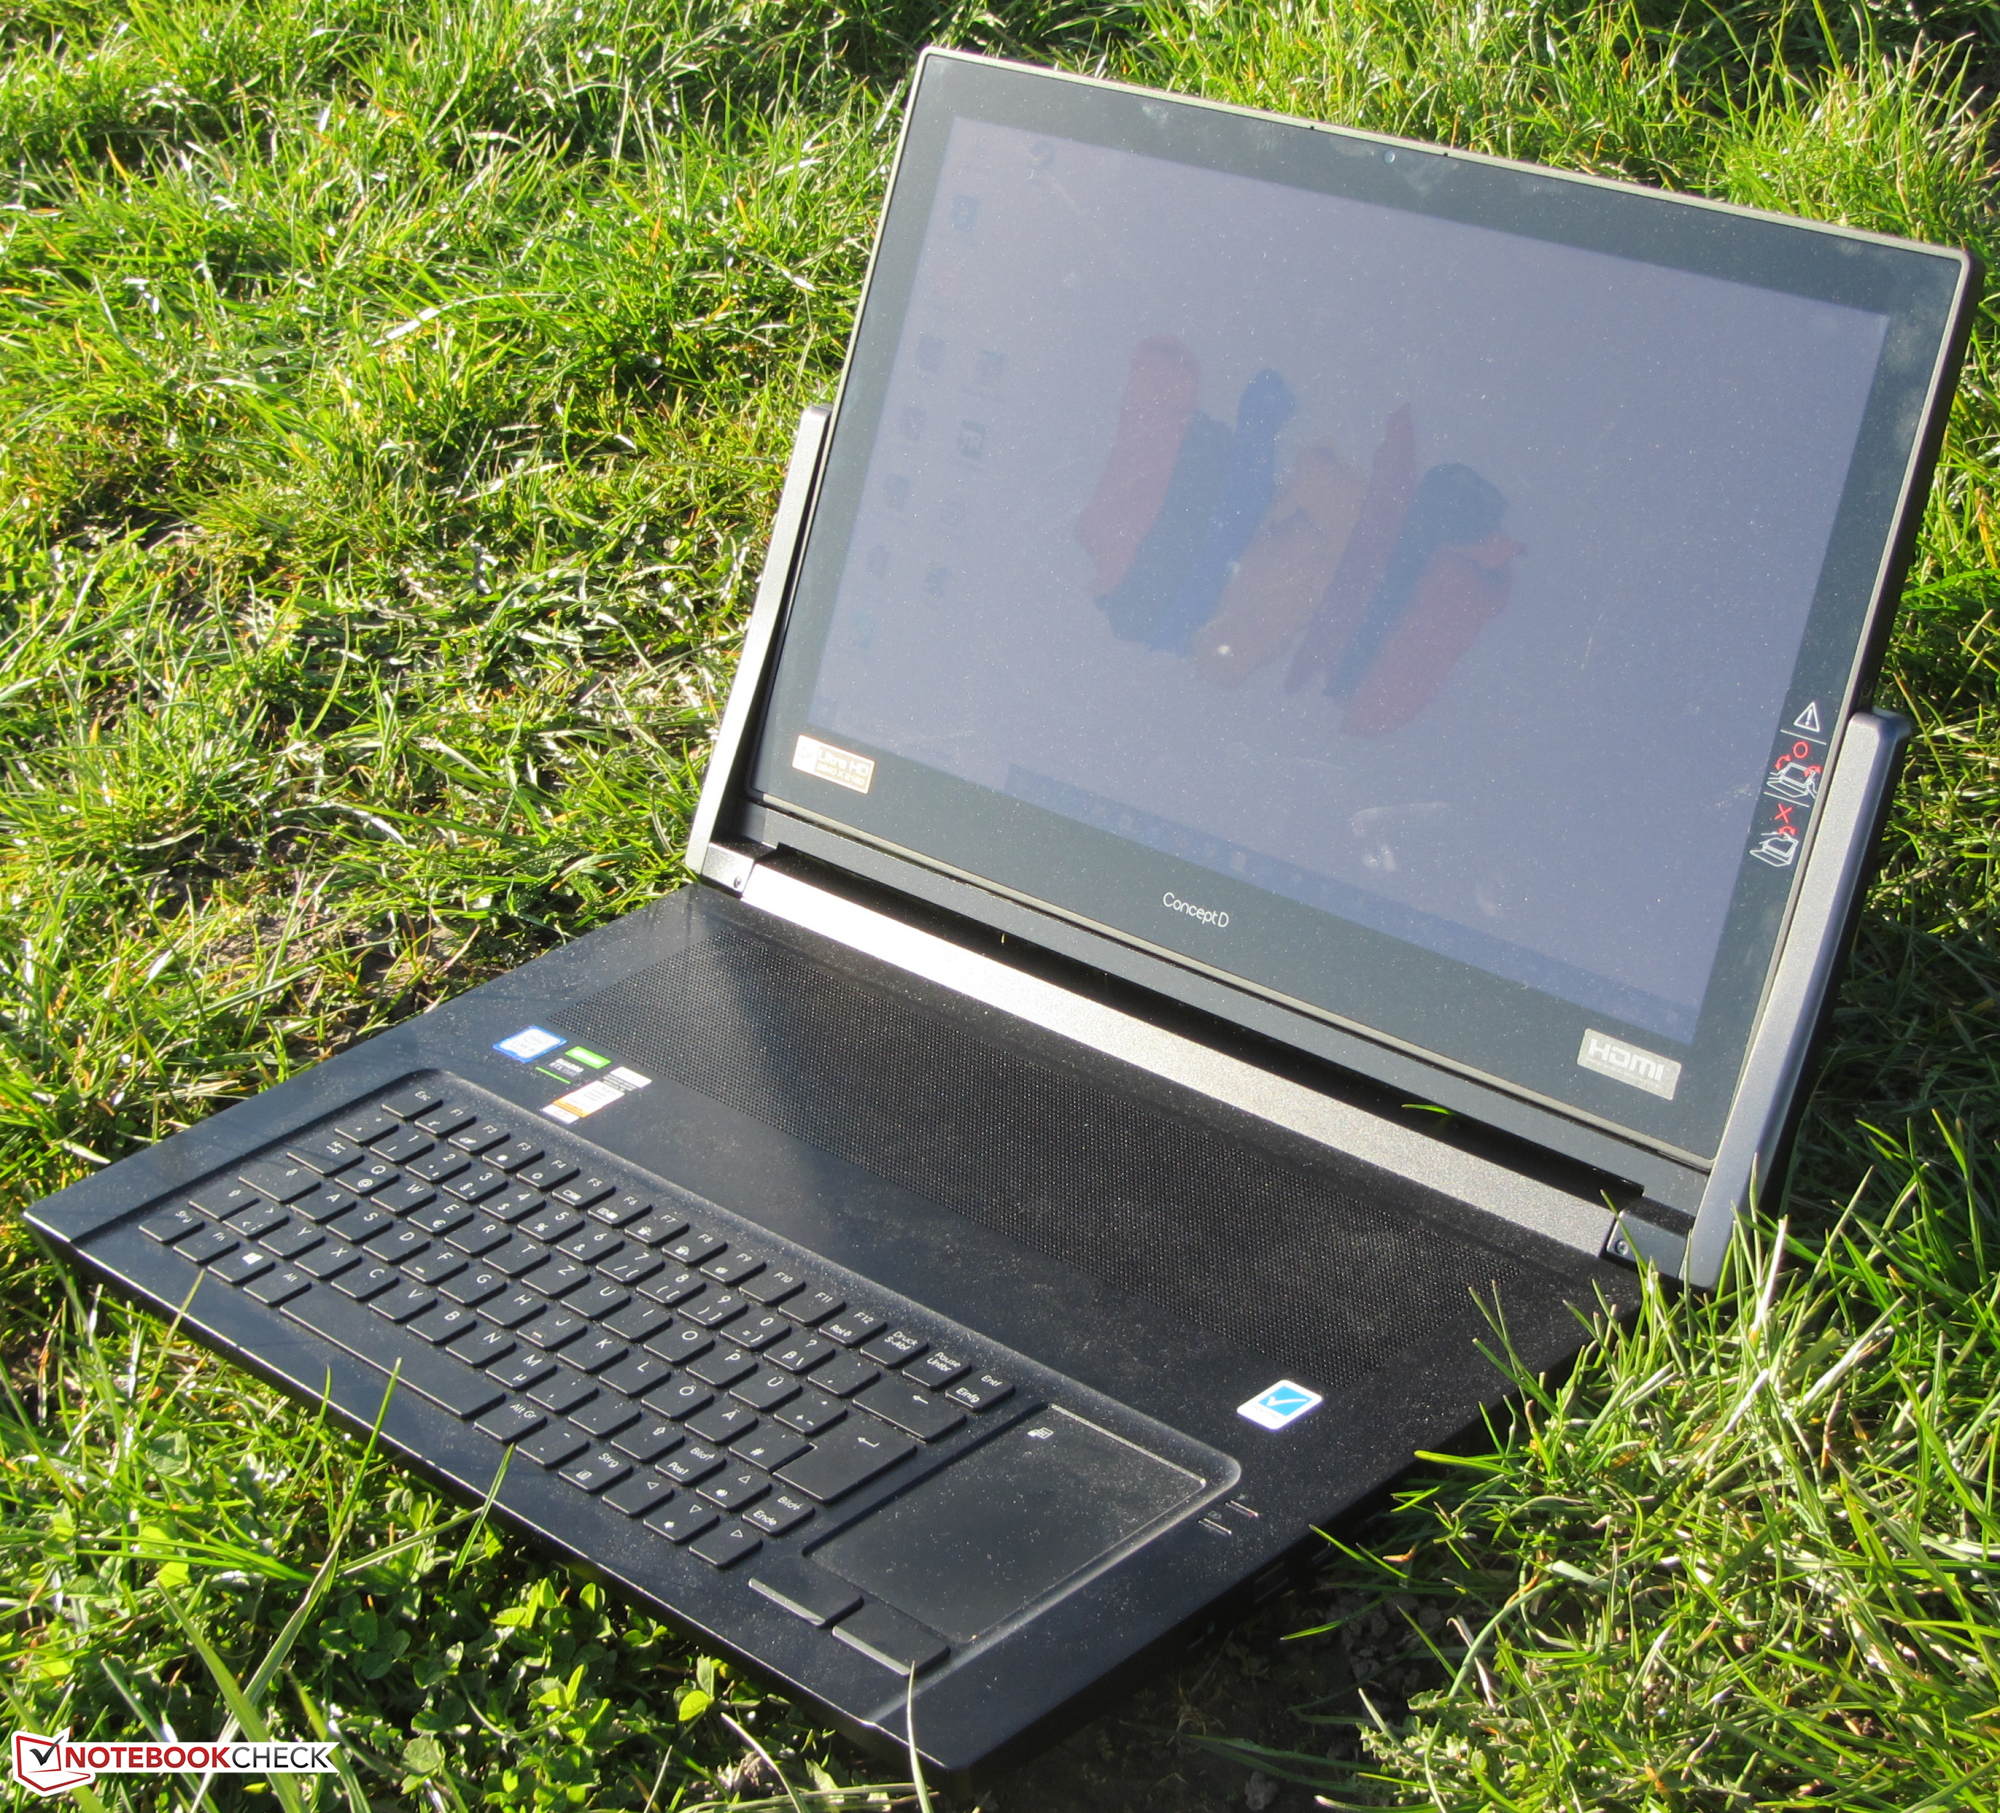
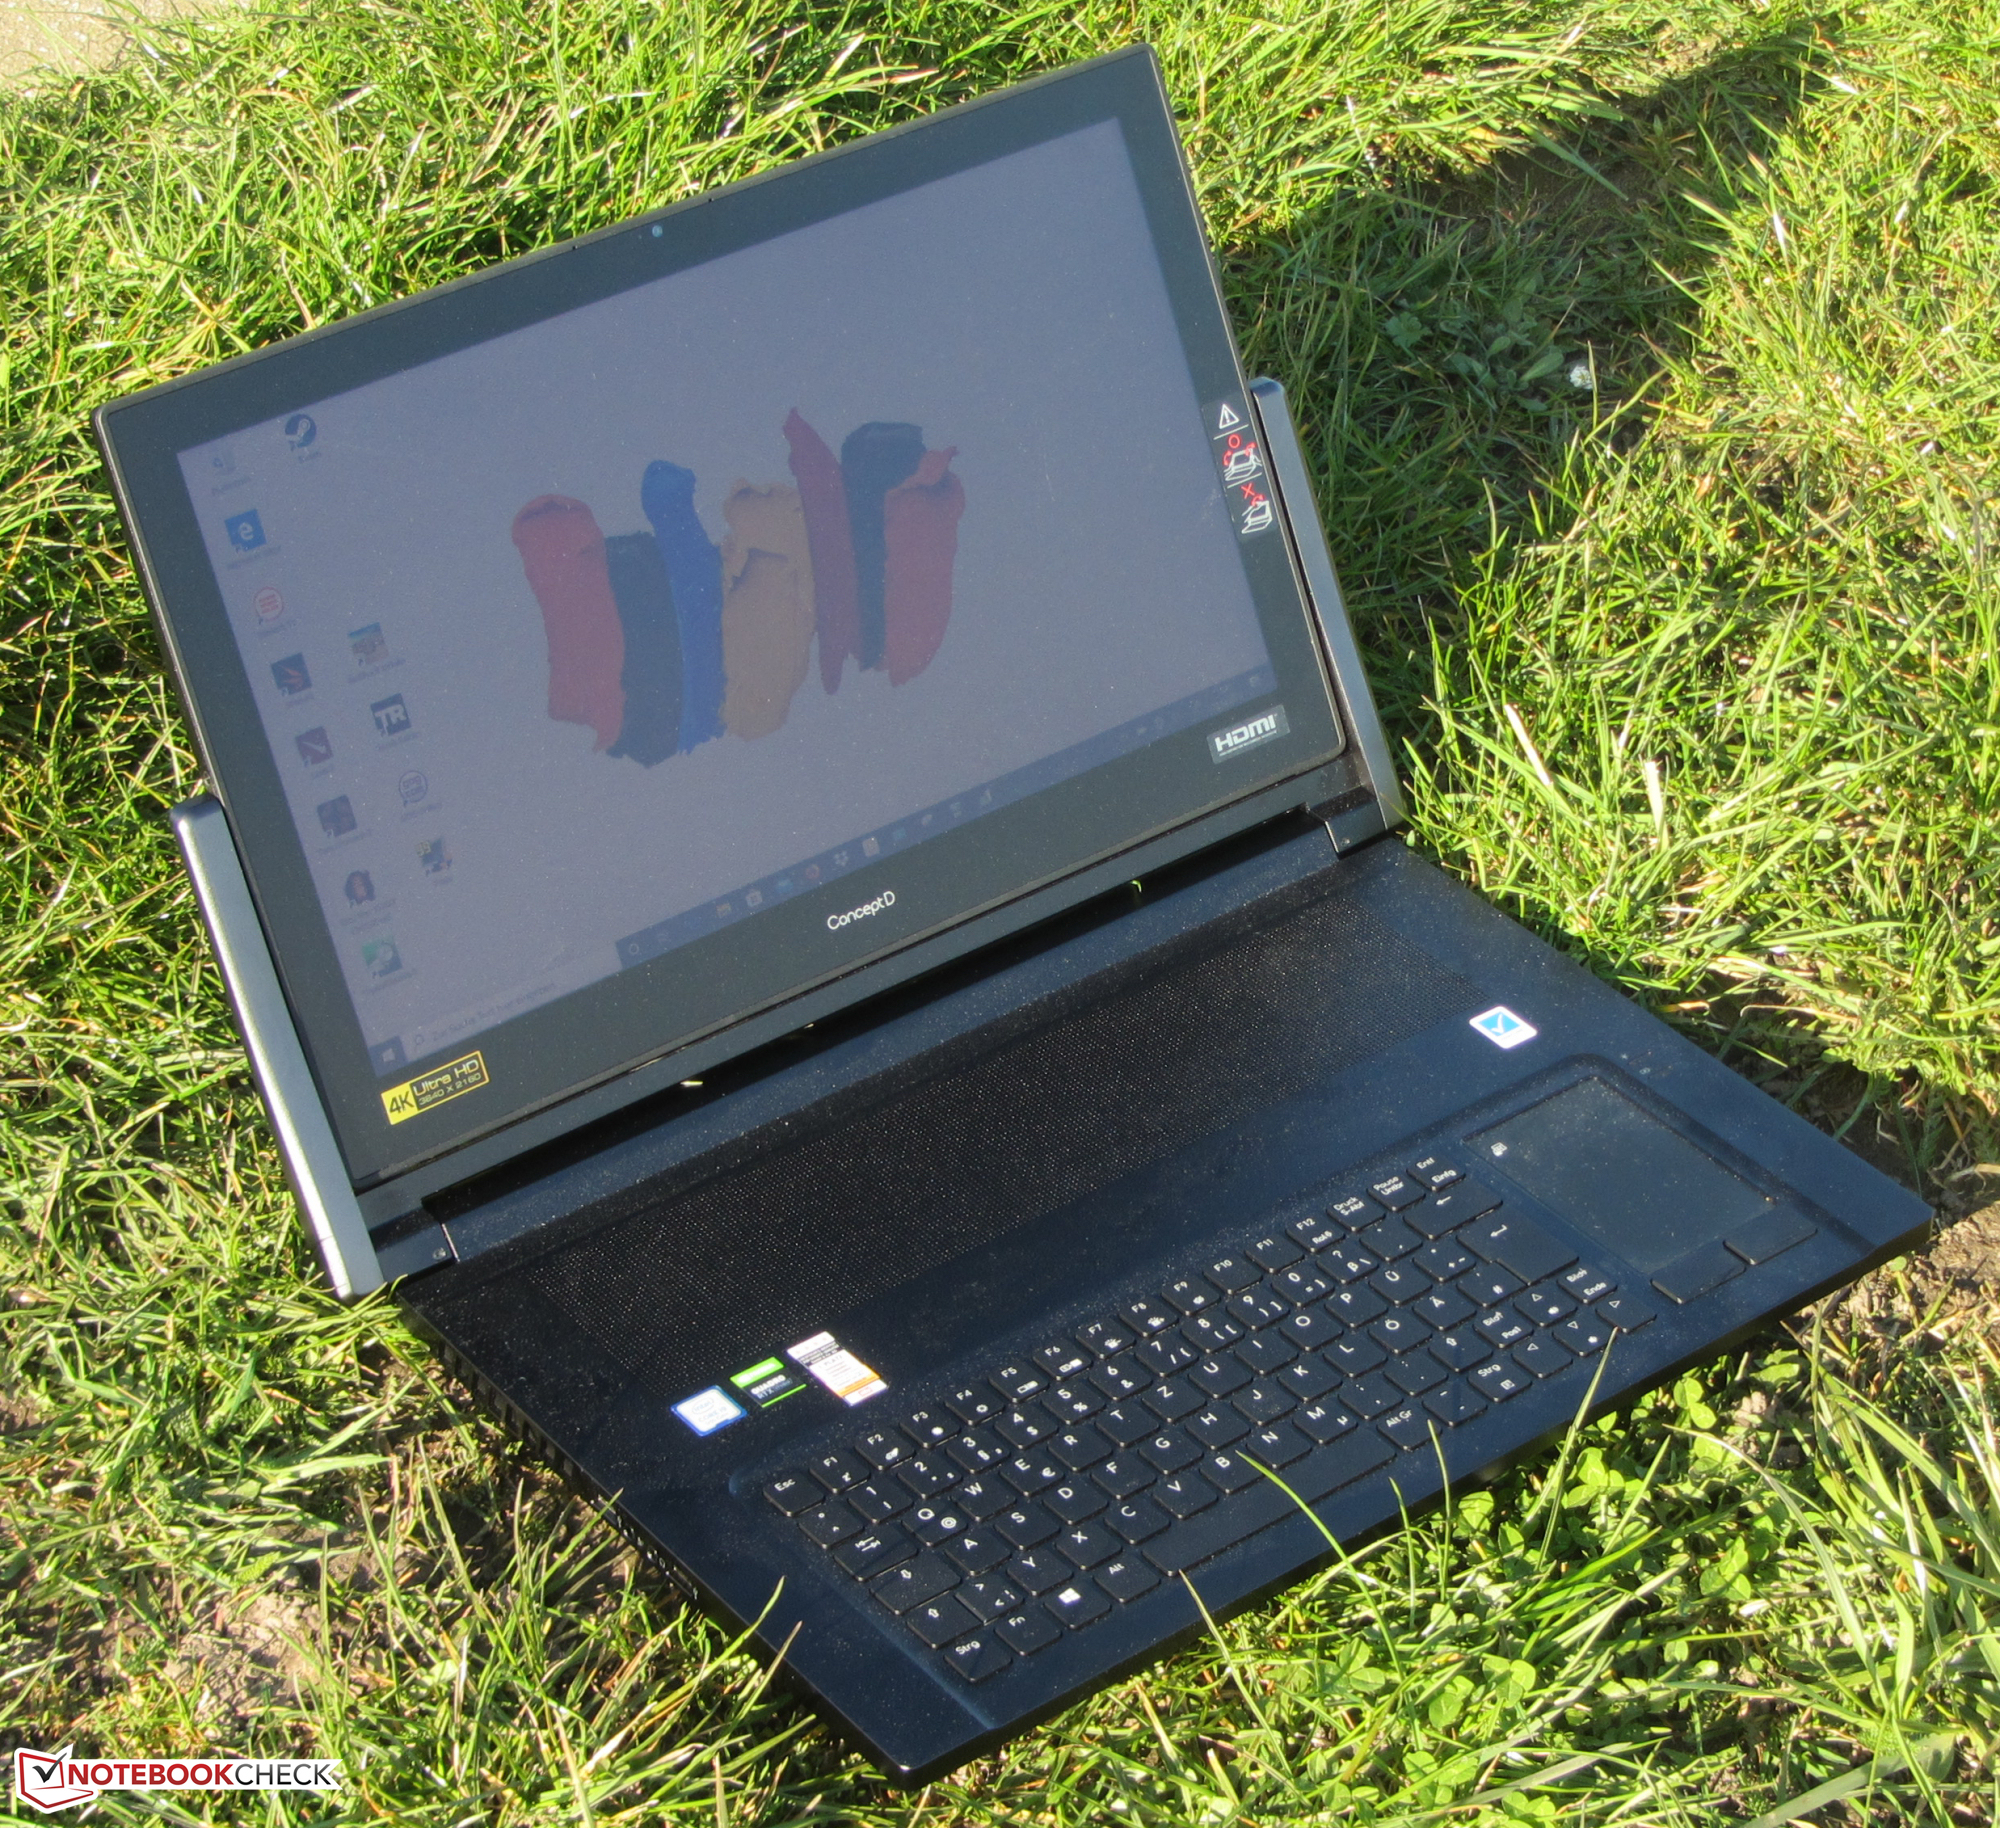
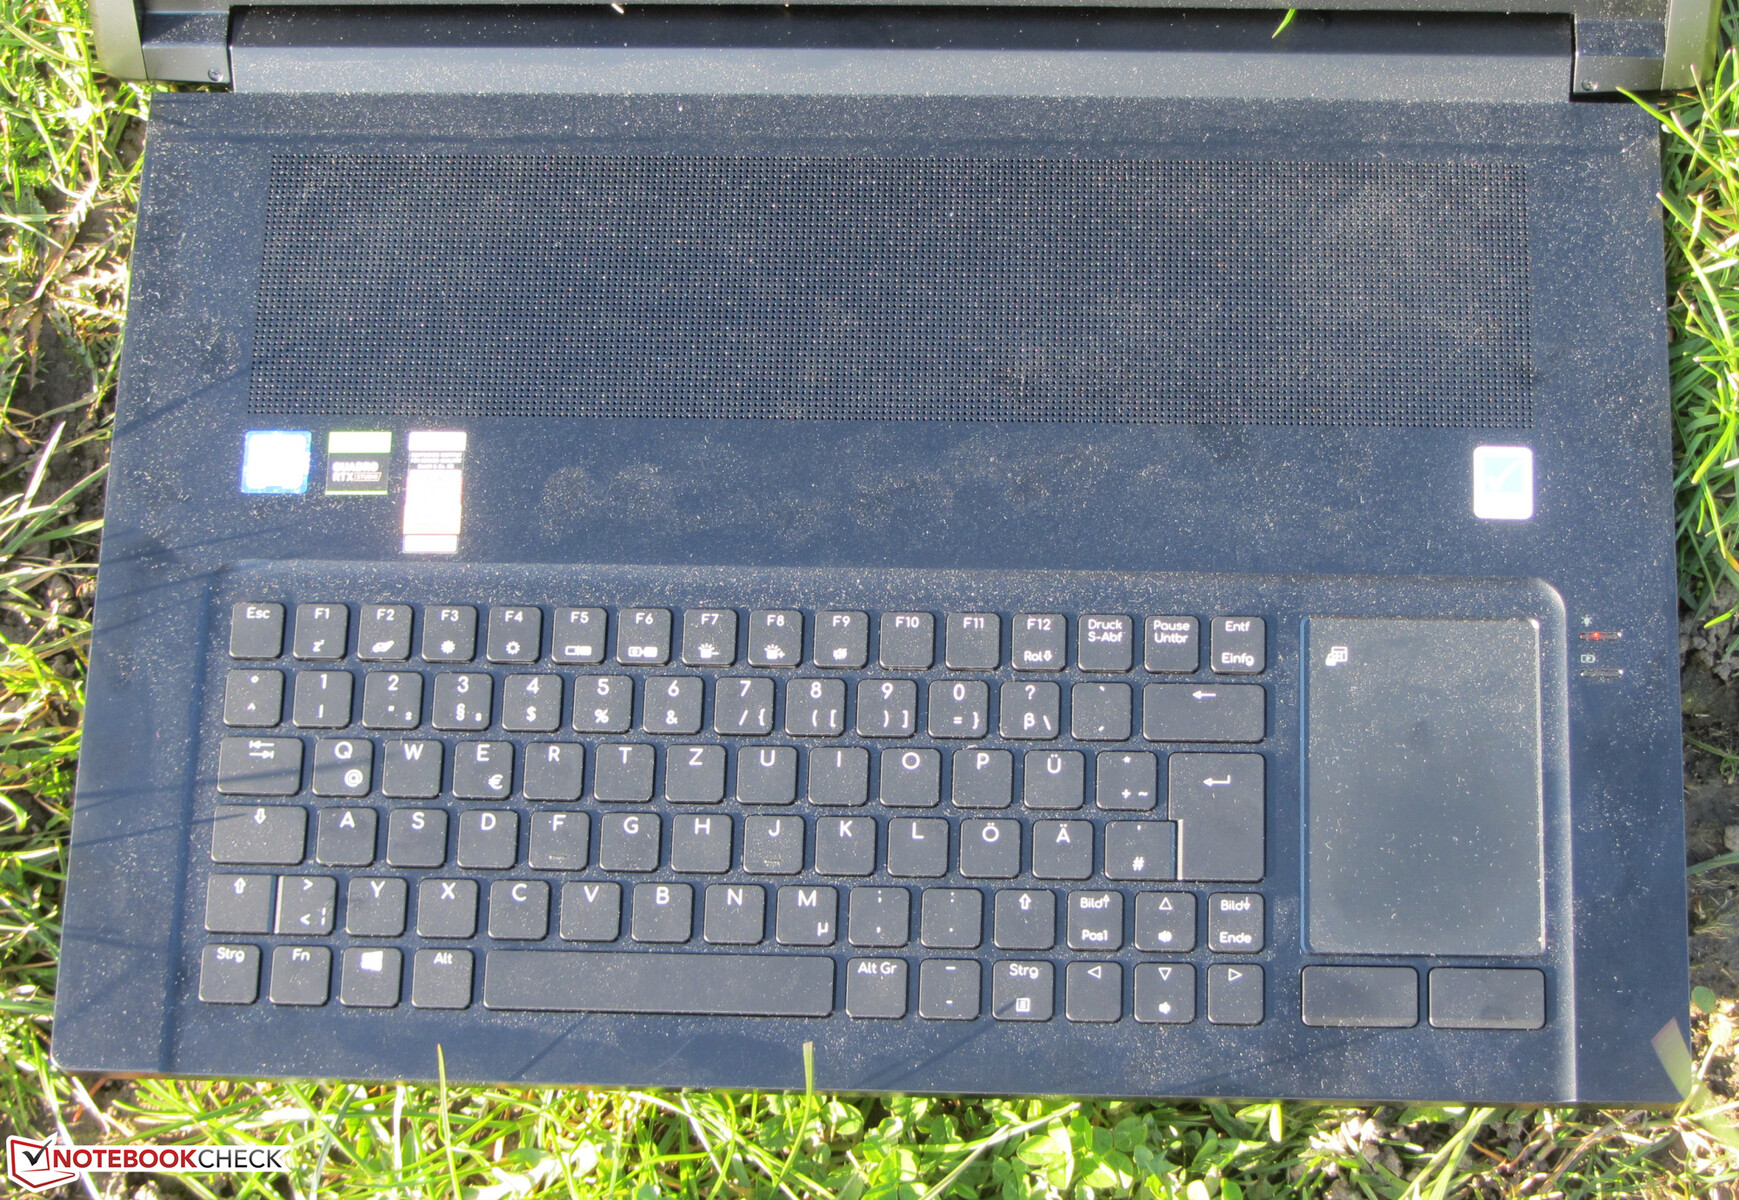
Acer went with a matte black metal chassis without any bells or whistles for the ConceptD 9 Pro. The keyboard has been relocated to the front of the base unit, in order to make room for various display positions. The touchpad is located to the right of the keyboard. Above the keyboard, there is a perforated area that facilitates airflow to the inside of the case.
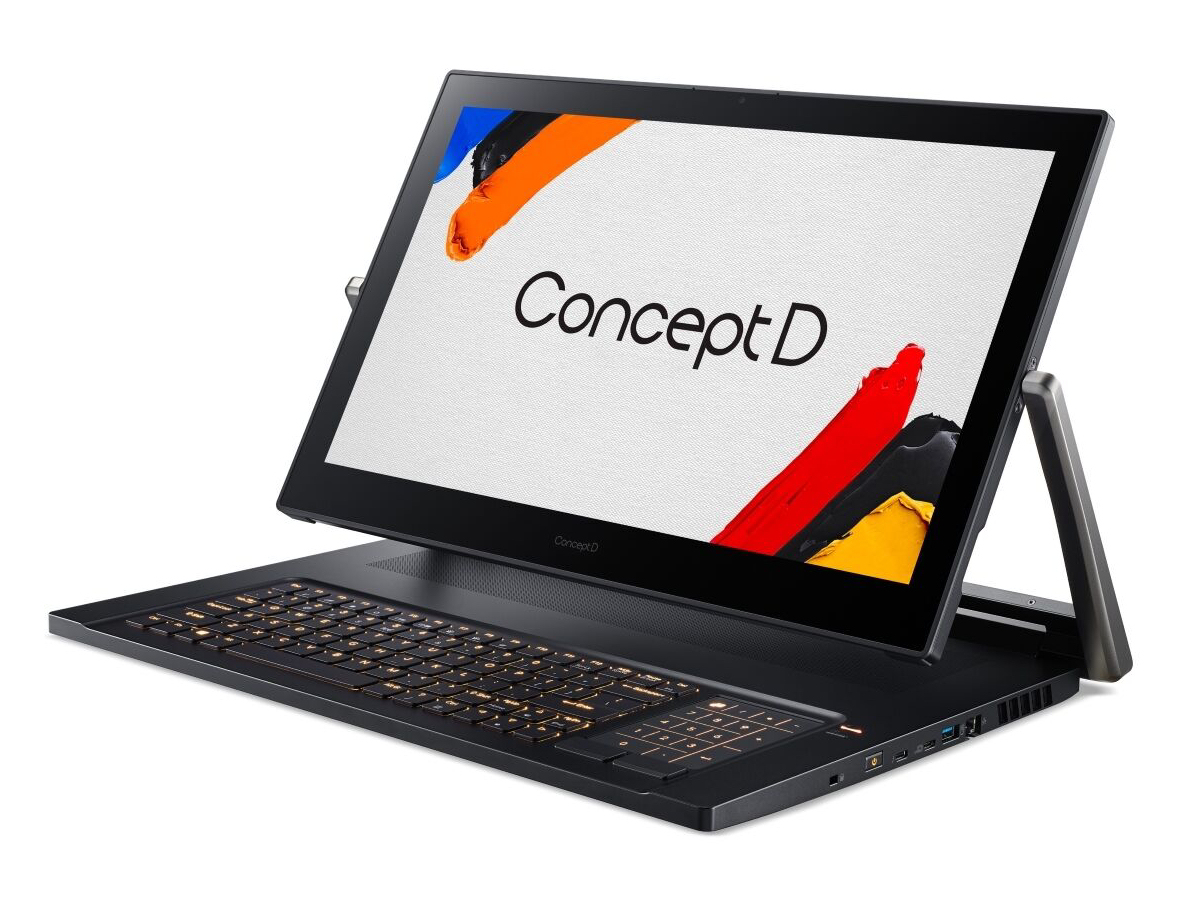
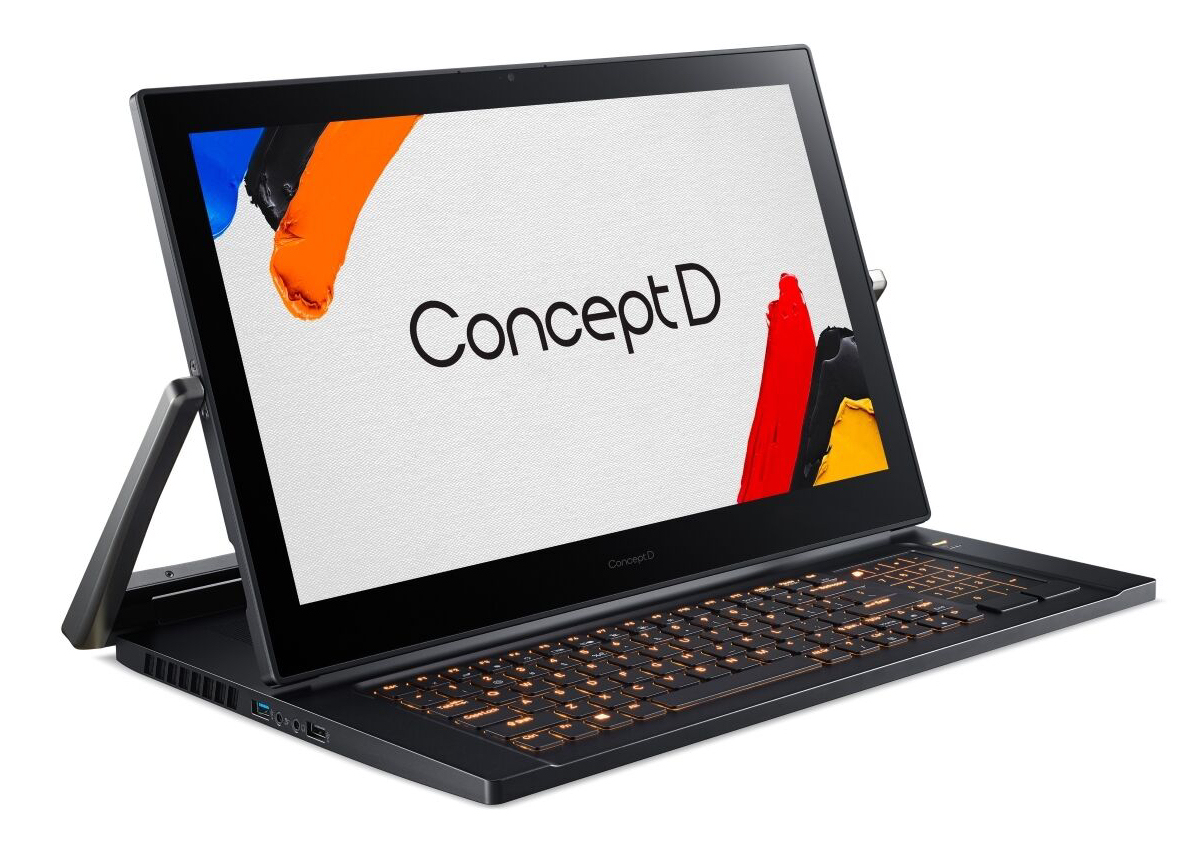
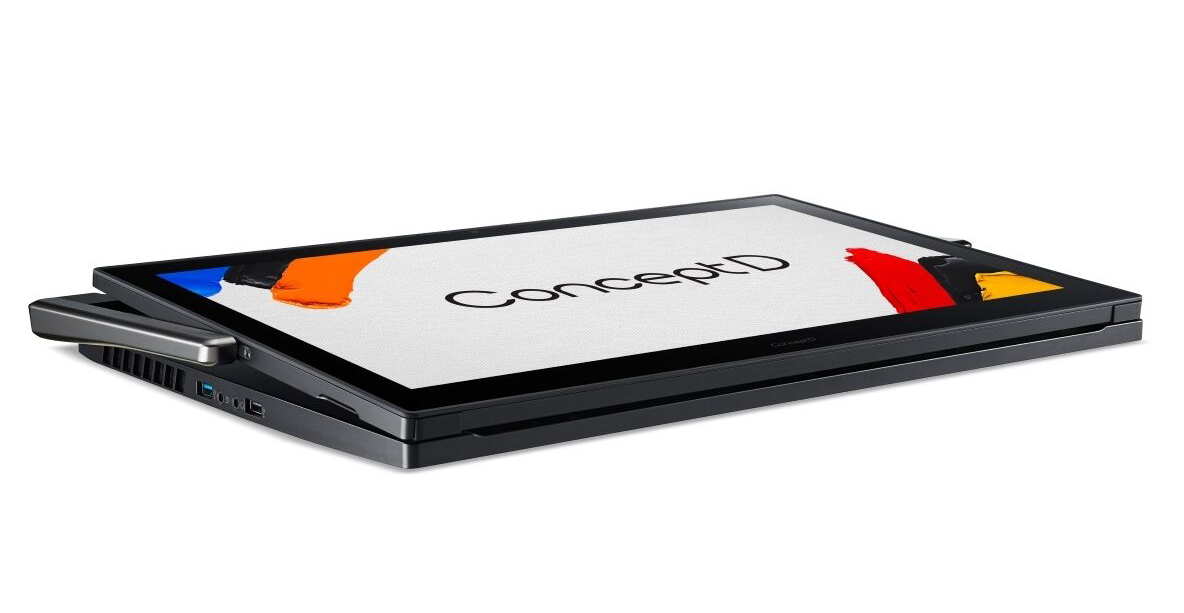
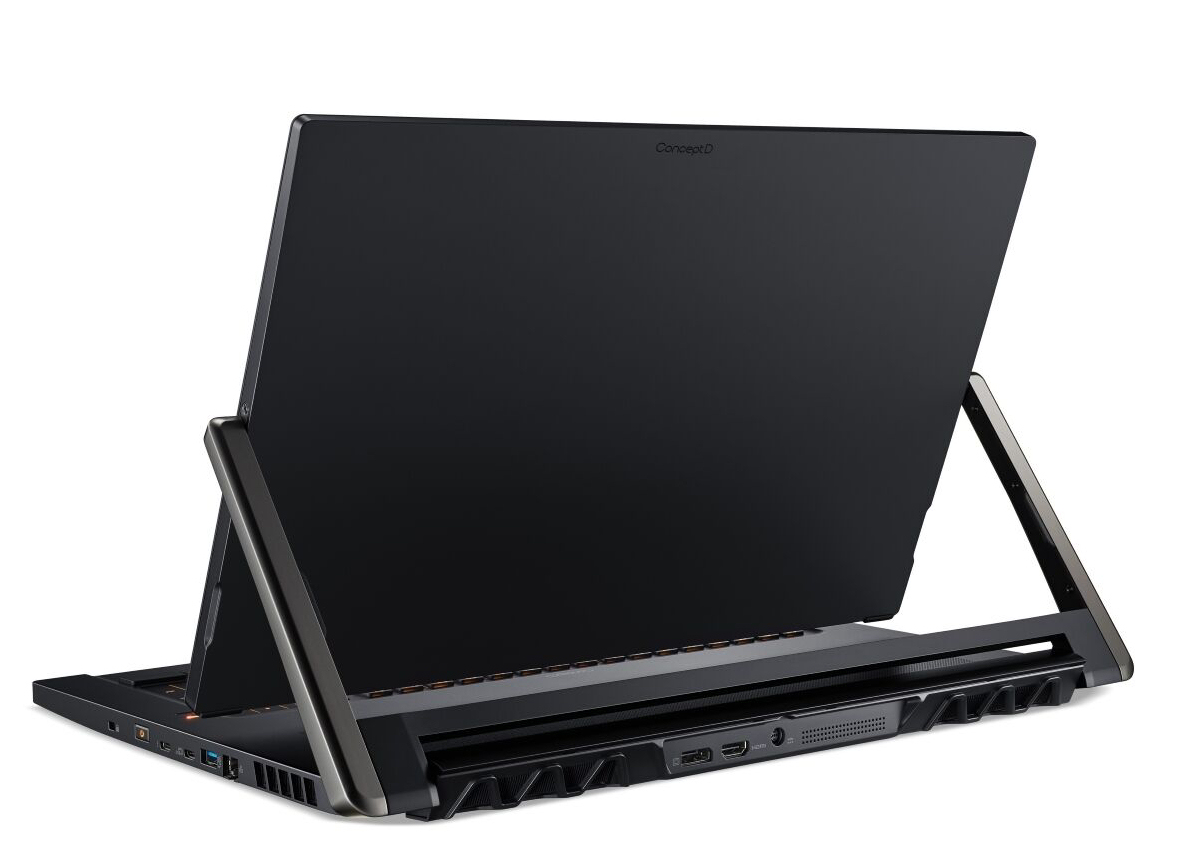
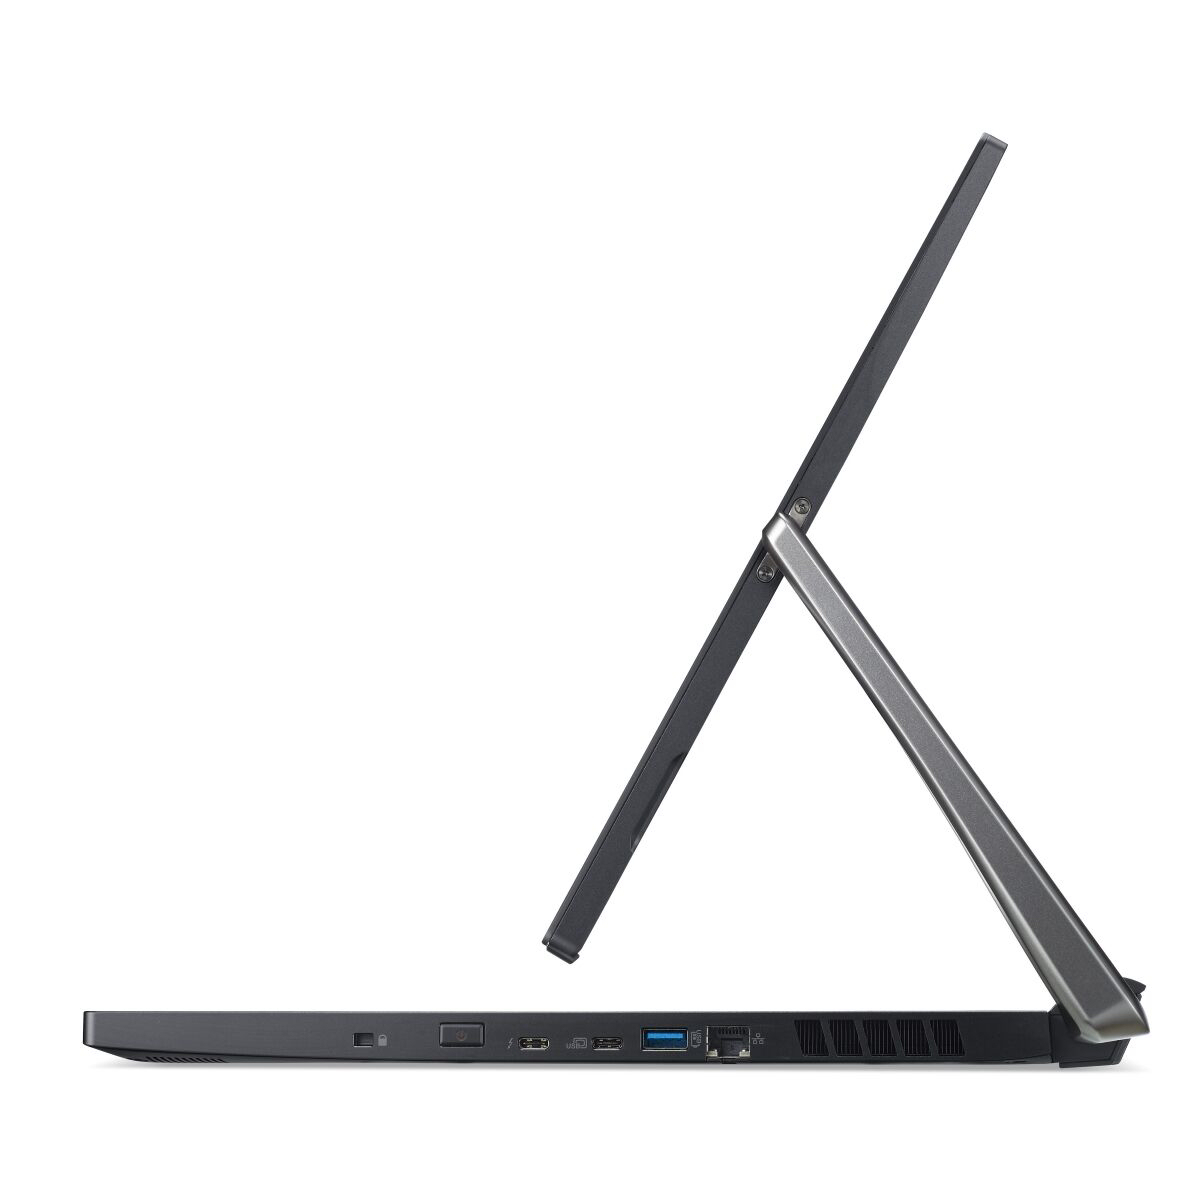
The massive hinges of the device are quite striking. They hold the display firmly in place regardless of its operating mode to allow for comfortable pen inputs. The lid can be opened to a maximum angle of 110 to 120 degrees. The display can also be rotated by 170 degrees. In tablet mode, it does not lie flatly on the base unit. Instead, it is slightly angled towards the user. The lid can be opened one-handed (when closed).
The build quality of the laptop is good. The clearances are adequate and there are no excess materials. There are no flaws in terms of the stability, either. At worst, the base unit and the lid can only be twisted slightly. The base unit's rigidity is particularly good. Applying pressure to the back of the lid does not distort the image. The battery is fixed. There is no maintenance hatch. In order to get to the inside, the case needs to be opened. More on this later.
At 4.5 kg, the Acer workstation is not exactly a lightweight device. Most of the competitors we selected weigh around 1 or 2 kg less. The Eurocom Tornado F7W is the only other device to cross the 4-kg mark. It also should not come as a surprise that the dimensions of the ConceptD are larger than those of most of its competitors. The Tornado F7W has the thickest and least compact case in terms of the surface area it occupies.
Features - ConceptD with Thunderbolt 3
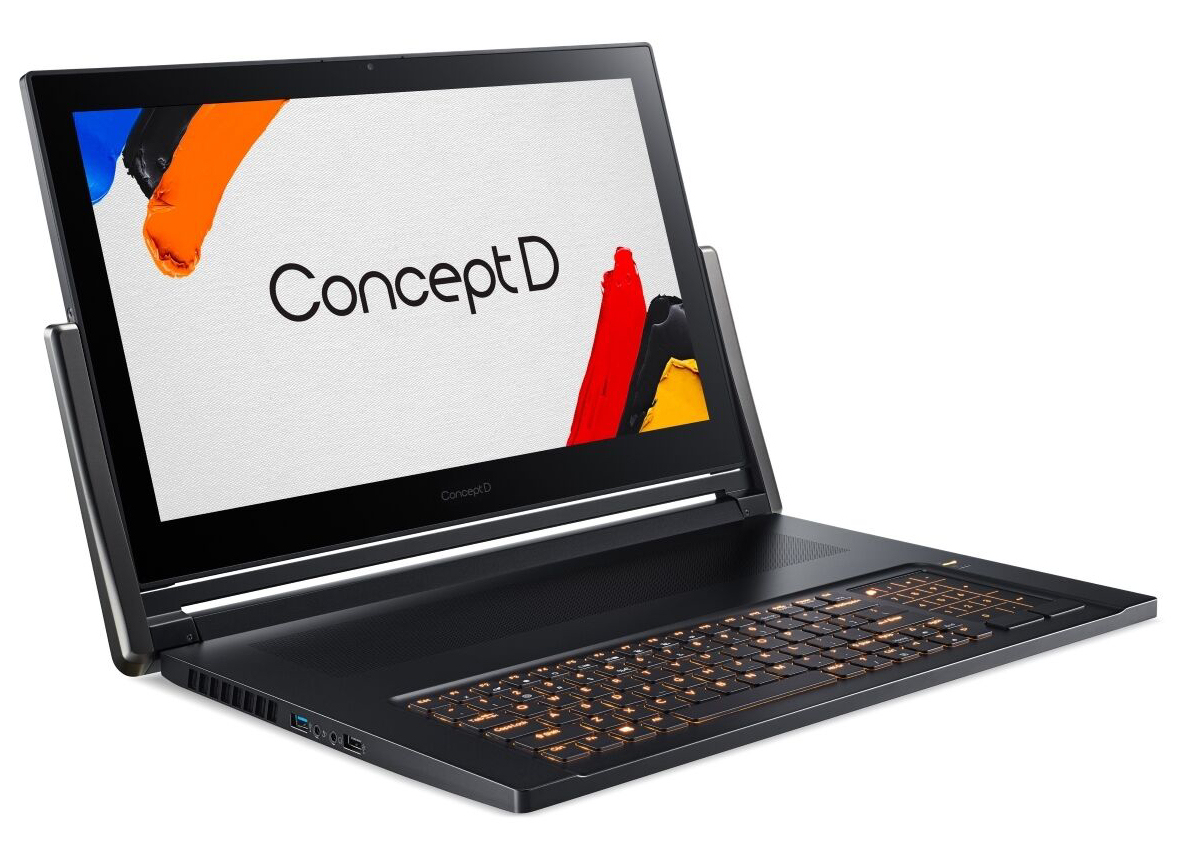
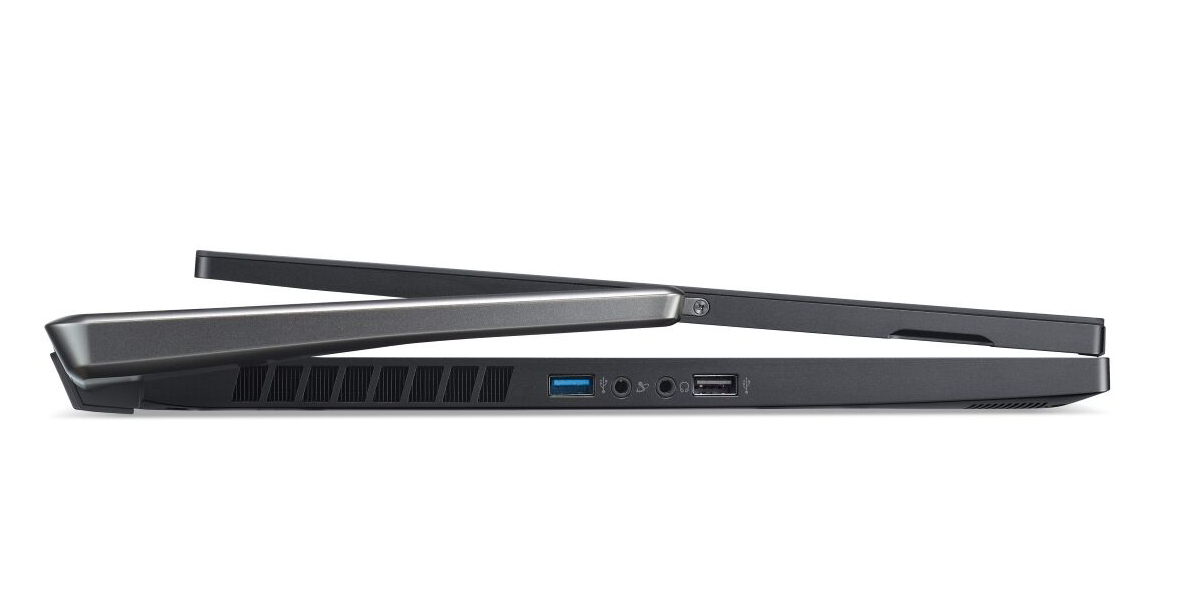
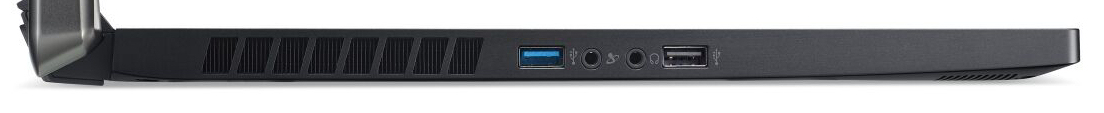
The Acer laptop offers a well-rounded port selection. There are three USB Type-A ports (2x USB 3.2 Gen 1, 1x USB 2.0) and two USB Type-C ports (1x USB 3.2 Gen 1, 1x Thunderbolt 3) available on the workstation. Both USB Type-C ports support the DisplayPort via USB-C feature (although this requires a separately available adapter). Combined with the dedicated DisplayPort and the HDMI port, this brings the workstation up to a total of four video outputs. Furthermore, two audio jacks (headphone output, microphone input), a Gigabit Ethernet port and a lock slot round off the package. Meanwhile, a card reader is nowhere to be found.
The ports are distributed across the left and right sides as well as the back. The ports on the sides are centered. As a result, cables are unlikely to get in the way when using an external mouse.


Communication
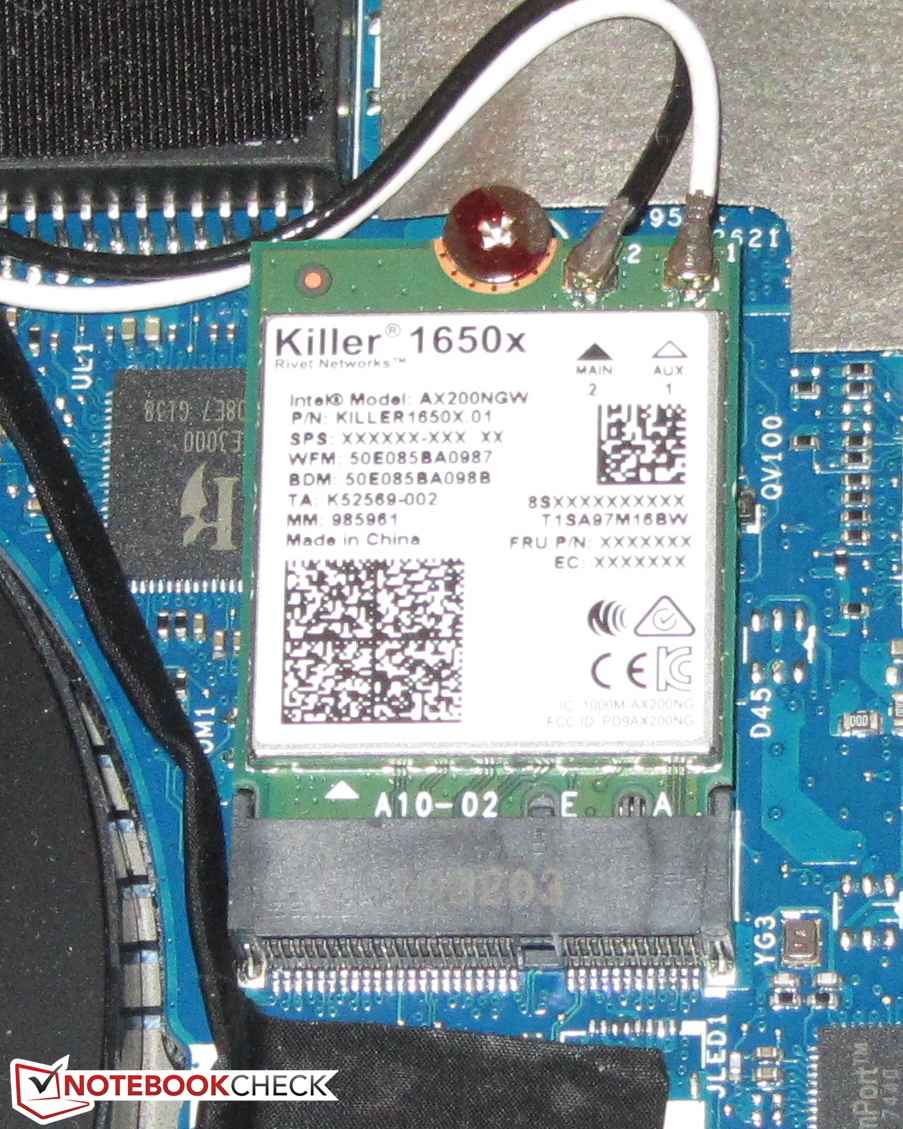
Apart from the Wi-Fi standards 802.11a/b/g/n/ac, the Killer Wi-Fi module also supports the faster ax standard. Under optimal conditions (no other Wi-Fi devices in proximity, short distance between the laptop and server), we recorded very good transfer speeds. A Killer E3000 Gigabit Ethernet controller is responsible for wired networking. There were no issues with it during our tests.
Webcam
The integrated 2.1-MP webcam can take pictures with a maximum resolution of 1920x1080 pixels. The results are decent. However, the color accuracy leaves something to be desired. Its deviation of 33.6 is significantly above the ideal range (DeltaE of less than three).

, i9-9980HK, WDC PC SN720 SDAQNTW-1T00")
, i9-9980HK, WDC PC SN720 SDAQNTW-1T00")
Accessories
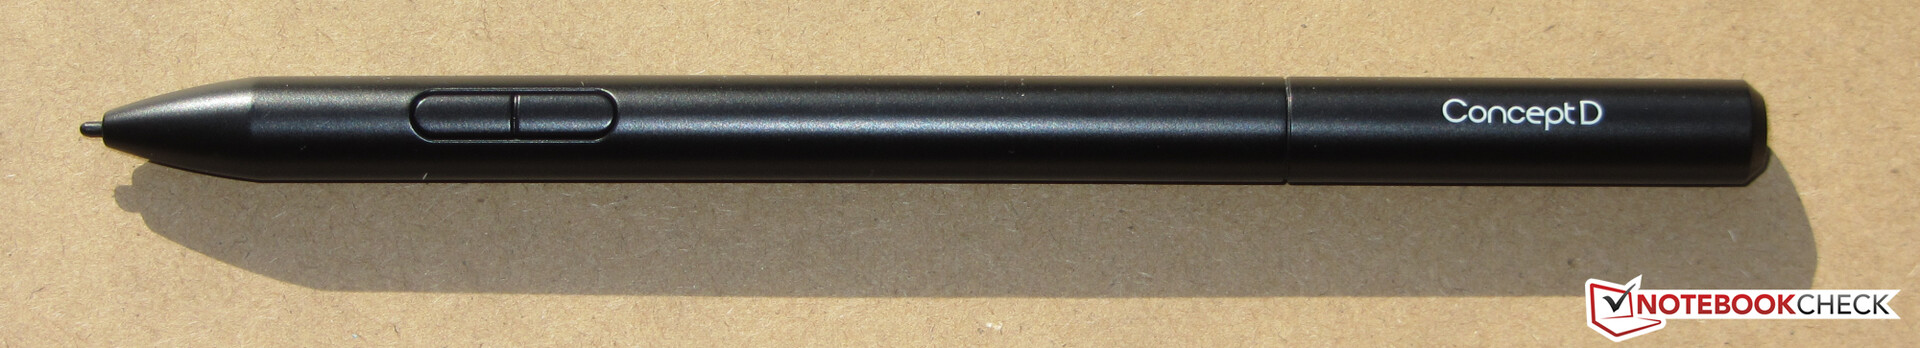
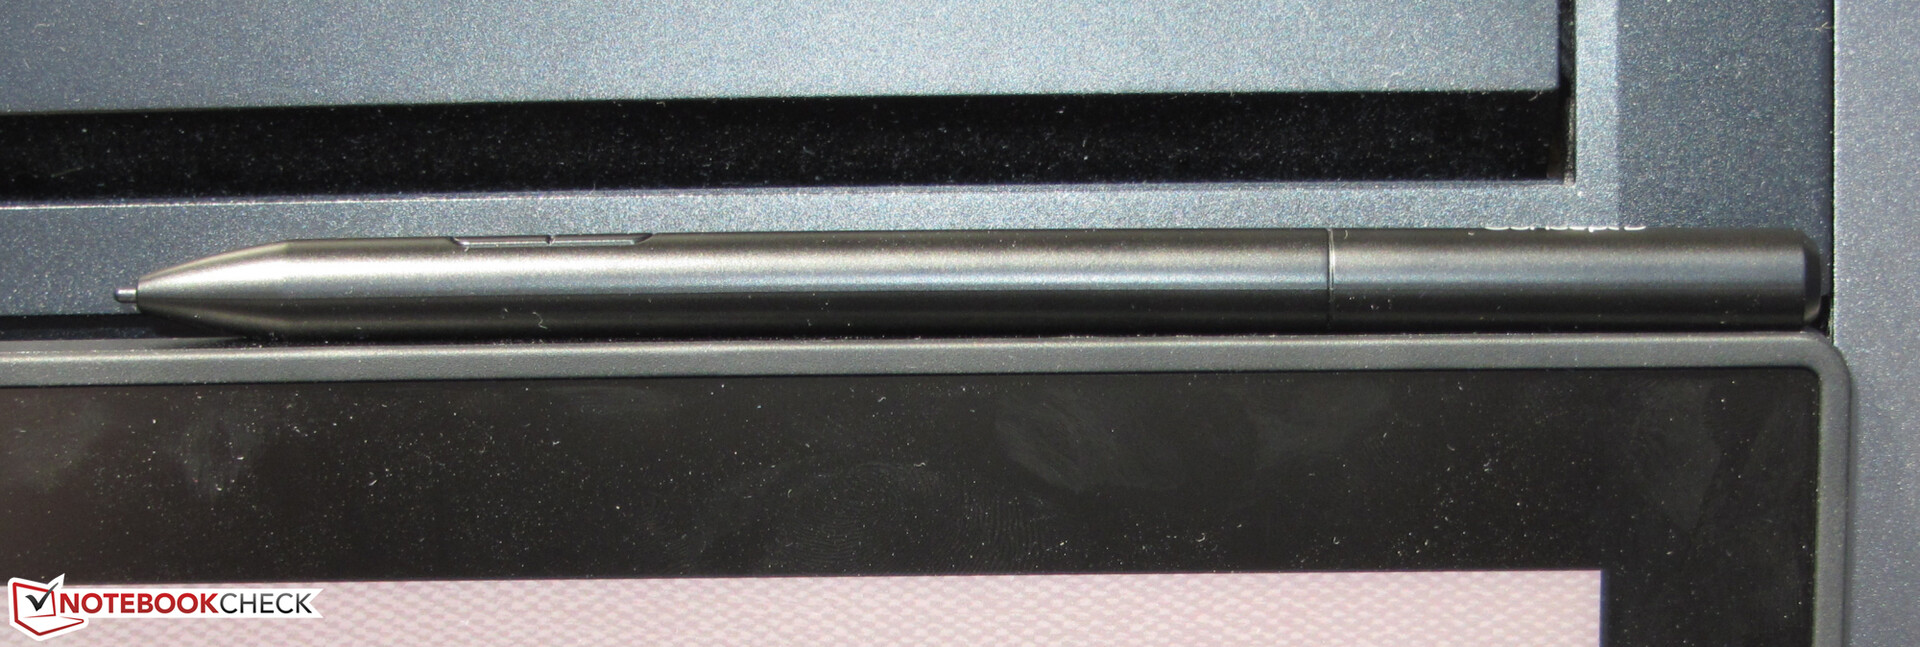
Aside from the usual accessories (warranty information, quick-start guide), the ConceptD also includes a Wacom digital pen.
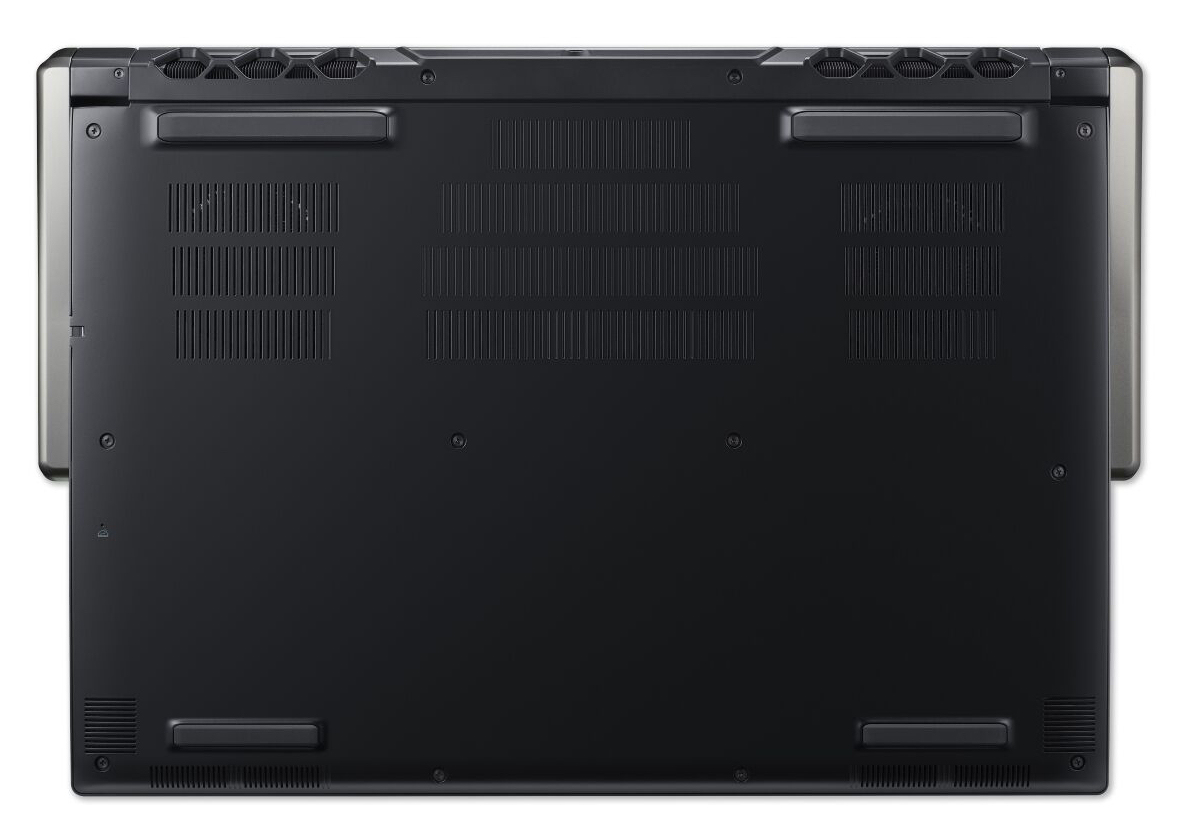
Maintenance
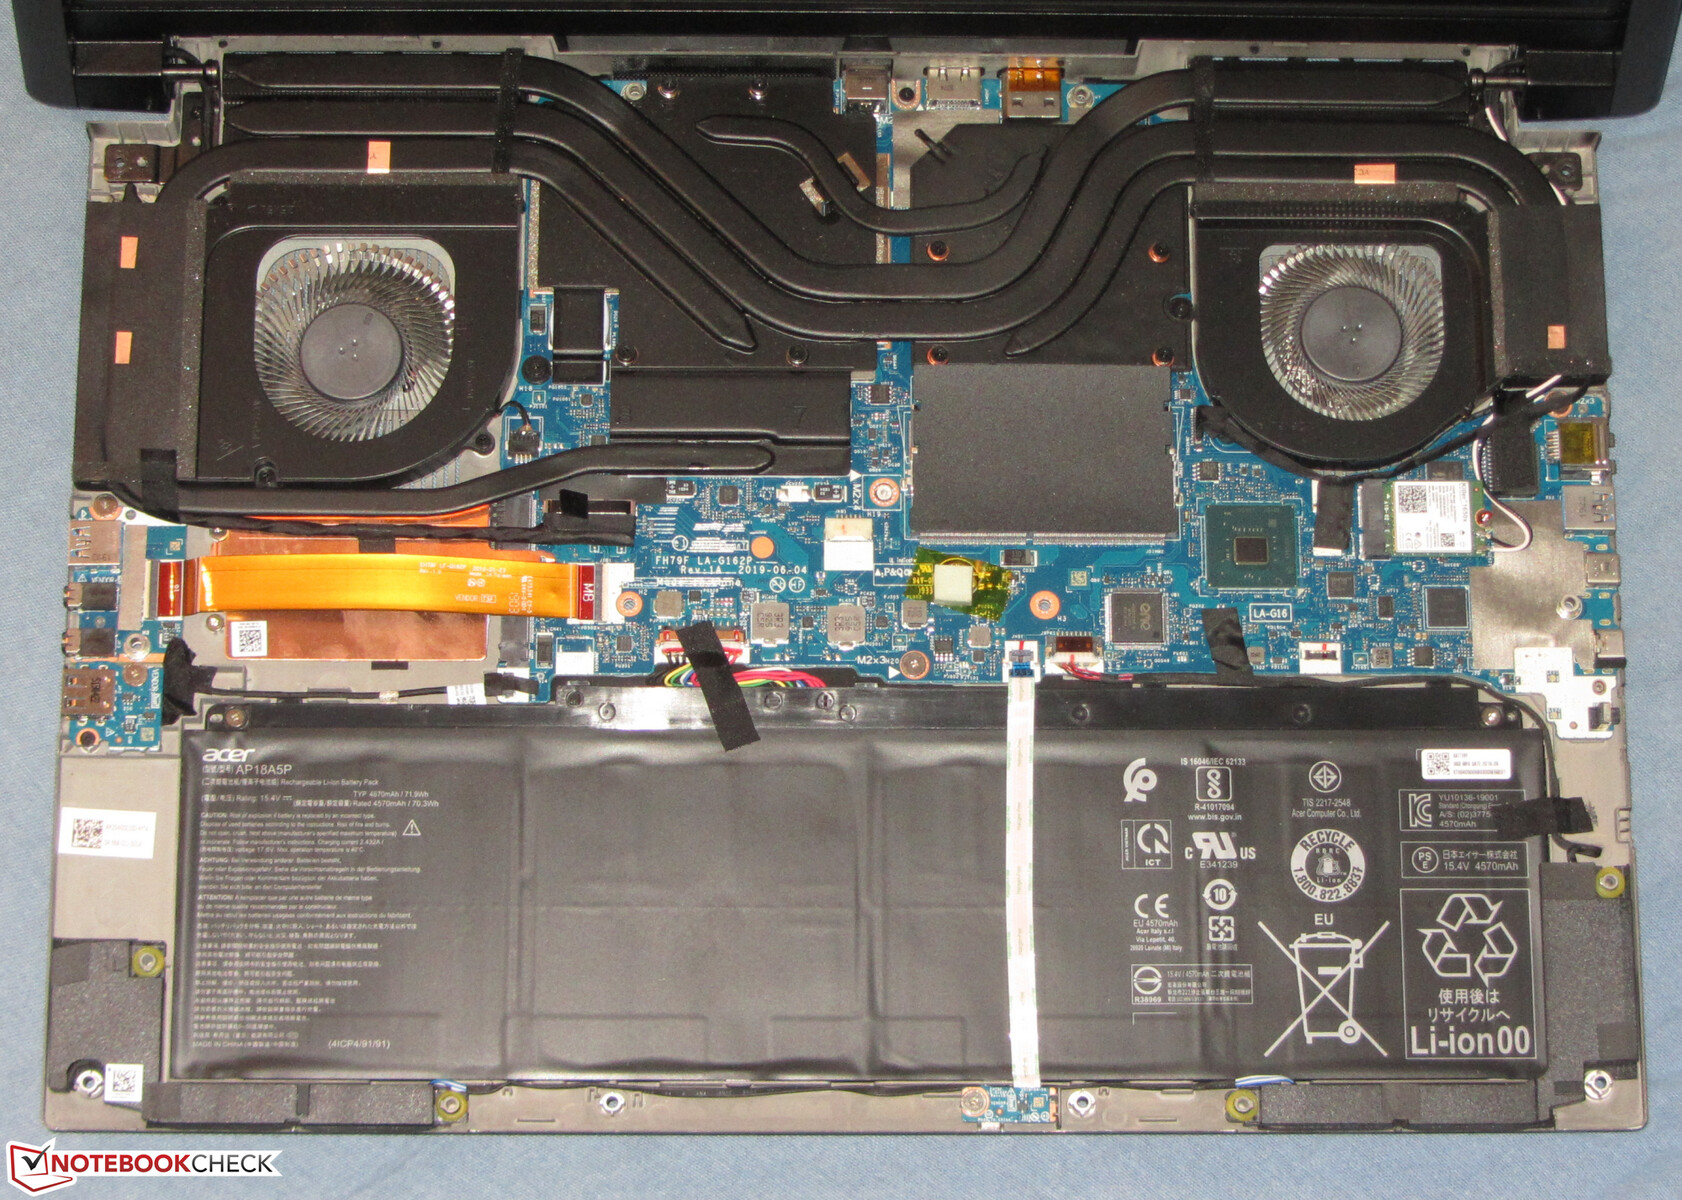
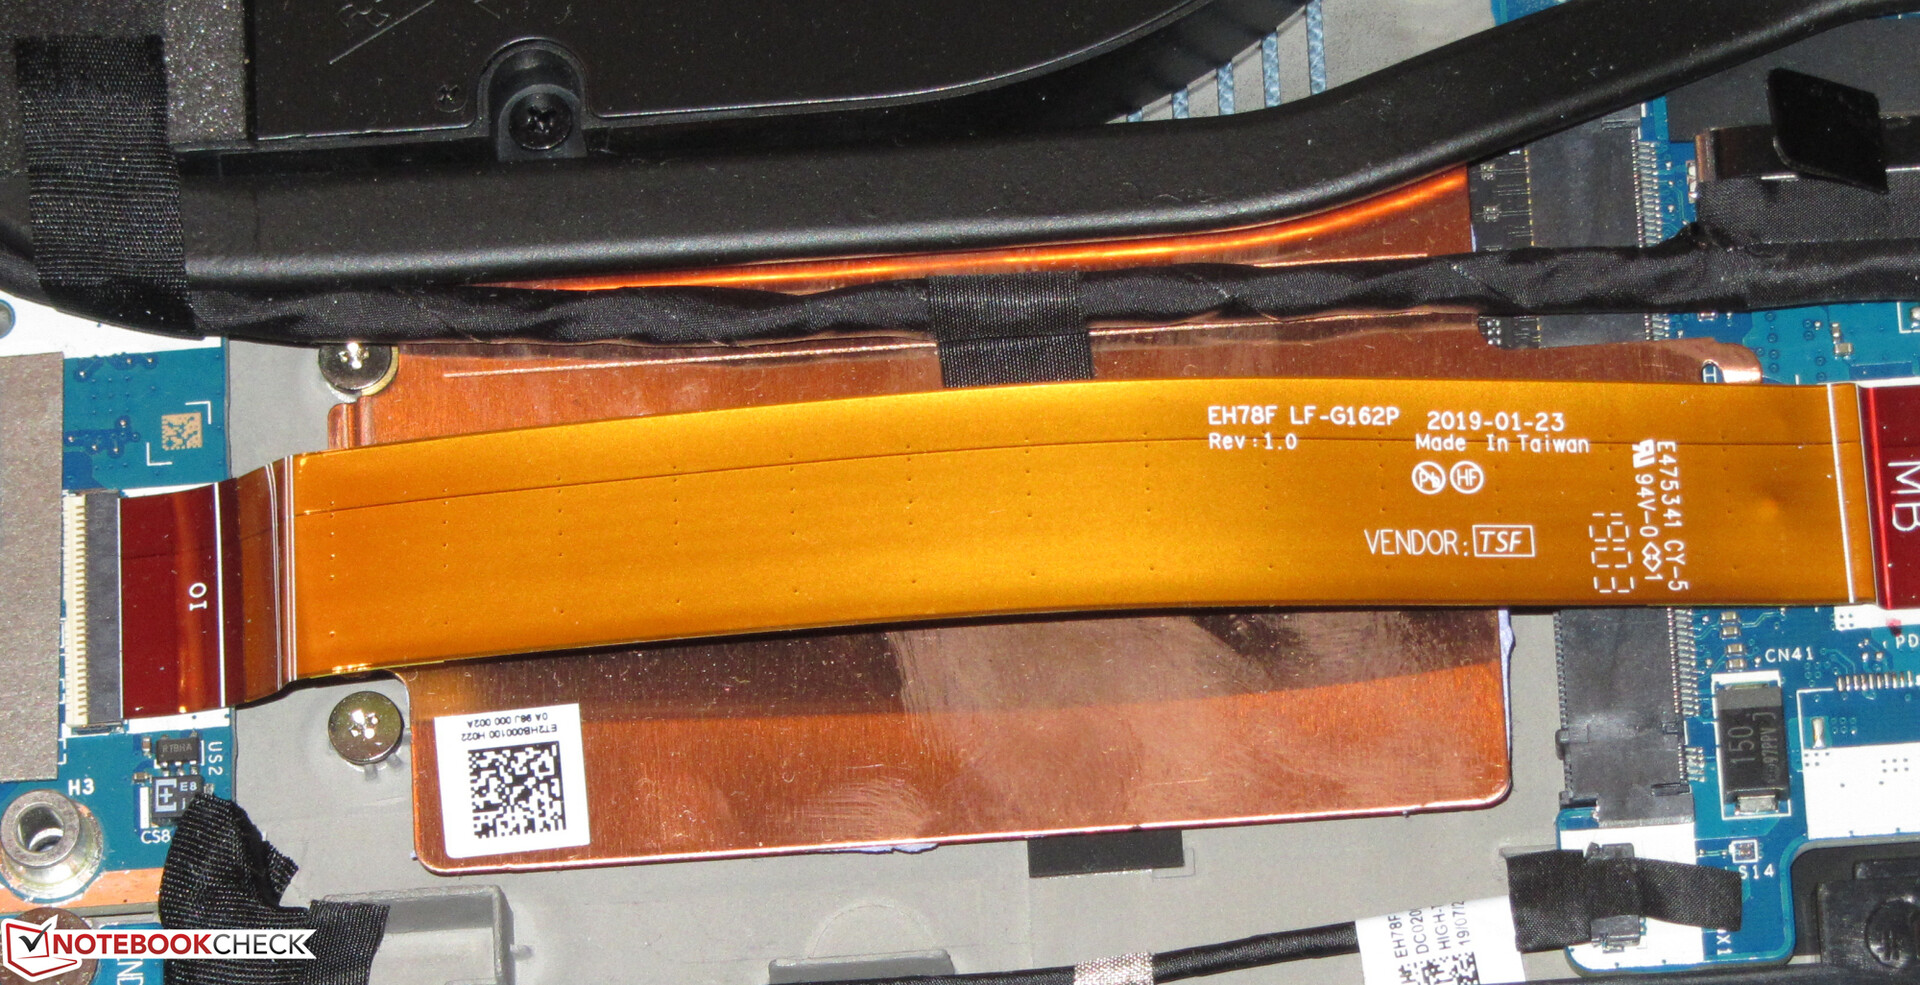
There is no maintenance hatch available on the workstation. In order to reach the components, the top panel needs to be removed. This can be accomplished by loosening all the screws on the bottom of the device and subsequently putting the device back on its feet. While the top panel can be lifted at this point, it cannot yet be detached entirely, since it is still held by plastic clips above the exhaust vents on the back. The clips can be removed by carefully moving the top part back and forth. Careful: The top part of the chassis will still be connected to the motherboard through two cables at this point. They need to be disconnected before the chassis can be opened fully.
Warranty
Acer offers buyers of the ConceptD a two-year warranty - including pickup and delivery service. The warranty also includes Predator Premium Service. With this service, Acer promises to check and repair a defective device within 72 hours.
Input Devices - Wacom Digital Pen Included with the CN917-71P
Keyboard
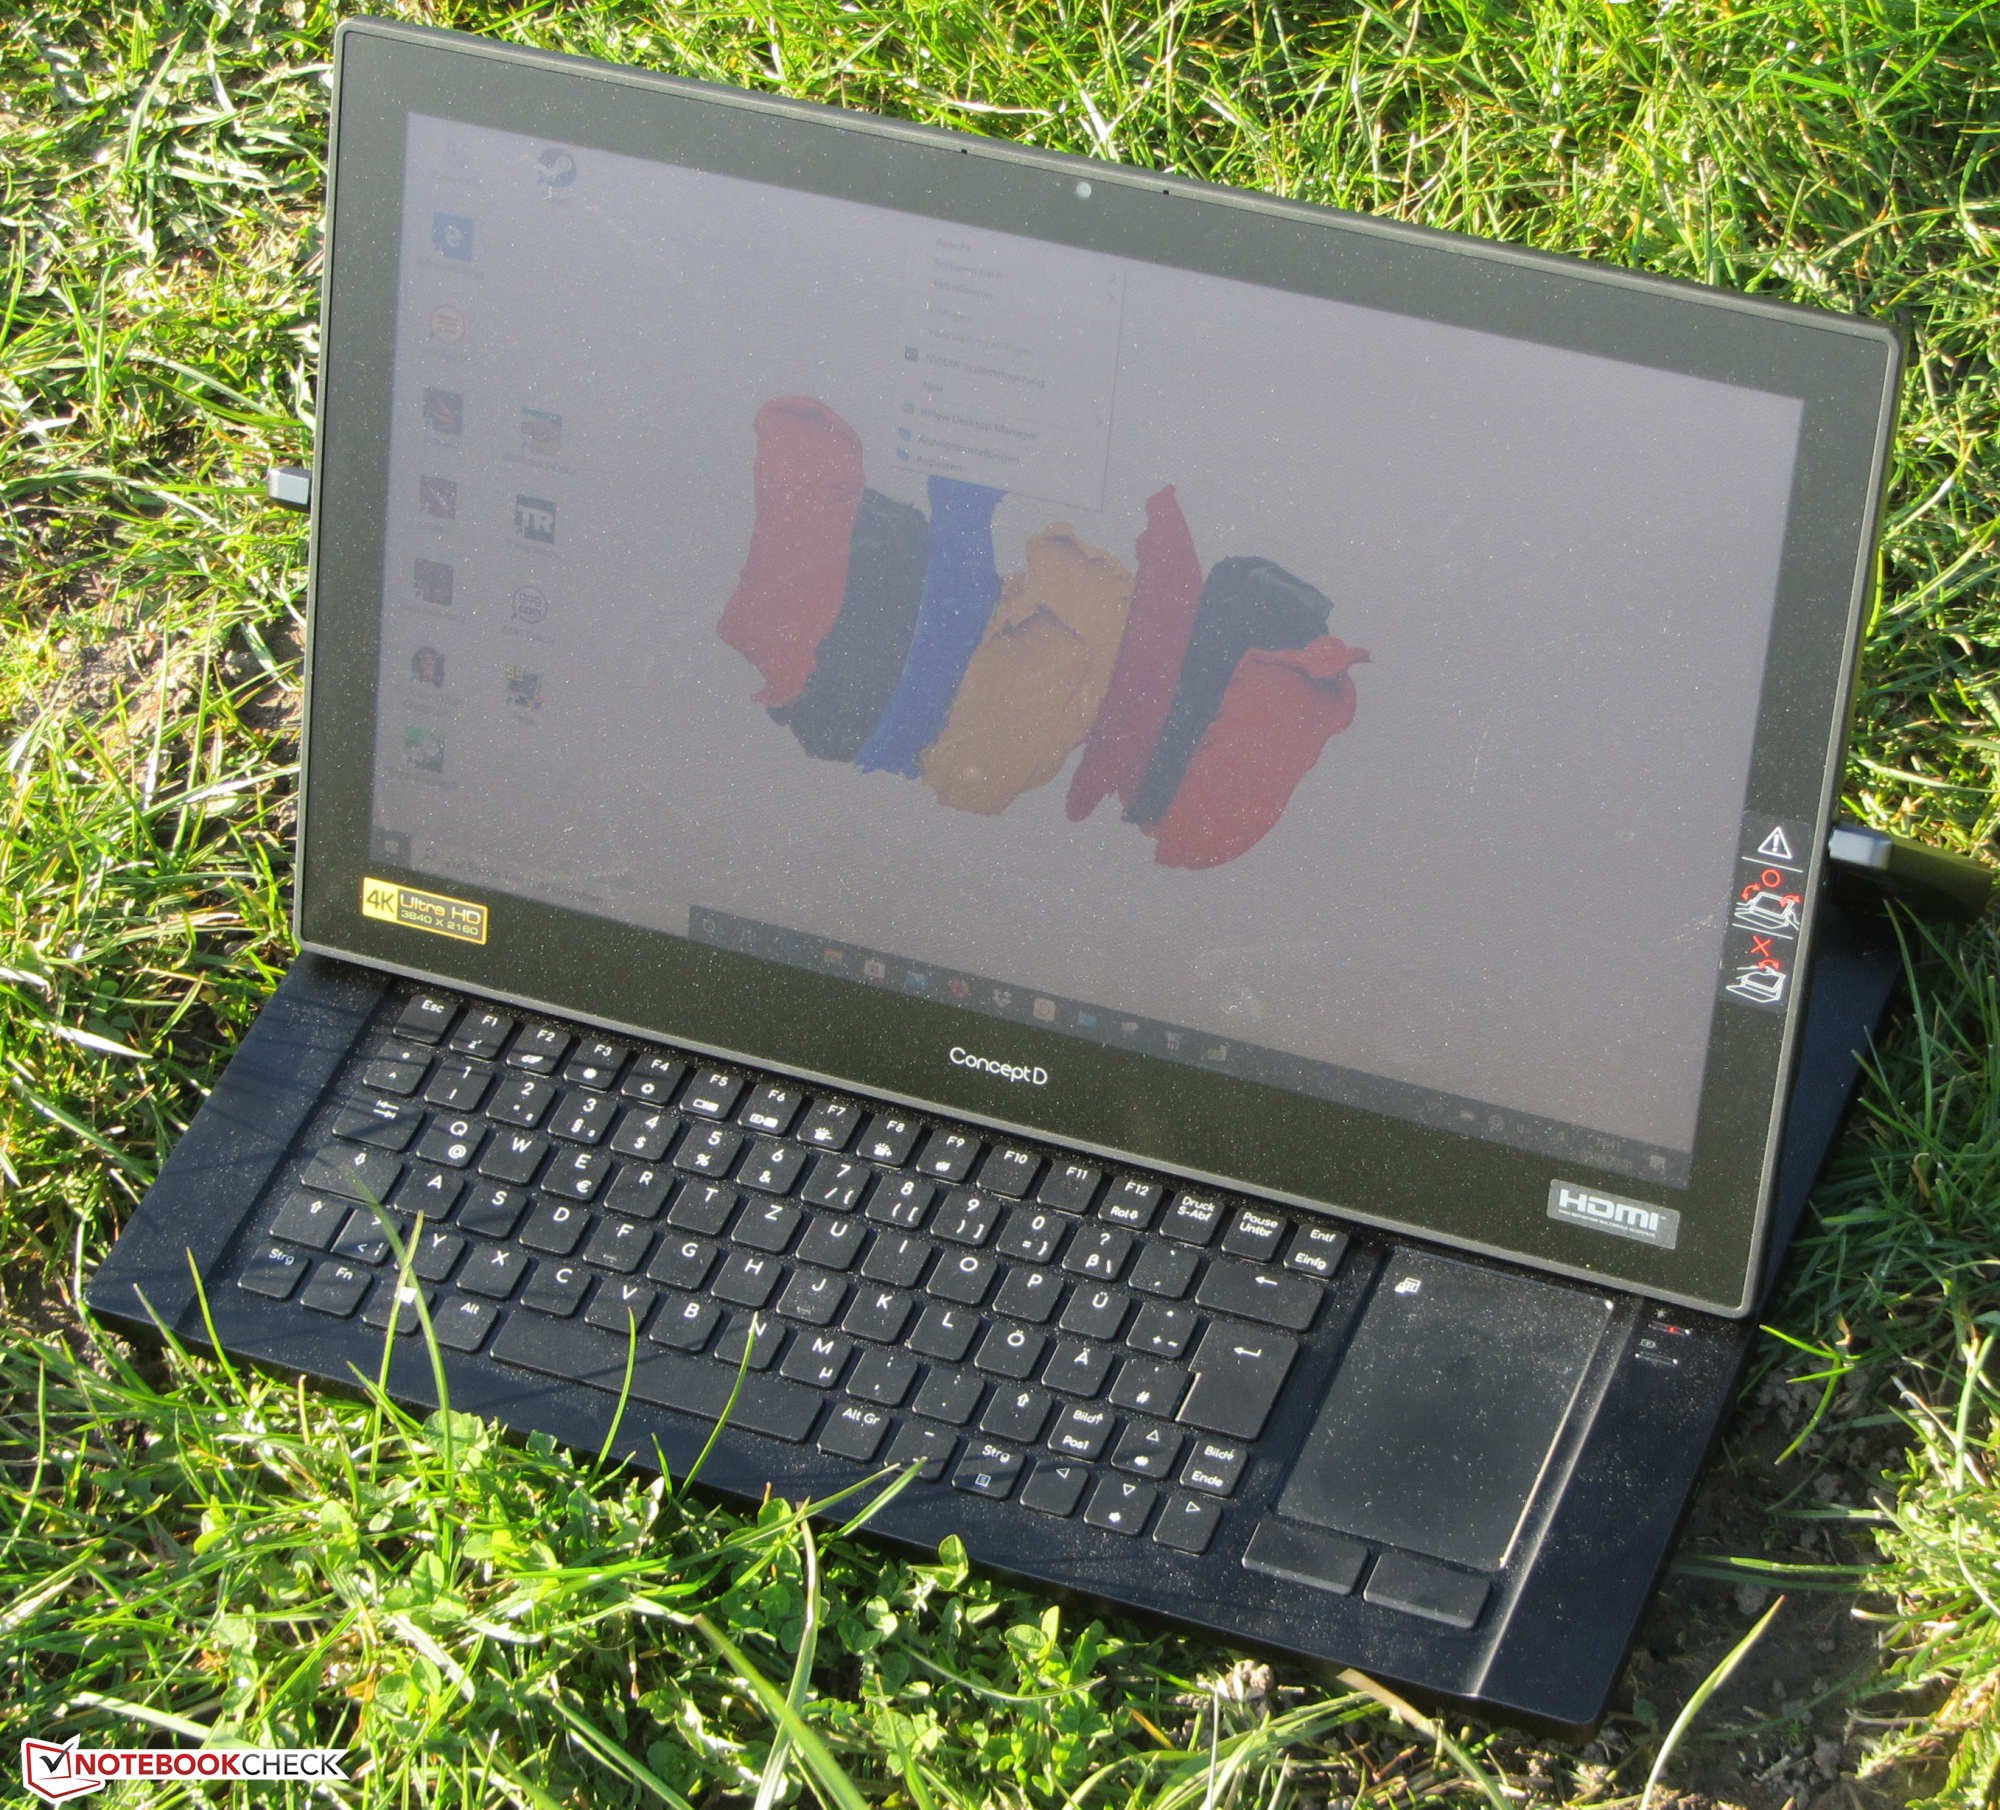
Acer has equipped the convertible with a backlit chiclet keyboard. The "warm, amber backlighting" (quote from an Acer press release) can be controlled via two function keys. The keyboard's keys are flat, smooth, and they offer shallow travel with a distinct actuation point that can be felt and also heard quite clearly. The individual keys have a clicky feedback. As such, the keyboard is unsuitable for use in quiet environments.
The keyboard does not have a standard layout. Not every key is in its usual position. Some of the keys that usually form the top row of the numpad have been integrated into the main area of the keyboard. Furthermore, the size of the shift keys is fairly small. As a result, we often found ourselves searching for them on the keyboard. Since the keyboard is located near the front edge of the base unit, there are no palm rests. Thus, typing is never a truly comfortable experience.
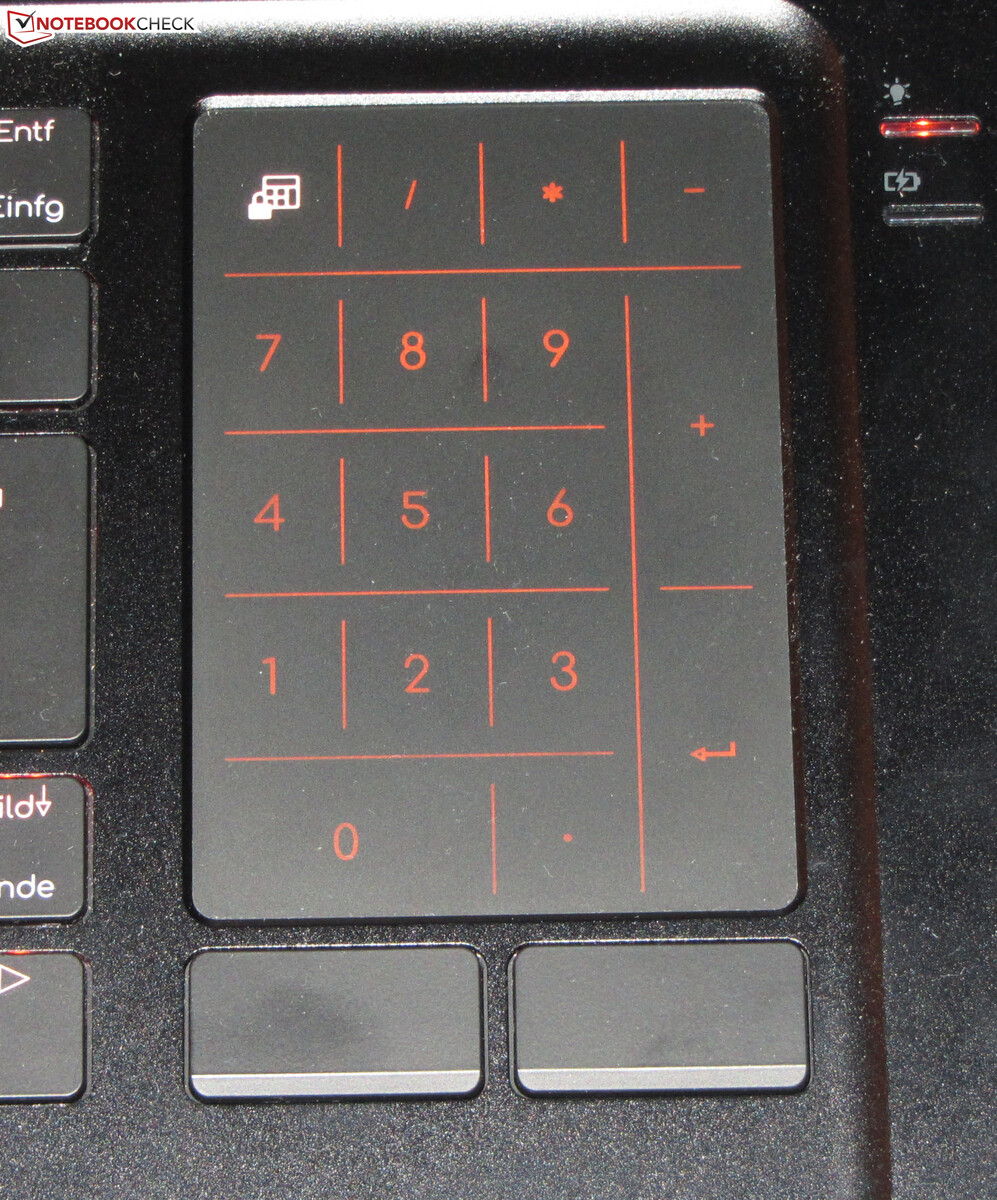
Touchpad
The multitouch-enabled touchpad spans an area of around 6.2 x 9 cm (~2.44 x 3.54 in). The smooth surface does not obstruct fingers when gliding over it. The touchpad responds precisely to inputs all the way into the corners. Below the touchpad, there are two dedicated mouse buttons that offer medium travel and a distinct feedback. Lastly, a numpad can be displayed on the touchpad.
Touchscreen
The touchscreen supports 10 multitouch points and promptly responds to inputs. We did not encounter any issues with it during our review. The screen can be used either with a finger or the included Wacom digital pen. The digital pen weighs 13 grams and detects 4,096 pressure levels.
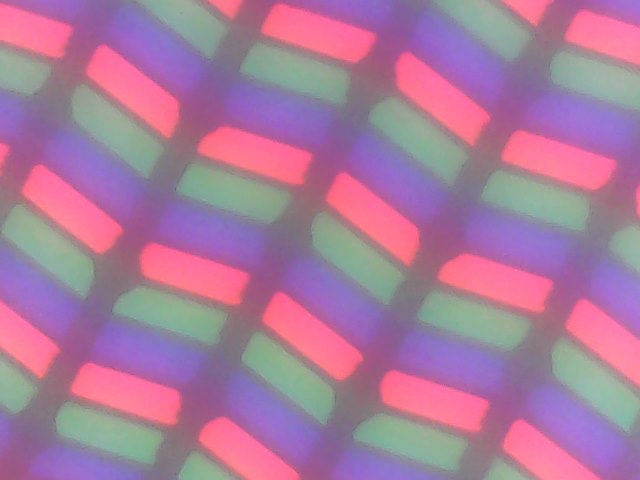
Display - 4K IPS on Board
The matte 17.3-inch touchscreen display has a native resolution of 3840x2160 pixels. The contrast ratio (1019:1) and brightness (367.1 cd/m²) are good. Positive: The display does not exhibit PWM flickering.
| |||||||||||||||||||||||||
Brightness Distribution: 83 %
Center on Battery: 381 cd/m²
Contrast: 1019:1 (Black: 0.37 cd/m²)
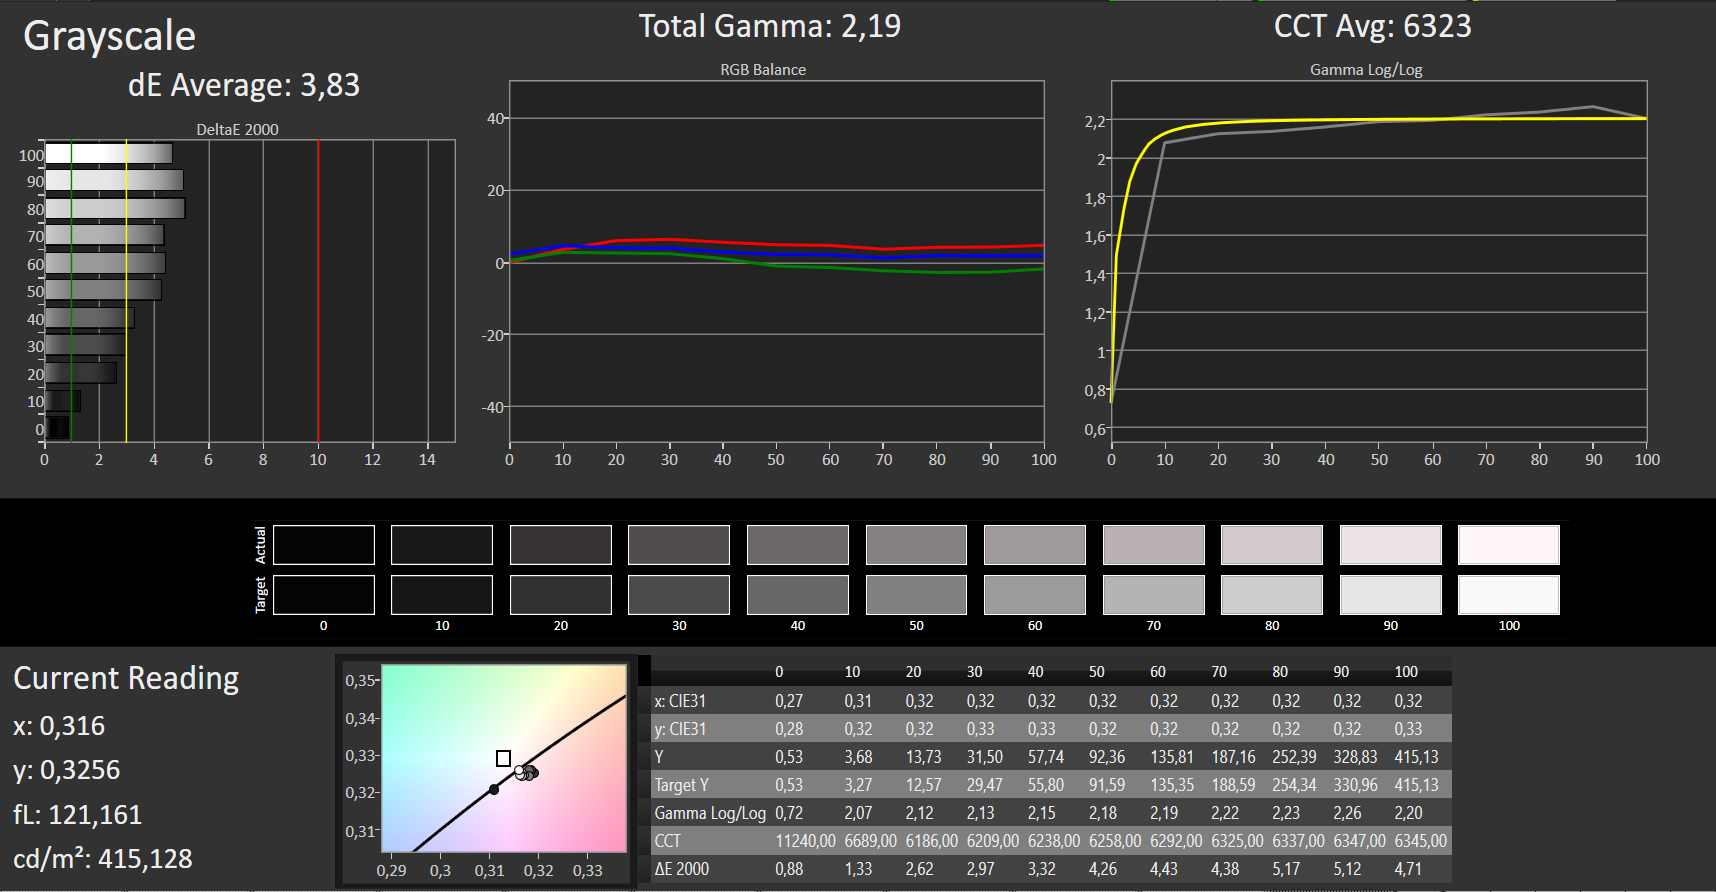
ΔE ColorChecker Calman: 2.52 | ∀{0.5-29.43 Ø4.71}
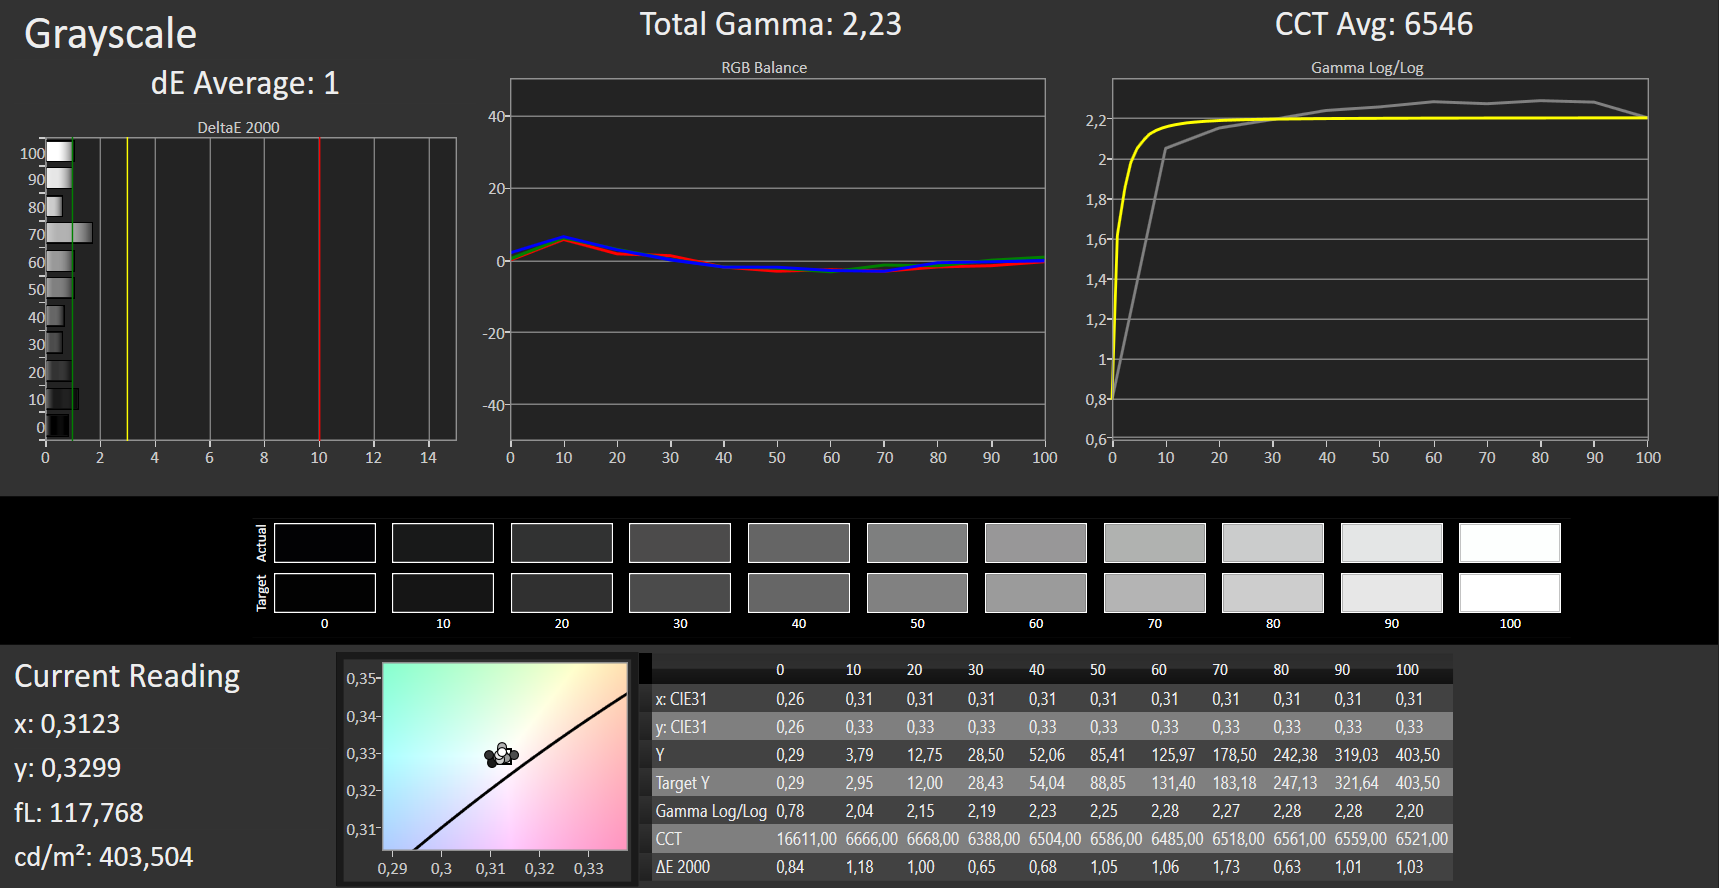
calibrated: 1.08
ΔE Greyscale Calman: 3.83 | ∀{0.09-98 Ø4.96}
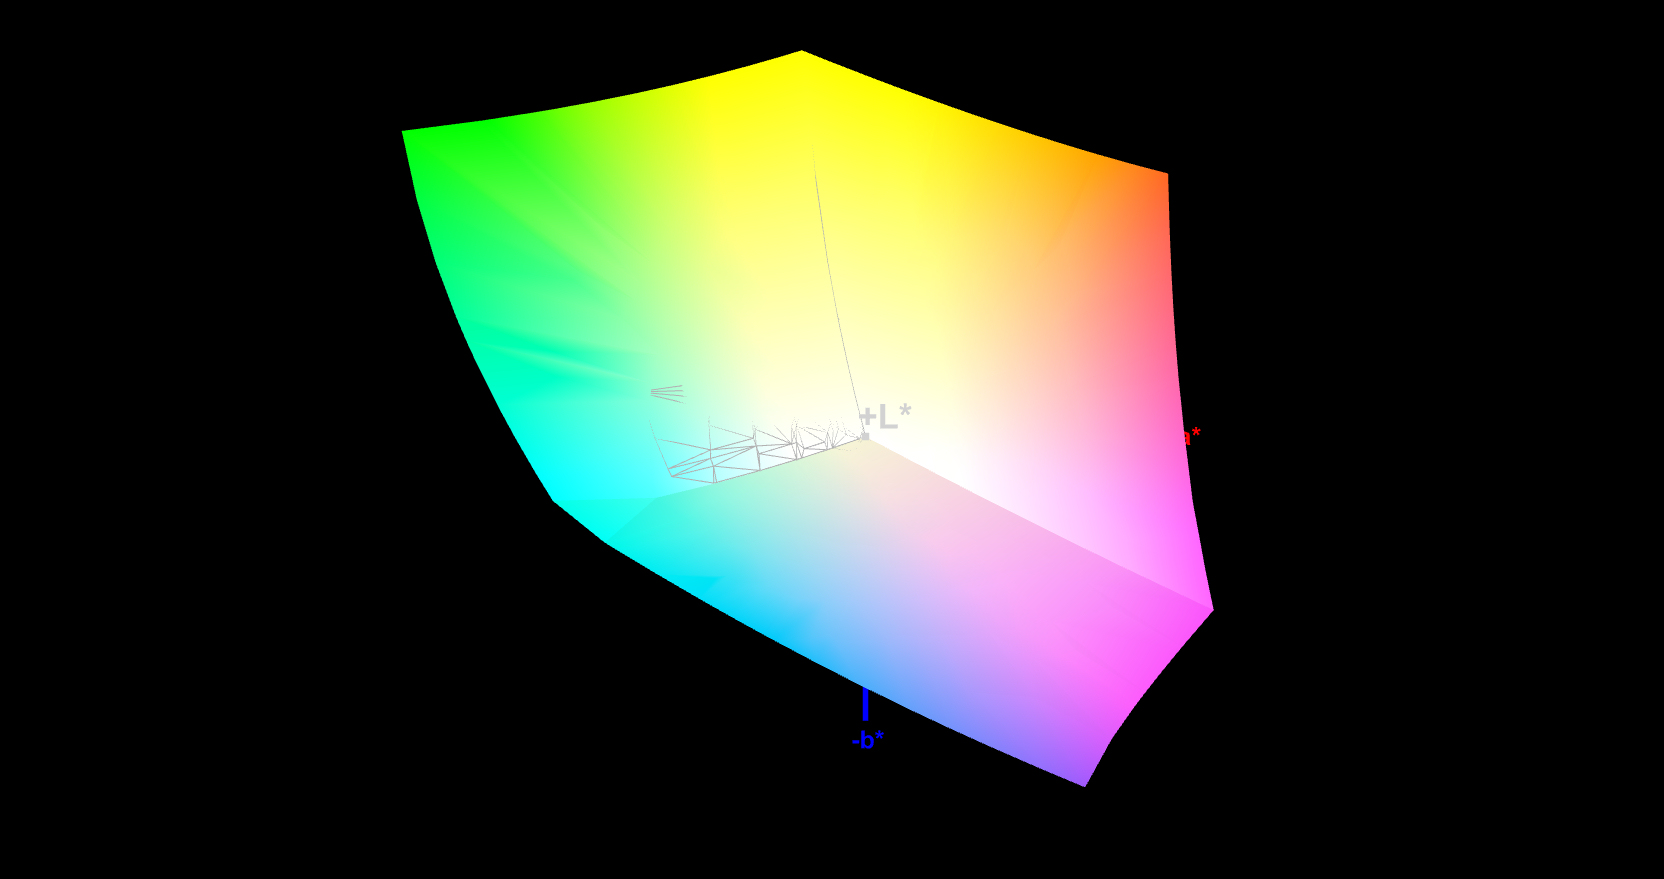
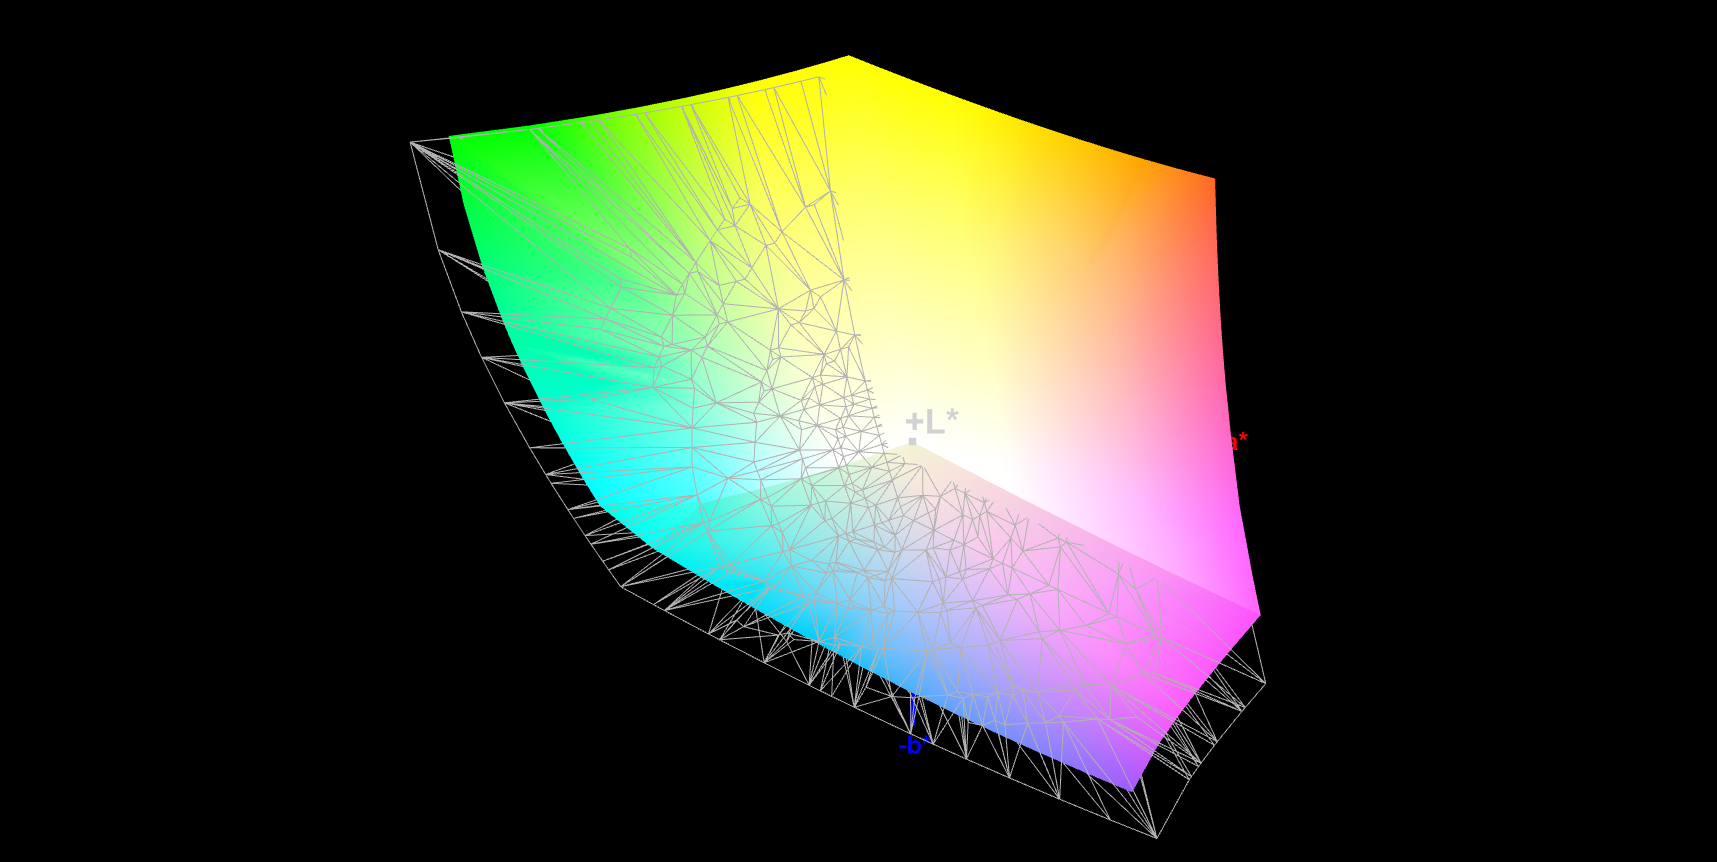
98% sRGB (Argyll 1.6.3 3D)
84% AdobeRGB 1998 (Argyll 1.6.3 3D)
95.1% AdobeRGB 1998 (Argyll 3D)
97.9% sRGB (Argyll 3D)
80.9% Display P3 (Argyll 3D)
Gamma: 2.19
CCT: 6323 K
| Acer ConceptD 9 Pro IPS, 3840x2160, 17.3" | Lenovo ThinkPad P73-20QR002DGE IPS LED, 1920x1080, 17.3" | MSI WE75 9TK IPS, 1920x1080, 17.3" | Dell Precision 7730 IPS LED, 1920x1080, 17.3" | Eurocom Tornado F7W IPS, 3840x2160, 17.3" | Fujitsu Celsius H980 IPS, 1920x1080, 17.3" | |
|---|---|---|---|---|---|---|
| Display | -17% | -21% | -18% | 4% | -22% | |
| Display P3 Coverage (%) | 80.9 | 67.5 -17% | 63.2 -22% | 65 -20% | 85.9 6% | 67.3 -17% |
| sRGB Coverage (%) | 97.9 | 94.2 -4% | 89.9 -8% | 93.4 -5% | 100 2% | 85 -13% |
| AdobeRGB 1998 Coverage (%) | 95.1 | 67.8 -29% | 64.3 -32% | 66.3 -30% | 98.3 3% | 62.2 -35% |
| Response Times | 25% | 29% | 10% | 20% | 33% | |
| Response Time Grey 50% / Grey 80% * (ms) | 53 ? | 40 ? 25% | 30.8 ? 42% | 48.8 ? 8% | 40 ? 25% | 38 ? 28% |
| Response Time Black / White * (ms) | 37 ? | 28 ? 24% | 31.2 ? 16% | 32.8 ? 11% | 31.6 ? 15% | 23.2 ? 37% |
| PWM Frequency (Hz) | 25000 ? | 120500 ? | ||||
| Screen | -28% | -19% | 2% | -54% | -51% | |
| Brightness middle (cd/m²) | 377 | 333 -12% | 287.3 -24% | 322 -15% | 328.2 -13% | 400 6% |
| Brightness (cd/m²) | 368 | 310 -16% | 280 -24% | 316 -14% | 310 -16% | 394 7% |
| Brightness Distribution (%) | 83 | 83 0% | 89 7% | 84 1% | 92 11% | 92 11% |
| Black Level * (cd/m²) | 0.37 | 0.39 -5% | 0.26 30% | 0.24 35% | 0.37 -0% | 0.51 -38% |
| Contrast (:1) | 1019 | 854 -16% | 1105 8% | 1342 32% | 887 -13% | 784 -23% |
| Colorchecker dE 2000 * | 2.52 | 4.4 -75% | 2.98 -18% | 2.2 13% | 6.62 -163% | 5.3 -110% |
| Colorchecker dE 2000 max. * | 5.55 | 7.5 -35% | 5.08 8% | 4.6 17% | 9.49 -71% | 9.3 -68% |
| Colorchecker dE 2000 calibrated * | 1.08 | 2 -85% | 3.06 -183% | 1.9 -76% | 3.93 -264% | 3.8 -252% |
| Greyscale dE 2000 * | 3.83 | 5.1 -33% | 3 22% | 1.6 58% | 6.7 -75% | 5.5 -44% |
| Gamma | 2.19 100% | 2.39 92% | 2.28 96% | 2.19 100% | 2.44 90% | 2.17 101% |
| CCT | 6323 103% | 7061 92% | 6993 93% | 6621 98% | 6462 101% | 6686 97% |
| Color Space (Percent of AdobeRGB 1998) (%) | 84 | 61.1 -27% | 58.1 -31% | 60.4 -28% | 87.9 5% | 55.8 -34% |
| Color Space (Percent of sRGB) (%) | 98 | 94 -4% | 89.5 -9% | 93.3 -5% | 100 2% | 84.9 -13% |
| Total Average (Program / Settings) | -7% /
-19% | -4% /
-14% | -2% /
-1% | -10% /
-34% | -13% /
-35% |
* ... smaller is better
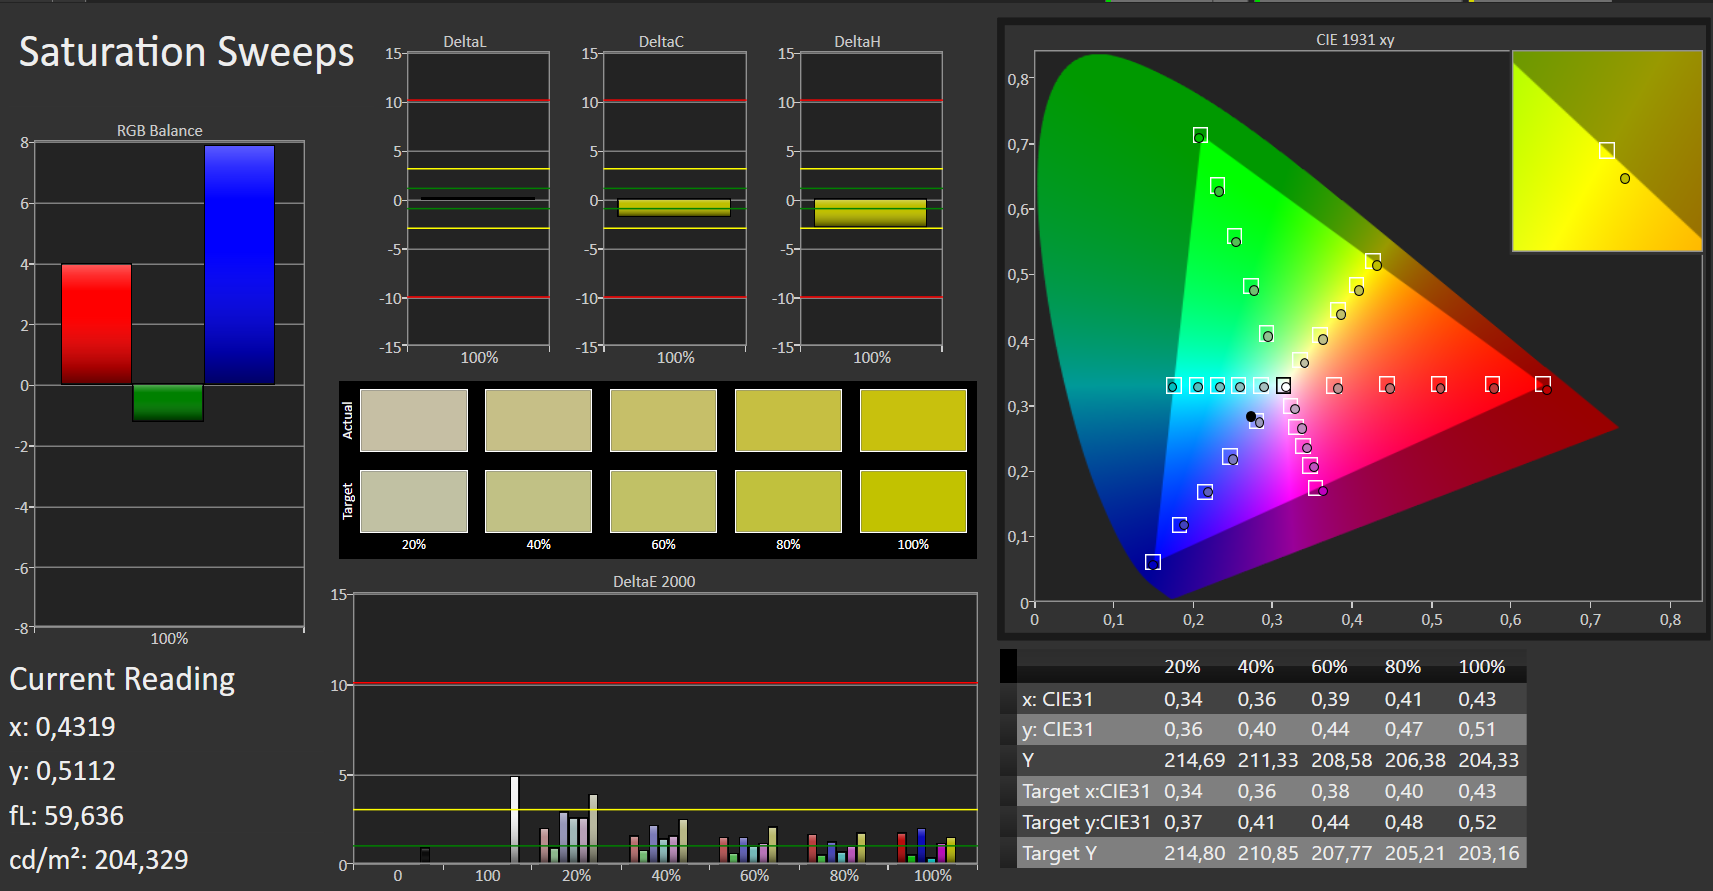
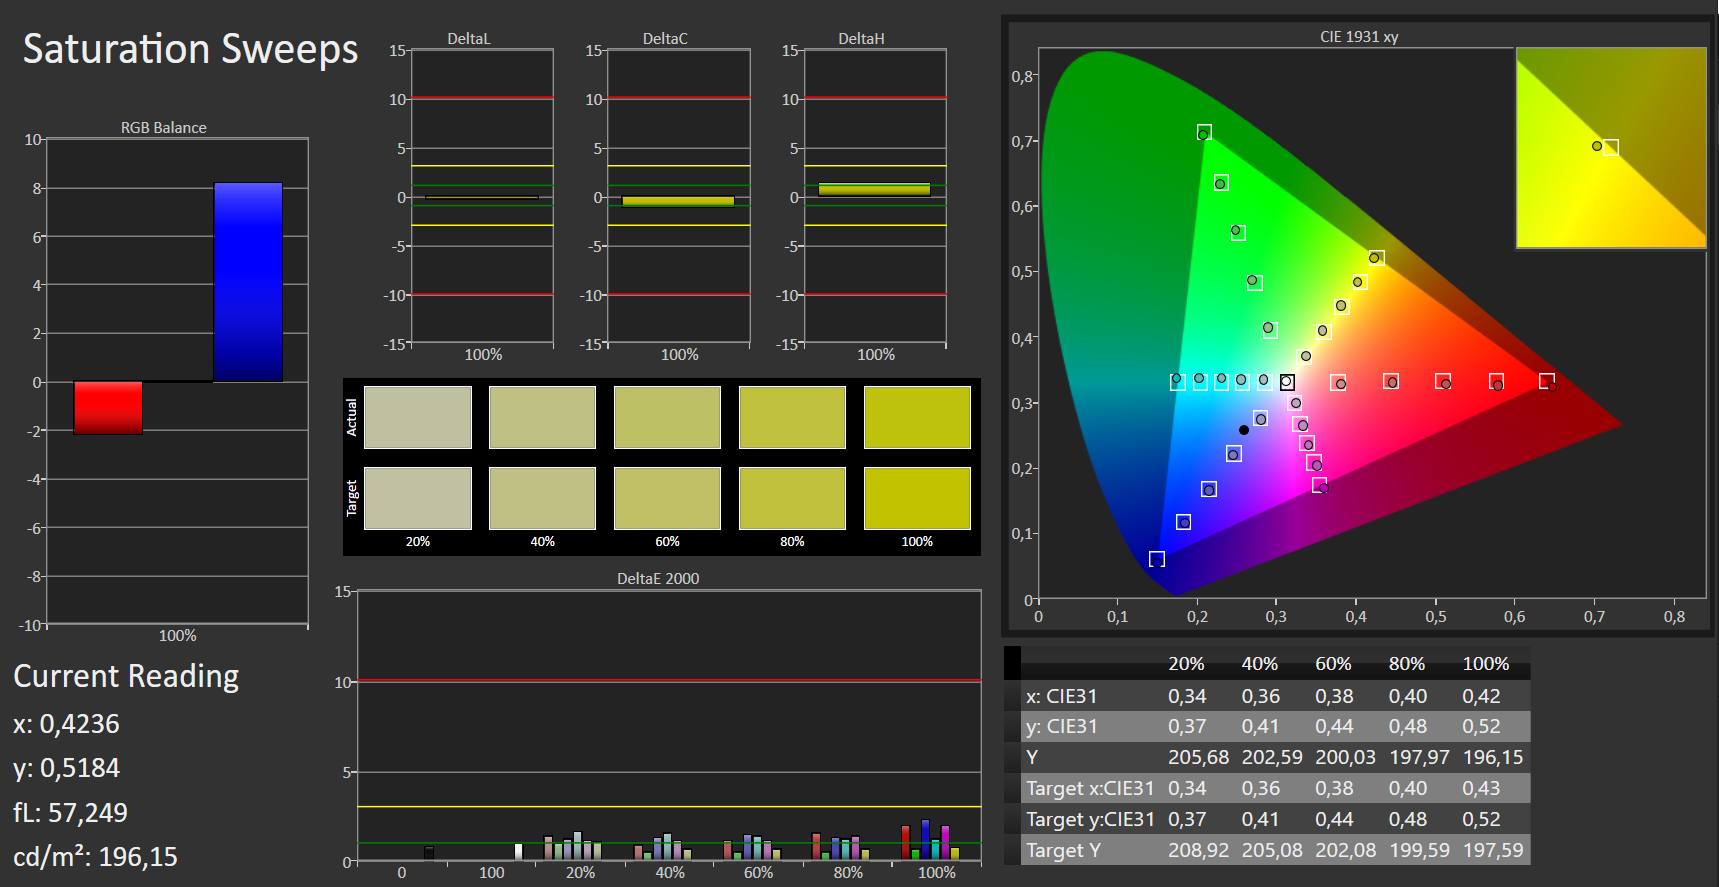
The panel can display a wide spectrum of colors ex-factory. With a DeltaE-2000 color deviation of about 2.5, it remains within the ideal range (DeltaE of less than three). The display does not suffer from a blue tint. By performing a calibration, we were able to further improve the display by a significant margin. This caused the grayscale and color DeltaE to drop to 1. Ex-factory, the grayscale DeltaE value was 3.8.
If an exact color representation is needed, calibration is thus worthwhile. Our calibrated color profile can be found in the box above. The display achieves a very good result in terms of the color-space coverage. It covers 84% (AdobeRGB) and 98% (sRGB) of the respective color spaces.


Display Response Times
| ↔ Response Time Black to White | ||
|---|---|---|
| 37 ms ... rise ↗ and fall ↘ combined | ↗ 21 ms rise | 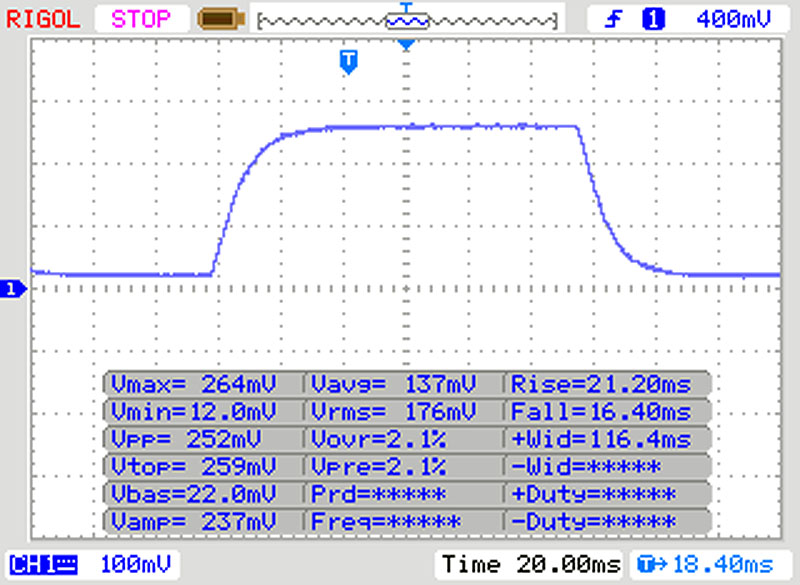 |
| ↘ 16 ms fall | ||
| The screen shows slow response rates in our tests and will be unsatisfactory for gamers. In comparison, all tested devices range from 0.1 (minimum) to 240 (maximum) ms. » 95 % of all devices are better. This means that the measured response time is worse than the average of all tested devices (19.8 ms). | ||
| ↔ Response Time 50% Grey to 80% Grey | ||
| 53 ms ... rise ↗ and fall ↘ combined | ↗ 27 ms rise | 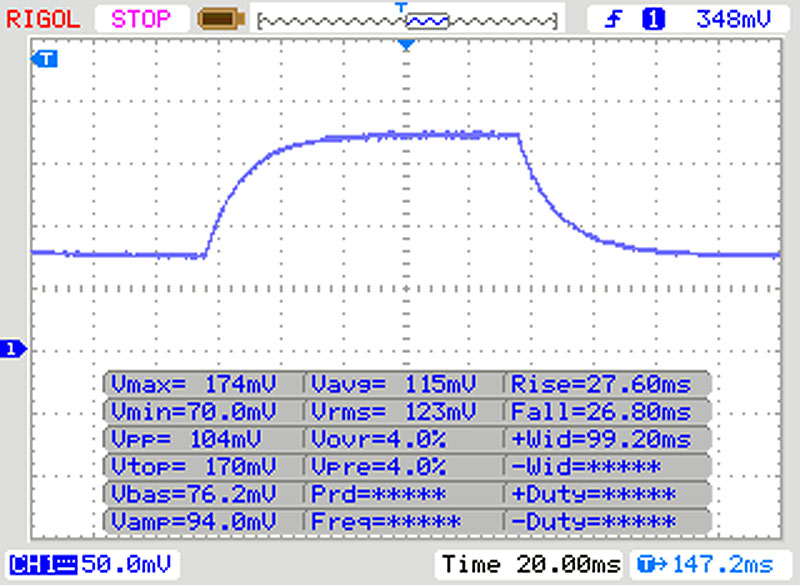 |
| ↘ 26 ms fall | ||
| The screen shows slow response rates in our tests and will be unsatisfactory for gamers. In comparison, all tested devices range from 0.165 (minimum) to 636 (maximum) ms. » 90 % of all devices are better. This means that the measured response time is worse than the average of all tested devices (31 ms). | ||
Screen Flickering / PWM (Pulse-Width Modulation)
| Screen flickering / PWM not detected | 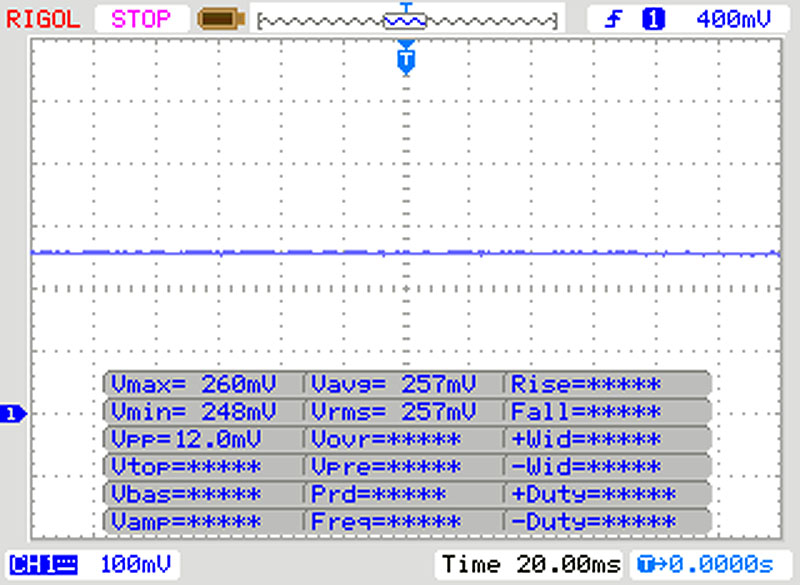 | ||
In comparison: 52 % of all tested devices do not use PWM to dim the display. If PWM was detected, an average of 7754 (minimum: 5 - maximum: 343500) Hz was measured. | |||
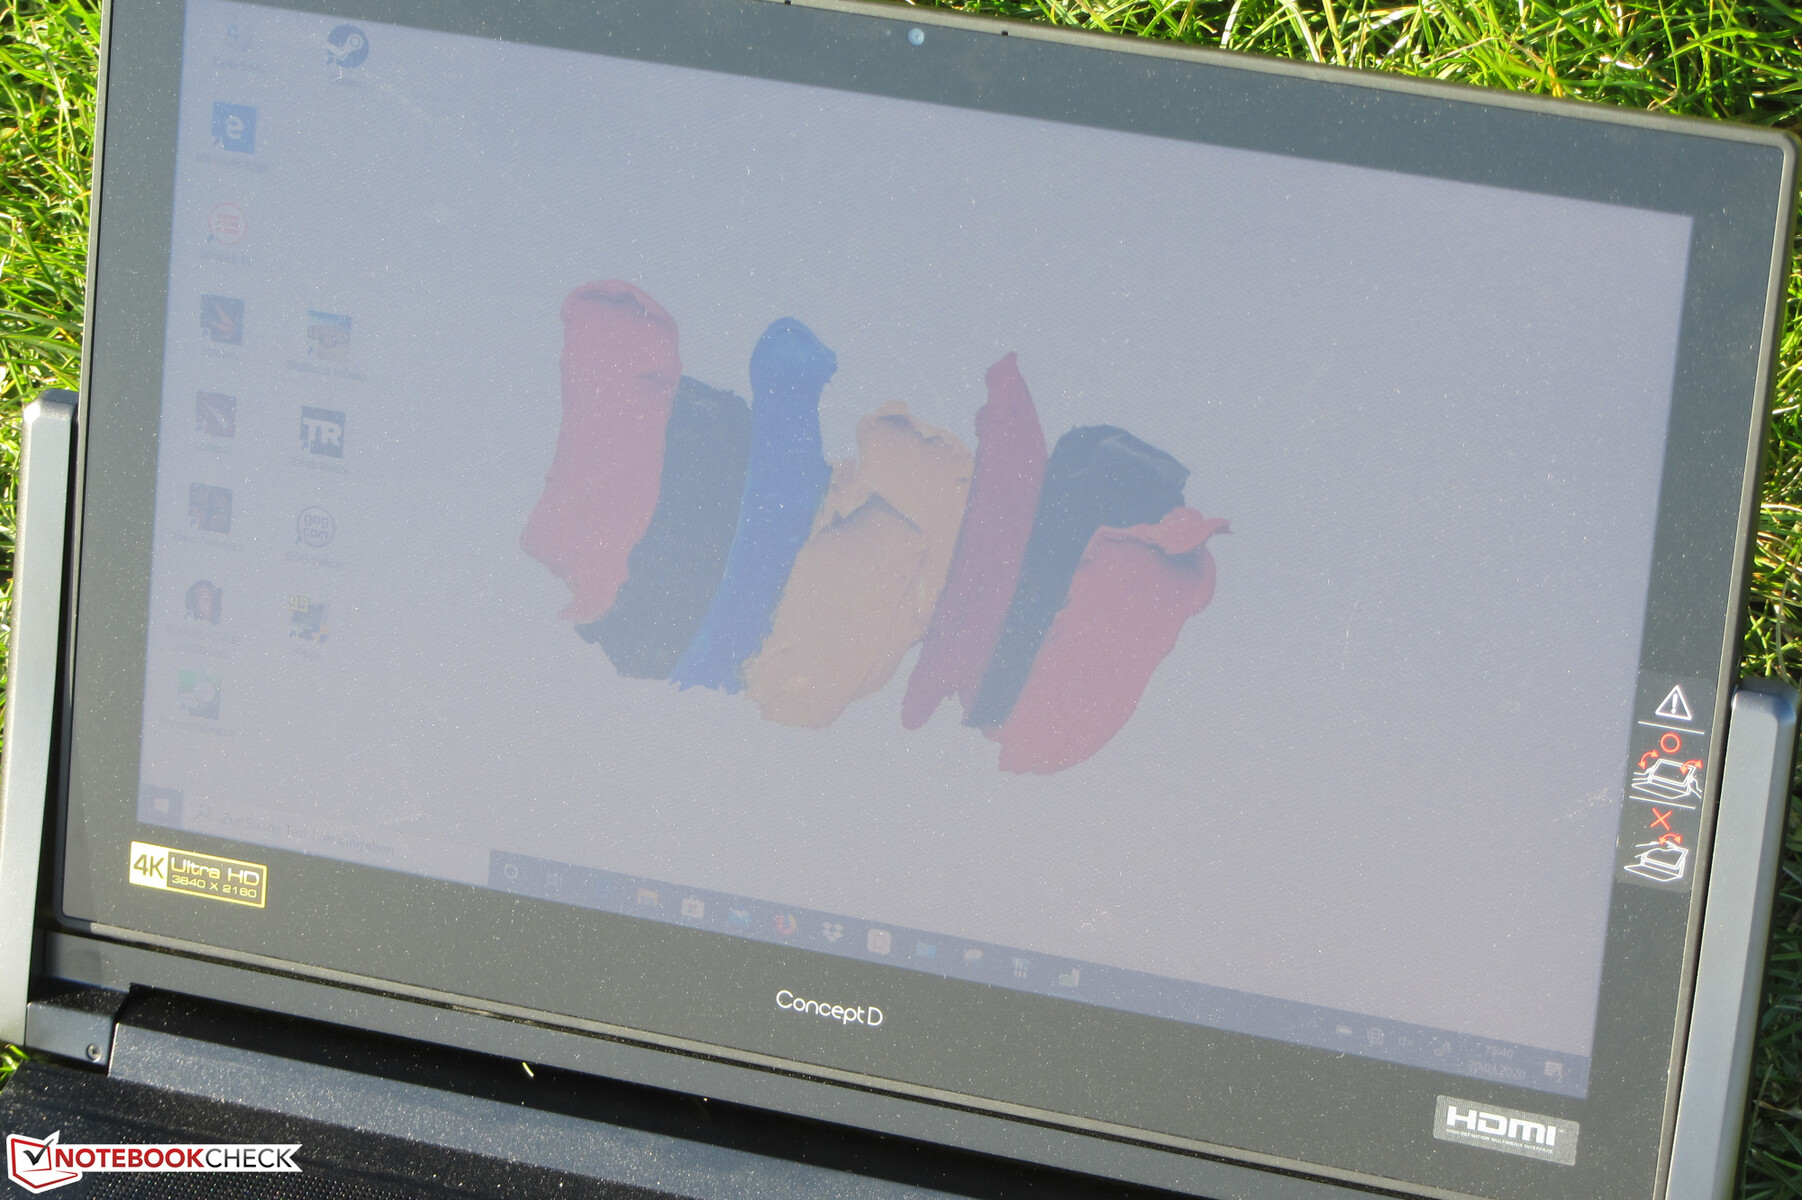
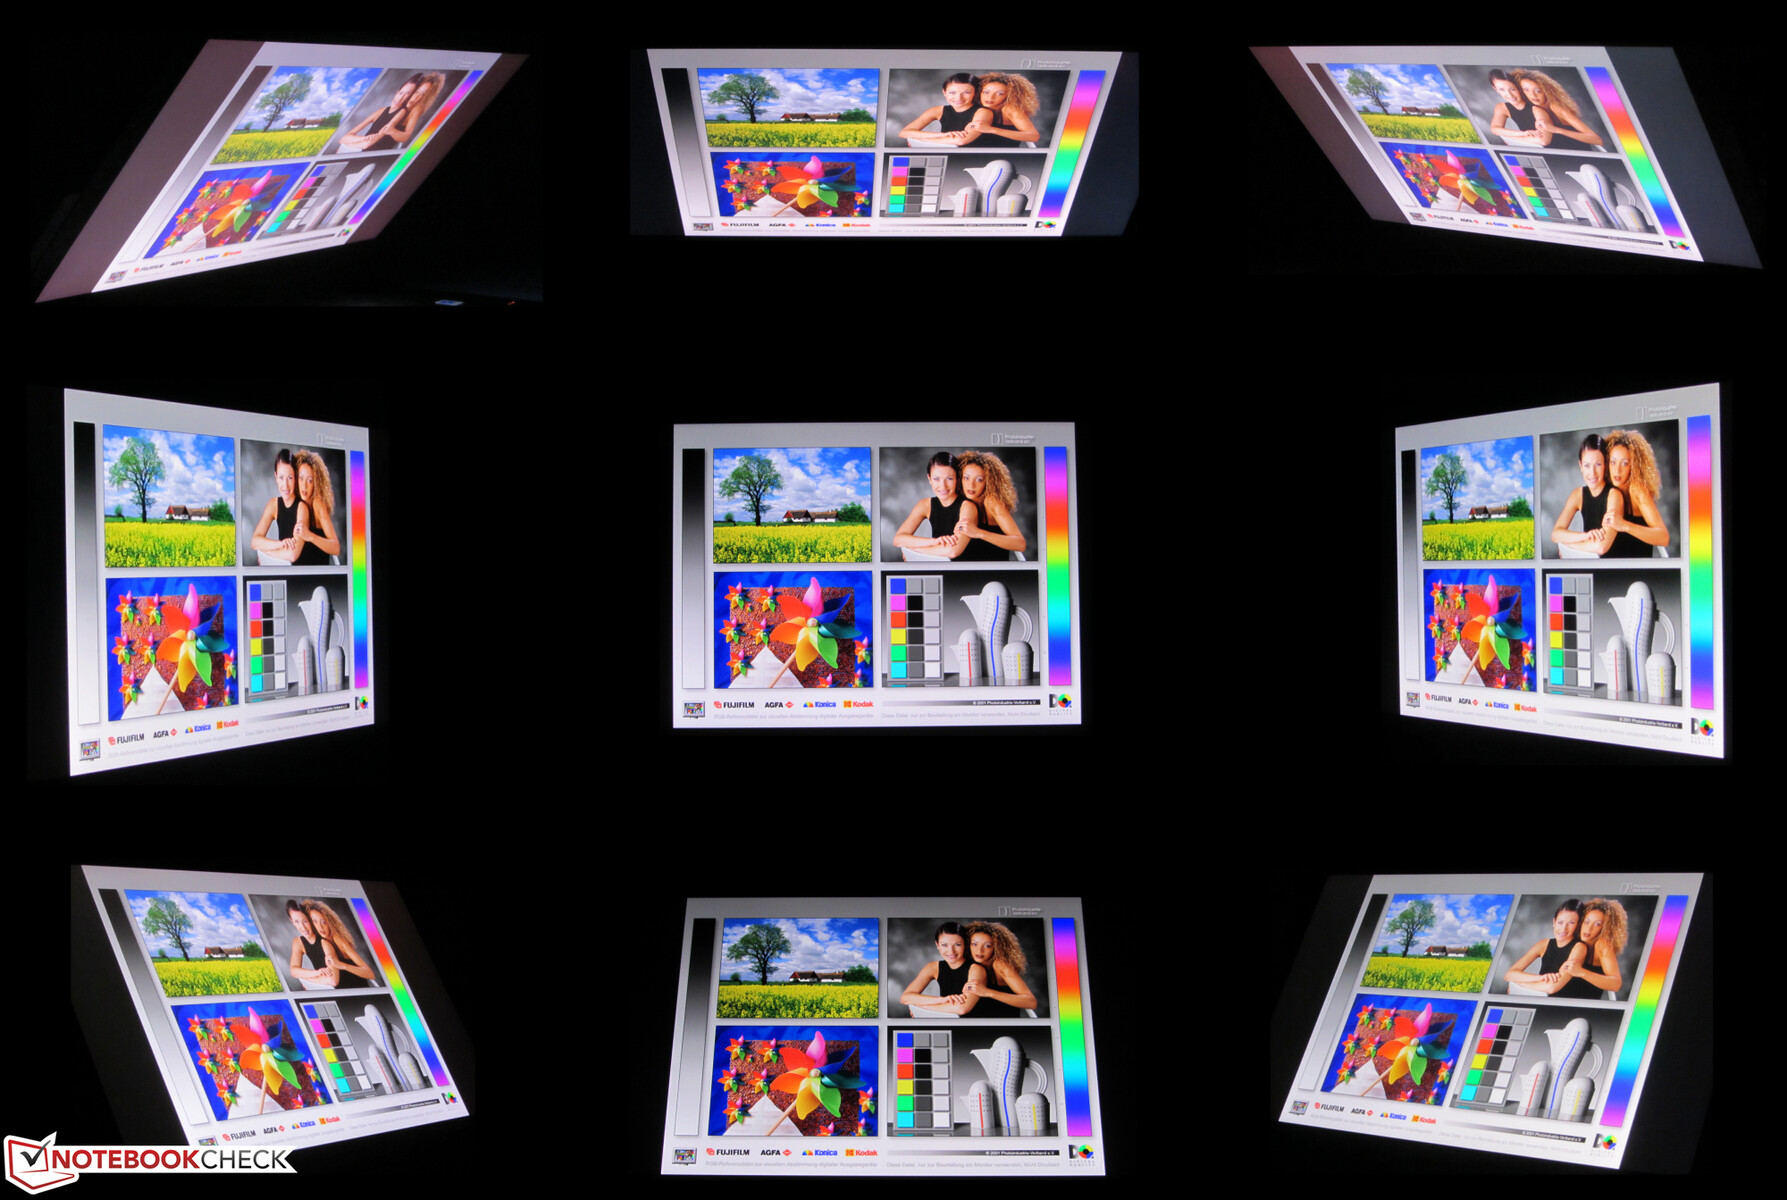
Acer has equipped the ConceptD 9 with an IPS panel with wide viewing angles. As a result, the screen can be read from any position. Provided the sun does not shine too brightly, this is also possible outdoors.
Performance - Acer Computer with High-End Hardware
With the ConceptD 9 Pro CN917-71P, Acer has a 17.3-inch workstation with more than enough processing power for all common use cases on offer. Our configuration of the device can be purchased starting from about 5,500 Euros (~$6,073). Other configurations are available as well.

Processor
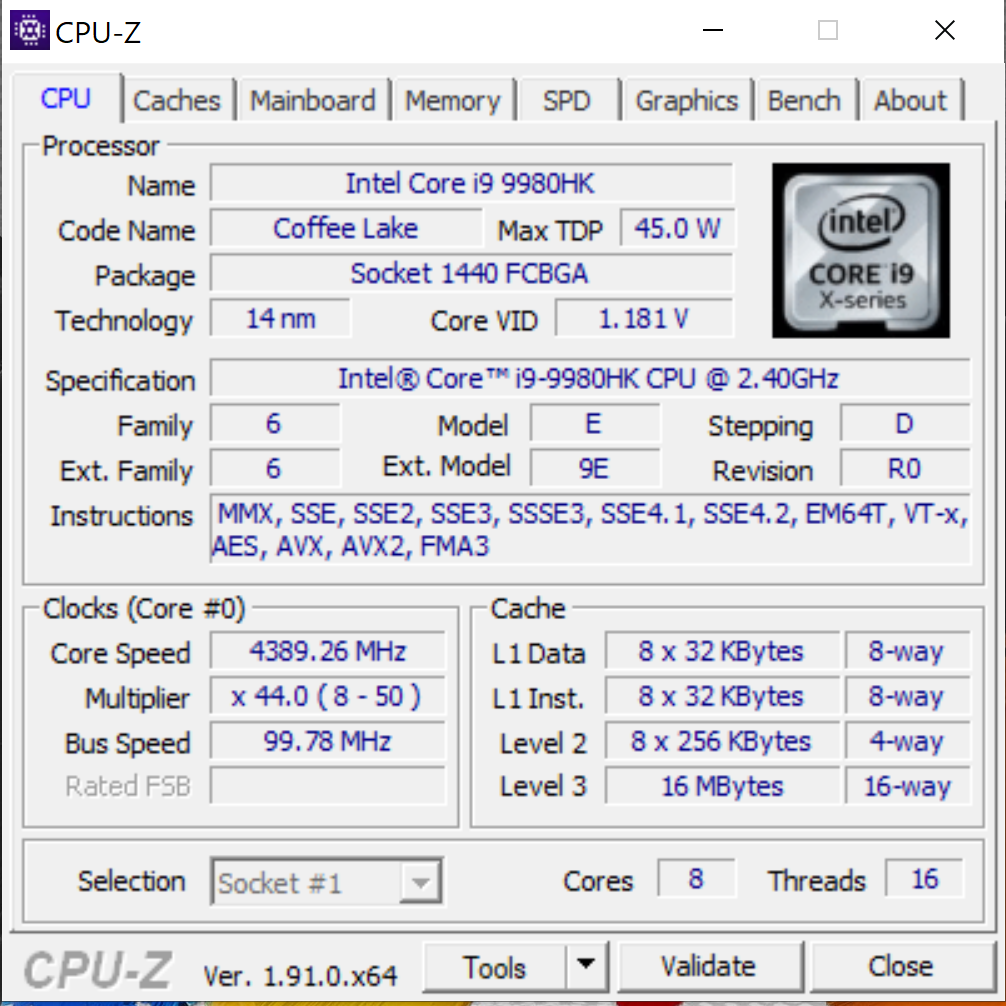
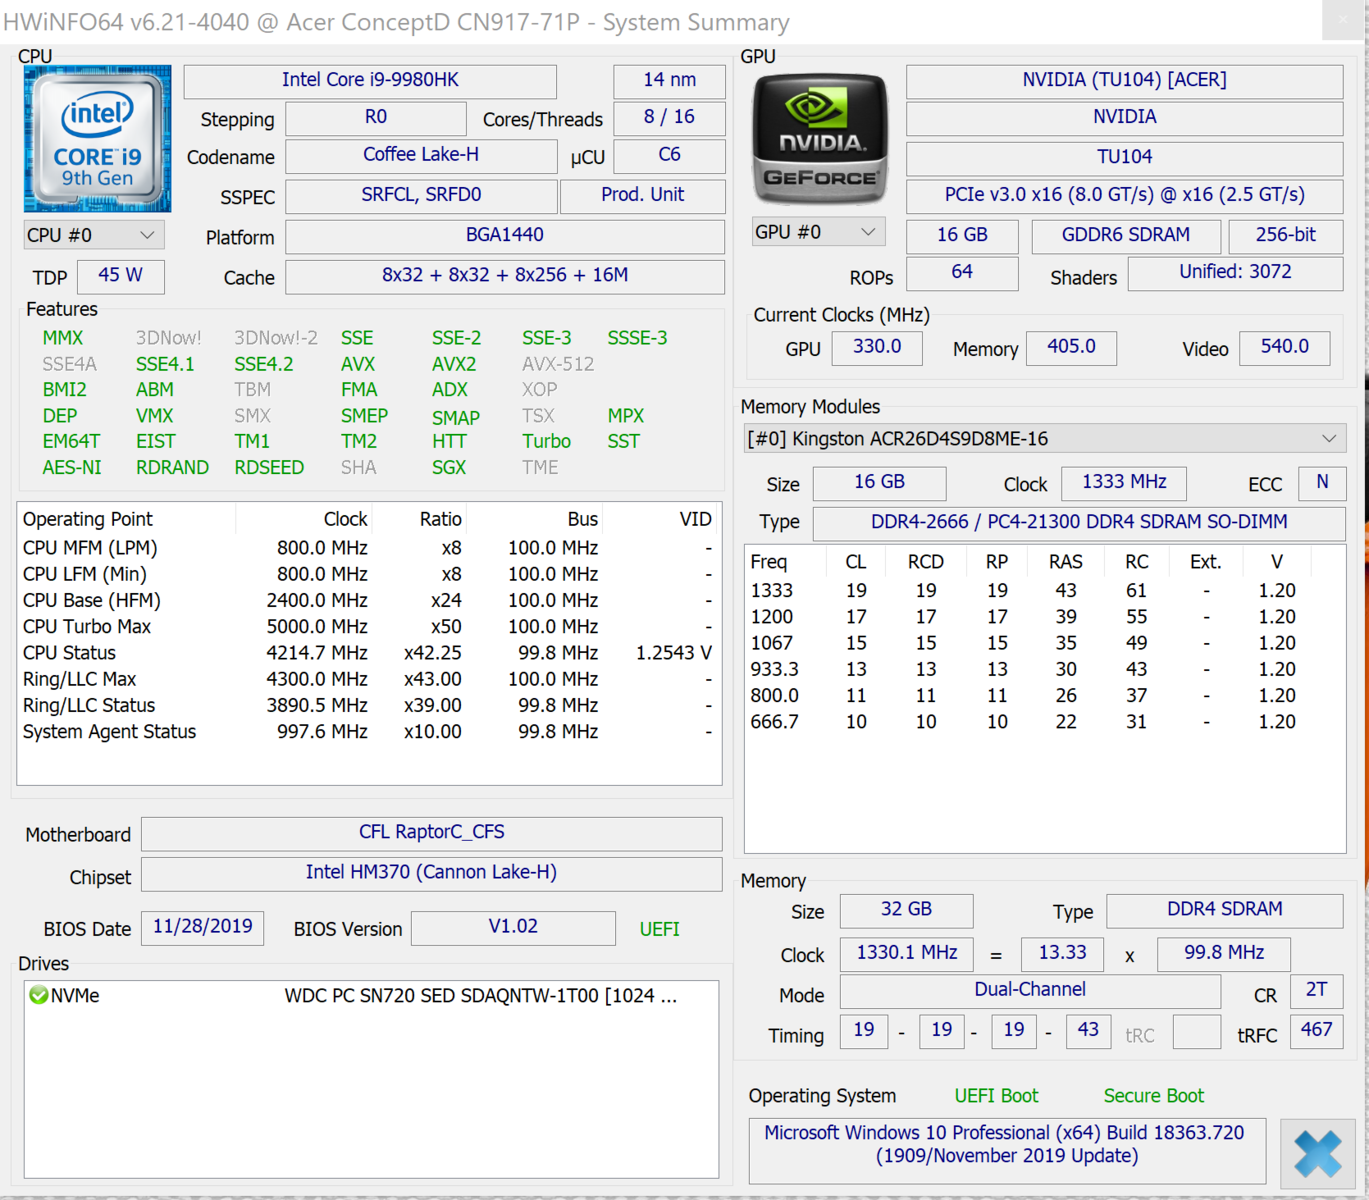
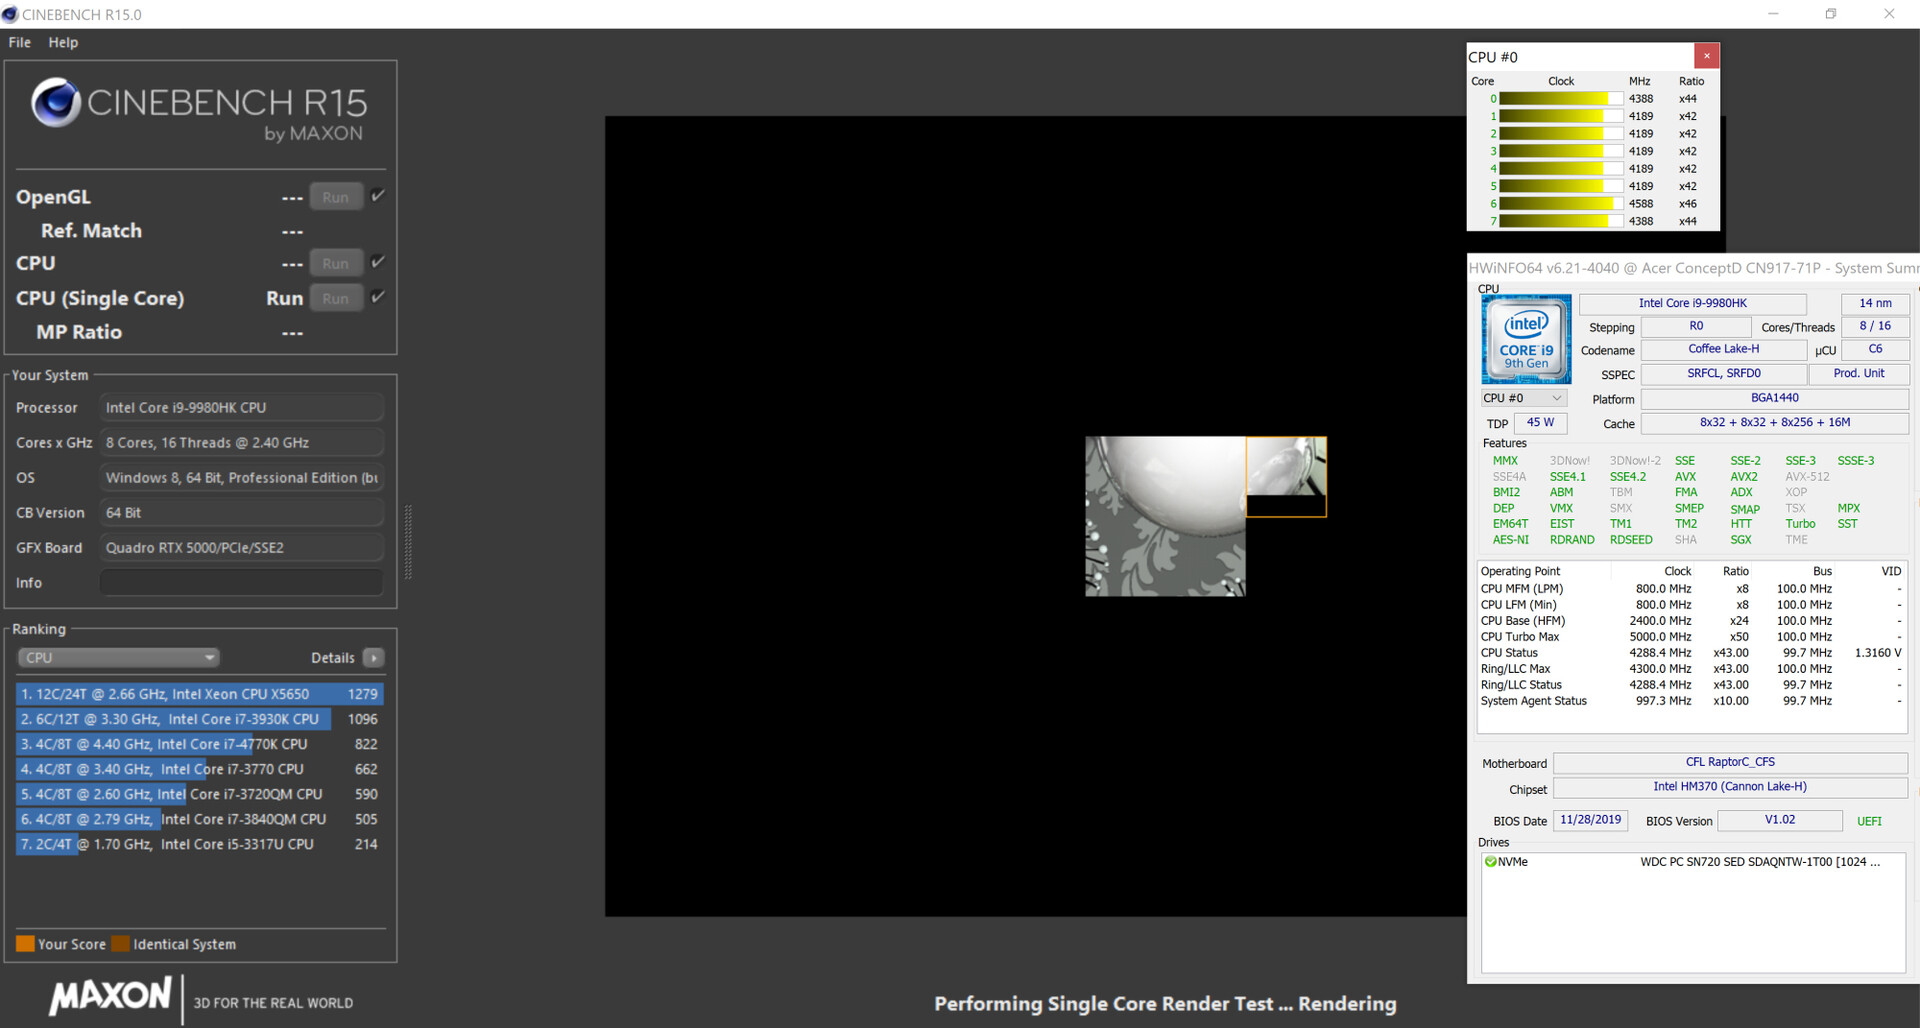
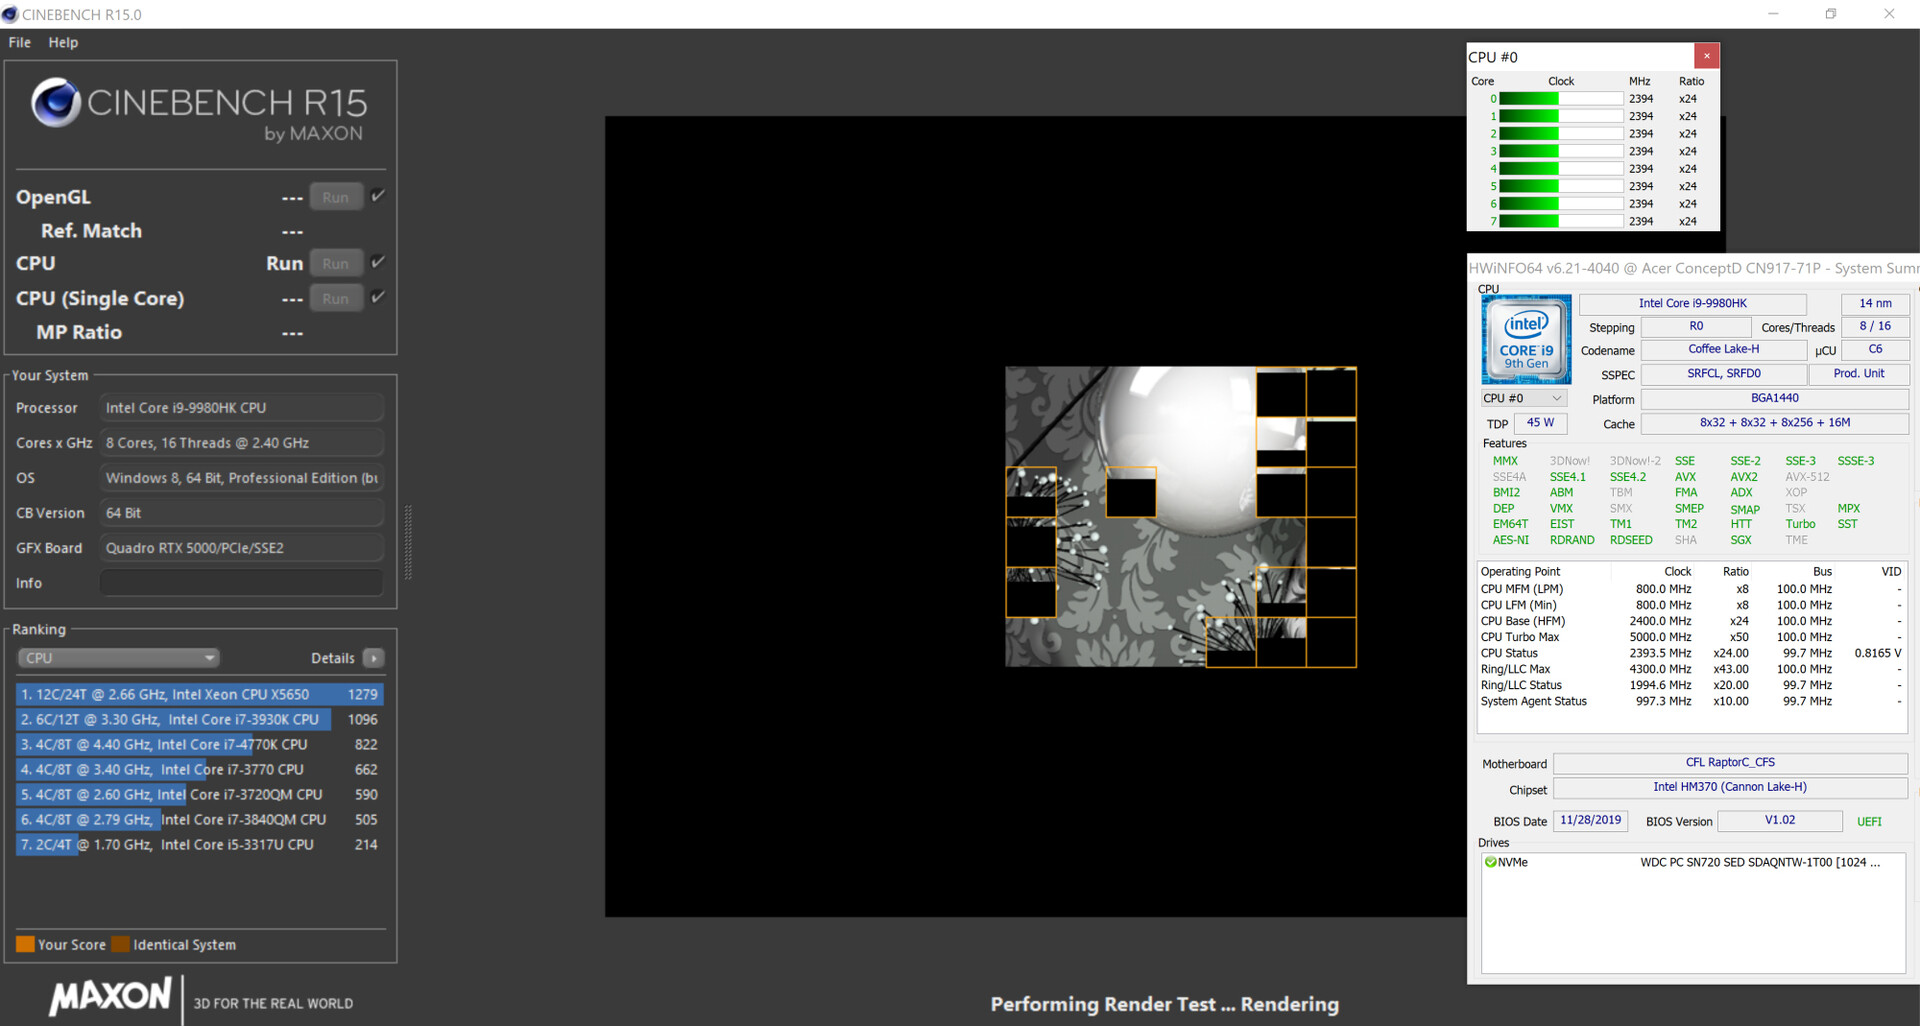
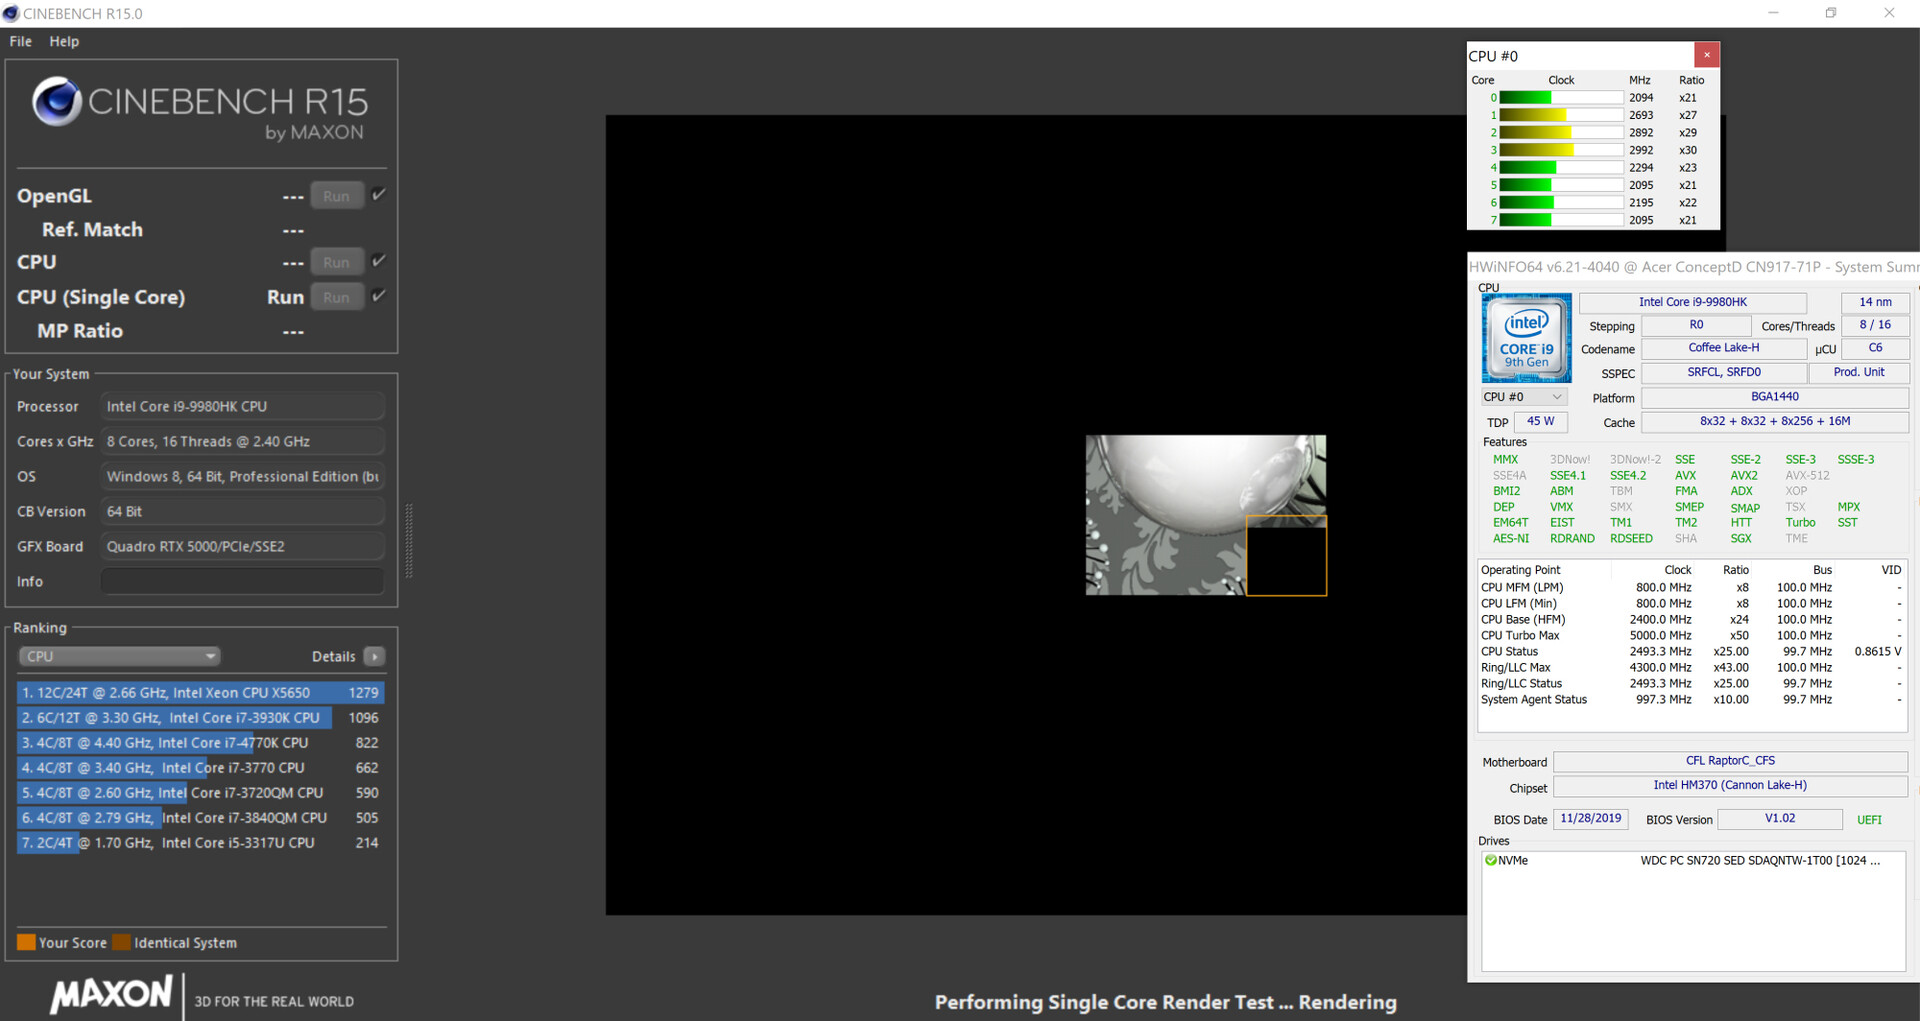
The ConceptD is powered by an eight-core Core i9-9980HK (Coffee Lake) processor. The CPU has a base clock of 2.4 GHz. Via Turbo Boost, the clock speed can be increased to 4.2 GHz (eight cores), 4.5 GHz (six cores), 4.7 GHz (four cores), 4.9 GHz (two cores) or 5 GHz (single core). Additionally, Hyper-Threading (two threads per core) is supported. Thanks to the unlocked multiplier, overclocking the processor is a very simple task.
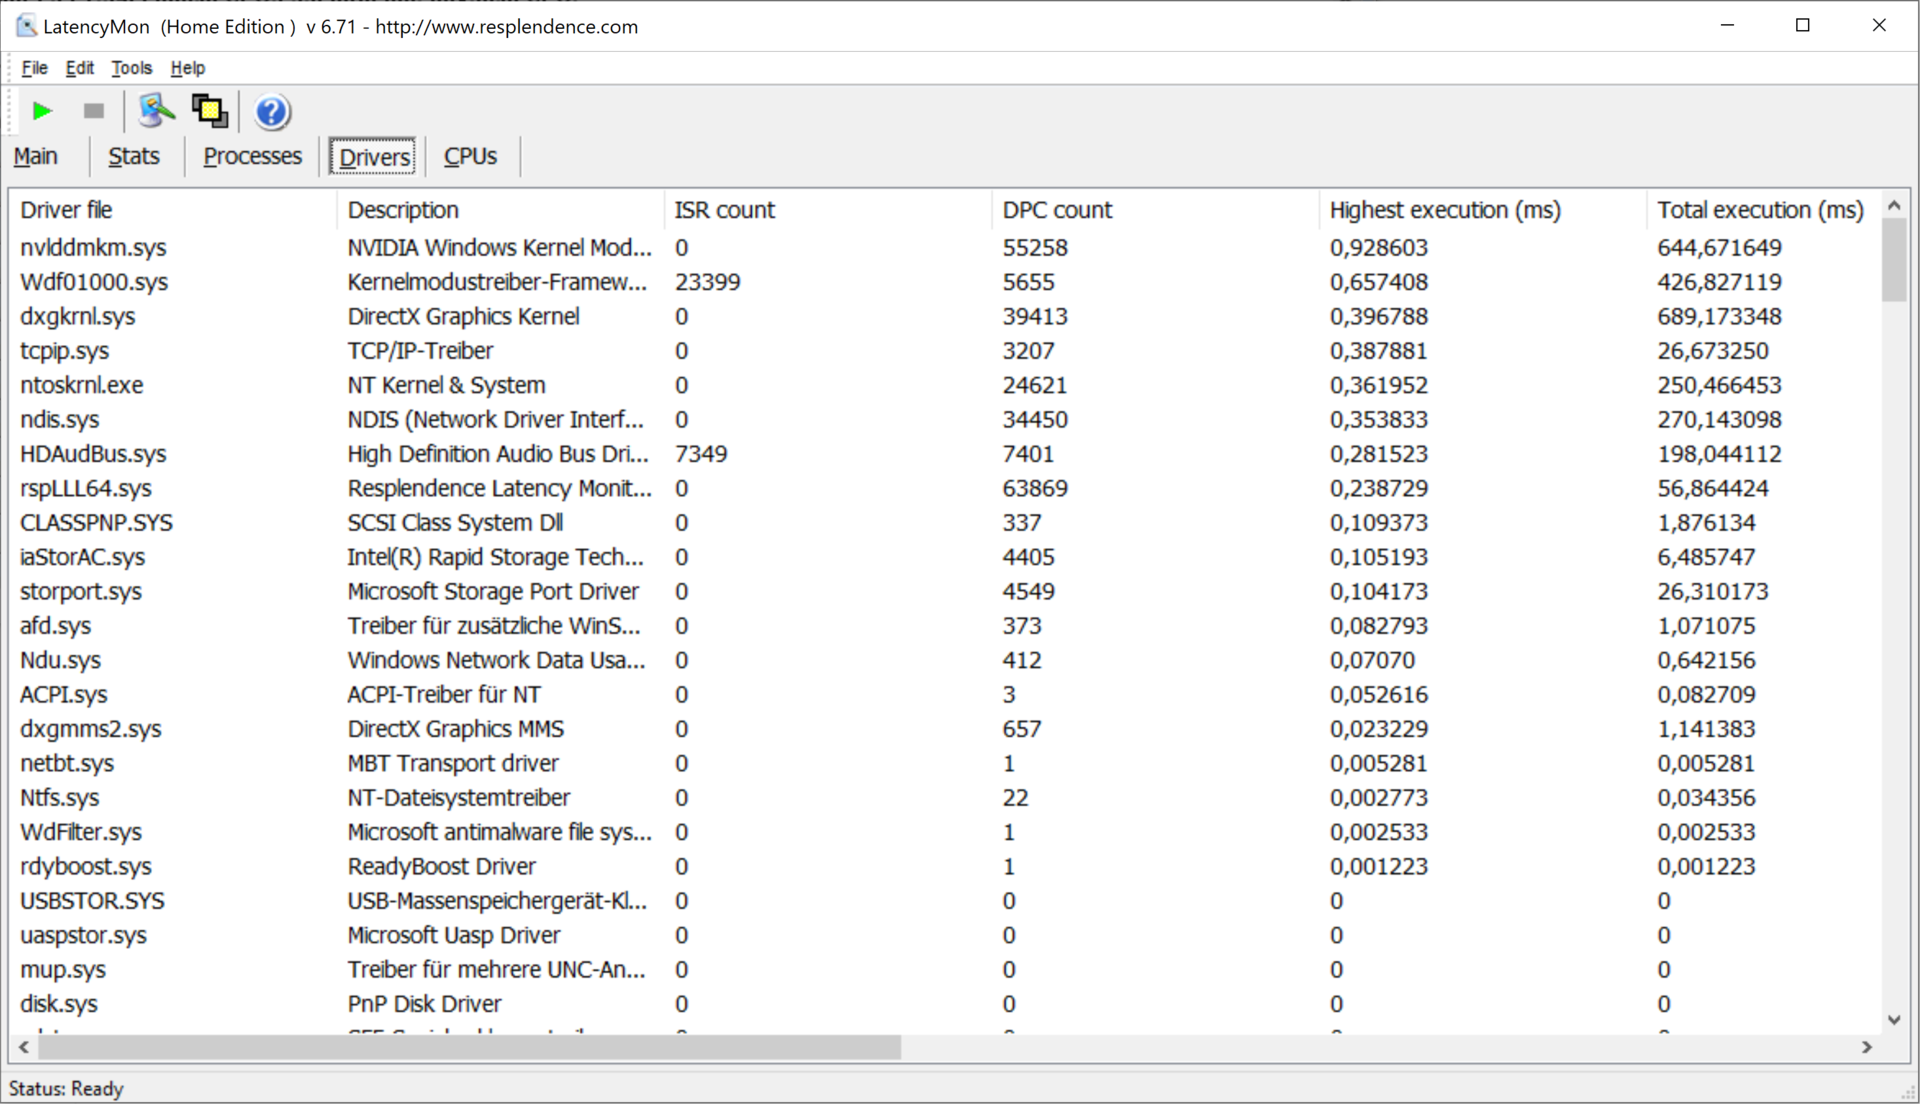
During Cinebench R15's multithread test, the processor temporarily runs at 4.1 to 4.2 GHz. Subsequently, the clock rate drops to 2.8 to 2.9 GHz. During the single-thread test, the clock speed ranges from 4.1 to 5 GHz. In battery mode, we can observe clock speed of 2.4 GHz (multithread) and 2.1 to 2.8 GHz (single-thread).

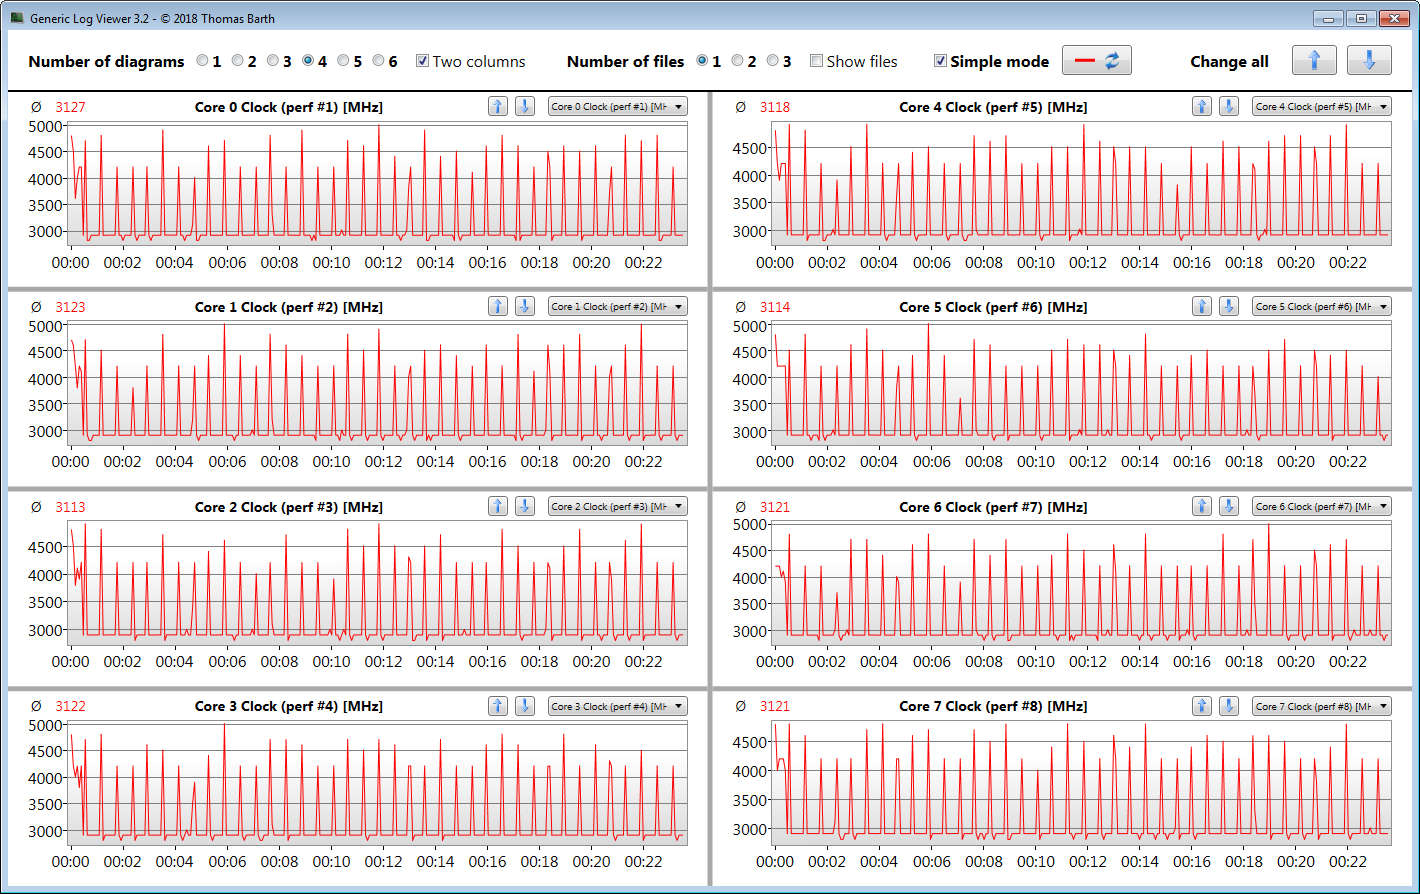
By running Cinebench R15's multithread test in a loop for at least 30 minutes, we determine whether the CPU Turbo Boost is permanently active while the laptop is connected to an outlet. The scores drop significantly by the second loop, and they stabilize on a fairly consistent level afterwards. During this, the Turbo Boost increases the clock speeds slightly.
| Cinebench R10 | |
| Rendering Single 32Bit | |
| Average of class Workstation (n=1last 2 years) | |
| Average Intel Core i9-9980HK (7709 - 9734, n=4) | |
| Eurocom Tornado F7W | |
| Acer ConceptD 9 Pro | |
| Fujitsu Celsius H980 | |
| Rendering Multiple CPUs 32Bit | |
| Average of class Workstation (n=1last 2 years) | |
| Average Intel Core i9-9980HK (39440 - 50439, n=4) | |
| Acer ConceptD 9 Pro | |
| Eurocom Tornado F7W | |
| Fujitsu Celsius H980 | |
| Geekbench 3 | |
| 32 Bit Multi-Core Score | |
| Acer ConceptD 9 Pro | |
| Average Intel Core i9-9980HK (n=1) | |
| 32 Bit Single-Core Score | |
| Acer ConceptD 9 Pro | |
| Average Intel Core i9-9980HK (n=1) | |
| Mozilla Kraken 1.1 - Total | |
| Fujitsu Celsius H980 (EDGE: 42.17134.1.0) | |
| Dell Precision 7730 (Edge) | |
| MSI WE75 9TK (Edge 44.17763.831.0) | |
| MSI WE75 9TK | |
| Lenovo ThinkPad P73-20QR002DGE (Edge) | |
| Acer ConceptD 9 Pro (Edge 44) | |
| Average Intel Core i9-9980HK (705 - 999, n=9) | |
| Average of class Workstation (411 - 538, n=23, last 2 years) | |
| Octane V2 - Total Score | |
| Average of class Workstation (112382 - 129420, n=3, last 2 years) | |
| Average Intel Core i9-9980HK (40364 - 46473, n=8) | |
| Acer ConceptD 9 Pro (Edge 44) | |
| Lenovo ThinkPad P73-20QR002DGE (Edge) | |
| MSI WE75 9TK (Edge 44.17763.831.0) | |
| Dell Precision 7730 (Edge) | |
| Fujitsu Celsius H980 (EDGE: 42.17134.1.0) | |
| JetStream 1.1 - 1.1 Total | |
| Eurocom Tornado F7W (Edge 42.17134.1.0) | |
| Acer ConceptD 9 Pro (Edge 44) | |
| Average Intel Core i9-9980HK (257 - 318, n=8) | |
| MSI WE75 9TK (Edge 44.17763.831.0) | |
| Fujitsu Celsius H980 (EDGE: 42.17134.1.0) | |
* ... smaller is better
System Performance
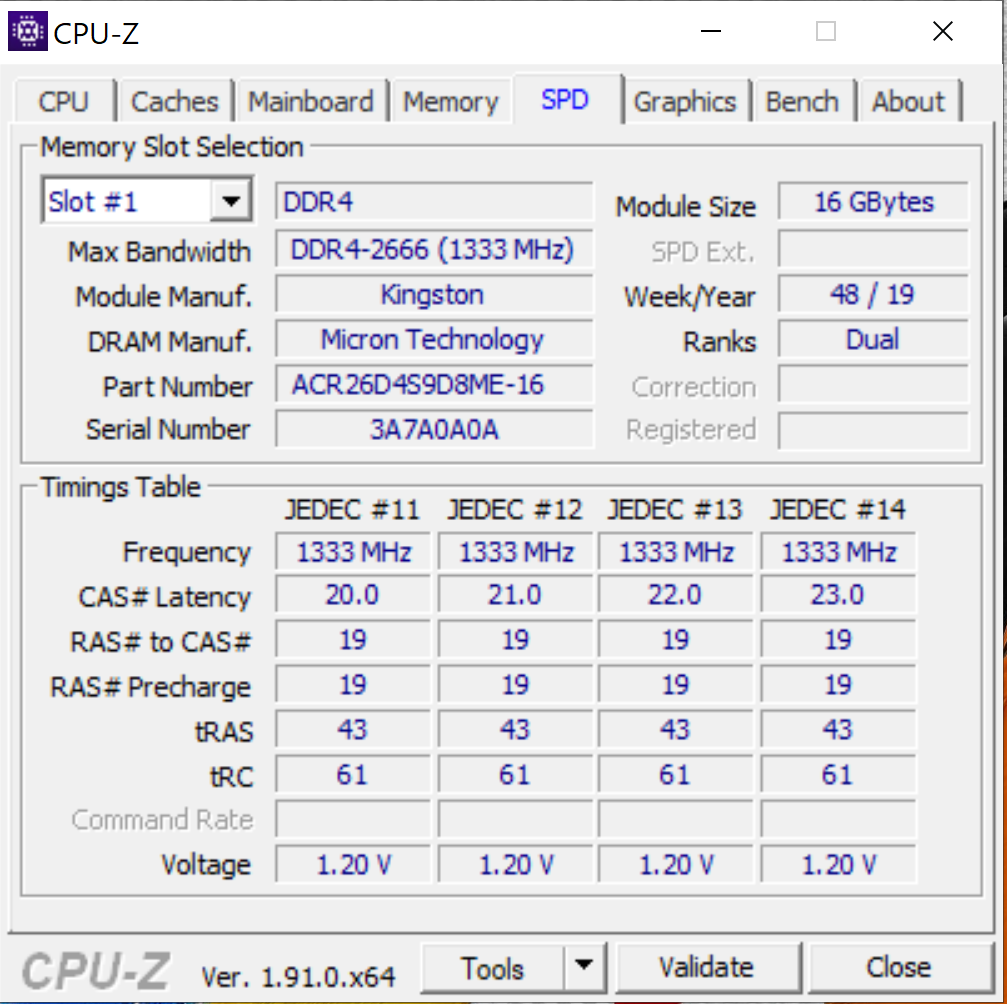
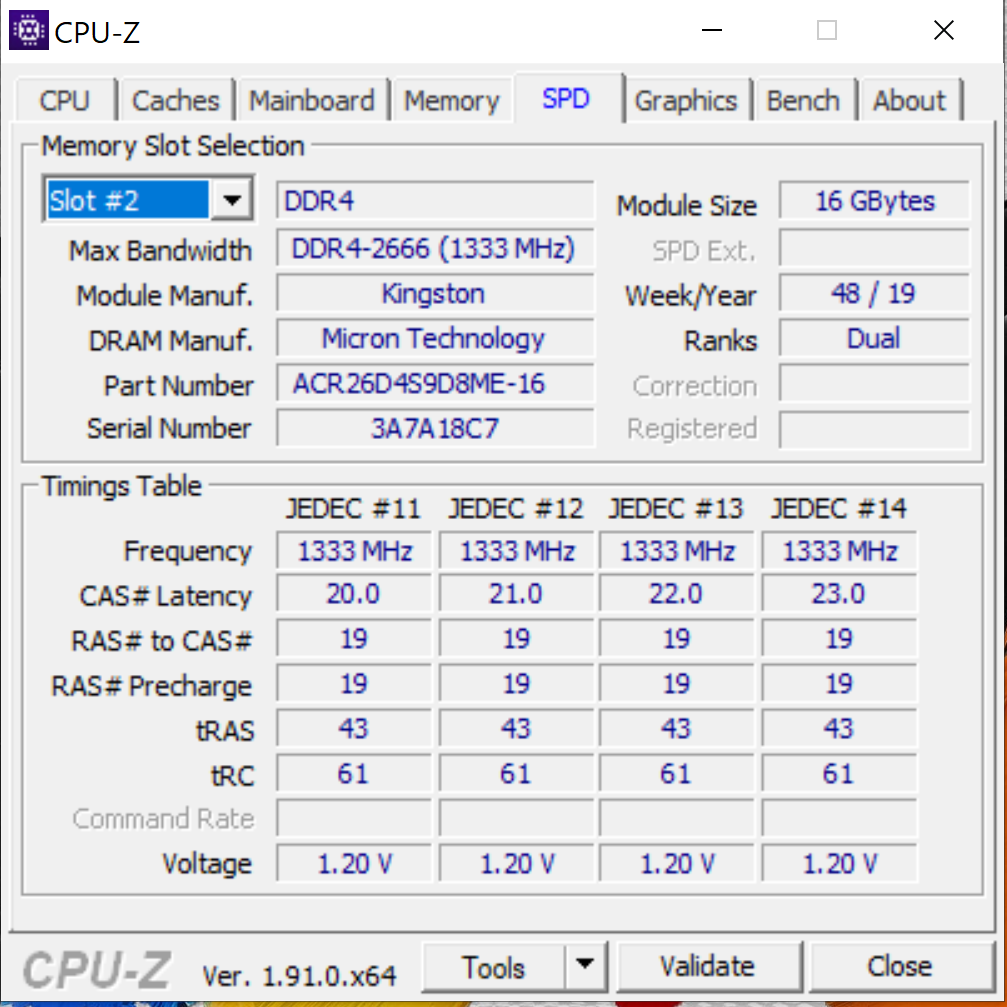
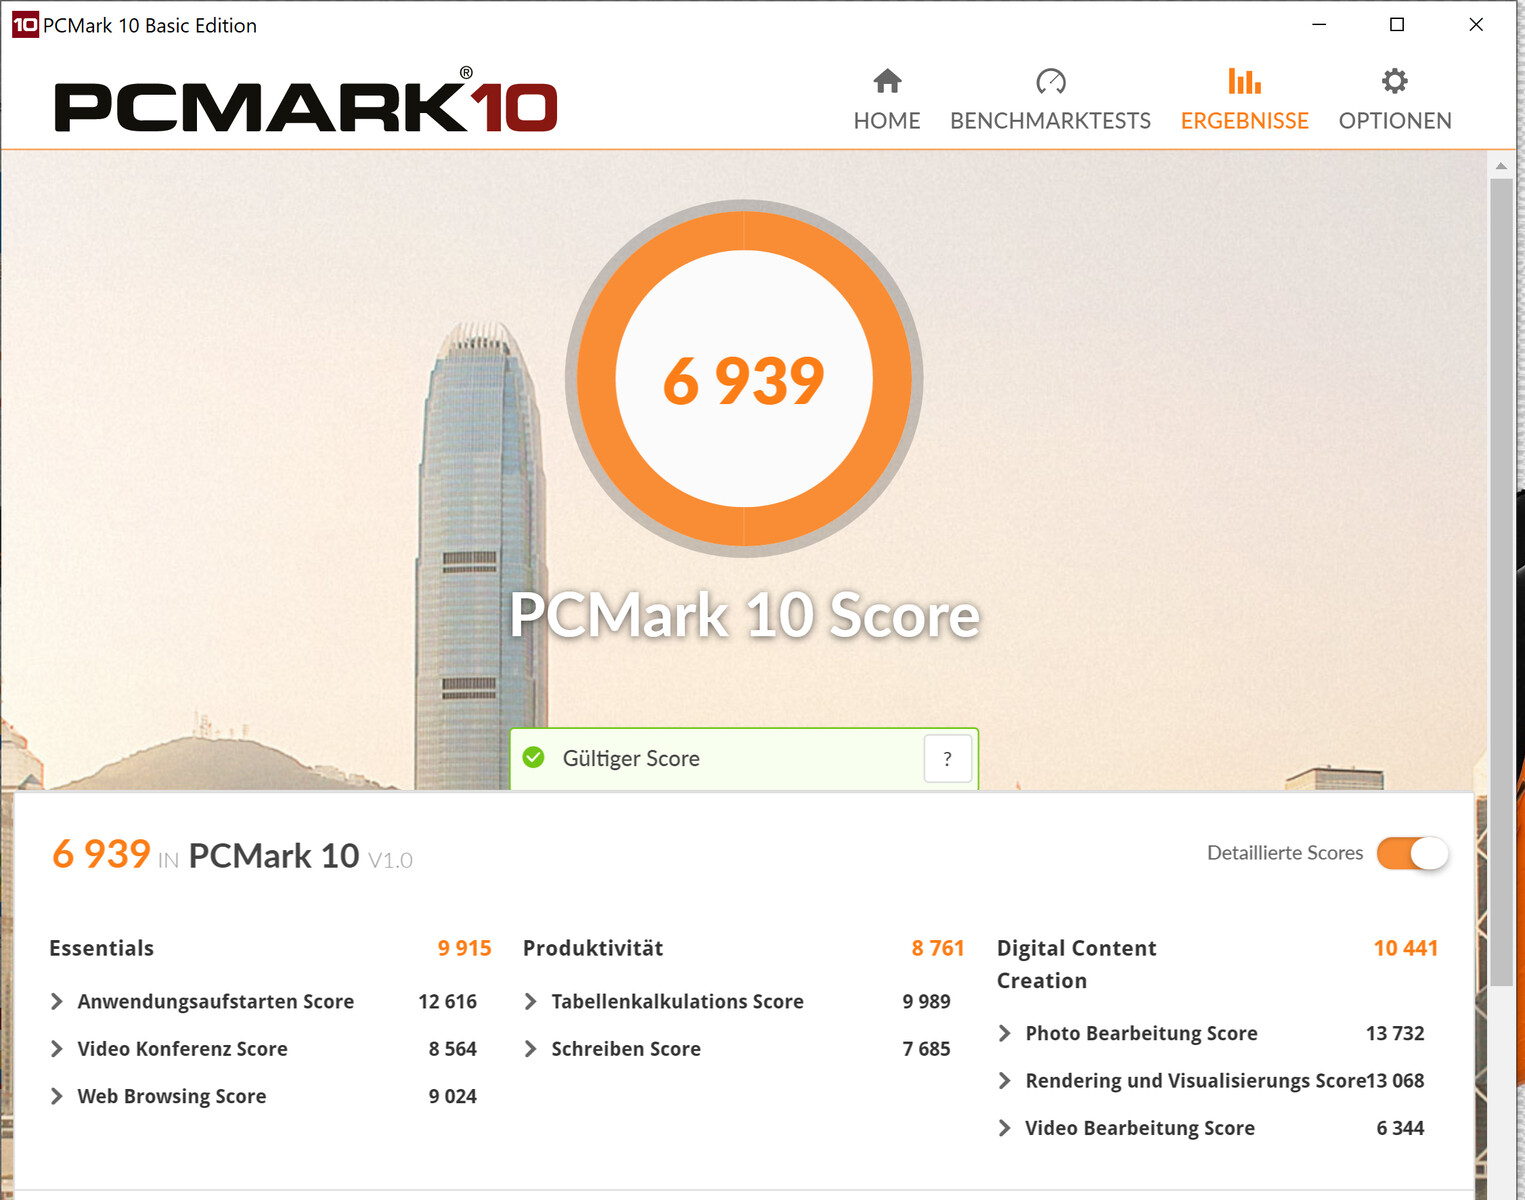
The 17.3-inch laptop does not lack system performance. A powerful eight-core processor, dual-channel mode RAM and a fast NVMe SSD make for a smooth and responsive system. On top of that, the workstation is equipped with a high-end GPU. The PCMark benchmark results are excellent, which again emphasizes the fact that the laptop is fast enough for all common use cases.
| PCMark 8 Home Score Accelerated v2 | 4487 points | |
| PCMark 8 Creative Score Accelerated v2 | 6412 points | |
| PCMark 8 Work Score Accelerated v2 | 4884 points | |
| PCMark 10 Score | 6939 points | |
Help | ||
Storage Solution
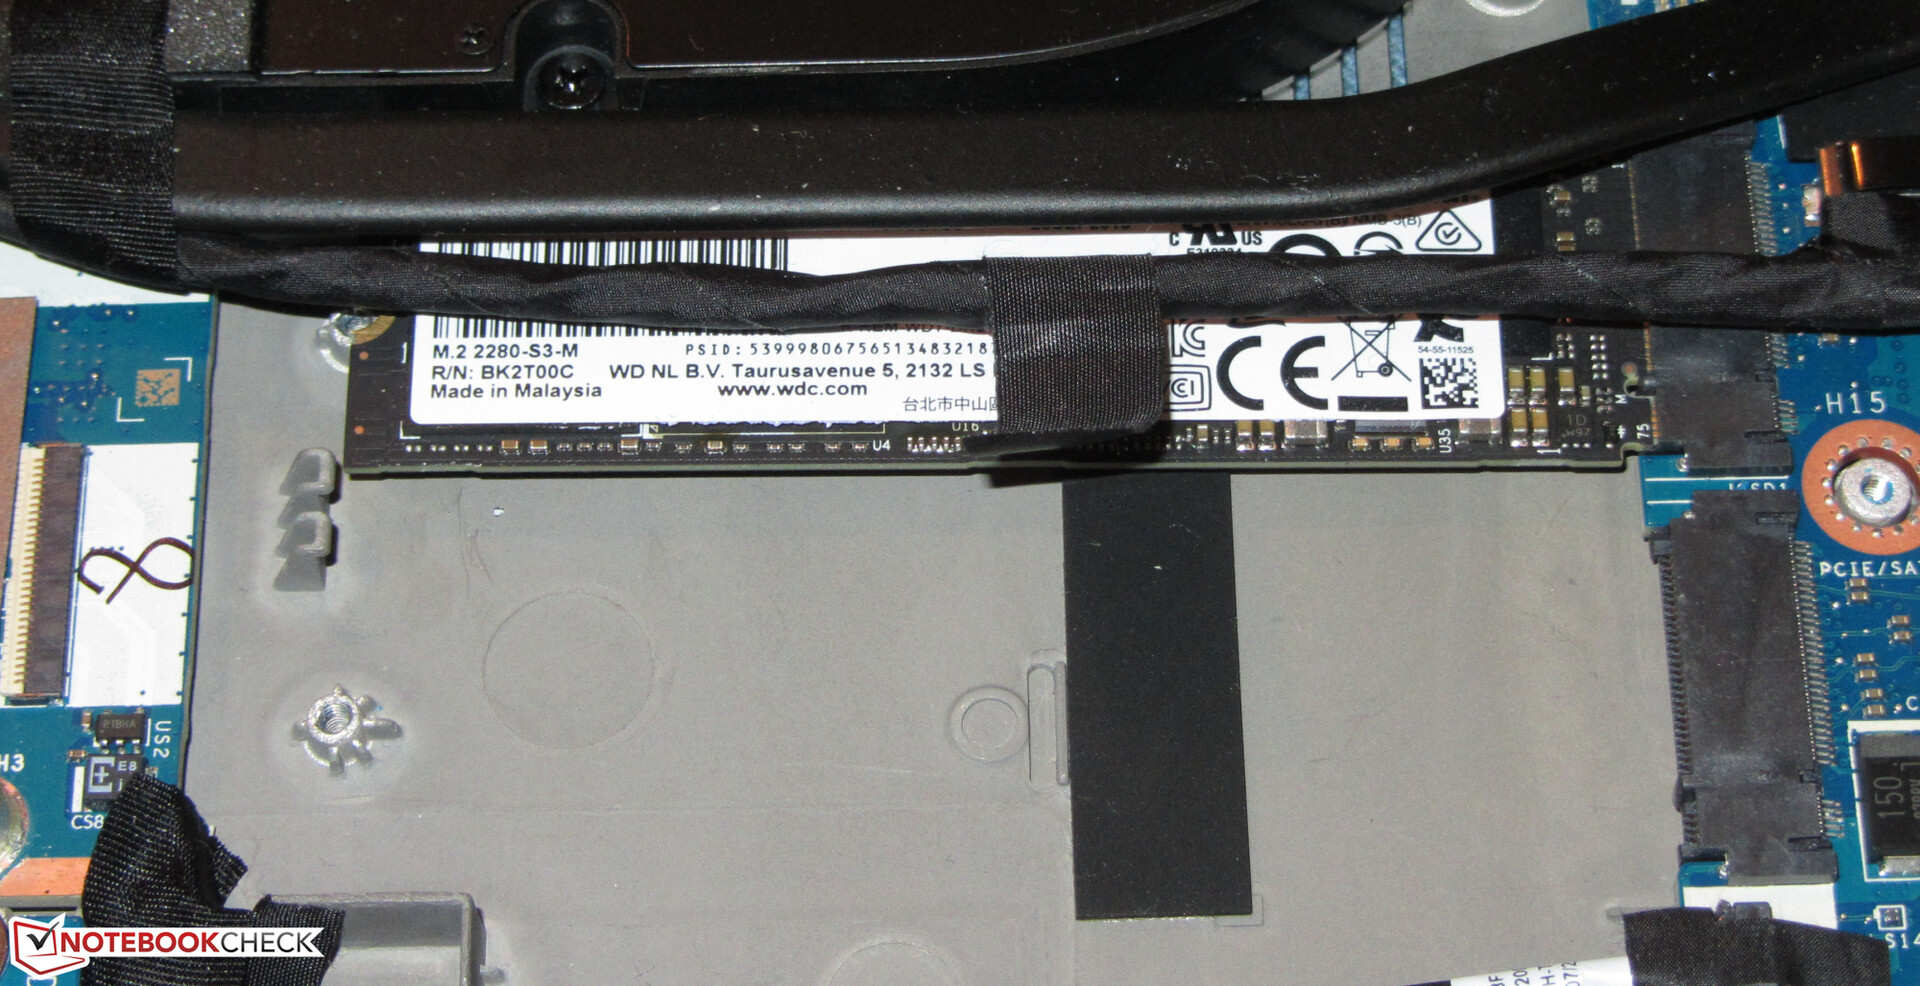
An NVMe SSD from Western Digital serves as the system drive. In this case, it is a model in the M.2 2280 form factor with 1 TB of storage space. Ex-factory, about 887 GB is available to users. The remaining space is occupied by the recovery partition and the windows system. The transfer rates are good. On the inside of the workstation, there is an additional M.2 2280 slot available. If two drives are installed, they can operate in RAID 0.

| Acer ConceptD 9 Pro WDC PC SN720 SDAQNTW-1T00 | Lenovo ThinkPad P73-20QR002DGE Intel SSD Pro 7600p SSDPEKKF512G8L | MSI WE75 9TK Samsung SSD PM981 MZVLB512HAJQ | Dell Precision 7730 Samsung SSD PM981 MZVLB512HAJQ | Eurocom Tornado F7W 3x Samsung SSD 970 Pro 512GB (RAID 0) | Fujitsu Celsius H980 Samsung SSD PM981 MZVLB512HAJQ | Average WDC PC SN720 SDAQNTW-1T00 | |
|---|---|---|---|---|---|---|---|
| CrystalDiskMark 5.2 / 6 | -6% | -3% | -24% | 2% | -30% | -3% | |
| Write 4K (MB/s) | 176 | 154.3 -12% | 135.4 -23% | 103.2 -41% | 116.3 -34% | 111.8 -36% | 168.6 ? -4% |
| Read 4K (MB/s) | 48.06 | 66.4 38% | 56.6 18% | 41.39 -14% | 52.7 10% | 32.02 -33% | 47.6 ? -1% |
| Write Seq (MB/s) | 2736 | 1561 -43% | 1972 -28% | 1880 -31% | 2539 -7% | 1539 -44% | 2602 ? -5% |
| Read Seq (MB/s) | 2381 | 2460 3% | 2101 -12% | 2350 -1% | 2972 25% | 1252 -47% | 2084 ? -12% |
| Write 4K Q32T1 (MB/s) | 418.6 | 438 5% | 527 26% | 282.3 -33% | 454.6 9% | 355.4 -15% | 391 ? -7% |
| Read 4K Q32T1 (MB/s) | 460.8 | 568 23% | 578 25% | 314.3 -32% | 515 12% | 408.7 -11% | 481 ? 4% |
| Write Seq Q32T1 (MB/s) | 2791 | 1581 -43% | 1985 -29% | 1881 -33% | 3101 11% | 1913 -31% | 2792 ? 0% |
| Read Seq Q32T1 (MB/s) | 3430 | 2724 -21% | 3358 -2% | 3216 -6% | 3078 -10% | 2530 -26% | 3377 ? -2% |
GPU Performance
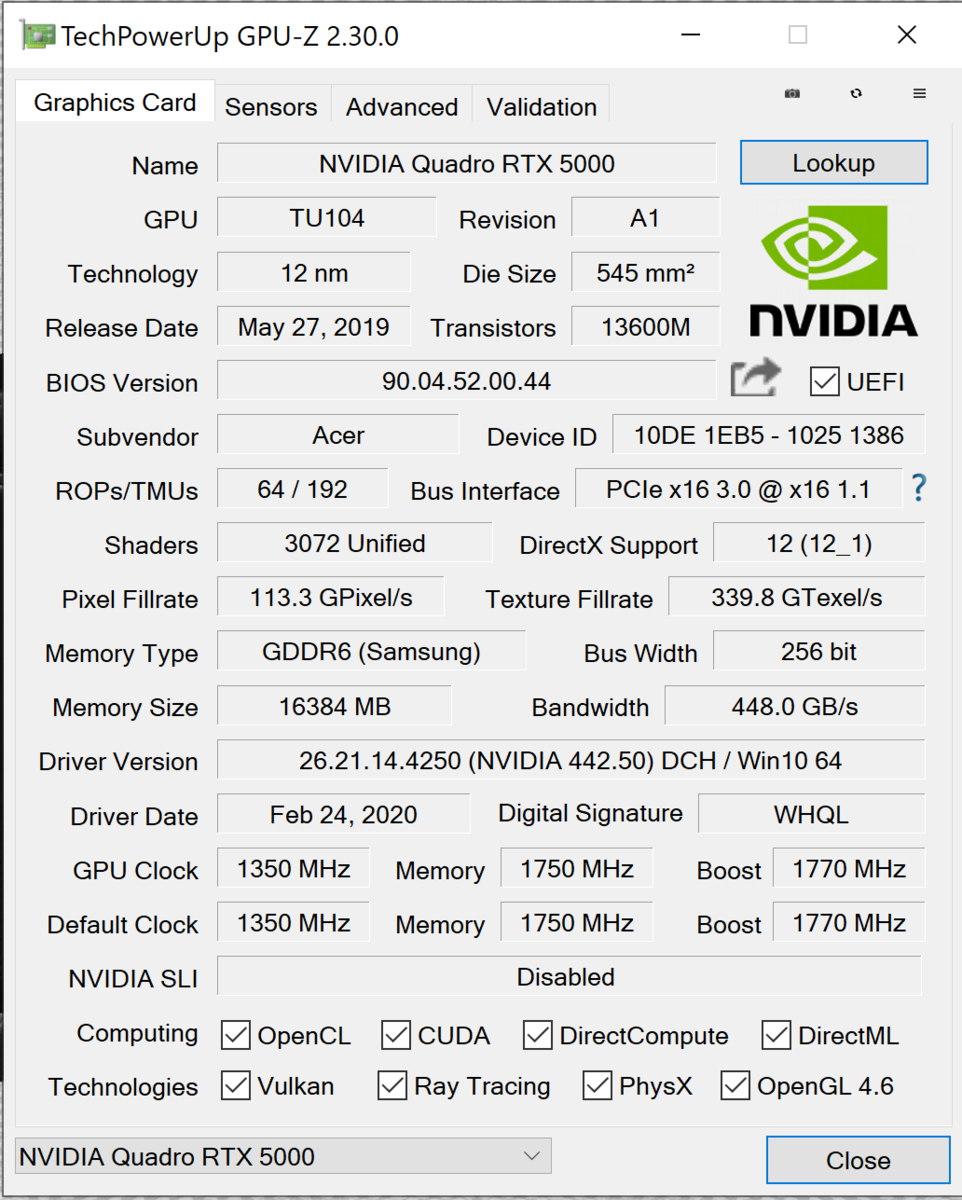
The Acer laptop is equipped with a Quadro RTX 5000 GPU. This GPU is based on Nvidia's Turing architecture and represents the professional version of the GeForce RTX 2080 GPU. However, the RTX 5000 has more shader units (3,072 instead of 2,944). It also has access to fast GDDR6 memory (16.384 GB).
There are two variants of the mobile RTX 5000 GPU, which differ in terms of their TGP (150 watts vs. 110 watts) and thus their performance. The stronger variant is installed in the ConceptD. Additionally, Nvidia also has three Max-Q versions of the RTX 5000 on offer.
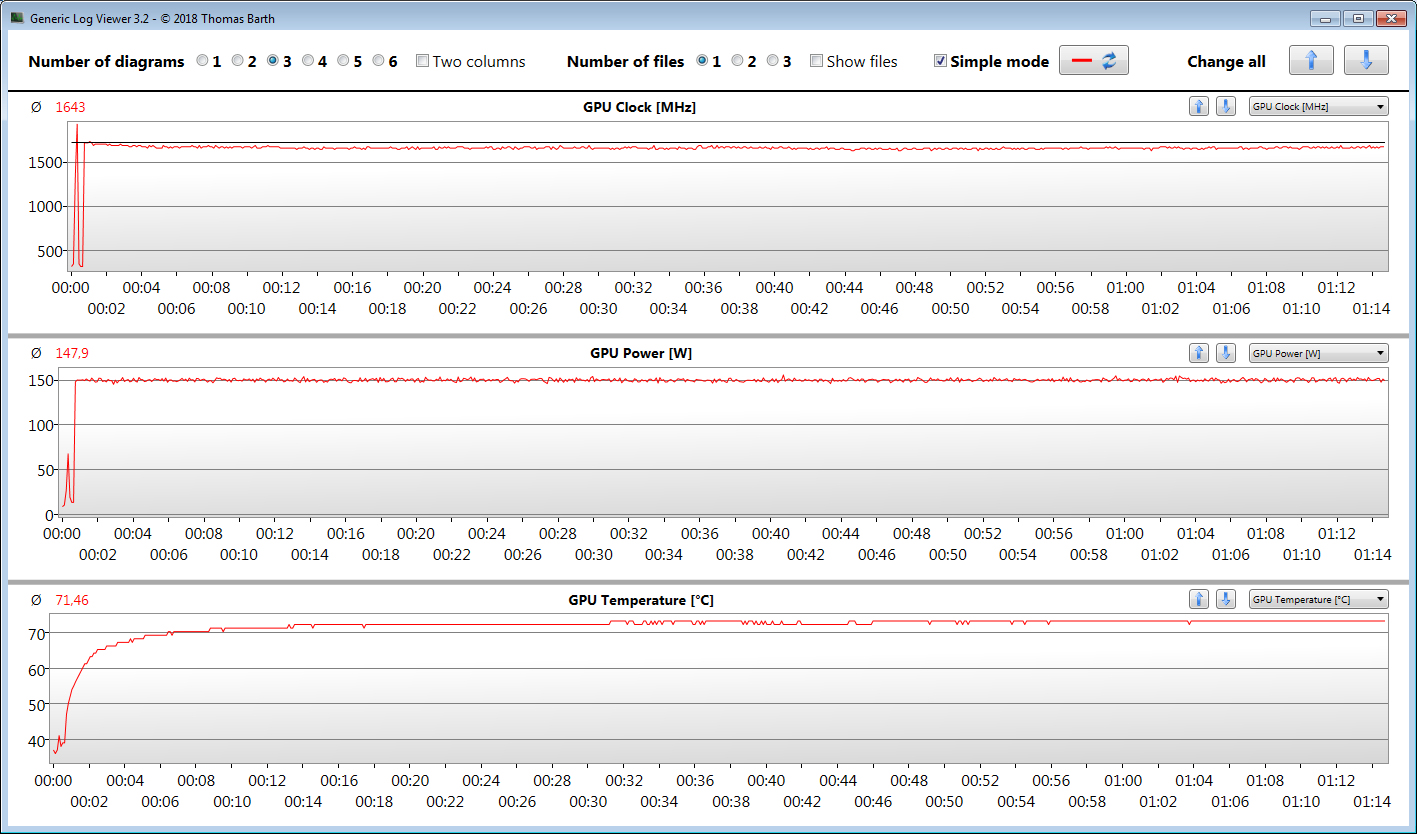
The RTX 5000 runs at a base clock speed of 1350 MHz. Via boost, this can be increased to 1770 MHz. Provided the GPU does not cross a certain predefined temperature and/or energy consumption threshold, even higher frequencies are possible. We recorded a peak core clock of 1927 MHz. In our The Witcher 3 test, the GPU runs at an average clock speed of 1643 MHz.
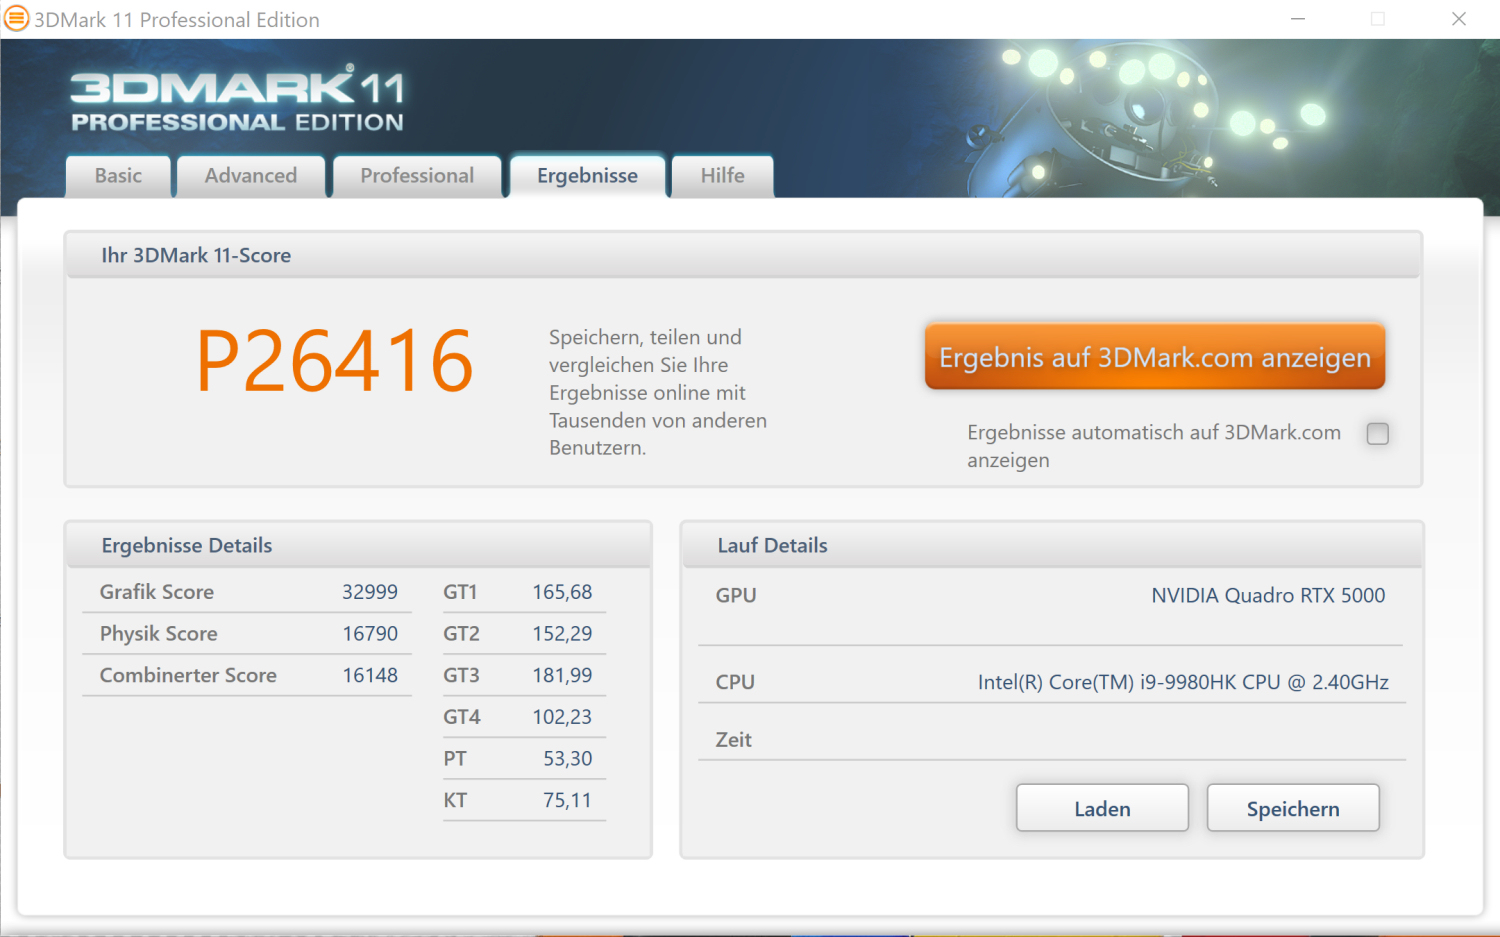
The 3DMark results match our expectations. The integrated UHD Graphics 630 GPU is disabled and the laptop does not use Nvidia's graphics-switching technology Optimus.

| 3DMark 06 Standard Score | 45180 points | |
| 3DMark 11 Performance | 26416 points | |
| 3DMark Ice Storm Standard Score | 184872 points | |
| 3DMark Cloud Gate Standard Score | 44296 points | |
| 3DMark Fire Strike Score | 20374 points | |
| 3DMark Time Spy Score | 9779 points | |
Help | ||
| Geekbench 5.5 | |
| Vulkan Score 5.1 | |
| Acer ConceptD 9 Pro | |
| Average NVIDIA Quadro RTX 5000 (Laptop) (n=1) | |
| OpenCL Score 5.1 | |
| Acer ConceptD 9 Pro | |
| Average NVIDIA Quadro RTX 5000 (Laptop) (n=1) | |
| VRMark | |
| Cyan Room | |
| Acer ConceptD 9 Pro | |
| Average NVIDIA Quadro RTX 5000 (Laptop) (n=1) | |
| Blue Room | |
| Acer ConceptD 9 Pro | |
| Average NVIDIA Quadro RTX 5000 (Laptop) (n=1) | |
| Orange Room | |
| Acer ConceptD 9 Pro | |
| Average NVIDIA Quadro RTX 5000 (Laptop) (n=1) | |
| Basemark GPU 1.2 | |
| 1920x1080 OpenGL Medium Offscreen | |
| Acer ConceptD 9 Pro | |
| Average NVIDIA Quadro RTX 5000 (Laptop) (n=1) | |
| 3840x2160 Vulkan High Offscreen | |
| Acer ConceptD 9 Pro | |
| Average NVIDIA Quadro RTX 5000 (Laptop) (n=1) | |
| Average of class Workstation (3.64 - 3.64, n=10, last 2 years) | |
| 1920x1080 Vulkan Medium Offscreen | |
| Acer ConceptD 9 Pro | |
| Average NVIDIA Quadro RTX 5000 (Laptop) (n=1) | |
| Average of class Workstation (104.6 - 2585, n=21, last 2 years) | |
Gaming Performance
Even though the CN917-71P is not technically a gaming laptop, it can run all games in our database at Full HD resolution as well as maximum quality settings and display them smoothly on its matte screen. Even resolutions above Full HD are not a big challenge for this GPU.
| The Witcher 3 - 1920x1080 Ultra Graphics & Postprocessing (HBAO+) | |
| Acer ConceptD 9 Pro | |
| Average NVIDIA Quadro RTX 5000 (Laptop) (90.4 - 109.9, n=2) | |
| Average of class Workstation (n=1last 2 years) | |
| Razer Blade 15 Studio Edition | |
| Lenovo ThinkPad P53-20QN000YGE | |
| Eurocom Tornado F7W | |
| MSI WE75 9TK | |
| Lenovo ThinkPad P73-20QR002DGE | |
| Dell Precision 7730 | |
| BioShock Infinite - 1920x1080 Ultra Preset, DX11 (DDOF) | |
| Acer ConceptD 9 Pro | |
| Average NVIDIA Quadro RTX 5000 (Laptop) (n=1) | |
| Razer Blade 15 Studio Edition | |
| MSI WE75 9TK | |
| Lenovo ThinkPad P73-20QR002DGE | |
| Dell Precision 7730 | |
| Fujitsu Celsius H980 | |
| Far Cry 5 - 1920x1080 Ultra Preset AA:T | |
| Acer ConceptD 9 Pro | |
| Average NVIDIA Quadro RTX 5000 (Laptop) (n=1) | |
| Average of class Workstation (37 - 128, n=9, last 2 years) | |
| Fujitsu Celsius H980 | |
| Shadow of the Tomb Raider - 1920x1080 Highest Preset AA:T | |
| Acer ConceptD 9 Pro | |
| Average NVIDIA Quadro RTX 5000 (Laptop) (73.1 - 118, n=2) | |
| Lenovo ThinkPad P53-20QN000YGE | |
| MSI WE75 9TK | |
| Eurocom Tornado F7W | |
| Borderlands 3 - 1920x1080 Badass Overall Quality (DX11) | |
| Acer ConceptD 9 Pro | |
| Average NVIDIA Quadro RTX 5000 (Laptop) (n=1) | |
| Razer Blade 15 Studio Edition | |
In order to determine whether the frame rates remain consistent over a prolonged period of time, we run The Witcher 3 for about 60 minutes at Full HD resolution and maximum quality settings. During the entire time, the character portrayed by the player is not moved. Our results show that the frame rates remain on a playable level for the entire duration. We did not observe any performance dips.
| low | med. | high | ultra | QHD | 4K | |
|---|---|---|---|---|---|---|
| Tomb Raider (2013) | 757 | 681 | 625 | 319.6 | ||
| BioShock Infinite (2013) | 458 | 396.9 | 367.9 | 216.3 | ||
| The Witcher 3 (2015) | 375.3 | 308.5 | 198.6 | 109.9 | 71 | |
| Rainbow Six Siege (2015) | 350.2 | 296.1 | 279.6 | 266.2 | 138 | |
| For Honor (2017) | 329.3 | 216.9 | 206.8 | 160.4 | 68.4 | |
| Far Cry 5 (2018) | 150 | 128 | 123 | 115 | 102 | 56 |
| Shadow of the Tomb Raider (2018) | 147 | 130 | 126 | 118 | 87 | 47 |
| Assassin´s Creed Odyssey (2018) | 113 | 104 | 94 | 73 | 63 | 40 |
| Battlefield V (2018) | 187 | 164.6 | 161.7 | 151.9 | 123.9 | 72.7 |
| Apex Legends (2019) | 144 | 144 | 144 | 143.9 | 135 | 76.3 |
| Metro Exodus (2019) | 161 | 124.4 | 95.2 | 77 | 59.3 | 36.7 |
| Dirt Rally 2.0 (2019) | 289.3 | 208.4 | 200.1 | 115.5 | 84.3 | 51.2 |
| The Division 2 (2019) | 178 | 156 | 131 | 55 | 55 | 38 |
| Anno 1800 (2019) | 119.2 | 118.8 | 93.1 | 51.1 | 46.9 | 30.3 |
| Rage 2 (2019) | 303.8 | 160.4 | 137.1 | 133.8 | 85.8 | 42.2 |
| Total War: Three Kingdoms (2019) | 271.6 | 154.6 | 113.7 | 83.6 | 53.3 | 25.9 |
| F1 2019 (2019) | 243 | 210 | 182 | 144 | 146 | 78 |
| Control (2019) | 239 | 123.7 | 93.3 | 60.5 | 30.1 | |
| Borderlands 3 (2019) | 153.8 | 130.2 | 104.5 | 85.5 | 59.8 | 31.5 |
| Ghost Recon Breakpoint (2019) | 152 | 125 | 118 | 88 | 66 | 38 |
| GRID 2019 (2019) | 186.6 | 144.5 | 142.5 | 100.7 | 80.7 | 54.9 |
| Call of Duty Modern Warfare 2019 (2019) | 232.6 | 156.2 | 144.9 | 119.3 | 86.6 | 48.8 |
| Need for Speed Heat (2019) | 109.9 | 104.9 | 98.7 | 95.9 | 89 | 52.7 |
| Star Wars Jedi Fallen Order (2019) | 112.8 | 112.1 | 107.5 | 89.6 | 50.2 | |
| Red Dead Redemption 2 (2019) | 145.6 | 125.9 | 87.4 | 54.1 | 43.7 | 28.1 |
| Escape from Tarkov (2020) | 121 | 121 | 120.3 | 110.6 | 106.6 | 53.8 |
| Hunt Showdown (2020) | 231.1 | 163.8 | 130.4 | 87.8 | 77.1 | |
| Doom Eternal (2020) | 234.5 | 200.2 | 183.7 | 180.8 | 128.5 | 68.6 |
Emissions - ConceptD 9 Pro with Moderate Noise and Heat Development
System Noise
The fans of the ConceptD Pro permanently spin at low speeds during idle. They are barely audible in this mode. Under load, they spin up noticeably. During our stress test, we recorded a fan noise level of 44.1 dB(A). While performing our The Witcher 3 test, this value is slightly higher.
Unfortunately, there is frequent, noticeable electronic noise that comes from the inside of the case. It occurs when moving large chunks of data - for example when starting a game.
Noise level
| Idle |
| 31.6 / 31.6 / 31.9 dB(A) |
| Load |
| 41.2 / 44.1 dB(A) |
 | ||
30 dB silent 40 dB(A) audible 50 dB(A) loud |
||
min: | ||
| Acer ConceptD 9 Pro i9-9980HK, Quadro RTX 5000 (Laptop) | Lenovo ThinkPad P73-20QR002DGE i7-9850H, Quadro RTX 3000 (Laptop) | MSI WE75 9TK i7-9750H, Quadro RTX 3000 (Laptop) | Dell Precision 7730 i7-8850H, Quadro P3200 | Eurocom Tornado F7W i9-9900K, Quadro P5200 | Fujitsu Celsius H980 i7-8750H, Quadro P3200 | Average NVIDIA Quadro RTX 5000 (Laptop) | Average of class Workstation | |
|---|---|---|---|---|---|---|---|---|
| Noise | 16% | 3% | 9% | -12% | 2% | 4% | 12% | |
| off / environment * (dB) | 30.8 | 29.3 5% | 28.5 7% | 29.7 4% | 28.2 8% | 29.6 4% | 30.1 ? 2% | 24.1 ? 22% |
| Idle Minimum * (dB) | 31.6 | 29.3 7% | 29 8% | 29.7 6% | 33.2 -5% | 29.6 6% | 30.5 ? 3% | 24.8 ? 22% |
| Idle Average * (dB) | 31.6 | 29.3 7% | 29 8% | 29.7 6% | 33.2 -5% | 32.5 -3% | 30.5 ? 3% | 25.5 ? 19% |
| Idle Maximum * (dB) | 31.9 | 29.3 8% | 31.5 1% | 29.7 7% | 33.2 -4% | 32.5 -2% | 31.2 ? 2% | 26.7 ? 16% |
| Load Average * (dB) | 41.2 | 30.2 27% | 32 22% | 31.4 24% | 47 -14% | 34.9 15% | 36.9 ? 10% | 39.2 ? 5% |
| Witcher 3 ultra * (dB) | 44.6 | 30.7 31% | 44.7 -0% | 37.9 15% | 52.2 -17% | |||
| Load Maximum * (dB) | 44.1 | 33.1 25% | 56.5 -28% | 44.2 -0% | 64 -45% | 49.1 -11% | 41.6 ? 6% | 50.7 ? -15% |
* ... smaller is better
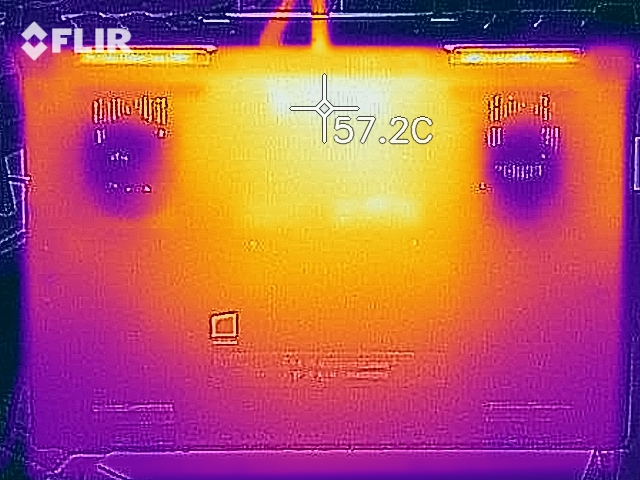
Temperature

During our stress test (running Prime95 and FurMark for at least one hour), the CPU and GPU run at 2.3-2.6 GHz and 1600 to 1700 MHz, respectively, while on mains. In battery mode, these values decrease to 800 MHz (CPU) and 300 MHz (GPU). The stress test represents an extreme case that does not occur during day-to-day use. We use this test to determine whether the system is stable even when under maximum load.
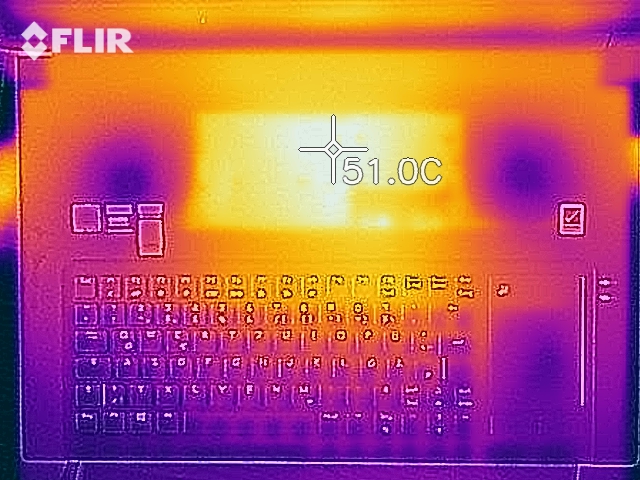
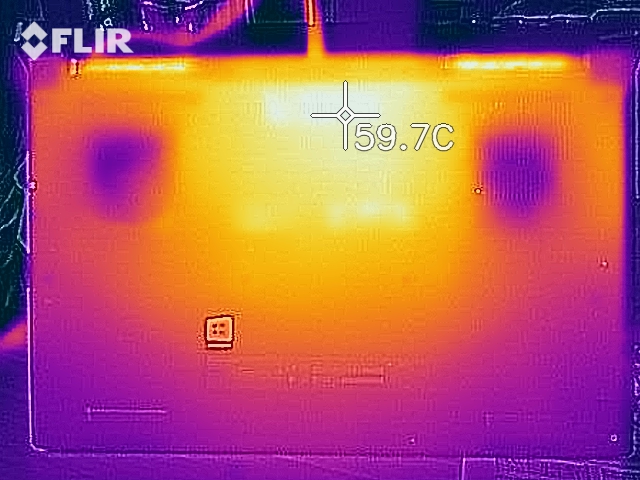
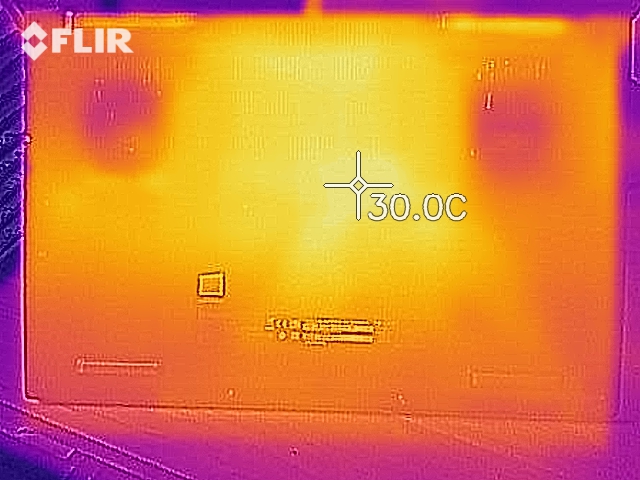
Despite the powerful hardware, the heat development of the laptop is moderate. While performing our stress test, we only measure a temperature above 50 °C in one spot. During our The Witcher 3 test, the temperatures rise to higher levels. Users will not need to worry about the temperatures during daily use.
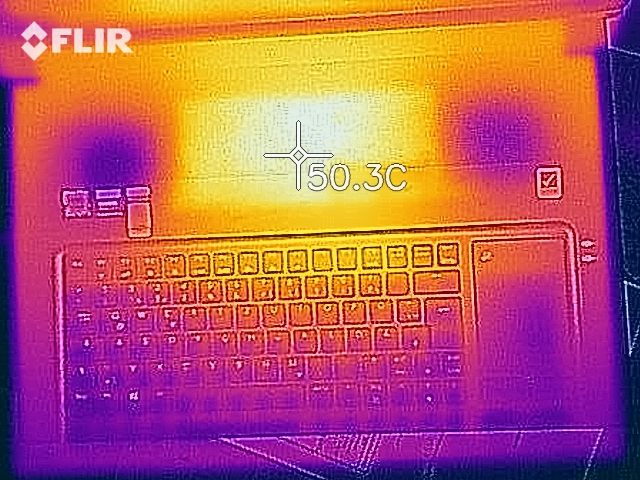
(±) The maximum temperature on the upper side is 43 °C / 109 F, compared to the average of 38.2 °C / 101 F, ranging from 22.2 to 69.8 °C for the class Workstation.
(-) The bottom heats up to a maximum of 53 °C / 127 F, compared to the average of 41.1 °C / 106 F
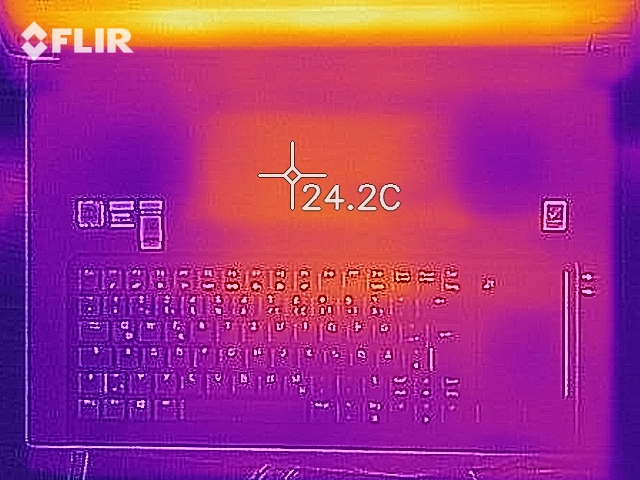
(+) In idle usage, the average temperature for the upper side is 23.9 °C / 75 F, compared to the device average of 32 °C / 90 F.
(±) Playing The Witcher 3, the average temperature for the upper side is 34.8 °C / 95 F, compared to the device average of 32 °C / 90 F.
(+) The palmrests and touchpad are reaching skin temperature as a maximum (32.2 °C / 90 F) and are therefore not hot.
(-) The average temperature of the palmrest area of similar devices was 27.8 °C / 82 F (-4.4 °C / -8 F).
| Acer ConceptD 9 Pro i9-9980HK, Quadro RTX 5000 (Laptop) | Lenovo ThinkPad P73-20QR002DGE i7-9850H, Quadro RTX 3000 (Laptop) | MSI WE75 9TK i7-9750H, Quadro RTX 3000 (Laptop) | Dell Precision 7730 i7-8850H, Quadro P3200 | Eurocom Tornado F7W i9-9900K, Quadro P5200 | Fujitsu Celsius H980 i7-8750H, Quadro P3200 | Average NVIDIA Quadro RTX 5000 (Laptop) | Average of class Workstation | |
|---|---|---|---|---|---|---|---|---|
| Heat | -7% | -7% | -16% | 12% | 2% | -1% | -8% | |
| Maximum Upper Side * (°C) | 43 | 52.2 -21% | 40.6 6% | 50 -16% | 34 21% | 41.8 3% | 43.5 ? -1% | 44 ? -2% |
| Maximum Bottom * (°C) | 53 | 47.8 10% | 46 13% | 59.8 -13% | 47.6 10% | 46.2 13% | 54.3 ? -2% | 45 ? 15% |
| Idle Upper Side * (°C) | 24.8 | 26.9 -8% | 29.2 -18% | 27.9 -13% | 23 7% | 25.6 -3% | 25.1 ? -1% | 30.6 ? -23% |
| Idle Bottom * (°C) | 25.6 | 28 -9% | 32.4 -27% | 31.4 -23% | 23.4 9% | 26.6 -4% | 25.8 ? -1% | 31.6 ? -23% |
* ... smaller is better
Speakers
The four speakers of the Acer workstation are located on the bottom near the front of the device. They produce a sound that is more than adequate, although there is barely any bass. Additionally, the maximum volume level could be slightly higher.
Acer ConceptD 9 Pro audio analysis
(-) | not very loud speakers (69.9 dB)
Bass 100 - 315 Hz
(-) | nearly no bass - on average 22.1% lower than median
(±) | linearity of bass is average (11.8% delta to prev. frequency)
Mids 400 - 2000 Hz
(+) | balanced mids - only 3.4% away from median
(±) | linearity of mids is average (7.2% delta to prev. frequency)
Highs 2 - 16 kHz
(+) | balanced highs - only 3.3% away from median
(±) | linearity of highs is average (10.1% delta to prev. frequency)
Overall 100 - 16.000 Hz
(±) | linearity of overall sound is average (20.8% difference to median)
Compared to same class
» 75% of all tested devices in this class were better, 6% similar, 18% worse
» The best had a delta of 7%, average was 17%, worst was 35%
Compared to all devices tested
» 56% of all tested devices were better, 8% similar, 36% worse
» The best had a delta of 4%, average was 23%, worst was 134%
Energy Management - High Consumption, Low Stamina
Energy Consumption
It should come as no surprise that the CN917 consumes a fair amount of power while idling. The dedicated RTX 5000 GPU works full-time after all. During the stress test, the power consumption climbs up to a peak of 241 watts. While gaming (The Witcher 3 test), we recorded an average consumption of 221 watts (216 to 229 watts). The power adapter is rated for 330 watts.
| Off / Standby | |
| Idle | |
| Load |
|
Key:
min: | |
| Acer ConceptD 9 Pro i9-9980HK, Quadro RTX 5000 (Laptop) | Lenovo ThinkPad P73-20QR002DGE i7-9850H, Quadro RTX 3000 (Laptop) | MSI WE75 9TK i7-9750H, Quadro RTX 3000 (Laptop) | Dell Precision 7730 i7-8850H, Quadro P3200 | Eurocom Tornado F7W i9-9900K, Quadro P5200 | Fujitsu Celsius H980 i7-8750H, Quadro P3200 | Average NVIDIA Quadro RTX 5000 (Laptop) | Average of class Workstation | |
|---|---|---|---|---|---|---|---|---|
| Power Consumption | 36% | 29% | 31% | -31% | 19% | 6% | 36% | |
| Idle Minimum * (Watt) | 18.8 | 8.9 53% | 12.1 36% | 10.1 46% | 28.5 -52% | 14.8 21% | 16.6 ? 12% | 9.11 ? 52% |
| Idle Average * (Watt) | 25 | 12.8 49% | 18.4 26% | 18 28% | 36.7 -47% | 20.4 18% | 22.1 ? 12% | 13.8 ? 45% |
| Idle Maximum * (Watt) | 30 | 16.4 45% | 18.8 37% | 19.7 34% | 37.8 -26% | 21.5 28% | 27.3 ? 9% | 17.9 ? 40% |
| Load Average * (Watt) | 116 | 108.4 7% | 95.1 18% | 89.6 23% | 144.6 -25% | 98.4 15% | 124.5 ? -7% | 96 ? 17% |
| Witcher 3 ultra * (Watt) | 221 | 153 31% | 135.5 39% | 134 39% | 218.9 1% | |||
| Load Maximum * (Watt) | 241 | 166 31% | 203.7 15% | 204 15% | 336 -39% | 213.5 11% | 232 ? 4% | 180.3 ? 25% |
* ... smaller is better
Battery Life
In our real-world Wi-Fi test, the ConceptD 9 achieves a runtime of 3:38 h. Here, we simulate a web-browsing load with the help of a script. For this test, we selected the "balanced" profile and set the display's brightness to about 150 cd/m². In our video test, the 17.3-inch workstation lasts 3:32 h. This test consists of playing the short film Big Buck Bunny (H.264 codec, 1920x1080 pixels) in a continuous loop. Before the test, we selected the "power saver" profile and reduced the display brightness to 150 cd/m².

| Acer ConceptD 9 Pro i9-9980HK, Quadro RTX 5000 (Laptop), 71.9 Wh | Lenovo ThinkPad P73-20QR002DGE i7-9850H, Quadro RTX 3000 (Laptop), 99 Wh | MSI WE75 9TK i7-9750H, Quadro RTX 3000 (Laptop), 65 Wh | Dell Precision 7730 i7-8850H, Quadro P3200, 92 Wh | Eurocom Tornado F7W i9-9900K, Quadro P5200, 90 Wh | Fujitsu Celsius H980 i7-8750H, Quadro P3200, 96 Wh | Average of class Workstation | |
|---|---|---|---|---|---|---|---|
| Battery runtime | 148% | 53% | 63% | -17% | 104% | 197% | |
| Reader / Idle (h) | 5.2 | 11 112% | 13.5 160% | 26.1 ? 402% | |||
| H.264 (h) | 3.5 | 9.8 180% | 5.8 66% | 5.9 69% | 10.1 ? 189% | ||
| WiFi v1.3 (h) | 3.6 | 11.1 208% | 4.9 36% | 5.6 56% | 3 -17% | 8.3 131% | 8.55 ? 138% |
| Load (h) | 0.9 | 1.4 56% | 1 11% | 1.5 67% | 1.4 56% | 1.441 ? 60% |
Pros
Cons
Verdict
With the ConceptD 9 Pro CN917-71P, Acer has delivered a mobile, convertible workstation in the 17.3-inch form factor. In this case, the term "mobile" should only be used in a limited capacity, since the device weighs almost 4.5 kg and offers short battery life. That being said, moving it from one desk to another is not a problem.
The ConceptD 9 Pro is a tool for creative users that makes a good impression overall.
The Core i9-9980HK processor and the GeForce RTX 5000 GPU inside the laptop are some of the latest components. While the CPU has to reduce its clock speed after a short period of stress, the graphics card is able to run at consistently high turbo speeds. Via the Thunderbolt 3 port, an even more powerful, external GPU can be connected.
A sleek, well-built, solid metal chassis houses the ConceptD's hardware. The massive hinges of the device are a striking physical feature. They hold the display firmly in place regardless of how it is angled for comfortable digital pen inputs.
The impressive IPS 4K touchscreen display has a good contrast ratio, good viewing angles, good brightness and - thanks to Pantone-validation - great colors. However, we were unable to confirm the full AdobeRGB color-space coverage advertised by the manufacturer. According to our measurements, only 84% is covered (98% of sRGB).
Meanwhile, the installed NVMe SSD does not just offer good transfer rates, but it also has a lot of storage space (1 TB). There is also a slot for a secondary M.2 2280 SSD. If two drives are installed, they can be used in RAID 0.
Acer ConceptD 9 Pro
- 03/30/2020 v7 (old)
Sascha Mölck
Price comparison

