Dell Precision 7730 (Core i7-8850H, Quadro P3200, FHD) Workstation Review
"Precision" - a word that stands for accuracy and quality. No wonder then that Dell named its high-performance workstation series after this word. The Precision 7730 is the focus of this review, a 17.3-inch device that succeeds the Precision 7720, which scored 89% overall in our review just over a year ago.
The market for mobile workstations is comparatively small, but their asking prices make it a profitable sector for OEMs. Dell remains in a fight with other manufacturers like Fujitsu, HP and Lenovo for a piece of the workstation market, although we do not have the most recent HP device against which to compare the Precision 7730. At least we have the ThinkPad P72, Celsius H980 and the Precision 7720 on hand to put the Precision 7730 through its paces.
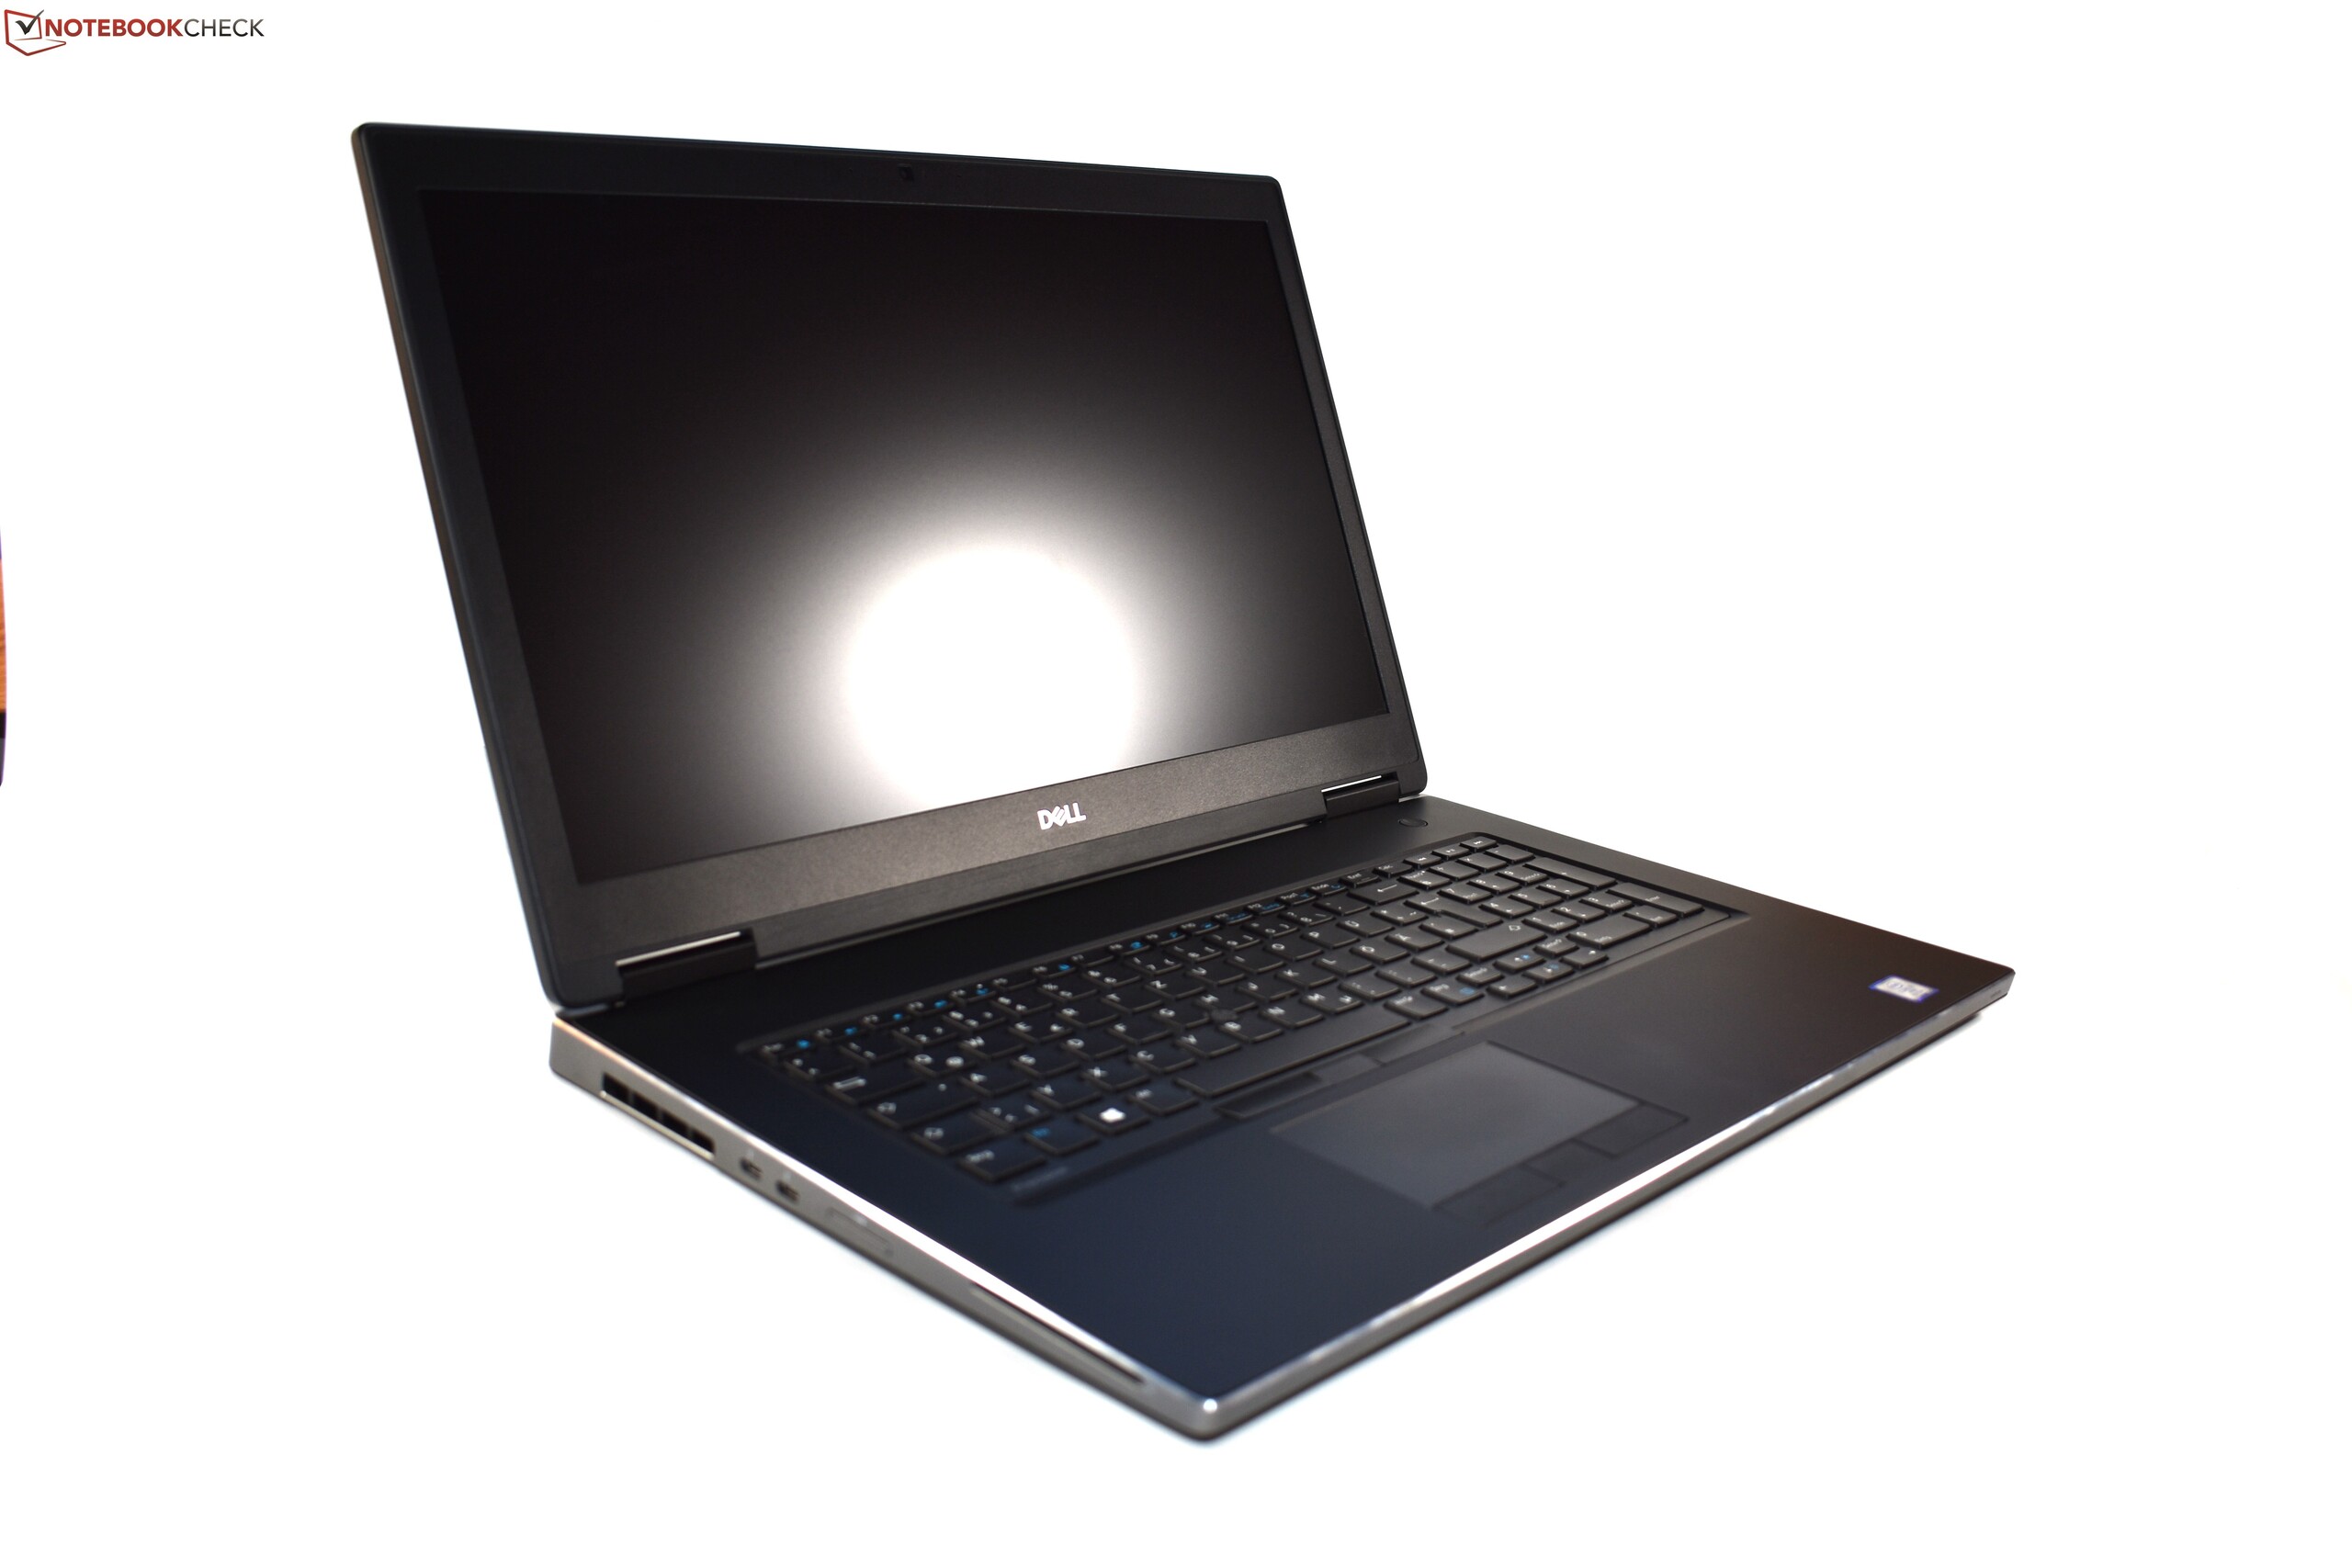
Visually, the Precision 7730 looks almost identical to its predecessor. The case is slightly more compact, but it shares its keyboard, trackpad and the arrangement of its ports with the Precision 7720. Hence, we shall not cover these in this review and refer you instead to our Precision 7720 review. You can also find additional opinions about the series in our Precision 7710 review.
We should also point out that our review unit is the midrange model, rather than the flagship version of the Precision 7720 that we tested last year. Our Precision 7730 review unit comes with an Intel Core i7-8850H processor, an Nvidia Quadro P3200 GPU, a 1080p display, 16 GB of RAM, and a 512 GB SSD. This configuration currently costs about 2,700 Euros (~$3,019), for reference.
Changes & differences between generations
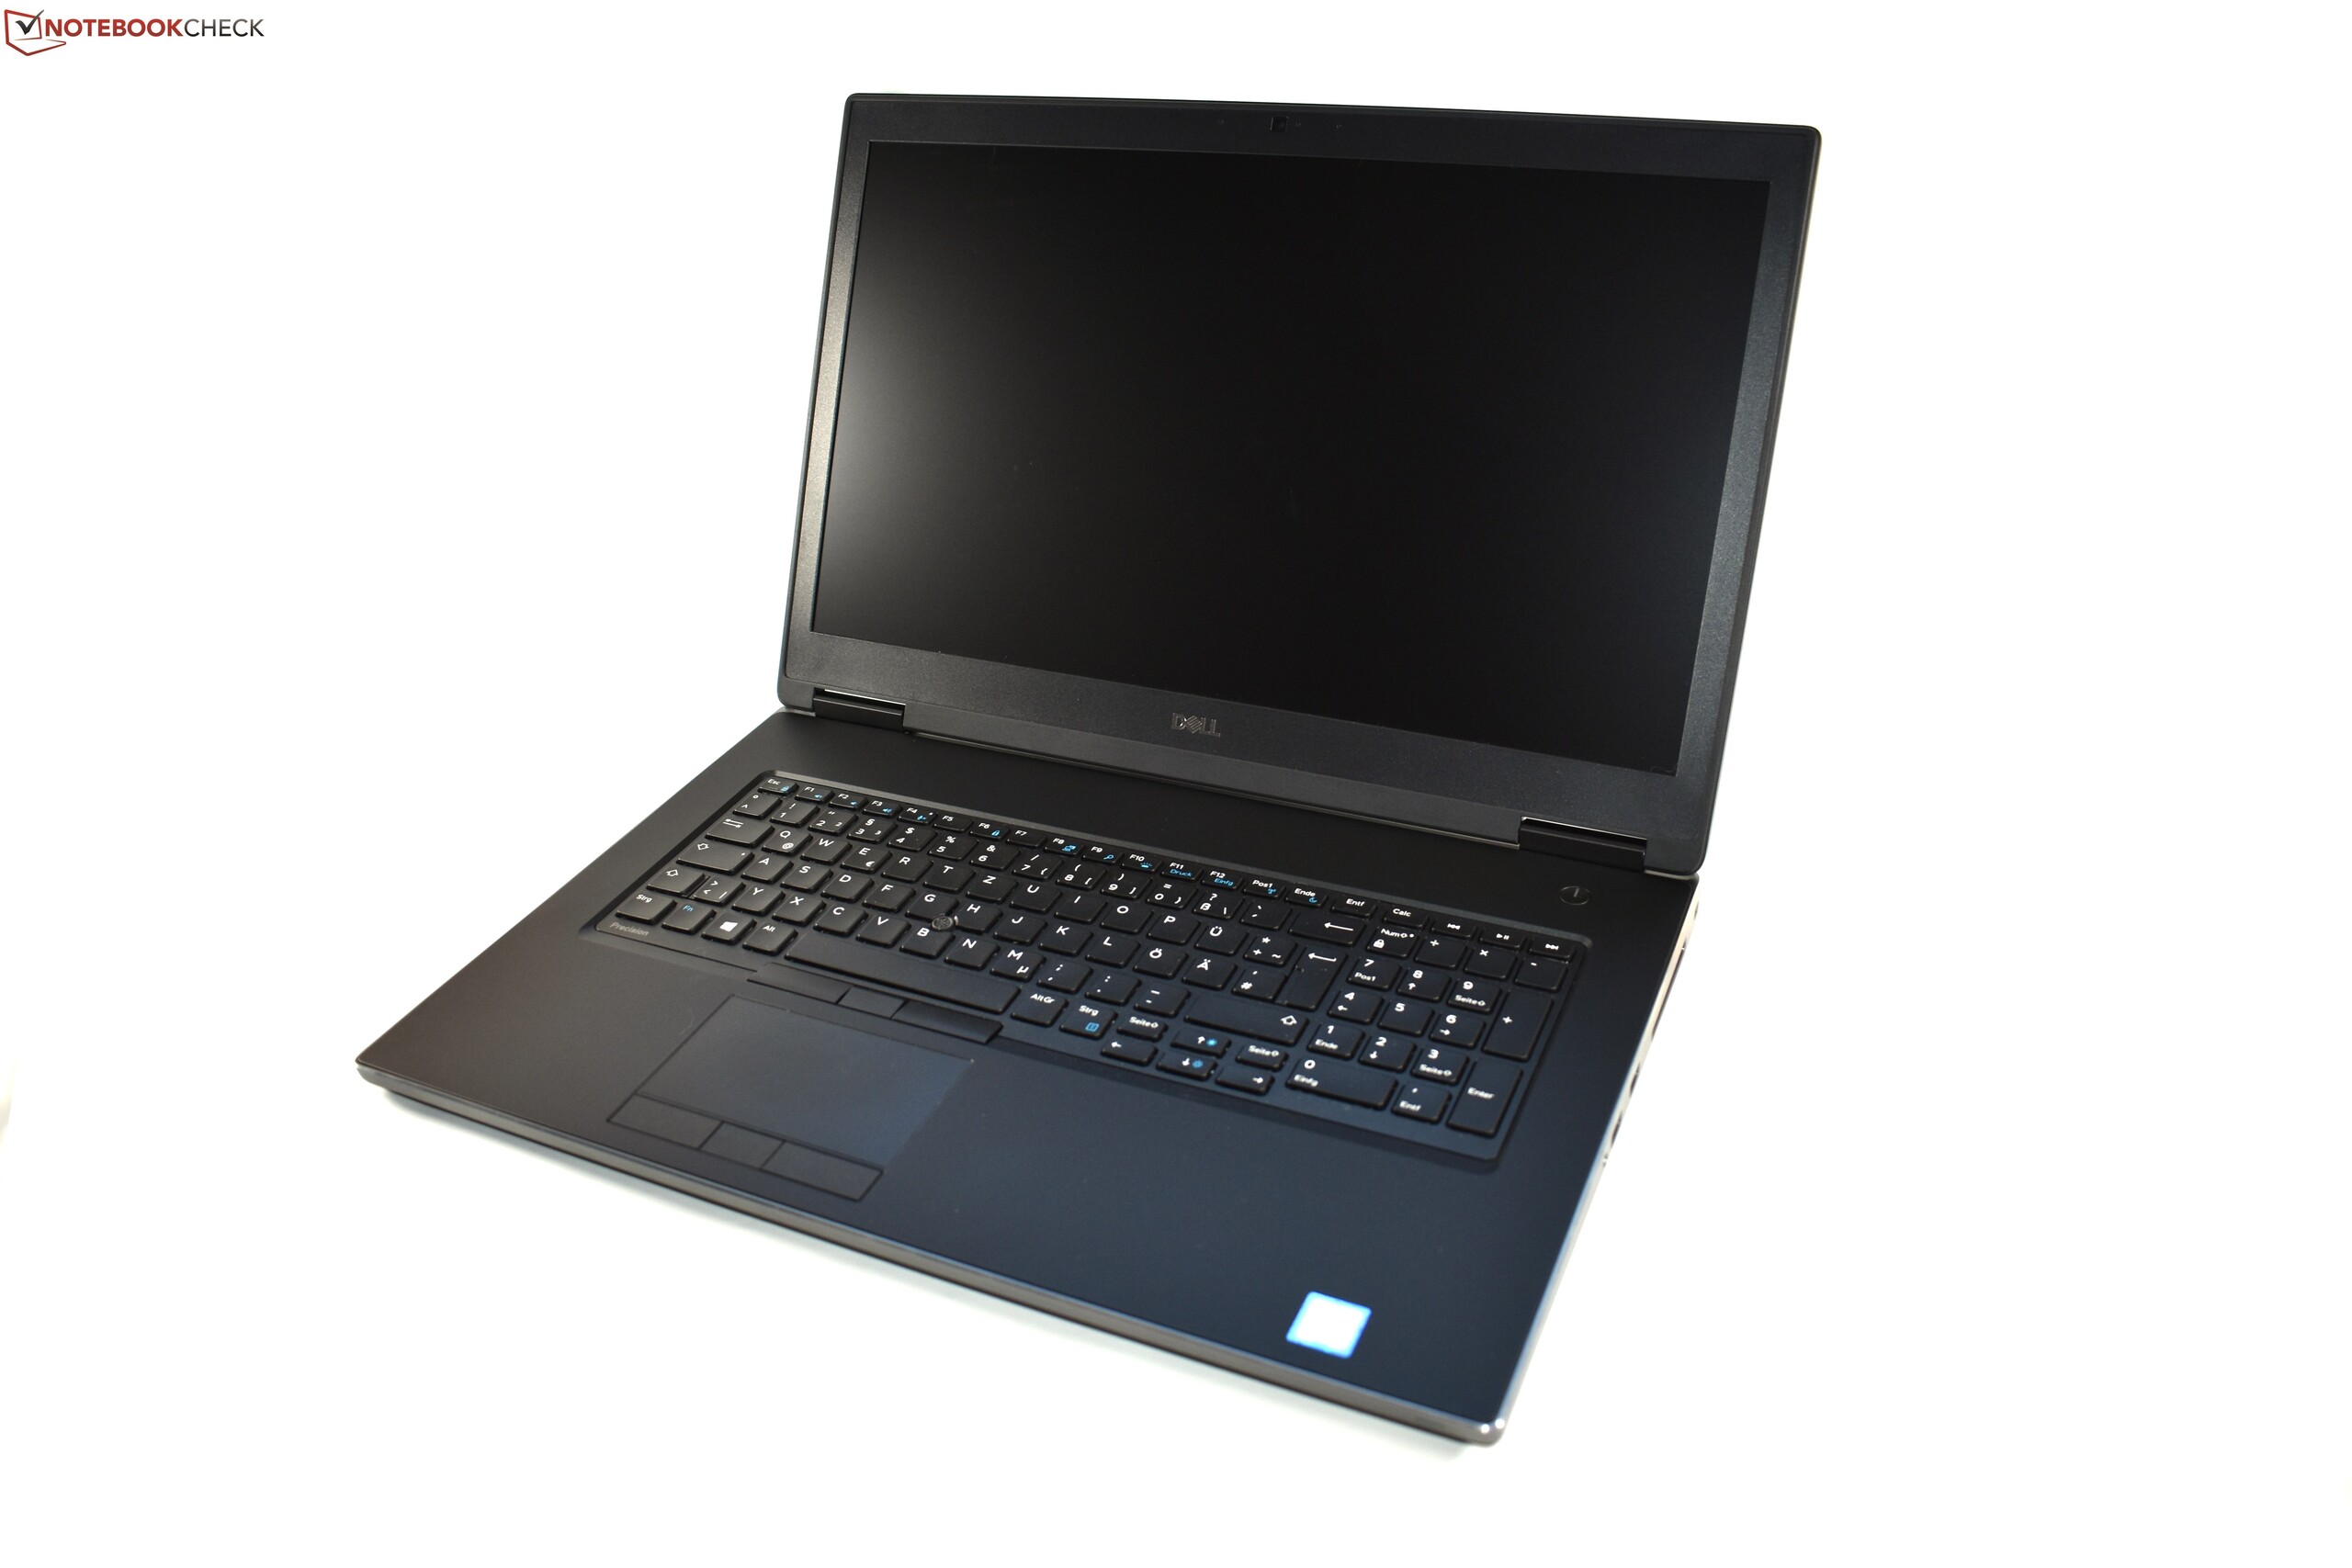
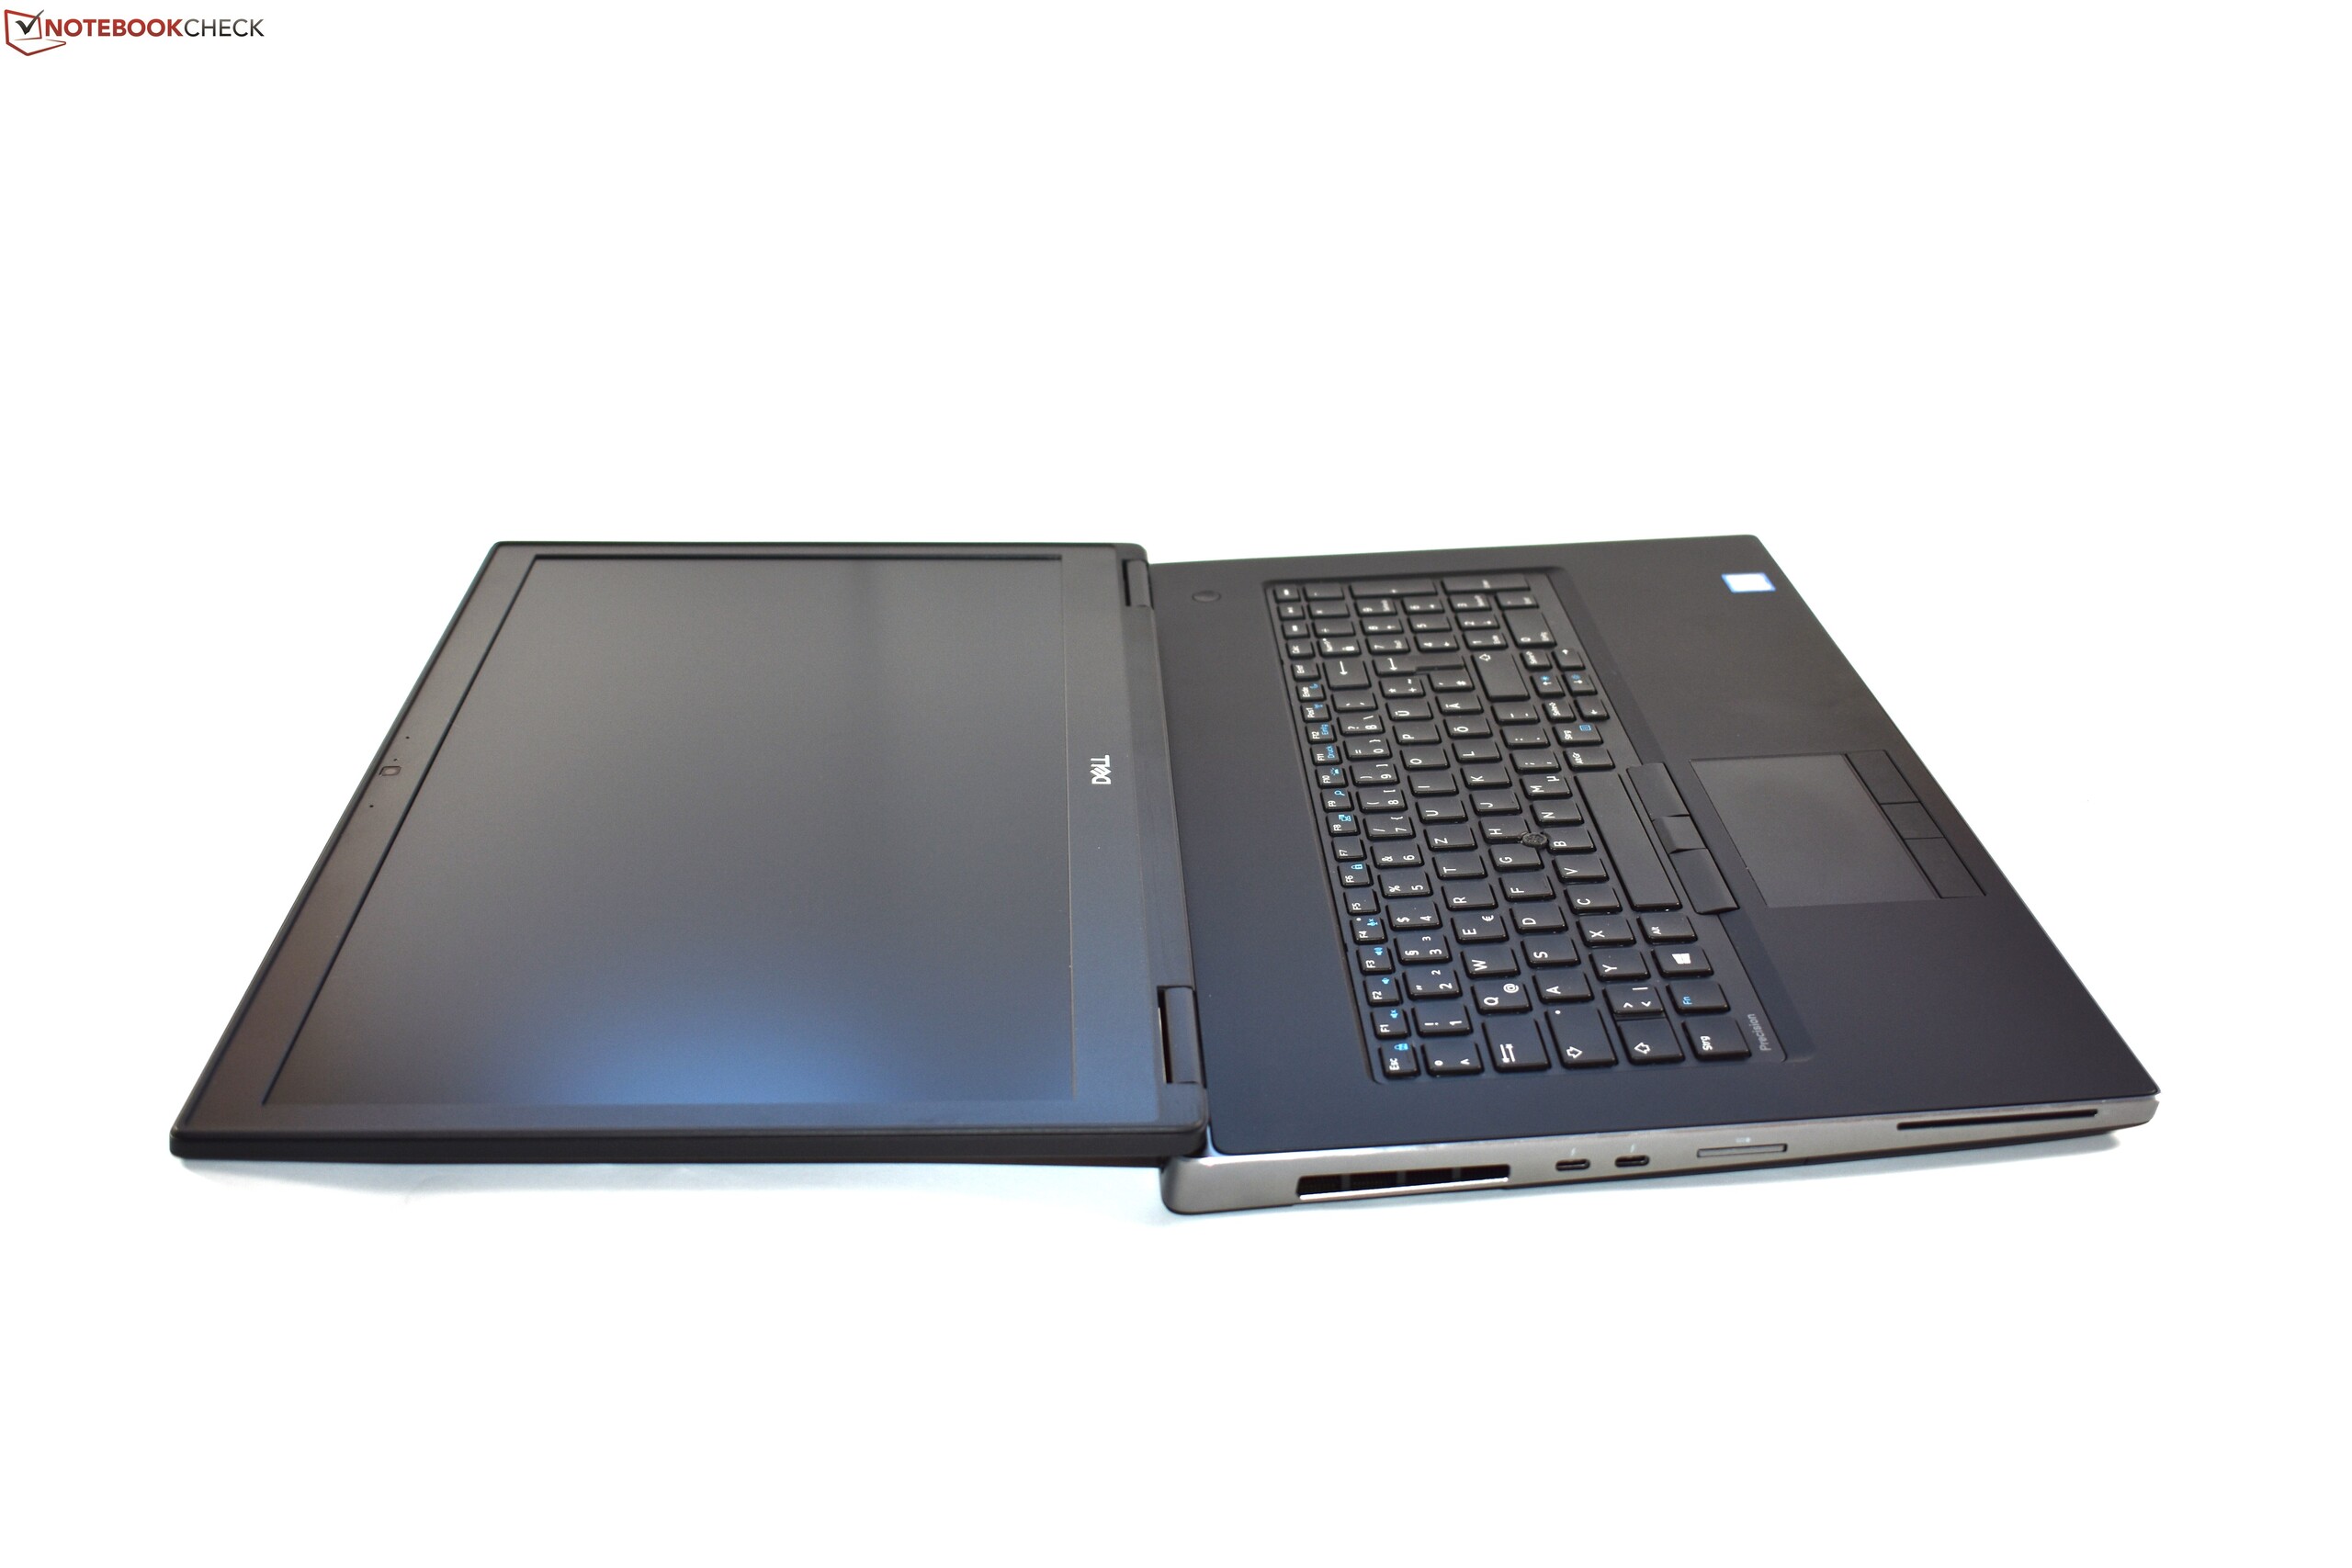
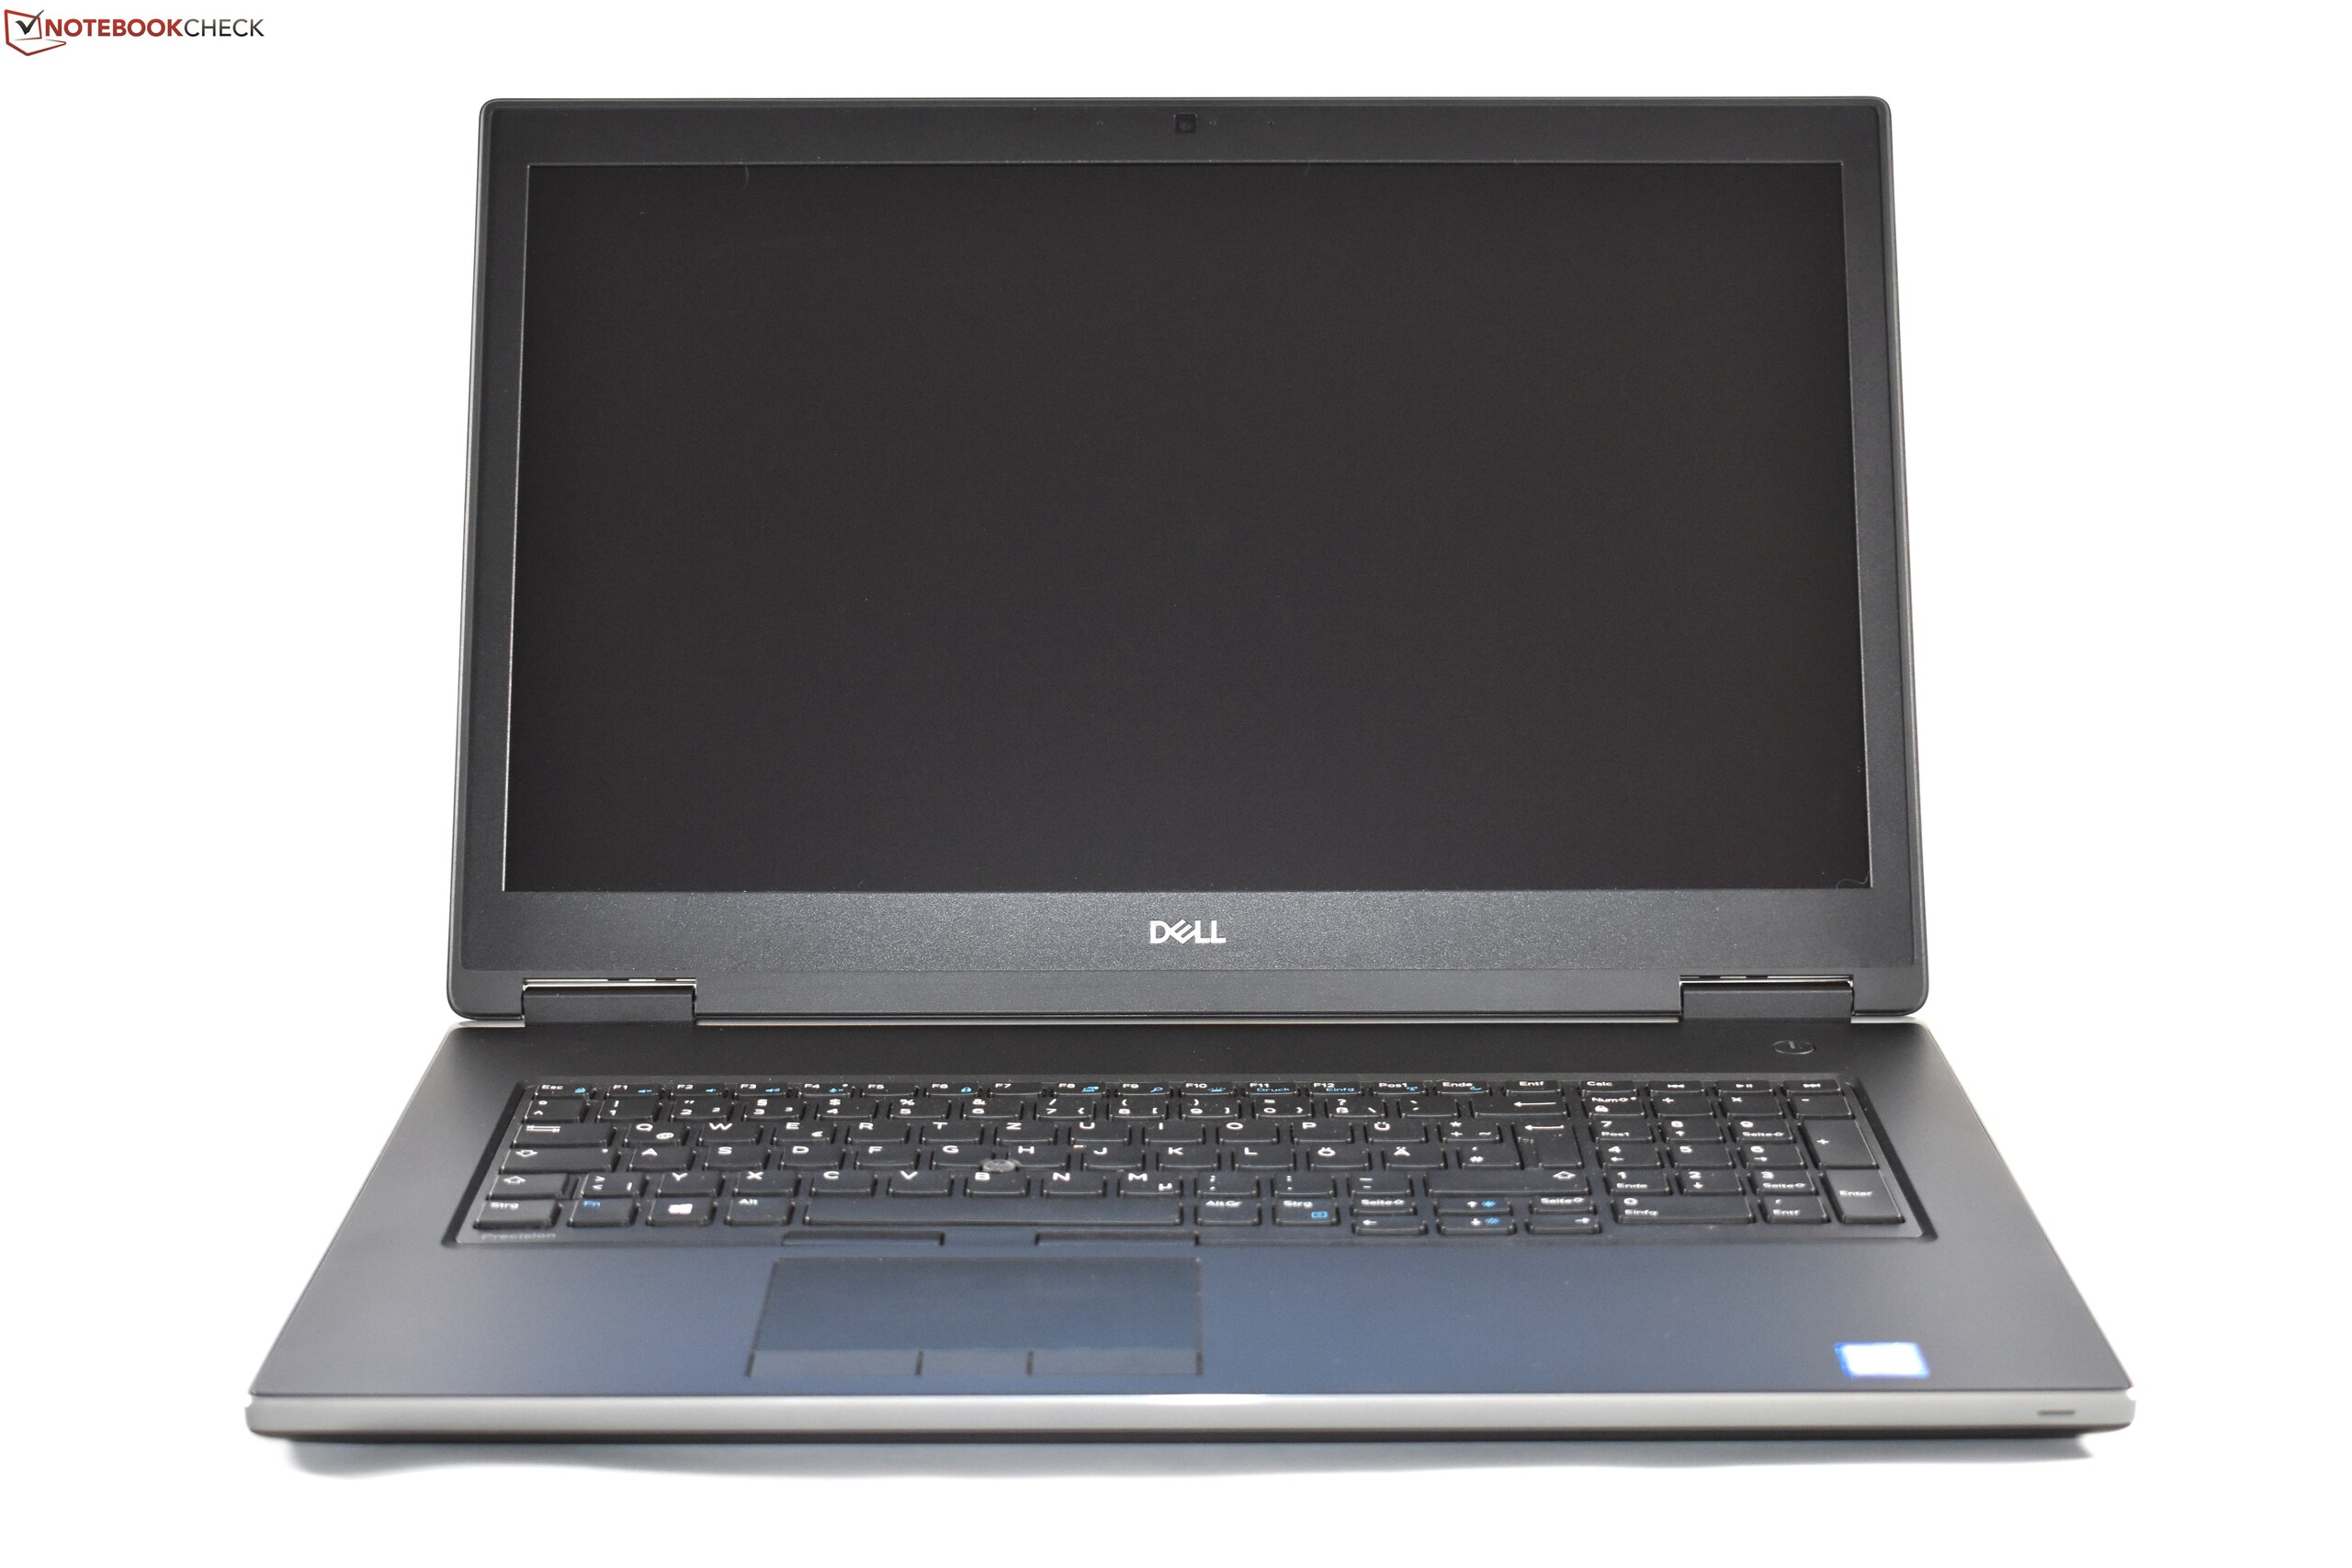
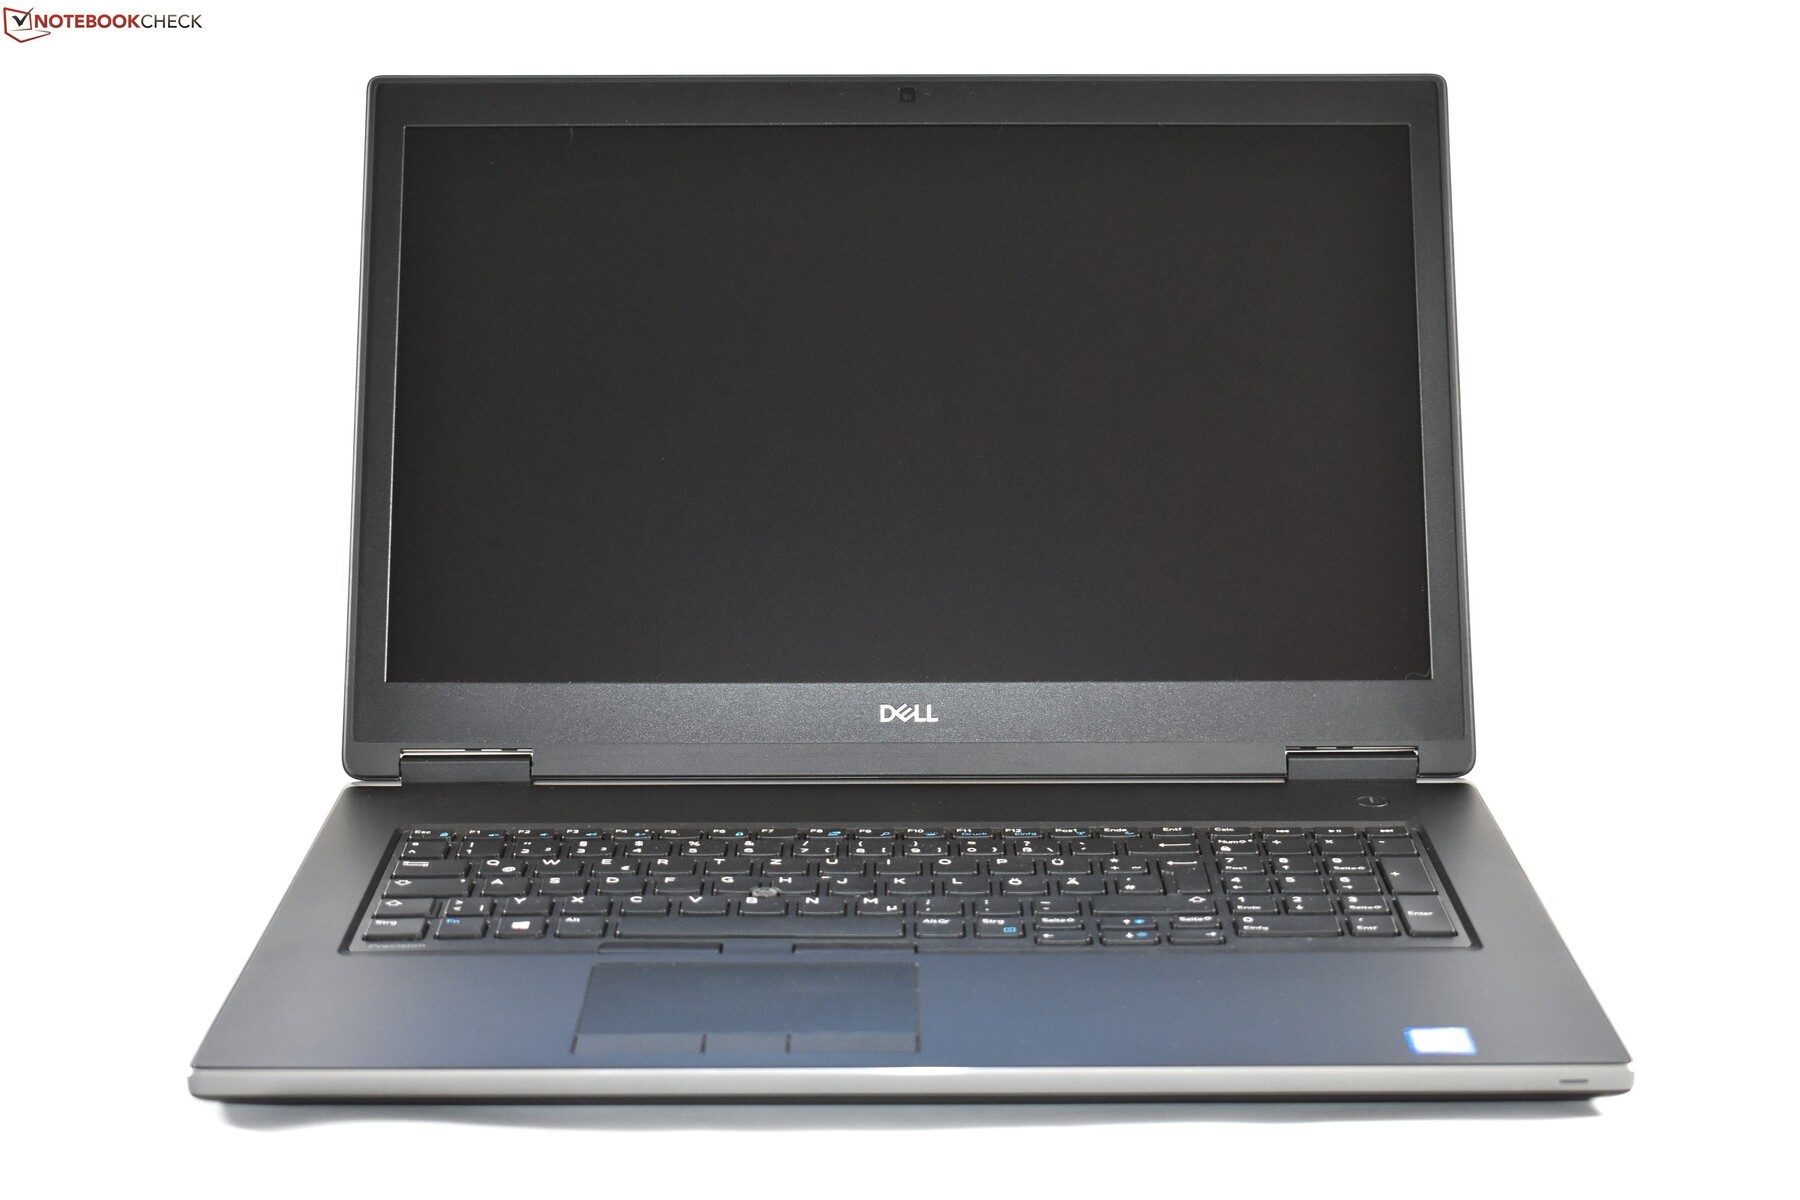
Although the Precision 7730 continues to look very much like its predecessor, Dell has given its 17.3-inch mobile workstation a redesign. Strikingly, the Precision 7730 has much narrower display bezels than the Precision 7720, while Dell has brought the keyboard and trackpad forward, leaving a greater gap to the display.
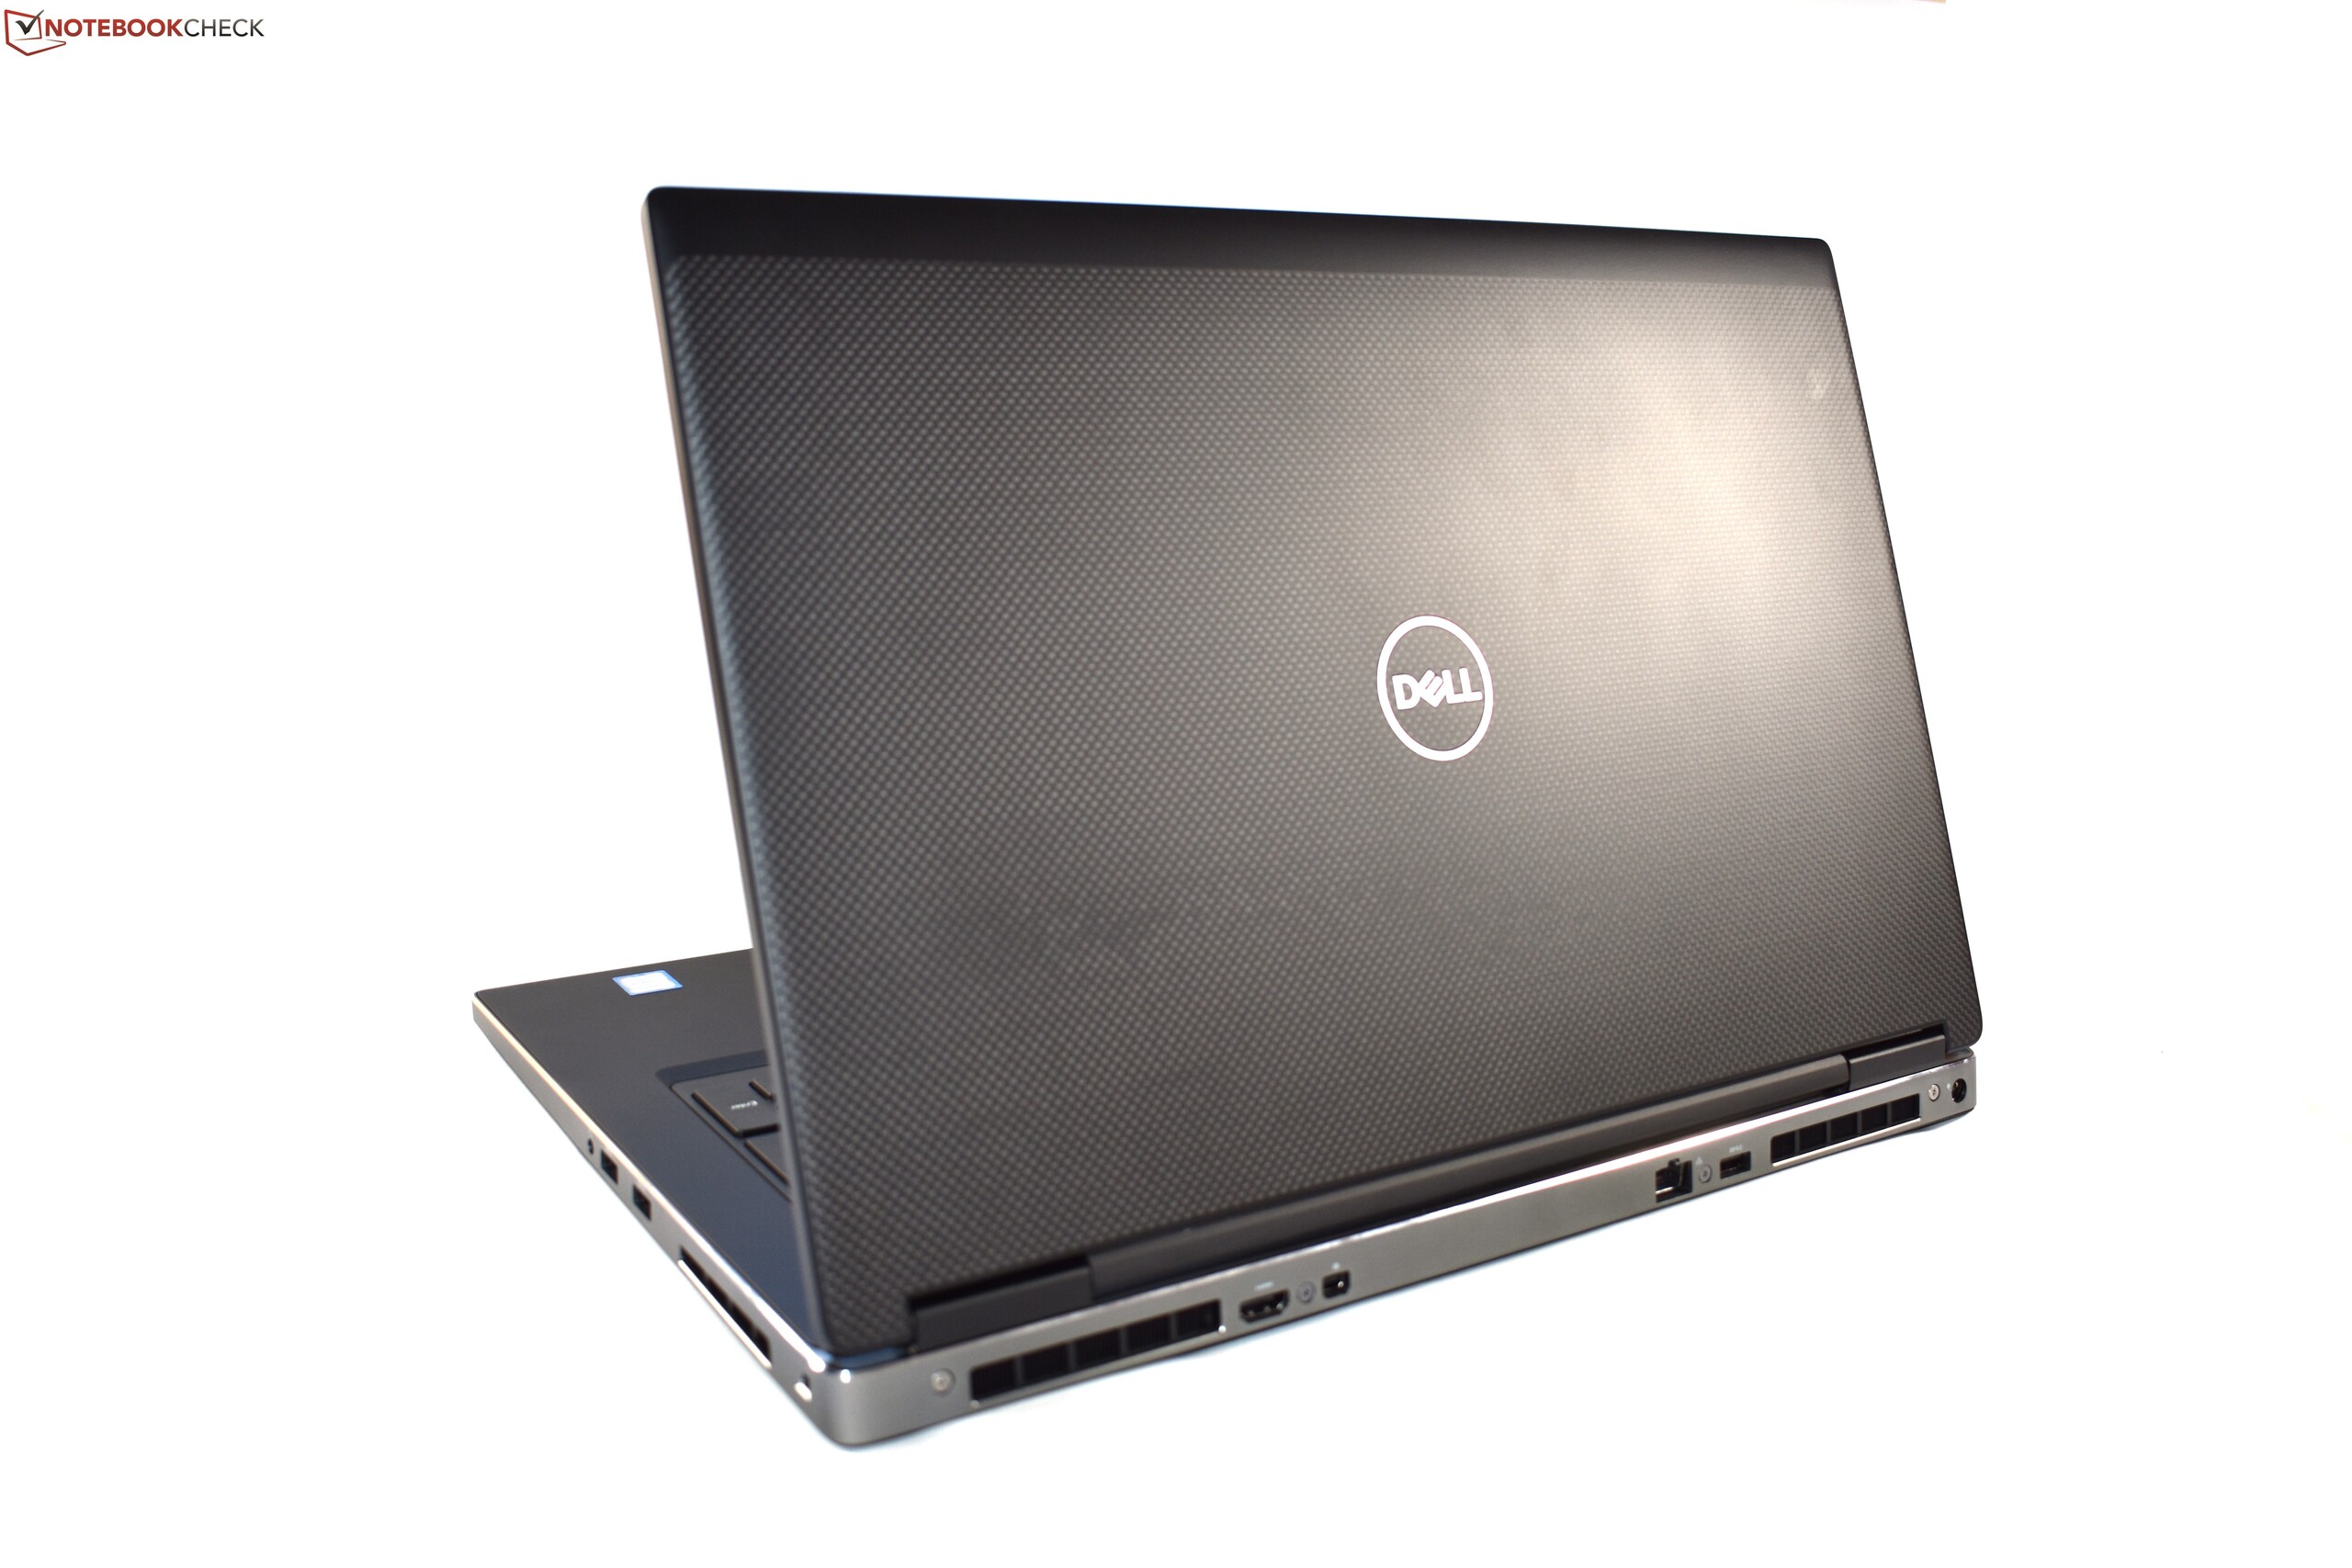
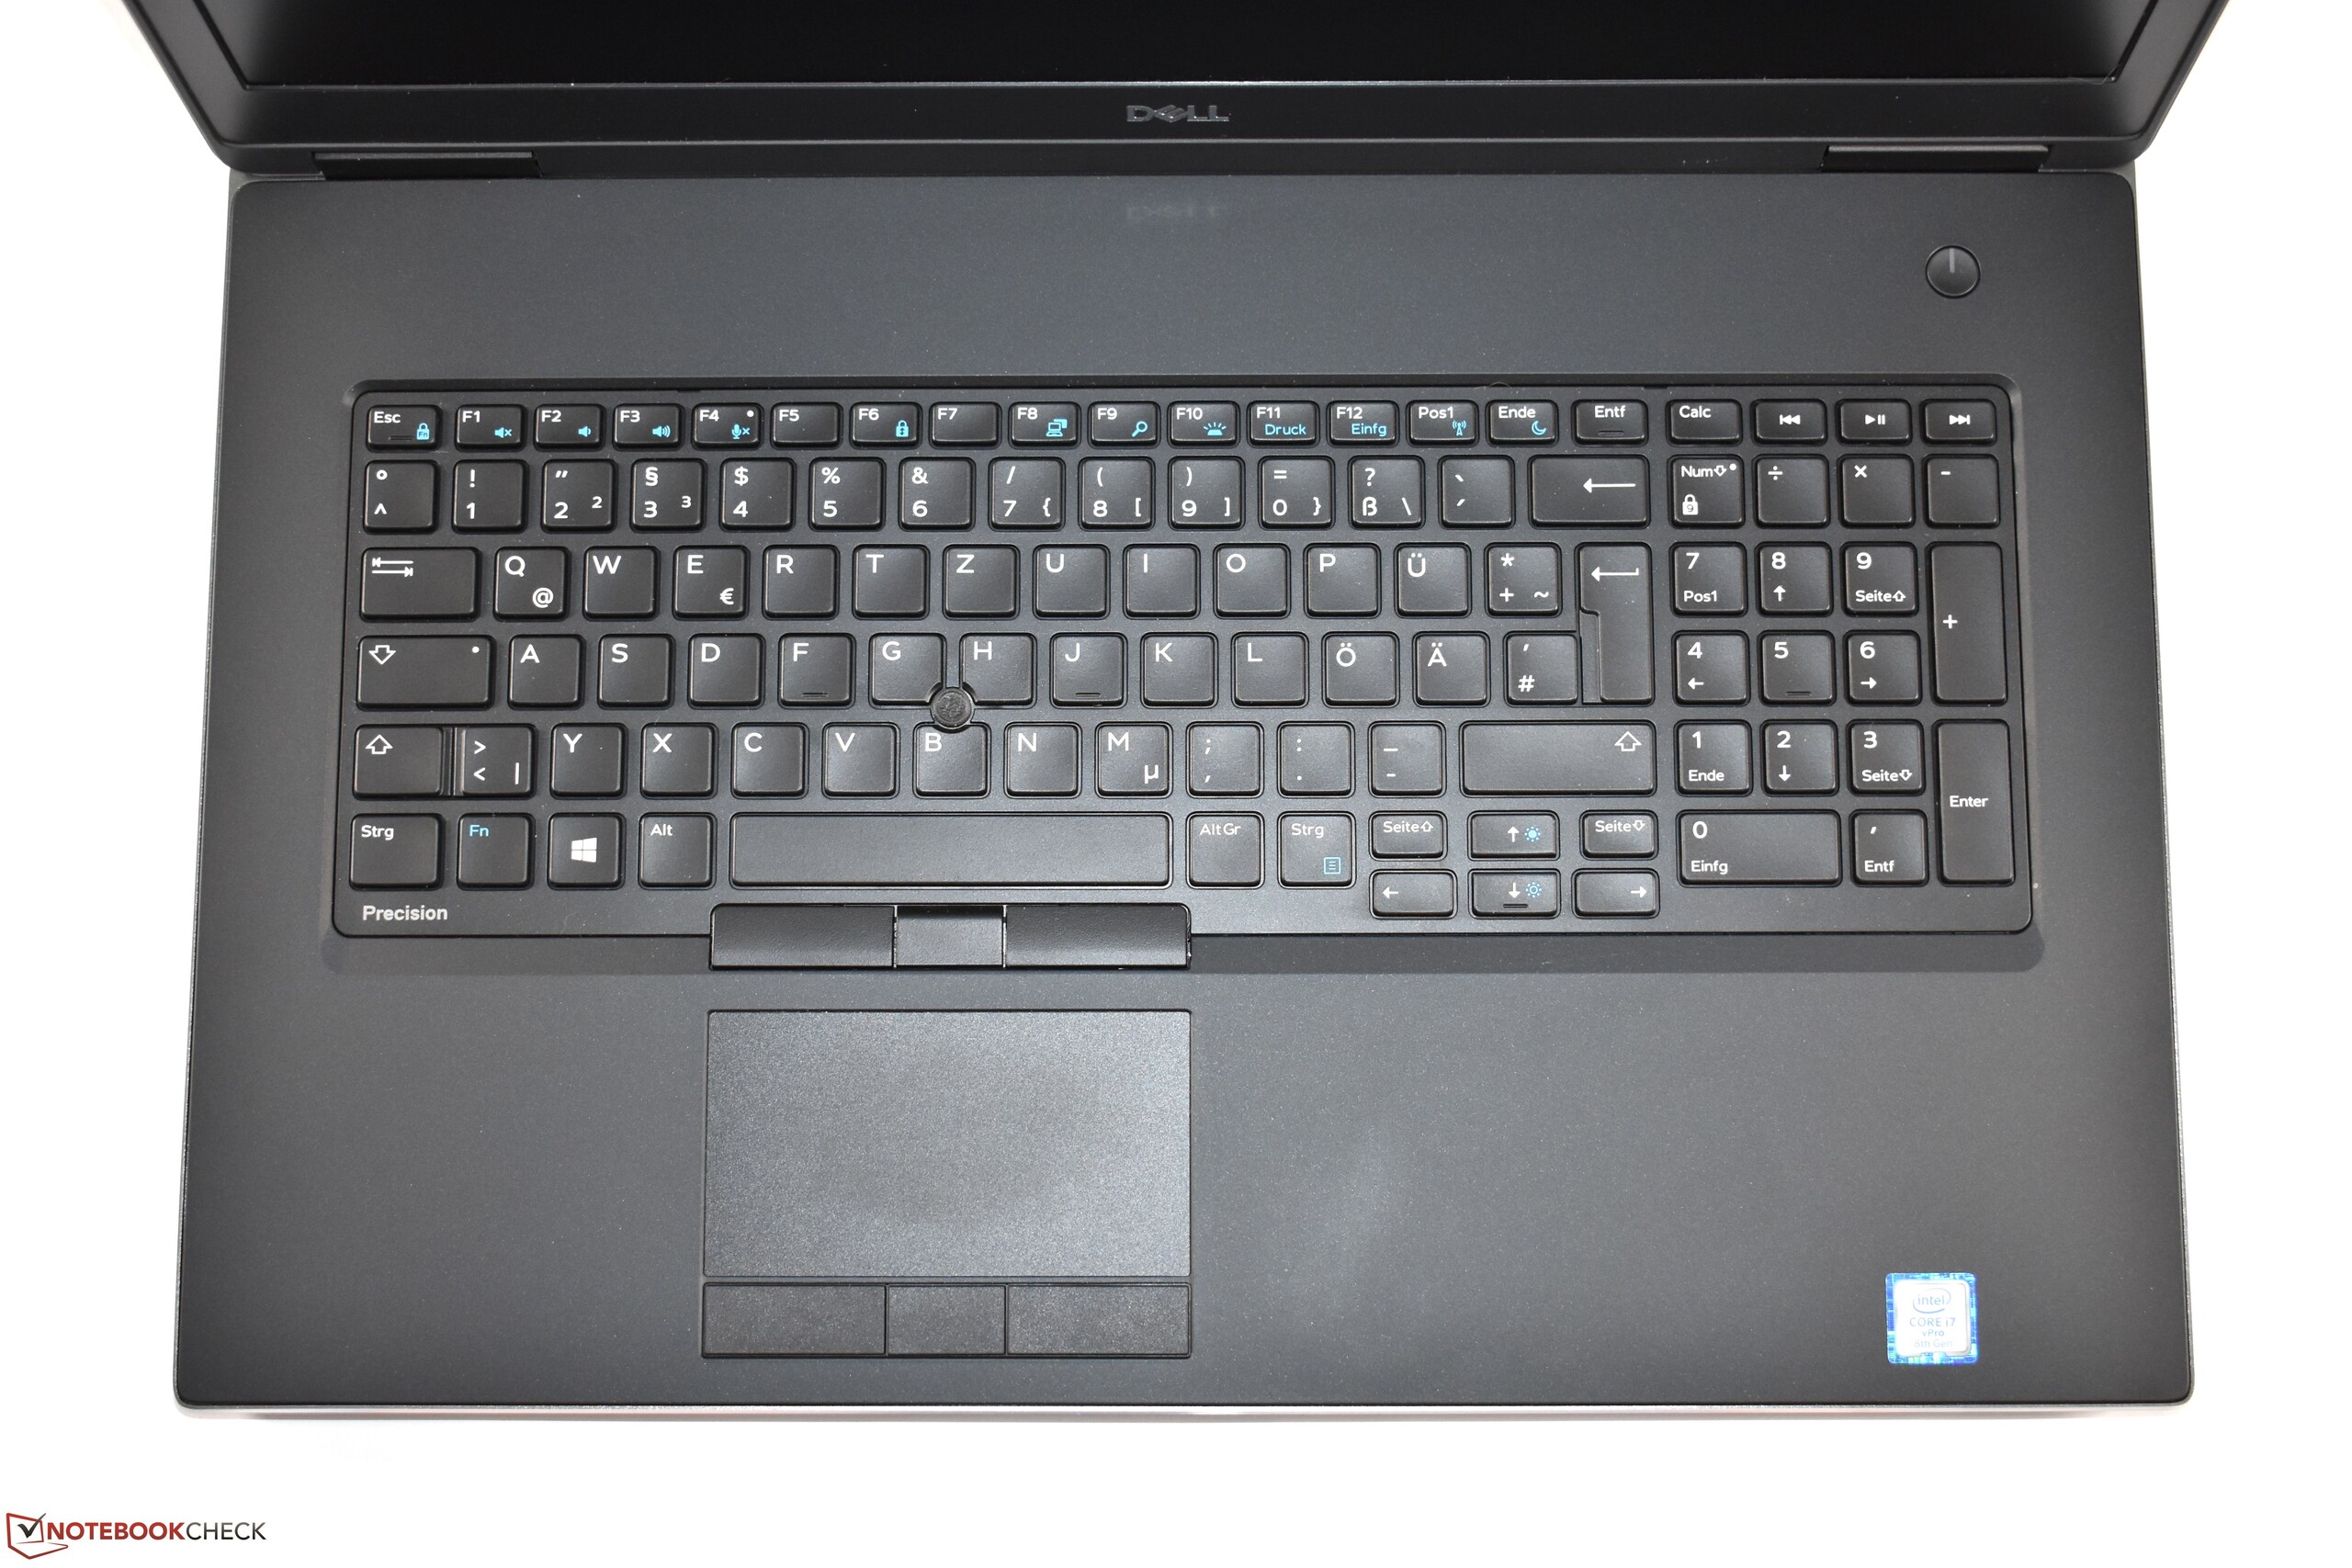
The keyboard has not changed much except for a few key assignments. Dell has not changed the overall design either, with the palm rest and display cover retaining the textured finish that its predecessors had. Moreover, the sides of the device are still aluminium too. Most of the case is actually made from a magnesium alloy, although the display cover has a carbon-fibre finish.
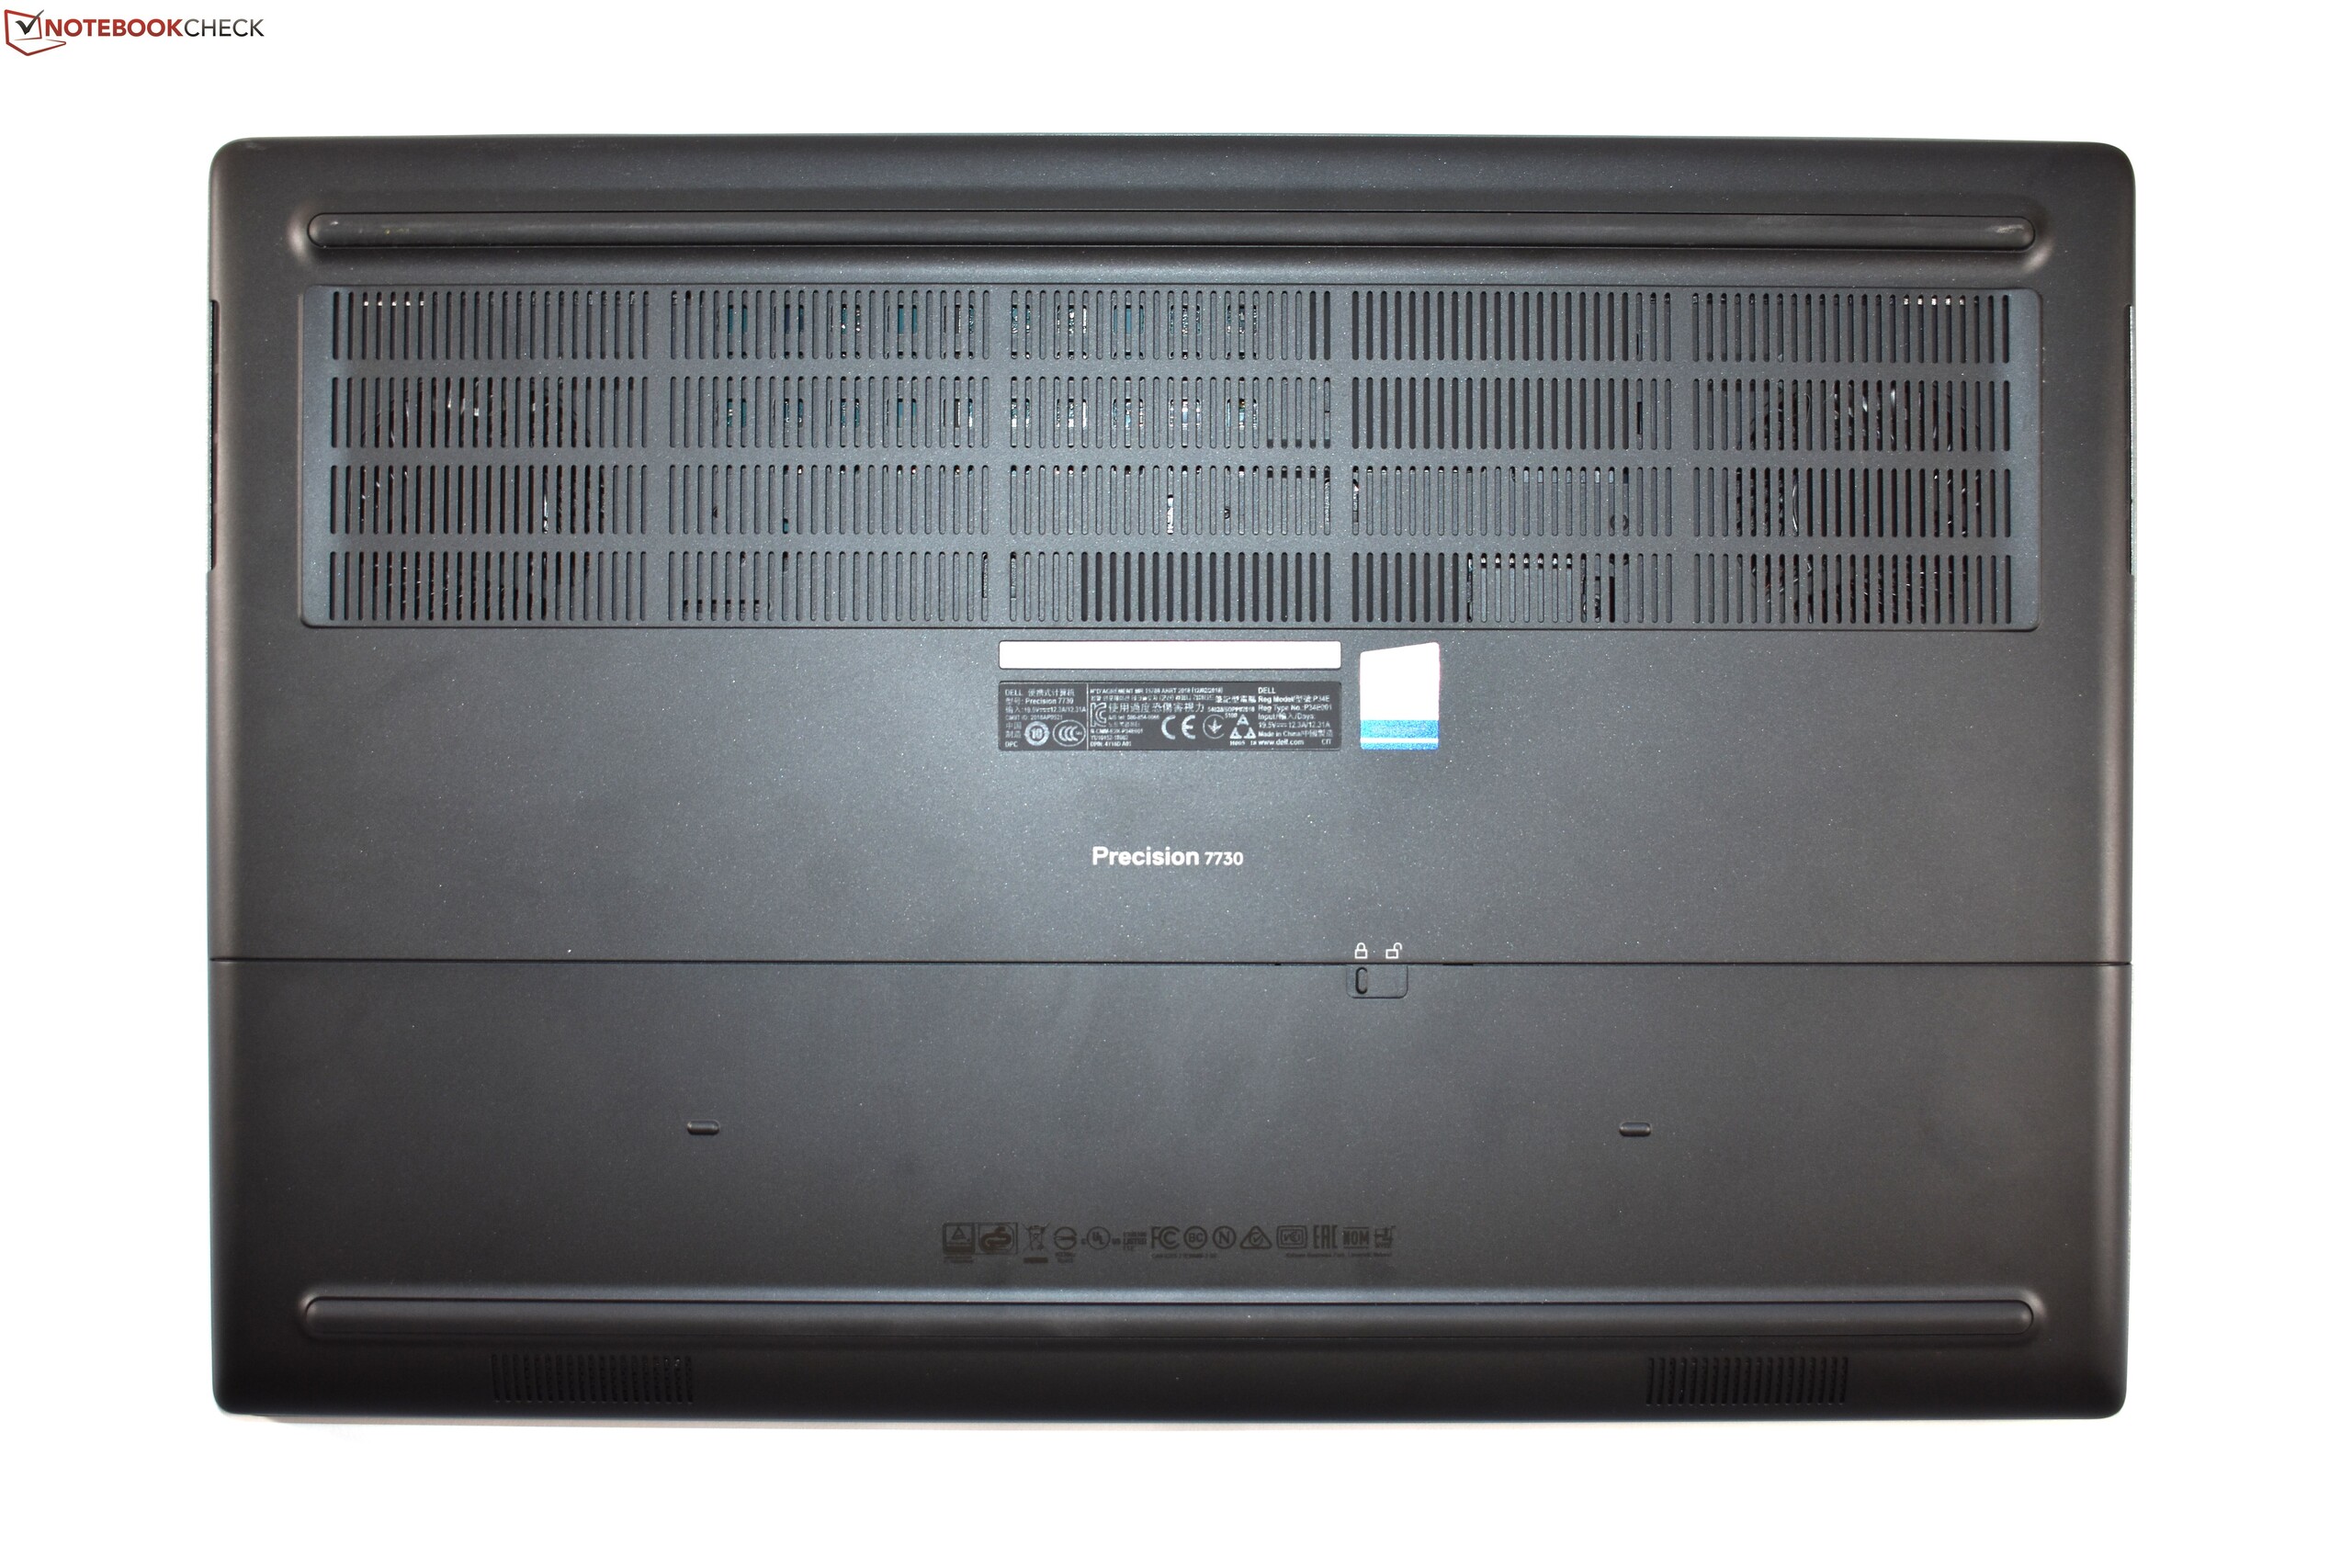
Dell has paid close attention to making the device more mobile, having shaved off around 300 g and reduced the case thickness by 5 mm. The Precision 7730 is slightly shorter and narrower than its predecessor too. Our review unit is about as thick as the Celsius H980 and ThinkPad P72, but both are marginally heavier than the Precision 7730. Likewise, both are ever so slightly longer and wider than the Dell laptop. Overall, the Precision 7730 has a smaller footprint than all our comparison devices, but not drastically so.
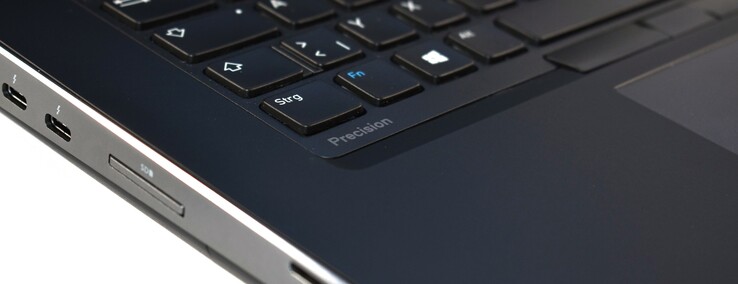
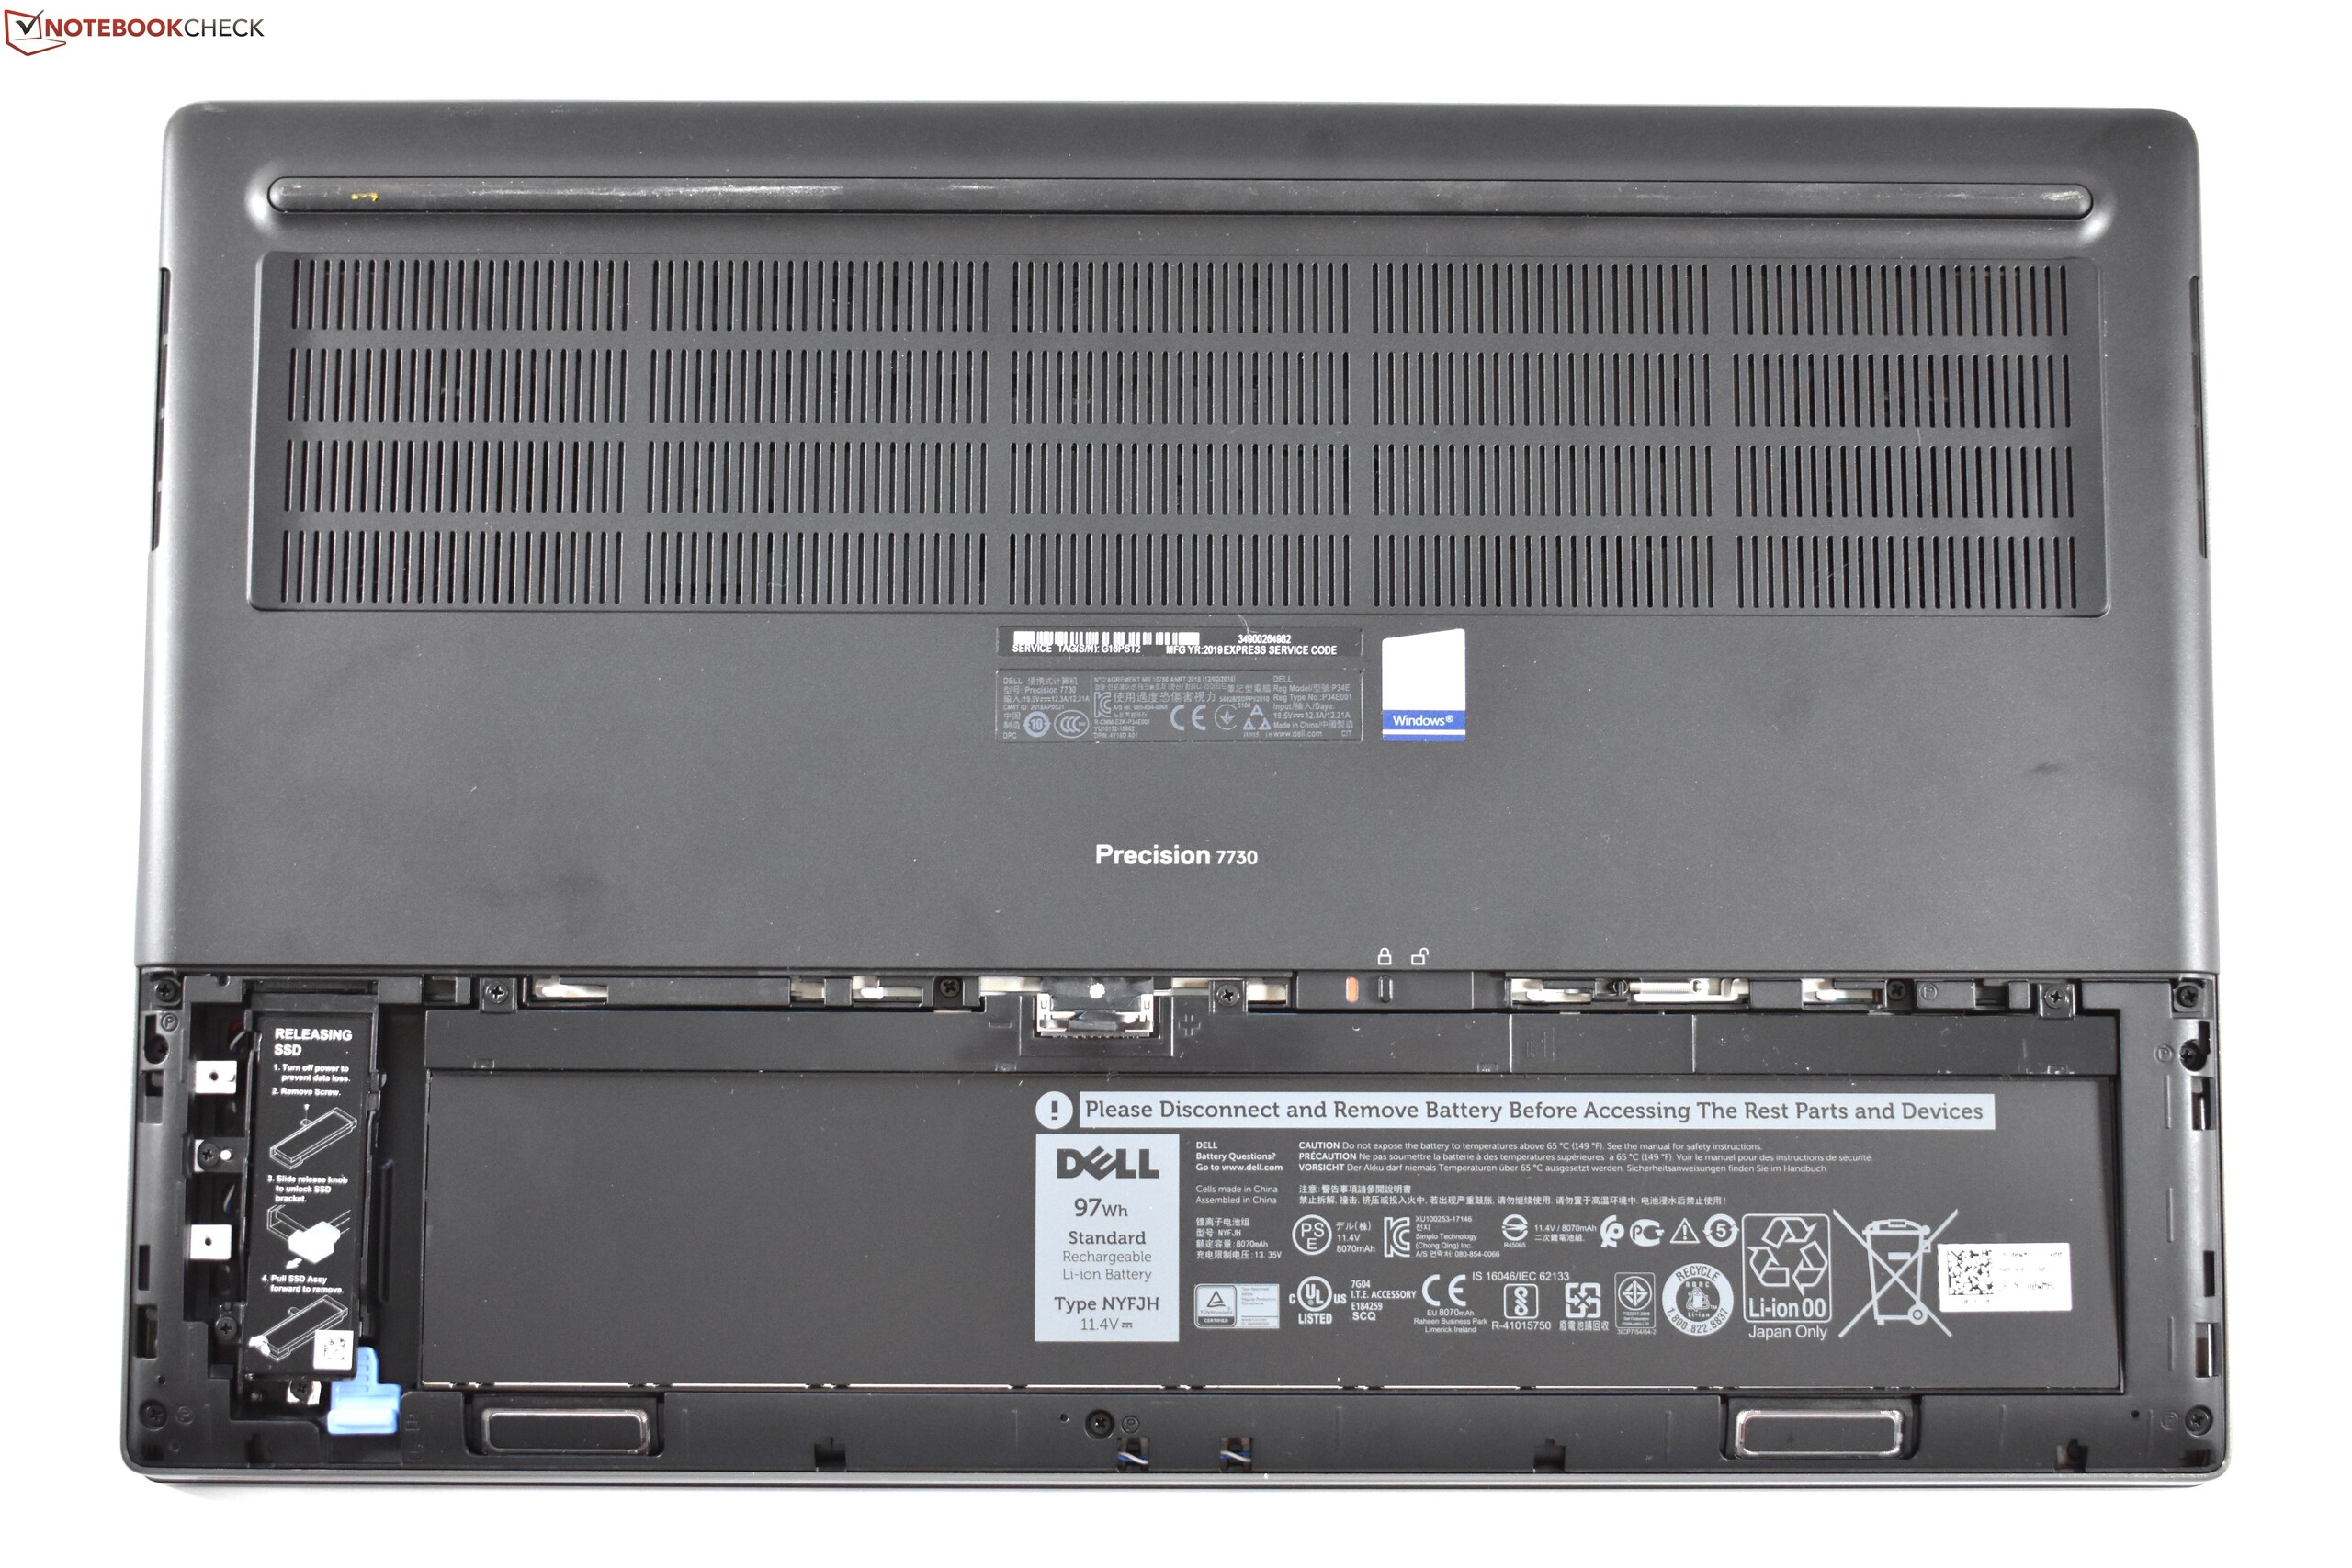
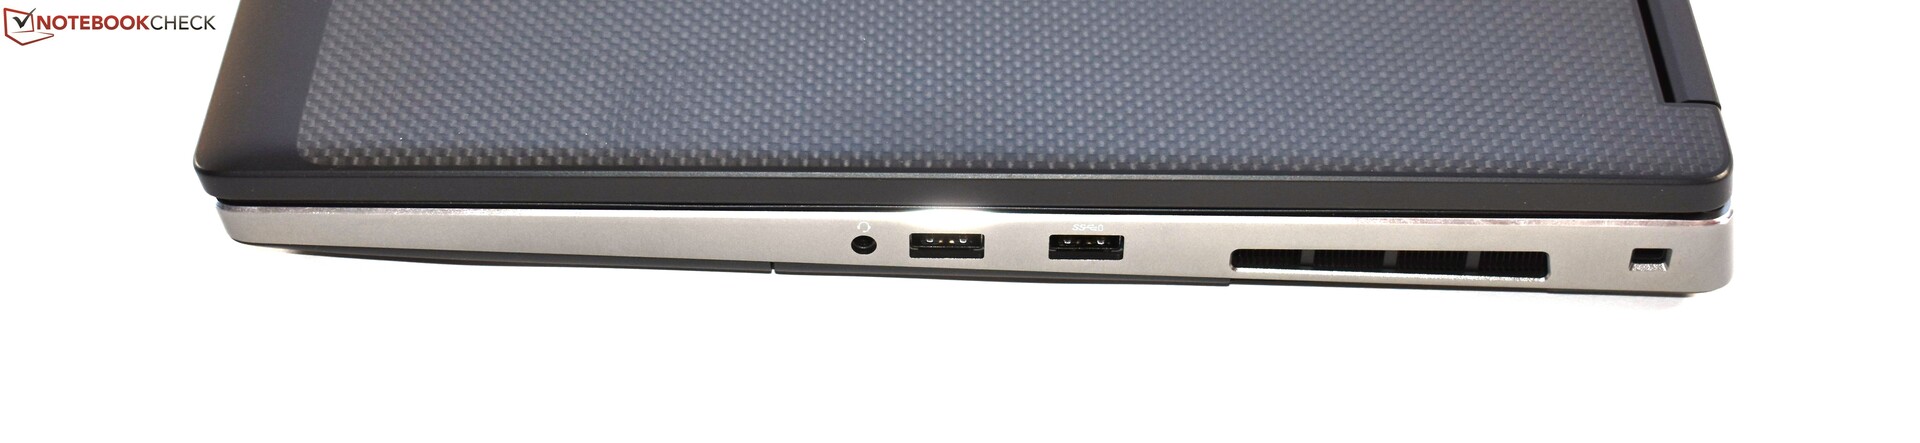
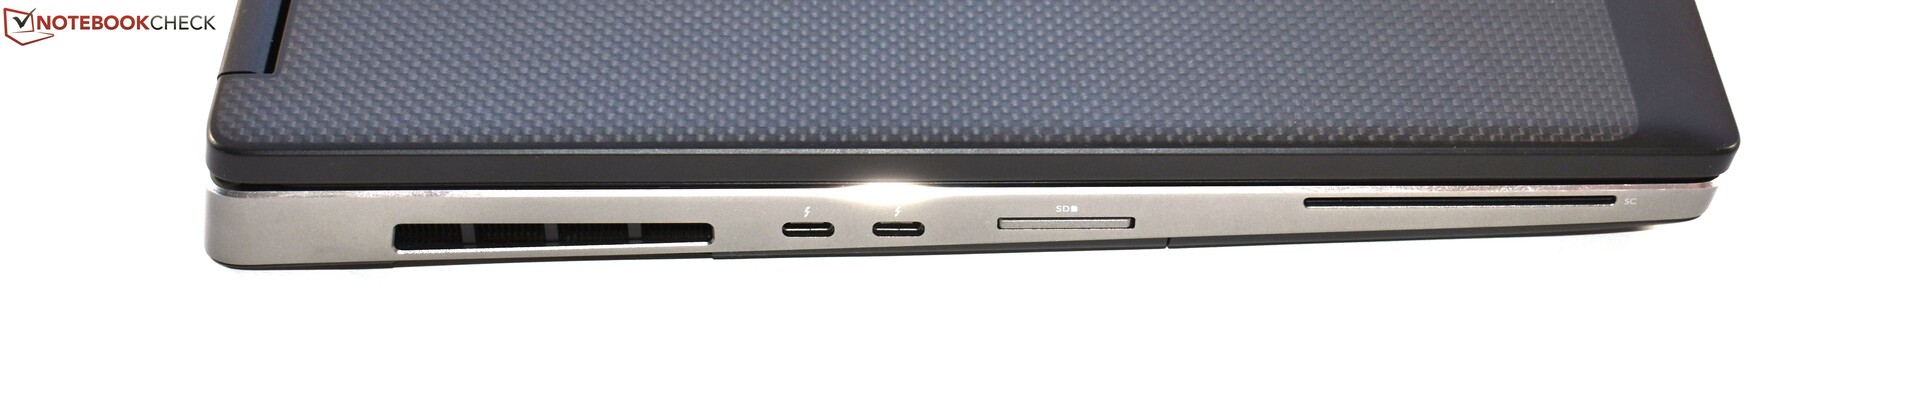
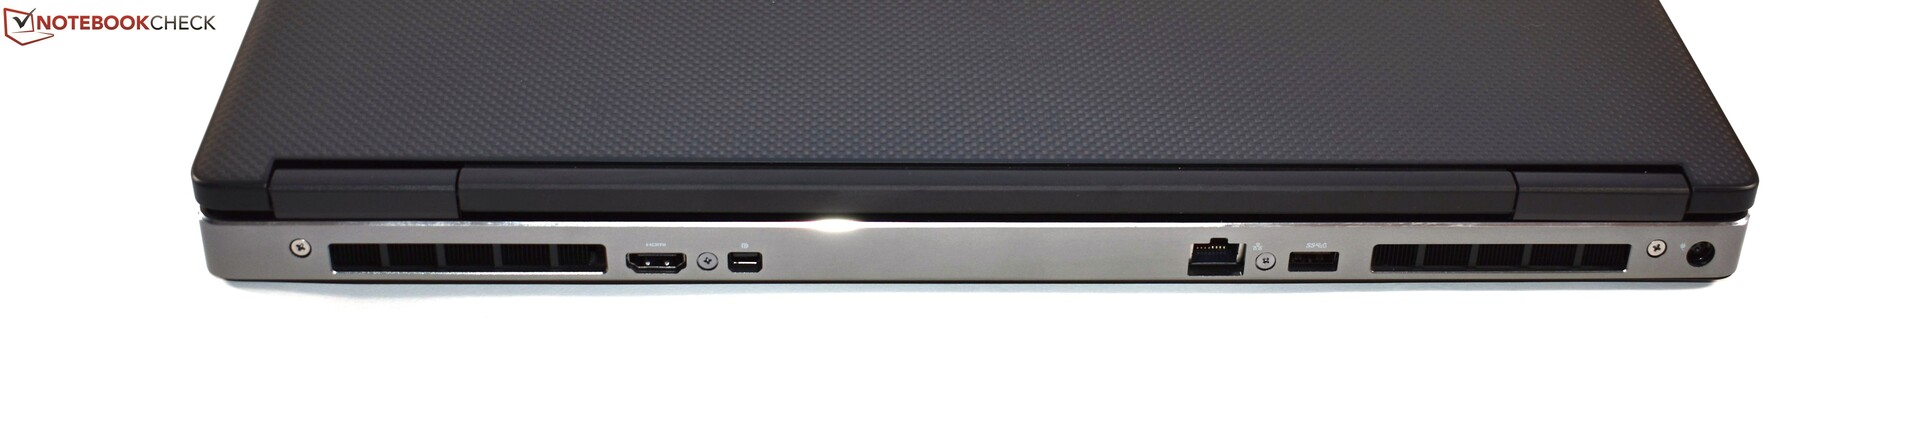
Dell has also repositioned most ports, with most now sitting on the back of the case rather on the left or right-hand sides. The Precision 7730 retains all the ports that its predecessor has but has gained a second Thunderbolt 3 port too. You cannot tell from our photos, but the device still has a proprietary docking port on its bottom case, which eliminates the need for a Thunderbolt 3 dock.
Connectivity
| SD Card Reader | |
| average JPG Copy Test (av. of 3 runs) | |
| Dell Precision 7730 (Toshiba Exceria Pro SDXC 64 GB UHS-II) | |
| Lenovo ThinkPad P72-20MB000EGE (Toshiba Exceria Pro SDXC 64 GB UHS-II) | |
| Fujitsu Celsius H980 (Toshiba Exceria Pro SDXC 64 GB UHS-II) | |
| Average of class Workstation (49.6 - 681, n=14, last 2 years) | |
| maximum AS SSD Seq Read Test (1GB) | |
| Average of class Workstation (87.6 - 1455, n=14, last 2 years) | |
| Dell Precision 7730 (Toshiba Exceria Pro SDXC 64 GB UHS-II) | |
| Lenovo ThinkPad P72-20MB000EGE (Toshiba Exceria Pro SDXC 64 GB UHS-II) | |
| Fujitsu Celsius H980 (Toshiba Exceria Pro SDXC 64 GB UHS-II) | |
| Networking | |
| iperf3 transmit AX12 | |
| Dell Precision 7730 | |
| Fujitsu Celsius H980 | |
| Lenovo ThinkPad P72-20MB000EGE | |
| Dell Precision 7720 | |
| iperf3 receive AX12 | |
| Fujitsu Celsius H980 | |
| Lenovo ThinkPad P72-20MB000EGE | |
| Dell Precision 7720 | |
| Dell Precision 7730 | |
Display
Dell currently offers three display options for the Precision 7730. The cheapest display is the HD+ (1600x900) TN panel, but we would recommend avoiding this if possible. The display has poor viewing angles and awful colour reproduction so we cannot understand why Dell offers such a bad option on a workstation. In our opinion, the Full HD IPS panel should be the base option, especially considering how expensive the Precision 7730 is. Dell states that the panel should achieve an average maximum brightness of 300 cd/m² and a 72% NTSC colour-space coverage. If these are not high enough measurements for you, then Dell also offers a 4K IPS touchscreen panel that is supposed to reach 400 cd/m² and cover 100% of NTSC. Incidentally, all display options have matte finishes.
Our review unit has the Full HD option, which carries the model number B173HAN01.3. This panel achieved a higher average maximum brightness in our tests, which X-Rite i1Pro 2 recorded at 316 cd/m². This makes it almost as bright as the ThinkPad P72, but 25% dimmer than the Celsius H980. The 4K panel in the Precision 7720 is 40% brighter than the Full HD one in our review unit too.
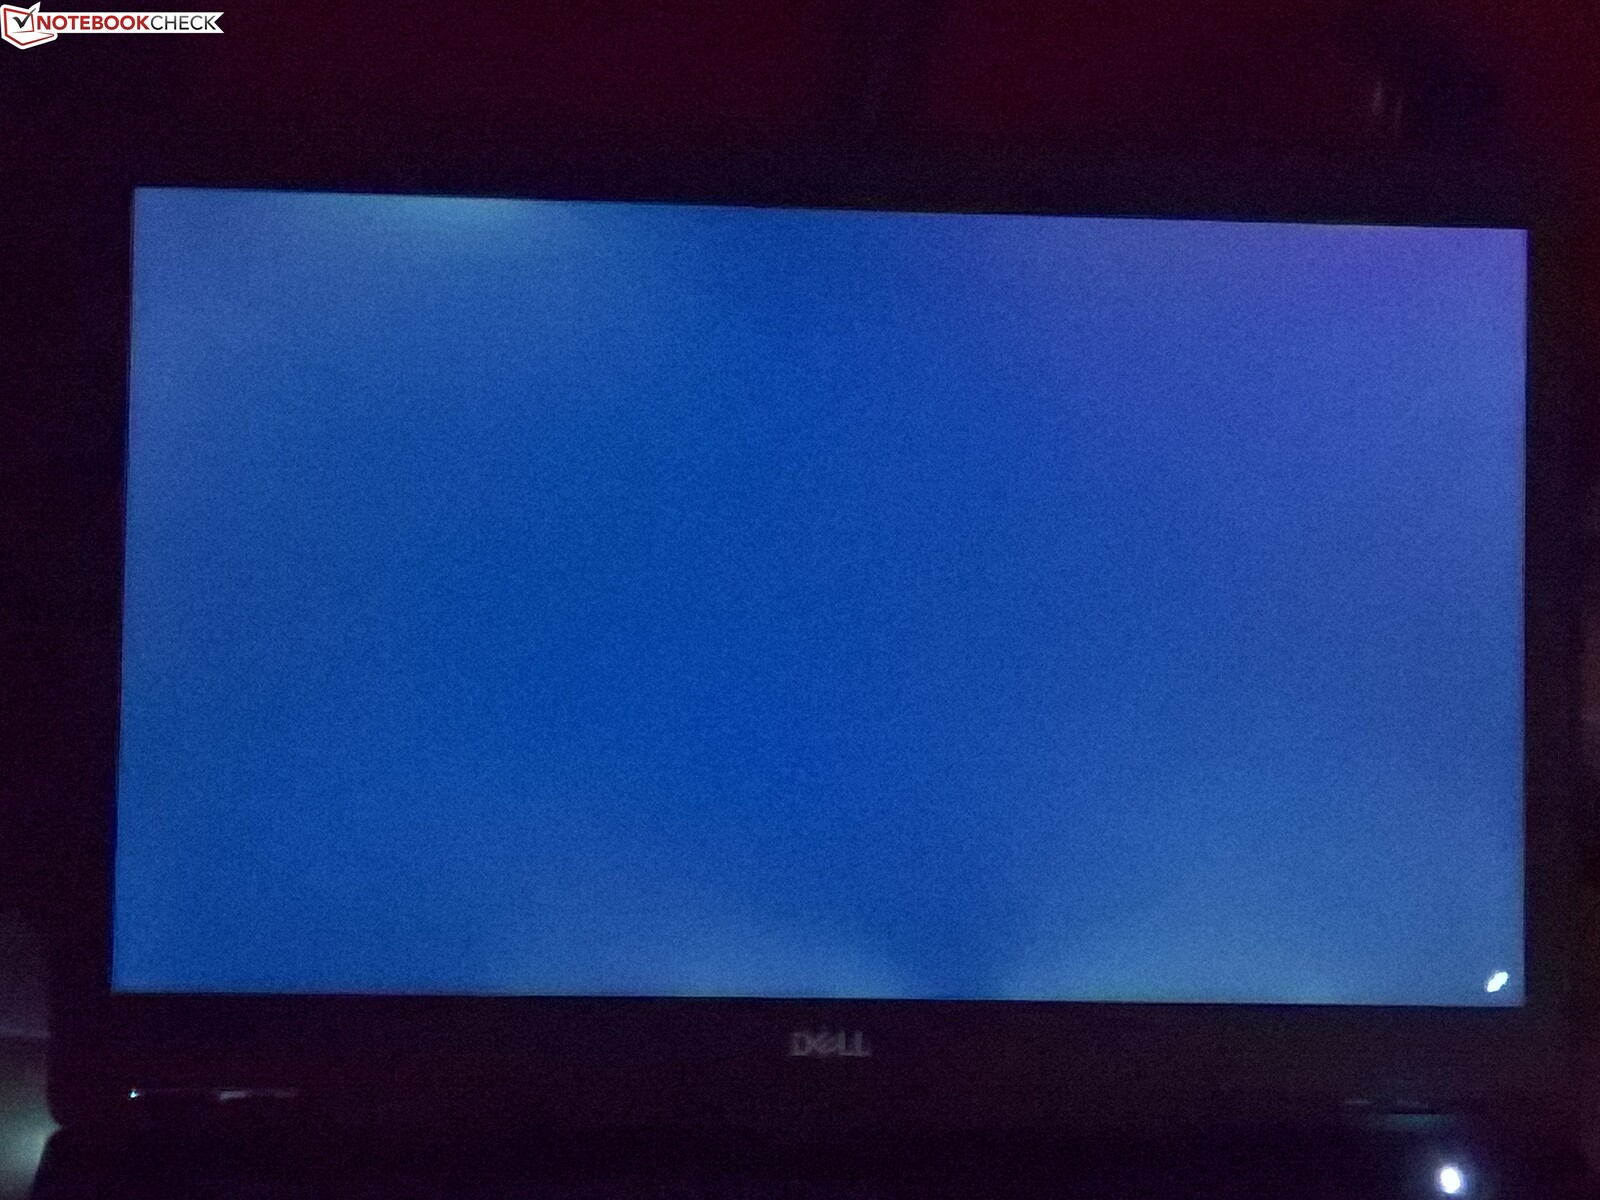
The display does not use pulse-width modulation (PWM) to regulate display brightness, so you should have no issues with looking at the screen for a prolonged period. The brightness distribution is a touch lower at 84% than our comparison devices, but large areas of homogenous colour should still look equally bright across the whole panel. Our review unit does suffer from significant backlight bleeding though, which we found annoying when looking at dark images in poorly lit rooms or when using the device at night.
| |||||||||||||||||||||||||
Brightness Distribution: 84 %
Center on Battery: 322 cd/m²
Contrast: 1342:1 (Black: 0.24 cd/m²)
ΔE ColorChecker Calman: 2.2 | ∀{0.5-29.43 Ø4.73}
calibrated: 1.9
ΔE Greyscale Calman: 1.6 | ∀{0.09-98 Ø4.97}
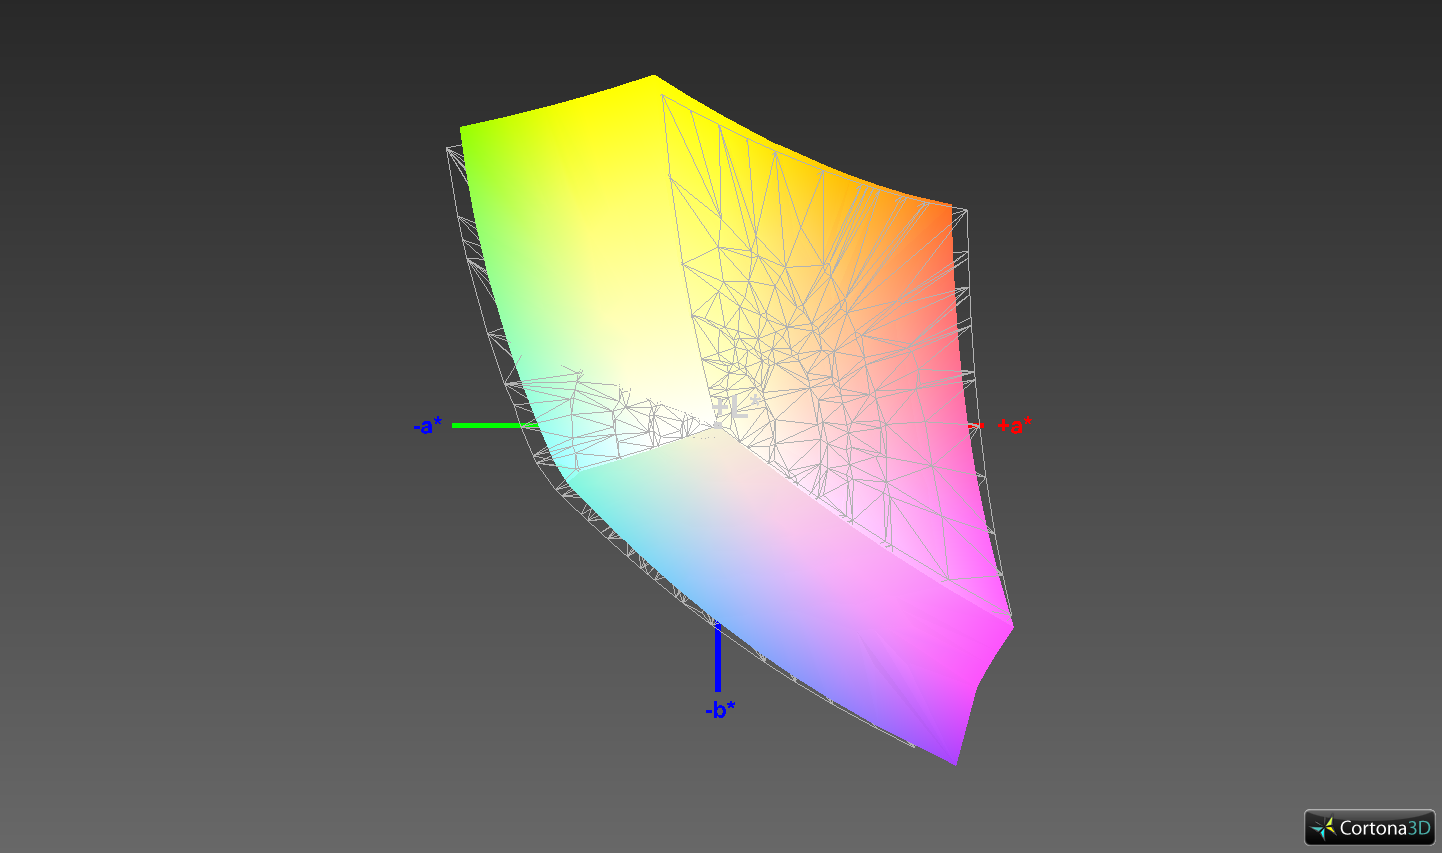
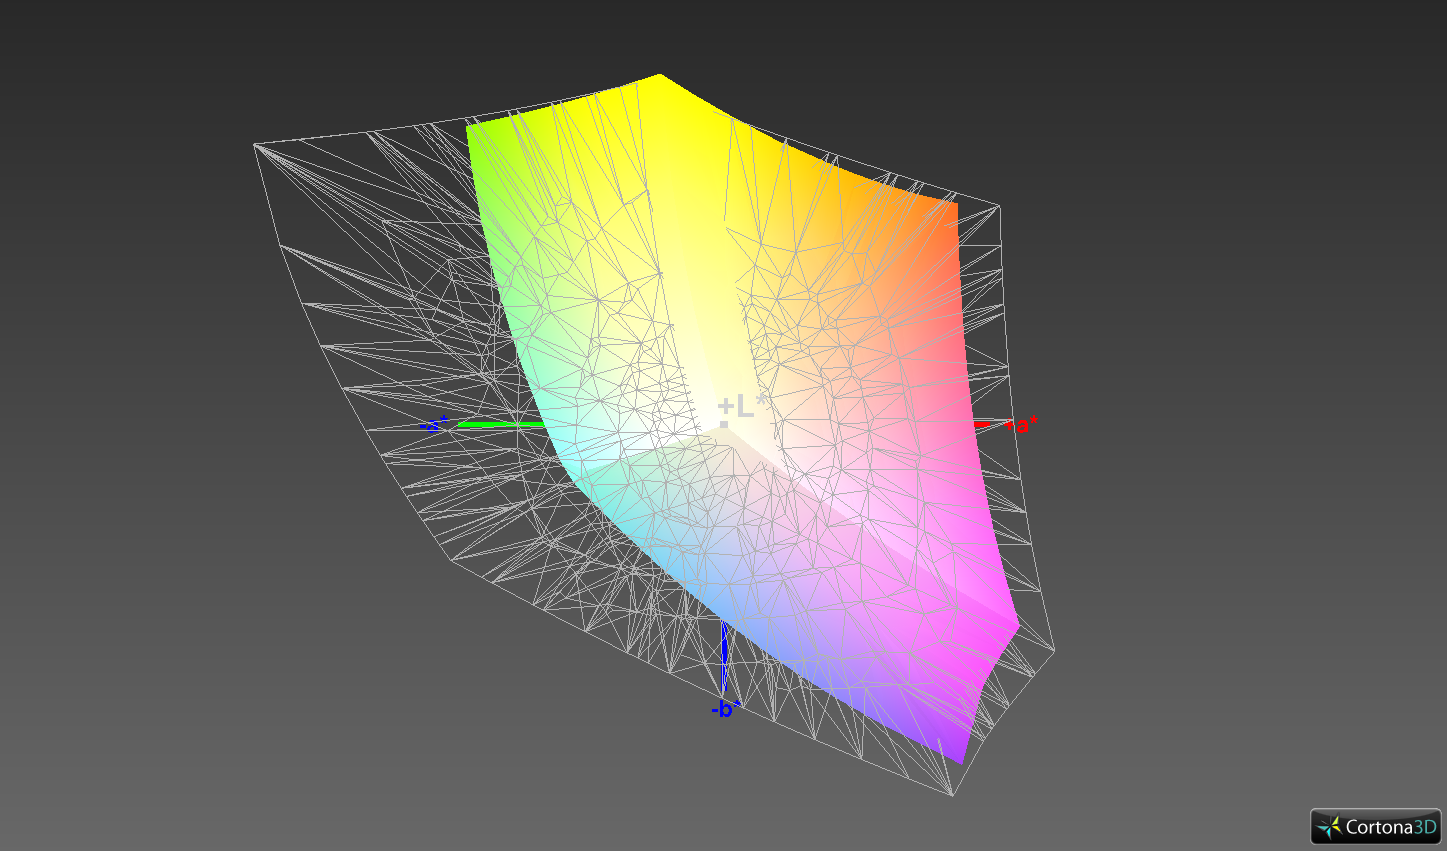
93.3% sRGB (Argyll 1.6.3 3D)
60.4% AdobeRGB 1998 (Argyll 1.6.3 3D)
66.3% AdobeRGB 1998 (Argyll 3D)
93.4% sRGB (Argyll 3D)
65% Display P3 (Argyll 3D)
Gamma: 2.19
CCT: 6621 K
| Dell Precision 7730 B173HAN01.3, , 1920x1080, 17.3" | Lenovo ThinkPad P72-20MB000EGE LP173WF4_SPF7, , 1920x1080, 17.3" | Fujitsu Celsius H980 LG Philips, LP173WF4-SPF5, , 1920x1080, 17.3" | Dell Precision 7720 SHP1446 (LQ173D1), , 3840x2160, 17.3" | |
|---|---|---|---|---|
| Display | -4% | -4% | 31% | |
| Display P3 Coverage (%) | 65 | 67.4 4% | 67.3 4% | 87.6 35% |
| sRGB Coverage (%) | 93.4 | 85 -9% | 85 -9% | 100 7% |
| AdobeRGB 1998 Coverage (%) | 66.3 | 62.2 -6% | 62.2 -6% | 99.2 50% |
| Response Times | 14% | 26% | -32% | |
| Response Time Grey 50% / Grey 80% * (ms) | 48.8 ? | 40.8 ? 16% | 38 ? 22% | 60 ? -23% |
| Response Time Black / White * (ms) | 32.8 ? | 28.8 ? 12% | 23.2 ? 29% | 46.4 ? -41% |
| PWM Frequency (Hz) | 120500 ? | 1020 ? | ||
| Screen | -35% | -64% | -21% | |
| Brightness middle (cd/m²) | 322 | 338 5% | 400 24% | 464 44% |
| Brightness (cd/m²) | 316 | 317 0% | 394 25% | 441 40% |
| Brightness Distribution (%) | 84 | 86 2% | 92 10% | 89 6% |
| Black Level * (cd/m²) | 0.24 | 0.28 -17% | 0.51 -113% | 0.45 -88% |
| Contrast (:1) | 1342 | 1207 -10% | 784 -42% | 1031 -23% |
| Colorchecker dE 2000 * | 2.2 | 4.3 -95% | 5.3 -141% | 3.2 -45% |
| Colorchecker dE 2000 max. * | 4.6 | 10.2 -122% | 9.3 -102% | 6.1 -33% |
| Colorchecker dE 2000 calibrated * | 1.9 | 3.7 -95% | 3.8 -100% | |
| Greyscale dE 2000 * | 1.6 | 2.2 -38% | 5.5 -244% | 4.2 -163% |
| Gamma | 2.19 100% | 2.17 101% | 2.17 101% | 2.01 109% |
| CCT | 6621 98% | 6621 98% | 6686 97% | 6736 96% |
| Color Space (Percent of AdobeRGB 1998) (%) | 60.4 | 55.8 -8% | 55.8 -8% | 88.1 46% |
| Color Space (Percent of sRGB) (%) | 93.3 | 84.7 -9% | 84.9 -9% | 100 7% |
| Total Average (Program / Settings) | -8% /
-23% | -14% /
-41% | -7% /
-12% |
* ... smaller is better
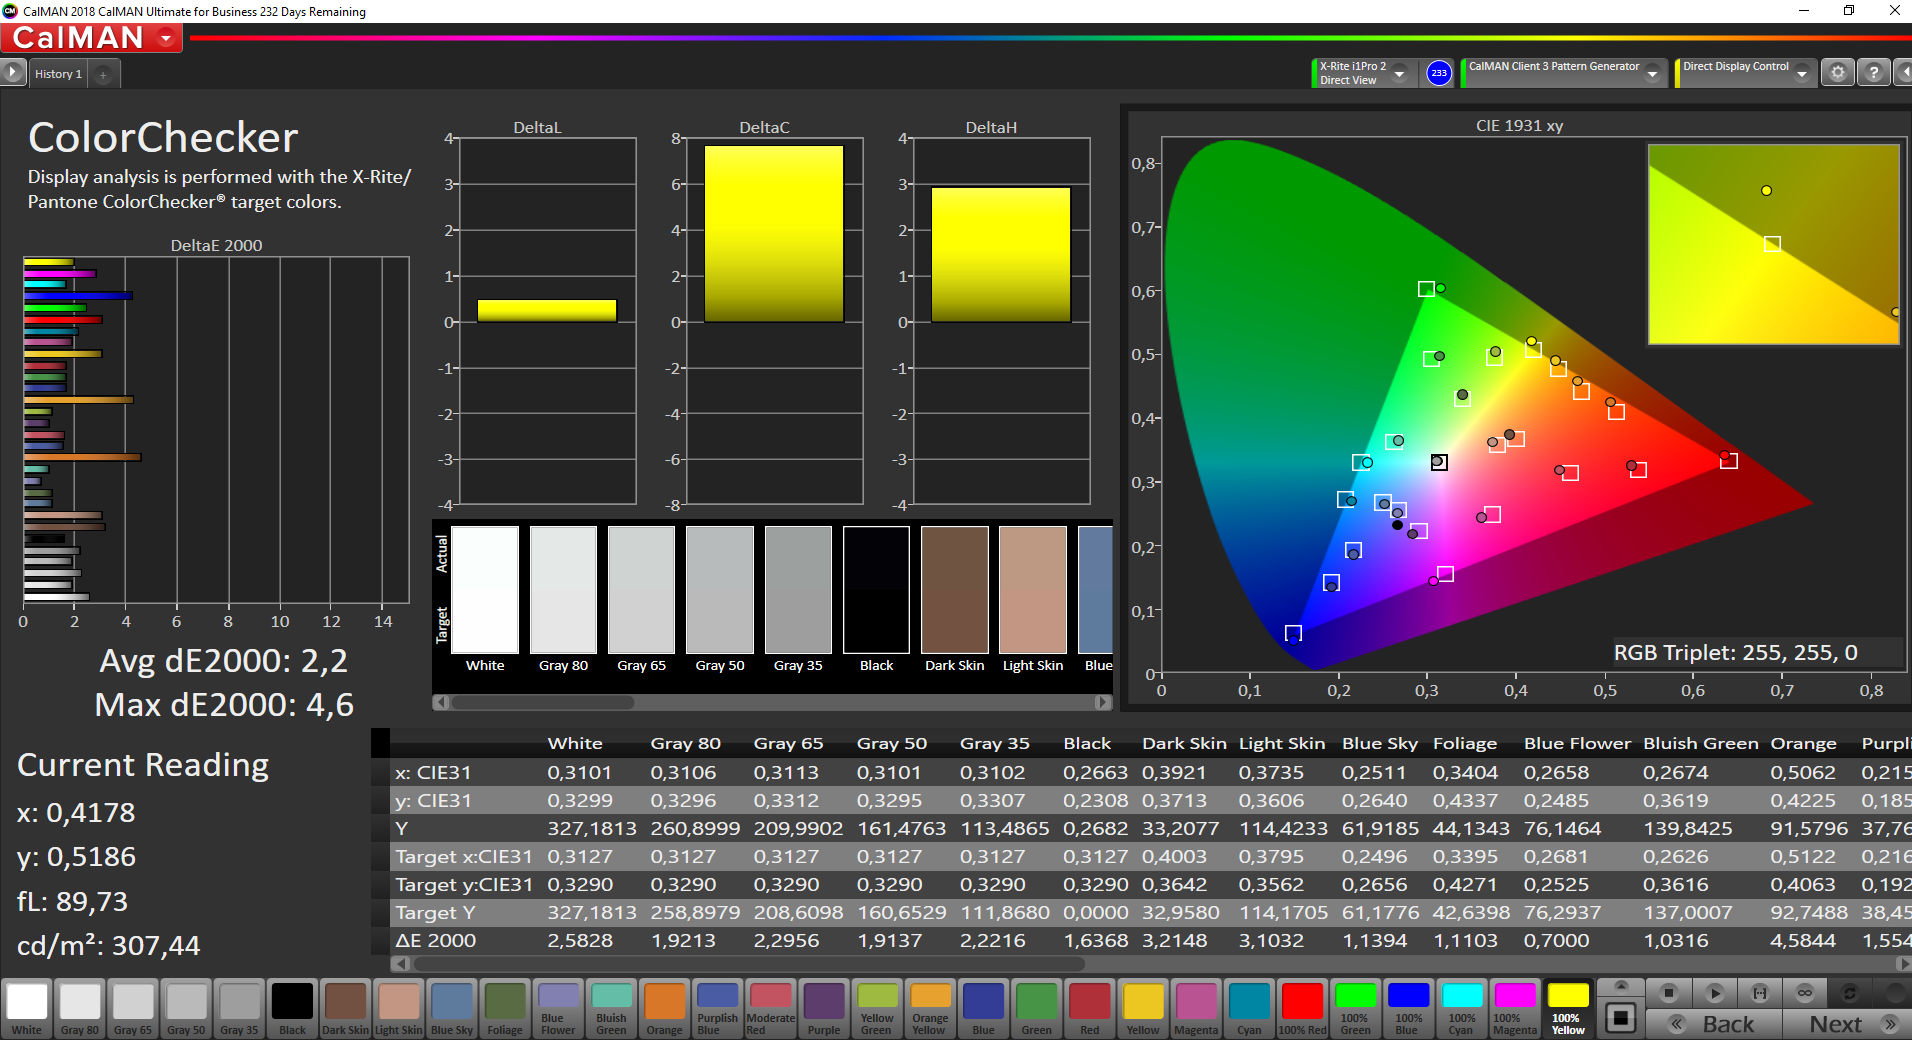
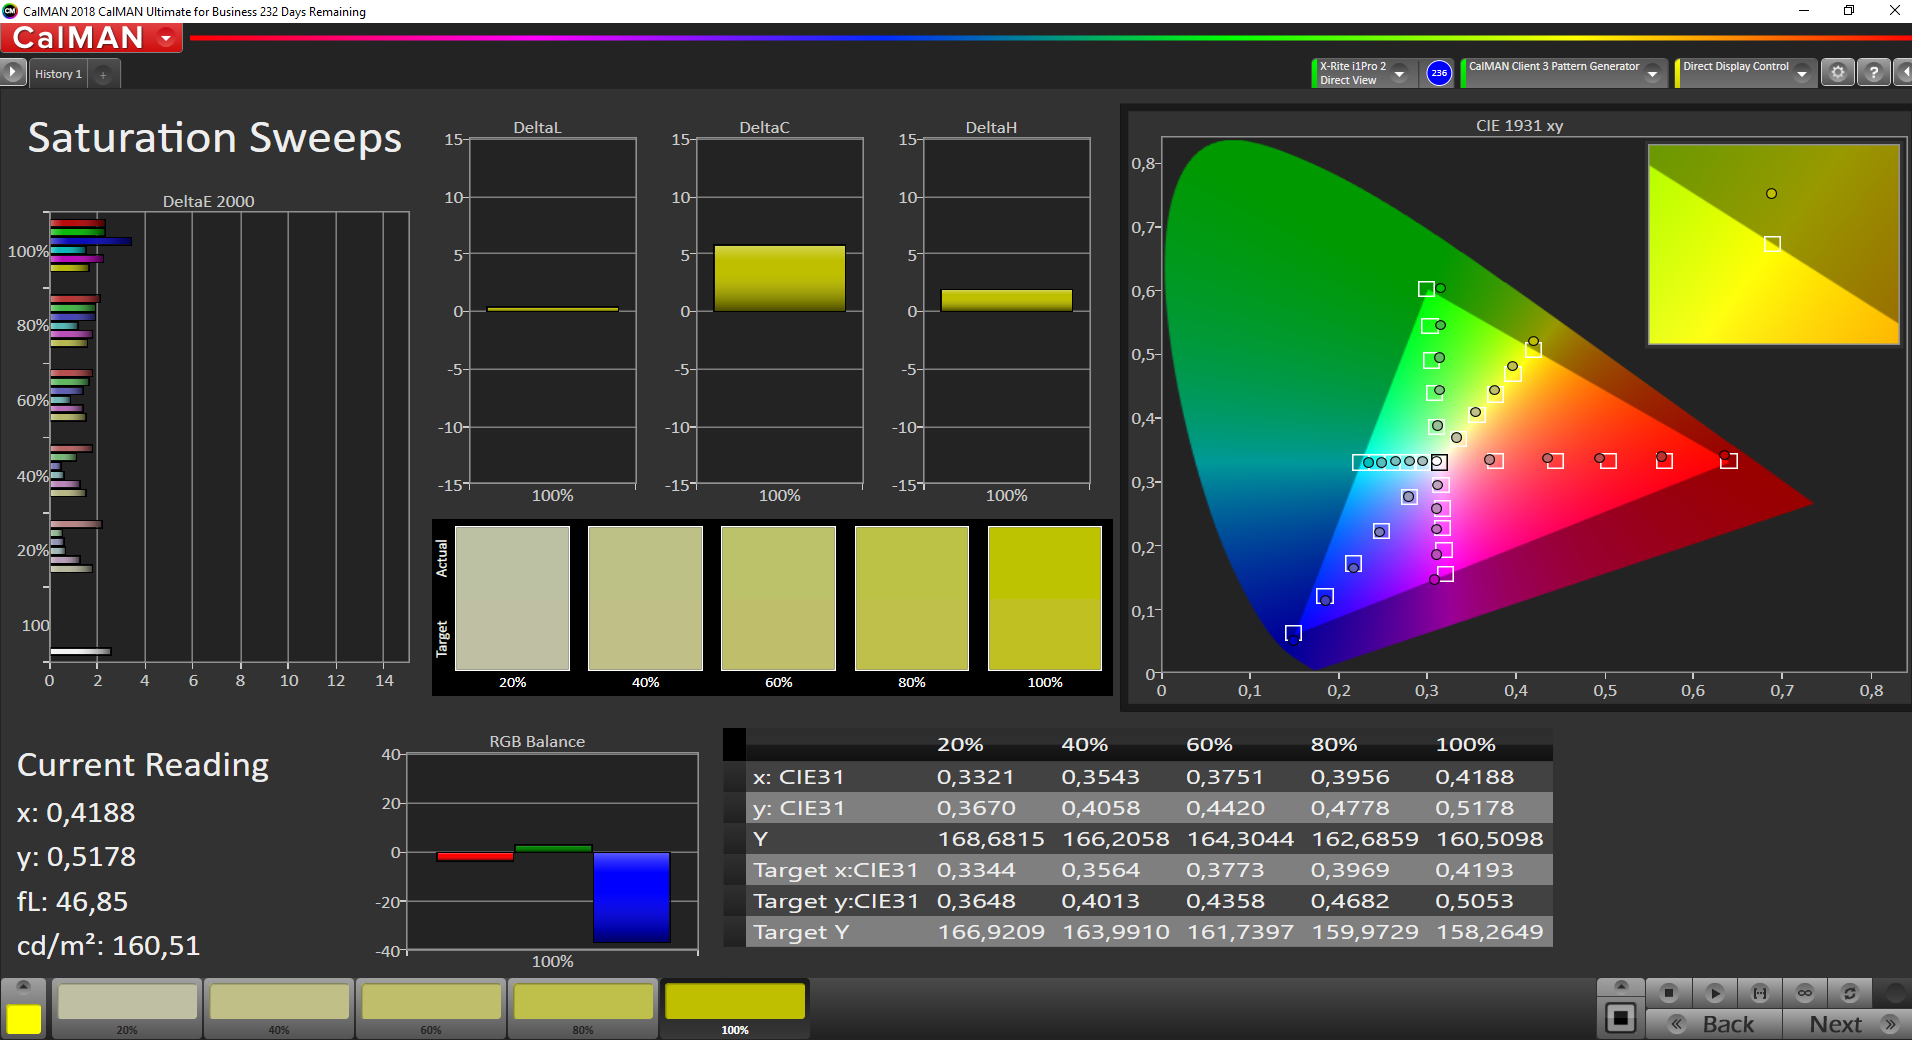

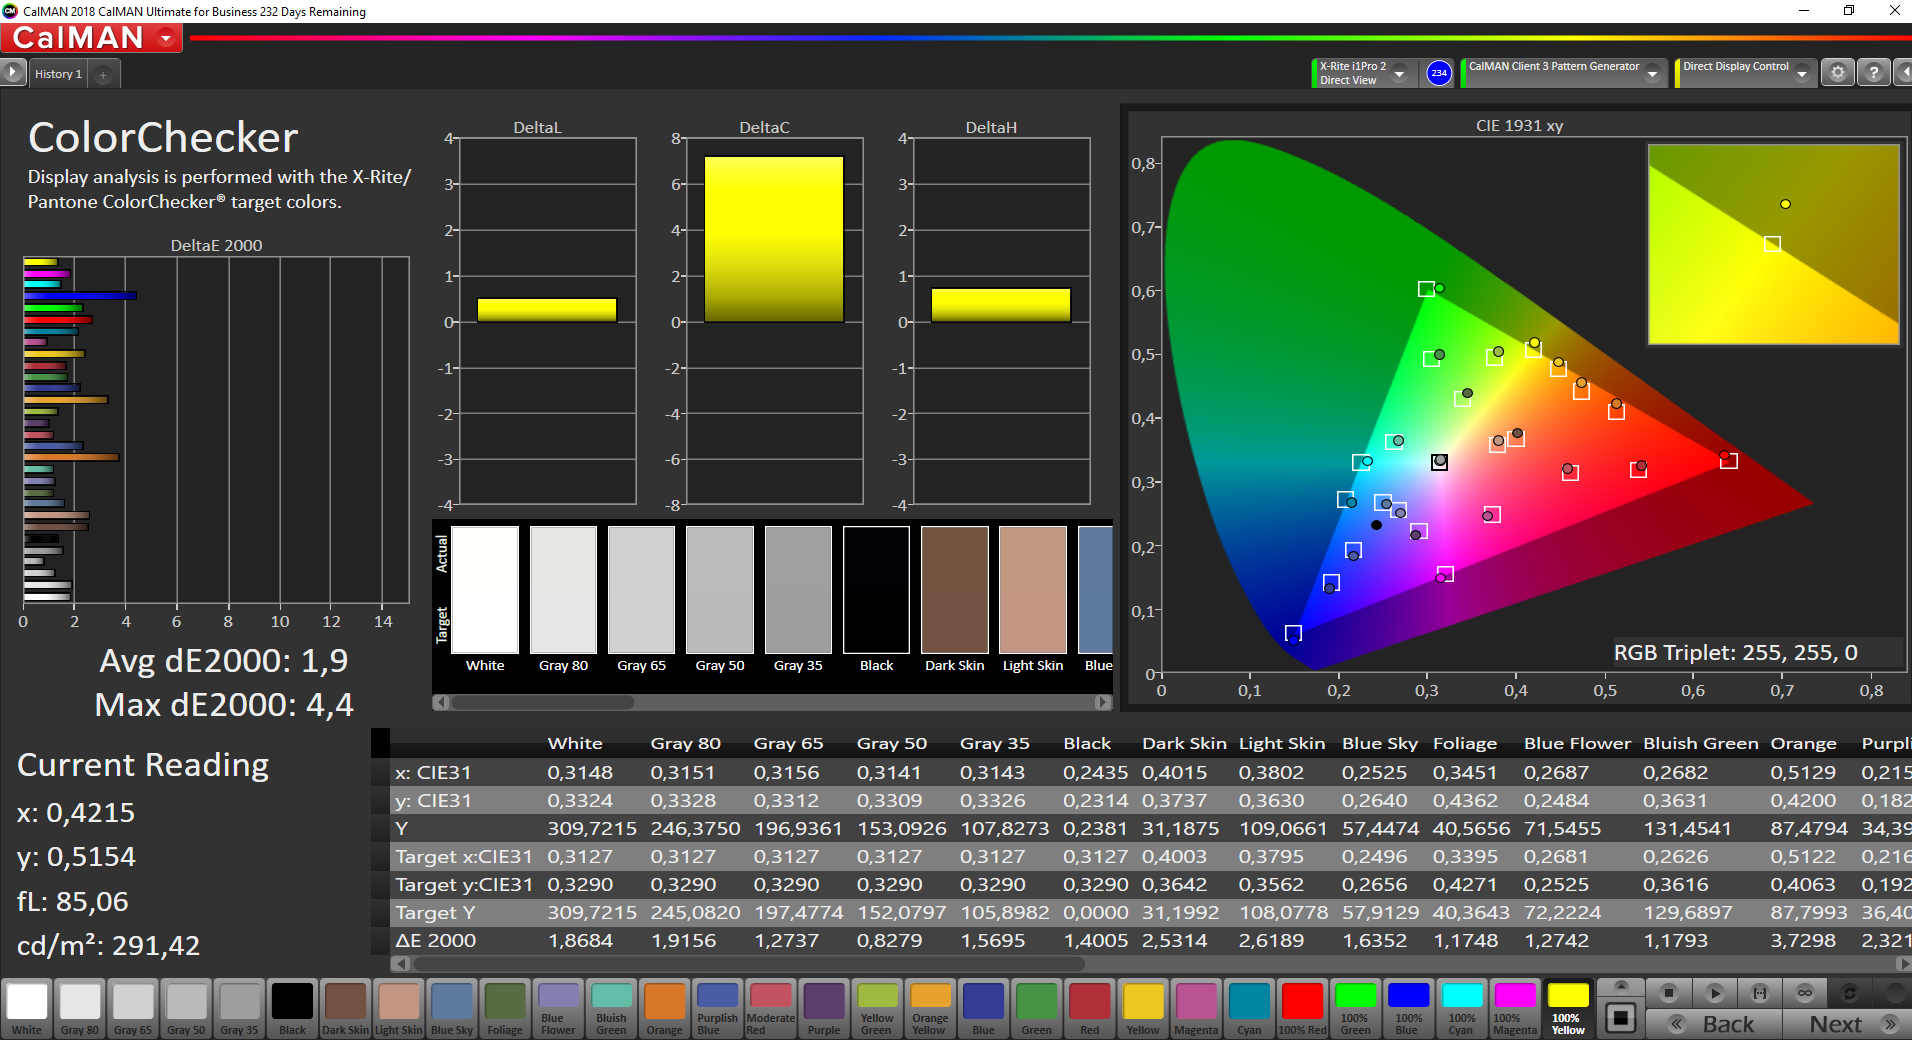
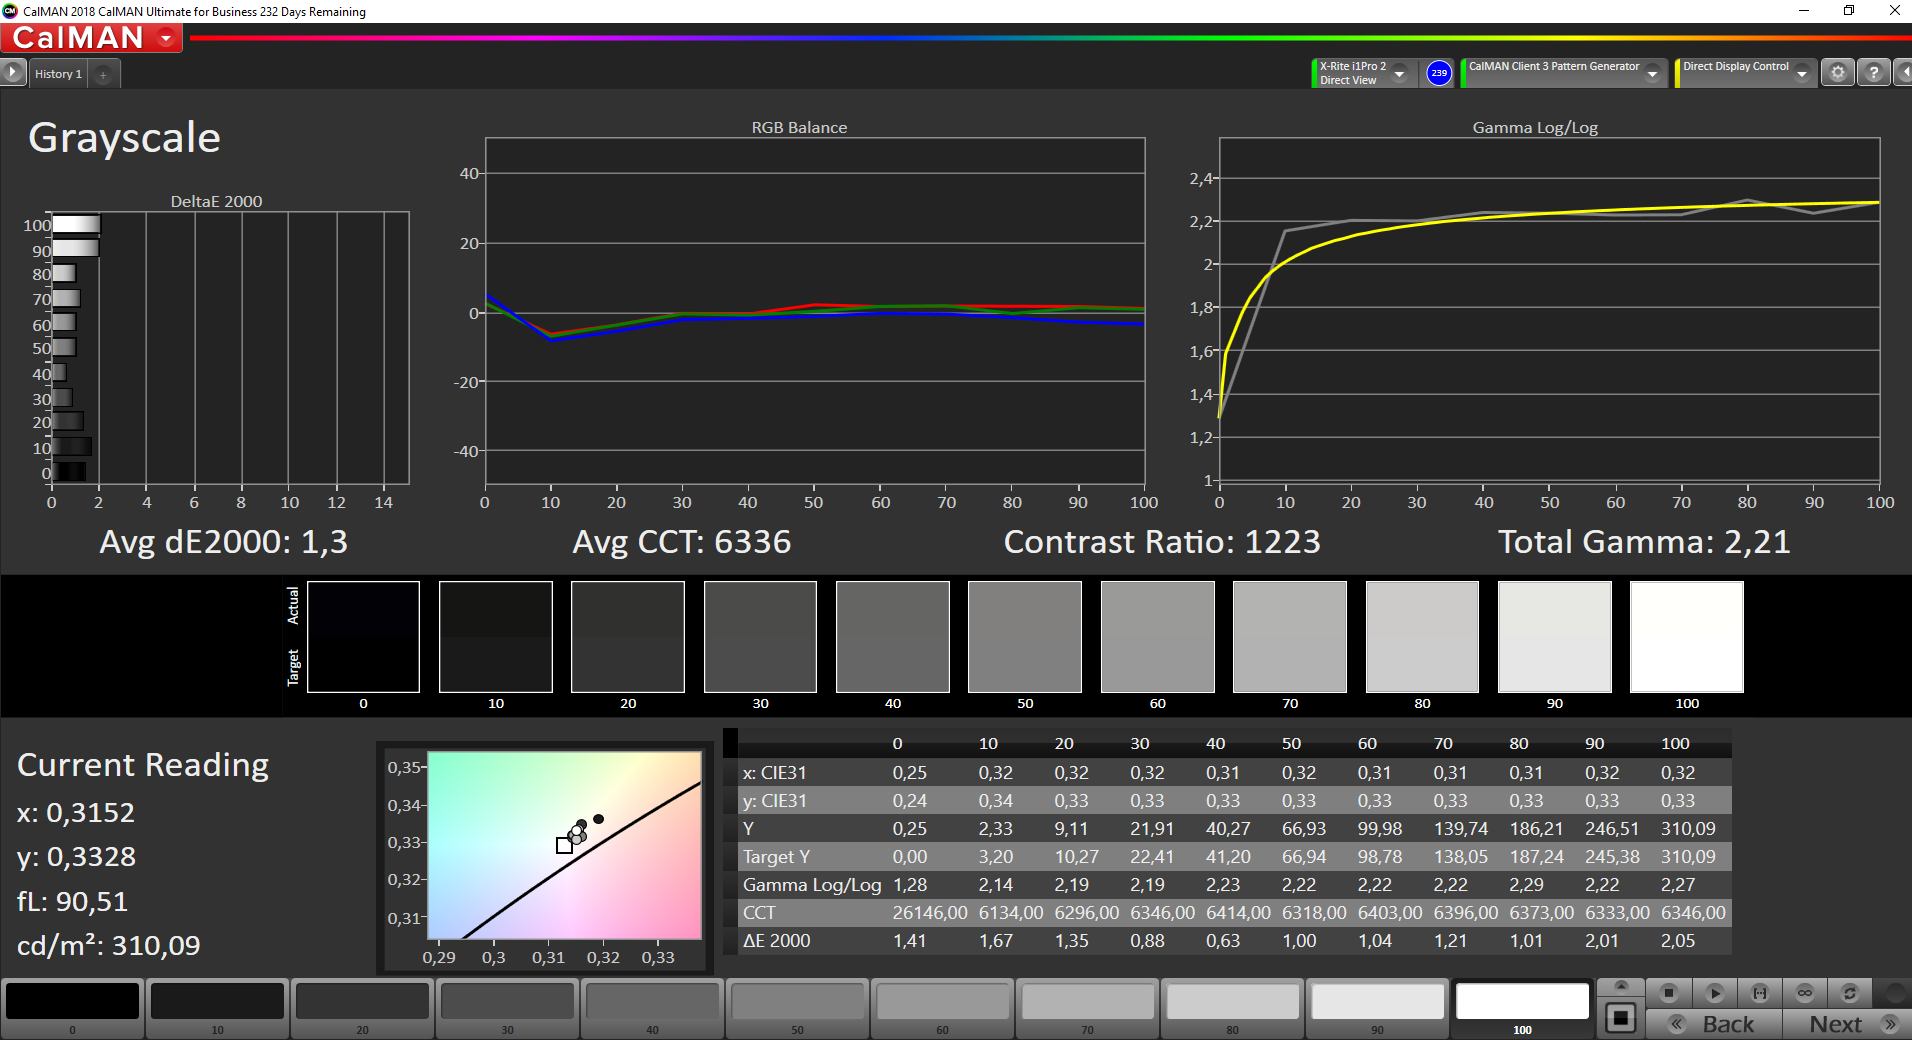
While the display has a few brightness-related shortcomings, it is impressively colour accurate. Upon delivery, our test device had hardly any DeltaE deviations beyond ideal values, but colour reproduction could still be improved with additional calibration. The panel also has a 1,342:1 contrast ratio and a 0.24 cd/m² black value, which are both better than the equivalents in our comparison devices.
Although the colour-space coverage does not quite cover 100% of sRGB, 93.3% remains a decent value. Our test device is more colour-accurate than the Celsius H980 and ThinkPad P72 in both sRGB and AdobeRGB colour spaces. However, the 4K panel in the Precision 7720 blows away the Full HD one in its successor, with 100% sRGB and 88.1% AdobeRGB coverages.
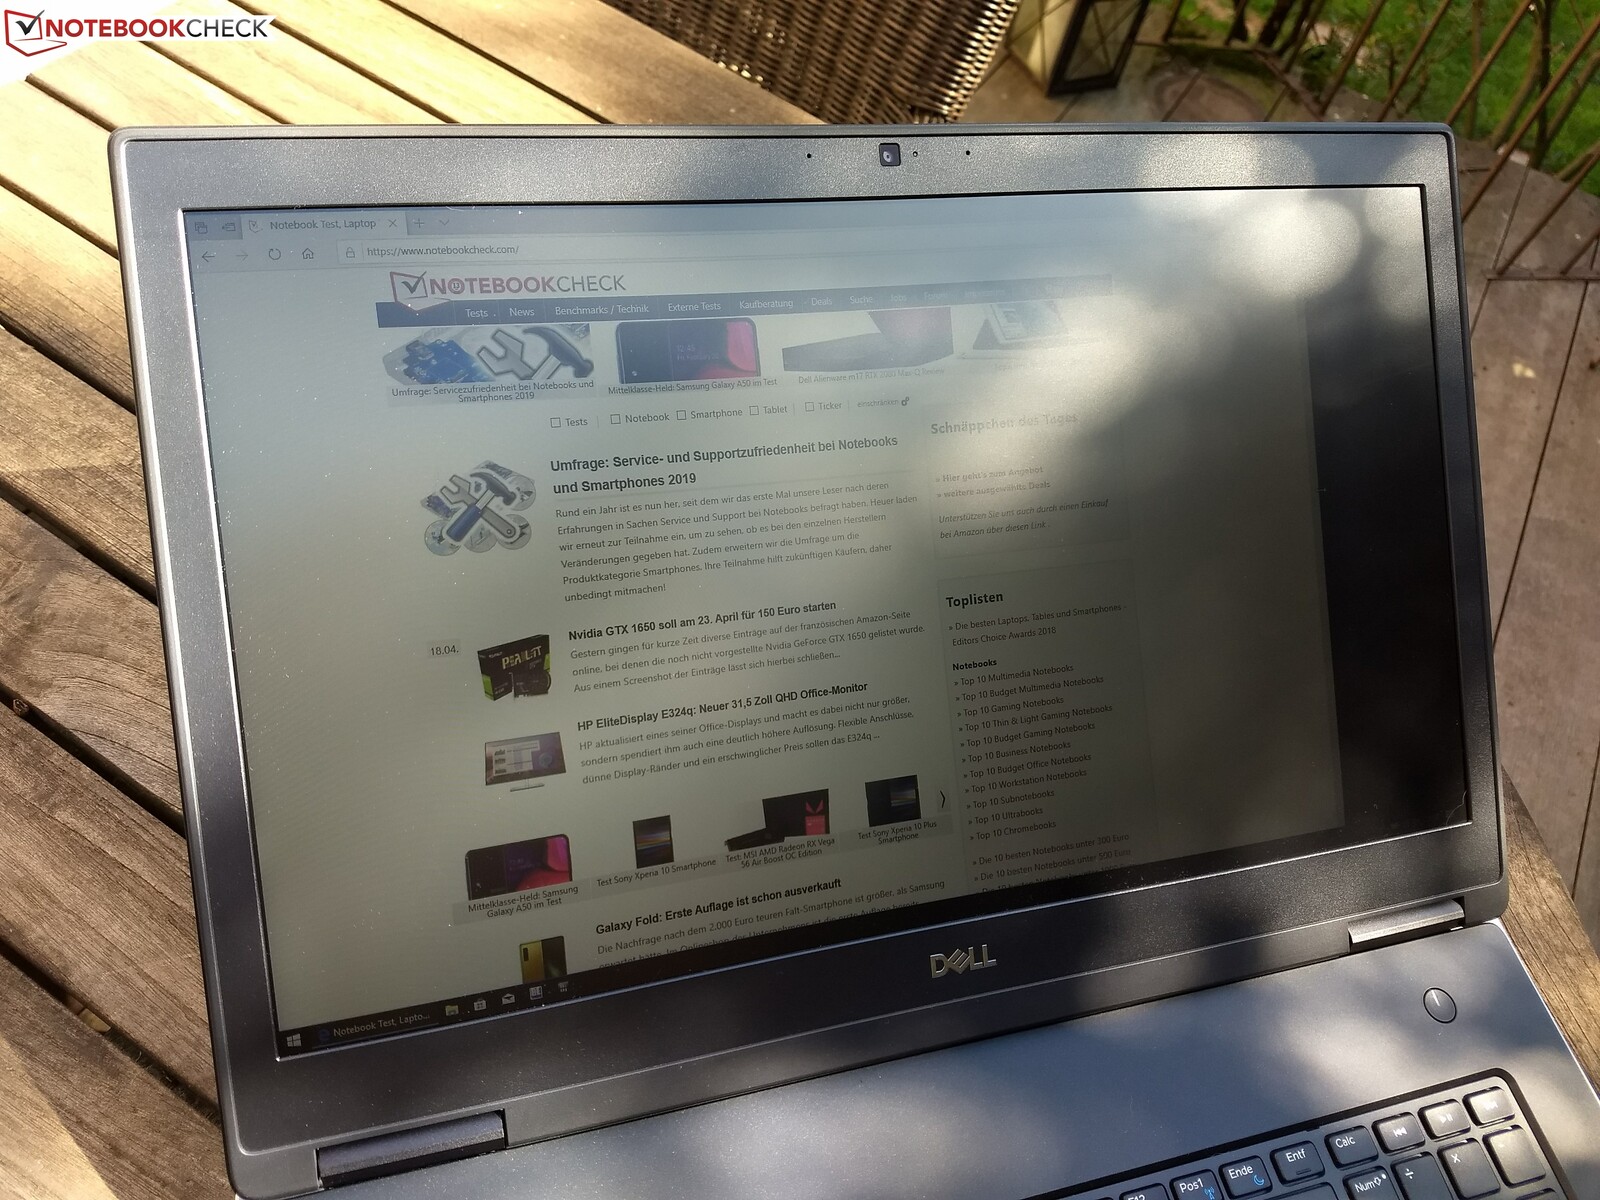
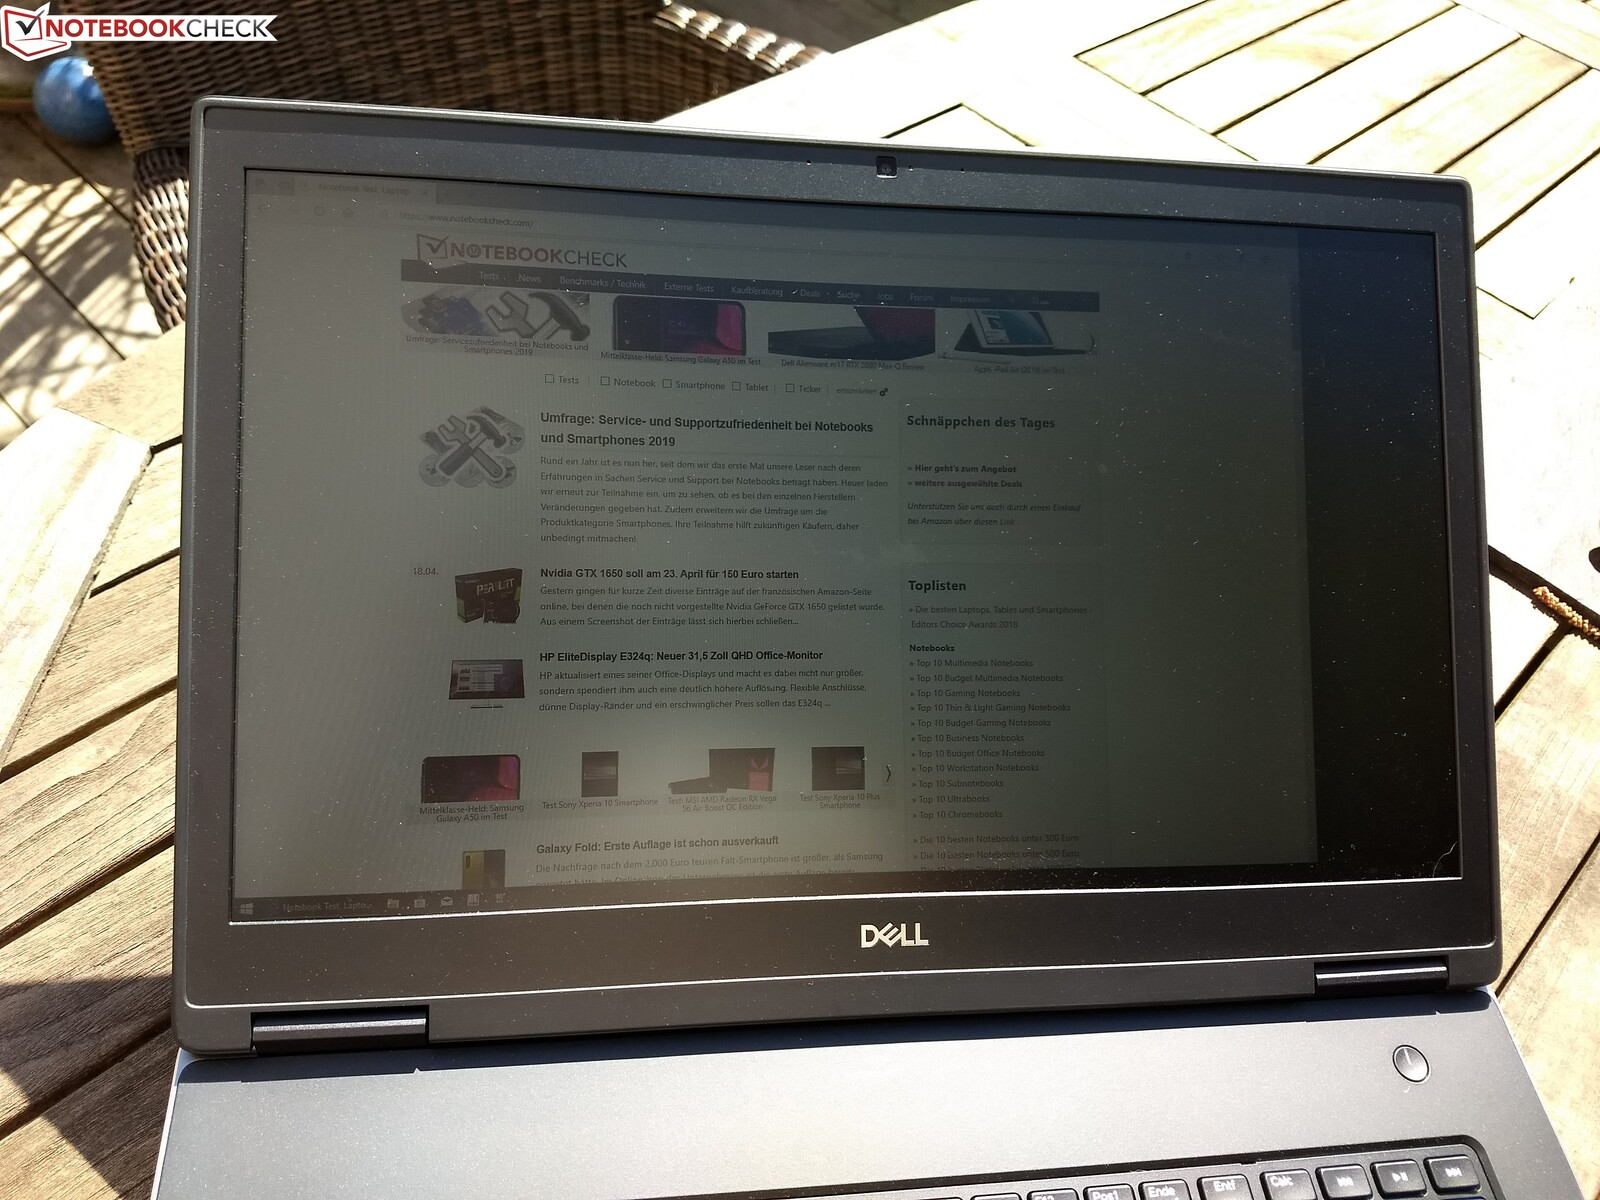
The Precision 7730 gets bright enough to use outdoors, although we would recommend finding a shady spot where possible. The matte display will diffuse most reflections, but our review still looks washed-out under bright sunlight.
Display Response Times
| ↔ Response Time Black to White | ||
|---|---|---|
| 32.8 ms ... rise ↗ and fall ↘ combined | ↗ 18.8 ms rise | 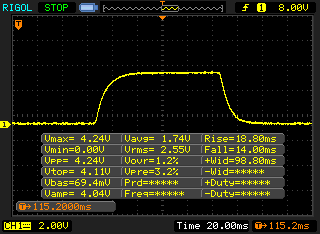 |
| ↘ 14 ms fall | ||
| The screen shows slow response rates in our tests and will be unsatisfactory for gamers. In comparison, all tested devices range from 0.1 (minimum) to 240 (maximum) ms. » 88 % of all devices are better. This means that the measured response time is worse than the average of all tested devices (19.9 ms). | ||
| ↔ Response Time 50% Grey to 80% Grey | ||
| 48.8 ms ... rise ↗ and fall ↘ combined | ↗ 24.4 ms rise | 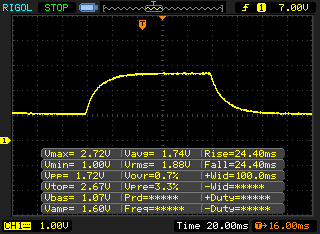 |
| ↘ 24.4 ms fall | ||
| The screen shows slow response rates in our tests and will be unsatisfactory for gamers. In comparison, all tested devices range from 0.165 (minimum) to 636 (maximum) ms. » 84 % of all devices are better. This means that the measured response time is worse than the average of all tested devices (31.1 ms). | ||
Screen Flickering / PWM (Pulse-Width Modulation)
| Screen flickering / PWM not detected | 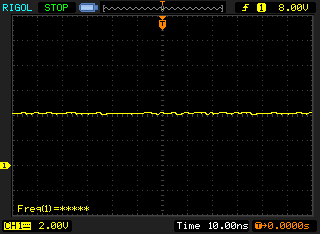 | ||
In comparison: 52 % of all tested devices do not use PWM to dim the display. If PWM was detected, an average of 7791 (minimum: 5 - maximum: 343500) Hz was measured. | |||
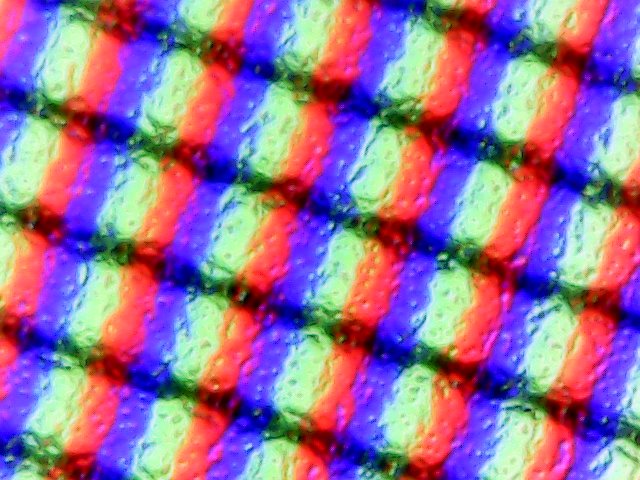
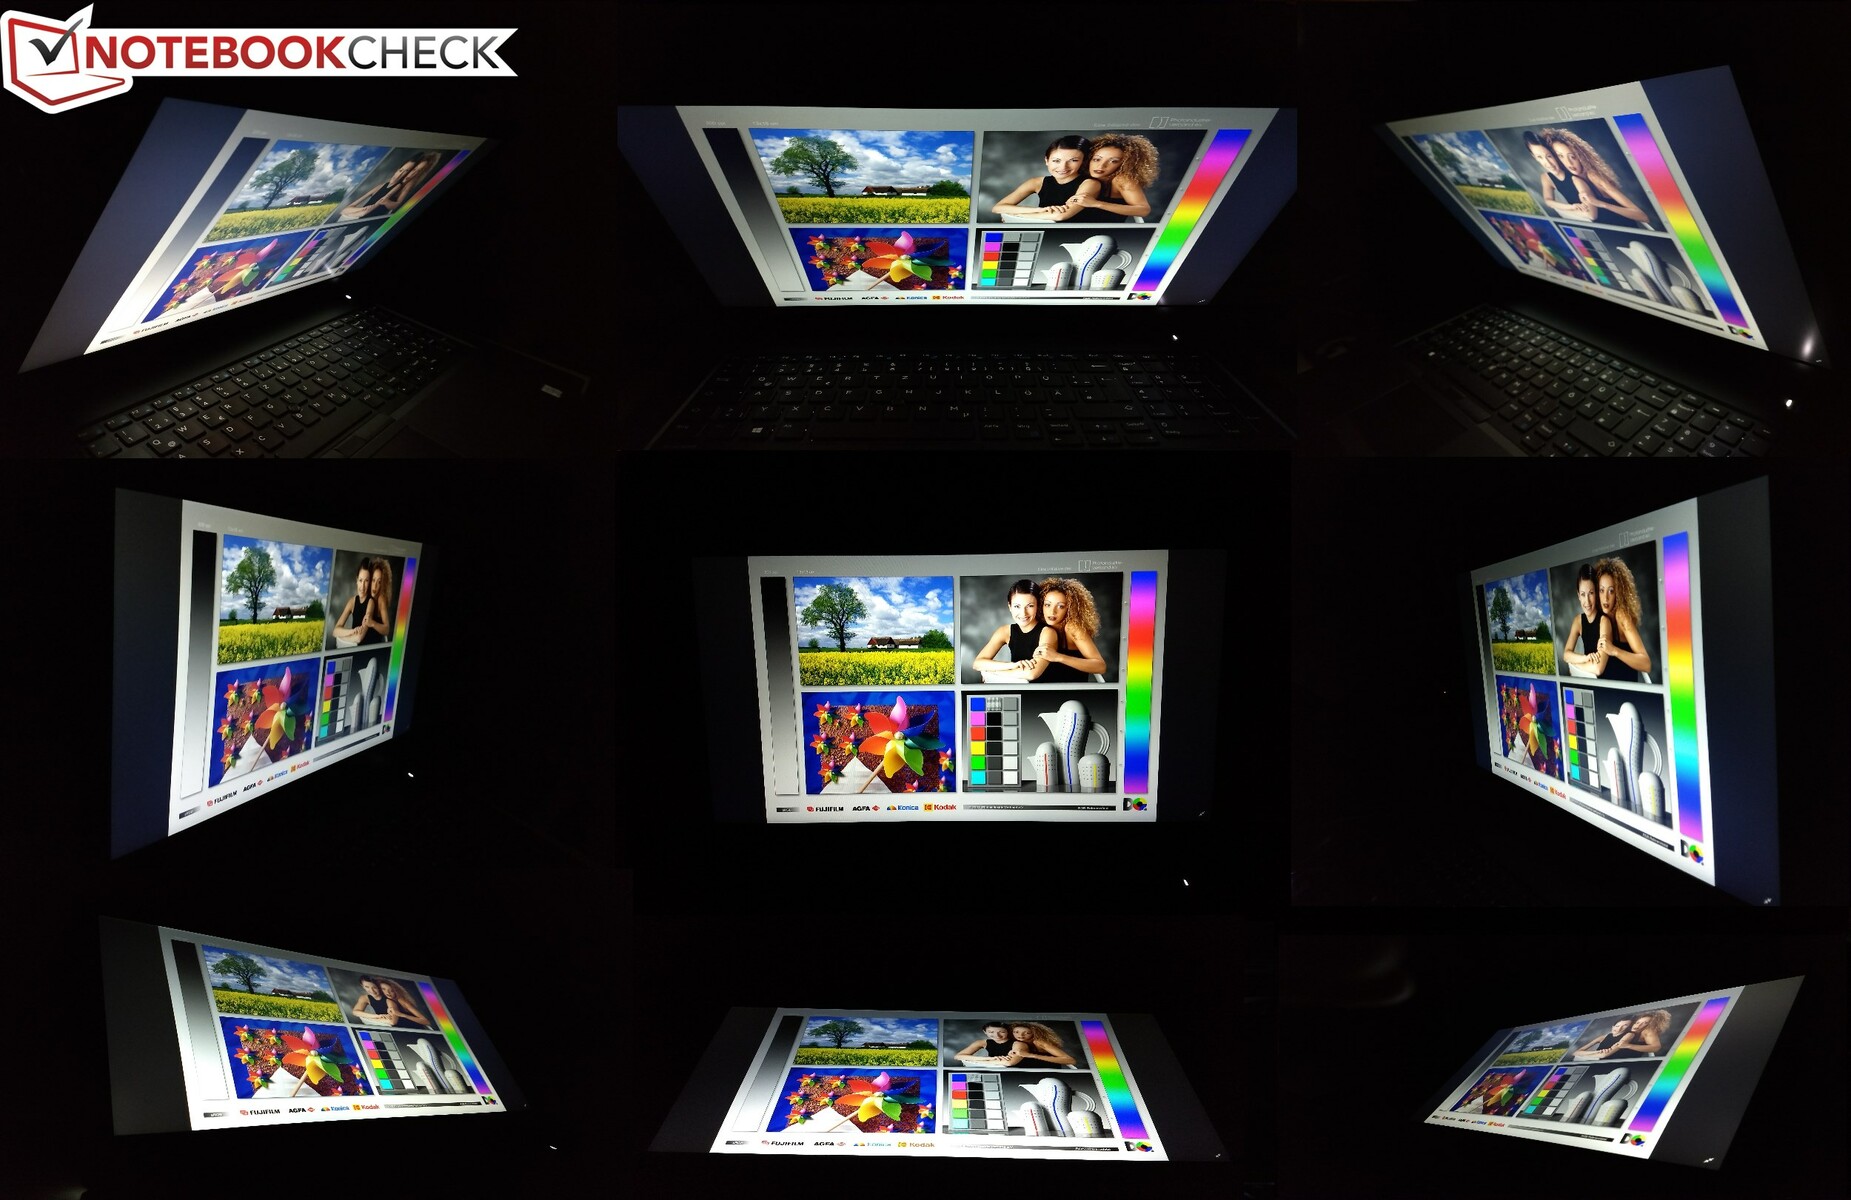
The IPS panel also provides good, but not perfect, viewing angles. The display in our test device suffers from a glowing effect that affects many IPS panels, which gives it a slight colour cast at acute viewing angles. It should not significantly reduce readability in daily use though.
Performance
The Precision 7730 comes with numerous configuration options. Starting with the processor, Dell currently allows you to choose from the Intel Core i5-8300H, Core i5-8400H, Core i7-8750H, Core i7-8850H and the Core i9-8950HK. You can even choose the Xeon E-2176M or E-2186M should you need server-grade performance. Likewise, there are plenty of GPU options. You could choose to just have an integrated GPU like the Intel UHD Graphics 630 or the HD Graphics P630, but Dell offers several dedicated GPUs too. At the time of writing, you can configure the Precision 7730 with an Nvidia Quadro P3200, Quadro P4200 or Quadro P5200 along with an AMD Radeon Pro WX 4150 or the Radeon Pro WX 7100. Moreover, you can equip the device with up to 128 GB DDR4-2666 RAM and four M.2-2280 SSDs, plus a 2.5-inch HDD for models with a smaller battery. Our review unit does not have a 2.5-inch HDD, for reference.
Processor
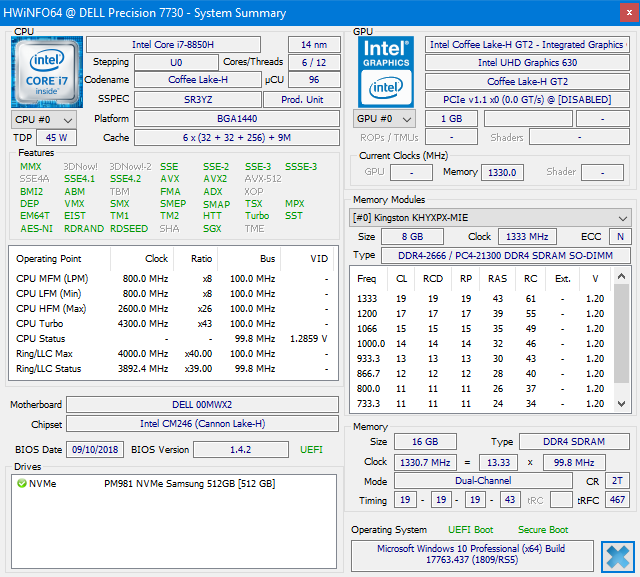
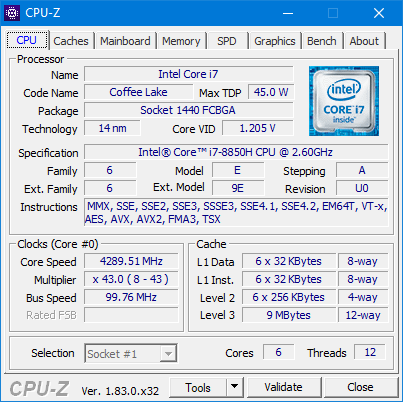
The Core i7-8850H powers our test device, which is a hexa-core processor based on Intel’s Coffee Lake architecture. The CPU has a 2.6 GHz base clock speed that it can boost to 4.3 GHz thanks to Intel Turbo Boost technology. The Core i7-8850H also has a 45 W thermal design power (TDP), which temporarily increases when the processor is running at maximum clock speeds. Please see our CPU benchmarks page for more information about the Core i7-8850H and how it compares against other processors.
Dell has configured the Core i7-8850H in our review unit to reach a maximum TDP of 90 W, which allows it to boost up to 4 GHz across all cores. However, the CPU exhausts its boost clock speeds within 30 seconds, during which time the core temperatures reach an unsustainable 97 °C. These high temperatures cause the CPU to reduce its TDP to 60 W to prevent catastrophic overheating, which causes clock speeds to also dip to 3.3 GHz.
We subjected our review unit to a loop of Cinebench R15 Multi 64Bit, which demonstrated the effect that this temporary boost in performance has. The Precision 7730 initially scored 1,276 points, which just edges the ThinkPad P72. Our review unit still generally outscores the ThinkPad when it limits its CPU to 60 W, but scores drop to 1,156 points, which is around a 10% reduction in performance.
Overall, the Precision 7730 is about as fast as the ThinkPad P72 in CPU benchmarks, while it blows away the Celsius H980 and its predecessor. The Precision 7720 has a quad-core processor though, so we expected such a gap in performance. The ThinkPad P72 can maintain peak performance throughout a 30-minute CB R15 loop when undervolted, for reference. We did not try undervolting the Precision 7730, but you may experience comparable performance improvements if you do. Please do thorough research before doing so though.
We should point out that the Precision 7730 significantly throttles its CPU when running on battery. Our test device dropped to a maximum of 985 points in CB R15 Multi 64Bit when we tested it on battery, which represents over a 20% performance reduction.
| Cinebench R15 | |
| CPU Single 64Bit | |
| Average of class Workstation (191.4 - 328, n=25, last 2 years) | |
| Lenovo ThinkPad P72-20MB000EGE | |
| Dell Precision 7730 | |
| Average Intel Core i7-8850H (176 - 185, n=10) | |
| Dell Precision 7720 | |
| Fujitsu Celsius H980 | |
| CPU Multi 64Bit | |
| Average of class Workstation (2489 - 5810, n=25, last 2 years) | |
| Dell Precision 7730 | |
| Lenovo ThinkPad P72-20MB000EGE | |
| Lenovo ThinkPad P72-20MB000EGE | |
| Average Intel Core i7-8850H (929 - 1276, n=15) | |
| Fujitsu Celsius H980 | |
| Dell Precision 7720 | |
System Performance
The Precision 7730 is an extremely powerful laptop, even by workstation standards. Therefore, it is unsurprising to see our review unit achieve excellent scores in system performance benchmarks like PCMark. These benchmarks reflect our experience in daily use. Our test device handled all tasks that we threw at it with ease, and we never encountered any lags or stutters even during heavy multitasking.
| PCMark 10 | |
| Score | |
| Average of class Workstation (6436 - 10409, n=21, last 2 years) | |
| Dell Precision 7730 | |
| Average Intel Core i7-8850H, NVIDIA Quadro P3200 (5287 - 5401, n=3) | |
| Lenovo ThinkPad P72-20MB000EGE | |
| Dell Precision 7720 | |
| Fujitsu Celsius H980 | |
| Essentials | |
| Average of class Workstation (9622 - 11157, n=21, last 2 years) | |
| Dell Precision 7730 | |
| Average Intel Core i7-8850H, NVIDIA Quadro P3200 (9121 - 9251, n=2) | |
| Lenovo ThinkPad P72-20MB000EGE | |
| Dell Precision 7720 | |
| Fujitsu Celsius H980 | |
| Productivity | |
| Average of class Workstation (8789 - 20616, n=21, last 2 years) | |
| Dell Precision 7720 | |
| Lenovo ThinkPad P72-20MB000EGE | |
| Average Intel Core i7-8850H, NVIDIA Quadro P3200 (7278 - 7459, n=2) | |
| Dell Precision 7730 | |
| Fujitsu Celsius H980 | |
| Digital Content Creation | |
| Average of class Workstation (7744 - 15631, n=21, last 2 years) | |
| Fujitsu Celsius H980 | |
| Dell Precision 7720 | |
| Dell Precision 7730 | |
| Average Intel Core i7-8850H, NVIDIA Quadro P3200 (6058 - 6353, n=2) | |
| Lenovo ThinkPad P72-20MB000EGE | |
| PCMark 8 | |
| Home Score Accelerated v2 | |
| Dell Precision 7730 | |
| Lenovo ThinkPad P72-20MB000EGE | |
| Average Intel Core i7-8850H, NVIDIA Quadro P3200 (4332 - 4657, n=3) | |
| Fujitsu Celsius H980 | |
| Dell Precision 7720 | |
| Work Score Accelerated v2 | |
| Lenovo ThinkPad P72-20MB000EGE | |
| Dell Precision 7730 | |
| Average Intel Core i7-8850H, NVIDIA Quadro P3200 (5276 - 5503, n=3) | |
| Fujitsu Celsius H980 | |
| Dell Precision 7720 | |
| PCMark 8 Home Score Accelerated v2 | 4657 points | |
| PCMark 8 Work Score Accelerated v2 | 5450 points | |
| PCMark 10 Score | 5401 points | |
Help | ||
Storage Devices
Dell has equipped our review unit with a 512 GB Samsung PM981 SSD. The drive operates on four lanes of PCIe and utilises the NVMe protocol to deliver exceptional transfer speeds. The Toshiba SSD in the Precision 7720 averaged higher speeds in CrystalDiskMark overall, but the PM981 remains a quick drive that impressed us in daily use.
| Dell Precision 7730 Samsung SSD PM981 MZVLB512HAJQ | Dell Precision 7720 Toshiba NVMe THNSN5512GPU7 | Lenovo ThinkPad P72-20MB000EGE Lenovo LENSE20256GMSP34MEAT2TA | Fujitsu Celsius H980 Samsung SSD PM981 MZVLB512HAJQ | Average Samsung SSD PM981 MZVLB512HAJQ | |
|---|---|---|---|---|---|
| CrystalDiskMark 5.2 / 6 | 8% | -4% | -5% | 9% | |
| Write 4K (MB/s) | 103.2 | 169.2 64% | 101 -2% | 111.8 8% | 126.7 ? 23% |
| Read 4K (MB/s) | 41.39 | 46.03 11% | 45.37 10% | 32.02 -23% | 44 ? 6% |
| Write Seq (MB/s) | 1880 | 1234 -34% | 1409 -25% | 1539 -18% | 1617 ? -14% |
| Read Seq (MB/s) | 2350 | 1854 -21% | 2129 -9% | 1252 -47% | 1716 ? -27% |
| Write 4K Q32T1 (MB/s) | 282.3 | 364.8 29% | 320.3 13% | 355.4 26% | 413 ? 46% |
| Read 4K Q32T1 (MB/s) | 314.3 | 552 76% | 348.3 11% | 408.7 30% | 420 ? 34% |
| Write Seq Q32T1 (MB/s) | 1881 | 1088 -42% | 1529 -19% | 1913 2% | 2076 ? 10% |
| Read Seq Q32T1 (MB/s) | 3216 | 2582 -20% | 2957 -8% | 2530 -21% | 3130 ? -3% |

Graphics Card
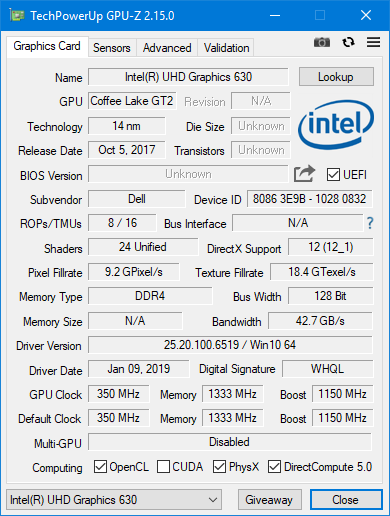
Our review unit has a Quadro P3200 GPU, which is a professional card that Nvidia optimises for computer-aided design (CAD). The Quadro P3200 is based on the Pascal generation and is most comparable to the GeForce GTX 1060 out of consumer GPUs. Please see our GPU benchmark page for more information on the Quadro P3200 and how it compares against other GPUs.
The Quadro P3200 is also the weakest Quadro card that Nvidia currently sells, but that is not to say that it is a slow GPU. The Quadro P3200 is powerful enough for demanding rendering tasks, while the one in our review unit performed at expected levels. The Celsius H980 and ThinkPad P72 are also equipped with the Quadro P3200 and both generally achieved comparable benchmark scores to the Precision 7730. Our test device scored significantly less than our comparison devices in SPECviewperf Test though.
The system also throttles the GPU when running on battery power. The Precision 7730 scored 6557 points in 3DMark 11 when running on battery, which is about 50% lower than what it scored when on charge.
| 3DMark 11 - 1280x720 Performance GPU | |
| Average of class Workstation (10888 - 69594, n=25, last 2 years) | |
| Dell Precision 7720 | |
| Lenovo ThinkPad P72-20MB000EGE | |
| Fujitsu Celsius H980 | |
| Dell Precision 7730 | |
| Average NVIDIA Quadro P3200 (14673 - 17021, n=4) | |
| 3DMark | |
| 1280x720 Cloud Gate Standard Graphics | |
| Average of class Workstation (46927 - 152418, n=15, last 2 years) | |
| Dell Precision 7720 | |
| Lenovo ThinkPad P72-20MB000EGE | |
| Dell Precision 7730 | |
| Fujitsu Celsius H980 | |
| Average NVIDIA Quadro P3200 (57501 - 84059, n=4) | |
| 1920x1080 Fire Strike Graphics | |
| Average of class Workstation (7578 - 52560, n=25, last 2 years) | |
| Dell Precision 7720 | |
| Dell Precision 7730 | |
| Lenovo ThinkPad P72-20MB000EGE | |
| Fujitsu Celsius H980 | |
| Average NVIDIA Quadro P3200 (11316 - 12558, n=4) | |
| 2560x1440 Time Spy Graphics | |
| Average of class Workstation (2725 - 24806, n=25, last 2 years) | |
| Lenovo ThinkPad P72-20MB000EGE | |
| Fujitsu Celsius H980 | |
| Average NVIDIA Quadro P3200 (3732 - 4378, n=3) | |
| Dell Precision 7720 | |
| LuxMark v2.0 64Bit | |
| Room GPUs-only | |
| Average of class Workstation (1760 - 6990, n=4, last 2 years) | |
| Dell Precision 7720 | |
| Dell Precision 7730 | |
| Fujitsu Celsius H980 | |
| Average NVIDIA Quadro P3200 (1842 - 2206, n=5) | |
| Lenovo ThinkPad P72-20MB000EGE | |
| Sala GPUs-only | |
| Average of class Workstation (5177 - 13967, n=4, last 2 years) | |
| Fujitsu Celsius H980 | |
| Dell Precision 7730 | |
| Dell Precision 7720 | |
| Average NVIDIA Quadro P3200 (3612 - 4383, n=5) | |
| Lenovo ThinkPad P72-20MB000EGE | |
| 3DMark 11 Performance | 15079 points | |
| 3DMark Cloud Gate Standard Score | 34440 points | |
| 3DMark Fire Strike Score | 11058 points | |
Help | ||
Gaming Performance
Nvidia did not design the Quadro P3200 for gaming, but it achieves playable frame rates in modern titles, nonetheless. Our review unit handled our gaming tests with ease in 1080p at maximum graphics and even averaged a playable 46.4 FPS in The Witcher 3 at ultra-graphics with post-processing switched on. Gaming in 4K is possible too, but we would recommend dropping the quality levels down from high or maximum details though. You should also be able to play some virtual reality (VR) games too.
| The Witcher 3 - 1920x1080 Ultra Graphics & Postprocessing (HBAO+) | |
| Average of class Workstation (26.3 - 91.7, n=3, last 2 years) | |
| Dell Precision 7720 | |
| Dell Precision 7730 | |
| Lenovo ThinkPad P72-20MB000EGE | |
| Average NVIDIA Quadro P3200 (41.6 - 46.4, n=4) | |
| low | med. | high | ultra | |
|---|---|---|---|---|
| BioShock Infinite (2013) | 306.9 | 265.1 | 246 | 114.2 |
| The Witcher 3 (2015) | 218.6 | 148.2 | 82.2 | 46.4 |
| Dota 2 Reborn (2015) | 140 | 131 | 123 | 117 |
| Rise of the Tomb Raider (2016) | 181.7 | 146.3 | 84.6 | 71.1 |
| X-Plane 11.11 (2018) | 101 | 86 | 73 |
Emissions
Fan Noise
The Precision 7730 has two fans, which are usually silent when the system is idling. Our tests did not pick this up, but the fans in our review unit occasionally ramp up for one to two seconds before switching off again. We have no idea why Dell has engineered such an odd fan curve, which some people may find annoying when using the Precision 7730 in a quiet space.
The fans also reach a maximum of 44.2 dB(a) under sustained load, which will sound loud to most people. By contrast, the ThinkPad P72 runs a few decibels quieter than the Precision 7730 does.
Unfortunately, our test device suffers from coil whine, which is a bane of many Dell laptops. We could only hear the electrical interference with our ear over the keyboard. However, our hearing may be less sensitive than yours, so please keep this in mind if you have previously found coil whine intrusive.
Noise level
| Idle |
| 29.7 / 29.7 / 29.7 dB(A) |
| Load |
| 31.4 / 44.2 dB(A) |
 | ||
30 dB silent 40 dB(A) audible 50 dB(A) loud |
||
min: | ||
Temperature
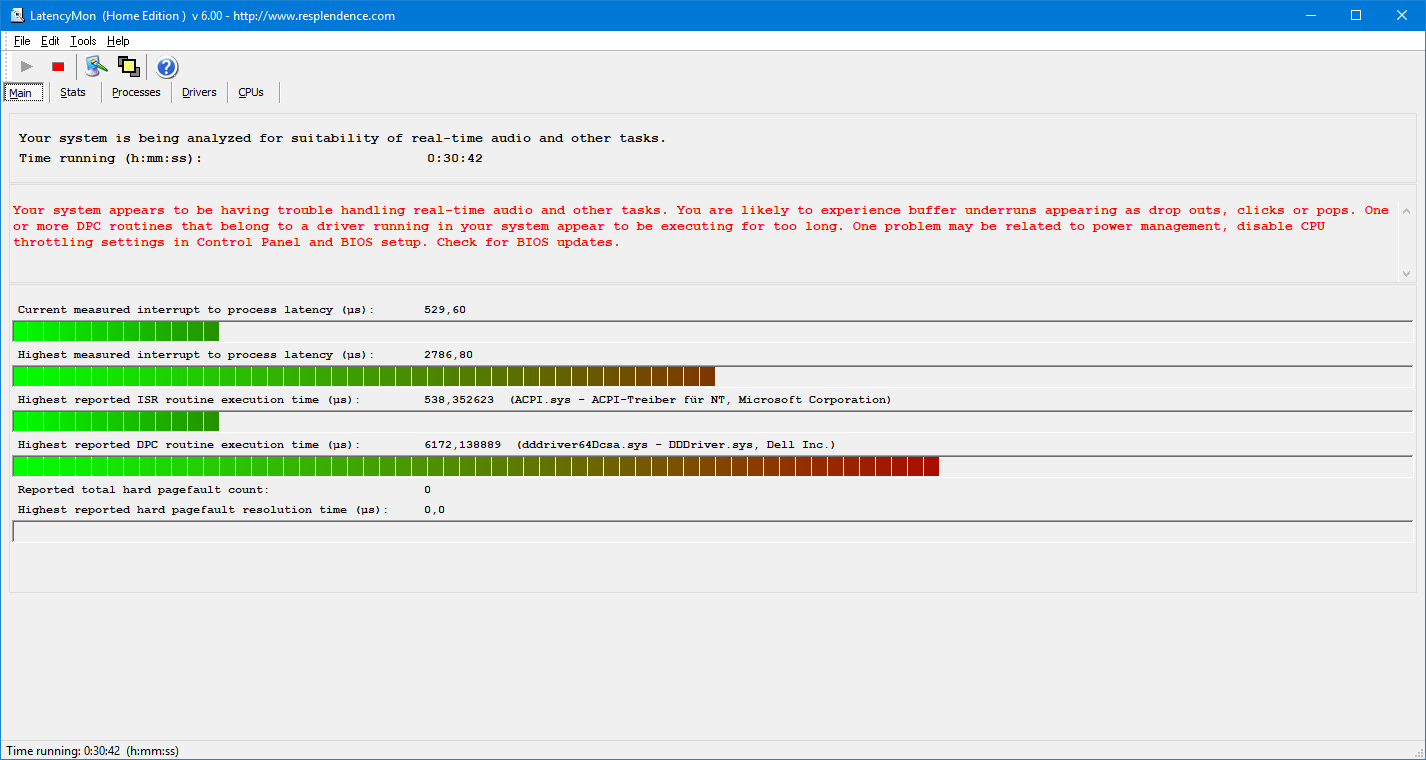
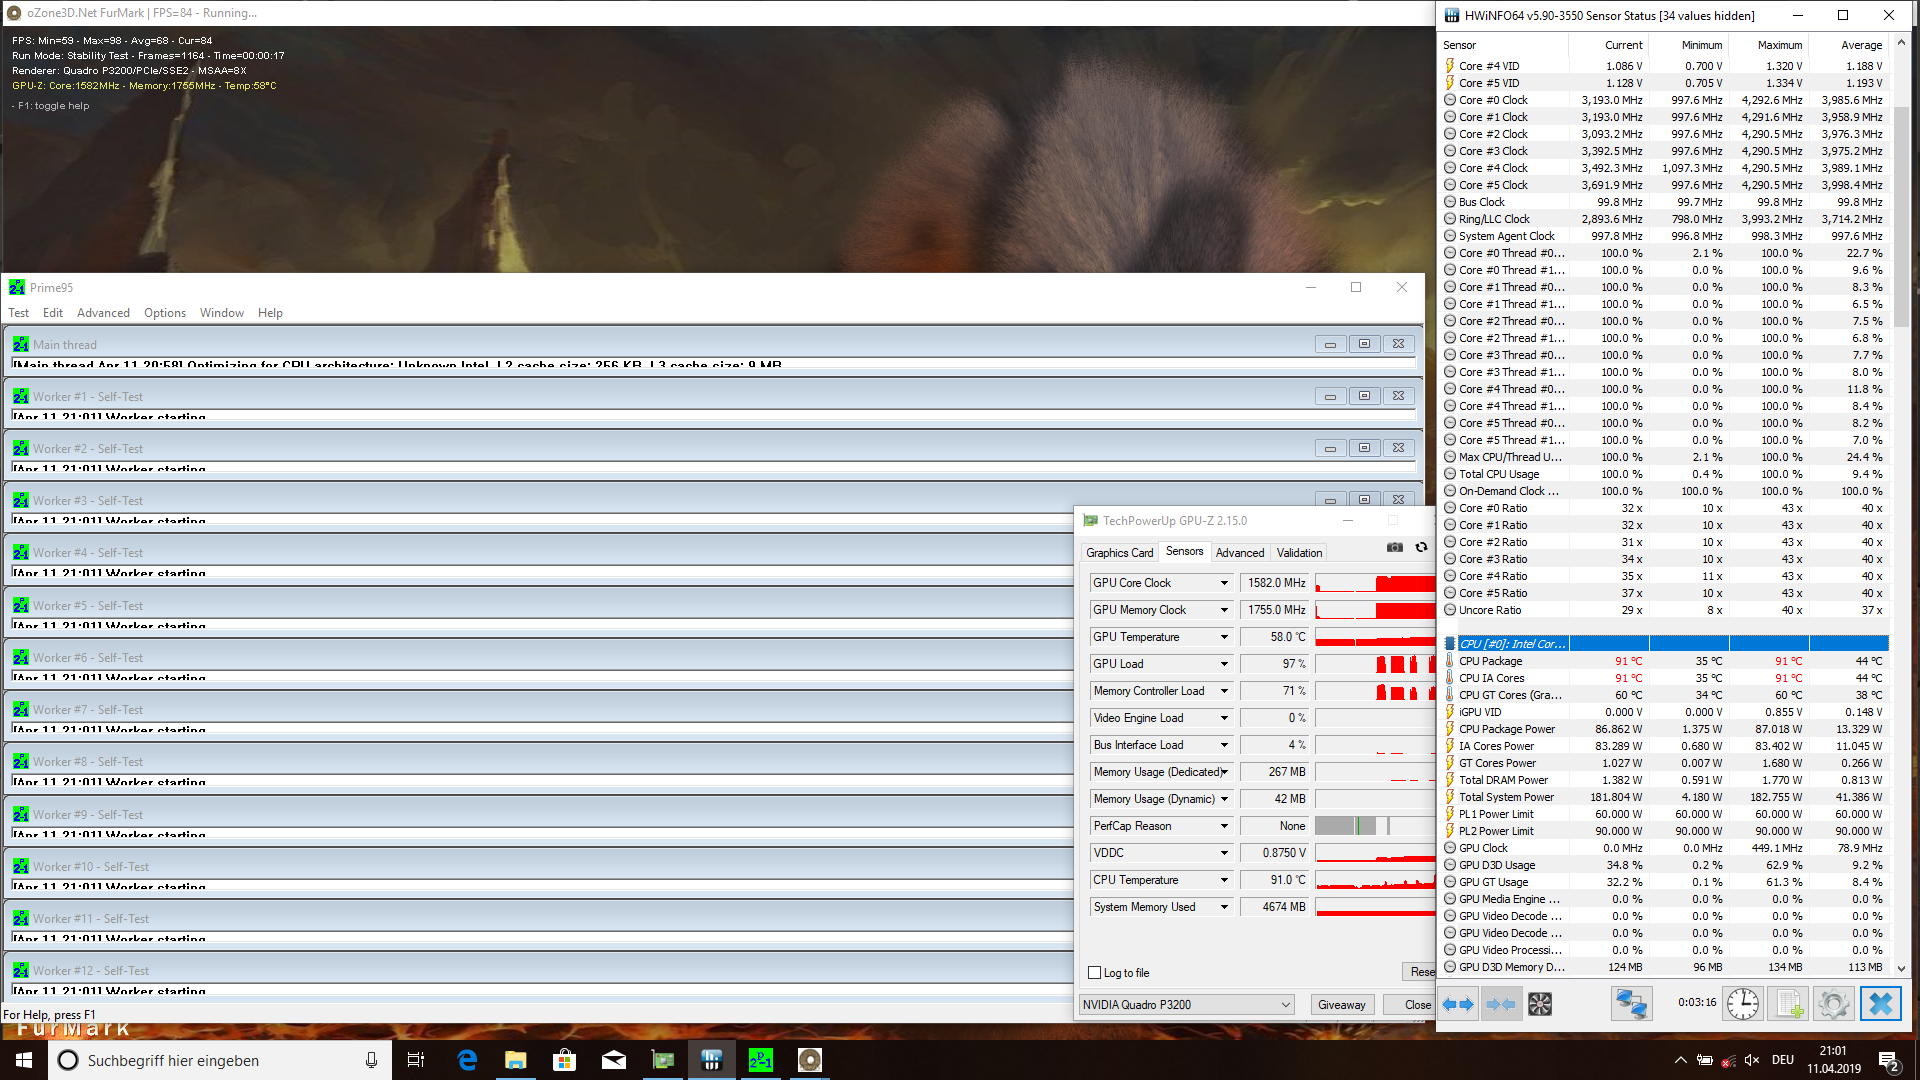
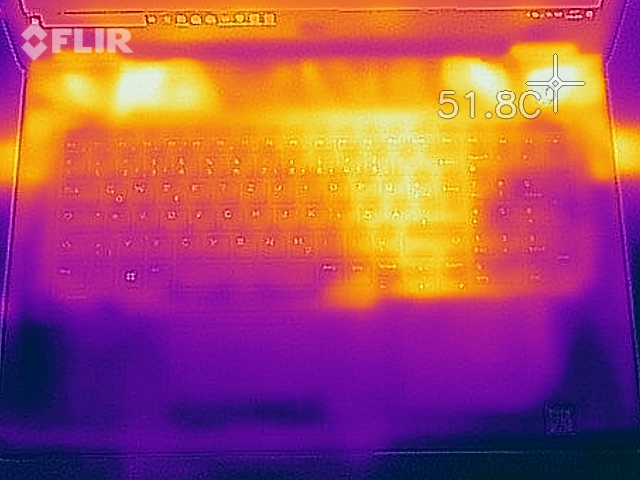
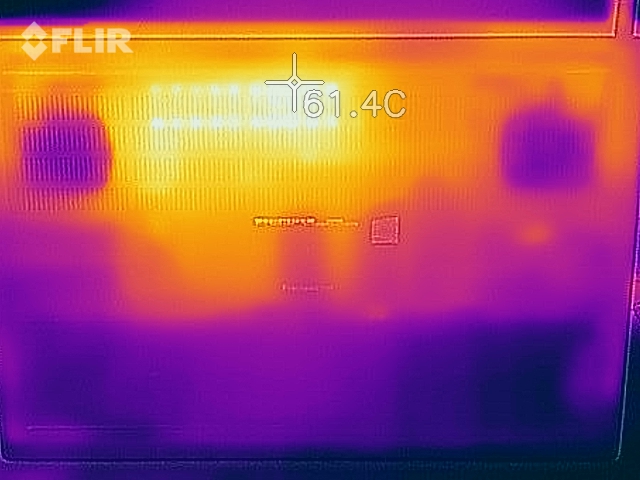
Unfortunately, while the fans in the Precision 7730 get loud, this does not correlate with good thermal management. Surface temperatures reach almost 60 °C on some areas of our review unit when we push it hard, which is worryingly hot. While Dell did not design the Precision for use on a lap, its surface temperatures should still be lower. We suspect that more-powerful variants will get even hotter, perhaps even dangerously so.
We also subjected our test device to a combined FurMark and Prime95 stress test, which we ran for just over an hour. The CPU initially consumed 90 W like in the CB R15 loop, during which the GPU operates at 1,582 MHz. CPU core temperatures reached a maximum of 91 °C when running at full tilt, which is only 9 °C short of its maximum operating temperature.
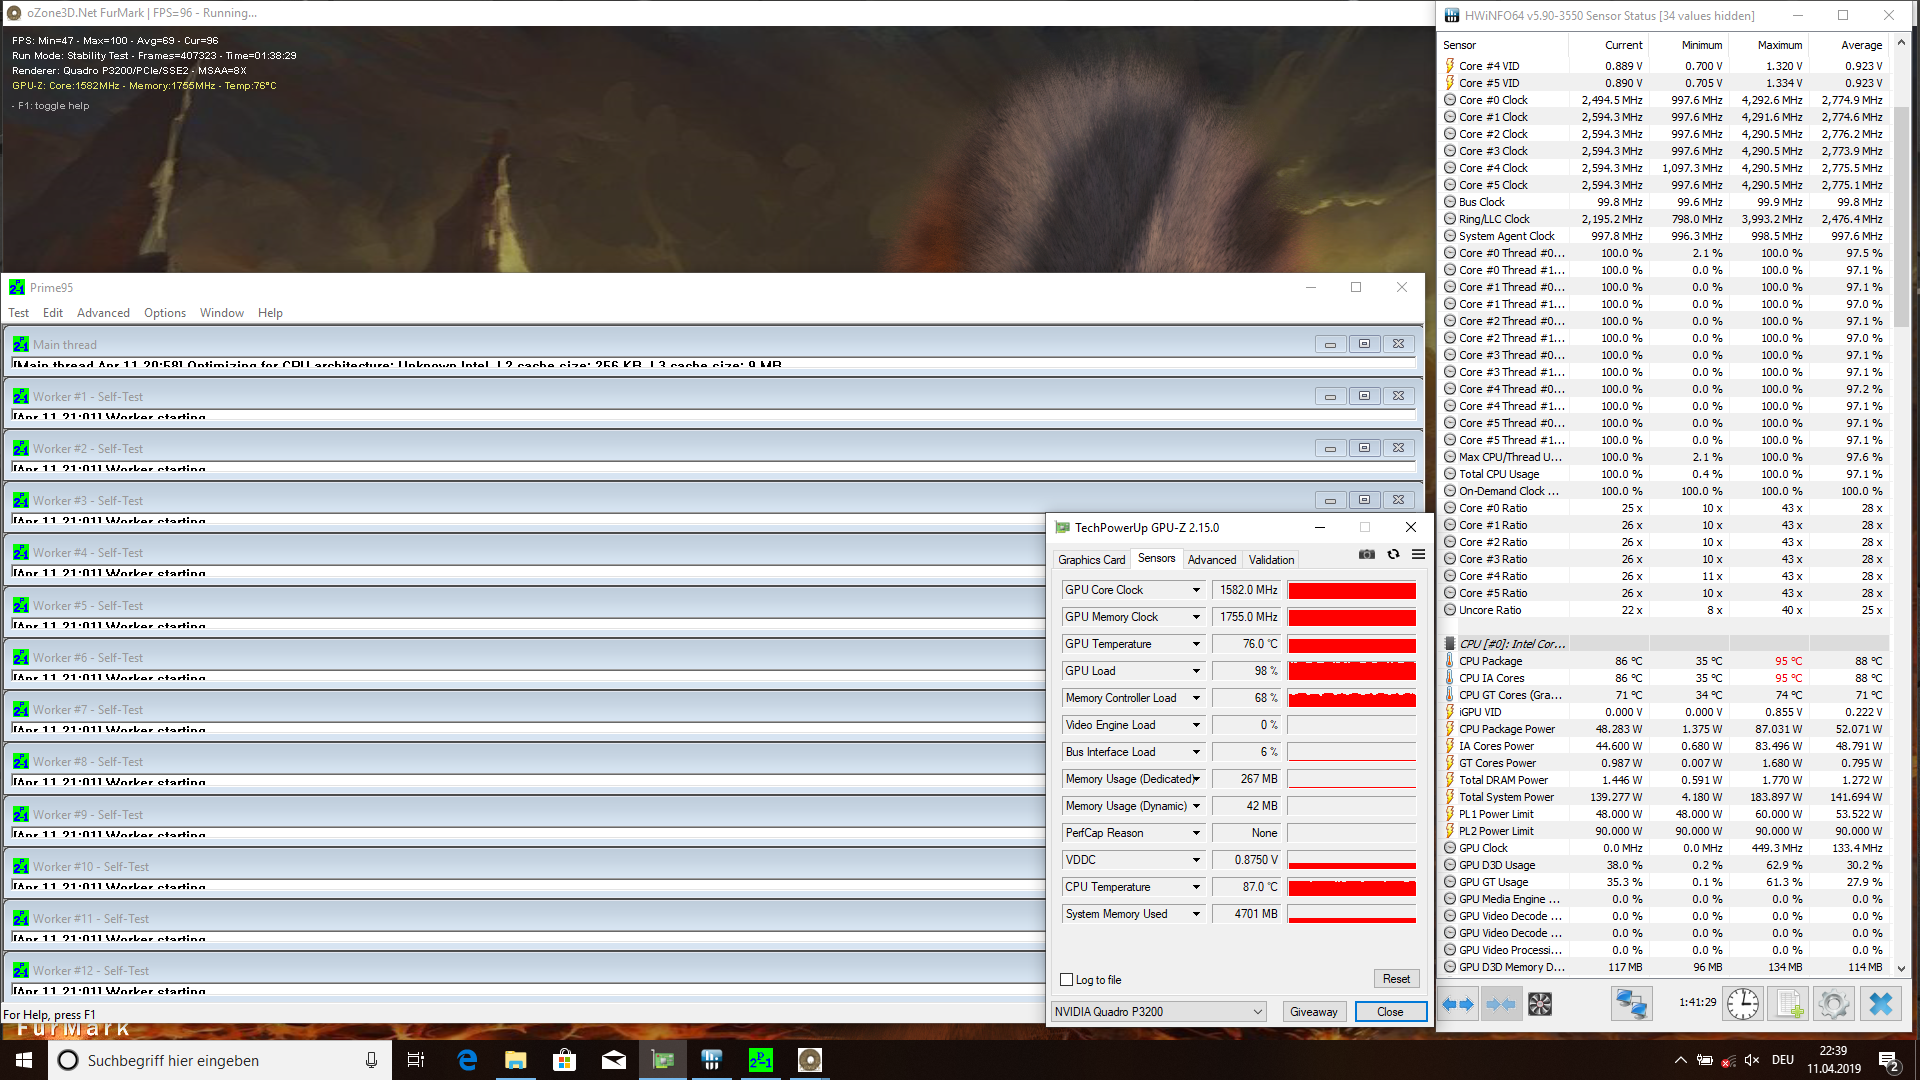
The CPU still consumed almost 50 W after over an hour of stress testing, but its clock speeds had dropped to 2.5 GHz, while its core temperatures remained at a toasty 86 °C. The GPU maintained its 1,582 MHz boost clock speed throughout our stress test though, and the cooling system kept its core temperatures to around 76 °C.
(-) The maximum temperature on the upper side is 50 °C / 122 F, compared to the average of 38.2 °C / 101 F, ranging from 22.2 to 69.8 °C for the class Workstation.
(-) The bottom heats up to a maximum of 59.8 °C / 140 F, compared to the average of 41.1 °C / 106 F
(+) In idle usage, the average temperature for the upper side is 26.4 °C / 80 F, compared to the device average of 32 °C / 90 F.
(±) Playing The Witcher 3, the average temperature for the upper side is 34.4 °C / 94 F, compared to the device average of 32 °C / 90 F.
(+) The palmrests and touchpad are cooler than skin temperature with a maximum of 29.9 °C / 85.8 F and are therefore cool to the touch.
(-) The average temperature of the palmrest area of similar devices was 27.8 °C / 82 F (-2.1 °C / -3.8 F).
Speakers
The Precision 7730 has decent speakers by laptop standards. Our review reproduces hardly any bass, but audio generally sounds comparatively balanced. The volume could be a bit higher in our opinion, but the speakers are louder than those in the ThinkPad P72.
We would recommend using the headphone jack or Bluetooth for audio output though, as both deliver a better listening experience than the inbuilt speakers do. We had no issues with either the headphone jack or Bluetooth during our tests.
Dell Precision 7730 audio analysis
(±) | speaker loudness is average but good (81.1 dB)
Bass 100 - 315 Hz
(-) | nearly no bass - on average 16.7% lower than median
(±) | linearity of bass is average (11.6% delta to prev. frequency)
Mids 400 - 2000 Hz
(±) | reduced mids - on average 5.4% lower than median
(+) | mids are linear (5.4% delta to prev. frequency)
Highs 2 - 16 kHz
(+) | balanced highs - only 4% away from median
(+) | highs are linear (5.8% delta to prev. frequency)
Overall 100 - 16.000 Hz
(±) | linearity of overall sound is average (17% difference to median)
Compared to same class
» 49% of all tested devices in this class were better, 10% similar, 41% worse
» The best had a delta of 7%, average was 17%, worst was 35%
Compared to all devices tested
» 30% of all tested devices were better, 8% similar, 62% worse
» The best had a delta of 4%, average was 24%, worst was 134%
Lenovo ThinkPad P72-20MB000EGE audio analysis
(-) | not very loud speakers (69.6 dB)
Bass 100 - 315 Hz
(-) | nearly no bass - on average 17.4% lower than median
(±) | linearity of bass is average (13.5% delta to prev. frequency)
Mids 400 - 2000 Hz
(±) | higher mids - on average 7.2% higher than median
(±) | linearity of mids is average (8.7% delta to prev. frequency)
Highs 2 - 16 kHz
(+) | balanced highs - only 4.4% away from median
(±) | linearity of highs is average (12.7% delta to prev. frequency)
Overall 100 - 16.000 Hz
(-) | overall sound is not linear (30.7% difference to median)
Compared to same class
» 97% of all tested devices in this class were better, 1% similar, 1% worse
» The best had a delta of 7%, average was 17%, worst was 35%
Compared to all devices tested
» 89% of all tested devices were better, 3% similar, 8% worse
» The best had a delta of 4%, average was 24%, worst was 134%
Power Management
Power Consumption
The power consumption of the Precision 7730 is disappointingly high. Our review unit consumes a minimum of 10.1 W when idling, which is much higher than what the Precision 7720 and ThinkPad P72 achieved during our tests. Overall, the latter averaged 28% lower power consumption than the Precision 7730 despite having the same CPU and GPU.
Our test device consumed a maximum of 204 W during our tests. Dell includes a sufficiently large power supply to keep the Precision 7730 charging even when it is running under full load though.
| Off / Standby | |
| Idle | |
| Load |
|
Key:
min: | |
| Dell Precision 7730 i7-8850H, Quadro P3200, Samsung SSD PM981 MZVLB512HAJQ, IPS LED, 1920x1080, 17.3" | Dell Precision 7720 E3-1535M v6, Quadro P5000, Toshiba NVMe THNSN5512GPU7, IGZO, 3840x2160, 17.3" | Lenovo ThinkPad P72-20MB000EGE i7-8850H, Quadro P3200, Lenovo LENSE20256GMSP34MEAT2TA, IPS, 1920x1080, 17.3" | Fujitsu Celsius H980 i7-8750H, Quadro P3200, Samsung SSD PM981 MZVLB512HAJQ, IPS, 1920x1080, 17.3" | Average NVIDIA Quadro P3200 | Average of class Workstation | |
|---|---|---|---|---|---|---|
| Power Consumption | -6% | 28% | -17% | -0% | 11% | |
| Idle Minimum * (Watt) | 10.1 | 9.6 5% | 4.6 54% | 14.8 -47% | 10.9 ? -8% | 8.94 ? 11% |
| Idle Average * (Watt) | 18 | 20.5 -14% | 12.2 32% | 20.4 -13% | 17.1 ? 5% | 13.8 ? 23% |
| Idle Maximum * (Watt) | 19.7 | 22.9 -16% | 15.4 22% | 21.5 -9% | 19.6 ? 1% | 17.5 ? 11% |
| Load Average * (Watt) | 89.6 | 96.8 -8% | 79.6 11% | 98.4 -10% | 95.1 ? -6% | 95 ? -6% |
| Witcher 3 ultra * (Watt) | 134 | 86 36% | ||||
| Load Maximum * (Watt) | 204 | 202.1 1% | 176 14% | 213.5 -5% | 191.3 ? 6% | 175.2 ? 14% |
* ... smaller is better
Battery Life
Workstations typically have at least 90 Wh batteries, and the Precision 7730 is no different. Dell has equipped the device with a 92 Wh battery, which is slightly smaller than the batteries in the Celsius H980 and ThinkPad P72. Unfortunately, the high battery capacity does not correlate with long battery life, because our review unit achieved embarrassingly short runtimes in our battery life tests. The Precision 7730 needed recharging after just 5:35 hours of our Wi-Fi battery life test, during which we run a script that simulates the load required to render websites. We also set the display luminosity to 150 cd/m², which is approximately 50% brightness in our review unit.
This runtime is not overly surprising considering the Precision 7730’s comparatively high power consumption. By contrast, the ThinkPad P72 averaged 66% longer runtimes than our review unit with its 99 Wh battery.
Please keep in mind that the Precision 7730 achieves these runtimes with a Full HD display, a Core i7-8850H processor and a Quadro P3200 GPU. Equipping the device with more-powerful components will significantly increase power consumption. Correspondingly, a more-powerful variant will also have considerably worse battery life than our review unit, as Dell does not, and cannot, sell a device with more than a 100 Wh battery.
| Dell Precision 7730 i7-8850H, Quadro P3200, 92 Wh | Dell Precision 7720 E3-1535M v6, Quadro P5000, 91 Wh | Lenovo ThinkPad P72-20MB000EGE i7-8850H, Quadro P3200, 99 Wh | Fujitsu Celsius H980 i7-8750H, Quadro P3200, 96 Wh | Average of class Workstation | |
|---|---|---|---|---|---|
| Battery runtime | 3% | 66% | 14% | 37% | |
| H.264 (h) | 5.8 | 6.8 17% | 12.3 112% | 5.9 2% | 9.51 ? 64% |
| WiFi v1.3 (h) | 5.6 | 6.3 13% | 11.2 100% | 8.3 48% | 8.53 ? 52% |
| Load (h) | 1.5 | 1.2 -20% | 1.3 -13% | 1.4 -7% | 1.429 ? -5% |
| Reader / Idle (h) | 11.4 | 28.3 | 13.5 | 26.1 ? |
Pros
Cons
Verdict
You would be forgiven for thinking that not much has changed with the new Precision 7700-series laptop. Dell has made the Precision 7730 more compact than its predecessor, but it is still made from the same materials.
The Precision 7730 still has a good keyboard along with a robust case and a range of ports. Furthermore, Dell offers more configuration options than its competitors do, which makes the Precision 7730 a more flexible option for people in our eyes. Our review unit has excellent CPU and GPU performance too, as is often the case for workstations, while we welcome the inclusion of matte display options. Dell has also equipped the Precision 7730 with an impressively fast SD card reader and includes a 36 months warranty as standard, both of which we like.
The Dell Precision 7730 is an excellent workstation that is let down by its disappointing battery life.
The biggest problem with the Precision 7730 is its awful battery life. While most people will keep the workstation on charge because of its size, the ThinkPad P72 remains a better option for those who occasionally need to use their device away from a power outlet. Likewise, our review unit has unacceptably high surface temperatures, while it also heavily throttles its CPU and GPU on battery.
It is a shame to see a workstation that is affected by backlight bleeding too. Moreover, we cannot understand why Dell removed the fingerprint scanner that was included on the Precision 7720.
On balance, we would still recommend buying the Precision 7730 if you are in the market for a workstation. Battery life aside, the Precision 7730 delivers all that you could want from a workstation. You will always need to have your charger with you if you plan to use the device on the move, but it is probably too bulky to use as a mobile workstation anyway, which is why we still recommend considering it over other workstations.
Dell Precision 7730
- 01/08/2020 v7 (old)
Benjamin Herzig
Price comparison

