Dell Inspiron 17 3000 3780 (i7-8565U, Radeon 520) Laptop Review
Users who don't want to spend a fortune on a high-end XPS system can opt for Dell's budget Inspiron series. The Inspiron 17 3780 is a low-end 17.3-inch offering for those who just need a basic laptop for browsing and video streaming.
SKUs range from $480 USD with an AMD Ryzen 3 2300U with Vega 6 graphics or Intel Core i3-7020U with UHD Graphics 620 up to $800 USD with the Core i7-8565U and discrete Radeon 520 graphics. All configurations come standard with a 1080p IPS display.
Direct competitors in this space include other 17.3-inch entry-level multimedia laptops like the HP 17, Acer Aspire ES 17, Lenovo IdeaPad 330-17IKB, and the Asus VivoBook 17. We recommend checking out our existing review on the Inspiron 17 5770 as the Inspiron 17 3780 shares the same chassis design.
More Dell Inspiron reviews:
Case
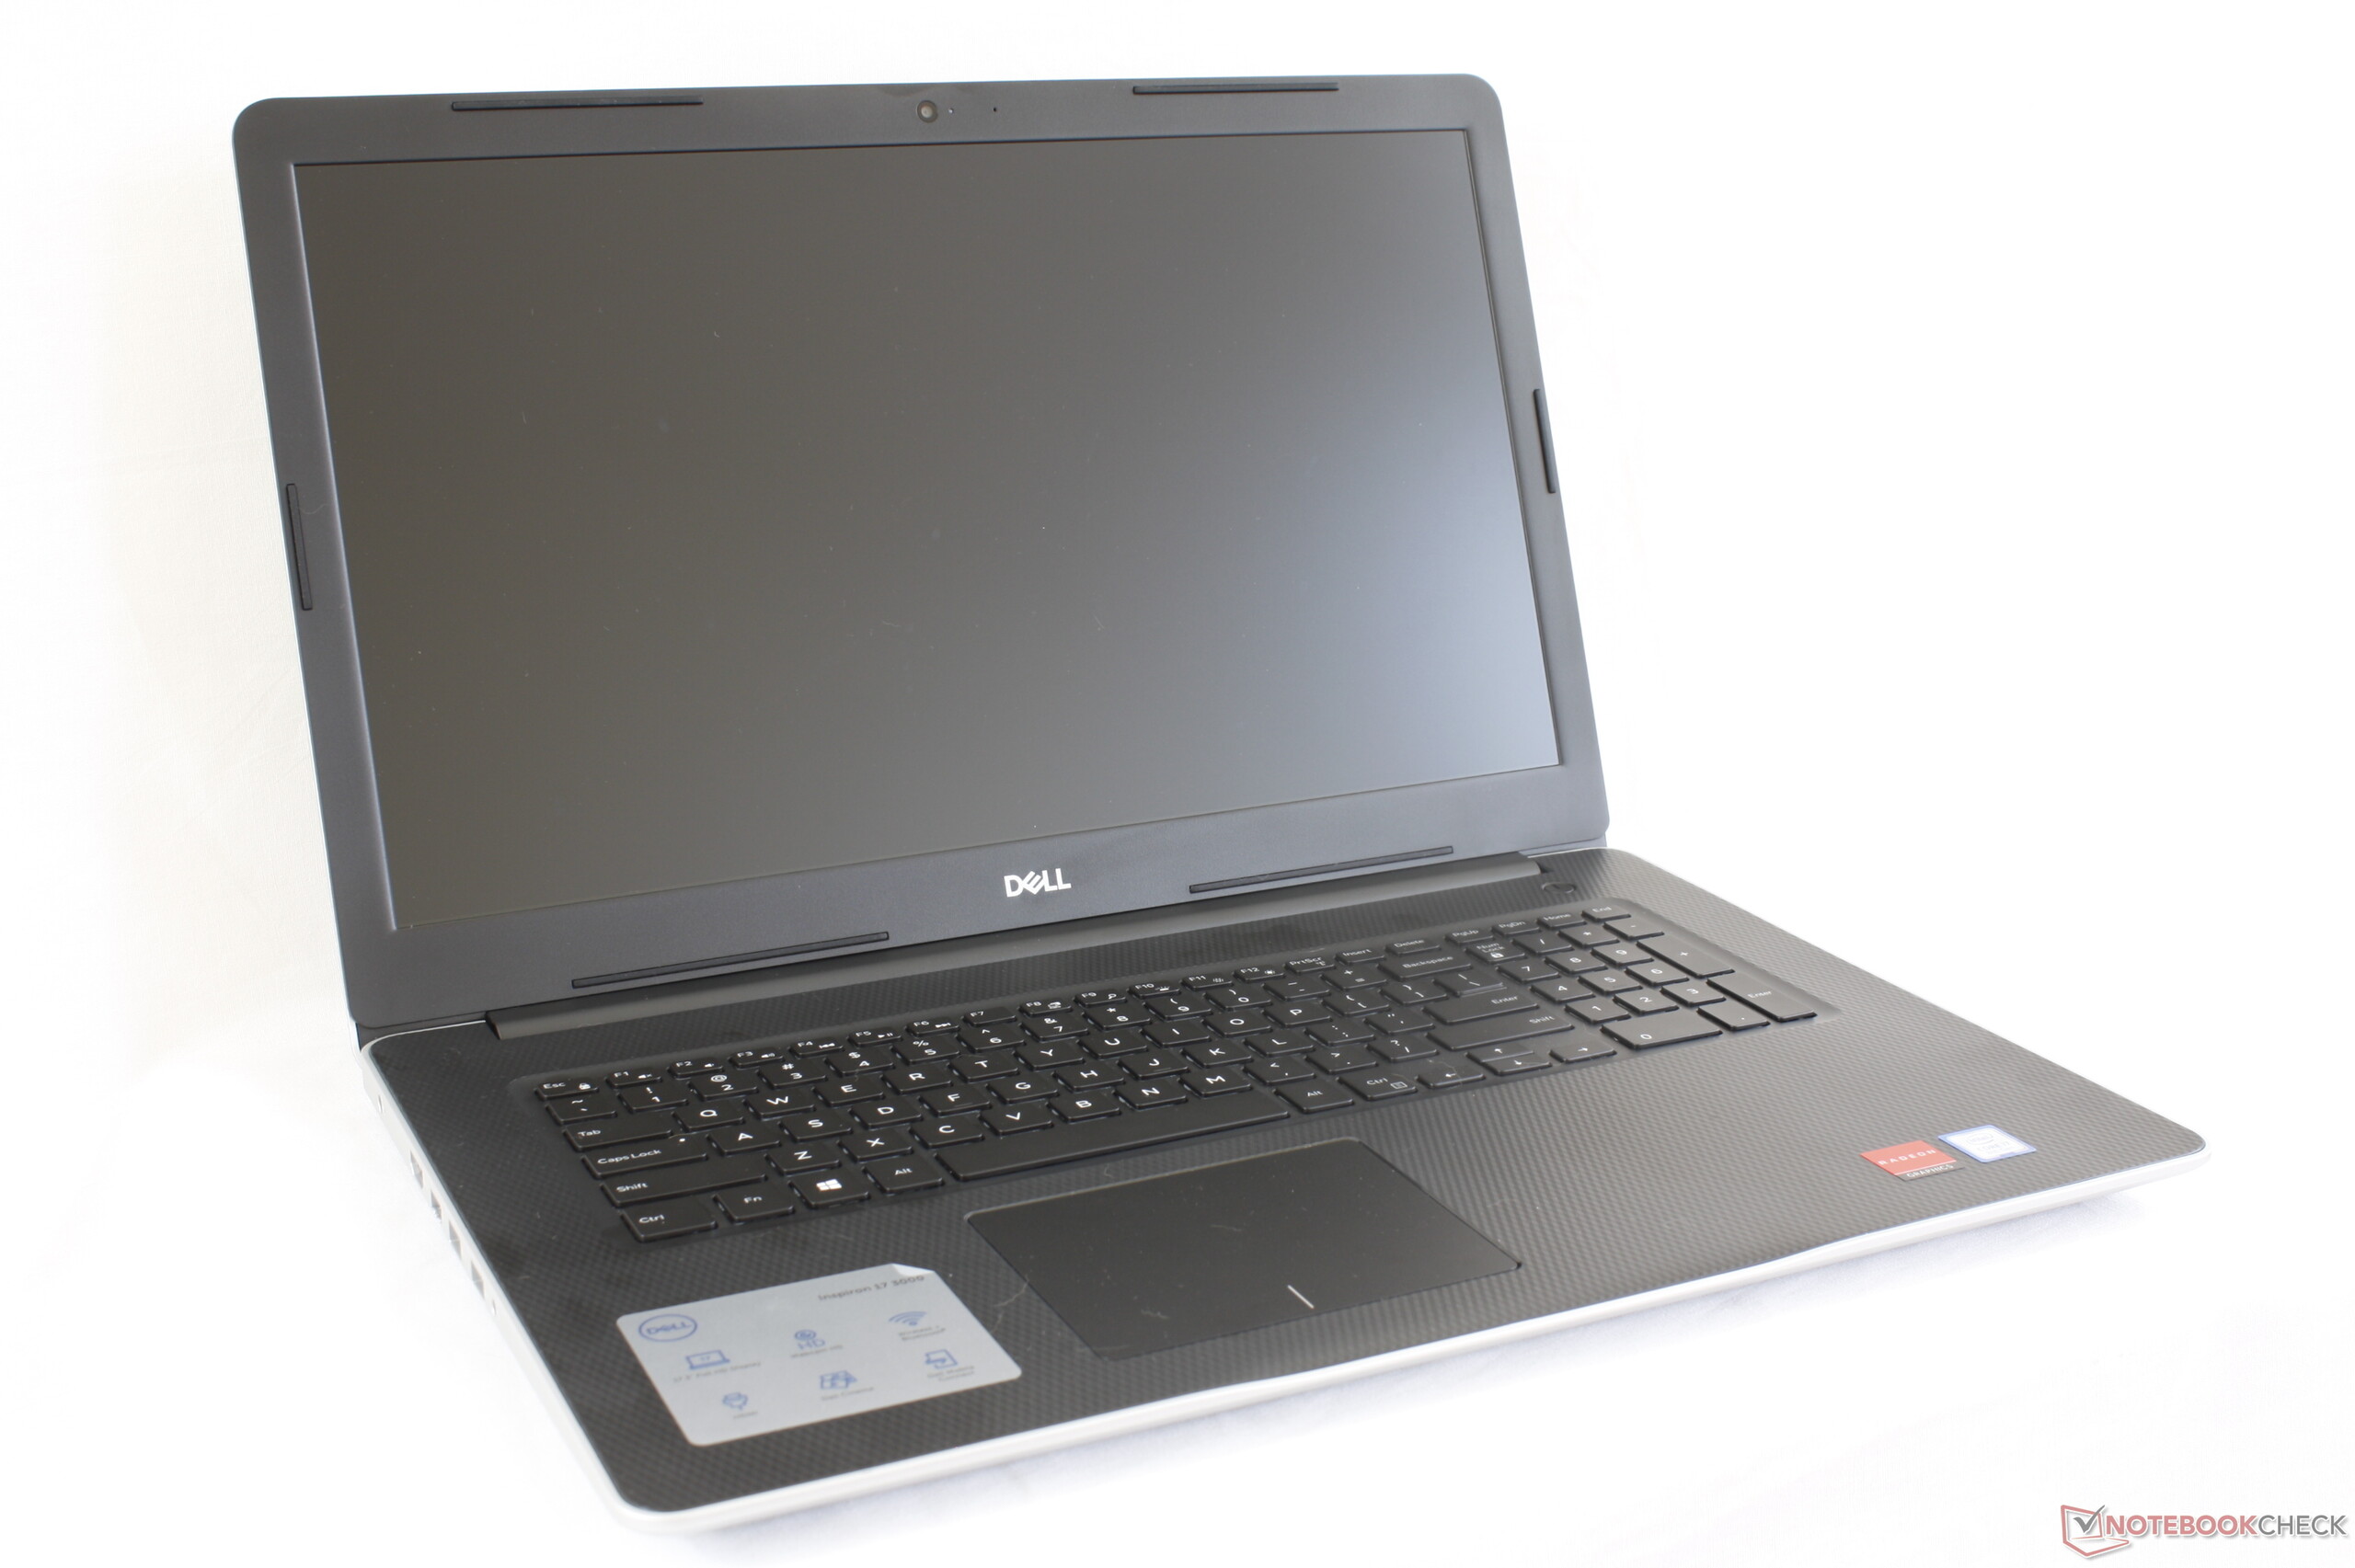
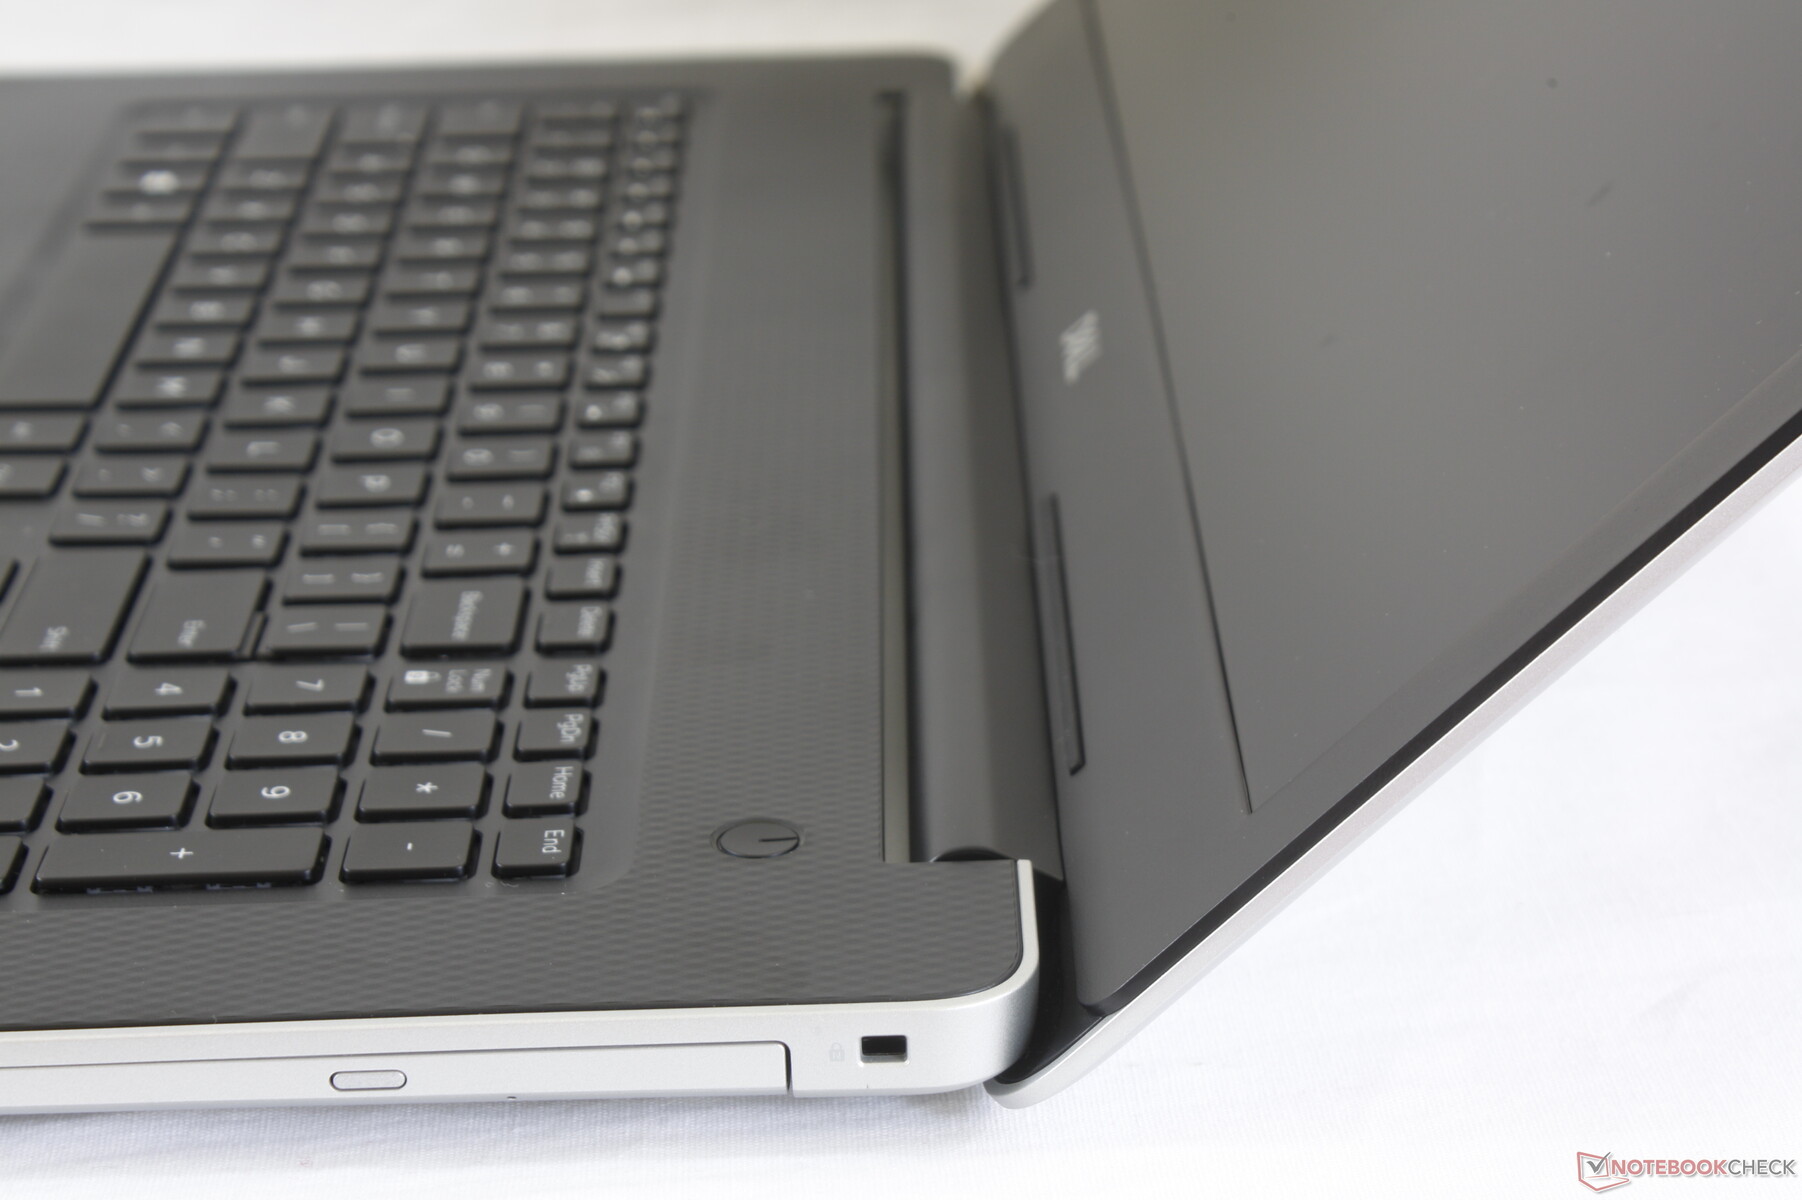
Our chassis comments on the Inspiron 17 5770 apply here on the Inspiron 17 3780. The heavy plastic base is firm and resistant to twists while the lid is free of any teetering issues while typing. Weak points include the center of the keyboard and outer lid where surfaces are more susceptible to warping when applying pressure. These drawbacks are noticeable for a cheap impression, but they don't impact everyday usability.
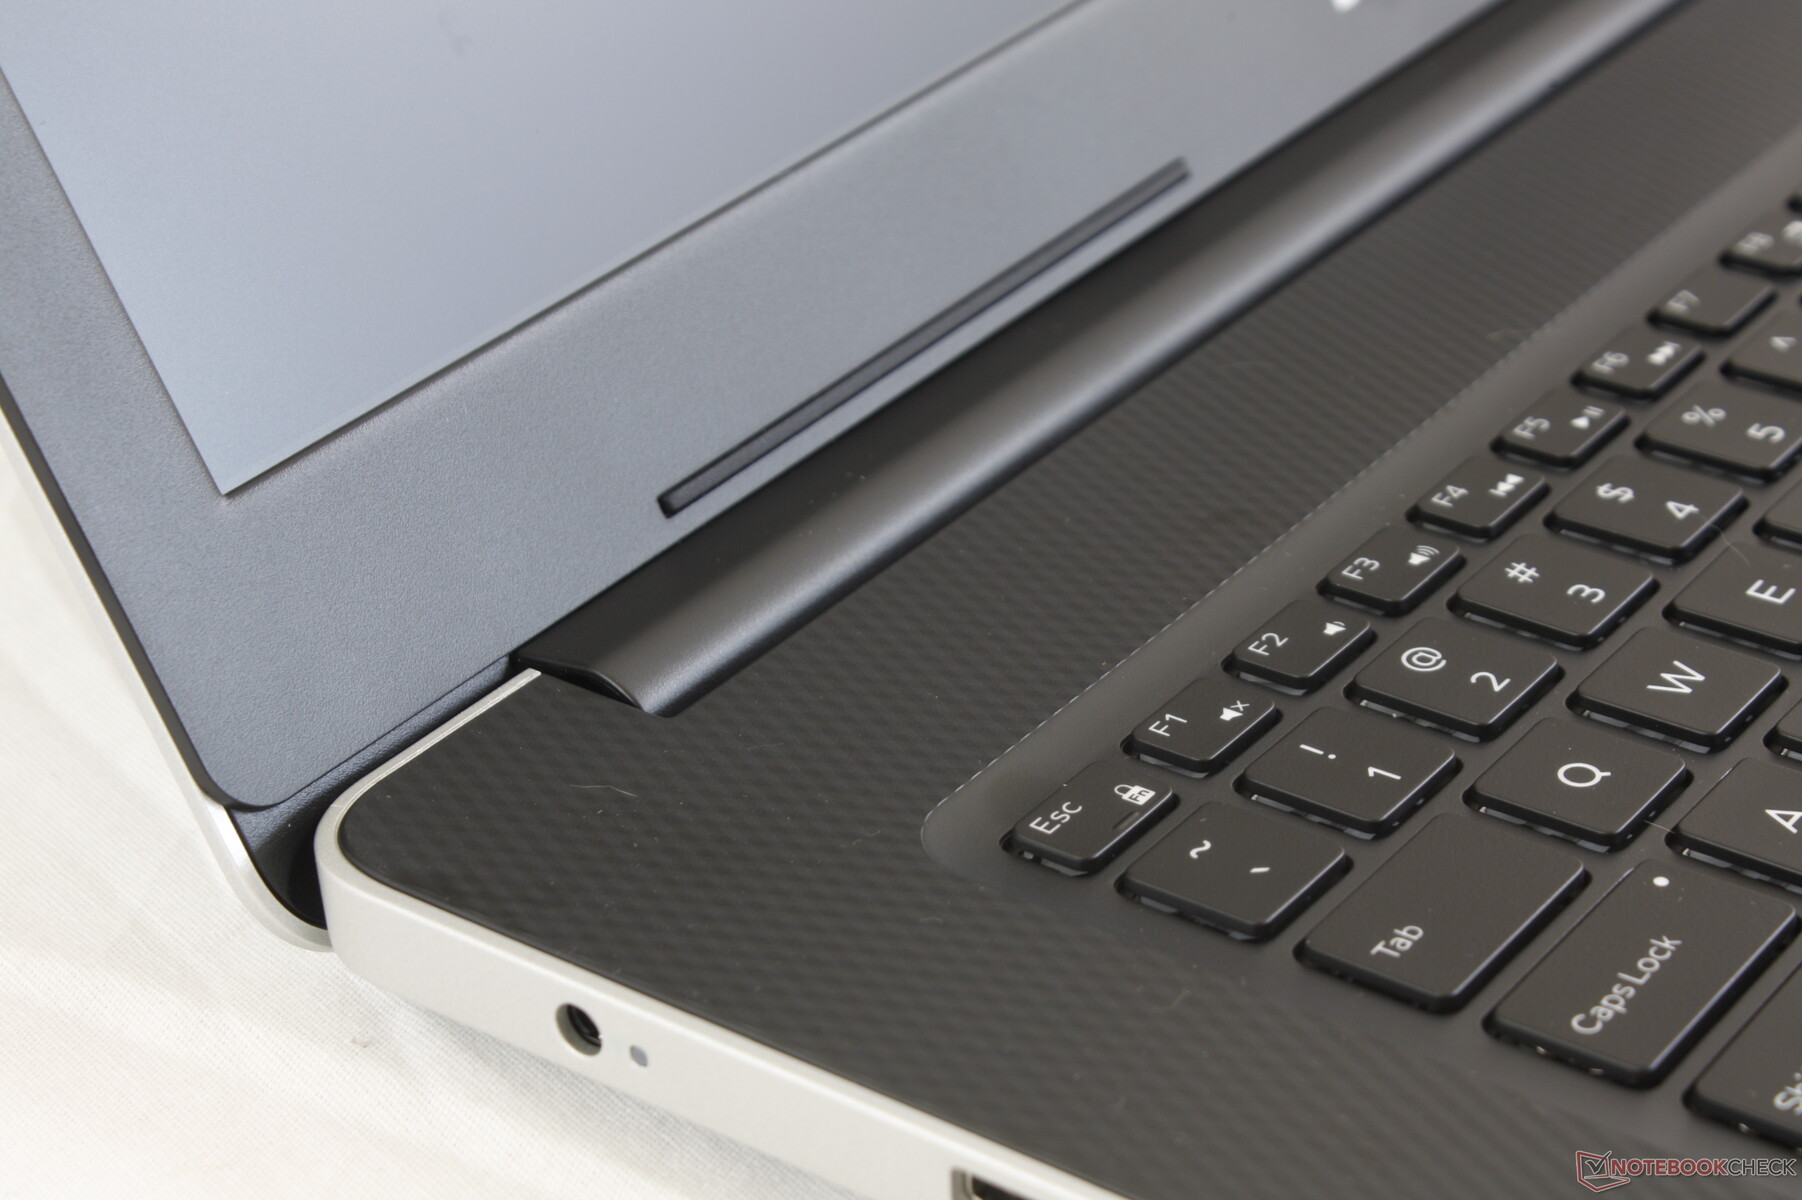
Construction quality is excellent from top to bottom with no unintended defects or uneven gaps between materials. While the outer matte gray surfaces hide fingerprints quite well, expect grease to accumulate quickly on the black keycaps and trackpad. The inexpensive plastic materials here contrast the magnesium and carbon fiber makeup of Dell's pricier XPS lineup.
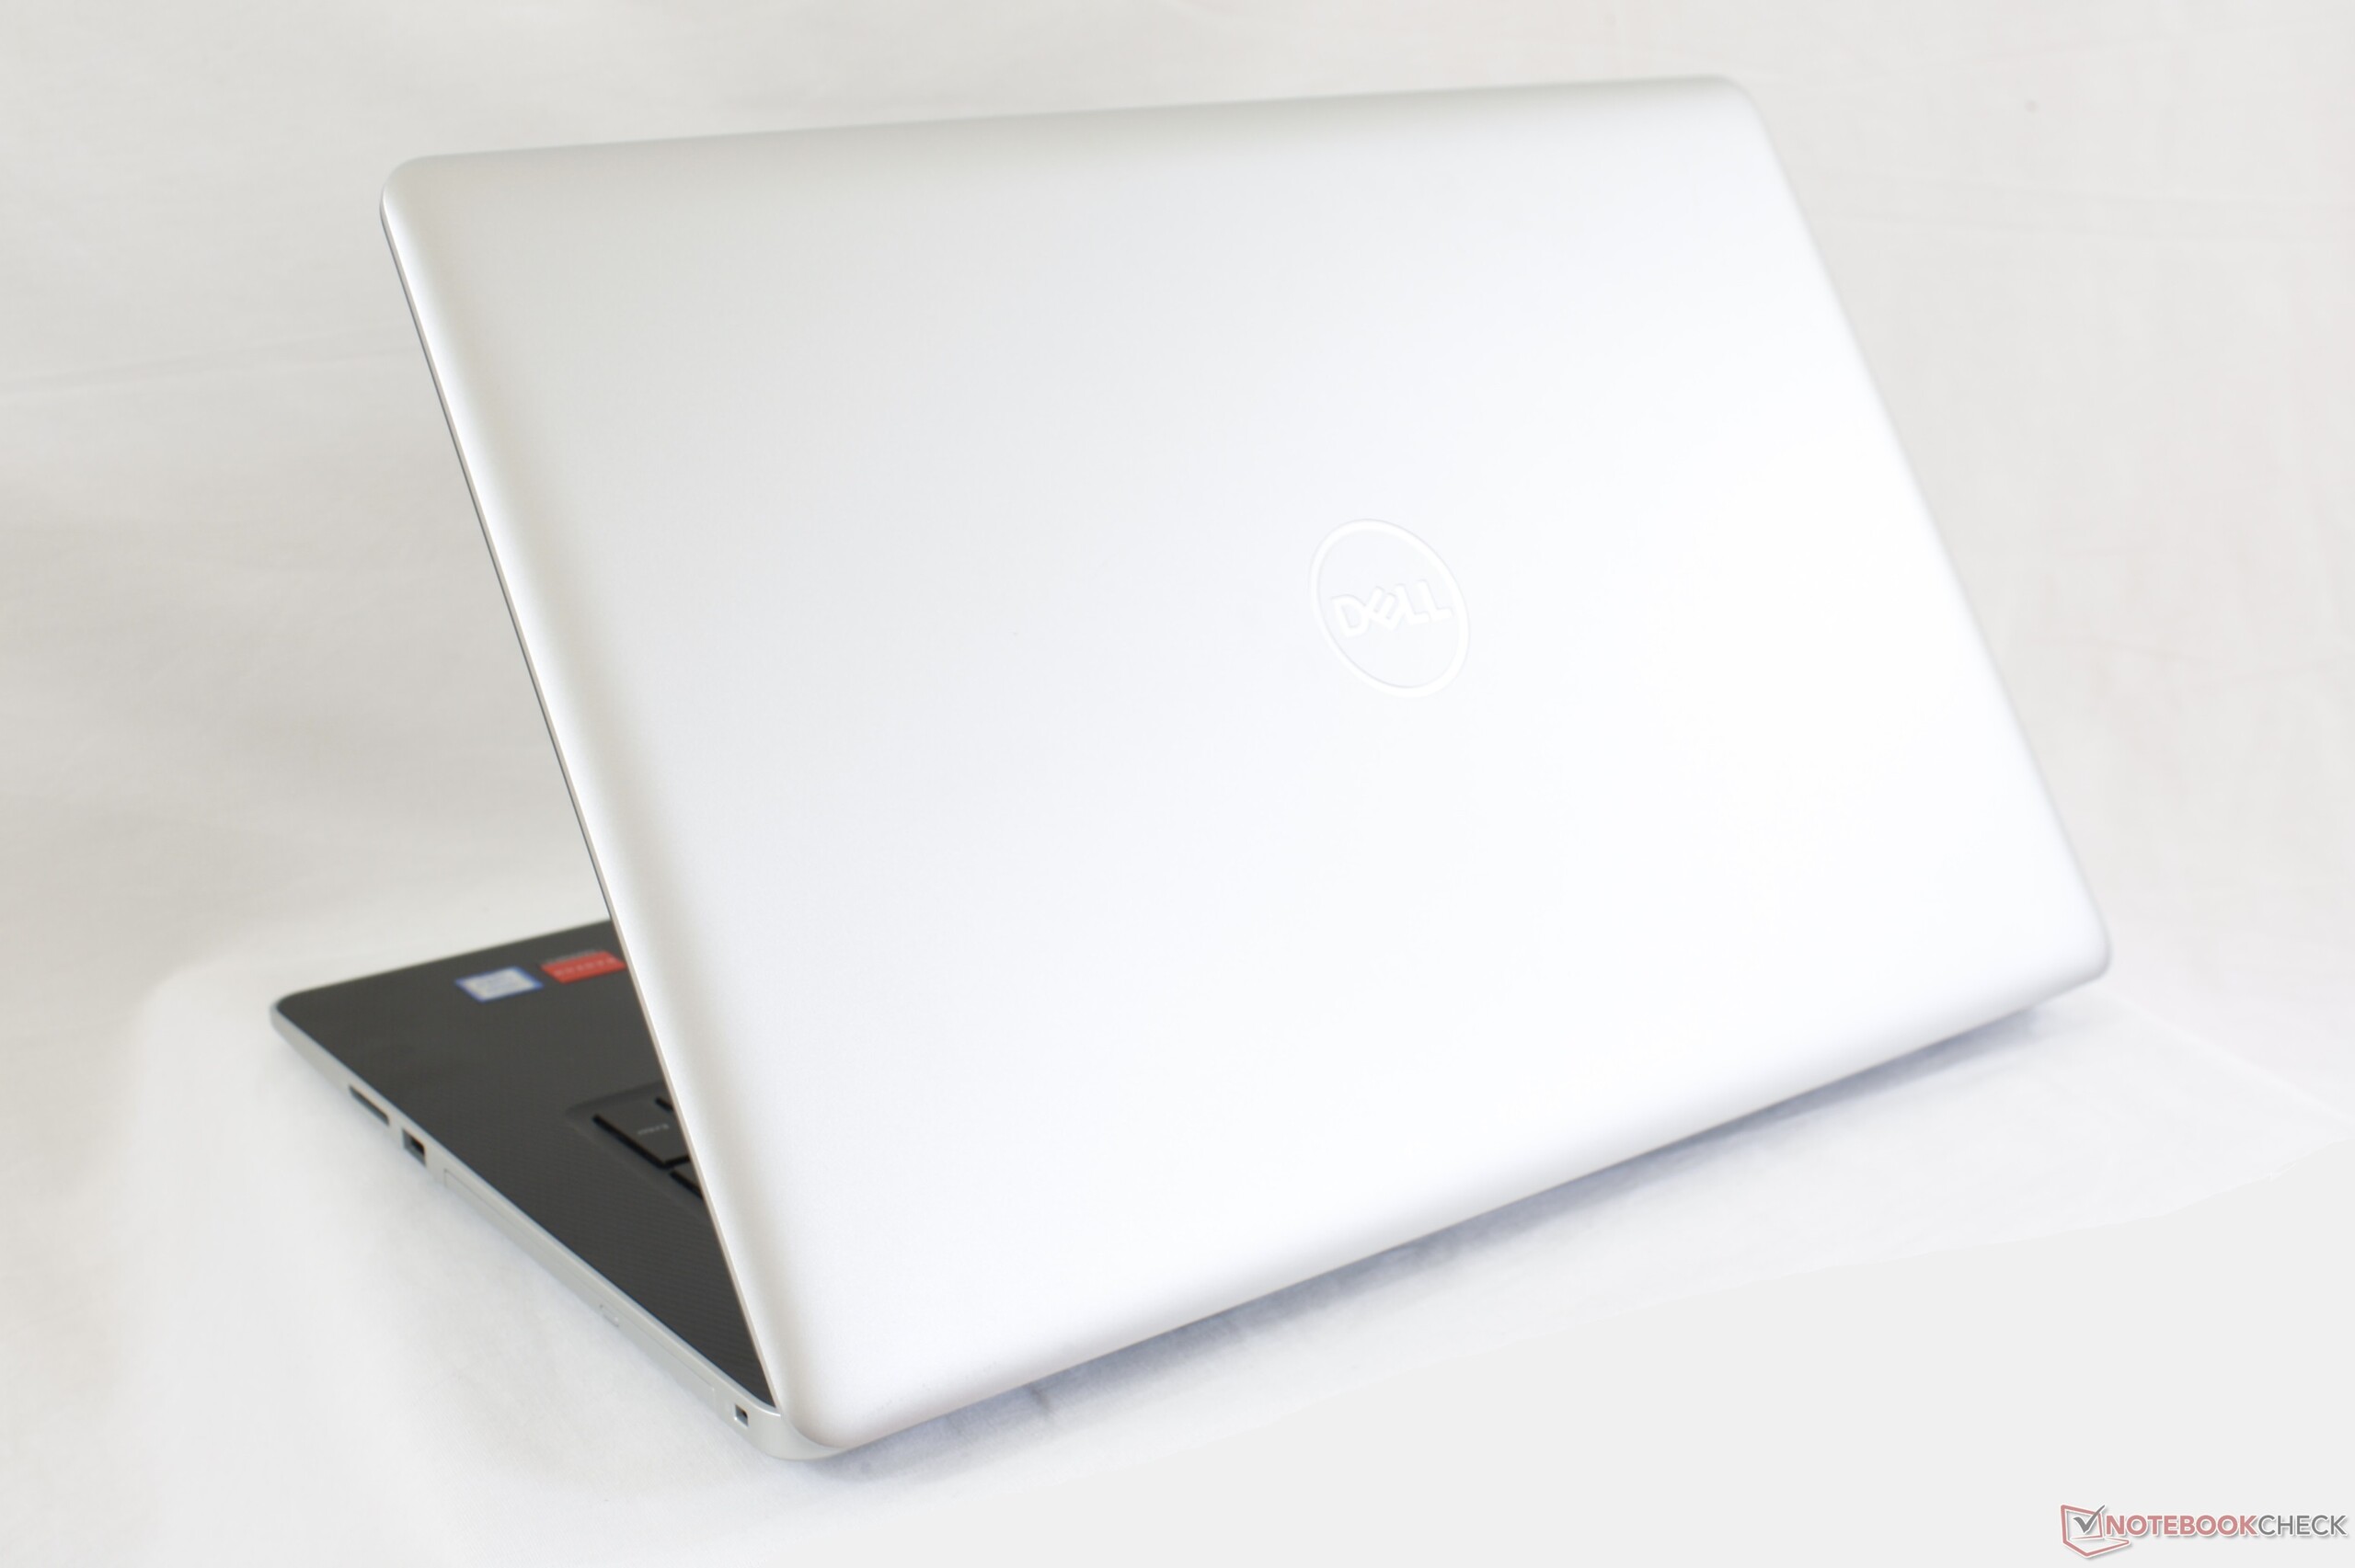
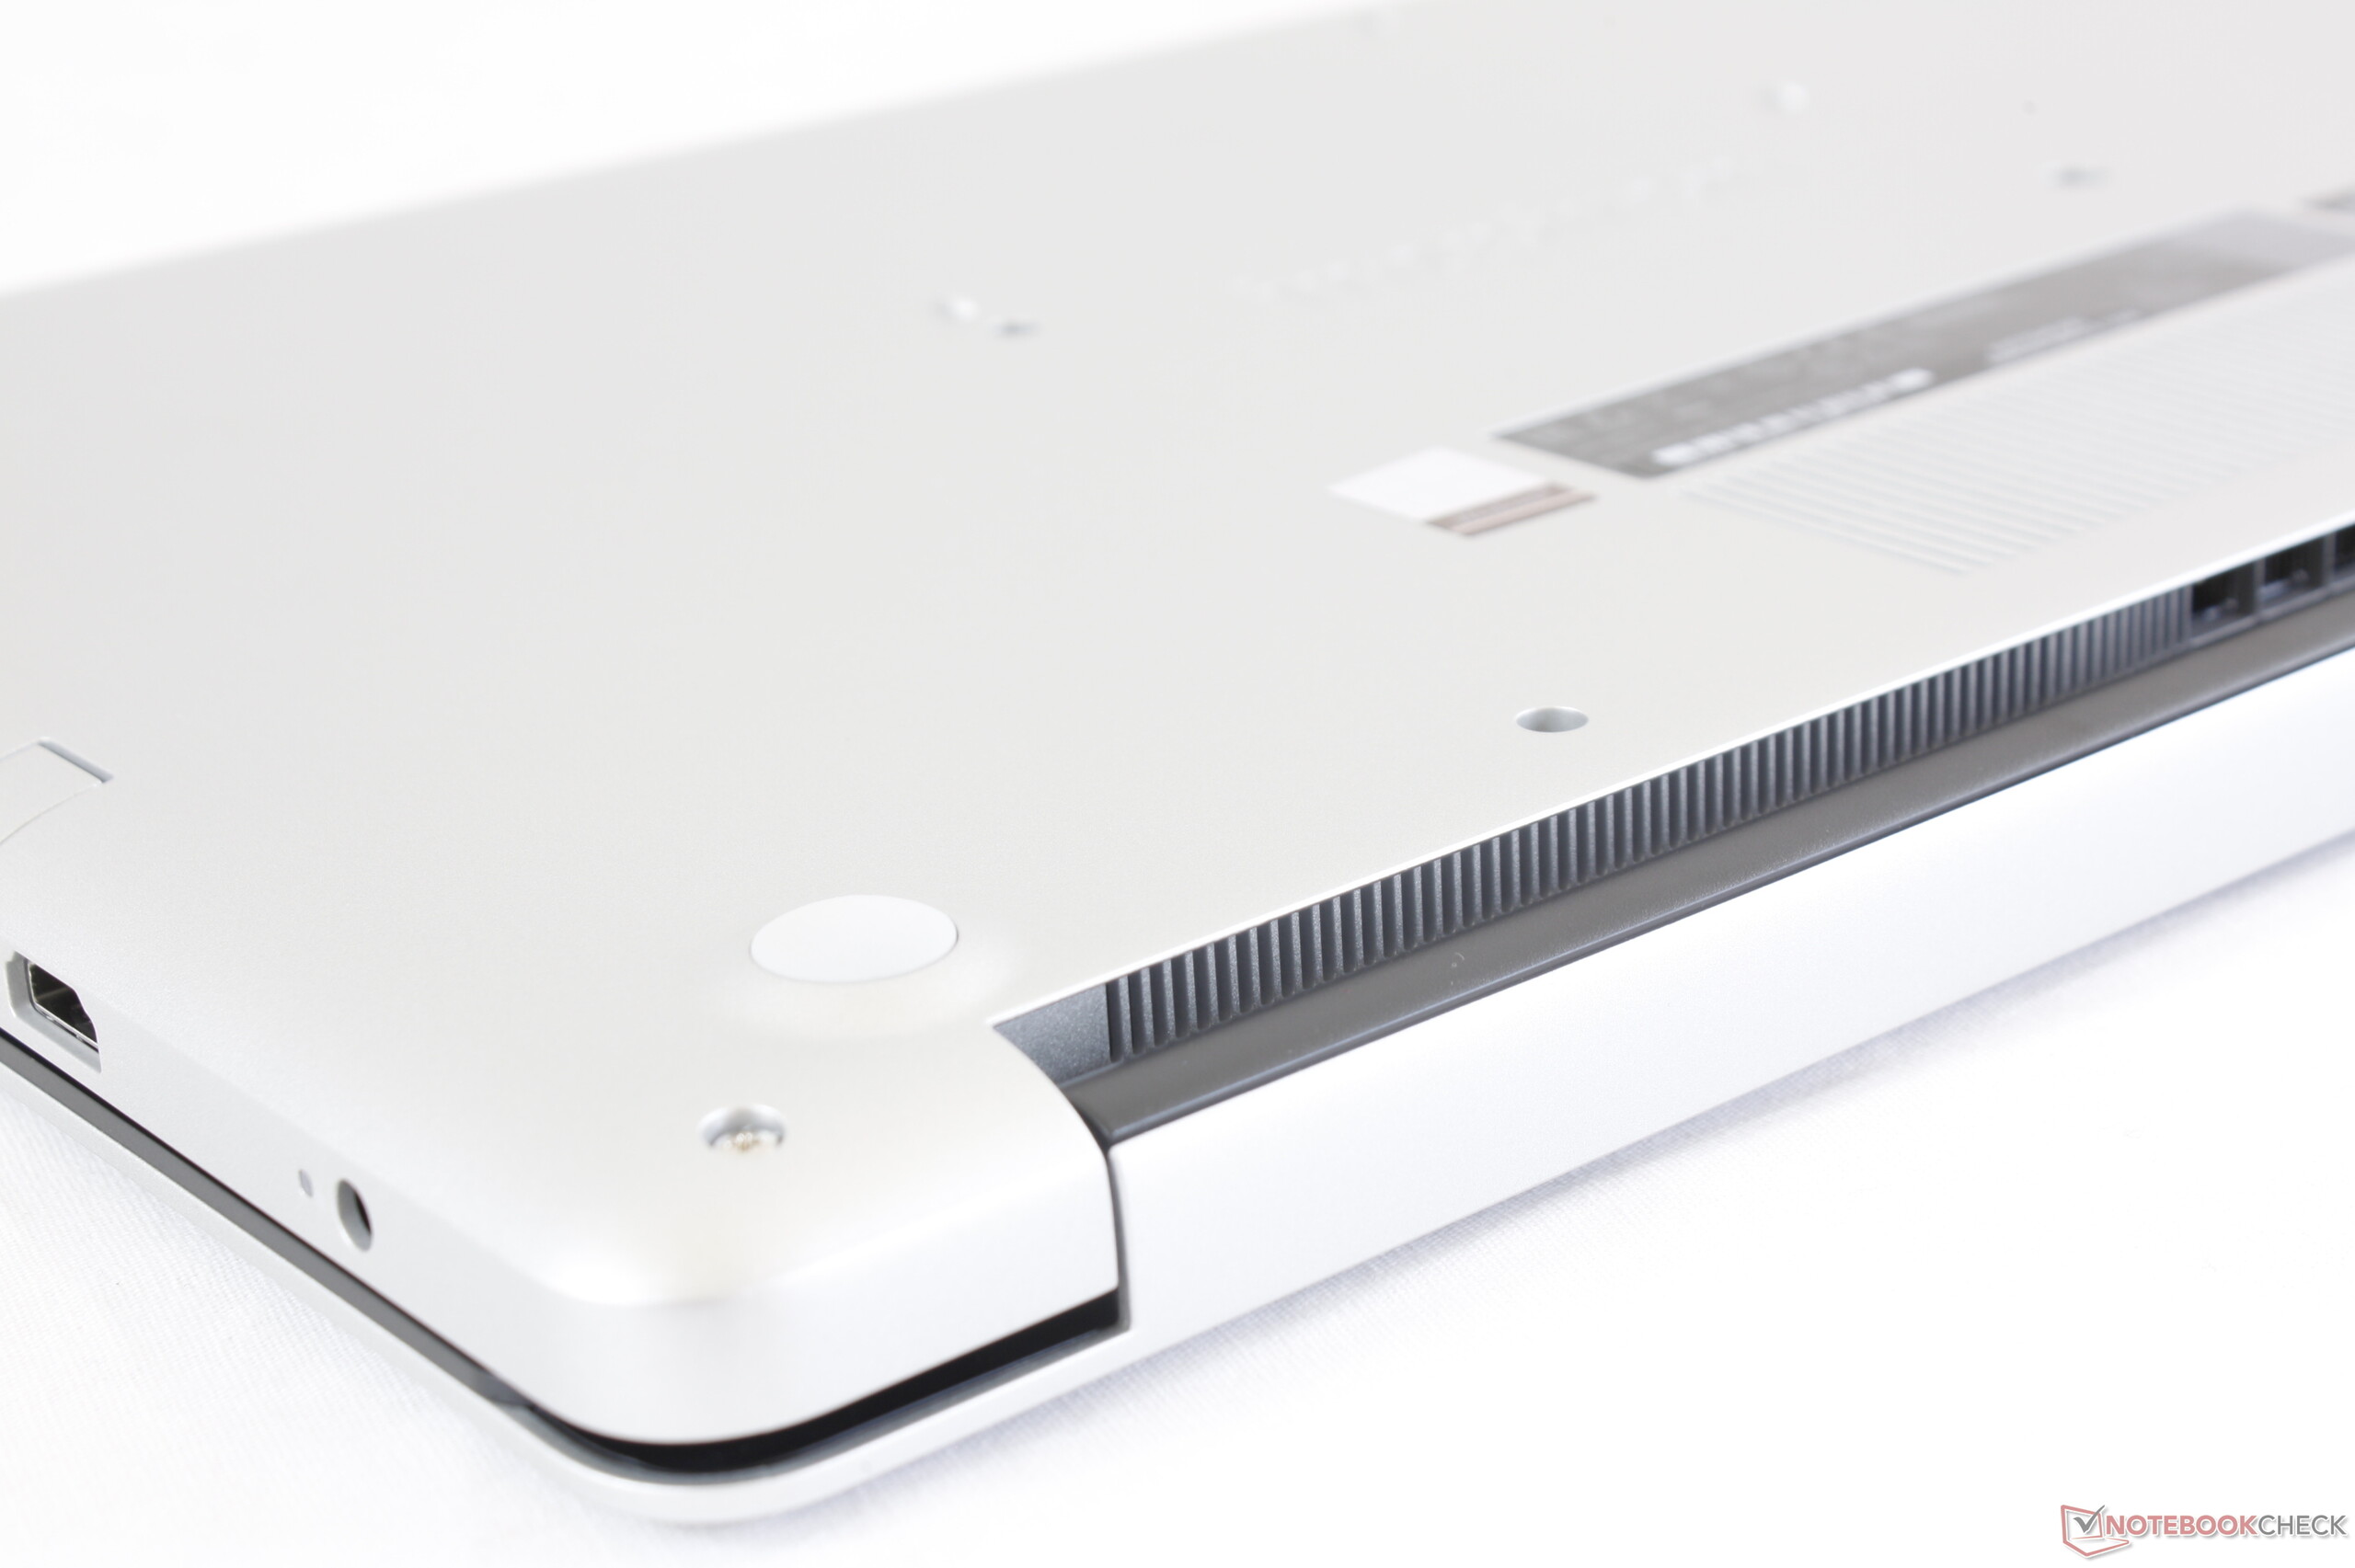
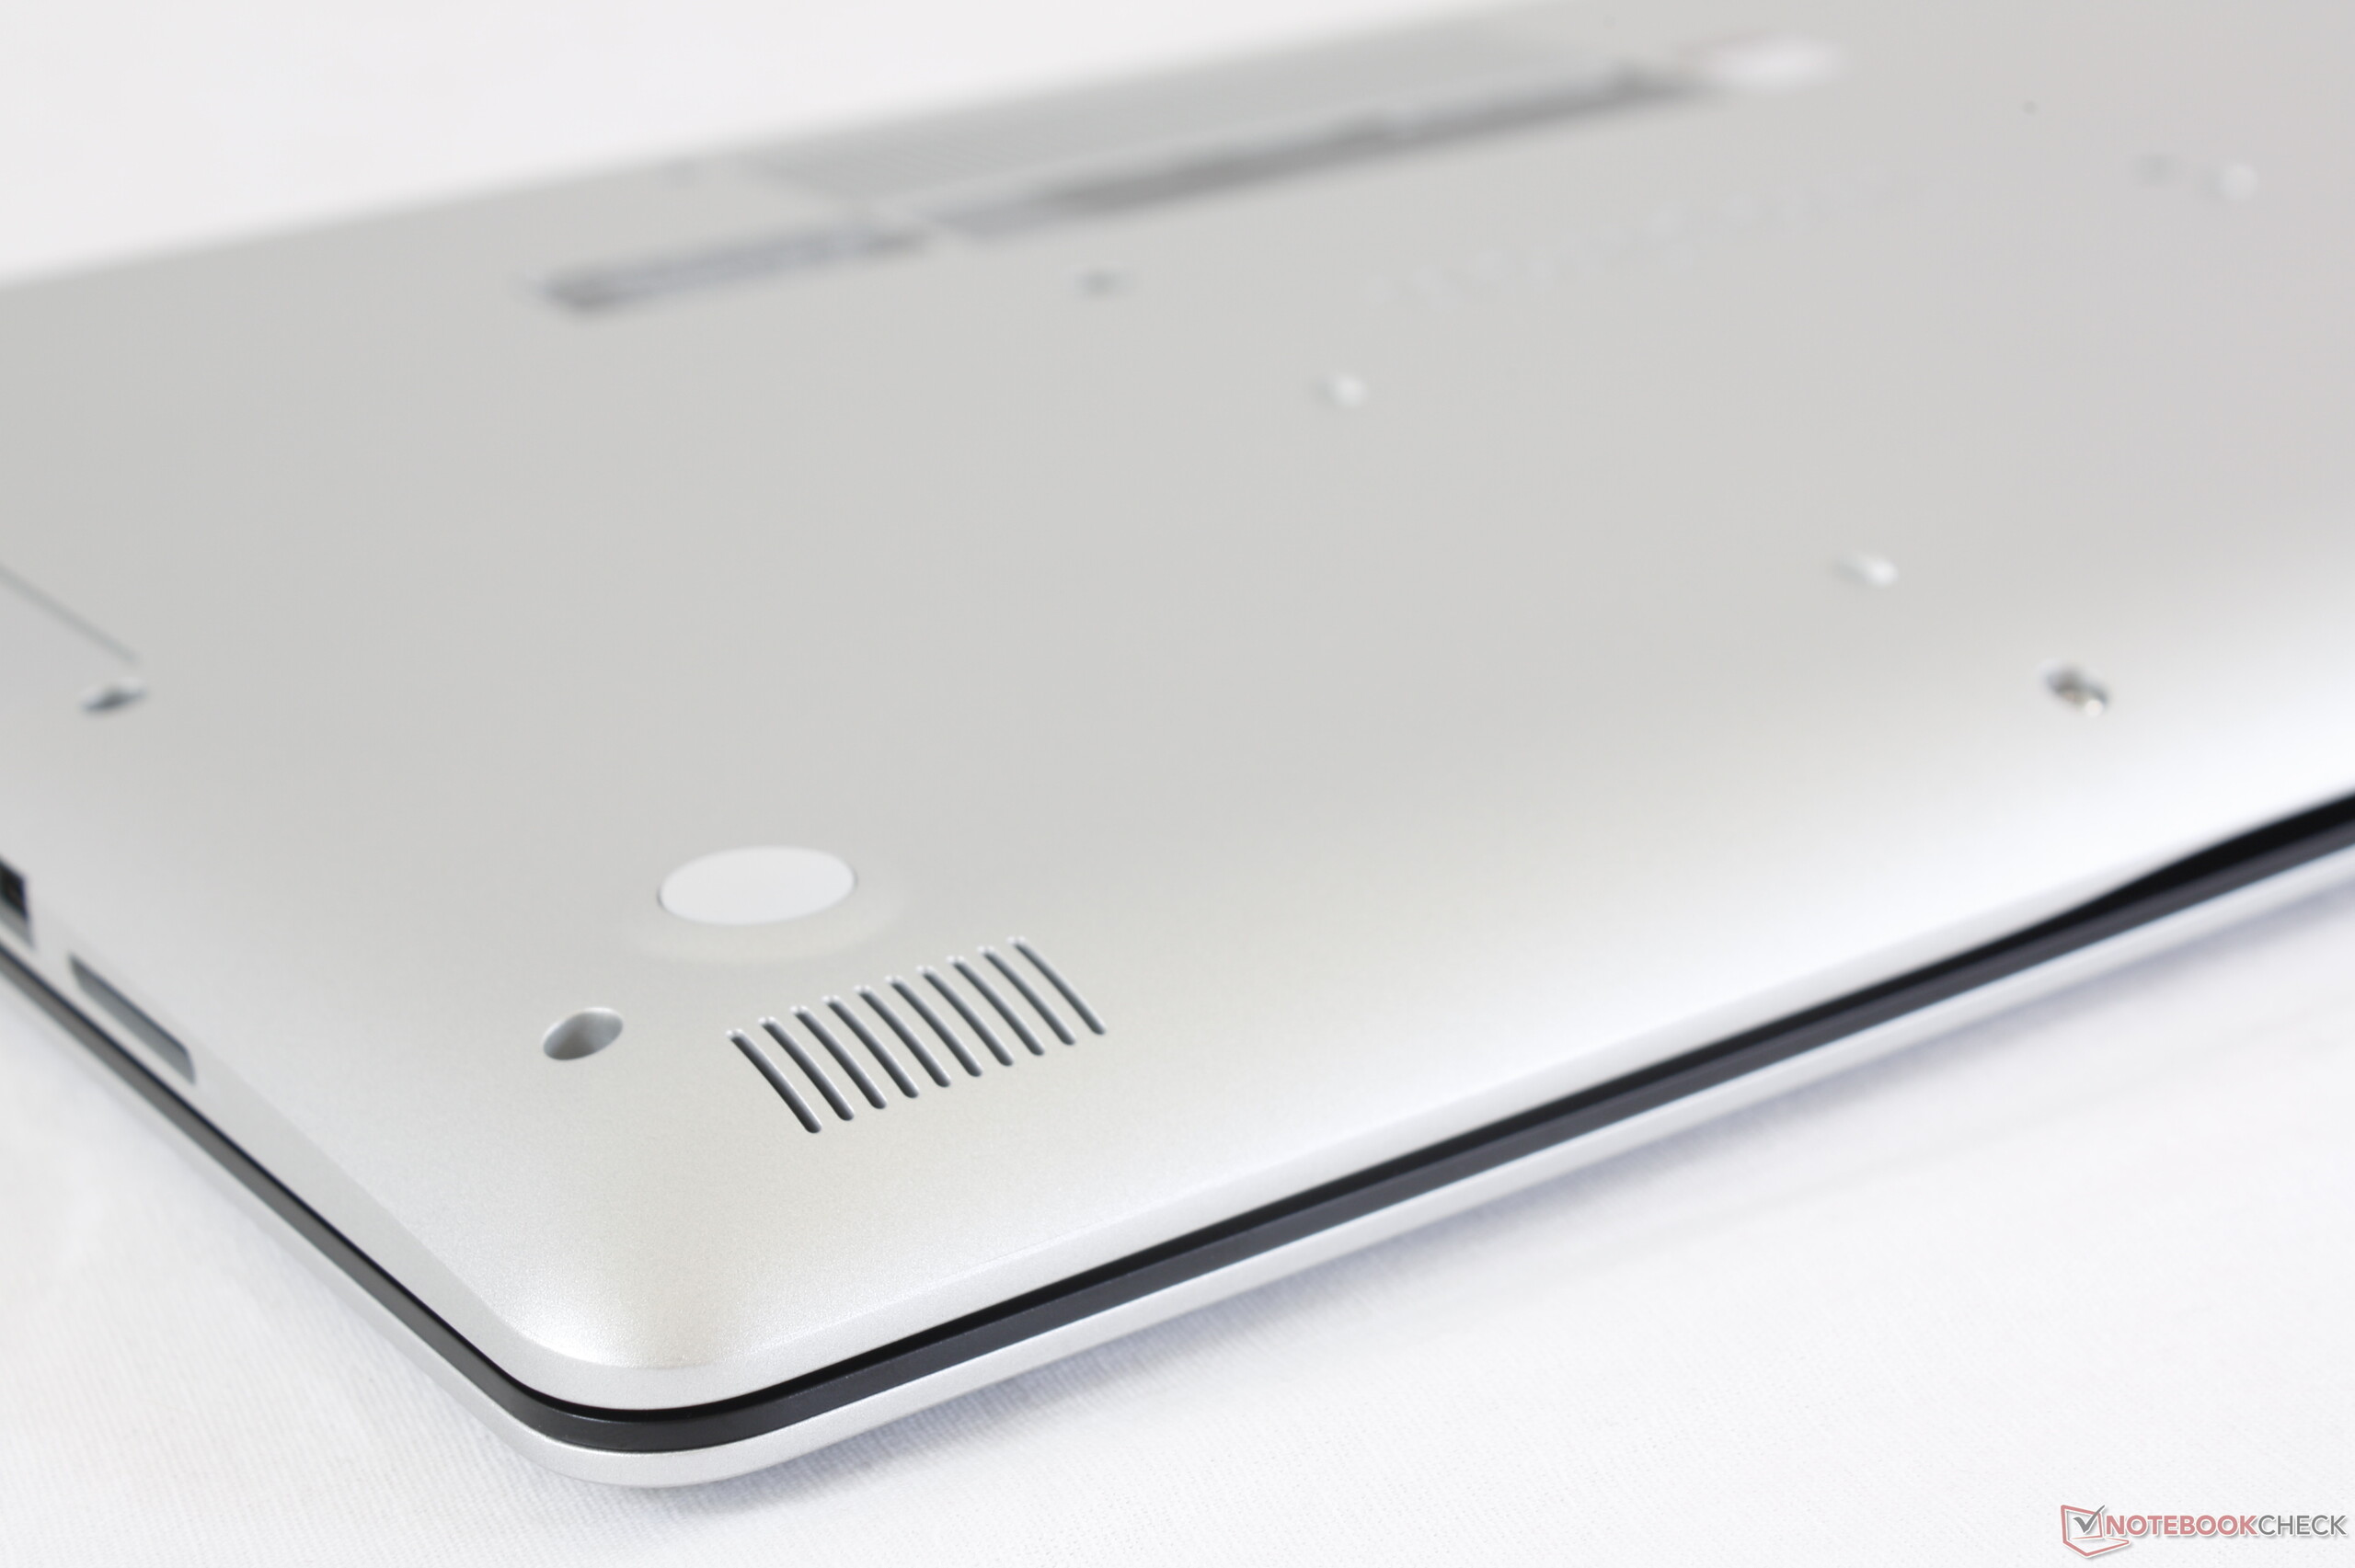
Chassis dimensions are nearly identical to the HP 17 even though the Dell system is noticeably heavier by about 300 g. Narrow bezel designs have yet to arrive on budget 17.3-inch laptops and so the Dell still feel unwieldy to carry.
Connectivity
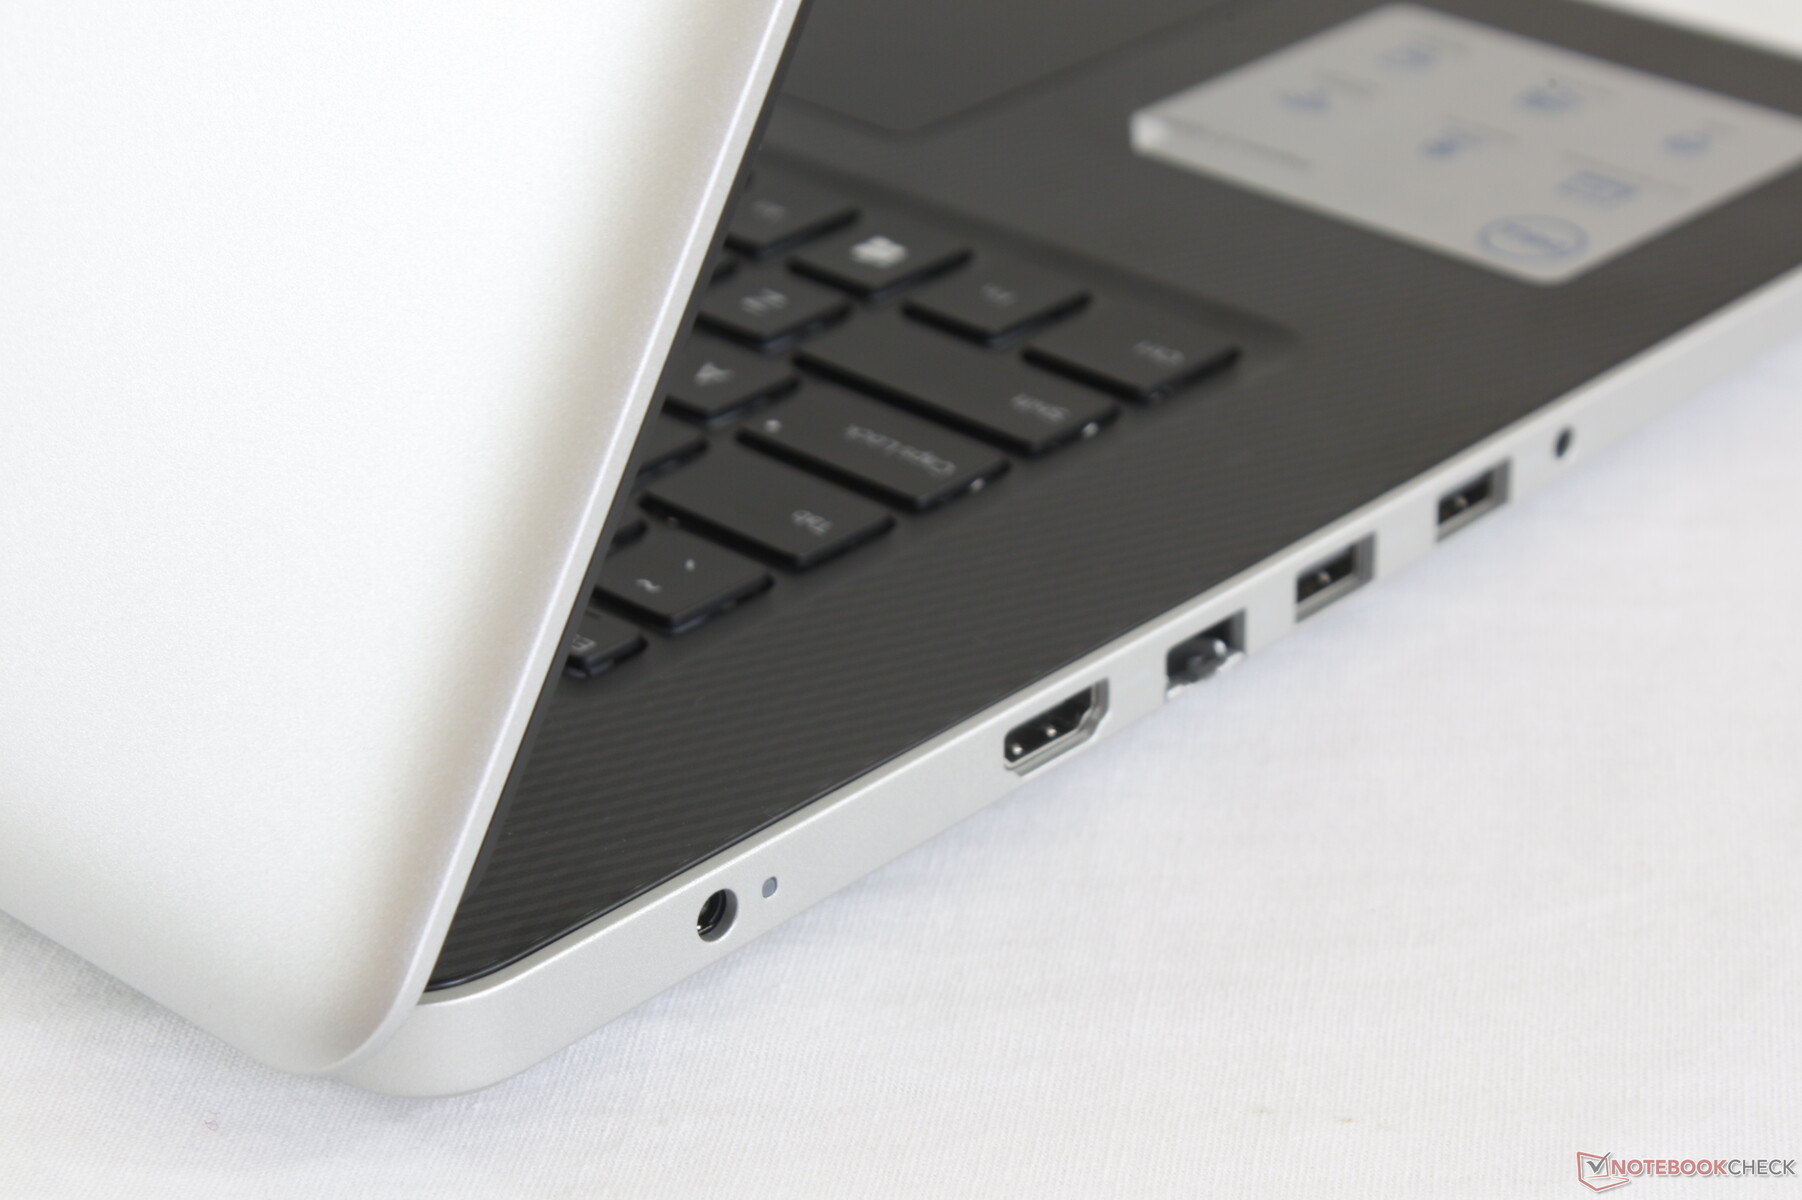
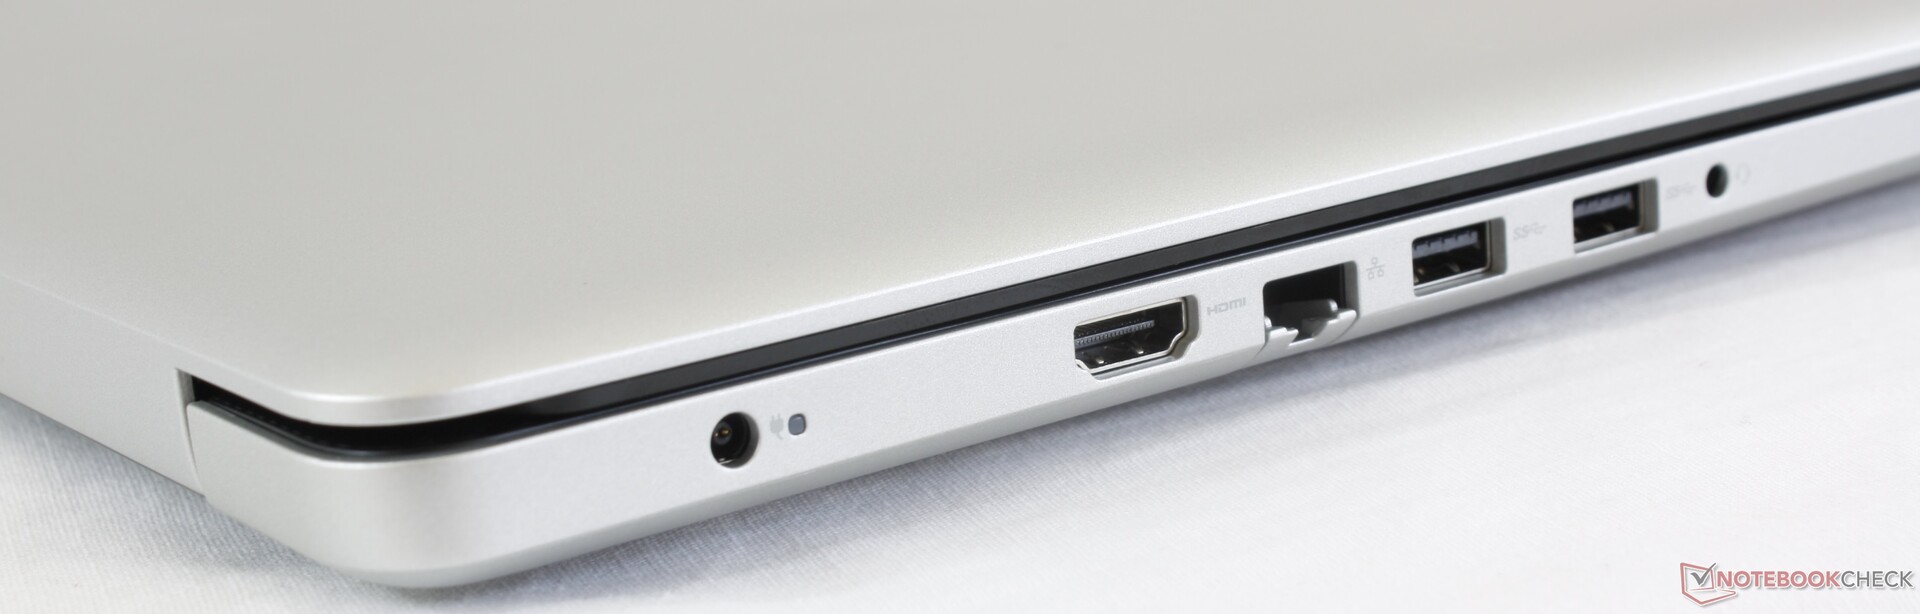
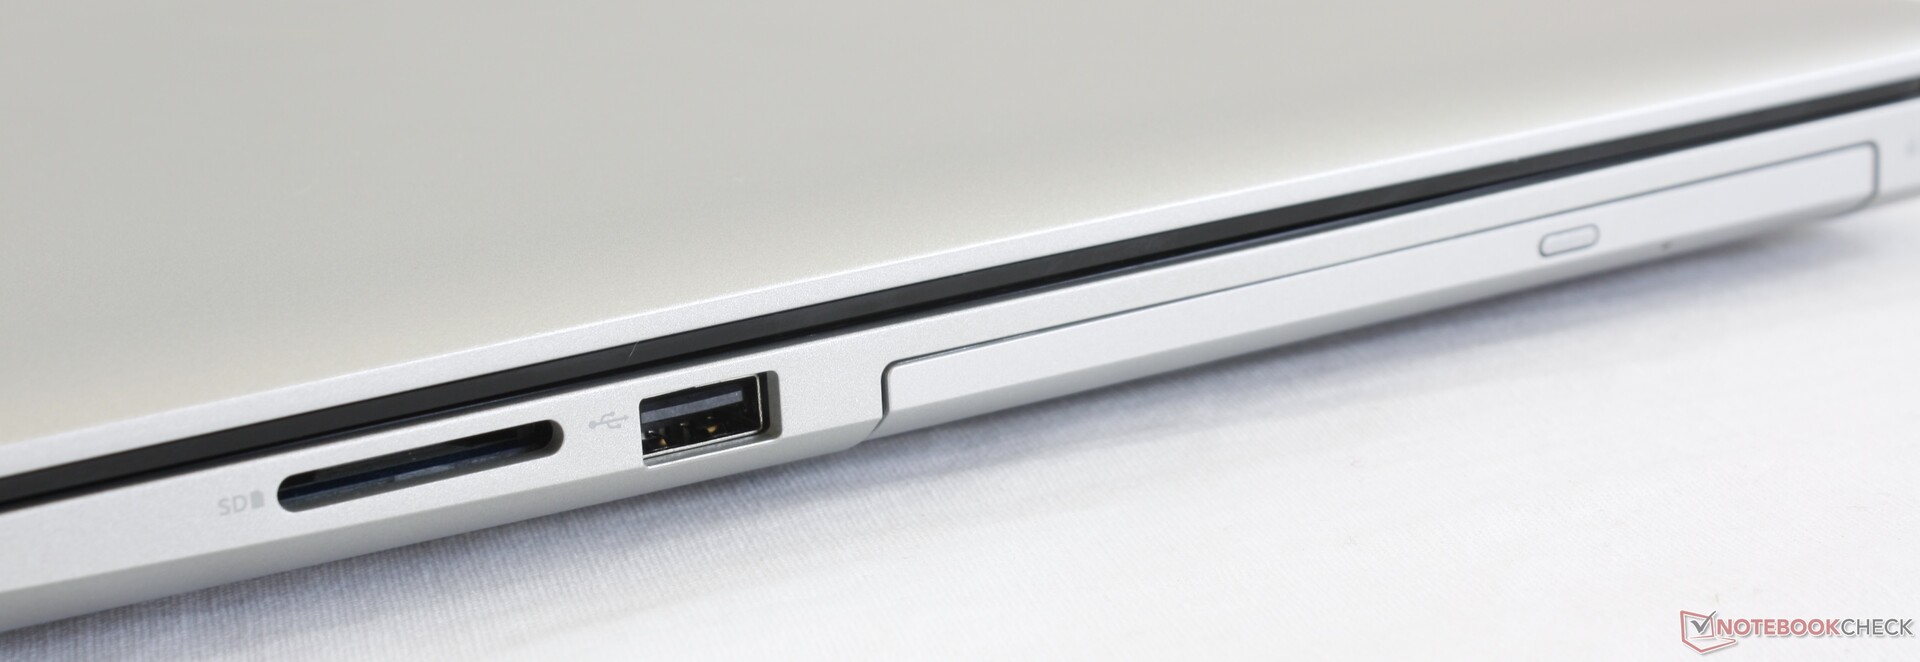
The Inspiron 17 3780 is one of the few remaining consumer laptops sporting a Whiskey Lake-U CPU and a removable optical drive. Port selection, however, is limited and exactly the same as on the HP 17. The RJ-45 port maxes out at just 100 Mbps and the chassis lacks a USB Type-C port. We believe USB Type-C has become common enough to be on all laptops regardless of price range.
SD Card Reader
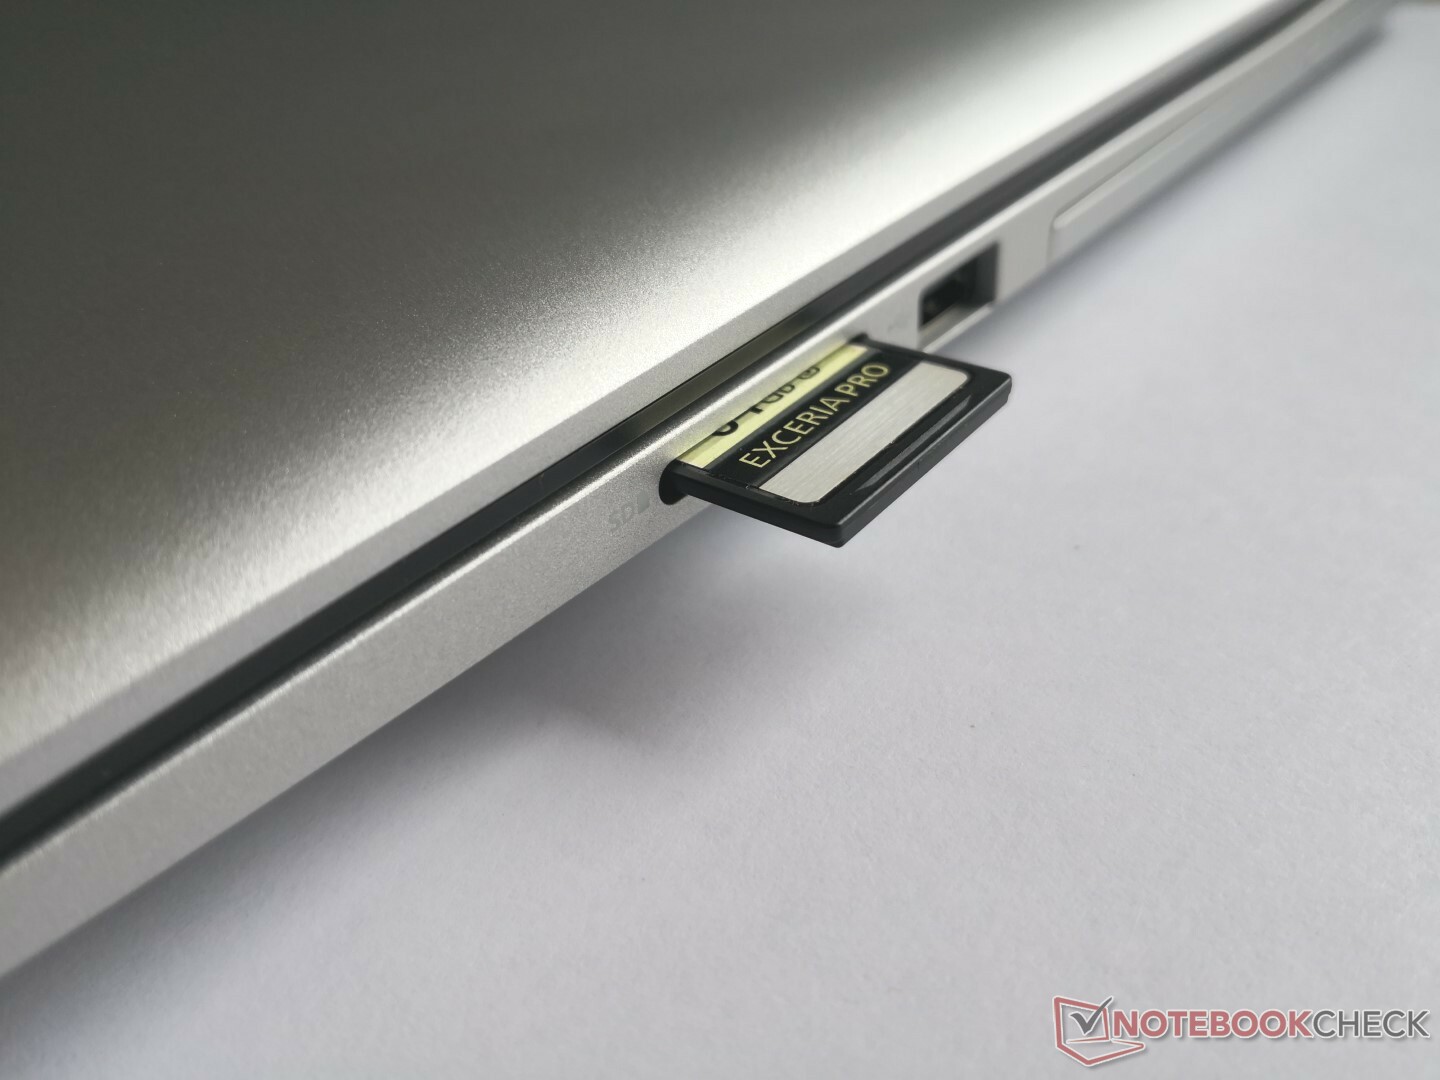
Transfer rates from the integrated SD card reader are slow at just under 33 MB/s. Moving 1 GB of pictures from our UHS-II test card to desktop takes about 37 seconds compared to just 7 seconds on the XPS 15.
The card reader is not spring-loaded and a fully inserted SD card will protrude by about half its length.
| SD Card Reader | |
| average JPG Copy Test (av. of 3 runs) | |
| Lenovo ThinkPad P71-20HK0004GE | |
| HP ProBook 470 G5 (Toshiba Exceria Pro SDXC 64 GB UHS-II) | |
| Dell Inspiron 17 3780 (Toshiba Exceria Pro SDXC 64 GB UHS-II) | |
| Dell Inspiron 17-7786 (Toshiba Exceria Pro SDXC 64 GB UHS-II) | |
| Lenovo V320-17IKB-81CN000MGE (Toshiba Exceria Pro SDXC 64 GB UHS-II) | |
| maximum AS SSD Seq Read Test (1GB) | |
| Lenovo ThinkPad P71-20HK0004GE | |
| HP ProBook 470 G5 (Toshiba Exceria Pro SDXC 64 GB UHS-II) | |
| Dell Inspiron 17 3780 (Toshiba Exceria Pro SDXC 64 GB UHS-II) | |
| Dell Inspiron 17-7786 (Toshiba Exceria Pro SDXC 64 GB UHS-II) | |
| Lenovo V320-17IKB-81CN000MGE (Toshiba Exceria Pro SDXC 64 GB UHS-II) | |
Communication
All SKUs ship with the same 1x1 Qualcomm Atheros QCA9377 budget WLAN card with integrated Bluetooth 4.1. Transfer rates are limited to 433 Mbps which is about four times slower than the newer 2x2 WLAN cards as found on the latest Ultrabooks. Even so, we didn't experience any connectivity issues and transfer rates are more than ough for home or streaming use.
Maintenance
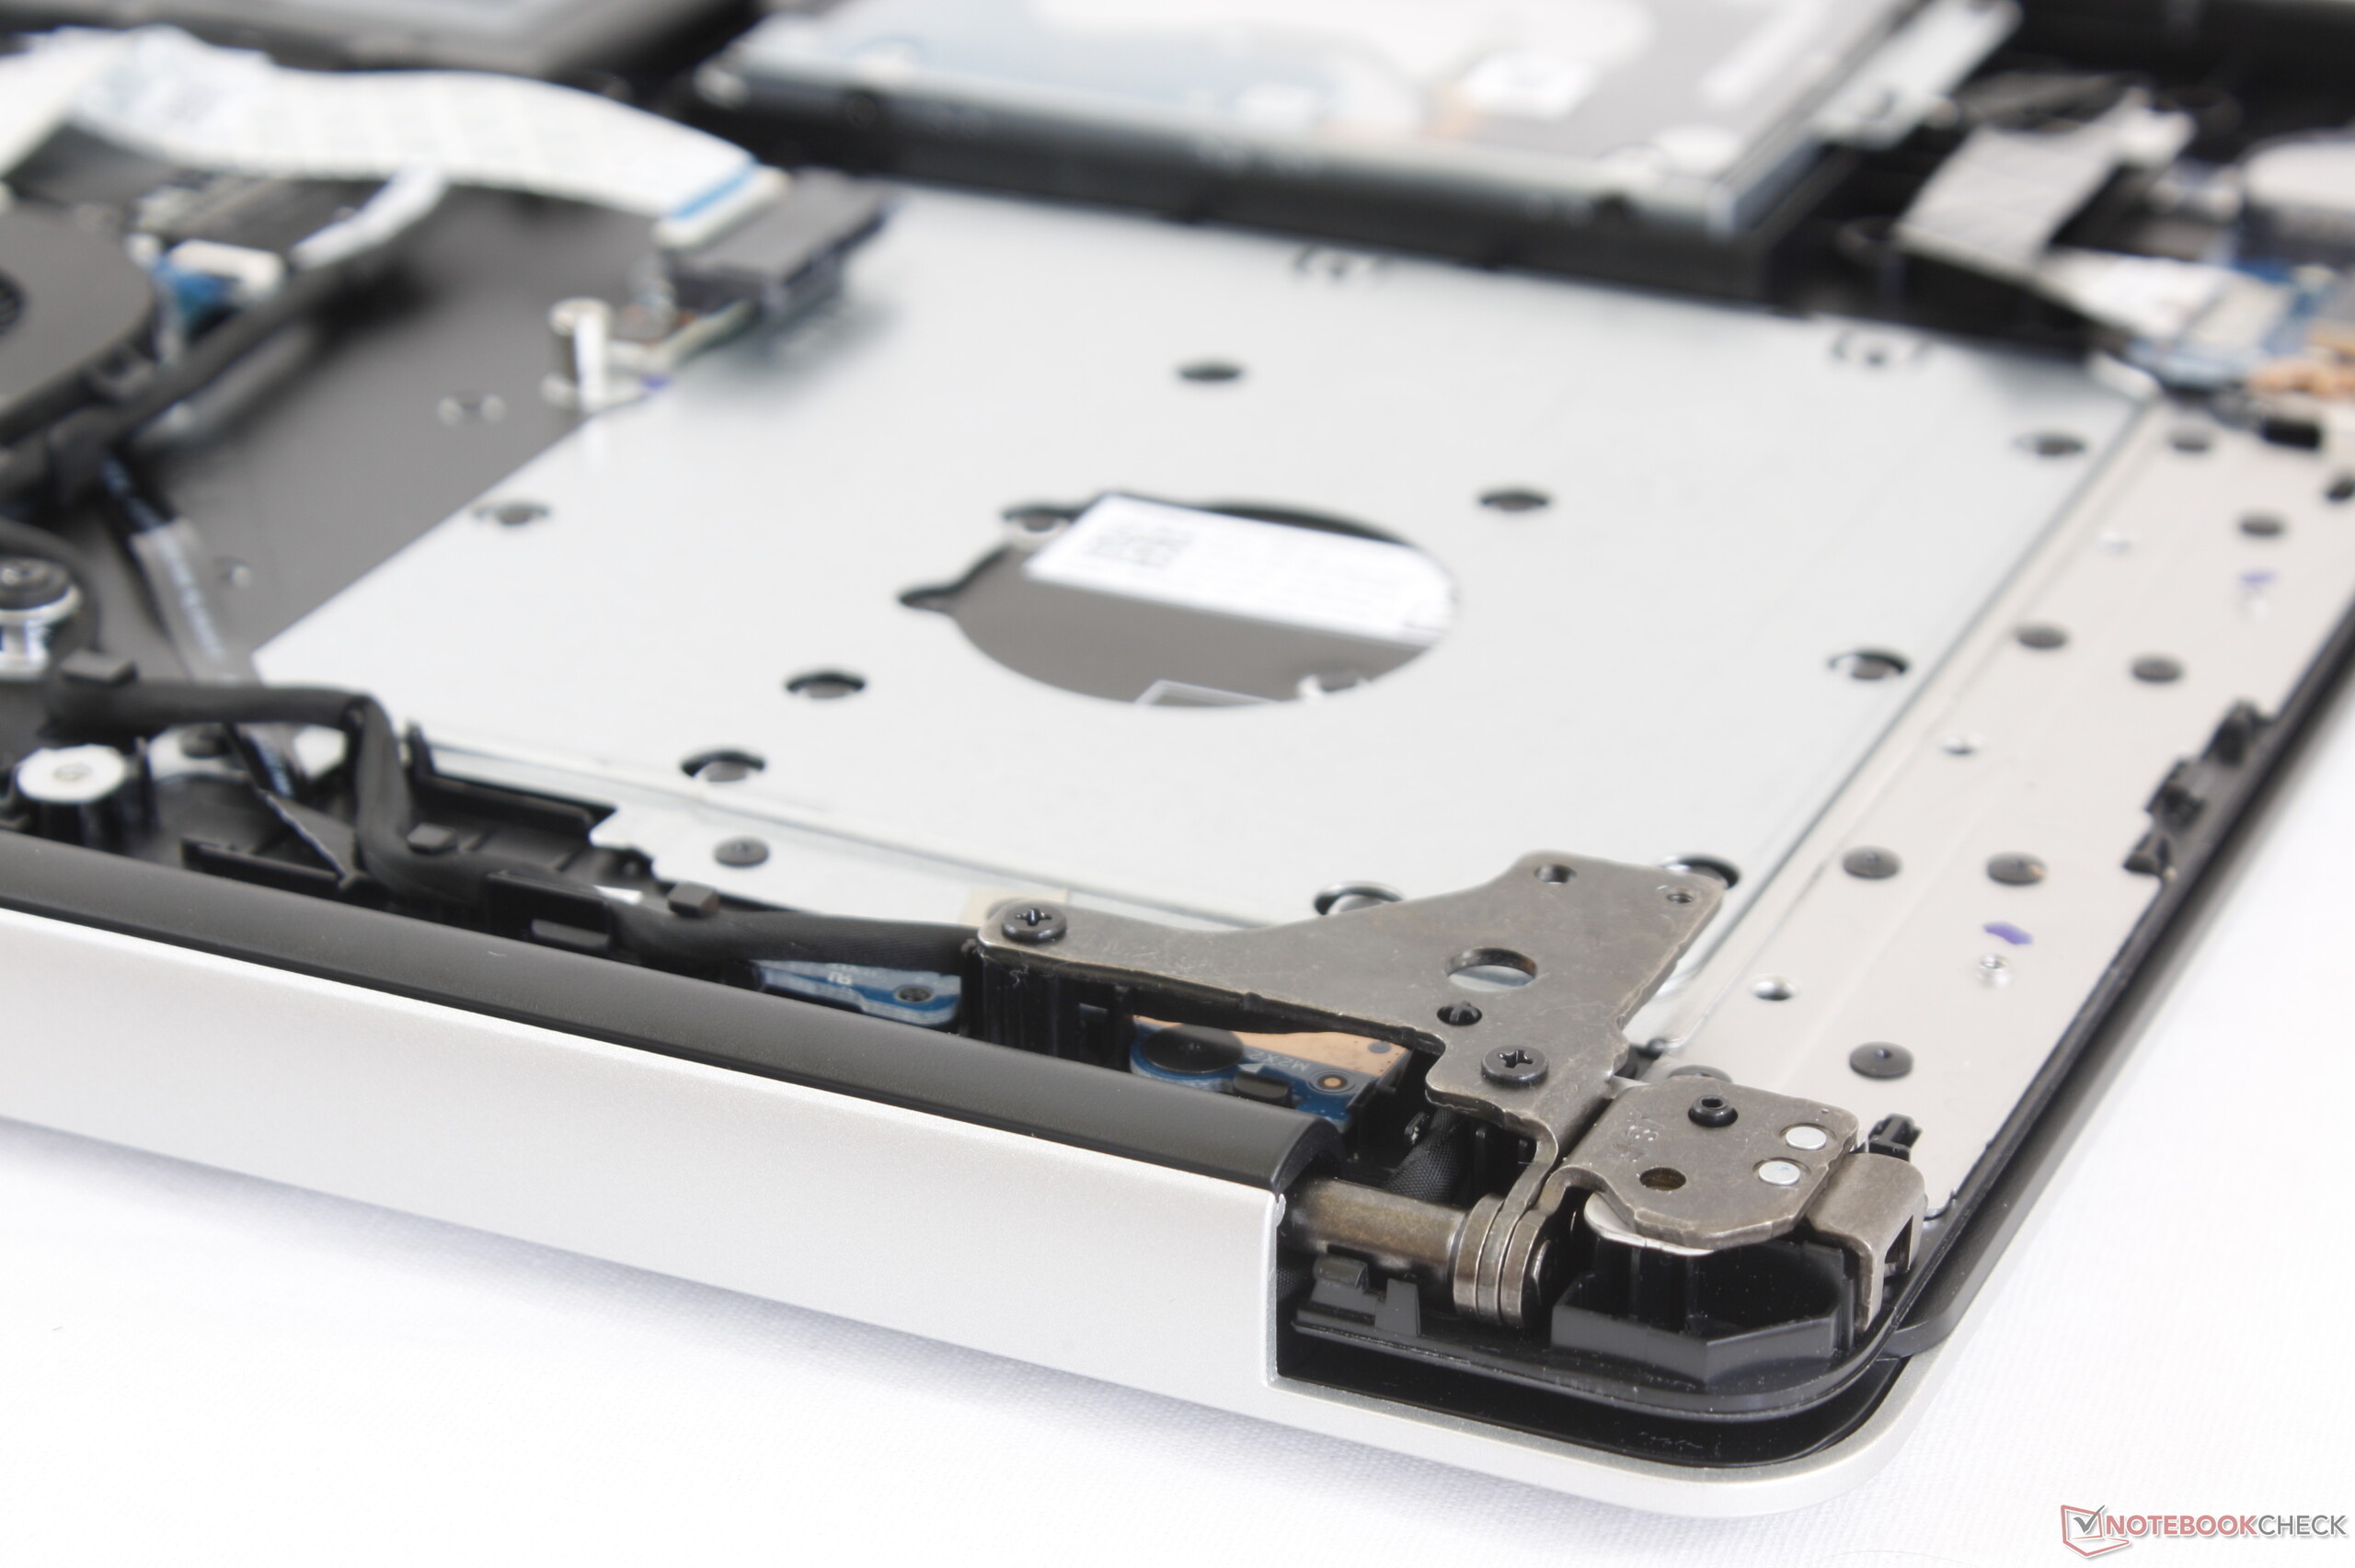
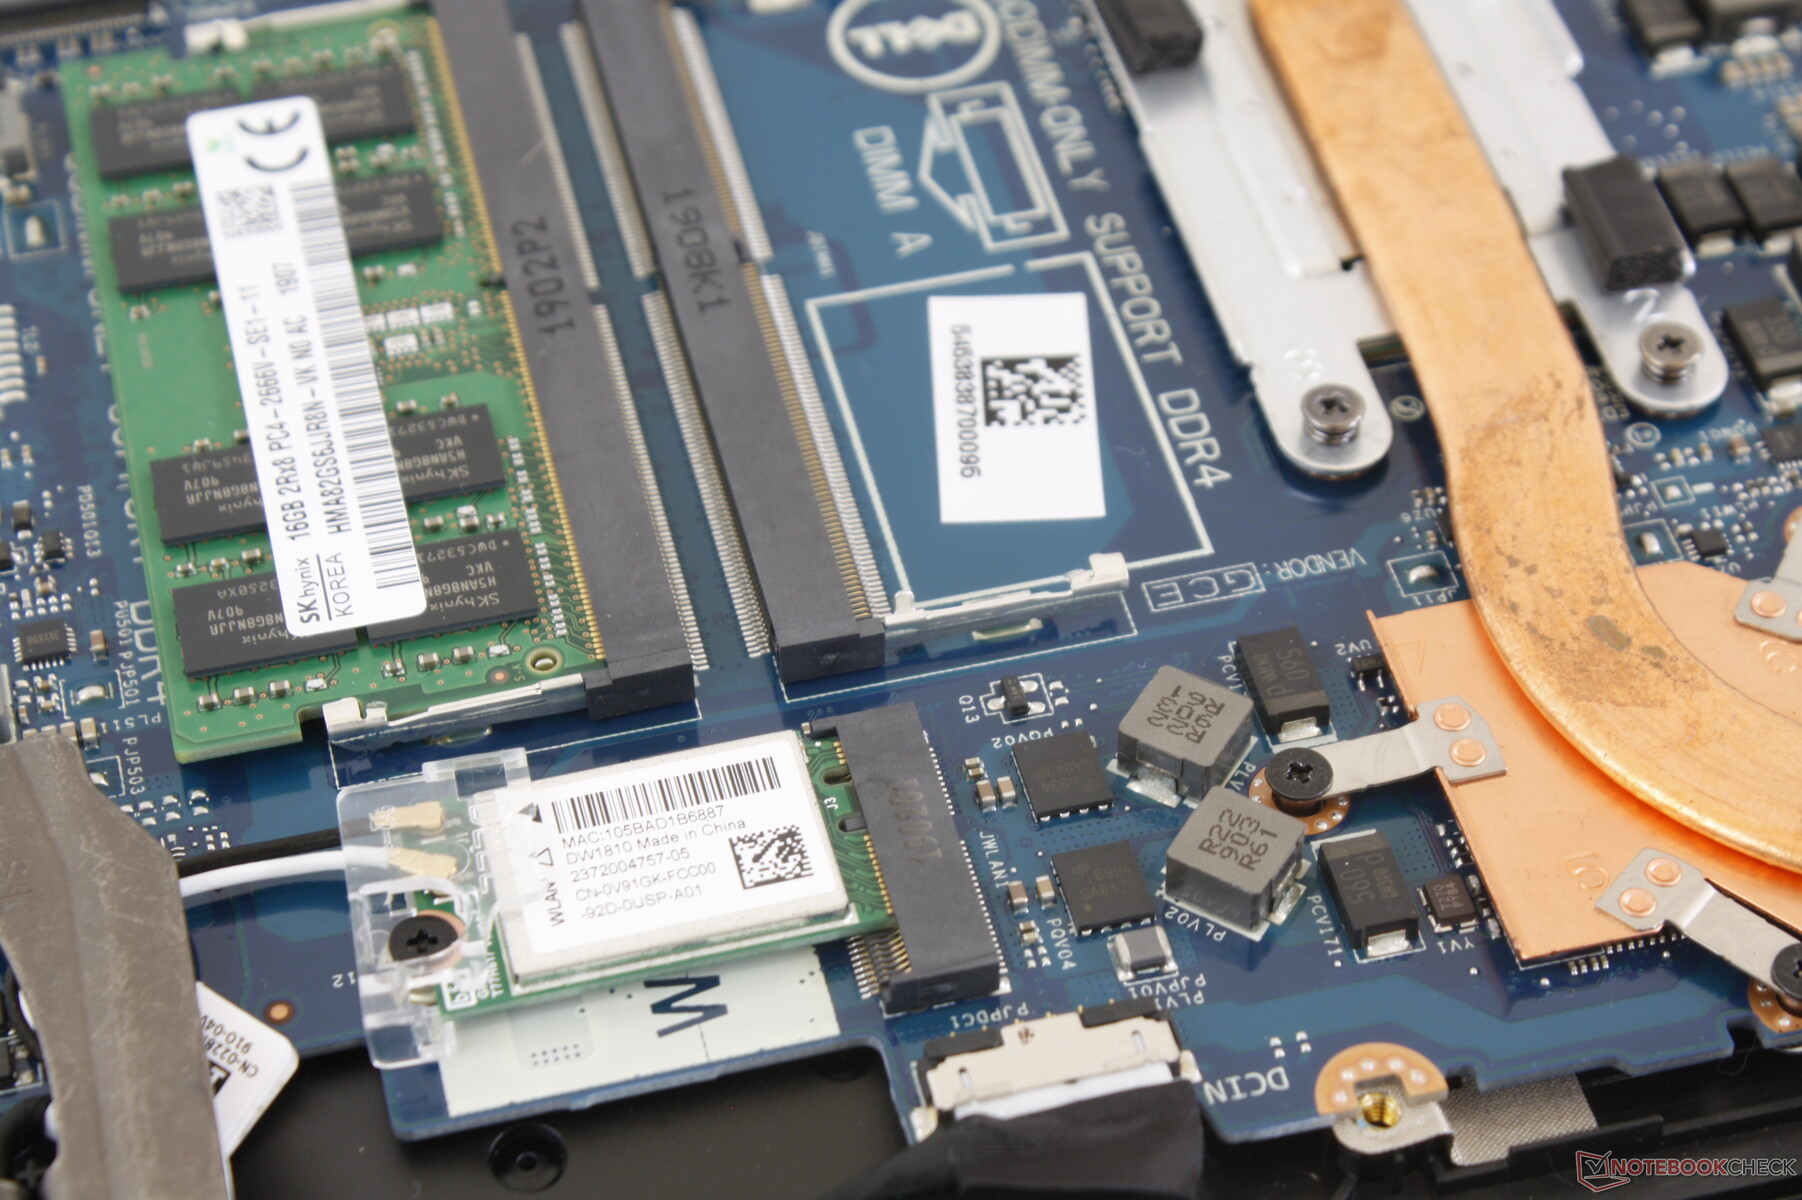
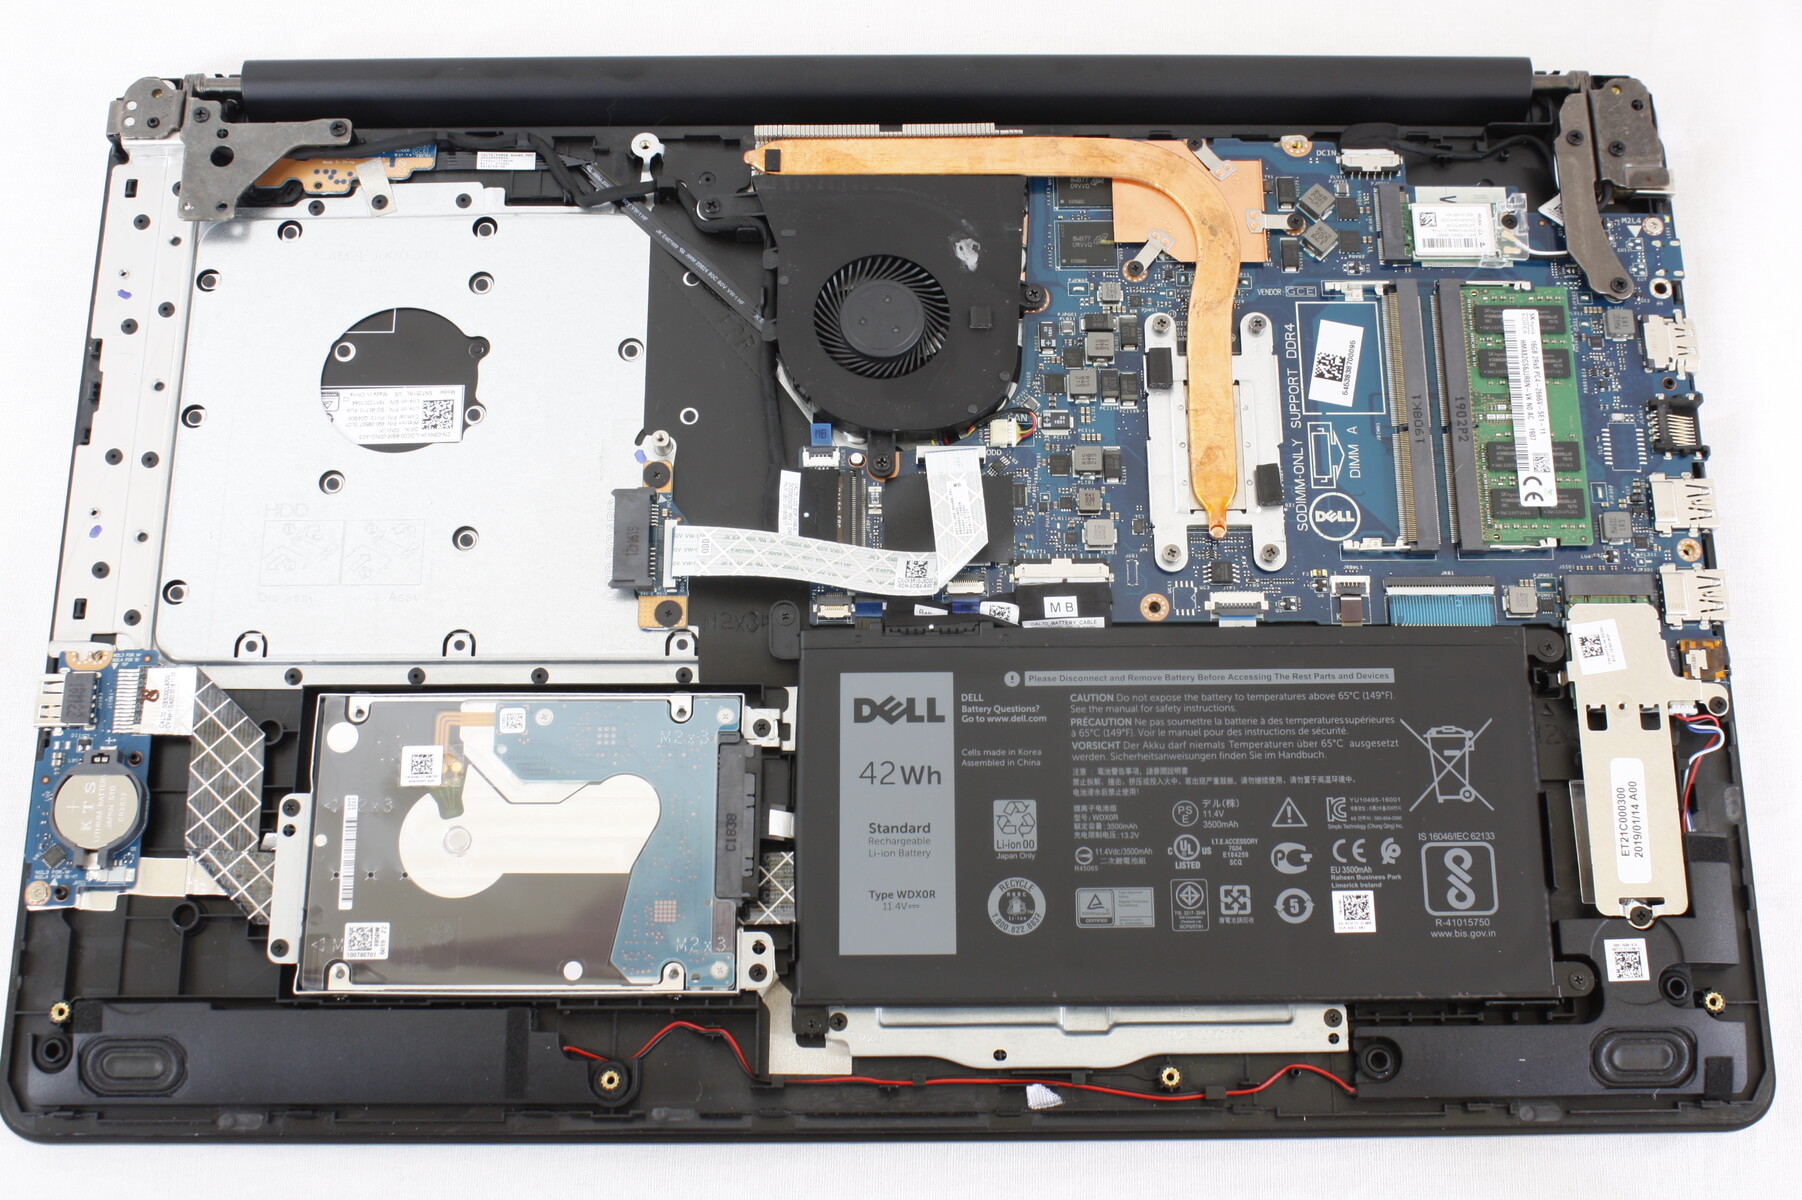
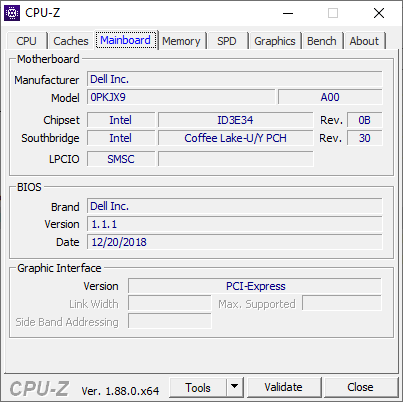
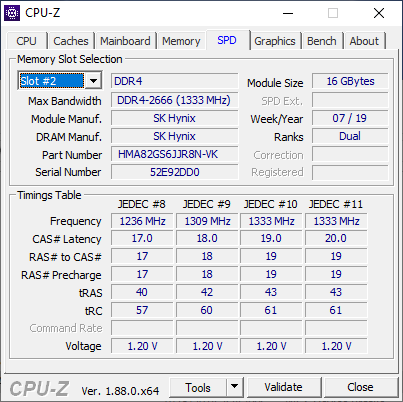
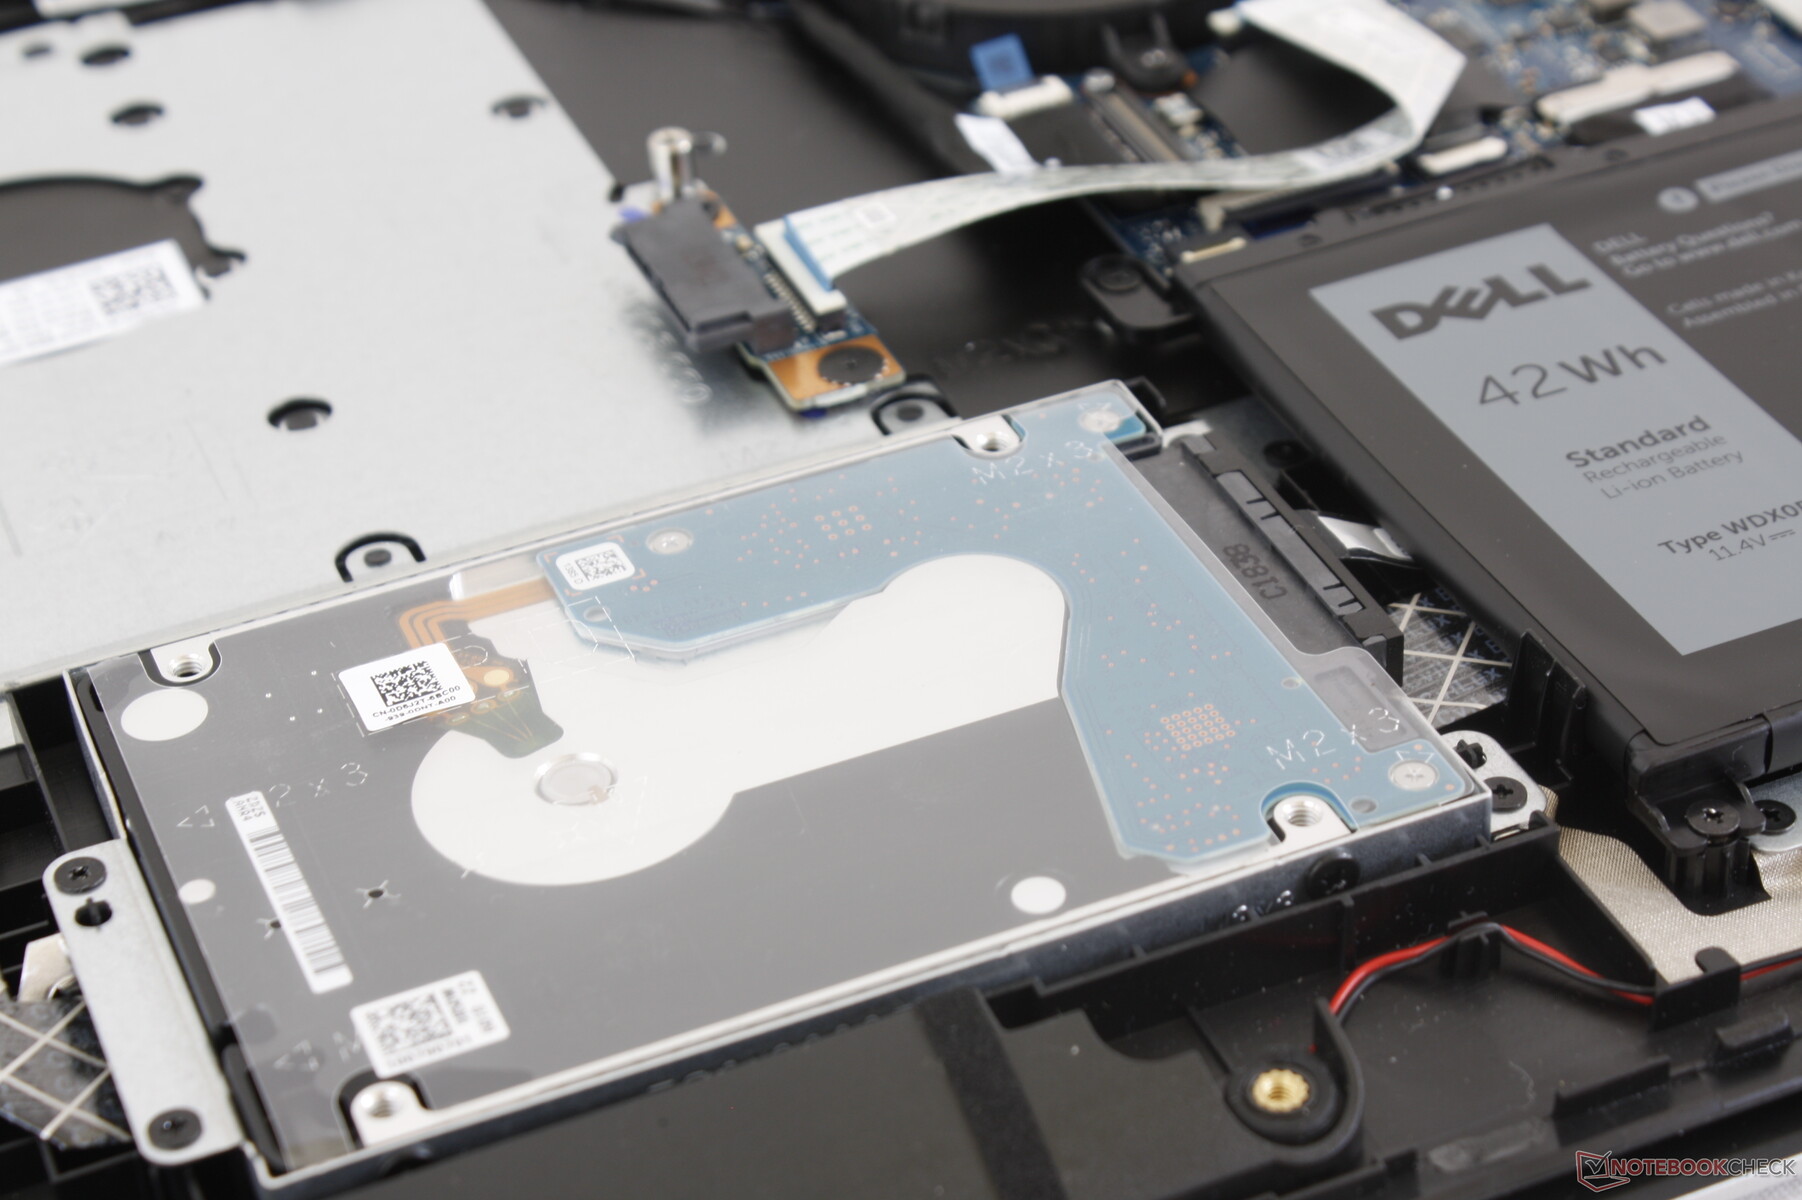
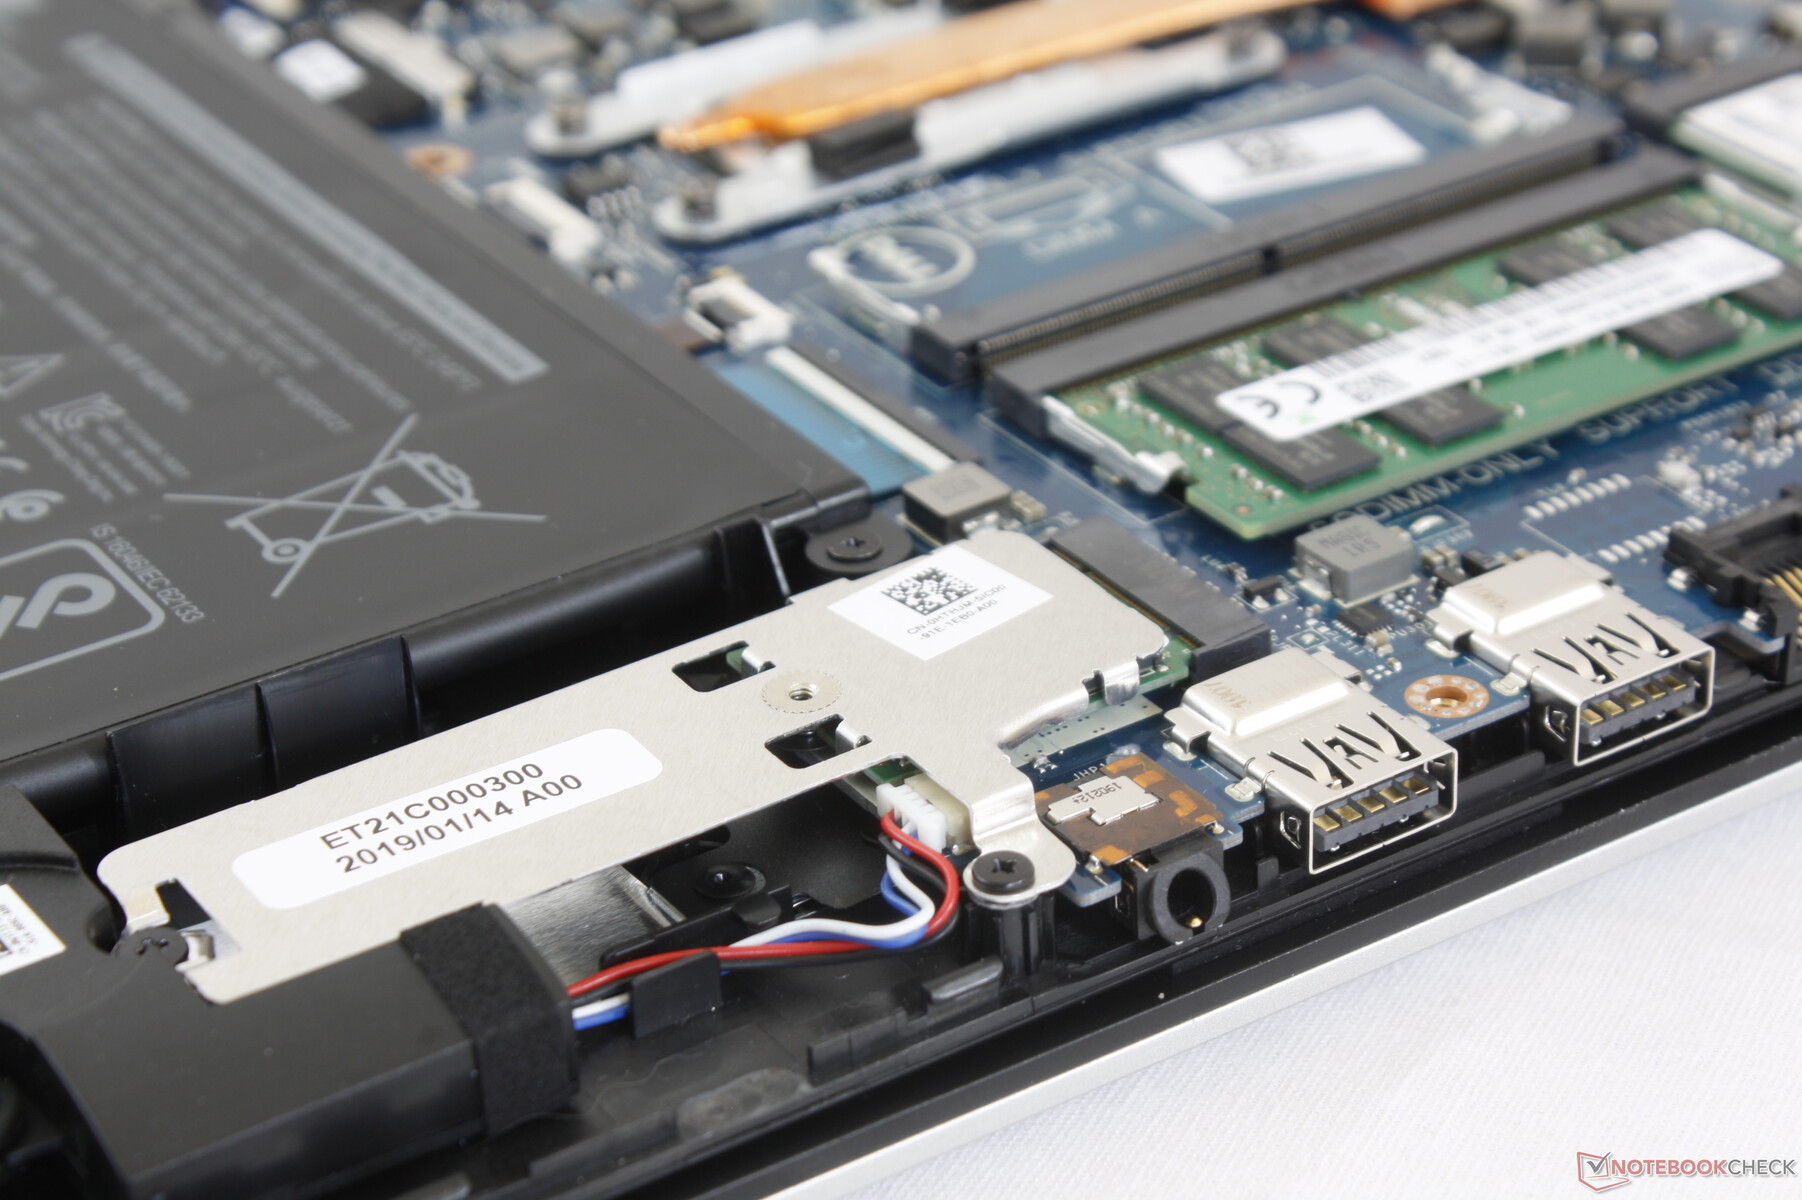
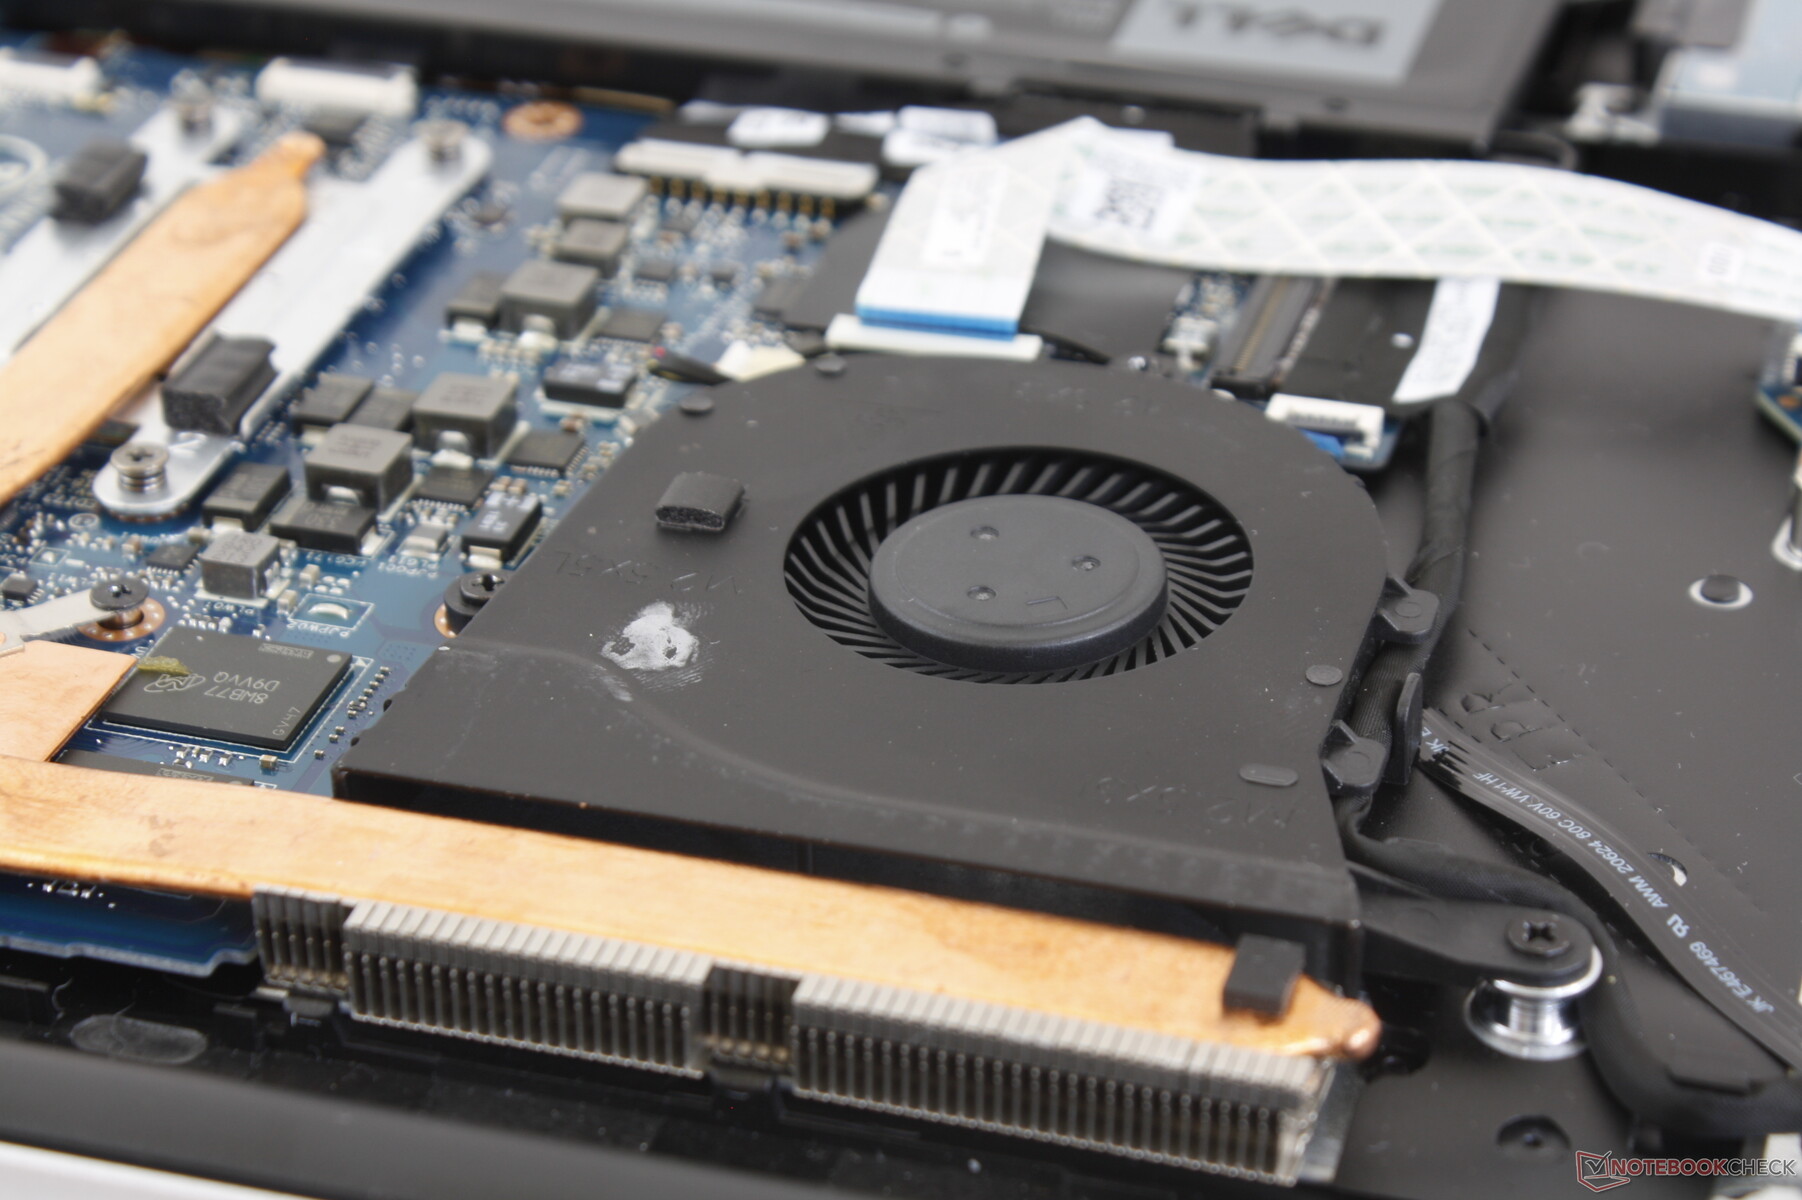
The bottom panel is relatively easy to remove with just a Philips screwdriver. Remember to slide out the optical bay and unscrew the remaining two screws underneath before prying apart the laptop. Owners get direct access to both SODIMM slots, both storage bays, and the WLAN module.
Accessories and Warranty
There are no included extras in the retail box other than the AC adapter and usual paperwork.
The standard one-year limited warranty applies. Dell offers a much wider range of extended warranty options and protection when compared to smaller brands.
Input Devices
Keyboard
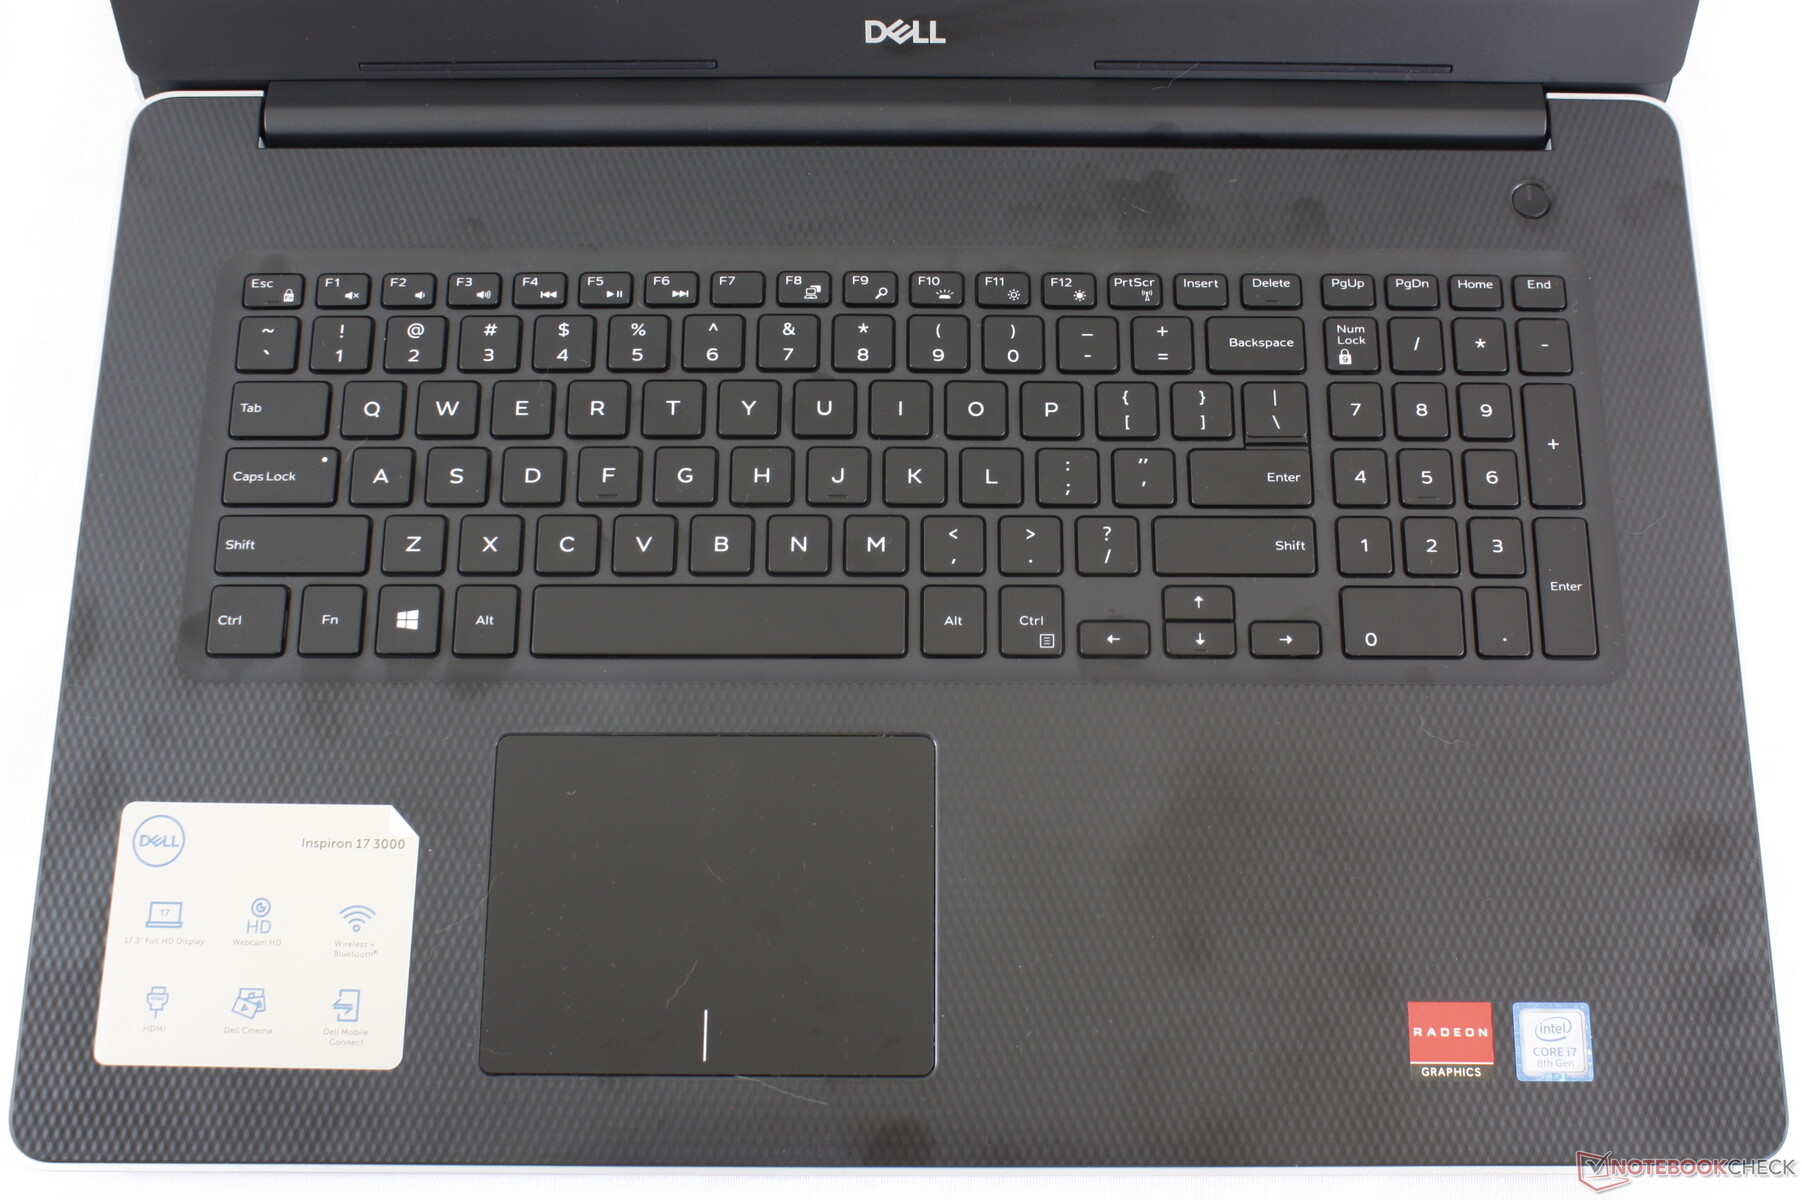
Key feedback is identical to the Inspiron 15 5770. We find the main QWERTY and Space keys to be short in travel with moderate clatter and satisfactory pressure akin to many Ultrabooks. They are slightly louder than the keys of the XPS 15 but thankfully not noticeably softer.
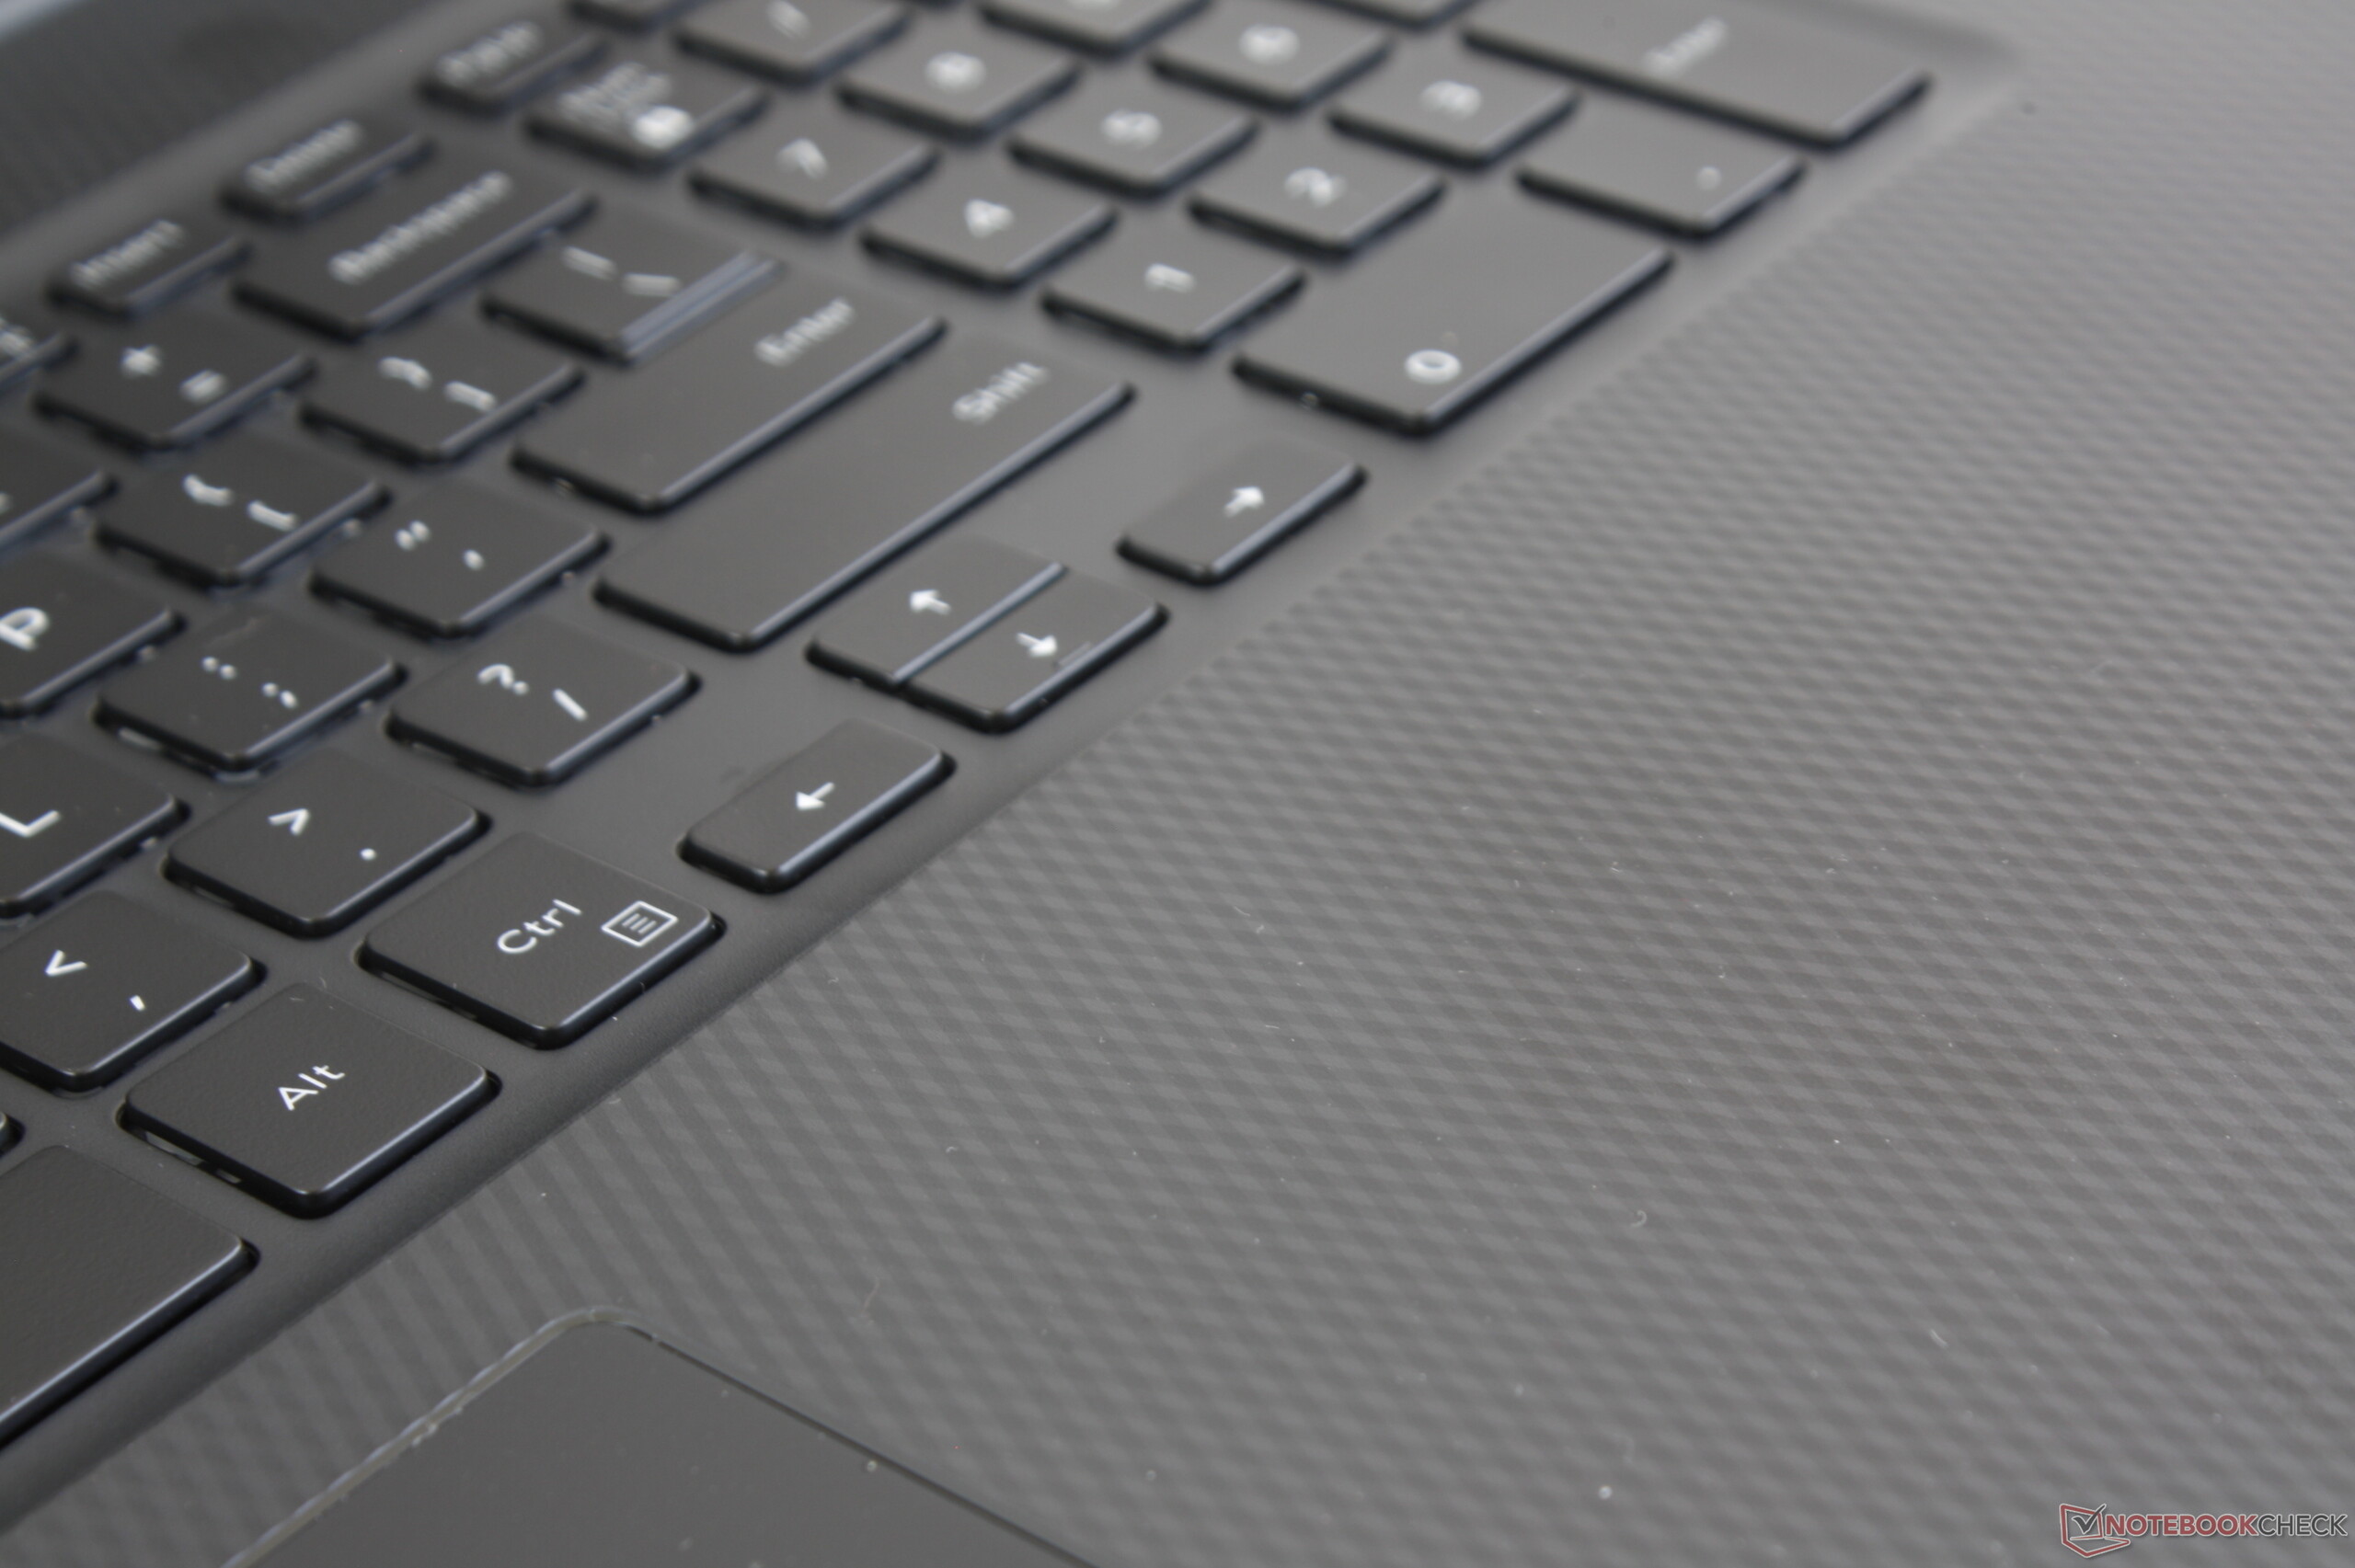
Perhaps the worst aspect of the keyboard is that both the individual NumPad keys and Arrow keys are smaller than the main QWERTY keys. These keys are spongier as a result and so users who rely on them for number-crunching or Excel work may be disappointed by the softer tactile feedback. We're hopeful that future models will increase the size of these keys especially since the 17.3-inch form factor is wide enough to support it.
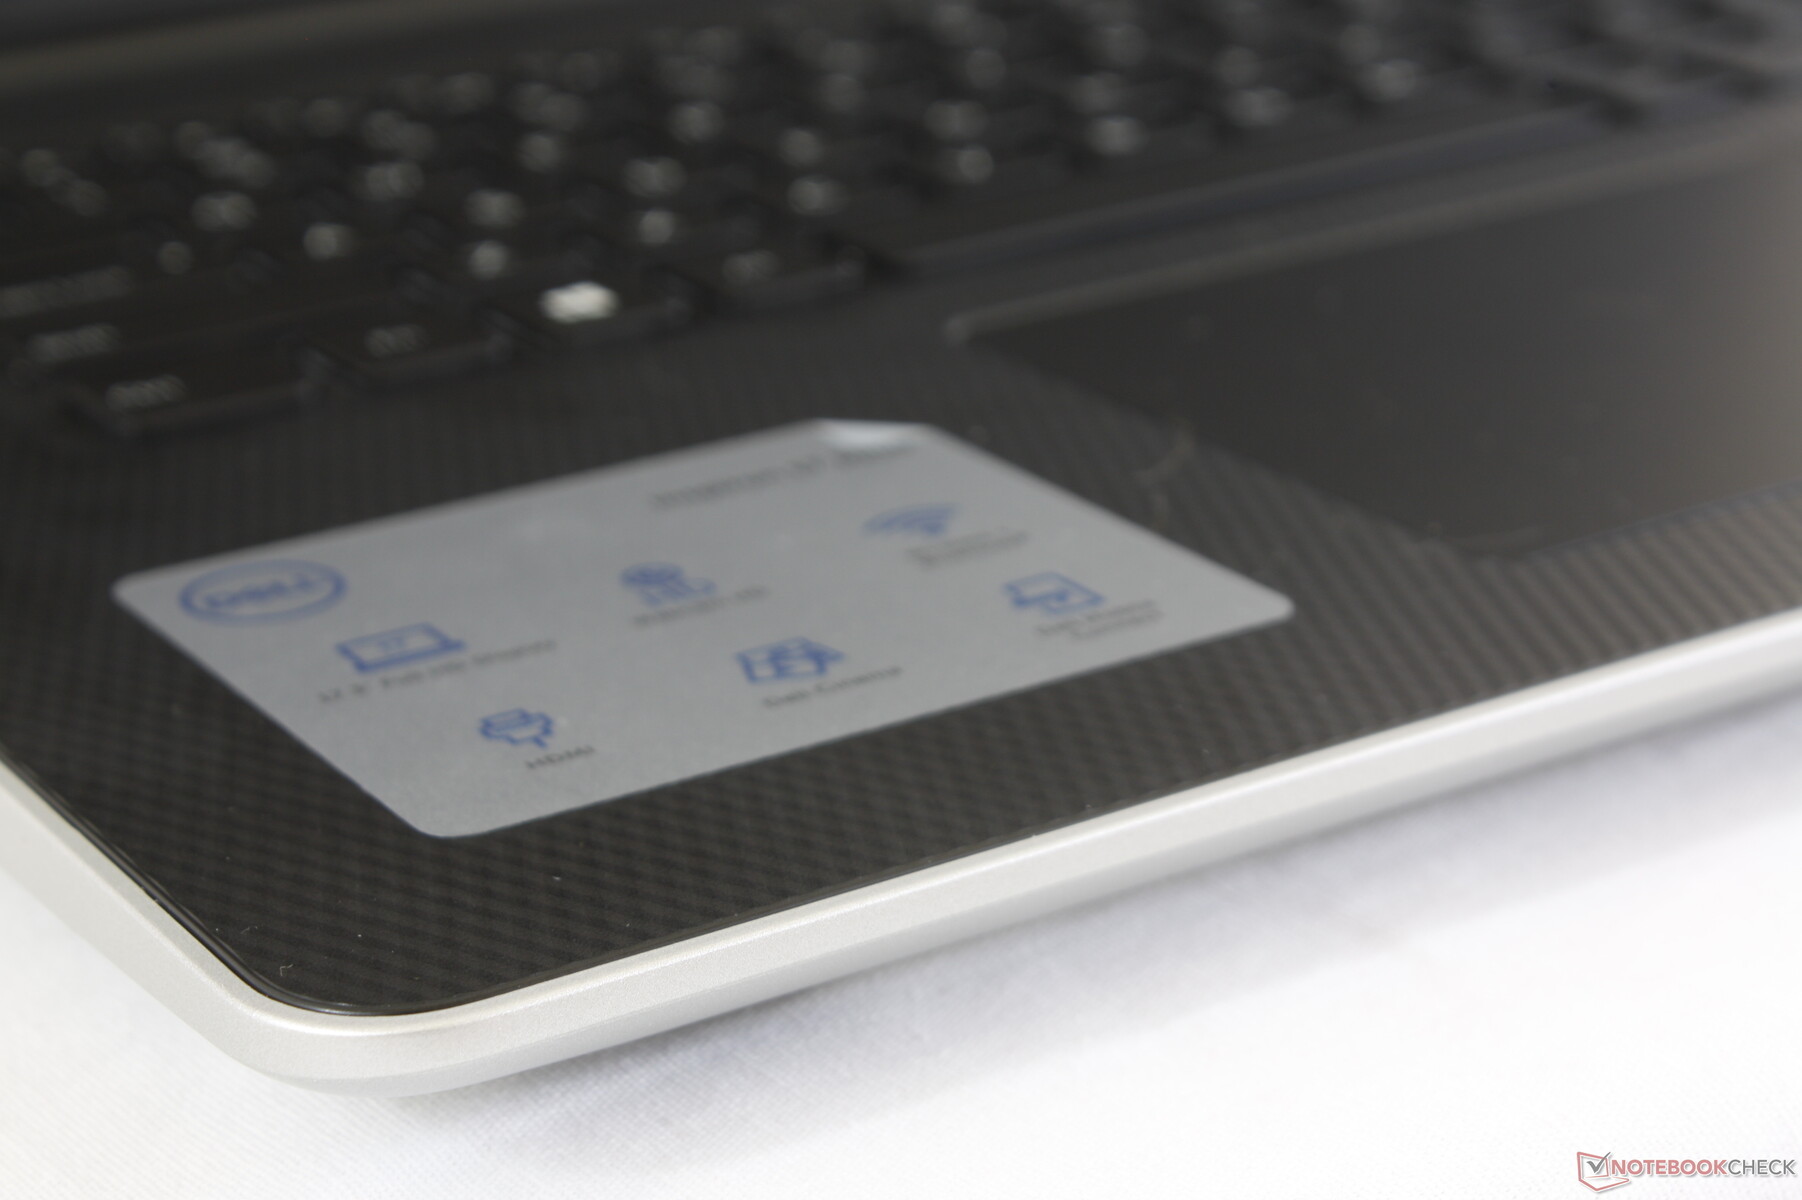
Touchpad
The trackpad (10.5 x 8 cm) is slightly smaller than the trackpad on the XPS 15 (10.5 x 8.5 cm) despite the fact that the Inspiron 17 chassis is much larger. Cursor control is smooth with no jumping even if gliding slowly across the smooth surface. There is some minor sticking if moving slowly across the trackpad surface, but we don't find this to be impactful to everyday use.
The integrated mouse keys are very shallow in travel with weak and quiet feedback when pressed. A firmer and more clicky feel would have made the clickpad easier to use. Perhaps a set of dedicated mouse keys would have been better given the ample space available on the large chassis.

Display
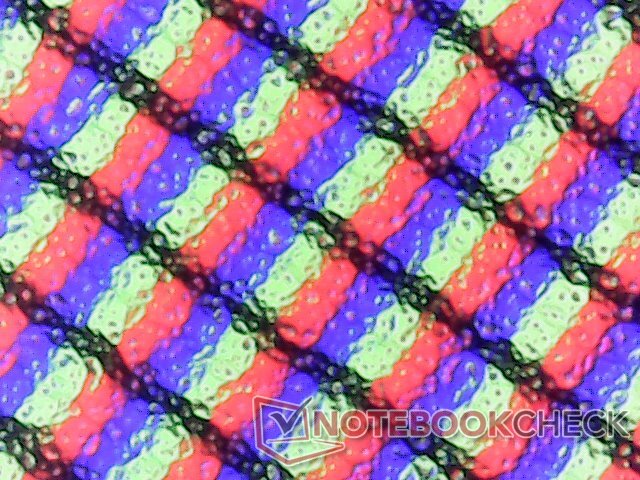
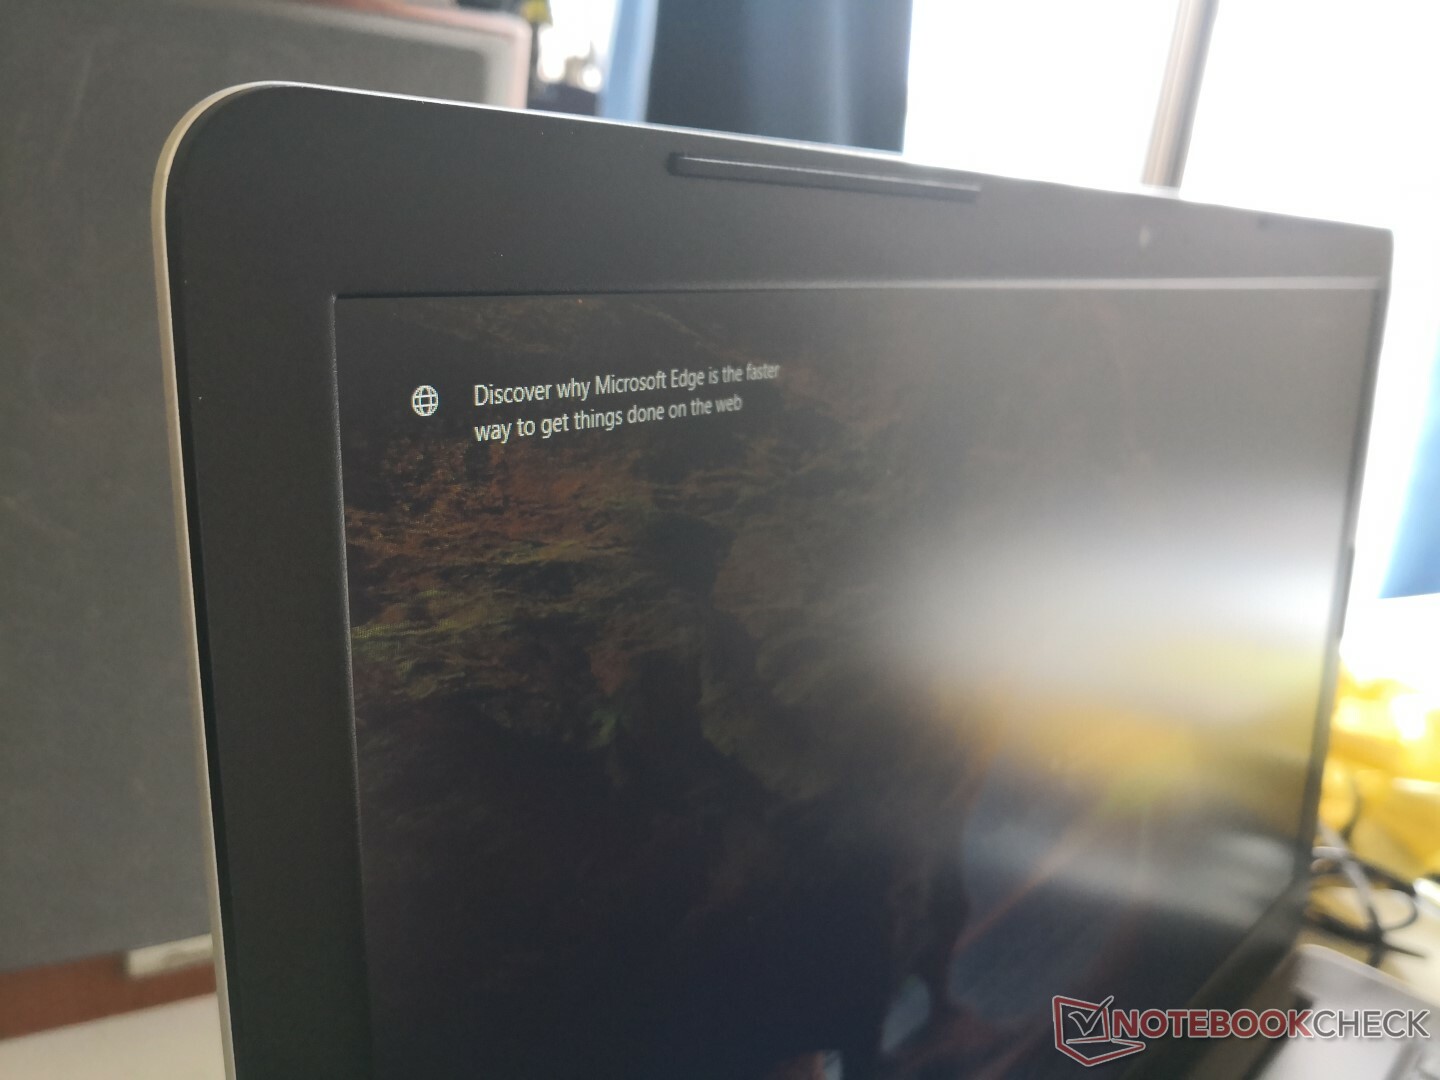
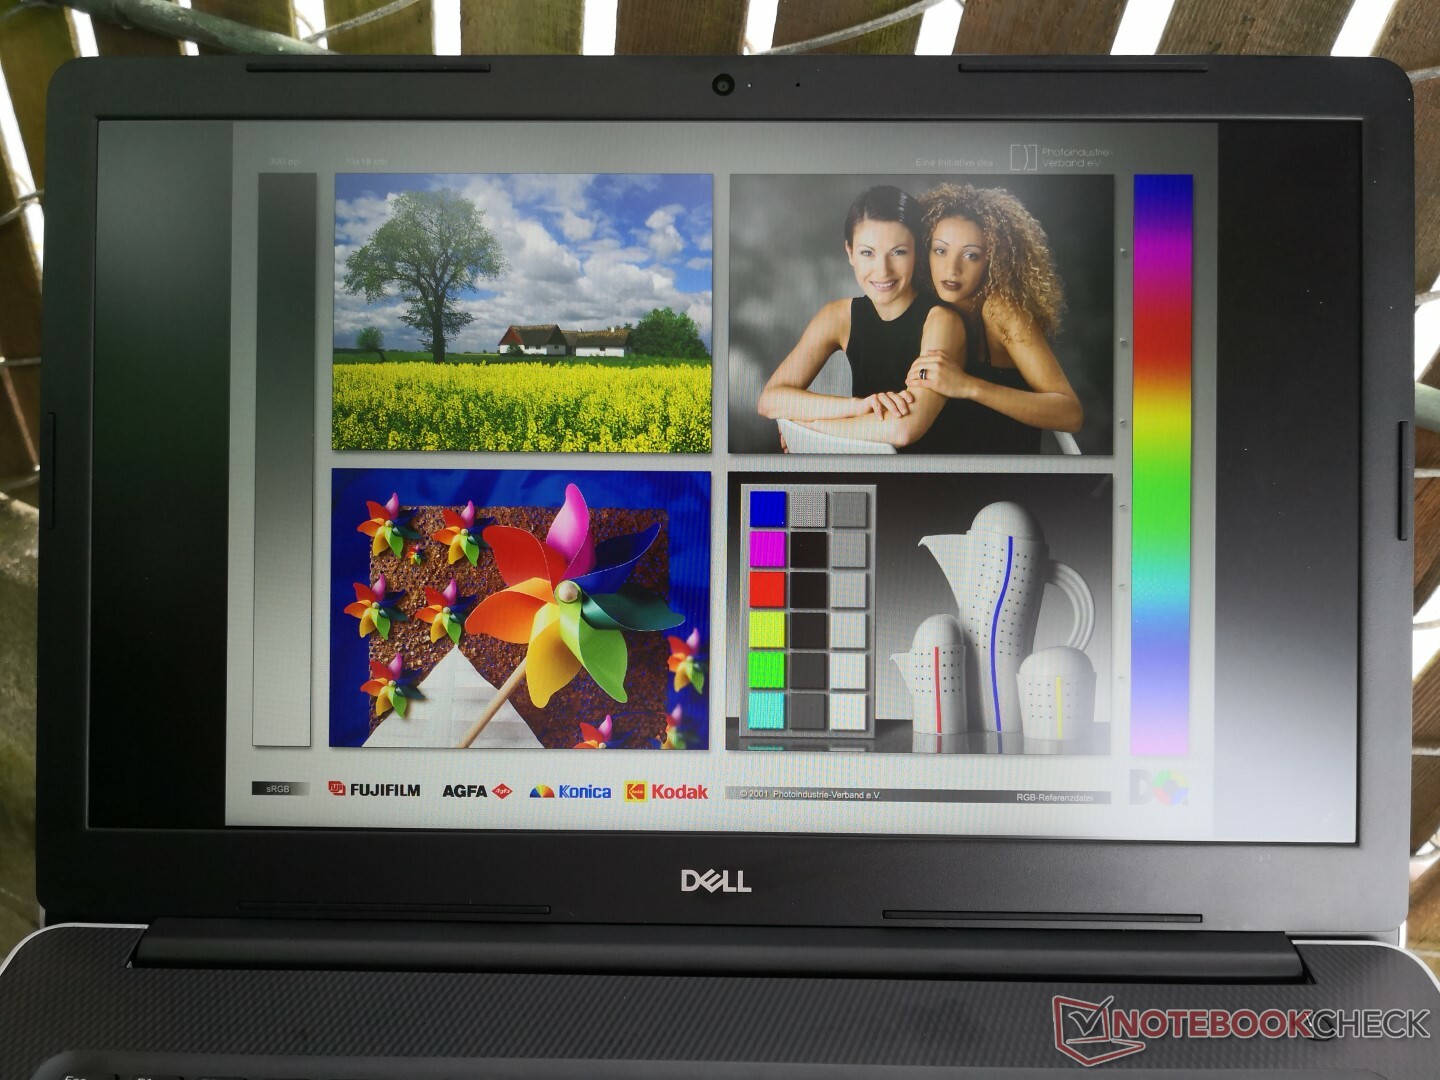
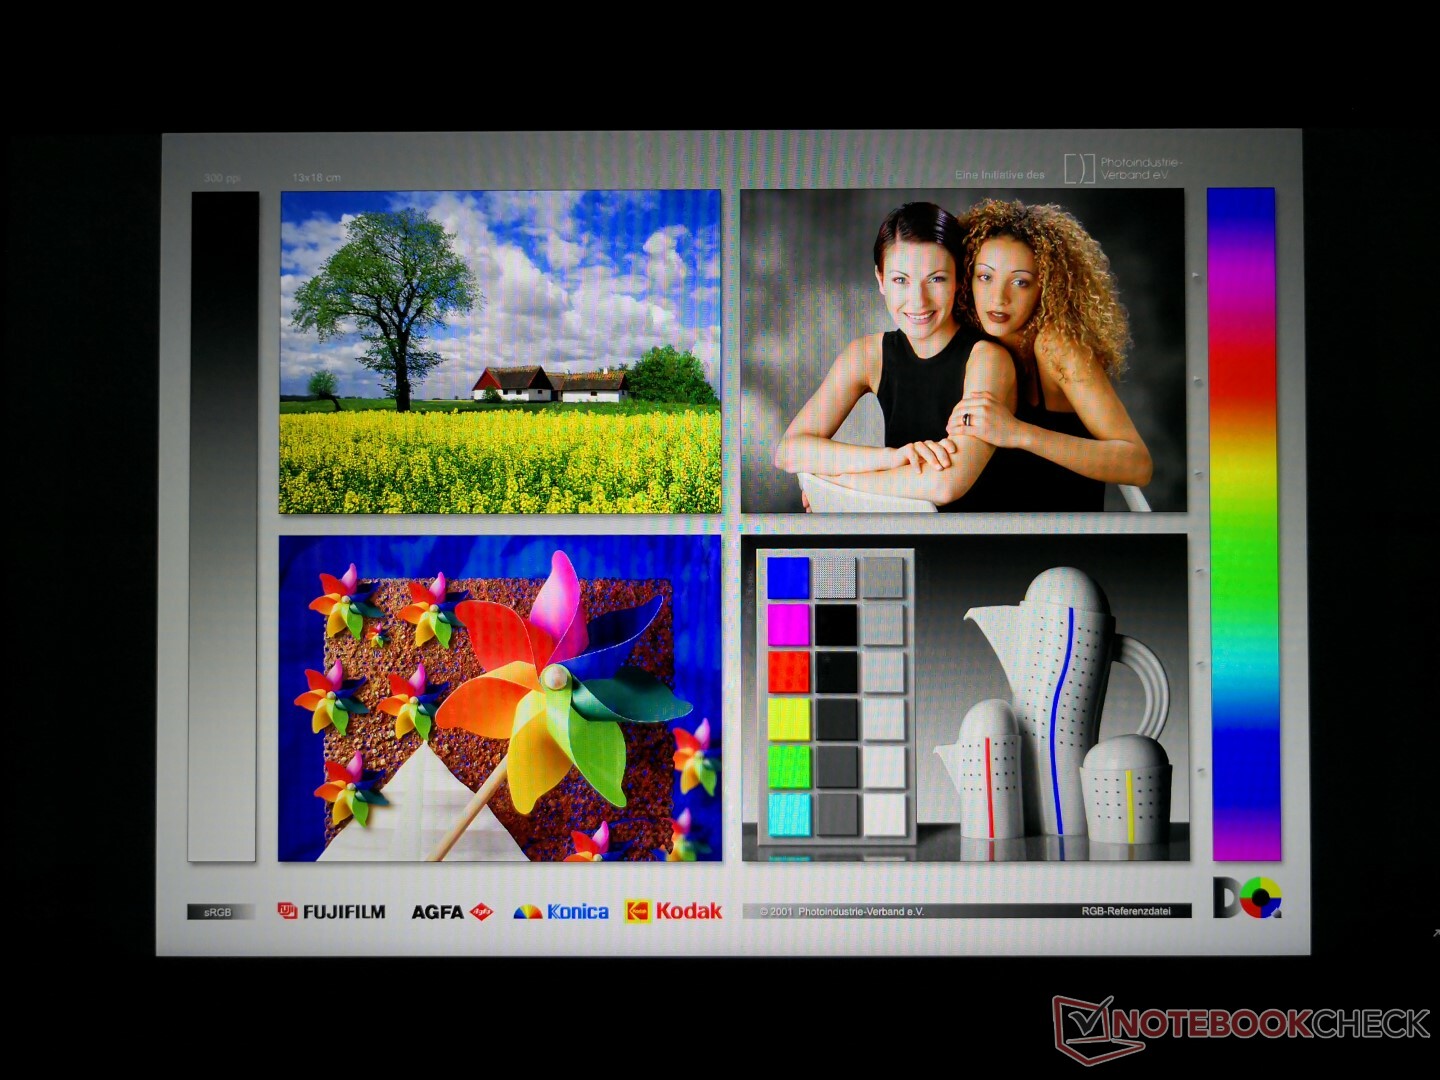
The system ships with the same AU Optronics B173HAN01.3 IPS panel as found on a number of other 17.3-inch Dell laptops including the Precision 7730 and G3 17. Thus, these laptops share similar qualities including the respectable contrast ratio and color space. Other aspects like response times and backlight brightness are merely average for the budget category. A notable disadvantage of the matte display display is its graininess and so image quality is not as crisp as a glossy panel.
Our test unit suffers from heavy backlight bleeding as shown by our image below. While not noticeble when browsing the web or word processing, it becomes painfully obvious during video playback or during the initial BIOS boot up screen.

| |||||||||||||||||||||||||
Brightness Distribution: 84 %
Center on Battery: 322.9 cd/m²
Contrast: 1242:1 (Black: 0.26 cd/m²)
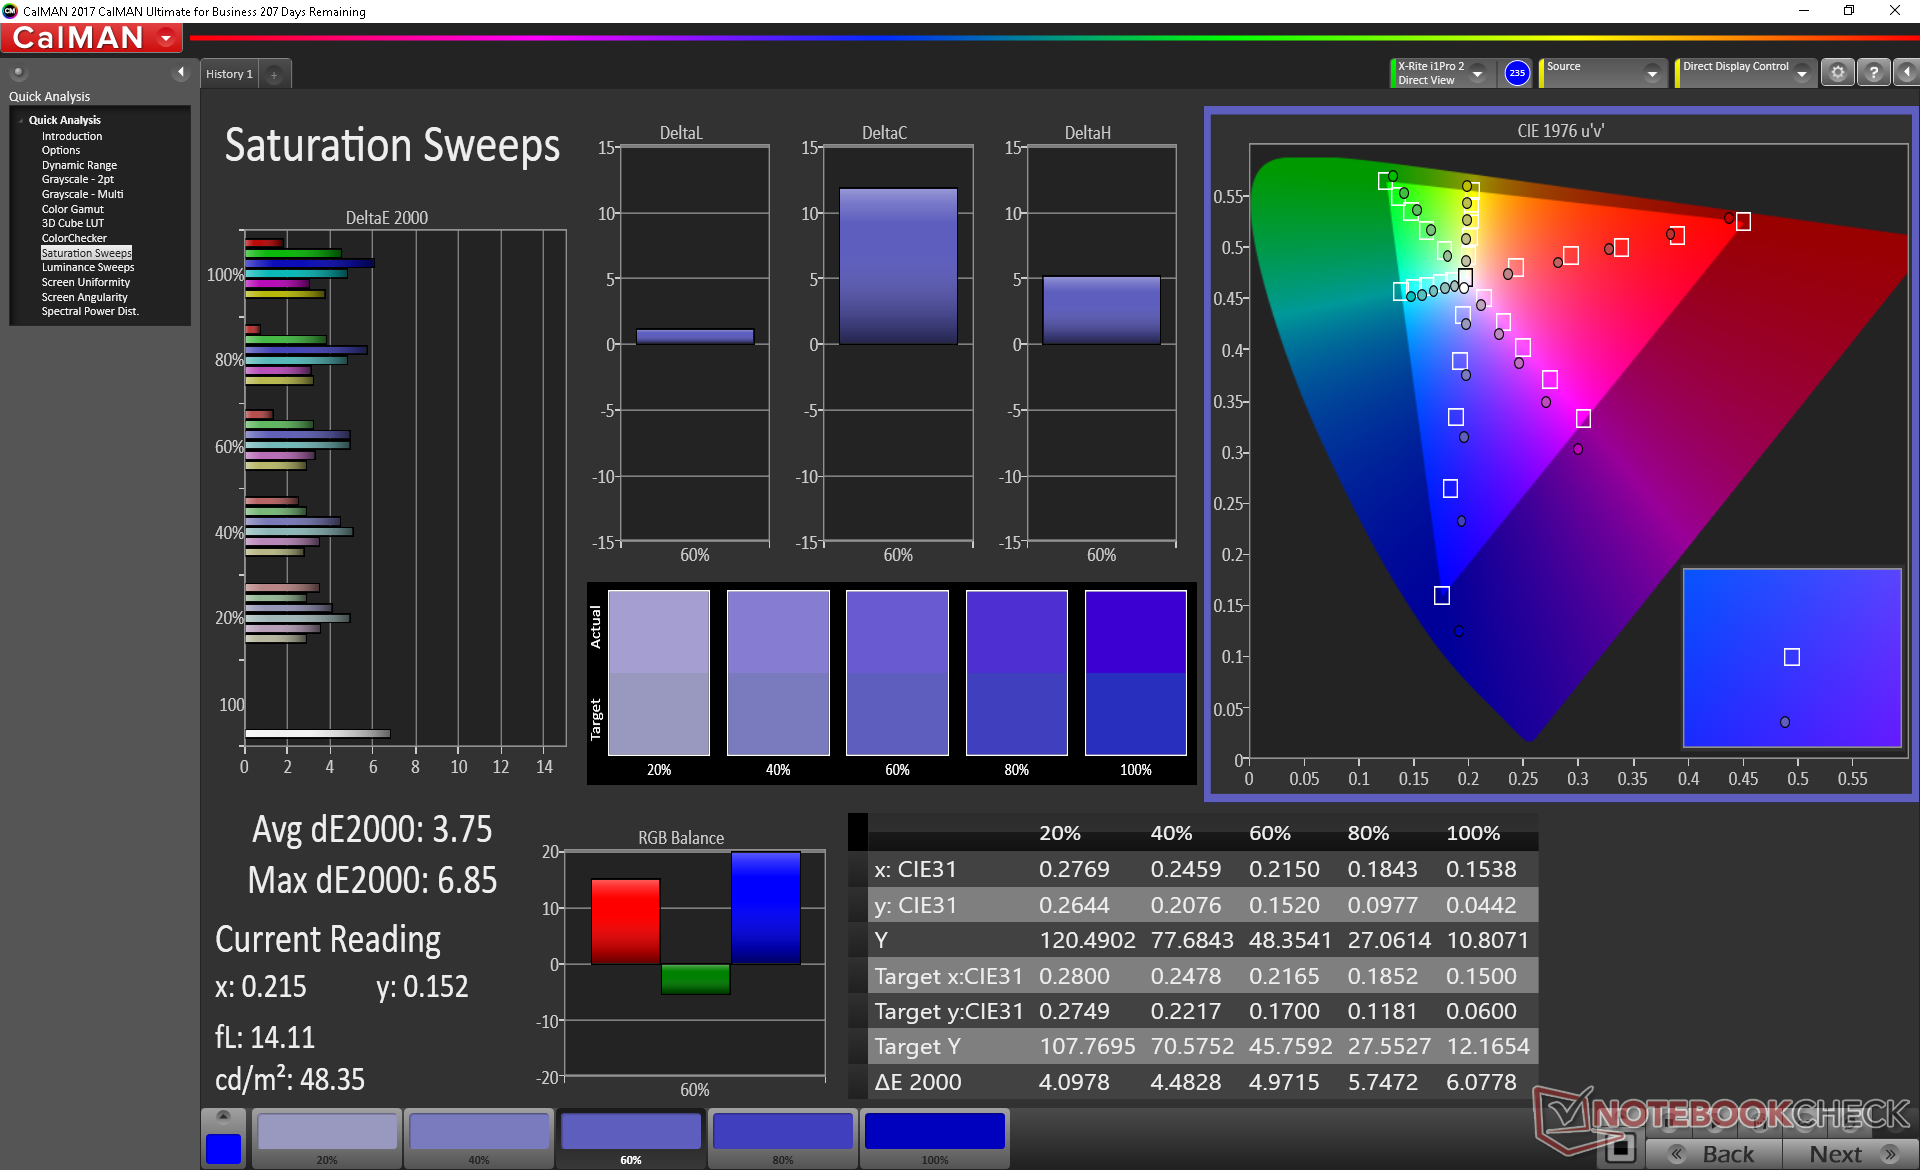
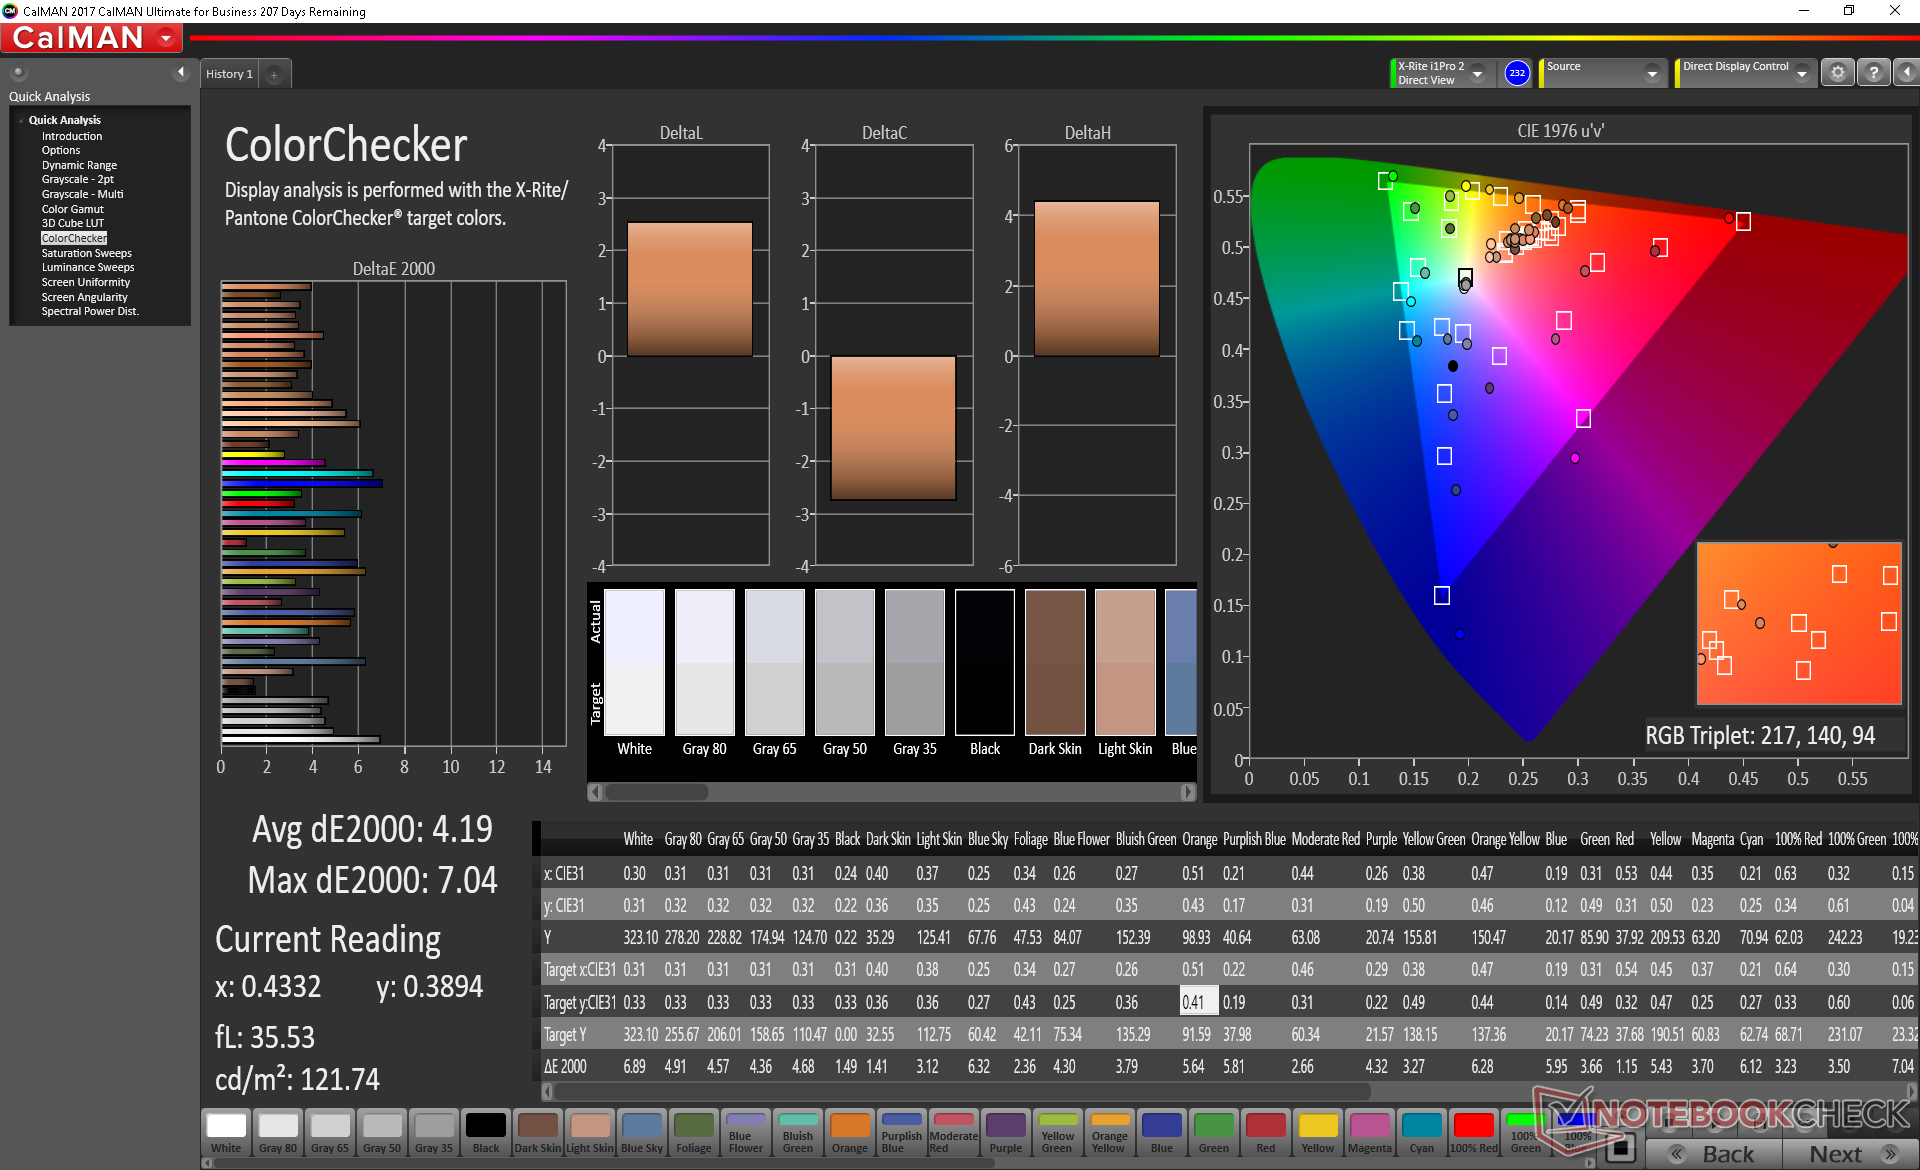
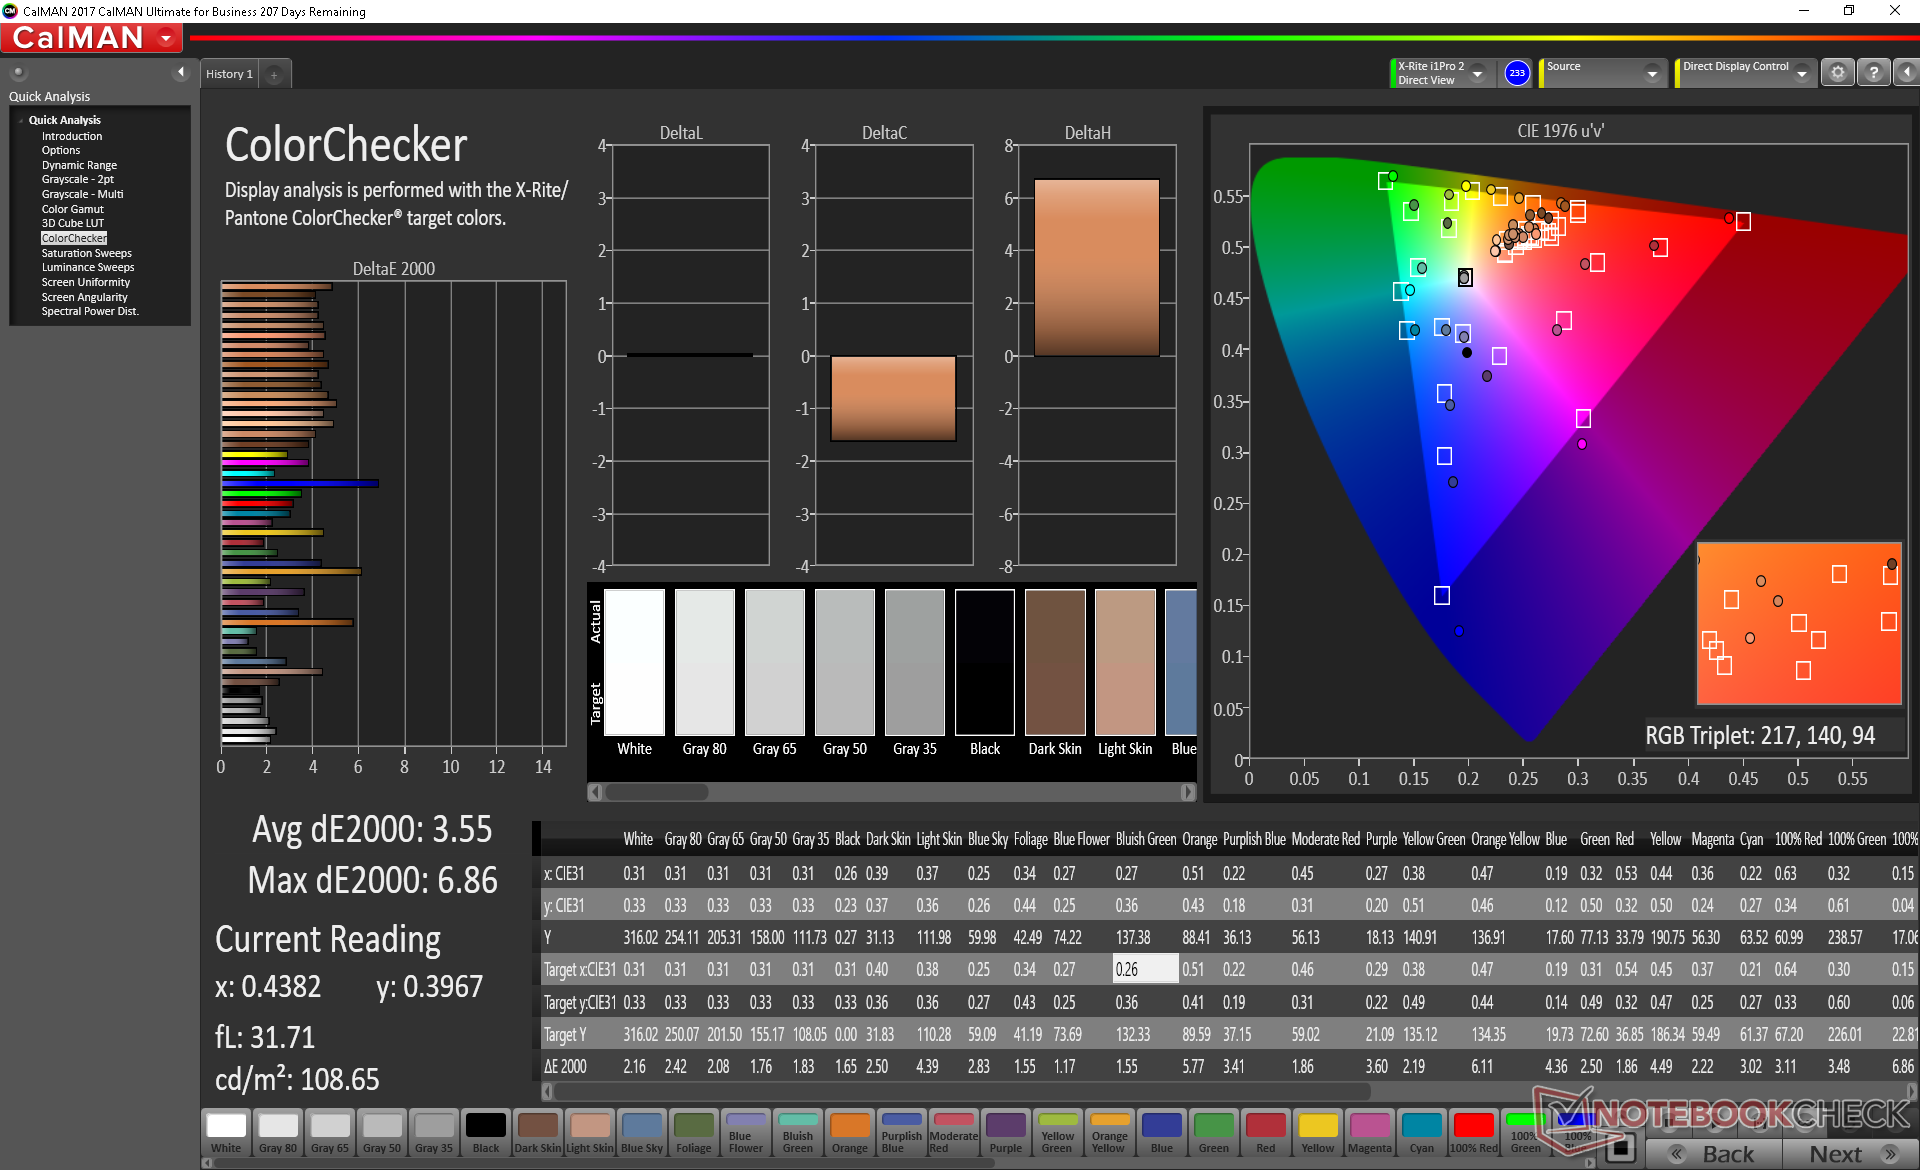
ΔE ColorChecker Calman: 4.19 | ∀{0.5-29.43 Ø4.73}
calibrated: 3.55
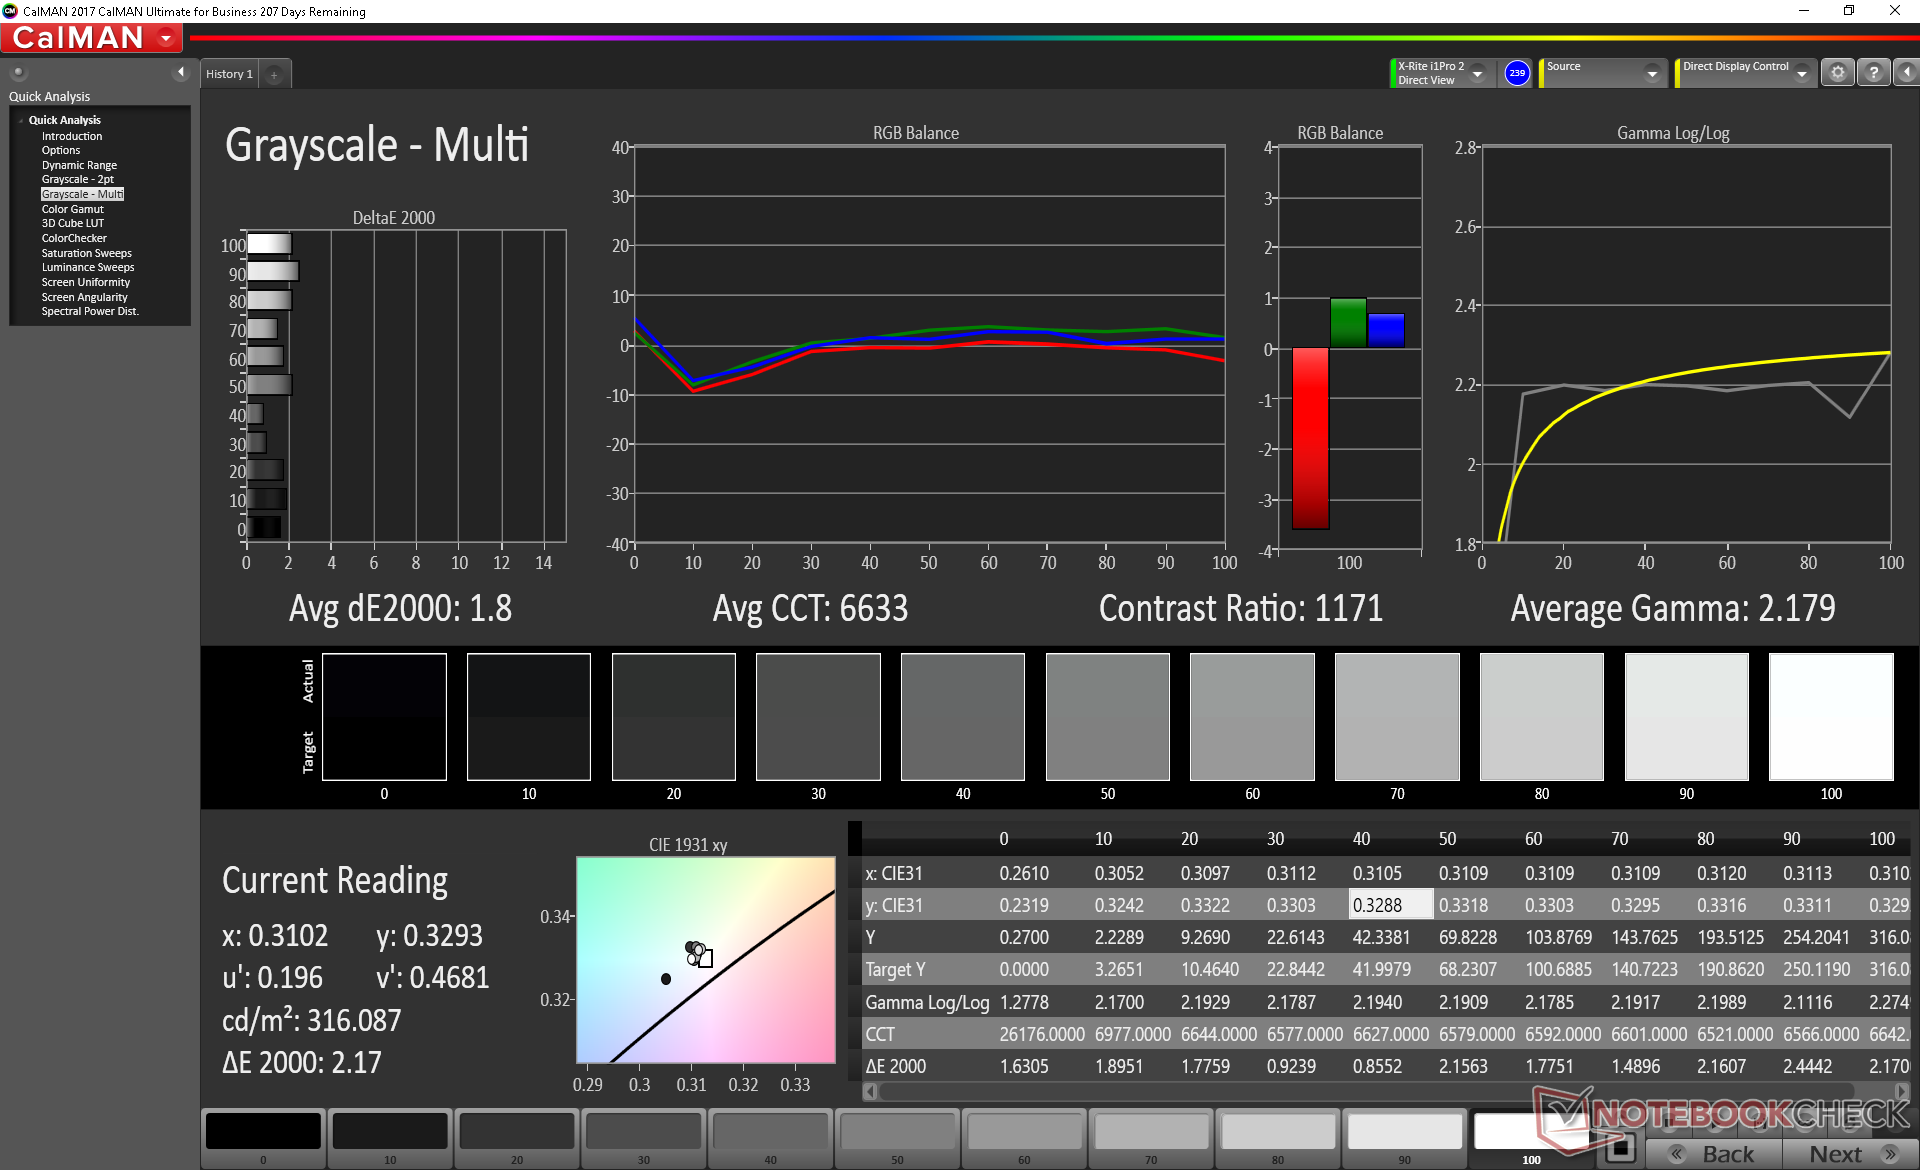
ΔE Greyscale Calman: 4.5 | ∀{0.09-98 Ø4.97}
88.4% sRGB (Argyll 1.6.3 3D)
57.6% AdobeRGB 1998 (Argyll 1.6.3 3D)
64.6% AdobeRGB 1998 (Argyll 3D)
88.9% sRGB (Argyll 3D)
63.7% Display P3 (Argyll 3D)
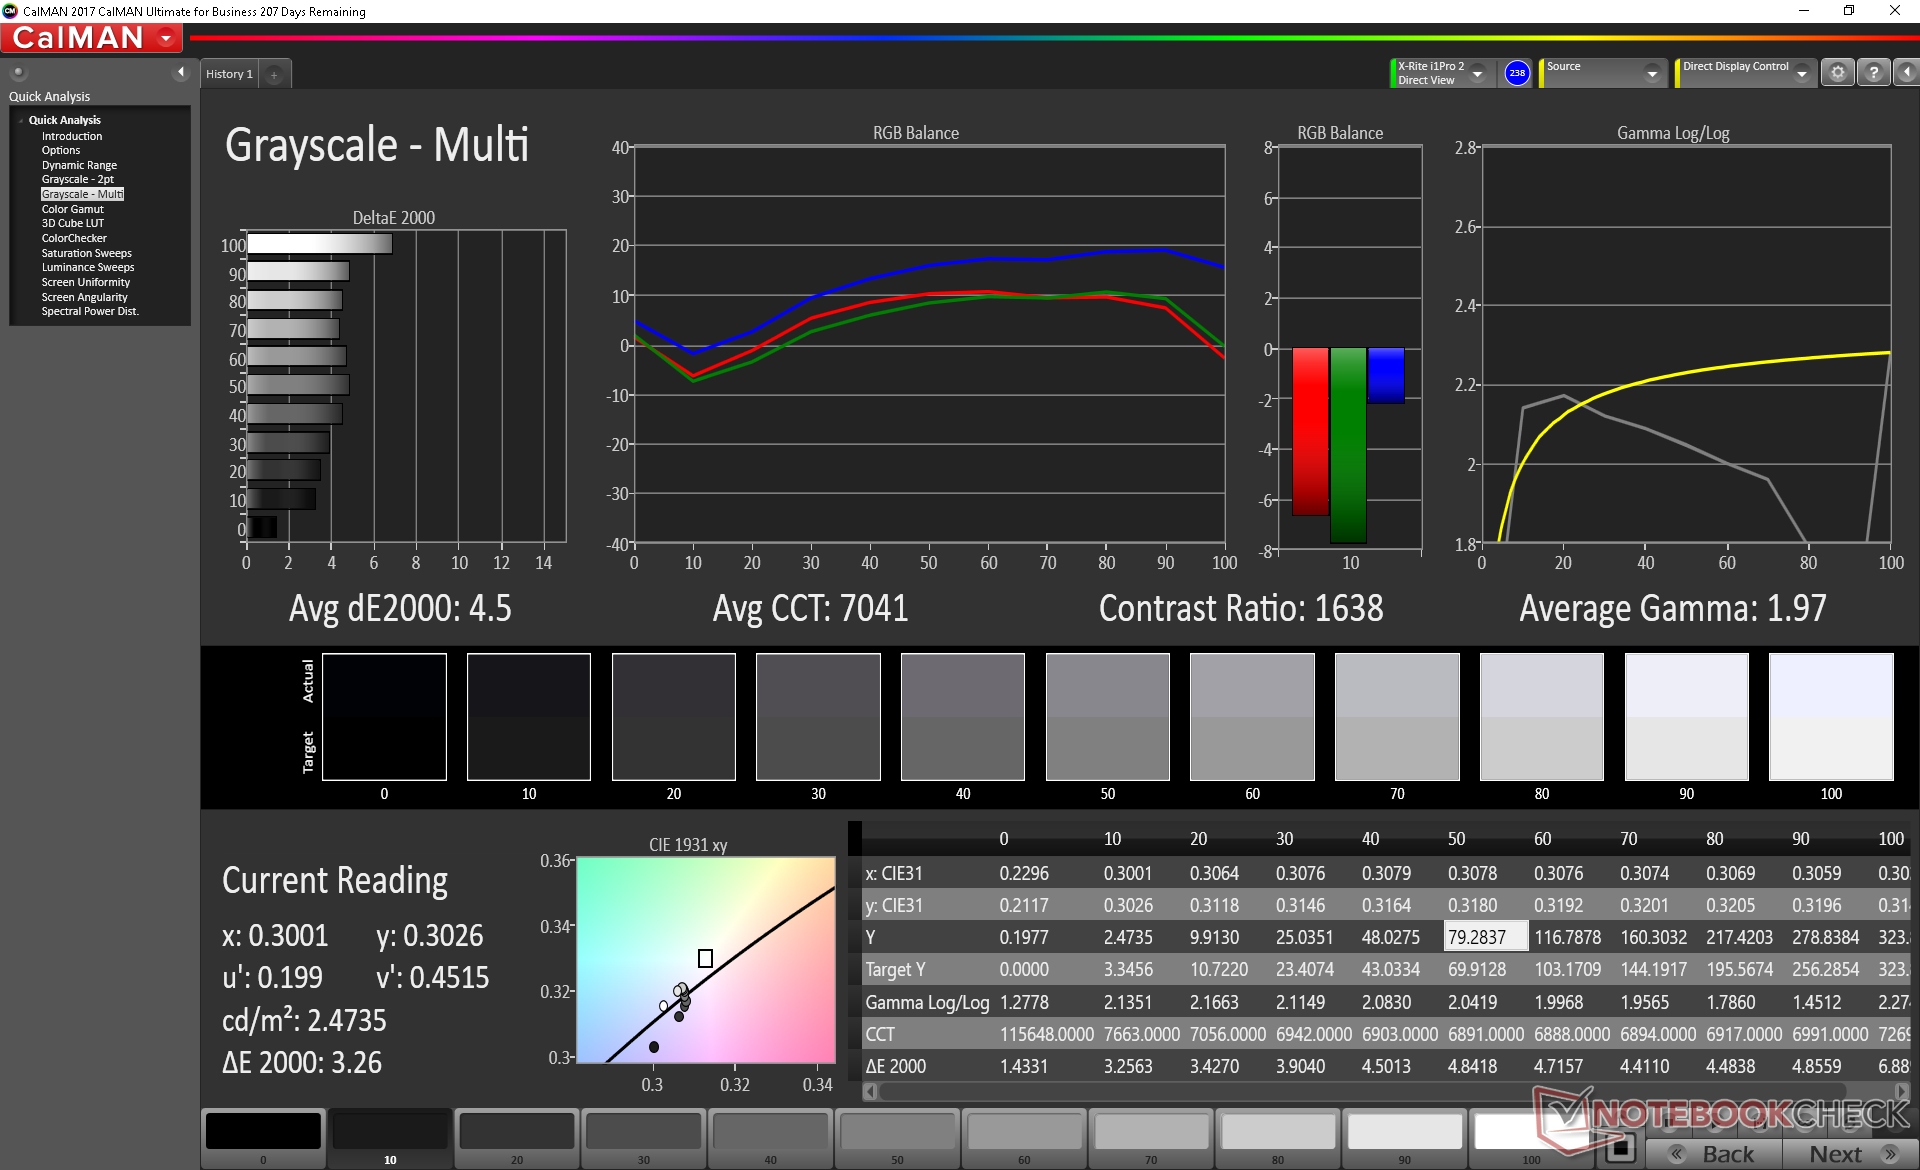
Gamma: 1.97
CCT: 7041 K
| Dell Inspiron 17 3780 AU Optronics B173HAN01.3, IPS, 17.3", 1920x1080 | Dell Inspiron 17-7786 LG Philips, 173W4F, IPS, 17.3", 1920x1080 | Lenovo V320-17IKB-81CN000MGE LG Philips LP173WF4-SPF5, IPS, 17.3", 1920x1080 | HP ProBook 470 G5 LG Philips, IPS, 17.3", 1920x1080 | Dell Inspiron 17-5770-0357 AUO109D (AU Optronics), IPS, 17.3", 1920x1080 | HP 17-ca0013ng LG Philips LGD059E, IPS, 17.3", 1920x1080 | |
|---|---|---|---|---|---|---|
| Display | -5% | -4% | -2% | 0% | 0% | |
| Display P3 Coverage (%) | 63.7 | 64.8 2% | 65.4 3% | 66.1 4% | 63.9 0% | 67 5% |
| sRGB Coverage (%) | 88.9 | 81.6 -8% | 82 -8% | 84.4 -5% | 88.7 0% | 86.4 -3% |
| AdobeRGB 1998 Coverage (%) | 64.6 | 59.7 -8% | 60 -7% | 61.8 -4% | 64.8 0% | 63.2 -2% |
| Response Times | 20% | 24% | 21% | 23% | 30% | |
| Response Time Grey 50% / Grey 80% * (ms) | 46 ? | 38 ? 17% | 33 ? 28% | 36 ? 22% | 38 ? 17% | 33 ? 28% |
| Response Time Black / White * (ms) | 35.2 ? | 27 ? 23% | 28 ? 20% | 28 ? 20% | 25 ? 29% | 24 ? 32% |
| PWM Frequency (Hz) | 119000 ? | |||||
| Screen | -12% | -8% | -16% | 9% | -14% | |
| Brightness middle (cd/m²) | 322.9 | 343 6% | 414 28% | 400 24% | 279 -14% | 394 22% |
| Brightness (cd/m²) | 322 | 313 -3% | 375 16% | 374 16% | 262 -19% | 352 9% |
| Brightness Distribution (%) | 84 | 82 -2% | 82 -2% | 87 4% | 85 1% | 83 -1% |
| Black Level * (cd/m²) | 0.26 | 0.37 -42% | 0.41 -58% | 0.63 -142% | 0.18 31% | 0.35 -35% |
| Contrast (:1) | 1242 | 927 -25% | 1010 -19% | 635 -49% | 1550 25% | 1126 -9% |
| Colorchecker dE 2000 * | 4.19 | 4.8 -15% | 4.5 -7% | 4.34 -4% | 3.58 15% | 6.08 -45% |
| Colorchecker dE 2000 max. * | 7.04 | 10.35 -47% | 9.59 -36% | 8.29 -18% | 5.98 15% | 10.88 -55% |
| Colorchecker dE 2000 calibrated * | 3.55 | 4.57 -29% | 2.8 21% | |||
| Greyscale dE 2000 * | 4.5 | 3.51 22% | 3.13 30% | 3.51 22% | 2.75 39% | 7.22 -60% |
| Gamma | 1.97 112% | 2.19 100% | 2.41 91% | 2.45 90% | 2.57 86% | 2.48 89% |
| CCT | 7041 92% | 6188 105% | 6198 105% | 6570 99% | 6836 95% | 7997 81% |
| Color Space (Percent of AdobeRGB 1998) (%) | 57.6 | 54 -6% | 54 -6% | 55 -5% | 58 1% | 57 -1% |
| Color Space (Percent of sRGB) (%) | 88.4 | 81 -8% | 82 -7% | 84 -5% | 88 0% | 86 -3% |
| Total Average (Program / Settings) | 1% /
-6% | 4% /
-3% | 1% /
-8% | 11% /
9% | 5% /
-6% |
* ... smaller is better
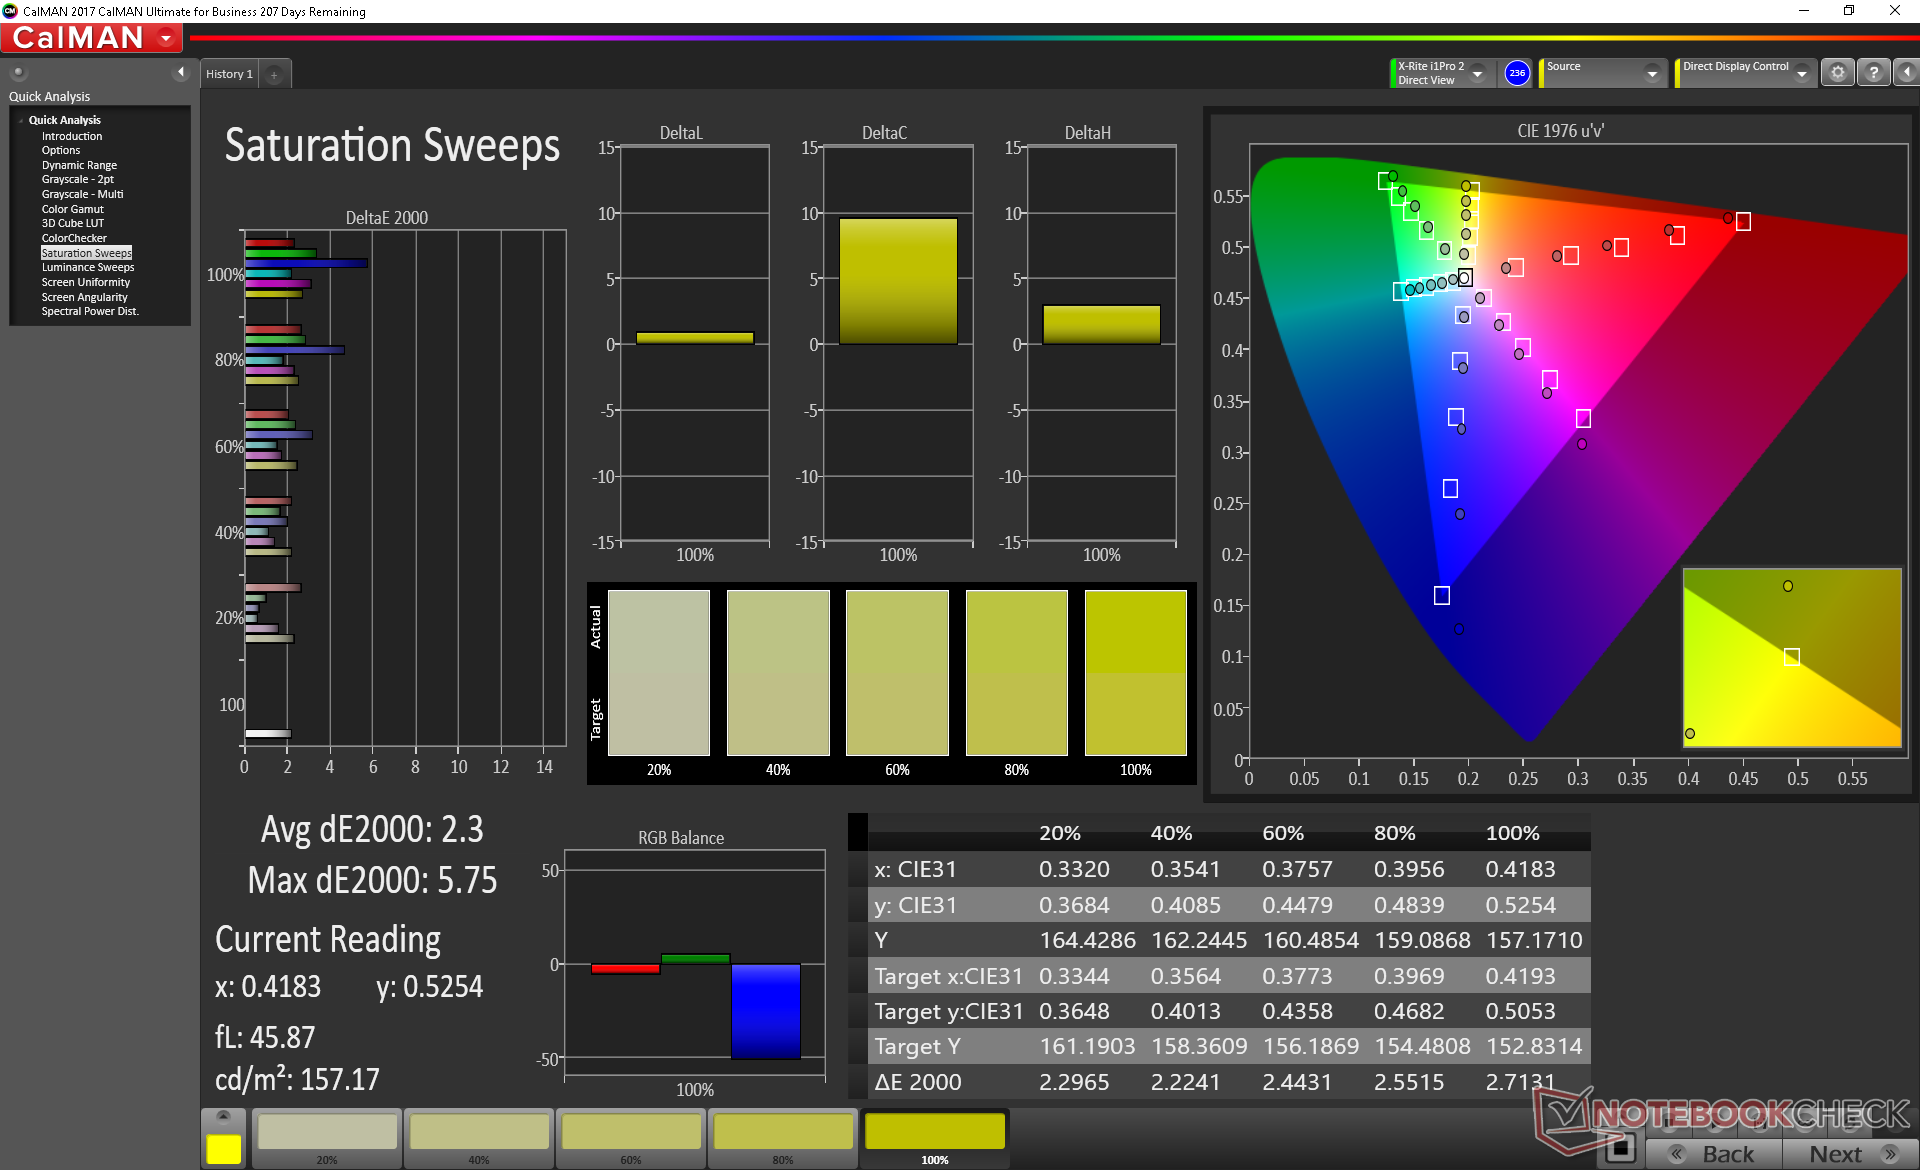
Color space covers approximately 88 percent of sRGB to be in between most flagship Ultrabooks where full sRGB coverage is expected and cheaper budget alternatives where 60 percent is common. Subjectively, colors appear deep albeit not deep enough to recommend for serious graphic artists.
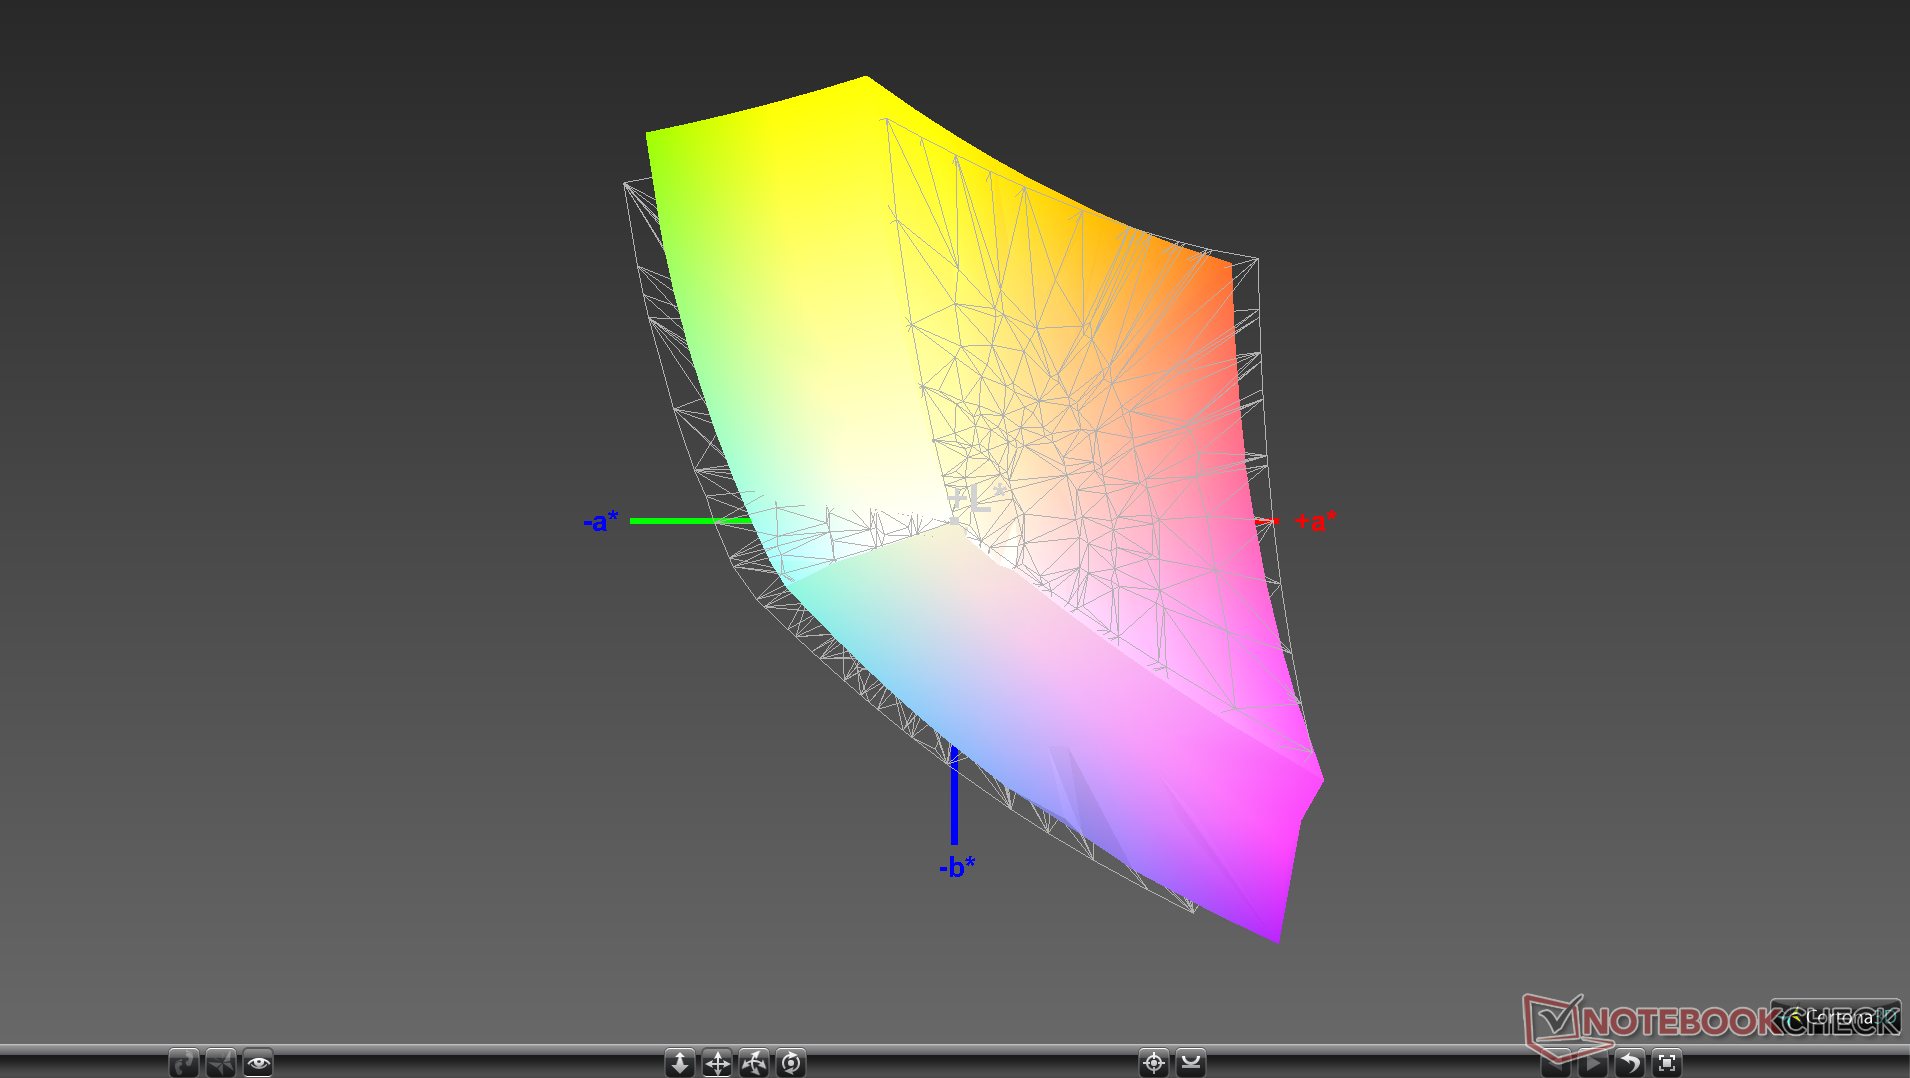
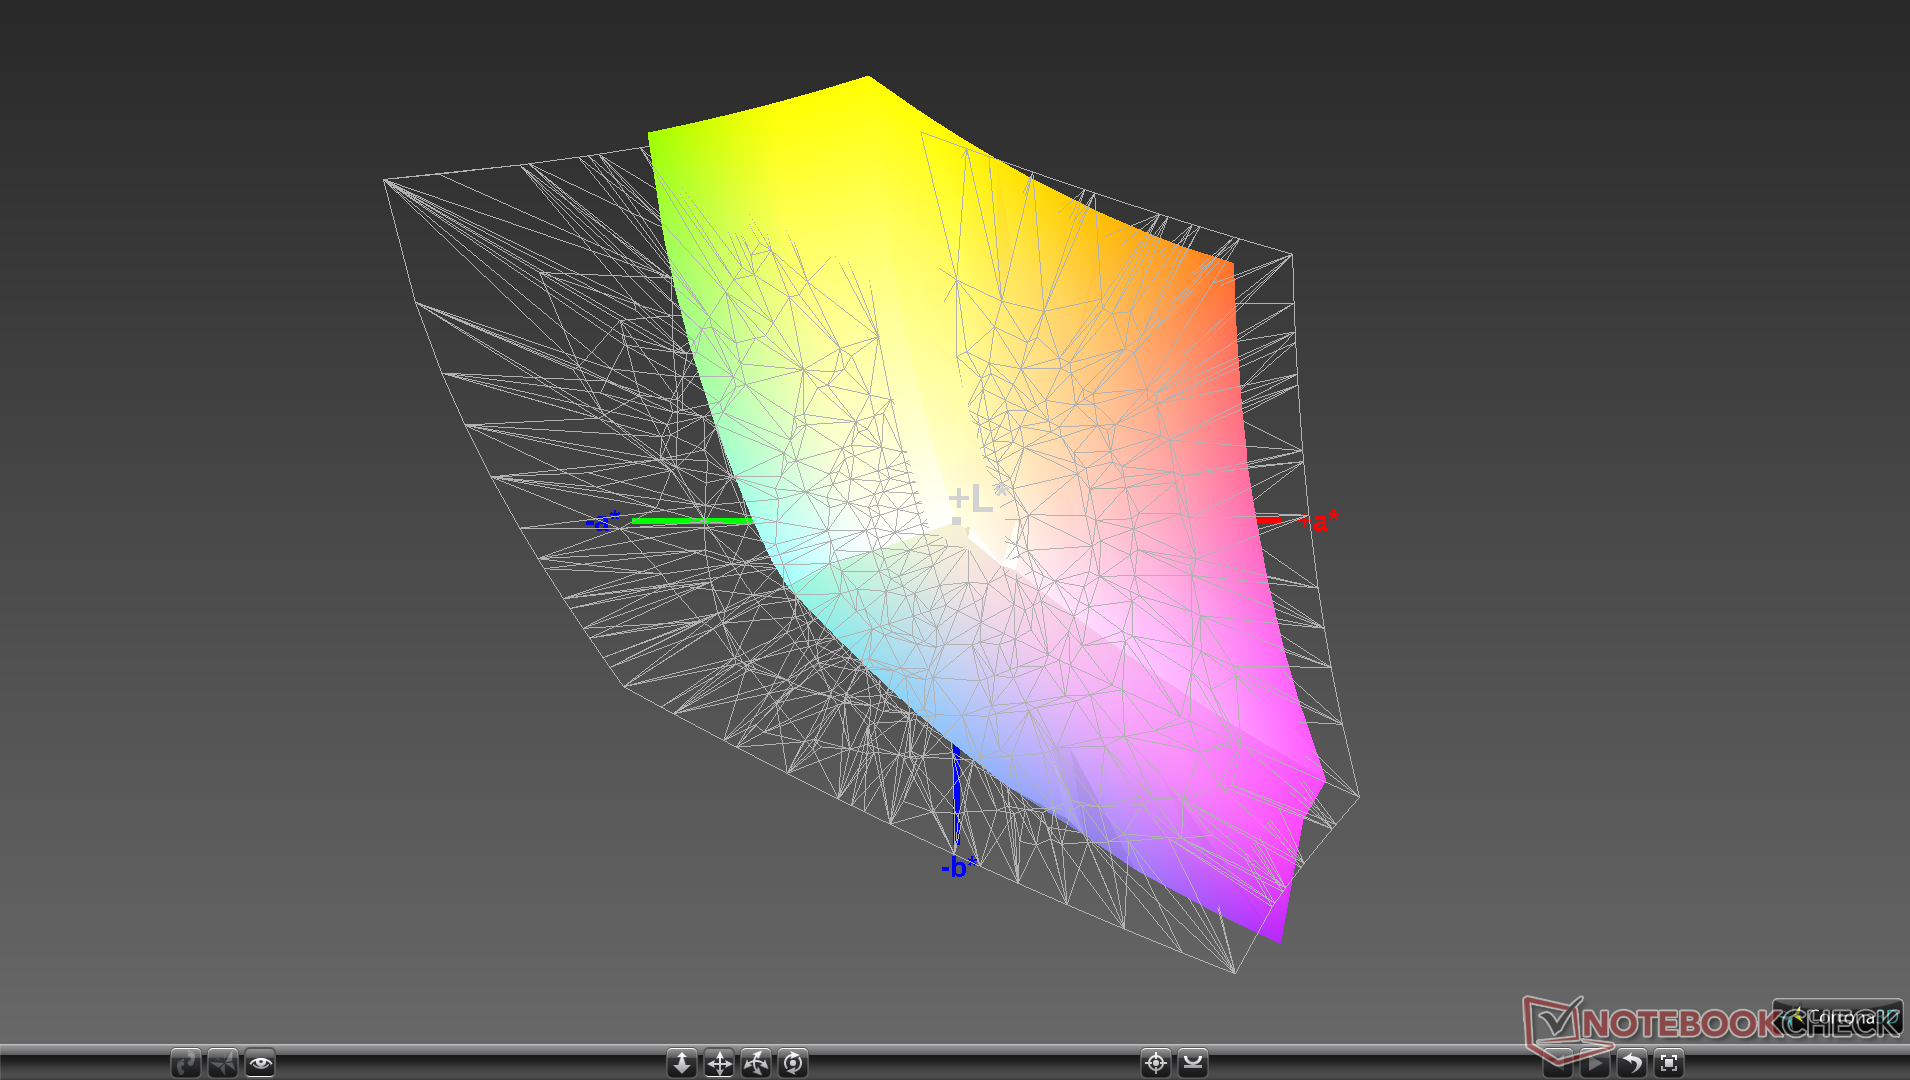
Further measurements with an X-Rite colorimeter reveal just average colors and grayscale. Our calibration attempt improves both by noticeable margins for final average grayscale and color deltaE values of 1.8 and 3.55, respectively. We recommend an end-user calibration for the best possible colors out of the Inspiron 17 3780.
Display Response Times
| ↔ Response Time Black to White | ||
|---|---|---|
| 35.2 ms ... rise ↗ and fall ↘ combined | ↗ 22 ms rise | 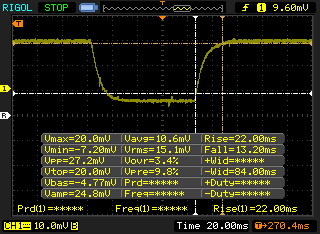 |
| ↘ 13.2 ms fall | ||
| The screen shows slow response rates in our tests and will be unsatisfactory for gamers. In comparison, all tested devices range from 0.1 (minimum) to 240 (maximum) ms. » 93 % of all devices are better. This means that the measured response time is worse than the average of all tested devices (19.9 ms). | ||
| ↔ Response Time 50% Grey to 80% Grey | ||
| 46 ms ... rise ↗ and fall ↘ combined | ↗ 24.4 ms rise | 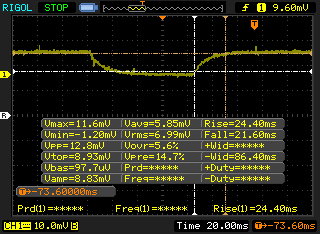 |
| ↘ 21.6 ms fall | ||
| The screen shows slow response rates in our tests and will be unsatisfactory for gamers. In comparison, all tested devices range from 0.165 (minimum) to 636 (maximum) ms. » 79 % of all devices are better. This means that the measured response time is worse than the average of all tested devices (31.1 ms). | ||
Screen Flickering / PWM (Pulse-Width Modulation)
| Screen flickering / PWM not detected | 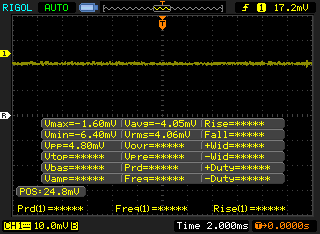 | ||
In comparison: 52 % of all tested devices do not use PWM to dim the display. If PWM was detected, an average of 7794 (minimum: 5 - maximum: 343500) Hz was measured. | |||
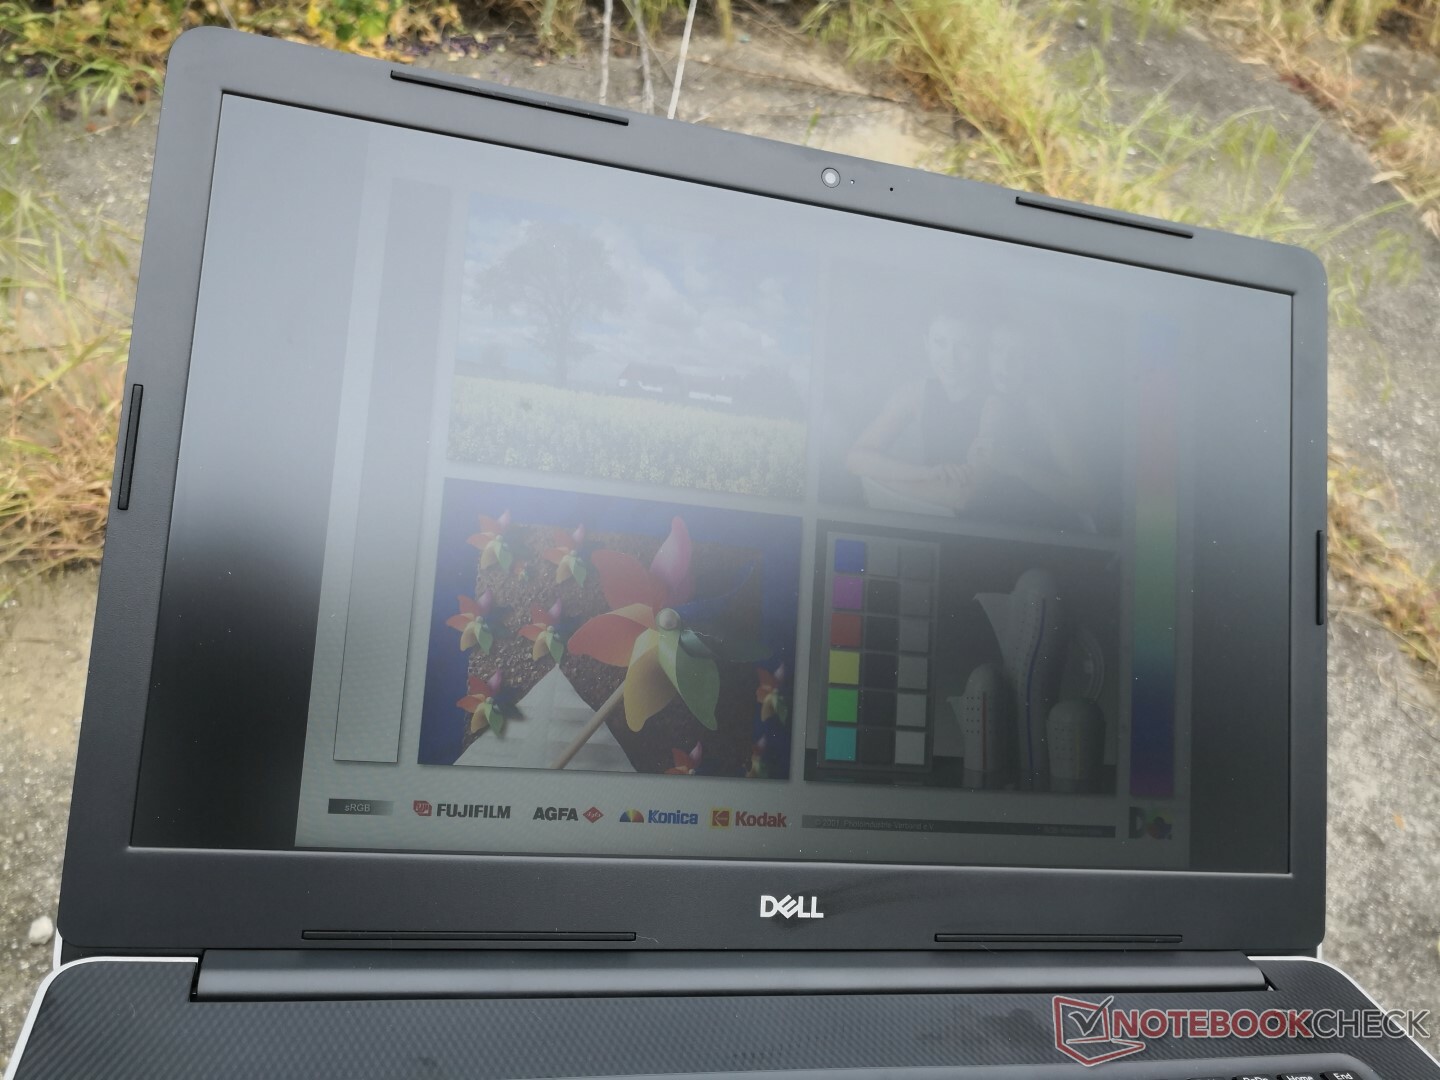
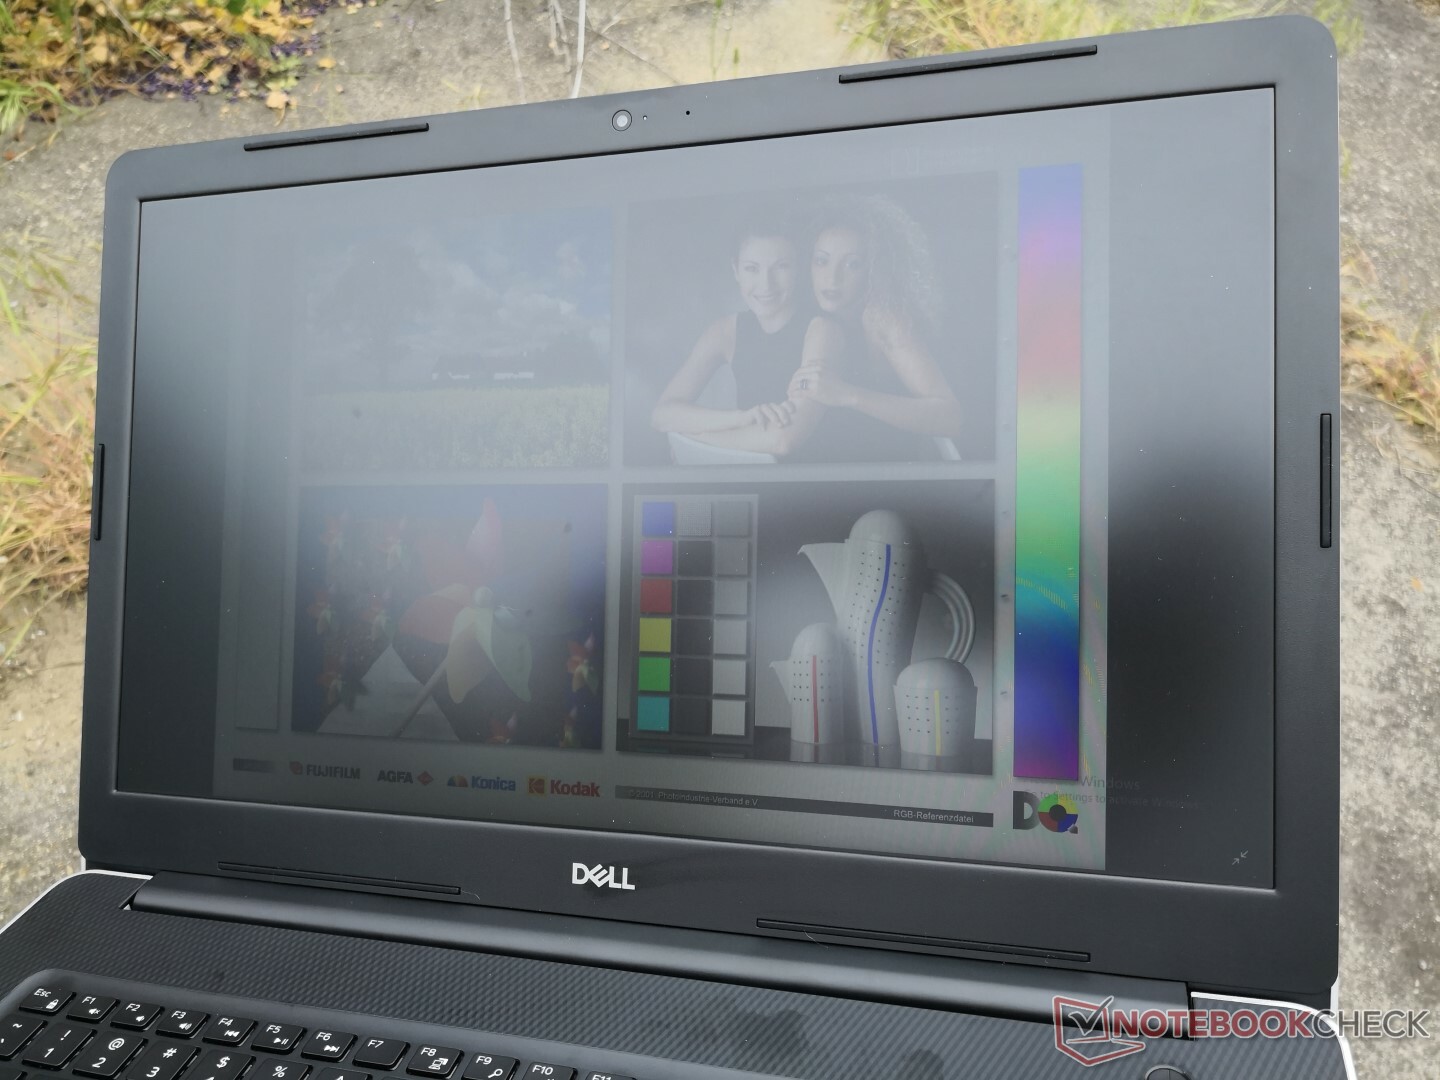
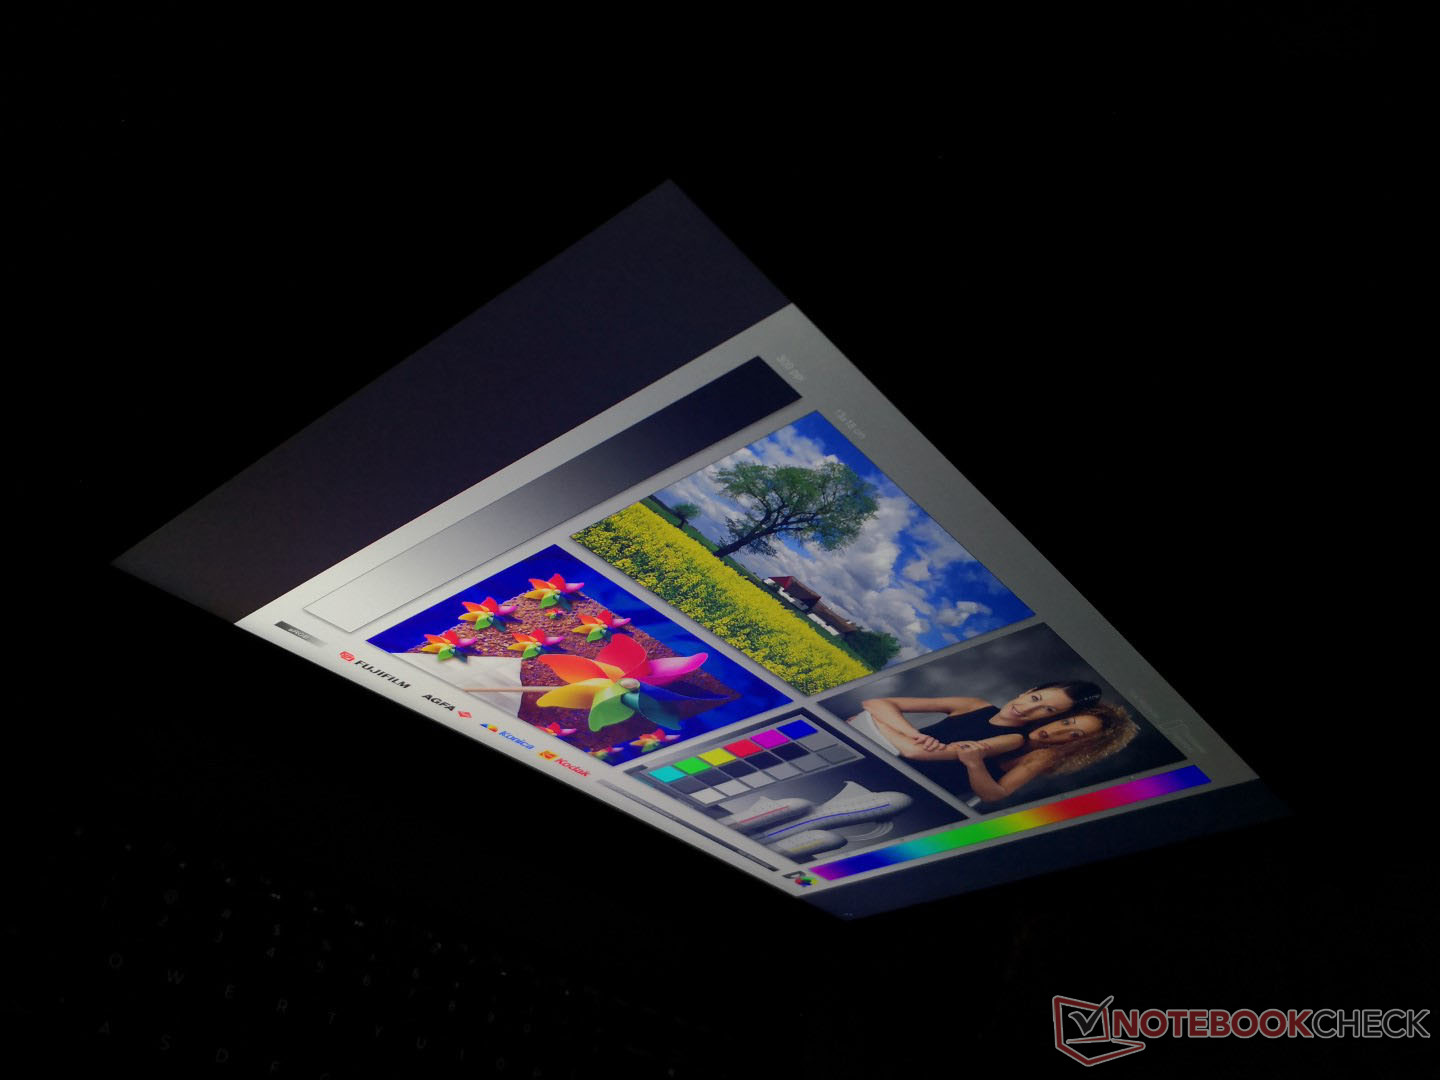
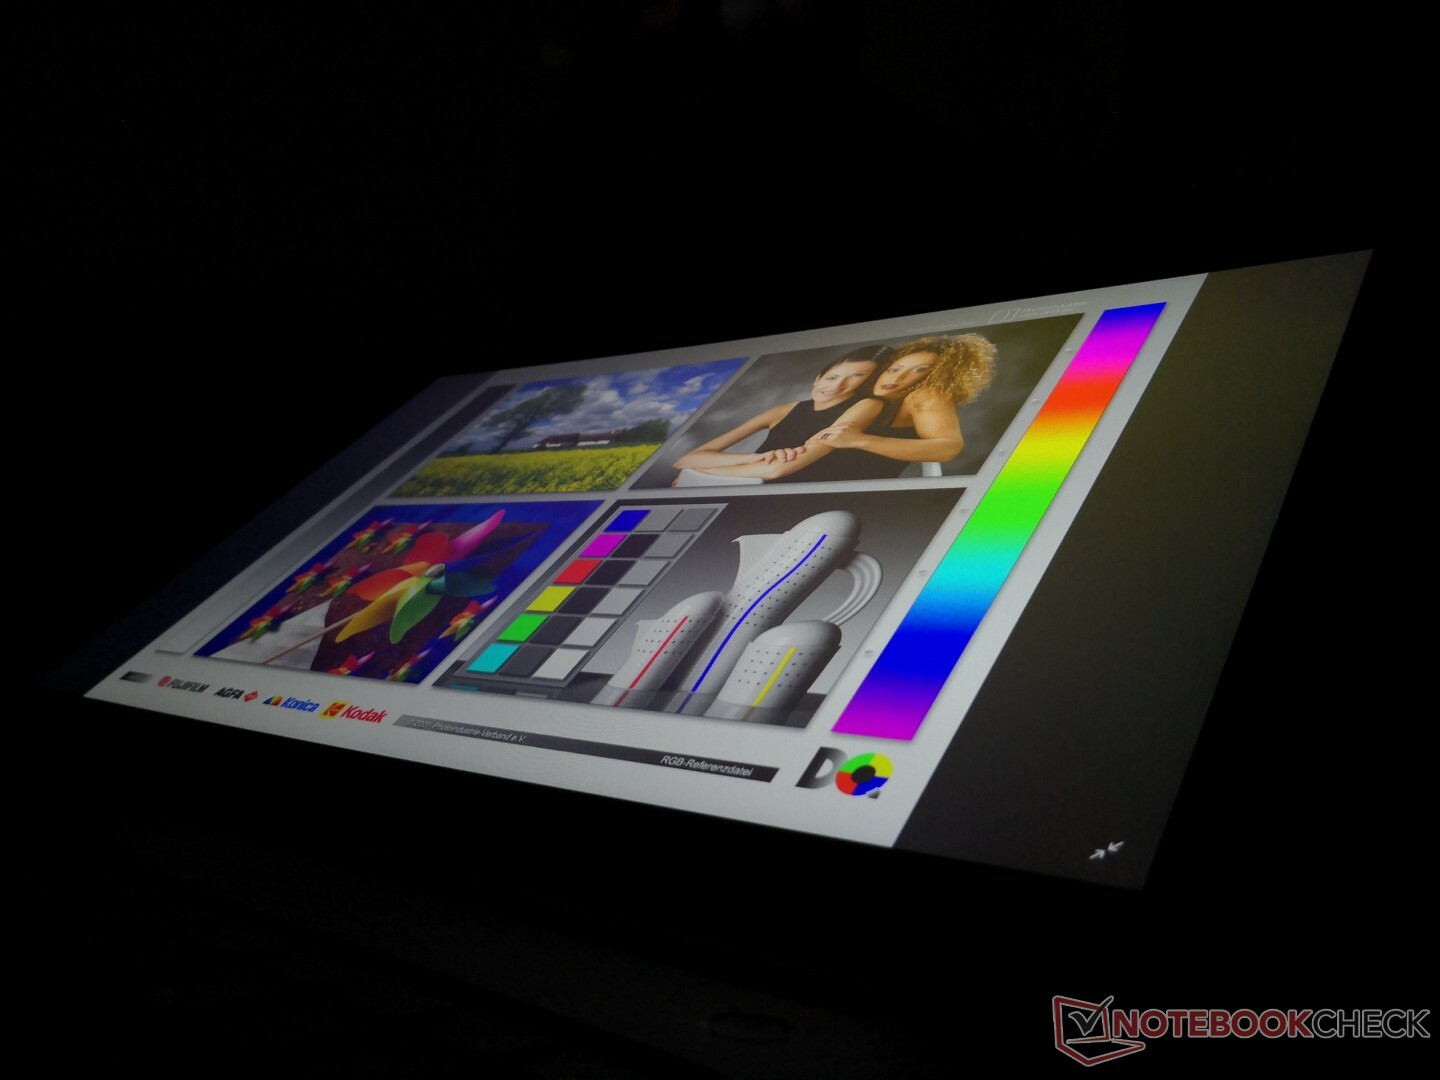
Outdoor visibility is below average as the backlight was not designed to overcome direct sunlight. Expect glare and washed out colors if not working under shade. Viewing angles are excellent as expected from an IPS panel to help minimize glare, but the dim backlight is still a hindrance.
Performance
All SKUs are limited to ULV CPUs with either integrated UHD Graphics 620, integrated Vega 6/8, or a discrete Radeon 520 GPU. Users who want more horsepower should consider the Dell G3 17 family which supports H-class CPUs and dedicated Nvidia GeForce GPUs. Interestingly, the Inspiron 17 3780 also comes in AMD-only configurations with Ryzen 3 2300U and Ryzen 5 2500U options. These less expensive SKUs can actually run faster than the Intel SKUs as our benchmarks below with show.
Processor
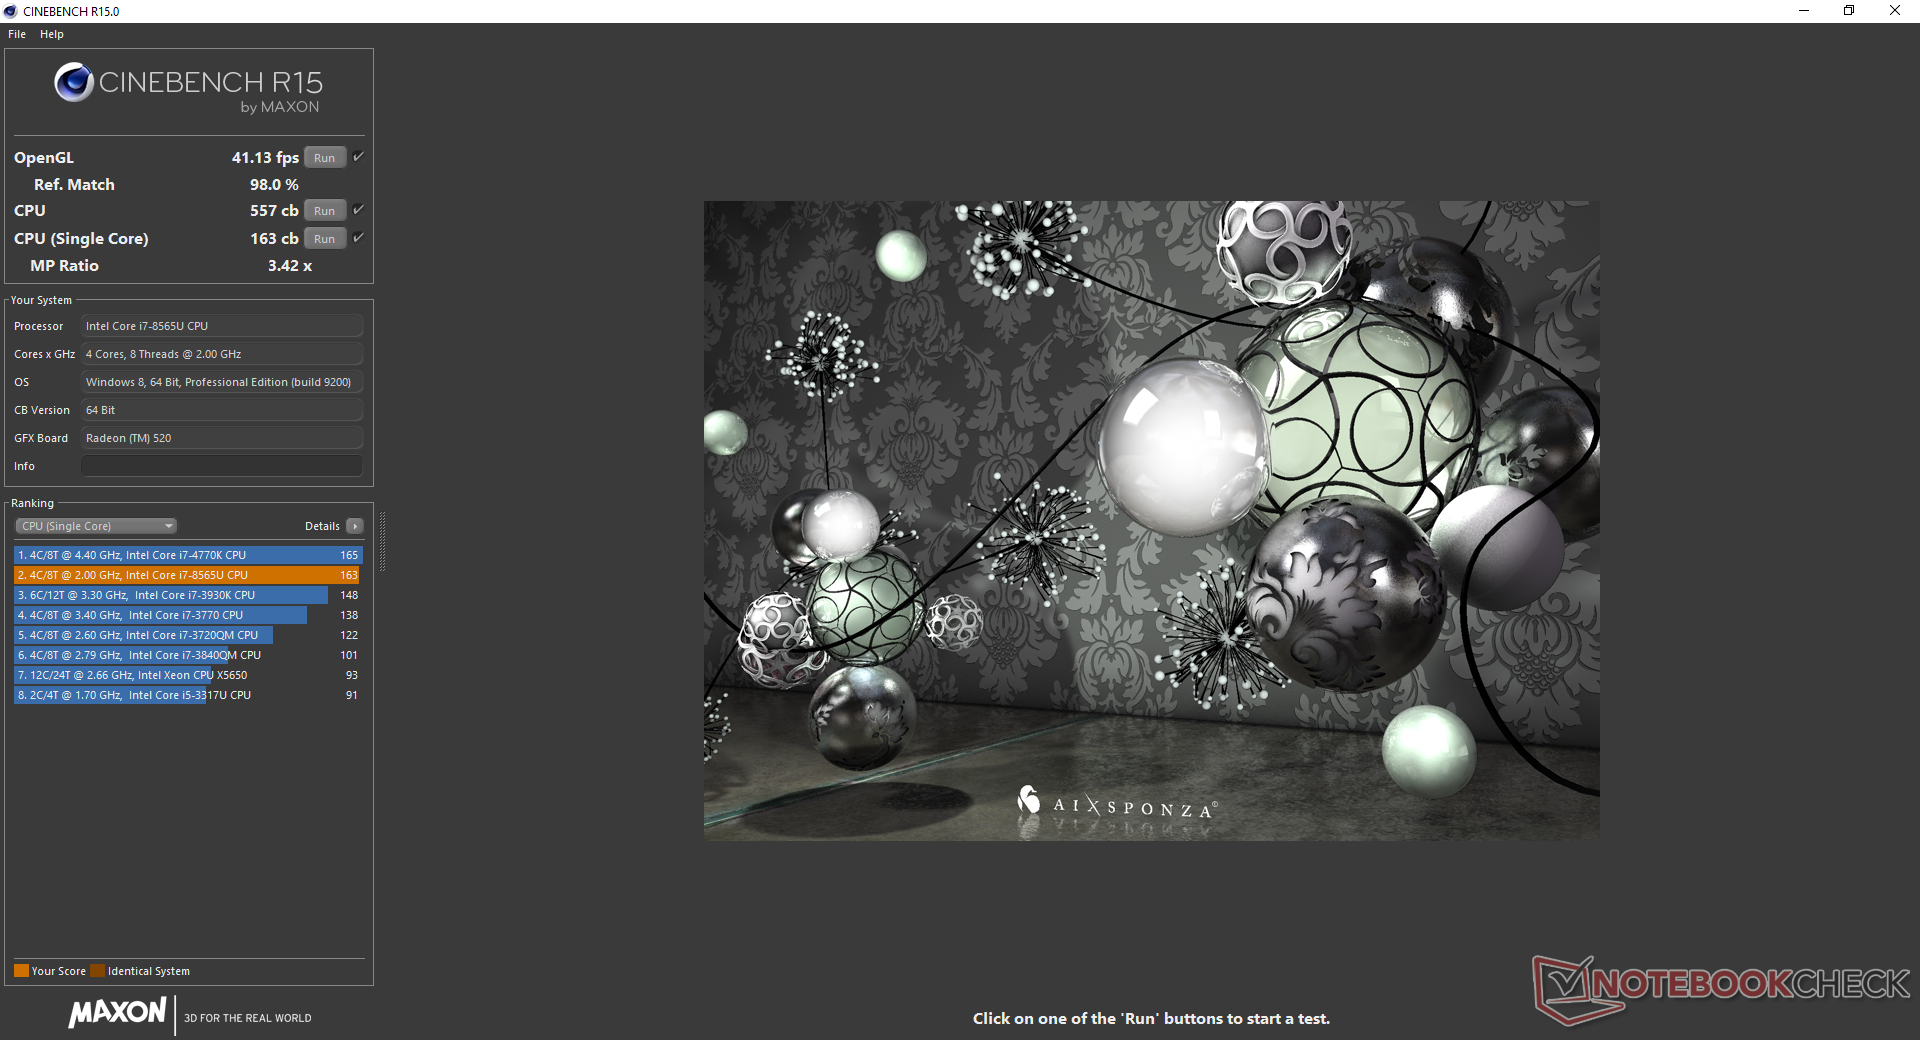
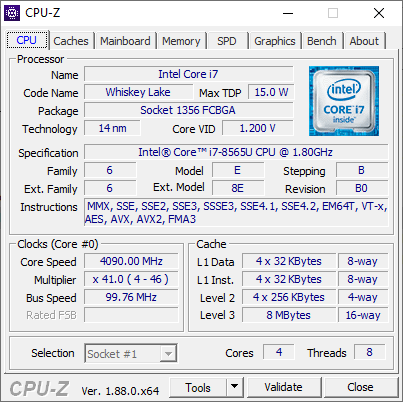
CPU performance is only within a few percentage points from the last generation Core i5-8250U or Core i7-8550U. Thus, users will get almost no performance benefits from the newer Whiskey Lake-U processor on this particular laptop model. Even the Ryzen 7 2700U in the smaller Latitude 14 5495 is able to outperform our Core i7-8565U by 20 percent according to CineBench R15 due to the very short-lived Turbo Boost performance on the Inspiron 17 3780. By running CineBench R15 Multi-Thread in a loop, we can see that performance hits a thermal wall after just the first loop.
Users who upgrade from the base SKU with the Core i3-7020U will still see a substantial 150 percent increase in multi-thread performance. Upgrading from the two-generations old Core i5-7200U or i7-7500U will get a 60 percent performance boost.
See our dedicated page on the Core i7-8565U for more technical information and benchmark comparisons.
System Performance
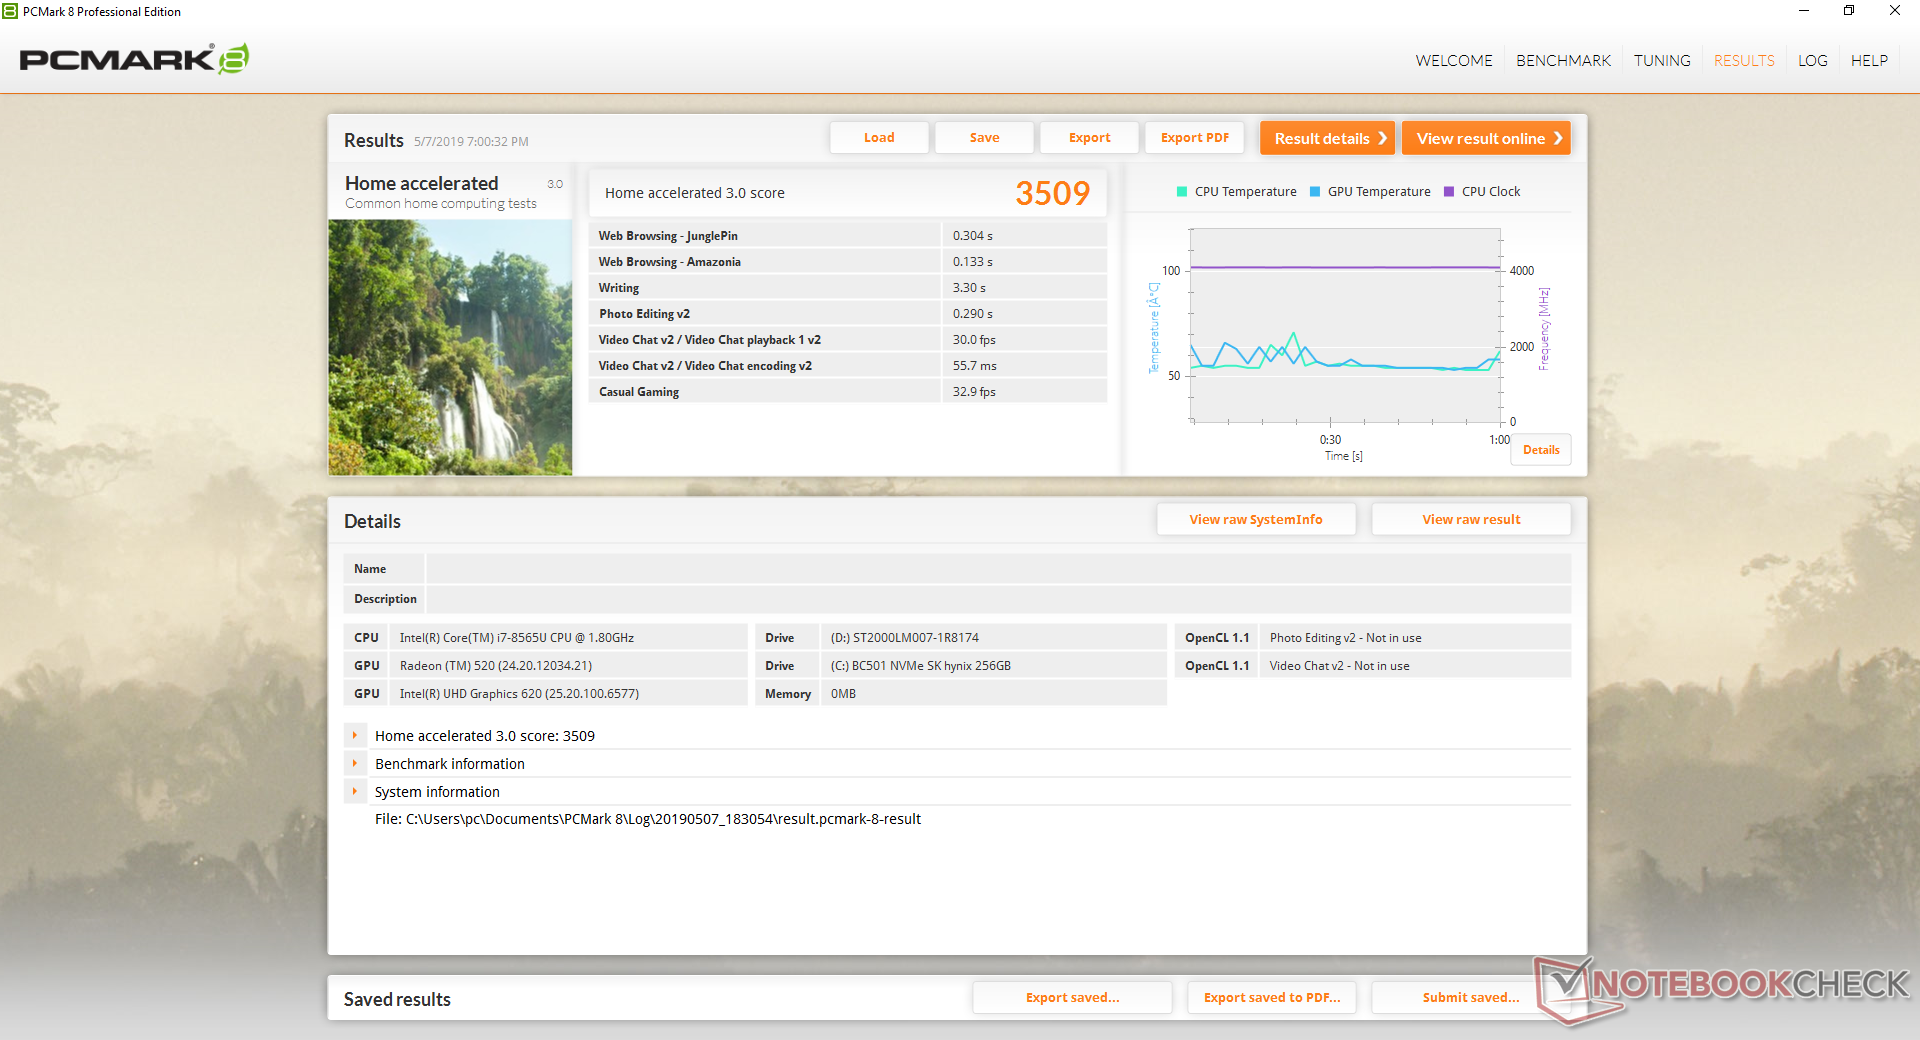
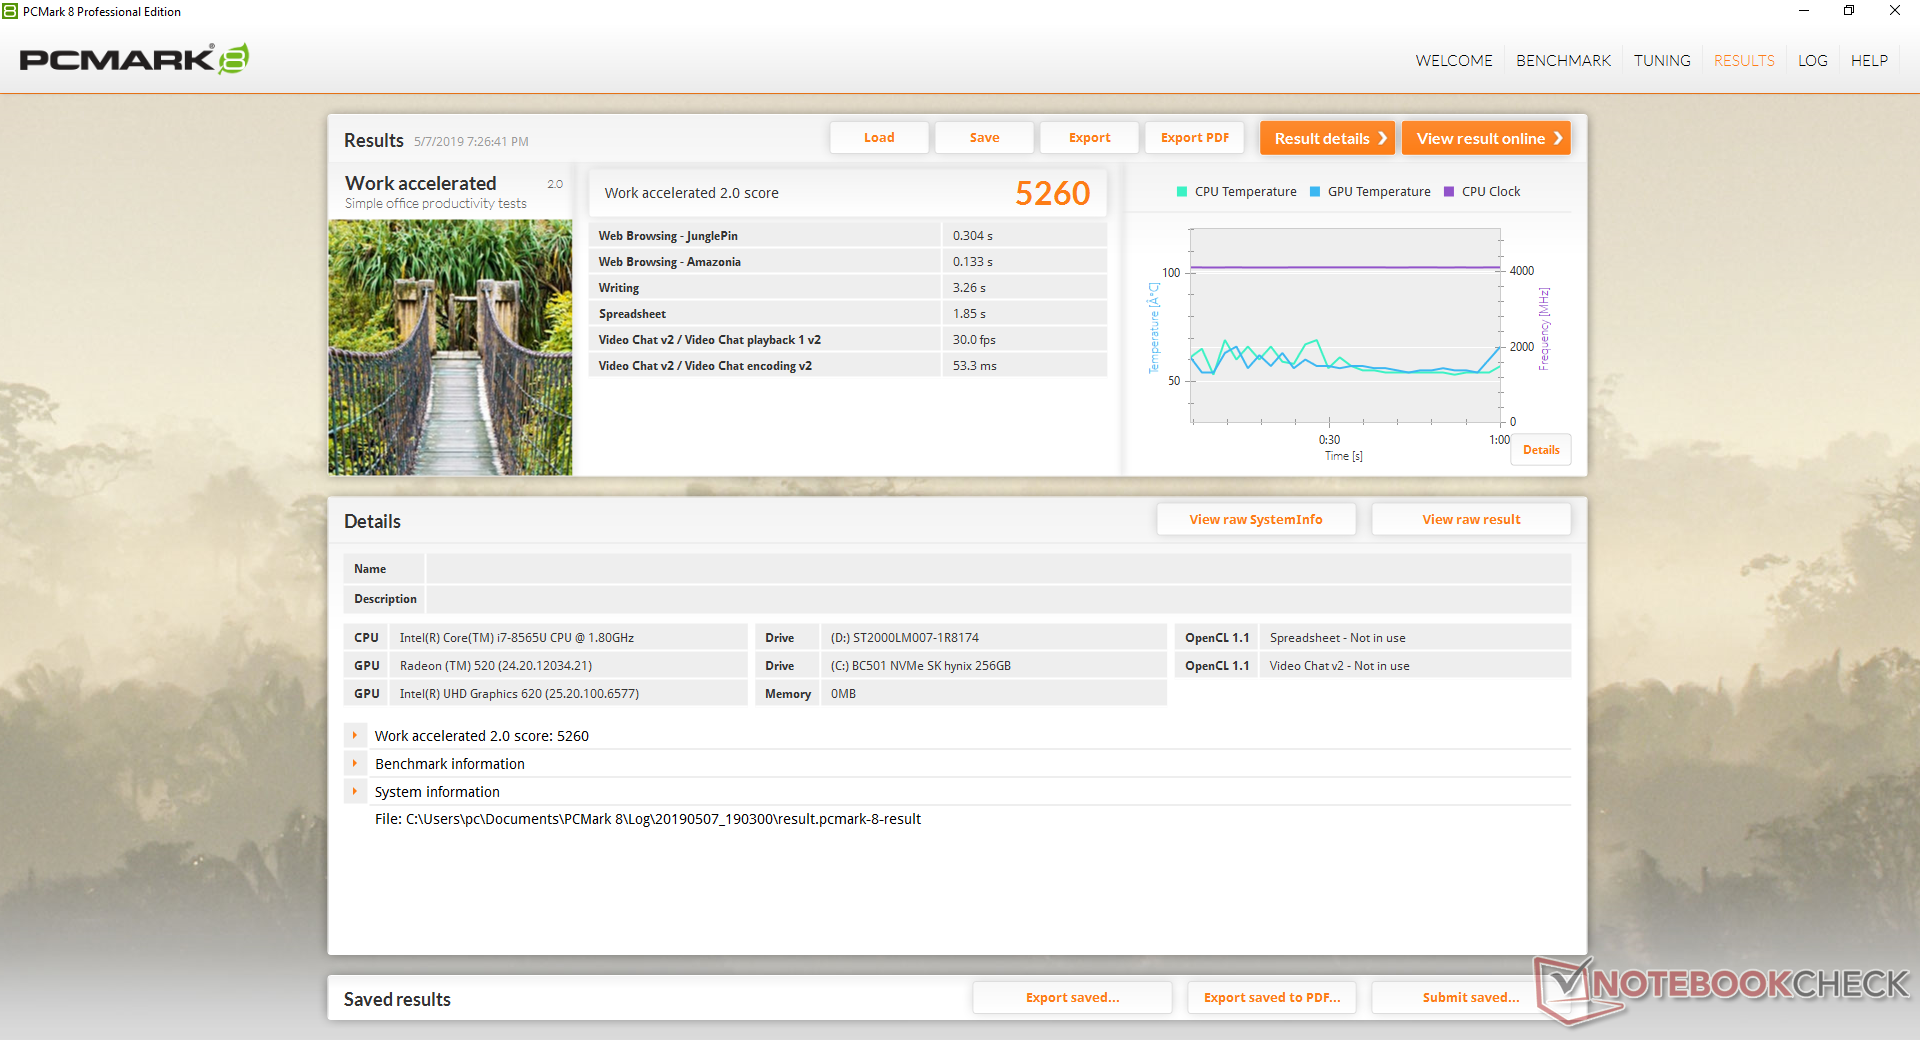
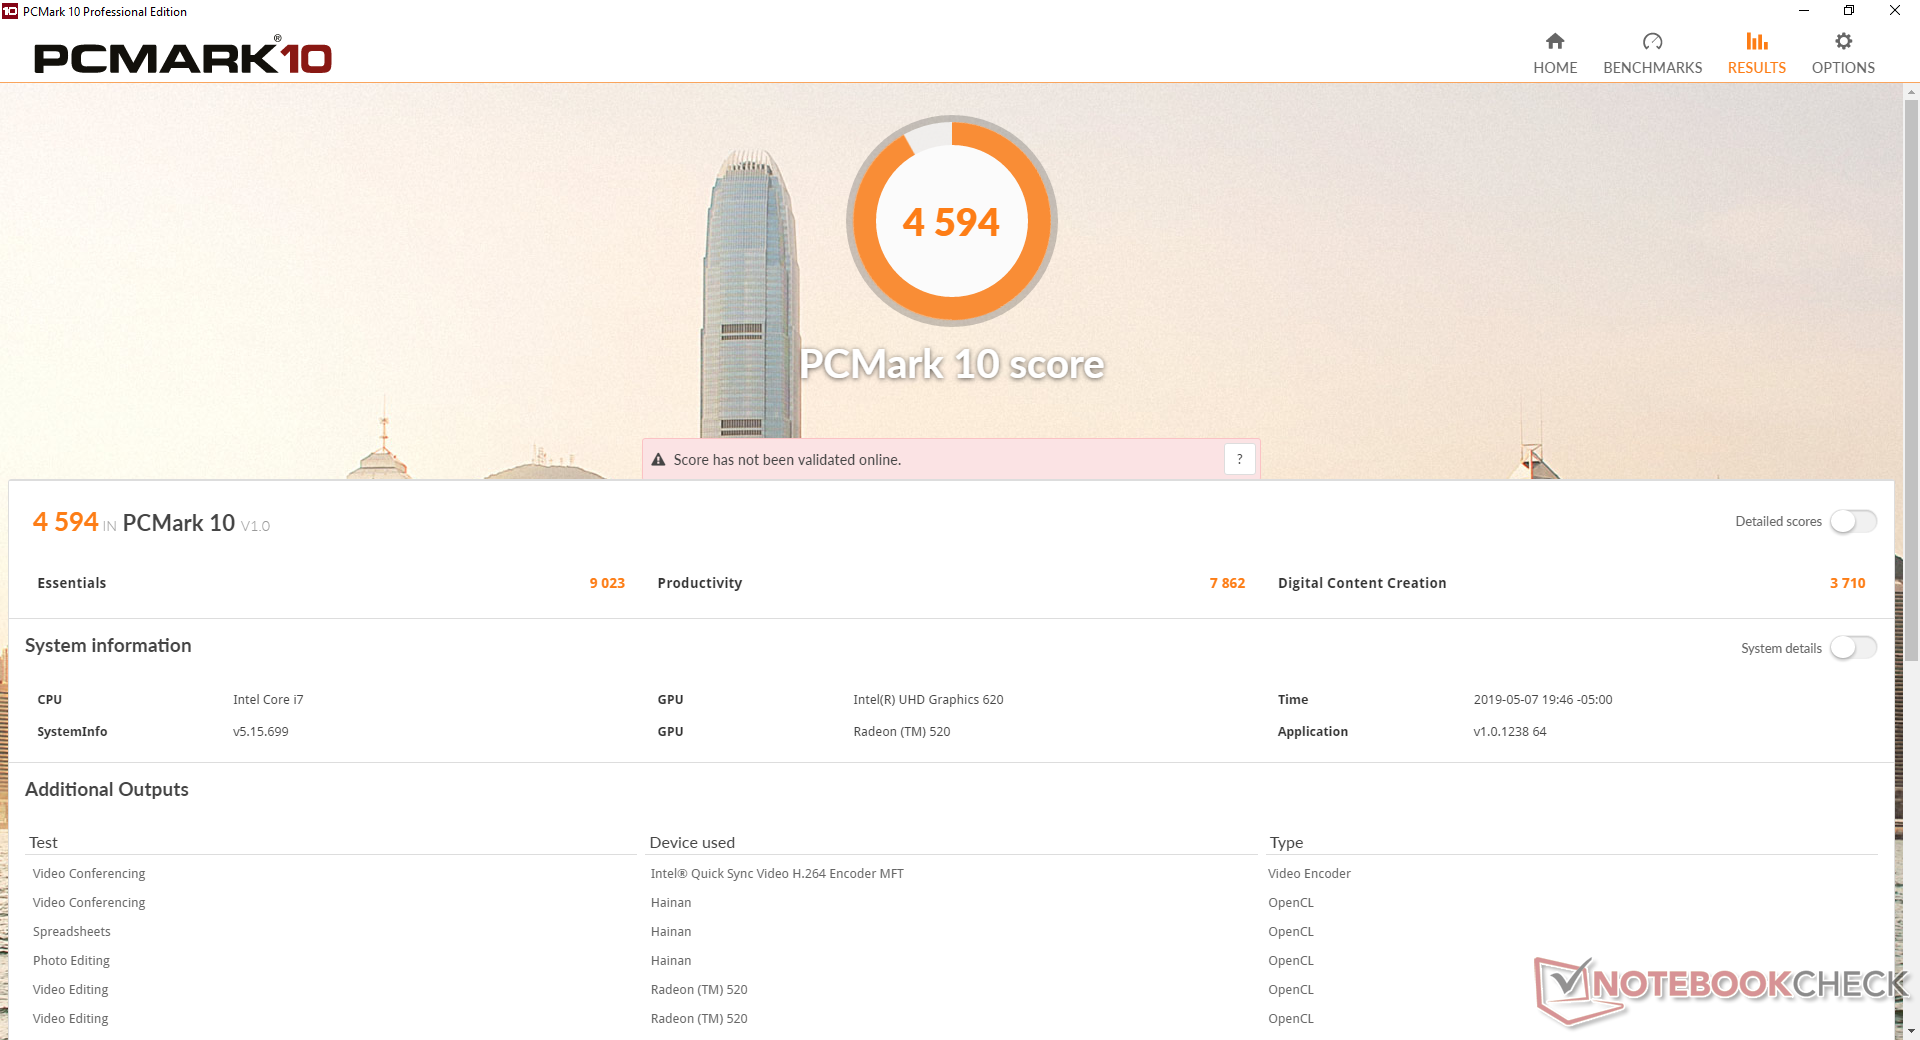
PCMark 10 benchmarks rank our system consistently higher than competing systems with integrated graphics including the Lenovo V320 and Inspiron 17 5770. Results are also better than the HP ProBook 470 G5 with GeForce 930MX graphics even though 3DMark benchmarks show the Radeon 520 to be roughly equal. We're a bit surprised by the good PCMark numbers from the Inspiron 17 3780 as a result.
We experienced no software or hardware hiccups during our time with the test unit.
| PCMark 8 | |
| Home Score Accelerated v2 | |
| Dell Inspiron 17-7786 | |
| Lenovo V320-17IKB-81CN000MGE | |
| HP ProBook 470 G5 | |
| Dell Inspiron 17-5770-0357 | |
| Dell Inspiron 17 3780 | |
| HP 17-ca0013ng | |
| Work Score Accelerated v2 | |
| Dell Inspiron 17 3780 | |
| Dell Inspiron 17-7786 | |
| HP ProBook 470 G5 | |
| Lenovo V320-17IKB-81CN000MGE | |
| Dell Inspiron 17-5770-0357 | |
| PCMark 8 Home Score Accelerated v2 | 3509 points | |
| PCMark 8 Work Score Accelerated v2 | 5260 points | |
| PCMark 10 Score | 4594 points | |
Help | ||
Storage Devices
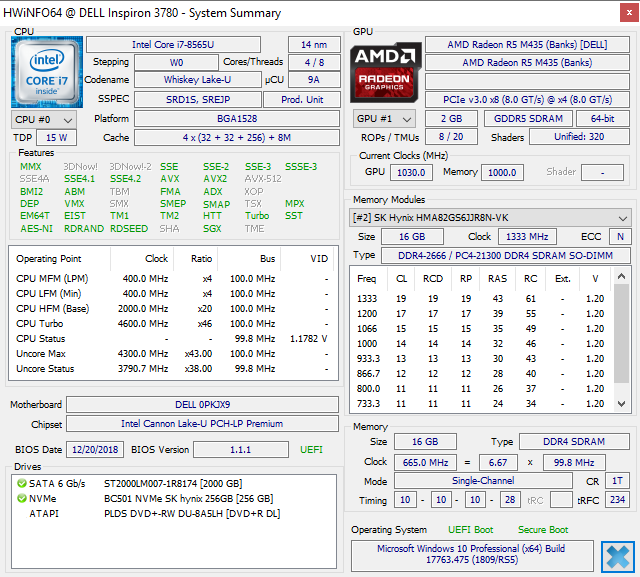
Internal storage options include a 2.5-inch SATA III bay and an M.2 2280 slot. Our test unit is equipped with a 2 TB Seagate ST2000LM007 HDD and an uncommon M.2 2230 256 GB SK Hynix BC501 NVMe SSD. Sequential read and write rates from this budget SSD show are two to three times slower than the pricier Samsung PM961 as found on the ThinkPad P71. Even so, average sequential read rate is still two times faster than a standard SATA III SSD.
HD Tune reveals an average transfer rate of 106 MB/s from the 5400 RPM Seagate HDD which is actually comparable to many 7200 RPM drives.
See our table of HDDs and SSDs for more benchmark comparisons.
| Dell Inspiron 17 3780 SK Hynix BC501 NVMe 256 GB | Lenovo V320-17IKB-81CN000MGE Liteonit CV3-DE256 | HP ProBook 470 G5 Intel SSD 600p SSDPEKKW256G7 | Dell Inspiron 17-5770-0357 SK hynix SC311 M.2 | HP 17-ca0013ng Toshiba KBG30ZMV256G | |
|---|---|---|---|---|---|
| AS SSD | -53% | -23% | -68% | -42% | |
| Seq Read (MB/s) | 1061 | 520 -51% | 1257 18% | 492.1 -54% | 1334 26% |
| Seq Write (MB/s) | 491.4 | 259.4 -47% | 461.8 -6% | 182.1 -63% | 760 55% |
| 4K Read (MB/s) | 39.13 | 21.59 -45% | 26.95 -31% | 25.6 -35% | 37.67 -4% |
| 4K Write (MB/s) | 104 | 53.6 -48% | 90.6 -13% | 68.8 -34% | 72 -31% |
| 4K-64 Read (MB/s) | 505 | 329.4 -35% | 279.4 -45% | 159.1 -68% | 629 25% |
| 4K-64 Write (MB/s) | 314.8 | 215.4 -32% | 429.4 36% | 73.4 -77% | 259 -18% |
| Access Time Read * (ms) | 0.063 | 0.084 -33% | 0.109 -73% | 0.128 -103% | 0.085 -35% |
| Access Time Write * (ms) | 0.034 | 0.072 -112% | 0.039 -15% | 0.061 -79% | 0.204 -500% |
| Score Read (Points) | 650 | 403 -38% | 432 -34% | 234 -64% | 800 23% |
| Score Write (Points) | 468 | 295 -37% | 566 21% | 160 -66% | 407 -13% |
| Score Total (Points) | 1434 | 897 -37% | 1188 -17% | 509 -65% | 1596 11% |
| Copy ISO MB/s (MB/s) | 876 | 305 -65% | 549 -37% | 162.8 -81% | 574 -34% |
| Copy Program MB/s (MB/s) | 653 | 99.2 -85% | 209.2 -68% | 107.8 -83% | 219.2 -66% |
| Copy Game MB/s (MB/s) | 512 | 147.8 -71% | 248.6 -51% | 130.9 -74% | 374 -27% |
* ... smaller is better

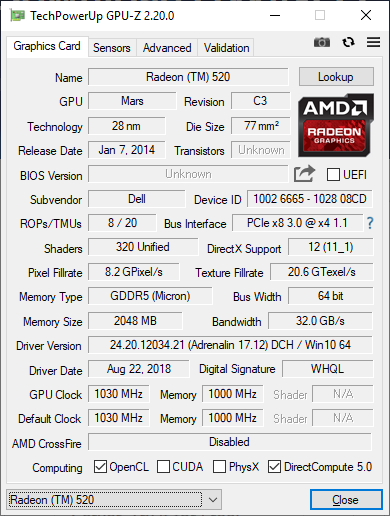
GPU Performance
The Radeon 520 performs poorly by today's standards. 3DMark results are about 10 to 20 percent slower than the two-generations old GeForce 940MX and over 50 percent slower than the significantly more efficient GeForce MX150. Even the base UHD Graphics 620 option is just 15 to 20 percent slower than the discrete AMD option. It's definitely strange to see such an old Radeon GPU paired with the latest ULV CPU from Intel.
See our dedicated page on the Radeon 520 for more technical details and benchmark comparisons.
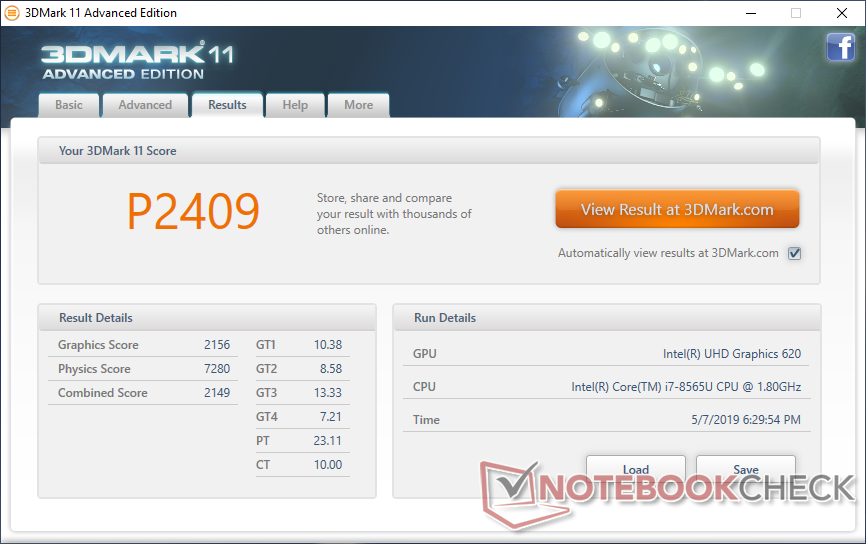
| 3DMark 11 Performance | 2409 points | |
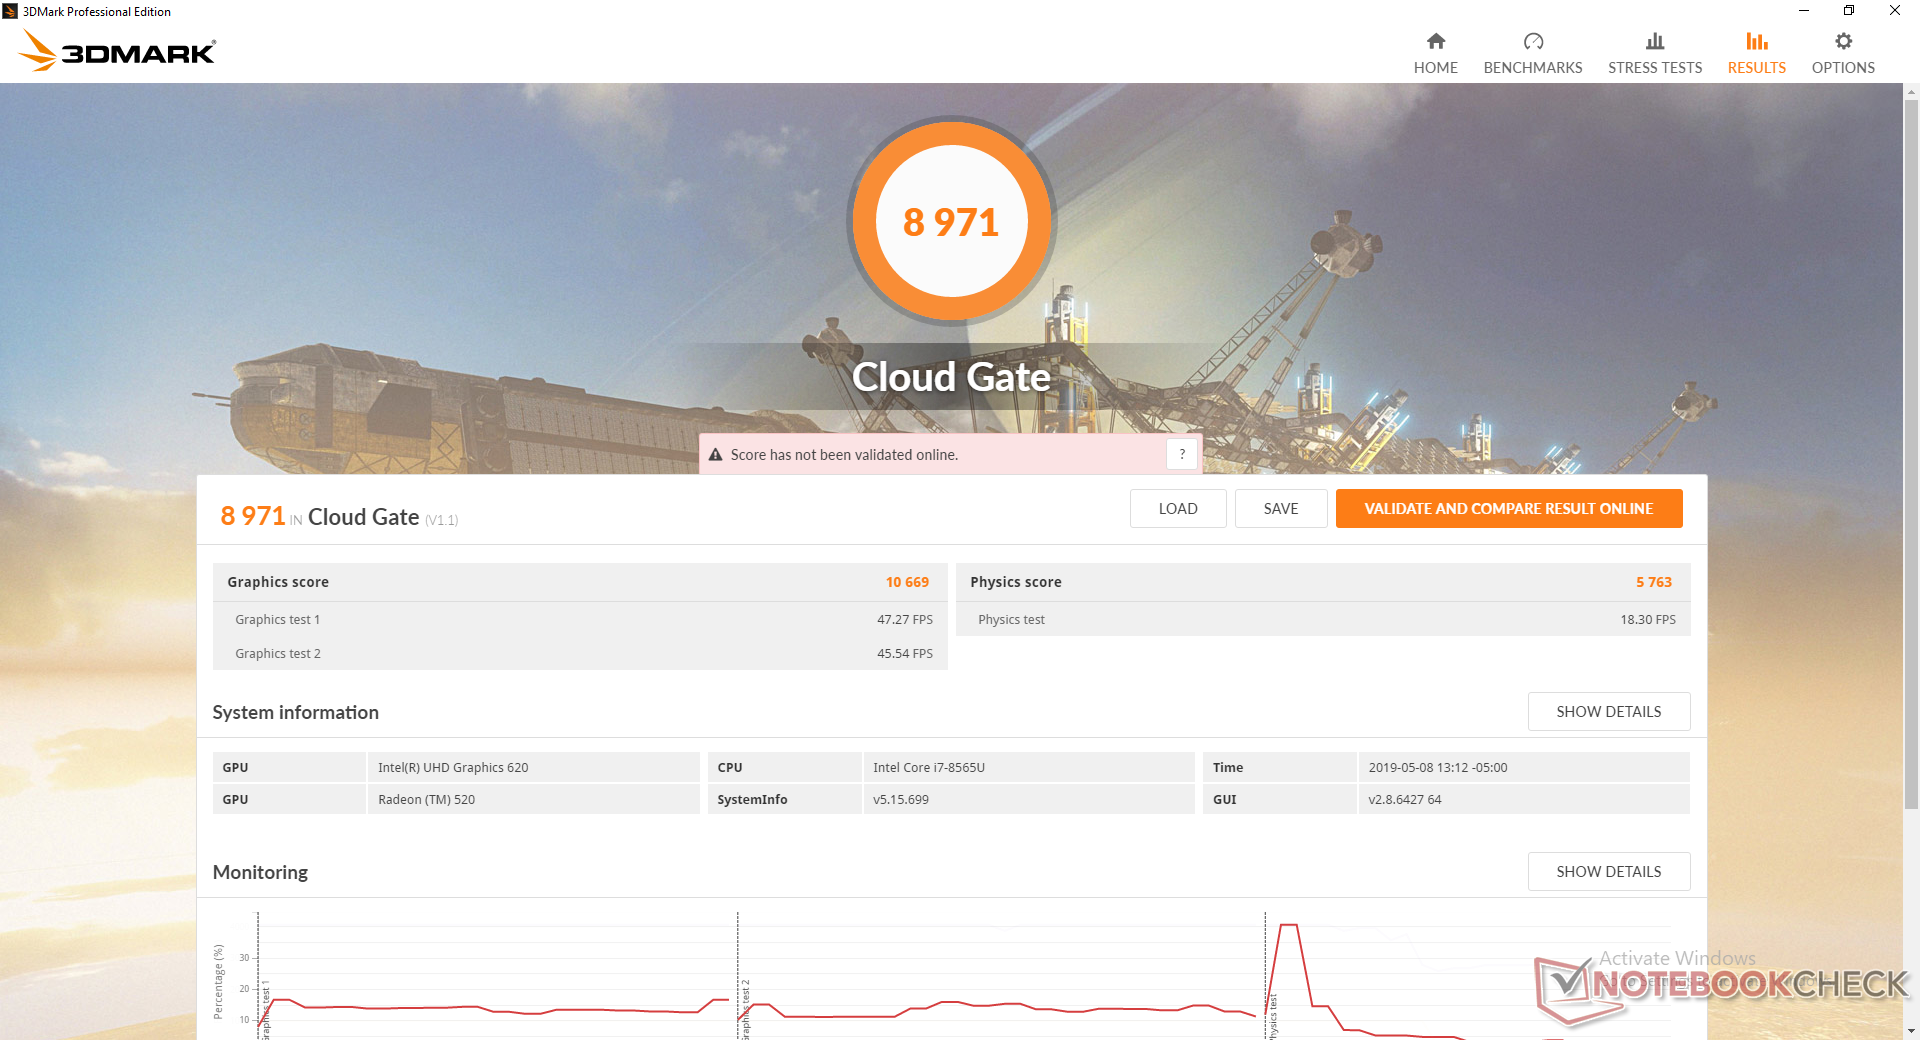
| 3DMark Cloud Gate Standard Score | 8971 points | |
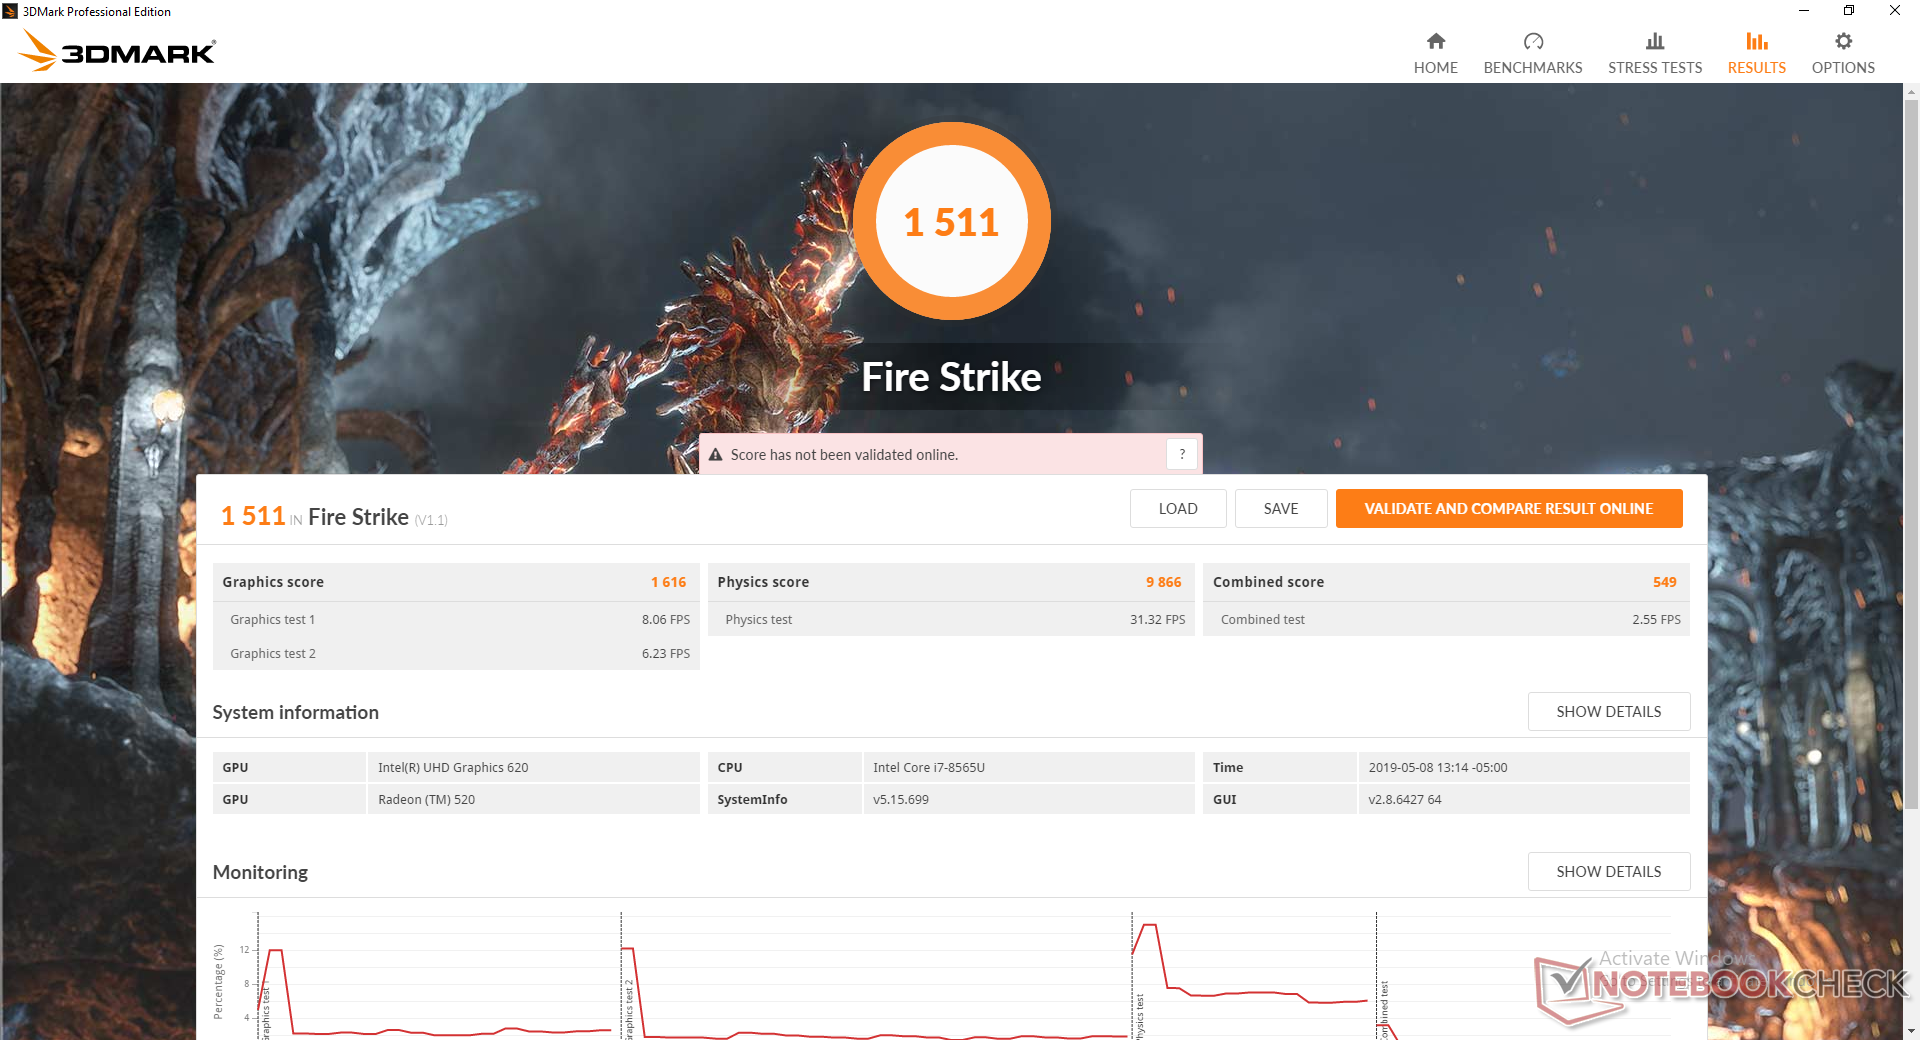
| 3DMark Fire Strike Score | 1511 points | |
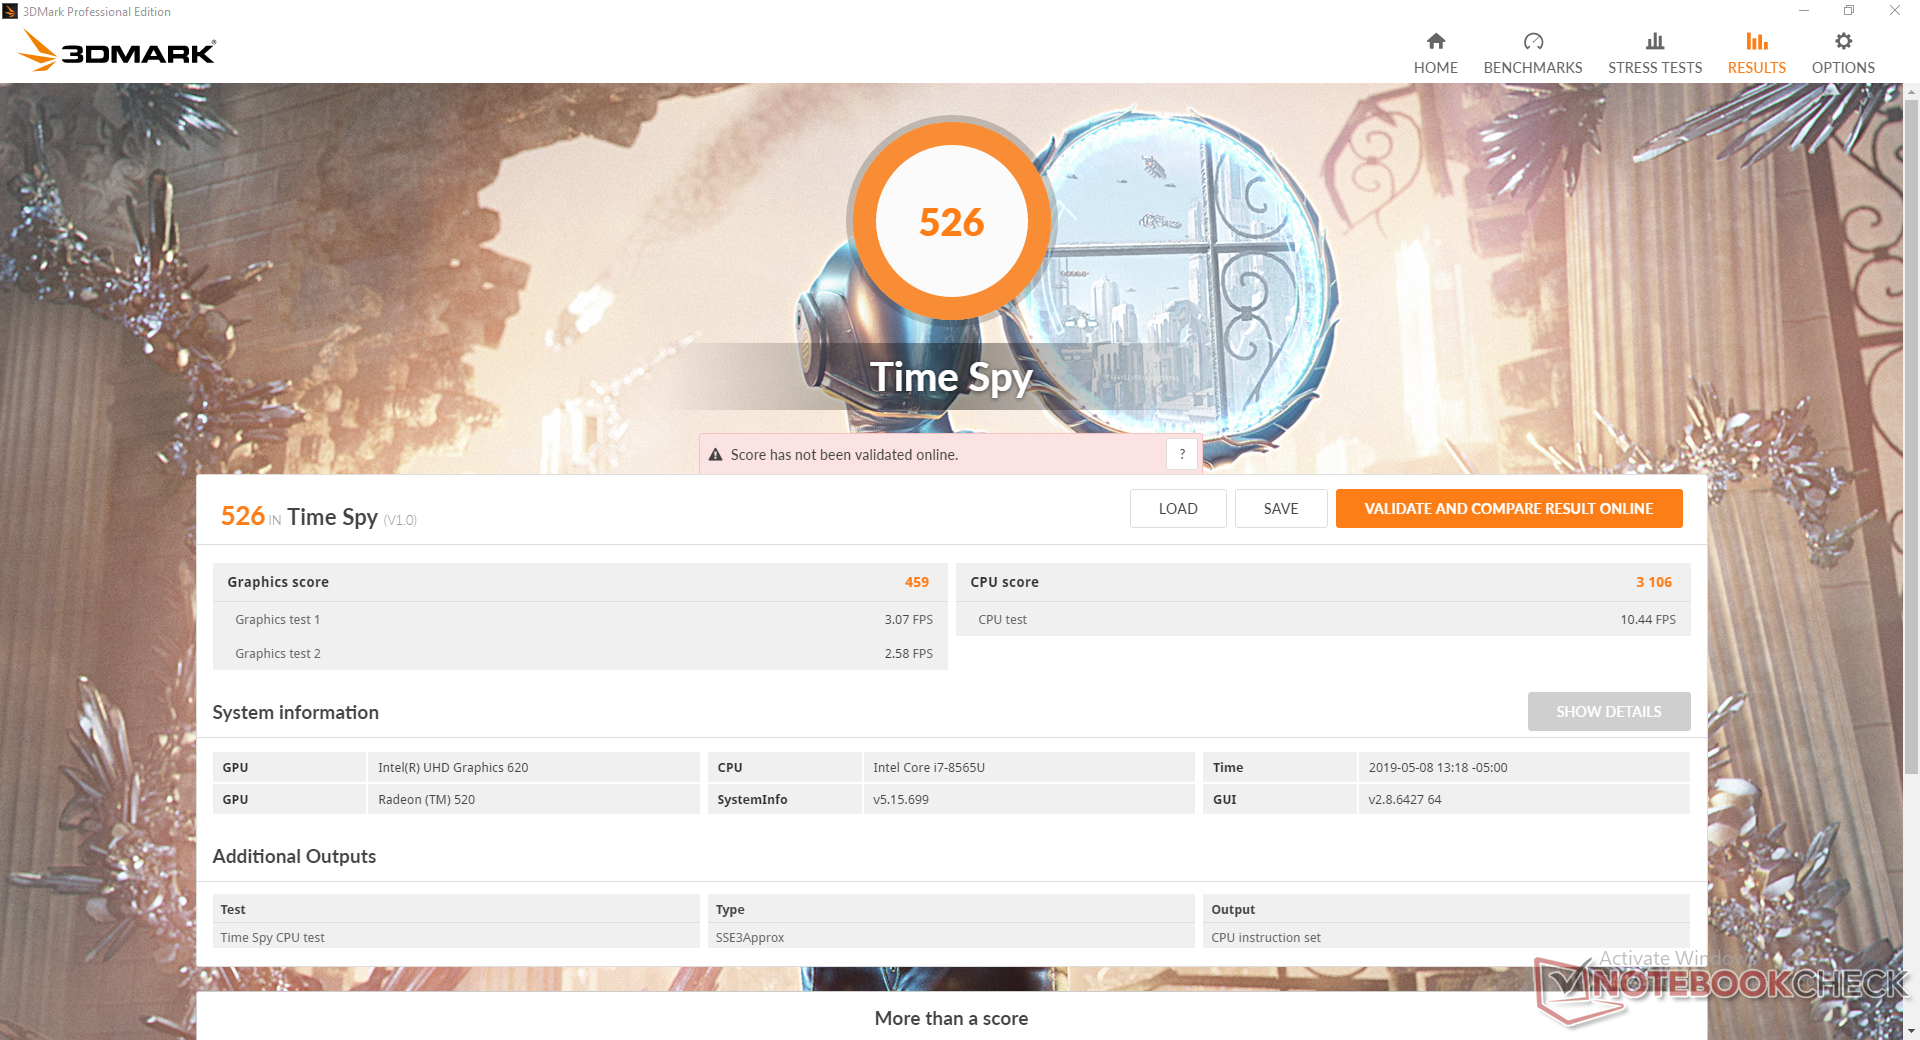
| 3DMark Time Spy Score | 526 points | |
Help | ||
| The Witcher 3 | |
| 1024x768 Low Graphics & Postprocessing | |
| Average of class Multimedia (68 - 380, n=10, last 2 years) | |
| Dell Inspiron 17 3780 | |
| Average AMD Radeon 520 (n=1) | |
| 1366x768 Medium Graphics & Postprocessing | |
| Average of class Multimedia (41 - 93, n=4, last 2 years) | |
| Dell Inspiron 17 3780 | |
| Average AMD Radeon 520 (n=1) | |
| 1920x1080 High Graphics & Postprocessing (Nvidia HairWorks Off) | |
| Average of class Multimedia (22 - 224, n=13, last 2 years) | |
| Dell Inspiron 17 3780 | |
| Average AMD Radeon 520 (n=1) | |
| 1920x1080 Ultra Graphics & Postprocessing (HBAO+) | |
| Average of class Multimedia (11 - 121, n=13, last 2 years) | |
| Dell Inspiron 17 3780 | |
| Average AMD Radeon 520 (n=1) | |
| low | med. | high | ultra | |
|---|---|---|---|---|
| BioShock Infinite (2013) | 82.4 | 43.7 | 36.3 | 11.7 |
| The Witcher 3 (2015) | 29.7 | 18.7 | 10.2 | 5.8 |
| Rise of the Tomb Raider (2016) | 36 | 20.8 | 9.8 | 7.4 |
Emissions
System Noise
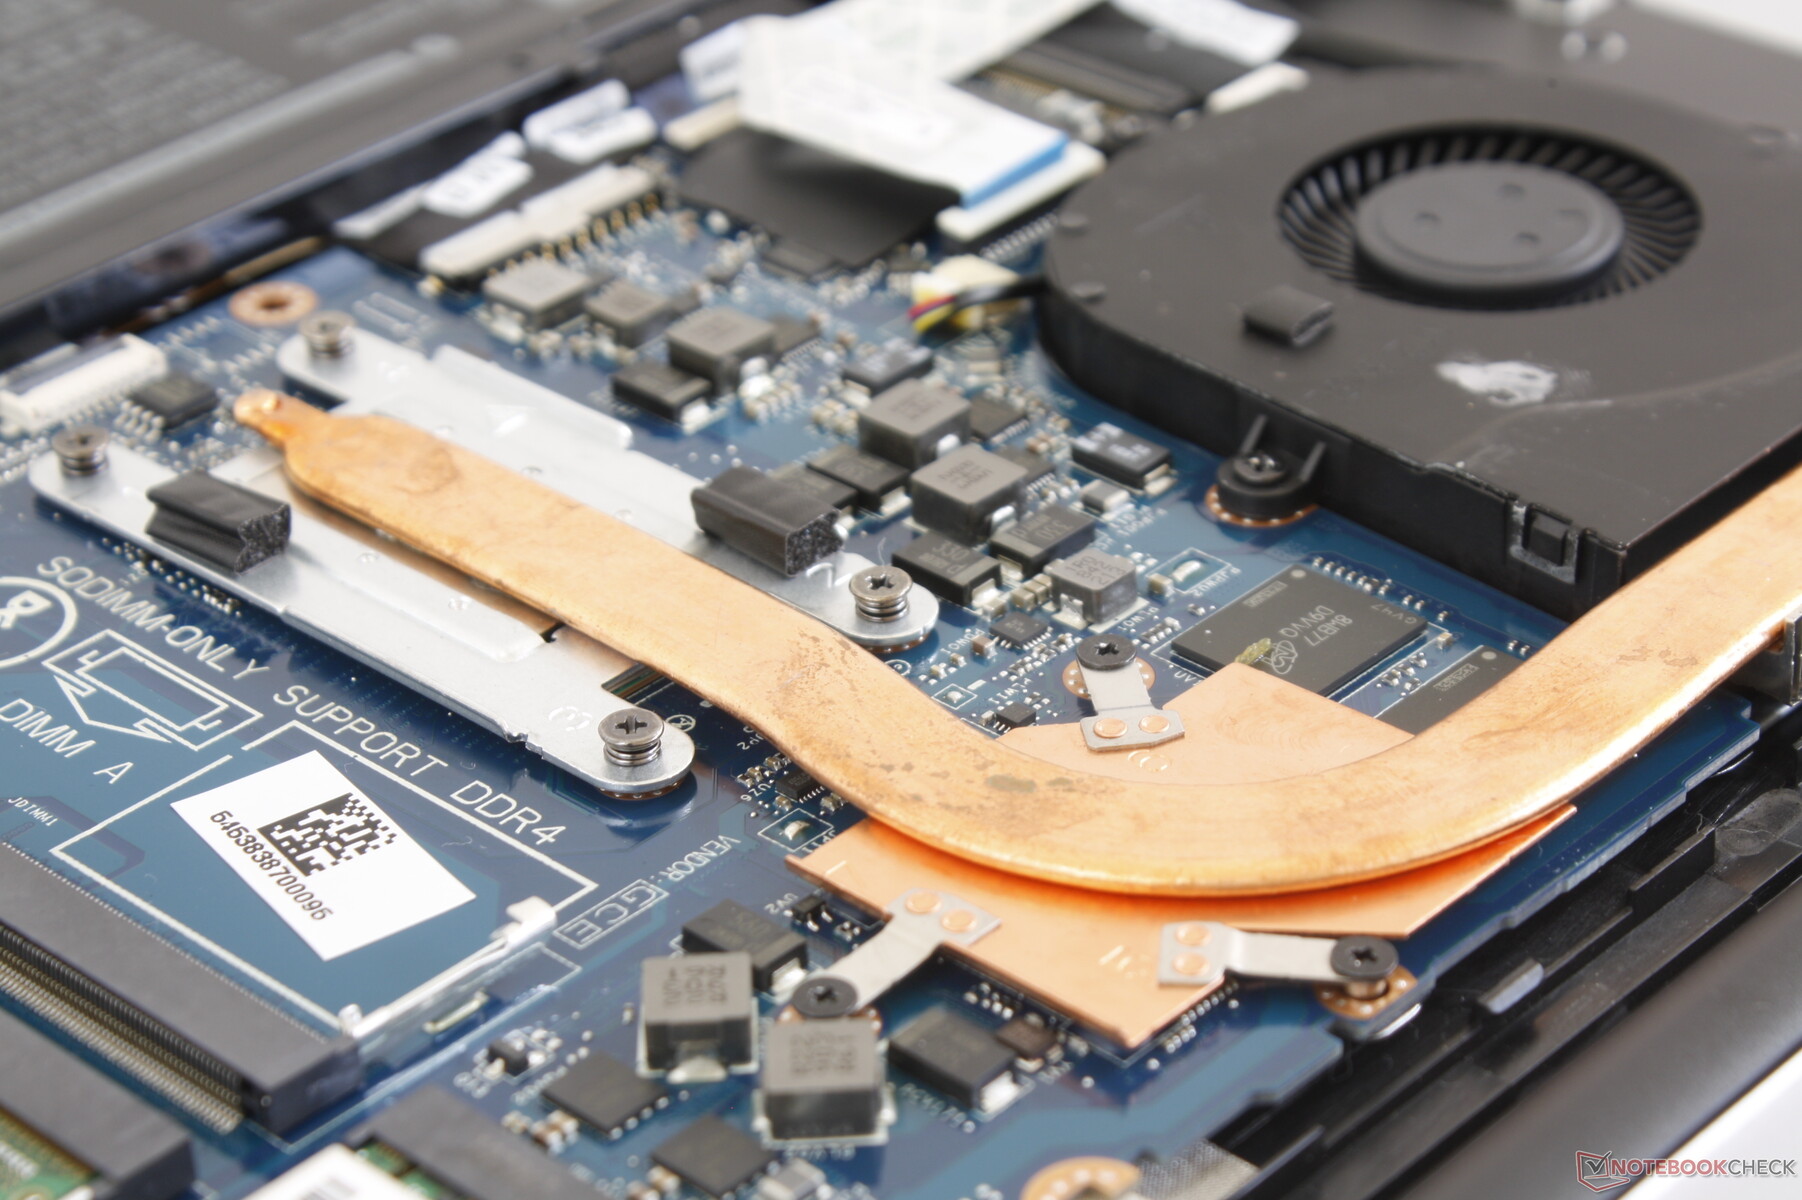
The cooling solution consists of just one 40 mm fan and a short heat pipe across both the CPU and GPU. The system fan is always active no matter the onscreen load at 31.8 dB(A) against a silent background of 28.1 dB(A). Disabling the spinning HDD when it's not needed will reduce the idling fan noise. In a typical home or office environment, however, this low of a fan noise is easy to ignore and never bothersome.
Running higher loads like gaming will steadily bump fan noise to 38.7 dB(A) up to 48.5 dB(A) if on maximum load. This is louder than the Dell Inspiron 17 7786 even though the latter sports a more powerful GPU.
We can notice no coil whine on our test unit.
| Dell Inspiron 17 3780 Radeon 520, i7-8565U, SK Hynix BC501 NVMe 256 GB | Dell Inspiron 17-7786 GeForce MX150, i7-8565U, KBG30ZMS128G | Lenovo V320-17IKB-81CN000MGE UHD Graphics 620, i5-8250U, Liteonit CV3-DE256 | HP ProBook 470 G5 GeForce 930MX, i5-8250U, Intel SSD 600p SSDPEKKW256G7 | Dell Inspiron 17-5770-0357 UHD Graphics 620, i5-8250U, SK hynix SC311 M.2 | HP 17-ca0013ng Vega 8, R5 2500U, Toshiba KBG30ZMV256G | |
|---|---|---|---|---|---|---|
| Noise | 6% | 7% | 7% | -0% | 3% | |
| off / environment * (dB) | 28.1 | 30.3 -8% | 30.4 -8% | 30.5 -9% | 30.1 -7% | 30.6 -9% |
| Idle Minimum * (dB) | 31.7 | 30.7 3% | 30.4 4% | 30.5 4% | 31.1 2% | 32.8 -3% |
| Idle Average * (dB) | 31.8 | 30.7 3% | 30 6% | 30.5 4% | 31.1 2% | 32.8 -3% |
| Idle Maximum * (dB) | 31.8 | 30.7 3% | 31.4 1% | 30.5 4% | 31.1 2% | 32.8 -3% |
| Load Average * (dB) | 38.7 | 33.4 14% | 34.1 12% | 33 15% | 44.4 -15% | 34.2 12% |
| Load Maximum * (dB) | 48.5 | 38.7 20% | 36.4 25% | 38 22% | 41.7 14% | 36.4 25% |
* ... smaller is better
Noise level
| Idle |
| 31.7 / 31.8 / 31.8 dB(A) |
| Load |
| 38.7 / 48.5 dB(A) |
 | ||
30 dB silent 40 dB(A) audible 50 dB(A) loud |
||
min: | ||
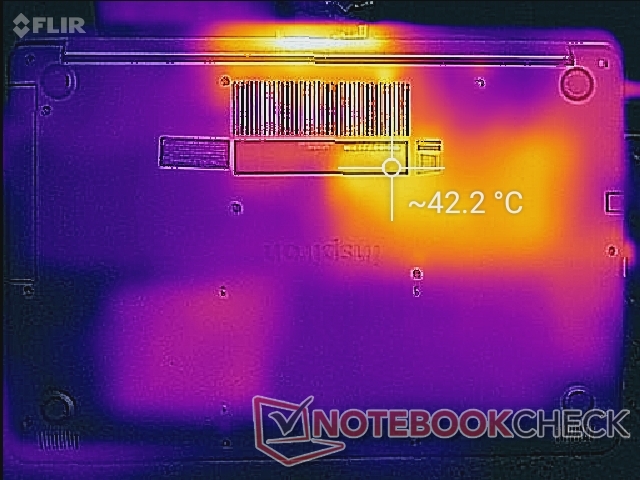
Temperature
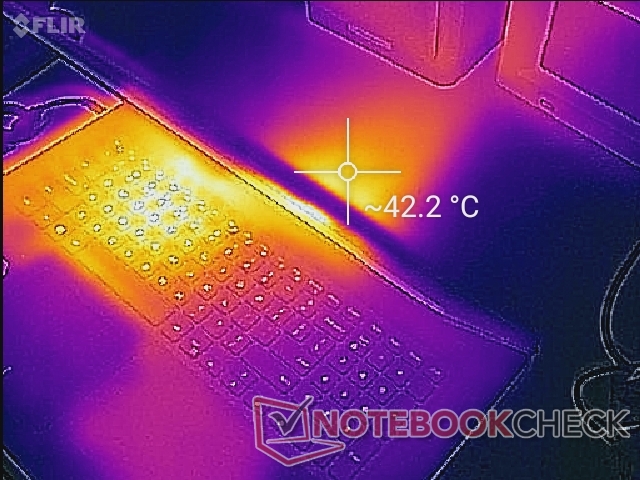
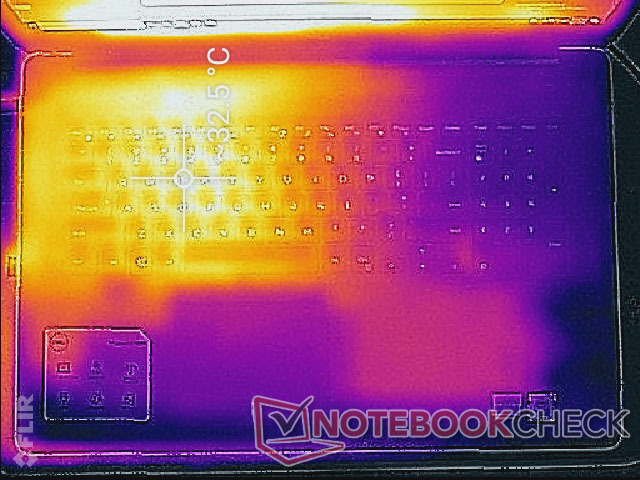
Like all other laptops with optical drives, the Inspiron 17 3780 will always be warmer on one side than the other for an asymmetric temperature development. In this case, the left side of the keyboard can become as warm as 49 C when under high loads compared to just 25 C on the NumPad as shown by our temperature maps below. The warm keys are noticeable when typing but we don't find them to be uncomfortable. The competing 17.3-inch Lenovo V320 is much cooler at 37 C when subjected to the same stressful loads albeit it is limited to slower integrated UHD Graphics.

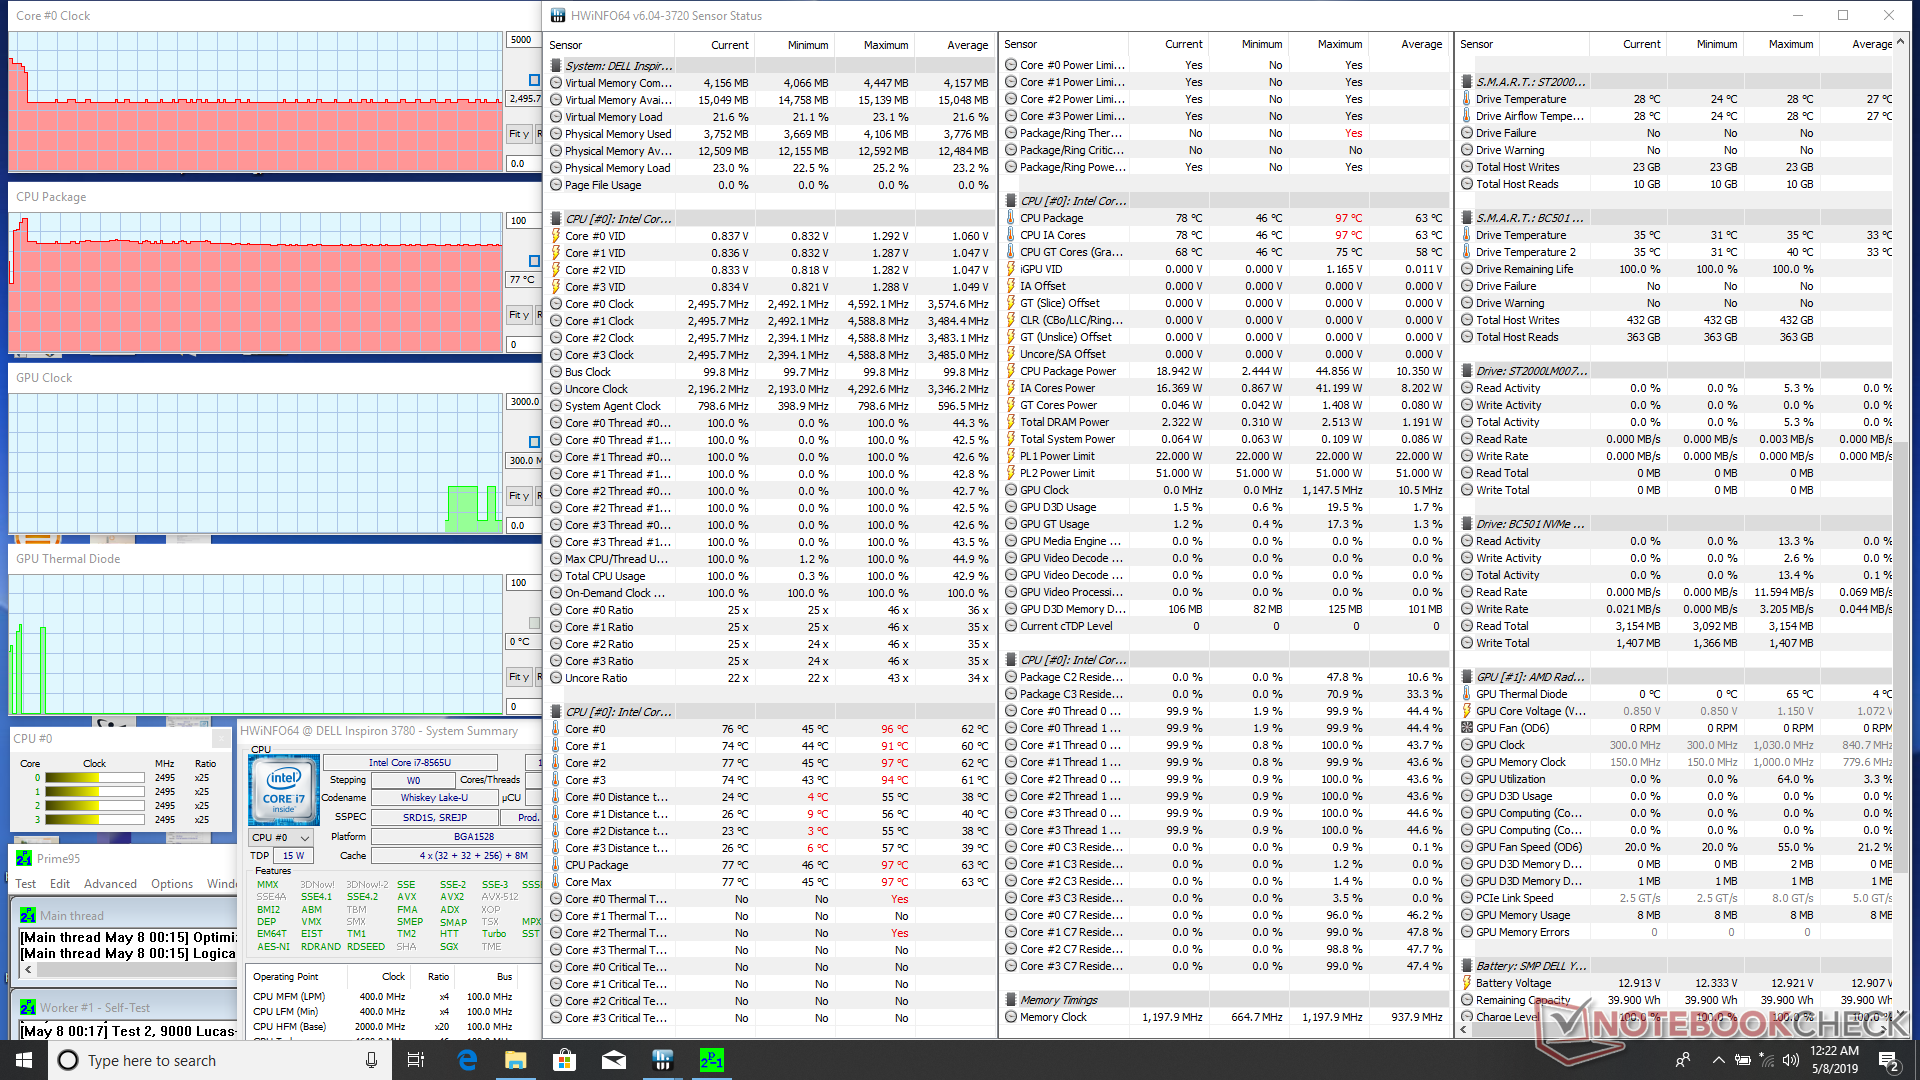
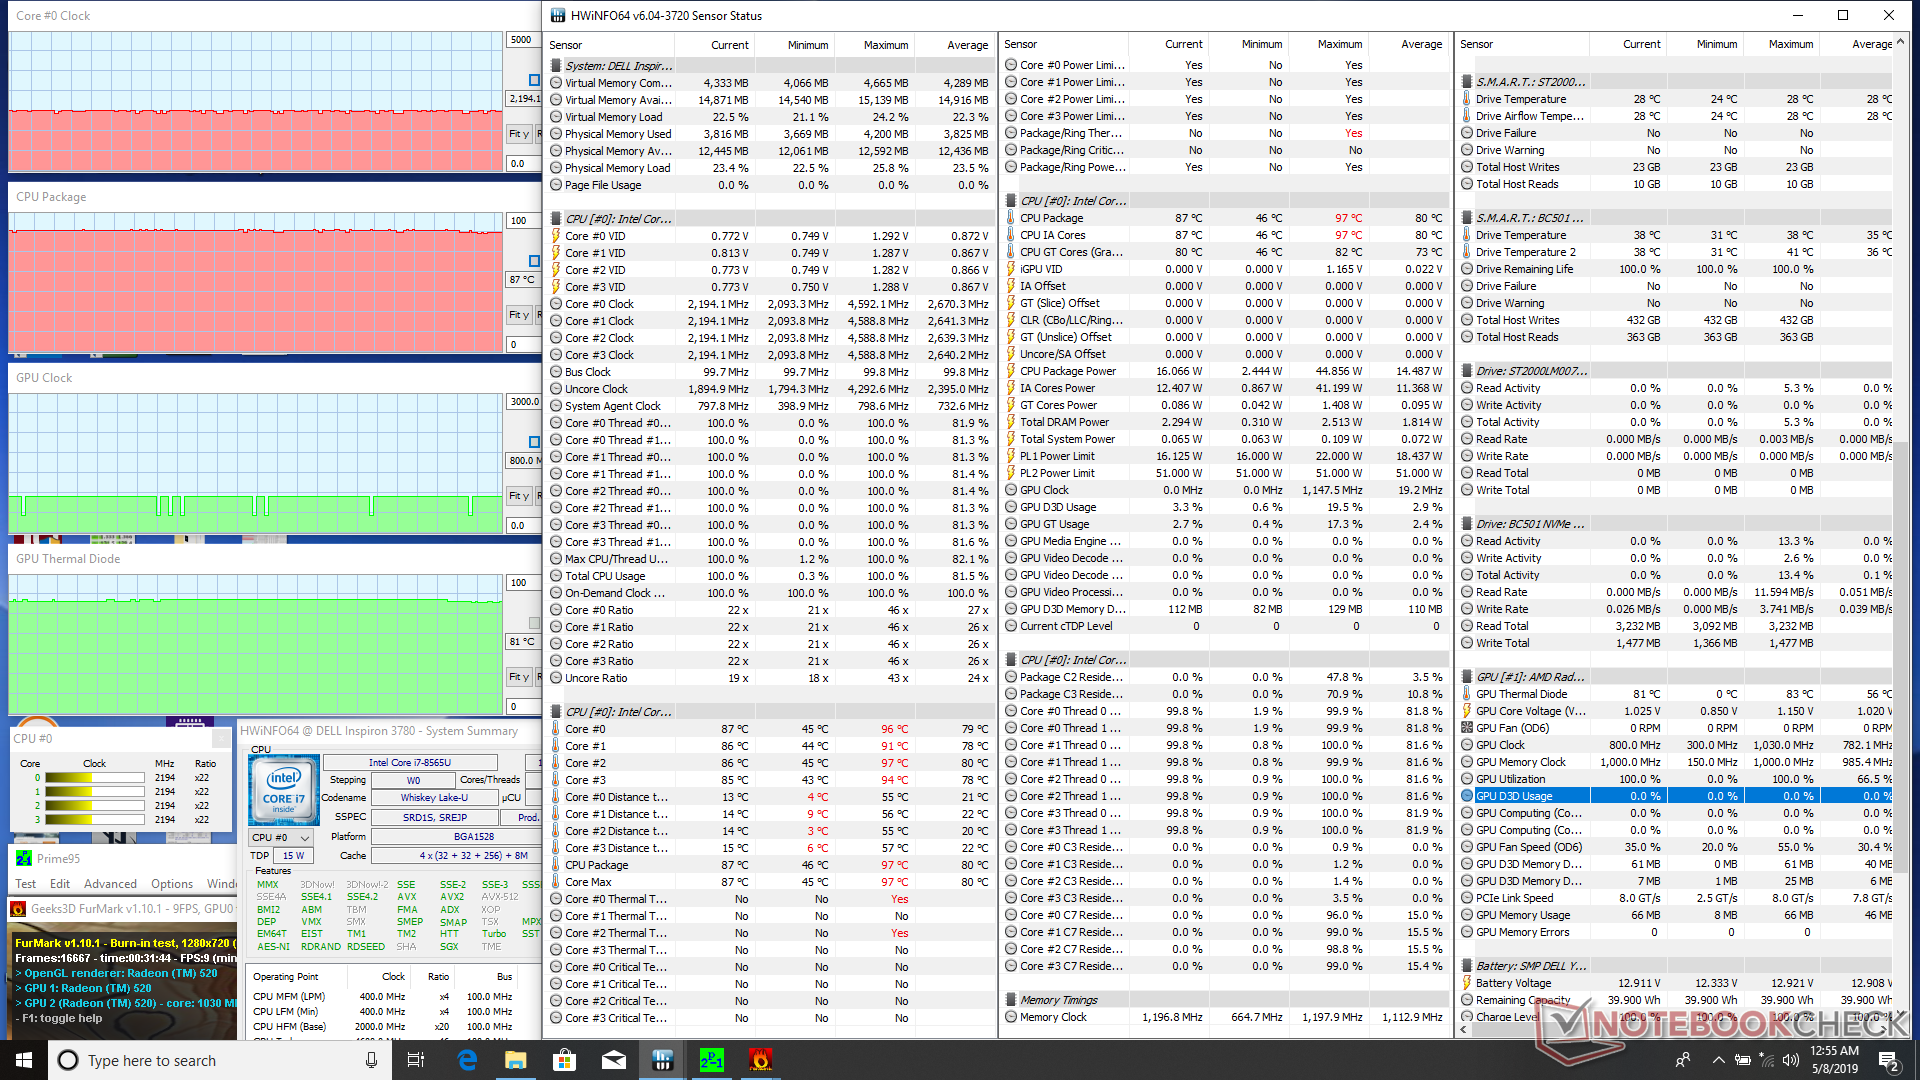
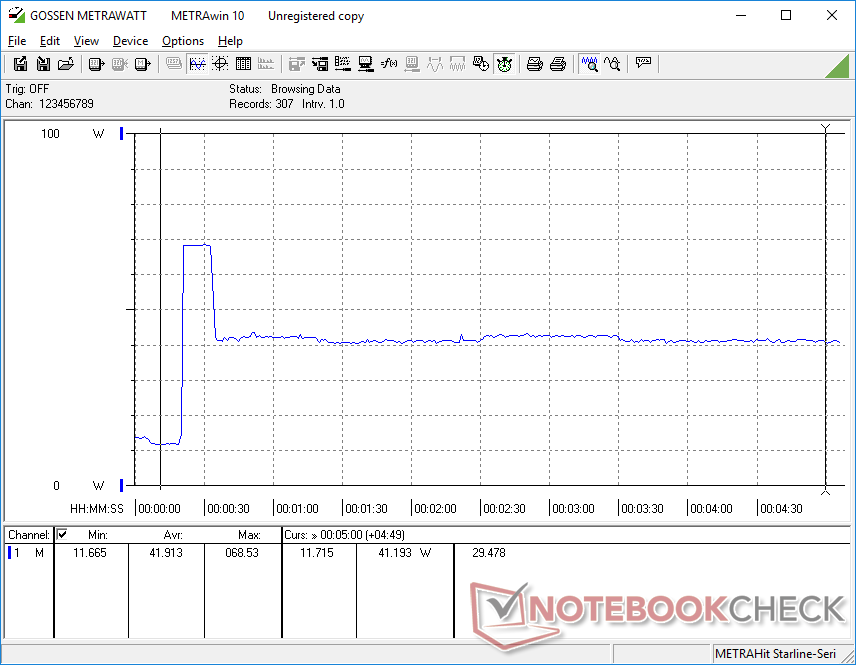
Stress Test
We stress the system with synthetic loads to identify for any potential throttling or stability issues. When running Prime95, the CPU can be observed running at up to 3.9 GHz for the first few seconds until reaching 97 C. Thereafter, clock rates steadily drop to stabilize at 2.5 GHz for a cooler and more manageable core temperature of 78 C. The stable Turbo Boost clock rate is a respectable 700 MHz faster than the base clock rate of the Core i7-8565U. When running both Prime95 and FurMark simultaneously, CPU and GPU temperatures plateau at 87 C and 81 C, respectively.
Running on battery power will limit GPU performance. A 3DMark 11 run on batteries returns Physics and Graphics of 7233 and 867 points, respectively, compared to 7280 and 2156 points when on mains.
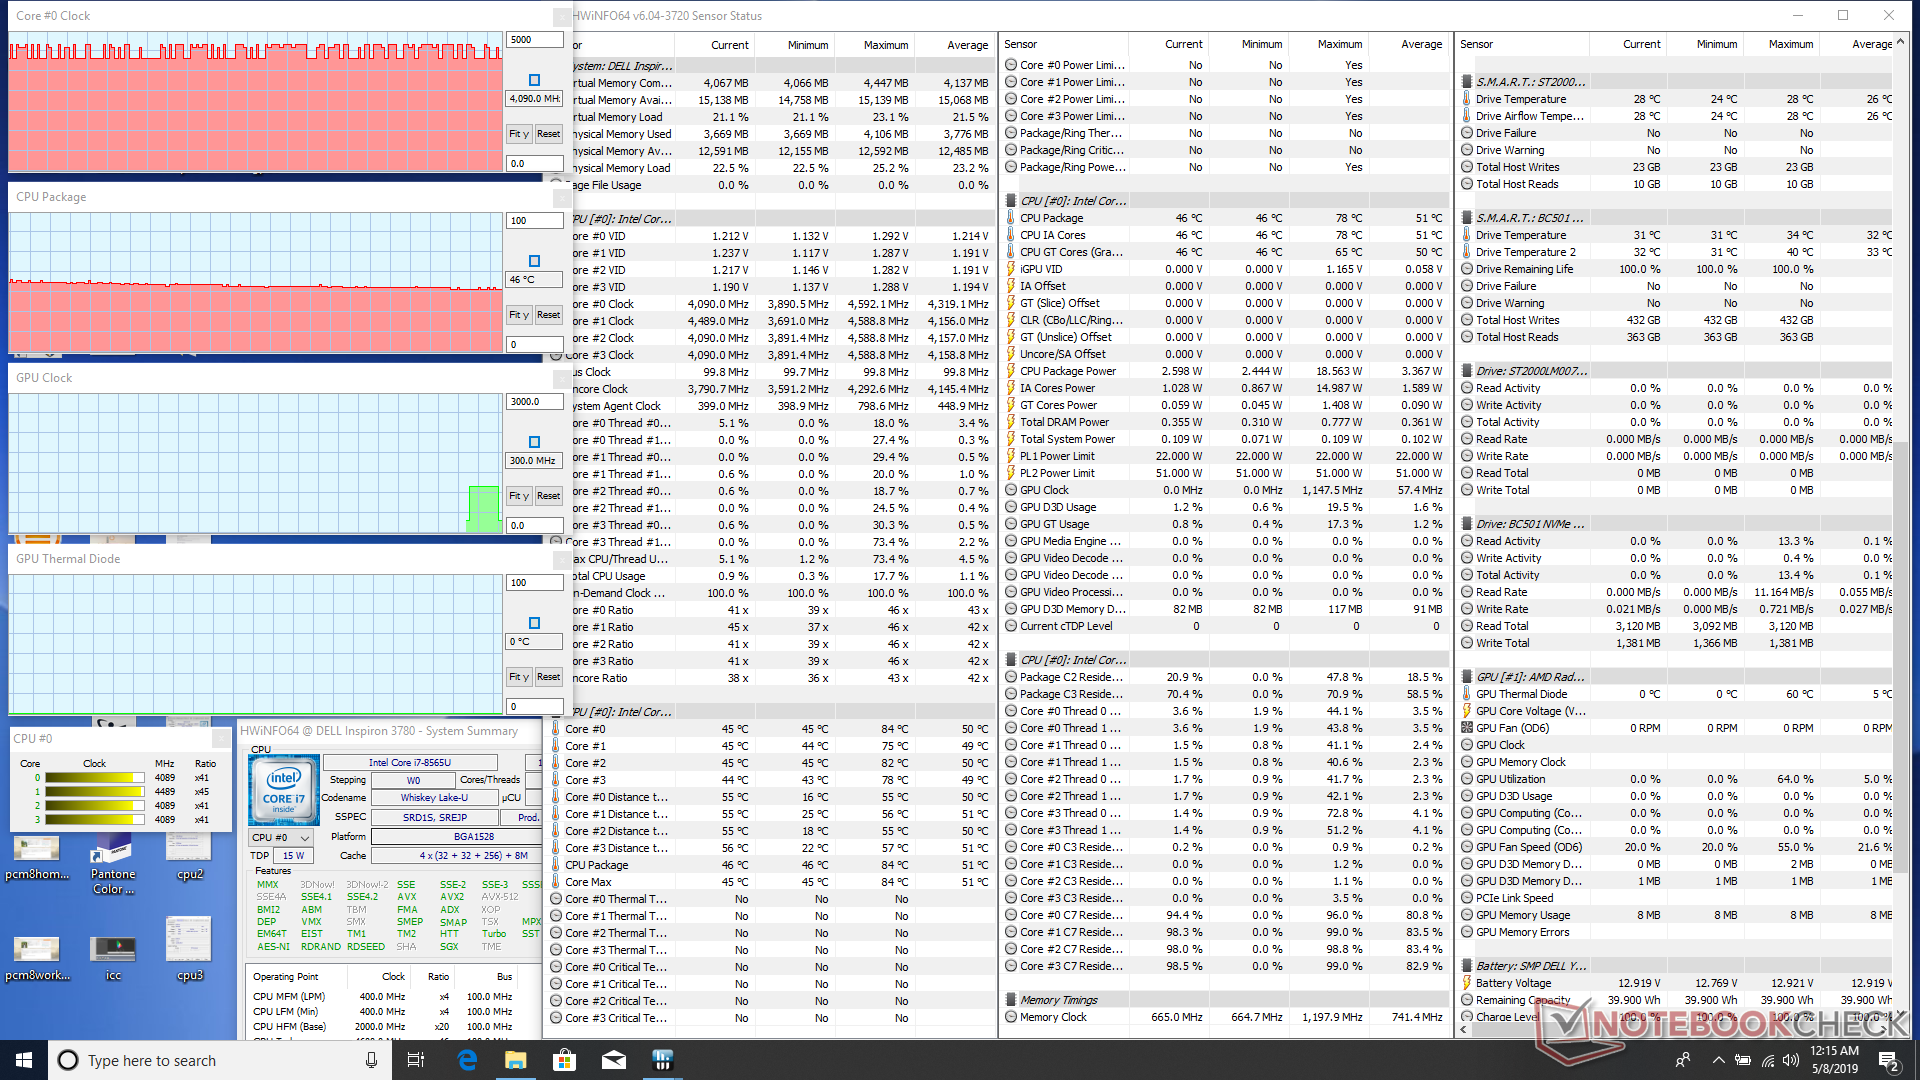
| CPU Clock (GHz) | GPU Clock (MHz) | Average CPU Temperature (°C) | Average GPU Temperature (°C) | |
| System Idle | -- | -- | 46 | -- |
| Prime95 Stress | 2.5 | -- | 77 | -- |
| Prime95 + FurMark Stress | 2.2 | 800 | 87 | 81 |
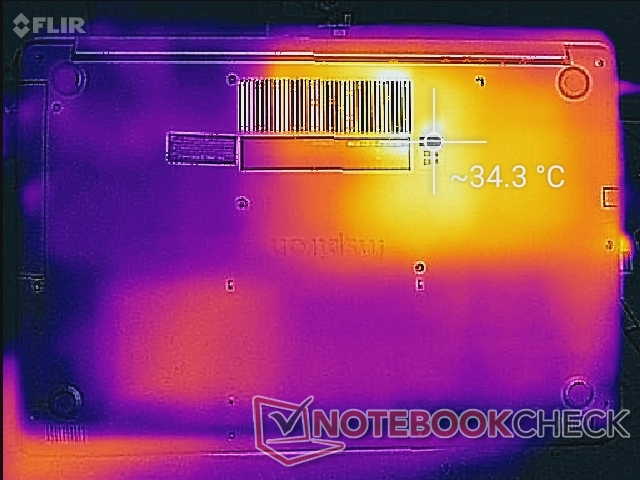
(-) The maximum temperature on the upper side is 49 °C / 120 F, compared to the average of 36.8 °C / 98 F, ranging from 21 to 71 °C for the class Multimedia.
(+) The bottom heats up to a maximum of 39.6 °C / 103 F, compared to the average of 39.1 °C / 102 F
(+) In idle usage, the average temperature for the upper side is 27.4 °C / 81 F, compared to the device average of 31.3 °C / 88 F.
(+) The palmrests and touchpad are cooler than skin temperature with a maximum of 27.4 °C / 81.3 F and are therefore cool to the touch.
(±) The average temperature of the palmrest area of similar devices was 28.7 °C / 83.7 F (+1.3 °C / 2.4 F).
Speakers
The stereo speakers are pretty good as far as budget office laptops go. Audio is loud and clear with no static or heavy imbalances between bass and treble. The palm rests will vibrate slightly at louder volume settings. The WavesAudio Pro software is included much like on the XPS series.


Apple MacBook 12 (Early 2016) 1.1 GHz audio analysis
(+) | speakers can play relatively loud (83.6 dB)
Bass 100 - 315 Hz
(±) | reduced bass - on average 11.3% lower than median
(±) | linearity of bass is average (14.2% delta to prev. frequency)
Mids 400 - 2000 Hz
(+) | balanced mids - only 2.4% away from median
(+) | mids are linear (5.5% delta to prev. frequency)
Highs 2 - 16 kHz
(+) | balanced highs - only 2% away from median
(+) | highs are linear (4.5% delta to prev. frequency)
Overall 100 - 16.000 Hz
(+) | overall sound is linear (10.2% difference to median)
Compared to same class
» 7% of all tested devices in this class were better, 2% similar, 91% worse
» The best had a delta of 5%, average was 18%, worst was 53%
Compared to all devices tested
» 5% of all tested devices were better, 1% similar, 94% worse
» The best had a delta of 4%, average was 24%, worst was 134%
Energy Management
Power Consumption
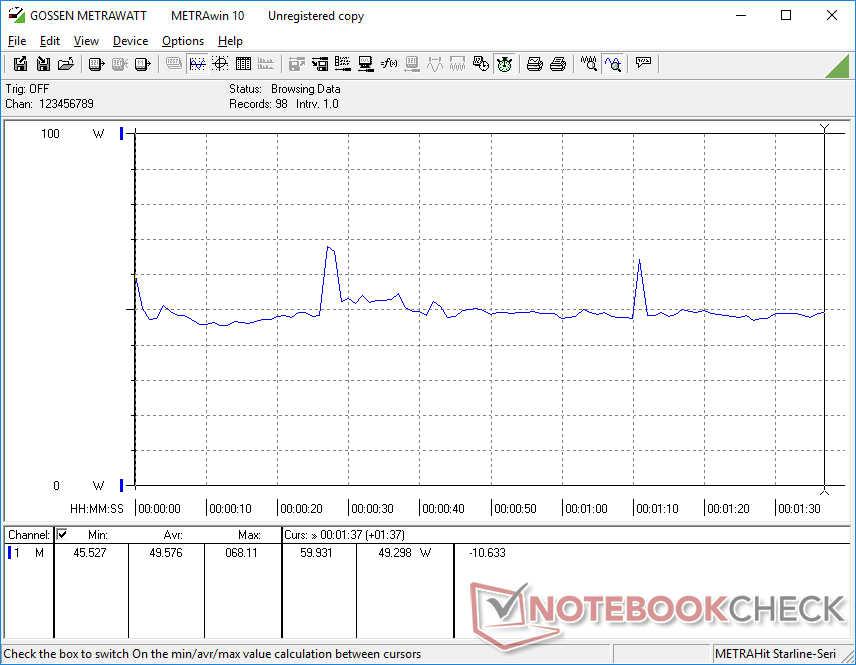
Idling on desktop demands between 5 W and 12 W depending on the Power profile and brightness setting to be similar to the Inspiron 17 7786. When under higher loads, however, the inefficiency of the Radeon 520 begins to show. The Inspiron 17 3780 demands 50 W when running 3DMark 06 compared to 56 W on the Inspiron 17 7786 with GeForce MX150 graphics even though the 7786 is able to offer roughly 130 percent faster graphics performance.
We're able to record a maximum draw of 67 W from the small (~18 x 4.8 x 2.8 cm) 65 W AC adapter. This high of a consumption is unsustainable as performance eventually throttles as exemplified in our Stress Test section above.
| Off / Standby | |
| Idle | |
| Load |
|
Key:
min: | |
| Dell Inspiron 17 3780 i7-8565U, Radeon 520, SK Hynix BC501 NVMe 256 GB, IPS, 1920x1080, 17.3" | Dell Inspiron 17-7786 i7-8565U, GeForce MX150, KBG30ZMS128G, IPS, 1920x1080, 17.3" | Lenovo V320-17IKB-81CN000MGE i5-8250U, UHD Graphics 620, Liteonit CV3-DE256, IPS, 1920x1080, 17.3" | HP ProBook 470 G5 i5-8250U, GeForce 930MX, Intel SSD 600p SSDPEKKW256G7, IPS, 1920x1080, 17.3" | Dell Inspiron 17-5770-0357 i5-8250U, UHD Graphics 620, SK hynix SC311 M.2, IPS, 1920x1080, 17.3" | HP 17-ca0013ng R5 2500U, Vega 8, Toshiba KBG30ZMV256G, IPS, 1920x1080, 17.3" | |
|---|---|---|---|---|---|---|
| Power Consumption | 3% | 20% | 14% | 23% | -12% | |
| Idle Minimum * (Watt) | 5 | 4.2 16% | 4.3 14% | 3.4 32% | 4.08 18% | 7.6 -52% |
| Idle Average * (Watt) | 10.9 | 9.4 14% | 10.2 6% | 9.6 12% | 8.45 22% | 12.9 -18% |
| Idle Maximum * (Watt) | 12 | 12.9 -8% | 10.5 12% | 11.8 2% | 9.6 20% | 13.7 -14% |
| Load Average * (Watt) | 49.6 | 56 -13% | 34 31% | 43 13% | 40.2 19% | 44 11% |
| Load Maximum * (Watt) | 66.9 | 63.4 5% | 42 37% | 61 9% | 41.4 38% | 57.1 15% |
* ... smaller is better
Battery Life
Battery capacity is small at just 42 Wh for an overall short battery life. Users can expect just over 4 hours of real-world WLAN use compared to twice that or more on the Dell Inspiron 17-7786 or HP ProBook 470 G5. Recharging still takes 1.5 to 2 hours despite the small capacity.
| Dell Inspiron 17 3780 i7-8565U, Radeon 520, 42 Wh | Dell Inspiron 17-7786 i7-8565U, GeForce MX150, 56 Wh | Lenovo V320-17IKB-81CN000MGE i5-8250U, UHD Graphics 620, 30 Wh | HP ProBook 470 G5 i5-8250U, GeForce 930MX, 48 Wh | Dell Inspiron 17-5770-0357 i5-8250U, UHD Graphics 620, 42 Wh | HP 17-ca0013ng R5 2500U, Vega 8, 40.6 Wh | |
|---|---|---|---|---|---|---|
| Battery runtime | 105% | 2% | 99% | 34% | -10% | |
| Reader / Idle (h) | 9.6 | 16.6 73% | 10.5 9% | 18.7 95% | 11.7 22% | |
| WiFi v1.3 (h) | 4.2 | 9 114% | 4.4 5% | 8.1 93% | 6.1 45% | 3.8 -10% |
| Load (h) | 1.1 | 2.5 127% | 1 -9% | 2.3 109% | 1.5 36% |
Pros
Cons
Verdict
The most compelling features of the Inspiron 17 3780 are its standard 1080p IPS display and low price. Competing systems like the Asus VivoBook 17 may have lower resolution displays and will only offer 1080p at an unnecessary price premium.
If considering the Inspiron 17 3780, we recommend skipping the pricier dedicated Radeon 520 GPU option as it offers both very poor graphics performance and low performance-per-Watt. If GPU power is desired, then the Lenovo IdeaPad 330-17IKB with GeForce MX150 graphics would be a worthwhile alternative. If your intention is mostly word processing, web browsing, and video streaming, then the base Core i5-8265U or Ryzen 5 2500U Inspiron 15 configurations would be sufficient.
We're hopeful that future revisions will address a few of the major disadvantages without needing to up the price. Namely, the thick bezels, soft clickpad, soft NumPad keys, and lack of USB Type-C all hinder the user experience and versatility of the system.
Avoid the Radeon 520 configuration and the affordable Inspiron 17 3780 will be a decent at-home laptop for basic tasks and video streaming. Invest in a primary SSD instead of the Core i7 option for tangibly faster system performance.
Dell Inspiron 17 3780
- 05/11/2019 v6 (old)
Allen Ngo
Price comparison
