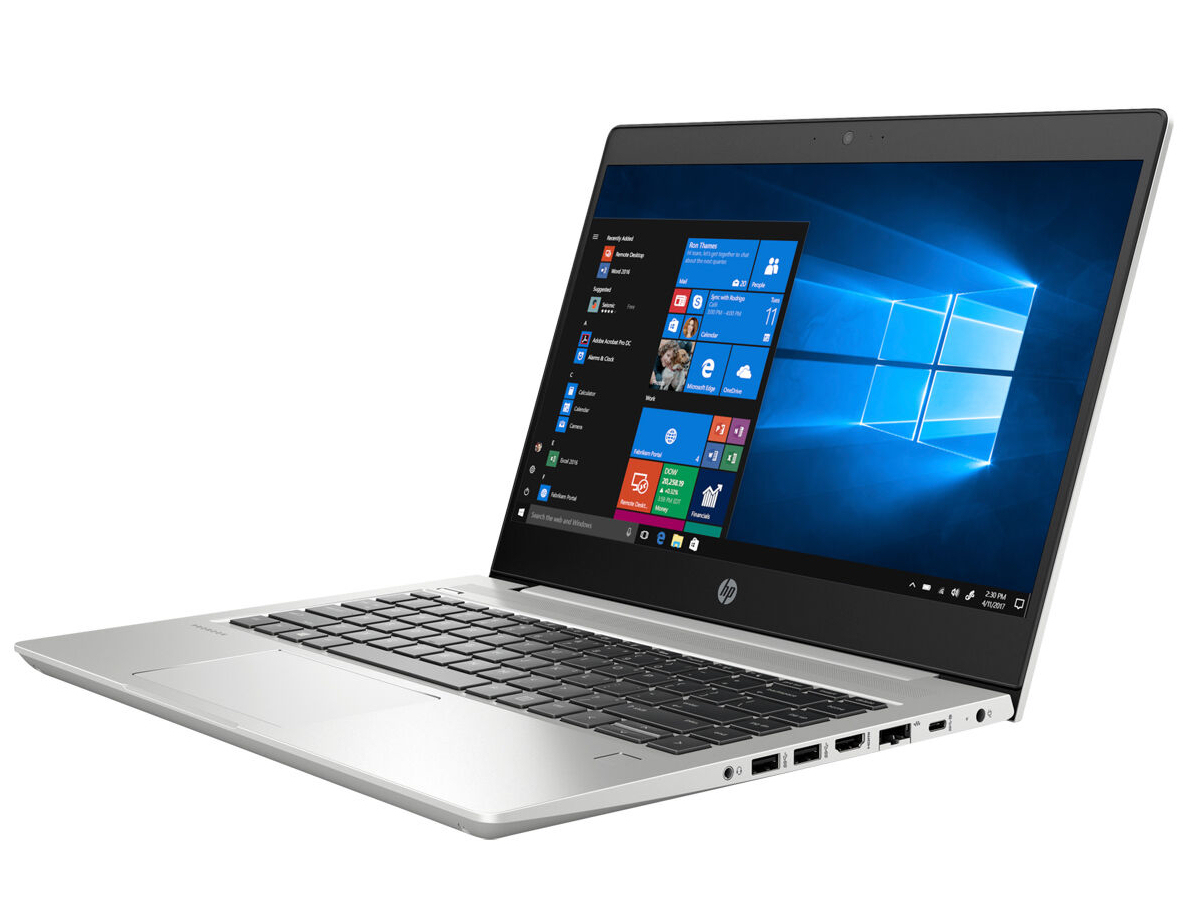
HP ProBook 445 G6 (Ryzen 5 2500U, RX Vega 8, SSD, FHD) Laptop Review

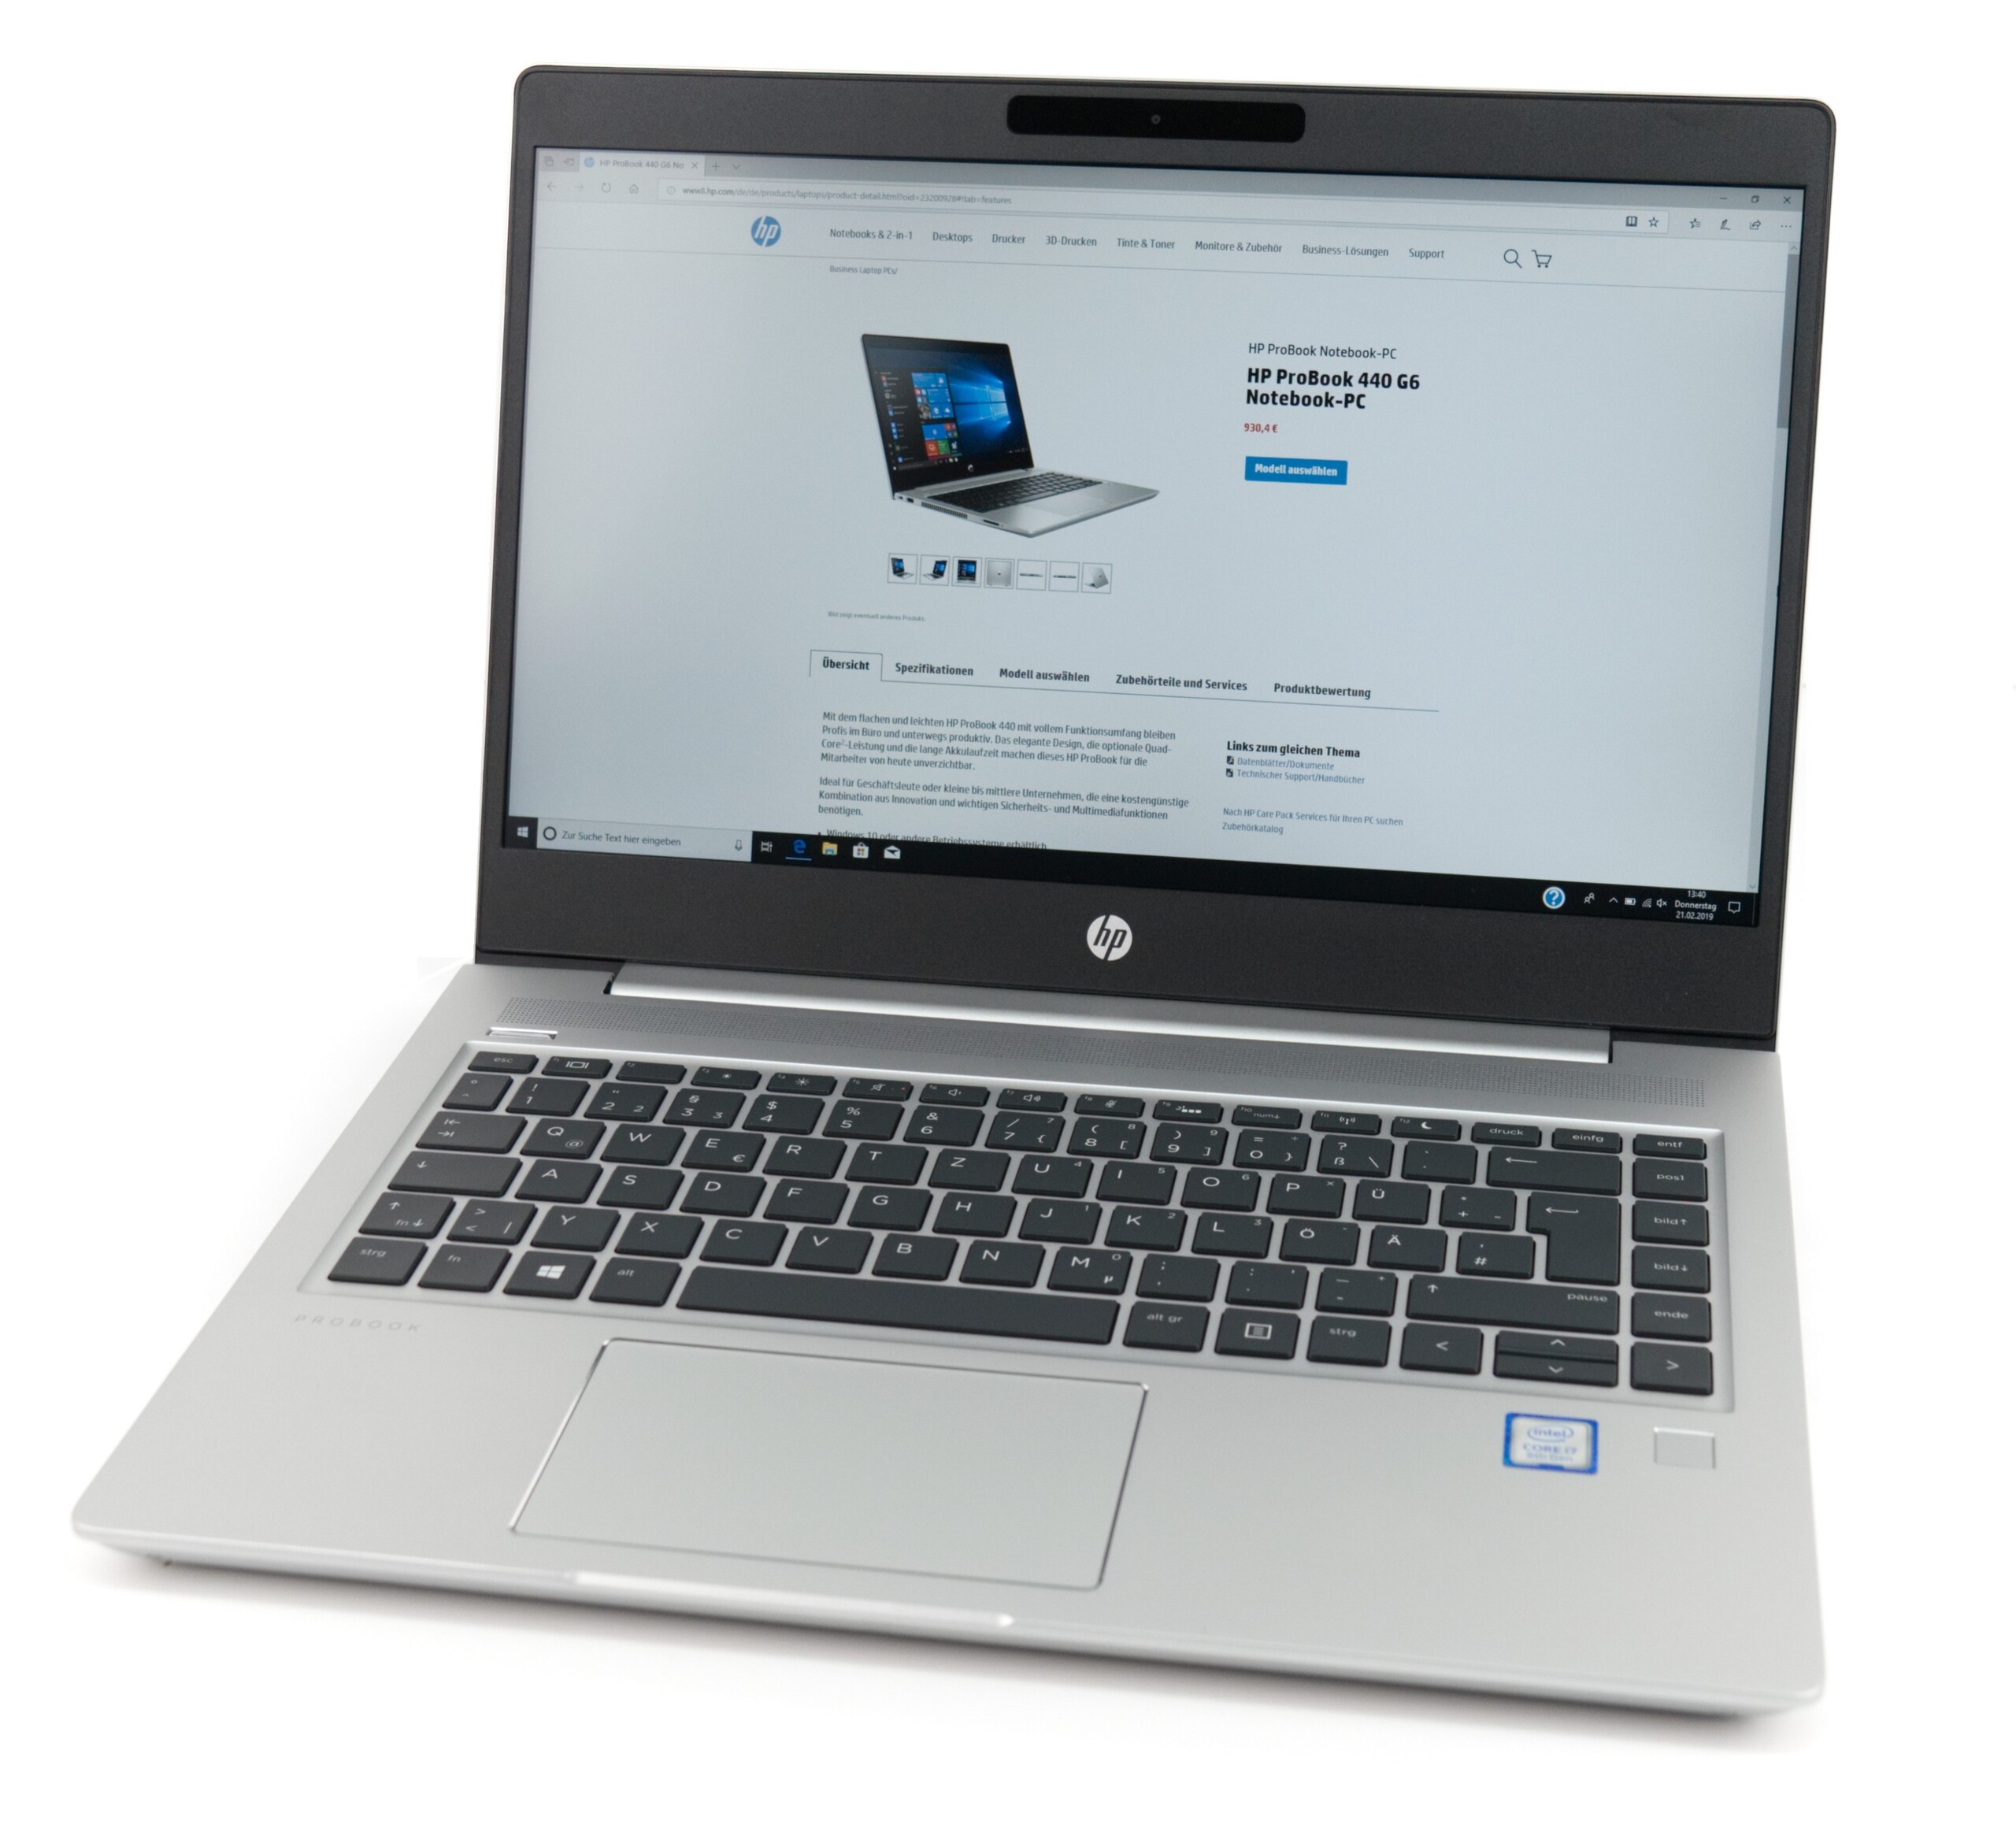
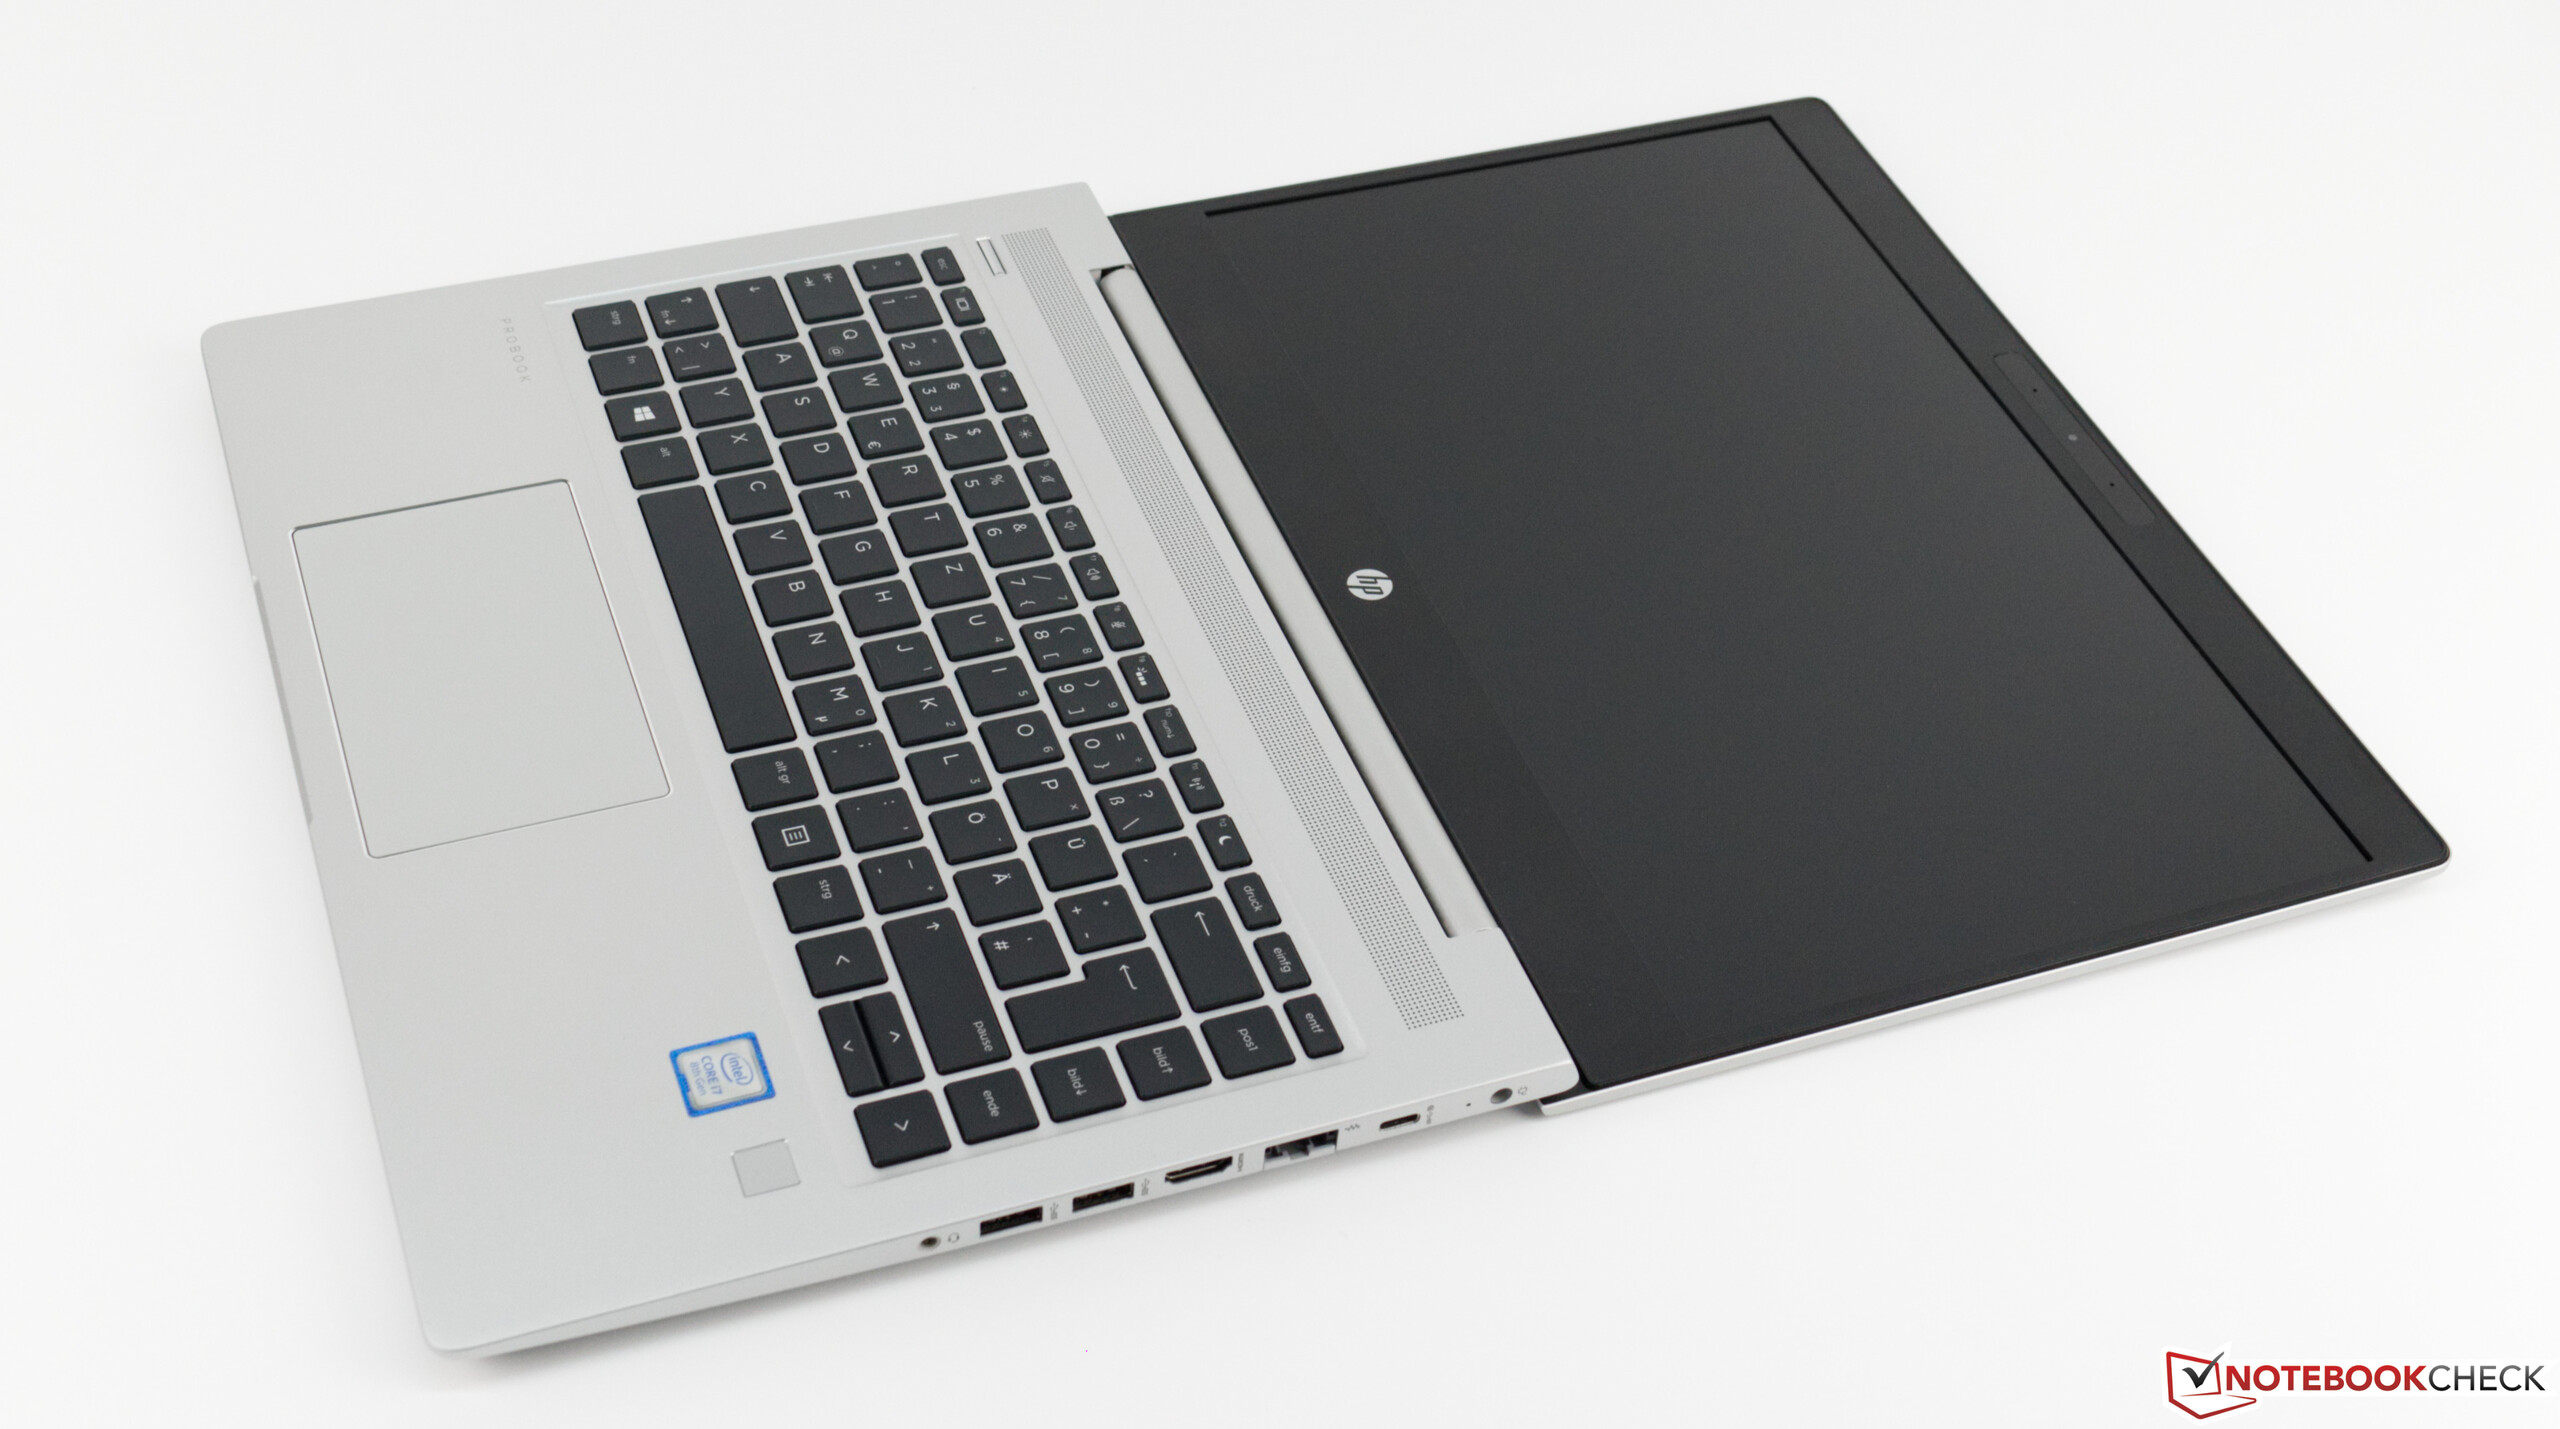
In HP’s business notebook lineup, the ProBook 400 series represents its entry-level business devices, and the ProBook 445 G6 is a 14-inch contender powered by AMD’s Ryzen APU. The Intel-equipped models, such as the ProBook 440 G6 5TK01EA, carry the 440 G6 branding but are otherwise identical. Its main competitors are the Lenovo ThinkPad E485, the Dell Latitude 14 5495, the Fujitsu LifeBook E548, and the Acer TravelMate X3410-M.
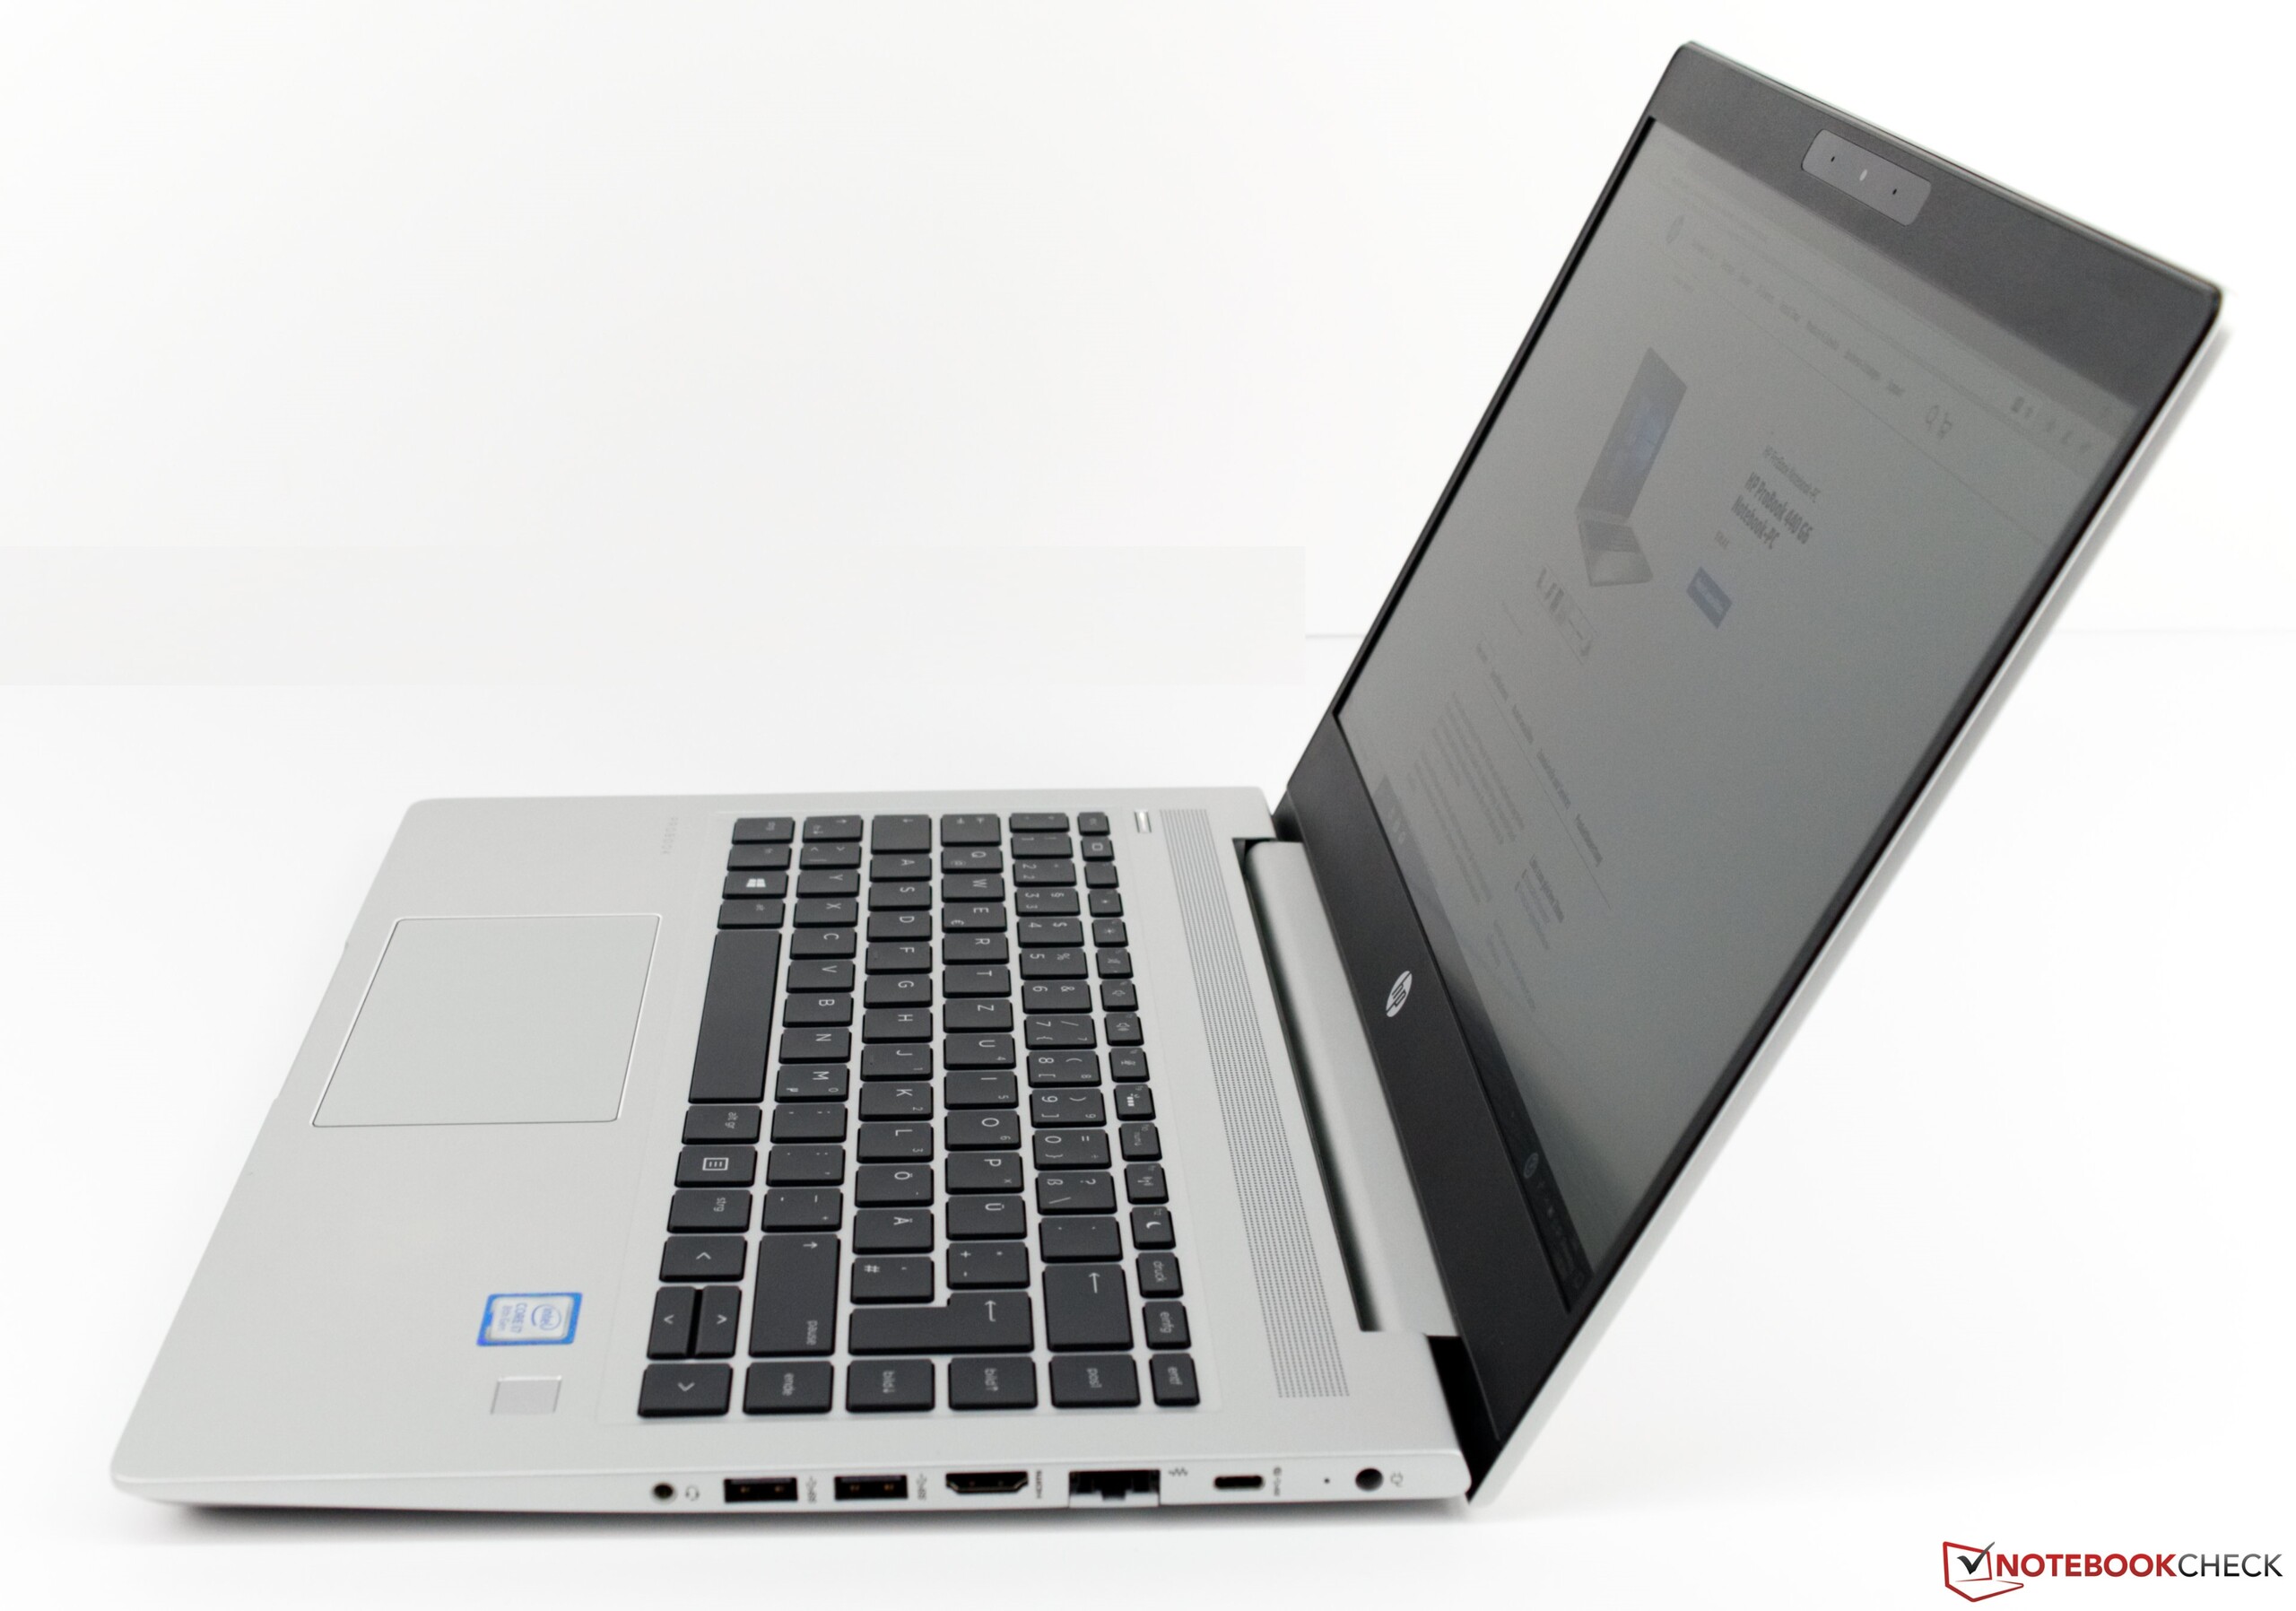
Given that the ProBook 440 G6 and ProBook 445 G6 are mostly identical we are not going to cover case, connectivity, and input devices as part of this review and would like to refer those interested in these aspects to our ProBook 440 G6 review.
| SD Card Reader | |
| average JPG Copy Test (av. of 3 runs) | |
| Dell Latitude 14 5495 (Toshiba Exceria Pro SDXC 64 GB UHS-II) | |
| HP ProBook 440 G6-5TK01EA (Toshiba Exceria Pro SDXC 64 GB UHS-II) | |
| HP ProBook 445 G6 (Toshiba Exceria Pro SDXC 64 GB UHS-II) | |
| Average of class Subnotebook (23.7 - 188, n=9, last 2 years) | |
| Lenovo ThinkPad E485-20KU000NGE (Toshiba Exceria Pro M501) | |
| Fujitsu Lifebook E548 (Toshiba Exceria Pro SDXC 64 GB UHS-II) | |
| Acer TravelMate X3410-M-866T (Toshiba Exceria Pro SDXC 64 GB UHS-II) | |
| Acer TravelMate X3410-M-50DD (Toshiba Exceria Pro SDXC 64 GB UHS-II) | |
| maximum AS SSD Seq Read Test (1GB) | |
| Dell Latitude 14 5495 (Toshiba Exceria Pro SDXC 64 GB UHS-II) | |
| Average of class Subnotebook (24.9 - 195, n=8, last 2 years) | |
| HP ProBook 445 G6 (Toshiba Exceria Pro SDXC 64 GB UHS-II) | |
| Lenovo ThinkPad E485-20KU000NGE (Toshiba Exceria Pro M501) | |
| HP ProBook 440 G6-5TK01EA (Toshiba Exceria Pro SDXC 64 GB UHS-II) | |
| Fujitsu Lifebook E548 (Toshiba Exceria Pro SDXC 64 GB UHS-II) | |
| Acer TravelMate X3410-M-50DD (Toshiba Exceria Pro SDXC 64 GB UHS-II) | |
| Acer TravelMate X3410-M-866T (Toshiba Exceria Pro SDXC 64 GB UHS-II) | |
Display

The matte 14-inch IPS display runs at a native resolution of 1920x1080. While its contrast ratio of 1,761:1 is decent, its maximum brightness of just 196 nits is abysmal and much too low (AMD Vari-Bright was disabled). In addition, what little light made its way through the panel was also very unevenly distributed.
Within our test group the ProBook and the Latitude 14 5495 boasted the dimmest displays. That being said, none of the competitors offered a decently bright display. We consider a display bright enough at levels of 300 nits and above.
Unfortunately, we also discovered PWM flickering at brightness levels of 60% and below at a very low frequency of just 208 Hz. Sensitive users should thus steer clear of this panel to avoid headaches and unnecessary eye strain.
| |||||||||||||||||||||||||
Brightness Distribution: 67 %
Center on Battery: 200 cd/m²
Contrast: 1176:1 (Black: 0.17 cd/m²)
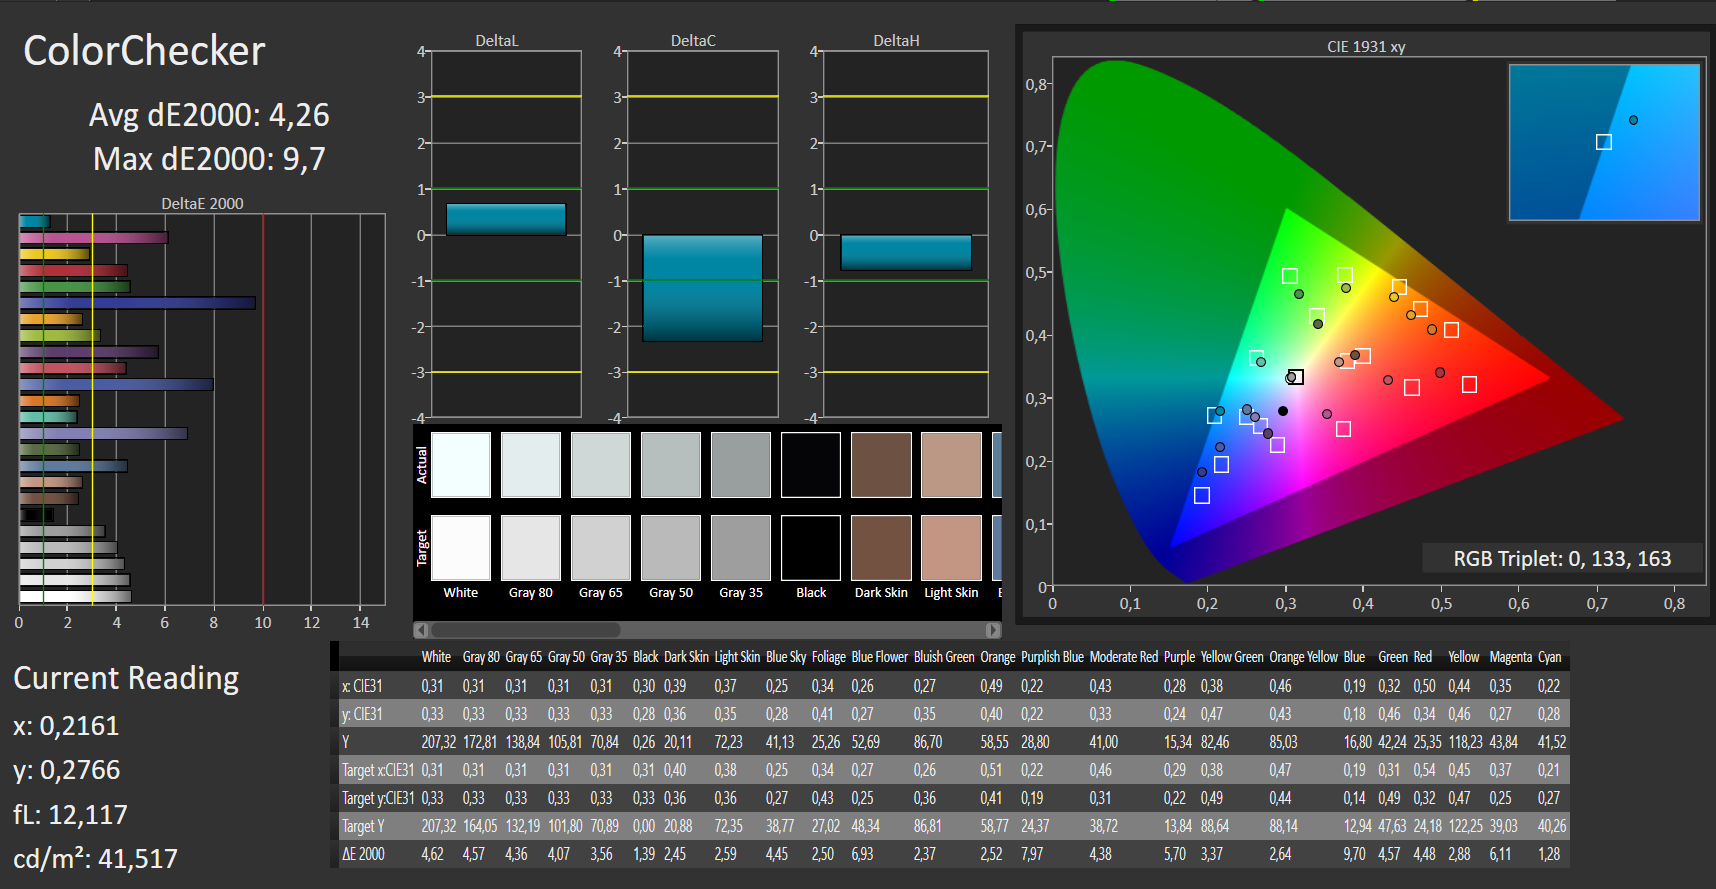
ΔE ColorChecker Calman: 4.26 | ∀{0.5-29.43 Ø4.72}
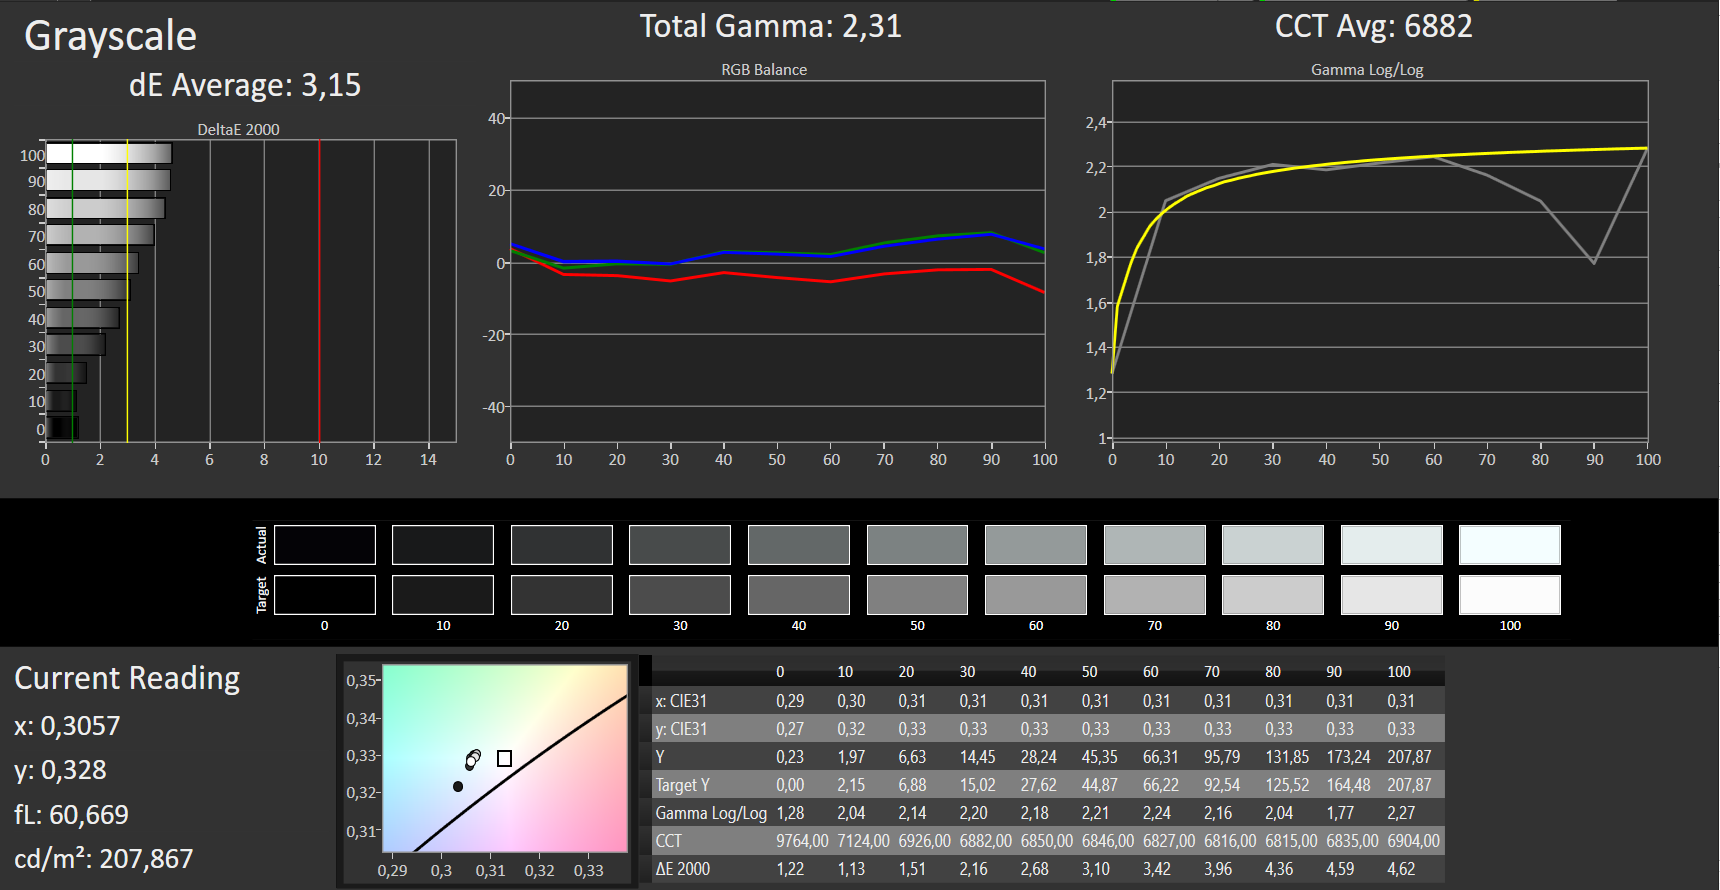
ΔE Greyscale Calman: 3.15 | ∀{0.09-98 Ø4.97}
62% sRGB (Argyll 1.6.3 3D)
40% AdobeRGB 1998 (Argyll 1.6.3 3D)
42.94% AdobeRGB 1998 (Argyll 3D)
62% sRGB (Argyll 3D)
41.53% Display P3 (Argyll 3D)
Gamma: 2.31
CCT: 6882 K
| HP ProBook 445 G6 IPS, 1920x1080, 14" | HP ProBook 440 G6-5TK01EA IPS, 1920x1080, 14" | Lenovo ThinkPad E485-20KU000NGE IPS, 1920x1080, 14" | Dell Latitude 14 5495 IPS LED, 1920x1080, 14" | Acer TravelMate X3410-M-866T IPS, 1920x1080, 14" | Fujitsu Lifebook E548 IPS, 1920x1080, 14" | Acer TravelMate X3410-M-50DD IPS LED, 1920x1080, 14" | |
|---|---|---|---|---|---|---|---|
| Display | -8% | -6% | -1% | 0% | -6% | 1% | |
| Display P3 Coverage (%) | 41.53 | 38.08 -8% | 39.21 -6% 38.48 -7% | 40.94 -1% | 41.59 0% | 39.21 -6% | 41.96 1% |
| sRGB Coverage (%) | 62 | 57.2 -8% | 58.8 -5% 57.9 -7% | 61.4 -1% | 62.4 1% | 58.5 -6% | 63 2% |
| AdobeRGB 1998 Coverage (%) | 42.94 | 39.37 -8% | 40.52 -6% 39.76 -7% | 42.32 -1% | 42.99 0% | 40.56 -6% | 43.37 1% |
| Response Times | -5% | -21% | -9% | -18% | 17% | -10% | |
| Response Time Grey 50% / Grey 80% * (ms) | 40 ? | 41.6 ? -4% | 44.8 ? -12% | 41 ? -2% | 40.4 ? -1% | 34 ? 15% | 42 ? -5% |
| Response Time Black / White * (ms) | 26 ? | 27.2 ? -5% | 33.6 ? -29% | 30 ? -15% | 35.2 ? -35% | 21 ? 19% | 30 ? -15% |
| PWM Frequency (Hz) | 208 ? | 25000 ? | 25000 ? | 24500 ? | |||
| Screen | -14% | -1% | -0% | -18% | -11% | 18% | |
| Brightness middle (cd/m²) | 200 | 256 28% | 289 45% | 212 6% | 253.1 27% | 278 39% | 255 27% |
| Brightness (cd/m²) | 196 | 238 21% | 271 38% | 200 2% | 230 17% | 240 22% | 218 11% |
| Brightness Distribution (%) | 67 | 85 27% | 87 30% | 89 33% | 77 15% | 78 16% | 72 7% |
| Black Level * (cd/m²) | 0.17 | 0.23 -35% | 0.19 -12% | 0.23 -35% | 0.3 -76% | 0.27 -59% | 0.08 53% |
| Contrast (:1) | 1176 | 1113 -5% | 1521 29% | 922 -22% | 844 -28% | 1030 -12% | 3188 171% |
| Colorchecker dE 2000 * | 4.26 | 6.2 -46% | 5.6 -31% | 4.34 -2% | 4.71 -11% | 5.57 -31% | 5.01 -18% |
| Colorchecker dE 2000 max. * | 9.7 | 18.2 -88% | 20.8 -114% | 9.01 7% | 20.72 -114% | 11.01 -14% | 17.44 -80% |
| Greyscale dE 2000 * | 3.15 | 3.8 -21% | 2.7 14% | 2.81 11% | 3.4 -8% | 4.94 -57% | 3 5% |
| Gamma | 2.31 95% | 2.5 88% | 1.96 112% | 2.22 99% | 1.997 110% | 2.6 85% | 2.26 97% |
| CCT | 6882 94% | 6643 98% | 6506 100% | 6286 103% | 6266 104% | 7322 89% | 6185 105% |
| Color Space (Percent of AdobeRGB 1998) (%) | 40 | 36.1 -10% | 37.2 -7% | 39 -2% | 40 0% | 37 -7% | 40 0% |
| Color Space (Percent of sRGB) (%) | 62 | 56.9 -8% | 58.5 -6% | 61 -2% | 62 0% | 58 -6% | 63 2% |
| Colorchecker dE 2000 calibrated * | 5.2 | 4.7 | 3.44 | 5.63 | 4.06 | ||
| Total Average (Program / Settings) | -9% /
-11% | -9% /
-5% | -3% /
-2% | -12% /
-14% | 0% /
-6% | 3% /
11% |
* ... smaller is better
Colors were fairly accurate out of the box, and we were able to determine a DeltaE deviation of just 4.26 (ideally you want this to be less than 3). The display did not suffer from a blue tint, but it was not able to cover AdobeRGB or sRGB completely and managed 40% and 62%, respectively.
The ICC profile resulting from our calibration attempts can improve upon color accuracy. Keep in mind to make sure that your display is identical to ours in make and model before applying the profile. Otherwise you may end up impairing instead of improving color accuracy. Many manufacturers source their panels from different suppliers even within the same model range.
Display Response Times
| ↔ Response Time Black to White | ||
|---|---|---|
| 26 ms ... rise ↗ and fall ↘ combined | ↗ 15 ms rise | 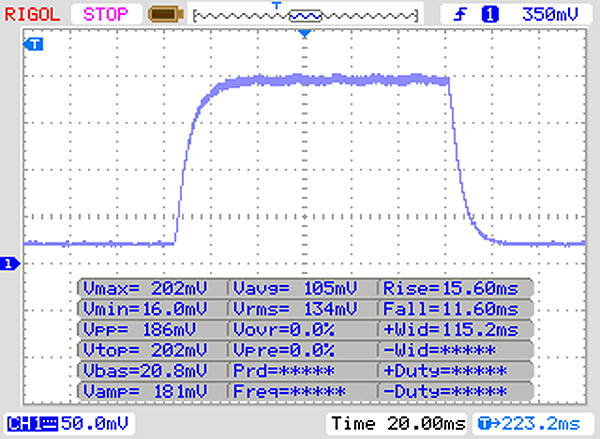 |
| ↘ 11 ms fall | ||
| The screen shows relatively slow response rates in our tests and may be too slow for gamers. In comparison, all tested devices range from 0.1 (minimum) to 240 (maximum) ms. » 63 % of all devices are better. This means that the measured response time is worse than the average of all tested devices (19.8 ms). | ||
| ↔ Response Time 50% Grey to 80% Grey | ||
| 40 ms ... rise ↗ and fall ↘ combined | ↗ 23 ms rise | 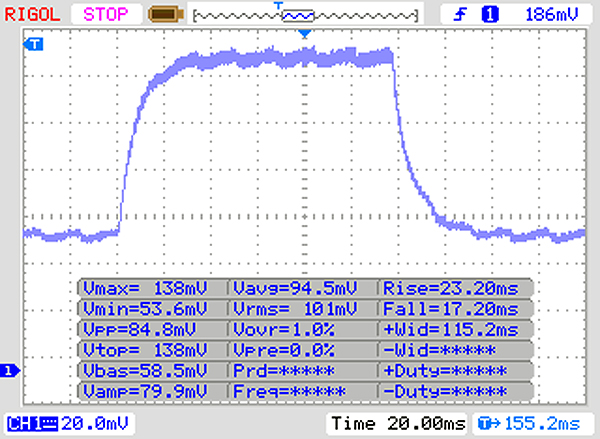 |
| ↘ 17 ms fall | ||
| The screen shows slow response rates in our tests and will be unsatisfactory for gamers. In comparison, all tested devices range from 0.165 (minimum) to 636 (maximum) ms. » 61 % of all devices are better. This means that the measured response time is worse than the average of all tested devices (31 ms). | ||
Screen Flickering / PWM (Pulse-Width Modulation)
| Screen flickering / PWM detected | 208 Hz | ≤ 50 % brightness setting | 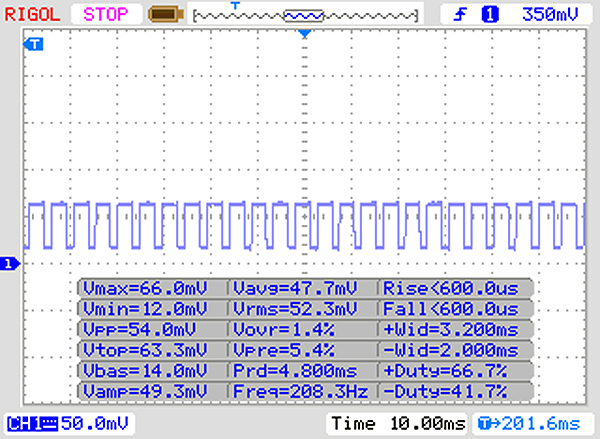 |
The display backlight flickers at 208 Hz (worst case, e.g., utilizing PWM) Flickering detected at a brightness setting of 50 % and below. There should be no flickering or PWM above this brightness setting. The frequency of 208 Hz is relatively low, so sensitive users will likely notice flickering and experience eyestrain at the stated brightness setting and below. In comparison: 52 % of all tested devices do not use PWM to dim the display. If PWM was detected, an average of 7747 (minimum: 5 - maximum: 343500) Hz was measured. | |||
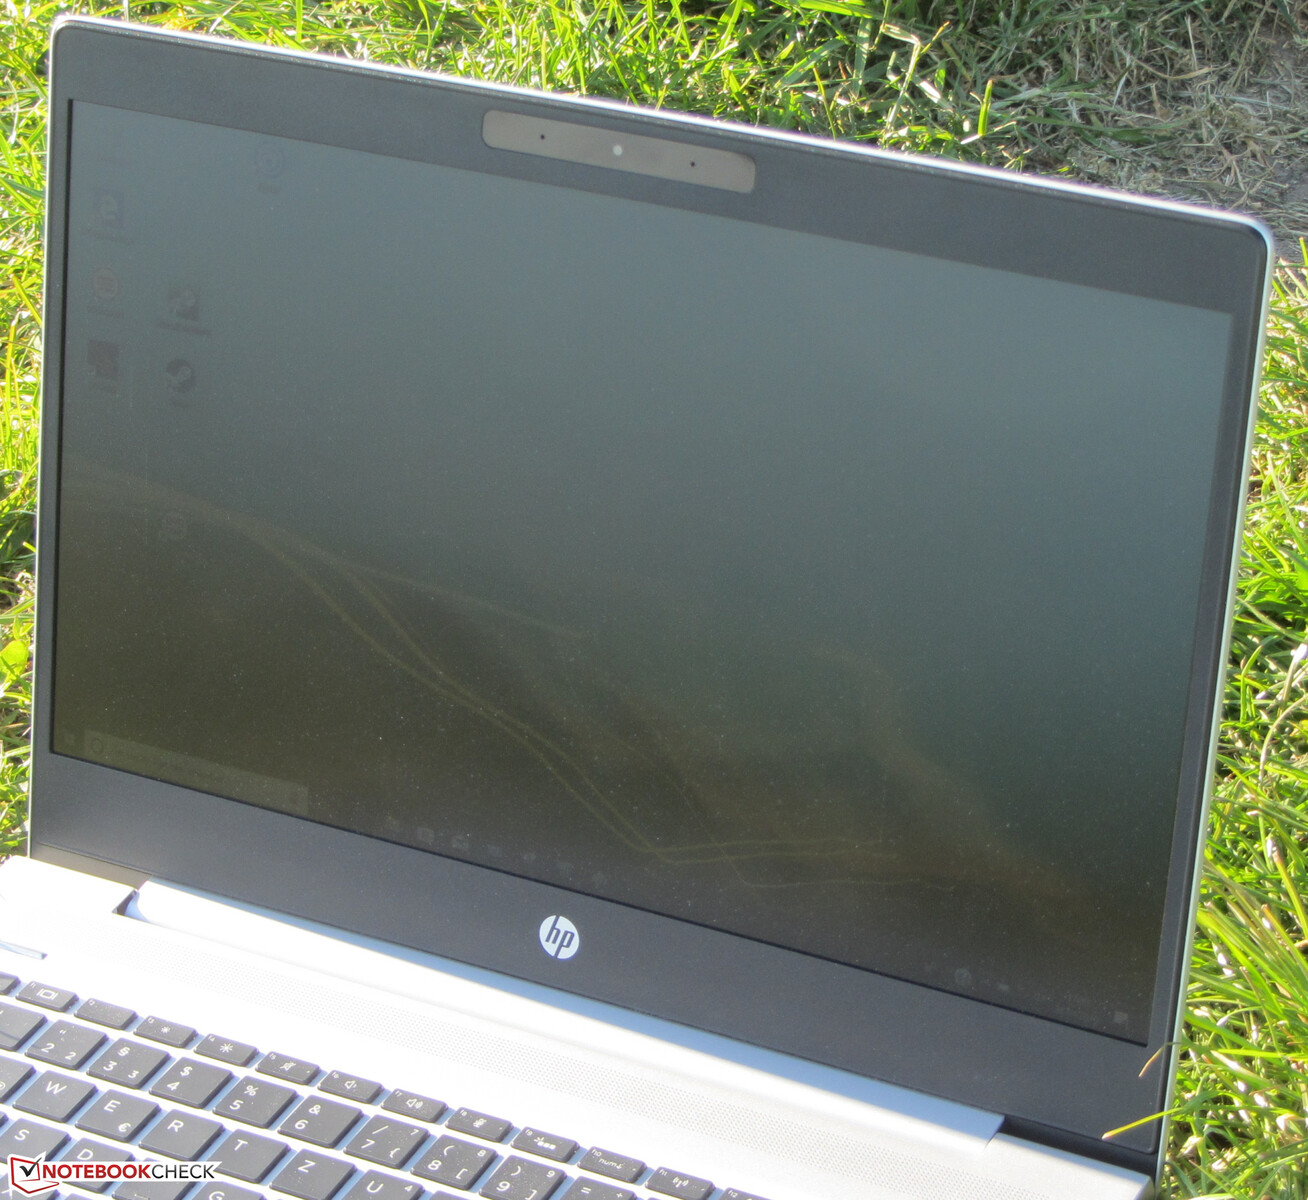
The IPS panel offered very wide viewing angles and remained very well readable from all angles and positions. Outdoor usability was somewhere between extremely difficult and non-existent due to the device’s dim display.

Performance
HP’s ProBook 445 G6 is a 14-inch business notebook. It offers more than enough performance for office and Internet applications, and its comparatively powerful iGPU even allows for graphically demanding use cases. At the time of writing, our review unit sold for around $700. Similar to the Intel-based ProBook 440 G6 a more-expensive SKU with 16 GB of RAM and a cheaper one with an HD display were also available.
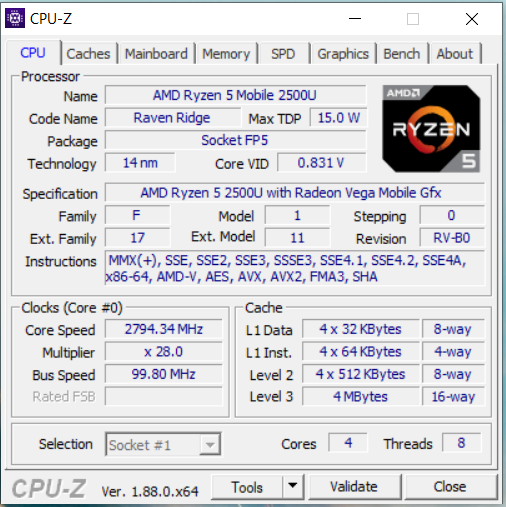
Processor
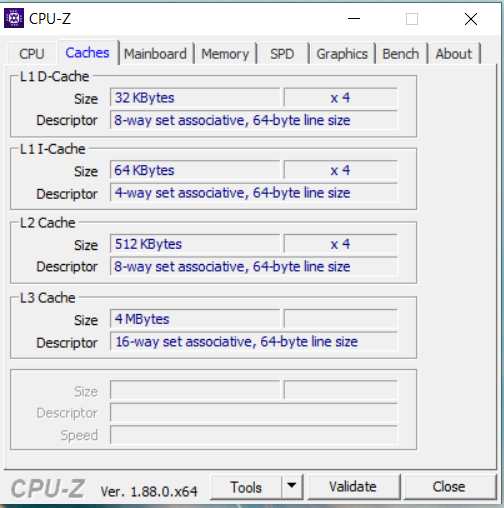
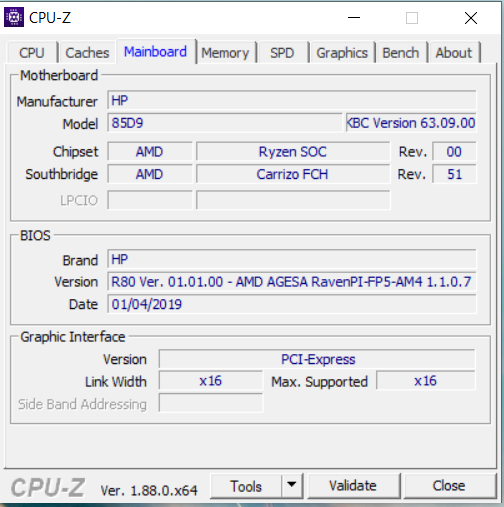
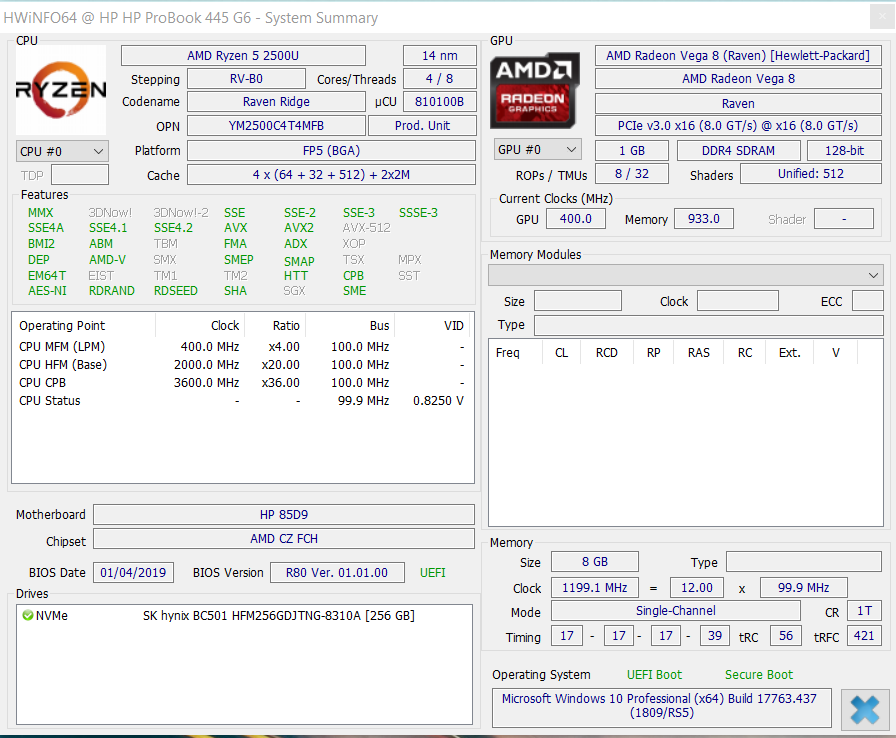
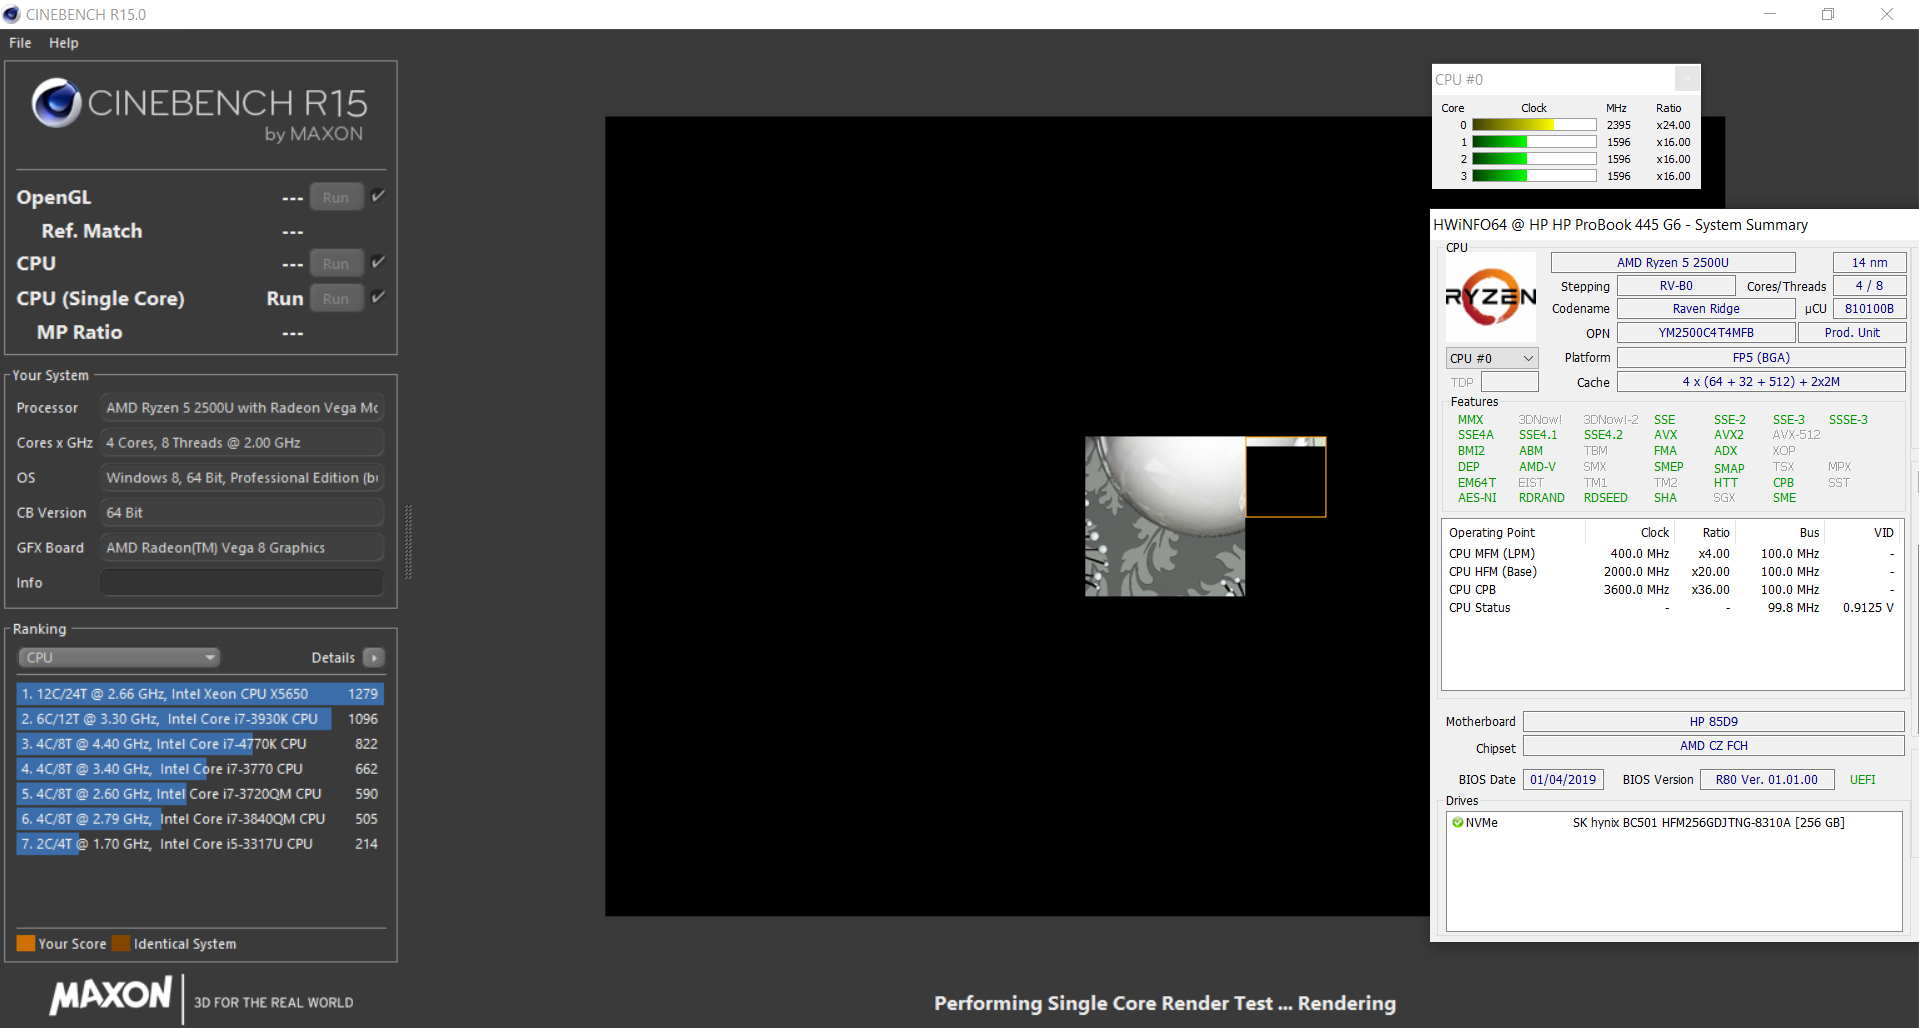
The ProBook is powered by an AMD Ryzen 5 2500U APU (Raven Ridge). Its quad-core CPU runs at a base clock speed of 2 GHz, is capable of boosting up to 3.6 GHz, and it supports simultaneous multi-threading with two threads per core.
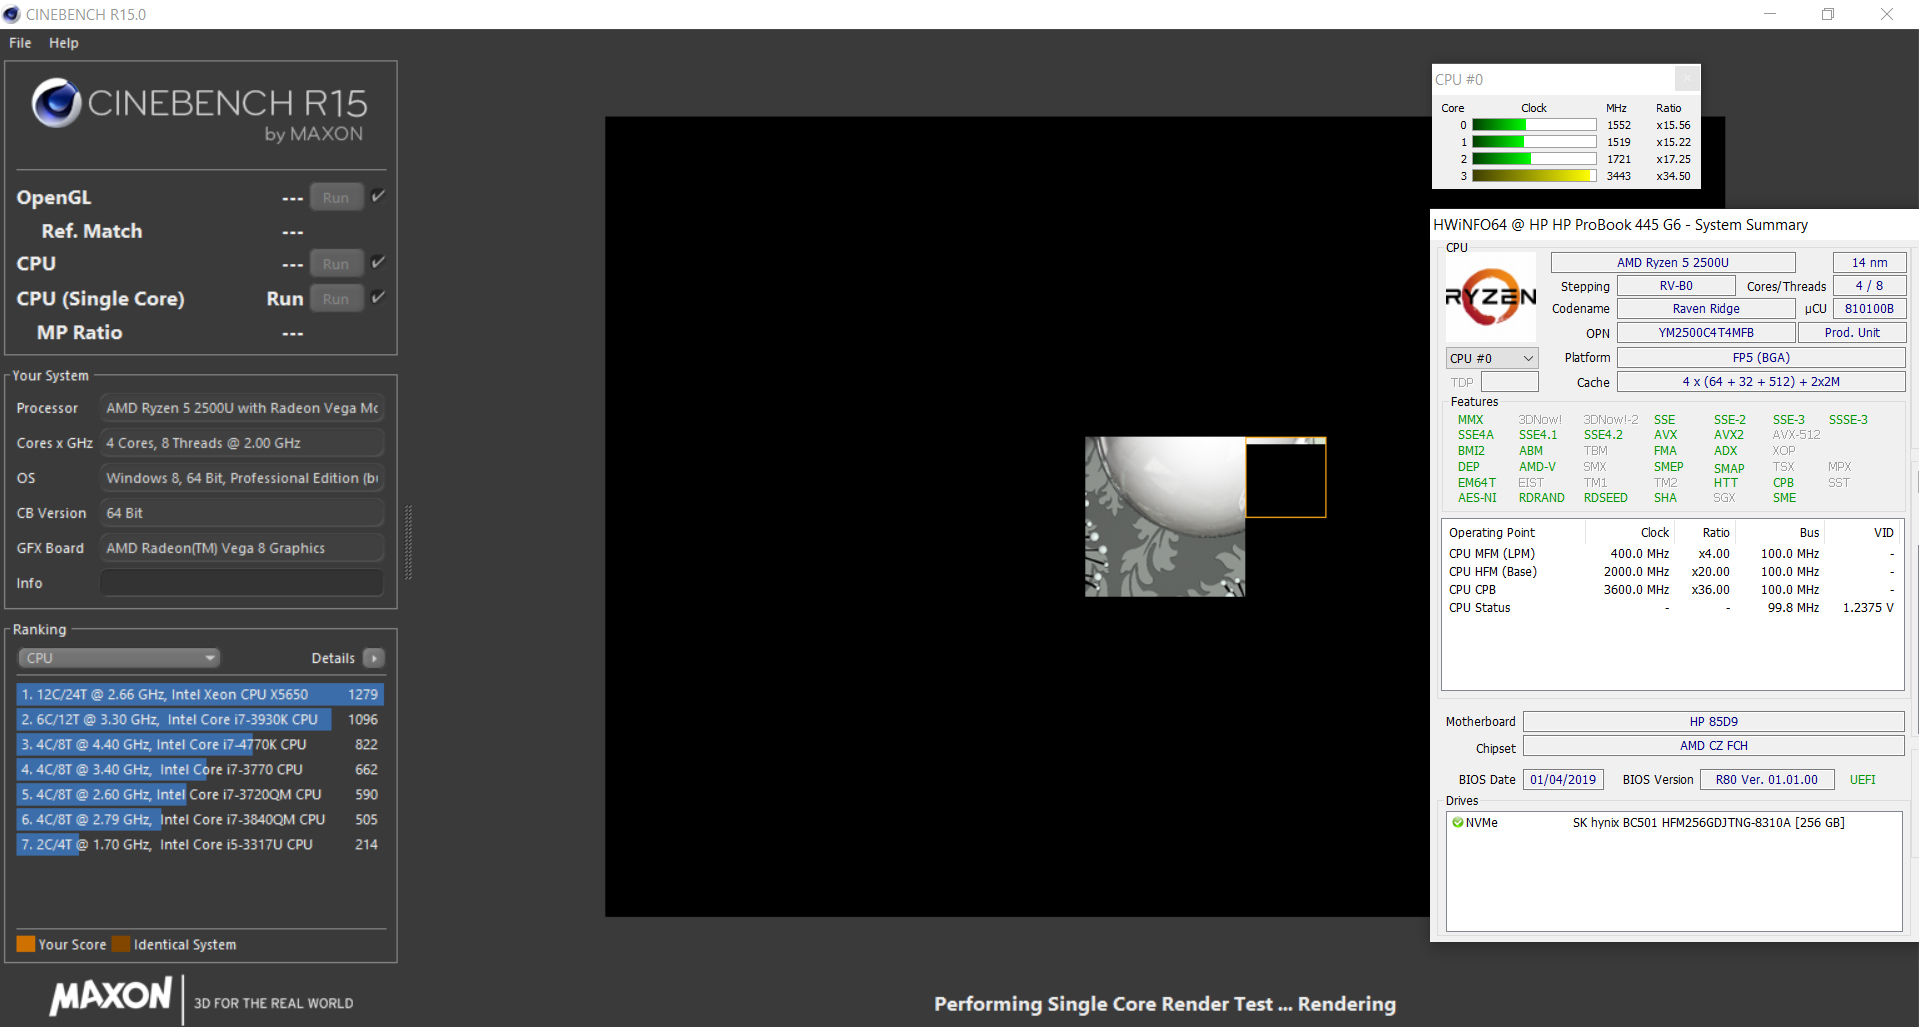
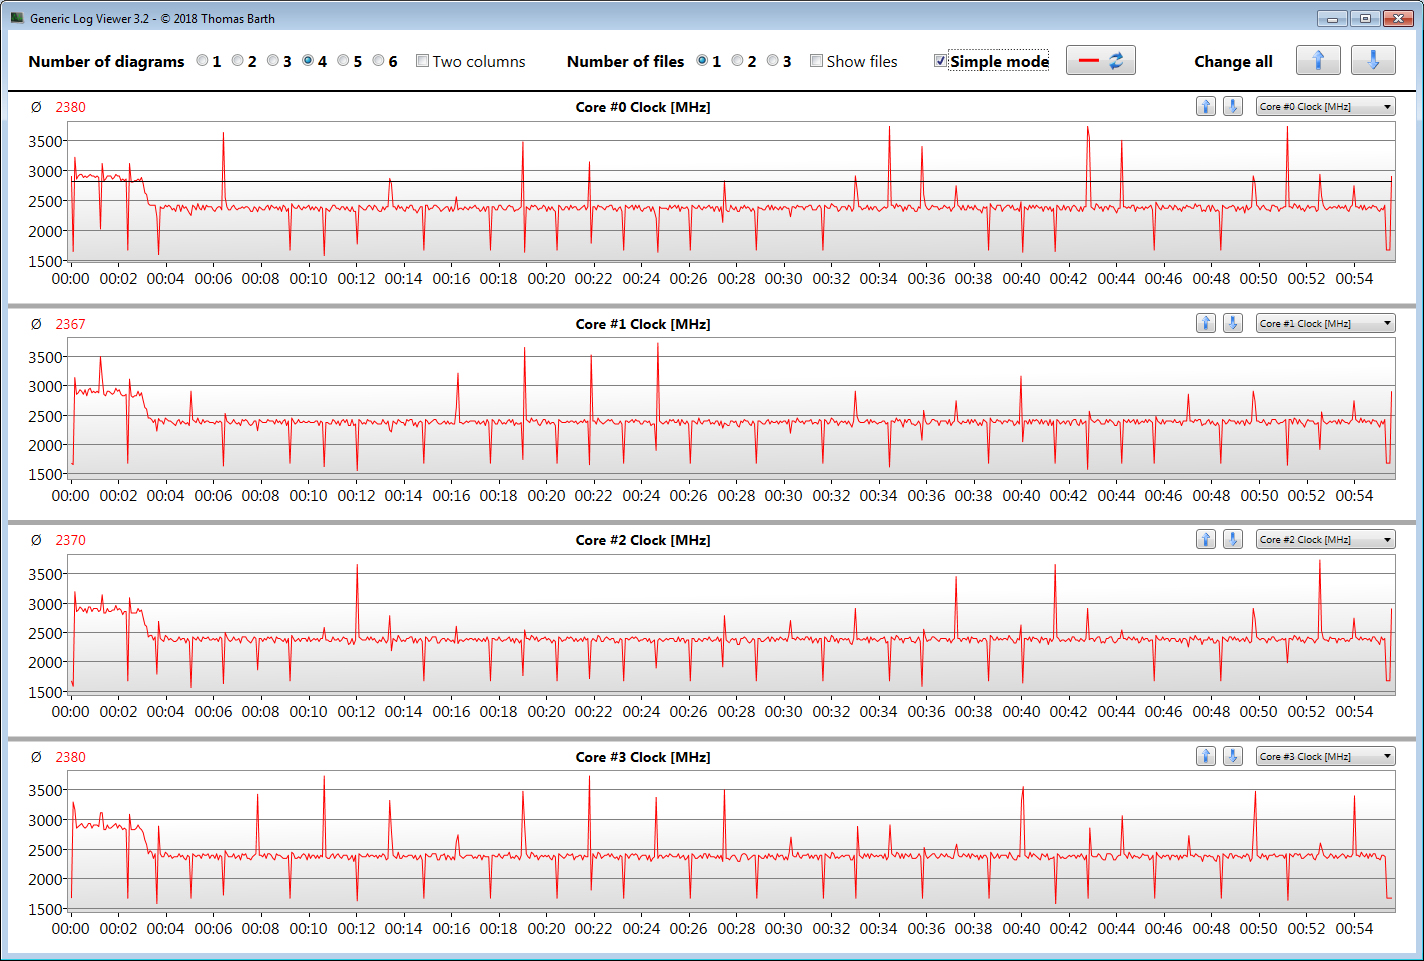
In our multithread Cinebench test the CPU ran at up to 3.1 GHz for a short period of time before it settled at around 2.8-2.9 GHz. In the single-thread test it ran at 1.5-3.6 GHz. At least on mains, that is. The results differed on battery. In the multithread test the CPU started at 2.4 GHz and slowly worked its way up to 2.9-3.1 GHz while the single-thread test was performed at between 1.6 and 2.4 GHz.
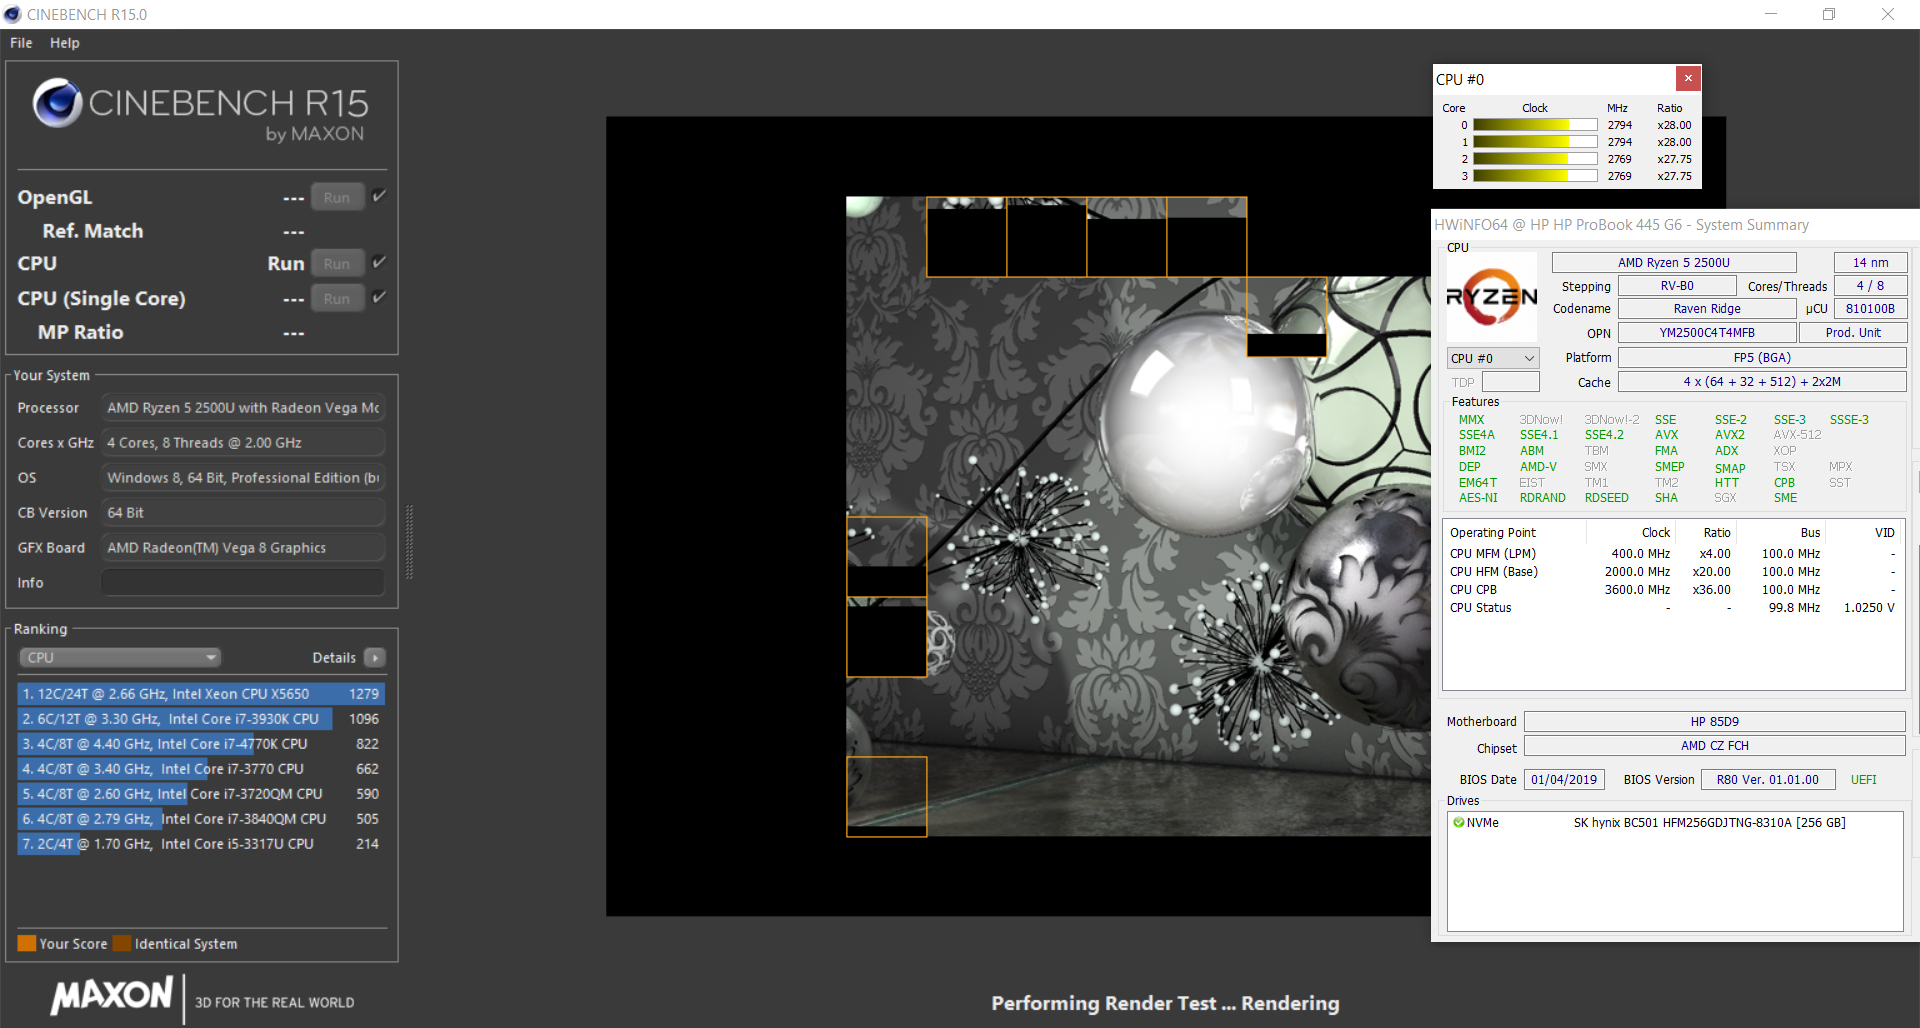
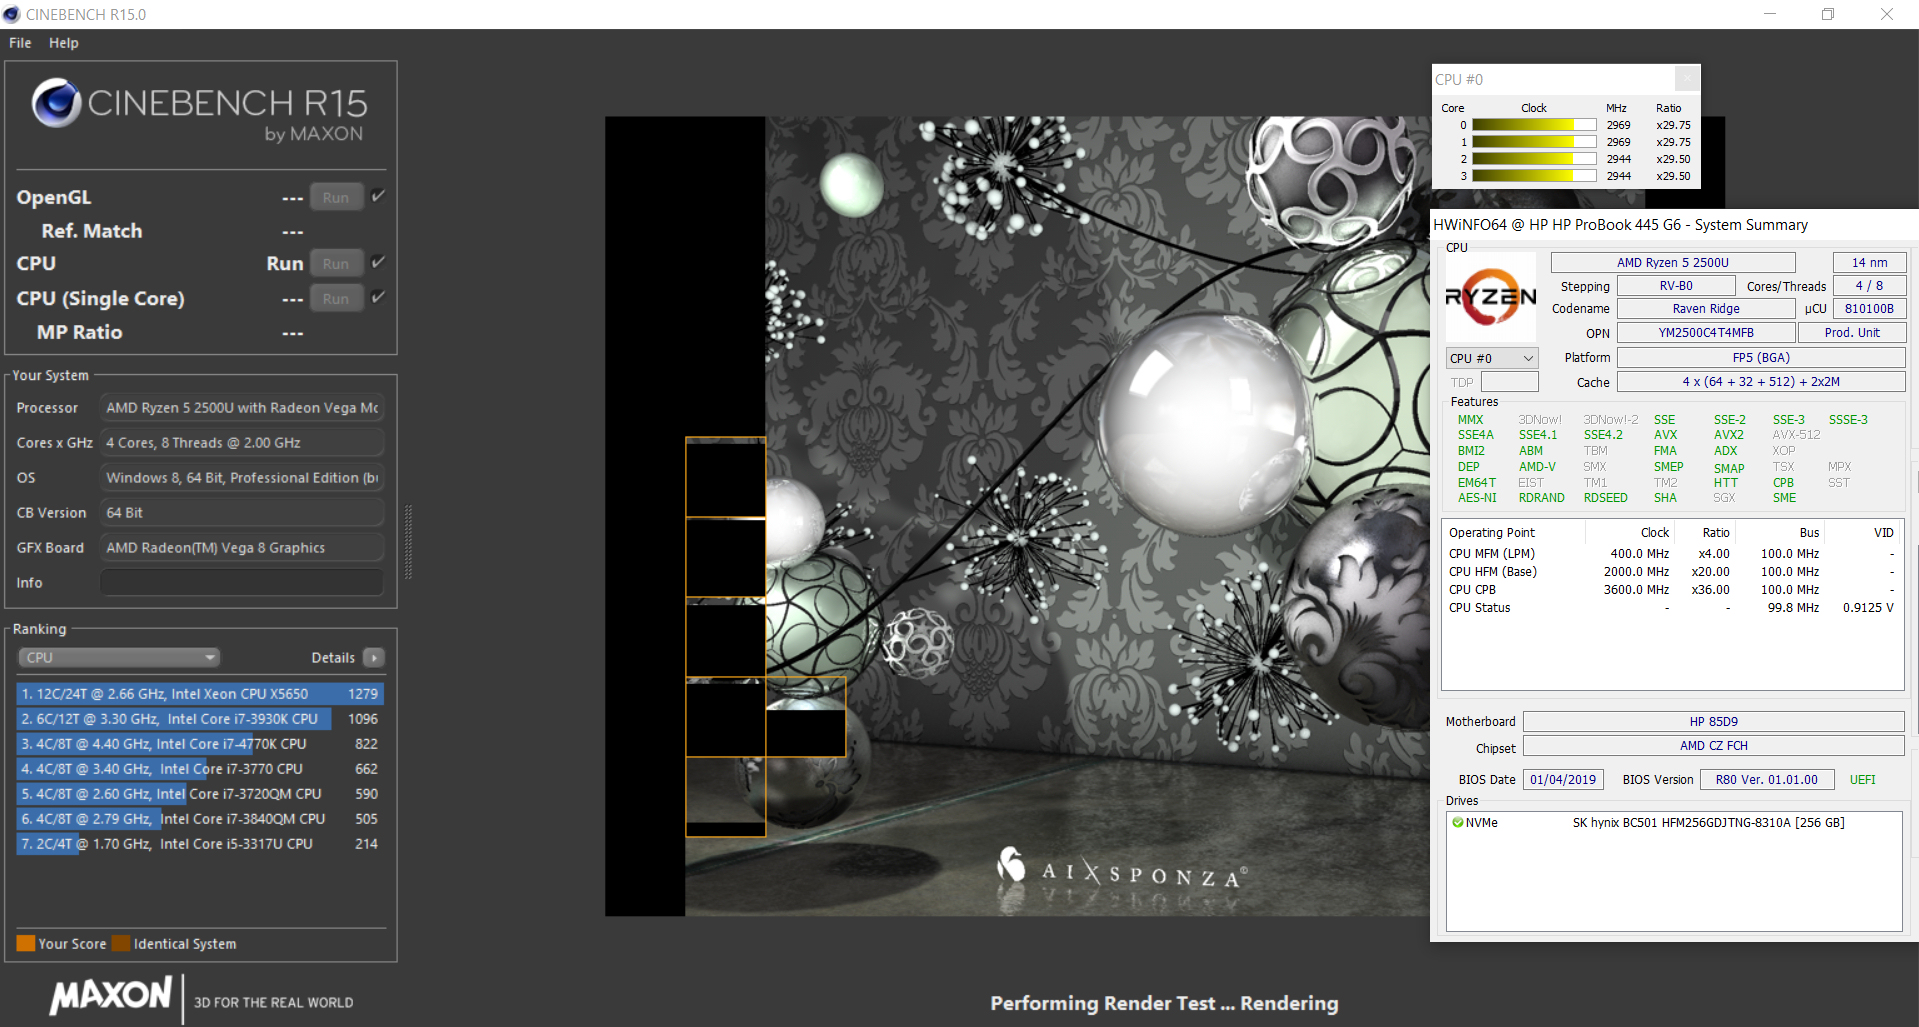
In order to determine whether or not a CPU is capable of maintaining a high level of CPU turbo boost over long periods of time we run the Cinebench R15 multithread test in a loop for at least 30 minutes. The scores decreased with every iteration between the first and fourth run but remained stable afterwards. CPU turbo was still applied albeit at a very low level.
| Cinebench R10 | |
| Rendering Single 32Bit | |
| Average of class Subnotebook (2299 - 10697, n=14, last 2 years) | |
| HP ProBook 440 G6-5TK01EA | |
| HP ProBook 445 G6 | |
| Average AMD Ryzen 5 2500U (4103 - 4473, n=6) | |
| Rendering Multiple CPUs 32Bit | |
| Average of class Subnotebook (14395 - 51868, n=14, last 2 years) | |
| HP ProBook 440 G6-5TK01EA | |
| HP ProBook 445 G6 | |
| Average AMD Ryzen 5 2500U (13850 - 16471, n=6) | |
| Geekbench 3 | |
| 32 Bit Multi-Core Score | |
| Average of class Subnotebook (n=1last 2 years) | |
| HP ProBook 445 G6 | |
| Average AMD Ryzen 5 2500U (10506 - 12280, n=5) | |
| 32 Bit Single-Core Score | |
| Average of class Subnotebook (n=1last 2 years) | |
| Average AMD Ryzen 5 2500U (3234 - 3477, n=5) | |
| HP ProBook 445 G6 | |
| Geekbench 4.4 | |
| 64 Bit Multi-Core Score | |
| Average of class Subnotebook (27854 - 45023, n=7, last 2 years) | |
| HP ProBook 440 G6-5TK01EA | |
| HP ProBook 445 G6 (Dual-Channel) | |
| Average AMD Ryzen 5 2500U (9434 - 10871, n=8) | |
| HP ProBook 445 G6 | |
| Lenovo ThinkPad E485-20KU000NGE | |
| 64 Bit Single-Core Score | |
| Average of class Subnotebook (5976 - 8929, n=7, last 2 years) | |
| HP ProBook 440 G6-5TK01EA | |
| HP ProBook 445 G6 (Dual-Channel) | |
| Lenovo ThinkPad E485-20KU000NGE | |
| Average AMD Ryzen 5 2500U (3275 - 3789, n=8) | |
| HP ProBook 445 G6 | |
| Mozilla Kraken 1.1 - Total | |
| Lenovo ThinkPad E485-20KU000NGE (Edge 42.17134.1.0) | |
| HP ProBook 445 G6 (Edge 44) | |
| Average AMD Ryzen 5 2500U (1138 - 1443, n=10) | |
| Dell Latitude 14 5495 (Edge) | |
| Acer TravelMate X3410-M-866T (Microsoft Edge 44.17763.1.0) | |
| Acer TravelMate X3410-M-50DD (Edge) | |
| HP ProBook 440 G6-5TK01EA (EDGE: 42.17134.1.0) | |
| Average of class Subnotebook (234 - 1104, n=61, last 2 years) | |
| Octane V2 - Total Score | |
| Average of class Subnotebook (35801 - 142020, n=29, last 2 years) | |
| HP ProBook 440 G6-5TK01EA (EDGE: 42.17134.1.0) | |
| Dell Latitude 14 5495 (Edge) | |
| HP ProBook 445 G6 (Edge 44) | |
| Acer TravelMate X3410-M-50DD (Edge) | |
| Average AMD Ryzen 5 2500U (21539 - 29587, n=10) | |
| Lenovo ThinkPad E485-20KU000NGE (Edge 42.17134.1.0) | |
| Acer TravelMate X3410-M-866T (Microsoft Edge 44.17763.1.0) | |
| Speedometer 2.0 - Result 2.0 | |
| Average of class Subnotebook (110 - 793, n=26, last 2 years) | |
| HP ProBook 445 G6 (Edge 44) | |
| Average AMD Ryzen 5 2500U (37.5 - 39.6, n=2) | |
| Lenovo ThinkPad E485-20KU000NGE (Edge 42.17134.1.0) | |
| WebXPRT 3 - Overall | |
| Average of class Subnotebook (156 - 530, n=56, last 2 years) | |
| HP ProBook 445 G6 (Edge 44) | |
| Average AMD Ryzen 5 2500U (n=1) | |
* ... smaller is better
System Performance
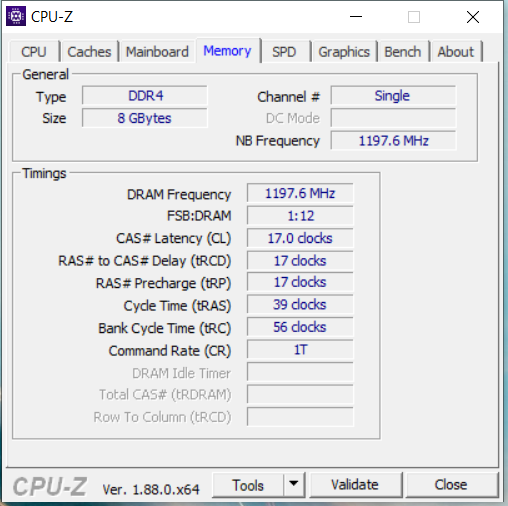
The system felt very smooth and snappy, and we did not encounter any issues during our test period. The system was more than powerful enough to run all office and Internet applications, which its more than decent PCMark benchmark results bore testament to. A minor performance improvement would be possible by adding a second RAM module and enabling dual-channel mode.
| PCMark 7 Score | 6304 points | |
| PCMark 8 Home Score Accelerated v2 | 3218 points | |
| PCMark 8 Creative Score Accelerated v2 | 3126 points | |
| PCMark 8 Work Score Accelerated v2 | 4379 points | |
| PCMark 10 Score | 3470 points | |
Help | ||
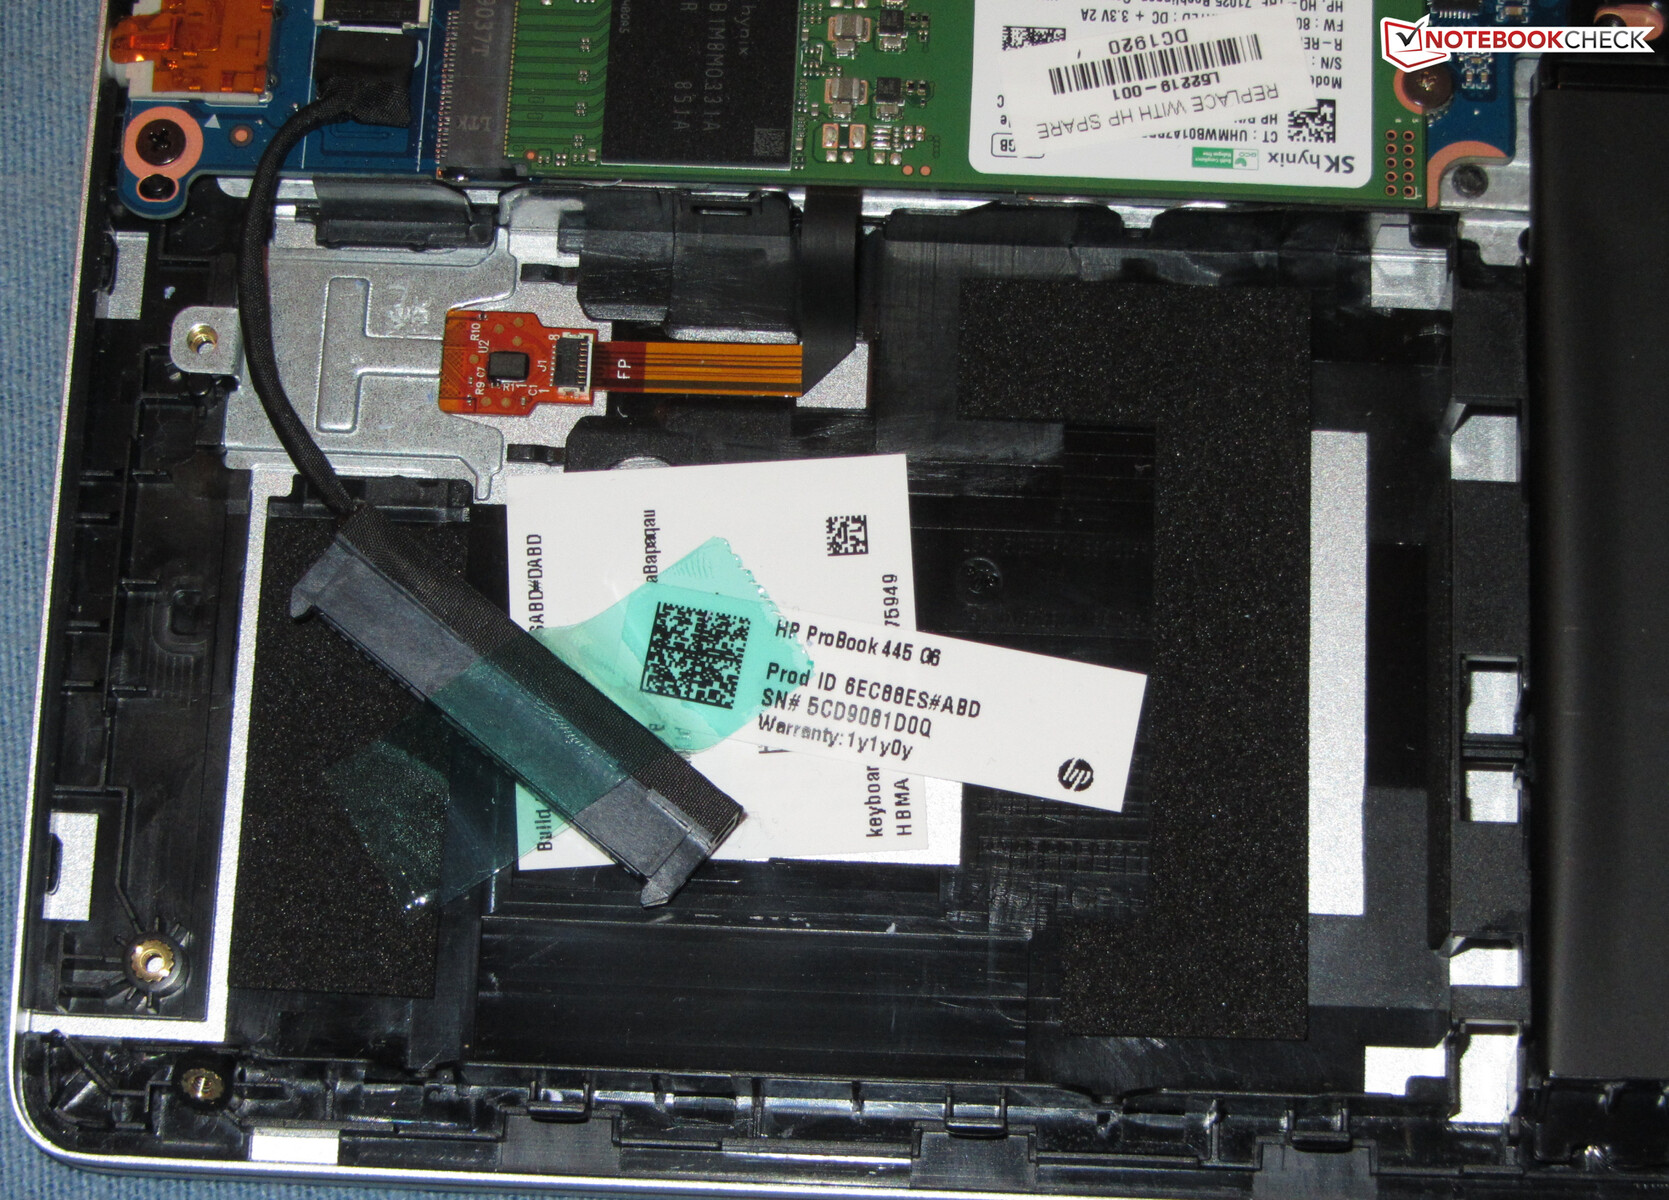
Storage Devices
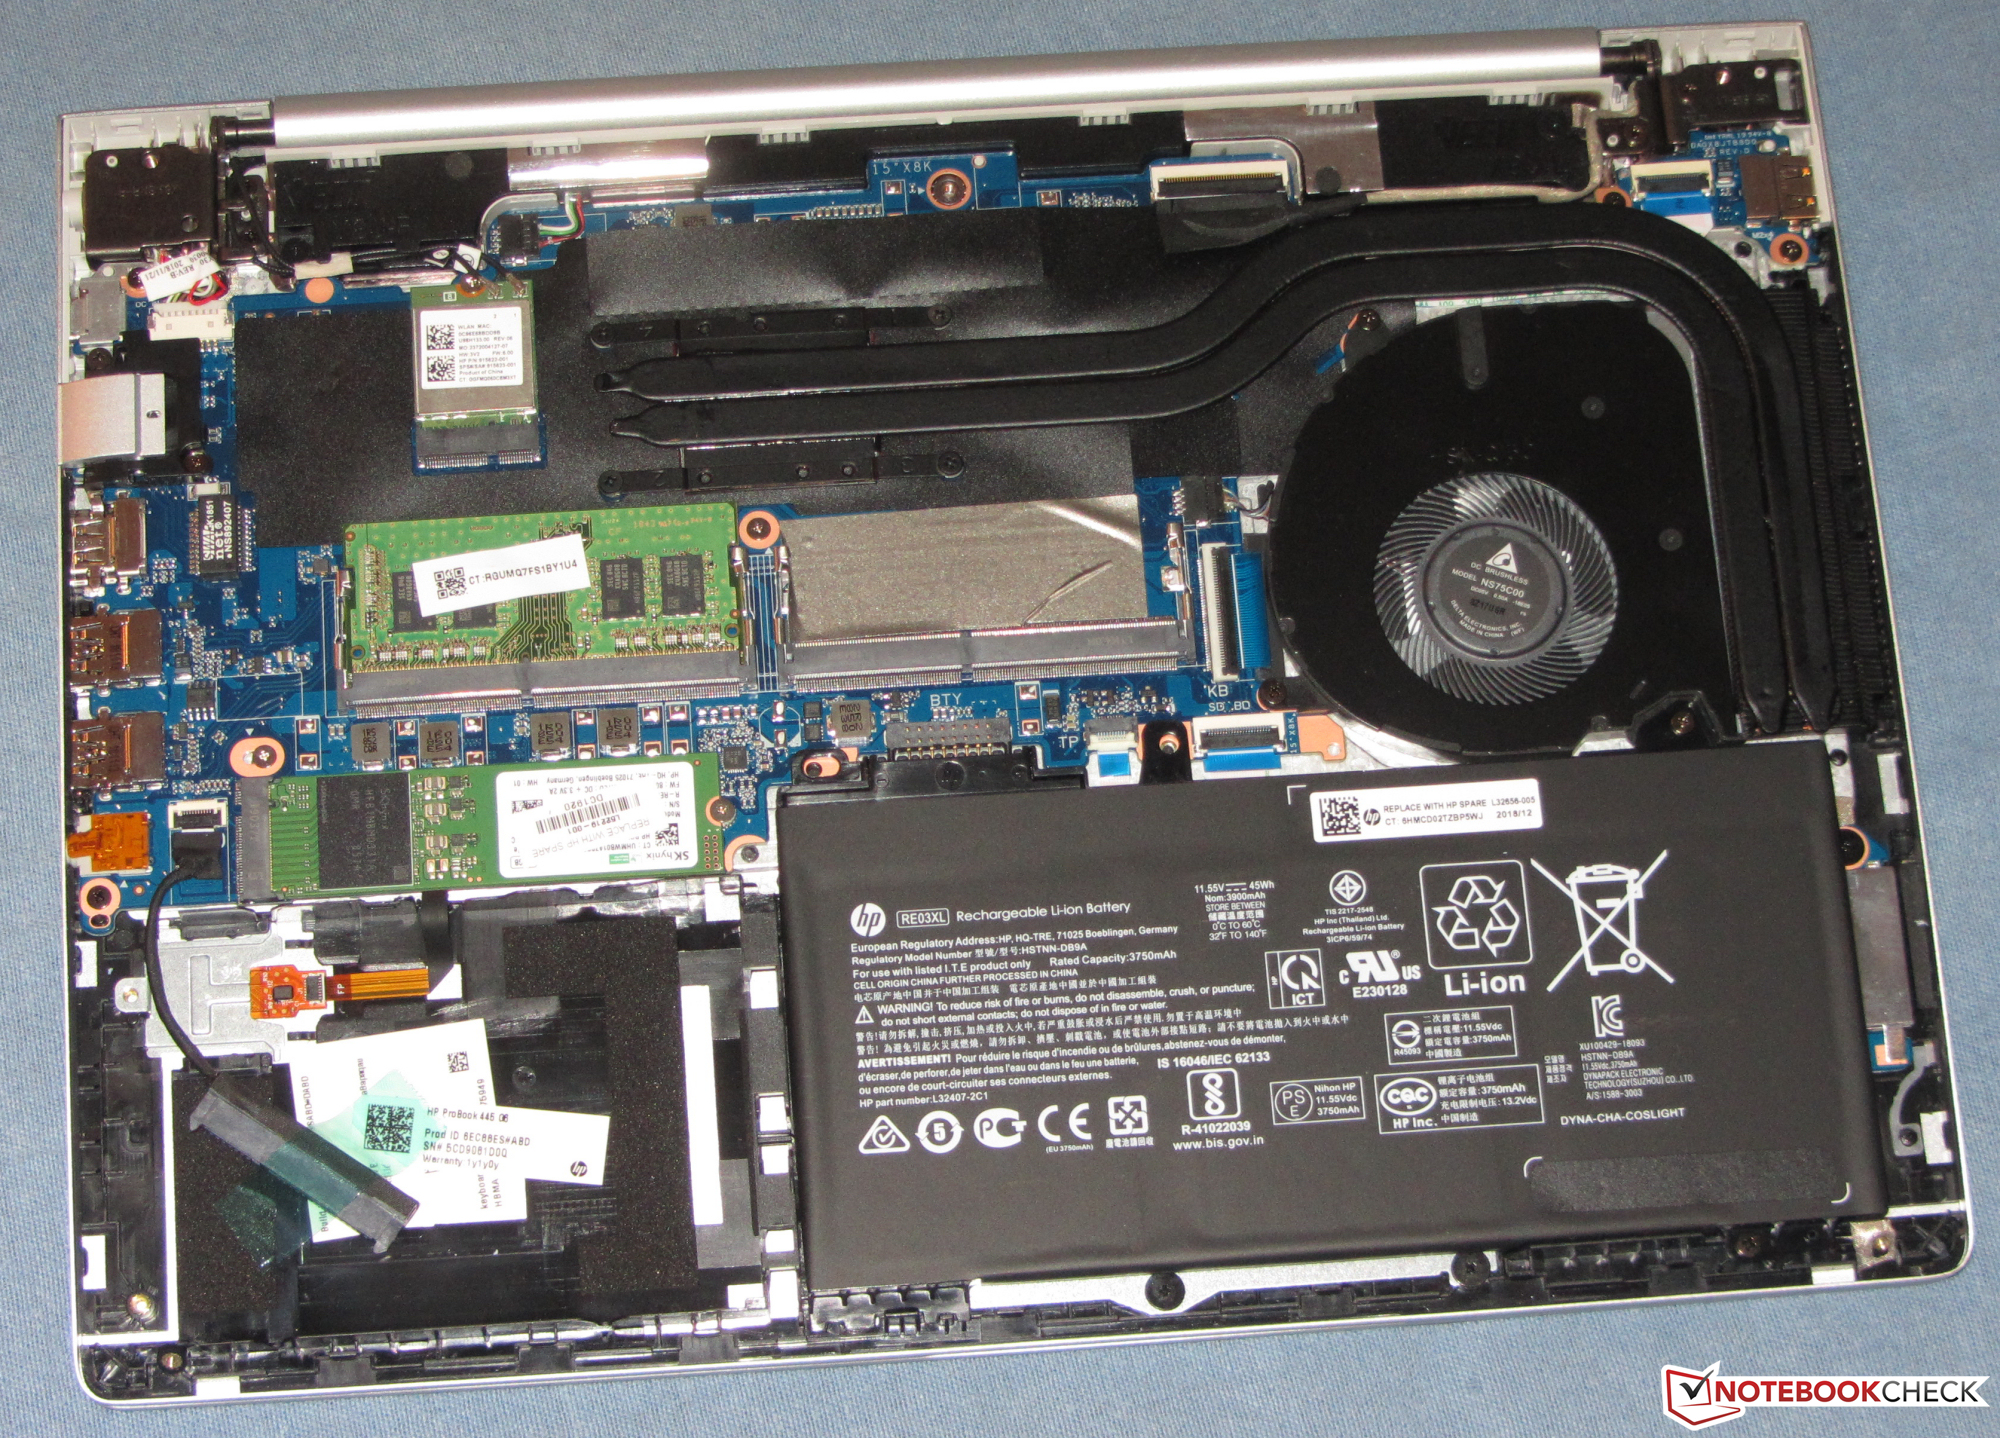
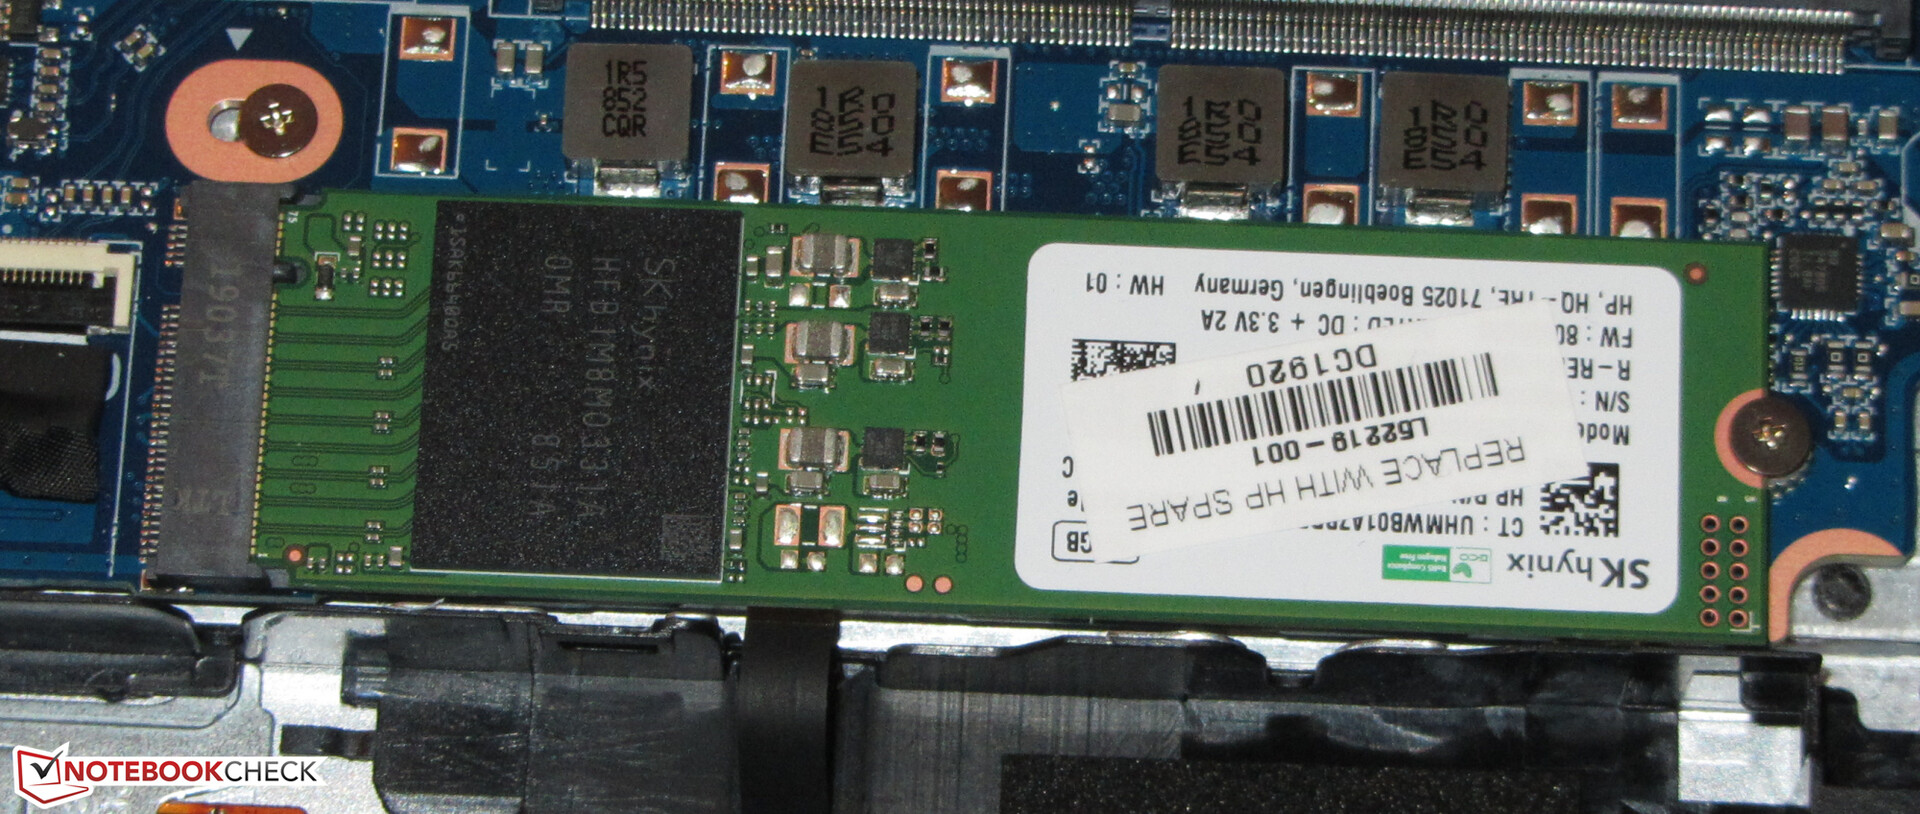
For the ProBook 445 G6, HP opted for an M.2-2280 256-GB large SK Hynix NVMe SSD. Out of the box around 204 GB was available to the user, and the rest was taken up by the Windows installation and the recovery partition. Transfer rates were decent; however, the SSD was not capable of keeping up with the big names in the NVMe SSD field.
The 445 G6 also features a free 2.5-inch HDD bay. A SATA III connector is installed; however, the mounting frame to hold the drive in place is missing.

| HP ProBook 445 G6 SK Hynix BC501 NVMe 256 GB | HP ProBook 440 G6-5TK01EA Toshiba XG5 KXG50ZNV512G | Lenovo ThinkPad E485-20KU000NGE Samsung PM961 MZVLW256HEHP | Dell Latitude 14 5495 Intel SSDSCKKF256G8 | Acer TravelMate X3410-M-866T Micron SSD 1100 SED 512GB, M.2 (MTFDDAV512TBN) | Fujitsu Lifebook E548 Samsung SSD PM871b MZNLN256HAJQ | Acer TravelMate X3410-M-50DD Micron 1100 MTFDDAV256TBN | Average SK Hynix BC501 NVMe 256 GB | |
|---|---|---|---|---|---|---|---|---|
| CrystalDiskMark 5.2 / 6 | 25% | 14% | -47% | -29% | -39% | -43% | 2% | |
| Write 4K (MB/s) | 110.4 | 117.6 7% | 72.2 -35% | 48.45 -56% | 113.3 3% | 83.2 -25% | 85.4 -23% | 110 ? 0% |
| Read 4K (MB/s) | 39.46 | 32.61 -17% | 35.25 -11% | 25.11 -36% | 28.65 -27% | 16.66 -58% | 26.4 -33% | 36.6 ? -7% |
| Write Seq (MB/s) | 808 | 527 -35% | 1412 75% | 341.2 -58% | 428.7 -47% | 384.3 -52% | 402.5 -50% | 699 ? -13% |
| Read Seq (MB/s) | 1130 | 2181 93% | 1523 35% | 521 -54% | 435.2 -61% | 466.8 -59% | 461.2 -59% | 1057 ? -6% |
| Write 4K Q32T1 (MB/s) | 260.8 | 508 95% | 102.1 -61% | 202 -23% | 274.6 5% | 269.7 3% | 175.8 -33% | 359 ? 38% |
| Read 4K Q32T1 (MB/s) | 308 | 352.1 14% | 170.9 -45% | 243.5 -21% | 326.5 6% | 260 -16% | 228.8 -26% | 339 ? 10% |
| Write Seq Q32T1 (MB/s) | 816 | 526 -36% | 1429 75% | 320.8 -61% | 505 -38% | 532 -35% | 442.9 -46% | 813 ? 0% |
| Read Seq Q32T1 (MB/s) | 1783 | 3135 76% | 3204 80% | 555 -69% | 530 -70% | 545 -69% | 522 -71% | 1670 ? -6% |
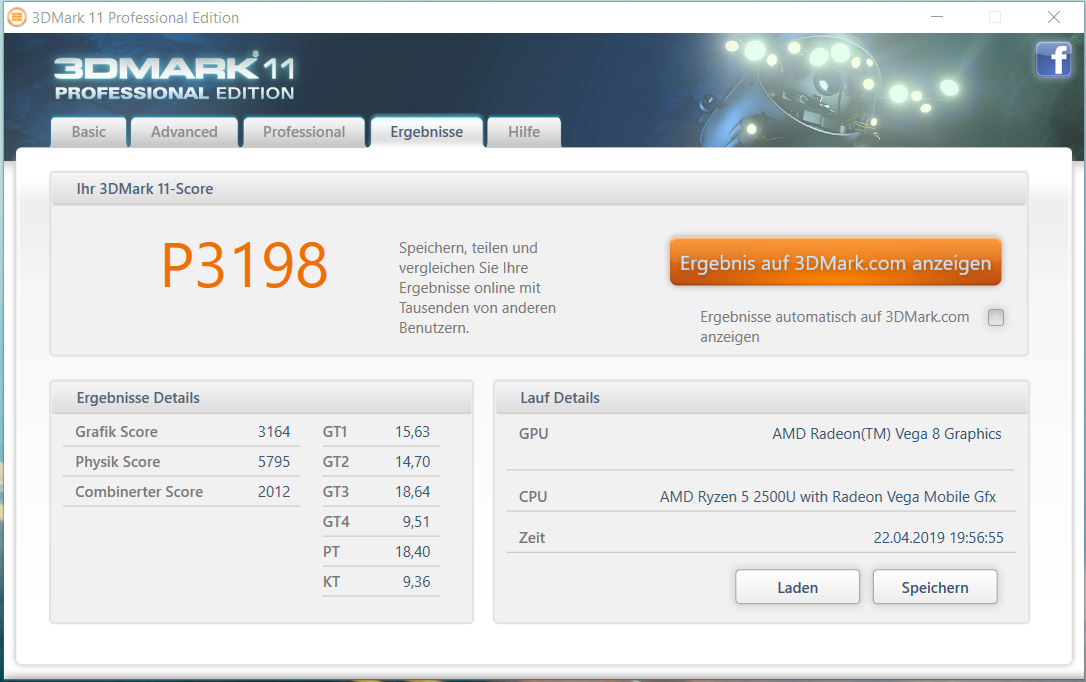
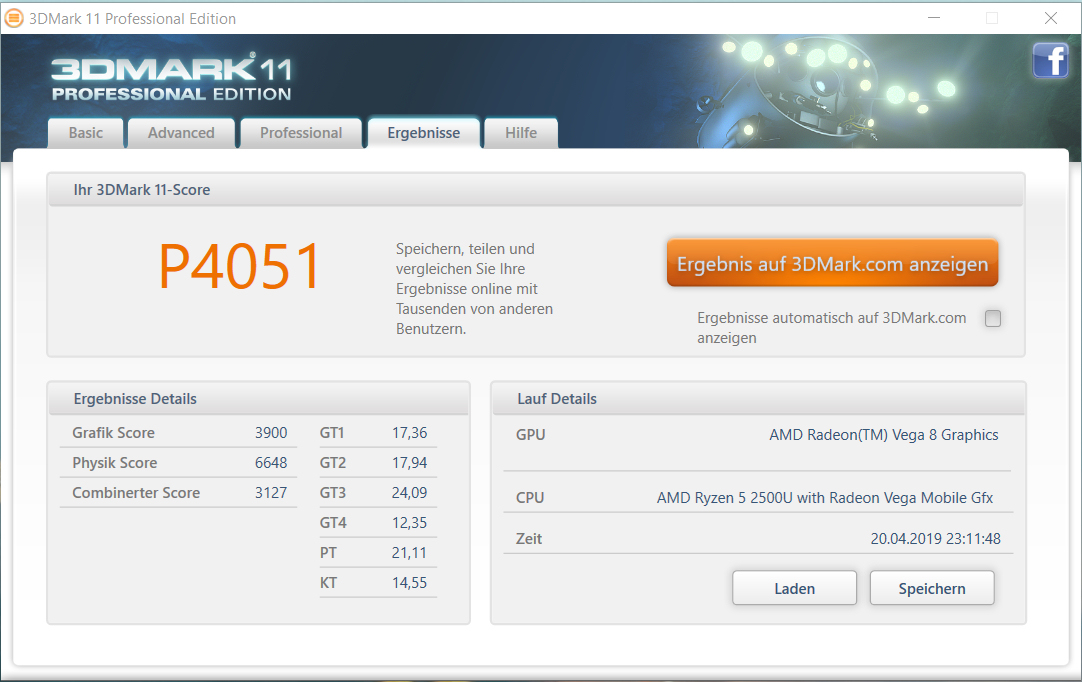
GPU Performance
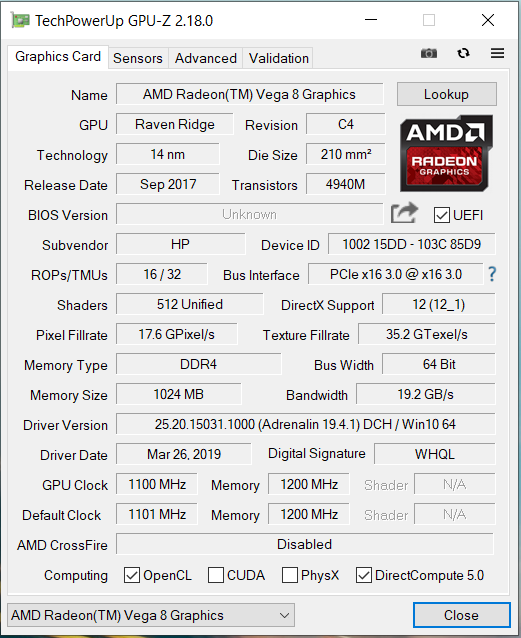
All things graphics are handled by AMD’s integrated Radeon RX Vega 8 GPU with support for DirectX 12 and clock speeds of up to 1,100 MHz. In 3DMark, it performed at a level expected of this GPU. Adding a second RAM module and enabling dual-channel mode would further improve GPU performance.
| 3DMark 06 Standard Score | 11098 points | |
| 3DMark 11 Performance | 3198 points | |
| 3DMark Ice Storm Standard Score | 63828 points | |
| 3DMark Cloud Gate Standard Score | 10876 points | |
| 3DMark Fire Strike Score | 1711 points | |
| 3DMark Time Spy Score | 627 points | |
Help | ||
| 3DMark 11 - 1280x720 Performance GPU | |
| Average of class Subnotebook (995 - 18489, n=55, last 2 years) | |
| HP ProBook 445 G6 (Dual-Channel) | |
| Average AMD Radeon RX Vega 8 (Ryzen 2000/3000) (1668 - 4317, n=44) | |
| Acer TravelMate X3410-M-50DD | |
| HP ProBook 445 G6 | |
| Dell Latitude 14 5495 | |
| Lenovo ThinkPad E485-20KU000NGE | |
| HP ProBook 440 G6-5TK01EA | |
| Acer TravelMate X3410-M-866T | |
| Fujitsu Lifebook E548 | |
| 3DMark | |
| 1280x720 Cloud Gate Standard Graphics | |
| Average of class Subnotebook (5577 - 61591, n=28, last 2 years) | |
| HP ProBook 445 G6 (Dual-Channel) | |
| Average AMD Radeon RX Vega 8 (Ryzen 2000/3000) (7309 - 19399, n=37) | |
| Acer TravelMate X3410-M-50DD | |
| HP ProBook 445 G6 | |
| Dell Latitude 14 5495 | |
| Lenovo ThinkPad E485-20KU000NGE | |
| HP ProBook 440 G6-5TK01EA | |
| Acer TravelMate X3410-M-866T | |
| 1920x1080 Fire Strike Graphics | |
| Average of class Subnotebook (832 - 16347, n=56, last 2 years) | |
| HP ProBook 445 G6 (Dual-Channel) | |
| Acer TravelMate X3410-M-50DD | |
| Average AMD Radeon RX Vega 8 (Ryzen 2000/3000) (1095 - 2901, n=41) | |
| HP ProBook 445 G6 | |
| Dell Latitude 14 5495 | |
| Lenovo ThinkPad E485-20KU000NGE | |
| HP ProBook 440 G6-5TK01EA | |
| Acer TravelMate X3410-M-866T | |
| 2560x1440 Time Spy Graphics | |
| Average of class Subnotebook (804 - 6288, n=55, last 2 years) | |
| HP ProBook 445 G6 (Dual-Channel) | |
| Average AMD Radeon RX Vega 8 (Ryzen 2000/3000) (523 - 790, n=23) | |
| HP ProBook 445 G6 | |
| GFXBench (DX / GLBenchmark) 2.7 | |
| 1920x1080 T-Rex Offscreen | |
| Average of class Subnotebook (81 - 915, n=7, last 2 years) | |
| HP ProBook 445 G6 (Dual-Channel) | |
| Average AMD Radeon RX Vega 8 (Ryzen 2000/3000) (127.9 - 177.3, n=5) | |
| HP ProBook 445 G6 | |
| T-Rex Onscreen | |
| Average of class Subnotebook (54.3 - 794, n=7, last 2 years) | |
| HP ProBook 445 G6 (Dual-Channel) | |
| Average AMD Radeon RX Vega 8 (Ryzen 2000/3000) (59.3 - 176.1, n=5) | |
| HP ProBook 445 G6 | |
| GFXBench 3.0 | |
| 1920x1080 1080p Manhattan Offscreen | |
| Average of class Subnotebook (206 - 591, n=6, last 2 years) | |
| Average AMD Radeon RX Vega 8 (Ryzen 2000/3000) (32.1 - 70.2, n=4) | |
| HP ProBook 445 G6 (Dual-Channel) | |
| HP ProBook 445 G6 | |
| on screen Manhattan Onscreen OGL | |
| Average of class Subnotebook (60 - 338, n=6, last 2 years) | |
| Average AMD Radeon RX Vega 8 (Ryzen 2000/3000) (31.1 - 65.4, n=4) | |
| HP ProBook 445 G6 (Dual-Channel) | |
| HP ProBook 445 G6 | |
| GFXBench 3.1 | |
| 1920x1080 Manhattan ES 3.1 Offscreen | |
| Average of class Subnotebook (157.5 - 336, n=6, last 2 years) | |
| HP ProBook 445 G6 (Dual-Channel) | |
| Average AMD Radeon RX Vega 8 (Ryzen 2000/3000) (36.3 - 54.3, n=4) | |
| HP ProBook 445 G6 | |
| on screen Manhattan ES 3.1 Onscreen | |
| Average of class Subnotebook (60 - 222, n=6, last 2 years) | |
| HP ProBook 445 G6 (Dual-Channel) | |
| Average AMD Radeon RX Vega 8 (Ryzen 2000/3000) (35.2 - 50.8, n=4) | |
| HP ProBook 445 G6 | |
| Geekbench 4.4 - Compute OpenCL Score | |
| Average of class Subnotebook (60571 - 101219, n=5, last 2 years) | |
| HP ProBook 445 G6 (Dual-Channel) | |
| Lenovo ThinkPad E485-20KU000NGE | |
| HP ProBook 440 G6-5TK01EA | |
| Average AMD Radeon RX Vega 8 (Ryzen 2000/3000) (23233 - 39262, n=27) | |
| HP ProBook 445 G6 | |
Gaming Performance
Many of the games in our database can be enjoyed smoothly on the ProBook 445 G6, albeit that list is mostly limited to either older or less-demanding titles. In these cases lowering the resolution to HD (1366x768) and reducing details to either low or medium will allow you to play those games. Some games will even allow more. Modern games released in 2018 and 2019 are less likely to be playable. Adding a second RAM module and enabling dual-channel mode will boost frame rates somewhat; however, demanding games such as Metro Exodus will remain unplayable nonetheless.
| low | med. | high | ultra | |
|---|---|---|---|---|
| BioShock Infinite (2013) | 88.2 | 54.5 | 42.8 | 13.9 |
| The Witcher 3 (2015) | 30.5 | 19.6 | 9.2 | 6.3 |
| Far Cry 5 (2018) | 21 | 8 | 7 | 7 |
| BioShock Infinite - 1366x768 Medium Preset | |
| Acer TravelMate X3410-M-50DD | |
| HP ProBook 445 G6 (Dual-Channel) | |
| Average AMD Radeon RX Vega 8 (Ryzen 2000/3000) (50.2 - 83, n=15) | |
| HP ProBook 445 G6 | |
| HP ProBook 440 G6-5TK01EA | |
| Acer TravelMate X3410-M-866T | |
| Fujitsu Lifebook E548 | |
| The Witcher 3 - 1024x768 Low Graphics & Postprocessing | |
| Average of class Subnotebook (38.8 - 176, n=13, last 2 years) | |
| Acer TravelMate X3410-M-50DD | |
| Average AMD Radeon RX Vega 8 (Ryzen 2000/3000) (22 - 50.7, n=18) | |
| Dell Latitude 14 5495 | |
| HP ProBook 445 G6 | |
Emissions
System Noise
The ProBook remained fairly quiet regardless of load. The fan is off more often than not when idle, and the device is completely silent. However, the tiniest bit of load is enough for the fan to ramp up and start producing an annoying squealing sound even at low speeds. It can get very fast under load but remained acceptably loud at just 37 dB(A).
Noise level
| Idle |
| 30.5 / 30.5 / 31.6 dB(A) |
| Load |
| 36.7 / 37 dB(A) |
 | ||
30 dB silent 40 dB(A) audible 50 dB(A) loud |
||
min: | ||
| HP ProBook 445 G6 R5 2500U, Vega 8 | HP ProBook 440 G6-5TK01EA i7-8565U, UHD Graphics 620 | Lenovo ThinkPad E485-20KU000NGE R5 2500U, Vega 8 | Dell Latitude 14 5495 R7 2700U, Vega 10 | Acer TravelMate X3410-M-866T i5-8550U, UHD Graphics 620 | Fujitsu Lifebook E548 i5-8250U, UHD Graphics 620 | Acer TravelMate X3410-M-50DD i5-8550U, GeForce MX130 | Average AMD Radeon RX Vega 8 (Ryzen 2000/3000) | Average of class Subnotebook | |
|---|---|---|---|---|---|---|---|---|---|
| Noise | 7% | 5% | -2% | 8% | 4% | 1% | 4% | 12% | |
| off / environment * (dB) | 30.5 | 29.4 4% | 29.4 4% | 30.7 -1% | 28.2 8% | 30 2% | 30.2 1% | 29.3 ? 4% | 24.2 ? 21% |
| Idle Minimum * (dB) | 30.5 | 29.4 4% | 29.4 4% | 30.7 -1% | 28.2 8% | 30 2% | 30.2 1% | 29.7 ? 3% | 24.3 ? 20% |
| Idle Average * (dB) | 30.5 | 29.4 4% | 29.4 4% | 30.7 -1% | 28.2 8% | 30 2% | 30.2 1% | 29.9 ? 2% | 24.5 ? 20% |
| Idle Maximum * (dB) | 31.6 | 30.2 4% | 31.2 1% | 30.7 3% | 28.2 11% | 30 5% | 30.2 4% | 30.2 ? 4% | 25.1 ? 21% |
| Load Average * (dB) | 36.7 | 31.8 13% | 32.7 11% | 35.4 4% | 33.2 10% | 35.3 4% | 36.8 -0% | 33.8 ? 8% | 34.5 ? 6% |
| Load Maximum * (dB) | 37 | 33.1 11% | 35.3 5% | 43 -16% | 35.6 4% | 33.9 8% | 36.8 1% | 36.1 ? 2% | 42.2 ? -14% |
* ... smaller is better
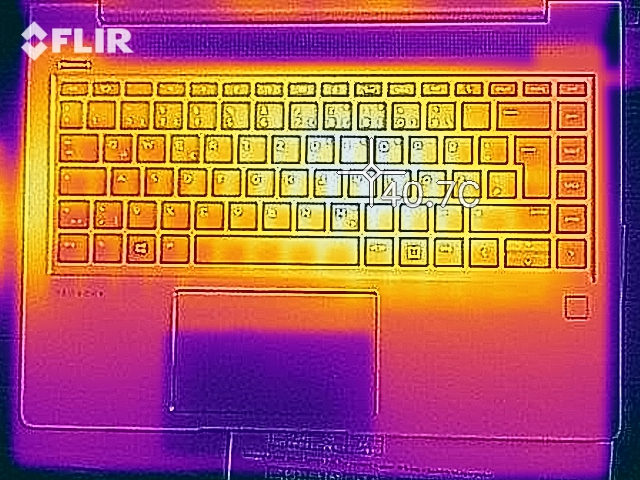
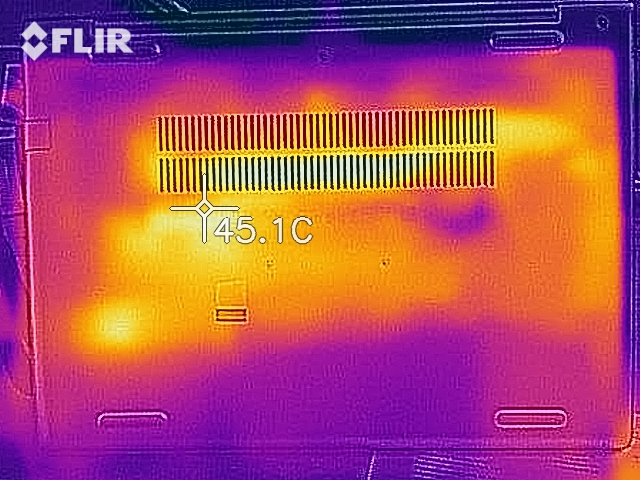
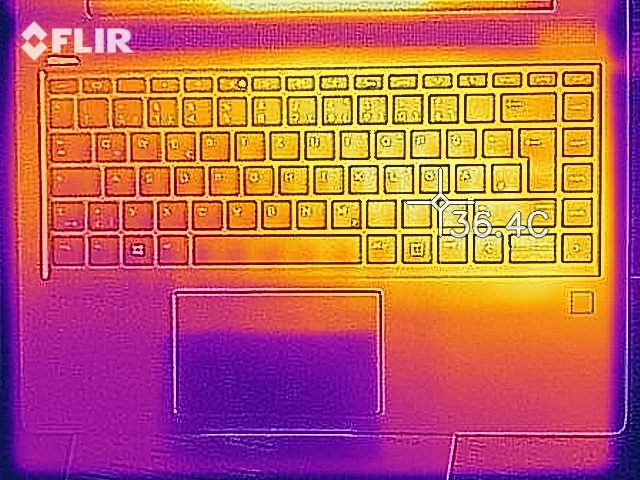
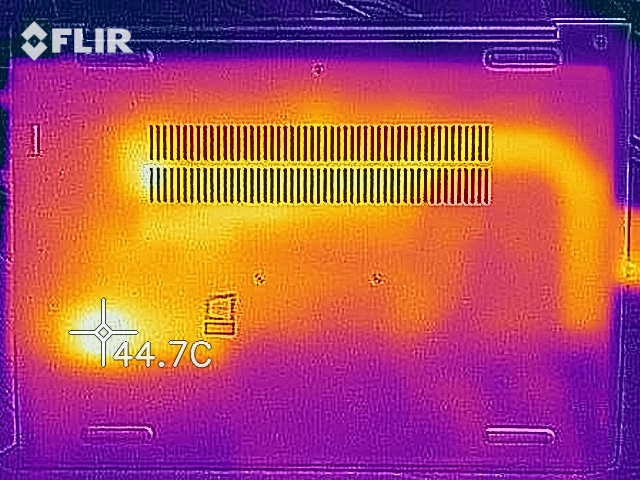
Temperature
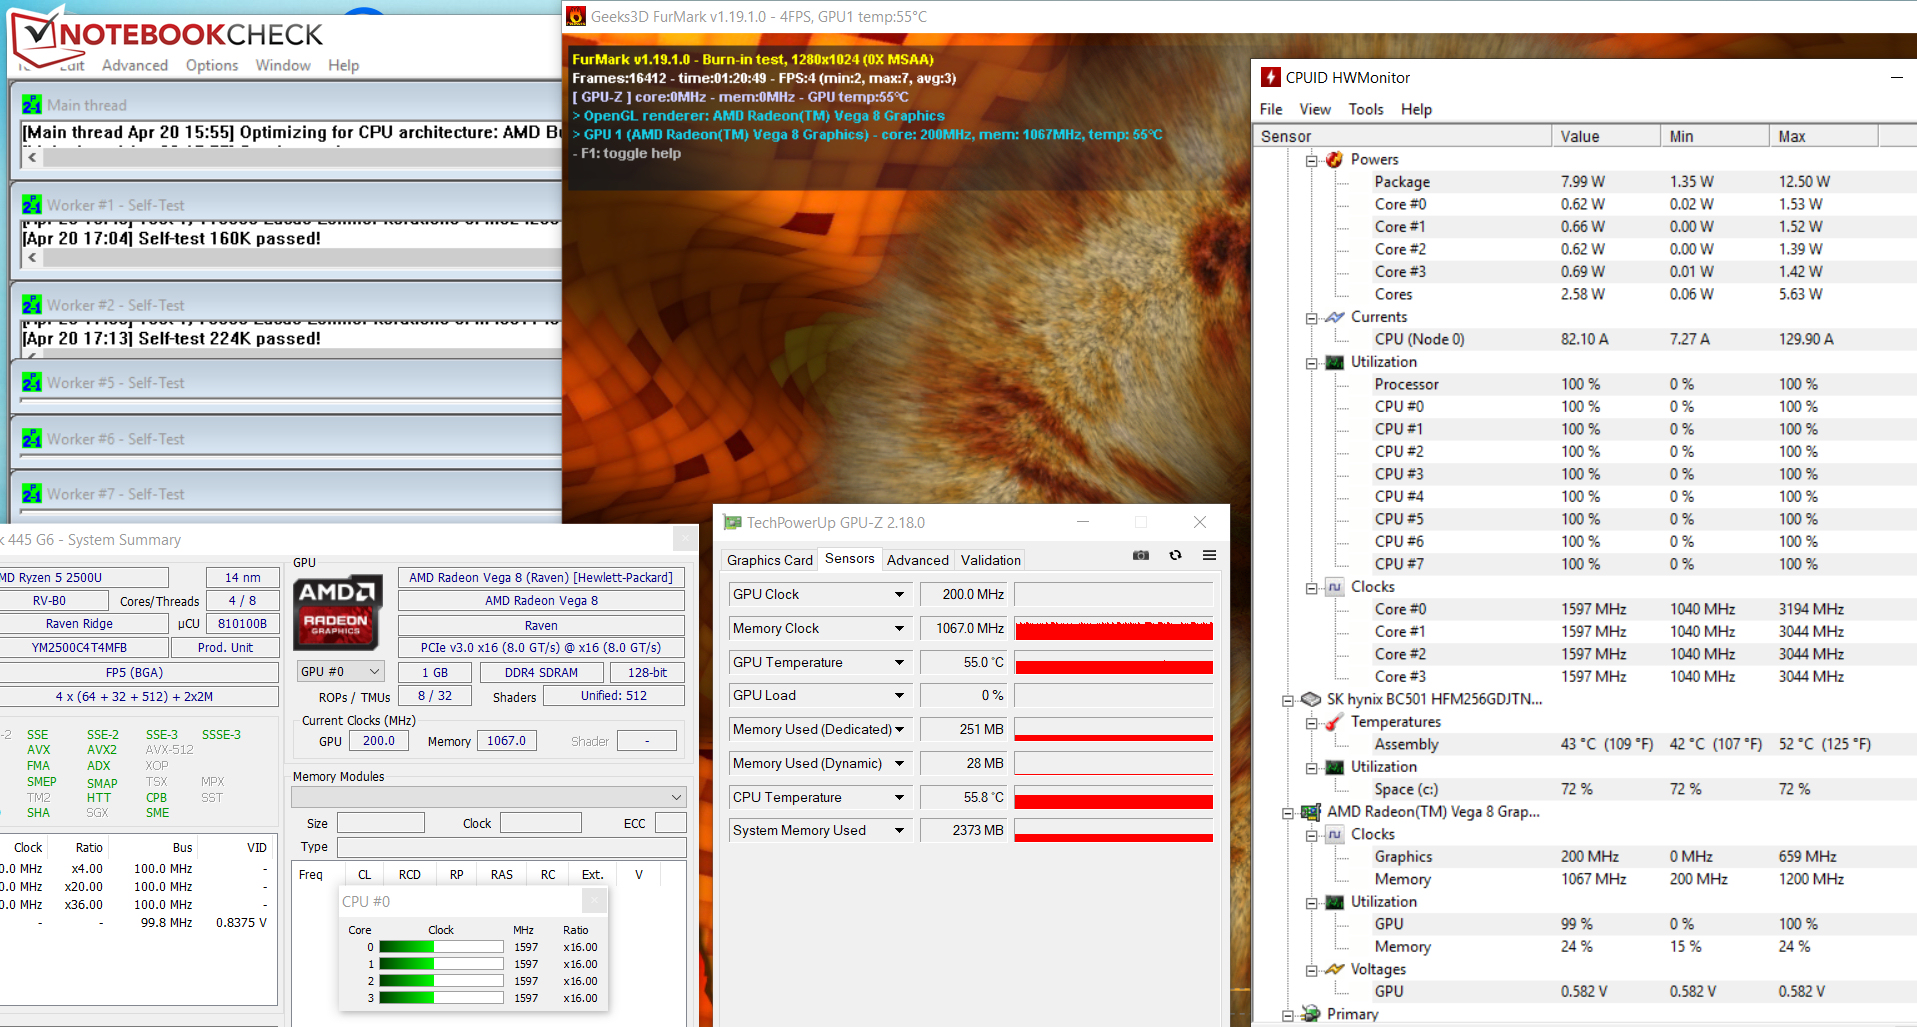
Our stress test (Prime95 and FurMark running simultaneously for at least one full hour) was performed identically on battery and on mains. During the first few minutes the CPU ran at clock speeds of 2.4-2.6 GHz while the GPU ran at 660 MHz. After around 3-4 minutes the clock speeds started to slowly decrease, and both CPU and GPU bottomed out after roughly 7 minutes at 1.6 GHz and 200 MHz, respectively. They remained at these levels throughout the remainder of the test.
All things considered, the notebook remained fairly cool. We were able to detect just one single hot spot of more than 40 °C while running our stress test, and temperatures were much lower in more common usage scenarios. Keep in mind that our stress test is an extreme load scenario that rarely ever occurs in the real world. We use this test to detect and reveal potential stability issues.
(+) The maximum temperature on the upper side is 36 °C / 97 F, compared to the average of 35.9 °C / 97 F, ranging from 21.4 to 59 °C for the class Subnotebook.
(±) The bottom heats up to a maximum of 43 °C / 109 F, compared to the average of 39.2 °C / 103 F
(+) In idle usage, the average temperature for the upper side is 28 °C / 82 F, compared to the device average of 30.8 °C / 87 F.
(+) The palmrests and touchpad are cooler than skin temperature with a maximum of 29.7 °C / 85.5 F and are therefore cool to the touch.
(±) The average temperature of the palmrest area of similar devices was 28.2 °C / 82.8 F (-1.5 °C / -2.7 F).
| HP ProBook 445 G6 R5 2500U, Vega 8 | HP ProBook 440 G6-5TK01EA i7-8565U, UHD Graphics 620 | Lenovo ThinkPad E485-20KU000NGE R5 2500U, Vega 8 | Dell Latitude 14 5495 R7 2700U, Vega 10 | Acer TravelMate X3410-M-866T i5-8550U, UHD Graphics 620 | Fujitsu Lifebook E548 i5-8250U, UHD Graphics 620 | Acer TravelMate X3410-M-50DD i5-8550U, GeForce MX130 | Average AMD Radeon RX Vega 8 (Ryzen 2000/3000) | Average of class Subnotebook | |
|---|---|---|---|---|---|---|---|---|---|
| Heat | 4% | -4% | 6% | 8% | -1% | -4% | 1% | 2% | |
| Maximum Upper Side * (°C) | 36 | 38.3 -6% | 42.3 -17% | 37.1 -3% | 35.2 2% | 40.3 -12% | 48.4 -34% | 40.1 ? -11% | 41.8 ? -16% |
| Maximum Bottom * (°C) | 43 | 50.5 -17% | 45.2 -5% | 45.6 -6% | 39.4 8% | 42.6 1% | 45 -5% | 42.7 ? 1% | 43.6 ? -1% |
| Idle Upper Side * (°C) | 29.6 | 24.6 17% | 28.8 3% | 24.6 17% | 27.6 7% | 28 5% | 27.2 8% | 28.1 ? 5% | 26.8 ? 9% |
| Idle Bottom * (°C) | 31.9 | 25.4 20% | 30.7 4% | 26.6 17% | 27.8 13% | 31 3% | 27.2 15% | 29.4 ? 8% | 27.4 ? 14% |
* ... smaller is better
Speakers
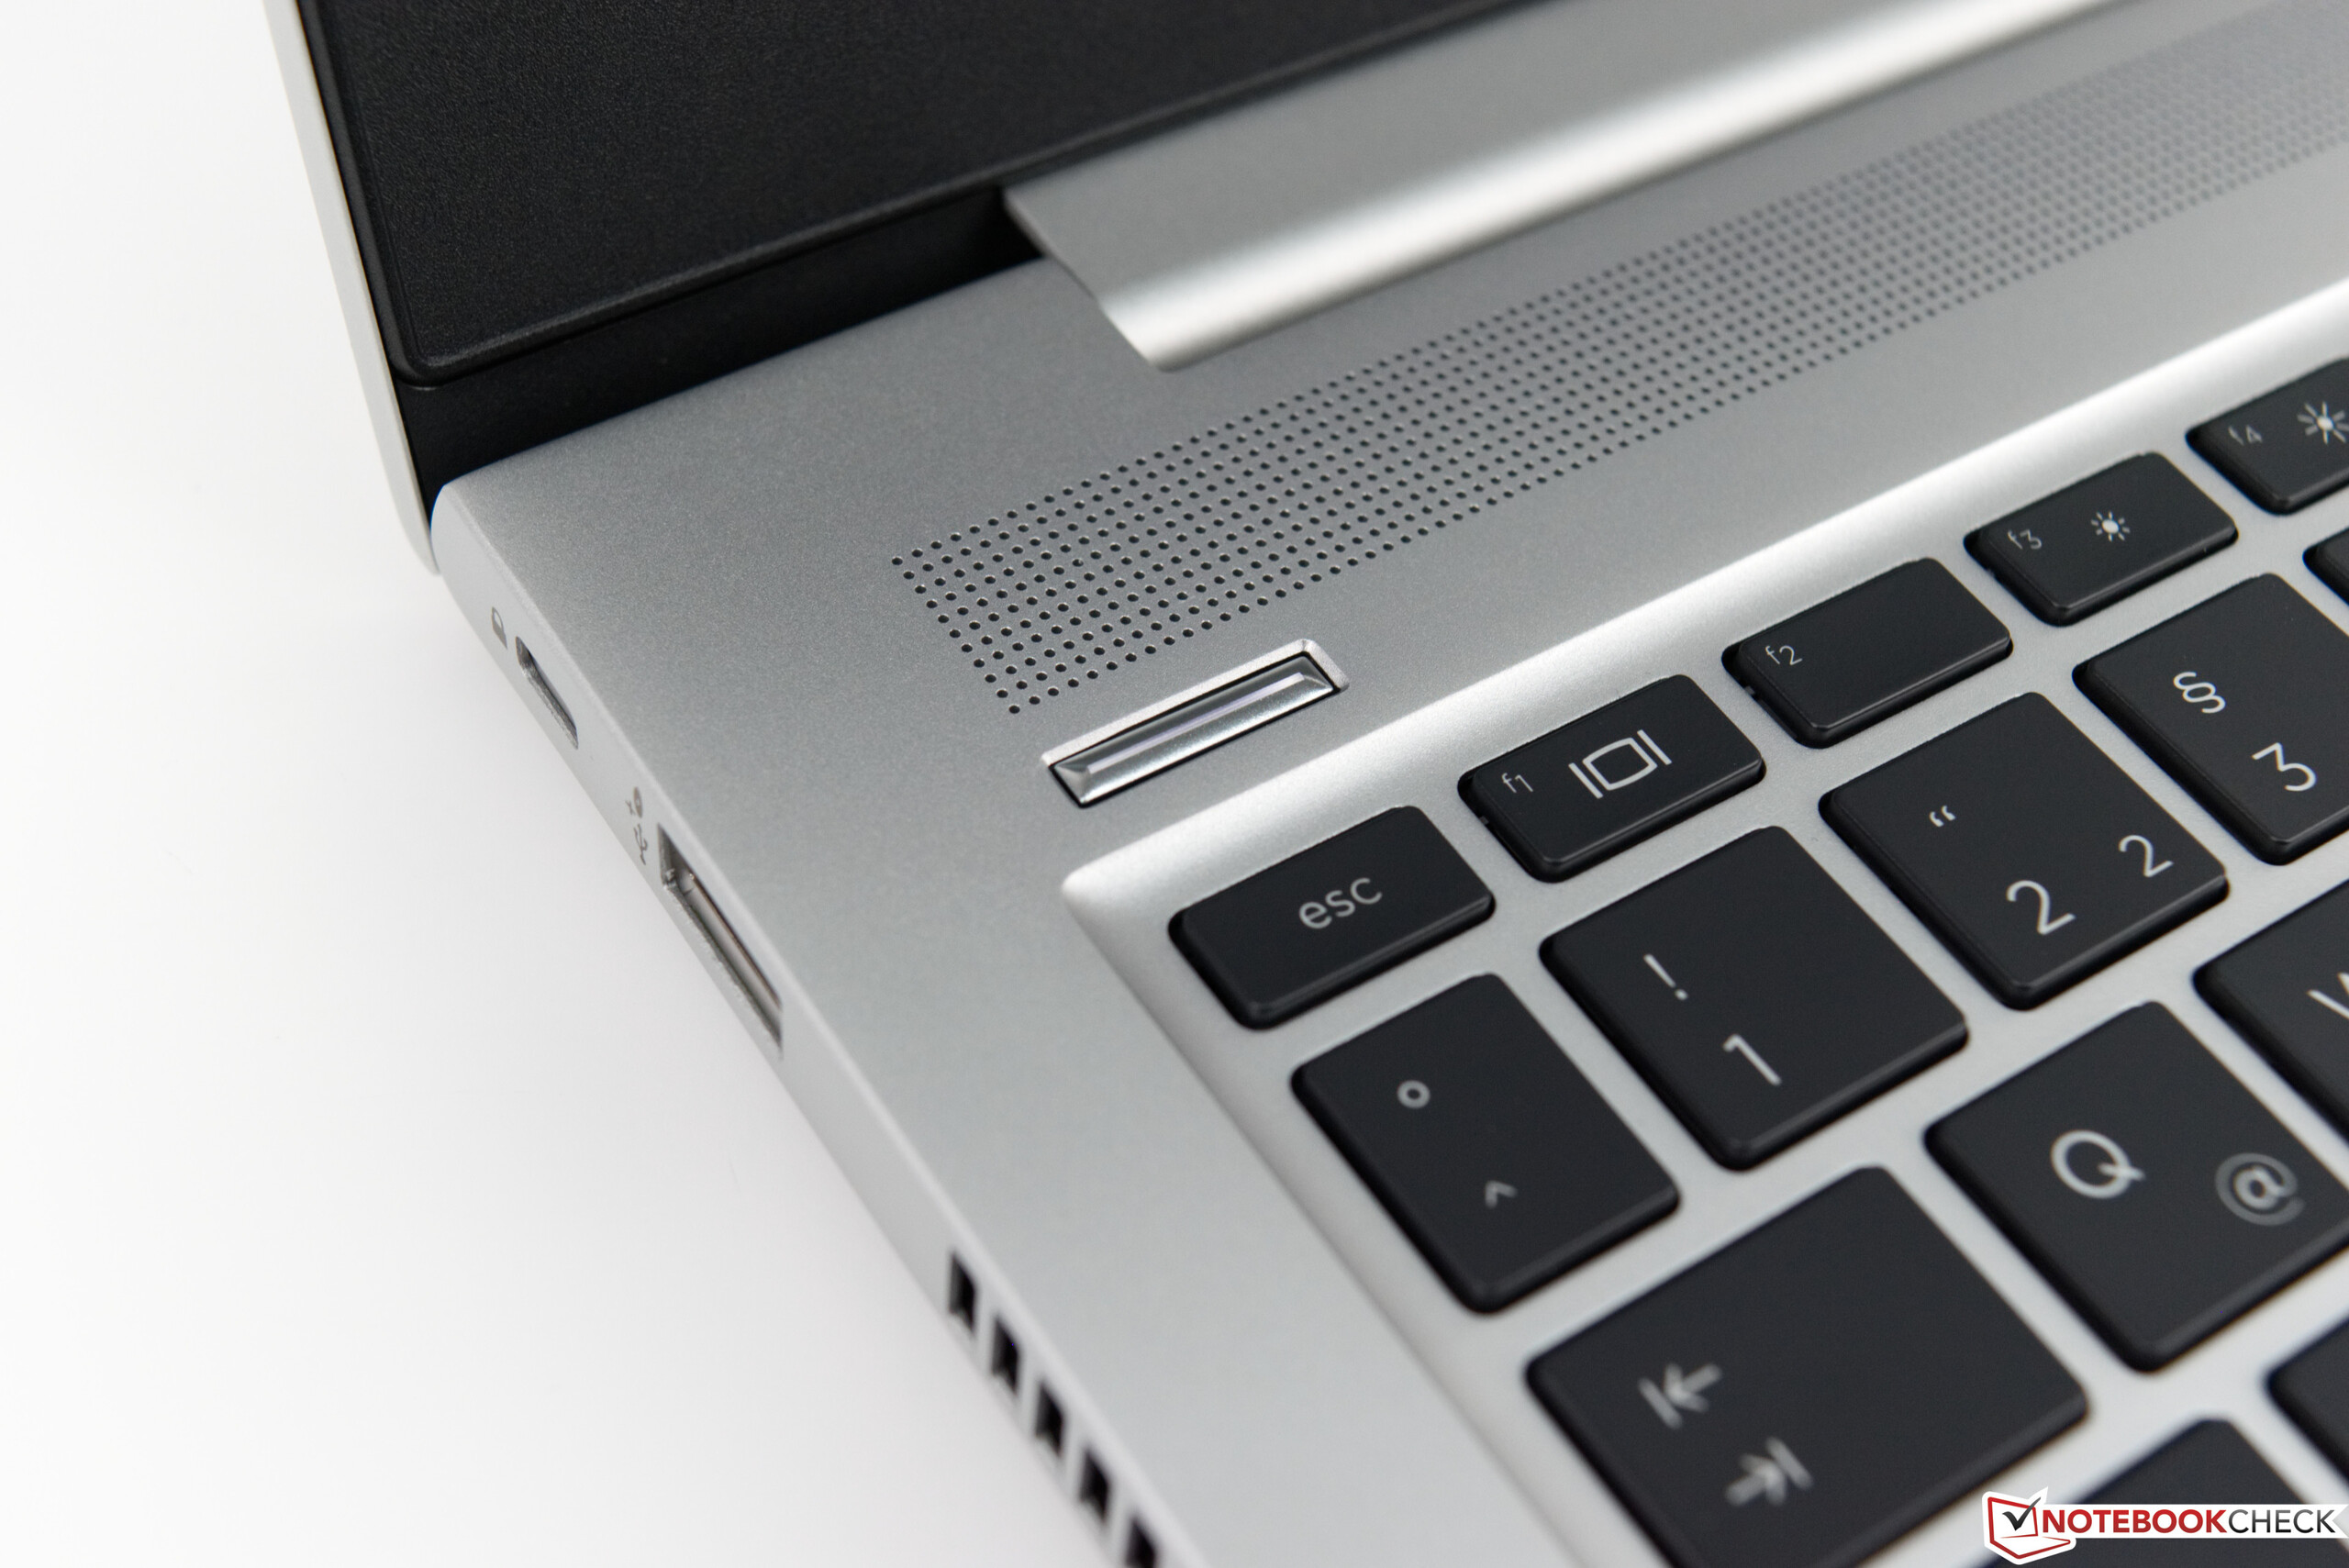
The ProBook’s stereo speakers are located above the keyboard behind a perforated cover. They performed decently overall but lacked bass. We recommend using external headphones or speakers for an improved and enjoyable audio experience.
Energy Management
Power Consumption
The ProBook’s power consumption was inconspicuous. When idle, the power meter read 9.8 W max, and thus more than its Intel-equipped twin. During our stress test (Prime95 and FurMark running simultaneously for at least one hour) it read 39.7 W. The power supply is rated at 45 W.
| Off / Standby | |
| Idle | |
| Load |
|
Key:
min: | |
| HP ProBook 445 G6 R5 2500U, Vega 8 | HP ProBook 440 G6-5TK01EA i7-8565U, UHD Graphics 620 | Lenovo ThinkPad E485-20KU000NGE R5 2500U, Vega 8 | Dell Latitude 14 5495 R7 2700U, Vega 10 | Acer TravelMate X3410-M-866T i5-8550U, UHD Graphics 620 | Fujitsu Lifebook E548 i5-8250U, UHD Graphics 620 | Acer TravelMate X3410-M-50DD i5-8550U, GeForce MX130 | Average AMD Radeon RX Vega 8 (Ryzen 2000/3000) | Average of class Subnotebook | |
|---|---|---|---|---|---|---|---|---|---|
| Power Consumption | 14% | -15% | 9% | -2% | 30% | -21% | -14% | -7% | |
| Idle Minimum * (Watt) | 4.8 | 2.98 38% | 6.2 -29% | 4.3 10% | 4.5 6% | 3.1 35% | 4.6 4% | 5.68 ? -18% | 3.76 ? 22% |
| Idle Average * (Watt) | 6.9 | 5.4 22% | 8.6 -25% | 6.6 4% | 6.3 9% | 5 28% | 6.5 6% | 8.75 ? -27% | 6.54 ? 5% |
| Idle Maximum * (Watt) | 9.8 | 7.9 19% | 9.7 1% | 7.7 21% | 7 29% | 6.1 38% | 8.5 13% | 10.1 ? -3% | 7.89 ? 19% |
| Load Average * (Watt) | 35 | 34.5 1% | 37.4 -7% | 32 9% | 28.7 18% | 27 23% | 56 -60% | 37.8 ? -8% | 42 ? -20% |
| Load Maximum * (Watt) | 39.7 | 43.3 -9% | 44.8 -13% | 40 -1% | 67.7 -71% | 29.7 25% | 67 -69% | 46.2 ? -16% | 64.8 ? -63% |
* ... smaller is better
Battery Life
In our real-world Wi-Fi test the ProBook lasted for 5:51 hours. We use this test to simulate a load typical for browsing the web. The power plan is set to “Balanced” and display brightness is normalized to 150 nits. In the video test it lasted just 4:46 hours. In this test we determine how long the device will last during video playback by running the Big Buck Bunny short film (H.264, 1920x1080) in a loop with disabled radios, the power plan set to “Power Saver”, and display brightness once again normalized to 150 nits.
Despite an identical battery the 445 G6 ran out of power much sooner than its Intel-equipped sibling. The latter turned out to be more energy-efficient in low-load and idle scenarios.
| HP ProBook 445 G6 R5 2500U, Vega 8, 45 Wh | HP ProBook 440 G6-5TK01EA i7-8565U, UHD Graphics 620, 45 Wh | Lenovo ThinkPad E485-20KU000NGE R5 2500U, Vega 8, 45 Wh | Dell Latitude 14 5495 R7 2700U, Vega 10, 61 Wh | Acer TravelMate X3410-M-866T i5-8550U, UHD Graphics 620, 57 Wh | Fujitsu Lifebook E548 i5-8250U, UHD Graphics 620, 50 Wh | Acer TravelMate X3410-M-50DD i5-8550U, GeForce MX130, 57 Wh | Average of class Subnotebook | |
|---|---|---|---|---|---|---|---|---|
| Battery runtime | 55% | -8% | 81% | 71% | 44% | 83% | 139% | |
| Reader / Idle (h) | 10.4 | 17.1 64% | 9.1 -13% | 18.2 75% | 20.8 100% | 17.4 67% | 28.6 ? 175% | |
| H.264 (h) | 4.8 | 7.6 58% | 5.7 19% | 11.8 146% | 11.6 142% | 15.4 ? 221% | ||
| WiFi v1.3 (h) | 5.9 | 8.4 42% | 5.4 -8% | 9.4 59% | 10.3 75% | 8.5 44% | 10.9 85% | 14 ? 137% |
| Load (h) | 1.6 | 2.5 56% | 1.1 -31% | 2.3 44% | 2.2 38% | 2.2 38% | 1.969 ? 23% |
Pros
Cons
Verdict
Hewlett Packard’s 14-inch notebook is equipped with an AMD Ryzen 5 2500U APU with more than enough power for all office and Internet applications and an integrated Vega 8 GPU that offers a much higher performance than Intel’s UHD Graphics 620 counterpart. This, in turn, is highly beneficial for applications dependent on GPU performance and gaming. Unfortunately, the fan turned out to make an annoying squealing sound.
The system felt very snappy thanks to a fast M.2-2280 NVMe SSD, and the notebook can be equipped with an additional 2.5-inch HDD. The bottom cover needs to be removed in order to access both drive bays - a task that turned out to be quite simple. The backlit keyboard was well usable. However, battery life was subpar. A 14-inch notebook needs to offer more.
Hewlett Packard did not do itself a favor with its choice of display for the ProBook.
While its viewing angles were wide and more than decent, and its matte coating and decent contrast ratio were a positive surprise, the maximum brightness was abysmal. Values of less than 200 nits are simply much too low for a 14-inch notebook that will most likely be used at various locations and under various lighting conditions. In addition, the display’s brightness distribution was fairly poor.
The question is: Which 14-inch ProBook should you buy? The answer depends on your specific needs. The Intel-based ProBook 440 G6 offers a higher CPU performance (more so in single-threaded than multithreaded load scenarios) and a longer battery life. The AMD-based model offers a higher GPU performance at a lower price (at the time of writing it was cheaper than every single Intel-based ProBook available).
HP ProBook 445 G6
- 04/28/2019 v6 (old)
Sascha Mölck
Price comparison

