HP ProBook 445 G10 in review: Lights and shadows of the office laptop

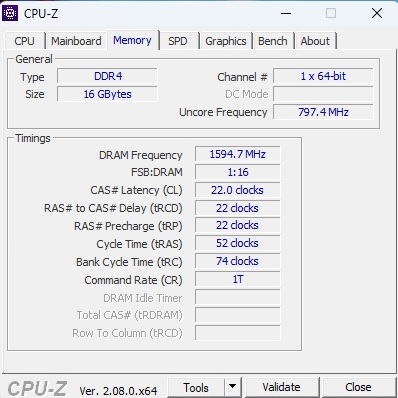
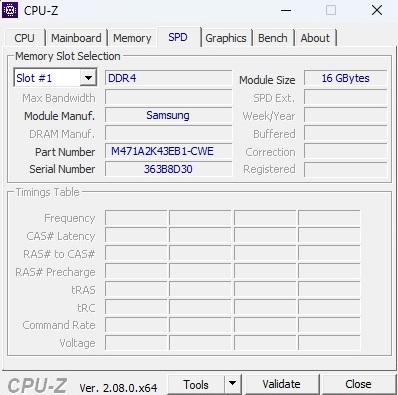
While HP's ProBook 440 G10 relies on a processor from Intel's Raptor Lake series, this ProBook 445 G10 uses a current Ryzen 7000 model. The Ryzen 5 7530U installed in the test device is supposed to be particularly energy-efficient, which speaks for good runtimes. The price of around 800 Euros also includes 16 GB of DDR4-3200 RAM and a 512 GB M.2 SSD. A matte IPS panel in 16:9 format with 1,920 x 1,080 pixels takes care of the image reproduction. Windows 11 Pro is preinstalled as the operating system.
The ProBook's competitors include other 14-inch office notebooks with AMD processors like the Lenovo ThinkPad L14 G4 and the Dell Inspiron 14 7435 (also Ryzen 5 7530U) as well as the Lenovo Thinkpad E14 G5 and the Asus ZenBook 14 (each Ryzen 7 7730U).
Possible competitors in comparison
Rating | Date | Model | Weight | Height | Size | Resolution | Price |
|---|---|---|---|---|---|---|---|
| 84.6 % v7 (old) | 10 / 2023 | HP ProBook 445 G10 R5 7530U, Vega 7 | 1.3 kg | 20 mm | 14.00" | 1920x1080 | |
| 88.6 % v7 (old) | 08 / 2023 | Lenovo ThinkPad L14 G4 21H6S00900 R5 7530U, Vega 7 | 1.5 kg | 19.83 mm | 14.00" | 1920x1080 | |
| 84.5 % v7 (old) | 08 / 2023 | Dell Inspiron 14 7435 2-in-1 R5 7530U, Vega 7 | 1.6 kg | 18.6 mm | 14.00" | 1920x1200 | |
| 88.3 % v7 (old) | 08 / 2023 | Lenovo ThinkPad E14 G5-21JSS05C00 R7 7730U, Vega 8 | 1.4 kg | 18 mm | 14.00" | 2240x1400 | |
| 85.3 % v7 (old) | 06 / 2023 | Asus ZenBook 14 UM3402Y R7 7730U, Vega 8 | 1.4 kg | 16.9 mm | 14.00" | 2880x1800 |
Apart from the design of the webcam bar and some connection details, the case looks very similar to the ProBook 440 G9 or ProBook 445 G8, so we will only briefly discuss the chassis, the equipment (interfaces), and the input devices in this article.
Case
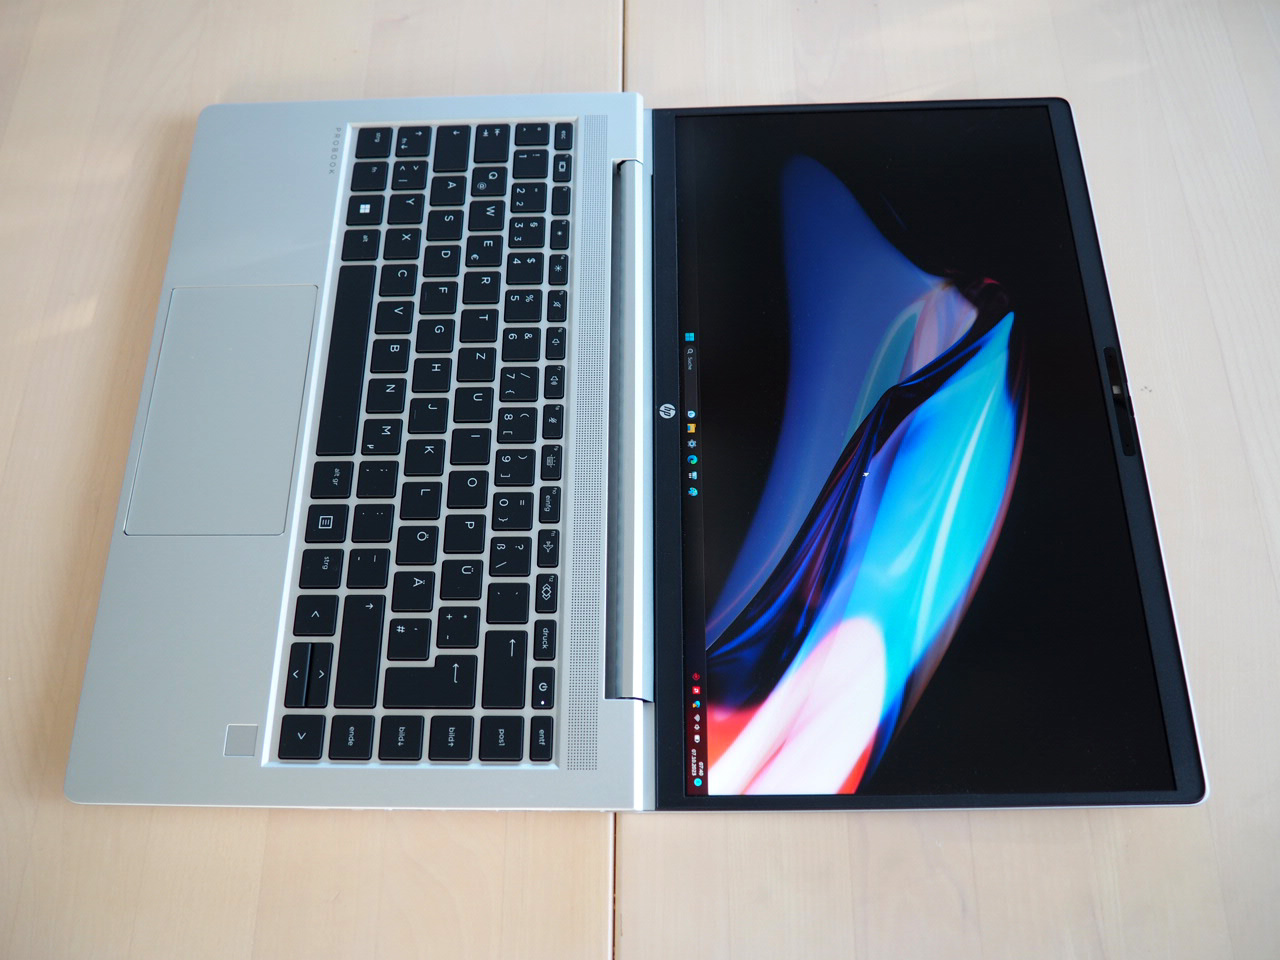
The chassis offers a solid quality without really being able to inspire. Compared to the recently tested ZBook Firefly 14 G10, the surfaces are not as high-quality and seem less stable. Meanwhile, there is nothing to complain about in terms of design and workmanship.
With a weight of only 1.3 kg, the 14-incher is the lightest notebook in the test field. The height of 2.0 cm is at the upper end of the scale, but the differences are quite small. Above all, the generous opening angle of up to 180° deserves praise. Opening the case is possible after removing five cross screws on the bottom. However, since it was a store device, we refrained from disassembling it.


Equipment
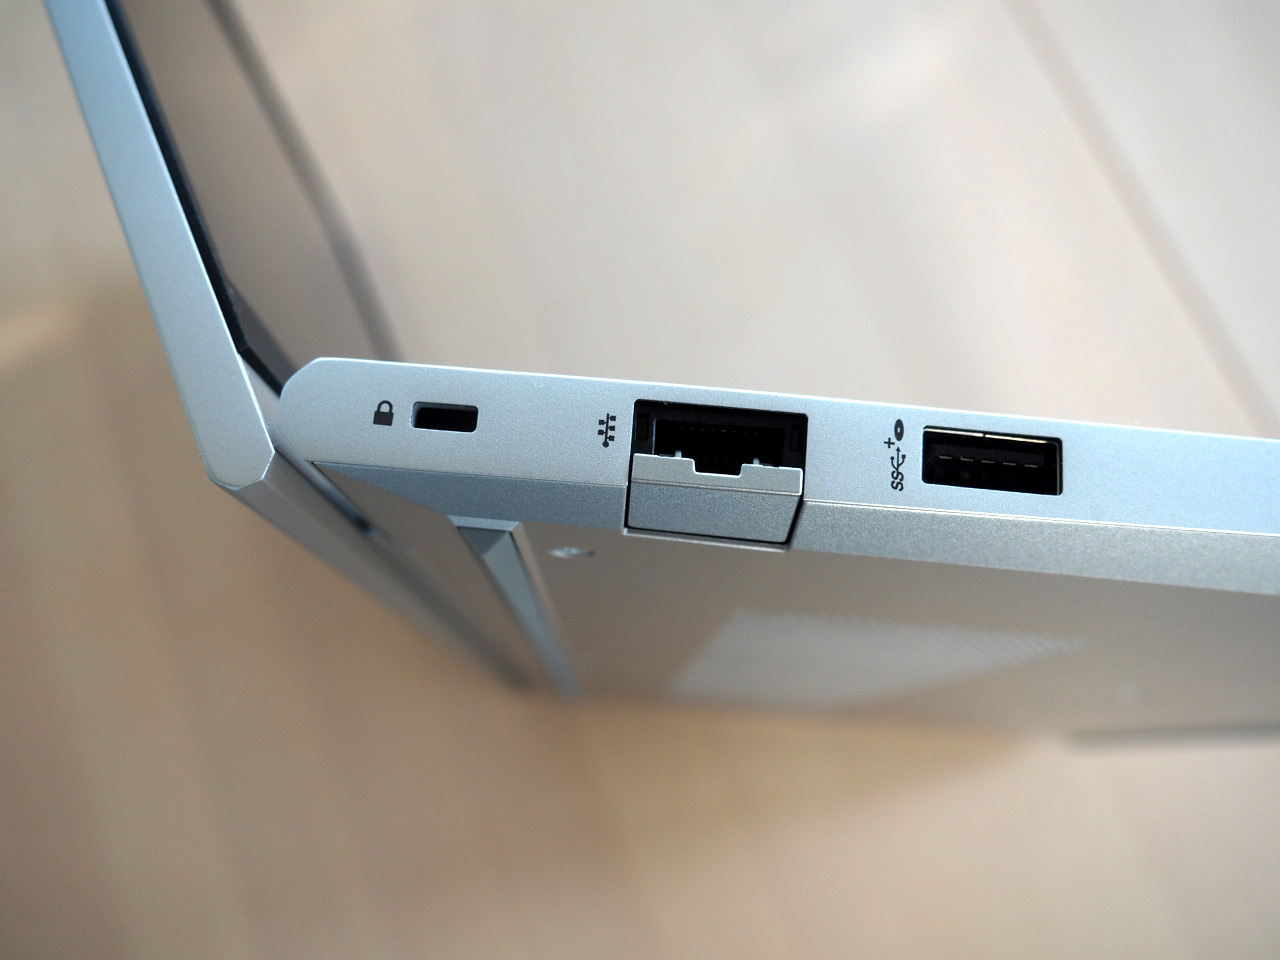
In addition to three classic USB A 3.0 ports, the 14-incher has a USB C 3.1 Gen2 port with PowerDelivery and DisplayPort 1.4 function. There is also an RJ45 Gigabit LAN port, an HDMI 2.1 output, a jack for headsets or microphones, and a Kensington Lock. Buyers have to do without a modern USB 4 as well as a card reader. Last but not least, there is a fingerprint scanner as a security feature.

Communication
A Realtek 8852CE chip is responsible for wireless communication, which achieves good rates during transmission and very good rates during reception.
Webcam
Although the webcam delivers better results than many rivals, you should not have too high expectations in terms of color accuracy, for example.


Accessories
The scope of delivery includes a few info booklets and a pleasingly compact as well as light 45-watt power cord (unfortunately no USB-C).
Input devices
Keyboard
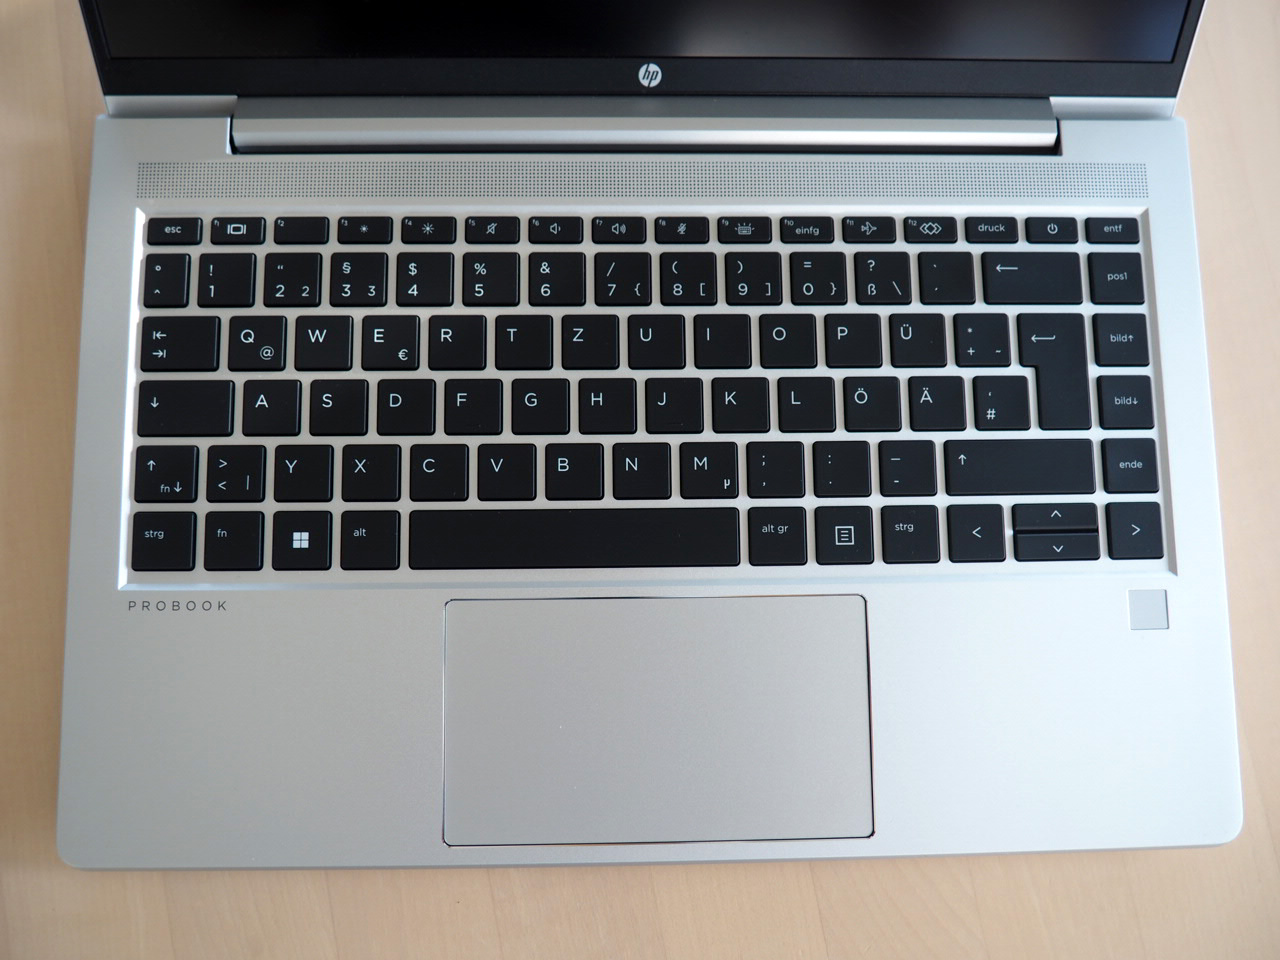
Analogous to the case, the keyboard cannot keep up with the Firefly 14 G10 since the typing feel, among other things, is much spongier. Many buyers will also have to get used to the unconventional layout. The 14-incher offers a white keyboard illumination for better visibility in low-light conditions.
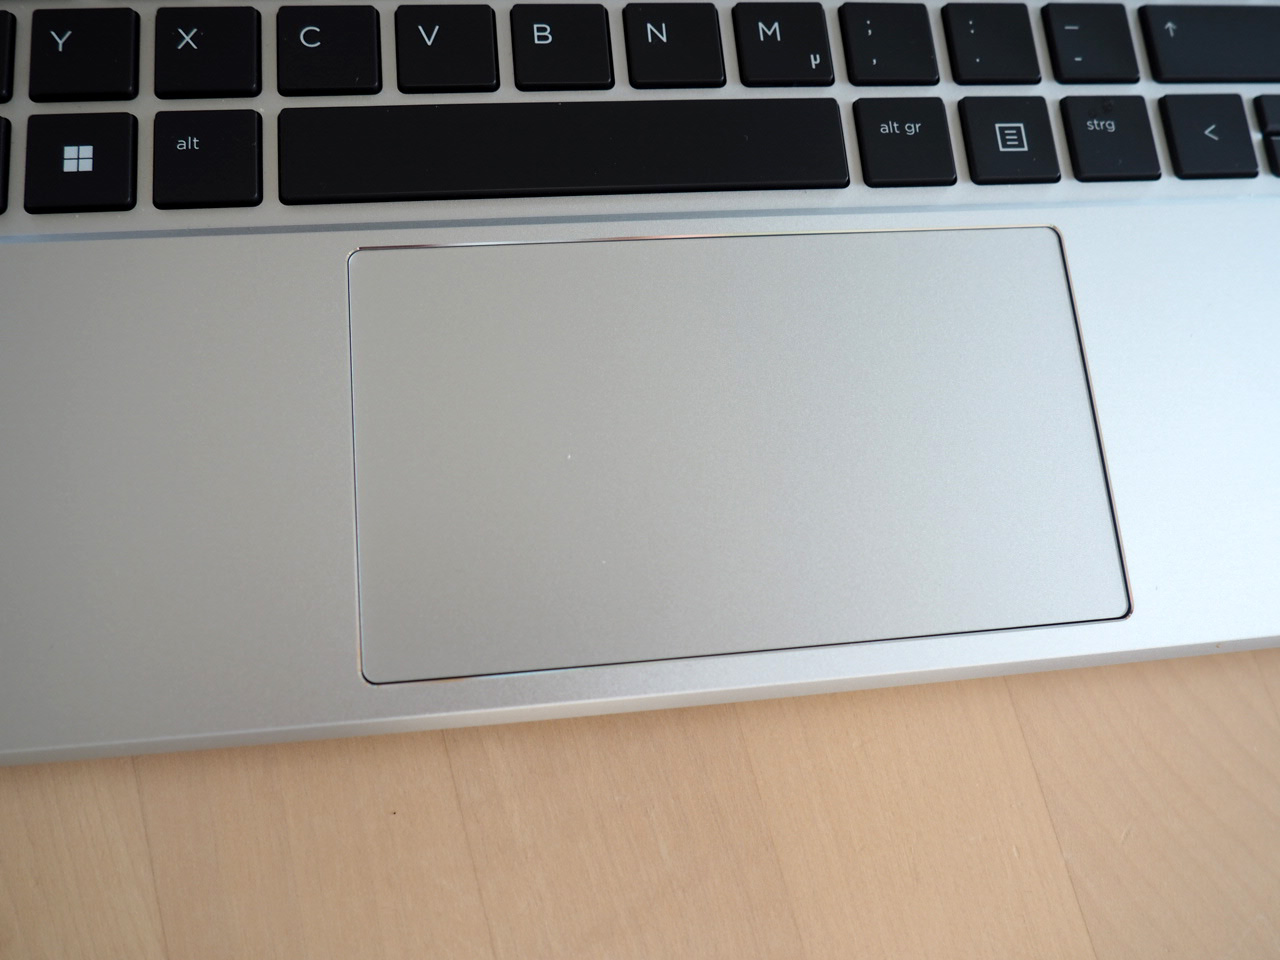
Touchpad
The touchpad proved to be unspectacular in the test, so it neither scores badly nor particularly well. Precision, gliding properties, click behavior, and gesture support are inconspicuous.
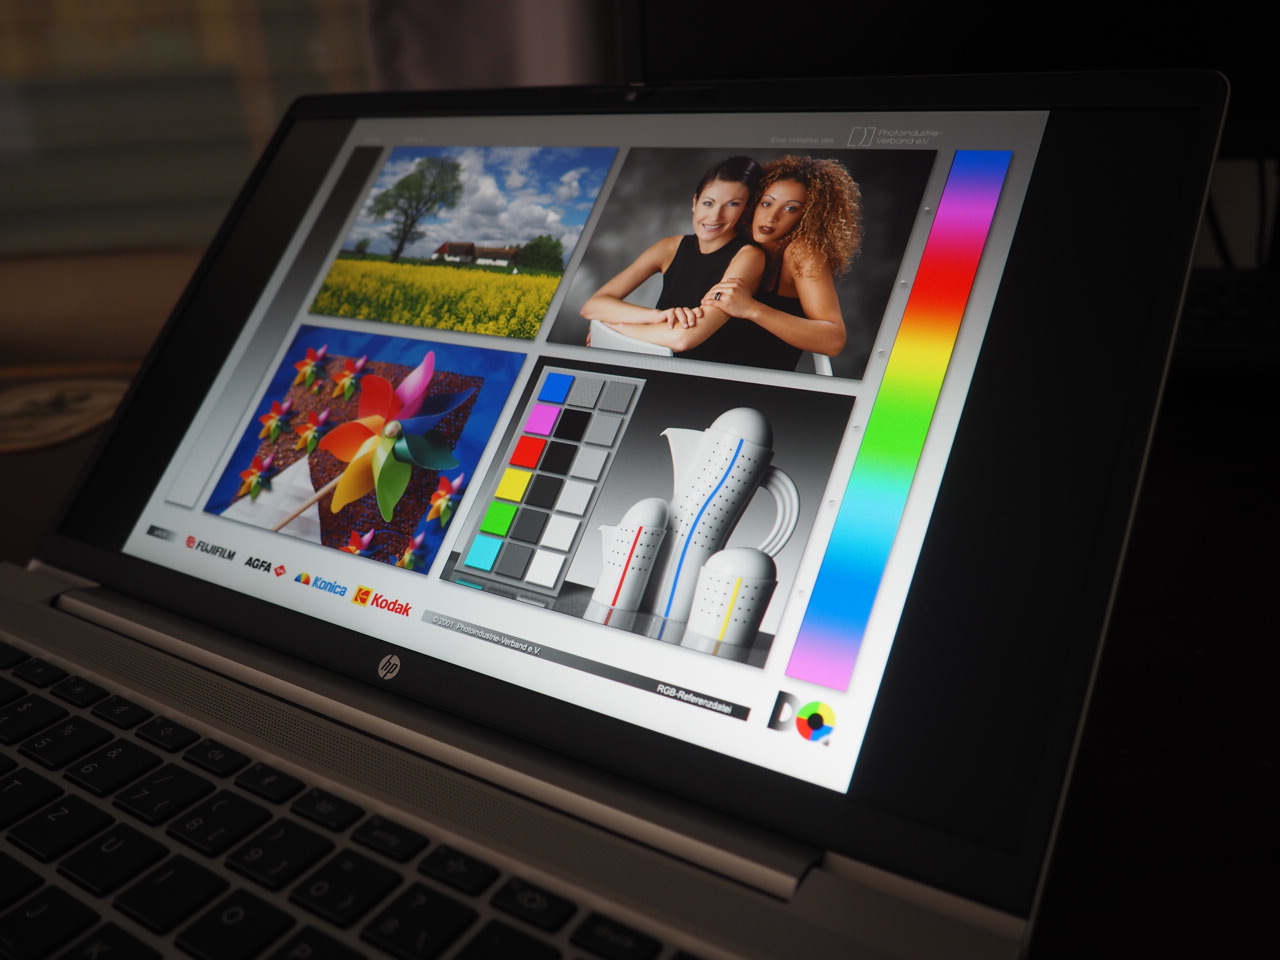
Display
While the display brightness of the ZBook Firefly 14 remained slightly below the manufacturer's specifications, the ProBook 445 even exceeds HP's promises. Instead of 400 cd/m², we could determine an average of 464 cd/m², which is very good for an IPS panel.
| |||||||||||||||||||||||||
Brightness Distribution: 87 %
Center on Battery: 501 cd/m²
Contrast: 1927:1 (Black: 0.26 cd/m²)
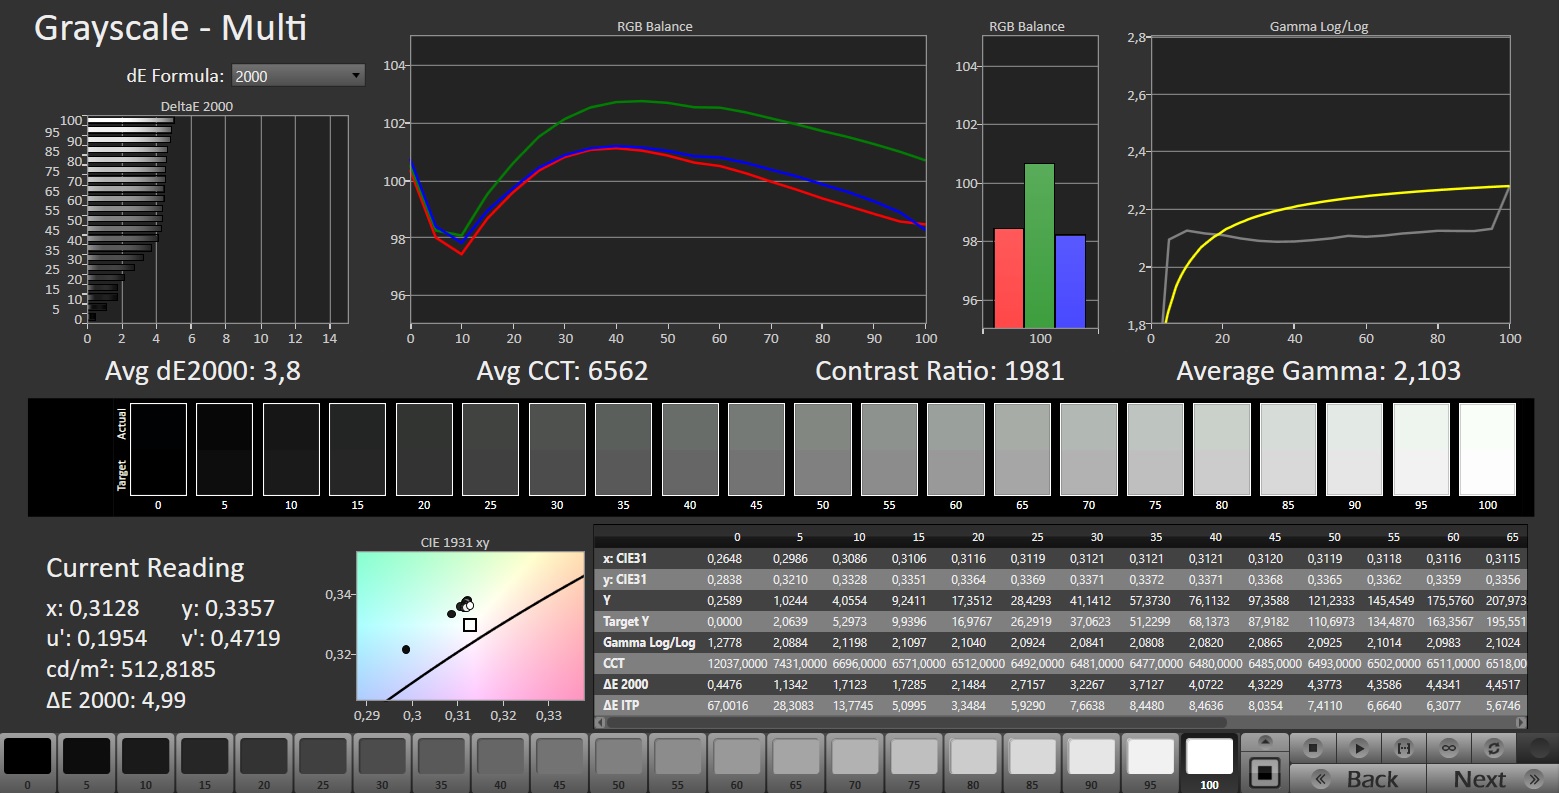
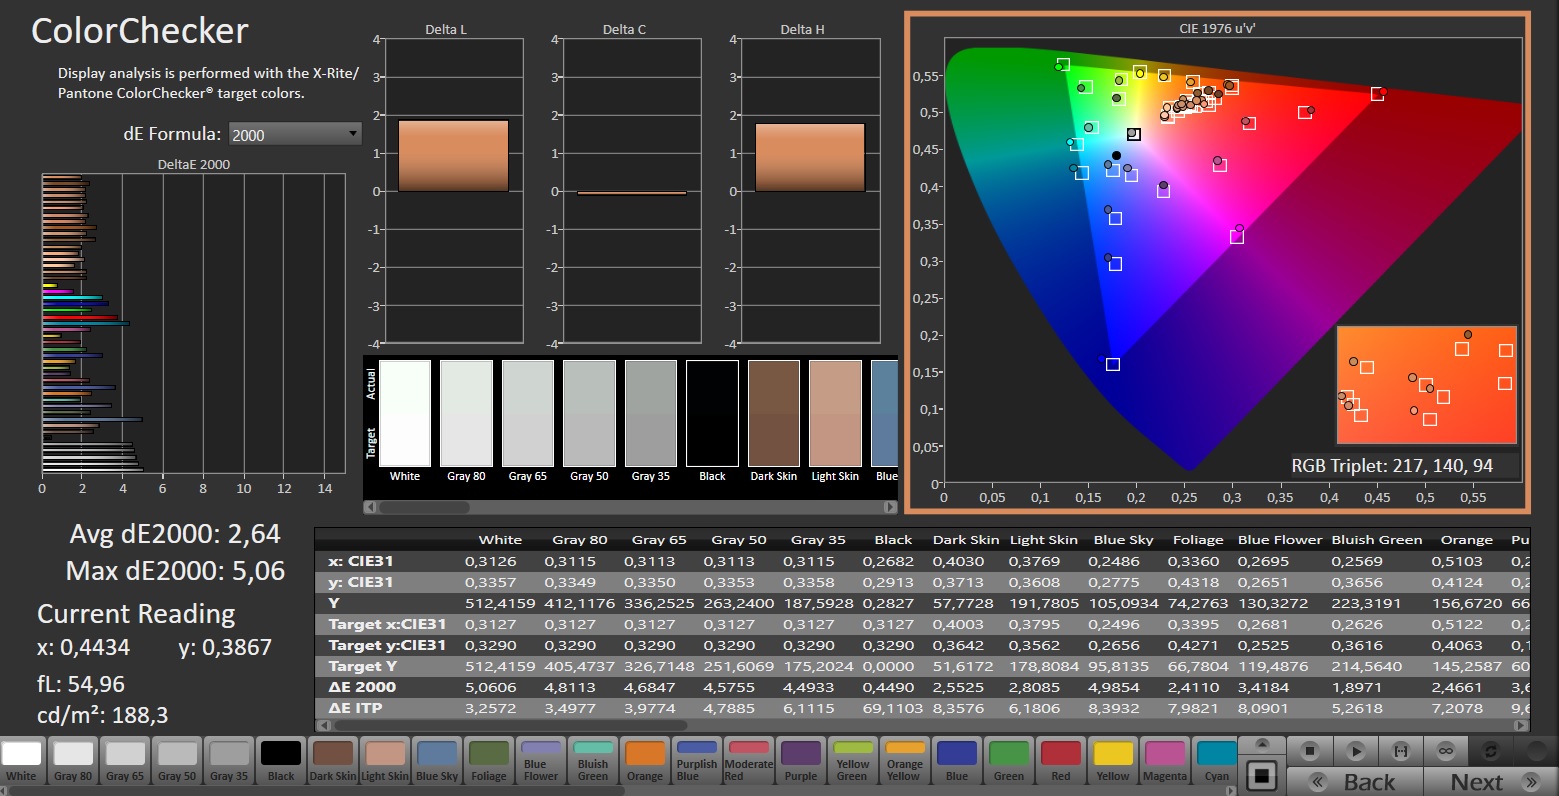
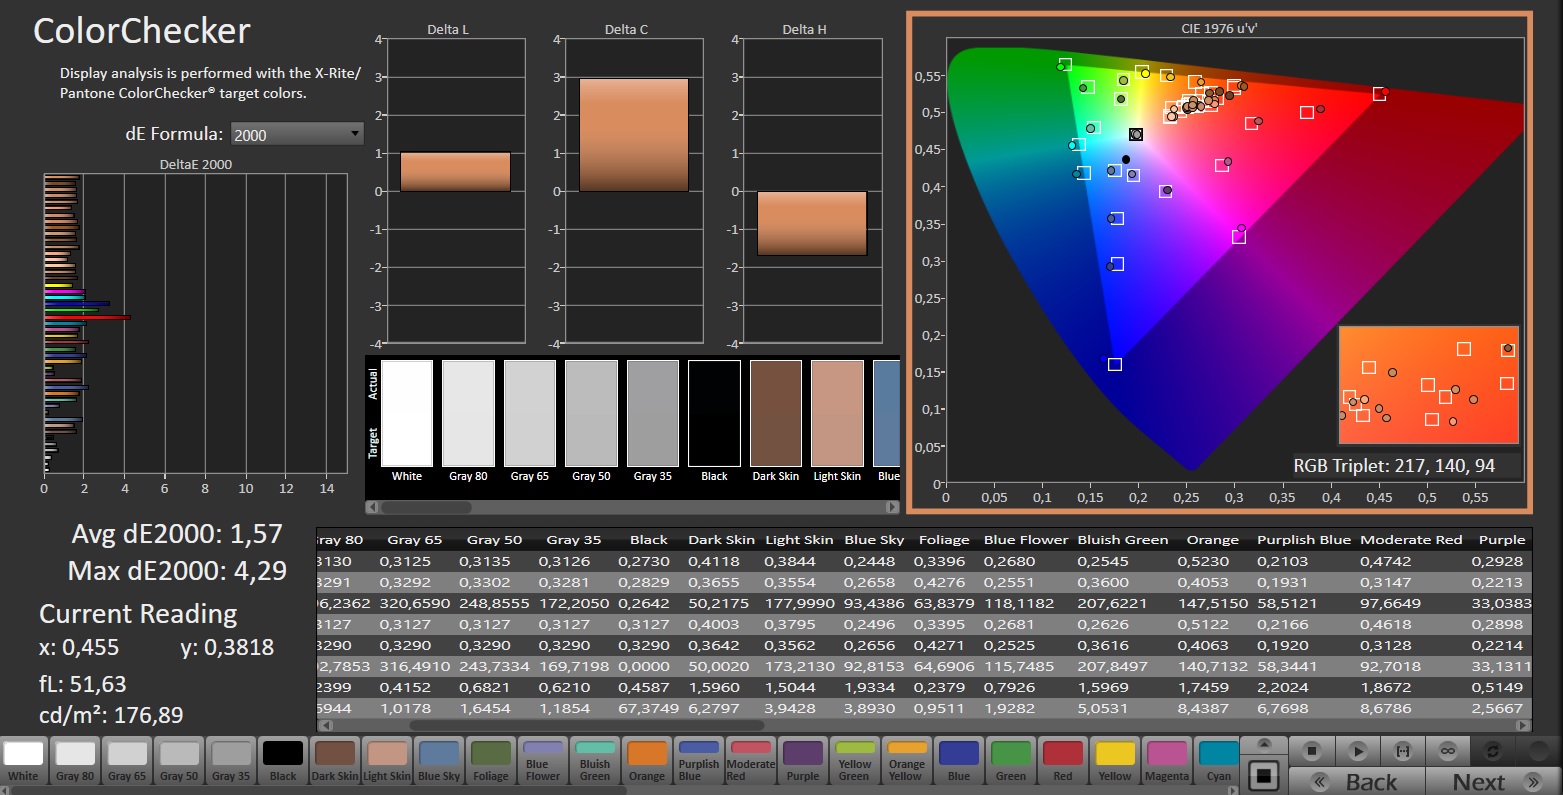
ΔE ColorChecker Calman: 2.64 | ∀{0.5-29.43 Ø4.73}
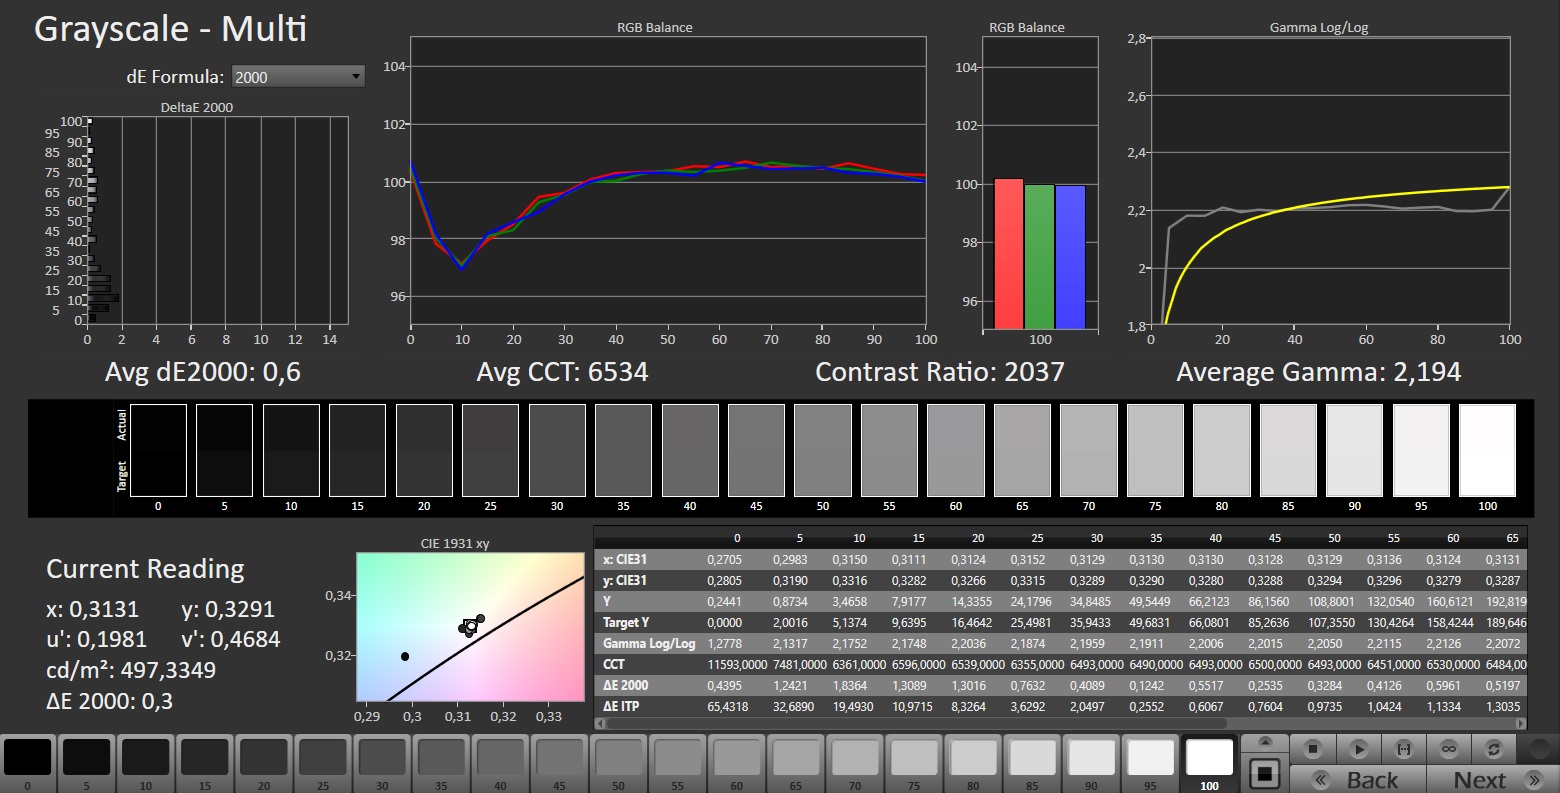
calibrated: 1.57
ΔE Greyscale Calman: 3.8 | ∀{0.09-98 Ø4.97}
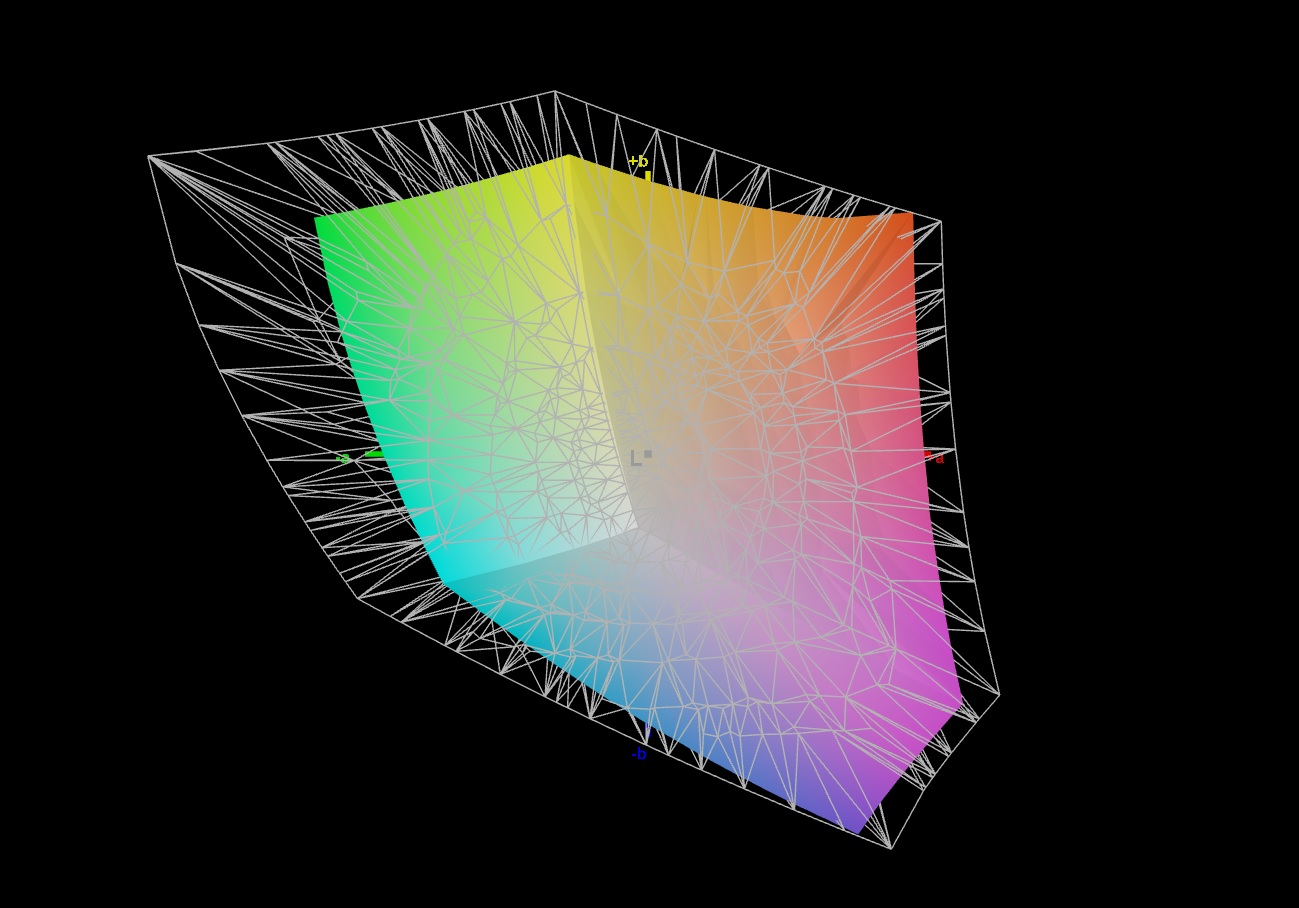
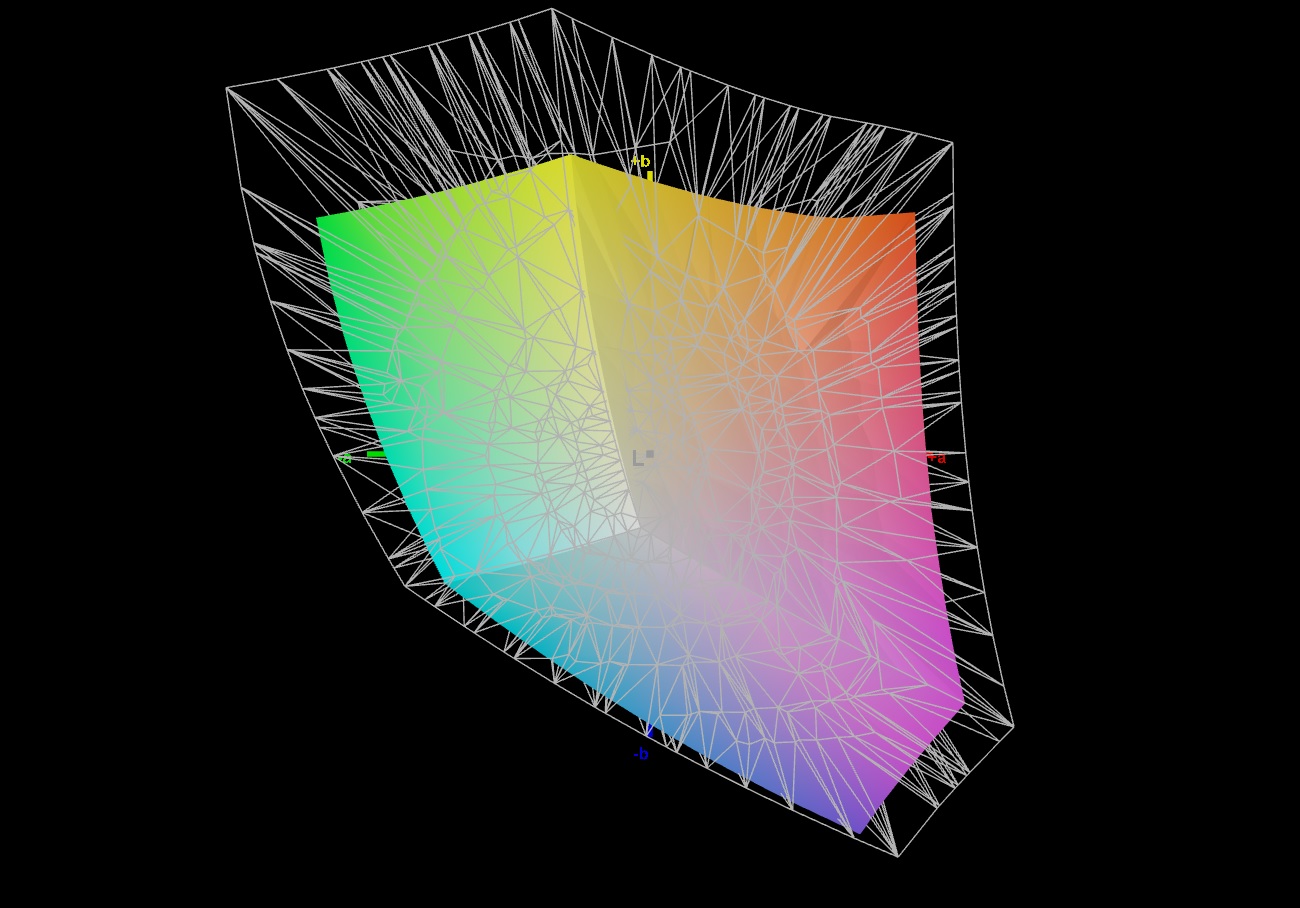
70.6% AdobeRGB 1998 (Argyll 3D)
95.2% sRGB (Argyll 3D)
68.4% Display P3 (Argyll 3D)
Gamma: 2.103
CCT: 6562 K
| HP ProBook 445 G10 AUO2FA6, IPS, 1920x1080, 14" | Lenovo ThinkPad L14 G4 21H6S00900 B140HAN06.9, IPS LED, 1920x1080, 14" | Dell Inspiron 14 7435 2-in-1 LG Philips 140WU2, IPS, 1920x1200, 14" | Lenovo ThinkPad E14 G5-21JSS05C00 M140NWHE R1, IPS, 2240x1400, 14" | Asus ZenBook 14 UM3402Y Samsung ATNA40YK07-1, OLED, 2880x1800, 14" | |
|---|---|---|---|---|---|
| Display | 5% | -34% | 1% | 30% | |
| Display P3 Coverage (%) | 68.4 | 73.2 7% | 44.4 -35% | 69.3 1% | 99.9 46% |
| sRGB Coverage (%) | 95.2 | 98.9 4% | 64.4 -32% | 97.6 3% | 100 5% |
| AdobeRGB 1998 Coverage (%) | 70.6 | 73.9 5% | 45.8 -35% | 70.4 0% | 98.3 39% |
| Response Times | -30% | 37% | 22% | 96% | |
| Response Time Grey 50% / Grey 80% * (ms) | 53.4 ? | 58.1 ? -9% | 19.6 ? 63% | 36.3 ? 32% | 1.19 ? 98% |
| Response Time Black / White * (ms) | 21.8 ? | 32.7 ? -50% | 19.3 ? 11% | 19.5 ? 11% | 1.62 ? 93% |
| PWM Frequency (Hz) | 362.3 ? | ||||
| Screen | -3% | -80% | 7% | 21% | |
| Brightness middle (cd/m²) | 501 | 430 -14% | 231.8 -54% | 362 -28% | 336.6 -33% |
| Brightness (cd/m²) | 464 | 409 -12% | 216 -53% | 354 -24% | 339 -27% |
| Brightness Distribution (%) | 87 | 88 1% | 87 0% | 91 5% | 98 13% |
| Black Level * (cd/m²) | 0.26 | 0.31 -19% | 0.27 -4% | 0.18 31% | |
| Contrast (:1) | 1927 | 1387 -28% | 859 -55% | 2011 4% | |
| Colorchecker dE 2000 * | 2.64 | 2.4 9% | 6.59 -150% | 2.6 2% | 0.84 68% |
| Colorchecker dE 2000 max. * | 5.06 | 4.7 7% | 16.83 -233% | 3.7 27% | 3.1 39% |
| Colorchecker dE 2000 calibrated * | 1.57 | 1.4 11% | 3.94 -151% | 1.1 30% | |
| Greyscale dE 2000 * | 3.8 | 3 21% | 4.5 -18% | 3.3 13% | 1.4 63% |
| Gamma | 2.103 105% | 2.3 96% | 2.17 101% | 2.28 96% | 2.24 98% |
| CCT | 6562 99% | 6489 100% | 6110 106% | 6761 96% | 6439 101% |
| Total Average (Program / Settings) | -9% /
-5% | -26% /
-53% | 10% /
8% | 49% /
37% |
* ... smaller is better
Thanks to the low black value of 0.26 cd/m², we get a respectable contrast of over 1,900:1. Only Lenovo's ThinkPad E14 can compete here. The color space is in line with the competition with 95% sRGB, 71% AdobeRGB, and 68% DCI-P3.
Meanwhile, the response time is somewhat poor. Around 22 ms black-to-white and 53 ms gray-to-grey are pretty meager and represent the second worst result in the test field.

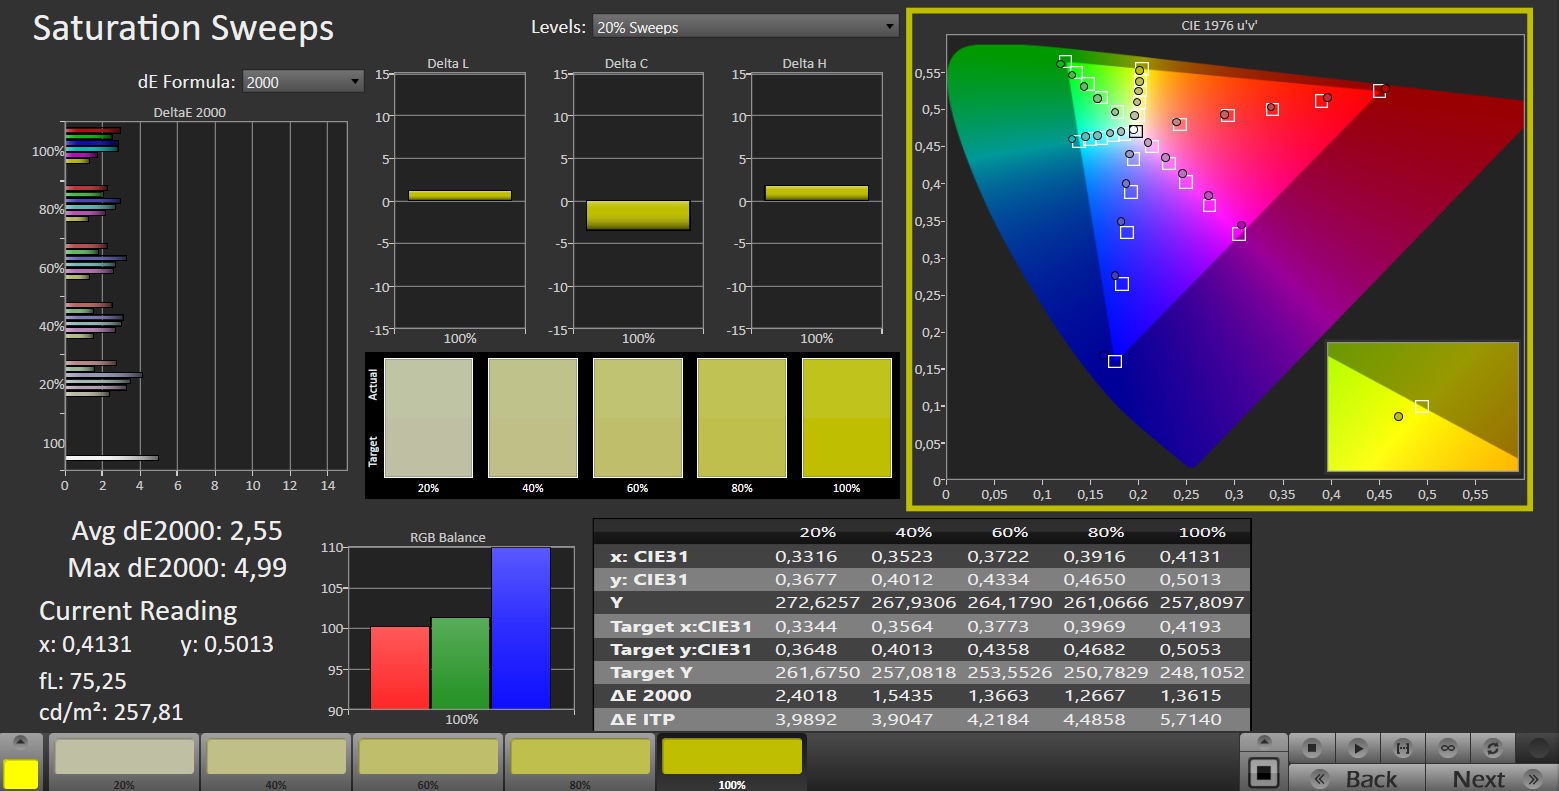
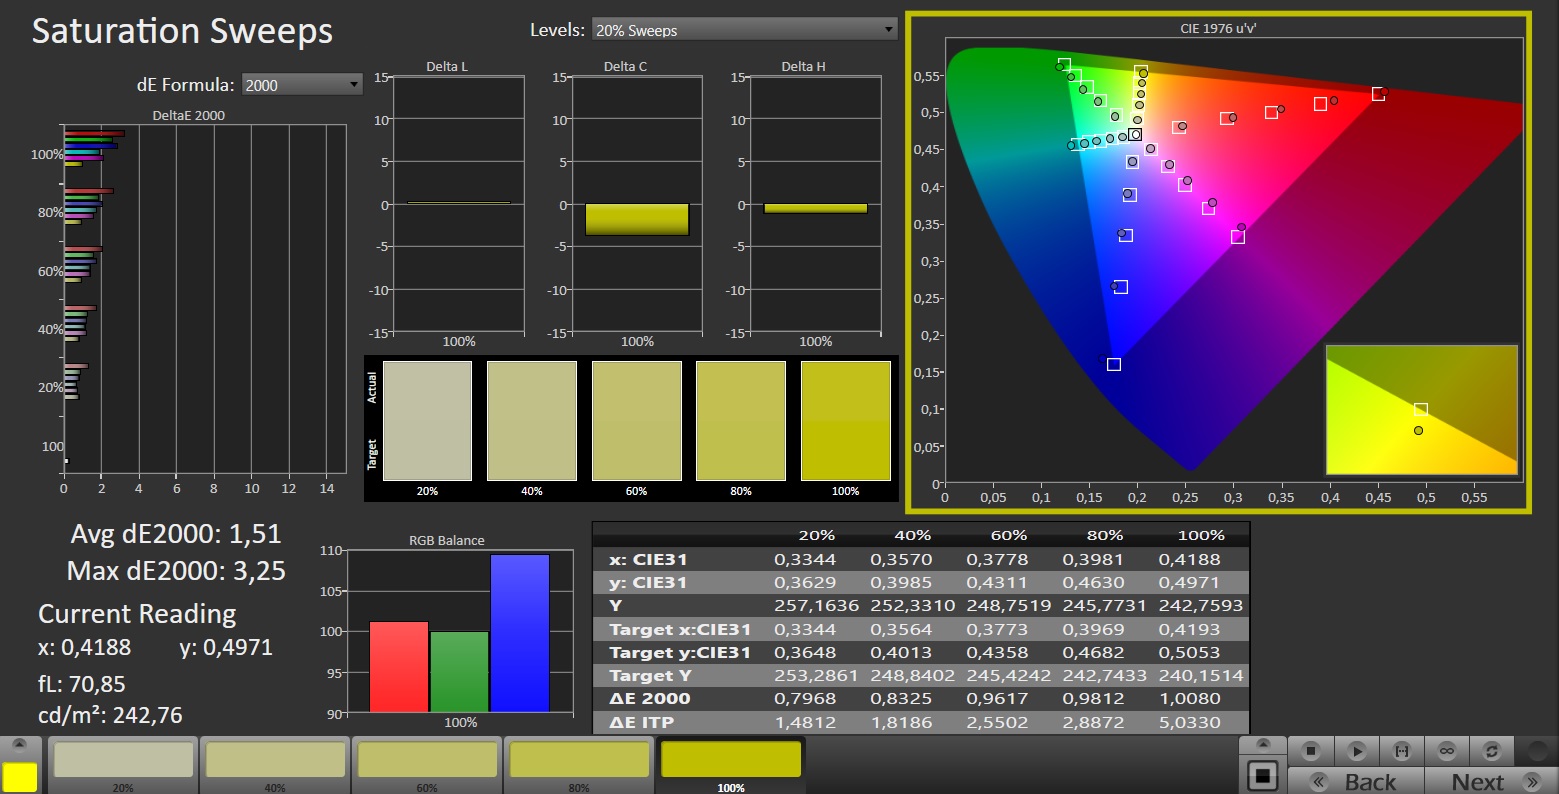
There is little to complain about in terms of color accuracy. Most colors are already in the ideal range in the state of delivery. The viewing angles are on the typical good IPS level. Flickering or noticeable screen bleeding did not occur.
Display Response Times
| ↔ Response Time Black to White | ||
|---|---|---|
| 21.8 ms ... rise ↗ and fall ↘ combined | ↗ 8.2 ms rise | 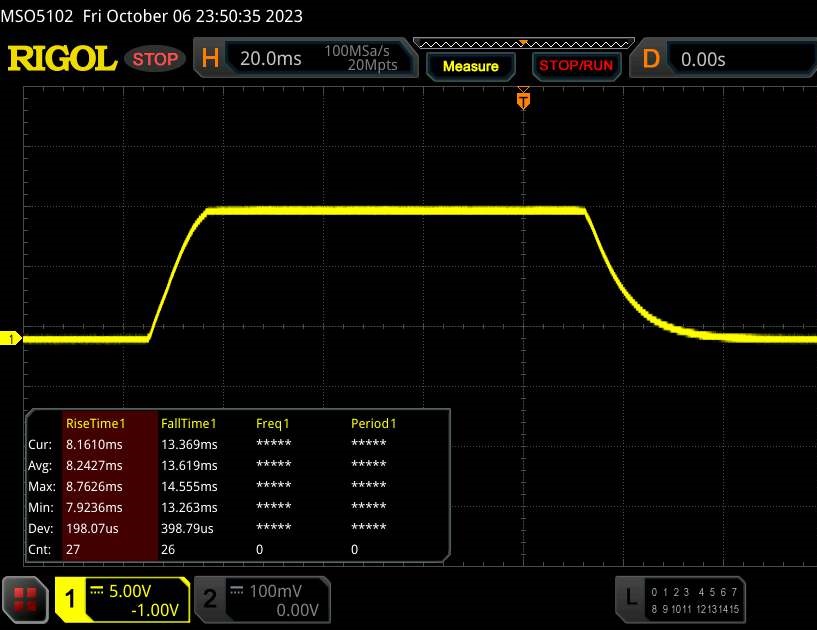 |
| ↘ 13.6 ms fall | ||
| The screen shows good response rates in our tests, but may be too slow for competitive gamers. In comparison, all tested devices range from 0.1 (minimum) to 240 (maximum) ms. » 48 % of all devices are better. This means that the measured response time is similar to the average of all tested devices (19.9 ms). | ||
| ↔ Response Time 50% Grey to 80% Grey | ||
| 53.4 ms ... rise ↗ and fall ↘ combined | ↗ 24.4 ms rise | 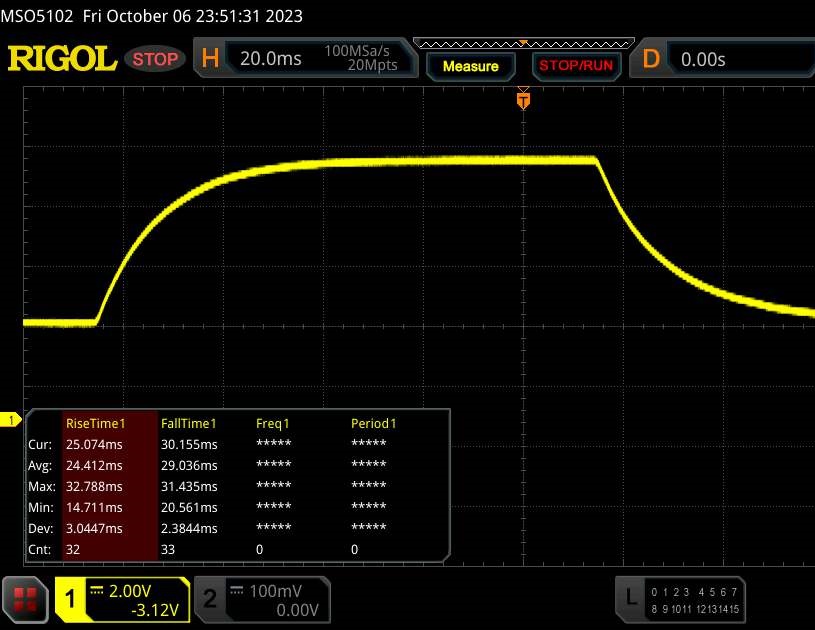 |
| ↘ 29 ms fall | ||
| The screen shows slow response rates in our tests and will be unsatisfactory for gamers. In comparison, all tested devices range from 0.165 (minimum) to 636 (maximum) ms. » 90 % of all devices are better. This means that the measured response time is worse than the average of all tested devices (31.1 ms). | ||
Screen Flickering / PWM (Pulse-Width Modulation)
| Screen flickering / PWM not detected |  | ||
In comparison: 52 % of all tested devices do not use PWM to dim the display. If PWM was detected, an average of 7797 (minimum: 5 - maximum: 343500) Hz was measured. | |||
Performance
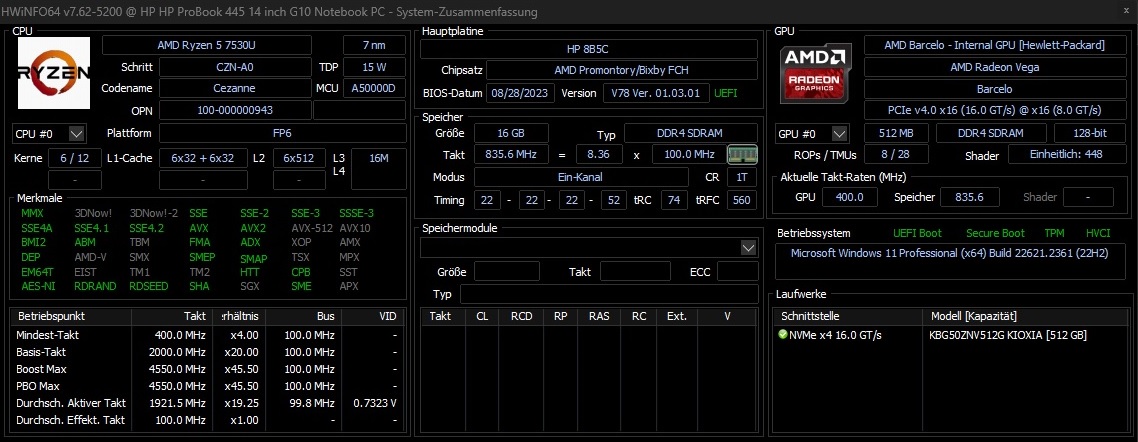
In terms of CPU performance, the ProBook 445 G10 belongs to the mid-range of office laptops. 16 GB of RAM should provide enough reserves for most buyers. Meanwhile, 512 GB of mass storage capacity is a bit modest in 2023.
Processor
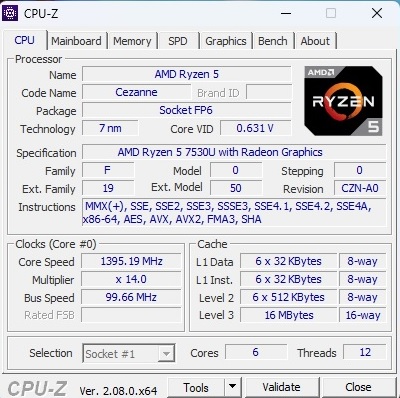
Although the name suggests otherwise, the Ryzen 5 7530U is not based on the new Zen 4, but still on the old Zen 3 architecture. The six-core model clocks with 2.0 to 4.5 GHz under load and can process up to 12 threads in parallel via SMT. HP has chosen 25 watts PL1 and 30 watts PL2 for the 7 nm chip's TDP.
The Ryzen 5 7530U performs as expected in the benchmark course and follows the previous average for this processor. The stronger Ryzen 7 7730U is about 20% faster across all benchmarks. Top: As the Cinebench loop shows, the ProBook achieves a constant long-term performance.
Cinebench R15 Multi loop
* ... smaller is better
AIDA64: FP32 Ray-Trace | FPU Julia | CPU SHA3 | CPU Queen | FPU SinJulia | FPU Mandel | CPU AES | CPU ZLib | FP64 Ray-Trace | CPU PhotoWorxx
| Performance rating | |
| Asus ZenBook 14 UM3402Y | |
| Lenovo ThinkPad E14 G5-21JSS05C00 | |
| Average of class Office | |
| Lenovo ThinkPad L14 G4 21H6S00900 | |
| Average AMD Ryzen 5 7530U | |
| Dell Inspiron 14 7435 2-in-1 | |
| HP ProBook 445 G10 | |
| AIDA64 / FP32 Ray-Trace | |
| Average of class Office (2083 - 31245, n=79, last 2 years) | |
| Asus ZenBook 14 UM3402Y | |
| Lenovo ThinkPad E14 G5-21JSS05C00 | |
| Dell Inspiron 14 7435 2-in-1 | |
| Average AMD Ryzen 5 7530U (7609 - 10970, n=9) | |
| HP ProBook 445 G10 | |
| Lenovo ThinkPad L14 G4 21H6S00900 | |
| AIDA64 / FPU Julia | |
| Asus ZenBook 14 UM3402Y | |
| Lenovo ThinkPad E14 G5-21JSS05C00 | |
| Average of class Office (8191 - 125394, n=79, last 2 years) | |
| Dell Inspiron 14 7435 2-in-1 | |
| Lenovo ThinkPad L14 G4 21H6S00900 | |
| Average AMD Ryzen 5 7530U (48473 - 68384, n=9) | |
| HP ProBook 445 G10 | |
| AIDA64 / CPU SHA3 | |
| Average of class Office (433 - 5755, n=79, last 2 years) | |
| Asus ZenBook 14 UM3402Y | |
| Lenovo ThinkPad E14 G5-21JSS05C00 | |
| Lenovo ThinkPad L14 G4 21H6S00900 | |
| Average AMD Ryzen 5 7530U (1591 - 2323, n=9) | |
| Dell Inspiron 14 7435 2-in-1 | |
| HP ProBook 445 G10 | |
| AIDA64 / CPU Queen | |
| Asus ZenBook 14 UM3402Y | |
| Lenovo ThinkPad E14 G5-21JSS05C00 | |
| Lenovo ThinkPad L14 G4 21H6S00900 | |
| Dell Inspiron 14 7435 2-in-1 | |
| Average AMD Ryzen 5 7530U (66646 - 78105, n=8) | |
| HP ProBook 445 G10 | |
| Average of class Office (22784 - 115197, n=69, last 2 years) | |
| AIDA64 / FPU SinJulia | |
| Asus ZenBook 14 UM3402Y | |
| Lenovo ThinkPad E14 G5-21JSS05C00 | |
| Dell Inspiron 14 7435 2-in-1 | |
| Average AMD Ryzen 5 7530U (7611 - 9248, n=9) | |
| HP ProBook 445 G10 | |
| Lenovo ThinkPad L14 G4 21H6S00900 | |
| Average of class Office (1378 - 18321, n=79, last 2 years) | |
| AIDA64 / FPU Mandel | |
| Asus ZenBook 14 UM3402Y | |
| Lenovo ThinkPad E14 G5-21JSS05C00 | |
| Lenovo ThinkPad L14 G4 21H6S00900 | |
| Dell Inspiron 14 7435 2-in-1 | |
| Average AMD Ryzen 5 7530U (26912 - 37624, n=9) | |
| HP ProBook 445 G10 | |
| Average of class Office (4601 - 66922, n=79, last 2 years) | |
| AIDA64 / CPU AES | |
| Lenovo ThinkPad L14 G4 21H6S00900 | |
| Asus ZenBook 14 UM3402Y | |
| Average of class Office (4854 - 155900, n=79, last 2 years) | |
| Average AMD Ryzen 5 7530U (33314 - 92360, n=9) | |
| Lenovo ThinkPad E14 G5-21JSS05C00 | |
| Dell Inspiron 14 7435 2-in-1 | |
| HP ProBook 445 G10 | |
| AIDA64 / CPU ZLib | |
| Asus ZenBook 14 UM3402Y | |
| Average of class Office (114.6 - 1366, n=79, last 2 years) | |
| Lenovo ThinkPad E14 G5-21JSS05C00 | |
| Dell Inspiron 14 7435 2-in-1 | |
| Average AMD Ryzen 5 7530U (443 - 612, n=9) | |
| HP ProBook 445 G10 | |
| Lenovo ThinkPad L14 G4 21H6S00900 | |
| AIDA64 / FP64 Ray-Trace | |
| Average of class Office (1109 - 17834, n=79, last 2 years) | |
| Asus ZenBook 14 UM3402Y | |
| Lenovo ThinkPad E14 G5-21JSS05C00 | |
| Dell Inspiron 14 7435 2-in-1 | |
| HP ProBook 445 G10 | |
| Average AMD Ryzen 5 7530U (4008 - 5738, n=9) | |
| Lenovo ThinkPad L14 G4 21H6S00900 | |
| AIDA64 / CPU PhotoWorxx | |
| Average of class Office (11090 - 65229, n=79, last 2 years) | |
| Asus ZenBook 14 UM3402Y | |
| Dell Inspiron 14 7435 2-in-1 | |
| Average AMD Ryzen 5 7530U (9832 - 19525, n=9) | |
| Lenovo ThinkPad E14 G5-21JSS05C00 | |
| HP ProBook 445 G10 | |
| Lenovo ThinkPad L14 G4 21H6S00900 | |
System performance
The gaps between the comparison devices are even smaller in terms of system performance, although the ProBook has to settle for last place here as well.
CrossMark: Overall | Productivity | Creativity | Responsiveness
| PCMark 10 / Score | |
| Average of class Office (2601 - 9298, n=63, last 2 years) | |
| Lenovo ThinkPad E14 G5-21JSS05C00 | |
| Asus ZenBook 14 UM3402Y | |
| Dell Inspiron 14 7435 2-in-1 | |
| Average AMD Ryzen 5 7530U, AMD Radeon RX Vega 7 (5686 - 6209, n=8) | |
| Lenovo ThinkPad L14 G4 21H6S00900 | |
| HP ProBook 445 G10 | |
| PCMark 10 / Essentials | |
| Lenovo ThinkPad L14 G4 21H6S00900 | |
| Lenovo ThinkPad E14 G5-21JSS05C00 | |
| Asus ZenBook 14 UM3402Y | |
| Average AMD Ryzen 5 7530U, AMD Radeon RX Vega 7 (9183 - 11242, n=8) | |
| HP ProBook 445 G10 | |
| Dell Inspiron 14 7435 2-in-1 | |
| Average of class Office (3245 - 11594, n=63, last 2 years) | |
| PCMark 10 / Productivity | |
| Average AMD Ryzen 5 7530U, AMD Radeon RX Vega 7 (8983 - 14037, n=8) | |
| Dell Inspiron 14 7435 2-in-1 | |
| HP ProBook 445 G10 | |
| Asus ZenBook 14 UM3402Y | |
| Average of class Office (5336 - 17243, n=63, last 2 years) | |
| Lenovo ThinkPad E14 G5-21JSS05C00 | |
| Lenovo ThinkPad L14 G4 21H6S00900 | |
| PCMark 10 / Digital Content Creation | |
| Average of class Office (2049 - 13541, n=63, last 2 years) | |
| Lenovo ThinkPad E14 G5-21JSS05C00 | |
| Asus ZenBook 14 UM3402Y | |
| Dell Inspiron 14 7435 2-in-1 | |
| Average AMD Ryzen 5 7530U, AMD Radeon RX Vega 7 (4941 - 6093, n=8) | |
| Lenovo ThinkPad L14 G4 21H6S00900 | |
| HP ProBook 445 G10 | |
| CrossMark / Overall | |
| Average of class Office (381 - 2010, n=73, last 2 years) | |
| Asus ZenBook 14 UM3402Y | |
| Lenovo ThinkPad E14 G5-21JSS05C00 | |
| Average AMD Ryzen 5 7530U, AMD Radeon RX Vega 7 (1029 - 1336, n=7) | |
| Dell Inspiron 14 7435 2-in-1 | |
| Lenovo ThinkPad L14 G4 21H6S00900 | |
| CrossMark / Productivity | |
| Average of class Office (464 - 1880, n=73, last 2 years) | |
| Asus ZenBook 14 UM3402Y | |
| Lenovo ThinkPad E14 G5-21JSS05C00 | |
| Average AMD Ryzen 5 7530U, AMD Radeon RX Vega 7 (1115 - 1370, n=7) | |
| Dell Inspiron 14 7435 2-in-1 | |
| Lenovo ThinkPad L14 G4 21H6S00900 | |
| CrossMark / Creativity | |
| Average of class Office (319 - 2361, n=73, last 2 years) | |
| Asus ZenBook 14 UM3402Y | |
| Lenovo ThinkPad E14 G5-21JSS05C00 | |
| Average AMD Ryzen 5 7530U, AMD Radeon RX Vega 7 (992 - 1390, n=7) | |
| Dell Inspiron 14 7435 2-in-1 | |
| Lenovo ThinkPad L14 G4 21H6S00900 | |
| CrossMark / Responsiveness | |
| Average of class Office (360 - 1690, n=73, last 2 years) | |
| Asus ZenBook 14 UM3402Y | |
| Lenovo ThinkPad E14 G5-21JSS05C00 | |
| Dell Inspiron 14 7435 2-in-1 | |
| Average AMD Ryzen 5 7530U, AMD Radeon RX Vega 7 (900 - 1096, n=7) | |
| Lenovo ThinkPad L14 G4 21H6S00900 | |
| PCMark 10 Score | 5690 points | |
Help | ||
| AIDA64 / Memory Copy | |
| Average of class Office (20075 - 110930, n=76, last 2 years) | |
| Asus ZenBook 14 UM3402Y | |
| Dell Inspiron 14 7435 2-in-1 | |
| Lenovo ThinkPad E14 G5-21JSS05C00 | |
| Average AMD Ryzen 5 7530U (20155 - 42853, n=9) | |
| HP ProBook 445 G10 | |
| Lenovo ThinkPad L14 G4 21H6S00900 | |
| AIDA64 / Memory Read | |
| Average of class Office (10084 - 128030, n=77, last 2 years) | |
| Asus ZenBook 14 UM3402Y | |
| Lenovo ThinkPad E14 G5-21JSS05C00 | |
| Dell Inspiron 14 7435 2-in-1 | |
| Average AMD Ryzen 5 7530U (23068 - 40270, n=9) | |
| HP ProBook 445 G10 | |
| Lenovo ThinkPad L14 G4 21H6S00900 | |
| AIDA64 / Memory Write | |
| Average of class Office (20073 - 119858, n=77, last 2 years) | |
| Asus ZenBook 14 UM3402Y | |
| Dell Inspiron 14 7435 2-in-1 | |
| Average AMD Ryzen 5 7530U (22954 - 41838, n=9) | |
| Lenovo ThinkPad E14 G5-21JSS05C00 | |
| HP ProBook 445 G10 | |
| Lenovo ThinkPad L14 G4 21H6S00900 | |
| AIDA64 / Memory Latency | |
| Dell Inspiron 14 7435 2-in-1 | |
| Asus ZenBook 14 UM3402Y | |
| Average of class Office (7.6 - 162.9, n=72, last 2 years) | |
| Average AMD Ryzen 5 7530U (88.1 - 110.8, n=9) | |
| Lenovo ThinkPad L14 G4 21H6S00900 | |
| Lenovo ThinkPad E14 G5-21JSS05C00 | |
| HP ProBook 445 G10 | |
* ... smaller is better
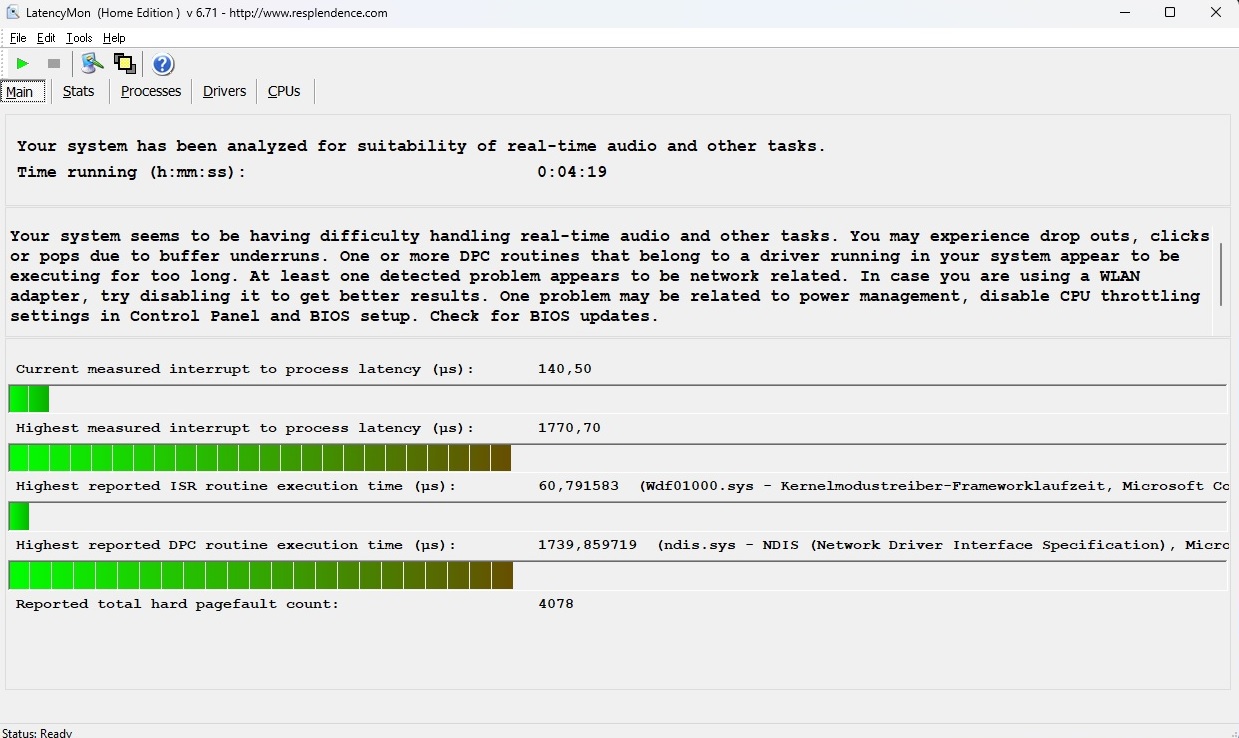
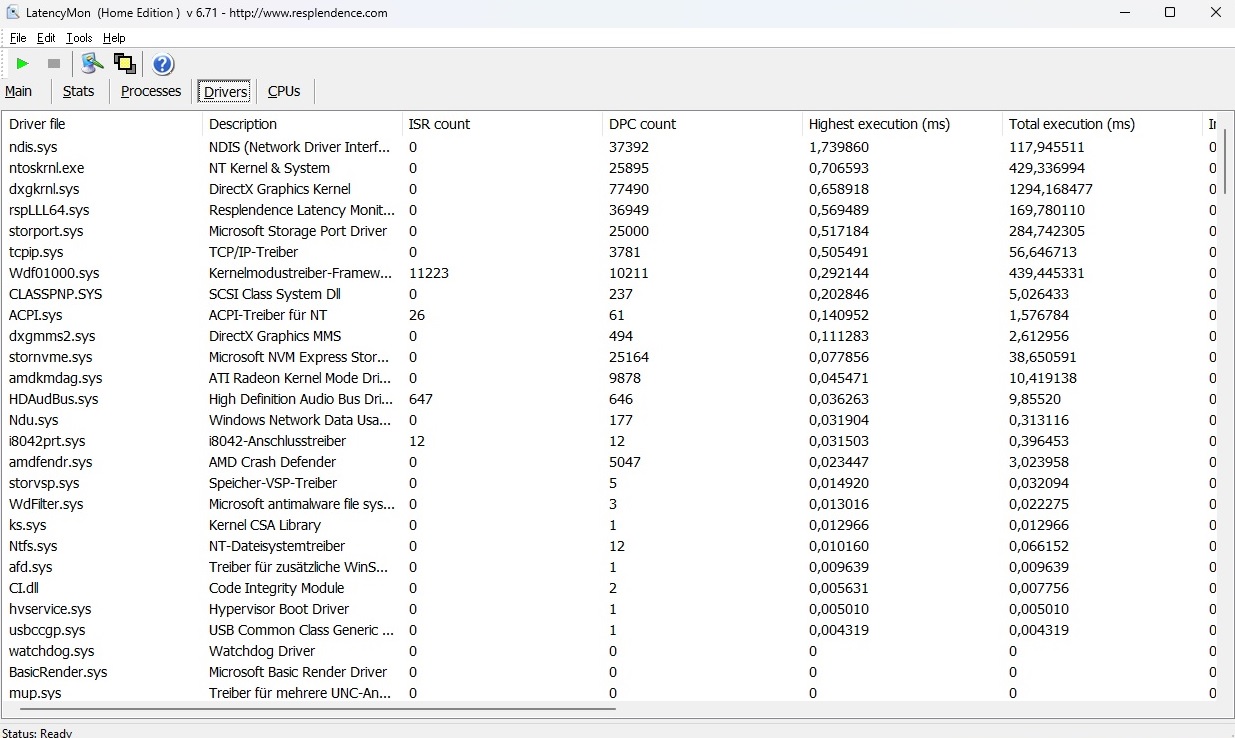
DPC latencies
The 14-incher reveals weaknesses, especially in terms of latencies. The tool LatencyMon sees possible problems in real-time audio and video editing.
| DPC Latencies / LatencyMon - interrupt to process latency (max), Web, Youtube, Prime95 | |
| Asus ZenBook 14 UM3402Y | |
| Lenovo ThinkPad L14 G4 21H6S00900 | |
| HP ProBook 445 G10 | |
| Lenovo ThinkPad E14 G5-21JSS05C00 | |
| Dell Inspiron 14 7435 2-in-1 | |
* ... smaller is better
Storage
Certain savings measures can be seen in the mass storage. Besides the mediocre size, the performance of the installed Kioxia SSD can only be convincing to some extent. At least the speed remains stable even after a longer load.

* ... smaller is better
Dauerleistung Lesen: DiskSpd Read Loop, Queue Depth 8
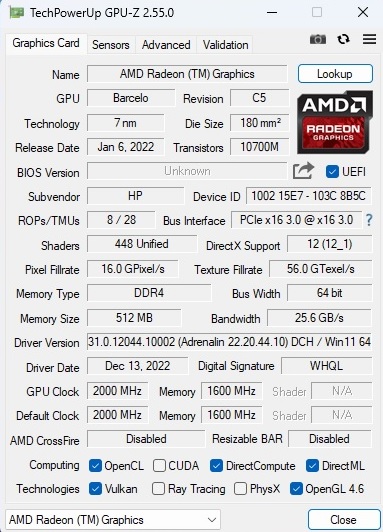
Graphics card
Unfortunately, the Ryzen 5 7530U does not include a Radeon 680M or 780M, but only a Radeon RX Vega 7 with only 448 shaders. To make matters worse, the latter performs below average in the ProBook 445. The Lenovo ThinkPad L14 is minimally outperformed in the 3DMarks, but the laptop does not stand a chance against the Dell Inspiron 14 7435 and the Vega 8 chips of the Asus ZenBook 14 and Lenovo ThinkPad E14.
| 3DMark Performance rating - Percent | |
| Average of class Office | |
| Asus ZenBook 14 UM3402Y -1! | |
| Dell Inspiron 14 7435 2-in-1 | |
| Lenovo ThinkPad E14 G5-21JSS05C00 -1! | |
| Average AMD Radeon RX Vega 7 | |
| HP ProBook 445 G10 -1! | |
| Lenovo ThinkPad L14 G4 21H6S00900 | |
| 3DMark 11 Performance | 4603 points | |
| 3DMark Ice Storm Standard Score | 122347 points | |
| 3DMark Cloud Gate Standard Score | 16606 points | |
| 3DMark Fire Strike Score | 2358 points | |
Help | ||
* ... smaller is better
Gaming performance
The graphics performance is only sufficient for older or less demanding games. High details rarely run smoothly in the native resolution, and you usually have to be happy if a title is playable at low or medium settings at all.
| The Witcher 3 - 1920x1080 Ultra Graphics & Postprocessing (HBAO+) | |
| Average of class Office (14.8 - 18.1, n=4, last 2 years) | |
| Asus ZenBook 14 UM3402Y | |
| Dell Inspiron 14 7435 2-in-1 | |
| Lenovo ThinkPad E14 G5-21JSS05C00 | |
| Average AMD Radeon RX Vega 7 (6.5 - 15.8, n=44) | |
| HP ProBook 445 G10 | |
| Lenovo ThinkPad L14 G4 21H6S00900 | |
| The Witcher 3 | |
| 1024x768 Low Graphics & Postprocessing | |
| Dell Inspiron 14 7435 2-in-1 | |
| Asus ZenBook 14 UM3402Y | |
| Average of class Office (32.2 - 103.7, n=4, last 2 years) | |
| Lenovo ThinkPad E14 G5-21JSS05C00 | |
| Average AMD Radeon RX Vega 7 (25.5 - 105.8, n=53) | |
| HP ProBook 445 G10 | |
| Lenovo ThinkPad L14 G4 21H6S00900 | |
| 1366x768 Medium Graphics & Postprocessing | |
| Average of class Office (44.7 - 63.9, n=4, last 2 years) | |
| Average AMD Radeon RX Vega 7 (9.74 - 81.3, n=39) | |
| HP ProBook 445 G10 | |
| Lenovo ThinkPad L14 G4 21H6S00900 | |
| 1920x1080 High Graphics & Postprocessing (Nvidia HairWorks Off) | |
| Average of class Office (23.7 - 39.9, n=4, last 2 years) | |
| Asus ZenBook 14 UM3402Y | |
| Dell Inspiron 14 7435 2-in-1 | |
| Lenovo ThinkPad E14 G5-21JSS05C00 | |
| Average AMD Radeon RX Vega 7 (8.96 - 26.2, n=52) | |
| HP ProBook 445 G10 | |
| Lenovo ThinkPad L14 G4 21H6S00900 | |
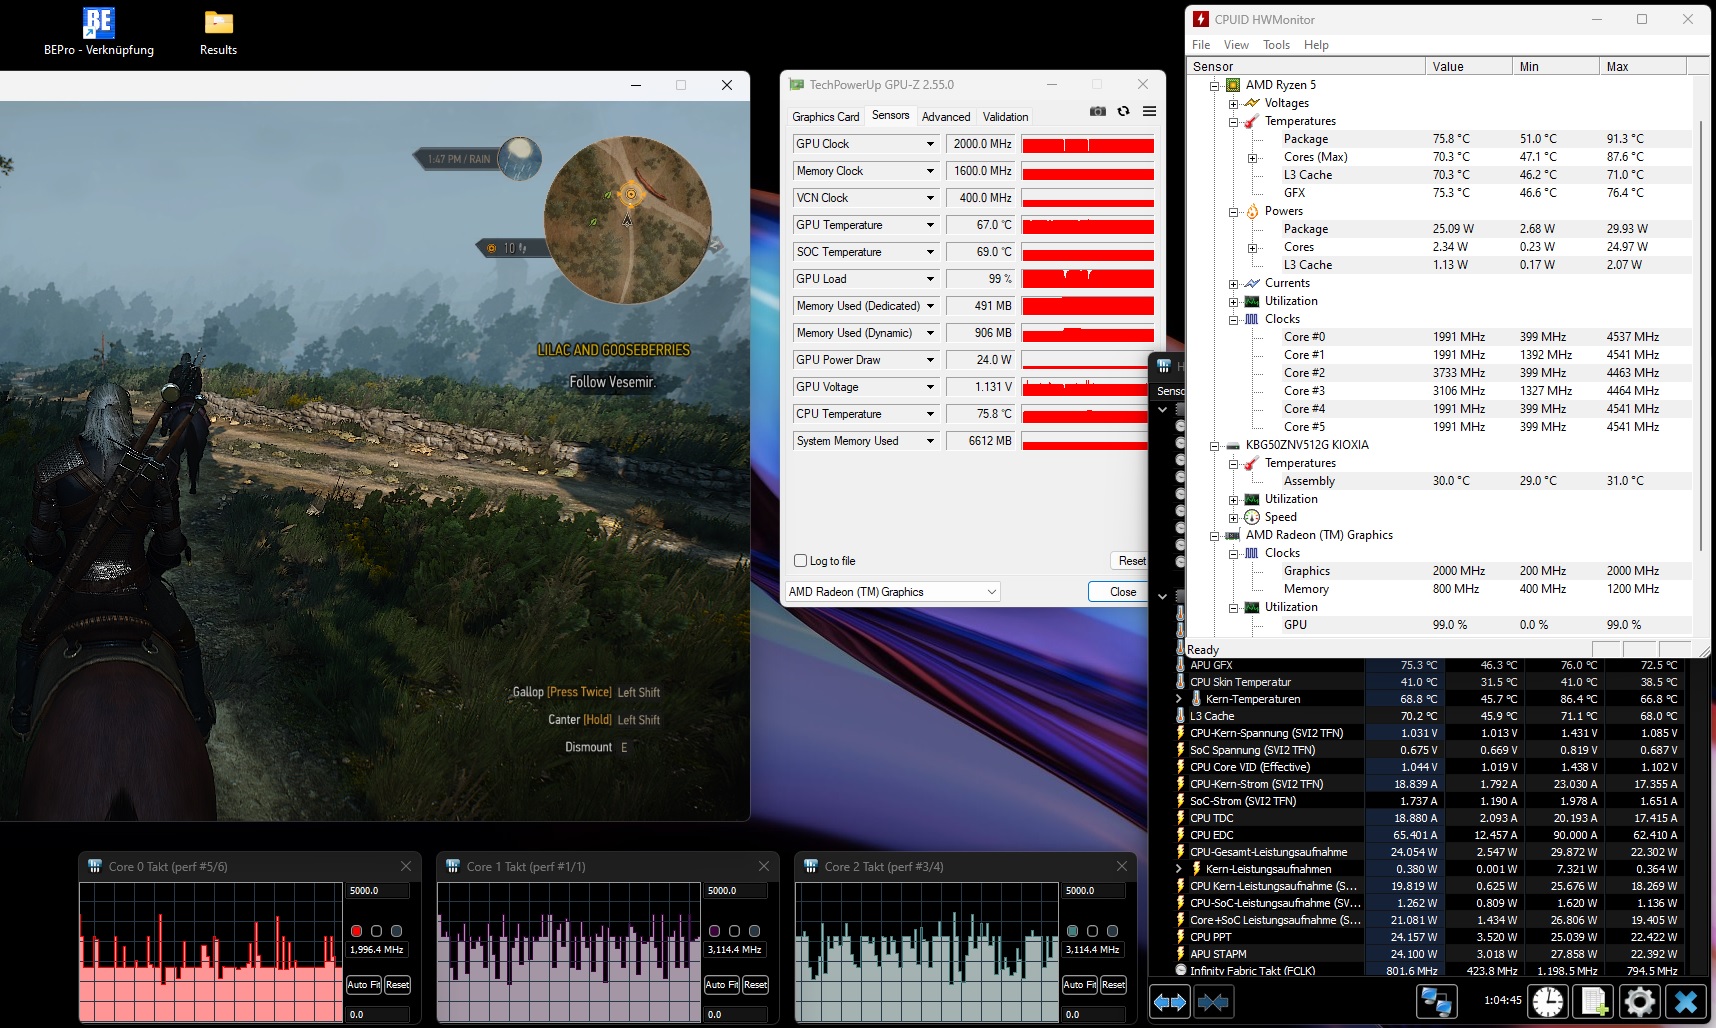
Besides the CPU and SSD performance, the GPU performance is at least pretty consistent, as our 60-minute test with The Witcher 3 proves.
Witcher 3 FPS chart
| low | med. | high | ultra | |
|---|---|---|---|---|
| GTA V (2015) | 58.1 | 51.5 | 13.9 | 6.49 |
| The Witcher 3 (2015) | 42.4 | 26.6 | 12.9 | 10 |
| Dota 2 Reborn (2015) | 103.7 | 76 | 37.8 | 36.1 |
| Final Fantasy XV Benchmark (2018) | 25 | 13.3 | 8.78 | |
| X-Plane 11.11 (2018) | 31.6 | 25.3 | 22.6 | |
| Strange Brigade (2018) | 49.3 | 19.4 | 16.4 | 14.3 |
Emissions
Noise emissions
The noise development is in line with the competition. When the notebook has nothing to do or is only confronted with simple activities (office, video, web), the fan is either off or spins with a quite decent level. Under load, the 14-incher is not particularly loud either given 33 to 36 dB(A) but stays at an acceptable level.
Noise level
| Idle |
| 24 / 25 / 28 dB(A) |
| Load |
| 33 / 36 dB(A) |
 | ||
30 dB silent 40 dB(A) audible 50 dB(A) loud |
||
min: | ||
| HP ProBook 445 G10 R5 7530U, Vega 7 | Lenovo ThinkPad L14 G4 21H6S00900 R5 7530U, Vega 7 | Dell Inspiron 14 7435 2-in-1 R5 7530U, Vega 7 | Lenovo ThinkPad E14 G5-21JSS05C00 R7 7730U, Vega 8 | Asus ZenBook 14 UM3402Y R7 7730U, Vega 8 | |
|---|---|---|---|---|---|
| Noise | -2% | 0% | -1% | -8% | |
| off / environment * (dB) | 24 | 25.2 -5% | 22.8 5% | 24.4 -2% | 22.6 6% |
| Idle Minimum * (dB) | 24 | 25.2 -5% | 23.2 3% | 24.4 -2% | 22.6 6% |
| Idle Average * (dB) | 25 | 25.2 -1% | 23.2 7% | 24.4 2% | 22.6 10% |
| Idle Maximum * (dB) | 28 | 27.3 2% | 23.2 17% | 25.7 8% | 22.6 19% |
| Load Average * (dB) | 33 | 32.1 3% | 33 -0% | 31.8 4% | 40.7 -23% |
| Witcher 3 ultra * (dB) | 36 | 35.7 1% | 40.9 -14% | 36.7 -2% | 46.6 -29% |
| Load Maximum * (dB) | 36 | 38.3 -6% | 41.3 -15% | 41.2 -14% | 52.5 -46% |
* ... smaller is better
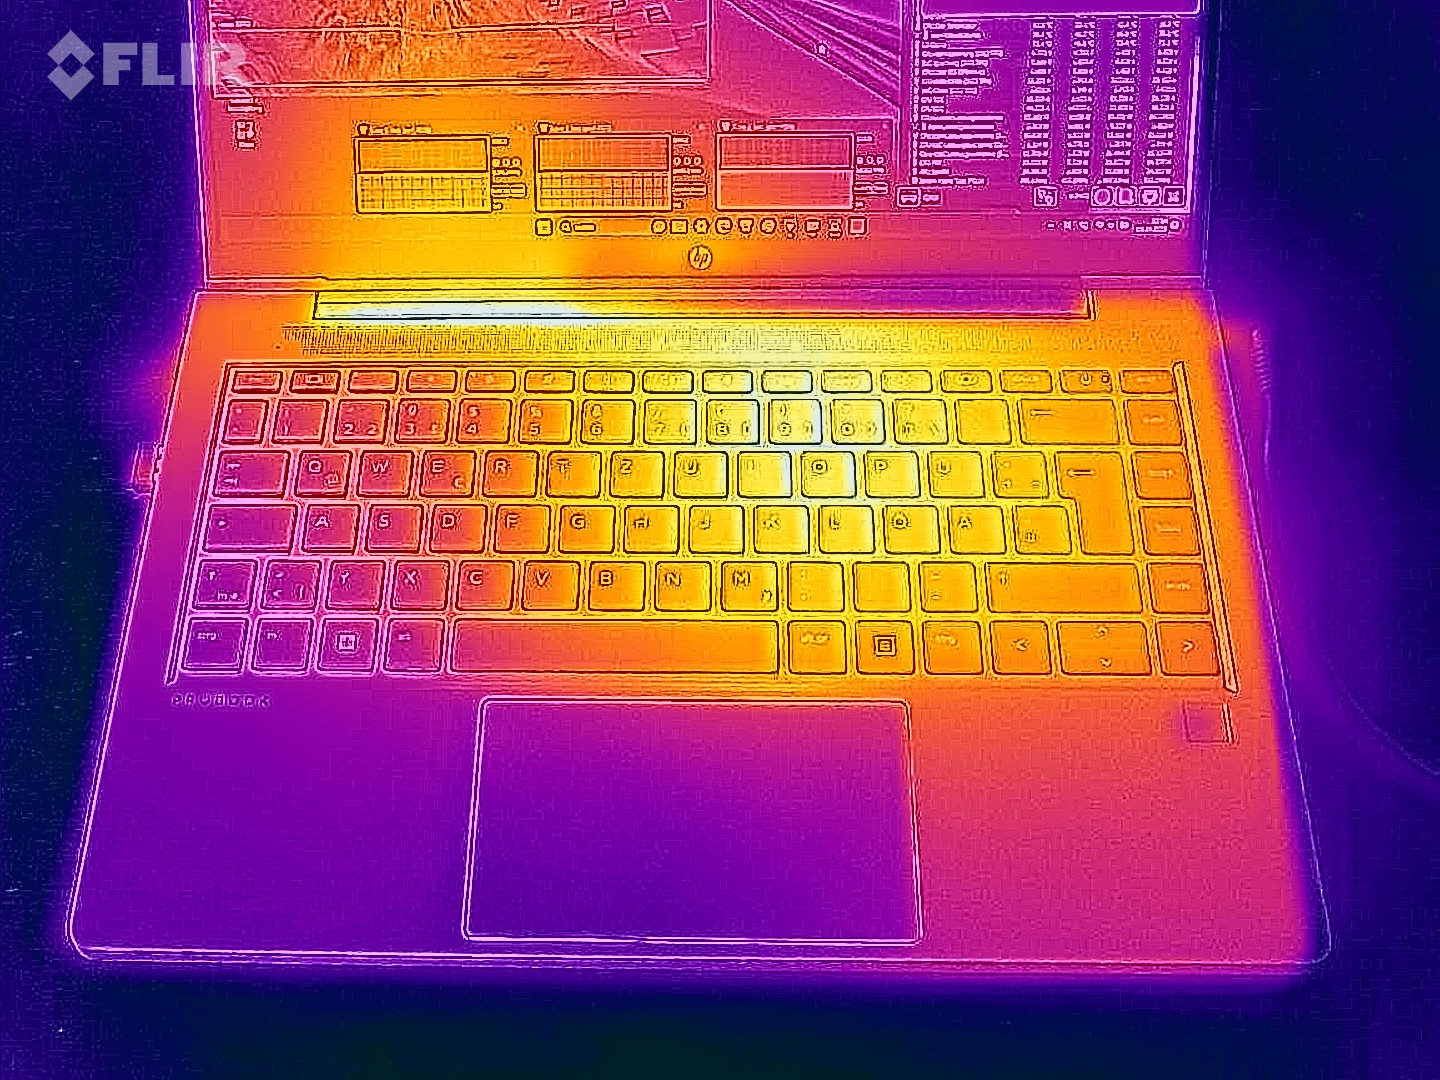
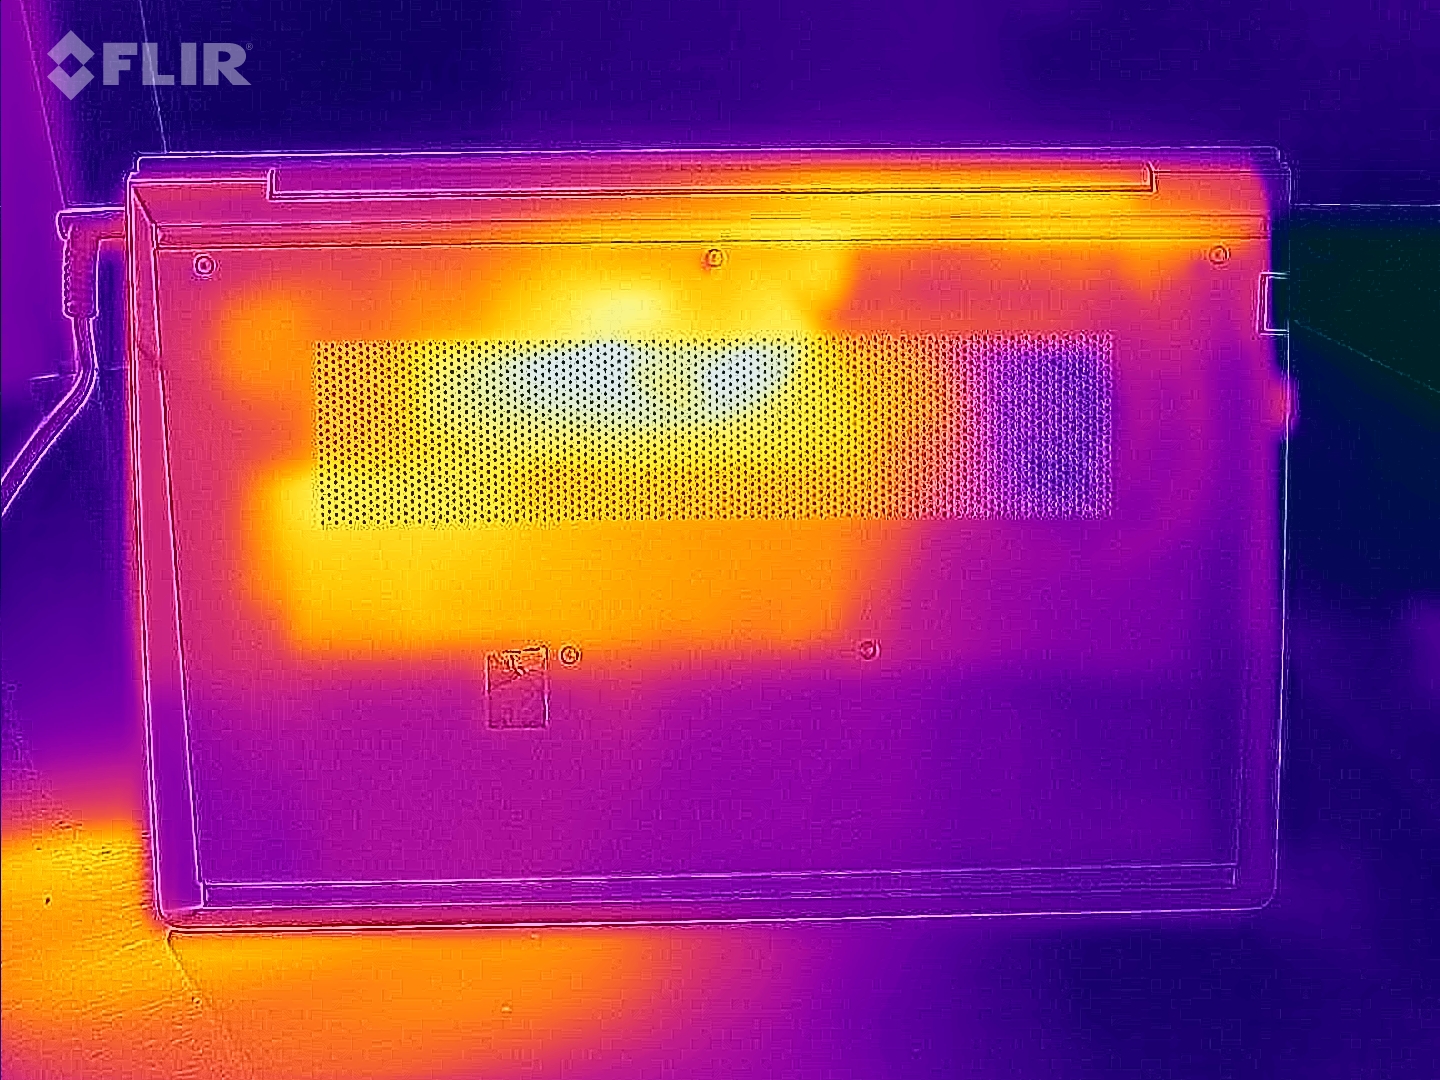
Temperature
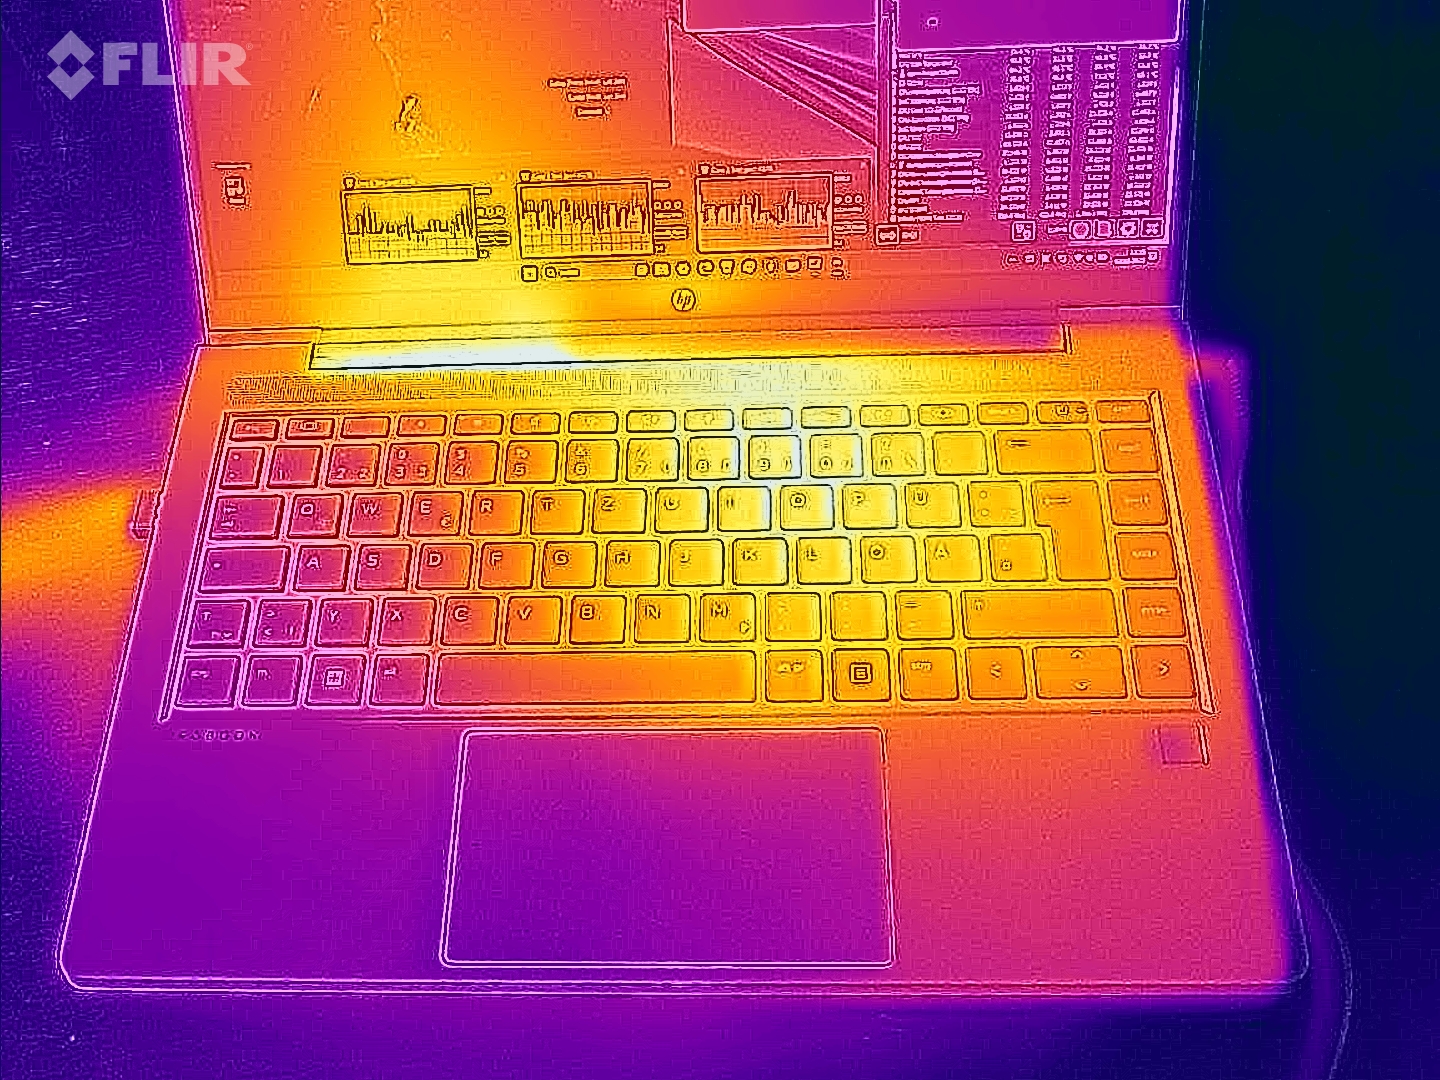
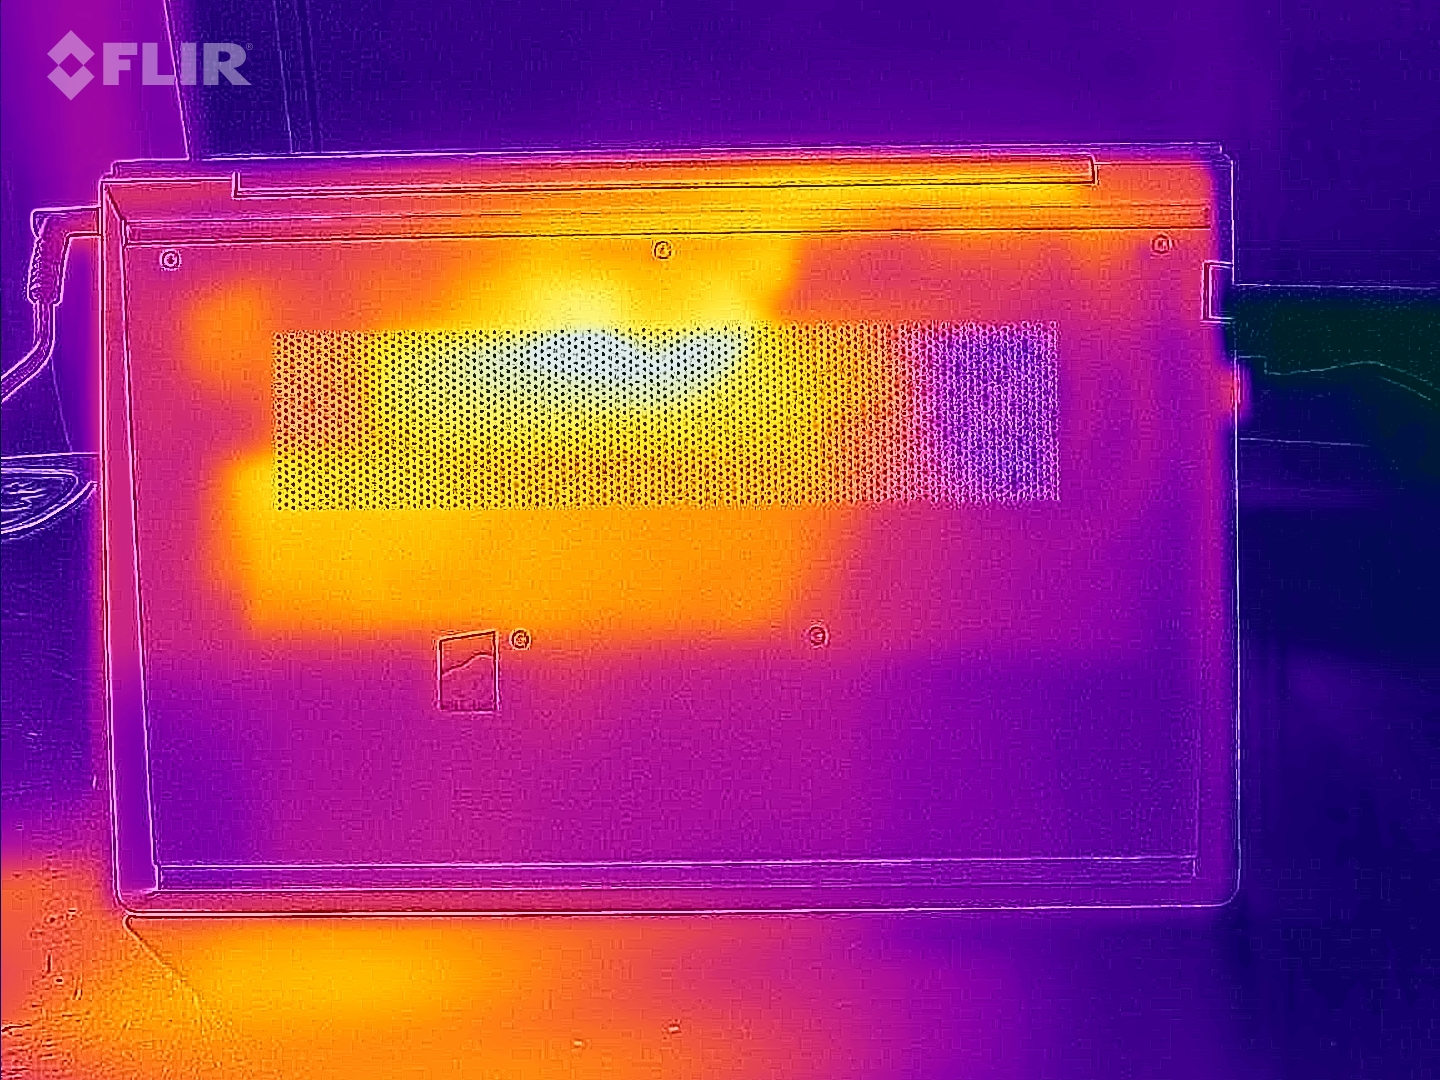
The underside of the case heats up most. After 60 minutes of stress testing with the tools Furmark and Prime95, we measured around 50 °C at two measuring points. The upper side did not get quite as warm with a maximum of 43 °C. The entire chassis stays pleasantly cool at 25 to 30 °C in idle mode.
(±) The maximum temperature on the upper side is 43 °C / 109 F, compared to the average of 34.3 °C / 94 F, ranging from 21.2 to 62.5 °C for the class Office.
(-) The bottom heats up to a maximum of 51 °C / 124 F, compared to the average of 36.8 °C / 98 F
(+) In idle usage, the average temperature for the upper side is 26.3 °C / 79 F, compared to the device average of 29.5 °C / 85 F.
(-) Playing The Witcher 3, the average temperature for the upper side is 38.3 °C / 101 F, compared to the device average of 29.5 °C / 85 F.
(+) The palmrests and touchpad are reaching skin temperature as a maximum (34 °C / 93.2 F) and are therefore not hot.
(-) The average temperature of the palmrest area of similar devices was 27.5 °C / 81.5 F (-6.5 °C / -11.7 F).
| HP ProBook 445 G10 R5 7530U, Vega 7 | Lenovo ThinkPad L14 G4 21H6S00900 R5 7530U, Vega 7 | Dell Inspiron 14 7435 2-in-1 R5 7530U, Vega 7 | Lenovo ThinkPad E14 G5-21JSS05C00 R7 7730U, Vega 8 | Asus ZenBook 14 UM3402Y R7 7730U, Vega 8 | |
|---|---|---|---|---|---|
| Heat | -1% | 7% | 2% | 4% | |
| Maximum Upper Side * (°C) | 43 | 39 9% | 35.2 18% | 42.6 1% | 39.4 8% |
| Maximum Bottom * (°C) | 51 | 46.3 9% | 38.2 25% | 55.3 -8% | 43.2 15% |
| Idle Upper Side * (°C) | 27 | 26.3 3% | 31.2 -16% | 25.8 4% | 28.6 -6% |
| Idle Bottom * (°C) | 30 | 37.5 -25% | 30.4 -1% | 27.4 9% | 30.6 -2% |
* ... smaller is better
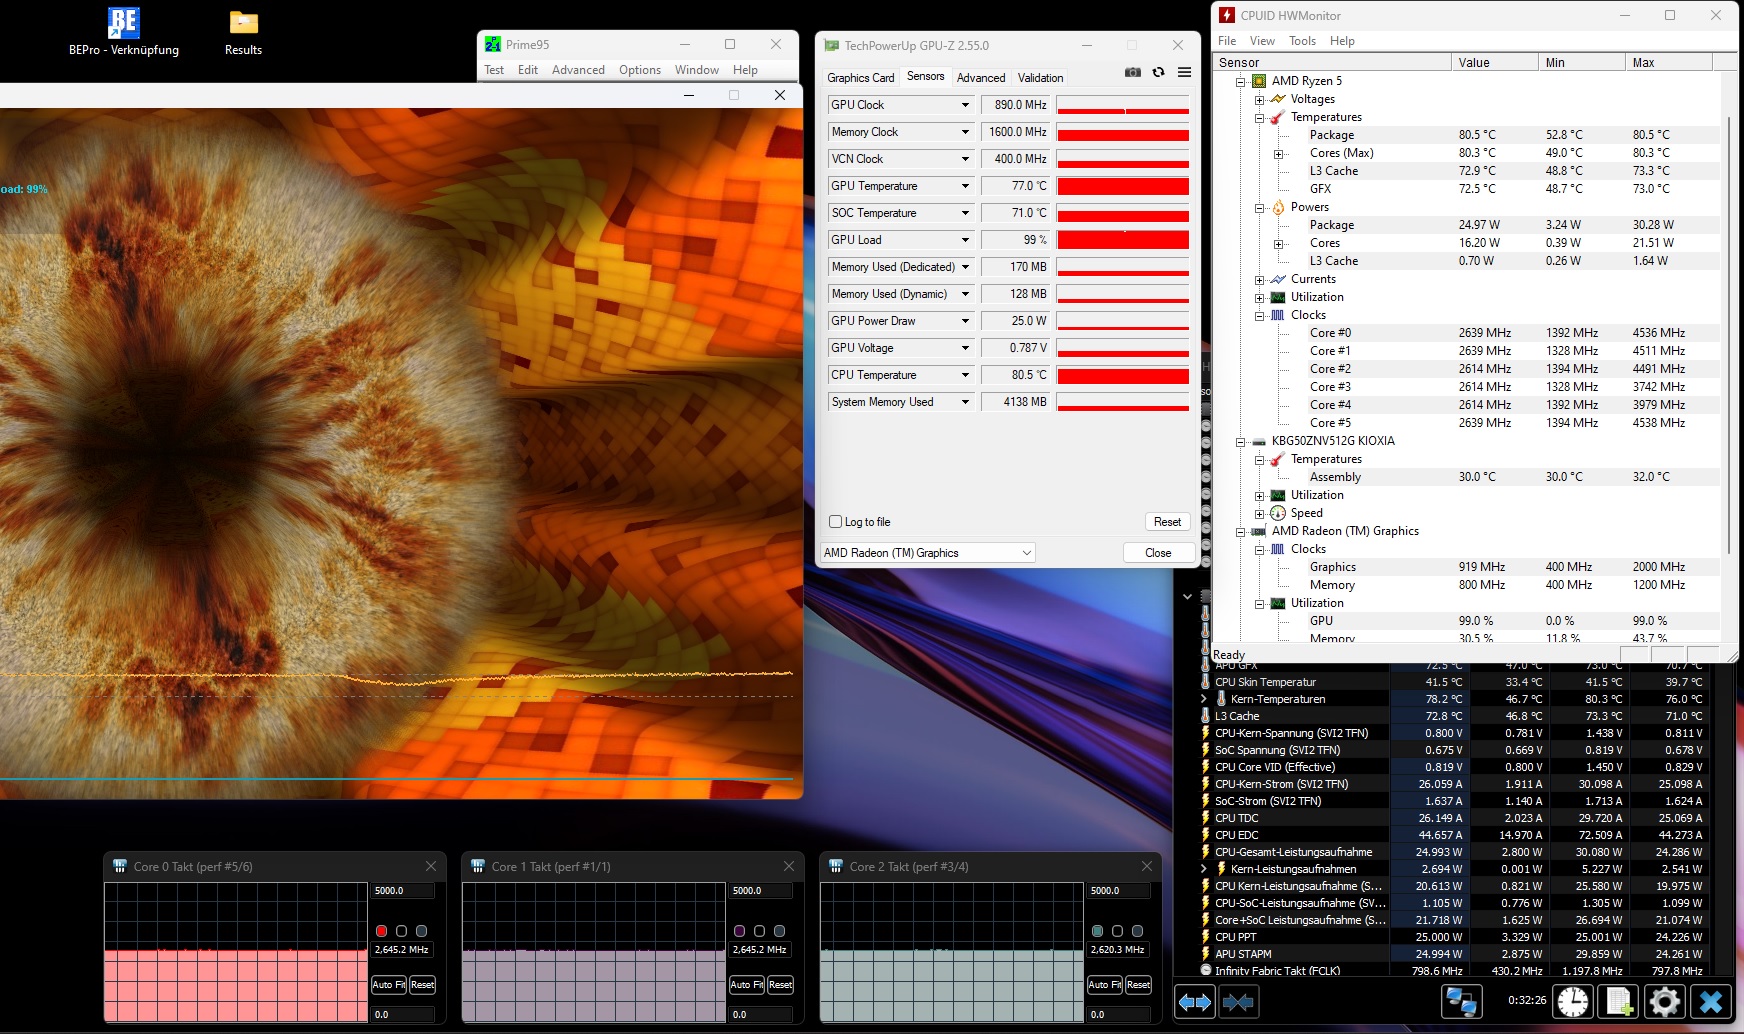
Stress test
We did not notice any throttling even under full load, around 2.6 GHz for the CPU is a decent value. An average temperature of 80 °C also does not give reason for criticism in such extreme situations.
Speaker
HP ProBook 445 G10 audio analysis
(±) | speaker loudness is average but good (76 dB)
Bass 100 - 315 Hz
(-) | nearly no bass - on average 28.2% lower than median
(±) | linearity of bass is average (10.9% delta to prev. frequency)
Mids 400 - 2000 Hz
(+) | balanced mids - only 2.3% away from median
(+) | mids are linear (5.3% delta to prev. frequency)
Highs 2 - 16 kHz
(±) | higher highs - on average 5.6% higher than median
(+) | highs are linear (4.8% delta to prev. frequency)
Overall 100 - 16.000 Hz
(±) | linearity of overall sound is average (23.9% difference to median)
Compared to same class
» 68% of all tested devices in this class were better, 9% similar, 23% worse
» The best had a delta of 7%, average was 21%, worst was 53%
Compared to all devices tested
» 72% of all tested devices were better, 6% similar, 22% worse
» The best had a delta of 4%, average was 24%, worst was 134%
Lenovo ThinkPad L14 G4 21H6S00900 audio analysis
(±) | speaker loudness is average but good (78.5 dB)
Bass 100 - 315 Hz
(-) | nearly no bass - on average 22% lower than median
(±) | linearity of bass is average (12% delta to prev. frequency)
Mids 400 - 2000 Hz
(+) | balanced mids - only 4.6% away from median
(+) | mids are linear (4.7% delta to prev. frequency)
Highs 2 - 16 kHz
(+) | balanced highs - only 2% away from median
(+) | highs are linear (4.4% delta to prev. frequency)
Overall 100 - 16.000 Hz
(±) | linearity of overall sound is average (20.1% difference to median)
Compared to same class
» 42% of all tested devices in this class were better, 10% similar, 47% worse
» The best had a delta of 7%, average was 21%, worst was 53%
Compared to all devices tested
» 52% of all tested devices were better, 8% similar, 40% worse
» The best had a delta of 4%, average was 24%, worst was 134%
Energy management
Power consumption
The power consumption is not out of line: 7 to 9 watts at idle and 34 to 47 watts under load are typical for an office notebook of this performance class.
| Off / Standby | |
| Idle | |
| Load |
|
Key:
min: | |
| HP ProBook 445 G10 R5 7530U, Vega 7 | Lenovo ThinkPad L14 G4 21H6S00900 R5 7530U, Vega 7 | Dell Inspiron 14 7435 2-in-1 R5 7530U, Vega 7 | Lenovo ThinkPad E14 G5-21JSS05C00 R7 7730U, Vega 8 | Asus ZenBook 14 UM3402Y R7 7730U, Vega 8 | Average of class Office | |
|---|---|---|---|---|---|---|
| Power Consumption | 9% | -16% | -5% | -31% | -3% | |
| Idle Minimum * (Watt) | 7 | 3.5 50% | 5.3 24% | 3.3 53% | 7.9 -13% | 4.44 ? 37% |
| Idle Average * (Watt) | 8 | 7.2 10% | 9.1 -14% | 7.6 5% | 8.8 -10% | 7.38 ? 8% |
| Idle Maximum * (Watt) | 9 | 7.6 16% | 9.4 -4% | 8.9 1% | 14.7 -63% | 8.59 ? 5% |
| Load Average * (Watt) | 34 | 32.2 5% | 54.9 -61% | 47.3 -39% | 46.9 -38% | 43 ? -26% |
| Witcher 3 ultra * (Watt) | 36.2 | 35.7 1% | 45 -24% | 45.1 -25% | 44.9 -24% | |
| Load Maximum * (Watt) | 47 | 61.3 -30% | 55.8 -19% | 57.8 -23% | 65.2 -39% | 64.5 ? -37% |
* ... smaller is better
Power consumtion Witcher 3 / Stresstest
Power consumtion with external monitor
Battery life
Although the ProBook 445 offers the smallest battery in the test field (only 42 Wh instead of 54 to 75 Wh), the runtime is quite respectable. 9.5 hours of Internet surfing via WLAN with reduced brightness of 150 cd/m² are reminiscent of Lenovo's ThinkPad E14, which manages almost 10 hours.
| HP ProBook 445 G10 R5 7530U, Vega 7, 42 Wh | Lenovo ThinkPad L14 G4 21H6S00900 R5 7530U, Vega 7, 57 Wh | Dell Inspiron 14 7435 2-in-1 R5 7530U, Vega 7, 54 Wh | Lenovo ThinkPad E14 G5-21JSS05C00 R7 7730U, Vega 8, 57 Wh | Asus ZenBook 14 UM3402Y R7 7730U, Vega 8, 75 Wh | Average of class Office | |
|---|---|---|---|---|---|---|
| Battery runtime | 43% | 17% | 4% | 27% | 36% | |
| WiFi v1.3 (h) | 9.5 | 13.6 43% | 11.1 17% | 9.9 4% | 12.1 27% | 12.9 ? 36% |
| Load (h) | 1.3 | 2 | 1.2 | 3.4 | 1.807 ? | |
| Reader / Idle (h) | 19.9 | 18.5 | 23.7 ? | |||
| H.264 (h) | 10.8 | 15 ? |
Pros
Cons
Verdict
For just under 800 Euros, HP sells a mid-range office laptop with the ProBook 445 G10.
Even though the Ryzen 5 7530U is still based on the old Zen 3 architecture, the performance (apart from the iGPU) is relatively convincing in relation to consumption.
The rest of the performance leaves mixed feelings. The case is by no means bad, but compared to some rivals or other HP models like the ZBook Firefly 14 G10, it should be even more stable and feel more high-quality. The situation is similar for the input devices. HP could also improve the connectivity (no card reader, no USB 4) and the sound quality.
Plus points are mainly awarded for the chic design, the low weight, and the bright (albeit weak) display.
Especially the competitors from Lenovo (ThinkPad L14 G4 & ThinkPad E14 G5) could achieve a higher overall rating in the test. The rating of the ProBook 445 G10 is more in line with the Dell Inspiron 14 7435 and Asus ZenBook 14.
Price and availability
The reviewed HP ProBook 445 G10 with Ryzen 5 7530U is available from various online stores. In the US, interested users can order the model via Amazon for around $640.
HP ProBook 445 G10
- 10/11/2023 v7 (old)
Florian Glaser
Transparency
The selection of devices to be reviewed is made by our editorial team. The test sample was provided to the author as a loan by the manufacturer or retailer for the purpose of this review. The lender had no influence on this review, nor did the manufacturer receive a copy of this review before publication. There was no obligation to publish this review. As an independent media company, Notebookcheck is not subjected to the authority of manufacturers, retailers or publishers.
This is how Notebookcheck is testing
Every year, Notebookcheck independently reviews hundreds of laptops and smartphones using standardized procedures to ensure that all results are comparable. We have continuously developed our test methods for around 20 years and set industry standards in the process. In our test labs, high-quality measuring equipment is utilized by experienced technicians and editors. These tests involve a multi-stage validation process. Our complex rating system is based on hundreds of well-founded measurements and benchmarks, which maintains objectivity. Further information on our test methods can be found here.
Price comparison

