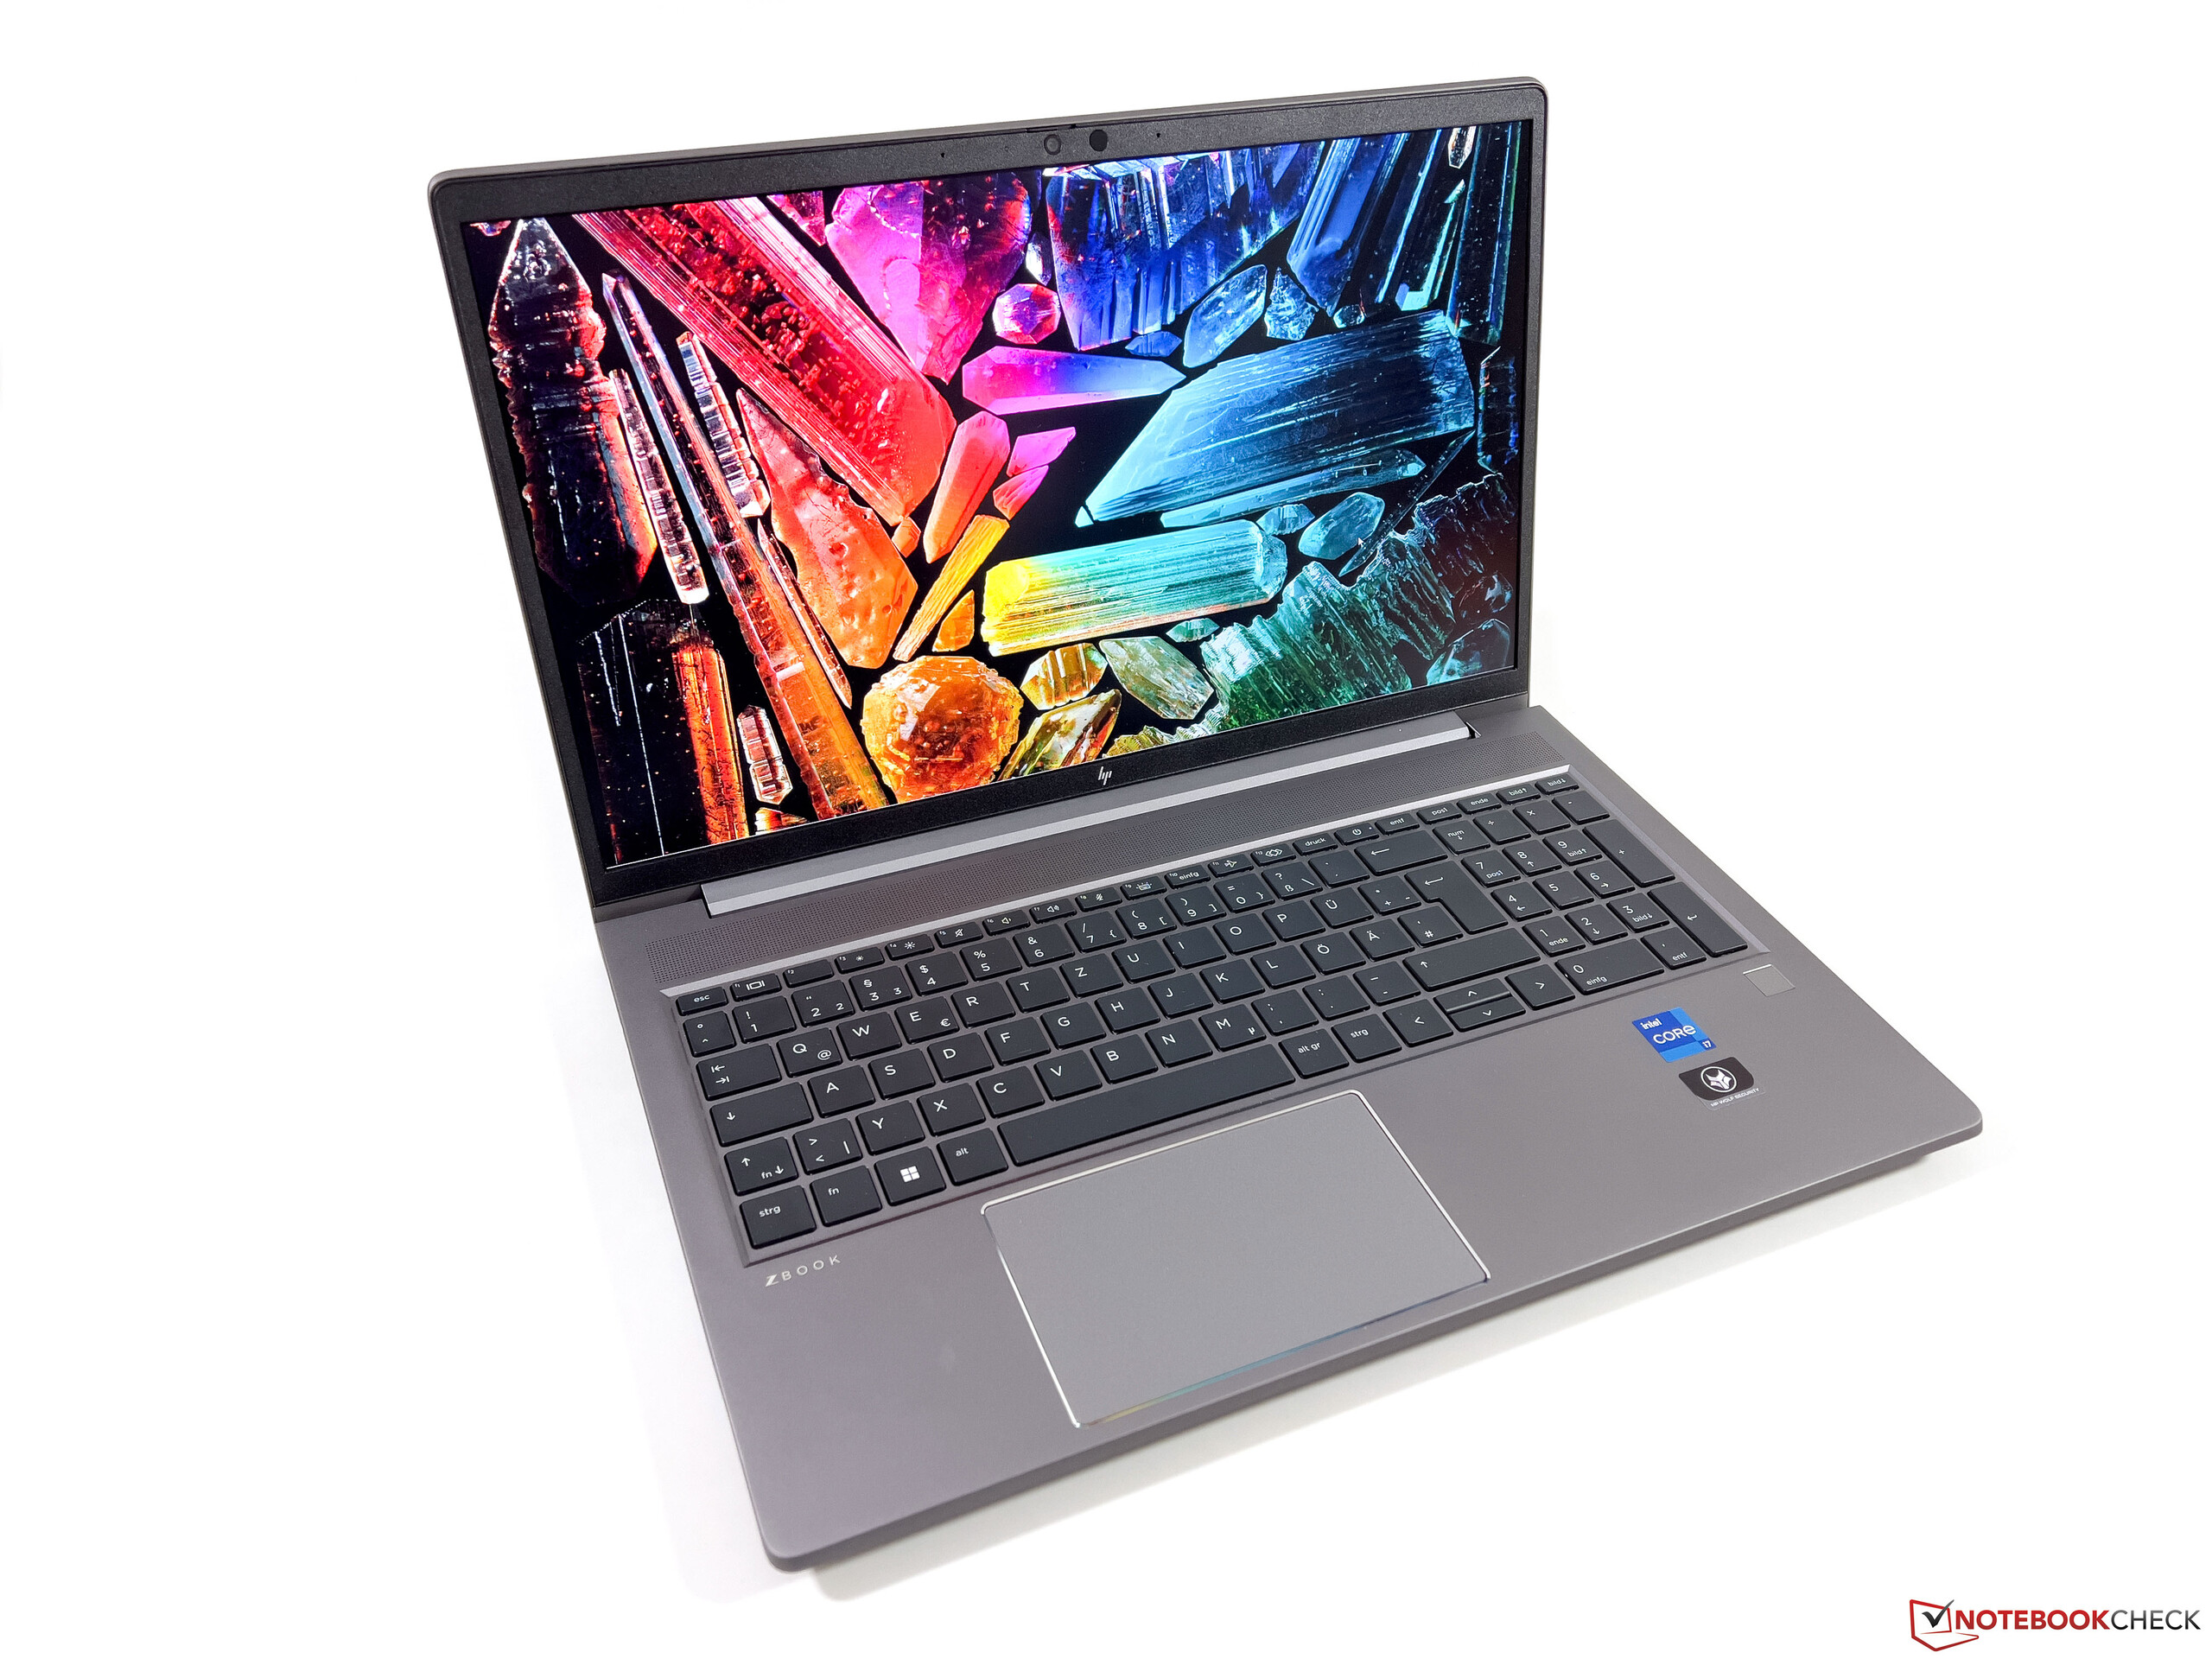
HP ZBook Power 15 G10 workstation review: Excellent alternative to the ThinkPad P15v

The HP ZBook Power 15 G10 replaces last year's ZBook Power 15 G9 by swapping out the Alder Lake 12th gen Intel CPUs for newer Raptor Lake 13th gen and AMD Ryzen Zen 4 options. The chassis is otherwise identical to the ZBook Power 15 G9 or ZBook Power 15 G8 and so we recommend checking out our older reviews to learn more about the physical features of the model.
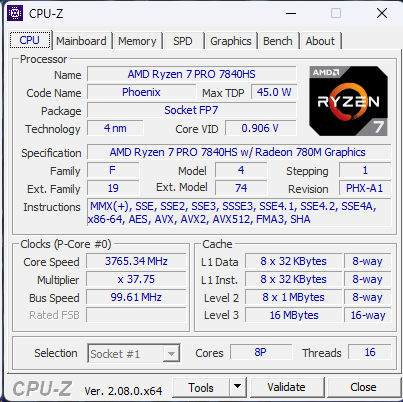
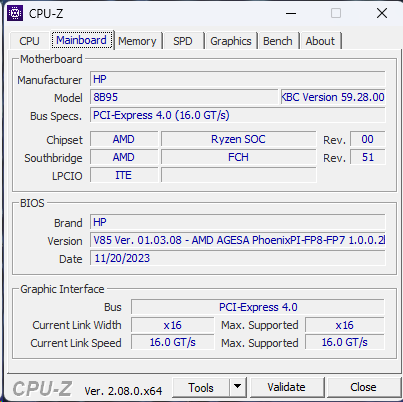
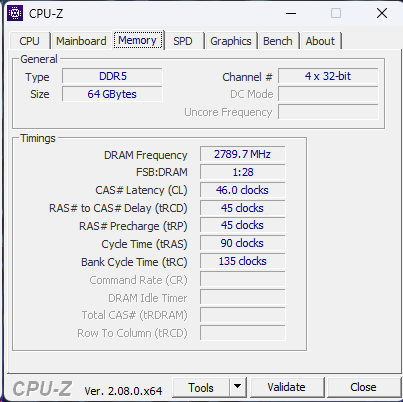
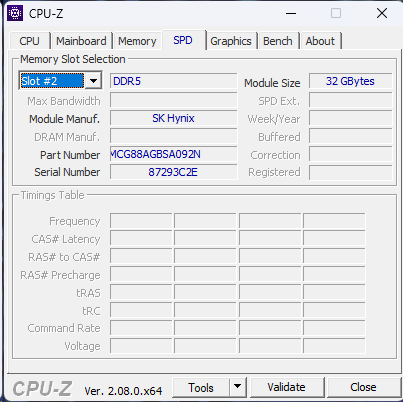
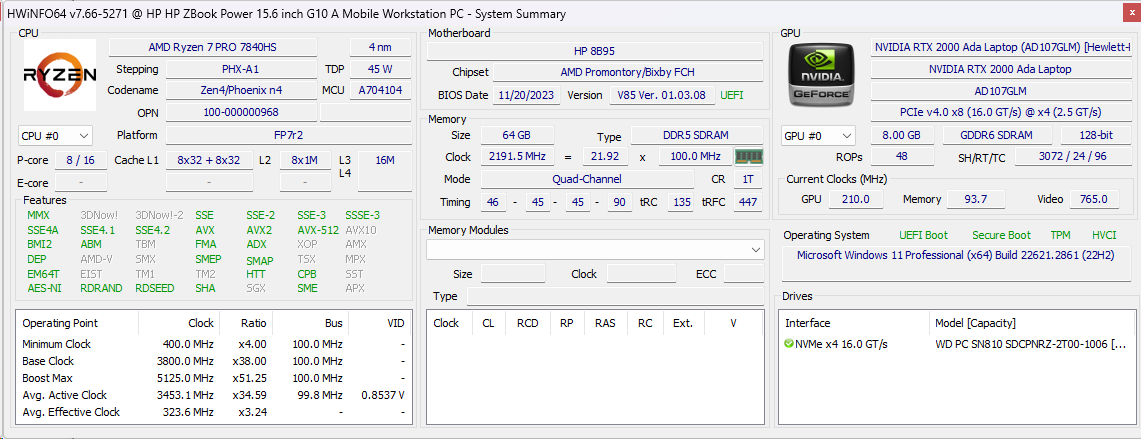
Our specific review unit is the highest-end AMD configuration with the Ryzen 7 Pro 7940HS CPU, Nvidia RTX 2000 Ada GPU, 1440p IPS display, and 64 GB of DDR5-5600 RAM for approximately $2600 USD. Lesser SKUs starting with the Ryzen 5 7640HS, 1080p display, and only integrated graphics are also available for as low as $1600. Note that configurations with Intel CPUs are called ZBook Power 15 G10 while those with AMD CPUs are sold as the ZBook Power 15 G10 A.
Alternatives to the ZBook Power 15 G10 include other ultrathin workstations like the Dell Precision 5560, Lenovo ThinkPad P15v G3, or Asus ExpertBook B6 Flip.
More HP reviews:
Potential Competitors in Comparison
Rating | Date | Model | Weight | Height | Size | Resolution | Price |
|---|---|---|---|---|---|---|---|
| 88.9 % v7 (old) | 12 / 2023 | HP ZBook Power 15 G10 R7 PRO 7840HS, RTX 2000 Ada Generation Laptop | 2 kg | 22.9 mm | 15.60" | 2560x1440 | |
| 87.4 % v7 (old) | 01 / 2023 | HP ZBook Power 15 G9 6B8C4EA i7-12700H, RTX A2000 Laptop GPU | 2 kg | 22.8 mm | 15.60" | 3840x2160 | |
| 87.8 % v7 (old) | 04 / 2023 | Lenovo ThinkPad P15v G3 21EM001AGE R7 PRO 6850H, RTX A2000 Laptop GPU | 2.2 kg | 22.7 mm | 15.60" | 3840x2160 | |
| 88.3 % v7 (old) | 10 / 2021 | Dell Precision 5000 5560 i7-11850H, RTX A2000 Laptop GPU | 2 kg | 18 mm | 15.60" | 3840x2400 | |
| 91.7 % v7 (old) | 10 / 2023 | Lenovo ThinkPad P1 G6-21FV000DGE i9-13900H, RTX 2000 Ada Generation Laptop | 1.9 kg | 17.5 mm | 16.00" | 2560x1600 | |
| 89.6 % v7 (old) | 01 / 2023 | Asus ExpertBook B6 Flip B6602FC2 i9-12950HX, RTX A2000 Laptop GPU | 2.8 kg | 27.2 mm | 16.00" | 2560x1600 |
Case
Communication
| Networking | |
| iperf3 transmit AX12 | |
| Dell Precision 5000 5560 | |
| iperf3 receive AX12 | |
| Dell Precision 5000 5560 | |
| iperf3 transmit AXE11000 | |
| HP ZBook Power 15 G10 | |
| Lenovo ThinkPad P1 G6-21FV000DGE | |
| Asus ExpertBook B6 Flip B6602FC2 | |
| Lenovo ThinkPad P15v G3 21EM001AGE | |
| iperf3 receive AXE11000 | |
| Lenovo ThinkPad P1 G6-21FV000DGE | |
| Lenovo ThinkPad P15v G3 21EM001AGE | |
| Asus ExpertBook B6 Flip B6602FC2 | |
| HP ZBook Power 15 G10 | |
| iperf3 transmit AXE11000 6GHz | |
| HP ZBook Power 15 G9 6B8C4EA | |
| HP ZBook Power 15 G10 | |
| Asus ExpertBook B6 Flip B6602FC2 | |
| Lenovo ThinkPad P15v G3 21EM001AGE | |
| iperf3 receive AXE11000 6GHz | |
| HP ZBook Power 15 G9 6B8C4EA | |
| Asus ExpertBook B6 Flip B6602FC2 | |
| Lenovo ThinkPad P15v G3 21EM001AGE | |
| HP ZBook Power 15 G10 | |
Webcam
Whereas our ZBook Power G9 was configured with a 1 MP webcam, our Power G10 comes with a 5 MP webcam instead for a much sharper picture. The IR and physical shutter features remain unchanged.


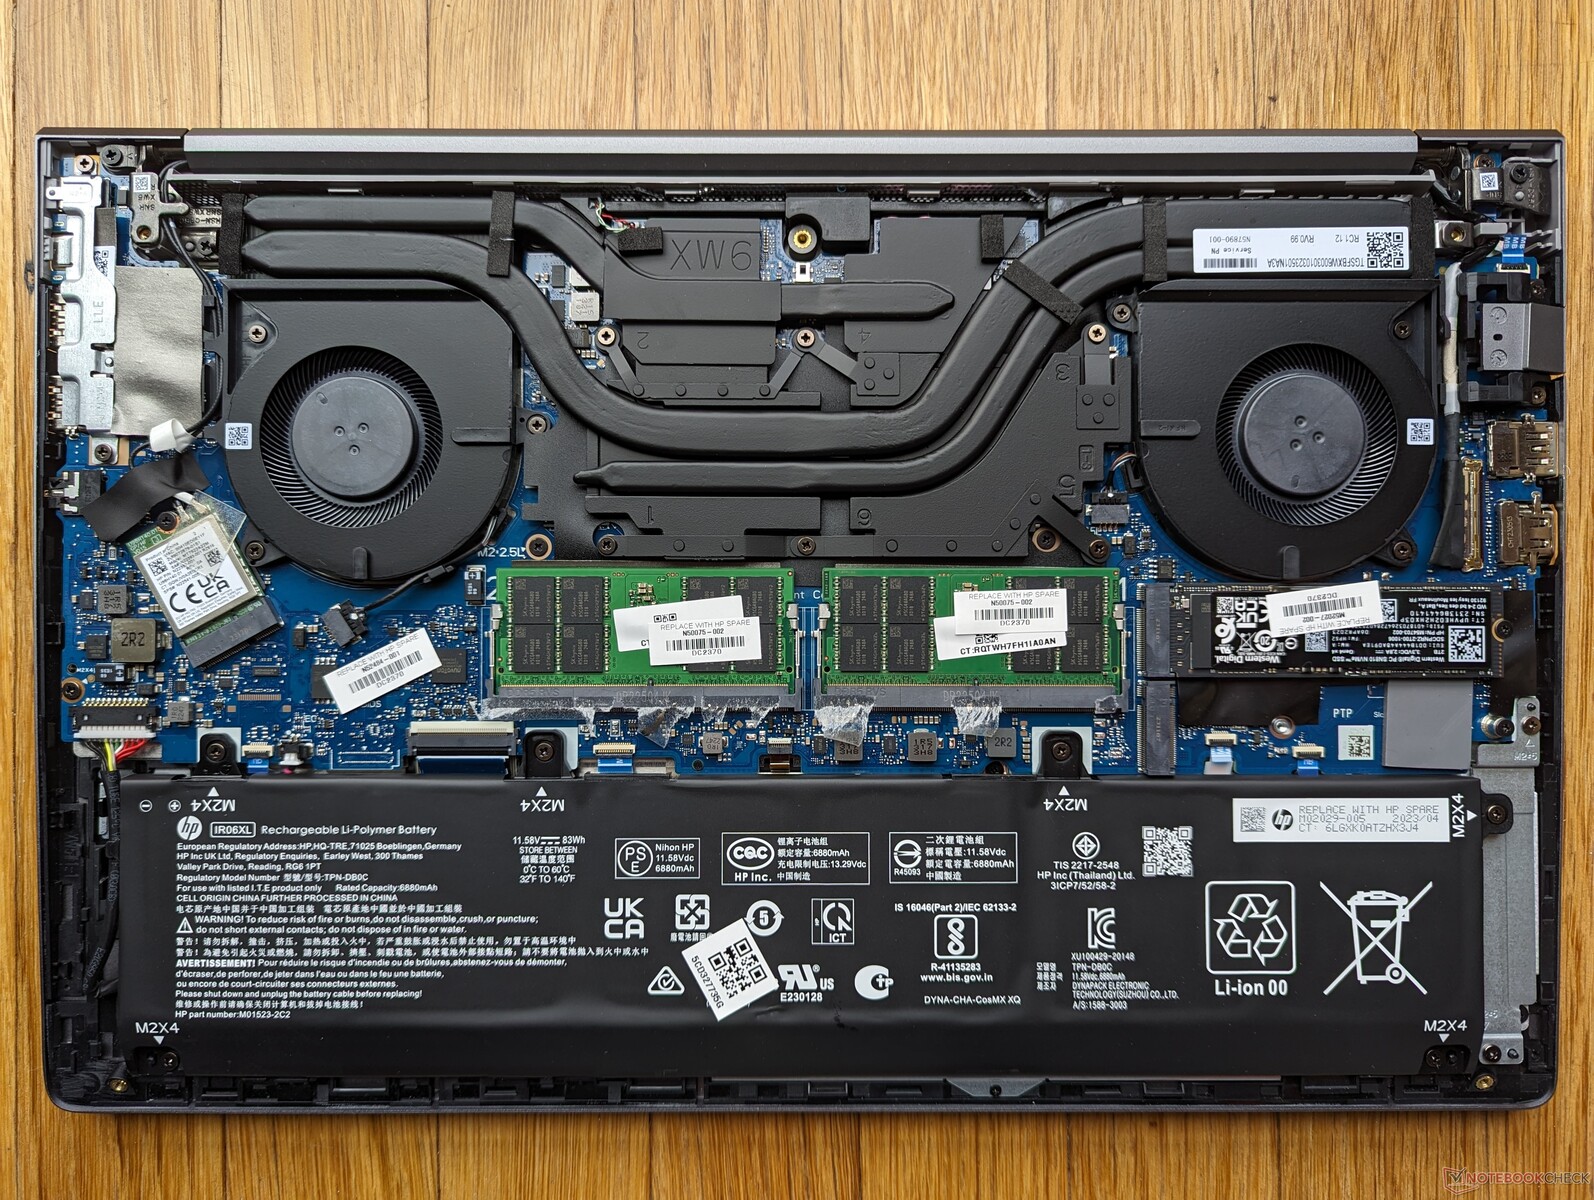
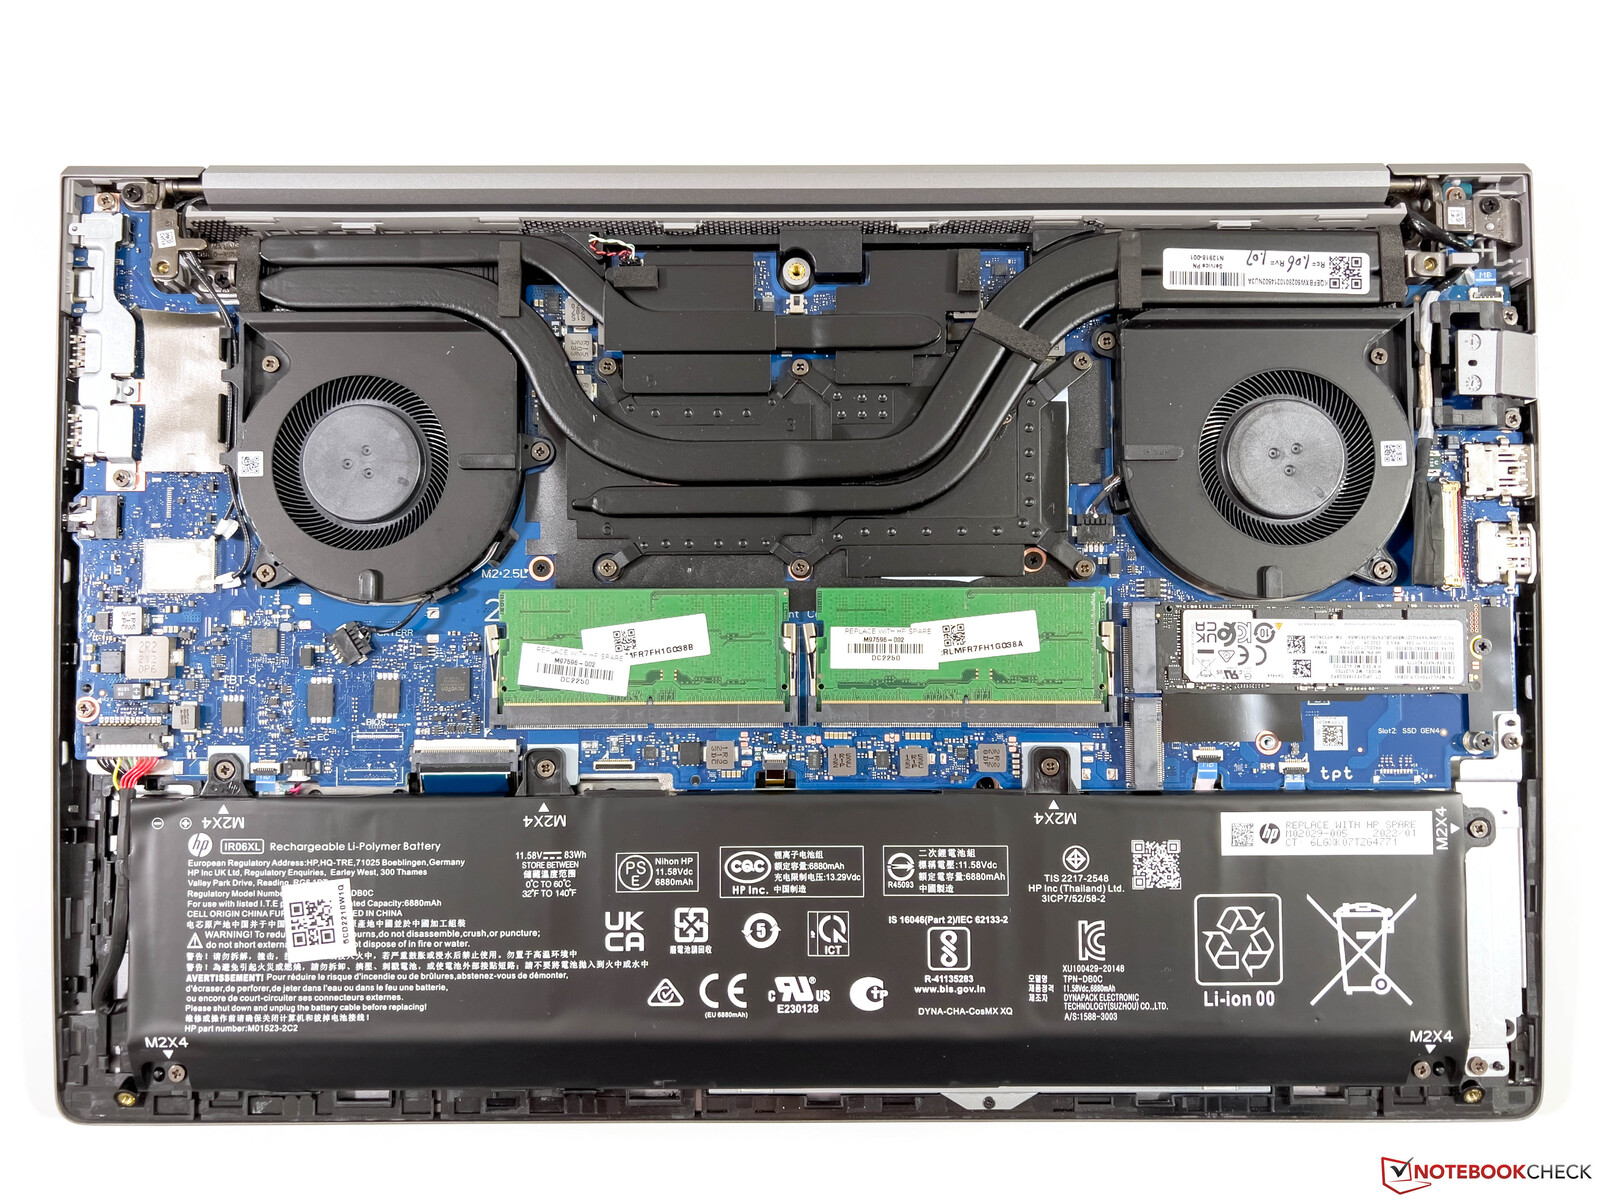
Maintenance
HP has made one small but notable change: the M.2 WLAN module is now replaceable whereas it was soldered on last year's ZBook Power 15 G9. Most everything else remains untouched including the two DDR5 SODIMM slots and two M.2 PCIe4 x4 slots.
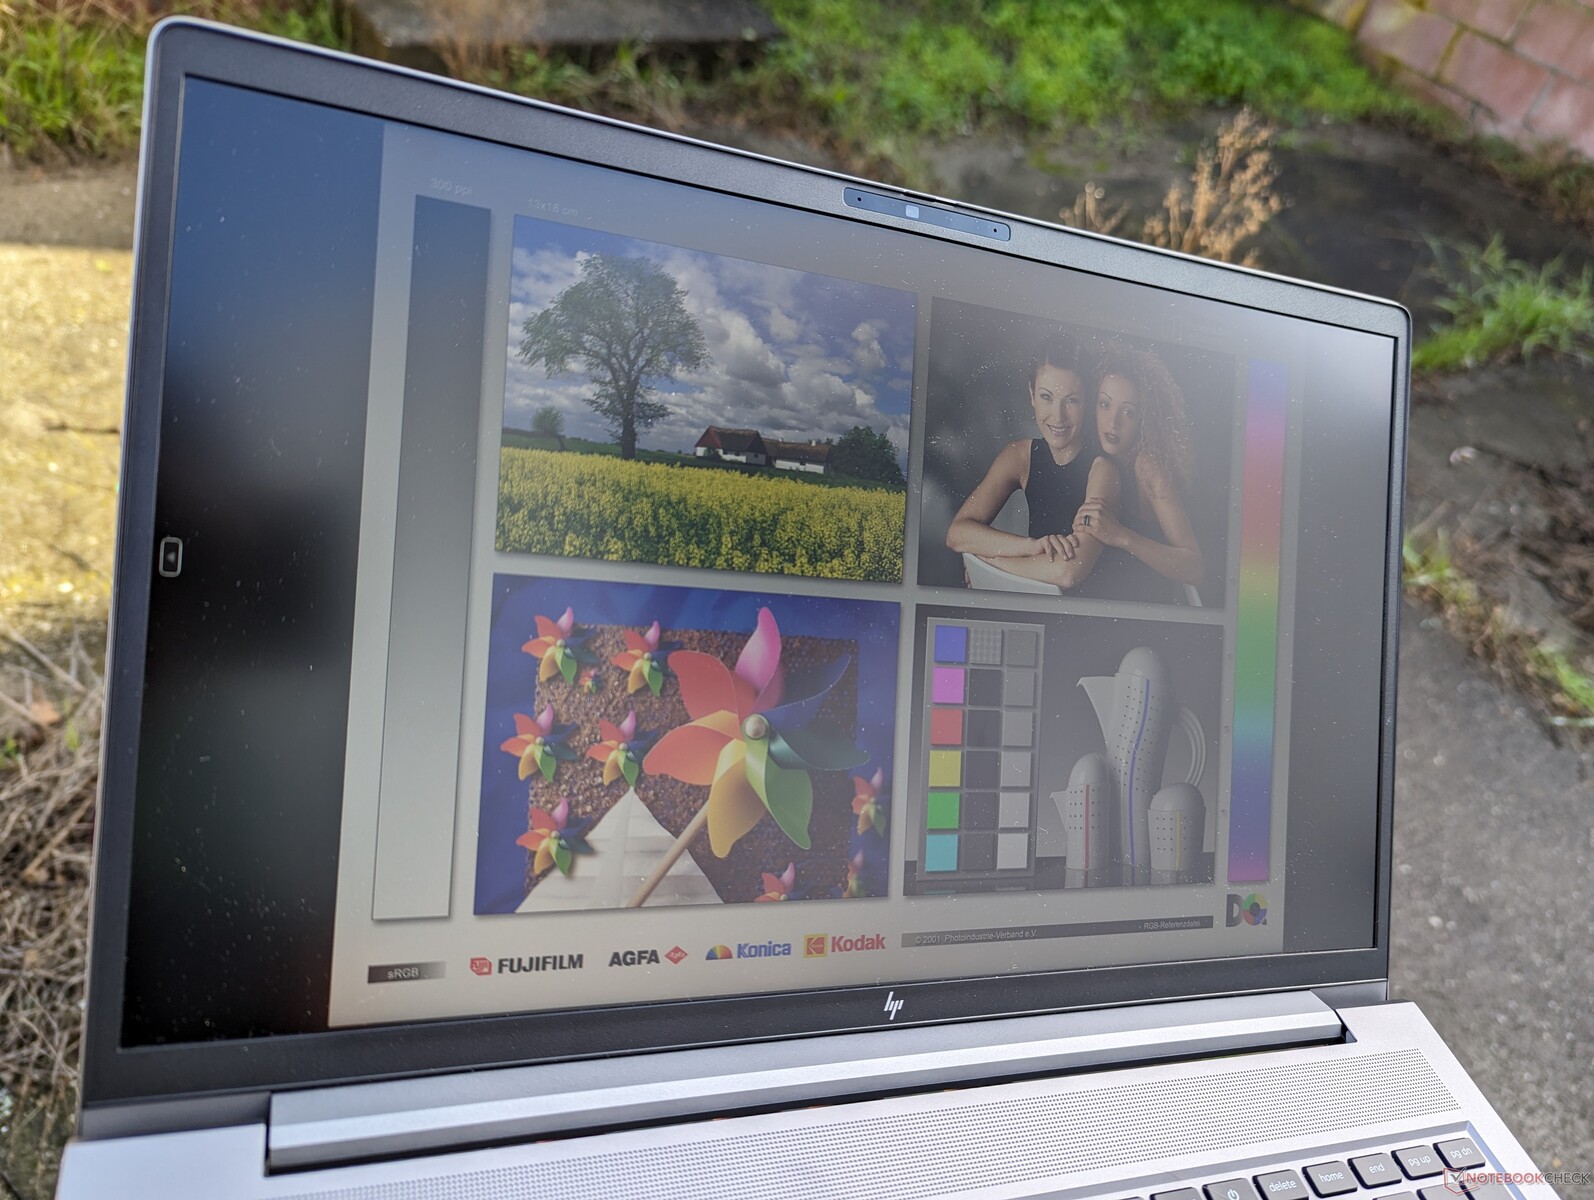
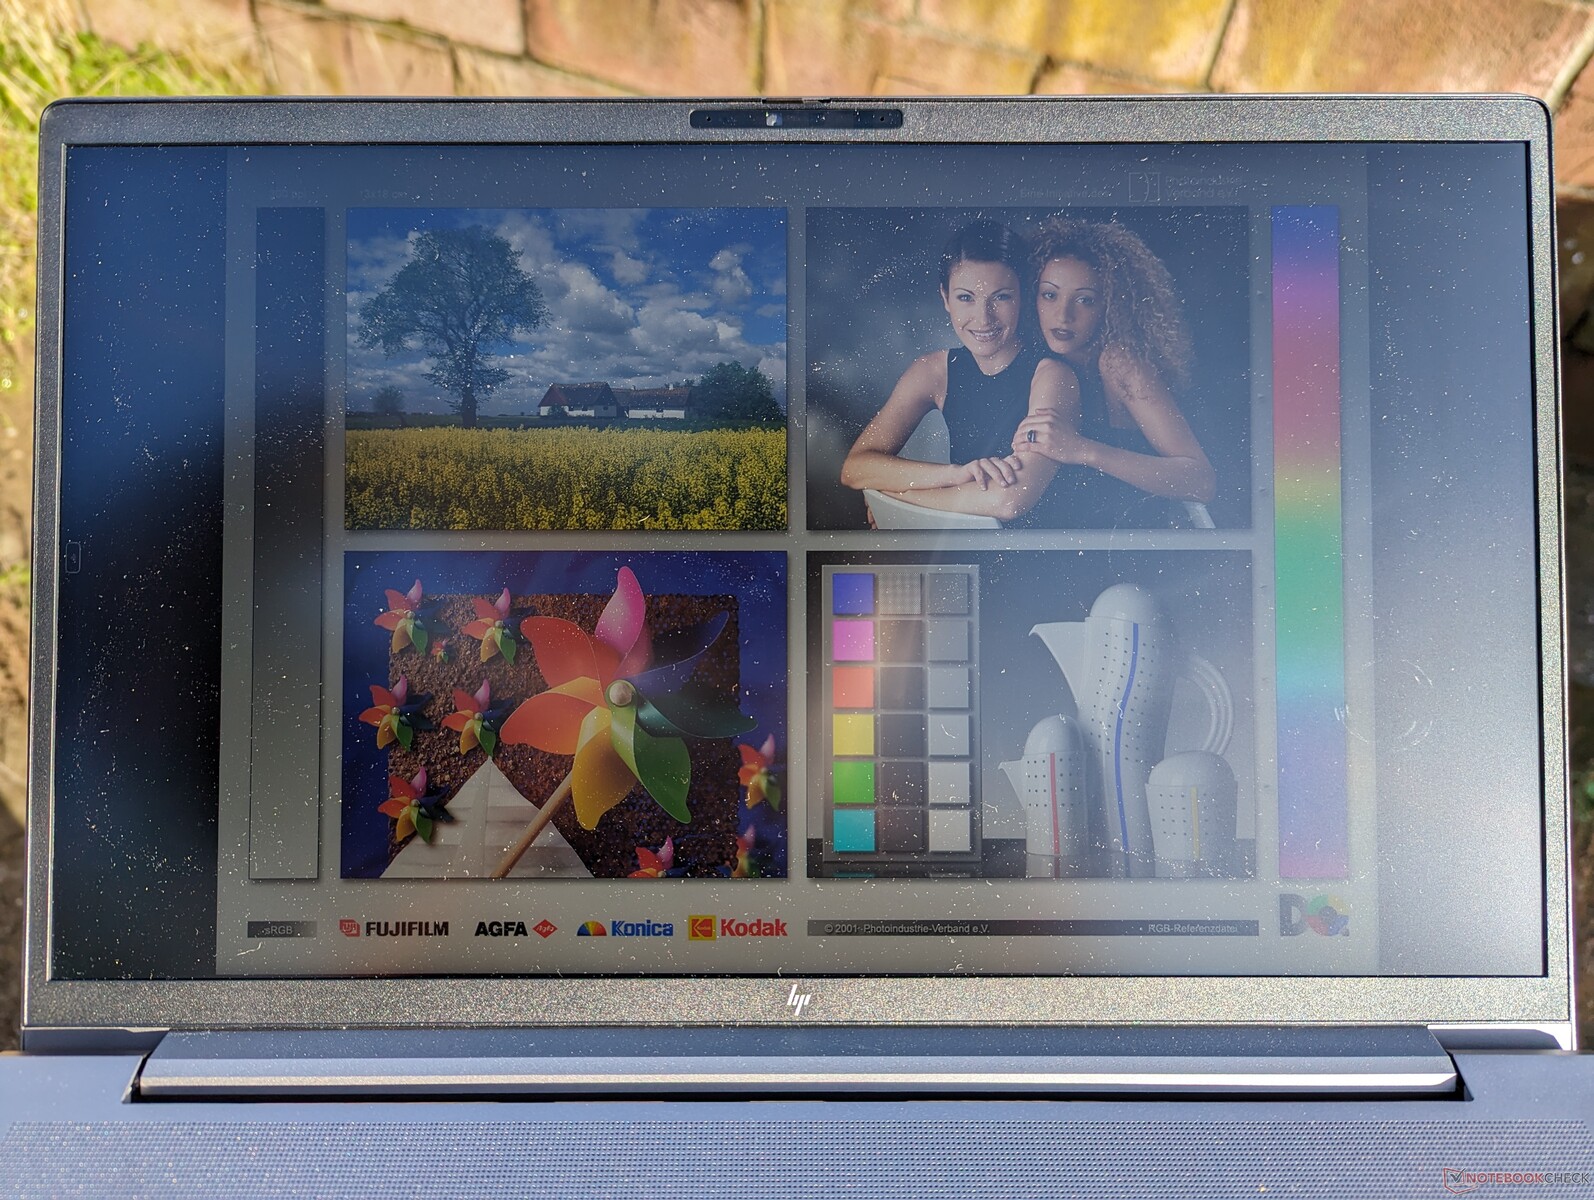
Display
The model offers four matte display options as follows:
- 1080p, 250 nits, 60% sRGB, touchscreen
- 1080p, 250 nits, 60% sRGB, non-touch
- 1080p, 400 nits, 100% sRGB, non-touch
- 1440p, 300 nits, 100% sRGB, non-touch, 120 Hz
Unless if touchscreen is a must, we recommend avoiding the two 250-nit options as they each cover only 45% of NTSC for noticeably shallower colors.
For reasons unknown, HP does not offer 4K options for any ZBook Power G10 configuration even though they were previously available on the ZBook Power G9. We suspect that this could be due to supply issues as manufacturers are currently moving away from 16:9 15.6-inch panels to 16:10 16-inch panels instead.
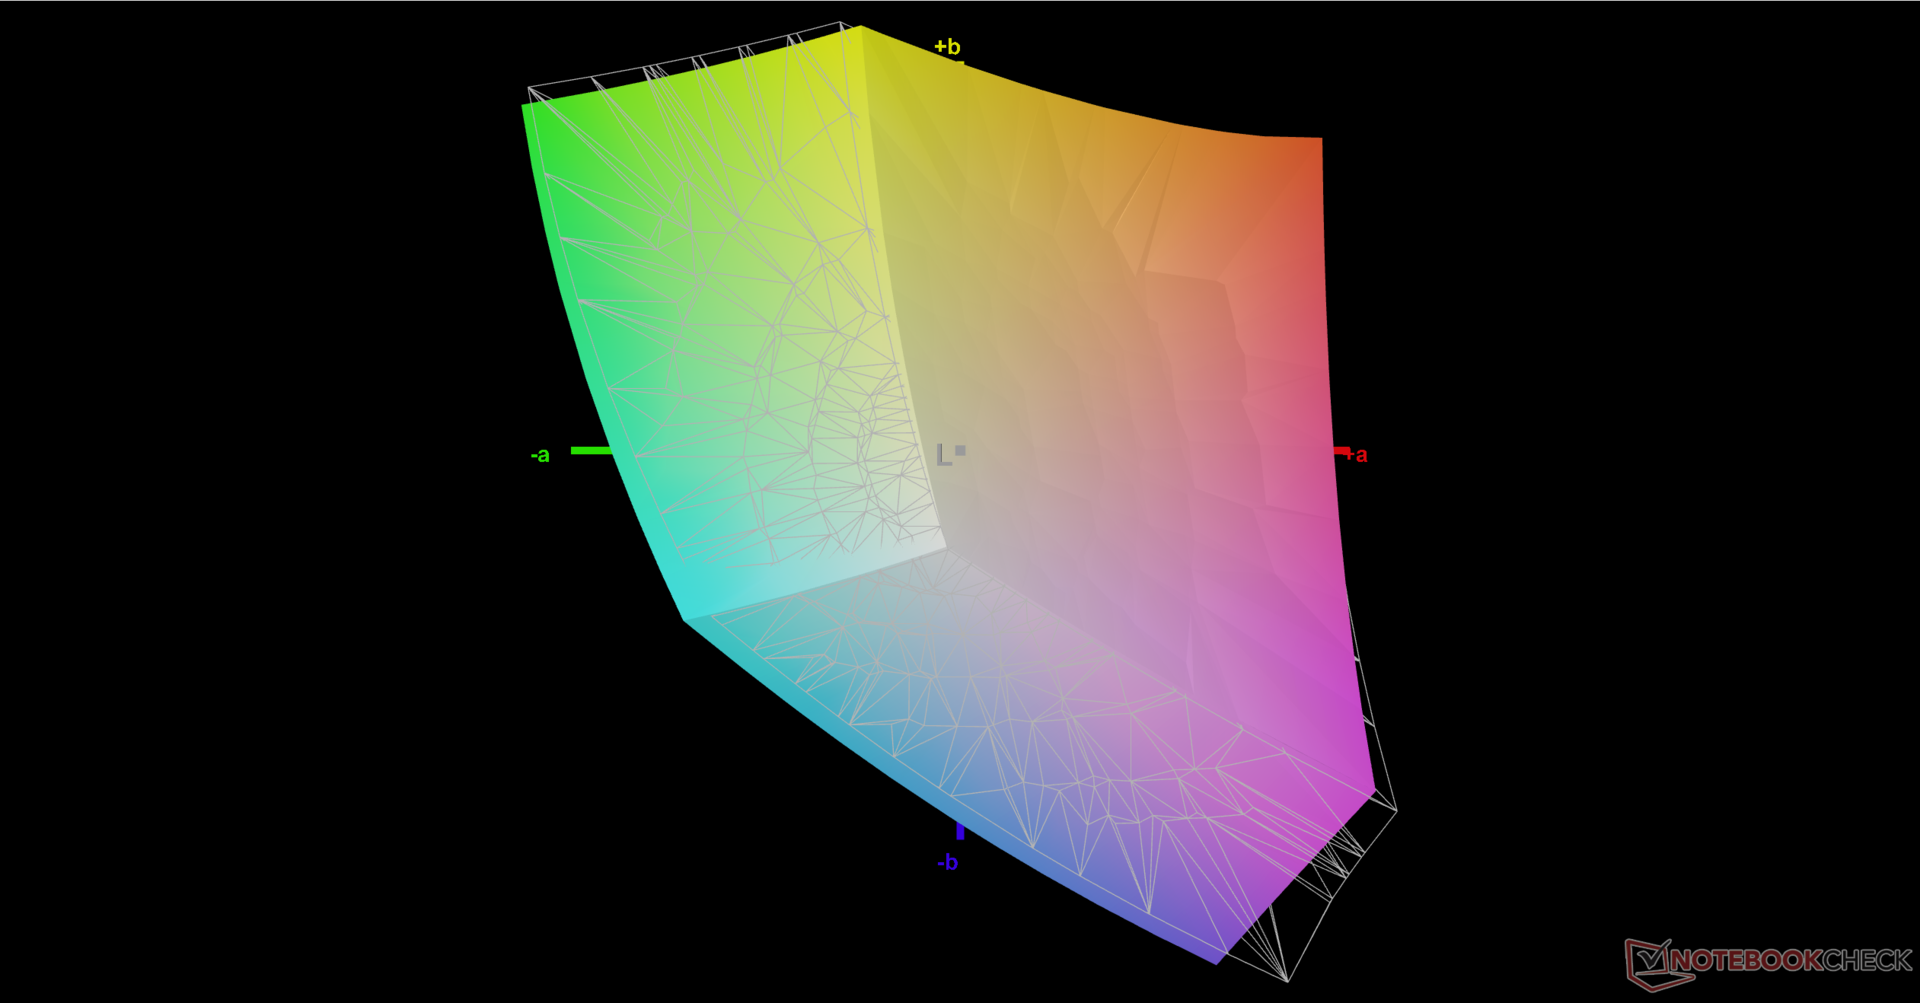
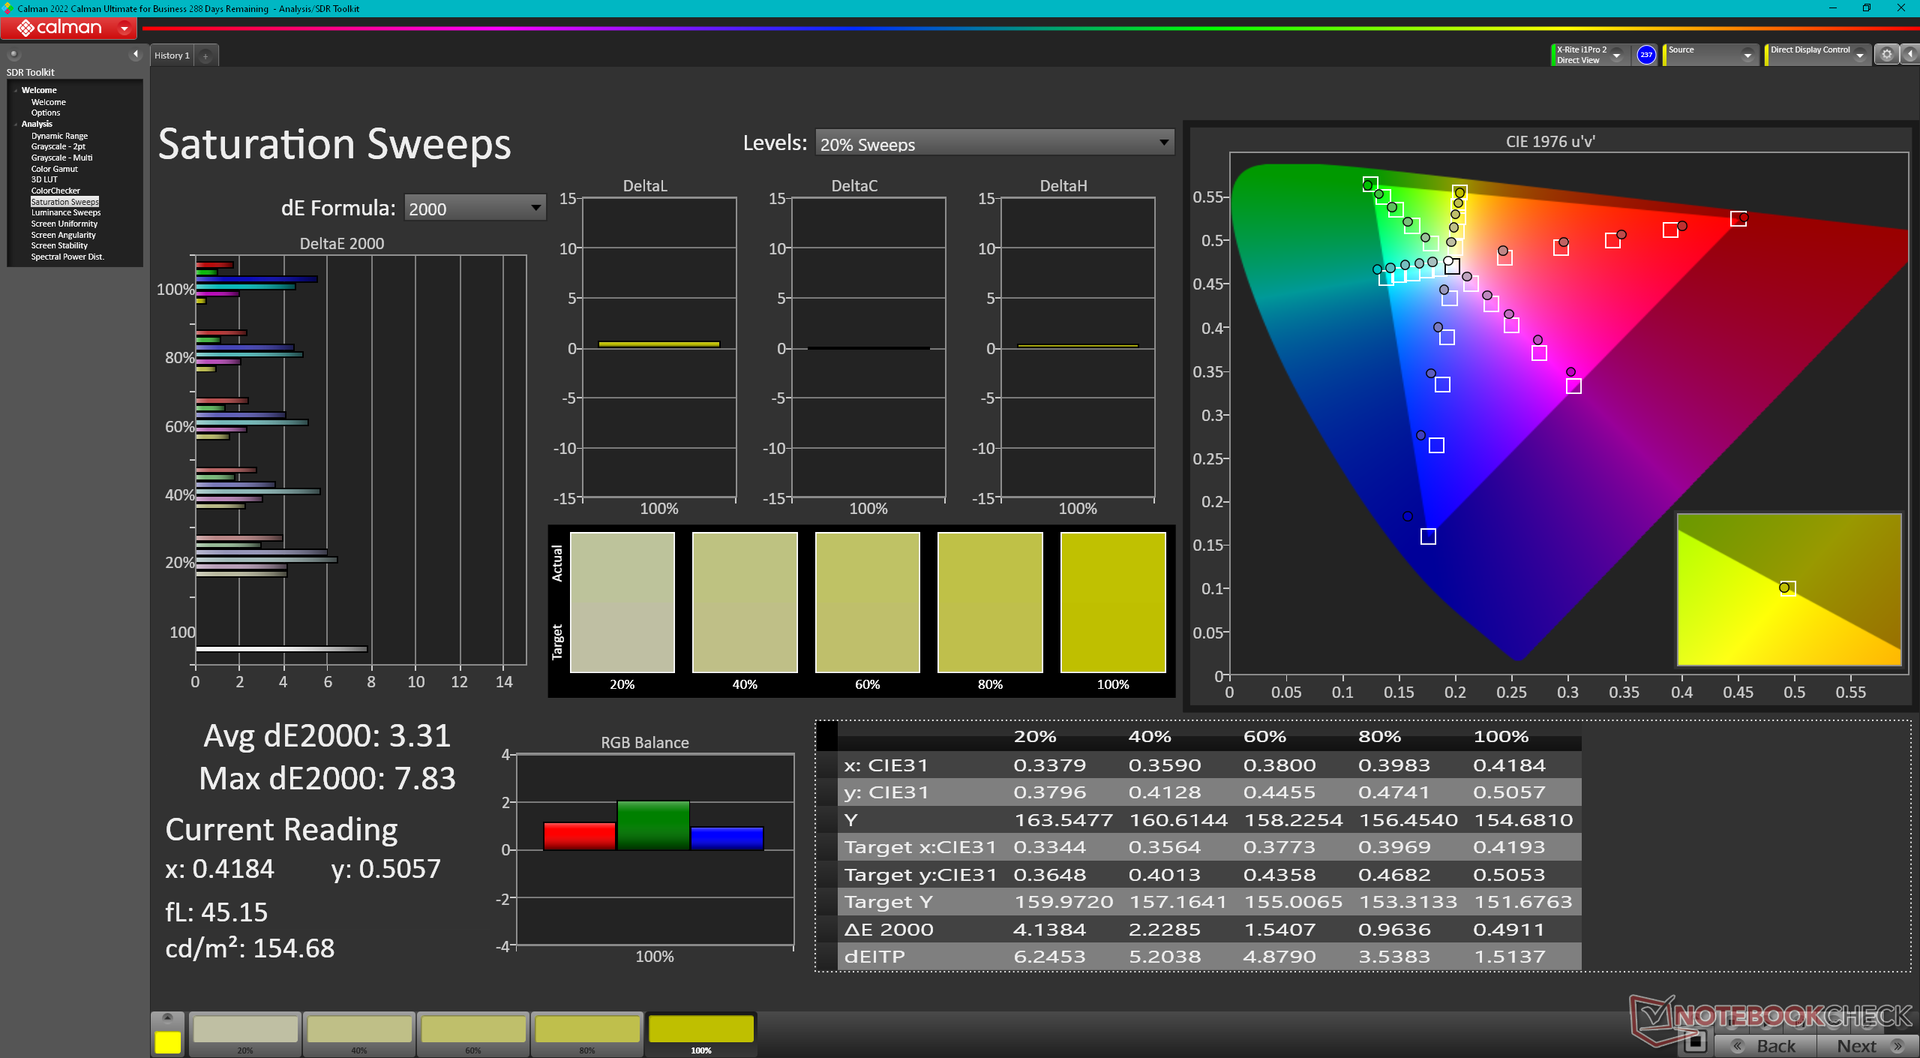
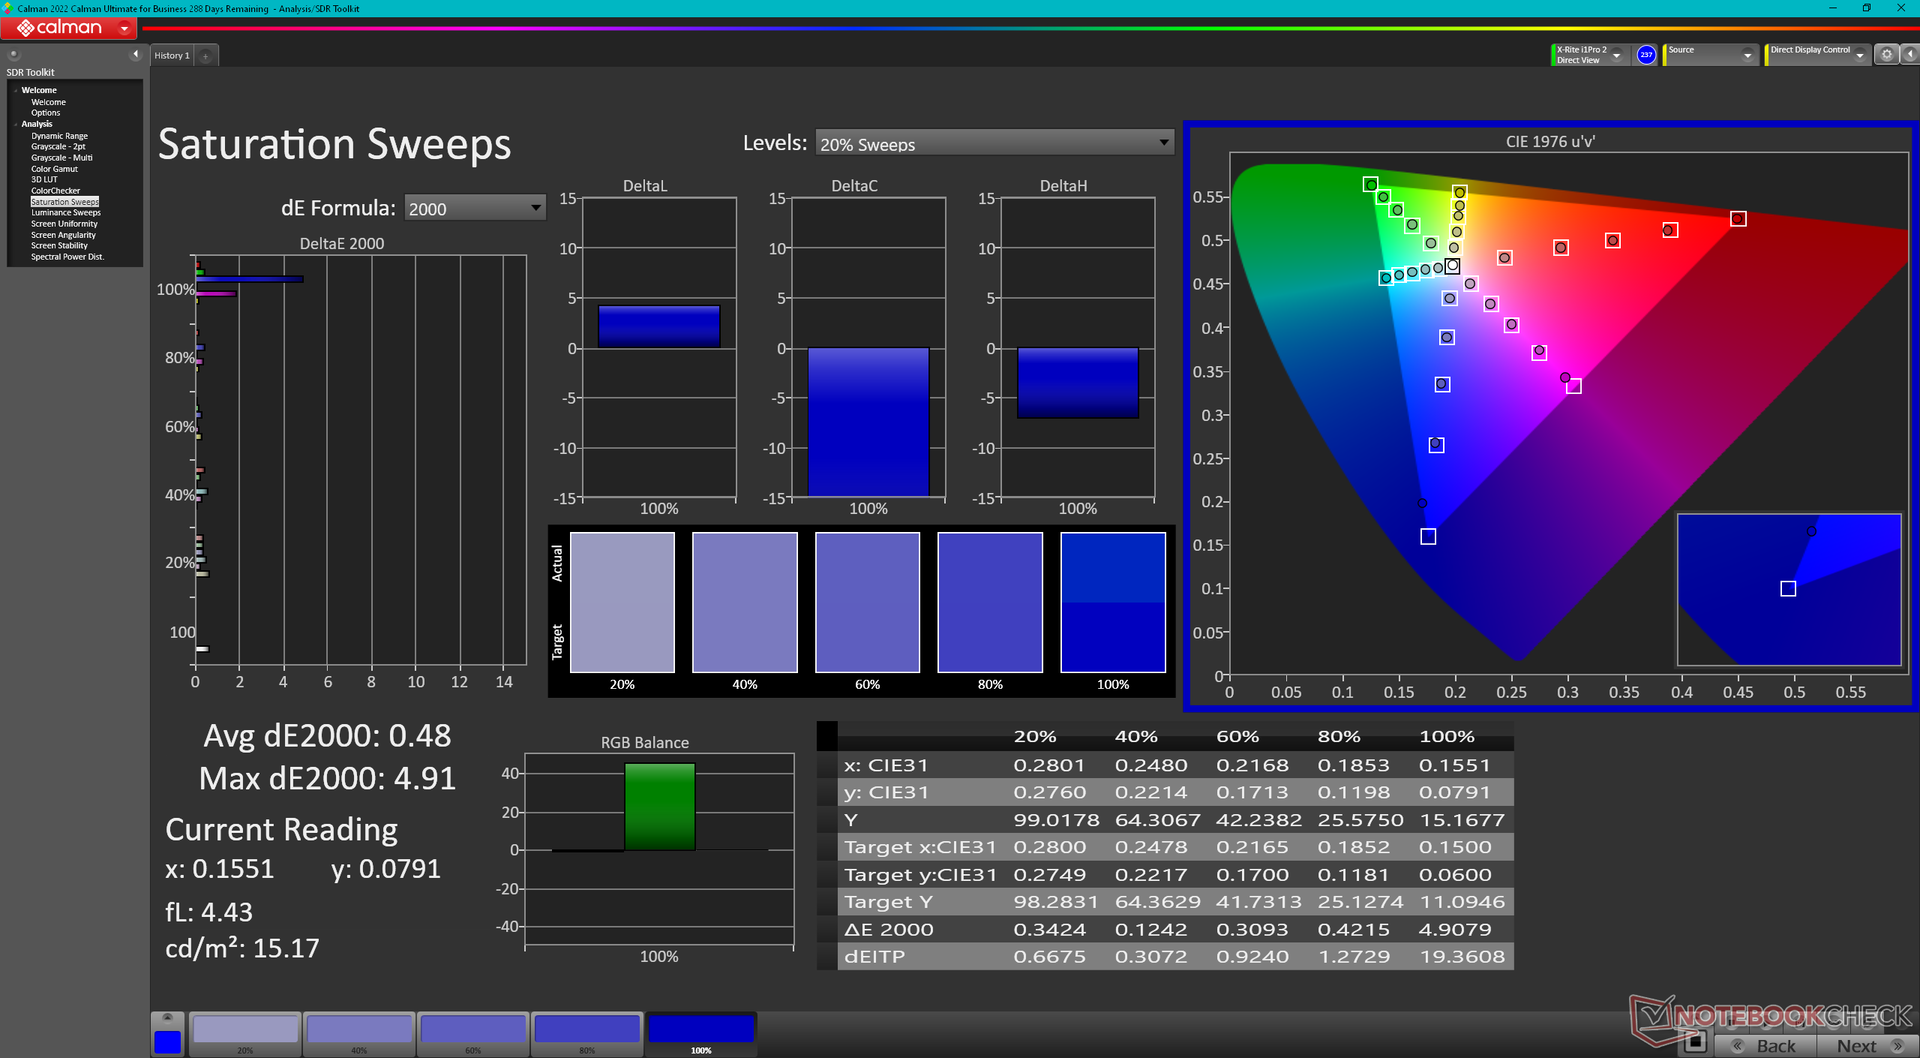
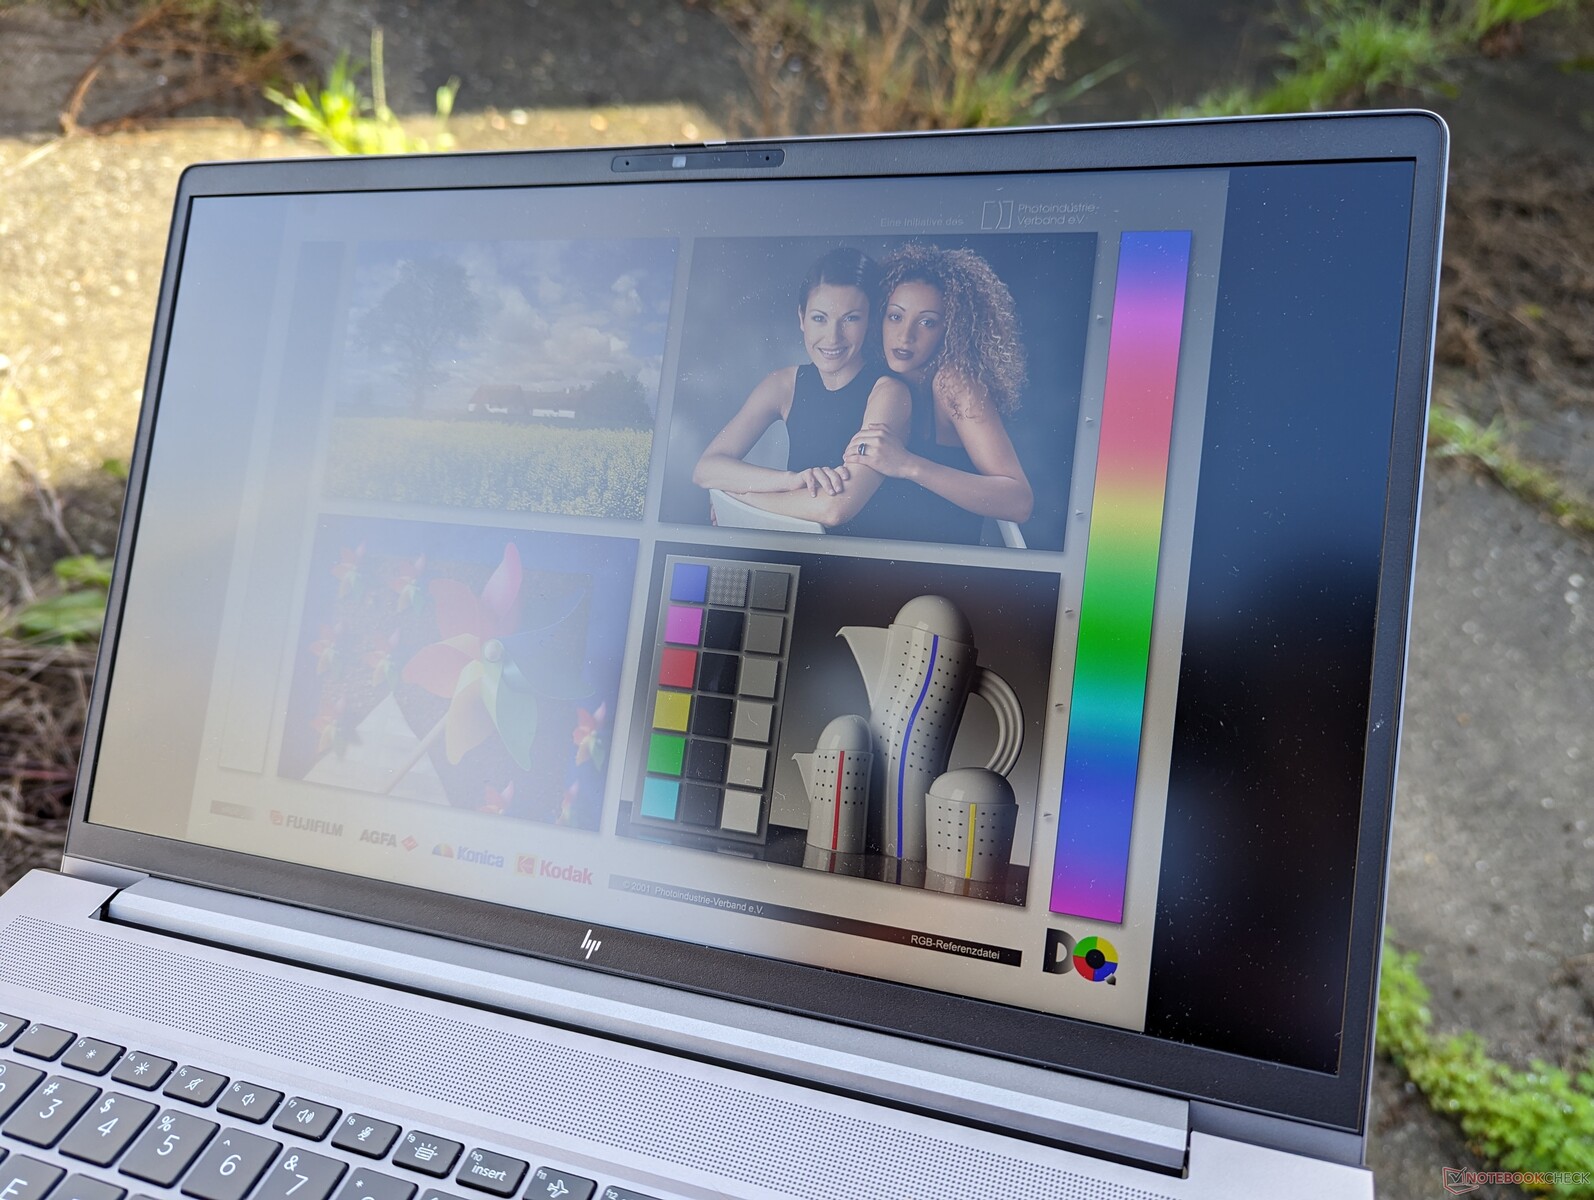
Our 1440p panel is nonetheless excellent with its fast refresh rate, fast response times, and accurate sRGB colors fit for content creation and even gaming. It may not be OLED or 4K, but it's still one of better 15.6-inch IPS displays out there.

| |||||||||||||||||||||||||
Brightness Distribution: 83 %
Center on Battery: 313.8 cd/m²
Contrast: 1082:1 (Black: 0.29 cd/m²)
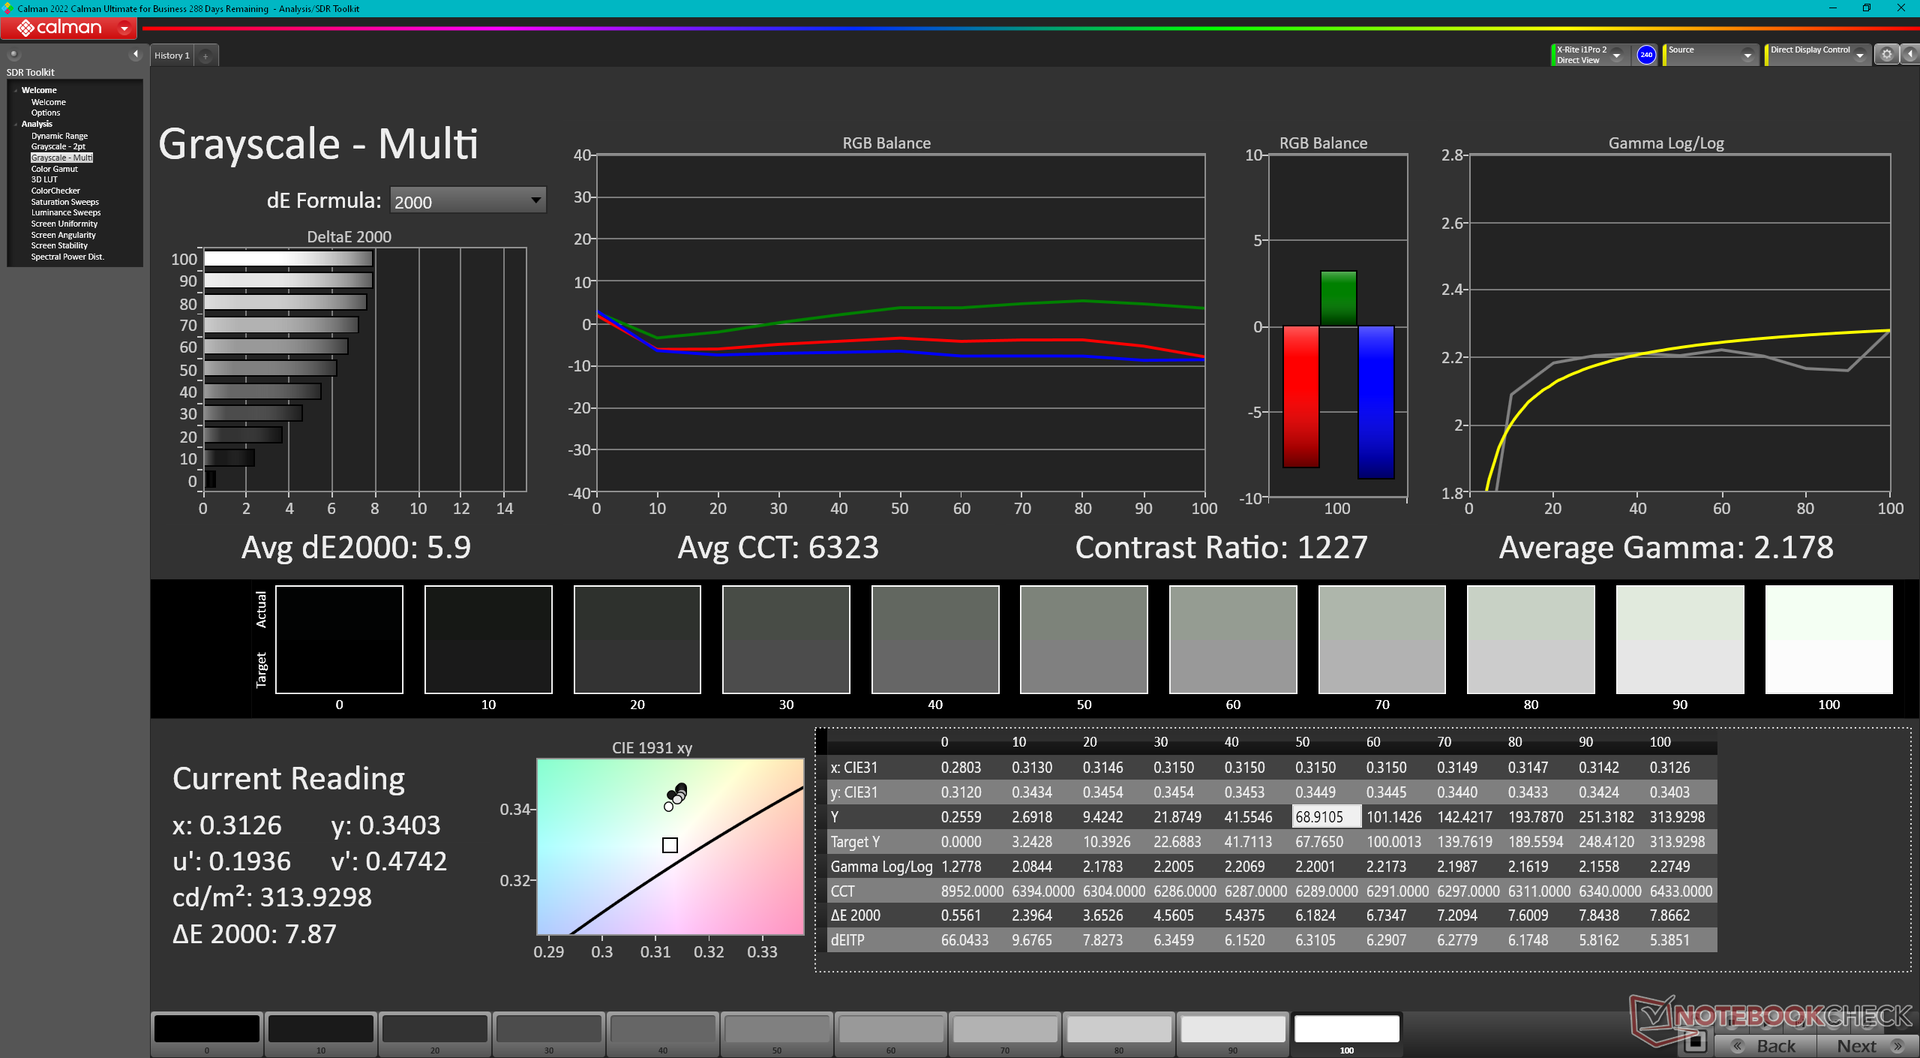
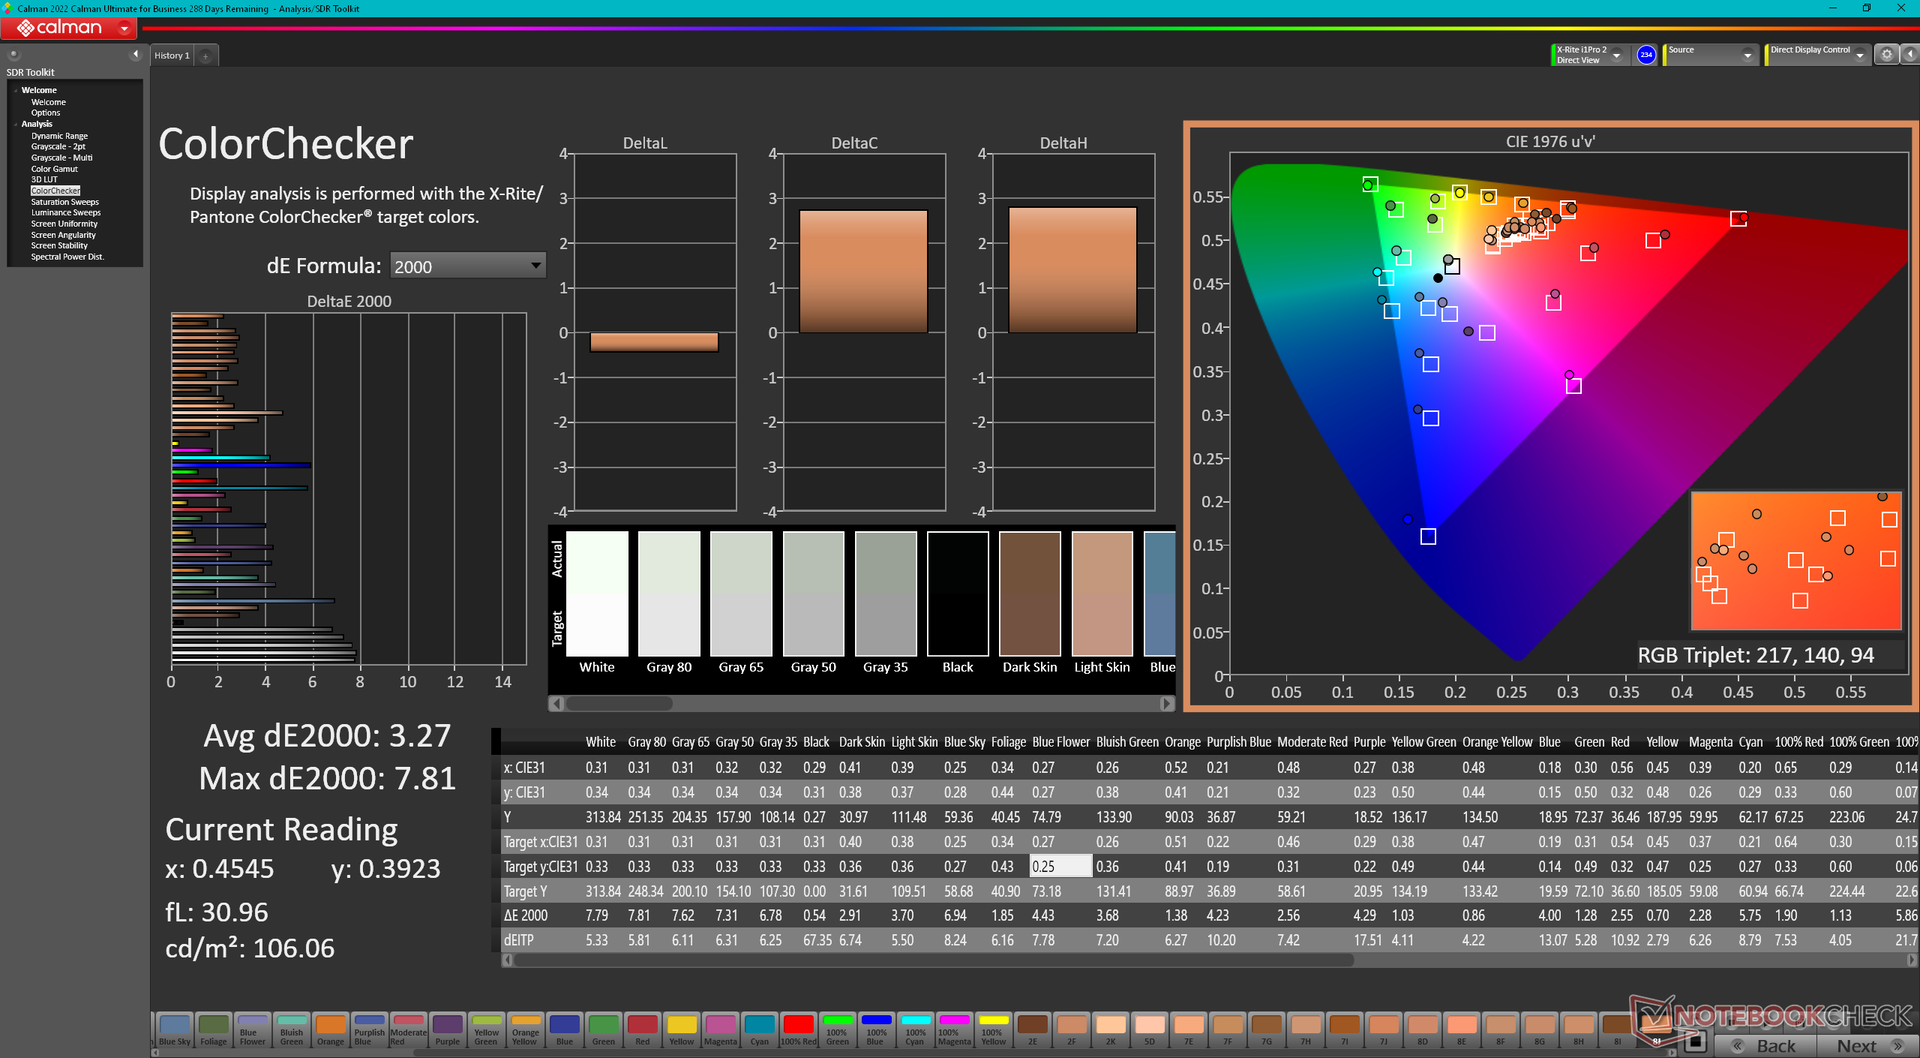
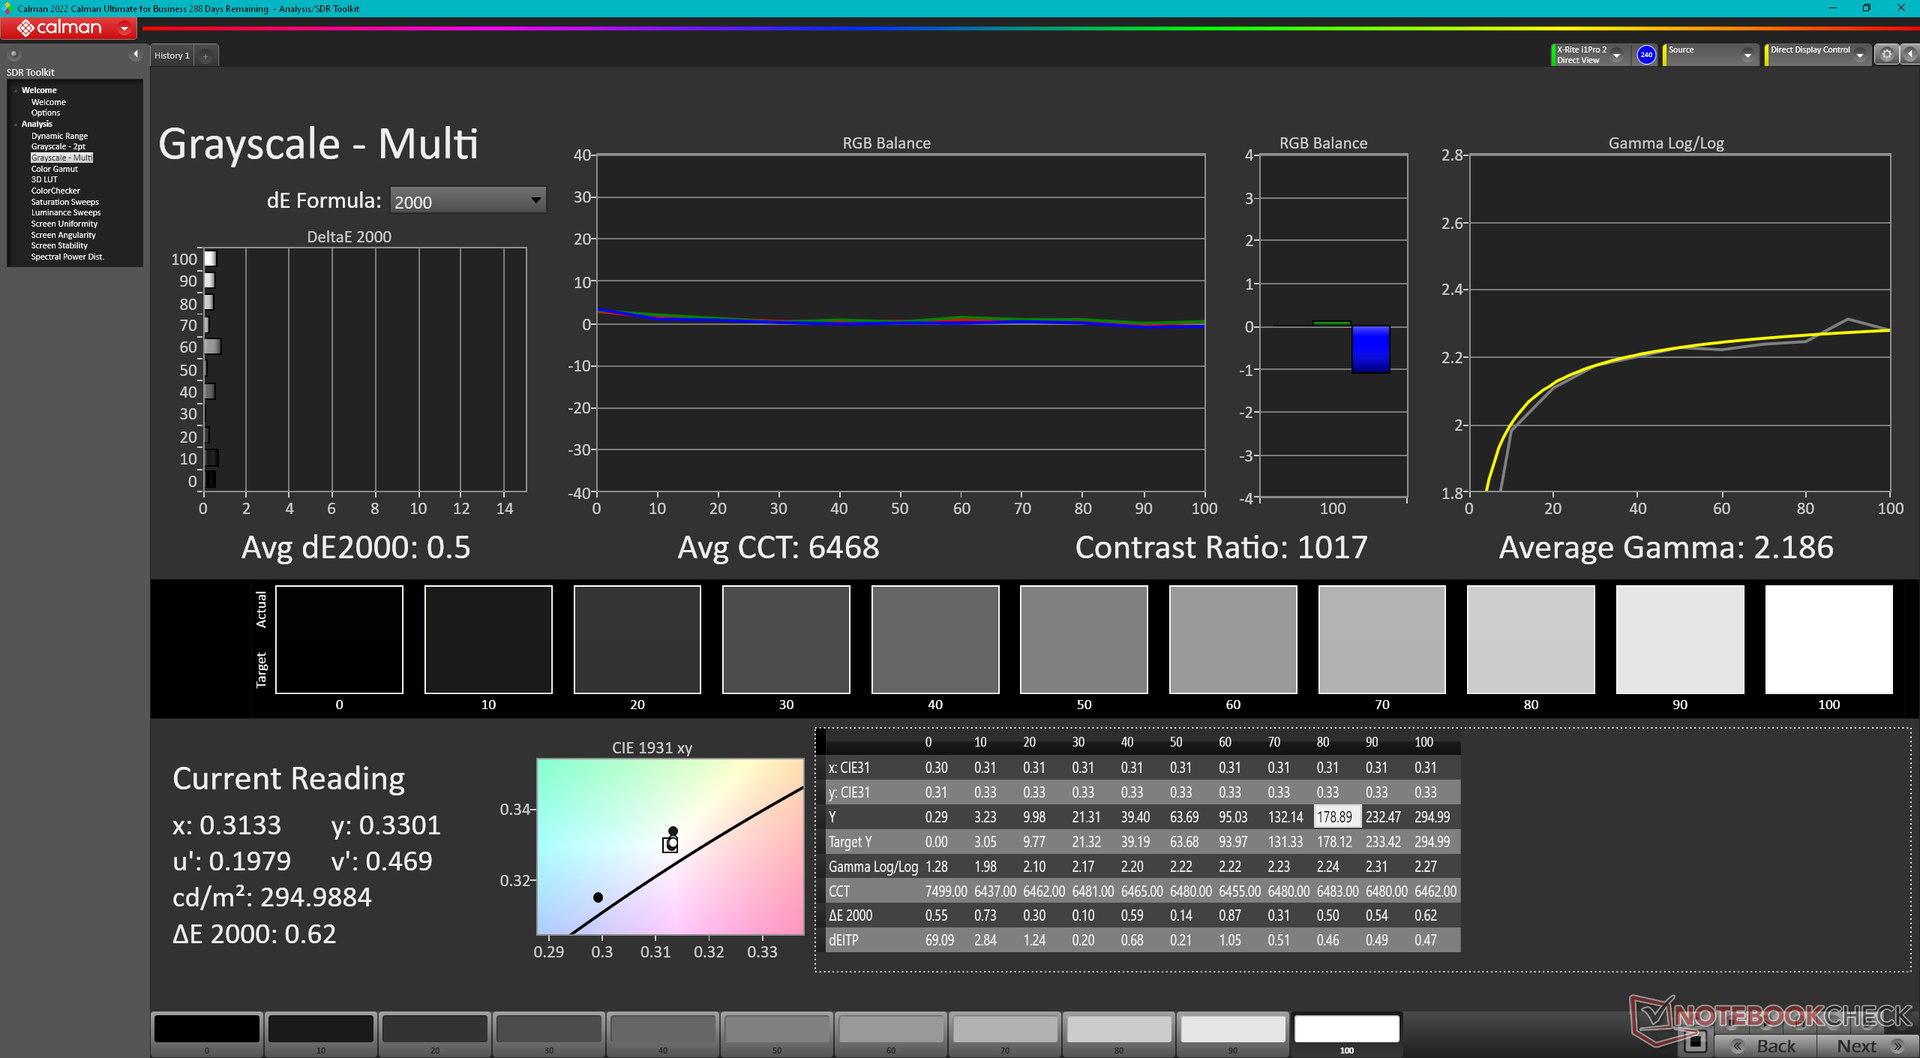
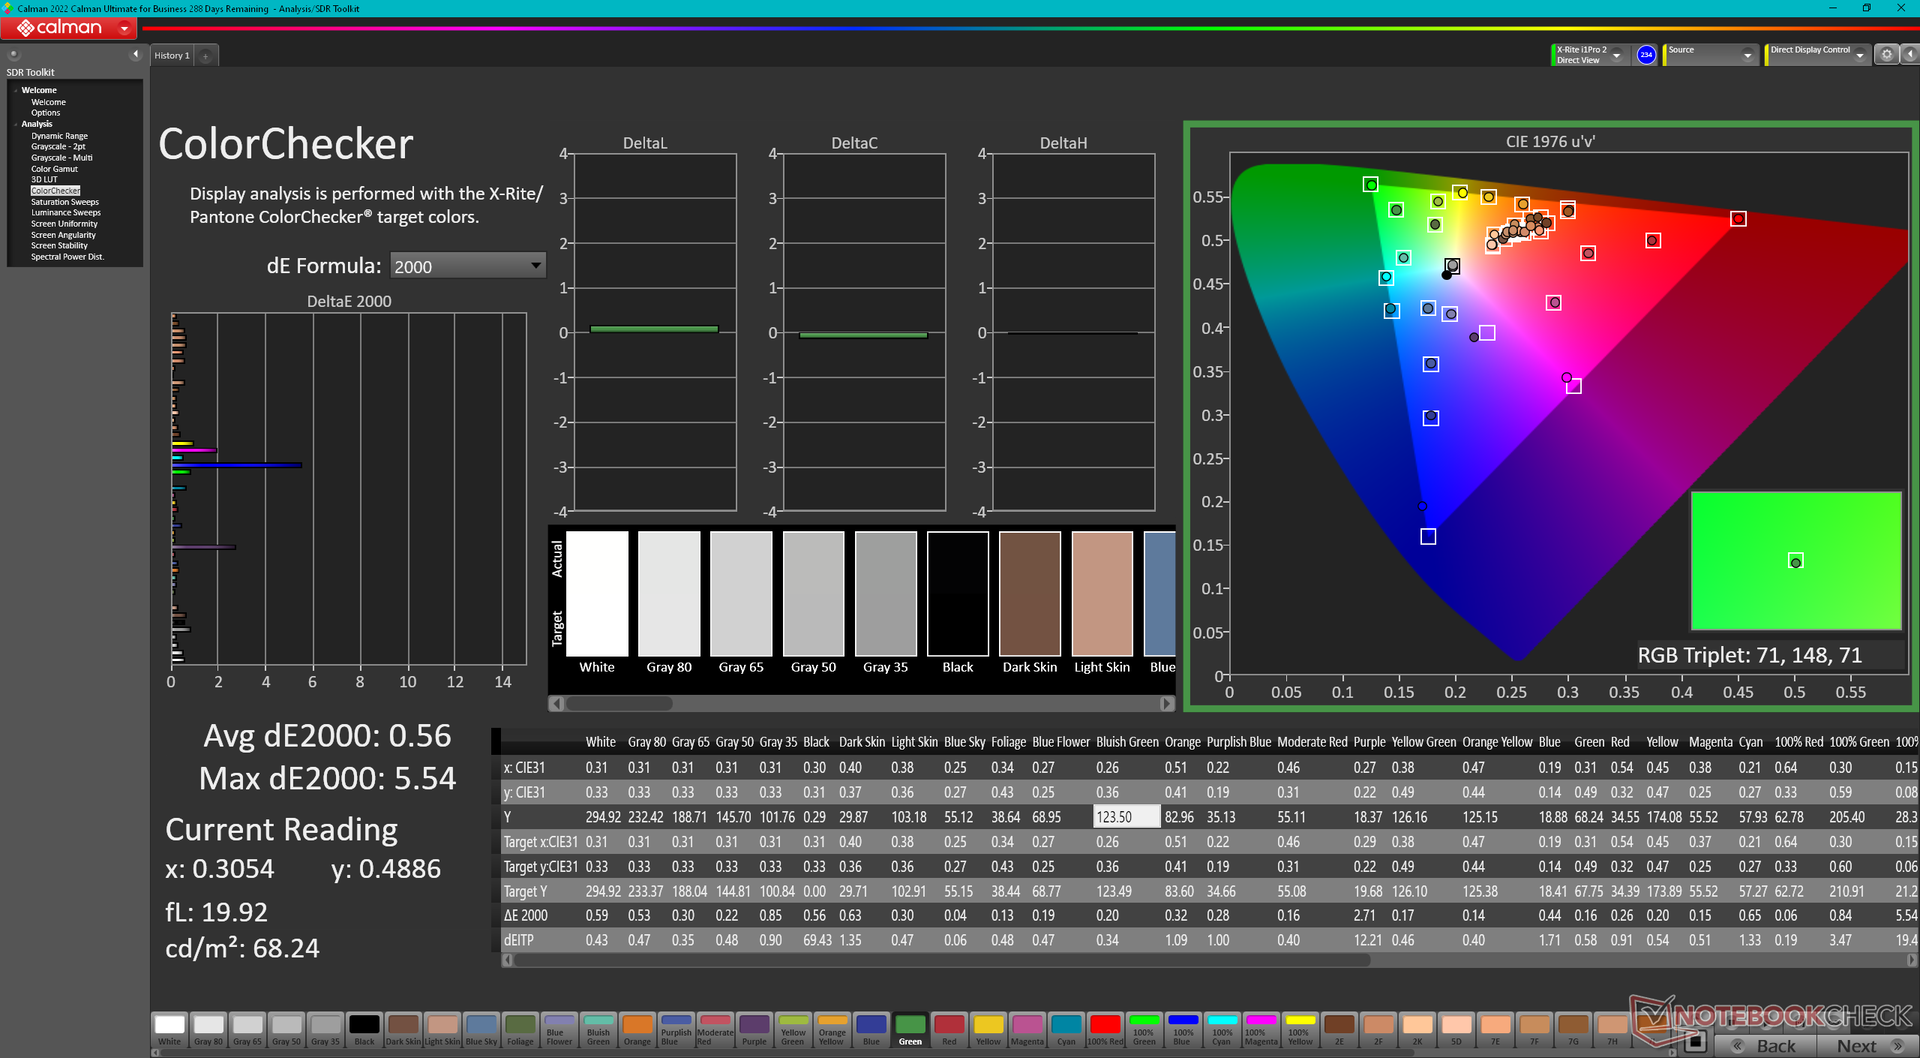
ΔE ColorChecker Calman: 3.27 | ∀{0.5-29.43 Ø4.72}
calibrated: 0.56
ΔE Greyscale Calman: 5.9 | ∀{0.09-98 Ø4.97}
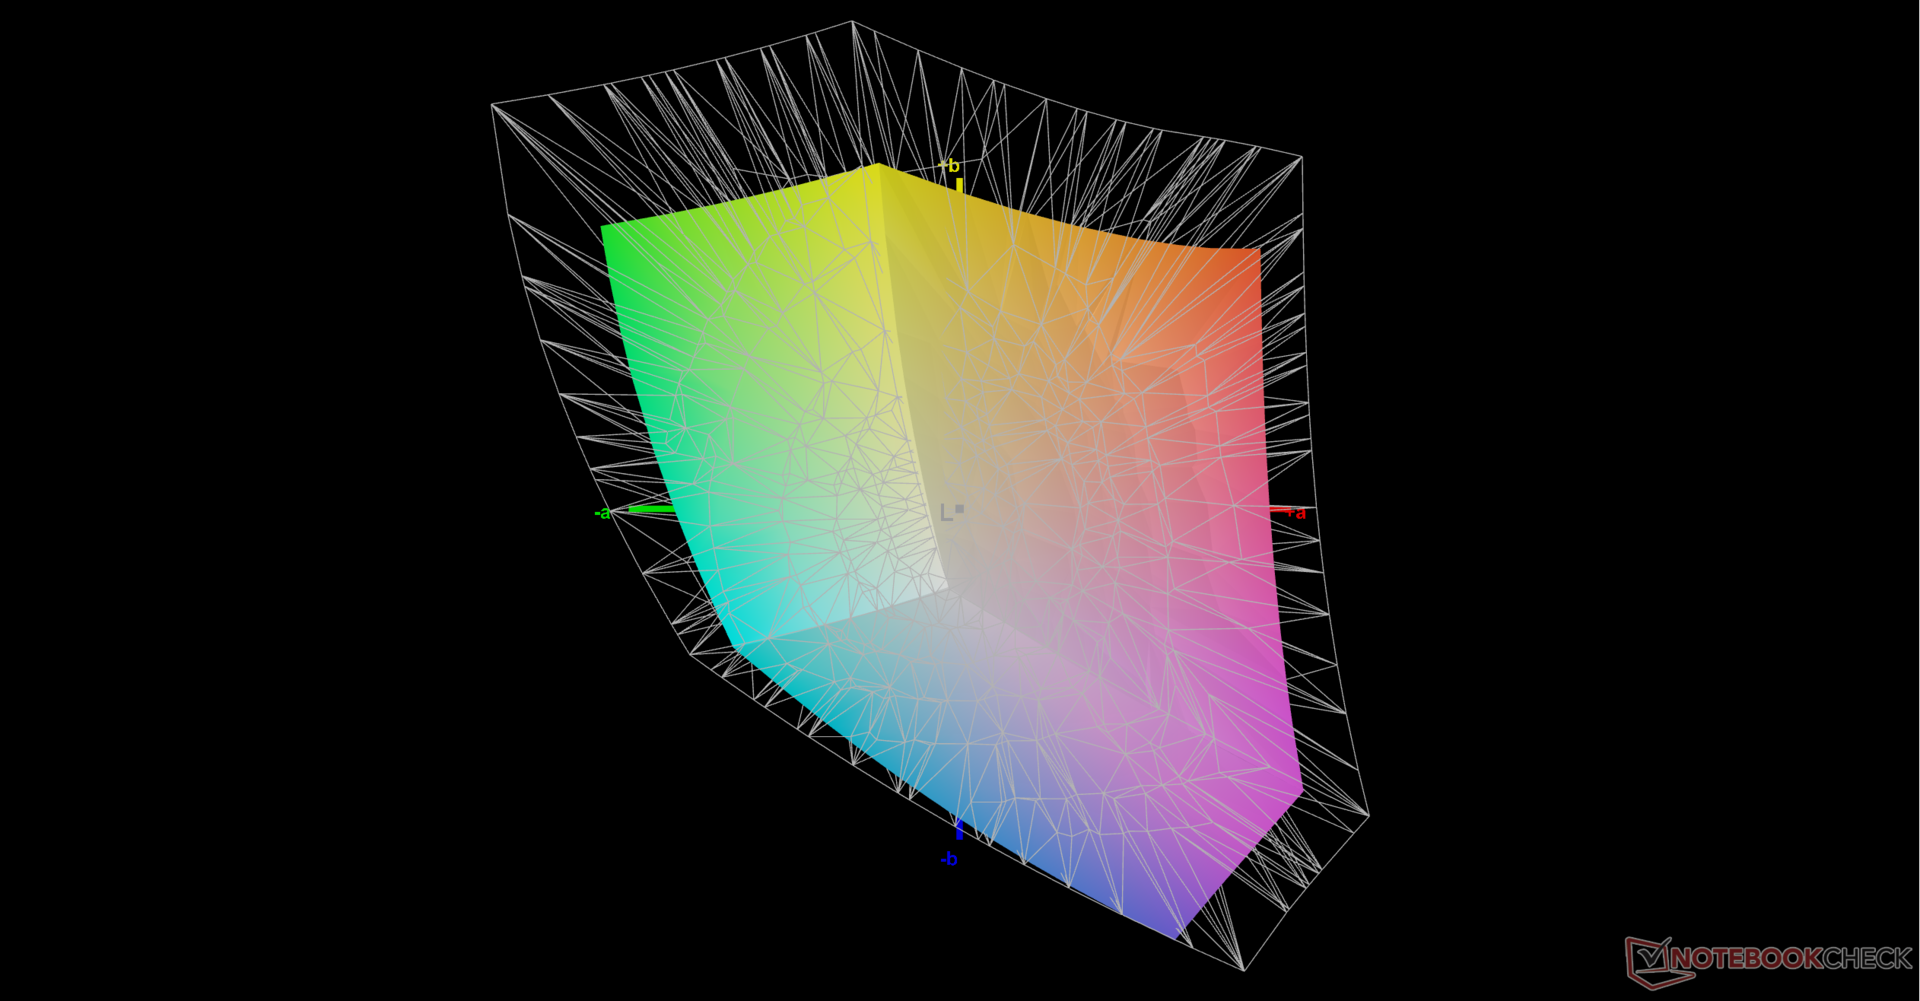
70.5% AdobeRGB 1998 (Argyll 3D)
95.6% sRGB (Argyll 3D)
68.2% Display P3 (Argyll 3D)
Gamma: 2.18
CCT: 6323 K
| HP ZBook Power 15 G10 BOE0B6A, IPS, 2560x1440, 15.6" | HP ZBook Power 15 G9 6B8C4EA LGD073F, IPS, 3840x2160, 15.6" | Lenovo ThinkPad P15v G3 21EM001AGE NE156QUM-N6C, IPS LED, 3840x2160, 15.6" | Dell Precision 5000 5560 Sharp LQ156R1, IPS, 3840x2400, 15.6" | Lenovo ThinkPad P1 G6-21FV000DGE NE160QDM-NY1, IPS, 2560x1600, 16" | Asus ExpertBook B6 Flip B6602FC2 AU Optronics Model: AUOE495, IPS, 2560x1600, 16" | |
|---|---|---|---|---|---|---|
| Display | 1% | 26% | 29% | 1% | 23% | |
| Display P3 Coverage (%) | 68.2 | 69.1 1% | 89.9 32% | 94.9 39% | 68.1 0% | 97.9 44% |
| sRGB Coverage (%) | 95.6 | 97.7 2% | 100 5% | 100 5% | 97.5 2% | 99.89 4% |
| AdobeRGB 1998 Coverage (%) | 70.5 | 69.6 -1% | 99.9 42% | 100 42% | 70.2 0% | 85.52 21% |
| Response Times | -214% | -211% | -228% | 2% | -120% | |
| Response Time Grey 50% / Grey 80% * (ms) | 13 ? | 45.8 ? -252% | 46.7 ? -259% | 47.2 ? -263% | 13.7 ? -5% | 36 ? -177% |
| Response Time Black / White * (ms) | 10.4 ? | 28.6 ? -175% | 27.3 ? -163% | 30.4 ? -192% | 9.6 ? 8% | 17 ? -63% |
| PWM Frequency (Hz) | ||||||
| Screen | 18% | 5% | 7% | 30% | -20% | |
| Brightness middle (cd/m²) | 313.8 | 392 25% | 588 87% | 501.5 60% | 521 66% | 440 40% |
| Brightness (cd/m²) | 302 | 388 28% | 536 77% | 467 55% | 484 60% | 418 38% |
| Brightness Distribution (%) | 83 | 88 6% | 83 0% | 83 0% | 89 7% | 82 -1% |
| Black Level * (cd/m²) | 0.29 | 0.15 48% | 0.38 -31% | 0.44 -52% | 0.36 -24% | 0.3 -3% |
| Contrast (:1) | 1082 | 2613 141% | 1547 43% | 1140 5% | 1447 34% | 1467 36% |
| Colorchecker dE 2000 * | 3.27 | 3.2 2% | 3.9 -19% | 4.73 -45% | 1.2 63% | 2.81 14% |
| Colorchecker dE 2000 max. * | 7.81 | 7 10% | 8.8 -13% | 8.45 -8% | 2.5 68% | 4.62 41% |
| Colorchecker dE 2000 calibrated * | 0.56 | 1.2 -114% | 1 -79% | 0.51 9% | 1 -79% | 2.99 -434% |
| Greyscale dE 2000 * | 5.9 | 4.9 17% | 7.1 -20% | 3.6 39% | 1.4 76% | 0.91 85% |
| Gamma | 2.18 101% | 2.13 103% | 2.12 104% | 2.08 106% | 2.25 98% | 2.2 100% |
| CCT | 6323 103% | 5982 109% | 7268 89% | 6447 101% | 6682 97% | 6600 98% |
| Total Average (Program / Settings) | -65% /
-19% | -60% /
-21% | -64% /
-22% | 11% /
20% | -39% /
-25% |
* ... smaller is better
HP does not ship the model pre-calibrated which is a shame for a ZBook-class laptop. Average grayscale and color DeltaE values out of the box would be at 5.9 and 3.27, respectively, with the color temperature being slightly too warm. Calibrating the display ourselves would improve the average deltaE values to just 0.5 and 0.56. Our calibrated ICM file is available to download above for free.
Display Response Times
| ↔ Response Time Black to White | ||
|---|---|---|
| 10.4 ms ... rise ↗ and fall ↘ combined | ↗ 5.5 ms rise | 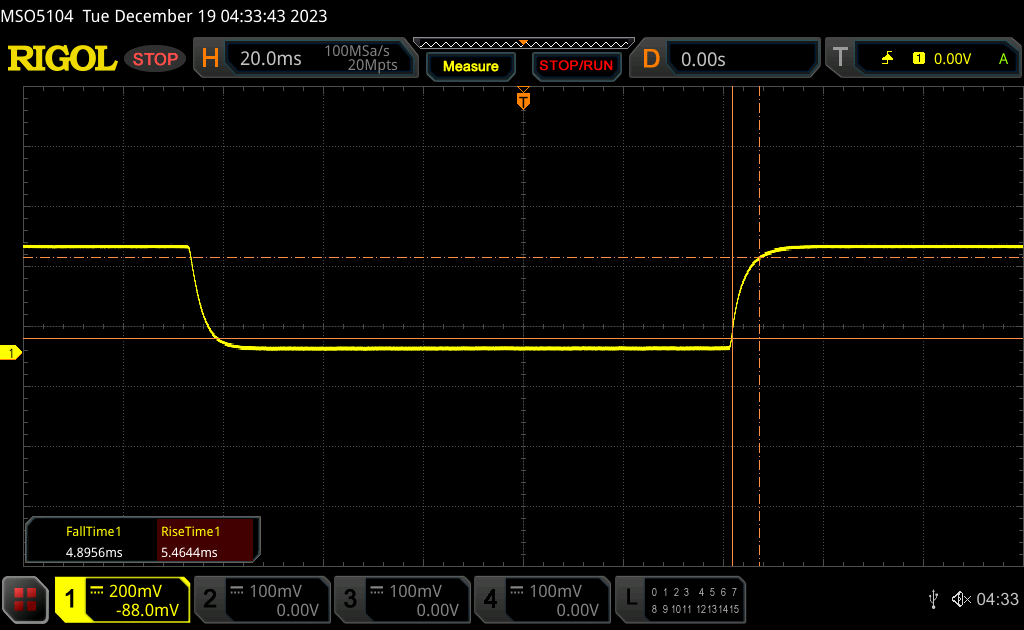 |
| ↘ 4.9 ms fall | ||
| The screen shows good response rates in our tests, but may be too slow for competitive gamers. In comparison, all tested devices range from 0.1 (minimum) to 240 (maximum) ms. » 28 % of all devices are better. This means that the measured response time is better than the average of all tested devices (19.8 ms). | ||
| ↔ Response Time 50% Grey to 80% Grey | ||
| 13 ms ... rise ↗ and fall ↘ combined | ↗ 6.4 ms rise | 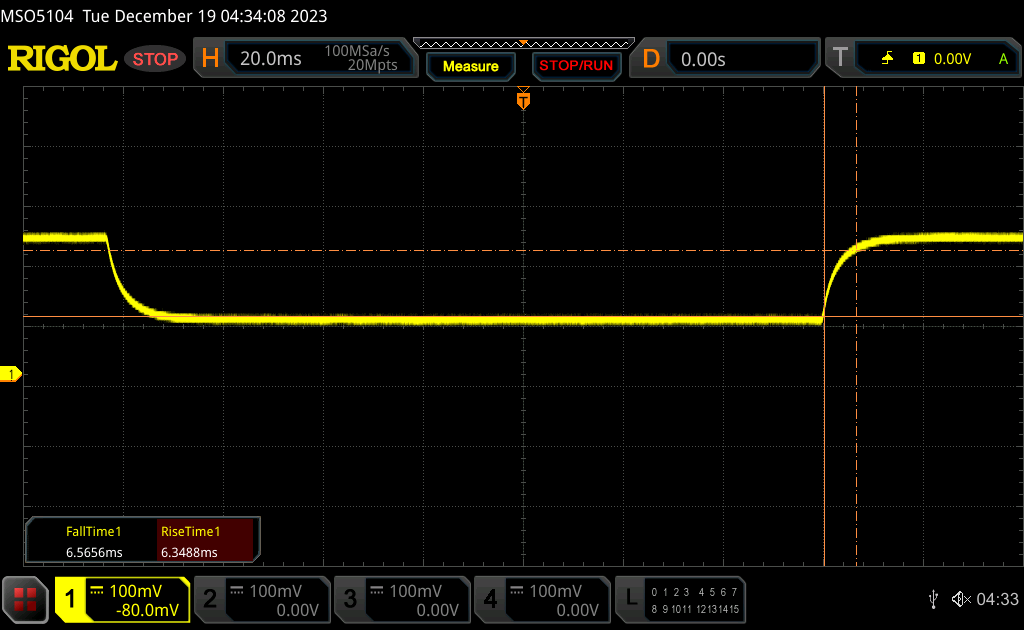 |
| ↘ 6.6 ms fall | ||
| The screen shows good response rates in our tests, but may be too slow for competitive gamers. In comparison, all tested devices range from 0.165 (minimum) to 636 (maximum) ms. » 27 % of all devices are better. This means that the measured response time is better than the average of all tested devices (31 ms). | ||
Screen Flickering / PWM (Pulse-Width Modulation)
| Screen flickering / PWM not detected | 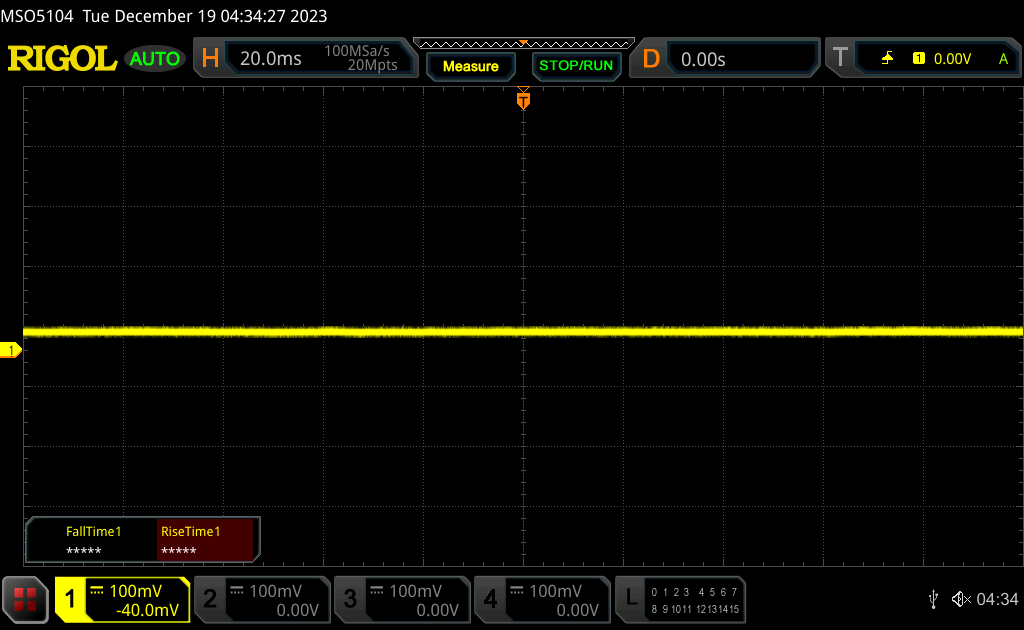 | ||
In comparison: 52 % of all tested devices do not use PWM to dim the display. If PWM was detected, an average of 7763 (minimum: 5 - maximum: 343500) Hz was measured. | |||
Performance
Testing Conditions
We set both Windows and Nvidia Control Panel to Performance mode prior to running the benchmarks below. The system does not appear to have any additional power profiles from HP.
Optimus is supported as expected, but there is no ECC VRAM mode unlike on the thicker ZBook Fury 16 G10 with the faster RTX 5000 Ada.
Processor
The Ryzen 7 Pro 7840HS offers up to 20 percent faster multi-thread performance than the Core i7-12700H in last year's ZBook Power 15 G9. For even faster performance, however, users should configure with the Intel Core i9-13900H instead which can run up to 30 percent faster than our Ryzen 7.
Downgrading to the Ryzen 5 Pro 7640HS configuration from our Ryzen 7 Pro 7840HS is expected to impact performance by as much as 25 to 30 percent. On the other hand, upgrading to the Ryzen 9 Pro 7940HS is expected to boost performance only marginally by about 5 to 10 percent based on our time with the Lenovo ThinkPad Z16 Gen 2. Thus, performance-per-dollar decreases significantly if configuring with Ryzen 9 instead of Ryzen 7.
Cinebench R15 Multi Loop
Cinebench R23: Multi Core | Single Core
Cinebench R20: CPU (Multi Core) | CPU (Single Core)
Cinebench R15: CPU Multi 64Bit | CPU Single 64Bit
Blender: v2.79 BMW27 CPU
7-Zip 18.03: 7z b 4 | 7z b 4 -mmt1
Geekbench 5.5: Multi-Core | Single-Core
HWBOT x265 Benchmark v2.2: 4k Preset
LibreOffice : 20 Documents To PDF
R Benchmark 2.5: Overall mean
* ... smaller is better
AIDA64: FP32 Ray-Trace | FPU Julia | CPU SHA3 | CPU Queen | FPU SinJulia | FPU Mandel | CPU AES | CPU ZLib | FP64 Ray-Trace | CPU PhotoWorxx
| Performance rating | |
| HP ZBook Power 15 G10 | |
| Average AMD Ryzen 7 PRO 7840HS | |
| Lenovo ThinkPad P1 G6-21FV000DGE | |
| Lenovo ThinkPad P15v G3 21EM001AGE | |
| Asus ExpertBook B6 Flip B6602FC2 | |
| HP ZBook Power 15 G9 6B8C4EA | |
| Dell Precision 5000 5560 -9! | |
| AIDA64 / FP32 Ray-Trace | |
| HP ZBook Power 15 G10 | |
| Average AMD Ryzen 7 PRO 7840HS (25606 - 25776, n=2) | |
| Lenovo ThinkPad P1 G6-21FV000DGE | |
| Asus ExpertBook B6 Flip B6602FC2 | |
| Lenovo ThinkPad P15v G3 21EM001AGE | |
| HP ZBook Power 15 G9 6B8C4EA | |
| AIDA64 / FPU Julia | |
| HP ZBook Power 15 G10 | |
| Average AMD Ryzen 7 PRO 7840HS (107907 - 109059, n=2) | |
| Lenovo ThinkPad P15v G3 21EM001AGE | |
| Lenovo ThinkPad P1 G6-21FV000DGE | |
| Asus ExpertBook B6 Flip B6602FC2 | |
| HP ZBook Power 15 G9 6B8C4EA | |
| AIDA64 / CPU SHA3 | |
| HP ZBook Power 15 G10 | |
| Average AMD Ryzen 7 PRO 7840HS (4631 - 4656, n=2) | |
| Lenovo ThinkPad P1 G6-21FV000DGE | |
| Asus ExpertBook B6 Flip B6602FC2 | |
| HP ZBook Power 15 G9 6B8C4EA | |
| Lenovo ThinkPad P15v G3 21EM001AGE | |
| AIDA64 / CPU Queen | |
| Lenovo ThinkPad P1 G6-21FV000DGE | |
| HP ZBook Power 15 G10 | |
| Average AMD Ryzen 7 PRO 7840HS (97729 - 115640, n=2) | |
| Asus ExpertBook B6 Flip B6602FC2 | |
| Lenovo ThinkPad P15v G3 21EM001AGE | |
| HP ZBook Power 15 G9 6B8C4EA | |
| AIDA64 / FPU SinJulia | |
| HP ZBook Power 15 G10 | |
| Average AMD Ryzen 7 PRO 7840HS (14693 - 14742, n=2) | |
| Lenovo ThinkPad P15v G3 21EM001AGE | |
| Asus ExpertBook B6 Flip B6602FC2 | |
| Lenovo ThinkPad P1 G6-21FV000DGE | |
| HP ZBook Power 15 G9 6B8C4EA | |
| AIDA64 / FPU Mandel | |
| HP ZBook Power 15 G10 | |
| Average AMD Ryzen 7 PRO 7840HS (57502 - 58181, n=2) | |
| Lenovo ThinkPad P15v G3 21EM001AGE | |
| Lenovo ThinkPad P1 G6-21FV000DGE | |
| Asus ExpertBook B6 Flip B6602FC2 | |
| HP ZBook Power 15 G9 6B8C4EA | |
| AIDA64 / CPU AES | |
| Lenovo ThinkPad P15v G3 21EM001AGE | |
| HP ZBook Power 15 G10 | |
| Average AMD Ryzen 7 PRO 7840HS (84454 - 85341, n=2) | |
| Lenovo ThinkPad P1 G6-21FV000DGE | |
| Asus ExpertBook B6 Flip B6602FC2 | |
| HP ZBook Power 15 G9 6B8C4EA | |
| AIDA64 / CPU ZLib | |
| Lenovo ThinkPad P1 G6-21FV000DGE | |
| HP ZBook Power 15 G10 | |
| Average AMD Ryzen 7 PRO 7840HS (1032 - 1043, n=2) | |
| Asus ExpertBook B6 Flip B6602FC2 | |
| HP ZBook Power 15 G9 6B8C4EA | |
| Lenovo ThinkPad P15v G3 21EM001AGE | |
| Dell Precision 5000 5560 | |
| AIDA64 / FP64 Ray-Trace | |
| HP ZBook Power 15 G10 | |
| Average AMD Ryzen 7 PRO 7840HS (13545 - 13800, n=2) | |
| Lenovo ThinkPad P1 G6-21FV000DGE | |
| Asus ExpertBook B6 Flip B6602FC2 | |
| Lenovo ThinkPad P15v G3 21EM001AGE | |
| HP ZBook Power 15 G9 6B8C4EA | |
| AIDA64 / CPU PhotoWorxx | |
| HP ZBook Power 15 G10 | |
| HP ZBook Power 15 G9 6B8C4EA | |
| Asus ExpertBook B6 Flip B6602FC2 | |
| Average AMD Ryzen 7 PRO 7840HS (24325 - 42810, n=2) | |
| Lenovo ThinkPad P1 G6-21FV000DGE | |
| Lenovo ThinkPad P15v G3 21EM001AGE | |
System Performance
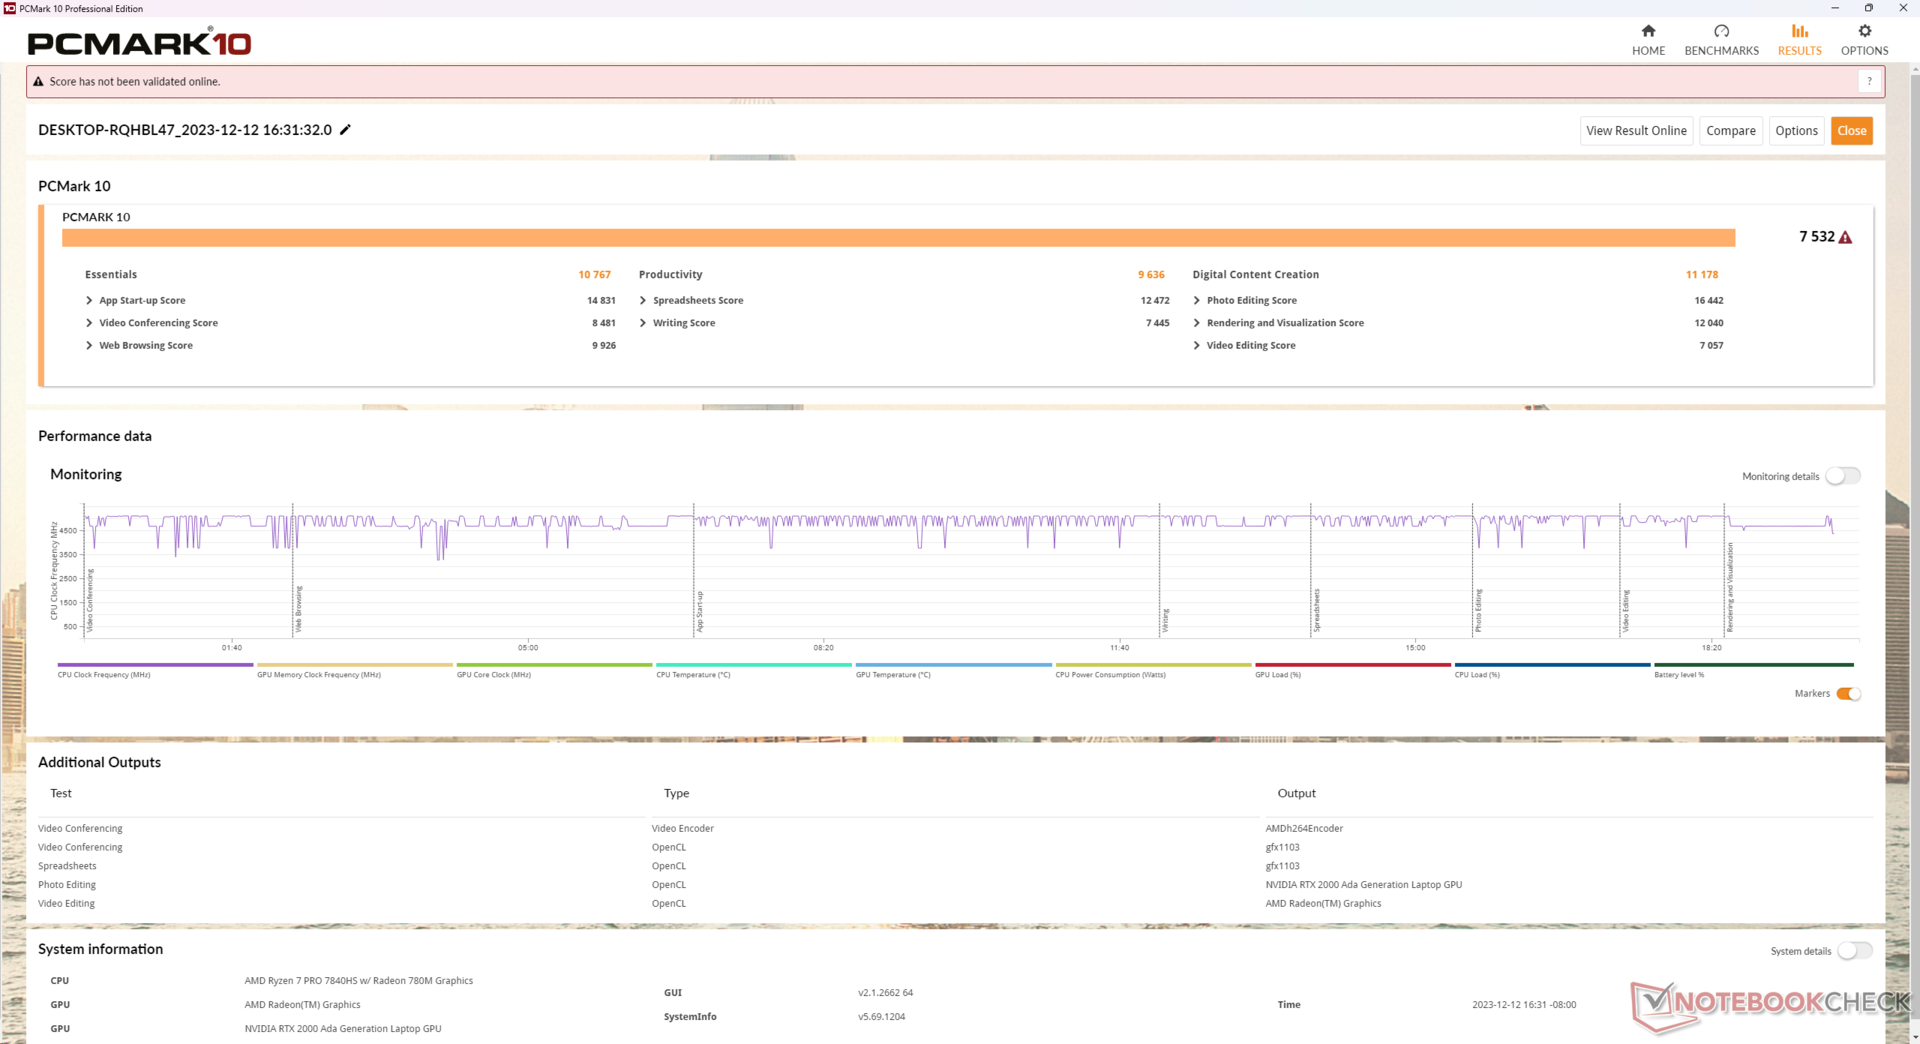
PCMark results are excellent with scores that are consistently higher than other workstations running on the older Nvidia RTX A2000 including the ZBook Power 15 G9. The fast 5600 MHz RAM is also a highlight as evident by the high AIDA64 memory scores.
CrossMark: Overall | Productivity | Creativity | Responsiveness
WebXPRT 3: Overall
WebXPRT 4: Overall
Mozilla Kraken 1.1: Total
| PCMark 10 / Score | |
| HP ZBook Power 15 G10 | |
| Average AMD Ryzen 7 PRO 7840HS, NVIDIA RTX 2000 Ada Generation Laptop (n=1) | |
| Lenovo ThinkPad P1 G6-21FV000DGE | |
| Asus ExpertBook B6 Flip B6602FC2 | |
| Dell Precision 5000 5560 | |
| Lenovo ThinkPad P15v G3 21EM001AGE | |
| HP ZBook Power 15 G9 6B8C4EA | |
| PCMark 10 / Essentials | |
| Lenovo ThinkPad P1 G6-21FV000DGE | |
| Asus ExpertBook B6 Flip B6602FC2 | |
| HP ZBook Power 15 G10 | |
| Average AMD Ryzen 7 PRO 7840HS, NVIDIA RTX 2000 Ada Generation Laptop (n=1) | |
| Dell Precision 5000 5560 | |
| Lenovo ThinkPad P15v G3 21EM001AGE | |
| HP ZBook Power 15 G9 6B8C4EA | |
| PCMark 10 / Productivity | |
| Asus ExpertBook B6 Flip B6602FC2 | |
| Lenovo ThinkPad P1 G6-21FV000DGE | |
| HP ZBook Power 15 G10 | |
| Average AMD Ryzen 7 PRO 7840HS, NVIDIA RTX 2000 Ada Generation Laptop (n=1) | |
| Dell Precision 5000 5560 | |
| Lenovo ThinkPad P15v G3 21EM001AGE | |
| HP ZBook Power 15 G9 6B8C4EA | |
| PCMark 10 / Digital Content Creation | |
| HP ZBook Power 15 G10 | |
| Average AMD Ryzen 7 PRO 7840HS, NVIDIA RTX 2000 Ada Generation Laptop (n=1) | |
| Lenovo ThinkPad P1 G6-21FV000DGE | |
| Asus ExpertBook B6 Flip B6602FC2 | |
| Lenovo ThinkPad P15v G3 21EM001AGE | |
| HP ZBook Power 15 G9 6B8C4EA | |
| Dell Precision 5000 5560 | |
| CrossMark / Overall | |
| Asus ExpertBook B6 Flip B6602FC2 | |
| Lenovo ThinkPad P1 G6-21FV000DGE | |
| HP ZBook Power 15 G9 6B8C4EA | |
| HP ZBook Power 15 G10 | |
| Average AMD Ryzen 7 PRO 7840HS, NVIDIA RTX 2000 Ada Generation Laptop (n=1) | |
| Lenovo ThinkPad P15v G3 21EM001AGE | |
| CrossMark / Productivity | |
| Asus ExpertBook B6 Flip B6602FC2 | |
| Lenovo ThinkPad P1 G6-21FV000DGE | |
| HP ZBook Power 15 G10 | |
| Average AMD Ryzen 7 PRO 7840HS, NVIDIA RTX 2000 Ada Generation Laptop (n=1) | |
| HP ZBook Power 15 G9 6B8C4EA | |
| Lenovo ThinkPad P15v G3 21EM001AGE | |
| CrossMark / Creativity | |
| Asus ExpertBook B6 Flip B6602FC2 | |
| Lenovo ThinkPad P1 G6-21FV000DGE | |
| HP ZBook Power 15 G9 6B8C4EA | |
| HP ZBook Power 15 G10 | |
| Average AMD Ryzen 7 PRO 7840HS, NVIDIA RTX 2000 Ada Generation Laptop (n=1) | |
| Lenovo ThinkPad P15v G3 21EM001AGE | |
| CrossMark / Responsiveness | |
| Asus ExpertBook B6 Flip B6602FC2 | |
| Lenovo ThinkPad P1 G6-21FV000DGE | |
| HP ZBook Power 15 G9 6B8C4EA | |
| HP ZBook Power 15 G10 | |
| Average AMD Ryzen 7 PRO 7840HS, NVIDIA RTX 2000 Ada Generation Laptop (n=1) | |
| Lenovo ThinkPad P15v G3 21EM001AGE | |
| WebXPRT 3 / Overall | |
| Lenovo ThinkPad P1 G6-21FV000DGE | |
| HP ZBook Power 15 G10 | |
| Average AMD Ryzen 7 PRO 7840HS, NVIDIA RTX 2000 Ada Generation Laptop (n=1) | |
| Asus ExpertBook B6 Flip B6602FC2 | |
| HP ZBook Power 15 G9 6B8C4EA | |
| Dell Precision 5000 5560 | |
| Lenovo ThinkPad P15v G3 21EM001AGE | |
| WebXPRT 4 / Overall | |
| Lenovo ThinkPad P1 G6-21FV000DGE | |
| Asus ExpertBook B6 Flip B6602FC2 | |
| HP ZBook Power 15 G9 6B8C4EA | |
| HP ZBook Power 15 G10 | |
| Average AMD Ryzen 7 PRO 7840HS, NVIDIA RTX 2000 Ada Generation Laptop (n=1) | |
| Lenovo ThinkPad P15v G3 21EM001AGE | |
| Mozilla Kraken 1.1 / Total | |
| Lenovo ThinkPad P15v G3 21EM001AGE | |
| Dell Precision 5000 5560 | |
| HP ZBook Power 15 G10 | |
| Average AMD Ryzen 7 PRO 7840HS, NVIDIA RTX 2000 Ada Generation Laptop (n=1) | |
| HP ZBook Power 15 G9 6B8C4EA | |
| Asus ExpertBook B6 Flip B6602FC2 | |
| Lenovo ThinkPad P1 G6-21FV000DGE | |
* ... smaller is better
| PCMark 10 Score | 7532 points | |
Help | ||
| AIDA64 / Memory Copy | |
| HP ZBook Power 15 G10 | |
| HP ZBook Power 15 G9 6B8C4EA | |
| Asus ExpertBook B6 Flip B6602FC2 | |
| Average AMD Ryzen 7 PRO 7840HS (34323 - 67943, n=2) | |
| Lenovo ThinkPad P1 G6-21FV000DGE | |
| Lenovo ThinkPad P15v G3 21EM001AGE | |
| AIDA64 / Memory Read | |
| HP ZBook Power 15 G9 6B8C4EA | |
| HP ZBook Power 15 G10 | |
| Asus ExpertBook B6 Flip B6602FC2 | |
| Average AMD Ryzen 7 PRO 7840HS (30787 - 61660, n=2) | |
| Lenovo ThinkPad P1 G6-21FV000DGE | |
| Lenovo ThinkPad P15v G3 21EM001AGE | |
| AIDA64 / Memory Write | |
| HP ZBook Power 15 G10 | |
| HP ZBook Power 15 G9 6B8C4EA | |
| Average AMD Ryzen 7 PRO 7840HS (39362 - 83167, n=2) | |
| Asus ExpertBook B6 Flip B6602FC2 | |
| Lenovo ThinkPad P1 G6-21FV000DGE | |
| Lenovo ThinkPad P15v G3 21EM001AGE | |
| AIDA64 / Memory Latency | |
| Average AMD Ryzen 7 PRO 7840HS (99.6 - 101.2, n=2) | |
| HP ZBook Power 15 G10 | |
| Lenovo ThinkPad P15v G3 21EM001AGE | |
| Asus ExpertBook B6 Flip B6602FC2 | |
| HP ZBook Power 15 G9 6B8C4EA | |
| Lenovo ThinkPad P1 G6-21FV000DGE | |
* ... smaller is better
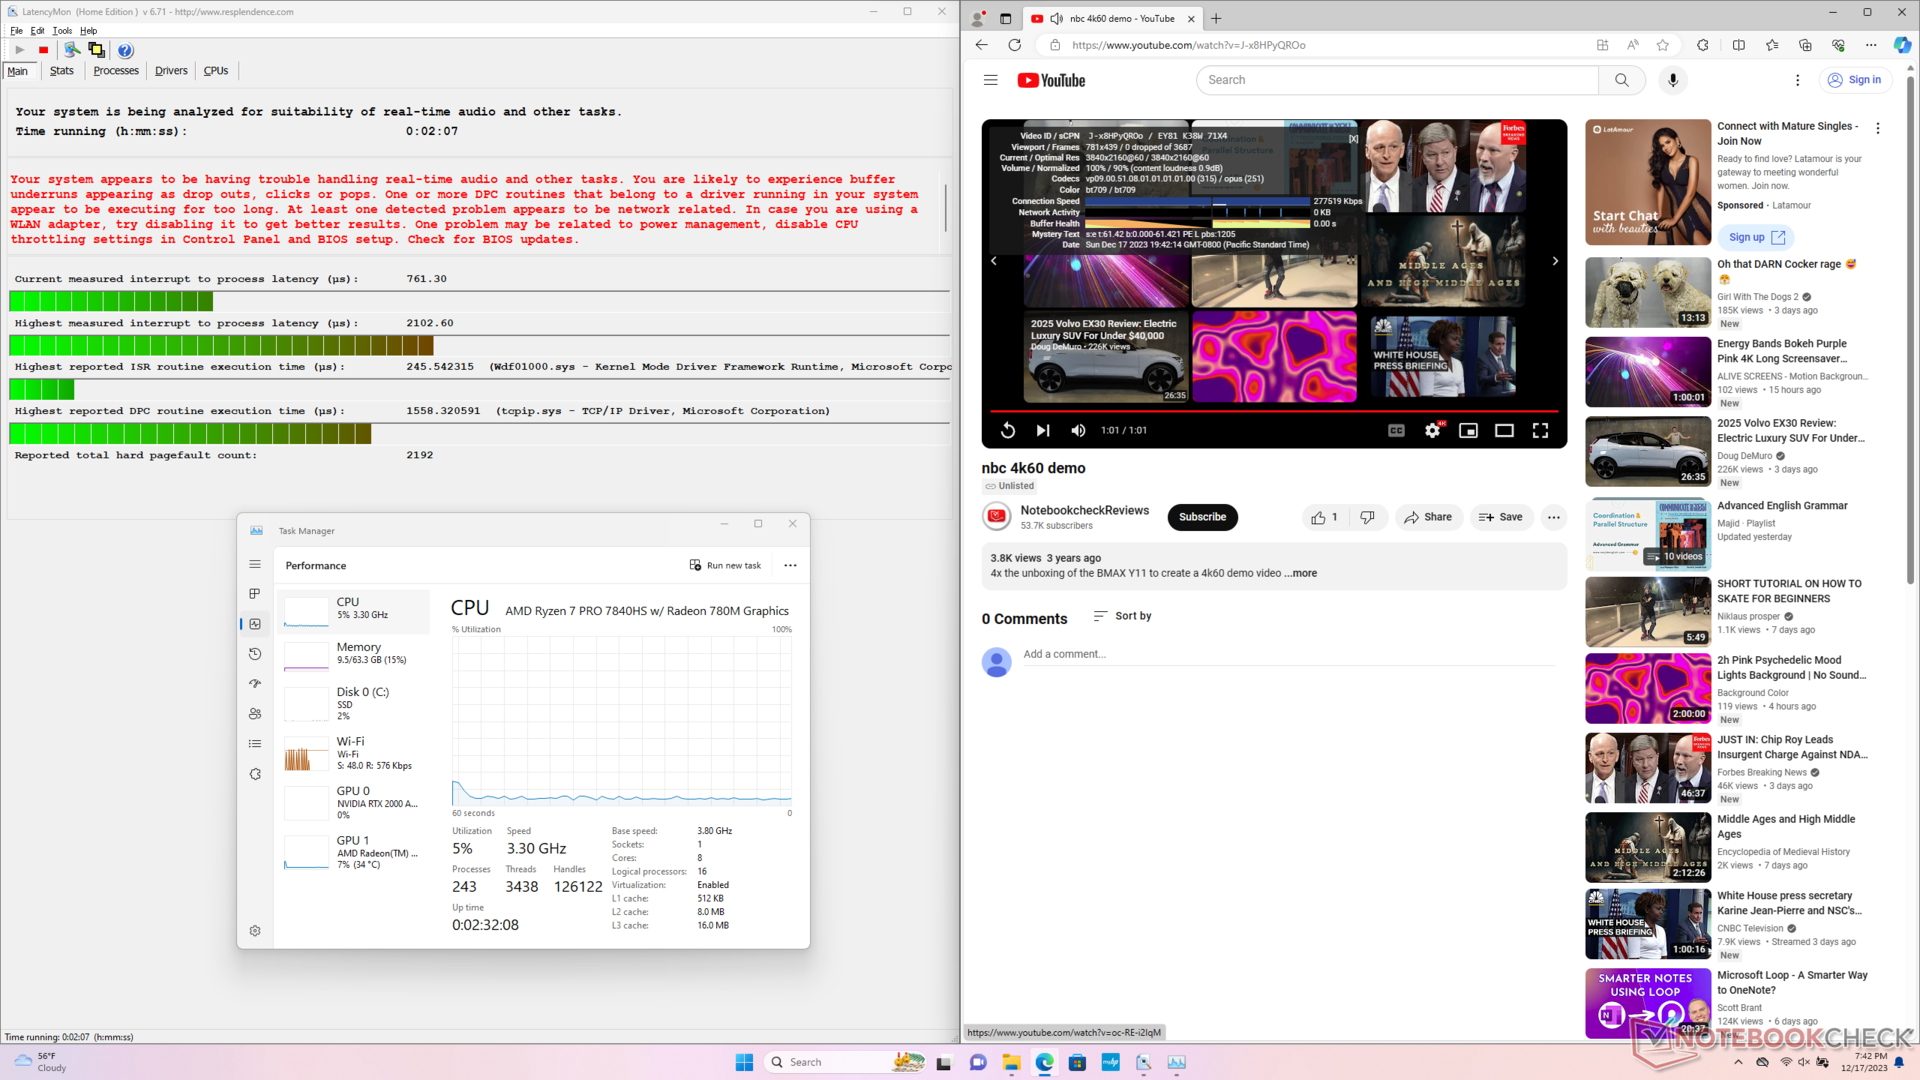
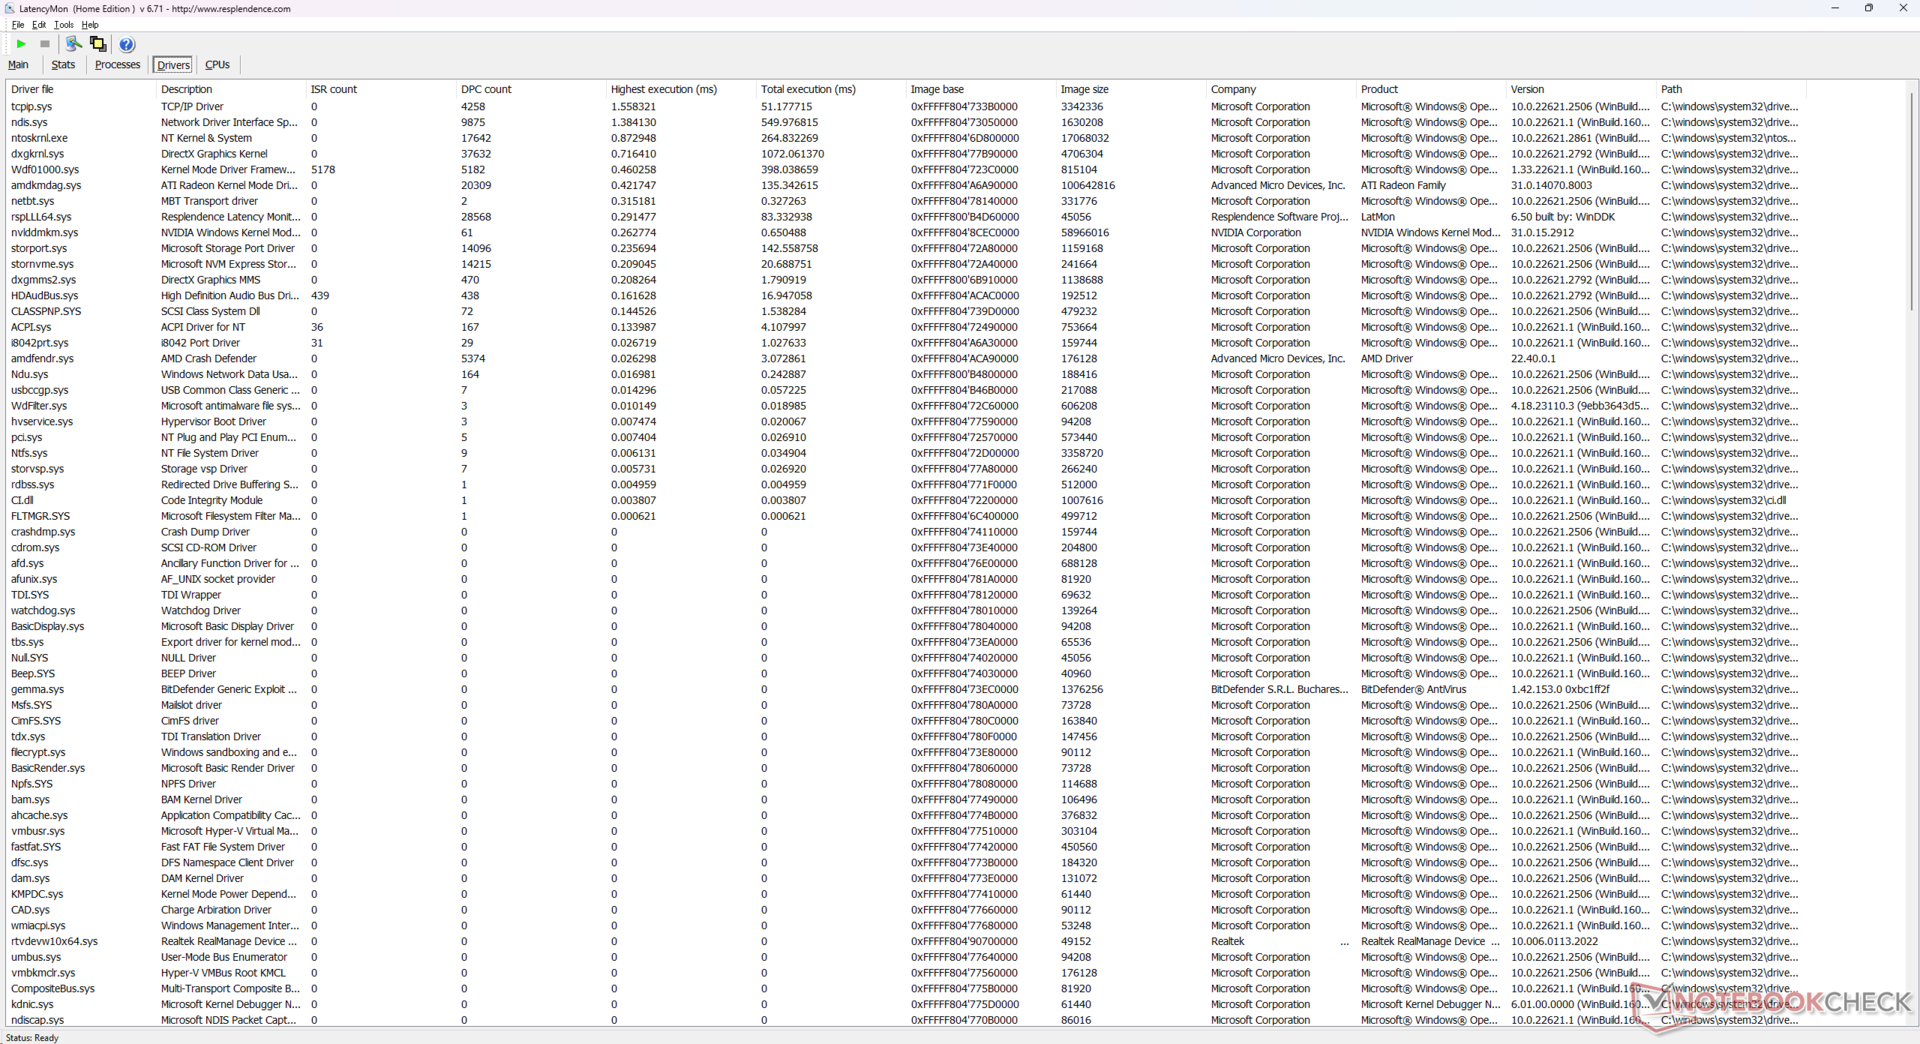
DPC Latency
LatencyMon reveals DPC issues when opening multiple browser tabs of our homepage. 4K video playback at 60 FPS is otherwise perfect with no dropped frames recorded.
| DPC Latencies / LatencyMon - interrupt to process latency (max), Web, Youtube, Prime95 | |
| Lenovo ThinkPad P1 G6-21FV000DGE | |
| Asus ExpertBook B6 Flip B6602FC2 | |
| HP ZBook Power 15 G10 | |
| HP ZBook Power 15 G9 6B8C4EA | |
| Dell Precision 5000 5560 | |
| Lenovo ThinkPad P15v G3 21EM001AGE | |
* ... smaller is better
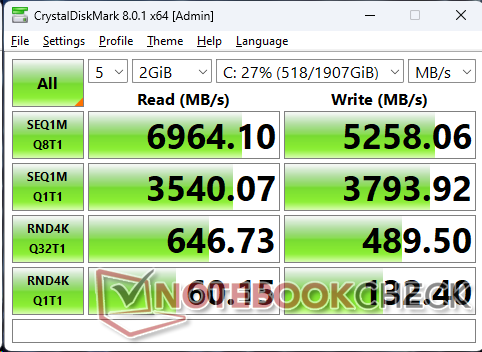
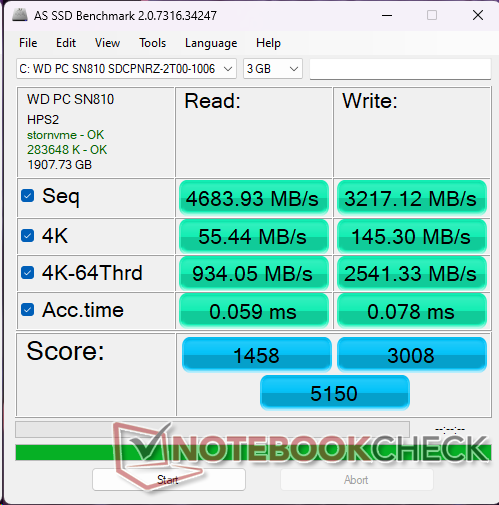
Storage Devices
Our unit comes configured with the WDC PC SN810 instead of the Samsung PM9A1 on last year's model. In general, the WDC drive is slower than the Samsung when it comes to reading and writing small 4K blocks at high queue depths. HP allows buyers to configure with SED or non-SED drives, but HP does not explicitly list the SSD brands in question.

* ... smaller is better
Disk Throttling: DiskSpd Read Loop, Queue Depth 8
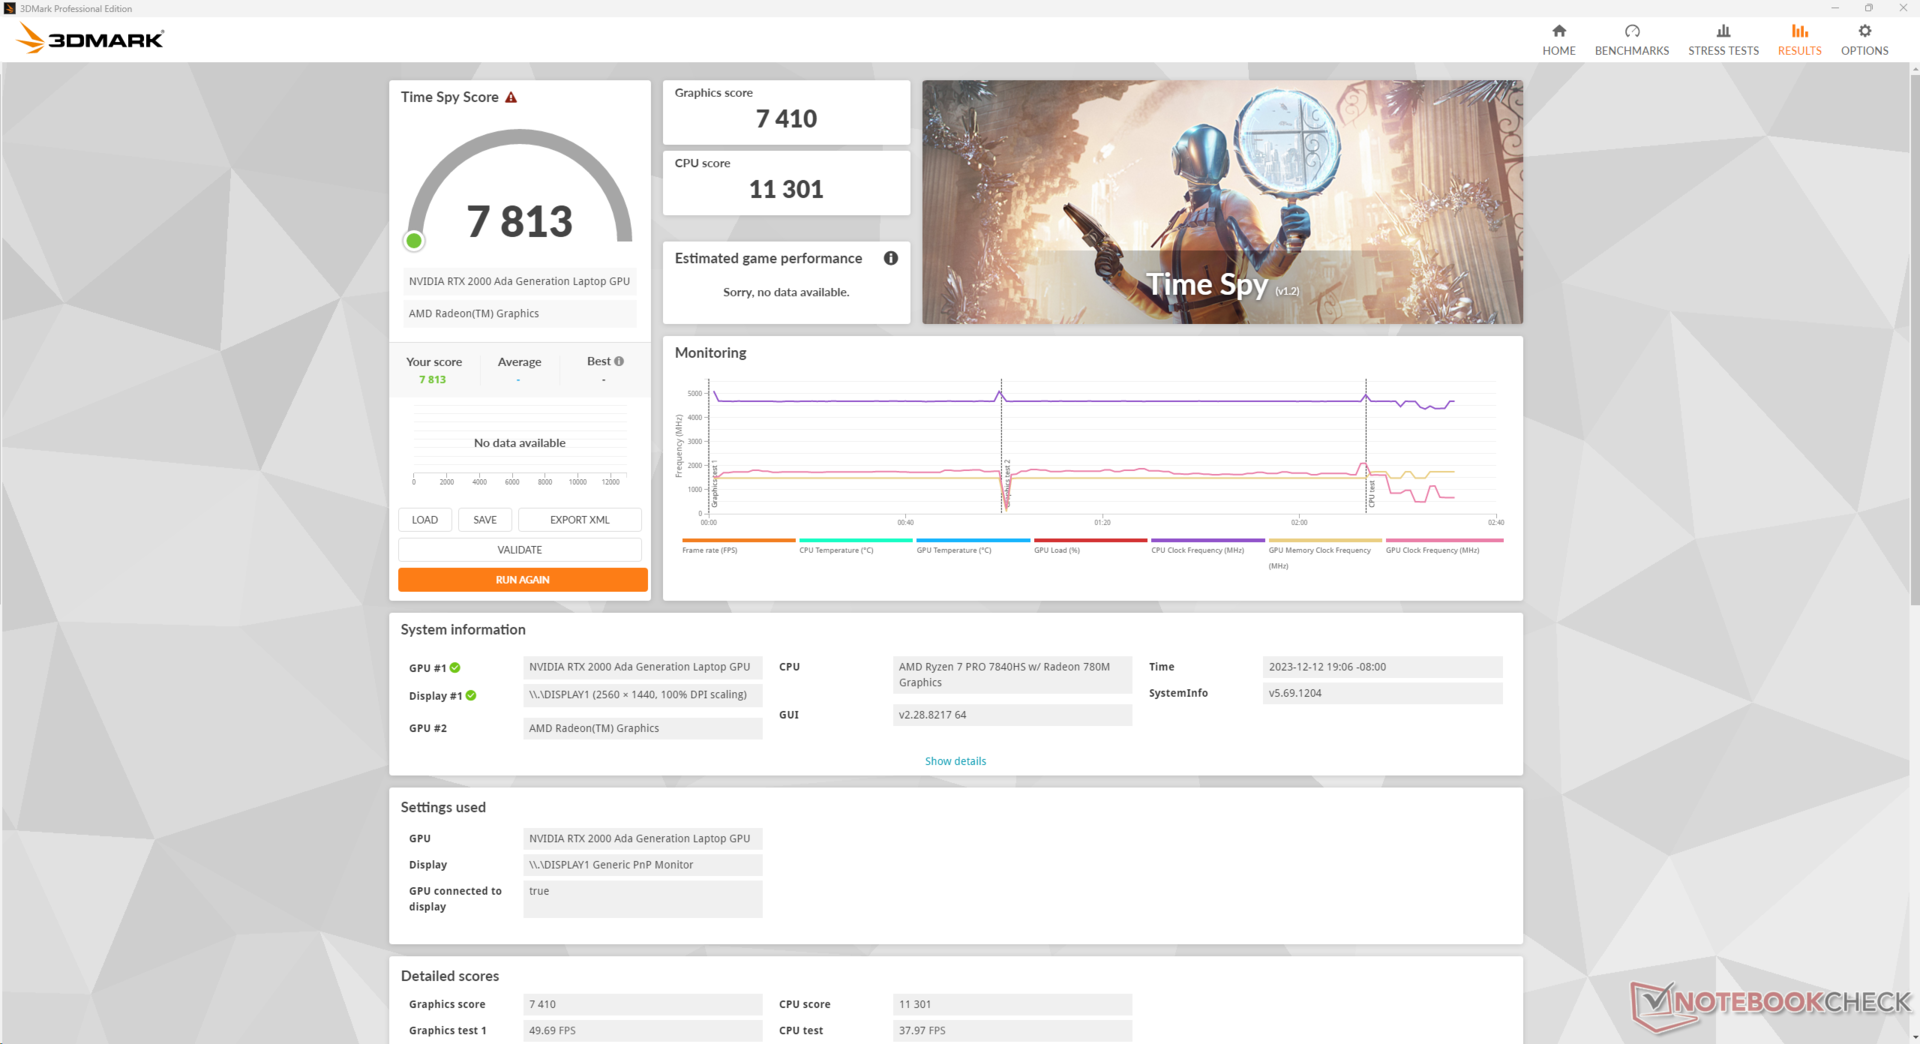
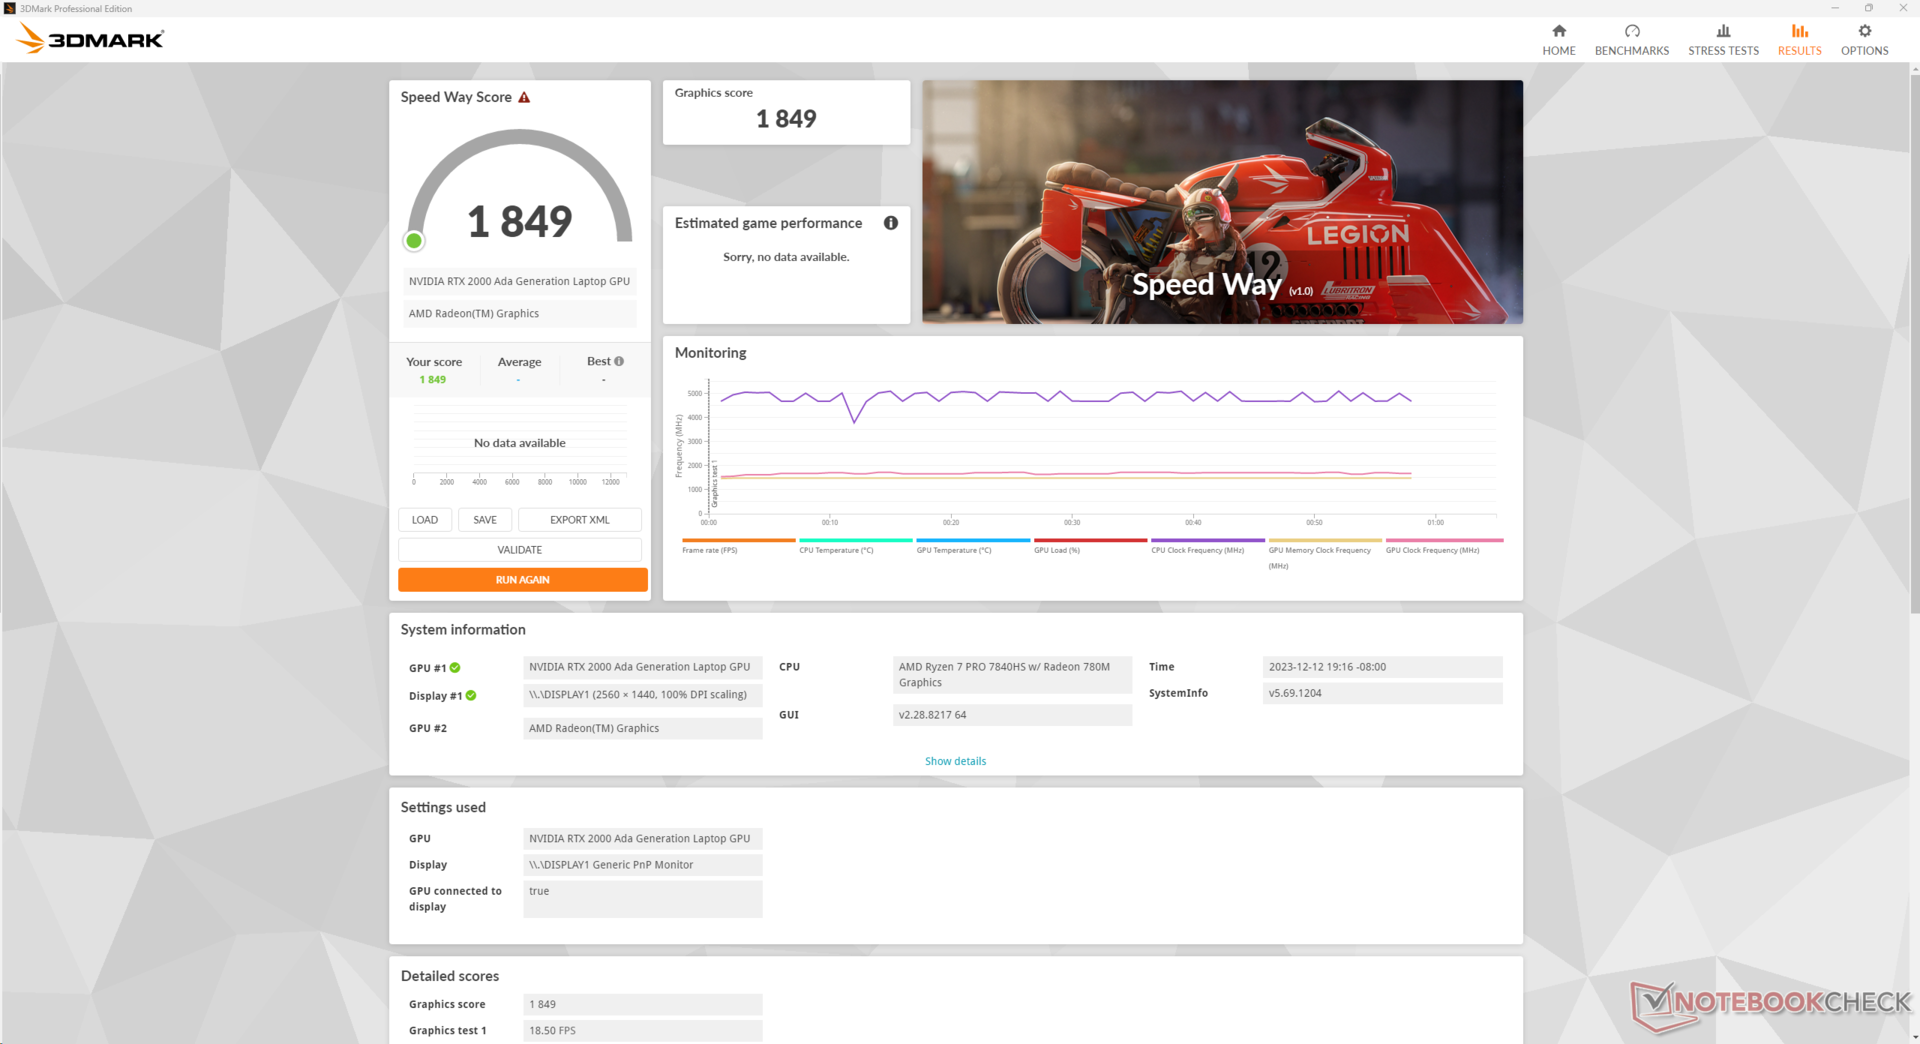
GPU Performance
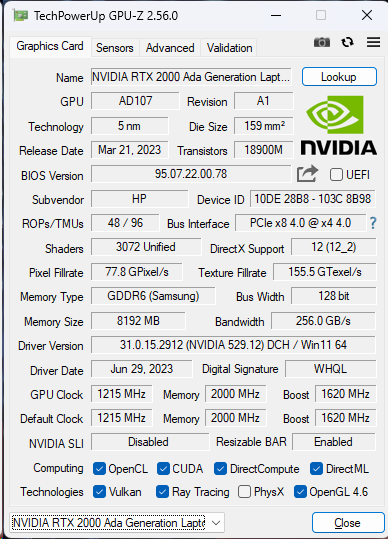
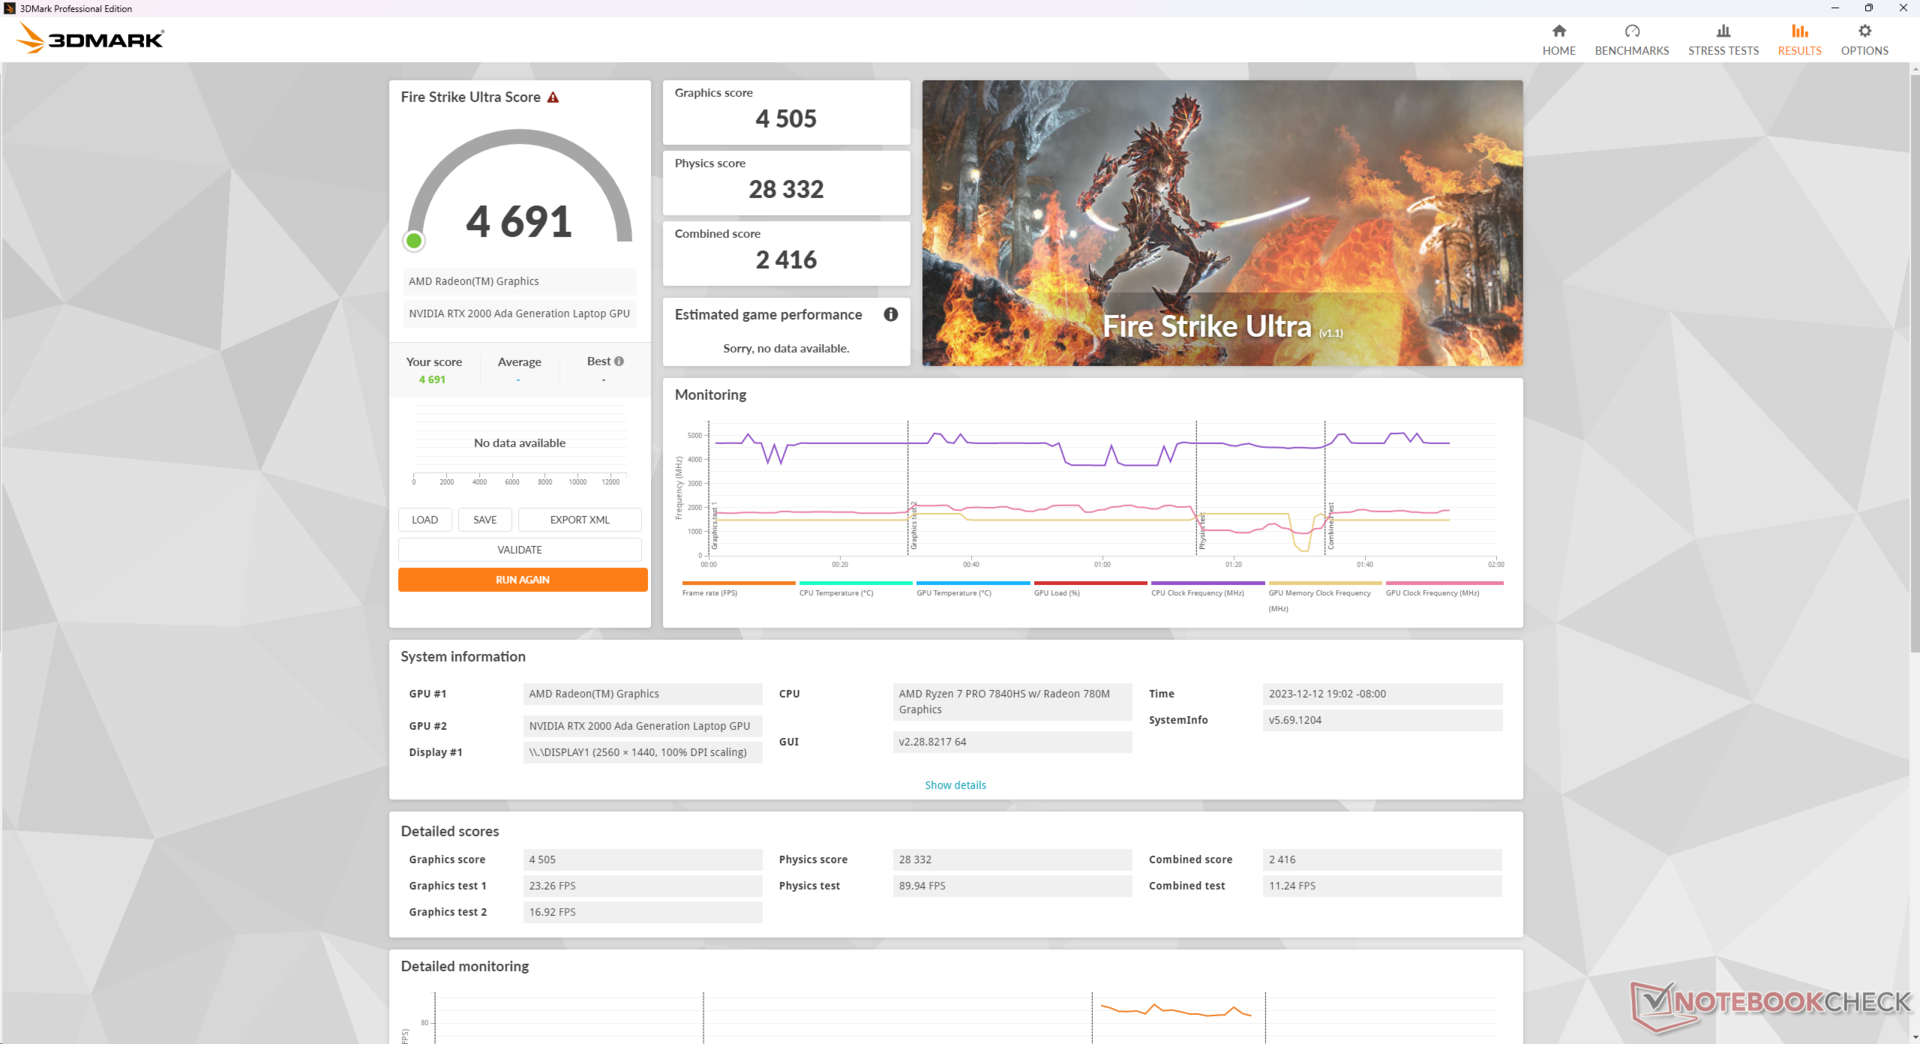
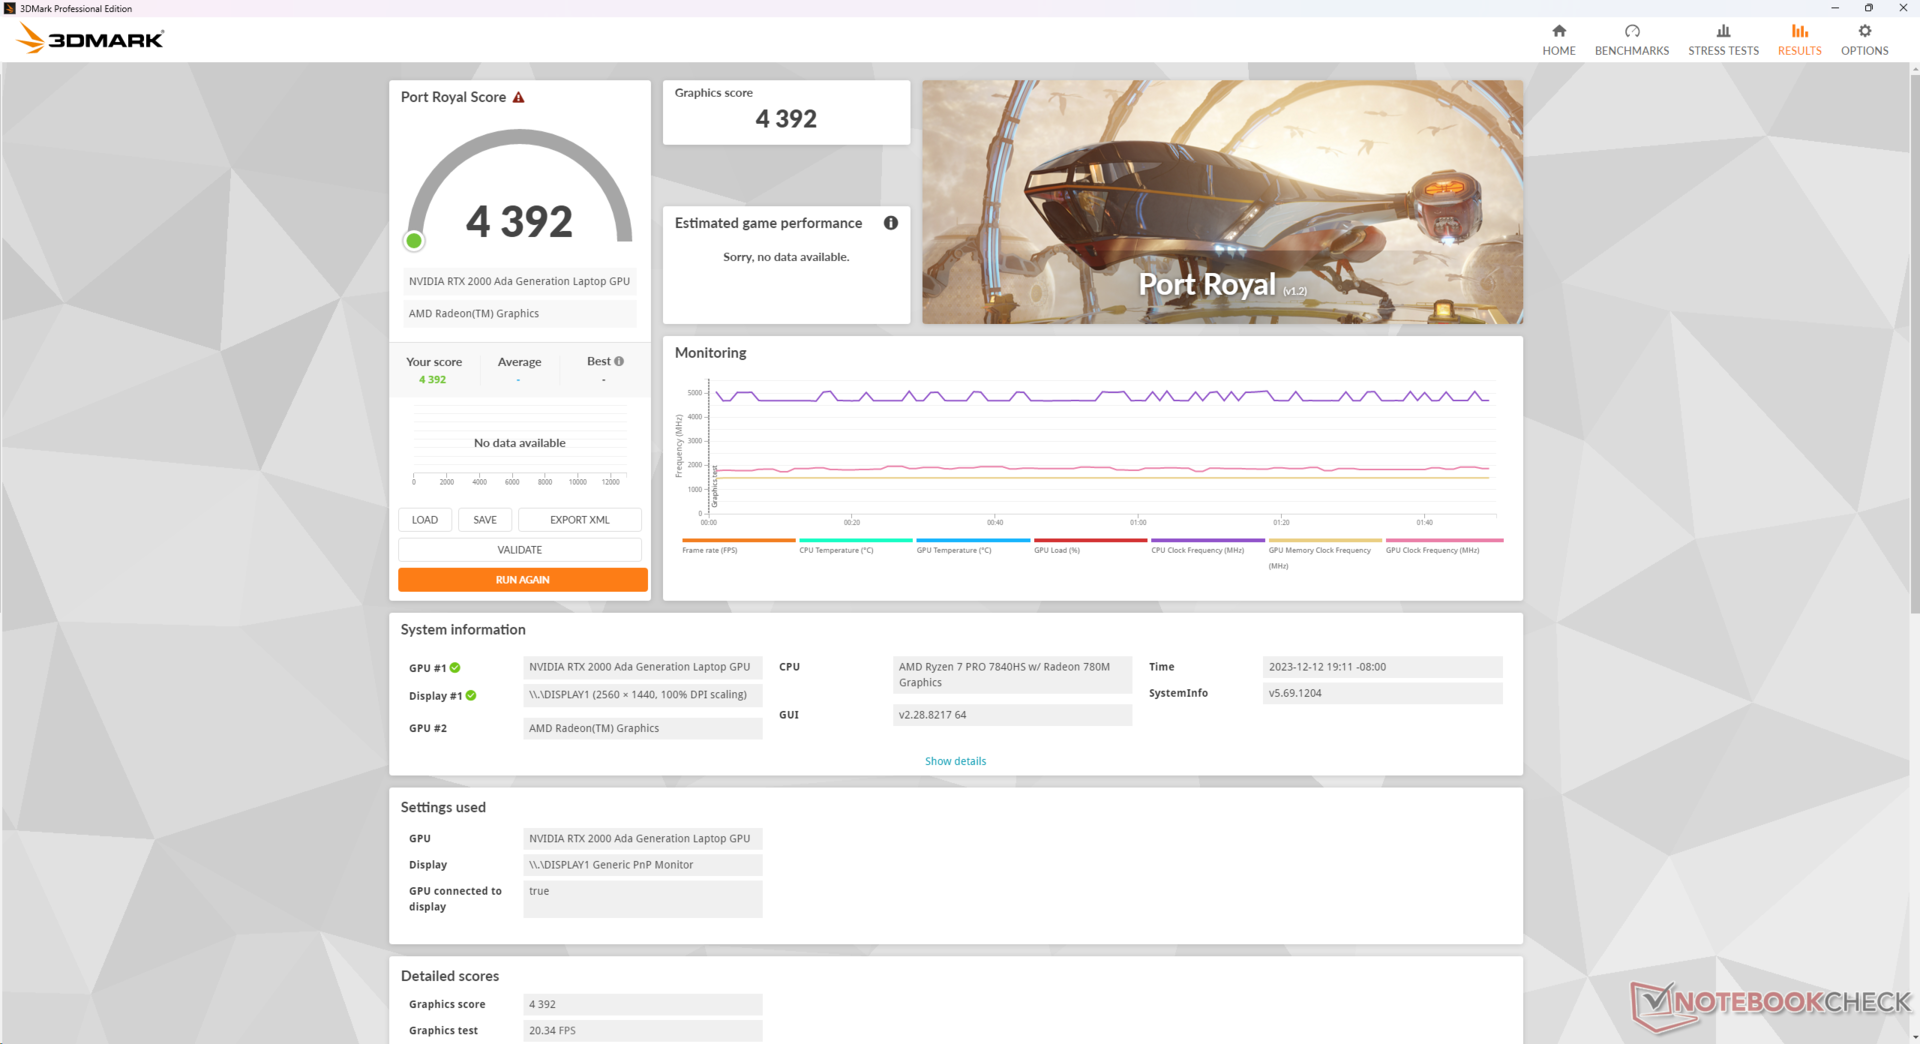
The Nvidia RTX 2000 Ada is a noticeable upgrade over the RTX A2000 in last year's ZBook Power 15 G9 and a major reason for choosing the newer G10 model over the previous version. Raw graphics power is roughly 55 to 65 percent faster and SpecViewPerf results are also consistently higher.
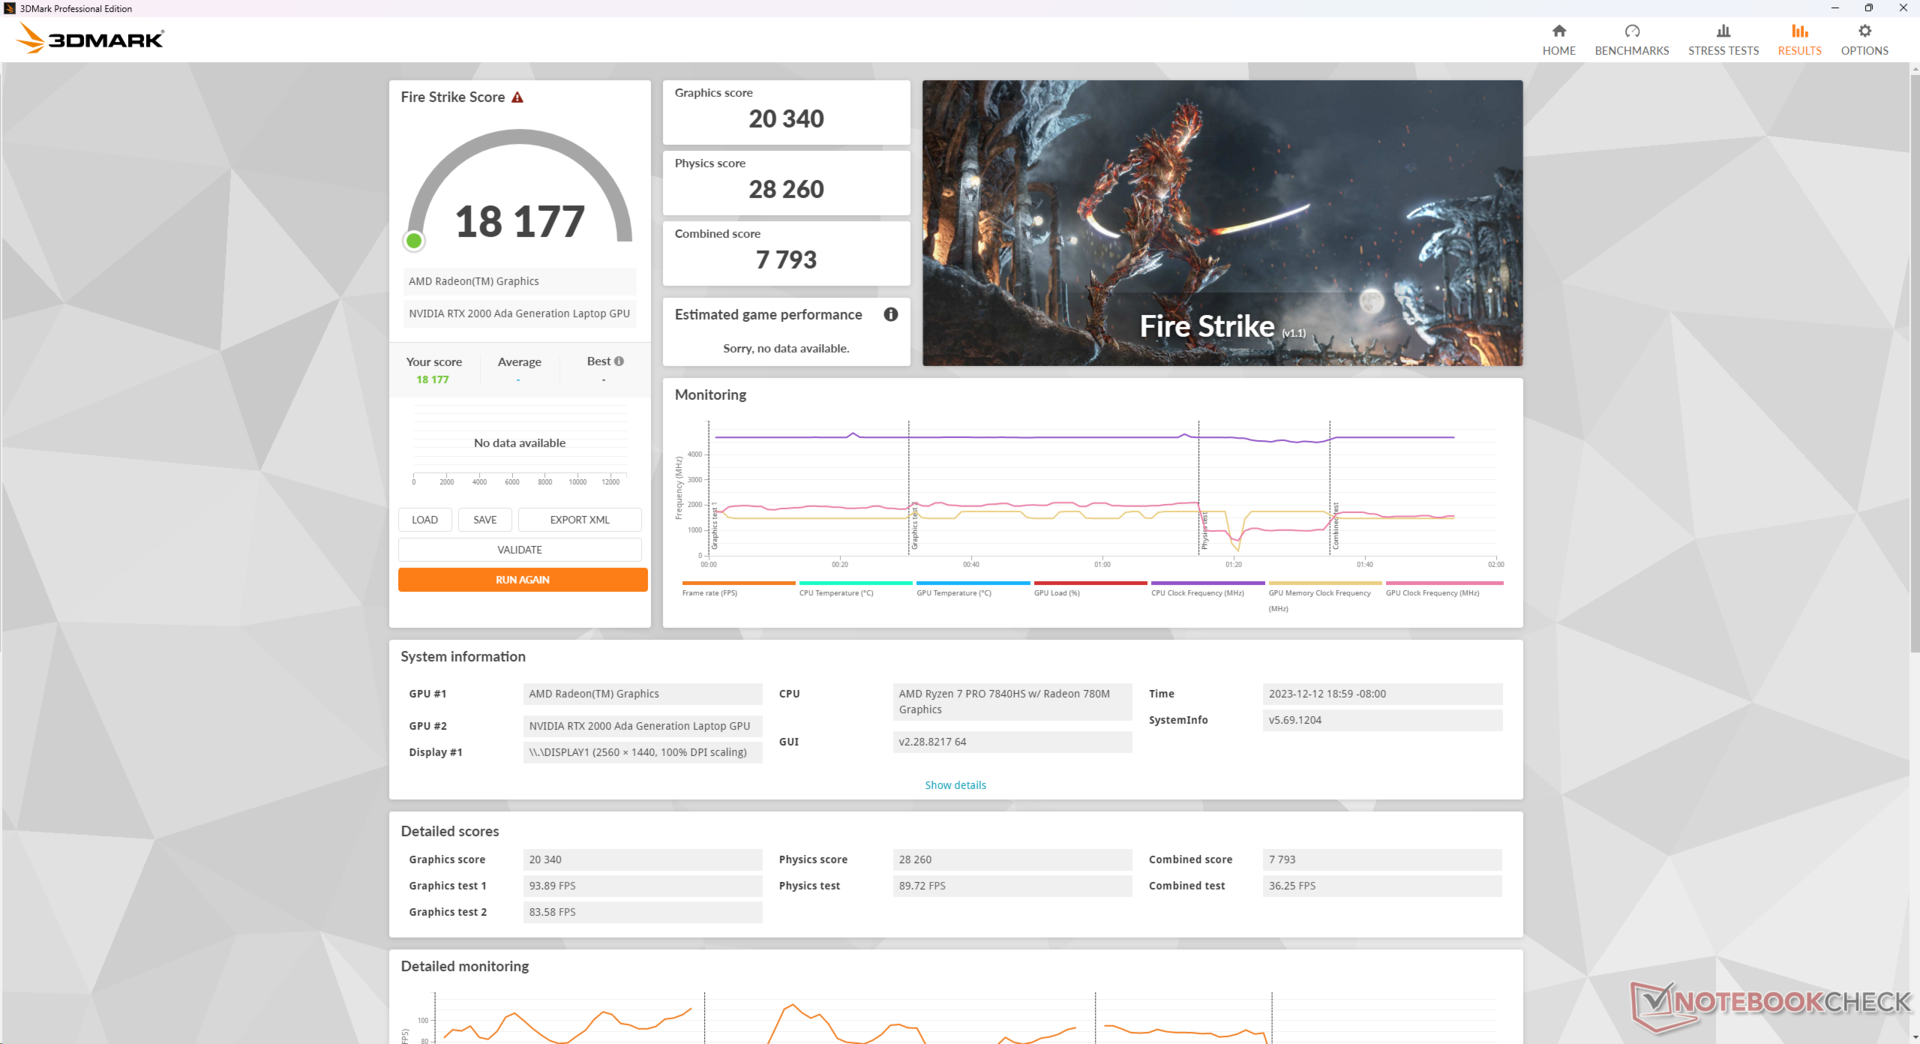
Running on Balanced mode instead of Performance mode does not appear to impact CPU or GPU performance as shown by our Fire Strike results below. Running on battery power, however, significantly reduces performance even if set to Performance mode.
| Power Profile | Physics Score | Graphics Score | Combined Score |
| Performance Mode (on mains) | 28260 | 20340 | 7793 |
| Balanced Mode (on mains) | 27579 (-0%) | 20812 (-0%) | 7877 (-0%) |
| Performance Mode (on battery) | 6105 (-78%) | 12744 (-37%) | 2392 (-69%) |
Annoyingly, HP offers the RTX 3000 Ada GPU only for Intel configurations of the ZBook Power 15 G10 while AMD configurations are limited to the RTX 2000 Ada. The 3000 Ada GPU offers roughly 5 to 15 percent faster performance than the 2000 Ada based on our time with the smaller Dell Precision 5480.
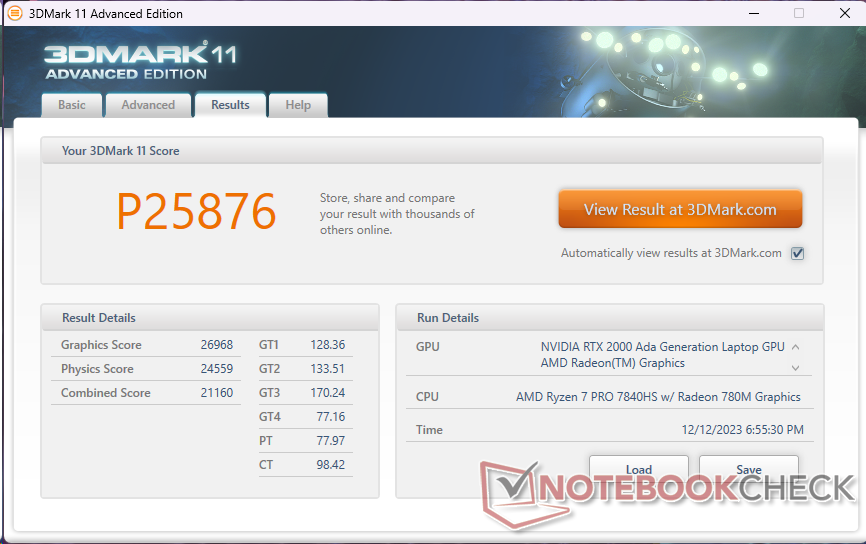
| 3DMark 11 Performance | 25876 points | |
| 3DMark Fire Strike Score | 18177 points | |
| 3DMark Time Spy Score | 7813 points | |
Help | ||
* ... smaller is better
Gaming Performance
Overall gaming performance is most similar to the GeForce RTX 4050 even though the 2000 Ada integrates more unified pipelines, TMUs, VRAM, and a wider memory bandwidth. Demanding games like Cyberpunk 2077 are playable at 1080p and Extreme settings, but lower settings are required if playing at the native 1440p resolution.
| Cyberpunk 2077 | |
| 1920x1080 Low Preset (FSR off) | |
| HP ZBook Power 15 G10 | |
| Average NVIDIA RTX 2000 Ada Generation Laptop (81.1 - 85.4, n=2) | |
| Lenovo ThinkPad Z16 Gen 2 | |
| 1920x1080 Medium Preset (FSR off) | |
| HP ZBook Power 15 G10 | |
| Average NVIDIA RTX 2000 Ada Generation Laptop (61.4 - 64.5, n=2) | |
| Lenovo ThinkPad Z16 Gen 2 | |
| 1920x1080 High Preset (FSR off) | |
| HP ZBook Power 15 G10 | |
| Average NVIDIA RTX 2000 Ada Generation Laptop (51.7 - 55.2, n=2) | |
| Lenovo ThinkPad Z16 Gen 2 | |
| 1920x1080 Ultra Preset (FSR off) | |
| HP ZBook Power 15 G10 | |
| Average NVIDIA RTX 2000 Ada Generation Laptop (44.8 - 48.3, n=2) | |
| Lenovo ThinkPad Z16 Gen 2 | |
| 2560x1440 Ultra Preset (FSR off) | |
| HP ZBook Power 15 G10 | |
| Average NVIDIA RTX 2000 Ada Generation Laptop (29.7 - 29.9, n=2) | |
| Lenovo ThinkPad Z16 Gen 2 | |
| 1920x1080 Ray Tracing Ultra Preset (DLSS off) | |
| HP ZBook Power 15 G10 | |
| Average NVIDIA RTX 2000 Ada Generation Laptop (19.2 - 21.6, n=2) | |
| Lenovo ThinkPad Z16 Gen 2 | |
Witcher 3 FPS Chart
| low | med. | high | ultra | QHD | |
|---|---|---|---|---|---|
| GTA V (2015) | 178.1 | 170.6 | 157.7 | 86.2 | 60.6 |
| The Witcher 3 (2015) | 336.4 | 219 | 127.9 | 65.5 | |
| Dota 2 Reborn (2015) | 155 | 140.8 | 136.9 | 132 | |
| Final Fantasy XV Benchmark (2018) | 173.3 | 93.5 | 67.7 | 50.3 | |
| X-Plane 11.11 (2018) | 80.6 | 73 | 52.5 | ||
| Far Cry 5 (2018) | 151 | 110 | 102 | 95 | 63 |
| Strange Brigade (2018) | 332 | 183 | 148.4 | 132.5 | 94.1 |
| Tiny Tina's Wonderlands (2022) | 119.8 | 110.5 | 77.3 | 62.3 | 43.5 |
| F1 22 (2022) | 166.7 | 151.8 | 119.9 | 44.2 | 28.9 |
| Cyberpunk 2077 (2023) | 85.4 | 64.5 | 55.2 | 48.3 | 29.9 |
Emissions
System Noise
Fan noise is essentially identical to last year's model with similar minimums and maximums despite their performance differences. For what it's worth, the internal fans of our G10 unit are able to remain quieter for slightly longer than on our G9 unit when running 3DMark 06, but this is of course dependent on initial temperature conditions.
Fan noise when running Witcher 3 would remain the same between Balanced and Performance modes which correlates with our test results showing minimal differences between the two power profiles.
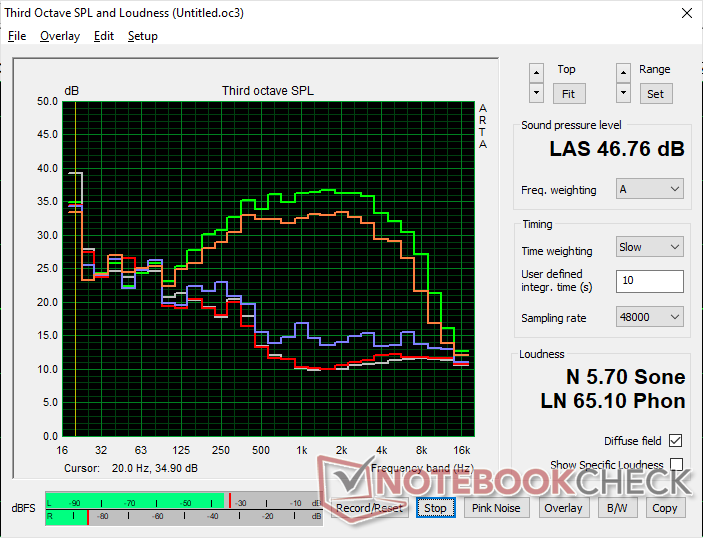
Noise level
| Idle |
| 24.4 / 24.4 / 24.4 dB(A) |
| Load |
| 27.4 / 46.8 dB(A) |
 | ||
30 dB silent 40 dB(A) audible 50 dB(A) loud |
||
min: | ||
| HP ZBook Power 15 G10 RTX 2000 Ada Generation Laptop, R7 PRO 7840HS, WDC PC SN810 2TB | HP ZBook Power 15 G9 6B8C4EA RTX A2000 Laptop GPU, i7-12700H, Samsung PM9A1 MZVL21T0HCLR | Lenovo ThinkPad P15v G3 21EM001AGE RTX A2000 Laptop GPU, R7 PRO 6850H, SK Hynix PC711 1TB HFS001TDE9X081N | Dell Precision 5000 5560 RTX A2000 Laptop GPU, i7-11850H, Samsung PM9A1 MZVL22T0HBLB | Lenovo ThinkPad P1 G6-21FV000DGE RTX 2000 Ada Generation Laptop, i9-13900H, SK Hynix PC711 1TB HFS001TDE9X084N | Asus ExpertBook B6 Flip B6602FC2 RTX A2000 Laptop GPU, i9-12950HX, Samsung PM9A1 MZVL21T0HCLR | |
|---|---|---|---|---|---|---|
| Noise | -8% | 3% | 5% | -10% | -34% | |
| off / environment * (dB) | 24.2 | 23.8 2% | 23.2 4% | 23.4 3% | 24.5 -1% | 26 -7% |
| Idle Minimum * (dB) | 24.4 | 23.8 2% | 23.2 5% | 23.6 3% | 24.5 -0% | 32.4 -33% |
| Idle Average * (dB) | 24.4 | 23.8 2% | 23.2 5% | 23.6 3% | 24.5 -0% | 32.4 -33% |
| Idle Maximum * (dB) | 24.4 | 23.8 2% | 23.2 5% | 23.6 3% | 24.5 -0% | 32.4 -33% |
| Load Average * (dB) | 27.4 | 42.9 -57% | 35 -28% | 25.8 6% | 48 -75% | 51.9 -89% |
| Witcher 3 ultra * (dB) | 43.3 | 44.5 -3% | 37.9 12% | 40.1 7% | 40.7 6% | |
| Load Maximum * (dB) | 46.8 | 47.9 -2% | 37.5 20% | 41.4 12% | 48 -3% | 52.1 -11% |
* ... smaller is better
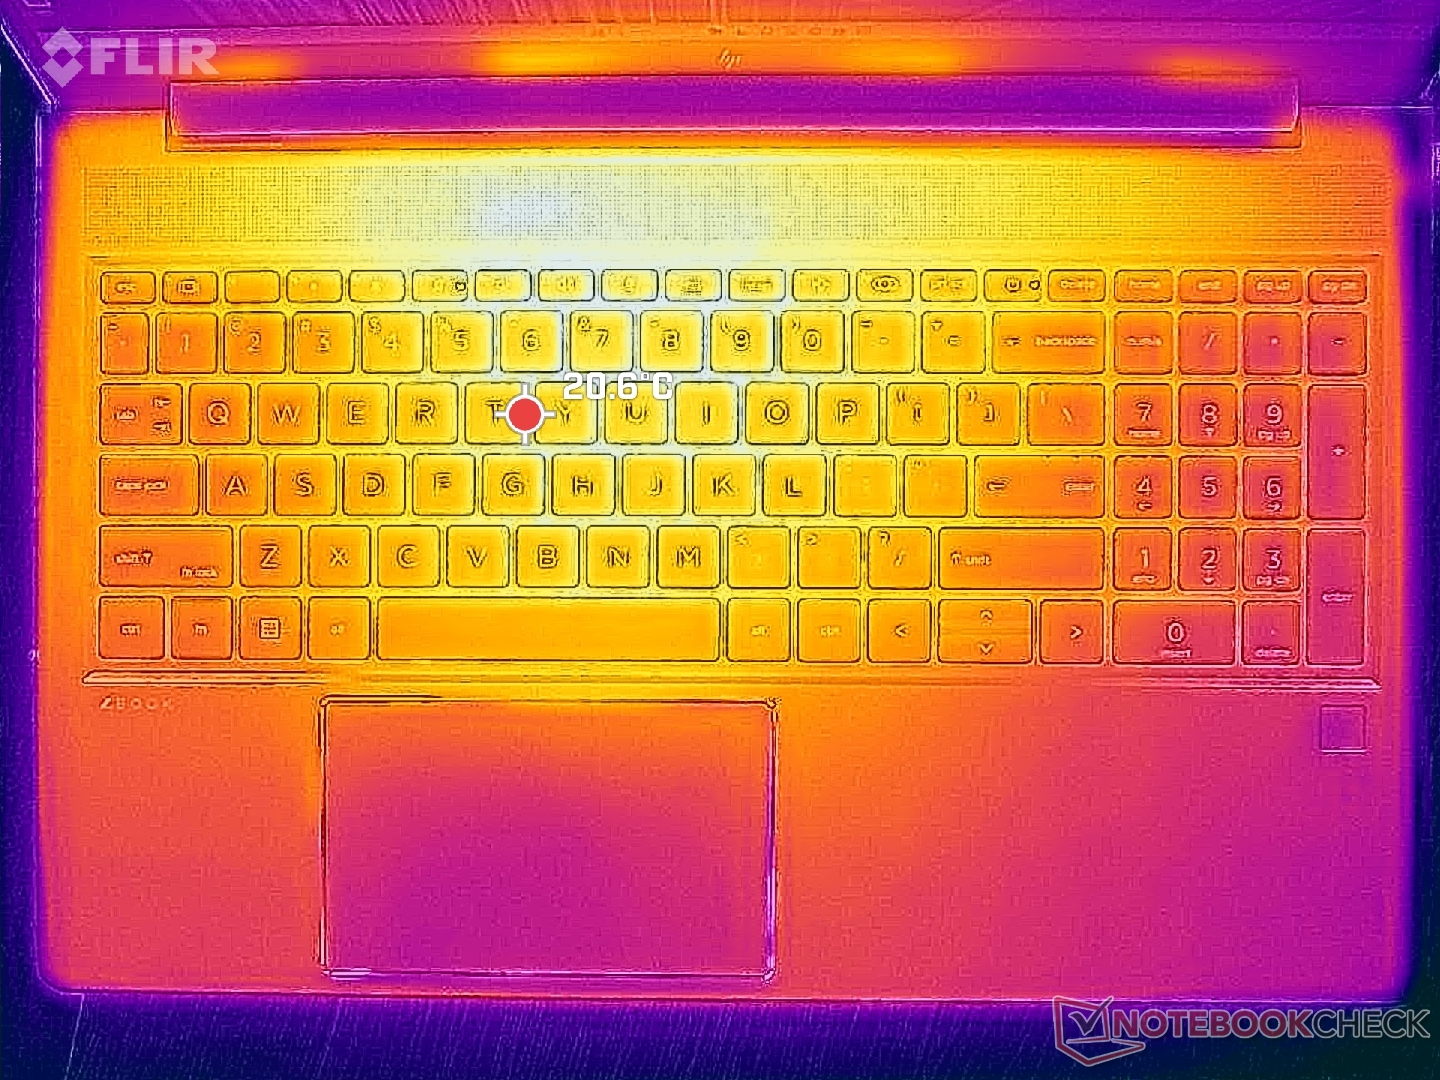
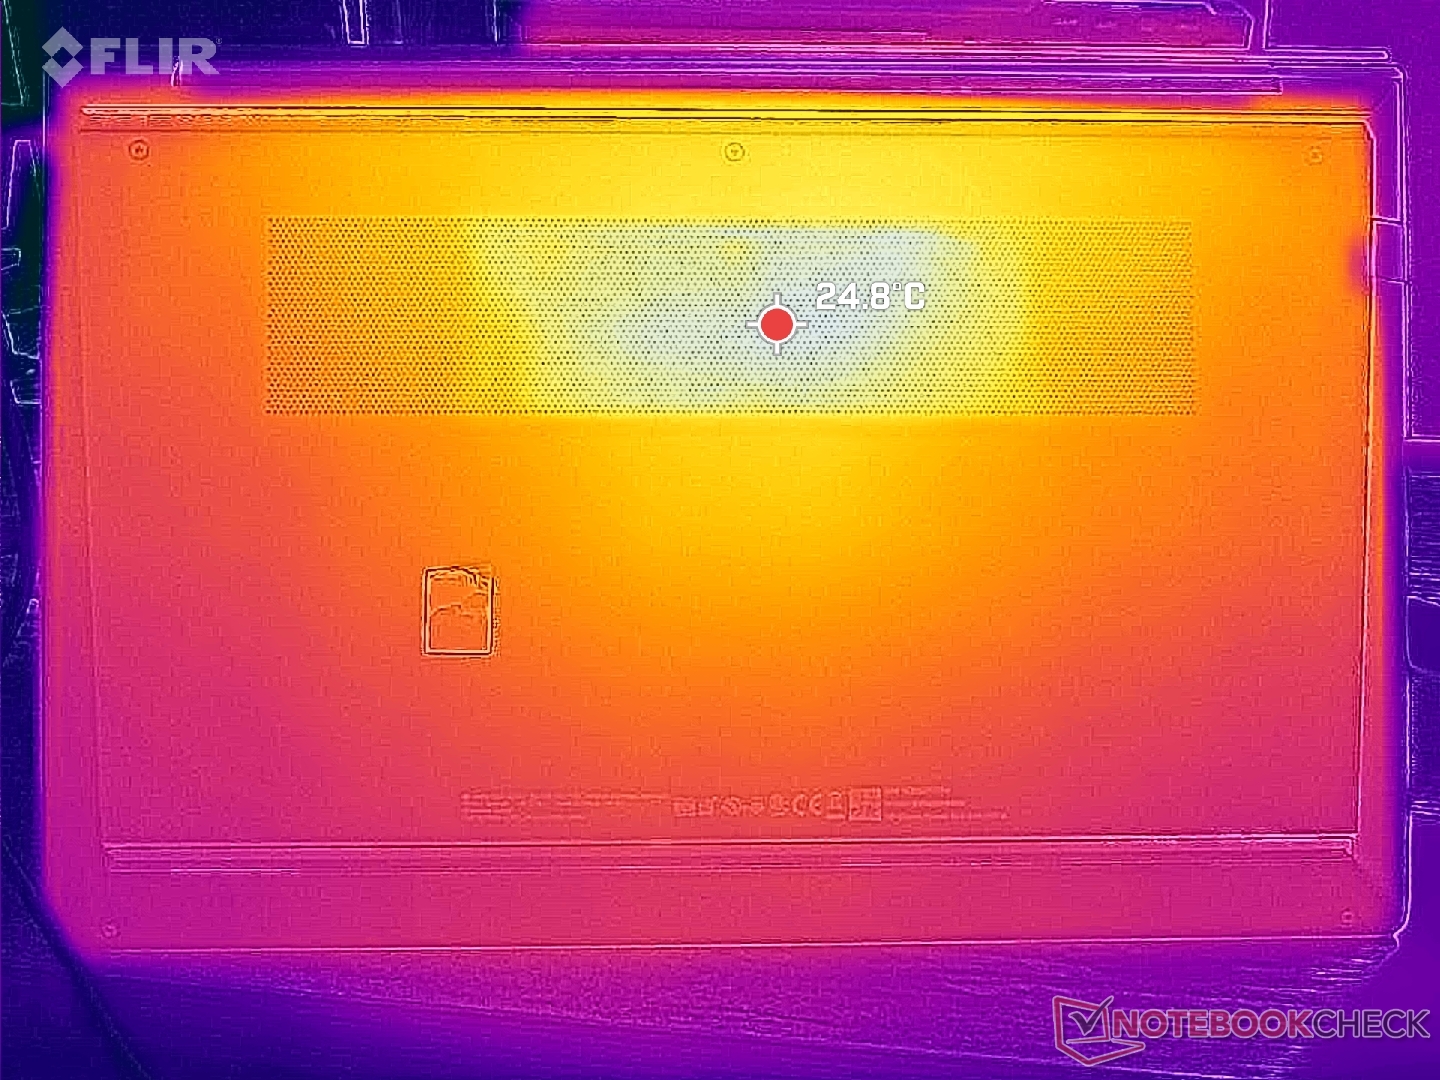
Temperature
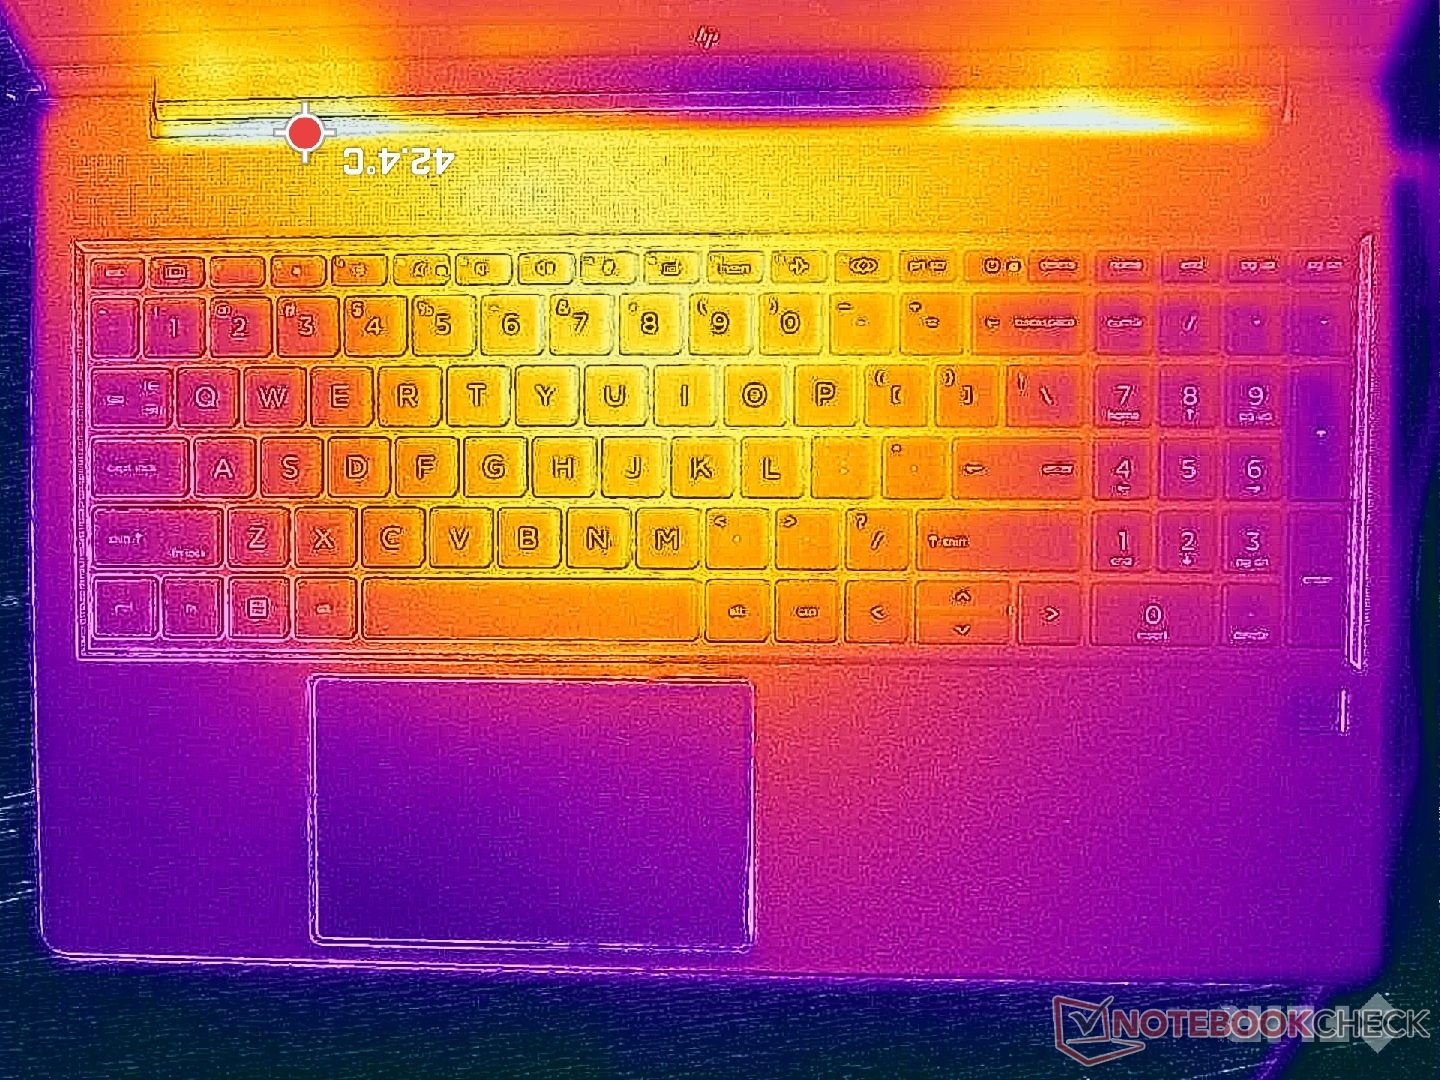
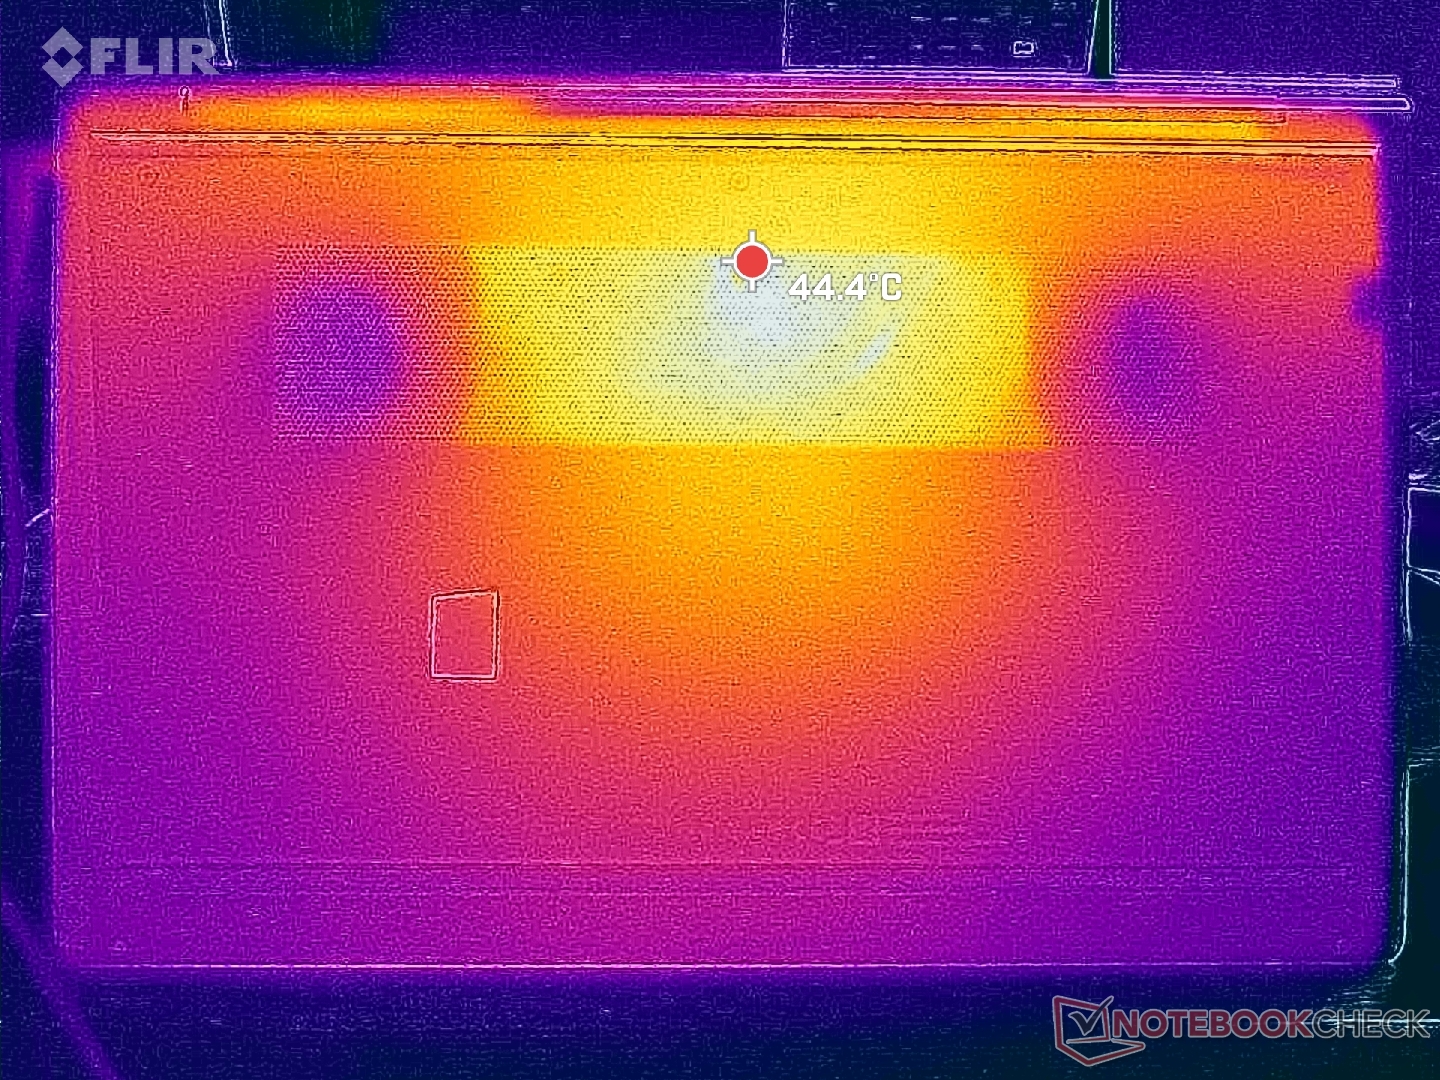
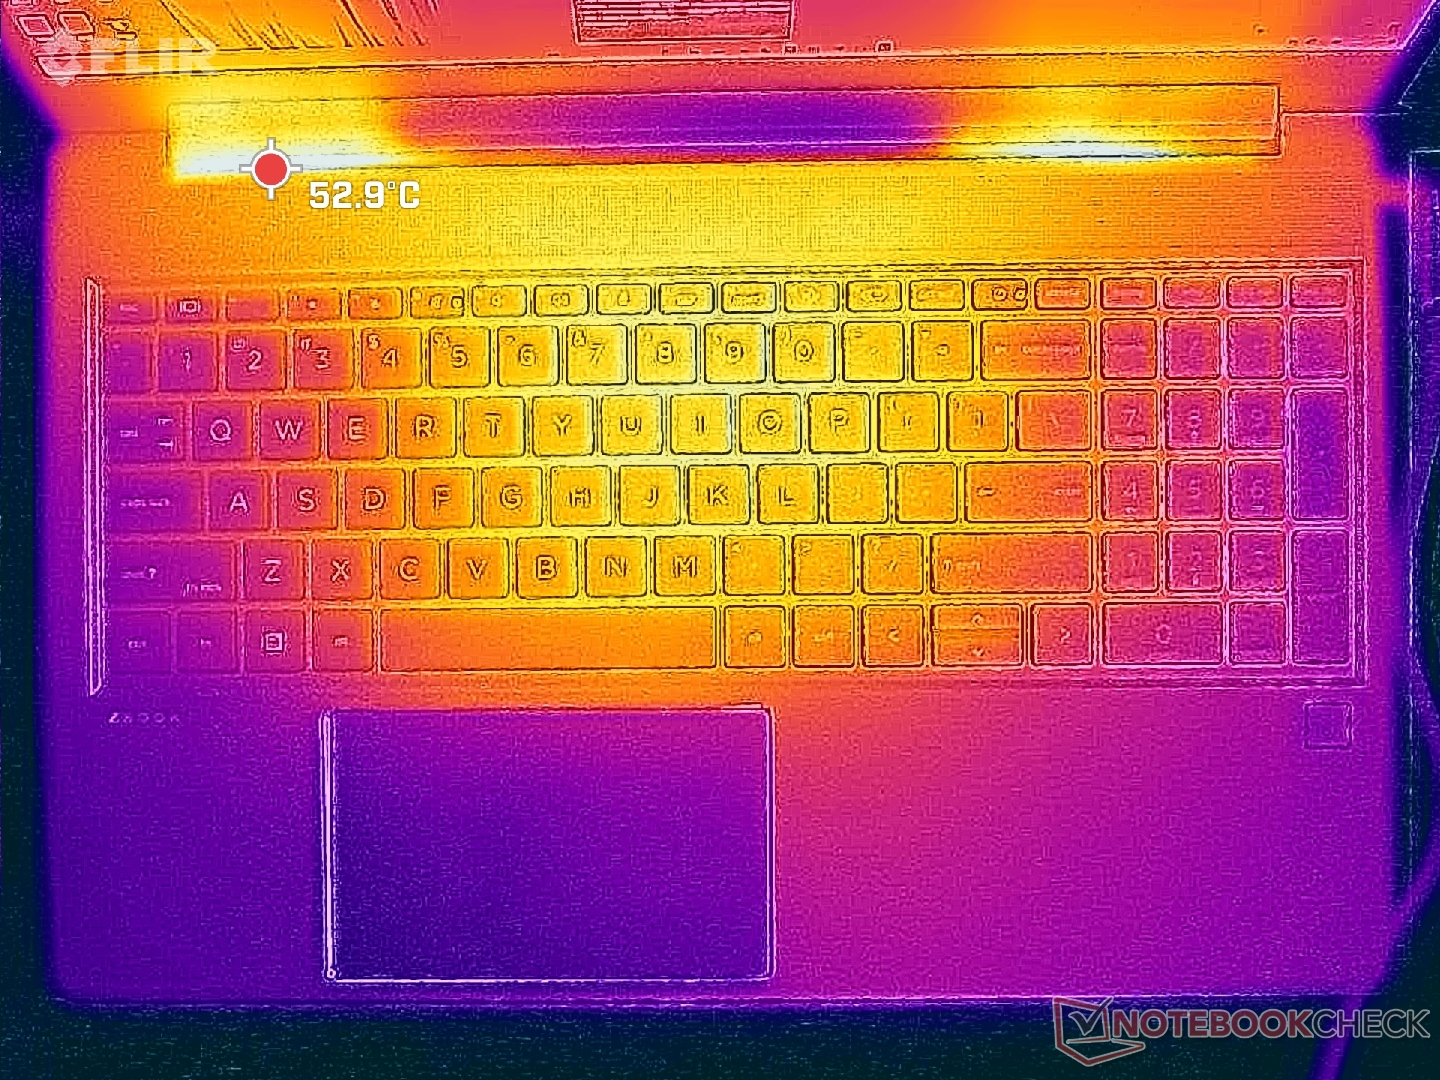
Surface temperatures are warmest toward the center and cooler along the sides of the keyboard or edges of the chassis. Hot spots on the keyboard center and bottom can reach over 42 C which is several degrees cooler than on the competing ThinkPad P1 G6 with the same RTX 2000 GPU.
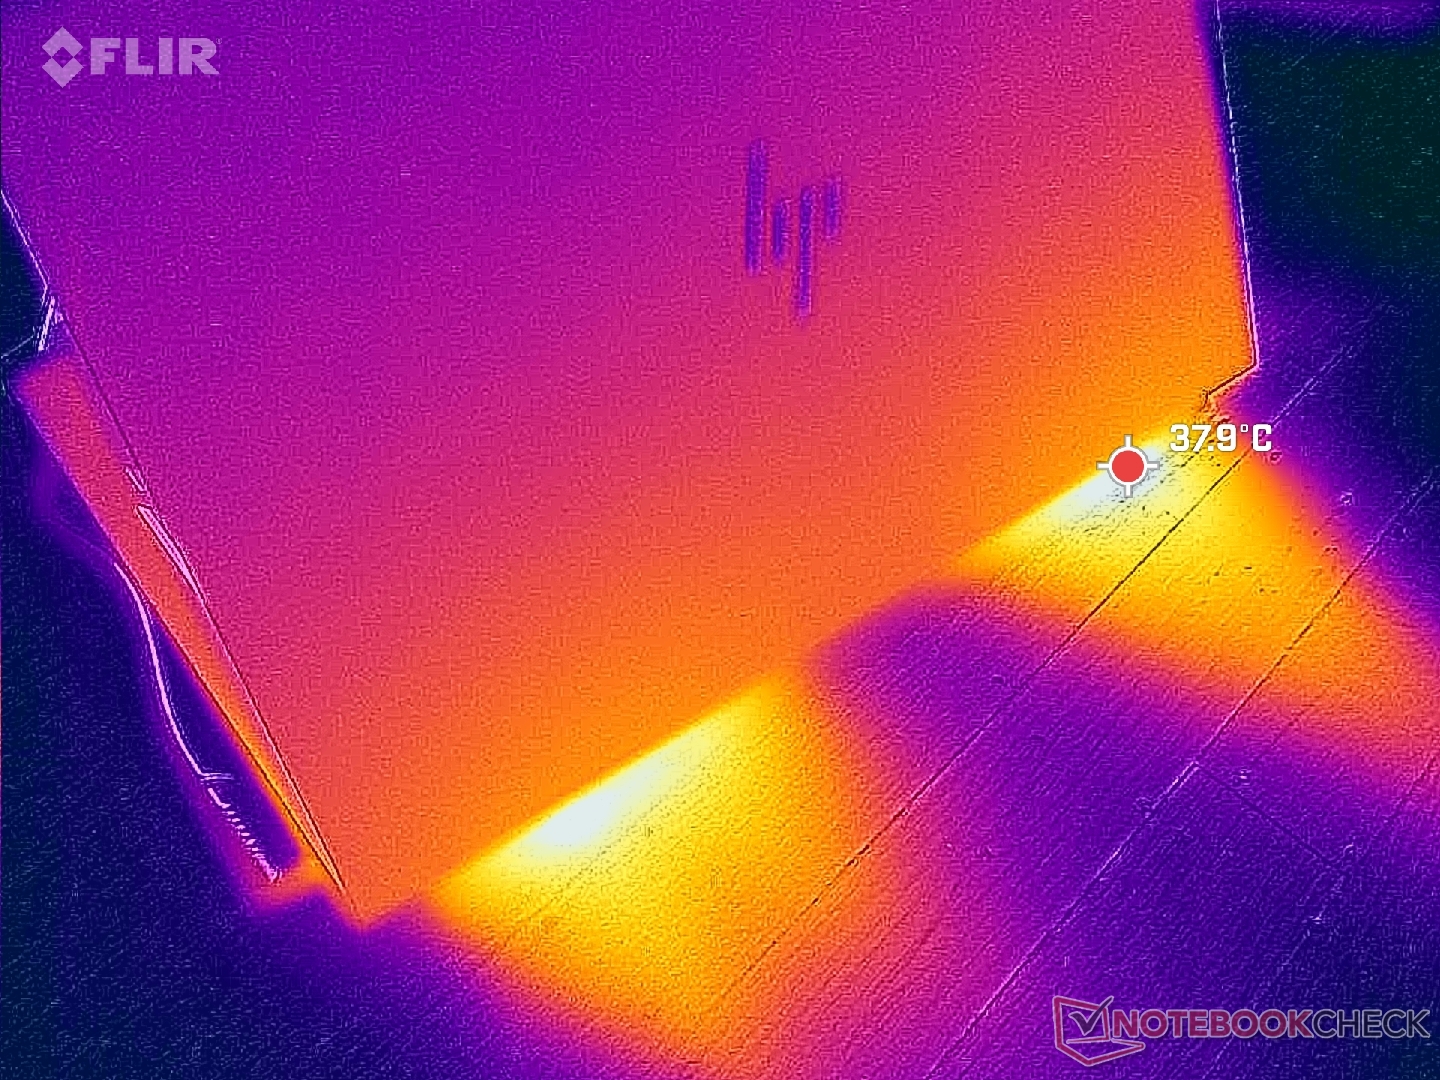
(±) The maximum temperature on the upper side is 42.4 °C / 108 F, compared to the average of 38.2 °C / 101 F, ranging from 22.2 to 69.8 °C for the class Workstation.
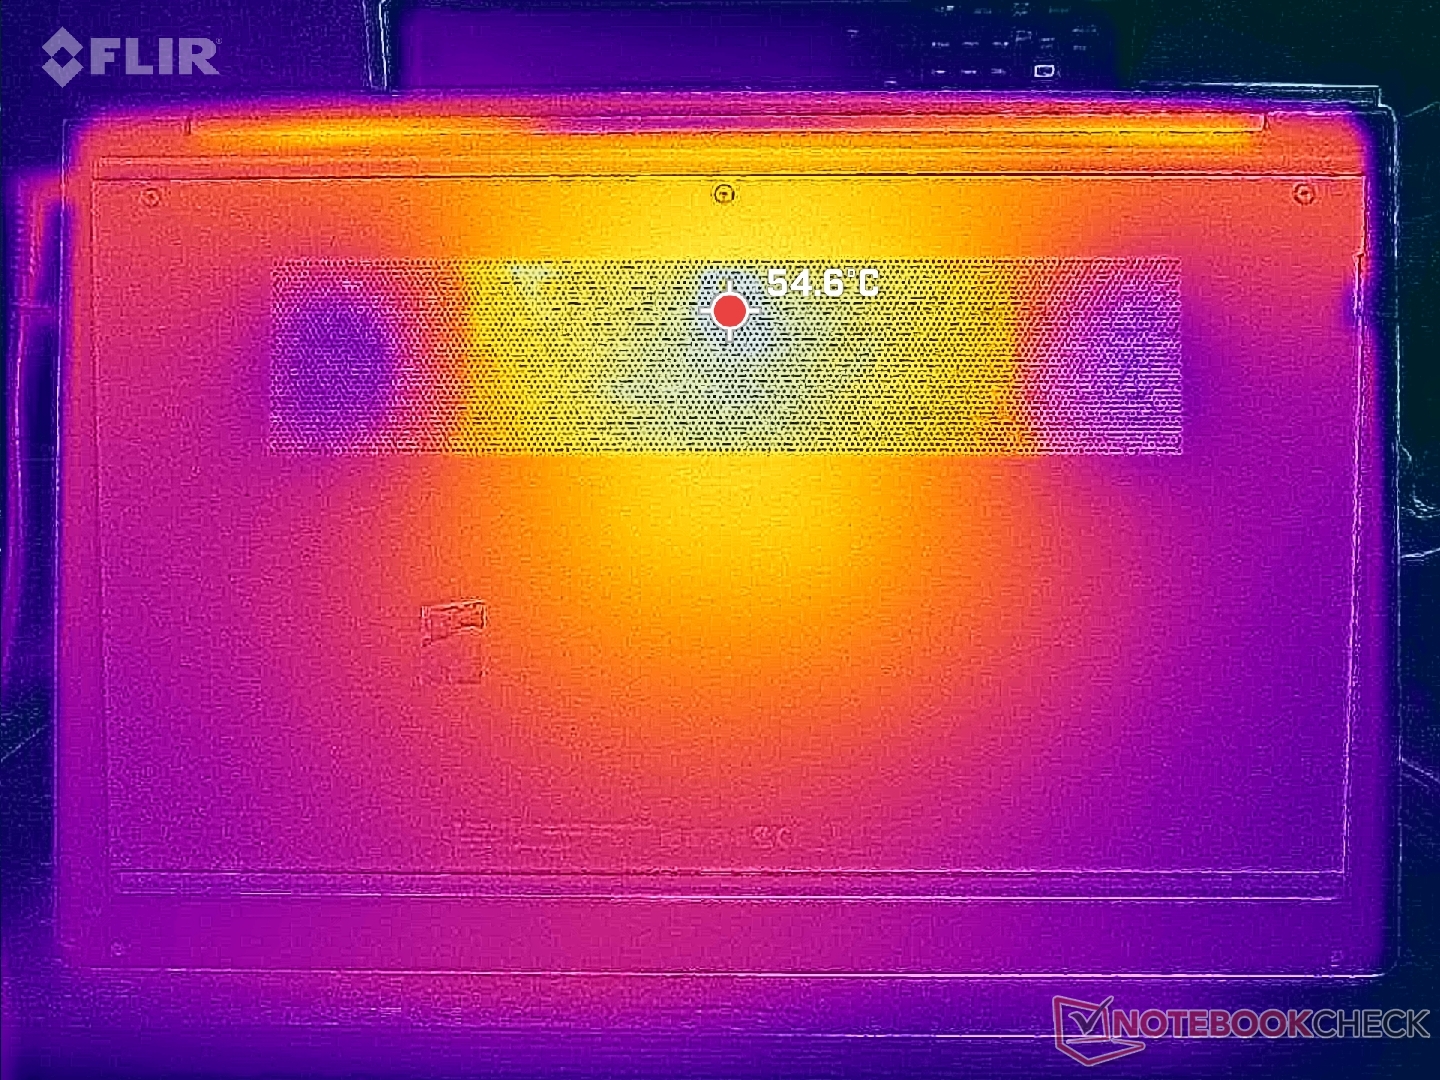
(-) The bottom heats up to a maximum of 47.8 °C / 118 F, compared to the average of 41.1 °C / 106 F
(+) In idle usage, the average temperature for the upper side is 24.4 °C / 76 F, compared to the device average of 32 °C / 90 F.
(+) Playing The Witcher 3, the average temperature for the upper side is 31.2 °C / 88 F, compared to the device average of 32 °C / 90 F.
(+) The palmrests and touchpad are cooler than skin temperature with a maximum of 27.6 °C / 81.7 F and are therefore cool to the touch.
(±) The average temperature of the palmrest area of similar devices was 27.8 °C / 82 F (+0.2 °C / 0.3 F).
| HP ZBook Power 15 G10 AMD Ryzen 7 PRO 7840HS, NVIDIA RTX 2000 Ada Generation Laptop | HP ZBook Power 15 G9 6B8C4EA Intel Core i7-12700H, NVIDIA RTX A2000 Laptop GPU | Lenovo ThinkPad P15v G3 21EM001AGE AMD Ryzen 7 PRO 6850H, NVIDIA RTX A2000 Laptop GPU | Dell Precision 5000 5560 Intel Core i7-11850H, NVIDIA RTX A2000 Laptop GPU | Lenovo ThinkPad P1 G6-21FV000DGE Intel Core i9-13900H, NVIDIA RTX 2000 Ada Generation Laptop | Asus ExpertBook B6 Flip B6602FC2 Intel Core i9-12950HX, NVIDIA RTX A2000 Laptop GPU | |
|---|---|---|---|---|---|---|
| Heat | 7% | -2% | -16% | -9% | -10% | |
| Maximum Upper Side * (°C) | 42.4 | 40.3 5% | 48.7 -15% | 48.2 -14% | 47.1 -11% | 48.4 -14% |
| Maximum Bottom * (°C) | 47.8 | 48.3 -1% | 50.5 -6% | 42.6 11% | 56.5 -18% | 52.3 -9% |
| Idle Upper Side * (°C) | 26.8 | 23.7 12% | 25 7% | 34.8 -30% | 28.1 -5% | 27.8 -4% |
| Idle Bottom * (°C) | 27.2 | 23.8 12% | 25.4 7% | 35.2 -29% | 27.6 -1% | 30.3 -11% |
* ... smaller is better
Stress Test
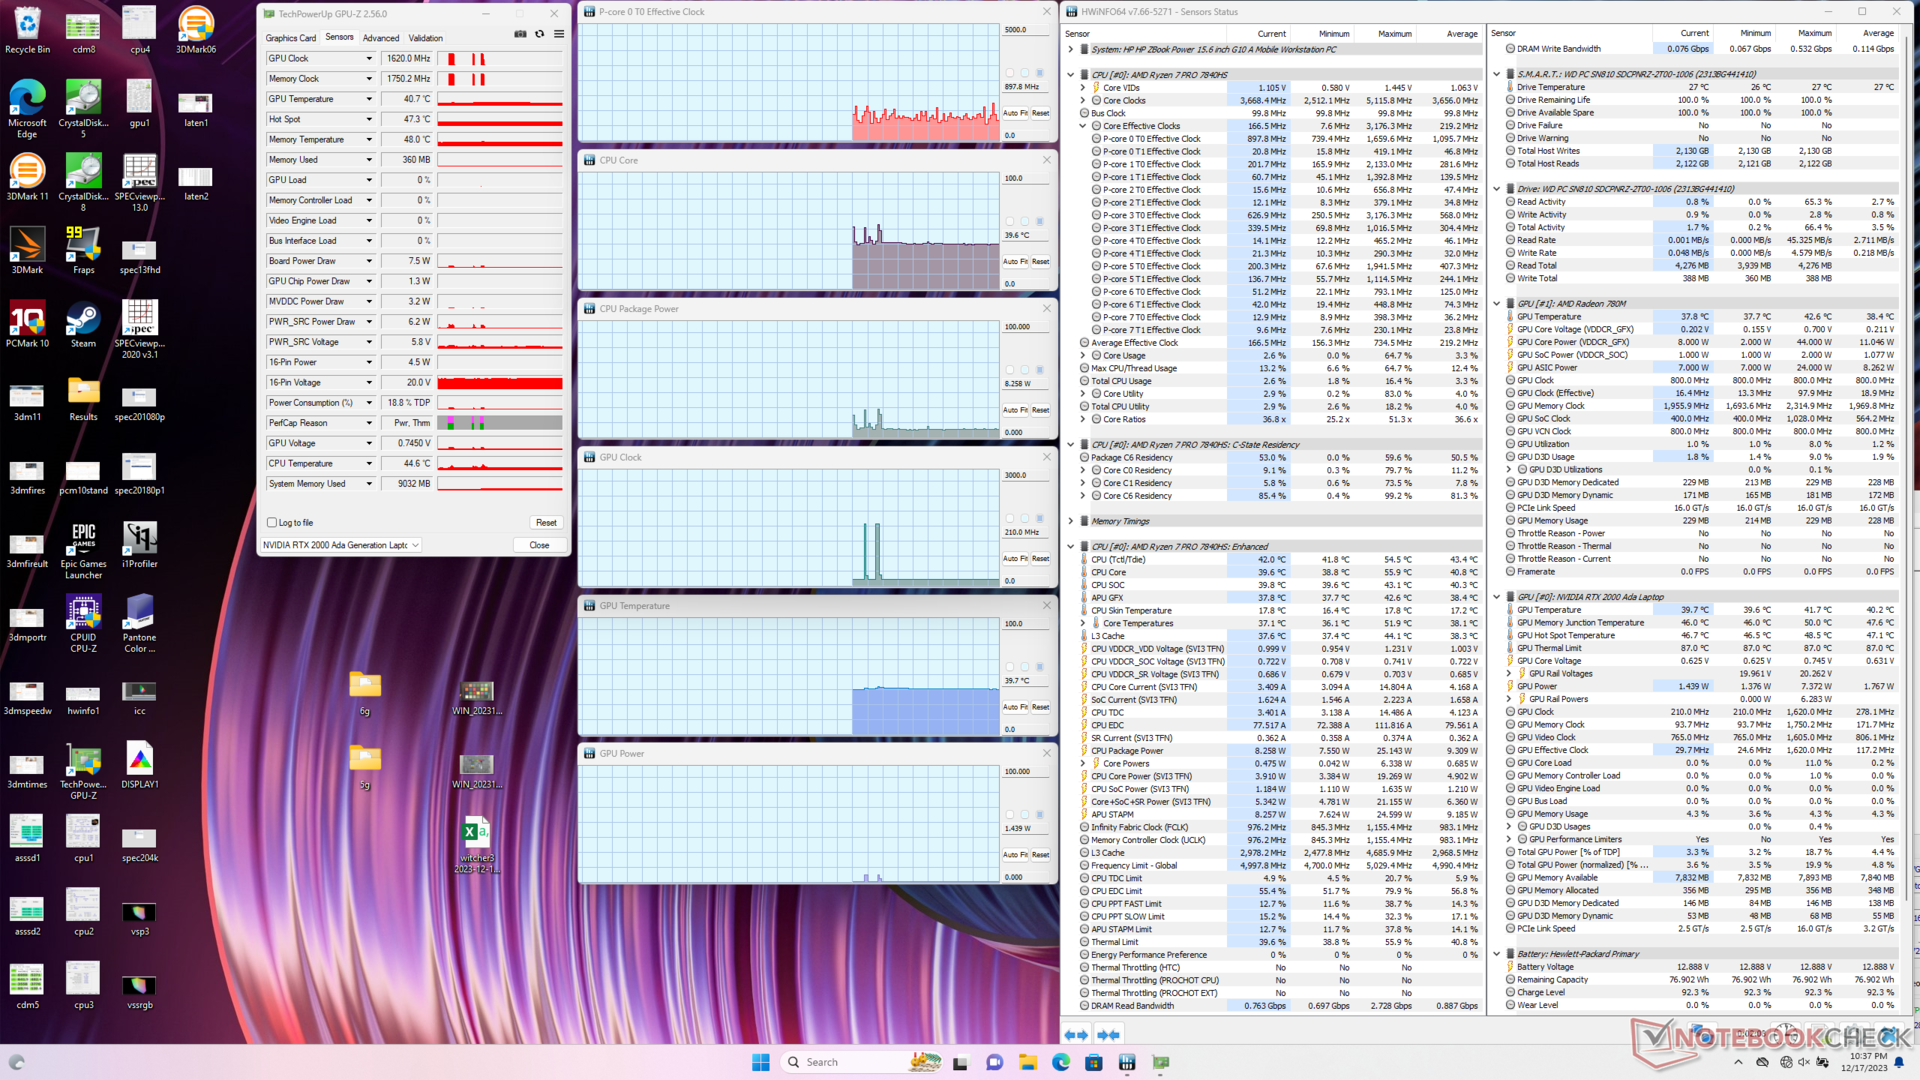
When stressed with Prime95, the CPU would boost to 4.2 GHz and 65 W for only the first few seconds before slightly falling and stabilizing at 4.0 GHz and 54 W. Core temperature would be quite warm at 87 C, but this may be par for the course when it comes to many Zen 4-powered laptops. Repeating this test on the ThinkPad Z16 G2, for example, would cause its Ryzen 9 CPU to stabilize at an even warmer 100 C.
Running Witcher 3 on Balanced mode would show no significant differences in temperatures or clock rates when compared to Performance mode which aligns with our Fire Strike observations in the section above. GPU board power draw would hover around 44 W against the 50 W target.
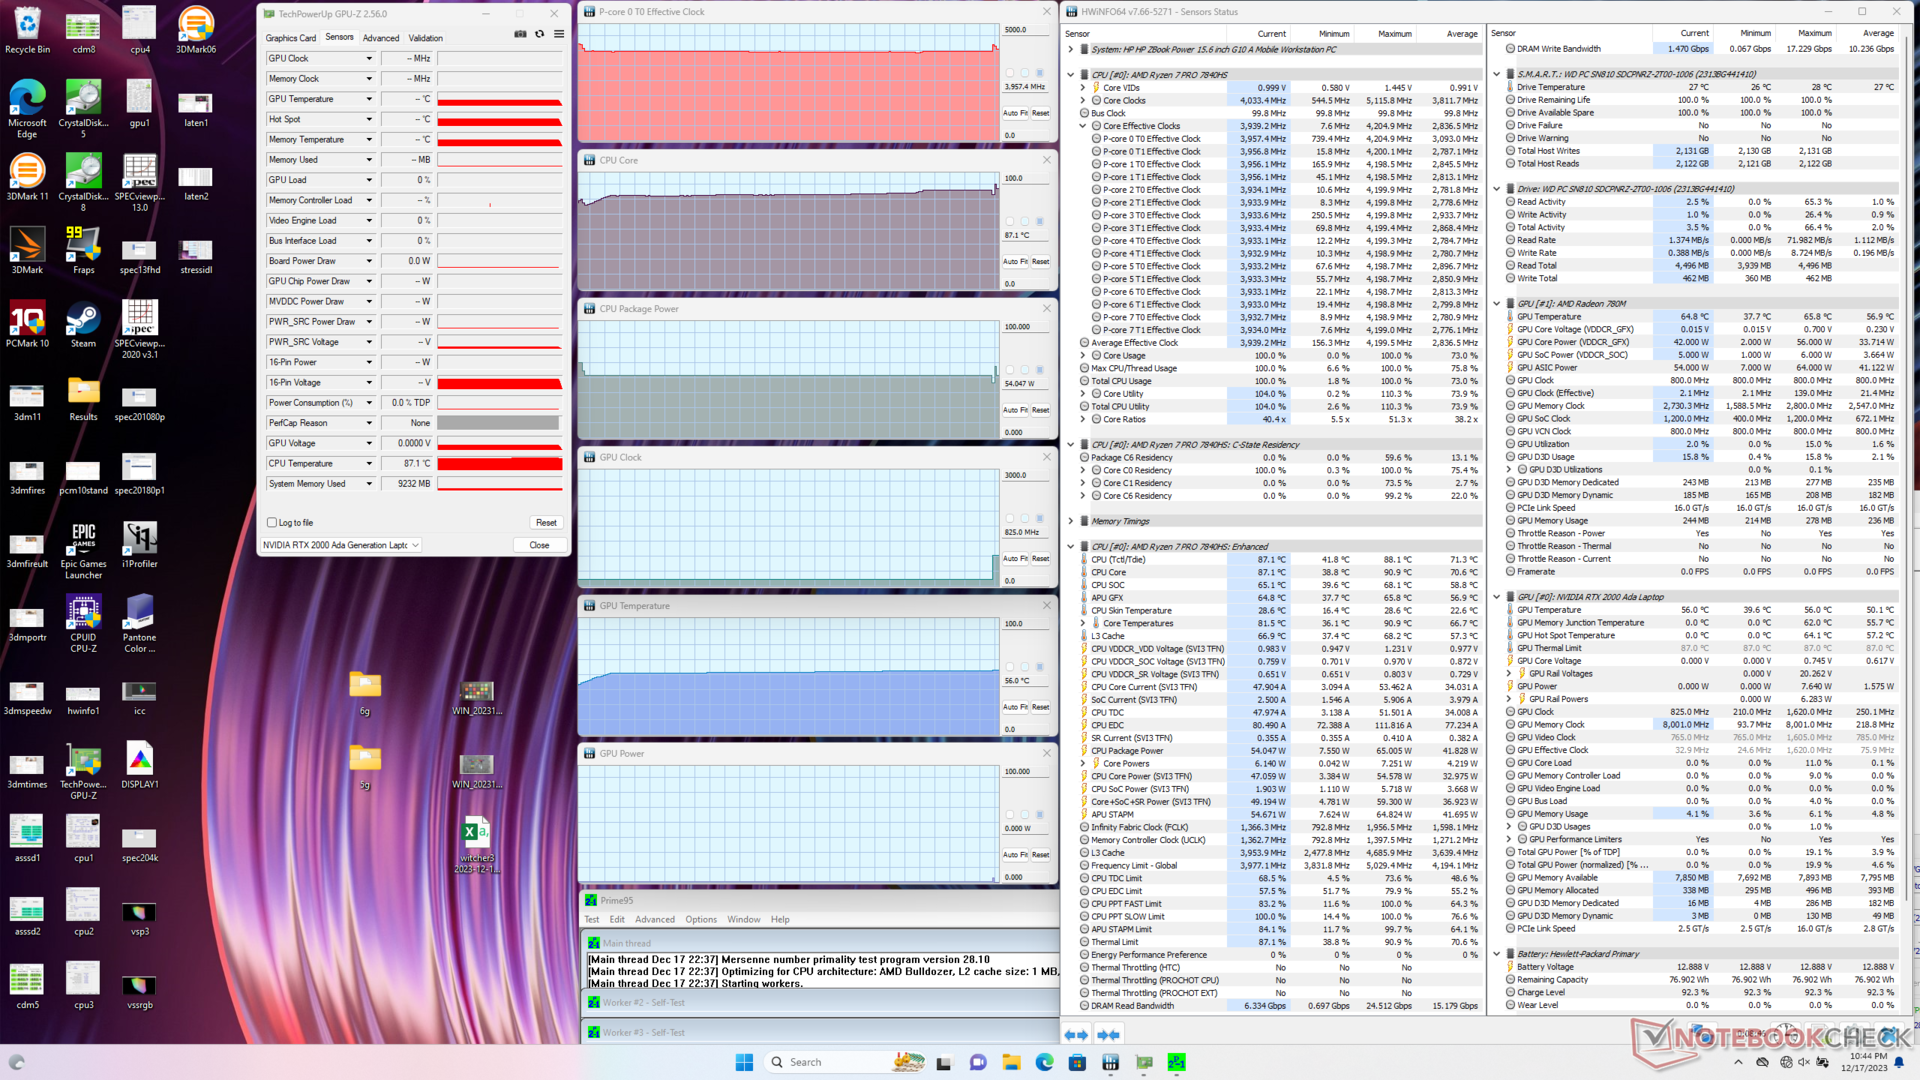
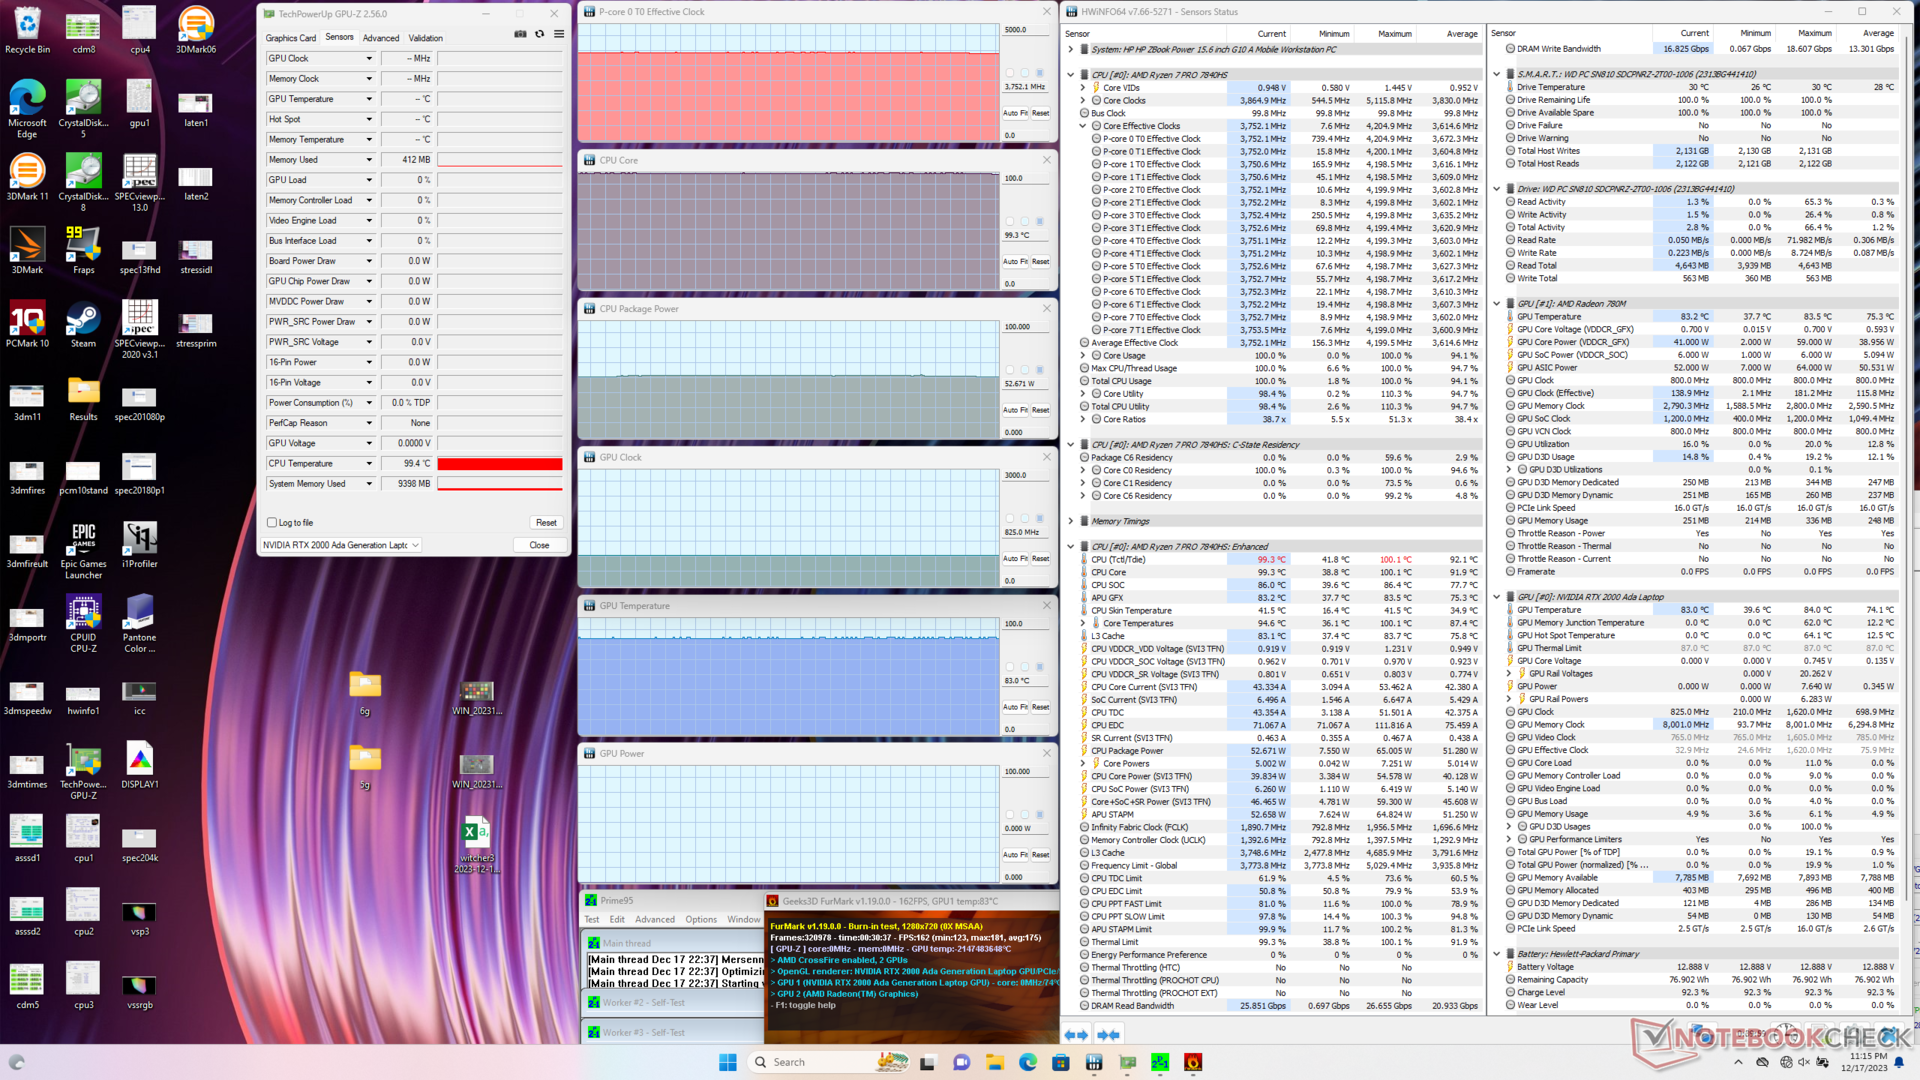
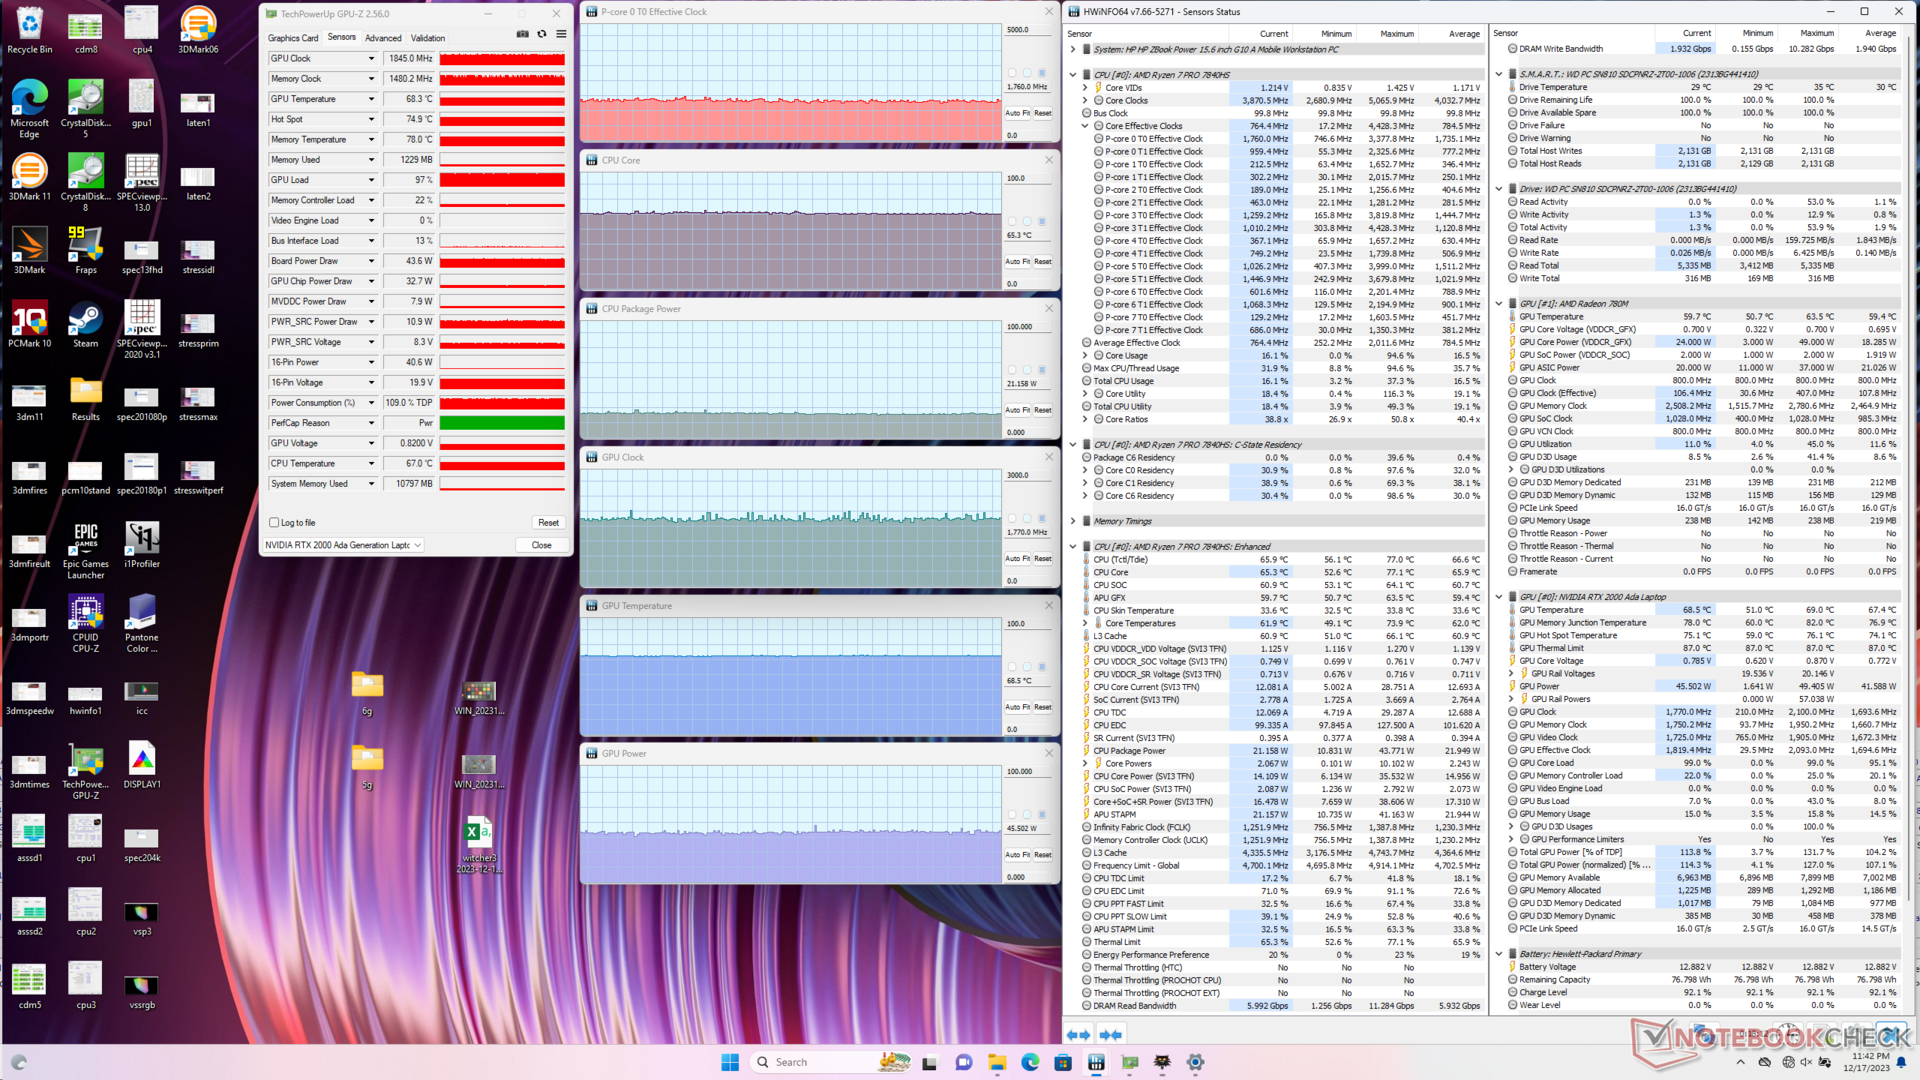
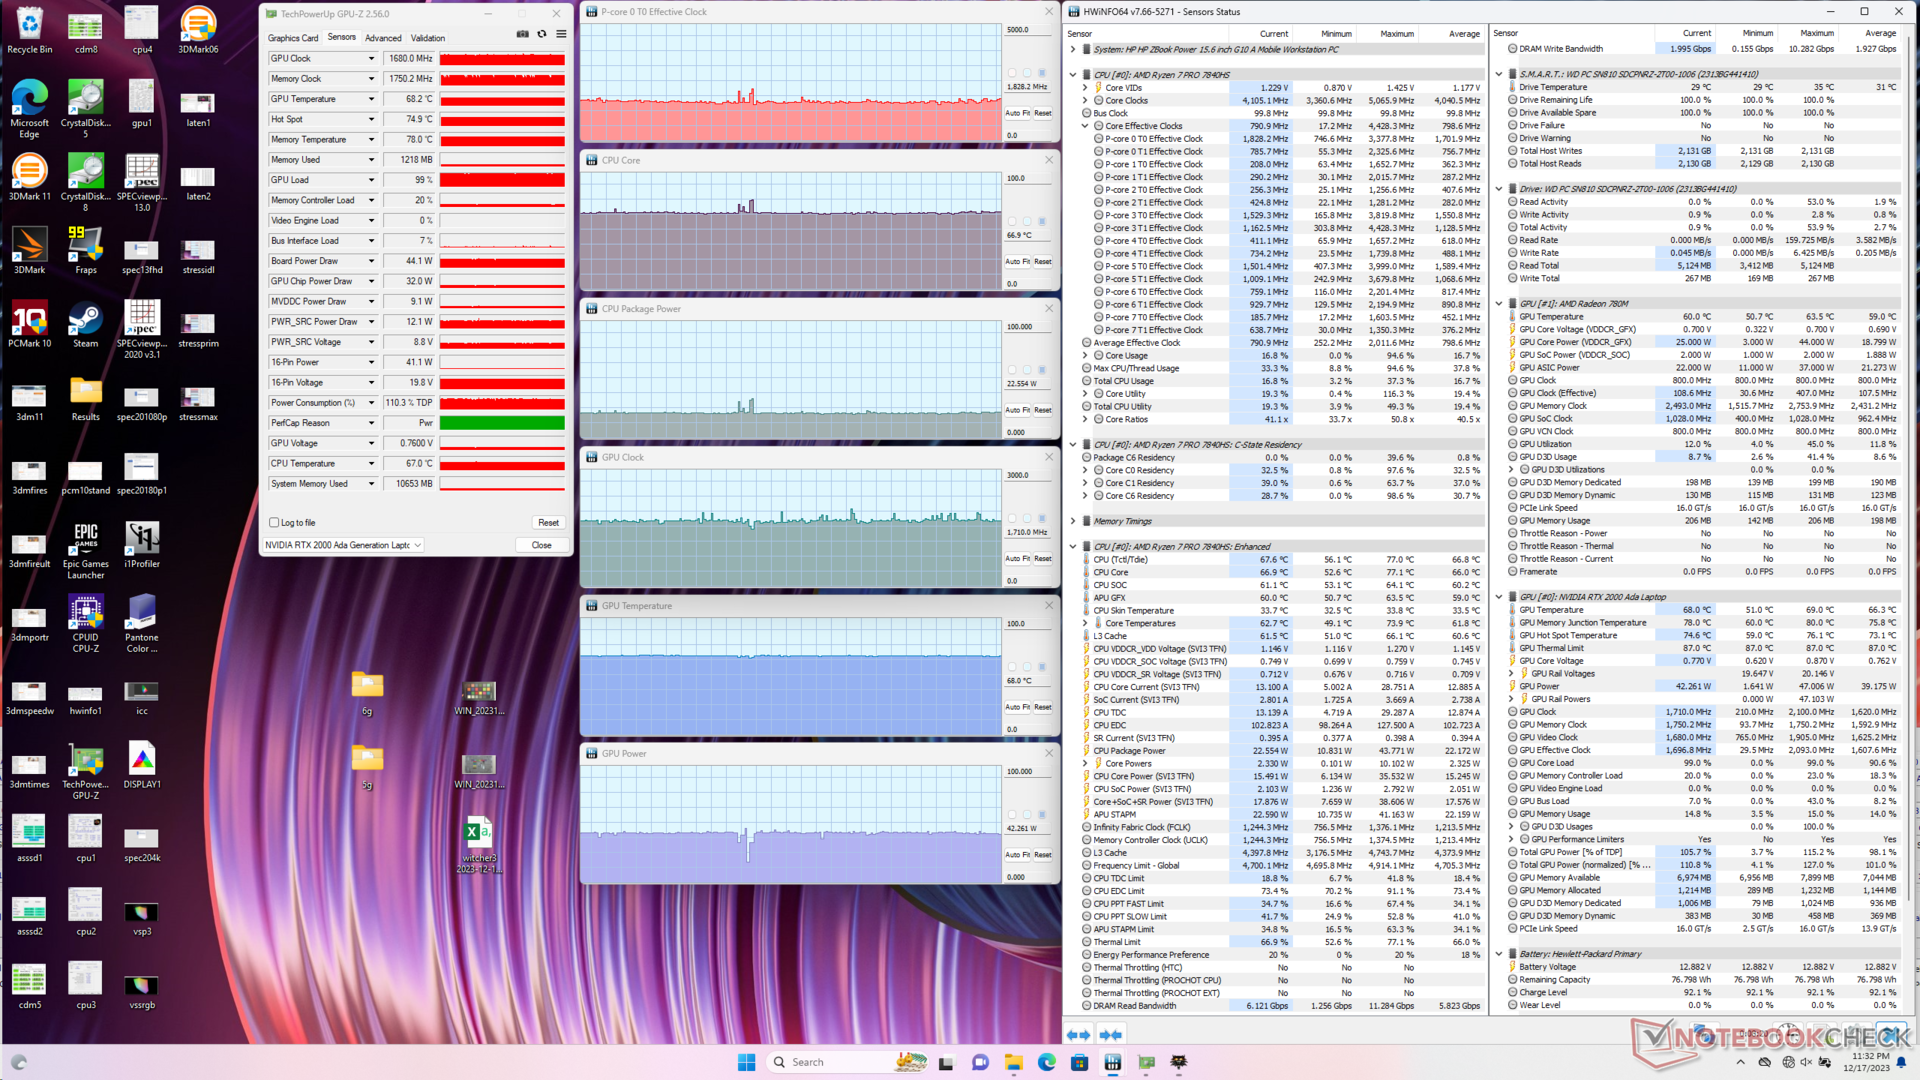
| CPU Clock (GHz) | GPU Clock (MHz) | Average CPU Temperature (°C) | Average GPU Temperature (°C) | |
| System Idle | -- | -- | 40 | 40 |
| Prime95 Stress | 4.0 | -- | 87 | 56 |
| Prime95 + FurMark Stress | 3.8 | 825 | 99 | 83 |
| Witcher 3 Stress (Balanced mode) | 1.8 | 1770 | 65 | 69 |
| Witcher 3 Stress (Performance mode) | 1.8 | 1710 | 67 | 68 |
Energy Management
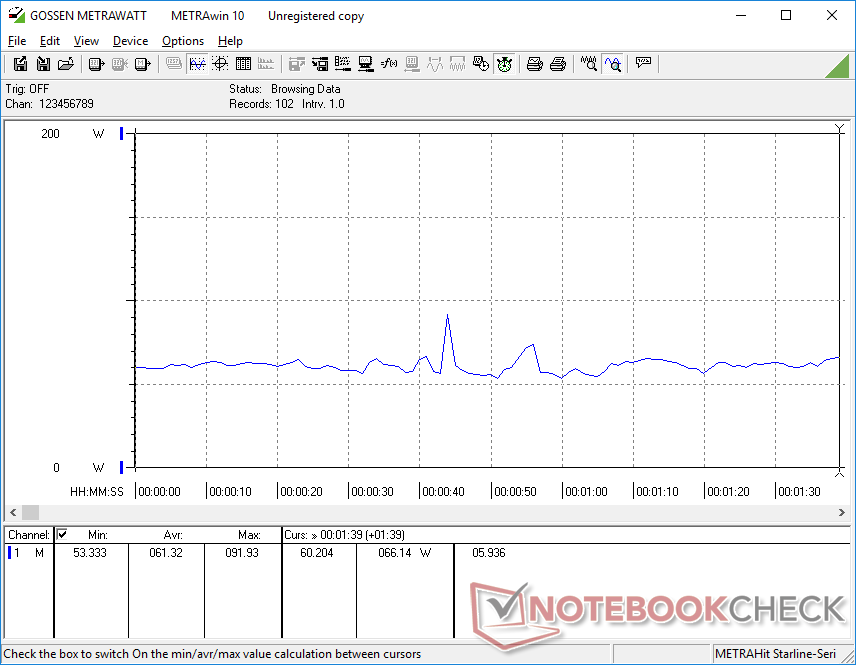
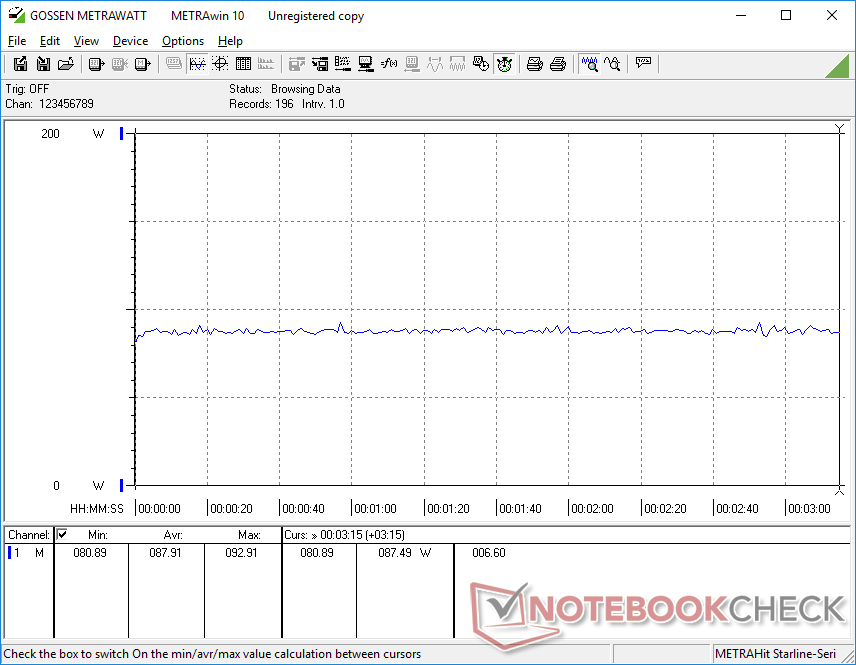
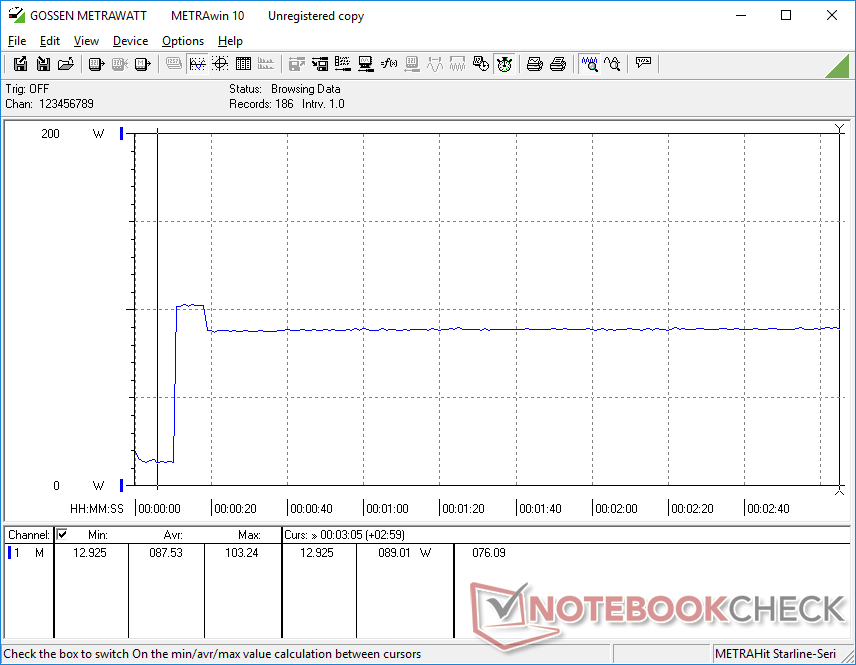
Power Consumption
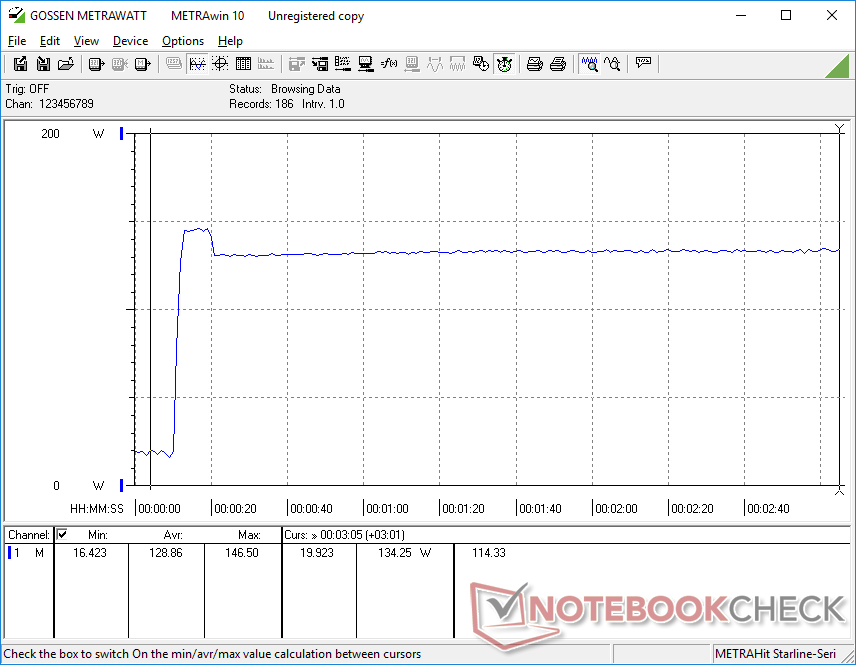
Overall power consumption is higher than on last year's model which correlates with the higher performance of our configuration. However, performance-per-watt still favors our newer model especially when it comes to graphics performance. For example, running Prime95 demands 16 percent more power for 20 percent faster multi-thread performance over the Core i7-12700H in the ZBook Power 15 G9 while running FurMark would demand just 14 percent more power for up to 65 percent more graphics performance.
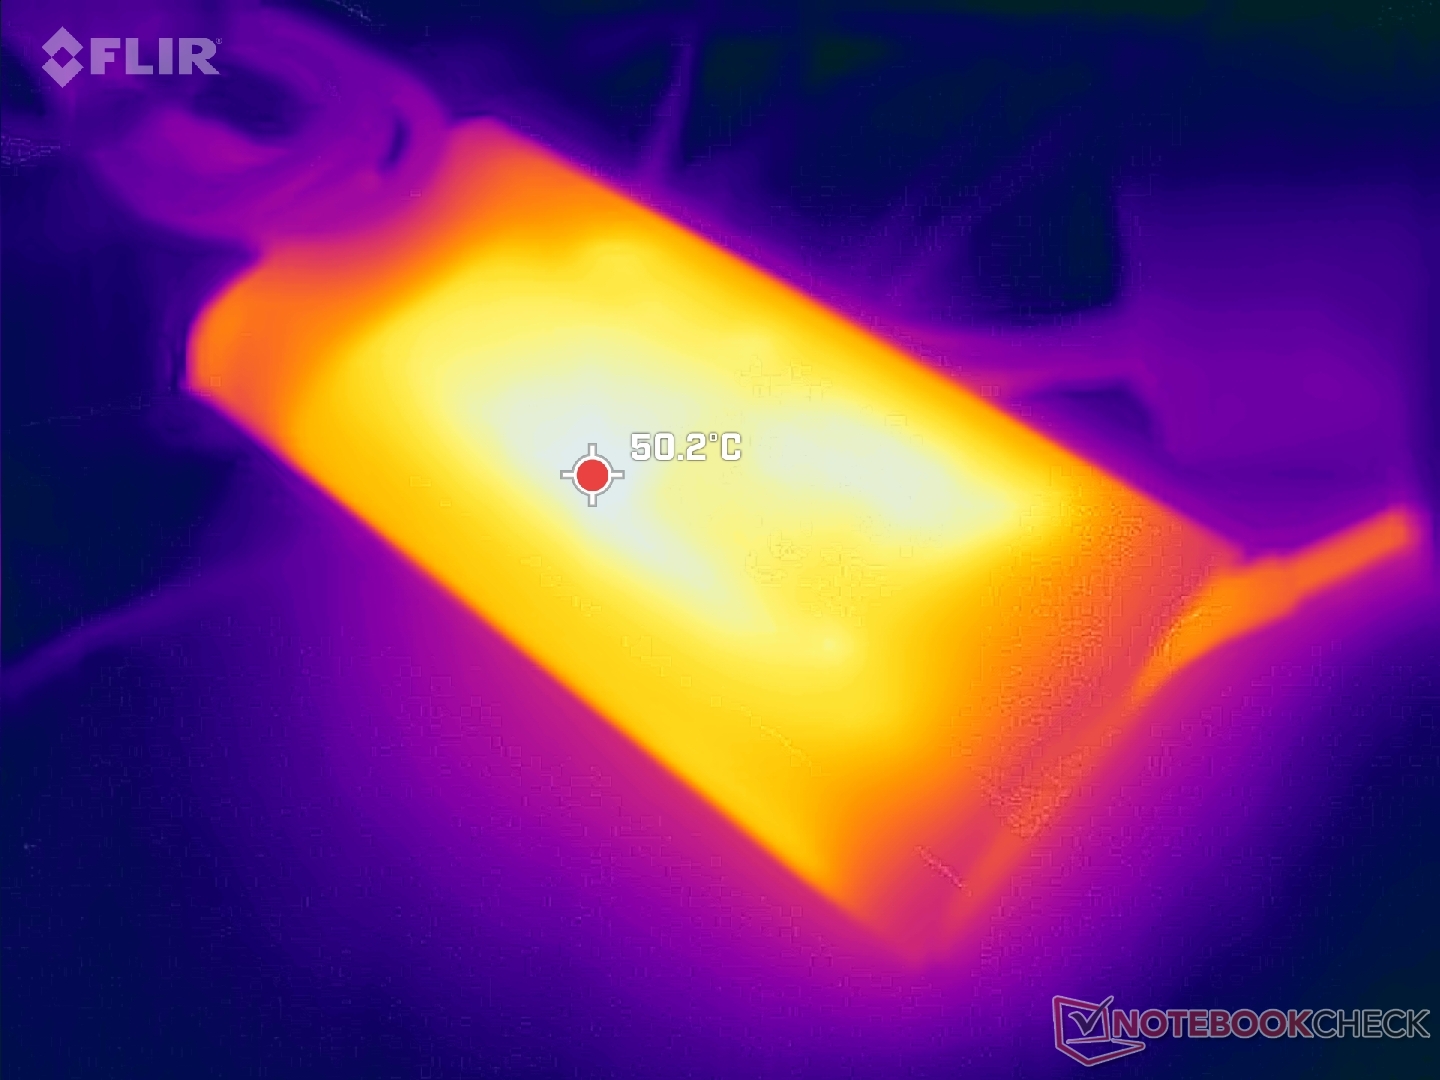
The medium-sized (~13.8 x 6.5 x 2.3 cm) 150 W AC adapter has not changed as the ZBook Power 15 G10 operates under the same power envelope as the ZBook Power 15 G9. USB-C charging is nonetheless supported; our 135 W USB-C charger from Lenovo, for example, is compatible with our HP test unit.
| Off / Standby | |
| Idle | |
| Load |
|
Key:
min: | |
| HP ZBook Power 15 G10 R7 PRO 7840HS, RTX 2000 Ada Generation Laptop, WDC PC SN810 2TB, IPS, 2560x1440, 15.6" | HP ZBook Power 15 G9 6B8C4EA i7-12700H, RTX A2000 Laptop GPU, Samsung PM9A1 MZVL21T0HCLR, IPS, 3840x2160, 15.6" | Lenovo ThinkPad P15v G3 21EM001AGE R7 PRO 6850H, RTX A2000 Laptop GPU, SK Hynix PC711 1TB HFS001TDE9X081N, IPS LED, 3840x2160, 15.6" | Dell Precision 5000 5560 i7-11850H, RTX A2000 Laptop GPU, Samsung PM9A1 MZVL22T0HBLB, IPS, 3840x2400, 15.6" | Lenovo ThinkPad P1 G6-21FV000DGE i9-13900H, RTX 2000 Ada Generation Laptop, SK Hynix PC711 1TB HFS001TDE9X084N, IPS, 2560x1600, 16" | Asus ExpertBook B6 Flip B6602FC2 i9-12950HX, RTX A2000 Laptop GPU, Samsung PM9A1 MZVL21T0HCLR, IPS, 2560x1600, 16" | |
|---|---|---|---|---|---|---|
| Power Consumption | 11% | -11% | -24% | -30% | -81% | |
| Idle Minimum * (Watt) | 5.3 | 3.9 26% | 6.3 -19% | 6.2 -17% | 8.3 -57% | 10.5 -98% |
| Idle Average * (Watt) | 9.9 | 7.2 27% | 13.9 -40% | 13.9 -40% | 14.5 -46% | 11.9 -20% |
| Idle Maximum * (Watt) | 16.7 | 8.5 49% | 14.5 13% | 23.8 -43% | 15.3 8% | 18 -8% |
| Load Average * (Watt) | 61.3 | 87.2 -42% | 82.8 -35% | 95.7 -56% | 91.8 -50% | 182 -197% |
| Witcher 3 ultra * (Watt) | 87.9 | 86.8 1% | 88.8 -1% | 87 1% | 104.7 -19% | 177.5 -102% |
| Load Maximum * (Watt) | 145.3 | 139 4% | 124.8 14% | 132.6 9% | 164.5 -13% | 229 -58% |
* ... smaller is better
Power Consumption Witcher 3 / Stresstest
Power Consumption external Monitor
Battery Life
Runtimes are almost exactly like what we recorded on the last year's model despite the differences in CPU, GPU, and display. Ten hours of real-world browsing is similar to many consumer-level Ultrabooks.
| HP ZBook Power 15 G10 R7 PRO 7840HS, RTX 2000 Ada Generation Laptop, 83 Wh | HP ZBook Power 15 G9 6B8C4EA i7-12700H, RTX A2000 Laptop GPU, 83 Wh | Lenovo ThinkPad P15v G3 21EM001AGE R7 PRO 6850H, RTX A2000 Laptop GPU, 68 Wh | Dell Precision 5000 5560 i7-11850H, RTX A2000 Laptop GPU, 86 Wh | Lenovo ThinkPad P1 G6-21FV000DGE i9-13900H, RTX 2000 Ada Generation Laptop, 90 Wh | Asus ExpertBook B6 Flip B6602FC2 i9-12950HX, RTX A2000 Laptop GPU, 90 Wh | |
|---|---|---|---|---|---|---|
| Battery runtime | 0% | -31% | -37% | -5% | -13% | |
| WiFi v1.3 (h) | 10 | 10 0% | 6.9 -31% | 6.3 -37% | 9.5 -5% | 8.7 -13% |
| H.264 (h) | 10.7 | 11.2 | 5.8 | |||
| Load (h) | 1.8 | 1.8 | 1.1 | 1.7 | ||
| Reader / Idle (h) | 12 | 12.5 |
Pros
Cons
Verdict — If It Ain't Broke, Don't Fix It
The ZBook Power 15 G10 design is approaching three years old. It's one of the few 16:9 15.6-inch workstations remaining to carry both AMD Zen 4 Pro CPUs and Nvidia RTX Ada GPUs while most others in this category have moved on to 16:10 16-inch form factors with additional display options including OLED and 4K. If the taller form factor and newer displays are important to your workloads, then you may want to wait until HP refreshes the ZBook Power design or look for alternatives like the Lenovo ThinkPad P1 G6 instead. If not, then the ZBook Power 15 G10 is still a classic and reliable option.
For potential 16:10 revisions in the future, we'd like to see HP go the extra mile by including both ECC RAM and ECC VRAM support and full USB-C charging only. The proprietary AC barrel charger is becoming more difficult to justify now that next generation Thunderbolt can support USB-C charging of up to 240 W.
The ZBook Power 15 G10 will likely be one of HP's last 15.6-inch workstations before the series is refreshed with a more modern 16:10 design.
The major differentiating factor between the ZBook Power 15 G9 and G10 is that the latter comes with Ada Lovelace GPUs for much higher performance-per-watt than the older Ampere GPUs. If the newer CPUs and GPUs are of value, then the G10 is recommended over the G9. Otherwise, the user experience between the models is essentially identical including even the battery life.
Price and Availability
HP is now shipping the ZBook Power 15 G10 starting at $1600 USD for the Ryzen 5 configuration to $2100 for our Ryzen 7 and Nvidia 2000 Ada configuration or higher.
HP ZBook Power 15 G10
- 12/20/2023 v7 (old)
Allen Ngo
Transparency
The selection of devices to be reviewed is made by our editorial team. The test sample was provided to the author as a loan by the manufacturer or retailer for the purpose of this review. The lender had no influence on this review, nor did the manufacturer receive a copy of this review before publication. There was no obligation to publish this review. As an independent media company, Notebookcheck is not subjected to the authority of manufacturers, retailers or publishers.
This is how Notebookcheck is testing
Every year, Notebookcheck independently reviews hundreds of laptops and smartphones using standardized procedures to ensure that all results are comparable. We have continuously developed our test methods for around 20 years and set industry standards in the process. In our test labs, high-quality measuring equipment is utilized by experienced technicians and editors. These tests involve a multi-stage validation process. Our complex rating system is based on hundreds of well-founded measurements and benchmarks, which maintains objectivity. Further information on our test methods can be found here.
Price comparison
