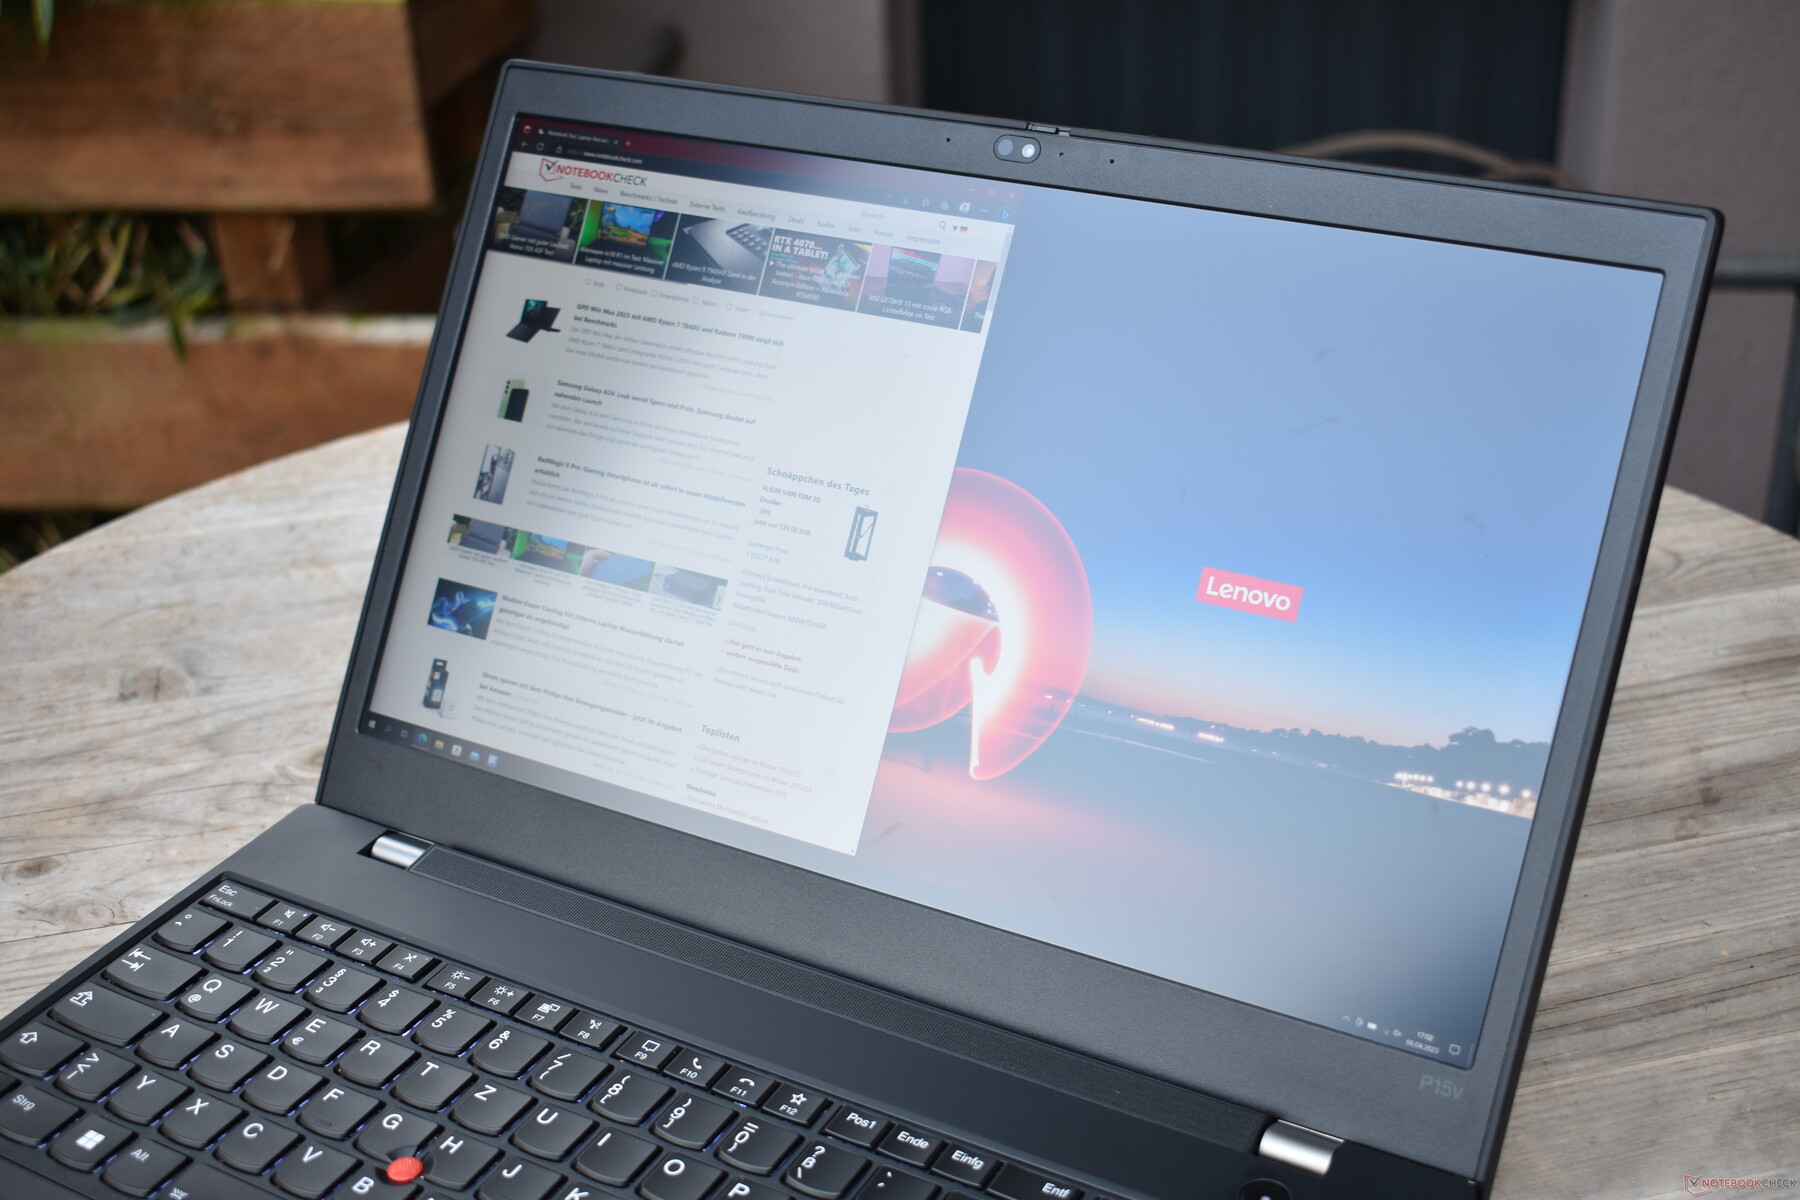
Lenovo ThinkPad P15v G3 AMD laptop review: a ThinkPad workstation now with a Ryzen 6000H for the first time
If the ThinkPad P-series workstations with RTX GPUs had one thing in common, it was the Intel processors. These powerful enterprise laptops had never come with AMD CPUs - until now. The Lenovo ThinkPad P15v Gen 3 changes the status quo by relying on the Ryzen 6000 series' H45 chips. At the same time, it's not a top-of-the-line model, with the "v" in the name standing for "value". Accordingly, it is more of a budget variant among workstation laptops, being priced below the Lenovo ThinkPad P16.
Possible competitors in comparison
Rating | Date | Model | Weight | Height | Size | Resolution | Price |
|---|---|---|---|---|---|---|---|
| 87.8 % v7 (old) | 04 / 2023 | Lenovo ThinkPad P15v G3 21EM001AGE R7 PRO 6850H, RTX A2000 Laptop GPU | 2.2 kg | 22.7 mm | 15.60" | 3840x2160 | |
| 88.2 % v7 (old) | 02 / 2023 | Lenovo ThinkPad P16 G1 21D6001DMB i7-12850HX, RTX A2000 Laptop GPU | 3 kg | 30.23 mm | 16.00" | 2560x1600 | |
| 86.2 % v7 (old) | 06 / 2022 | Lenovo ThinkPad P15v G2 21A9000XGE i7-11800H, T1200 Laptop GPU | 2.3 kg | 22.7 mm | 15.60" | 1920x1080 | |
| 87.4 % v7 (old) | 01 / 2023 | HP ZBook Power 15 G9 6B8C4EA i7-12700H, RTX A2000 Laptop GPU | 2 kg | 22.8 mm | 15.60" | 3840x2160 | |
| 88.4 % v7 (old) | 10 / 2022 | Dell Precision 7670 i7-12850HX, RTX A2000 Laptop GPU | 2.7 kg | 24.7 mm | 16.00" | 3840x2400 |
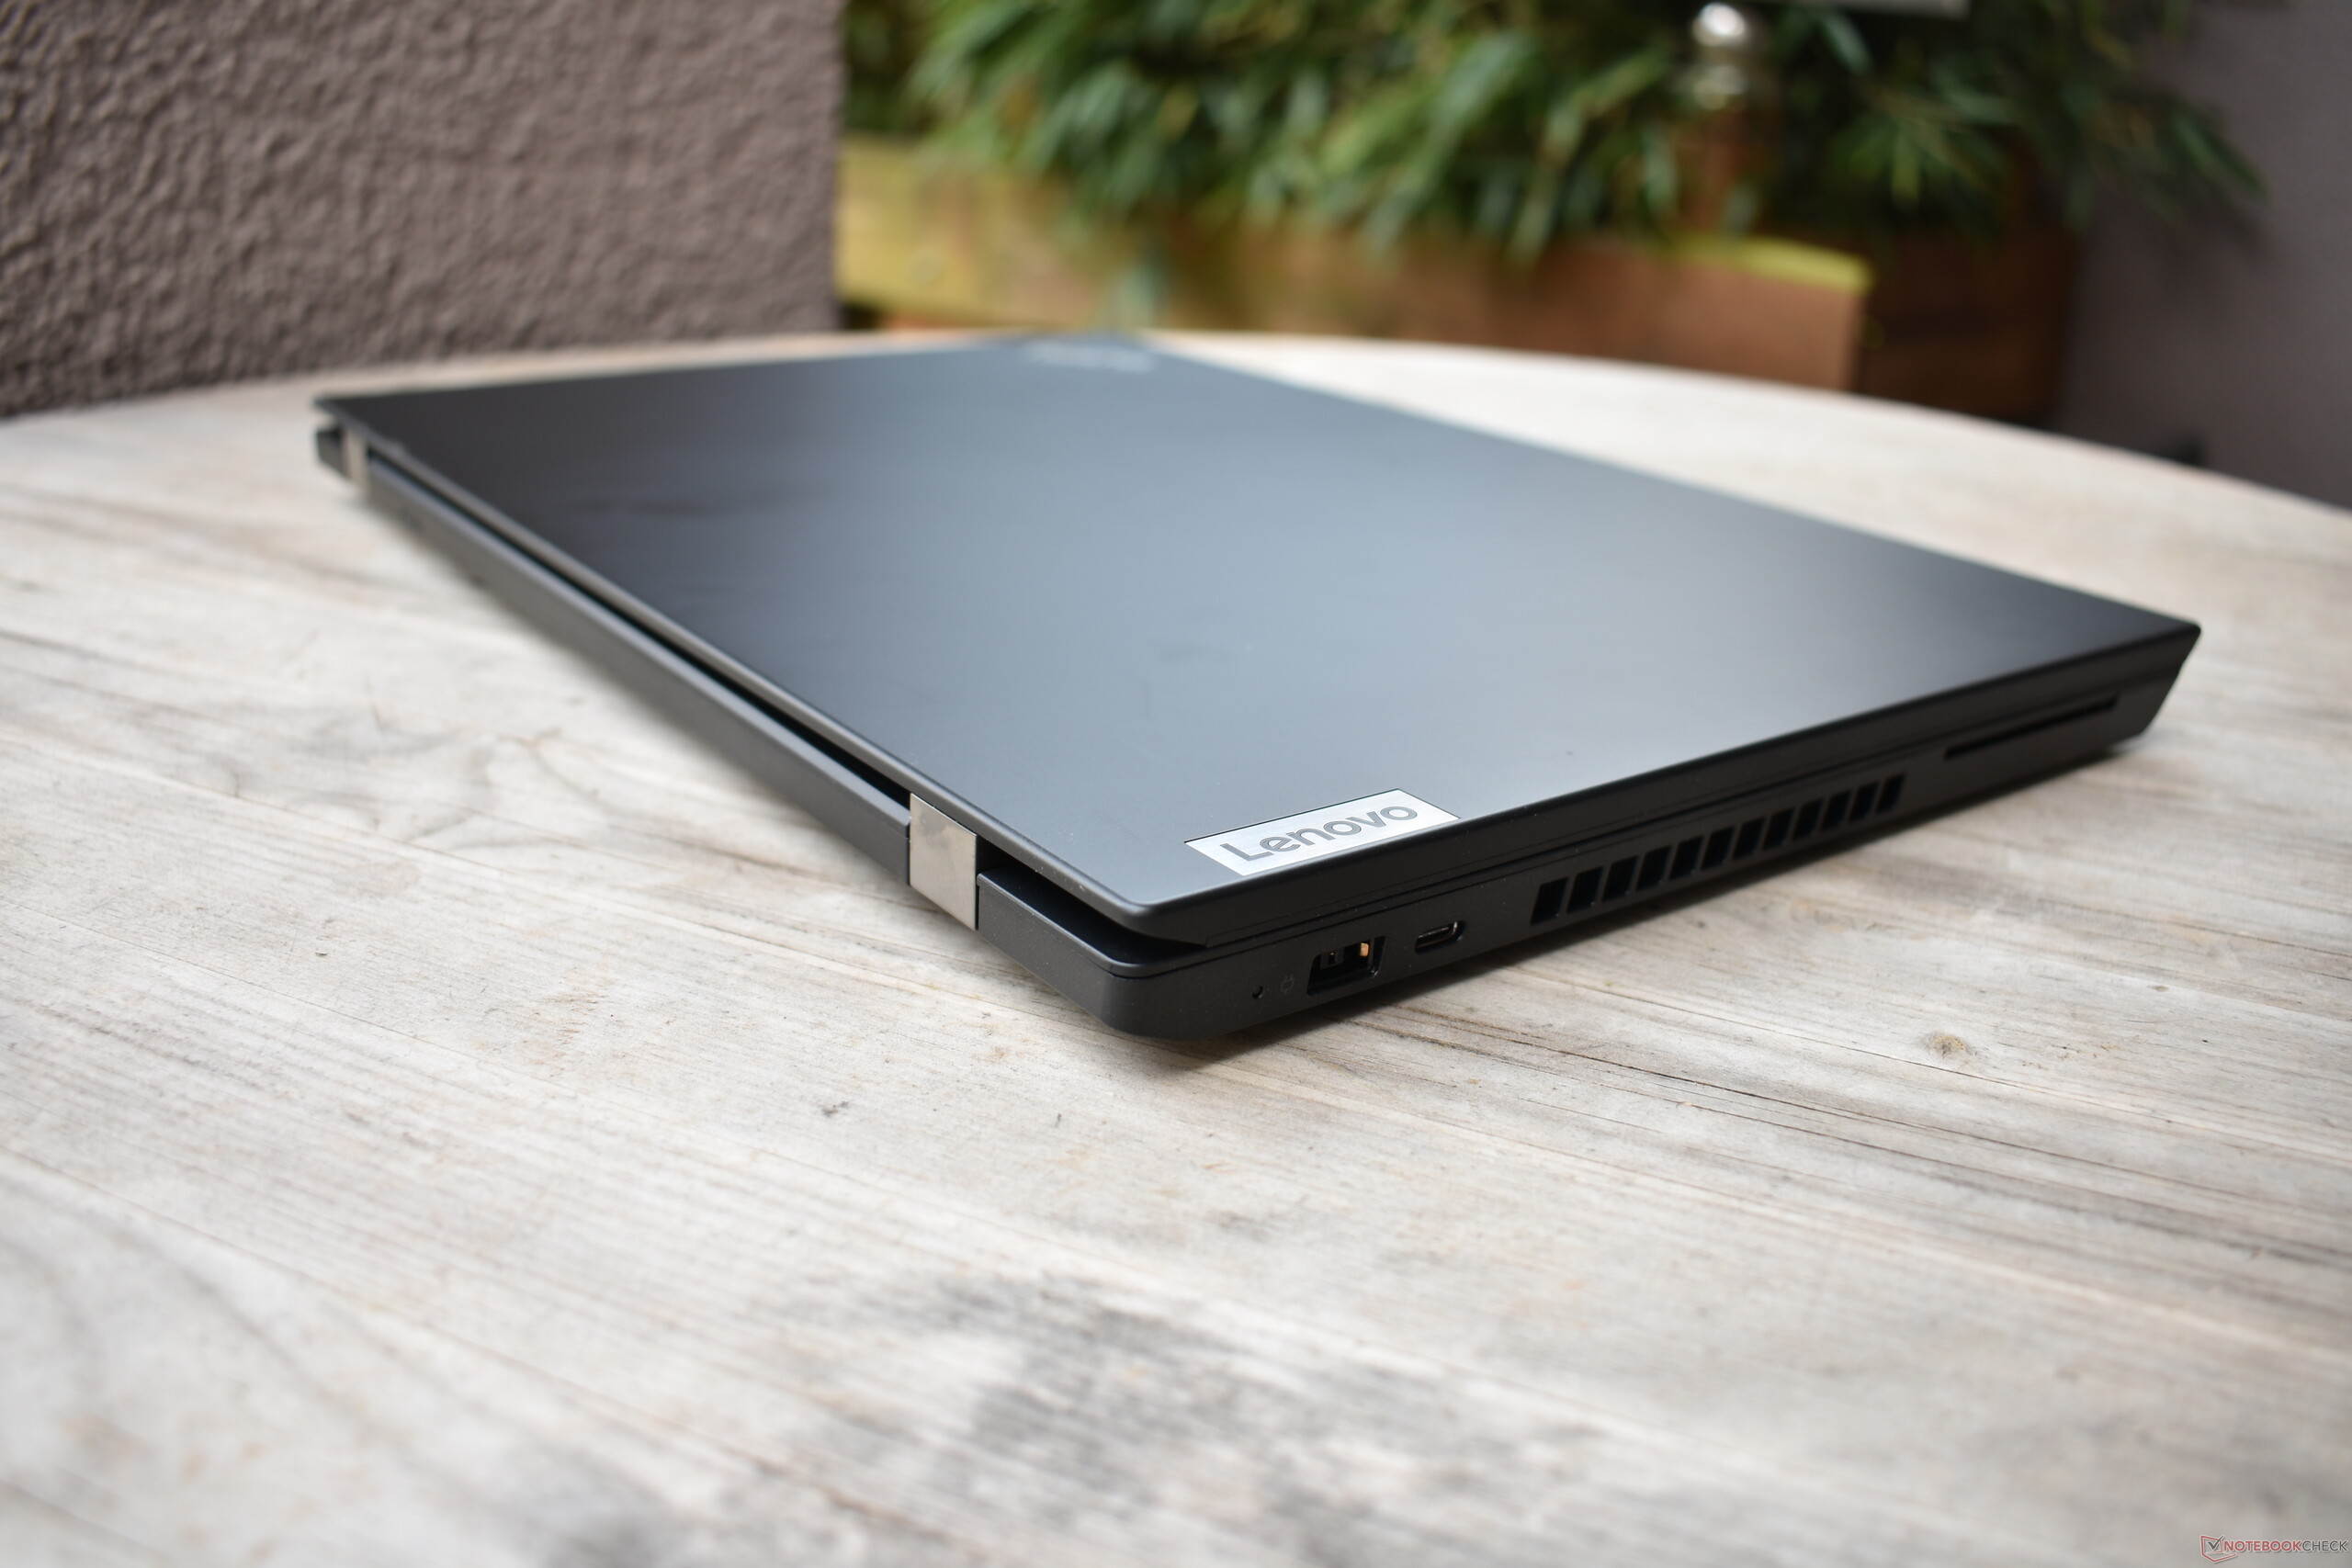
Case: Rustic ThinkPad design in matte black
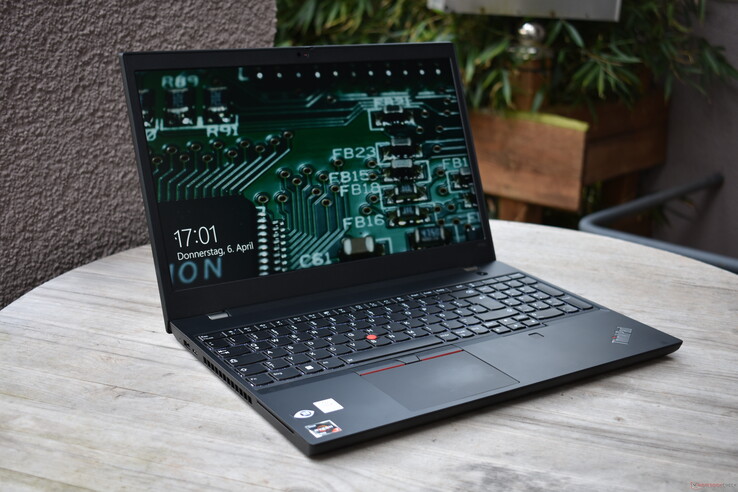
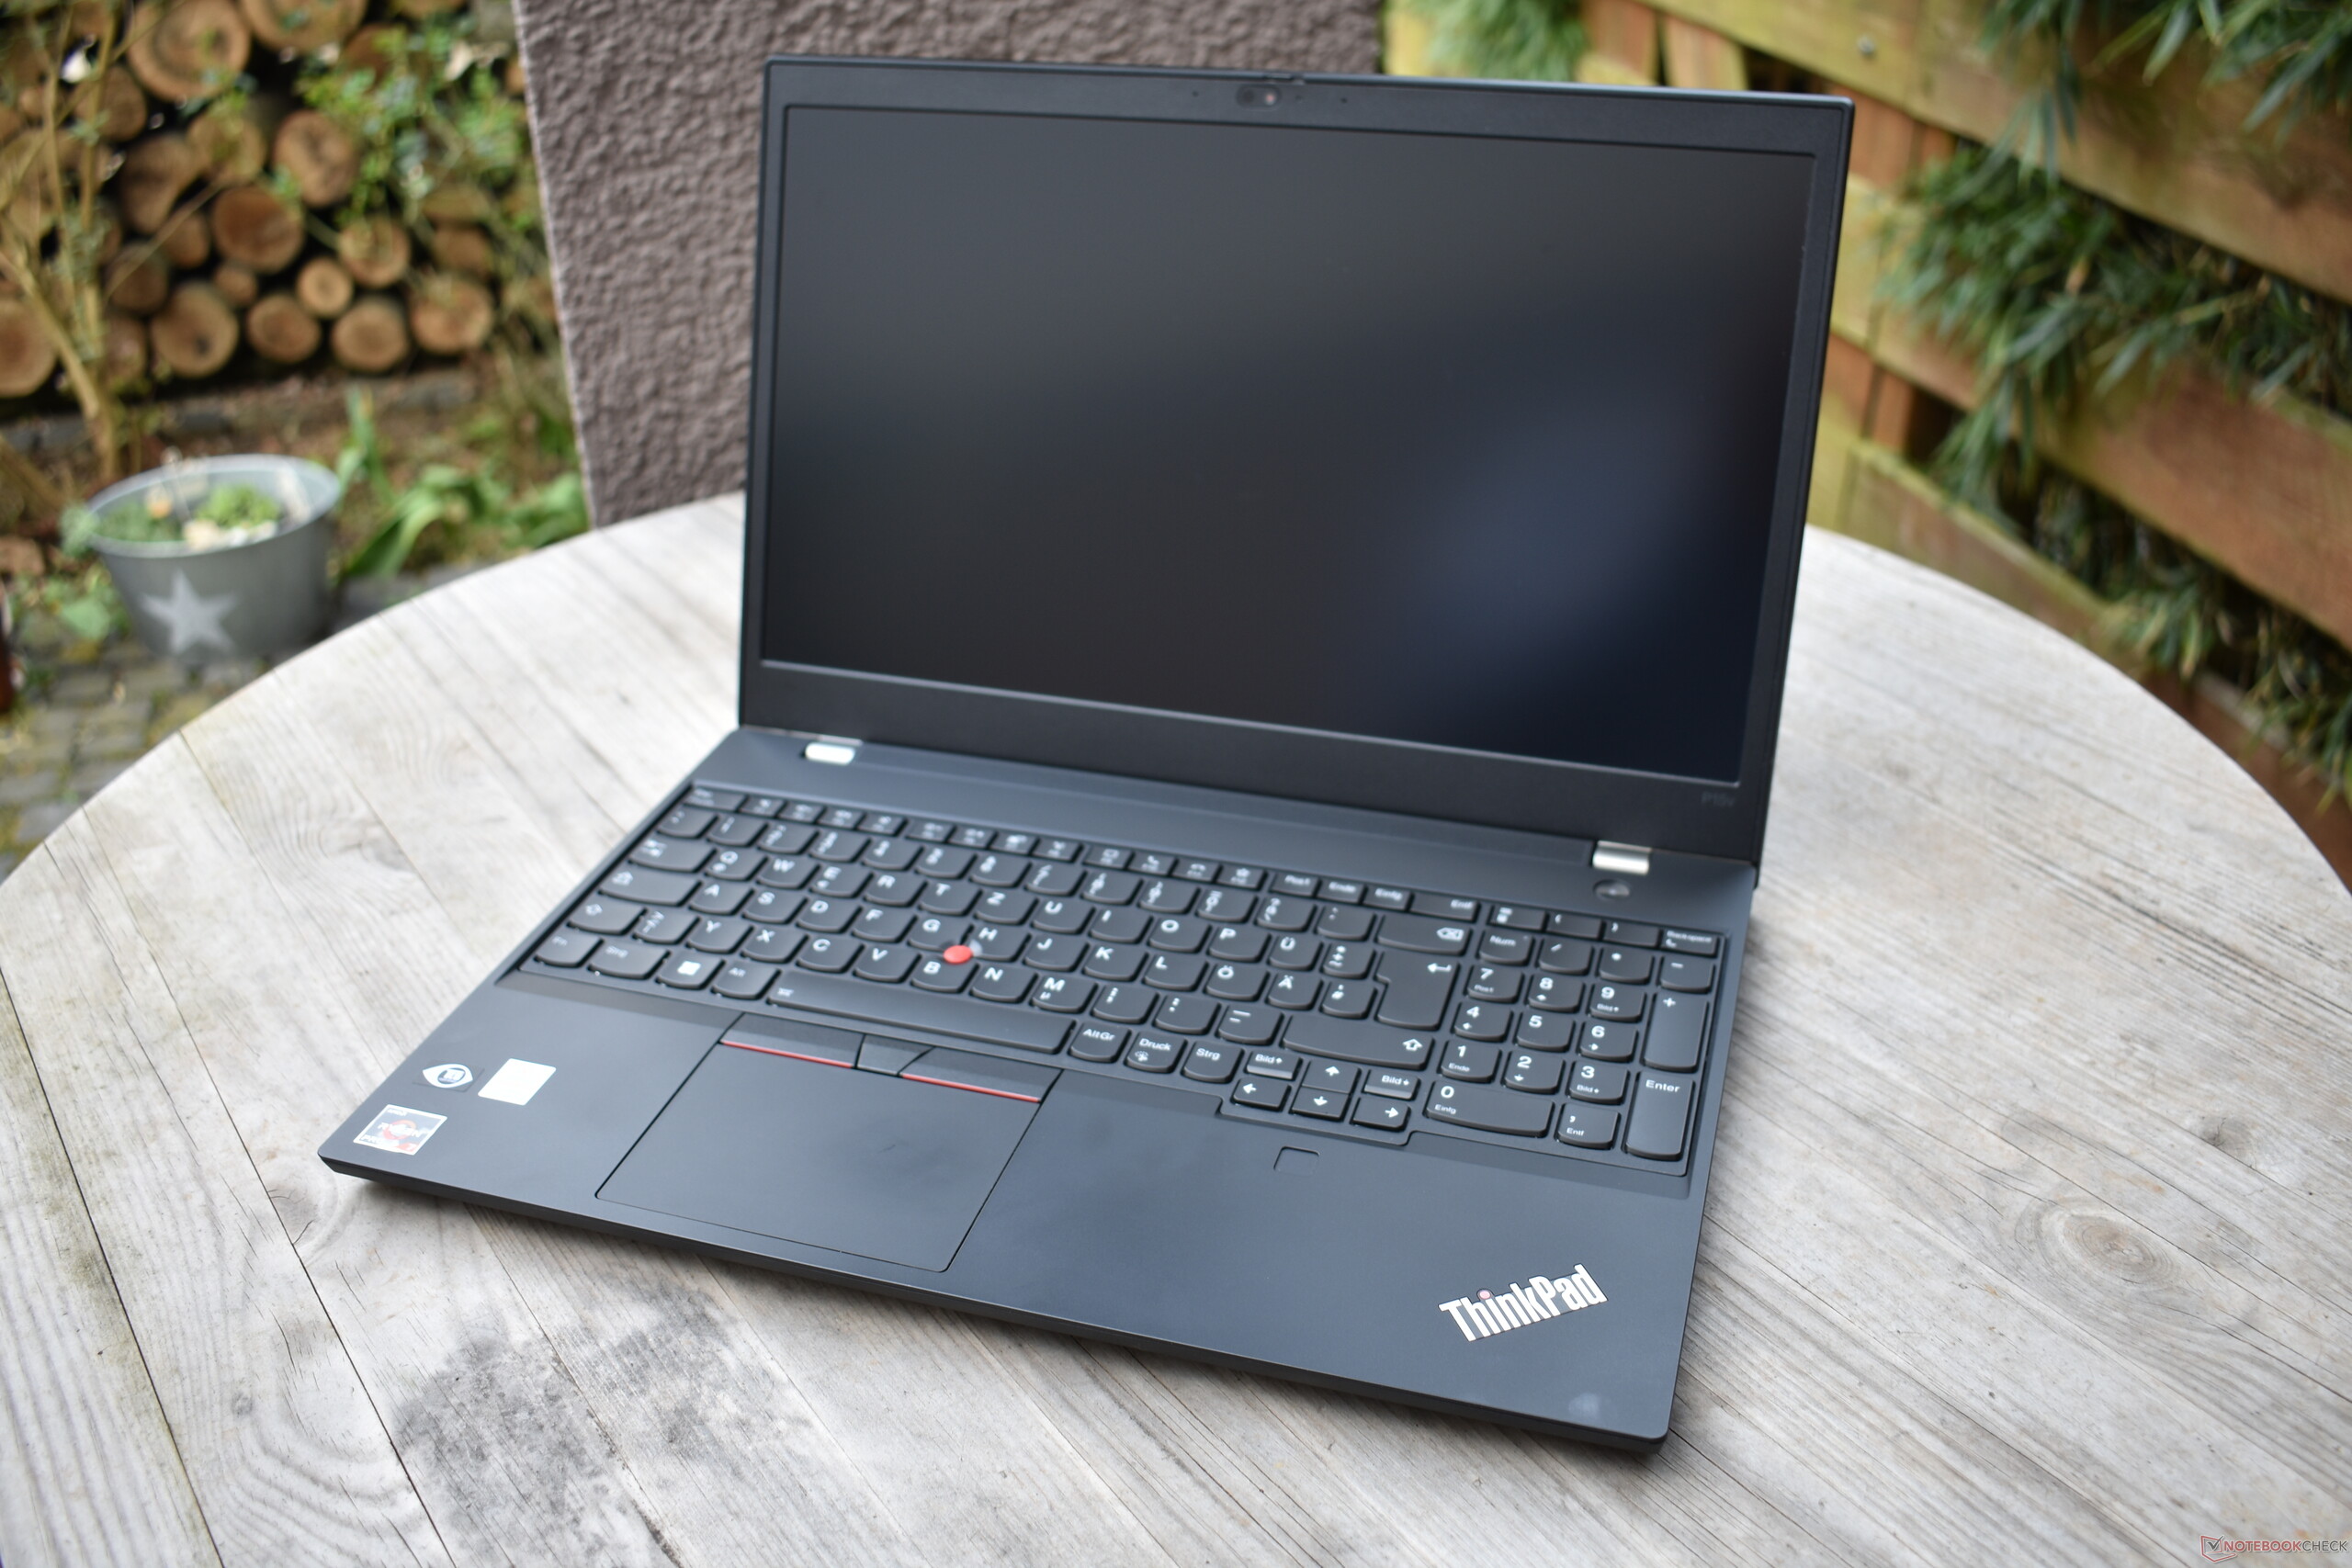
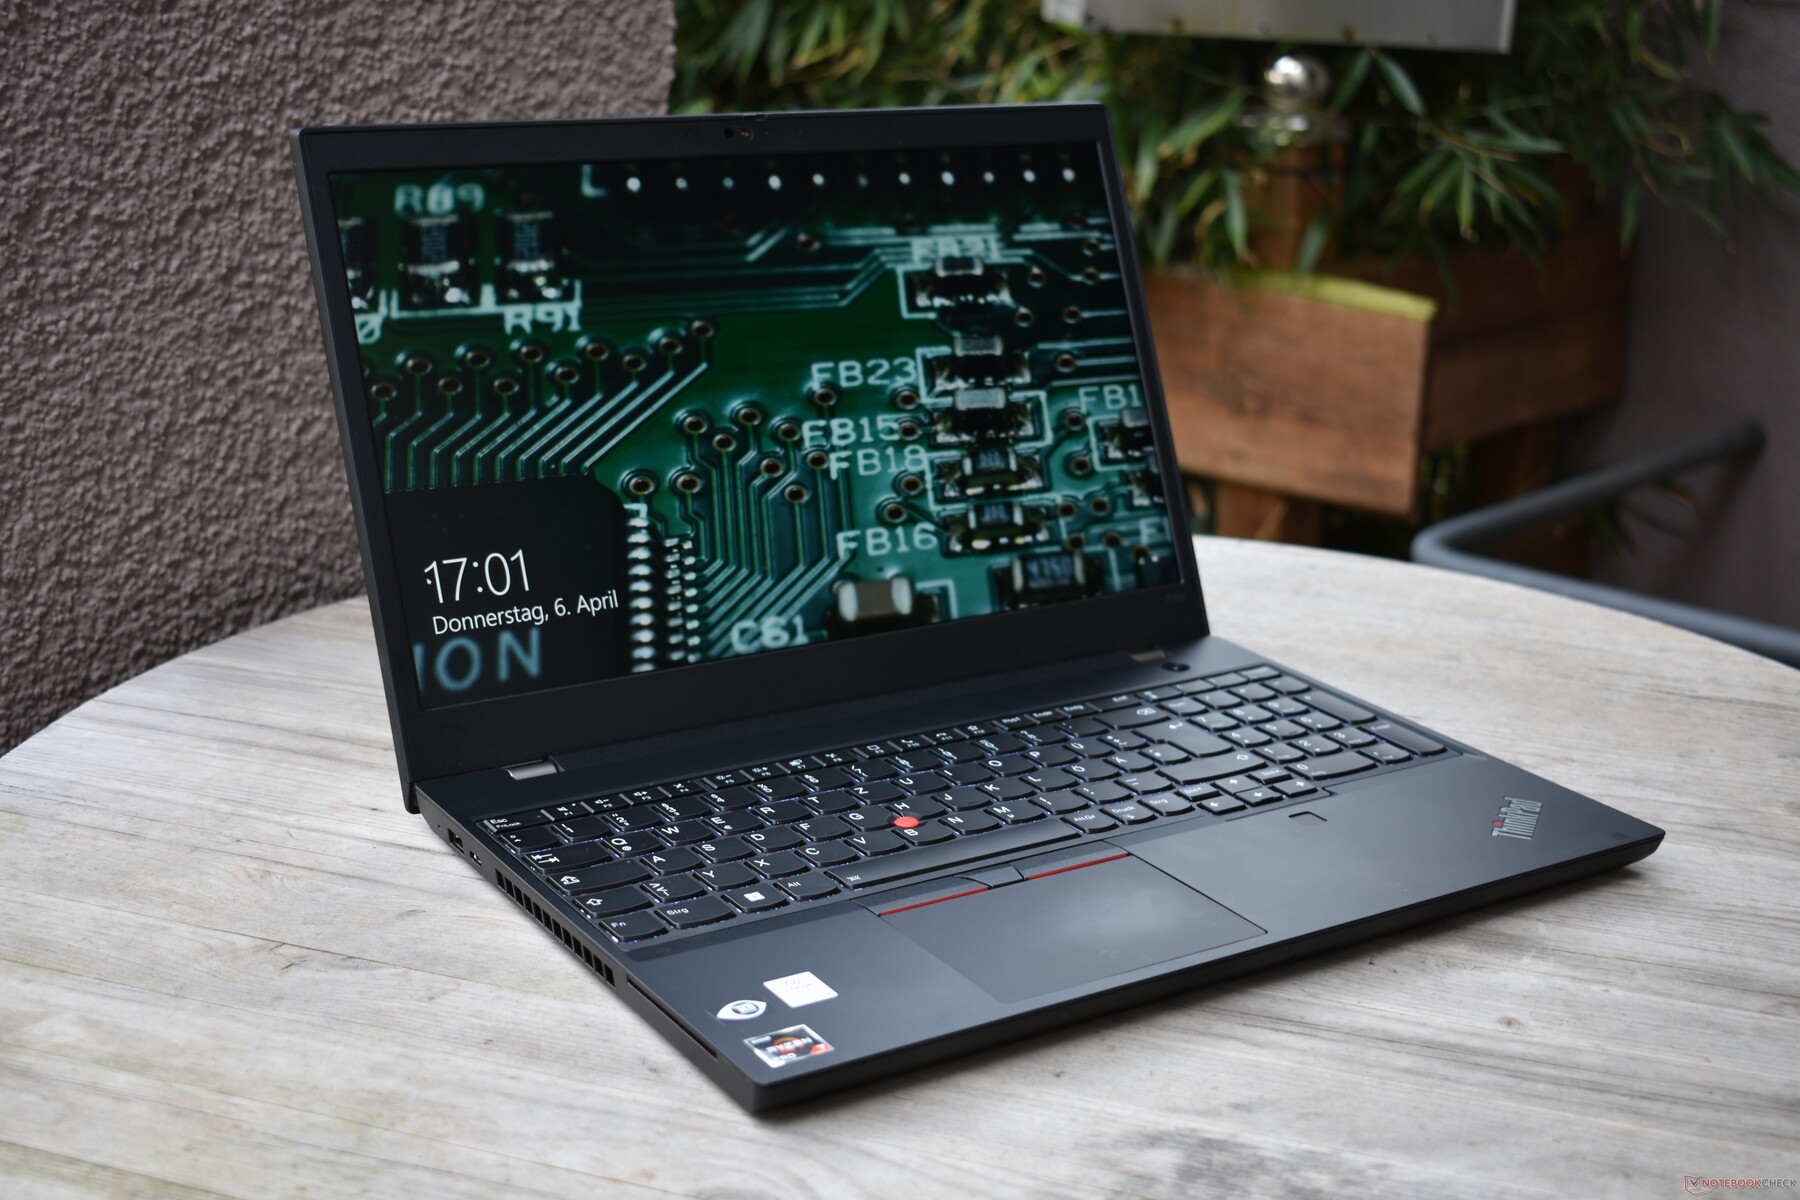
Among the 2022 ThinkPads, the Lenovo ThinkPad P15v Gen 3 is a special beast: it's based on an older design that first appeared in 2020 as the Lenovo ThinkPad T15p or P15v Gen 1. Because of that, it looks much more similar to older models like the ThinkPad T15 than the current ThinkPad T16 does. This is expressed, among other things, in the 16:9 format, with significantly wider bezels especially below the screen. The P15v Gen 3 also still comes in deep black, rather than the more anthracite-colored "Thunder Black" of the ThinkPad T16. Thus, depending on your point of view, the design looks either a bit old-fashioned or very classic. The ThinkPad P15v Gen 3 looks like a typical ThinkPad and resembles older ThinkPad models with its very boxy, angular design, which also contrasts strongly with the ThinkPad P16, which took a very different design approach.
The design of the ThinkPad P15v Gen 3 is very similar to the ThinkPad T series. The motherboard is attached to the palm rest or keyboard frame from below, which is also reinforced with a magnesium frame. This ensures a high stability in the keyboard area, only the plastic above the SD card reader is a bit flexible. The workmanship is absolutely flawless, but the feel falls behind other ThinkPads: the case is unfortunately made of ABS plastic on the outside. The palm rest area has a velvety coating, the bottom and the display bezels are roughened, and the display cover is made of smooth plastic without a coating. All surfaces are comparatively sensitive to dirt. Speaking of the display cover: The case is comparatively easy to twist, although Lenovo is relying on a rather thick cover. Pressure on the display's back, however, does not seem to affect the display.
The two large drop-down hinges with metal covers have a good grip on the lid, allowing it to be opened up to 180 degrees, and the display can also be opened with one hand.
Compared to the ThinkPad P16, the Lenovo ThinkPad P15v Gen 3 AMD is a vastly more mobile option, weighing around 0.8 kilograms less and with a significantly slimmer case. HP's main competitor, the HP ZBook Power 15 G9, is a bit lighter and more compact.
Features: Lots of connectivity, but no WWAN
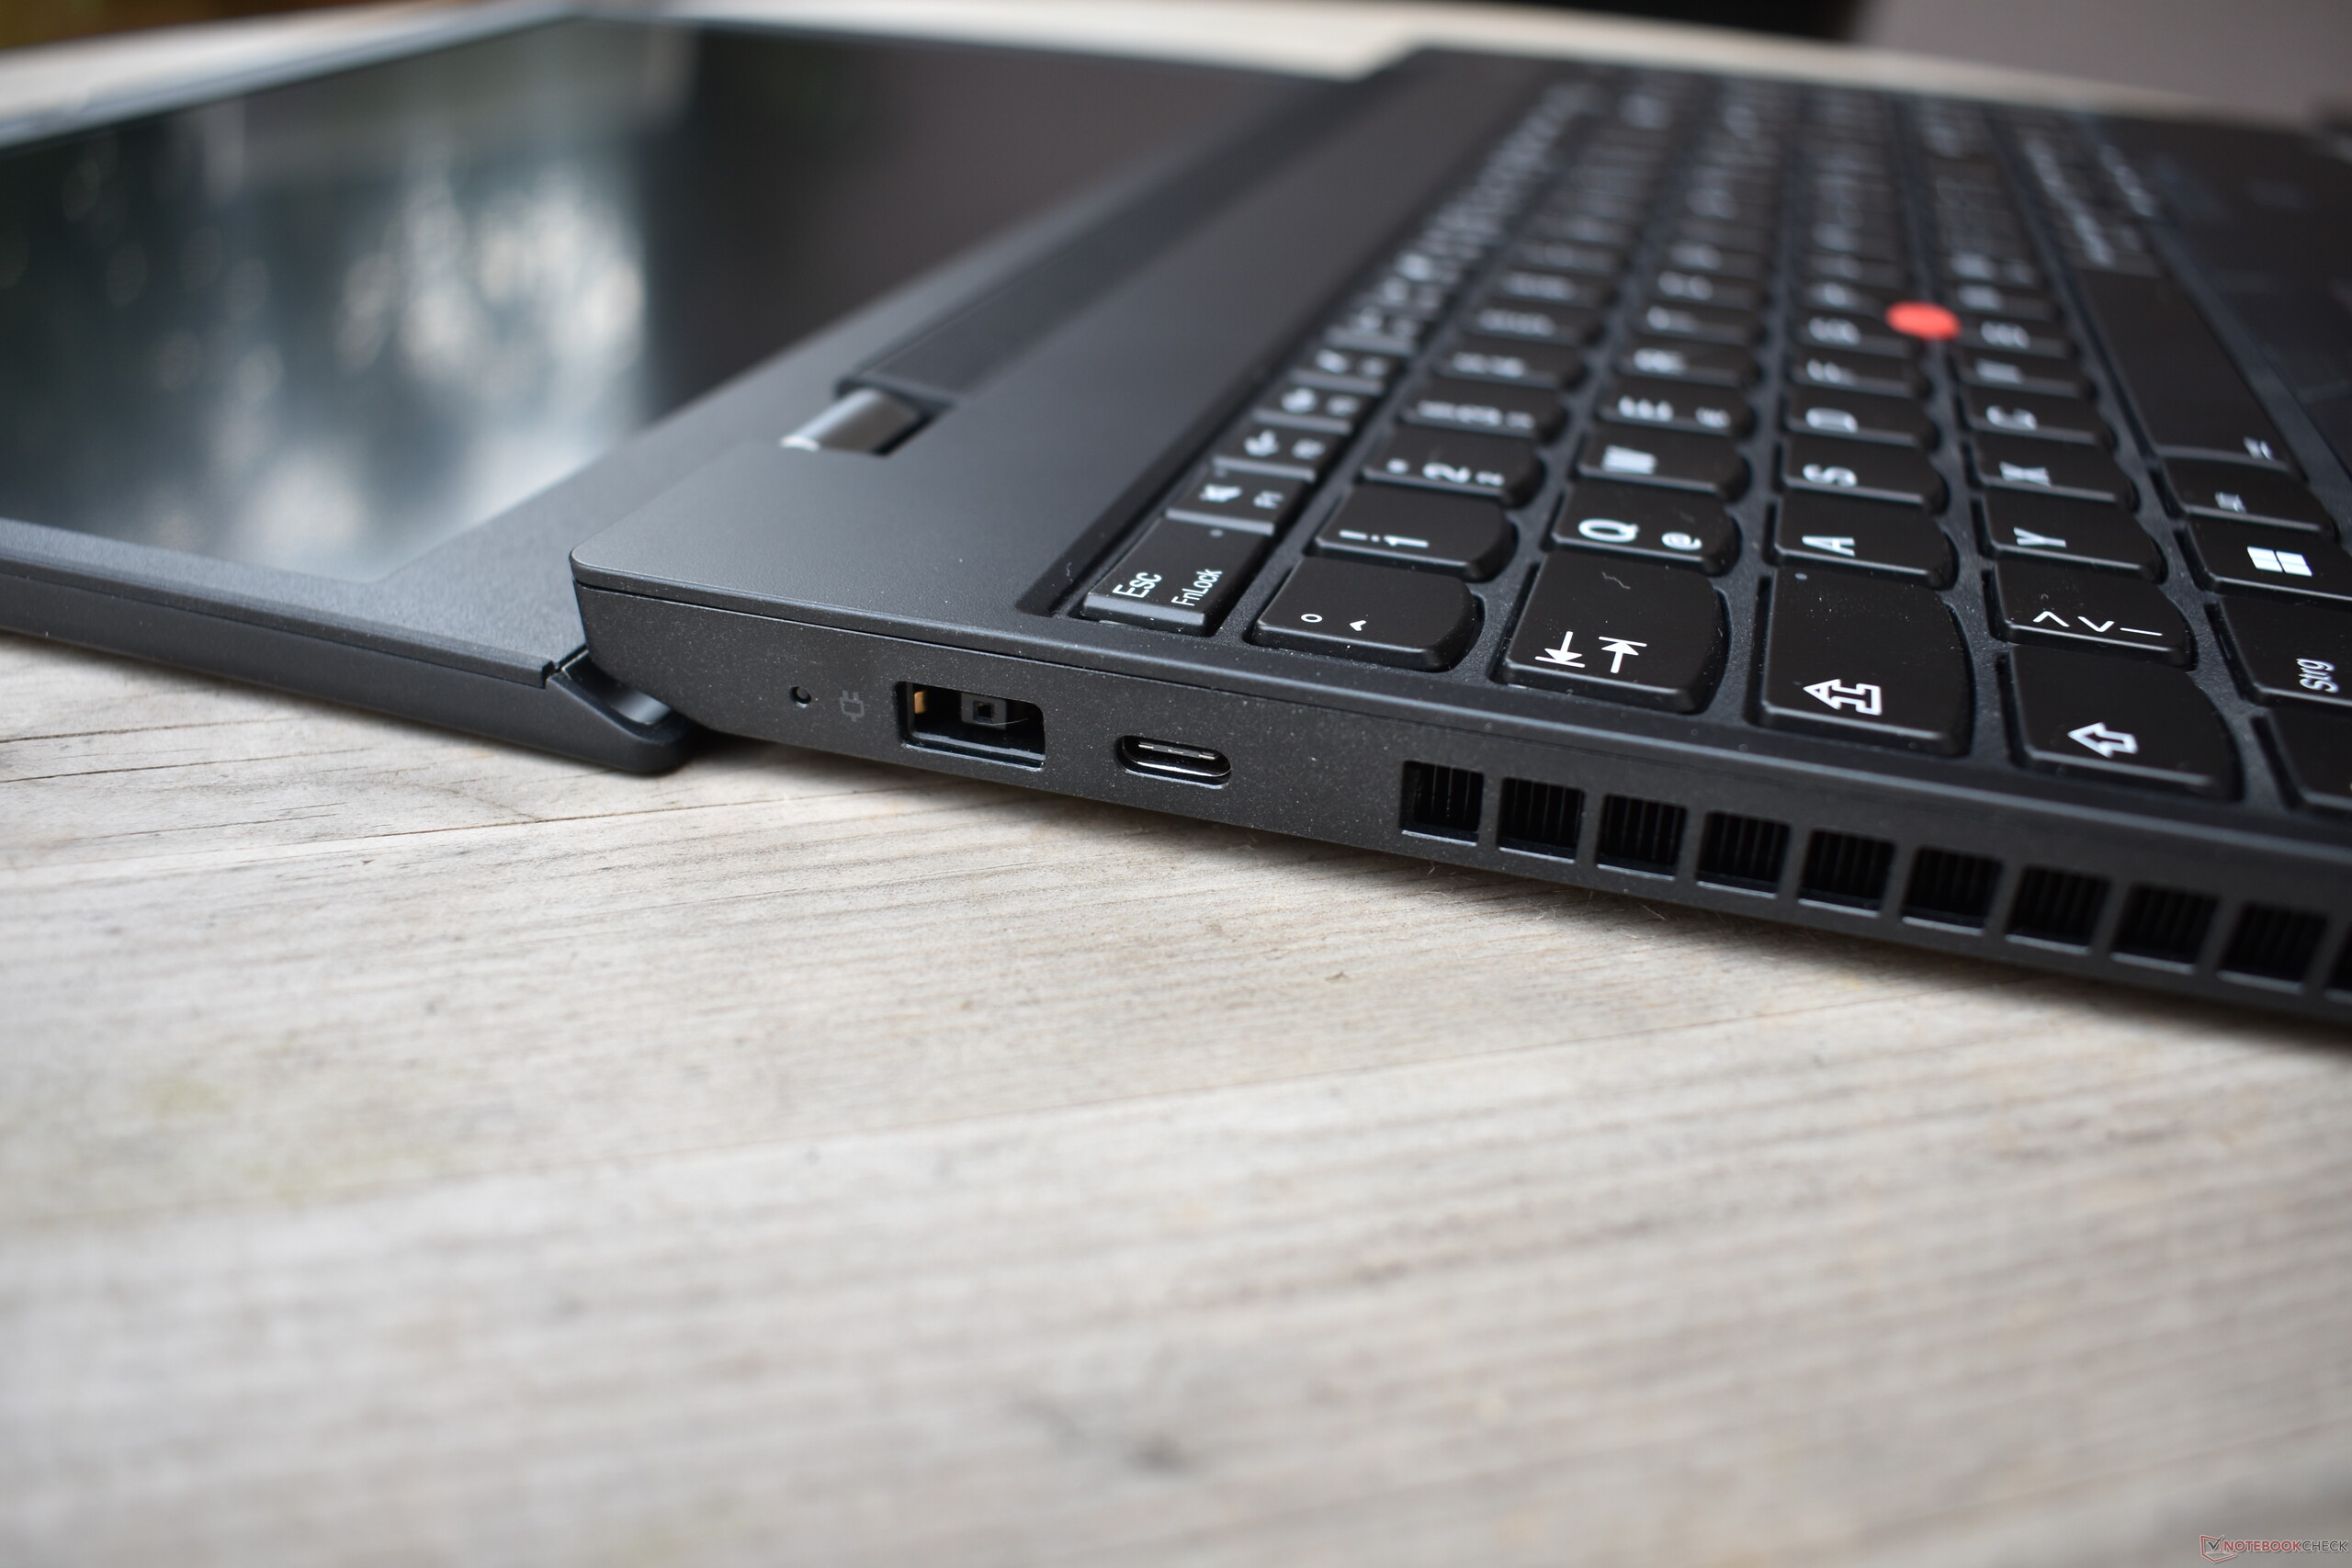
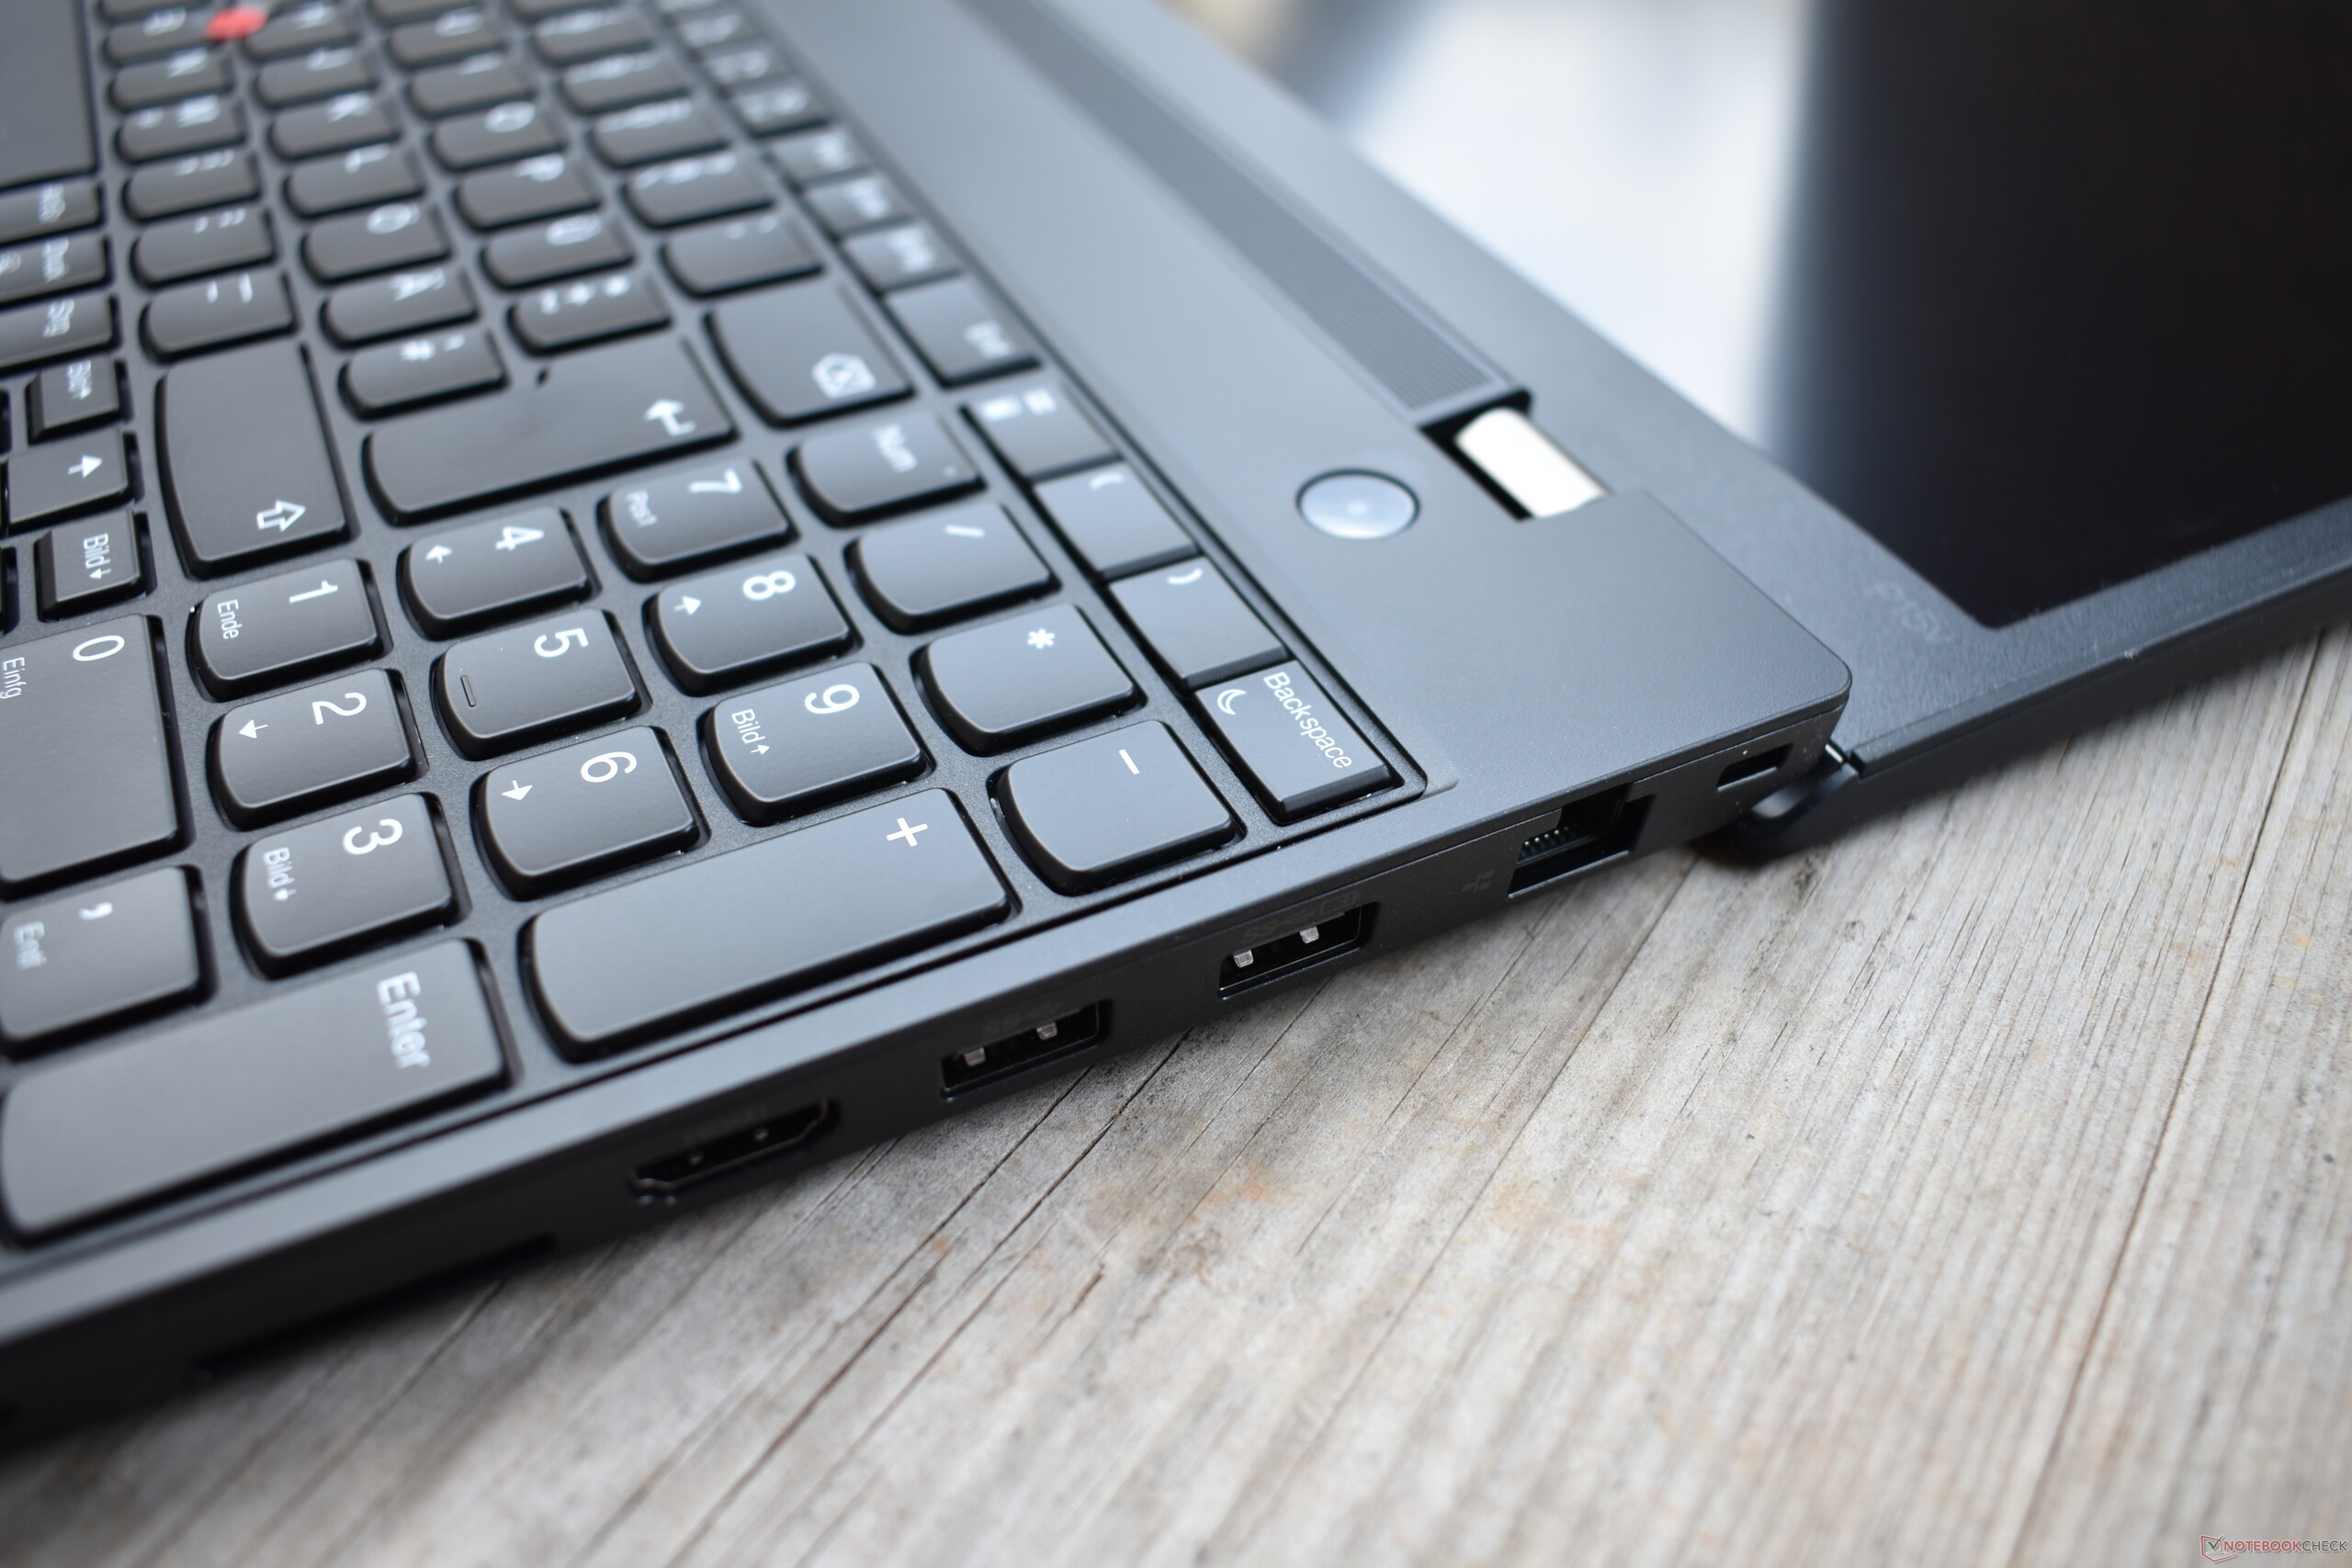
Lenovo hasn't changed the connectivity options much since the ThinkPad P15v debuted back in 2020. A special feature of the AMD version is the presence of USB4 instead of Thunderbolt - the fact that there is only one such connection is somewhat limiting. In return, the ThinkPad P15v G3 still has RJ45 Ethernet, which we missed on the larger ThinkPad P16.
SD card reader
Unlike the HP ZBook Power 15, the ThinkPad P15v has an SD card reader. This delivered high speeds in our read test with the AV Pro 128 GB V60 reference card. When writing data, the speed is roughly halved, but this is still enough to outclass the actually more expensive ThinkPad P16.
| SD Card Reader | |
| average JPG Copy Test (av. of 3 runs) | |
| Dell Precision 7670 (Toshiba Exceria Pro SDXC 64 GB UHS-II) | |
| Average of class Workstation (49.6 - 681, n=14, last 2 years) | |
| Lenovo ThinkPad P15v G2 21A9000XGE | |
| Lenovo ThinkPad P15v G3 21EM001AGE (AV Pro V60) | |
| Lenovo ThinkPad P16 G1 21D6001DMB (AV Pro V60) | |
| maximum AS SSD Seq Read Test (1GB) | |
| Lenovo ThinkPad P15v G2 21A9000XGE | |
| Average of class Workstation (87.6 - 1455, n=14, last 2 years) | |
| Lenovo ThinkPad P15v G3 21EM001AGE (AV Pro V60) | |
| Dell Precision 7670 (Toshiba Exceria Pro SDXC 64 GB UHS-II) | |
| Lenovo ThinkPad P16 G1 21D6001DMB (AV Pro V60) | |
Communication
Like all current AMD-based Lenovo ThinkPads, the P15v Gen 3 relies on a 2x2 WiFi 6E solution from Qualcomm. So far, this WiFi module has performed well in our tests - which made the poor signal stability of the ThinkPad P15v G3 all the more astonishing to us. There were repeated and reproducible performance drops both when sending and when receiving data. When receiving data, this phenomenon was not as severe as when transmitting, where the Qualcomm module was far from its maximum performance.
Webcam
The ThinkPad P15v G3 is one of the last ThinkPads to be sold exclusively with 720p webcams. The picture isn't particularly good, and an external solution would be much better for video calls. The camera installed here should be used as a last resort.


Security
Lenovo doesn't cut corners when it comes to security: A Kensington lock is available, as well as a dedicated fingerprint reader in the palm rest, a smart card reader or the mechanical camera aperture. The BIOS has features such as tamper detection and Computrace, and there is also a dedicated TPM 2.0 chip.
Accessories
Apart from the power adapter with the proprietary slim-tip port, no other accessories are included. The ThinkPad Thunderbolt 4 Workstation Dock is a model-specific dock.
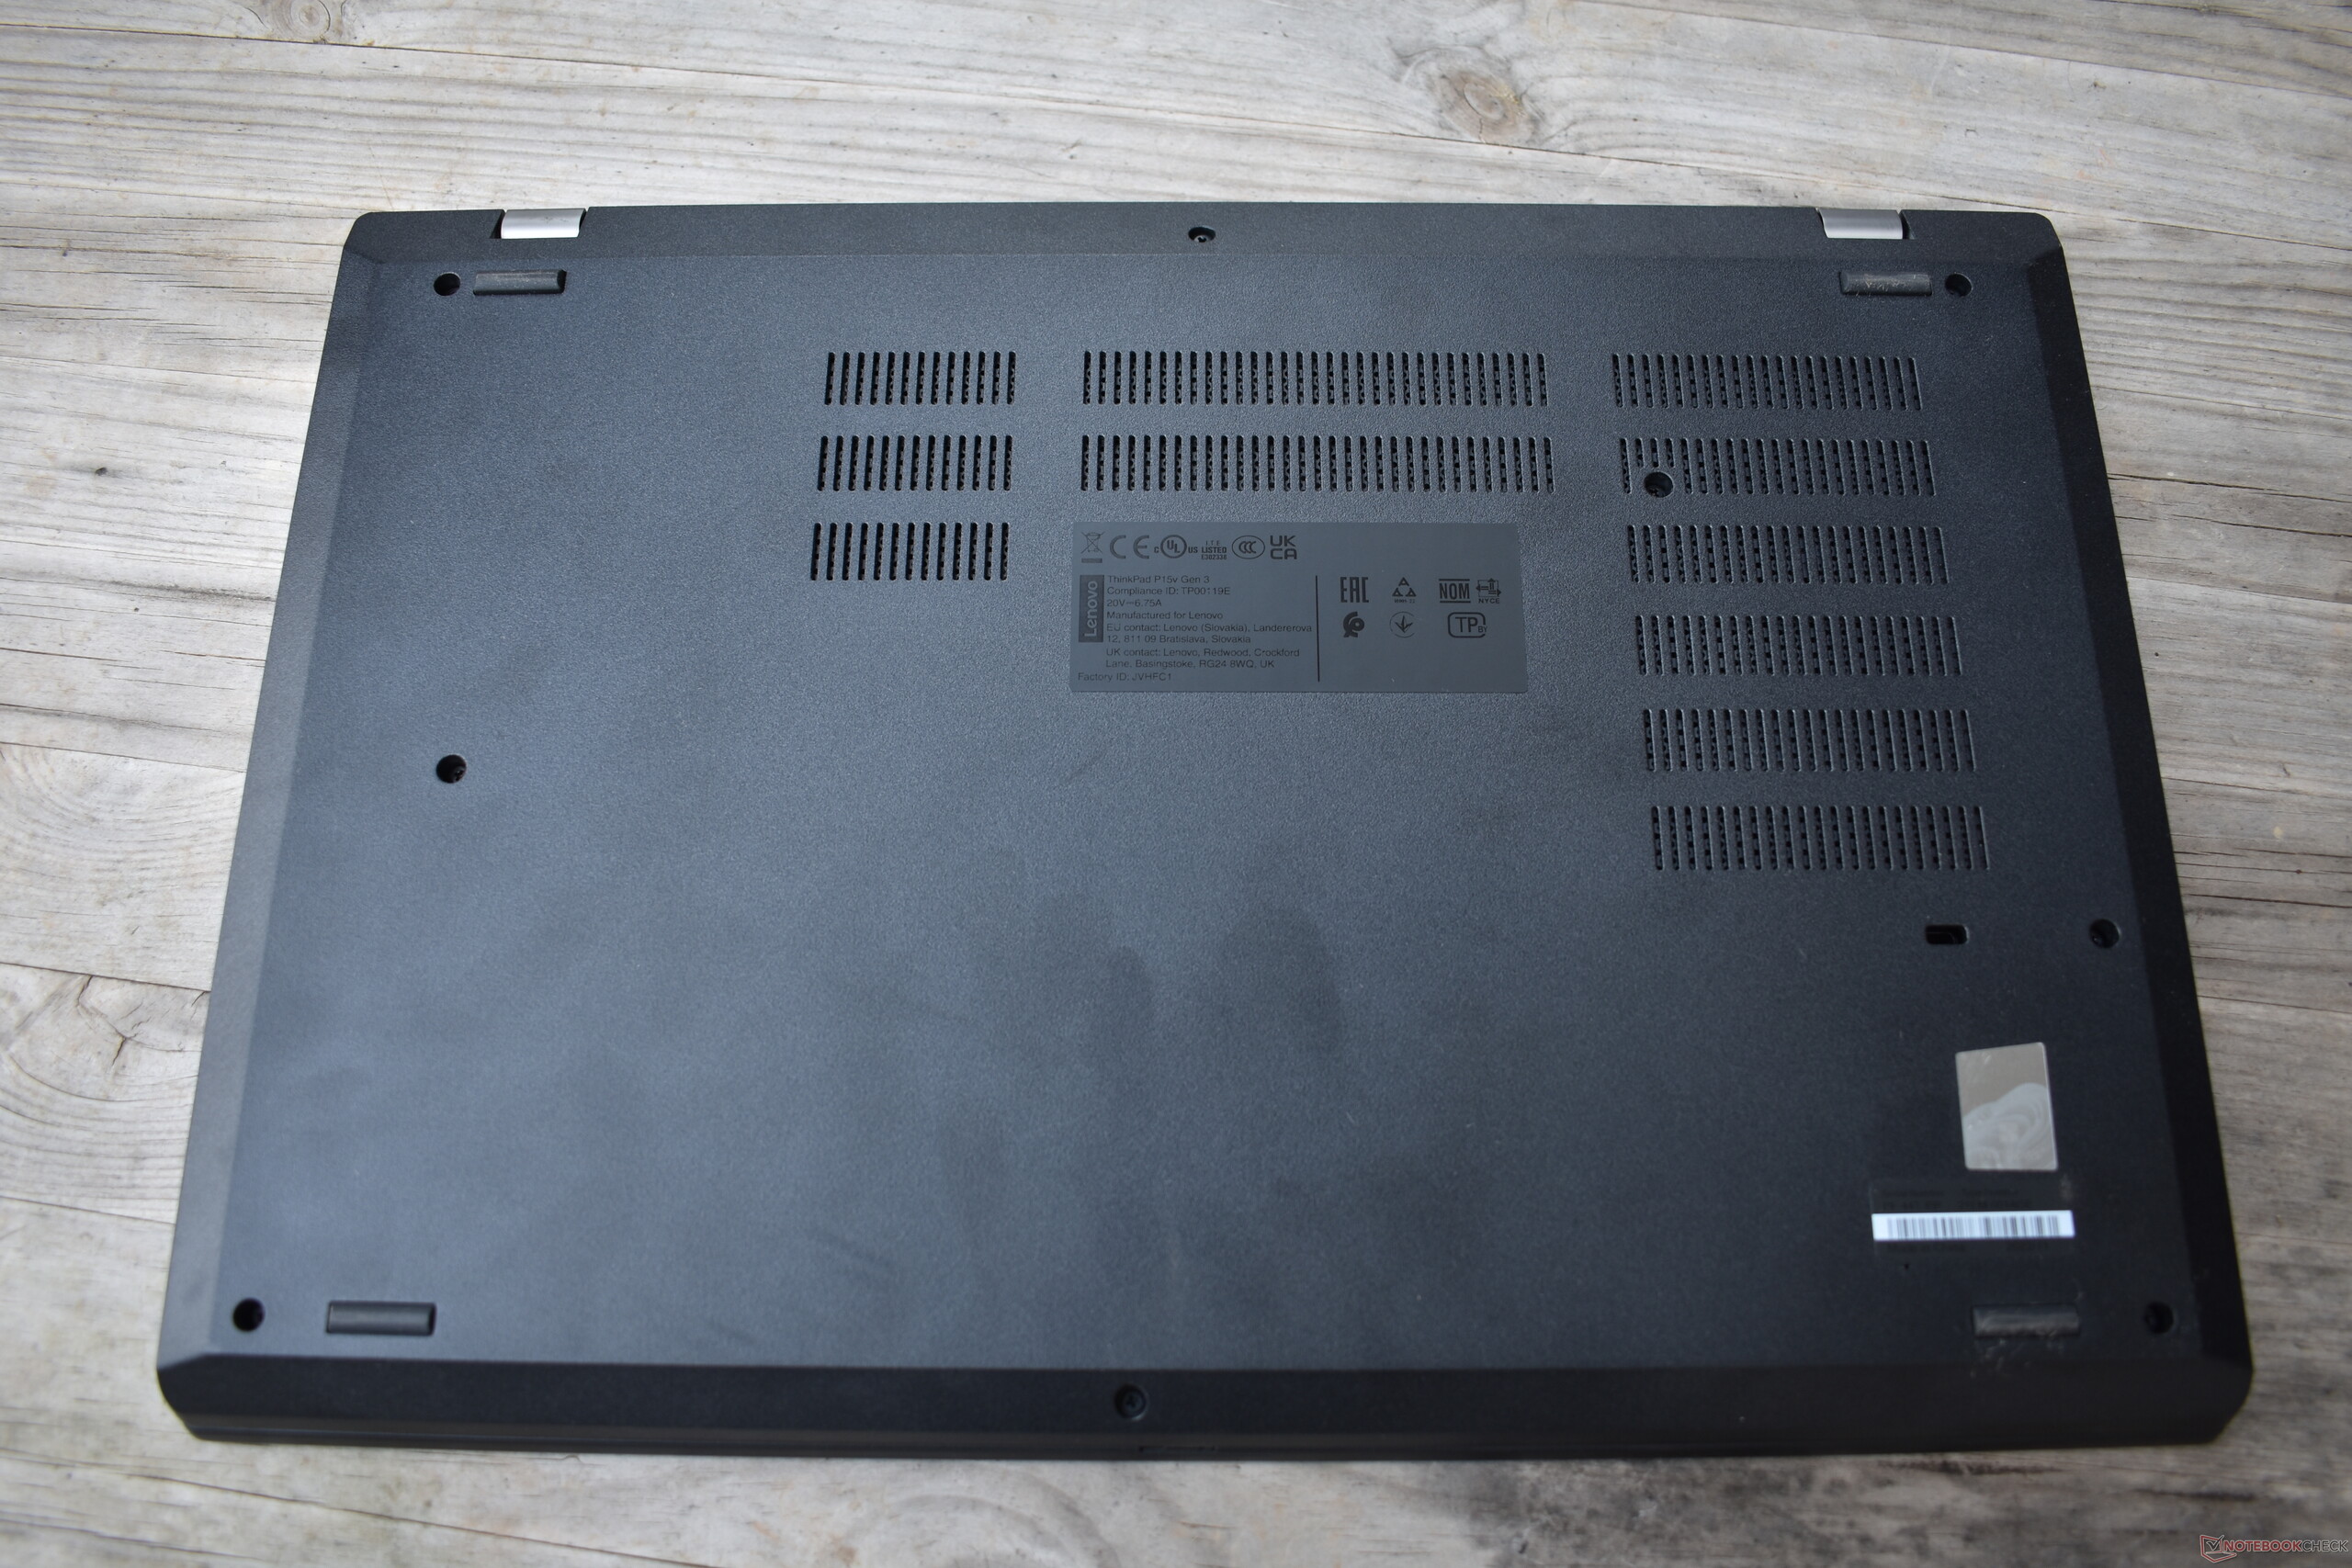
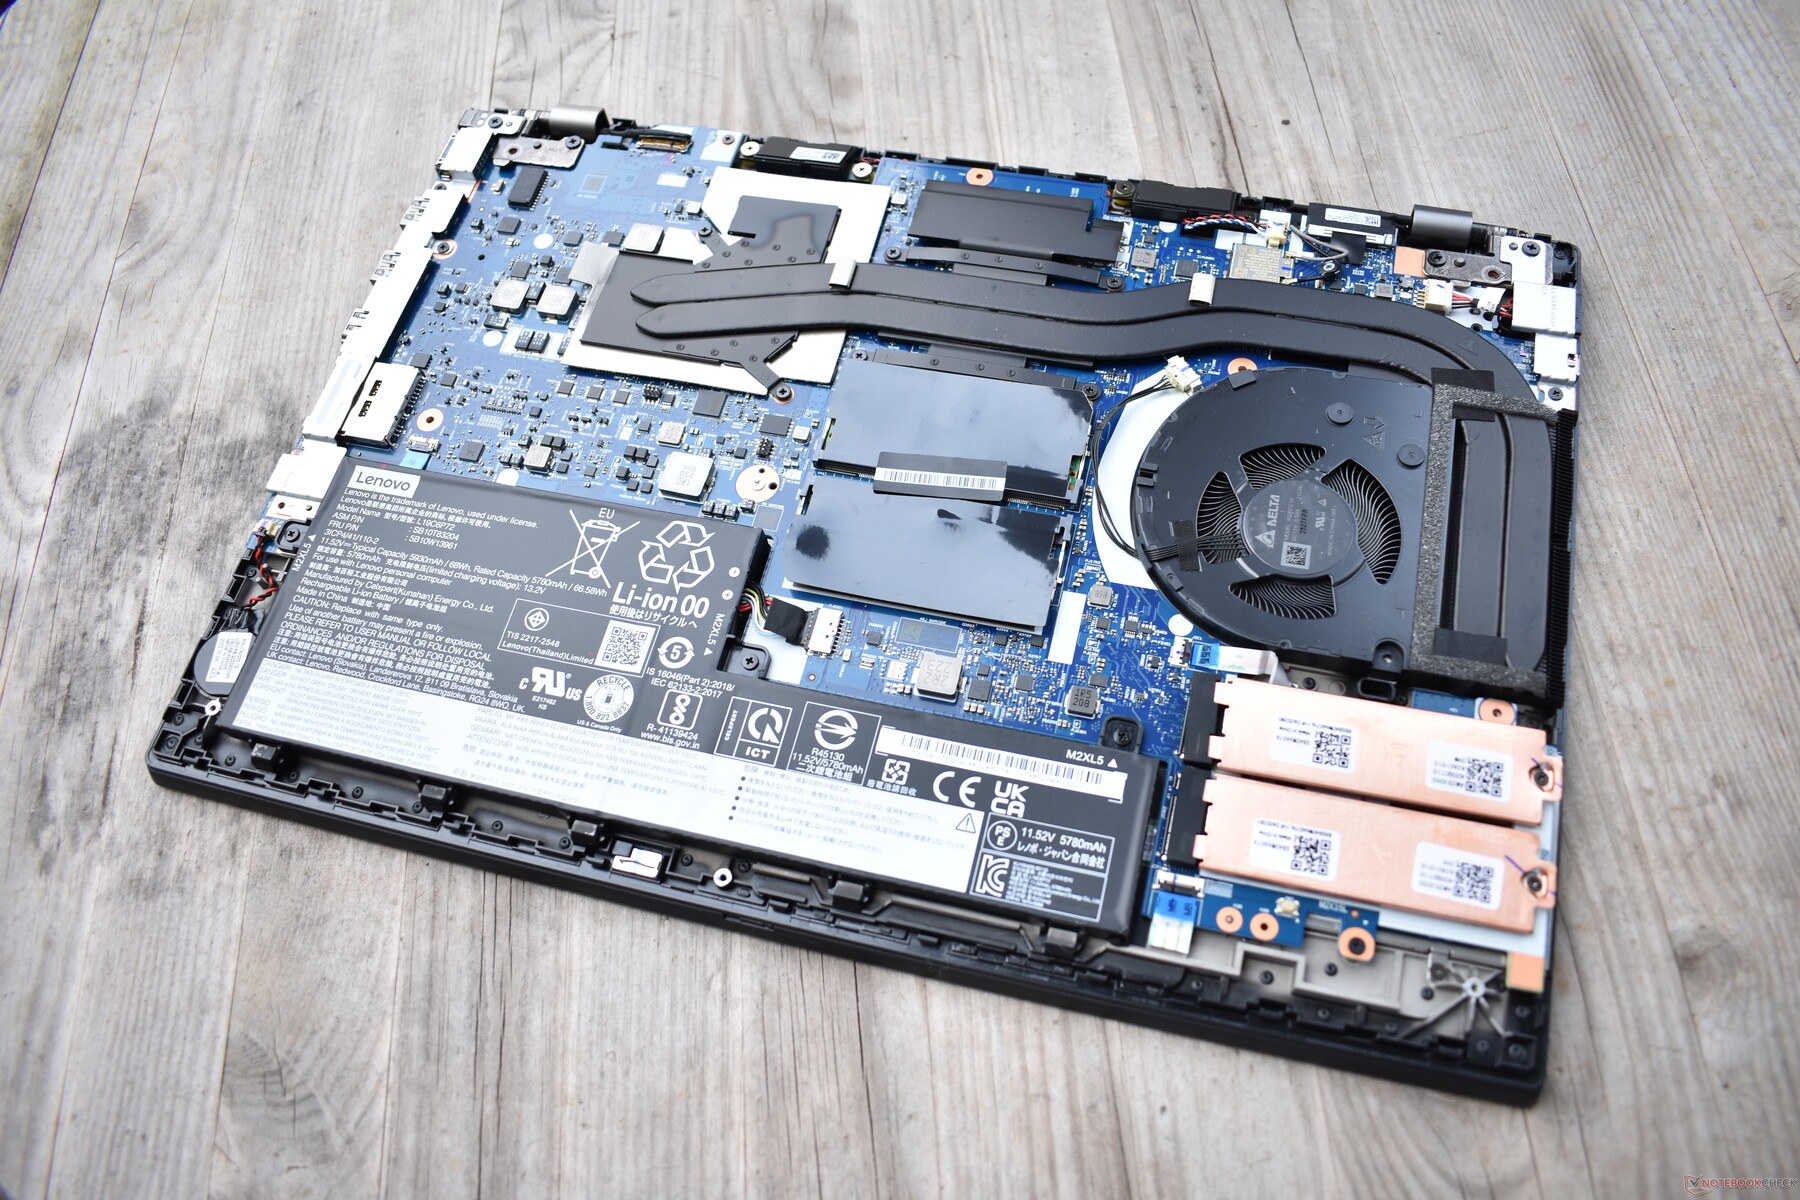
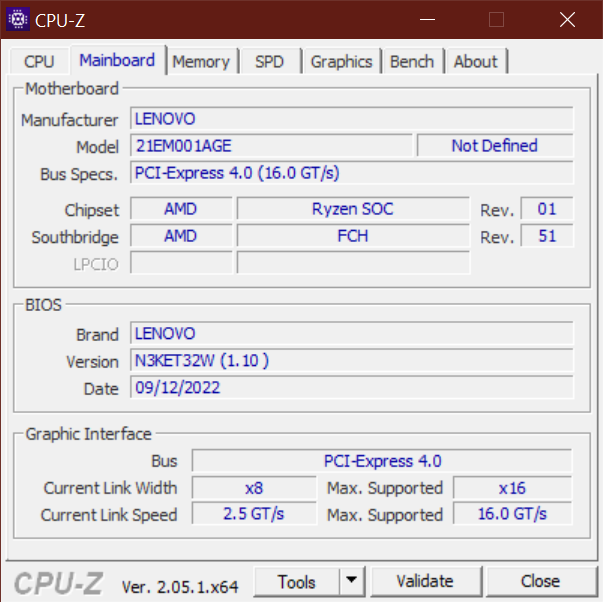
Maintenance
Access to the inner workings of the device is possible via the removable base plate, which can be taken off after loosening nine screws and a few clips on the back. The ThinkPad P15v G3 is very upgradeable, and only the processor and the WiFi module are soldered on. There are two M.2 2280 slots for SSDs, two SO-DIMM slots for up to 64 GB of RAM and the battery and cooling system can also be serviced. On the other hand, WWAN is not supported, and there is no corresponding slot for it available.
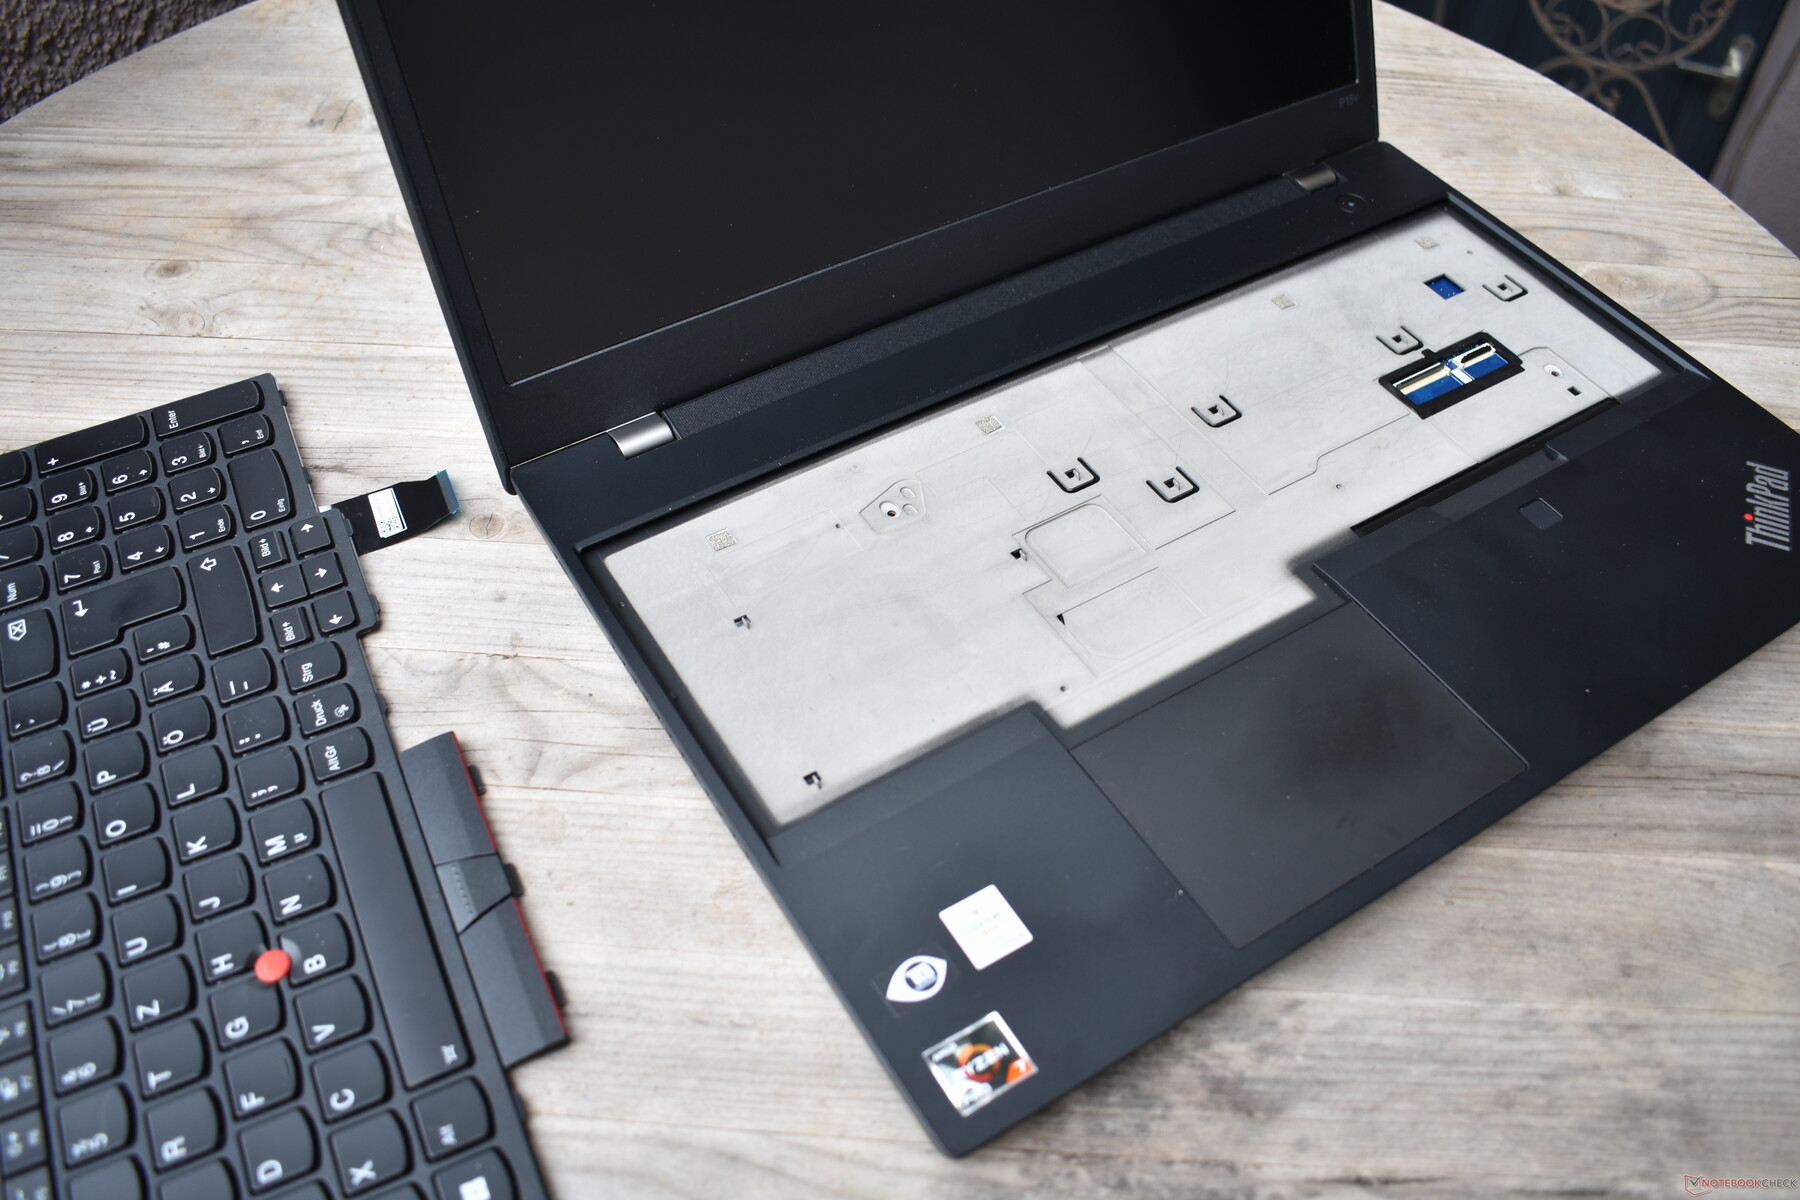
A special feature of the ThinkPad P15v Gen 3 is the easily exchangeable keyboard, which can be removed very quickly after loosening two screws. Since the keyboard is a consumable part, this is a very commendable design.
Warranty
If you buy the ThinkPad P15v Gen 3 in its present configuration, Lenovo grants a voluntary manufacturer's warranty of three years, valid worldwide. Service includes depot service as standard, so the laptop has to be sent in for repairs.
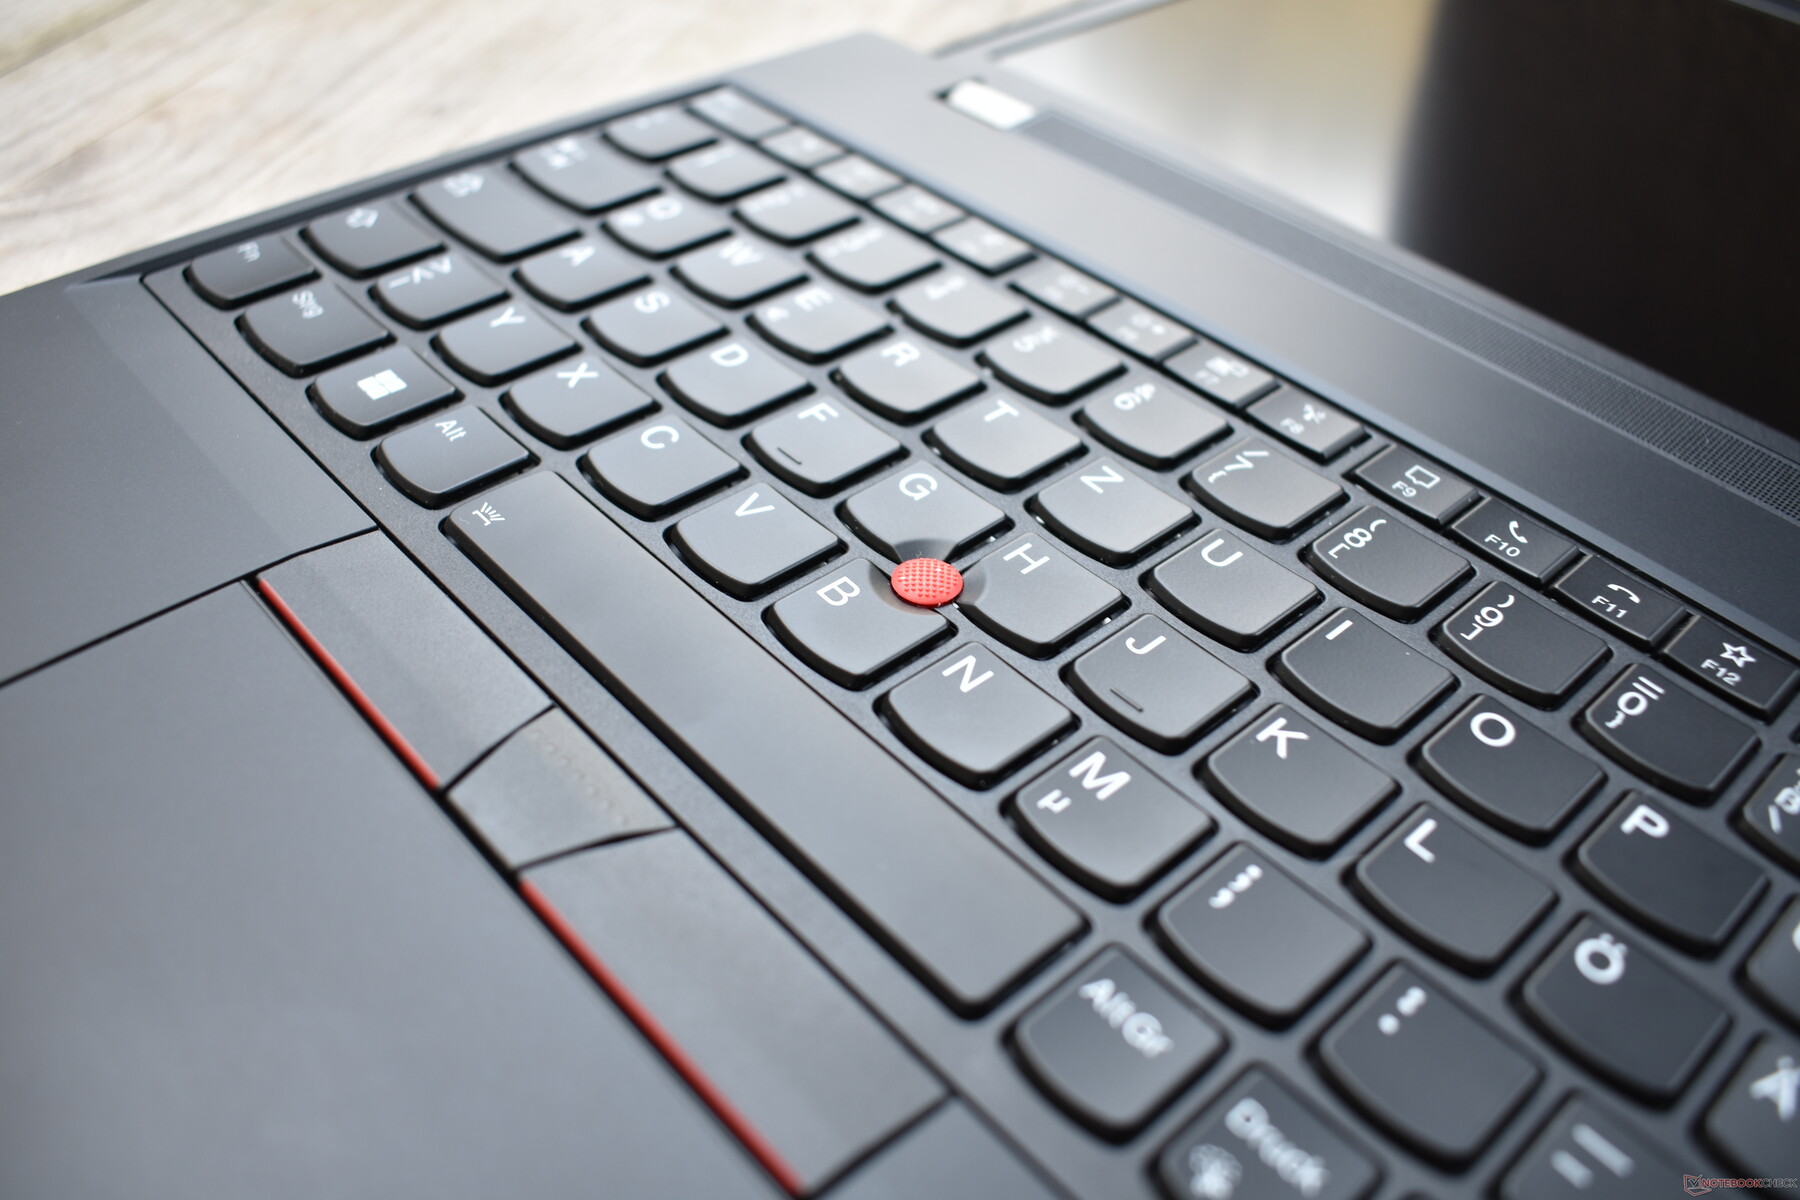
Input devices: Classic ThinkPad typing feel with 1.8 mm of travel
Keyboard
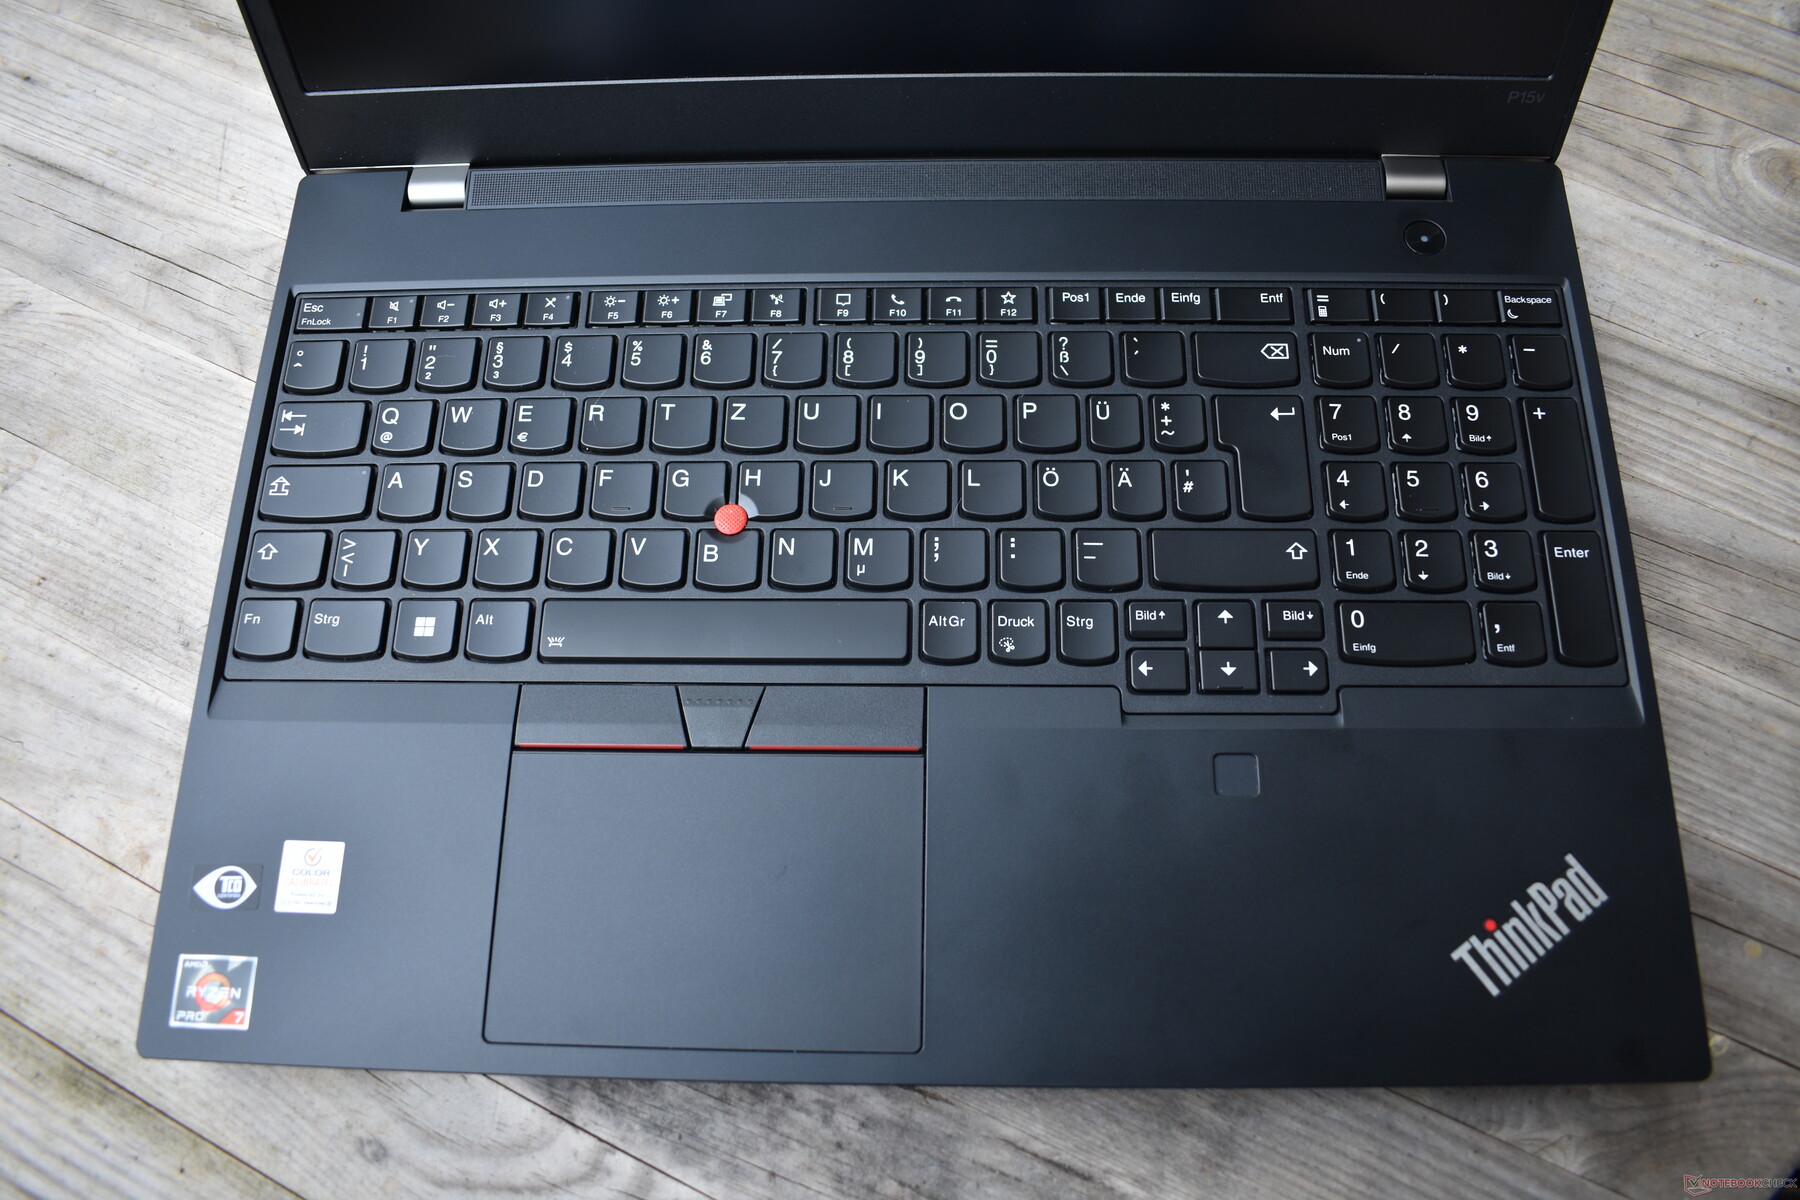
Practically all ThinkPad laptops have been switched from keyboards with 1.8 millimeters of travel to those with 1.5 mm travel in recent years. The Lenovo ThinkPad P15v Gen 3 is an exception precisely because it still has that 2020 design, so when it comes to keyboard quality, no other current ThinkPad can keep up with the P15v G3. The additional hub, together with the larger key height, ensure a luxurious, very pleasant typing experience. The black keys have a smooth feel and feature a dual-level white and blue backlight.
Like most workstation laptops, the ThinkPad P15v Gen 3 has a full-size keyboard with a number pad to the right of the key pad. As a result, the keyboard is shifted to the left - not ideal, but certainly an acceptable compromise for users who rely on the numeric keypad. Everyone else would have to use other models, like the ThinkPad X1 Extreme G5.
Touchpad
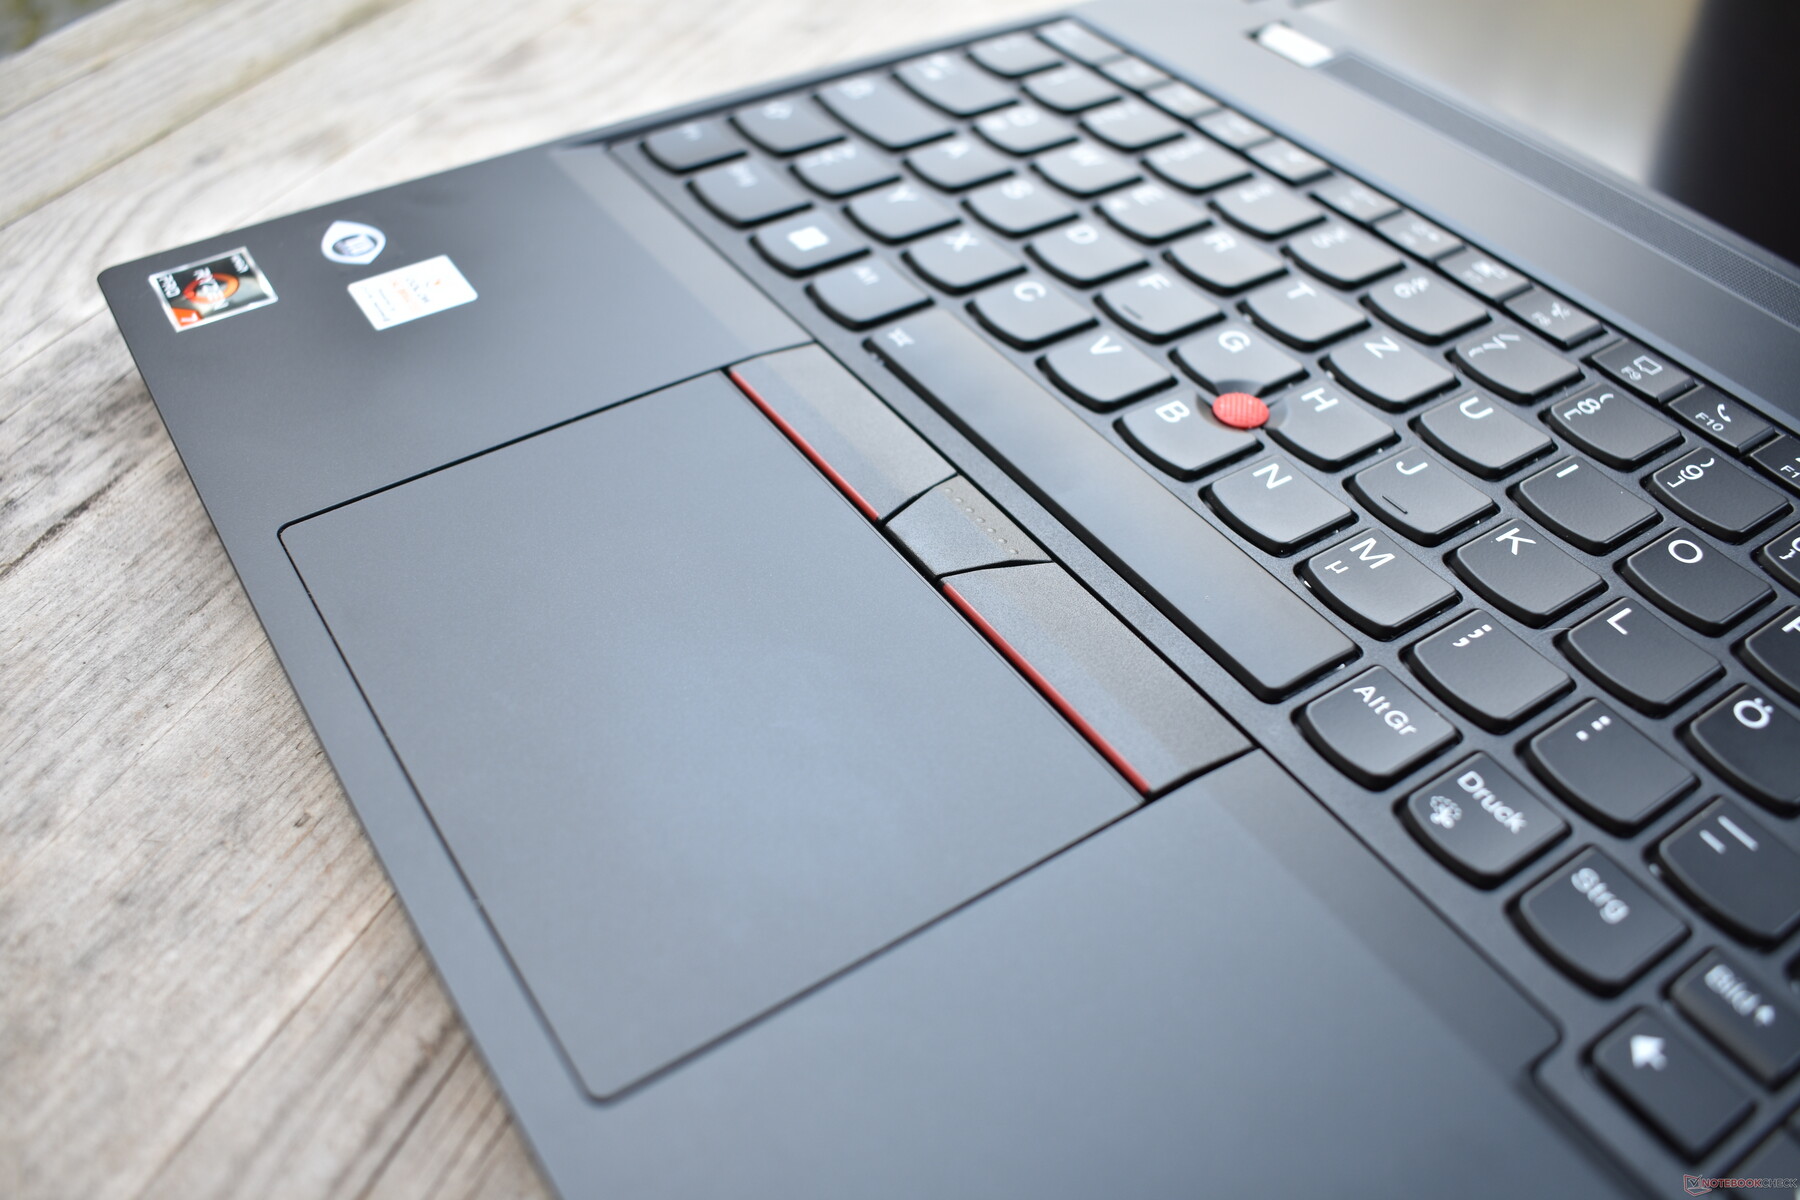
The Lenovo ThinkPad P15v G3 has the usual ThinkPad combination of touchpad and TrackPoint. The touchpad is a reasonable size, with a surface made of plastic, but it's not as smooth as in newer ThinkPads - like the rest of the case, the touchpad is also very sensitive to dirt. The touchpad does its job well without going above and beyond. Glass touchpads are definitely better, but there is nothing really to complain about here. The click mechanism is also pleasantly dampened.
As a second option, there is the already mentioned TrackPoint from Synaptics. The TrackPoint is very helpful, especially when typing, in order to move the mouse pointer quickly and precisely. In cramped conditions, for example on an airplane, we find that it's still superior to the touchpad. The dedicated buttons above the touchpad belong to the TrackPoint and work flawlessly. Strangely enough, the right mouse button is louder than the left one.
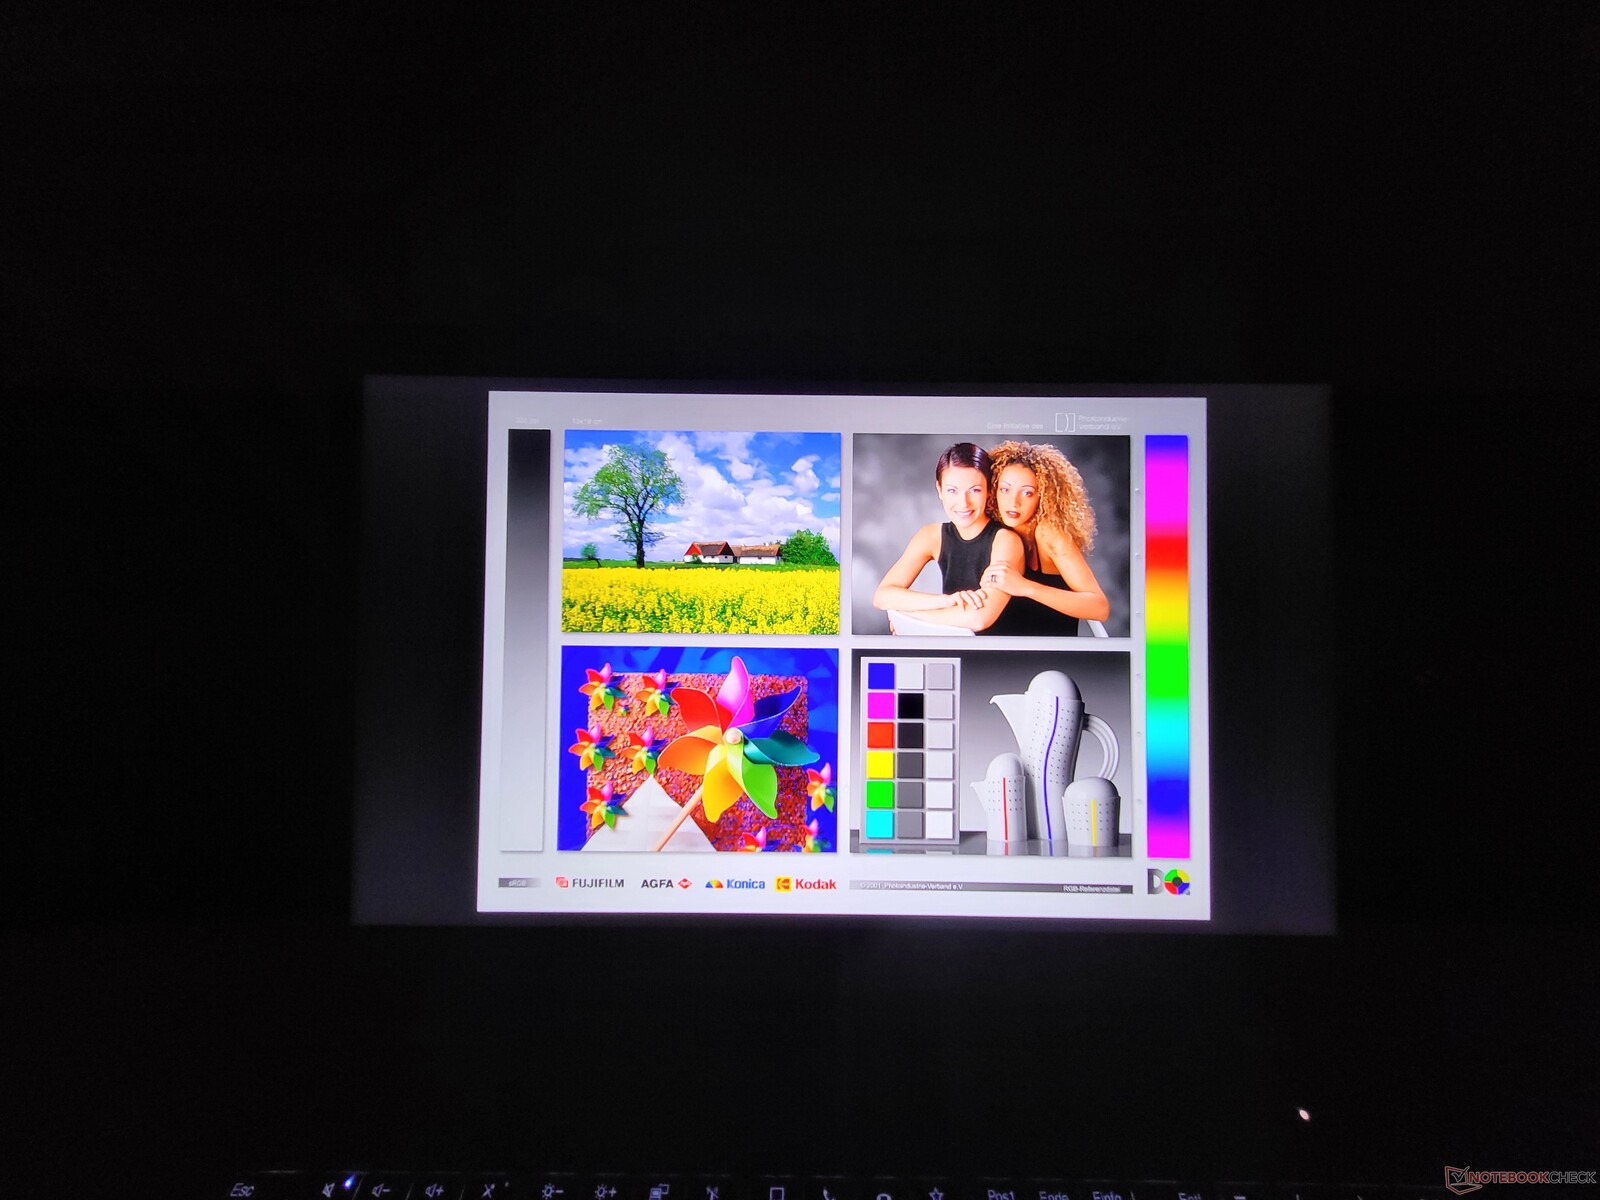
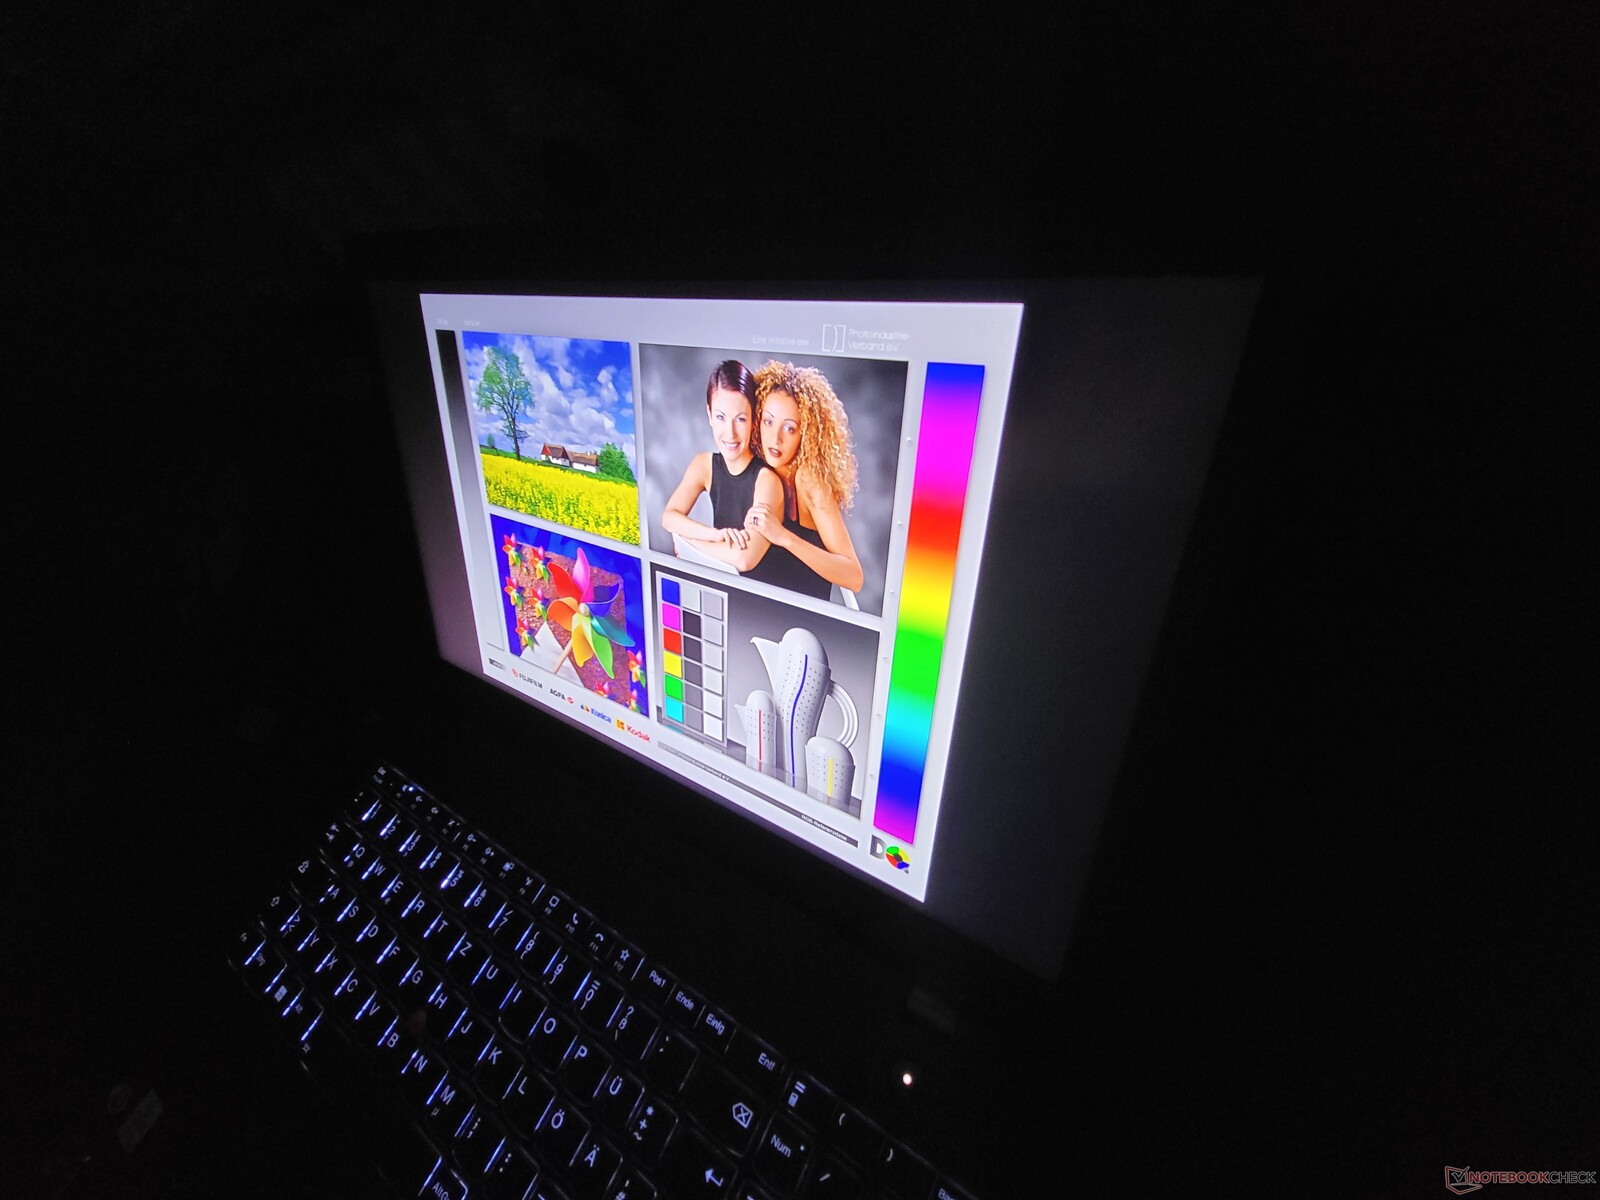
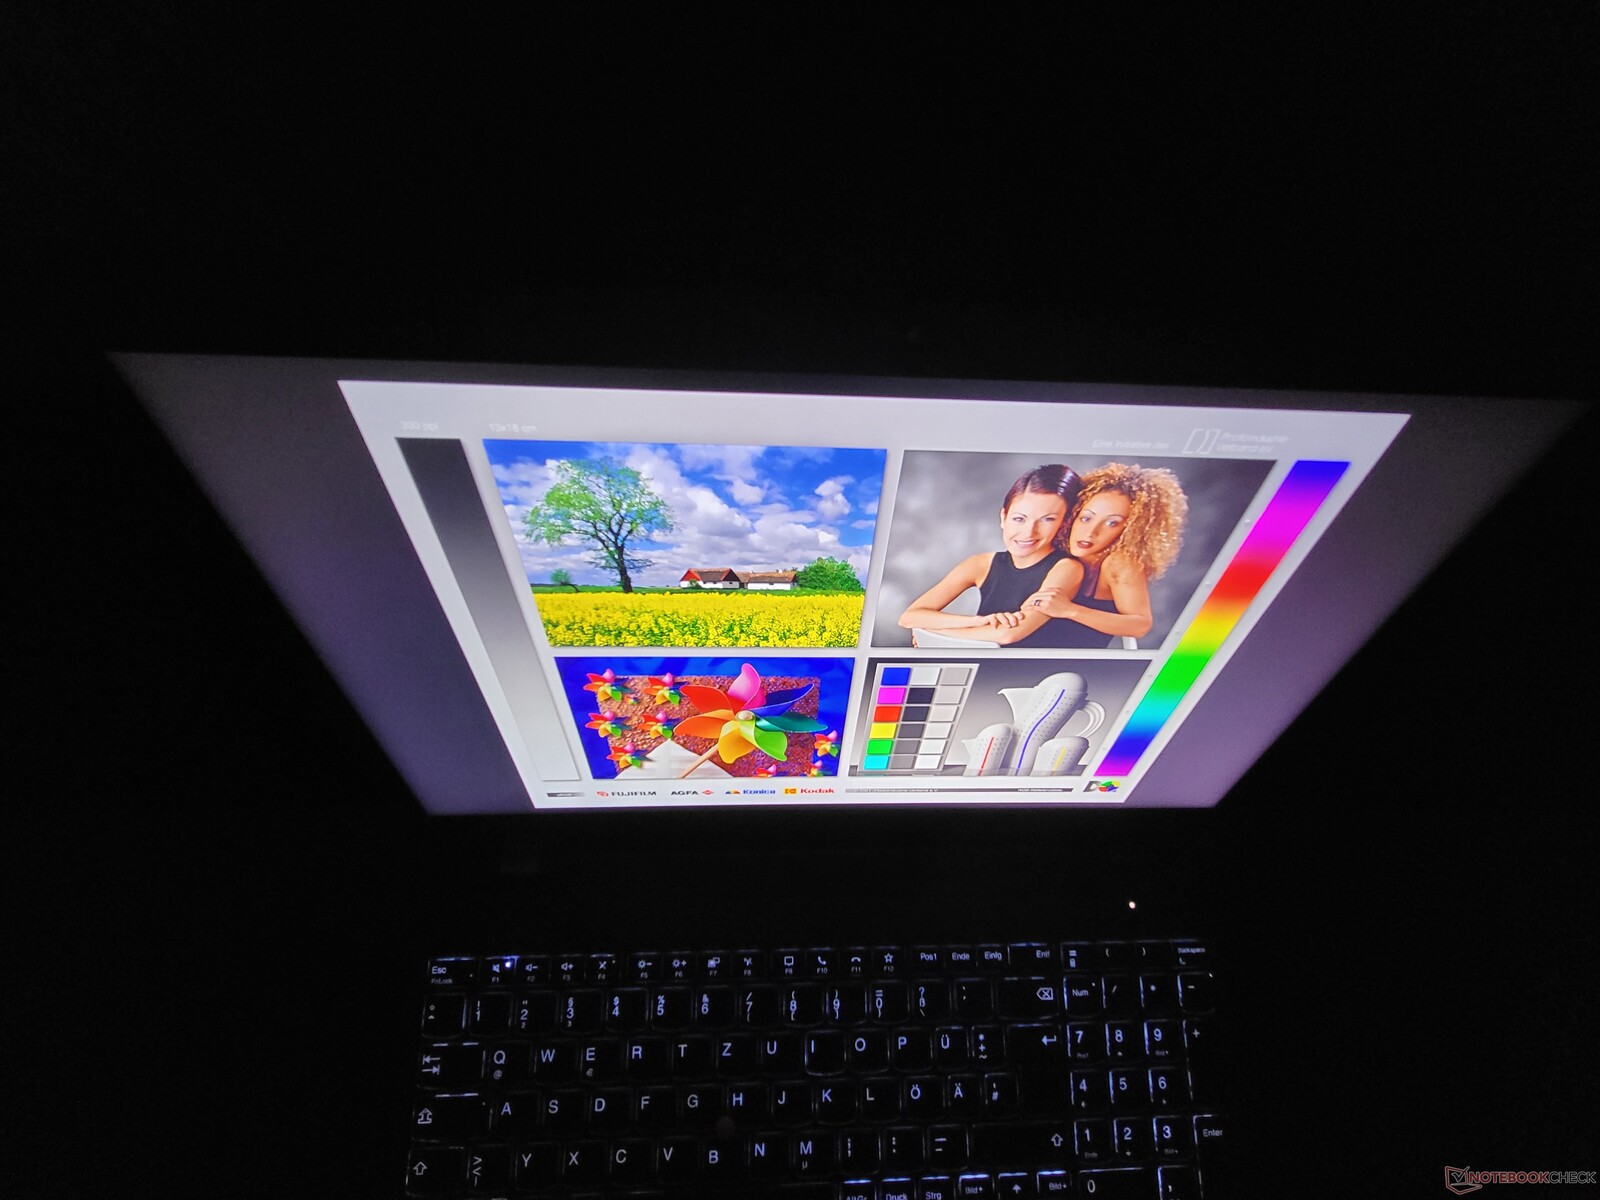
Display: Matte 4K-UHD panel with 100% AdobeRGB

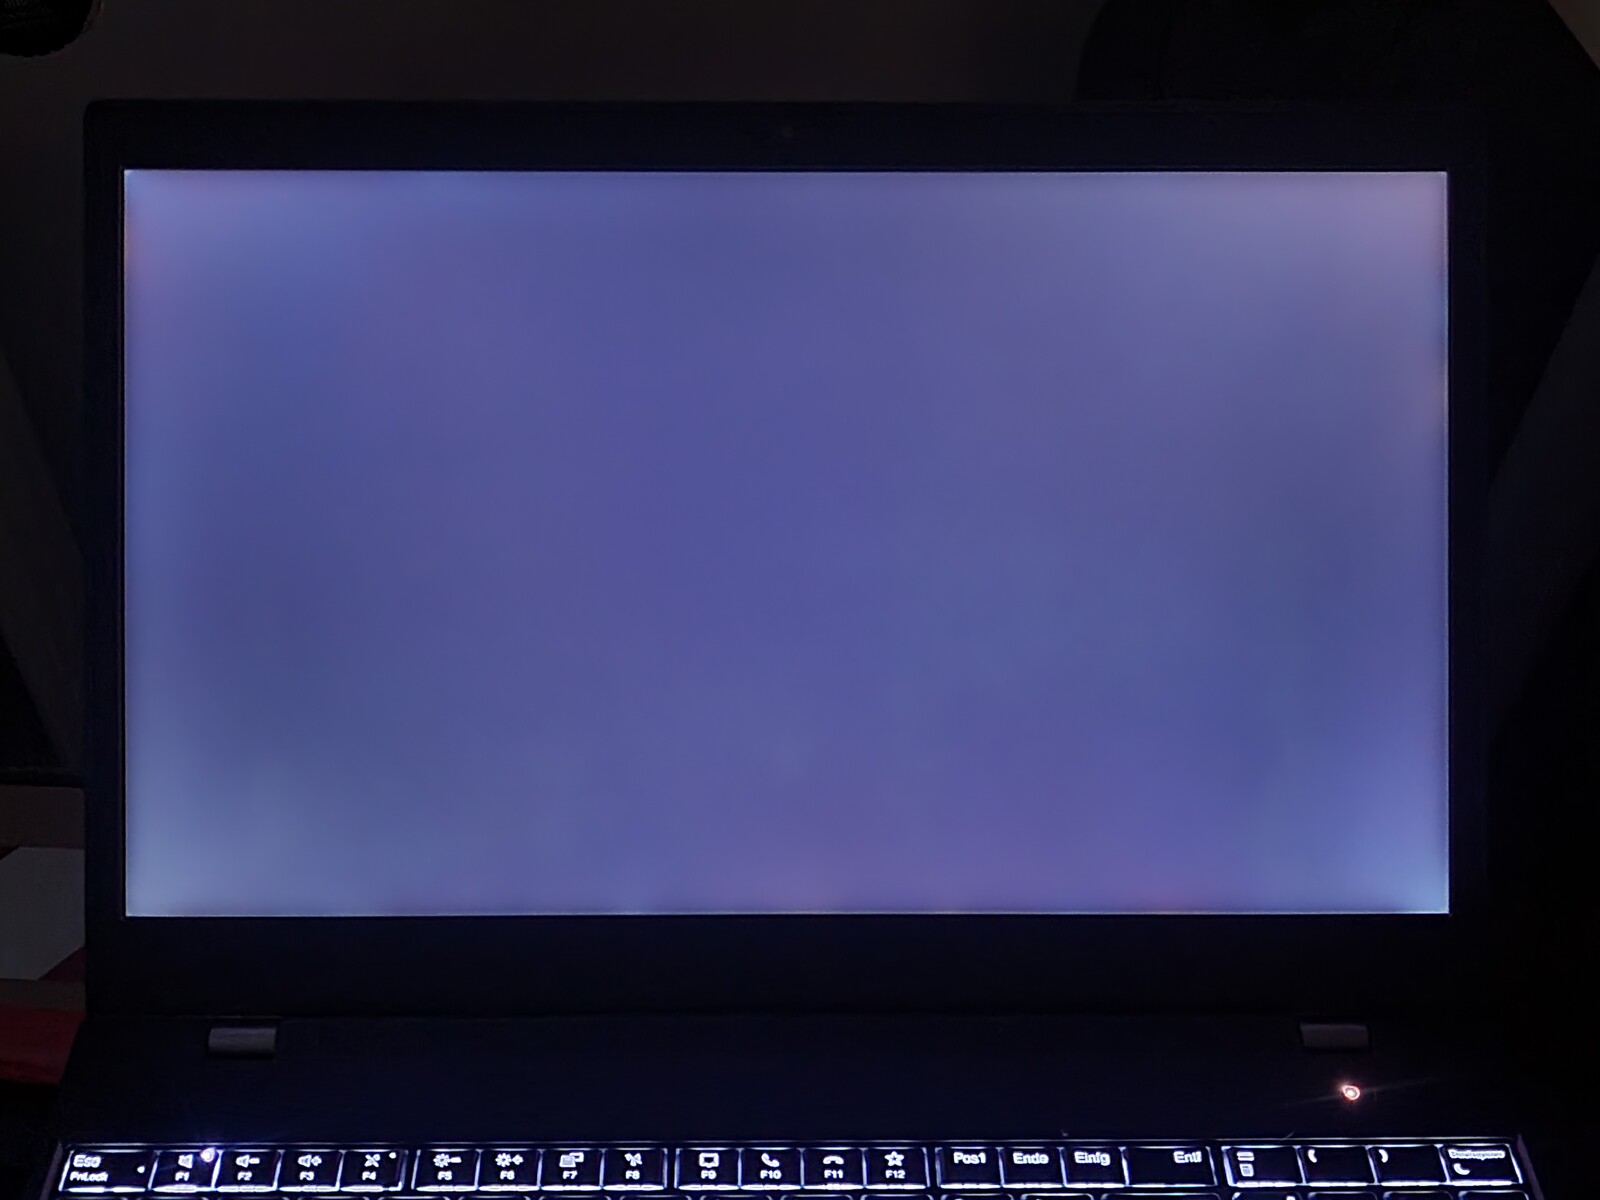
As one of the last ThinkPads of 2022, the Lenovo ThinkPad P15v Gen 3 still uses a 16:9 screen. There are a total of three different matte IPS LCDs with a 15.6-inch diagonal to choose from:
- Full HD (1,920 x 1,080), 300 cd/m², 45% NTSC
- Full HD (1,920 x 1,080), 300 cd/m², 72% NTSC
- 4K UHD (3840 x 2160), 600 nits, 100% AdobeRGB
The BOE panel installed here misses the 600 cd/m² mark; it has a maximum of 590 cd/m² and an average of 536 cd/m². While this isn't great, the screen is still significantly brighter than the 4K UHD screen of the HP ZBook Power 15 G9. The brightness has room for improvement at 83%, but fortunately we didn't notice any visible shading with the naked eye.
| |||||||||||||||||||||||||
Brightness Distribution: 83 %
Center on Battery: 588 cd/m²
Contrast: 1547:1 (Black: 0.38 cd/m²)
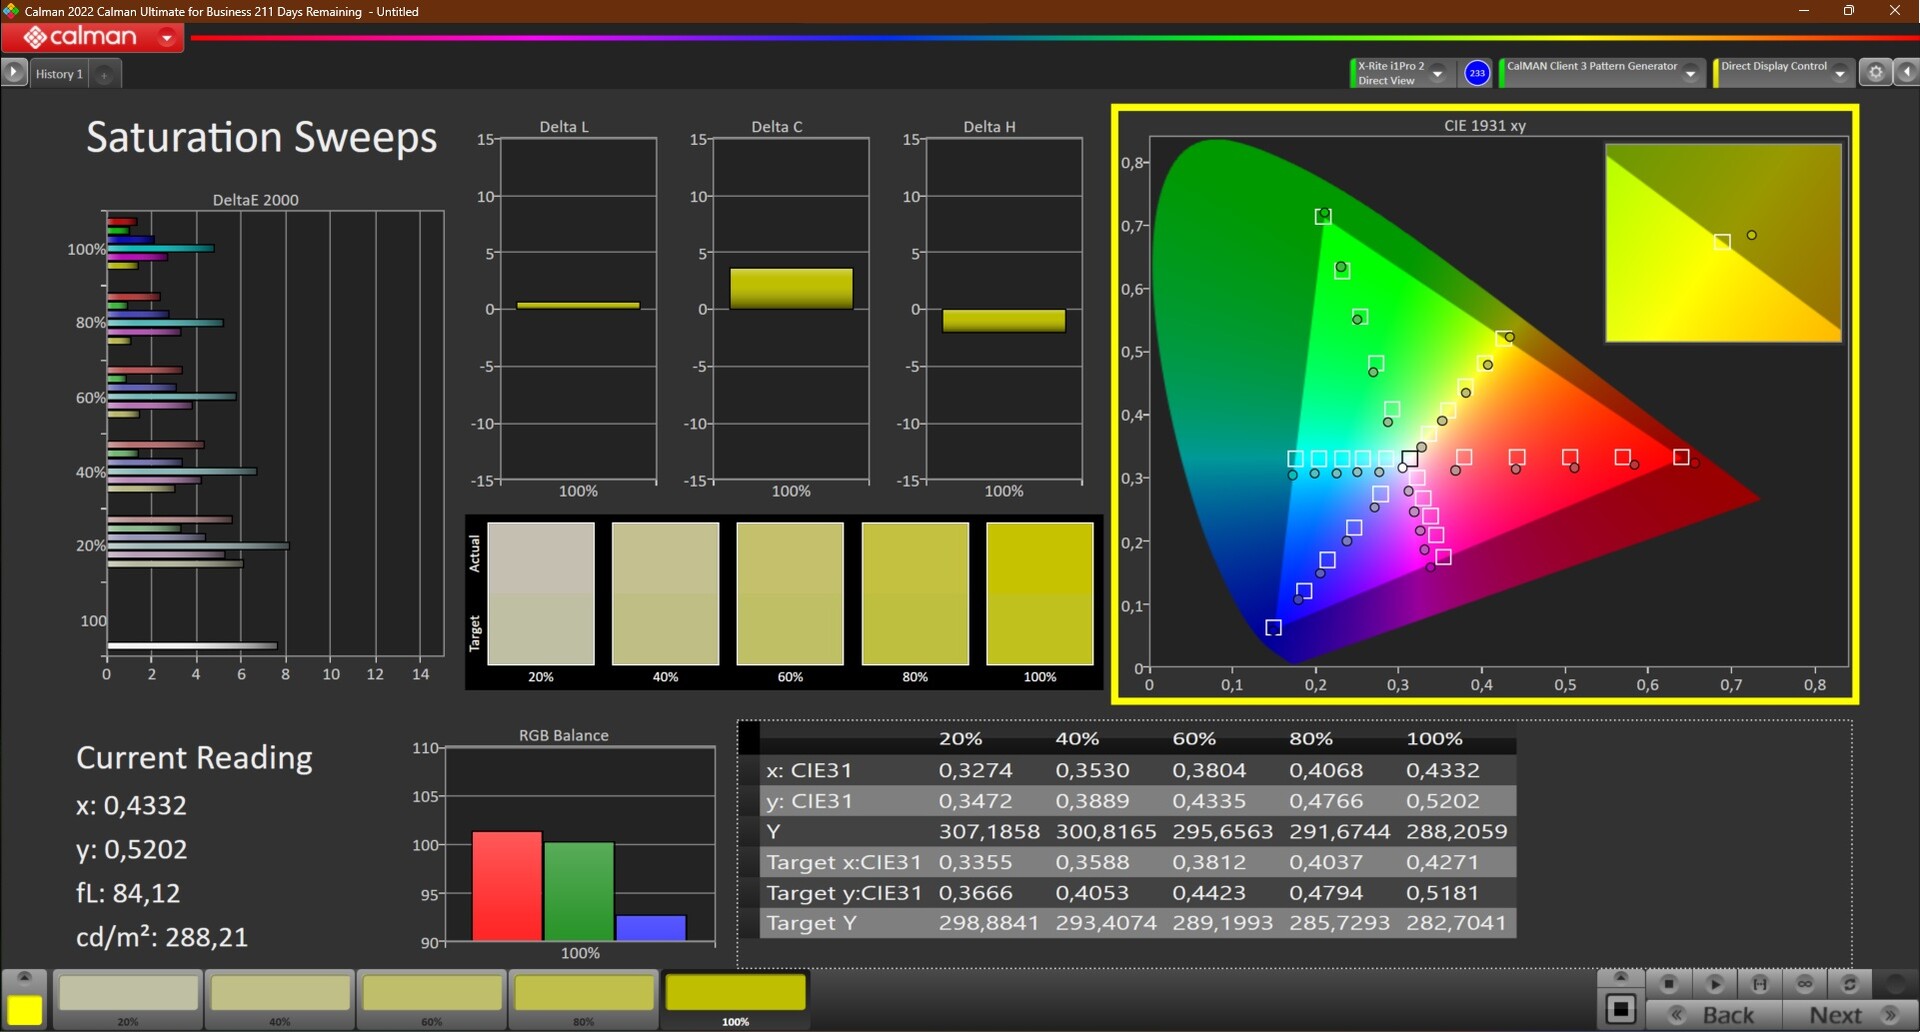
ΔE ColorChecker Calman: 3.9 | ∀{0.5-29.43 Ø4.71}
calibrated: 1
ΔE Greyscale Calman: 7.1 | ∀{0.09-98 Ø4.96}
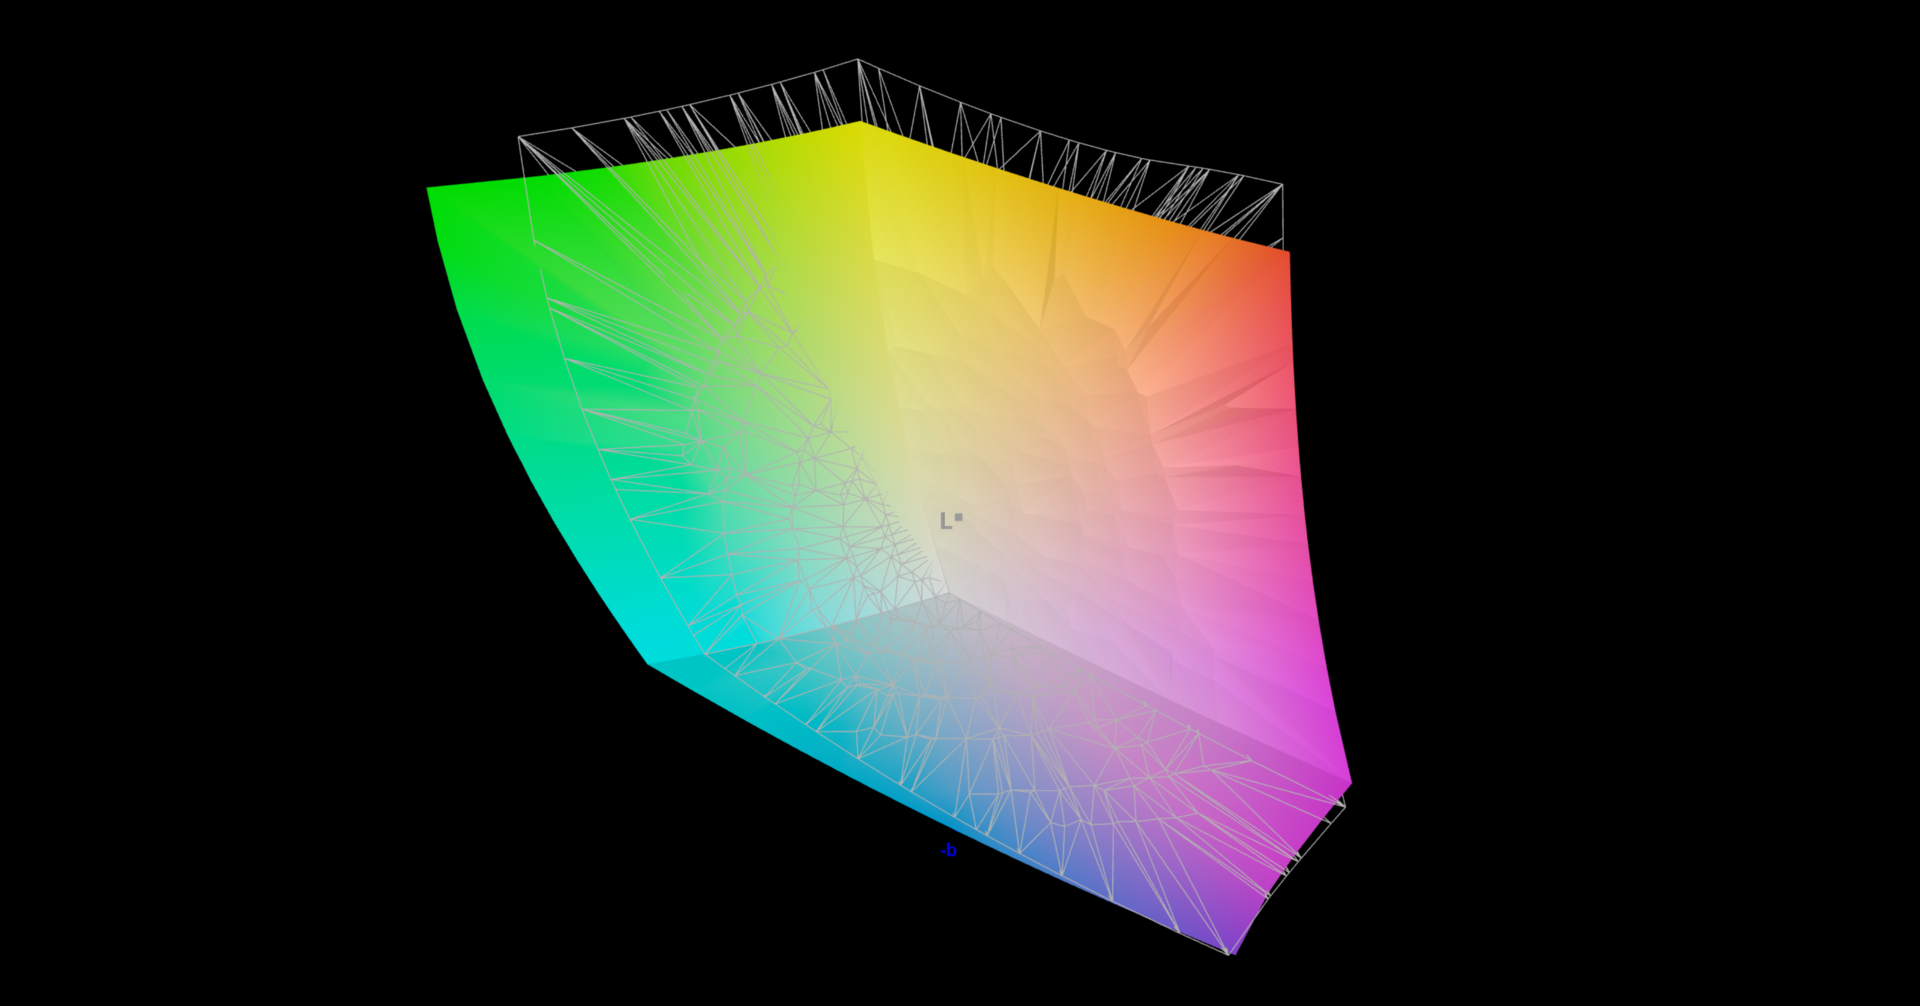
99.9% AdobeRGB 1998 (Argyll 3D)
100% sRGB (Argyll 3D)
89.9% Display P3 (Argyll 3D)
Gamma: 2.12
CCT: 7268 K
| Lenovo ThinkPad P15v G3 21EM001AGE NE156QUM-N6C, IPS LED, 3840x2160, 15.6" | Lenovo ThinkPad P16 G1 21D6001DMB NE160QDM-N63 , IPS LED, 2560x1600, 16" | Lenovo ThinkPad P15v G2 21A9000XGE N156HCA-EAC, IPS LED, 1920x1080, 15.6" | HP ZBook Power 15 G9 6B8C4EA LGD073F, IPS, 3840x2160, 15.6" | Dell Precision 7670 Samsung 160YV03, OLED, 3840x2400, 16" | Lenovo ThinkPad P16 G1 RTX A5500 LP160UQ1-SPB1, IPS, 3840x2400, 16" | |
|---|---|---|---|---|---|---|
| Display | -16% | -47% | -18% | 3% | -4% | |
| Display P3 Coverage (%) | 89.9 | 71.5 -20% | 43.7 -51% | 69.1 -23% | 99.9 11% | 82.9 -8% |
| sRGB Coverage (%) | 100 | 100 0% | 65.1 -35% | 97.7 -2% | 100 0% | 98.9 -1% |
| AdobeRGB 1998 Coverage (%) | 99.9 | 73.3 -27% | 45.3 -55% | 69.6 -30% | 97.5 -2% | 95.9 -4% |
| Response Times | 12% | -3% | -2% | 95% | -17% | |
| Response Time Grey 50% / Grey 80% * (ms) | 46.7 ? | 37.7 ? 19% | 48 ? -3% | 45.8 ? 2% | 1.9 ? 96% | 45.6 ? 2% |
| Response Time Black / White * (ms) | 27.3 ? | 26.3 ? 4% | 28 ? -3% | 28.6 ? -5% | 2 ? 93% | 36.8 ? -35% |
| PWM Frequency (Hz) | 59.5 ? | |||||
| Screen | 16% | -68% | 14% | 6% | 14% | |
| Brightness middle (cd/m²) | 588 | 424 -28% | 305 -48% | 392 -33% | 340.1 -42% | 601.9 2% |
| Brightness (cd/m²) | 536 | 398 -26% | 281 -48% | 388 -28% | 342 -36% | 569 6% |
| Brightness Distribution (%) | 83 | 90 8% | 88 6% | 88 6% | 98 18% | 77 -7% |
| Black Level * (cd/m²) | 0.38 | 0.24 37% | 0.32 16% | 0.15 61% | 0.47 -24% | |
| Contrast (:1) | 1547 | 1767 14% | 953 -38% | 2613 69% | 1281 -17% | |
| Colorchecker dE 2000 * | 3.9 | 2.6 33% | 5.9 -51% | 3.2 18% | 2.5 36% | 2.45 37% |
| Colorchecker dE 2000 max. * | 8.8 | 4.9 44% | 20.1 -128% | 7 20% | 8.19 7% | 4.46 49% |
| Colorchecker dE 2000 calibrated * | 1 | 0.8 20% | 4.5 -350% | 1.2 -20% | ||
| Greyscale dE 2000 * | 7.1 | 4.1 42% | 5.3 25% | 4.9 31% | 3.5 51% | 2.6 63% |
| Gamma | 2.12 104% | 2.13 103% | 2.1 105% | 2.13 103% | 2.12 104% | 2.3 96% |
| CCT | 7268 89% | 7252 90% | 6307 103% | 5982 109% | 6704 97% | 6805 96% |
| Total Average (Program / Settings) | 4% /
9% | -39% /
-55% | -2% /
5% | 35% /
21% | -2% /
5% |
* ... smaller is better
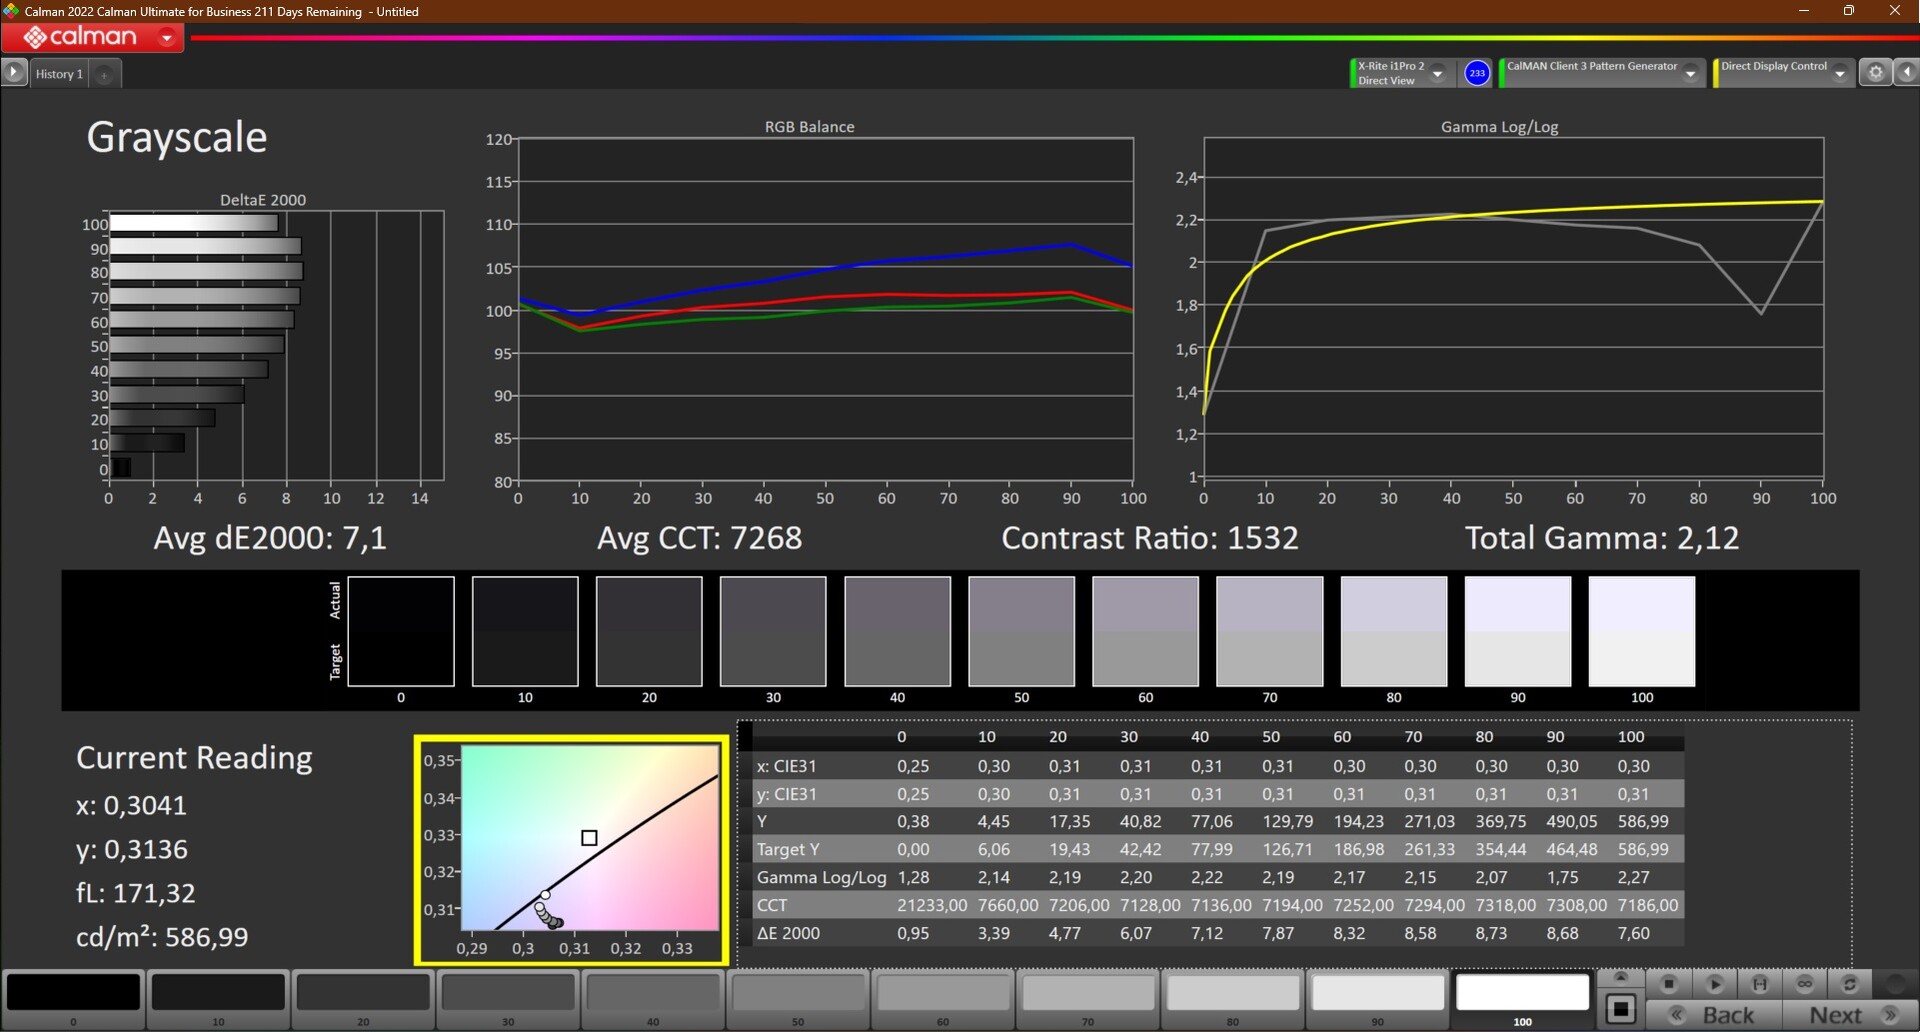
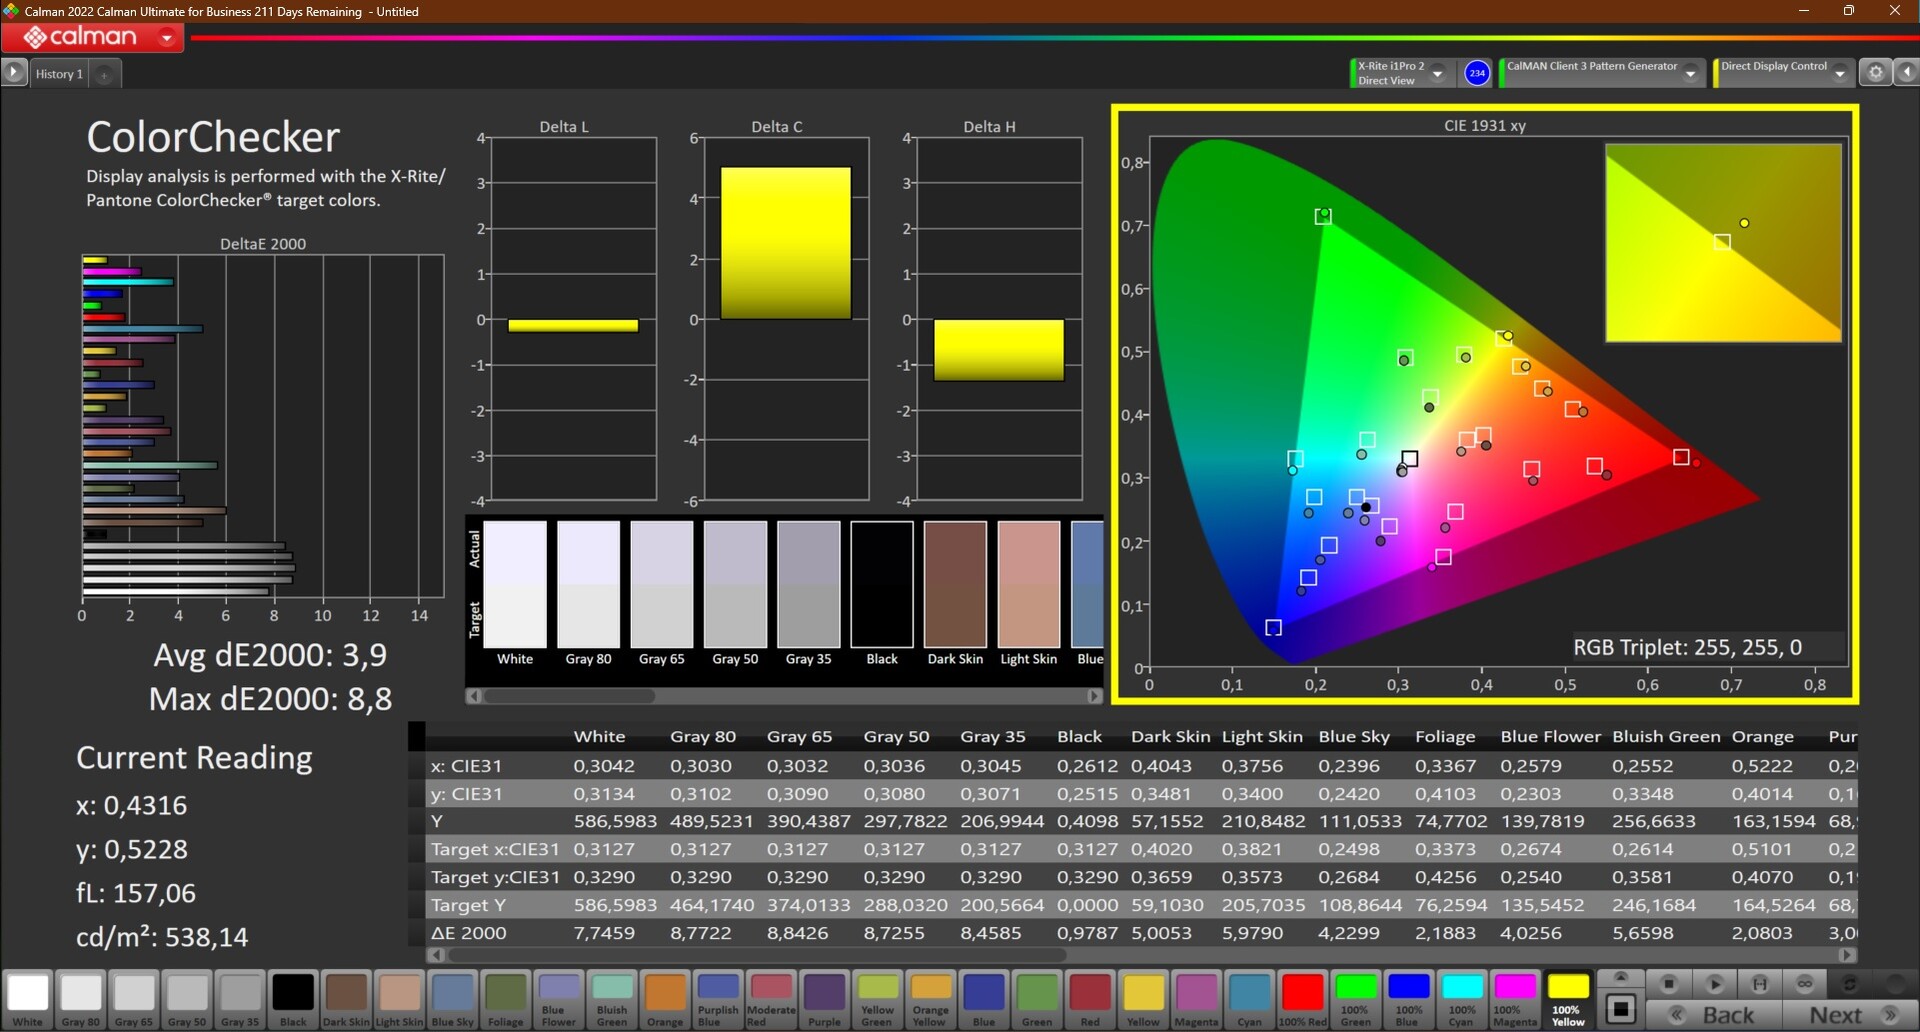
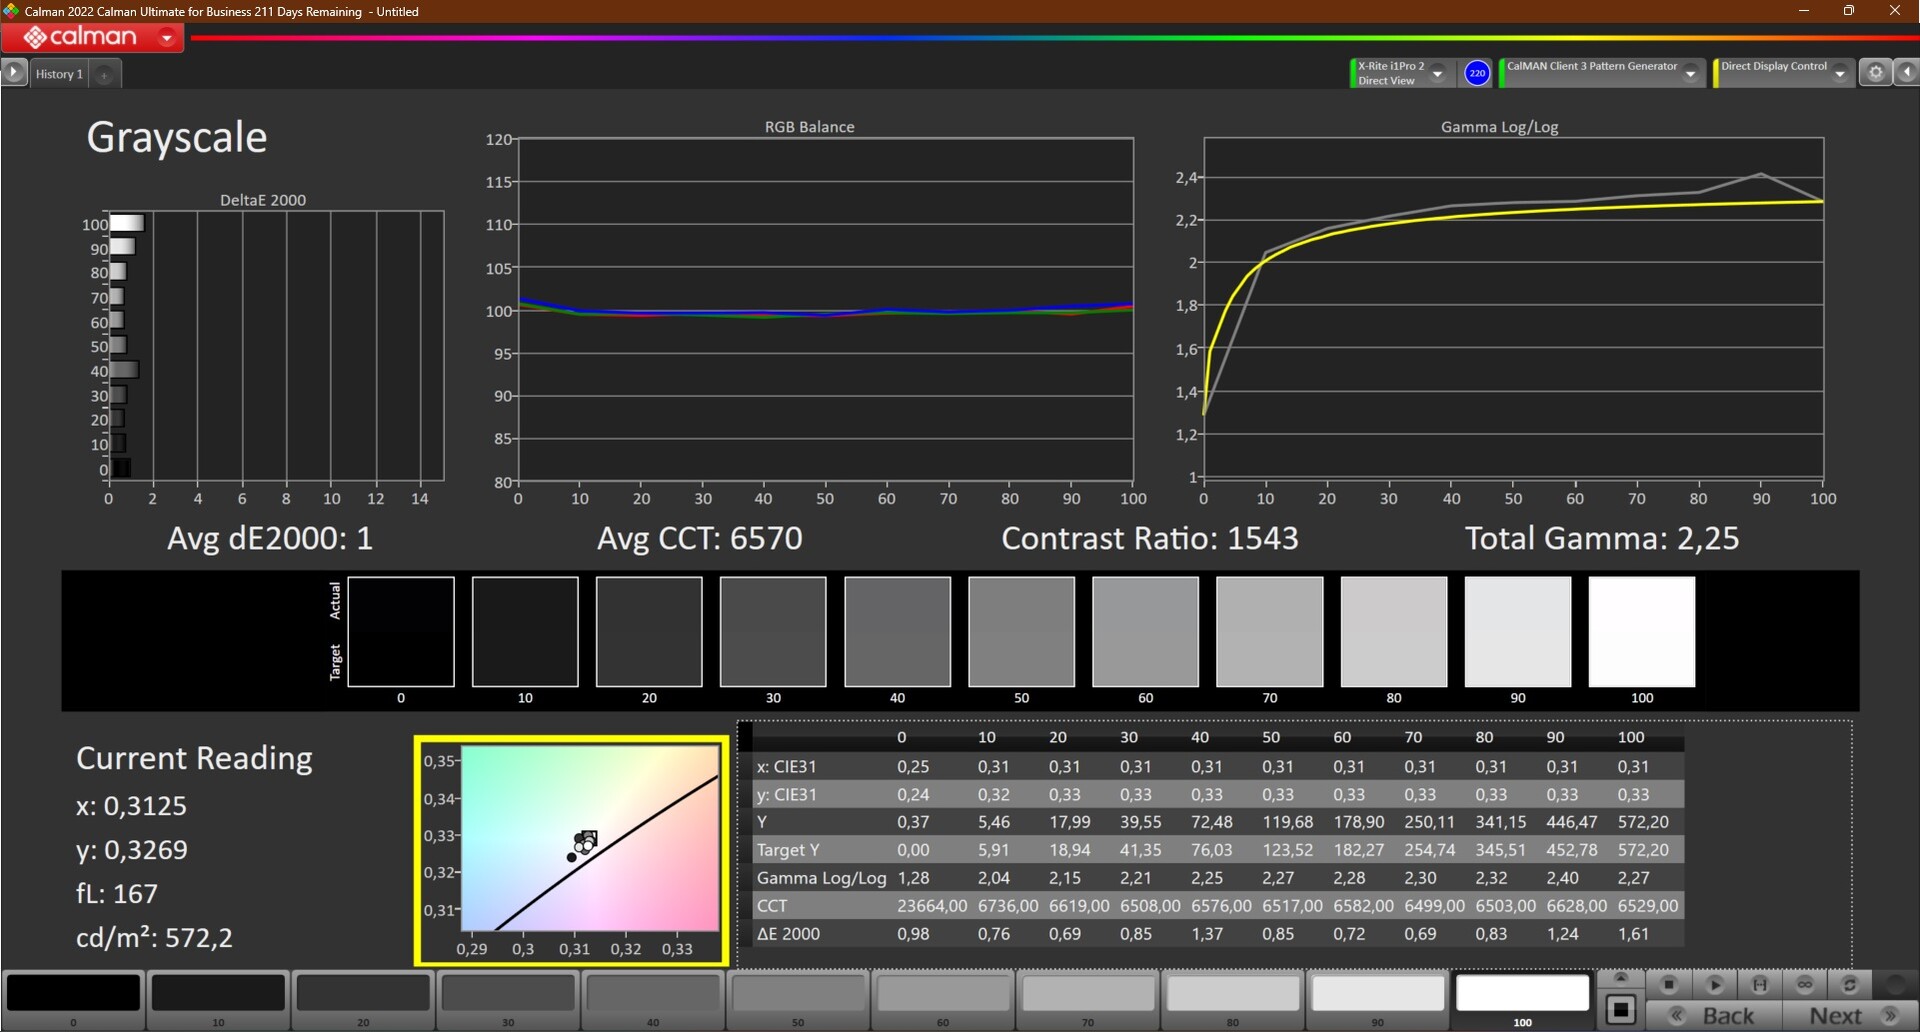

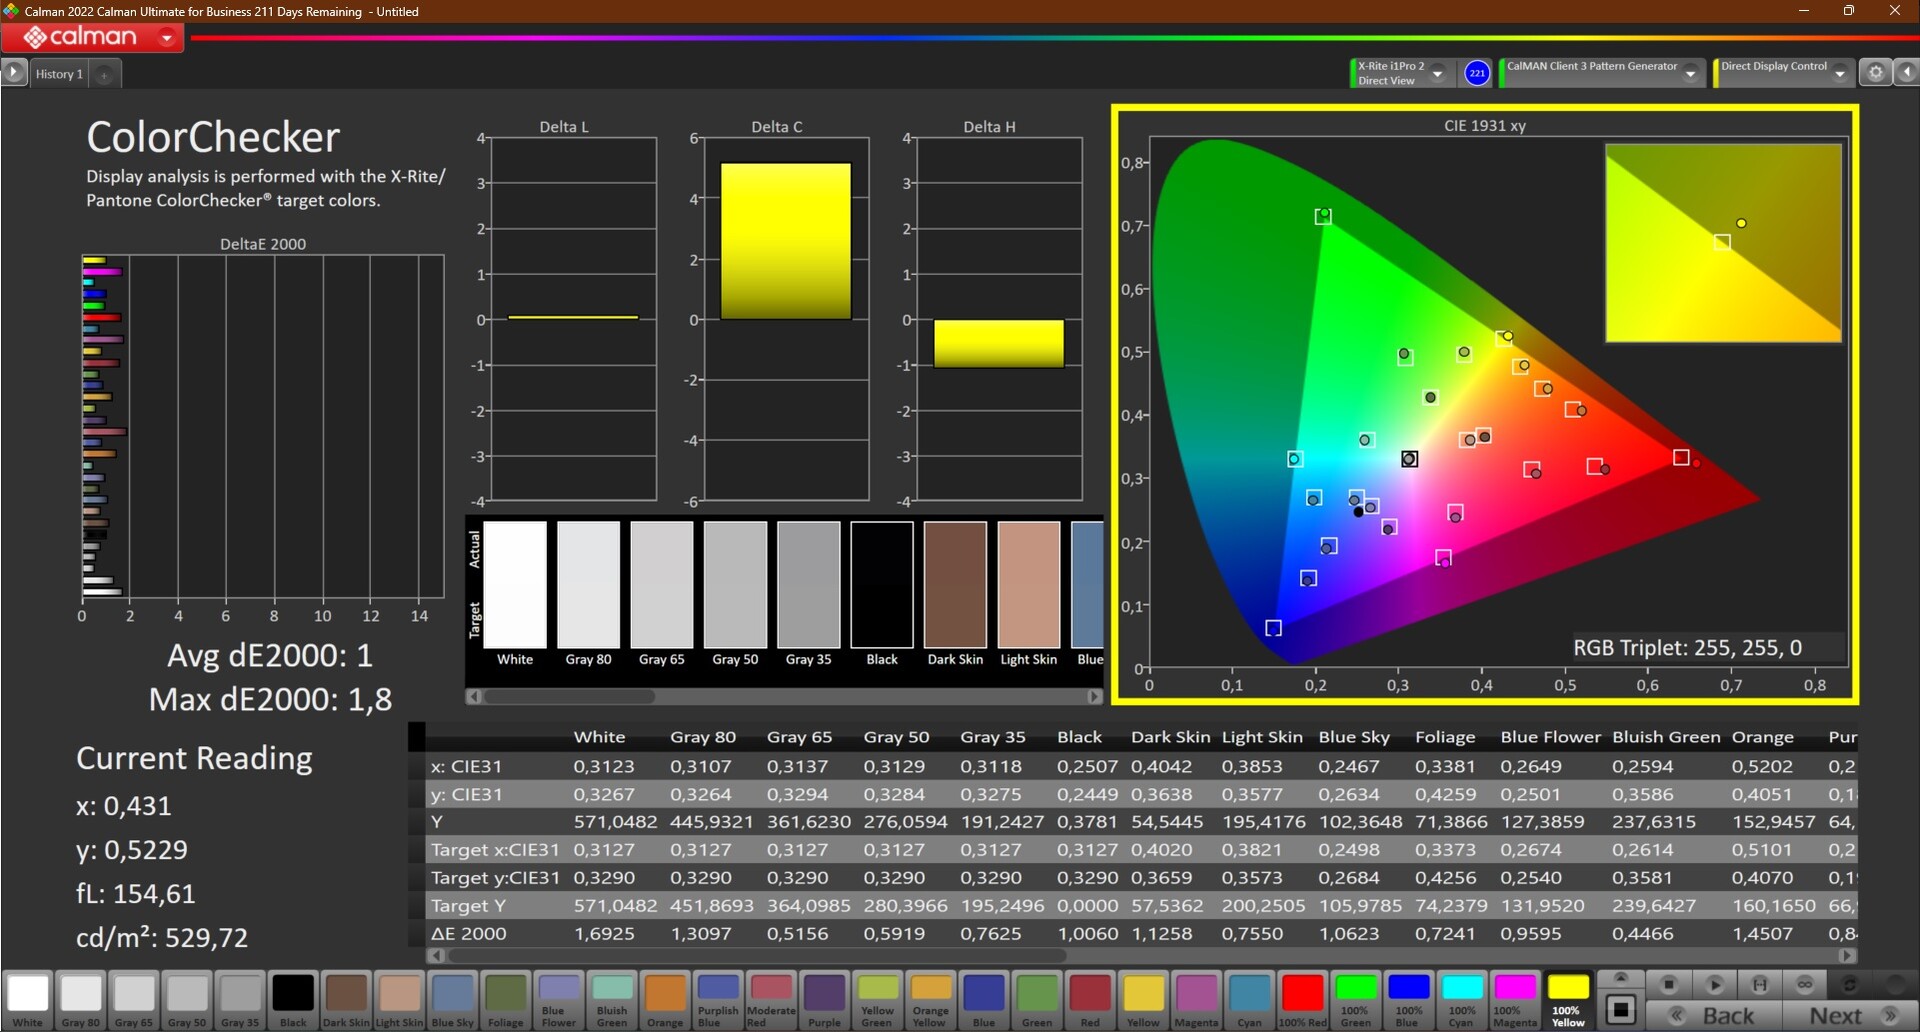
Out of the box, the deviations in the grayscale measured with CalMAN are particularly strong, which is made clear by the high deltaE value in the grayscale. After calibration with the X-Rite i1Pro 2 spectrophotometer and the X-Rite i1Profiler, the overall deltaE value was an average value of 1, which is a very good result.
Although Lenovo doesn't quite deliver the promised brightness, the specification for the color space coverage is correct: We measure 99.99% coverage for the wide AdobeRGB color space. This makes this panel a very good choice for image editing.


With a matte display surface and brightness values above the 500 cd/m² mark, it's not a surprise that the Lenovo ThinkPads P15v Gen 3 AMD is well-suited for outdoor use.
Display Response Times
| ↔ Response Time Black to White | ||
|---|---|---|
| 27.3 ms ... rise ↗ and fall ↘ combined | ↗ 14.3 ms rise | 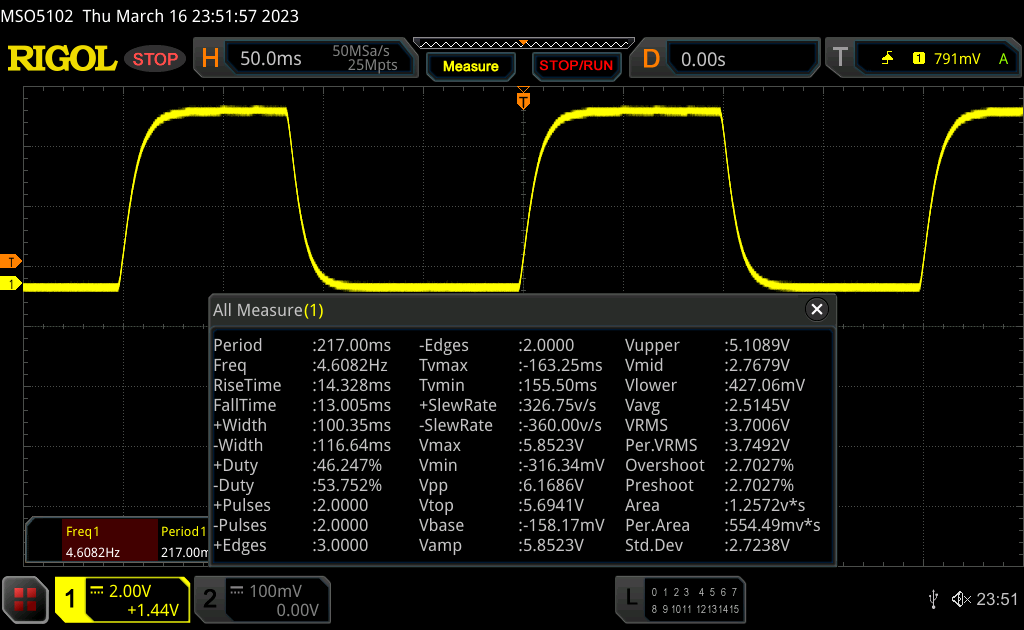 |
| ↘ 13 ms fall | ||
| The screen shows relatively slow response rates in our tests and may be too slow for gamers. In comparison, all tested devices range from 0.1 (minimum) to 240 (maximum) ms. » 70 % of all devices are better. This means that the measured response time is worse than the average of all tested devices (19.8 ms). | ||
| ↔ Response Time 50% Grey to 80% Grey | ||
| 46.7 ms ... rise ↗ and fall ↘ combined | ↗ 21.5 ms rise | 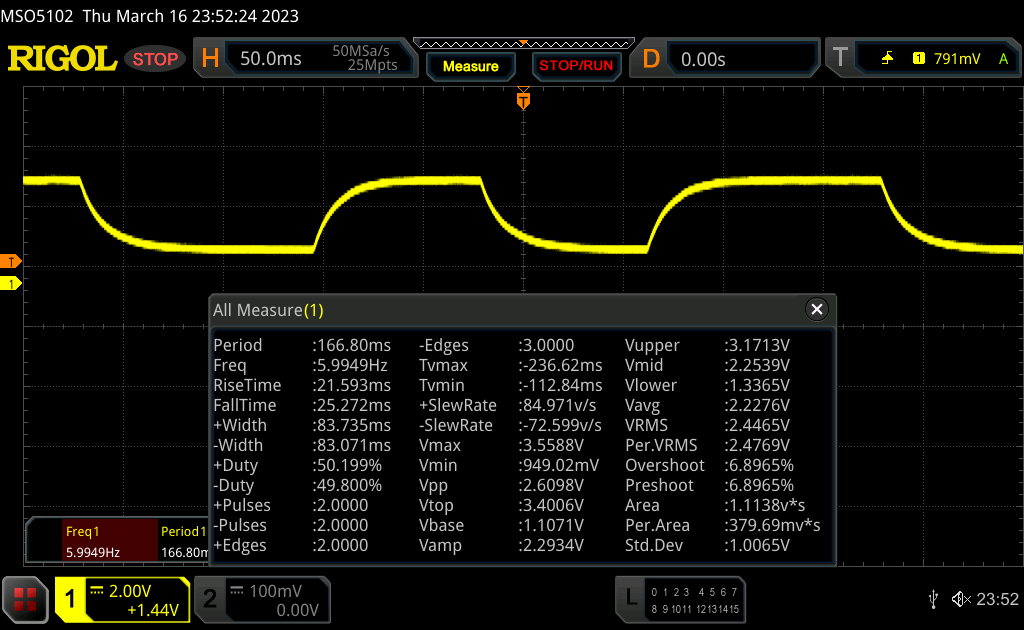 |
| ↘ 25.2 ms fall | ||
| The screen shows slow response rates in our tests and will be unsatisfactory for gamers. In comparison, all tested devices range from 0.165 (minimum) to 636 (maximum) ms. » 81 % of all devices are better. This means that the measured response time is worse than the average of all tested devices (30.9 ms). | ||
Screen Flickering / PWM (Pulse-Width Modulation)
| Screen flickering / PWM not detected | 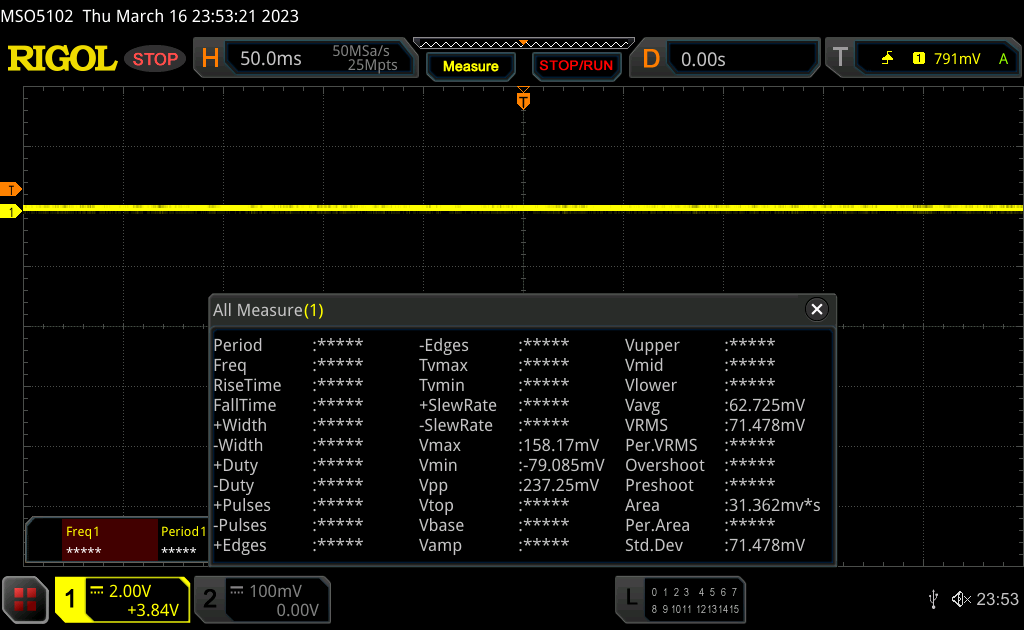 | ||
In comparison: 52 % of all tested devices do not use PWM to dim the display. If PWM was detected, an average of 7744 (minimum: 5 - maximum: 343500) Hz was measured. | |||

Performance: Very good CPU performance meets a limited GPU
Lenovo offers a total of two processors in the ThinkPad P15v Gen 3 AMD: you have a choice between the Ryzen 7 Pro 6850H or the Ryzen 5 Pro 6650H. There is one more option for the graphics chips, with all three coming from Nvidia: The T600, the RTX A1000 and the RTX A2000. There's no variant without a dedicated GPU.
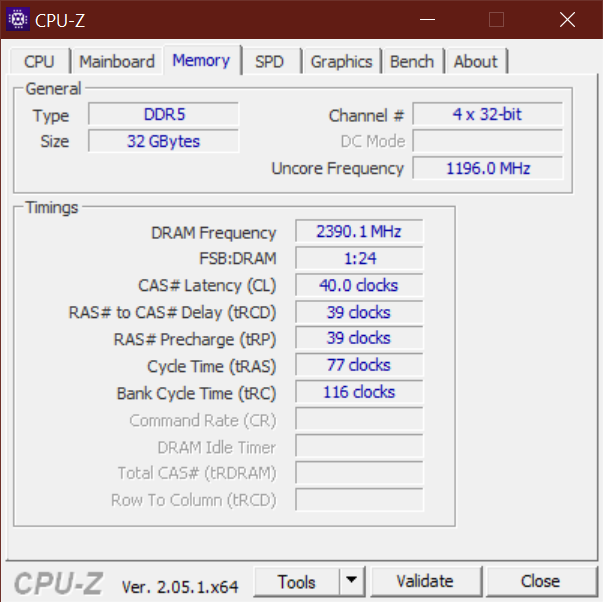
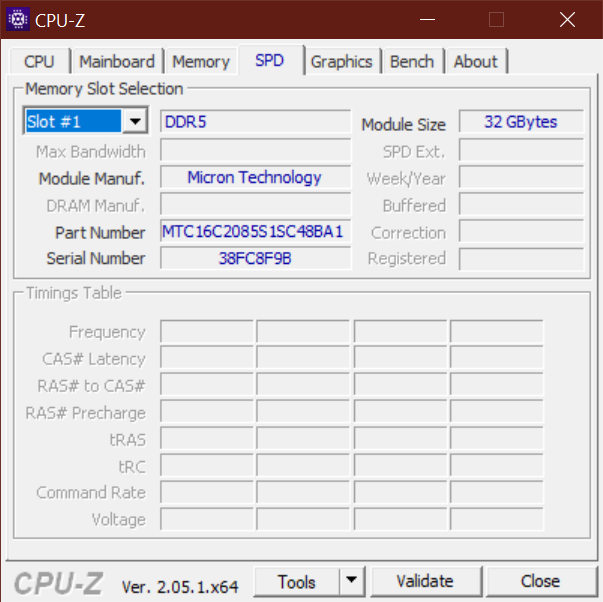
The maximum RAM expansion is 64 GB DDR5-4800, with two SO-DIMM slots available. There are also two M.2 2280 slots, with Lenovo offering up to 4 TB of storage space (two 2 TB).
Test conditions
There are a total of two performance modes that can be selected through the Windows settings. With "More battery efficiency" mode on, the processor is limited to 15 watts. If "better performance" or "best performance" is selected, the CPU can consume 65 watts briefly, with a longer-term power limit of 54 watts.
The ThinkPad P15v G3 was delivered with Windows 10 Pro 64-bit. As with the larger ThinkPad P16, we had the problem that Cinebench R15 ran as a background task and the full performance was therefore not being used. We therefore switched to the newer Cinebench R23 for our endurance test.
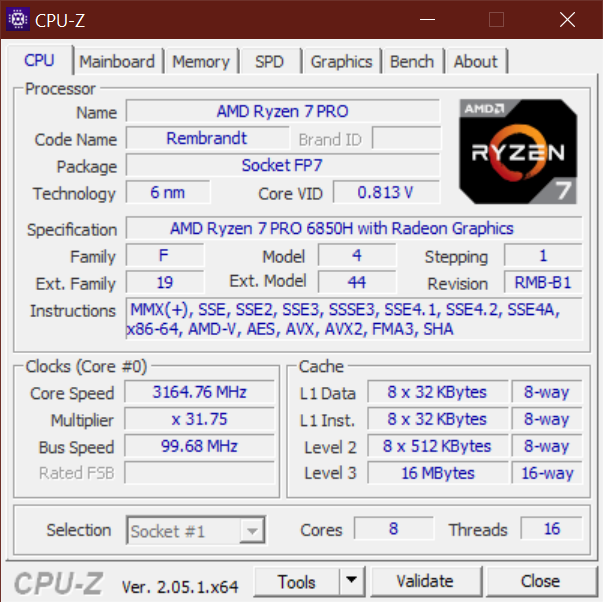
Processor
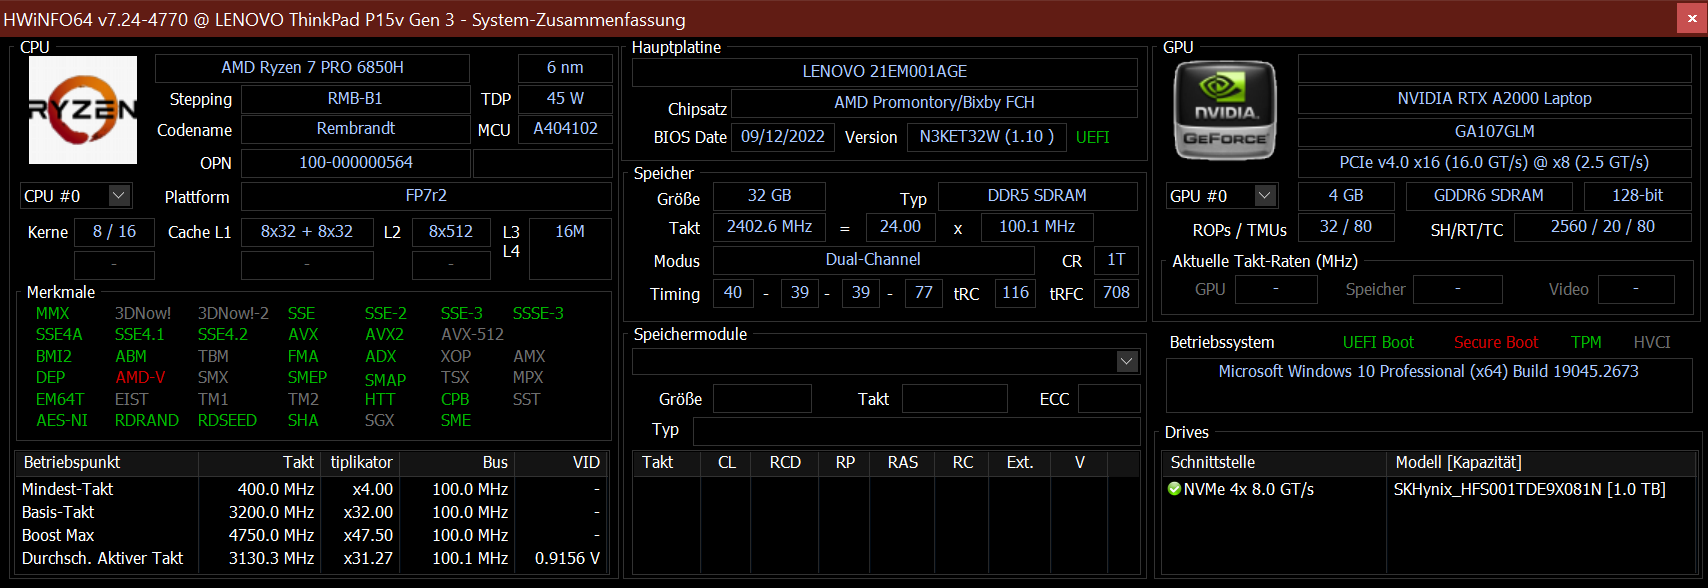
The AMD Ryzen 7 Pro 6850H is an eight-core processor of the "Rembrandt" generation. The maximum clock rate is 4.7 GHz, the base clock is 3.2 GHz. As an H processor, the typical TDP is 45 watts. Our CPU list can be used for further benchmark comparisons with other CPUs.
The ThinkPad P15v G3 AMD performs fairly well in the CPU benchmarks, considering that the larger Lenovo ThinkPad P16 and Dell Precision 7670 use nominally more powerful Intel HX55 CPUs, and it's even tied with the Dell laptop in continuous load. However, the overall result is dragged down by the single-core performance; the Intel competitors are clearly ahead here. Only the ThinkPad P16 is clearly faster in all CPU tests.
The processor performance is reduced in battery mode. Instead of 4946 points, the ThinkPad P15v G3 achieves 2990 points in the Cinebench R23 multi-core test. This corresponds to a power reduction of 40 percent.
Cinebench R23 Multi endurance test
Cinebench R23: Multi Core | Single Core
Cinebench R20: CPU (Multi Core) | CPU (Single Core)
Cinebench R15: CPU Multi 64Bit | CPU Single 64Bit
Blender: v2.79 BMW27 CPU
7-Zip 18.03: 7z b 4 | 7z b 4 -mmt1
Geekbench 5.5: Multi-Core | Single-Core
HWBOT x265 Benchmark v2.2: 4k Preset
LibreOffice : 20 Documents To PDF
R Benchmark 2.5: Overall mean
| CPU Performance rating | |
| Average of class Workstation | |
| Lenovo ThinkPad P16 G1 21D6001DMB | |
| Dell Precision 7670 | |
| HP ZBook Power 15 G9 6B8C4EA | |
| Average AMD Ryzen 7 PRO 6850H | |
| Lenovo ThinkPad P15v G3 21EM001AGE | |
| Lenovo ThinkPad P15v G2 21A9000XGE -1! | |
| Cinebench R23 / Multi Core | |
| Average of class Workstation (14621 - 38520, n=23, last 2 years) | |
| Lenovo ThinkPad P16 G1 21D6001DMB | |
| Dell Precision 7670 | |
| HP ZBook Power 15 G9 6B8C4EA | |
| Lenovo ThinkPad P15v G3 21EM001AGE | |
| Average AMD Ryzen 7 PRO 6850H (12016 - 12770, n=2) | |
| Lenovo ThinkPad P15v G2 21A9000XGE | |
| Cinebench R23 / Single Core | |
| Average of class Workstation (1712 - 2228, n=23, last 2 years) | |
| Lenovo ThinkPad P16 G1 21D6001DMB | |
| HP ZBook Power 15 G9 6B8C4EA | |
| Dell Precision 7670 | |
| Average AMD Ryzen 7 PRO 6850H (1469 - 1491, n=2) | |
| Lenovo ThinkPad P15v G3 21EM001AGE | |
| Cinebench R20 / CPU (Multi Core) | |
| Average of class Workstation (5760 - 15043, n=23, last 2 years) | |
| Lenovo ThinkPad P16 G1 21D6001DMB | |
| Dell Precision 7670 | |
| HP ZBook Power 15 G9 6B8C4EA | |
| Lenovo ThinkPad P15v G3 21EM001AGE | |
| Lenovo ThinkPad P15v G3 21EM001AGE | |
| Average AMD Ryzen 7 PRO 6850H (2990 - 4946, n=3) | |
| Lenovo ThinkPad P15v G2 21A9000XGE | |
| Cinebench R20 / CPU (Single Core) | |
| Average of class Workstation (671 - 857, n=23, last 2 years) | |
| Lenovo ThinkPad P16 G1 21D6001DMB | |
| Dell Precision 7670 | |
| HP ZBook Power 15 G9 6B8C4EA | |
| Lenovo ThinkPad P15v G3 21EM001AGE | |
| Lenovo ThinkPad P15v G3 21EM001AGE | |
| Average AMD Ryzen 7 PRO 6850H (564 - 583, n=3) | |
| Lenovo ThinkPad P15v G2 21A9000XGE | |
| Cinebench R15 / CPU Multi 64Bit | |
| Average of class Workstation (2489 - 5810, n=23, last 2 years) | |
| Lenovo ThinkPad P16 G1 21D6001DMB | |
| Dell Precision 7670 | |
| Lenovo ThinkPad P15v G3 21EM001AGE | |
| Average AMD Ryzen 7 PRO 6850H (2081 - 2090, n=2) | |
| HP ZBook Power 15 G9 6B8C4EA | |
| Lenovo ThinkPad P15v G2 21A9000XGE | |
| Cinebench R15 / CPU Single 64Bit | |
| Average of class Workstation (191.4 - 328, n=23, last 2 years) | |
| Lenovo ThinkPad P16 G1 21D6001DMB | |
| Dell Precision 7670 | |
| HP ZBook Power 15 G9 6B8C4EA | |
| Lenovo ThinkPad P15v G2 21A9000XGE | |
| Average AMD Ryzen 7 PRO 6850H (166.2 - 244, n=2) | |
| Lenovo ThinkPad P15v G3 21EM001AGE | |
| Blender / v2.79 BMW27 CPU | |
| Lenovo ThinkPad P15v G2 21A9000XGE | |
| Lenovo ThinkPad P15v G3 21EM001AGE | |
| Average AMD Ryzen 7 PRO 6850H (235 - 248, n=2) | |
| HP ZBook Power 15 G9 6B8C4EA | |
| Dell Precision 7670 | |
| Lenovo ThinkPad P16 G1 21D6001DMB | |
| Average of class Workstation (91 - 222, n=23, last 2 years) | |
| 7-Zip 18.03 / 7z b 4 | |
| Average of class Workstation (60489 - 116969, n=23, last 2 years) | |
| Lenovo ThinkPad P16 G1 21D6001DMB | |
| HP ZBook Power 15 G9 6B8C4EA | |
| Average AMD Ryzen 7 PRO 6850H (52391 - 56498, n=2) | |
| Dell Precision 7670 | |
| Lenovo ThinkPad P15v G3 21EM001AGE | |
| Lenovo ThinkPad P15v G2 21A9000XGE | |
| 7-Zip 18.03 / 7z b 4 -mmt1 | |
| Average of class Workstation (5126 - 6960, n=23, last 2 years) | |
| Lenovo ThinkPad P16 G1 21D6001DMB | |
| HP ZBook Power 15 G9 6B8C4EA | |
| Dell Precision 7670 | |
| Lenovo ThinkPad P15v G3 21EM001AGE | |
| Average AMD Ryzen 7 PRO 6850H (5374 - 5460, n=2) | |
| Lenovo ThinkPad P15v G2 21A9000XGE | |
| Geekbench 5.5 / Multi-Core | |
| Average of class Workstation (11542 - 25554, n=23, last 2 years) | |
| Lenovo ThinkPad P16 G1 21D6001DMB | |
| HP ZBook Power 15 G9 6B8C4EA | |
| Dell Precision 7670 | |
| Average AMD Ryzen 7 PRO 6850H (8093 - 8851, n=2) | |
| Lenovo ThinkPad P15v G3 21EM001AGE | |
| Lenovo ThinkPad P15v G2 21A9000XGE | |
| Geekbench 5.5 / Single-Core | |
| Average of class Workstation (1783 - 2183, n=23, last 2 years) | |
| Lenovo ThinkPad P16 G1 21D6001DMB | |
| Dell Precision 7670 | |
| HP ZBook Power 15 G9 6B8C4EA | |
| Average AMD Ryzen 7 PRO 6850H (1474 - 1481, n=2) | |
| Lenovo ThinkPad P15v G2 21A9000XGE | |
| Lenovo ThinkPad P15v G3 21EM001AGE | |
| HWBOT x265 Benchmark v2.2 / 4k Preset | |
| Average of class Workstation (17.8 - 40.5, n=23, last 2 years) | |
| Dell Precision 7670 | |
| Lenovo ThinkPad P16 G1 21D6001DMB | |
| HP ZBook Power 15 G9 6B8C4EA | |
| Average AMD Ryzen 7 PRO 6850H (12.7 - 15.9, n=2) | |
| Lenovo ThinkPad P15v G3 21EM001AGE | |
| Lenovo ThinkPad P15v G2 21A9000XGE | |
| LibreOffice / 20 Documents To PDF | |
| Lenovo ThinkPad P15v G3 21EM001AGE | |
| Average AMD Ryzen 7 PRO 6850H (50.7 - 95.2, n=2) | |
| Lenovo ThinkPad P15v G2 21A9000XGE | |
| Dell Precision 7670 | |
| Average of class Workstation (37.1 - 74.7, n=23, last 2 years) | |
| Lenovo ThinkPad P16 G1 21D6001DMB | |
| HP ZBook Power 15 G9 6B8C4EA | |
| R Benchmark 2.5 / Overall mean | |
| Lenovo ThinkPad P15v G2 21A9000XGE | |
| Lenovo ThinkPad P15v G3 21EM001AGE | |
| Average AMD Ryzen 7 PRO 6850H (0.516 - 0.524, n=2) | |
| HP ZBook Power 15 G9 6B8C4EA | |
| Dell Precision 7670 | |
| Lenovo ThinkPad P16 G1 21D6001DMB | |
| Average of class Workstation (0.3825 - 0.603, n=23, last 2 years) | |
* ... smaller is better
AIDA64: FP32 Ray-Trace | FPU Julia | CPU SHA3 | CPU Queen | FPU SinJulia | FPU Mandel | CPU AES | CPU ZLib | FP64 Ray-Trace | CPU PhotoWorxx
| Performance rating | |
| Average of class Workstation | |
| Lenovo ThinkPad P16 G1 21D6001DMB | |
| Lenovo ThinkPad P15v G3 21EM001AGE | |
| Average AMD Ryzen 7 PRO 6850H | |
| HP ZBook Power 15 G9 6B8C4EA | |
| Dell Precision 7670 | |
| Lenovo ThinkPad P15v G2 21A9000XGE | |
| AIDA64 / FP32 Ray-Trace | |
| Average of class Workstation (16730 - 61611, n=23, last 2 years) | |
| Lenovo ThinkPad P16 G1 21D6001DMB | |
| Average AMD Ryzen 7 PRO 6850H (15009 - 15301, n=2) | |
| Lenovo ThinkPad P15v G3 21EM001AGE | |
| HP ZBook Power 15 G9 6B8C4EA | |
| Dell Precision 7670 | |
| Lenovo ThinkPad P15v G2 21A9000XGE | |
| AIDA64 / FPU Julia | |
| Average of class Workstation (89597 - 186971, n=23, last 2 years) | |
| Average AMD Ryzen 7 PRO 6850H (93021 - 94997, n=2) | |
| Lenovo ThinkPad P15v G3 21EM001AGE | |
| Lenovo ThinkPad P16 G1 21D6001DMB | |
| Dell Precision 7670 | |
| HP ZBook Power 15 G9 6B8C4EA | |
| Lenovo ThinkPad P15v G2 21A9000XGE | |
| AIDA64 / CPU SHA3 | |
| Average of class Workstation (4178 - 8975, n=23, last 2 years) | |
| Lenovo ThinkPad P16 G1 21D6001DMB | |
| Lenovo ThinkPad P15v G2 21A9000XGE | |
| HP ZBook Power 15 G9 6B8C4EA | |
| Average AMD Ryzen 7 PRO 6850H (3155 - 3169, n=2) | |
| Lenovo ThinkPad P15v G3 21EM001AGE | |
| Dell Precision 7670 | |
| AIDA64 / CPU Queen | |
| Average of class Workstation (60778 - 144411, n=23, last 2 years) | |
| Average AMD Ryzen 7 PRO 6850H (100724 - 102905, n=2) | |
| Lenovo ThinkPad P15v G3 21EM001AGE | |
| HP ZBook Power 15 G9 6B8C4EA | |
| Lenovo ThinkPad P16 G1 21D6001DMB | |
| Lenovo ThinkPad P15v G2 21A9000XGE | |
| Dell Precision 7670 | |
| AIDA64 / FPU SinJulia | |
| Average of class Workstation (8165 - 29343, n=23, last 2 years) | |
| Average AMD Ryzen 7 PRO 6850H (12309 - 12638, n=2) | |
| Lenovo ThinkPad P15v G3 21EM001AGE | |
| Lenovo ThinkPad P16 G1 21D6001DMB | |
| Dell Precision 7670 | |
| Lenovo ThinkPad P15v G2 21A9000XGE | |
| HP ZBook Power 15 G9 6B8C4EA | |
| AIDA64 / FPU Mandel | |
| Average of class Workstation (44497 - 98153, n=23, last 2 years) | |
| Average AMD Ryzen 7 PRO 6850H (51299 - 51802, n=2) | |
| Lenovo ThinkPad P15v G3 21EM001AGE | |
| Lenovo ThinkPad P16 G1 21D6001DMB | |
| Dell Precision 7670 | |
| HP ZBook Power 15 G9 6B8C4EA | |
| Lenovo ThinkPad P15v G2 21A9000XGE | |
| AIDA64 / CPU AES | |
| Lenovo ThinkPad P15v G3 21EM001AGE | |
| Average of class Workstation (73133 - 187841, n=23, last 2 years) | |
| Average AMD Ryzen 7 PRO 6850H (60476 - 128243, n=2) | |
| Lenovo ThinkPad P16 G1 21D6001DMB | |
| Lenovo ThinkPad P15v G2 21A9000XGE | |
| Dell Precision 7670 | |
| HP ZBook Power 15 G9 6B8C4EA | |
| AIDA64 / CPU ZLib | |
| Average of class Workstation (929 - 2148, n=23, last 2 years) | |
| Lenovo ThinkPad P16 G1 21D6001DMB | |
| HP ZBook Power 15 G9 6B8C4EA | |
| Dell Precision 7670 | |
| Lenovo ThinkPad P15v G3 21EM001AGE | |
| Average AMD Ryzen 7 PRO 6850H (806 - 809, n=2) | |
| Lenovo ThinkPad P15v G2 21A9000XGE | |
| AIDA64 / FP64 Ray-Trace | |
| Average of class Workstation (8545 - 32891, n=23, last 2 years) | |
| Lenovo ThinkPad P16 G1 21D6001DMB | |
| Average AMD Ryzen 7 PRO 6850H (7876 - 8104, n=2) | |
| Lenovo ThinkPad P15v G3 21EM001AGE | |
| Dell Precision 7670 | |
| HP ZBook Power 15 G9 6B8C4EA | |
| Lenovo ThinkPad P15v G2 21A9000XGE | |
| AIDA64 / CPU PhotoWorxx | |
| Average of class Workstation (37151 - 93684, n=23, last 2 years) | |
| HP ZBook Power 15 G9 6B8C4EA | |
| Dell Precision 7670 | |
| Lenovo ThinkPad P16 G1 21D6001DMB | |
| Average AMD Ryzen 7 PRO 6850H (18157 - 26176, n=2) | |
| Lenovo ThinkPad P15v G3 21EM001AGE | |
| Lenovo ThinkPad P15v G2 21A9000XGE | |
System Performance
The system performance benchmarks paint a mixed picture. The ThinkPad P15v Gen 3 AMD achieves a very good result in PCMark 10, but it's slower than the competition in CrossMark. The memory in particular is slower than the Intel models. In everyday use, however, the P15v runs very quickly.
CrossMark: Overall | Productivity | Creativity | Responsiveness
| PCMark 10 / Score | |
| Average of class Workstation (6563 - 10409, n=19, last 2 years) | |
| Dell Precision 7670 | |
| Lenovo ThinkPad P15v G3 21EM001AGE | |
| Average AMD Ryzen 7 PRO 6850H, NVIDIA RTX A2000 Laptop GPU (n=1) | |
| HP ZBook Power 15 G9 6B8C4EA | |
| Lenovo ThinkPad P16 G1 21D6001DMB | |
| Lenovo ThinkPad P15v G2 21A9000XGE | |
| PCMark 10 / Essentials | |
| Dell Precision 7670 | |
| Average of class Workstation (9622 - 11157, n=19, last 2 years) | |
| Lenovo ThinkPad P16 G1 21D6001DMB | |
| Lenovo ThinkPad P15v G3 21EM001AGE | |
| Average AMD Ryzen 7 PRO 6850H, NVIDIA RTX A2000 Laptop GPU (n=1) | |
| HP ZBook Power 15 G9 6B8C4EA | |
| Lenovo ThinkPad P15v G2 21A9000XGE | |
| PCMark 10 / Productivity | |
| Average of class Workstation (8789 - 20616, n=19, last 2 years) | |
| Lenovo ThinkPad P16 G1 21D6001DMB | |
| Dell Precision 7670 | |
| Lenovo ThinkPad P15v G3 21EM001AGE | |
| Average AMD Ryzen 7 PRO 6850H, NVIDIA RTX A2000 Laptop GPU (n=1) | |
| Lenovo ThinkPad P15v G2 21A9000XGE | |
| HP ZBook Power 15 G9 6B8C4EA | |
| PCMark 10 / Digital Content Creation | |
| Average of class Workstation (8108 - 15631, n=19, last 2 years) | |
| Lenovo ThinkPad P15v G3 21EM001AGE | |
| Average AMD Ryzen 7 PRO 6850H, NVIDIA RTX A2000 Laptop GPU (n=1) | |
| HP ZBook Power 15 G9 6B8C4EA | |
| Dell Precision 7670 | |
| Lenovo ThinkPad P16 G1 21D6001DMB | |
| Lenovo ThinkPad P15v G2 21A9000XGE | |
| CrossMark / Overall | |
| Average of class Workstation (1307 - 2267, n=22, last 2 years) | |
| Lenovo ThinkPad P16 G1 21D6001DMB | |
| HP ZBook Power 15 G9 6B8C4EA | |
| Dell Precision 7670 | |
| Lenovo ThinkPad P15v G2 21A9000XGE | |
| Lenovo ThinkPad P15v G3 21EM001AGE | |
| Average AMD Ryzen 7 PRO 6850H, NVIDIA RTX A2000 Laptop GPU (n=1) | |
| CrossMark / Productivity | |
| Average of class Workstation (1130 - 2122, n=22, last 2 years) | |
| Lenovo ThinkPad P16 G1 21D6001DMB | |
| HP ZBook Power 15 G9 6B8C4EA | |
| Dell Precision 7670 | |
| Lenovo ThinkPad P15v G3 21EM001AGE | |
| Average AMD Ryzen 7 PRO 6850H, NVIDIA RTX A2000 Laptop GPU (n=1) | |
| Lenovo ThinkPad P15v G2 21A9000XGE | |
| CrossMark / Creativity | |
| Average of class Workstation (1657 - 2725, n=22, last 2 years) | |
| Lenovo ThinkPad P16 G1 21D6001DMB | |
| HP ZBook Power 15 G9 6B8C4EA | |
| Dell Precision 7670 | |
| Lenovo ThinkPad P15v G2 21A9000XGE | |
| Lenovo ThinkPad P15v G3 21EM001AGE | |
| Average AMD Ryzen 7 PRO 6850H, NVIDIA RTX A2000 Laptop GPU (n=1) | |
| CrossMark / Responsiveness | |
| Average of class Workstation (993 - 2096, n=22, last 2 years) | |
| Lenovo ThinkPad P16 G1 21D6001DMB | |
| HP ZBook Power 15 G9 6B8C4EA | |
| Lenovo ThinkPad P15v G3 21EM001AGE | |
| Average AMD Ryzen 7 PRO 6850H, NVIDIA RTX A2000 Laptop GPU (n=1) | |
| Dell Precision 7670 | |
| Lenovo ThinkPad P15v G2 21A9000XGE | |
| PCMark 10 Score | 6457 points | |
Help | ||
| AIDA64 / Memory Copy | |
| Average of class Workstation (56003 - 164795, n=23, last 2 years) | |
| HP ZBook Power 15 G9 6B8C4EA | |
| Dell Precision 7670 | |
| Lenovo ThinkPad P16 G1 21D6001DMB | |
| Average AMD Ryzen 7 PRO 6850H (30324 - 48504, n=2) | |
| Lenovo ThinkPad P15v G3 21EM001AGE | |
| Lenovo ThinkPad P15v G2 21A9000XGE | |
| AIDA64 / Memory Read | |
| Average of class Workstation (55795 - 121563, n=23, last 2 years) | |
| Dell Precision 7670 | |
| HP ZBook Power 15 G9 6B8C4EA | |
| Lenovo ThinkPad P16 G1 21D6001DMB | |
| Average AMD Ryzen 7 PRO 6850H (33791 - 42736, n=2) | |
| Lenovo ThinkPad P15v G3 21EM001AGE | |
| Lenovo ThinkPad P15v G2 21A9000XGE | |
| AIDA64 / Memory Write | |
| Average of class Workstation (55663 - 214520, n=23, last 2 years) | |
| HP ZBook Power 15 G9 6B8C4EA | |
| Dell Precision 7670 | |
| Lenovo ThinkPad P16 G1 21D6001DMB | |
| Average AMD Ryzen 7 PRO 6850H (32728 - 51157, n=2) | |
| Lenovo ThinkPad P15v G3 21EM001AGE | |
| Lenovo ThinkPad P15v G2 21A9000XGE | |
| AIDA64 / Memory Latency | |
| Average of class Workstation (84.5 - 165.2, n=23, last 2 years) | |
| Average AMD Ryzen 7 PRO 6850H (93.5 - 132.1, n=2) | |
| Lenovo ThinkPad P16 G1 21D6001DMB | |
| Lenovo ThinkPad P15v G2 21A9000XGE | |
| Lenovo ThinkPad P15v G3 21EM001AGE | |
| HP ZBook Power 15 G9 6B8C4EA | |
| Dell Precision 7670 | |
* ... smaller is better
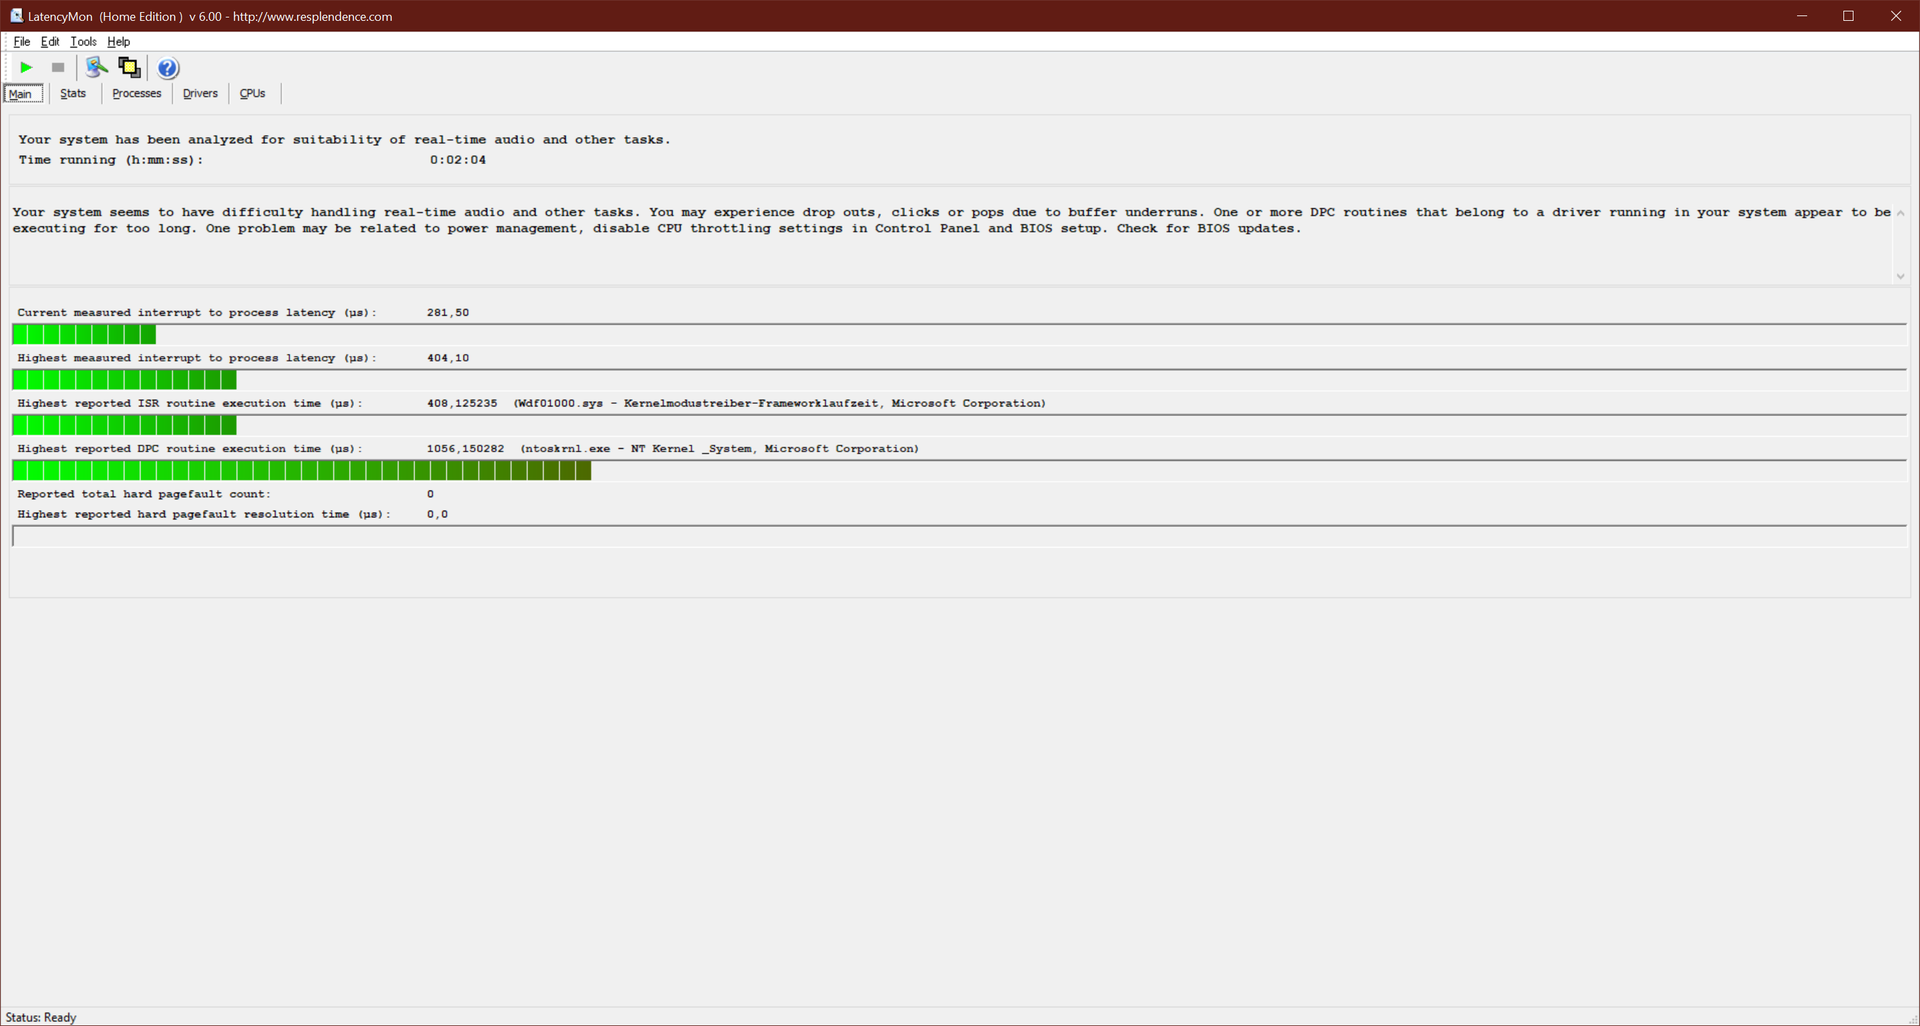
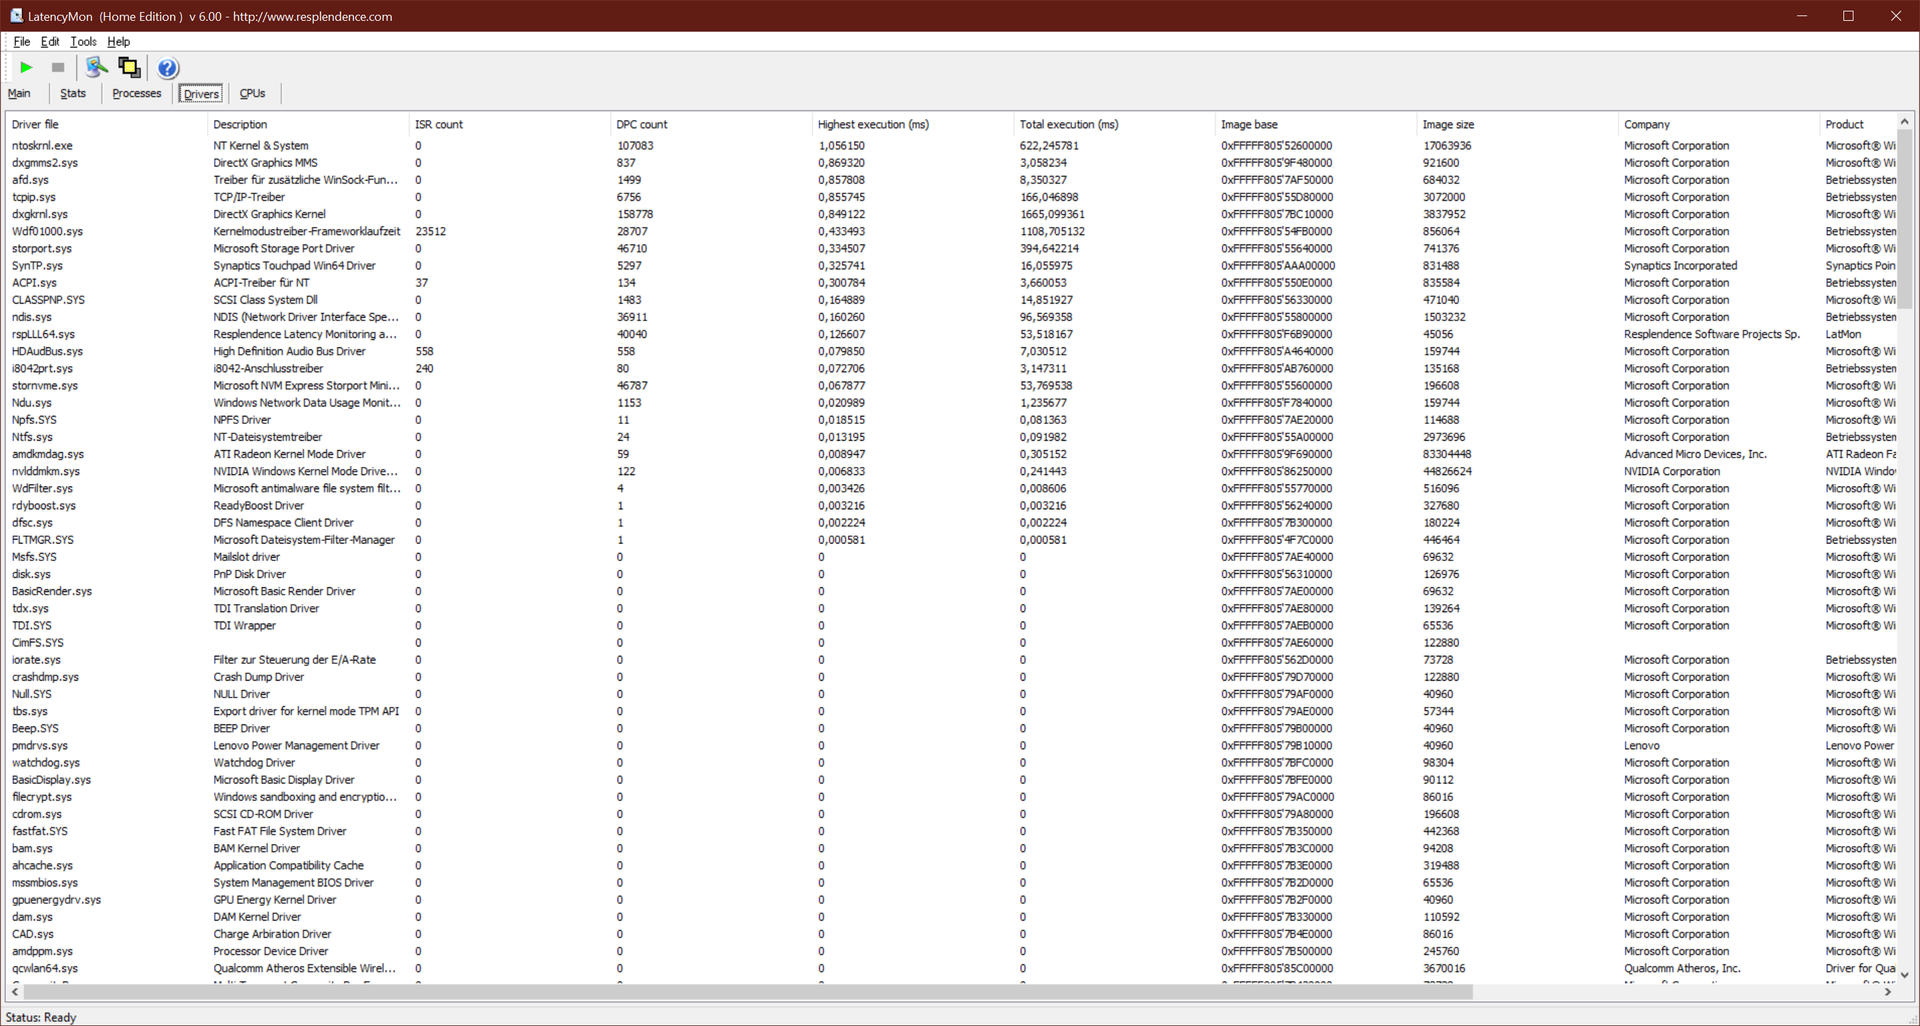
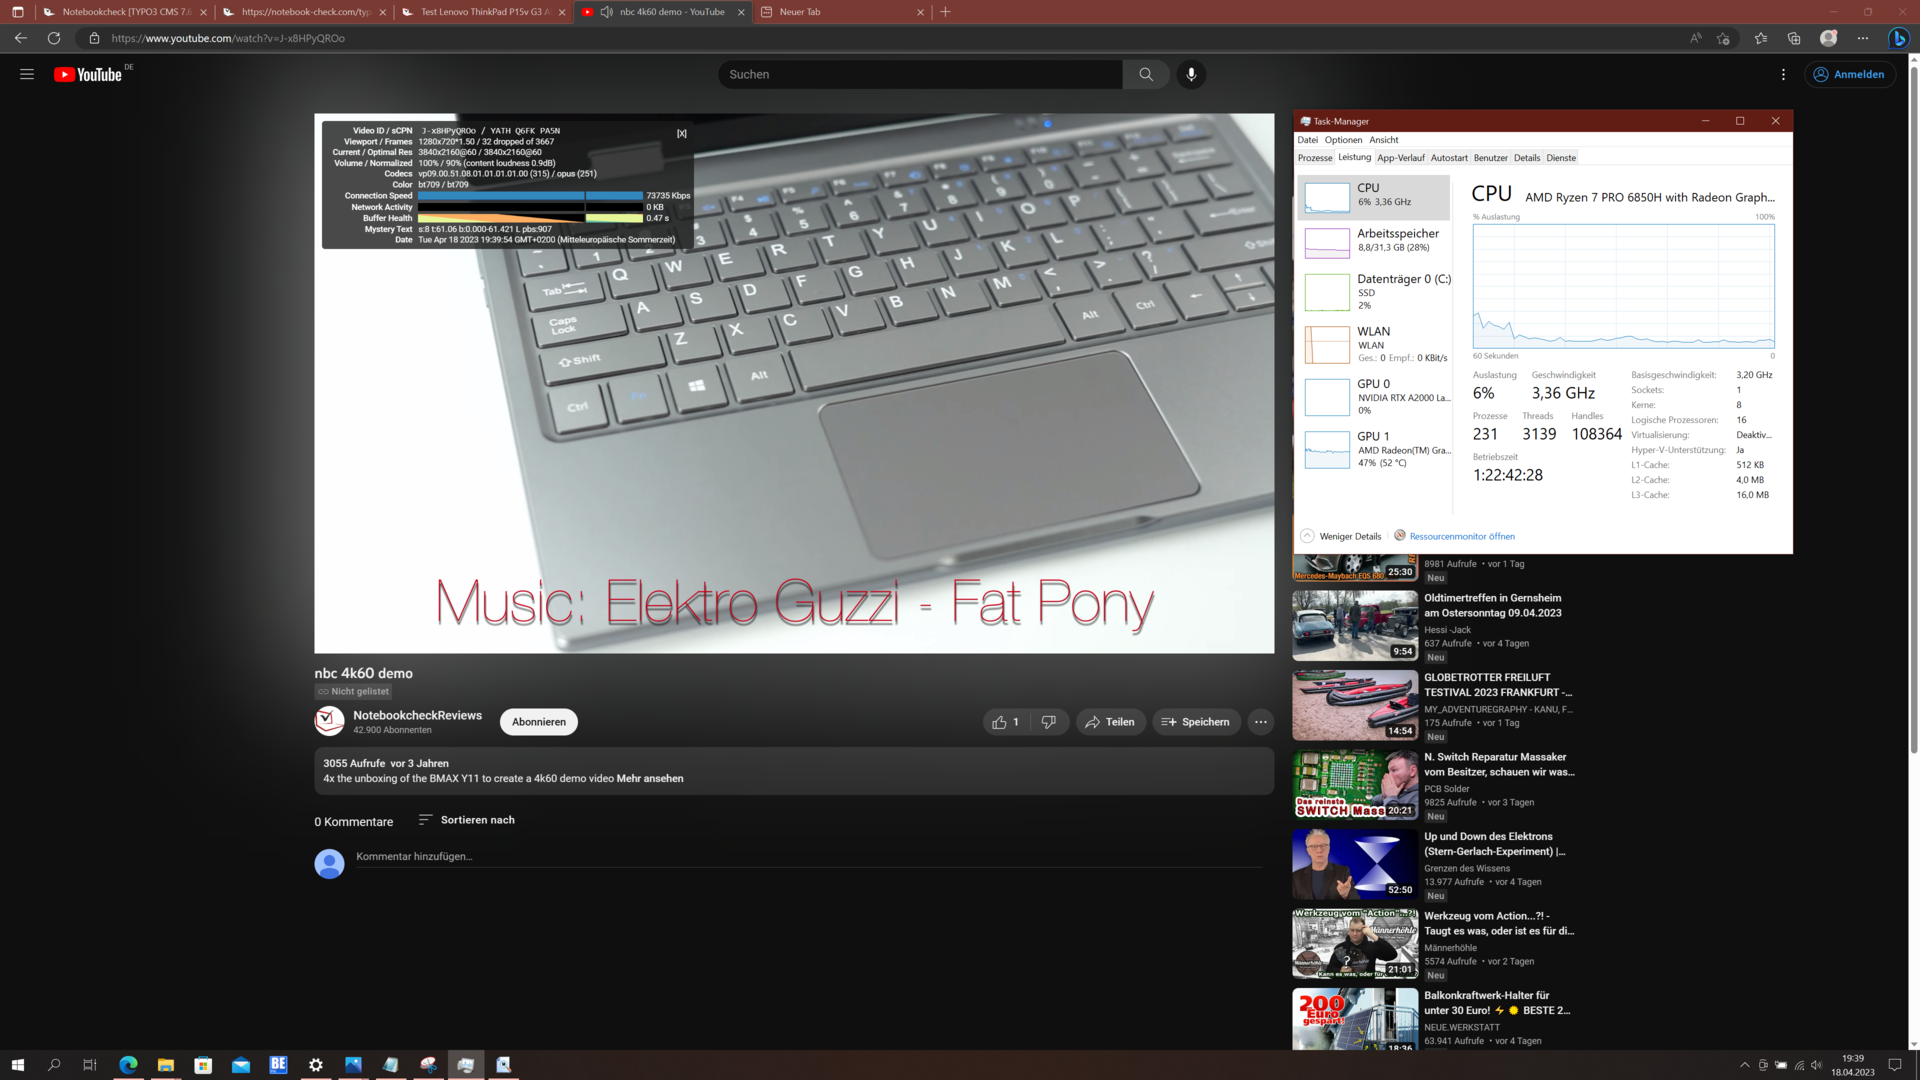
DPC latency
DPC latency is lower than the competition, but this Lenovo laptop still has problems with video playback. We observed a total of 32 dropped frames in the YouTube test. However, this behavior could change at any time with a driver update.
| DPC Latencies / LatencyMon - interrupt to process latency (max), Web, Youtube, Prime95 | |
| Lenovo ThinkPad P15v G2 21A9000XGE | |
| Dell Precision 7670 | |
| Lenovo ThinkPad P16 G1 21D6001DMB | |
| HP ZBook Power 15 G9 6B8C4EA | |
| Lenovo ThinkPad P15v G3 21EM001AGE | |
* ... smaller is better
Mass storage
Lenovo ships the ThinkPad P15v G3 AMD with a maximum of two M.2 2280 SSDs. Our test unit has to make do with one SSD, a fast 1 TB NVMe PCIe 4.0 SSD from SK Hynix. Its performance was quite high, and it's also good under continuous load.

* ... smaller is better
Continuous read: DiskSpd Read Loop, Queue Depth 8
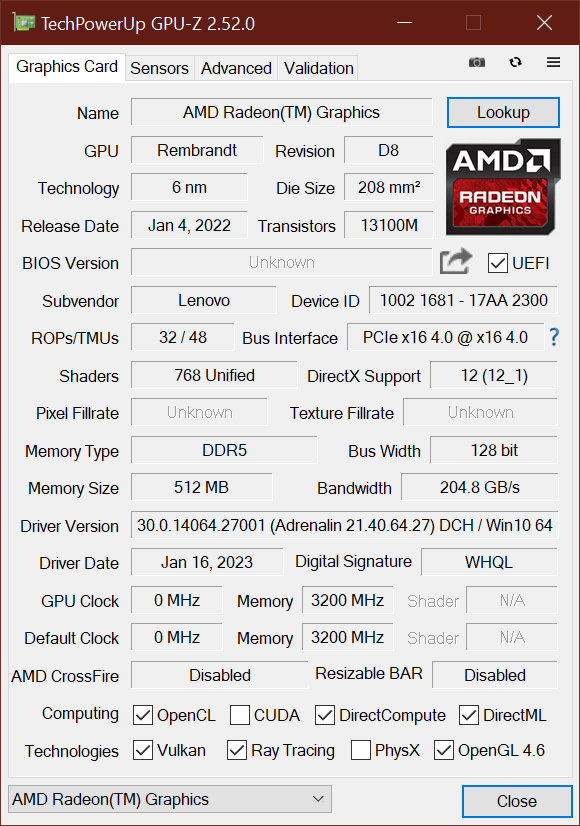
GPU
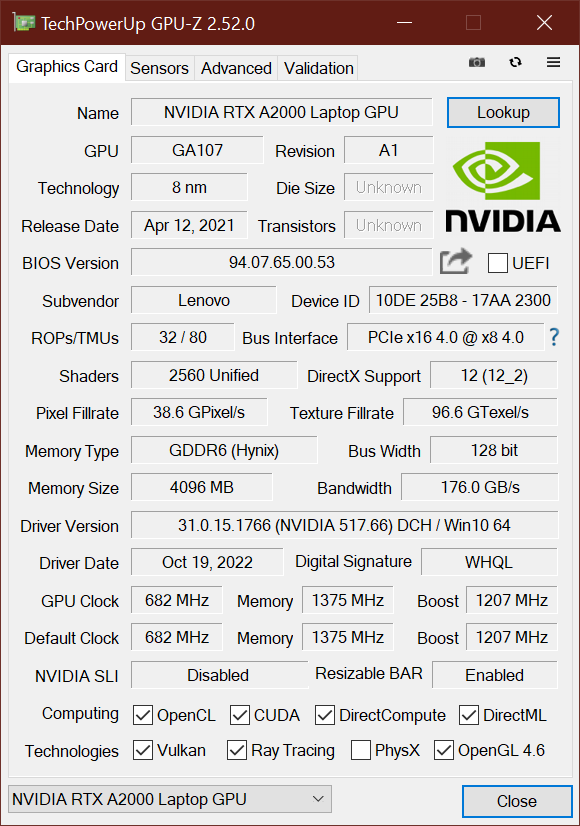
The Nvidia RTX A2000 is an entry-level GPU for professional applications from Nvidia, with the ISV-certified drivers being particularly optimized for CAD. The 2,560 shader units work at a maximum of 1.69 GHz, the TGP is a maximum of 95 watts, while the main memory is four to eight gigabytes. Benchmark comparisons are possible with our GPU comparison list.
Lenovo specifies a TGP of 35 watts for the GPU, the absolute minimum for the RTX A2000. It is also the weaker variant with 4 GB of memory. The maximum consumption of our test device is 40 watts, which is still quite low. Both the ThinkPad P16 G1 (60 watts) and the Dell Precision 7670 (95 watts) allow the same graphics chip to consume significantly more. In this respect, the rather low GPU benchmark results of the P15v Gen 3 are not surprising - at the same time, it is still the most powerful ThinkPad workstation with an AMD processor.
In battery mode, the Lenovo workstation still achieved 11,792 points in the 3DMark 11 graphics test. This corresponds to a reduction in GPU performance of around 20 percent.
| SPECviewperf Performance rating - Percent | |
| Average of class Workstation -1! | |
| Lenovo ThinkPad P16 G1 RTX A5500 | |
| Dell Precision 7670 -1! | |
| HP ZBook Power 15 G9 6B8C4EA -8! | |
| Average NVIDIA RTX A2000 Laptop GPU | |
| Lenovo ThinkPad P15v G3 21EM001AGE | |
| Lenovo ThinkPad P15v G2 21A9000XGE -8! | |
| 3DMark 11 Performance | 14564 points | |
| 3DMark Cloud Gate Standard Score | 36070 points | |
| 3DMark Fire Strike Score | 10333 points | |
| 3DMark Time Spy Score | 4566 points | |
Help | ||
* ... smaller is better
Gaming Performance
The gaming performance is roughly in line with what we would expect from the synthetic benchmarks: performance is better than the ThinkPad P15v Gen 2 with Nvidia T1200, but worse than all other competitors. It is sufficient for Full HD gaming, but the frame rates drop rapidly at higher resolutions.
| The Witcher 3 - 1920x1080 Ultra Graphics & Postprocessing (HBAO+) | |
| Lenovo ThinkPad P16 G1 RTX A5500 | |
| Average of class Workstation (n=1last 2 years) | |
| Dell Precision 7670 | |
| HP ZBook Power 15 G9 6B8C4EA | |
| Lenovo ThinkPad P15v G3 21EM001AGE | |
| Lenovo ThinkPad P15v G2 21A9000XGE | |
| Final Fantasy XV Benchmark - 1920x1080 High Quality | |
| Lenovo ThinkPad P16 G1 RTX A5500 | |
| Average of class Workstation (26.4 - 197.6, n=23, last 2 years) | |
| Dell Precision 7670 | |
| HP ZBook Power 15 G9 6B8C4EA | |
| Lenovo ThinkPad P15v G3 21EM001AGE | |
| Lenovo ThinkPad P15v G2 21A9000XGE | |
| Strange Brigade - 1920x1080 ultra AA:ultra AF:16 | |
| Average of class Workstation (93.2 - 418, n=17, last 2 years) | |
| Lenovo ThinkPad P16 G1 RTX A5500 | |
| Dell Precision 7670 | |
| HP ZBook Power 15 G9 6B8C4EA | |
| Lenovo ThinkPad P15v G3 21EM001AGE | |
| Lenovo ThinkPad P15v G2 21A9000XGE | |
| Dota 2 Reborn - 1920x1080 ultra (3/3) best looking | |
| Lenovo ThinkPad P16 G1 RTX A5500 | |
| Average of class Workstation (50.7 - 178.4, n=23, last 2 years) | |
| Dell Precision 7670 | |
| HP ZBook Power 15 G9 6B8C4EA | |
| Lenovo ThinkPad P15v G2 21A9000XGE | |
| Lenovo ThinkPad P15v G3 21EM001AGE | |
Witcher 3 FPS diagram
| low | med. | high | ultra | QHD | 4K | |
|---|---|---|---|---|---|---|
| GTA V (2015) | 167.3 | 157.6 | 117.2 | 61.1 | 44.1 | 41.2 |
| The Witcher 3 (2015) | 218 | 145.6 | 82.2 | 43.9 | 29.2 | |
| Dota 2 Reborn (2015) | 122.3 | 111.1 | 105.3 | 100.4 | 64.2 | |
| Final Fantasy XV Benchmark (2018) | 112.5 | 62.5 | 46 | 33.4 | 17.7 | |
| X-Plane 11.11 (2018) | 88.2 | 77 | 63.2 | 51.3 | ||
| Strange Brigade (2018) | 238 | 113.8 | 89.9 | 77.9 | 57.1 | 33 |
| F1 22 (2022) | 130.3 | 125.8 | 89.5 | 27.6 | 16.7 | 7.1 |
Emissions: the ThinkPad P15v runs quieter than the competition
Noise emissions
The Lenovo ThinkPad P15v G3 has a weak cooling system for a workstation, with only one fan. Despite the good performance of the laptop, the fan usually remains silent or comparatively quiet. The maximum fan noise stays below 40 dB(A) - some of the comparison devices are significantly louder.
We did not detect any coil whine on the Lenovo ThinkPad.
Noise level
| Idle |
| 23.2 / 23.2 / 23.2 dB(A) |
| Load |
| 35 / 37.5 dB(A) |
 | ||
30 dB silent 40 dB(A) audible 50 dB(A) loud |
||
min: | ||
| Lenovo ThinkPad P15v G3 21EM001AGE RTX A2000 Laptop GPU, R7 PRO 6850H, SK Hynix PC711 1TB HFS001TDE9X081N | Lenovo ThinkPad P16 G1 21D6001DMB RTX A2000 Laptop GPU, i7-12850HX, Micron 3400 1TB MTFDKBA1T0TFH | Lenovo ThinkPad P15v G2 21A9000XGE T1200 Laptop GPU, i7-11800H, Toshiba XG6 KXG6AZNV512G | HP ZBook Power 15 G9 6B8C4EA RTX A2000 Laptop GPU, i7-12700H, Samsung PM9A1 MZVL21T0HCLR | Dell Precision 7670 RTX A2000 Laptop GPU, i7-12850HX, SK Hynix HFS001TEJ9X115N | |
|---|---|---|---|---|---|
| Noise | -11% | -9% | -11% | -14% | |
| off / environment * (dB) | 23.2 | 23.2 -0% | 25.21 -9% | 23.8 -3% | 22.7 2% |
| Idle Minimum * (dB) | 23.2 | 23.2 -0% | 25.21 -9% | 23.8 -3% | 22.9 1% |
| Idle Average * (dB) | 23.2 | 23.2 -0% | 25.21 -9% | 23.8 -3% | 22.9 1% |
| Idle Maximum * (dB) | 23.2 | 23.2 -0% | 25.21 -9% | 23.8 -3% | 24.5 -6% |
| Load Average * (dB) | 35 | 47.8 -37% | 39.09 -12% | 42.9 -23% | 48.7 -39% |
| Witcher 3 ultra * (dB) | 37.9 | 34.1 10% | 36.6 3% | 44.5 -17% | 45.2 -19% |
| Load Maximum * (dB) | 37.5 | 56.3 -50% | 43.53 -16% | 47.9 -28% | 52.1 -39% |
* ... smaller is better
Temperature
The Lenovo laptop gets particularly warm above the keyboard and in the middle on the underside, with the ThinkPad heating up slightly more during the Witcher 3 test. The maximum temperature we recorded was 53 degrees Celsius (127.4 degrees Fahrenheit) on the underside, with the palm rest remaining relatively cool in any case.
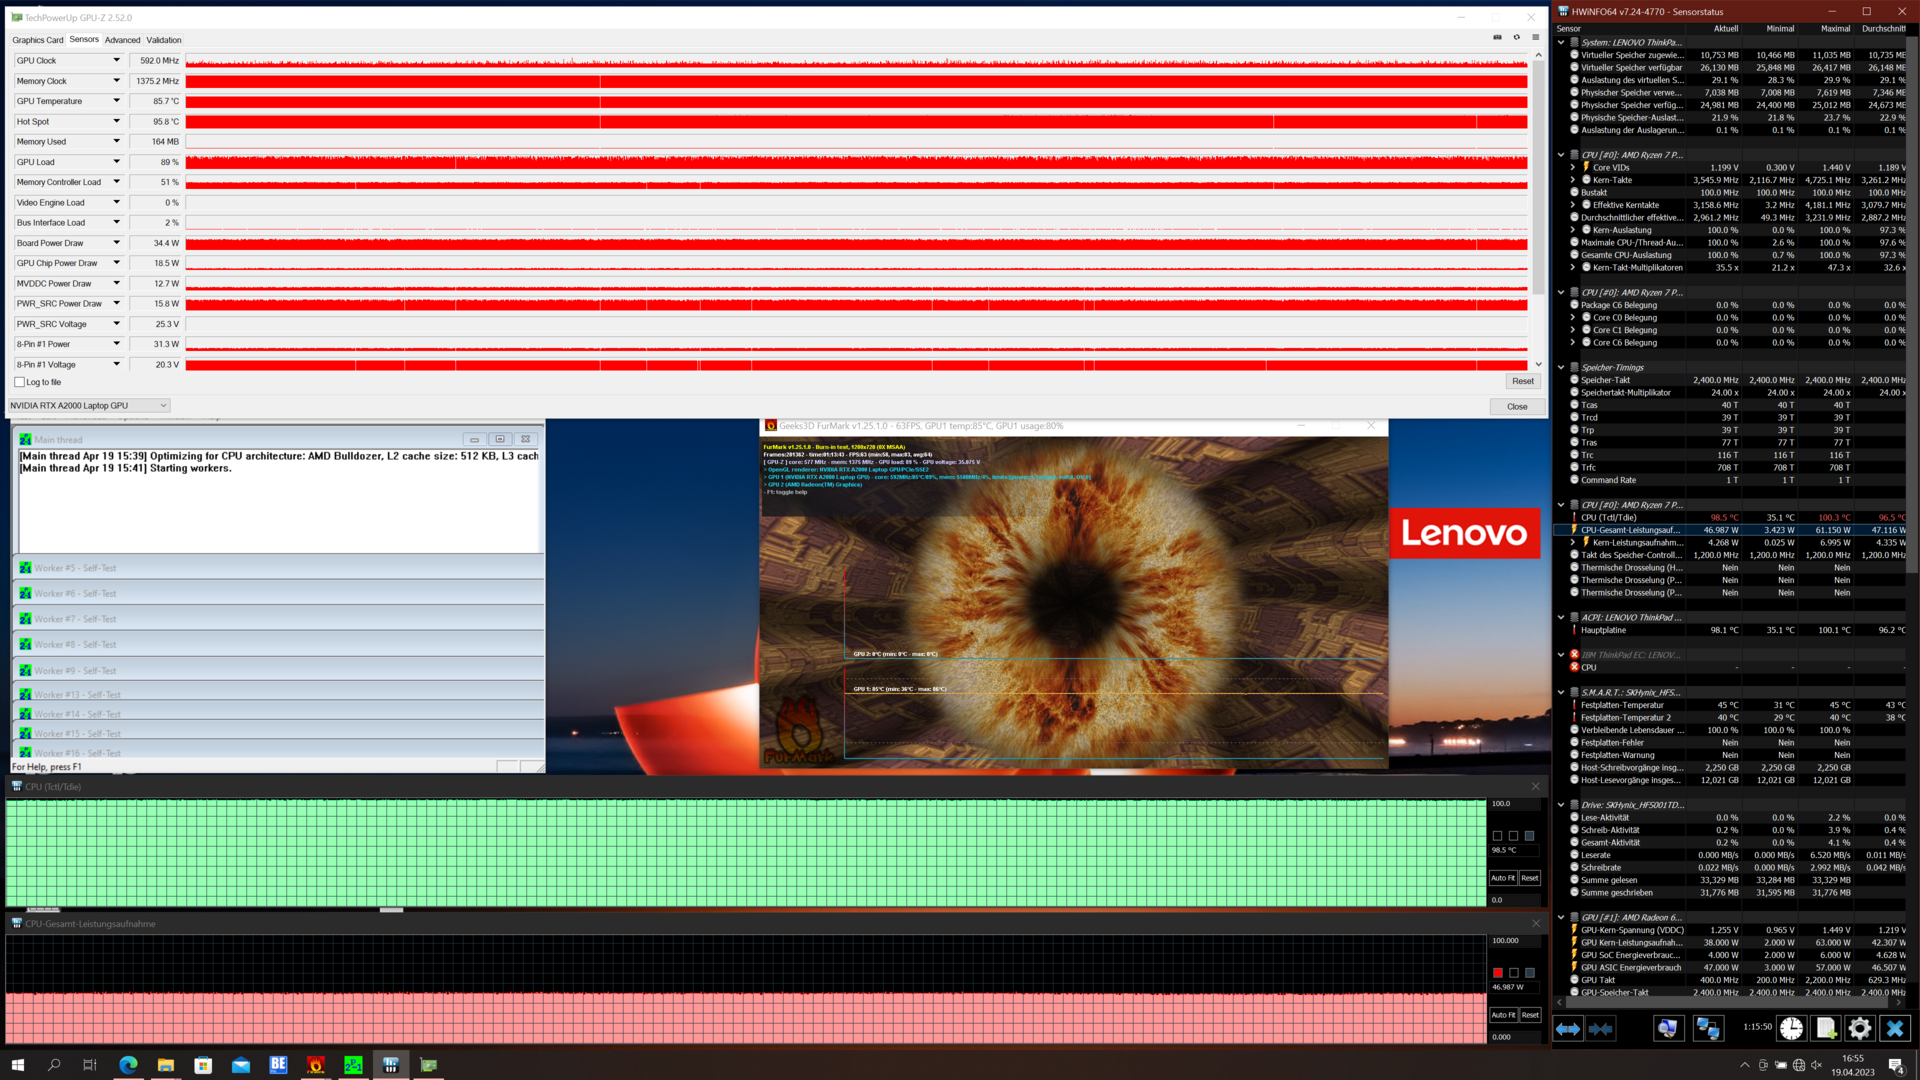
After about an hour of continuous stress testing, the CPU power limit was at 45 watts, and the graphics chip was consuming 35 watts. There was no throttling.
(-) The maximum temperature on the upper side is 48.7 °C / 120 F, compared to the average of 38.2 °C / 101 F, ranging from 22.2 to 69.8 °C for the class Workstation.
(-) The bottom heats up to a maximum of 50.5 °C / 123 F, compared to the average of 41.1 °C / 106 F
(+) In idle usage, the average temperature for the upper side is 24.3 °C / 76 F, compared to the device average of 32 °C / 90 F.
(-) Playing The Witcher 3, the average temperature for the upper side is 38.8 °C / 102 F, compared to the device average of 32 °C / 90 F.
(+) The palmrests and touchpad are reaching skin temperature as a maximum (35.1 °C / 95.2 F) and are therefore not hot.
(-) The average temperature of the palmrest area of similar devices was 27.8 °C / 82 F (-7.3 °C / -13.2 F).
| Lenovo ThinkPad P15v G3 21EM001AGE AMD Ryzen 7 PRO 6850H, NVIDIA RTX A2000 Laptop GPU | Lenovo ThinkPad P16 G1 21D6001DMB Intel Core i7-12850HX, NVIDIA RTX A2000 Laptop GPU | Lenovo ThinkPad P15v G2 21A9000XGE Intel Core i7-11800H, NVIDIA T1200 Laptop GPU | HP ZBook Power 15 G9 6B8C4EA Intel Core i7-12700H, NVIDIA RTX A2000 Laptop GPU | Dell Precision 7670 Intel Core i7-12850HX, NVIDIA RTX A2000 Laptop GPU | |
|---|---|---|---|---|---|
| Heat | 5% | -8% | 8% | -13% | |
| Maximum Upper Side * (°C) | 48.7 | 43.1 11% | 53.8 -10% | 40.3 17% | 51 -5% |
| Maximum Bottom * (°C) | 50.5 | 39.9 21% | 52.1 -3% | 48.3 4% | 45.8 9% |
| Idle Upper Side * (°C) | 25 | 26 -4% | 27.6 -10% | 23.7 5% | 31.8 -27% |
| Idle Bottom * (°C) | 25.4 | 27.6 -9% | 27.7 -9% | 23.8 6% | 32.6 -28% |
* ... smaller is better
Speakers
The speakers of the ThinkPad P15v G3 AMD could use an improvement. Above all, they are relatively quiet and largely lack bass. The speakers of the HP ZBook Power 15 are not significantly better, but they are at least a little louder.
Lenovo ThinkPad P15v G3 21EM001AGE audio analysis
(-) | not very loud speakers (70.4 dB)
Bass 100 - 315 Hz
(-) | nearly no bass - on average 22.3% lower than median
(±) | linearity of bass is average (12% delta to prev. frequency)
Mids 400 - 2000 Hz
(+) | balanced mids - only 3.1% away from median
(±) | linearity of mids is average (8.1% delta to prev. frequency)
Highs 2 - 16 kHz
(+) | balanced highs - only 3% away from median
(+) | highs are linear (2.6% delta to prev. frequency)
Overall 100 - 16.000 Hz
(±) | linearity of overall sound is average (21.4% difference to median)
Compared to same class
» 77% of all tested devices in this class were better, 6% similar, 18% worse
» The best had a delta of 7%, average was 17%, worst was 35%
Compared to all devices tested
» 60% of all tested devices were better, 7% similar, 33% worse
» The best had a delta of 4%, average was 23%, worst was 134%
HP ZBook Power 15 G9 6B8C4EA audio analysis
(±) | speaker loudness is average but good (77.9 dB)
Bass 100 - 315 Hz
(-) | nearly no bass - on average 28.5% lower than median
(±) | linearity of bass is average (9.4% delta to prev. frequency)
Mids 400 - 2000 Hz
(+) | balanced mids - only 3.9% away from median
(+) | mids are linear (5.1% delta to prev. frequency)
Highs 2 - 16 kHz
(±) | higher highs - on average 5.1% higher than median
(+) | highs are linear (4.1% delta to prev. frequency)
Overall 100 - 16.000 Hz
(±) | linearity of overall sound is average (22.9% difference to median)
Compared to same class
» 82% of all tested devices in this class were better, 3% similar, 15% worse
» The best had a delta of 7%, average was 17%, worst was 35%
Compared to all devices tested
» 68% of all tested devices were better, 6% similar, 26% worse
» The best had a delta of 4%, average was 23%, worst was 134%
Energy management: Despite the small battery, battery life is not too bad
Power consumption
The Lenovo ThinkPad P15v Gen 3 AMD doesn't run very efficiently, which is not surprising given the inefficient components, especially the 4K UHD display. The low consumption of the HP ZBook Power 15 is rather surprising in comparison, while the ThinkPad P16 (with 4K LCD) and the Dell Precision 7670 have an even higher idle consumption overall.
With a maximum of 124 watts at peak load, the ThinkPad P15v G3 is not an energy-saving miracle. However, the consumption stays within the bounds of the compact 135 watt power adapter.
| Off / Standby | |
| Idle | |
| Load |
|
Key:
min: | |
| Lenovo ThinkPad P15v G3 21EM001AGE R7 PRO 6850H, RTX A2000 Laptop GPU, SK Hynix PC711 1TB HFS001TDE9X081N, IPS LED, 3840x2160, 15.6" | Lenovo ThinkPad P16 G1 21D6001DMB i7-12850HX, RTX A2000 Laptop GPU, Micron 3400 1TB MTFDKBA1T0TFH, IPS LED, 2560x1600, 16" | Lenovo ThinkPad P15v G2 21A9000XGE i7-11800H, T1200 Laptop GPU, Toshiba XG6 KXG6AZNV512G, IPS LED, 1920x1080, 15.6" | HP ZBook Power 15 G9 6B8C4EA i7-12700H, RTX A2000 Laptop GPU, Samsung PM9A1 MZVL21T0HCLR, IPS, 3840x2160, 15.6" | Dell Precision 7670 i7-12850HX, RTX A2000 Laptop GPU, SK Hynix HFS001TEJ9X115N, OLED, 3840x2400, 16" | Lenovo ThinkPad P16 G1 RTX A5500 i9-12950HX, RTX A5500 Laptop GPU, WDC PC SN810 2TB, IPS, 3840x2400, 16" | Average NVIDIA RTX A2000 Laptop GPU | Average of class Workstation | |
|---|---|---|---|---|---|---|---|---|
| Power Consumption | 0% | 9% | 19% | -47% | -95% | -16% | -25% | |
| Idle Minimum * (Watt) | 6.3 | 5.1 19% | 5.96 5% | 3.9 38% | 7.5 -19% | 7.5 -19% | 6.6 ? -5% | 9.11 ? -45% |
| Idle Average * (Watt) | 13.9 | 9.2 34% | 8.37 40% | 7.2 48% | 9.5 32% | 20.1 -45% | 11.8 ? 15% | 13.8 ? 1% |
| Idle Maximum * (Watt) | 14.5 | 9.9 32% | 9.05 38% | 8.5 41% | 28.4 -96% | 40 -176% | 16.7 ? -15% | 17.9 ? -23% |
| Load Average * (Watt) | 82.8 | 124.1 -50% | 91.82 -11% | 87.2 -5% | 139.1 -68% | 137 -65% | 116.3 ? -40% | 96 ? -16% |
| Witcher 3 ultra * (Watt) | 88.8 | 87.7 1% | 102 -15% | 86.8 2% | 134 -51% | 208 -134% | ||
| Load Maximum * (Watt) | 124.8 | 168.9 -35% | 126.38 -1% | 139 -11% | 220.8 -77% | 285.9 -129% | 171.2 ? -37% | 180.3 ? -44% |
* ... smaller is better
Power consumption Witcher 3 / Stress test
Power consumption with an external monitor
Battery life
The internal lithium-polymer battery has a capacity of only 68 watt hours, and all the devices we compared had a larger battery capacity. Nevertheless, the Lenovo ThinkPad P15v G3 AMD achieves a respectable battery life - with a larger battery or an energy-saving Full HD display, it could even be a battery life champion among workstations.
| Lenovo ThinkPad P15v G3 21EM001AGE R7 PRO 6850H, RTX A2000 Laptop GPU, 68 Wh | Lenovo ThinkPad P16 G1 21D6001DMB i7-12850HX, RTX A2000 Laptop GPU, 94 Wh | Lenovo ThinkPad P15v G2 21A9000XGE i7-11800H, T1200 Laptop GPU, 68 Wh | HP ZBook Power 15 G9 6B8C4EA i7-12700H, RTX A2000 Laptop GPU, 83 Wh | Dell Precision 7670 i7-12850HX, RTX A2000 Laptop GPU, 83 Wh | Lenovo ThinkPad P16 G1 RTX A5500 i9-12950HX, RTX A5500 Laptop GPU, 94 Wh | Average of class Workstation | |
|---|---|---|---|---|---|---|---|
| Battery runtime | 18% | -22% | 45% | -21% | -16% | -1% | |
| H.264 (h) | 10.7 | 8 -25% | 10.1 ? -6% | ||||
| WiFi v1.3 (h) | 6.9 | 9.4 36% | 7.5 9% | 10 45% | 5.9 -14% | 5.8 -16% | 8.55 ? 24% |
| Load (h) | 1.8 | 1.8 0% | 0.9 -50% | 1.3 -28% | 1.441 ? -20% |
Pros
Cons
Conclusion: the ThinkPad P15v Gen 3 AMD is a rare combination with strengths and weaknesses

The Lenovo ThinkPad P15v Gen 3 represents the entry level into the more powerful range of ThinkPad workstations. Because of that, there are a few places where Lenovo has cut some corners. The model we tested has a small battery, WWAN is not available in the AMD variant, the displays are still in the dated 16:9 format and Lenovo has gone with a weak 720p webcam and speakers that are too quiet. These are all valid points of criticism; in addition, the WiFi performance varies on and off.
At the same time, this Lenovo laptop also has some great strengths, and is even somewhat superior to the more expensive ThinkPad P16. The P15v Gen 3 has the better keyboard and runs much quieter, even under load, for example, which is possible thanks to the efficient AMD processor, which also helps to lift the battery life to an acceptable level despite the limited battery capacity. The P15v Gen 3 has a fast SD card reader as well as RJ45 Ethernet, a bright, matte 4K UHD display that covers the AdobeRGB color space, and also offers very good processor performance thanks to the AMD-H CPU. At the same time, the upgradeability or maintainability of this model is quite high. The GPU is rather weak, but to be fair, HP's direct competitor in this price range doesn't really do any better in this regard.
ThinkPad P15v G3 AMD: A keyboard with long travel plus AMD Ryzen 6000 is a winning combination - but with some clear weaknesses.
In Lenovo's lineup, the Lenovo ThinkPad P15v Gen 3 AMD is a very interesting model - one of the last models with the older design, but at the same time now coming with very efficient and modern AMD processors. It is a pity that Lenovo didn't include WWAN capabilities in this model and that it doesn't offer a bigger battery at least as an upgrade option. These mistakes cost the P15v the absolute top spot in this category, but it is still a very useful and good work laptop.
There is a similar story with the P15v's main competitor, HP's ZBook Power 15, which has a higher-quality metal case and a bigger battery, but is only available with Intel CPUs and does not have an SD card reader.
Price and availability
The Lenovo ThinkPad P15v Gen 3 AMD is available in the tested configuration for $2,293 from Amazon. It can also be found on Lenovo's website for roughly $2300.
Lenovo ThinkPad P15v G3 21EM001AGE
- 04/24/2023 v7 (old)
Benjamin Herzig
Transparency
The selection of devices to be reviewed is made by our editorial team. The test sample was provided to the author as a loan by the manufacturer or retailer for the purpose of this review. The lender had no influence on this review, nor did the manufacturer receive a copy of this review before publication. There was no obligation to publish this review. As an independent media company, Notebookcheck is not subjected to the authority of manufacturers, retailers or publishers.
This is how Notebookcheck is testing
Every year, Notebookcheck independently reviews hundreds of laptops and smartphones using standardized procedures to ensure that all results are comparable. We have continuously developed our test methods for around 20 years and set industry standards in the process. In our test labs, high-quality measuring equipment is utilized by experienced technicians and editors. These tests involve a multi-stage validation process. Our complex rating system is based on hundreds of well-founded measurements and benchmarks, which maintains objectivity. Further information on our test methods can be found here.
Price comparison

