Lenovo ThinkPad P14s G3 AMD laptop review: Lightweight workstation without dGPU
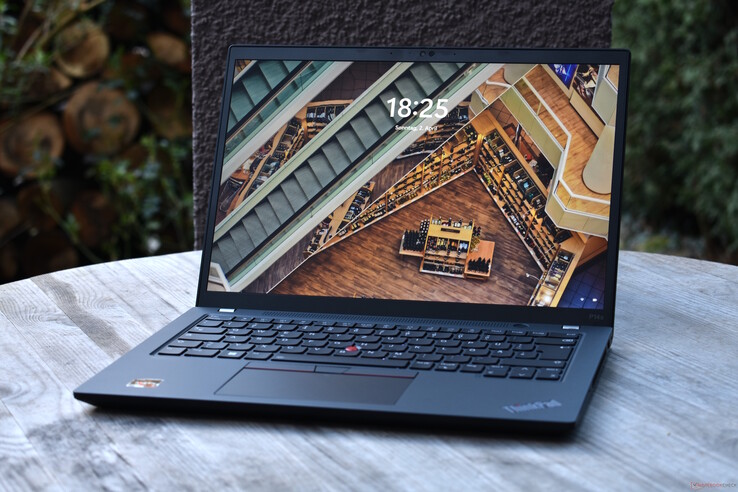
Mobile workstations traditionally have relatively large screens - meaning 15 inches and larger - whereas 14-inch workstations are quite rare. The Lenovo ThinkPad P14s G3 is one of the latter models. This product series may not be new, but the AMD variants of the P14s are quite new in comparison. We will be testing one today.
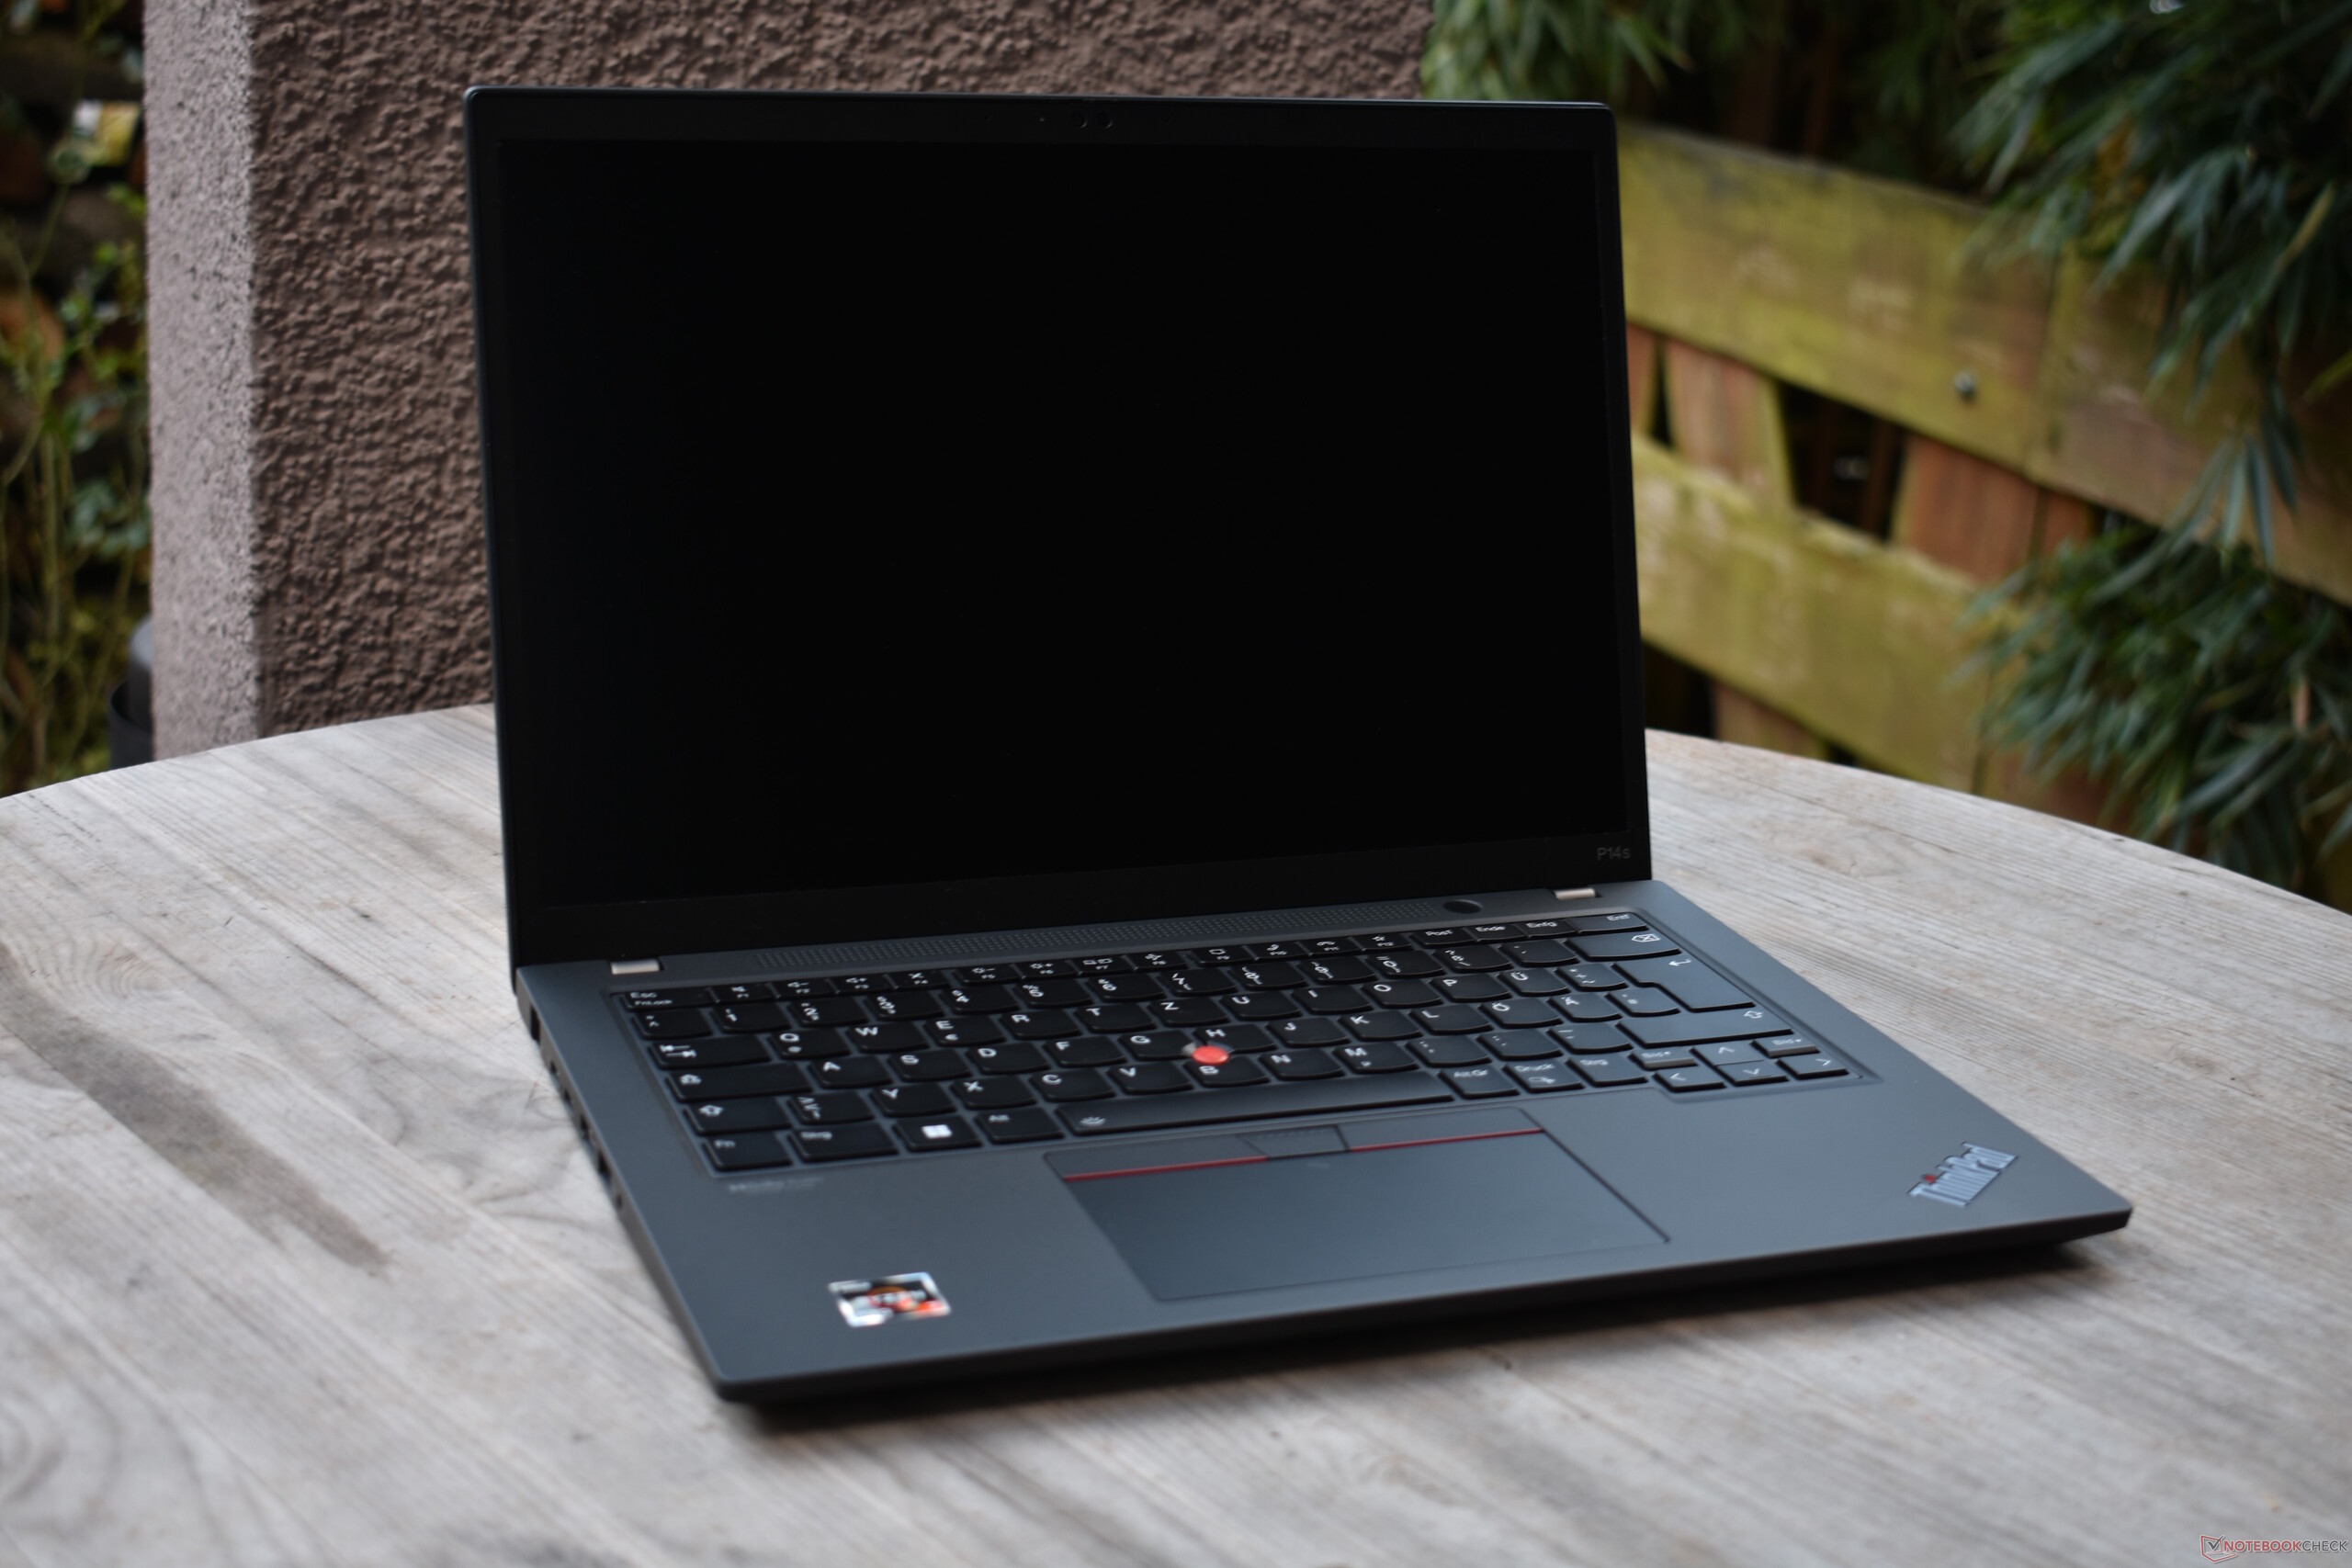
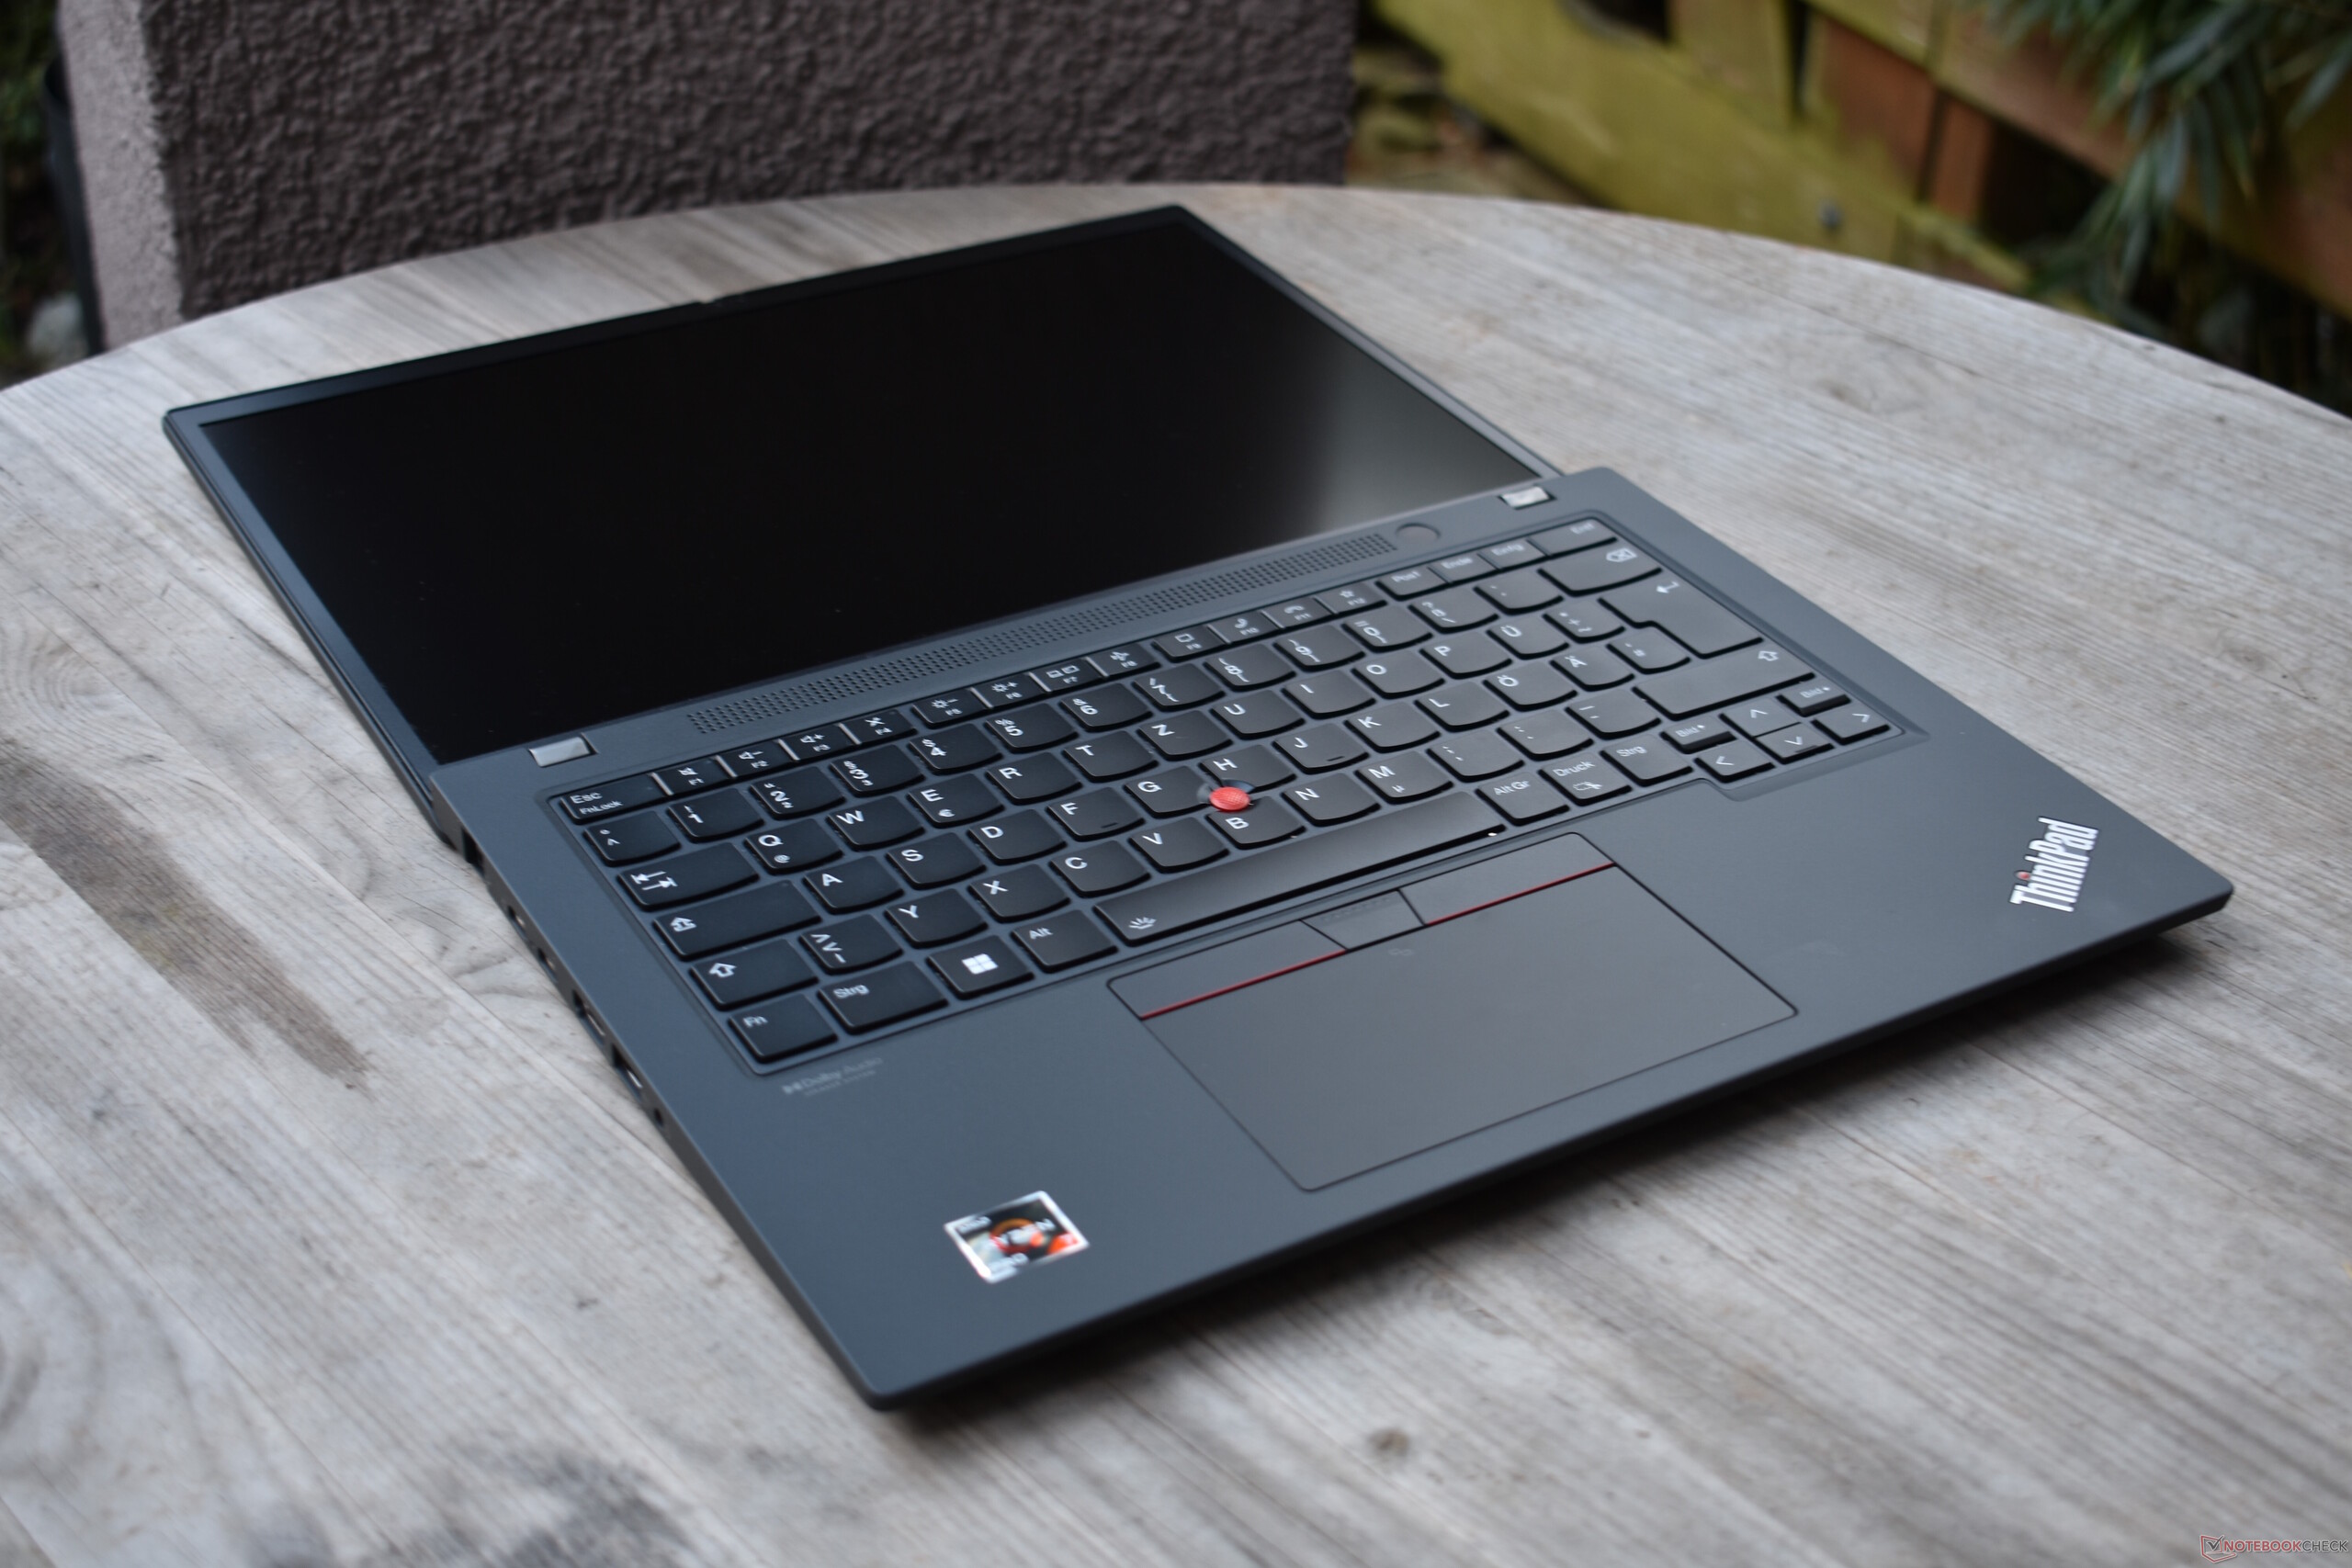
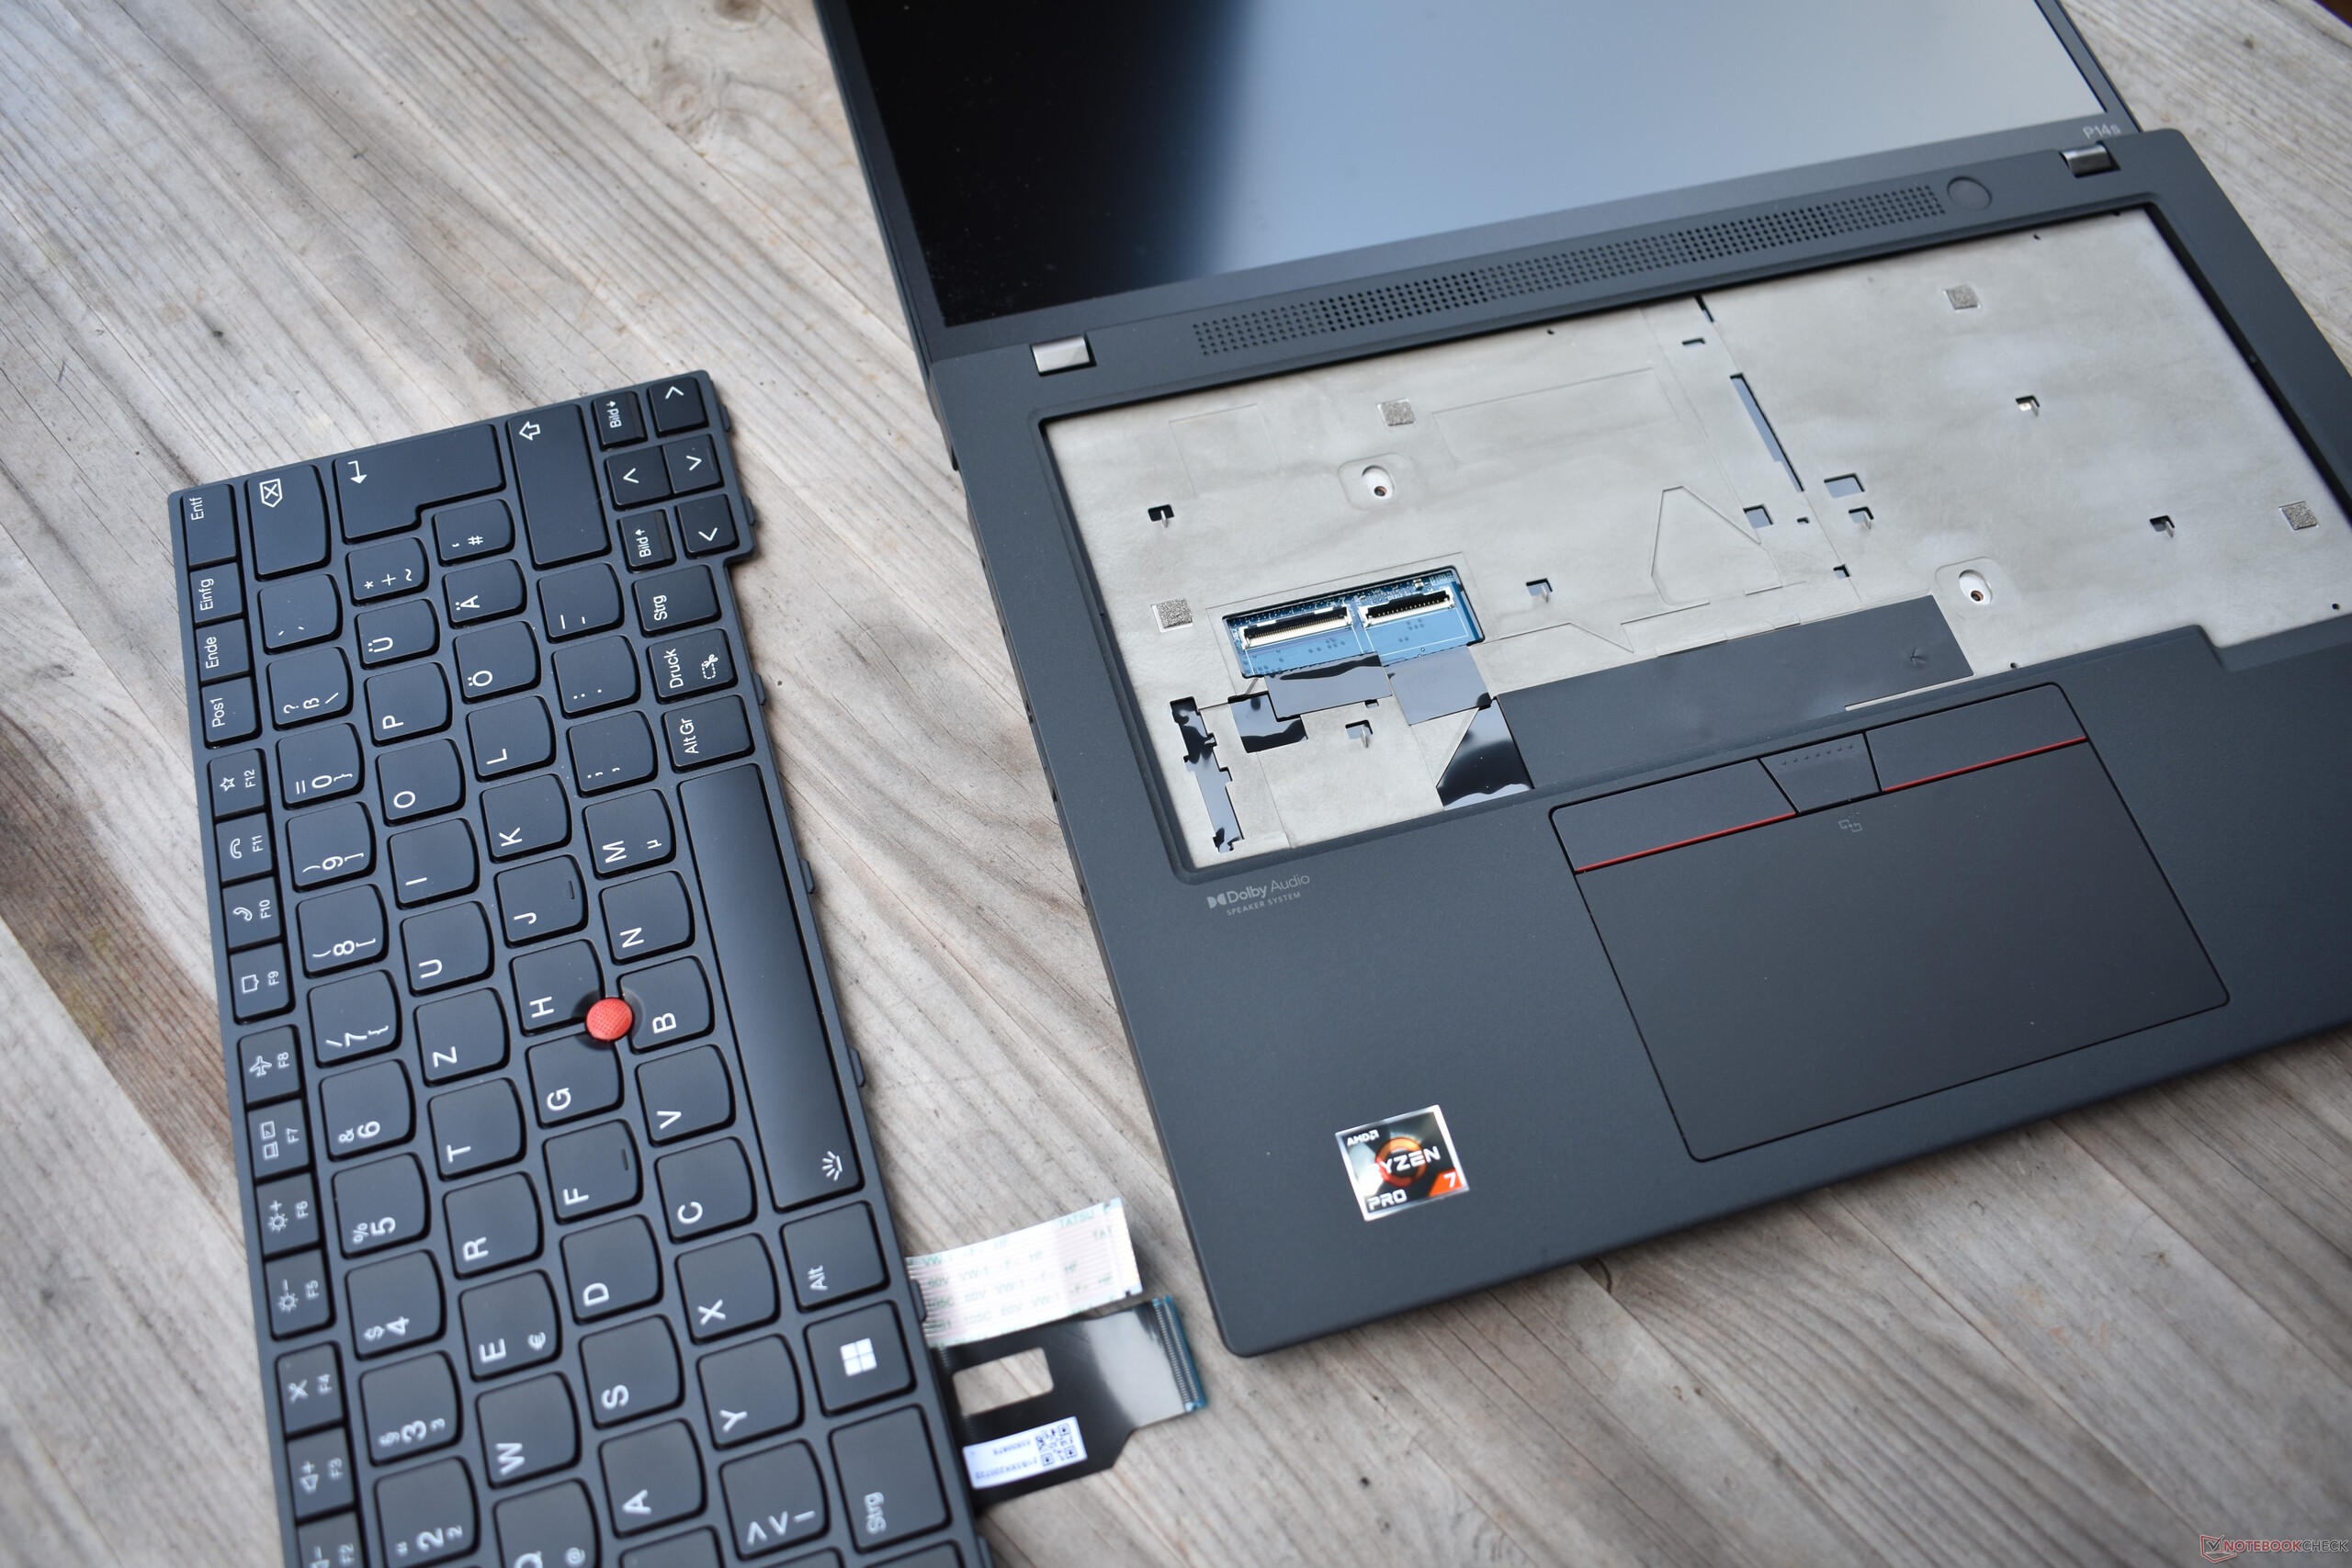
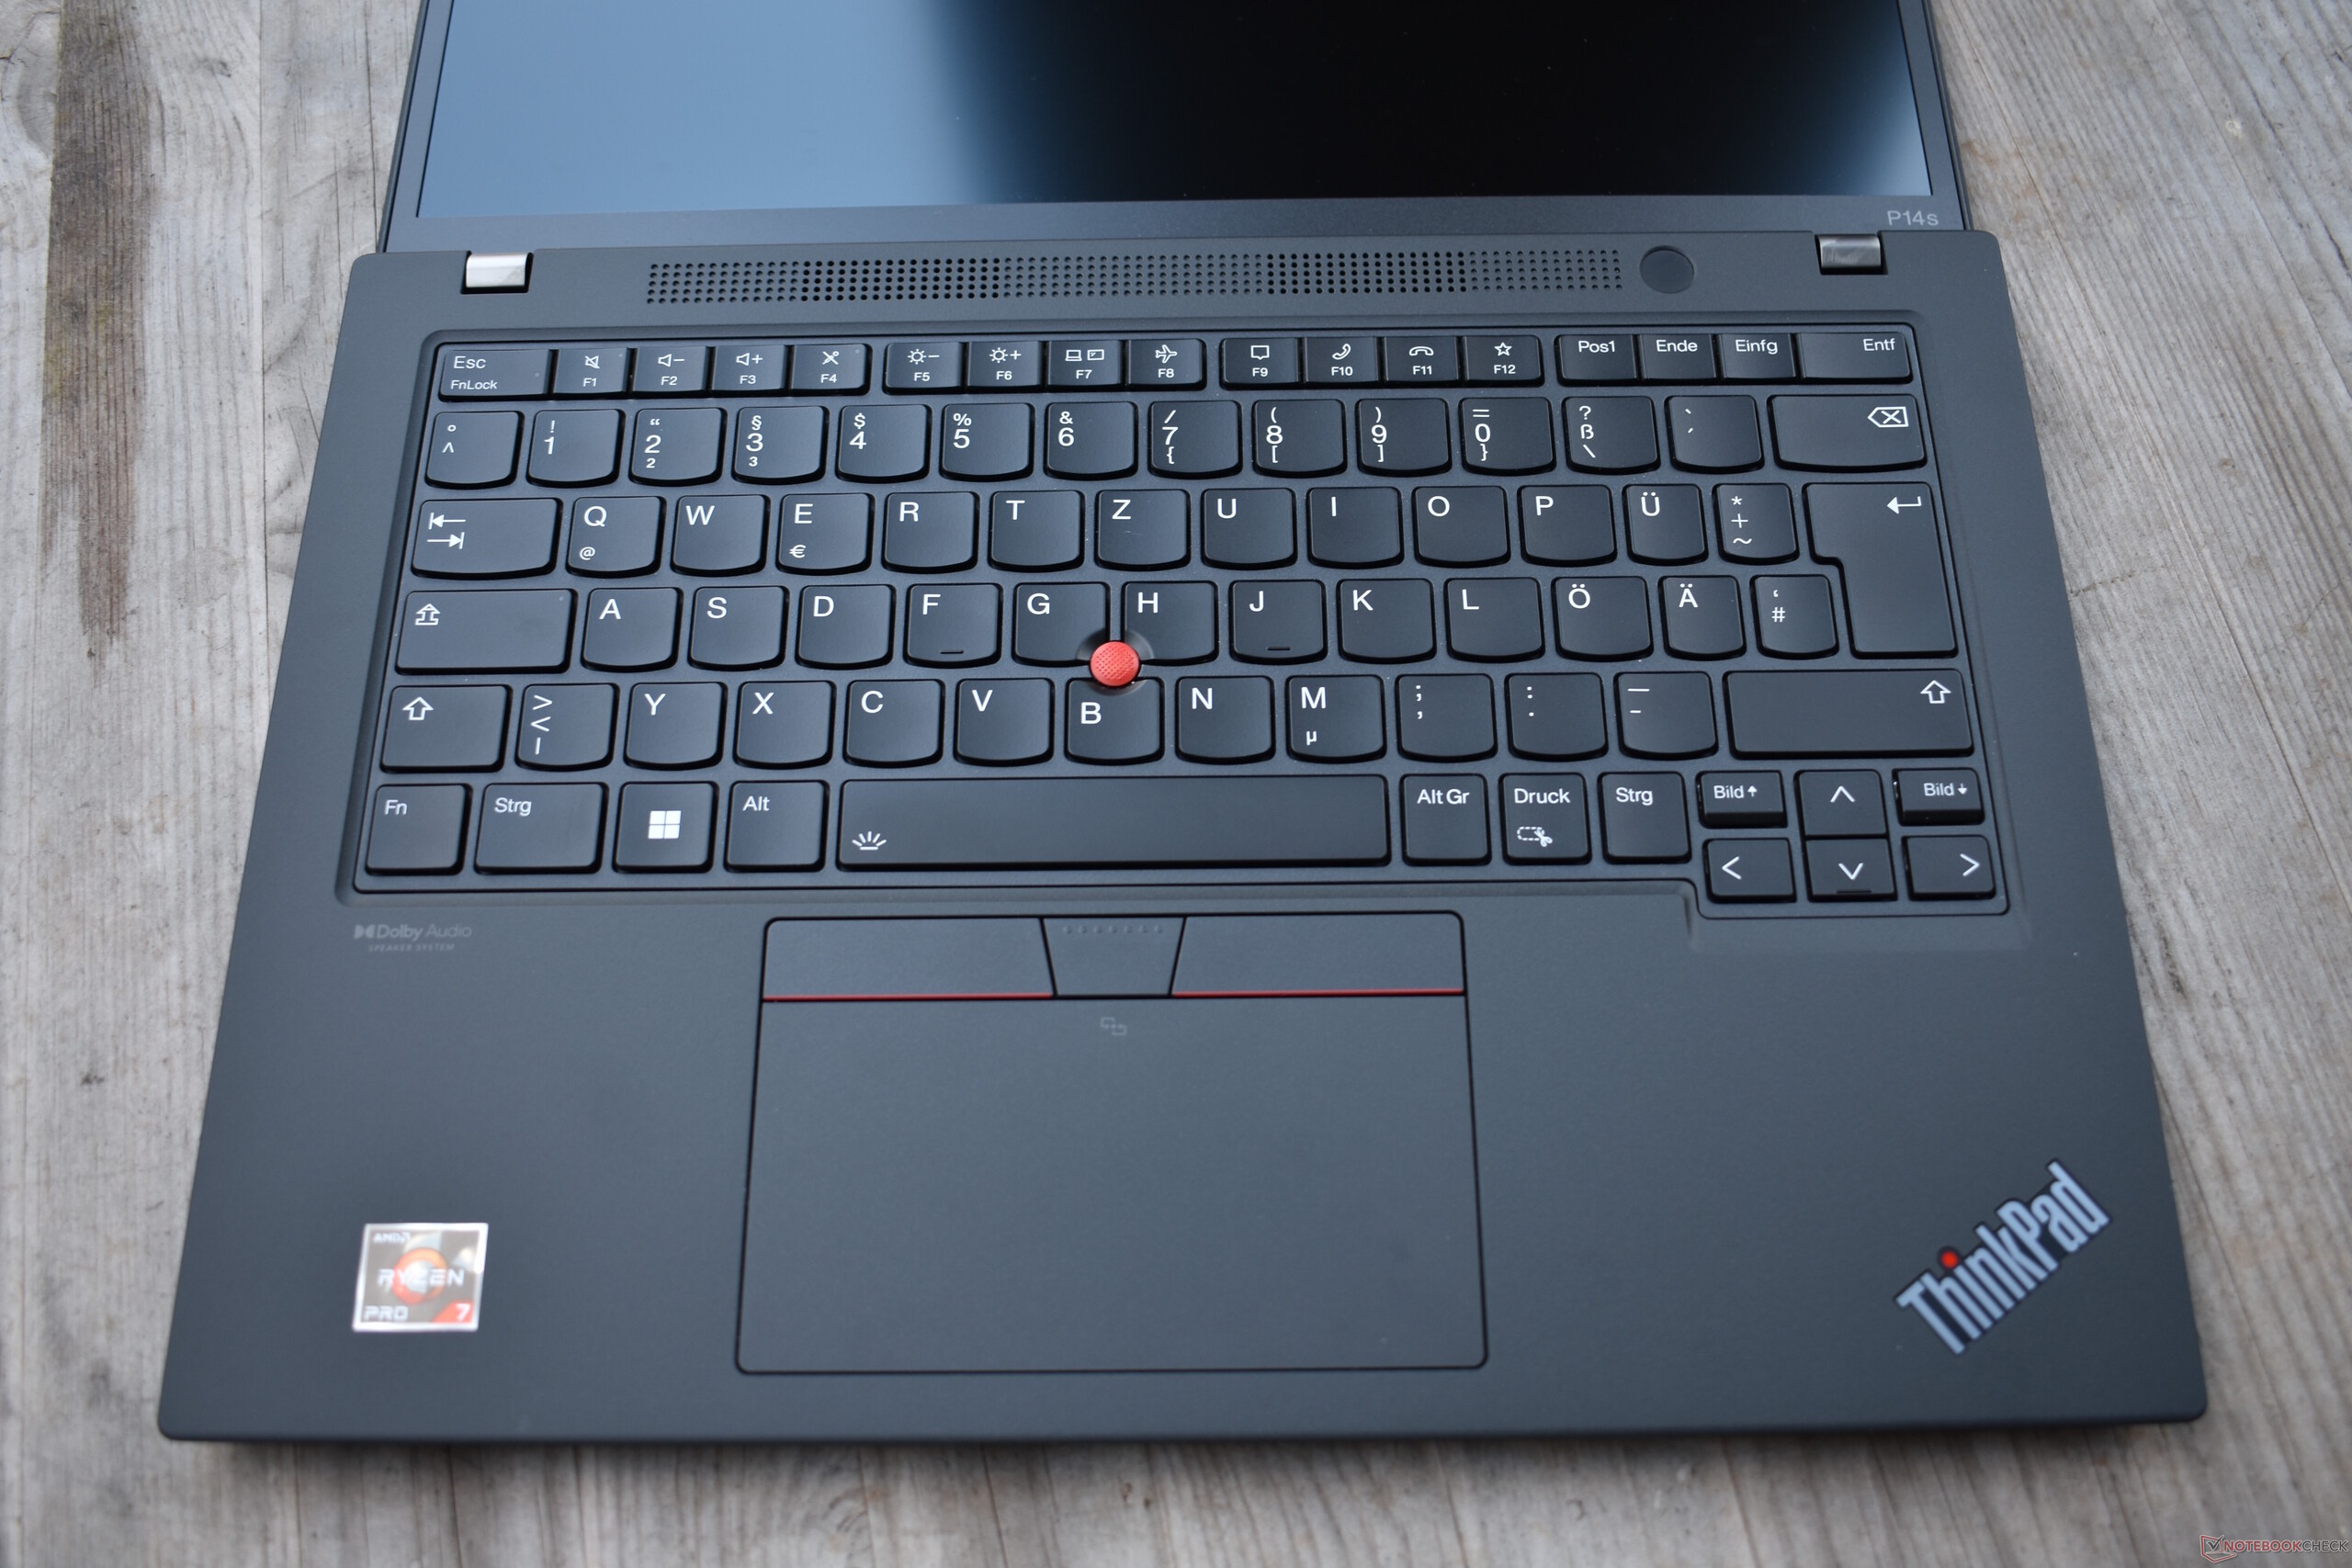
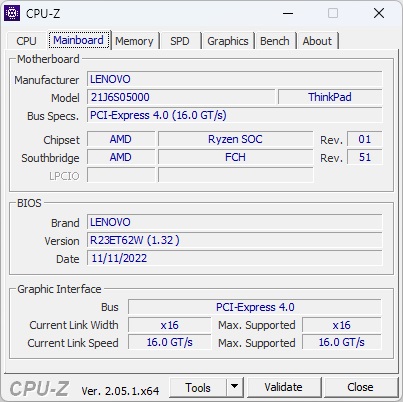
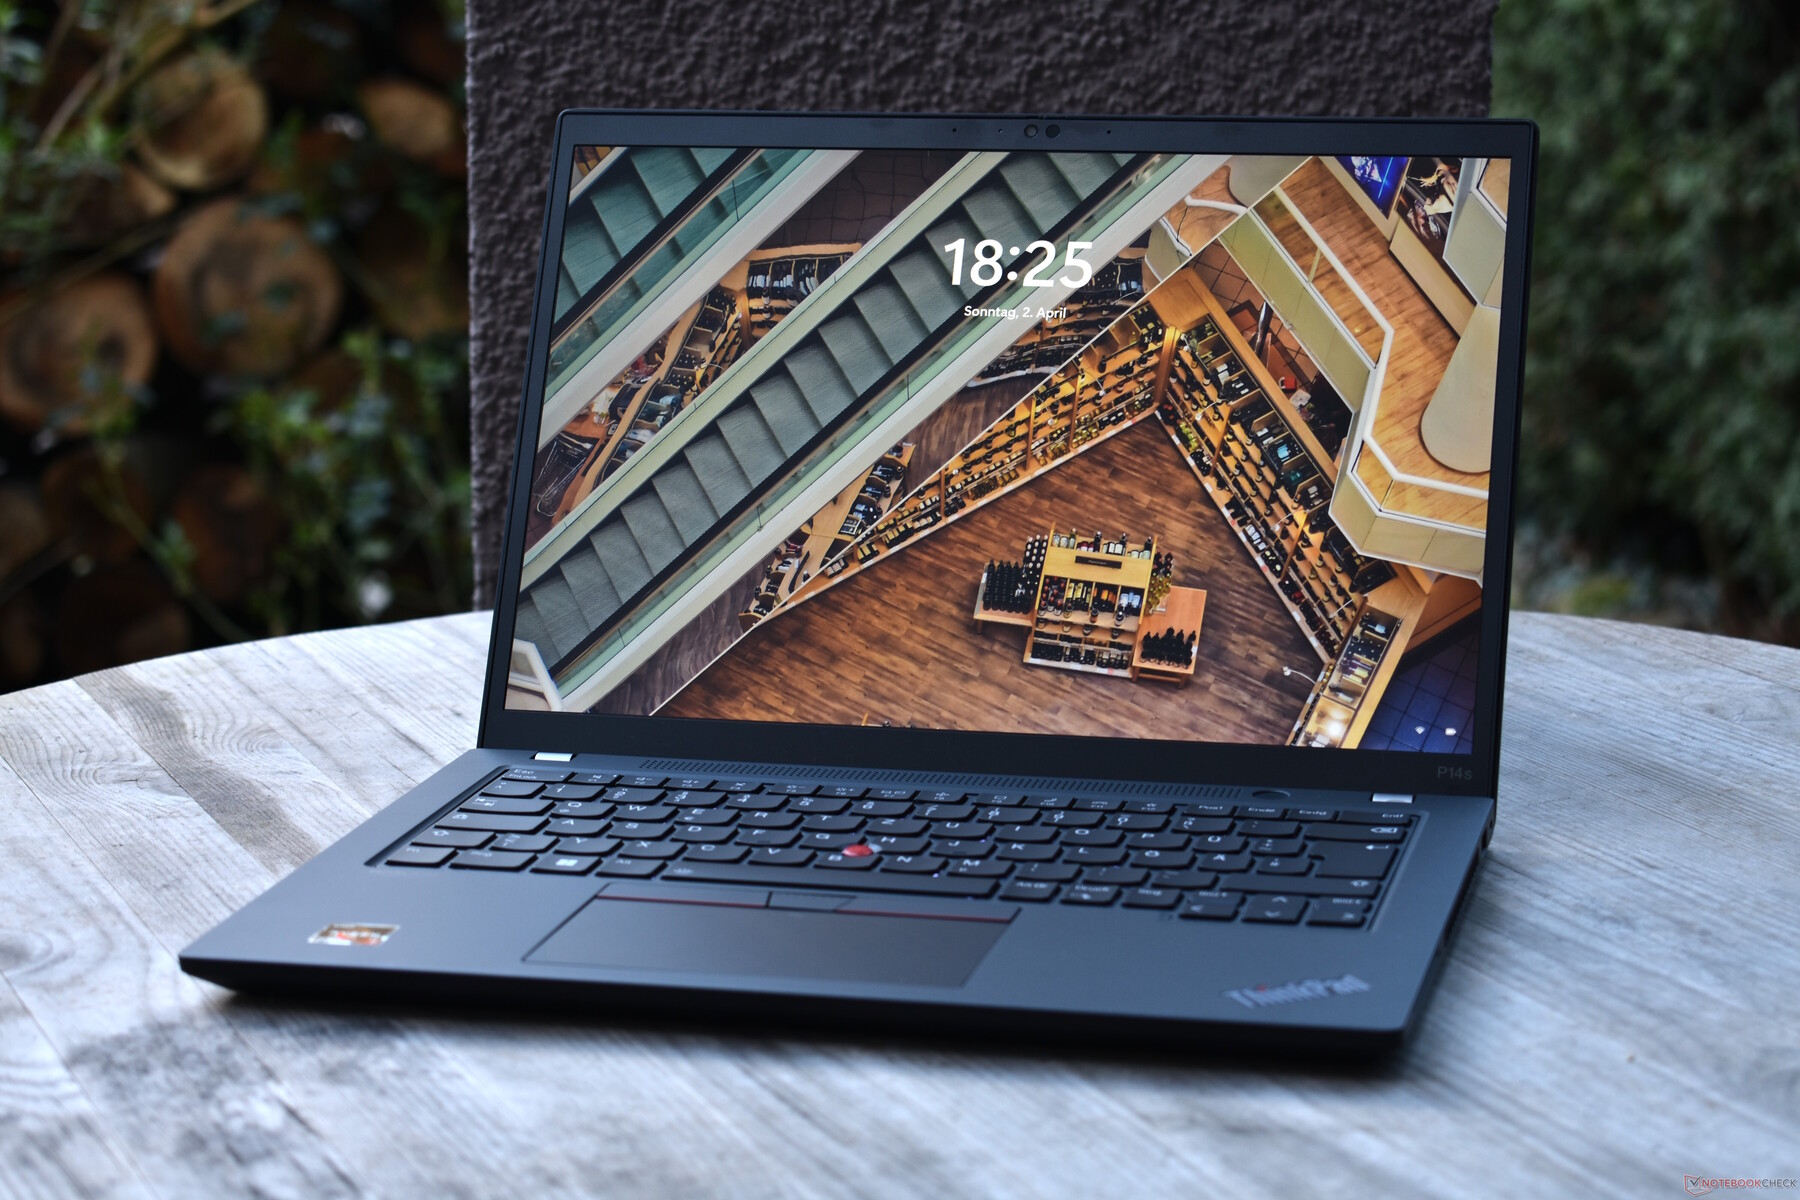
The ThinkPad P14s is a sister model of Lenovo's ThinkPad T14. Externally, both look the exact same, which means you can check out our review of Lenovo's ThinkPad T14 Gen 3 if you are interested in reading about its design, features and input devices.
Possible competitors compared
Rating | Date | Model | Weight | Height | Size | Resolution | Price |
|---|---|---|---|---|---|---|---|
| 86.9 % v7 (old) | 04 / 2023 | Lenovo ThinkPad P14s G3 AMD 21J6S05000 R7 PRO 6850U, Radeon 680M | 1.5 kg | 17.9 mm | 14.00" | 1920x1200 | |
| 85.1 % v7 (old) | 06 / 2021 | Lenovo ThinkPad P14s Gen2-20VX000GGE i7-1185G7, T500 Laptop GPU | 1.5 kg | 18 mm | 14.00" | 1920x1080 | |
| 88.8 % v7 (old) | 09 / 2022 | Lenovo ThinkPad T14 G3-21CF004NGE R7 PRO 6850U, Radeon 680M | 1.4 kg | 17.9 mm | 14.00" | 1920x1200 | |
| 87.6 % v7 (old) | 09 / 2022 | Dell Precision 5000 5470 i9-12900H, RTX A1000 Laptop GPU | 1.6 kg | 18.95 mm | 14.00" | 2560x1600 | |
| 83.6 % v7 (old) | 10 / 2022 | HP ZBook Firefly 14 G9-6B8A2EA i7-1265U, T550 Laptop GPU | 1.5 kg | 19.9 mm | 14.00" | 1920x1200 |
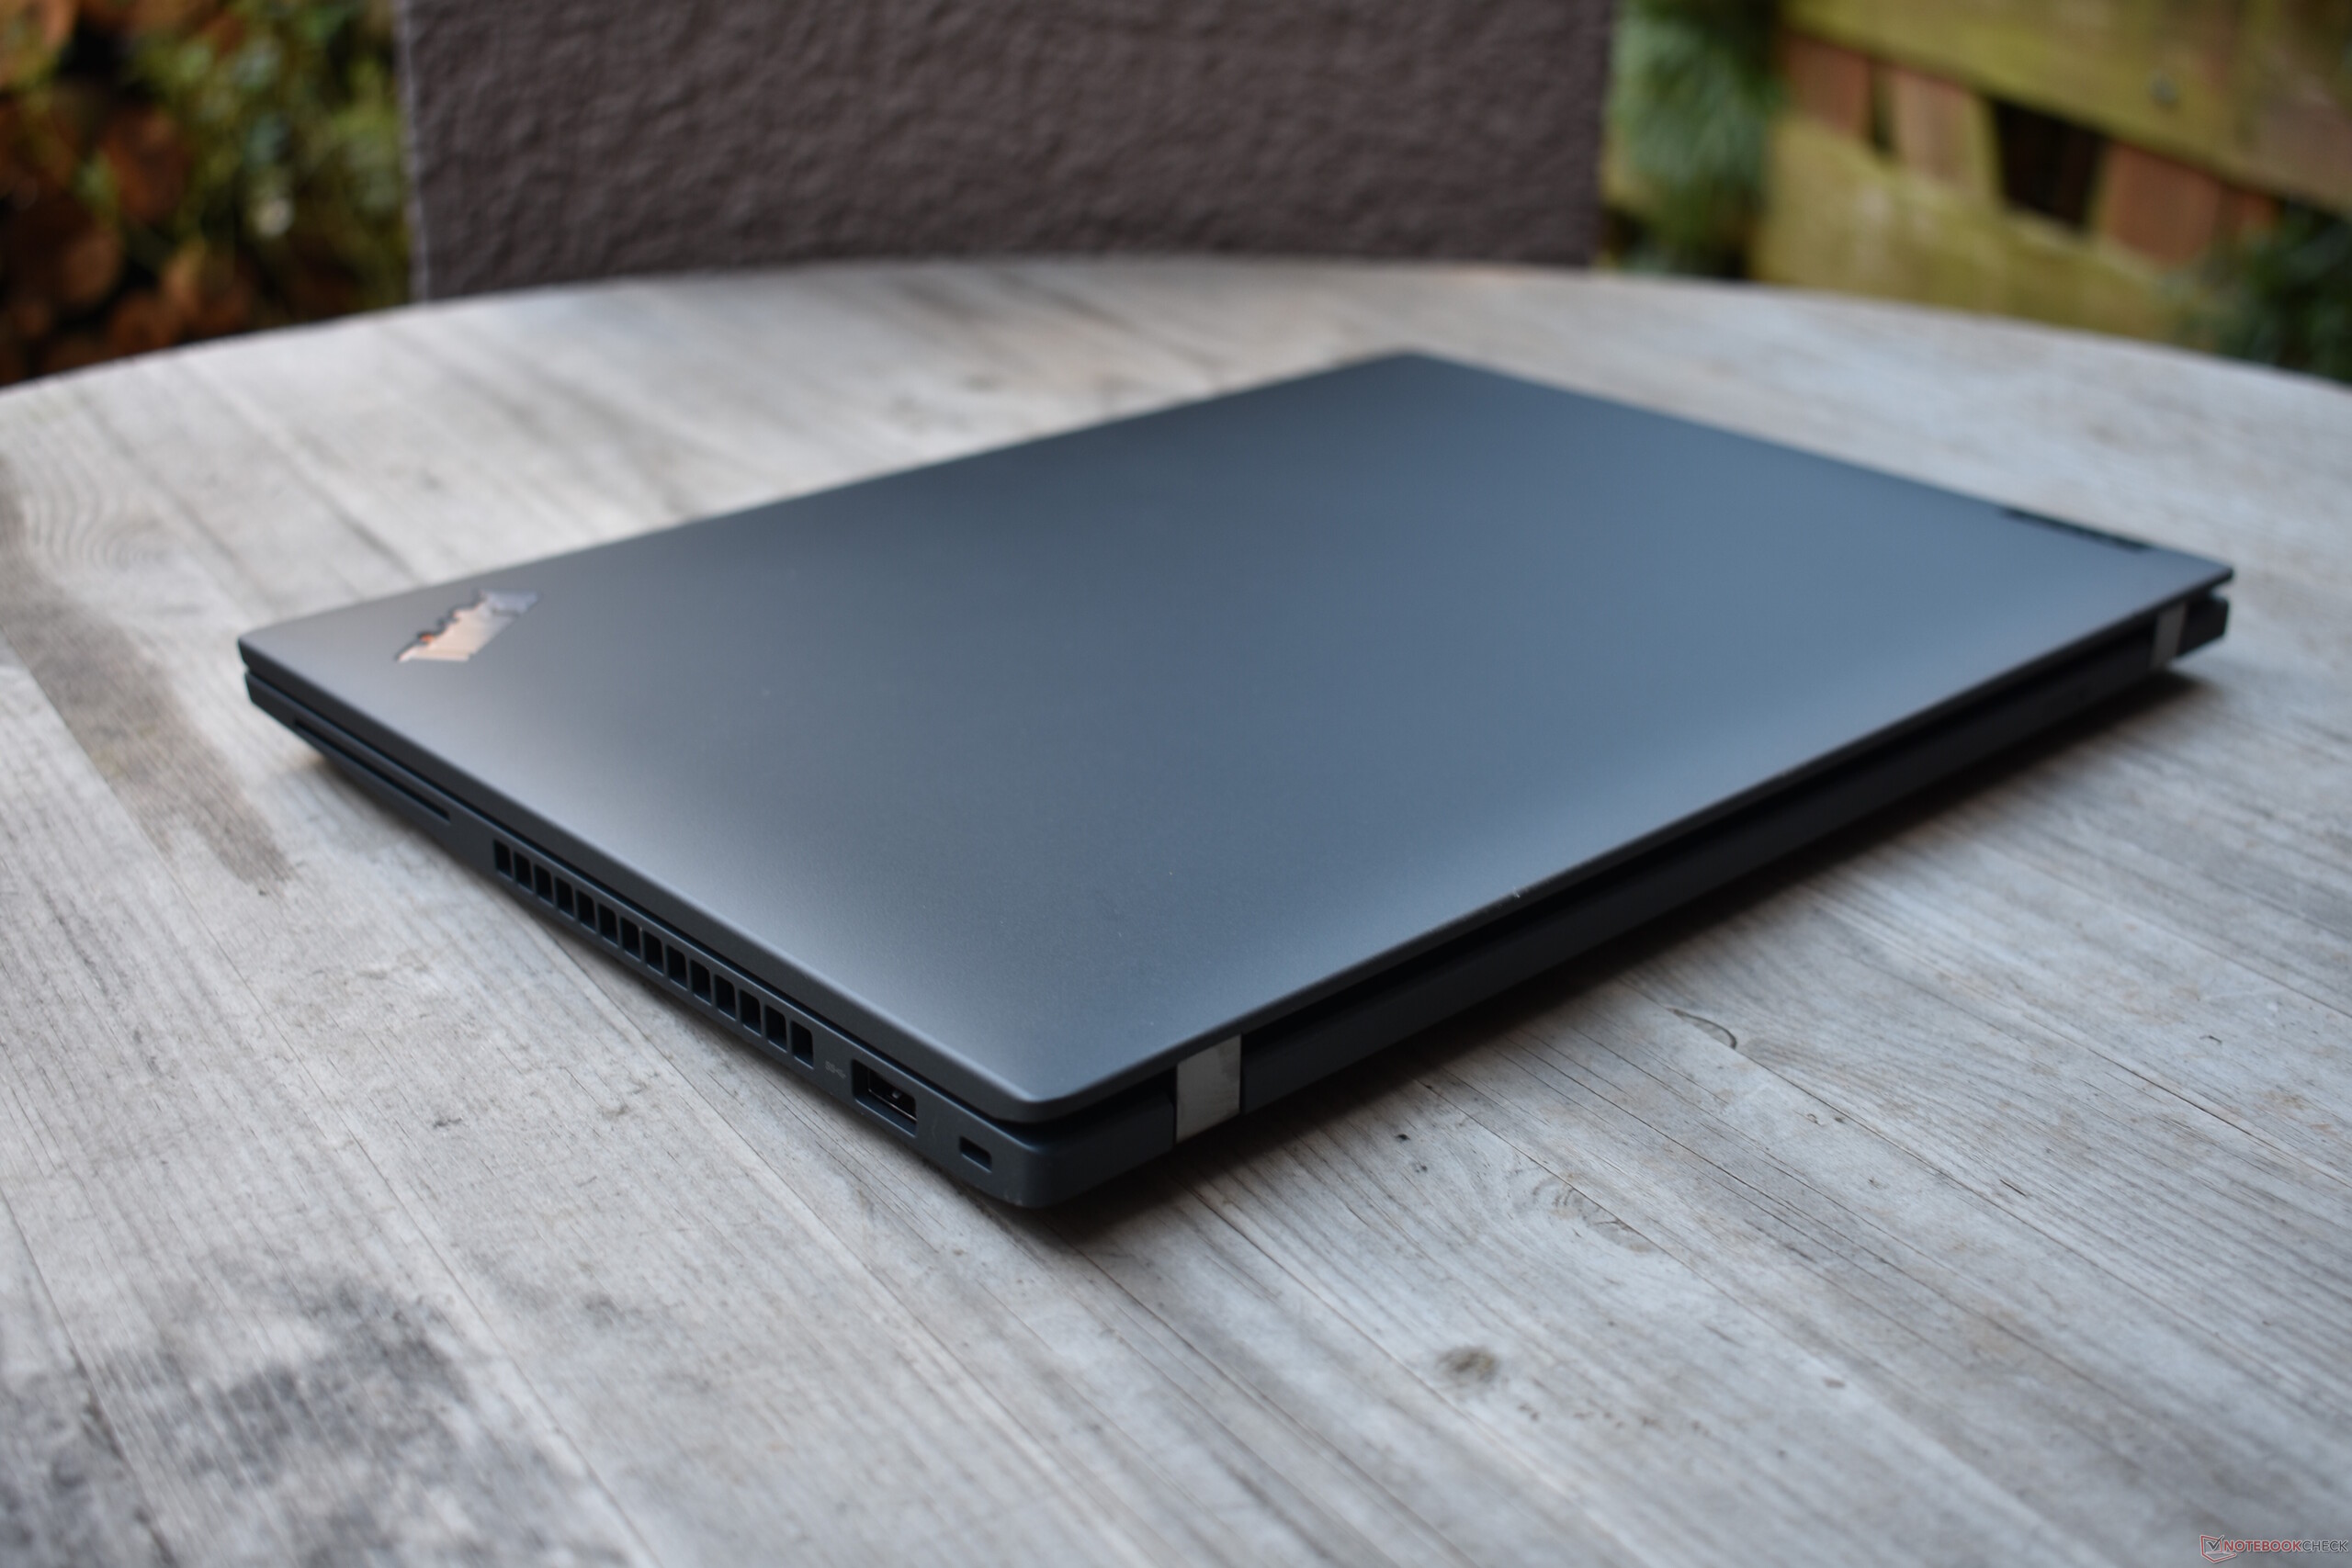
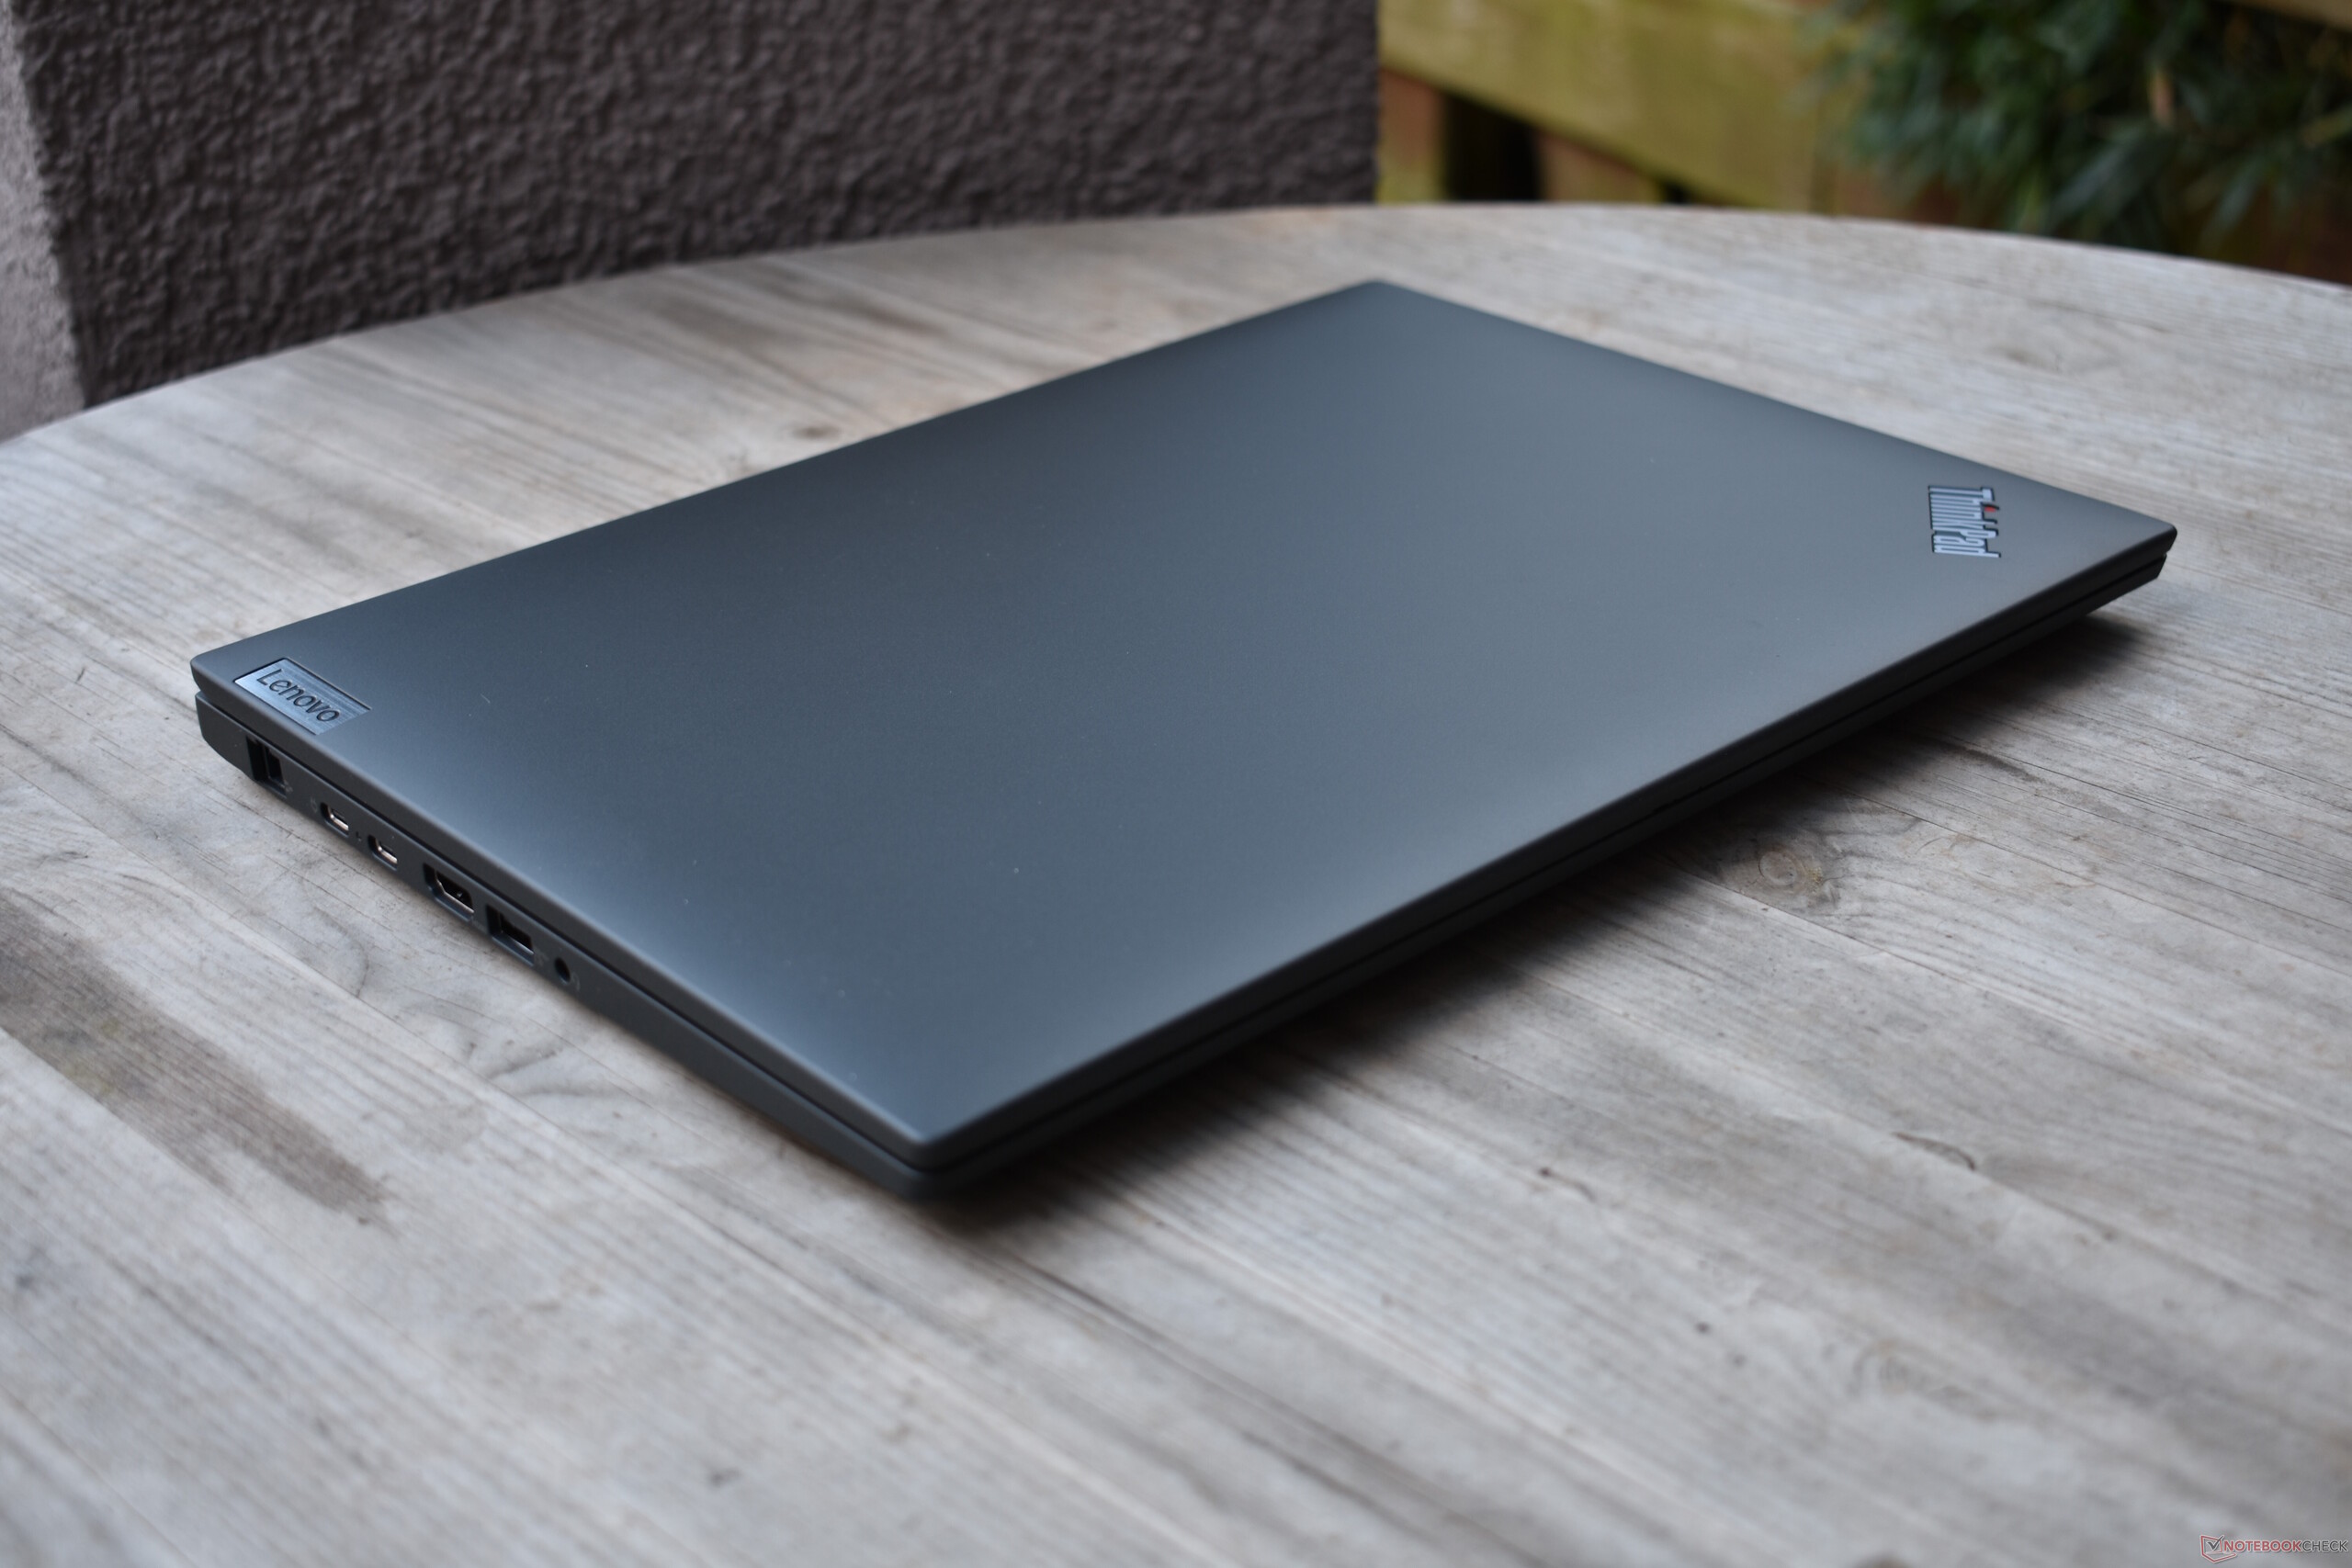
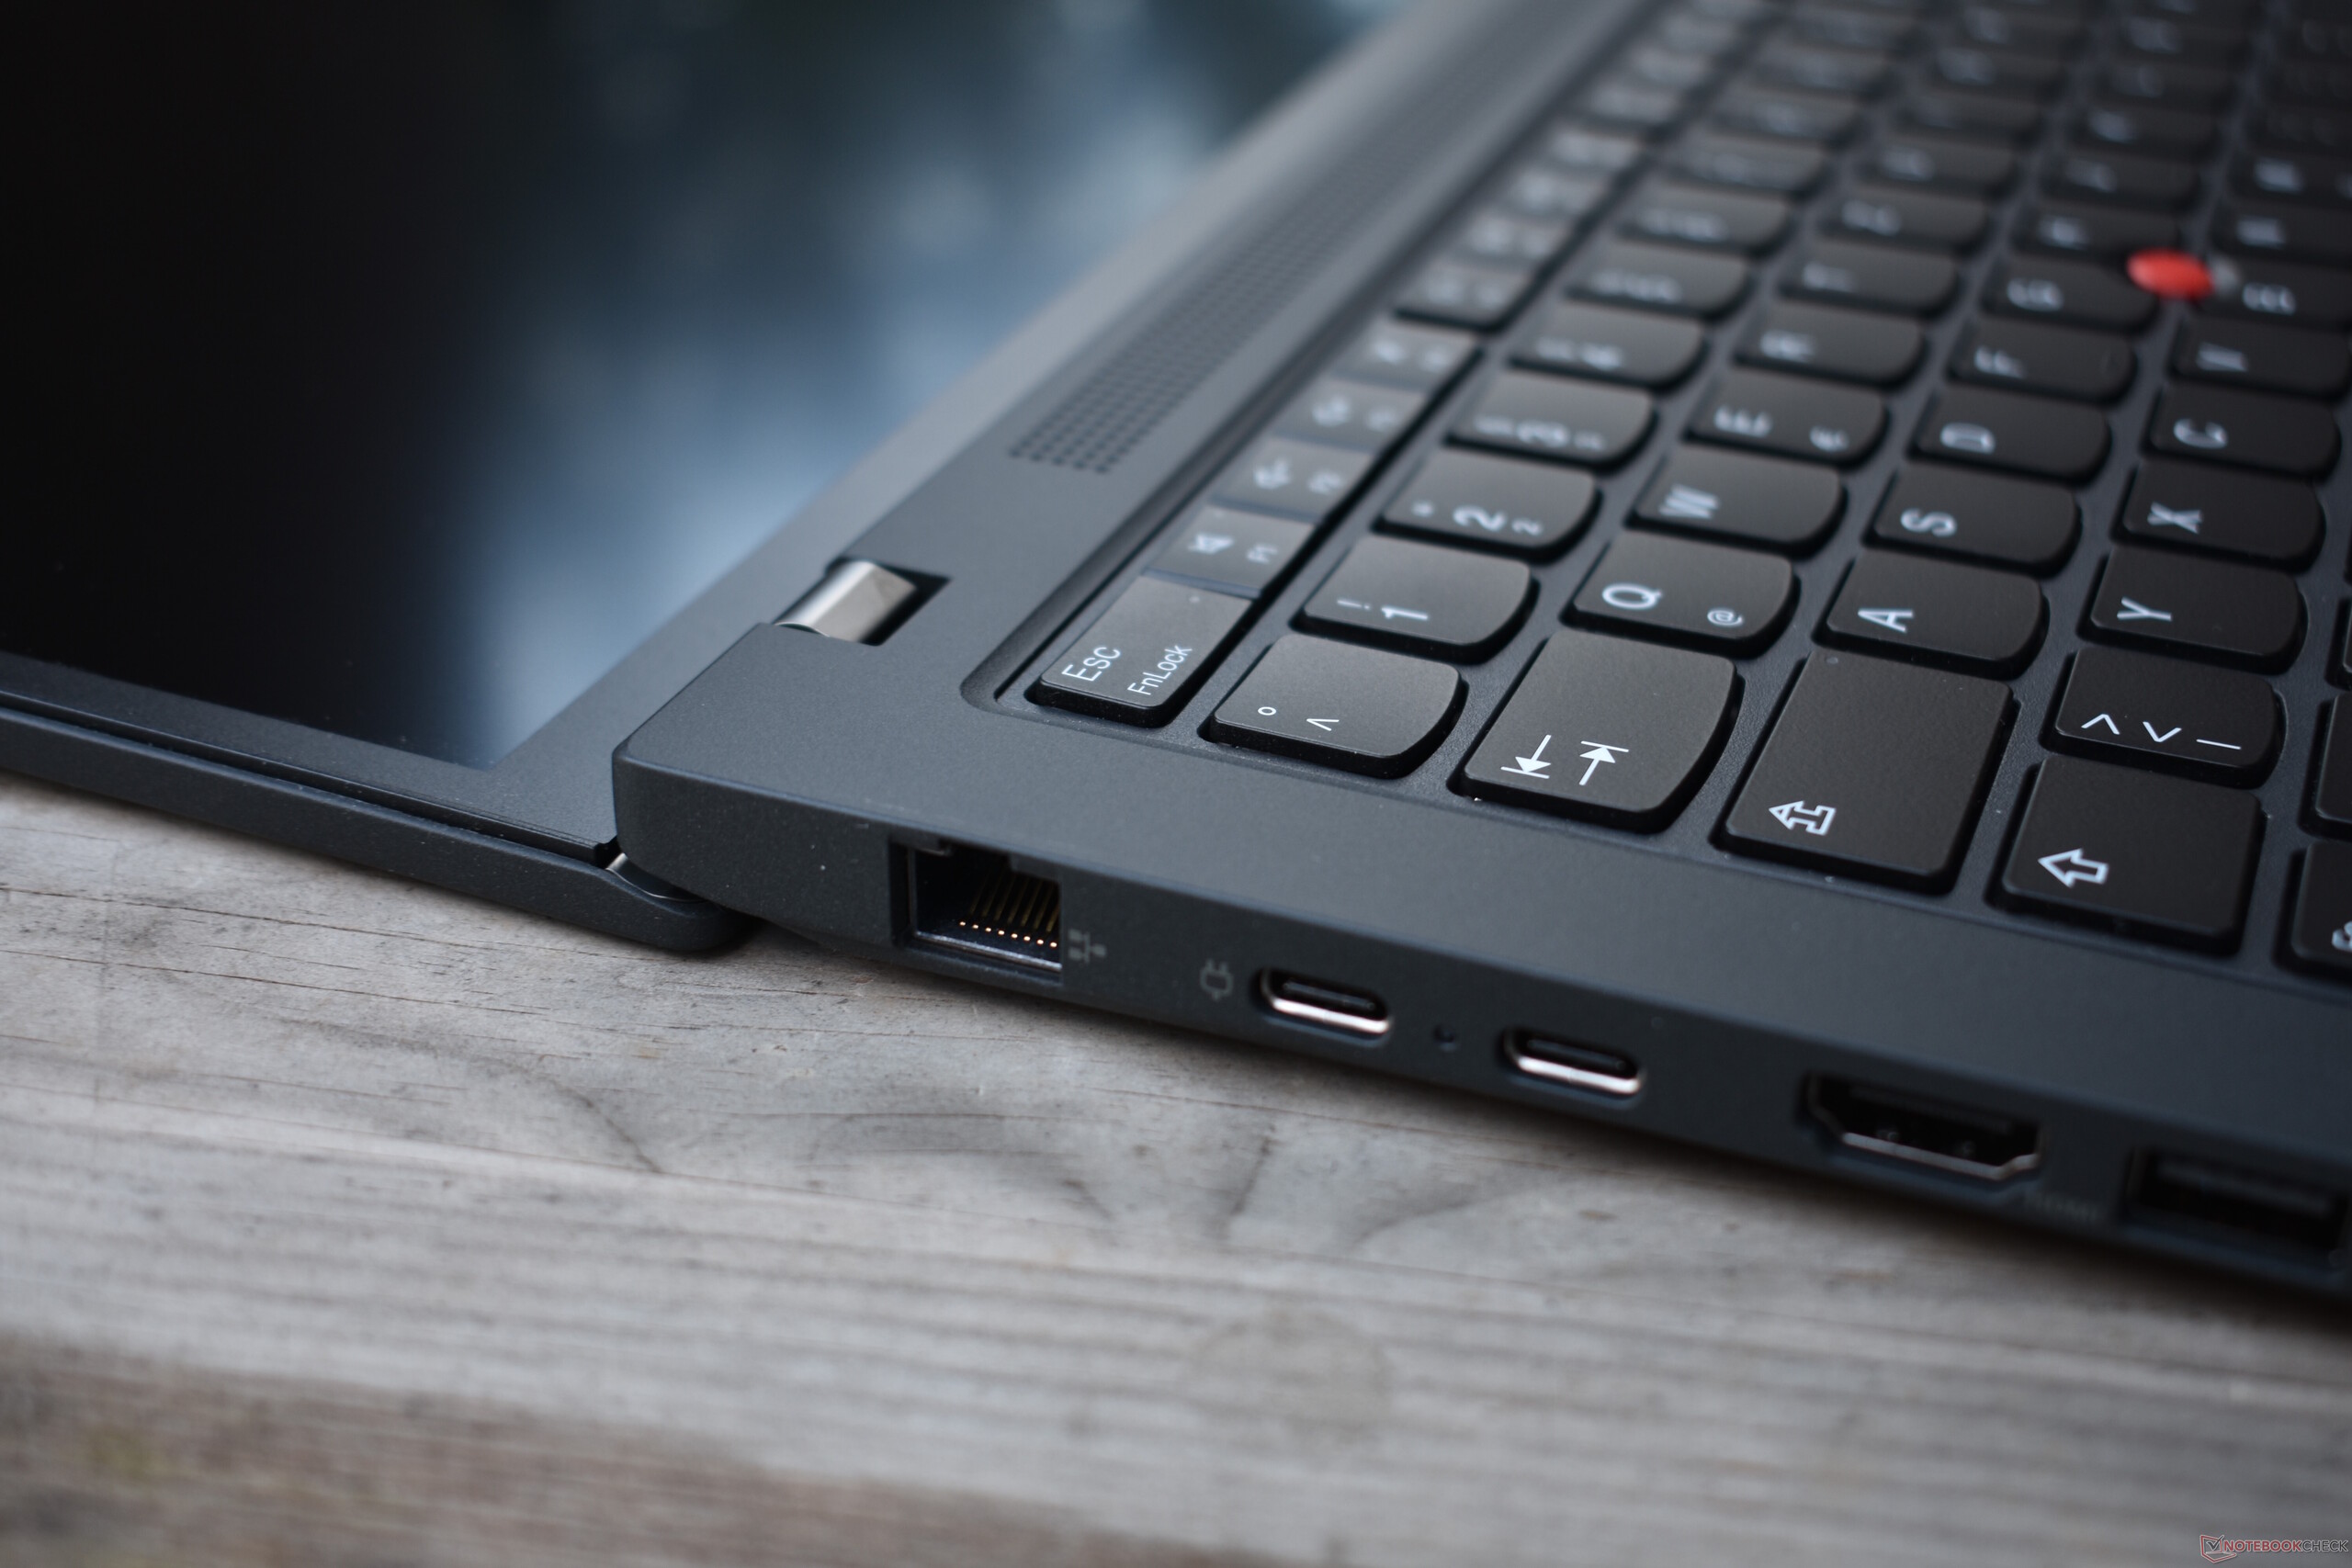
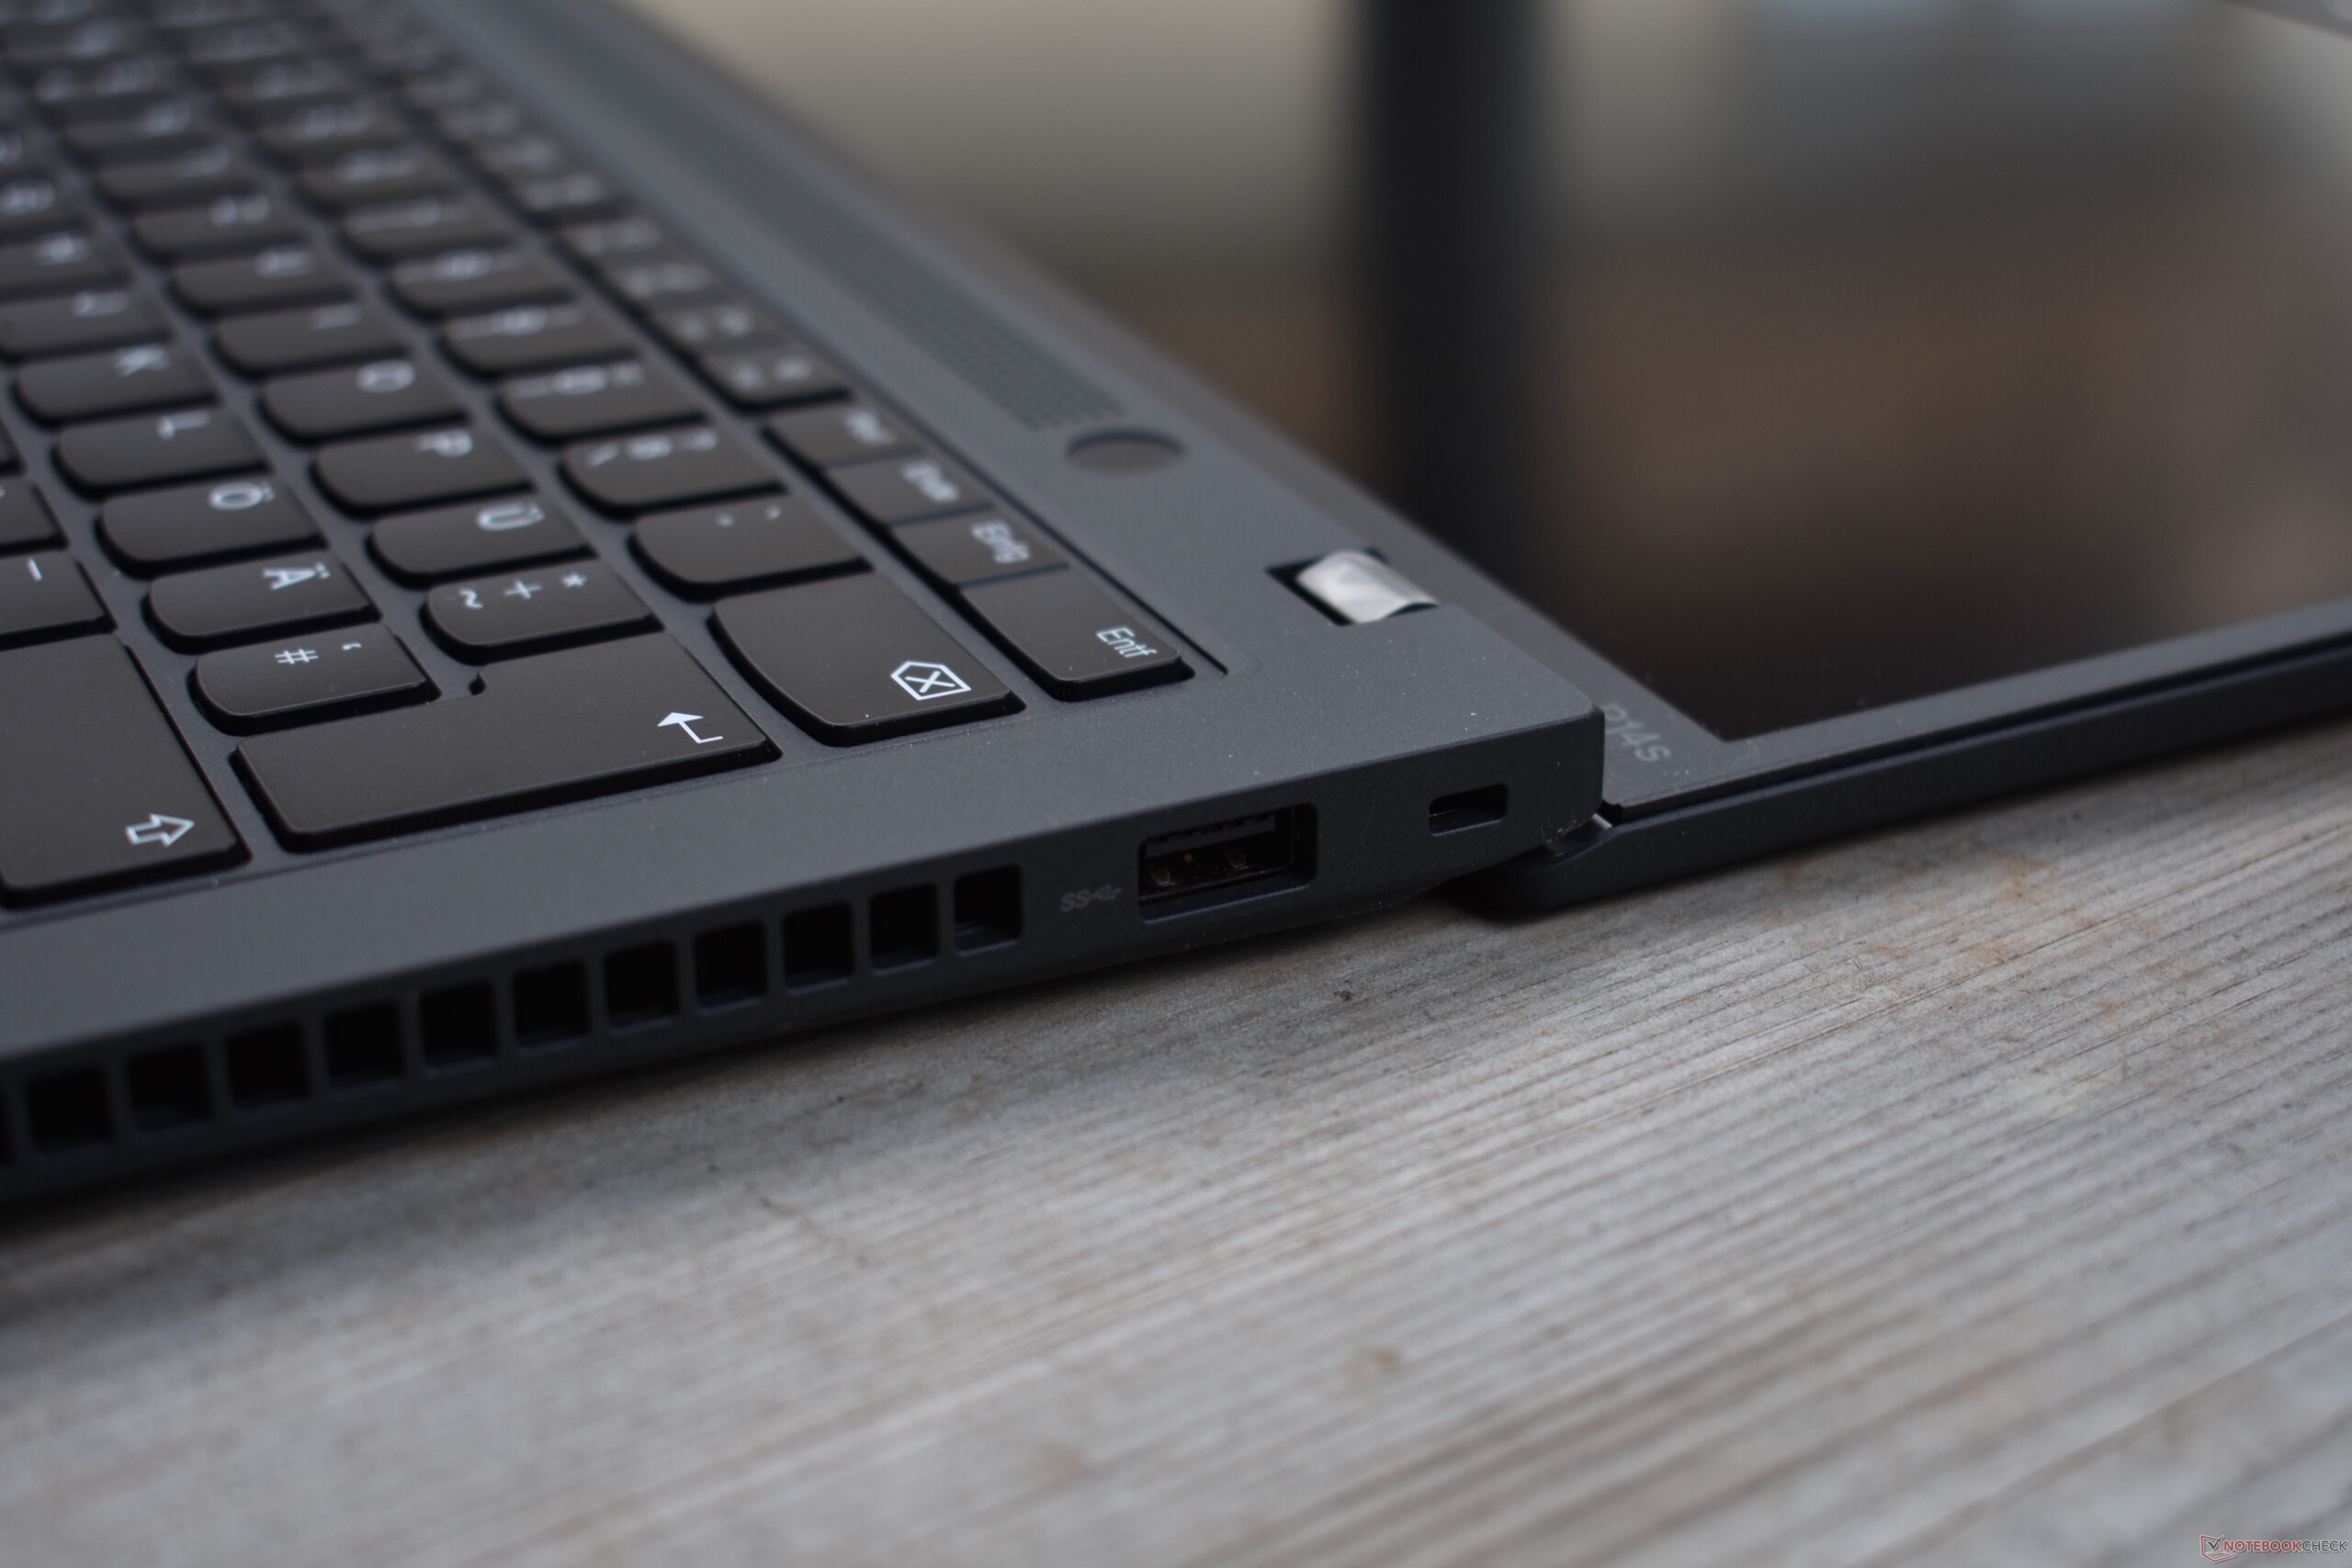
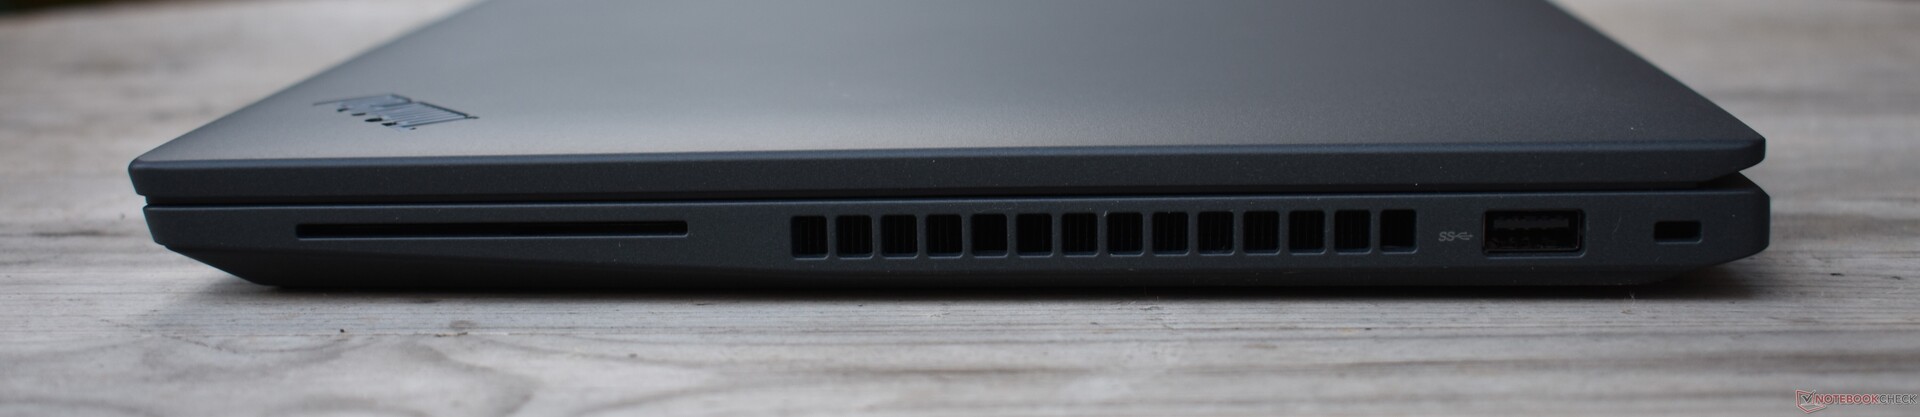
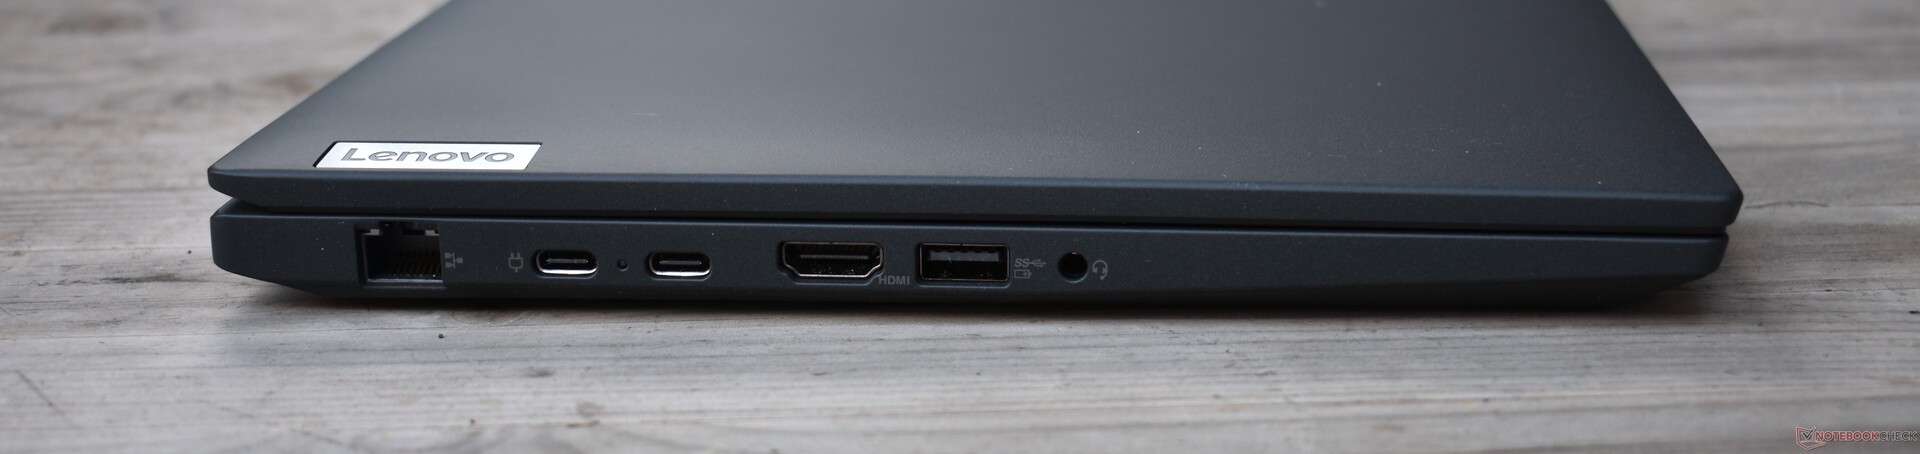
Ports
Its broad connectivity options are identical to those of the ThinkPad T14 Gen 3. Its lack of USB4 and as a result, Thunderbolt, is disappointing. In return, the Lenovo ThinkPad P14s G3 features RJ45 Ethernet - Dell and HP's 14-inch workstations do not have this port. However, an SD or at least microSD card slot would ideally be included in this kind of laptop.
Connectivity
Like all other current AMD ThinkPads, the Lenovo ThinkPad P14s Gen 3 relies on a Wi-Fi solution from Qualcomm. This can achieve high transfer rates, but the connection was not very stable when sending data.


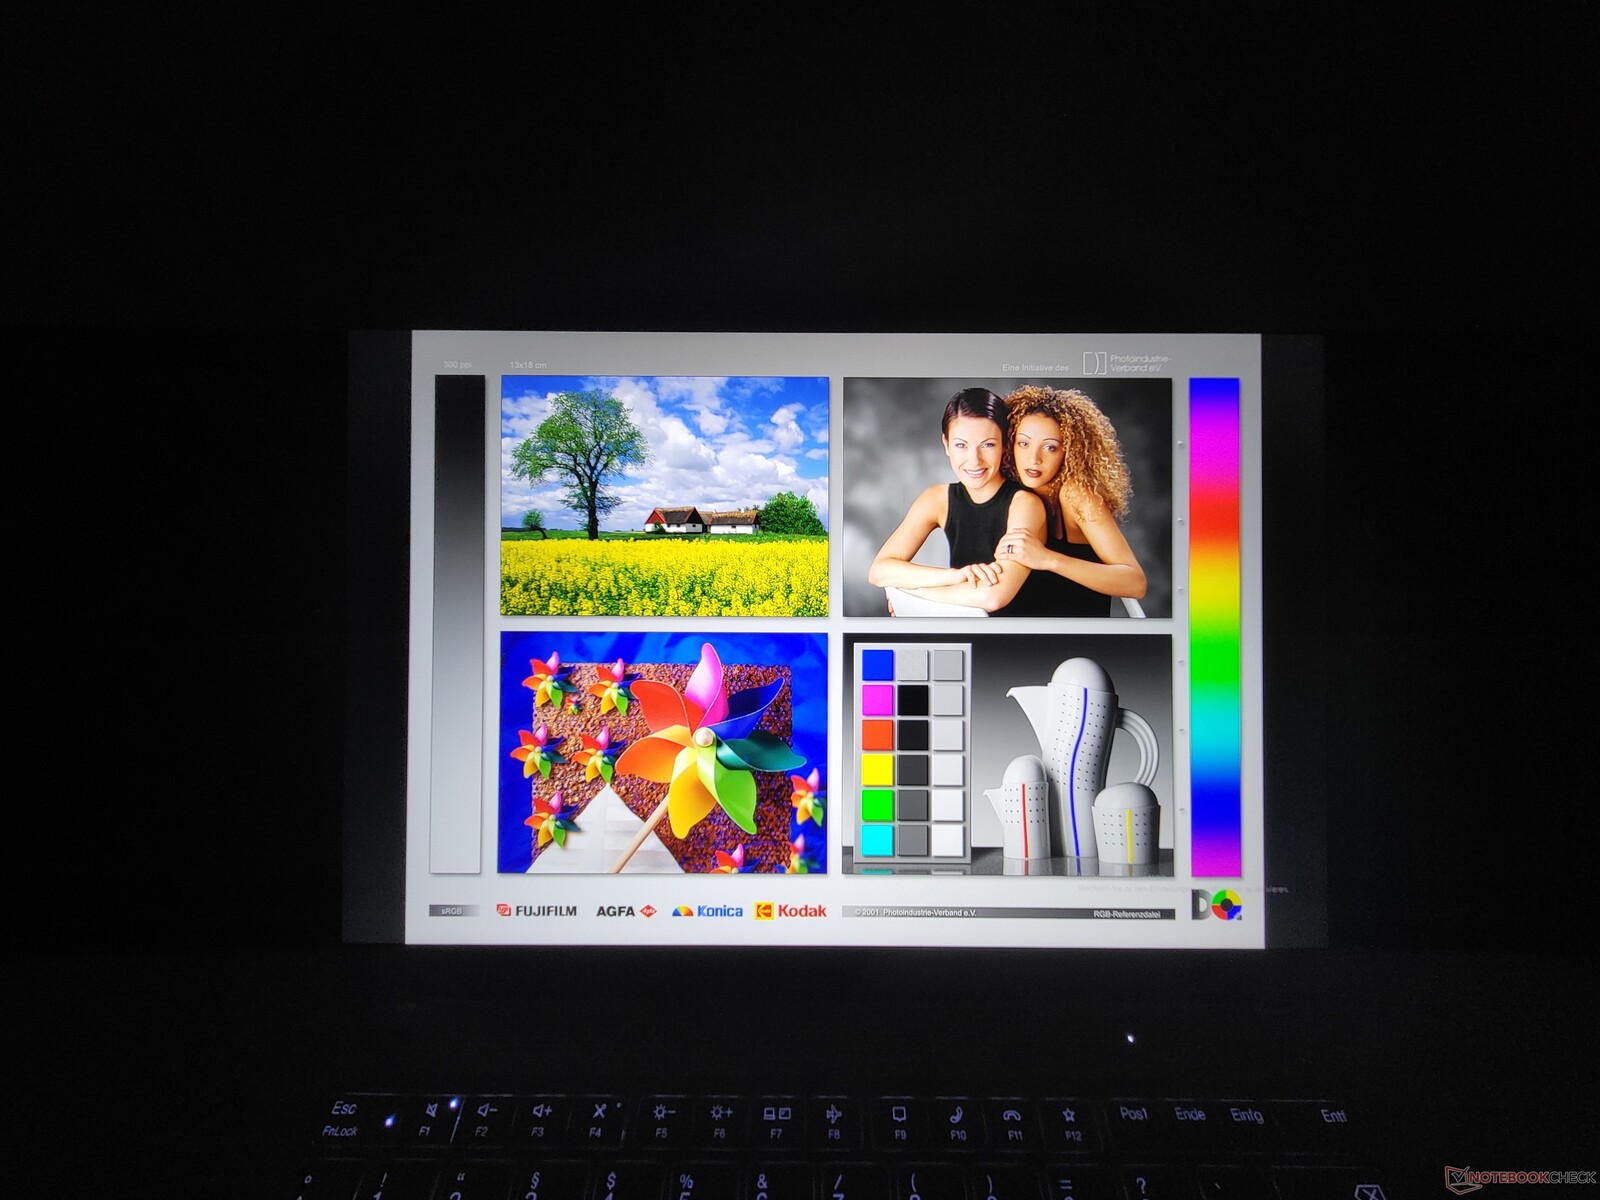
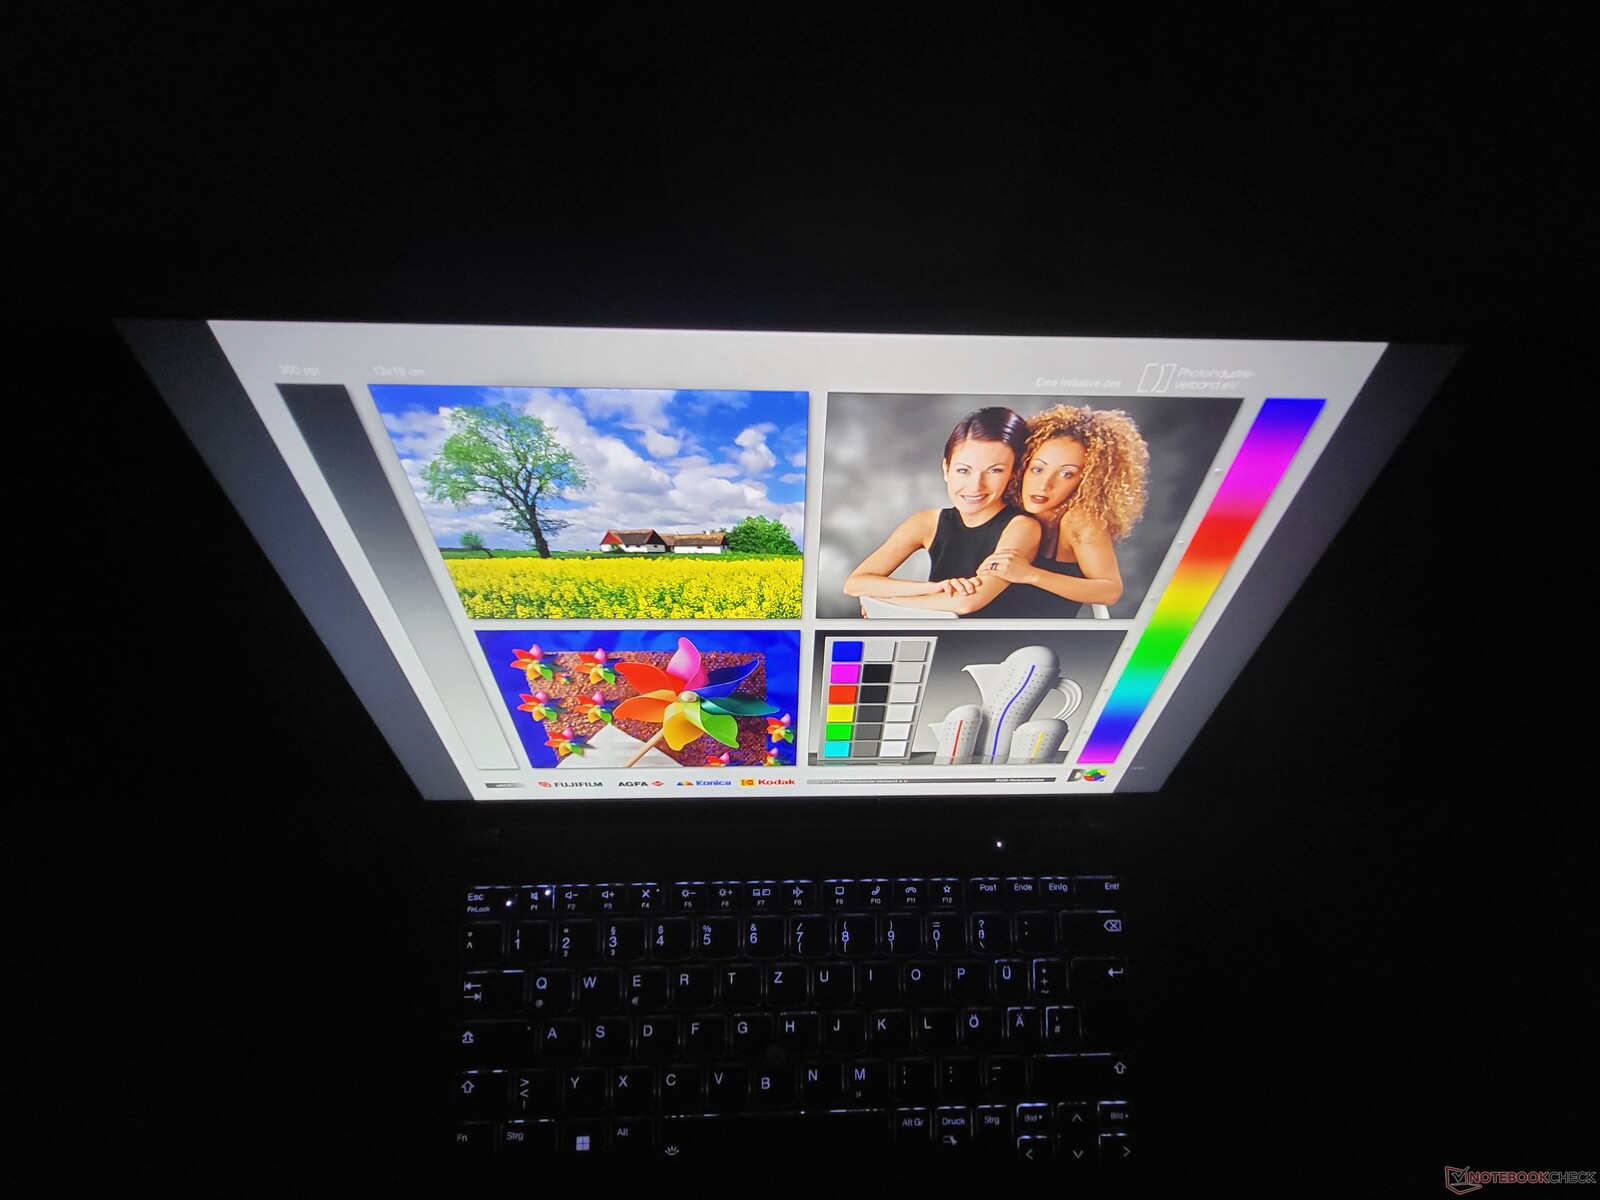
Display: The ThinkPad's matte low-power panel
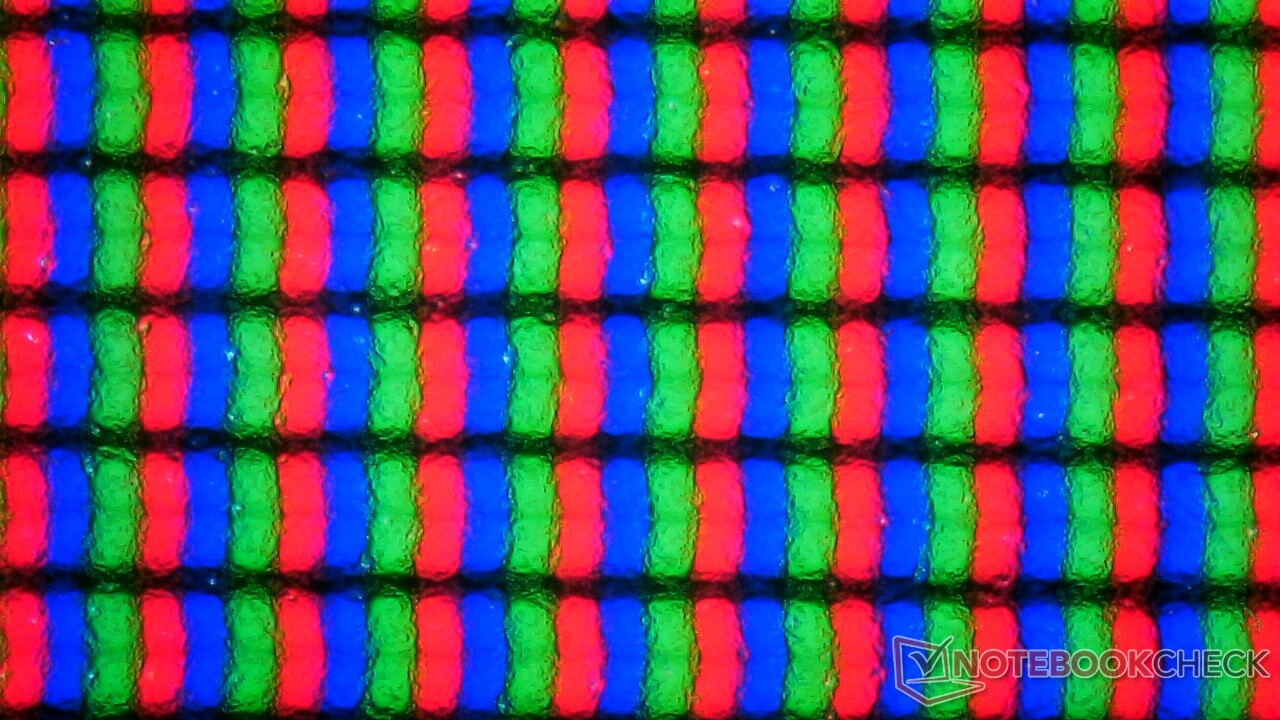
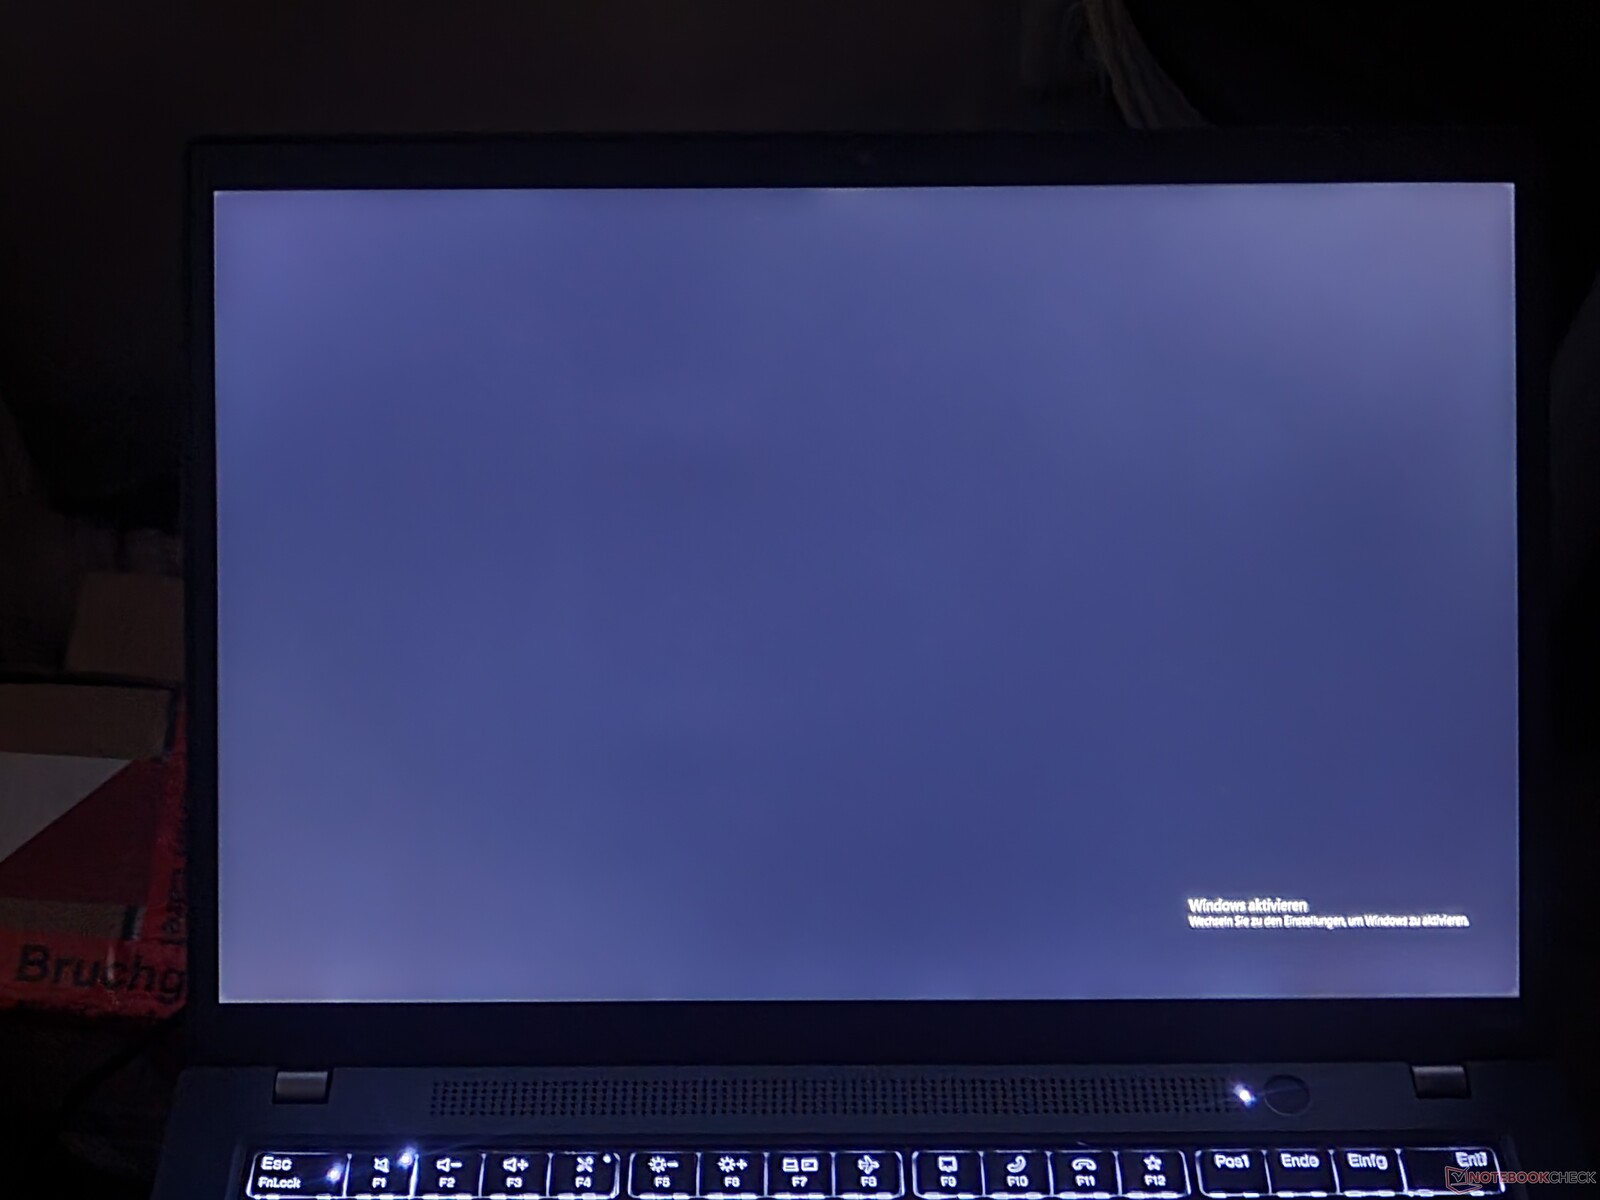
As is often the case with Lenovo ThinkPad laptops and business laptops in general, the ThinkPad P14s Gen 3 also has several display options. The features these screens all have in common: Their 14-inch diagonal, their 16:10 format as well as their IPS-LCD technology:
- WUXGA (1.920 x 1.200), 300 cd/m², 45 % NTSC, Anti-Glare
- WUXGA (1.920 x 1.200), 400 cd/m², 100 % sRGB, Anti-Glare, Low Power
- WUXGA (1.920 x 1.200), 300 cd/m², 45 % NTSC, Anti-Glare, On-Cell-Multitouch
- WQUXGA (3.840 x 2.400), 500 cd/m², 100 % DCI-P3, Anti-Reflection, Add-On-Film-Multitouch
We already tested LG's low-power display on the ThinkPad T14 Gen 3. It exceeded the stated brightness value of 400 cd/m² - its average brightness was 422 cd/m². This is not the only panel that Lenovo markets as a "low-power display" - on the ThinkPad T14s Gen 3, for example, we tested a CSOT panel which delivered slightly less brightness. This "display lottery" is also the case with the ThinkPad P14s G3.
| |||||||||||||||||||||||||
Brightness Distribution: 85 %
Center on Battery: 448 cd/m²
Contrast: 1948:1 (Black: 0.23 cd/m²)
ΔE ColorChecker Calman: 2.5 | ∀{0.5-29.43 Ø4.73}
calibrated: 1.3
ΔE Greyscale Calman: 2.9 | ∀{0.09-98 Ø4.97}
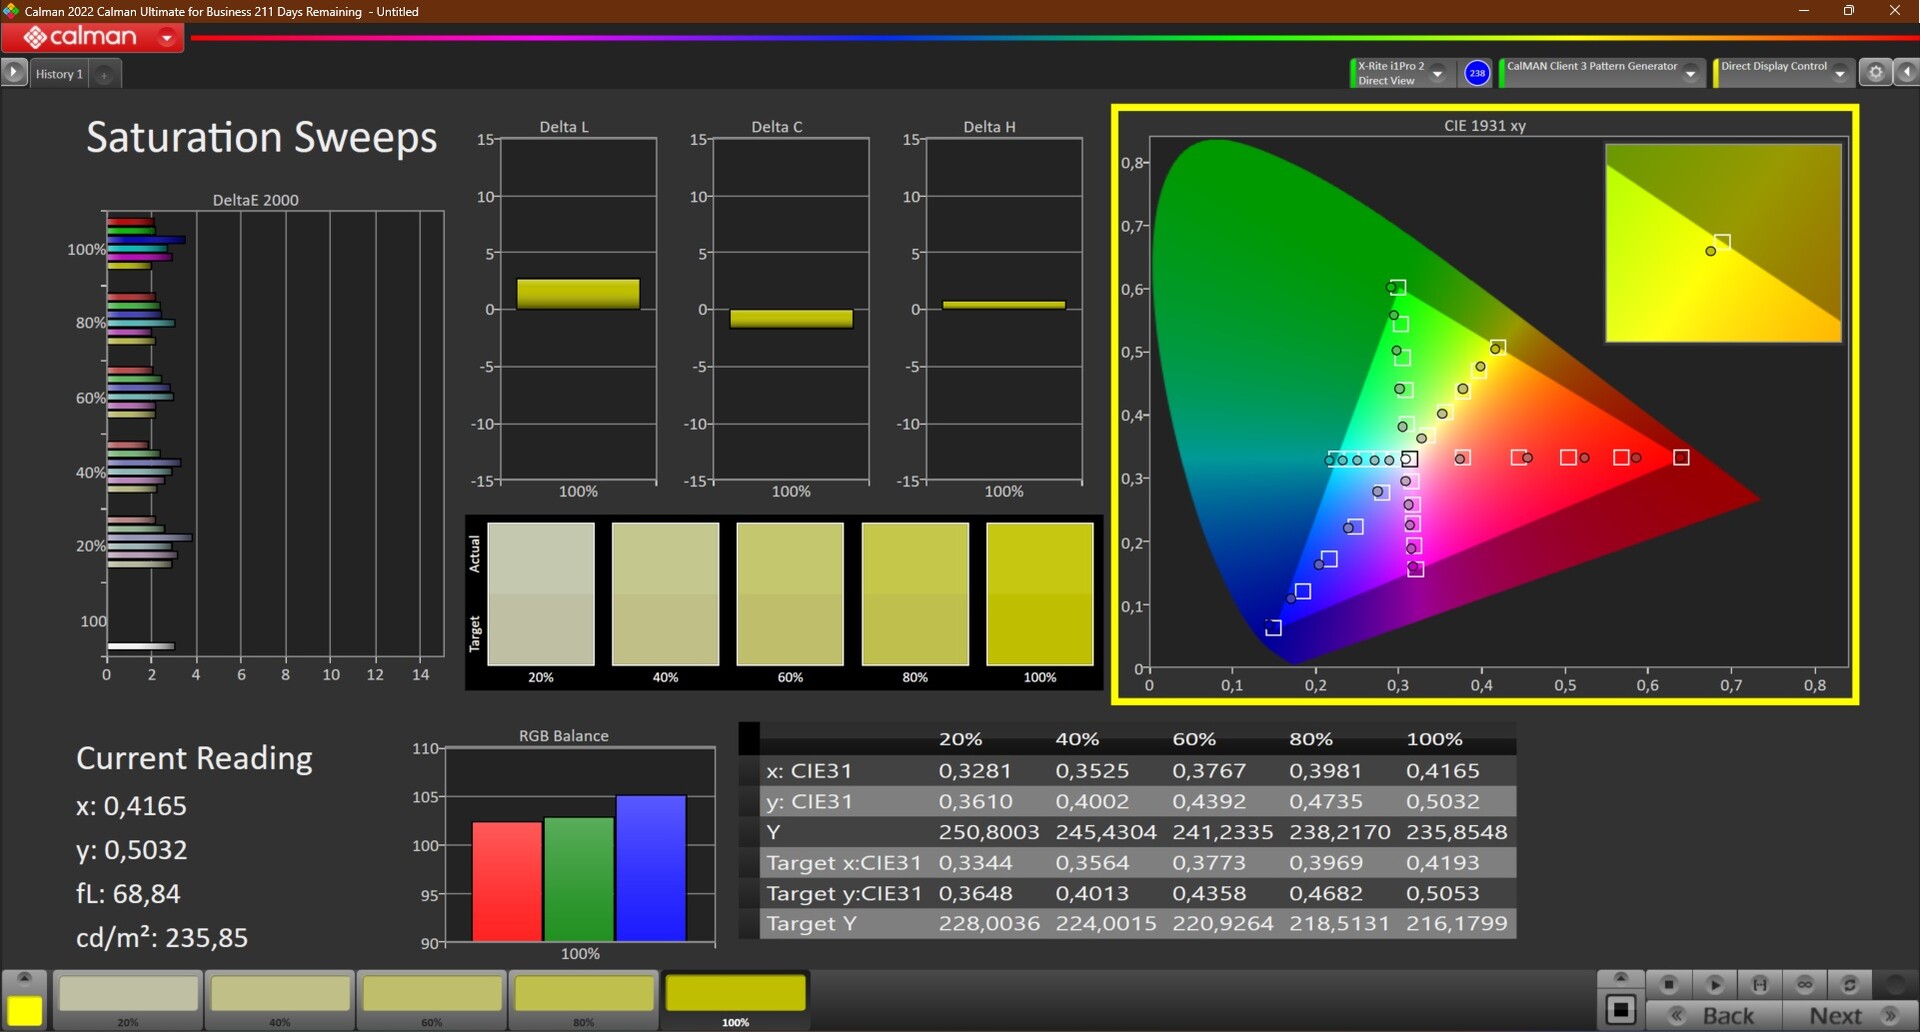
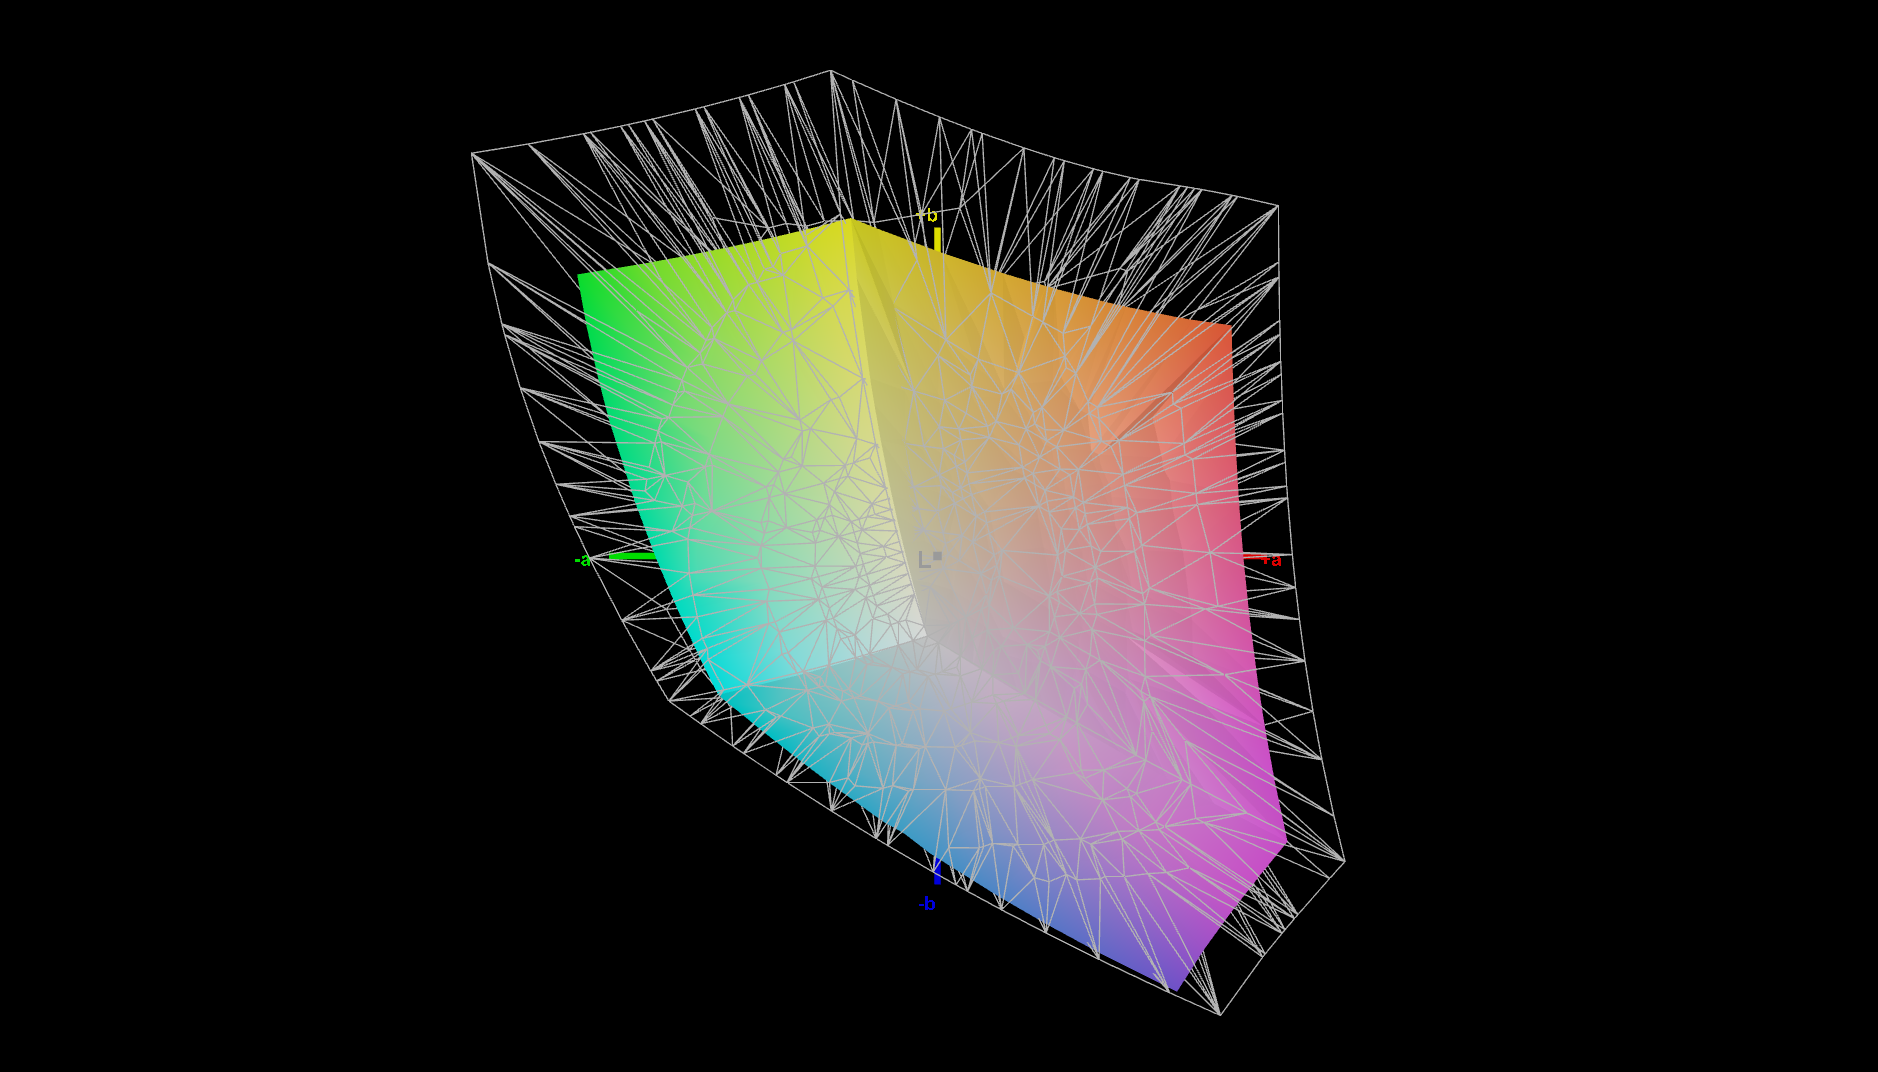
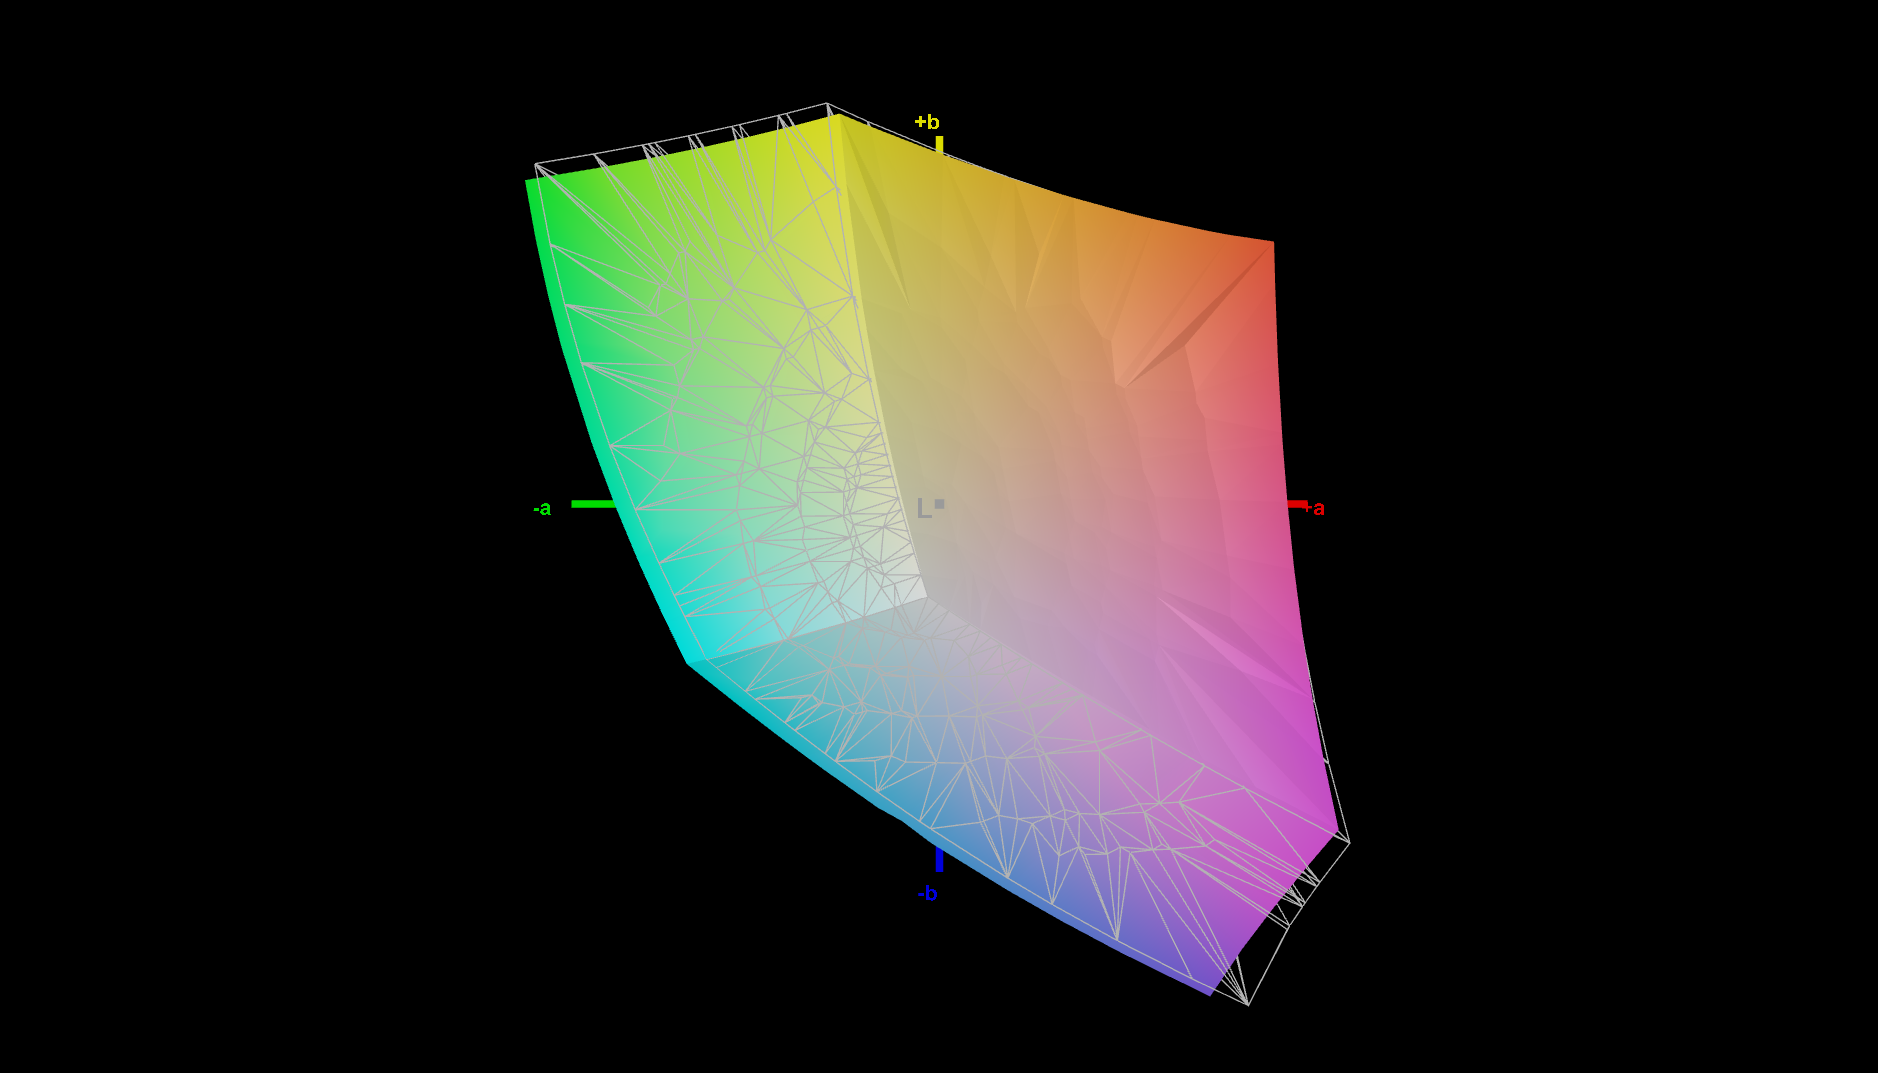
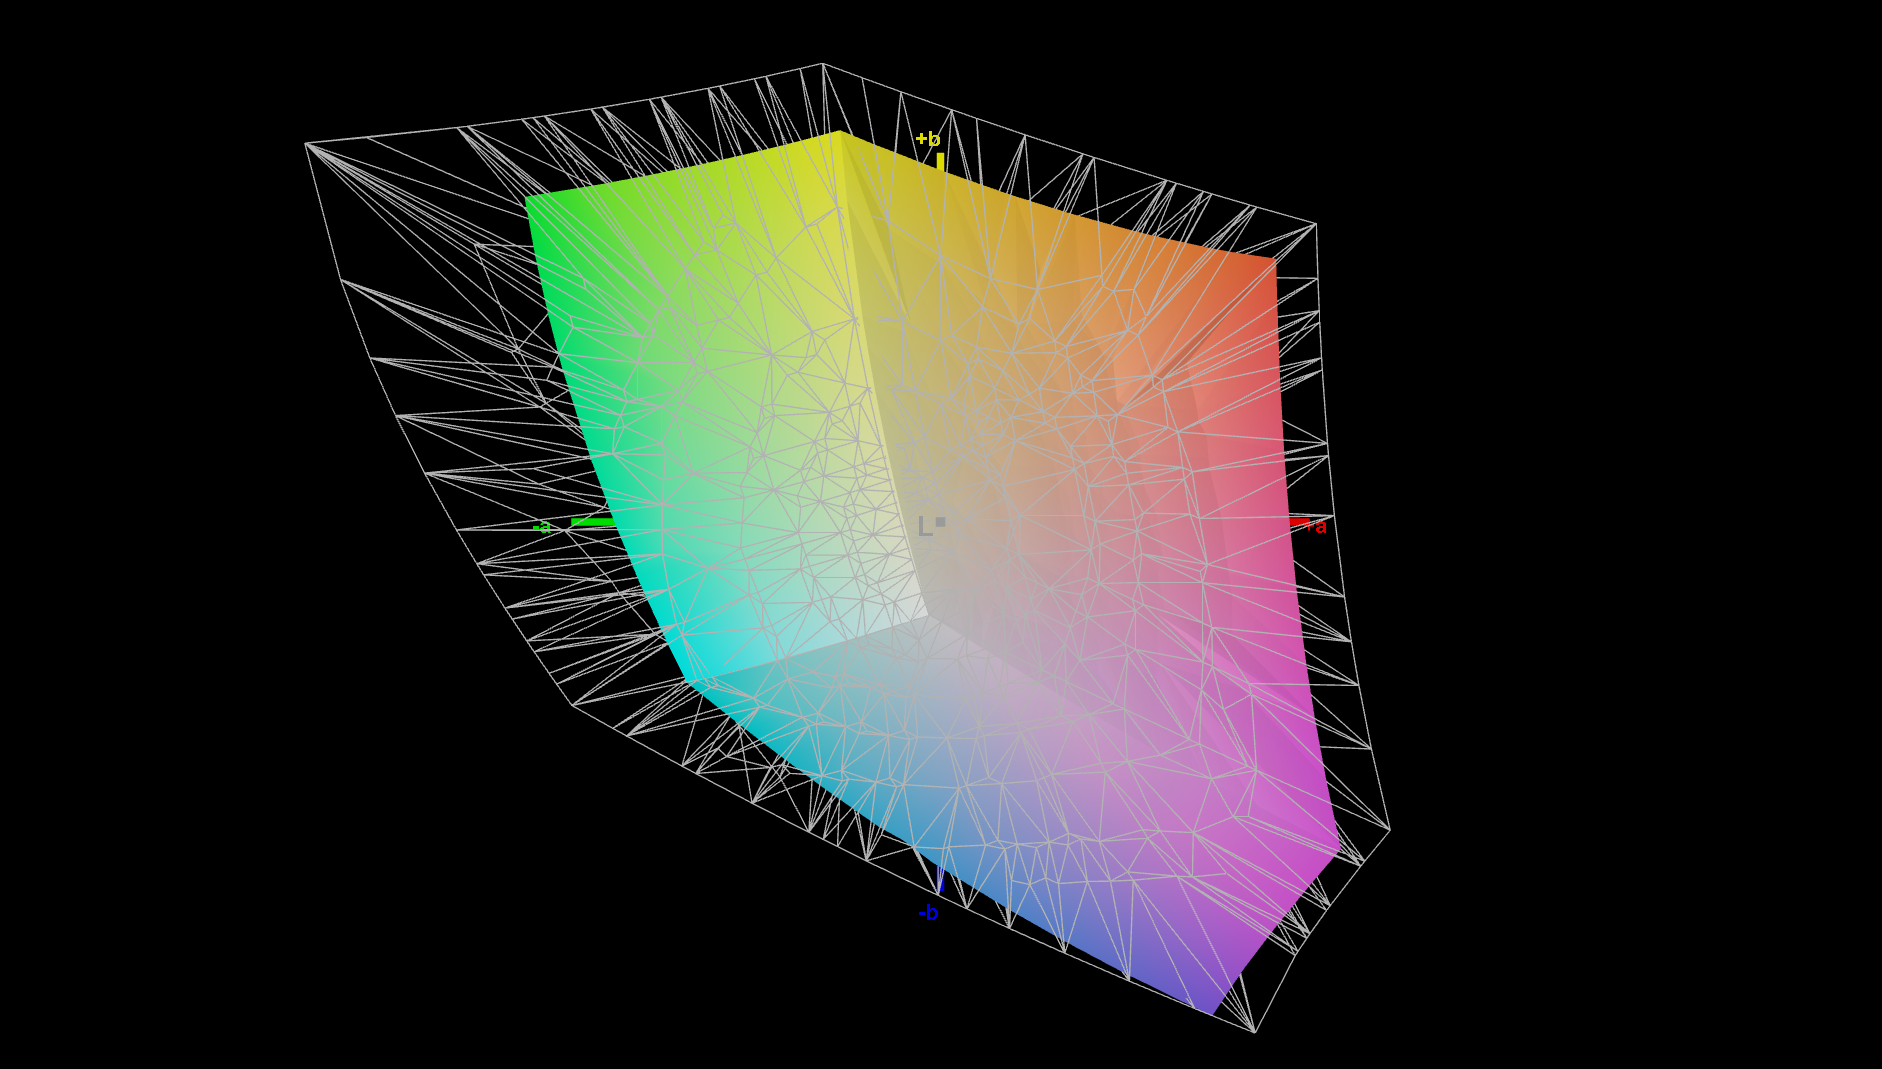
68.2% AdobeRGB 1998 (Argyll 3D)
94.3% sRGB (Argyll 3D)
65.9% Display P3 (Argyll 3D)
Gamma: 2.03
CCT: 6840 K
| Lenovo ThinkPad P14s G3 AMD 21J6S05000 LP140WU1-SPB2, IPS LED, 1920x1200, 14" | Lenovo ThinkPad P14s Gen2-20VX000GGE B140HAN05.7, IPS, 1920x1080, 14" | Lenovo ThinkPad T14 G3-21CF004NGE LP140WU1-SPB2, IPS, 1920x1200, 14" | Dell Precision 5000 5470 AU Optronics B140QAN, IPS, 2560x1600, 14" | HP ZBook Firefly 14 G9-6B8A2EA CMN1435, IPS, 1920x1200, 14" | Lenovo ThinkPad T14s G3 21CQ002LGE MNE007JA1-1, LTPS IPS LED, 1920x1200, 14" | |
|---|---|---|---|---|---|---|
| Display | -0% | 4% | 14% | 5% | 5% | |
| Display P3 Coverage (%) | 65.9 | 65.4 -1% | 69.2 5% | 79.3 20% | 69.6 6% | 69.4 5% |
| sRGB Coverage (%) | 94.3 | 96.6 2% | 97.4 3% | 100 6% | 99.9 6% | 99.8 6% |
| AdobeRGB 1998 Coverage (%) | 68.2 | 66.5 -2% | 71.5 5% | 78.7 15% | 71.1 4% | 71.4 5% |
| Response Times | -54% | -1% | -43% | -37% | -1% | |
| Response Time Grey 50% / Grey 80% * (ms) | 33.5 ? | 58.8 ? -76% | 41.4 ? -24% | 52.4 ? -56% | 56.3 ? -68% | 36.3 ? -8% |
| Response Time Black / White * (ms) | 24.9 ? | 32.8 ? -32% | 19.2 ? 23% | 32.4 ? -30% | 26.2 ? -5% | 23.1 ? 7% |
| PWM Frequency (Hz) | ||||||
| Screen | -24% | 1% | -2% | -15% | 13% | |
| Brightness middle (cd/m²) | 448 | 350 -22% | 451 1% | 537 20% | 432 -4% | 396 -12% |
| Brightness (cd/m²) | 422 | 348 -18% | 435 3% | 518 23% | 407 -4% | 379 -10% |
| Brightness Distribution (%) | 85 | 94 11% | 94 11% | 94 11% | 91 7% | 92 8% |
| Black Level * (cd/m²) | 0.23 | 0.14 39% | 0.21 9% | 0.33 -43% | 0.28 -22% | 0.26 -13% |
| Contrast (:1) | 1948 | 2500 28% | 2148 10% | 1627 -16% | 1543 -21% | 1523 -22% |
| Colorchecker dE 2000 * | 2.5 | 4.3 -72% | 2.4 4% | 2.97 -19% | 3.1 -24% | 1.3 48% |
| Colorchecker dE 2000 max. * | 3.7 | 6.7 -81% | 4.1 -11% | 5.33 -44% | 5.6 -51% | 2.7 27% |
| Colorchecker dE 2000 calibrated * | 1.3 | 1.5 -15% | 1.3 -0% | 0.88 32% | 0.8 38% | 0.7 46% |
| Greyscale dE 2000 * | 2.9 | 5.3 -83% | 3.3 -14% | 2.4 17% | 4.5 -55% | 1.6 45% |
| Gamma | 2.03 108% | 2.42 91% | 2.13 103% | 2.06 107% | 2 110% | 2.14 103% |
| CCT | 6840 95% | 7631 85% | 6848 95% | 6668 97% | 6528 100% | 6554 99% |
| Color Space (Percent of AdobeRGB 1998) (%) | 61.1 | |||||
| Color Space (Percent of sRGB) (%) | 96.4 | |||||
| Total Average (Program / Settings) | -26% /
-23% | 1% /
2% | -10% /
-5% | -16% /
-14% | 6% /
9% |
* ... smaller is better
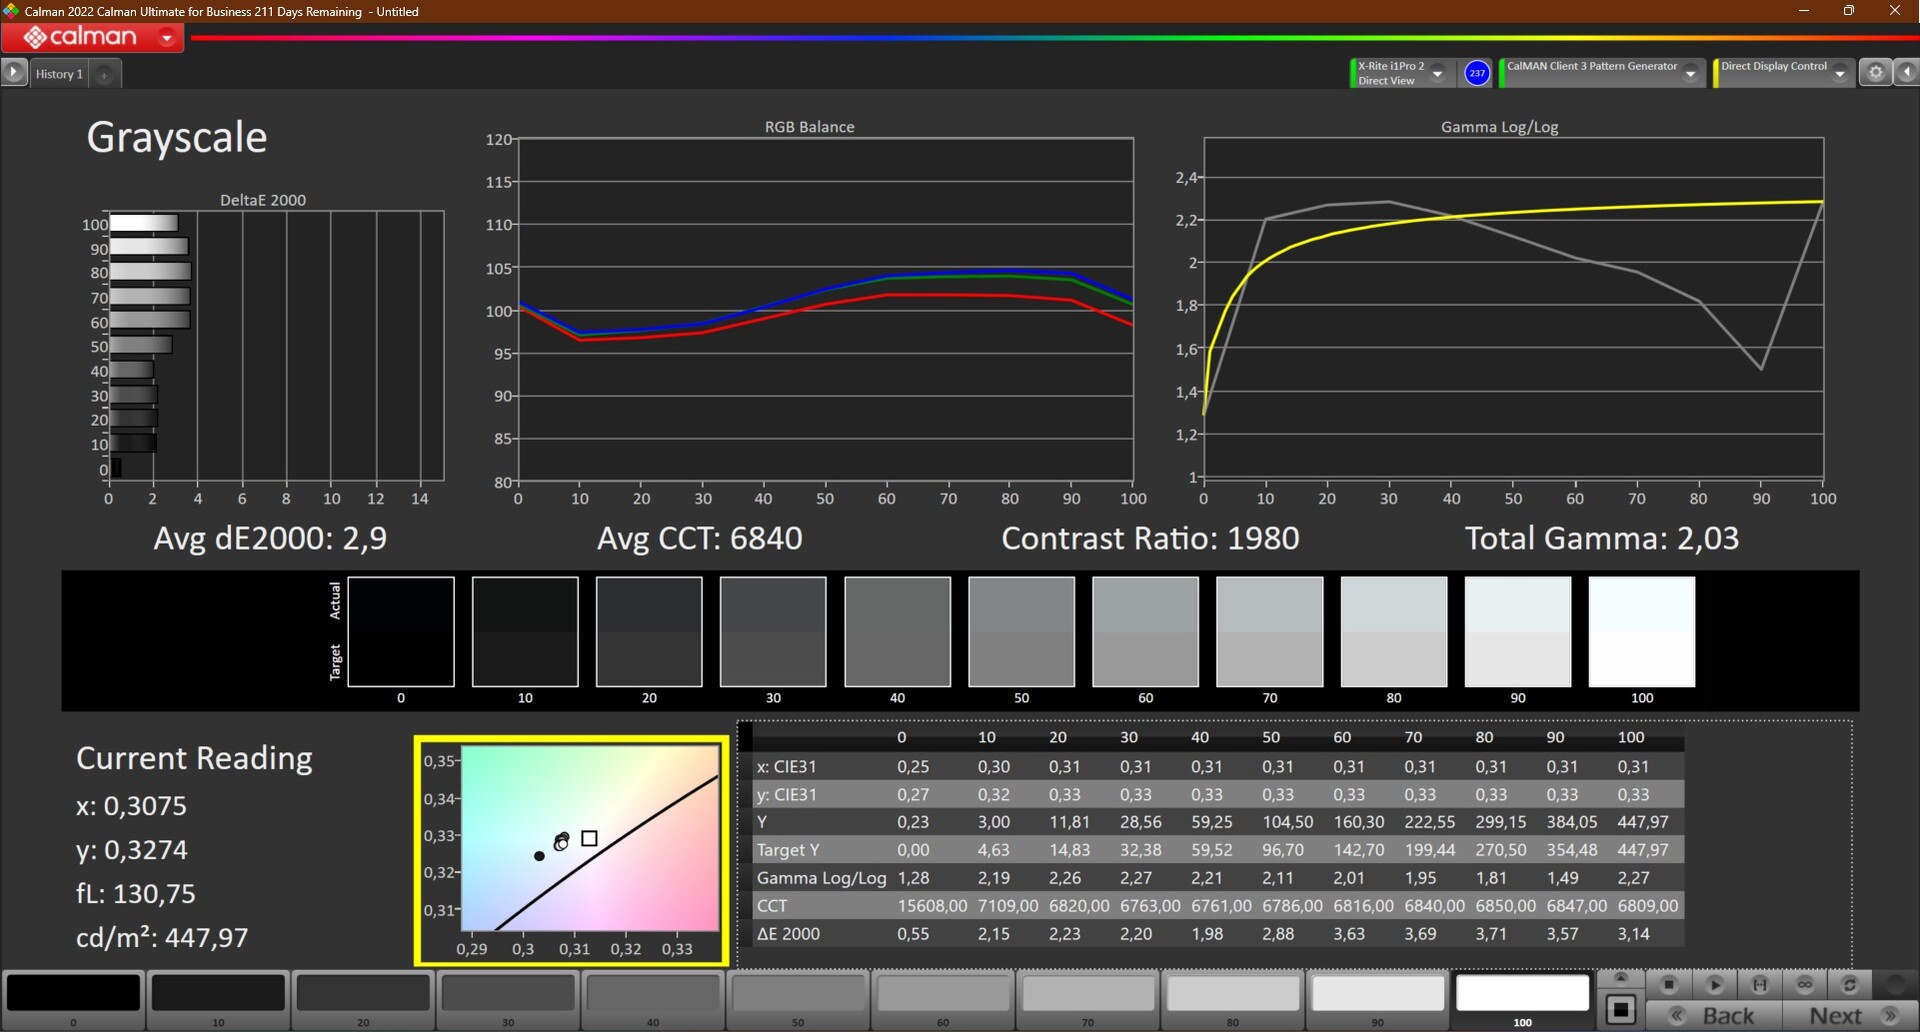
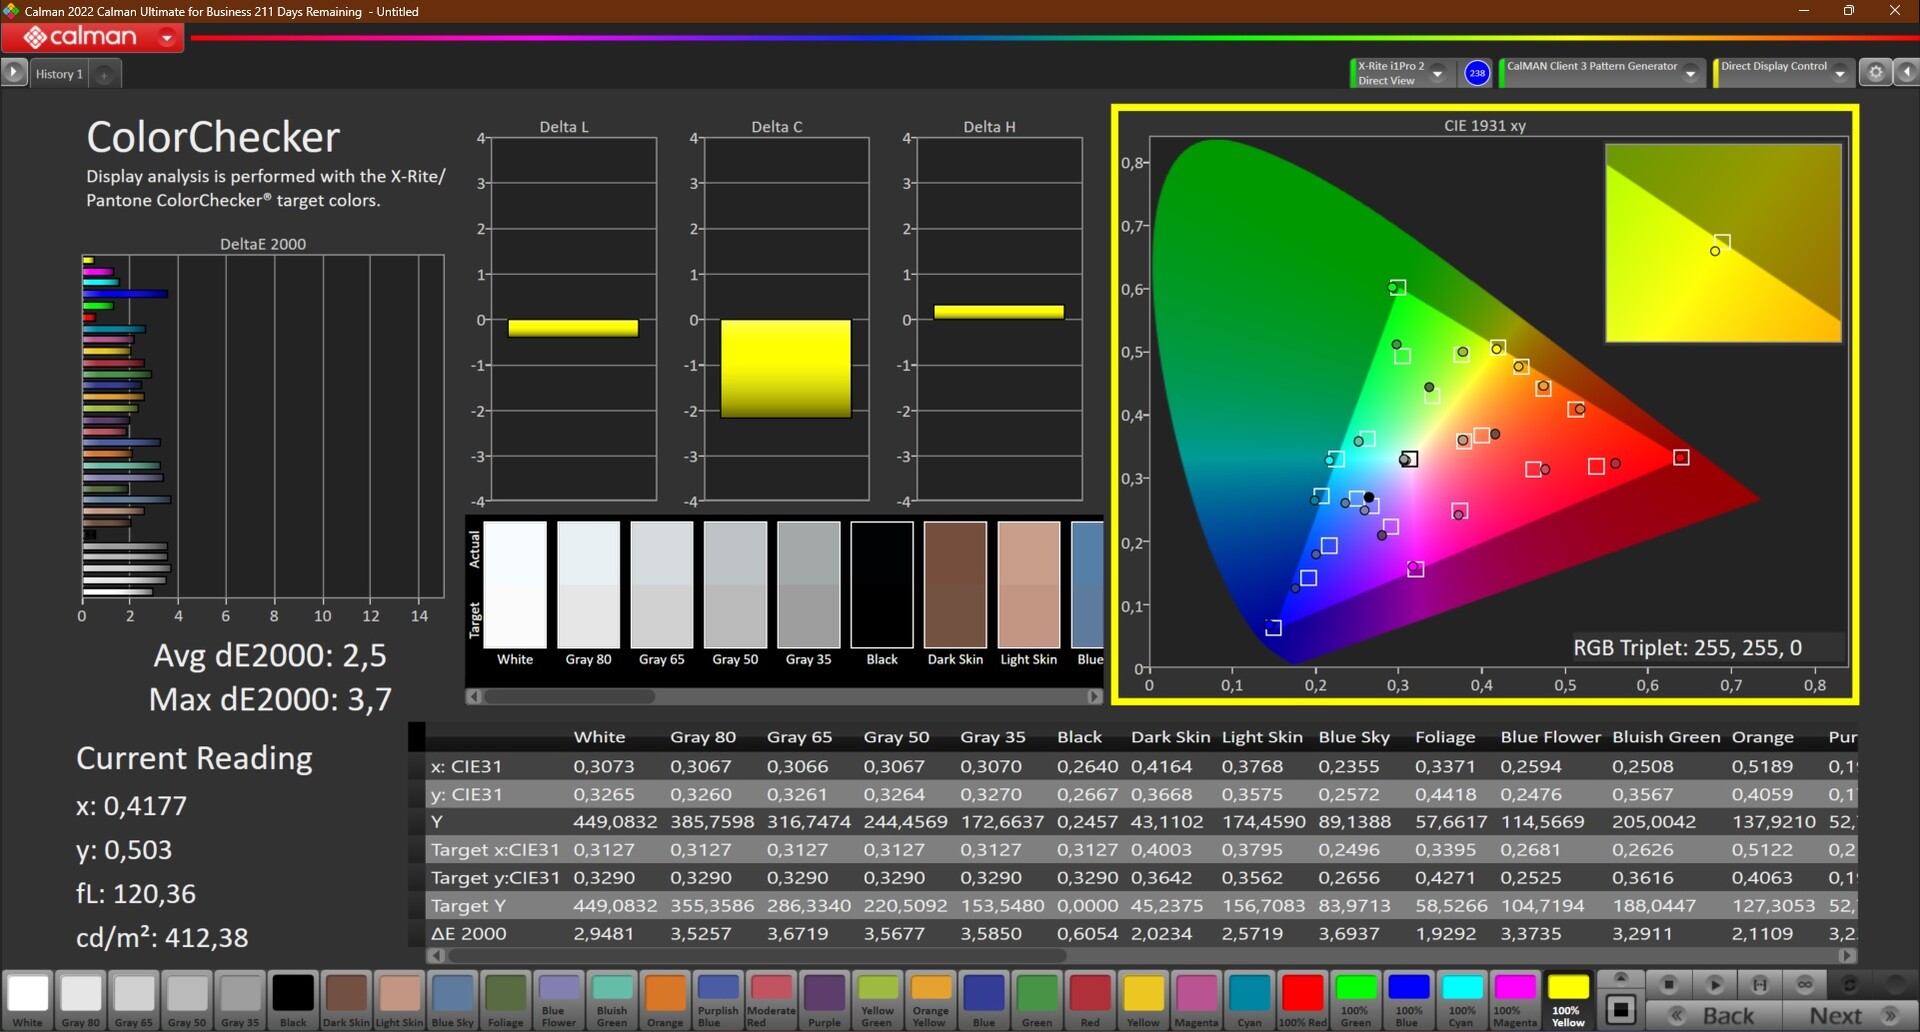
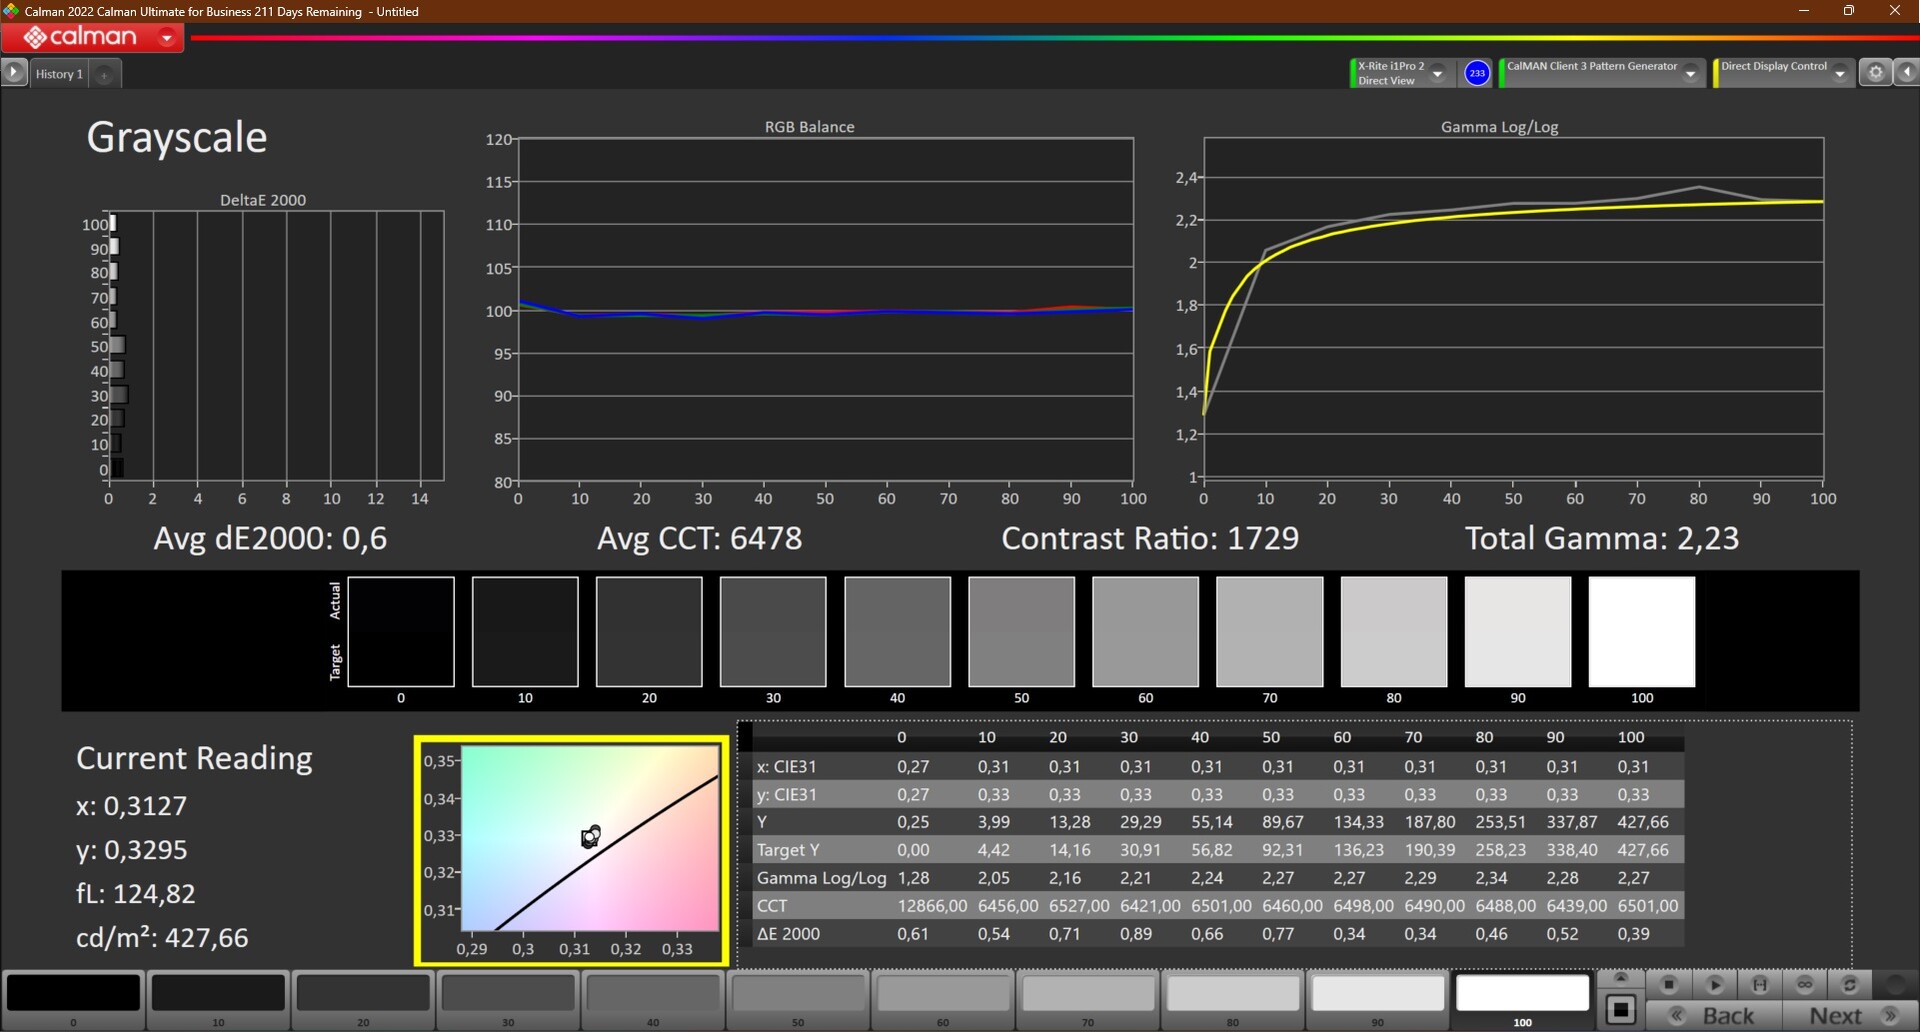
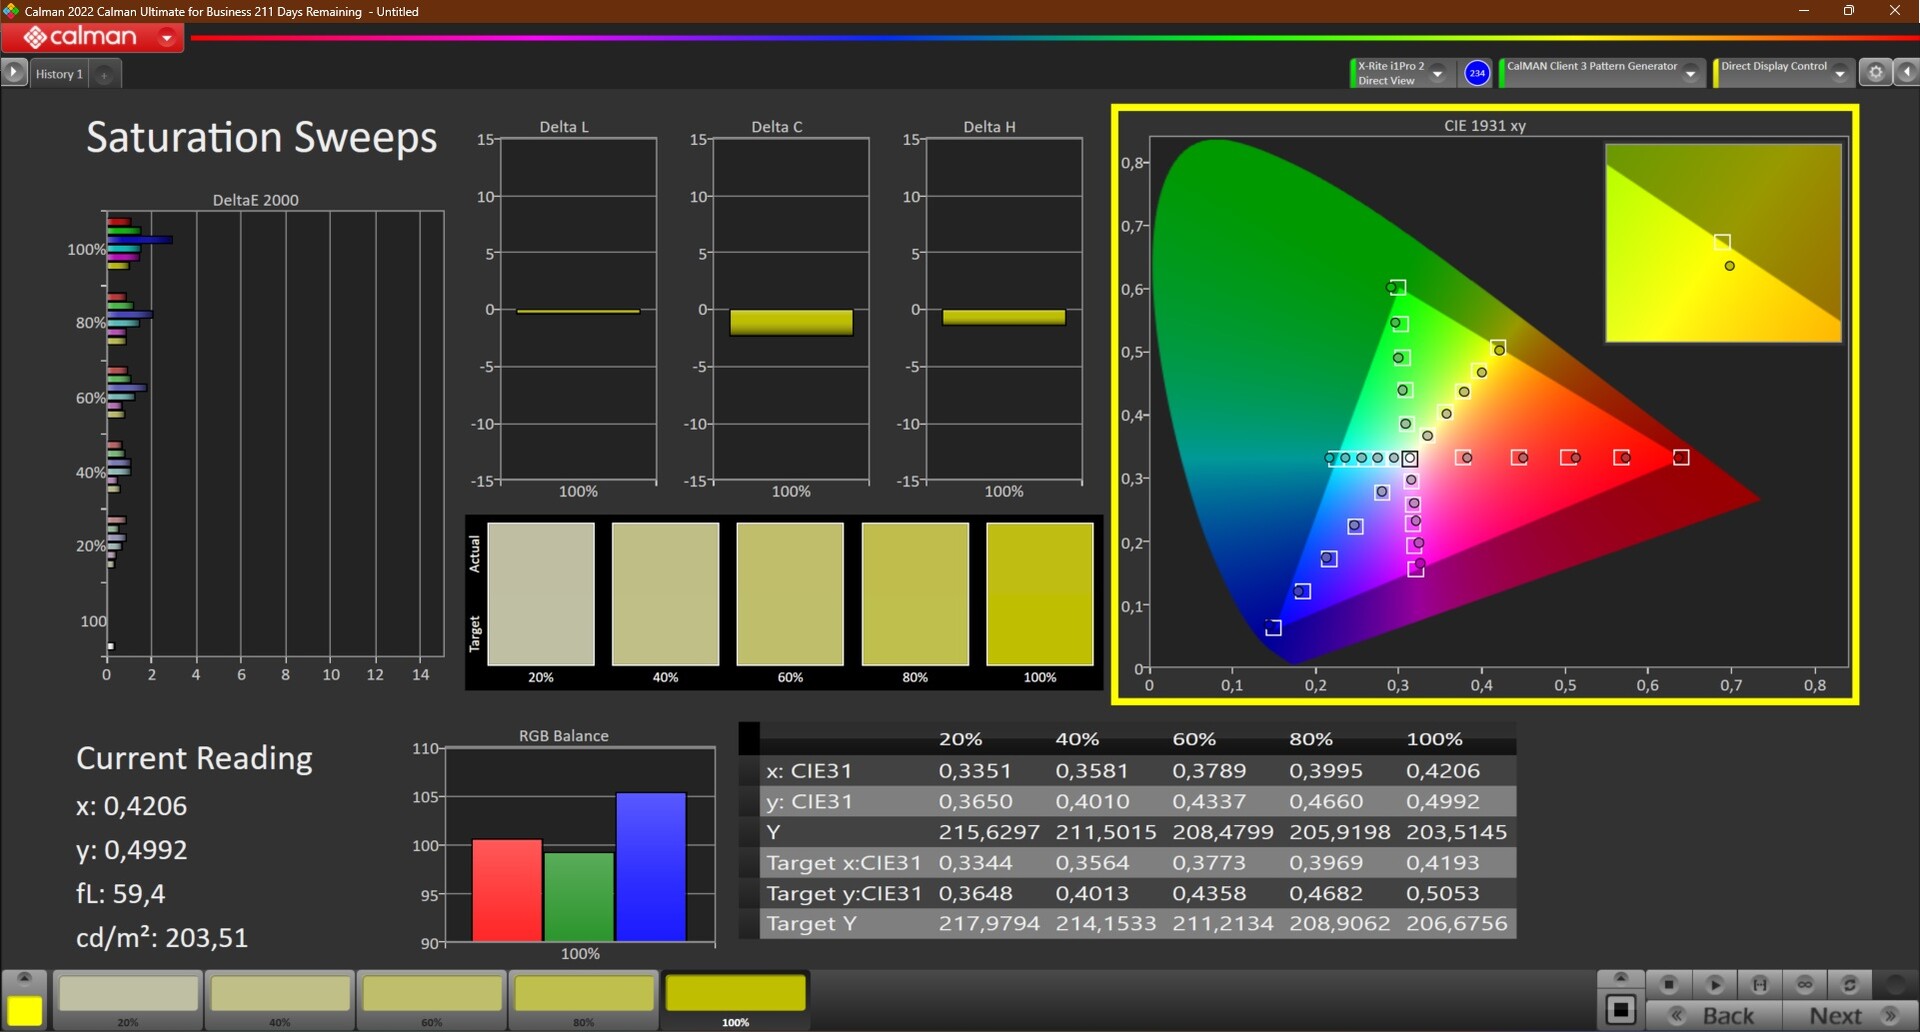
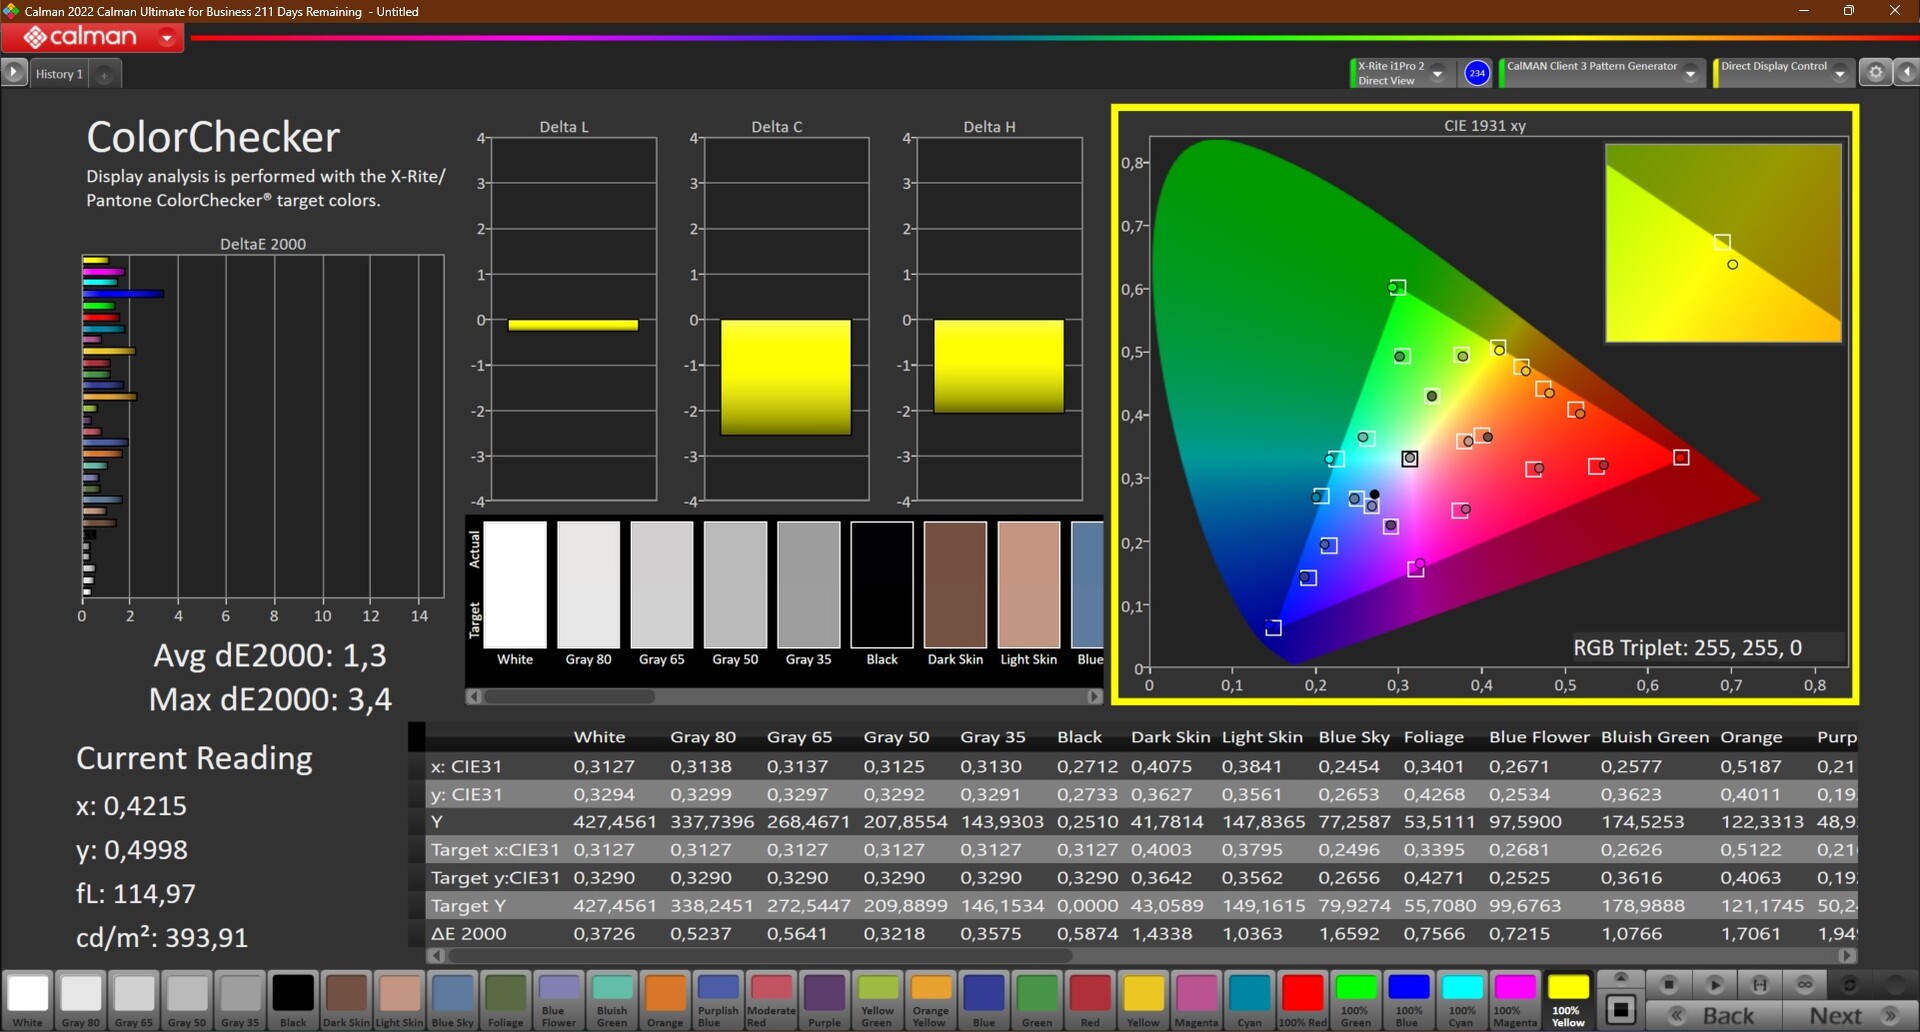
The screen's colors were a little cold straight out of the box, which we measured using the Calman software and the X-Rite i1Pro 2 colorimeter. A calibration using the i1Profiler was able to correct this color imbalance. As always, the corresponding profile is available for free download in the grey box with the measured values. The deltaE--Colorchecker value reached a very good 1.3 in the calibrated state.
The LG display was not able to reach the advertised value of 100% sRGB: At 94.3%, the target was just missed. Subsequently, the Lenovo ThinkPad P14s Gen 3's panel can't be recommended for image editing. Users looking to do so would be better off with the WQUXGA screen.
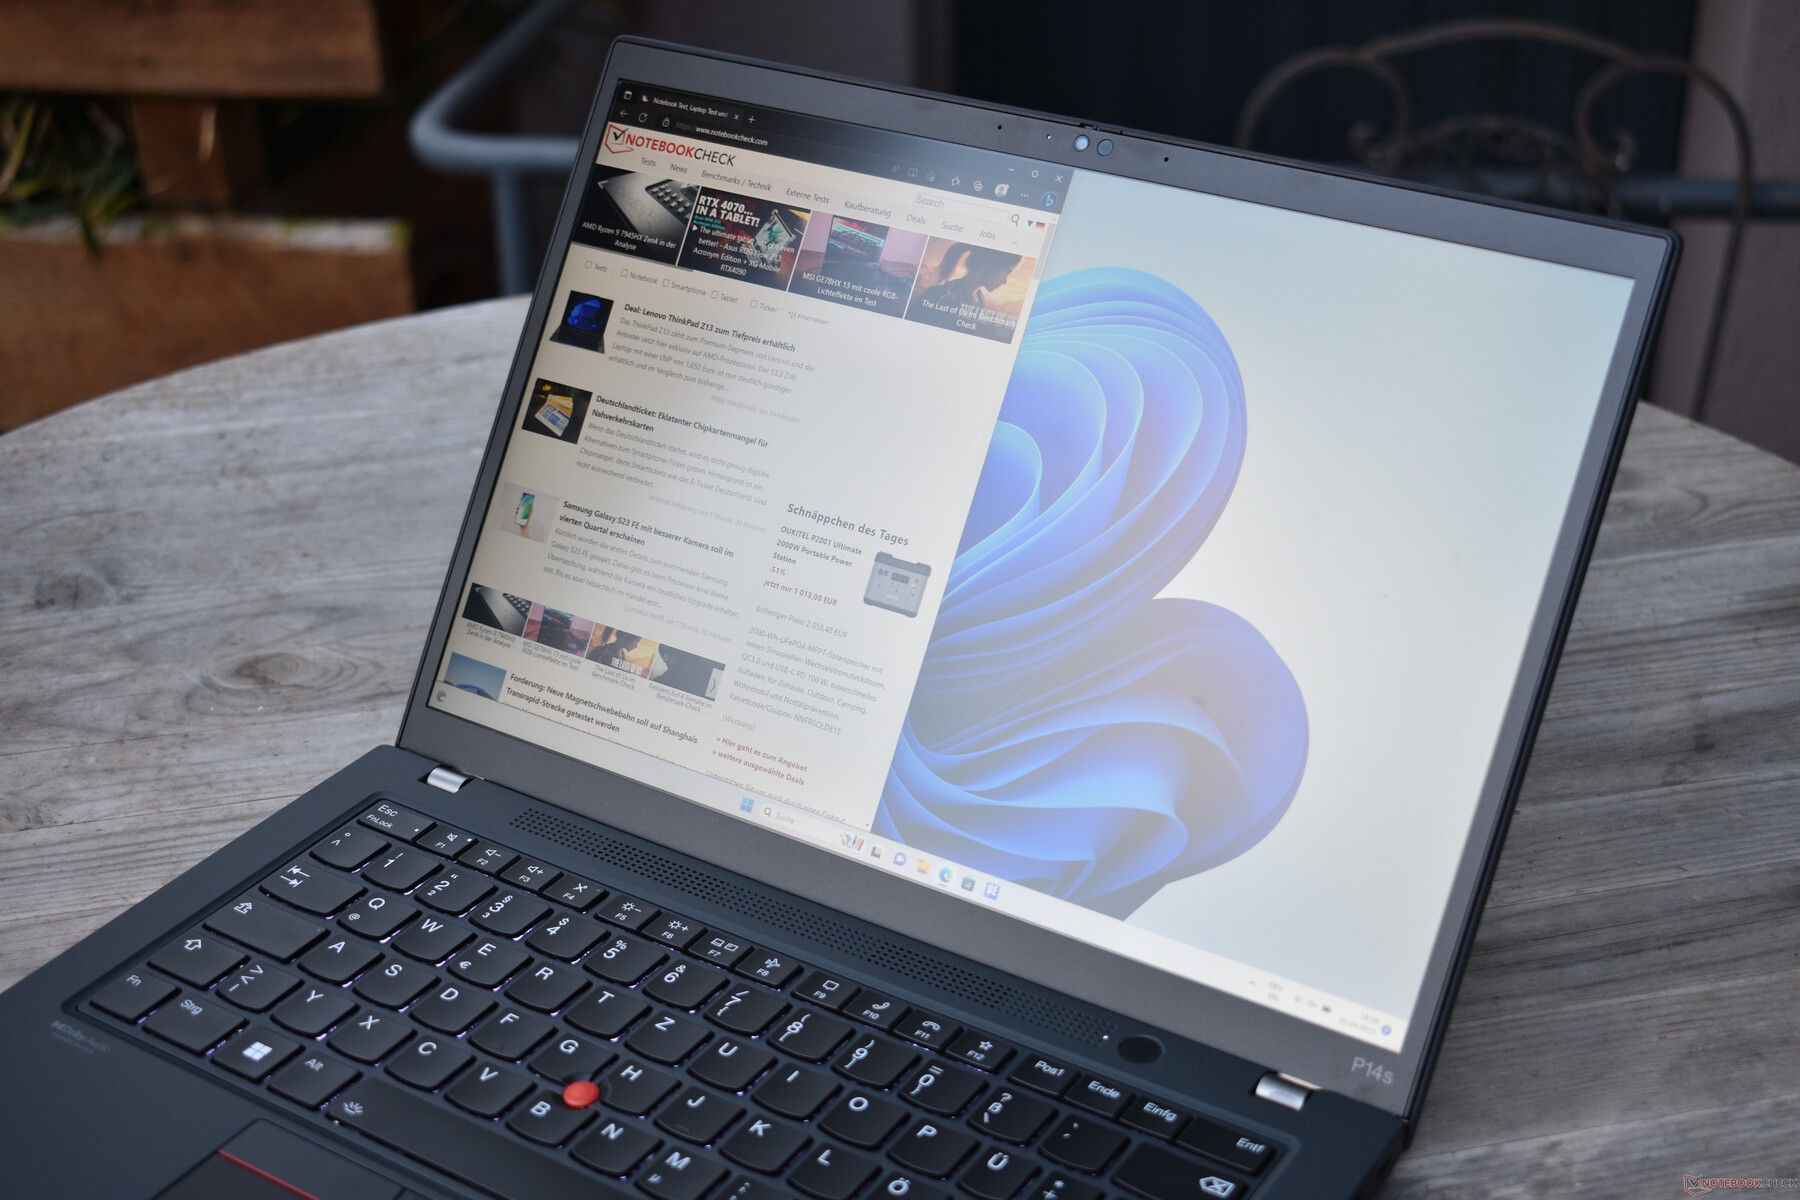
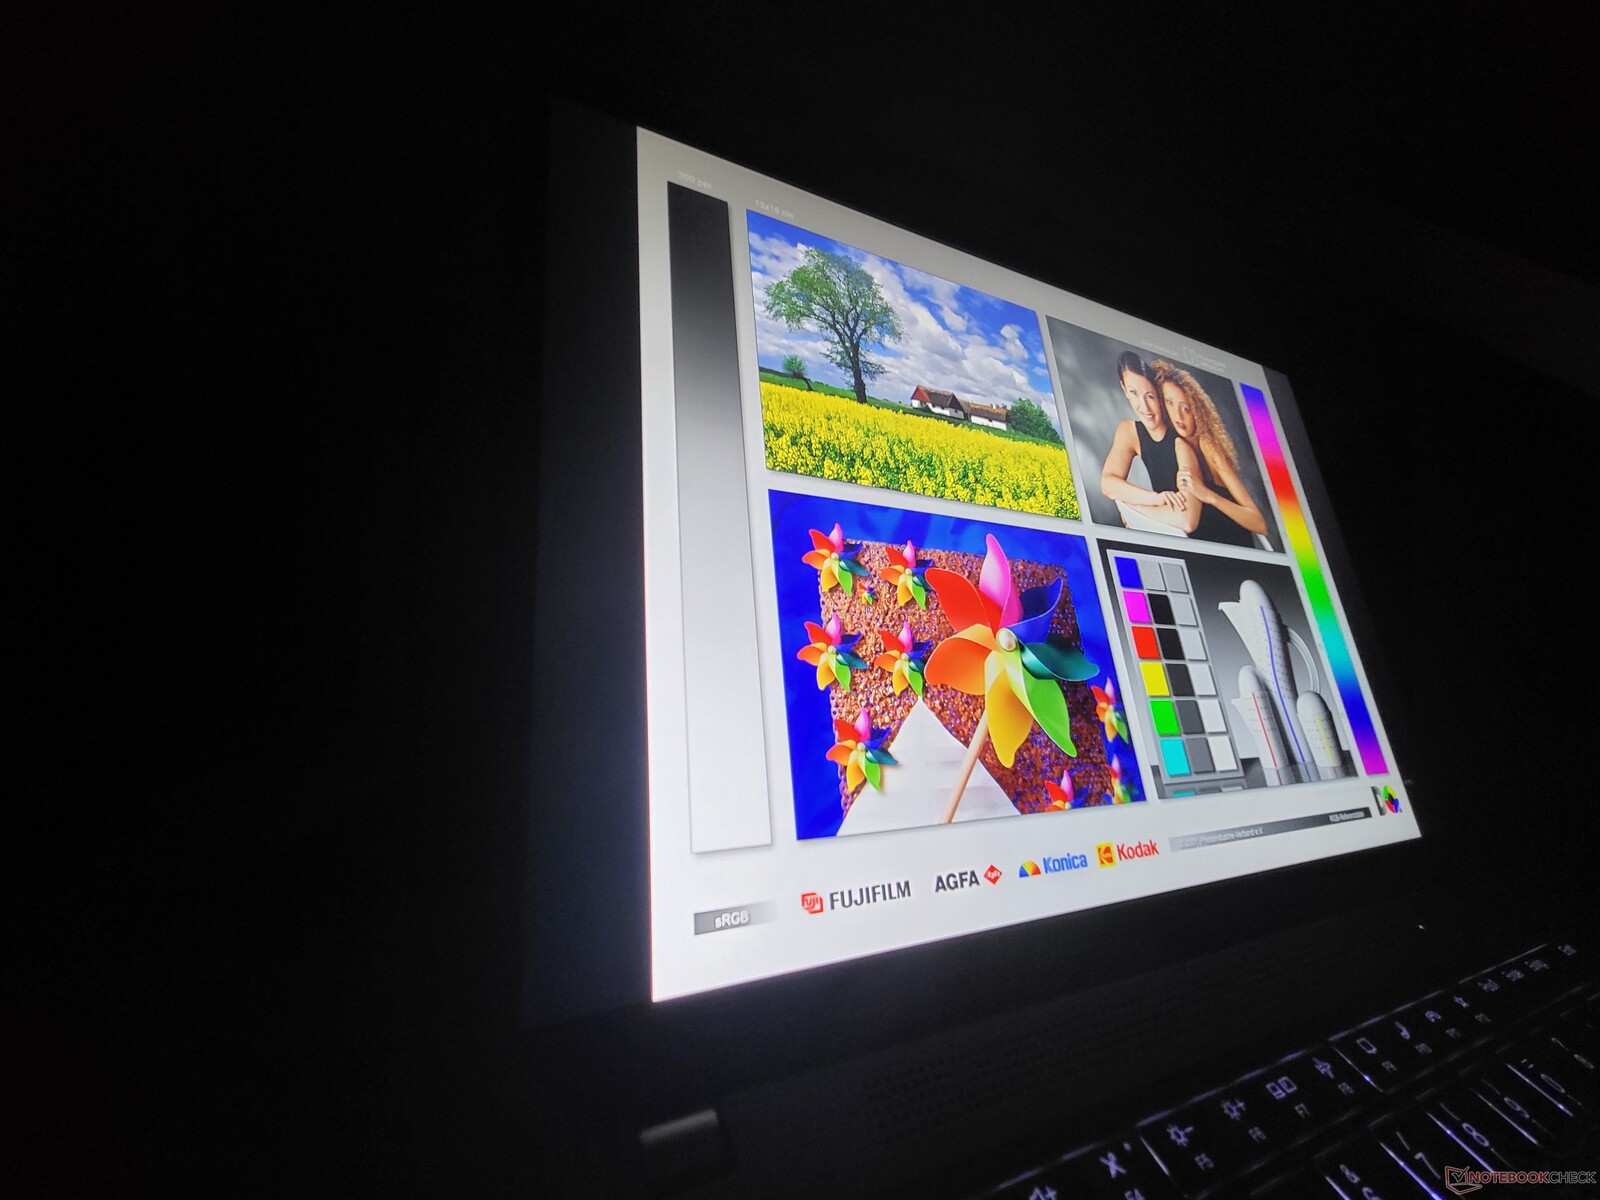
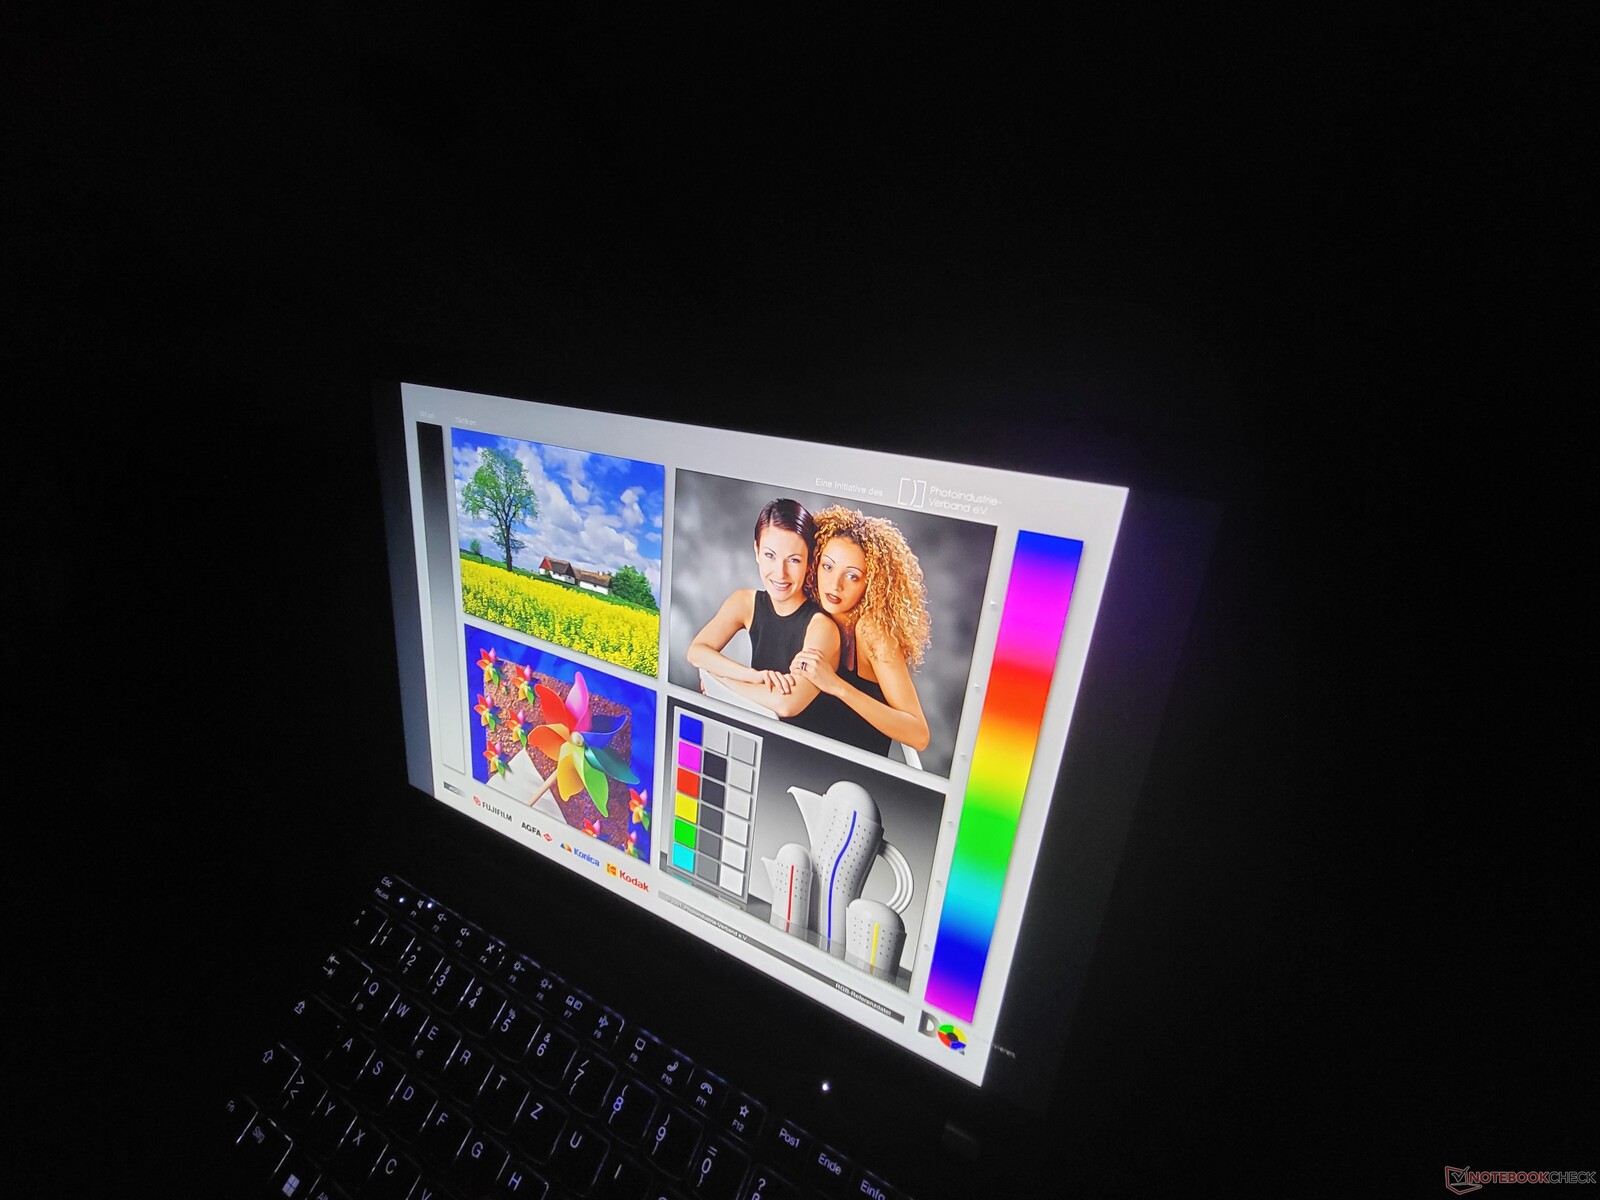
The ThinkPad laptop performed acceptably in outdoor use, which could be attributed to the combination of good display brightness and its matte surface (called anti-glare by Lenovo).
Display Response Times
| ↔ Response Time Black to White | ||
|---|---|---|
| 24.9 ms ... rise ↗ and fall ↘ combined | ↗ 11.6 ms rise | 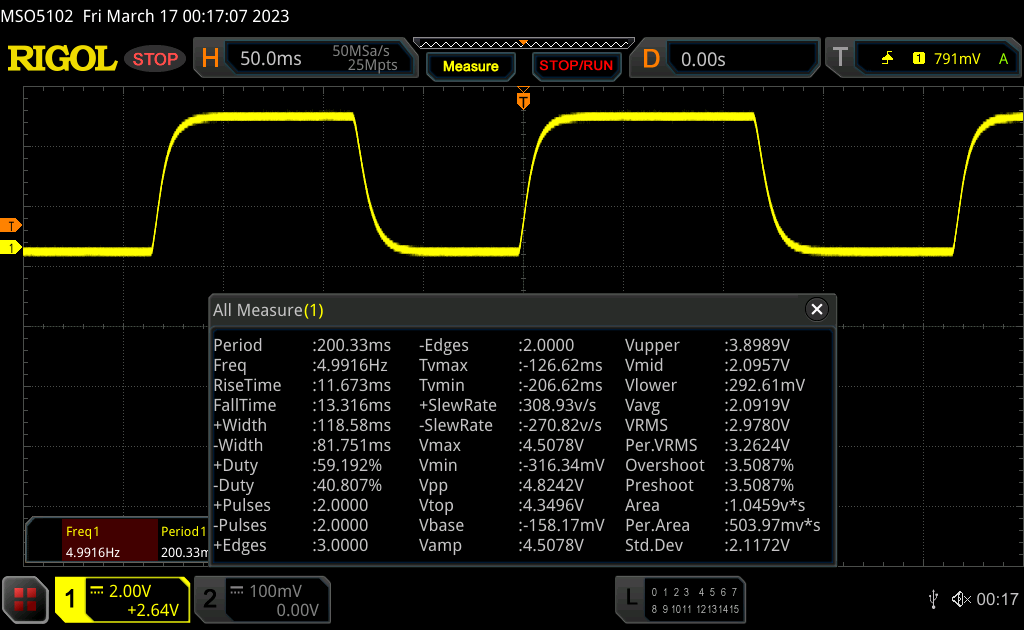 |
| ↘ 13.3 ms fall | ||
| The screen shows good response rates in our tests, but may be too slow for competitive gamers. In comparison, all tested devices range from 0.1 (minimum) to 240 (maximum) ms. » 59 % of all devices are better. This means that the measured response time is worse than the average of all tested devices (19.9 ms). | ||
| ↔ Response Time 50% Grey to 80% Grey | ||
| 33.5 ms ... rise ↗ and fall ↘ combined | ↗ 14.9 ms rise | 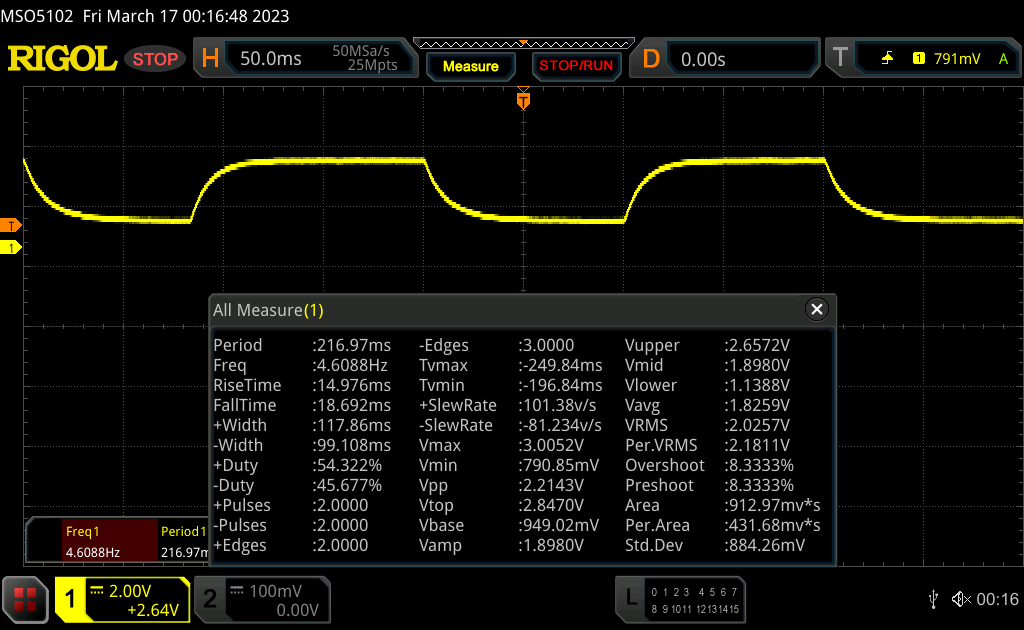 |
| ↘ 18.6 ms fall | ||
| The screen shows slow response rates in our tests and will be unsatisfactory for gamers. In comparison, all tested devices range from 0.165 (minimum) to 636 (maximum) ms. » 46 % of all devices are better. This means that the measured response time is similar to the average of all tested devices (31.1 ms). | ||
Screen Flickering / PWM (Pulse-Width Modulation)
| Screen flickering / PWM not detected | 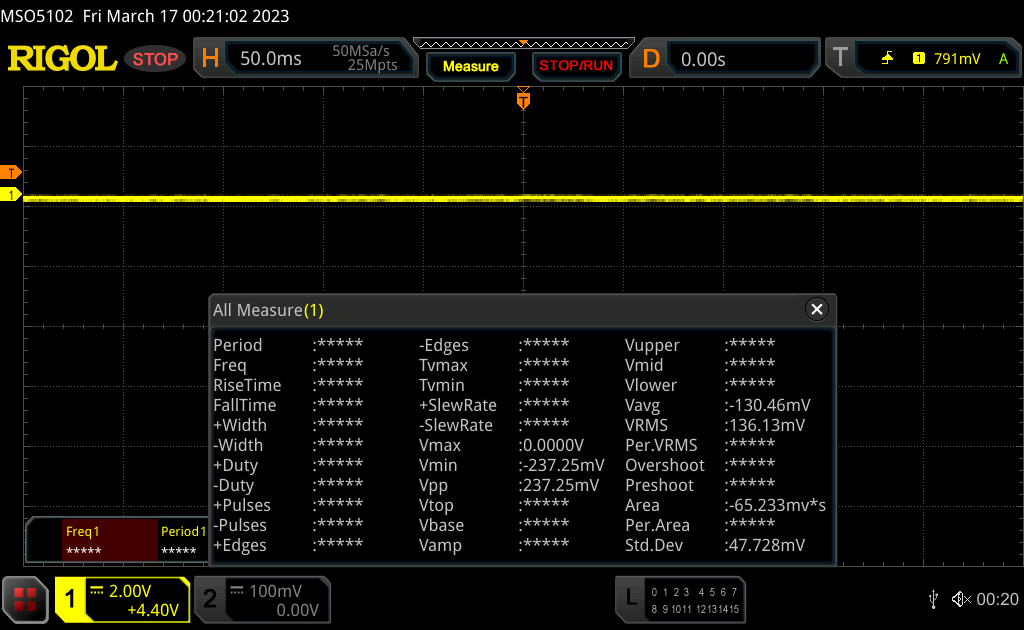 | ||
In comparison: 52 % of all tested devices do not use PWM to dim the display. If PWM was detected, an average of 7791 (minimum: 5 - maximum: 343500) Hz was measured. | |||
Performance: AMD Ryzen 6000U with great performance
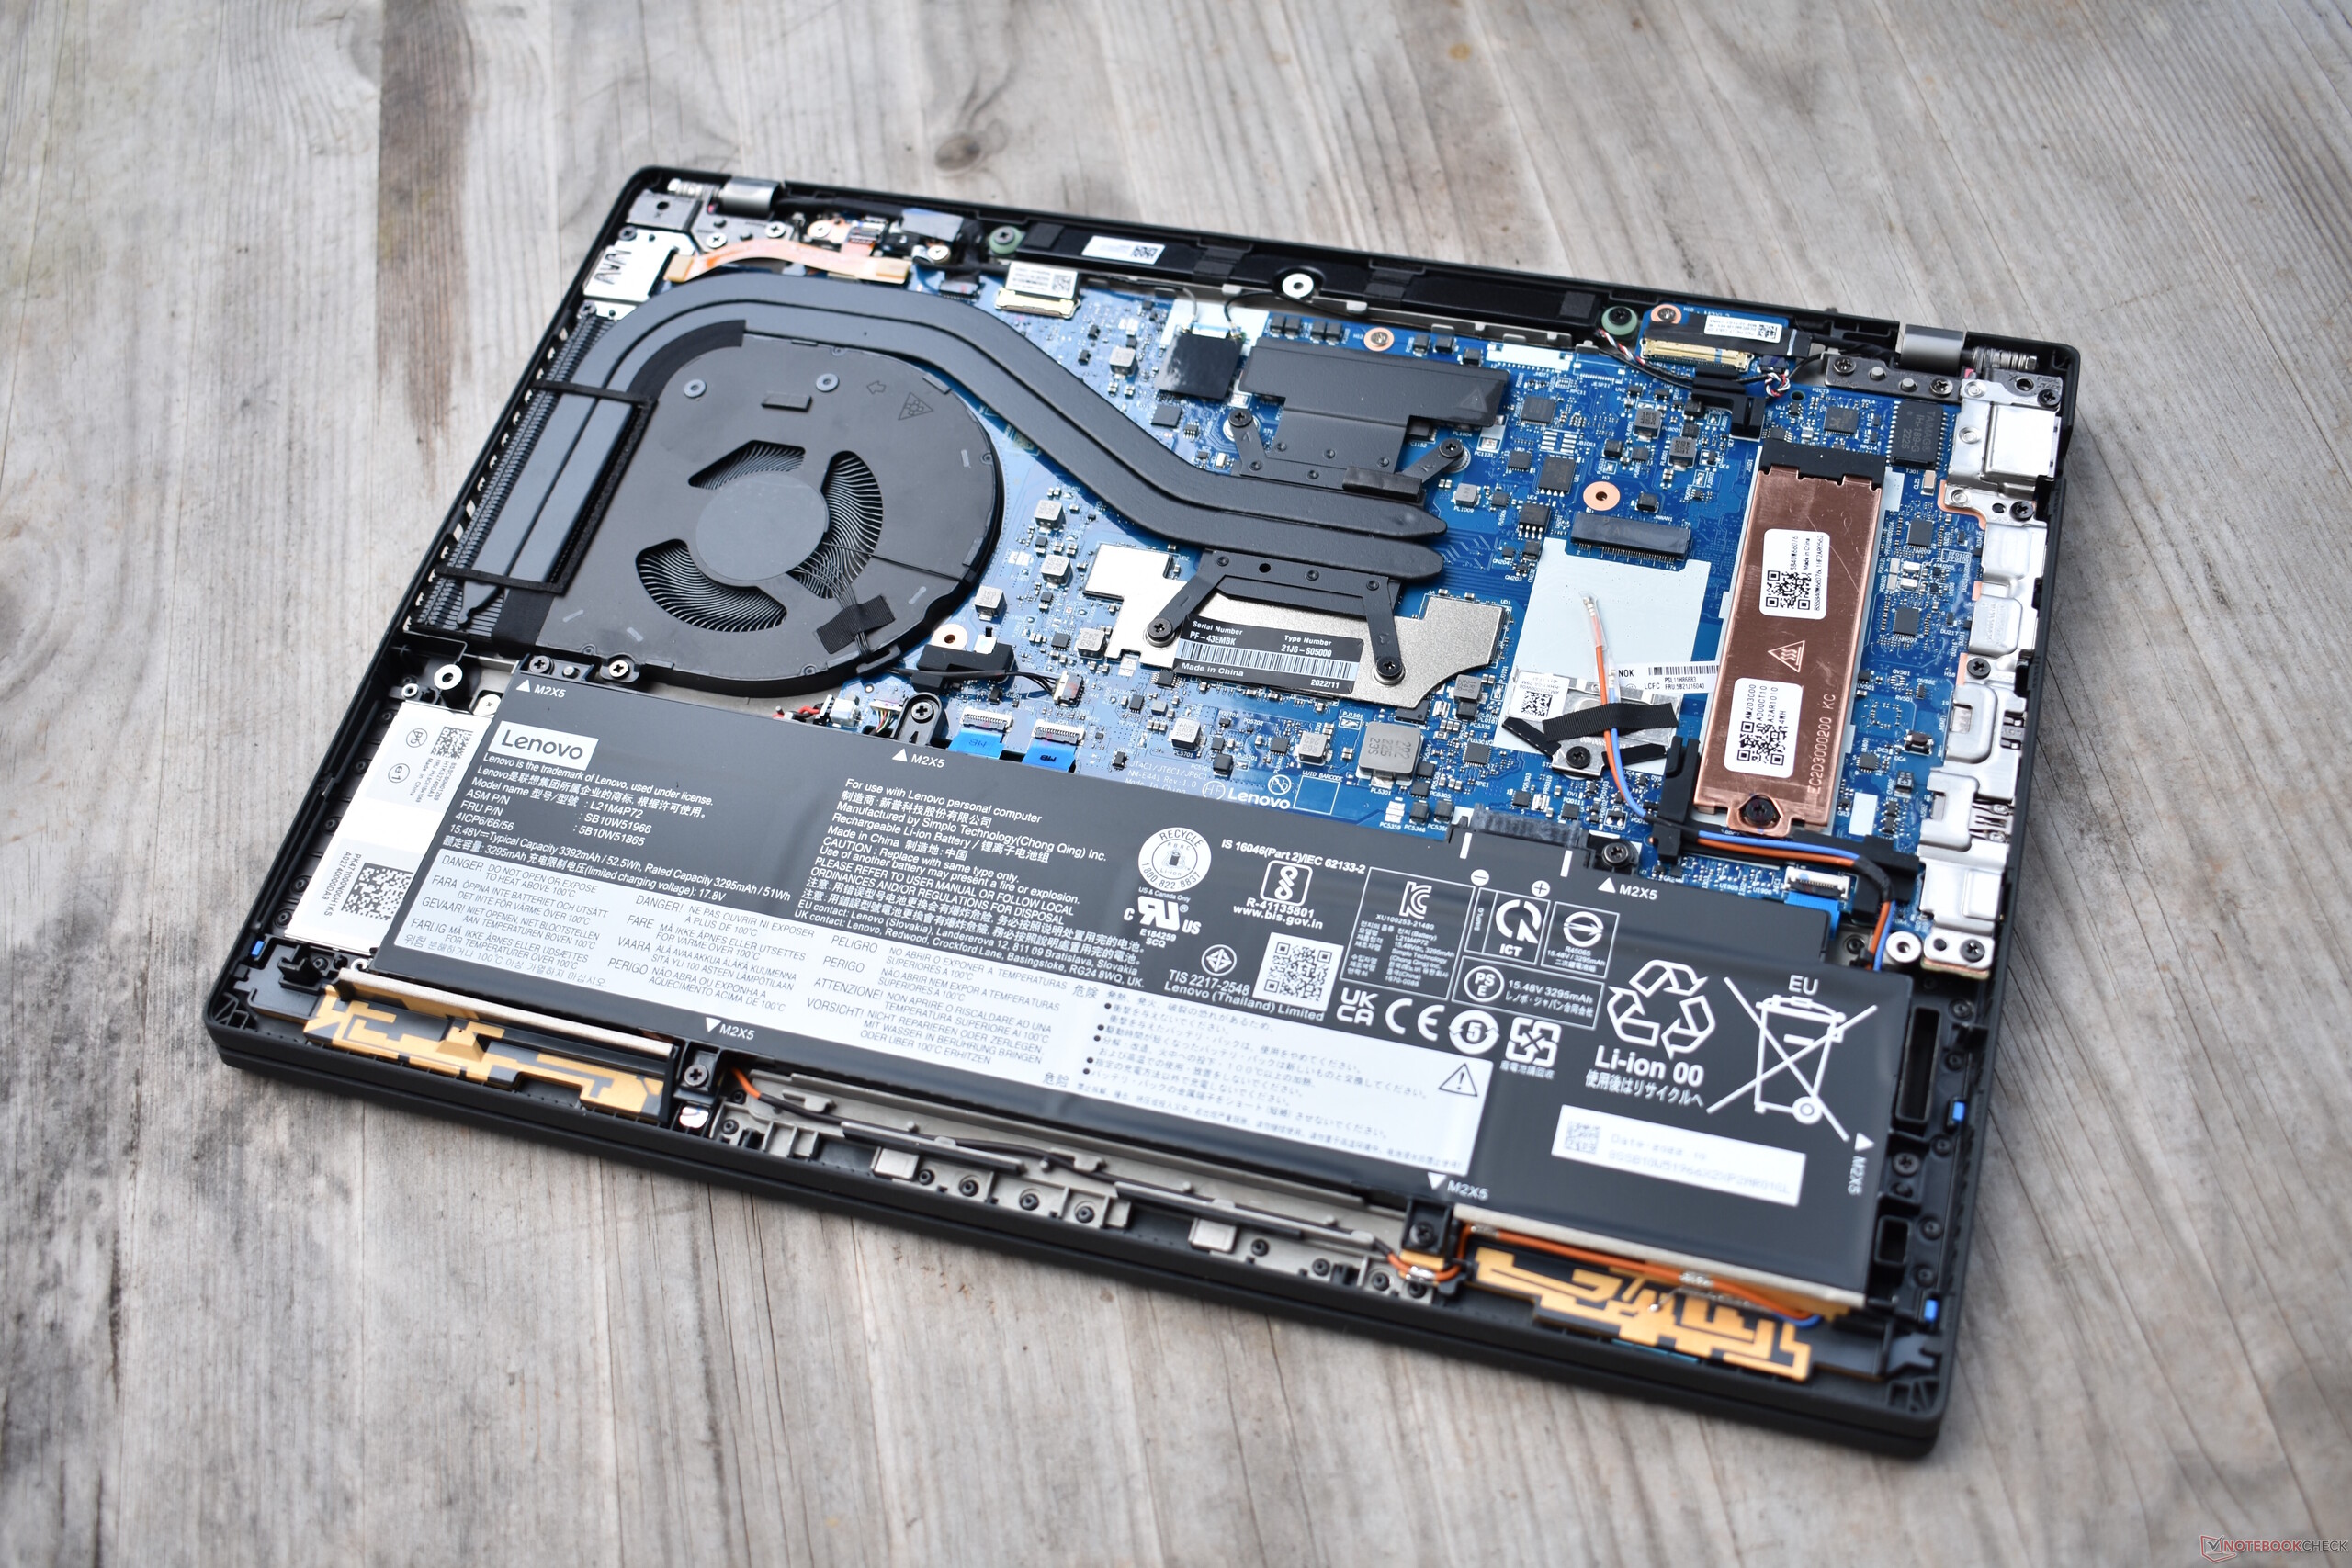
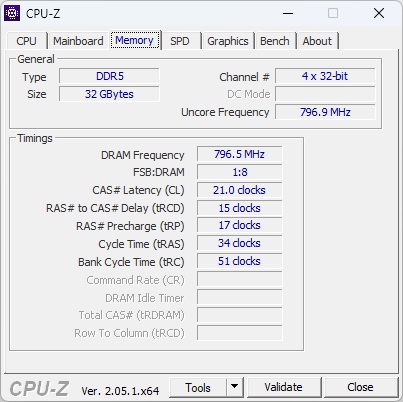
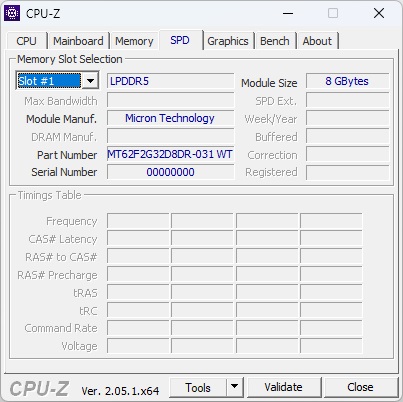
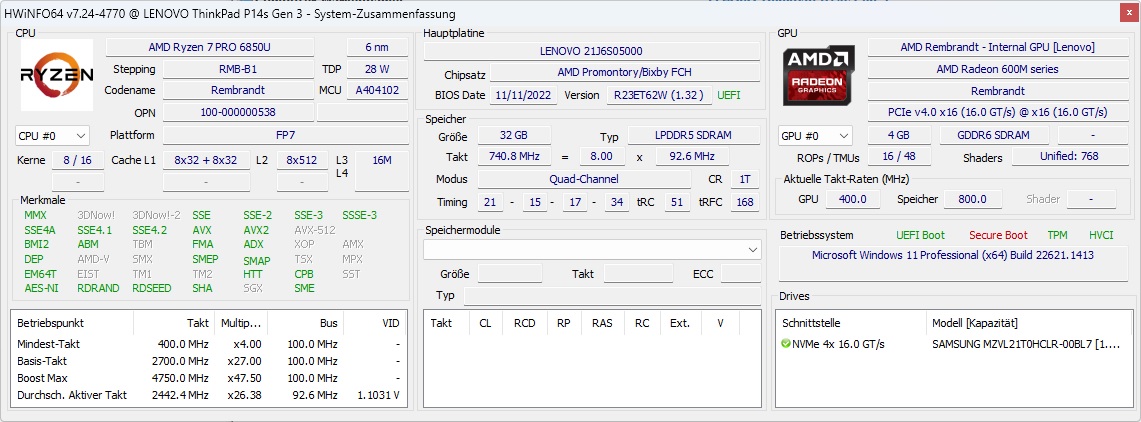
The Lenovo ThinkPad P14s Gen 3 comes in multiple different configurations. They all use AMD's Ryzen CPUs, with the Ryzen 5 Pro 6650U and Ryzen 7 Pro 6850U being available to choose from. The Ryzen 5 features the AMD Radeon 660M, and the Ryzen 7 has the more powerful Radeon 680M. RAM is generally soldered on the AMD version of the P14s, with Lenovo offering 16 or 32 GB of LPDDR5-6400. A single M.2-2280 SSD acts as its storage; ex-works, Lenovo install a maximum of 2 TB.
Testing conditions
On their ThinkPad laptops, Lenovo have interwoven their in-house energy profiles with the Windows energy control. Thus, three different profiles that affect the performance can be selected in the Windows settings app:
- Best energy savings: 30 watts (short-term power limit) / 25 watts (long-term power limit).
- Balanced: 36 watts (short-term power limit) / 31 watts (long-term power limit)
- Best power: 40 watts (short-term power limit) / 31 watts (long-term power limit)
Processor
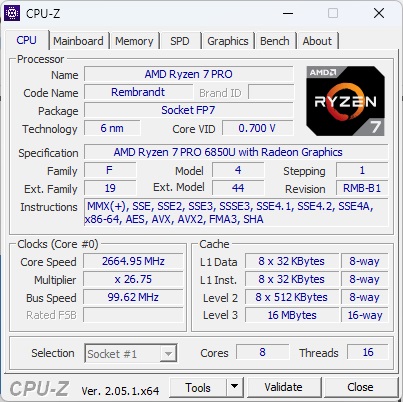
The AMD Ryzen 7 Pro 6850U is the fastest "U" processor in the Ryzen 6000 series (apart from the 6860Z, which is only available in the ThinkPad Z13). As a U-CPU, it is optimized for a consumption of 15 to 25 watts. Its eight cores with 16 threads operate at 2.7 to 4.7 GHz. You can take a look at our CPU benchmark list for more extensive comparisons with other processors.
Compared to the ThinkPad T14 G3 with the same CPU, its power limits are a little higher. This could be observed in the Cinebench R15 multicore loop, for example, where the ThinkPad P14s scored better than the T14. However, the difference was not big. When comparing it to its competitors, its CPU performance is respectable. The ThinkPad P14s Gen 3 is significantly faster than the ZBook Firefly 14 G9 and not far behind the Dell Precision 5470, despite its nominally higher-rated H45 CPU. Only in terms of single-core performance do the Intel models have an advantage.
The CPU also performs successfully on battery power alone.
Cinebench R15 multi continuous test
Cinebench R23: Multi Core | Single Core
Cinebench R20: CPU (Multi Core) | CPU (Single Core)
Cinebench R15: CPU Multi 64Bit | CPU Single 64Bit
Blender: v2.79 BMW27 CPU
7-Zip 18.03: 7z b 4 | 7z b 4 -mmt1
Geekbench 5.5: Multi-Core | Single-Core
HWBOT x265 Benchmark v2.2: 4k Preset
LibreOffice : 20 Documents To PDF
R Benchmark 2.5: Overall mean
| CPU Performance rating | |
| Average of class Workstation | |
| Dell Precision 5000 5470 | |
| Lenovo ThinkPad T14 G3-21CF004NGE | |
| Average AMD Ryzen 7 PRO 6850U | |
| HP ZBook Firefly 14 G9-6B8A2EA | |
| Lenovo ThinkPad P14s G3 AMD 21J6S05000 | |
| Lenovo ThinkPad P14s Gen2-20VX000GGE | |
| Cinebench R23 / Multi Core | |
| Average of class Workstation (14055 - 38520, n=25, last 2 years) | |
| Dell Precision 5000 5470 | |
| Lenovo ThinkPad P14s G3 AMD 21J6S05000 | |
| Average AMD Ryzen 7 PRO 6850U (9923 - 12945, n=7) | |
| Lenovo ThinkPad T14 G3-21CF004NGE | |
| HP ZBook Firefly 14 G9-6B8A2EA | |
| Lenovo ThinkPad P14s Gen2-20VX000GGE | |
| Cinebench R23 / Single Core | |
| Average of class Workstation (1712 - 2228, n=25, last 2 years) | |
| Dell Precision 5000 5470 | |
| HP ZBook Firefly 14 G9-6B8A2EA | |
| Lenovo ThinkPad P14s G3 AMD 21J6S05000 | |
| Average AMD Ryzen 7 PRO 6850U (1409 - 1536, n=7) | |
| Lenovo ThinkPad P14s Gen2-20VX000GGE | |
| Lenovo ThinkPad T14 G3-21CF004NGE | |
| Cinebench R20 / CPU (Multi Core) | |
| Average of class Workstation (5471 - 15043, n=25, last 2 years) | |
| Dell Precision 5000 5470 | |
| Lenovo ThinkPad P14s G3 AMD 21J6S05000 | |
| Average AMD Ryzen 7 PRO 6850U (3784 - 5022, n=7) | |
| Lenovo ThinkPad T14 G3-21CF004NGE | |
| HP ZBook Firefly 14 G9-6B8A2EA | |
| Lenovo ThinkPad P14s Gen2-20VX000GGE | |
| Cinebench R20 / CPU (Single Core) | |
| Average of class Workstation (671 - 857, n=25, last 2 years) | |
| Dell Precision 5000 5470 | |
| HP ZBook Firefly 14 G9-6B8A2EA | |
| Lenovo ThinkPad P14s G3 AMD 21J6S05000 | |
| Average AMD Ryzen 7 PRO 6850U (587 - 596, n=7) | |
| Lenovo ThinkPad T14 G3-21CF004NGE | |
| Lenovo ThinkPad P14s Gen2-20VX000GGE | |
| Cinebench R15 / CPU Multi 64Bit | |
| Average of class Workstation (2489 - 5810, n=25, last 2 years) | |
| Dell Precision 5000 5470 | |
| Lenovo ThinkPad P14s G3 AMD 21J6S05000 | |
| Average AMD Ryzen 7 PRO 6850U (1652 - 2092, n=7) | |
| Lenovo ThinkPad T14 G3-21CF004NGE | |
| HP ZBook Firefly 14 G9-6B8A2EA | |
| Lenovo ThinkPad P14s Gen2-20VX000GGE | |
| Cinebench R15 / CPU Single 64Bit | |
| Average of class Workstation (191.4 - 328, n=25, last 2 years) | |
| HP ZBook Firefly 14 G9-6B8A2EA | |
| Dell Precision 5000 5470 | |
| Lenovo ThinkPad P14s G3 AMD 21J6S05000 | |
| Lenovo ThinkPad T14 G3-21CF004NGE | |
| Average AMD Ryzen 7 PRO 6850U (228 - 244, n=7) | |
| Lenovo ThinkPad P14s Gen2-20VX000GGE | |
| Blender / v2.79 BMW27 CPU | |
| Lenovo ThinkPad P14s Gen2-20VX000GGE | |
| HP ZBook Firefly 14 G9-6B8A2EA | |
| Lenovo ThinkPad T14 G3-21CF004NGE | |
| Lenovo ThinkPad P14s G3 AMD 21J6S05000 | |
| Average AMD Ryzen 7 PRO 6850U (241 - 307, n=7) | |
| Dell Precision 5000 5470 | |
| Average of class Workstation (91 - 261, n=25, last 2 years) | |
| 7-Zip 18.03 / 7z b 4 | |
| Average of class Workstation (54741 - 116969, n=25, last 2 years) | |
| Dell Precision 5000 5470 | |
| Lenovo ThinkPad T14 G3-21CF004NGE | |
| Average AMD Ryzen 7 PRO 6850U (44011 - 59045, n=7) | |
| Lenovo ThinkPad P14s G3 AMD 21J6S05000 | |
| HP ZBook Firefly 14 G9-6B8A2EA | |
| Lenovo ThinkPad P14s Gen2-20VX000GGE | |
| 7-Zip 18.03 / 7z b 4 -mmt1 | |
| Average of class Workstation (5126 - 6960, n=25, last 2 years) | |
| HP ZBook Firefly 14 G9-6B8A2EA | |
| Lenovo ThinkPad P14s Gen2-20VX000GGE | |
| Dell Precision 5000 5470 | |
| Average AMD Ryzen 7 PRO 6850U (5057 - 5662, n=7) | |
| Lenovo ThinkPad T14 G3-21CF004NGE | |
| Lenovo ThinkPad P14s G3 AMD 21J6S05000 | |
| Geekbench 5.5 / Multi-Core | |
| Average of class Workstation (11542 - 25554, n=25, last 2 years) | |
| Dell Precision 5000 5470 | |
| HP ZBook Firefly 14 G9-6B8A2EA | |
| Lenovo ThinkPad P14s G3 AMD 21J6S05000 | |
| Average AMD Ryzen 7 PRO 6850U (7044 - 9241, n=7) | |
| Lenovo ThinkPad T14 G3-21CF004NGE | |
| Lenovo ThinkPad P14s Gen2-20VX000GGE | |
| Geekbench 5.5 / Single-Core | |
| Average of class Workstation (1781 - 2183, n=25, last 2 years) | |
| Dell Precision 5000 5470 | |
| HP ZBook Firefly 14 G9-6B8A2EA | |
| Lenovo ThinkPad P14s Gen2-20VX000GGE | |
| Lenovo ThinkPad T14 G3-21CF004NGE | |
| Lenovo ThinkPad P14s G3 AMD 21J6S05000 | |
| Average AMD Ryzen 7 PRO 6850U (1433 - 1533, n=7) | |
| HWBOT x265 Benchmark v2.2 / 4k Preset | |
| Average of class Workstation (14.4 - 40.5, n=25, last 2 years) | |
| Dell Precision 5000 5470 | |
| Lenovo ThinkPad T14 G3-21CF004NGE | |
| Lenovo ThinkPad P14s G3 AMD 21J6S05000 | |
| Average AMD Ryzen 7 PRO 6850U (11.7 - 16.3, n=7) | |
| HP ZBook Firefly 14 G9-6B8A2EA | |
| Lenovo ThinkPad P14s Gen2-20VX000GGE | |
| LibreOffice / 20 Documents To PDF | |
| Lenovo ThinkPad P14s G3 AMD 21J6S05000 | |
| Average AMD Ryzen 7 PRO 6850U (46.3 - 74, n=7) | |
| Lenovo ThinkPad T14 G3-21CF004NGE | |
| Average of class Workstation (37.1 - 74.7, n=25, last 2 years) | |
| Dell Precision 5000 5470 | |
| HP ZBook Firefly 14 G9-6B8A2EA | |
| Lenovo ThinkPad P14s Gen2-20VX000GGE | |
| R Benchmark 2.5 / Overall mean | |
| Lenovo ThinkPad P14s Gen2-20VX000GGE | |
| Lenovo ThinkPad P14s G3 AMD 21J6S05000 | |
| Lenovo ThinkPad T14 G3-21CF004NGE | |
| Average AMD Ryzen 7 PRO 6850U (0.4932 - 0.544, n=7) | |
| HP ZBook Firefly 14 G9-6B8A2EA | |
| Dell Precision 5000 5470 | |
| Average of class Workstation (0.3825 - 0.603, n=25, last 2 years) | |
* ... smaller is better
AIDA64: FP32 Ray-Trace | FPU Julia | CPU SHA3 | CPU Queen | FPU SinJulia | FPU Mandel | CPU AES | CPU ZLib | FP64 Ray-Trace | CPU PhotoWorxx
| Performance rating | |
| Average of class Workstation | |
| Average AMD Ryzen 7 PRO 6850U | |
| Lenovo ThinkPad P14s G3 AMD 21J6S05000 | |
| Dell Precision 5000 5470 | |
| Lenovo ThinkPad T14 G3-21CF004NGE | |
| HP ZBook Firefly 14 G9-6B8A2EA | |
| AIDA64 / FP32 Ray-Trace | |
| Average of class Workstation (10658 - 61611, n=25, last 2 years) | |
| Dell Precision 5000 5470 | |
| Average AMD Ryzen 7 PRO 6850U (11272 - 14704, n=8) | |
| Lenovo ThinkPad P14s G3 AMD 21J6S05000 | |
| Lenovo ThinkPad T14 G3-21CF004NGE | |
| HP ZBook Firefly 14 G9-6B8A2EA | |
| AIDA64 / FPU Julia | |
| Average of class Workstation (56664 - 186971, n=25, last 2 years) | |
| Average AMD Ryzen 7 PRO 6850U (72242 - 92957, n=8) | |
| Lenovo ThinkPad P14s G3 AMD 21J6S05000 | |
| Lenovo ThinkPad T14 G3-21CF004NGE | |
| Dell Precision 5000 5470 | |
| HP ZBook Firefly 14 G9-6B8A2EA | |
| AIDA64 / CPU SHA3 | |
| Average of class Workstation (2608 - 8975, n=25, last 2 years) | |
| Dell Precision 5000 5470 | |
| Average AMD Ryzen 7 PRO 6850U (2419 - 3104, n=8) | |
| Lenovo ThinkPad P14s G3 AMD 21J6S05000 | |
| Lenovo ThinkPad T14 G3-21CF004NGE | |
| HP ZBook Firefly 14 G9-6B8A2EA | |
| AIDA64 / CPU Queen | |
| Dell Precision 5000 5470 | |
| Average of class Workstation (60778 - 144411, n=25, last 2 years) | |
| Lenovo ThinkPad P14s G3 AMD 21J6S05000 | |
| Average AMD Ryzen 7 PRO 6850U (86644 - 96912, n=7) | |
| Lenovo ThinkPad T14 G3-21CF004NGE | |
| HP ZBook Firefly 14 G9-6B8A2EA | |
| AIDA64 / FPU SinJulia | |
| Average of class Workstation (8165 - 29343, n=25, last 2 years) | |
| Lenovo ThinkPad P14s G3 AMD 21J6S05000 | |
| Average AMD Ryzen 7 PRO 6850U (10917 - 12571, n=8) | |
| Lenovo ThinkPad T14 G3-21CF004NGE | |
| Dell Precision 5000 5470 | |
| HP ZBook Firefly 14 G9-6B8A2EA | |
| AIDA64 / FPU Mandel | |
| Average of class Workstation (27301 - 98153, n=25, last 2 years) | |
| Average AMD Ryzen 7 PRO 6850U (39609 - 51296, n=8) | |
| Lenovo ThinkPad P14s G3 AMD 21J6S05000 | |
| Lenovo ThinkPad T14 G3-21CF004NGE | |
| Dell Precision 5000 5470 | |
| HP ZBook Firefly 14 G9-6B8A2EA | |
| AIDA64 / CPU AES | |
| Average of class Workstation (56077 - 187841, n=25, last 2 years) | |
| Average AMD Ryzen 7 PRO 6850U (45568 - 60867, n=8) | |
| Lenovo ThinkPad T14 G3-21CF004NGE | |
| Lenovo ThinkPad P14s G3 AMD 21J6S05000 | |
| HP ZBook Firefly 14 G9-6B8A2EA | |
| Dell Precision 5000 5470 | |
| AIDA64 / CPU ZLib | |
| Average of class Workstation (742 - 2148, n=25, last 2 years) | |
| Lenovo ThinkPad P14s G3 AMD 21J6S05000 | |
| Average AMD Ryzen 7 PRO 6850U (641 - 805, n=8) | |
| Lenovo ThinkPad T14 G3-21CF004NGE | |
| HP ZBook Firefly 14 G9-6B8A2EA | |
| Dell Precision 5000 5470 | |
| AIDA64 / FP64 Ray-Trace | |
| Average of class Workstation (5580 - 32891, n=25, last 2 years) | |
| Dell Precision 5000 5470 | |
| Average AMD Ryzen 7 PRO 6850U (5967 - 7821, n=8) | |
| Lenovo ThinkPad P14s G3 AMD 21J6S05000 | |
| Lenovo ThinkPad T14 G3-21CF004NGE | |
| HP ZBook Firefly 14 G9-6B8A2EA | |
| AIDA64 / CPU PhotoWorxx | |
| Average of class Workstation (37151 - 93684, n=25, last 2 years) | |
| Dell Precision 5000 5470 | |
| HP ZBook Firefly 14 G9-6B8A2EA | |
| Average AMD Ryzen 7 PRO 6850U (19707 - 27840, n=8) | |
| Lenovo ThinkPad T14 G3-21CF004NGE | |
| Lenovo ThinkPad P14s G3 AMD 21J6S05000 | |
System performance
Its system performance was slightly worse than that of its direct rivals, but this is not that noticeable in everyday use. A typical feature for current AMD systems is its poorer memory performance compared to the Intel models.
CrossMark: Overall | Productivity | Creativity | Responsiveness
| PCMark 10 / Score | |
| Average of class Workstation (6436 - 10409, n=21, last 2 years) | |
| Dell Precision 5000 5470 | |
| HP ZBook Firefly 14 G9-6B8A2EA | |
| Average AMD Ryzen 7 PRO 6850U, AMD Radeon 680M (5873 - 6311, n=7) | |
| Lenovo ThinkPad T14 G3-21CF004NGE | |
| Lenovo ThinkPad P14s G3 AMD 21J6S05000 | |
| Lenovo ThinkPad P14s Gen2-20VX000GGE | |
| PCMark 10 / Essentials | |
| Dell Precision 5000 5470 | |
| Average of class Workstation (9622 - 11157, n=21, last 2 years) | |
| HP ZBook Firefly 14 G9-6B8A2EA | |
| Lenovo ThinkPad T14 G3-21CF004NGE | |
| Average AMD Ryzen 7 PRO 6850U, AMD Radeon 680M (9151 - 10263, n=7) | |
| Lenovo ThinkPad P14s Gen2-20VX000GGE | |
| Lenovo ThinkPad P14s G3 AMD 21J6S05000 | |
| PCMark 10 / Productivity | |
| Average of class Workstation (8789 - 20616, n=21, last 2 years) | |
| HP ZBook Firefly 14 G9-6B8A2EA | |
| Lenovo ThinkPad P14s Gen2-20VX000GGE | |
| Average AMD Ryzen 7 PRO 6850U, AMD Radeon 680M (8435 - 8891, n=7) | |
| Lenovo ThinkPad T14 G3-21CF004NGE | |
| Dell Precision 5000 5470 | |
| Lenovo ThinkPad P14s G3 AMD 21J6S05000 | |
| PCMark 10 / Digital Content Creation | |
| Average of class Workstation (7744 - 15631, n=21, last 2 years) | |
| Dell Precision 5000 5470 | |
| Lenovo ThinkPad P14s G3 AMD 21J6S05000 | |
| Average AMD Ryzen 7 PRO 6850U, AMD Radeon 680M (6796 - 8422, n=7) | |
| Lenovo ThinkPad T14 G3-21CF004NGE | |
| HP ZBook Firefly 14 G9-6B8A2EA | |
| Lenovo ThinkPad P14s Gen2-20VX000GGE | |
| CrossMark / Overall | |
| Average of class Workstation (1307 - 2267, n=24, last 2 years) | |
| Dell Precision 5000 5470 | |
| HP ZBook Firefly 14 G9-6B8A2EA | |
| Lenovo ThinkPad T14 G3-21CF004NGE | |
| Average AMD Ryzen 7 PRO 6850U, AMD Radeon 680M (1154 - 1442, n=7) | |
| Lenovo ThinkPad P14s G3 AMD 21J6S05000 | |
| CrossMark / Productivity | |
| Average of class Workstation (1130 - 2122, n=24, last 2 years) | |
| Dell Precision 5000 5470 | |
| HP ZBook Firefly 14 G9-6B8A2EA | |
| Lenovo ThinkPad T14 G3-21CF004NGE | |
| Average AMD Ryzen 7 PRO 6850U, AMD Radeon 680M (1188 - 1444, n=7) | |
| Lenovo ThinkPad P14s G3 AMD 21J6S05000 | |
| CrossMark / Creativity | |
| Average of class Workstation (1657 - 2725, n=24, last 2 years) | |
| Dell Precision 5000 5470 | |
| HP ZBook Firefly 14 G9-6B8A2EA | |
| Lenovo ThinkPad T14 G3-21CF004NGE | |
| Average AMD Ryzen 7 PRO 6850U, AMD Radeon 680M (1180 - 1523, n=7) | |
| Lenovo ThinkPad P14s G3 AMD 21J6S05000 | |
| CrossMark / Responsiveness | |
| Average of class Workstation (993 - 2096, n=24, last 2 years) | |
| Dell Precision 5000 5470 | |
| HP ZBook Firefly 14 G9-6B8A2EA | |
| Lenovo ThinkPad T14 G3-21CF004NGE | |
| Average AMD Ryzen 7 PRO 6850U, AMD Radeon 680M (990 - 1282, n=7) | |
| Lenovo ThinkPad P14s G3 AMD 21J6S05000 | |
| PCMark 10 Score | 5953 points | |
Help | ||
| AIDA64 / Memory Copy | |
| Average of class Workstation (56003 - 164795, n=25, last 2 years) | |
| Dell Precision 5000 5470 | |
| HP ZBook Firefly 14 G9-6B8A2EA | |
| Lenovo ThinkPad T14 G3-21CF004NGE | |
| Lenovo ThinkPad P14s G3 AMD 21J6S05000 | |
| Average AMD Ryzen 7 PRO 6850U (31003 - 48605, n=8) | |
| AIDA64 / Memory Read | |
| Average of class Workstation (55795 - 121563, n=25, last 2 years) | |
| Dell Precision 5000 5470 | |
| HP ZBook Firefly 14 G9-6B8A2EA | |
| Average AMD Ryzen 7 PRO 6850U (34682 - 45912, n=8) | |
| Lenovo ThinkPad T14 G3-21CF004NGE | |
| Lenovo ThinkPad P14s G3 AMD 21J6S05000 | |
| AIDA64 / Memory Write | |
| Average of class Workstation (55663 - 214520, n=25, last 2 years) | |
| HP ZBook Firefly 14 G9-6B8A2EA | |
| Dell Precision 5000 5470 | |
| Lenovo ThinkPad P14s G3 AMD 21J6S05000 | |
| Lenovo ThinkPad T14 G3-21CF004NGE | |
| Average AMD Ryzen 7 PRO 6850U (34532 - 51096, n=8) | |
| AIDA64 / Memory Latency | |
| Average of class Workstation (84.5 - 165.2, n=25, last 2 years) | |
| Lenovo ThinkPad P14s G3 AMD 21J6S05000 | |
| Lenovo ThinkPad T14 G3-21CF004NGE | |
| Dell Precision 5000 5470 | |
| Average AMD Ryzen 7 PRO 6850U (86.1 - 135.3, n=8) | |
| HP ZBook Firefly 14 G9-6B8A2EA | |
* ... smaller is better
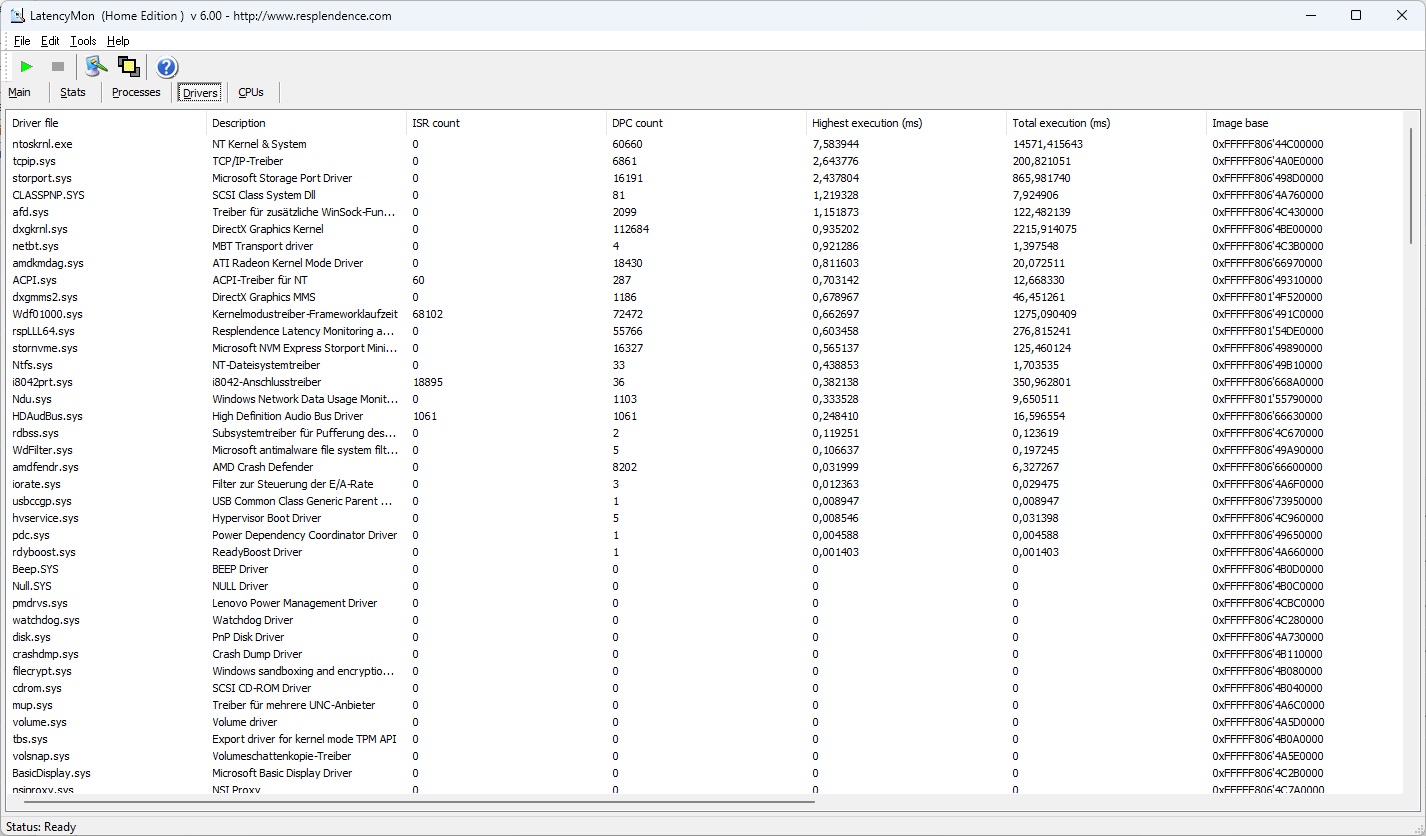
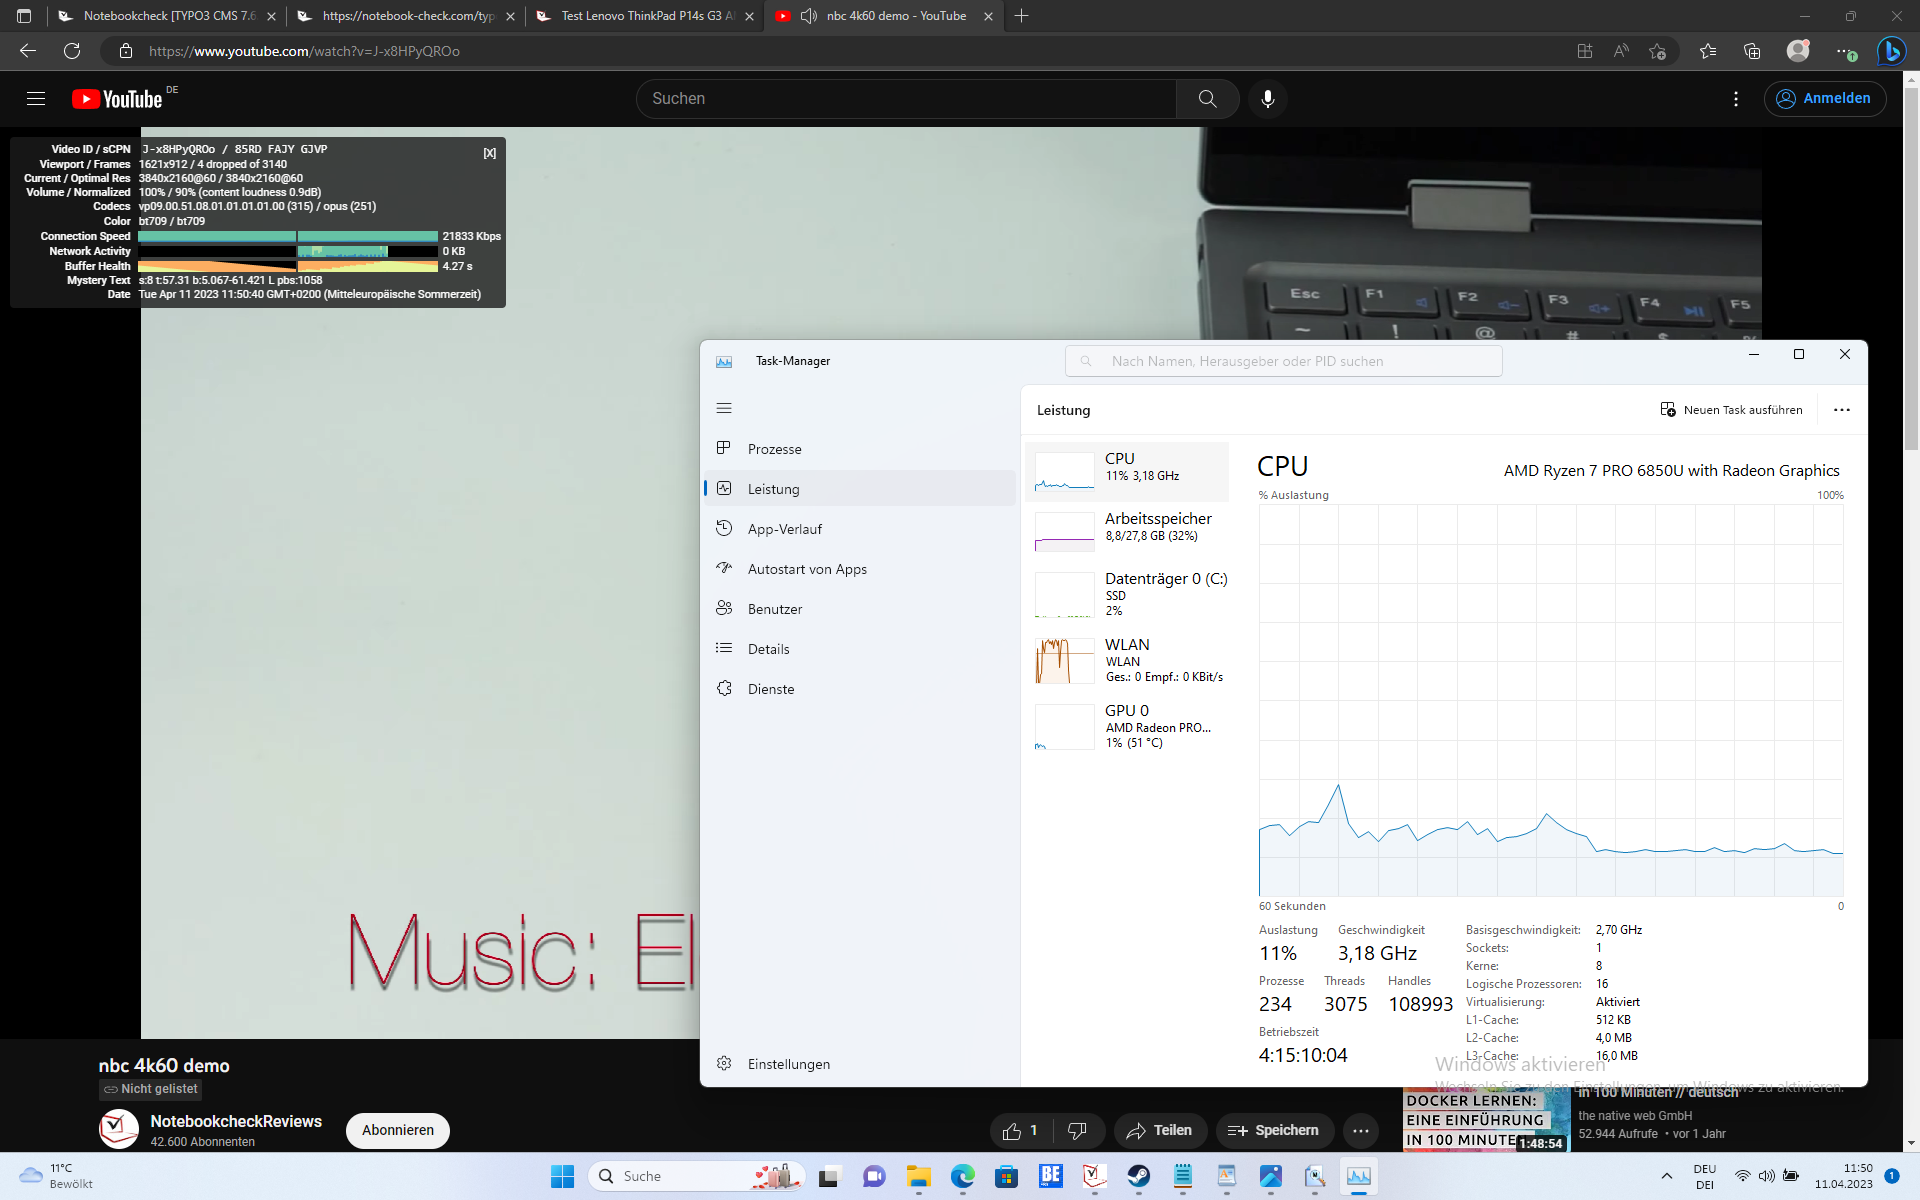
DPC latency
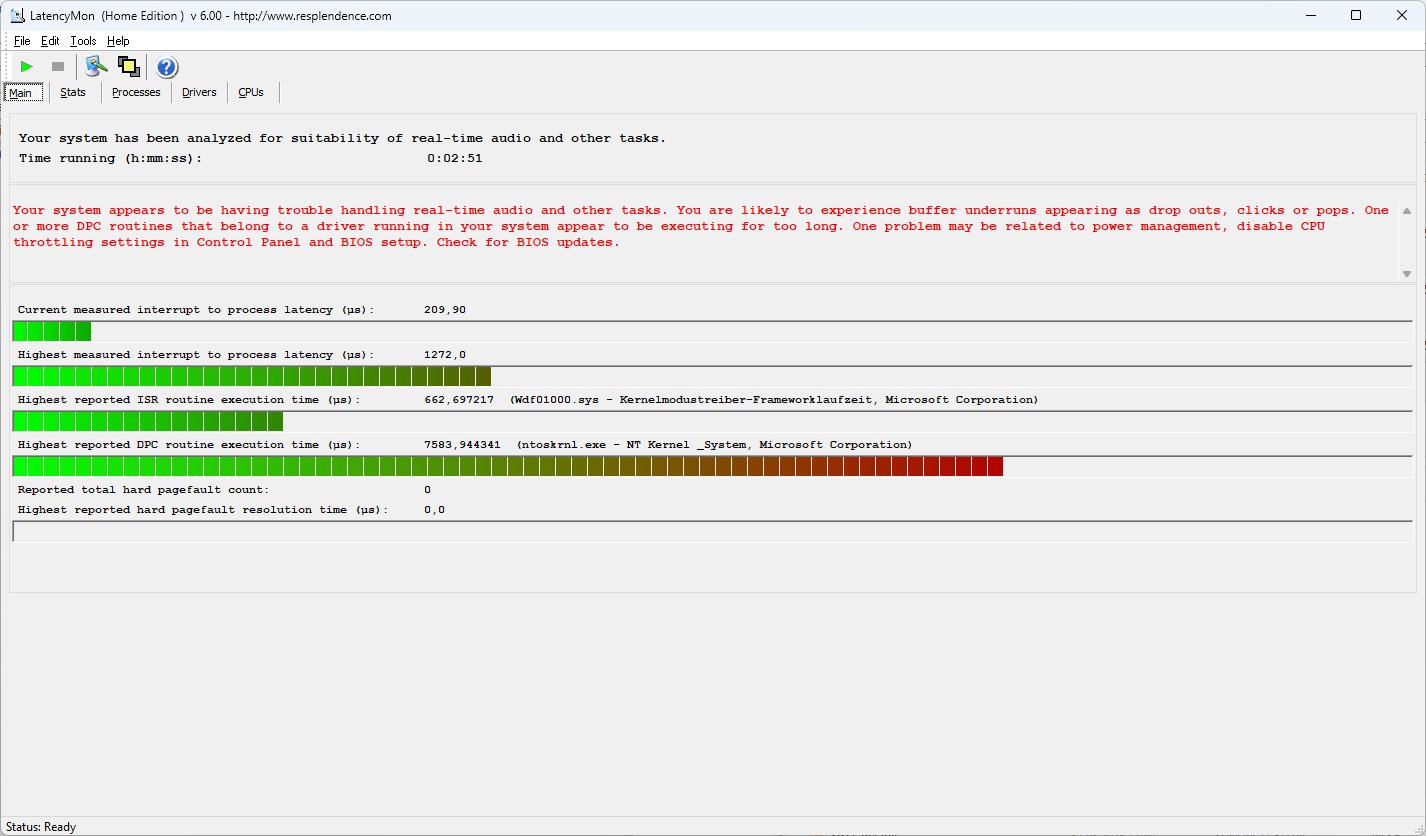
The ThinkPad P14s Gen 3 struggles with DPC latencies in the presented configuration. This could be due to a driver issue, and may well be resolved in a future software update.
| DPC Latencies / LatencyMon - interrupt to process latency (max), Web, Youtube, Prime95 | |
| Dell Precision 5000 5470 | |
| Lenovo ThinkPad P14s G3 AMD 21J6S05000 | |
| Lenovo ThinkPad P14s Gen2-20VX000GGE | |
| HP ZBook Firefly 14 G9-6B8A2EA | |
| Lenovo ThinkPad T14 G3-21CF004NGE | |
* ... smaller is better
Storage devices
The Samsung PM9A1 in the Lenovo ThinkPad P14s G3 delivers high performance - typical for a PCIe 4.0 SSD. The M.2-2280 single-sided SSD also runs very fast under continuous load and without throttling.

* ... smaller is better
Reading continuous performance: DiskSpd Read Loop, Queue Depth 8
Graphics card
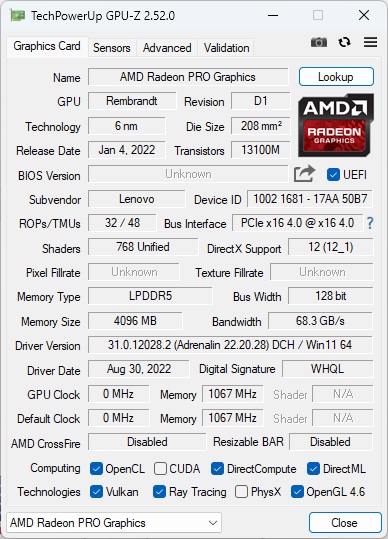
A hallmark of mobile workstations is that, unlike office laptops, their graphics perform well in CAD and other GPU-intensive tasks. A dedicated GPU would typically be installed for this. However, Lenovo have decided not to put one in the ThinkPad P14s Gen 3. Instead, the Lenovo laptop relies exclusively on the integrated AMD Radeon 680M.
The result is weak GPU performance for a workstation - far below average. To be fair, though, the Nvidia T550 in the ZBook Firefly 14 isn't really any better. Only the Nvidia RTX A1000 in the Dell Precision 5470 starts to show significantly better performance. One thing should be clear if you are thinking about buying the P14: It is an absolute entry-level model that forgoes GPU performance in the name of mobility.
For gaming, the P14s G3 is just as suitable as all other current AMD laptops with a Radeon 680M: Many games run quite smoothly in Full HD - but with reduced detail settings.
As with the processor, we didn't notice any GPU limitations in battery mode.
| 3DMark 11 Performance | 10377 points | |
| 3DMark Cloud Gate Standard Score | 30226 points | |
| 3DMark Fire Strike Score | 6722 points | |
| 3DMark Time Spy Score | 2724 points | |
Help | ||
* ... smaller is better
| The Witcher 3 - 1920x1080 Ultra Graphics & Postprocessing (HBAO+) | |
| Average of class Workstation (26.3 - 91.7, n=3, last 2 years) | |
| Dell Precision 5000 5470 | |
| Lenovo ThinkPad P14s G3 AMD 21J6S05000 | |
| Lenovo ThinkPad T14 G3-21CF004NGE | |
| HP ZBook Firefly 14 G9-6B8A2EA | |
| Lenovo ThinkPad P14s Gen2-20VX000GGE | |
Witcher 3 fps diagram
| low | med. | high | ultra | |
|---|---|---|---|---|
| GTA V (2015) | 123.2 | 110.2 | 47.6 | 23.8 |
| The Witcher 3 (2015) | 111.1 | 42.6 | 26.8 | |
| Dota 2 Reborn (2015) | 90.2 | 84.7 | 67.4 | 57.8 |
| Final Fantasy XV Benchmark (2018) | 61.3 | 36.1 | 25.4 | |
| X-Plane 11.11 (2018) | 52 | 39.3 | 31.9 | |
| Far Cry 5 (2018) | 60 | 38 | 35 | 33 |
| Strange Brigade (2018) | 106.8 | 49.1 | 39.9 | 34.1 |
| F1 22 (2022) | 53.1 | 49.1 | 35.4 | 8.32 |
Emissions: A little louder than the ThinkPad T14 G3 AMD
Noise emissions
Compared to the ThinkPad T14 Gen 3, the ThinkPad P14s Gen 3 had the tendency to get a little louder - especially in the Witcher 3 test. Although, their maximum noise levels were comparable. Its Dell and HP competitors have much louder active cooling systems.
We weren't able to notice any coil whining in the P14s G3 - however, we observed a sort of quiet crackling, which was probably just the SSD.
Noise level
| Idle |
| 22.9 / 22.9 / 22.9 dB(A) |
| Load |
| 30.8 / 39.5 dB(A) |
 | ||
30 dB silent 40 dB(A) audible 50 dB(A) loud |
||
min: | ||
| Lenovo ThinkPad P14s G3 AMD 21J6S05000 Radeon 680M, R7 PRO 6850U, Samsung PM9A1 MZVL21T0HCLR | Lenovo ThinkPad P14s Gen2-20VX000GGE T500 Laptop GPU, i7-1185G7, Toshiba XG6 KXG6AZNV1T02 | Lenovo ThinkPad T14 G3-21CF004NGE Radeon 680M, R7 PRO 6850U, Kioxia BG5 KBG5AZNV512G | Dell Precision 5000 5470 RTX A1000 Laptop GPU, i9-12900H, Samsung PM9A1 MZVL21T0HCLR | HP ZBook Firefly 14 G9-6B8A2EA T550 Laptop GPU, i7-1265U, Micron 3400 1TB MTFDKBA1T0TFH | |
|---|---|---|---|---|---|
| Noise | -9% | -3% | -16% | -9% | |
| off / environment * (dB) | 22.9 | 24.6 -7% | 24.2 -6% | 23 -0% | 23.6 -3% |
| Idle Minimum * (dB) | 22.9 | 24.6 -7% | 24.2 -6% | 23.3 -2% | 23.6 -3% |
| Idle Average * (dB) | 22.9 | 24.6 -7% | 24.2 -6% | 23.3 -2% | 23.6 -3% |
| Idle Maximum * (dB) | 22.9 | 24.6 -7% | 25.8 -13% | 23.3 -2% | 23.6 -3% |
| Load Average * (dB) | 30.8 | 38.9 -26% | 32.2 -5% | 48.5 -57% | 42.5 -38% |
| Witcher 3 ultra * (dB) | 39.4 | 34.1 13% | 48.6 -23% | 42.5 -8% | |
| Load Maximum * (dB) | 39.5 | 38.9 2% | 38.8 2% | 50.4 -28% | 42.5 -8% |
* ... smaller is better
Temperature
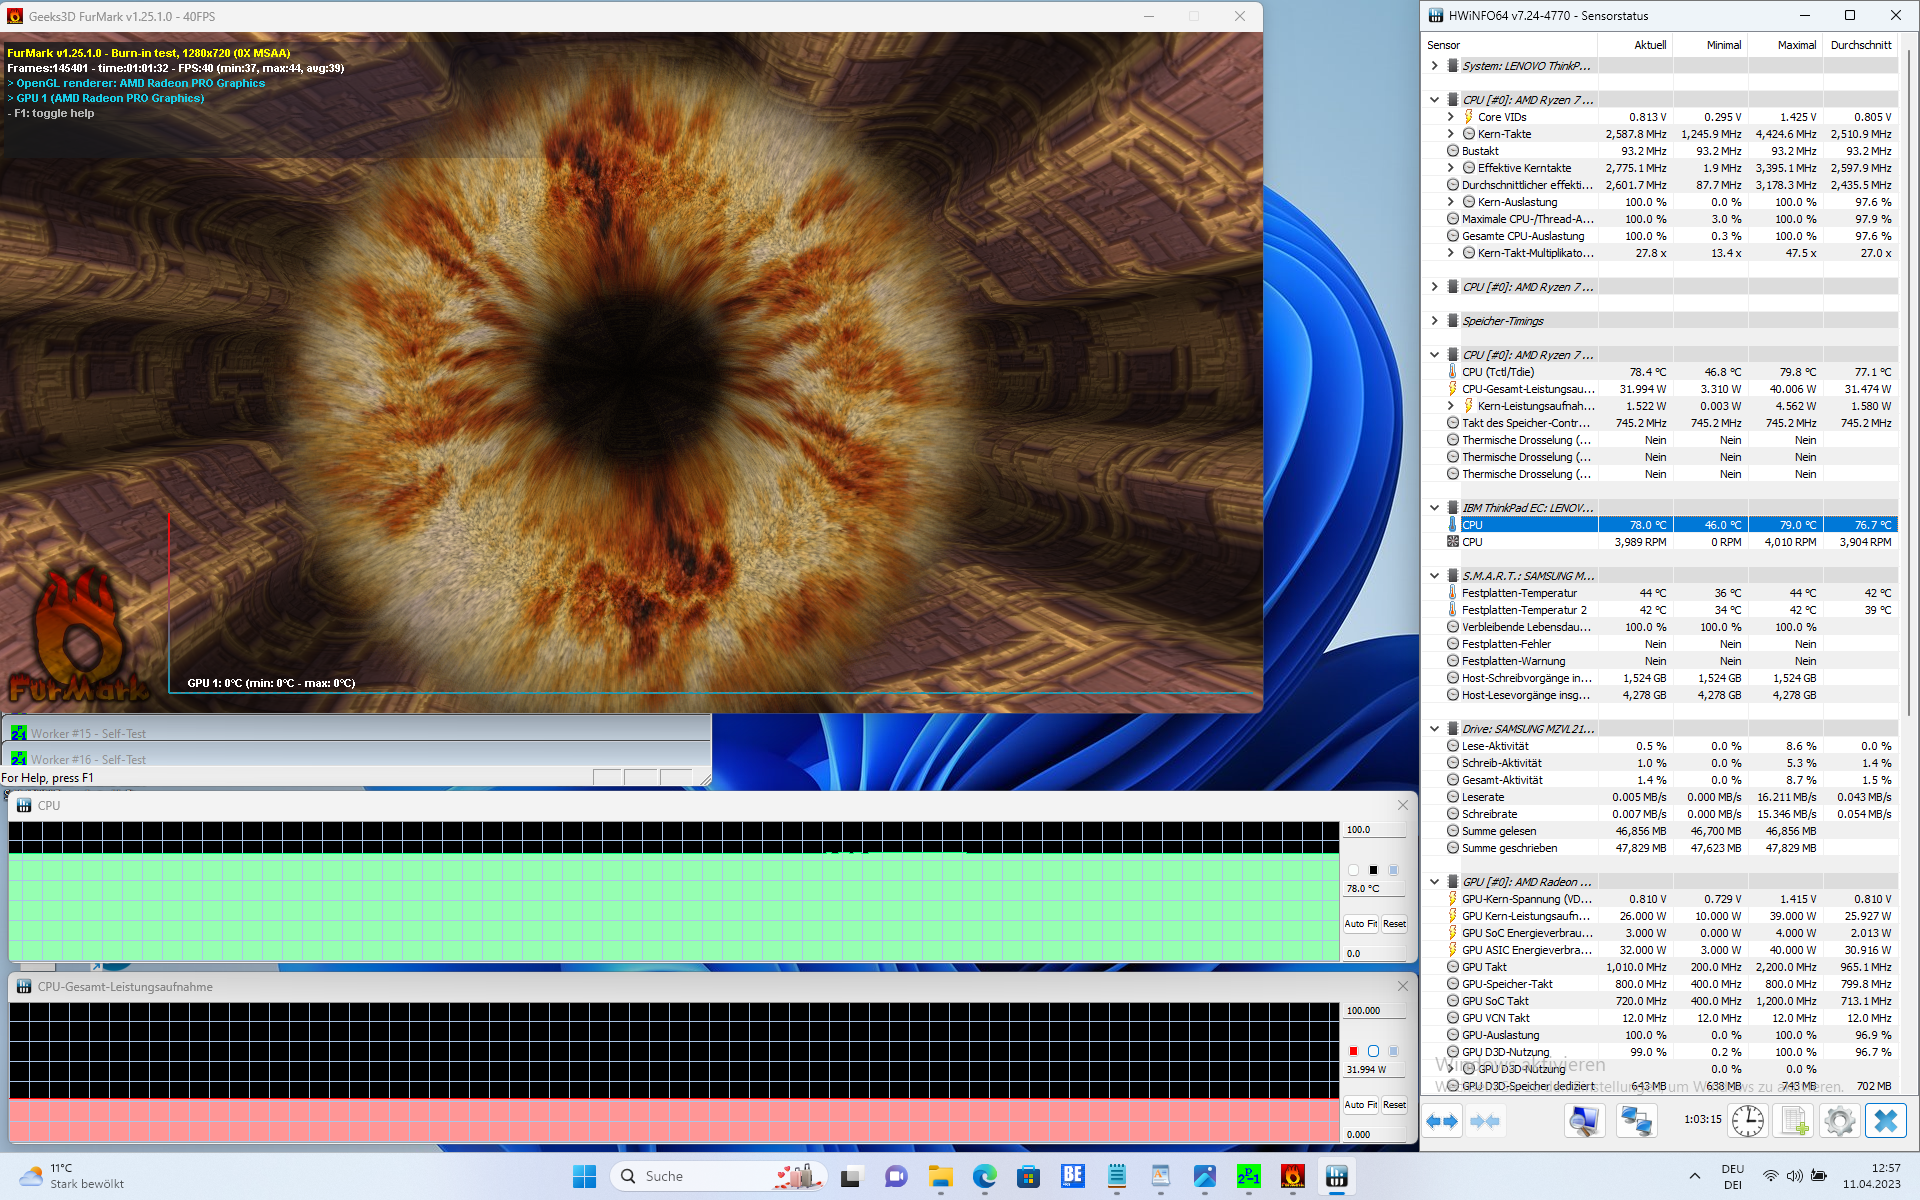
The P14s G3 AMD is a comparatively cool laptop. The Intel-based P14s Gen 2 predecessor in particular ran much hotter. We measured a maximum of 43.1 degrees Celsius in the P14s, which is also below the maximum temperature of the T14 Gen 3 AMD - presumably because of its somewhat more active fan.
There was absolutely no throttling in the stress test, its processor was able to keep its performance stable.
(±) The maximum temperature on the upper side is 42.7 °C / 109 F, compared to the average of 38.2 °C / 101 F, ranging from 22.2 to 69.8 °C for the class Workstation.
(±) The bottom heats up to a maximum of 43.1 °C / 110 F, compared to the average of 41.1 °C / 106 F
(+) In idle usage, the average temperature for the upper side is 24.6 °C / 76 F, compared to the device average of 32 °C / 90 F.
(±) Playing The Witcher 3, the average temperature for the upper side is 32.3 °C / 90 F, compared to the device average of 32 °C / 90 F.
(+) The palmrests and touchpad are cooler than skin temperature with a maximum of 26.8 °C / 80.2 F and are therefore cool to the touch.
(±) The average temperature of the palmrest area of similar devices was 27.8 °C / 82 F (+1 °C / 1.8 F).
| Lenovo ThinkPad P14s G3 AMD 21J6S05000 AMD Ryzen 7 PRO 6850U, AMD Radeon 680M | Lenovo ThinkPad P14s Gen2-20VX000GGE Intel Core i7-1185G7, NVIDIA T500 Laptop GPU | Lenovo ThinkPad T14 G3-21CF004NGE AMD Ryzen 7 PRO 6850U, AMD Radeon 680M | Dell Precision 5000 5470 Intel Core i9-12900H, NVIDIA RTX A1000 Laptop GPU | HP ZBook Firefly 14 G9-6B8A2EA Intel Core i7-1265U, NVIDIA T550 Laptop GPU | |
|---|---|---|---|---|---|
| Heat | -16% | -6% | -11% | -3% | |
| Maximum Upper Side * (°C) | 42.7 | 52.4 -23% | 48.2 -13% | 41.8 2% | 41.2 4% |
| Maximum Bottom * (°C) | 43.1 | 63.7 -48% | 52.8 -23% | 36 16% | 47.9 -11% |
| Idle Upper Side * (°C) | 25.7 | 24.6 4% | 24.4 5% | 34.6 -35% | 26.5 -3% |
| Idle Bottom * (°C) | 26.4 | 26 2% | 24.5 7% | 33.6 -27% | 27 -2% |
* ... smaller is better
Speakers
The ThinkPad P14s Gen 3's speakers, which are placed above the keyboard, aren't particularly good. They are too quiet and not bassy enough. An external solution is definitely recommended for listening to music.
Lenovo ThinkPad P14s G3 AMD 21J6S05000 audio analysis
(-) | not very loud speakers (69.6 dB)
Bass 100 - 315 Hz
(-) | nearly no bass - on average 20.4% lower than median
(-) | bass is not linear (15.1% delta to prev. frequency)
Mids 400 - 2000 Hz
(+) | balanced mids - only 1.6% away from median
(+) | mids are linear (5.8% delta to prev. frequency)
Highs 2 - 16 kHz
(+) | balanced highs - only 2% away from median
(+) | highs are linear (6.1% delta to prev. frequency)
Overall 100 - 16.000 Hz
(±) | linearity of overall sound is average (18.7% difference to median)
Compared to same class
» 63% of all tested devices in this class were better, 8% similar, 29% worse
» The best had a delta of 7%, average was 17%, worst was 35%
Compared to all devices tested
» 43% of all tested devices were better, 8% similar, 50% worse
» The best had a delta of 4%, average was 24%, worst was 134%
HP ZBook Firefly 14 G9-6B8A2EA audio analysis
(+) | speakers can play relatively loud (84.5 dB)
Bass 100 - 315 Hz
(-) | nearly no bass - on average 19.6% lower than median
(±) | linearity of bass is average (13% delta to prev. frequency)
Mids 400 - 2000 Hz
(+) | balanced mids - only 2.5% away from median
(+) | mids are linear (3.5% delta to prev. frequency)
Highs 2 - 16 kHz
(+) | balanced highs - only 1.9% away from median
(+) | highs are linear (3.2% delta to prev. frequency)
Overall 100 - 16.000 Hz
(+) | overall sound is linear (12.7% difference to median)
Compared to same class
» 21% of all tested devices in this class were better, 4% similar, 74% worse
» The best had a delta of 7%, average was 17%, worst was 35%
Compared to all devices tested
» 12% of all tested devices were better, 3% similar, 86% worse
» The best had a delta of 4%, average was 24%, worst was 134%
Power management: AMD efficiency makes for good runtimes
Power consumption
Its energy consumption is very similar to that of the ThinkPad T14 G3 - the difference being that the ThinkPad P14s G3 consumes a bit more under load. However, its consumption is still so low that a 65-watt power supply is more than sufficient. This is not the case for its Dell and HP competitors.
| Off / Standby | |
| Idle | |
| Load |
|
Key:
min: | |
| Lenovo ThinkPad P14s G3 AMD 21J6S05000 R7 PRO 6850U, Radeon 680M, Samsung PM9A1 MZVL21T0HCLR, IPS LED, 1920x1200, 14" | Lenovo ThinkPad P14s Gen2-20VX000GGE i7-1185G7, T500 Laptop GPU, Toshiba XG6 KXG6AZNV1T02, IPS, 1920x1080, 14" | Lenovo ThinkPad T14 G3-21CF004NGE R7 PRO 6850U, Radeon 680M, Kioxia BG5 KBG5AZNV512G, IPS, 1920x1200, 14" | Dell Precision 5000 5470 i9-12900H, RTX A1000 Laptop GPU, Samsung PM9A1 MZVL21T0HCLR, IPS, 2560x1600, 14" | HP ZBook Firefly 14 G9-6B8A2EA i7-1265U, T550 Laptop GPU, Micron 3400 1TB MTFDKBA1T0TFH, IPS, 1920x1200, 14" | Average AMD Radeon 680M | Average of class Workstation | |
|---|---|---|---|---|---|---|---|
| Power Consumption | -34% | 9% | -110% | -19% | -72% | -182% | |
| Idle Minimum * (Watt) | 2.6 | 4.5 -73% | 2.4 8% | 4.3 -65% | 4.2 -62% | 6.93 ? -167% | 8.94 ? -244% |
| Idle Average * (Watt) | 5 | 7.1 -42% | 5.3 -6% | 8.9 -78% | 6.5 -30% | 8.98 ? -80% | 13.8 ? -176% |
| Idle Maximum * (Watt) | 5.6 | 9.7 -73% | 5.6 -0% | 18.9 -238% | 7.2 -29% | 10.5 ? -88% | 17.5 ? -213% |
| Load Average * (Watt) | 49.7 | 37.8 24% | 39.7 20% | 94 -89% | 47.7 4% | 53.5 ? -8% | 95 ? -91% |
| Witcher 3 ultra * (Watt) | 50.6 | 42.8 15% | 83.2 -64% | 42.9 15% | |||
| Load Maximum * (Watt) | 61.1 | 64.7 -6% | 50.6 17% | 137.5 -125% | 68.2 -12% | 70.5 ? -15% | 175.2 ? -187% |
* ... smaller is better
Power consumption Witcher 3 / stress test
Power consumption with external monitor
Battery life
Like Lenovo's ThinkPad T14 Gen 3, the ThinkPad P14s G3 manages to get a lot out of its 52.5-watt-hour battery. Twelve hours in the Wi-Fi test (150 cd/m²) make for a respectable result. Even with maximum display brightness, the ThinkPad laptop still ran for almost ten hours in the Wi-Fi test. Its Intel-based rivals from Dell and HP can only dream of that.
| Lenovo ThinkPad P14s G3 AMD 21J6S05000 R7 PRO 6850U, Radeon 680M, 52.5 Wh | Lenovo ThinkPad P14s Gen2-20VX000GGE i7-1185G7, T500 Laptop GPU, 50 Wh | Lenovo ThinkPad T14 G3-21CF004NGE R7 PRO 6850U, Radeon 680M, 52.5 Wh | Dell Precision 5000 5470 i9-12900H, RTX A1000 Laptop GPU, 72 Wh | HP ZBook Firefly 14 G9-6B8A2EA i7-1265U, T550 Laptop GPU, 51 Wh | Average of class Workstation | |
|---|---|---|---|---|---|---|
| Battery runtime | -25% | 20% | -11% | -28% | -7% | |
| H.264 (h) | 12 | 16.4 37% | 9.51 ? -21% | |||
| WiFi v1.3 (h) | 12.2 | 9.2 -25% | 12.9 6% | 9.6 -21% | 8.8 -28% | 8.53 ? -30% |
| Load (h) | 1.1 | 1.3 18% | 1.1 0% | 1.429 ? 30% |
Pros
Cons
Verdict: The Lenovo ThinkPad P14s G3 AMD is a great entry-level workstation

A mobile workstation which renders elaborate CAD projects for hours on end or which can be used for game development - this is exactly what the Lenovo ThinkPad P14s Gen 3 AMD is not. Rather, it is an entry-level model that primarily offers good CPU performance, but lags far behind the larger workstation laptops in terms of GPU performance. The Lenovo laptop makes up for this lower performance with very good mobility.
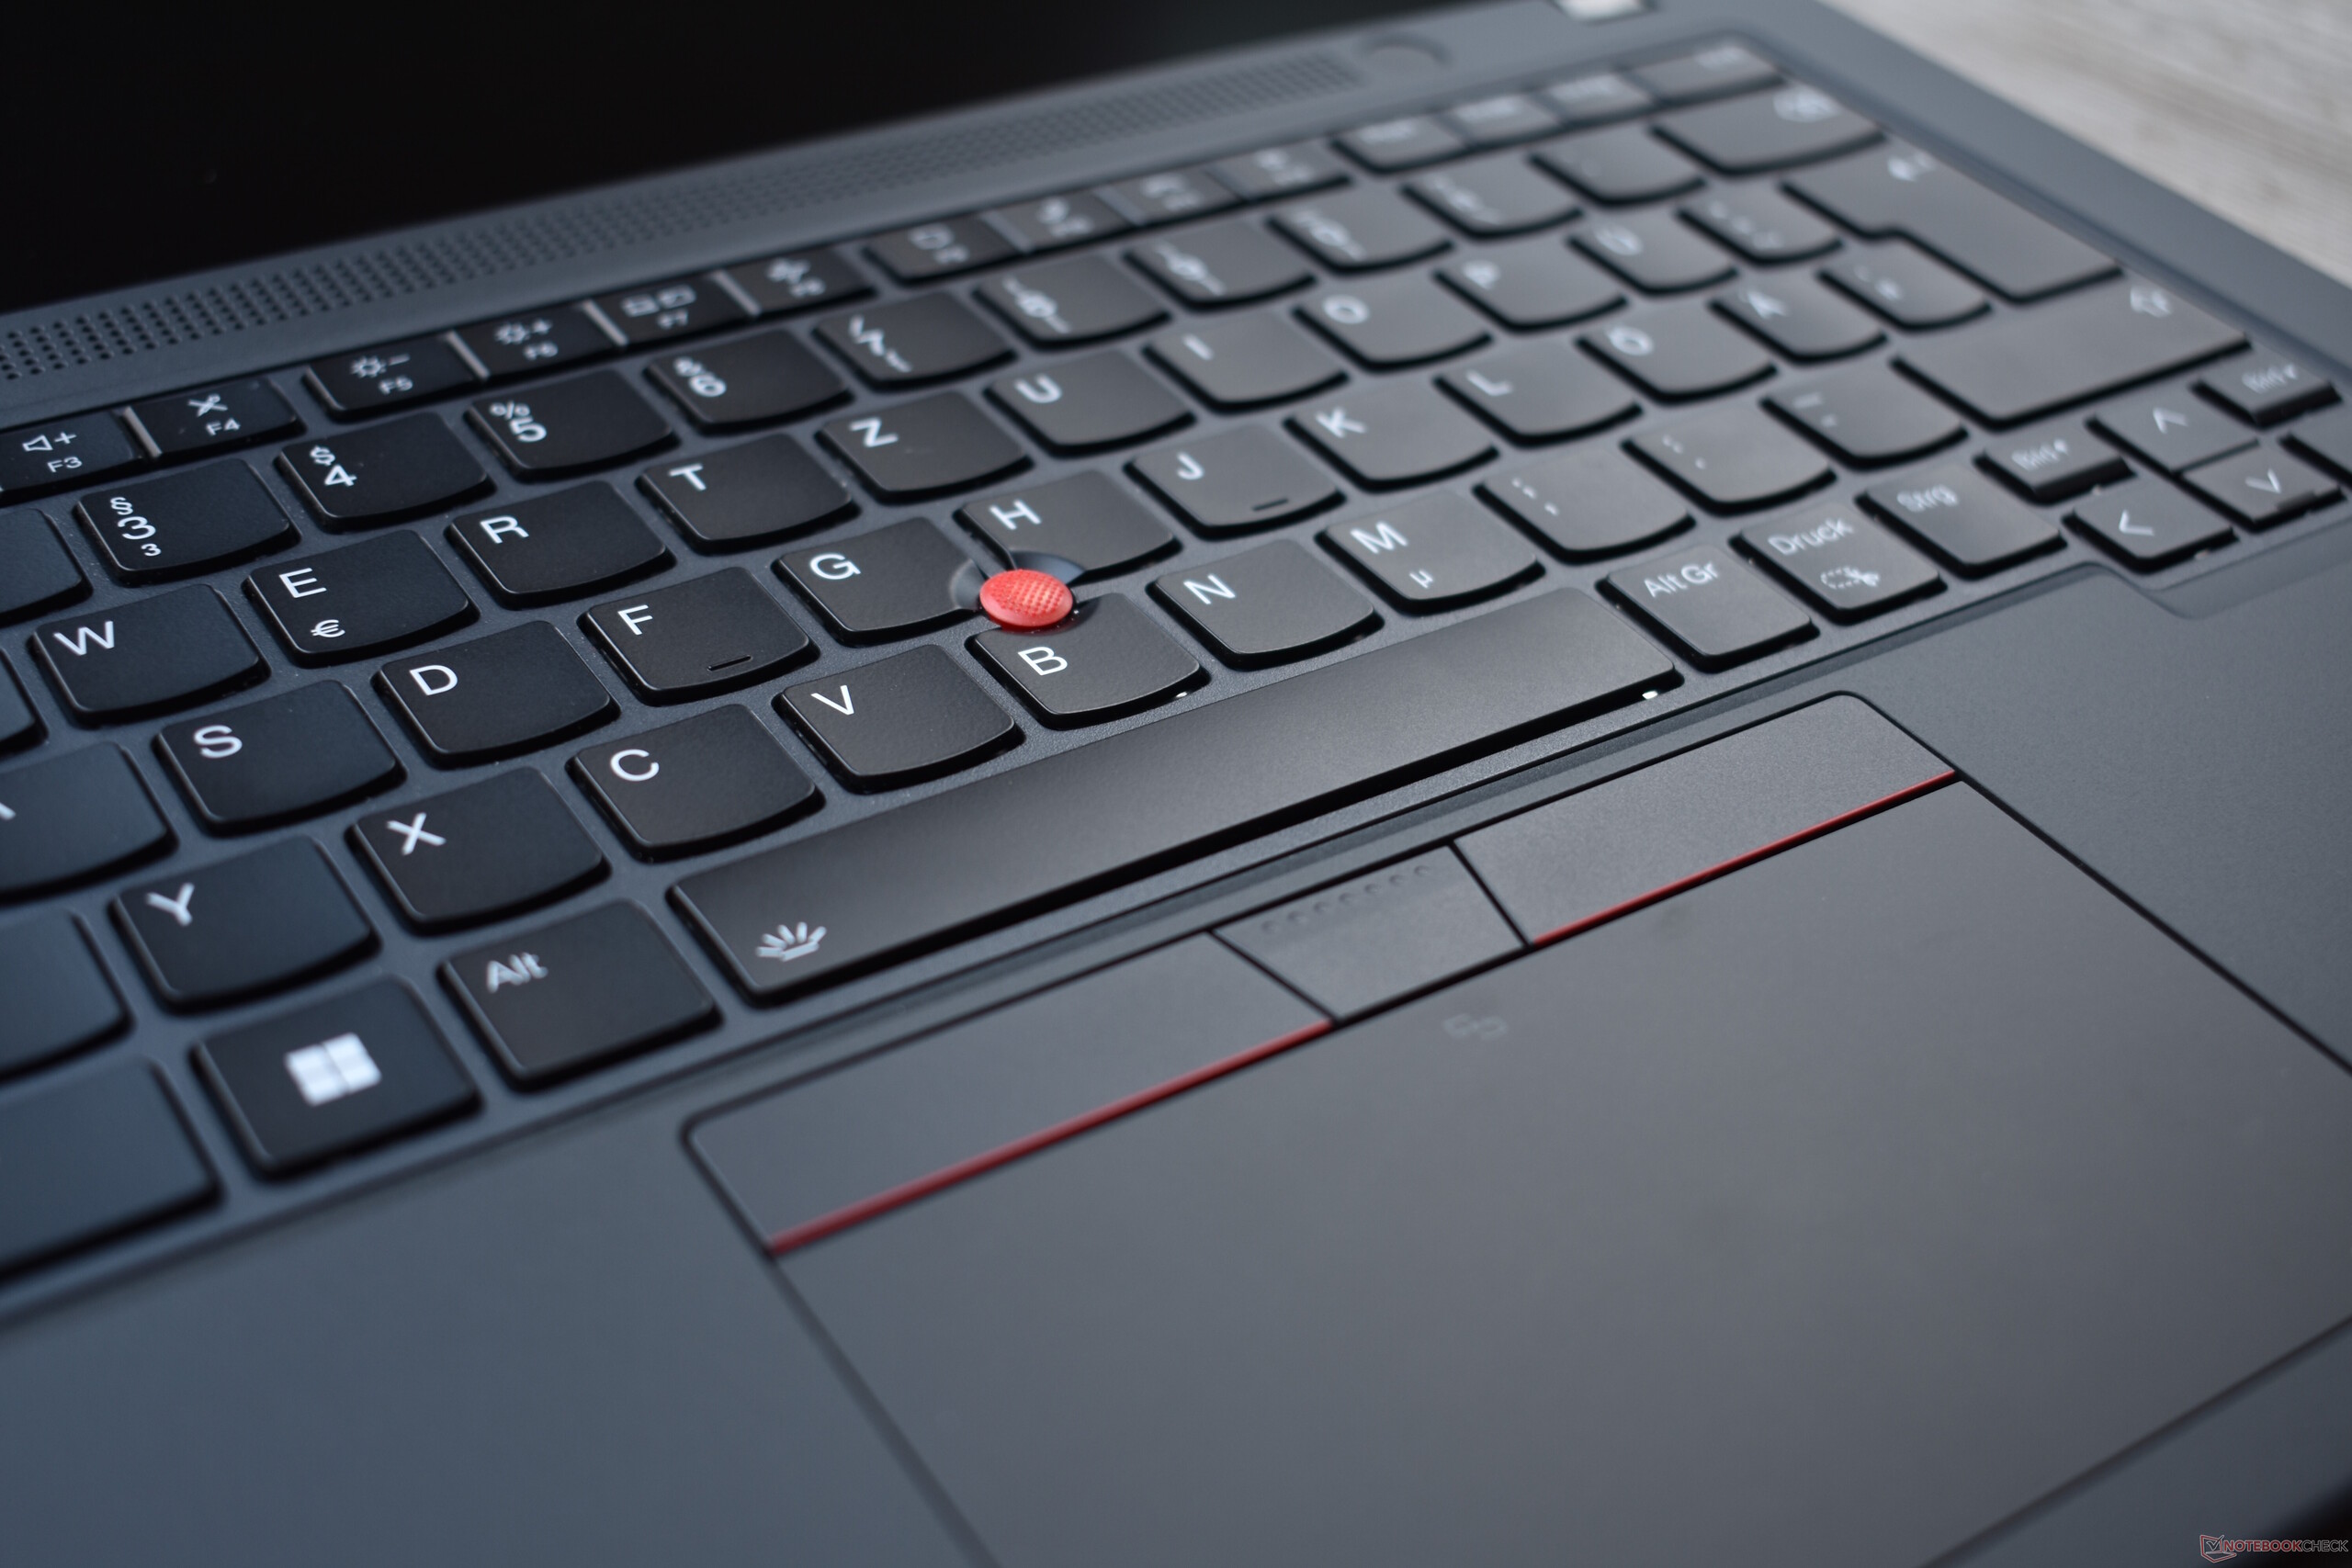
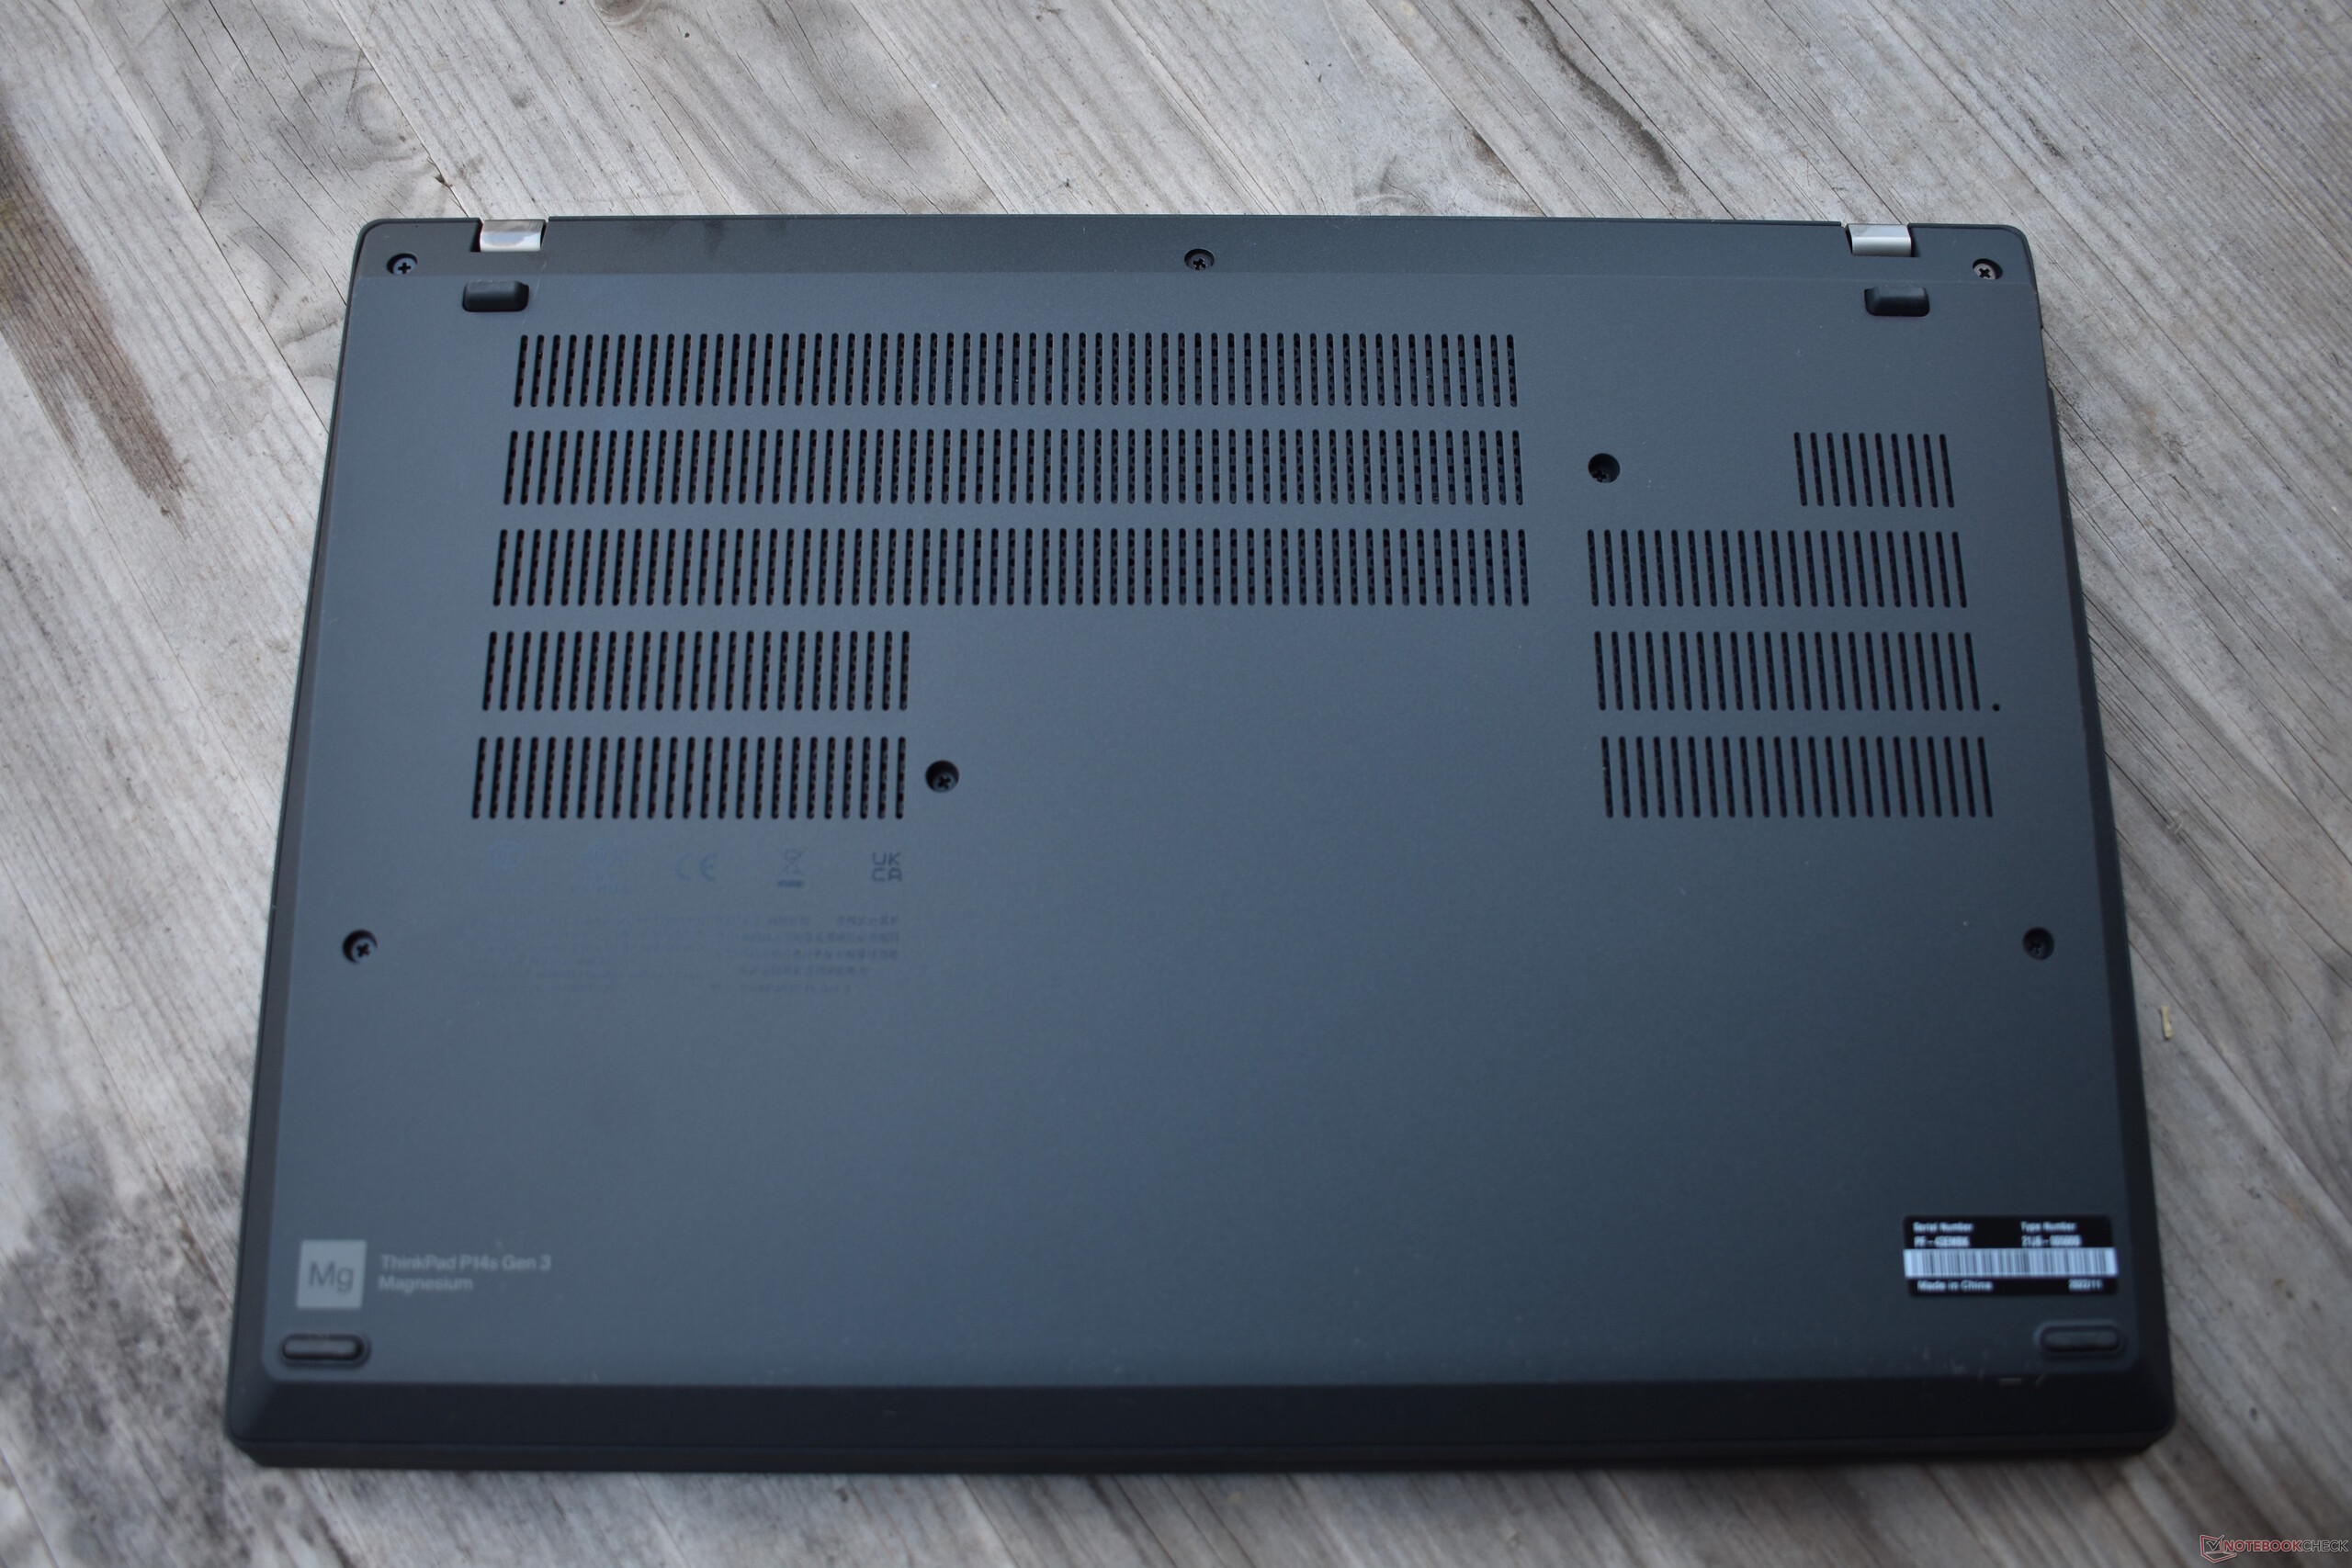
This should also make it clear that it is not meant to replace "big" workstations like the ThinkPad P16. It is a variant of the ThinkPad T14 G3 - an office laptop that is also marketed for workstation customers. Logically, it shares similar strengths and weaknesses with the ThinkPad T14 G3 AMD. Its missing SD card slot is one of those weaknesses, as is the unsupported USB4 standard. The soldered RAM is even more of a nuisance in a workstation device, and the keyboard is not quite on the same level compared to the P14s Gen 2, although it is still very good. Its Ethernet presence and easily replaceable keyboard are also positives.
Good CPU performance and battery life, low GPU performance for a workstation: The Lenovo ThinkPad P14s Gen 3 AMD
The Lenovo ThinkPad P14s Gen 3 AMD is an excellent mobile workstation for tasks that require CPU performance. Its main competitors are the HP ZBook Firefly 14 G9, which offers Thunderbolt but has poorer multicore performance and less battery life with the more inefficient Intel processor. Another alternative is the Dell Precision 5470, which is primarily characterized by its significantly better GPU performance - but it makes big sacrifices in terms of ports (apart from the presence of Thunderbolt and an SD card reader).
Price and availability
The model we tested with Ryzen 7, WUXGA display, 32 GB RAM and 1 TB SSD with the model number 21J6S05000 is a special model that is only available in Lenovo's Campus program for eligible buyers. It costs around $1,640 and comes without an operating system. For all other customers, this model with Windows 11 Pro (21J5002FGE) is available for around $1,900. Amazon has the ThinkPad P14s Gen 3 AMD with a higher-resolution WQUXGA screen on offer for around $1,661.
Lenovo ThinkPad P14s G3 AMD 21J6S05000
- 04/17/2023 v7 (old)
Benjamin Herzig
Transparency
The selection of devices to be reviewed is made by our editorial team. The test sample was provided to the author as a loan by the manufacturer or retailer for the purpose of this review. The lender had no influence on this review, nor did the manufacturer receive a copy of this review before publication. There was no obligation to publish this review. As an independent media company, Notebookcheck is not subjected to the authority of manufacturers, retailers or publishers.
This is how Notebookcheck is testing
Every year, Notebookcheck independently reviews hundreds of laptops and smartphones using standardized procedures to ensure that all results are comparable. We have continuously developed our test methods for around 20 years and set industry standards in the process. In our test labs, high-quality measuring equipment is utilized by experienced technicians and editors. These tests involve a multi-stage validation process. Our complex rating system is based on hundreds of well-founded measurements and benchmarks, which maintains objectivity. Further information on our test methods can be found here.
Price comparison

