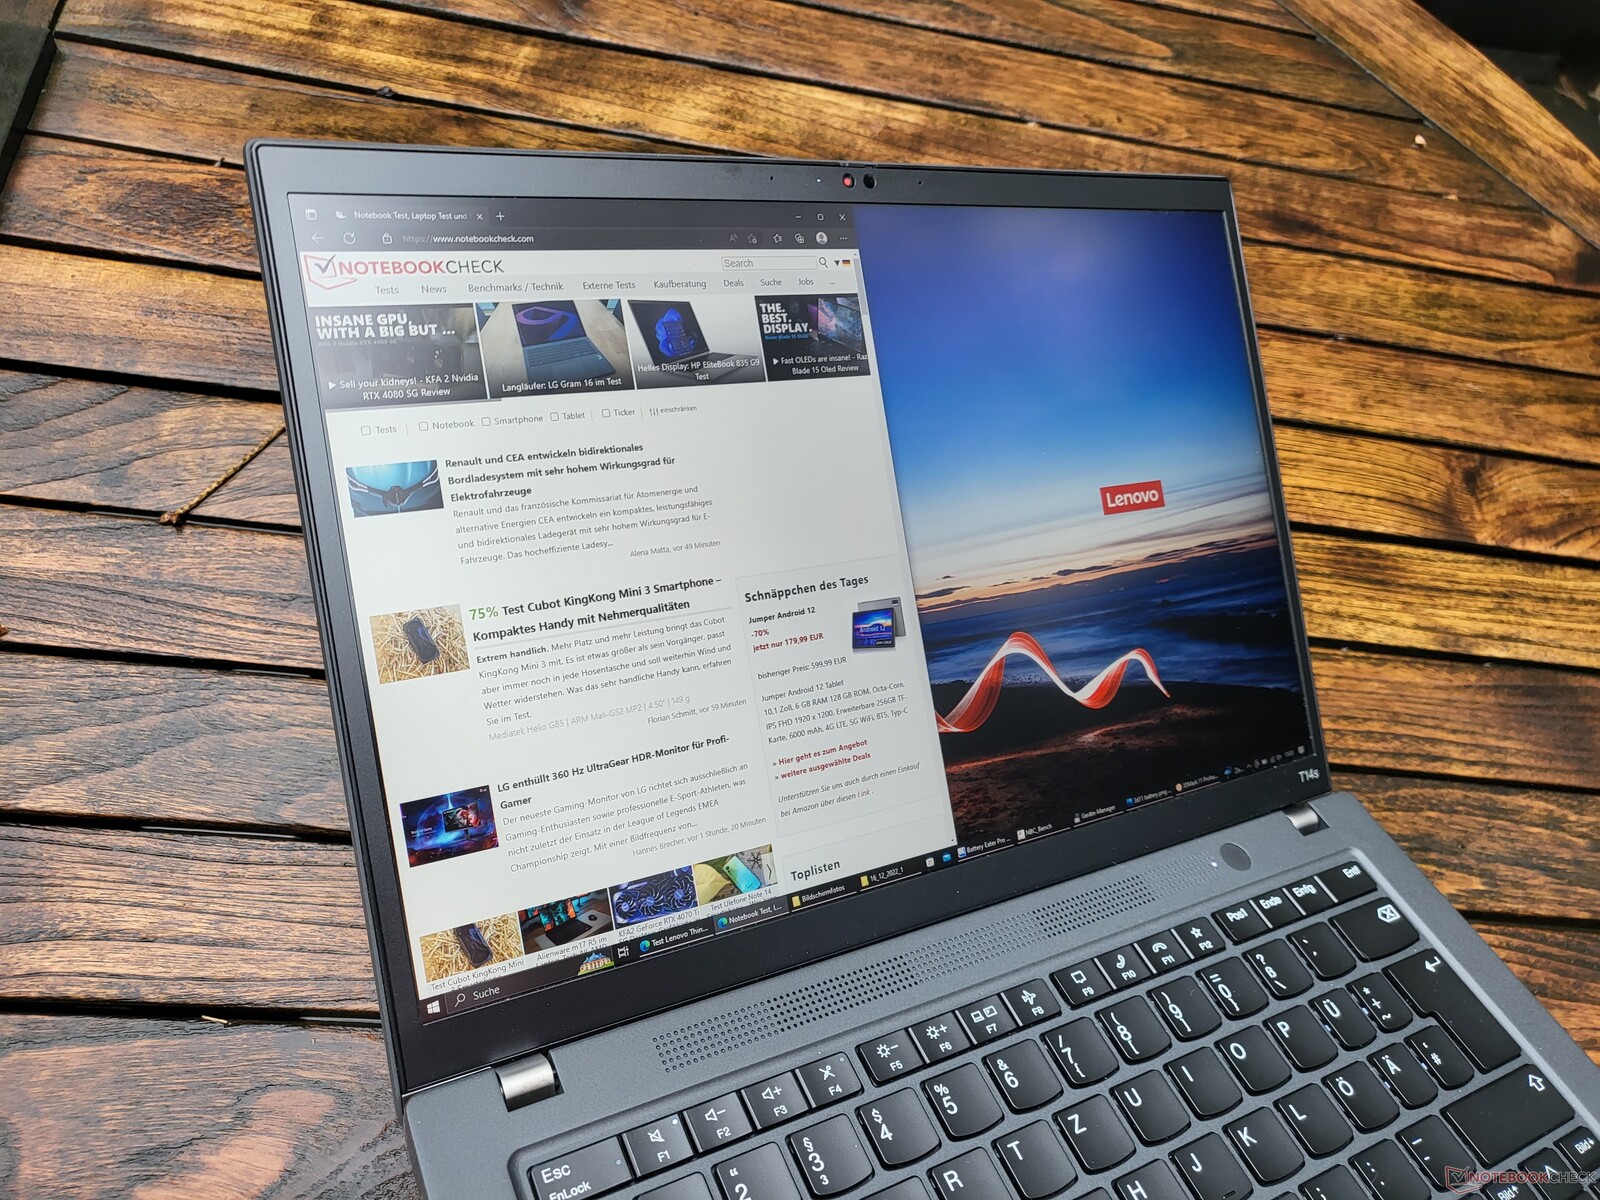
Lenovo ThinkPad T14s G3 AMD laptop review: Quiet and efficient workhorse with Ryzen power
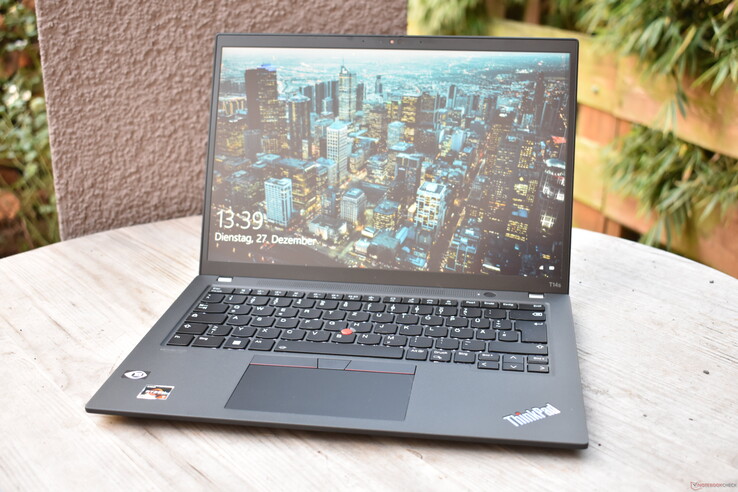
Lenovo's lineup for business customers is clearly aligned: The standard laptop for the office is the Lenovo ThinkPad T14 G3. For the executive floor and particularly mobile users, Lenovo offers the significantly more expensive ThinkPad X1 Carbon Gen 10. And if that is too expensive but mobility is still important, the Lenovo ThinkPad T14s G3 represents another option that is supposed to combine the best from both models. An advantage compared to the ThinkPad X1 Carbon is that the T14s is also available with AMD processors, such as the AMD Ryzen Pro 6850U included in our test unit today.
Since the T14s G3 always uses the same case, regardless of whether it houses an Intel or AMD processor, this review is a test update. You can find information on the case and design, the equipment, and the input devices in our review of the Lenovo ThinkPad T14s G3 Intel.
Possible Competitors in Comparison
Rating | Date | Model | Weight | Height | Size | Resolution | Price |
|---|---|---|---|---|---|---|---|
| 90.6 % v7 (old) | 01 / 2023 | Lenovo ThinkPad T14s G3 21CQ002LGE R7 PRO 6850U, Radeon 680M | 1.3 kg | 16.9 mm | 14.00" | 1920x1200 | |
| 89.1 % v7 (old) | 12 / 2022 | Lenovo ThinkPad T14s G3 21BR00CDGE i5-1235U, Iris Xe G7 80EUs | 1.3 kg | 16.9 mm | 14.00" | 1920x1200 | |
| 90.1 % v7 (old) | 03 / 2022 | Lenovo ThinkPad T14s G2 20XGS01100 R7 PRO 5850U, Vega 8 | 1.3 kg | 16.14 mm | 14.00" | 1920x1080 | |
| 89.8 % v7 (old) | 08 / 2022 | Dell Latitude 9430 2-in-1 i7-1265U, Iris Xe G7 96EUs | 1.5 kg | 13.94 mm | 14.00" | 2560x1600 | |
| 88.6 % v7 (old) | 11 / 2022 | HP EliteBook 845 G9 6F6H9EA R5 PRO 6650U, Radeon 660M | 1.4 kg | 19 mm | 14.00" | 1920x1200 |
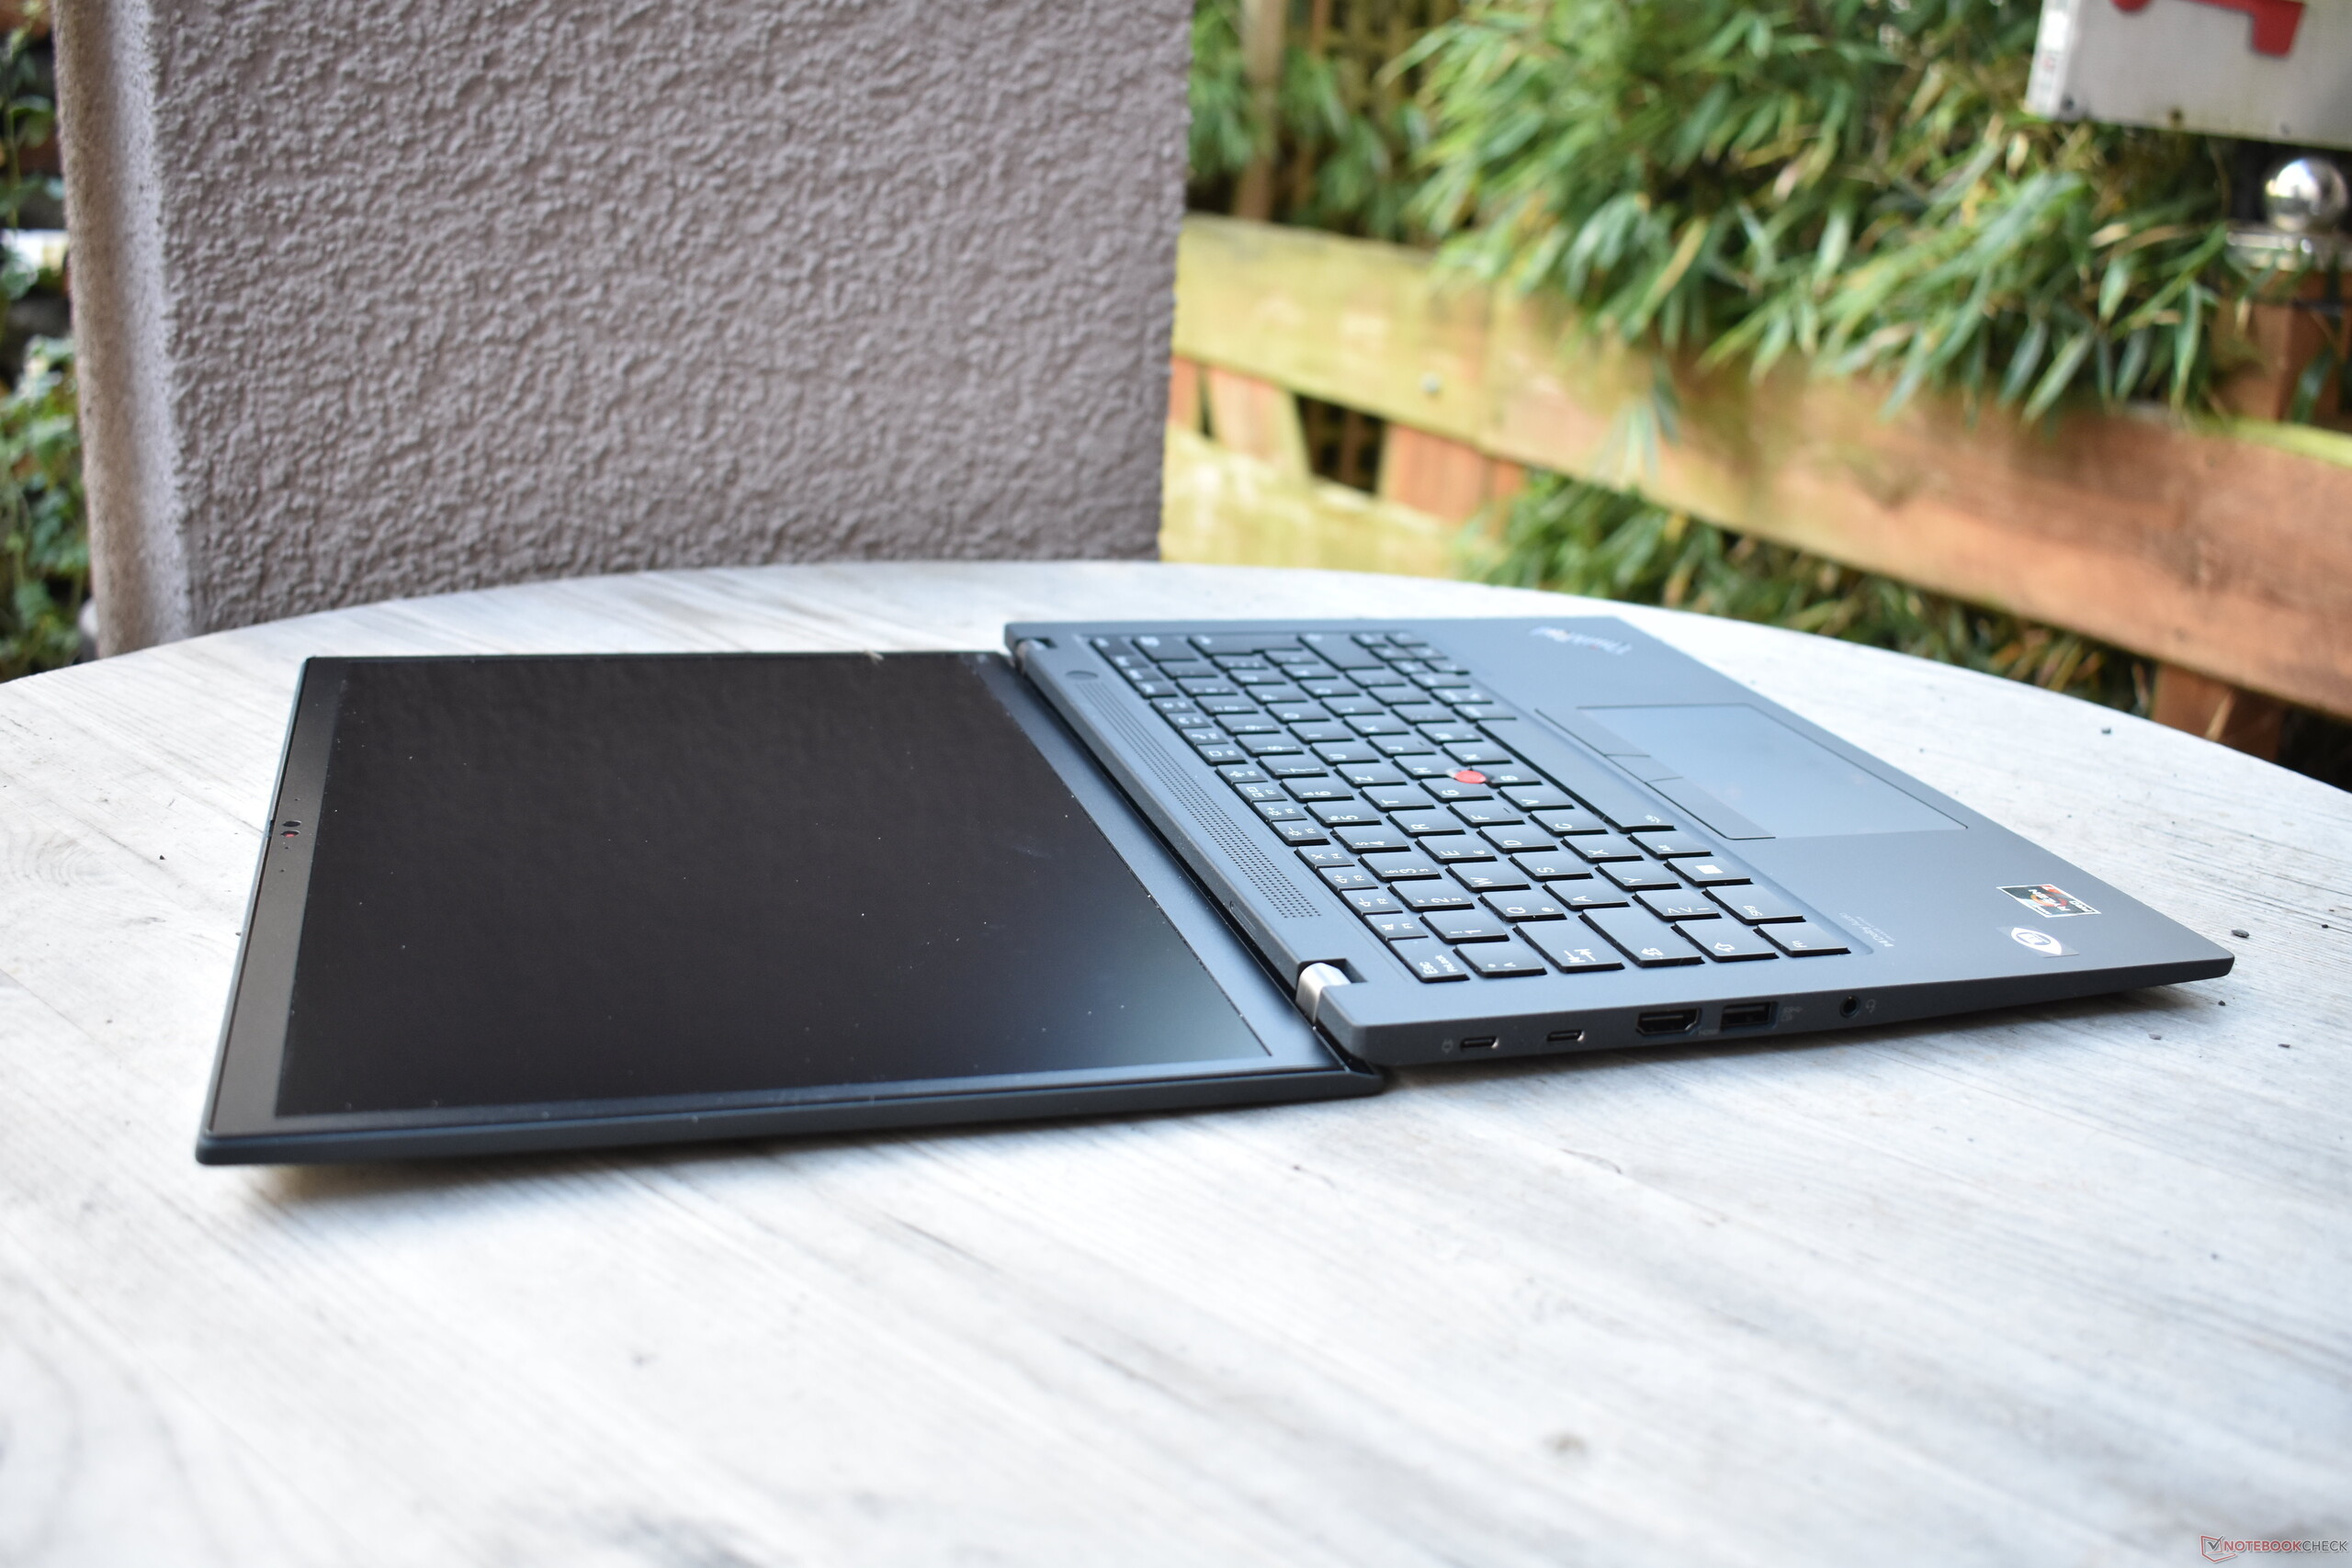
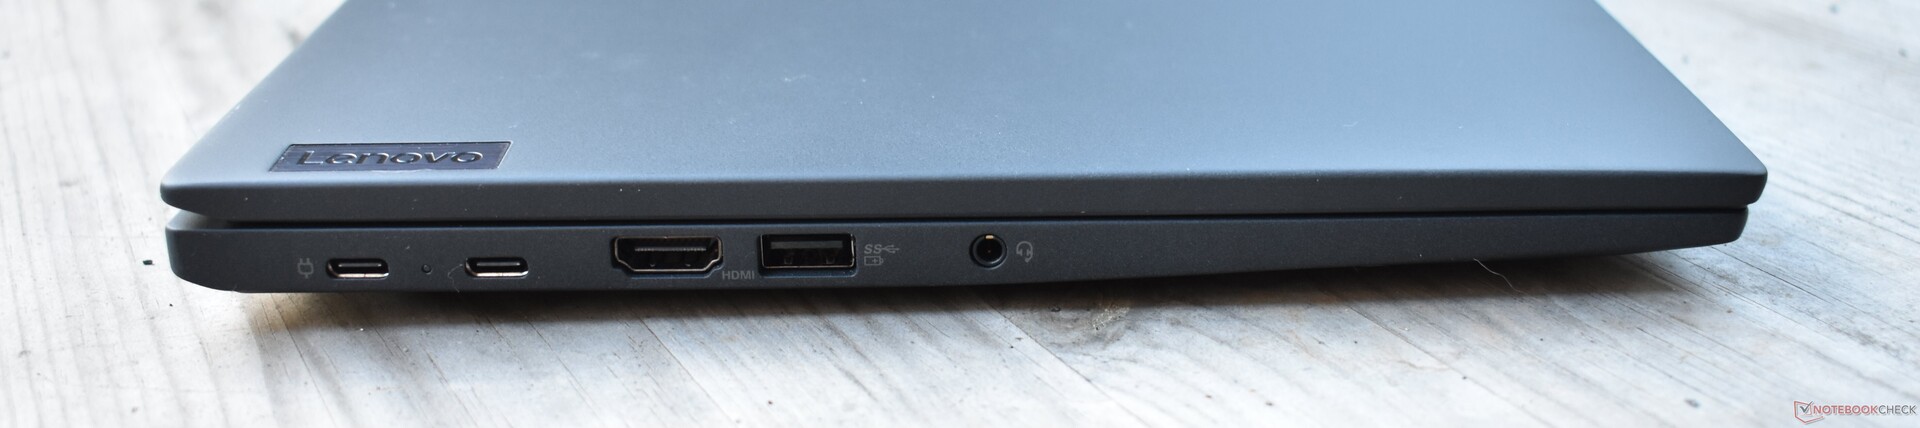
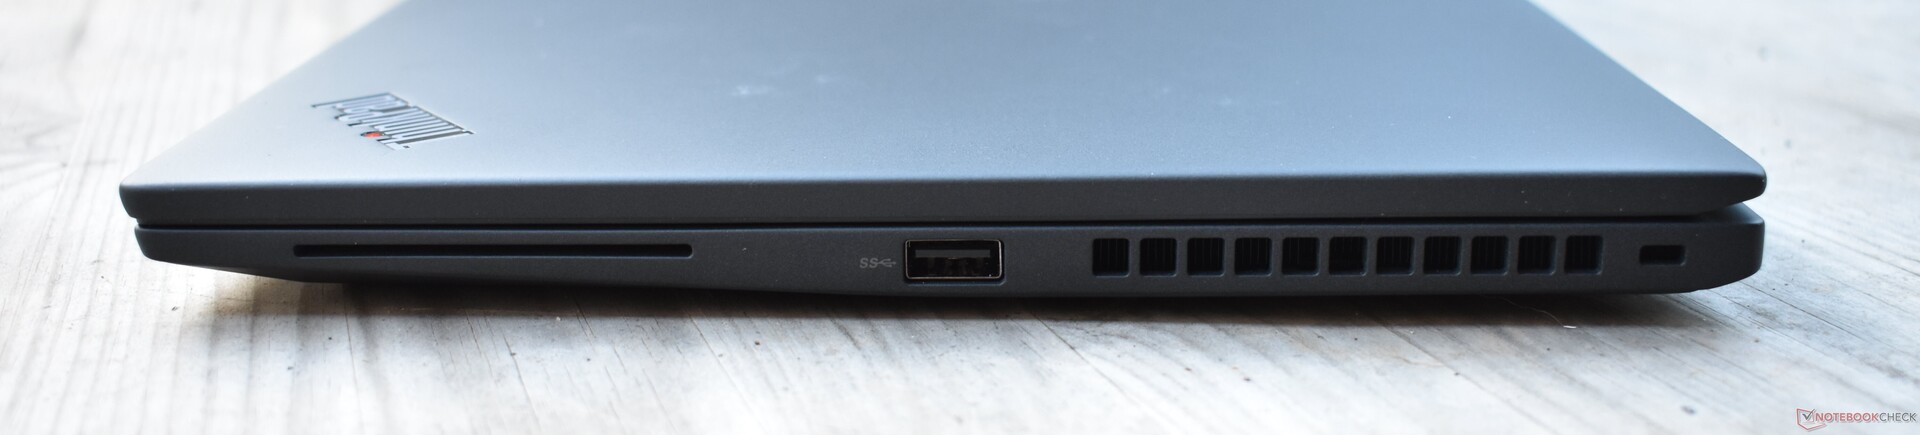
Connections
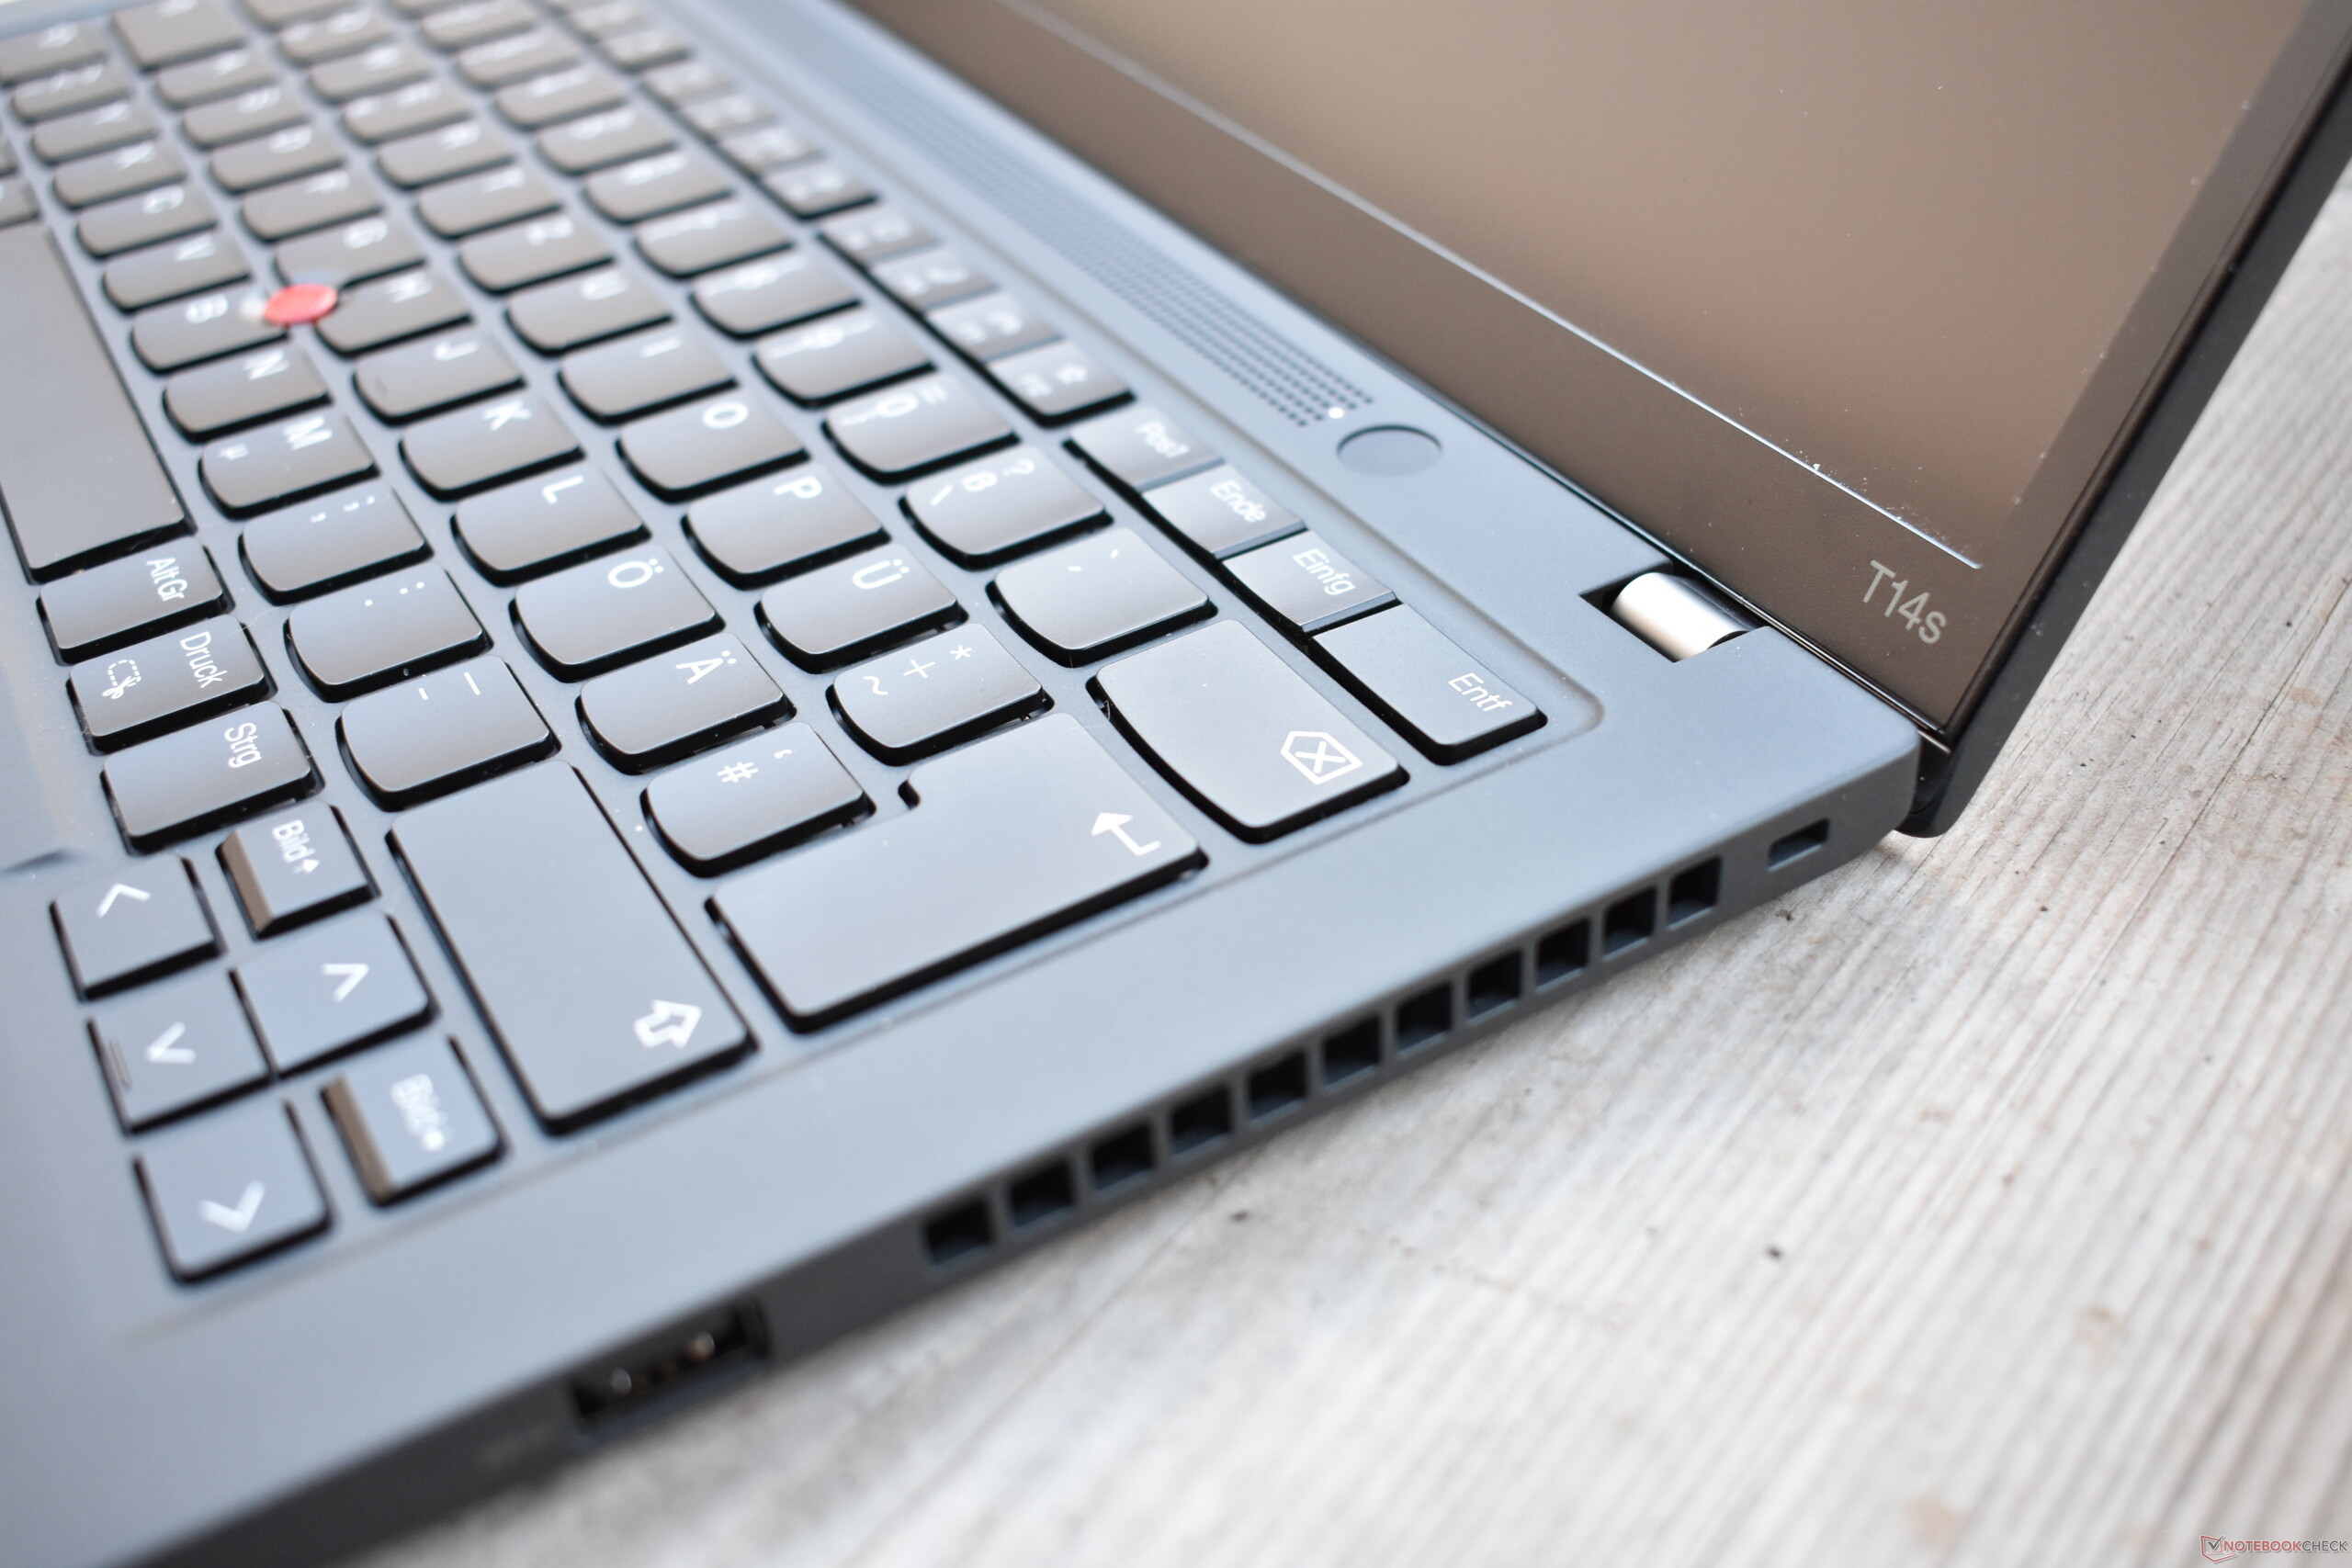
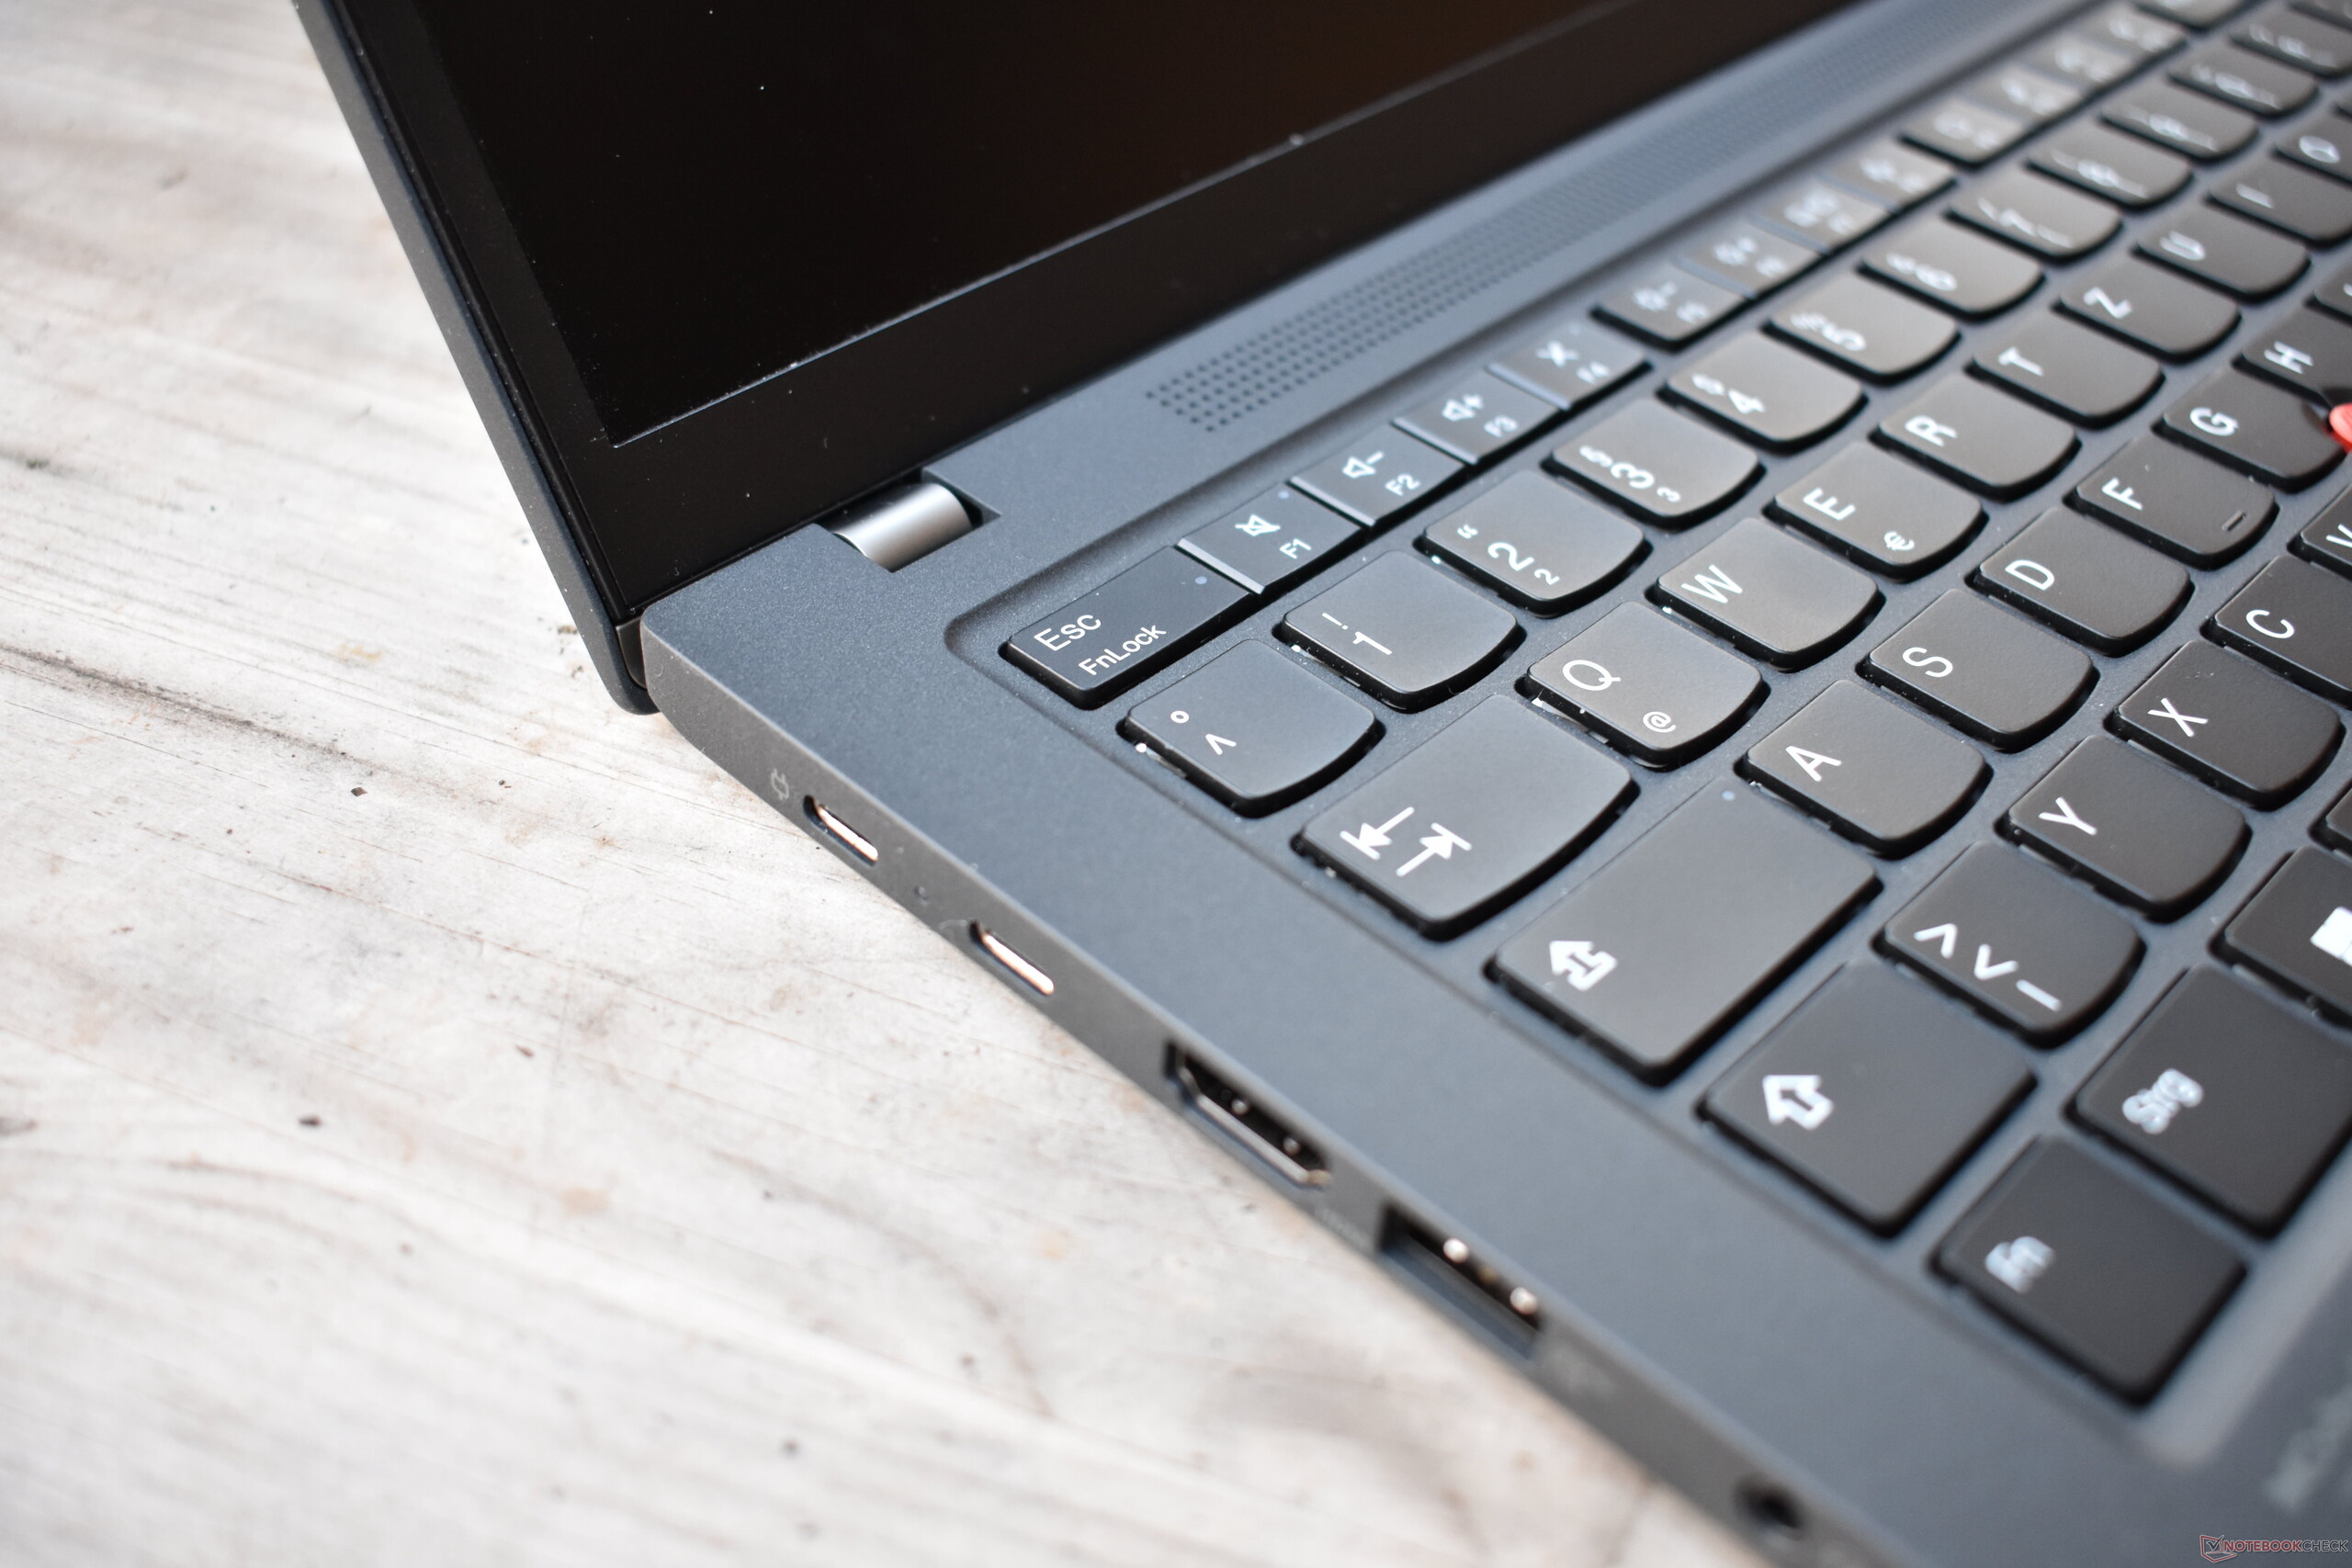
The connections are almost identical to those of the Lenovo ThinkPad T14s G3 Intel. The only difference is that instead of two Thunderbolt 4 ports, the ThinkPad T14s G3 AMD offers one USB 4 connection and one USB-C port that supports a maximum of USB 3.2 Gen 2. Both connections can be used for charging via USB-C power delivery, and both also have the DisplayPort alternate mode. To test this, we connected a Thunderbolt 3 eGPU and a Thunderbolt display to the ThinkPad, and both ran without any problems using the USB 4 port.
Communication
The communication equipment is identical, except for the WiFi chip: While the T14s G3 Intel has a WiFi module from Intel, the T14s G3 AMD uses a WiFi chip from Qualcomm. The performance specs are almost identical, and both solutions also perform similarly well in the benchmarks.
Webcam
The 1080p webcam is identical to that in the ThinkPad T14s G3 Intel.


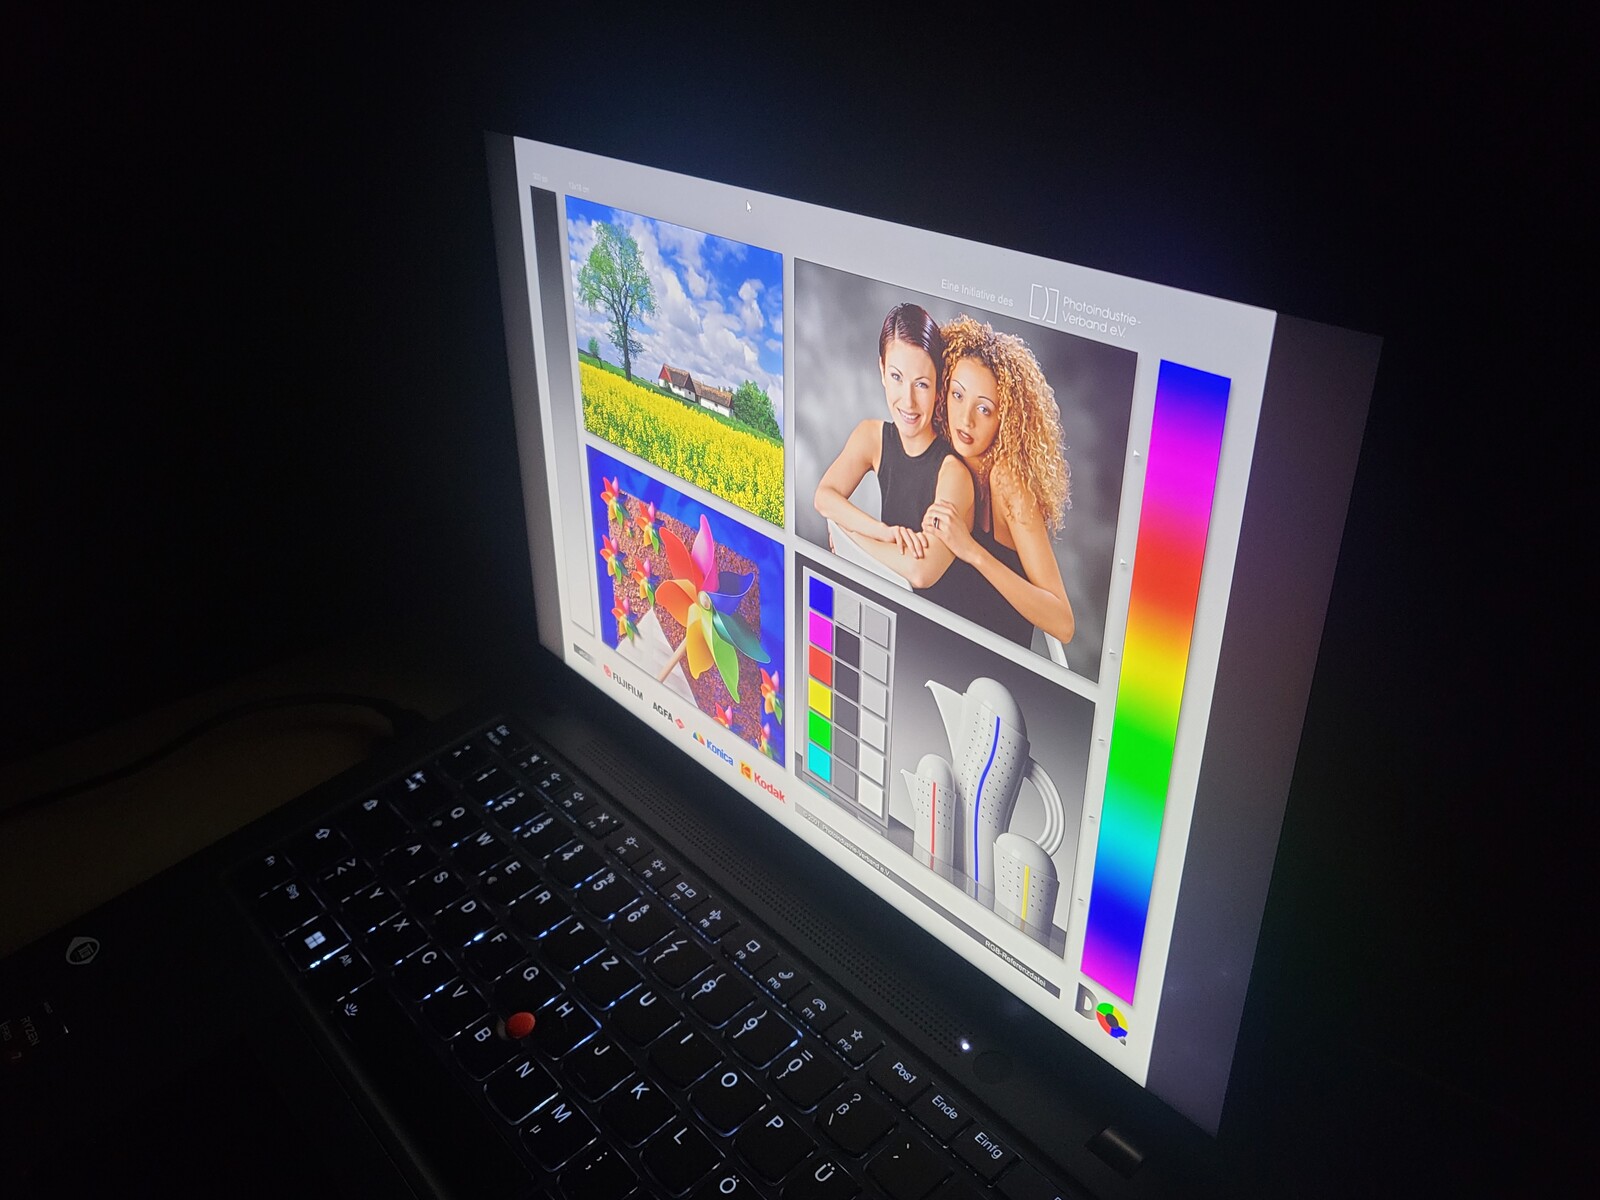
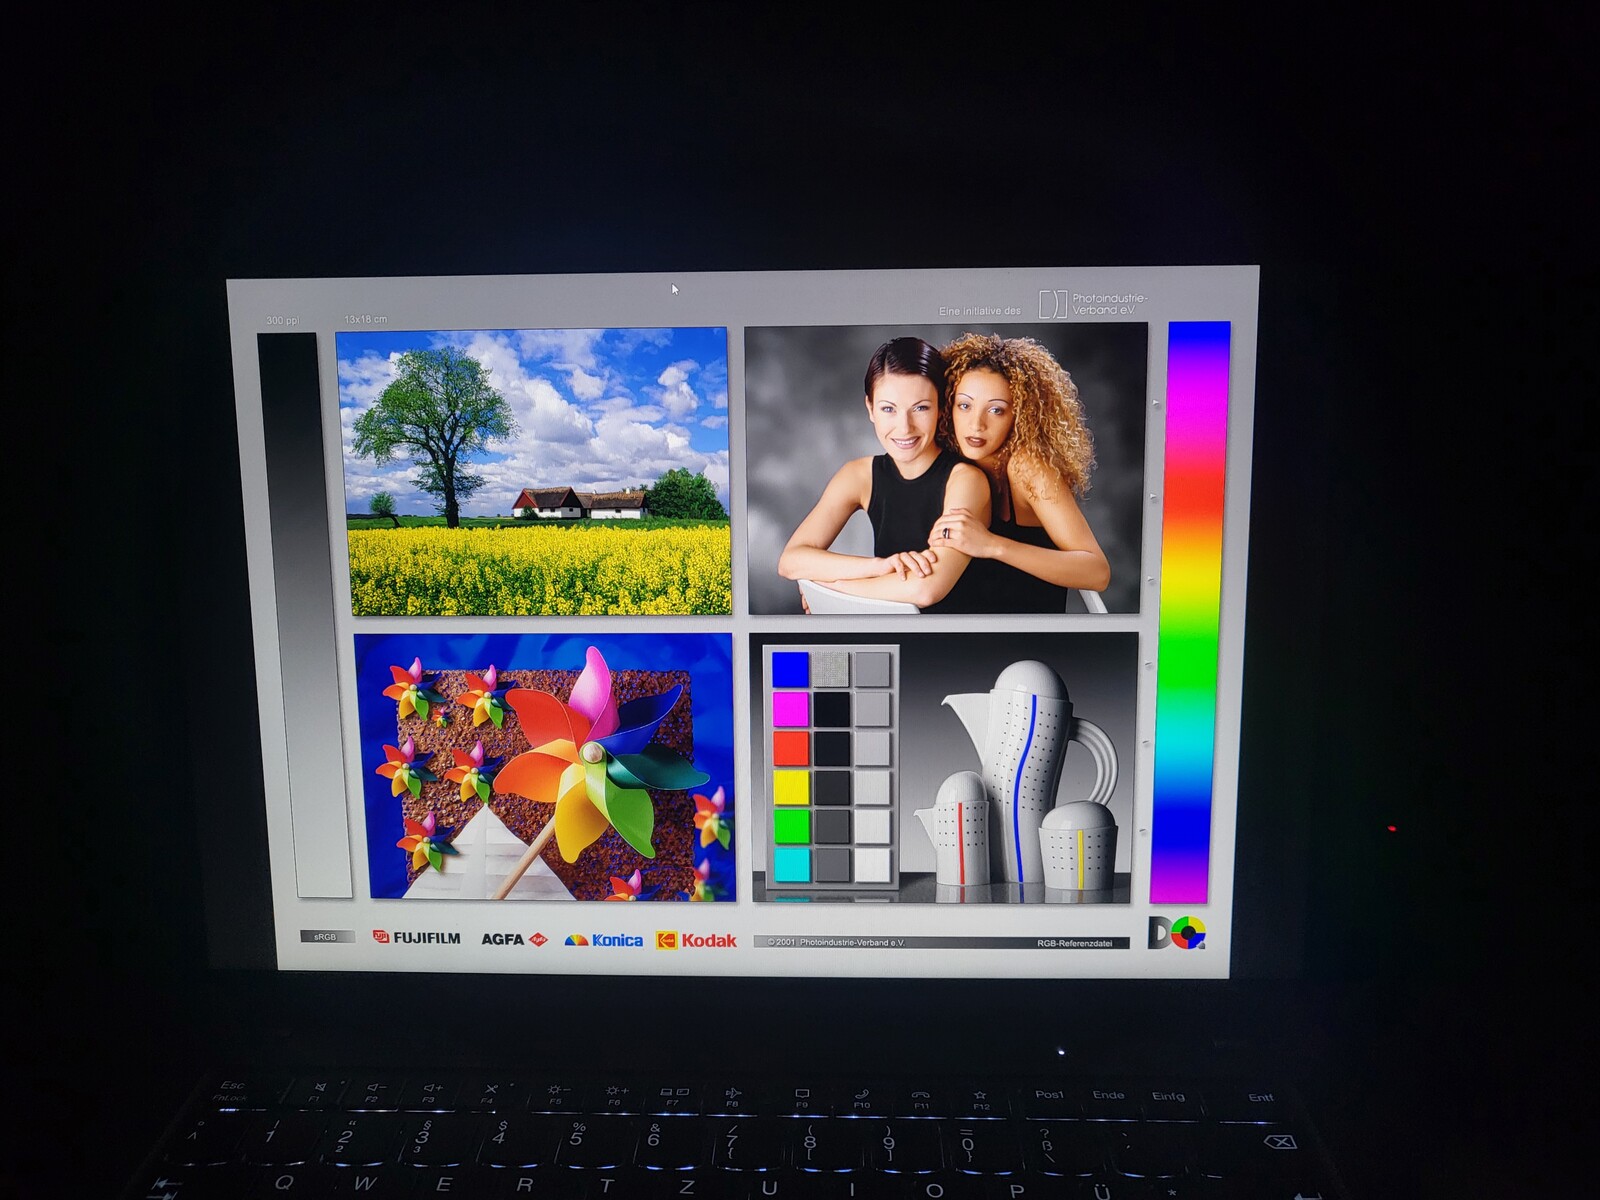
Low-Power Display with a Matte Surface
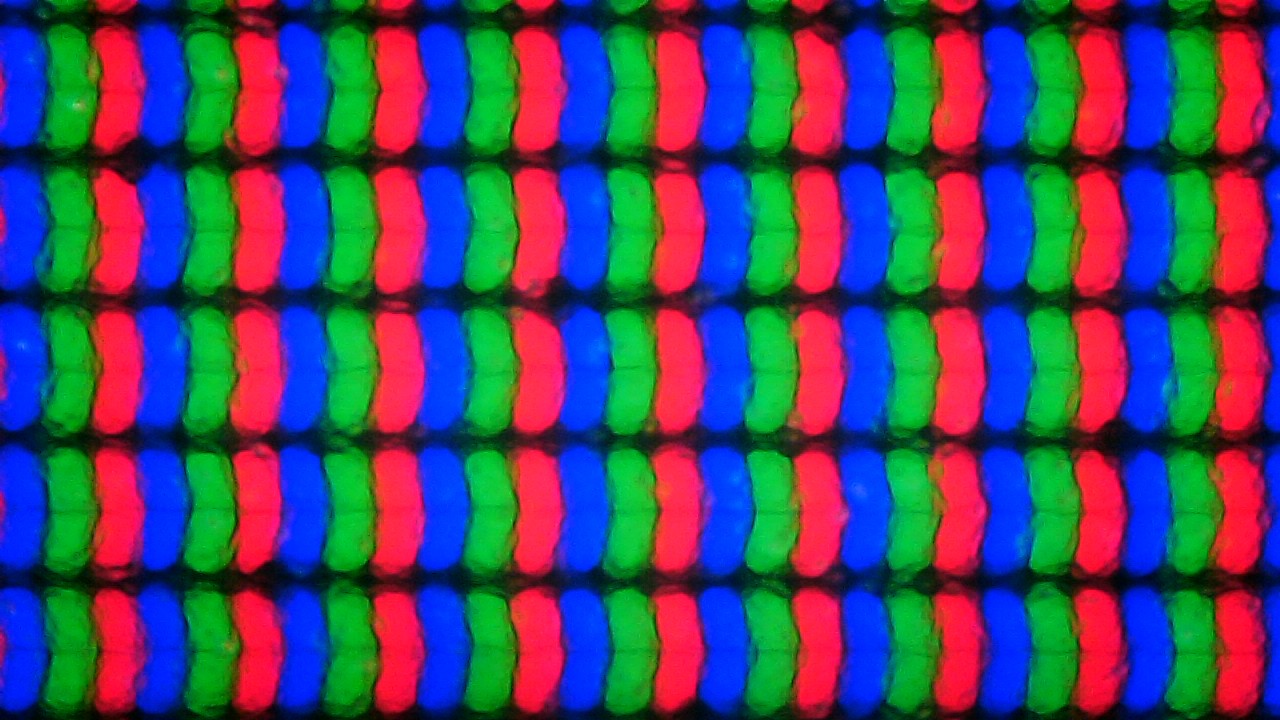
In terms of the display, there are also many similarities to the Lenovo ThinkPad T14s G3 Intel. The available display options as well as the display model used in our test unit are identical. Even the model numbers of the 14-inch, 16:10 display are the same: MNE007JA1-1. This is a power-saving low-power panel on IPS basis with a WUXGA resolution (1.920 x 1.200).
Lenovo specifies a brightness value of 400 cd/m², but the display of our Intel test unit remained far below that. Fortunately, our ThinkPad T14s G3 AMD test unit does not confirm this result, and at about 379 cd/m² on average, it is much closer to the target value than the T14s G3 Intel, which only offered 301 cd/m².
| |||||||||||||||||||||||||
Brightness Distribution: 92 %
Center on Battery: 396 cd/m²
Contrast: 1523:1 (Black: 0.26 cd/m²)
ΔE ColorChecker Calman: 1.3 | ∀{0.5-29.43 Ø4.73}
calibrated: 0.7
ΔE Greyscale Calman: 1.6 | ∀{0.09-98 Ø4.97}
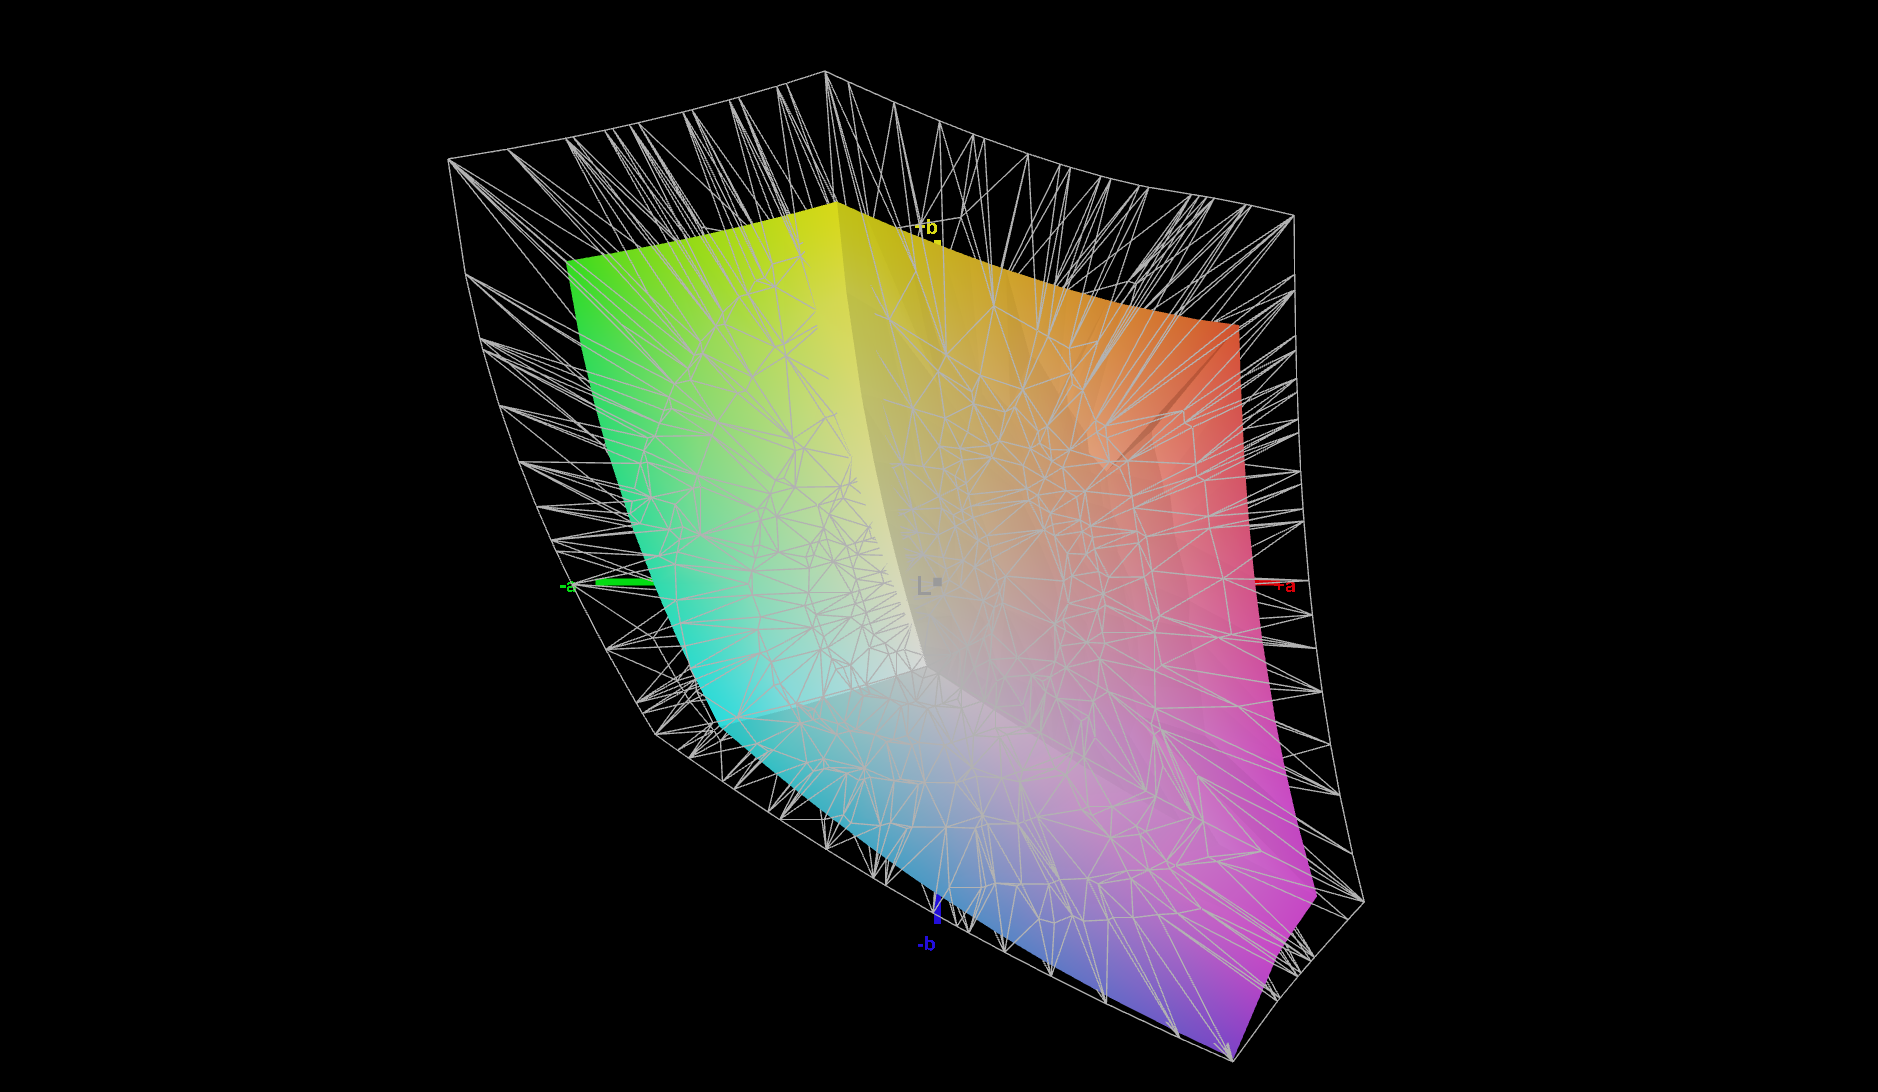
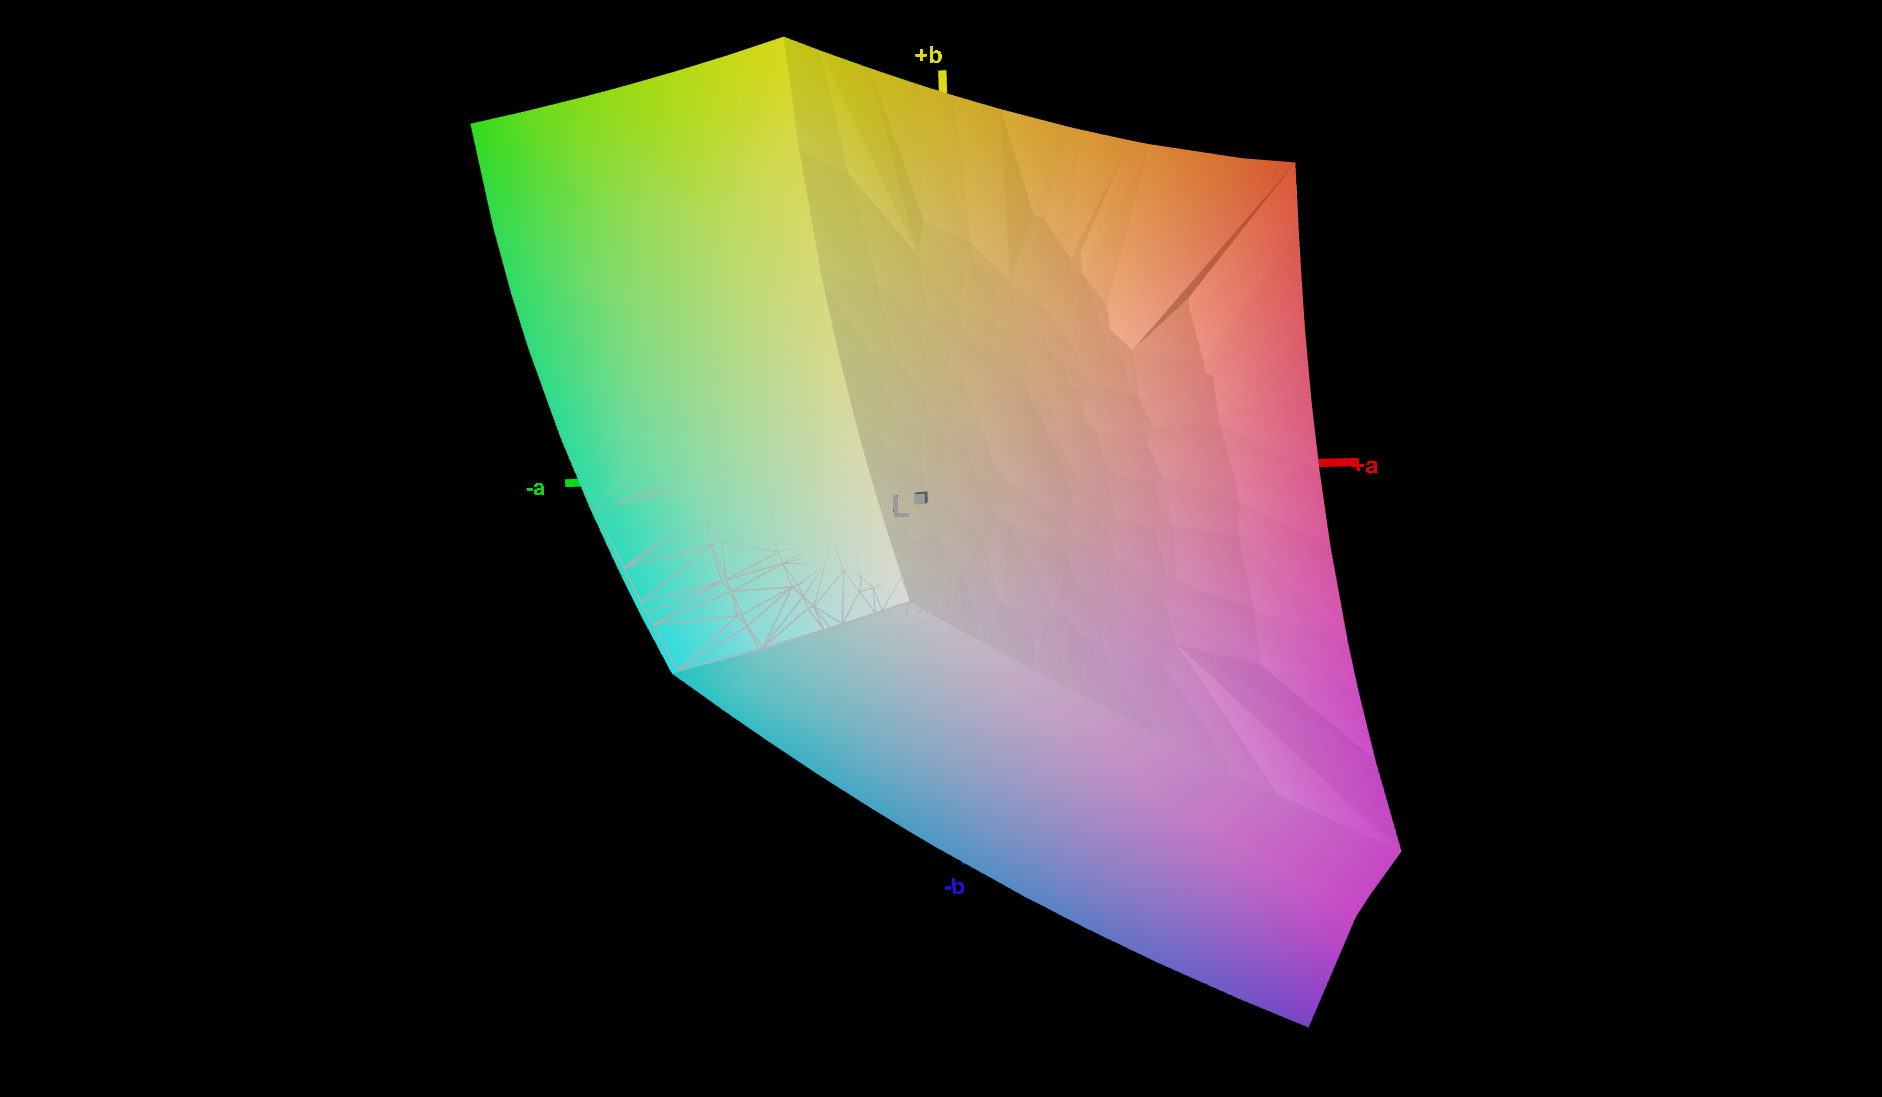
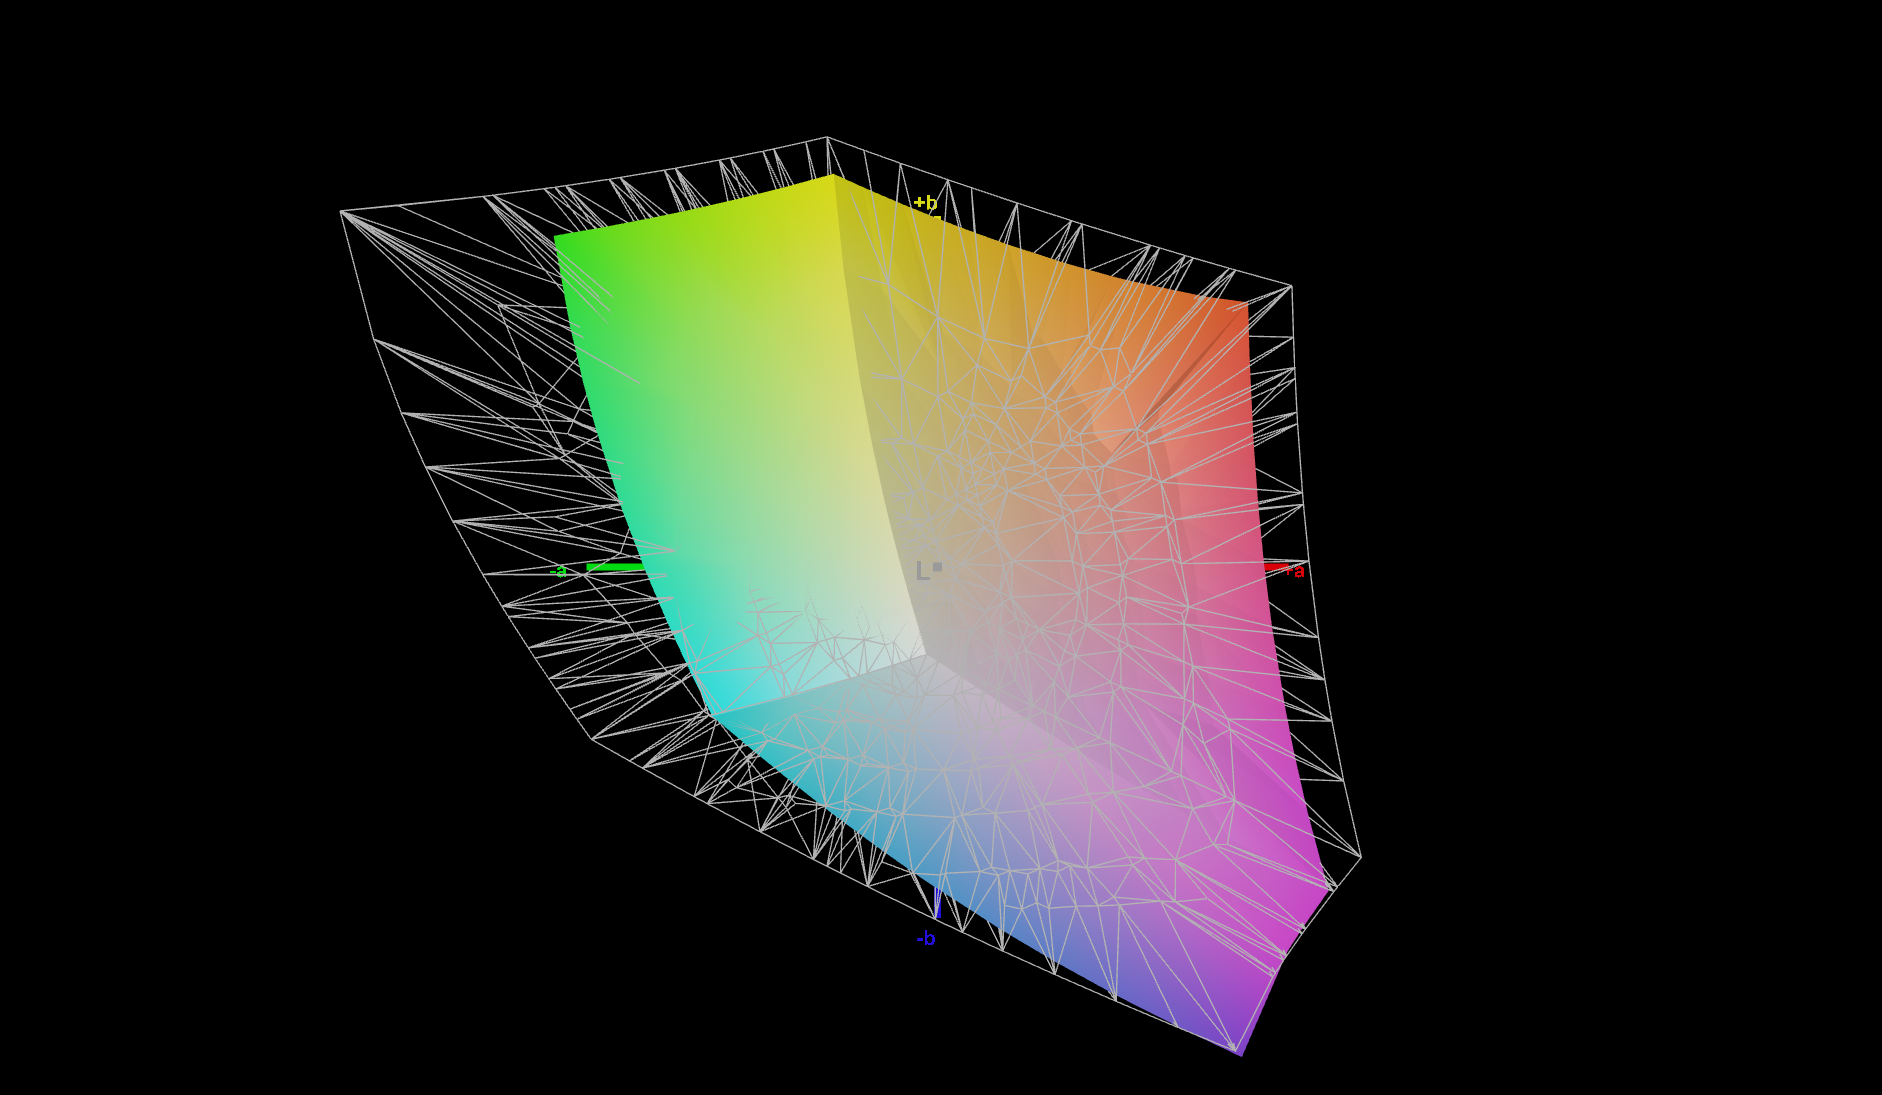
71.4% AdobeRGB 1998 (Argyll 3D)
99.8% sRGB (Argyll 3D)
69.4% Display P3 (Argyll 3D)
Gamma: 2.14
CCT: 6554 K
| Lenovo ThinkPad T14s G3 21CQ002LGE MNE007JA1-1, LTPS IPS LED, 1920x1200, 14" | Lenovo ThinkPad T14s G3 21BR00CDGE MNE007JA1-1, IPS LED, 1920x1200, 14" | Lenovo ThinkPad T14s G2 20XGS01100 NE140FHM-N61, IPS LED, 1920x1080, 14" | Dell Latitude 9430 2-in-1 AU Optronics B140QAN, IPS, 2560x1600, 14" | HP EliteBook 845 G9 6F6H9EA AUOA49A, IPS, 1920x1200, 14" | |
|---|---|---|---|---|---|
| Display | -2% | -5% | 8% | 5% | |
| Display P3 Coverage (%) | 69.4 | 67.8 -2% | 69.7 0% | 79.4 14% | 75.4 9% |
| sRGB Coverage (%) | 99.8 | 98.6 -1% | 91.8 -8% | 100 0% | 100 0% |
| AdobeRGB 1998 Coverage (%) | 71.4 | 70.1 -2% | 67.2 -6% | 79.4 11% | 76.6 7% |
| Response Times | -16% | -137% | -60% | -39% | |
| Response Time Grey 50% / Grey 80% * (ms) | 36.3 ? | 41.4 ? -14% | 84 ? -131% | 63.6 ? -75% | 58.8 ? -62% |
| Response Time Black / White * (ms) | 23.1 ? | 27.2 ? -18% | 56 ? -142% | 33.6 ? -45% | 26.7 ? -16% |
| PWM Frequency (Hz) | 2451 ? | ||||
| Screen | -34% | -147% | -41% | -28% | |
| Brightness middle (cd/m²) | 396 | 312 -21% | 397 0% | 517.7 31% | 408 3% |
| Brightness (cd/m²) | 379 | 301 -21% | 386 2% | 493 30% | 402 6% |
| Brightness Distribution (%) | 92 | 93 1% | 88 -4% | 90 -2% | 92 0% |
| Black Level * (cd/m²) | 0.26 | 0.16 38% | 0.28 -8% | 0.33 -27% | 0.24 8% |
| Contrast (:1) | 1523 | 1950 28% | 1418 -7% | 1569 3% | 1700 12% |
| Colorchecker dE 2000 * | 1.3 | 2.2 -69% | 5.8 -346% | 3.38 -160% | 2.09 -61% |
| Colorchecker dE 2000 max. * | 2.7 | 5.6 -107% | 12.6 -367% | 6.25 -131% | 5.09 -89% |
| Colorchecker dE 2000 calibrated * | 0.7 | 1.3 -86% | 1.9 -171% | 0.41 41% | 1.56 -123% |
| Greyscale dE 2000 * | 1.6 | 2.7 -69% | 8.3 -419% | 4 -150% | 1.7 -6% |
| Gamma | 2.14 103% | 2.11 104% | 2.07 106% | 2.13 103% | 2.138 103% |
| CCT | 6554 99% | 6196 105% | 6867 95% | 6186 105% | 6628 98% |
| Total Average (Program / Settings) | -17% /
-25% | -96% /
-115% | -31% /
-33% | -21% /
-22% |
* ... smaller is better
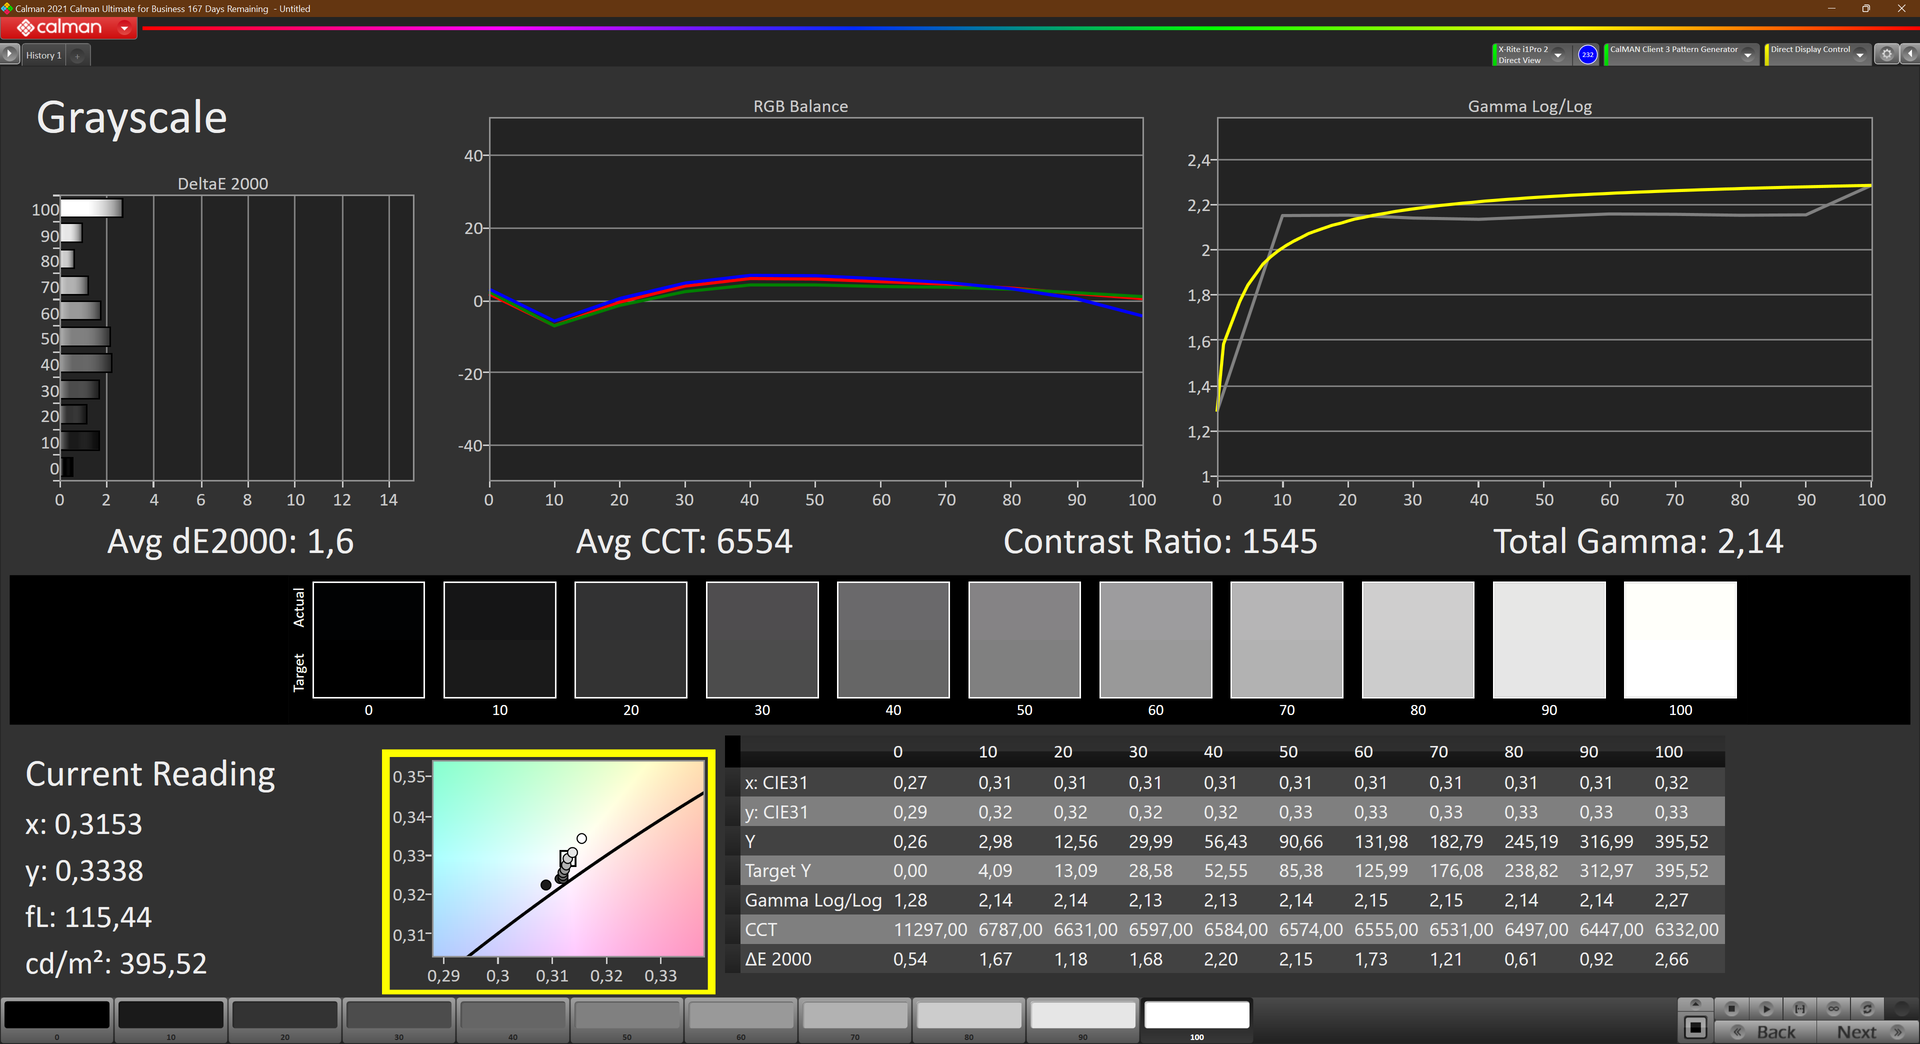
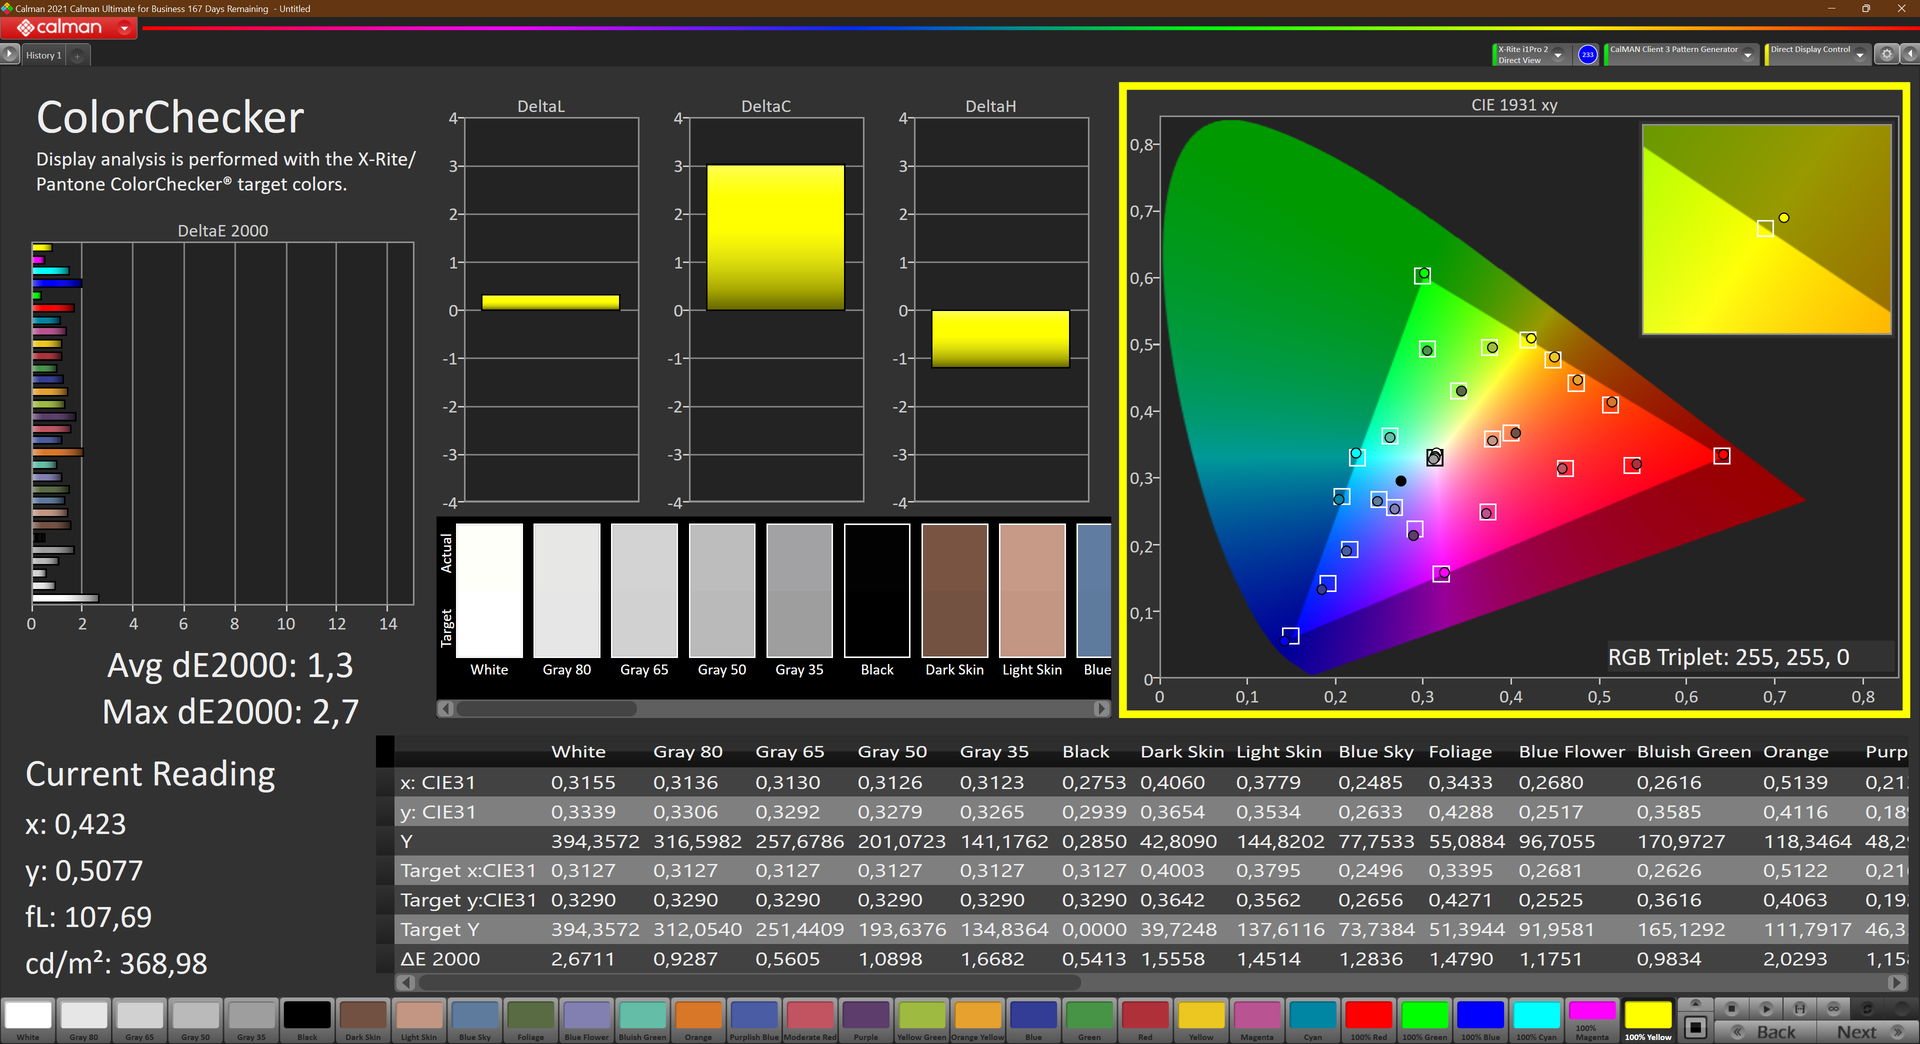
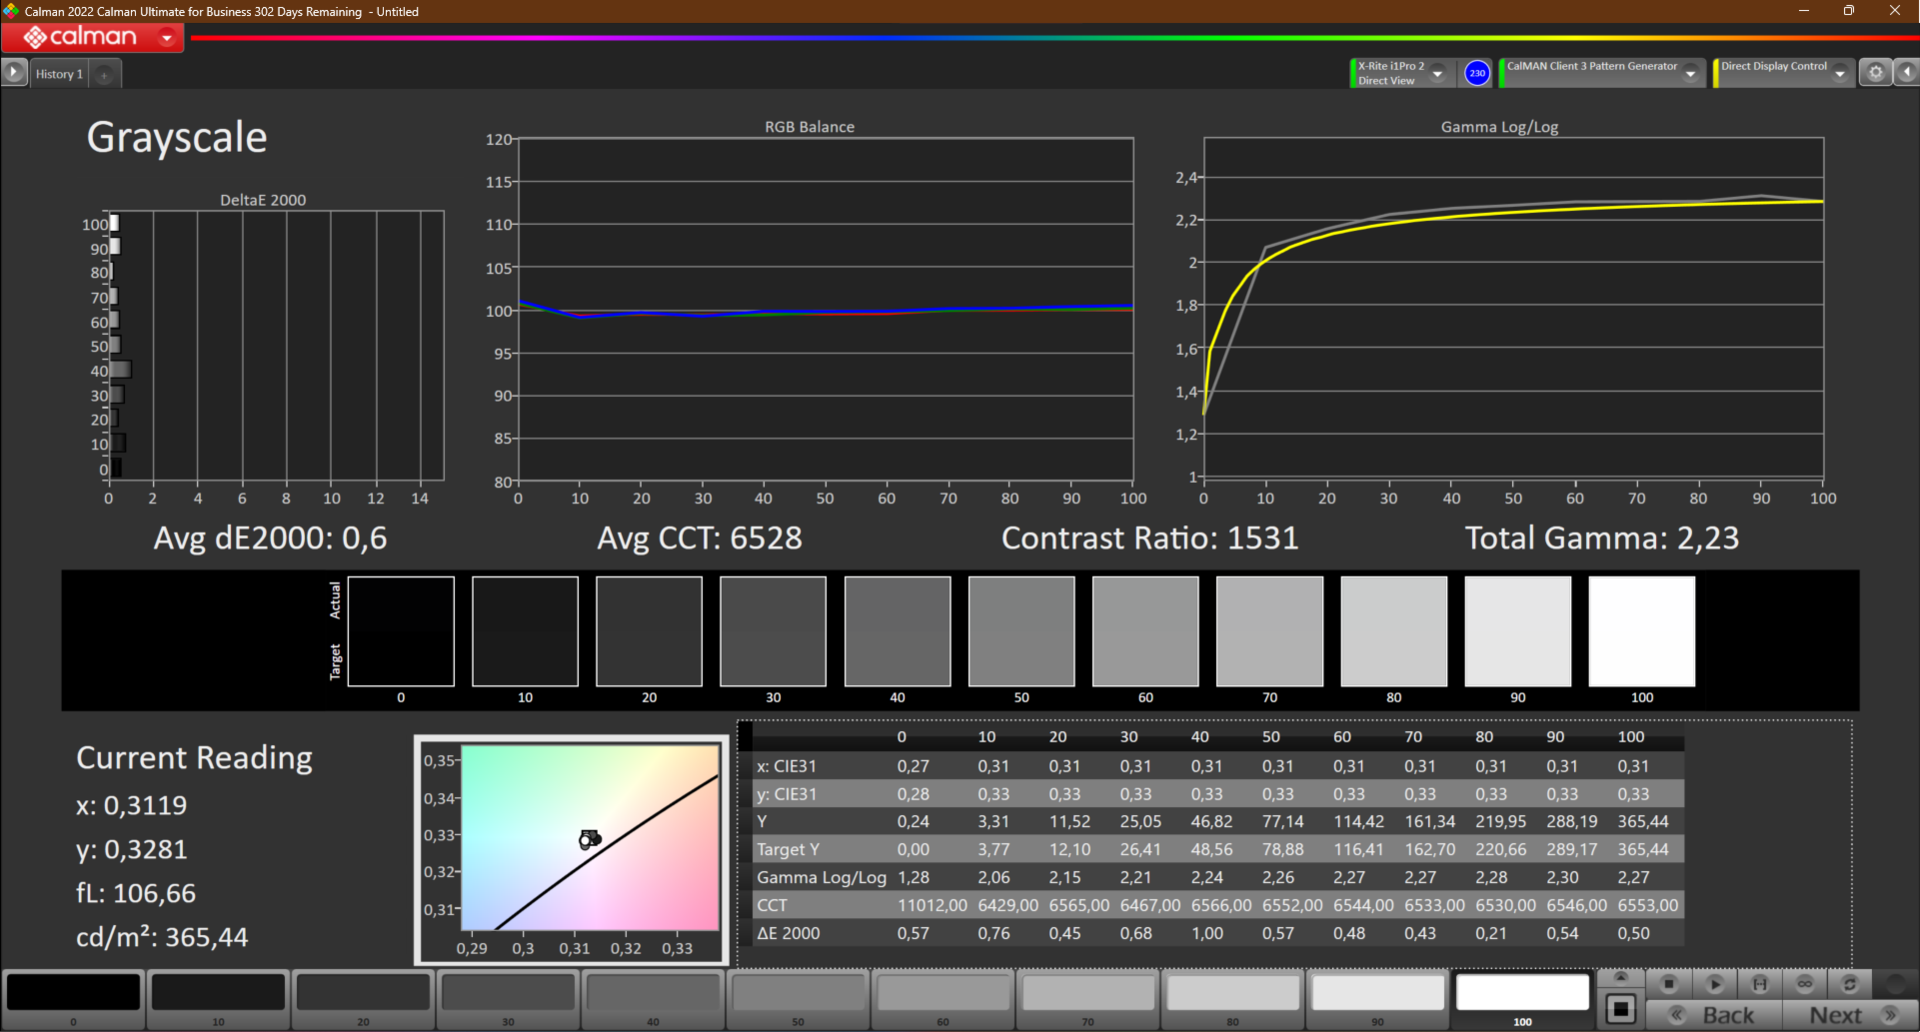
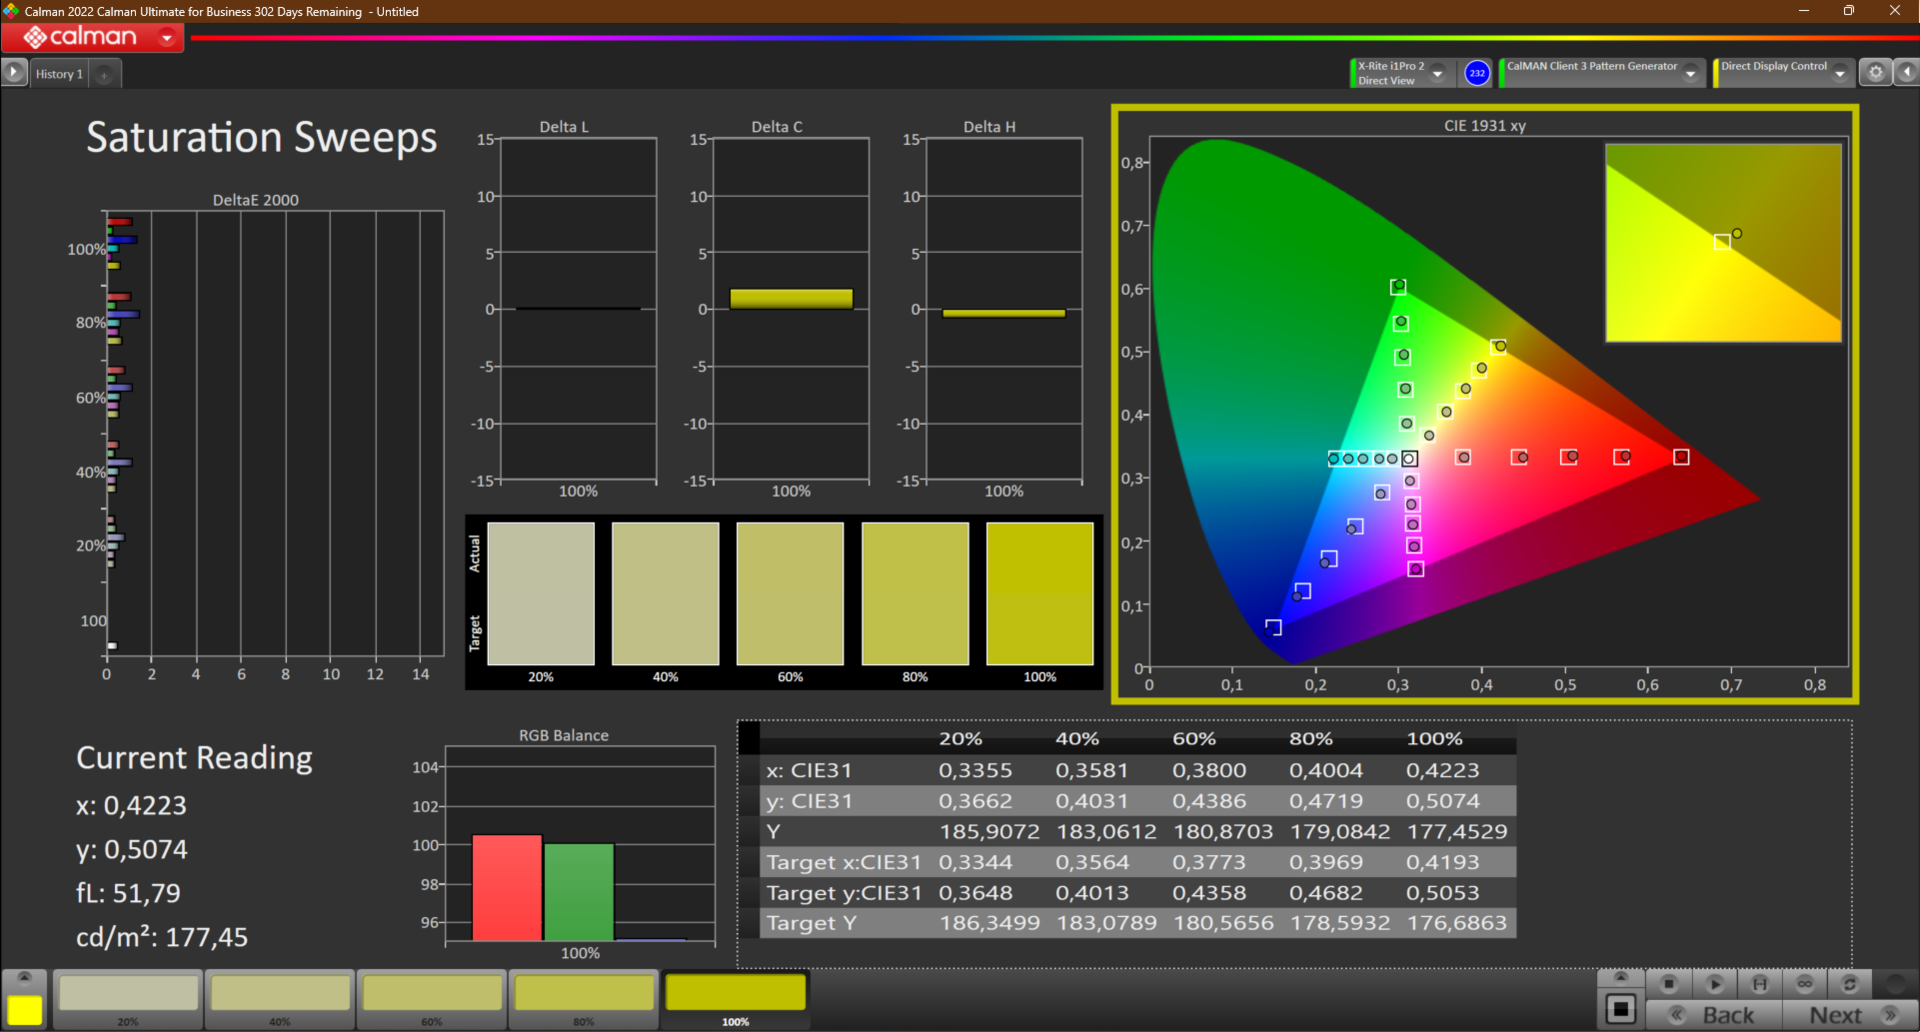

The DeltaE values are already very low in the state of delivery, and an average of 1.3 in the Calman ColorChecker is very good. Through a calibration with the X-Rite i1Pro 2 Colorimeter, we are even able to further improve the ColorChecker DeltaE value to an excellent 0.7, which corresponds to an accurate color display without any tint. As always, you can download the profile we created from the link above for free.
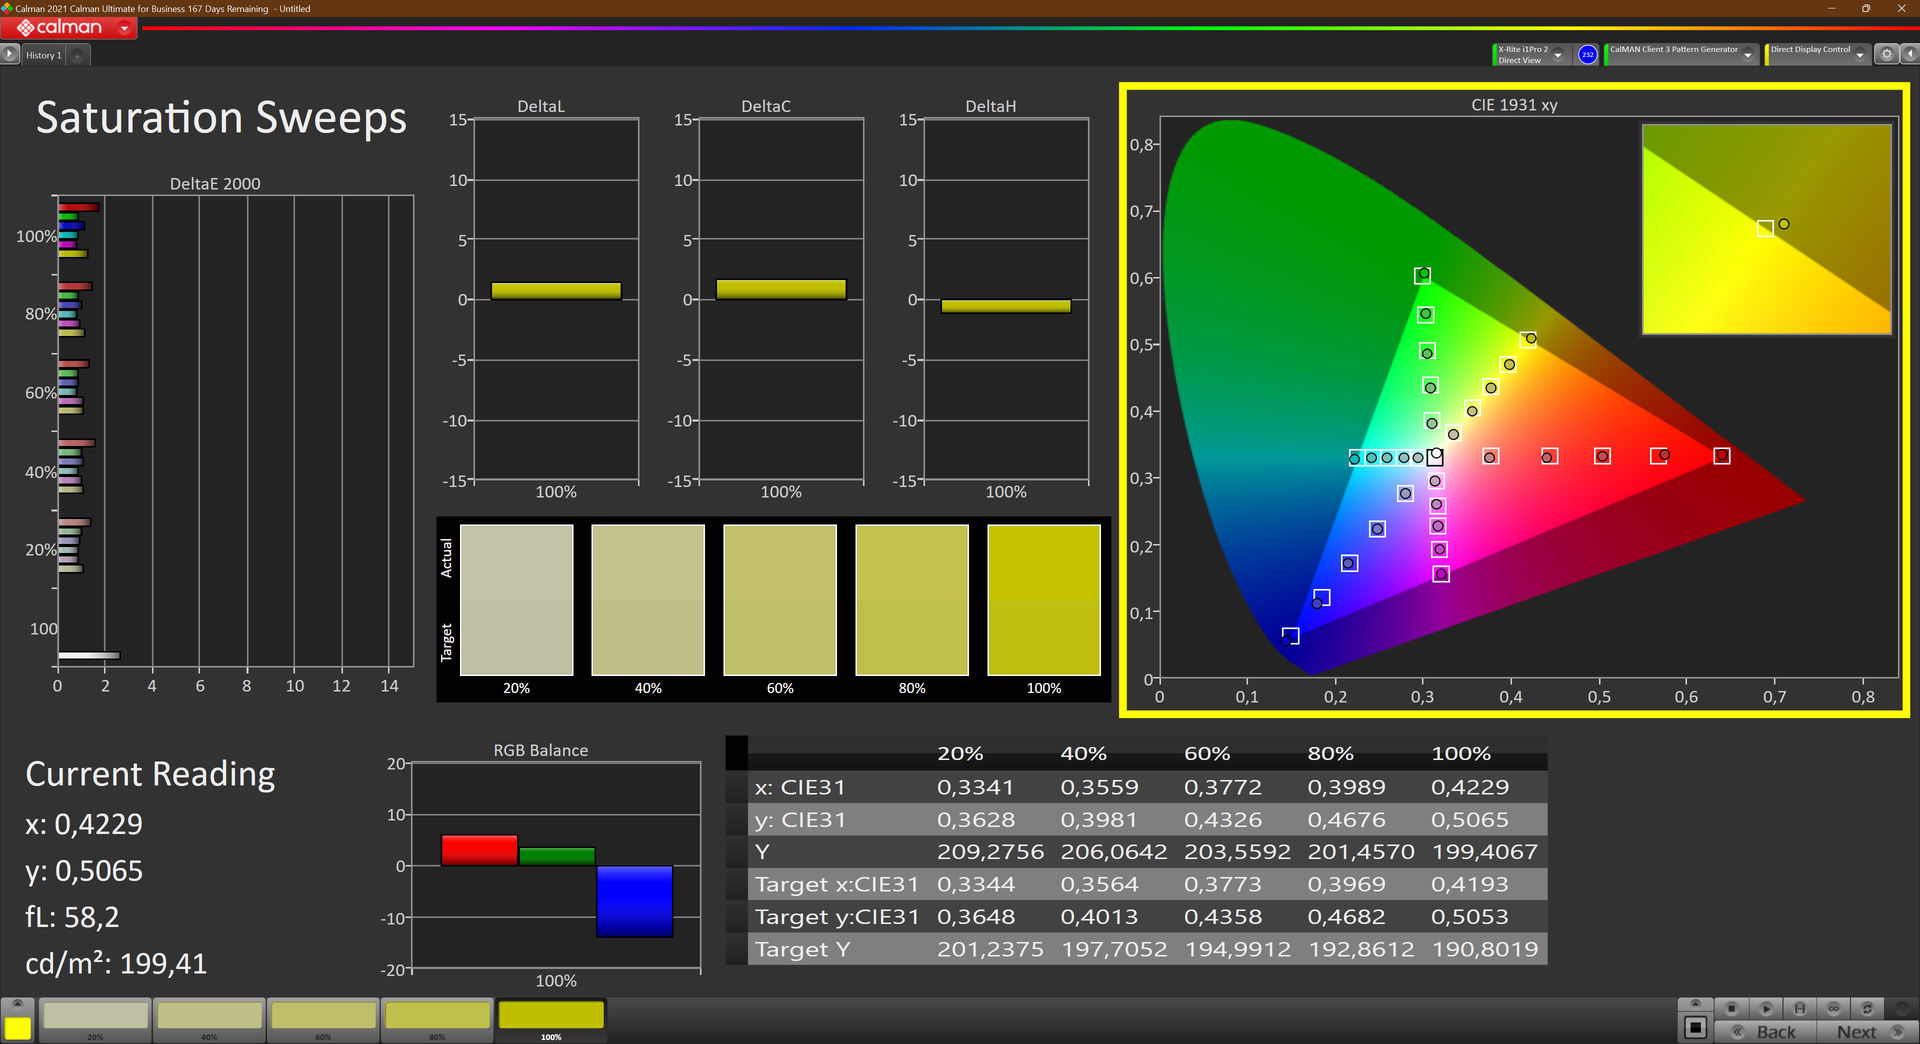
Lenovo advertises 100% sRGB for the low-power panel, and we measure 99.8%. This means that nothing should prevent you from using it for image processing tasks at a simple level. However, for the display of the wider AdobeRGB and DCI-P3 color spaces, you'd need to use an external display.
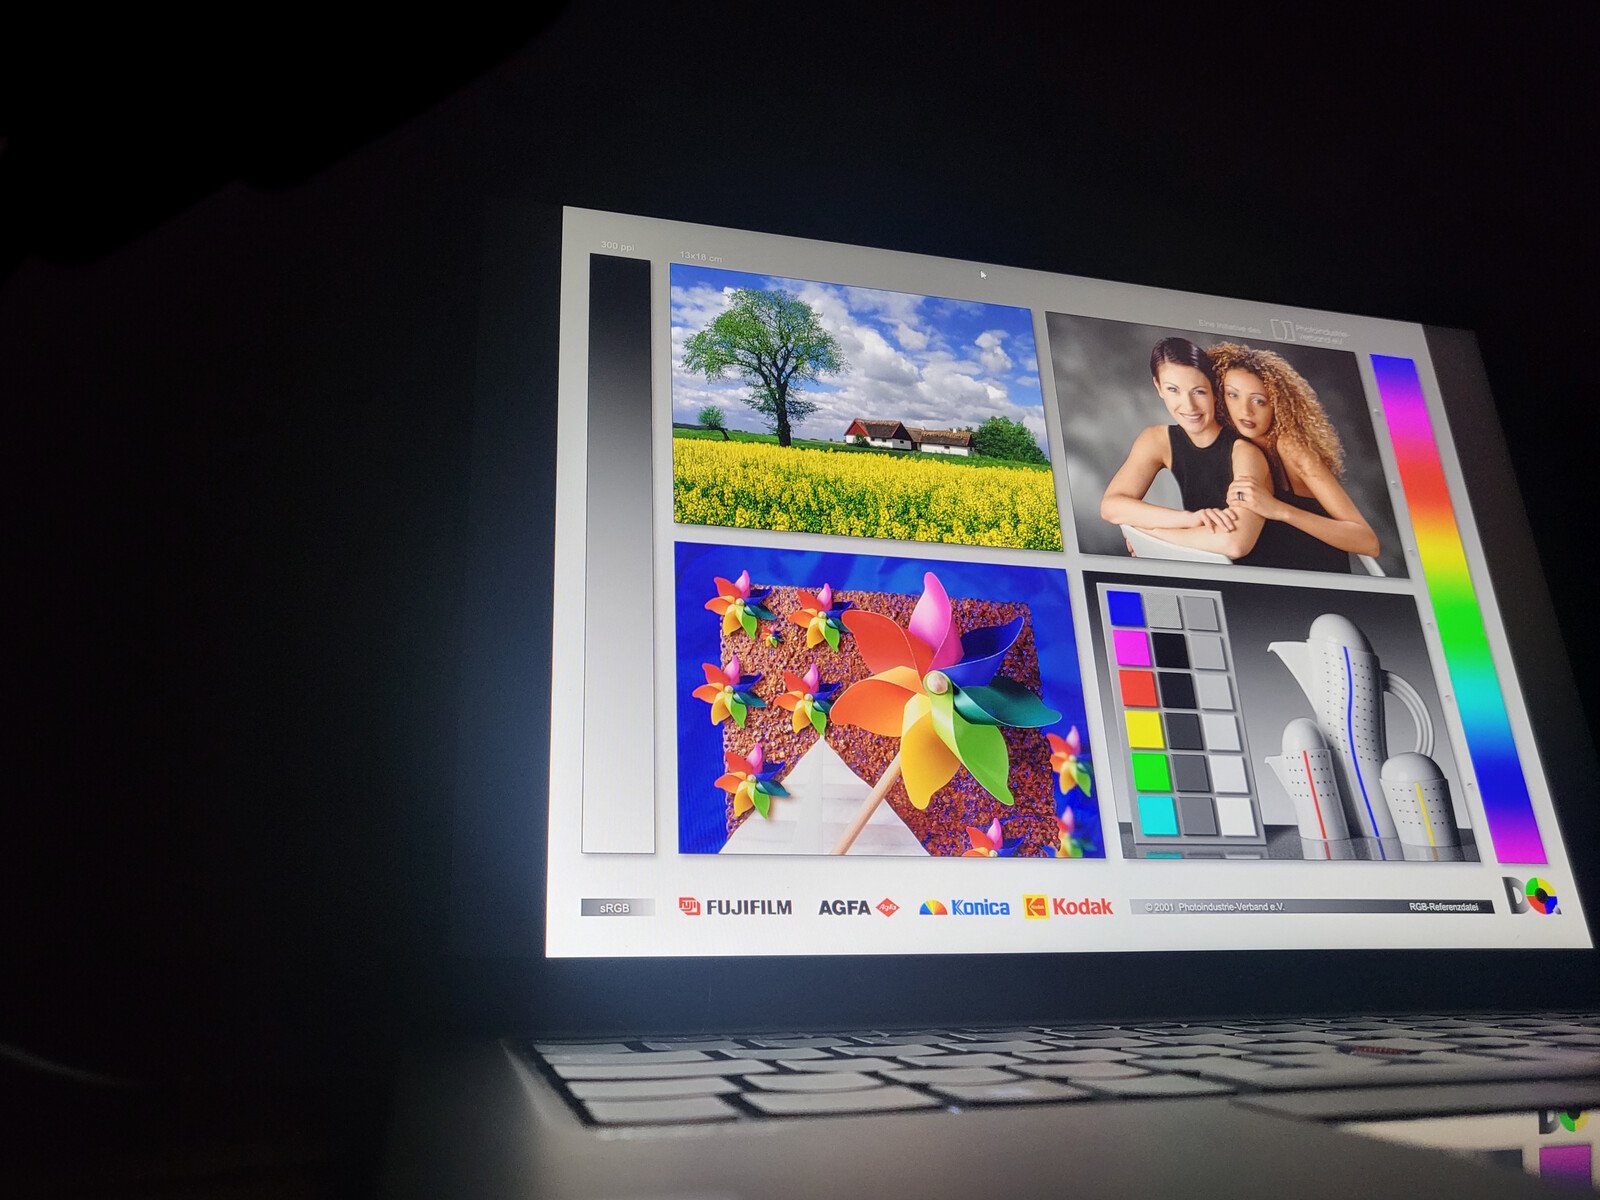
The Lenovo ThinkPad T14s Gen 3 shows itself quite usable outdoors, but this isn't particularly surprising, since the brightness is relatively high and it offers a matte display surface.
Display Response Times
| ↔ Response Time Black to White | ||
|---|---|---|
| 23.1 ms ... rise ↗ and fall ↘ combined | ↗ 10.4 ms rise | 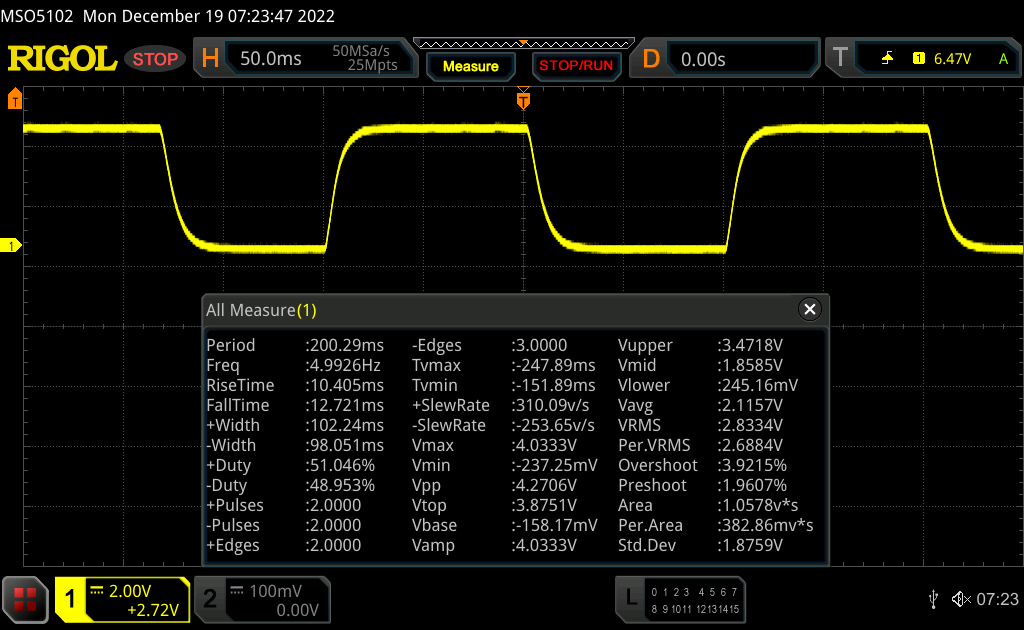 |
| ↘ 12.7 ms fall | ||
| The screen shows good response rates in our tests, but may be too slow for competitive gamers. In comparison, all tested devices range from 0.1 (minimum) to 240 (maximum) ms. » 53 % of all devices are better. This means that the measured response time is worse than the average of all tested devices (19.9 ms). | ||
| ↔ Response Time 50% Grey to 80% Grey | ||
| 36.3 ms ... rise ↗ and fall ↘ combined | ↗ 16.4 ms rise | 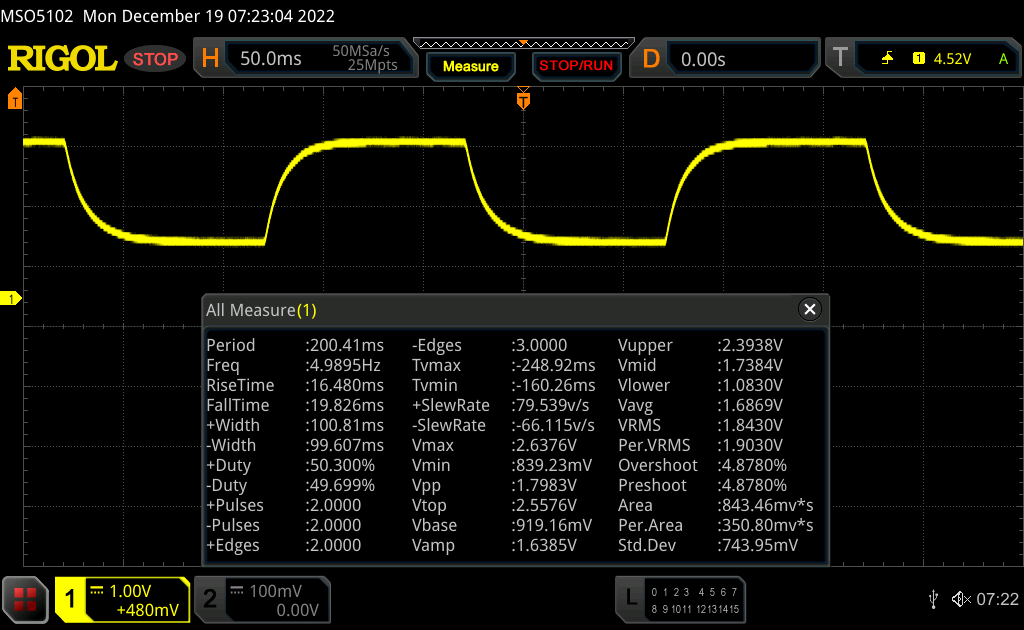 |
| ↘ 19.8 ms fall | ||
| The screen shows slow response rates in our tests and will be unsatisfactory for gamers. In comparison, all tested devices range from 0.165 (minimum) to 636 (maximum) ms. » 52 % of all devices are better. This means that the measured response time is worse than the average of all tested devices (31.1 ms). | ||
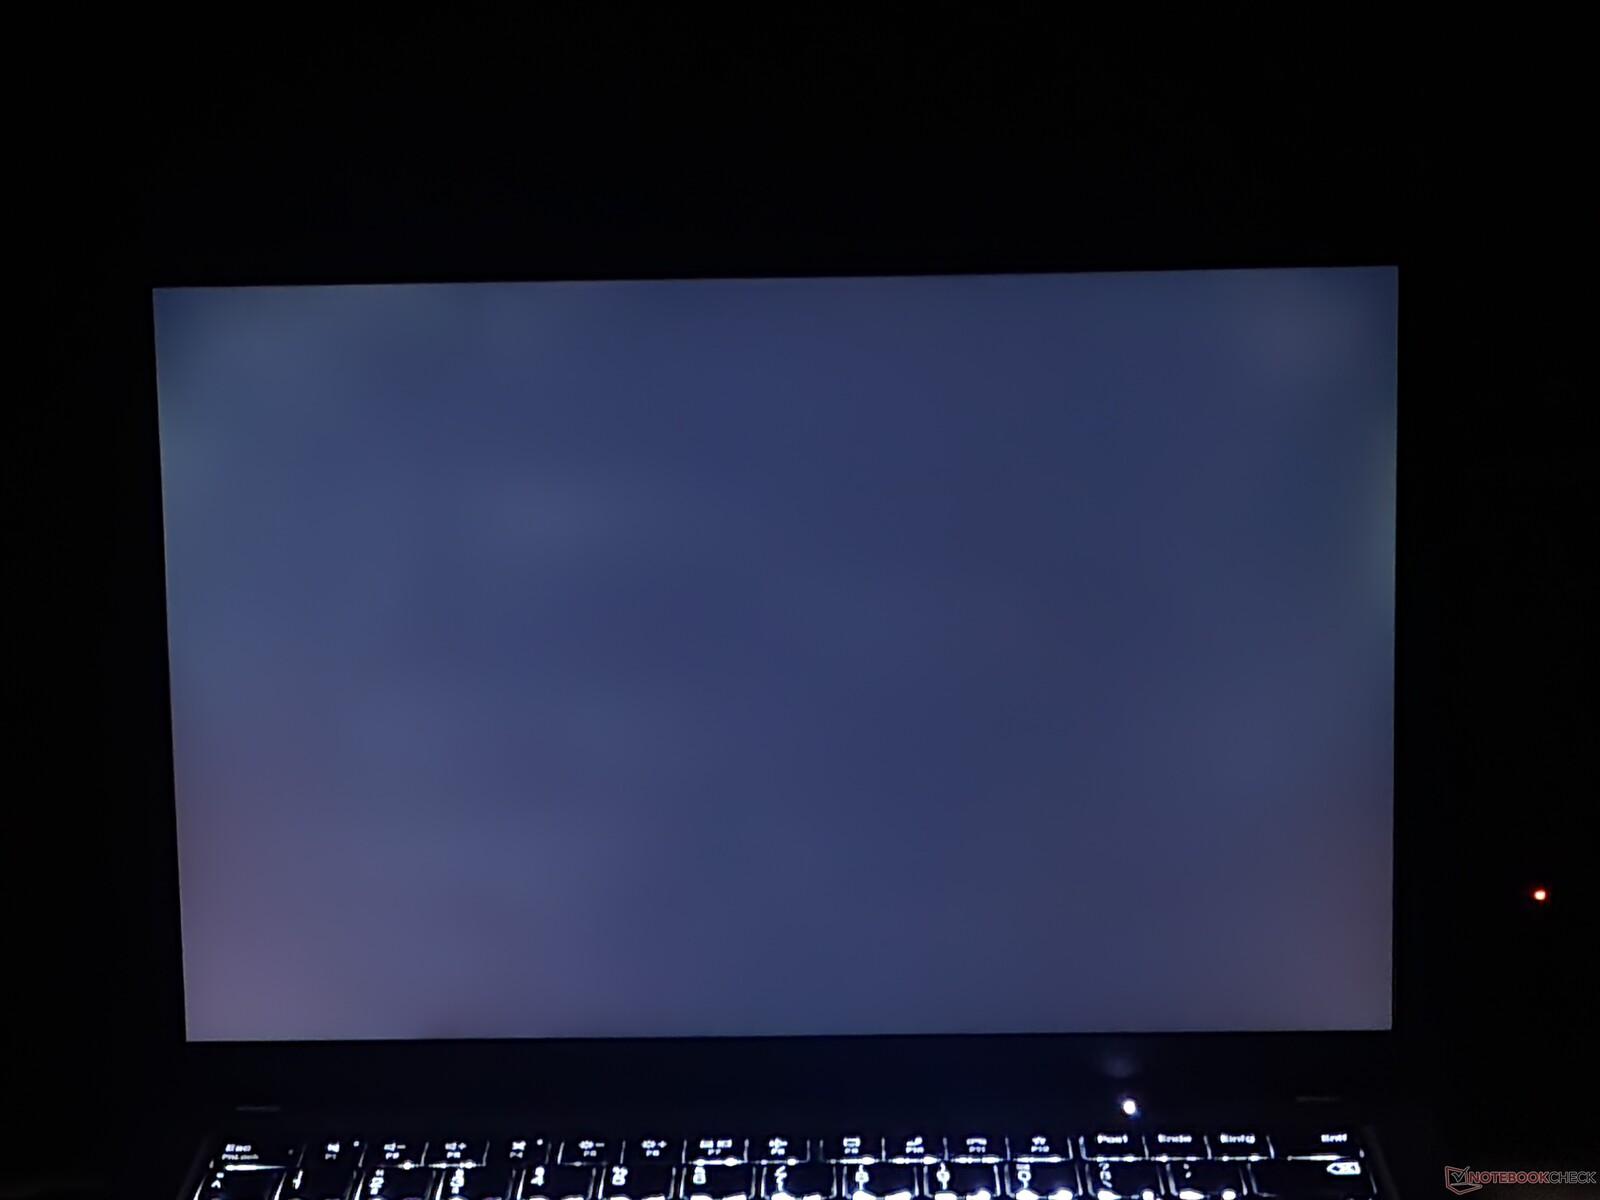
Screen Flickering / PWM (Pulse-Width Modulation)
| Screen flickering / PWM not detected | 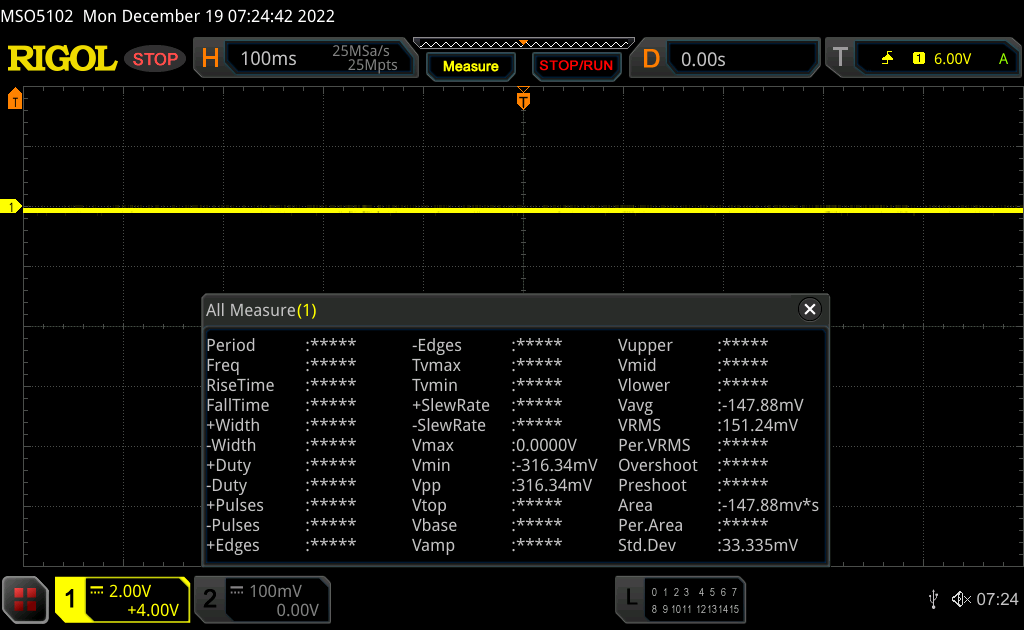 | ||
In comparison: 52 % of all tested devices do not use PWM to dim the display. If PWM was detected, an average of 7798 (minimum: 5 - maximum: 343500) Hz was measured. | |||
Performance: Ryzen 6000 beats Intel in the multicore performance significantly
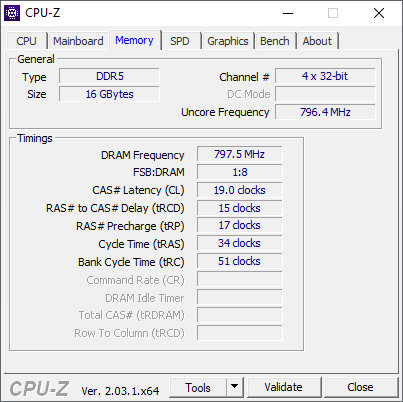
Lenovo sells the ThinkPad T14s G3 AMD with two different processor options: the AMD Ryzen 7 Pro 6850U and the Ryzen 5 Pro 6650U. There is no dedicated GPU, and you have to use the integrated AMD Radeon, which is more powerful in the Ryzen 7 (Radeon 680M) than in the Ryzen 5 (Radeon 660M). The working memory is soldered in. Lenovo uses the most current LPDDR5-6400 storage. The maximum available is 32 GB, but for less demanding customers, 8 and 16 GB are also offered. As the storage solution, there is an M.2-2280 SSD that is connected via NVMe PCIe 4.0 x4.
Test Conditions
Lenovo doesn't use its own power management software in its ThinkPad laptops, but the performance modes can be selected directly from the Windows Settings. There are three different modes that differ in terms of the power consumption limits (PL2, which is the short-term power limit, and PL1, which is the long-term power limit):
- Best Power Efficiency: PL2 12 Watt, PL1 12 Watt
- Balanced: PL2 24 Watt, PL1 16.5 Watt
- Best Performance: PL2 30 Watt, PL1 24 Watt
We run our performance tests solely using the "Best Performance" mode, and "Balanced" is used during the WiFi battery test.
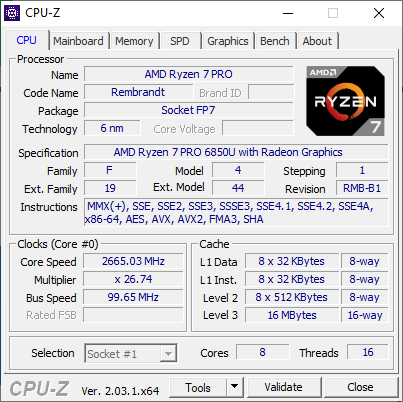
Processor
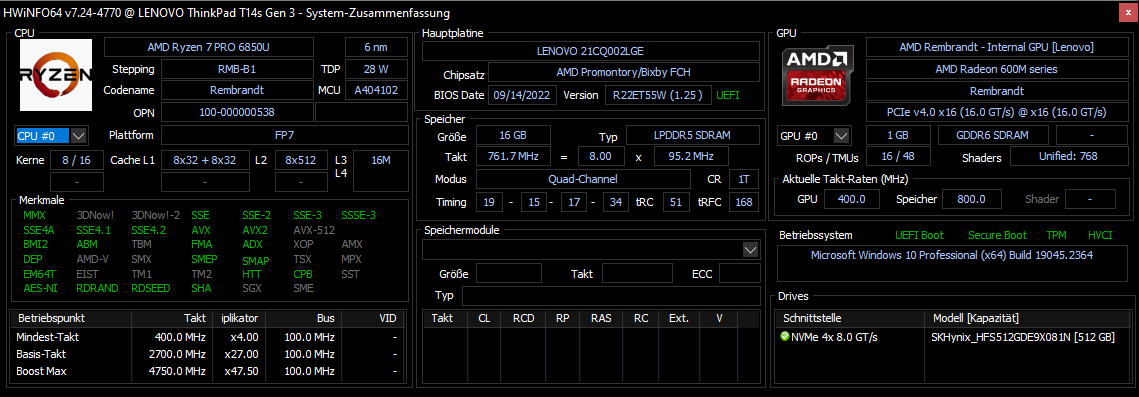
The AMD Ryzen 7 Pro 6850U is a processor of the Ryzen 6000 generation with the codename "Rembrandt." This is a Zen3+ chip with a total of 8 cores and 16 threads. The maximum clock speed is 4.7 GHz and the basic clock speed 2.7 GHz. AMD specifies the typical TDP of this CPU as 15 to 28 watts. You can find more extensive benchmark comparisons in our CPU benchmark list.
In the Lenovo ThinkPad T14s G3, the Ryzen 7 delivers a very good performance. In the multicore benchmarks, the T14s places above all the models from the competitors, even in the performance under constant load. However, the picture changes in the single-core performance, where the current Intel model and also the Apple M2 perform slightly better. In addition, the CPU performance overall is minimally better in the ThinkPad T14 G3 with the same processor.
The CPU performance is not limited in battery operation.
Cinebench R15 Multi Constant Load Test
Cinebench R23: Multi Core | Single Core
Cinebench R20: CPU (Multi Core) | CPU (Single Core)
Cinebench R15: CPU Multi 64Bit | CPU Single 64Bit
Blender: v2.79 BMW27 CPU
7-Zip 18.03: 7z b 4 | 7z b 4 -mmt1
Geekbench 5.5: Multi-Core | Single-Core
HWBOT x265 Benchmark v2.2: 4k Preset
LibreOffice : 20 Documents To PDF
R Benchmark 2.5: Overall mean
| CPU Performance rating | |
| Dell Latitude 9430 2-in-1 -1! | |
| Average of class Office | |
| Average AMD Ryzen 7 PRO 6850U | |
| Lenovo ThinkPad T14 G3-21CF004NGE | |
| Lenovo ThinkPad T14s G3 21CQ002LGE | |
| Lenovo ThinkPad T14s G3 21BR00CDGE | |
| Lenovo ThinkPad X1 Carbon G10 21CB00DCGE | |
| Apple MacBook Pro 13 2022 M2 -5! | |
| Lenovo ThinkPad T14s G2 20XGS01100 | |
| HP EliteBook 845 G9 6F6H9EA | |
| Cinebench R23 / Multi Core | |
| Average of class Office (1673 - 22808, n=73, last 2 years) | |
| Average AMD Ryzen 7 PRO 6850U (9923 - 12945, n=7) | |
| Lenovo ThinkPad T14 G3-21CF004NGE | |
| Lenovo ThinkPad T14s G3 21CQ002LGE | |
| Lenovo ThinkPad X1 Carbon G10 21CB00DCGE | |
| Dell Latitude 9430 2-in-1 | |
| Lenovo ThinkPad T14s G3 21BR00CDGE | |
| Apple MacBook Pro 13 2022 M2 | |
| Lenovo ThinkPad T14s G2 20XGS01100 | |
| HP EliteBook 845 G9 6F6H9EA | |
| Cinebench R23 / Single Core | |
| Dell Latitude 9430 2-in-1 | |
| Lenovo ThinkPad T14s G3 21BR00CDGE | |
| Average of class Office (708 - 2130, n=73, last 2 years) | |
| Lenovo ThinkPad X1 Carbon G10 21CB00DCGE | |
| Apple MacBook Pro 13 2022 M2 | |
| Lenovo ThinkPad T14s G3 21CQ002LGE | |
| Average AMD Ryzen 7 PRO 6850U (1409 - 1536, n=7) | |
| Lenovo ThinkPad T14 G3-21CF004NGE | |
| HP EliteBook 845 G9 6F6H9EA | |
| Lenovo ThinkPad T14s G2 20XGS01100 | |
| Cinebench R20 / CPU (Multi Core) | |
| Average of class Office (648 - 8840, n=72, last 2 years) | |
| Average AMD Ryzen 7 PRO 6850U (3784 - 5022, n=7) | |
| Lenovo ThinkPad T14 G3-21CF004NGE | |
| Lenovo ThinkPad T14s G3 21CQ002LGE | |
| Lenovo ThinkPad X1 Carbon G10 21CB00DCGE | |
| Dell Latitude 9430 2-in-1 | |
| Lenovo ThinkPad T14s G3 21BR00CDGE | |
| Lenovo ThinkPad T14s G2 20XGS01100 | |
| HP EliteBook 845 G9 6F6H9EA | |
| Apple MacBook Pro 13 2022 M2 | |
| Cinebench R20 / CPU (Single Core) | |
| Dell Latitude 9430 2-in-1 | |
| Average of class Office (345 - 816, n=72, last 2 years) | |
| Lenovo ThinkPad T14s G3 21BR00CDGE | |
| Lenovo ThinkPad X1 Carbon G10 21CB00DCGE | |
| Lenovo ThinkPad T14s G3 21CQ002LGE | |
| Average AMD Ryzen 7 PRO 6850U (587 - 596, n=7) | |
| Lenovo ThinkPad T14 G3-21CF004NGE | |
| HP EliteBook 845 G9 6F6H9EA | |
| Lenovo ThinkPad T14s G2 20XGS01100 | |
| Apple MacBook Pro 13 2022 M2 | |
| Cinebench R15 / CPU Multi 64Bit | |
| Average AMD Ryzen 7 PRO 6850U (1652 - 2092, n=7) | |
| Average of class Office (250 - 3380, n=74, last 2 years) | |
| Lenovo ThinkPad T14 G3-21CF004NGE | |
| Lenovo ThinkPad T14s G3 21CQ002LGE | |
| Lenovo ThinkPad X1 Carbon G10 21CB00DCGE | |
| Lenovo ThinkPad T14s G3 21BR00CDGE | |
| Dell Latitude 9430 2-in-1 | |
| Lenovo ThinkPad T14s G2 20XGS01100 | |
| HP EliteBook 845 G9 6F6H9EA | |
| Apple MacBook Pro 13 2022 M2 | |
| Cinebench R15 / CPU Single 64Bit | |
| Dell Latitude 9430 2-in-1 | |
| Average of class Office (99.5 - 312, n=74, last 2 years) | |
| Lenovo ThinkPad T14s G3 21BR00CDGE | |
| Lenovo ThinkPad T14s G3 21CQ002LGE | |
| Lenovo ThinkPad T14 G3-21CF004NGE | |
| Average AMD Ryzen 7 PRO 6850U (228 - 244, n=7) | |
| HP EliteBook 845 G9 6F6H9EA | |
| Lenovo ThinkPad T14s G2 20XGS01100 | |
| Apple MacBook Pro 13 2022 M2 | |
| Lenovo ThinkPad X1 Carbon G10 21CB00DCGE | |
| Blender / v2.79 BMW27 CPU | |
| Apple MacBook Pro 13 2022 M2 | |
| Lenovo ThinkPad T14s G3 21BR00CDGE | |
| HP EliteBook 845 G9 6F6H9EA | |
| Average of class Office (158 - 1940, n=73, last 2 years) | |
| Lenovo ThinkPad X1 Carbon G10 21CB00DCGE | |
| Lenovo ThinkPad T14s G2 20XGS01100 | |
| Lenovo ThinkPad T14s G3 21CQ002LGE | |
| Lenovo ThinkPad T14 G3-21CF004NGE | |
| Average AMD Ryzen 7 PRO 6850U (241 - 307, n=7) | |
| 7-Zip 18.03 / 7z b 4 | |
| Lenovo ThinkPad T14 G3-21CF004NGE | |
| Average AMD Ryzen 7 PRO 6850U (44011 - 59045, n=7) | |
| Lenovo ThinkPad T14s G3 21CQ002LGE | |
| Lenovo ThinkPad T14s G2 20XGS01100 | |
| Average of class Office (7098 - 76886, n=75, last 2 years) | |
| Lenovo ThinkPad X1 Carbon G10 21CB00DCGE | |
| Lenovo ThinkPad T14s G3 21BR00CDGE | |
| Dell Latitude 9430 2-in-1 | |
| HP EliteBook 845 G9 6F6H9EA | |
| 7-Zip 18.03 / 7z b 4 -mmt1 | |
| Dell Latitude 9430 2-in-1 | |
| HP EliteBook 845 G9 6F6H9EA | |
| Average AMD Ryzen 7 PRO 6850U (5057 - 5662, n=7) | |
| Average of class Office (3387 - 6469, n=74, last 2 years) | |
| Lenovo ThinkPad T14s G3 21CQ002LGE | |
| Lenovo ThinkPad T14 G3-21CF004NGE | |
| Lenovo ThinkPad T14s G2 20XGS01100 | |
| Lenovo ThinkPad T14s G3 21BR00CDGE | |
| Lenovo ThinkPad X1 Carbon G10 21CB00DCGE | |
| Geekbench 5.5 / Multi-Core | |
| Dell Latitude 9430 2-in-1 | |
| Apple MacBook Pro 13 2022 M2 | |
| Average of class Office (1483 - 16999, n=71, last 2 years) | |
| Lenovo ThinkPad X1 Carbon G10 21CB00DCGE | |
| Lenovo ThinkPad T14s G3 21BR00CDGE | |
| Average AMD Ryzen 7 PRO 6850U (7044 - 9241, n=7) | |
| Lenovo ThinkPad T14 G3-21CF004NGE | |
| Lenovo ThinkPad T14s G3 21CQ002LGE | |
| Lenovo ThinkPad T14s G2 20XGS01100 | |
| HP EliteBook 845 G9 6F6H9EA | |
| Geekbench 5.5 / Single-Core | |
| Apple MacBook Pro 13 2022 M2 | |
| Average of class Office (811 - 2128, n=71, last 2 years) | |
| Dell Latitude 9430 2-in-1 | |
| Lenovo ThinkPad X1 Carbon G10 21CB00DCGE | |
| Lenovo ThinkPad T14s G3 21BR00CDGE | |
| Lenovo ThinkPad T14 G3-21CF004NGE | |
| Average AMD Ryzen 7 PRO 6850U (1433 - 1533, n=7) | |
| Lenovo ThinkPad T14s G3 21CQ002LGE | |
| HP EliteBook 845 G9 6F6H9EA | |
| Lenovo ThinkPad T14s G2 20XGS01100 | |
| HWBOT x265 Benchmark v2.2 / 4k Preset | |
| Lenovo ThinkPad T14 G3-21CF004NGE | |
| Average AMD Ryzen 7 PRO 6850U (11.7 - 16.3, n=7) | |
| Average of class Office (2.21 - 26, n=73, last 2 years) | |
| Lenovo ThinkPad T14s G3 21CQ002LGE | |
| Lenovo ThinkPad T14s G2 20XGS01100 | |
| Dell Latitude 9430 2-in-1 | |
| HP EliteBook 845 G9 6F6H9EA | |
| Lenovo ThinkPad T14s G3 21BR00CDGE | |
| Lenovo ThinkPad X1 Carbon G10 21CB00DCGE | |
| LibreOffice / 20 Documents To PDF | |
| HP EliteBook 845 G9 6F6H9EA | |
| Average of class Office (41.5 - 102.3, n=73, last 2 years) | |
| Average AMD Ryzen 7 PRO 6850U (46.3 - 74, n=7) | |
| Lenovo ThinkPad T14s G3 21CQ002LGE | |
| Lenovo ThinkPad T14 G3-21CF004NGE | |
| Lenovo ThinkPad T14s G2 20XGS01100 | |
| Lenovo ThinkPad X1 Carbon G10 21CB00DCGE | |
| Dell Latitude 9430 2-in-1 | |
| Lenovo ThinkPad T14s G3 21BR00CDGE | |
| R Benchmark 2.5 / Overall mean | |
| Lenovo ThinkPad T14s G2 20XGS01100 | |
| Average of class Office (0.4098 - 0.888, n=73, last 2 years) | |
| Lenovo ThinkPad X1 Carbon G10 21CB00DCGE | |
| Lenovo ThinkPad T14 G3-21CF004NGE | |
| HP EliteBook 845 G9 6F6H9EA | |
| Average AMD Ryzen 7 PRO 6850U (0.4932 - 0.544, n=7) | |
| Lenovo ThinkPad T14s G3 21CQ002LGE | |
| Lenovo ThinkPad T14s G3 21BR00CDGE | |
| Dell Latitude 9430 2-in-1 | |
* ... smaller is better
AIDA64: FP32 Ray-Trace | FPU Julia | CPU SHA3 | CPU Queen | FPU SinJulia | FPU Mandel | CPU AES | CPU ZLib | FP64 Ray-Trace | CPU PhotoWorxx
| Performance rating | |
| Average AMD Ryzen 7 PRO 6850U | |
| Lenovo ThinkPad T14s G3 21CQ002LGE | |
| Average of class Office | |
| Lenovo ThinkPad T14s G2 20XGS01100 | |
| HP EliteBook 845 G9 6F6H9EA | |
| Dell Latitude 9430 2-in-1 | |
| Lenovo ThinkPad T14s G3 21BR00CDGE | |
| Lenovo ThinkPad X1 Carbon G10 21CB00DCGE | |
| AIDA64 / FP32 Ray-Trace | |
| Average of class Office (2083 - 31245, n=79, last 2 years) | |
| Average AMD Ryzen 7 PRO 6850U (11272 - 14704, n=8) | |
| Lenovo ThinkPad T14s G3 21CQ002LGE | |
| Lenovo ThinkPad T14s G2 20XGS01100 | |
| HP EliteBook 845 G9 6F6H9EA | |
| Dell Latitude 9430 2-in-1 | |
| Lenovo ThinkPad T14s G3 21BR00CDGE | |
| Lenovo ThinkPad X1 Carbon G10 21CB00DCGE | |
| AIDA64 / FPU Julia | |
| Average AMD Ryzen 7 PRO 6850U (72242 - 92957, n=8) | |
| Lenovo ThinkPad T14s G3 21CQ002LGE | |
| Lenovo ThinkPad T14s G2 20XGS01100 | |
| HP EliteBook 845 G9 6F6H9EA | |
| Average of class Office (8191 - 125394, n=79, last 2 years) | |
| Dell Latitude 9430 2-in-1 | |
| Lenovo ThinkPad T14s G3 21BR00CDGE | |
| Lenovo ThinkPad X1 Carbon G10 21CB00DCGE | |
| AIDA64 / CPU SHA3 | |
| Average of class Office (433 - 5755, n=79, last 2 years) | |
| Average AMD Ryzen 7 PRO 6850U (2419 - 3104, n=8) | |
| Lenovo ThinkPad T14s G3 21CQ002LGE | |
| Lenovo ThinkPad T14s G2 20XGS01100 | |
| Dell Latitude 9430 2-in-1 | |
| Lenovo ThinkPad T14s G3 21BR00CDGE | |
| HP EliteBook 845 G9 6F6H9EA | |
| Lenovo ThinkPad X1 Carbon G10 21CB00DCGE | |
| AIDA64 / CPU Queen | |
| Average AMD Ryzen 7 PRO 6850U (86644 - 96912, n=7) | |
| Lenovo ThinkPad T14s G3 21CQ002LGE | |
| Lenovo ThinkPad T14s G2 20XGS01100 | |
| Lenovo ThinkPad X1 Carbon G10 21CB00DCGE | |
| HP EliteBook 845 G9 6F6H9EA | |
| Dell Latitude 9430 2-in-1 | |
| Average of class Office (22784 - 115197, n=69, last 2 years) | |
| Lenovo ThinkPad T14s G3 21BR00CDGE | |
| AIDA64 / FPU SinJulia | |
| Average AMD Ryzen 7 PRO 6850U (10917 - 12571, n=8) | |
| Lenovo ThinkPad T14s G3 21CQ002LGE | |
| Lenovo ThinkPad T14s G2 20XGS01100 | |
| HP EliteBook 845 G9 6F6H9EA | |
| Average of class Office (1378 - 18321, n=79, last 2 years) | |
| Dell Latitude 9430 2-in-1 | |
| Lenovo ThinkPad X1 Carbon G10 21CB00DCGE | |
| Lenovo ThinkPad T14s G3 21BR00CDGE | |
| AIDA64 / FPU Mandel | |
| Average AMD Ryzen 7 PRO 6850U (39609 - 51296, n=8) | |
| Lenovo ThinkPad T14s G3 21CQ002LGE | |
| Lenovo ThinkPad T14s G2 20XGS01100 | |
| HP EliteBook 845 G9 6F6H9EA | |
| Average of class Office (4601 - 66922, n=79, last 2 years) | |
| Dell Latitude 9430 2-in-1 | |
| Lenovo ThinkPad T14s G3 21BR00CDGE | |
| Lenovo ThinkPad X1 Carbon G10 21CB00DCGE | |
| AIDA64 / CPU AES | |
| Lenovo ThinkPad T14s G2 20XGS01100 | |
| Average of class Office (4854 - 155900, n=79, last 2 years) | |
| Average AMD Ryzen 7 PRO 6850U (45568 - 60867, n=8) | |
| Lenovo ThinkPad T14s G3 21CQ002LGE | |
| Dell Latitude 9430 2-in-1 | |
| HP EliteBook 845 G9 6F6H9EA | |
| Lenovo ThinkPad T14s G3 21BR00CDGE | |
| Lenovo ThinkPad X1 Carbon G10 21CB00DCGE | |
| AIDA64 / CPU ZLib | |
| Average of class Office (114.6 - 1366, n=79, last 2 years) | |
| Average AMD Ryzen 7 PRO 6850U (641 - 805, n=8) | |
| Lenovo ThinkPad T14s G3 21CQ002LGE | |
| Dell Latitude 9430 2-in-1 | |
| Lenovo ThinkPad T14s G3 21BR00CDGE | |
| Lenovo ThinkPad T14s G2 20XGS01100 | |
| HP EliteBook 845 G9 6F6H9EA | |
| Lenovo ThinkPad X1 Carbon G10 21CB00DCGE | |
| AIDA64 / FP64 Ray-Trace | |
| Average of class Office (1109 - 17834, n=79, last 2 years) | |
| Average AMD Ryzen 7 PRO 6850U (5967 - 7821, n=8) | |
| Lenovo ThinkPad T14s G3 21CQ002LGE | |
| Lenovo ThinkPad T14s G2 20XGS01100 | |
| HP EliteBook 845 G9 6F6H9EA | |
| Dell Latitude 9430 2-in-1 | |
| Lenovo ThinkPad T14s G3 21BR00CDGE | |
| Lenovo ThinkPad X1 Carbon G10 21CB00DCGE | |
| AIDA64 / CPU PhotoWorxx | |
| Dell Latitude 9430 2-in-1 | |
| Lenovo ThinkPad T14s G3 21BR00CDGE | |
| Lenovo ThinkPad X1 Carbon G10 21CB00DCGE | |
| Average of class Office (11090 - 65229, n=79, last 2 years) | |
| Lenovo ThinkPad T14s G3 21CQ002LGE | |
| Average AMD Ryzen 7 PRO 6850U (19707 - 27840, n=8) | |
| HP EliteBook 845 G9 6F6H9EA | |
| Lenovo ThinkPad T14s G2 20XGS01100 | |
System Performance
In PCMark 10, the Lenovo ThinkPad T14s G3 takes the top spot. While the same is not the case in the CrossMark, the distance to the top is not very large there either. So it is not surprising, that the Lenovo ThinkPad T14s Gen 3 runs very fast and smooth in everyday operation.
CrossMark: Overall | Productivity | Creativity | Responsiveness
| PCMark 10 / Score | |
| Average of class Office (2601 - 9298, n=63, last 2 years) | |
| Lenovo ThinkPad T14s G3 21CQ002LGE | |
| Average AMD Ryzen 7 PRO 6850U, AMD Radeon 680M (5873 - 6311, n=7) | |
| Lenovo ThinkPad T14s G2 20XGS01100 | |
| HP EliteBook 845 G9 6F6H9EA | |
| Dell Latitude 9430 2-in-1 | |
| Lenovo ThinkPad T14s G3 21BR00CDGE | |
| PCMark 10 / Essentials | |
| Dell Latitude 9430 2-in-1 | |
| Lenovo ThinkPad T14s G2 20XGS01100 | |
| Average of class Office (3245 - 11594, n=63, last 2 years) | |
| Lenovo ThinkPad T14s G3 21BR00CDGE | |
| Lenovo ThinkPad T14s G3 21CQ002LGE | |
| HP EliteBook 845 G9 6F6H9EA | |
| Average AMD Ryzen 7 PRO 6850U, AMD Radeon 680M (9151 - 10263, n=7) | |
| PCMark 10 / Productivity | |
| Average of class Office (5336 - 17243, n=63, last 2 years) | |
| Lenovo ThinkPad T14s G2 20XGS01100 | |
| Lenovo ThinkPad T14s G3 21CQ002LGE | |
| HP EliteBook 845 G9 6F6H9EA | |
| Average AMD Ryzen 7 PRO 6850U, AMD Radeon 680M (8435 - 8891, n=7) | |
| Dell Latitude 9430 2-in-1 | |
| Lenovo ThinkPad T14s G3 21BR00CDGE | |
| PCMark 10 / Digital Content Creation | |
| Average of class Office (2049 - 13541, n=63, last 2 years) | |
| Average AMD Ryzen 7 PRO 6850U, AMD Radeon 680M (6796 - 8422, n=7) | |
| Lenovo ThinkPad T14s G3 21CQ002LGE | |
| Lenovo ThinkPad T14s G2 20XGS01100 | |
| Dell Latitude 9430 2-in-1 | |
| HP EliteBook 845 G9 6F6H9EA | |
| Lenovo ThinkPad T14s G3 21BR00CDGE | |
| CrossMark / Overall | |
| Dell Latitude 9430 2-in-1 | |
| Lenovo ThinkPad T14s G3 21BR00CDGE | |
| Average of class Office (381 - 2010, n=74, last 2 years) | |
| Lenovo ThinkPad T14s G3 21CQ002LGE | |
| Average AMD Ryzen 7 PRO 6850U, AMD Radeon 680M (1154 - 1442, n=7) | |
| Lenovo ThinkPad T14s G2 20XGS01100 | |
| CrossMark / Productivity | |
| Dell Latitude 9430 2-in-1 | |
| Lenovo ThinkPad T14s G3 21BR00CDGE | |
| Lenovo ThinkPad T14s G3 21CQ002LGE | |
| Average of class Office (464 - 1880, n=74, last 2 years) | |
| Average AMD Ryzen 7 PRO 6850U, AMD Radeon 680M (1188 - 1444, n=7) | |
| Lenovo ThinkPad T14s G2 20XGS01100 | |
| CrossMark / Creativity | |
| Dell Latitude 9430 2-in-1 | |
| Average of class Office (319 - 2361, n=74, last 2 years) | |
| Lenovo ThinkPad T14s G3 21BR00CDGE | |
| Lenovo ThinkPad T14s G3 21CQ002LGE | |
| Lenovo ThinkPad T14s G2 20XGS01100 | |
| Average AMD Ryzen 7 PRO 6850U, AMD Radeon 680M (1180 - 1523, n=7) | |
| CrossMark / Responsiveness | |
| Dell Latitude 9430 2-in-1 | |
| Lenovo ThinkPad T14s G3 21BR00CDGE | |
| Average of class Office (360 - 1690, n=74, last 2 years) | |
| Lenovo ThinkPad T14s G3 21CQ002LGE | |
| Average AMD Ryzen 7 PRO 6850U, AMD Radeon 680M (990 - 1282, n=7) | |
| Lenovo ThinkPad T14s G2 20XGS01100 | |
| PCMark 10 Score | 6152 points | |
Help | ||
| AIDA64 / Memory Copy | |
| Dell Latitude 9430 2-in-1 | |
| Average of class Office (20075 - 110930, n=76, last 2 years) | |
| Lenovo ThinkPad T14s G3 21BR00CDGE | |
| Lenovo ThinkPad T14s G3 21CQ002LGE | |
| Average AMD Ryzen 7 PRO 6850U (31003 - 48605, n=8) | |
| Lenovo ThinkPad T14s G2 20XGS01100 | |
| HP EliteBook 845 G9 6F6H9EA | |
| AIDA64 / Memory Read | |
| Average of class Office (10084 - 128030, n=77, last 2 years) | |
| Lenovo ThinkPad T14s G3 21BR00CDGE | |
| Dell Latitude 9430 2-in-1 | |
| Average AMD Ryzen 7 PRO 6850U (34682 - 45912, n=8) | |
| Lenovo ThinkPad T14s G3 21CQ002LGE | |
| Lenovo ThinkPad T14s G2 20XGS01100 | |
| HP EliteBook 845 G9 6F6H9EA | |
| AIDA64 / Memory Write | |
| Average of class Office (20073 - 119858, n=77, last 2 years) | |
| Dell Latitude 9430 2-in-1 | |
| Lenovo ThinkPad T14s G3 21BR00CDGE | |
| Lenovo ThinkPad T14s G3 21CQ002LGE | |
| Average AMD Ryzen 7 PRO 6850U (34532 - 51096, n=8) | |
| Lenovo ThinkPad T14s G2 20XGS01100 | |
| HP EliteBook 845 G9 6F6H9EA | |
| AIDA64 / Memory Latency | |
| Lenovo ThinkPad T14s G3 21CQ002LGE | |
| Lenovo ThinkPad T14s G2 20XGS01100 | |
| Average AMD Ryzen 7 PRO 6850U (86.1 - 135.3, n=8) | |
| Dell Latitude 9430 2-in-1 | |
| Average of class Office (7.6 - 162.9, n=72, last 2 years) | |
| HP EliteBook 845 G9 6F6H9EA | |
| Lenovo ThinkPad T14s G3 21BR00CDGE | |
* ... smaller is better
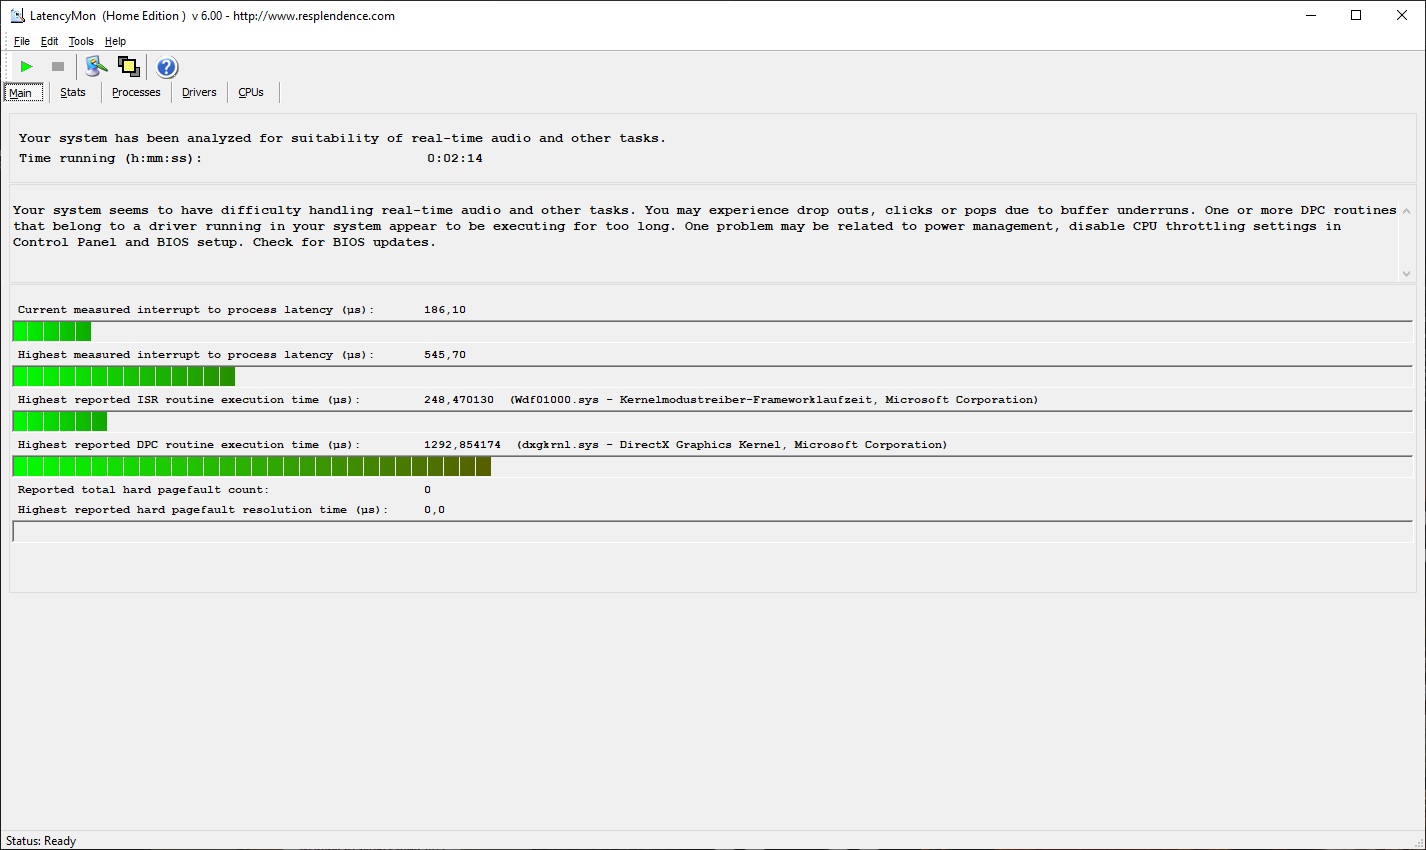
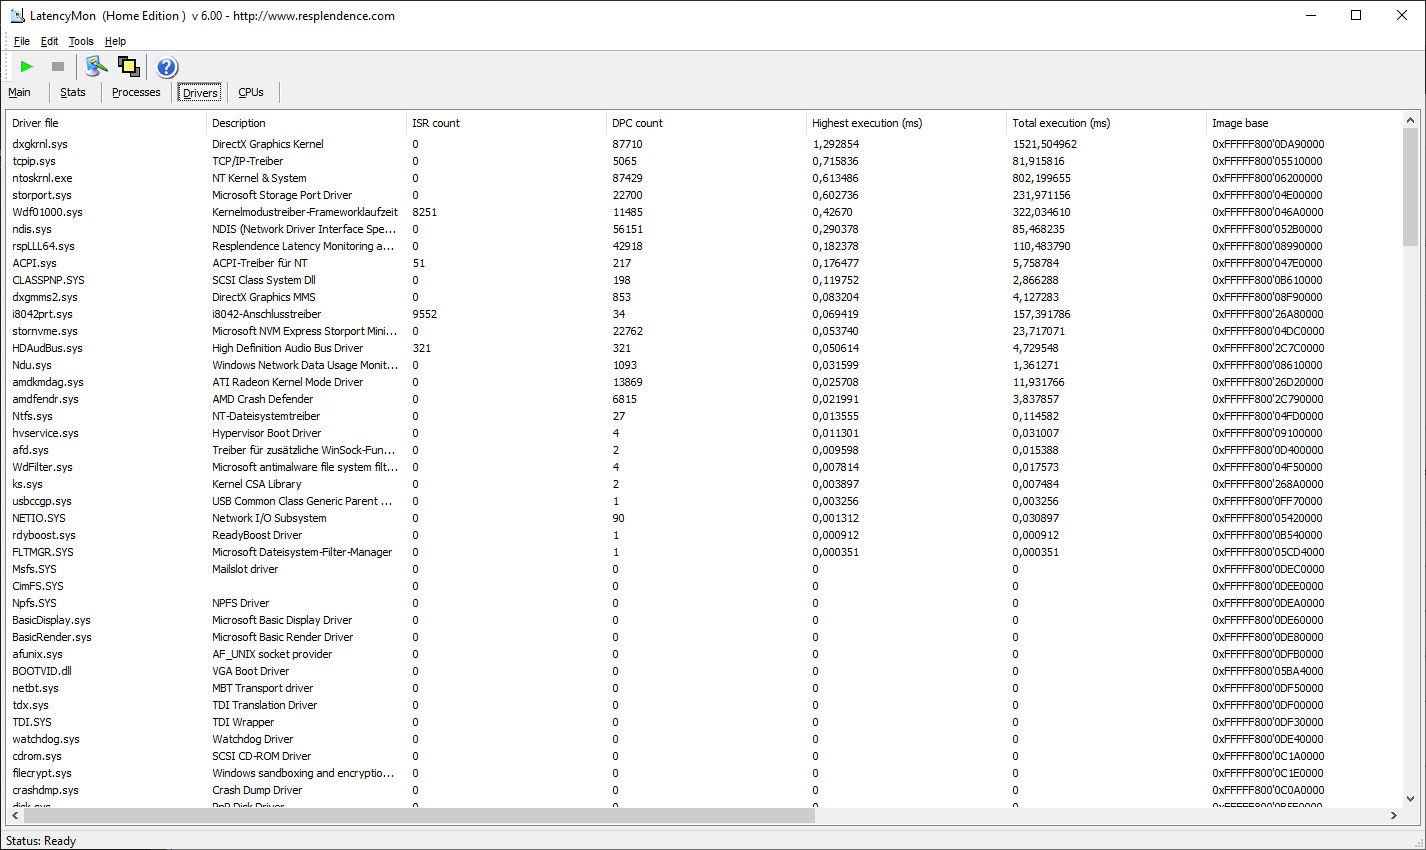
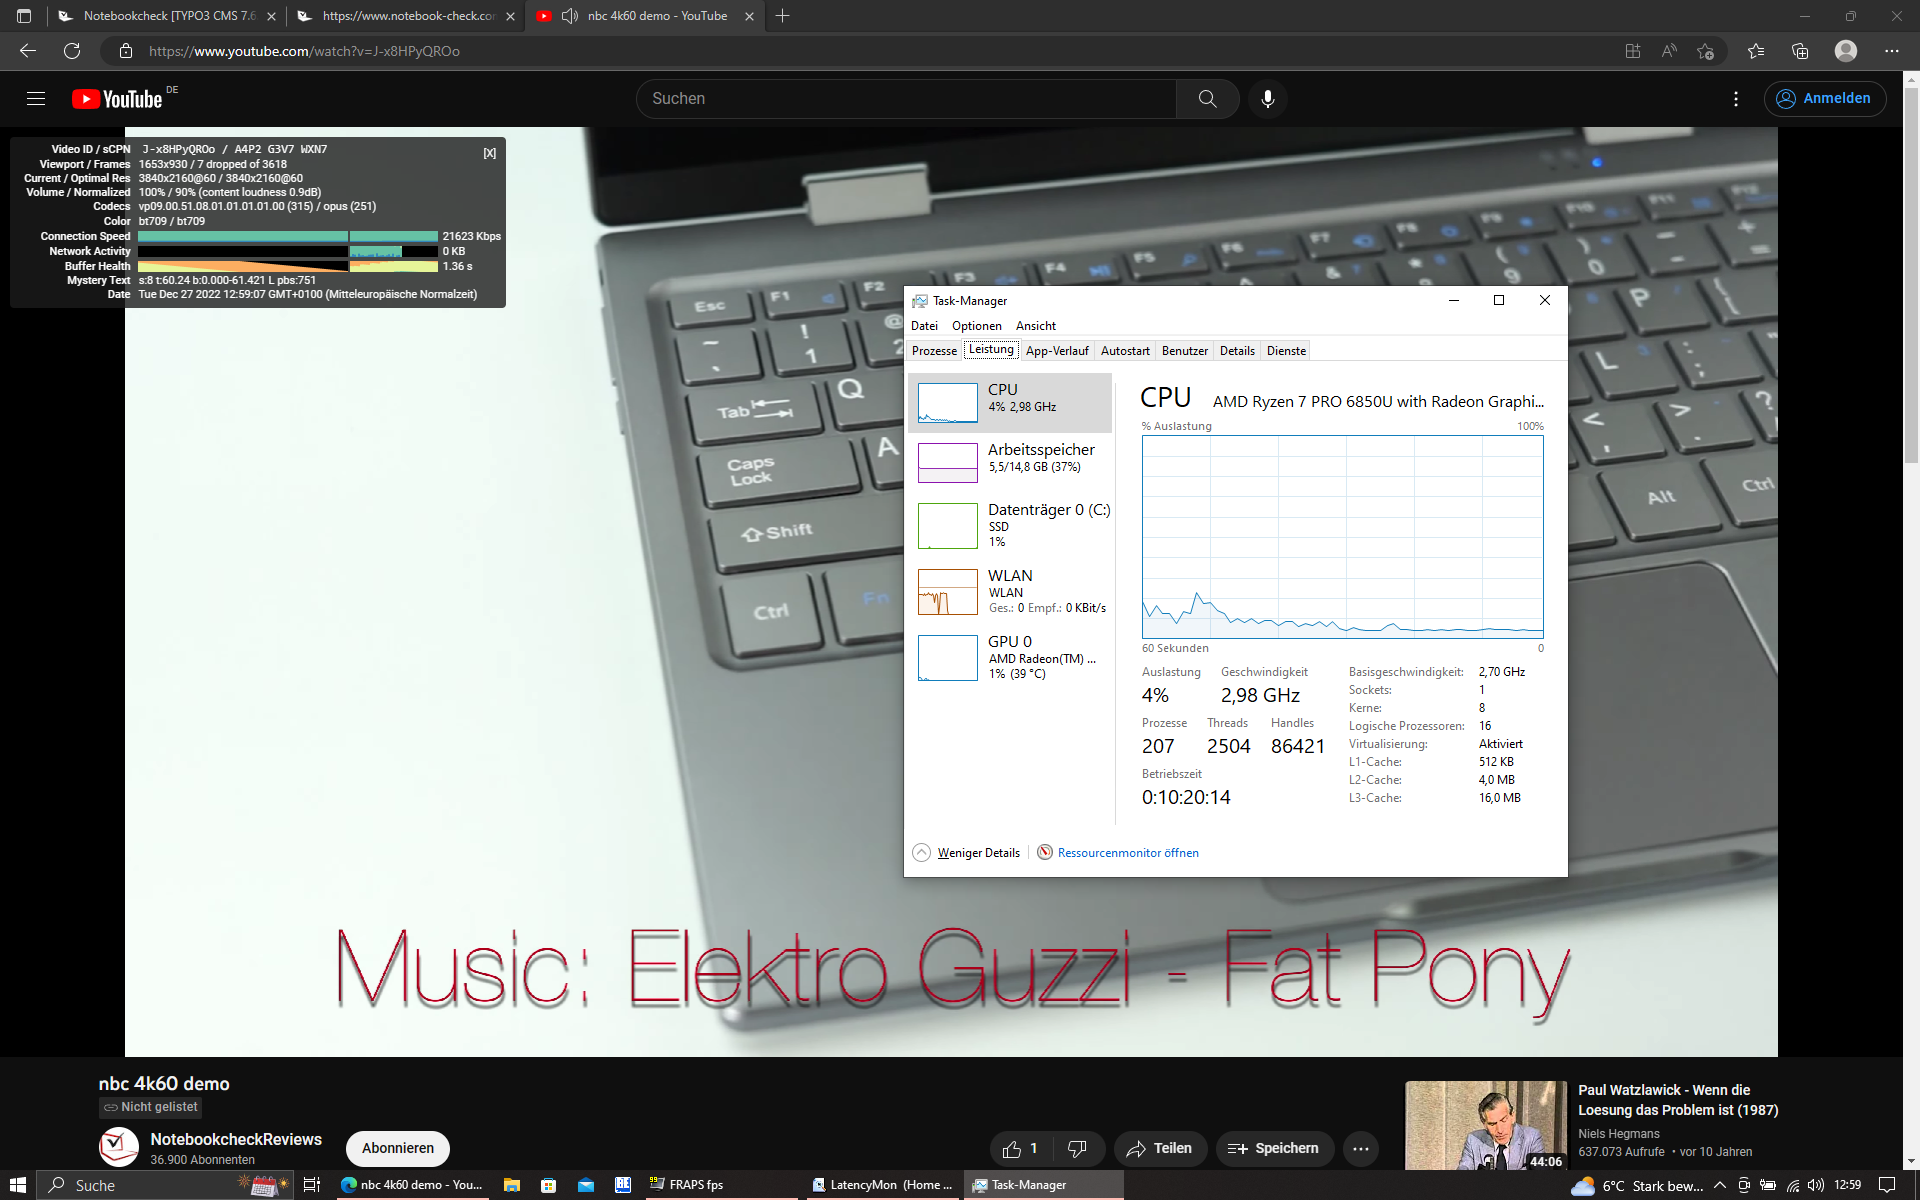
DPC Latencies
While the measured DPC latencies are not particularly high, they are still problematic for real-time audio and video work, at least in the version we tested, with the state of drivers that are current at the time of our testing.
| DPC Latencies / LatencyMon - interrupt to process latency (max), Web, Youtube, Prime95 | |
| Lenovo ThinkPad T14s G2 20XGS01100 | |
| HP EliteBook 845 G9 6F6H9EA | |
| Lenovo ThinkPad T14s G3 21BR00CDGE | |
| Dell Latitude 9430 2-in-1 | |
| Lenovo ThinkPad T14s G3 21CQ002LGE | |
* ... smaller is better
Storage Solution
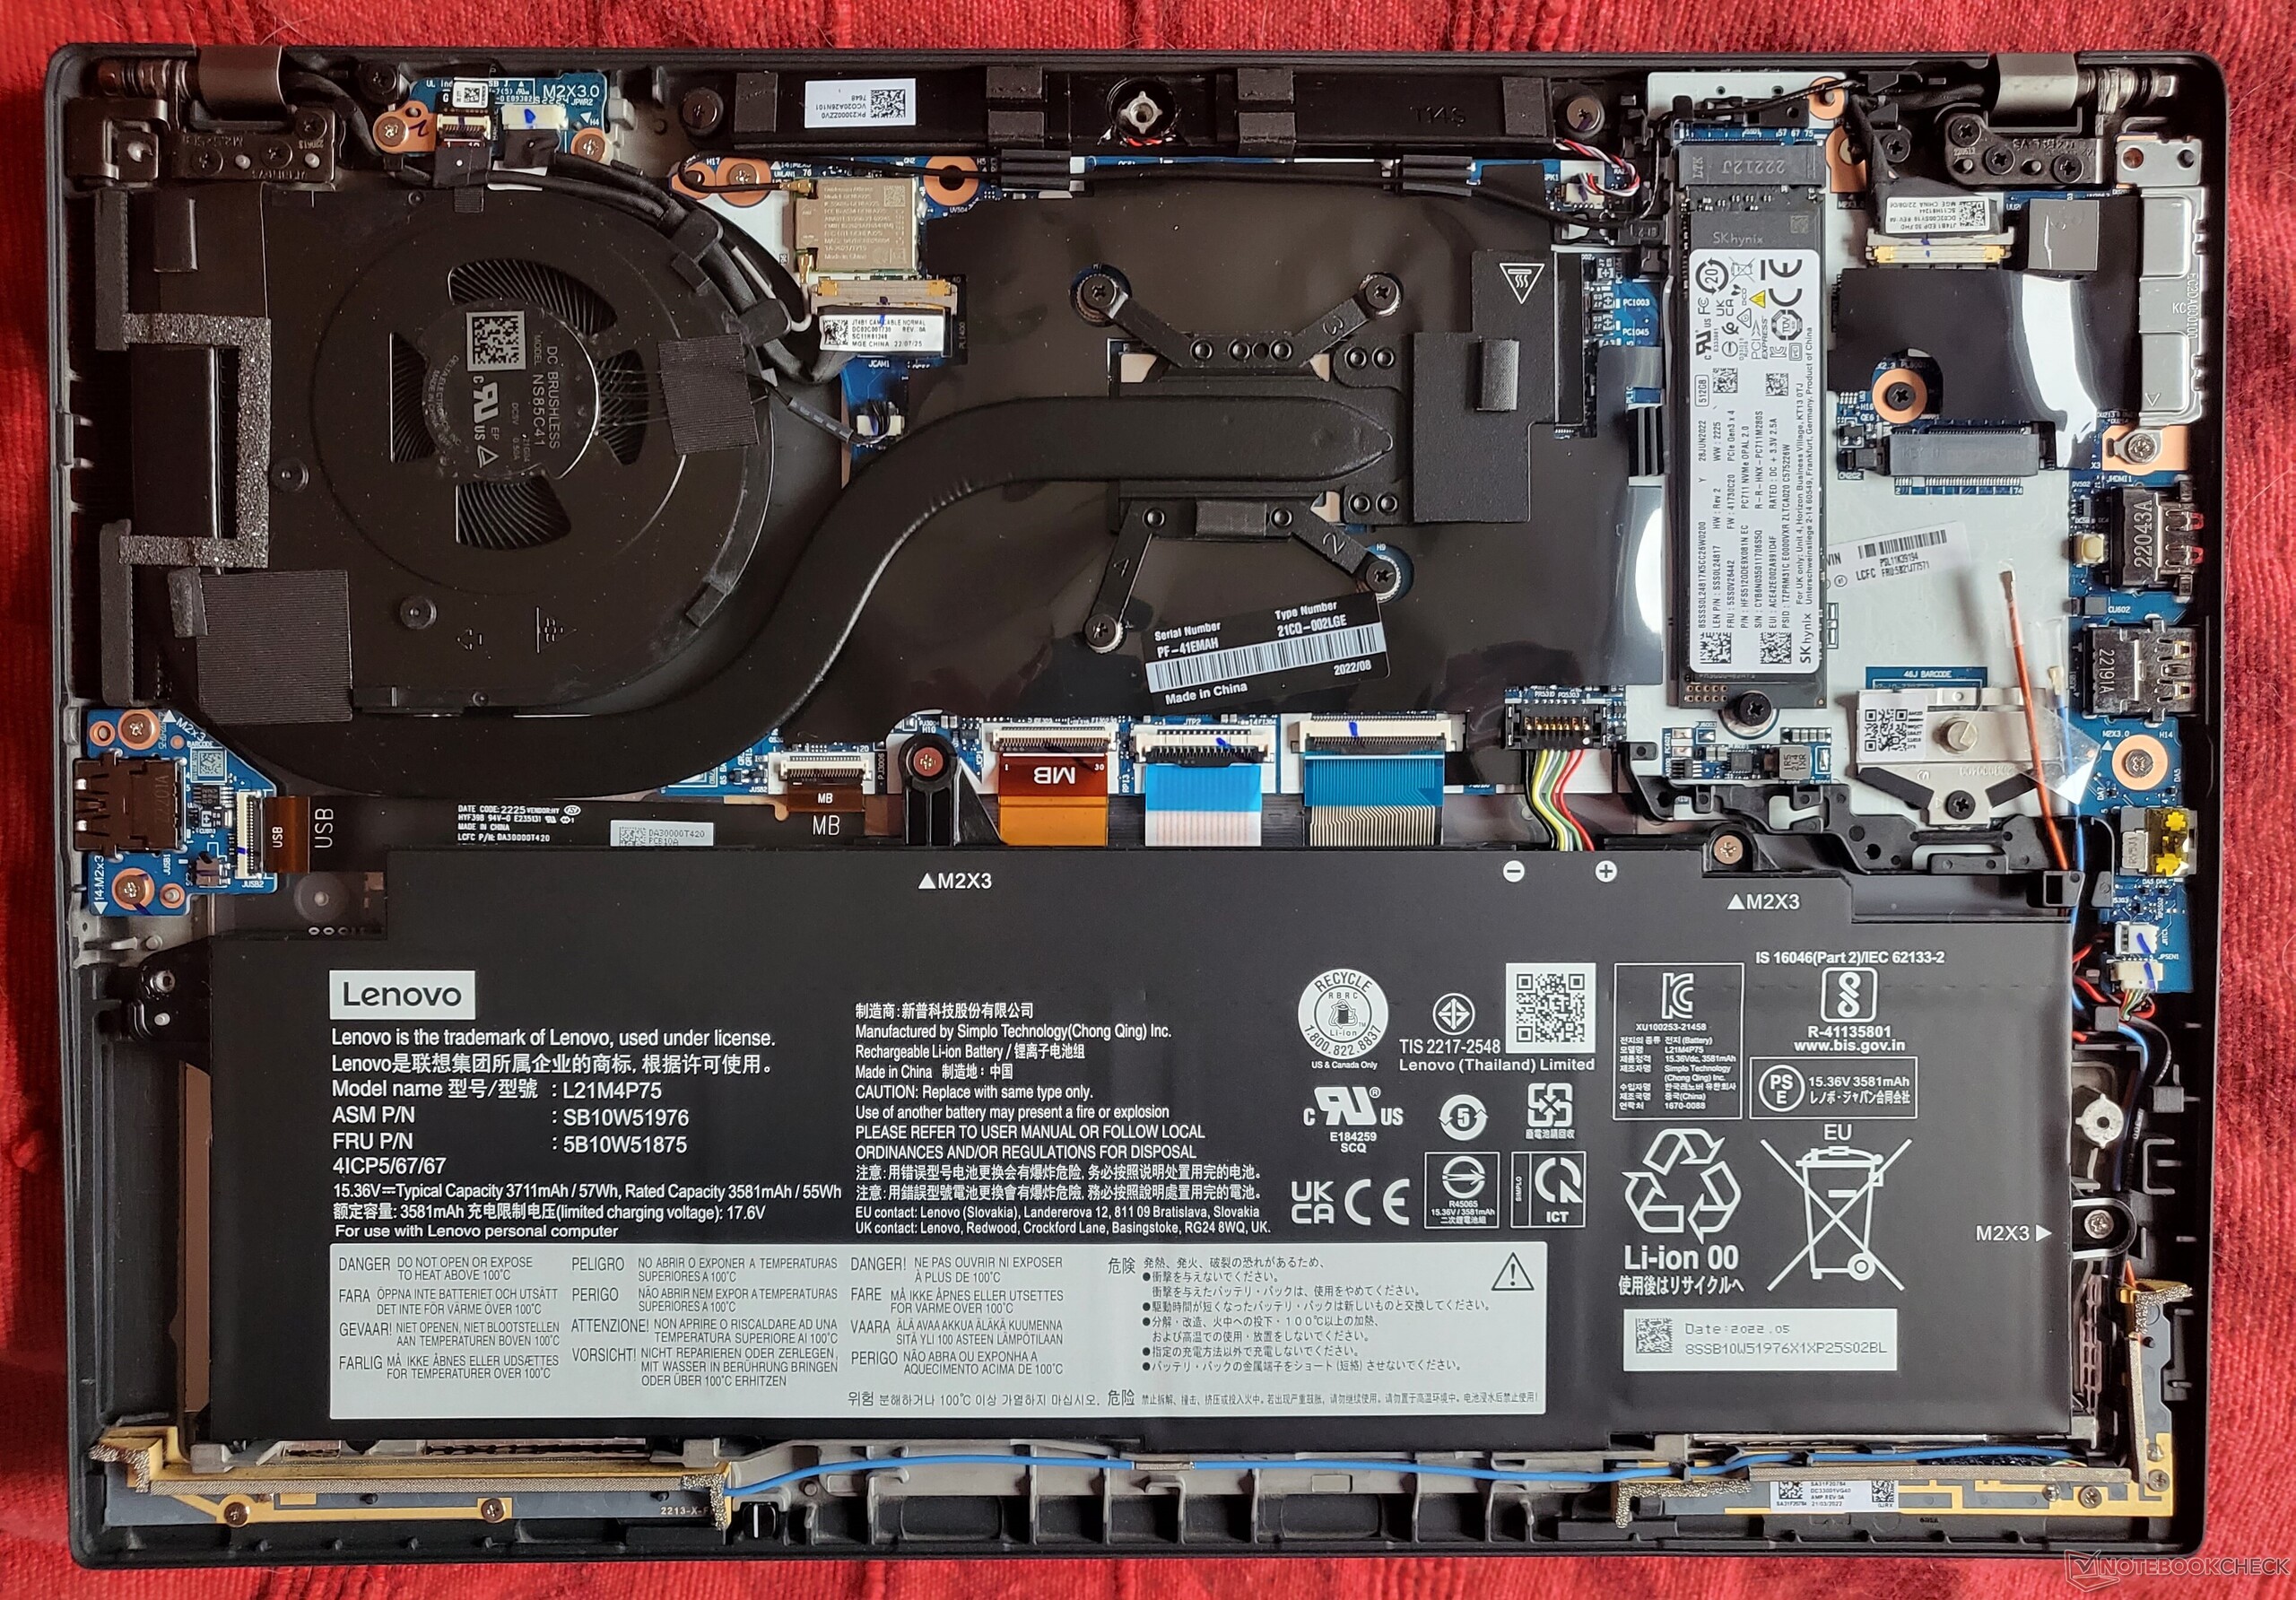
The Hynix SSD of our test unit of the Lenovo ThinkPad T14s G3 offers a 512 GB capacity. The M.2-2280 SSD is connected via the fast NVMe PCIe 4.0 standard, achieving better benchmark results than all the competitors in our comparison. However, under constant load, there can be some performance drops, which might be due to some thermal limitations.

* ... smaller is better
Disk Throttling: DiskSpd Read Loop, Queue Depth 8
Graphics
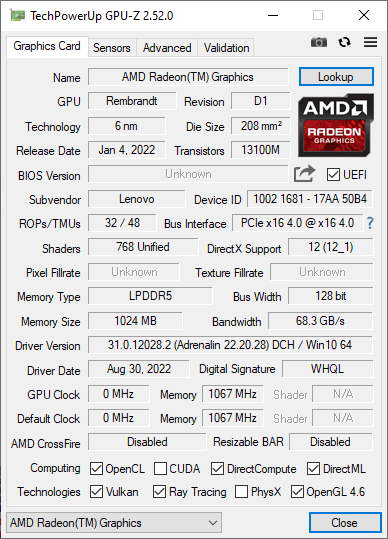
The AMD Radeon 680M is an integrated GPU that, just like nearly all present-day iGPUs, does not have a single megabyte of video memory of its own. This RNDA2 GPU in the Lenovo ThinkPad T14s G3 achieves benchmark results that are far ahead of the competitors with Intel GPUs, regardless of whether we look at the 3DMark tests or at our games benchmarks, although we admit that those are less meaningful for a business laptop. What might be more interesting is perhaps Blender v3.3, where the Radeon 680M in the Lenovo ThinkPad runs about twice as fast as the Radeon 660M of the HP EliteBook 845 G9 during the HIP test. With this, the ThinkPad T14s G3 AMD can also be used quite well for rendering.
| 3DMark 11 Performance | 9637 points | |
| 3DMark Cloud Gate Standard Score | 29621 points | |
| 3DMark Fire Strike Score | 5908 points | |
| 3DMark Time Spy Score | 2171 points | |
Help | ||
* ... smaller is better
| The Witcher 3 - 1920x1080 Ultra Graphics & Postprocessing (HBAO+) | |
| Lenovo ThinkPad T14s G3 21CQ002LGE | |
| Average of class Office (14.8 - 18.1, n=4, last 2 years) | |
| Dell Latitude 9430 2-in-1 | |
| Lenovo ThinkPad T14s G2 20XGS01100 | |
| Lenovo ThinkPad T14s G3 21BR00CDGE | |
| HP EliteBook 845 G9 6F6H9EA | |
| Final Fantasy XV Benchmark - 1920x1080 High Quality | |
| Average of class Office (8.09 - 79.5, n=67, last 2 years) | |
| Lenovo ThinkPad T14s G3 21CQ002LGE | |
| Dell Latitude 9430 2-in-1 | |
| Lenovo ThinkPad T14s G3 21BR00CDGE | |
| HP EliteBook 845 G9 6F6H9EA | |
| Dota 2 Reborn - 1920x1080 ultra (3/3) best looking | |
| Dell Latitude 9430 2-in-1 | |
| Lenovo ThinkPad T14s G3 21CQ002LGE | |
| Average of class Office (14.6 - 135, n=73, last 2 years) | |
| Lenovo ThinkPad T14s G2 20XGS01100 | |
| HP EliteBook 845 G9 6F6H9EA | |
| Lenovo ThinkPad T14s G3 21BR00CDGE | |
The Witcher 3 FPS Chart
| low | med. | high | ultra | |
|---|---|---|---|---|
| The Witcher 3 (2015) | 119.7 | 40.5 | 24.5 | |
| Dota 2 Reborn (2015) | 109.1 | 90.4 | 66.3 | 56.6 |
| Final Fantasy XV Benchmark (2018) | 58.7 | 30.4 | 21.7 | |
| X-Plane 11.11 (2018) | 50.7 | 38.6 | 31.2 | |
| Strange Brigade (2018) | 133.7 | 54.7 | 45.1 | 38.3 |
Emissions: ThinkPad T14s G3 with an almost silent fan
Noise Levels
When we started testing the noise levels of the ThinkPad T14s G3, we first wondered whether the fan was working, since the ThinkPad laptop stayed very quiet. During idle operation, it remains completely quiet throughout, and even our test for average loads does not cause the fan to activate. Only under maximum load, the cooling finally activates, but even then, it remains practically silent at only 27.3 dB(a). All the comparison models without exception show higher fan noise levels.
We do not notice any coil whine in the T14s Gen 3.
Noise level
| Idle |
| 22.8 / 22.8 / 22.8 dB(A) |
| Load |
| 22.8 / 27.3 dB(A) |
 | ||
30 dB silent 40 dB(A) audible 50 dB(A) loud |
||
min: | ||
| Lenovo ThinkPad T14s G3 21CQ002LGE Radeon 680M, R7 PRO 6850U, SK Hynix PC711 512GB HFS512GDE9X081N | Lenovo ThinkPad T14s G3 21BR00CDGE Iris Xe G7 80EUs, i5-1235U, SK Hynix HFS512 GDE9X081N | Lenovo ThinkPad T14s G2 20XGS01100 Vega 8, R7 PRO 5850U, Lenovo UMIS AM630 RPETJ1T24MGE2QDQ | Dell Latitude 9430 2-in-1 Iris Xe G7 96EUs, i7-1265U | HP EliteBook 845 G9 6F6H9EA Radeon 660M, R5 PRO 6650U, Samsung PM991 MZVLQ512HBLU | |
|---|---|---|---|---|---|
| Noise | -16% | -21% | -26% | -23% | |
| off / environment * (dB) | 22.8 | 24.6 -8% | 26.81 -18% | 23.7 -4% | 24 -5% |
| Idle Minimum * (dB) | 22.8 | 24.6 -8% | 26.81 -18% | 23.7 -4% | 24 -5% |
| Idle Average * (dB) | 22.8 | 24.6 -8% | 26.81 -18% | 23.7 -4% | 25 -10% |
| Idle Maximum * (dB) | 22.8 | 24.6 -8% | 26.81 -18% | 23.7 -4% | 26 -14% |
| Load Average * (dB) | 22.8 | 26.1 -14% | 30.16 -32% | 35.1 -54% | 34 -49% |
| Witcher 3 ultra * (dB) | 27.5 | 35.9 -31% | 43.3 -57% | 38 -38% | |
| Load Maximum * (dB) | 27.3 | 36.3 -33% | 33.98 -24% | 43 -58% | 38 -39% |
* ... smaller is better
Temperature
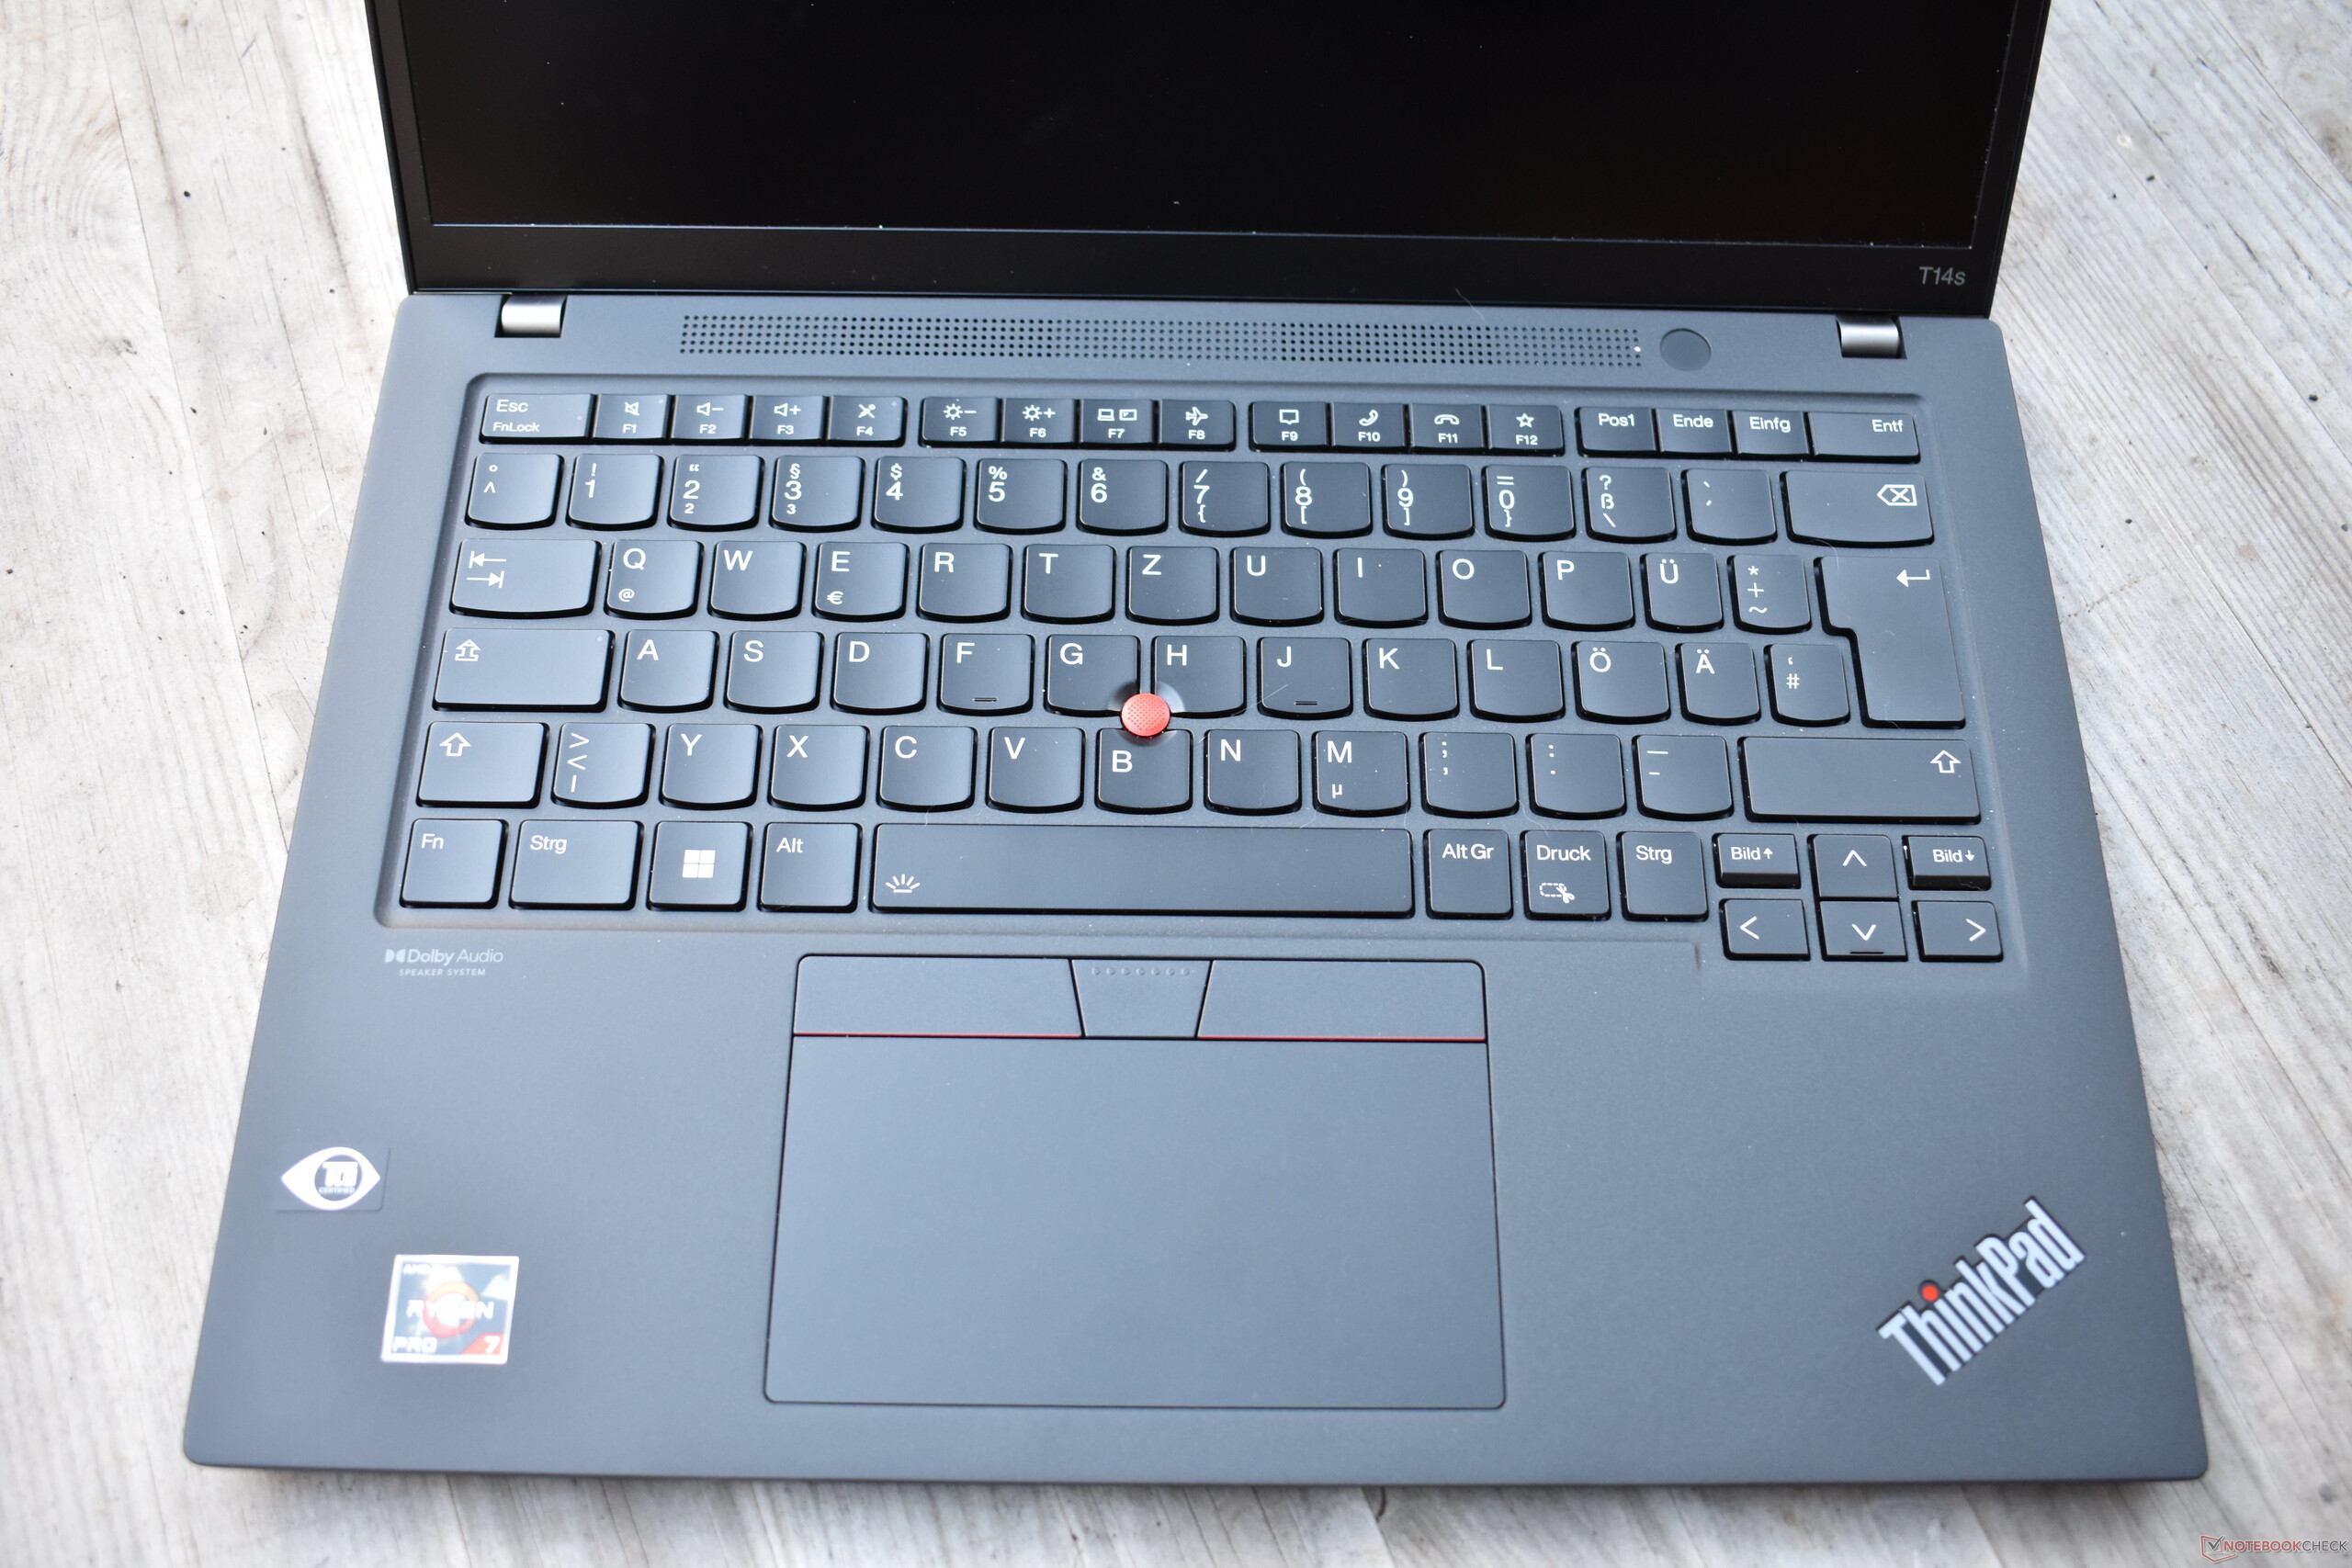
Generally, the Lenovo ThinkPad T14s Gen 3 stays very cool, and even under load, almost none of the measurement spots exceeds the 40-degree Celsius mark (104 °F). The one exception is the area in the center of the keyboard around the TrackPoint, where particularly the gap between the keys reaches temperatures in the 47.7 to 49.2 °C (118 - 120 °F) range. On a positive note, the palm rest remains comfortably cool in all cases.
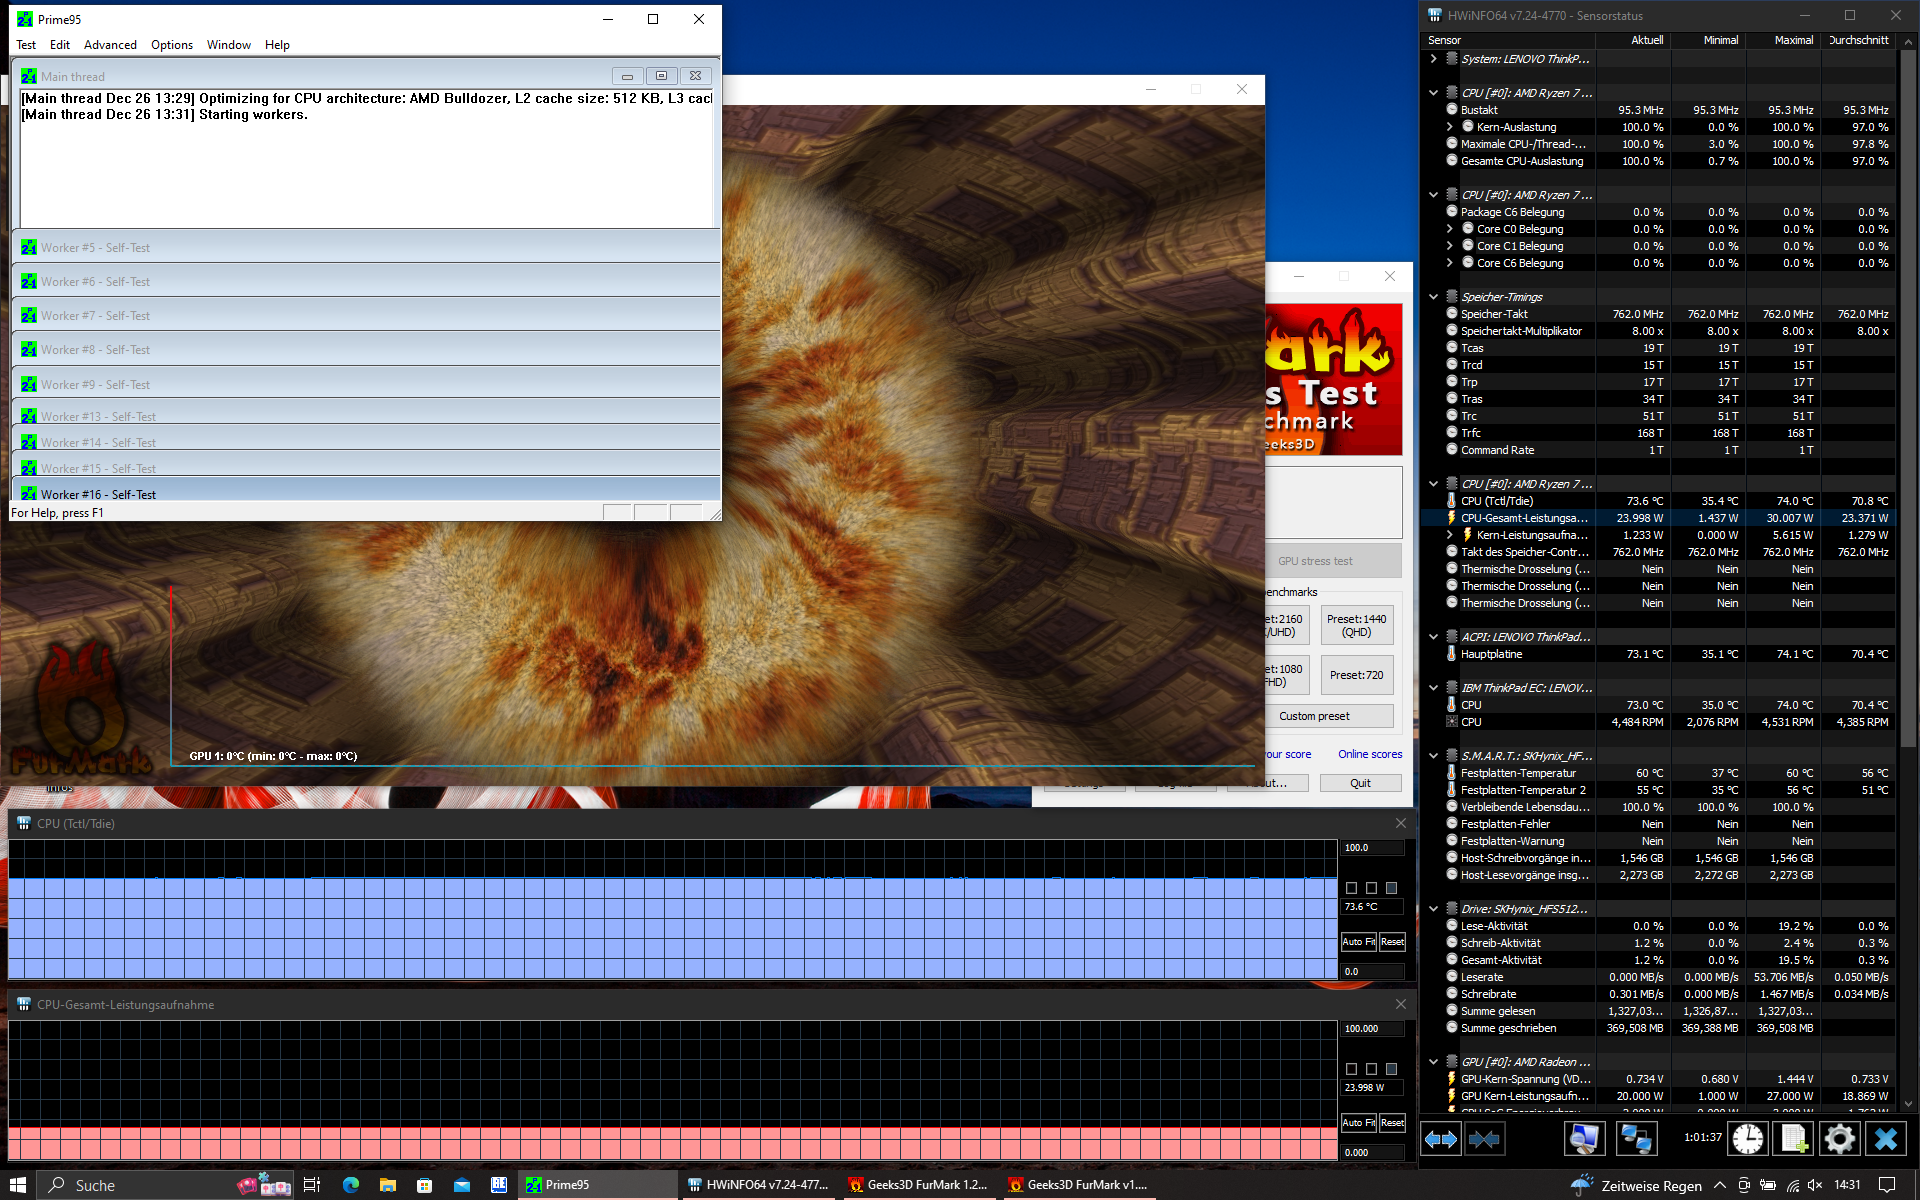
We do not see any throttling at all during the stress test. Even after one hour, the processor is able to keep its long-term power limit of 24 watts.
(-) The maximum temperature on the upper side is 49.2 °C / 121 F, compared to the average of 34.3 °C / 94 F, ranging from 21.2 to 62.5 °C for the class Office.
(+) The bottom heats up to a maximum of 37.2 °C / 99 F, compared to the average of 36.8 °C / 98 F
(+) In idle usage, the average temperature for the upper side is 25.2 °C / 77 F, compared to the device average of 29.5 °C / 85 F.
(±) Playing The Witcher 3, the average temperature for the upper side is 34.7 °C / 94 F, compared to the device average of 29.5 °C / 85 F.
(+) The palmrests and touchpad are cooler than skin temperature with a maximum of 28.2 °C / 82.8 F and are therefore cool to the touch.
(±) The average temperature of the palmrest area of similar devices was 27.5 °C / 81.5 F (-0.7 °C / -1.3 F).
| Lenovo ThinkPad T14s G3 21CQ002LGE AMD Ryzen 7 PRO 6850U, AMD Radeon 680M | Lenovo ThinkPad T14s G3 21BR00CDGE Intel Core i5-1235U, Intel Iris Xe Graphics G7 80EUs | Lenovo ThinkPad T14s G2 20XGS01100 AMD Ryzen 7 PRO 5850U, AMD Radeon RX Vega 8 (Ryzen 4000/5000) | Dell Latitude 9430 2-in-1 Intel Core i7-1265U, Intel Iris Xe Graphics G7 96EUs | HP EliteBook 845 G9 6F6H9EA AMD Ryzen 5 PRO 6650U, AMD Radeon 660M | |
|---|---|---|---|---|---|
| Heat | -1% | 2% | 11% | -0% | |
| Maximum Upper Side * (°C) | 49.2 | 43.6 11% | 44.2 10% | 39.2 20% | 44 11% |
| Maximum Bottom * (°C) | 37.2 | 42 -13% | 38.9 -5% | 44.8 -20% | 45 -21% |
| Idle Upper Side * (°C) | 31.1 | 28.1 10% | 27.7 11% | 21.4 31% | 27 13% |
| Idle Bottom * (°C) | 26 | 28.9 -11% | 28.3 -9% | 22.4 14% | 27 -4% |
* ... smaller is better
Speakers
The speakers are an aspect, where the ThinkPad T series is clearly surpassed by the high-end models of the X1 series. The stereo speakers above the keyboard produce a sound that is balanced in the mids and highs but also very quiet, lacking the bass.
Lenovo ThinkPad T14s G3 21CQ002LGE audio analysis
(-) | not very loud speakers (70.2 dB)
Bass 100 - 315 Hz
(-) | nearly no bass - on average 16.8% lower than median
(±) | linearity of bass is average (14.6% delta to prev. frequency)
Mids 400 - 2000 Hz
(+) | balanced mids - only 2.3% away from median
(+) | mids are linear (5.4% delta to prev. frequency)
Highs 2 - 16 kHz
(+) | balanced highs - only 1.6% away from median
(+) | highs are linear (3.5% delta to prev. frequency)
Overall 100 - 16.000 Hz
(±) | linearity of overall sound is average (15.7% difference to median)
Compared to same class
» 17% of all tested devices in this class were better, 5% similar, 79% worse
» The best had a delta of 7%, average was 21%, worst was 53%
Compared to all devices tested
» 24% of all tested devices were better, 5% similar, 71% worse
» The best had a delta of 4%, average was 24%, worst was 134%
Lenovo ThinkPad X1 Carbon G10 21CC001RGE audio analysis
(±) | speaker loudness is average but good (75.09 dB)
Bass 100 - 315 Hz
(±) | reduced bass - on average 13.2% lower than median
(-) | bass is not linear (16% delta to prev. frequency)
Mids 400 - 2000 Hz
(+) | balanced mids - only 2.8% away from median
(+) | mids are linear (3.6% delta to prev. frequency)
Highs 2 - 16 kHz
(+) | balanced highs - only 2.7% away from median
(+) | highs are linear (4.1% delta to prev. frequency)
Overall 100 - 16.000 Hz
(+) | overall sound is linear (13.7% difference to median)
Compared to same class
» 8% of all tested devices in this class were better, 4% similar, 88% worse
» The best had a delta of 7%, average was 21%, worst was 53%
Compared to all devices tested
» 15% of all tested devices were better, 4% similar, 81% worse
» The best had a delta of 4%, average was 24%, worst was 134%
Power Management: AMD Ryzen 6000 ensures high efficiency
Power Consumption
The Lenovo ThinkPad T14s G3 AMD is an extremely efficient laptop. Compared to the ThinkPad T14s G3 Intel, it is around 8% more efficient on average. The distance to the HP EliteBook 845 G9, which consumes 22% more power on average, is even larger.
The ThinkPad laptop consumes a maximum of around 48.5 watts, so its power consumption is more than covered by its 65-Watt charger.
| Off / Standby | |
| Idle | |
| Load |
|
Key:
min: | |
| Lenovo ThinkPad T14s G3 21CQ002LGE R7 PRO 6850U, Radeon 680M, SK Hynix PC711 512GB HFS512GDE9X081N, LTPS IPS LED, 1920x1200, 14" | Lenovo ThinkPad T14s G3 21BR00CDGE i5-1235U, Iris Xe G7 80EUs, SK Hynix HFS512 GDE9X081N, IPS LED, 1920x1200, 14" | Lenovo ThinkPad T14s G2 20XGS01100 R7 PRO 5850U, Vega 8, Lenovo UMIS AM630 RPETJ1T24MGE2QDQ, IPS LED, 1920x1080, 14" | Dell Latitude 9430 2-in-1 i7-1265U, Iris Xe G7 96EUs, , IPS, 2560x1600, 14" | HP EliteBook 845 G9 6F6H9EA R5 PRO 6650U, Radeon 660M, Samsung PM991 MZVLQ512HBLU, IPS, 1920x1200, 14" | Average AMD Radeon 680M | Average of class Office | |
|---|---|---|---|---|---|---|---|
| Power Consumption | -8% | -15% | -27% | -22% | -106% | -59% | |
| Idle Minimum * (Watt) | 2.2 | 2.3 -5% | 3.16 -44% | 2.9 -32% | 3 -36% | 6.93 ? -215% | 4.4 ? -100% |
| Idle Average * (Watt) | 4.4 | 4.6 -5% | 5.6 -27% | 5.8 -32% | 5 -14% | 8.98 ? -104% | 7.32 ? -66% |
| Idle Maximum * (Watt) | 5.1 | 5.6 -10% | 7.13 -40% | 6.6 -29% | 9 -76% | 10.5 ? -106% | 8.56 ? -68% |
| Load Average * (Watt) | 33.3 | 37.1 -11% | 30.86 7% | 49.2 -48% | 41 -23% | 53.5 ? -61% | 42.5 ? -28% |
| Witcher 3 ultra * (Watt) | 40.1 | 32.8 18% | 37 8% | 35.3 12% | 32.6 19% | ||
| Load Maximum * (Watt) | 48.5 | 65.8 -36% | 46.55 4% | 63.1 -30% | 50 -3% | 70.5 ? -45% | 64.1 ? -32% |
* ... smaller is better
Power Consumption The Witcher 3 / Stress Test
Power Consumption With External Monitor
Battery Life
All the ThinkPad T14s models, regardless of their generation and which processor they use, have a battery capacity of 57 Wh. With this internal battery, the Lenovo laptop achieves a runtime of about 12 hours in the WiFi test at 150 cd/m² display brightness. Interestingly, this is worse than the ThinkPad T14s G2 AMD predecessor, but also significantly longer than the T14s G3 Intel, which lasted less than 10 hours.
| Lenovo ThinkPad T14s G3 21CQ002LGE R7 PRO 6850U, Radeon 680M, 57 Wh | Lenovo ThinkPad T14s G3 21BR00CDGE i5-1235U, Iris Xe G7 80EUs, 57 Wh | Lenovo ThinkPad T14s G2 20XGS01100 R7 PRO 5850U, Vega 8, 57 Wh | Dell Latitude 9430 2-in-1 i7-1265U, Iris Xe G7 96EUs, 60 Wh | HP EliteBook 845 G9 6F6H9EA R5 PRO 6650U, Radeon 660M, 51 Wh | Average of class Office | |
|---|---|---|---|---|---|---|
| Battery runtime | -34% | -5% | 2% | 1% | -10% | |
| WiFi v1.3 (h) | 12 | 9.6 -20% | 14.6 22% | 12.8 7% | 12.1 1% | 12.9 ? 8% |
| Load (h) | 2.5 | 1.3 -48% | 1.7 -32% | 2.4 -4% | 1.807 ? -28% |
Pros
Cons
Verdict: The Lenovo ThinkPad T14s G3 is a winner

If there was a corresponding laptop for the ThinkPad X1 Carbon G10 with an AMD CPU, the Lenovo ThinkPad T14s Gen 3 AMD would not be far from that. It is the model that comes closest to this idea.
The combination of the AMD Ryzen CPUs of the 6000 series and the T14s platform is a great success. This is a Lenovo laptop that practically doesn't have any weaknesses, aside from the upgradeability and a few weak points in the low power display. It is relatively light and compact, while at the same time still being robust, due to the combination of light metals and carbon fiber. The ThinkPad T14s G3 offers equipment suitable for businesses including USB 4, very good input devices, and a matte and bright display. The Ryzen 7 Pro delivers a high performance without driving up the power consumption too high. The result is a good battery life and a fan that almost always remains quiet.
Compact, robust, fast, and with a long battery life: the Lenovo ThinkPad T14s Gen 3 AMD has many positive attributes
So it is not surprising that the Lenovo ThinkPad T14s G3 earns a very good evaluation of around 91%. With that, it is well-positioned in the business market. The hottest competitors come from HP in form of the HP EliteBook 845 G9 and from Dell in form of the Dell Latitude 9430 2-in-1. In the comparison with its competitors, the ThinkPad impresses particularly with its lower weight, longer battery life, and significantly more quiet fans.
Price and Availability
The Lenovo ThinkPad T14s G3 AMD is available directly from Lenovo starting from around $984. A configuration similar to our test unit is also available from B&H for around $1999, for example.
Lenovo ThinkPad T14s G3 21CQ002LGE
- 01/17/2023 v7 (old)
Benjamin Herzig

