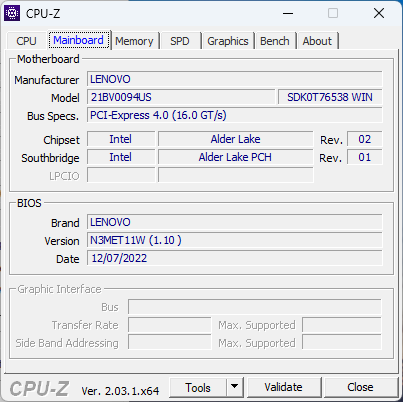
Lenovo ThinkPad T16 Gen 1 Core i7 laptop review: Quiet at the cost of performance
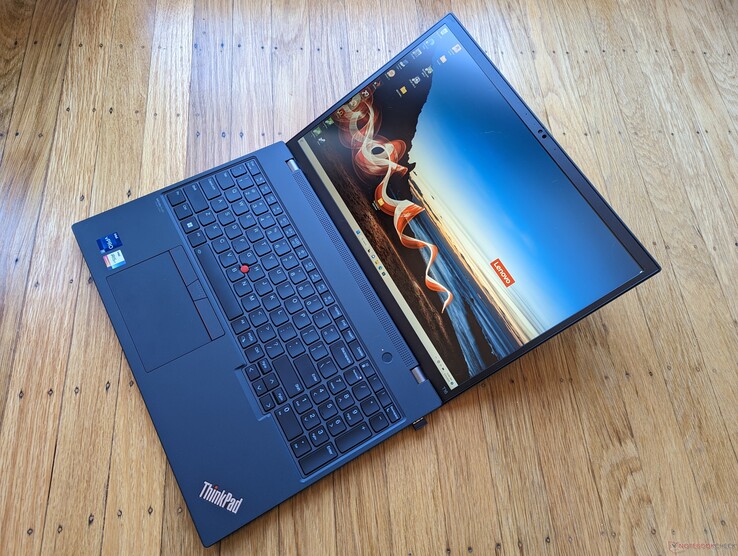
The ThinkPad T16 G1 is Lenovo's second 16-inch ThinkPad designed to be a step up from the existing prosumer ThinkBook 16 series. It carries both 12th gen Core U and Core P CPU options alongside the discrete GeForce MX550 GPU on select SKUs.
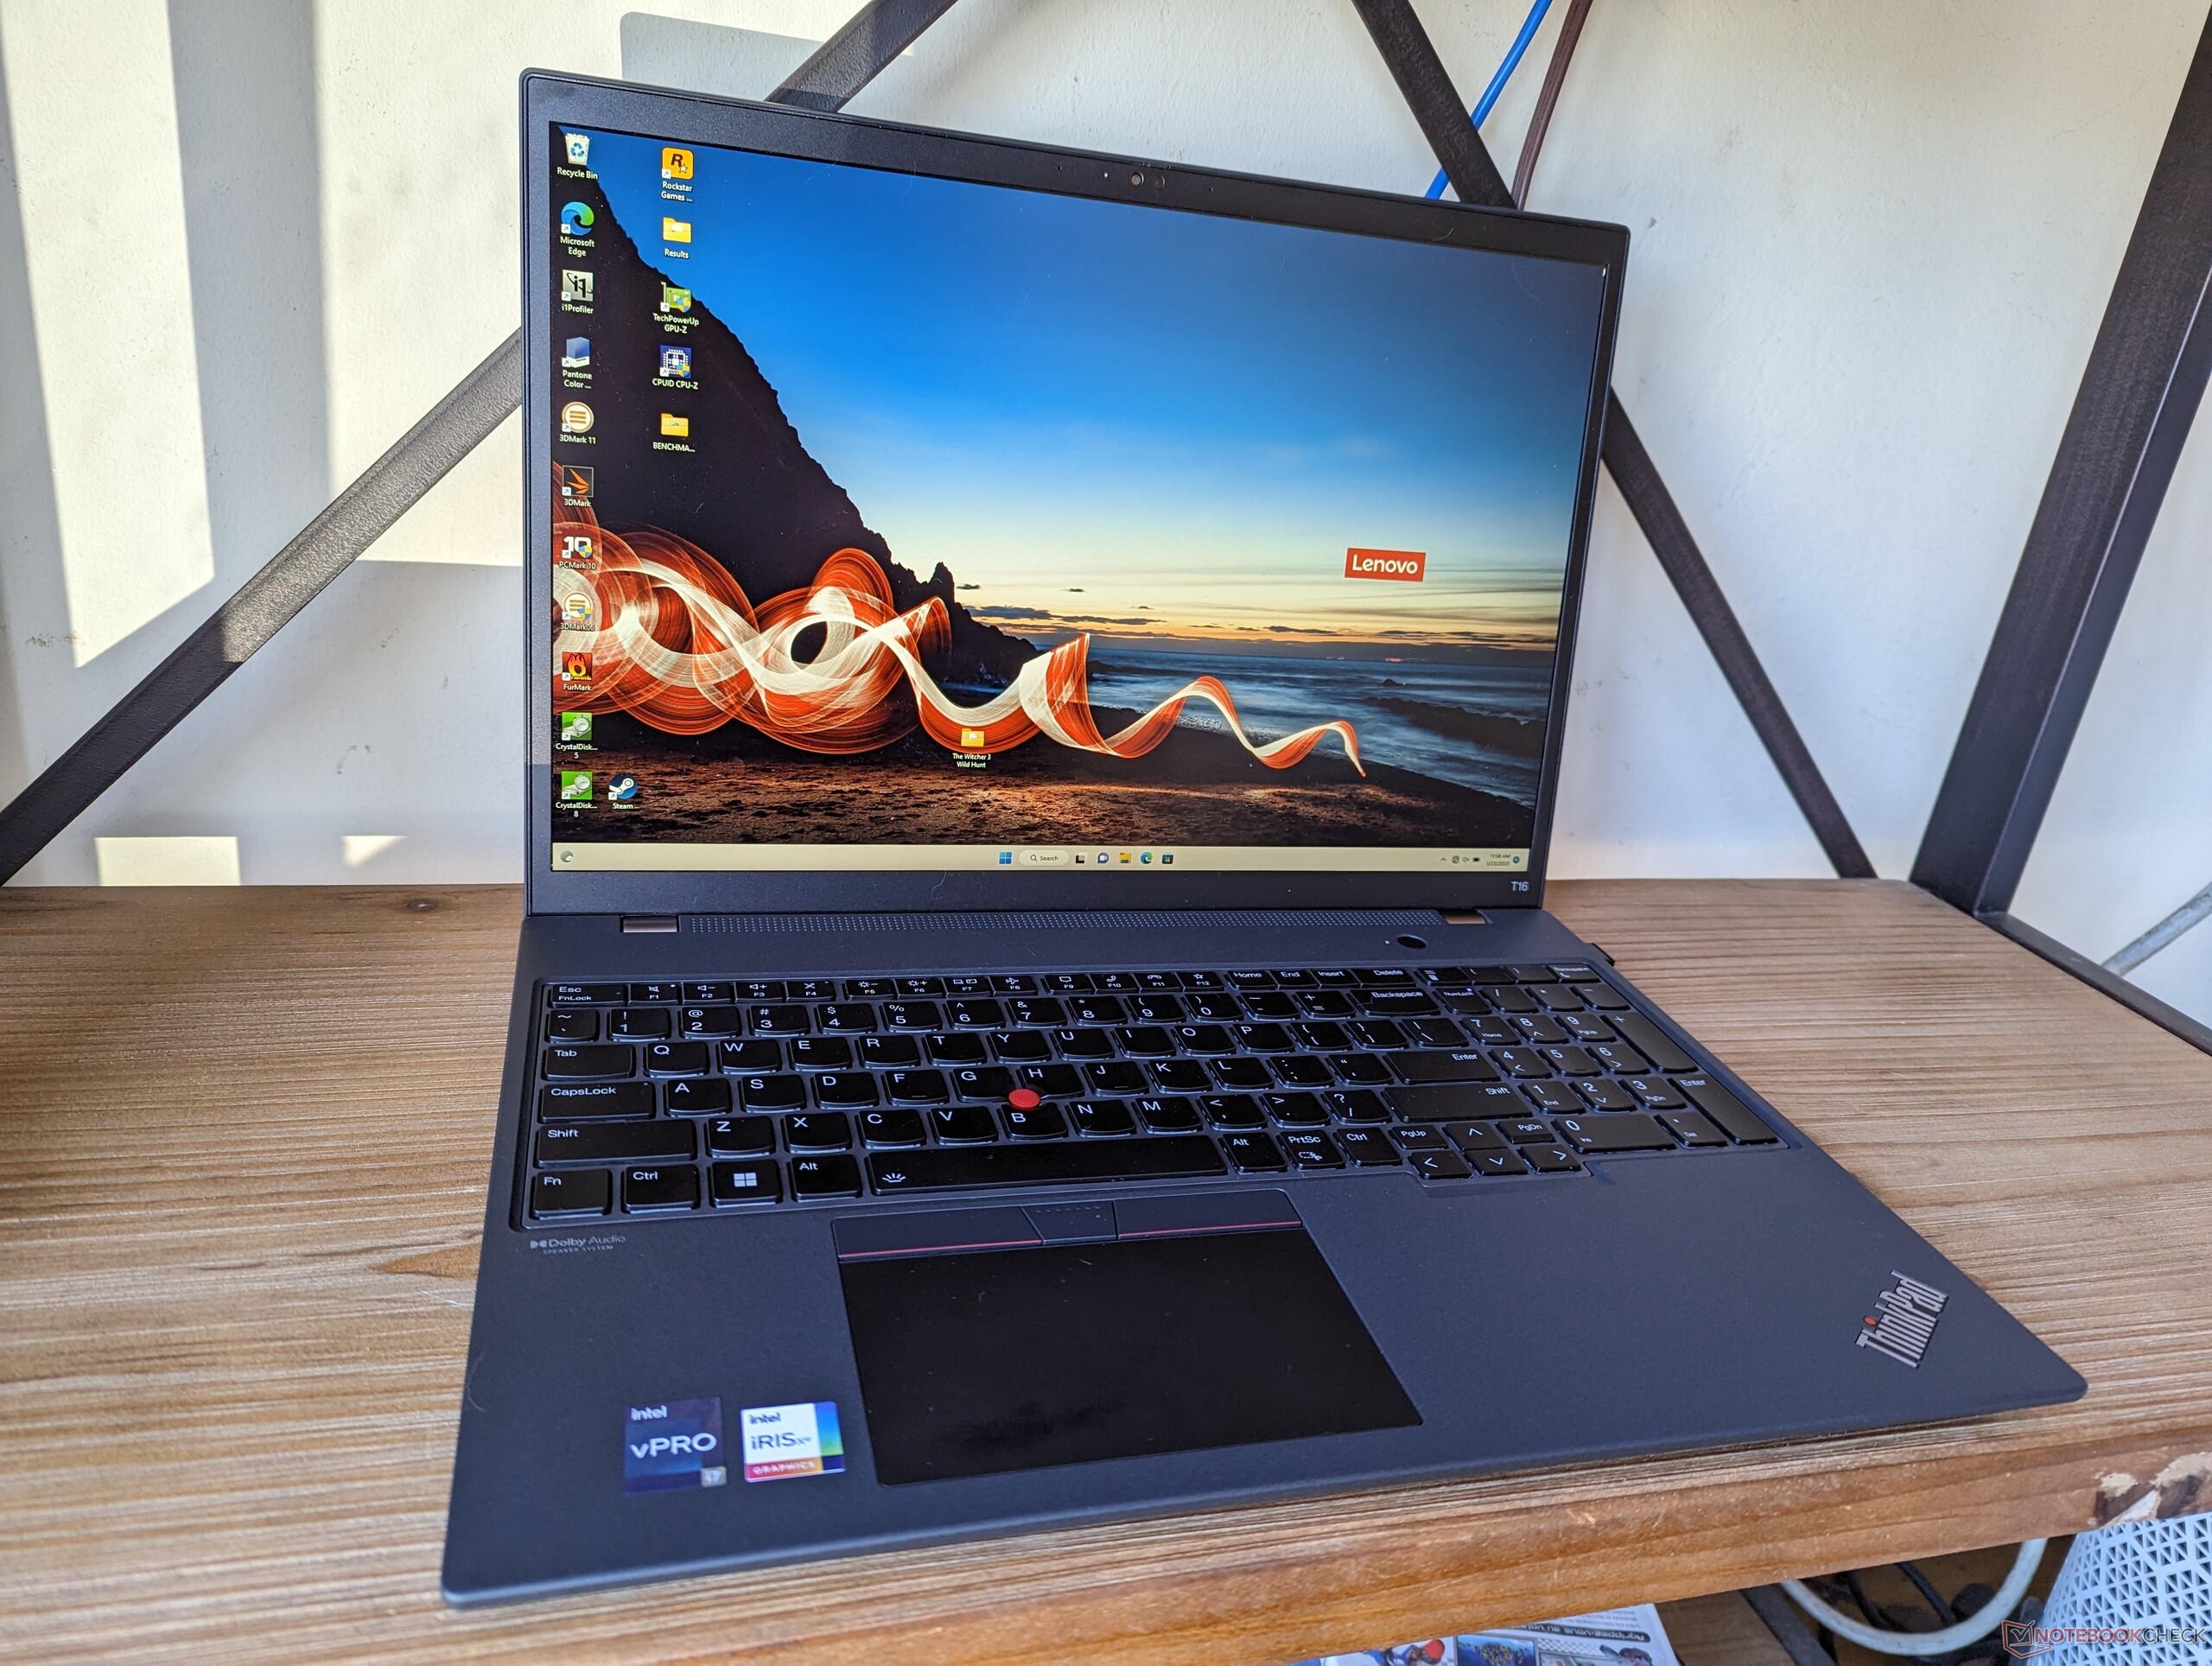
We recently reviewed the Core i5-1240P and Ryzen 5 Pro 6650U configurations and so this review will focus on the Core i7-1270P configuration. We recommend checking out our existing review on the Core i5 version to learn more about the chassis and other physical features of the ThinkPad T16 G1. How much of a performance difference can users expect when upgrading to the costlier Core i7 option?
Competitors to the ThinkPad T16 G1 include the 16-inch LG Gram 16, MSI Summit E16, or HP EliteBook 860/865 G9. Dell has yet to launch a direct 16-inch Latitude competitor at the time of writing. Our configuration as reviewed retails for approximately $1800 USD.
More Lenovo reviews:
Potential Competitors in Comparison
Rating | Date | Model | Weight | Height | Size | Resolution | Price |
|---|---|---|---|---|---|---|---|
| 88.6 % v7 (old) | 01 / 2023 | Lenovo ThinkPad T16 Gen 1 Core i7-1270P i7-1270P, Iris Xe G7 96EUs | 2 kg | 20.5 mm | 16.00" | 1920x1200 | |
| 90.2 % v7 (old) | 02 / 2023 | Lenovo ThinkPad T16 G1 21CH004MGE R5 PRO 6650U, Radeon 660M | 1.8 kg | 20.5 mm | 16.00" | 2560x1600 | |
| 86.6 % v7 (old) | 01 / 2023 | LG Gram 16Z90Q i7-1260P, Iris Xe G7 96EUs | 1.2 kg | 16.8 mm | 16.00" | 2560x1600 | |
| 87.2 % v7 (old) | 12 / 2022 | HP EliteBook 865 G9 R7 PRO 6850U, Radeon 680M | 1.9 kg | 19 mm | 16.00" | 1920x1200 | |
| 86.4 % v7 (old) | 07 / 2022 | Huawei MateBook 16s i7 i7-12700H, Iris Xe G7 96EUs | 2 kg | 17.8 mm | 16.00" | 2520x1680 | |
| 93.2 % v7 (old) | 11 / 2021 | Apple MacBook Pro 16 2021 M1 Pro M1 Pro, M1 Pro 16-Core GPU | 2.2 kg | 16.8 mm | 16.20" | 3456x2234 |
Case — A Little Big
Though the model is just a few months old, its chassis design is slightly larger in all dimensions when compared to competing 16-inch laptops like the HP EliteBook 865 G9 or Apple MacBook Pro 16. The LG Gram 16 in particular is especially lighter by 800 grams.
Expect grease and fingerprints to accumulate very quickly on the matte black surfaces. The dark carbon fiber, fiberglass and plastic approach here contrasts the bright gray metal alloy approach of the competing HP EliteBook.
Communication
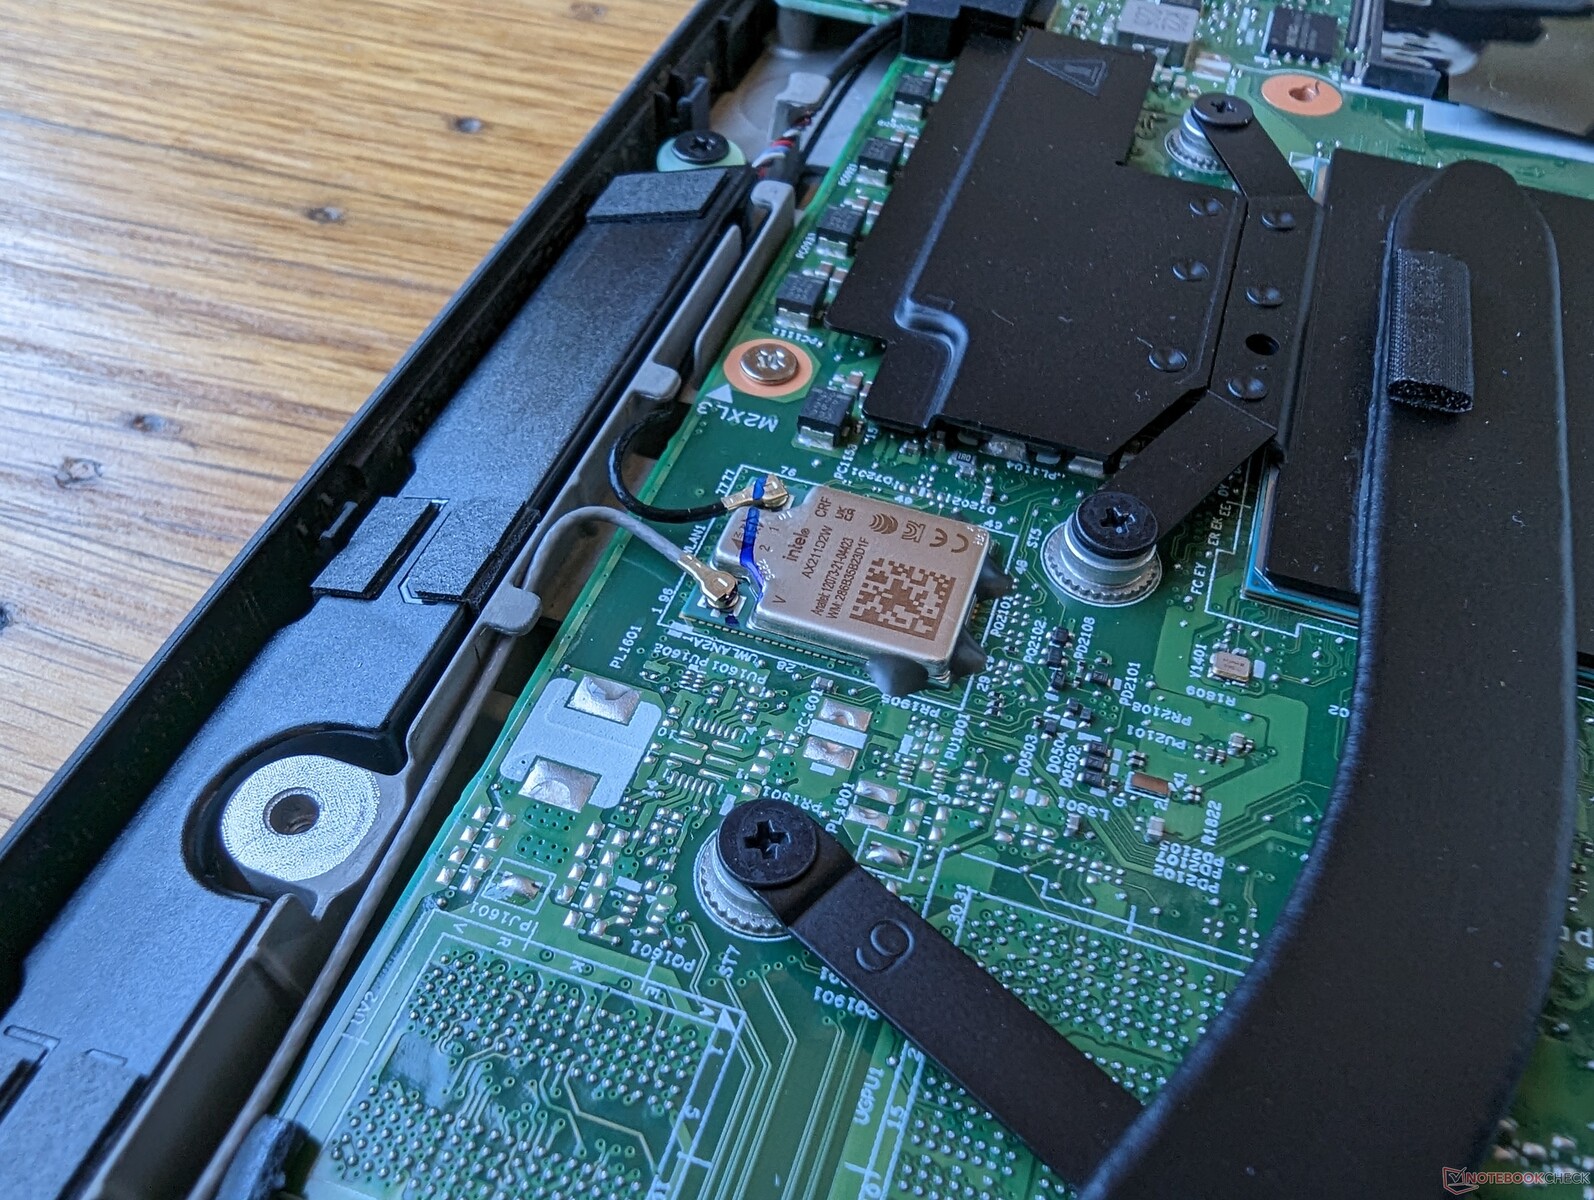
An Intel AX211 comes standard for Bluetooth 5.2 and Wi-Fi 6E connectivity. Transfer rates are steady when paired to our Asus AXE11000 test router.
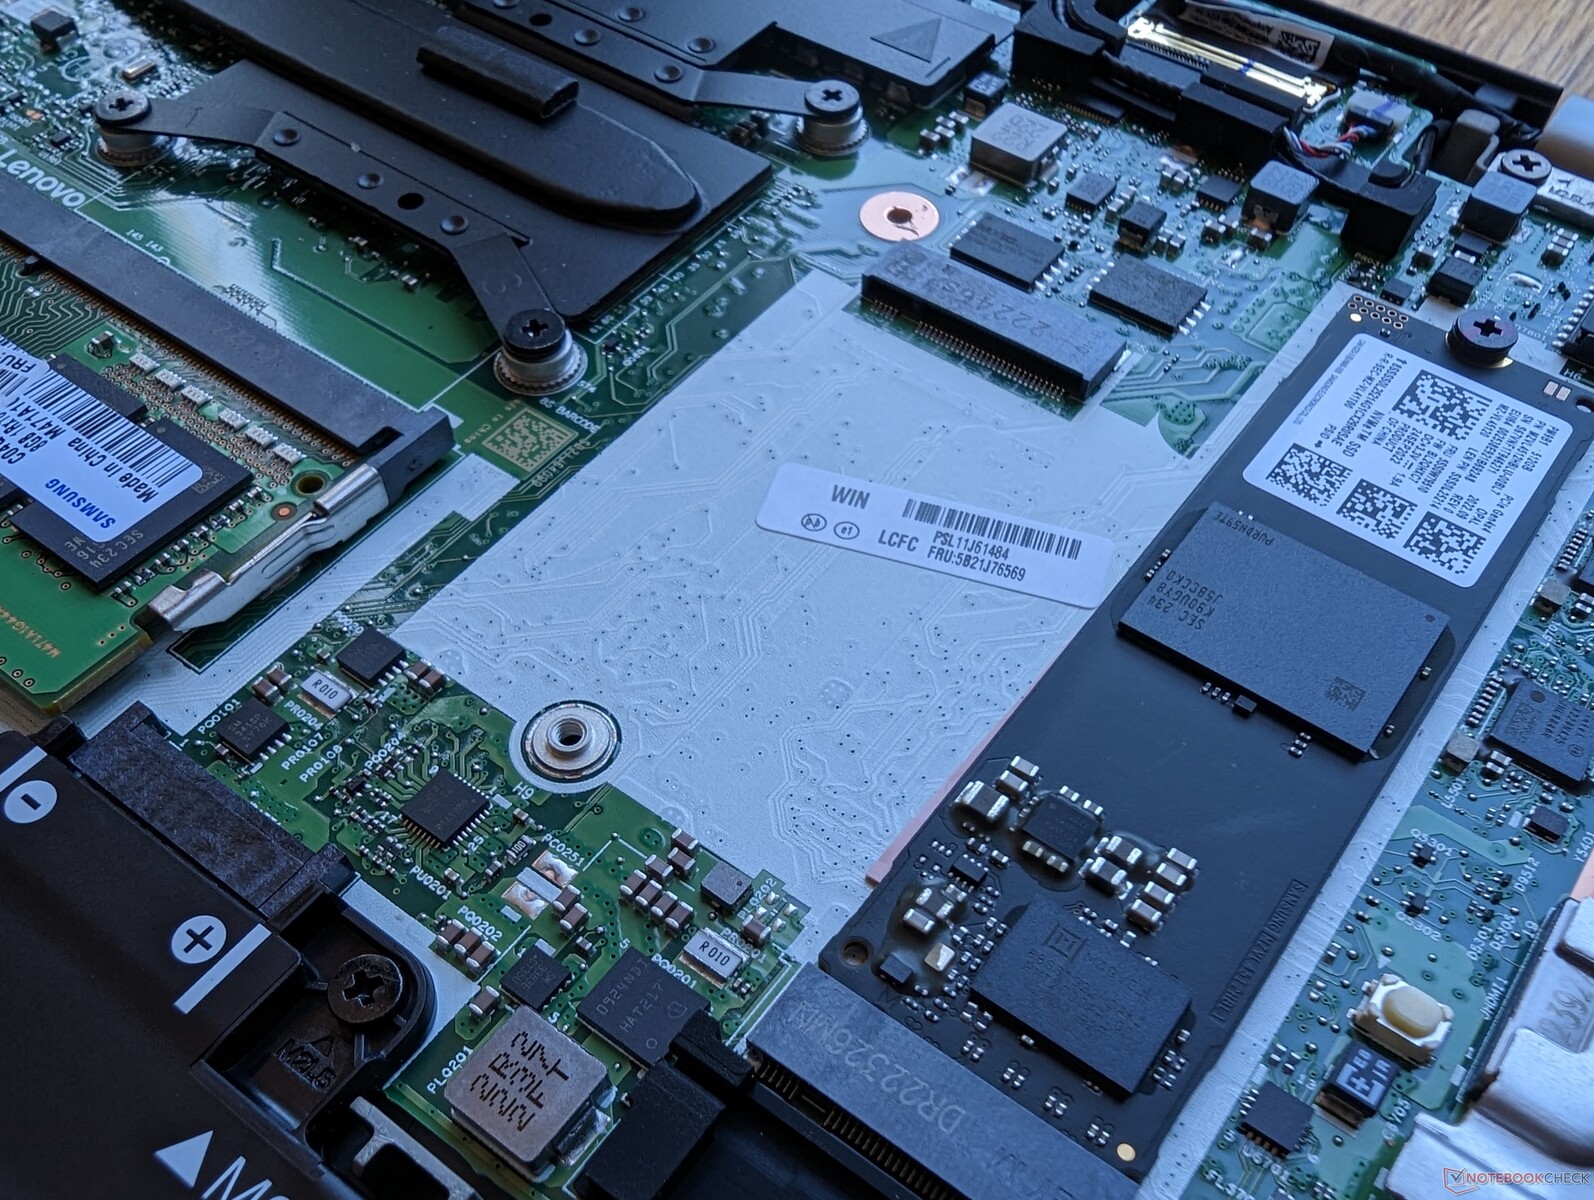
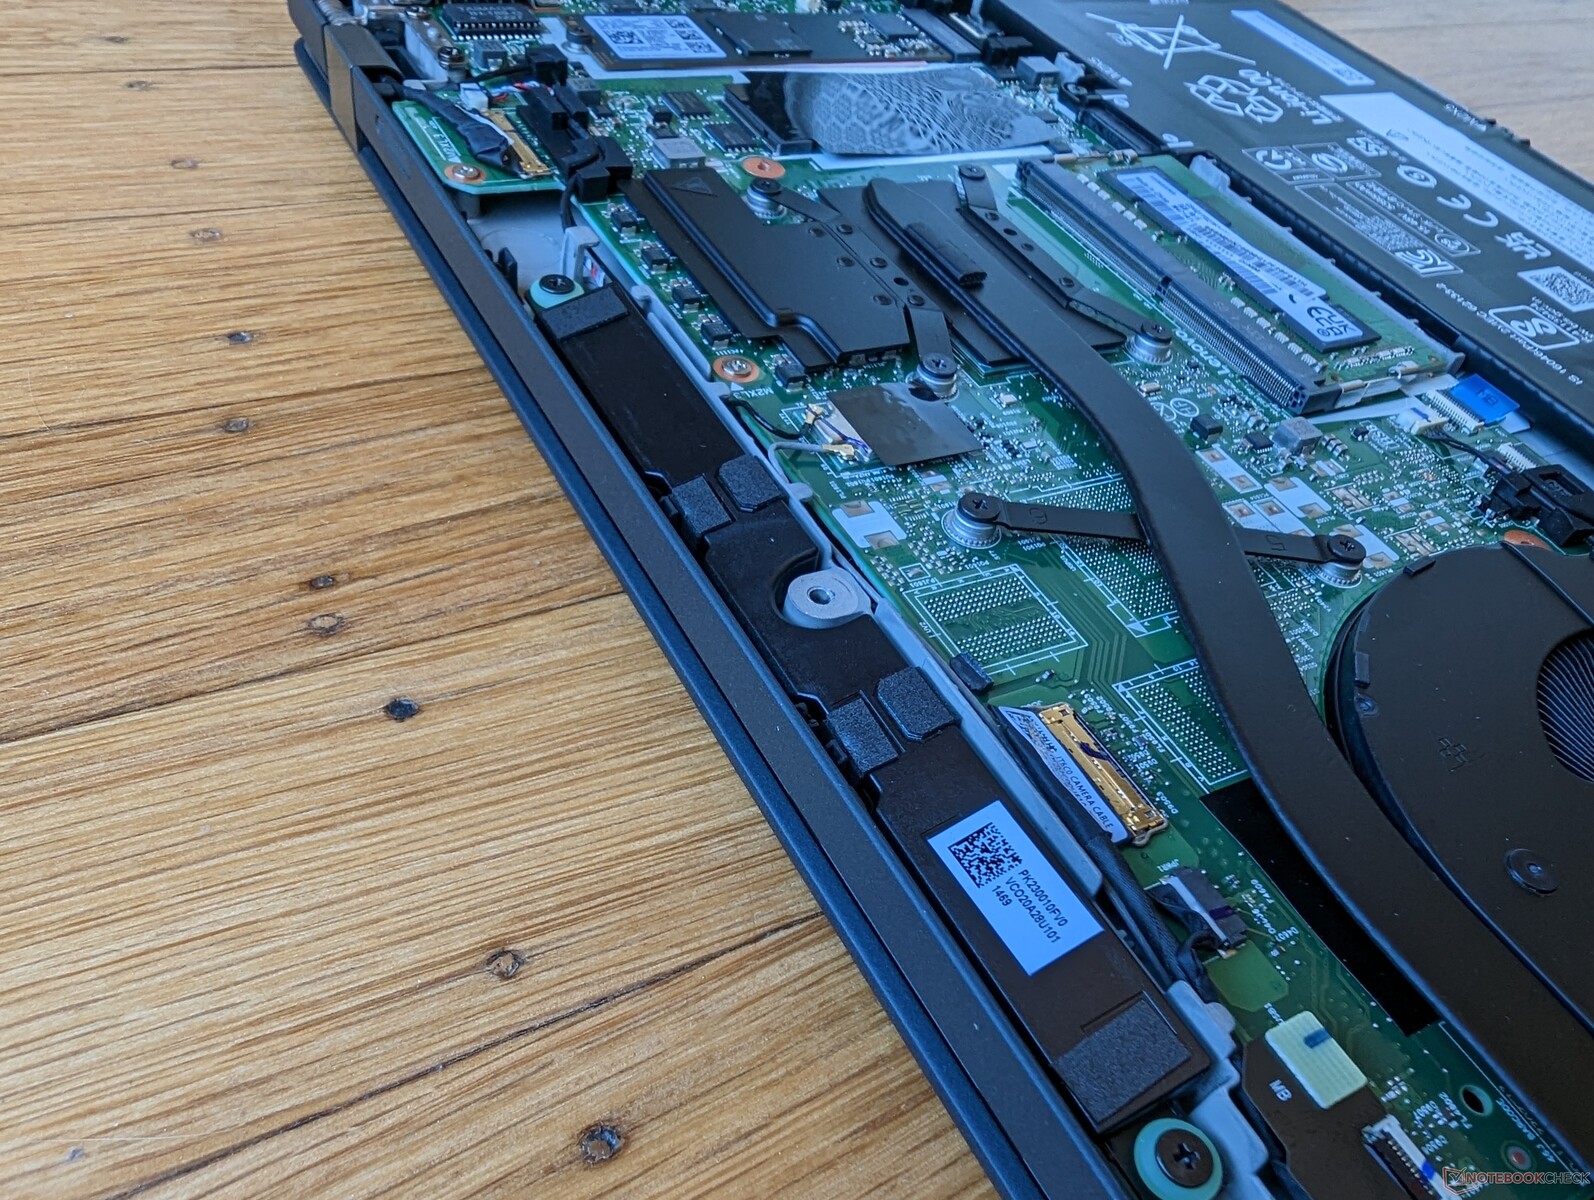
The M.2 WWAN slot is empty in our specific configuration as shown by the picture below. Unfortunately, Lenovo does not include the antenna if configuring without WWAN.
| Networking | |
| iperf3 transmit AX12 | |
| Apple MacBook Pro 16 2021 M1 Pro | |
| iperf3 receive AX12 | |
| Apple MacBook Pro 16 2021 M1 Pro | |
| iperf3 receive AXE11000 6GHz | |
| Lenovo ThinkPad T16 G1 21CH004MGE | |
| Huawei MateBook 16s i7 | |
| Lenovo ThinkPad T16 Gen 1 Core i7-1270P | |
| iperf3 receive AXE11000 | |
| Lenovo ThinkPad T16 G1 21CH004MGE | |
| HP EliteBook 865 G9 | |
| LG Gram 16Z90Q | |
| Lenovo ThinkPad T16 Gen 1 Core i7-1270P | |
| Apple MacBook Pro 16 2021 M1 Pro | |
| iperf3 transmit AXE11000 | |
| Lenovo ThinkPad T16 G1 21CH004MGE | |
| HP EliteBook 865 G9 | |
| LG Gram 16Z90Q | |
| Lenovo ThinkPad T16 Gen 1 Core i7-1270P | |
| Apple MacBook Pro 16 2021 M1 Pro | |
| iperf3 transmit AXE11000 6GHz | |
| Lenovo ThinkPad T16 G1 21CH004MGE | |
| Huawei MateBook 16s i7 | |
| Lenovo ThinkPad T16 Gen 1 Core i7-1270P | |
Webcam
The 2 MP webcam pales in comparison to the 5 MP webcams that are now shipping on many HP EliteBook models. Both IR and a physical shutter are included on the ThinkPad T16.


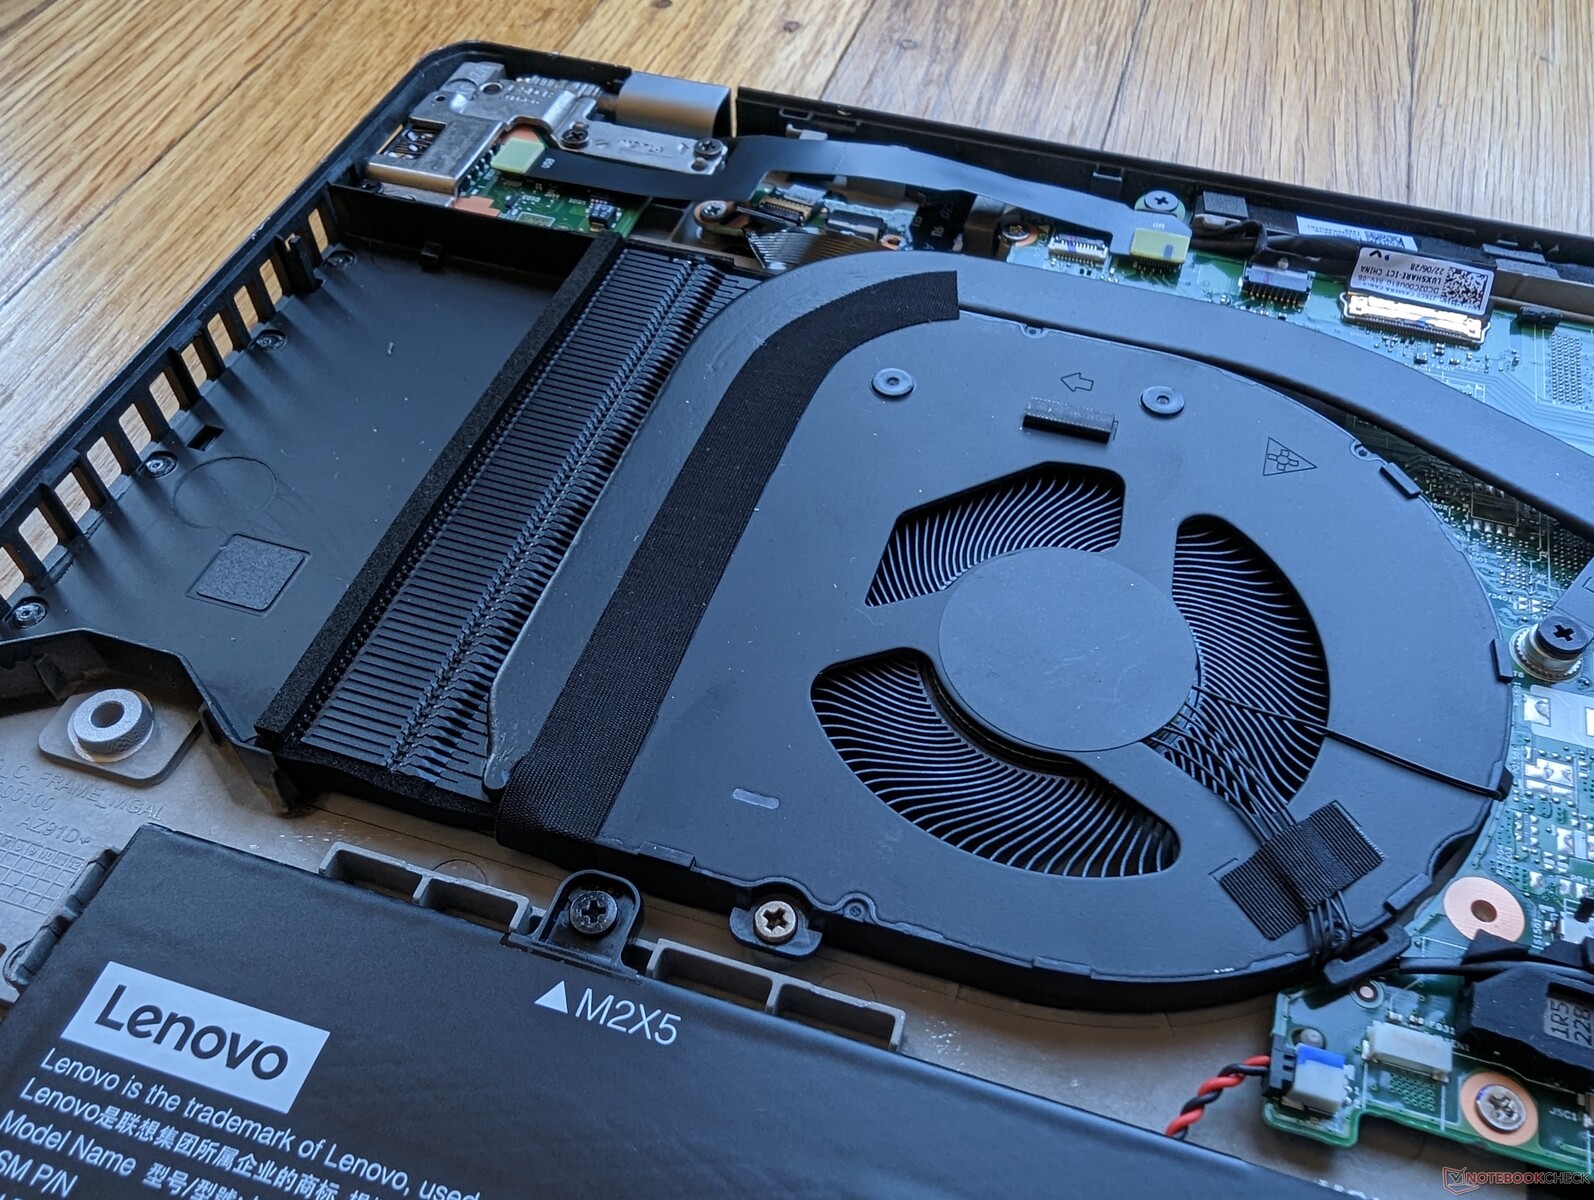
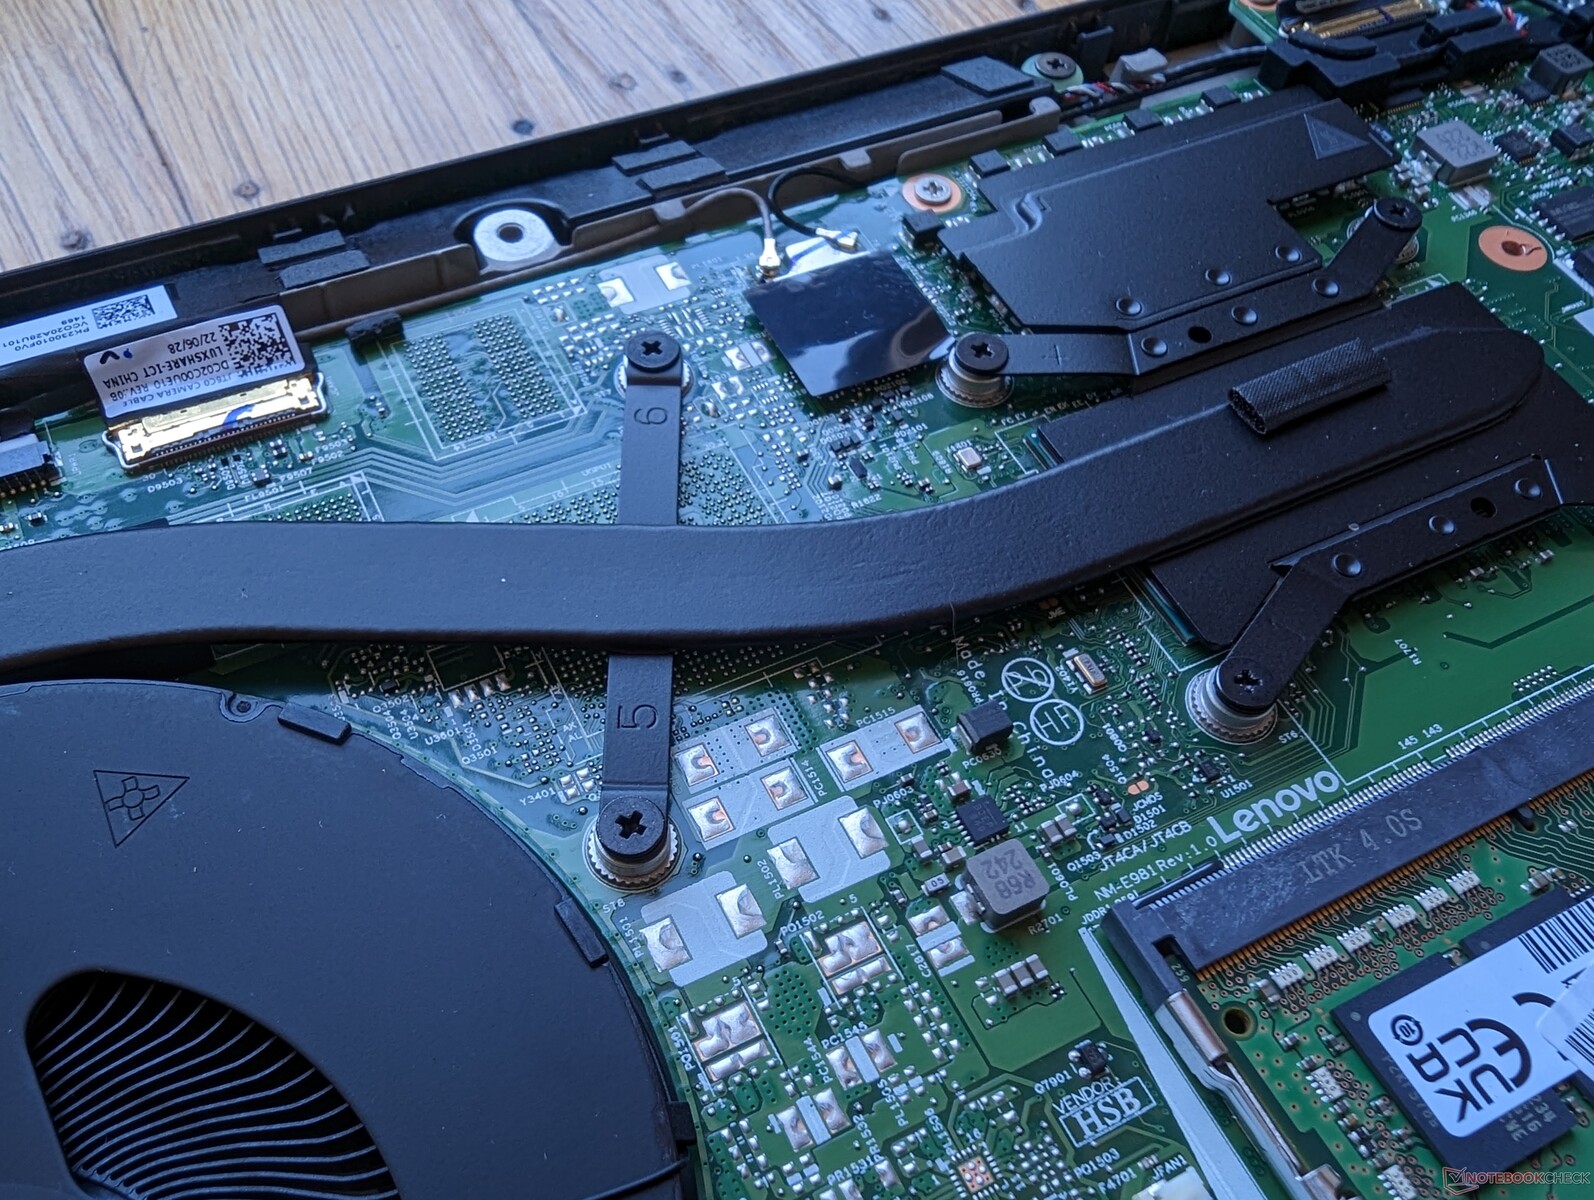
Maintenance
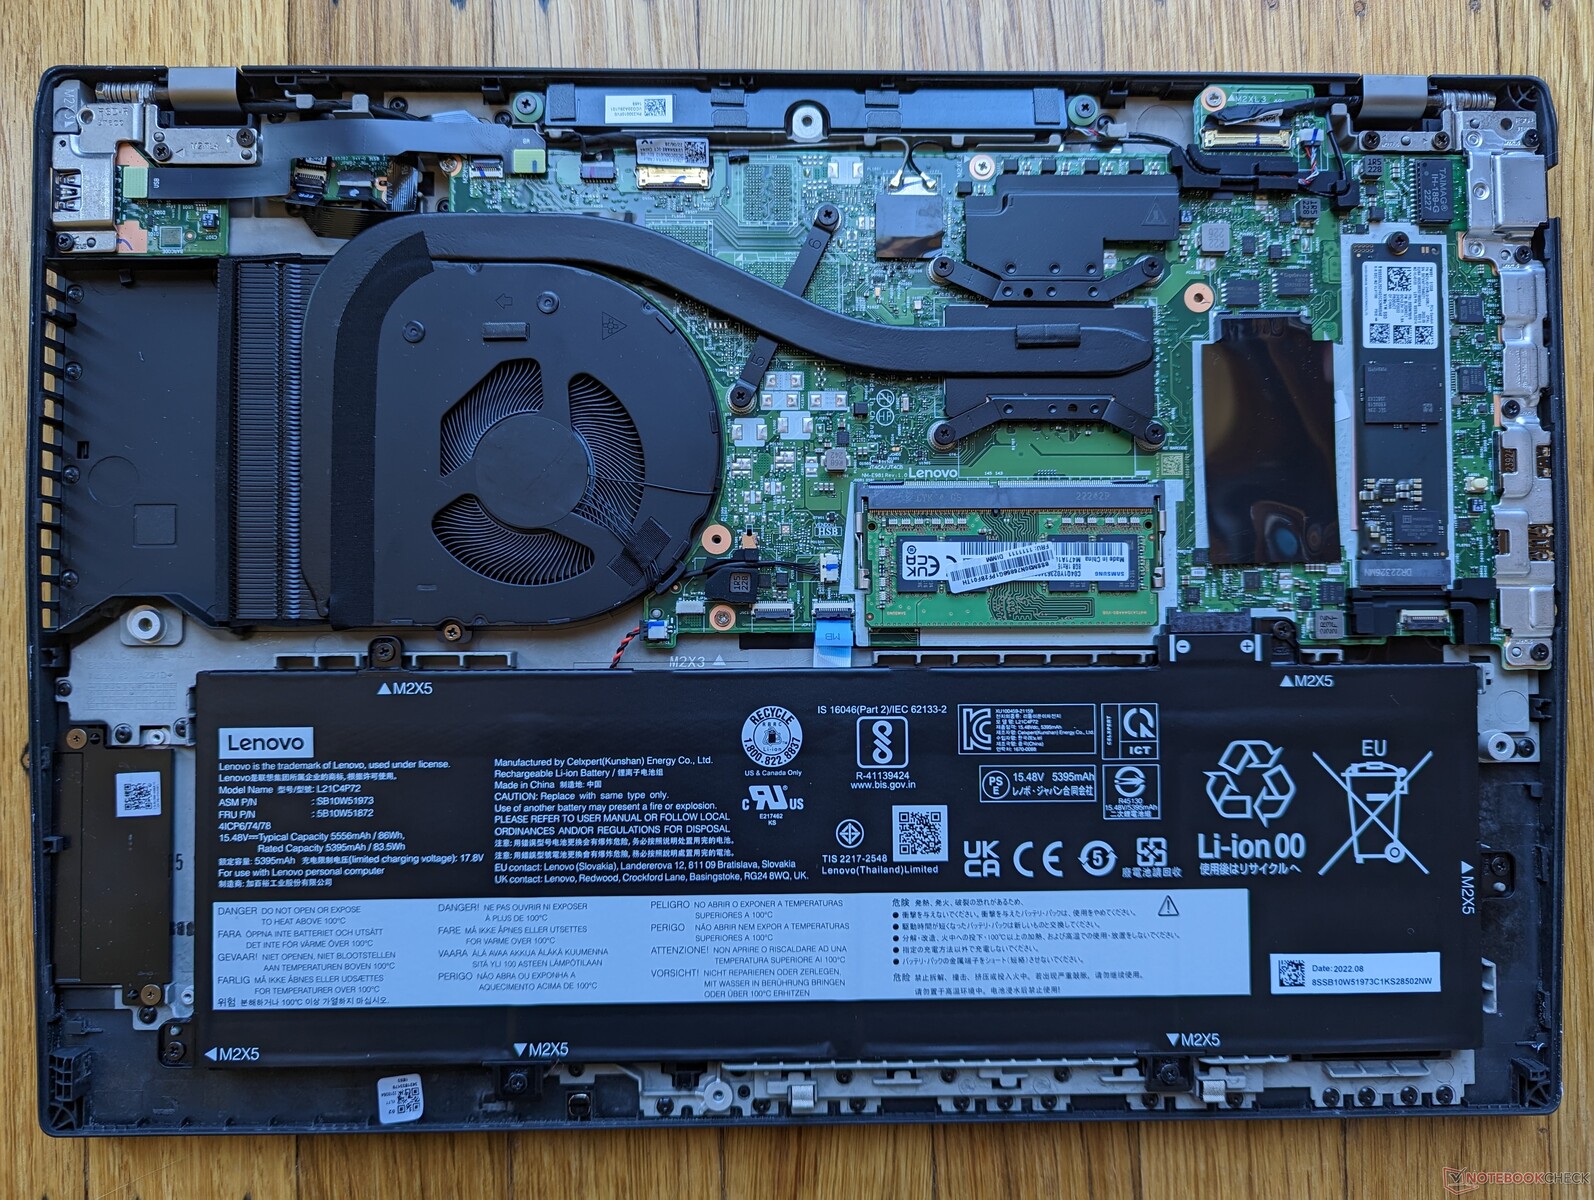
The bottom panel is secured by eight Philips screws for easy servicing. Keep in mind that the model comes with 8 GB of soldered RAM plus 1x SODIMM slot for expansion whereas most other laptops use exclusively soldered RAM or 2x SODIMM. Certain SKUs may come with 16 GB of soldered RAM instead.
Accessories and Warranty
There are no extras in the retail box other than the AC adapter and paperwork. A one-year limited manufacturer applies if purchased in the US.
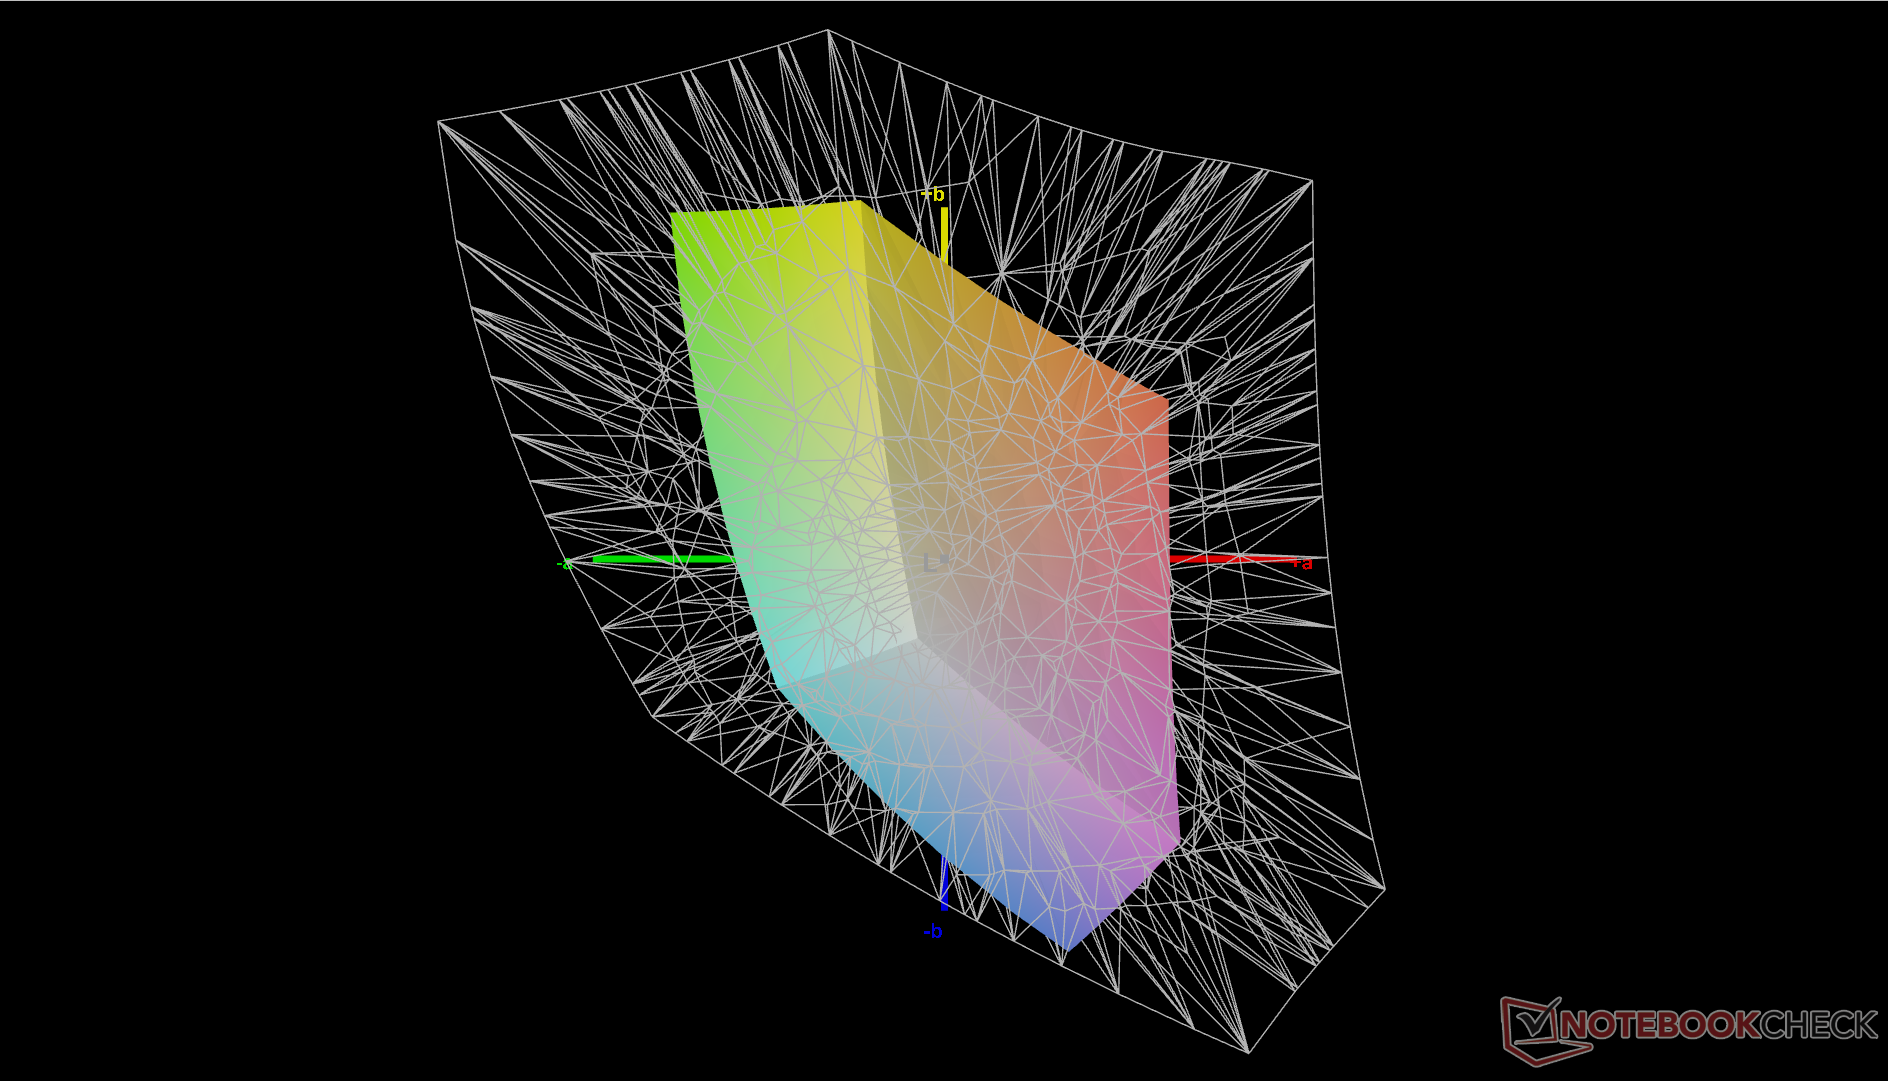
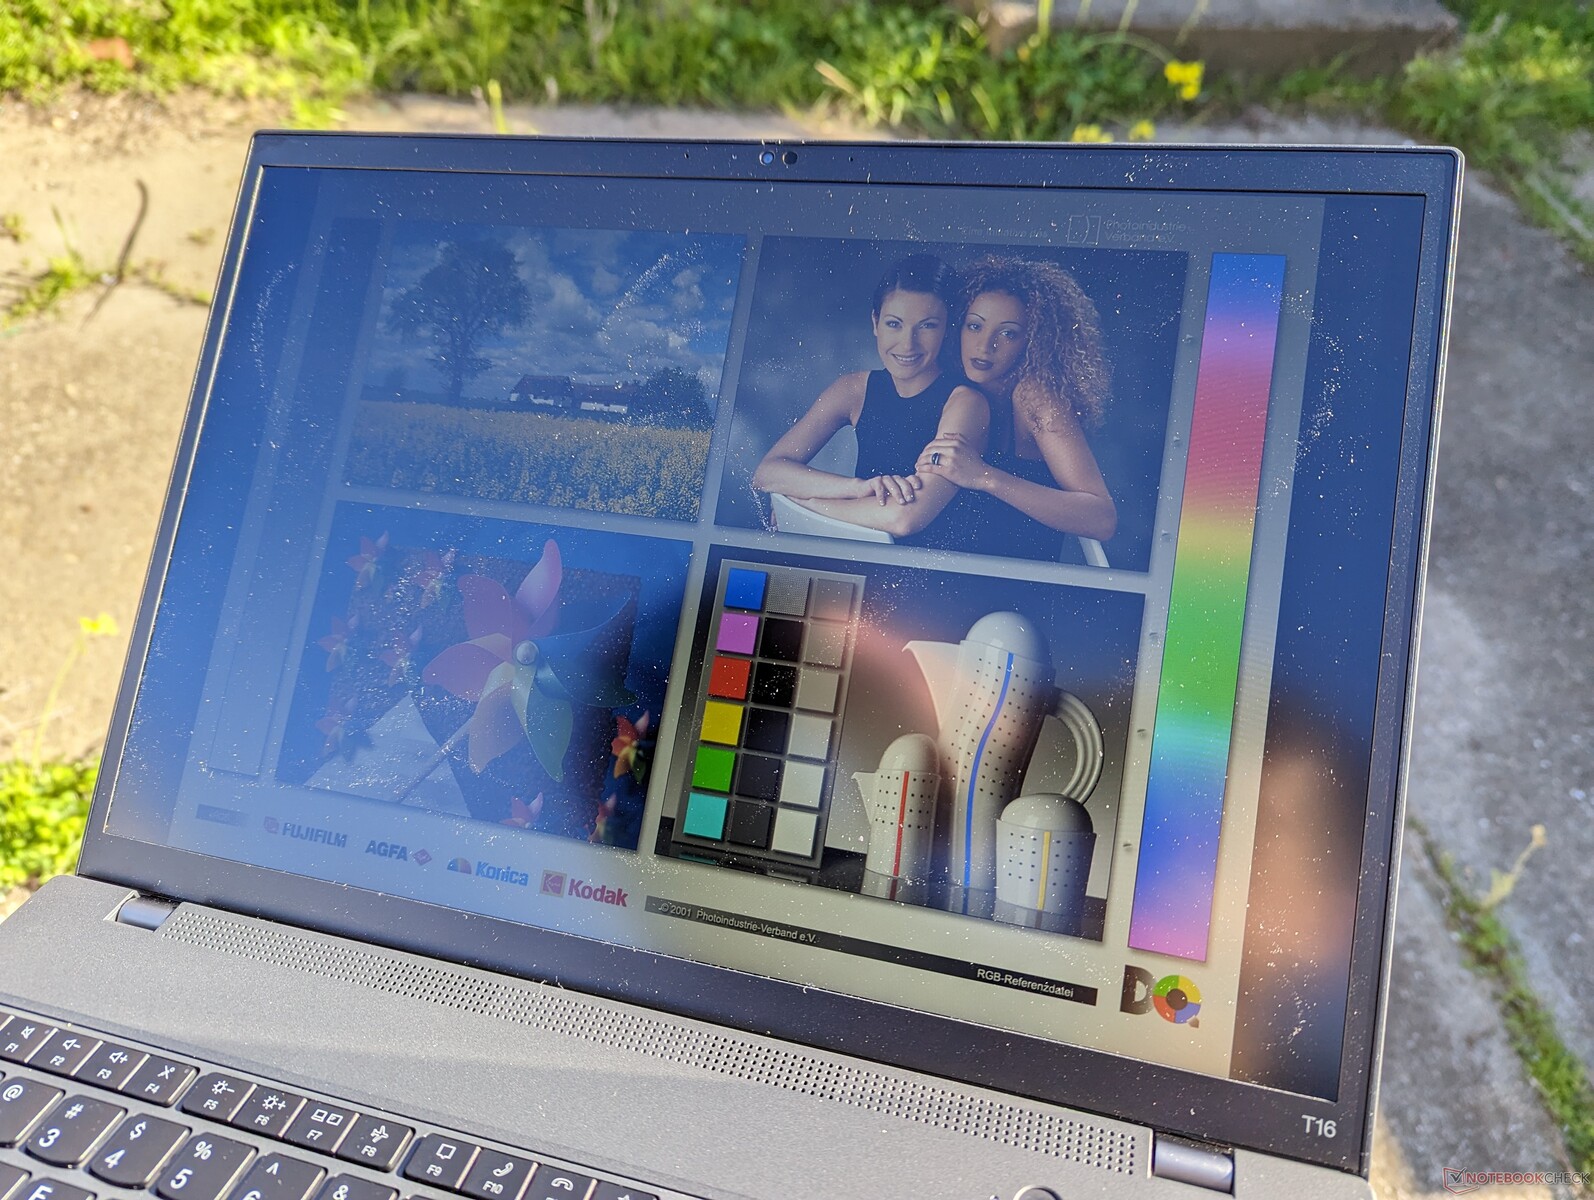
Display — Low-End to High-End
Lenovo currently offers five different matte IPS display options as follows:
- 1920 x 1200, 300 nits, 45% NTSC
- 1920 x 1200, 300 nits, touchscreen, 45% NTSC
- 1920 x 1200, low power, 400 nits, 100% sRGB, low blue light
- 1920 x 1200, touchscreen with Privacy Guard, 500-nit, 100% sRGB, low blue light
- 2560 x 1600, 400 nits, low blue light, International Color Consortium calibrated
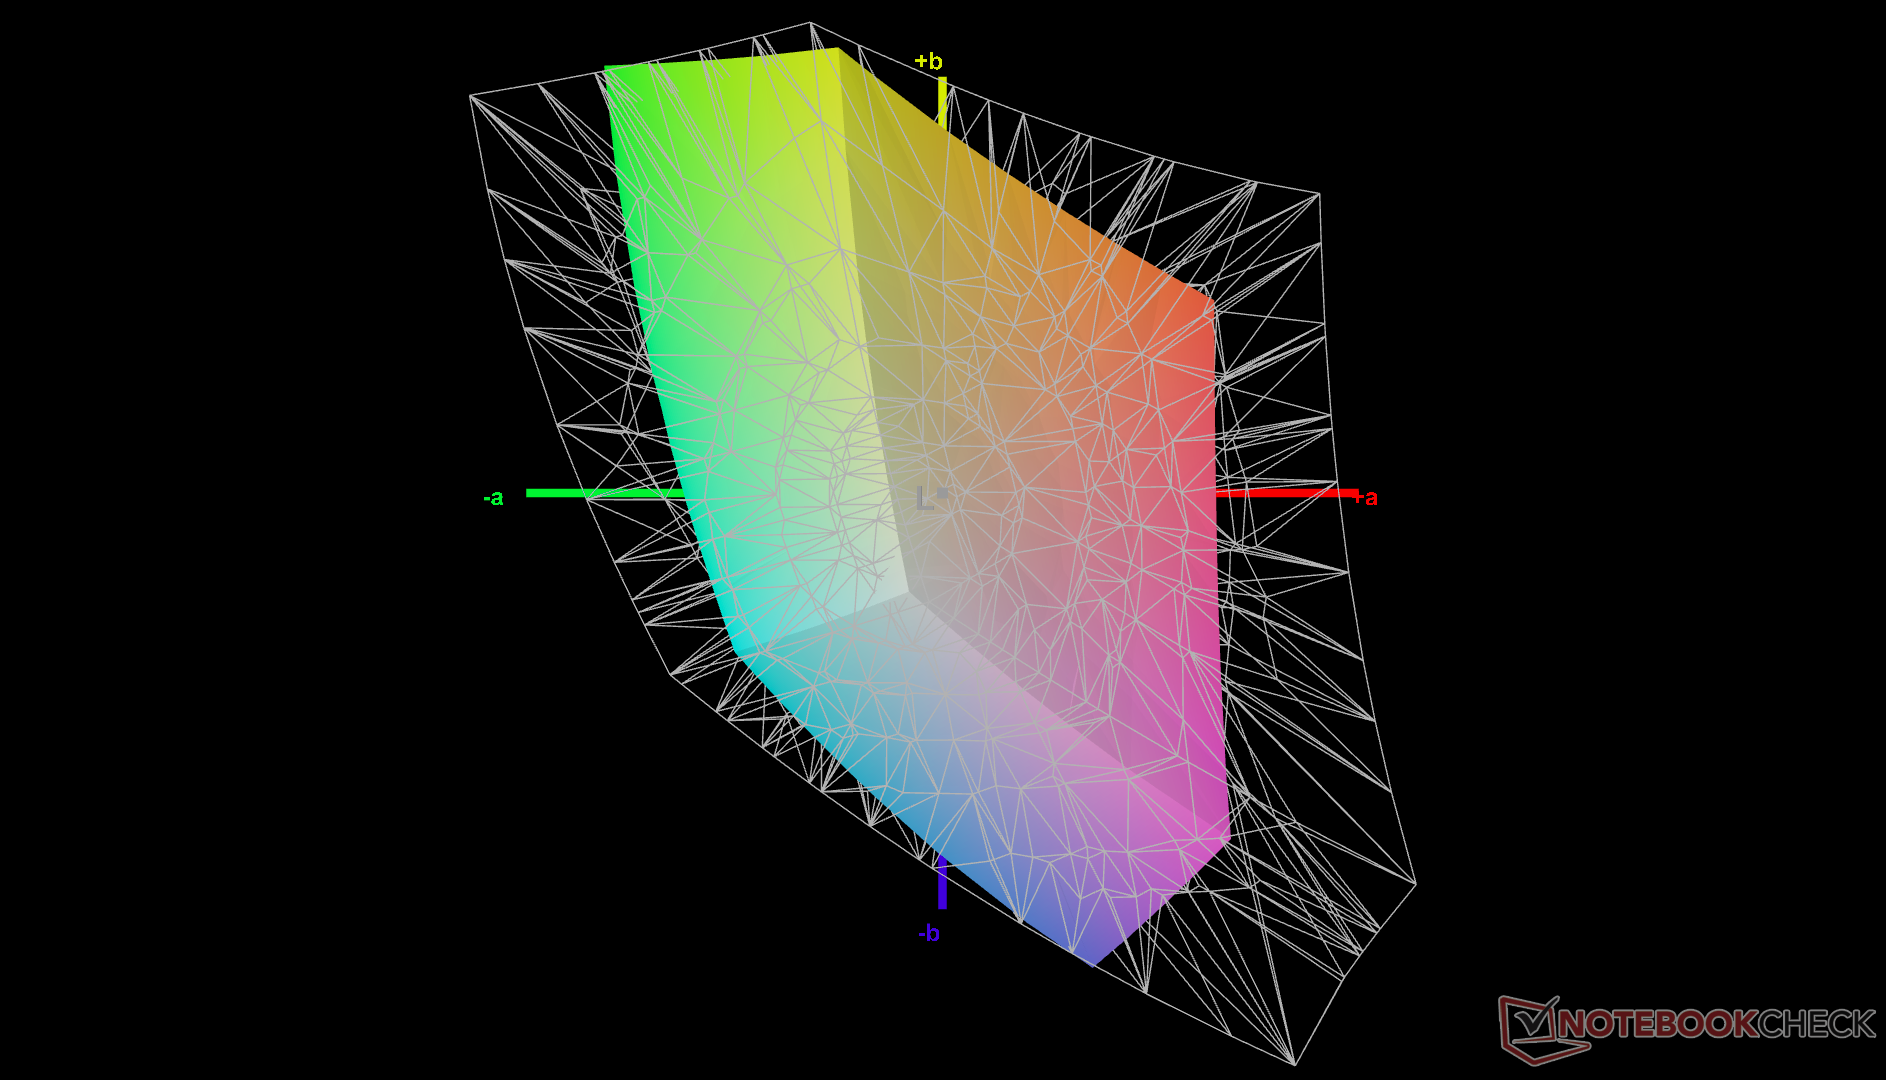
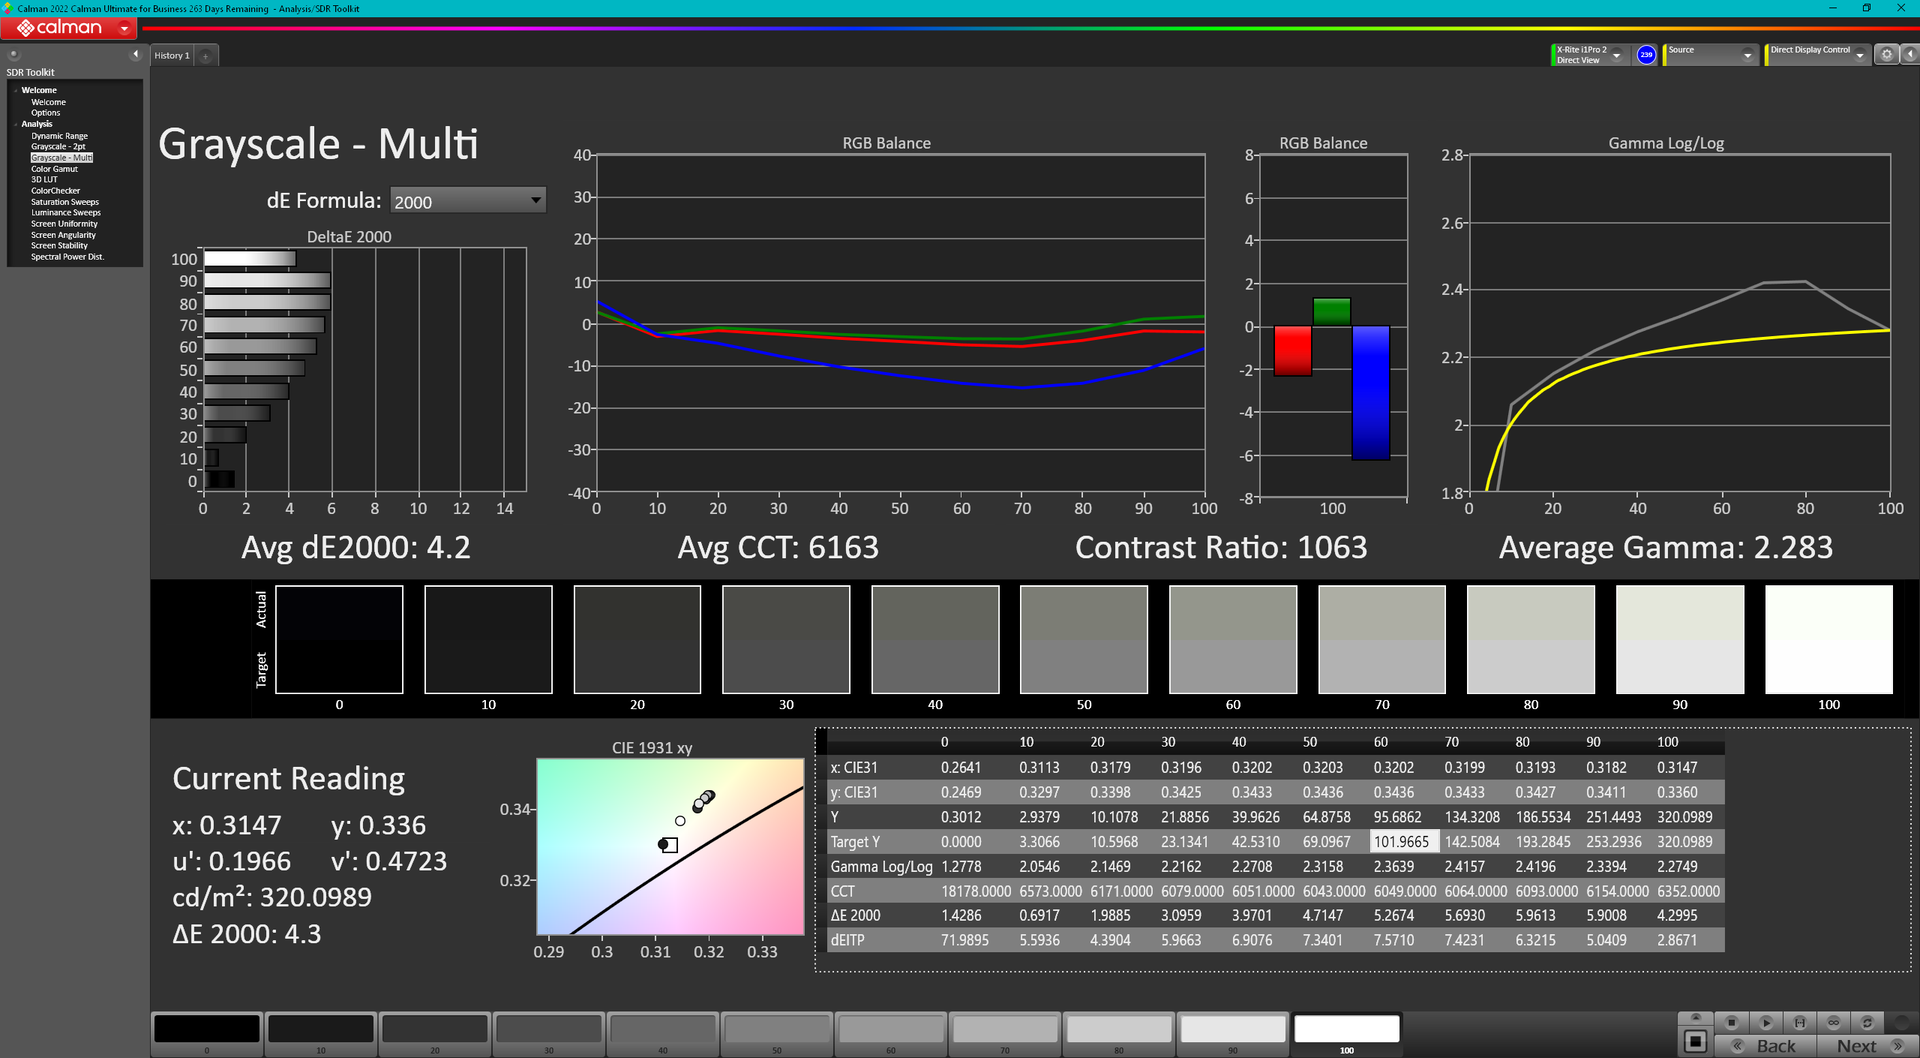
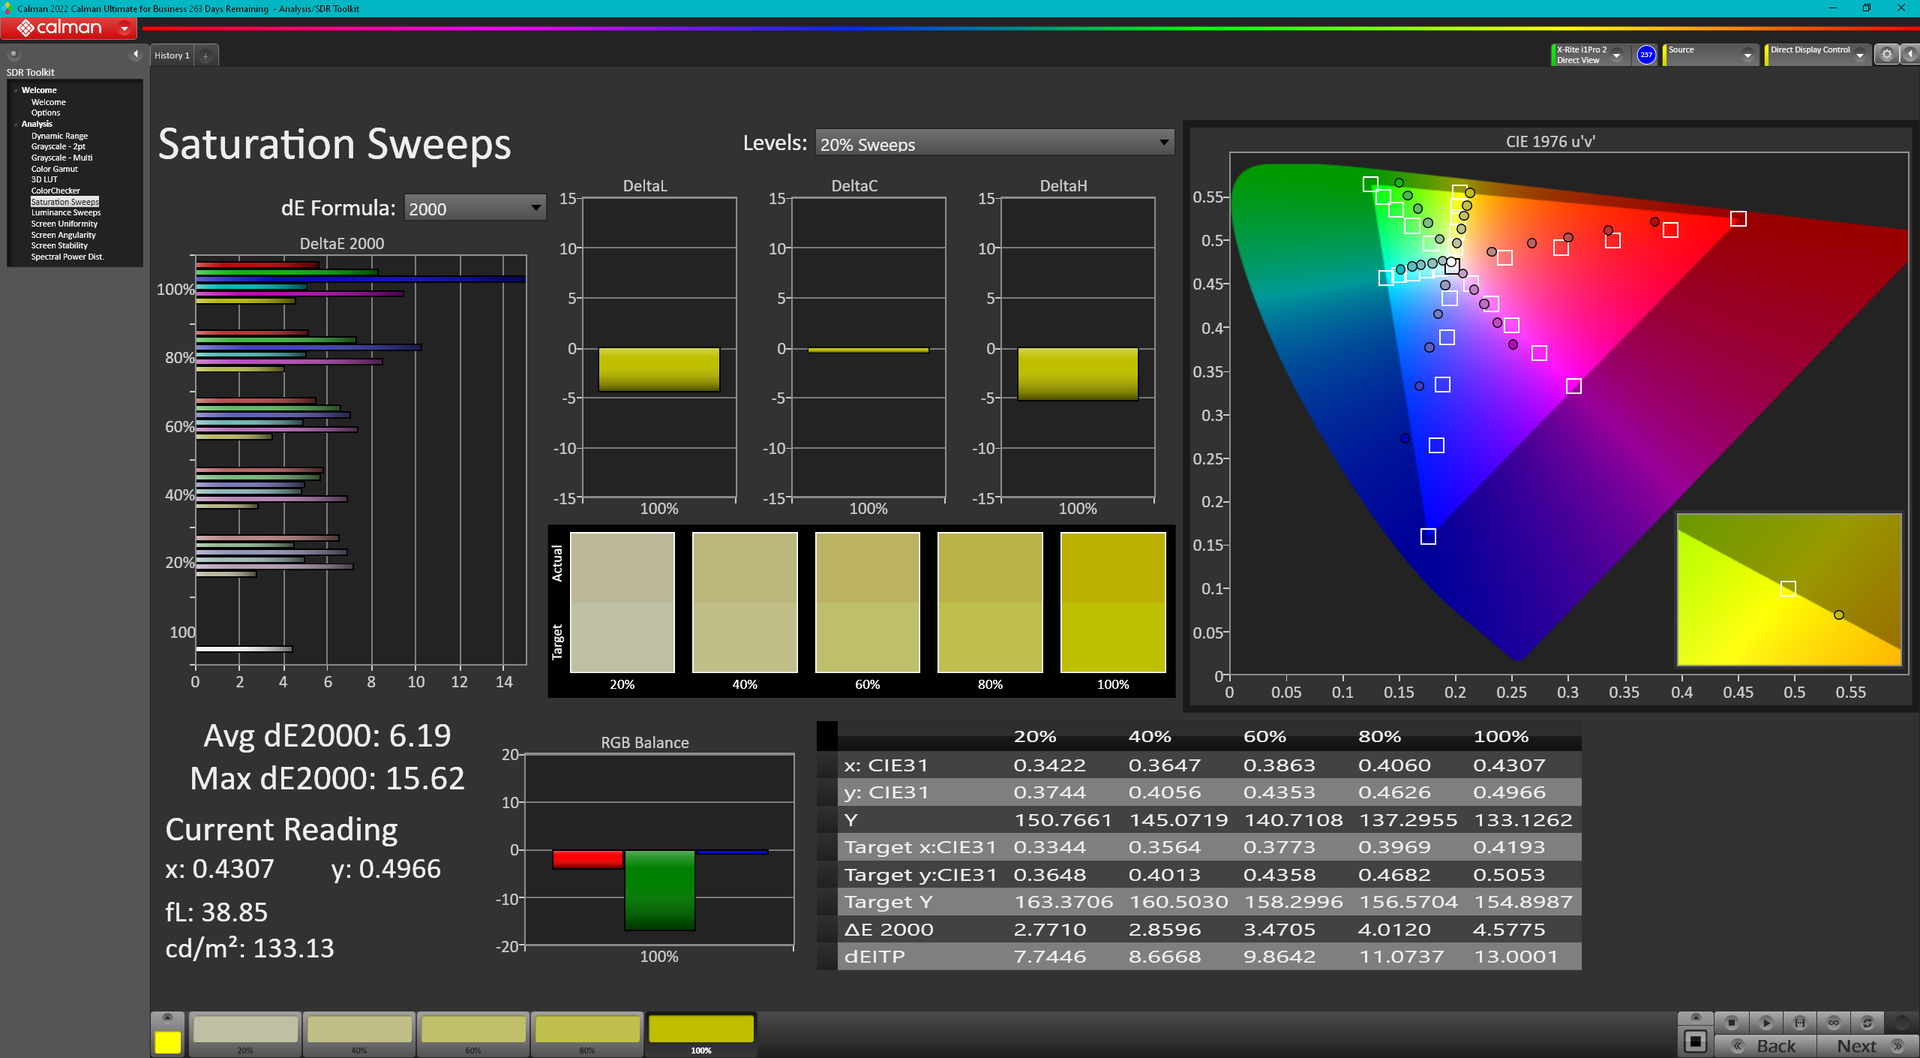
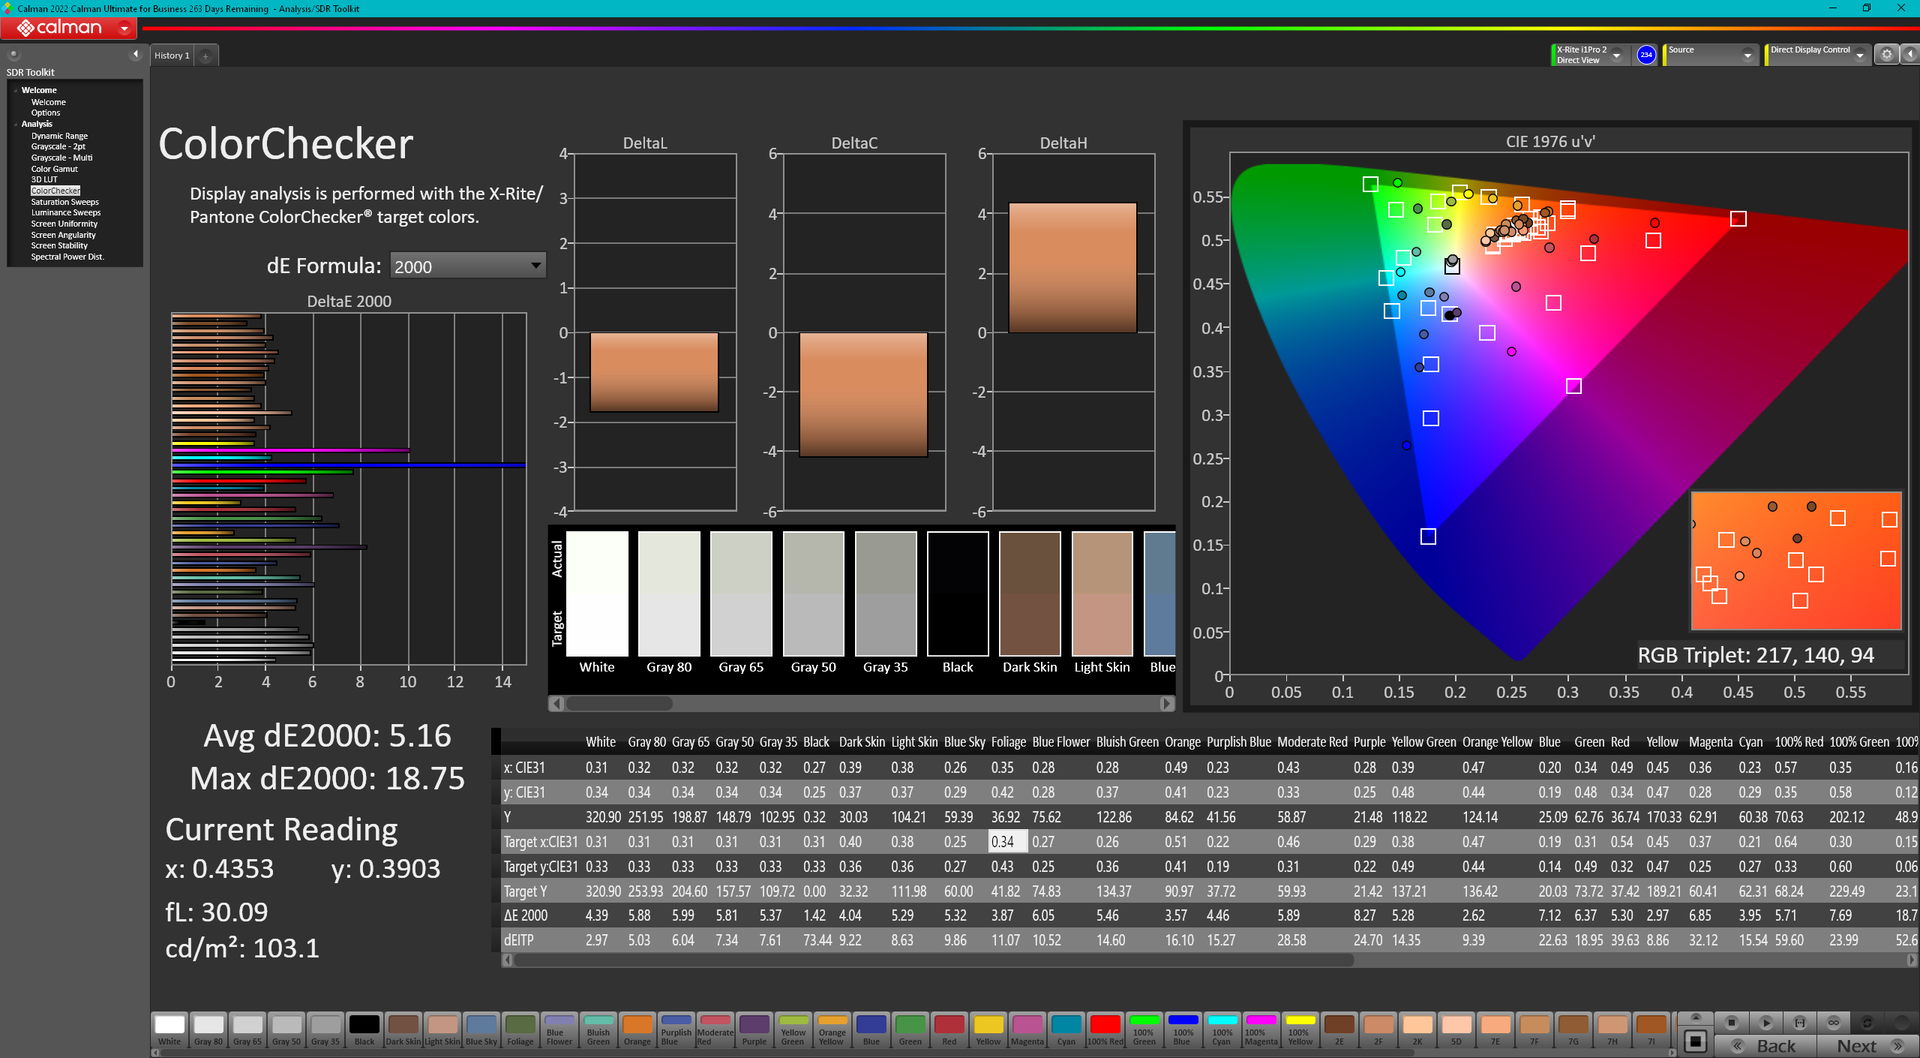
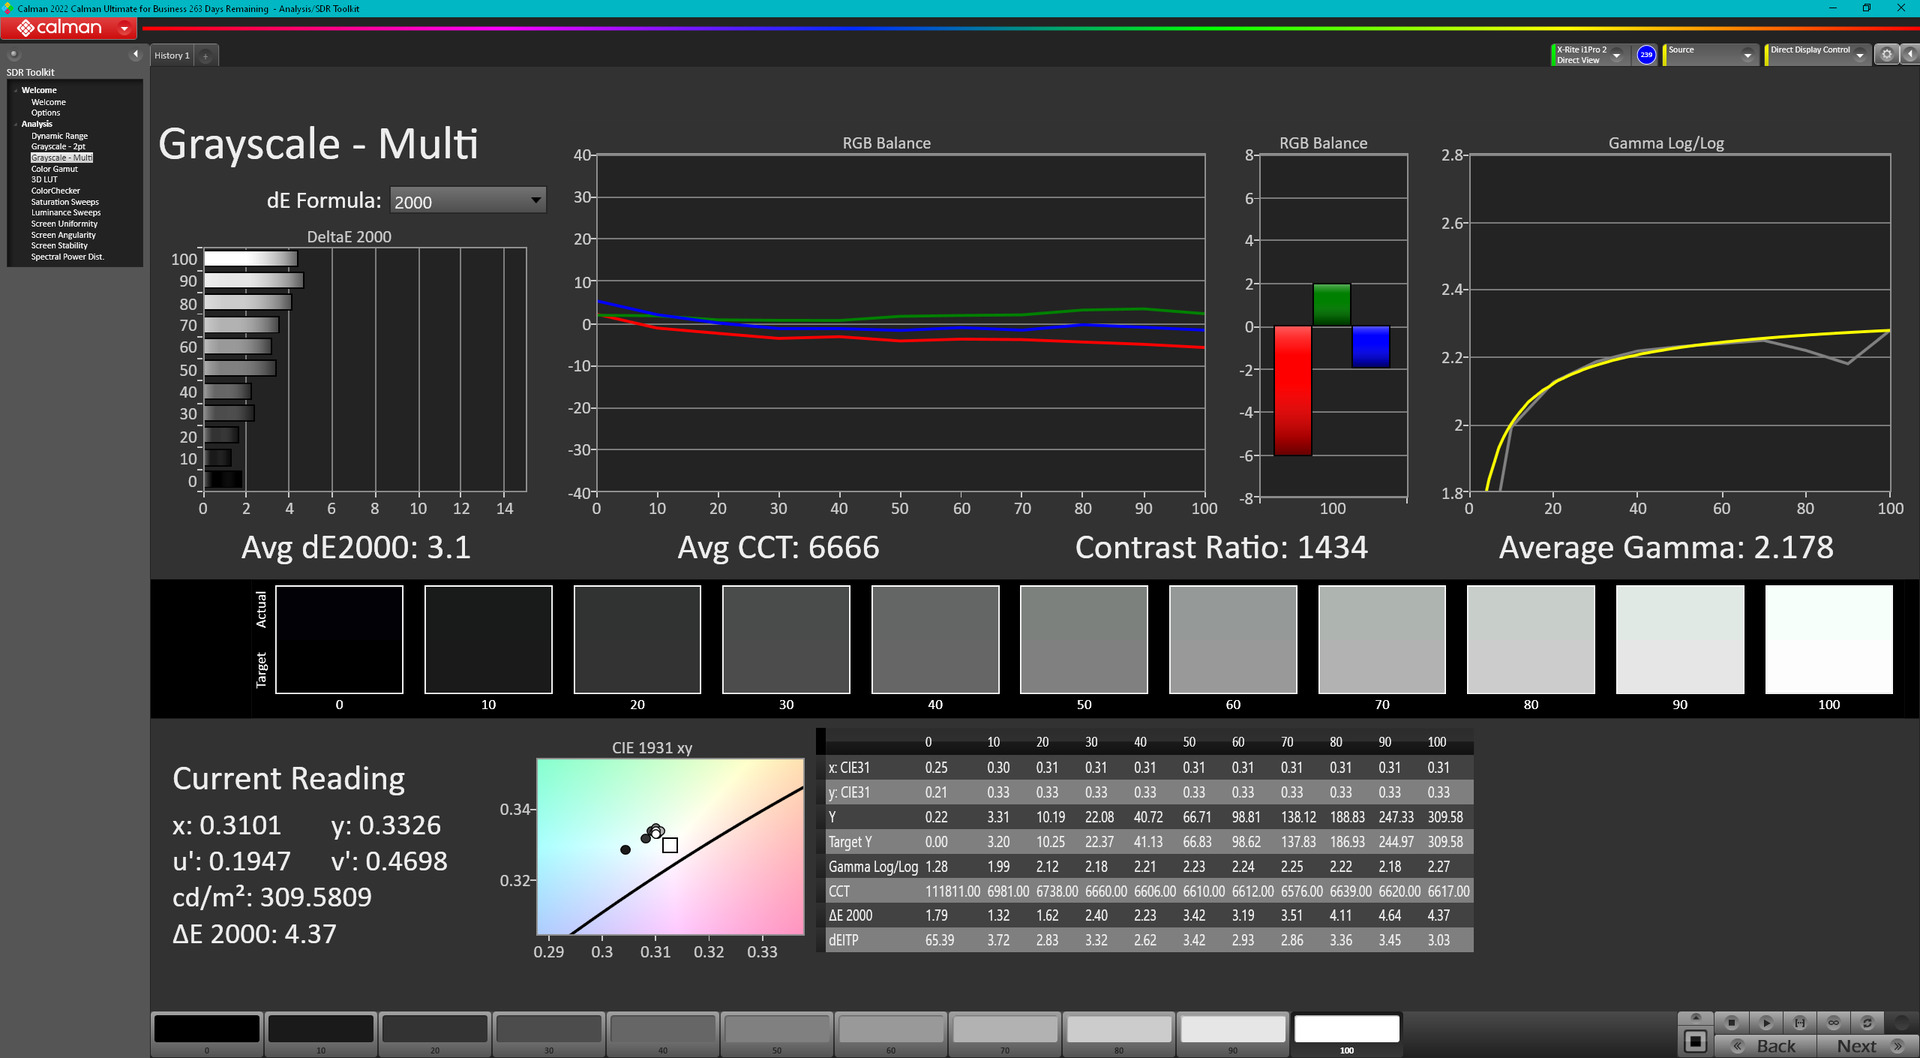
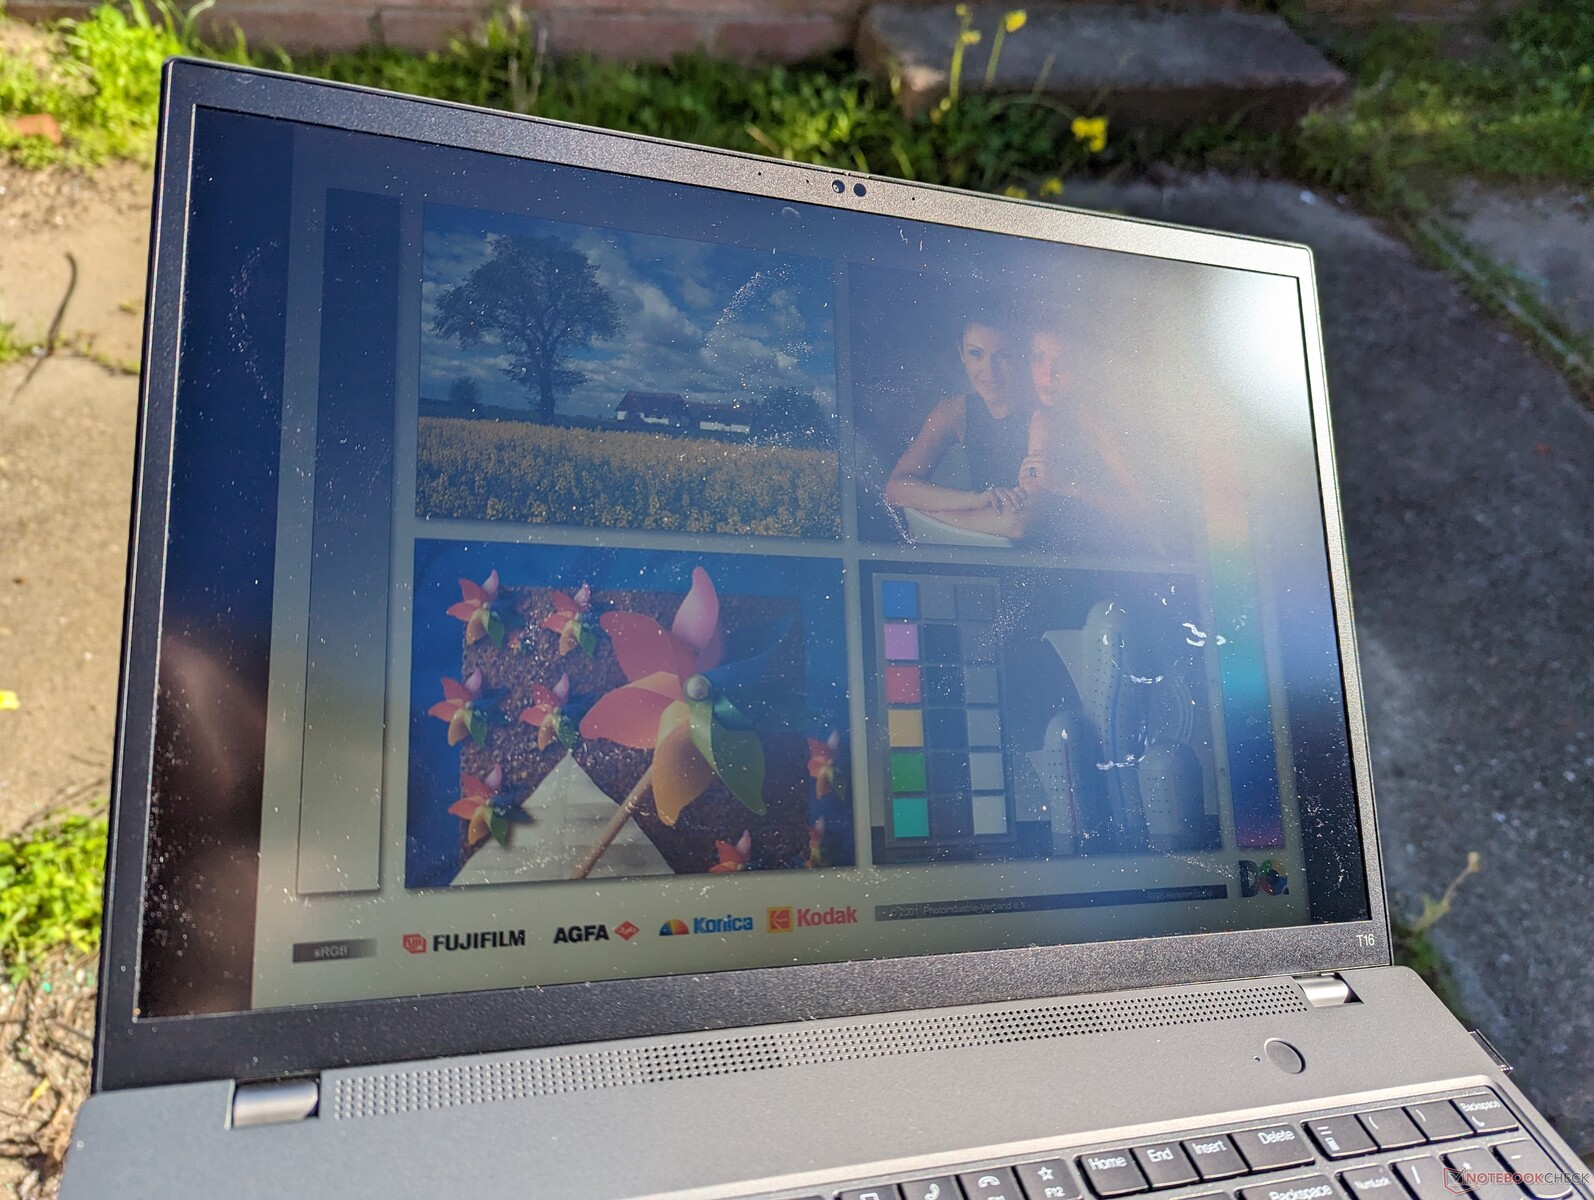
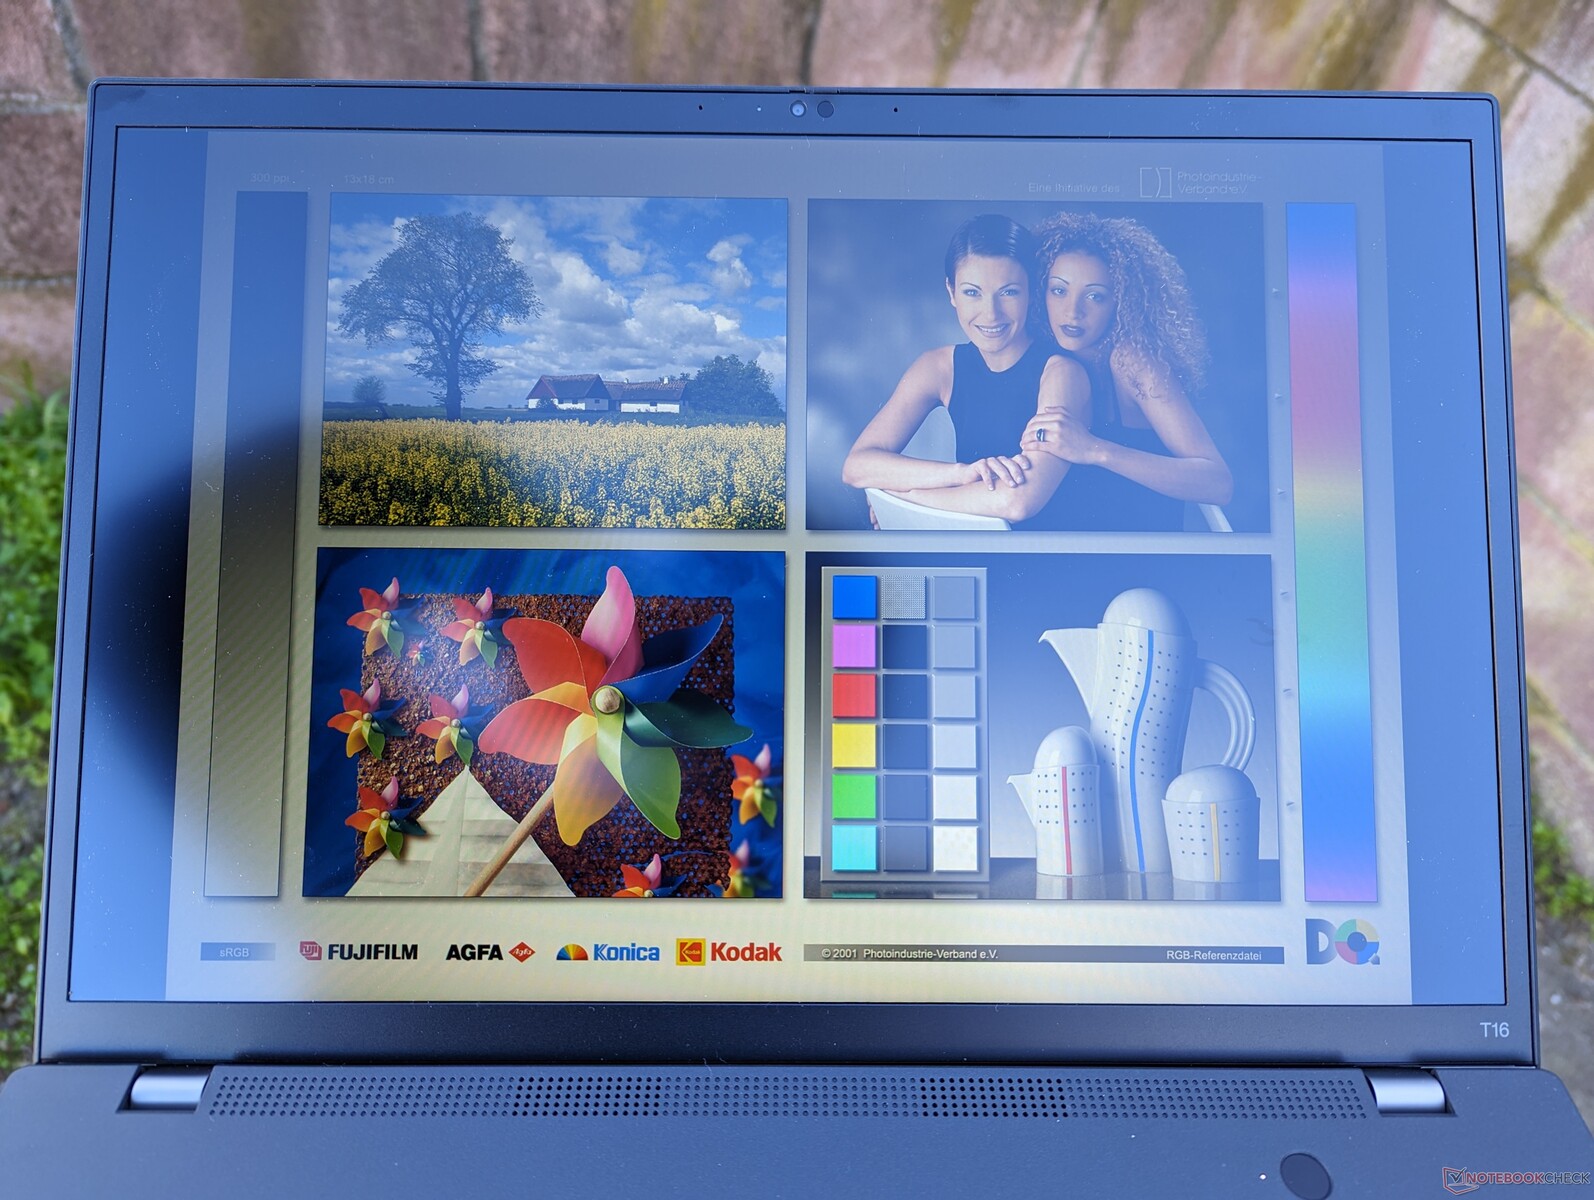
Our configuration comes with the bolded B160UAN03.2 panel above which is the least expensive option. When compared to the higher-end 1600p panel, our 1200p one has both inferior colors and sharpness by noticeable margins. It's still a decent display, however, especially when compared to other panels with a similar 60 percent sRGB gamut, but you'll want to choose full sRGB coverage for any sort of video or graphics editing.


| |||||||||||||||||||||||||
Brightness Distribution: 82 %
Center on Battery: 321.3 cd/m²
Contrast: 1036:1 (Black: 0.31 cd/m²)
ΔE ColorChecker Calman: 5.16 | ∀{0.5-29.43 Ø4.72}
calibrated: 2.76
ΔE Greyscale Calman: 4.2 | ∀{0.09-98 Ø4.97}
41% AdobeRGB 1998 (Argyll 3D)
59% sRGB (Argyll 3D)
39.7% Display P3 (Argyll 3D)
Gamma: 2.28
CCT: 6163 K
| Lenovo ThinkPad T16 Gen 1 Core i7-1270P B160UAN3.2, IPS, 1920x1200, 16" | Lenovo ThinkPad T16 G1 21CH004MGE MNG007DA1-C, IPS-LED, 2560x1600, 16" | LG Gram 16Z90Q LG LP160WQ1-SPB2 (LGD06EB), IPS, 2560x1600, 16" | HP EliteBook 865 G9 X160NV42, IPS, 1920x1200, 16" | Huawei MateBook 16s i7 BOE XS TV160DKT-NH0, IPS, 2520x1680, 16" | Apple MacBook Pro 16 2021 M1 Pro Liquid Retina XDR, Mini-LED, 3456x2234, 16.2" | |
|---|---|---|---|---|---|---|
| Display | 66% | 106% | 76% | 63% | 111% | |
| Display P3 Coverage (%) | 39.7 | 66.7 68% | 96.8 144% | 71.4 80% | 64.5 62% | 99.1 150% |
| sRGB Coverage (%) | 59 | 95.7 62% | 99.9 69% | 99.3 68% | 96.7 64% | 100 69% |
| AdobeRGB 1998 Coverage (%) | 41 | 69.1 69% | 84.6 106% | 73.2 79% | 66.6 62% | 88 115% |
| Response Times | 7% | -19% | -9% | -9% | -161% | |
| Response Time Grey 50% / Grey 80% * (ms) | 29.2 ? | 32.1 ? -10% | 45.7 ? -57% | 35.5 ? -22% | 35.7 ? -22% | 42.8 ? -47% |
| Response Time Black / White * (ms) | 24.4 ? | 18.9 ? 23% | 19.7 ? 19% | 23.5 ? 4% | 23.2 ? 5% | 91.6 ? -275% |
| PWM Frequency (Hz) | 56.7 | 14880 | ||||
| Screen | 43% | 23% | 73% | 49% | 352% | |
| Brightness middle (cd/m²) | 321.3 | 417 30% | 366 14% | 865 169% | 311 -3% | 514 60% |
| Brightness (cd/m²) | 315 | 388 23% | 347 10% | 771 145% | 319 1% | 497 58% |
| Brightness Distribution (%) | 82 | 81 -1% | 89 9% | 72 -12% | 91 11% | 95 16% |
| Black Level * (cd/m²) | 0.31 | 0.24 23% | 0.32 -3% | 0.3 3% | 0.17 45% | 0.02 94% |
| Contrast (:1) | 1036 | 1738 68% | 1144 10% | 2883 178% | 1829 77% | 25700 2381% |
| Colorchecker dE 2000 * | 5.16 | 1.7 67% | 2.82 45% | 2.4 53% | 1 81% | 1.4 73% |
| Colorchecker dE 2000 max. * | 18.75 | 3.5 81% | 4.65 75% | 5.8 69% | 1.7 91% | 2.8 85% |
| Colorchecker dE 2000 calibrated * | 2.76 | 1.4 49% | 2.69 3% | 1.5 46% | 0.8 71% | |
| Greyscale dE 2000 * | 4.2 | 2.4 43% | 2.3 45% | 3.8 10% | 1.5 64% | 2.3 45% |
| Gamma | 2.28 96% | 2.16 102% | 1.971 112% | 2.36 93% | 2.15 102% | 2.27 97% |
| CCT | 6163 105% | 6924 94% | 6796 96% | 6922 94% | 6432 101% | 6792 96% |
| Total Average (Program / Settings) | 39% /
43% | 37% /
35% | 47% /
62% | 34% /
44% | 101% /
217% |
* ... smaller is better
Color temperature is too warm out of the box which can fortunately be addressed with a proper calibration. Average color DeltaE would improve from 5.05 to 2.23, but colors are still inaccurate at high saturation levels due to the limited color coverage of the panel. We recommend applying our calibrated ICM profile above as the display is not calibrated at factory.
Display Response Times
| ↔ Response Time Black to White | ||
|---|---|---|
| 24.4 ms ... rise ↗ and fall ↘ combined | ↗ 14 ms rise | 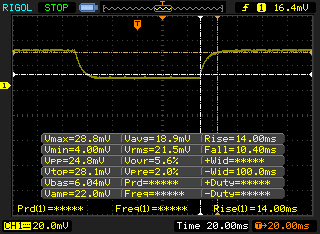 |
| ↘ 10.4 ms fall | ||
| The screen shows good response rates in our tests, but may be too slow for competitive gamers. In comparison, all tested devices range from 0.1 (minimum) to 240 (maximum) ms. » 58 % of all devices are better. This means that the measured response time is worse than the average of all tested devices (19.8 ms). | ||
| ↔ Response Time 50% Grey to 80% Grey | ||
| 29.2 ms ... rise ↗ and fall ↘ combined | ↗ 15.6 ms rise | 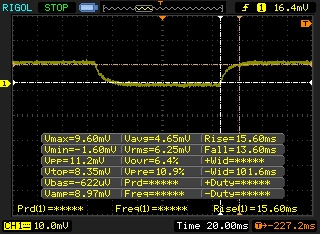 |
| ↘ 13.6 ms fall | ||
| The screen shows relatively slow response rates in our tests and may be too slow for gamers. In comparison, all tested devices range from 0.165 (minimum) to 636 (maximum) ms. » 40 % of all devices are better. This means that the measured response time is similar to the average of all tested devices (31 ms). | ||
Screen Flickering / PWM (Pulse-Width Modulation)
| Screen flickering / PWM not detected | 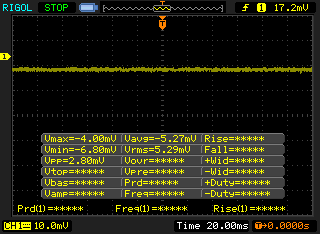 | ||
In comparison: 52 % of all tested devices do not use PWM to dim the display. If PWM was detected, an average of 7747 (minimum: 5 - maximum: 343500) Hz was measured. | |||
Outdoor visibility is average at best on our 300-nit panel. Users may want to consider the 500-nit options to reduce the effects of glare. If visibility is a concern, then we recommend taking a look at the HP EliteBook 860/865 G9 and its much brighter 1000-nit panel options.

Performance — 12th gen Intel Options
Testing Conditions
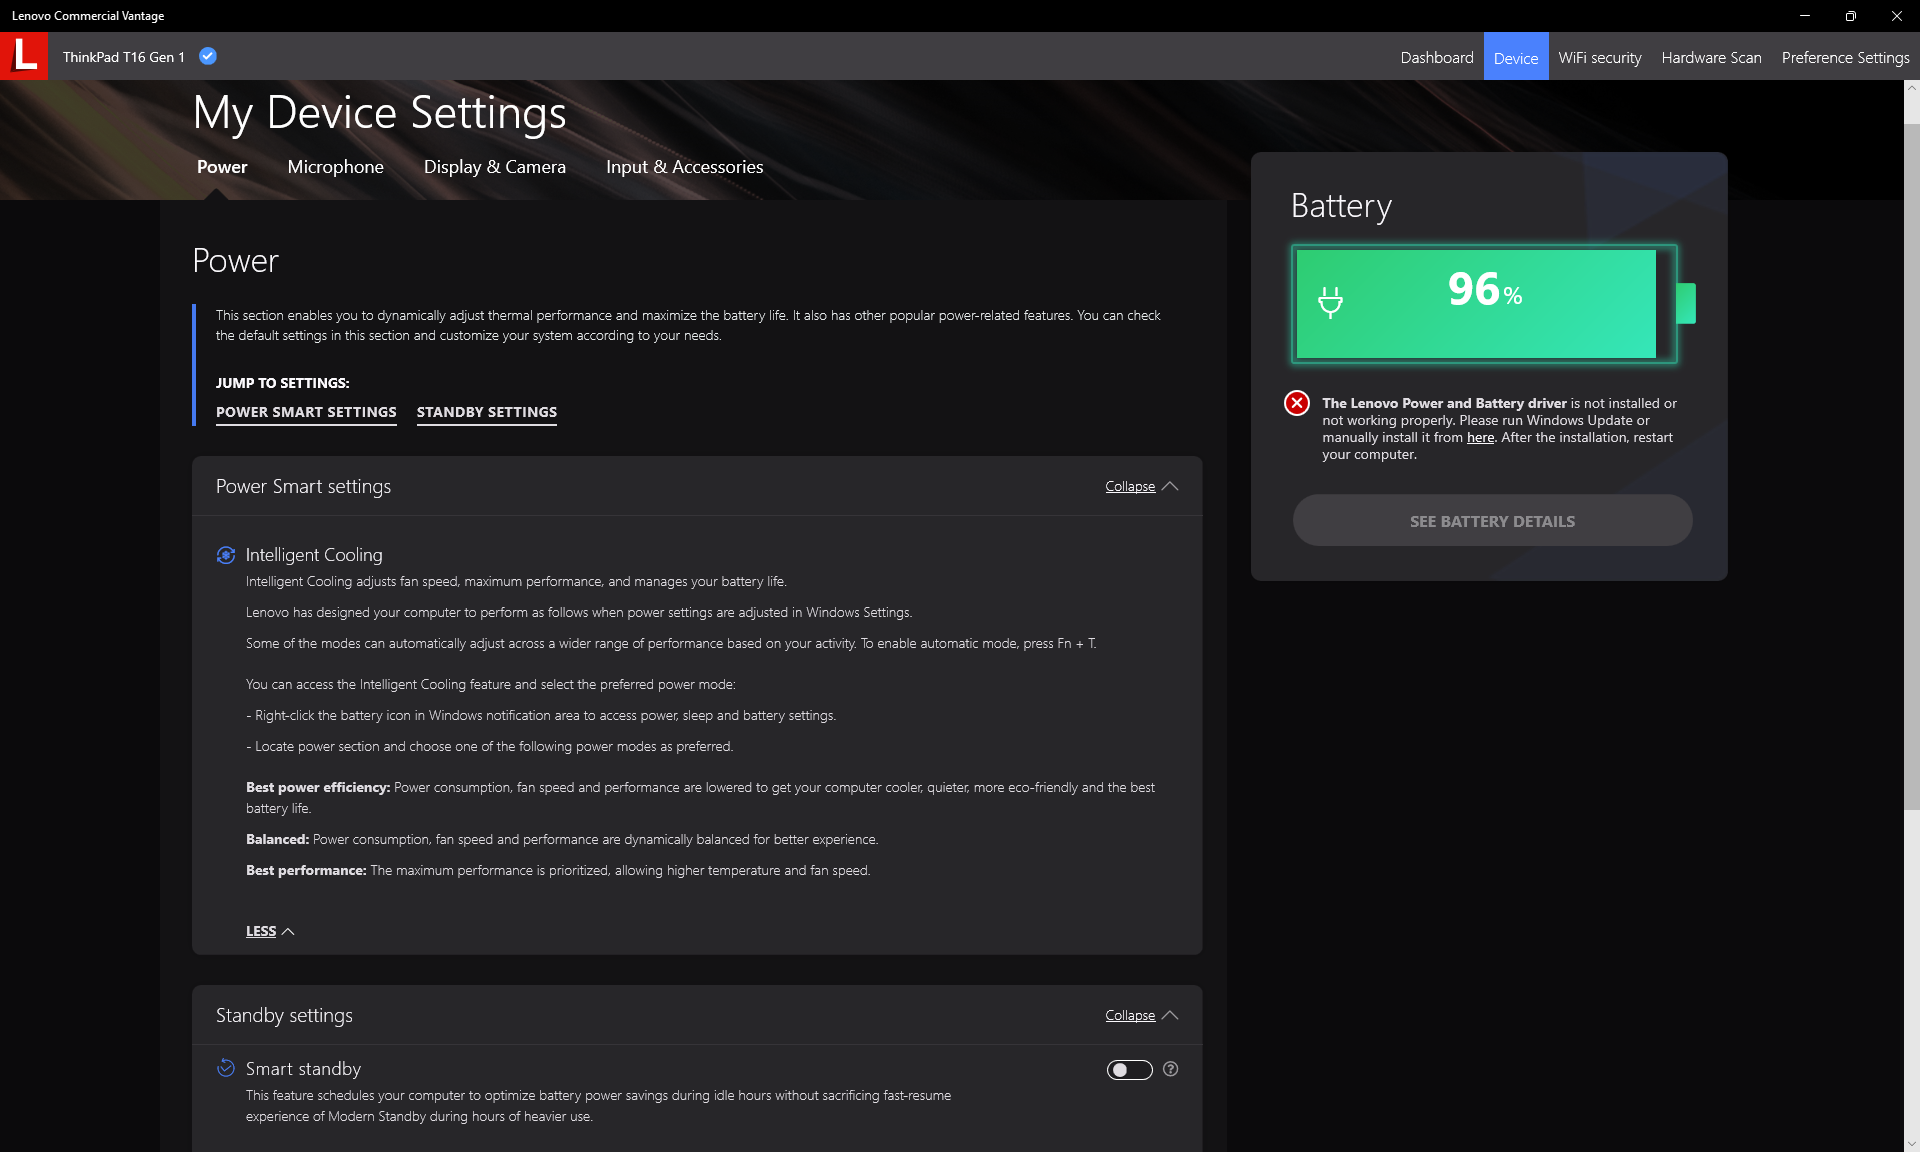
We set our unit to Performance mode via Windows prior to running any benchmarks below. Users should become familiar with the Lenovo Commercial Vantage software as it is the hub for additional settings related to updates, warranty, security, and more. The screenshots below show a few of the options.
Processor — Turbo Boost Could Be Better
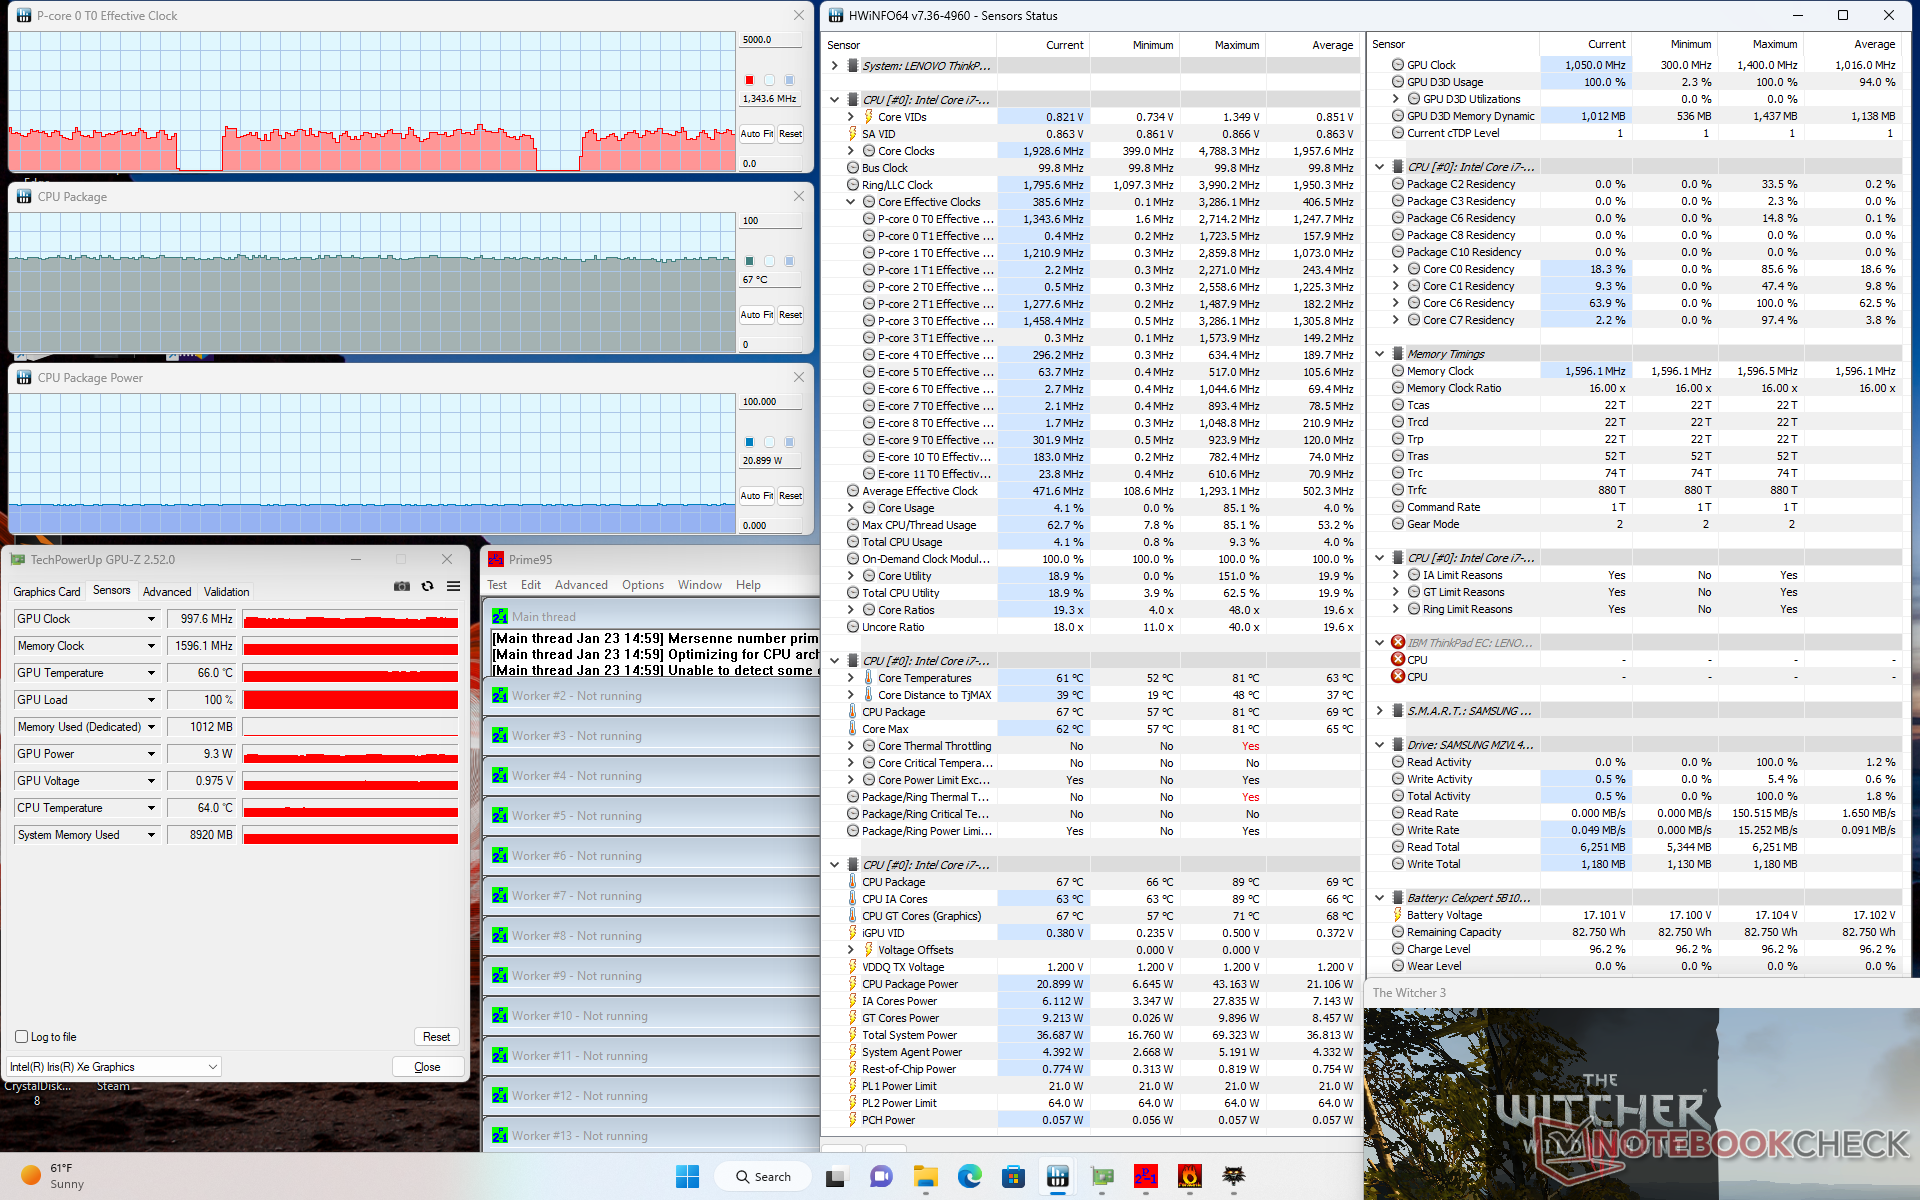
Our Core i7-1270P unit would exhibit similar throttling behavior to what we observed on the Core i5-1240P SKU. When running CineBench R15 xT in a loop, for example, the initial score of 1782 points would drop by as much as 44 percent over time which is significantly more than on most other laptops. In contrast, the Ryzen 5 PRO 6650U SKU would be slower during the few minutes of the loop test, but it is able to sustain faster clock rates and performance over longer periods as shown by our graph below. The Turbo Boost benefits of the Core i7-1270P are therefore very short-lived on the ThinkPad T16 G1.
Users can install ThrottleStop to minimize the performance throttling by about 20 percent if desired. Even so, it's disappointing that Lenovo doesn't offer such a performance option without resorting to third party software.
Cinebench R15 Multi Loop
Cinebench R20: CPU (Multi Core) | CPU (Single Core)
Cinebench R23: Multi Core | Single Core
Cinebench R15: CPU Multi 64Bit | CPU Single 64Bit
Blender: v2.79 BMW27 CPU
7-Zip 18.03: 7z b 4 | 7z b 4 -mmt1
Geekbench 5.5: Multi-Core | Single-Core
HWBOT x265 Benchmark v2.2: 4k Preset
LibreOffice : 20 Documents To PDF
R Benchmark 2.5: Overall mean
* ... smaller is better
* ... smaller is better
AIDA64: FP32 Ray-Trace | FPU Julia | CPU SHA3 | CPU Queen | FPU SinJulia | FPU Mandel | CPU AES | CPU ZLib | FP64 Ray-Trace | CPU PhotoWorxx
| Performance rating | |
| HP EliteBook 865 G9 | |
| Lenovo ThinkPad T16 G1 21CH004MGE | |
| Huawei MateBook 16s i7 | |
| Lenovo ThinkPad T16 Gen 1 Core i7-1270P | |
| LG Gram 16Z90Q | |
| Average Intel Core i7-1270P | |
| AIDA64 / FP32 Ray-Trace | |
| HP EliteBook 865 G9 | |
| Lenovo ThinkPad T16 G1 21CH004MGE | |
| Lenovo ThinkPad T16 Gen 1 Core i7-1270P | |
| LG Gram 16Z90Q | |
| Huawei MateBook 16s i7 | |
| Average Intel Core i7-1270P (4789 - 6722, n=2) | |
| AIDA64 / FPU Julia | |
| HP EliteBook 865 G9 | |
| Lenovo ThinkPad T16 G1 21CH004MGE | |
| Lenovo ThinkPad T16 Gen 1 Core i7-1270P | |
| Average Intel Core i7-1270P (22017 - 37567, n=2) | |
| Huawei MateBook 16s i7 | |
| LG Gram 16Z90Q | |
| AIDA64 / CPU SHA3 | |
| HP EliteBook 865 G9 | |
| Lenovo ThinkPad T16 G1 21CH004MGE | |
| Huawei MateBook 16s i7 | |
| Lenovo ThinkPad T16 Gen 1 Core i7-1270P | |
| Average Intel Core i7-1270P (1543 - 1853, n=2) | |
| LG Gram 16Z90Q | |
| AIDA64 / CPU Queen | |
| Huawei MateBook 16s i7 | |
| HP EliteBook 865 G9 | |
| Lenovo ThinkPad T16 G1 21CH004MGE | |
| Lenovo ThinkPad T16 Gen 1 Core i7-1270P | |
| LG Gram 16Z90Q | |
| Average Intel Core i7-1270P (61703 - 76671, n=2) | |
| AIDA64 / FPU SinJulia | |
| HP EliteBook 865 G9 | |
| Lenovo ThinkPad T16 G1 21CH004MGE | |
| Huawei MateBook 16s i7 | |
| Average Intel Core i7-1270P (5059 - 5210, n=2) | |
| Lenovo ThinkPad T16 Gen 1 Core i7-1270P | |
| LG Gram 16Z90Q | |
| AIDA64 / FPU Mandel | |
| HP EliteBook 865 G9 | |
| Lenovo ThinkPad T16 G1 21CH004MGE | |
| Lenovo ThinkPad T16 Gen 1 Core i7-1270P | |
| Huawei MateBook 16s i7 | |
| Average Intel Core i7-1270P (12876 - 17891, n=2) | |
| LG Gram 16Z90Q | |
| AIDA64 / CPU AES | |
| Lenovo ThinkPad T16 G1 21CH004MGE | |
| Huawei MateBook 16s i7 | |
| HP EliteBook 865 G9 | |
| Lenovo ThinkPad T16 Gen 1 Core i7-1270P | |
| Average Intel Core i7-1270P (33137 - 39956, n=2) | |
| LG Gram 16Z90Q | |
| AIDA64 / CPU ZLib | |
| Huawei MateBook 16s i7 | |
| HP EliteBook 865 G9 | |
| Lenovo ThinkPad T16 G1 21CH004MGE | |
| Lenovo ThinkPad T16 Gen 1 Core i7-1270P | |
| Average Intel Core i7-1270P (553 - 579, n=2) | |
| LG Gram 16Z90Q | |
| AIDA64 / FP64 Ray-Trace | |
| HP EliteBook 865 G9 | |
| Lenovo ThinkPad T16 G1 21CH004MGE | |
| LG Gram 16Z90Q | |
| Lenovo ThinkPad T16 Gen 1 Core i7-1270P | |
| Huawei MateBook 16s i7 | |
| Average Intel Core i7-1270P (2603 - 3521, n=2) | |
| AIDA64 / CPU PhotoWorxx | |
| Huawei MateBook 16s i7 | |
| LG Gram 16Z90Q | |
| Average Intel Core i7-1270P (21056 - 34745, n=2) | |
| Lenovo ThinkPad T16 G1 21CH004MGE | |
| Lenovo ThinkPad T16 Gen 1 Core i7-1270P | |
| HP EliteBook 865 G9 | |
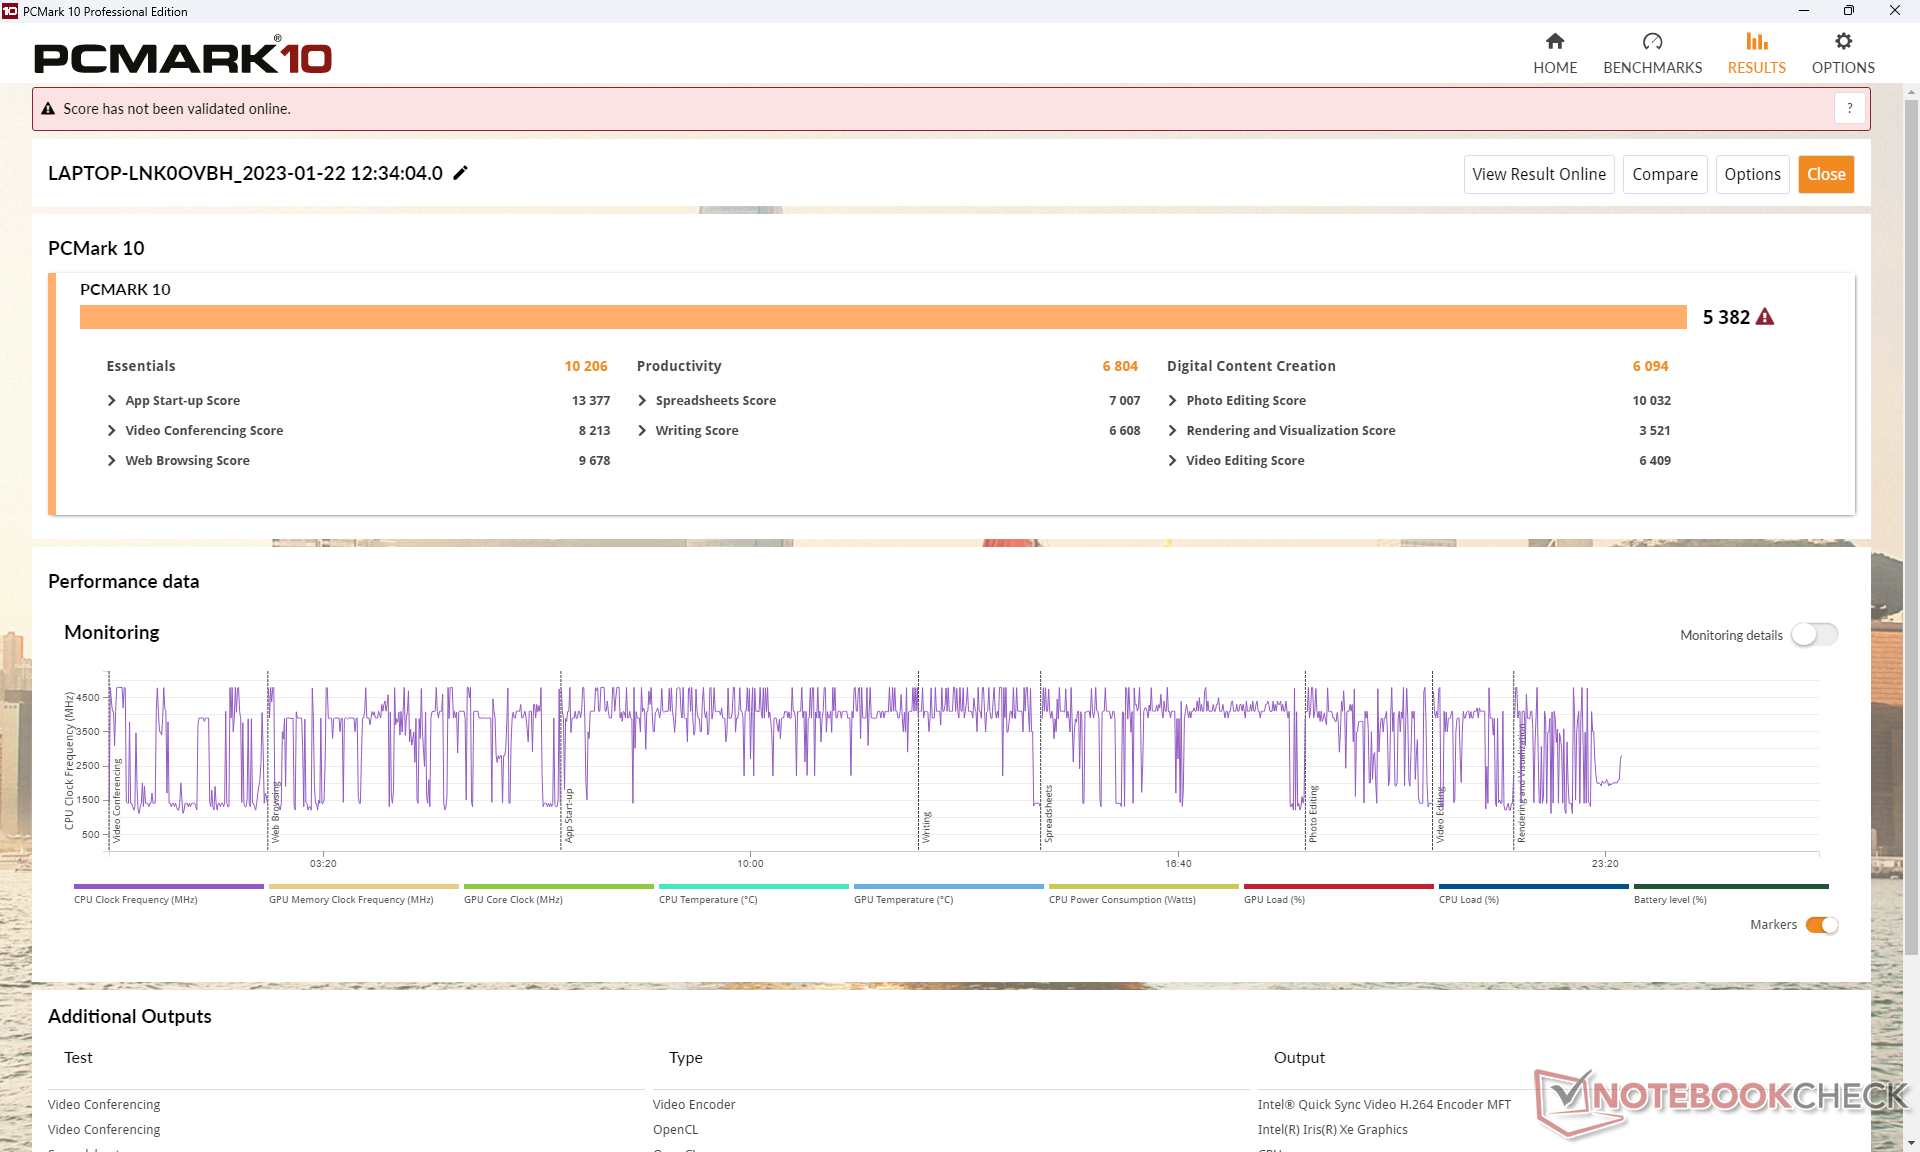
System Performance
Average PCMark results are between the slower Core i5-powered and faster Ryzen 5-powered SKUs as shown by the comparison chart below. The AMD SKU is noticeably ahead in the Productivity subtest likely due to its faster multi-thread performance and integrated GPU when compared to the Intel SKUs.
CrossMark: Overall | Productivity | Creativity | Responsiveness
| PCMark 10 / Score | |
| Huawei MateBook 16s i7 | |
| Lenovo ThinkPad T16 G1 21CH004MGE | |
| HP EliteBook 865 G9 | |
| Average Intel Core i7-1270P, Intel Iris Xe Graphics G7 96EUs (5382 - 5647, n=2) | |
| Lenovo ThinkPad T16 Gen 1 Core i7-1270P | |
| LG Gram 16Z90Q | |
| Lenovo ThinkPad T16 G1 21BWS00200 | |
| PCMark 10 / Essentials | |
| Huawei MateBook 16s i7 | |
| Average Intel Core i7-1270P, Intel Iris Xe Graphics G7 96EUs (10206 - 11224, n=2) | |
| Lenovo ThinkPad T16 Gen 1 Core i7-1270P | |
| LG Gram 16Z90Q | |
| Lenovo ThinkPad T16 G1 21CH004MGE | |
| Lenovo ThinkPad T16 G1 21BWS00200 | |
| HP EliteBook 865 G9 | |
| PCMark 10 / Productivity | |
| Lenovo ThinkPad T16 G1 21CH004MGE | |
| HP EliteBook 865 G9 | |
| Huawei MateBook 16s i7 | |
| Average Intel Core i7-1270P, Intel Iris Xe Graphics G7 96EUs (6804 - 6805, n=2) | |
| Lenovo ThinkPad T16 Gen 1 Core i7-1270P | |
| LG Gram 16Z90Q | |
| Lenovo ThinkPad T16 G1 21BWS00200 | |
| PCMark 10 / Digital Content Creation | |
| Huawei MateBook 16s i7 | |
| HP EliteBook 865 G9 | |
| Lenovo ThinkPad T16 G1 21CH004MGE | |
| Average Intel Core i7-1270P, Intel Iris Xe Graphics G7 96EUs (6094 - 6398, n=2) | |
| Lenovo ThinkPad T16 Gen 1 Core i7-1270P | |
| LG Gram 16Z90Q | |
| Lenovo ThinkPad T16 G1 21BWS00200 | |
| CrossMark / Overall | |
| Huawei MateBook 16s i7 | |
| Average Intel Core i7-1270P, Intel Iris Xe Graphics G7 96EUs (1585 - 1712, n=2) | |
| Lenovo ThinkPad T16 Gen 1 Core i7-1270P | |
| Apple MacBook Pro 16 2021 M1 Pro | |
| Lenovo ThinkPad T16 G1 21CH004MGE | |
| Lenovo ThinkPad T16 G1 21BWS00200 | |
| HP EliteBook 865 G9 | |
| CrossMark / Productivity | |
| Huawei MateBook 16s i7 | |
| Average Intel Core i7-1270P, Intel Iris Xe Graphics G7 96EUs (1567 - 1636, n=2) | |
| Lenovo ThinkPad T16 Gen 1 Core i7-1270P | |
| Lenovo ThinkPad T16 G1 21CH004MGE | |
| Lenovo ThinkPad T16 G1 21BWS00200 | |
| HP EliteBook 865 G9 | |
| Apple MacBook Pro 16 2021 M1 Pro | |
| CrossMark / Creativity | |
| Apple MacBook Pro 16 2021 M1 Pro | |
| Huawei MateBook 16s i7 | |
| Average Intel Core i7-1270P, Intel Iris Xe Graphics G7 96EUs (1684 - 1839, n=2) | |
| Lenovo ThinkPad T16 Gen 1 Core i7-1270P | |
| Lenovo ThinkPad T16 G1 21CH004MGE | |
| Lenovo ThinkPad T16 G1 21BWS00200 | |
| HP EliteBook 865 G9 | |
| CrossMark / Responsiveness | |
| Huawei MateBook 16s i7 | |
| Average Intel Core i7-1270P, Intel Iris Xe Graphics G7 96EUs (1365 - 1584, n=2) | |
| Lenovo ThinkPad T16 Gen 1 Core i7-1270P | |
| Lenovo ThinkPad T16 G1 21BWS00200 | |
| Lenovo ThinkPad T16 G1 21CH004MGE | |
| HP EliteBook 865 G9 | |
| Apple MacBook Pro 16 2021 M1 Pro | |
| PCMark 10 Score | 5382 points | |
Help | ||
| AIDA64 / Memory Copy | |
| Huawei MateBook 16s i7 | |
| LG Gram 16Z90Q | |
| Average Intel Core i7-1270P (39471 - 62300, n=2) | |
| Lenovo ThinkPad T16 G1 21CH004MGE | |
| Lenovo ThinkPad T16 Gen 1 Core i7-1270P | |
| HP EliteBook 865 G9 | |
| AIDA64 / Memory Read | |
| Huawei MateBook 16s i7 | |
| LG Gram 16Z90Q | |
| Average Intel Core i7-1270P (42289 - 72572, n=2) | |
| Lenovo ThinkPad T16 Gen 1 Core i7-1270P | |
| Lenovo ThinkPad T16 G1 21CH004MGE | |
| HP EliteBook 865 G9 | |
| AIDA64 / Memory Write | |
| LG Gram 16Z90Q | |
| Huawei MateBook 16s i7 | |
| Average Intel Core i7-1270P (43051 - 61340, n=2) | |
| Lenovo ThinkPad T16 G1 21CH004MGE | |
| Lenovo ThinkPad T16 Gen 1 Core i7-1270P | |
| HP EliteBook 865 G9 | |
| AIDA64 / Memory Latency | |
| Lenovo ThinkPad T16 G1 21CH004MGE | |
| Huawei MateBook 16s i7 | |
| LG Gram 16Z90Q | |
| HP EliteBook 865 G9 | |
| Lenovo ThinkPad T16 Gen 1 Core i7-1270P | |
| Average Intel Core i7-1270P (89.3 - 89.3, n=2) | |
* ... smaller is better
DPC Latency
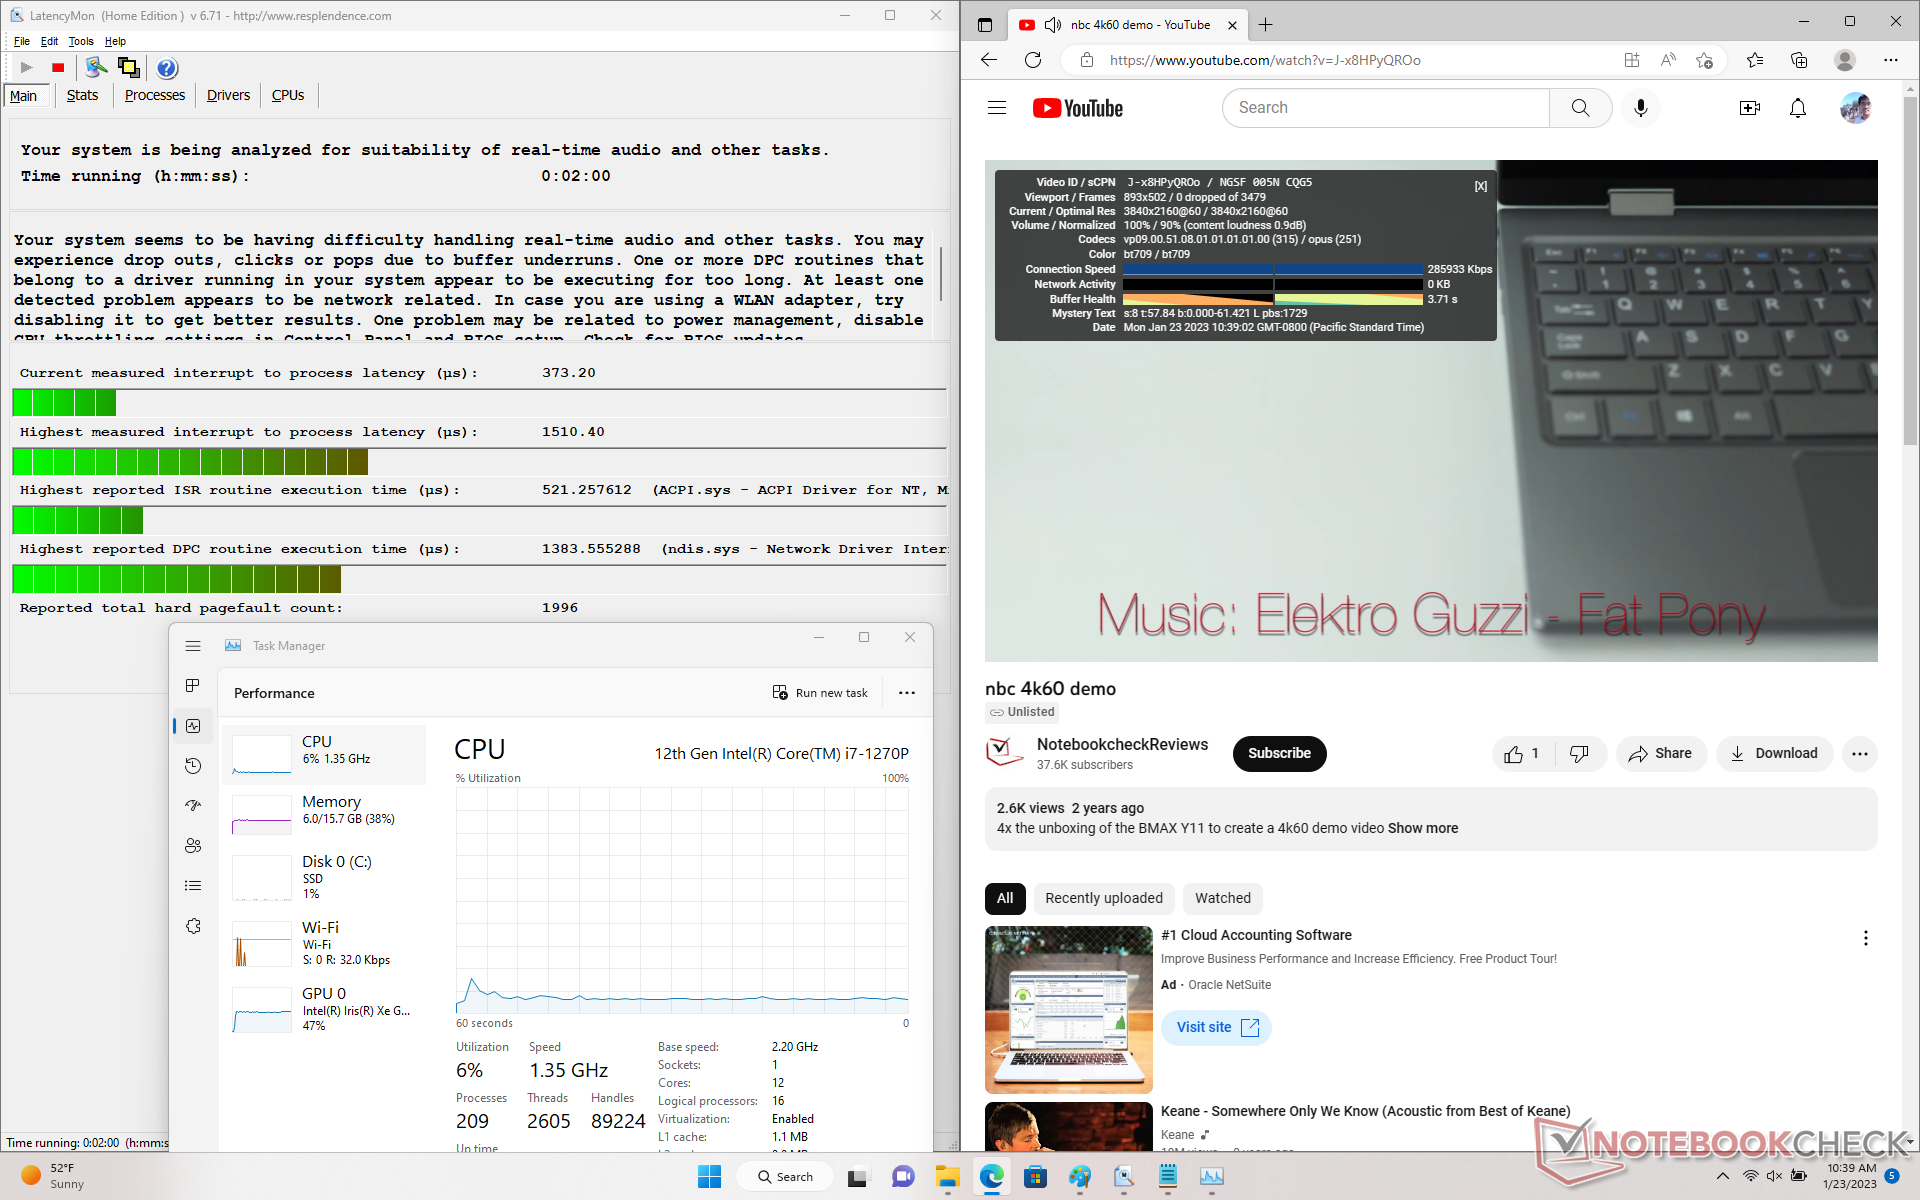
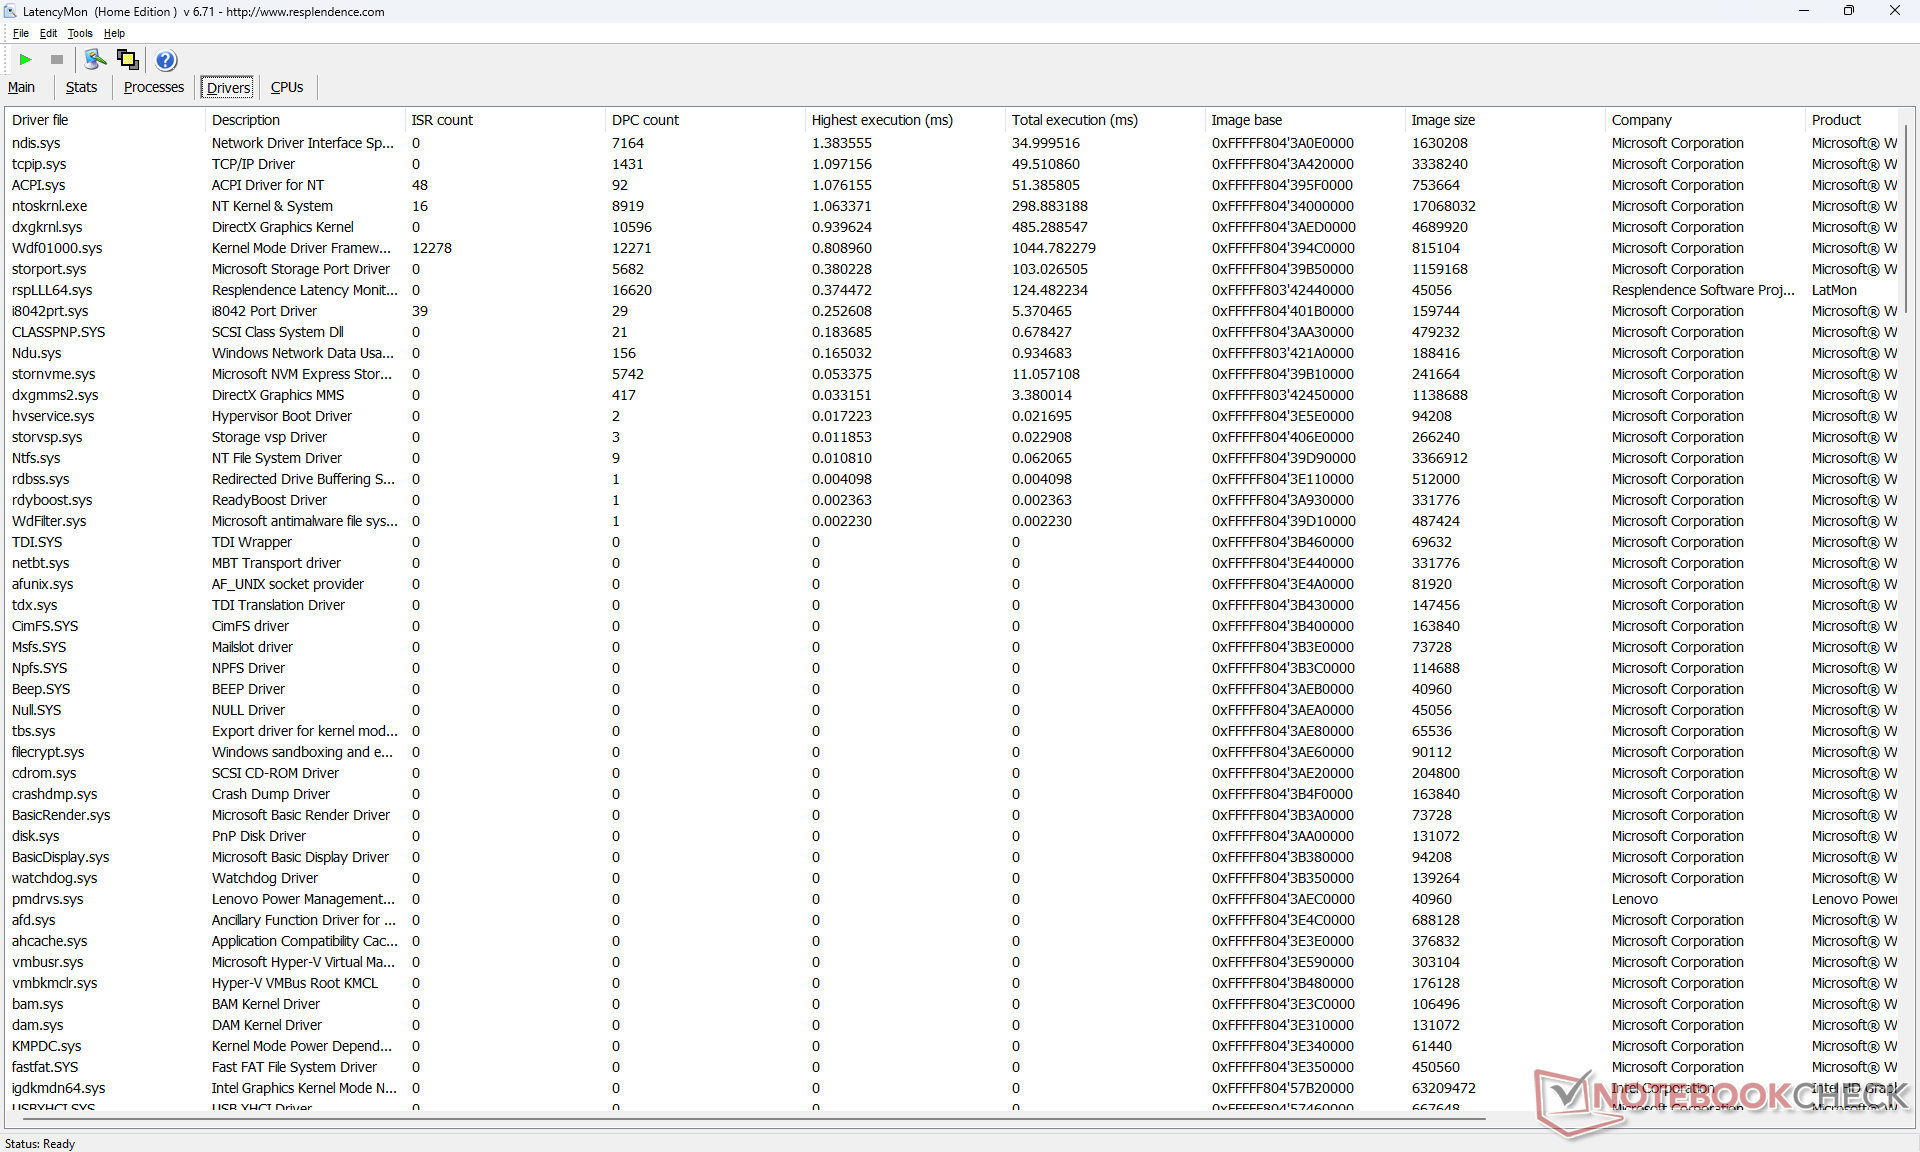
LatencyMon shows DPC issues when opening multiple browser tabs of our homepage. 4K video playback at 60 FPS is otherwise perfect and without any dropped frames.
| DPC Latencies / LatencyMon - interrupt to process latency (max), Web, Youtube, Prime95 | |
| LG Gram 16Z90Q | |
| Lenovo ThinkPad T16 Gen 1 Core i7-1270P | |
| Lenovo ThinkPad T16 G1 21CH004MGE | |
| HP EliteBook 865 G9 | |
* ... smaller is better
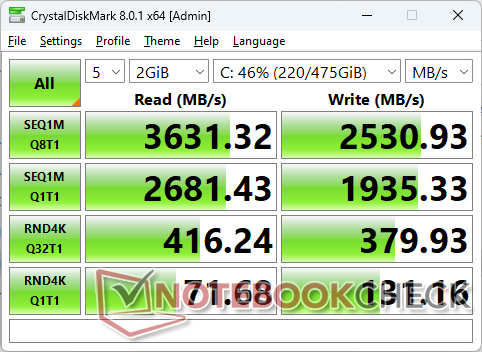
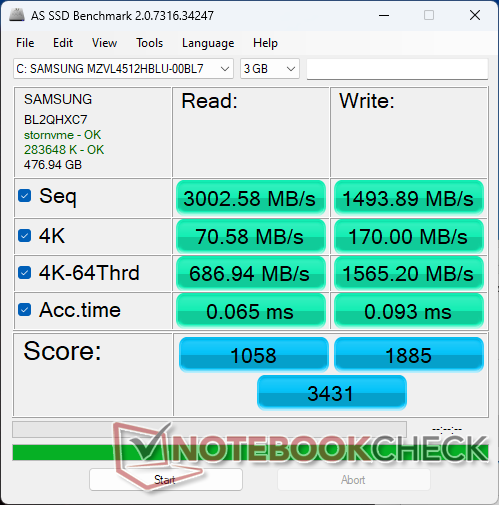
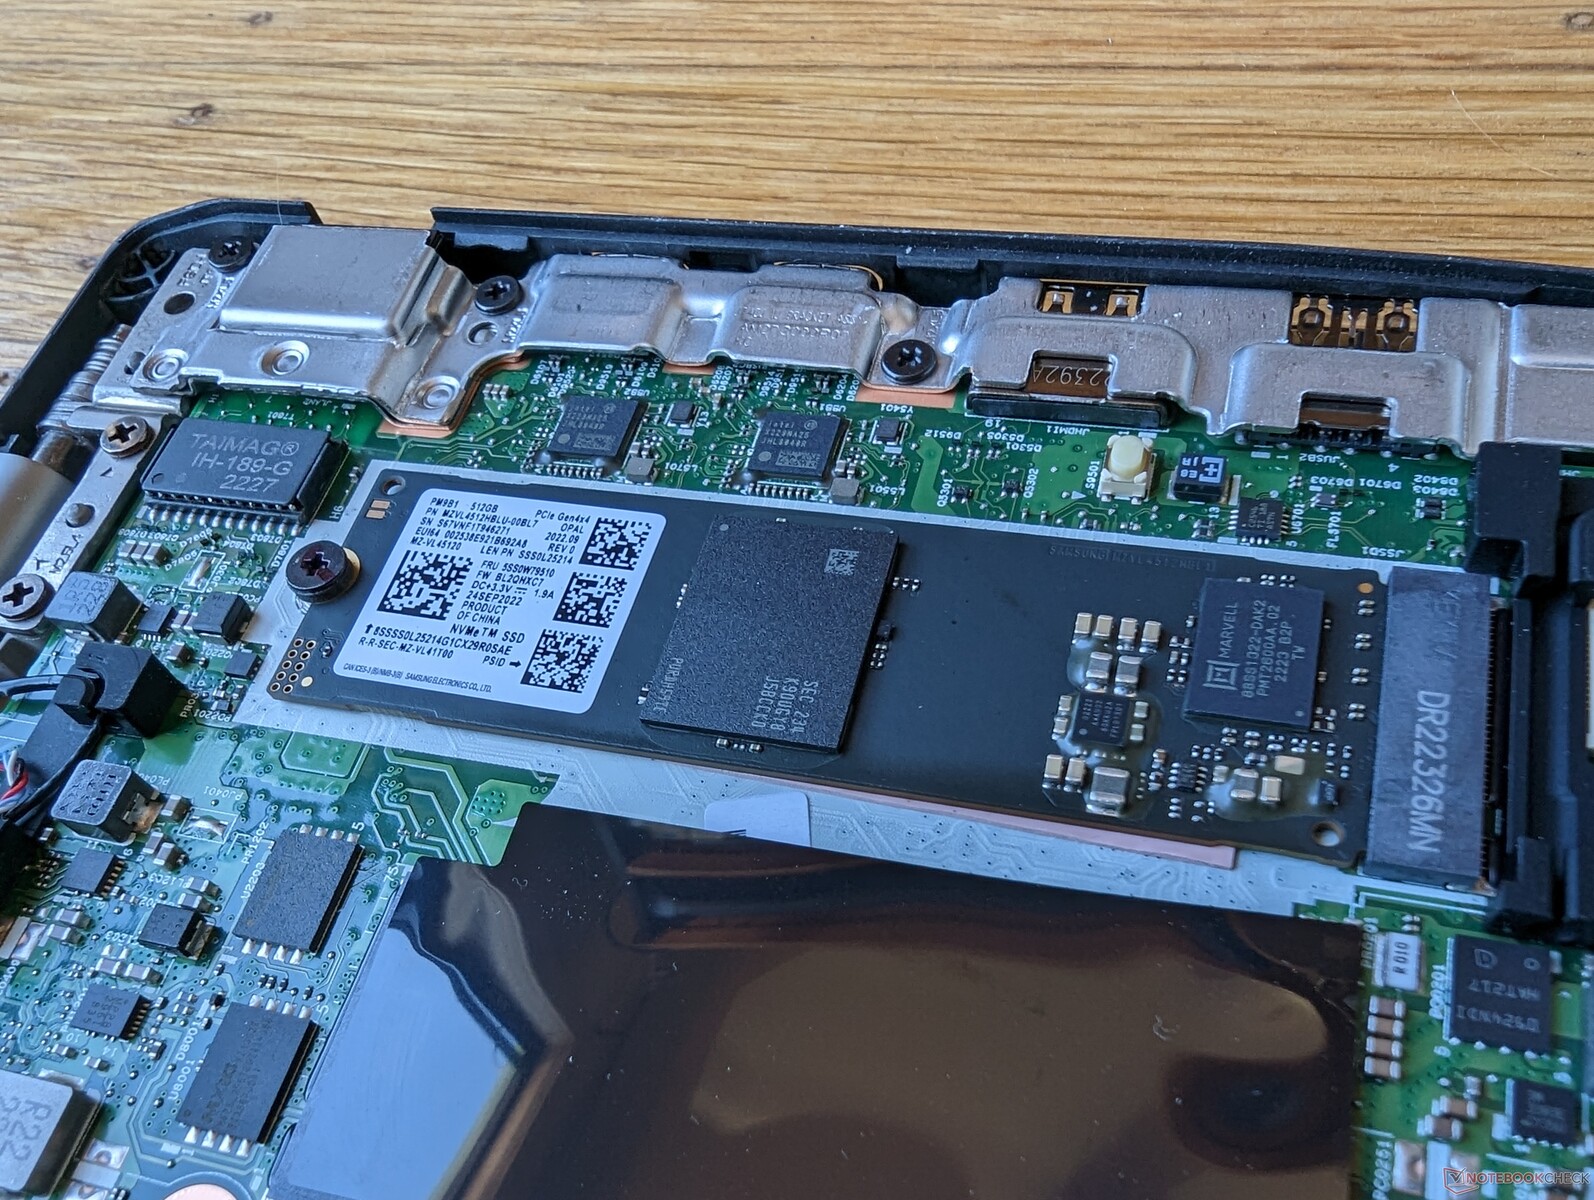
Storage Devices
Our unit ships with a 512 GB Samsung PM9B1 PCIe4 x4 NVMe SSD instead of the more common Samsung PM9A1. The PM9B1 series offers slower transfer rates by almost half; sequential read rates top out at ~3600 MB/s on our unit compared to ~6300 MB/s on the LG Gram 16 with the Samsung PM9A1.

| Drive Performance rating - Percent | |
| Huawei MateBook 16s i7 | |
| LG Gram 16Z90Q | |
| Lenovo ThinkPad T16 G1 21CH004MGE | |
| Lenovo ThinkPad T16 Gen 1 Core i7-1270P | |
| HP EliteBook 865 G9 | |
* ... smaller is better
Disk Throttling: DiskSpd Read Loop, Queue Depth 8
GPU Performance — Held Back By Slow RAM
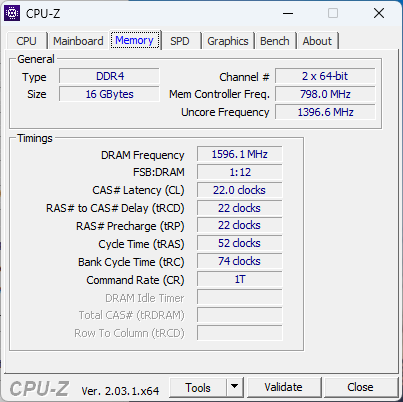
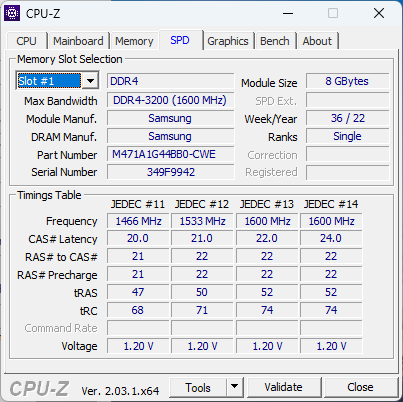
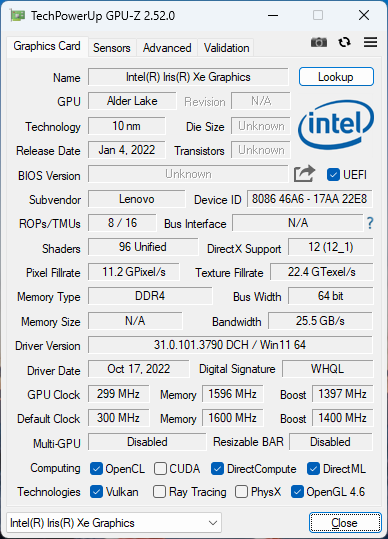
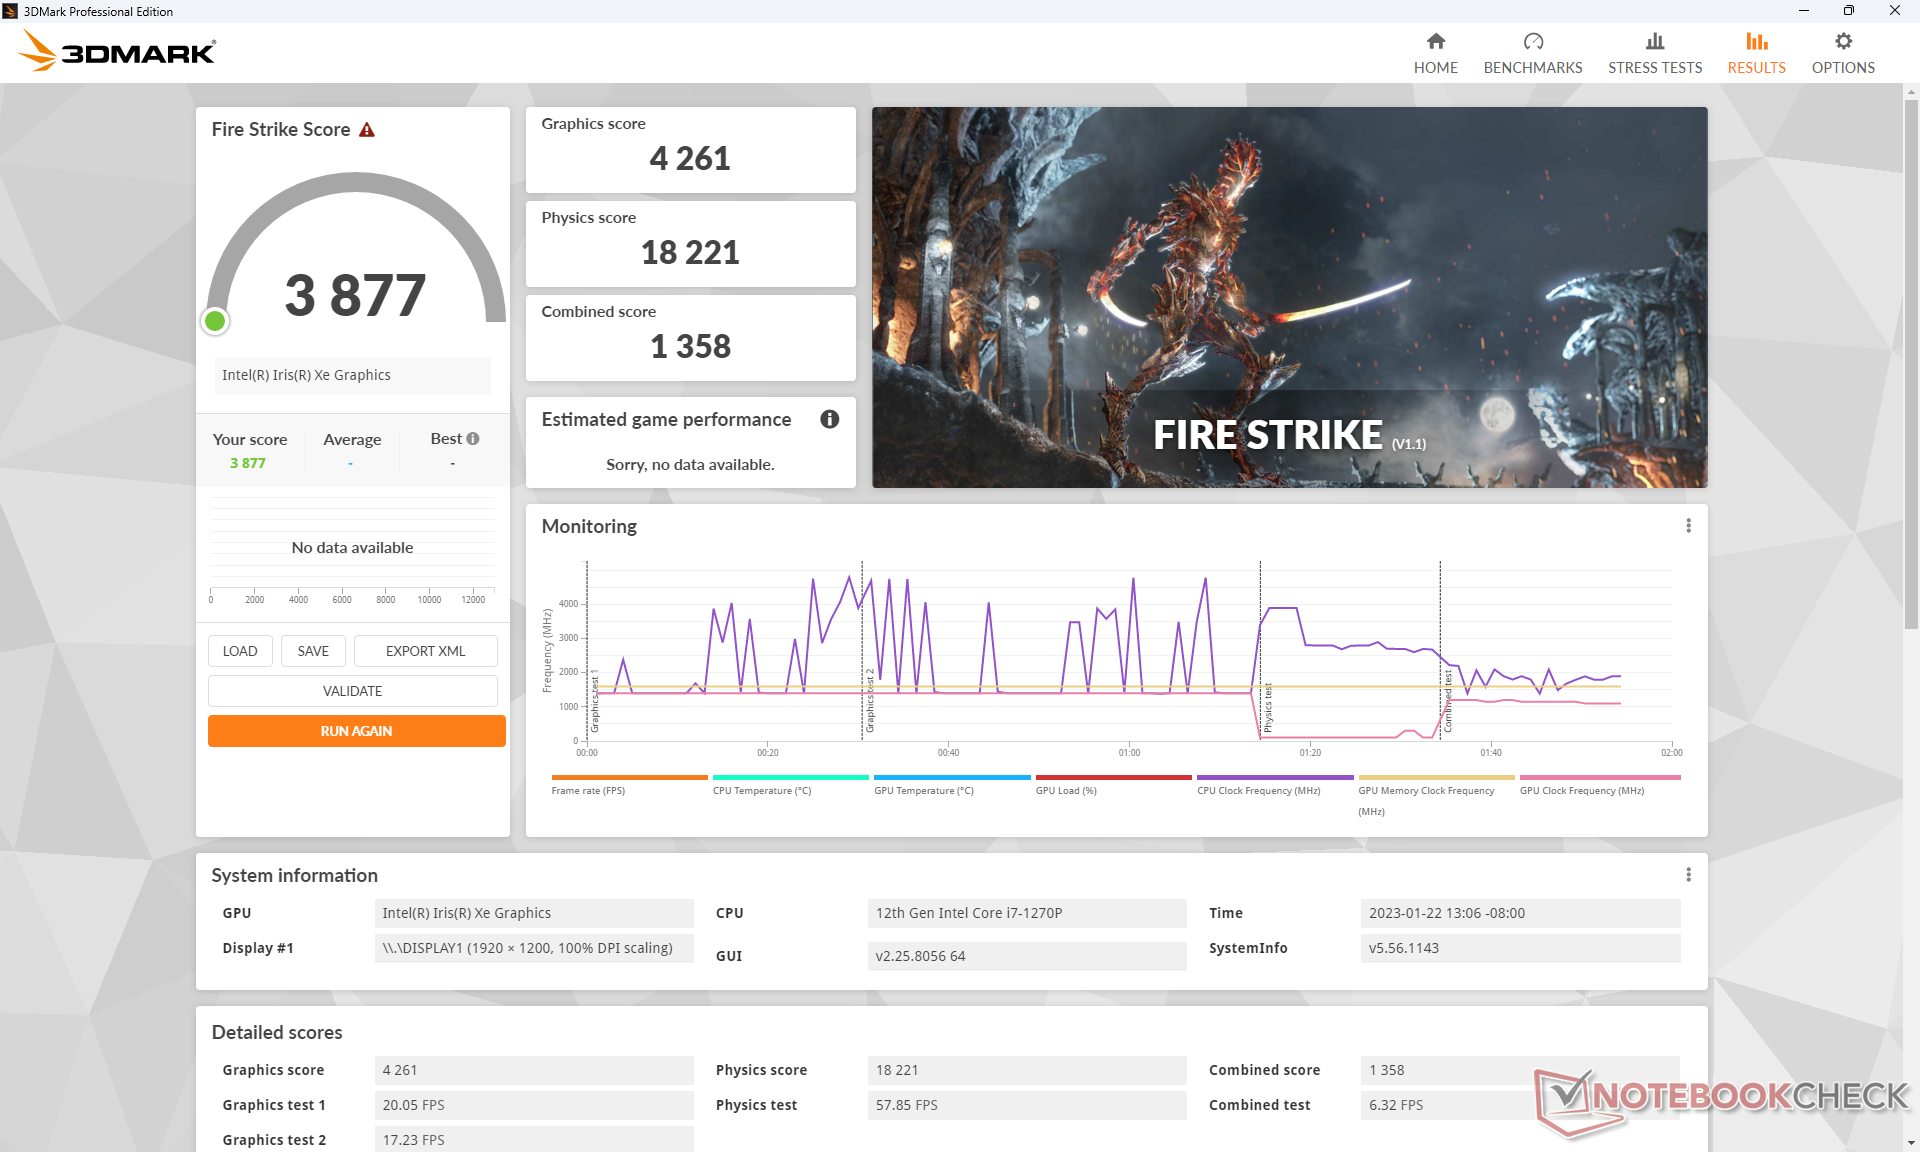
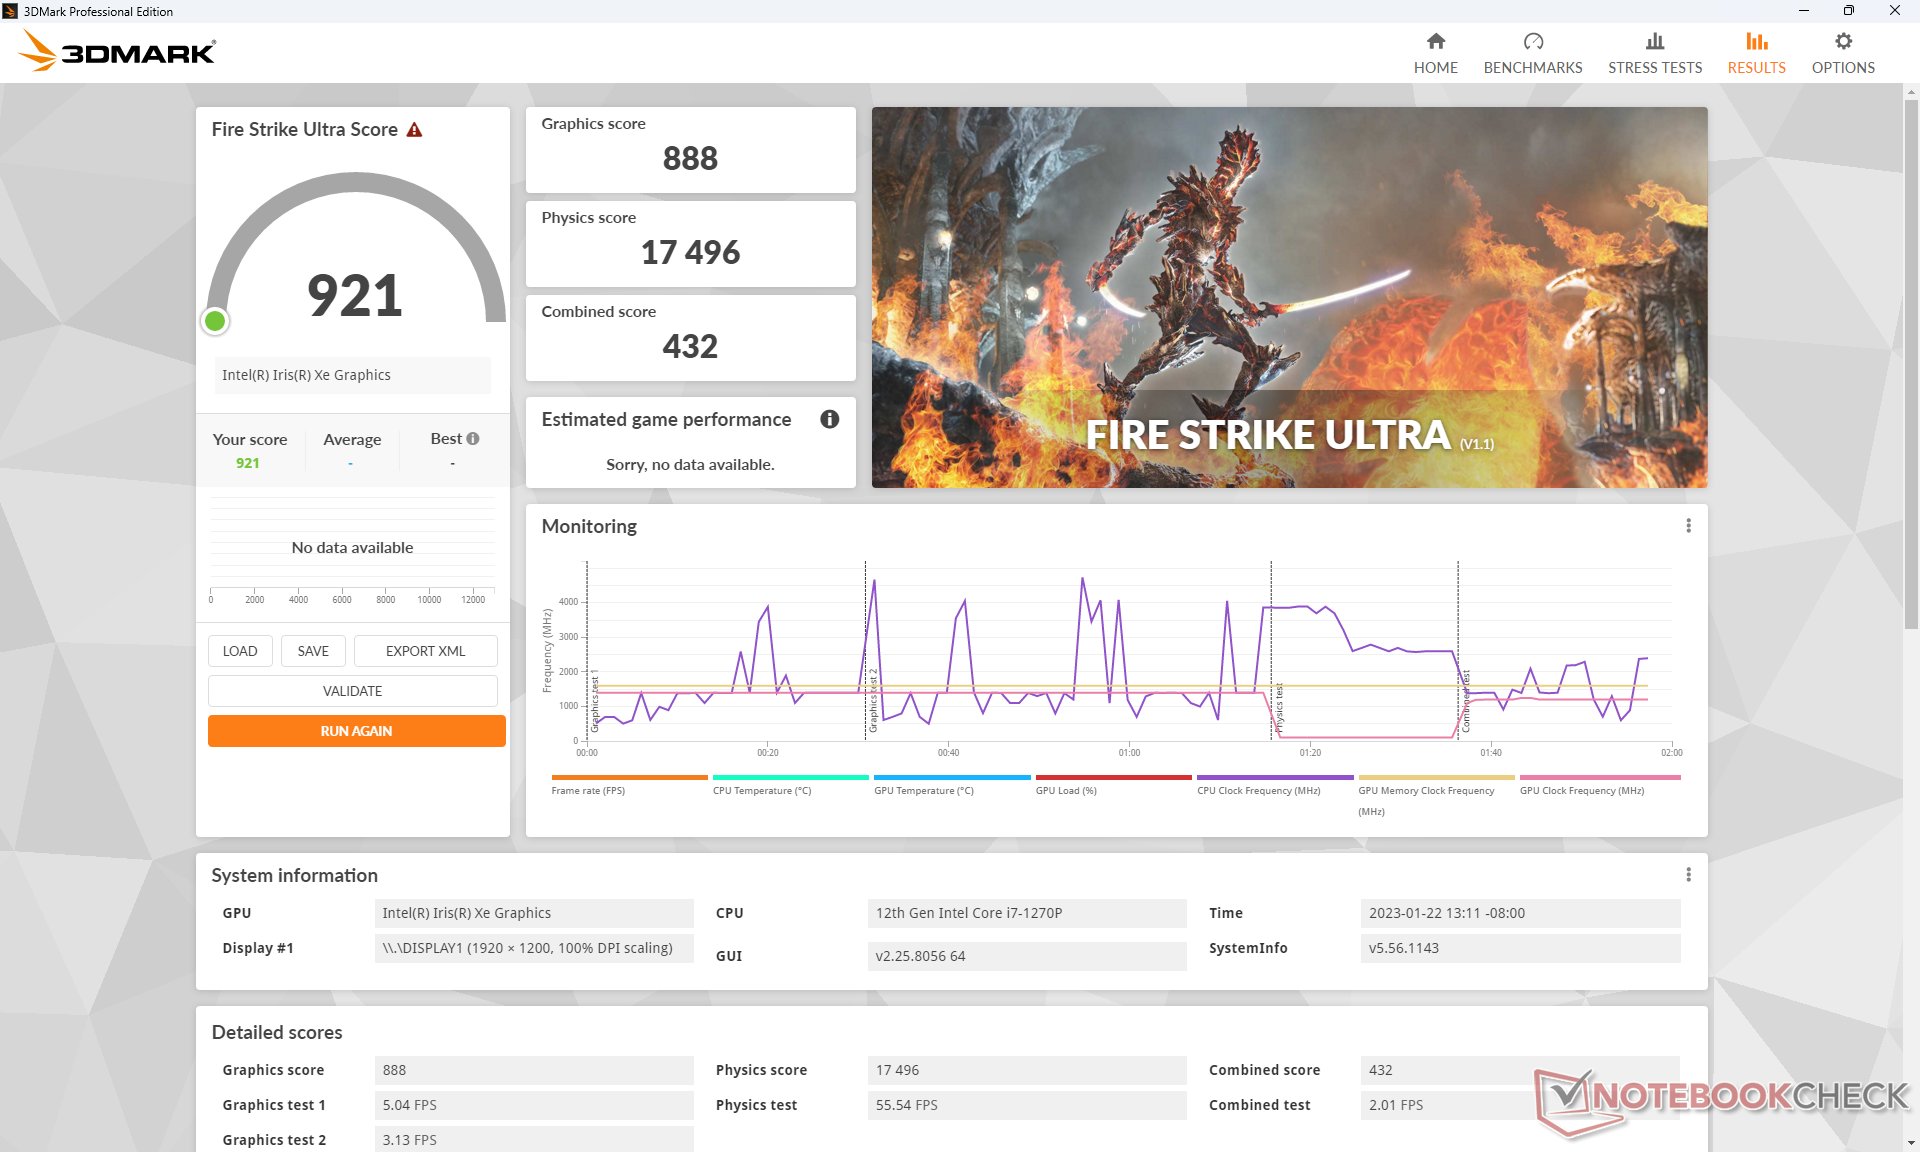
Graphics performance is about 10 percent slower than the average laptop in our database equipped with the same Iris Xe 96 EUs GPU. The underperformance can be partly attributed to the slow DDR4-3200 RAM relative to most other laptops powered by 12th gen Intel CPUs. The LG Gram 16, for example, ships with faster LPDDR5-5200 RAM as standard.
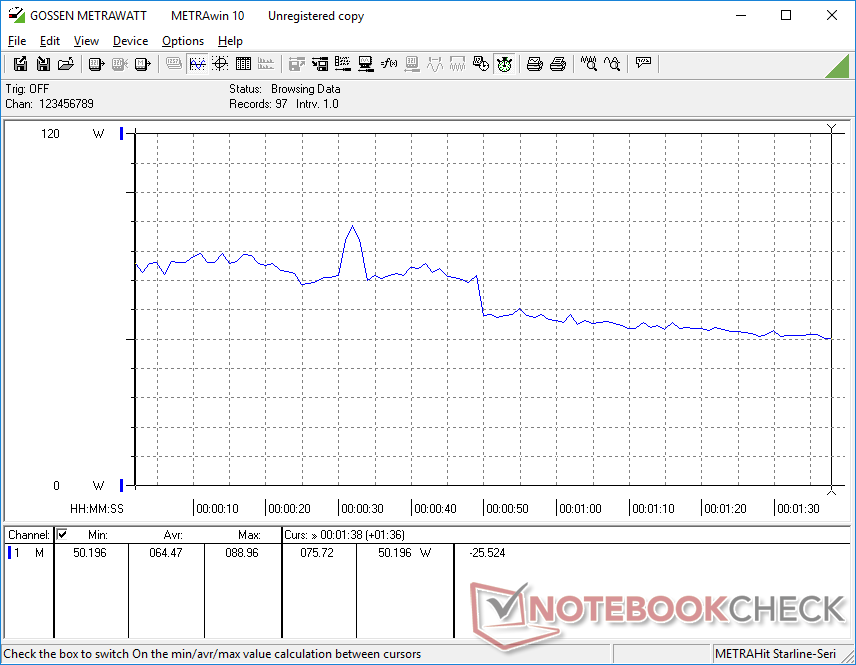
Additionally, graphics performance may become gradually slower when running high loads for extended periods. When idling on Witcher 3 at low settings, for example, frame rates would drop from 84 FPS during the start of the test to ~70 FPS after a couple of minutes as shown by the graph below due to the limited Turbo Boost potential of the system.
Upgrading to the Ryzen 5 Radeon 660M SKU of the same model will boost graphics performance by about 10 to 15 percent.
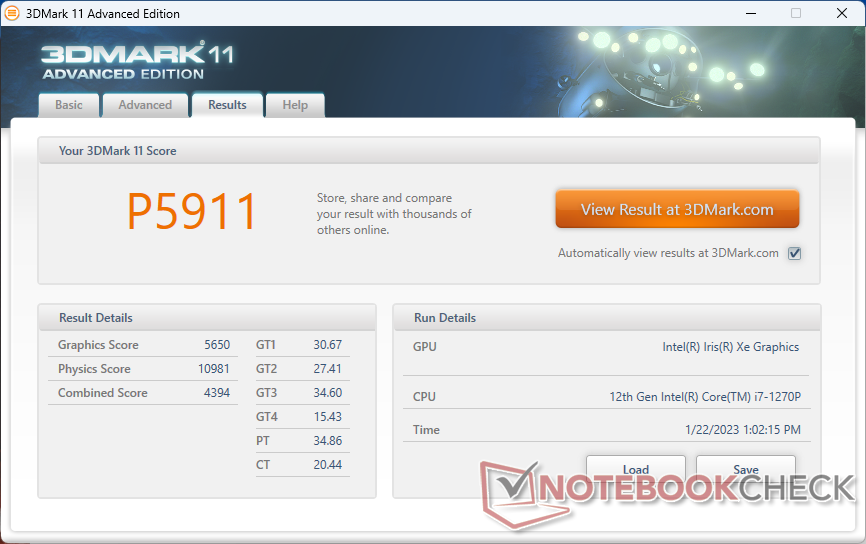
| 3DMark 11 Performance | 5911 points | |
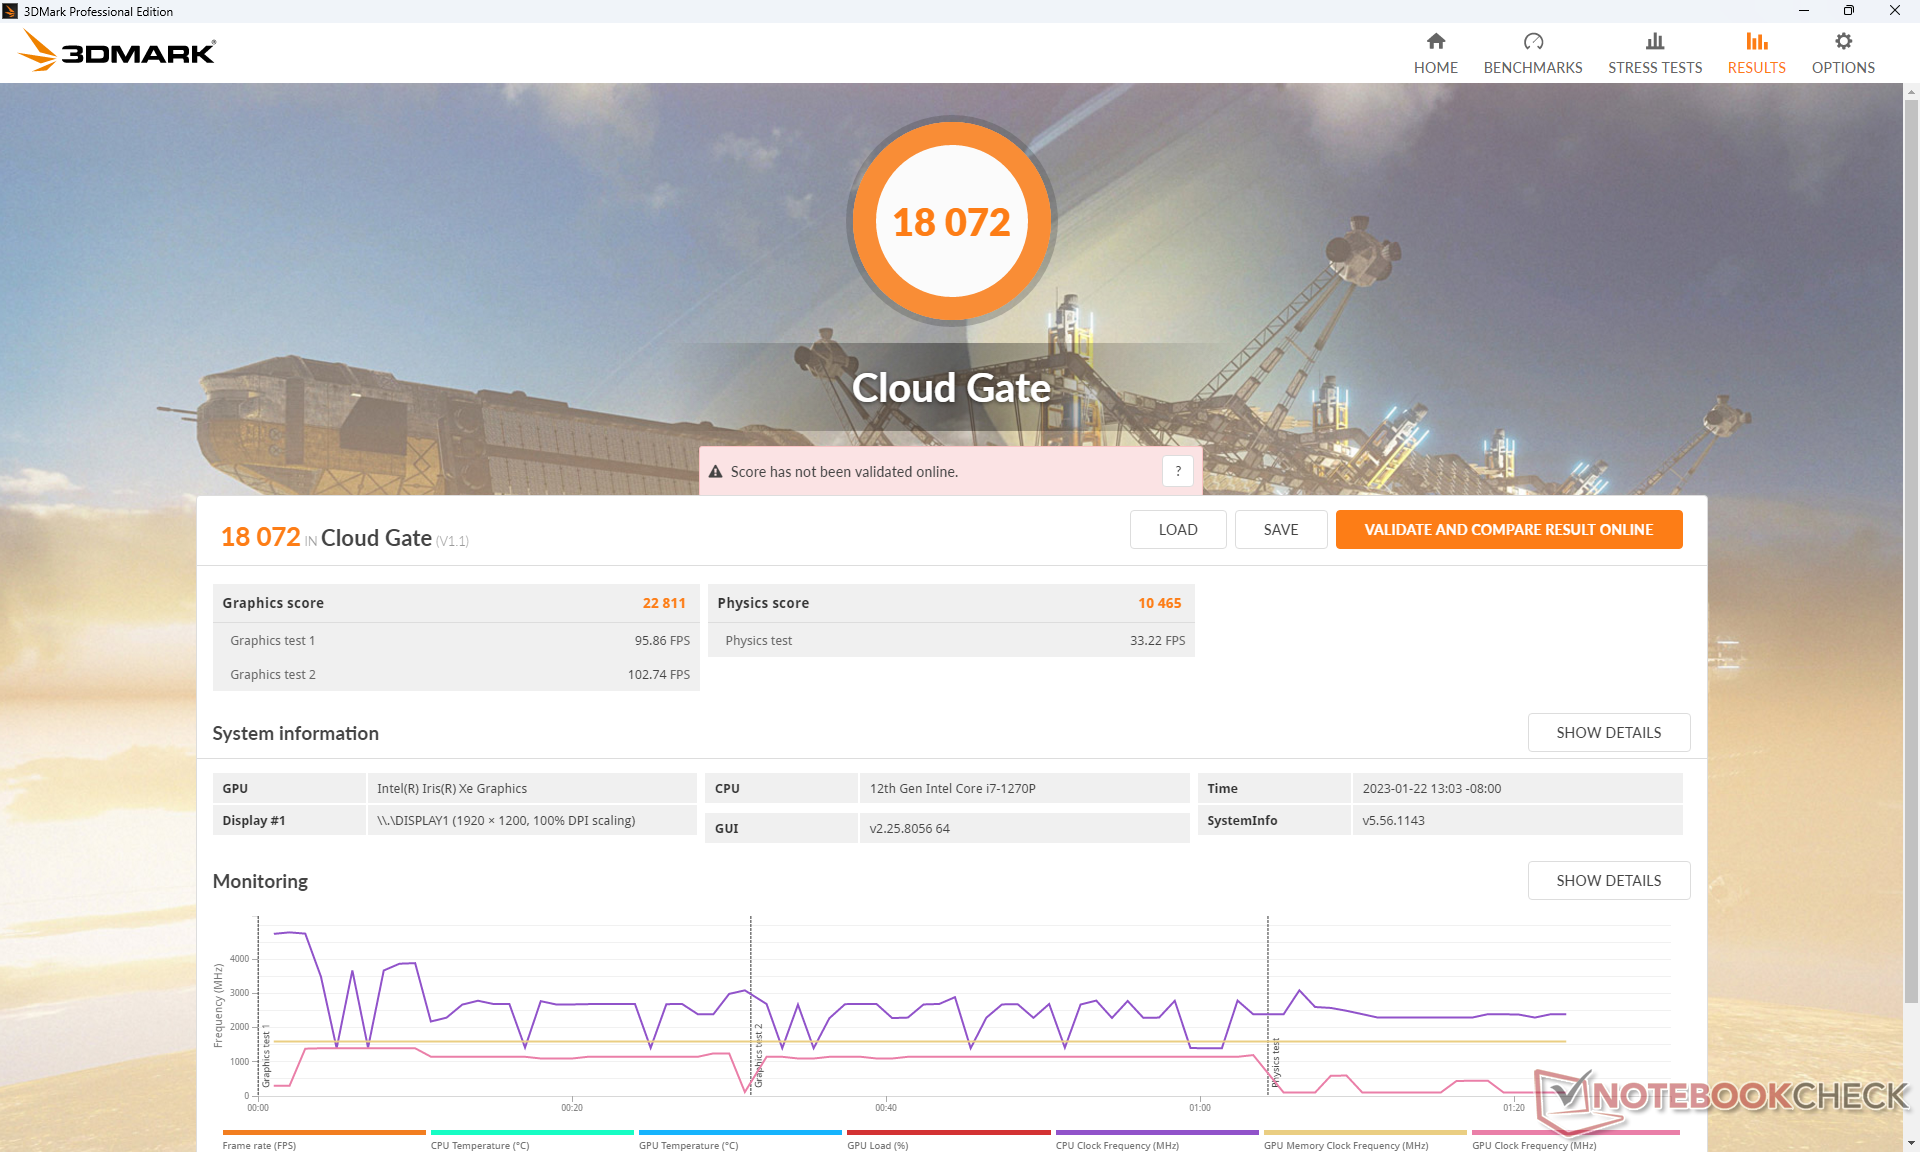
| 3DMark Cloud Gate Standard Score | 18072 points | |
| 3DMark Fire Strike Score | 3877 points | |
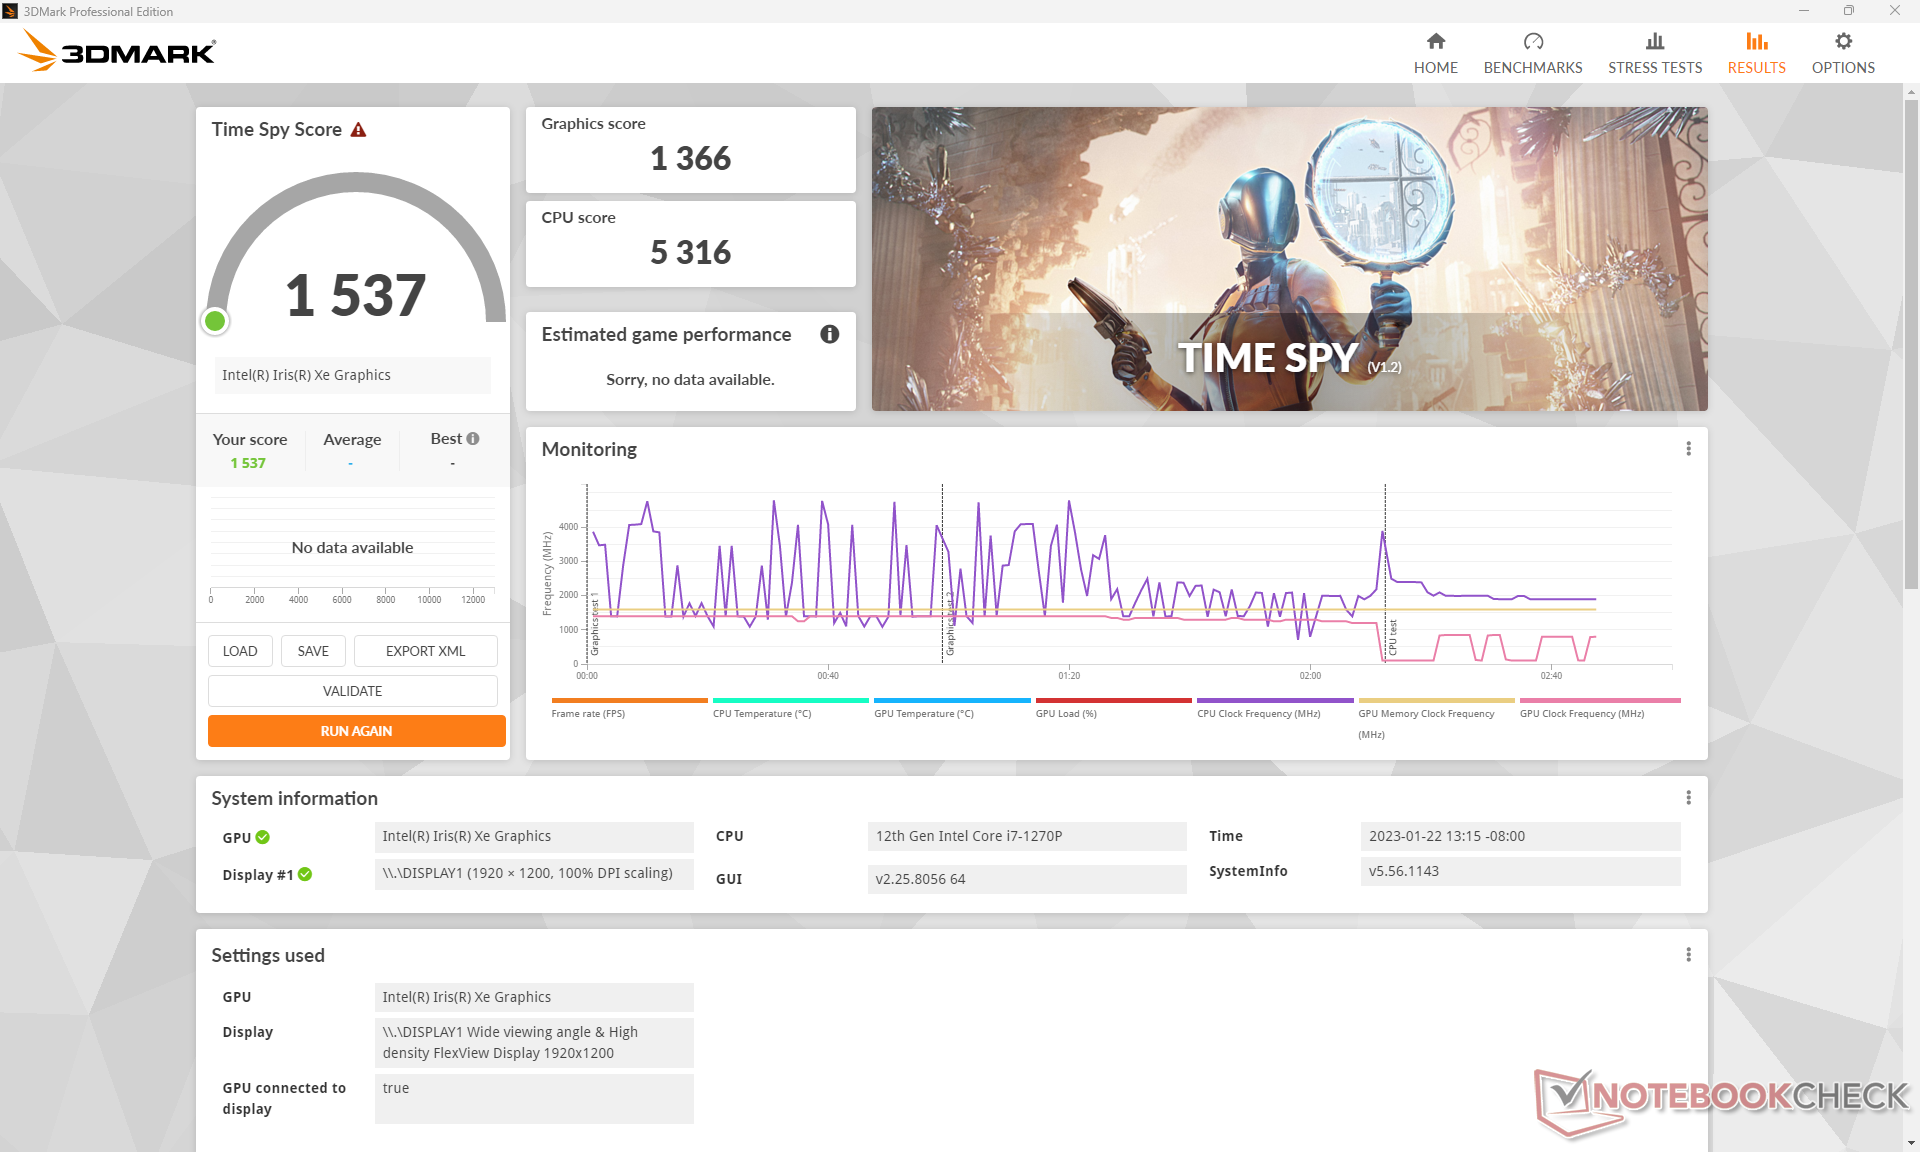
| 3DMark Time Spy Score | 1537 points | |
Help | ||
| Cyberpunk 2077 1.6 - 1920x1080 Low Preset | |
| Lenovo Yoga 7-14ARB G7 | |
| Asus ZenBook Flip 15 Q508U | |
| Average Intel Iris Xe Graphics G7 96EUs (13 - 25.9, n=42) | |
| Lenovo ThinkPad T16 Gen 1 Core i7-1270P | |
Witcher 3 FPS Chart
| low | med. | high | ultra | |
|---|---|---|---|---|
| GTA V (2015) | 97.8 | 74.8 | 14.1 | 4.85 |
| The Witcher 3 (2015) | 82.1 | 50.4 | 24.4 | 11.2 |
| Dota 2 Reborn (2015) | 110.6 | 71.9 | 48.9 | 44.6 |
| Final Fantasy XV Benchmark (2018) | 31.4 | 16.8 | 12.6 | |
| X-Plane 11.11 (2018) | 39.7 | 31.9 | 29.2 | |
| Strange Brigade (2018) | 79.2 | 29.8 | 24.2 | 19.1 |
| Cyberpunk 2077 1.6 (2022) | 18.4 |
Emissions
System Noise — Almost Always Quiet
Fan noise is one of the quietest for the screen size which partially explains the poor performance sustainability of the processor in the benchmarks above. The internal fan is just barely audible even when set to Performance mode and running demanding loads like games. It may pulse up to 34 dB(A) for short periods every once a while before returning to near silence, but even this maximum is quieter than on most laptops. The HP EliteBook 865 G9 takes a similar approach to fan noise for a very quiet user experience as well. There's little reason to select any mode other than Performance for fan noise control as a result.
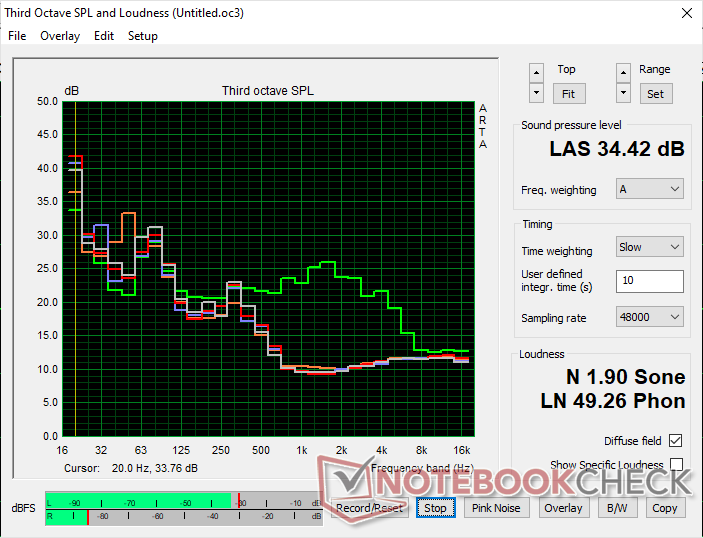
Noise level
| Idle |
| 24.7 / 24.7 / 24.7 dB(A) |
| Load |
| 24.5 / 34.4 dB(A) |
 | ||
30 dB silent 40 dB(A) audible 50 dB(A) loud |
||
min: | ||
| Lenovo ThinkPad T16 Gen 1 Core i7-1270P Iris Xe G7 96EUs, i7-1270P, Samsung PM9B1 512GB MZAL4512HBLU | Lenovo ThinkPad T16 G1 21CH004MGE Radeon 660M, R5 PRO 6650U, Micron 2450 512GB MTFDKBA512TFK | LG Gram 16Z90Q Iris Xe G7 96EUs, i7-1260P, Samsung PM9A1 MZVL21T0HCLR | HP EliteBook 865 G9 Radeon 680M, R7 PRO 6850U, Samsung PM991 MZVLQ512HBLU | Huawei MateBook 16s i7 Iris Xe G7 96EUs, i7-12700H, Silicon Motion PCIe-8 SSD | Apple MacBook Pro 16 2021 M1 Pro M1 Pro 16-Core GPU, M1 Pro, Apple SSD AP1024R | |
|---|---|---|---|---|---|---|
| Noise | -6% | -21% | -1% | -15% | -3% | |
| off / environment * (dB) | 24.7 | 23.1 6% | 25 -1% | 23 7% | 24 3% | 24.7 -0% |
| Idle Minimum * (dB) | 24.7 | 23.1 6% | 26 -5% | 23 7% | 24 3% | 24.7 -0% |
| Idle Average * (dB) | 24.7 | 23.1 6% | 27 -9% | 23 7% | 25.2 -2% | 24.7 -0% |
| Idle Maximum * (dB) | 24.7 | 23.1 6% | 28 -13% | 23 7% | 27.2 -10% | 24.7 -0% |
| Load Average * (dB) | 24.5 | 25.4 -4% | 38 -55% | 29.1 -19% | 34.8 -42% | 26.1 -7% |
| Witcher 3 ultra * (dB) | 24.3 | 35.93 -48% | 37 -52% | 29.1 -20% | 34.8 -43% | |
| Load Maximum * (dB) | 34.4 | 39.1 -14% | 38 -10% | 32.9 4% | 39 -13% | 37.4 -9% |
* ... smaller is better
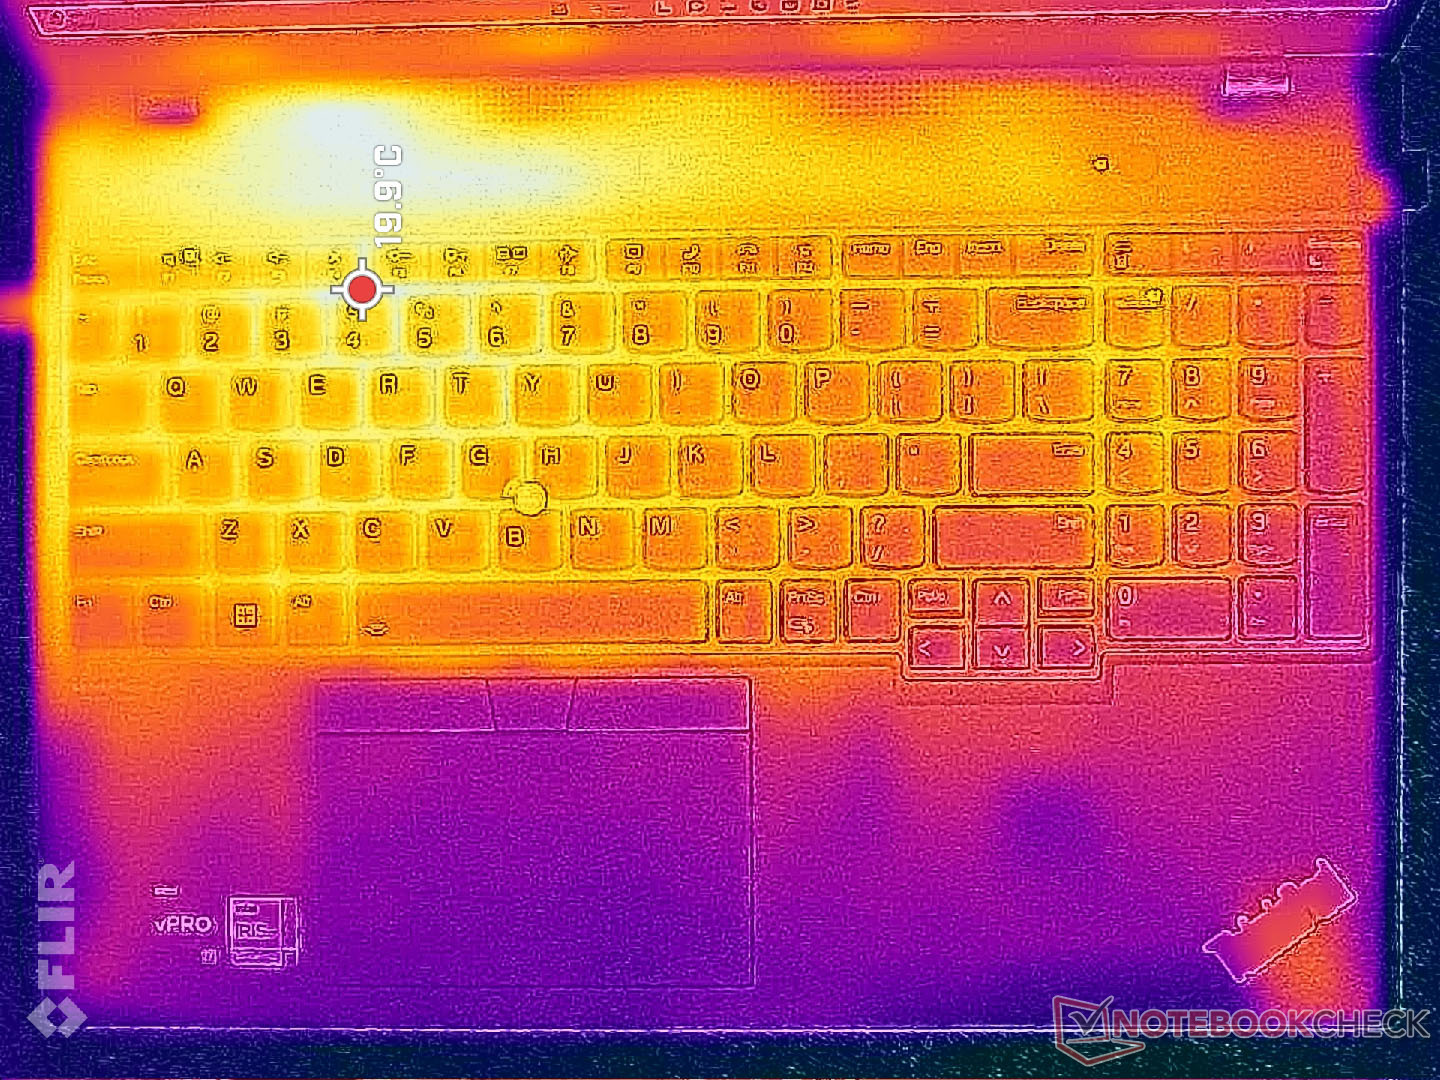
Temperature
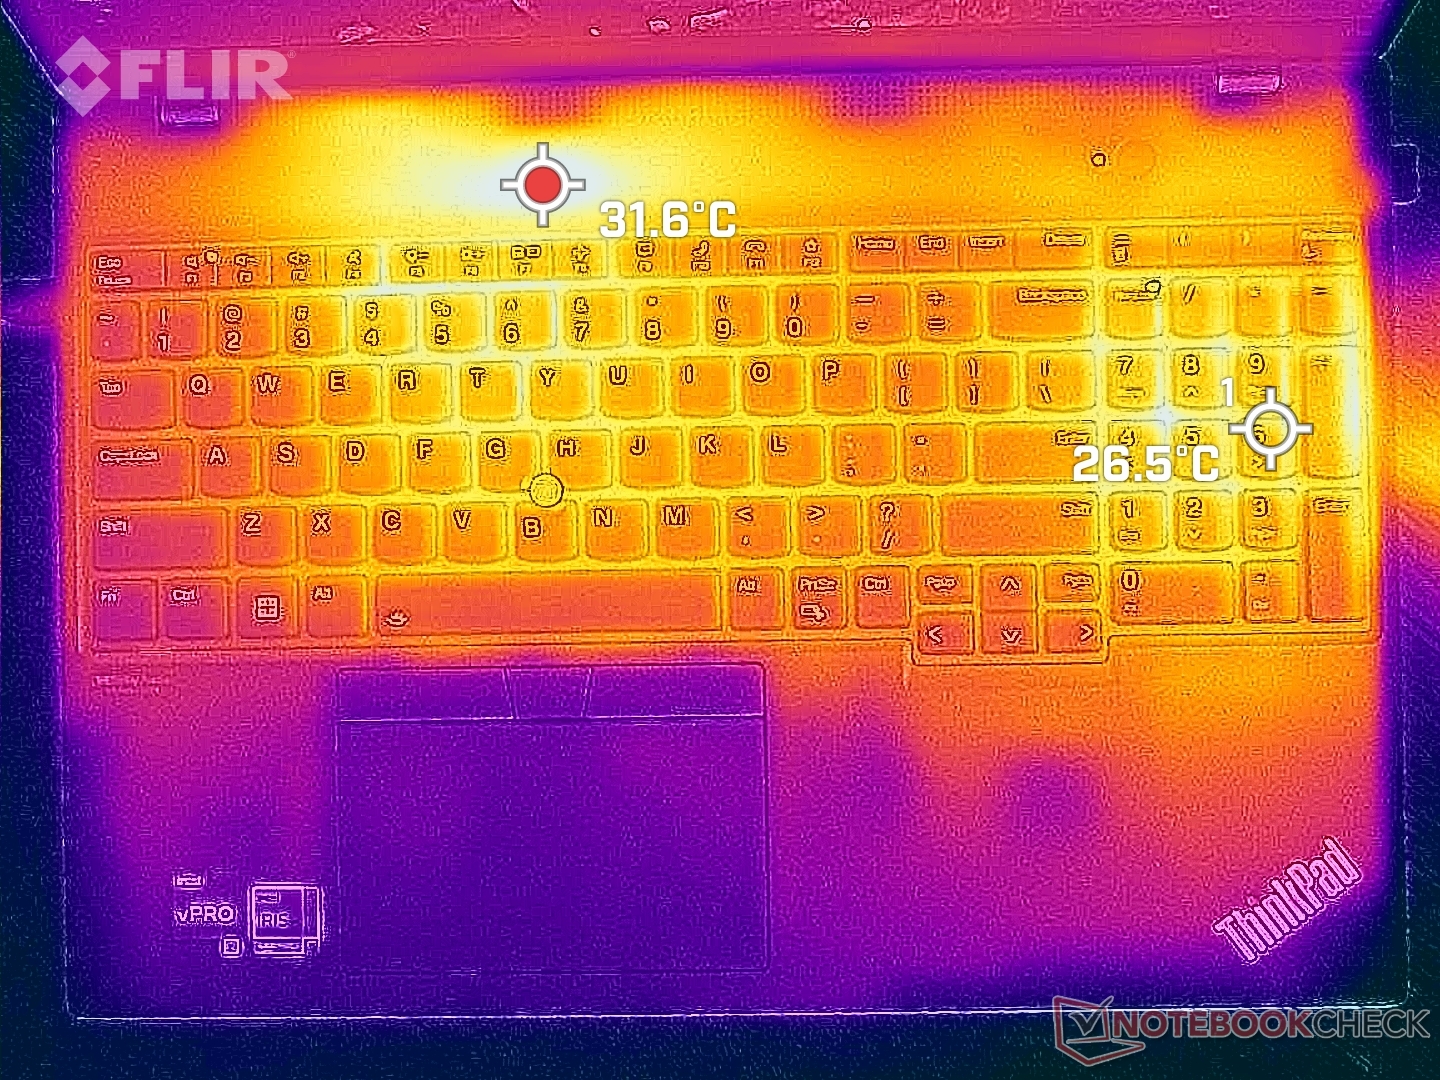
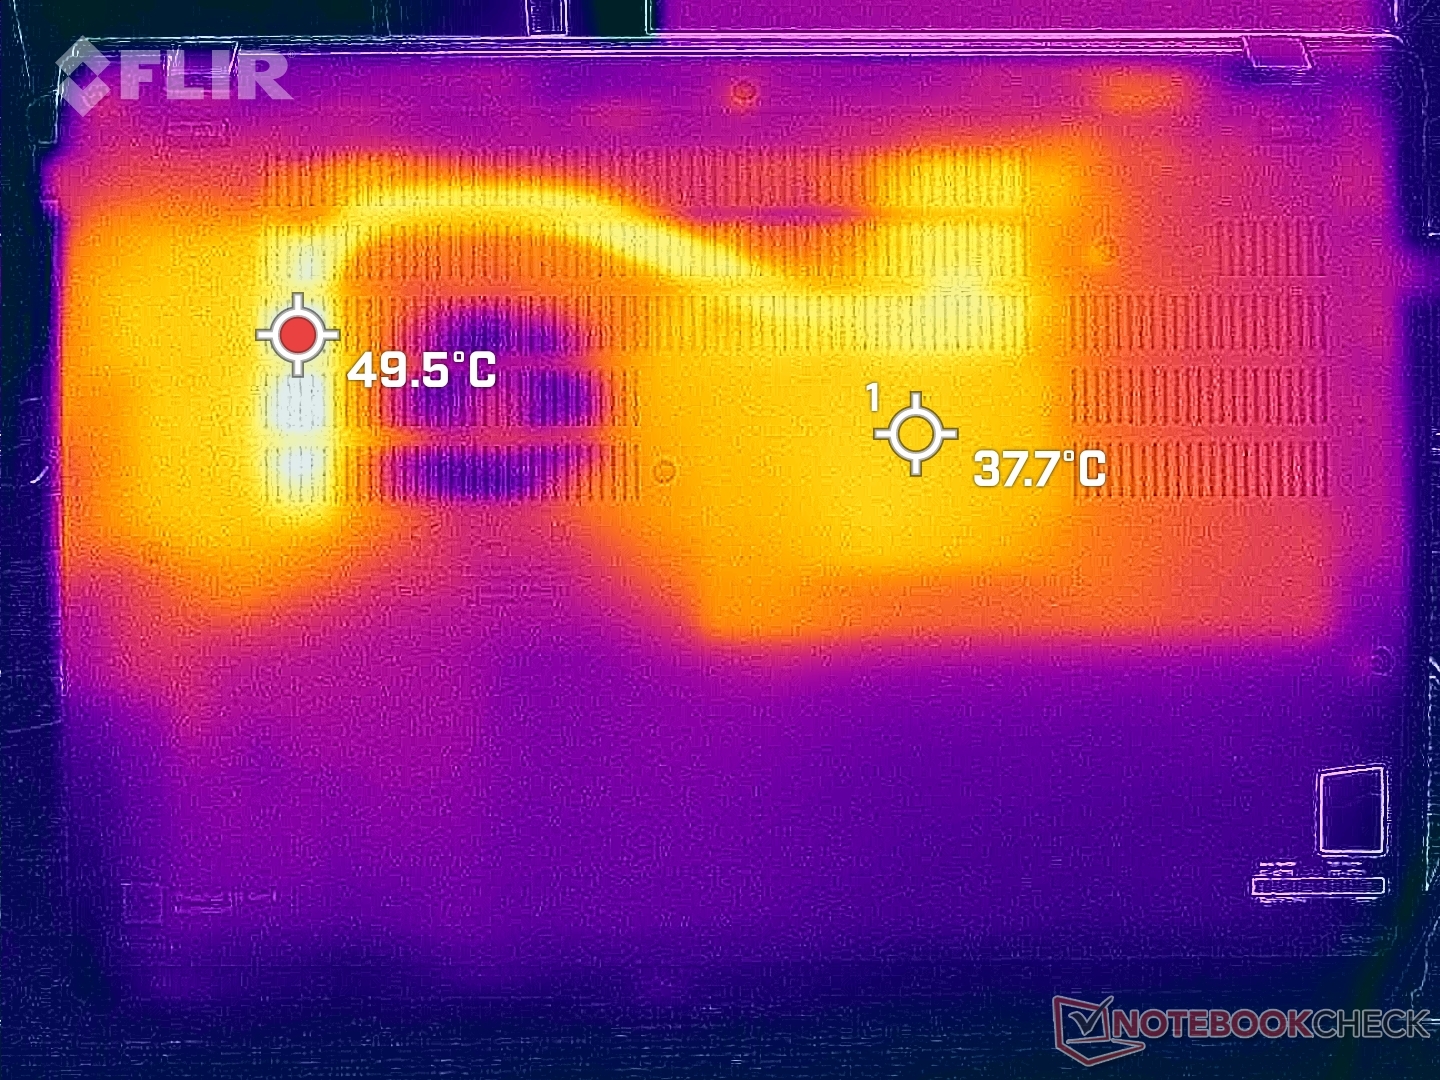
Surface temperatures are much cooler on the top deck than on the bottom. The average temperature on the keyboard deck and palm rests is about 29 C when running demanding loads compared to 36 C on the bottom surface. This is in contrast to most other laptops like on the LG Gram 16 where the keyboard center can reach 44 C to be over 10 C warmer than on our ThinkPad T16 G1.
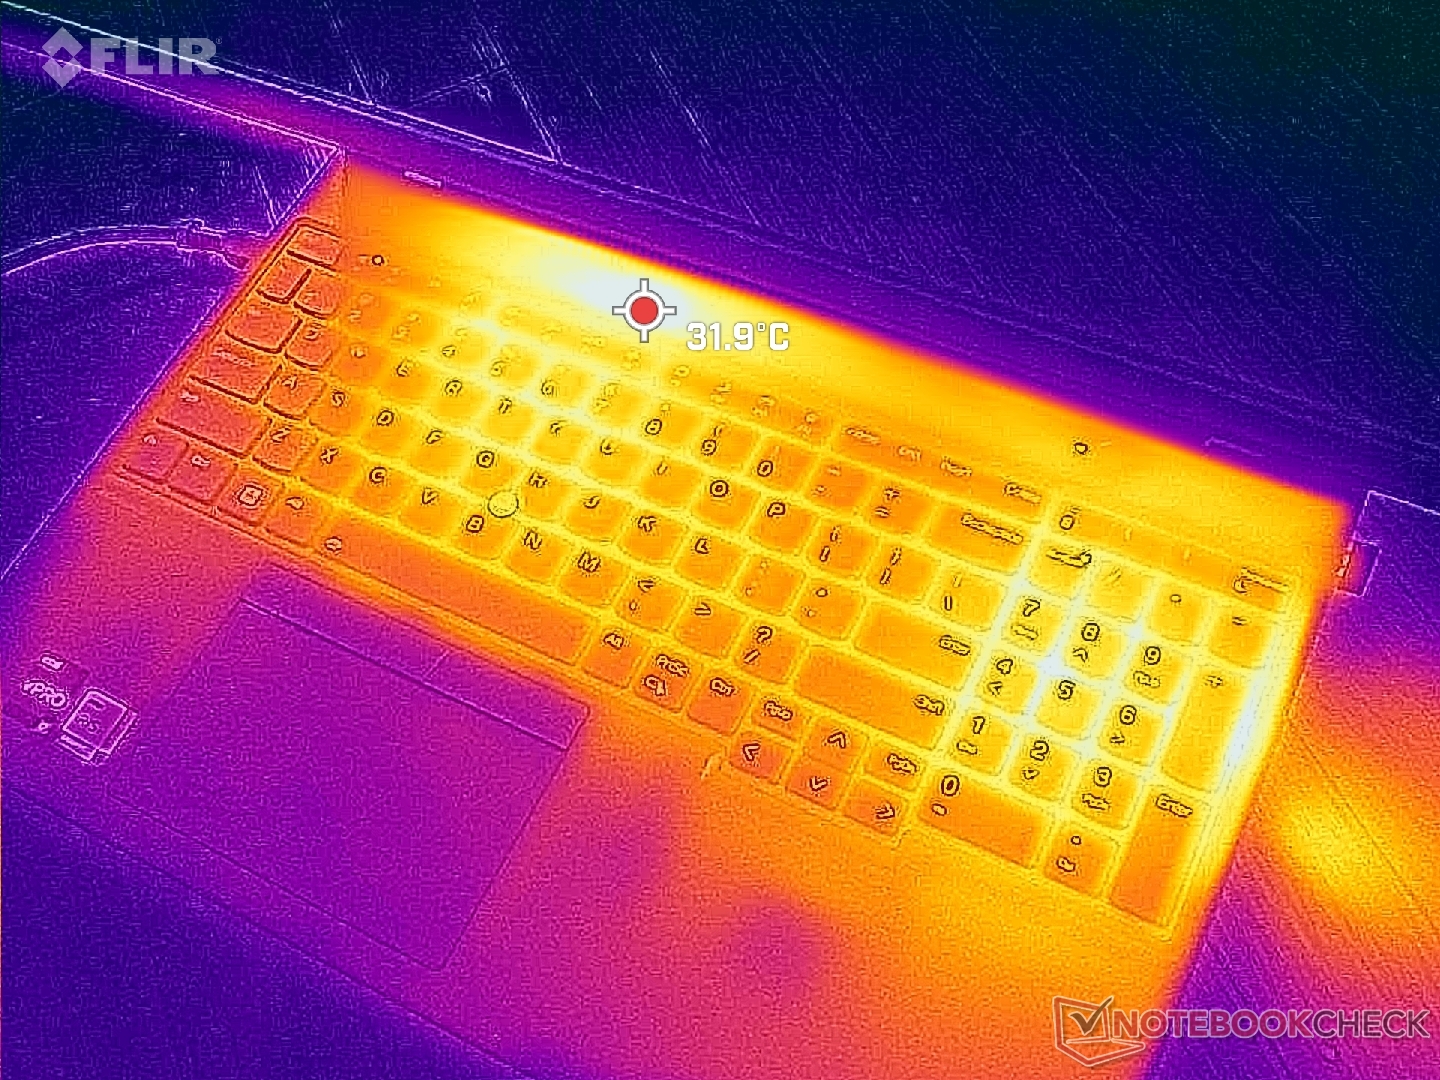
(+) The maximum temperature on the upper side is 33.8 °C / 93 F, compared to the average of 34.3 °C / 94 F, ranging from 21.2 to 62.5 °C for the class Office.
(-) The bottom heats up to a maximum of 47 °C / 117 F, compared to the average of 36.8 °C / 98 F
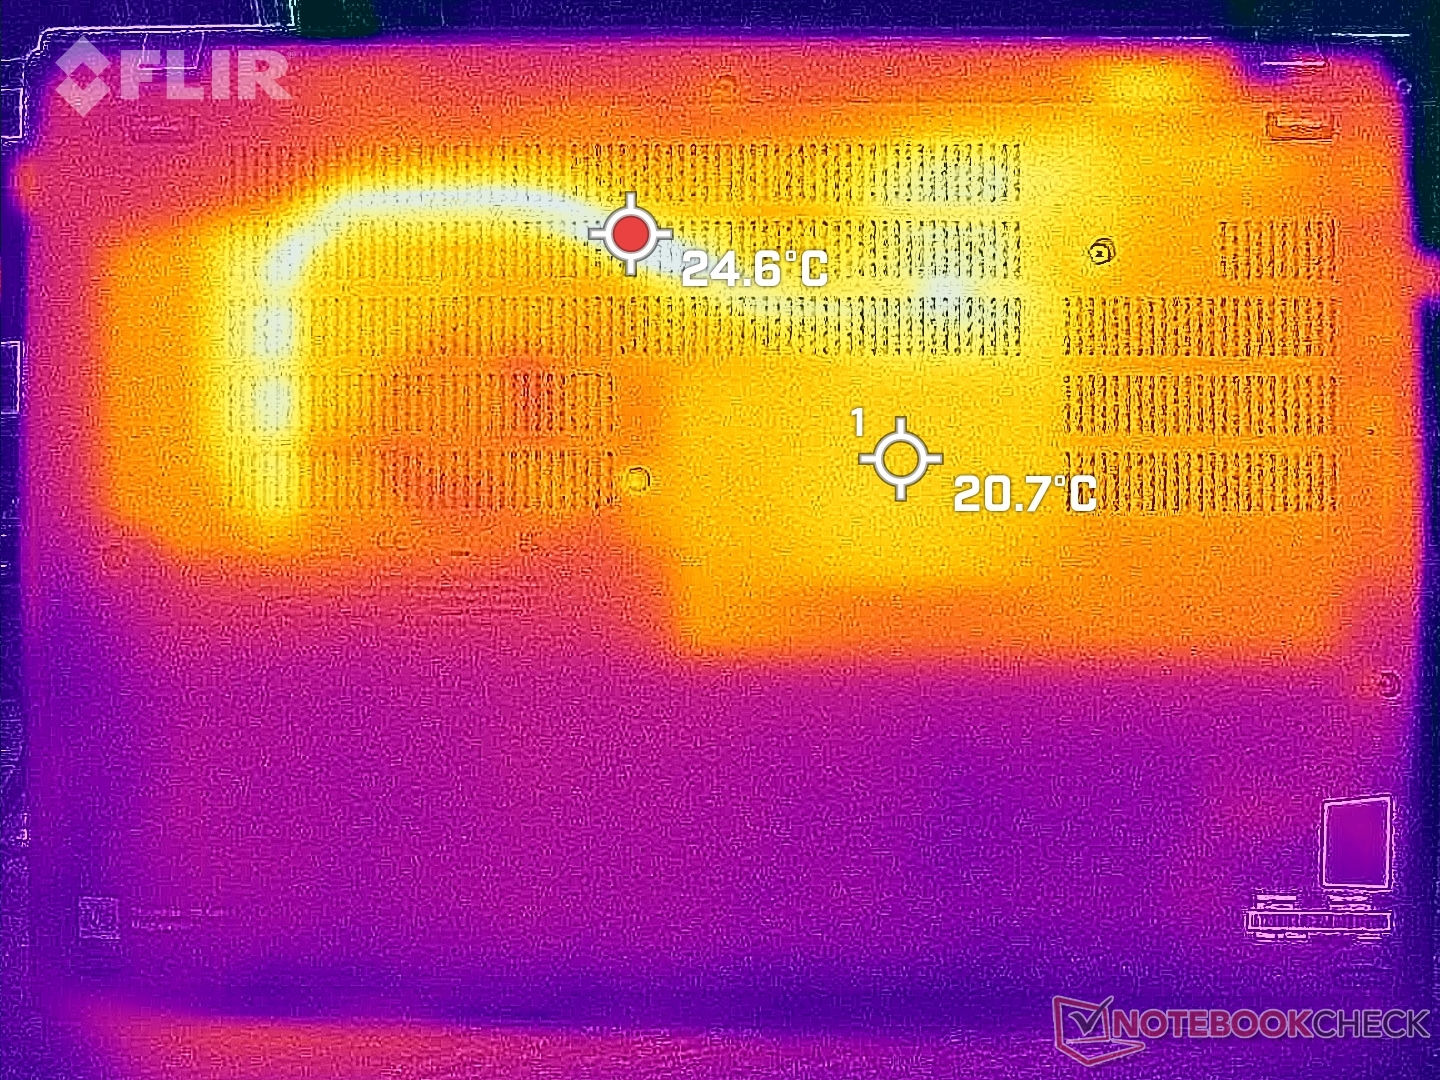
(+) In idle usage, the average temperature for the upper side is 22.6 °C / 73 F, compared to the device average of 29.5 °C / 85 F.
(+) The palmrests and touchpad are cooler than skin temperature with a maximum of 24.6 °C / 76.3 F and are therefore cool to the touch.
(+) The average temperature of the palmrest area of similar devices was 27.5 °C / 81.5 F (+2.9 °C / 5.2 F).
| Lenovo ThinkPad T16 Gen 1 Core i7-1270P Intel Core i7-1270P, Intel Iris Xe Graphics G7 96EUs | Lenovo ThinkPad T16 G1 21BWS00200 Intel Core i5-1240P, Intel Iris Xe Graphics G7 80EUs | LG Gram 16Z90Q Intel Core i7-1260P, Intel Iris Xe Graphics G7 96EUs | HP EliteBook 865 G9 AMD Ryzen 7 PRO 6850U, AMD Radeon 680M | Huawei MateBook 16s i7 Intel Core i7-12700H, Intel Iris Xe Graphics G7 96EUs | Apple MacBook Pro 16 2021 M1 Pro Apple M1 Pro, Apple M1 Pro 16-Core GPU | |
|---|---|---|---|---|---|---|
| Heat | -19% | -6% | 0% | -13% | 3% | |
| Maximum Upper Side * (°C) | 33.8 | 45 -33% | 45 -33% | 39.4 -17% | 40.9 -21% | 41 -21% |
| Maximum Bottom * (°C) | 47 | 42.8 9% | 43 9% | 47.6 -1% | 48.3 -3% | 39 17% |
| Idle Upper Side * (°C) | 24.6 | 33 -34% | 26 -6% | 23.6 4% | 29.2 -19% | 24 2% |
| Idle Bottom * (°C) | 28.2 | 33.6 -19% | 26 8% | 24.1 15% | 30.4 -8% | 24 15% |
* ... smaller is better
Stress Test
The steep performance drops during our Witcher 3 and CineBench R15 xT loop tests above can be observed through HWiNFO. When running Prime95, for example, CPU clock rates and board power draw would boost to high as 3.5 GHz and 48 W, respectively. Once core temperature reaches 97 C a few seconds later, however, clock rates and board power draw would begin to steadily decline to as low as 1.7 GHz and 22 W, respectively, in order to maintain a cooler core temperature of 69 C. Deploying ThrottleStop will raise the stable clock rate to a higher 2 to 3 GHz range albeit at the cost of warmer core temperatures.
GPU clock rates and temperature when running Witcher 3 would stabilize at 998 MHz and 67 C, respectively, compared to 1100 MHz and 58 C on the smaller HP Dragonfly Folio 13.5 G3. Running on battery power does not appear to impact performance.
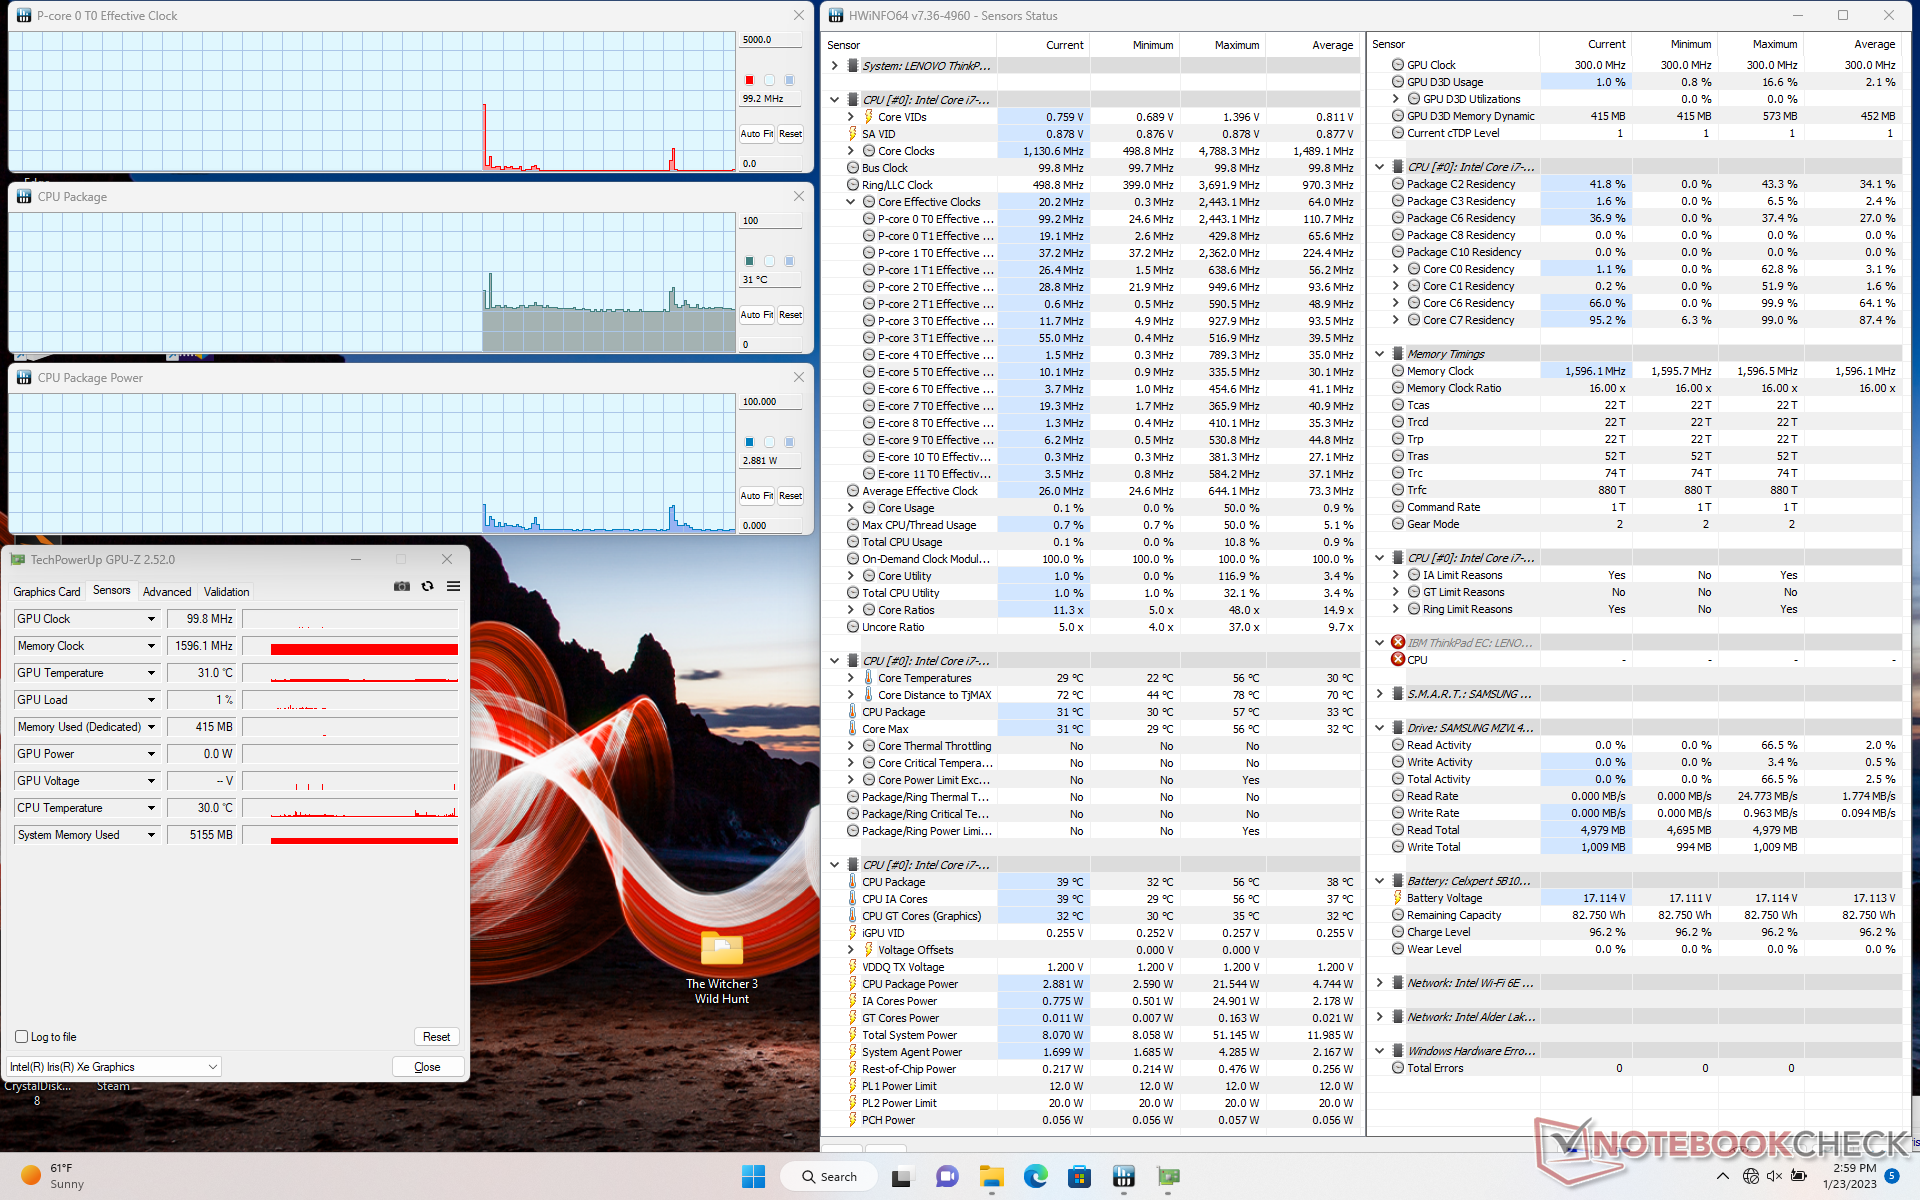
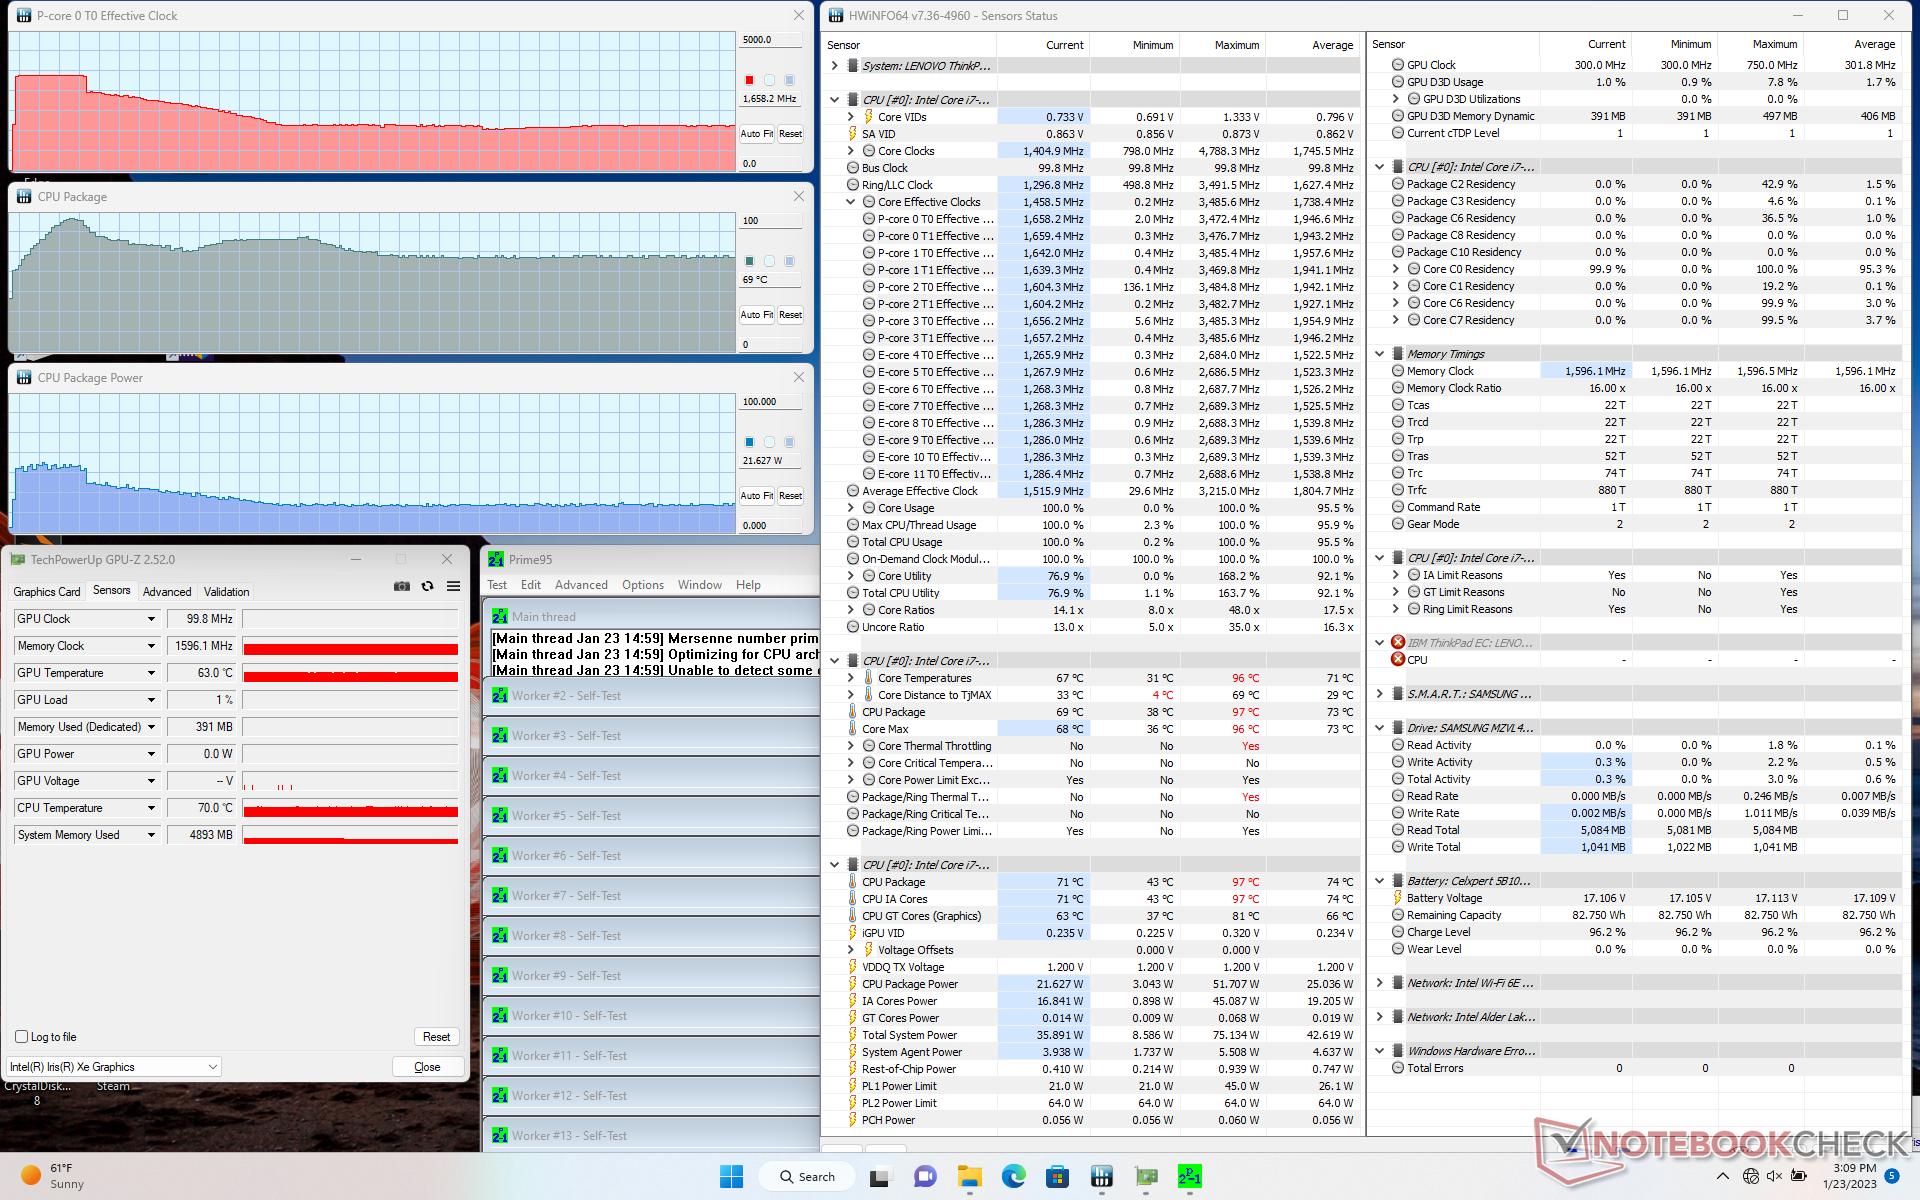
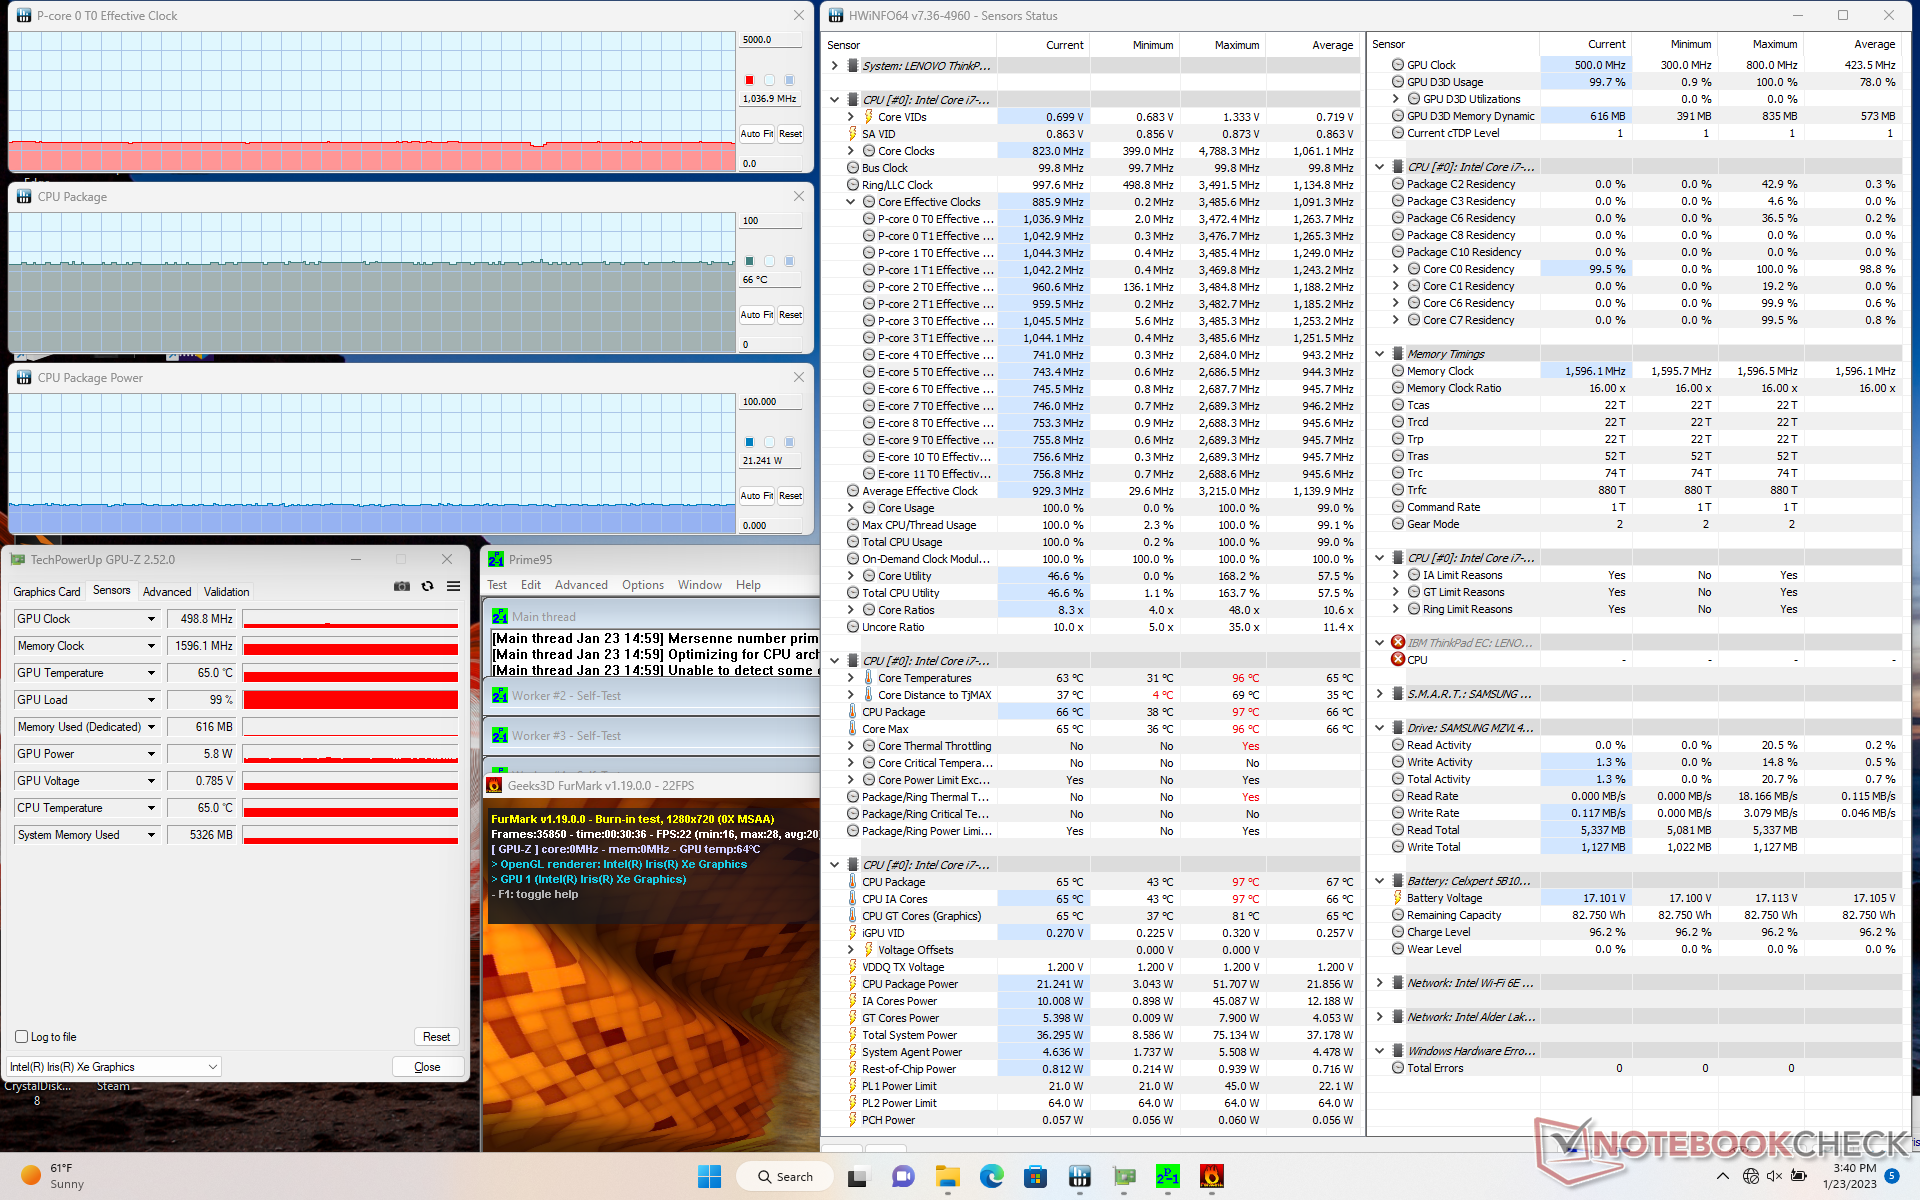
| CPU Clock (GHz) | GPU Clock (MHz) | Average CPU Temperature (°C) | |
| System Idle | -- | -- | 31 |
| Prime95 Stress | 1.7 | -- | 69 |
| Prime95 + FurMark Stress | 1.0 | 499 | 66 |
| Witcher 3 Stress | ~1.3 | 998 | 67 |
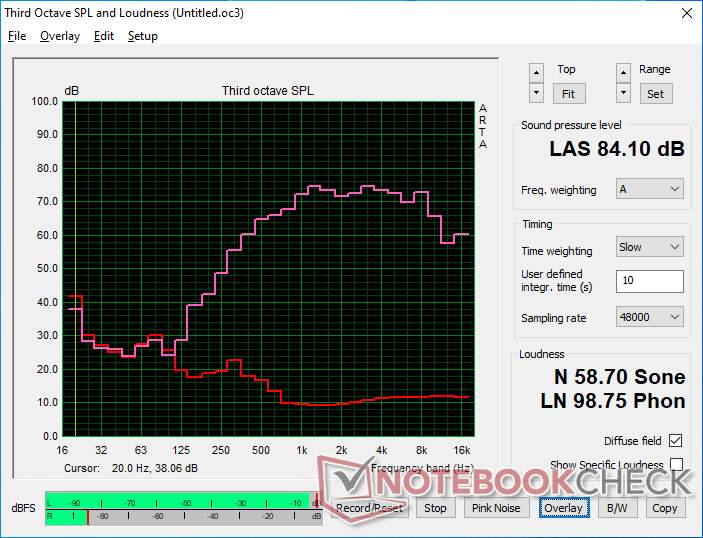
Speakers
Lenovo ThinkPad T16 Gen 1 Core i7-1270P audio analysis
(+) | speakers can play relatively loud (84.1 dB)
Bass 100 - 315 Hz
(-) | nearly no bass - on average 26.3% lower than median
(±) | linearity of bass is average (11.1% delta to prev. frequency)
Mids 400 - 2000 Hz
(+) | balanced mids - only 4.5% away from median
(+) | mids are linear (5.1% delta to prev. frequency)
Highs 2 - 16 kHz
(±) | higher highs - on average 5.8% higher than median
(+) | highs are linear (4.8% delta to prev. frequency)
Overall 100 - 16.000 Hz
(±) | linearity of overall sound is average (20.1% difference to median)
Compared to same class
» 43% of all tested devices in this class were better, 10% similar, 47% worse
» The best had a delta of 7%, average was 21%, worst was 53%
Compared to all devices tested
» 52% of all tested devices were better, 8% similar, 40% worse
» The best had a delta of 4%, average was 23%, worst was 134%
Apple MacBook Pro 16 2021 M1 Pro audio analysis
(+) | speakers can play relatively loud (84.7 dB)
Bass 100 - 315 Hz
(+) | good bass - only 3.8% away from median
(+) | bass is linear (5.2% delta to prev. frequency)
Mids 400 - 2000 Hz
(+) | balanced mids - only 1.3% away from median
(+) | mids are linear (2.1% delta to prev. frequency)
Highs 2 - 16 kHz
(+) | balanced highs - only 1.9% away from median
(+) | highs are linear (2.7% delta to prev. frequency)
Overall 100 - 16.000 Hz
(+) | overall sound is linear (4.6% difference to median)
Compared to same class
» 0% of all tested devices in this class were better, 0% similar, 100% worse
» The best had a delta of 5%, average was 17%, worst was 45%
Compared to all devices tested
» 0% of all tested devices were better, 0% similar, 100% worse
» The best had a delta of 4%, average was 23%, worst was 134%
Energy Management
Power Consumption
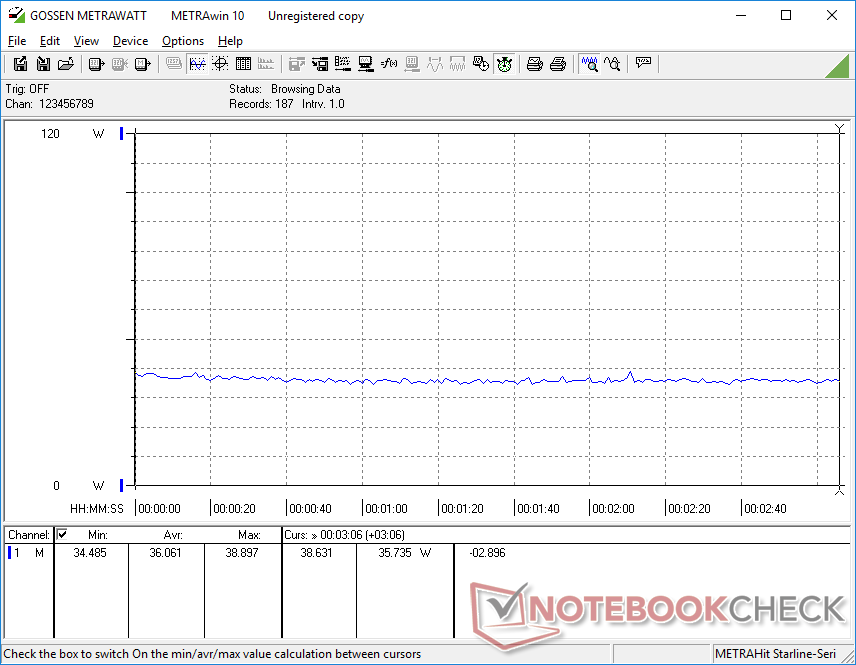
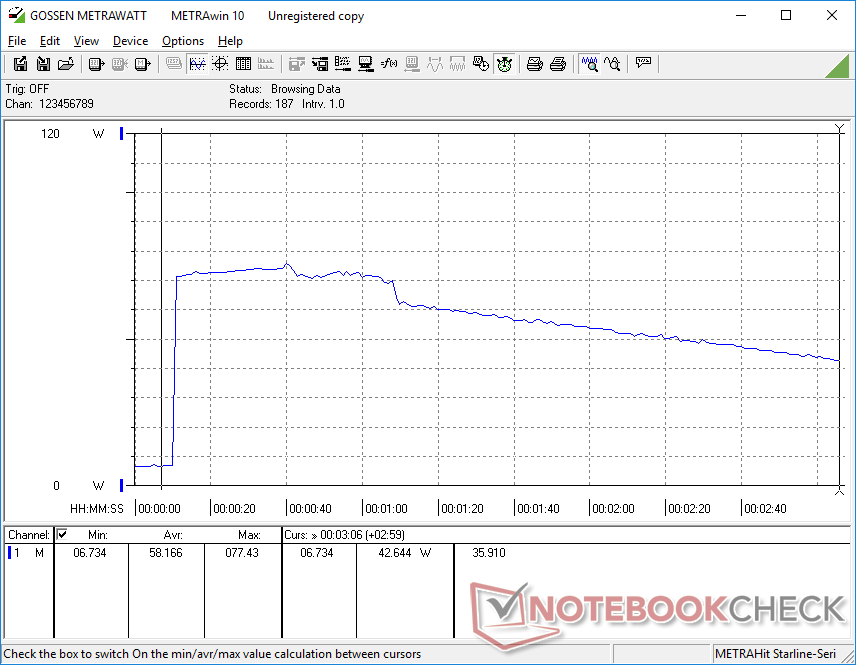
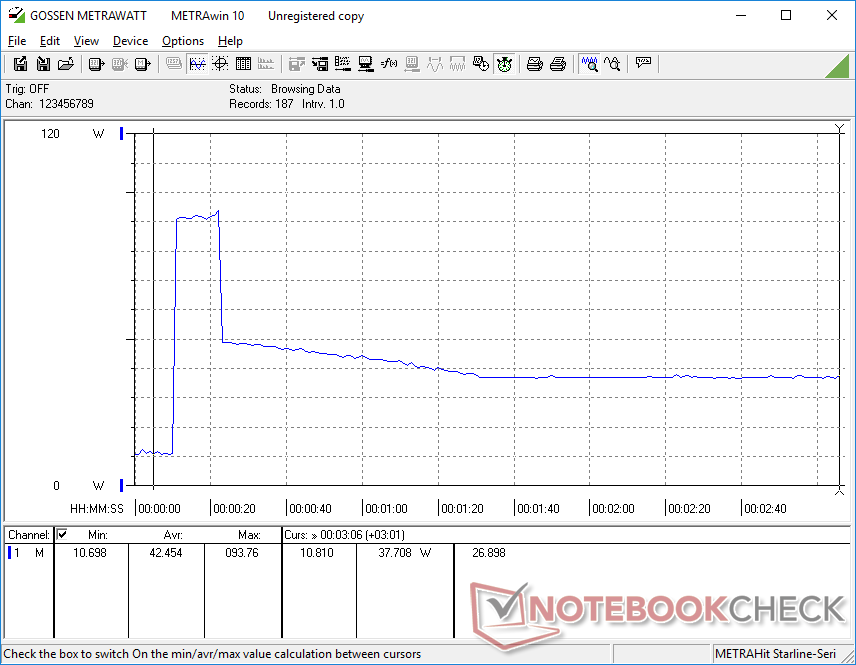
Power consumption when running higher loads reflects our clock rate and performance observations above. Namely, it can be high during the first few moments of stress before falling off a cliff to lower levels due to performance throttling. When running Prime95, for example, consumption would be high at around 77 W for roughly 60 seconds before falling to 42 W or lower over time. This would occur even if set to High Performance mode.
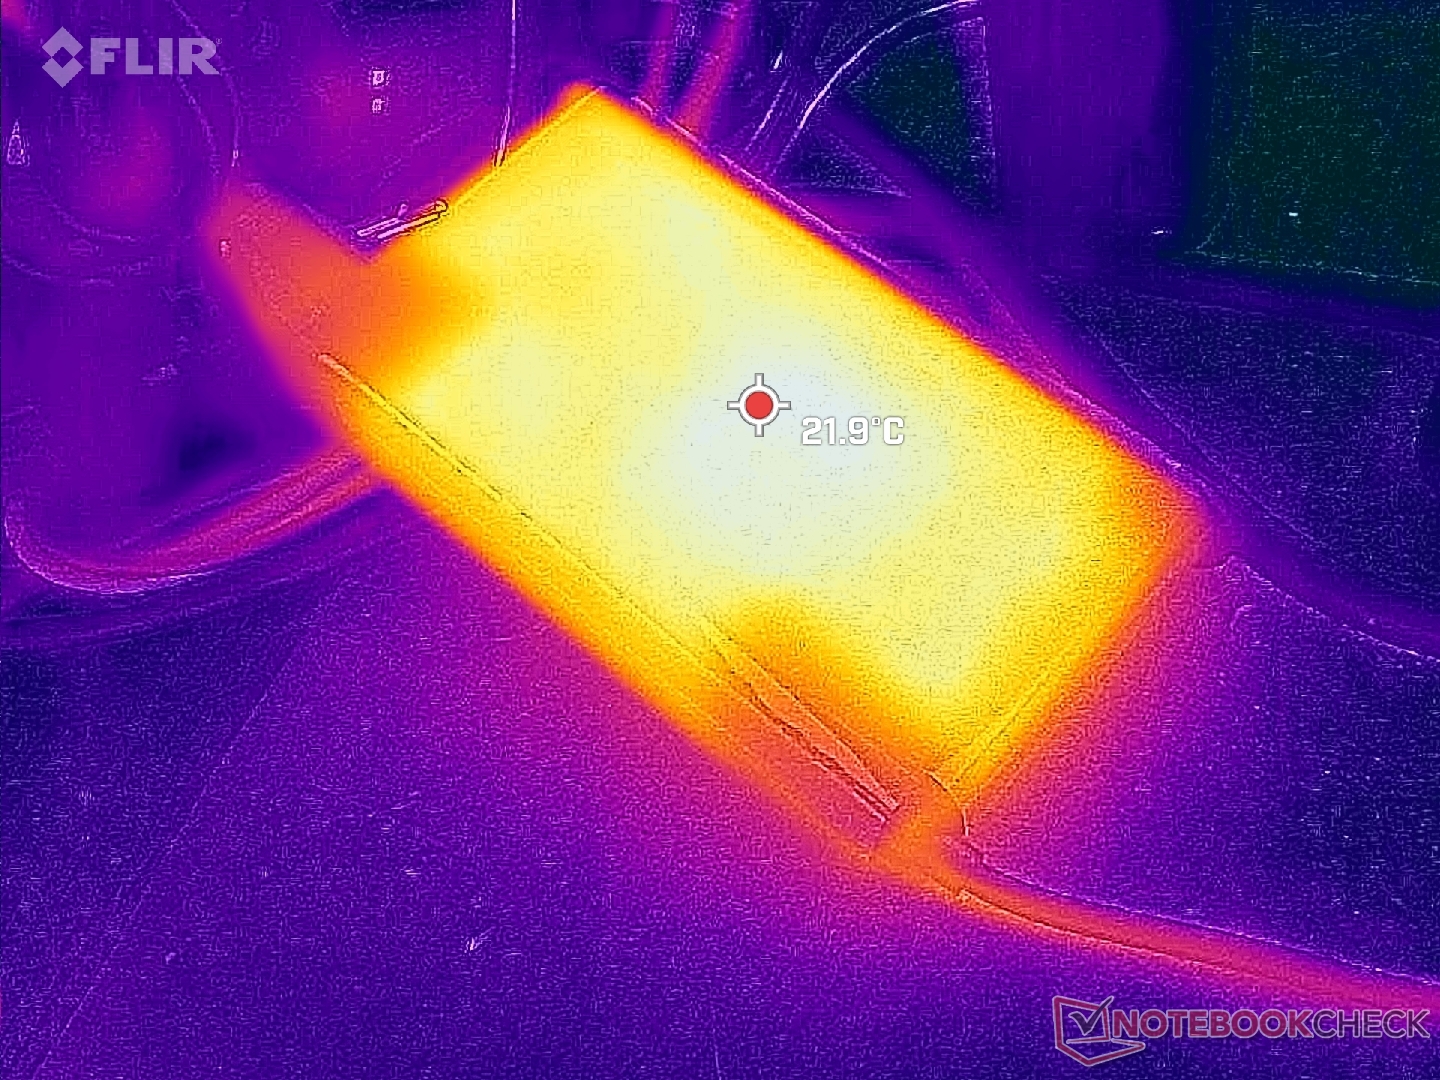
We're able to record a maximum draw of 94 W from the small-medium (~14.6 x 7.7 x 2.5 cm) 135 W USB-C AC adapter when the CPU and integrated GPU are each at 100 percent utilization. This rate is only temporary, however, as shown by the graph below. The relatively high overhead allows the laptop to power more demanding Thunderbolt devices like certain docks and monitors. Lenovo offers a smaller and more portable 65 W AC adapter as an alternative.
| Off / Standby | |
| Idle | |
| Load |
|
Key:
min: | |
| Lenovo ThinkPad T16 Gen 1 Core i7-1270P i7-1270P, Iris Xe G7 96EUs, Samsung PM9B1 512GB MZAL4512HBLU, IPS, 1920x1200, 16" | Lenovo ThinkPad T16 G1 21BWS00200 i5-1240P, Iris Xe G7 80EUs, Samsung PM9A1 MZVL2512HCJQ, IPS, 1920x1200, 16" | LG Gram 16Z90Q i7-1260P, Iris Xe G7 96EUs, Samsung PM9A1 MZVL21T0HCLR, IPS, 2560x1600, 16" | HP EliteBook 865 G9 R7 PRO 6850U, Radeon 680M, Samsung PM991 MZVLQ512HBLU, IPS, 1920x1200, 16" | Huawei MateBook 16s i7 i7-12700H, Iris Xe G7 96EUs, Silicon Motion PCIe-8 SSD, IPS, 2520x1680, 16" | Apple MacBook Pro 16 2021 M1 Pro M1 Pro, M1 Pro 16-Core GPU, Apple SSD AP1024R, Mini-LED, 3456x2234, 16.2" | |
|---|---|---|---|---|---|---|
| Power Consumption | 21% | -3% | -21% | -45% | -34% | |
| Idle Minimum * (Watt) | 3.5 | 2.9 17% | 5 -43% | 5.3 -51% | 6.8 -94% | 5 -43% |
| Idle Average * (Watt) | 7.4 | 6 19% | 8 -8% | 12.8 -73% | 13.2 -78% | 15.1 -104% |
| Idle Maximum * (Watt) | 10.7 | 6.9 36% | 14 -31% | 14.1 -32% | 13.8 -29% | 15.5 -45% |
| Load Average * (Watt) | 64.5 | 27.3 58% | 47 27% | 48.5 25% | 75.2 -17% | 54 16% |
| Witcher 3 ultra * (Watt) | 36.1 | 42.6 -18% | 37.8 -5% | 48.7 -35% | 56.1 -55% | |
| Load Maximum * (Watt) | 93.8 | 81.53 13% | 56 40% | 56.6 40% | 90.6 3% | 90 4% |
* ... smaller is better
Power Consumption Witcher 3 / Stresstest
Power Consumption external Monitor
Battery Life — All Day Web Browsing
WLAN runtime is significantly shorter than what we recorded on the Core i5 SKU of the Thinkpad T16 G1 as shown by the table below. We made sure to run the test on the same Balanced power profile settings between the two configurations and results would not change. Even so, 8 hours of real-world browsing usage is likely sufficient for most users.
Charging from empty to full capacity takes about 90 minutes with the included AC adapter.
| Lenovo ThinkPad T16 Gen 1 Core i7-1270P i7-1270P, Iris Xe G7 96EUs, 86 Wh | Lenovo ThinkPad T16 G1 21BWS00200 i5-1240P, Iris Xe G7 80EUs, 86 Wh | LG Gram 16Z90Q i7-1260P, Iris Xe G7 96EUs, 80 Wh | HP EliteBook 865 G9 R7 PRO 6850U, Radeon 680M, 76 Wh | Huawei MateBook 16s i7 i7-12700H, Iris Xe G7 96EUs, 84 Wh | Apple MacBook Pro 16 2021 M1 Pro M1 Pro, M1 Pro 16-Core GPU, 99.6 Wh | |
|---|---|---|---|---|---|---|
| Battery runtime | 76% | 26% | 88% | 1% | 111% | |
| WiFi v1.3 (h) | 8 | 14.1 76% | 10.1 26% | 15 88% | 8.1 1% | 16.9 111% |
| H.264 (h) | 10.4 | 18.5 | 9.3 | 17.5 | ||
| Load (h) | 3.5 | 2.6 | 1.8 | 1.9 | ||
| Reader / Idle (h) | 18.1 |
Pros
Cons
Verdict — Not For Extreme Performance Users
Though the ThinkPad T16 G1 wasn't designed for high performance users, it's still disappointing to see such steep CPU throttling rates when running more demanding loads. The throttling is significant enough that the performance of our Core i7-1270P can fall to be as slow as the cheaper Core i5-1240P SKU after a certain period. Such a behavior means that the Core i7-1270P option is only at its best for short bursts of high performance such as when launching applications or processing images rather than for lengthy video encoding or heavy graphics work where throttling can occur over time.
A built-in option to increase processor performance at the cost of louder fan noise and/or warmer temperatures would have mitigated the throttling somewhat.
The Ryzen 5 Pro 6650U option offers more consistent performance than the Core i7-1270P option. Performance throttling is heavier of configuring with a Core P series CPU.
Other than the processor, users should also watch out for the slow system RAM and some of the display options available. The former impacts graphics performance by up to 10 percent while some of the panels may not have the colors demanded by graphics professionals. The competing HP EliteBook 865 G9 is a slimmer alternative with options not available on the ThinkPad T16 G1 including a brighter 1000-nit display and higher resolution 5 MP webcam.
Price and Availability
The ThinkPad T16 G1 is now shipping directly from Lenovo starting at $1050 USD for the base Core i5-1235U configuration up to $2040 USD for the Core i7-1270P configuration. Newegg and Amazon also have the model in stock in various configurations starting at about $1500 if configured with the Core i7-1270P.
Lenovo ThinkPad T16 Gen 1 Core i7-1270P
- 01/25/2023 v7 (old)
Allen Ngo
Transparency
The selection of devices to be reviewed is made by our editorial team. The test sample was provided to the author as a loan by the manufacturer or retailer for the purpose of this review. The lender had no influence on this review, nor did the manufacturer receive a copy of this review before publication. There was no obligation to publish this review. As an independent media company, Notebookcheck is not subjected to the authority of manufacturers, retailers or publishers.
This is how Notebookcheck is testing
Every year, Notebookcheck independently reviews hundreds of laptops and smartphones using standardized procedures to ensure that all results are comparable. We have continuously developed our test methods for around 20 years and set industry standards in the process. In our test labs, high-quality measuring equipment is utilized by experienced technicians and editors. These tests involve a multi-stage validation process. Our complex rating system is based on hundreds of well-founded measurements and benchmarks, which maintains objectivity. Further information on our test methods can be found here.
Price comparison
