Lenovo ThinkPad X1 Extreme G5 Laptop reviewed - Flagship ThinkPad with more CPU power
After receiving an extensive fourth generation update just last year to its flagship Thinkpad X1 Extreme, Lenovo is now concentrating on the inner quality of the new model - the G5 - by installing a new and improved liquid metal cooling system, as well as a current 12th generation Intel processor (Alder Lake H). The graphics cards continue to be from Nvidia's range of GPUs from the RTX 3000 series including a fast RTX 3080 Ti option.
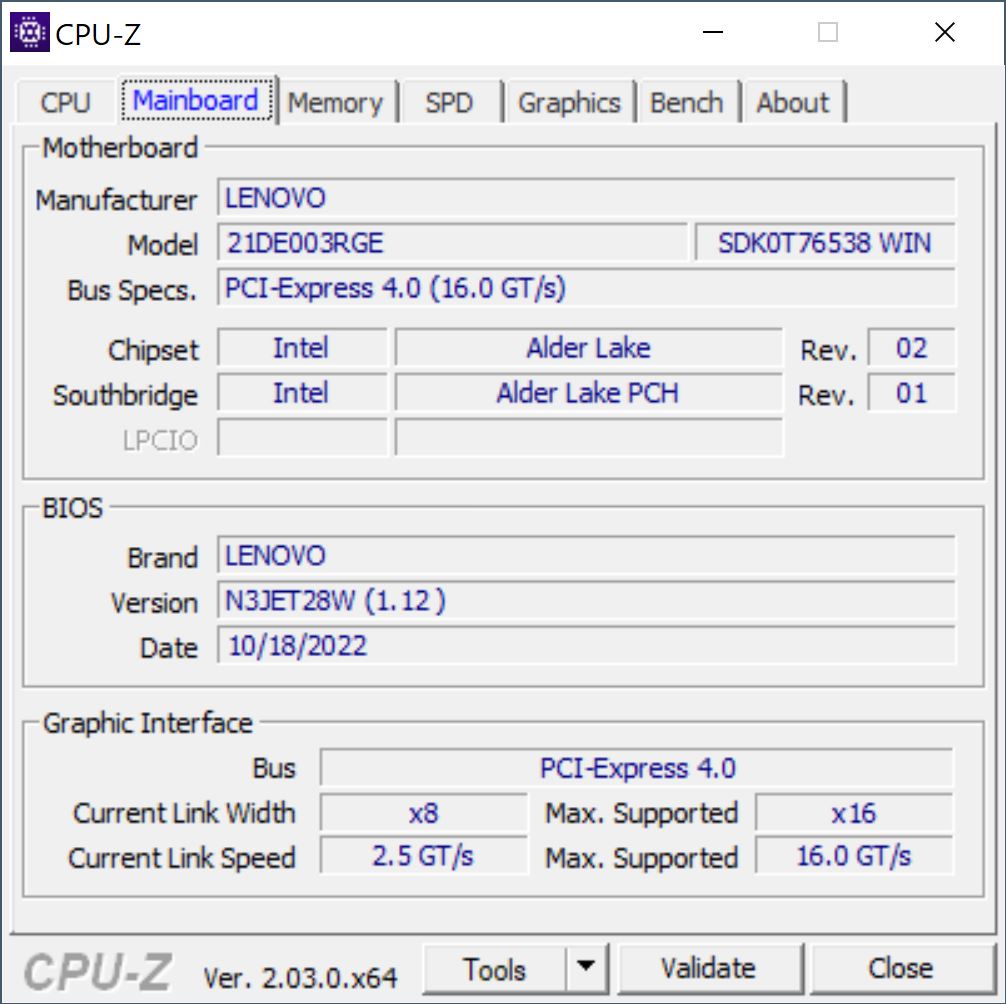
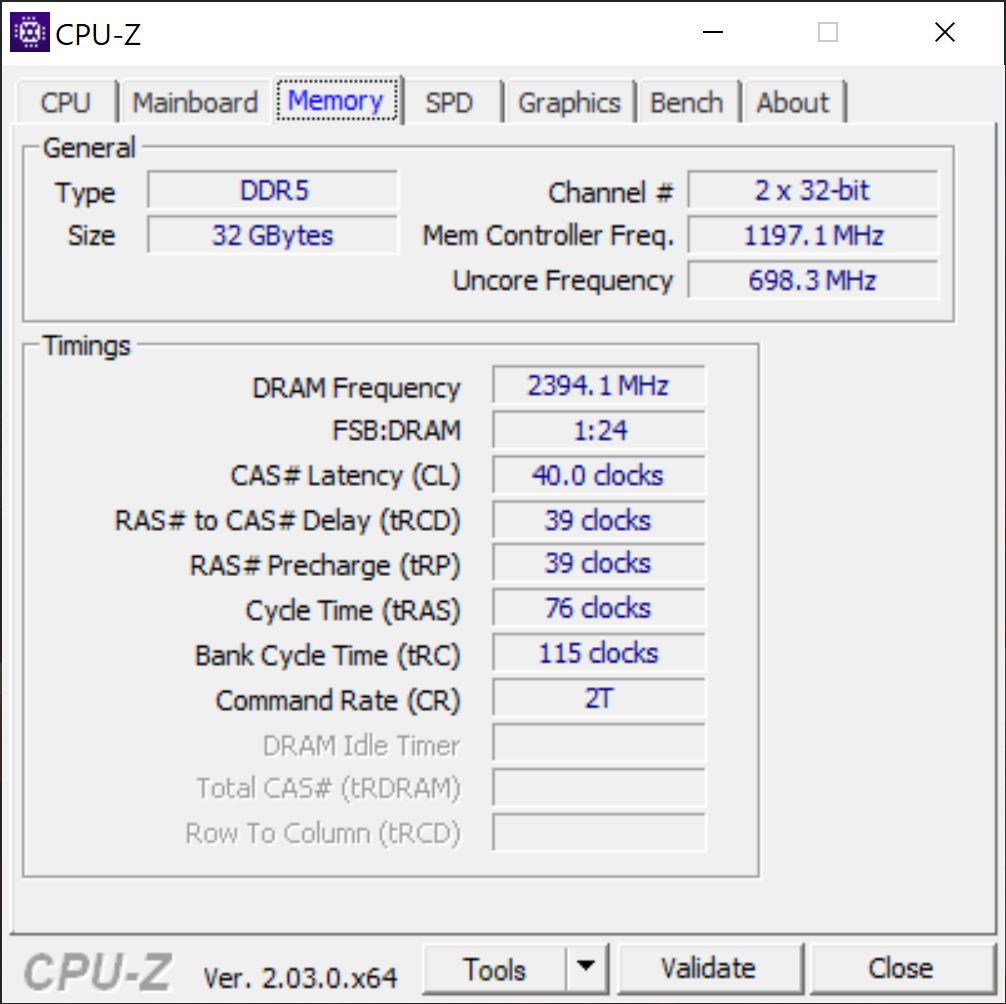
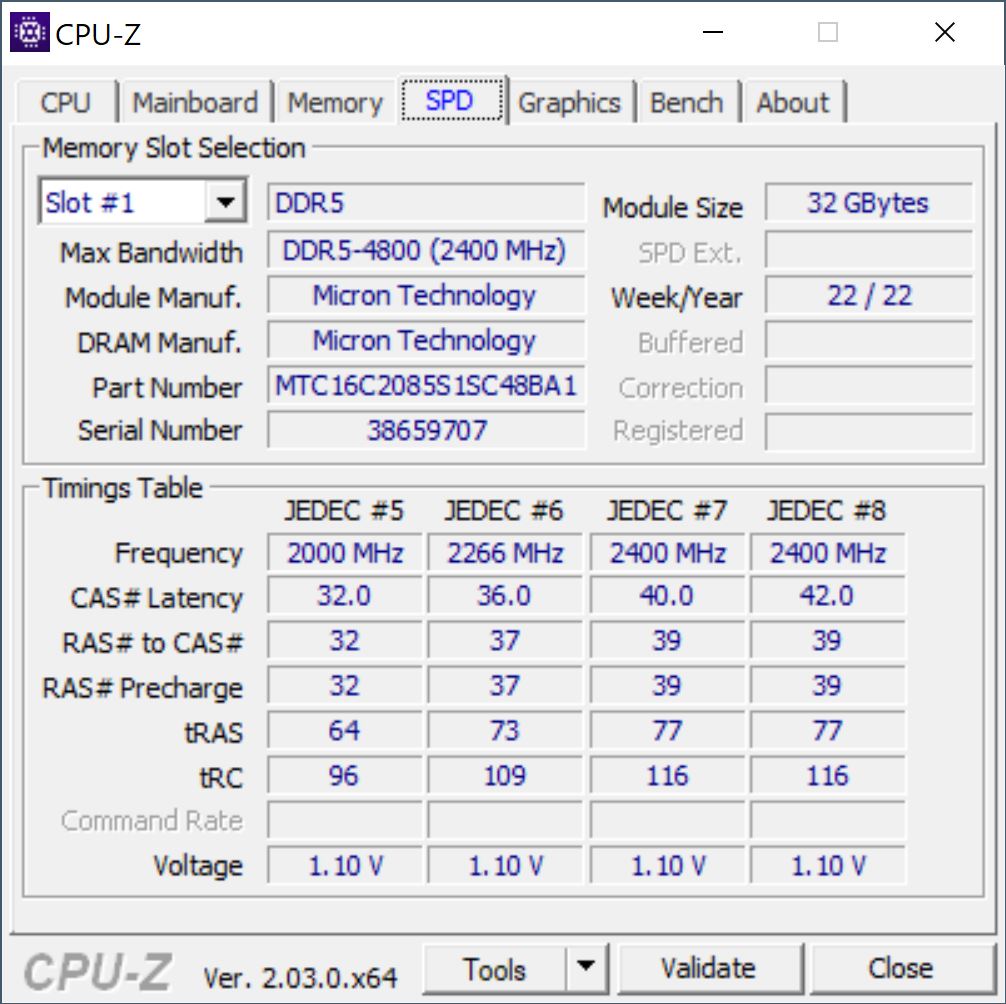
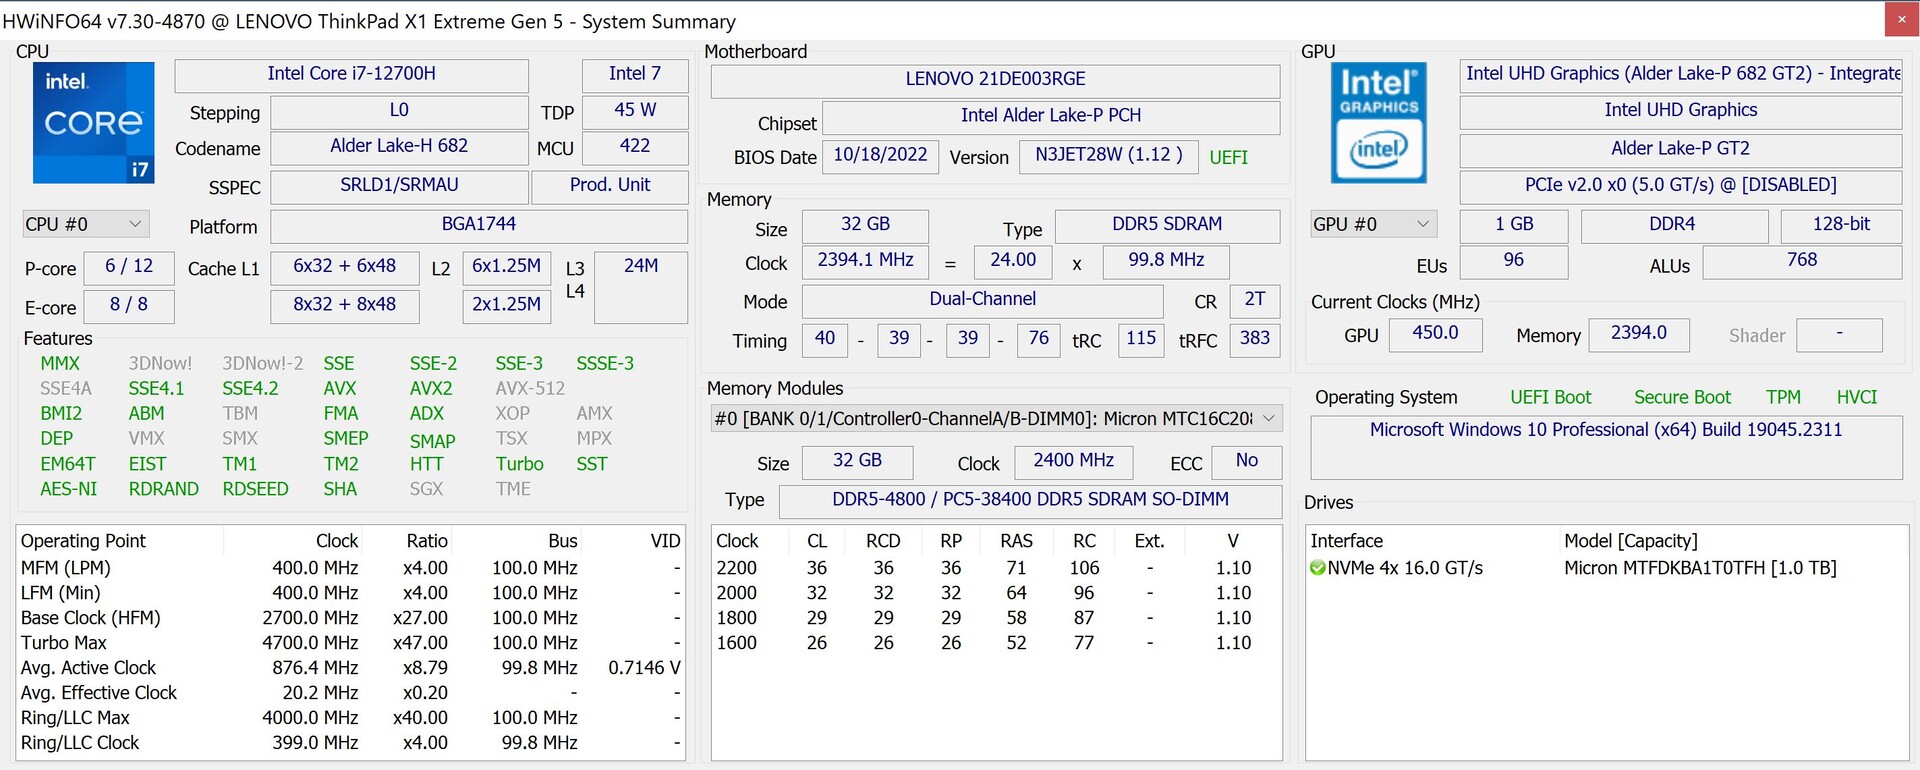
Our review model, the 21DE003RGE, can be had for around 3600 US dollars and comes with an Intel Core i7-12700H, 32 GB of DDR5-4800 RAM, a 1 TB PCIe 4.0 SSD, a 4K IPS display with full AdobeRGB coverage, as well as a dedicated GPU, the GeForce RTX 3060. Our model was preinstalled with Windows 10 Pro (via downgrade rights from Windows 11 Pro). Unfortunately, we experienced some performance issues including Wi-Fi 6E not working with Windows 10. For this reason, we used Windows 11 Pro during testing and would also recommend this update to all users.
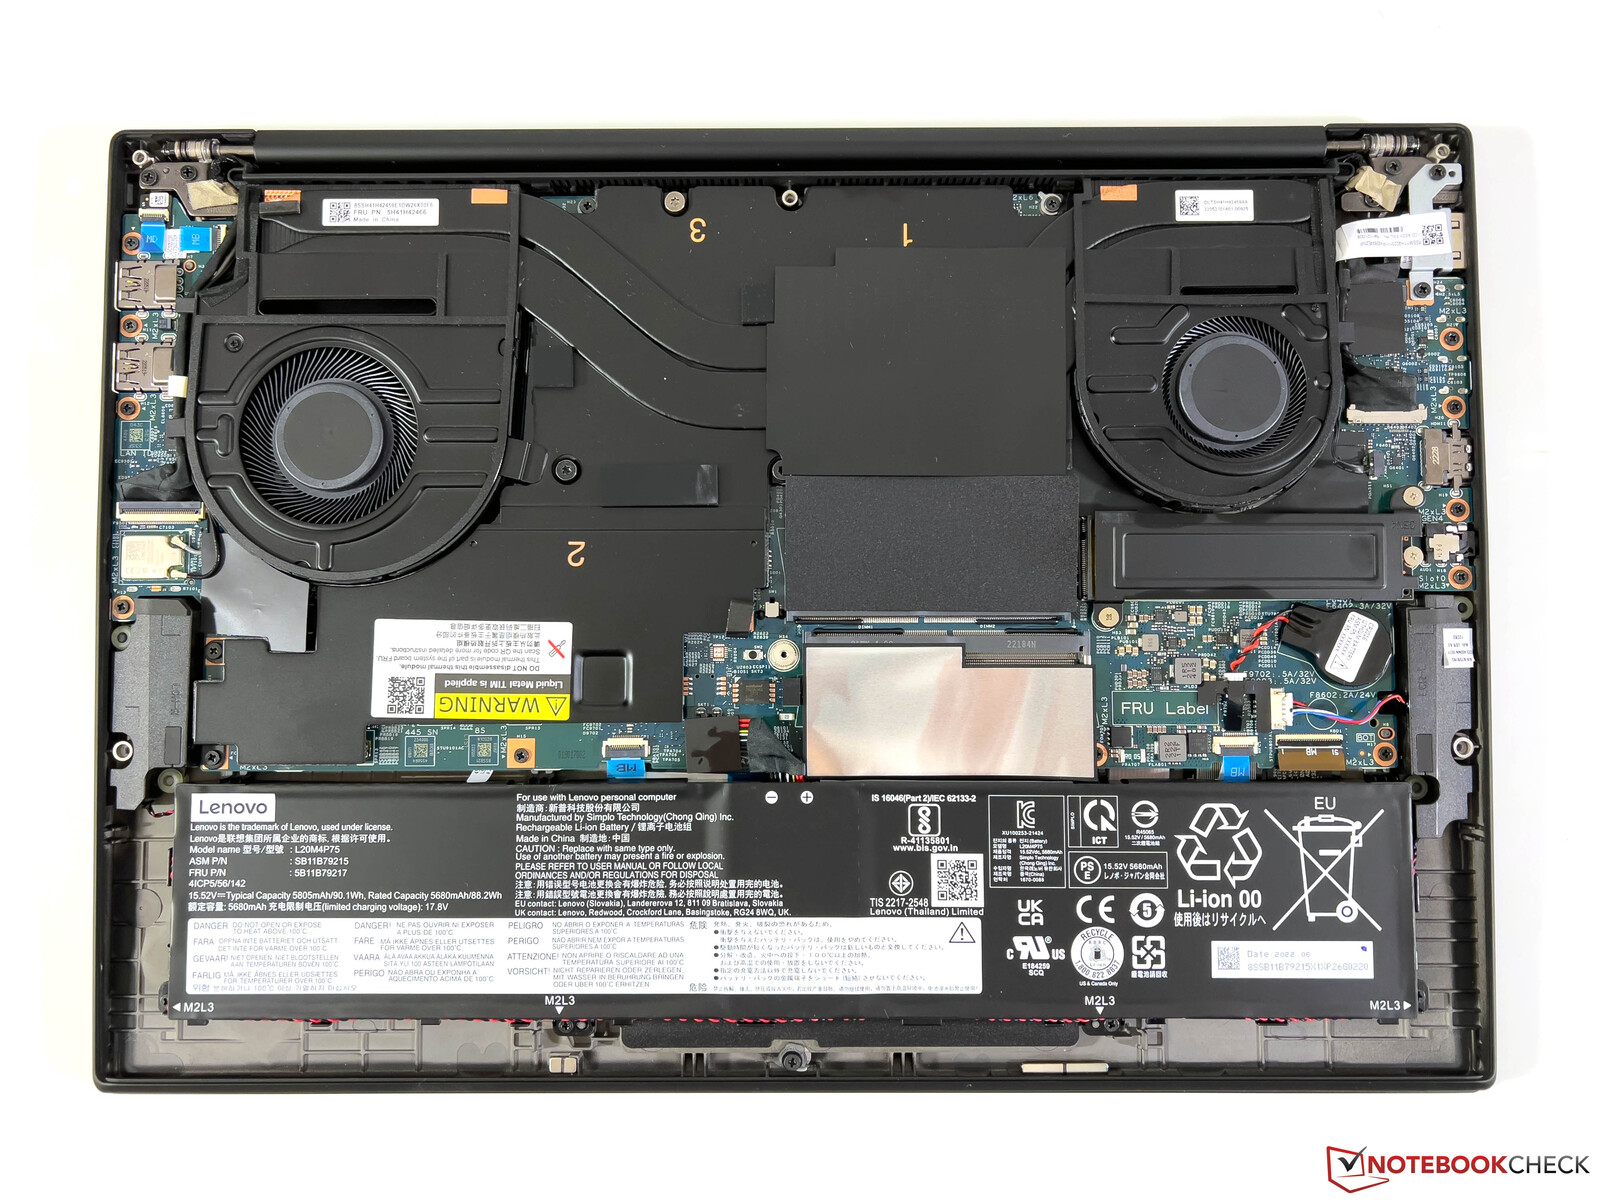
Note: as with the last model, the X1 Extreme G5 comes in two basic versions. Configurations with the RTX 3050 Ti use normal heat pipe-based cooling which is why there is additional space for a second M.2 SSD as well as a WWAN module. Configurations with more powerful GPUs (from the RTX 3060 and upwards) are fitted with a larger vapor chamber cooling system resulting in the implementation of only one M.2 SSD.
Possible competitors compared
Rating | Date | Model | Weight | Height | Size | Resolution | Price |
|---|---|---|---|---|---|---|---|
| 88.7 % v7 (old) | 12 / 2022 | Lenovo ThinkPad X1 Extreme G5-21DE003RGE i7-12700H, GeForce RTX 3060 Laptop GPU | 2.1 kg | 17.9 mm | 16.00" | 3840x2400 | |
| 86.9 % v7 (old) | 09 / 2022 | HP Envy 16 h0112nr i7-12700H, GeForce RTX 3060 Laptop GPU | 2.3 kg | 19.8 mm | 16.00" | 3840x2400 | |
| 87.8 % v7 (old) | 11 / 2022 | Schenker Vision 16 Pro RTX 3070 Ti i7-12700H, GeForce RTX 3070 Ti Laptop GPU | 1.7 kg | 17.1 mm | 16.00" | 2560x1600 | |
| 89.5 % v7 (old) | 05 / 2022 | Dell XPS 15 9520 RTX 3050 Ti i7-12700H, GeForce RTX 3050 Ti Laptop GPU | 1.9 kg | 18 mm | 15.60" | 3456x2160 | |
| 93.2 % v7 (old) | 11 / 2021 | Apple MacBook Pro 16 2021 M1 Pro M1 Pro, M1 Pro 16-Core GPU | 2.2 kg | 16.8 mm | 16.20" | 3456x2234 | |
| 88.8 % v7 (old) | 05 / 2022 | Dell XPS 17 9720 RTX 3060 i7-12700H, GeForce RTX 3060 Laptop GPU | 2.5 kg | 19.5 mm | 17.00" | 3840x2400 |
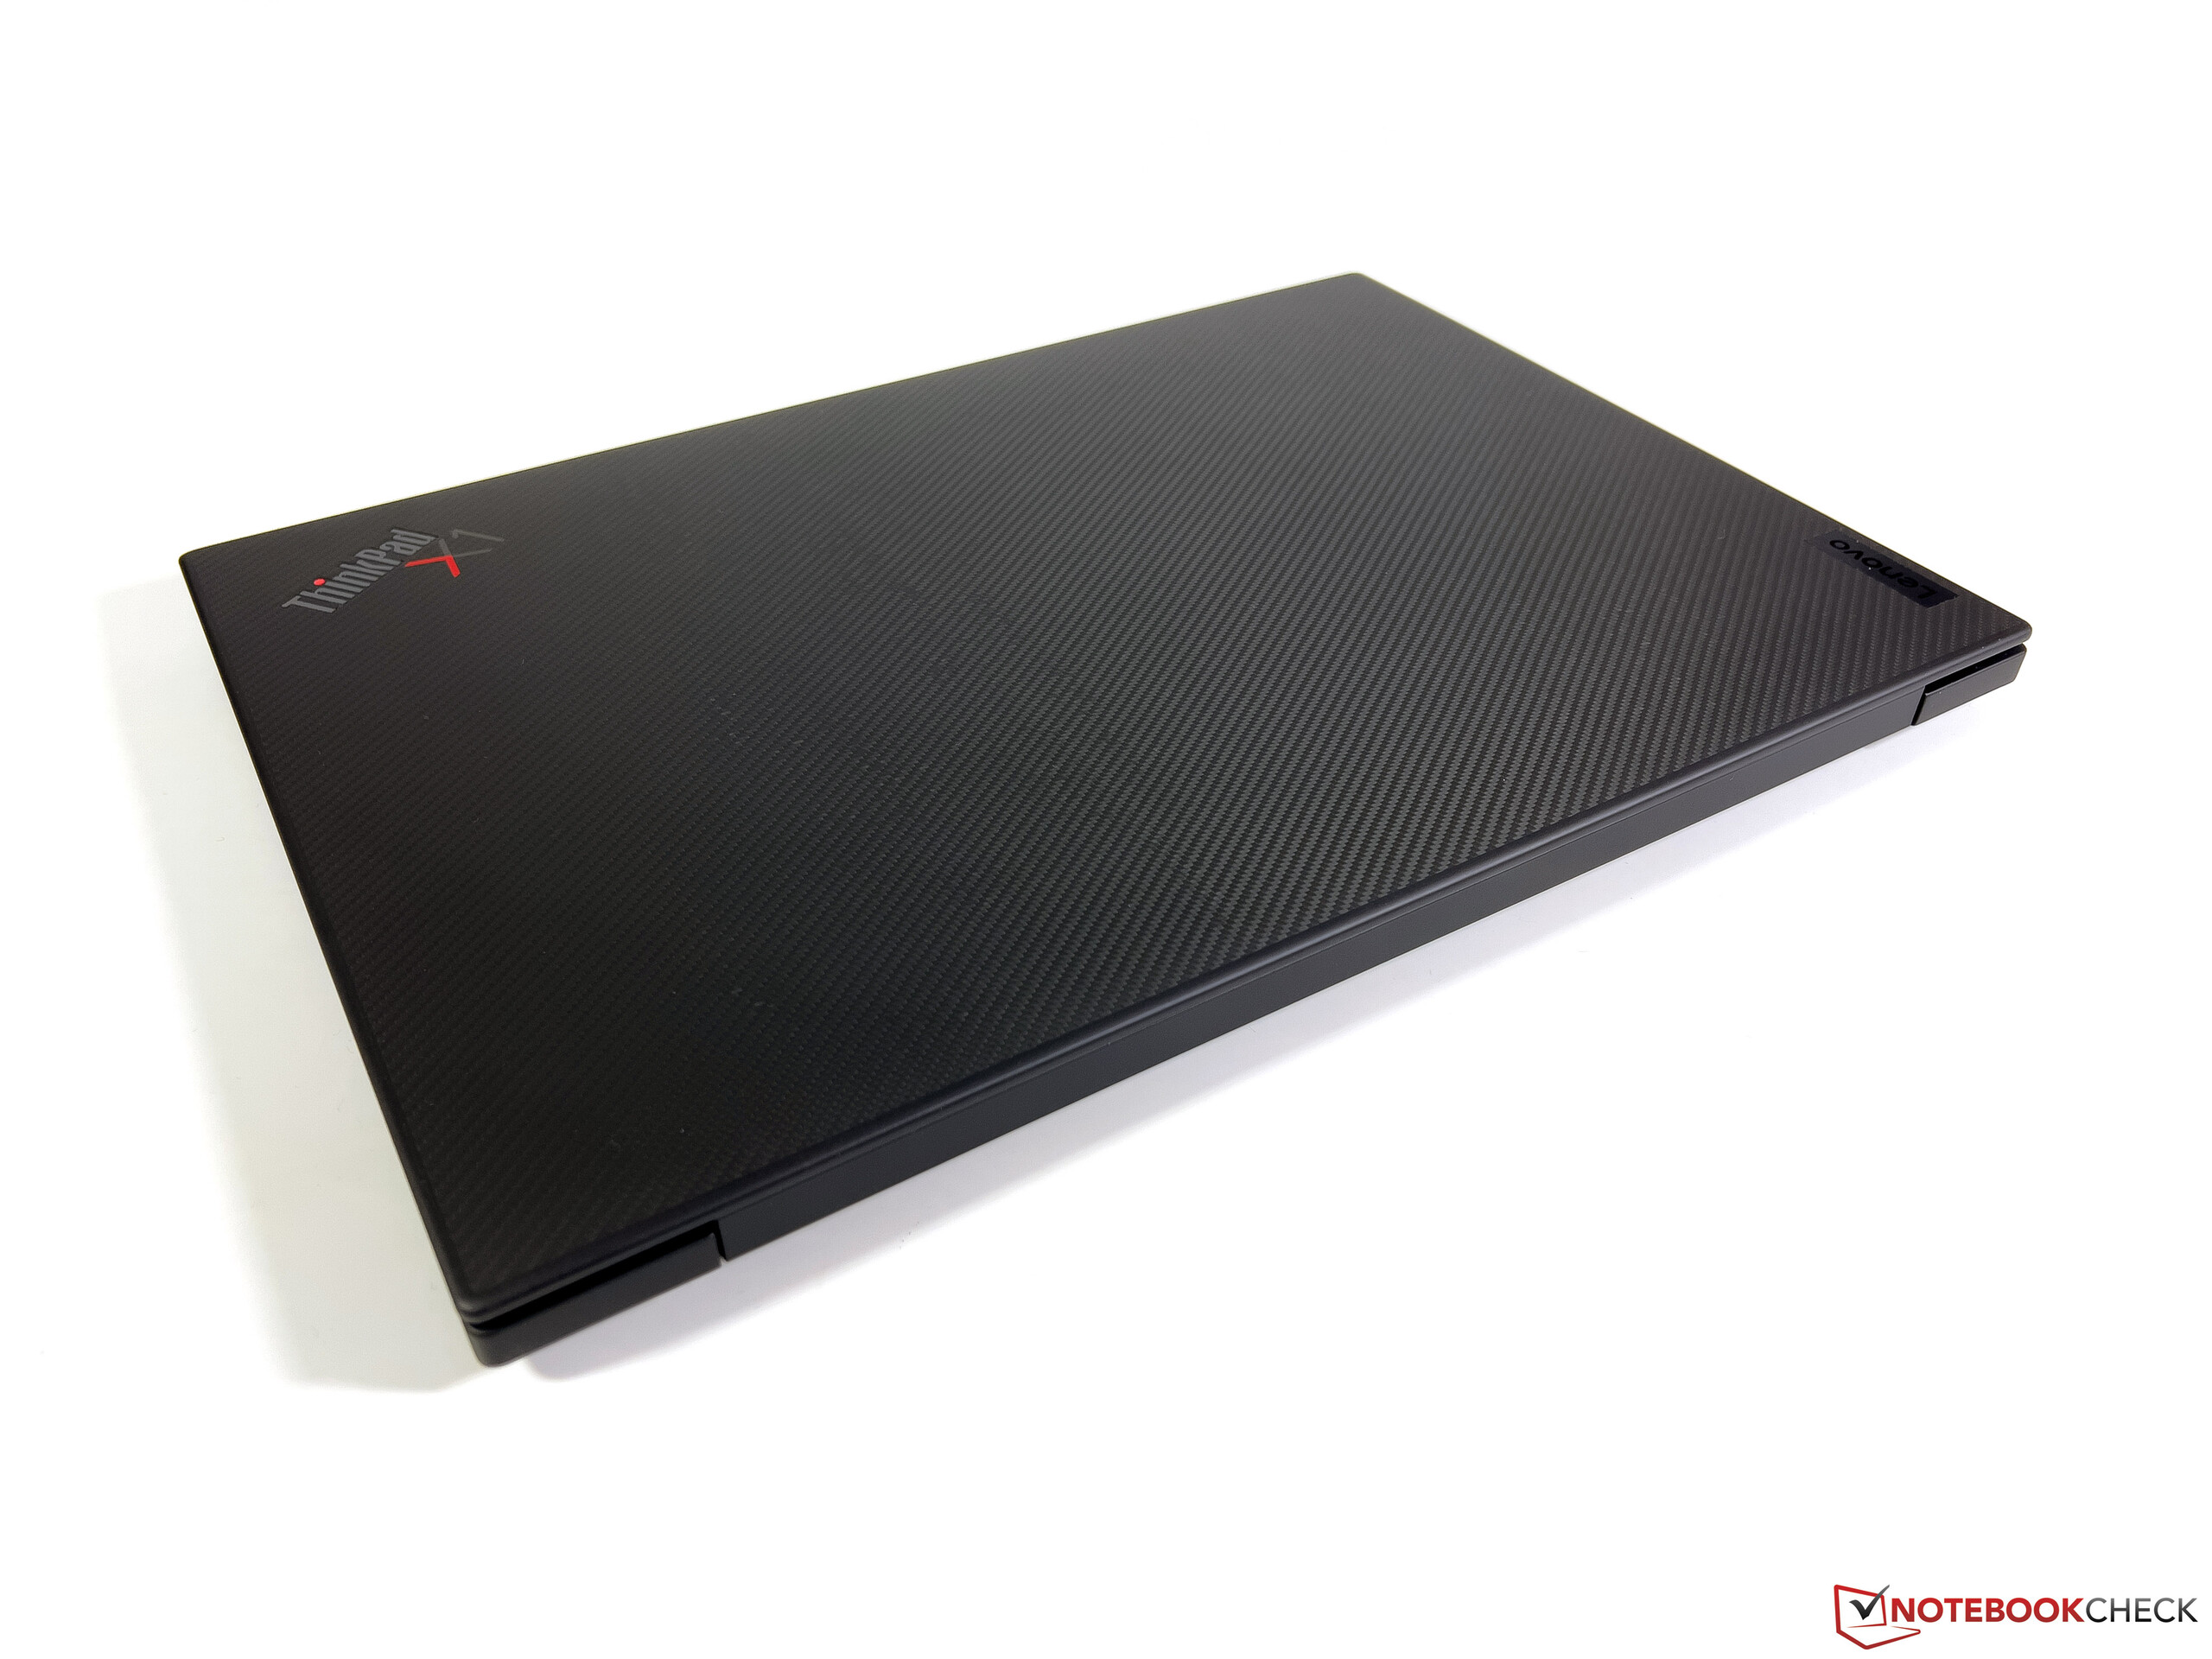
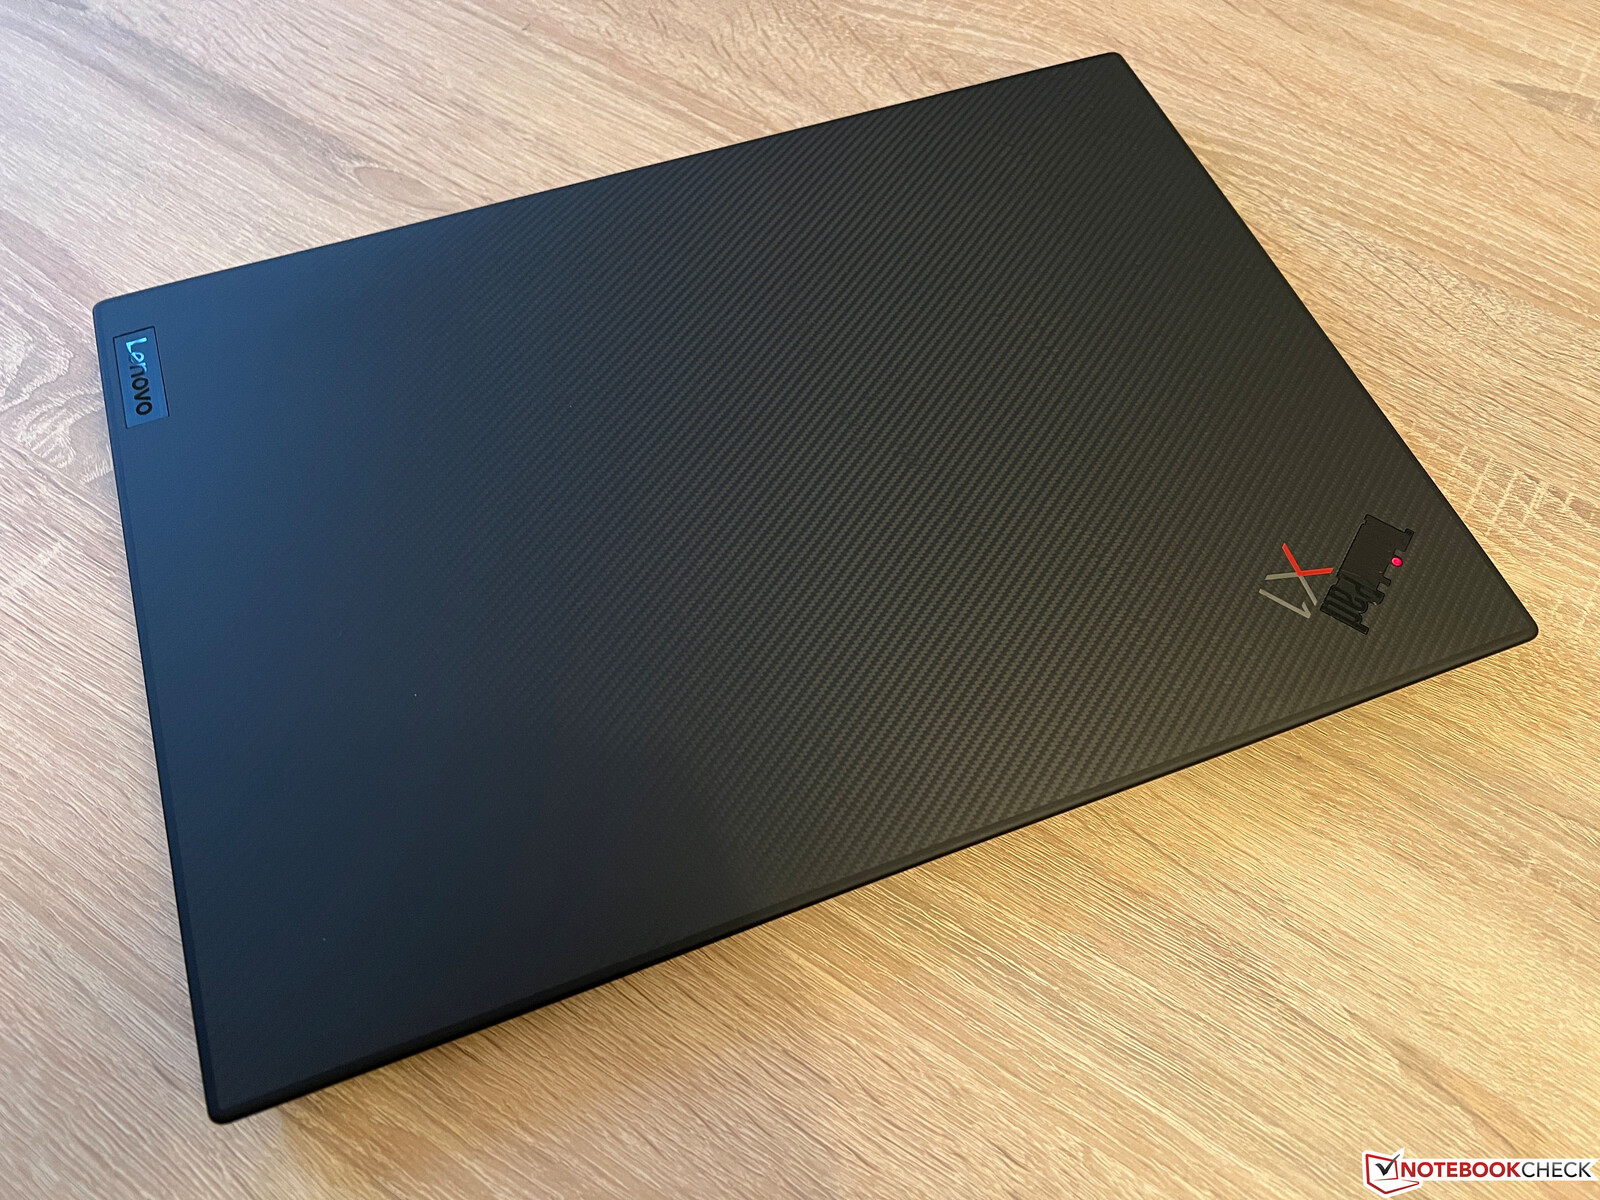
Case - Lenovo goes for carbon fibre and magnesium
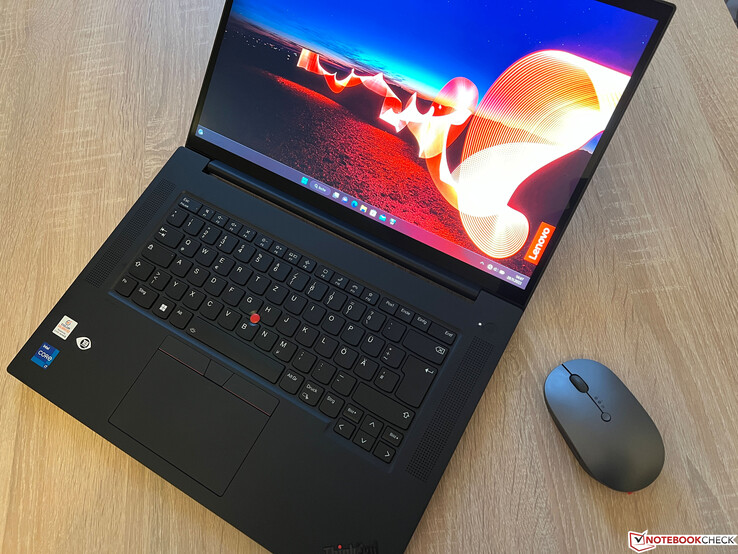
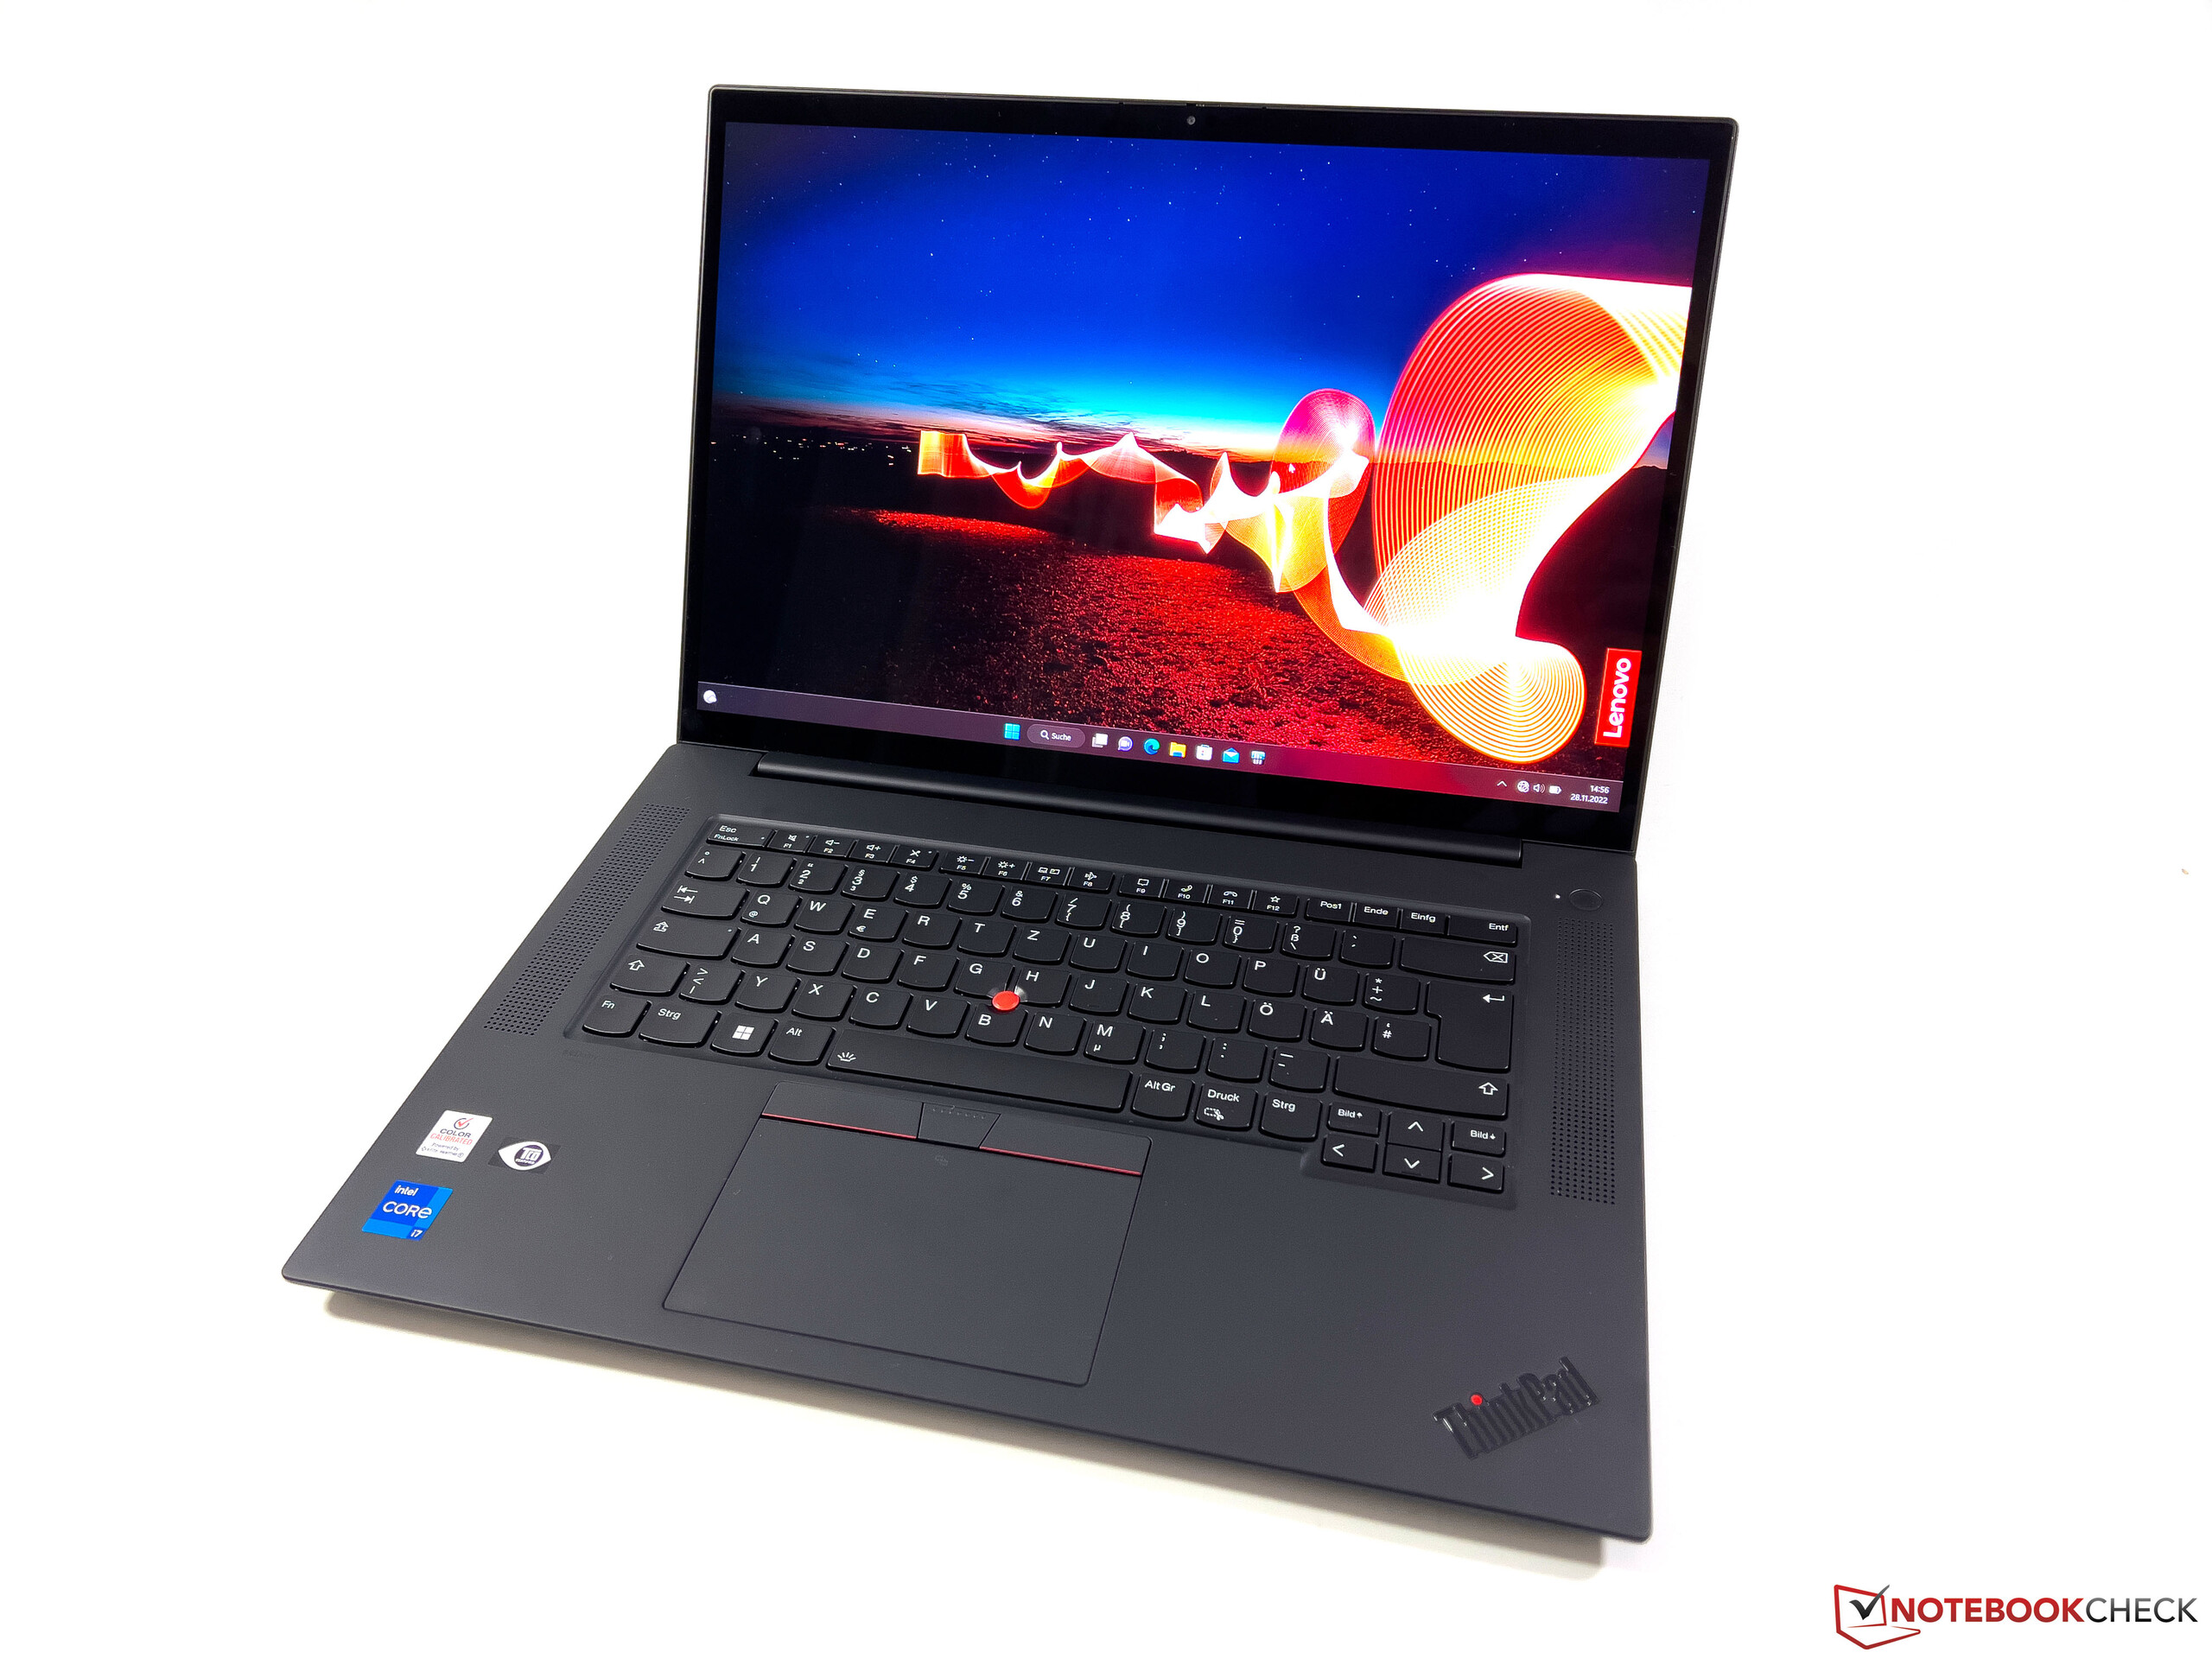
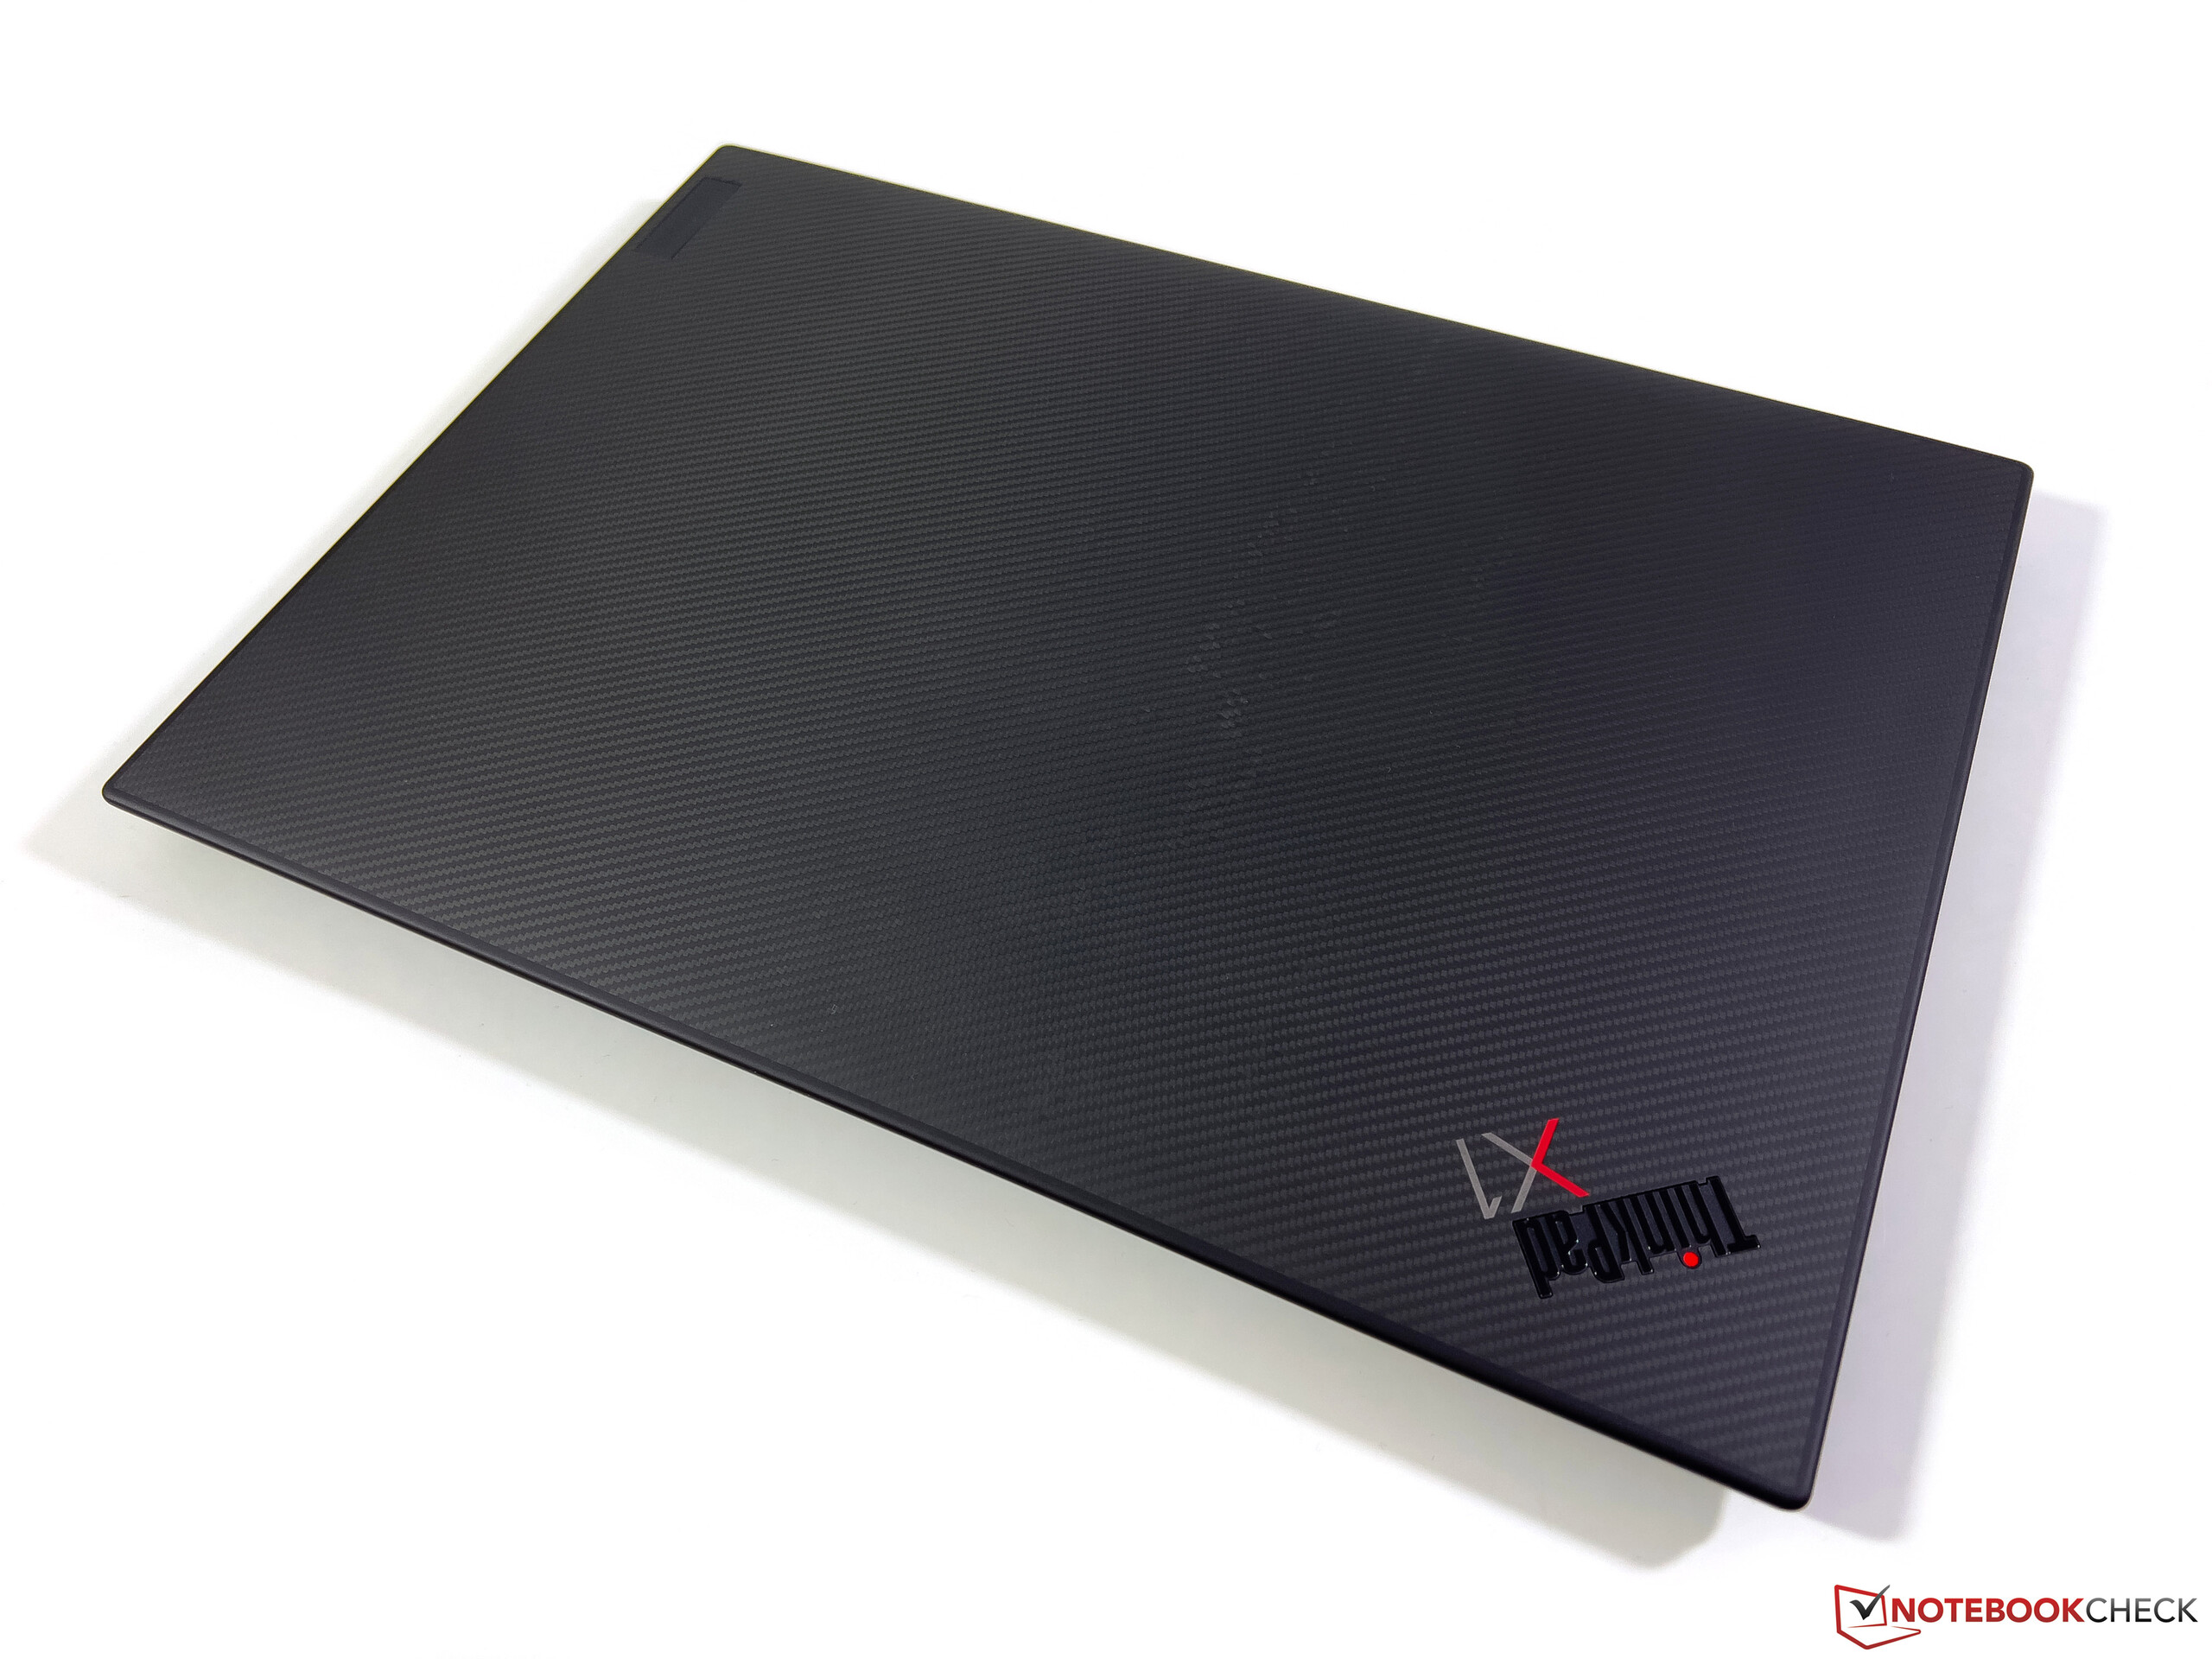
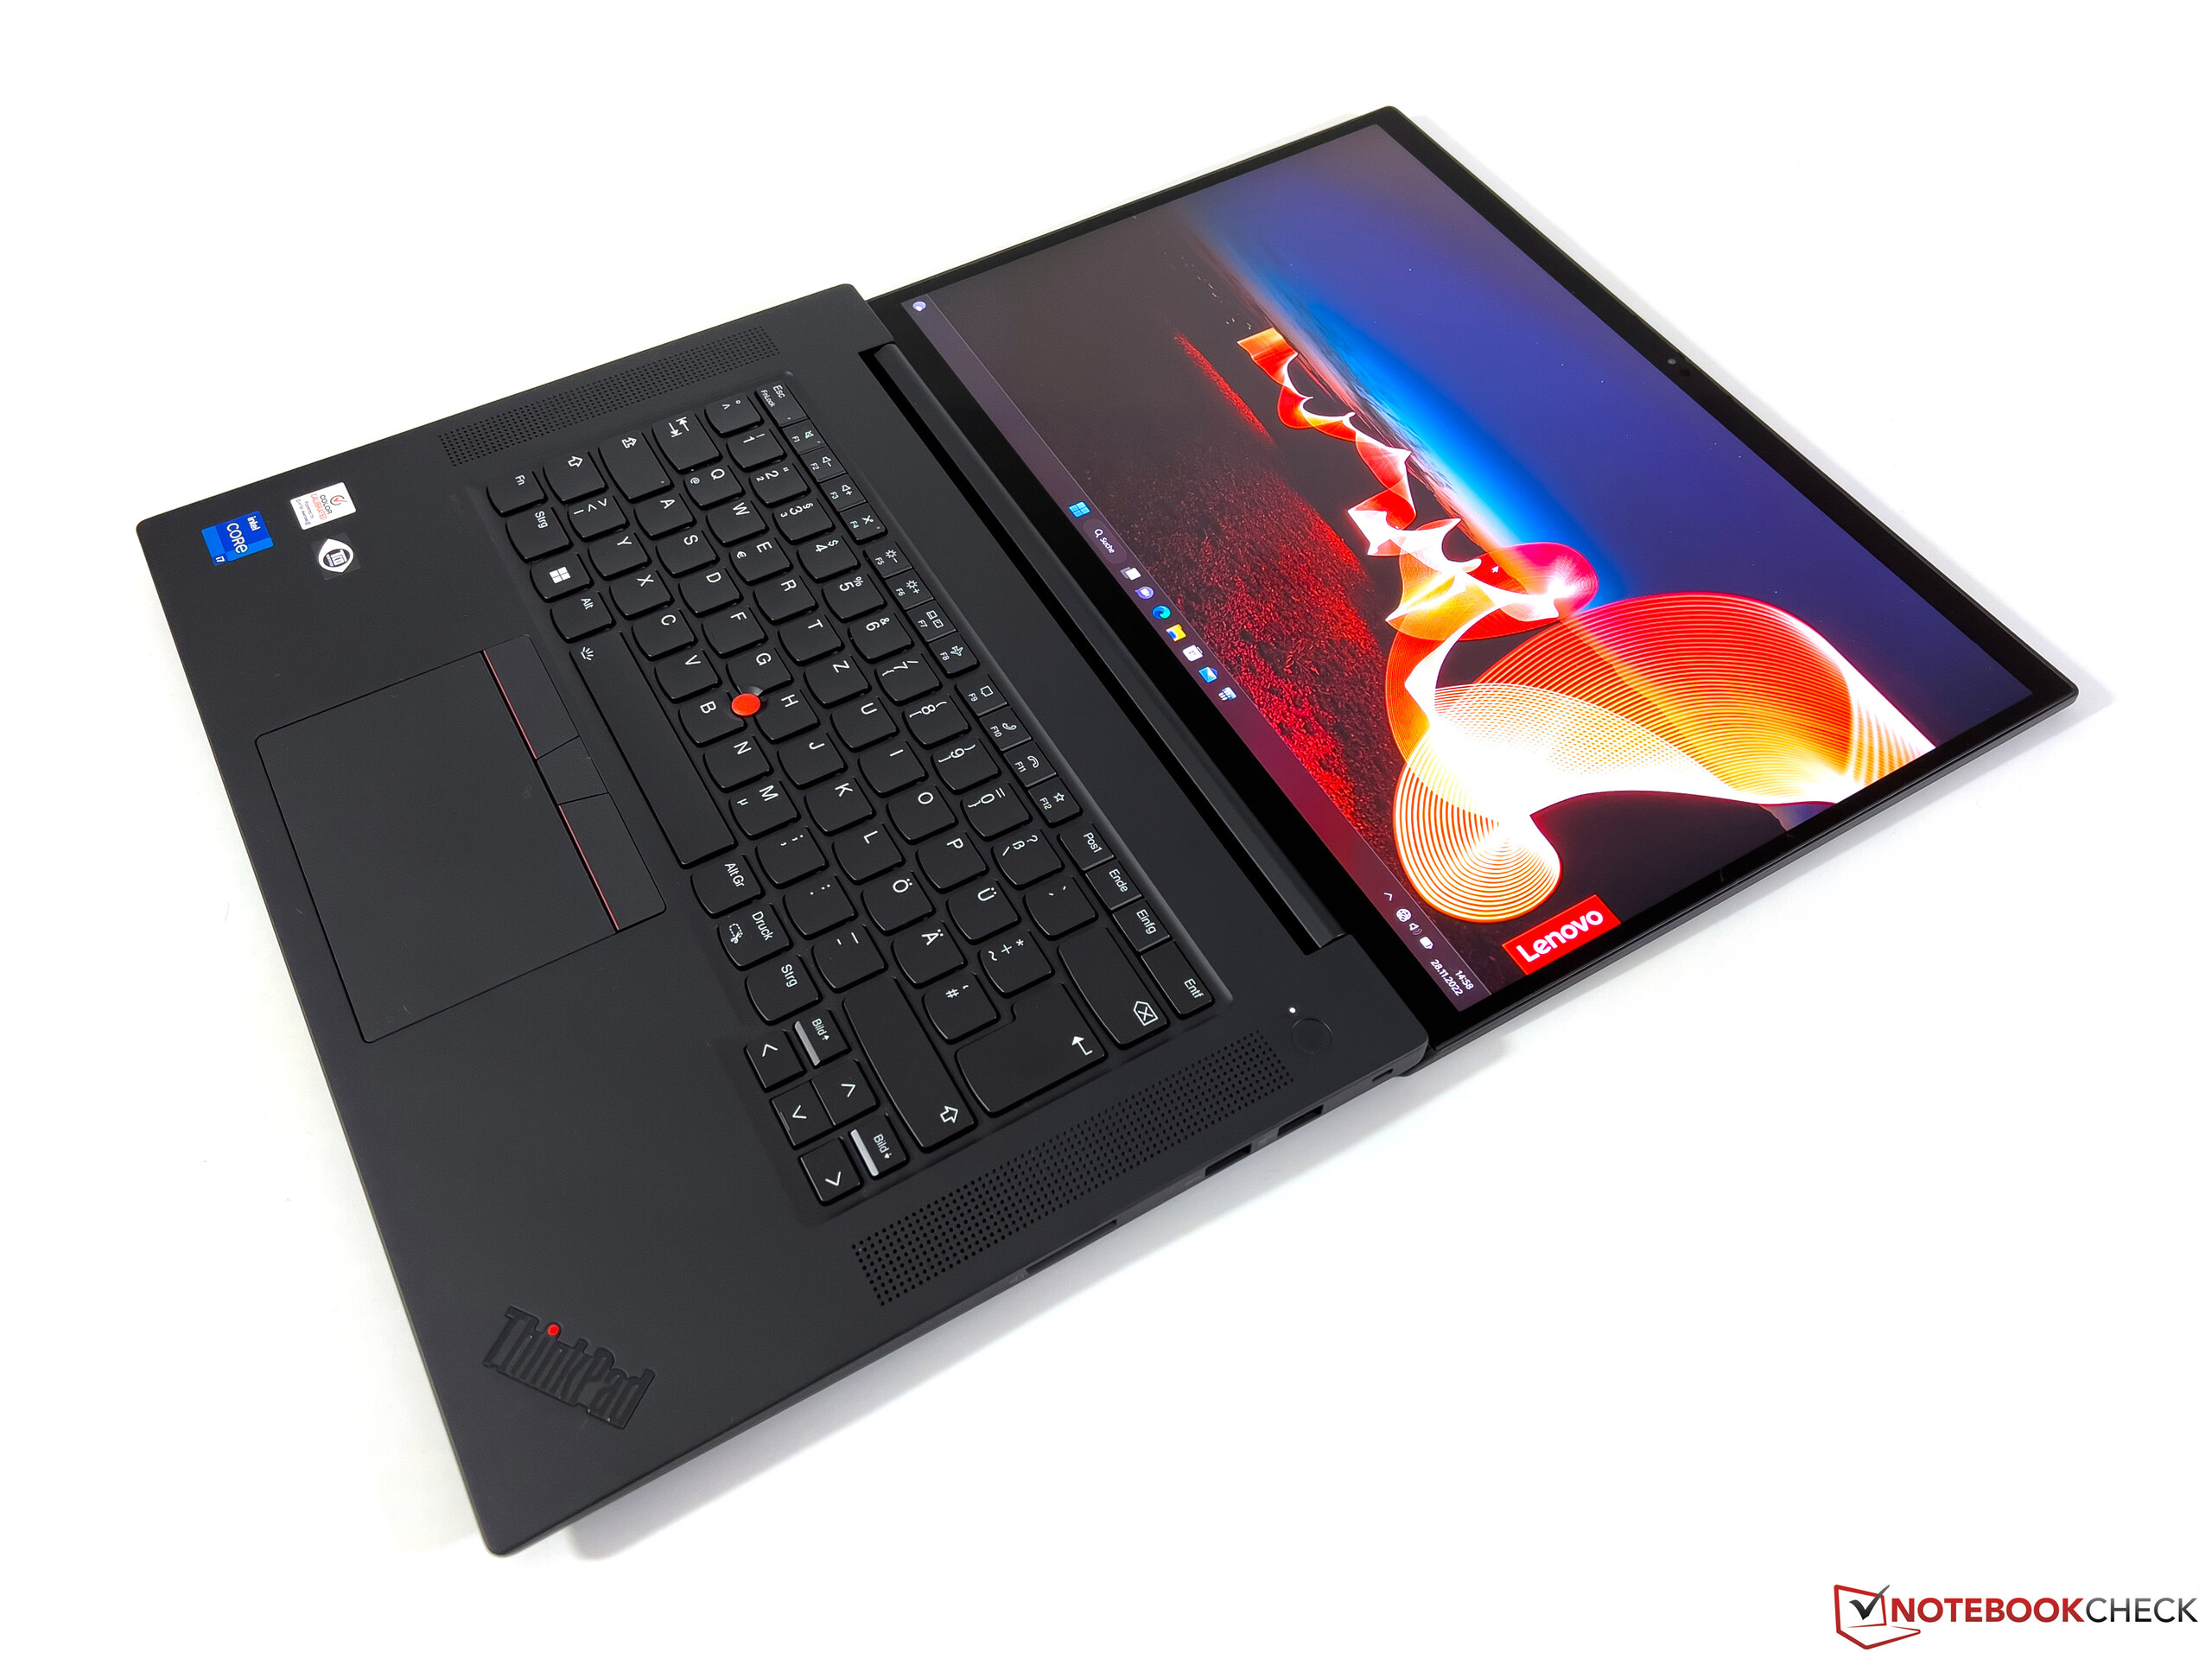
After last year's major redesign, the X1 Extreme G5's case remains unchanged with a continued mix of carbon fiber and magnesium. In addition, the 4K model's lid has a carbon fiber look, although this is just an imprint. Otherwise, the black ThinkPad looks very reserved with the color accents being focussed on the logo as well as the red TrackPoint in the middle of the keyboard.
Both the base unit and display lid are very stable meaning keyboard flex is only possible by applying a lot of pressure on the middle area. The display hinges are also wonderfully calibrated as the display lid can be easily opened with one hand and thereby almost completely avoiding any rocking motion. The maximum opening angle is 180 degrees.
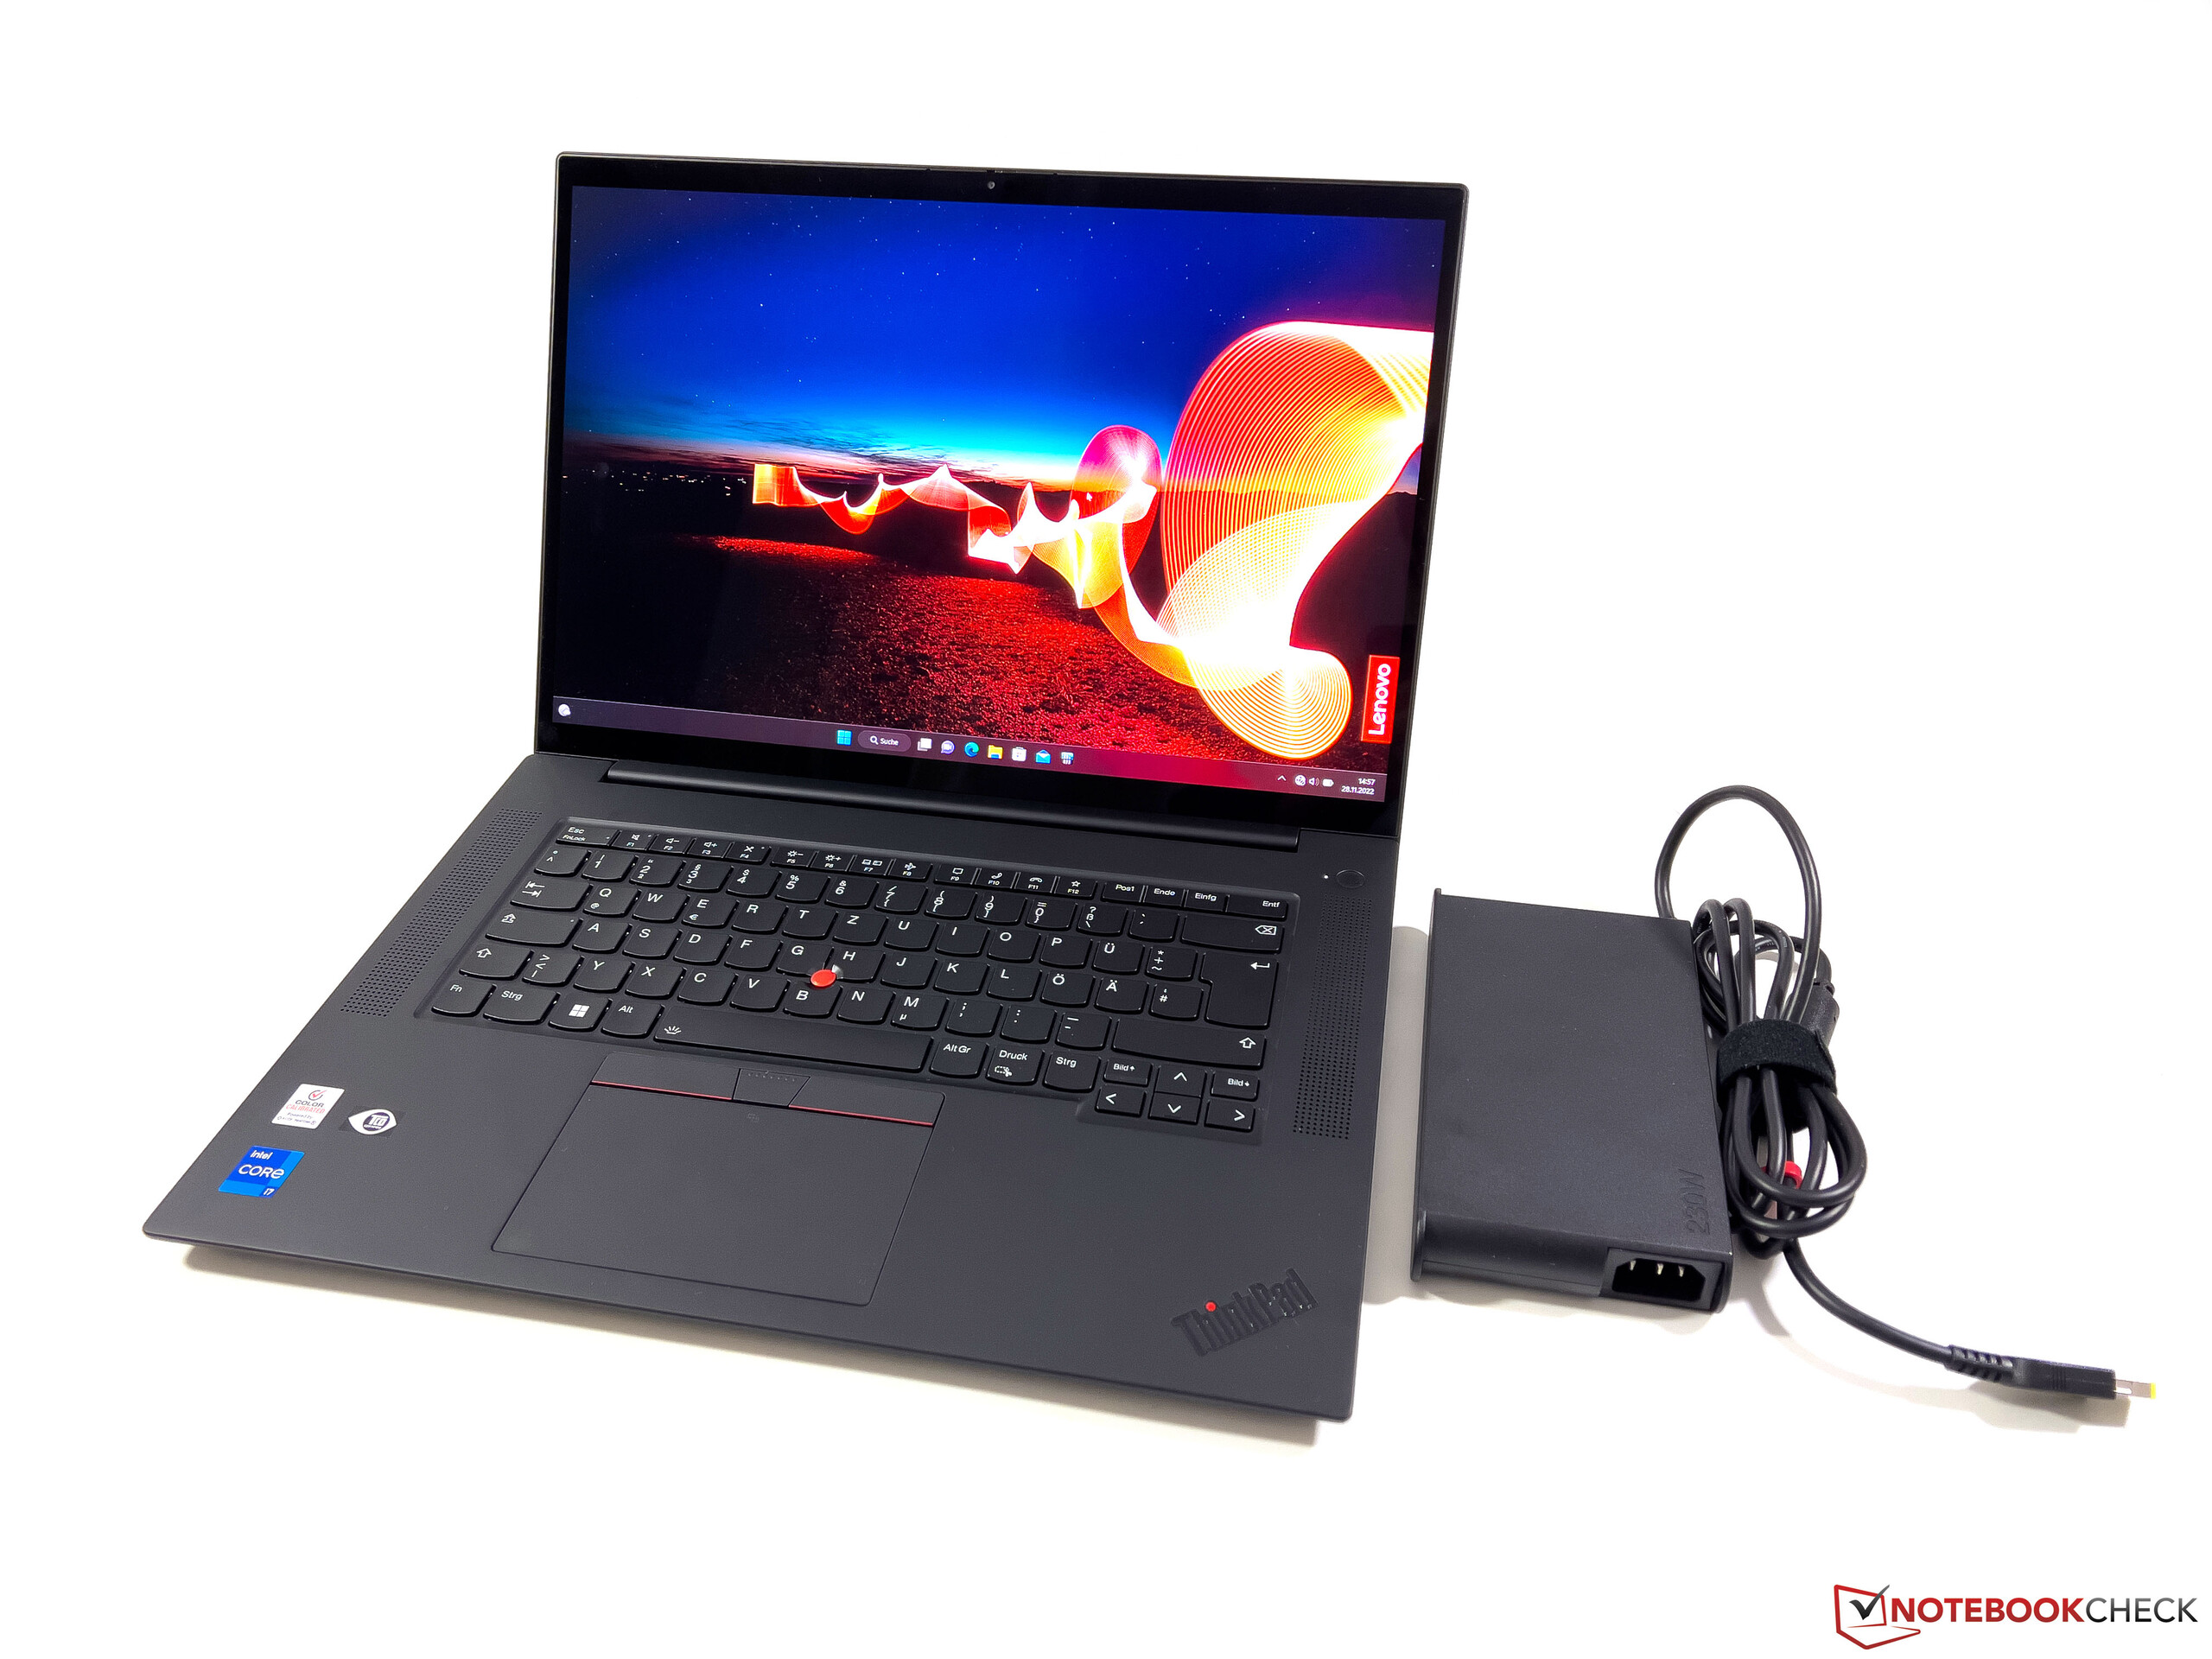
Tipping the scales at just 2.1 kg, our review model sits in the middle of the pack when compared to its competitors, whereby both the 15 and 17 inch XPS models should not be included in the comparison because they have a smaller and a larger display than the ThinkPad, respectively. In the 16 inch category, only the Schenker Vision 16 Pro is much lighter and the X1 Extreme also has the largest footprint. On the go, another 880 grams must be added for the power supply.
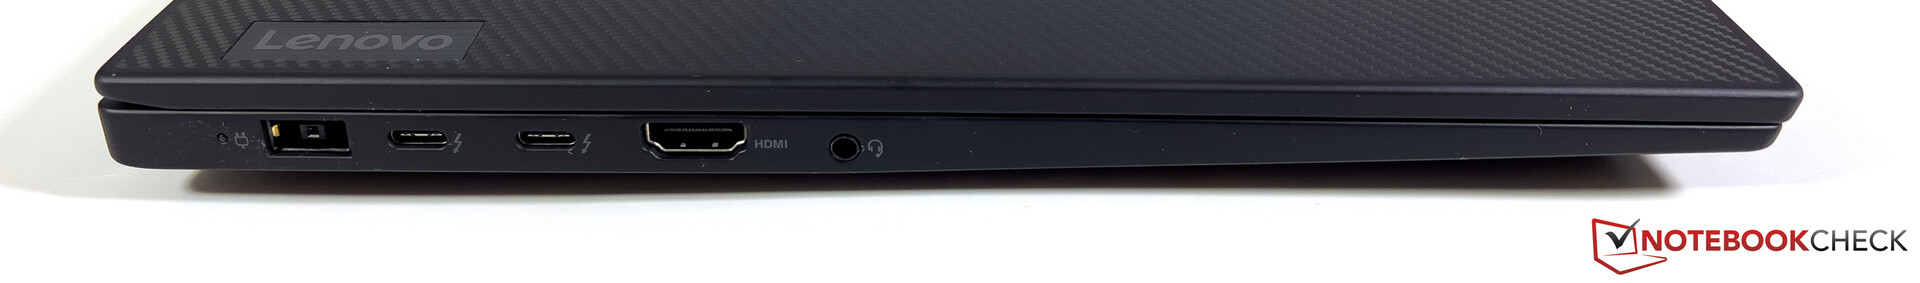
Connectivity - X1 Extreme G5 with TB4 and Wi-Fi 6E
In terms of connectivity, there are no changes to the predecessor on either side of the device. In addition to Thunderbolt 4 via USB-C, there are also regular USB-A ports. On the go, the X1 Extreme G5 can be charged via USB-C, albeit, with at minimum, a 90 watt power supply. A total of four displays can be connected (1x internal + 3x external).
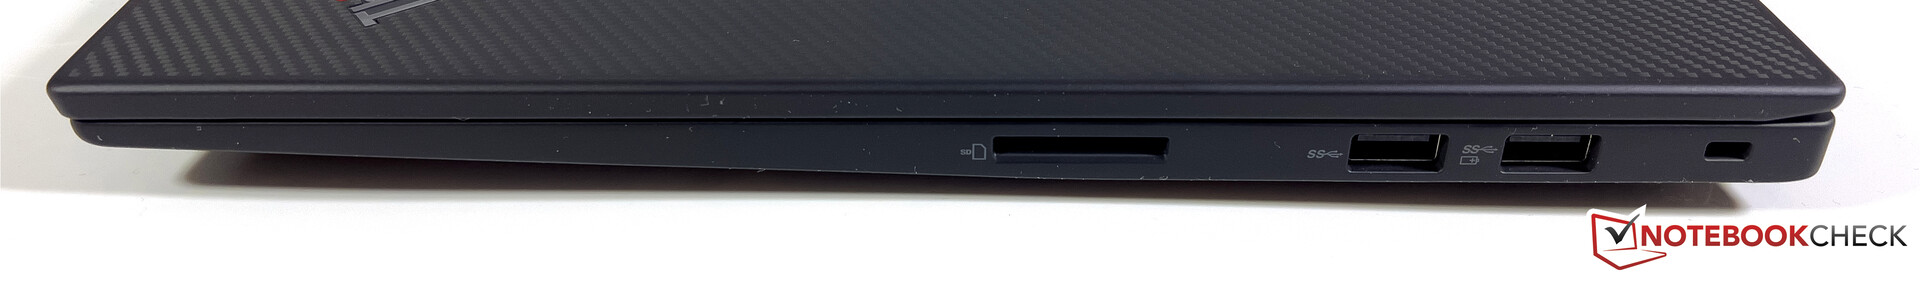
SD Card Reader
On the right hand side of the device, the SD card reader continues to accept full-sized SD cards but at a reduced speed compared to that of its predecessor. With both our current (Angelbird AV Pro V60) as well as our previous reference cards, only 80 MB/s is possible. The X1 Extreme G4 was able to manage more than 170 MB/s.
| SD Card Reader | |
| average JPG Copy Test (av. of 3 runs) | |
| Dell XPS 17 9720 RTX 3060 (Toshiba Exceria Pro SDXC 64 GB UHS-II) | |
| Lenovo ThinkPad X1 Extreme G4-20Y5CTO1WW (3050 Ti) (AV Pro V60) | |
| Dell XPS 15 9520 RTX 3050 Ti (Toshiba Exceria Pro SDXC 64 GB UHS-II) | |
| Average of class Multimedia (23 - 531, n=42, last 2 years) | |
| Apple MacBook Pro 16 2021 M1 Pro (Angelbird AV Pro V60) | |
| Schenker Vision 16 Pro RTX 3070 Ti (AV Pro V60) | |
| Lenovo ThinkPad X1 Extreme G5-21DE003RGE (AV Pro V60) | |
| HP Envy 16 h0112nr (AV Pro SD microSD 128 GB V60) | |
| maximum AS SSD Seq Read Test (1GB) | |
| Dell XPS 17 9720 RTX 3060 (Toshiba Exceria Pro SDXC 64 GB UHS-II) | |
| Average of class Multimedia (37.3 - 1455, n=41, last 2 years) | |
| Dell XPS 15 9520 RTX 3050 Ti (Toshiba Exceria Pro SDXC 64 GB UHS-II) | |
| Lenovo ThinkPad X1 Extreme G4-20Y5CTO1WW (3050 Ti) (AV Pro V60) | |
| HP Envy 16 h0112nr (AV Pro SD microSD 128 GB V60) | |
| Schenker Vision 16 Pro RTX 3070 Ti (AV Pro V60) | |
| Lenovo ThinkPad X1 Extreme G5-21DE003RGE (AV Pro V60) | |
Communication
Lenovo has equipped the X1 Extreme G5 with the AX211 module from Intel which supports the current Wi-Fi-6E standard. Windows 11 is necessary in order to be able to connect to 6 GHz networks. After the update, we were able to connect to our Asus reference router's 6 GHz network. The transfer rates are very high and stable and Bluetooth 5.2 is also supported. Wired networks can only be used with an appropriate adapter via Thunderbolt/USB-C.
The less powerful X1 Extreme G5 with the RTX 3050 Ti and conventional cooling is optional and also available with 5G but with the added premium in the configurator coming in at a whopping 330 US dollars. In addition, the corresponding antennas are not prepared and there is also no Nano SIM slot as long as WWAN is not configured at the factory.
| Networking | |
| Lenovo ThinkPad X1 Extreme G5-21DE003RGE | |
| iperf3 receive AXE11000 6GHz | |
| iperf3 transmit AXE11000 6GHz | |
| HP Envy 16 h0112nr | |
| iperf3 receive AXE11000 6GHz | |
| iperf3 transmit AXE11000 6GHz | |
| Schenker Vision 16 Pro RTX 3070 Ti | |
| iperf3 receive AXE11000 | |
| iperf3 transmit AXE11000 | |
| Dell XPS 15 9520 RTX 3050 Ti | |
| iperf3 receive AXE11000 | |
| iperf3 transmit AXE11000 | |
| Apple MacBook Pro 16 2021 M1 Pro | |
| iperf3 transmit AX12 | |
| iperf3 receive AX12 | |
| iperf3 receive AXE11000 | |
| iperf3 transmit AXE11000 | |
| Dell XPS 17 9720 RTX 3060 | |
| iperf3 receive AXE11000 | |
| iperf3 transmit AXE11000 | |
Webcam
Nothing has changed regarding the 1080p webcam and its mechanical privacy shutter. The quality is marginally better than the old 720p modules without really producing convincing results - even under favorable lighting conditions. An additional IR module is at hand for face recognition.


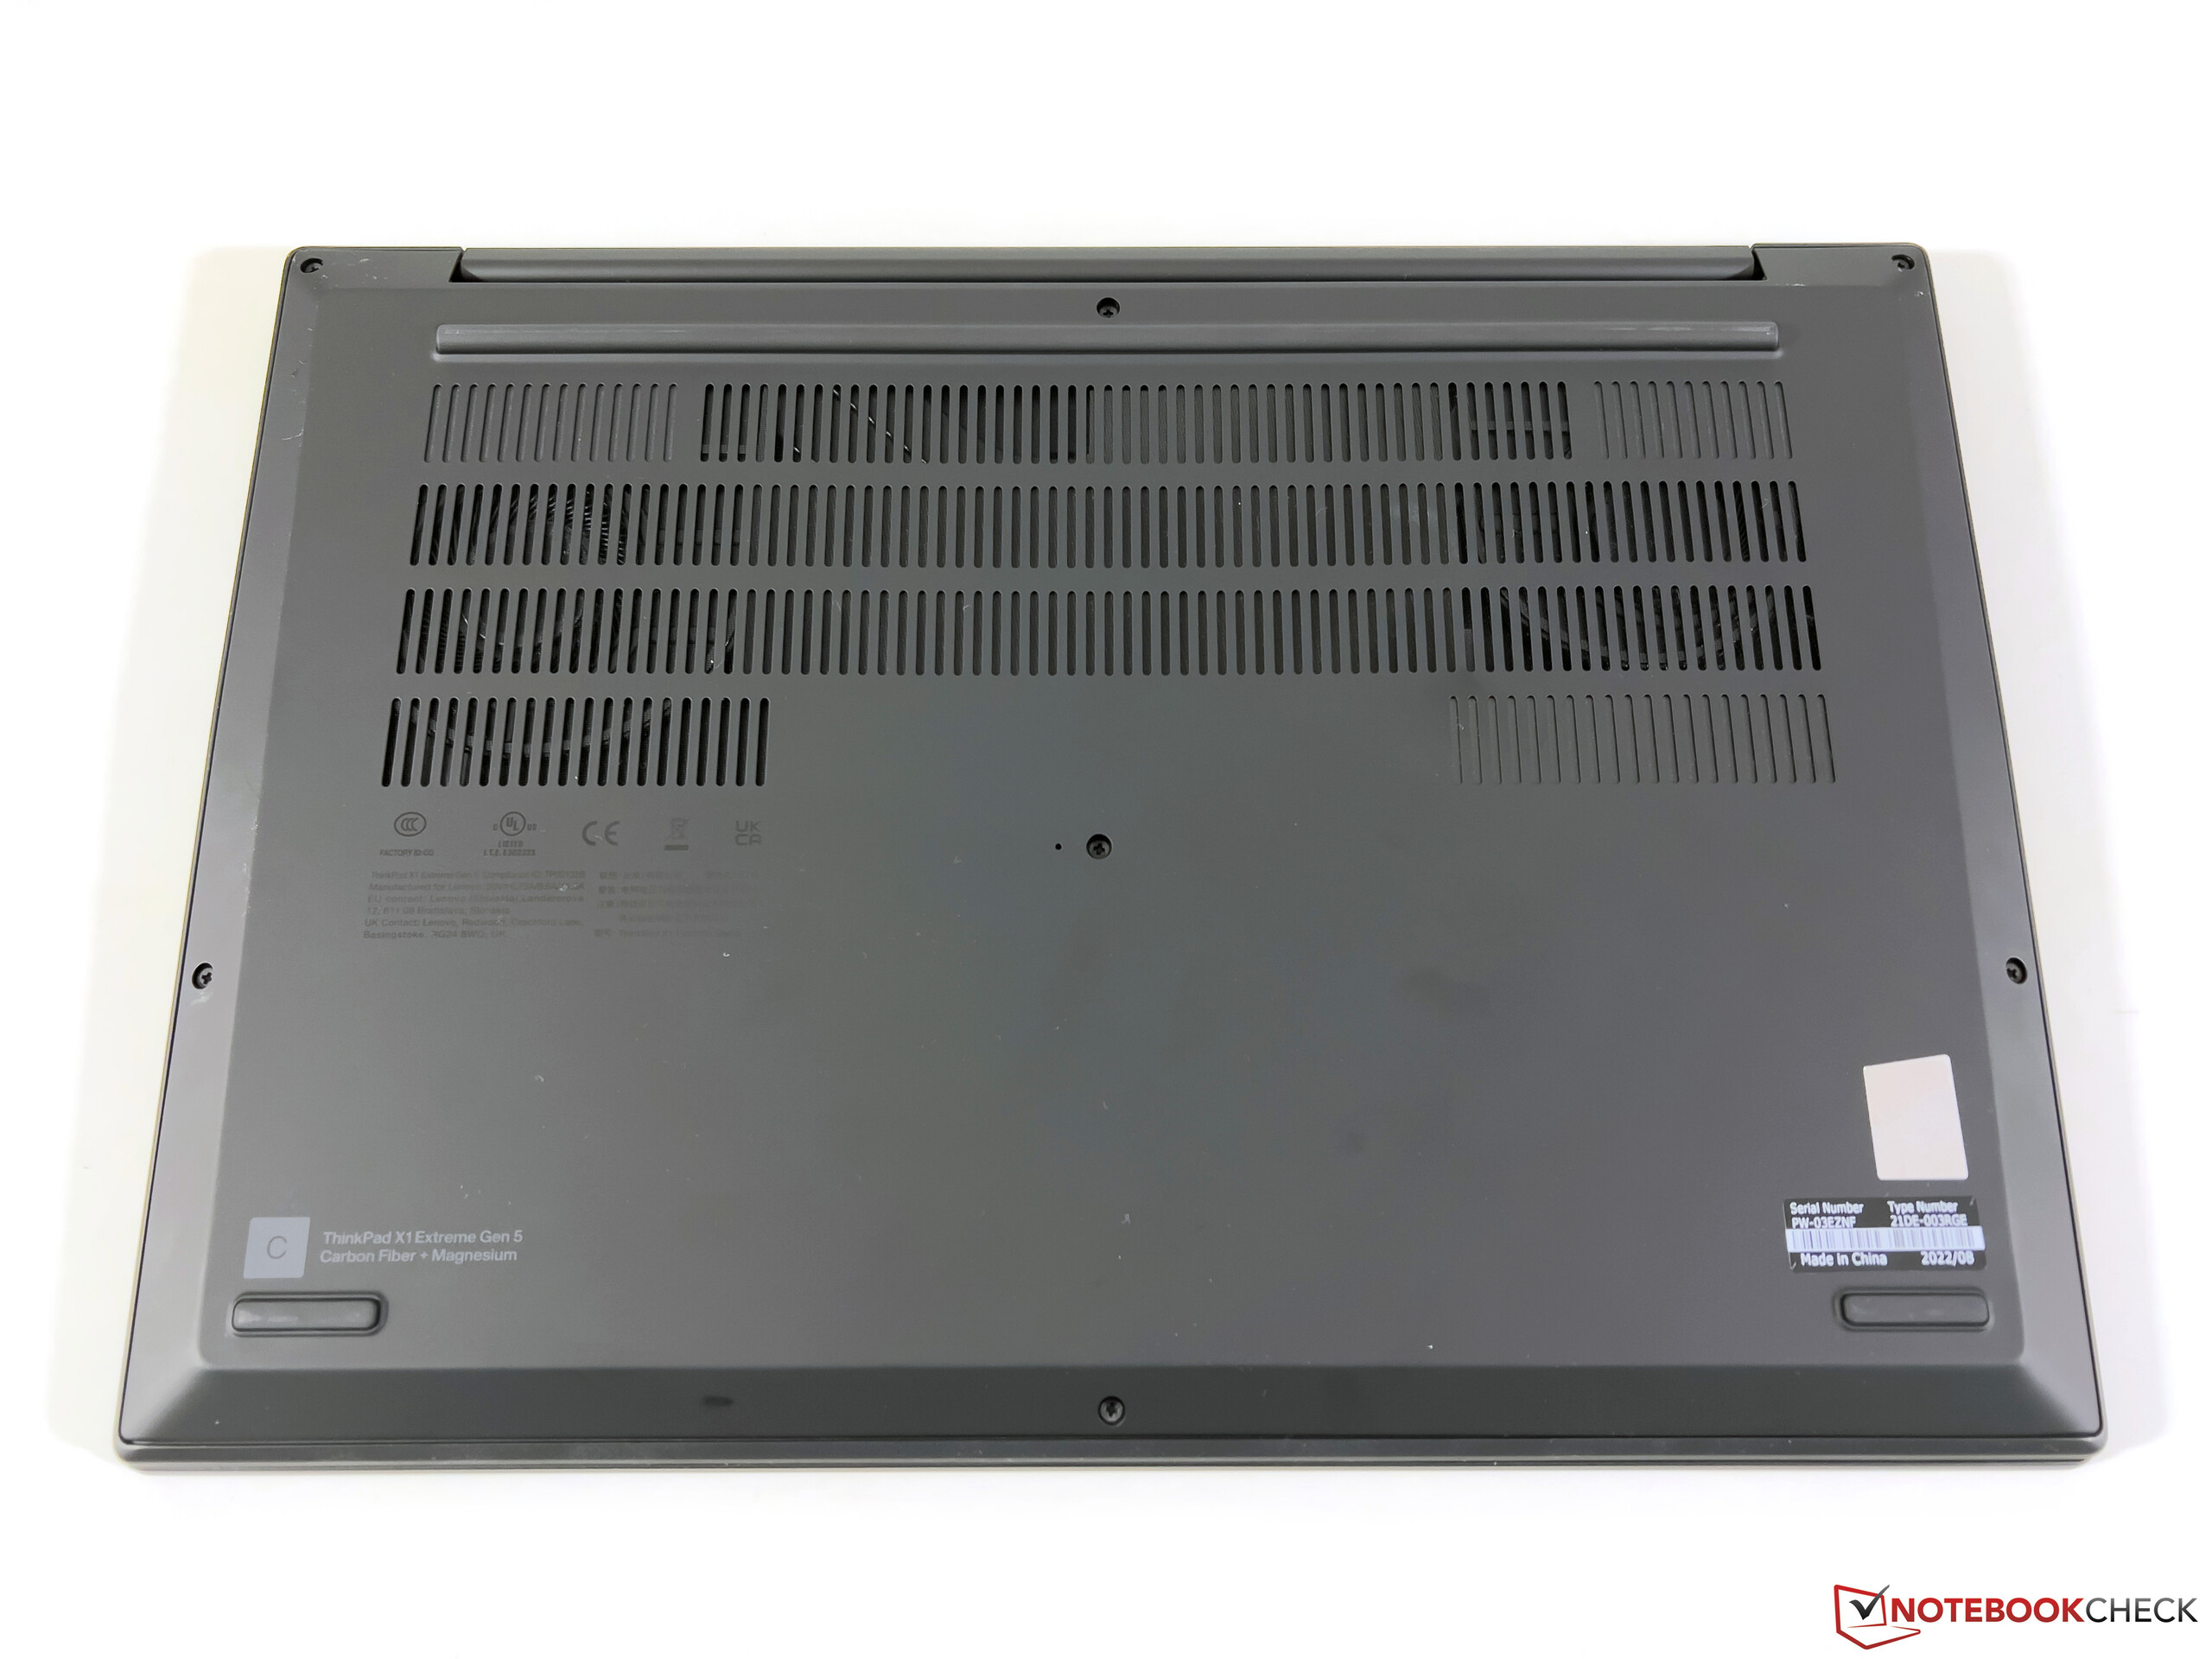
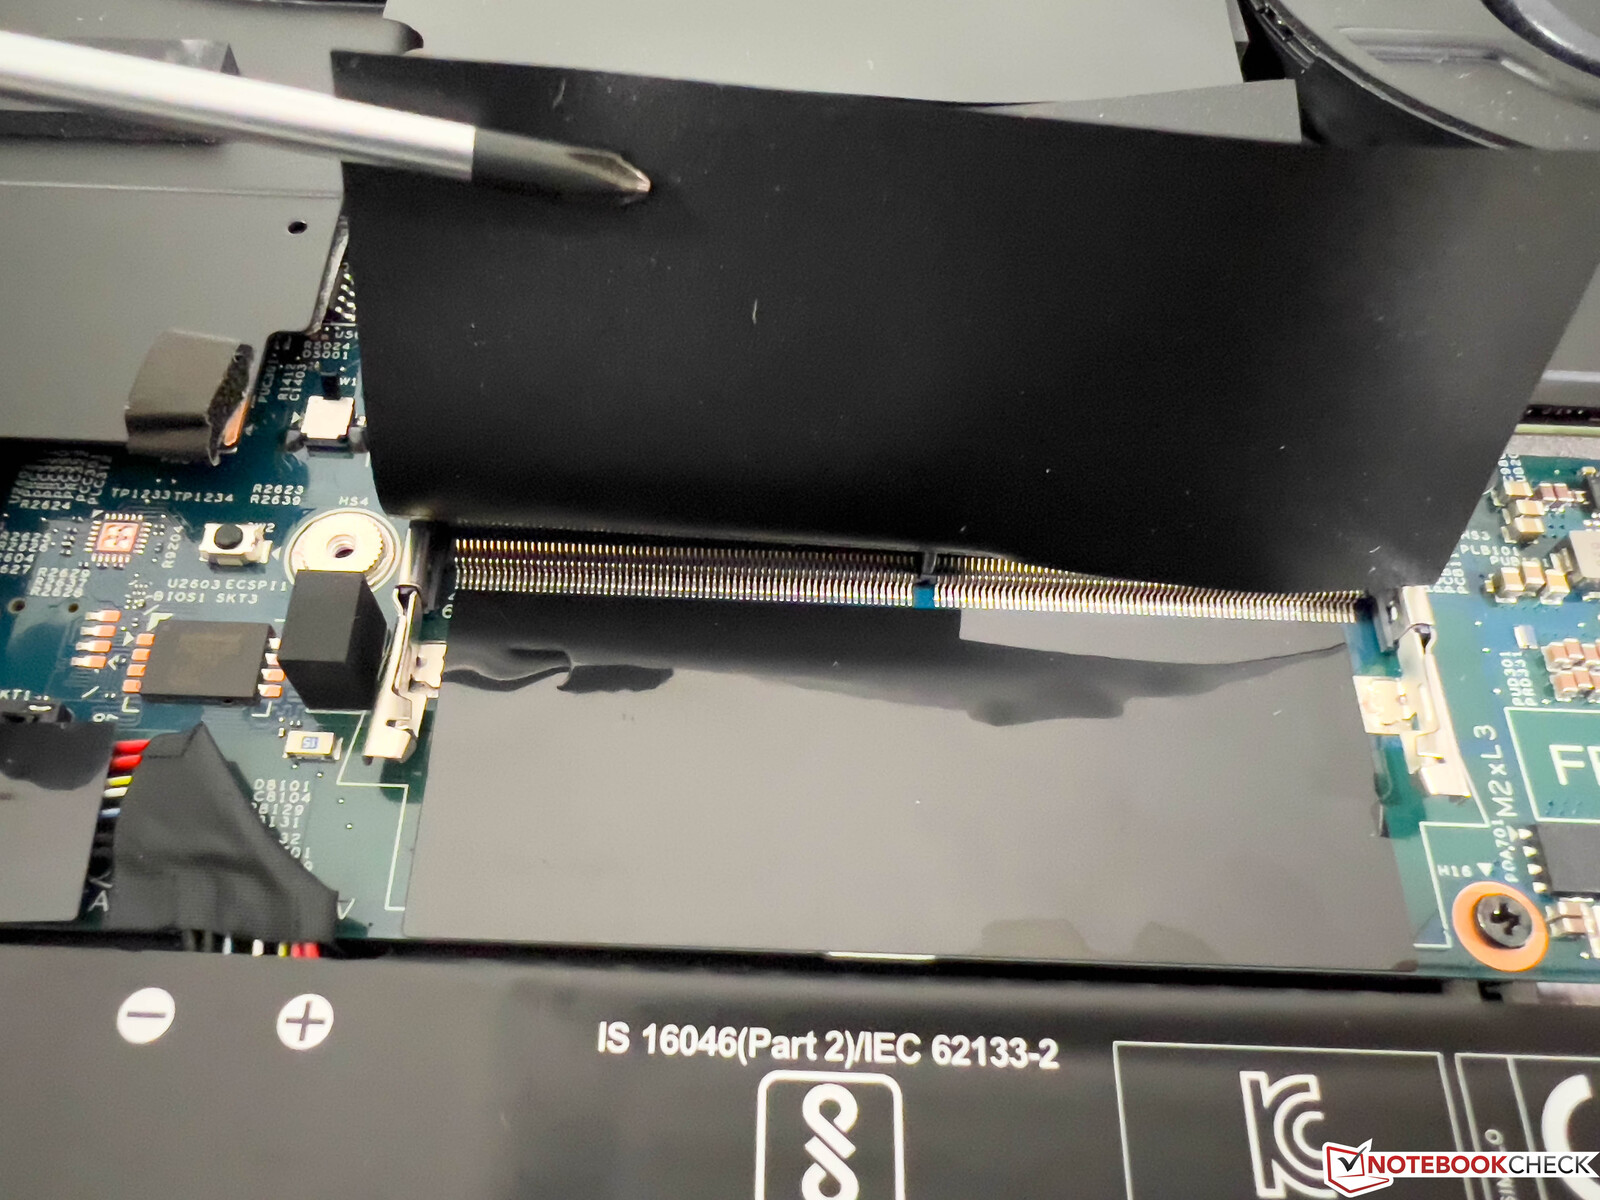
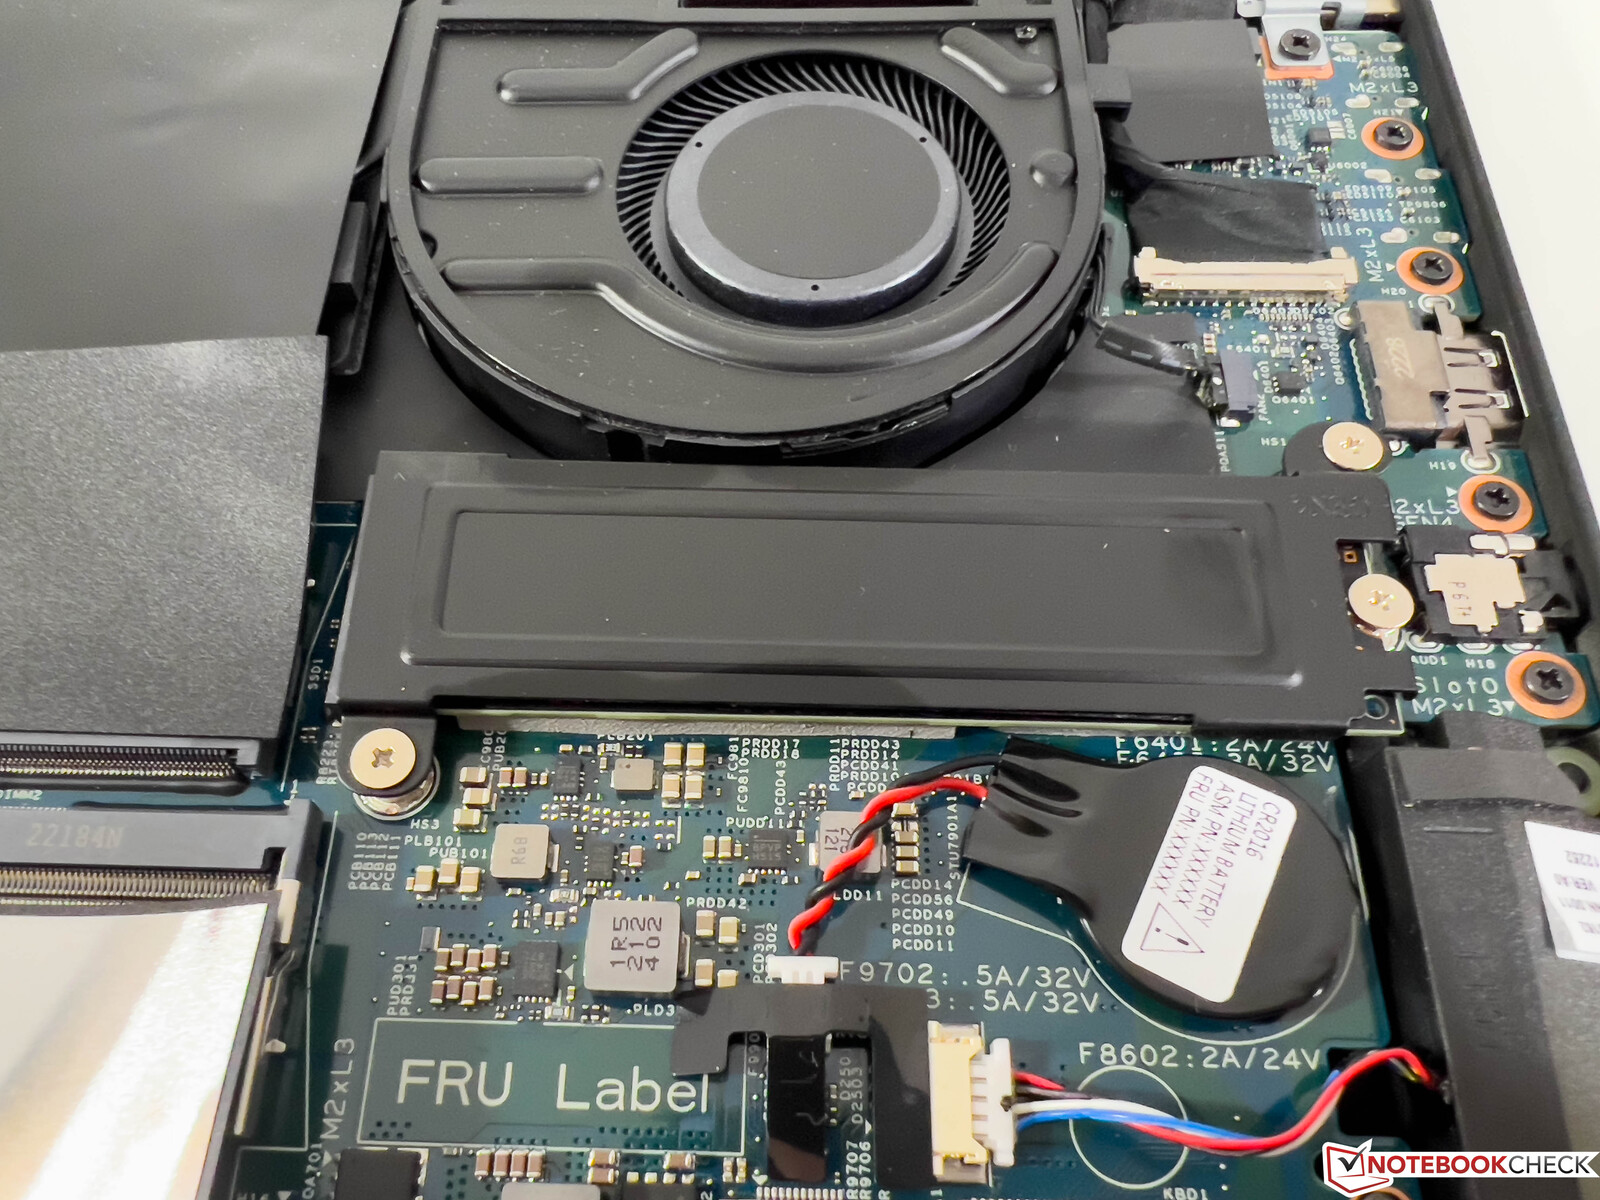
Maintenance
The base cover is only secured with six normal cross-headed screws (caution: only loosen and don't completely unscrew) and can be removed very easily. Inside you have access to the two fans, the M.2 2280 SSD and both RAM slots.
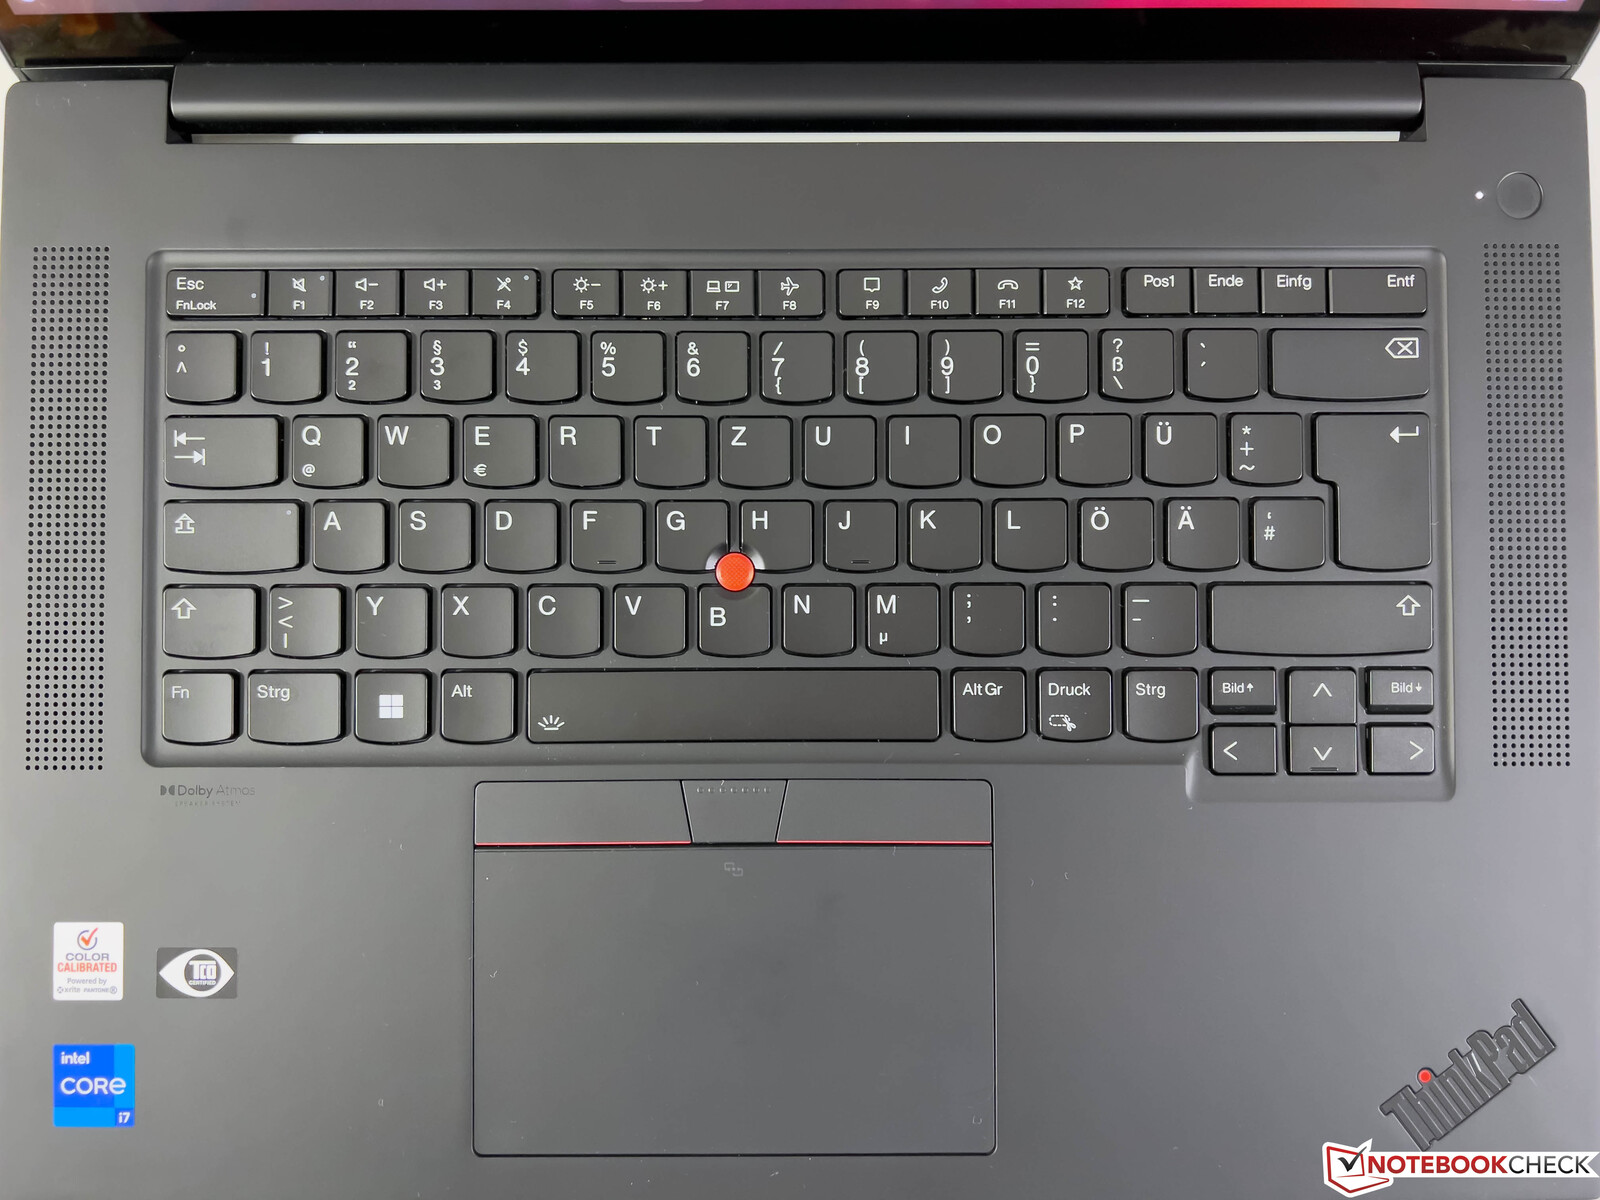
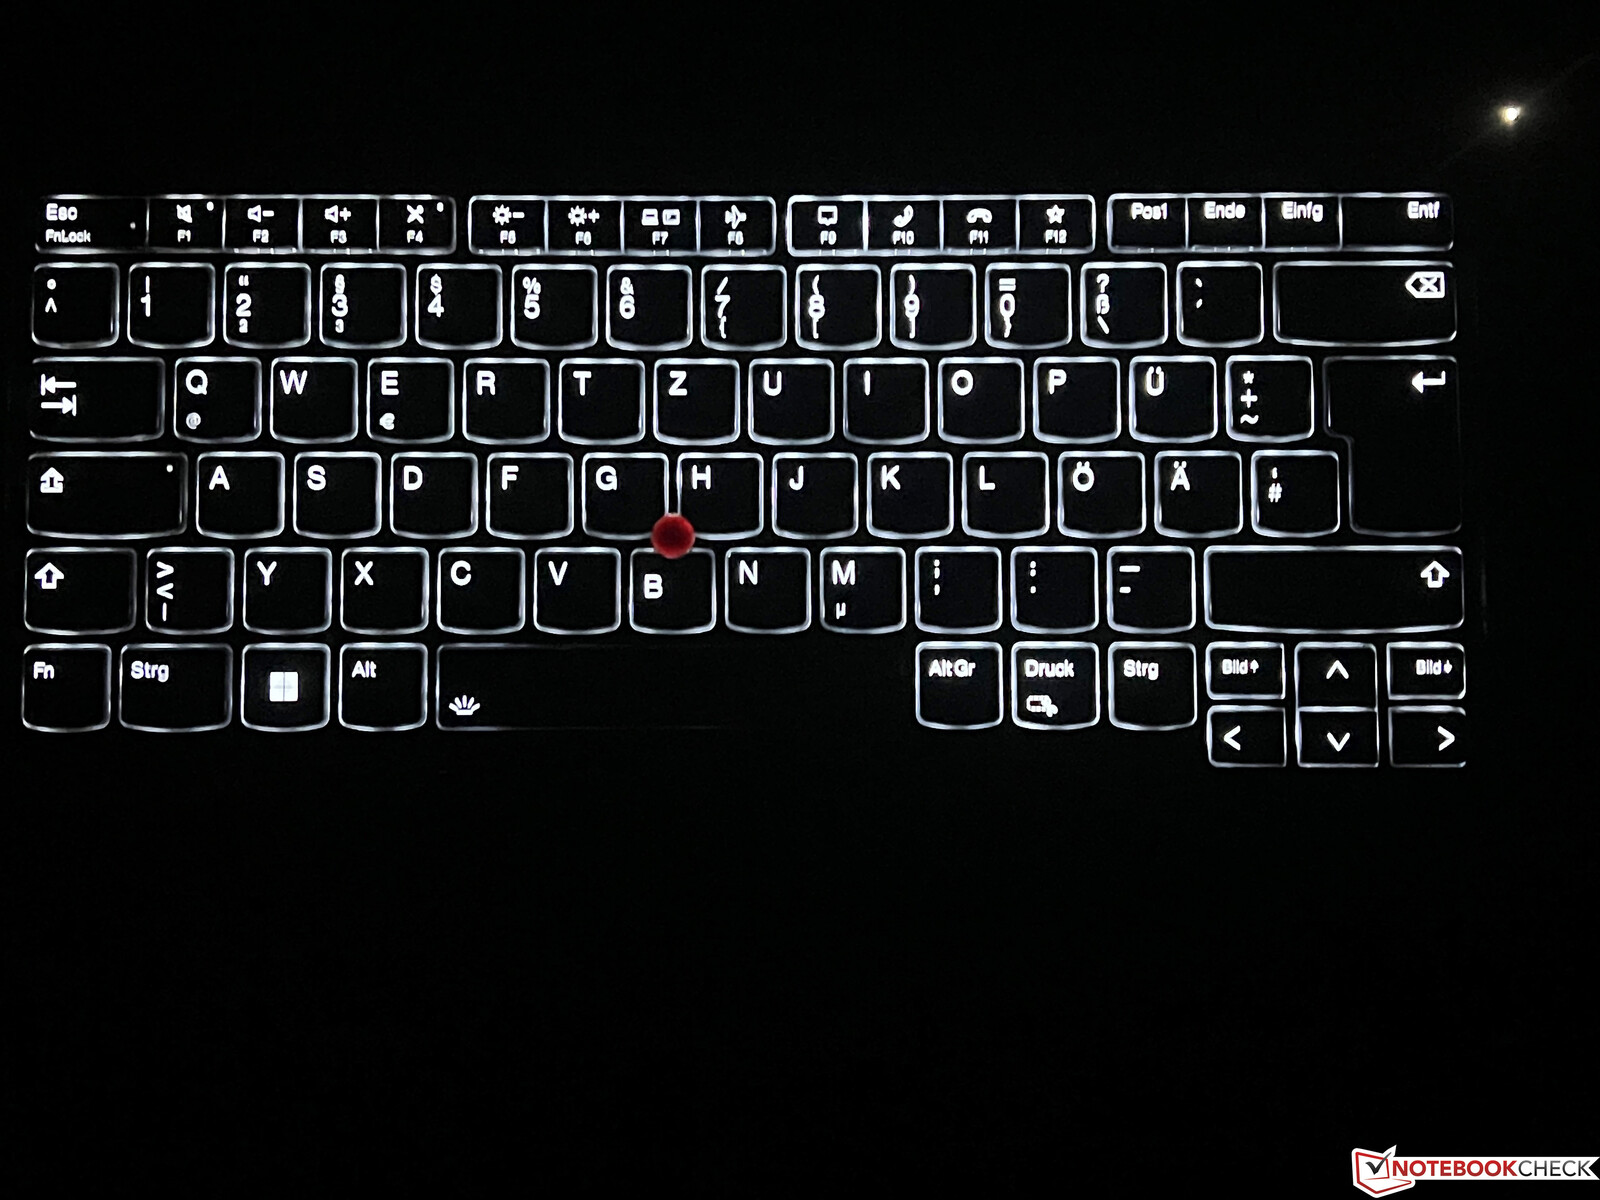
Input devices - Flagship ThinkPad with 1.5 mm key travel
With last year's X1 Extreme G4, Lenovo switched to a keyboard with shorter key travel and thereby noticeably worsened the quality compared to the old models (1.8 mm travel). The current keyboard is not bad but leaves us at a loss as to why Lenovo chose to shorten the key travel with a device as large as the X1 Extreme G5. The only ThinkPad keyboard advantage is now gone. As usual, the keyboard has a white, two-level backlight and the fingerprint scanner is integrated in the power button on the right above the keyboard.
The trackpad feels very smooth to the touch, offering a good mechanics, with quiet, high quality clicking sounds. Additionally, there is a TrackPoint with dedicated keys which can be used to control the pointer. The flat keys provide a good, quiet response with intuitive control. On top of this, a capacitive touchscreen is also available which also supports stylus input (compatible with the optional Lenovo Active Pen 2 and Lenovo Pen Pro).
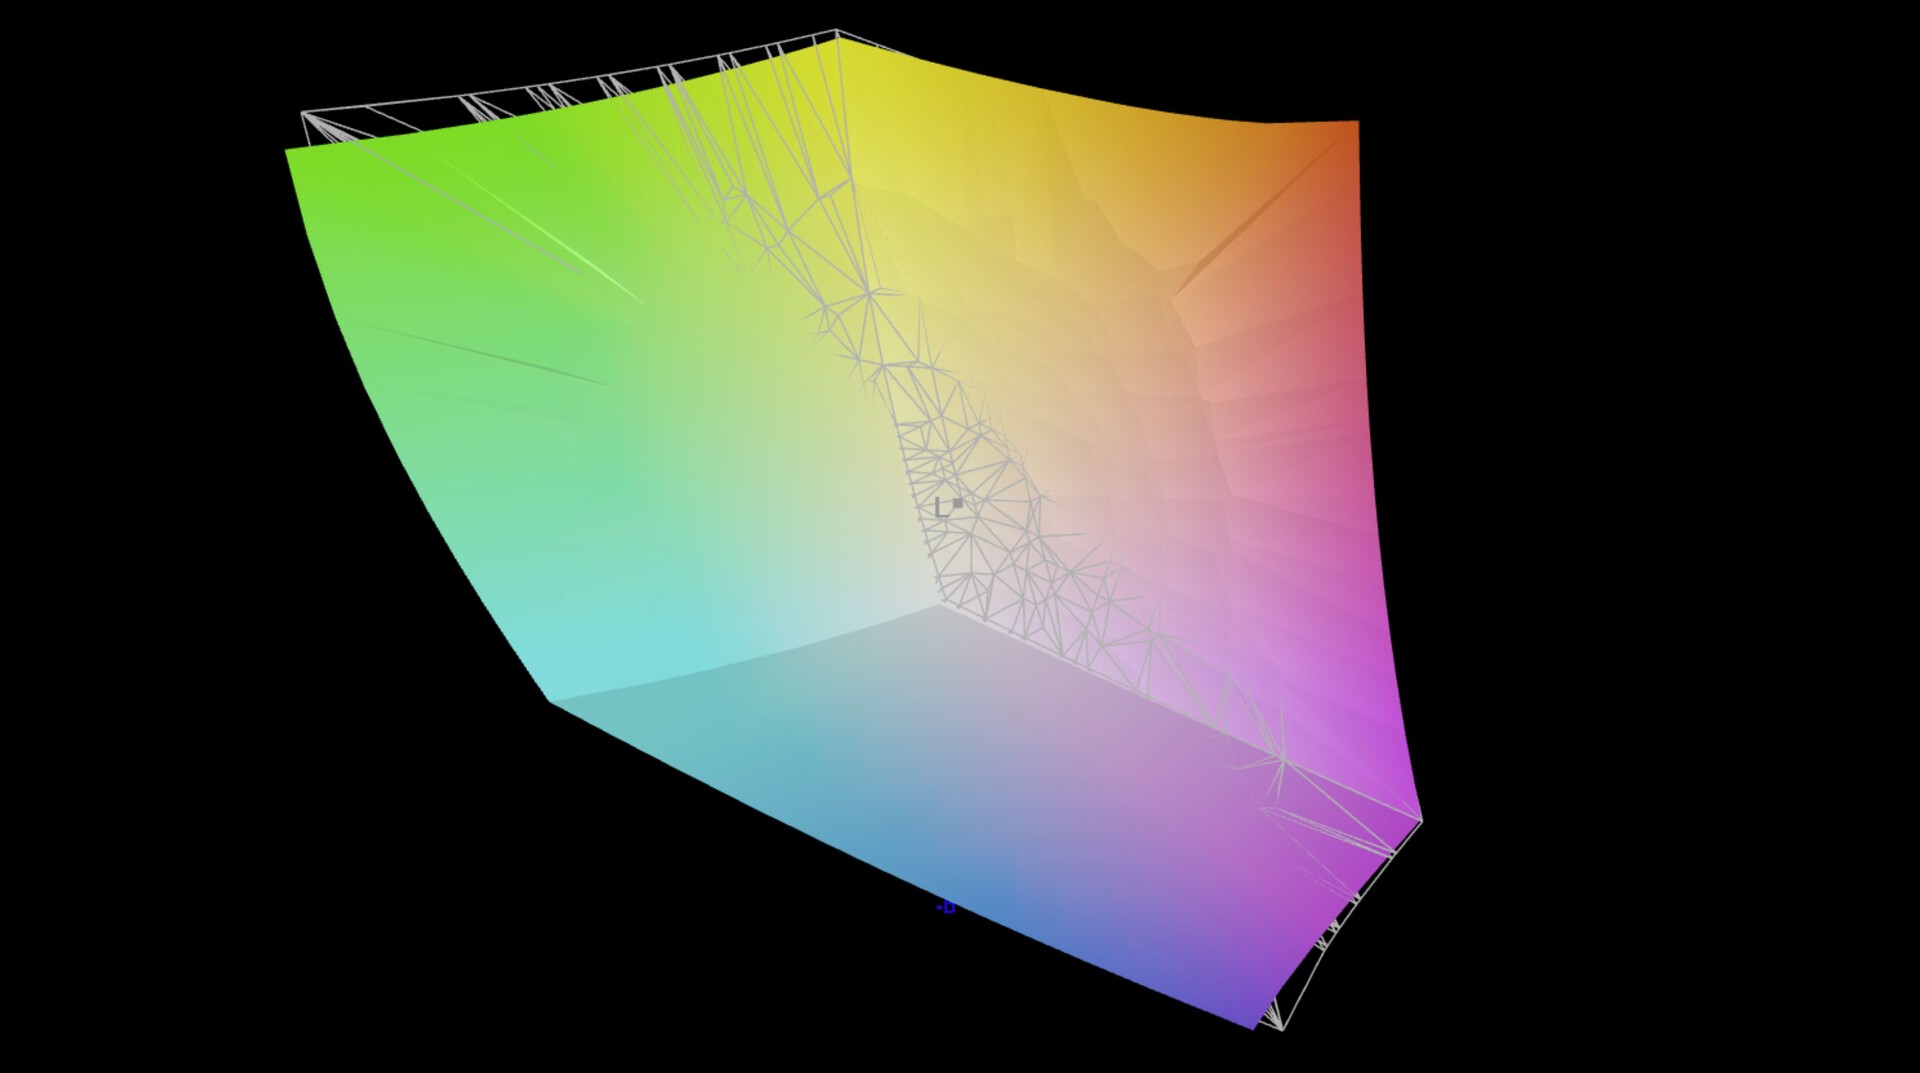
Display - the X1 Extreme still comes with AdobeRGB


Lenovo is one of the few manufacturers who still offer AdobeRGB displays. The 16:10 format (3840 x 2400 pixels), 4K touchscreen is the same as its predecessor. A new feature in this generation is the matte, 165 Hz WQHD panel which we will shortly put through its paces in the ThinkPad P1 G5. Seen subjectively, the reflective panel makes an excellent visual impression. Although Lenovo has used the same panel as its predecessor, our tests revealed the display brightness to be an average of 470 cd/m² which is not only much lower this time around but also below the manufacturer's specification of 600 cd/m². At the same time, however, the black level is somewhat better resulting in an unchanged contrast ratio of just under 1400:1. In addition, the display supports HDR without any hint of PWM. On top of this, response times are better than that of its predecessor.
| |||||||||||||||||||||||||
Brightness Distribution: 90 %
Center on Battery: 475 cd/m²
Contrast: 1360:1 (Black: 0.35 cd/m²)
ΔE ColorChecker Calman: 1.9 | ∀{0.5-29.43 Ø4.72}
calibrated: 1.3
ΔE Greyscale Calman: 2.4 | ∀{0.09-98 Ø4.97}
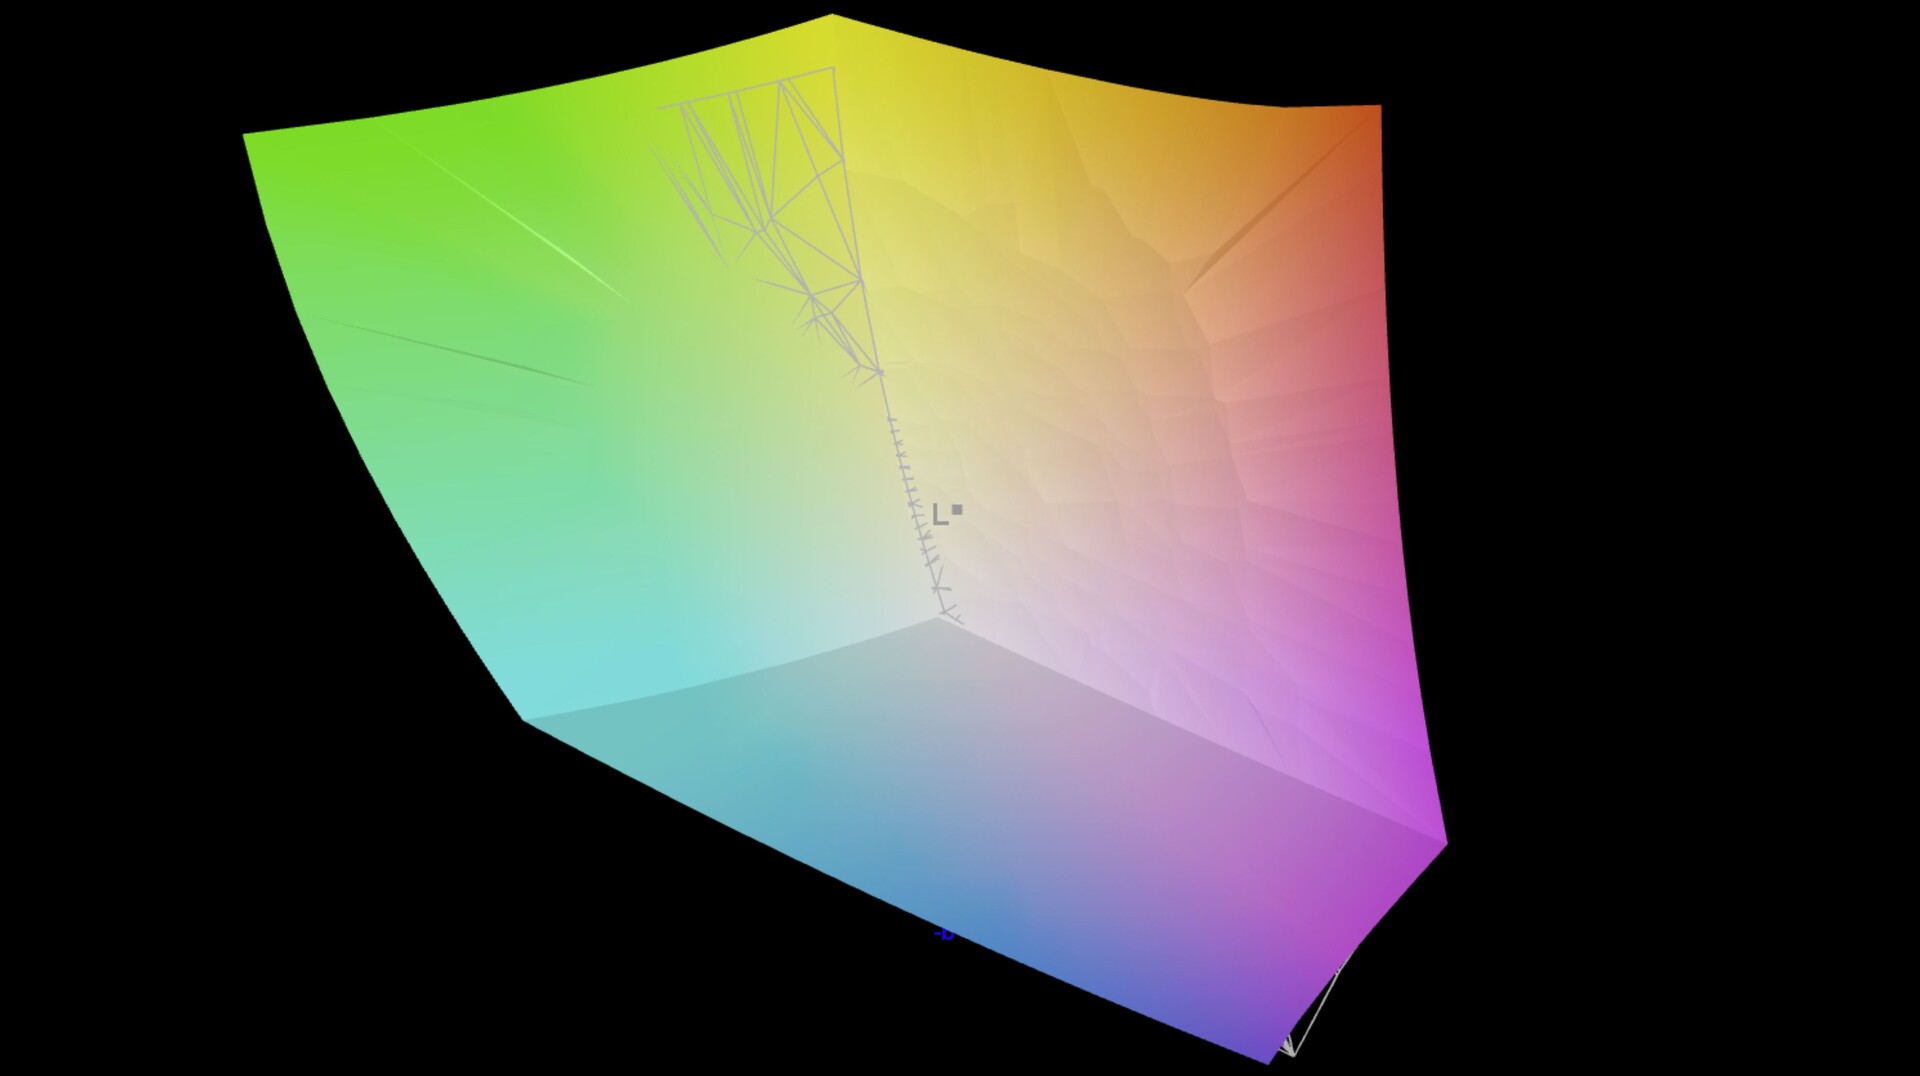
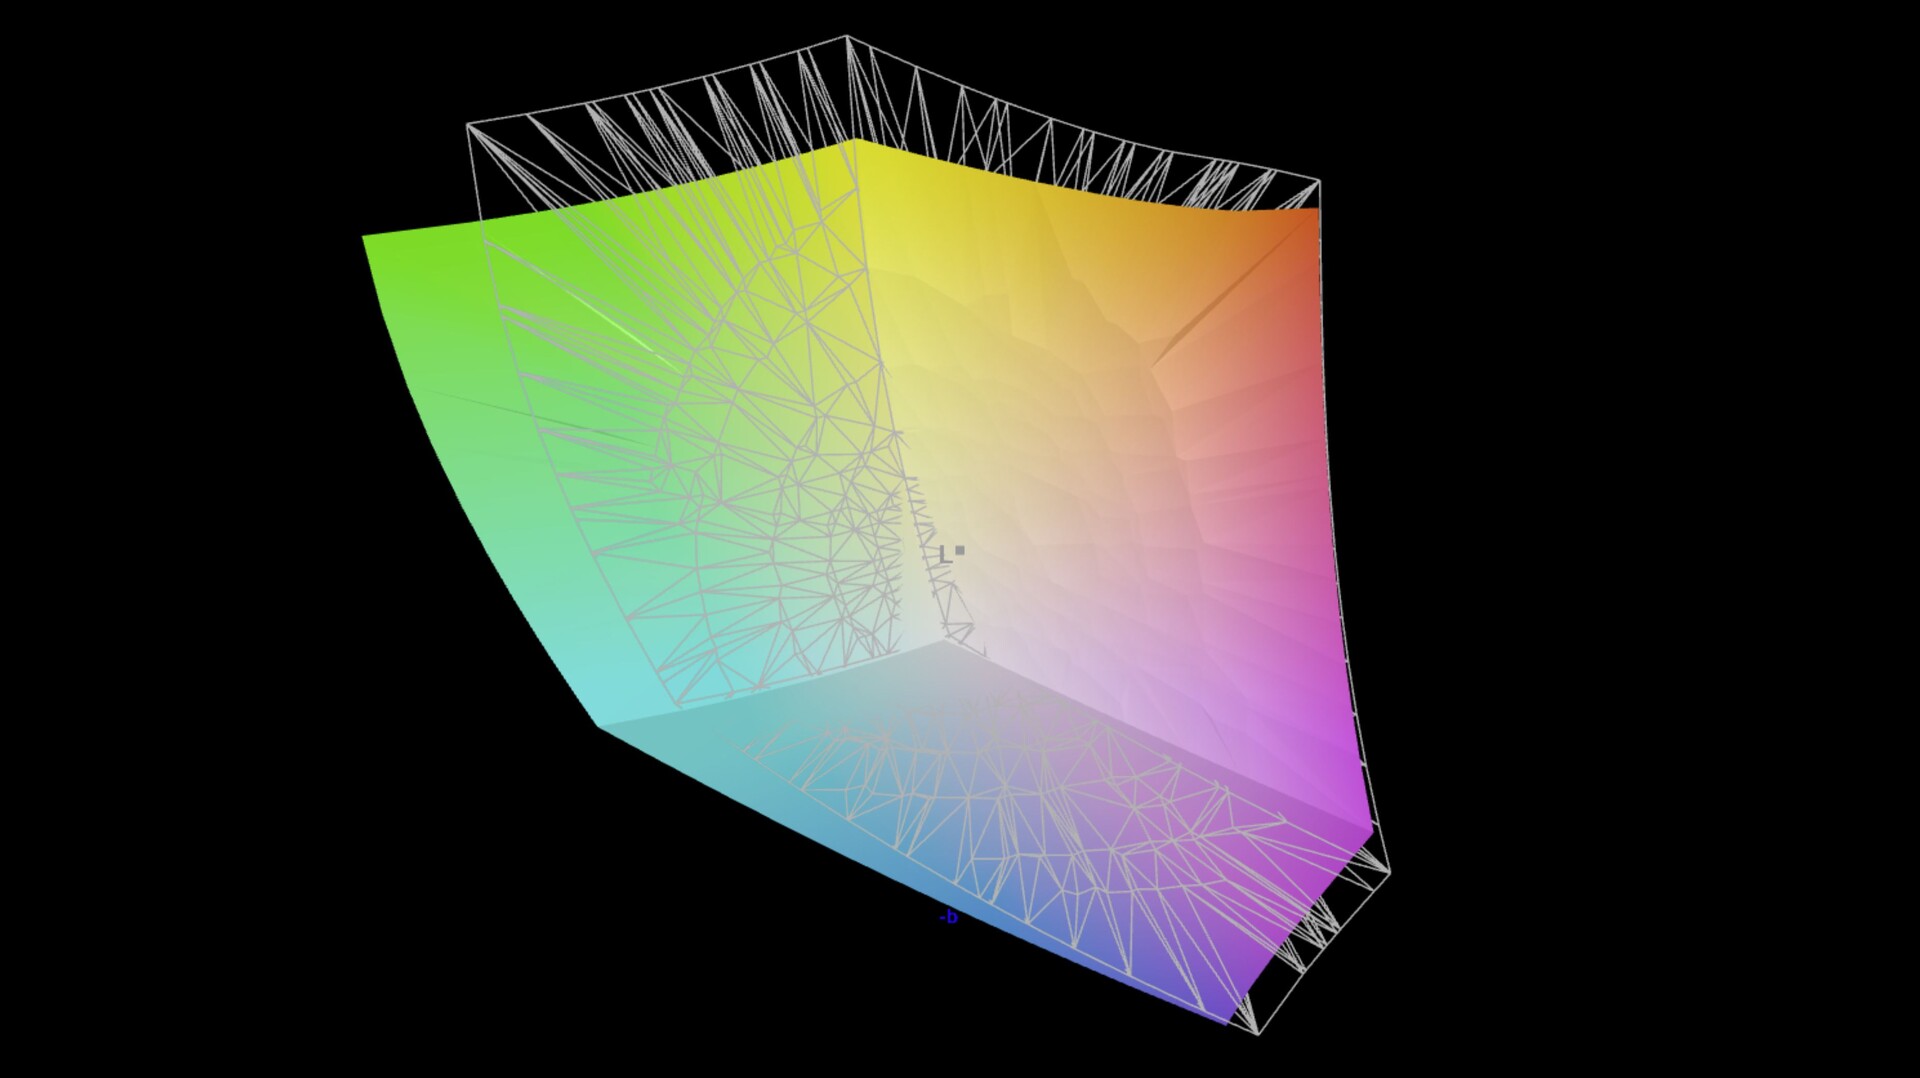
97.7% AdobeRGB 1998 (Argyll 3D)
99.2% sRGB (Argyll 3D)
84.6% Display P3 (Argyll 3D)
Gamma: 2.24
CCT: 6377 K
| Lenovo ThinkPad X1 Extreme G5-21DE003RGE LP160UQ1-SPB1, IPS, 3840x2400, 16" | HP Envy 16 h0112nr Samsung SDC4174, OLED, 3840x2400, 16" | Schenker Vision 16 Pro RTX 3070 Ti N160QDM-NZ1, IPS, 2560x1600, 16" | Dell XPS 15 9520 RTX 3050 Ti Samsung 156XG01, OLED, 3456x2160, 15.6" | Apple MacBook Pro 16 2021 M1 Pro Liquid Retina XDR, Mini-LED, 3456x2234, 16.2" | Dell XPS 17 9720 RTX 3060 Sharp LQ170R1, IPS, 3840x2400, 17" | Lenovo ThinkPad X1 Extreme G4-20Y5CTO1WW (3050 Ti) LP160UQ1-SPB1, IPS LED, 3840x2400, 16" | |
|---|---|---|---|---|---|---|---|
| Display | 3% | -17% | 2% | 3% | -1% | -0% | |
| Display P3 Coverage (%) | 84.6 | 99.3 17% | 68.7 -19% | 97.8 16% | 99.1 17% | 92.9 10% | 84.3 0% |
| sRGB Coverage (%) | 99.2 | 100 1% | 96.7 -3% | 99.9 1% | 100 1% | 100 1% | 98.3 -1% |
| AdobeRGB 1998 Coverage (%) | 97.7 | 88 -10% | 70 -28% | 86 -12% | 88 -10% | 85.3 -13% | 97.8 0% |
| Response Times | 93% | 62% | 93% | -185% | -47% | -75% | |
| Response Time Grey 50% / Grey 80% * (ms) | 46 ? | 2 ? 96% | 14.3 ? 69% | 1.9 ? 96% | 42.8 ? 7% | 51.2 ? -11% | 60 ? -30% |
| Response Time Black / White * (ms) | 19.2 ? | 1.9 ? 90% | 8.6 ? 55% | 1.9 ? 90% | 91.6 ? -377% | 35.2 ? -83% | 42 ? -119% |
| PWM Frequency (Hz) | 240.4 ? | 59.52 ? | 14880 | ||||
| Screen | -3% | -41% | -40% | 247% | -68% | 2% | |
| Brightness middle (cd/m²) | 476 | 328.8 -31% | 364 -24% | 381.4 -20% | 514 8% | 512.7 8% | 639 34% |
| Brightness (cd/m²) | 470 | 332 -29% | 347 -26% | 384 -18% | 497 6% | 463 -1% | 612 30% |
| Brightness Distribution (%) | 90 | 97 8% | 89 -1% | 95 6% | 95 6% | 85 -6% | 84 -7% |
| Black Level * (cd/m²) | 0.35 | 0.3 14% | 0.02 94% | 0.32 9% | 0.47 -34% | ||
| Contrast (:1) | 1360 | 1213 -11% | 25700 1790% | 1602 18% | 1360 0% | ||
| Colorchecker dE 2000 * | 1.9 | 1.53 19% | 3.3 -74% | 4.34 -128% | 1.4 26% | 5.98 -215% | 2.2 -16% |
| Colorchecker dE 2000 max. * | 4.7 | 6.04 -29% | 6.6 -40% | 9.24 -97% | 2.8 40% | 12.09 -157% | 5.3 -13% |
| Colorchecker dE 2000 calibrated * | 1.3 | 2.5 -92% | 1.4 -8% | ||||
| Greyscale dE 2000 * | 2.4 | 1.3 46% | 5.2 -117% | 2 17% | 2.3 4% | 7.2 -200% | 1.7 29% |
| Gamma | 2.24 98% | 2.18 101% | 2.14 103% | 2.13 103% | 2.27 97% | 2.54 87% | 2.31 95% |
| CCT | 6377 102% | 6362 102% | 6331 103% | 6210 105% | 6792 96% | 6914 94% | 6390 102% |
| Total Average (Program / Settings) | 31% /
16% | 1% /
-21% | 18% /
-4% | 22% /
124% | -39% /
-49% | -24% /
-10% |
* ... smaller is better

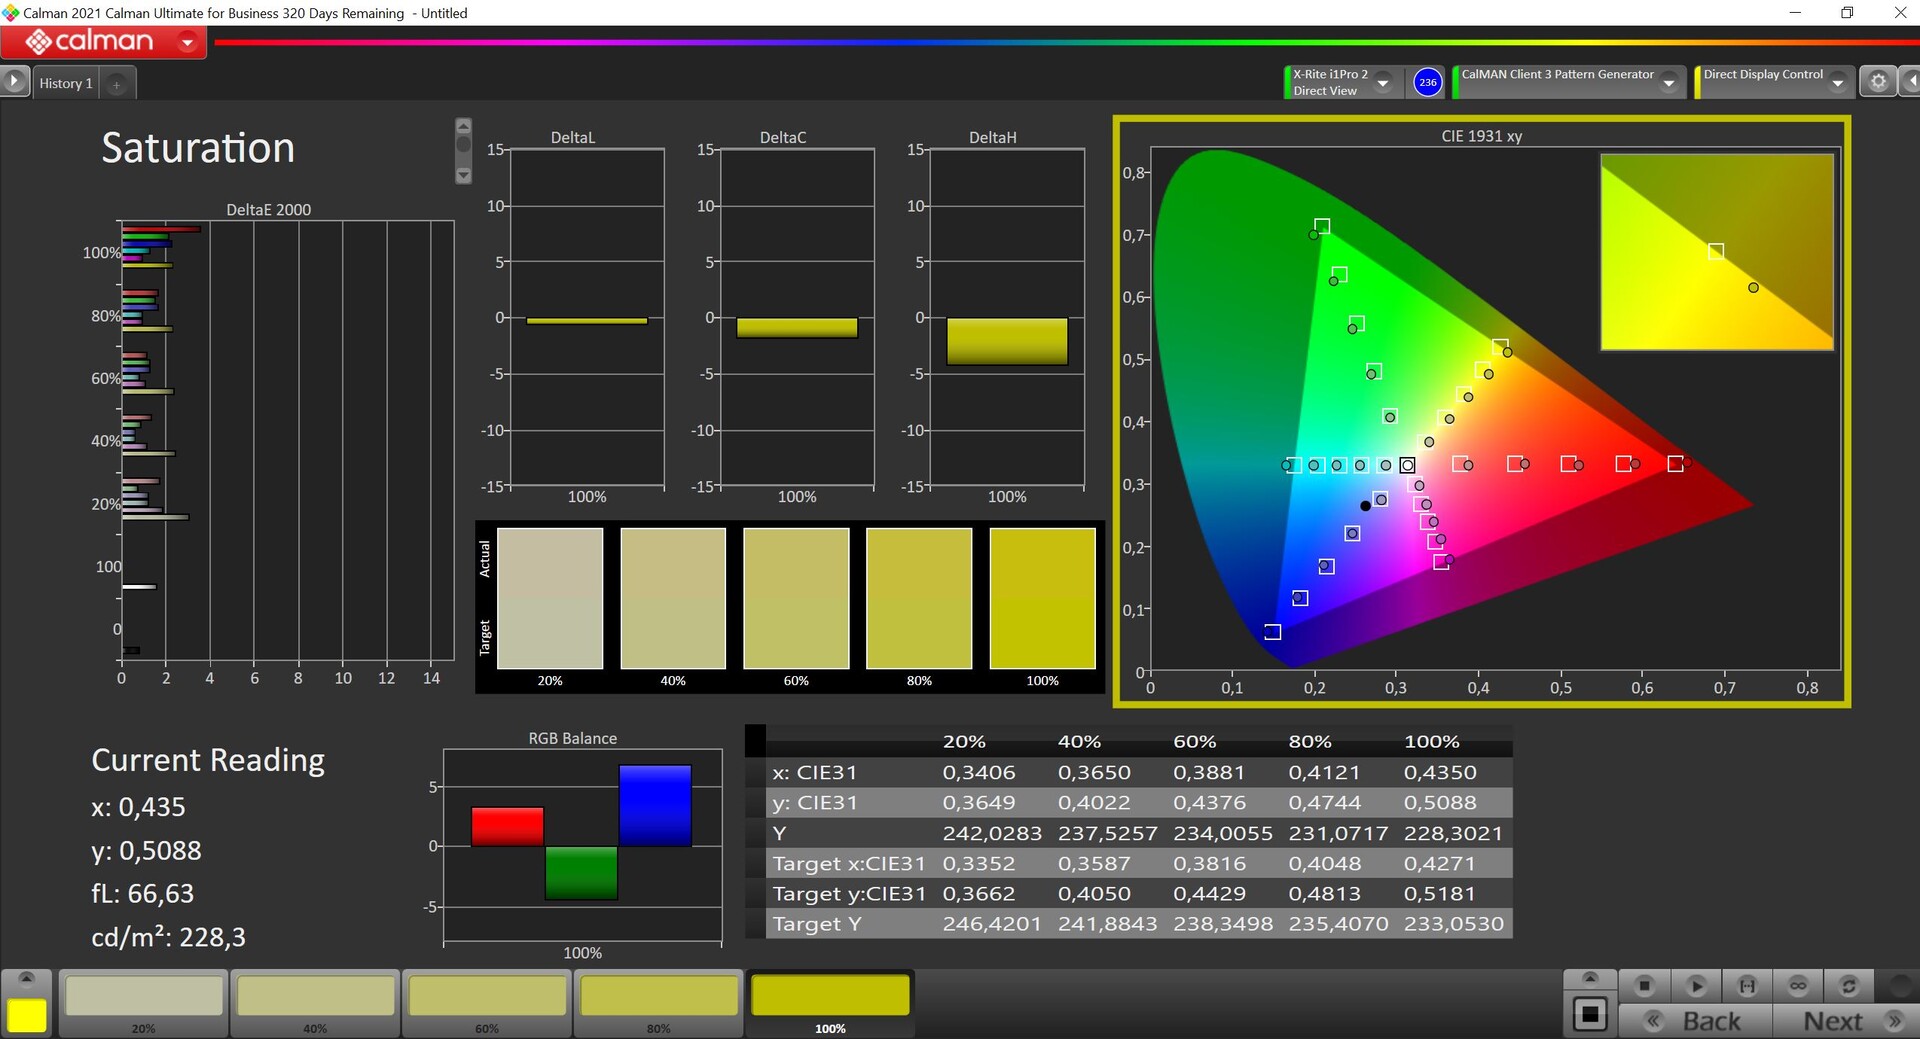
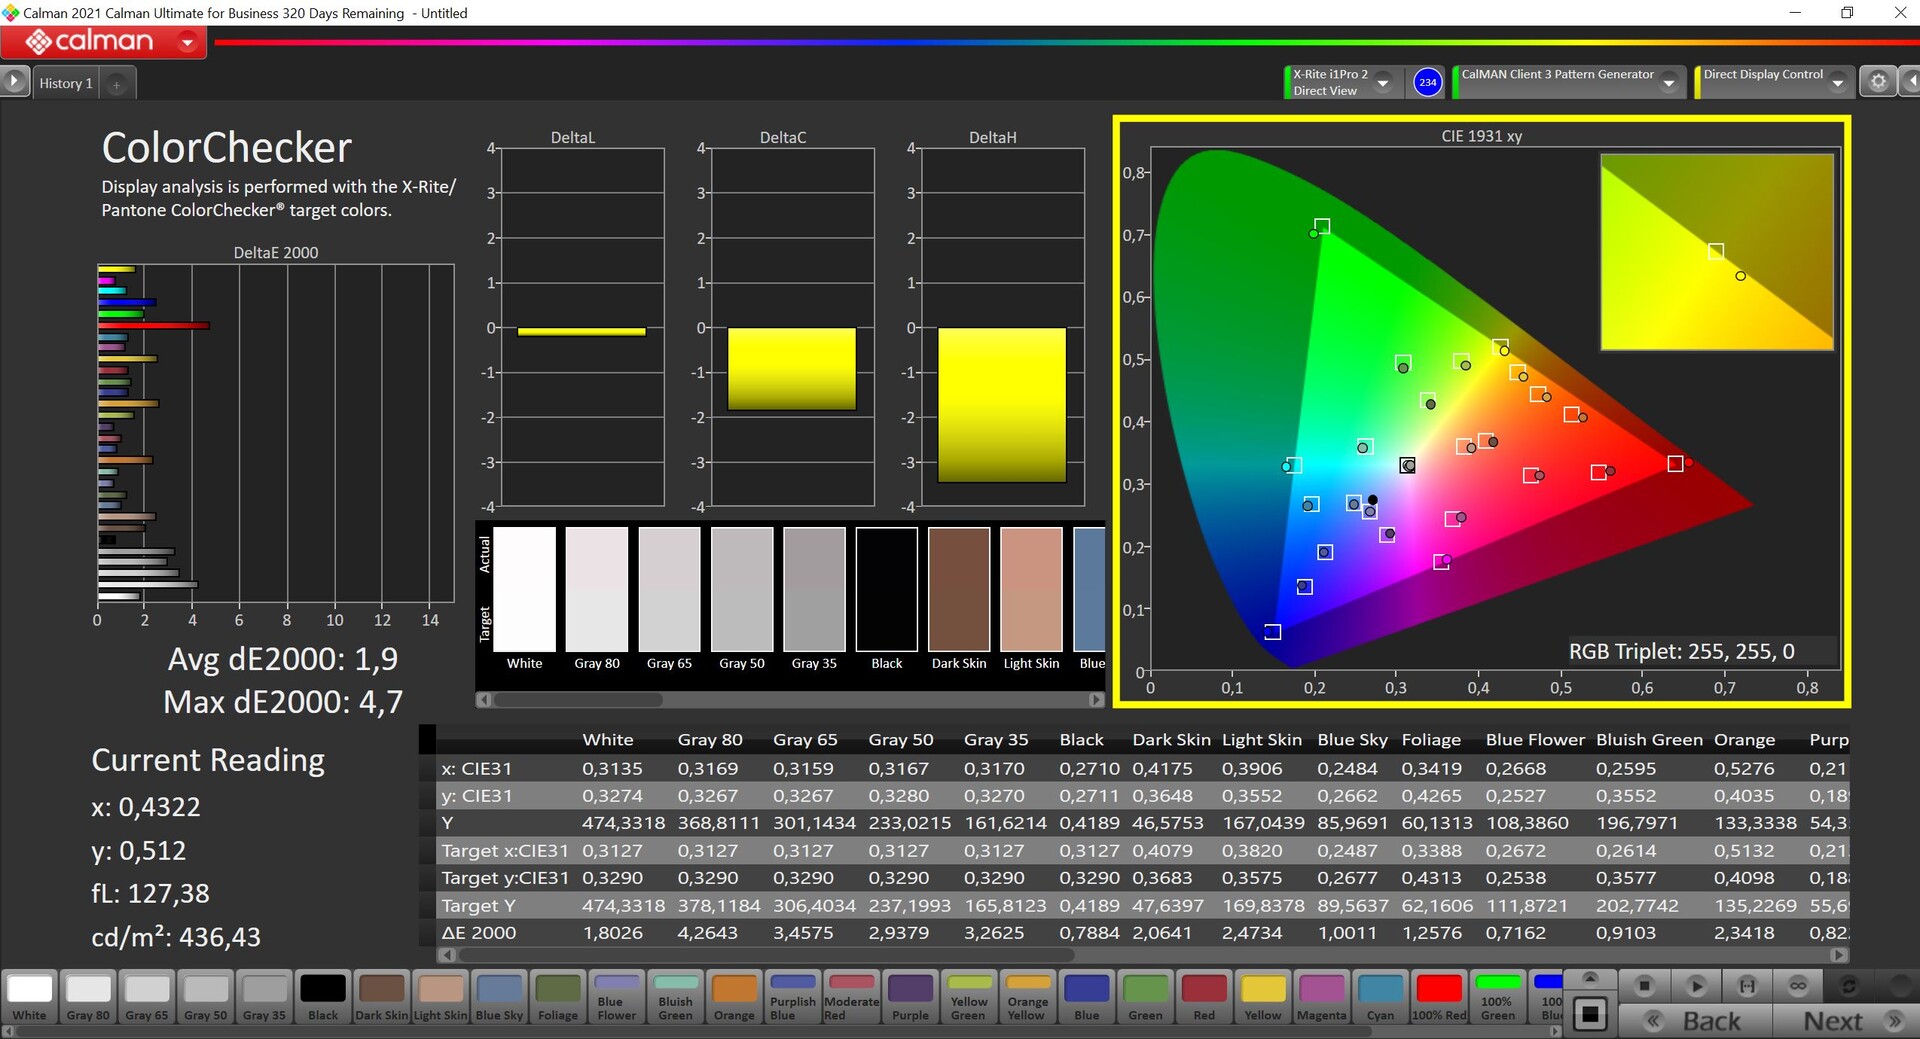
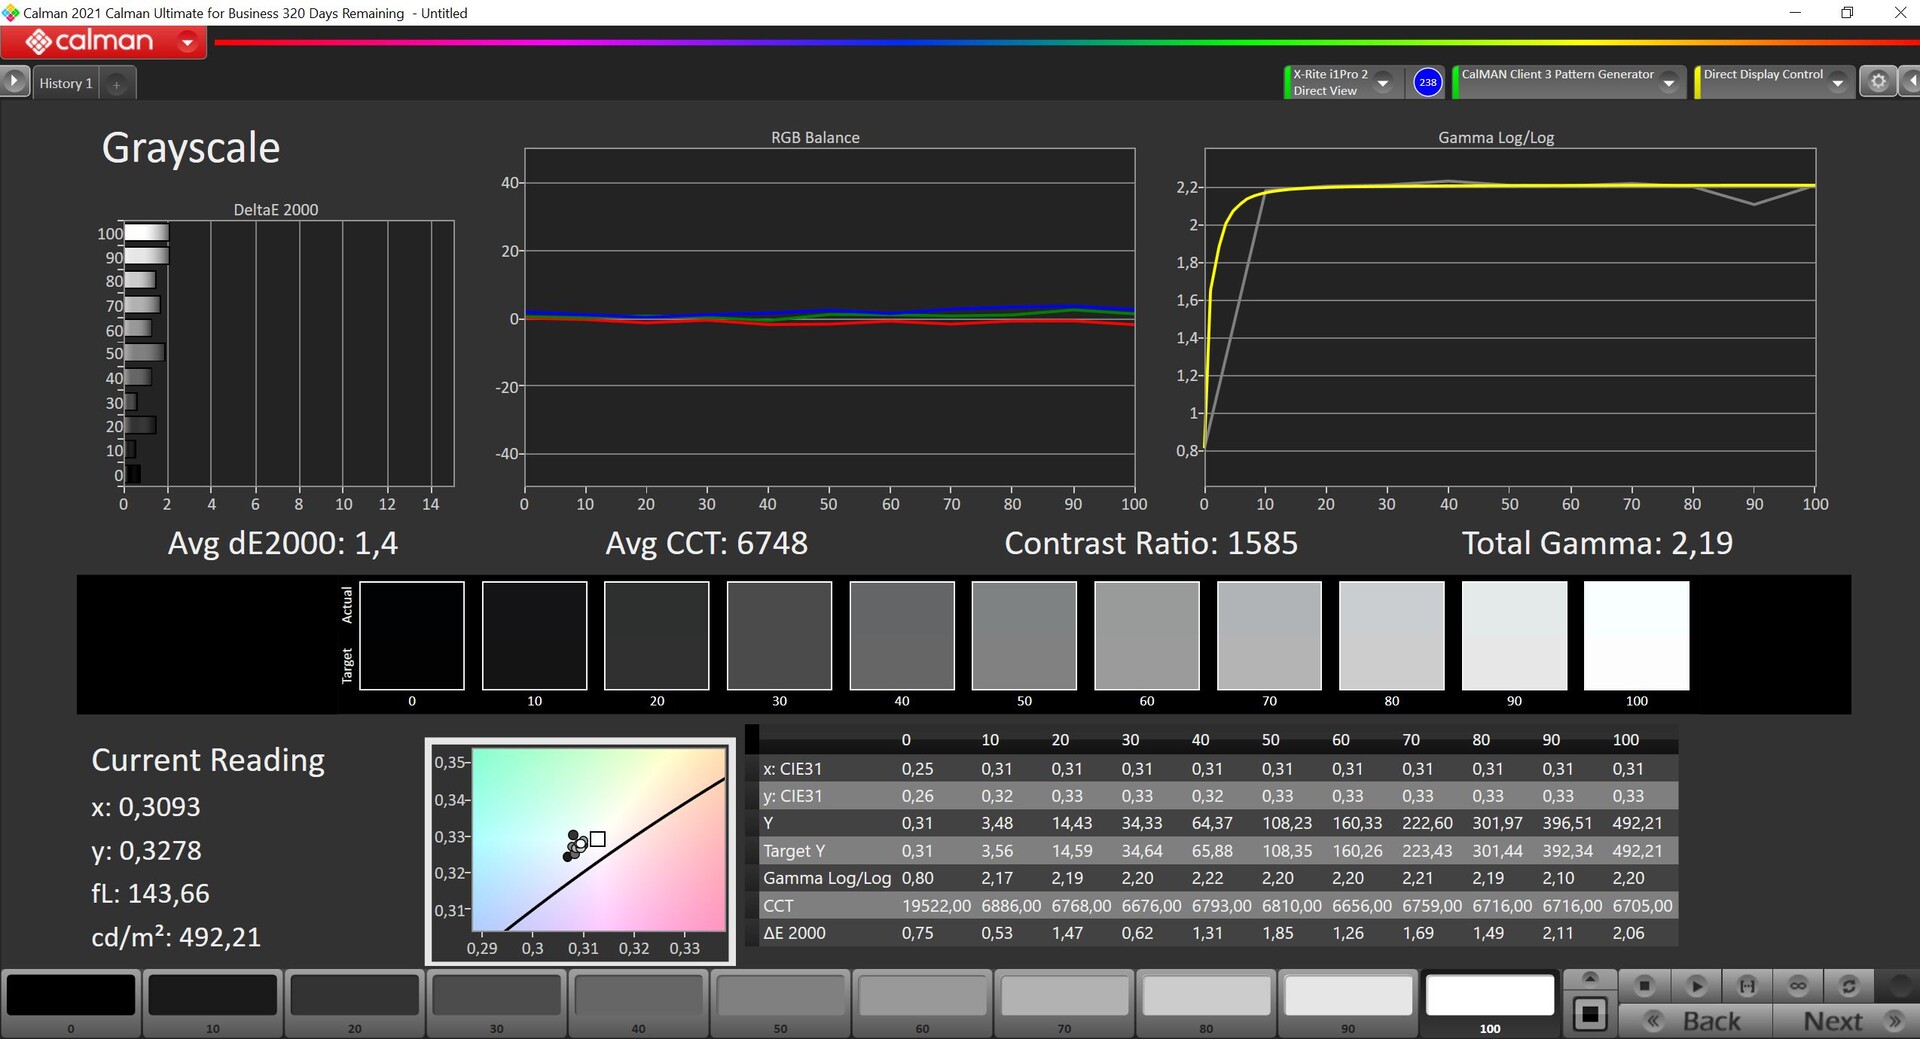
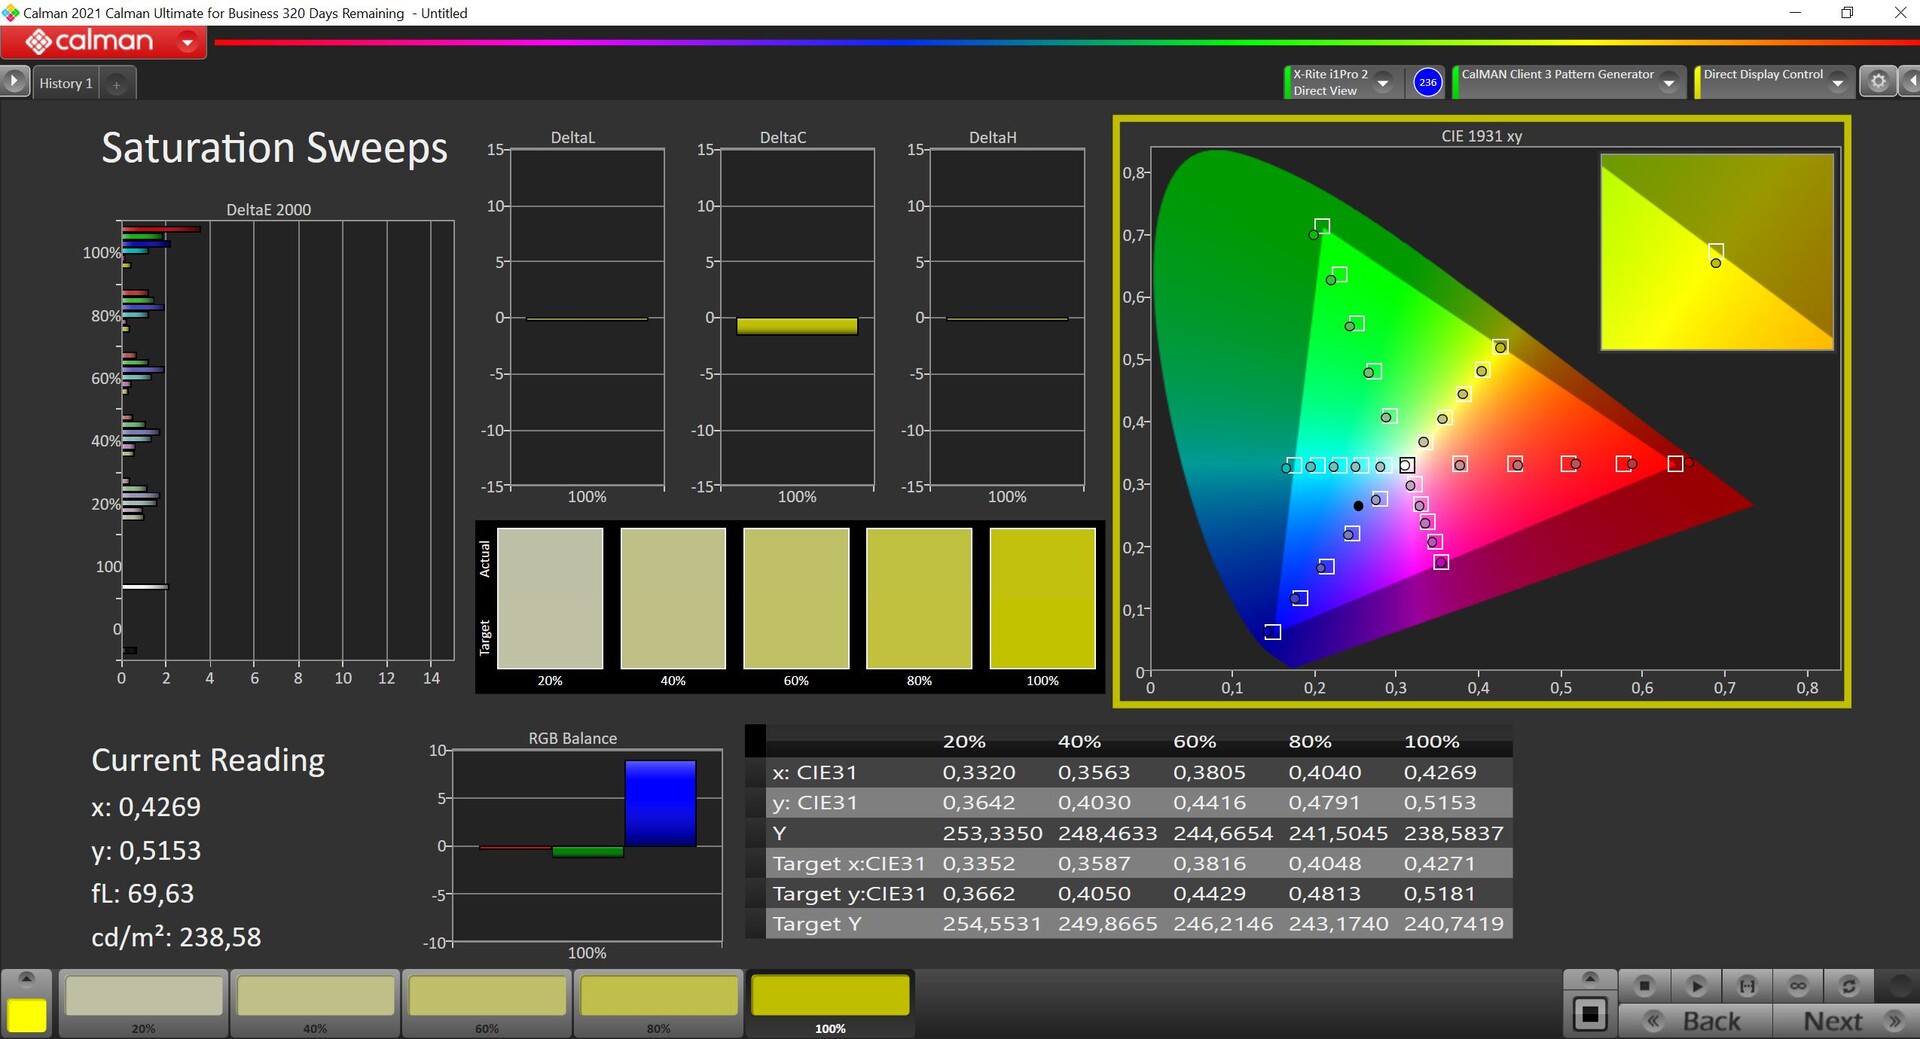
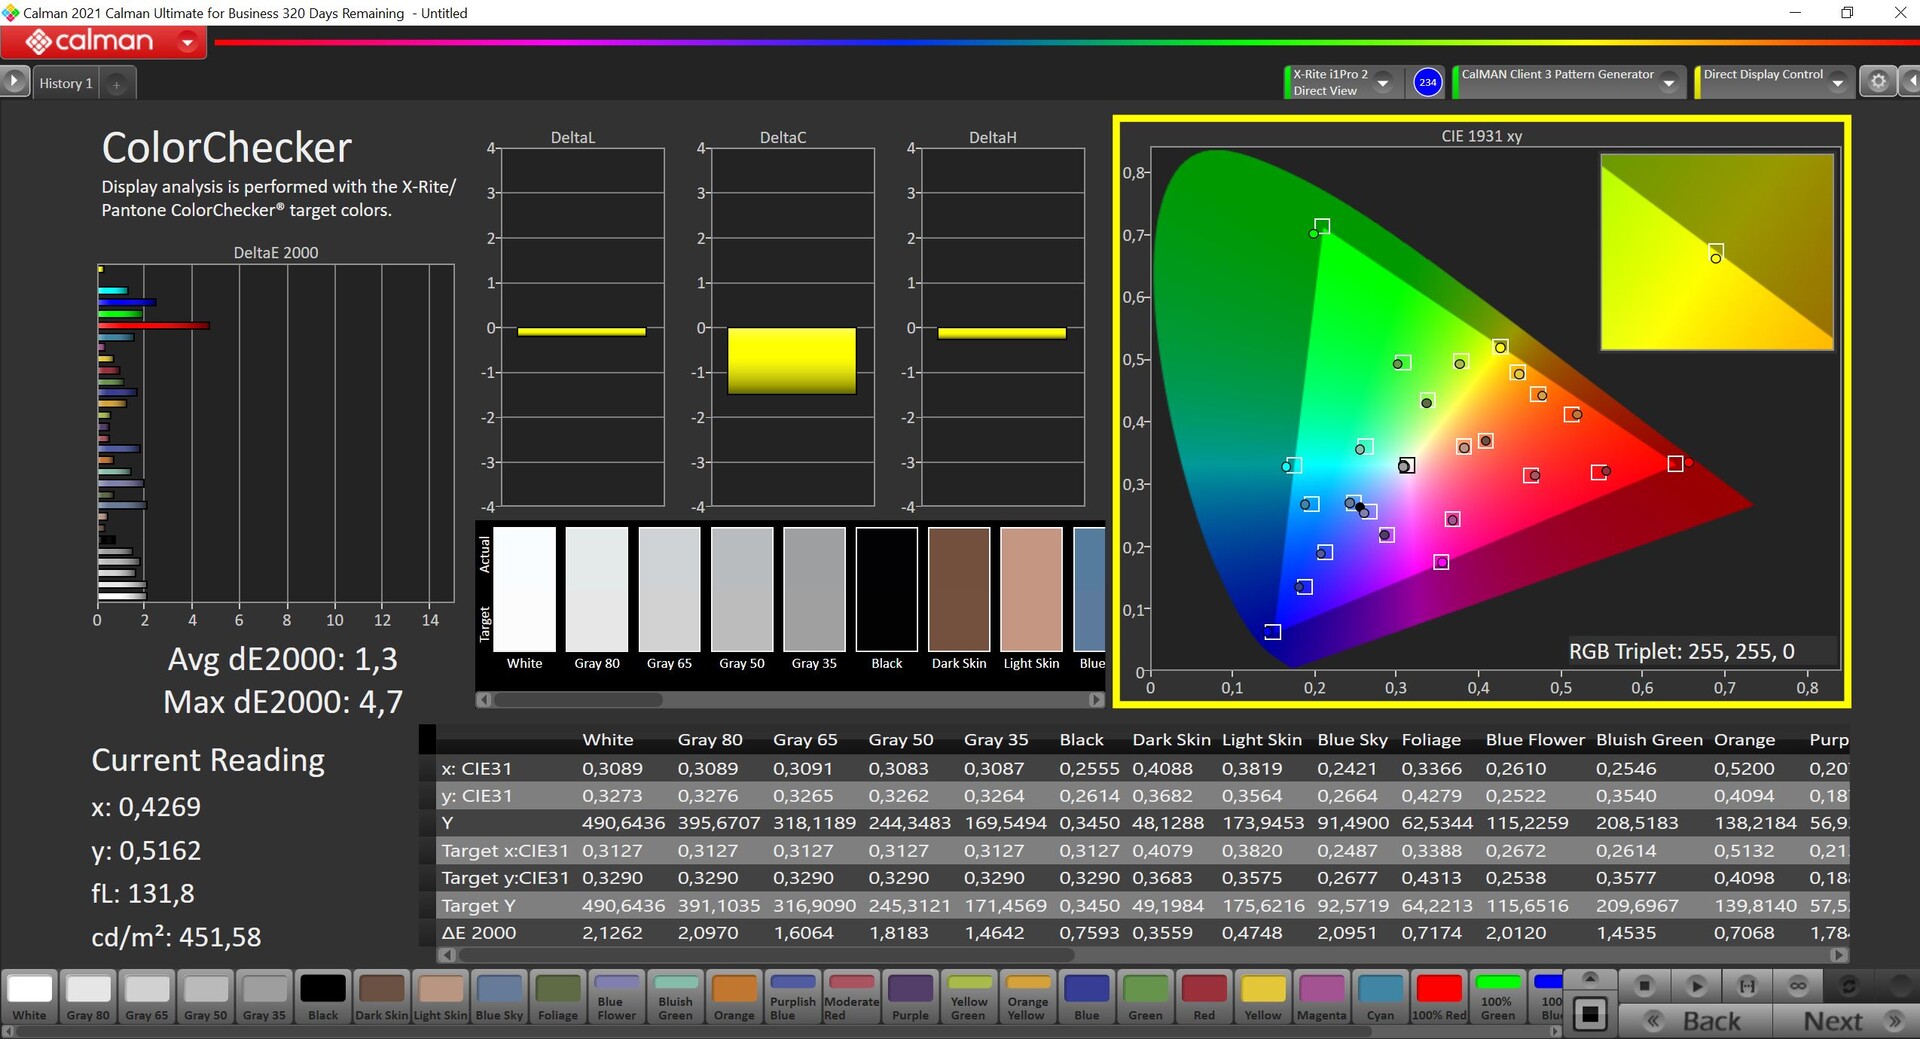
The 4K display comes with X-Rite software preinstalled and offers various profiles. We analyzed the display with the professional CalMAN software package (X-Rite i1 Pro 2) using the pre-set "Native" profile. There are no unwanted shifts in color hues compared to the AdobeRGB reference, the average DeltaE 2000 grayscale deviations are under the target value of 3. This also applies to colors, with only 100% red showing a strong deviation. We were able to reduce this with our own calibration, even if the other deviations are smaller. Subsequent calibration is therefore not necessary, also making the panel very suitable for image editing due to its almost 100% AdobeRGB coverage.
Display Response Times
| ↔ Response Time Black to White | ||
|---|---|---|
| 19.2 ms ... rise ↗ and fall ↘ combined | ↗ 6 ms rise | 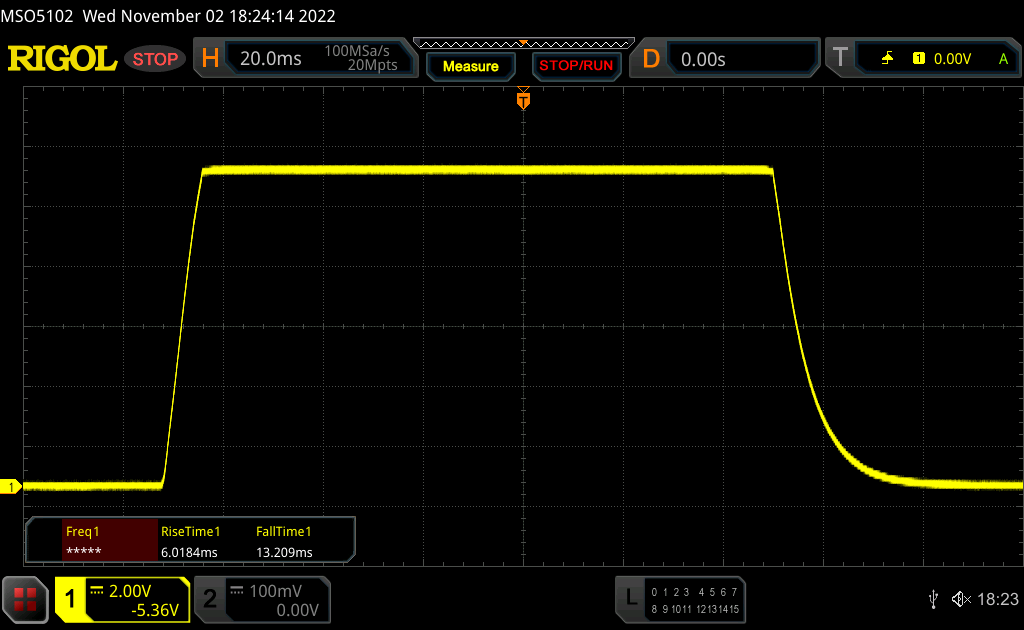 |
| ↘ 13.2 ms fall | ||
| The screen shows good response rates in our tests, but may be too slow for competitive gamers. In comparison, all tested devices range from 0.1 (minimum) to 240 (maximum) ms. » 43 % of all devices are better. This means that the measured response time is similar to the average of all tested devices (19.8 ms). | ||
| ↔ Response Time 50% Grey to 80% Grey | ||
| 46 ms ... rise ↗ and fall ↘ combined | ↗ 21.2 ms rise | 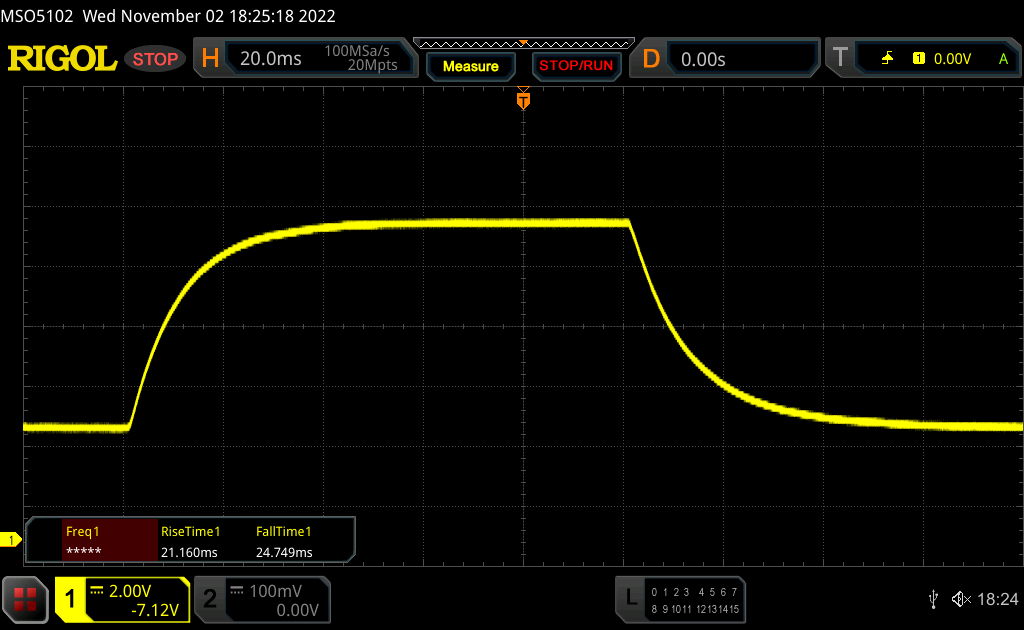 |
| ↘ 24.8 ms fall | ||
| The screen shows slow response rates in our tests and will be unsatisfactory for gamers. In comparison, all tested devices range from 0.165 (minimum) to 636 (maximum) ms. » 79 % of all devices are better. This means that the measured response time is worse than the average of all tested devices (31 ms). | ||
Screen Flickering / PWM (Pulse-Width Modulation)
| Screen flickering / PWM not detected | 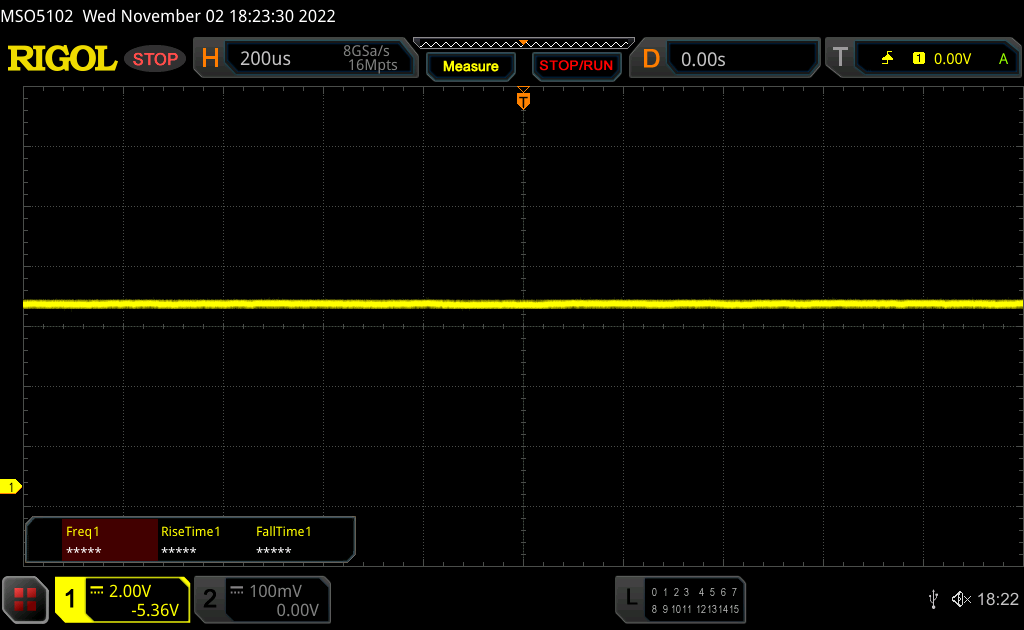 | ||
In comparison: 52 % of all tested devices do not use PWM to dim the display. If PWM was detected, an average of 7750 (minimum: 5 - maximum: 343500) Hz was measured. | |||
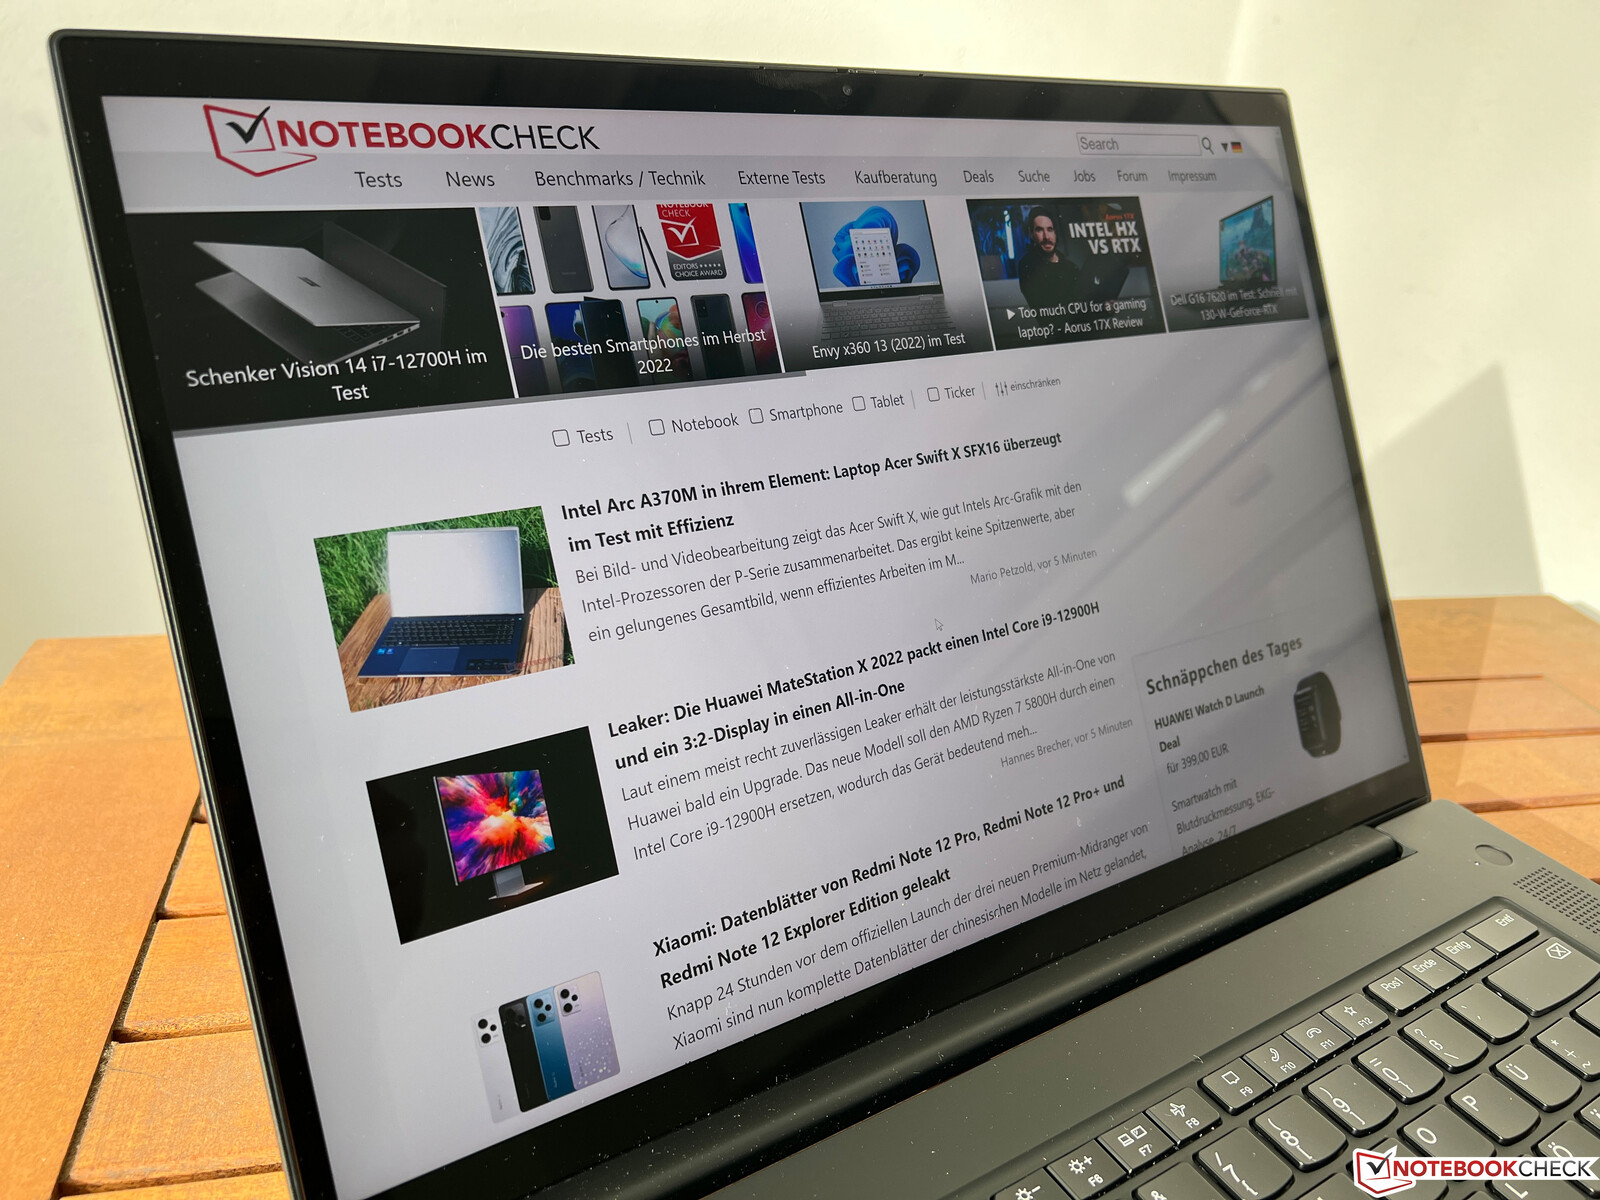
Outdoors - and especially on bright days - it can be difficult to work comfortably as the glossy display is inevitably very reflective. X1 Extreme G5 users who often find themselves working on the go would therefore be better off considering a configuration with a matte panel. Nevertheless, no fault can be found with IPS panel's viewing angle stability.

Performance - X1 Extreme G5 optionally with the RTX 3080 Ti
The ThinkPad X1 Extreme G5 is available with a range of Intel processors, including the optional vPro models. Graphics cards start with the GeForce RTX 3050 Ti and go all the way up to the RTX 3080 Ti. For professional GPUs, it's worth taking a look at the ThinkPad P1 G5. Our review device came equipped with a single RAM module (32 GB) and only operates in single-channel mode.
Test conditions
Rather than offer additional energy profiles, Lenovo links the settings to the regular Windows energy settings which is very convenient in practice. In contrast to some AMD ThinkPads, there is no way of activating or deactivating the "intelligent cooling" function.
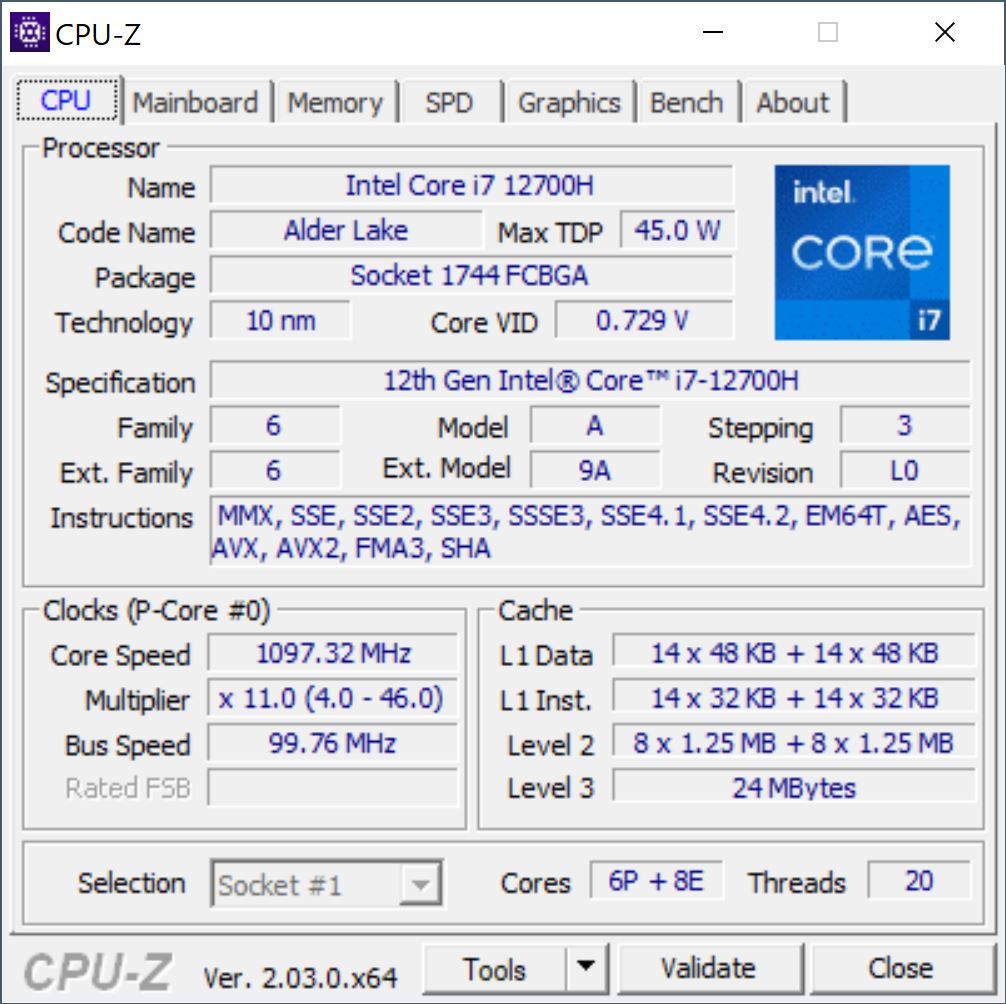
Processor - Core i7-12700H
The Core i7-12700H belongs to Intel's current Alder Lake generation and offers 6 performance as well as 8 efficiency cores. For short usage, the ThinkPad's processor uses 112 watts and 80 watts during sustained use which is why the benchmark results are good, even under lengthier load. For this reason, the ThinkPad belongs to the fastest models in our comparison group. When all CPU benchmarks are taken into consideration, the X1 Extreme G5 sits 28 % ahead of its predecessor with the older Core i7-11800H. This where the liquid metal heat paste's stronger cooling abilities really pay off.
The processor still uses around 70 watts in battery mode causing performance in the multi-core tests to only drop by 13 %; single-core performance is unaffected. Additional CPU benchmarks can found in our tech section.
Cinebench R15 Multi endurance test
Cinebench R23: Multi Core | Single Core
Cinebench R20: CPU (Multi Core) | CPU (Single Core)
Cinebench R15: CPU Multi 64Bit | CPU Single 64Bit
Blender: v2.79 BMW27 CPU
7-Zip 18.03: 7z b 4 | 7z b 4 -mmt1
Geekbench 5.5: Multi-Core | Single-Core
HWBOT x265 Benchmark v2.2: 4k Preset
LibreOffice : 20 Documents To PDF
R Benchmark 2.5: Overall mean
| CPU Performance rating | |
| Lenovo ThinkPad X1 Extreme G5-21DE003RGE | |
| Average of class Multimedia | |
| Dell XPS 17 9720 RTX 3060 | |
| Average Intel Core i7-12700H | |
| Dell XPS 15 9520 RTX 3050 Ti | |
| HP Envy 16 h0112nr | |
| Schenker Vision 16 Pro RTX 3070 Ti | |
| Apple MacBook Pro 16 2021 M1 Pro -5! | |
| Lenovo ThinkPad X1 Extreme G4-20Y5CTO1WW (3050 Ti) | |
| Cinebench R23 / Multi Core | |
| Lenovo ThinkPad X1 Extreme G5-21DE003RGE | |
| Dell XPS 17 9720 RTX 3060 | |
| Average of class Multimedia (4861 - 33362, n=79, last 2 years) | |
| Average Intel Core i7-12700H (4032 - 19330, n=64) | |
| Dell XPS 15 9520 RTX 3050 Ti | |
| HP Envy 16 h0112nr | |
| Schenker Vision 16 Pro RTX 3070 Ti | |
| Lenovo ThinkPad X1 Extreme G4-20Y5CTO1WW (3050 Ti) | |
| Apple MacBook Pro 16 2021 M1 Pro | |
| Cinebench R23 / Single Core | |
| Average of class Multimedia (1128 - 2459, n=71, last 2 years) | |
| Lenovo ThinkPad X1 Extreme G5-21DE003RGE | |
| Schenker Vision 16 Pro RTX 3070 Ti | |
| Dell XPS 15 9520 RTX 3050 Ti | |
| HP Envy 16 h0112nr | |
| Dell XPS 17 9720 RTX 3060 | |
| Average Intel Core i7-12700H (778 - 1826, n=63) | |
| Apple MacBook Pro 16 2021 M1 Pro | |
| Lenovo ThinkPad X1 Extreme G4-20Y5CTO1WW (3050 Ti) | |
| Cinebench R20 / CPU (Multi Core) | |
| Lenovo ThinkPad X1 Extreme G5-21DE003RGE | |
| Dell XPS 17 9720 RTX 3060 | |
| Average of class Multimedia (1887 - 12912, n=62, last 2 years) | |
| Average Intel Core i7-12700H (1576 - 7407, n=64) | |
| Dell XPS 15 9520 RTX 3050 Ti | |
| HP Envy 16 h0112nr | |
| Schenker Vision 16 Pro RTX 3070 Ti | |
| Lenovo ThinkPad X1 Extreme G4-20Y5CTO1WW (3050 Ti) | |
| Apple MacBook Pro 16 2021 M1 Pro | |
| Cinebench R20 / CPU (Single Core) | |
| Average of class Multimedia (425 - 853, n=62, last 2 years) | |
| Lenovo ThinkPad X1 Extreme G5-21DE003RGE | |
| Schenker Vision 16 Pro RTX 3070 Ti | |
| HP Envy 16 h0112nr | |
| Dell XPS 15 9520 RTX 3050 Ti | |
| Average Intel Core i7-12700H (300 - 704, n=64) | |
| Dell XPS 17 9720 RTX 3060 | |
| Lenovo ThinkPad X1 Extreme G4-20Y5CTO1WW (3050 Ti) | |
| Apple MacBook Pro 16 2021 M1 Pro | |
| Cinebench R15 / CPU Multi 64Bit | |
| Lenovo ThinkPad X1 Extreme G5-21DE003RGE | |
| Schenker Vision 16 Pro RTX 3070 Ti | |
| Schenker Vision 16 Pro RTX 3070 Ti | |
| Average of class Multimedia (856 - 5224, n=66, last 2 years) | |
| HP Envy 16 h0112nr | |
| Average Intel Core i7-12700H (1379 - 2916, n=70) | |
| Dell XPS 17 9720 RTX 3060 | |
| Dell XPS 15 9520 RTX 3050 Ti | |
| Lenovo ThinkPad X1 Extreme G4-20Y5CTO1WW (3050 Ti) | |
| Apple MacBook Pro 16 2021 M1 Pro | |
| Cinebench R15 / CPU Single 64Bit | |
| Average of class Multimedia (184.8 - 326, n=64, last 2 years) | |
| Schenker Vision 16 Pro RTX 3070 Ti | |
| Lenovo ThinkPad X1 Extreme G5-21DE003RGE | |
| HP Envy 16 h0112nr | |
| Dell XPS 17 9720 RTX 3060 | |
| Average Intel Core i7-12700H (113 - 263, n=65) | |
| Dell XPS 15 9520 RTX 3050 Ti | |
| Lenovo ThinkPad X1 Extreme G4-20Y5CTO1WW (3050 Ti) | |
| Apple MacBook Pro 16 2021 M1 Pro | |
| Blender / v2.79 BMW27 CPU | |
| Schenker Vision 16 Pro RTX 3070 Ti | |
| Lenovo ThinkPad X1 Extreme G4-20Y5CTO1WW (3050 Ti) | |
| Average of class Multimedia (100 - 557, n=63, last 2 years) | |
| HP Envy 16 h0112nr | |
| Dell XPS 15 9520 RTX 3050 Ti | |
| Average Intel Core i7-12700H (168 - 732, n=63) | |
| Dell XPS 17 9720 RTX 3060 | |
| Lenovo ThinkPad X1 Extreme G5-21DE003RGE | |
| Apple MacBook Pro 16 2021 M1 Pro | |
| 7-Zip 18.03 / 7z b 4 | |
| Dell XPS 17 9720 RTX 3060 | |
| Lenovo ThinkPad X1 Extreme G5-21DE003RGE | |
| Dell XPS 15 9520 RTX 3050 Ti | |
| Average Intel Core i7-12700H (22844 - 73067, n=63) | |
| Average of class Multimedia (26062 - 130368, n=60, last 2 years) | |
| HP Envy 16 h0112nr | |
| Schenker Vision 16 Pro RTX 3070 Ti | |
| Lenovo ThinkPad X1 Extreme G4-20Y5CTO1WW (3050 Ti) | |
| 7-Zip 18.03 / 7z b 4 -mmt1 | |
| Average of class Multimedia (3666 - 7545, n=61, last 2 years) | |
| Lenovo ThinkPad X1 Extreme G5-21DE003RGE | |
| Schenker Vision 16 Pro RTX 3070 Ti | |
| Dell XPS 15 9520 RTX 3050 Ti | |
| HP Envy 16 h0112nr | |
| Dell XPS 17 9720 RTX 3060 | |
| Average Intel Core i7-12700H (2743 - 5972, n=63) | |
| Lenovo ThinkPad X1 Extreme G4-20Y5CTO1WW (3050 Ti) | |
| Geekbench 5.5 / Multi-Core | |
| Average of class Multimedia (4652 - 20422, n=60, last 2 years) | |
| HP Envy 16 h0112nr | |
| Apple MacBook Pro 16 2021 M1 Pro | |
| Dell XPS 17 9720 RTX 3060 | |
| Dell XPS 15 9520 RTX 3050 Ti | |
| Lenovo ThinkPad X1 Extreme G5-21DE003RGE | |
| Average Intel Core i7-12700H (5144 - 13745, n=64) | |
| Schenker Vision 16 Pro RTX 3070 Ti | |
| Lenovo ThinkPad X1 Extreme G4-20Y5CTO1WW (3050 Ti) | |
| Geekbench 5.5 / Single-Core | |
| Average of class Multimedia (805 - 2974, n=60, last 2 years) | |
| Schenker Vision 16 Pro RTX 3070 Ti | |
| Lenovo ThinkPad X1 Extreme G5-21DE003RGE | |
| HP Envy 16 h0112nr | |
| Dell XPS 15 9520 RTX 3050 Ti | |
| Apple MacBook Pro 16 2021 M1 Pro | |
| Average Intel Core i7-12700H (803 - 1851, n=64) | |
| Dell XPS 17 9720 RTX 3060 | |
| Lenovo ThinkPad X1 Extreme G4-20Y5CTO1WW (3050 Ti) | |
| HWBOT x265 Benchmark v2.2 / 4k Preset | |
| Average of class Multimedia (5.26 - 36.1, n=61, last 2 years) | |
| Lenovo ThinkPad X1 Extreme G5-21DE003RGE | |
| Average Intel Core i7-12700H (4.67 - 21.8, n=64) | |
| Dell XPS 17 9720 RTX 3060 | |
| Dell XPS 15 9520 RTX 3050 Ti | |
| HP Envy 16 h0112nr | |
| Schenker Vision 16 Pro RTX 3070 Ti | |
| Lenovo ThinkPad X1 Extreme G4-20Y5CTO1WW (3050 Ti) | |
| LibreOffice / 20 Documents To PDF | |
| Average of class Multimedia (23.9 - 146.7, n=62, last 2 years) | |
| Average Intel Core i7-12700H (34.2 - 95.3, n=63) | |
| HP Envy 16 h0112nr | |
| Schenker Vision 16 Pro RTX 3070 Ti | |
| Dell XPS 17 9720 RTX 3060 | |
| Lenovo ThinkPad X1 Extreme G4-20Y5CTO1WW (3050 Ti) | |
| Dell XPS 15 9520 RTX 3050 Ti | |
| Lenovo ThinkPad X1 Extreme G5-21DE003RGE | |
| R Benchmark 2.5 / Overall mean | |
| Lenovo ThinkPad X1 Extreme G4-20Y5CTO1WW (3050 Ti) | |
| Average Intel Core i7-12700H (0.4441 - 1.052, n=63) | |
| Average of class Multimedia (0.3604 - 0.947, n=61, last 2 years) | |
| Lenovo ThinkPad X1 Extreme G5-21DE003RGE | |
| Dell XPS 17 9720 RTX 3060 | |
| HP Envy 16 h0112nr | |
| Schenker Vision 16 Pro RTX 3070 Ti | |
| Dell XPS 15 9520 RTX 3050 Ti | |
* ... smaller is better
AIDA64: FP32 Ray-Trace | FPU Julia | CPU SHA3 | CPU Queen | FPU SinJulia | FPU Mandel | CPU AES | CPU ZLib | FP64 Ray-Trace | CPU PhotoWorxx
| Performance rating | |
| Average of class Multimedia | |
| Lenovo ThinkPad X1 Extreme G5-21DE003RGE | |
| Lenovo ThinkPad X1 Extreme G4-20Y5CTO1WW (3050 Ti) | |
| HP Envy 16 h0112nr | |
| Schenker Vision 16 Pro RTX 3070 Ti | |
| Average Intel Core i7-12700H | |
| Dell XPS 17 9720 RTX 3060 | |
| Dell XPS 15 9520 RTX 3050 Ti | |
| AIDA64 / FP32 Ray-Trace | |
| Average of class Multimedia (2214 - 50388, n=58, last 2 years) | |
| Lenovo ThinkPad X1 Extreme G5-21DE003RGE | |
| Lenovo ThinkPad X1 Extreme G4-20Y5CTO1WW (3050 Ti) | |
| Schenker Vision 16 Pro RTX 3070 Ti | |
| HP Envy 16 h0112nr | |
| Average Intel Core i7-12700H (2585 - 17957, n=64) | |
| Dell XPS 15 9520 RTX 3050 Ti | |
| Dell XPS 17 9720 RTX 3060 | |
| AIDA64 / FPU Julia | |
| Average of class Multimedia (12867 - 201874, n=59, last 2 years) | |
| Lenovo ThinkPad X1 Extreme G5-21DE003RGE | |
| Schenker Vision 16 Pro RTX 3070 Ti | |
| Lenovo ThinkPad X1 Extreme G4-20Y5CTO1WW (3050 Ti) | |
| HP Envy 16 h0112nr | |
| Average Intel Core i7-12700H (12439 - 90760, n=64) | |
| Dell XPS 17 9720 RTX 3060 | |
| Dell XPS 15 9520 RTX 3050 Ti | |
| AIDA64 / CPU SHA3 | |
| Lenovo ThinkPad X1 Extreme G4-20Y5CTO1WW (3050 Ti) | |
| Average of class Multimedia (626 - 8623, n=59, last 2 years) | |
| Lenovo ThinkPad X1 Extreme G5-21DE003RGE | |
| Average Intel Core i7-12700H (833 - 4242, n=64) | |
| Schenker Vision 16 Pro RTX 3070 Ti | |
| HP Envy 16 h0112nr | |
| Dell XPS 15 9520 RTX 3050 Ti | |
| Dell XPS 17 9720 RTX 3060 | |
| AIDA64 / CPU Queen | |
| Lenovo ThinkPad X1 Extreme G5-21DE003RGE | |
| HP Envy 16 h0112nr | |
| Dell XPS 17 9720 RTX 3060 | |
| Dell XPS 15 9520 RTX 3050 Ti | |
| Average Intel Core i7-12700H (57923 - 103202, n=63) | |
| Lenovo ThinkPad X1 Extreme G4-20Y5CTO1WW (3050 Ti) | |
| Schenker Vision 16 Pro RTX 3070 Ti | |
| Average of class Multimedia (13483 - 181505, n=46, last 2 years) | |
| AIDA64 / FPU SinJulia | |
| Lenovo ThinkPad X1 Extreme G5-21DE003RGE | |
| Lenovo ThinkPad X1 Extreme G4-20Y5CTO1WW (3050 Ti) | |
| Average Intel Core i7-12700H (3249 - 9939, n=64) | |
| Dell XPS 17 9720 RTX 3060 | |
| Average of class Multimedia (886 - 28794, n=59, last 2 years) | |
| Dell XPS 15 9520 RTX 3050 Ti | |
| Schenker Vision 16 Pro RTX 3070 Ti | |
| HP Envy 16 h0112nr | |
| AIDA64 / FPU Mandel | |
| Average of class Multimedia (6395 - 105740, n=58, last 2 years) | |
| Lenovo ThinkPad X1 Extreme G5-21DE003RGE | |
| Lenovo ThinkPad X1 Extreme G4-20Y5CTO1WW (3050 Ti) | |
| Schenker Vision 16 Pro RTX 3070 Ti | |
| HP Envy 16 h0112nr | |
| Average Intel Core i7-12700H (7135 - 44760, n=64) | |
| Dell XPS 15 9520 RTX 3050 Ti | |
| Dell XPS 17 9720 RTX 3060 | |
| AIDA64 / CPU AES | |
| Lenovo ThinkPad X1 Extreme G4-20Y5CTO1WW (3050 Ti) | |
| HP Envy 16 h0112nr | |
| Average Intel Core i7-12700H (31839 - 144360, n=64) | |
| Dell XPS 15 9520 RTX 3050 Ti | |
| Dell XPS 17 9720 RTX 3060 | |
| Lenovo ThinkPad X1 Extreme G5-21DE003RGE | |
| Average of class Multimedia (8171 - 126790, n=59, last 2 years) | |
| Schenker Vision 16 Pro RTX 3070 Ti | |
| AIDA64 / CPU ZLib | |
| Lenovo ThinkPad X1 Extreme G5-21DE003RGE | |
| Average of class Multimedia (143.8 - 2022, n=59, last 2 years) | |
| Average Intel Core i7-12700H (305 - 1171, n=64) | |
| Dell XPS 17 9720 RTX 3060 | |
| Schenker Vision 16 Pro RTX 3070 Ti | |
| Dell XPS 15 9520 RTX 3050 Ti | |
| HP Envy 16 h0112nr | |
| Lenovo ThinkPad X1 Extreme G4-20Y5CTO1WW (3050 Ti) | |
| AIDA64 / FP64 Ray-Trace | |
| Average of class Multimedia (1014 - 26875, n=59, last 2 years) | |
| Lenovo ThinkPad X1 Extreme G5-21DE003RGE | |
| Lenovo ThinkPad X1 Extreme G4-20Y5CTO1WW (3050 Ti) | |
| Schenker Vision 16 Pro RTX 3070 Ti | |
| HP Envy 16 h0112nr | |
| Average Intel Core i7-12700H (1437 - 9692, n=64) | |
| Dell XPS 15 9520 RTX 3050 Ti | |
| Dell XPS 17 9720 RTX 3060 | |
| AIDA64 / CPU PhotoWorxx | |
| Average of class Multimedia (8187 - 88154, n=59, last 2 years) | |
| Schenker Vision 16 Pro RTX 3070 Ti | |
| Dell XPS 17 9720 RTX 3060 | |
| HP Envy 16 h0112nr | |
| Dell XPS 15 9520 RTX 3050 Ti | |
| Average Intel Core i7-12700H (12863 - 52207, n=64) | |
| Lenovo ThinkPad X1 Extreme G5-21DE003RGE | |
| Lenovo ThinkPad X1 Extreme G4-20Y5CTO1WW (3050 Ti) | |
System Performance
The ThinkPad X1 Extreme G5 is basically a very fast and responsive device but the absence of a dual-channel RAM configuration is noticeable, especially in synthetic tests. Although it is possible to easily upgrade the RAM, the onboard 32 GB ought to be more than sufficient even for most users. However, a 2 x 16 GB factory configuration would have been a more sensible choice. As mentioned right at the start, we experienced occasional performance issues with Windows 10 and for this reason we would recommend un update to Windows 11 Pro.
CrossMark: Overall | Productivity | Creativity | Responsiveness
| PCMark 10 / Score | |
| Average of class Multimedia (4325 - 10386, n=56, last 2 years) | |
| HP Envy 16 h0112nr | |
| Dell XPS 17 9720 RTX 3060 | |
| Lenovo ThinkPad X1 Extreme G5-21DE003RGE | |
| Average Intel Core i7-12700H, NVIDIA GeForce RTX 3060 Laptop GPU (5986 - 8156, n=12) | |
| Dell XPS 15 9520 RTX 3050 Ti | |
| Lenovo ThinkPad X1 Extreme G4-20Y5CTO1WW (3050 Ti) | |
| PCMark 10 / Essentials | |
| HP Envy 16 h0112nr | |
| Dell XPS 15 9520 RTX 3050 Ti | |
| Lenovo ThinkPad X1 Extreme G4-20Y5CTO1WW (3050 Ti) | |
| Dell XPS 17 9720 RTX 3060 | |
| Average Intel Core i7-12700H, NVIDIA GeForce RTX 3060 Laptop GPU (9289 - 12144, n=12) | |
| Lenovo ThinkPad X1 Extreme G5-21DE003RGE | |
| Average of class Multimedia (8025 - 11664, n=55, last 2 years) | |
| PCMark 10 / Productivity | |
| Average of class Multimedia (7323 - 18233, n=55, last 2 years) | |
| Dell XPS 15 9520 RTX 3050 Ti | |
| Dell XPS 17 9720 RTX 3060 | |
| Lenovo ThinkPad X1 Extreme G5-21DE003RGE | |
| HP Envy 16 h0112nr | |
| Average Intel Core i7-12700H, NVIDIA GeForce RTX 3060 Laptop GPU (6161 - 10362, n=12) | |
| Lenovo ThinkPad X1 Extreme G4-20Y5CTO1WW (3050 Ti) | |
| PCMark 10 / Digital Content Creation | |
| Average Intel Core i7-12700H, NVIDIA GeForce RTX 3060 Laptop GPU (8950 - 12554, n=12) | |
| HP Envy 16 h0112nr | |
| Average of class Multimedia (3651 - 16240, n=55, last 2 years) | |
| Lenovo ThinkPad X1 Extreme G5-21DE003RGE | |
| Dell XPS 17 9720 RTX 3060 | |
| Dell XPS 15 9520 RTX 3050 Ti | |
| Lenovo ThinkPad X1 Extreme G4-20Y5CTO1WW (3050 Ti) | |
| CrossMark / Overall | |
| Dell XPS 17 9720 RTX 3060 | |
| Dell XPS 15 9520 RTX 3050 Ti | |
| Average of class Multimedia (866 - 2728, n=65, last 2 years) | |
| HP Envy 16 h0112nr | |
| Average Intel Core i7-12700H, NVIDIA GeForce RTX 3060 Laptop GPU (1649 - 2017, n=11) | |
| Lenovo ThinkPad X1 Extreme G5-21DE003RGE | |
| Schenker Vision 16 Pro RTX 3070 Ti | |
| Apple MacBook Pro 16 2021 M1 Pro | |
| CrossMark / Productivity | |
| Dell XPS 15 9520 RTX 3050 Ti | |
| Dell XPS 17 9720 RTX 3060 | |
| Average of class Multimedia (931 - 2489, n=65, last 2 years) | |
| HP Envy 16 h0112nr | |
| Average Intel Core i7-12700H, NVIDIA GeForce RTX 3060 Laptop GPU (1536 - 1958, n=11) | |
| Lenovo ThinkPad X1 Extreme G5-21DE003RGE | |
| Schenker Vision 16 Pro RTX 3070 Ti | |
| Apple MacBook Pro 16 2021 M1 Pro | |
| CrossMark / Creativity | |
| Average of class Multimedia (907 - 3465, n=65, last 2 years) | |
| Dell XPS 17 9720 RTX 3060 | |
| Apple MacBook Pro 16 2021 M1 Pro | |
| HP Envy 16 h0112nr | |
| Dell XPS 15 9520 RTX 3050 Ti | |
| Average Intel Core i7-12700H, NVIDIA GeForce RTX 3060 Laptop GPU (1816 - 2084, n=11) | |
| Lenovo ThinkPad X1 Extreme G5-21DE003RGE | |
| Schenker Vision 16 Pro RTX 3070 Ti | |
| CrossMark / Responsiveness | |
| Dell XPS 15 9520 RTX 3050 Ti | |
| Dell XPS 17 9720 RTX 3060 | |
| Average Intel Core i7-12700H, NVIDIA GeForce RTX 3060 Laptop GPU (1210 - 2207, n=11) | |
| HP Envy 16 h0112nr | |
| Average of class Multimedia (605 - 2024, n=65, last 2 years) | |
| Lenovo ThinkPad X1 Extreme G5-21DE003RGE | |
| Schenker Vision 16 Pro RTX 3070 Ti | |
| Apple MacBook Pro 16 2021 M1 Pro | |
| PCMark 10 Score | 7243 points | |
Help | ||
| AIDA64 / Memory Copy | |
| Average of class Multimedia (11299 - 132135, n=59, last 2 years) | |
| Schenker Vision 16 Pro RTX 3070 Ti | |
| Dell XPS 17 9720 RTX 3060 | |
| Dell XPS 15 9520 RTX 3050 Ti | |
| HP Envy 16 h0112nr | |
| Average Intel Core i7-12700H (25615 - 80511, n=64) | |
| Lenovo ThinkPad X1 Extreme G4-20Y5CTO1WW (3050 Ti) | |
| Lenovo ThinkPad X1 Extreme G5-21DE003RGE | |
| AIDA64 / Memory Read | |
| Average of class Multimedia (11624 - 174586, n=59, last 2 years) | |
| Dell XPS 17 9720 RTX 3060 | |
| HP Envy 16 h0112nr | |
| Schenker Vision 16 Pro RTX 3070 Ti | |
| Dell XPS 15 9520 RTX 3050 Ti | |
| Average Intel Core i7-12700H (25586 - 79442, n=64) | |
| Lenovo ThinkPad X1 Extreme G4-20Y5CTO1WW (3050 Ti) | |
| Lenovo ThinkPad X1 Extreme G5-21DE003RGE | |
| AIDA64 / Memory Write | |
| Average of class Multimedia (11755 - 134998, n=59, last 2 years) | |
| Schenker Vision 16 Pro RTX 3070 Ti | |
| Dell XPS 17 9720 RTX 3060 | |
| HP Envy 16 h0112nr | |
| Dell XPS 15 9520 RTX 3050 Ti | |
| Average Intel Core i7-12700H (23679 - 88660, n=64) | |
| Lenovo ThinkPad X1 Extreme G4-20Y5CTO1WW (3050 Ti) | |
| Lenovo ThinkPad X1 Extreme G5-21DE003RGE | |
| AIDA64 / Memory Latency | |
| Average of class Multimedia (7 - 535, n=58, last 2 years) | |
| Dell XPS 15 9520 RTX 3050 Ti | |
| Dell XPS 17 9720 RTX 3060 | |
| Schenker Vision 16 Pro RTX 3070 Ti | |
| HP Envy 16 h0112nr | |
| Lenovo ThinkPad X1 Extreme G5-21DE003RGE | |
| Lenovo ThinkPad X1 Extreme G4-20Y5CTO1WW (3050 Ti) | |
| Average Intel Core i7-12700H (76.2 - 133.9, n=62) | |
* ... smaller is better
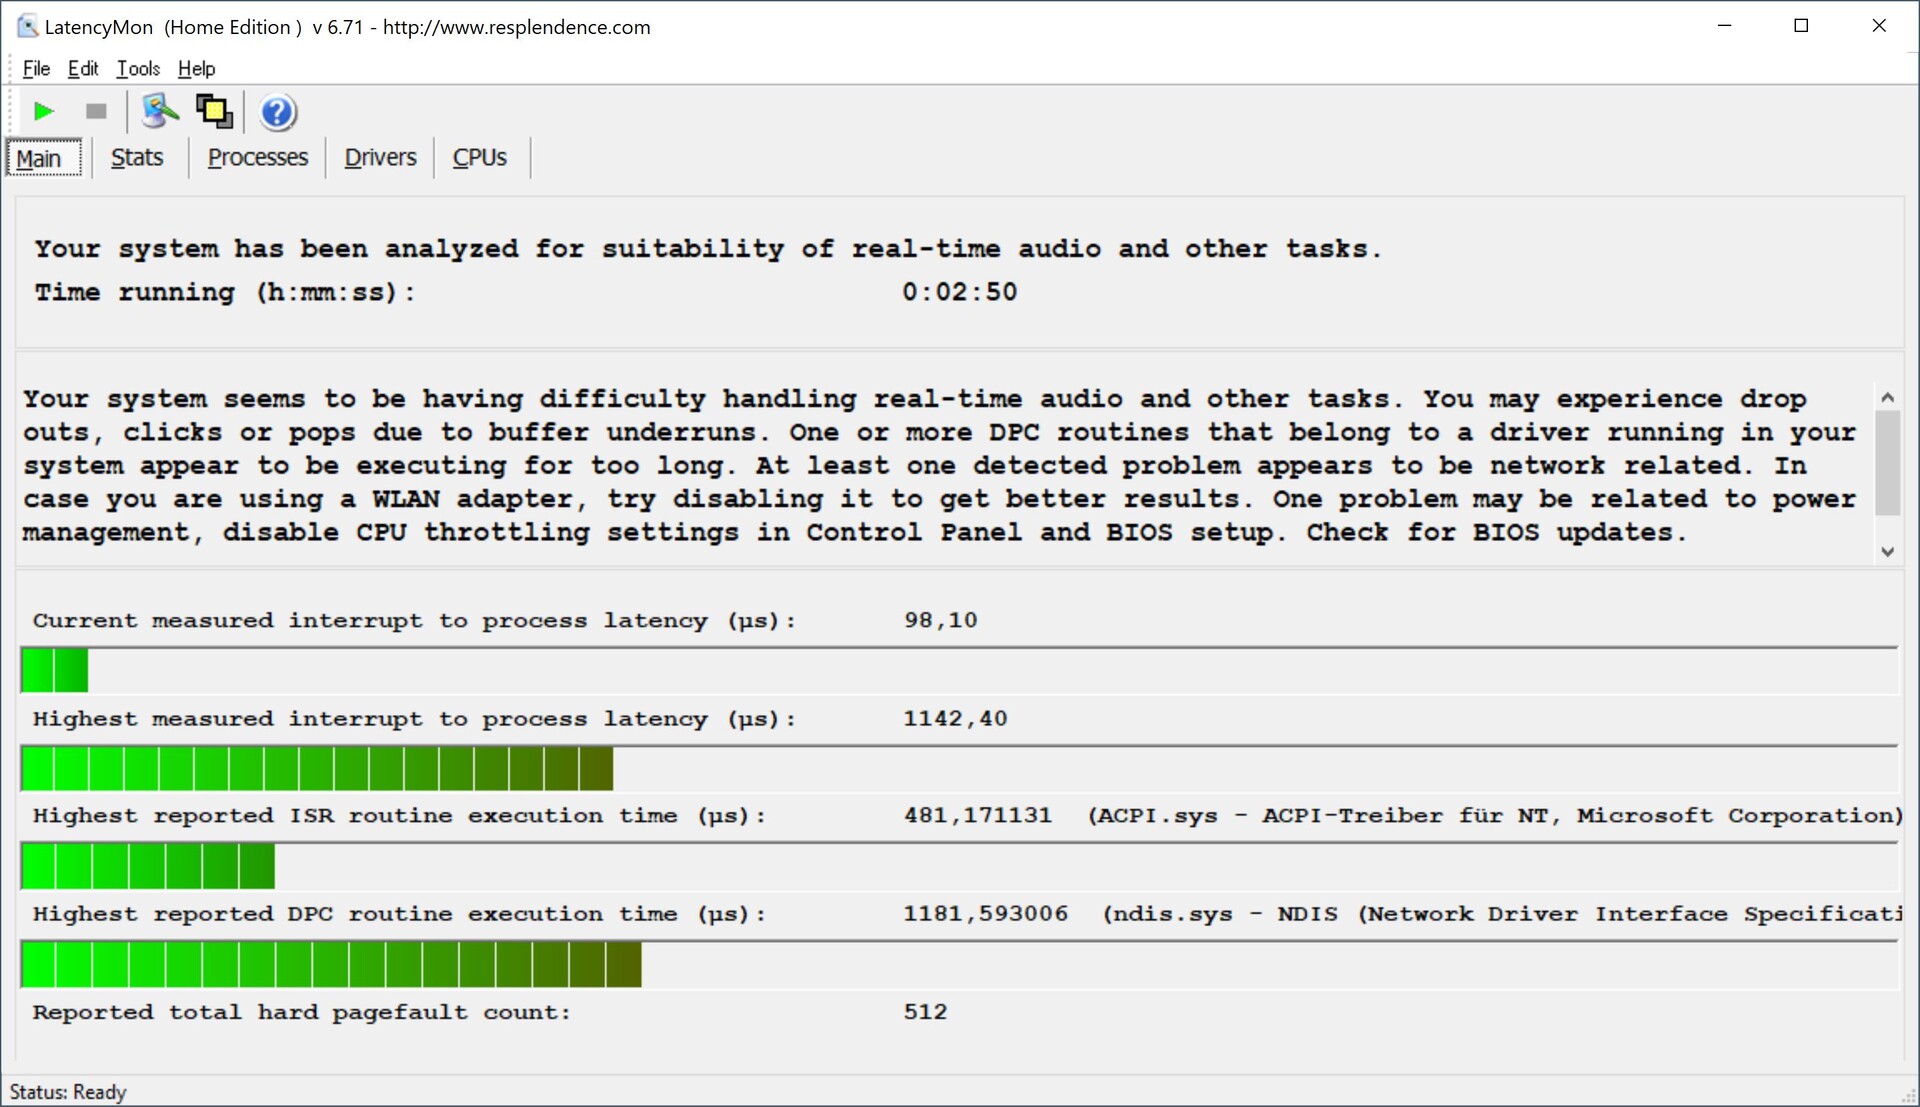
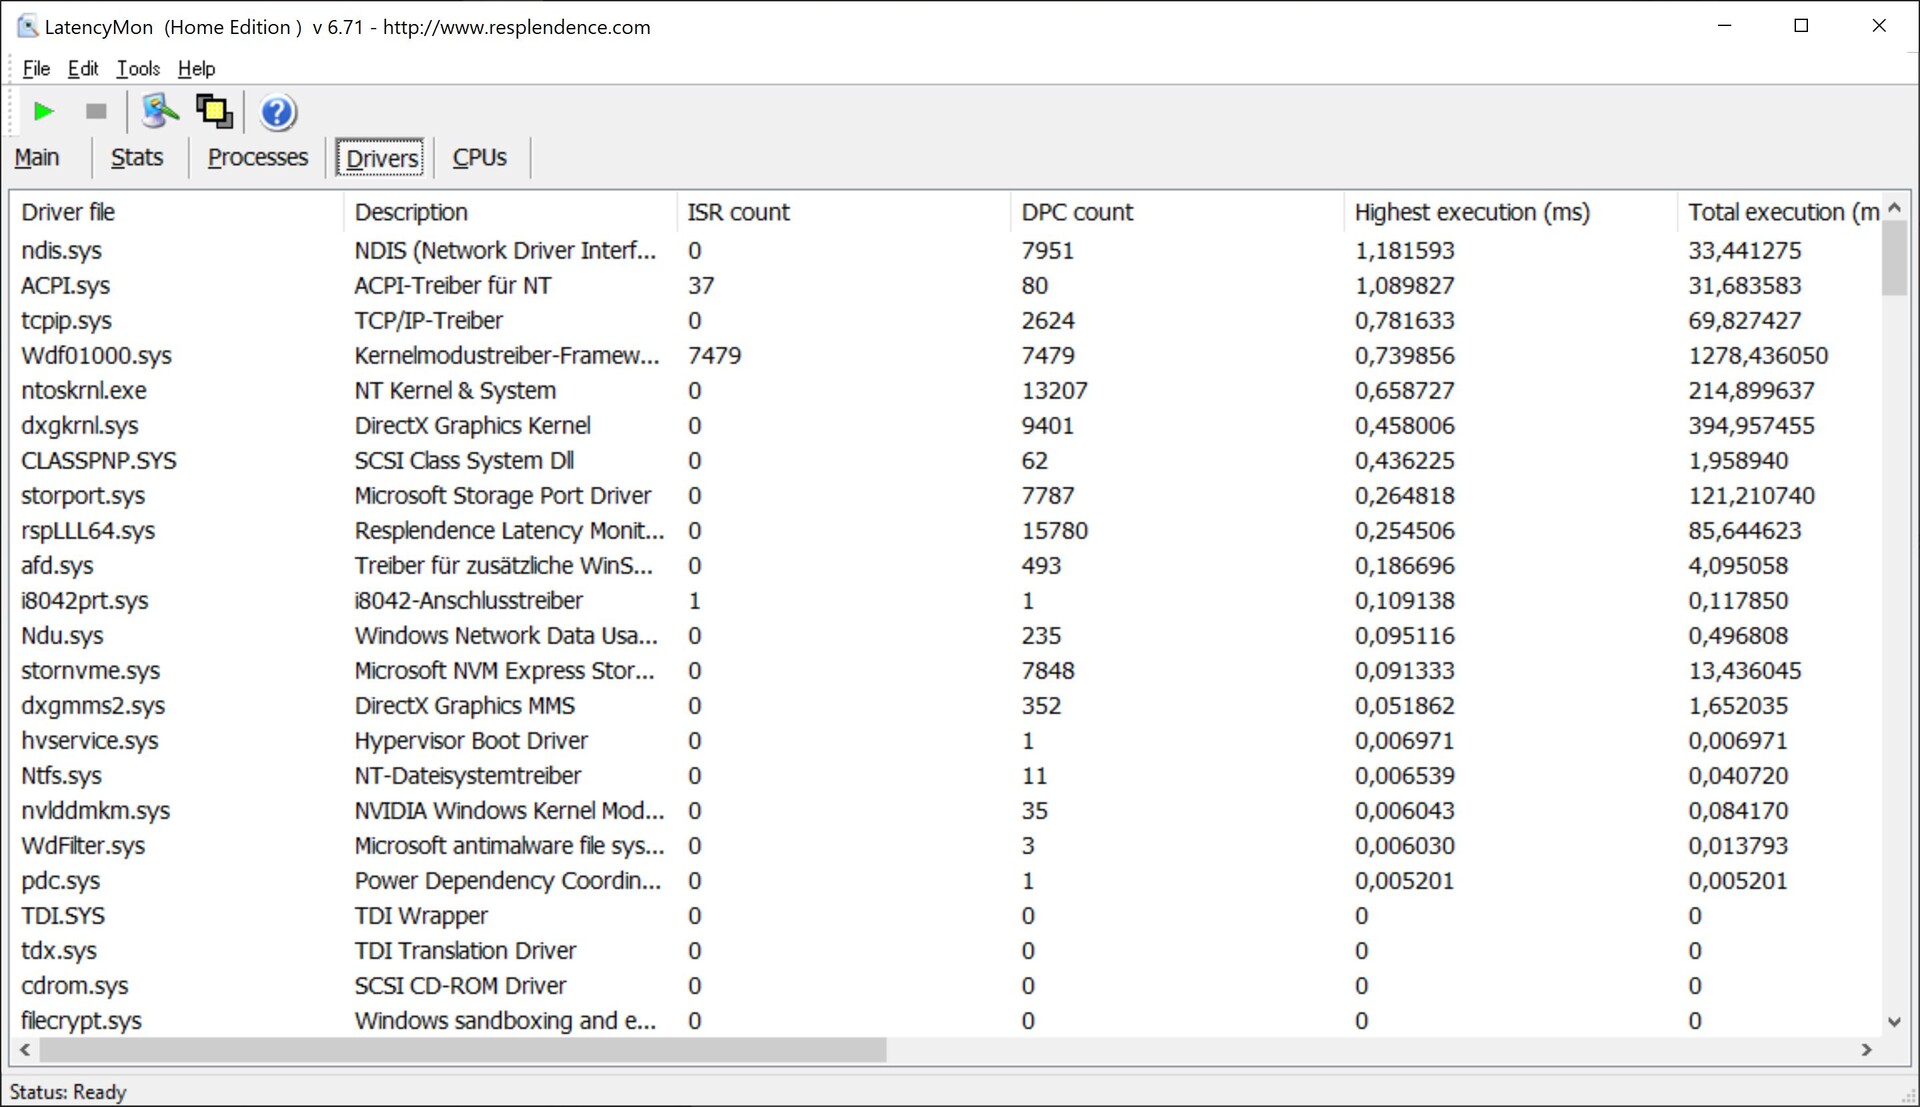
DPC latencies
In our standardized latency test (surfing the Internet, 4K YouTube playback, CPU load), the review device demonstrates some limitations with the present BIOS version and is therefore more suited to the use of real-time audio applications.
| DPC Latencies / LatencyMon - interrupt to process latency (max), Web, Youtube, Prime95 | |
| Lenovo ThinkPad X1 Extreme G5-21DE003RGE | |
| Lenovo ThinkPad X1 Extreme G4-20Y5CTO1WW (3050 Ti) | |
| Dell XPS 15 9520 RTX 3050 Ti | |
| HP Envy 16 h0112nr | |
| Schenker Vision 16 Pro RTX 3070 Ti | |
| Dell XPS 17 9720 RTX 3060 | |
* ... smaller is better
Mass storage
In our review device, Lenovo equipped the X1 Extreme G5 with a fast PCIe 4.0 SSD from Micron (3400) providing a storage capacity of 1 TB from which 900 GB are available after the first installation. All in all, somewhat quicker PCIe 4.0 drives are available, however, the difference in practice is negligible with the device also remaining completely stable during lengthier load. Additional SSD benchmarks can be found here.

* ... smaller is better
Continuous load read: DiskSpd Read Loop, Queue Depth 8
Graphics card
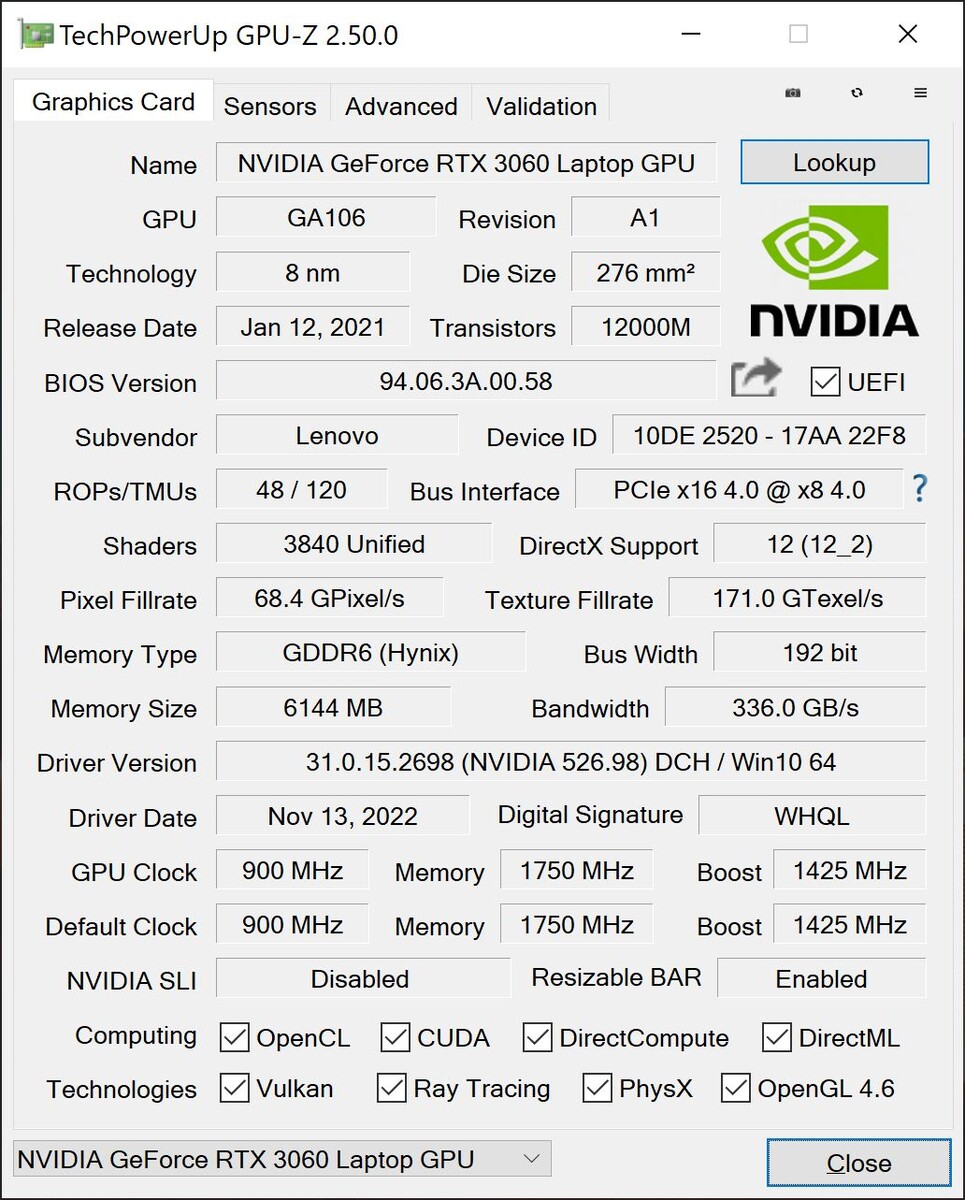
Lenovo uses the 80 watt version of the Nvidia GeForce RTX 3060. The GPU can also use 15 Watt dynamic boost, thereby allowing it to use a total of 95 watts. The RTX 3060 provides 6 GB GDDR6 VRAM and the system can switch dynamically between the integrated and dedicated GPU via Optimus technology. We assume that the two optional RTX 3070 Ti and RTX 3080 Ti will, too, be used with a maximum of 80 and 95 watts - making them the slowest versions of these GPUs available.
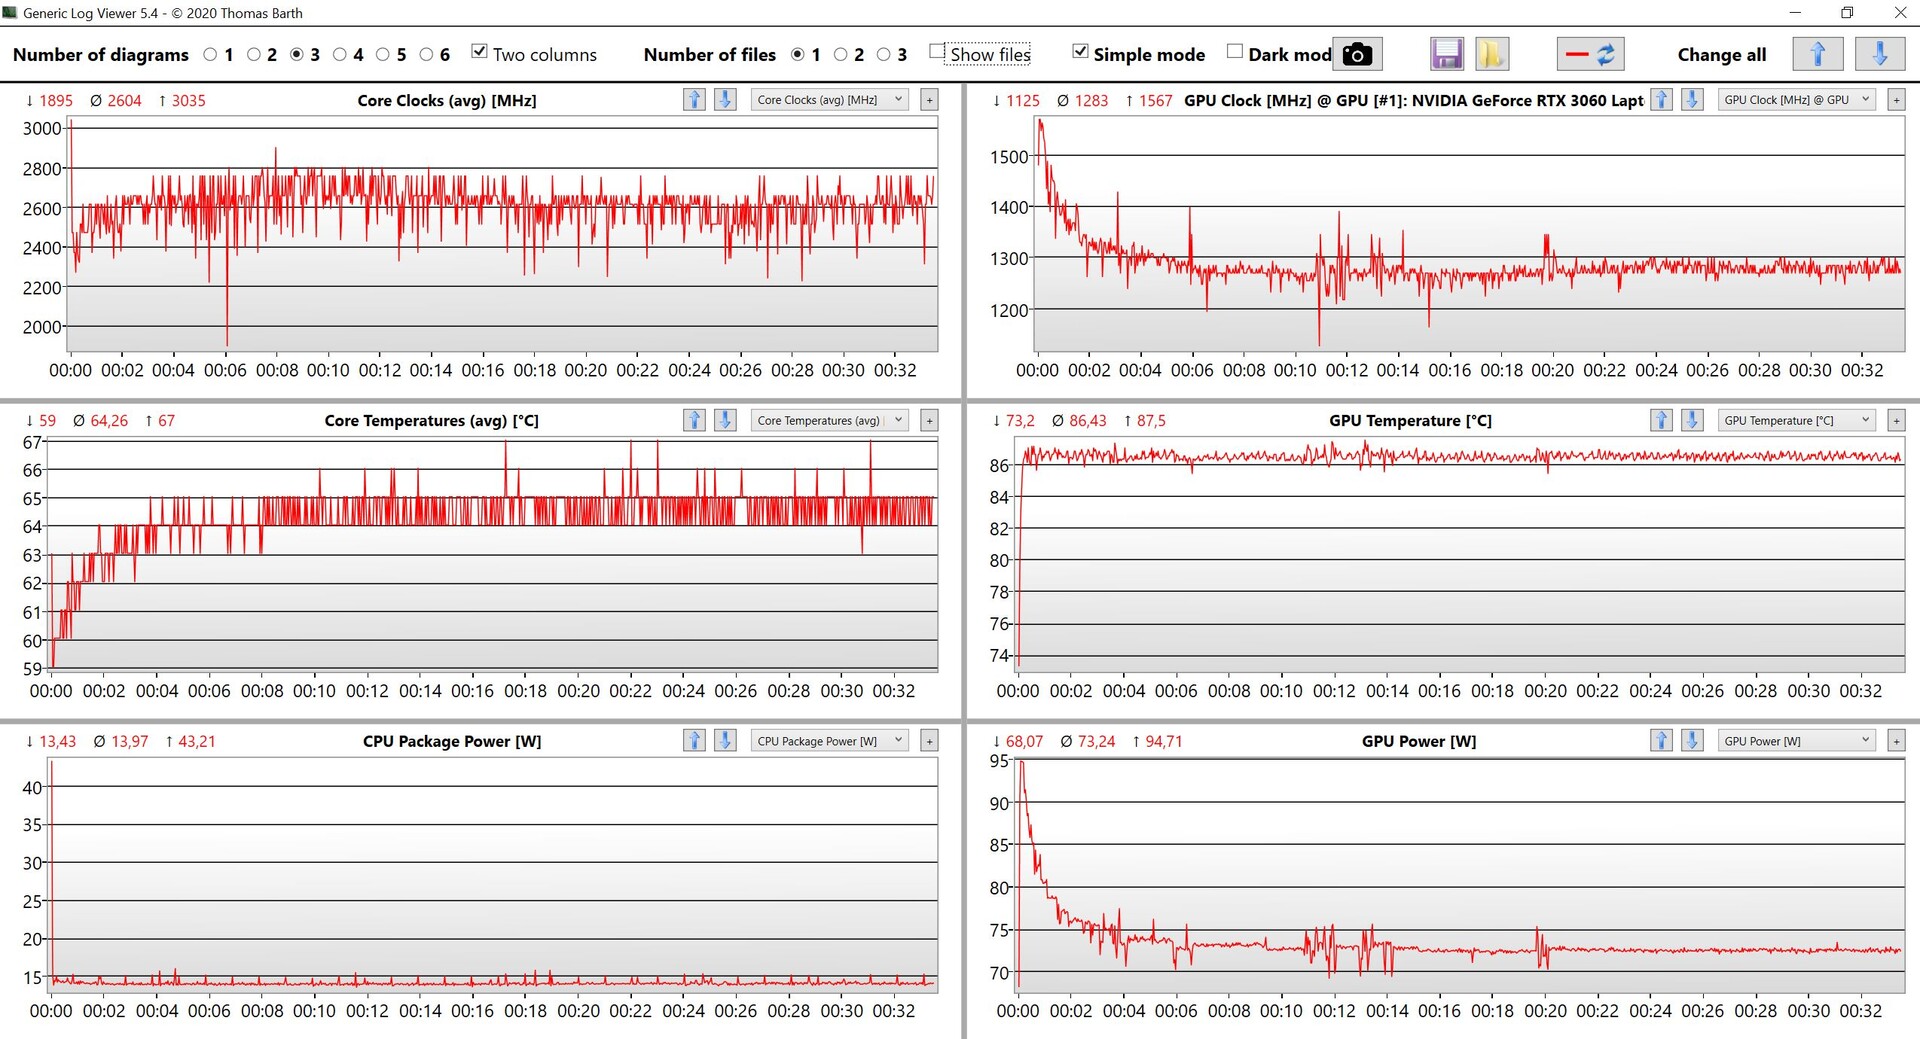
Benchmarks quickly show that the system cannot maintain 95 watts for long and the GPU quickly drops to 80 watts. This explains the slight deficit compared to the HP Envy 16 which is similarly equipped with the 95 watt version of the RTX 3060. Additionally, the ThinkPad was only able to achieve an unimpressive result of 91 % in the 3DMark Time Spy stress test. In battery mode, there is a small performance deficit of approximately 30 %. Additional GPU benchmarks can be found here.
| 3DMark 11 Performance | 22654 points | |
| 3DMark Fire Strike Score | 15945 points | |
| 3DMark Time Spy Score | 7111 points | |
Help | ||
| Blender / v3.3 Classroom OPTIX/RTX | |
| HP Envy 16 h0112nr | |
| Lenovo ThinkPad X1 Extreme G5-21DE003RGE | |
| Average of class Multimedia (12 - 105, n=24, last 2 years) | |
| Average NVIDIA GeForce RTX 3060 Laptop GPU (30 - 56, n=15) | |
| Schenker Vision 16 Pro RTX 3070 Ti | |
| Blender / v3.3 Classroom CUDA | |
| HP Envy 16 h0112nr | |
| Lenovo ThinkPad X1 Extreme G5-21DE003RGE | |
| Average of class Multimedia (20 - 186, n=24, last 2 years) | |
| Average NVIDIA GeForce RTX 3060 Laptop GPU (51 - 89, n=15) | |
| Schenker Vision 16 Pro RTX 3070 Ti | |
| Blender / v3.3 Classroom CPU | |
| HP Envy 16 h0112nr | |
| Schenker Vision 16 Pro RTX 3070 Ti | |
| Average of class Multimedia (134.5 - 1042, n=65, last 2 years) | |
| Average NVIDIA GeForce RTX 3060 Laptop GPU (291 - 508, n=15) | |
| Lenovo ThinkPad X1 Extreme G5-21DE003RGE | |
* ... smaller is better
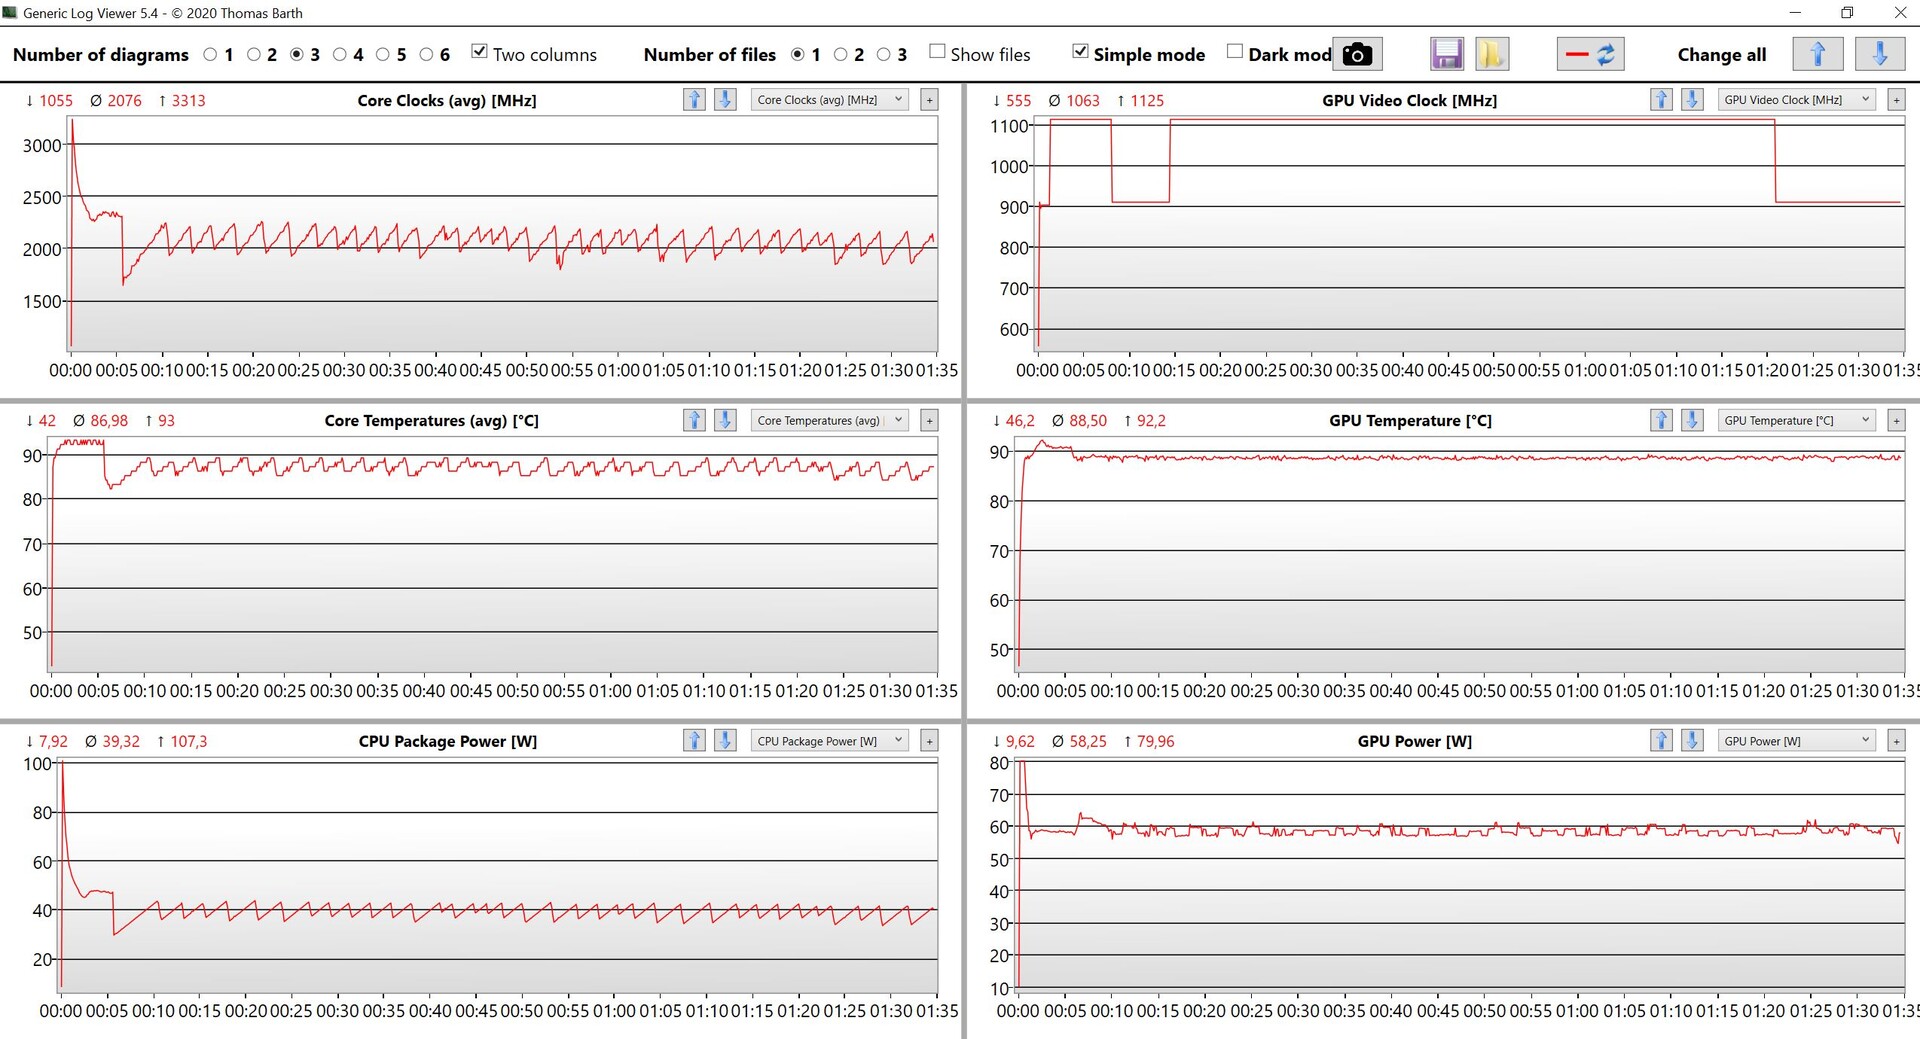
Gaming Performance
Basically, the RTX 3060 offers decent gaming power, although a drop in performance is noticeable here as well. The assessment of our Witcher 3 loop demonstrates that the graphics card only uses a little more than 70 watts as soon as the processor is pushed. The expensive vapor chamber cooling is somewhat disappointing. With its RTX 3060, the X1 Extreme G5 finds itself ahead of the old RTX 3050 Ti model but by a smaller than expected margin - something that is not a good prerequisite for the faster and more expensive RTX 3070 Ti and RTX 3080 Ti GeForce GPUs.
Generally, the RTX 3060 in the X1 Extreme G5 offers sufficient performance for high, and in some cases, maximum detail settings at 1080p, and, depending on the title, even at QHD resolution. For native 4K resolution the GPU is too weak. Additional gaming benchmarks are listed here.
| The Witcher 3 - 1920x1080 Ultra Graphics & Postprocessing (HBAO+) | |
| Schenker Vision 16 Pro RTX 3070 Ti | |
| HP Envy 16 h0112nr | |
| Dell XPS 17 9720 RTX 3060 | |
| Lenovo ThinkPad X1 Extreme G5-21DE003RGE | |
| Average of class Multimedia (11 - 121, n=11, last 2 years) | |
| Lenovo ThinkPad X1 Extreme G4-20Y5CTO1WW (3050 Ti) | |
| Dell XPS 15 9520 RTX 3050 Ti | |
| Final Fantasy XV Benchmark - 1920x1080 High Quality | |
| Schenker Vision 16 Pro RTX 3070 Ti | |
| HP Envy 16 h0112nr | |
| Dell XPS 17 9720 RTX 3060 | |
| Lenovo ThinkPad X1 Extreme G5-21DE003RGE | |
| Average of class Multimedia (7.61 - 144.4, n=63, last 2 years) | |
| Dell XPS 15 9520 RTX 3050 Ti | |
Witcher 3 FPS diagram
| low | med. | high | ultra | QHD | 4K | |
|---|---|---|---|---|---|---|
| GTA V (2015) | 182.6 | 176.9 | 146.8 | 72 | 52 | 42.8 |
| The Witcher 3 (2015) | 313 | 210 | 126 | 60.5 | 26 | |
| Dota 2 Reborn (2015) | 169.6 | 150.7 | 143.2 | 133.4 | 66.1 | |
| Final Fantasy XV Benchmark (2018) | 123.2 | 70.4 | 55 | 41.1 | 22.9 | |
| X-Plane 11.11 (2018) | 135.1 | 110.1 | 91.6 | 58.5 | ||
| Far Cry 5 (2018) | 148 | 106 | 98 | 92 | 58 | 32 |
| Strange Brigade (2018) | 357 | 154.9 | 115.6 | 102.2 | 75.4 | 40 |
| F1 2021 (2021) | 263 | 163.7 | 128.9 | 76.2 | 47.5 | 25.9 |
| Cyberpunk 2077 1.6 (2022) | 80 | 68 | 48 | 40 | 23 | 11 |
| F1 22 (2022) | 144.2 | 135.2 | 112.9 | 36.6 | 22.8 | 10.6 |
Emissions - quieter fans in the G5 model
Noise emissions
Configurations with the GeForce RTX 3060 or faster come with Lenovo's vapor chamber cooling. Both fans are usually off during idle use and are generally either silent or very quiet at low load. However, as soon as more is demanded of either the processor and/ or the graphics card, both fans reach their maximum speed which corresponds to a noise level of 45.5 dB(A). We were able to determine this measurement during both gaming and in our stress tests. By achieving this, the new X1 Extreme G5 is noticeably quieter than the G4 model with its RTX 3050 Ti and its conventional cooling.
Quieter fans are, of course, always welcome but we would have at least preferred more stable GPU performance combined with slightly noisier fans using the fastest energy profile setting. On a positive note, we were unable to detect any other electronic noises.
Noise level
| Idle |
| 23.2 / 23.2 / 23.2 dB(A) |
| Load |
| 45.5 / 45.5 dB(A) |
 | ||
30 dB silent 40 dB(A) audible 50 dB(A) loud |
||
min: | ||
| Lenovo ThinkPad X1 Extreme G5-21DE003RGE GeForce RTX 3060 Laptop GPU, i7-12700H, Micron 3400 1TB MTFDKBA1T0TFH | HP Envy 16 h0112nr GeForce RTX 3060 Laptop GPU, i7-12700H, Micron 3400 1TB MTFDKBA1T0TFH | Schenker Vision 16 Pro RTX 3070 Ti GeForce RTX 3070 Ti Laptop GPU, i7-12700H, Samsung SSD 980 Pro 1TB MZ-V8P1T0BW | Dell XPS 15 9520 RTX 3050 Ti GeForce RTX 3050 Ti Laptop GPU, i7-12700H, WDC PC SN810 512GB | Apple MacBook Pro 16 2021 M1 Pro M1 Pro 16-Core GPU, M1 Pro, Apple SSD AP1024R | Dell XPS 17 9720 RTX 3060 GeForce RTX 3060 Laptop GPU, i7-12700H, Samsung PM9A1 MZVL21T0HCLR | Lenovo ThinkPad X1 Extreme G4-20Y5CTO1WW (3050 Ti) GeForce RTX 3050 Ti Laptop GPU, i7-11800H, Samsung PM9A1 MZVL21T0HCLR | |
|---|---|---|---|---|---|---|---|
| Noise | -6% | -3% | 8% | 6% | -3% | -4% | |
| off / environment * (dB) | 23.2 | 22.8 2% | 22.9 1% | 22.8 2% | 24.7 -6% | 23.8 -3% | 23.52 -1% |
| Idle Minimum * (dB) | 23.2 | 22.9 1% | 24.3 -5% | 22.9 1% | 24.7 -6% | 24.1 -4% | 23.52 -1% |
| Idle Average * (dB) | 23.2 | 22.9 1% | 24.3 -5% | 22.9 1% | 24.7 -6% | 24.1 -4% | 23.52 -1% |
| Idle Maximum * (dB) | 23.2 | 30.5 -31% | 24.3 -5% | 22.9 1% | 24.7 -6% | 24.1 -4% | 23.52 -1% |
| Load Average * (dB) | 45.5 | 41.4 9% | 38.5 15% | 30.9 32% | 26.1 43% | 43.2 5% | 42.9 6% |
| Witcher 3 ultra * (dB) | 45.5 | 51.1 -12% | 51 -12% | 37.8 17% | 48 -5% | 52.5 -15% | |
| Load Maximum * (dB) | 45.5 | 51.4 -13% | 51 -12% | 44.7 2% | 37.4 18% | 48 -5% | 52.45 -15% |
* ... smaller is better
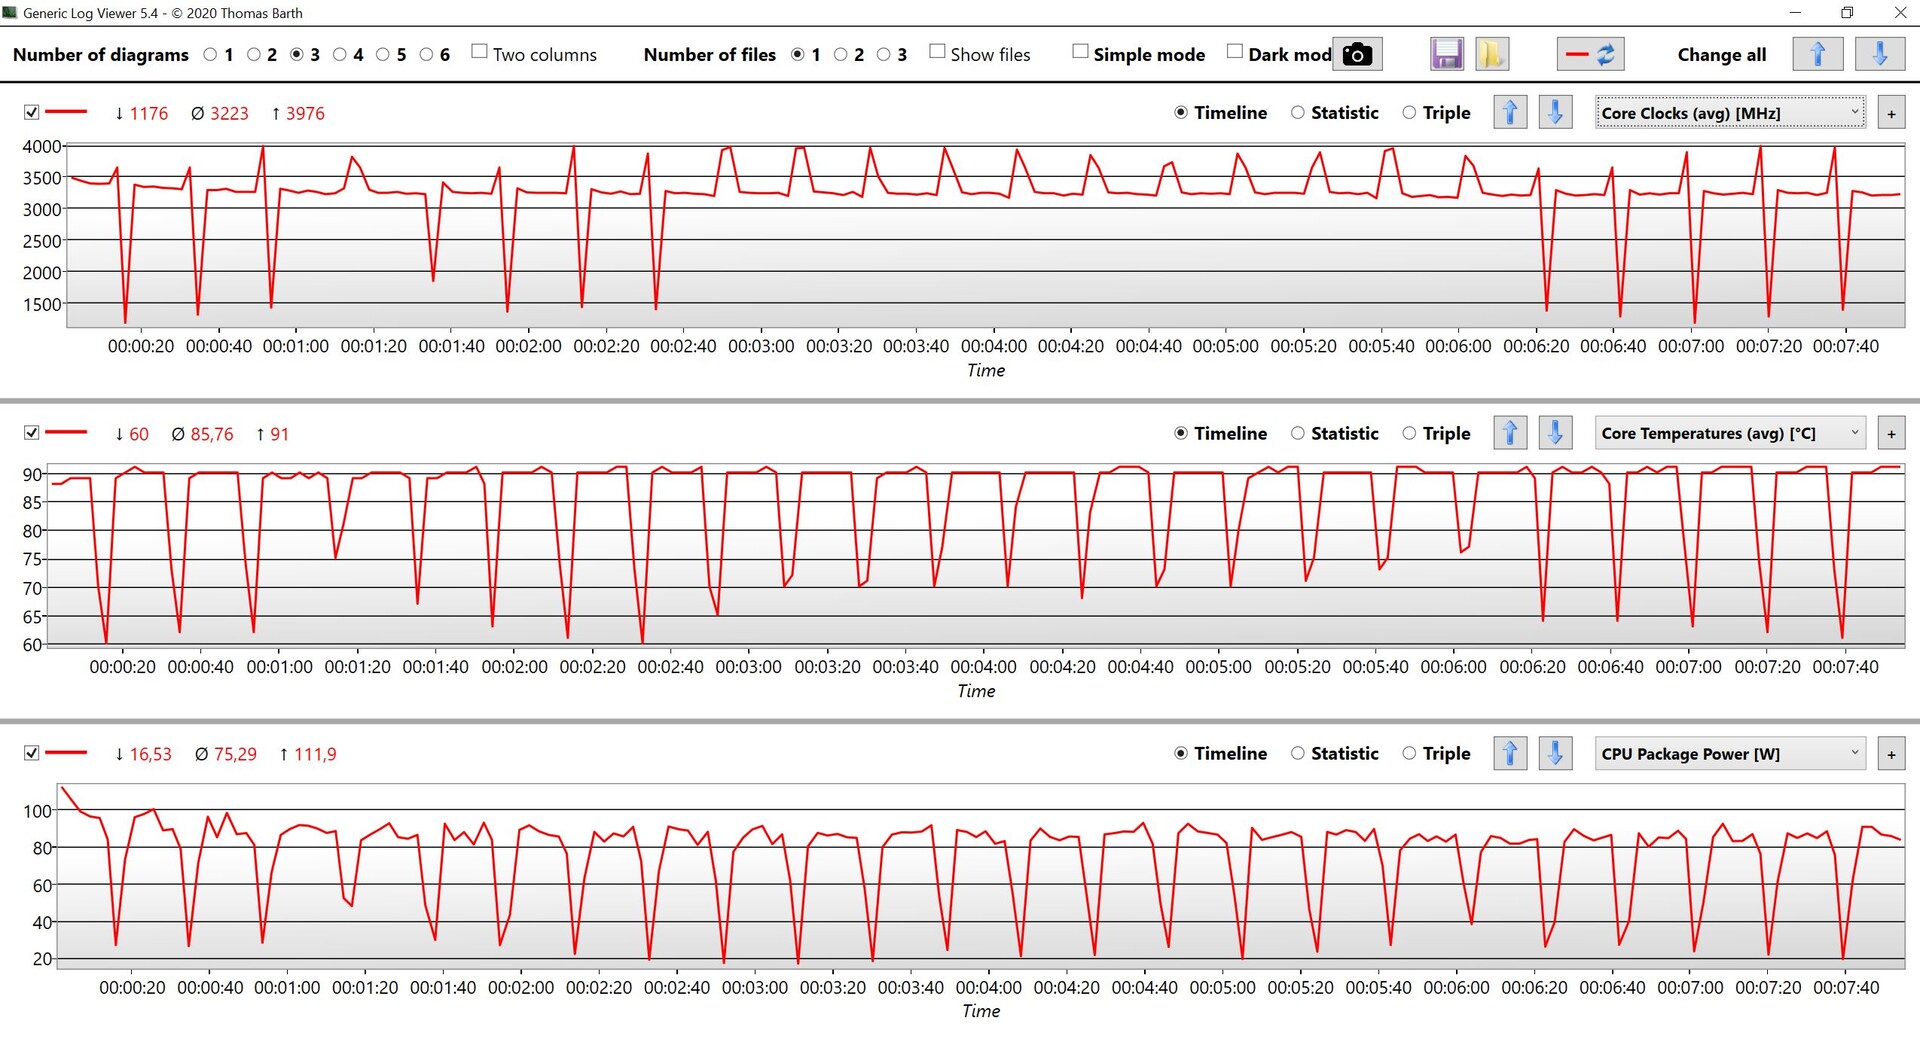
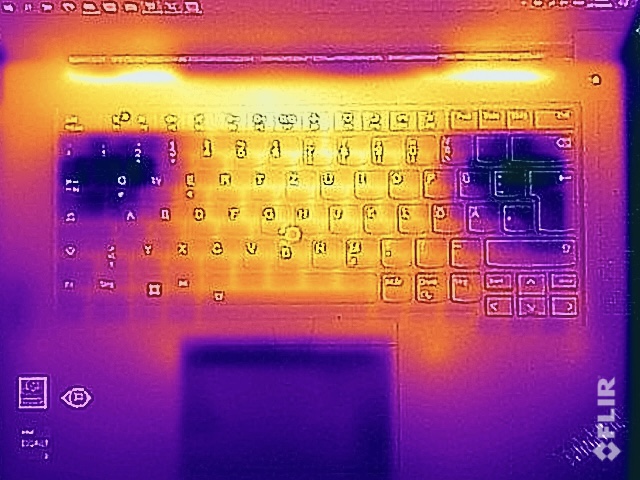
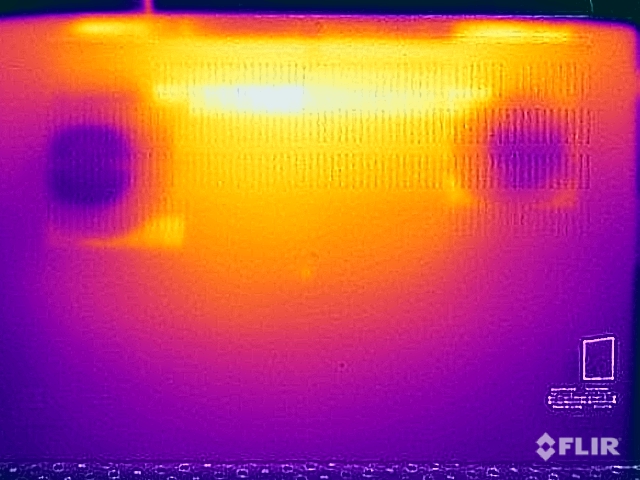
Temperature

Recently, Lenovo has been using a liquid metal thermal paste to cool the CPU better which has already had a positive effect on CPU performance. However, things get warm under load which is related to the slower fans. During both gaming and the stress test, we measured more than 55 °C on the bottom and 50 °C on the top of the base unit, respectively. Under load, it is unwise to have the device placed on the user's lap and also warm fingers can be expected when typing. However, there are no temperature problems during everyday tasks.
In stress tests, the CPU and GPU quickly level off at 40 and 60 watts, respectively, meaning the system is able to cool a total of 100 watts. At 90 °C, both components quickly get very hot. On stress test completion there was no drop in performance.
(-) The maximum temperature on the upper side is 52 °C / 126 F, compared to the average of 36.8 °C / 98 F, ranging from 21 to 71 °C for the class Multimedia.
(-) The bottom heats up to a maximum of 56.4 °C / 134 F, compared to the average of 39.1 °C / 102 F
(+) In idle usage, the average temperature for the upper side is 25.6 °C / 78 F, compared to the device average of 31.3 °C / 88 F.
(-) Playing The Witcher 3, the average temperature for the upper side is 41.1 °C / 106 F, compared to the device average of 31.3 °C / 88 F.
(±) The palmrests and touchpad can get very hot to the touch with a maximum of 36.1 °C / 97 F.
(-) The average temperature of the palmrest area of similar devices was 28.7 °C / 83.7 F (-7.4 °C / -13.3 F).
| Lenovo ThinkPad X1 Extreme G5-21DE003RGE Intel Core i7-12700H, NVIDIA GeForce RTX 3060 Laptop GPU | HP Envy 16 h0112nr Intel Core i7-12700H, NVIDIA GeForce RTX 3060 Laptop GPU | Schenker Vision 16 Pro RTX 3070 Ti Intel Core i7-12700H, NVIDIA GeForce RTX 3070 Ti Laptop GPU | Dell XPS 15 9520 RTX 3050 Ti Intel Core i7-12700H, NVIDIA GeForce RTX 3050 Ti Laptop GPU | Apple MacBook Pro 16 2021 M1 Pro Apple M1 Pro, Apple M1 Pro 16-Core GPU | Dell XPS 17 9720 RTX 3060 Intel Core i7-12700H, NVIDIA GeForce RTX 3060 Laptop GPU | Lenovo ThinkPad X1 Extreme G4-20Y5CTO1WW (3050 Ti) Intel Core i7-11800H, NVIDIA GeForce RTX 3050 Ti Laptop GPU | |
|---|---|---|---|---|---|---|---|
| Heat | -3% | 5% | -6% | 18% | -8% | -1% | |
| Maximum Upper Side * (°C) | 52 | 45.2 13% | 50.8 2% | 51.4 1% | 41 21% | 51.8 -0% | 49 6% |
| Maximum Bottom * (°C) | 56.4 | 44 22% | 46.3 18% | 51 10% | 39 31% | 44.2 22% | 44.4 21% |
| Idle Upper Side * (°C) | 26.4 | 33.6 -27% | 27.2 -3% | 30 -14% | 24 9% | 34.8 -32% | 32.1 -22% |
| Idle Bottom * (°C) | 27.2 | 32.6 -20% | 26.6 2% | 33 -21% | 24 12% | 33.2 -22% | 29.8 -10% |
* ... smaller is better
Speakers
Lenovo continues to fit the device with two stereo speakers which are not only capable of outputting 2 watts but also produce decent sound. Nevertheless, the result is simply not as loud or punchy as the competitors boasting more modules such as the MacBook Pro 16 with six speakers, or the XPS 17 with four.
Lenovo ThinkPad X1 Extreme G5-21DE003RGE audio analysis
(±) | speaker loudness is average but good (81.4 dB)
Bass 100 - 315 Hz
(±) | reduced bass - on average 11.5% lower than median
(±) | linearity of bass is average (10.6% delta to prev. frequency)
Mids 400 - 2000 Hz
(±) | higher mids - on average 6.1% higher than median
(+) | mids are linear (4.6% delta to prev. frequency)
Highs 2 - 16 kHz
(+) | balanced highs - only 3.4% away from median
(+) | highs are linear (4.2% delta to prev. frequency)
Overall 100 - 16.000 Hz
(+) | overall sound is linear (14.5% difference to median)
Compared to same class
» 34% of all tested devices in this class were better, 4% similar, 61% worse
» The best had a delta of 5%, average was 17%, worst was 45%
Compared to all devices tested
» 18% of all tested devices were better, 4% similar, 77% worse
» The best had a delta of 4%, average was 23%, worst was 134%
Apple MacBook Pro 16 2021 M1 Pro audio analysis
(+) | speakers can play relatively loud (84.7 dB)
Bass 100 - 315 Hz
(+) | good bass - only 3.8% away from median
(+) | bass is linear (5.2% delta to prev. frequency)
Mids 400 - 2000 Hz
(+) | balanced mids - only 1.3% away from median
(+) | mids are linear (2.1% delta to prev. frequency)
Highs 2 - 16 kHz
(+) | balanced highs - only 1.9% away from median
(+) | highs are linear (2.7% delta to prev. frequency)
Overall 100 - 16.000 Hz
(+) | overall sound is linear (4.6% difference to median)
Compared to same class
» 0% of all tested devices in this class were better, 0% similar, 100% worse
» The best had a delta of 5%, average was 17%, worst was 45%
Compared to all devices tested
» 0% of all tested devices were better, 0% similar, 100% worse
» The best had a delta of 4%, average was 23%, worst was 134%
Energy management - a power-hungry 4K panel
Energy consumption

As expected, our energy analysis didn't uncover any surprises. The 4K panel continues to consume a lot a power, measuring up to 23 watts in idle usage. Under load, we briefly saw 226 watts after which consumption quickly levelled off at 156 watts. During gaming, the device consumes 130 watts which means the supplied 230 watt power supply is more than sufficient and is even able to charge the device under load. At 1.3 watts, standby usage is a little high.
| Off / Standby | |
| Idle | |
| Load |
|
Key:
min: | |
| Lenovo ThinkPad X1 Extreme G5-21DE003RGE i7-12700H, GeForce RTX 3060 Laptop GPU, Micron 3400 1TB MTFDKBA1T0TFH, IPS, 3840x2400, 16" | HP Envy 16 h0112nr i7-12700H, GeForce RTX 3060 Laptop GPU, Micron 3400 1TB MTFDKBA1T0TFH, OLED, 3840x2400, 16" | Schenker Vision 16 Pro RTX 3070 Ti i7-12700H, GeForce RTX 3070 Ti Laptop GPU, Samsung SSD 980 Pro 1TB MZ-V8P1T0BW, IPS, 2560x1600, 16" | Dell XPS 15 9520 RTX 3050 Ti i7-12700H, GeForce RTX 3050 Ti Laptop GPU, WDC PC SN810 512GB, OLED, 3456x2160, 15.6" | Apple MacBook Pro 16 2021 M1 Pro M1 Pro, M1 Pro 16-Core GPU, Apple SSD AP1024R, Mini-LED, 3456x2234, 16.2" | Dell XPS 17 9720 RTX 3060 i7-12700H, GeForce RTX 3060 Laptop GPU, Samsung PM9A1 MZVL21T0HCLR, IPS, 3840x2400, 17" | Lenovo ThinkPad X1 Extreme G4-20Y5CTO1WW (3050 Ti) i7-11800H, GeForce RTX 3050 Ti Laptop GPU, Samsung PM9A1 MZVL21T0HCLR, IPS LED, 3840x2400, 16" | Average NVIDIA GeForce RTX 3060 Laptop GPU | Average of class Multimedia | |
|---|---|---|---|---|---|---|---|---|---|
| Power Consumption | 11% | 22% | 45% | 49% | 22% | 16% | 17% | 51% | |
| Idle Minimum * (Watt) | 11.8 | 10 15% | 9 24% | 5.5 53% | 5 58% | 5.9 50% | 10.3 13% | 10.4 ? 12% | 5.65 ? 52% |
| Idle Average * (Watt) | 22.4 | 10.9 51% | 13.3 41% | 7.2 68% | 15.1 33% | 15.8 29% | 22.06 2% | 14.5 ? 35% | 10 ? 55% |
| Idle Maximum * (Watt) | 23.1 | 27.8 -20% | 14.3 38% | 16 31% | 15.5 33% | 26.7 -16% | 23 -0% | 21.4 ? 7% | 12.3 ? 47% |
| Load Average * (Watt) | 138 | 116.4 16% | 107 22% | 91.8 33% | 54 61% | 117.4 15% | 102.57 26% | 109.3 ? 21% | 65.1 ? 53% |
| Witcher 3 ultra * (Watt) | 129.9 | 133.7 -3% | 155.2 -19% | 74.6 43% | 114.8 12% | 106 18% | |||
| Load Maximum * (Watt) | 225.6 | 209.8 7% | 172 24% | 134.7 40% | 90 60% | 136.6 39% | 147.8 34% | 206 ? 9% | 112.5 ? 50% |
* ... smaller is better
Energy consumption Witcher 3 / stress test
Energy consumption with an external monitor
Battery life
Nothing has changed concerning the 90 watt hour battery and runtimes are generally comparable to its predecessor which we also tested with a 4K panel. At 150 cd/m² brightness (representing 56 % of maximum brightness), the video test ran for more than 7 hours and the Wi-Fi test roughly 6.5 hours. At maximum brightness, a runtime of only 4.5 hours was possible.
A full charge takes 100 minutes, whereby 35 % charge is achieved after just 14 minutes and 80 % is available after approximately 52 minutes.
| Lenovo ThinkPad X1 Extreme G5-21DE003RGE i7-12700H, GeForce RTX 3060 Laptop GPU, 90 Wh | HP Envy 16 h0112nr i7-12700H, GeForce RTX 3060 Laptop GPU, 83 Wh | Schenker Vision 16 Pro RTX 3070 Ti i7-12700H, GeForce RTX 3070 Ti Laptop GPU, 80 Wh | Dell XPS 15 9520 RTX 3050 Ti i7-12700H, GeForce RTX 3050 Ti Laptop GPU, 86 Wh | Apple MacBook Pro 16 2021 M1 Pro M1 Pro, M1 Pro 16-Core GPU, 99.6 Wh | Dell XPS 17 9720 RTX 3060 i7-12700H, GeForce RTX 3060 Laptop GPU, 97 Wh | Lenovo ThinkPad X1 Extreme G4-20Y5CTO1WW (3050 Ti) i7-11800H, GeForce RTX 3050 Ti Laptop GPU, 90 Wh | Average of class Multimedia | |
|---|---|---|---|---|---|---|---|---|
| Battery runtime | 6% | -17% | 60% | 146% | -6% | -13% | 66% | |
| H.264 (h) | 7.3 | 6.1 -16% | 17.5 140% | 6.7 -8% | 16.2 ? 122% | |||
| WiFi v1.3 (h) | 6.7 | 7.9 18% | 6 -10% | 8.8 31% | 16.9 152% | 8.7 30% | 6.6 -1% | 12 ? 79% |
| Load (h) | 1.7 | 1.6 -6% | 1.3 -24% | 3.2 88% | 1 -41% | 1.2 -29% | 1.669 ? -2% |
Pros
Cons
Verdict - A ThinkPad with added CPU power

Even if nothing has appeared to change on the outside, Lenovo has managed to introduce some interesting innovations to its 5th generation ThinkPad X1 Extreme. Compared to the old model, the processor now consumes considerably more power. Together with the new Alder Lake processor, this contributes to a tangible boost in performance. This is where the use of liquid metal thermal paste really pays off. Generally speaking, the vapor chamber cooling does a good job and although the fans stay comparatively quiet, graphic performance is inconsistent.
The ThinkPad still ships with Windows 10 Pro which left us experiencing some performance issues. Wi-Fi 6E is only supported by Windows 11 and is one reason why we recommend an update. An optional 5G modem is also available but the WWAN module must be ordered ex works otherwise neither the necessary antennas nor the SIM card slot are prepared. Additionally, a limitation still exists that a WWAN module (as well as a second M.2 SSD) are only available in models equipped with a RTX 3050 Ti which use conventional cooling. The single-channel RAM configuration is somewhat unfortunate as 32 GB is sufficient for most users and two 16 GB modules would have undoubtedly been the better choice.
With the ThinkPad X1 Extreme G5, Lenovo mainly improves on processing power and offers optional 5G connectivity with graphics performance remaining somewhat unstable.
Once more, we feel the need to criticize the keyboard quality. Up to the G3 models, the X1 Extreme keyboard belonged to the best the mobile sector had to offer. It continues to puzzle us as to why Lenovo found it necessary to reduce the key travel of a comparatively thick device such as the X1 Extreme (after all, we're not dealing with the X1 Nano or X1 Carbon here).
Lenovo is still one of the few manufacturers who offer a panel with full AdobeRGB coverage as even HP has only been using its P3 color space DreamColor panels for some time now. Seen subjectively, image quality is very good without suffering from PWM issues. However, power consumption is very high and outdoor reflections could be a problem. We will shortly test the new 165 Hz WQHD panel found in the ThinkPad P1 G5 workstation offshoot.
The X1 Extreme G5 has a lot of competition, especially when considering the high price. This starts with the wonderful MacBook Pro 16 with its mini LED display as well as newcomers such as the Schenker Vision 16 Pro, which offers more power in a smaller and lighter form factor. Nevertheless, neither device can boast better battery life. HP's Envy 16 is a little heavier and thicker but offers more stable GPU performance. Currently, Dell has not updated its XPS 16 leaving potential buyers to choose between the XPS 15 and 17.
Price and availability
The ThinkPad X1 Extreme can be configured in Lenovo's online store from 2189 dollars. Our review configuration is available online from 3643 US dollars at Amazon.
Lenovo ThinkPad X1 Extreme G5-21DE003RGE
- 12/05/2022 v7 (old)
Andreas Osthoff
Price comparison

