Apple MacBook Pro 16 2021 M1 Pro in Review - The best Multimedia Laptop for Content Creators?

In addition to the new MacBook Pro 14, which we have already reviewed, Apple also launched a completely revamped version of the larger MacBook Pro 16. It is also available with the new M1 Pro and M1 Max chips in combination with the 16-inch Mini-LED screen. Our review unit is the model with the M1 Pro SoC with 16 GPU cores; the review of the MacBook Pro 16 with the M1 Max and 32 GPU cores will follow in a couple of days.
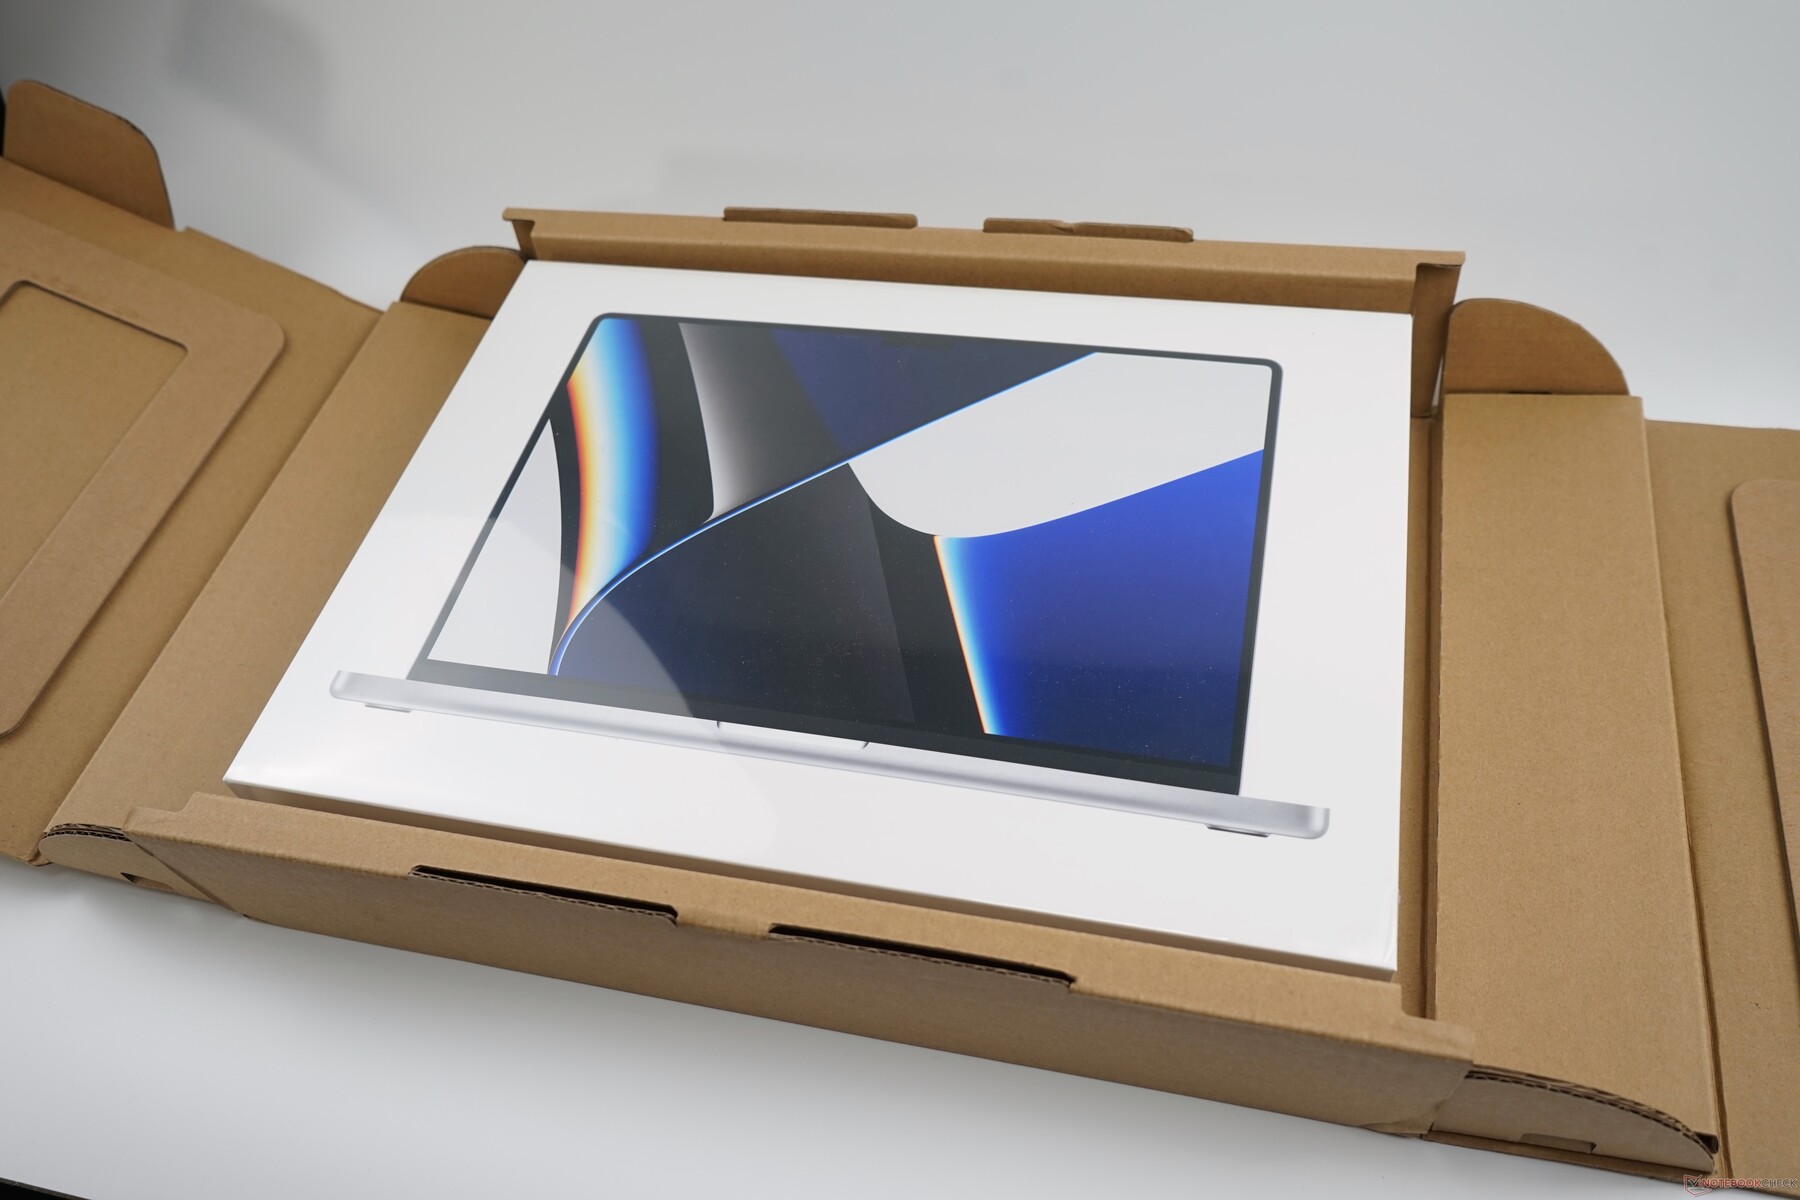
We purchased our review unit in Apple’s online store. It is the base model with the M1 Pro SoC and 16 GB RAM; we only ticked the box for the larger 1 TB SSD. The price for this configuration is 2,979 Euros (~US$3,409).
Comparison of potential competitors
Rating | Date | Model | Weight | Height | Size | Resolution | Price |
|---|---|---|---|---|---|---|---|
| 93.2 % v7 (old) | 11 / 2021 | Apple MacBook Pro 16 2021 M1 Pro M1 Pro, M1 Pro 16-Core GPU | 2.2 kg | 16.8 mm | 16.20" | 3456x2234 | |
| 89.7 % v7 (old) | 12 / 2019 | Apple MacBook Pro 16 2019 i9 5500M i9-9880H, Radeon Pro 5500M | 2 kg | 16.2 mm | 16.00" | 3072x1920 | |
| 89.8 % v7 (old) | 11 / 2021 | Lenovo ThinkPad P1 G4-20Y4S0KS00 i7-11850H, GeForce RTX 3070 Laptop GPU | 2 kg | 17.7 mm | 16.00" | 3840x2400 | |
| 88.4 % v7 (old) | 08 / 2021 | Dell XPS 15 9510 11800H RTX 3050 Ti OLED i7-11800H, GeForce RTX 3050 Ti Laptop GPU | 1.9 kg | 18 mm | 15.60" | 3456x2160 | |
| 87.8 % v7 (old) | 08 / 2021 | HP ZBook Studio 15 G8 i9-11950H, GeForce RTX 3070 Laptop GPU | 1.9 kg | 18 mm | 15.60" | 3840x2160 | |
| 88.9 % v7 (old) | 07 / 2021 | Razer Blade 15 Advanced (Mid 2021) i7-11800H, GeForce RTX 3080 Laptop GPU | 2 kg | 16.99 mm | 15.60" | 1920x1080 |
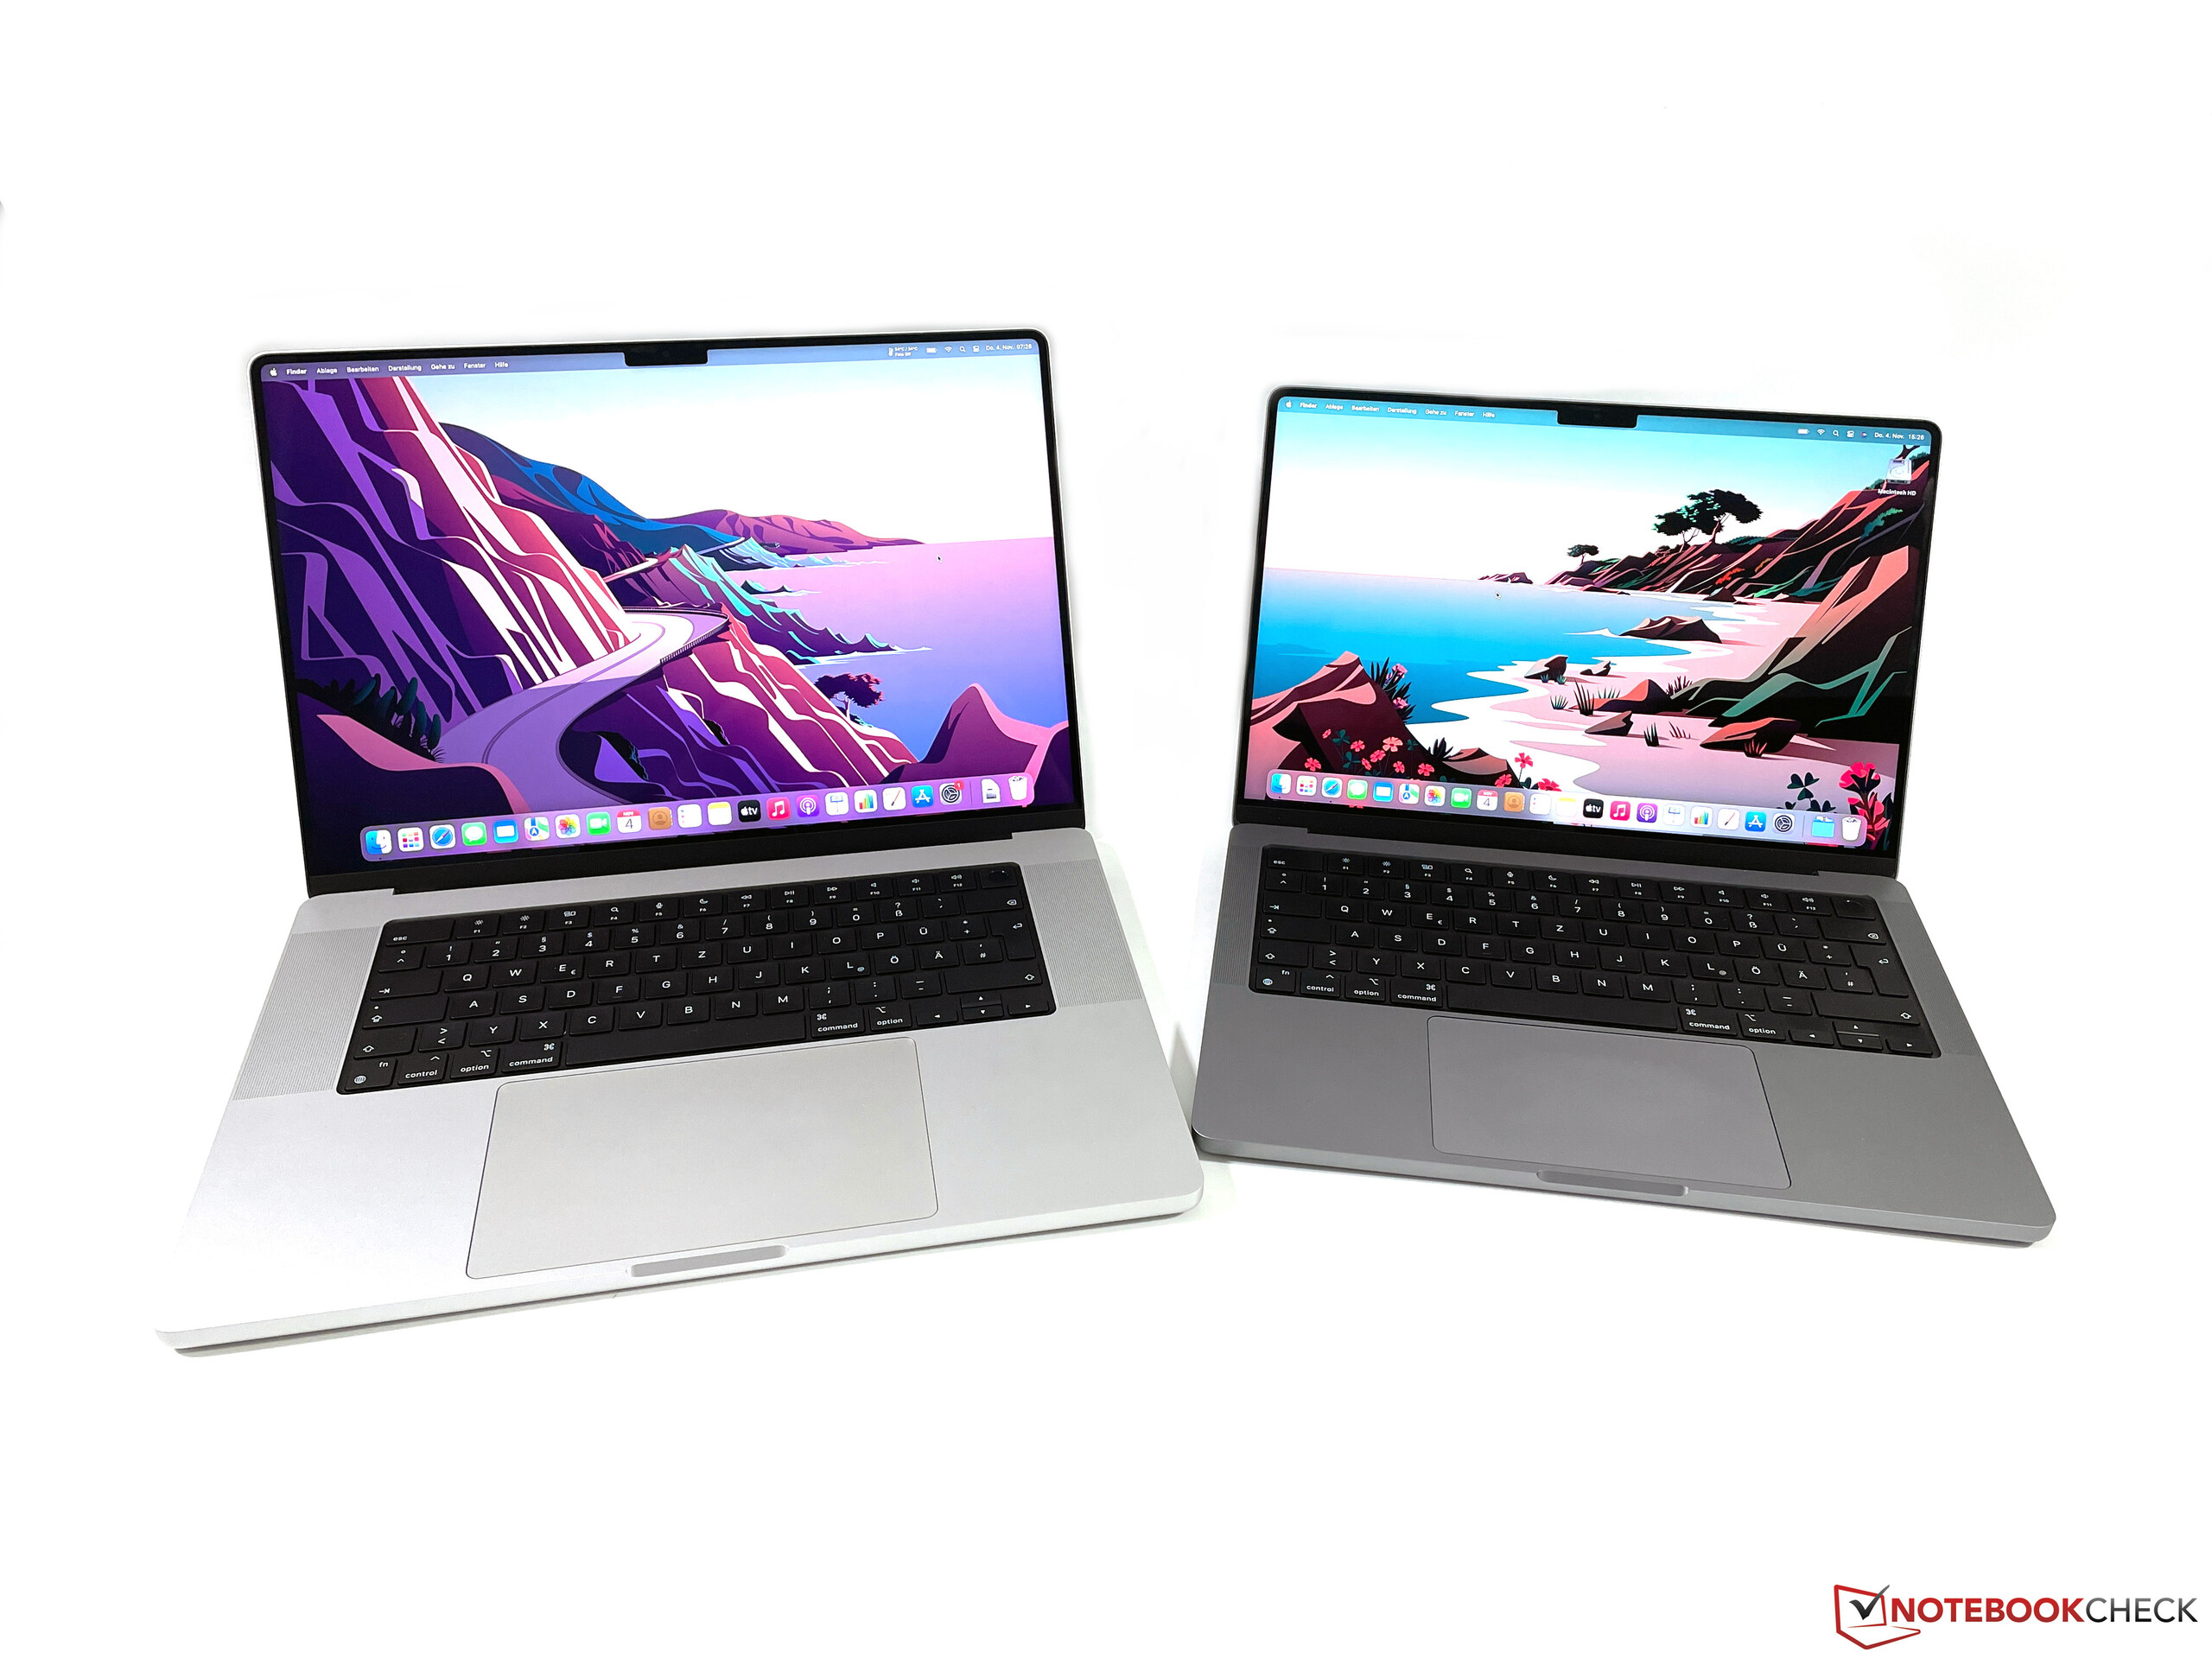
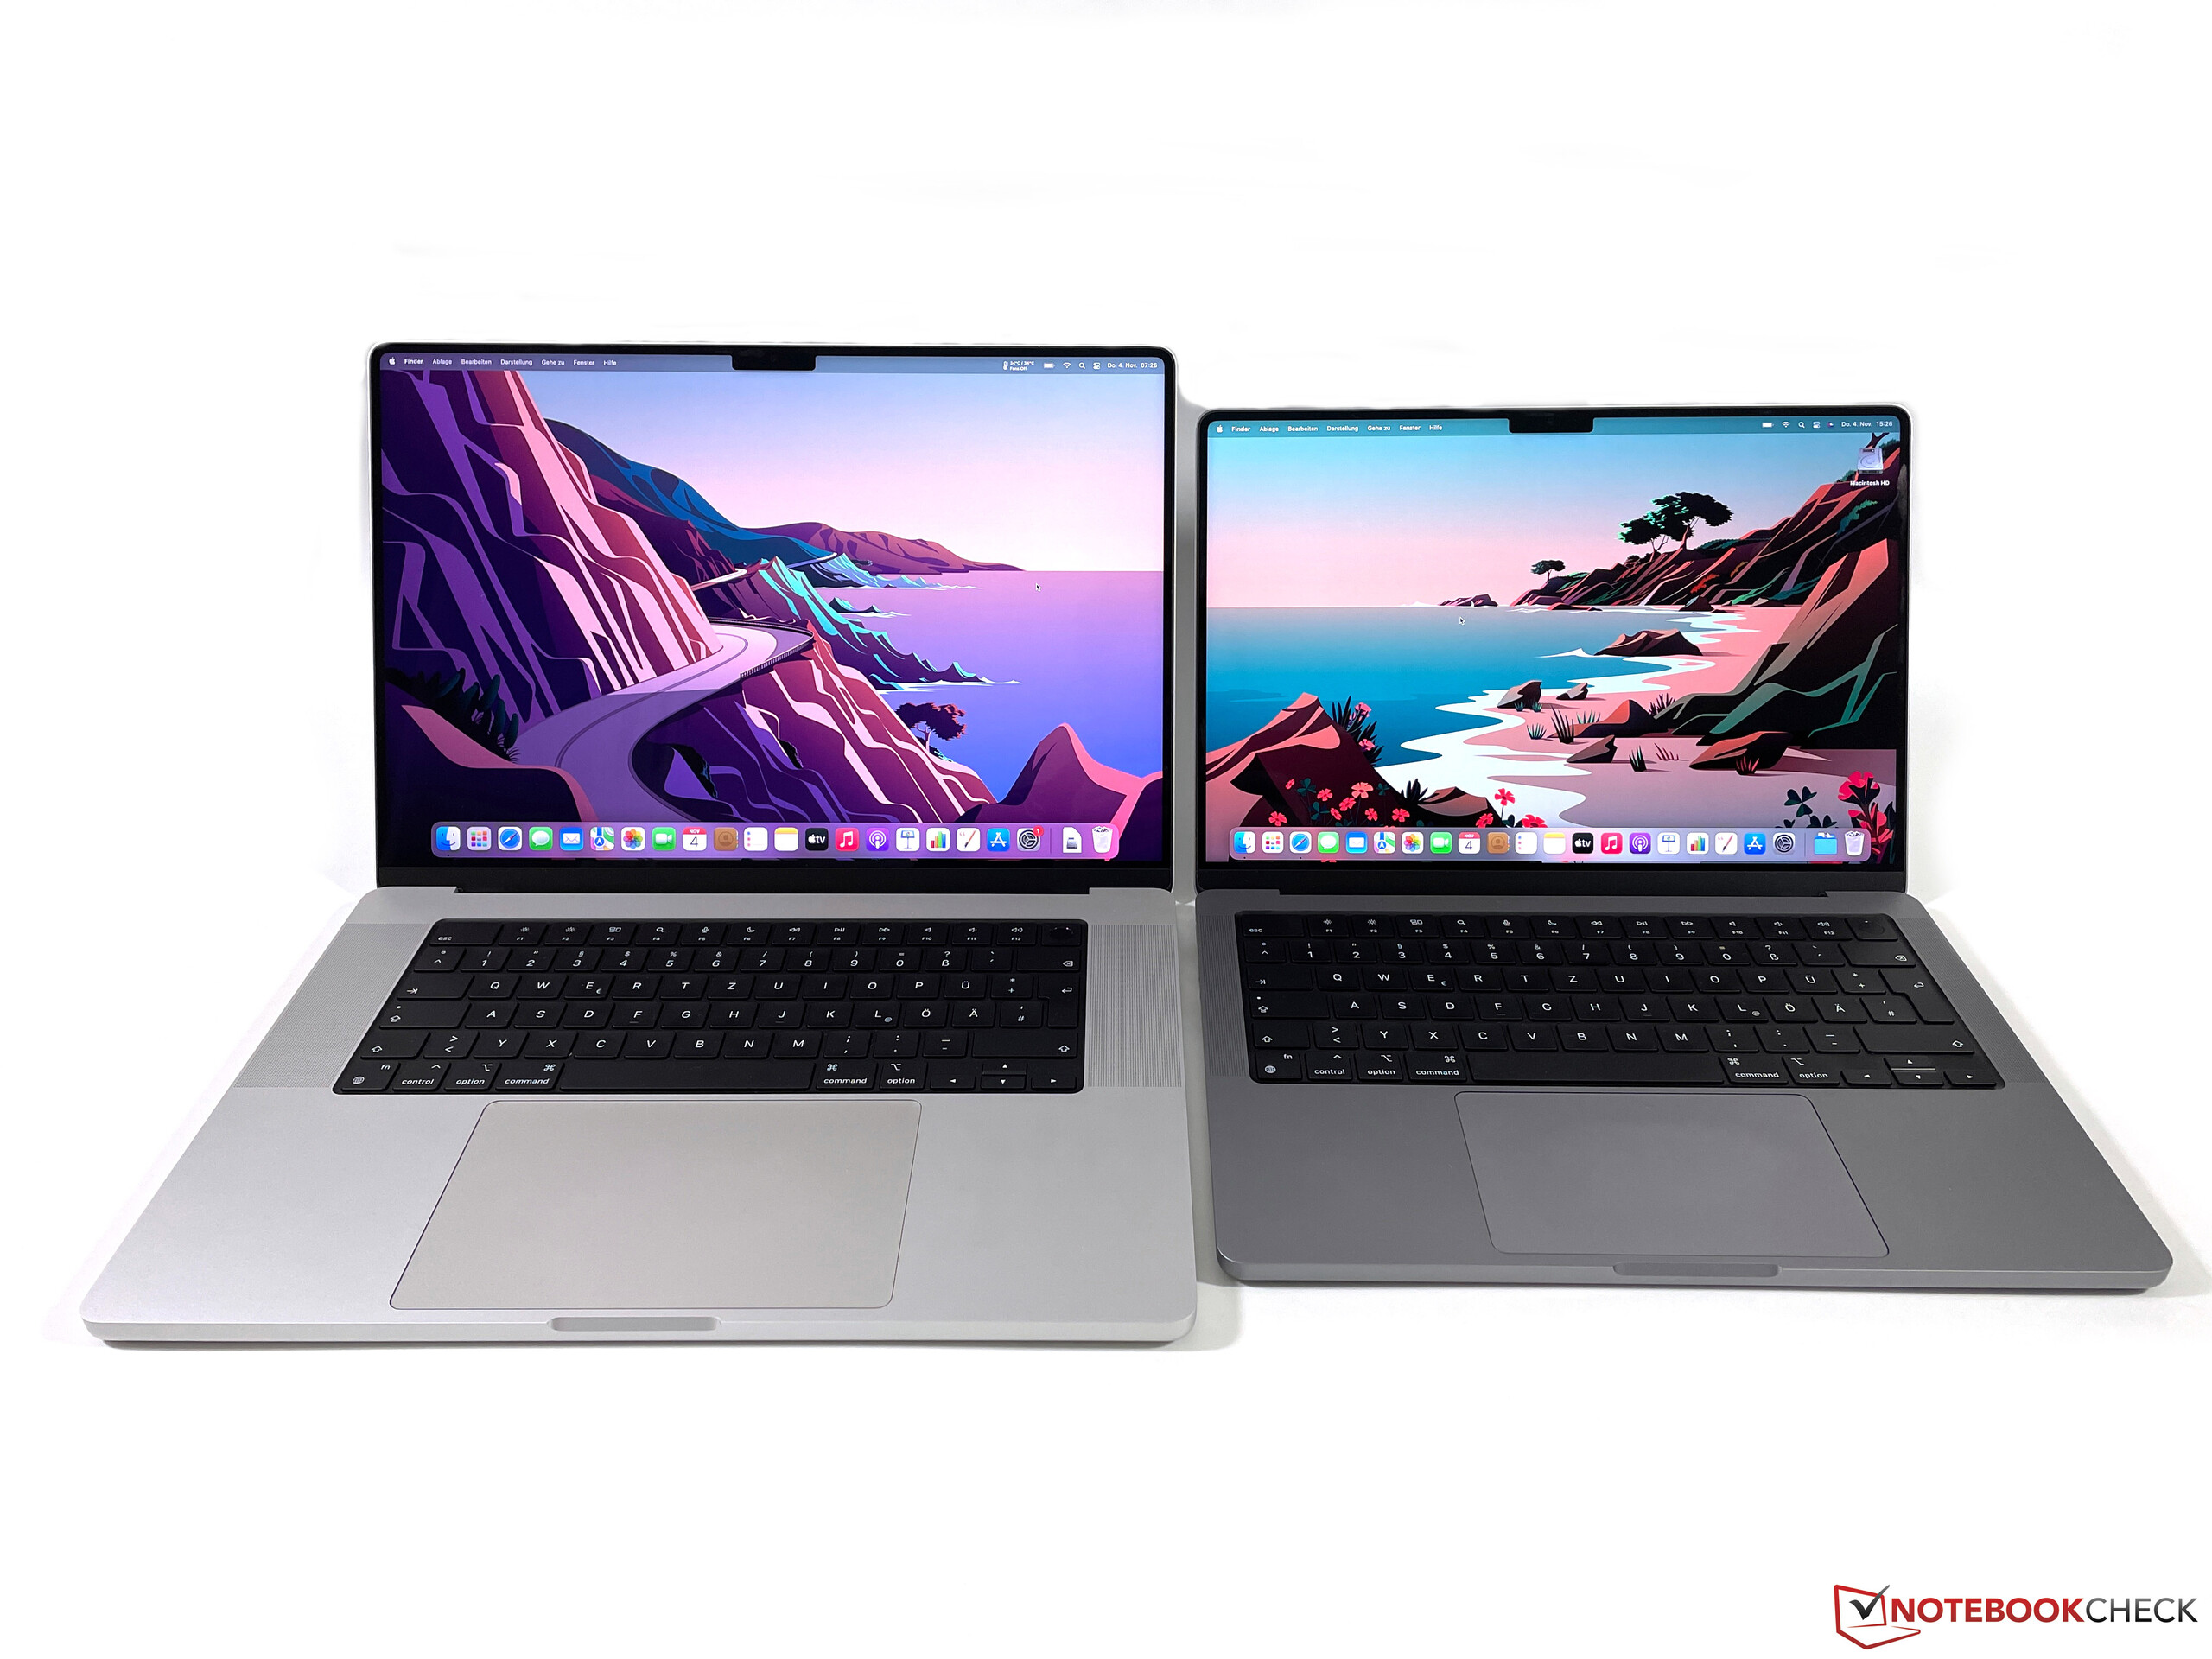
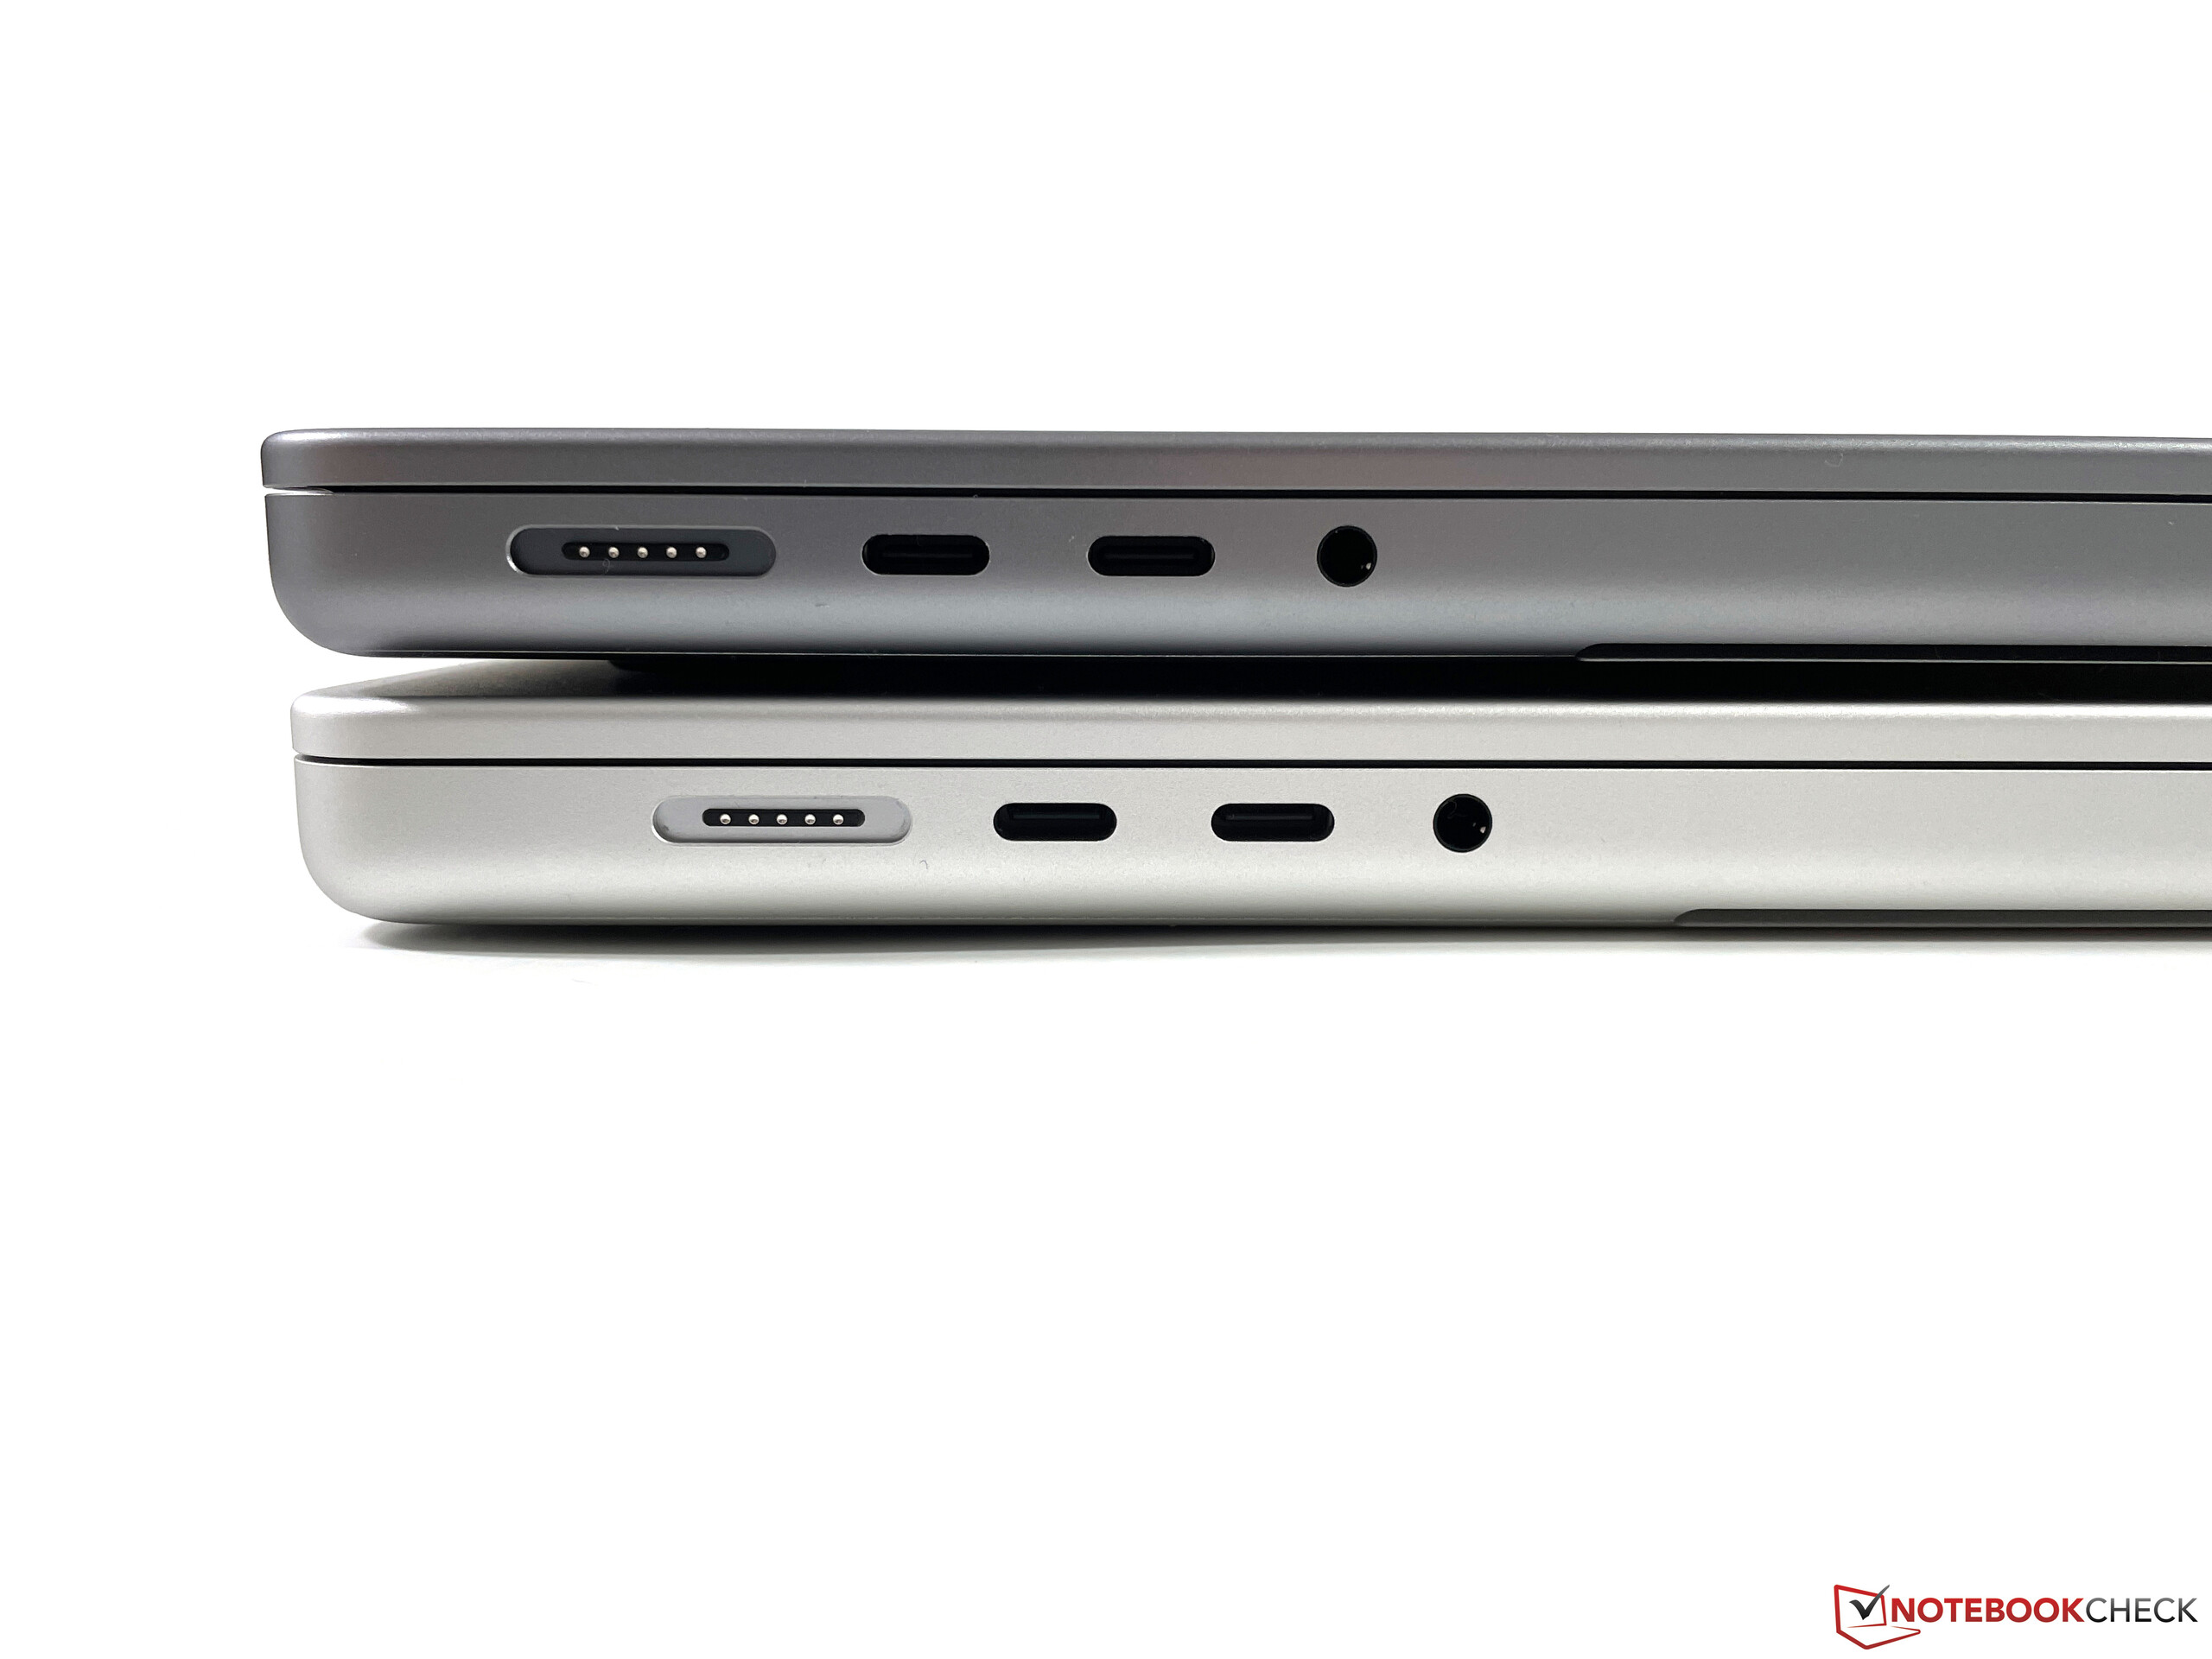
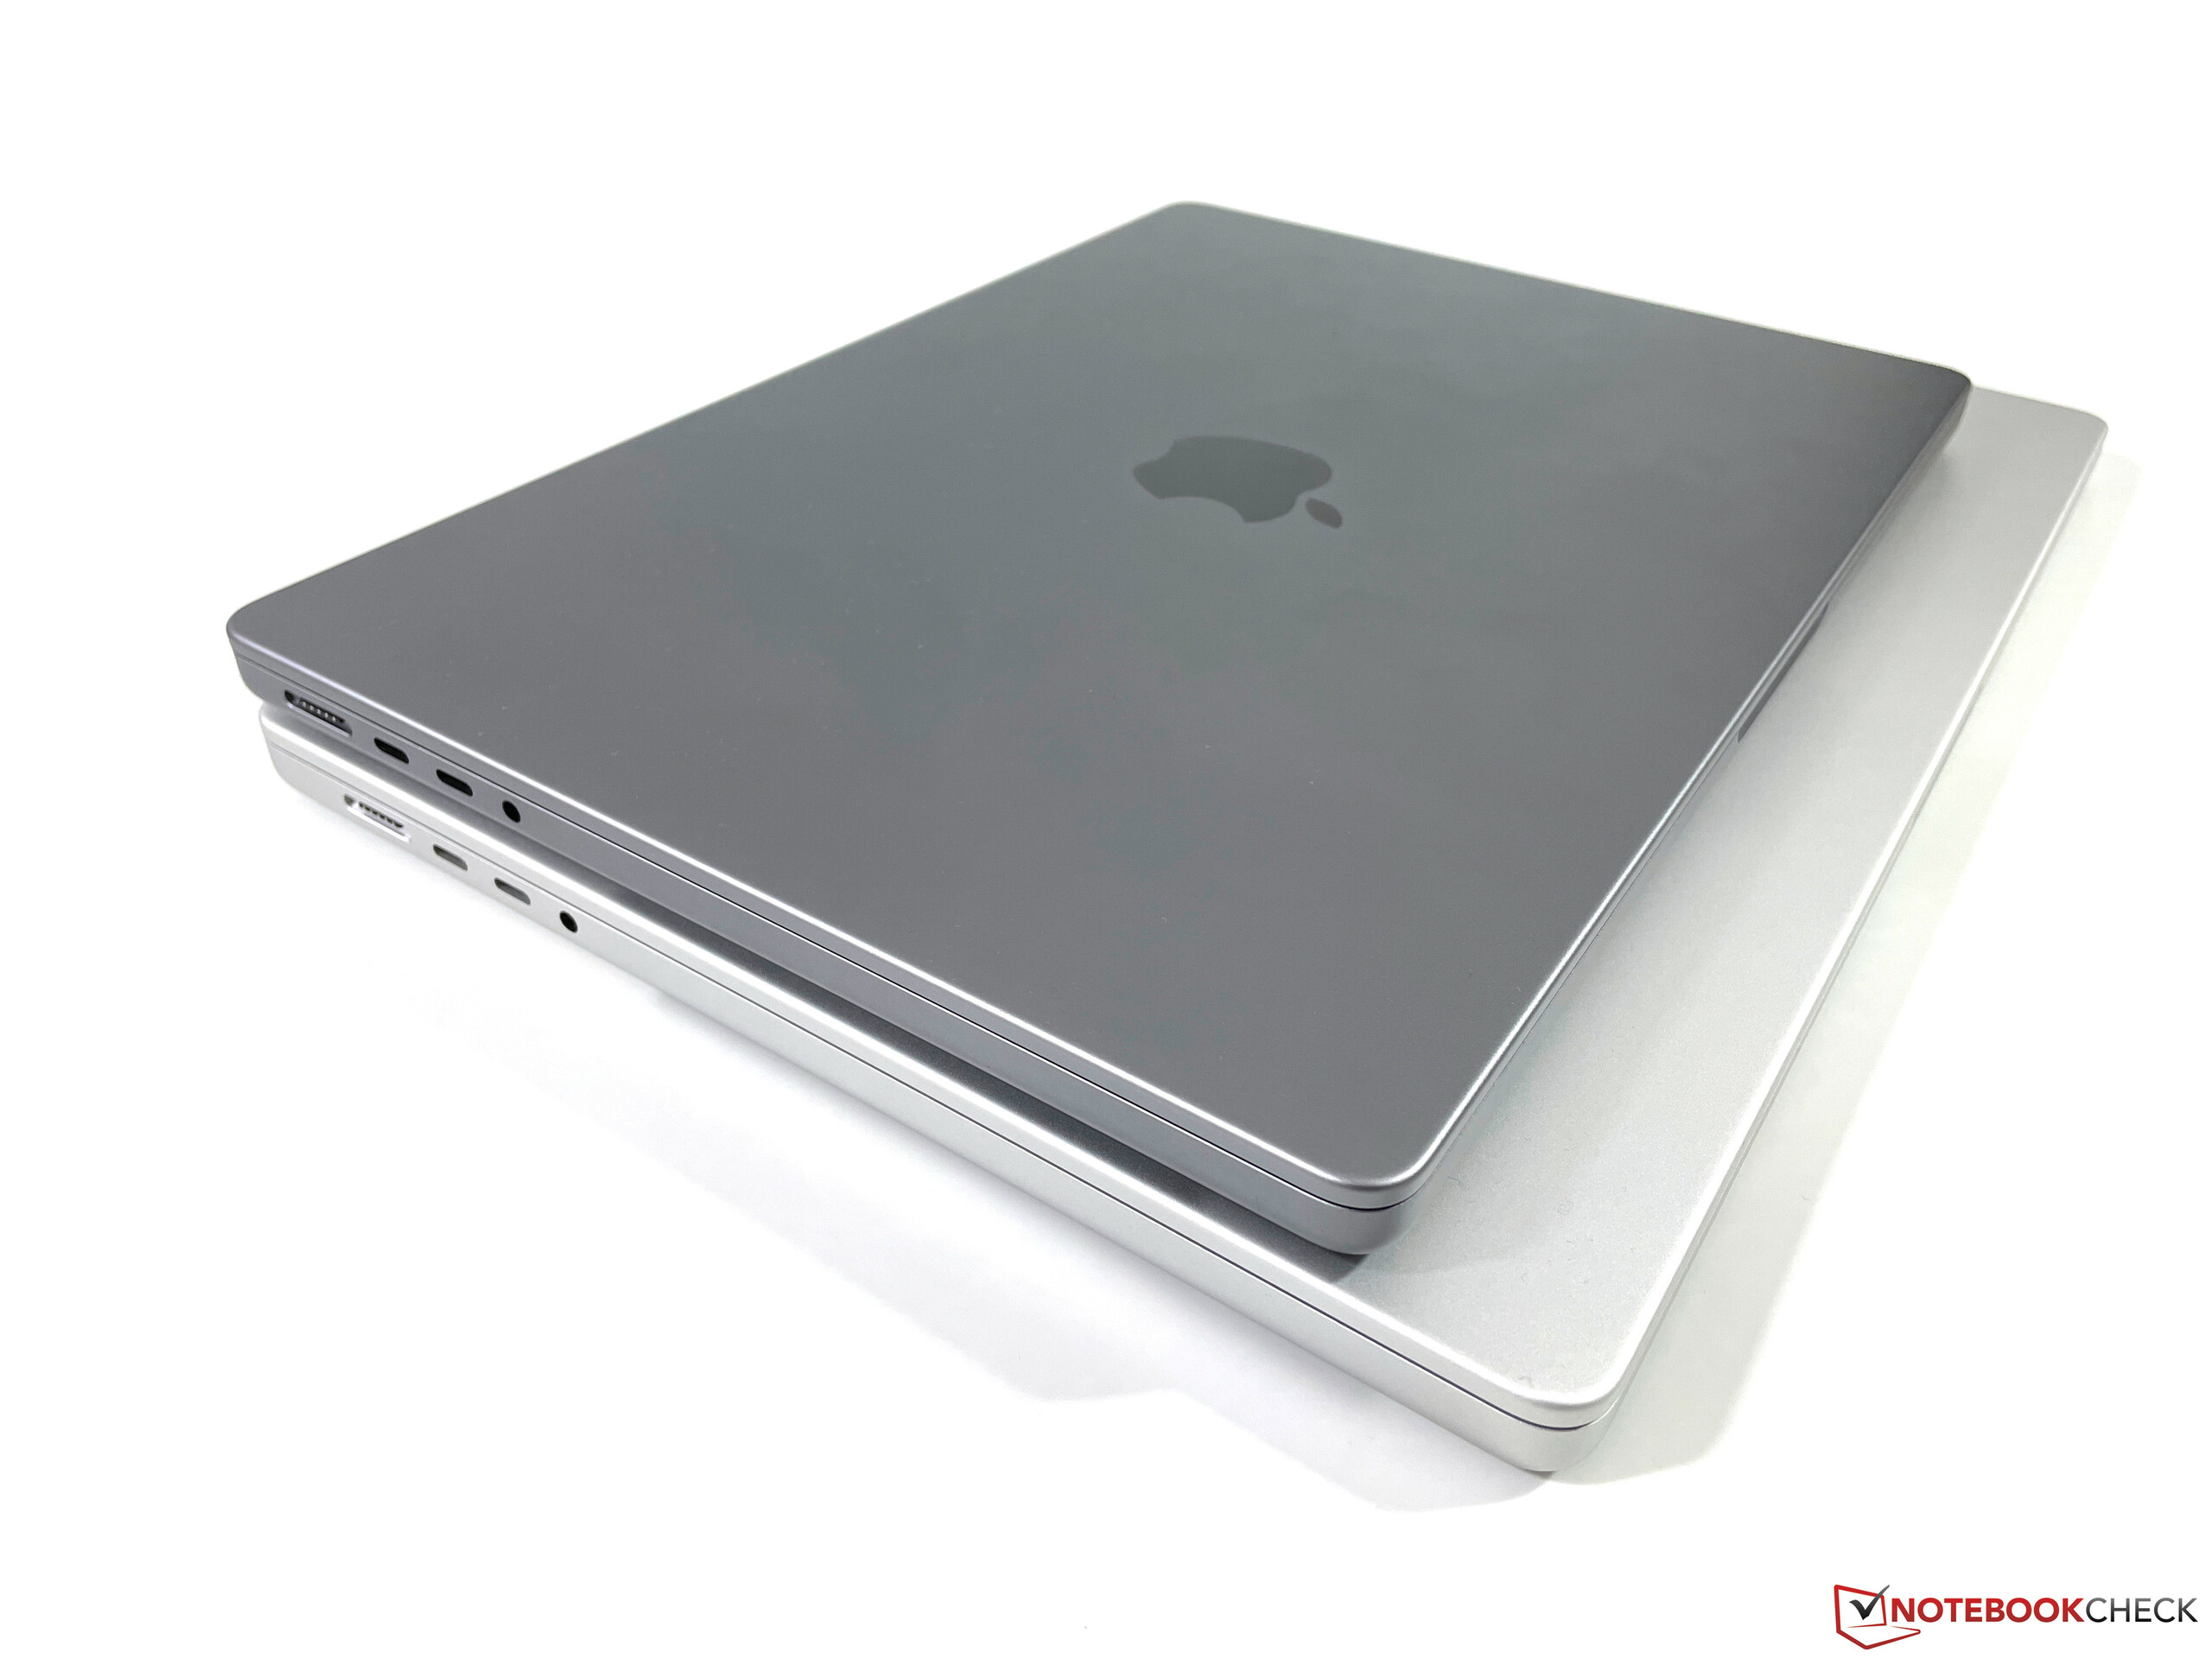
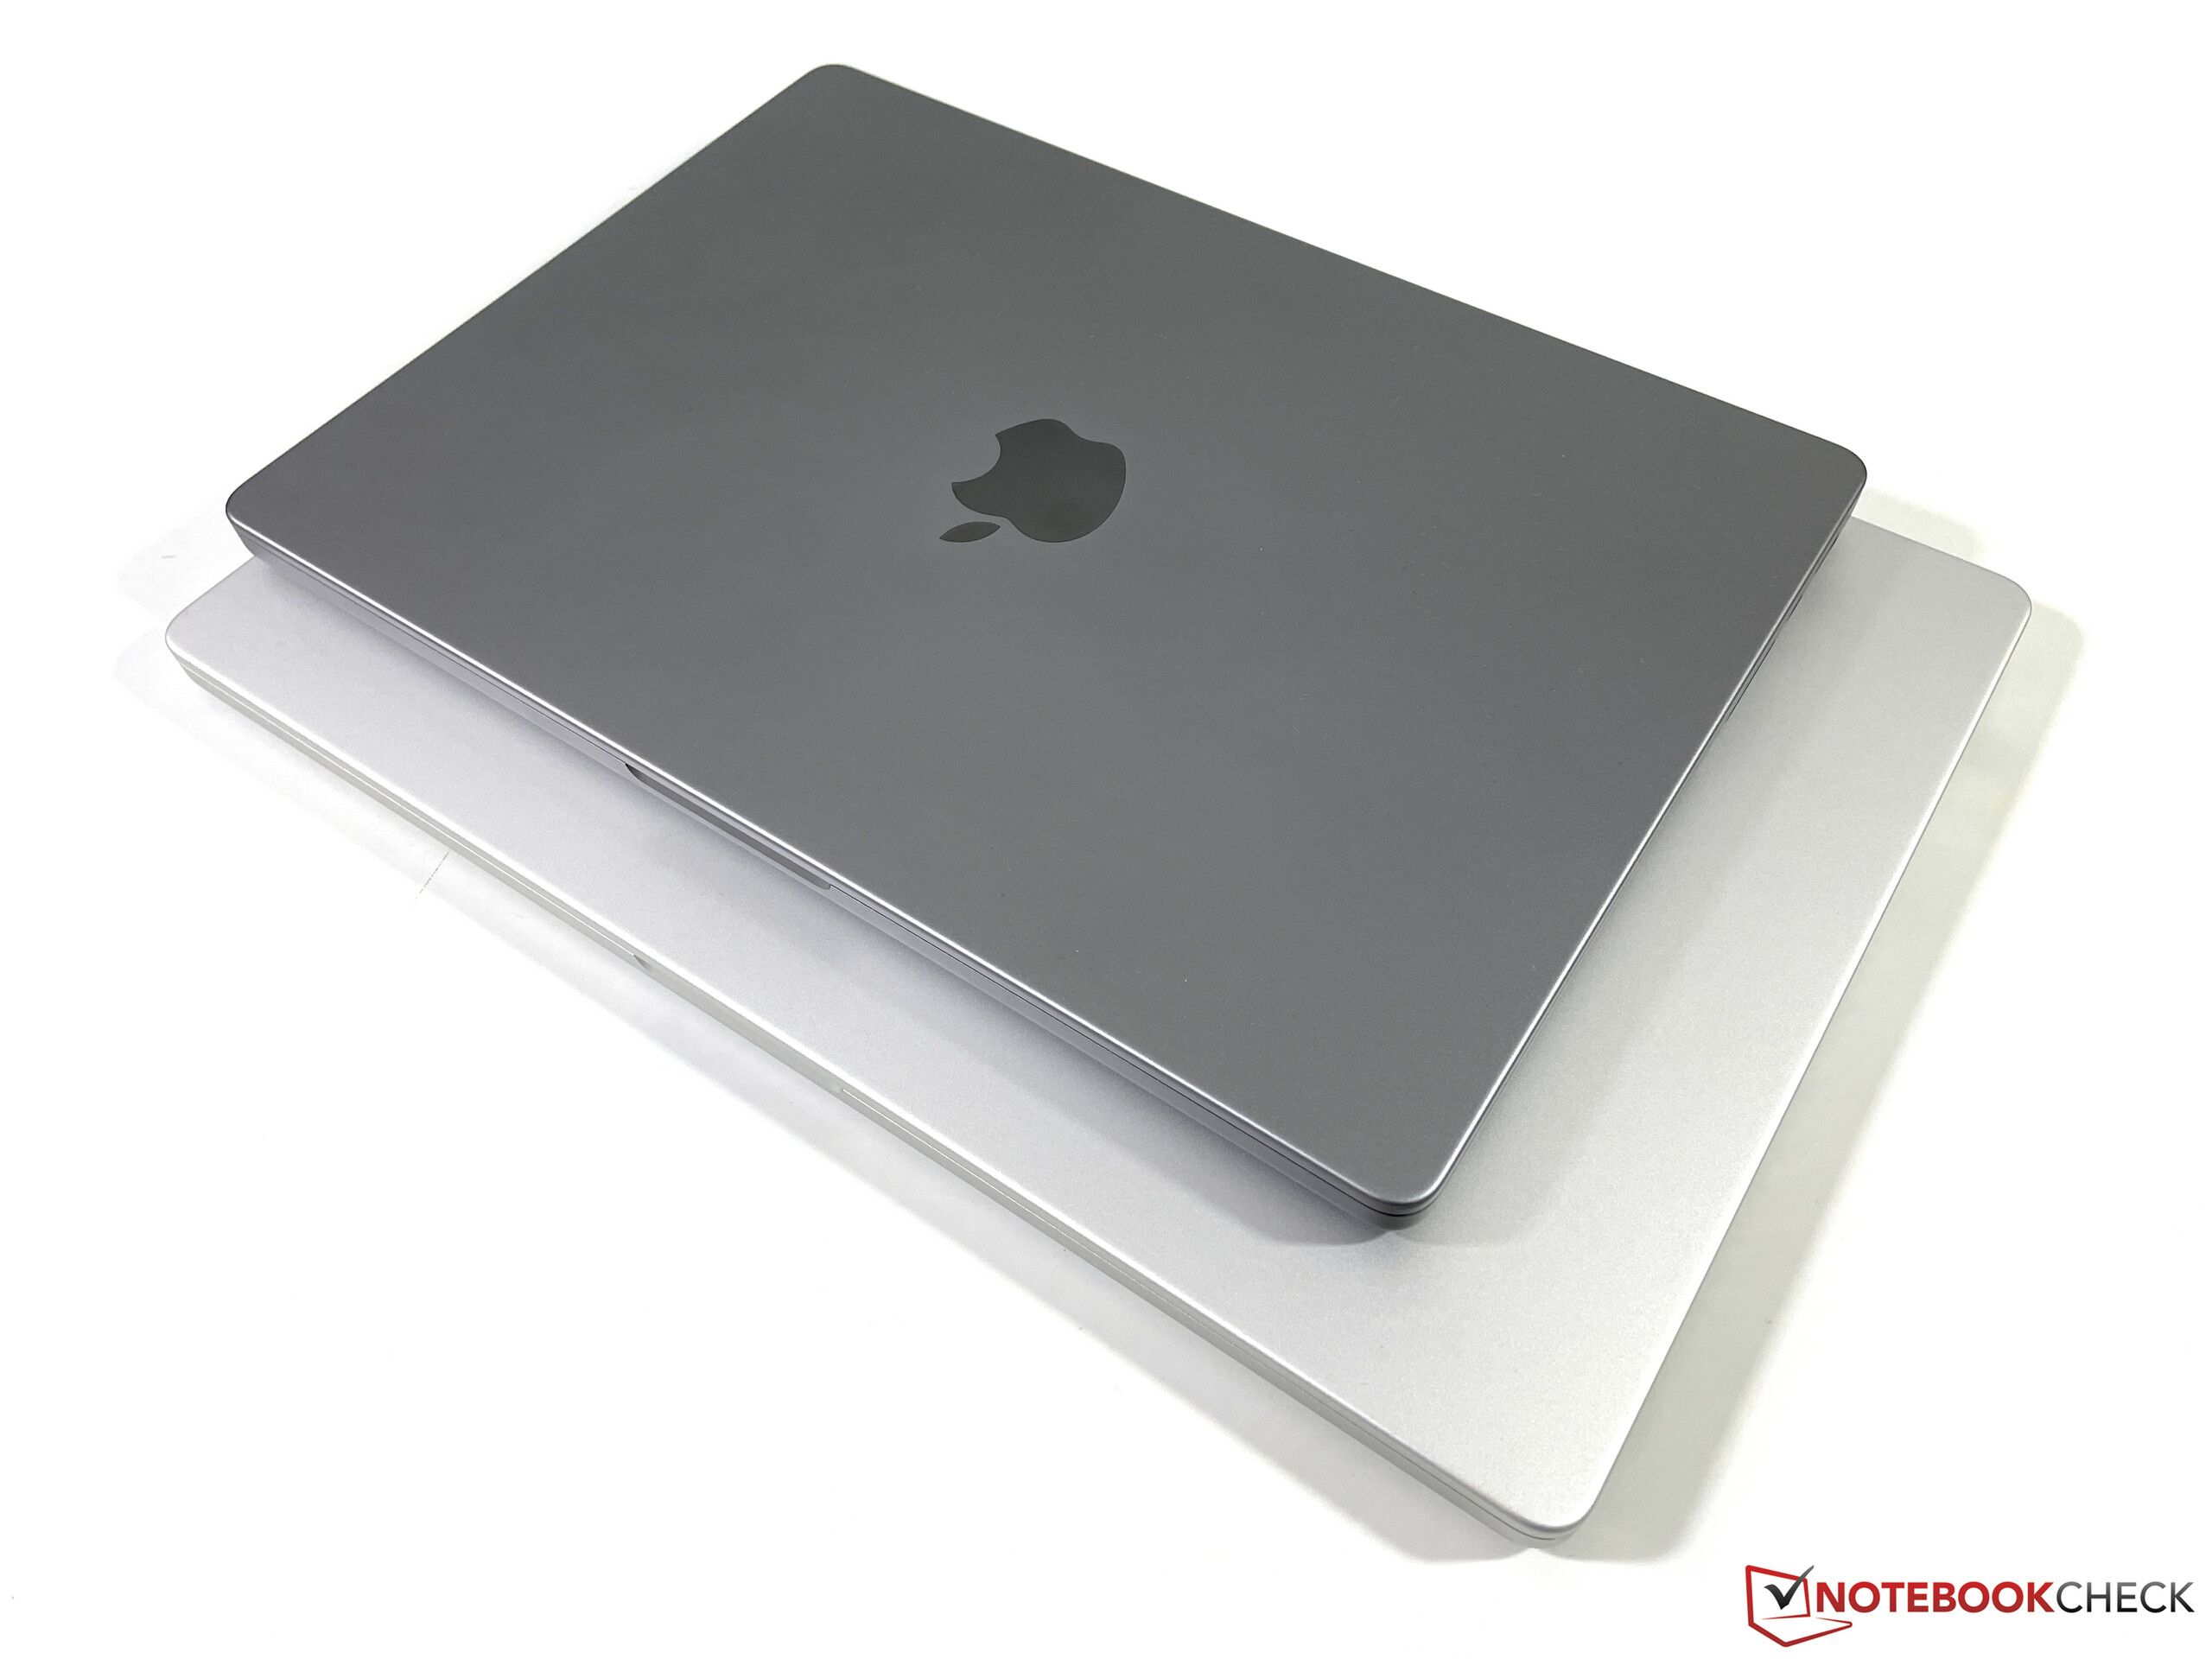
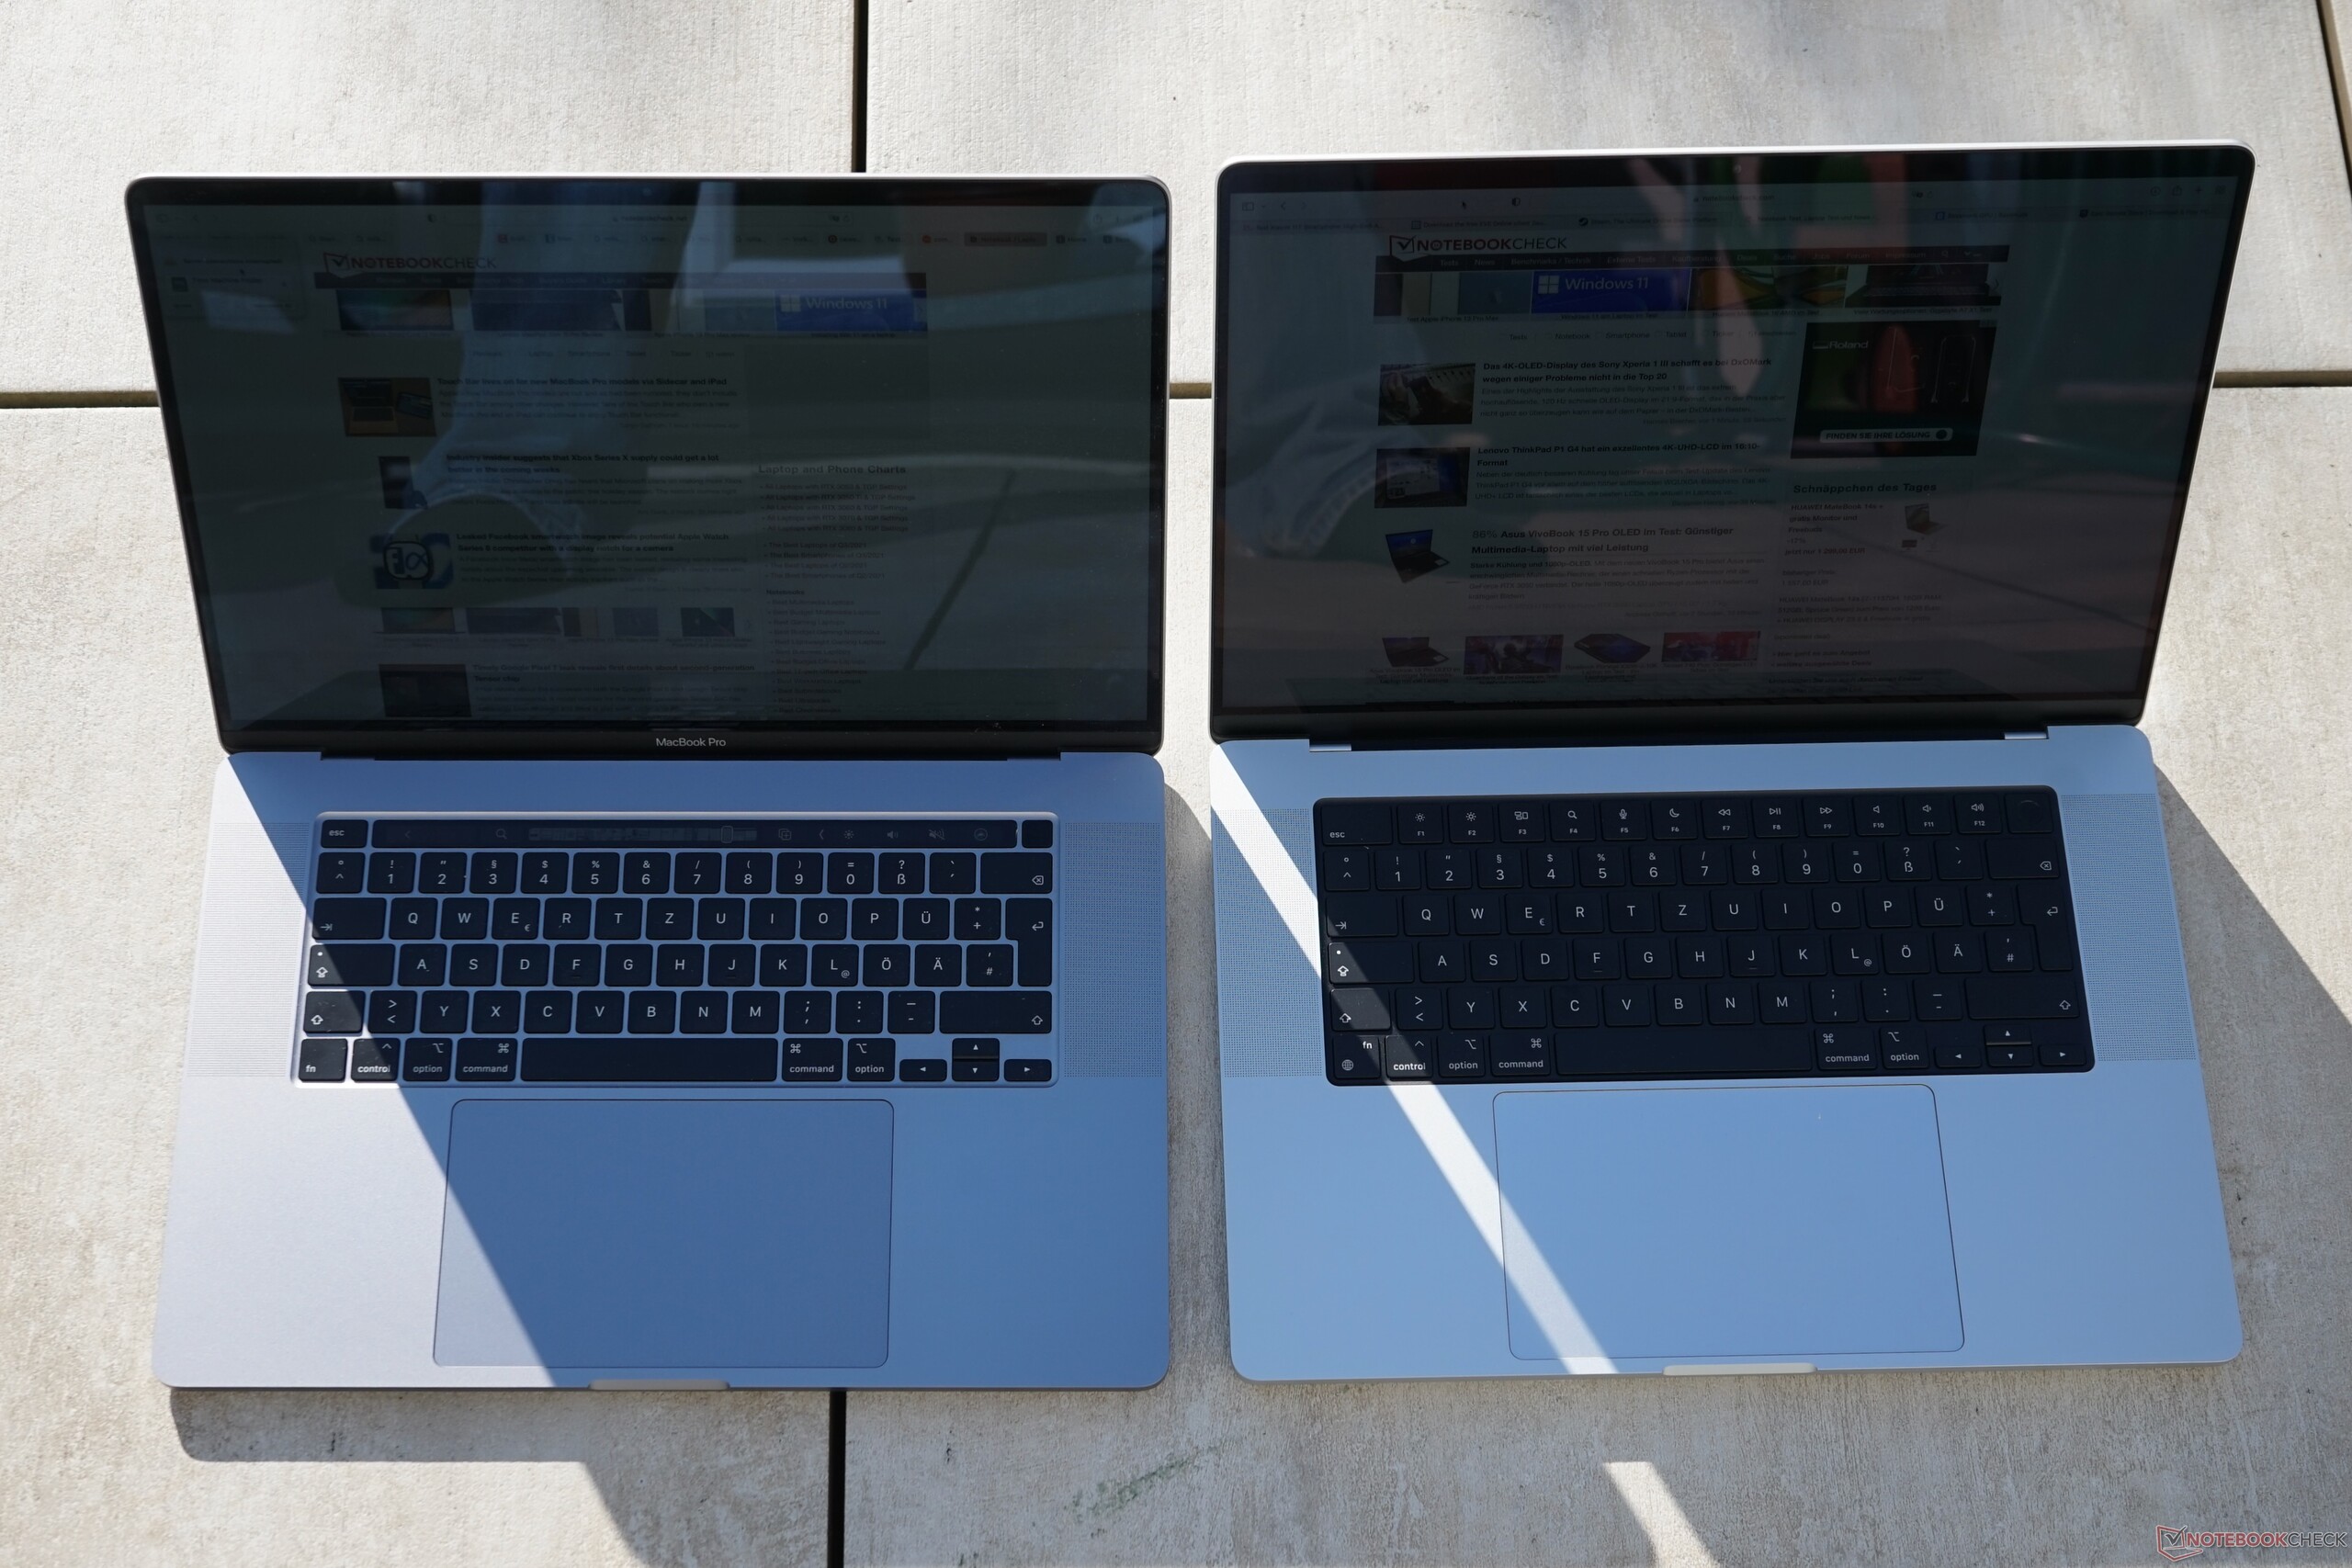
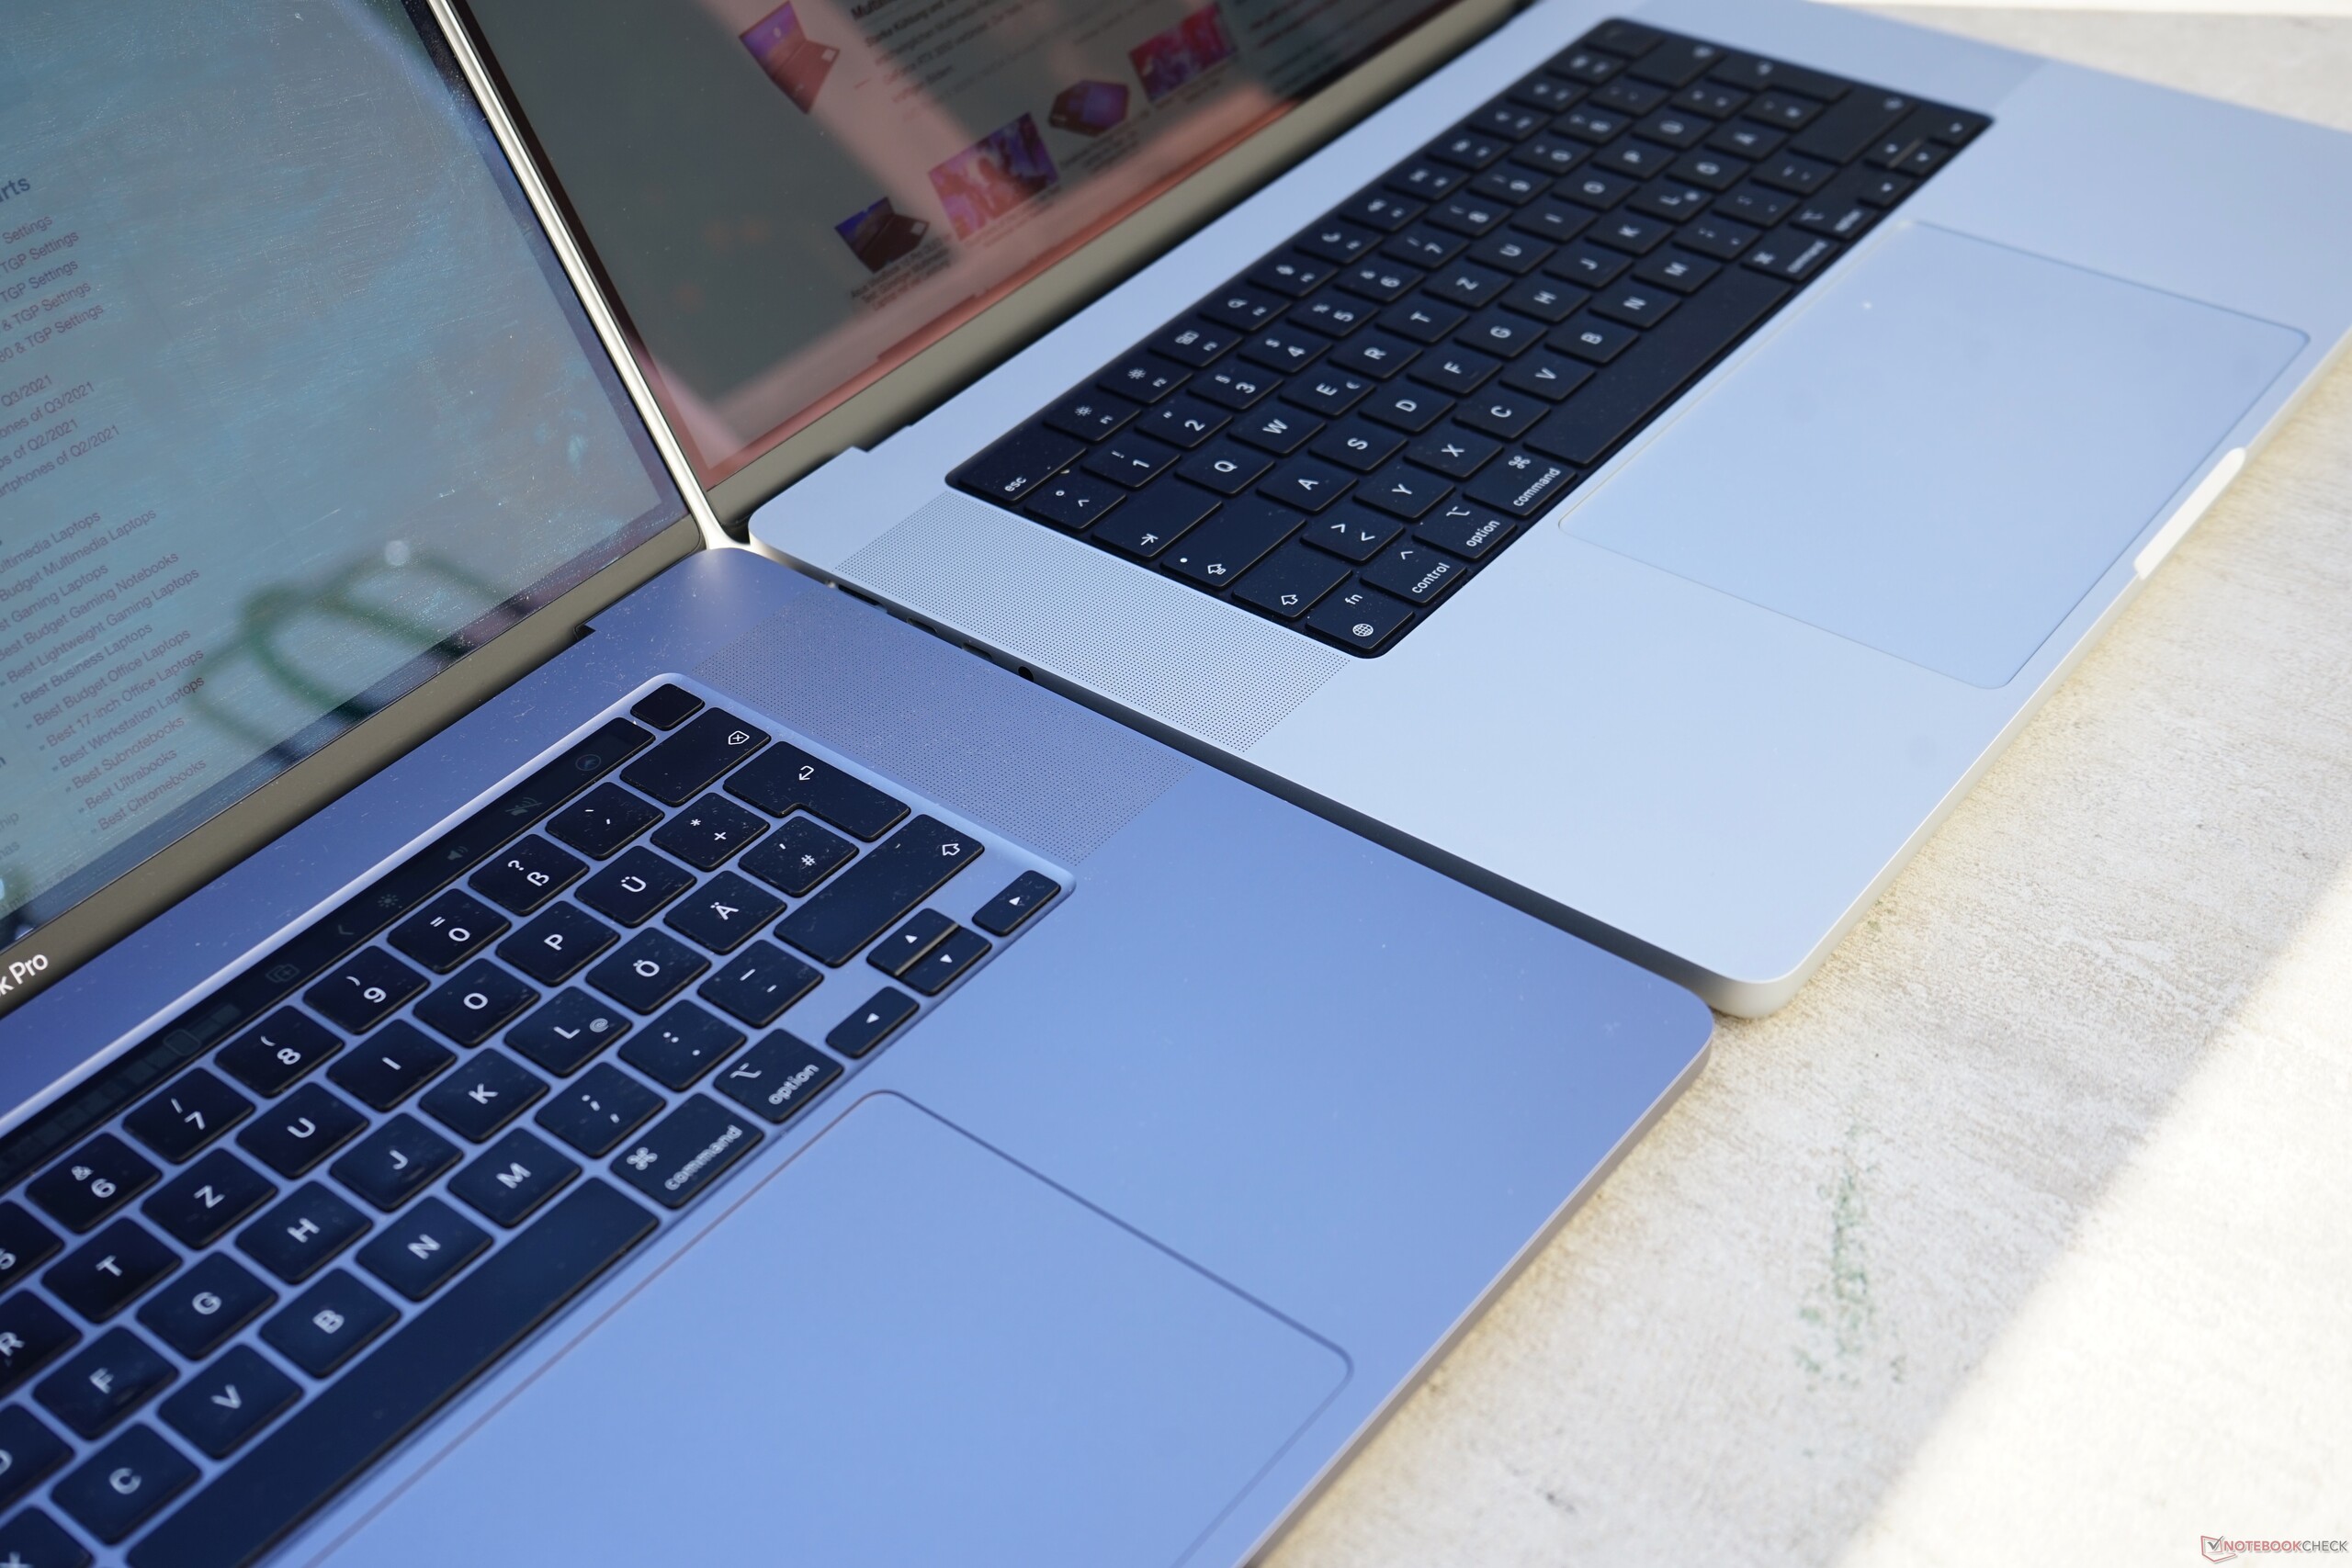
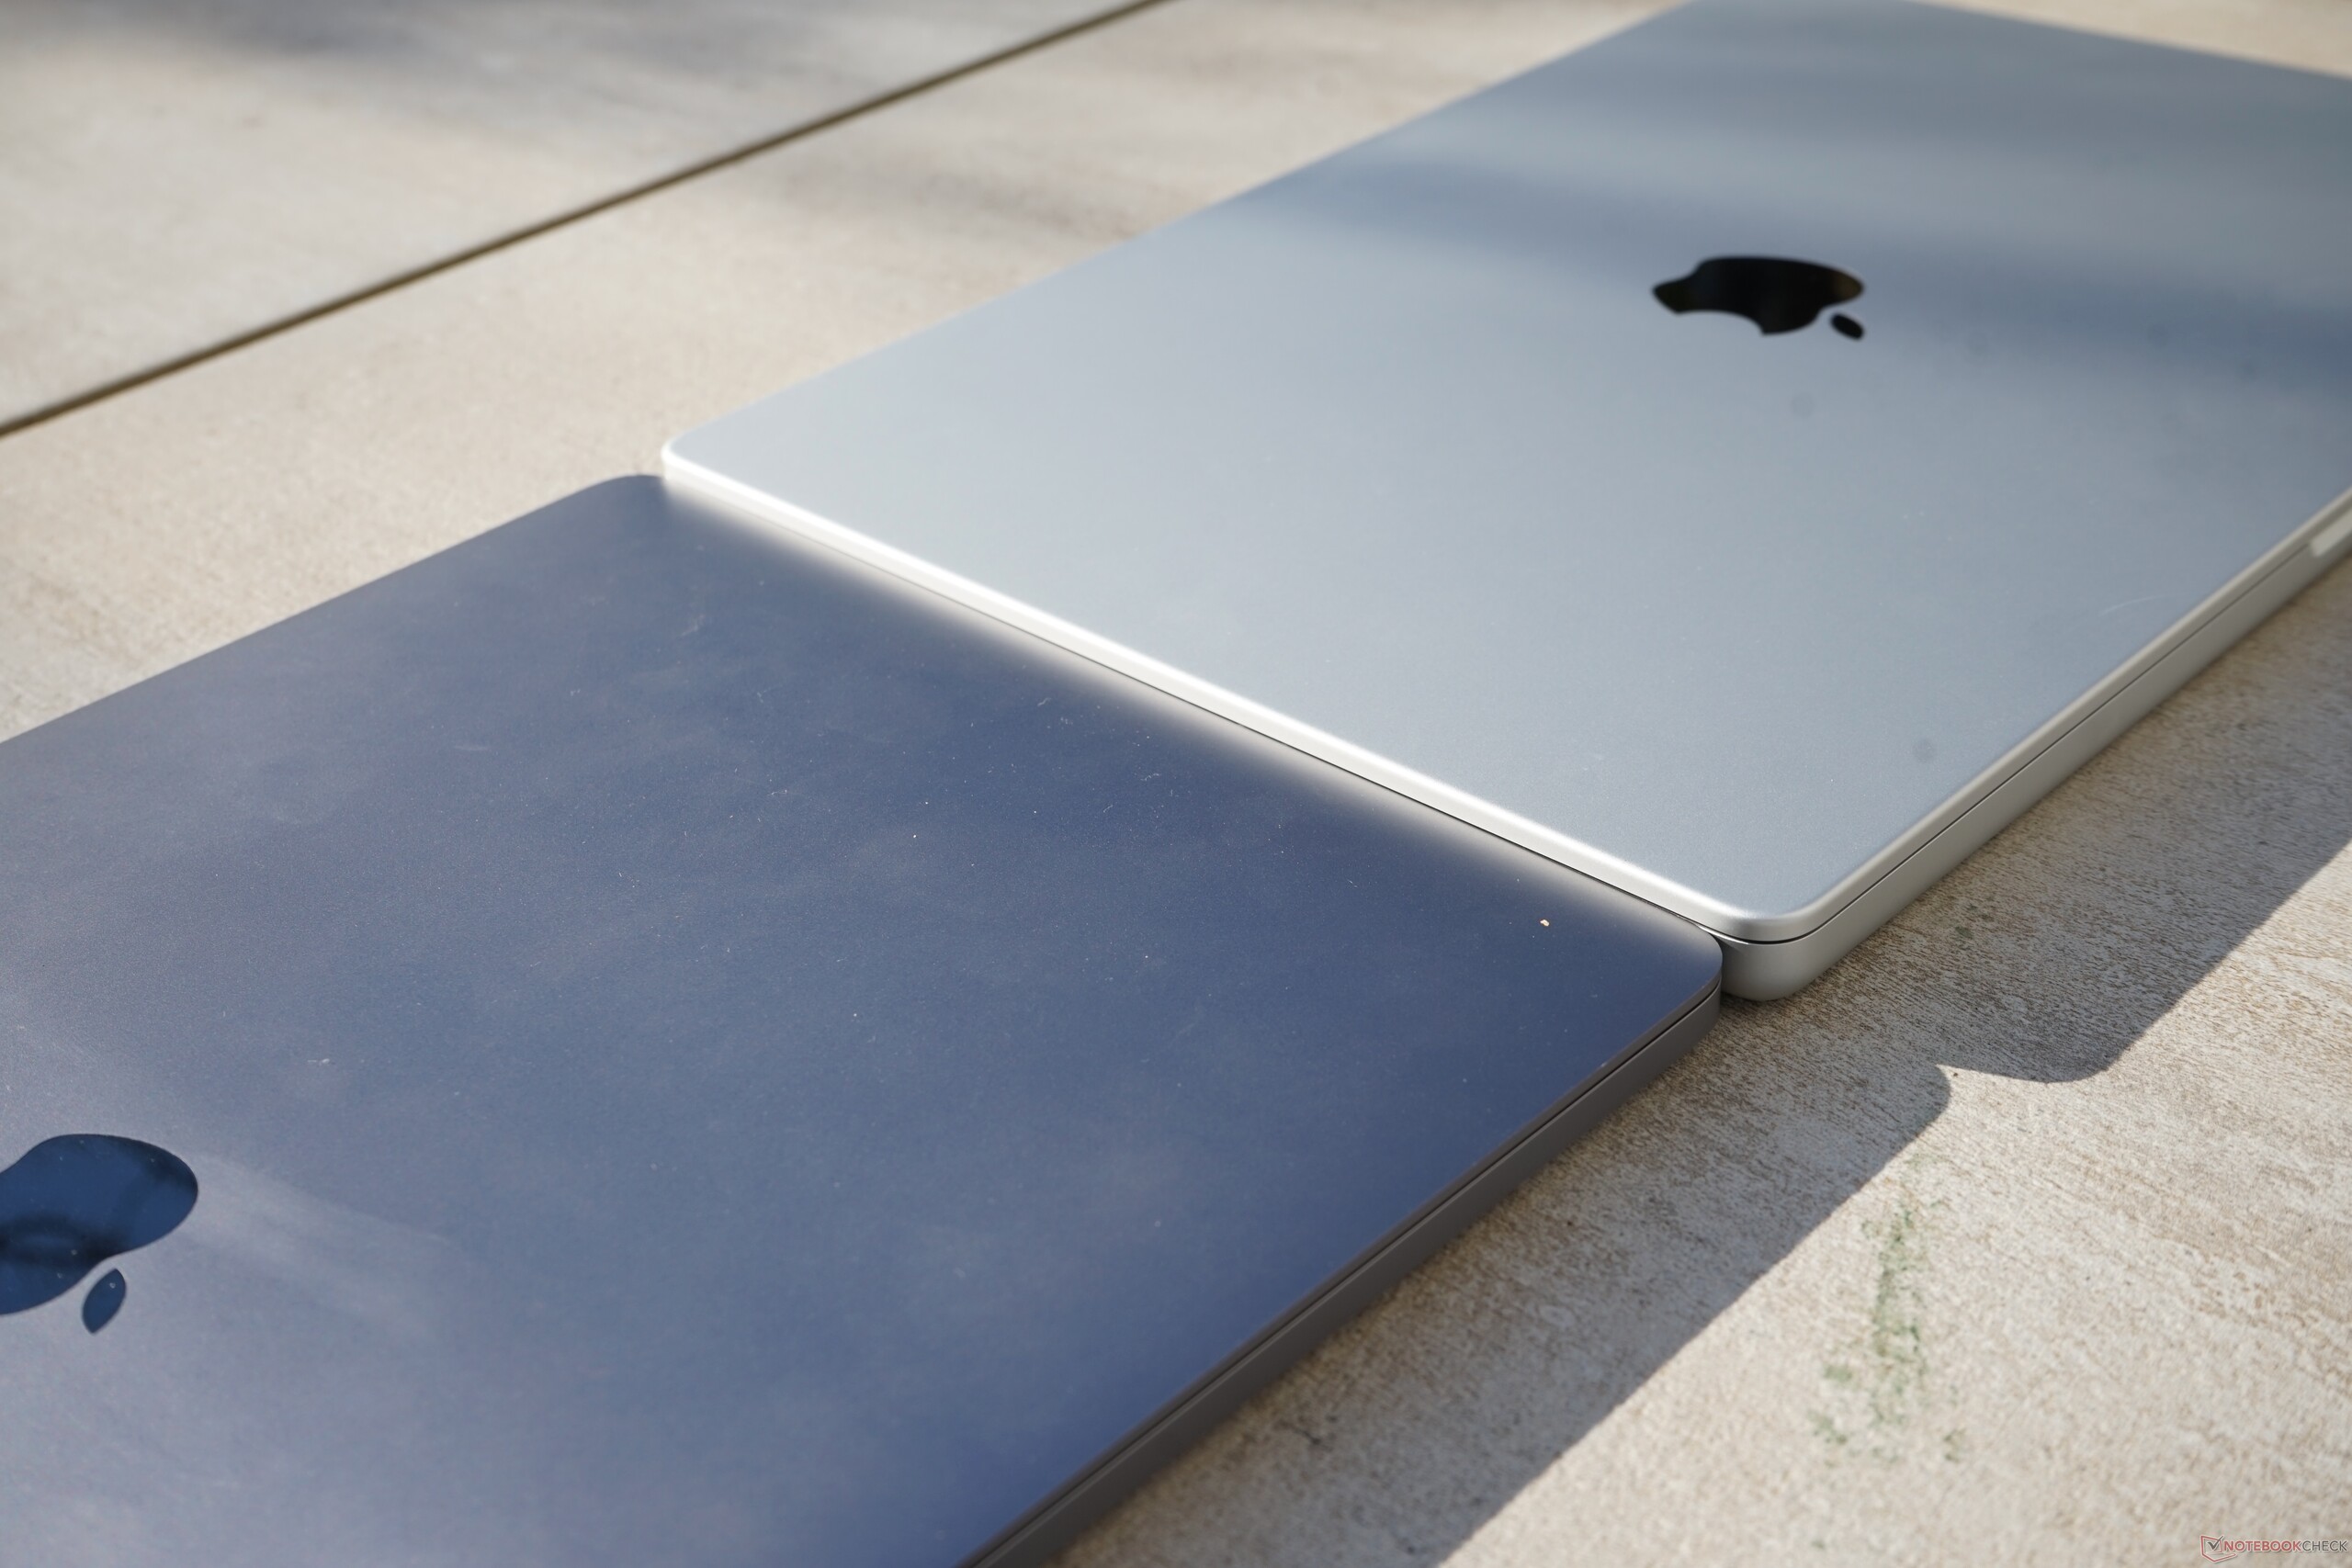
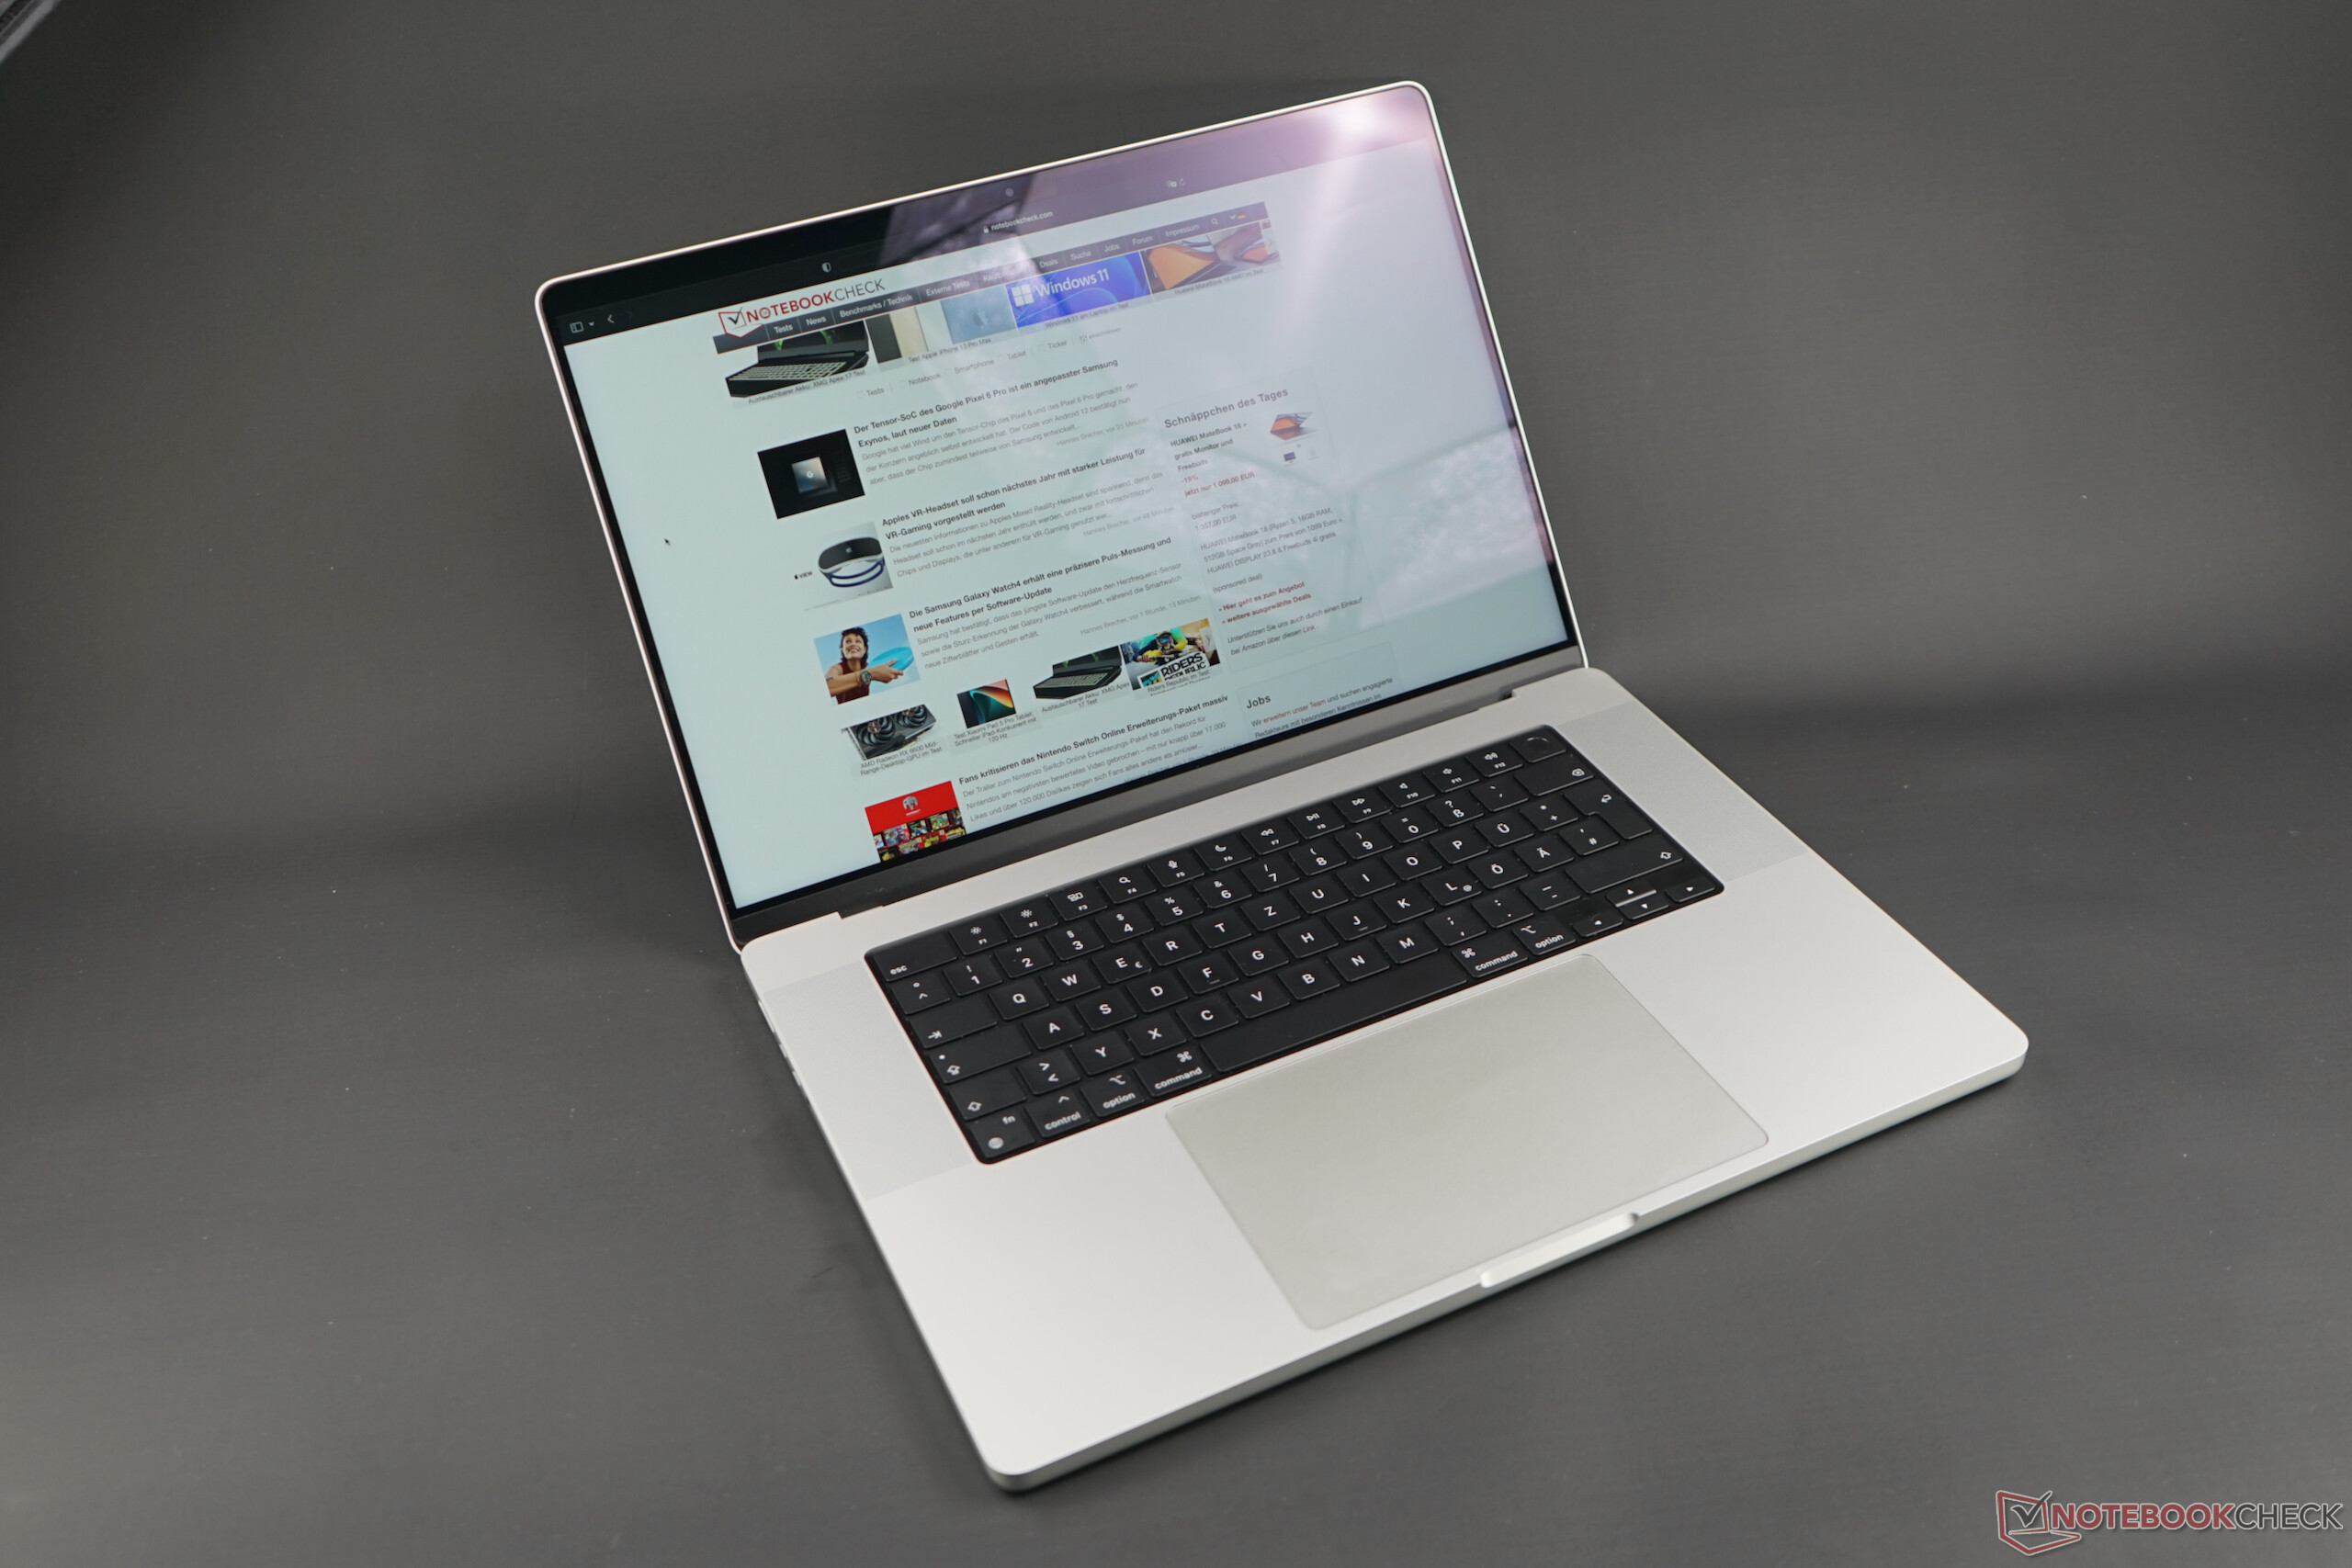
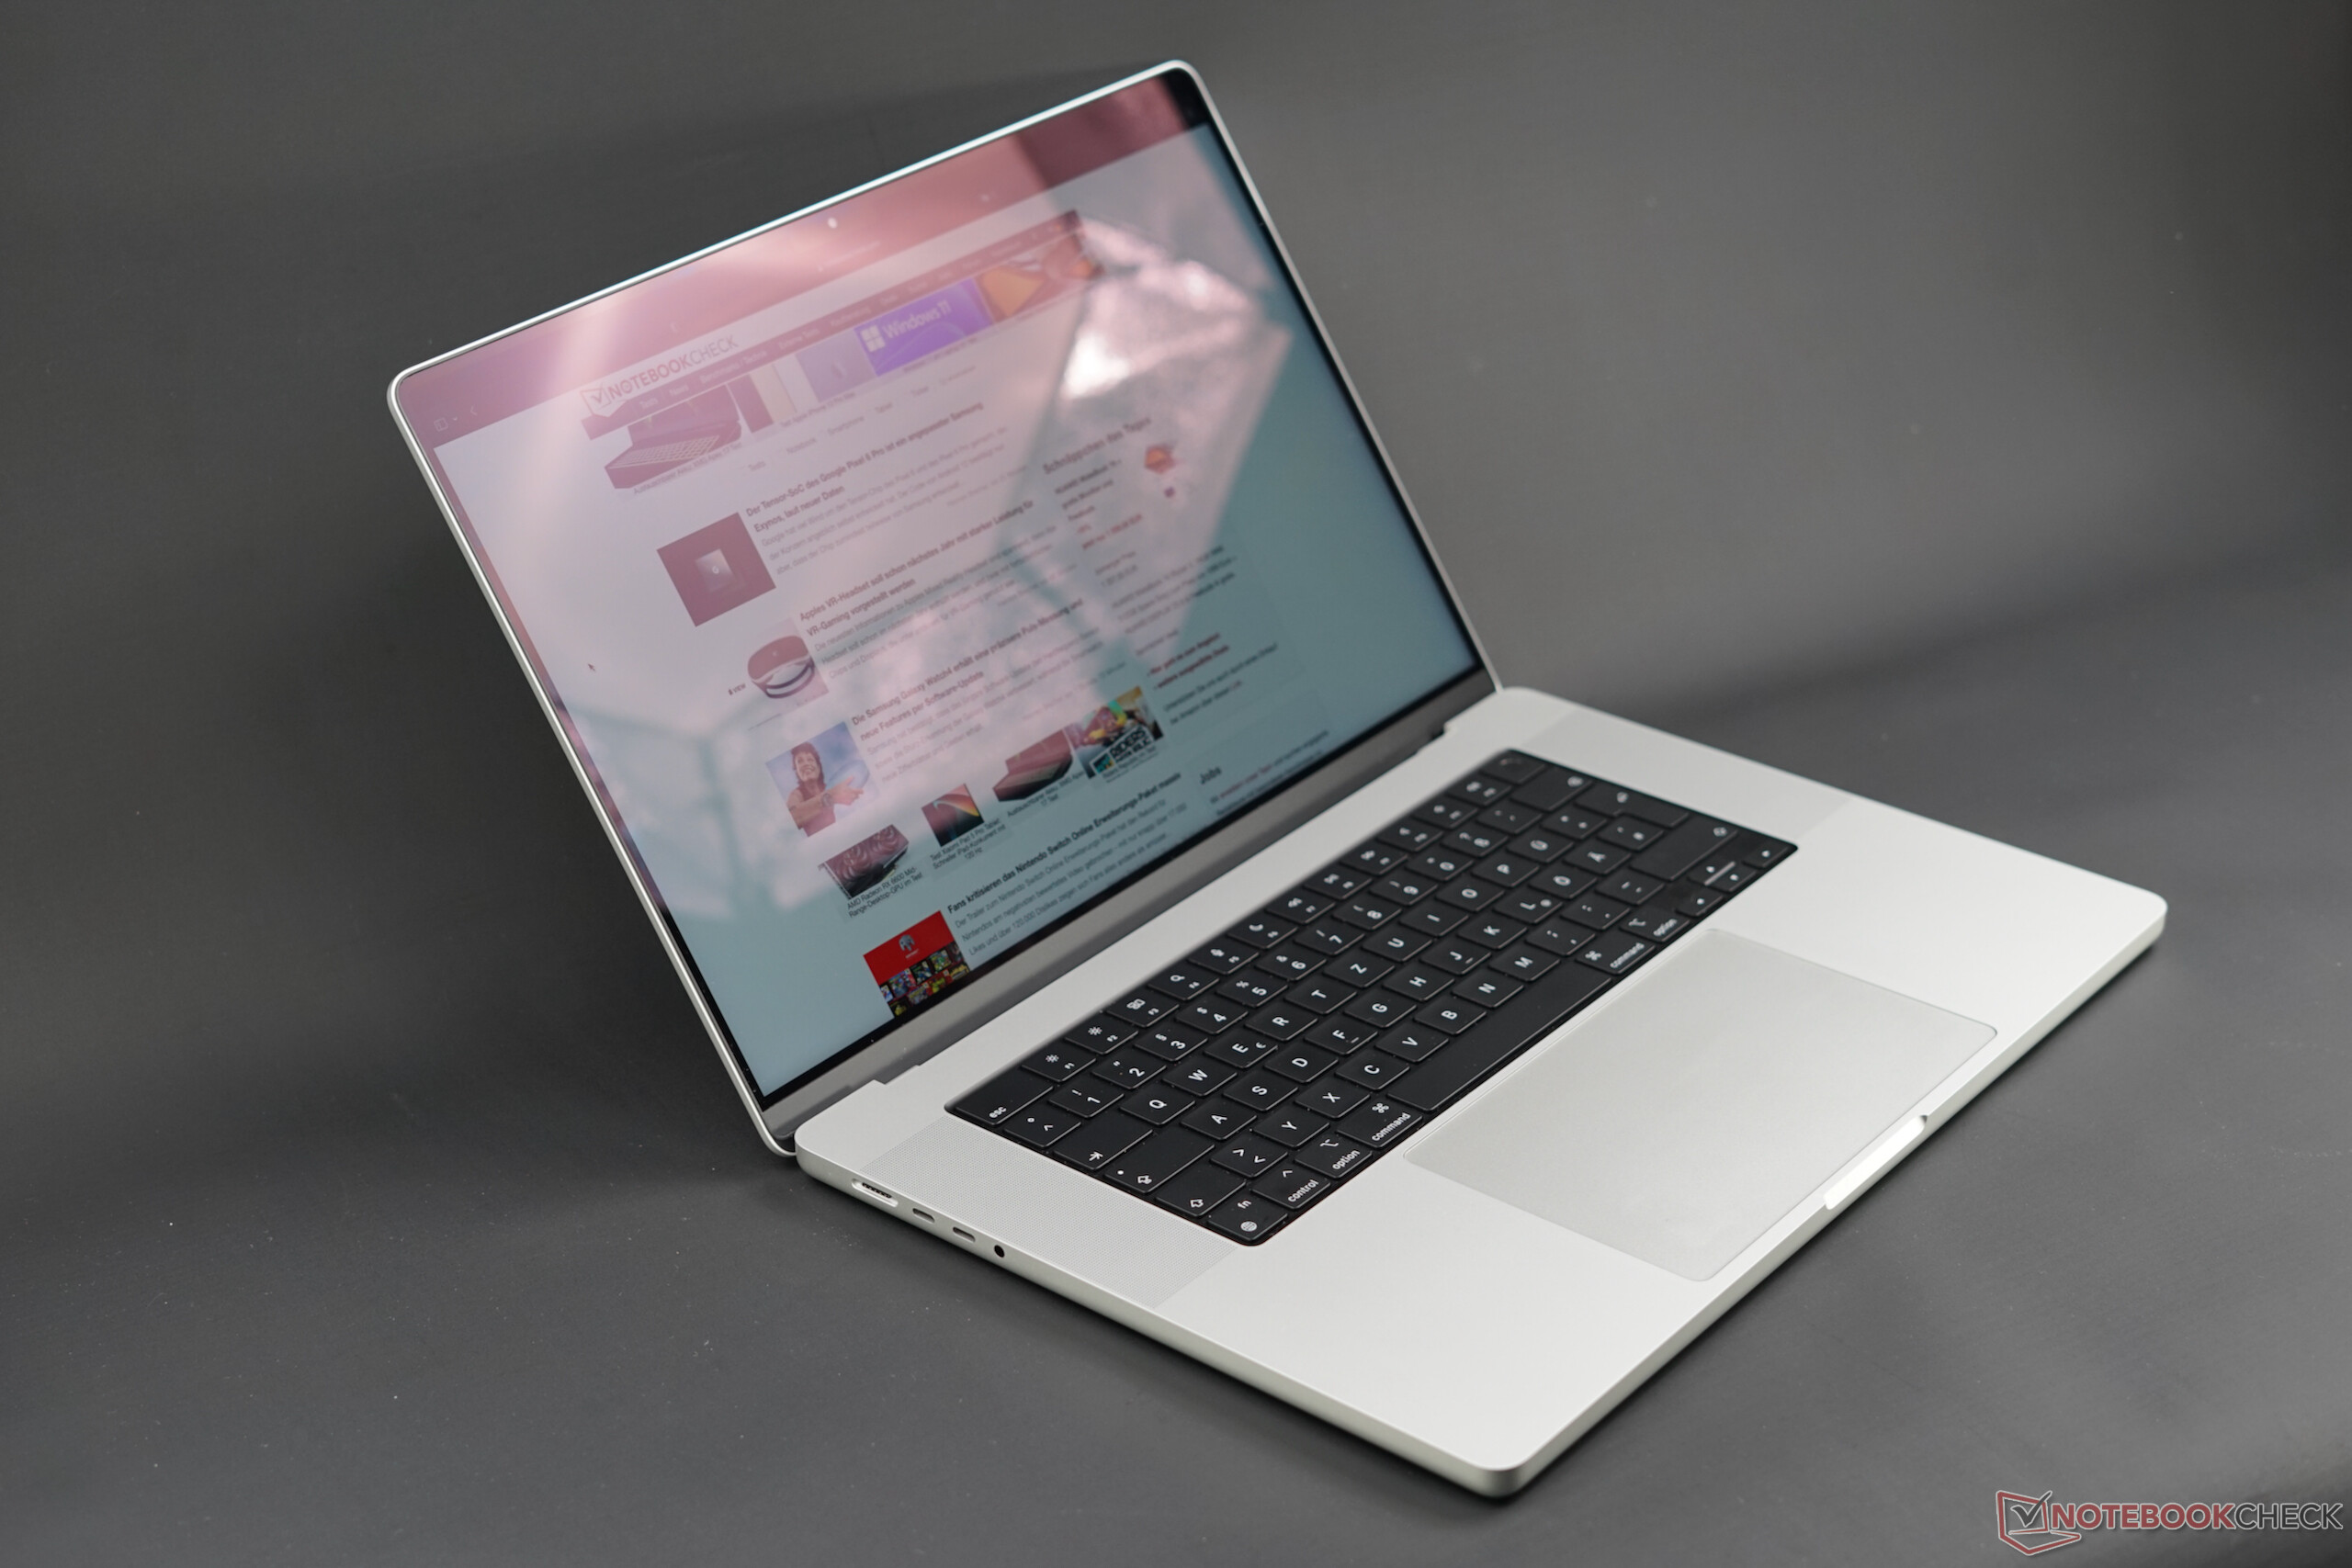
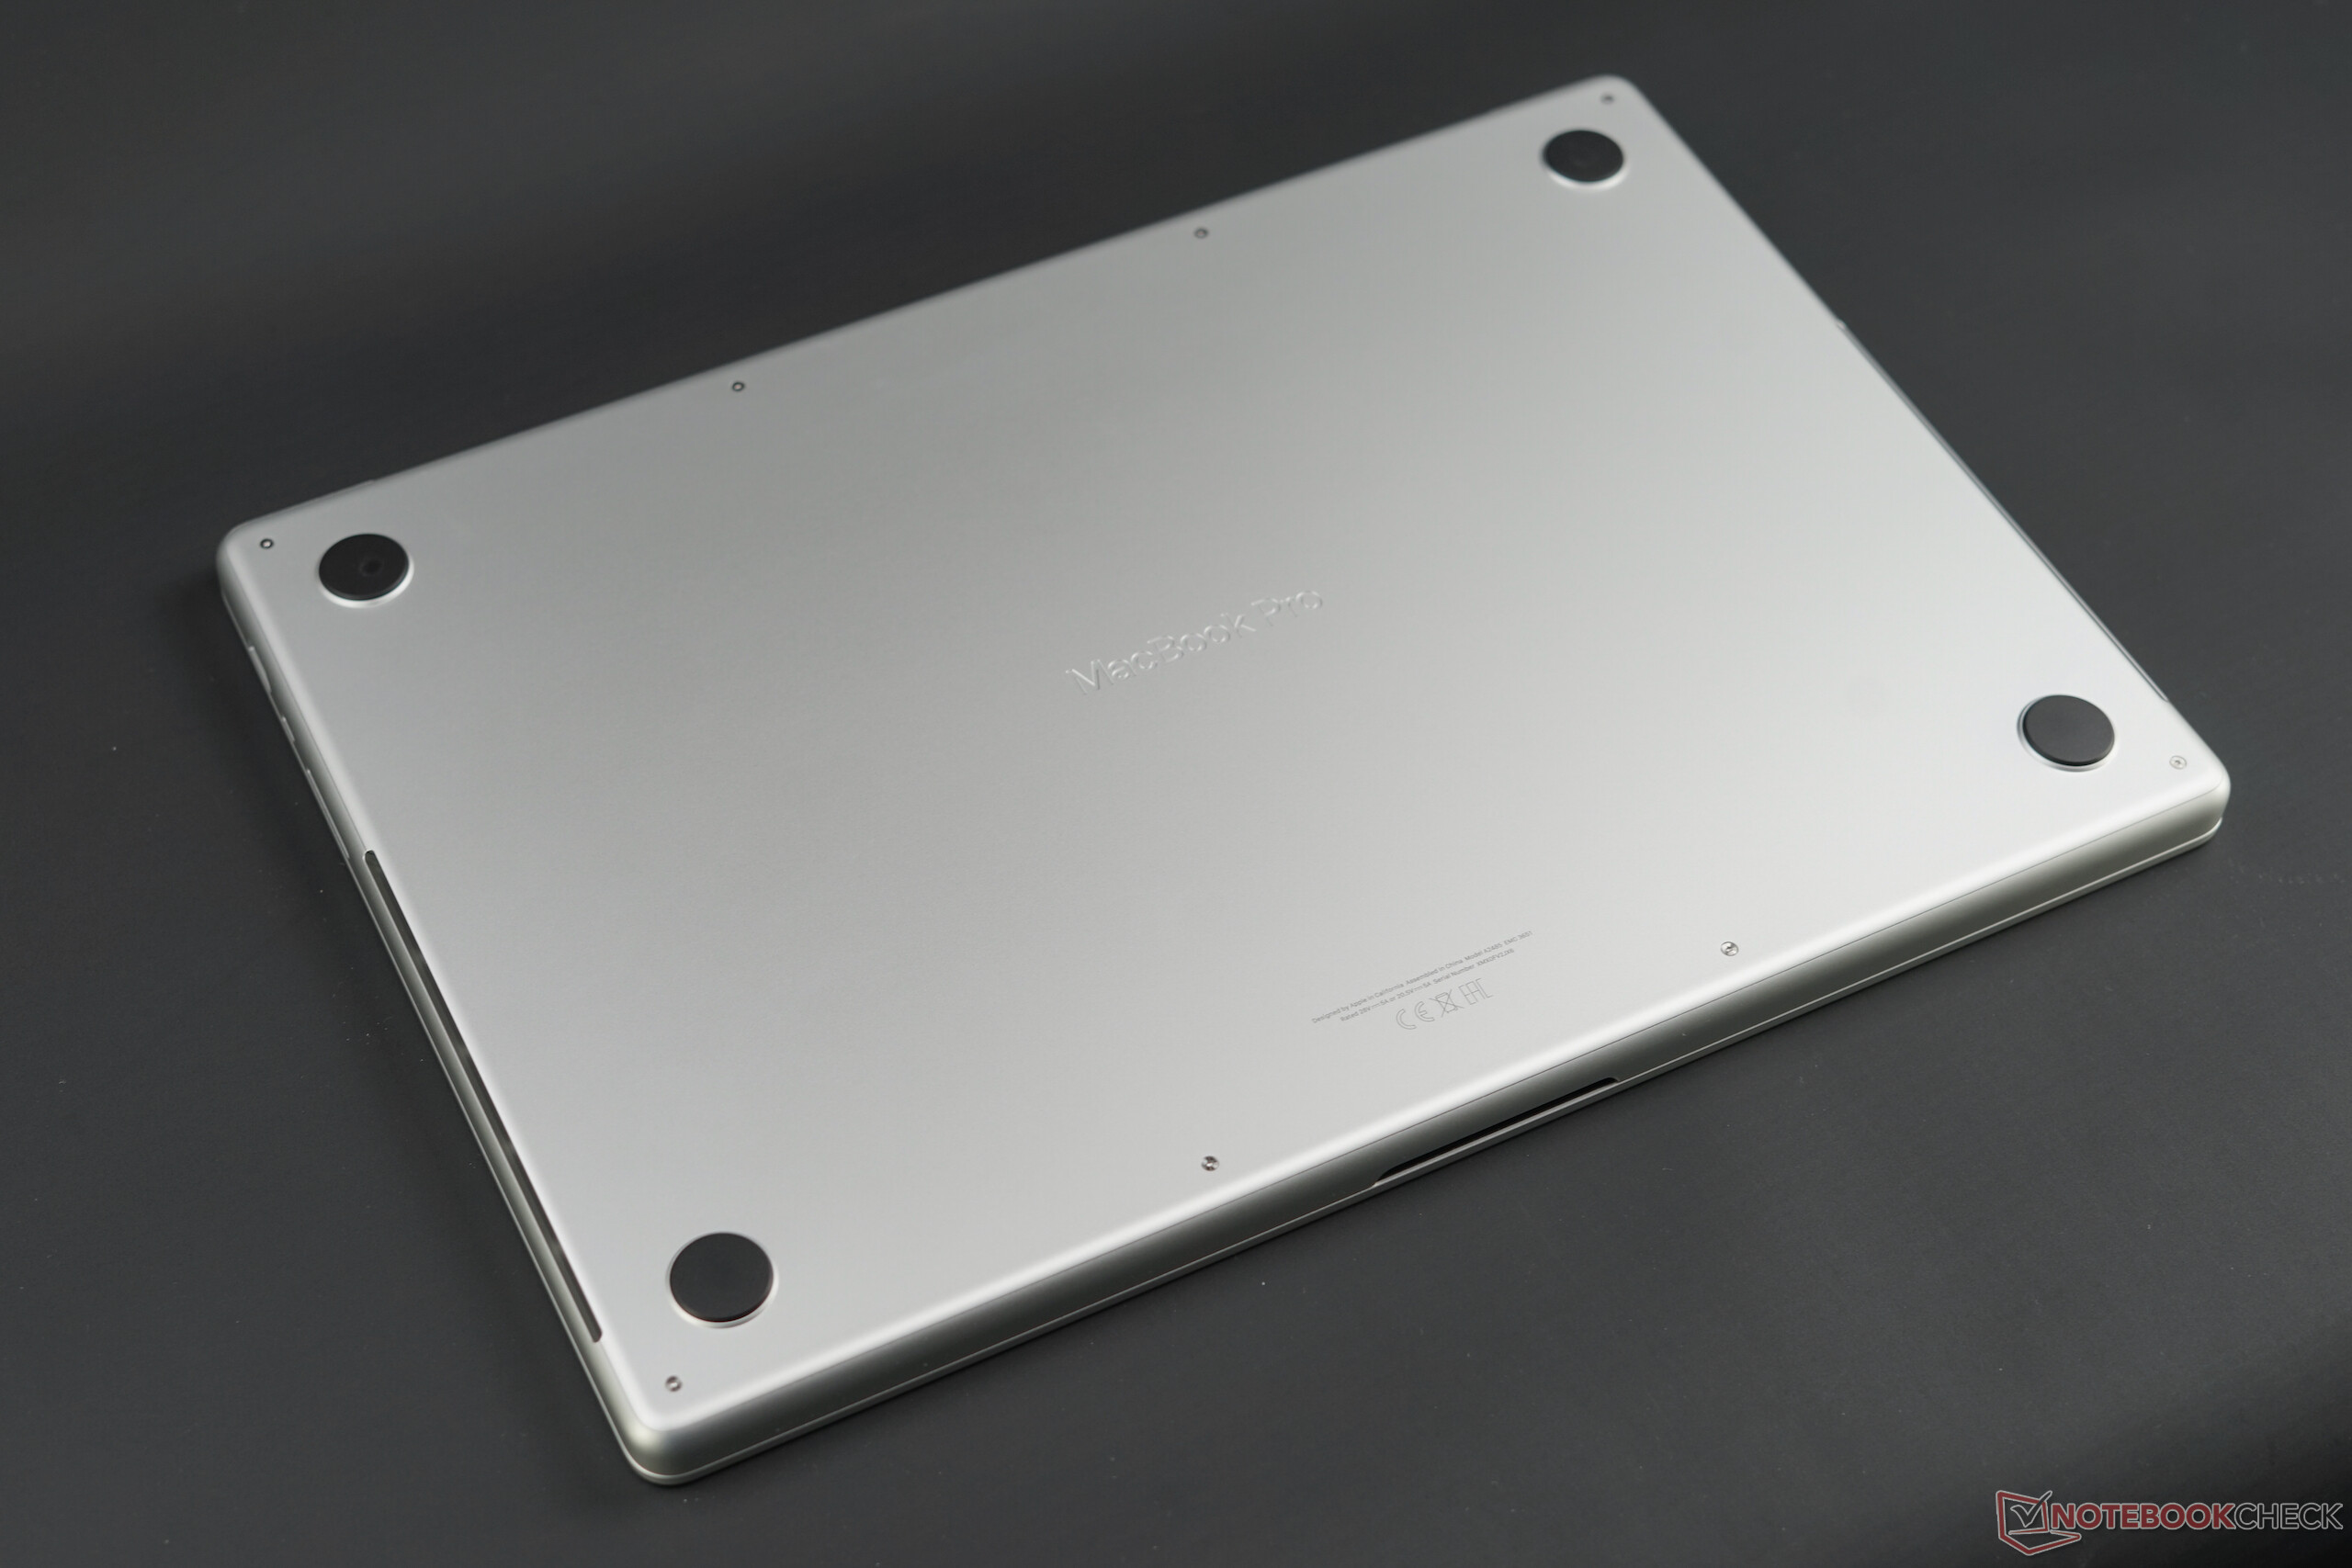
Case - The new MacBook Pro 16 is bulkier
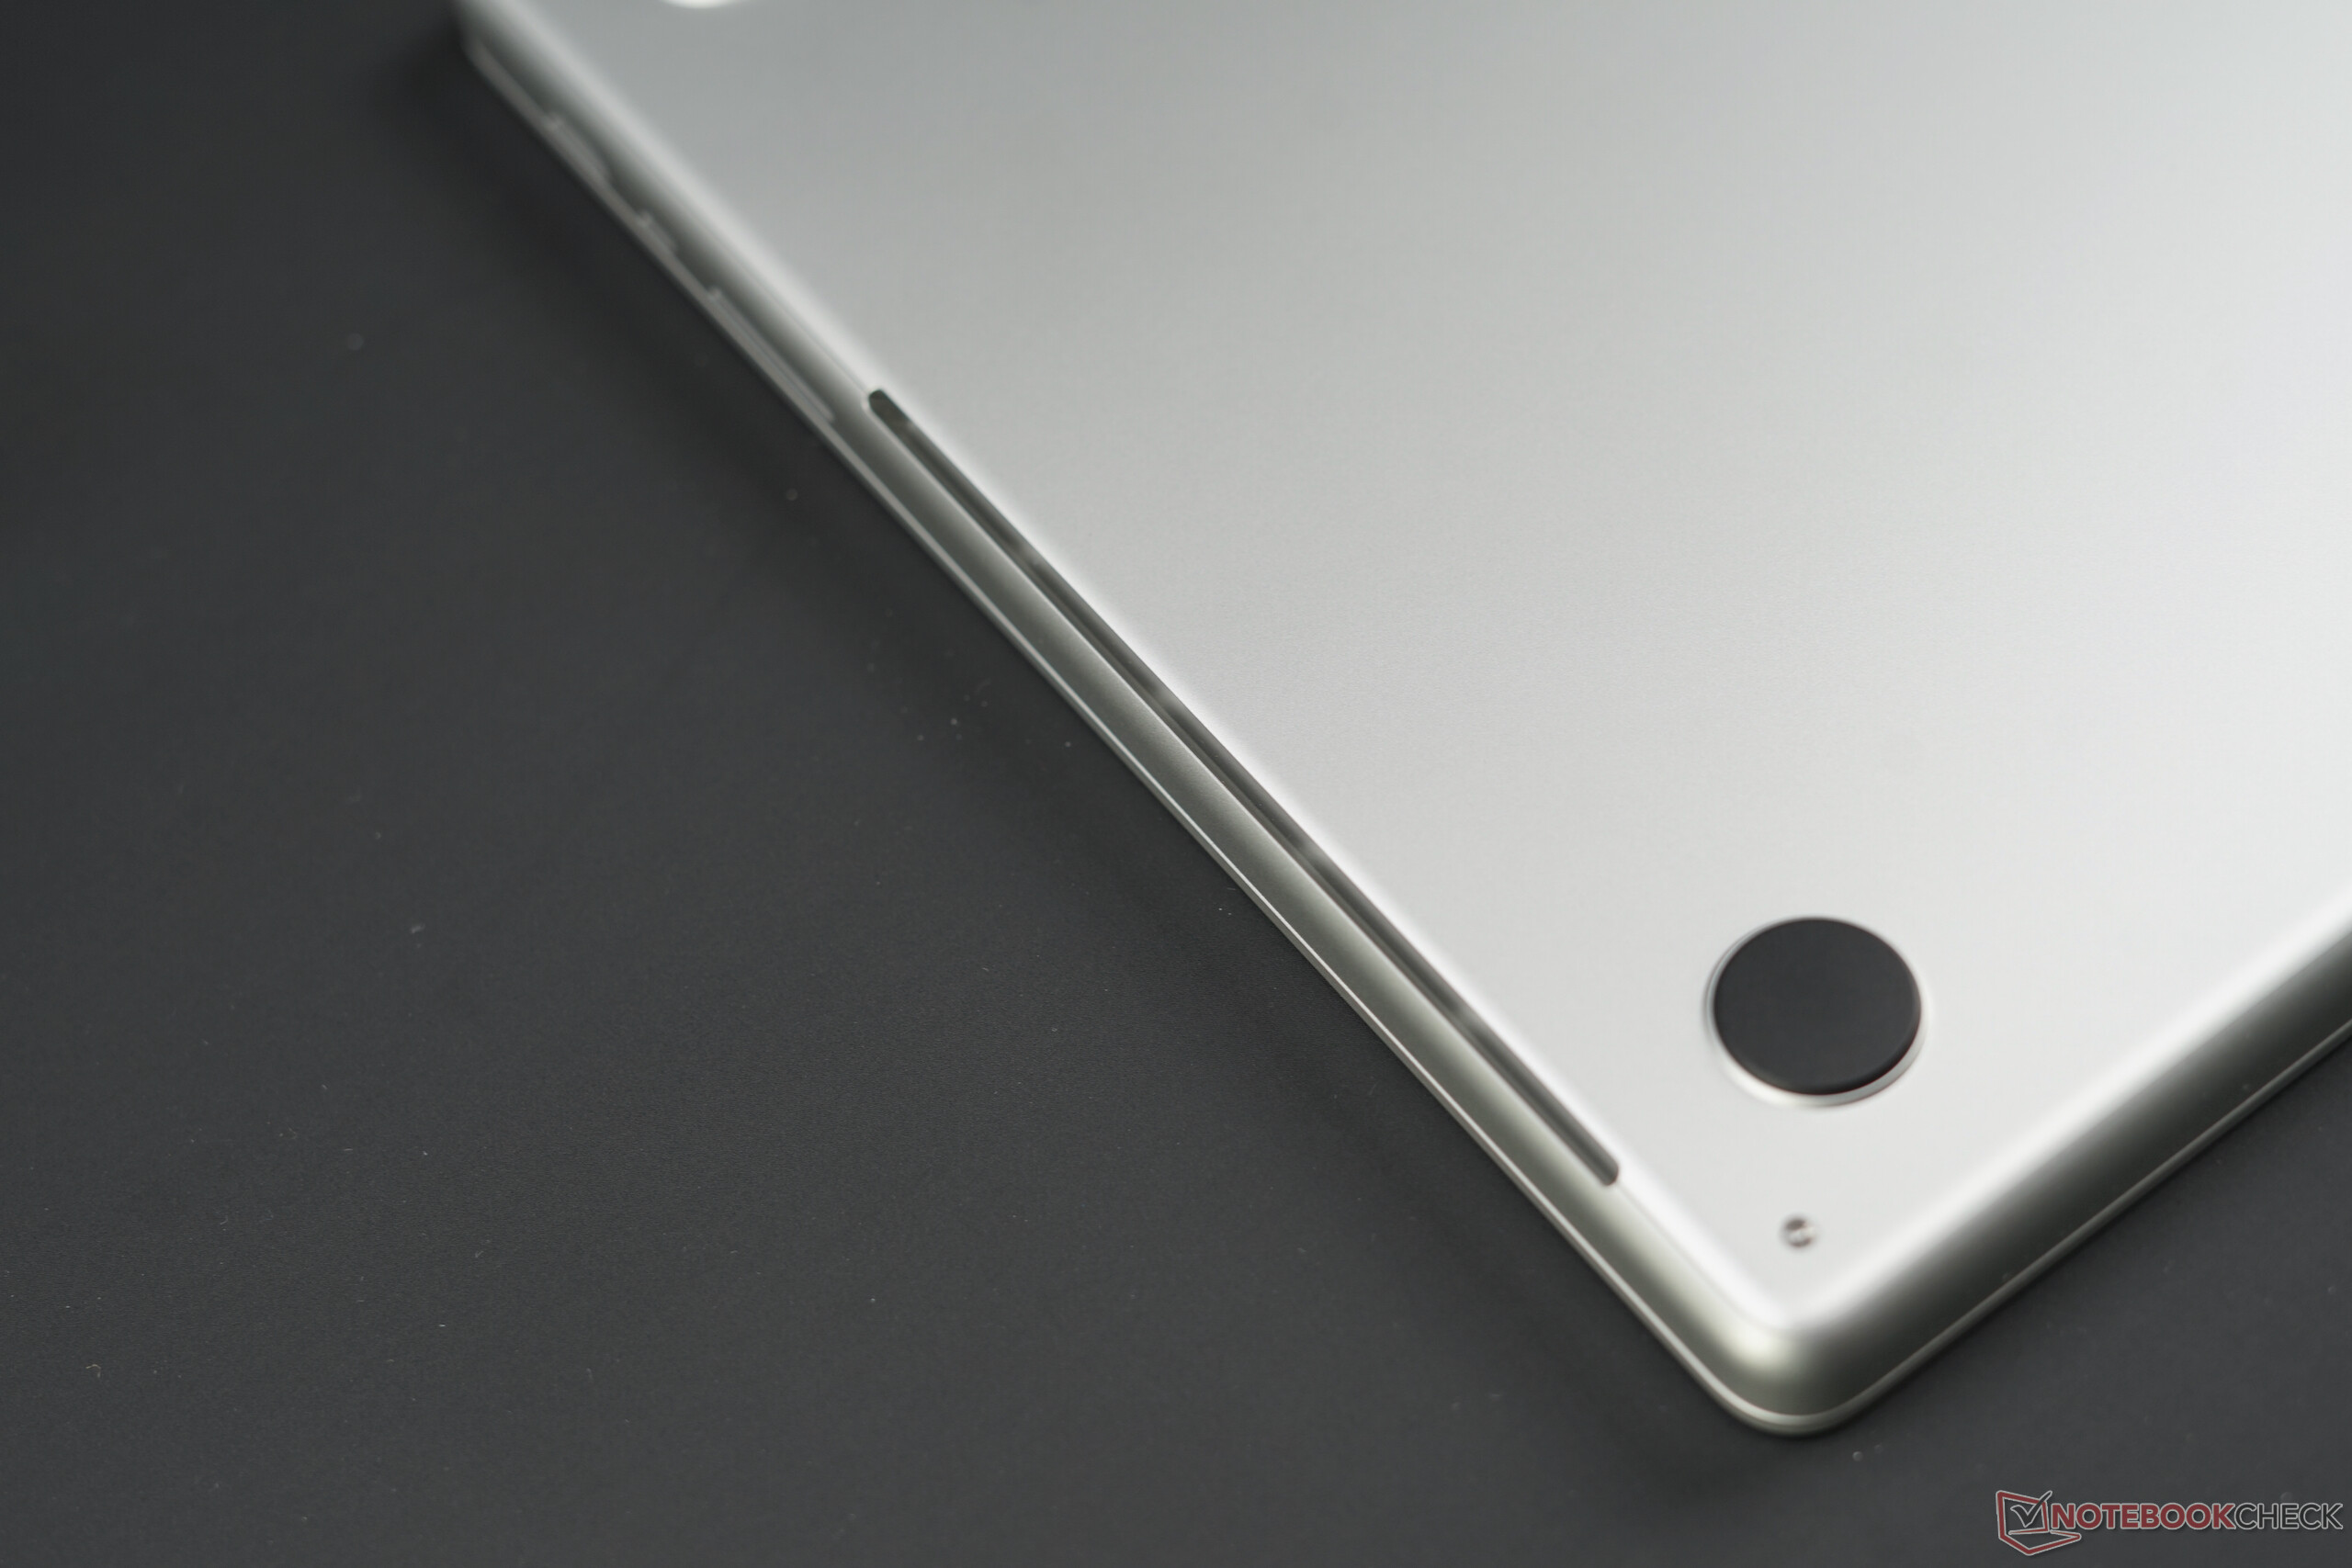
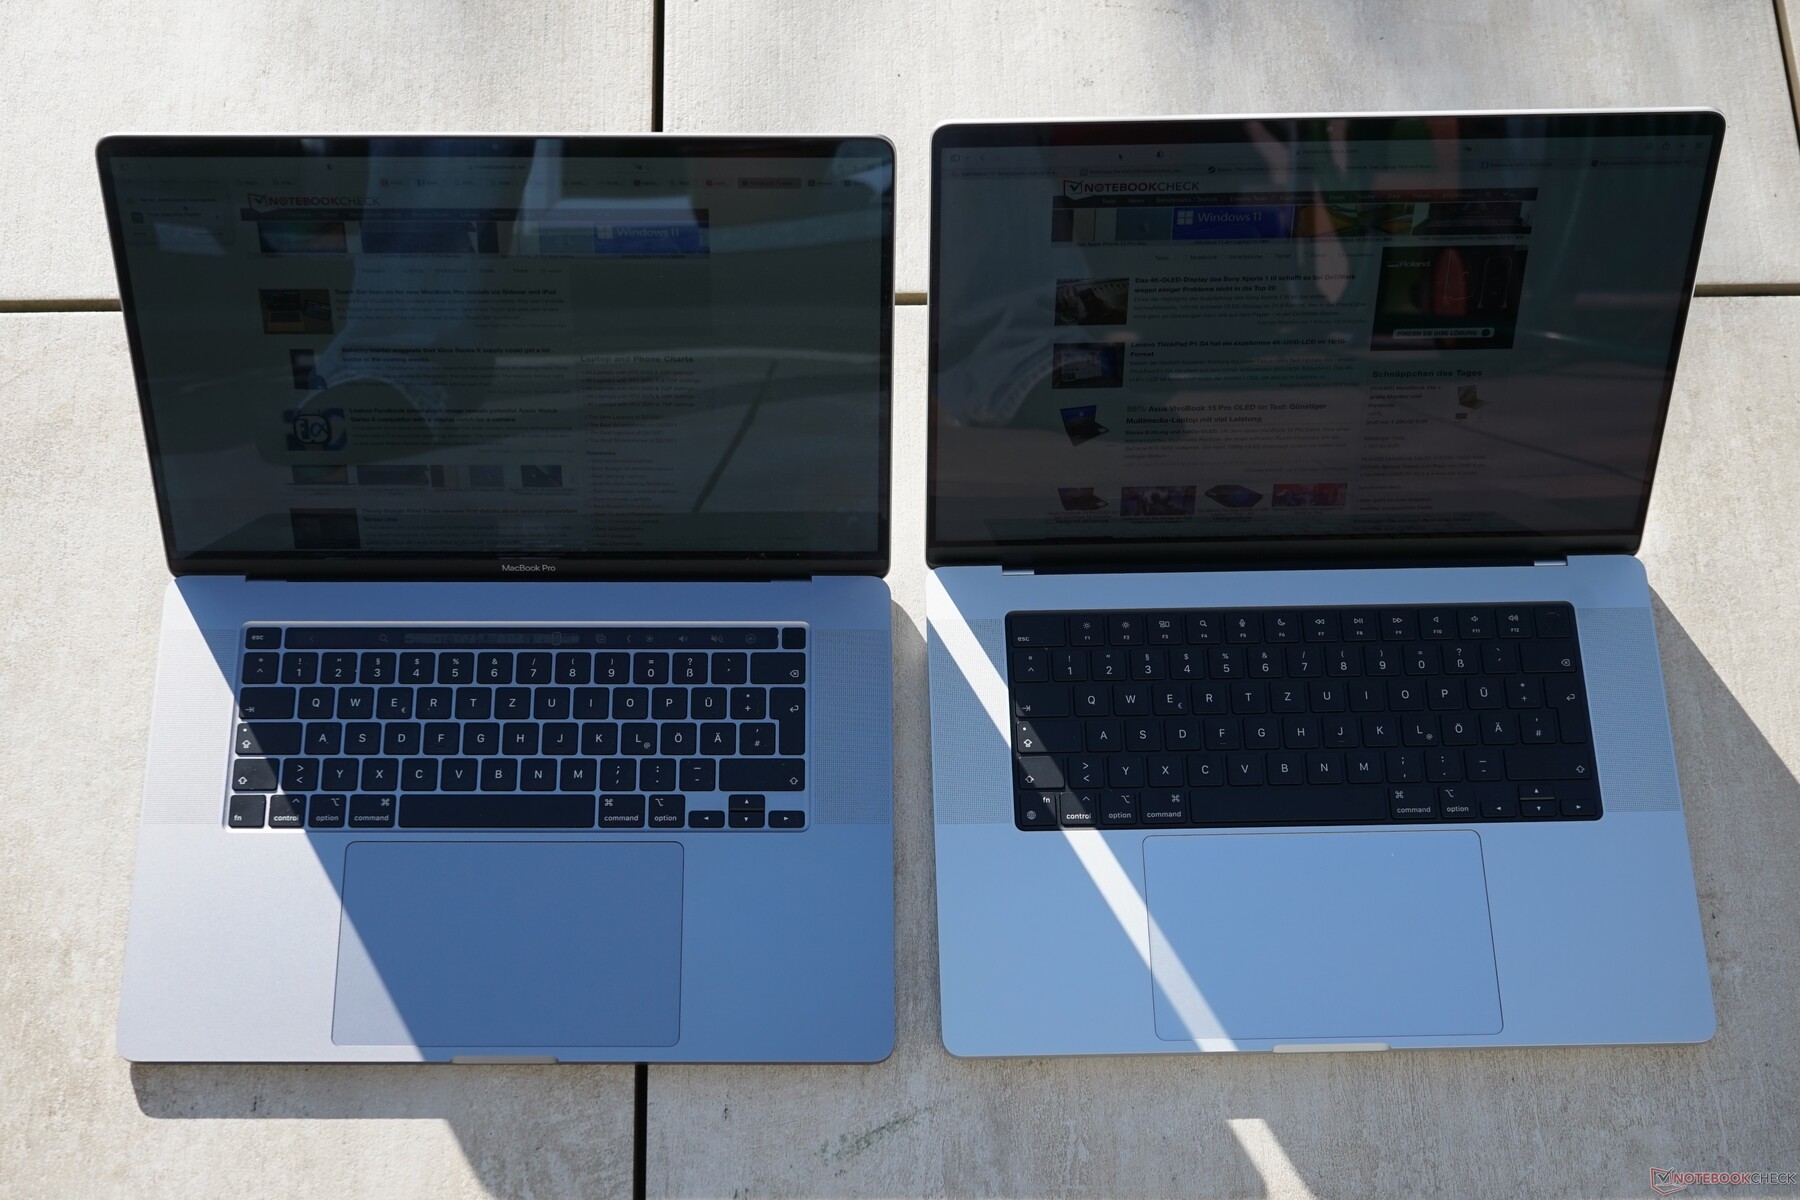
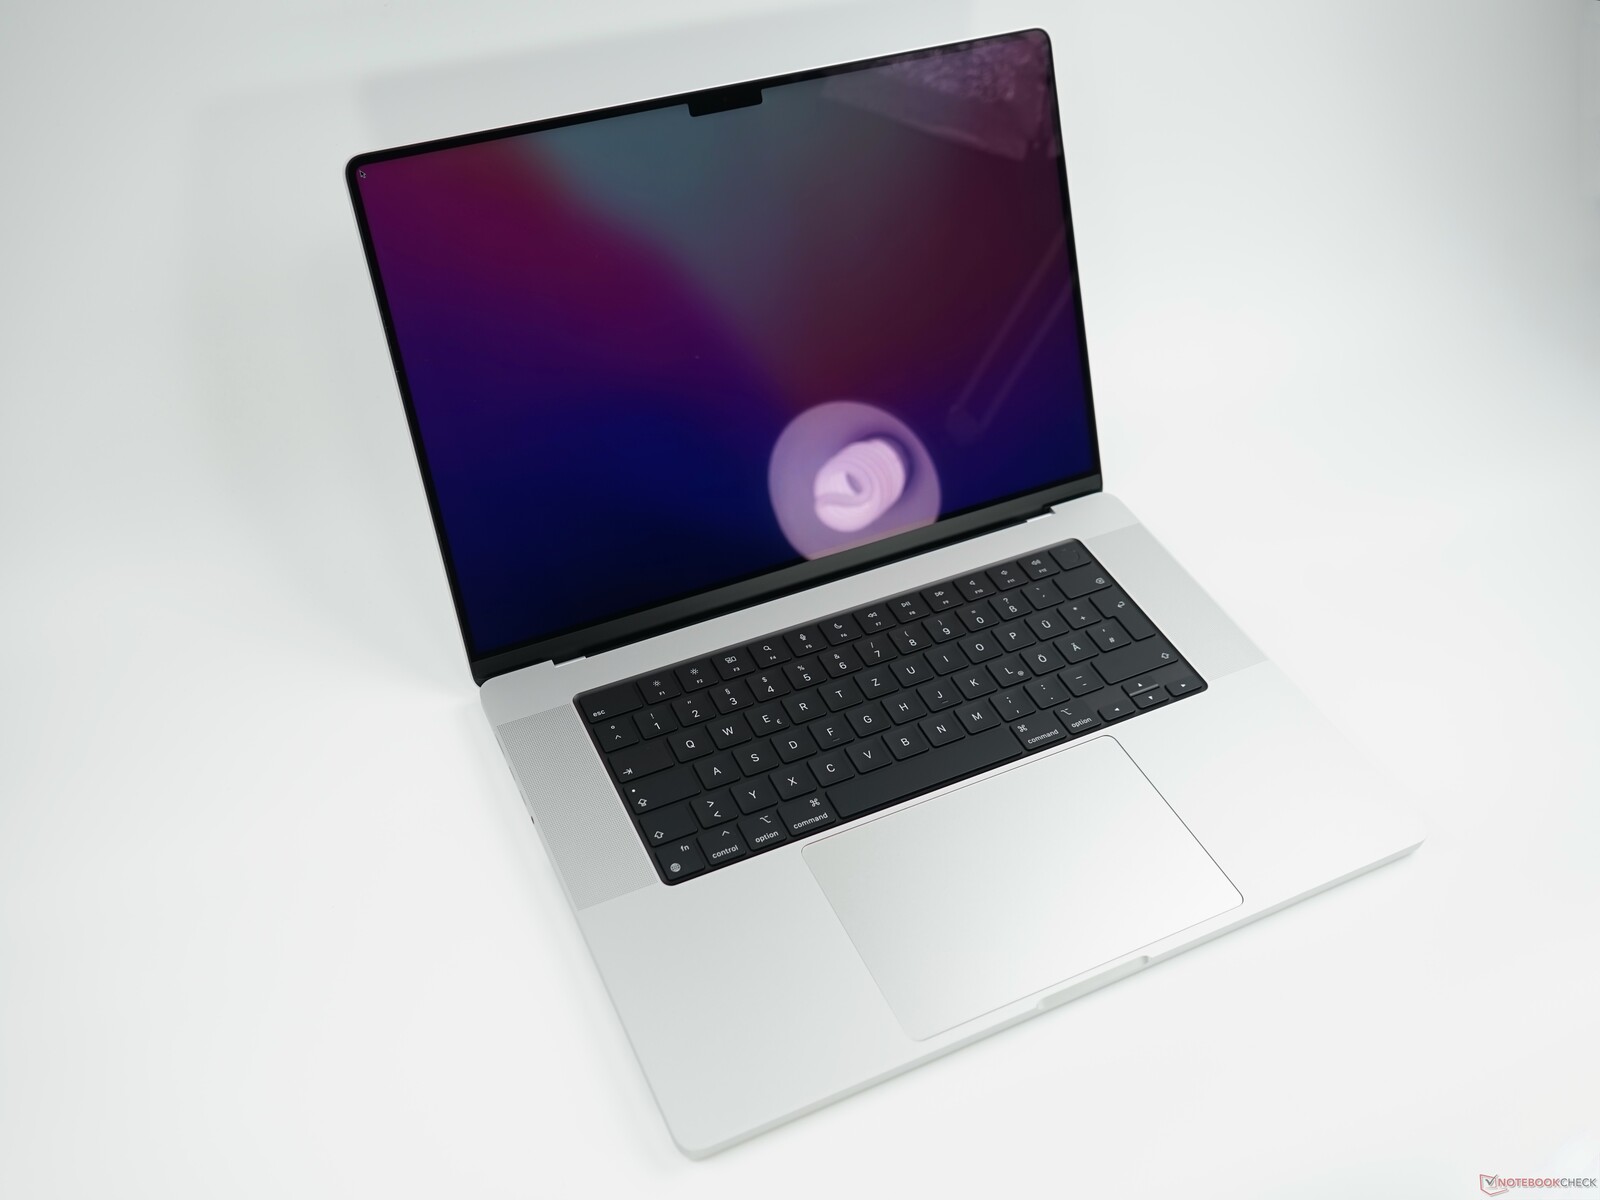
The chassis design of the two new models MacBook Pro 16 and MacBook Pro 14 is identical and both feel quite bulky, because the case is not tapered the chassis height is pretty much identical everywhere. However, the subjective difference between the new MBP 16 and the old MBP 16 is not as noticeable compared to the difference between the new MacBook Pro 14 and the old 13-inch model. The new model is still noticeably thicker than the old MBP 16 though (see comparison pictures below).
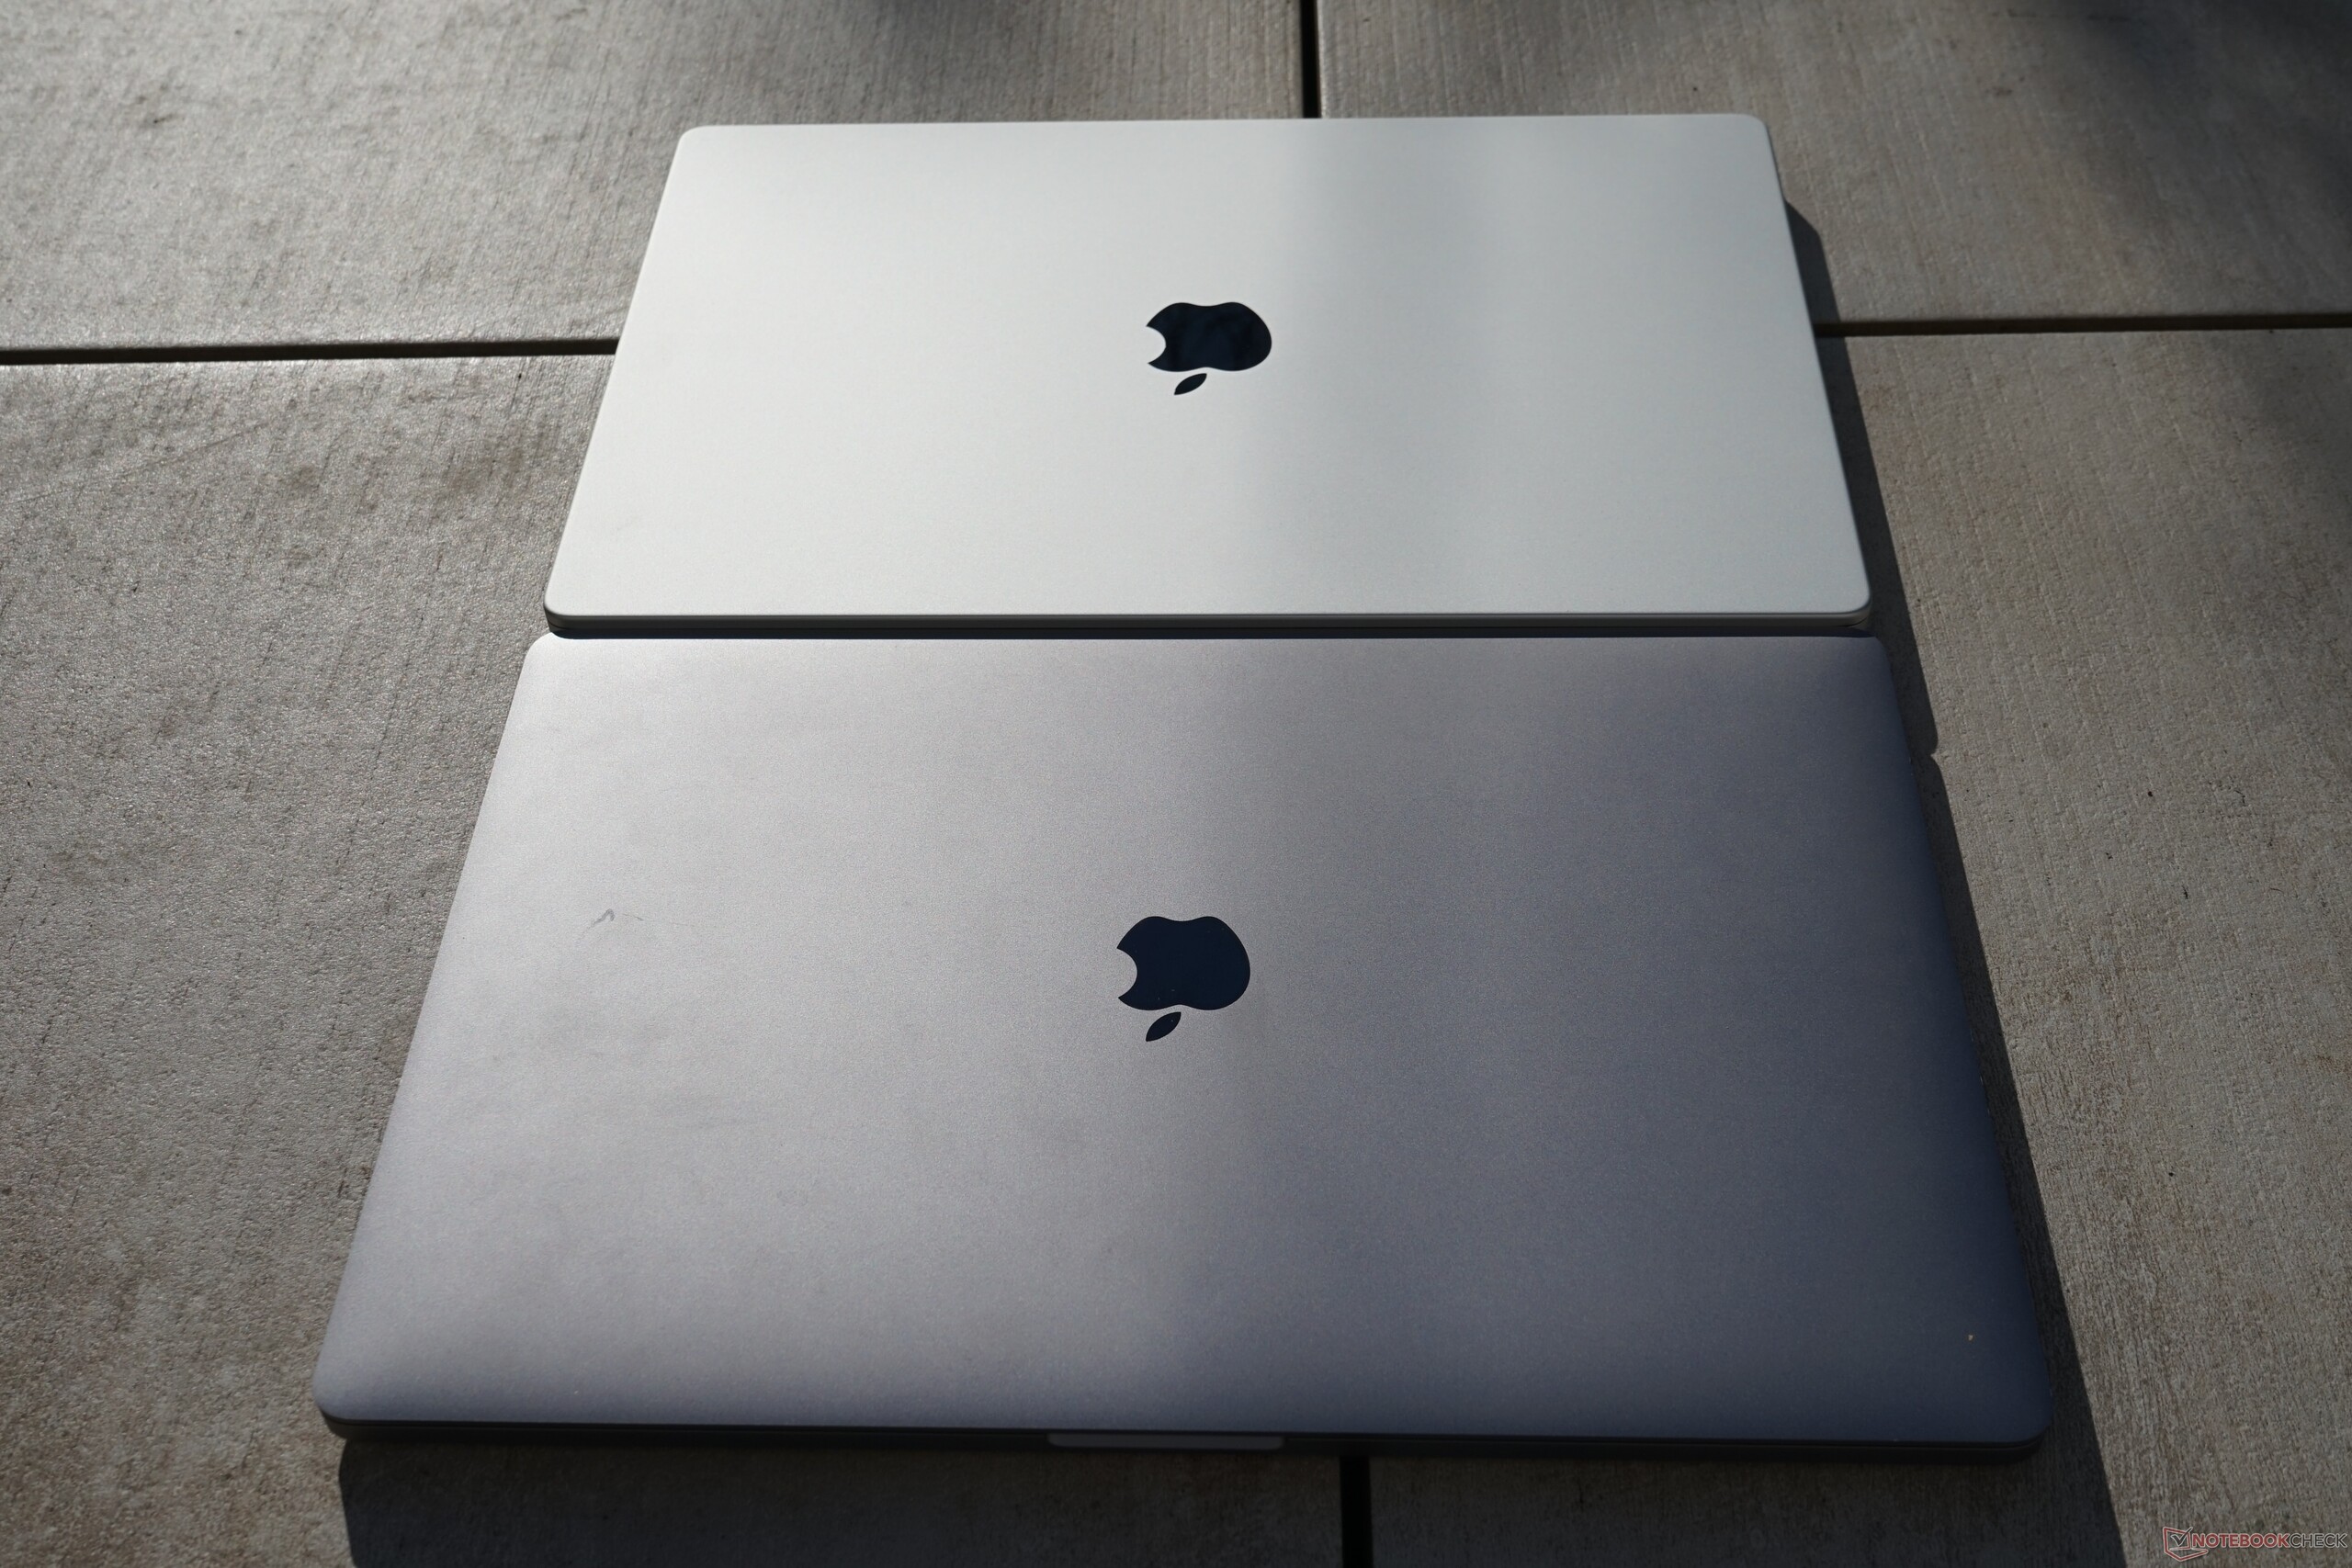
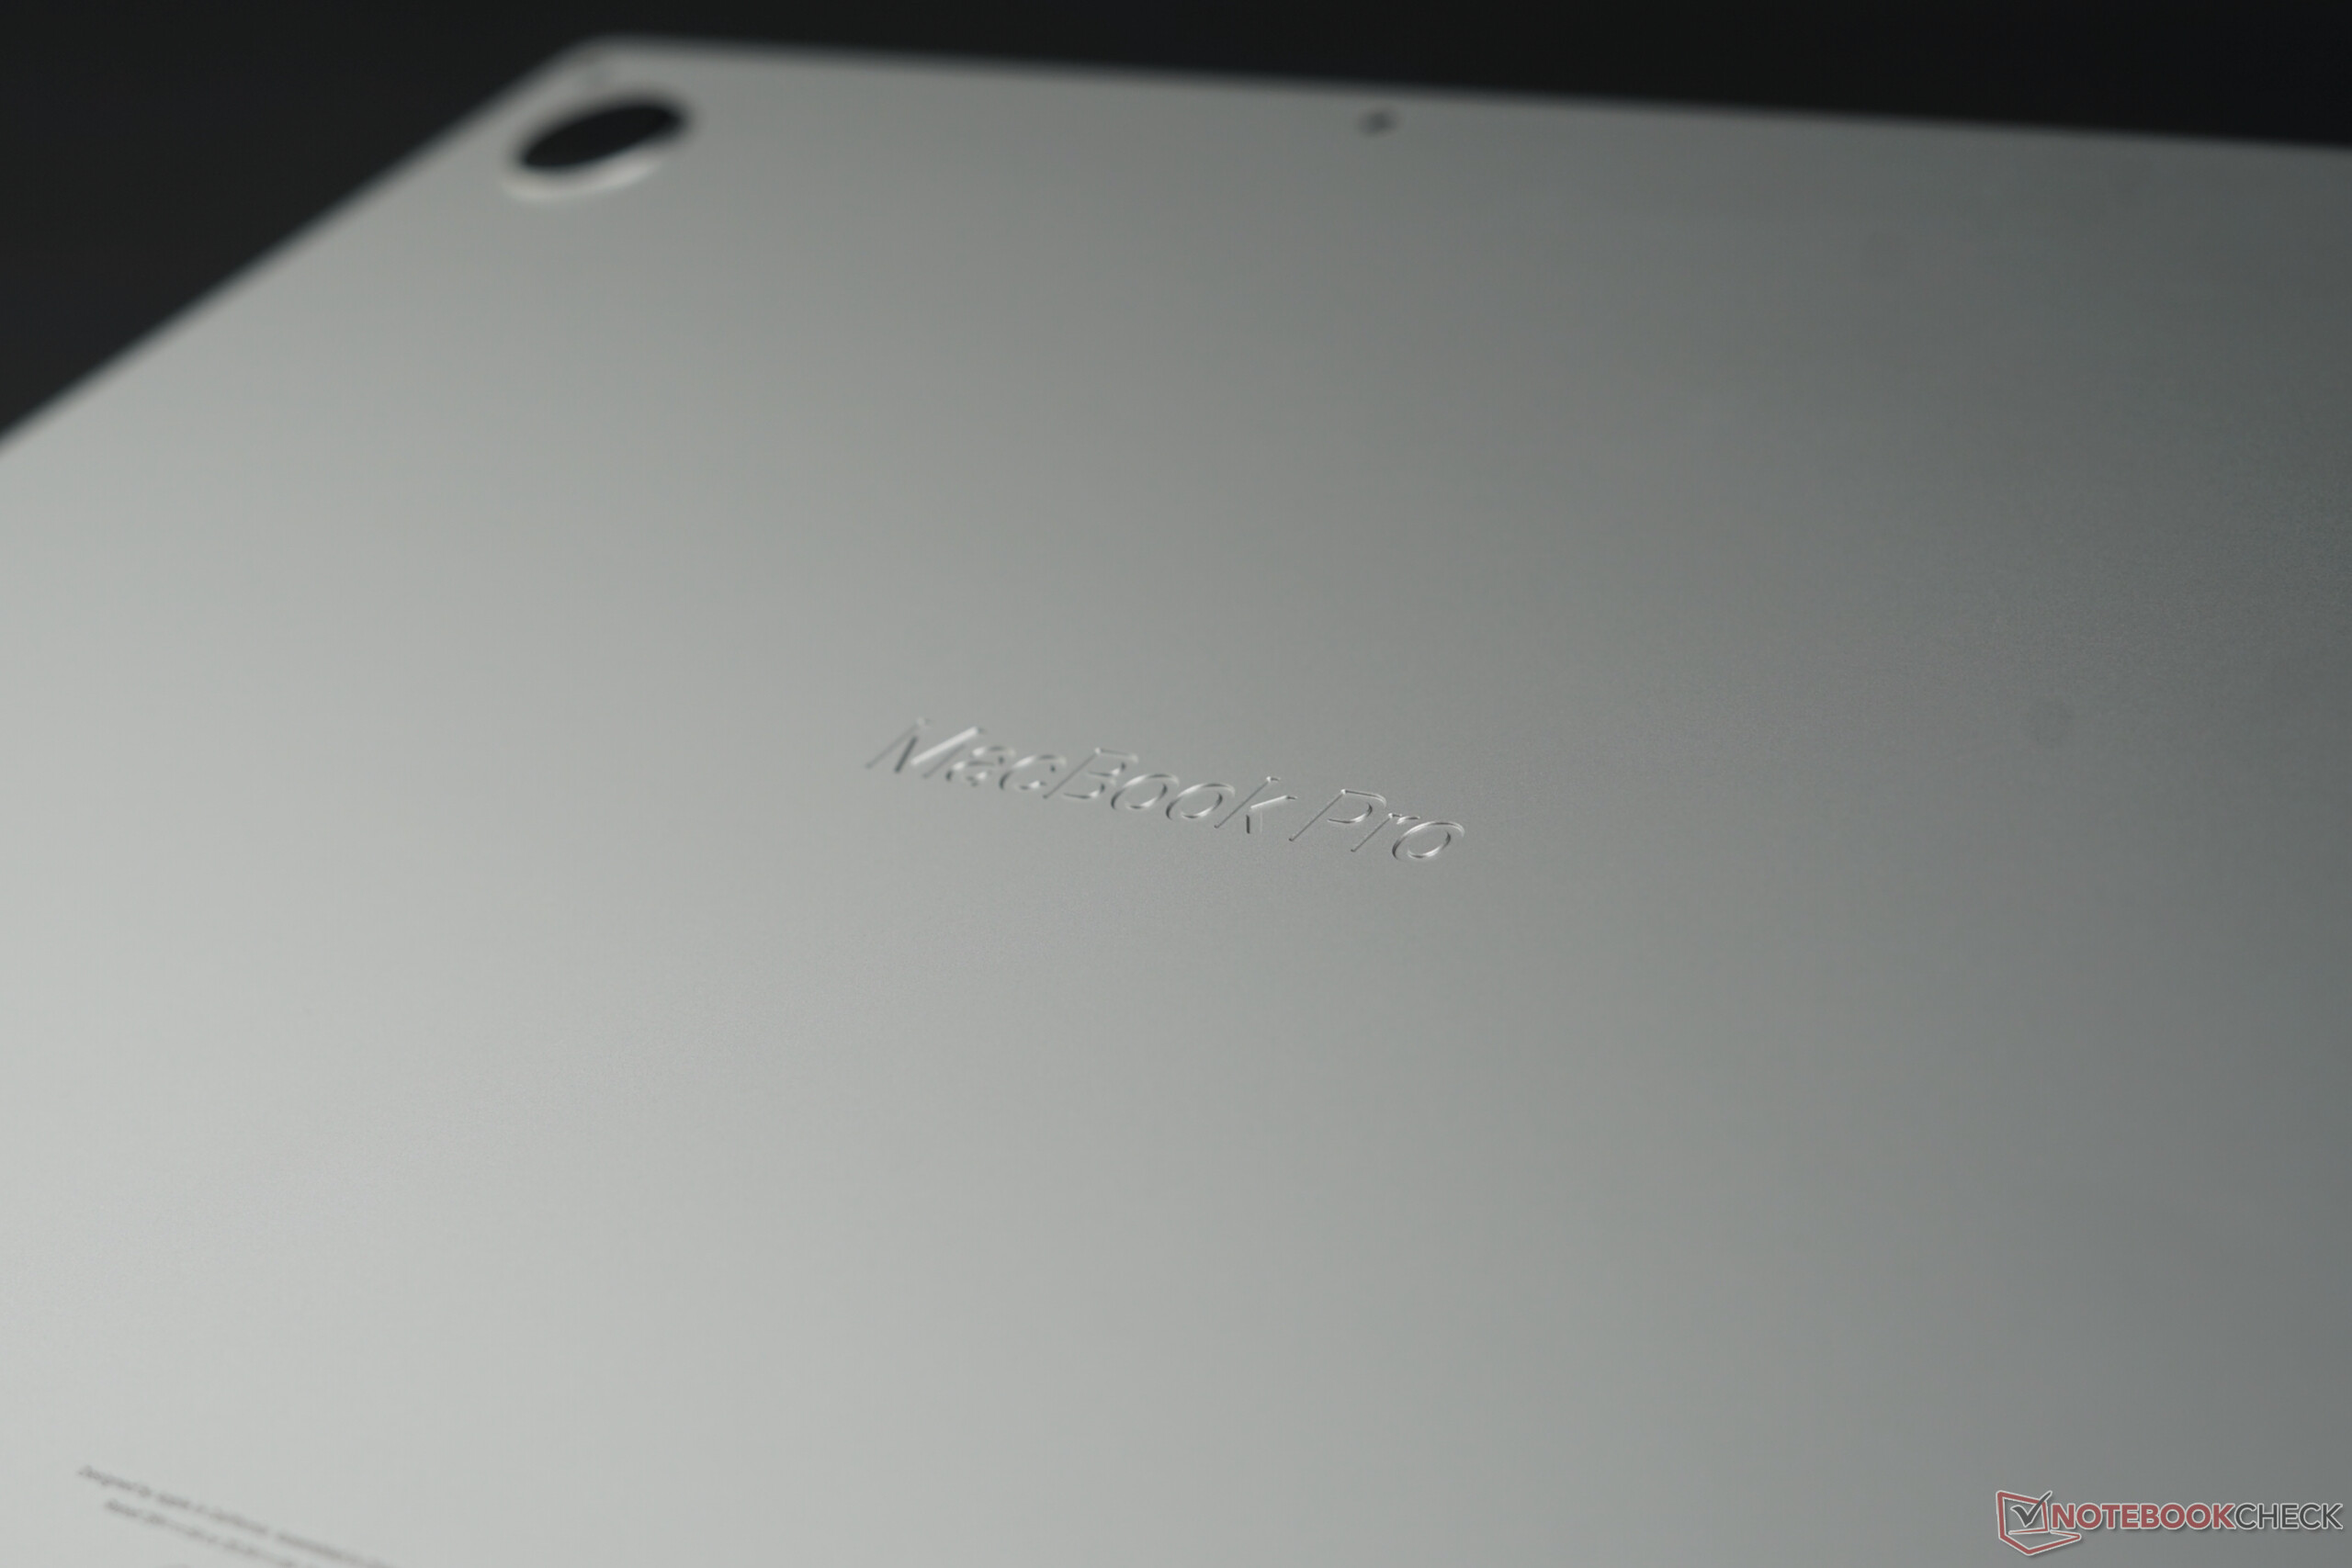
The chassis quality itself is once again basically flawless (just like the smaller MBP 14). Apple’s aluminum unibody design once again leaves a very high quality impression and neither of the two colors (silver and space gray) are very susceptible to dirt or fingerprints. The base unit is extremely sturdy and there are no creaking noises. The lid is also very sturdy in general, but similar to the smaller MBP 14, we can once again provoke some ripples on the screen with concentrated pressure, even though this should not be an issue in practice.
The hinges also leave a good impression on the larger MacBook Pro. It is no problem to open the lid with one hand and it does not automatically fall down at small angles, but there is slightly more bouncing compared to the smaller sibling when you adjust the opening angle (up to 135 degrees). This is a result of the larger screen area.

The new model is bulkier than the old MacBook Pro 16, but the situation is different compared to the Windows competition, like the 16-inch rival Lenovo ThinkPad X1 Extreme G4. The other rivals have a smaller footprint, but they are also equipped with slightly smaller 15.6-inch panels. The MacBook is slimmer though. It tips the scale at around 2.1 kg, which is a bit heavier than the competition, but the difference is not huge.
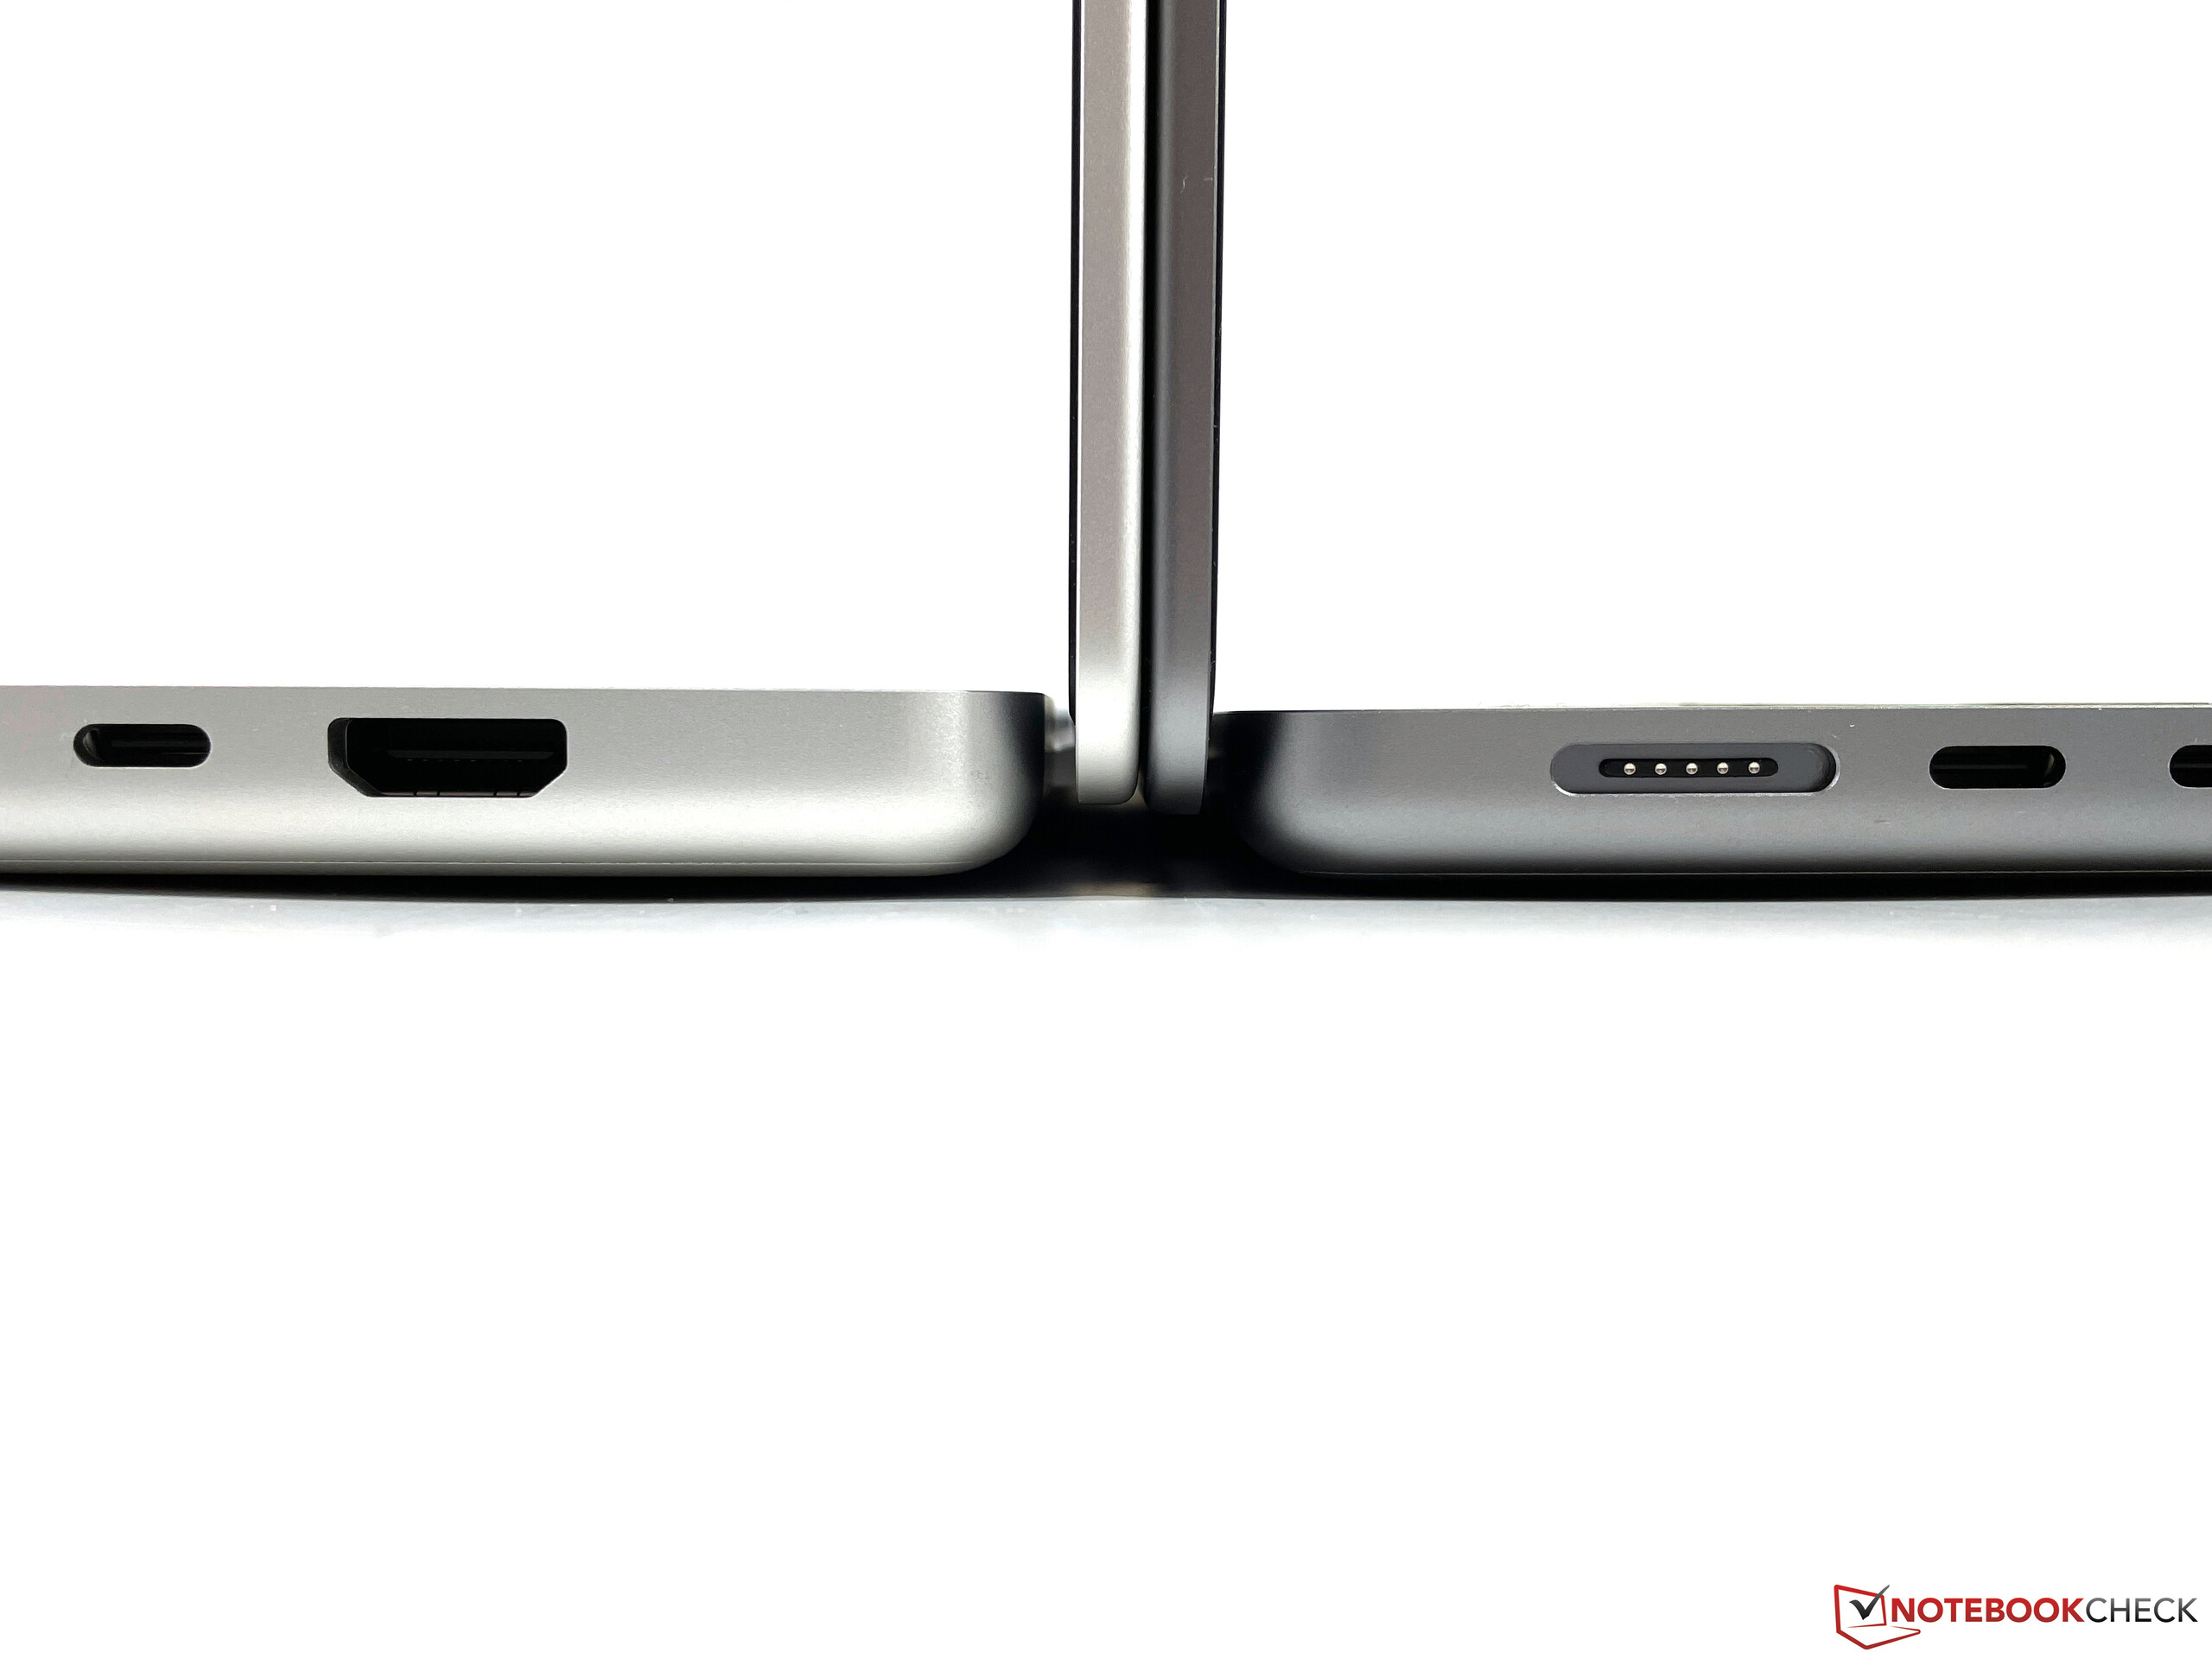
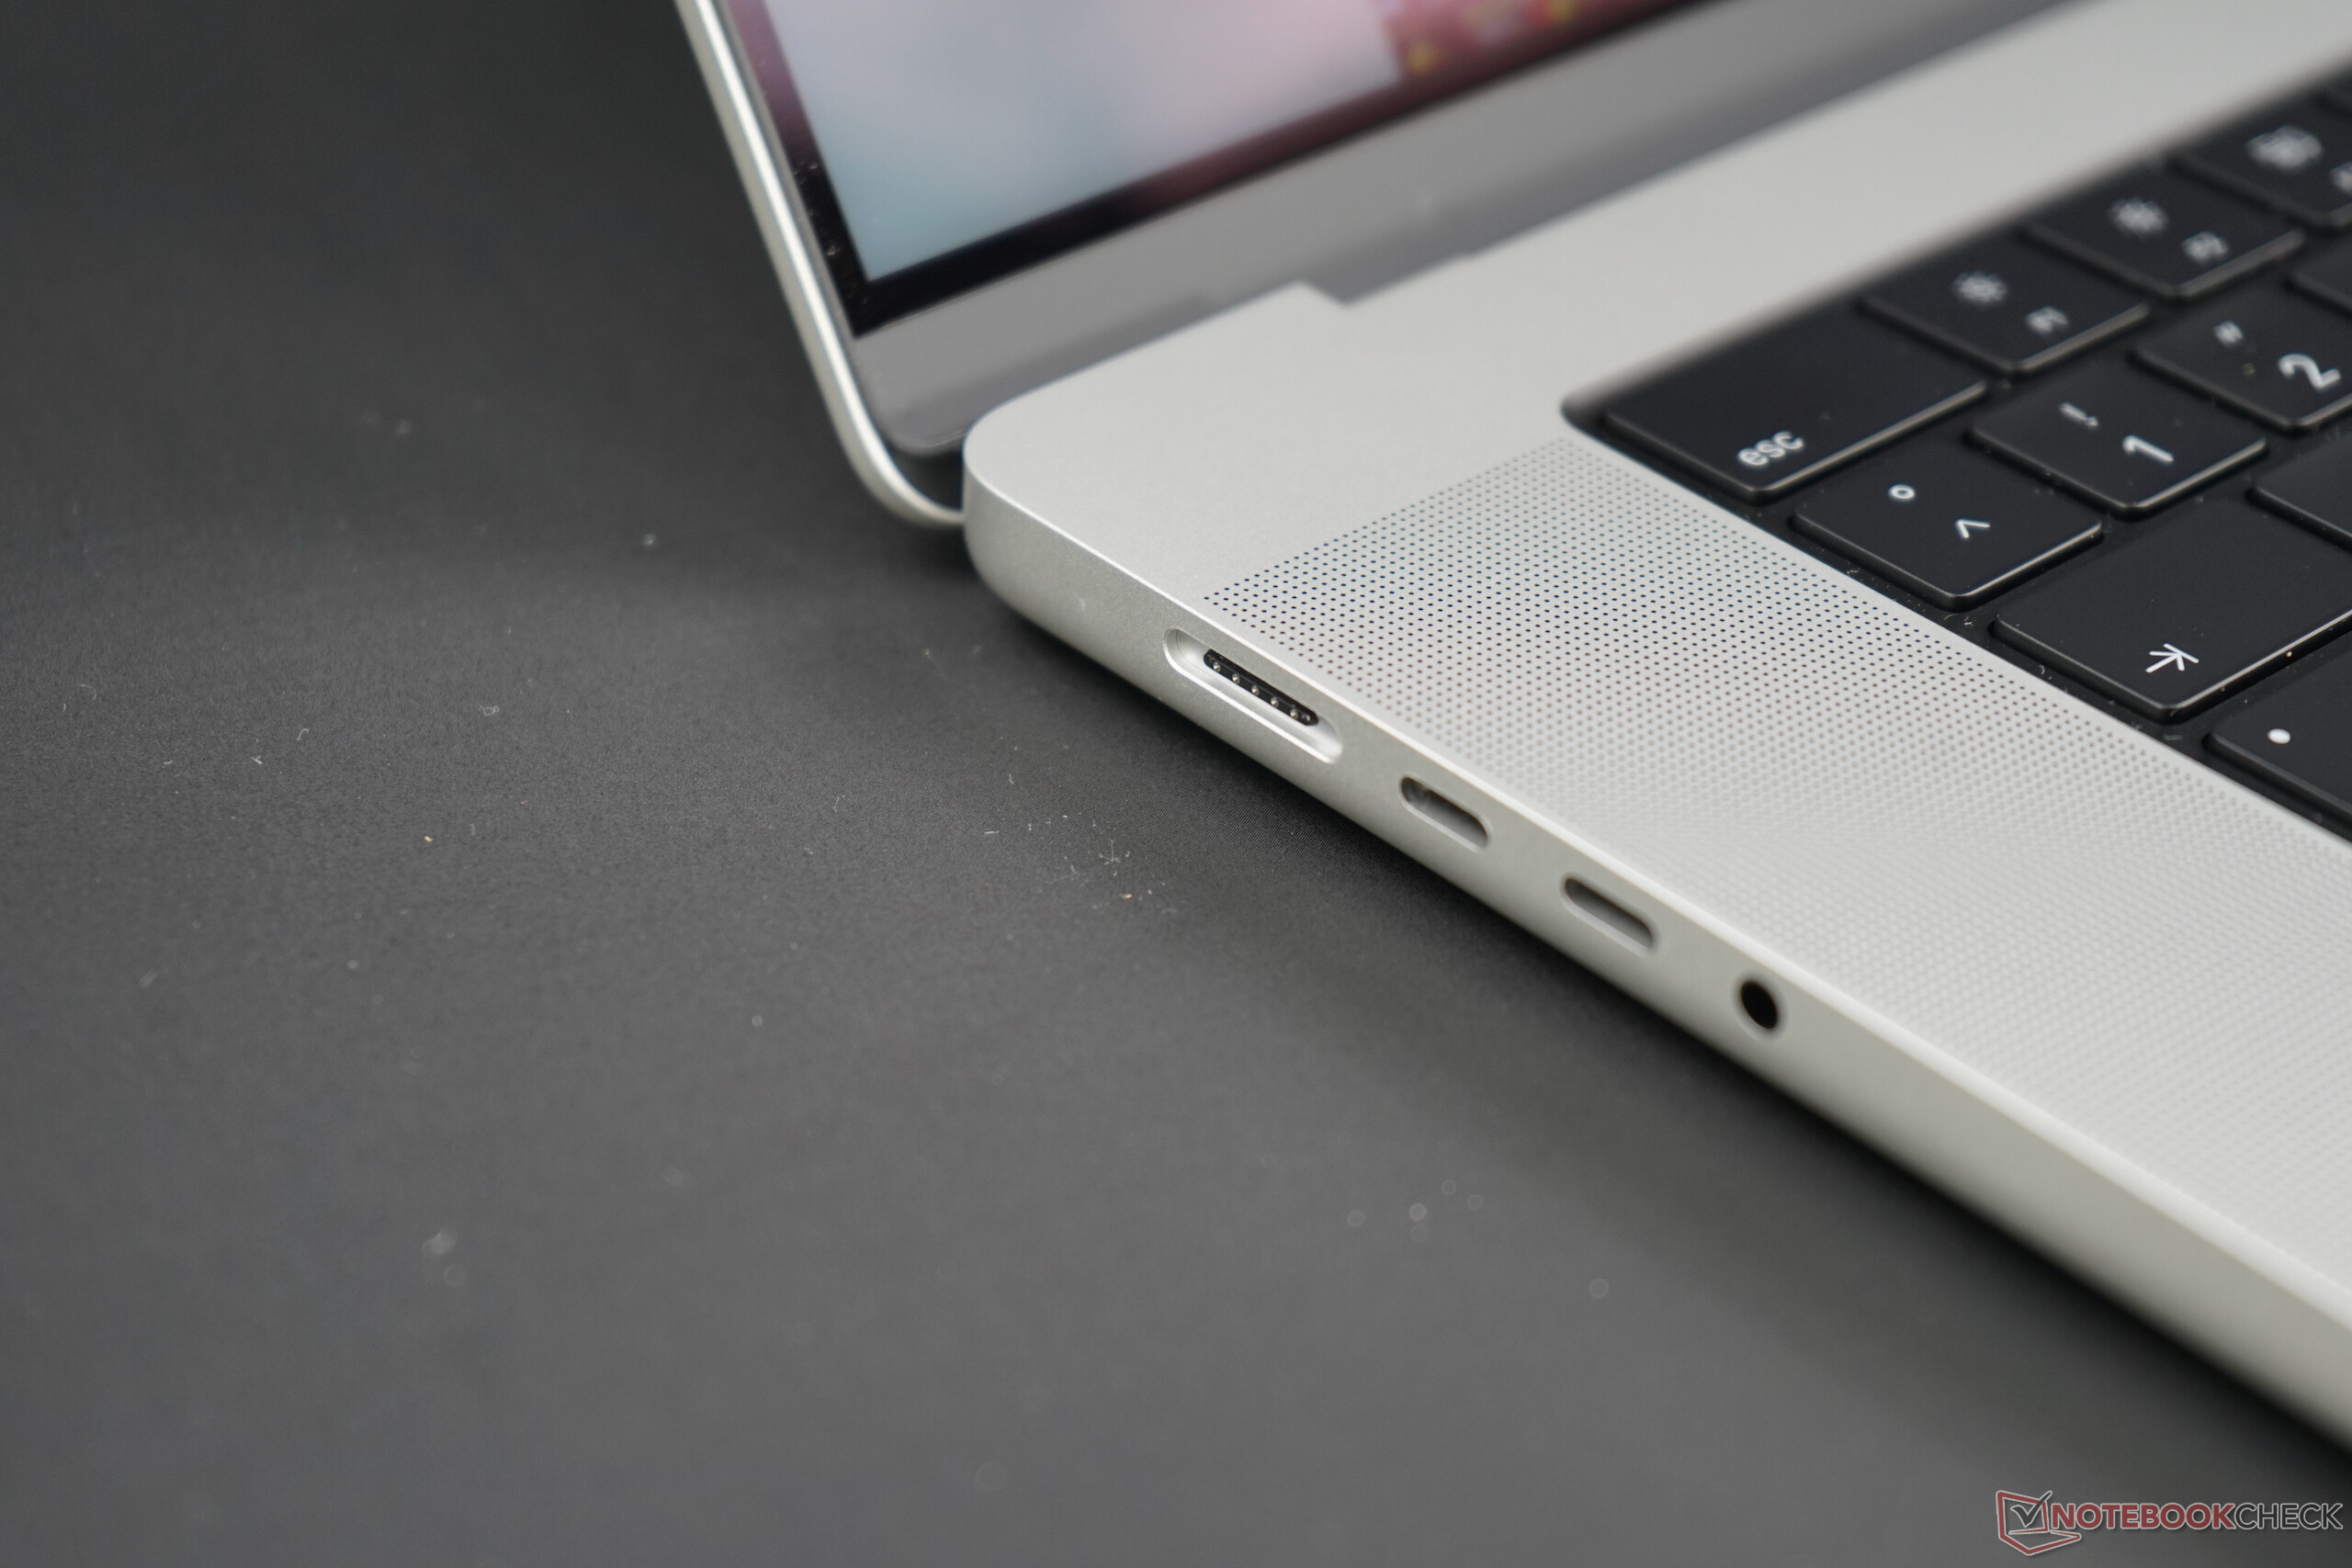
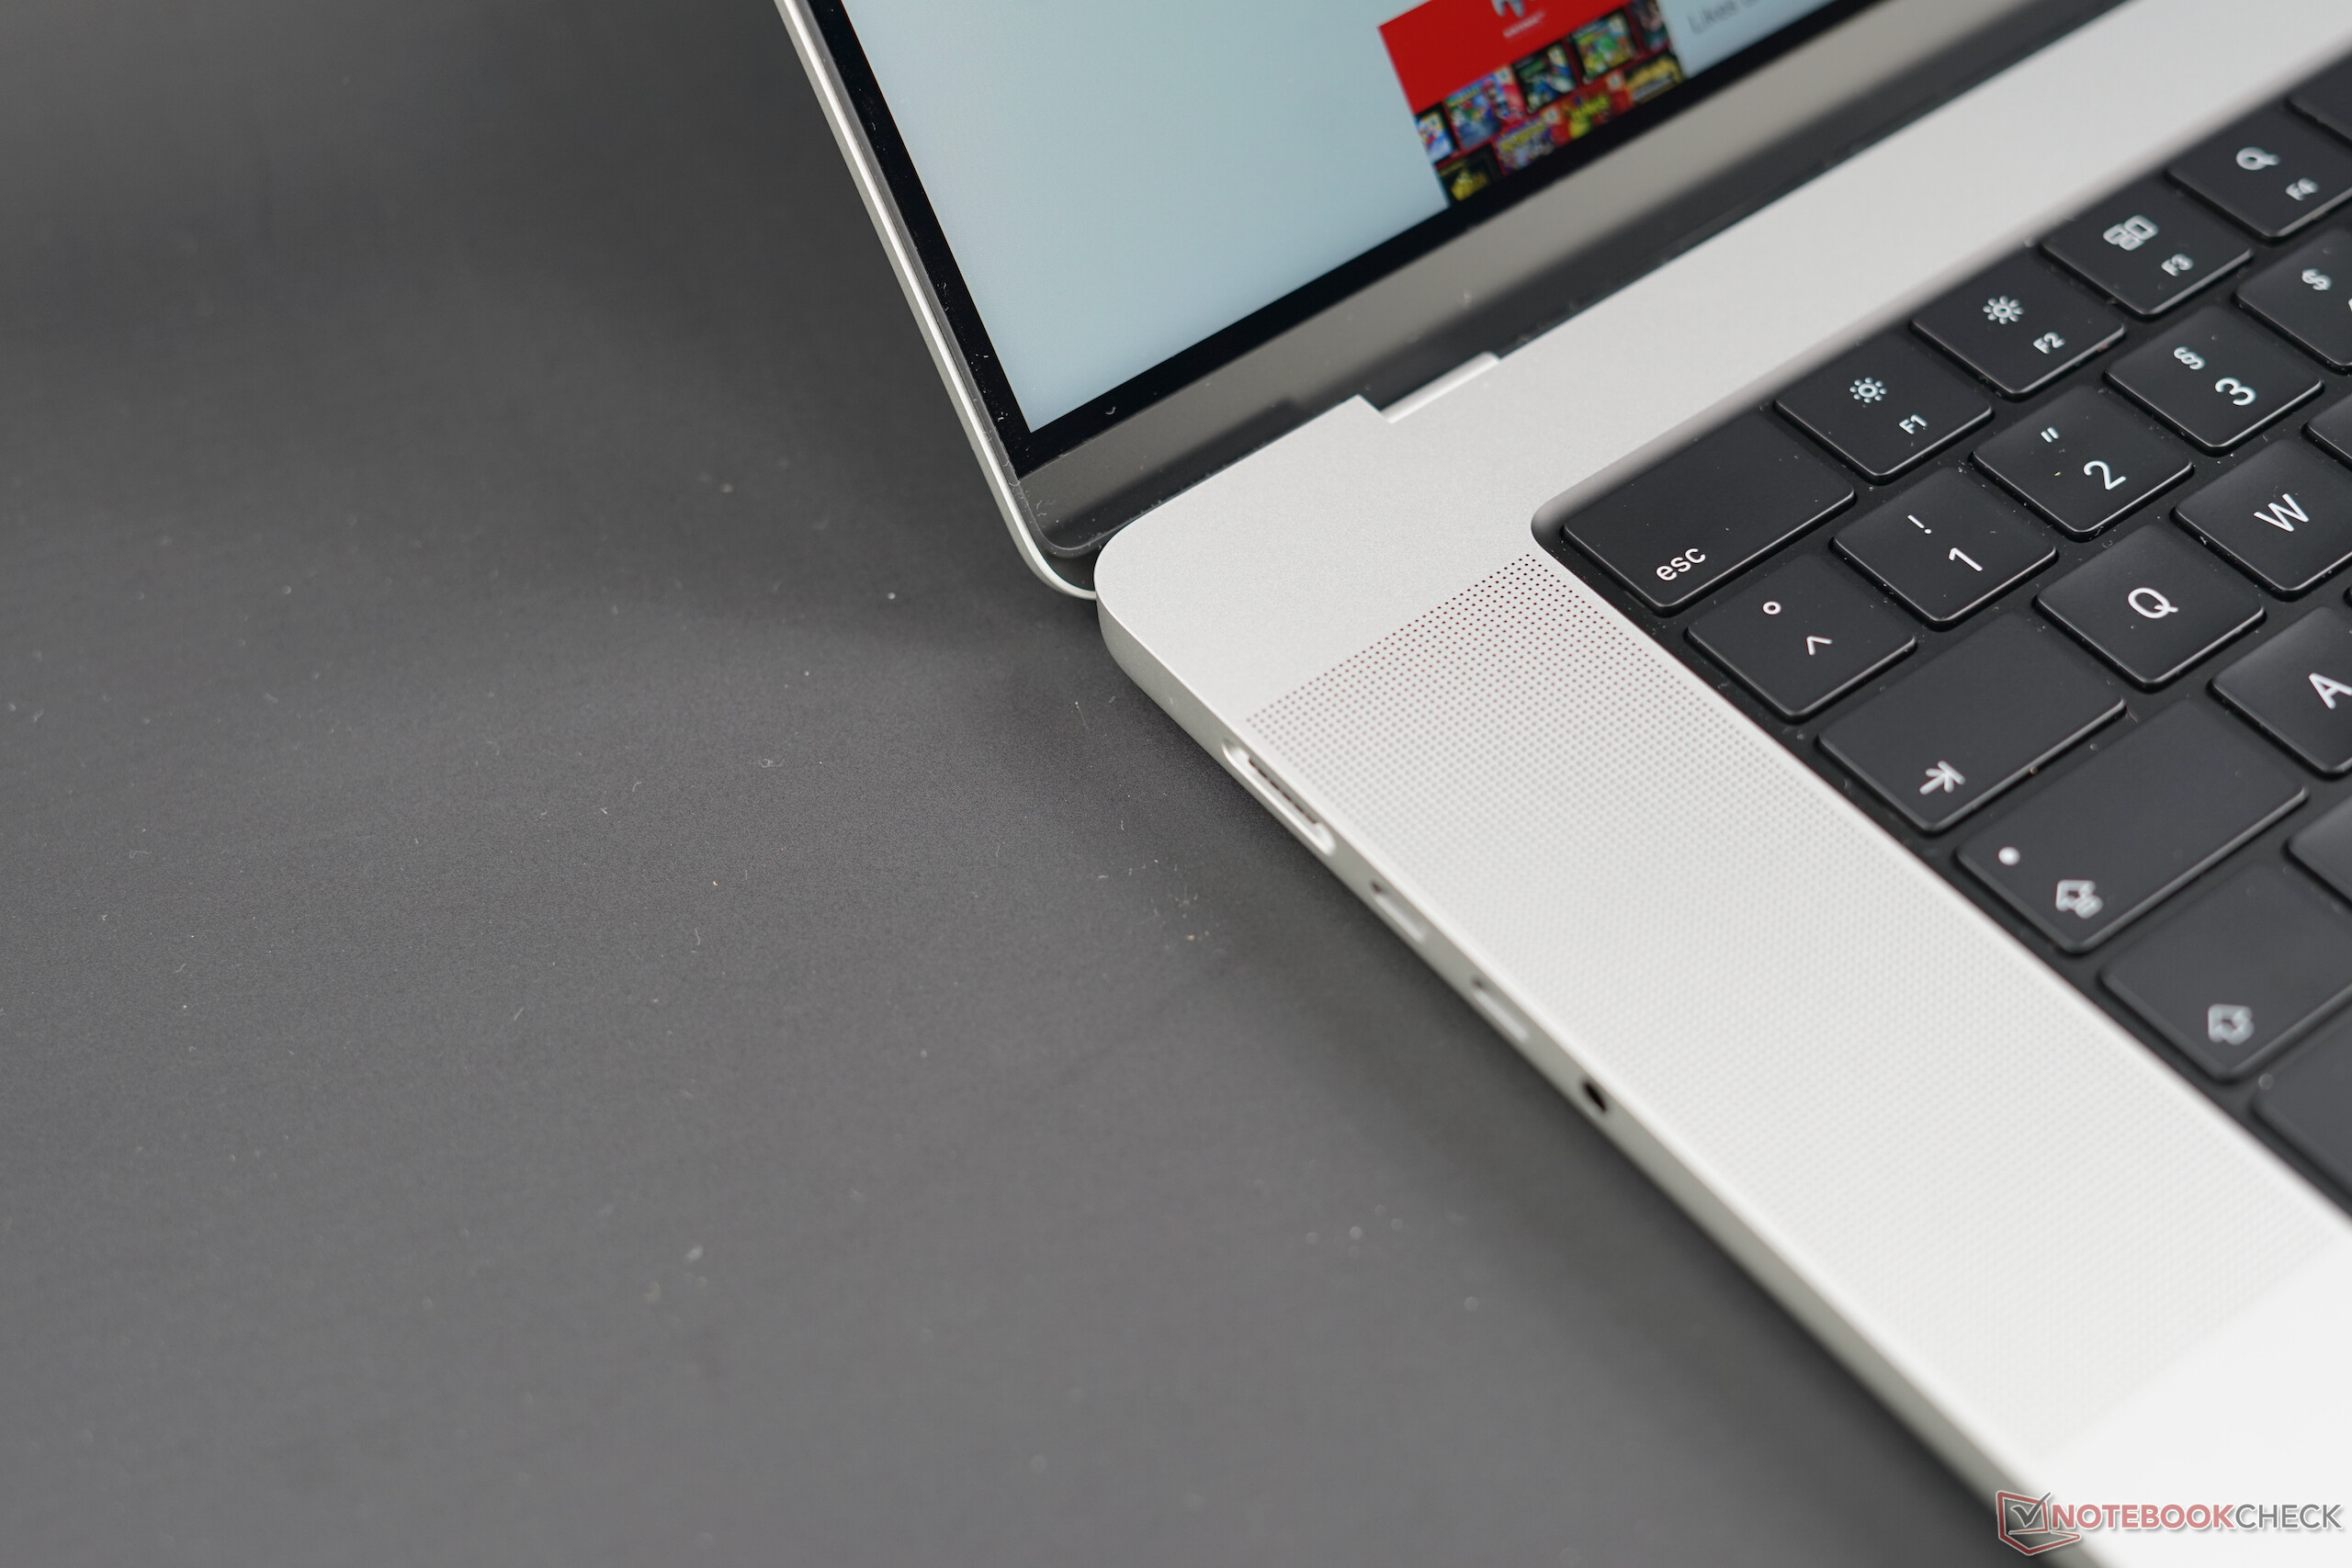
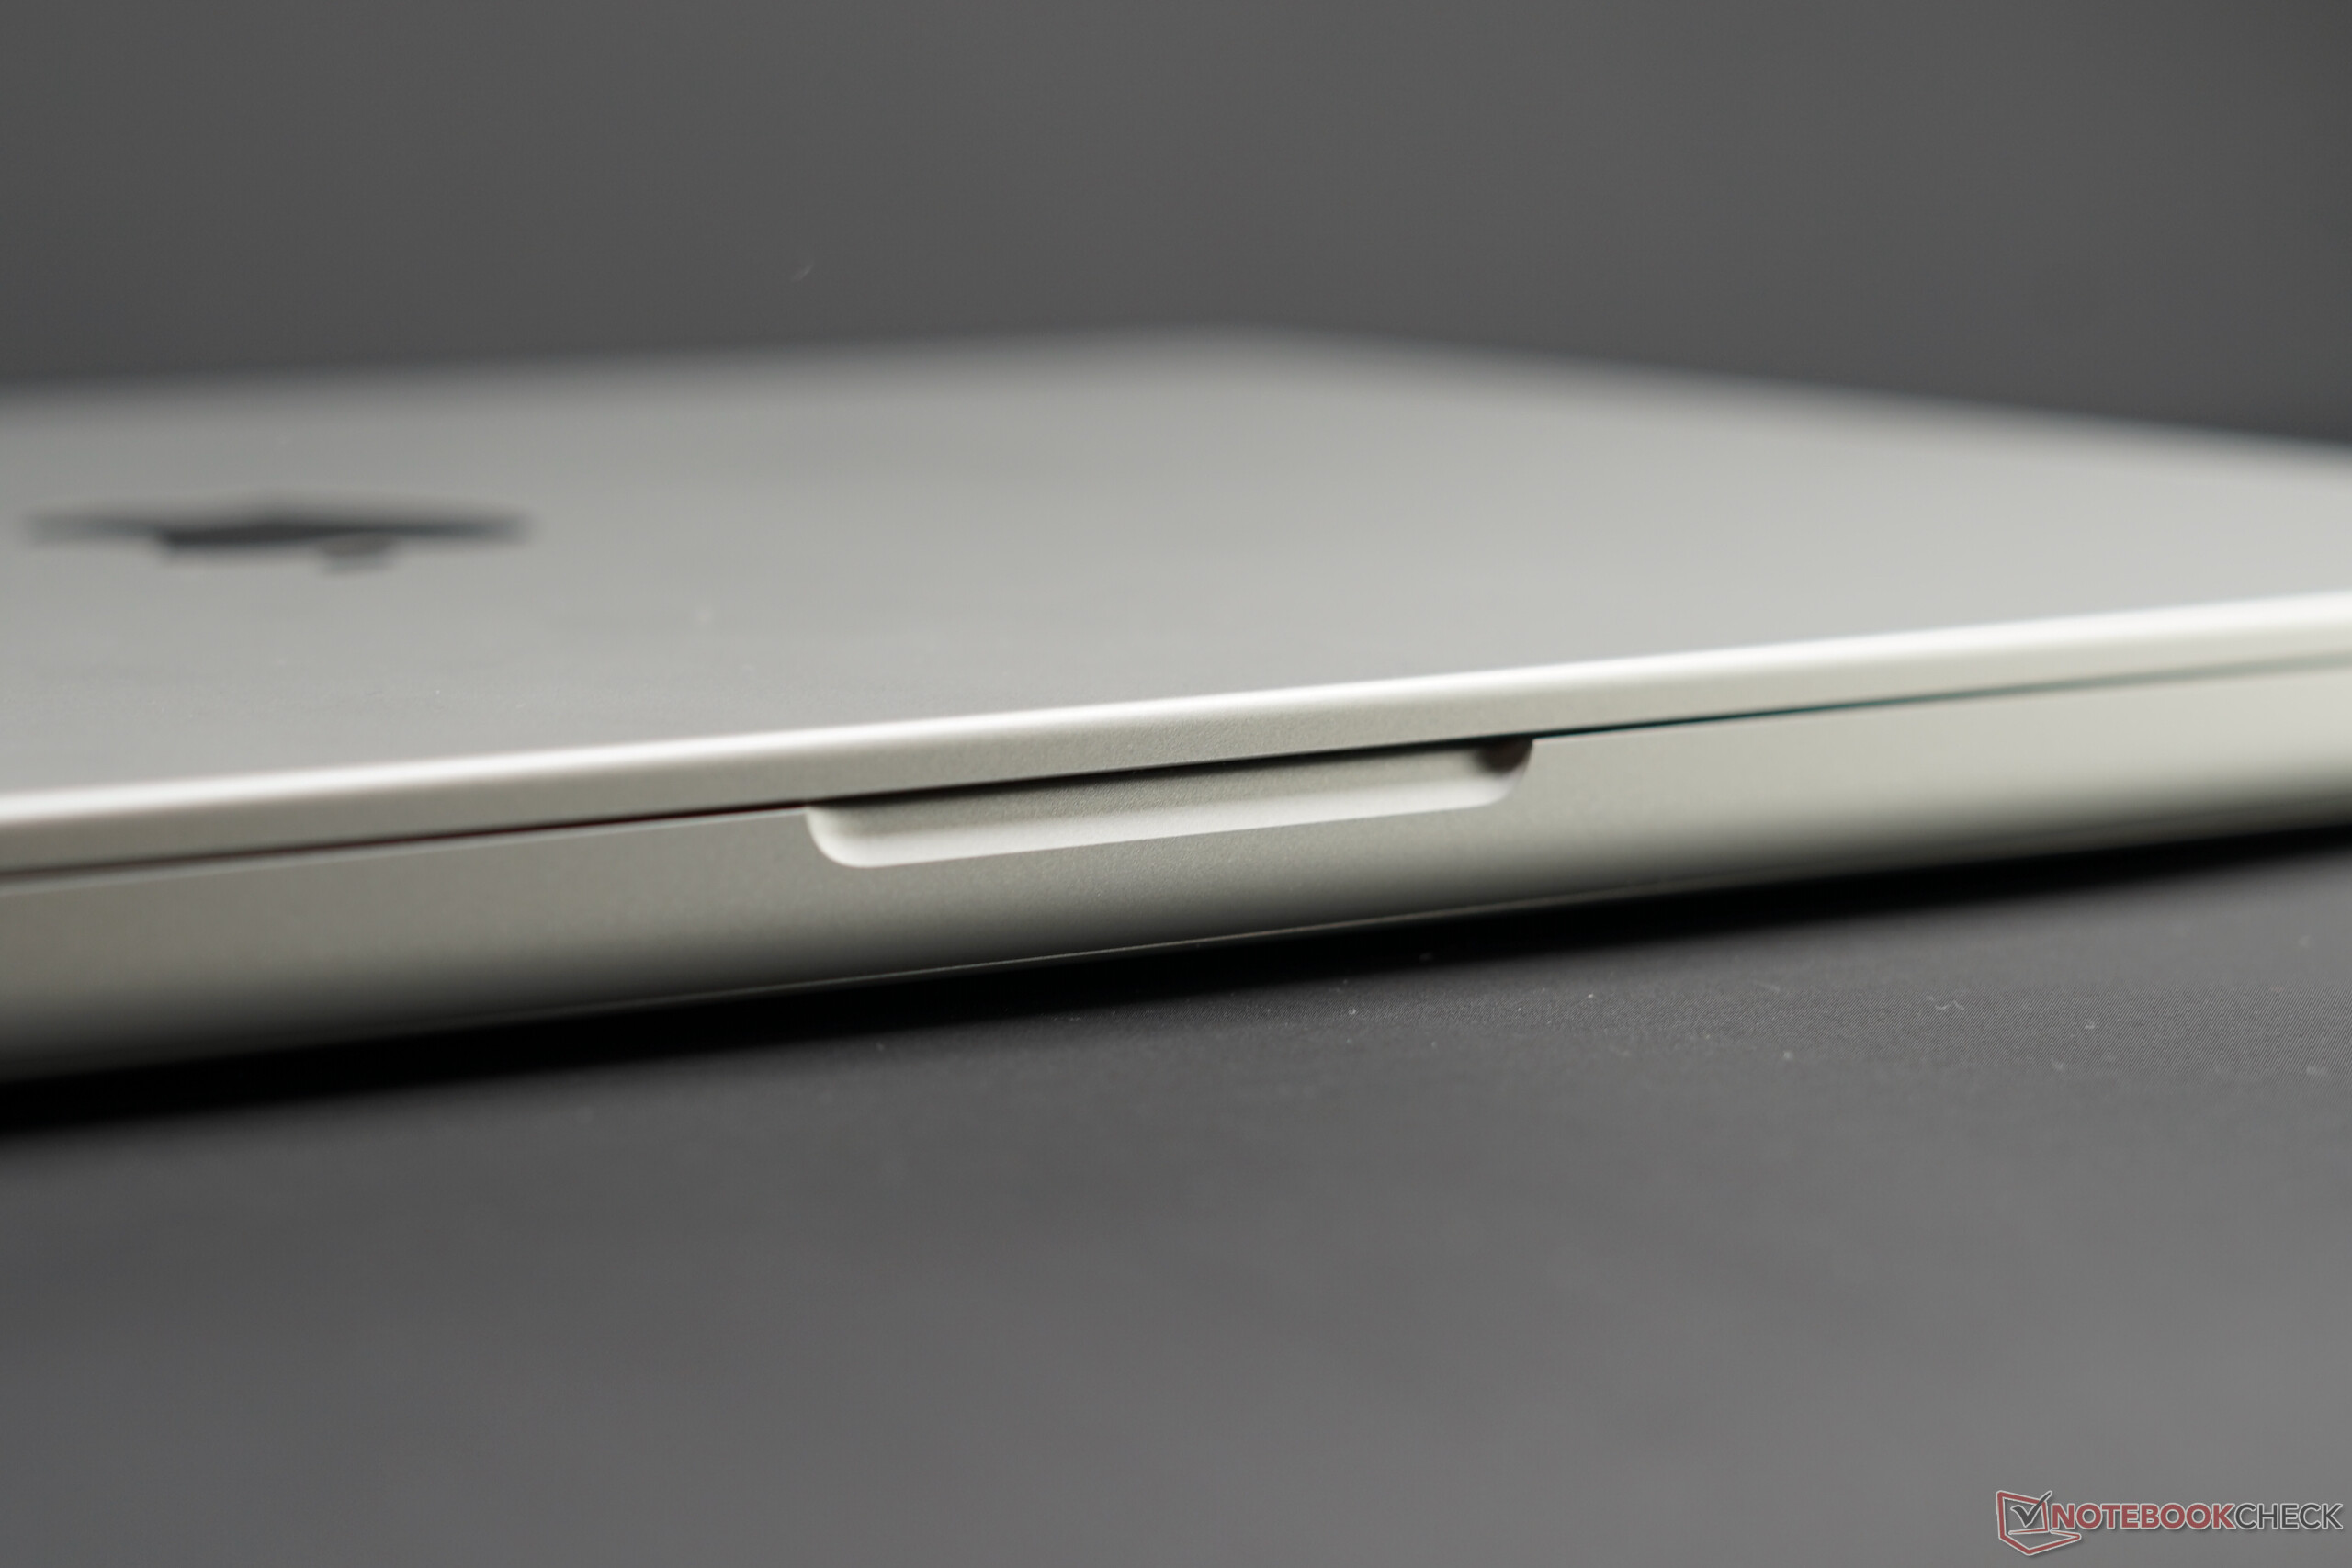
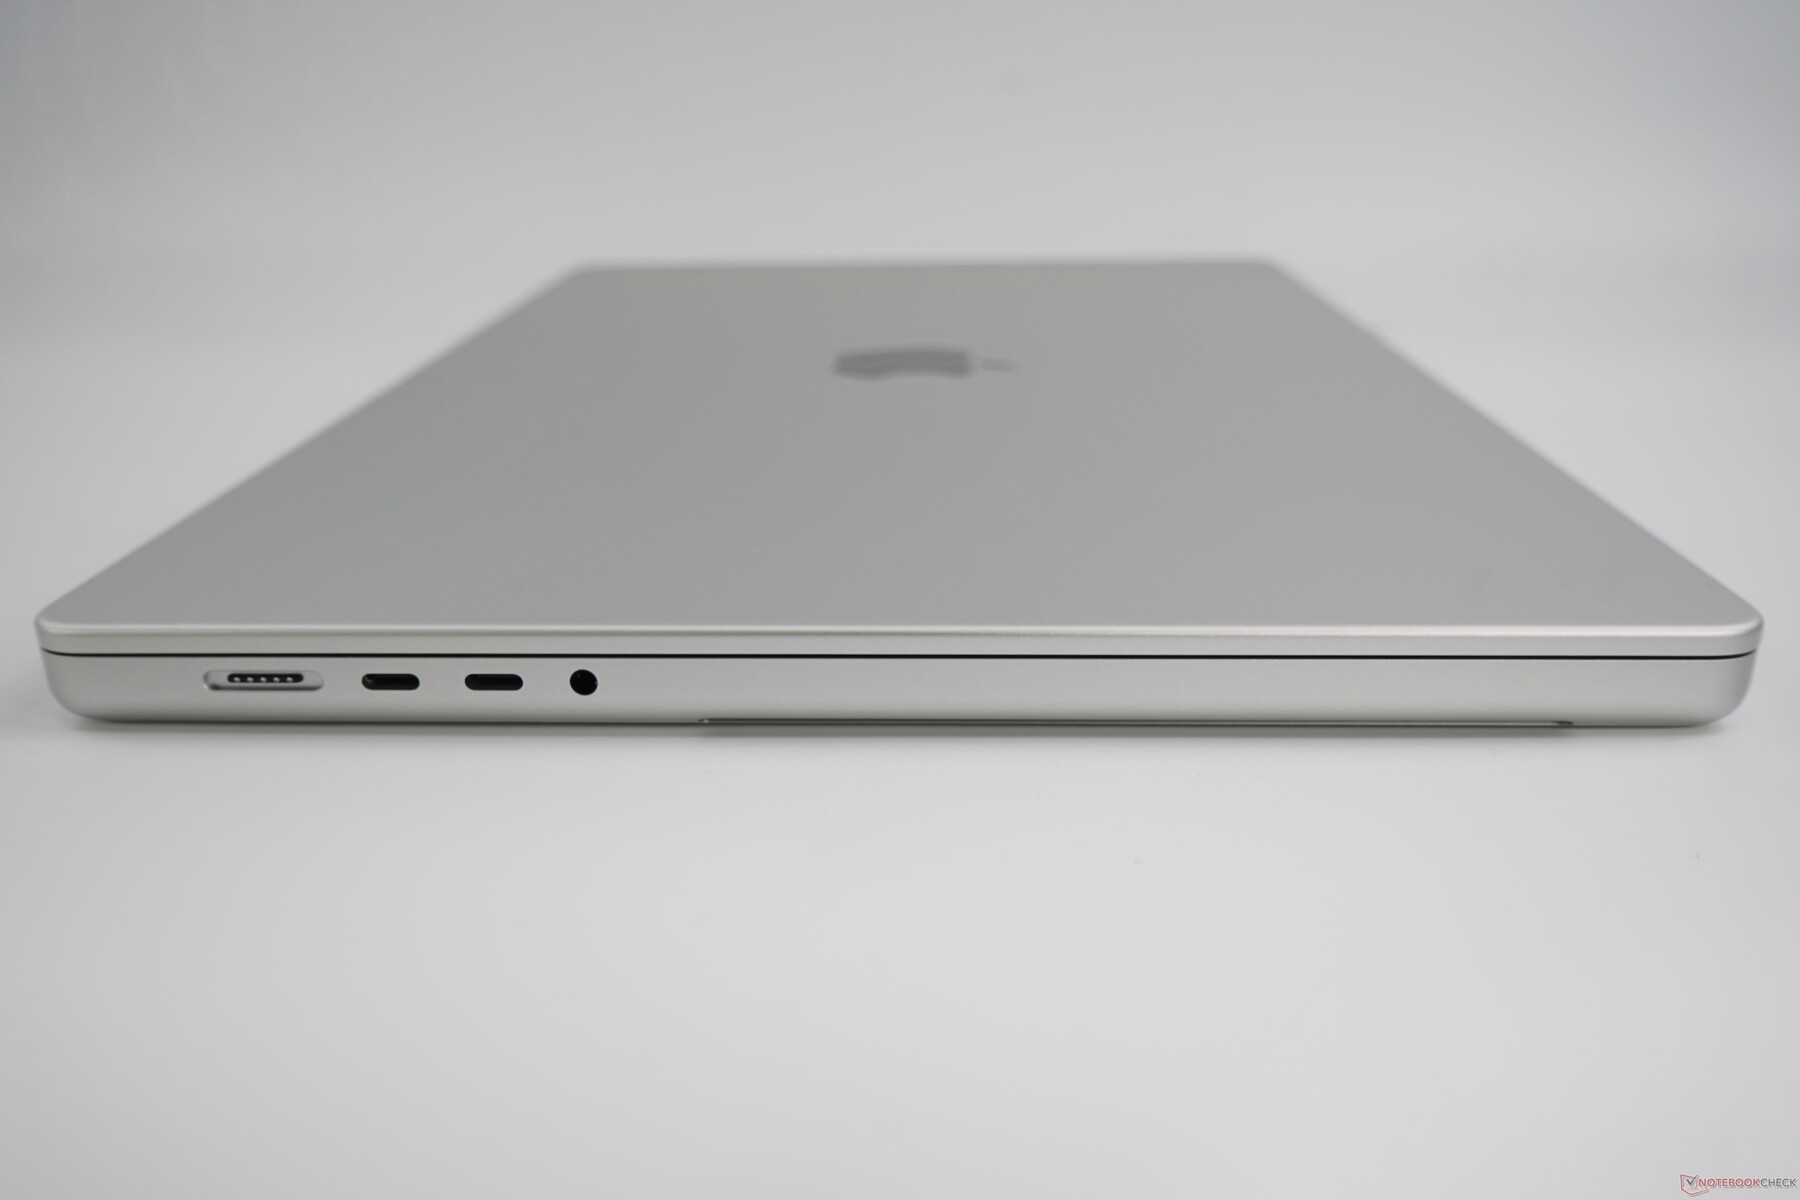
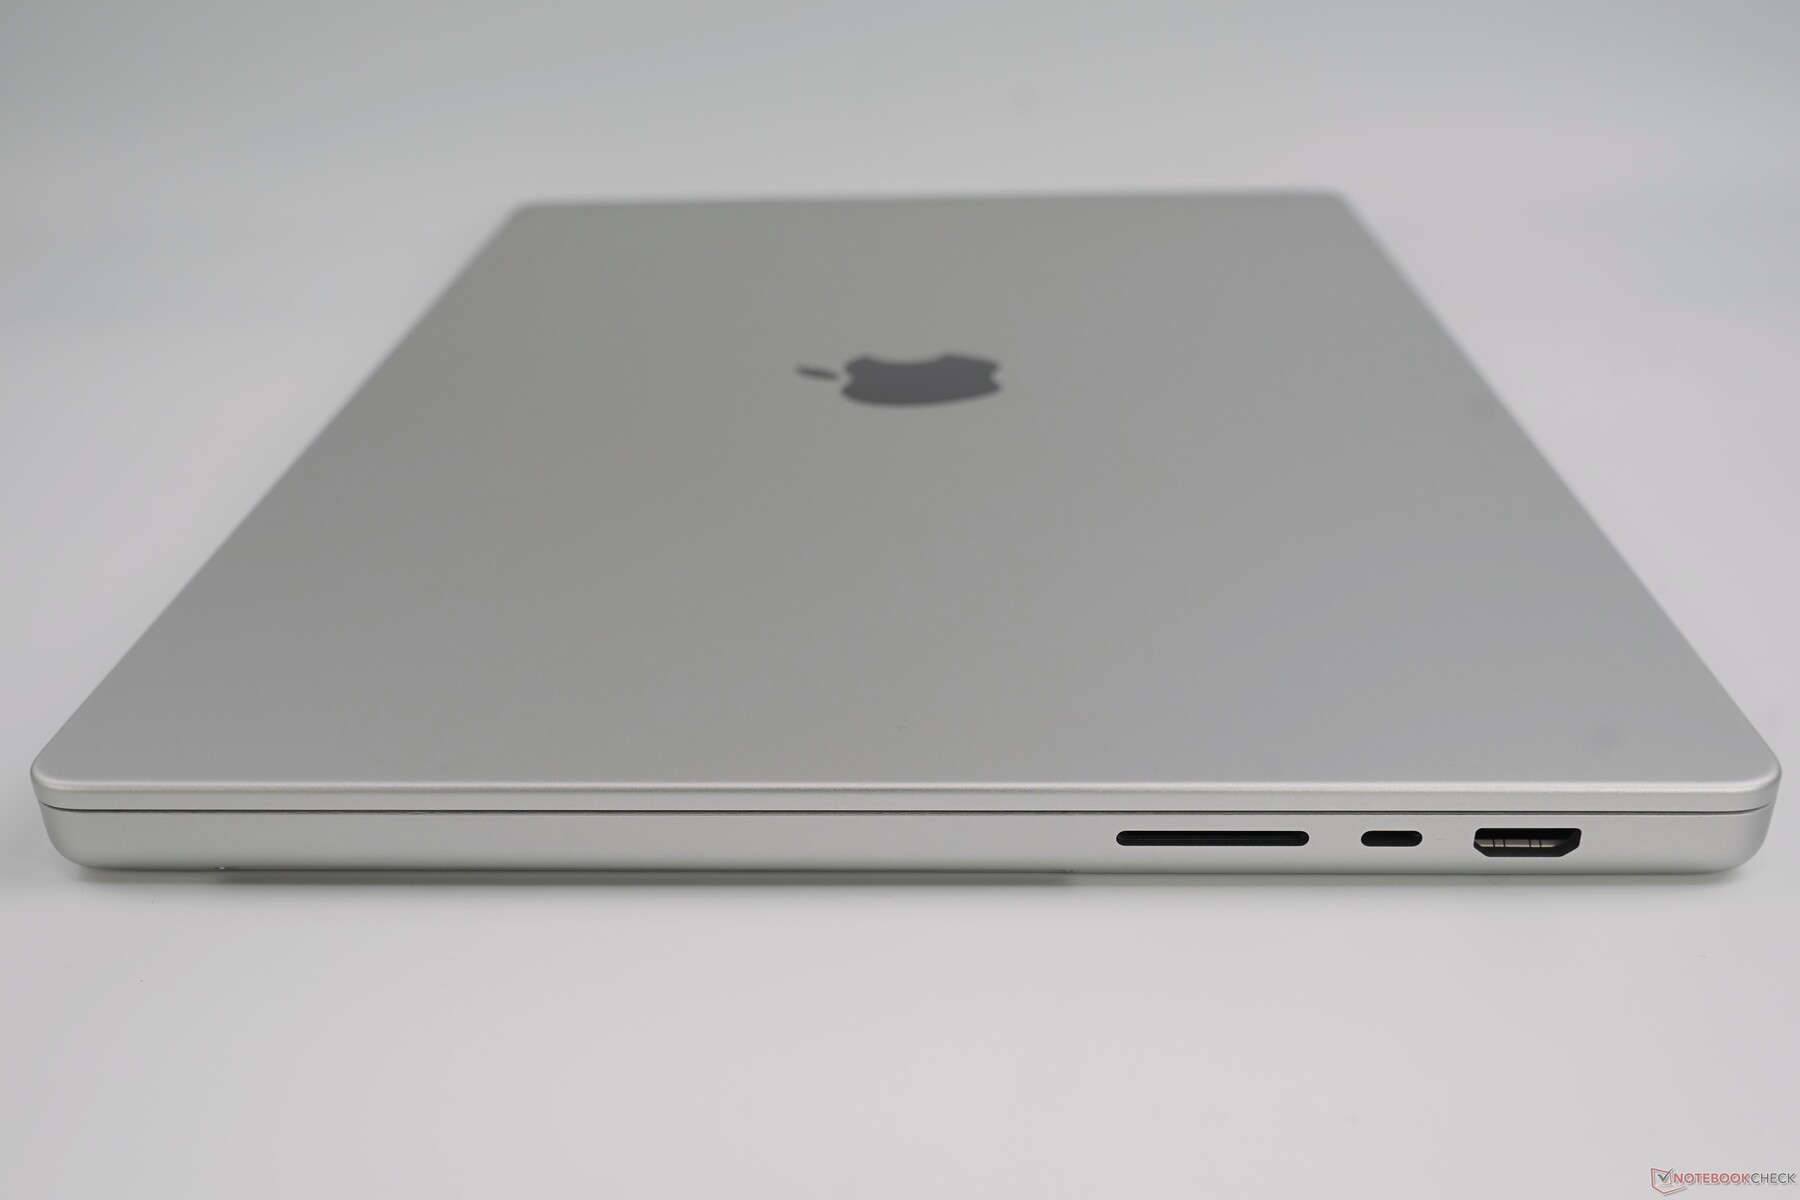
Connectivity - MagSafe is back
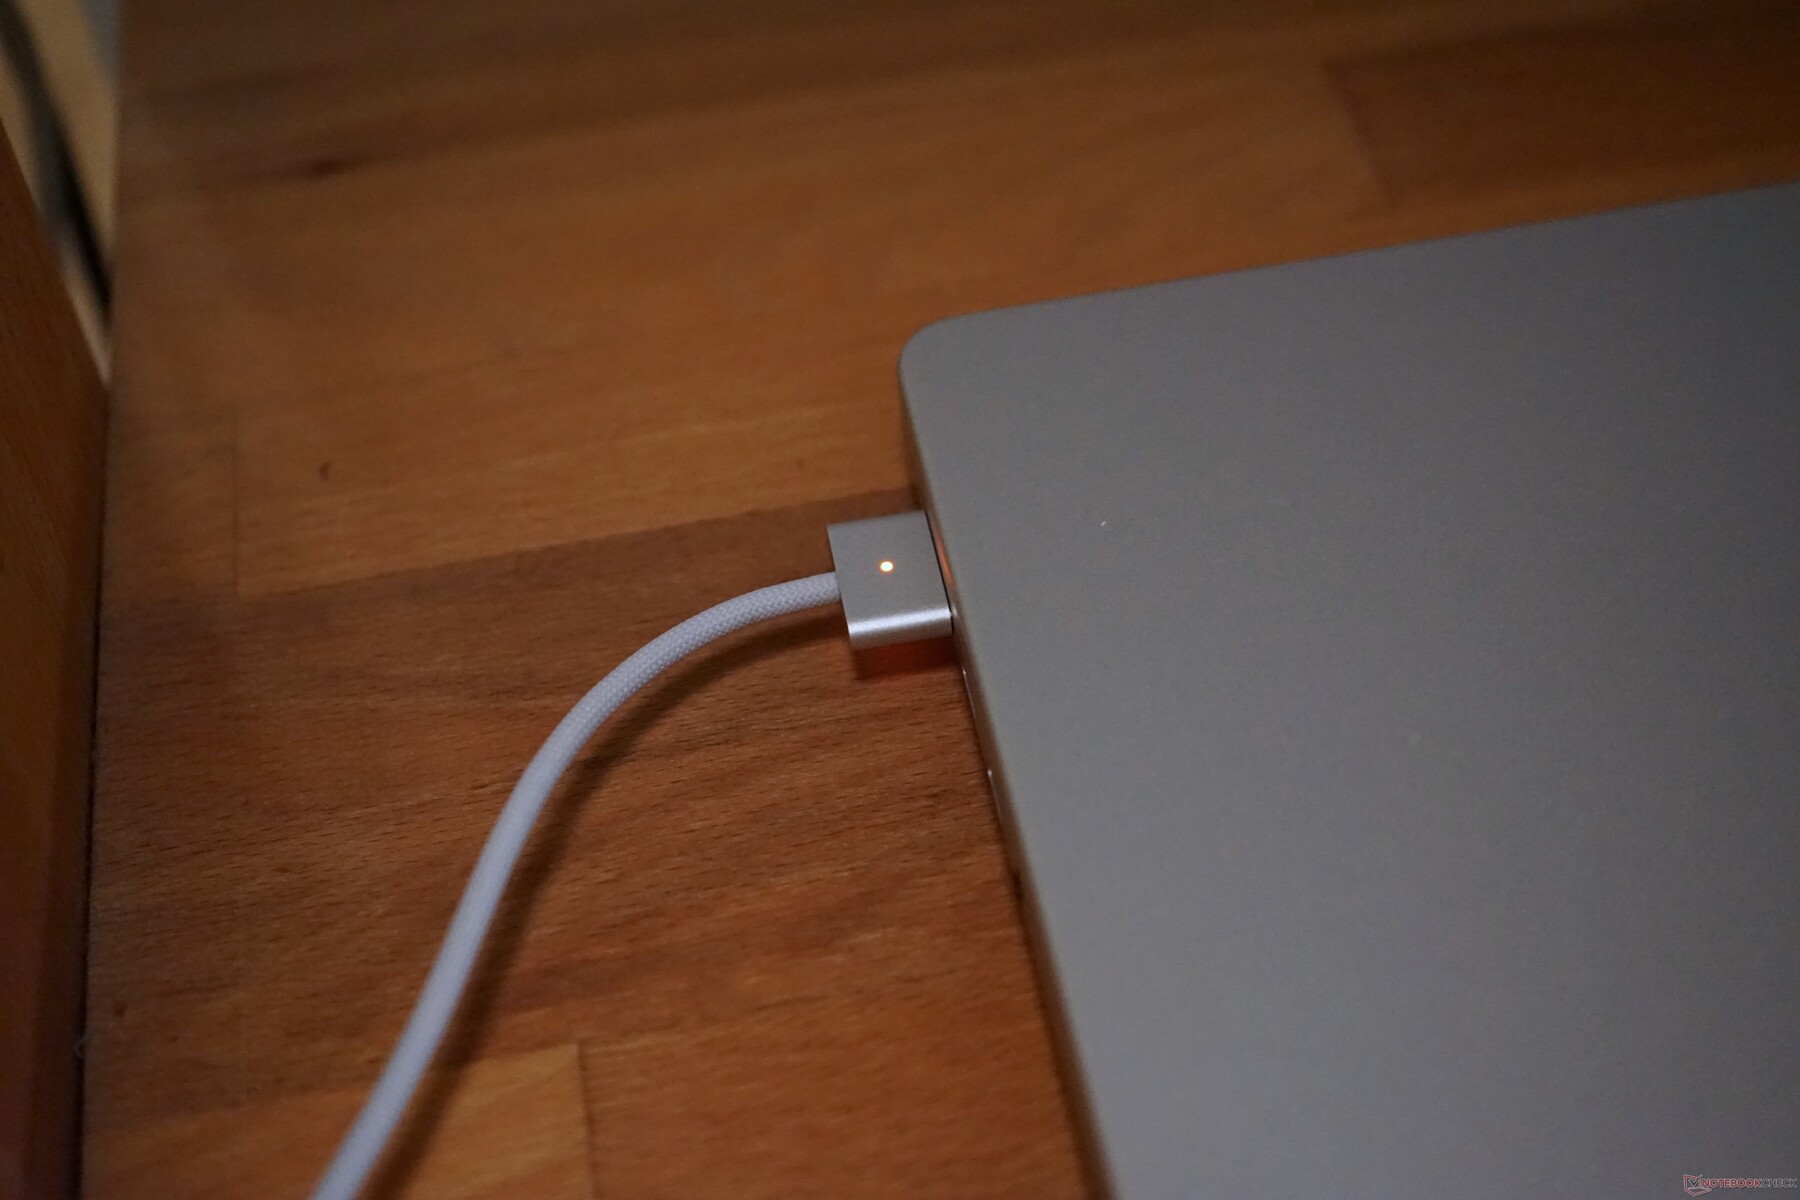
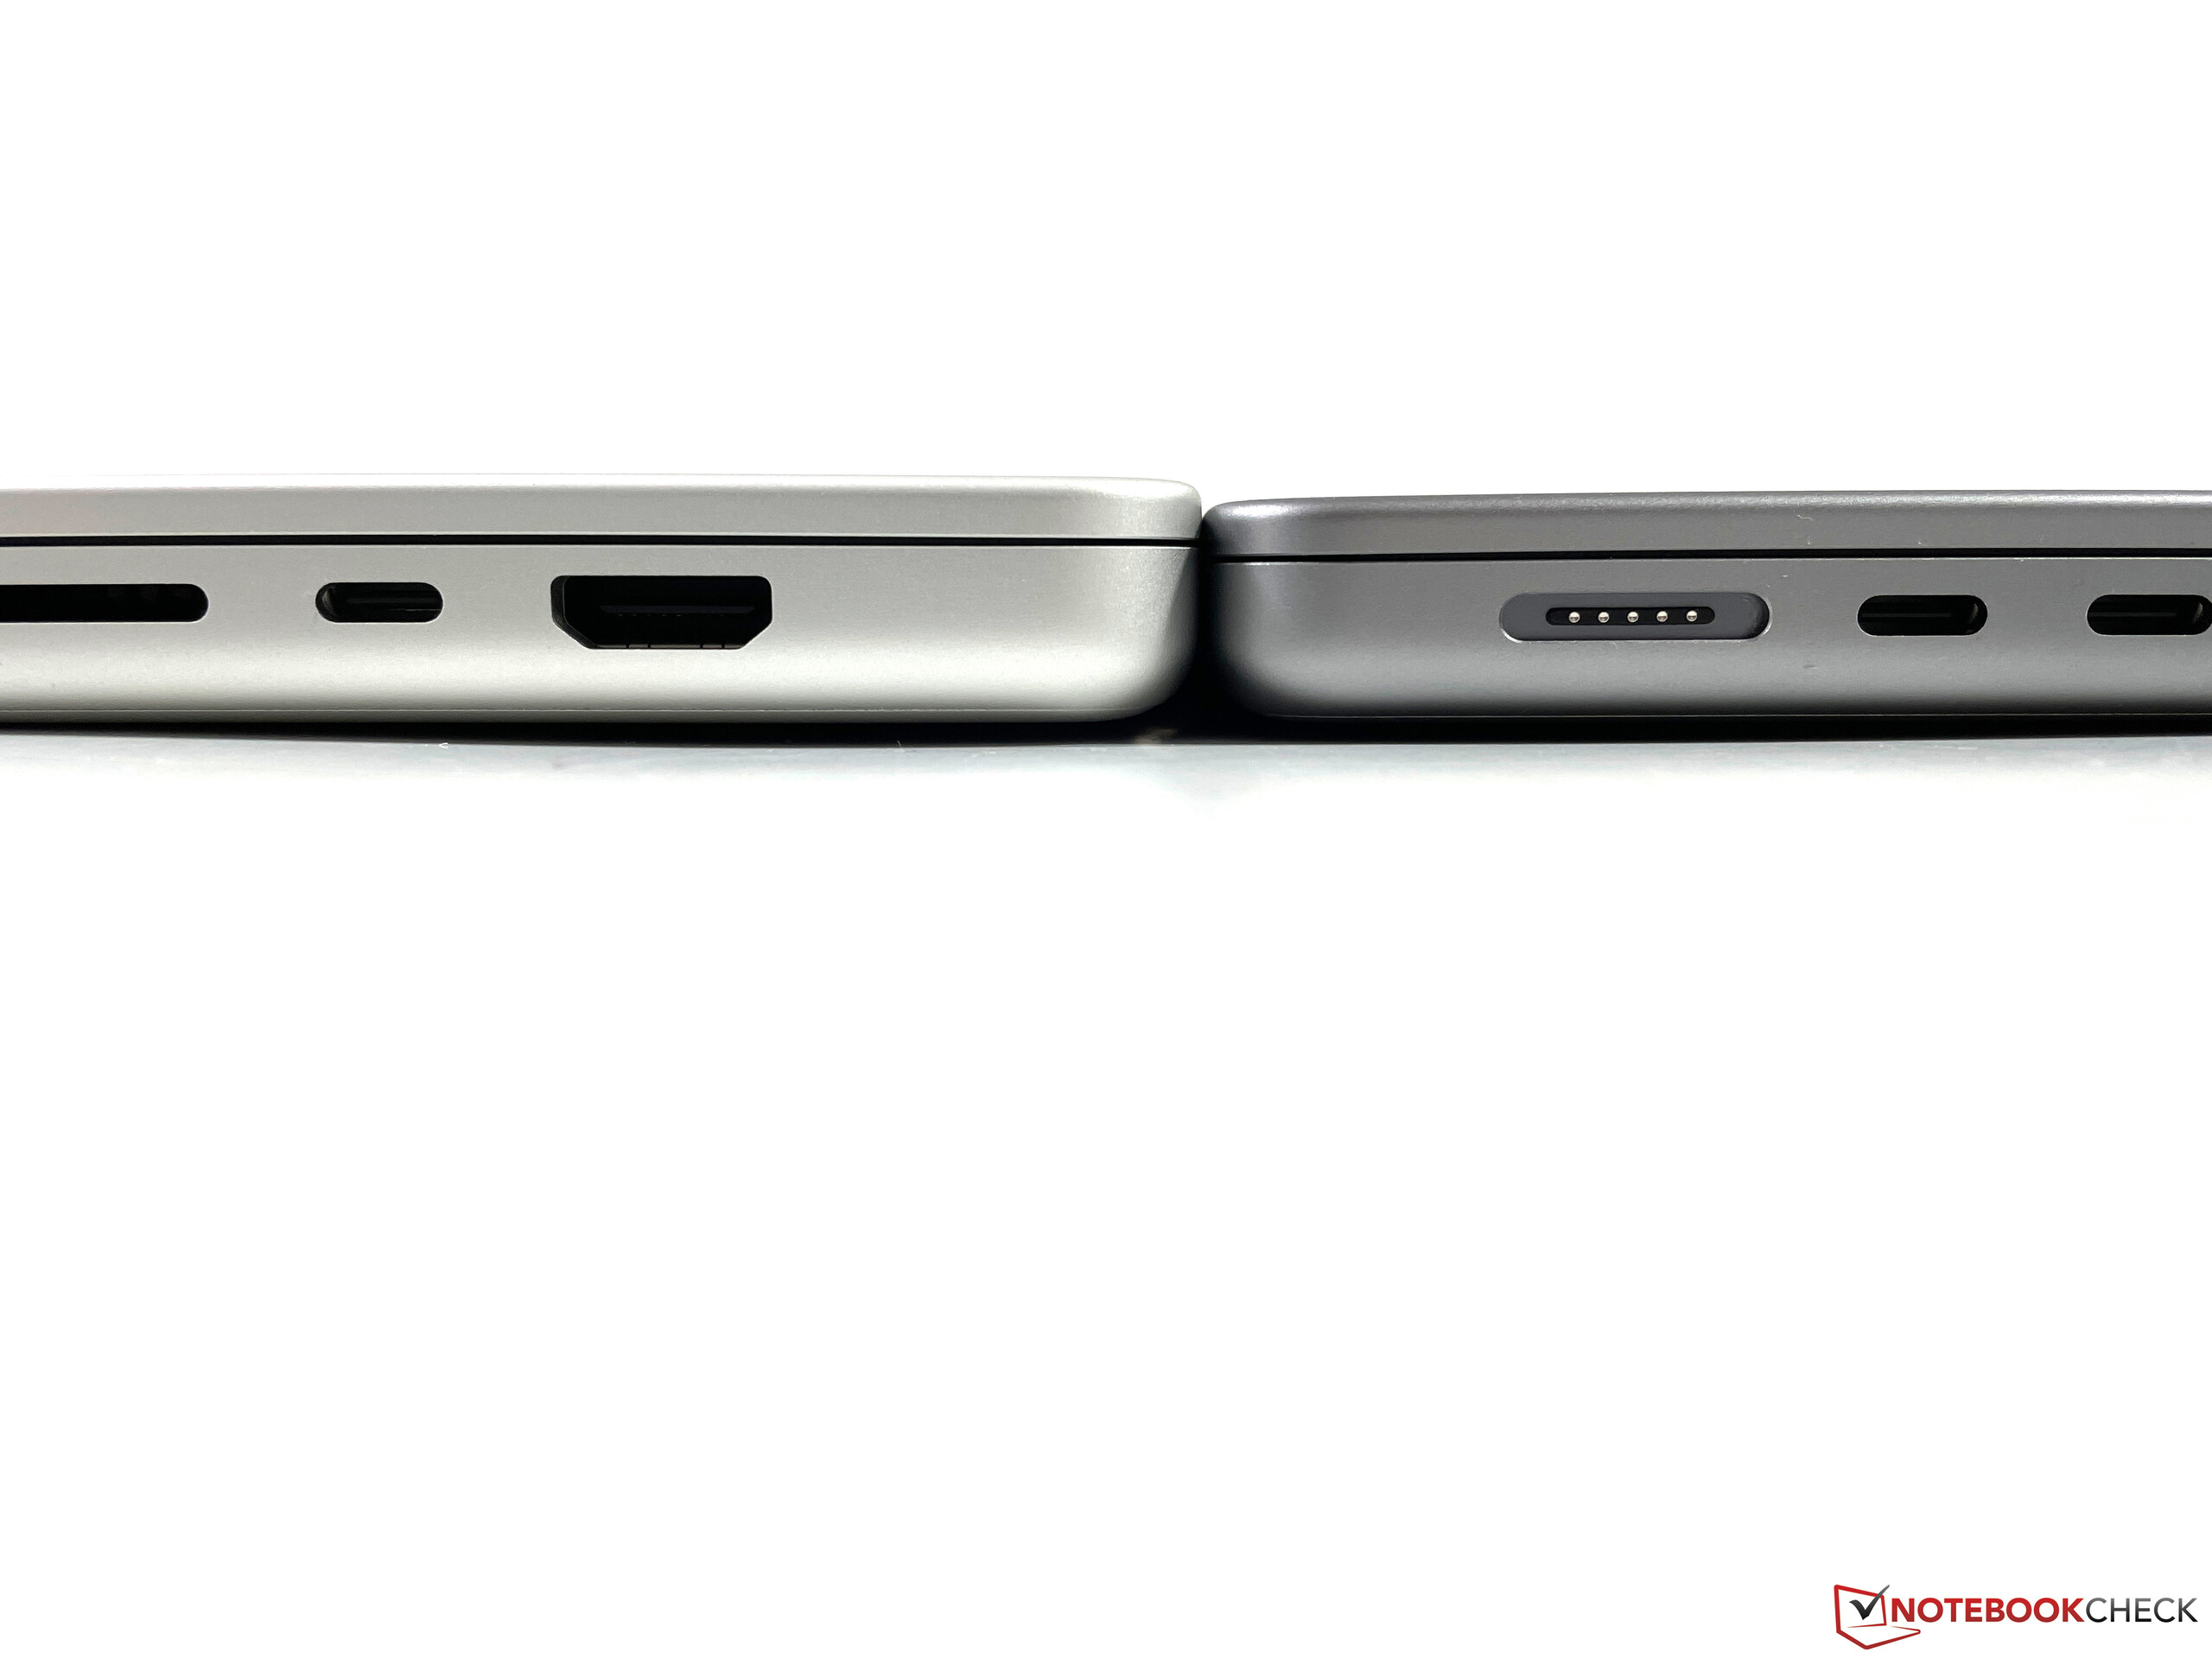
On paper, the new MacBook Pro 16 might have lost one of its Thunderbolt ports, because now you “only” get three instead of four USB-C ports (updated to Thunderbolt 4). However, one of the TB ports was usually blocked by the power adapter anyway, which is now taken care of by the MagSafe connector, which has returned. You can also charge the MBP 16 via USB-C, but only with up to 100 Watts. There are two more familiar connectors with a comeback: The HDMI output as well as the SDXC card reader. A USB-A port would have probably fitted as well, but the lack of it means you will probably require adapters from time to time.
The port standards are only up to date in terms of Thunderbolt 4, while HDMI only supports the 2.0 standard, so the external 4K monitors are limited to 60 Hz. SKUs with the M1 Pro can drive up to two external 4K screens at 60 Hz, while SKUs with the M1 Max can drive up to three external 6K screens (60 Hz) and one additional 4K display (60 Hz).
Each of the Thunderbolt 4 ports is attached via 40 GBit/s interface and we managed to get transfer rates of more than 2.5 GB/s with an external SSD. There are still some issues with external displays and docking stations (transfer rates are limited to USB 3.0 speeds), but this is caused by the new macOS Monterey.
SD Card Reader
We determine maximum transfer rates of 121 MB/s when we copy pictures from our reference card (Angelbird AV Pro V60 UHS-II). There is still room for improvement here, because rivals like the Dell XPS 15 or Lenovo's ThinkPad P1 G4 manage higher transfer rates.
| SD Card Reader - average JPG Copy Test (av. of 3 runs) | |
| Dell XPS 15 9510 11800H RTX 3050 Ti OLED (AV Pro V60) | |
| Lenovo ThinkPad P1 G4-20Y30017GE (AV PRO V60) | |
| Average of class Multimedia (23 - 531, n=40, last 2 years) | |
| Apple MacBook Pro 16 2021 M1 Pro (Angelbird AV Pro V60) | |
| HP ZBook Studio 15 G8 (AV Pro V60) | |
Communication
Apple’s MacBook Pro 16 does not support the latest Wi-Fi 6E standard, which is getting more common among high-end laptops. The manufacturer lists a maximum transfer speed of 1.2 Gbps, which means it only supports 80 MHz Wi-Fi connections. There can be slight differences depending on the router (ASUS ROG Rapture managed slightly better transfer rates than our reference router Netgear Nighthawk RAX120), but the Windows competition with 160 MHz support definitely has an advantage in this regard.
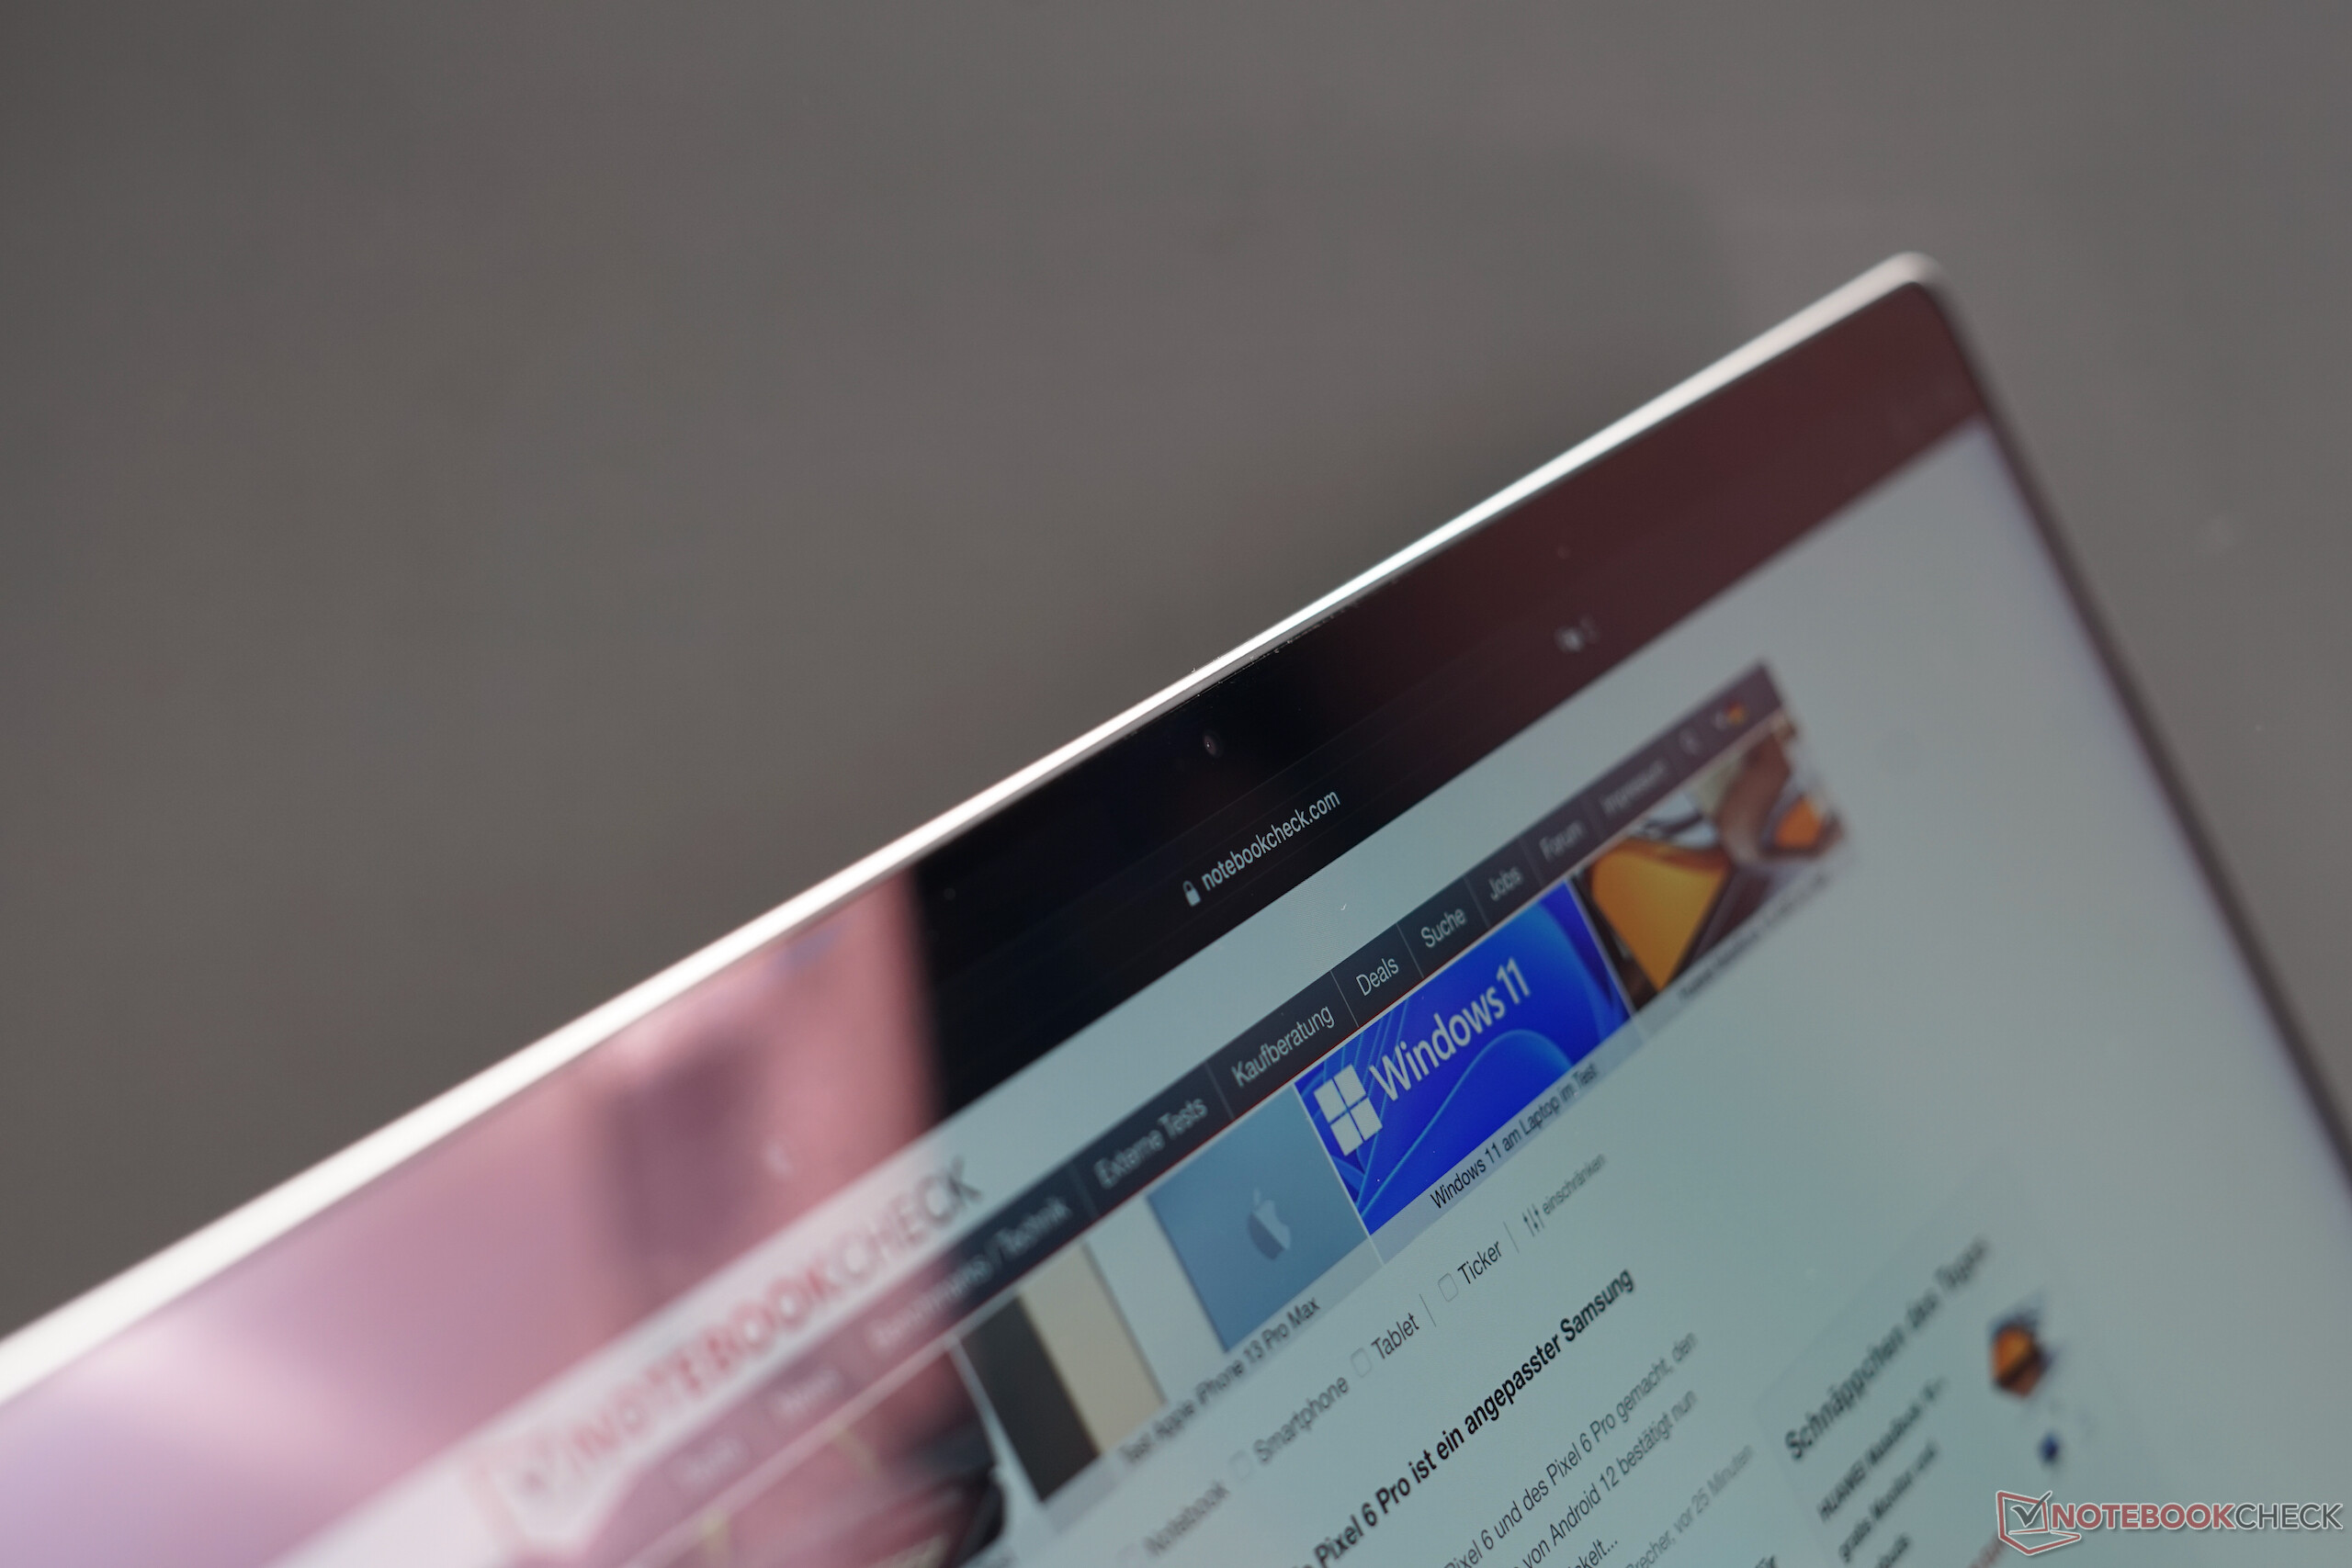
Webcam
The notch accommodates a 1080p webcam with a wider aperture (f/2.4). The quality is better compared to the old 720p models and the image processing of the M1 SoC helps as well, but it is still a bit sobering if you look at the front cameras of iPhones and iPads. The Center Stage feature of the iPads is not available as well and Apple does not equip the MacBook Pro with a Face ID module, either.


Accessories
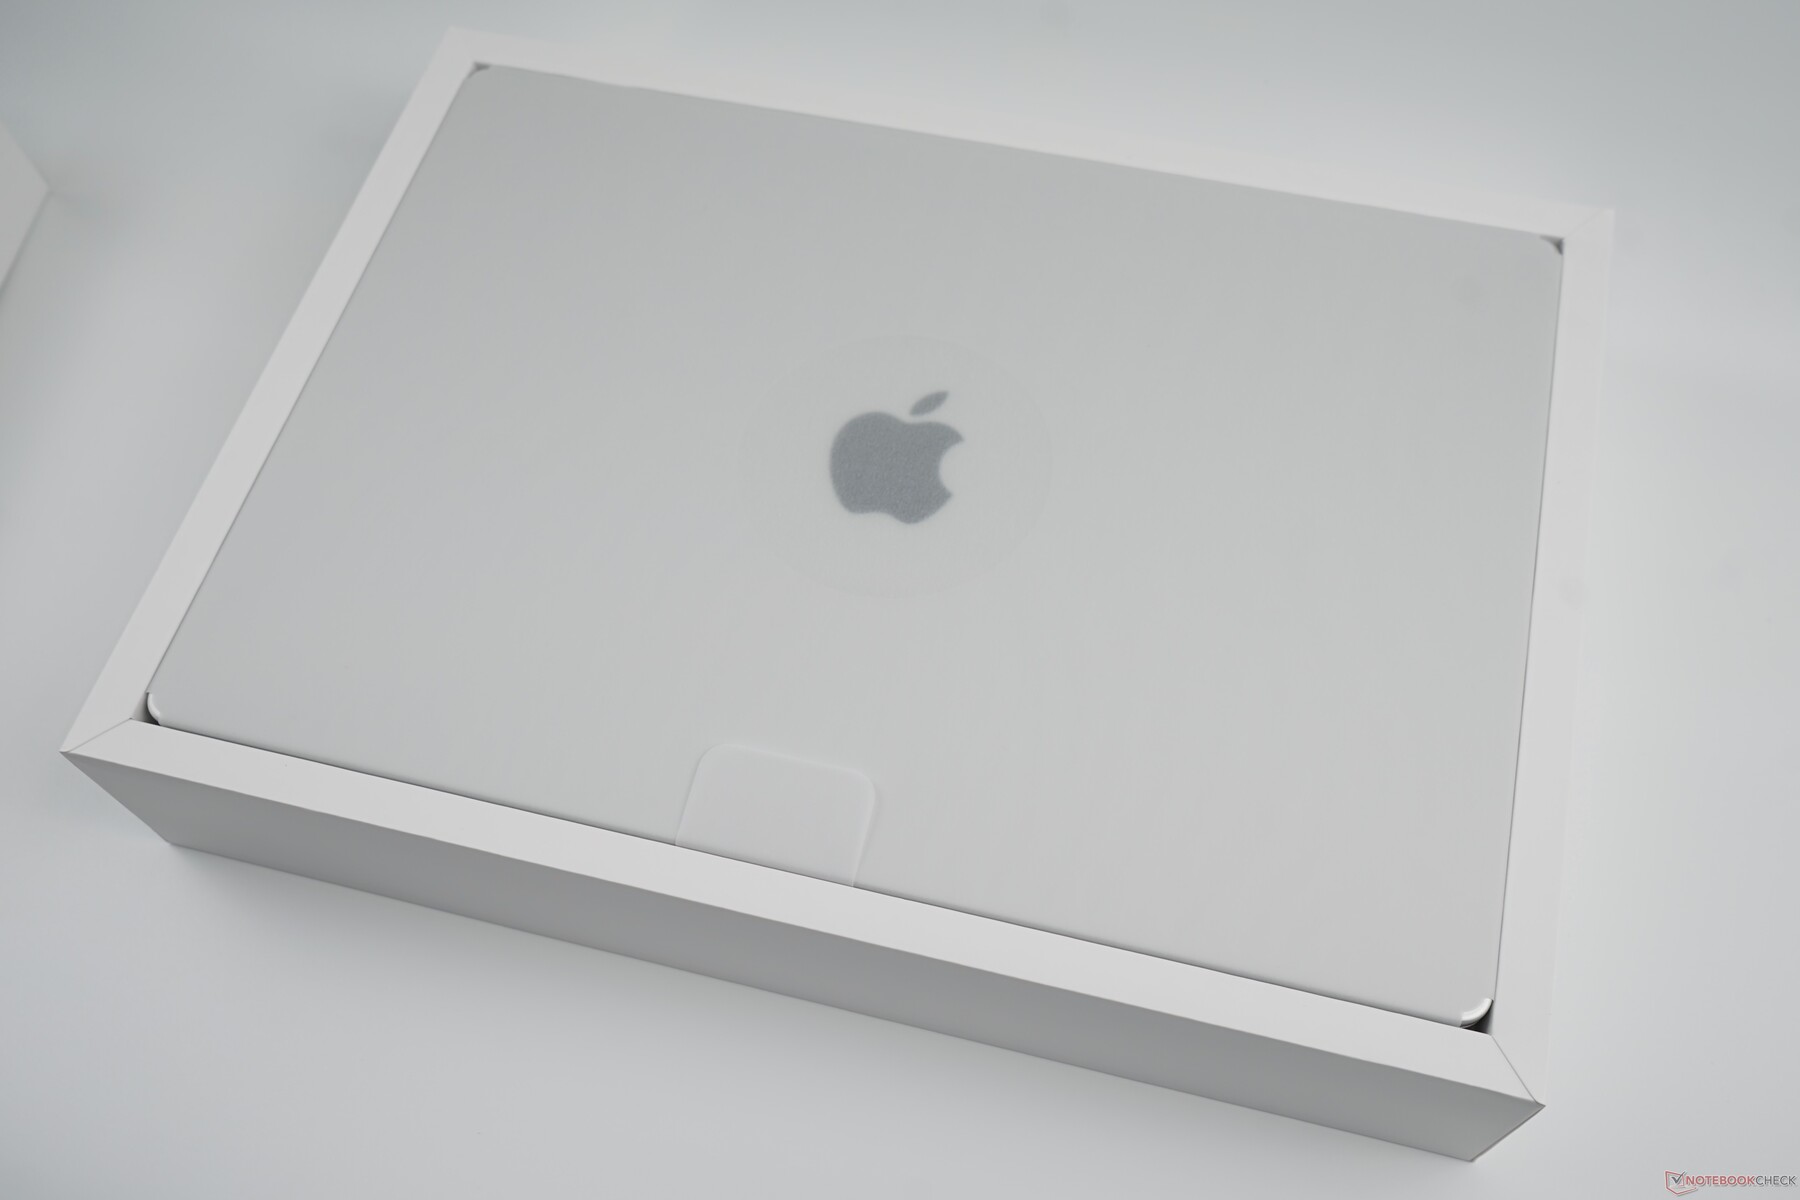
Apple ships all models of the MacBook Pro 16 with a 140 W power adapter and a charging cable (USB-C to MagSafe 3, two meters). Except for some service brochures and two black Apple logo stickers, there are no accessories in the box.
Maintenance
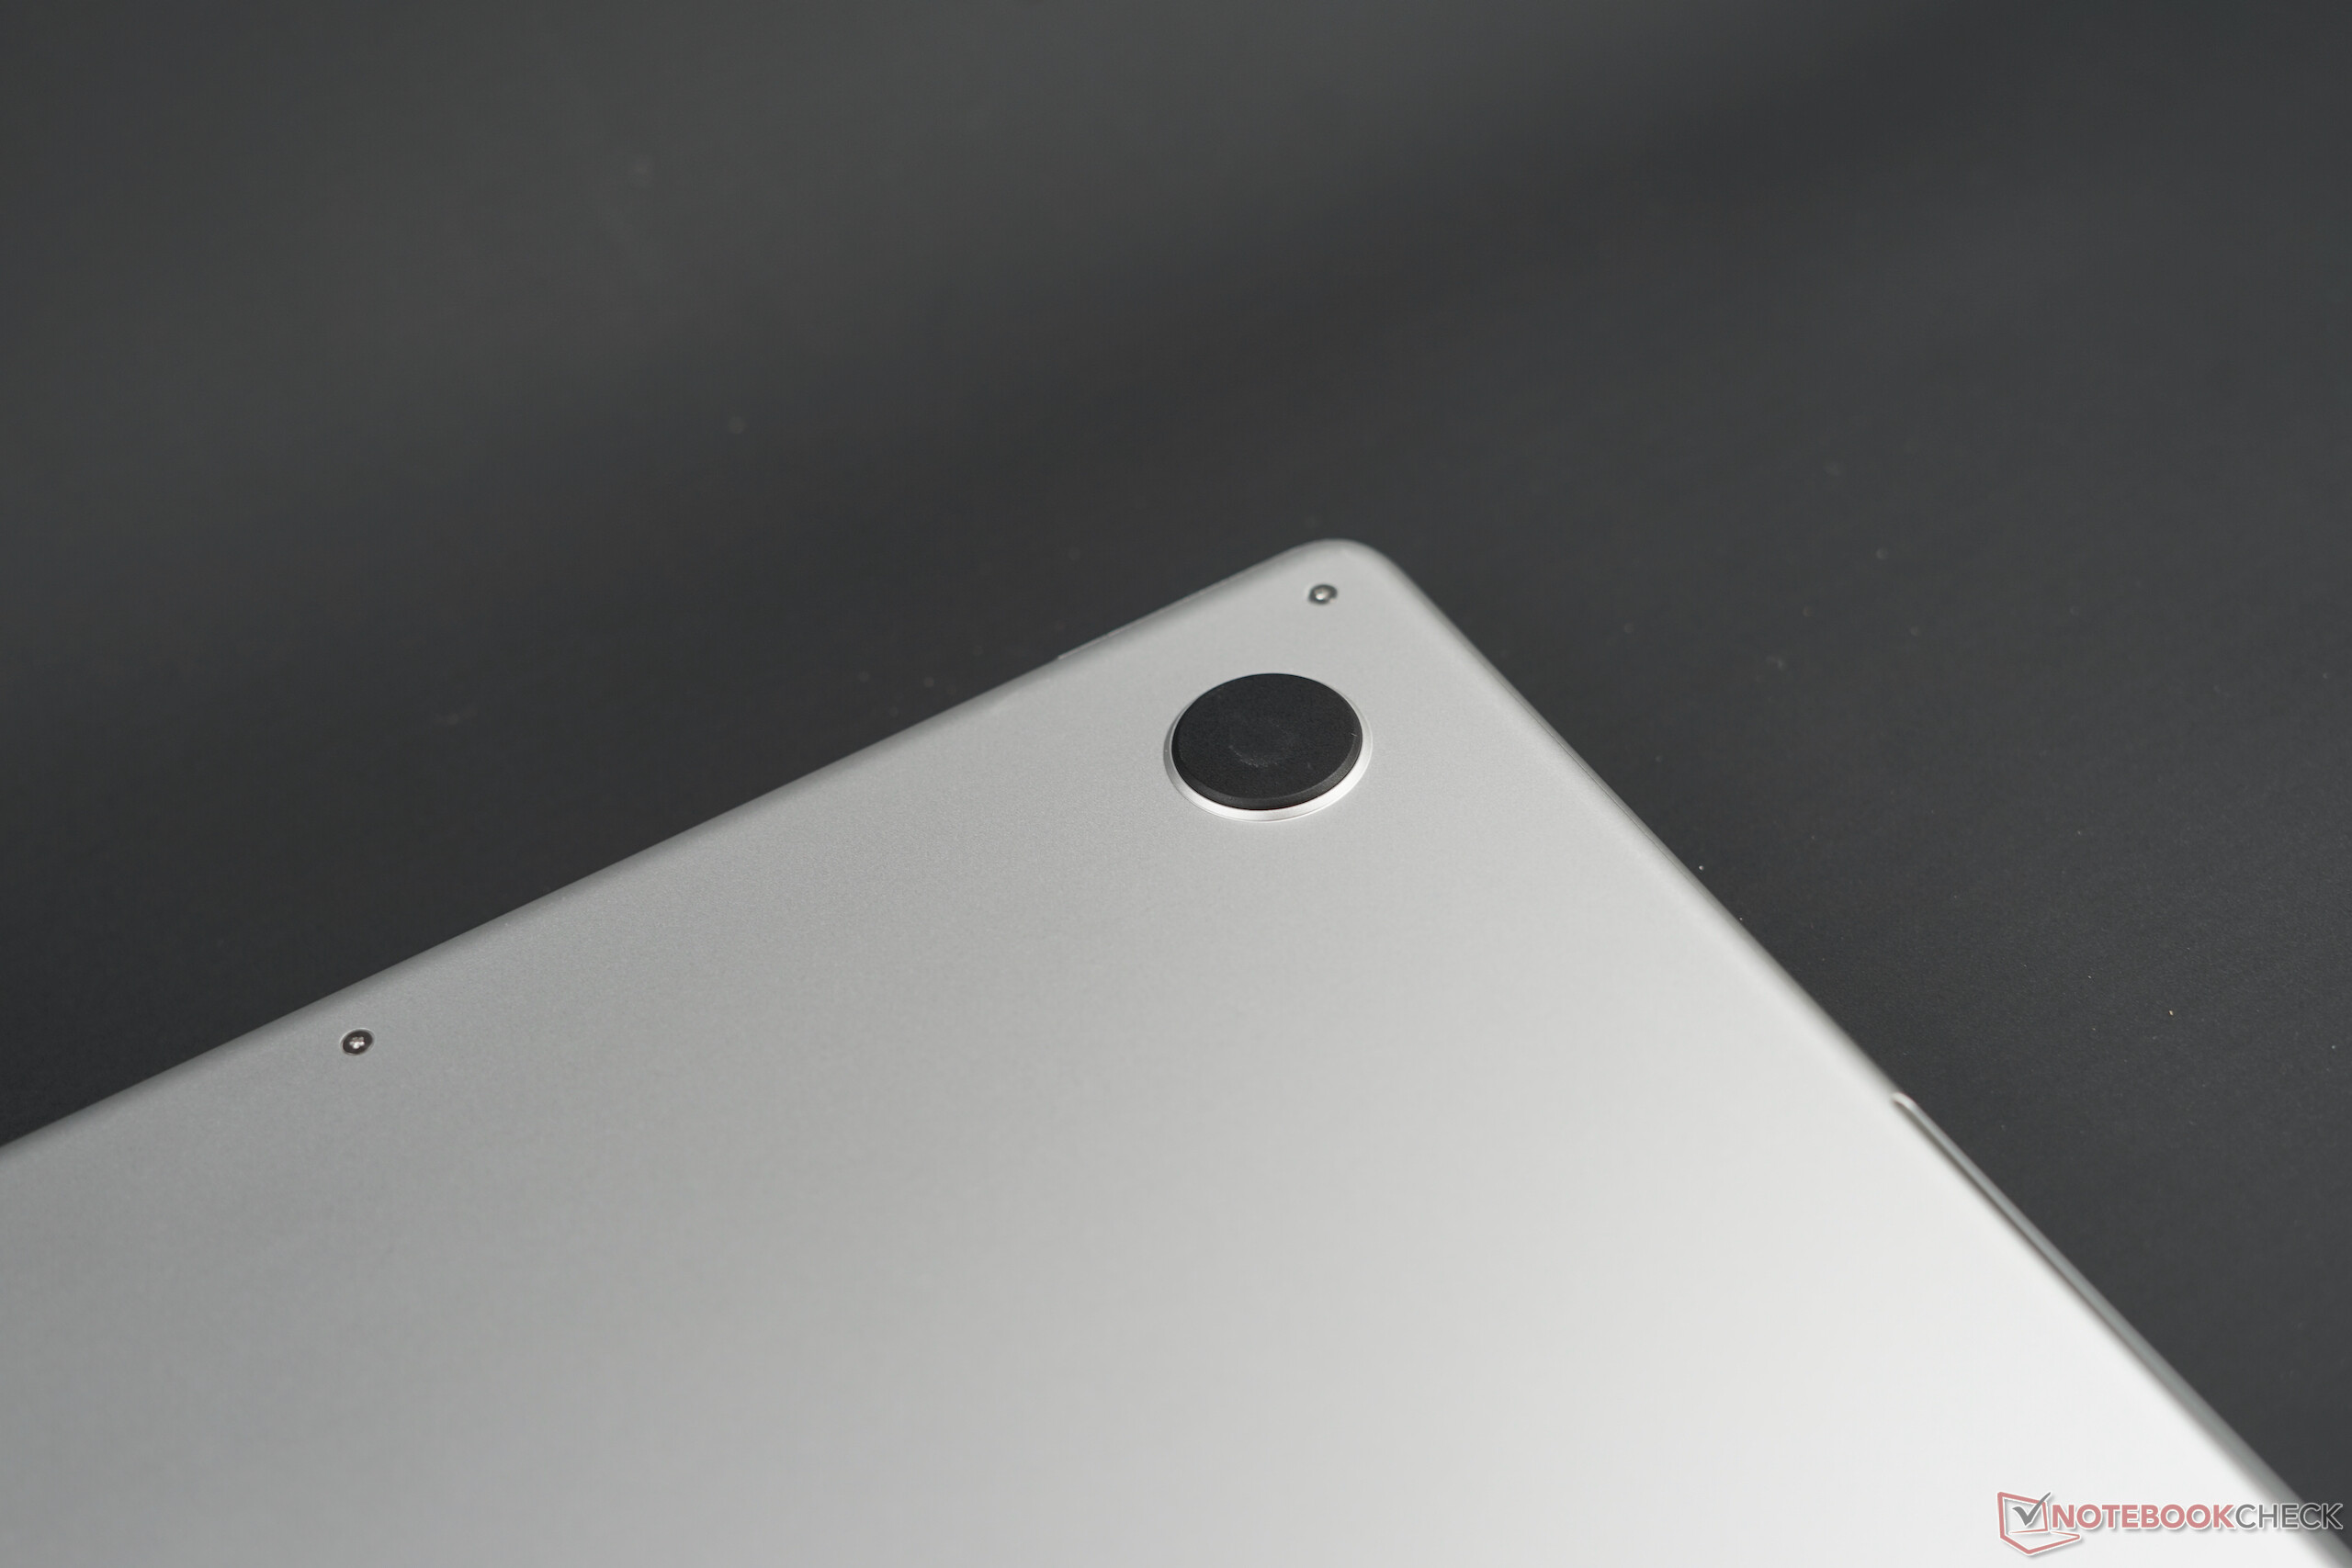
As per usual, the bottom panel is secured by pentalobe screws and is pretty easy to remove. You will have to push the cover to the front, which can be a tricky when you want to put it back. You can clean the two fans, but that’s about it. According to our colleagues from iFixit, the battery is now easier to replace and the ports are not soldered, either.
Warranty
The warranty period is just one year. You can add two more years for an additional 399 Euros (~US$457).
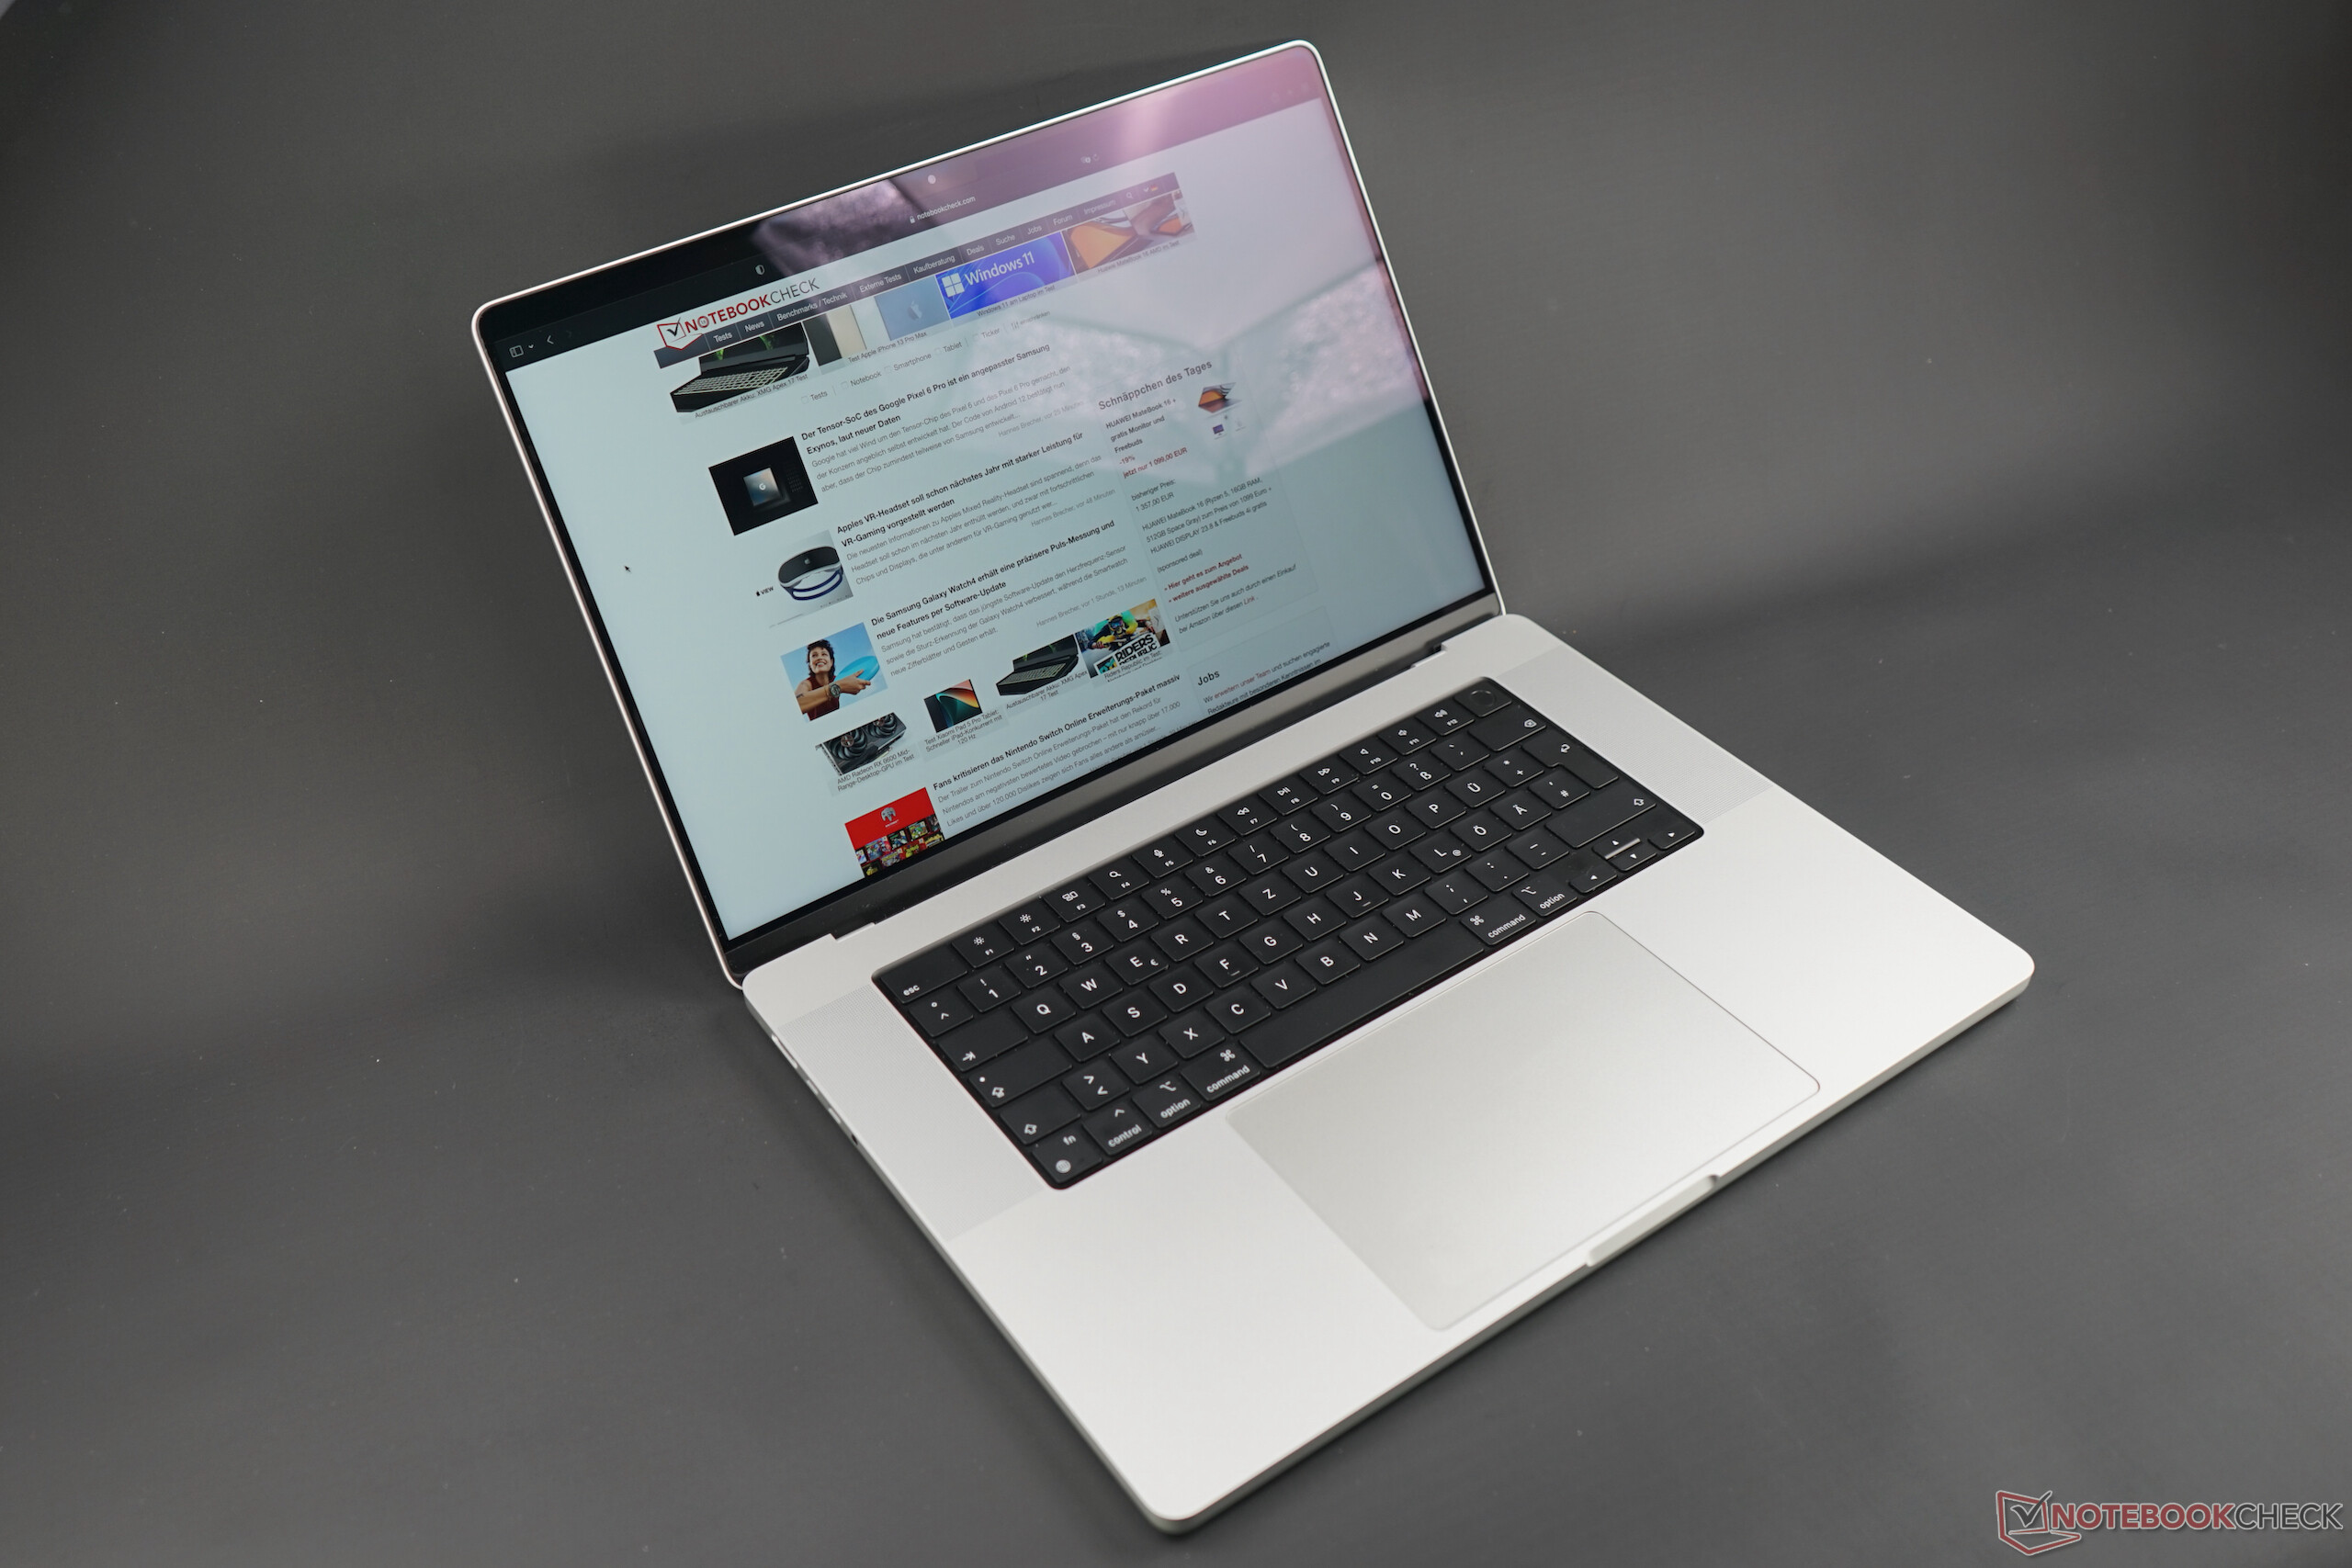
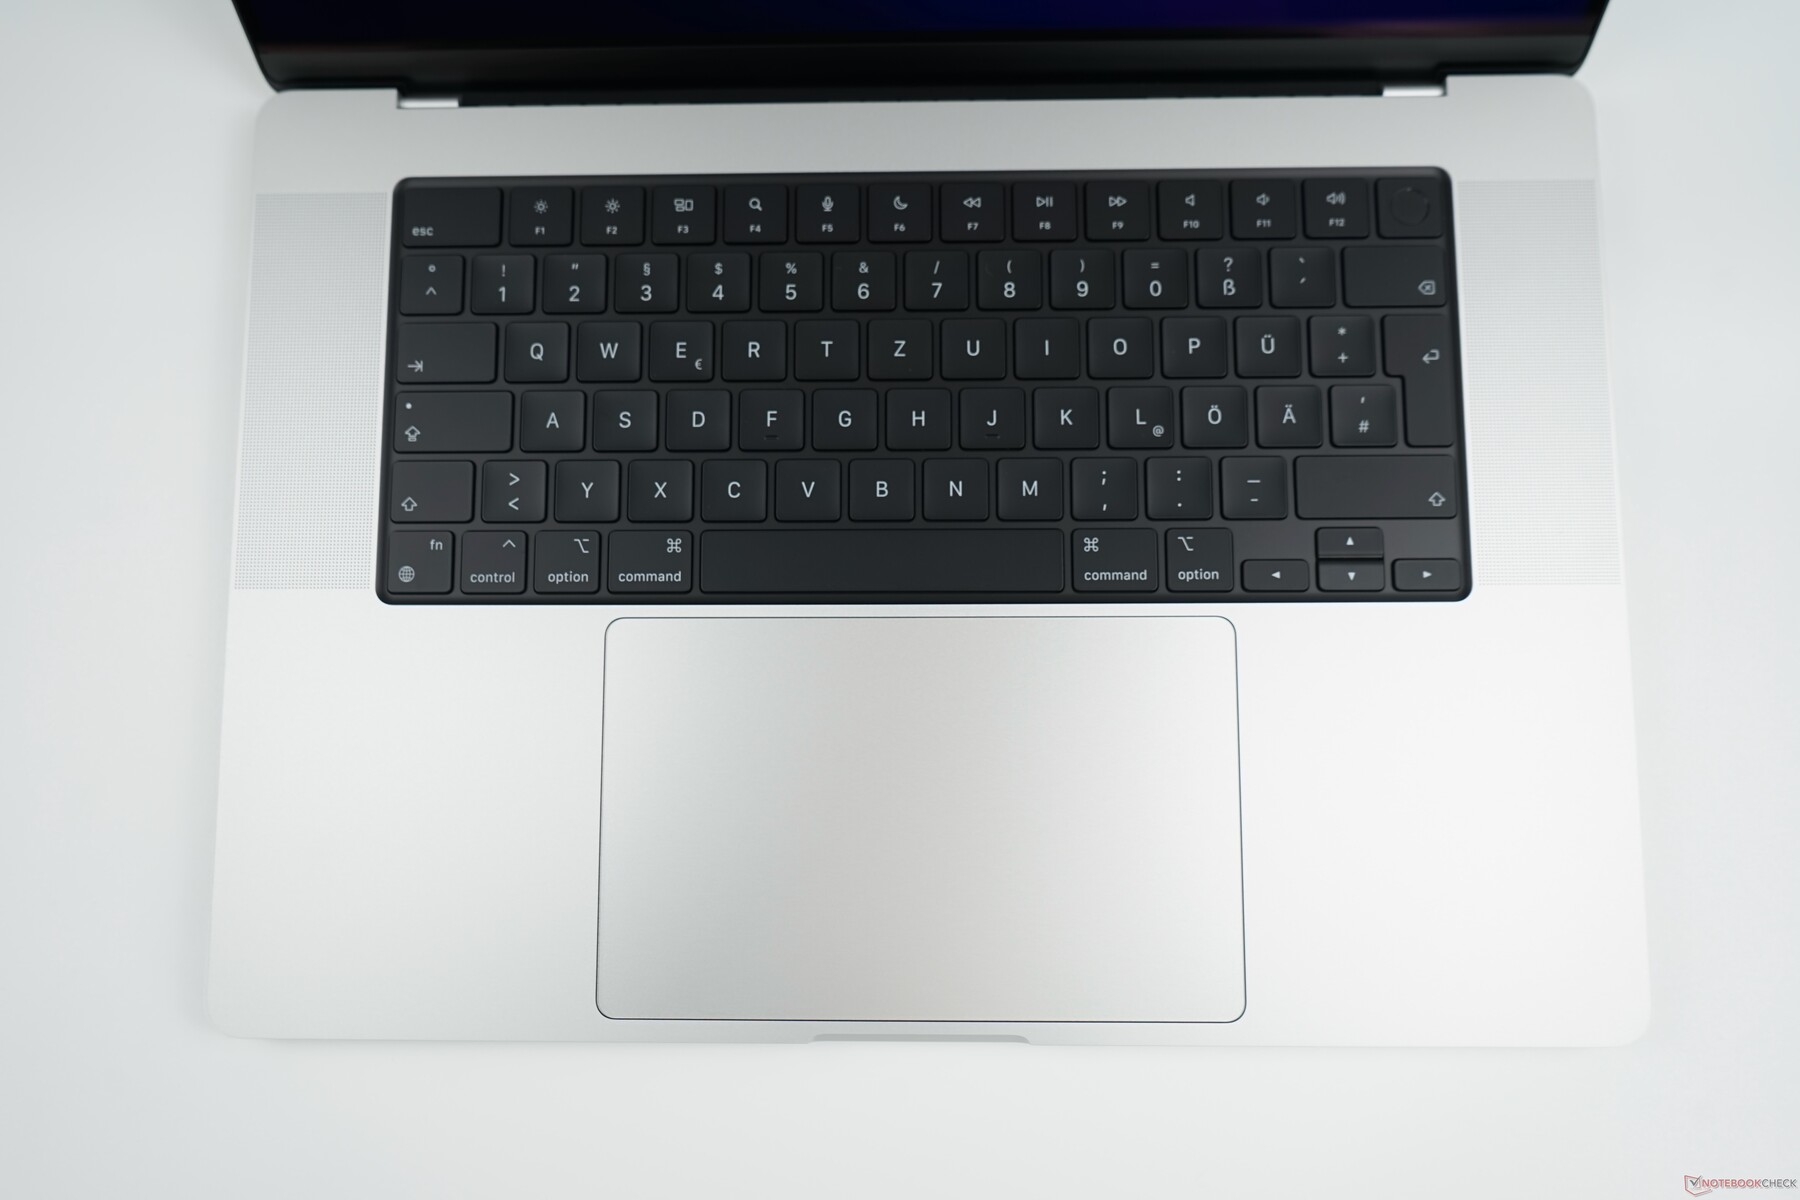
Input Devices - Magic Keyboard and Touch-ID
Keyboard
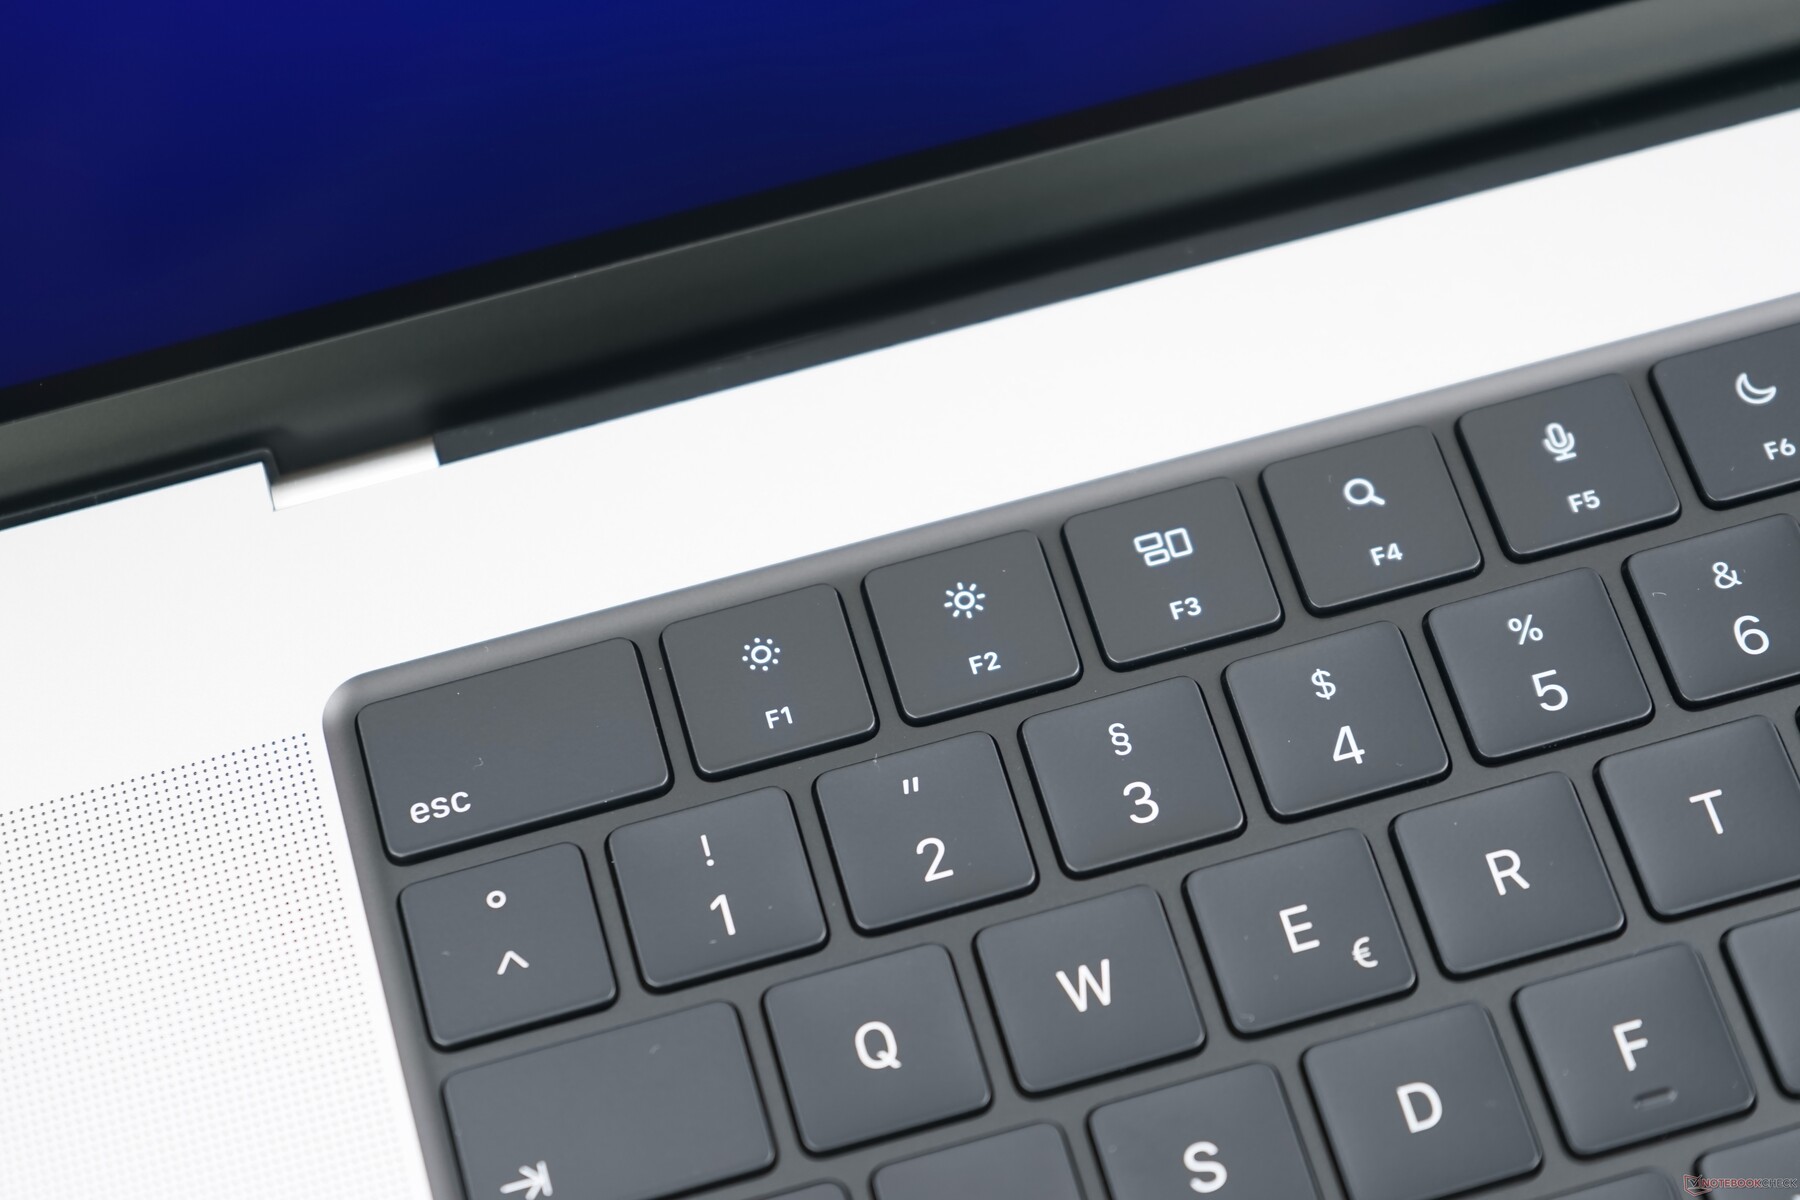
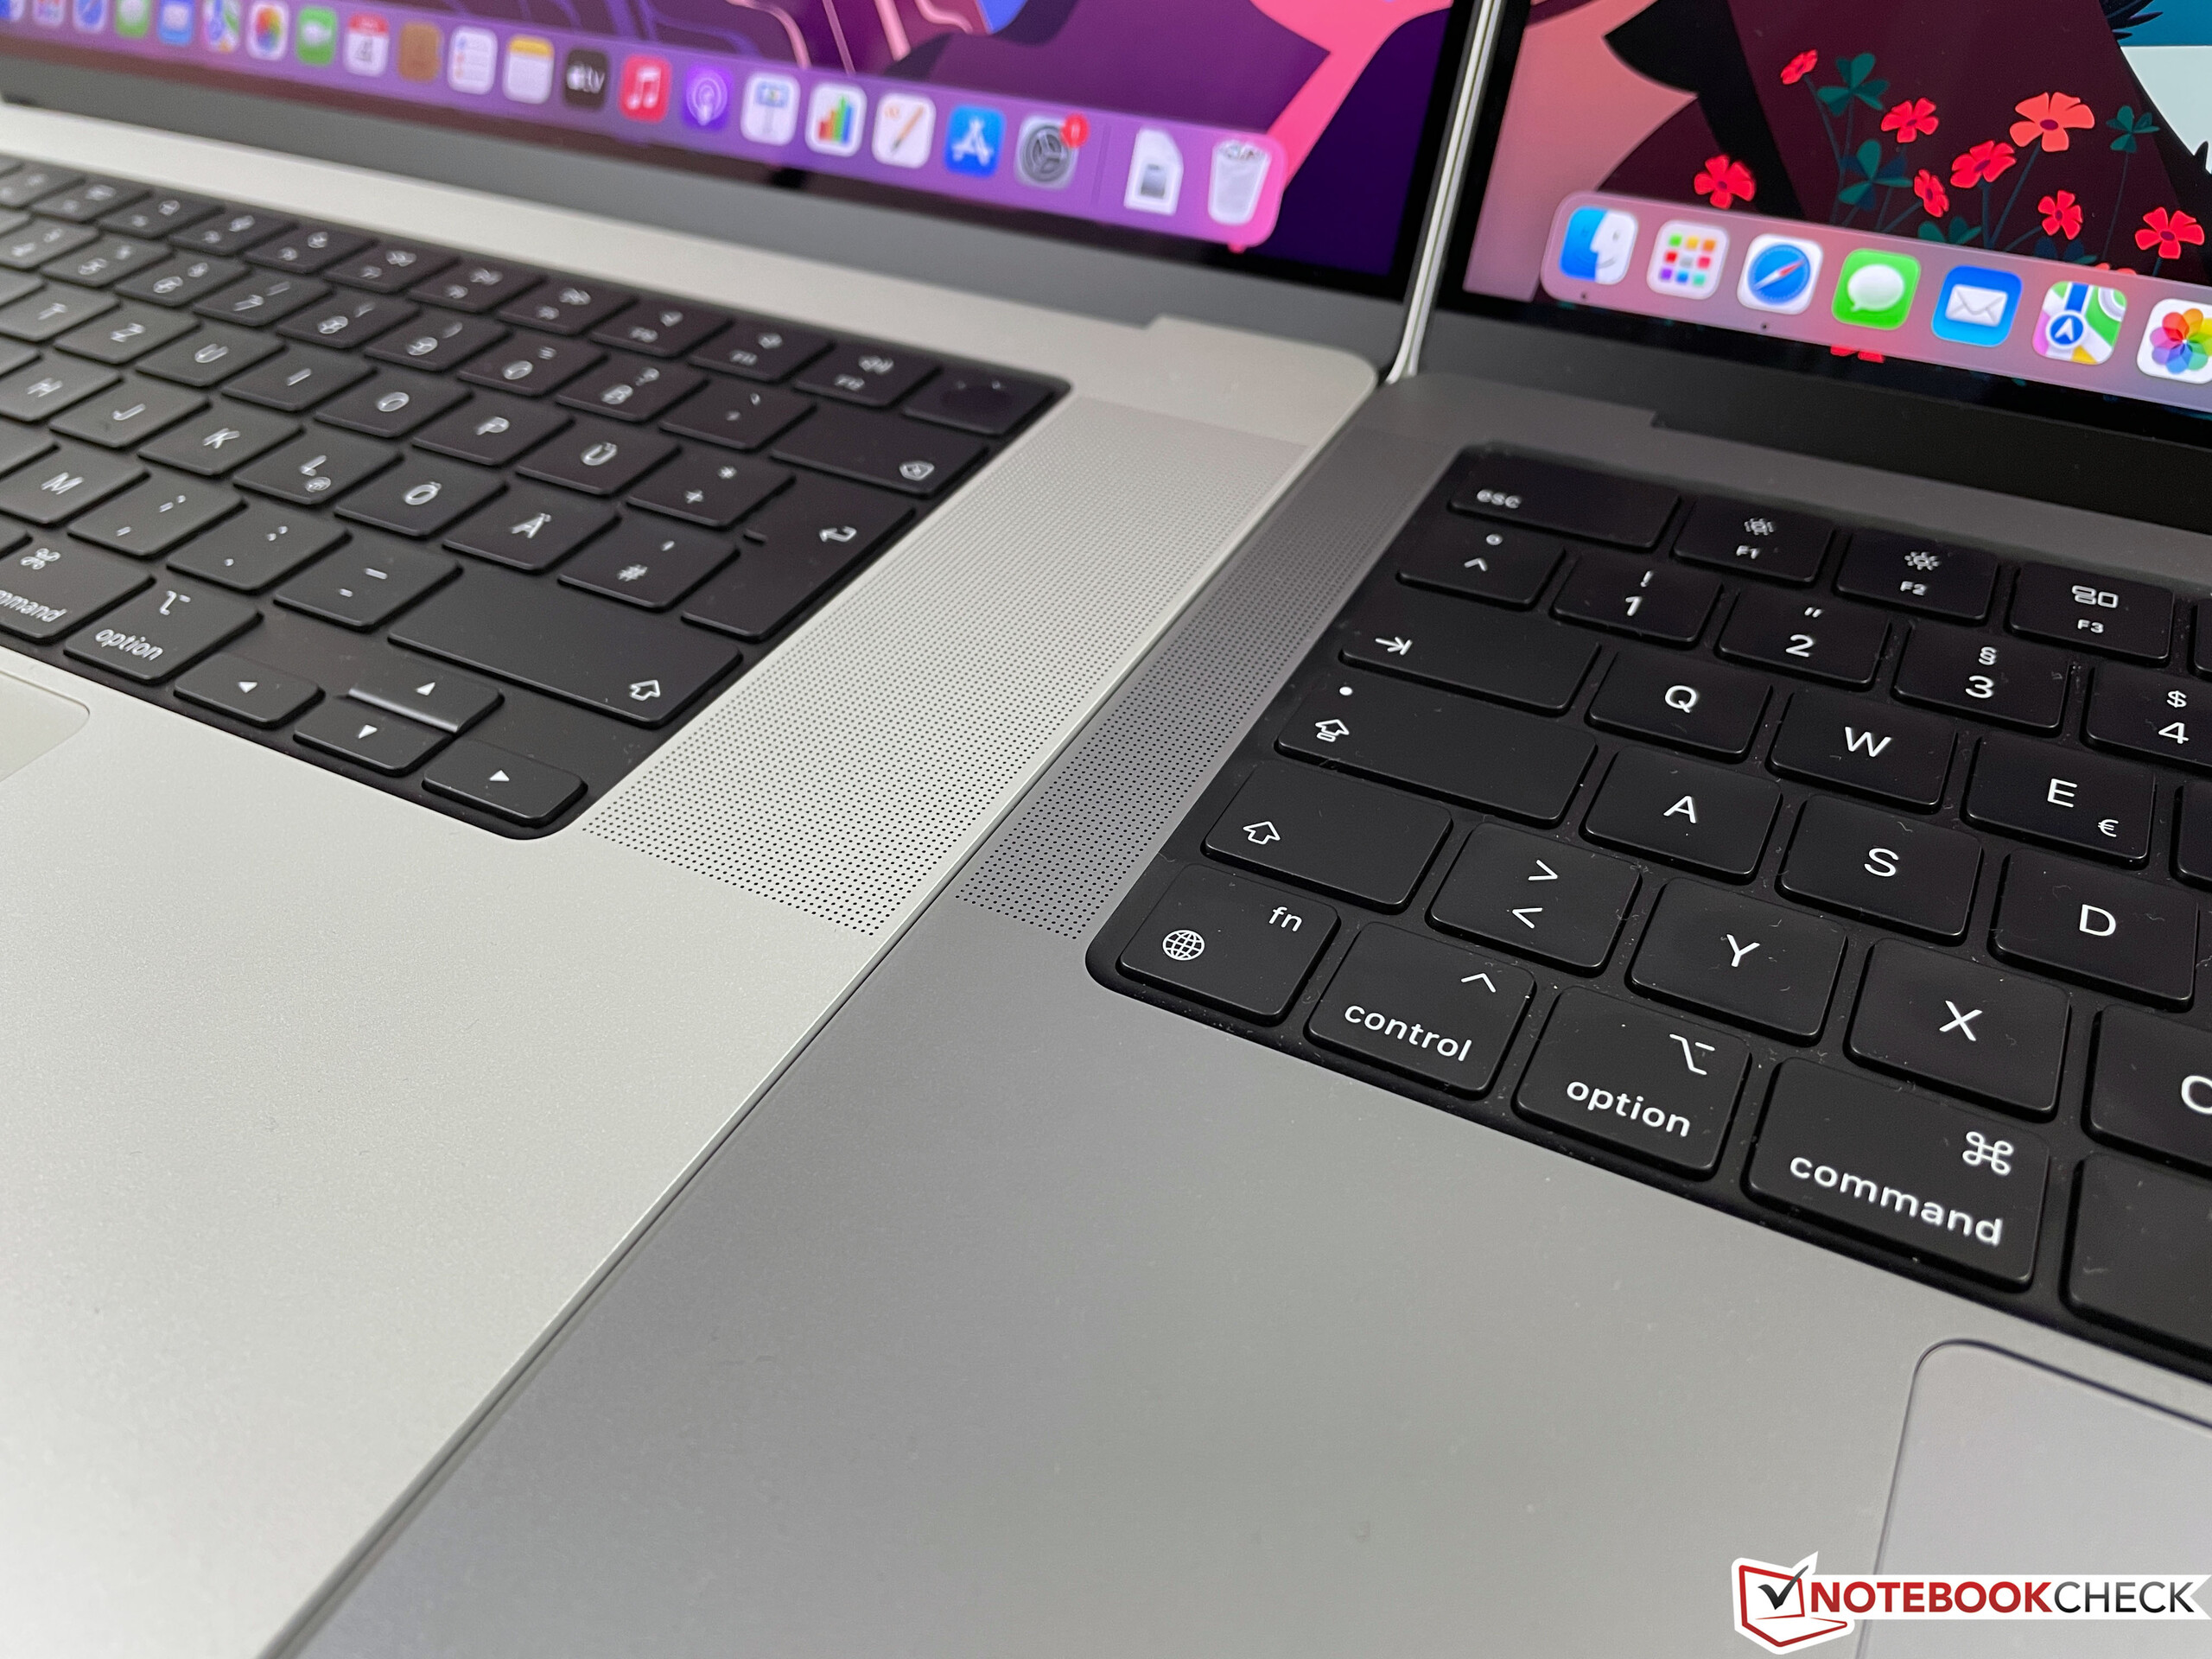
Apple keeps its familiar keyboard with the standard scissor keys and the typing experience of the new keyboard hardly differs from the old MBP 16. The key stroke is just slightly more muffled. The keyboard, which is also used in other MacBook models, still convinces with a very precise and even feedback, but we would have liked to see more key travel considering the thicker base unit. It is also a matter of taste and you can type very quickly and comfortably, but there are devices with better and more comfortable keyboards in this price segment.
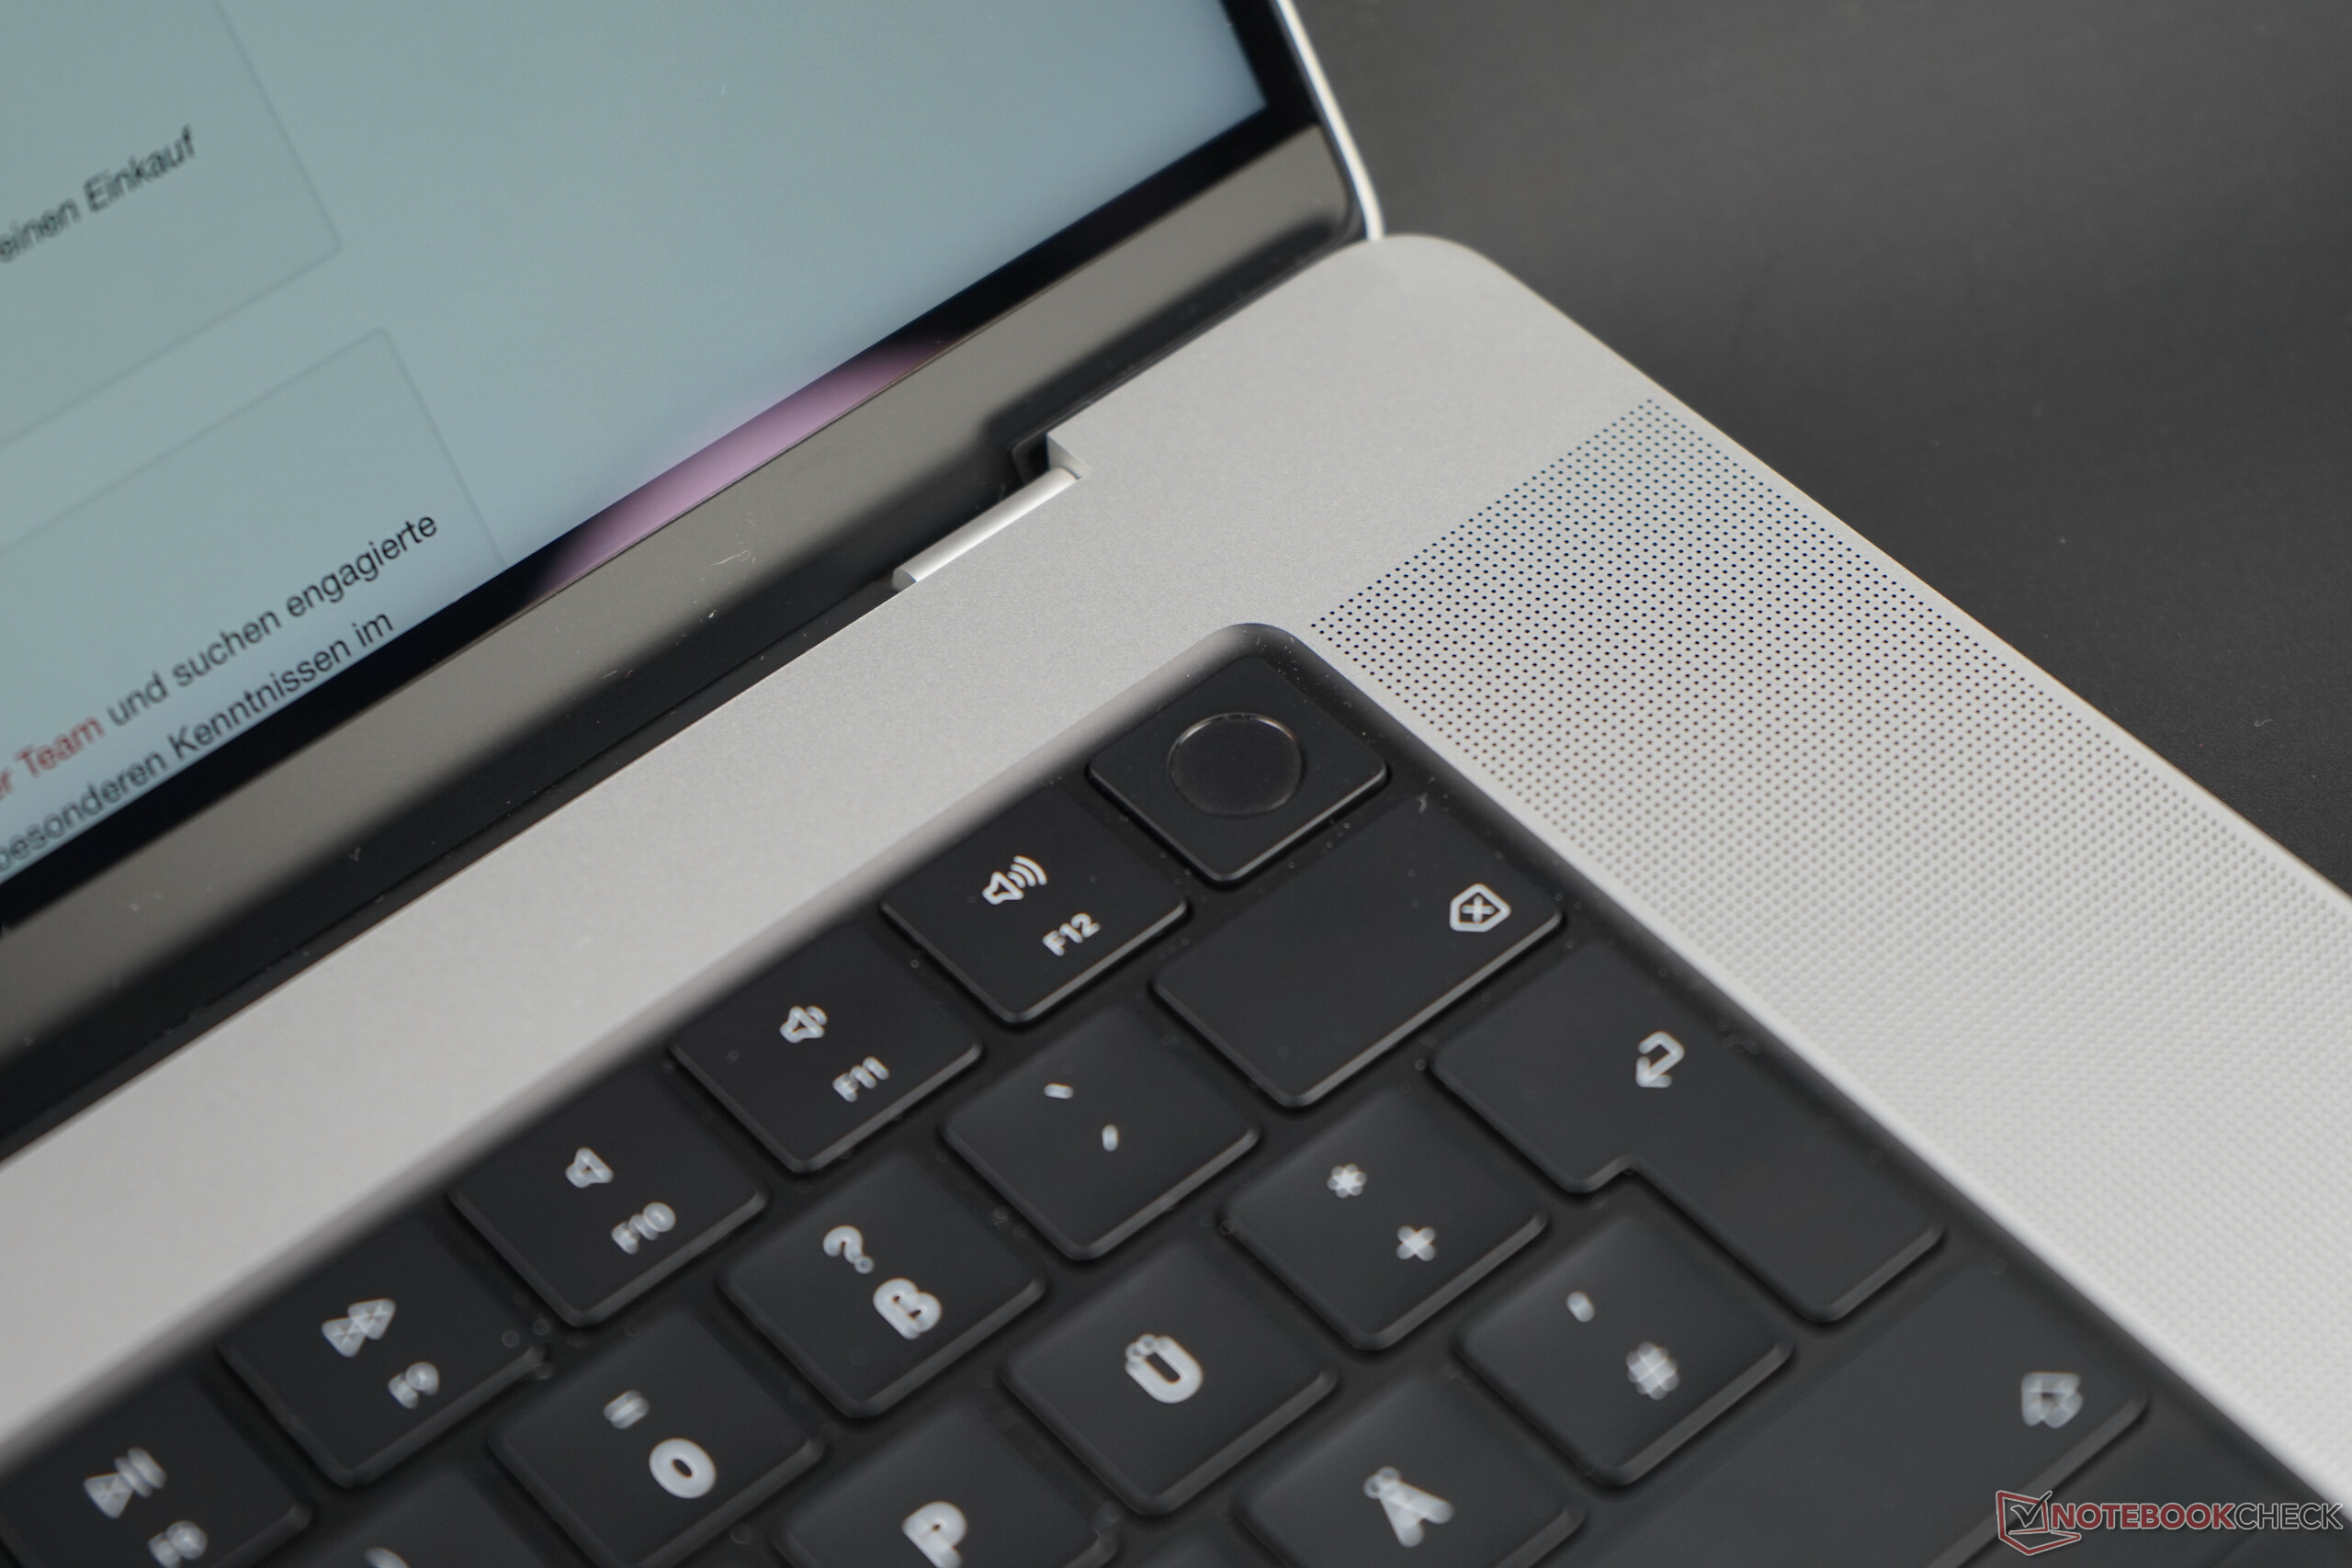
The manufacturer now uses black for the space between the keys, which used to be the chassis color in the previous versions. The Touch Bar of the old models was also replaced by standard function keys, which, contrary to the current MacBook Air, have the same vertical height than all the other keys. Apple is definitely still ahead of the rivals in terms of keyboard illumination, which is automatically activated/deactivated and the intensity is adjusted in very fine steps. Most rivals only offer two or three brightness levels and often without a sensor.
The Touch-ID fingerprint scanner is located inside the power button in the upper right corner and a ring highlights it, but this is just a visual gimmick.
Touchpad
Apple is also still the benchmark in terms of the TrackPad, because the cursor control (including gestures) is flawless in combination with the operating system. Gliding capabilities are excellent and there are many options to configure it (like shifting windows with three fingers).
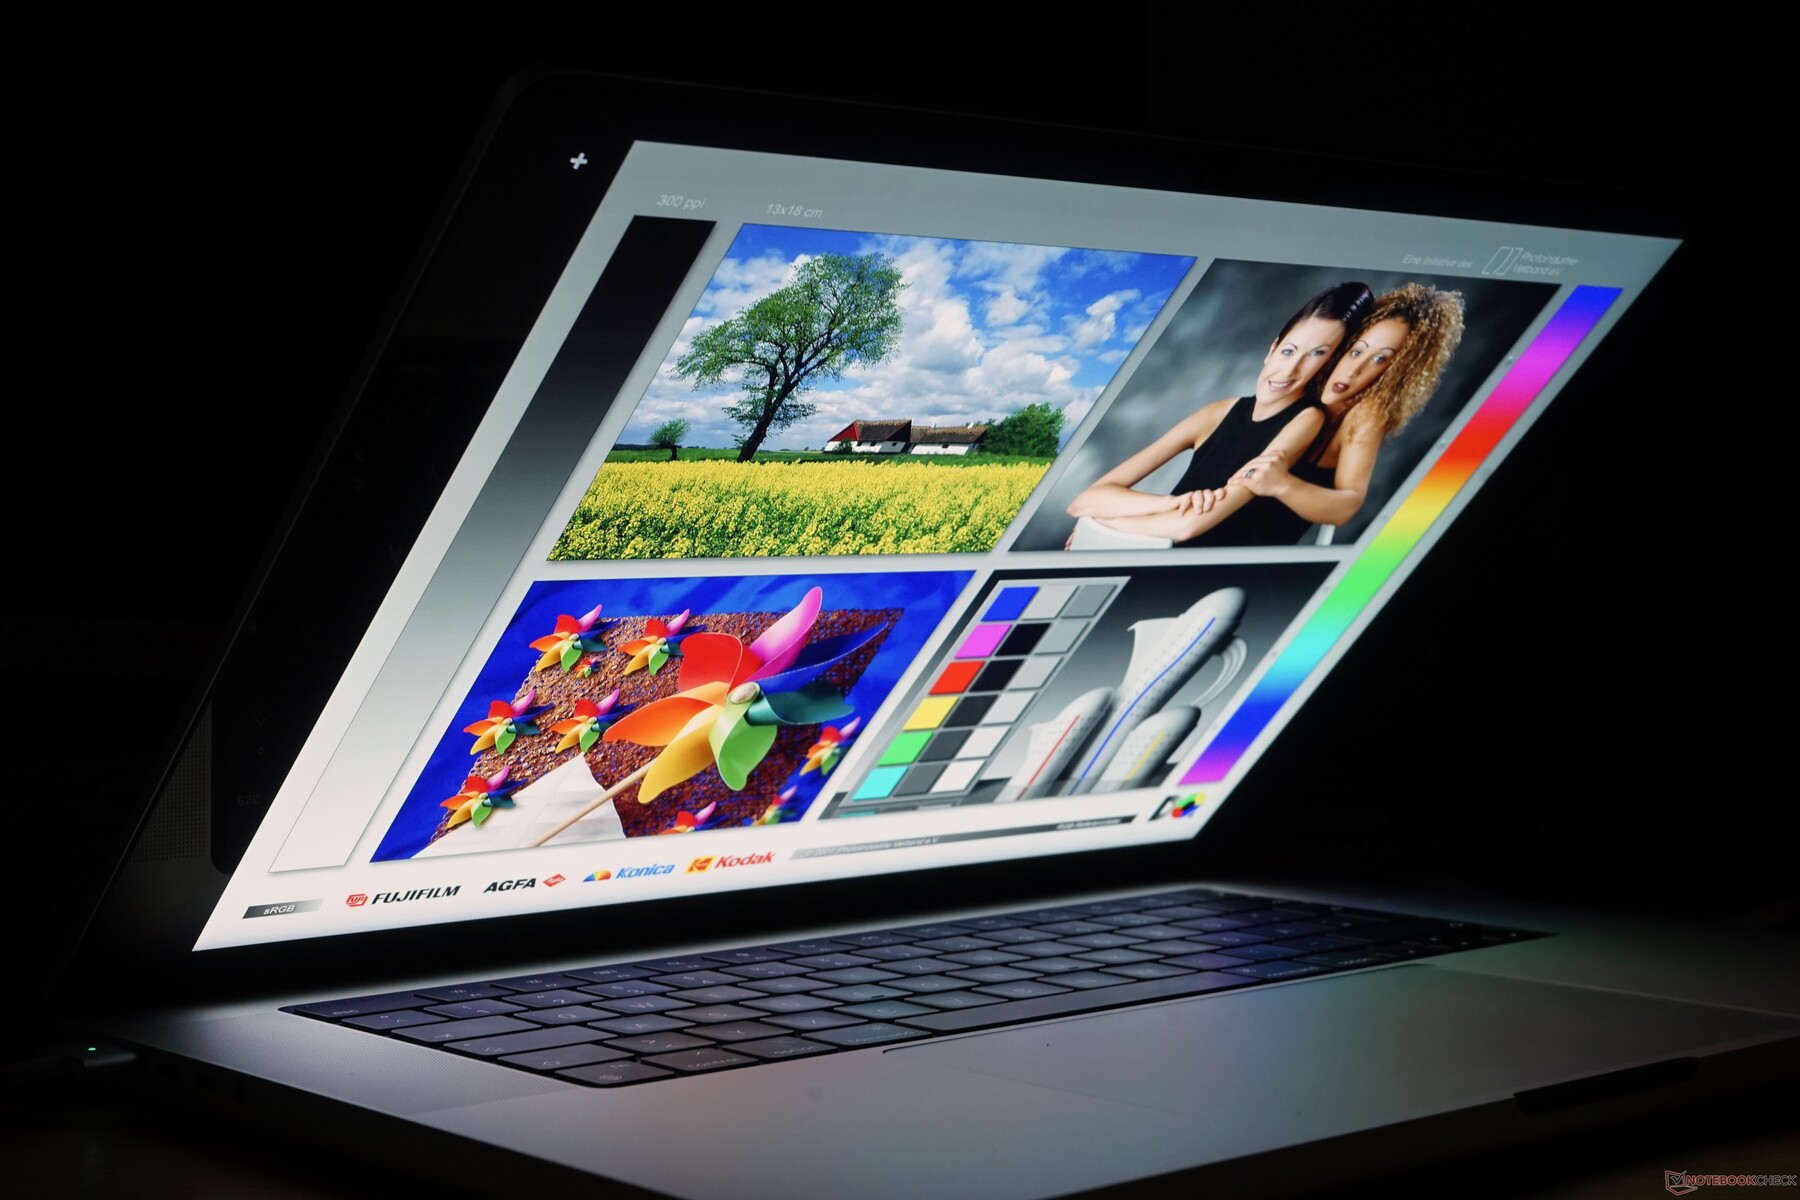
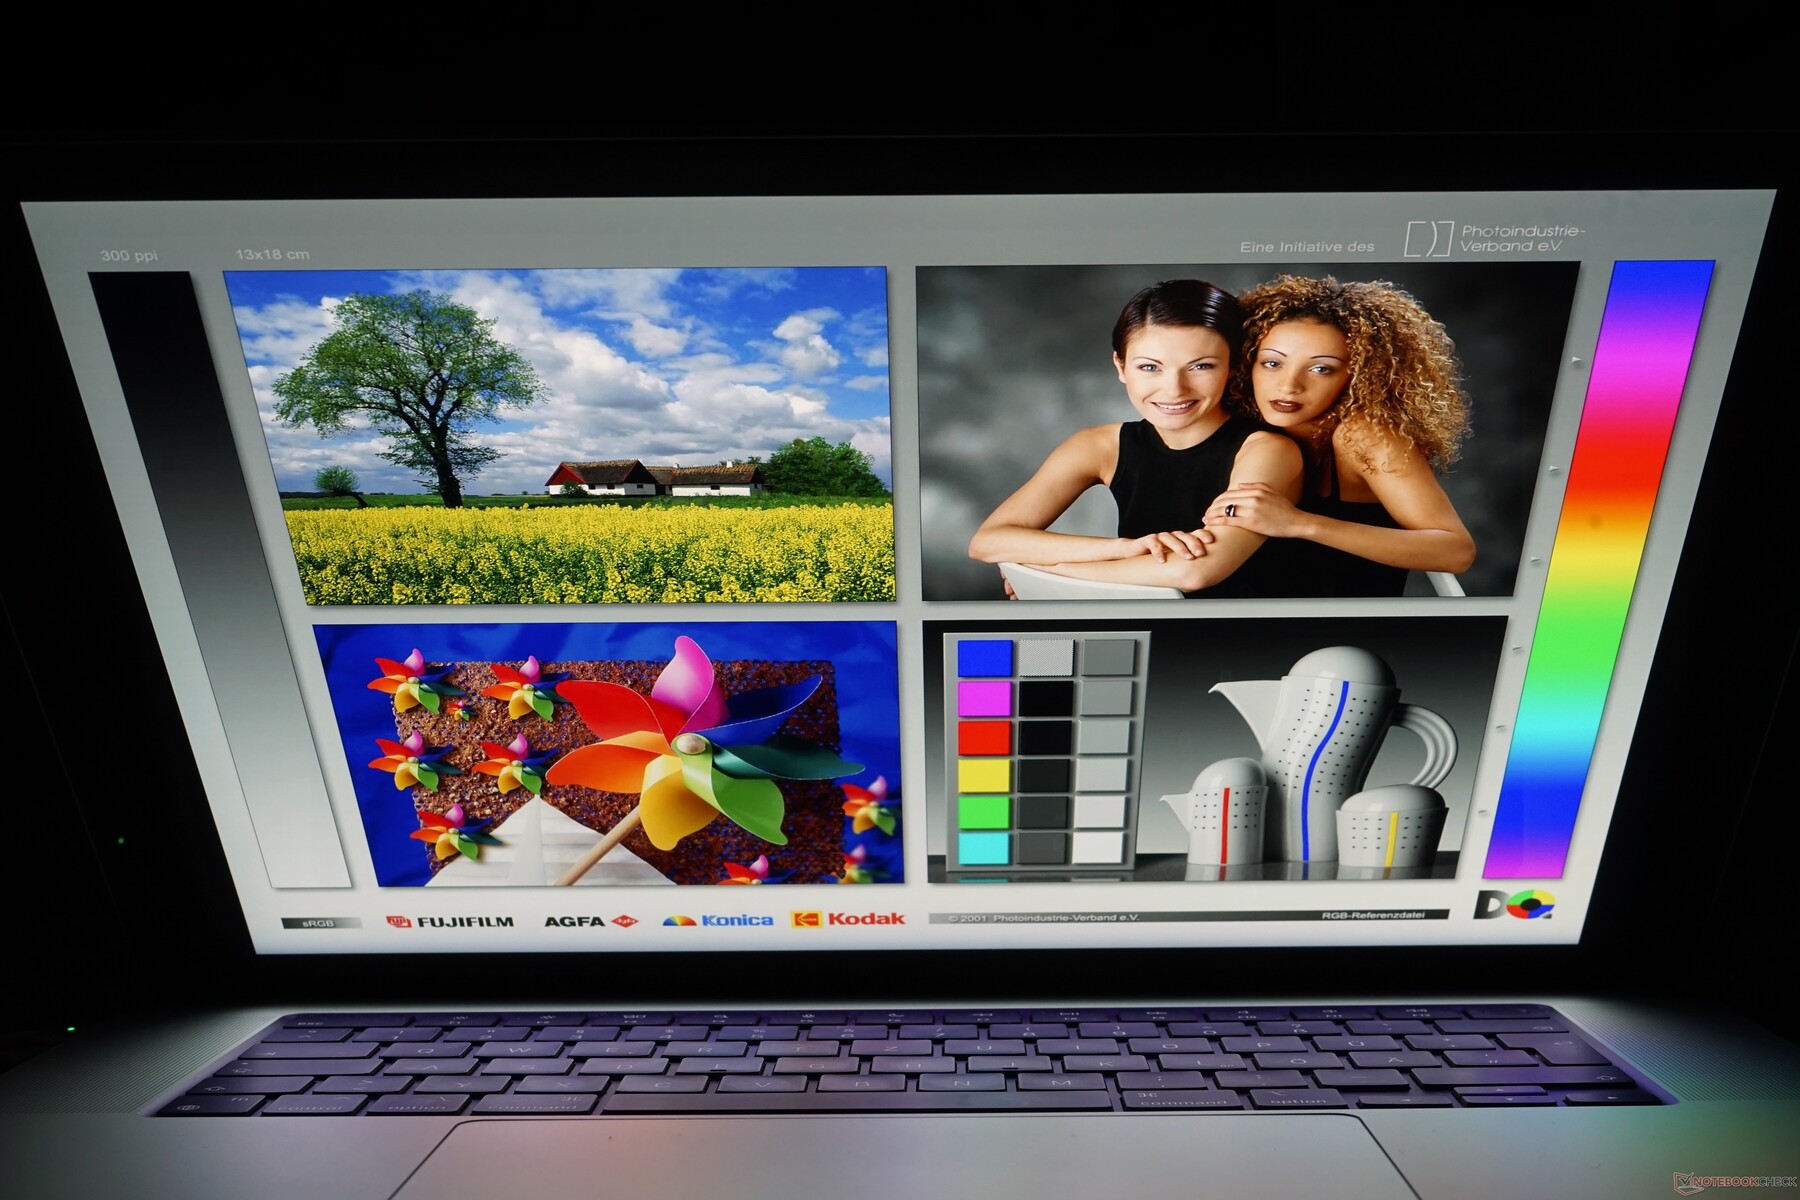
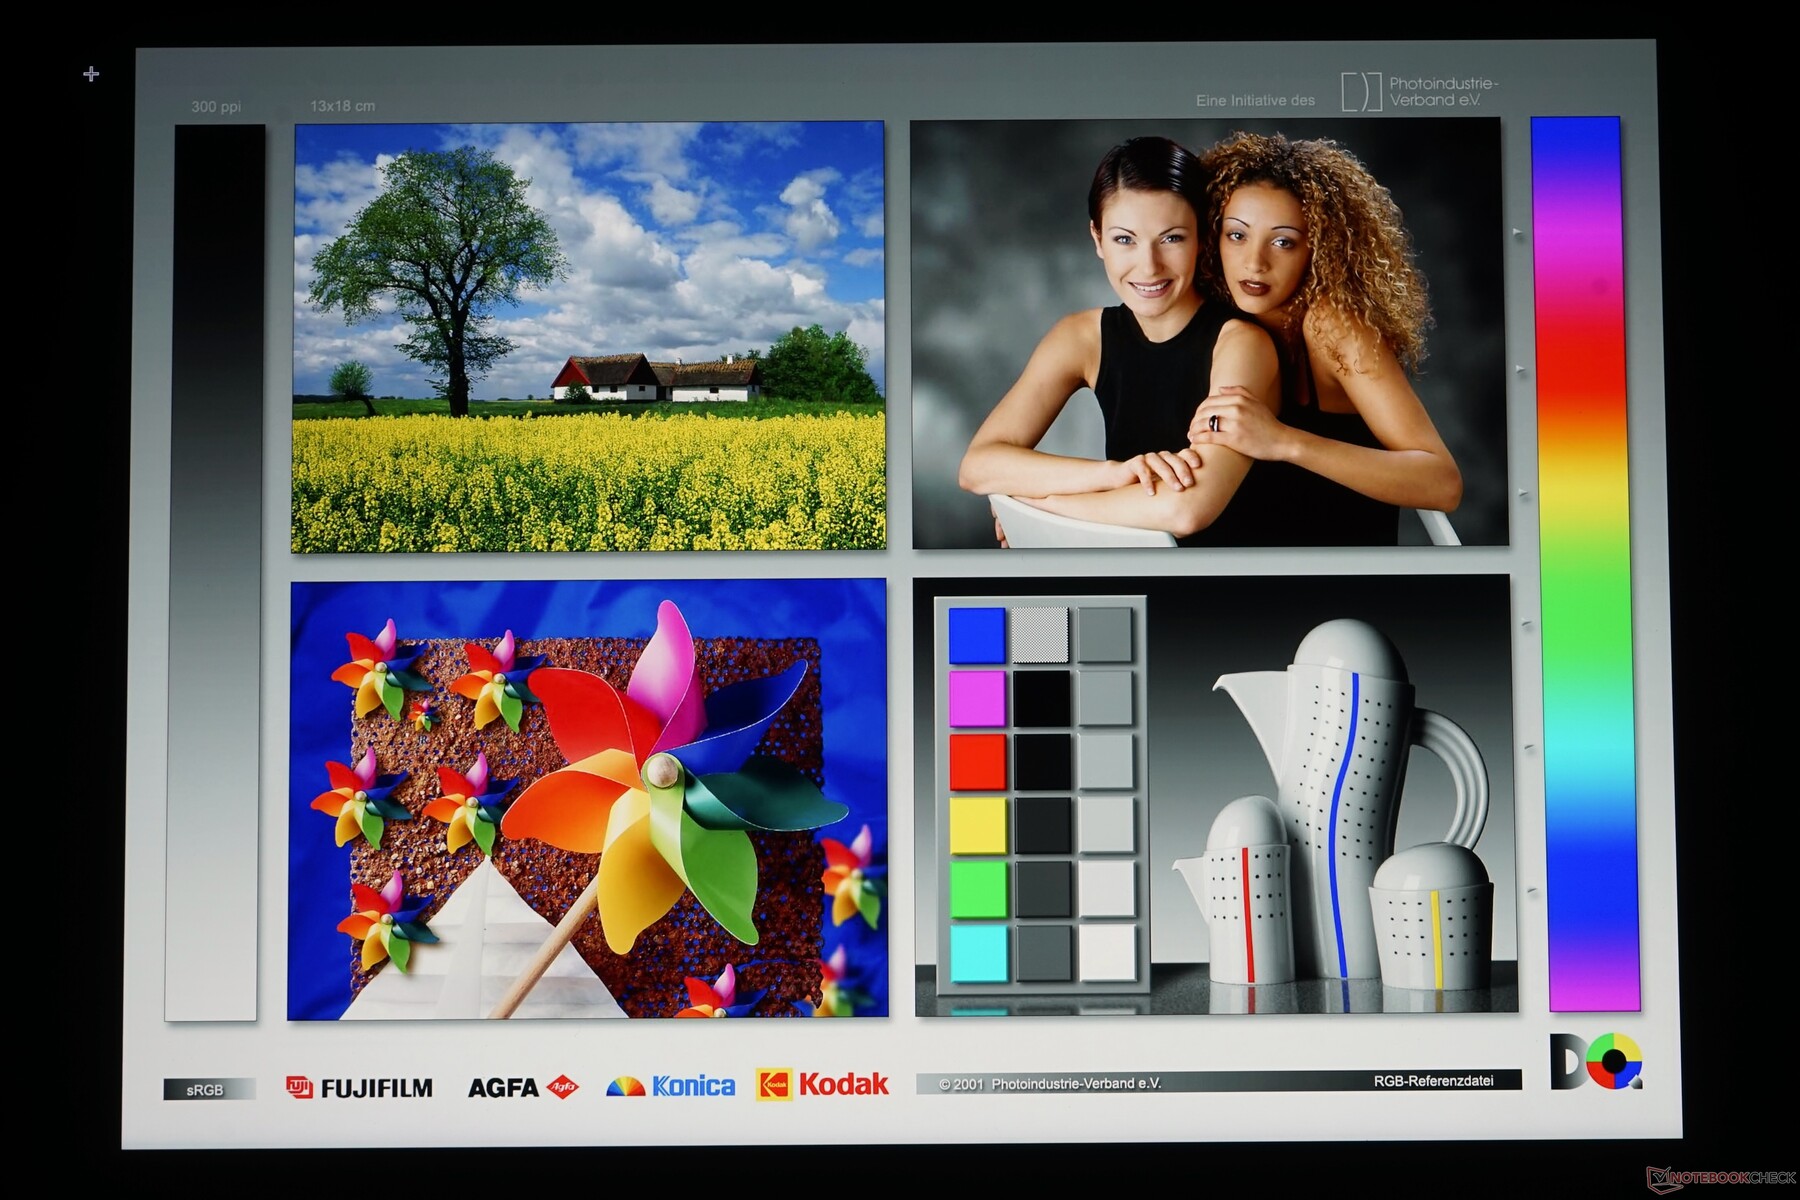
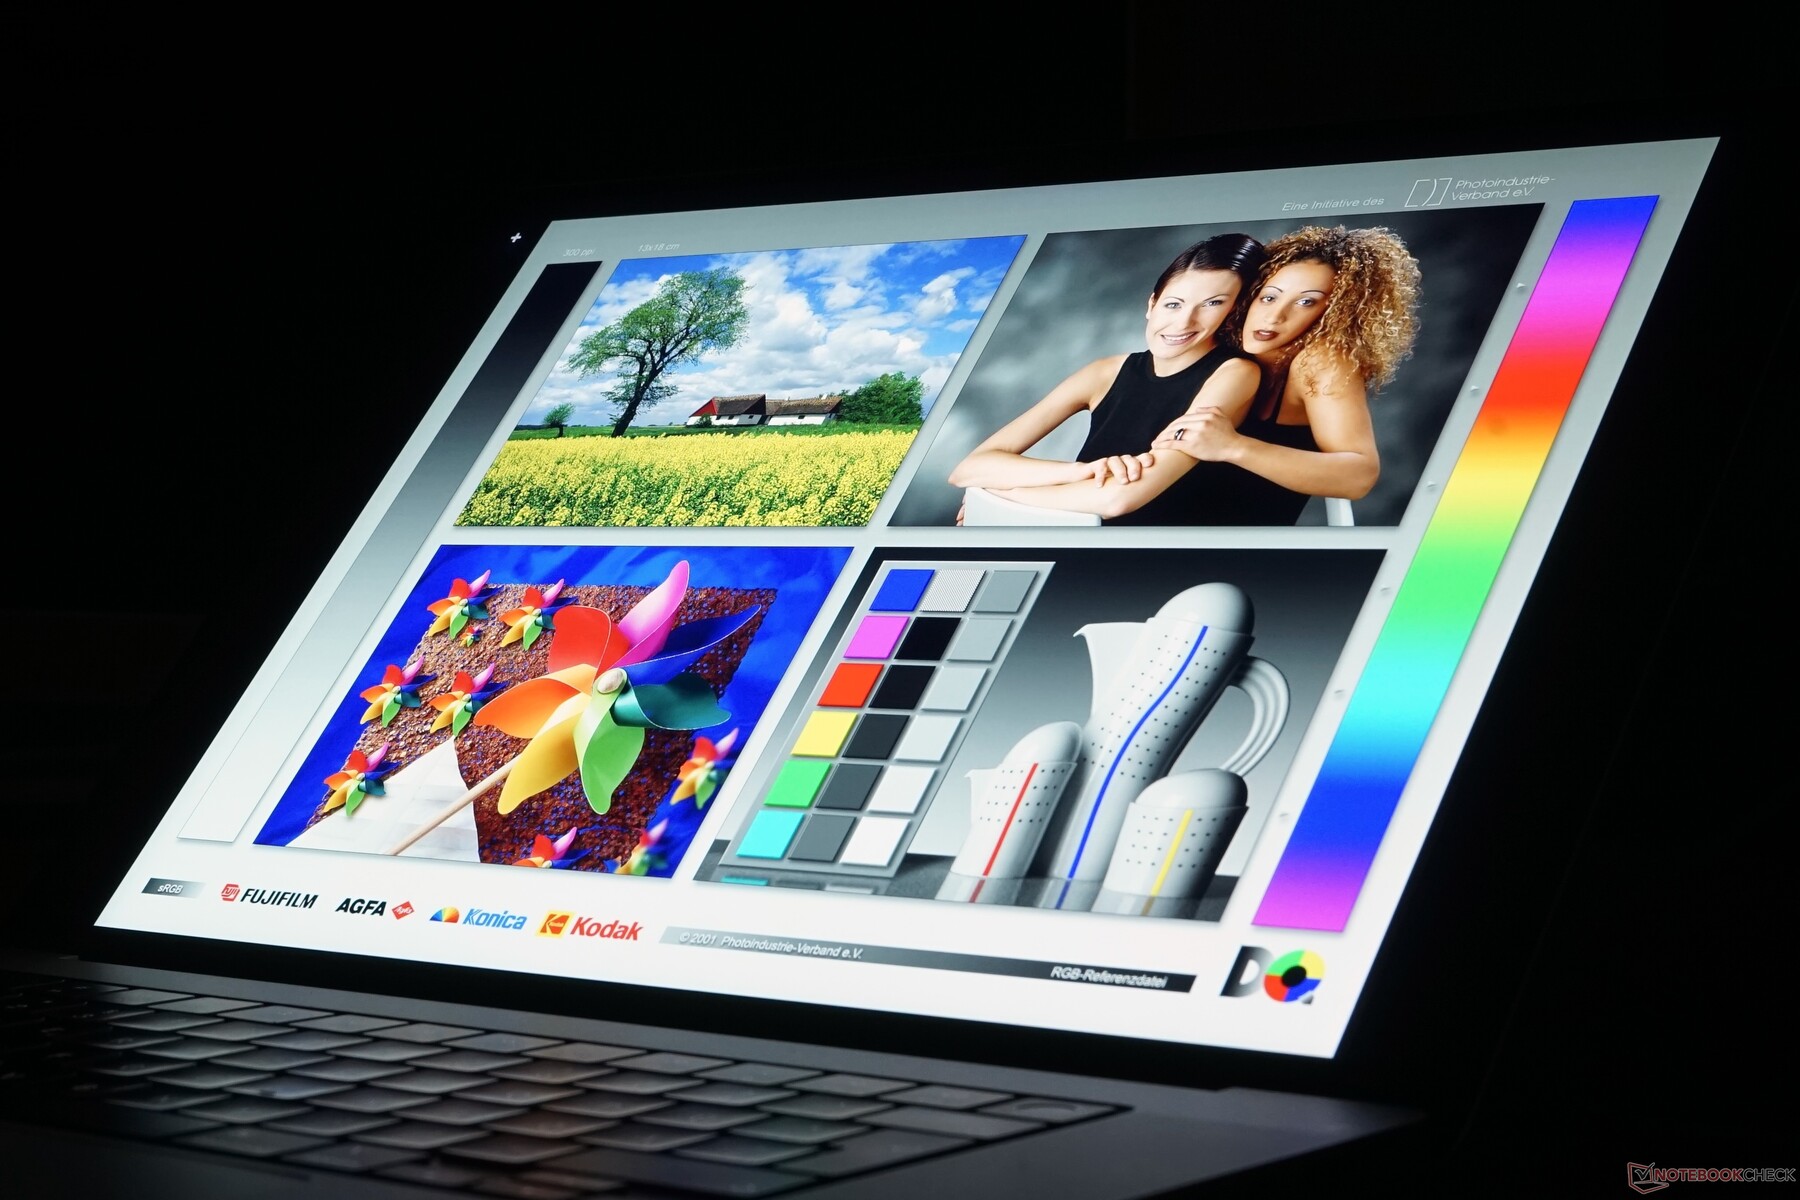
Display - Liquid Retina XDR Mini-LED
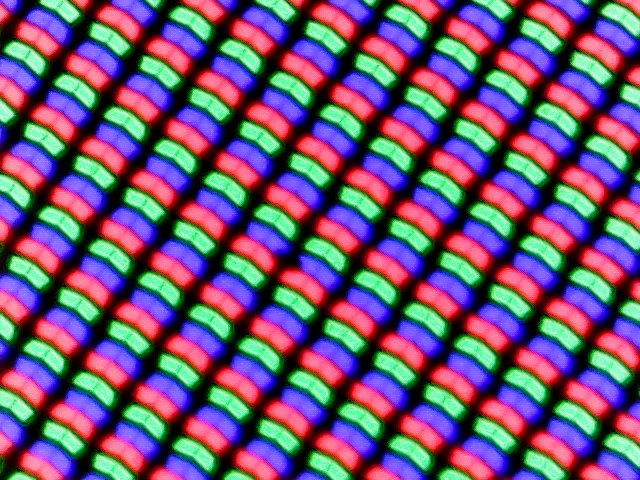
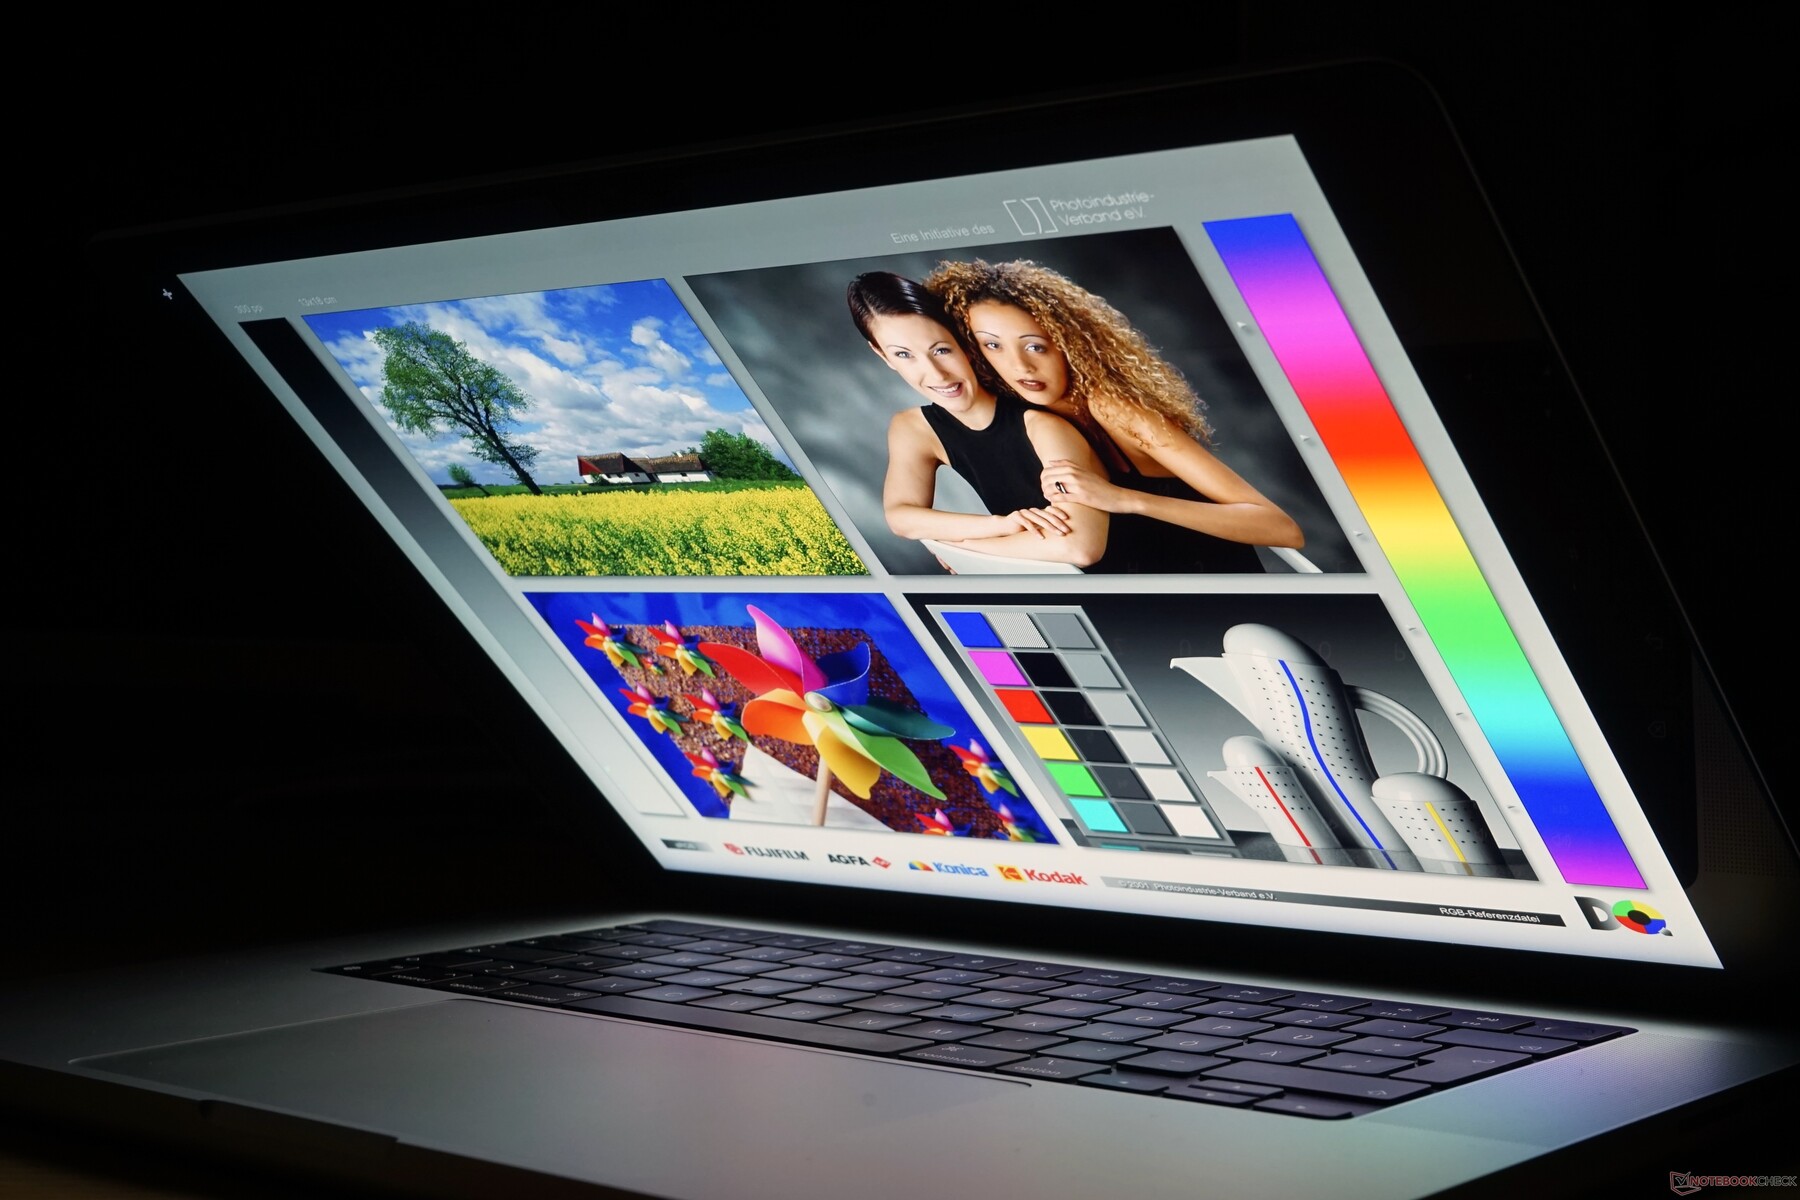
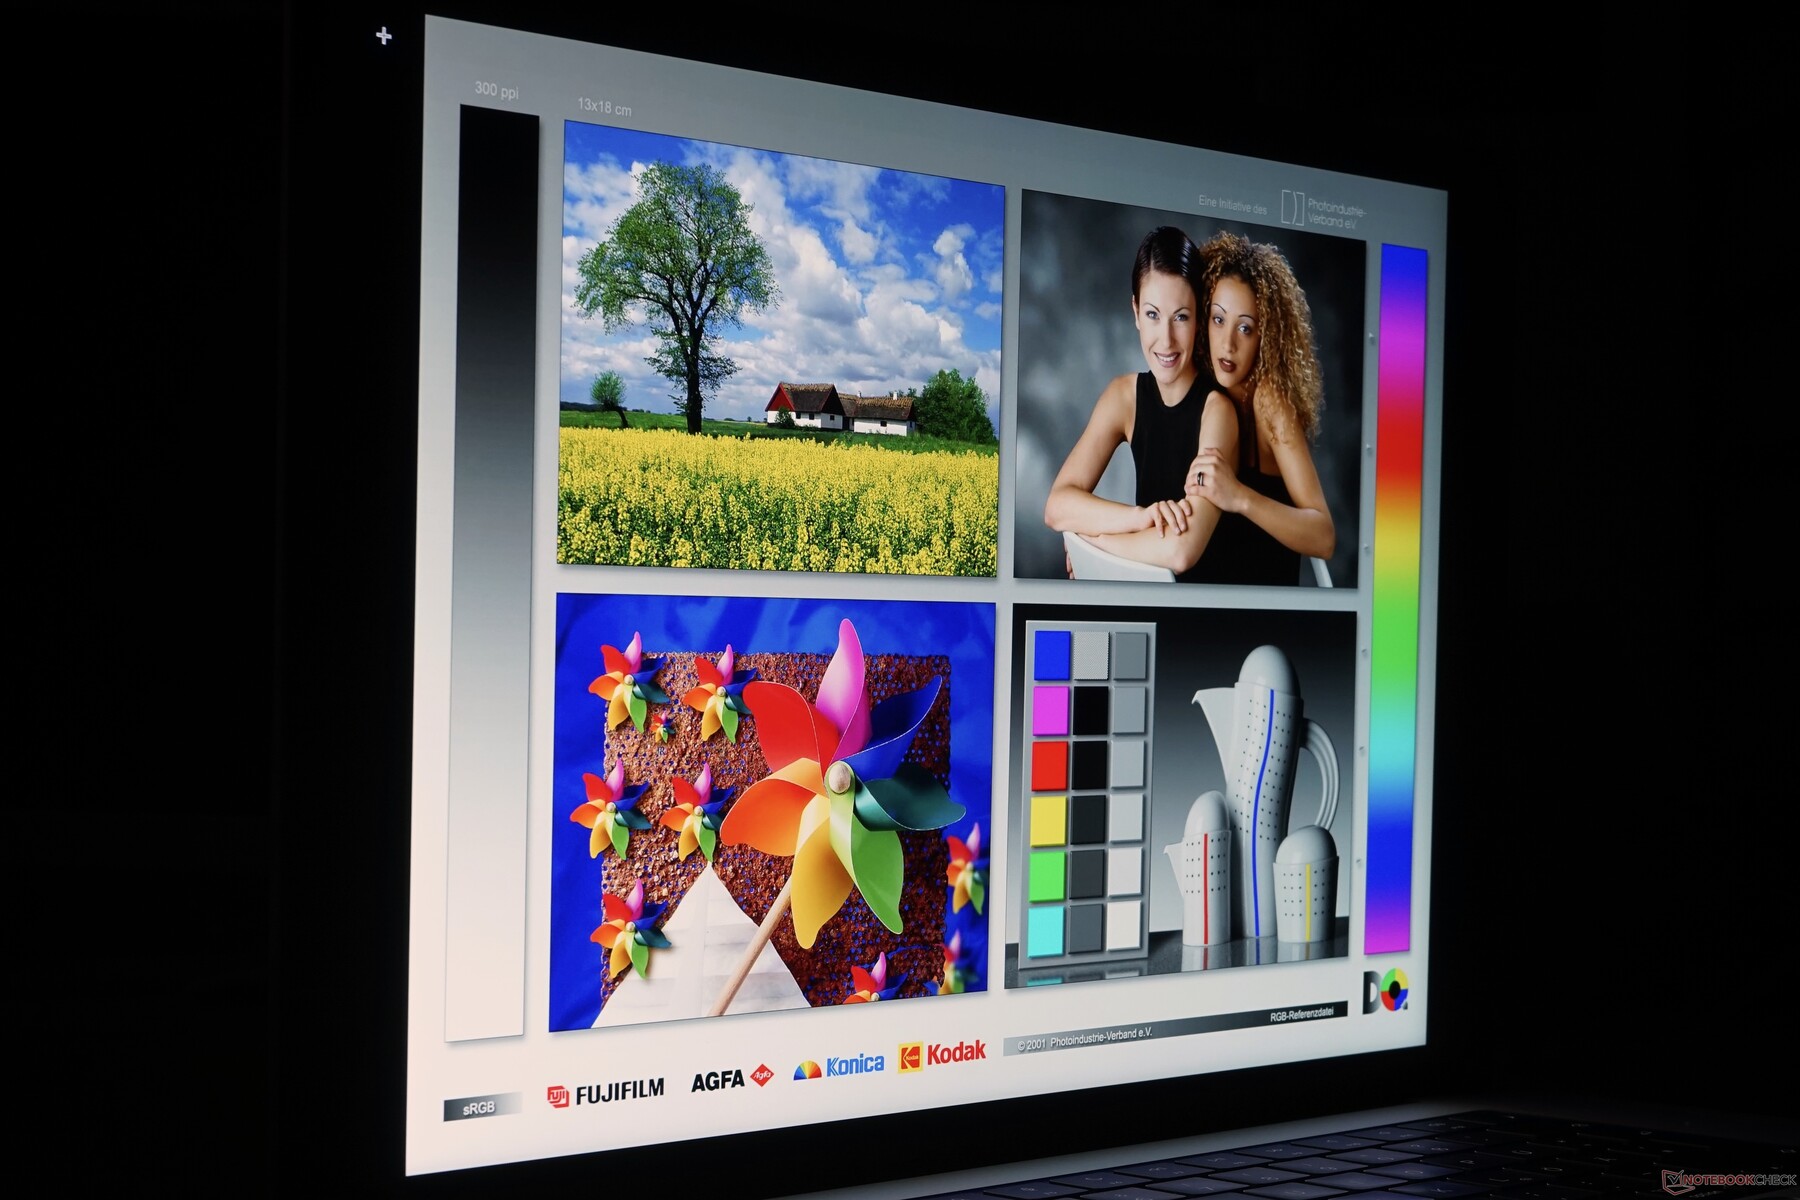
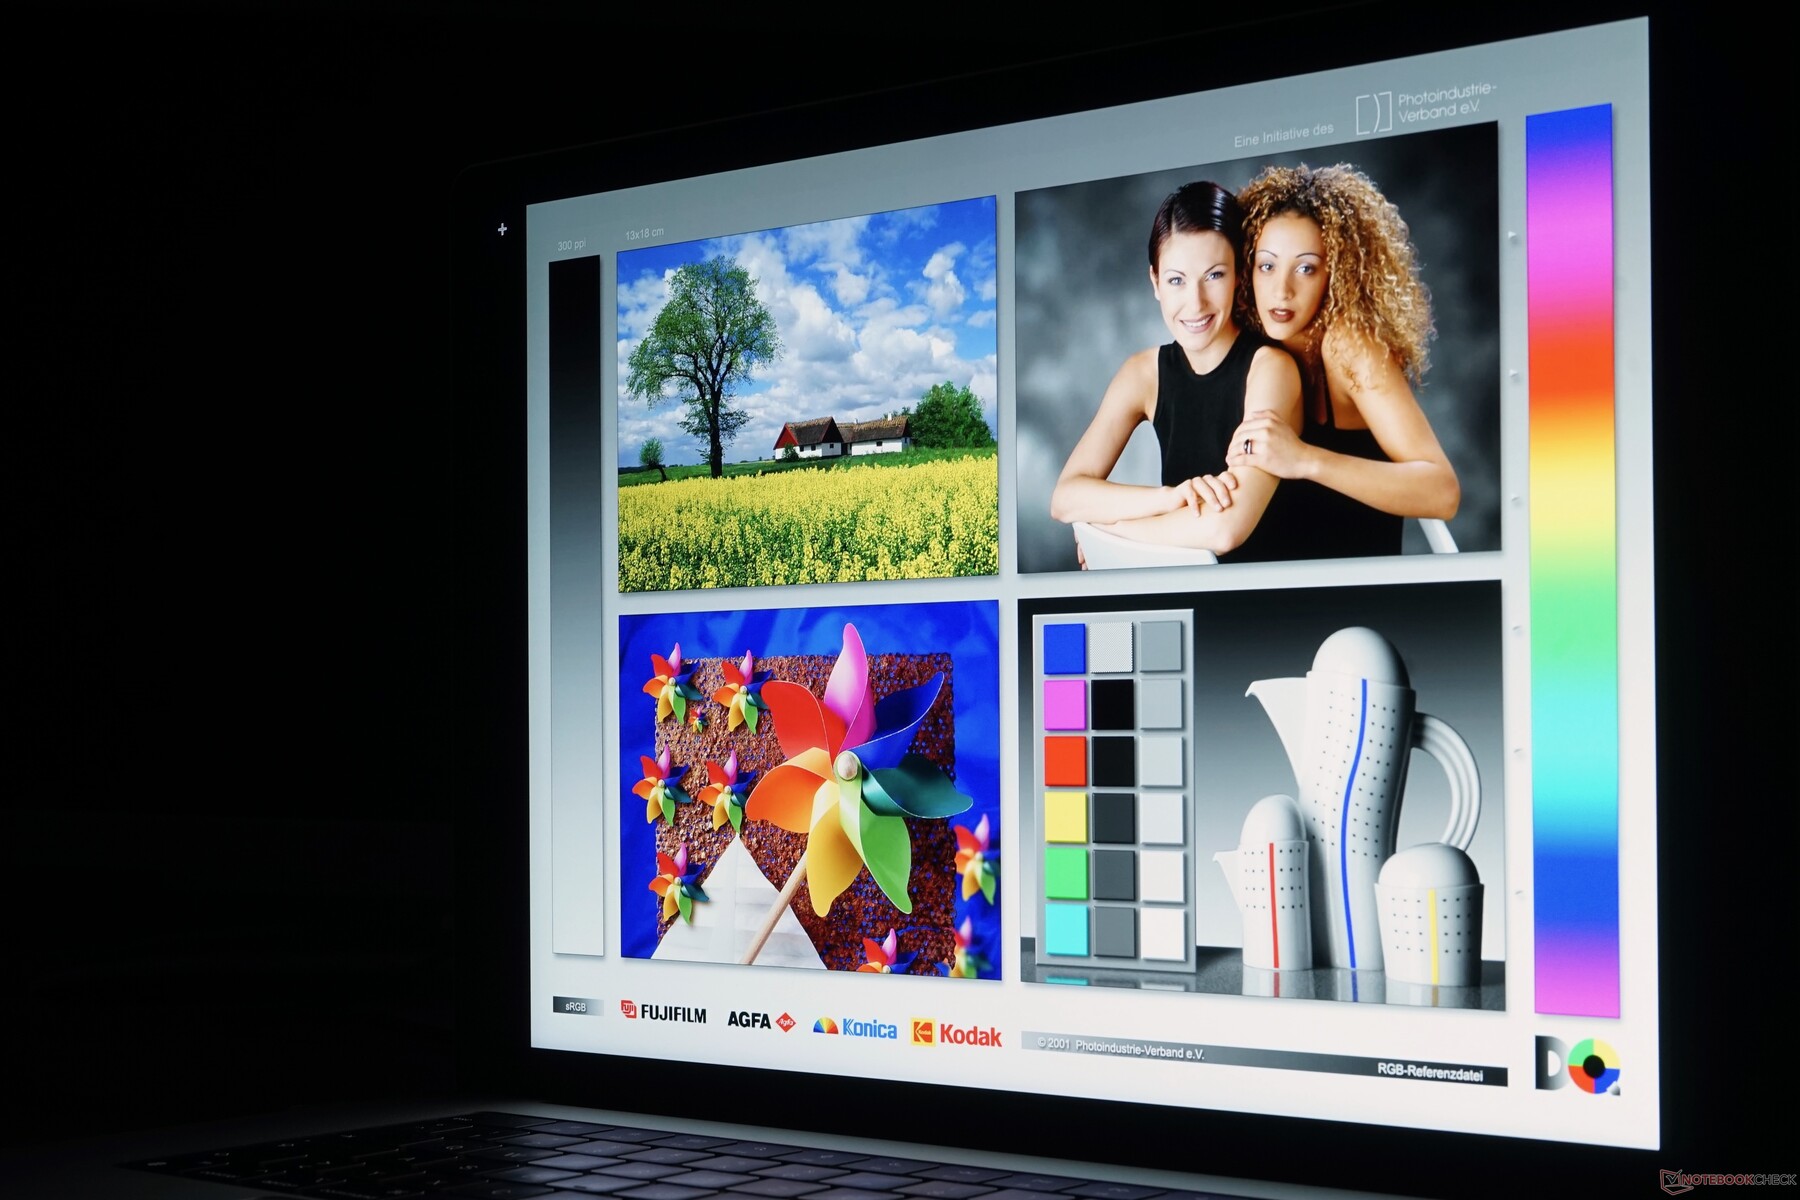
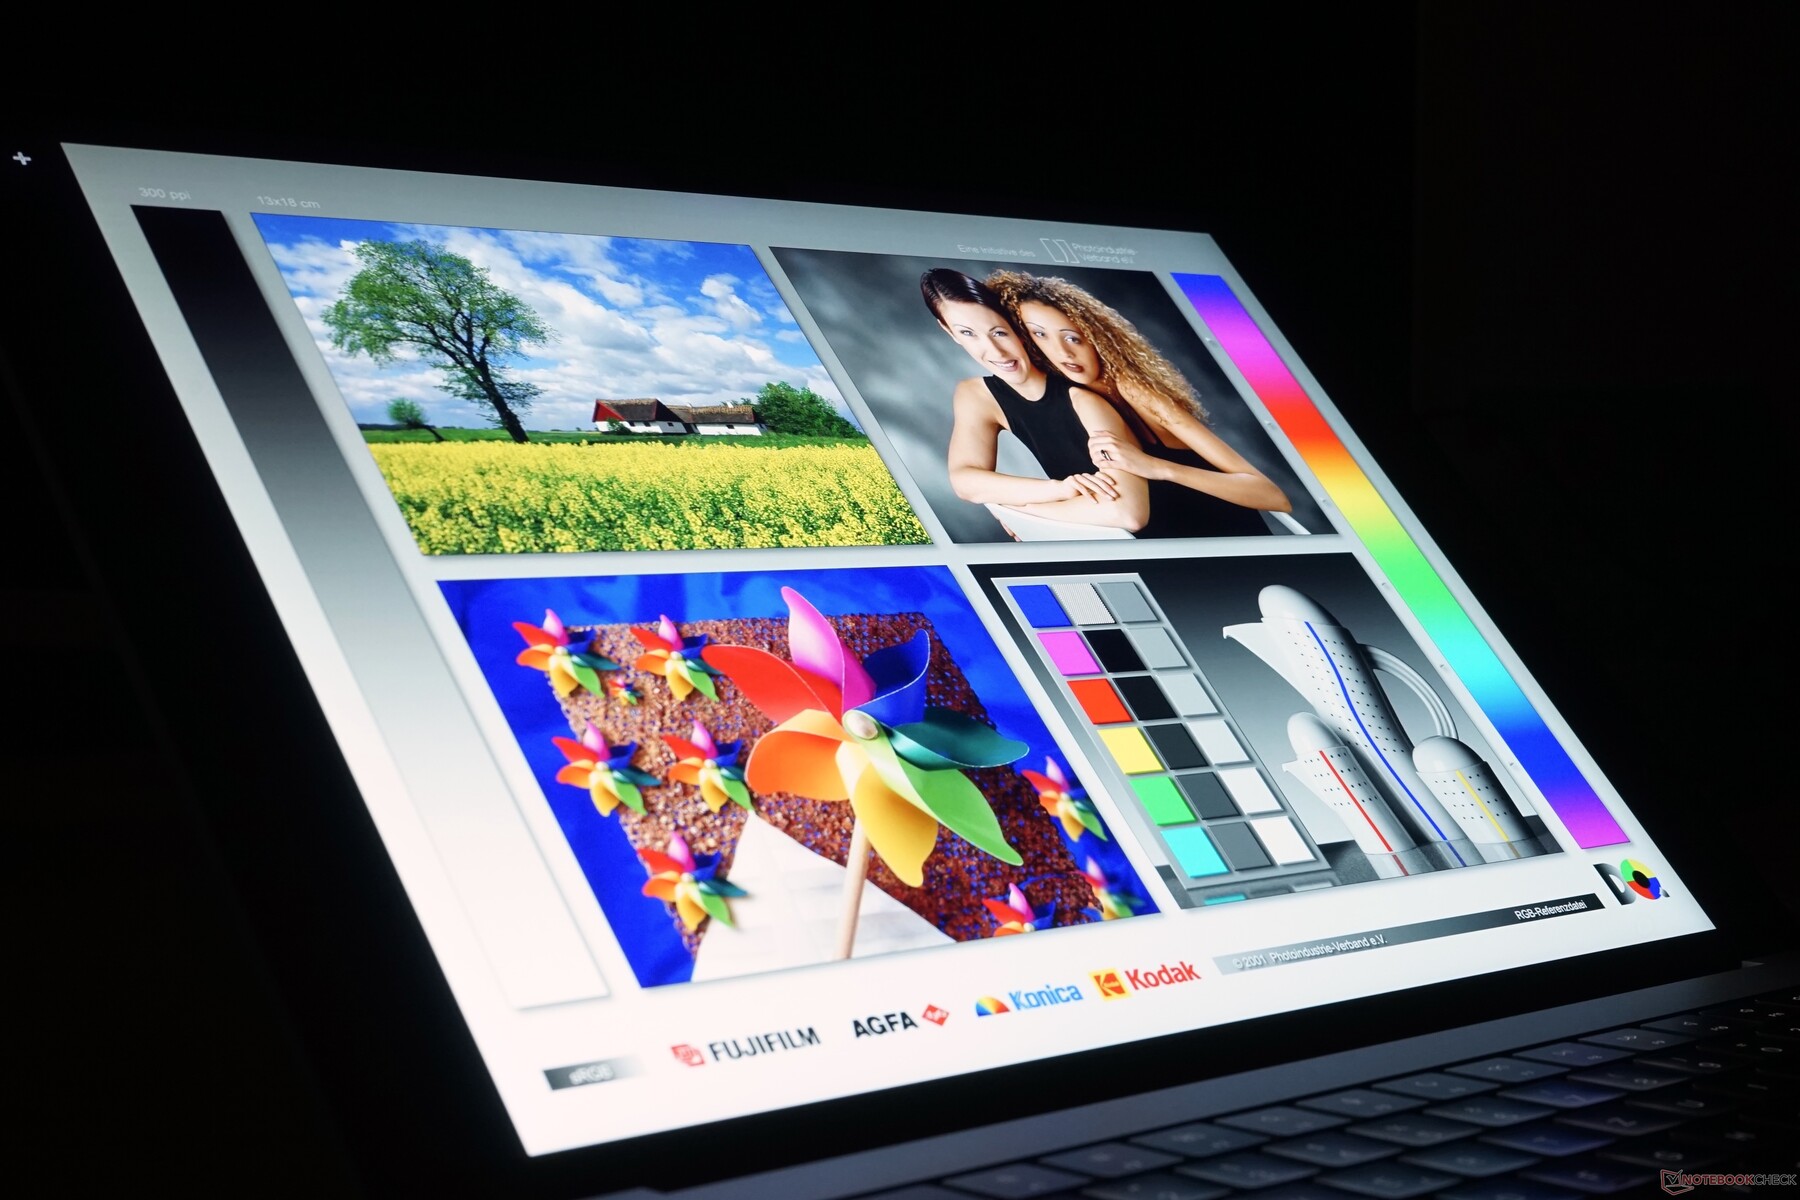
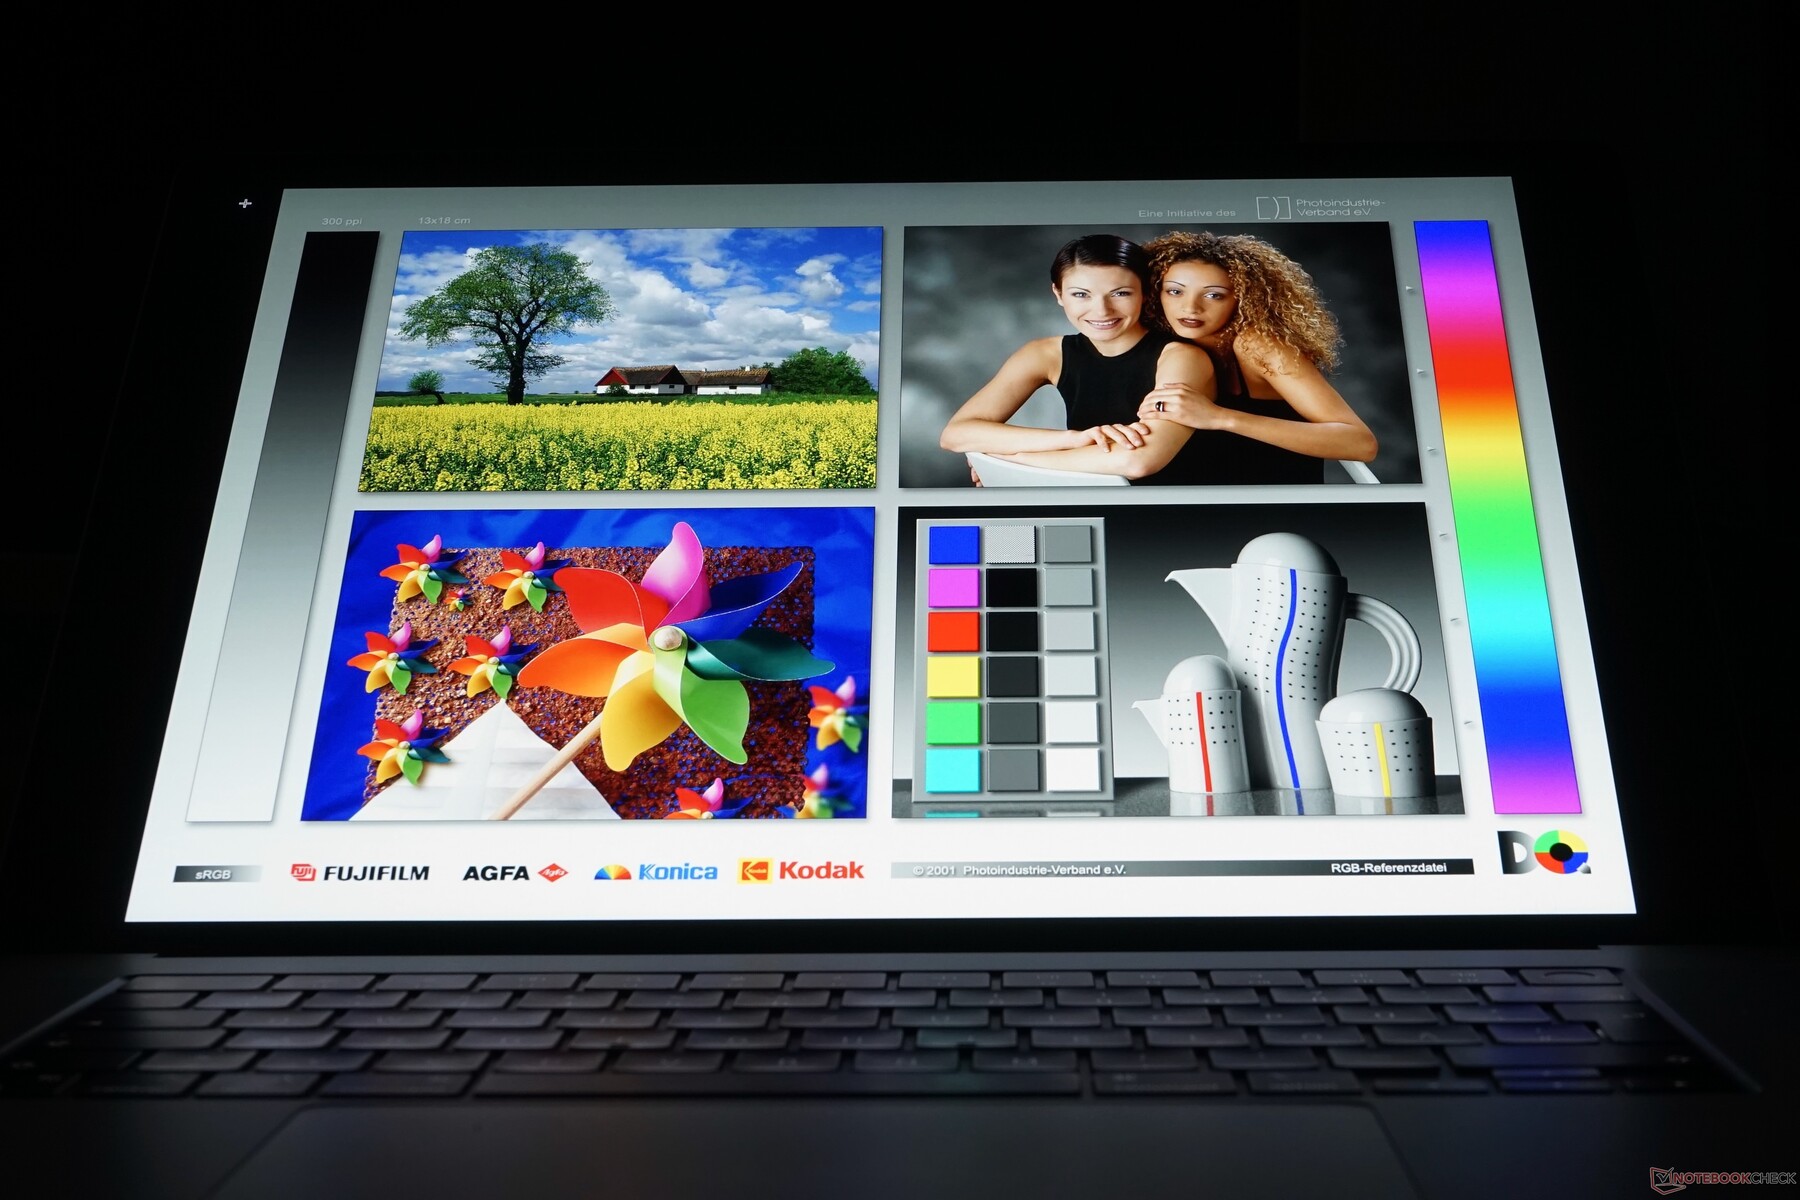
Apple manages a pixel density of 255 ppi, both for the 14 as well as the 16-inch MacBook Pro models. Since the display is obviously larger, the resolution is higher as well. Instead of IPS screens, Apple now uses Mini-LED panels. It manages extremely low black values and very high contrast ratios similar to OLED panels. Due to the technology, however, there are visible halo effects when bright contents are displayed on dark backgrounds. This is just a small criticism though, because the subjective picture impression is excellent. All contents are very sharp and crisp, because macOS does not have any scaling problems despite the high resolution and black is really black, which results in extremely high-contrast images. HDR contents in particular look amazing and the viewing-angle stability is great.
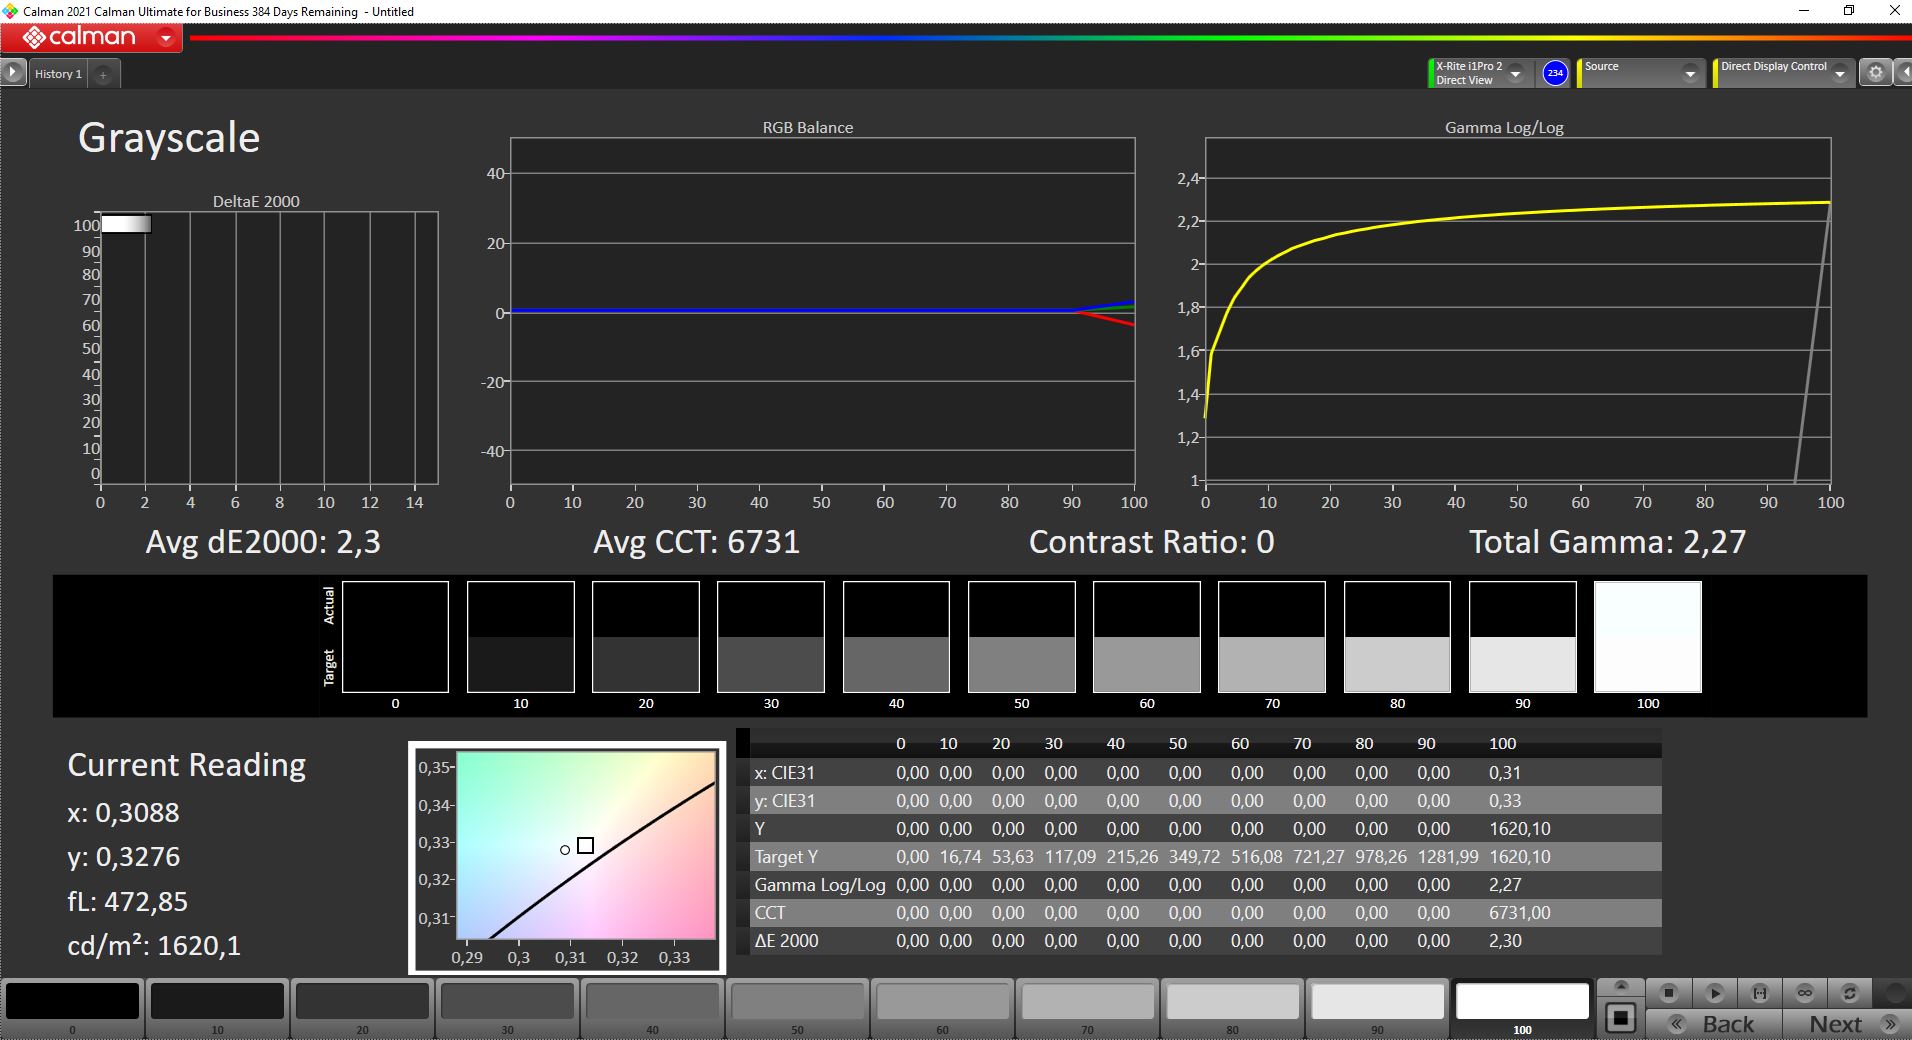
Like on the smaller MacBook Pro 14, Apple’s official brightness specs only apply for HDR images. Up to an APL of 50 (average picture level, even distribution of bright and dark contents) we can measure a peak brightness of up to 1620 nits, and still very good 1174 nits at a completely white image (at least a 16:9 video with small black borders), so we can confirm Apple’s claims. However, this does not really help most of the time because most everyday stuff uses SDR contents, where the brightness is once again limited to little more than 500 nits, which is on par with the predecessor. The Mini-LED panel has an advantage thanks to the superior contrast ratio. As soon as an application with HDR images (preview window in Final Cut, for example) requires more brightness, the panel will provide it.
The constant PWM flickering at around 15 kHz is another problem, and we can even detect it at the maximum HDR brightness. The frequency is very high and will not be an issue for most users, but the panel of the new MacBook Pro 16 is not suited for you if you are very sensitive to the flickering. This constant flickering also makes it extremely hard to determine the response times. They are pretty slow according to our measurements, but you do not really notice ghosting in practice. It looks like Apple’s Pro Motion technology with a dynamic refresh rate of up to 120 Hz helps a bit. You notice smoother transitions when you navigate the OS, for example, but not all of Apple’s own apps support the higher refresh rate yet. The Safari browser is one of these apps, so do not expect smoother scrolling yet.
The notch and the areas next to it, which are used for menu items, are basically sitting on top of the regular 16:10 aspect ratio screen and do not block any portion of the panel. The notch does not look very appealing and there can still be some functional issues, but there are already tools available to black out the menu bar, so you will never see the notch.
| |||||||||||||||||||||||||
Brightness Distribution: 95 %
Center on Battery: 514 cd/m²
Contrast: 25700:1 (Black: 0.02 cd/m²)
ΔE ColorChecker Calman: 1.4 | ∀{0.5-29.43 Ø4.71}
ΔE Greyscale Calman: 2.3 | ∀{0.09-98 Ø4.96}
88% AdobeRGB 1998 (Argyll 3D)
100% sRGB (Argyll 3D)
99.1% Display P3 (Argyll 3D)
Gamma: 2.27
CCT: 6792 K
| Apple MacBook Pro 16 2021 M1 Pro Liquid Retina XDR, Mini-LED, 3456x2234, 16.2" | Apple MacBook Pro 16 2019 i9 5500M APPA044, IPS, 3072x1920, 16" | Lenovo ThinkPad P1 G4-20Y4S0KS00 LP160UQ1-SPB1, IPS LED, 3840x2400, 16" | Dell XPS 15 9510 11800H RTX 3050 Ti OLED SDC414D, OLED, 3456x2160, 15.6" | HP ZBook Studio 15 G8 SDC4145, OLED, 3840x2160, 15.6" | Razer Blade 15 Advanced (Mid 2021) TL156VDXP02-0, IPS, 1920x1080, 15.6" | Apple MacBook Pro 14 2021 M1 Pro Entry Mini-LED, 3024x1964, 14.2" | |
|---|---|---|---|---|---|---|---|
| Display | -1% | 4% | 3% | -19% | 0% | ||
| Display P3 Coverage (%) | 99.1 | 85.7 -14% | 99.9 1% | 99.9 1% | 66.9 -32% | 99.3 0% | |
| sRGB Coverage (%) | 100 | 99.4 -1% | 100 0% | 100 0% | 97.1 -3% | ||
| AdobeRGB 1998 Coverage (%) | 88 | 98.9 12% | 98.1 11% | 95.3 8% | 69 -22% | ||
| Response Times | 20% | 19% | 95% | 96% | 90% | 10% | |
| Response Time Grey 50% / Grey 80% * (ms) | 42.8 ? | 52.4 ? -22% | 55.2 ? -29% | 3.6 ? 92% | 2.4 ? 94% | 4.2 ? 90% | 58.4 ? -36% |
| Response Time Black / White * (ms) | 91.6 ? | 34.9 ? 62% | 31.2 ? 66% | 2.8 ? 97% | 2.4 ? 97% | 10 ? 89% | 40.4 ? 56% |
| PWM Frequency (Hz) | 14880 | 131700 | 59.5 ? | 240.4 ? | 14880 | ||
| Screen | -262% | -269% | -49% | -85% | -227% | 35% | |
| Brightness middle (cd/m²) | 514 | 519 1% | 630 23% | 362 -30% | 379.6 -26% | 353.4 -31% | 489 -5% |
| Brightness (cd/m²) | 497 | 477 -4% | 622 25% | 367 -26% | 380 -24% | 340 -32% | 479 -4% |
| Brightness Distribution (%) | 95 | 86 -9% | 90 -5% | 97 2% | 95 0% | 92 -3% | 94 -1% |
| Black Level * (cd/m²) | 0.02 | 0.39 -1850% | 0.41 -1950% | 0.06 -200% | 0.31 -1450% | 0.01 50% | |
| Contrast (:1) | 25700 | 1331 -95% | 1537 -94% | 6033 -77% | 1140 -96% | 48900 90% | |
| Colorchecker dE 2000 * | 1.4 | 2.28 -63% | 2.2 -57% | 2.1 -50% | 5.15 -268% | 2.17 -55% | 0.8 43% |
| Colorchecker dE 2000 max. * | 2.8 | 6.54 -134% | 5 -79% | 4.1 -46% | 7.79 -178% | 5.69 -103% | 1.3 54% |
| Greyscale dE 2000 * | 2.3 | 0.9 61% | 2.7 -17% | 1.4 39% | 2.6 -13% | 3.4 -48% | 1.1 52% |
| Gamma | 2.27 97% | 2145 0% | 2.26 97% | 2.18 101% | 1.99 111% | 2.2 100% | 2.24 98% |
| CCT | 6792 96% | 6572 99% | 6886 94% | 6608 98% | 6166 105% | 6830 95% | |
| Colorchecker dE 2000 calibrated * | 0.86 | 1 | 2.5 | 3.1 | 1.05 | ||
| Color Space (Percent of AdobeRGB 1998) (%) | 78 | ||||||
| Total Average (Program / Settings) | -121% /
-205% | -84% /
-163% | 17% /
-14% | 5% /
-28% | -52% /
-130% | 15% /
27% |
* ... smaller is better
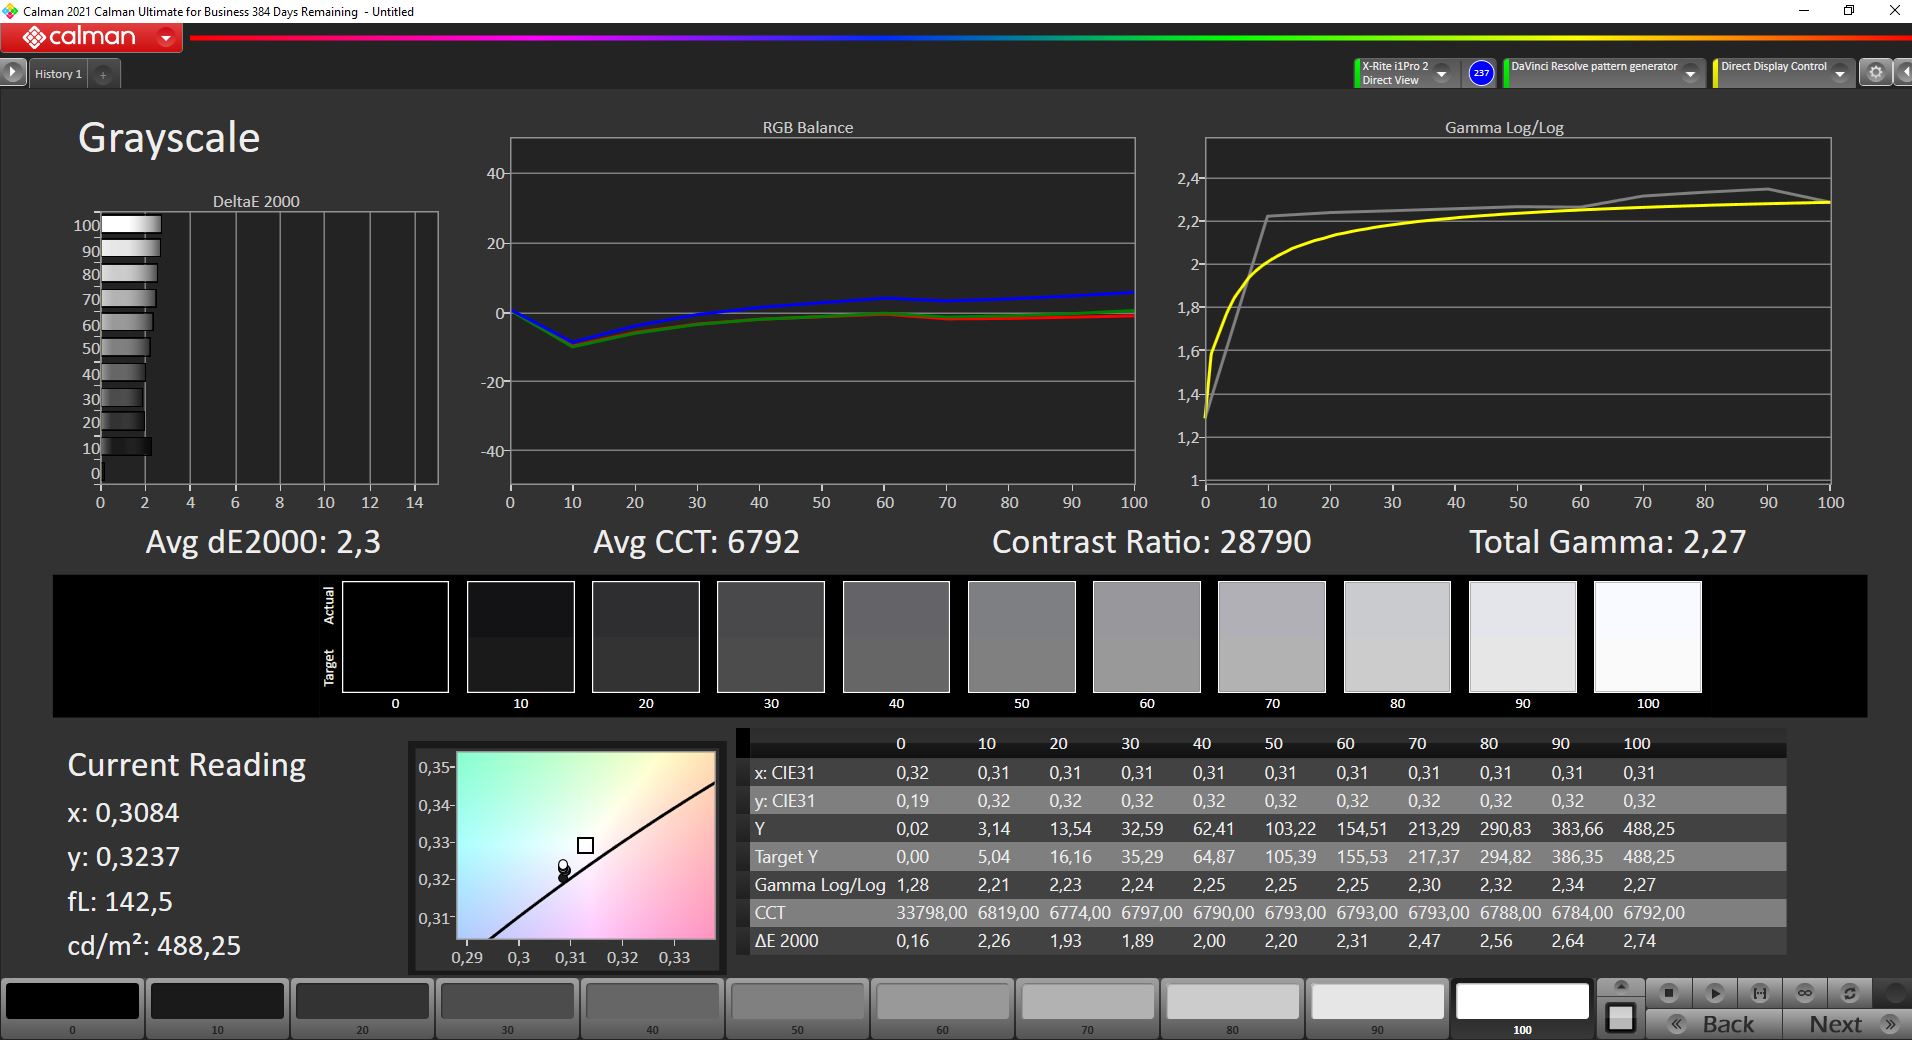
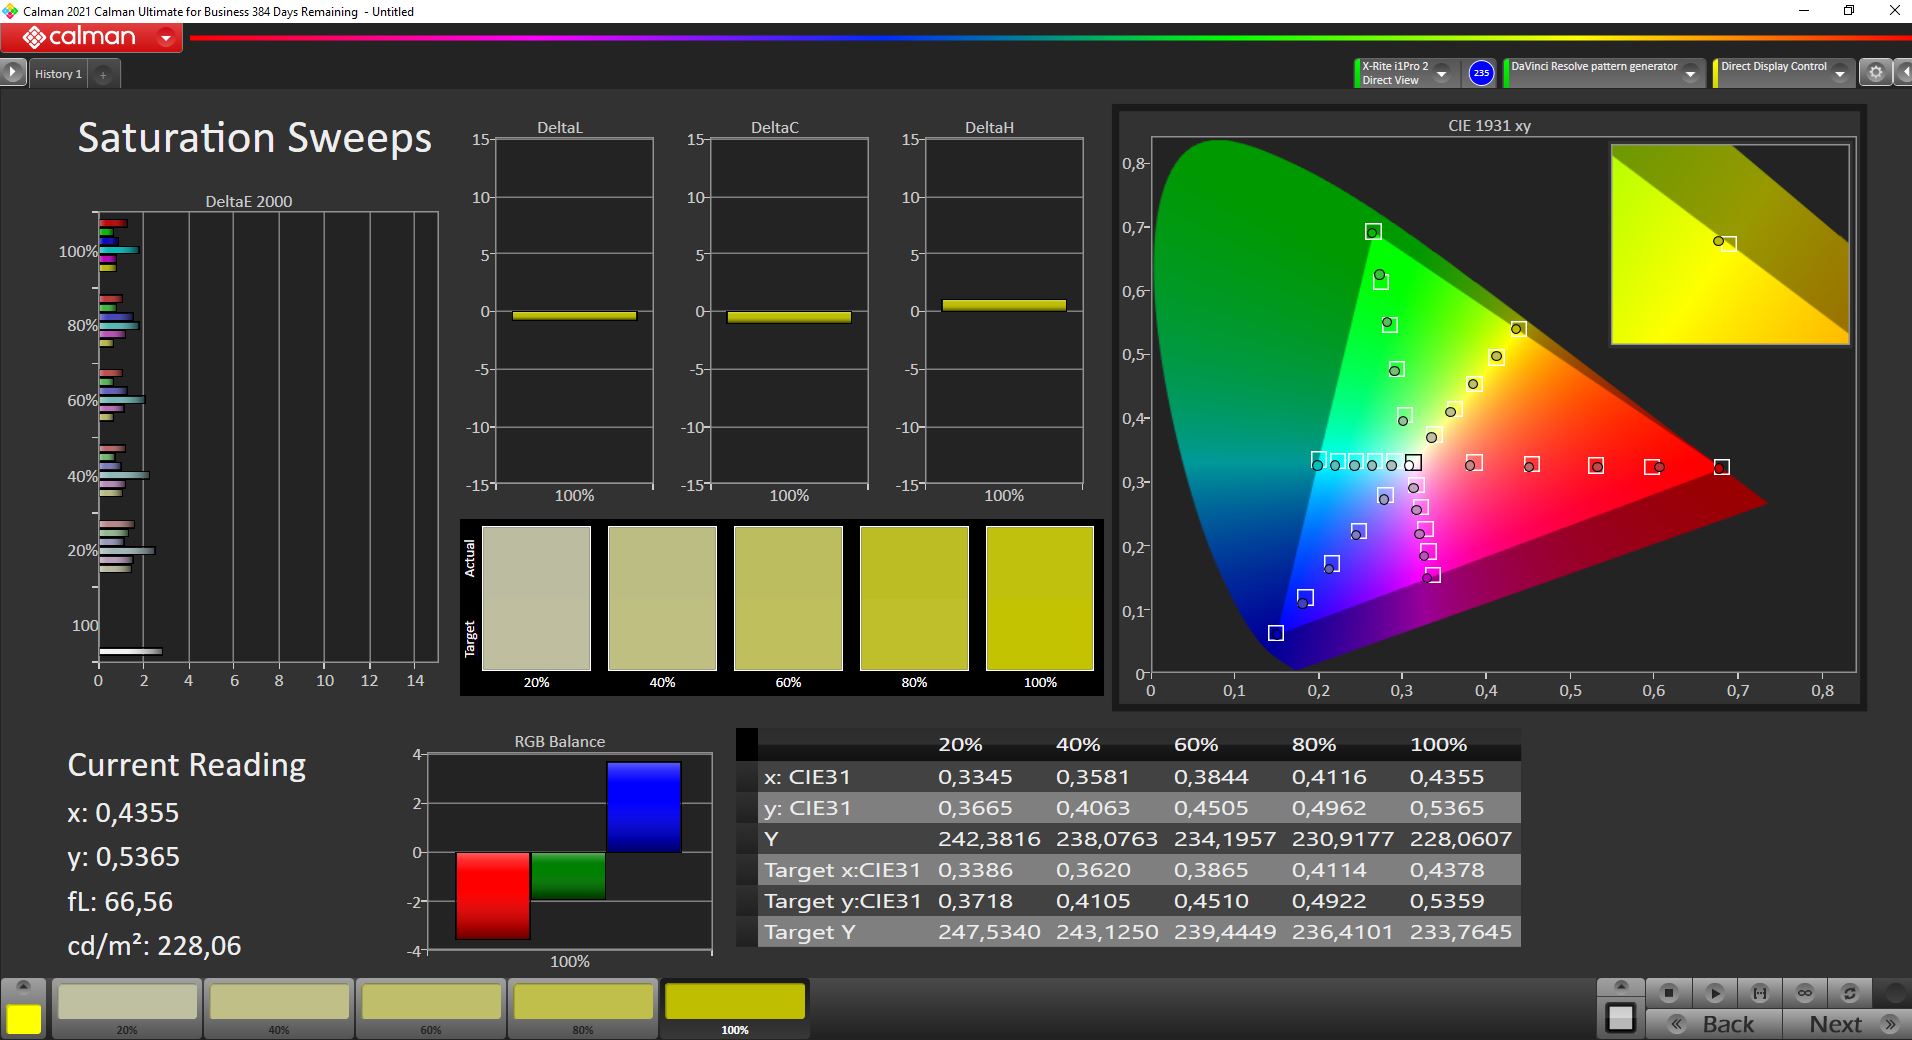
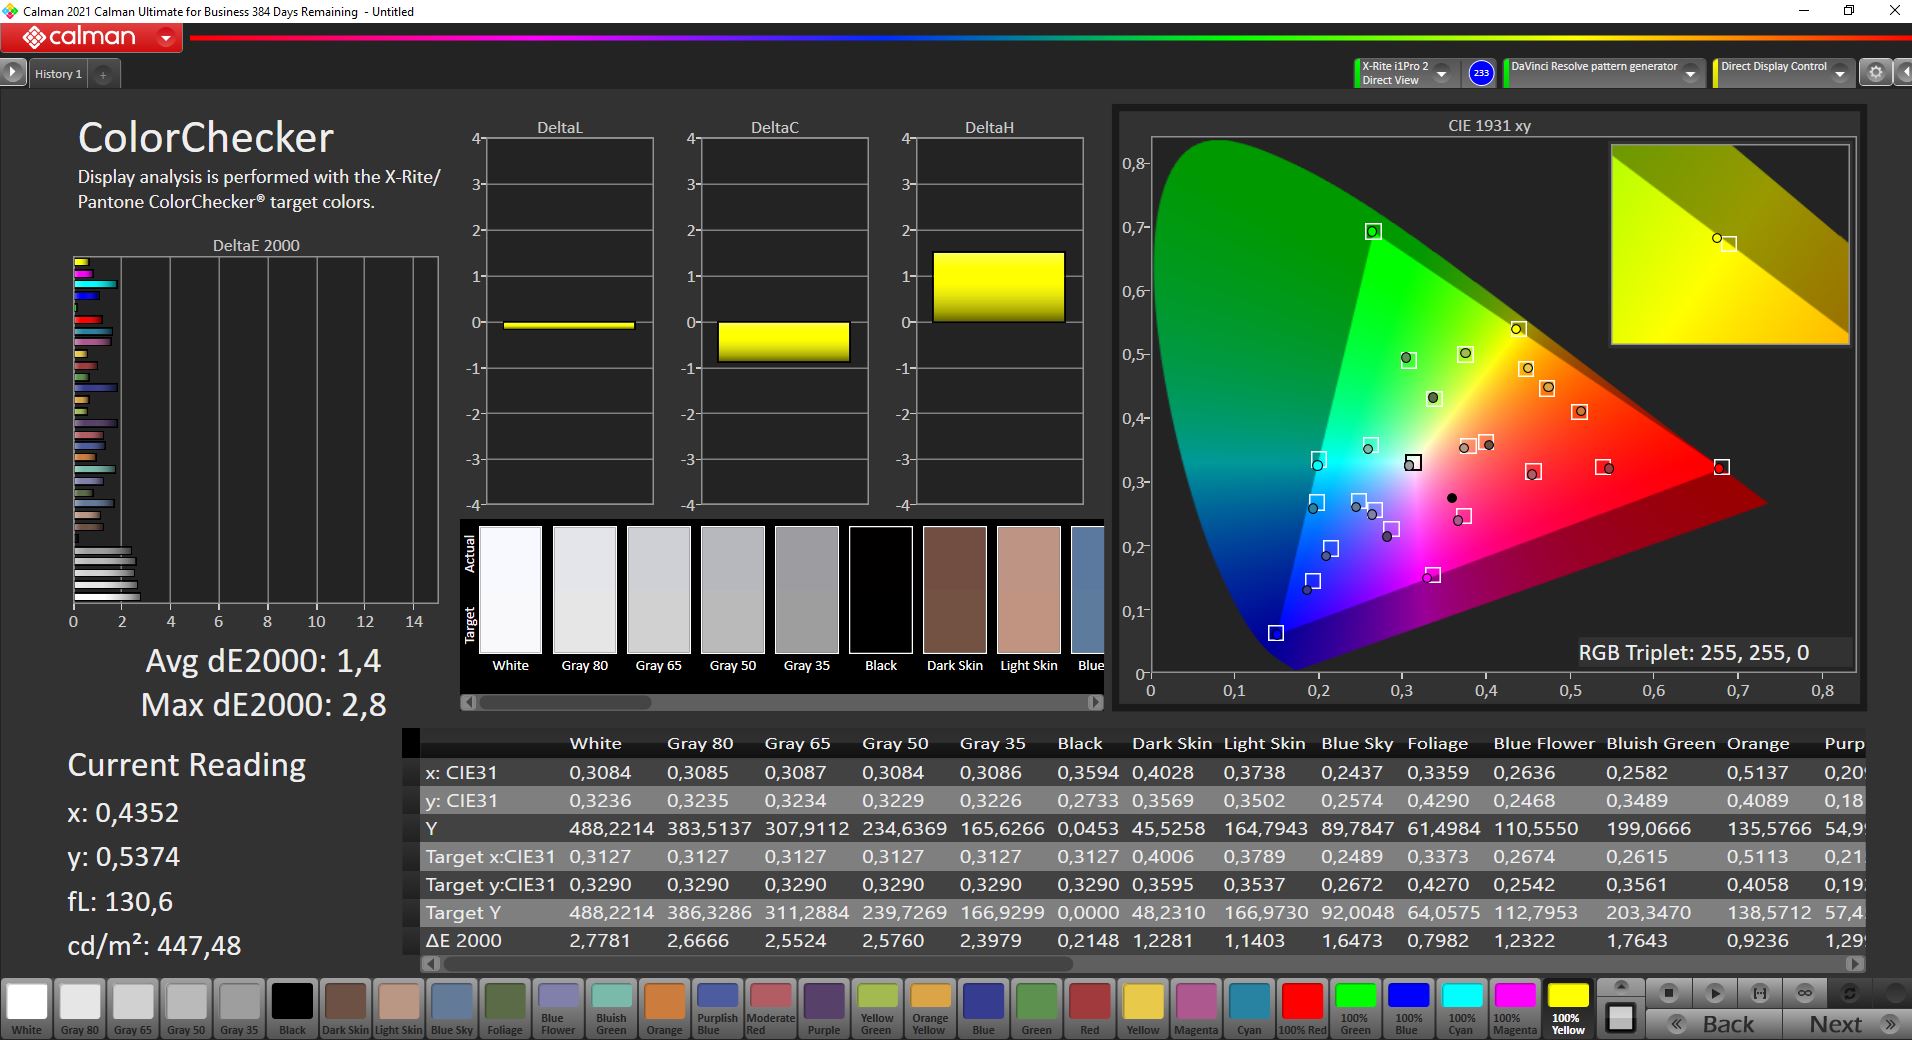
Our analysis with the professional CalMAN software and the X-Rite i1 Pro 2 spectrophotometer shows that the panel calibration of the new MBP 16 is not as good compared to the 14-inch unit out of the box. The color temperature is slightly too cool and there is a minor blue cast in the grayscale. Unfortunately, we are not able to calibrate the panel with our device. Both the average DeltaE-2000 deviations for the colors as well as the grayscale are already smaller than 3 though, so this is moaning on a very high level and there are no restrictions for picture/video editing.
Display Response Times
| ↔ Response Time Black to White | ||
|---|---|---|
| 91.6 ms ... rise ↗ and fall ↘ combined | ↗ 76 ms rise | 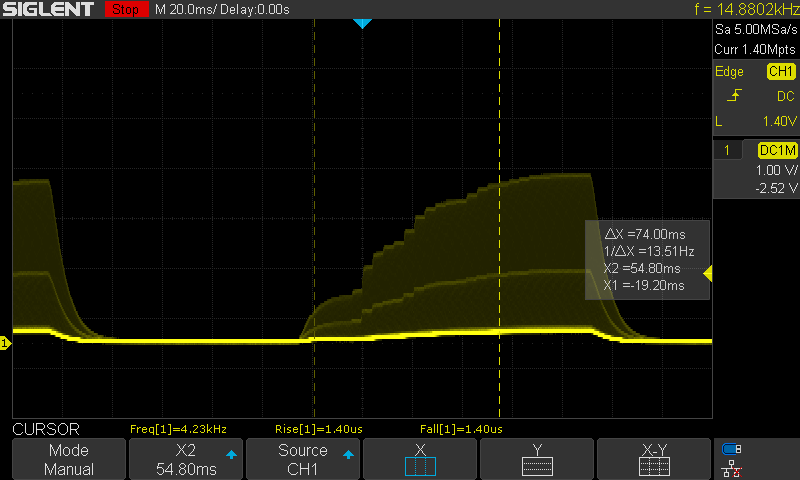 |
| ↘ 15.6 ms fall | ||
| The screen shows slow response rates in our tests and will be unsatisfactory for gamers. In comparison, all tested devices range from 0.1 (minimum) to 240 (maximum) ms. » 100 % of all devices are better. This means that the measured response time is worse than the average of all tested devices (19.8 ms). | ||
| ↔ Response Time 50% Grey to 80% Grey | ||
| 42.8 ms ... rise ↗ and fall ↘ combined | ↗ 19.6 ms rise | 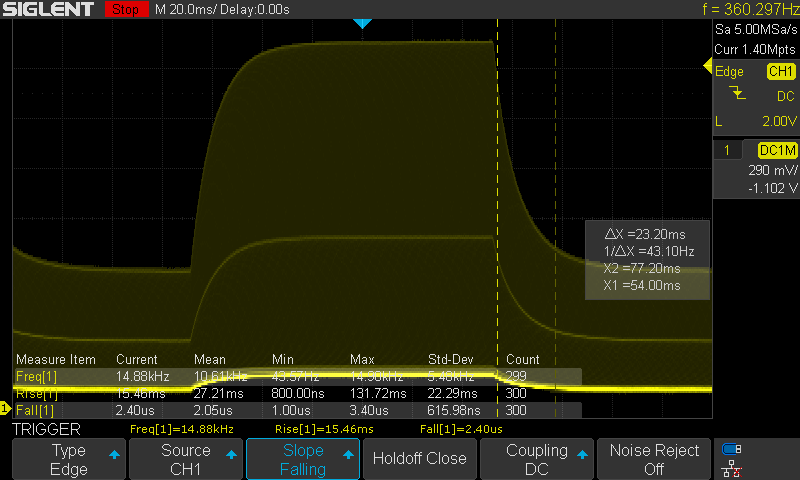 |
| ↘ 23.2 ms fall | ||
| The screen shows slow response rates in our tests and will be unsatisfactory for gamers. In comparison, all tested devices range from 0.165 (minimum) to 636 (maximum) ms. » 70 % of all devices are better. This means that the measured response time is worse than the average of all tested devices (31 ms). | ||
Screen Flickering / PWM (Pulse-Width Modulation)
| Screen flickering / PWM detected | 14880 Hz | 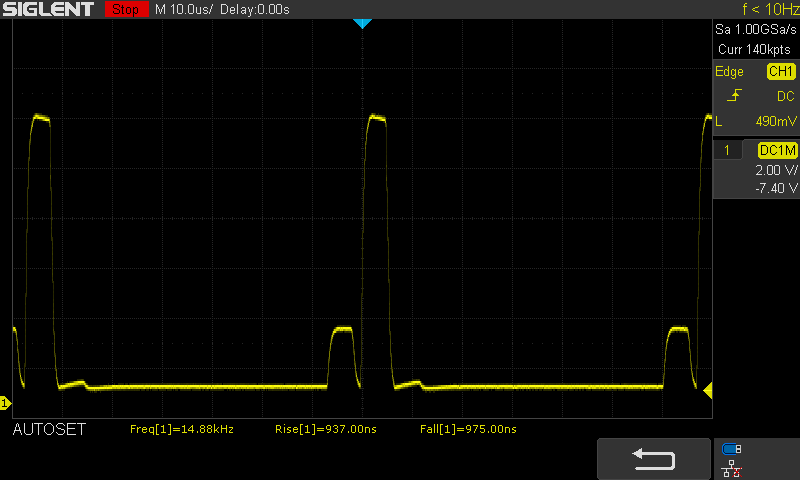 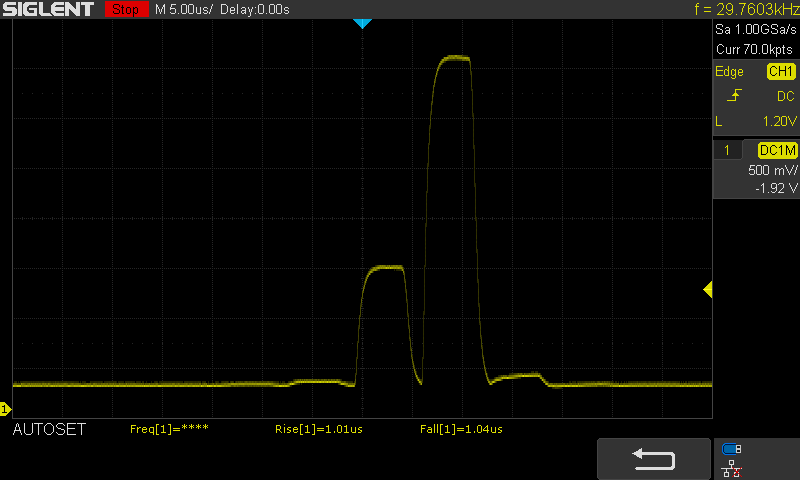 | |
The display backlight flickers at 14880 Hz (worst case, e.g., utilizing PWM) . The frequency of 14880 Hz is quite high, so most users sensitive to PWM should not notice any flickering. In comparison: 52 % of all tested devices do not use PWM to dim the display. If PWM was detected, an average of 7757 (minimum: 5 - maximum: 343500) Hz was measured. | |||
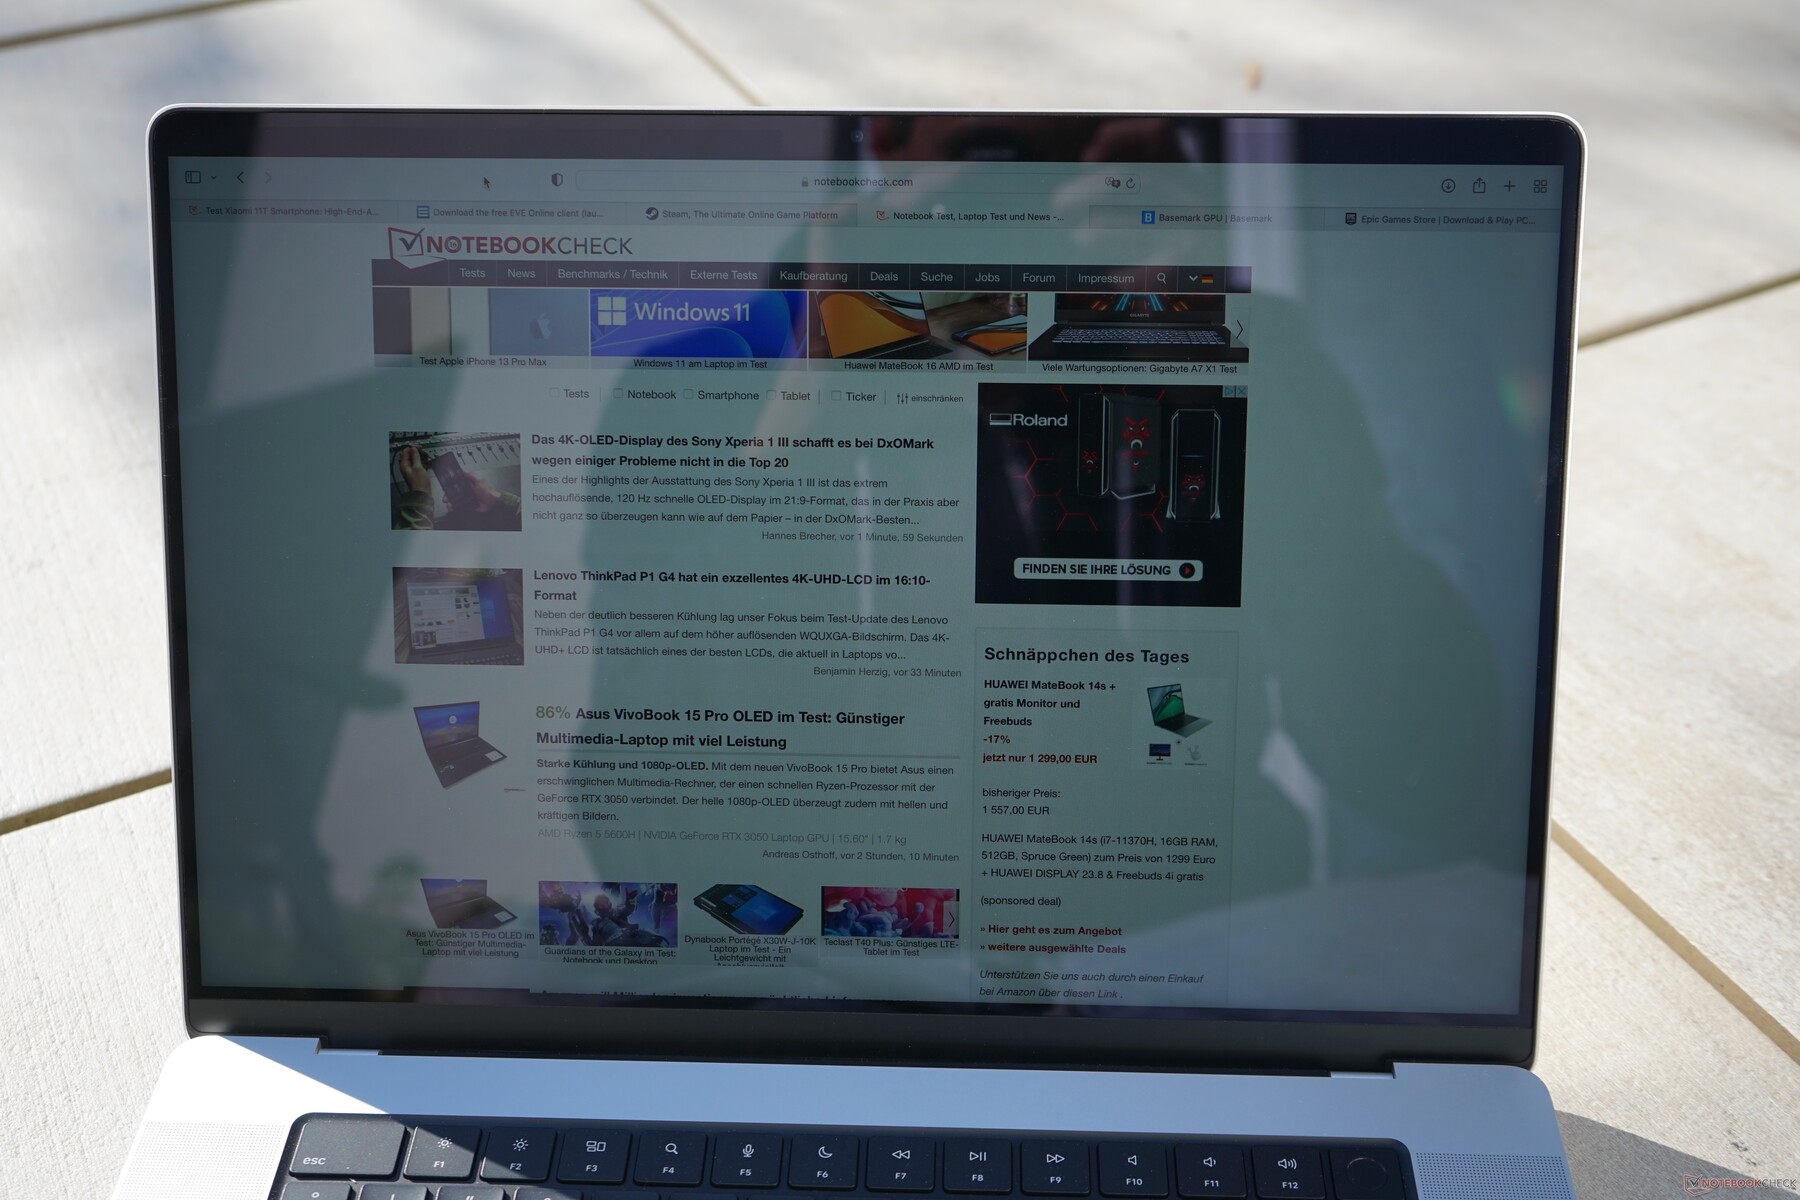
The MacBook Pro 16 does have a glossy screen surface, but it is not as reflective as many other laptops with glossy displays or touchscreens. You can still work pretty comfortably outdoors even in brighter environments as long as you avoid reflections, but the panel would obviously benefit from higher brightness levels. You will be disappointed in this regard if you saw Apple’s specs and hoped for improved outdoor capabilities.
Performance - M1 Pro with 10/16 Cores
Unlike the smaller MacBook Pro 14, the larger 16-inch model is always shipped with the full version of the M1 Pro SoC, so you get 10 CPU cores (2 efficiency cores & 8 performance cores) in combination with 16 GPU cores. If you select similar components, the price difference between the two models is only 230 Euros (~US$263).
| SoC | CPU Cores | GPU Cores | RAM | Additional Price |
|---|---|---|---|---|
| M1 Pro | 2 Efficiency cores & 8 Performance cores | 16 | 16 or 32 GB | |
| M1 Max | 2 Efficiency cores & 8 Performance cores | 24 | 32 or 64 GB | 230 Euros (~US$263) |
| M1 Max | 2 Efficiency cores & 8 Performance cores | 32 | 32 or 64 GB | 410 Euros (~US$469) |
Apple also offers two versions of its new M1 Max chip (with 24 or 32 GPU cores) as optional upgrades. The CPU performance will pretty much stay the same; some apps might benefit from more memory. You can upgrade to 32 GB RAM with the M1 Pro and all the way up to 64 GB with the M1 Max.
Processor - M1 Pro with 10 Cores
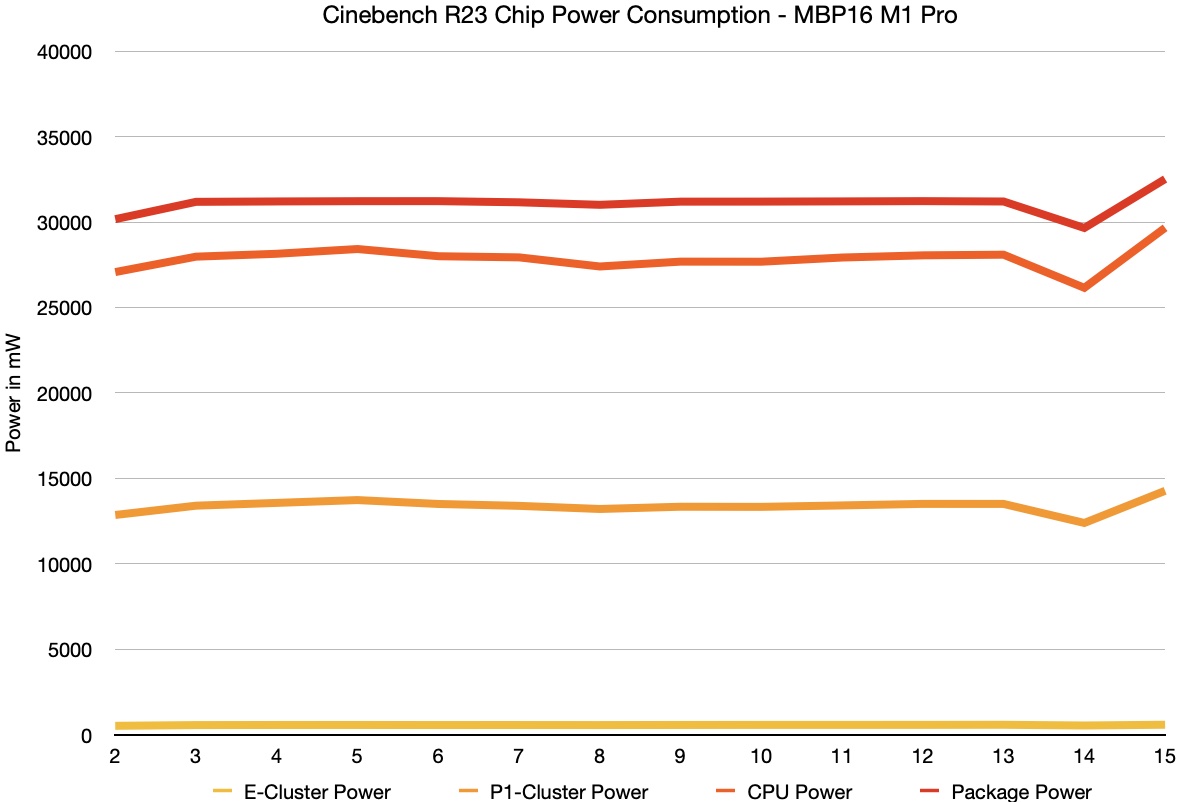
The M1 Pro consists of two efficiency clusters (two cores up to 2,064 MHz) in combination with two performance clusters with 4 cores each (up to 3.2 GHz). The underlying architecture of the cores does not differ from last year’s Apple M1 SoC, which is used for the MacBook Air and the MacBook Pro 13, for example. This means the single-core performance is also comparable, which is also the case for the optional M1 Max chip. Apple can keep up with modern mobile processors from AMD and Intel in this regard but is much more efficient (~7 W package & 4 W core vs. ~20 W @Intel & ~15 W @AMD).
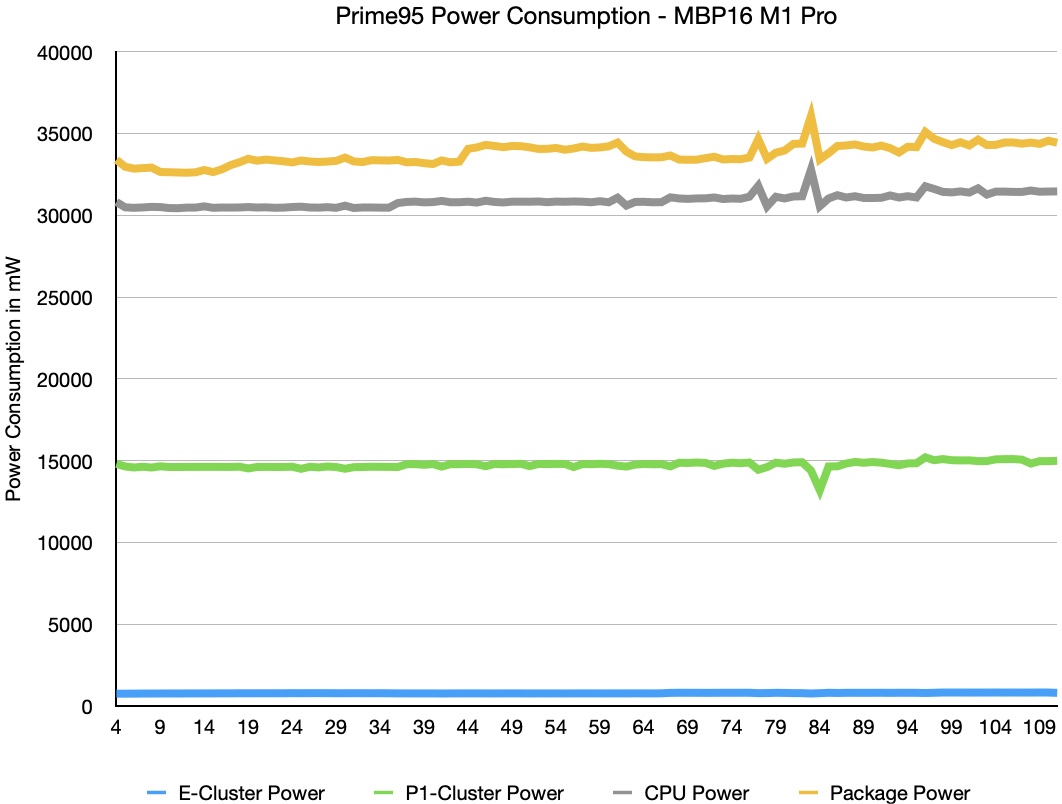
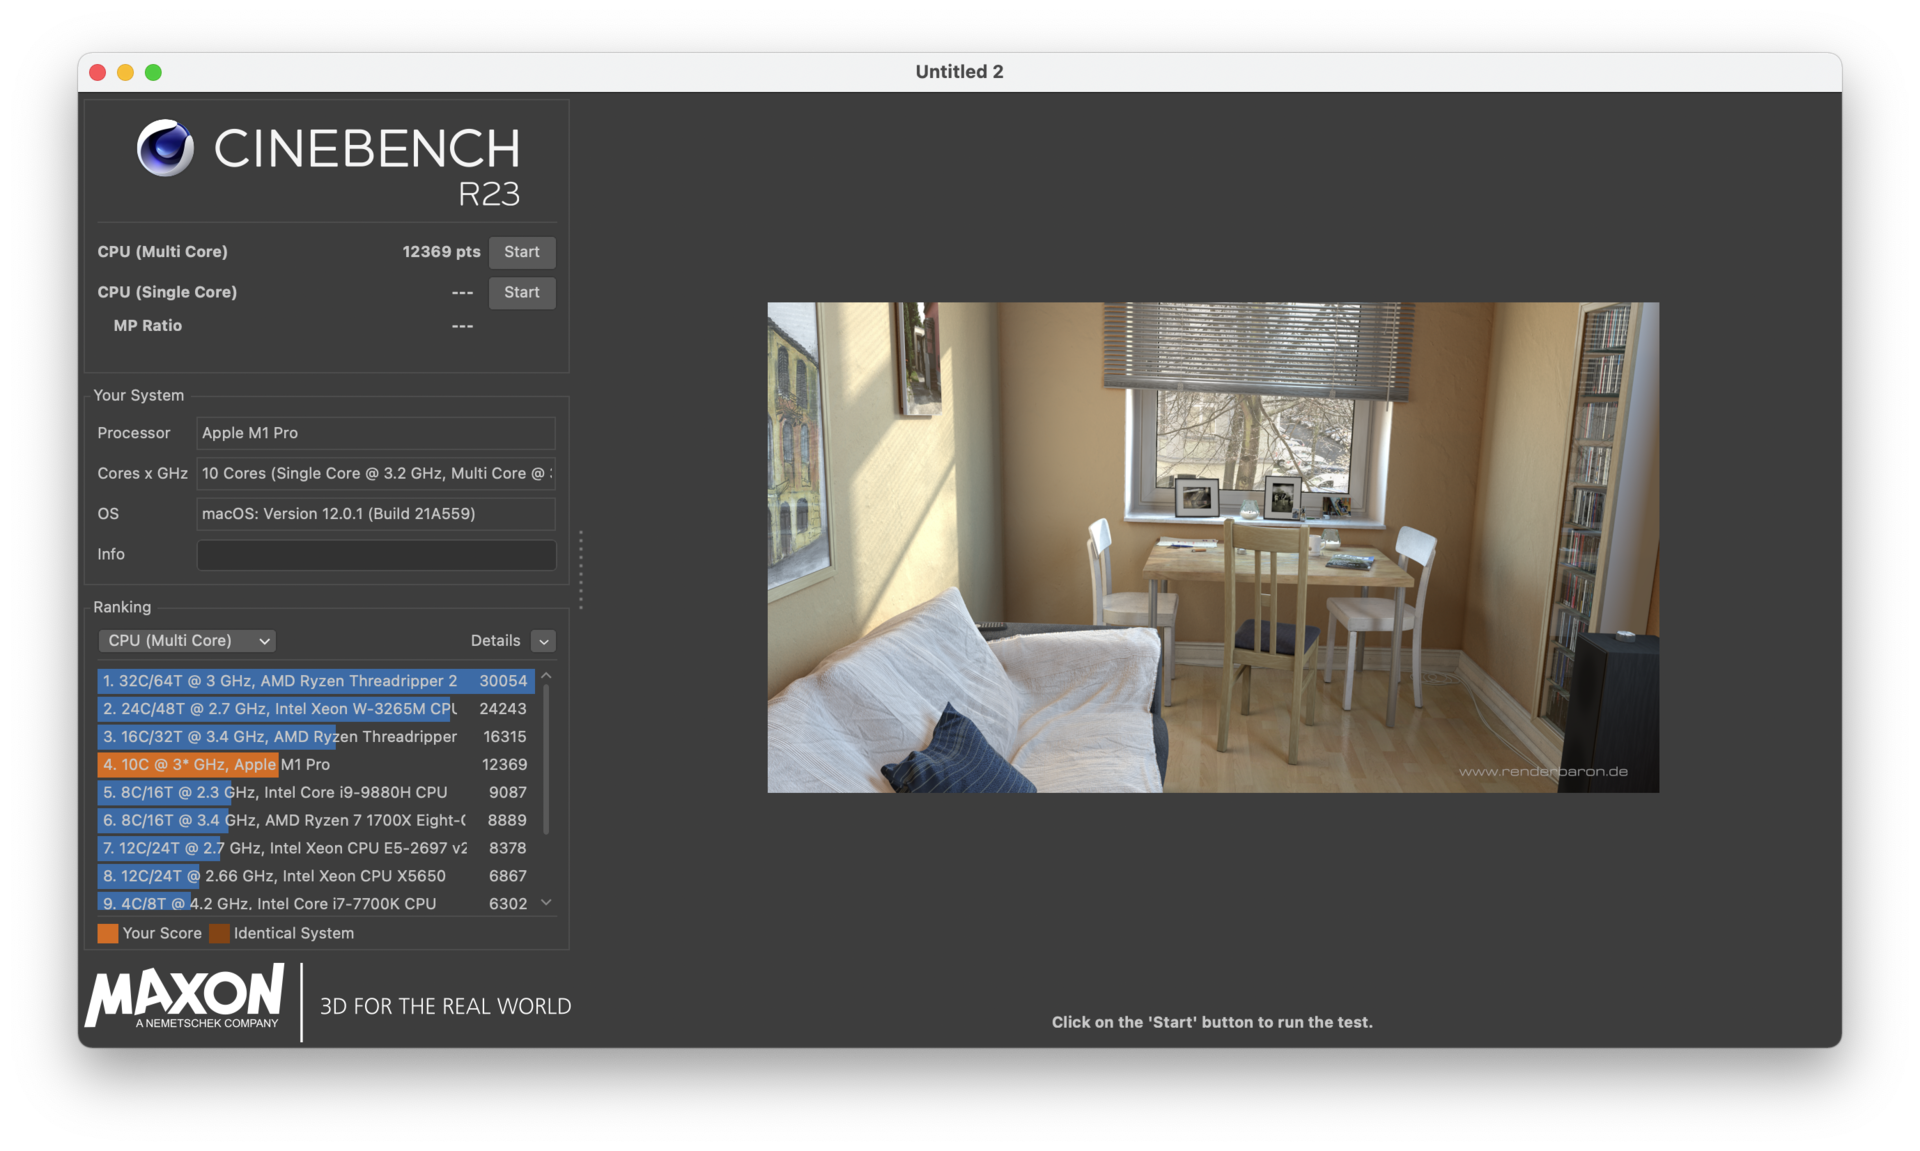
The Cinebench R23 Multi test, which is running natively on the MacBook Pro 16, only results in a consumption of ~30 W package and ~27 W for the cores. This is comparable with the current AMD Ryzen 7 5800U (Zen 3, 8 cores, 16 threads), but the performance is lower (~20%) and comparable to the smaller 8-core M1 Pro chip. Both AMD and Intel have mobile CPUs with more performance in the 45 W segment, but they also consume much more power. One major advantage of the new MacBook Pro 16 is that the performance is stable, both under sustained workloads and on battery power. More CPU benchmarks are available here.
Cinebench R15 Multi Loop
Cinebench R23: Multi Core | Single Core
Cinebench R20: CPU (Multi Core) | CPU (Single Core)
Cinebench R15: CPU Multi 64Bit | CPU Single 64Bit
Blender: v2.79 BMW27 CPU
7-Zip 18.03: 7z b 4 | 7z b 4 -mmt1
Geekbench 5.5: Multi-Core | Single-Core
HWBOT x265 Benchmark v2.2: 4k Preset
LibreOffice : 20 Documents To PDF
R Benchmark 2.5: Overall mean
| CPU Performance rating | |
| Average of class Multimedia | |
| Apple MacBook Pro 14 2021 M1 Pro Entry -8! | |
| Apple MacBook Pro 16 2021 M1 Pro -5! | |
| Average Apple M1 Pro -5! | |
| Lenovo ThinkPad P1 G4-20Y4S0KS00 | |
| HP ZBook Studio 15 G8 | |
| Razer Blade 15 Advanced (Mid 2021) -2! | |
| Dell XPS 15 9510 11800H RTX 3050 Ti OLED | |
| Apple MacBook Pro 16 2019 i9 5500M | |
| Cinebench R23 / Multi Core | |
| Average of class Multimedia (4861 - 33362, n=76, last 2 years) | |
| Apple MacBook Pro 16 2021 M1 Pro | |
| Average Apple M1 Pro (n=1) | |
| Razer Blade 15 Advanced (Mid 2021) | |
| HP ZBook Studio 15 G8 | |
| Lenovo ThinkPad P1 G4-20Y4S0KS00 | |
| Dell XPS 15 9510 11800H RTX 3050 Ti OLED | |
| Apple MacBook Pro 14 2021 M1 Pro Entry | |
| Apple MacBook Pro 16 2019 i9 5500M | |
| Apple MacBook Pro 16 2019 i9 5500M | |
| Cinebench R23 / Single Core | |
| Average of class Multimedia (1128 - 2459, n=68, last 2 years) | |
| HP ZBook Studio 15 G8 | |
| Lenovo ThinkPad P1 G4-20Y4S0KS00 | |
| Apple MacBook Pro 16 2021 M1 Pro | |
| Average Apple M1 Pro (n=1) | |
| Apple MacBook Pro 14 2021 M1 Pro Entry | |
| Razer Blade 15 Advanced (Mid 2021) | |
| Dell XPS 15 9510 11800H RTX 3050 Ti OLED | |
| Apple MacBook Pro 16 2019 i9 5500M | |
| Cinebench R20 / CPU (Multi Core) | |
| Average of class Multimedia (1887 - 12912, n=59, last 2 years) | |
| Razer Blade 15 Advanced (Mid 2021) | |
| Lenovo ThinkPad P1 G4-20Y4S0KS00 | |
| HP ZBook Studio 15 G8 | |
| Dell XPS 15 9510 11800H RTX 3050 Ti OLED | |
| Apple MacBook Pro 16 2019 i9 5500M | |
| Apple MacBook Pro 16 2019 i9 5500M | |
| Apple MacBook Pro 16 2021 M1 Pro | |
| Average Apple M1 Pro (n=1) | |
| Cinebench R20 / CPU (Single Core) | |
| Average of class Multimedia (425 - 853, n=59, last 2 years) | |
| HP ZBook Studio 15 G8 | |
| Lenovo ThinkPad P1 G4-20Y4S0KS00 | |
| Razer Blade 15 Advanced (Mid 2021) | |
| Dell XPS 15 9510 11800H RTX 3050 Ti OLED | |
| Apple MacBook Pro 16 2019 i9 5500M | |
| Apple MacBook Pro 16 2019 i9 5500M | |
| Apple MacBook Pro 16 2021 M1 Pro | |
| Average Apple M1 Pro (n=1) | |
| Cinebench R15 / CPU Multi 64Bit | |
| Average of class Multimedia (856 - 5224, n=63, last 2 years) | |
| Dell XPS 15 9510 11800H RTX 3050 Ti OLED | |
| Dell XPS 15 9510 11800H RTX 3050 Ti OLED | |
| Lenovo ThinkPad P1 G4-20Y4S0KS00 | |
| Razer Blade 15 Advanced (Mid 2021) | |
| HP ZBook Studio 15 G8 | |
| Apple MacBook Pro 16 2021 M1 Pro | |
| Average Apple M1 Pro (n=1) | |
| Apple MacBook Pro 16 2019 i9 5500M | |
| Apple MacBook Pro 16 2019 i9 5500M | |
| Apple MacBook Pro 14 2021 M1 Pro Entry | |
| Cinebench R15 / CPU Single 64Bit | |
| Average of class Multimedia (184.8 - 326, n=61, last 2 years) | |
| HP ZBook Studio 15 G8 | |
| Lenovo ThinkPad P1 G4-20Y4S0KS00 | |
| Dell XPS 15 9510 11800H RTX 3050 Ti OLED | |
| Razer Blade 15 Advanced (Mid 2021) | |
| Apple MacBook Pro 14 2021 M1 Pro Entry | |
| Apple MacBook Pro 16 2021 M1 Pro | |
| Average Apple M1 Pro (n=1) | |
| Apple MacBook Pro 16 2019 i9 5500M | |
| Apple MacBook Pro 16 2019 i9 5500M | |
| Blender / v2.79 BMW27 CPU | |
| Apple MacBook Pro 16 2019 i9 5500M | |
| Dell XPS 15 9510 11800H RTX 3050 Ti OLED | |
| Razer Blade 15 Advanced (Mid 2021) | |
| Lenovo ThinkPad P1 G4-20Y4S0KS00 | |
| HP ZBook Studio 15 G8 | |
| Average of class Multimedia (100 - 557, n=60, last 2 years) | |
| Apple MacBook Pro 16 2021 M1 Pro | |
| Average Apple M1 Pro (n=1) | |
| 7-Zip 18.03 / 7z b 4 | |
| Average of class Multimedia (26062 - 130368, n=57, last 2 years) | |
| Razer Blade 15 Advanced (Mid 2021) | |
| Lenovo ThinkPad P1 G4-20Y4S0KS00 | |
| HP ZBook Studio 15 G8 | |
| Dell XPS 15 9510 11800H RTX 3050 Ti OLED | |
| Apple MacBook Pro 16 2019 i9 5500M | |
| 7-Zip 18.03 / 7z b 4 -mmt1 | |
| Average of class Multimedia (3666 - 7545, n=58, last 2 years) | |
| HP ZBook Studio 15 G8 | |
| Lenovo ThinkPad P1 G4-20Y4S0KS00 | |
| Razer Blade 15 Advanced (Mid 2021) | |
| Dell XPS 15 9510 11800H RTX 3050 Ti OLED | |
| Apple MacBook Pro 16 2019 i9 5500M | |
| Geekbench 5.5 / Multi-Core | |
| Average of class Multimedia (4652 - 20422, n=58, last 2 years) | |
| Apple MacBook Pro 16 2021 M1 Pro | |
| Average Apple M1 Pro (n=1) | |
| Apple MacBook Pro 14 2021 M1 Pro Entry | |
| Lenovo ThinkPad P1 G4-20Y4S0KS00 | |
| Dell XPS 15 9510 11800H RTX 3050 Ti OLED | |
| HP ZBook Studio 15 G8 | |
| Apple MacBook Pro 16 2019 i9 5500M | |
| Geekbench 5.5 / Single-Core | |
| Average of class Multimedia (805 - 2974, n=58, last 2 years) | |
| Apple MacBook Pro 14 2021 M1 Pro Entry | |
| Apple MacBook Pro 16 2021 M1 Pro | |
| Average Apple M1 Pro (n=1) | |
| HP ZBook Studio 15 G8 | |
| Lenovo ThinkPad P1 G4-20Y4S0KS00 | |
| Dell XPS 15 9510 11800H RTX 3050 Ti OLED | |
| Apple MacBook Pro 16 2019 i9 5500M | |
| HWBOT x265 Benchmark v2.2 / 4k Preset | |
| Average of class Multimedia (5.26 - 36.1, n=58, last 2 years) | |
| Razer Blade 15 Advanced (Mid 2021) | |
| HP ZBook Studio 15 G8 | |
| Lenovo ThinkPad P1 G4-20Y4S0KS00 | |
| Dell XPS 15 9510 11800H RTX 3050 Ti OLED | |
| Apple MacBook Pro 16 2019 i9 5500M | |
| LibreOffice / 20 Documents To PDF | |
| Apple MacBook Pro 16 2019 i9 5500M | |
| Apple MacBook Pro 16 2019 i9 5500M | |
| Average of class Multimedia (23.9 - 146.7, n=59, last 2 years) | |
| HP ZBook Studio 15 G8 | |
| Dell XPS 15 9510 11800H RTX 3050 Ti OLED | |
| Razer Blade 15 Advanced (Mid 2021) | |
| Lenovo ThinkPad P1 G4-20Y4S0KS00 | |
| R Benchmark 2.5 / Overall mean | |
| Apple MacBook Pro 16 2019 i9 5500M | |
| Apple MacBook Pro 16 2019 i9 5500M | |
| Dell XPS 15 9510 11800H RTX 3050 Ti OLED | |
| HP ZBook Studio 15 G8 | |
| Razer Blade 15 Advanced (Mid 2021) | |
| Lenovo ThinkPad P1 G4-20Y4S0KS00 | |
| Average of class Multimedia (0.3604 - 0.947, n=58, last 2 years) | |
* ... smaller is better
System Performance
The new MacBook Pro 16 is a very fast multimedia laptop and all tasks are executed very quickly and without noticeable delays. You can also use Intel apps thanks to Rosetta 2, and it works well, but you will notice a performance difference when you use complex applications like Photoshop or Premiere Pro, where the M1 versions are much snappier. We have included PugetBench results, but they are not really representative because they only run with the emulated Intel versions of the Adobe apps.
The cross-platform benchmark CrossMark shows an advantage for the MacBook Pro 16 with the M1 Pro over the smaller MacBook Pro 14, but the ThinkPad P1 G4 with the Core i7 and the GeForce RTX 3070 is faster. It will obviously depend on the software you use, and if you can take advantage of ProRes, for example, the MacBooks with the M1 chips will have a massive advantage.
CrossMark: Overall | Productivity | Creativity | Responsiveness
Photoshop PugetBench: Overall Score | GPU Score | General Score | Filter Score
Premiere Pro PugetBench: Overall Score 0.9 | Export 0.9 | Live Playback 0.9 | GPU 0.9
| Blackmagic RAW Speed Test / 12:1 8K Metal | |
| Average of class Multimedia (78 - 430, n=7, last 2 years) | |
| Apple MacBook Pro 16 2021 M1 Pro | |
| Average Apple M1 Pro, Apple M1 Pro 16-Core GPU (n=1) | |
| Apple MacBook Pro 14 2021 M1 Pro Entry | |
| Apple MacBook Pro 16 2019 i9 5500M | |
| Blackmagic RAW Speed Test / 12:1 8K CPU | |
| Average of class Multimedia (44 - 102, n=7, last 2 years) | |
| Apple MacBook Pro 16 2019 i9 5500M | |
| Apple MacBook Pro 16 2021 M1 Pro | |
| Average Apple M1 Pro, Apple M1 Pro 16-Core GPU (n=1) | |
| Apple MacBook Pro 14 2021 M1 Pro Entry | |
| CrossMark / Overall | |
| Average of class Multimedia (866 - 2728, n=62, last 2 years) | |
| Lenovo ThinkPad P1 G4-20Y4S0KS00 | |
| Apple MacBook Pro 16 2021 M1 Pro | |
| Average Apple M1 Pro, Apple M1 Pro 16-Core GPU (n=1) | |
| Apple MacBook Pro 14 2021 M1 Pro Entry | |
| Apple MacBook Pro 16 2019 i9 5500M | |
| CrossMark / Productivity | |
| Average of class Multimedia (931 - 2489, n=62, last 2 years) | |
| Lenovo ThinkPad P1 G4-20Y4S0KS00 | |
| Apple MacBook Pro 16 2021 M1 Pro | |
| Average Apple M1 Pro, Apple M1 Pro 16-Core GPU (n=1) | |
| Apple MacBook Pro 14 2021 M1 Pro Entry | |
| Apple MacBook Pro 16 2019 i9 5500M | |
| CrossMark / Creativity | |
| Average of class Multimedia (907 - 3465, n=62, last 2 years) | |
| Apple MacBook Pro 16 2021 M1 Pro | |
| Average Apple M1 Pro, Apple M1 Pro 16-Core GPU (n=1) | |
| Apple MacBook Pro 14 2021 M1 Pro Entry | |
| Lenovo ThinkPad P1 G4-20Y4S0KS00 | |
| Apple MacBook Pro 16 2019 i9 5500M | |
| CrossMark / Responsiveness | |
| Average of class Multimedia (605 - 2024, n=62, last 2 years) | |
| Lenovo ThinkPad P1 G4-20Y4S0KS00 | |
| Apple MacBook Pro 16 2021 M1 Pro | |
| Average Apple M1 Pro, Apple M1 Pro 16-Core GPU (n=1) | |
| Apple MacBook Pro 14 2021 M1 Pro Entry | |
| Apple MacBook Pro 16 2019 i9 5500M | |
| Photoshop PugetBench / Overall Score | |
| Lenovo ThinkPad P1 G4-20Y4S0KS00 | |
| Lenovo ThinkPad X1 Extreme G4-20Y5CTO1WW (3050 Ti) | |
| Apple MacBook Pro 16 2021 M1 Pro | |
| Average Apple M1 Pro, Apple M1 Pro 16-Core GPU (n=1) | |
| Apple MacBook Pro 16 2019 i9 5500M | |
| Apple MacBook Pro 14 2021 M1 Pro Entry | |
| Photoshop PugetBench / GPU Score | |
| Lenovo ThinkPad P1 G4-20Y4S0KS00 | |
| Apple MacBook Pro 16 2021 M1 Pro | |
| Average Apple M1 Pro, Apple M1 Pro 16-Core GPU (n=1) | |
| Lenovo ThinkPad X1 Extreme G4-20Y5CTO1WW (3050 Ti) | |
| Apple MacBook Pro 14 2021 M1 Pro Entry | |
| Apple MacBook Pro 16 2019 i9 5500M | |
| Photoshop PugetBench / General Score | |
| Lenovo ThinkPad P1 G4-20Y4S0KS00 | |
| Apple MacBook Pro 16 2021 M1 Pro | |
| Average Apple M1 Pro, Apple M1 Pro 16-Core GPU (n=1) | |
| Apple MacBook Pro 14 2021 M1 Pro Entry | |
| Lenovo ThinkPad X1 Extreme G4-20Y5CTO1WW (3050 Ti) | |
| Apple MacBook Pro 16 2019 i9 5500M | |
| Photoshop PugetBench / Filter Score | |
| Lenovo ThinkPad P1 G4-20Y4S0KS00 | |
| Lenovo ThinkPad X1 Extreme G4-20Y5CTO1WW (3050 Ti) | |
| Apple MacBook Pro 16 2019 i9 5500M | |
| Apple MacBook Pro 16 2021 M1 Pro | |
| Average Apple M1 Pro, Apple M1 Pro 16-Core GPU (n=1) | |
| Apple MacBook Pro 14 2021 M1 Pro Entry | |
| Premiere Pro PugetBench / Overall Score 0.9 | |
| Apple MacBook Pro 14 2021 M1 Pro Entry | |
| Lenovo ThinkPad P1 G4-20Y4S0KS00 | |
| Apple MacBook Pro 16 2021 M1 Pro | |
| Average Apple M1 Pro, Apple M1 Pro 16-Core GPU (n=1) | |
| Lenovo ThinkPad X1 Extreme G4-20Y5CTO1WW (3050 Ti) | |
| Premiere Pro PugetBench / Export 0.9 | |
| Lenovo ThinkPad P1 G4-20Y4S0KS00 | |
| Lenovo ThinkPad X1 Extreme G4-20Y5CTO1WW (3050 Ti) | |
| Apple MacBook Pro 16 2021 M1 Pro | |
| Average Apple M1 Pro, Apple M1 Pro 16-Core GPU (n=1) | |
| Apple MacBook Pro 14 2021 M1 Pro Entry | |
| Premiere Pro PugetBench / Live Playback 0.9 | |
| Apple MacBook Pro 14 2021 M1 Pro Entry | |
| Apple MacBook Pro 16 2021 M1 Pro | |
| Average Apple M1 Pro, Apple M1 Pro 16-Core GPU (n=1) | |
| Lenovo ThinkPad P1 G4-20Y4S0KS00 | |
| Lenovo ThinkPad X1 Extreme G4-20Y5CTO1WW (3050 Ti) | |
| Premiere Pro PugetBench / GPU 0.9 | |
| Lenovo ThinkPad P1 G4-20Y4S0KS00 | |
| Lenovo ThinkPad X1 Extreme G4-20Y5CTO1WW (3050 Ti) | |
| Apple MacBook Pro 16 2021 M1 Pro | |
| Average Apple M1 Pro, Apple M1 Pro 16-Core GPU (n=1) | |
| Apple MacBook Pro 14 2021 M1 Pro Entry | |
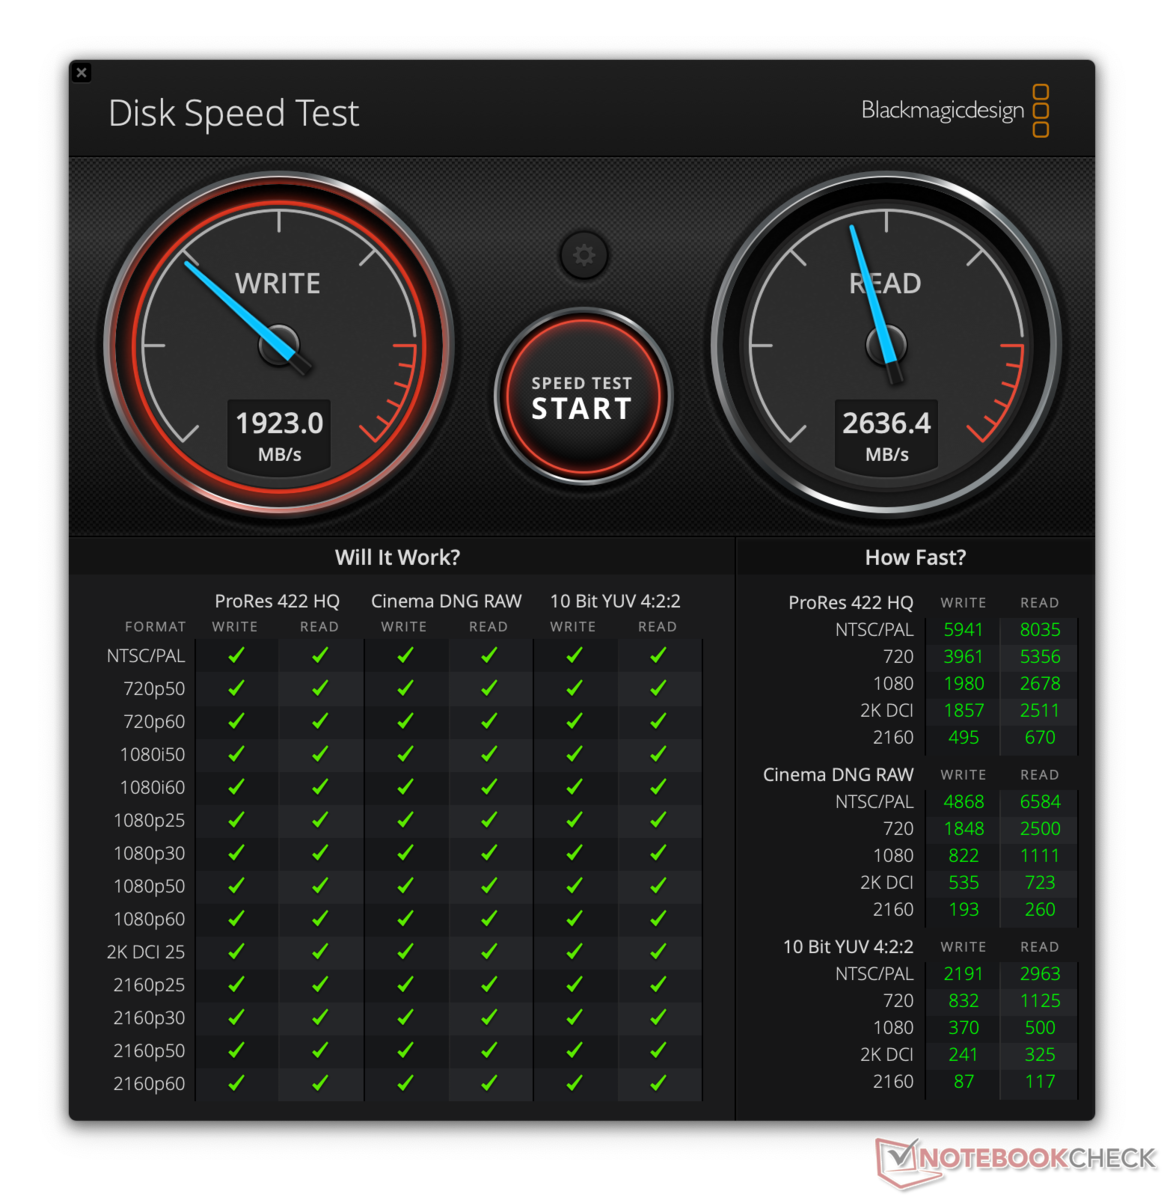
Storage Devices
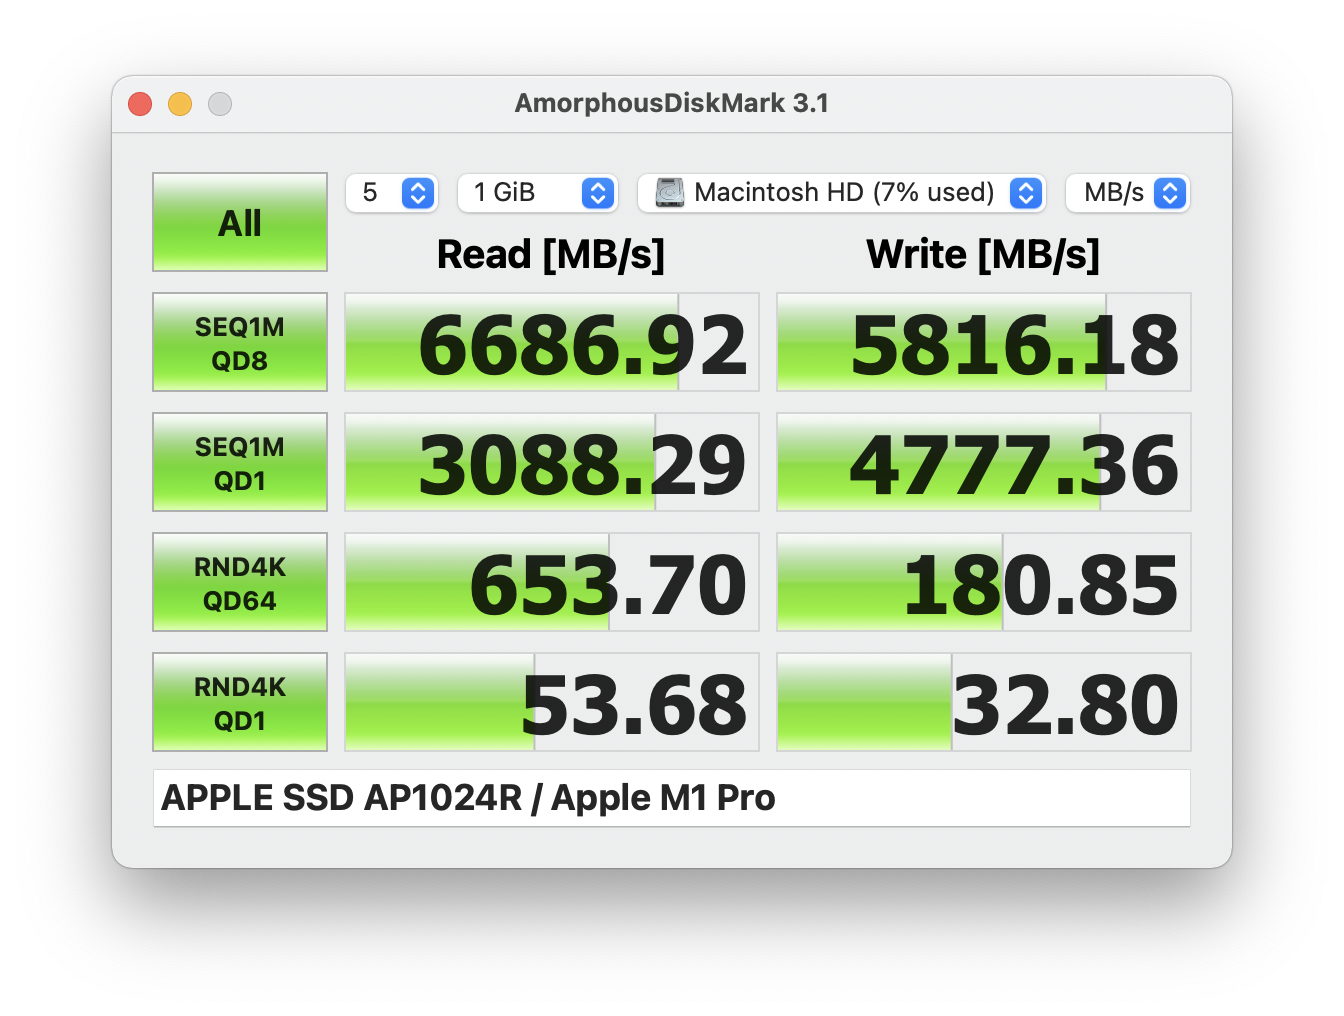
Apple uses faster PCIe 4.0 storage for the new MacBook Pro models. The base model is shipped with a 512 GB SSD; our test unit is equipped with the optional 1 TB drive. The read performance is similar to the smaller SSD, but the 1 TB model is faster in terms of write performance. All in all, the transfer rates are very good at more than 5 GB/s. In the AmorphousDiskMark 3.1 we also see very good results. Only the 4K write results are rather low compared with high end PCIe SSDs. Apple offers up to 8 TB internal SSD storage, but the prices are astronomical (the jump from the 512 GB SSD to 8 TB is 2,760 Euros (~US$3,158)). More SSD benchmarks are listed here.
| Drive Performance rating - Percent | |
| Average of class Multimedia | |
| Apple MacBook Pro 16 2021 M1 Pro | |
| Average Apple SSD AP1024R | |
| Apple MacBook Pro 14 2021 M1 Pro Entry | |
| Apple MacBook Pro 16 2019 i9 5500M | |
GPU Performance
Contrary to the smaller MBP 14, Apple only ships the MBP 16 with the fastest M1 Pro SoC, which offers 10 CPU cores and 16 GPU cores. The advantage over the 14-core GPU is just 8-12% depending on the benchmark, so not that big. Nvidia's RTX 3050 Ti in the Dell XPS 15 is noticeably faster, and the closest rivals to the Apple iGPU in terms of performance is the dedicated GeForce GTX 1650 from Nvidia. However, the M1 iGPU is much more efficient and requires less power.
Gaming Performance
The gaming capabilities of the MacBook Pro 16 are much more limited compared to Windows laptops because there are just not as many games. There are only some titles with native support for macOS and some titles can be emulated or run via additional software like CrossWare (like The Witcher 3 or GTA V via Steam), but the MacBook is just not a gaming device. You can obviously also take advantage of Apple’s own Arcade gaming collection.
The gaming benchmarks we performed show a slight advantage for the new MacBook Pro 16 over the MBP 14 with the 14-core GPU and also the old MacBook Pro 16 with the dedicated Radeon Pro 5500M.
| low | med. | high | ultra | |
|---|---|---|---|---|
| Deus Ex Mankind Divided (2016) | 54.2 | 43.1 | ||
| Civilization 6 (2016) | 45.5 | 45.5 | ||
| Shadow of the Tomb Raider (2018) | 63 | 57 | 50 | |
| Total War: Three Kingdoms (2019) | 114 | 69.6 | 43.8 | 31.8 |
| Borderlands 3 (2019) | 56.6 | 48 | 34.8 | 26.2 |
Emissions - The MBP 16 is extremely quiet
System Noise
The two fans of the MacBook Pro 16 are much quieter compared to the 14-inch model and hardly spin faster than 3,000 rpm even under maximum load, which results in around 37 dB(A). If you only stress the processor or the graphics cards, you will hardly hear more than 27 dB(A) (also during gaming), so the device is not very audible at all in normal environments despite the high performance. You can manually set the fans to their maximum speed (~49 dB(A)) via tools, but we never reached this level during our tests. We did not notice any electronic noises (like coil whine).
Noise level
| Idle |
| 24.7 / 24.7 / 24.7 dB(A) |
| Load |
| 26.1 / 37.4 dB(A) |
 | ||
30 dB silent 40 dB(A) audible 50 dB(A) loud |
||
min: | ||
| Apple MacBook Pro 16 2021 M1 Pro M1 Pro 16-Core GPU, M1 Pro, Apple SSD AP1024R | Apple MacBook Pro 16 2019 i9 5500M Radeon Pro 5500M, i9-9880H, Apple SSD AP1024 7171 | Lenovo ThinkPad P1 G4-20Y4S0KS00 GeForce RTX 3070 Laptop GPU, i7-11850H, Samsung PM9A1 MZVL21T0HCLR | Dell XPS 15 9510 11800H RTX 3050 Ti OLED GeForce RTX 3050 Ti Laptop GPU, i7-11800H, Micron 2300 512GB MTFDHBA512TDV | HP ZBook Studio 15 G8 GeForce RTX 3070 Laptop GPU, i9-11950H, Samsung PM981a MZVLB2T0HALB | Razer Blade 15 Advanced (Mid 2021) GeForce RTX 3080 Laptop GPU, i7-11800H, SSSTC CA6-8D1024 | Apple MacBook Pro 14 2021 M1 Pro Entry M1 Pro 14-Core GPU, M1 Pro 8-Core, Apple SSD AP0512 | |
|---|---|---|---|---|---|---|---|
| Noise | -29% | -13% | -4% | -15% | -18% | -7% | |
| off / environment * (dB) | 24.7 | 29.8 -21% | 23.8 4% | 23.8 4% | 23.5 5% | 25.1 -2% | 24.8 -0% |
| Idle Minimum * (dB) | 24.7 | 29.9 -21% | 23.8 4% | 23.8 4% | 25.3 -2% | 25.3 -2% | 24.8 -0% |
| Idle Average * (dB) | 24.7 | 29.9 -21% | 23.8 4% | 23.8 4% | 25.3 -2% | 25.3 -2% | 24.8 -0% |
| Idle Maximum * (dB) | 24.7 | 29.9 -21% | 28.3 -15% | 23.8 4% | 25.3 -2% | 25.3 -2% | 24.8 -0% |
| Load Average * (dB) | 26.1 | 43 -65% | 38.6 -48% | 36 -38% | 41.2 -58% | 42 -61% | 27.8 -7% |
| Load Maximum * (dB) | 37.4 | 46.1 -23% | 47.4 -27% | 38.2 -2% | 49.4 -32% | 51.6 -38% | 49.5 -32% |
| Witcher 3 ultra * (dB) | 45.4 | 47.4 | 36 | 49.4 | 45.6 | 27.8 |
* ... smaller is better
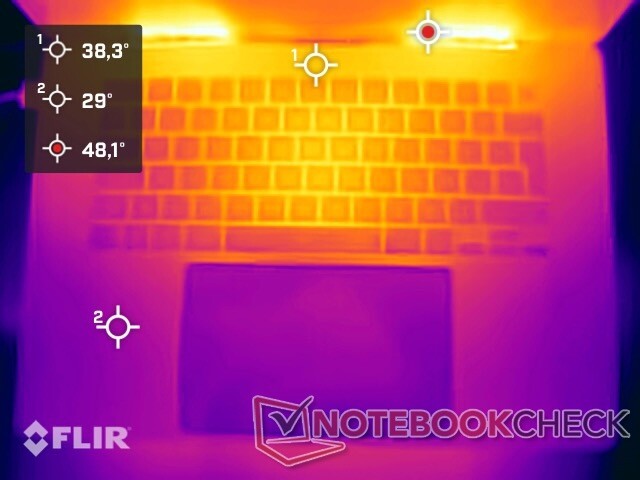
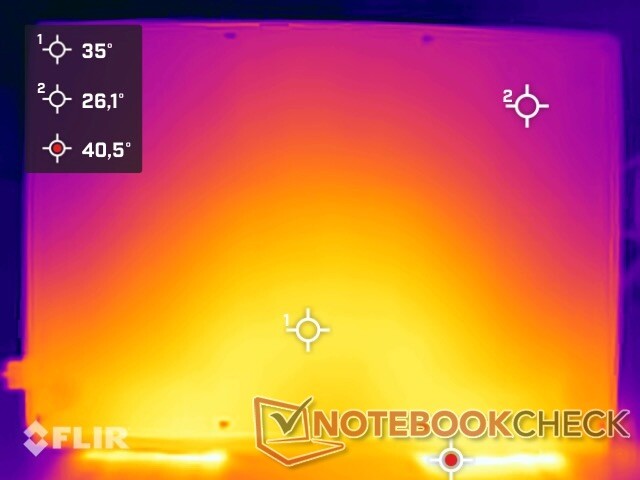
Temperature
The cooling system has no problems with the M1 Pro, and the surface temperatures are not very high under load despite the quiet fans. The keyboard in particular stays cooler than the smaller MBP 14. You will hardly notice any warming during most everyday tasks and the efficient architecture of the M1 Pro definitely pays off in this regard, because Windows rivals reach noticeably higher temperatures. The performance of the M1 Pro is also stable during the stress test, which is not the case for powerful Windows laptops.
(±) The maximum temperature on the upper side is 41 °C / 106 F, compared to the average of 36.8 °C / 98 F, ranging from 21 to 71 °C for the class Multimedia.
(+) The bottom heats up to a maximum of 39 °C / 102 F, compared to the average of 39.1 °C / 102 F
(+) In idle usage, the average temperature for the upper side is 22.8 °C / 73 F, compared to the device average of 31.3 °C / 88 F.
(+) The palmrests and touchpad are cooler than skin temperature with a maximum of 29 °C / 84.2 F and are therefore cool to the touch.
(±) The average temperature of the palmrest area of similar devices was 28.7 °C / 83.7 F (-0.3 °C / -0.5 F).
Speakers
The speakers in the new MacBook Pro 16 have improved compared to the already excellent sound system in the old model and even perform slightly better than the MacBook Pro 14 in the frequency diagram. Subjectively, the sound is great considering the chassis size and there is even some bass from the thin case thanks to four woofers. 3D audio is also supported by the sound system with 6 speakers, and it works surprisingly well.
Apple MacBook Pro 16 2021 M1 Pro audio analysis
(+) | speakers can play relatively loud (84.7 dB)
Bass 100 - 315 Hz
(+) | good bass - only 3.8% away from median
(+) | bass is linear (5.2% delta to prev. frequency)
Mids 400 - 2000 Hz
(+) | balanced mids - only 1.3% away from median
(+) | mids are linear (2.1% delta to prev. frequency)
Highs 2 - 16 kHz
(+) | balanced highs - only 1.9% away from median
(+) | highs are linear (2.7% delta to prev. frequency)
Overall 100 - 16.000 Hz
(+) | overall sound is linear (4.6% difference to median)
Compared to same class
» 0% of all tested devices in this class were better, 0% similar, 100% worse
» The best had a delta of 5%, average was 17%, worst was 45%
Compared to all devices tested
» 0% of all tested devices were better, 0% similar, 100% worse
» The best had a delta of 4%, average was 23%, worst was 134%
Apple MacBook Pro 14 2021 M1 Pro Entry audio analysis
(+) | speakers can play relatively loud (84.9 dB)
Bass 100 - 315 Hz
(+) | good bass - only 4.3% away from median
(+) | bass is linear (5.9% delta to prev. frequency)
Mids 400 - 2000 Hz
(+) | balanced mids - only 1.1% away from median
(+) | mids are linear (1.9% delta to prev. frequency)
Highs 2 - 16 kHz
(+) | balanced highs - only 2.9% away from median
(+) | highs are linear (3% delta to prev. frequency)
Overall 100 - 16.000 Hz
(+) | overall sound is linear (5.6% difference to median)
Compared to same class
» 2% of all tested devices in this class were better, 1% similar, 97% worse
» The best had a delta of 5%, average was 17%, worst was 45%
Compared to all devices tested
» 0% of all tested devices were better, 0% similar, 100% worse
» The best had a delta of 4%, average was 23%, worst was 134%
Apple MacBook Pro 16 2019 i9 5500M audio analysis
(+) | speakers can play relatively loud (82.3 dB)
Bass 100 - 315 Hz
(+) | good bass - only 2.3% away from median
(+) | bass is linear (5% delta to prev. frequency)
Mids 400 - 2000 Hz
(+) | balanced mids - only 2.7% away from median
(+) | mids are linear (3.4% delta to prev. frequency)
Highs 2 - 16 kHz
(+) | balanced highs - only 2.1% away from median
(+) | highs are linear (2.6% delta to prev. frequency)
Overall 100 - 16.000 Hz
(+) | overall sound is linear (6.9% difference to median)
Compared to same class
» 5% of all tested devices in this class were better, 1% similar, 94% worse
» The best had a delta of 5%, average was 17%, worst was 45%
Compared to all devices tested
» 1% of all tested devices were better, 0% similar, 99% worse
» The best had a delta of 4%, average was 23%, worst was 134%
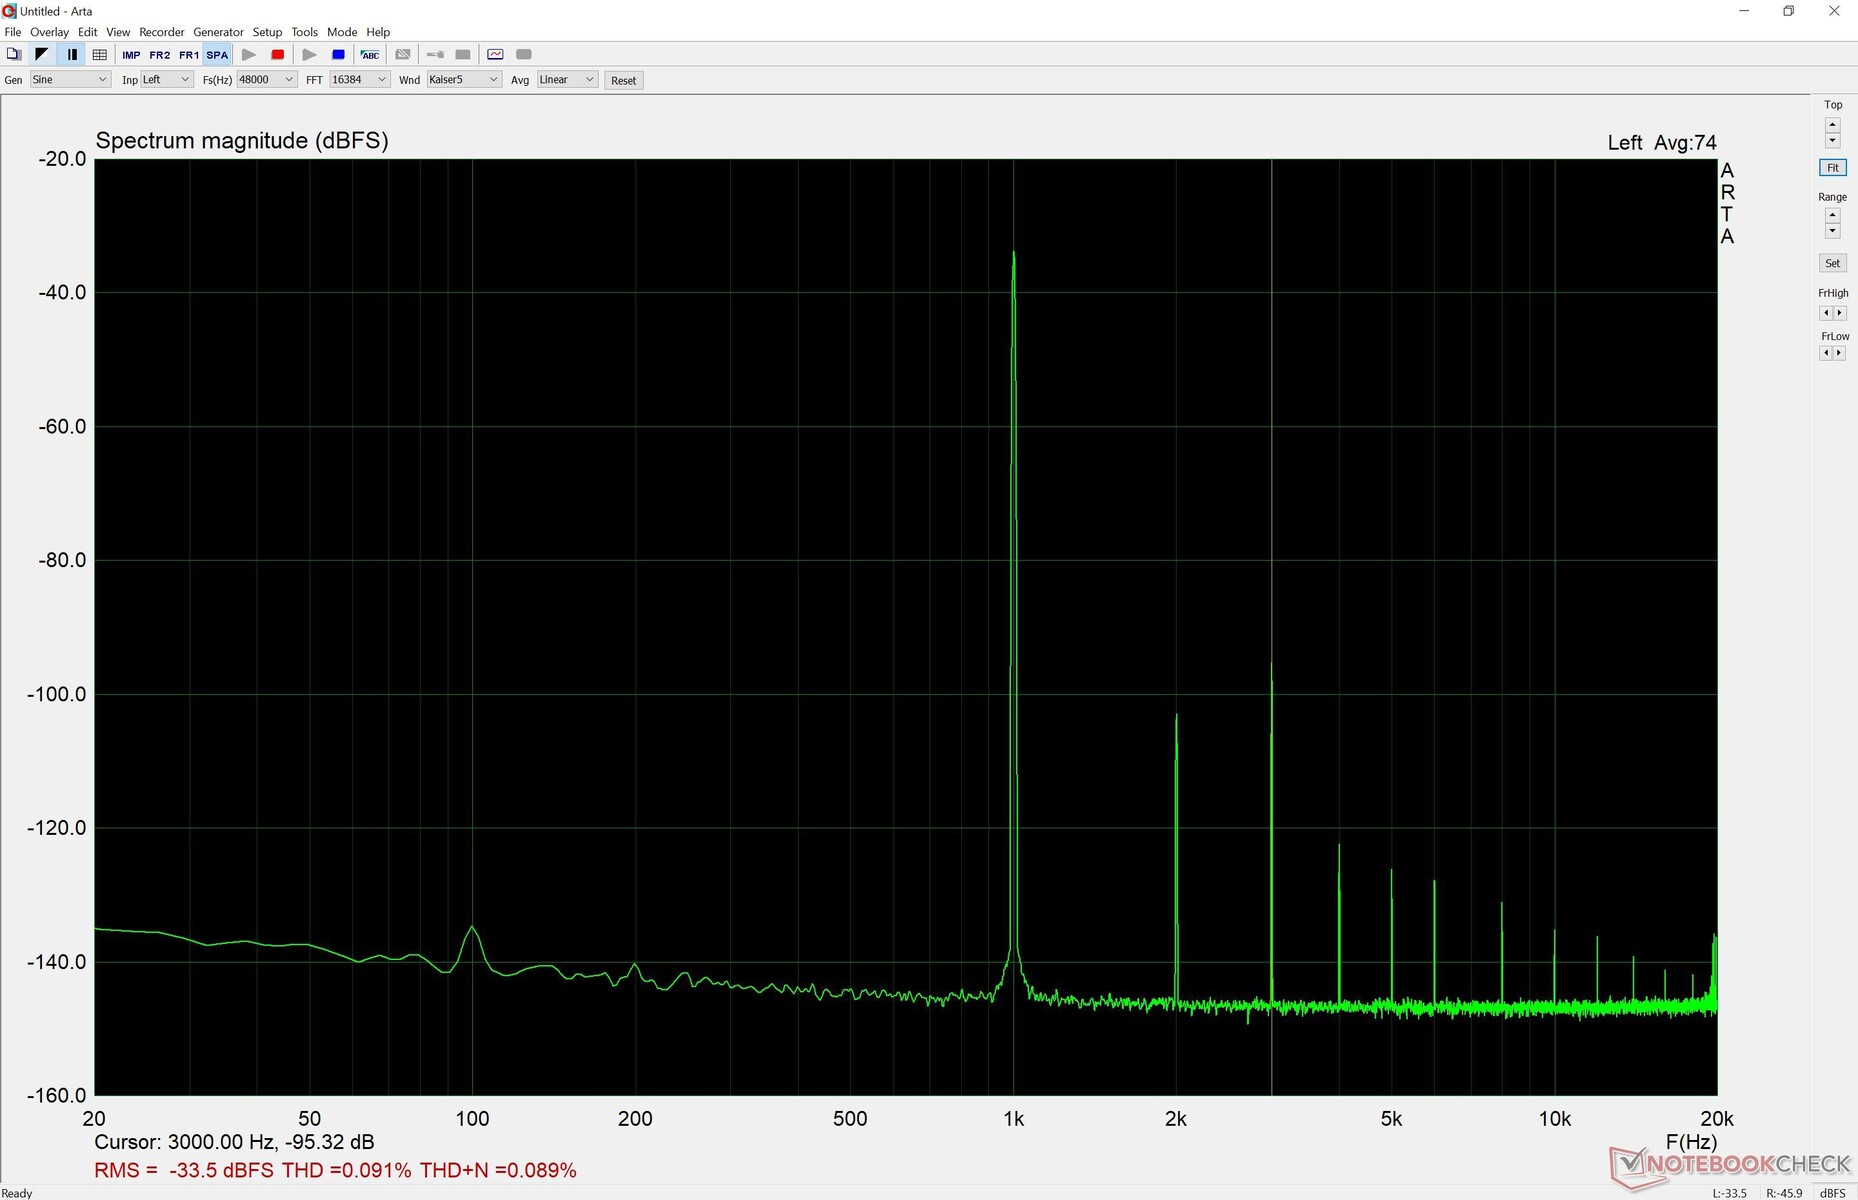
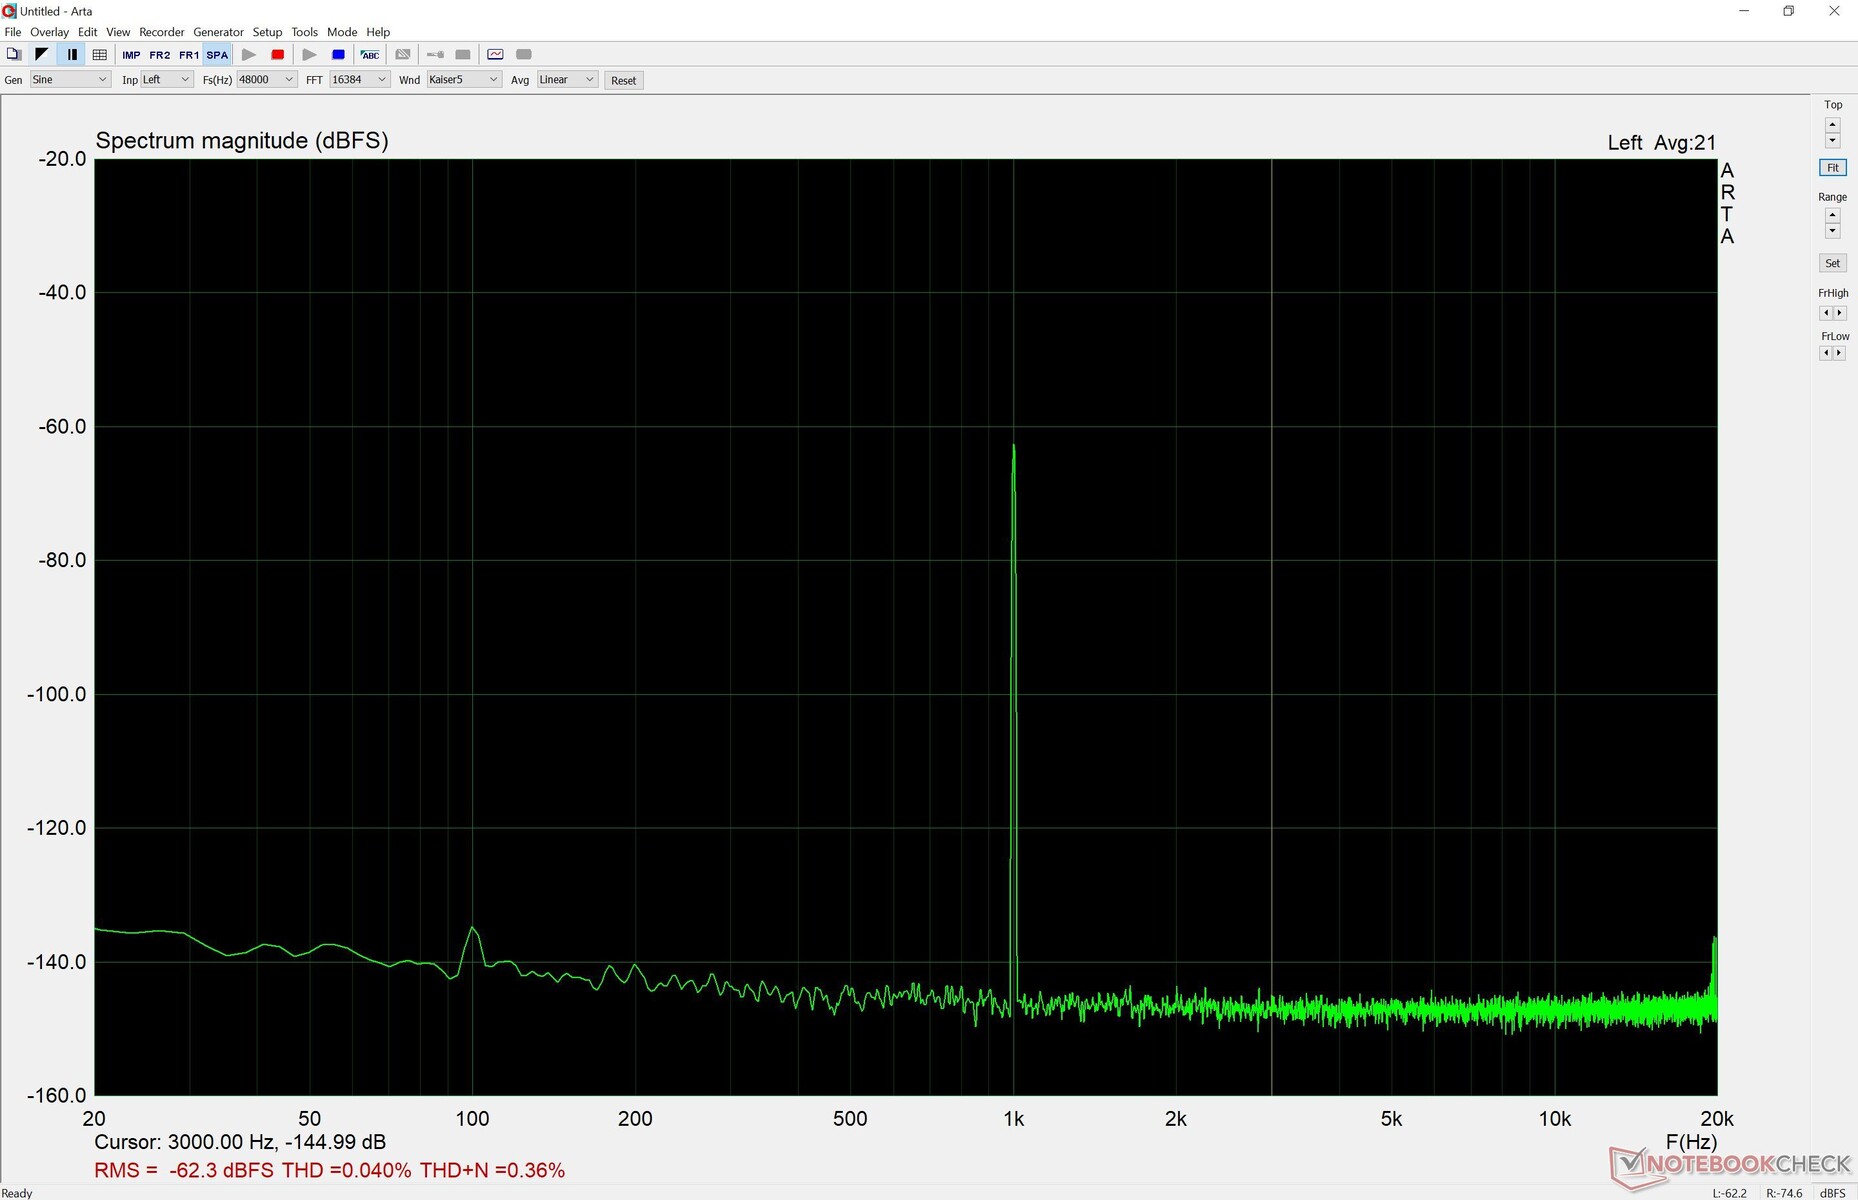
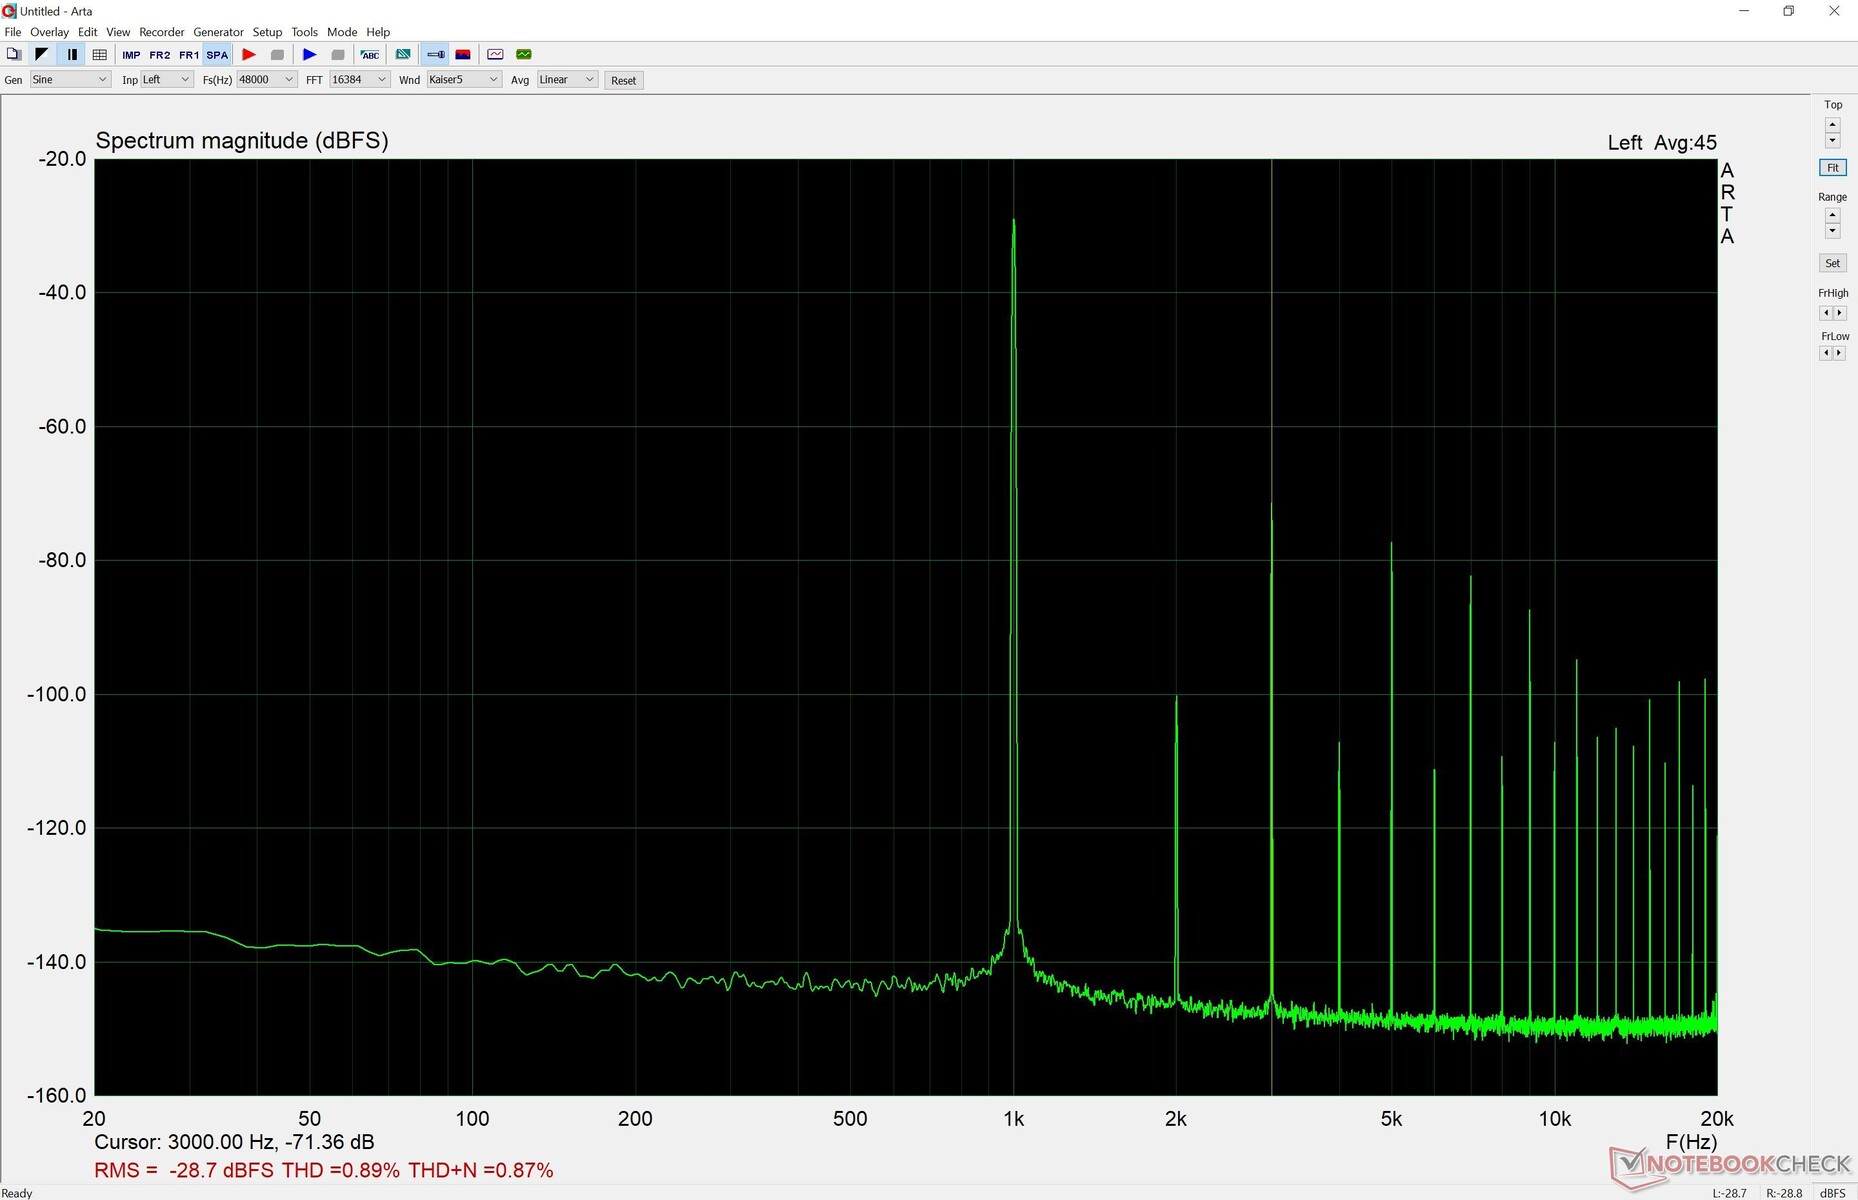
Apple also improved the integrated headset jack and it now supports headphones with higher impedance, but our measurement clearly shows that there are distortions at higher volume levels. This means it cannot replace a high-quality external amplifier, but it now supports high-impedance headphones.
Energy Management - M1 Pro is very efficient
Power Consumption
Our idle measurements show similar results to the previous MacBook Pro 16 with SDR contents, but there can be peaks of up to 30 W when you consume HDR contents. We determine slightly more than 50 W under load on average and up to 90 W during the stress test, which means the MBP 16 is once again much more efficient than the Windows competition. The 140 W power adapter is almost too powerful for the base model of the MBP 16 and we are a bit surprised that Apple does not save money and only ships it with the 96W power adapter. This would not support fast charging, but this is also the case for the base model of the smaller MBP 14, which is shipped with a 67 W PSU by default.
| Off / Standby | |
| Idle | |
| Load |
|
Key:
min: | |
| Apple MacBook Pro 16 2021 M1 Pro M1 Pro, M1 Pro 16-Core GPU, Apple SSD AP1024R, Mini-LED, 3456x2234, 16.2" | Apple MacBook Pro 16 2019 i9 5500M i9-9880H, Radeon Pro 5500M, Apple SSD AP1024 7171, IPS, 3072x1920, 16" | Lenovo ThinkPad P1 G4-20Y4S0KS00 i7-11850H, GeForce RTX 3070 Laptop GPU, Samsung PM9A1 MZVL21T0HCLR, IPS LED, 3840x2400, 16" | Dell XPS 15 9510 11800H RTX 3050 Ti OLED i7-11800H, GeForce RTX 3050 Ti Laptop GPU, Micron 2300 512GB MTFDHBA512TDV, OLED, 3456x2160, 15.6" | HP ZBook Studio 15 G8 i9-11950H, GeForce RTX 3070 Laptop GPU, Samsung PM981a MZVLB2T0HALB, OLED, 3840x2160, 15.6" | Razer Blade 15 Advanced (Mid 2021) i7-11800H, GeForce RTX 3080 Laptop GPU, SSSTC CA6-8D1024, IPS, 1920x1080, 15.6" | Apple MacBook Pro 14 2021 M1 Pro Entry M1 Pro 8-Core, M1 Pro 14-Core GPU, Apple SSD AP0512, Mini-LED, 3024x1964, 14.2" | Average Apple M1 Pro 16-Core GPU | Average of class Multimedia | |
|---|---|---|---|---|---|---|---|---|---|
| Power Consumption | -9% | -58% | -17% | -87% | -145% | 24% | 0% | -2% | |
| Idle Minimum * (Watt) | 5 | 3.7 26% | 8.1 -62% | 7.6 -52% | 11 -120% | 19.5 -290% | 2.9 42% | 5 ? -0% | 5.72 ? -14% |
| Idle Average * (Watt) | 15.1 | 12.1 20% | 20.2 -34% | 9.9 34% | 18.8 -25% | 23.3 -54% | 11.6 23% | 15.1 ? -0% | 10.2 ? 32% |
| Idle Maximum * (Watt) | 15.5 | 17 -10% | 21.9 -41% | 10.8 30% | 31.7 -105% | 40.1 -159% | 11.9 23% | 15.5 ? -0% | 12.4 ? 20% |
| Load Average * (Watt) | 54 | 91.5 -69% | 88.2 -63% | 81 -50% | 105.2 -95% | 98.9 -83% | 49.5 8% | 54 ? -0% | 65.5 ? -21% |
| Load Maximum * (Watt) | 90 | 102.3 -14% | 170.6 -90% | 131 -46% | 171.8 -91% | 214 -138% | 68.5 24% | 90 ? -0% | 114 ? -27% |
| Witcher 3 ultra * (Watt) | 103 | 149 | 76.2 | 148 | 174 | 58.2 |
* ... smaller is better
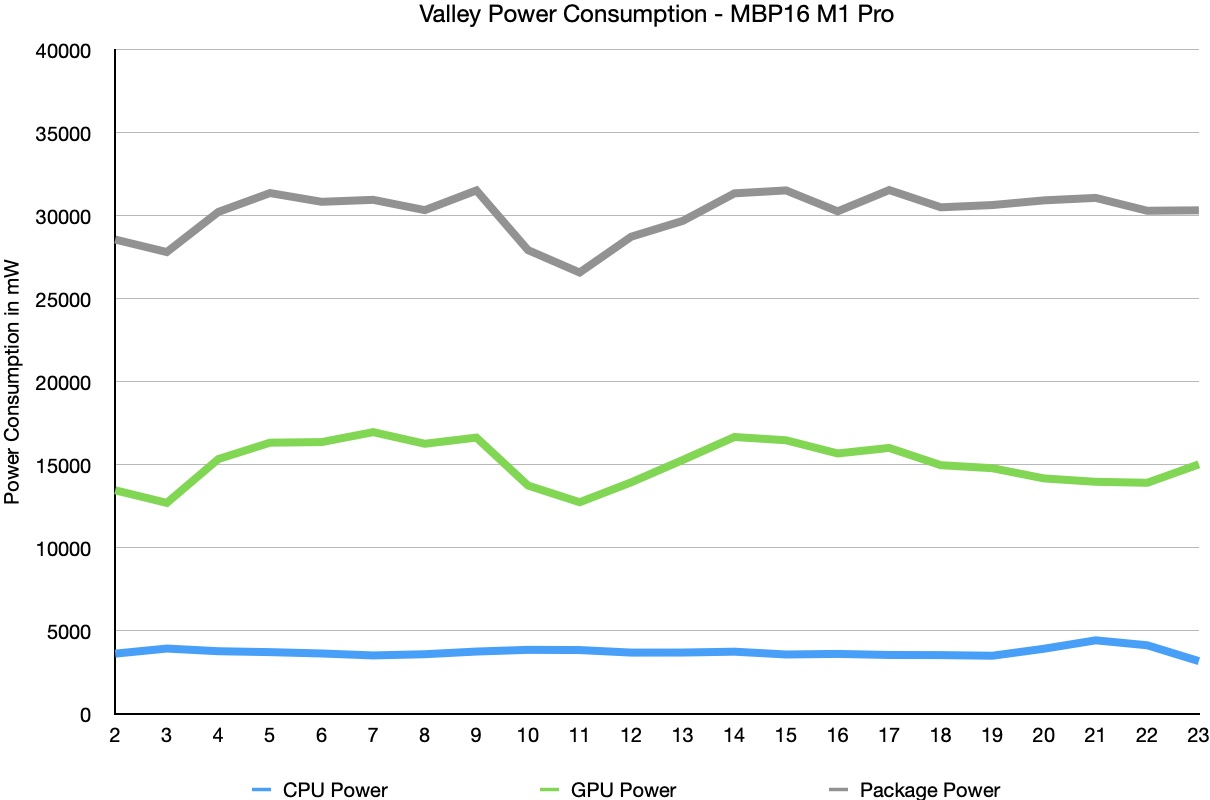
The M1 Pro is also very efficient when we have a look at the internal consumption (via powermetrics) and there is no throttling or turbo peaks at the start of the benchmarks.
Battery Runtime
The battery capacity of the 16-inch MacBook Pro is 99.6 Wh and therefore much higher compared to the smaller MBP 14 (69.9 Wh) and the battery runtime is better in our tests. Our Wi-Fi test at an adjusted brightness of 150 nits runs for almost 17 hours and is still around 8 hours at the maximum SDR brightness. Contrary to previous macOS versions, we did not see a difference when we used full-screen mode. An HDR video at the maximum brightness ran for about 4.5 hours on our test unit of the MBP 16 with the M1 Max SoC (currently also in review), which is a bit longer than on the smaller MBP 14 with about 4 hours. A standard video at 150 nits on the other hand runs for about 17.5 hours.
The 140 W power adapter supports fast charging and 50% of the capacity is available after 30 minutes. You can also charge the MBP 16 via USB-C ports, but they do not support fast charging.
We did not notice performance drops for the CPU or GPU on battery power. This is once again an advantage for the MacBook Pro 16 compared to the Windows competition, where powerful systems always reduce the performance (especially dGPUs) on battery power.
| Apple MacBook Pro 16 2021 M1 Pro M1 Pro, M1 Pro 16-Core GPU, 99.6 Wh | Apple MacBook Pro 16 2019 i9 5500M i9-9880H, Radeon Pro 5500M, 99.8 Wh | Lenovo ThinkPad P1 G4-20Y4S0KS00 i7-11850H, GeForce RTX 3070 Laptop GPU, 90 Wh | Dell XPS 15 9510 11800H RTX 3050 Ti OLED i7-11800H, GeForce RTX 3050 Ti Laptop GPU, 86 Wh | HP ZBook Studio 15 G8 i9-11950H, GeForce RTX 3070 Laptop GPU, 83 Wh | Razer Blade 15 Advanced (Mid 2021) i7-11800H, GeForce RTX 3080 Laptop GPU, 80 Wh | Apple MacBook Pro 14 2021 M1 Pro Entry M1 Pro 8-Core, M1 Pro 14-Core GPU, 69.9 Wh | Average of class Multimedia | |
|---|---|---|---|---|---|---|---|---|
| Battery runtime | -37% | -59% | -50% | -63% | -65% | -17% | -17% | |
| H.264 (h) | 17.5 | 9.7 -45% | 7.2 -59% | 10.4 -41% | 15 -14% | 16.4 ? -6% | ||
| WiFi v1.3 (h) | 16.9 | 12 -29% | 7 -59% | 7 -59% | 6.2 -63% | 5.9 -65% | 13.6 -20% | 12.2 ? -28% |
| Witcher 3 ultra (h) | 0.9 | |||||||
| Load (h) | 1 | 1.2 | 1.8 | 1.8 | 1.2 | 1.668 ? | ||
| Reader / Idle (h) | 12.9 | 24.9 ? |
Pros
Cons
Verdict - The new design works better on the MacBook Pro 16
The new MacBook Pro 16 leaves a slightly better overall impression compared to the smaller 14-inch model. The bulkier chassis design is not quite as noticeable and the full-fledged version of the M1 Pro is more convincing. The cooling solution is also quieter and you will hardly hear more than a quiet murmur with most tasks. The high efficiency of Apple’s own processor improves several aspects. In addition to the quiet fans, it provides good performance figures and the performance is very stable, both on mains as well as battery power. Other multimedia laptops with dedicated GPUs just cannot match the new MBP 16 in these sections.
We can pretty much repeat our verdict from the MBP 14 when we talk about the screen: The picture quality is extremely good, especially with HDR contents. The limitation to 500 nits with standard SDR contents should be advertised by Apple and we would have appreciated higher brightness values outdoors. The constant PWM flickering can also cause issues for some users.
The new Liquid Retina XDR display with the Mini-LED technology is not perfect, but the picture quality is amazing, especially with HDR contents. The speakers are also a bit better compared to the smaller 14-inch model.
The connectivity standards do not really meet the high-end expectations, either, because the Wi-Fi module, the HDMI port as well as the card reader leave room for improvement. There are also hardly any maintenance options and the storage and memory upgrades are very expensive. However, it is good that Apple still offers that much internal storage (up to 8 TB).
The new MacBook Pro 16 is an impressive multimedia laptop and definitely one of the best devices for content creators, especially when they are working with HDR contents. The device stays very quiet and cool, despite the high performance, which is currently just not possible on comparable Windows laptops.
With the high performance and the HDR panel, the new MacBook Pro 16 is mainly designed for content creators, who might benefit from an upgrade to one of the optional M1 Max chips if they need more RAM and/or more GPU performance. If you are not sure whether you need the upgrade, you will probably be fine with the M1 Pro. Unlike the MBP 14, the larger MBP 16 does not offer slower versions of the M1 Pro, so it is easier to choose the right SKU for you.
The MacBook Pro 16 is also a good choice if you just want a high-end multimedia laptop with a great screen, long battery runtime and great speakers and you are willing to pay the high price. However, you should know that the MacBook Pro is no gaming laptop, because there are not many blockbuster games for macOS. In this case, we would recommend a Windows device instead (like the Dell XPS 15 or Lenovo ThinkPad X1 Extreme G4) since there are many more games available. Other areas (like CAD, engineering) depend on the software support as well.
Price and Availability
The availability of the new MacBook Pro 16 is currently limited. The best option is a pickup in one of Apple's retail stores, where you can get our test unit with the 1 TB SDD for $2,699 or the base model with 512 GB SSD storage for $2,499.
Apple MacBook Pro 16 2021 M1 Pro
- 11/13/2021 v7 (old)
Andreas Osthoff
Price comparison
