Apple iPad Pro 12.9 2021 tablet review - A Mini LED trump card?
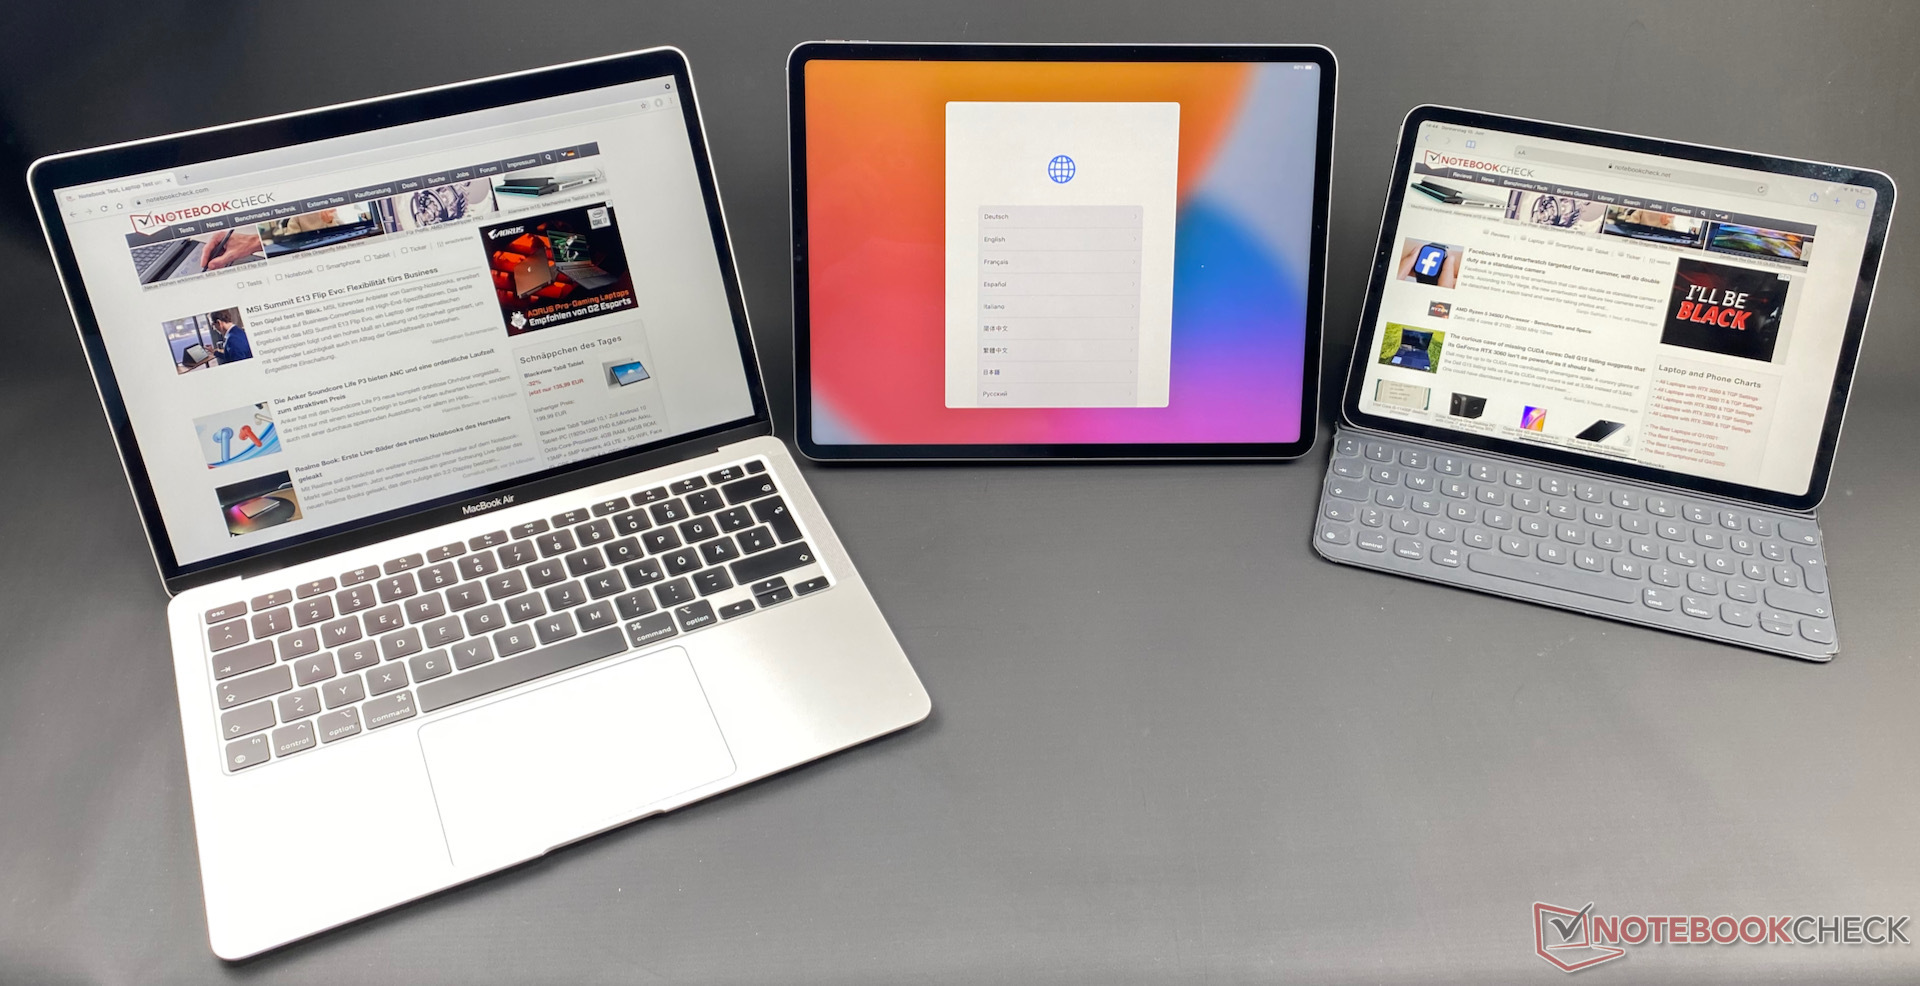
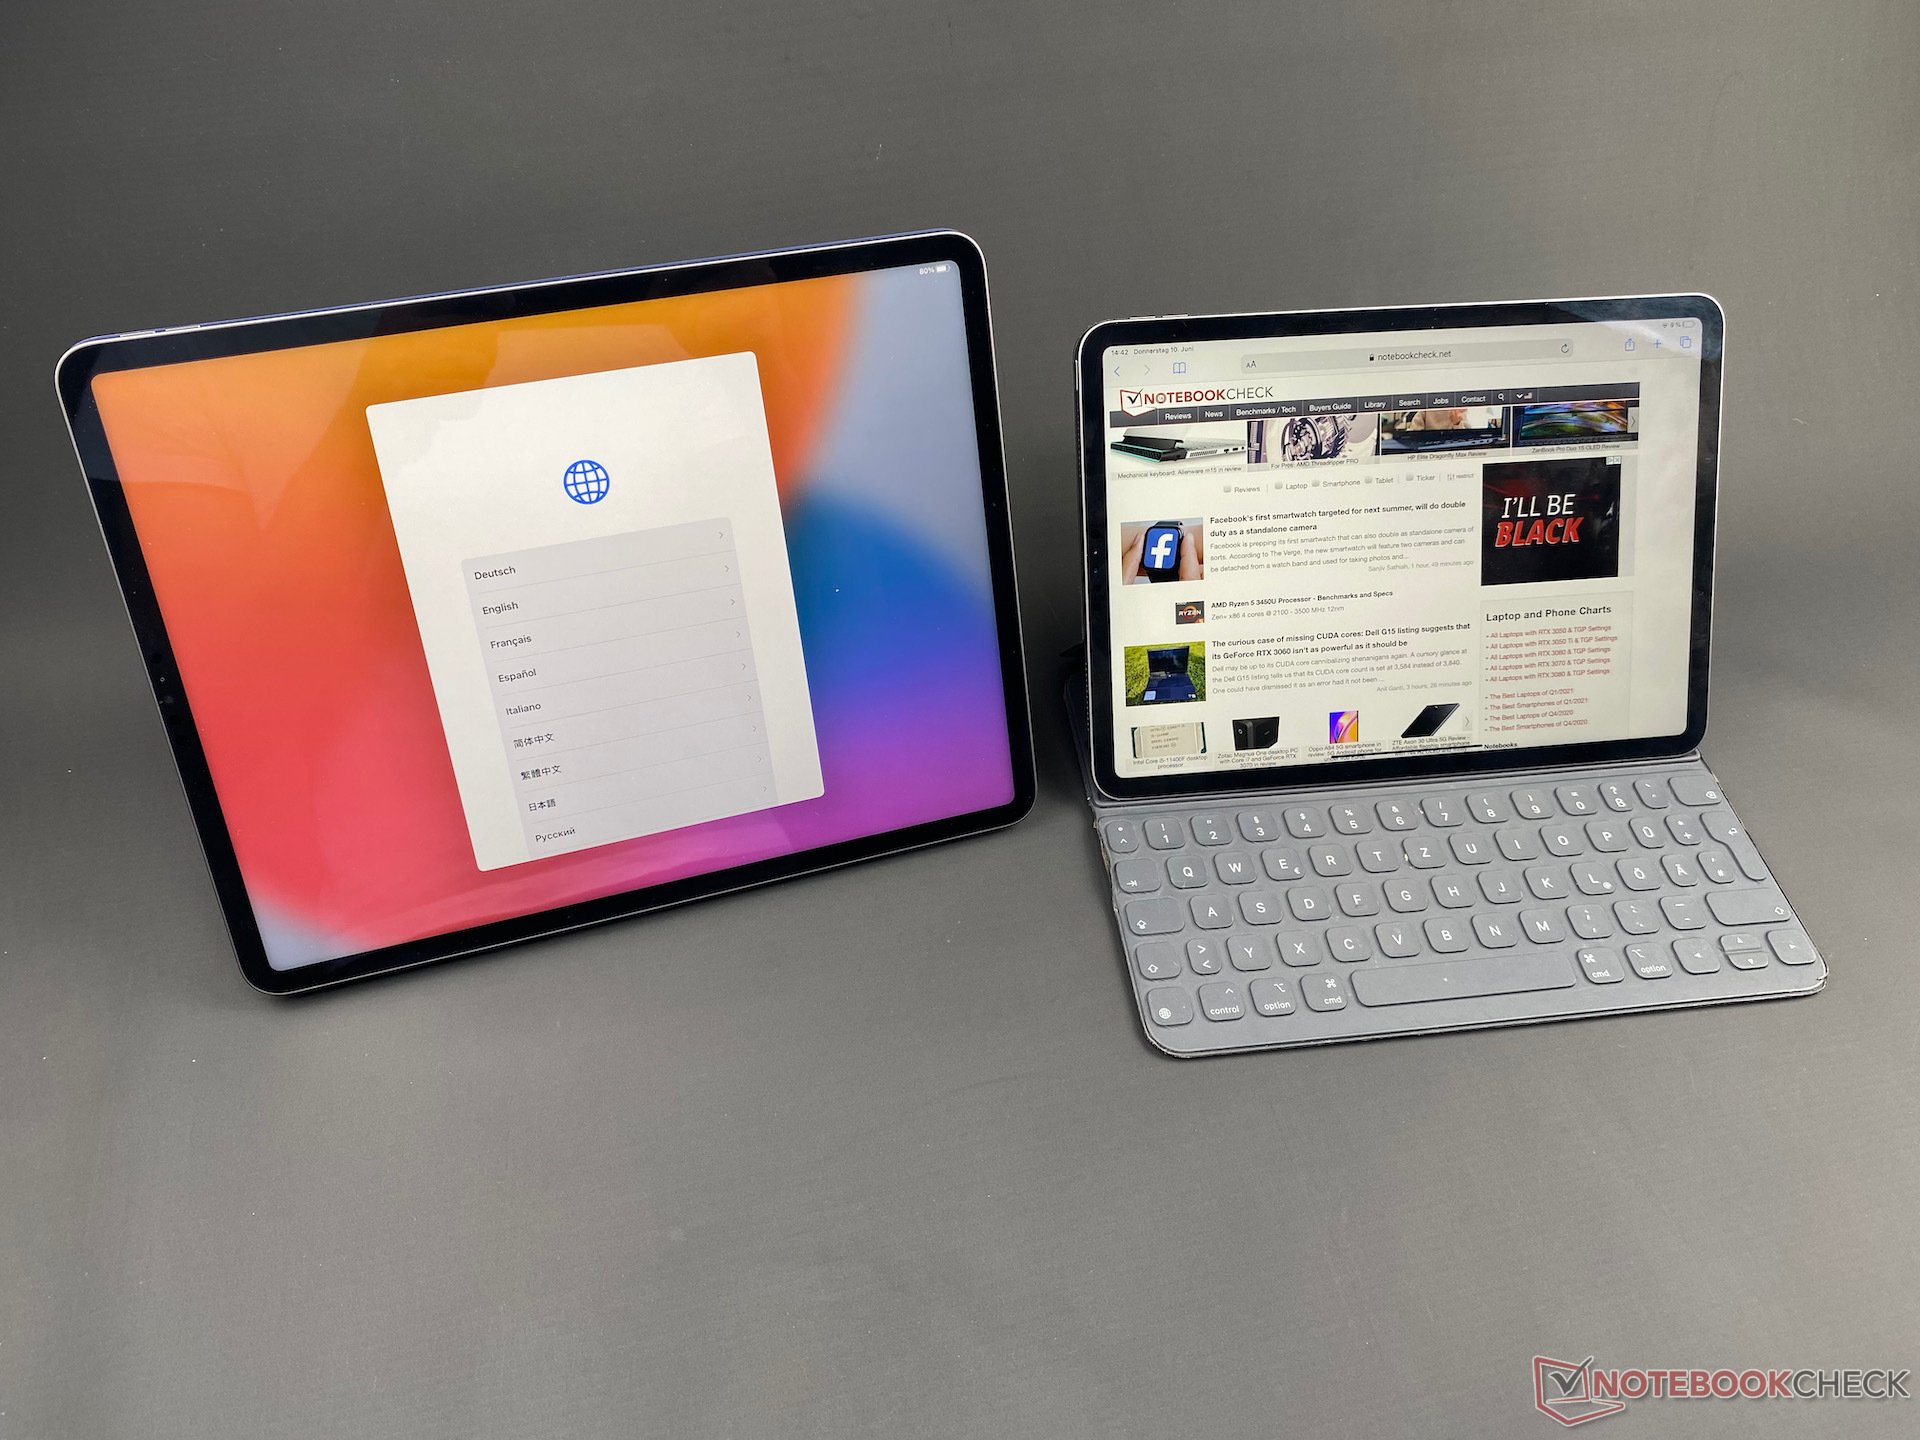
The large iPad Pro has always held a particularly special position, seeing as it is actually too big to be used as a portable tablet. Illustration, drawing or even media consumption suit the 12.9-inch tablet best, while combining it with Apple's 'Magic Keyboard' mutate the iPad Pro into a laptop replacement. Therefore, its keyboard attachment puts the iPad Pro 12.9 in competition with the MacBook Air and MacBook Pro 13, two laptops that also utilise the Apple M1 SoC. Additionally, Microsoft's Surface Pro series offers a good comparison against the iPad Pro 12.9, such as the Surface Pro 7 Plus or Surface Pro X. Also, there is one Android competitor, the Samsung Galaxy Tab S7 Plus with its 12.4-inch display, which targets the same market as Apple's latest iPad Pro 12.9 does.
Possible competitors in comparison
Rating | Date | Model | Weight | Height | Size | Resolution | Price |
|---|---|---|---|---|---|---|---|
| 91.3 % v7 (old) | 06 / 2021 | Apple iPad Pro 12.9 2021 A2378 M1, M1 8-Core GPU | 682 g | 6.4 mm | 12.90" | 2732x2048 | |
| 92.6 % v7 (old) | 06 / 2021 | Apple iPad Pro 11 2021 M1, M1 8-Core GPU | 468 g | 5.9 mm | 11.00" | 2388x1668 | |
| 91.1 % v7 (old) | 12 / 2020 | Apple MacBook Air 2020 M1 Entry M1, M1 7-Core GPU | 1.3 kg | 16.1 mm | 13.30" | 2560x1600 | |
| 91.1 % v7 (old) | 12 / 2020 | Apple MacBook Pro 13 Late 2020 M1 Entry (8 / 256 GB) M1, M1 8-Core GPU | 1.4 kg | 15.6 mm | 13.30" | 2560x1600 | |
| 89.3 % v7 (old) | 05 / 2020 | Apple iPad Pro 12.9 2020 A12Z Bionic, A12Z Bionic GPU | 641 g | 5.9 mm | 12.90" | 2732x2048 | |
| 88.1 % v7 (old) | 10 / 2020 | Samsung Galaxy Tab S7 Plus SD 865+ (Plus), Adreno 650 | 575 g | 5.7 mm | 12.40" | 2800x1752 | |
| 88.4 % v7 (old) | 08 / 2020 | Huawei MatePad Pro 10.8 Kirin 990, Mali-G76 MP16 | 460 g | 7.2 mm | 10.80" | 2560x1600 | |
| 88.5 % v7 (old) | 03 / 2021 | Microsoft Surface Pro 7 Plus i5-1135G7, Iris Xe G7 80EUs | 796 g | 8.5 mm | 12.30" | 2736x1824 | |
| 84.4 % v7 (old) | 03 / 2021 | Microsoft Surface Pro X SQ1, Adreno 685 | 1 kg | 7.3 mm | 13.00" | 2880x1920 | |
| 86.2 % v7 (old) | 04 / 2021 | Lenovo Tab P11 Pro SD 730G, Adreno 618 | 485 g | 5.8 mm | 11.50" | 2560x1600 |
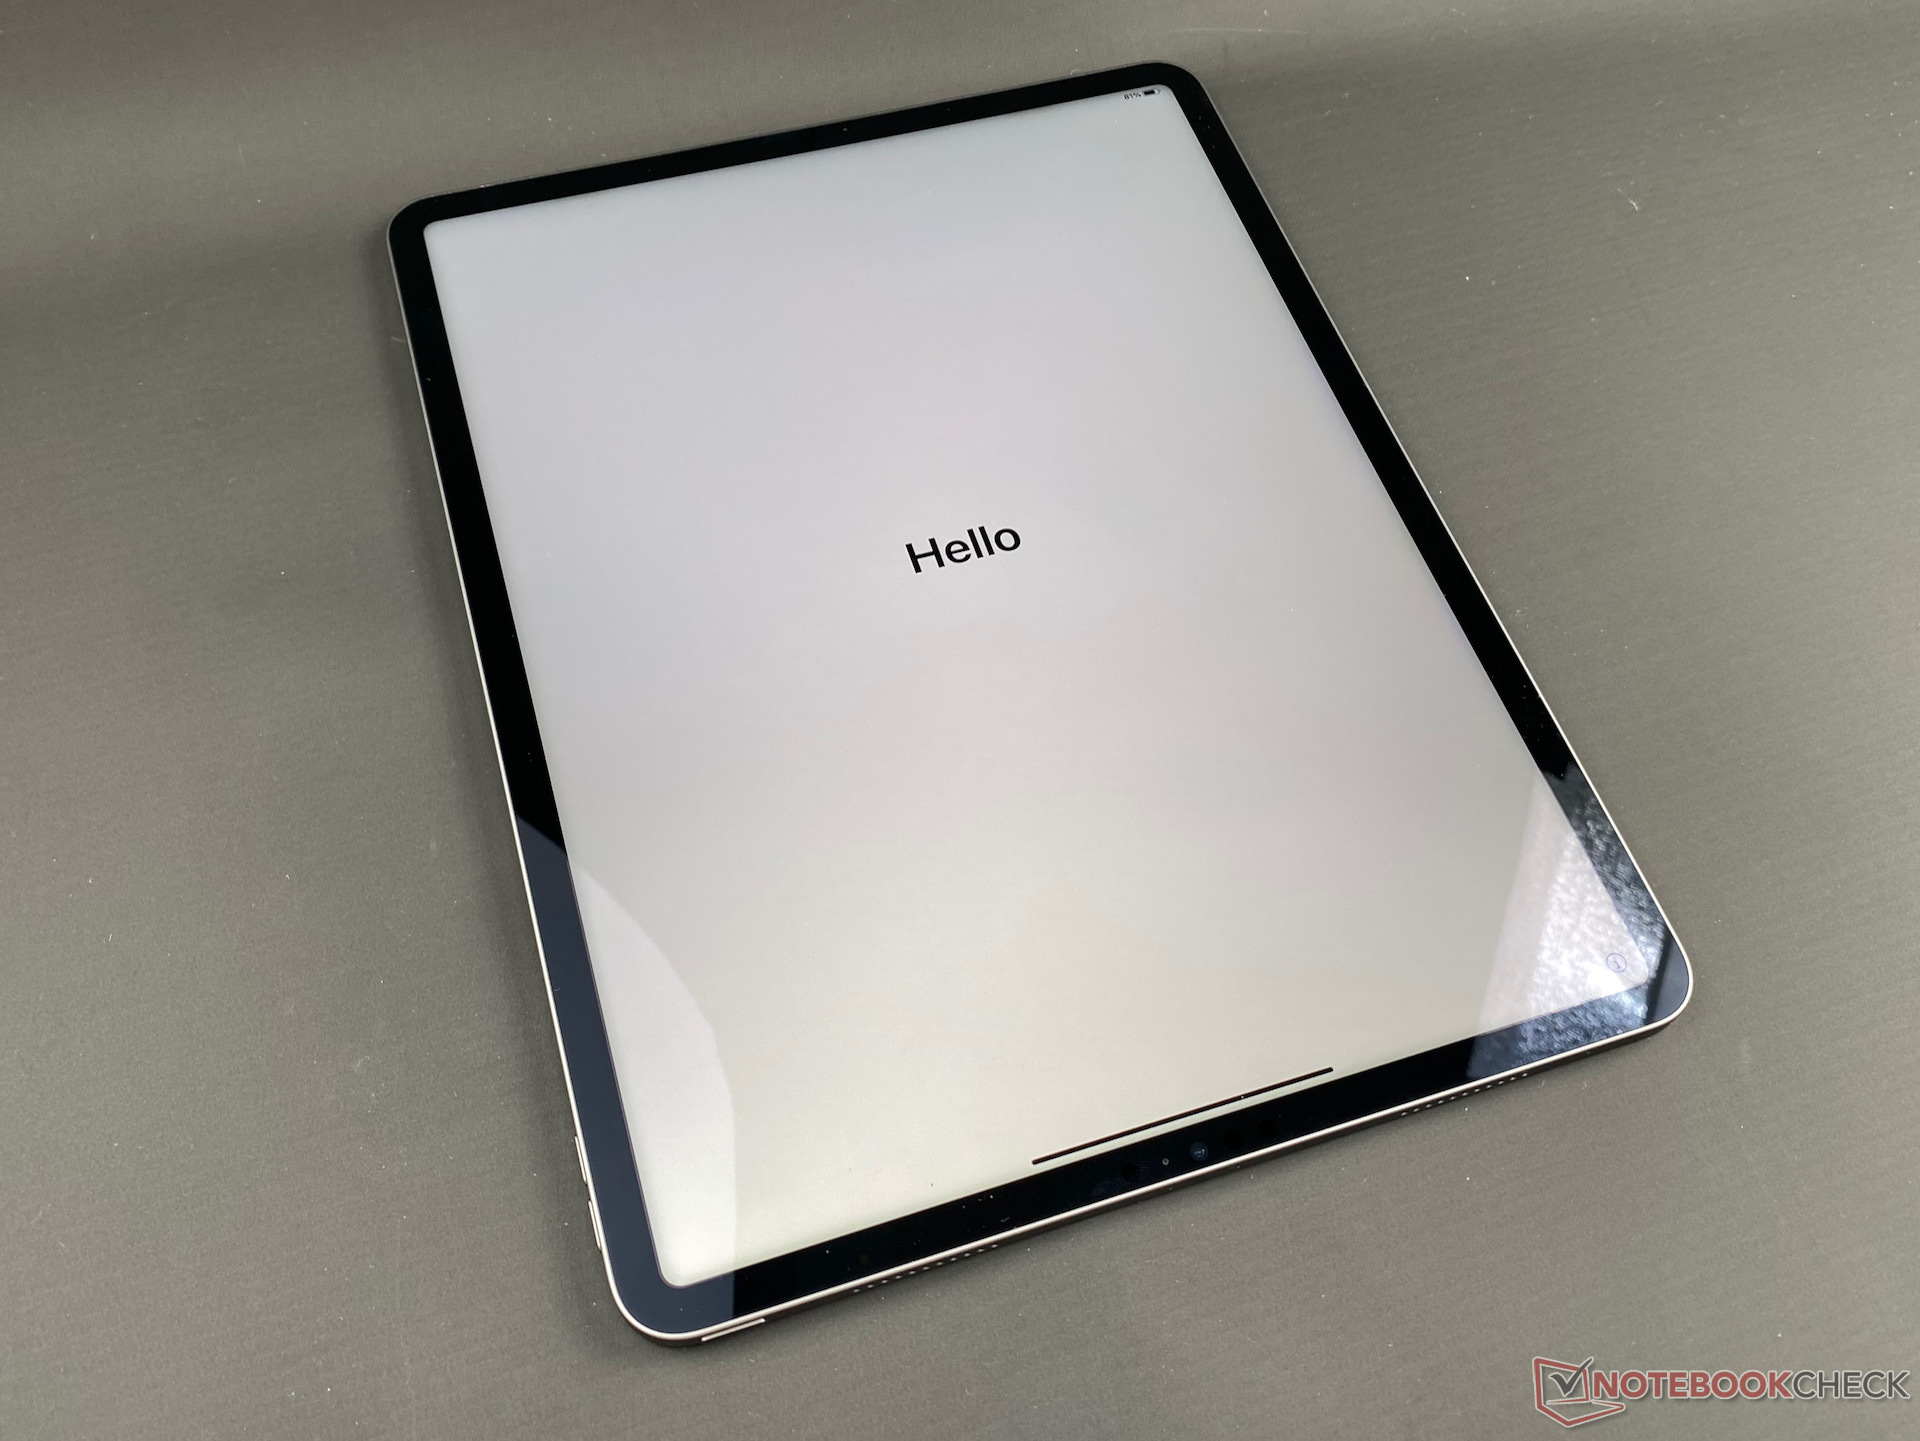
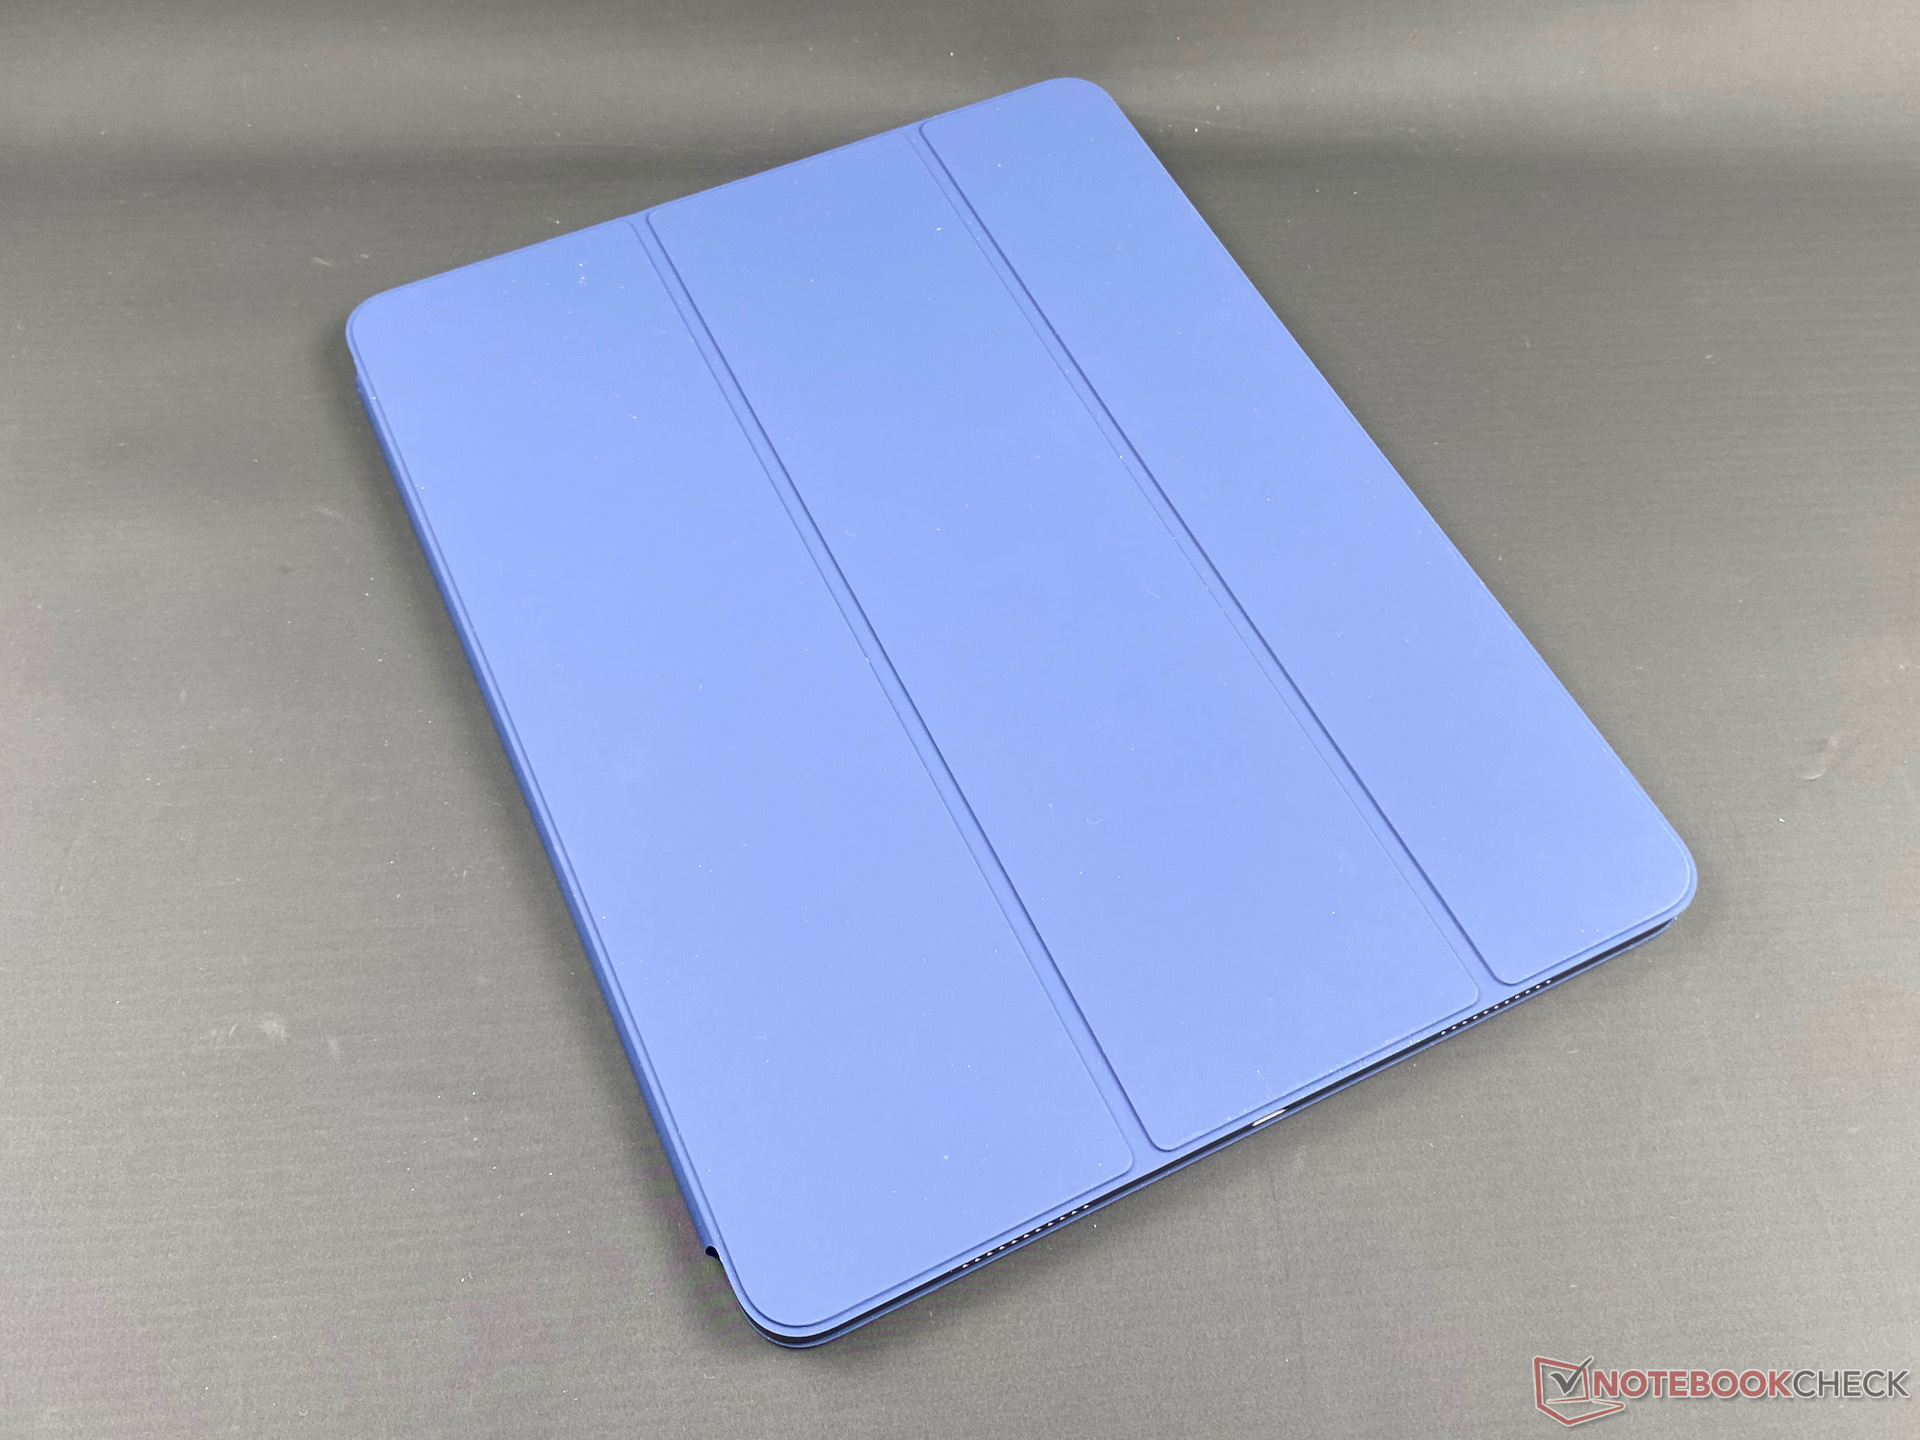
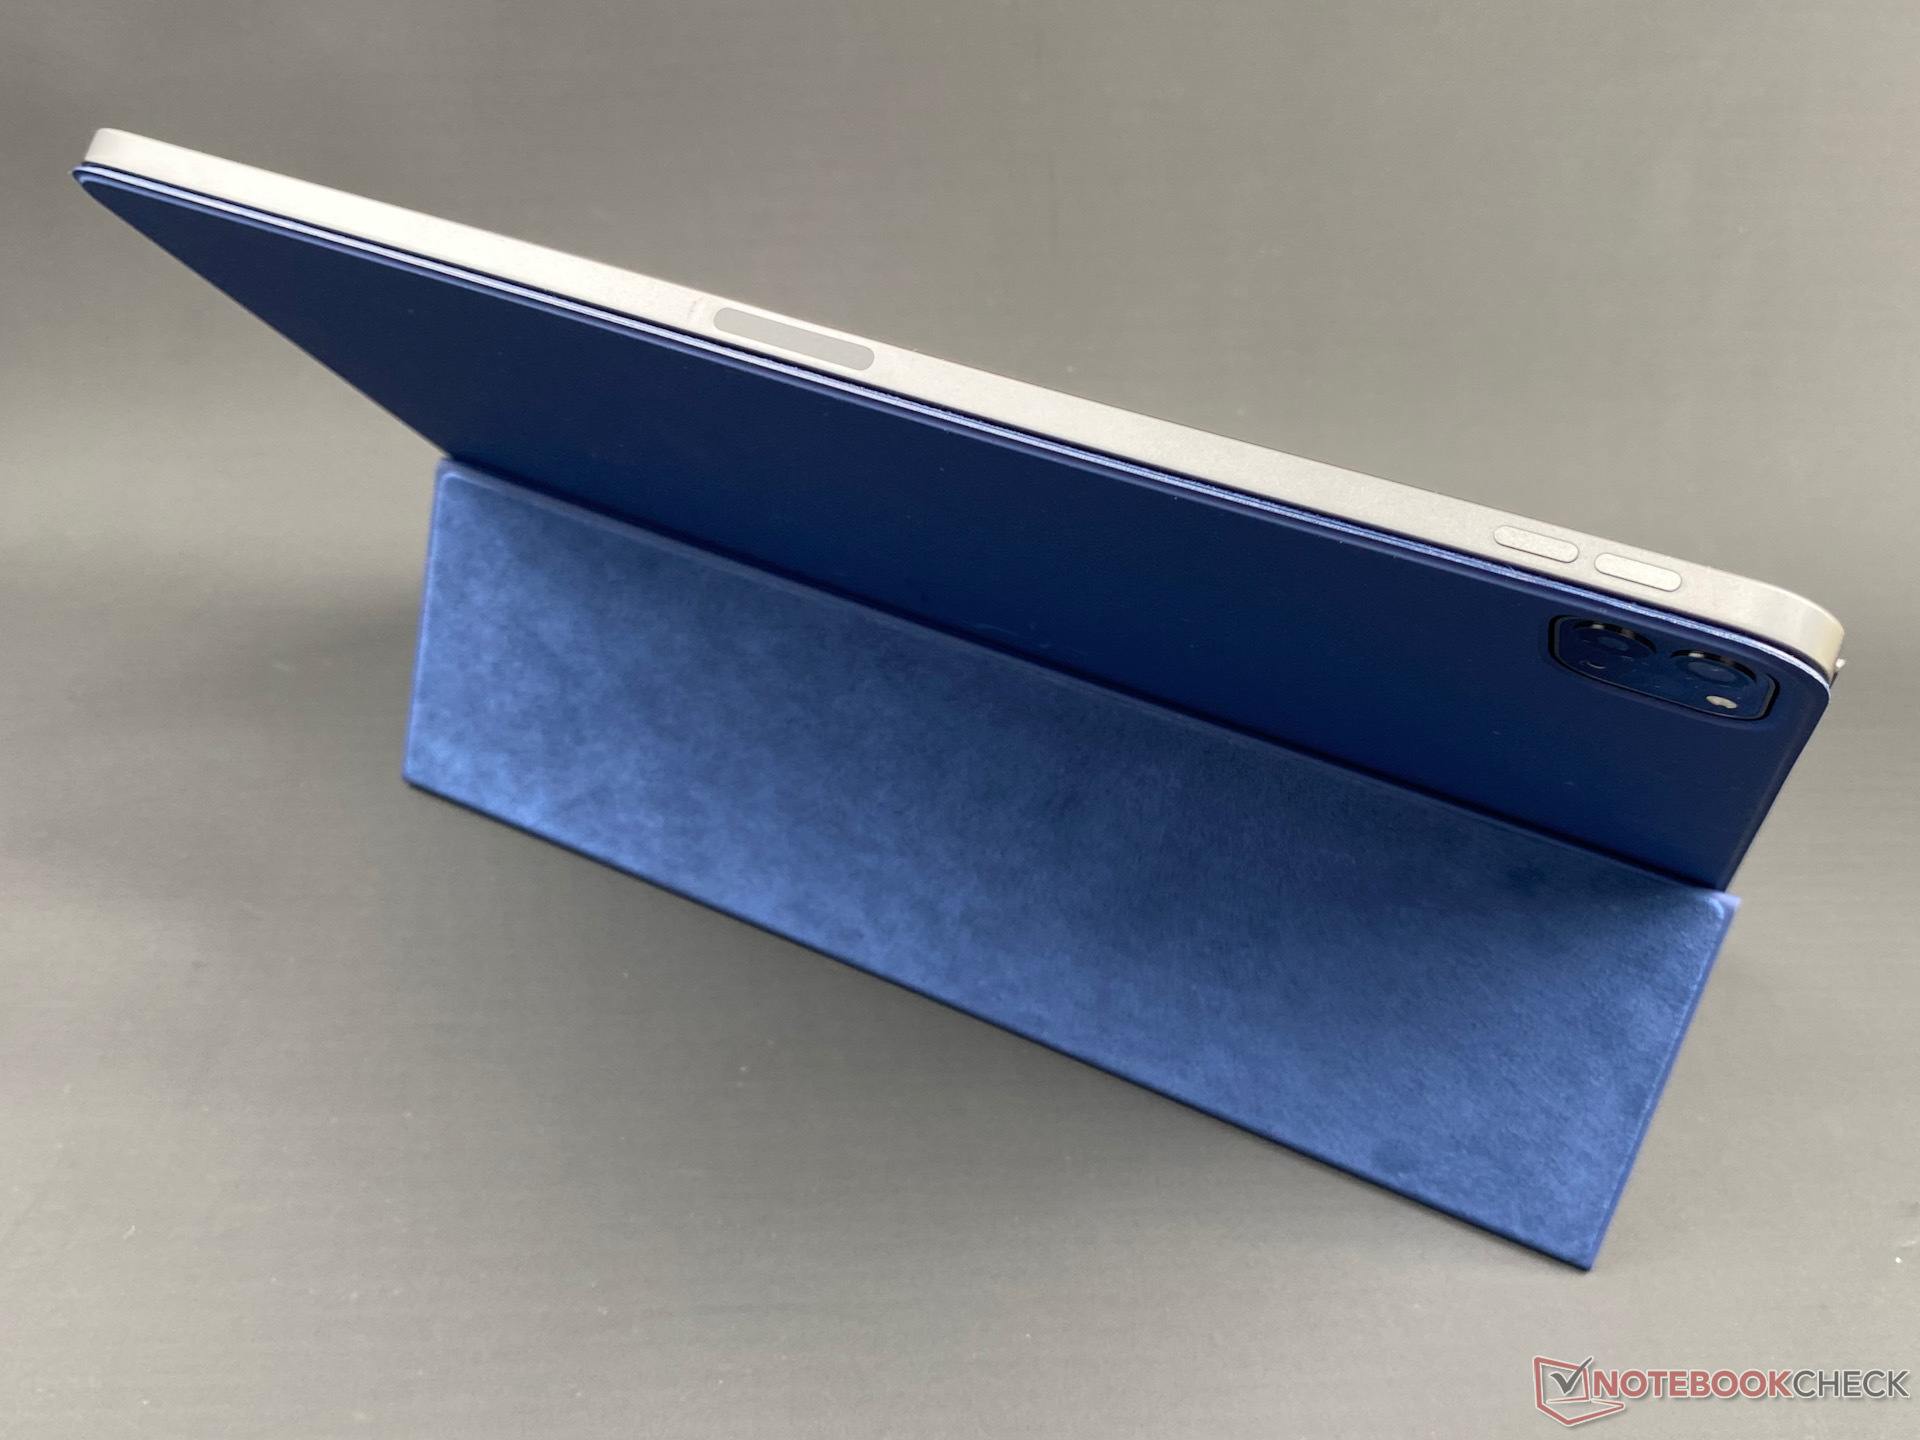
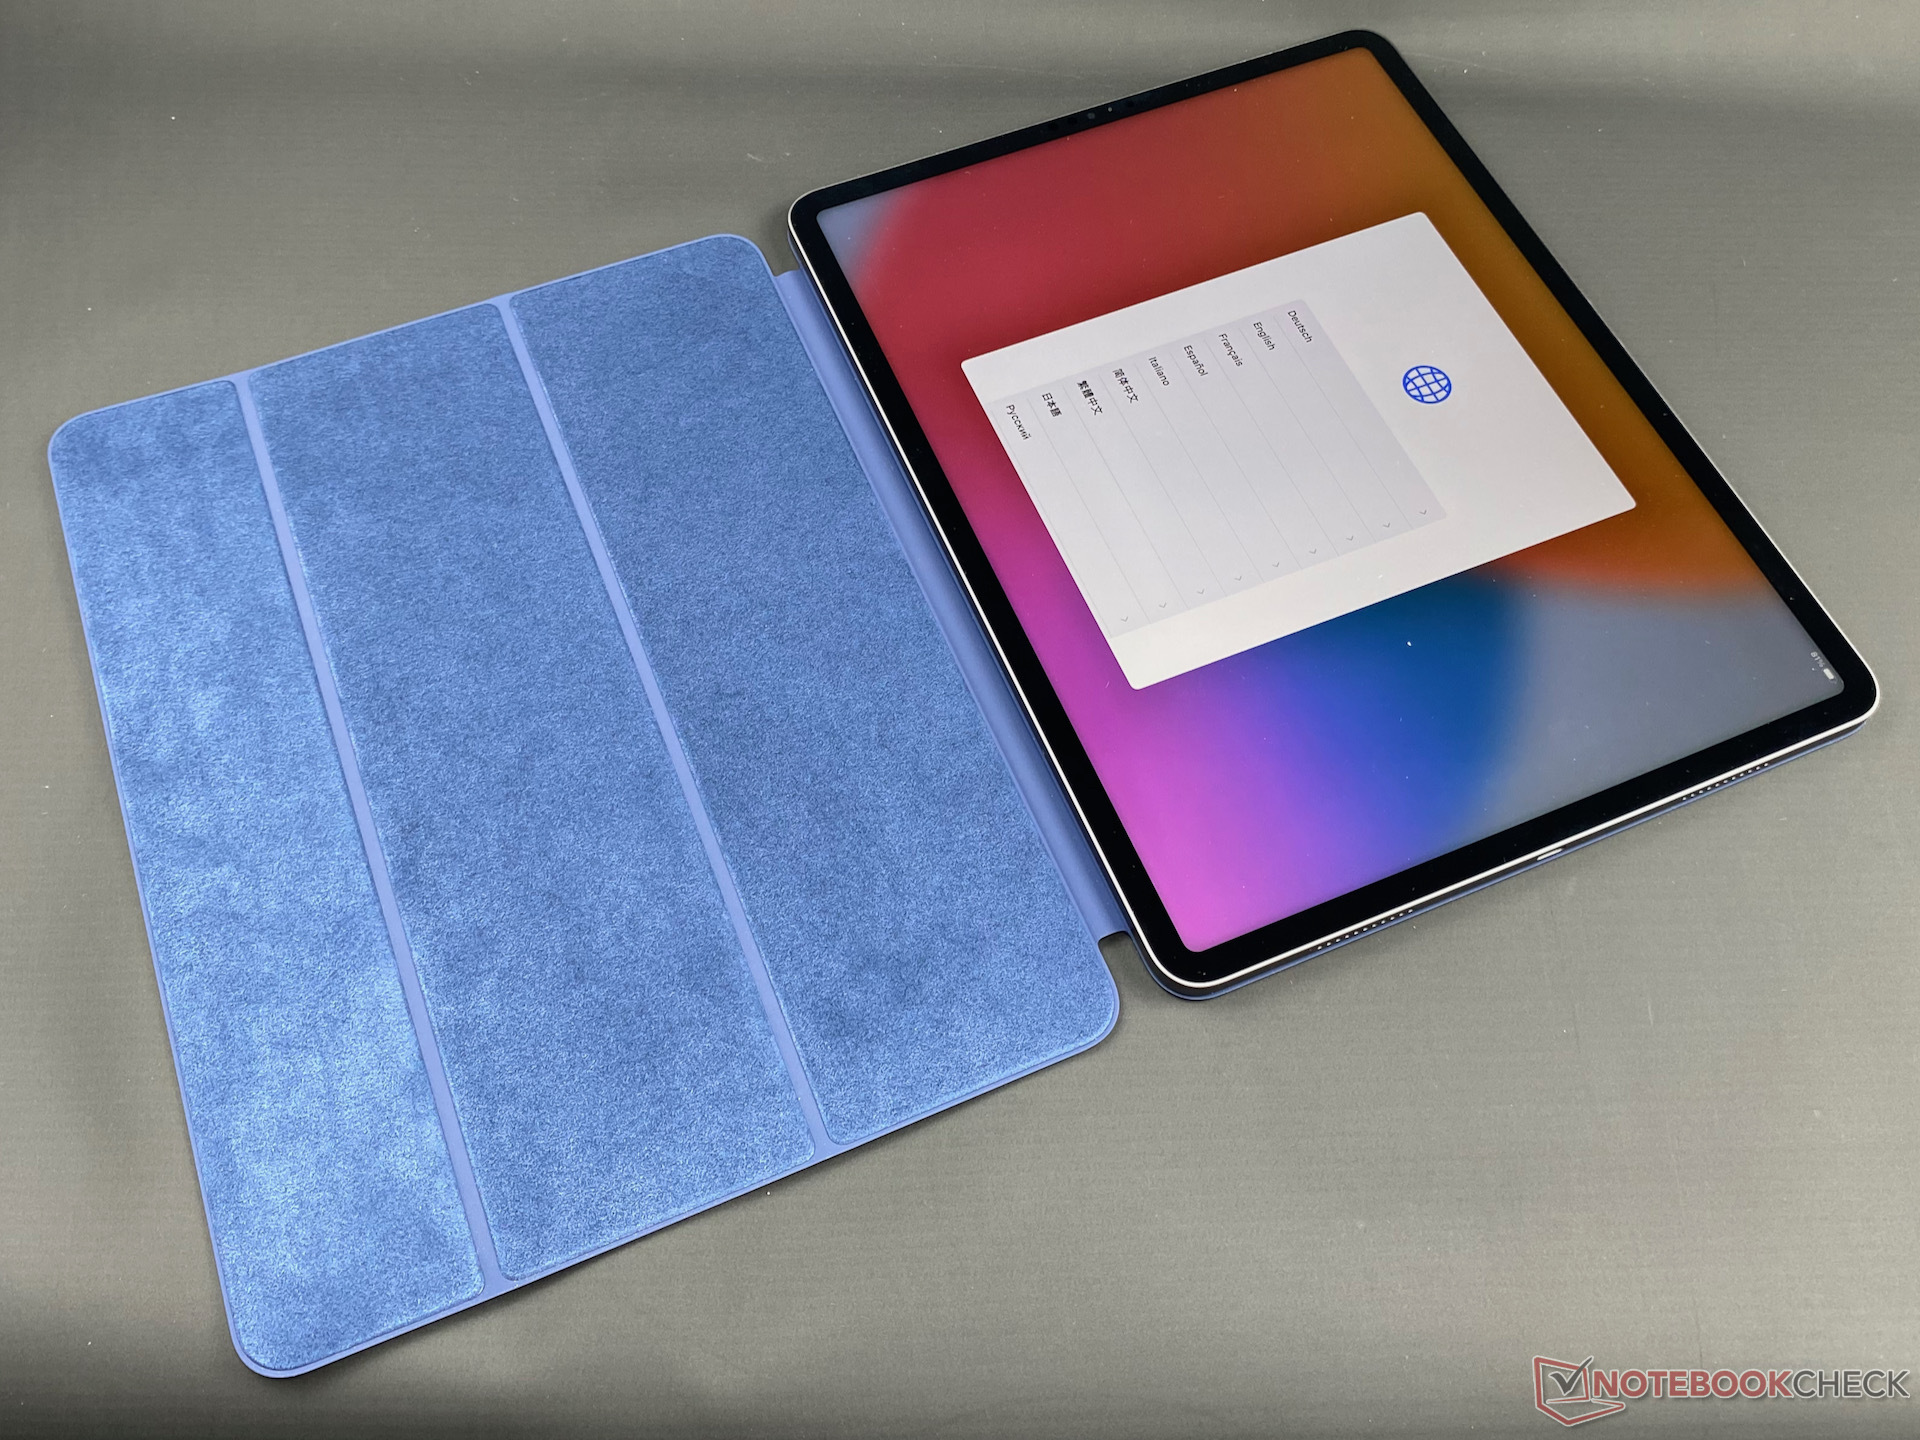
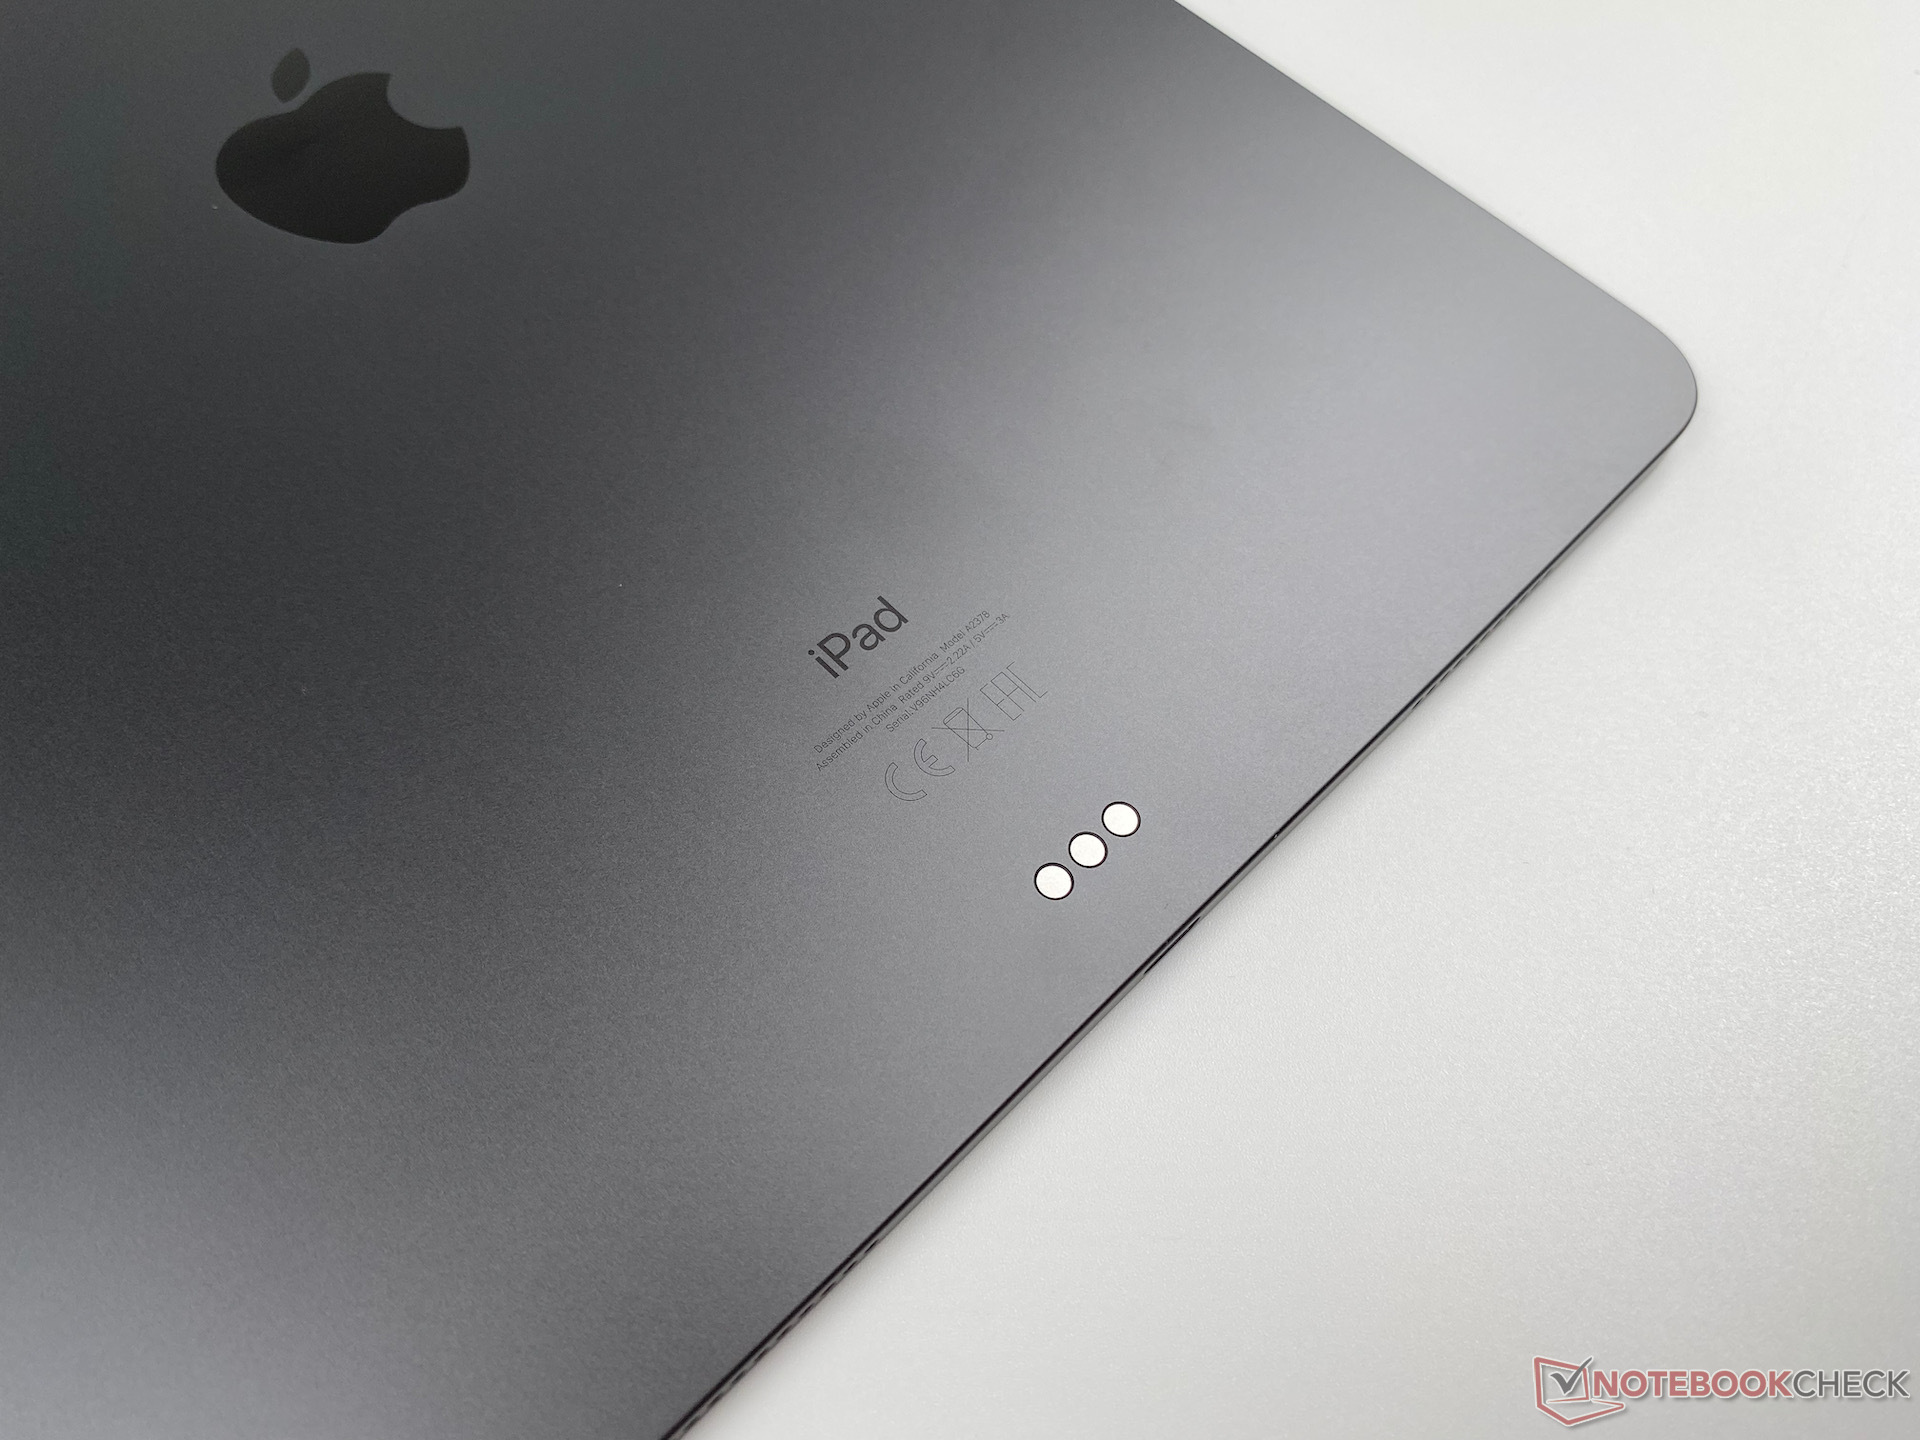
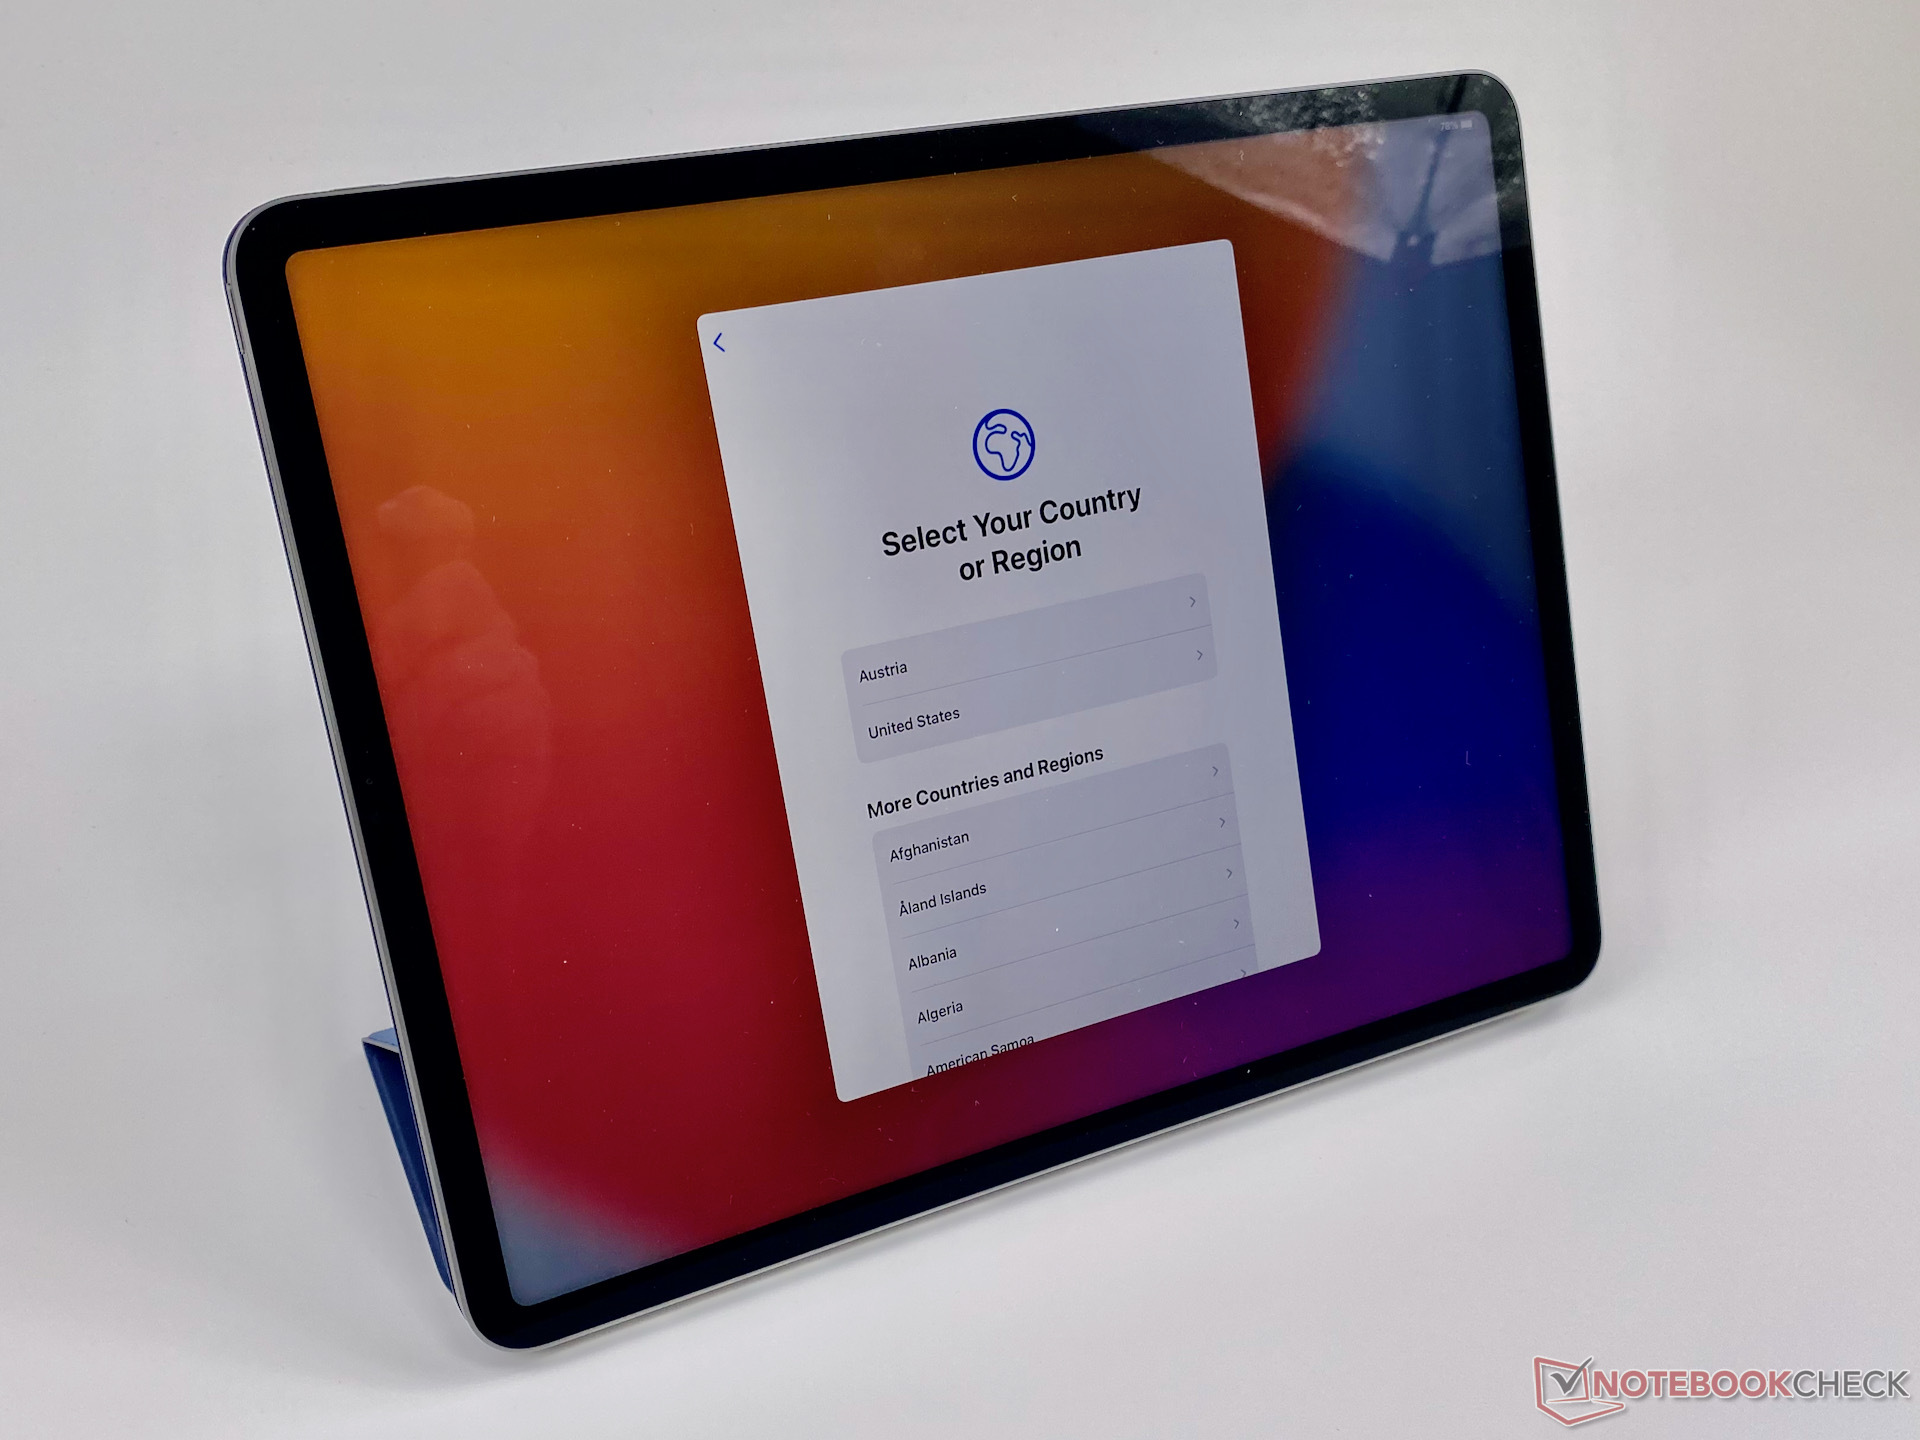
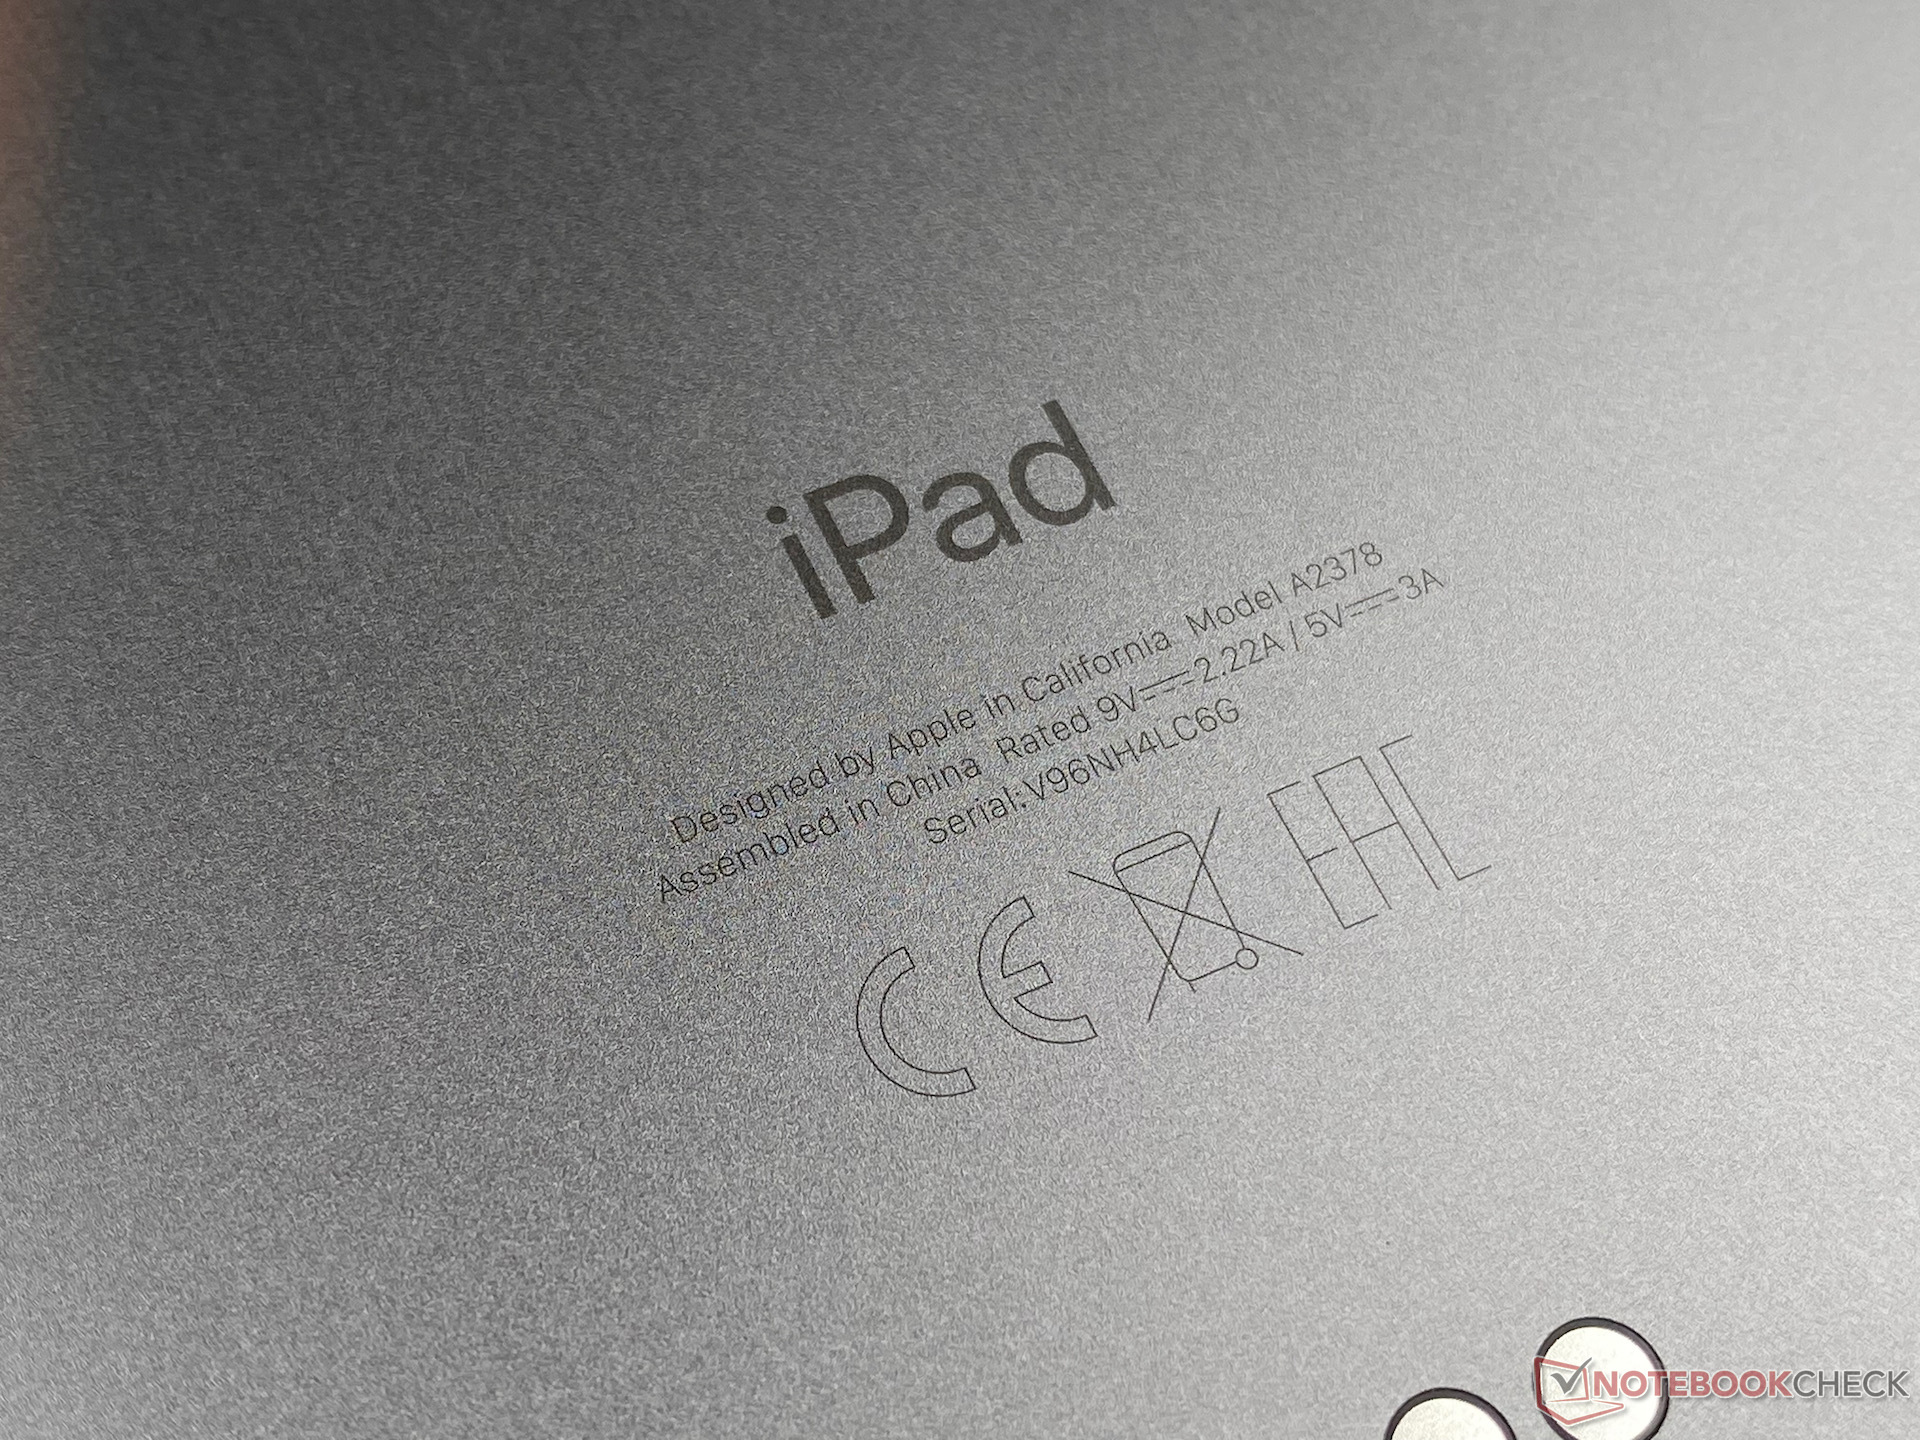
Case - Slightly bulkier, well-built and sustainable, but poor repairability
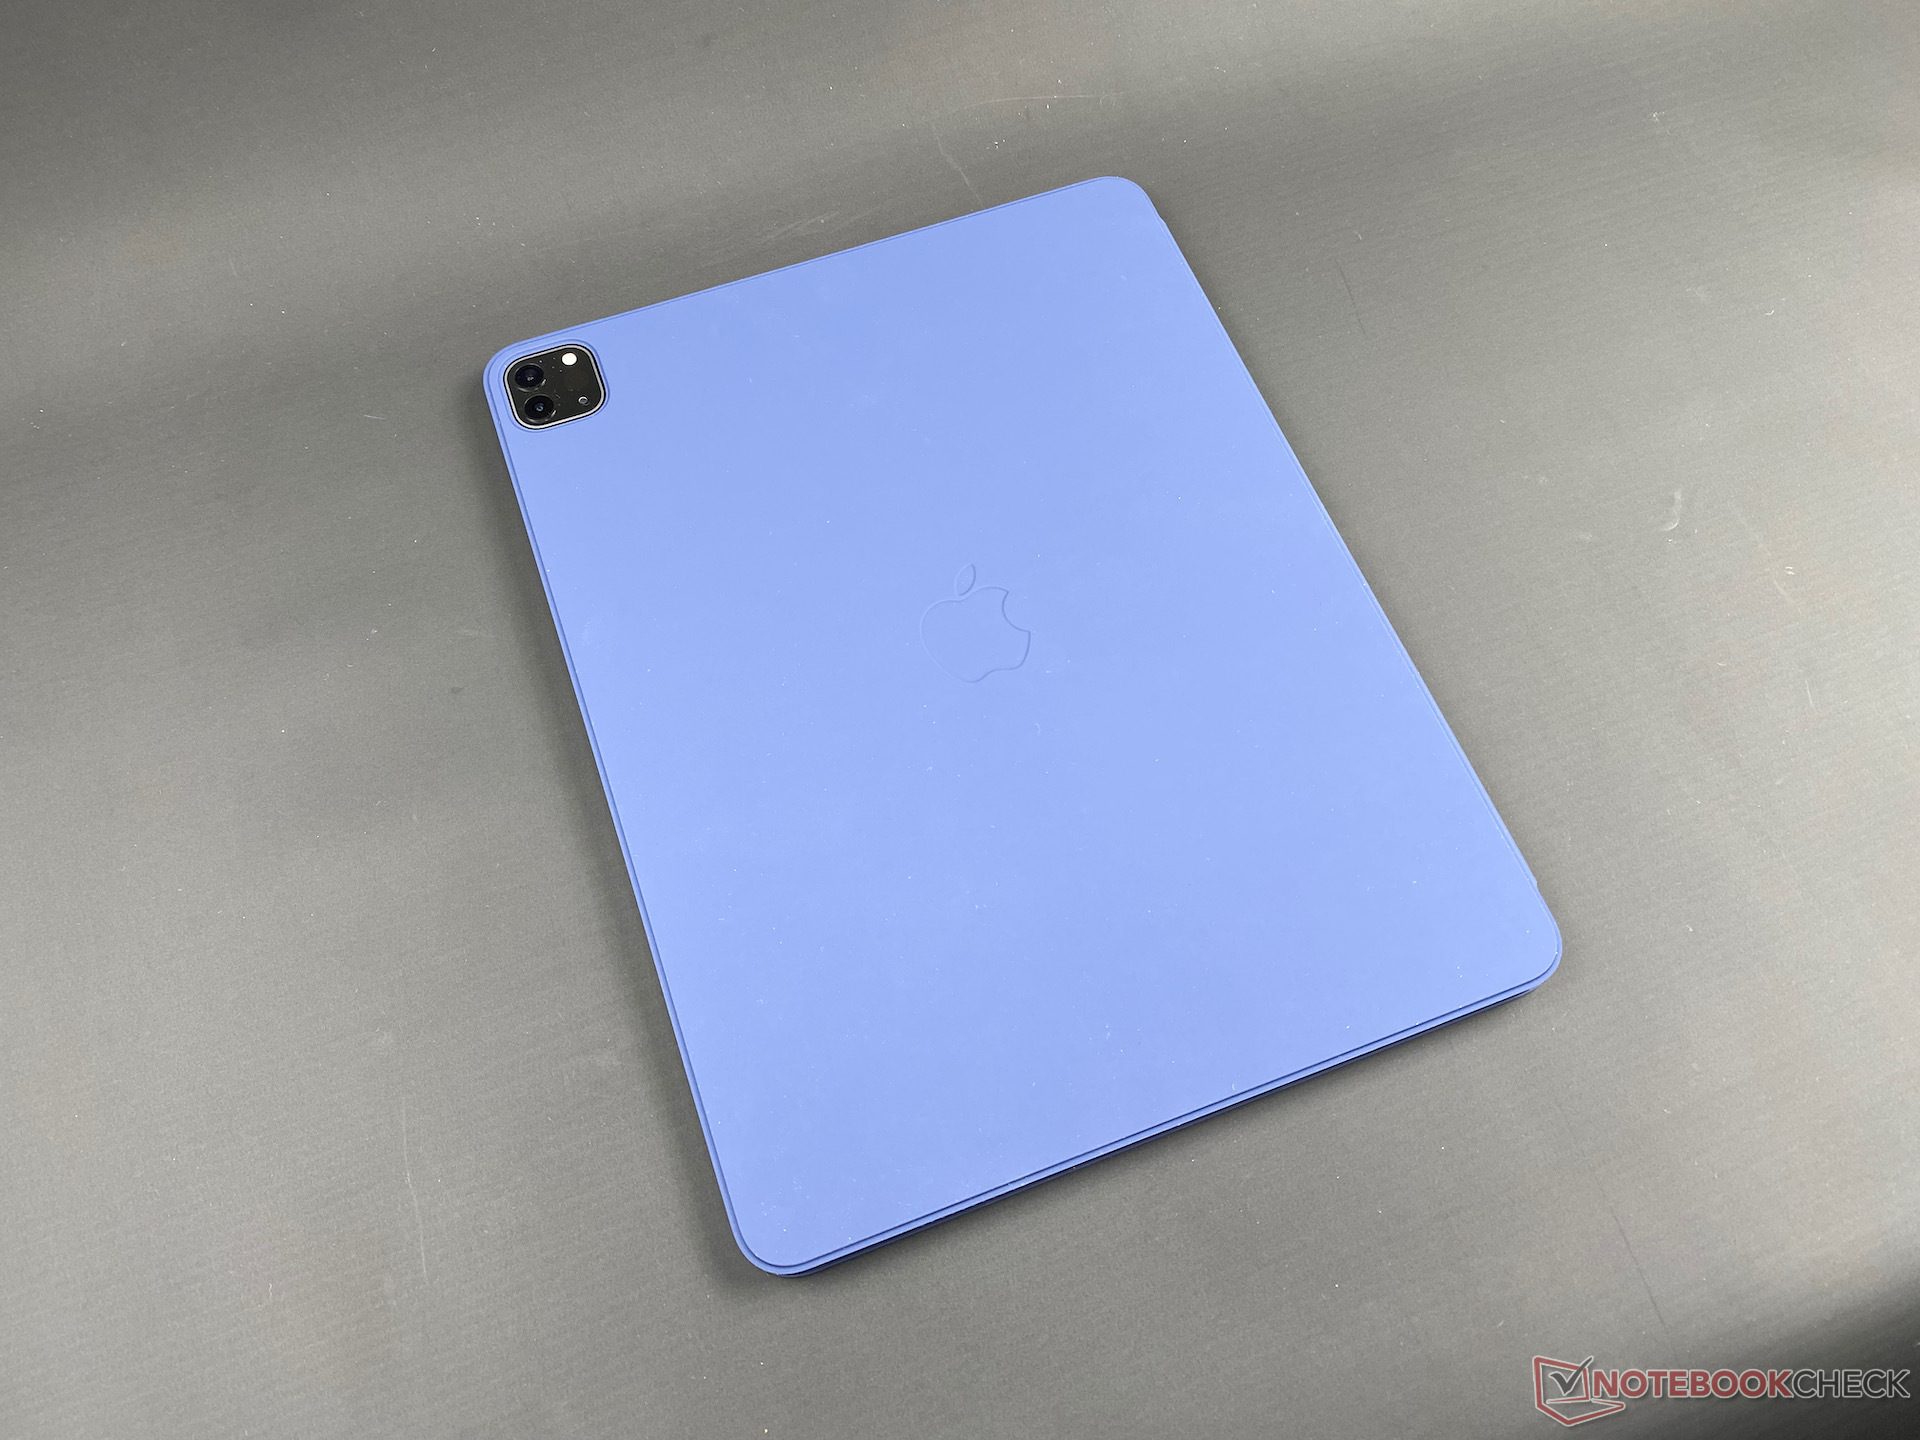
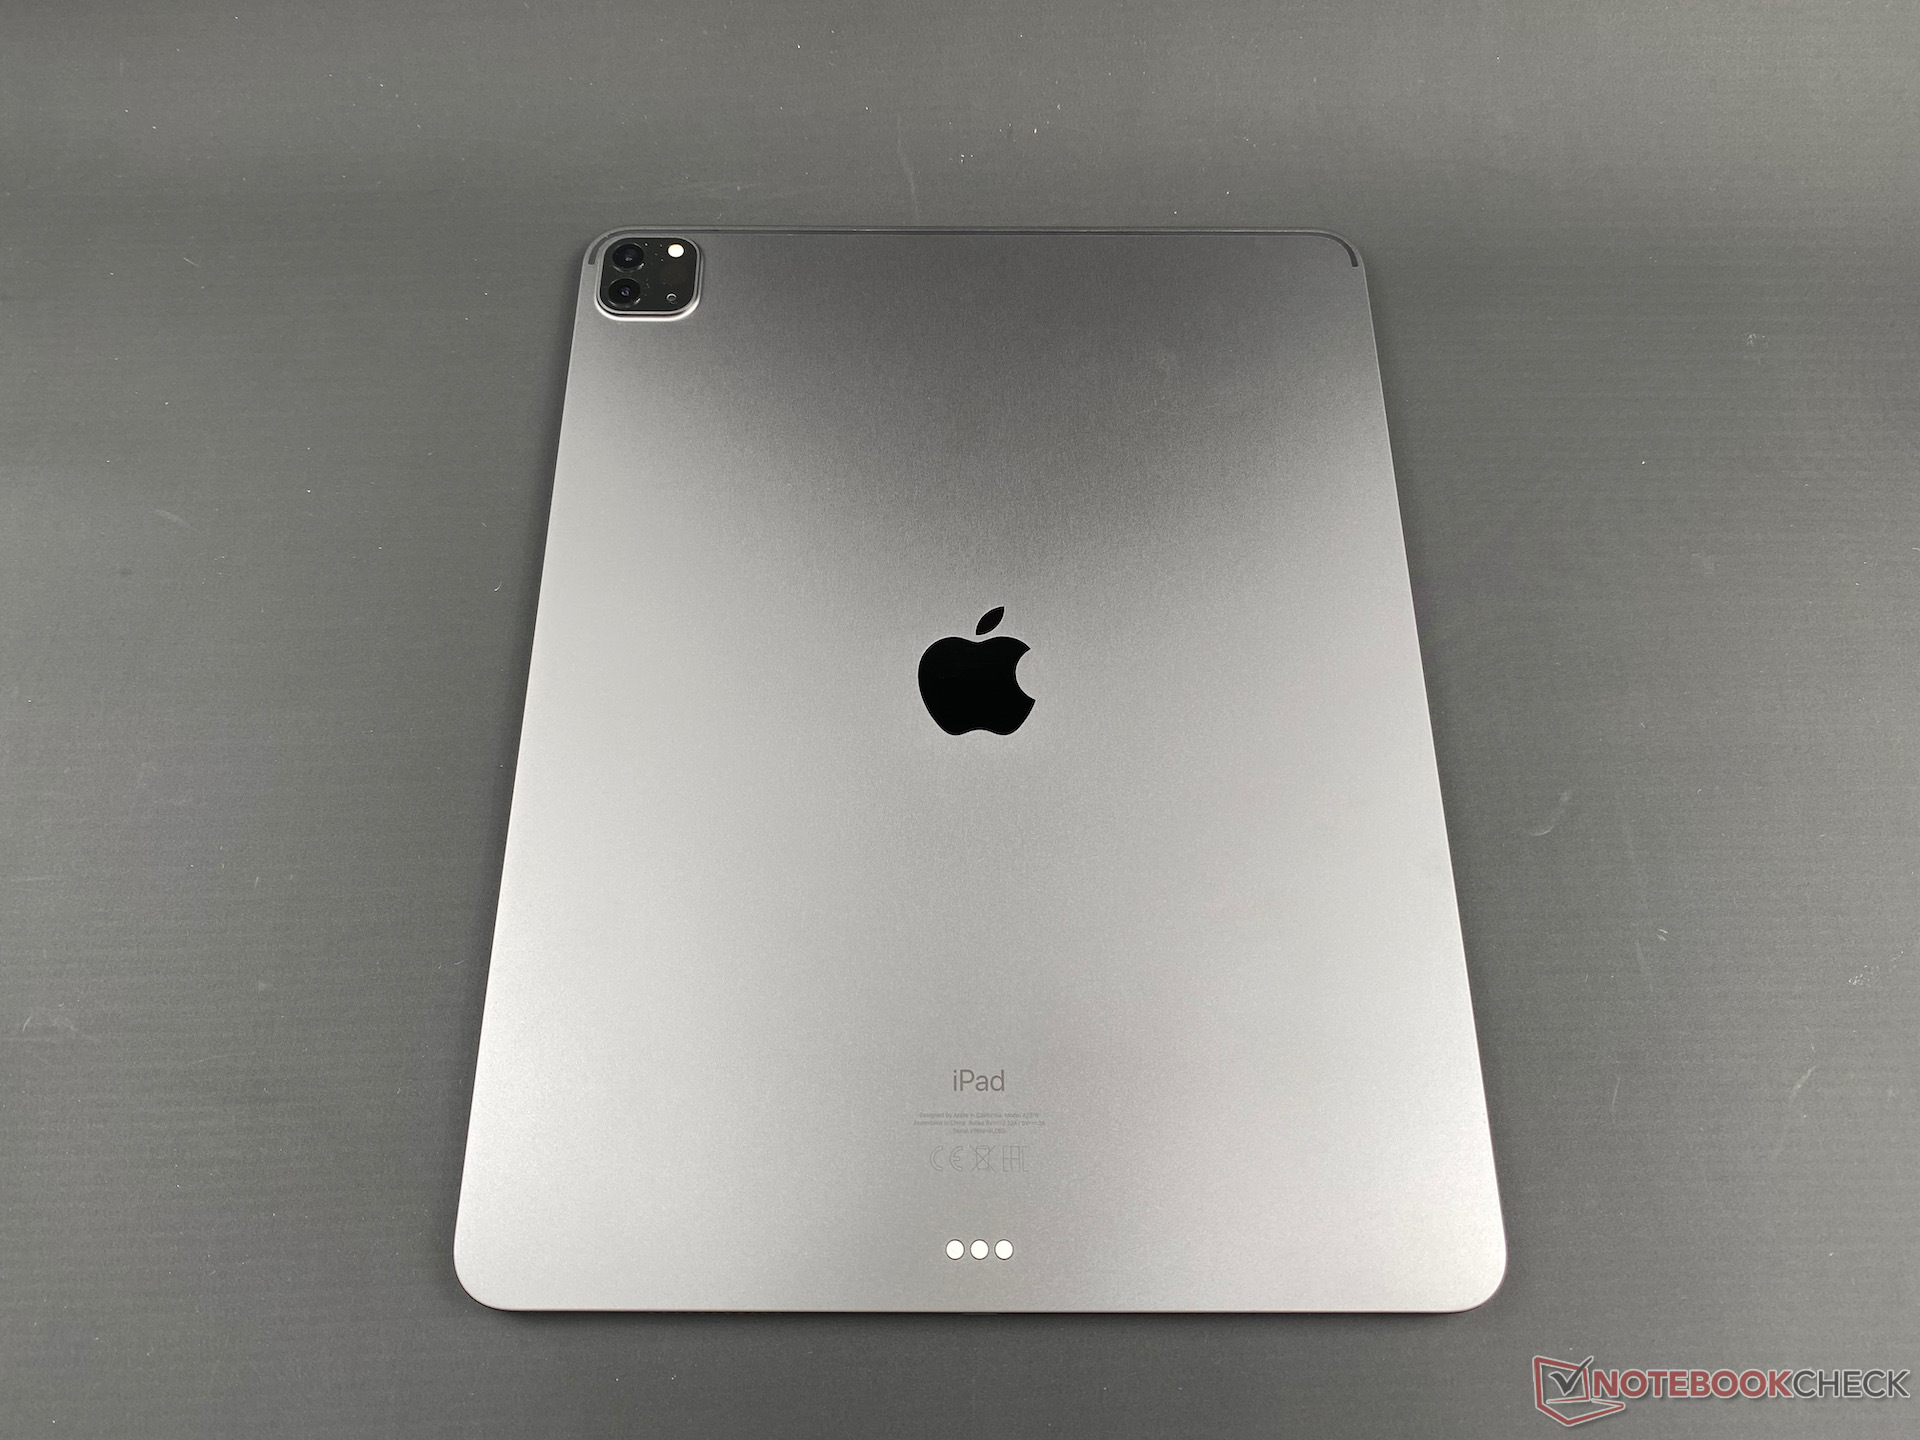
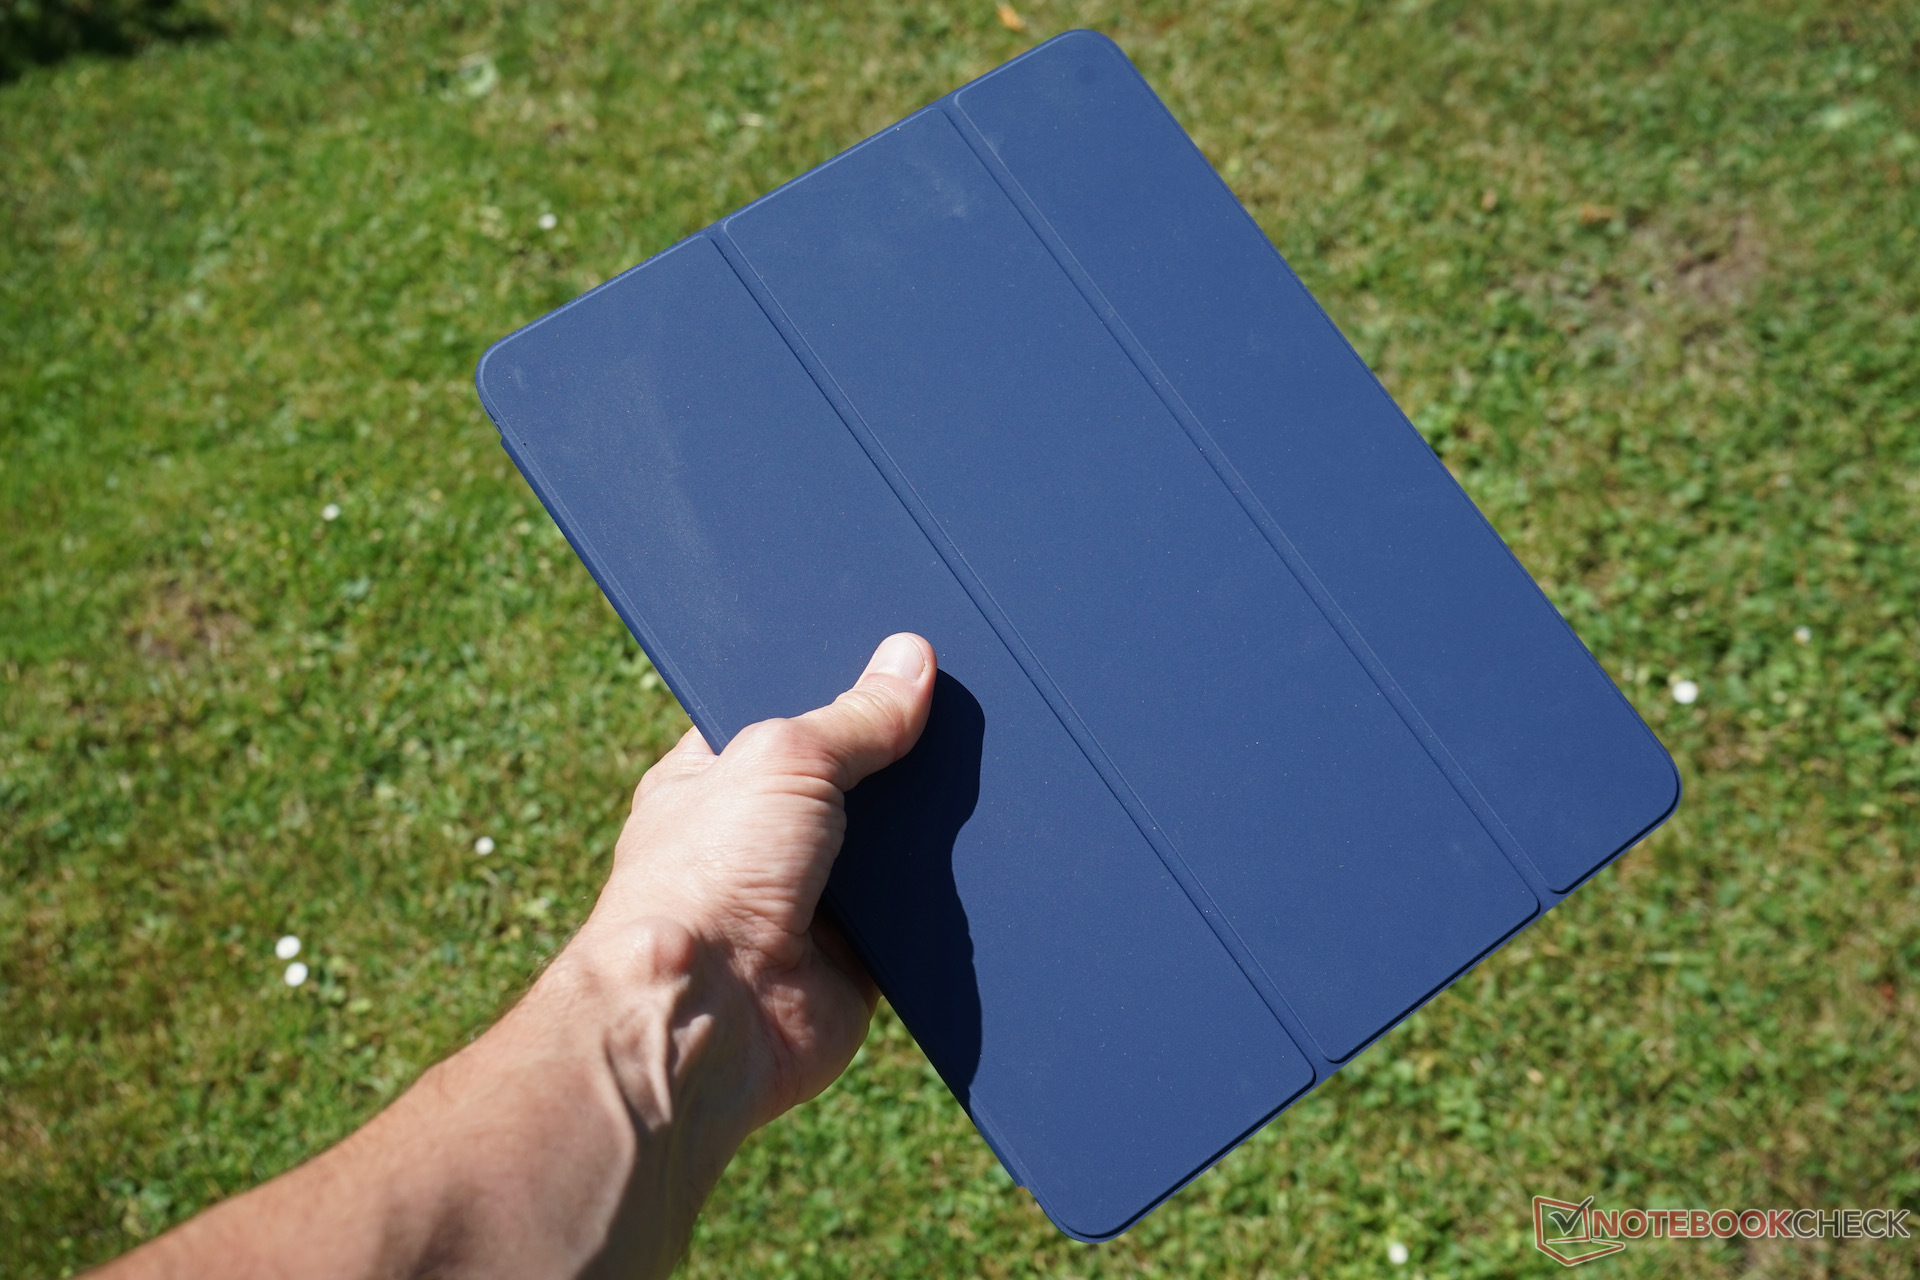
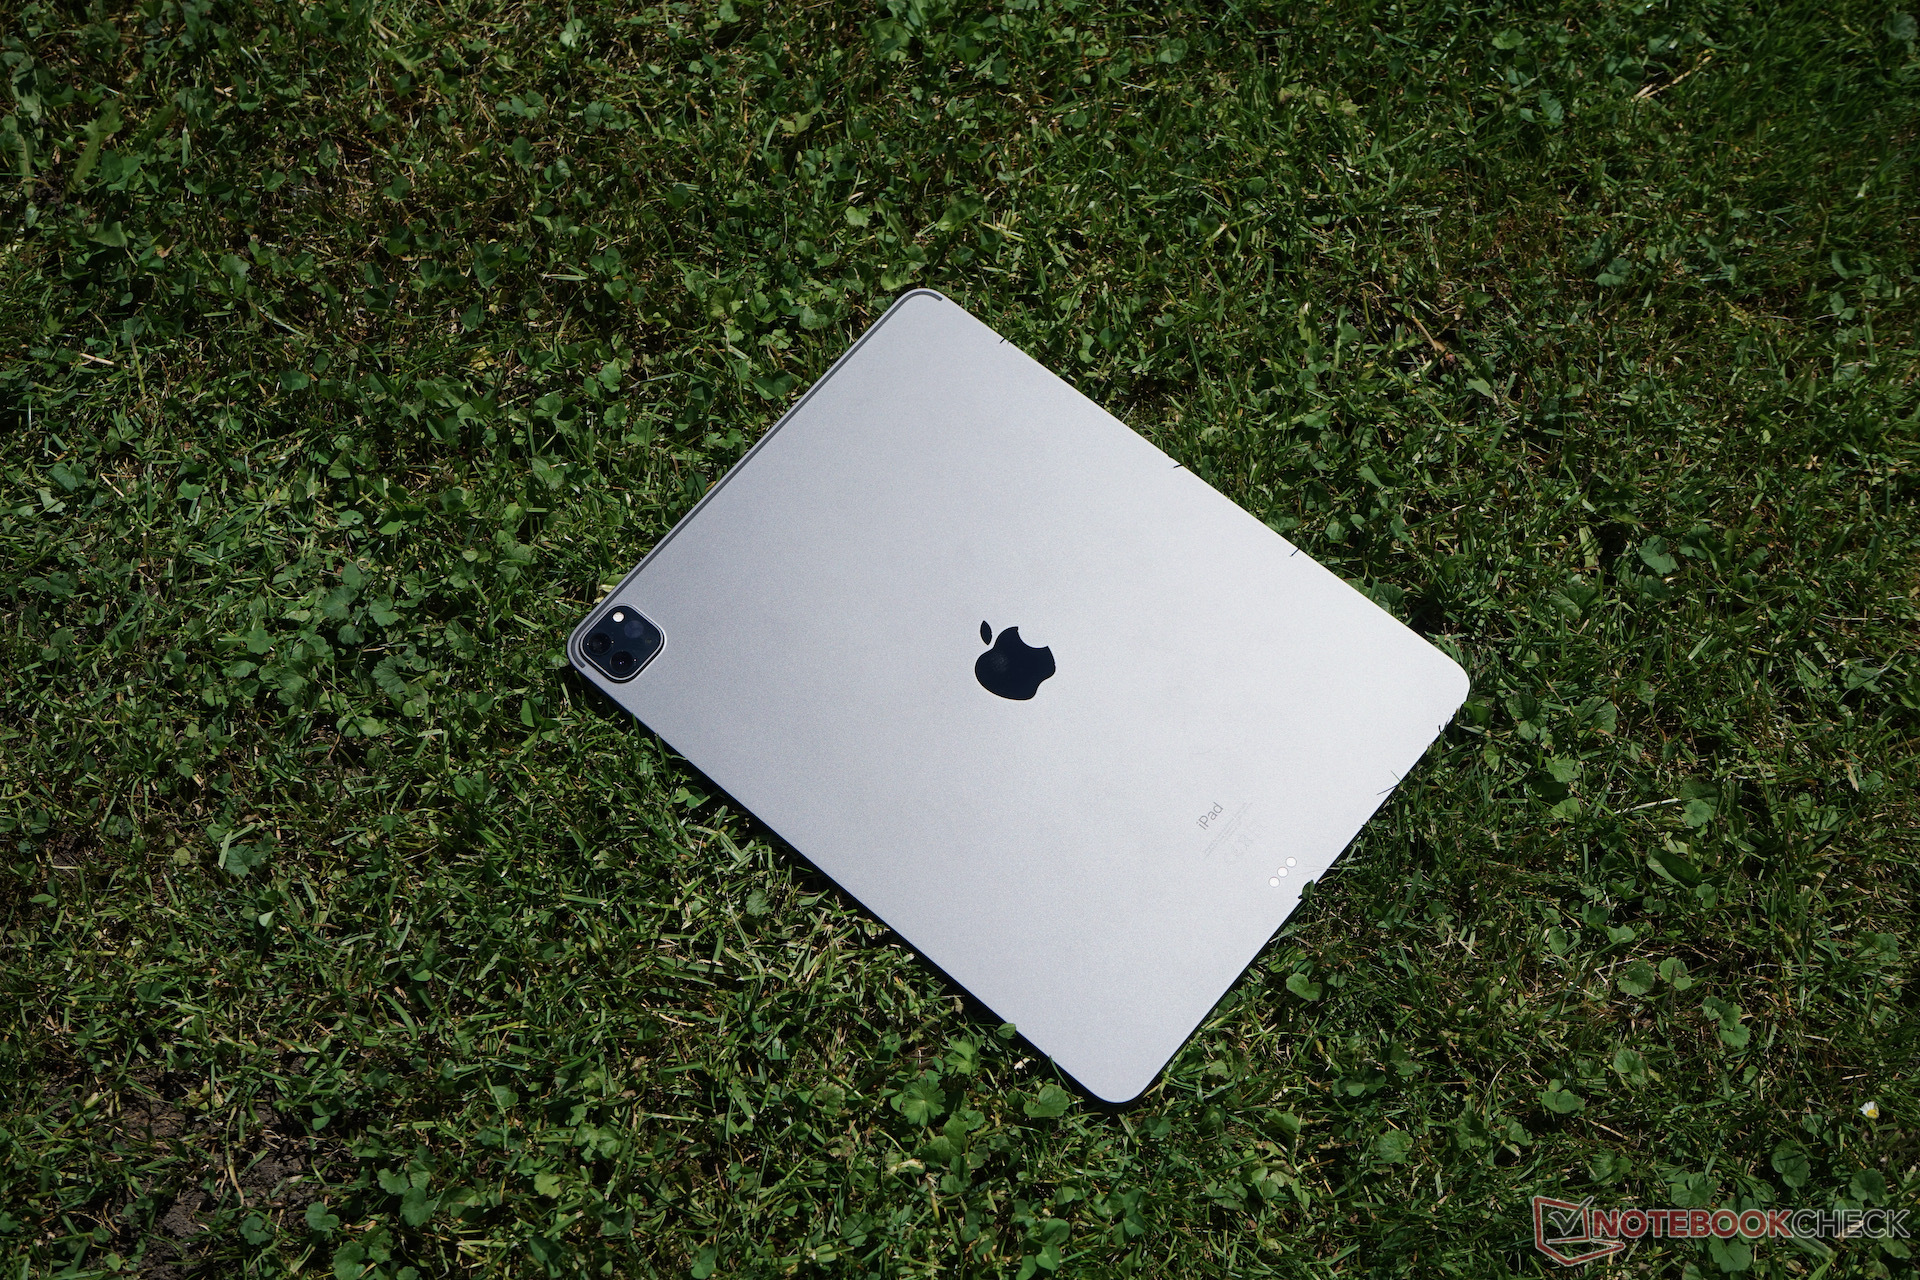
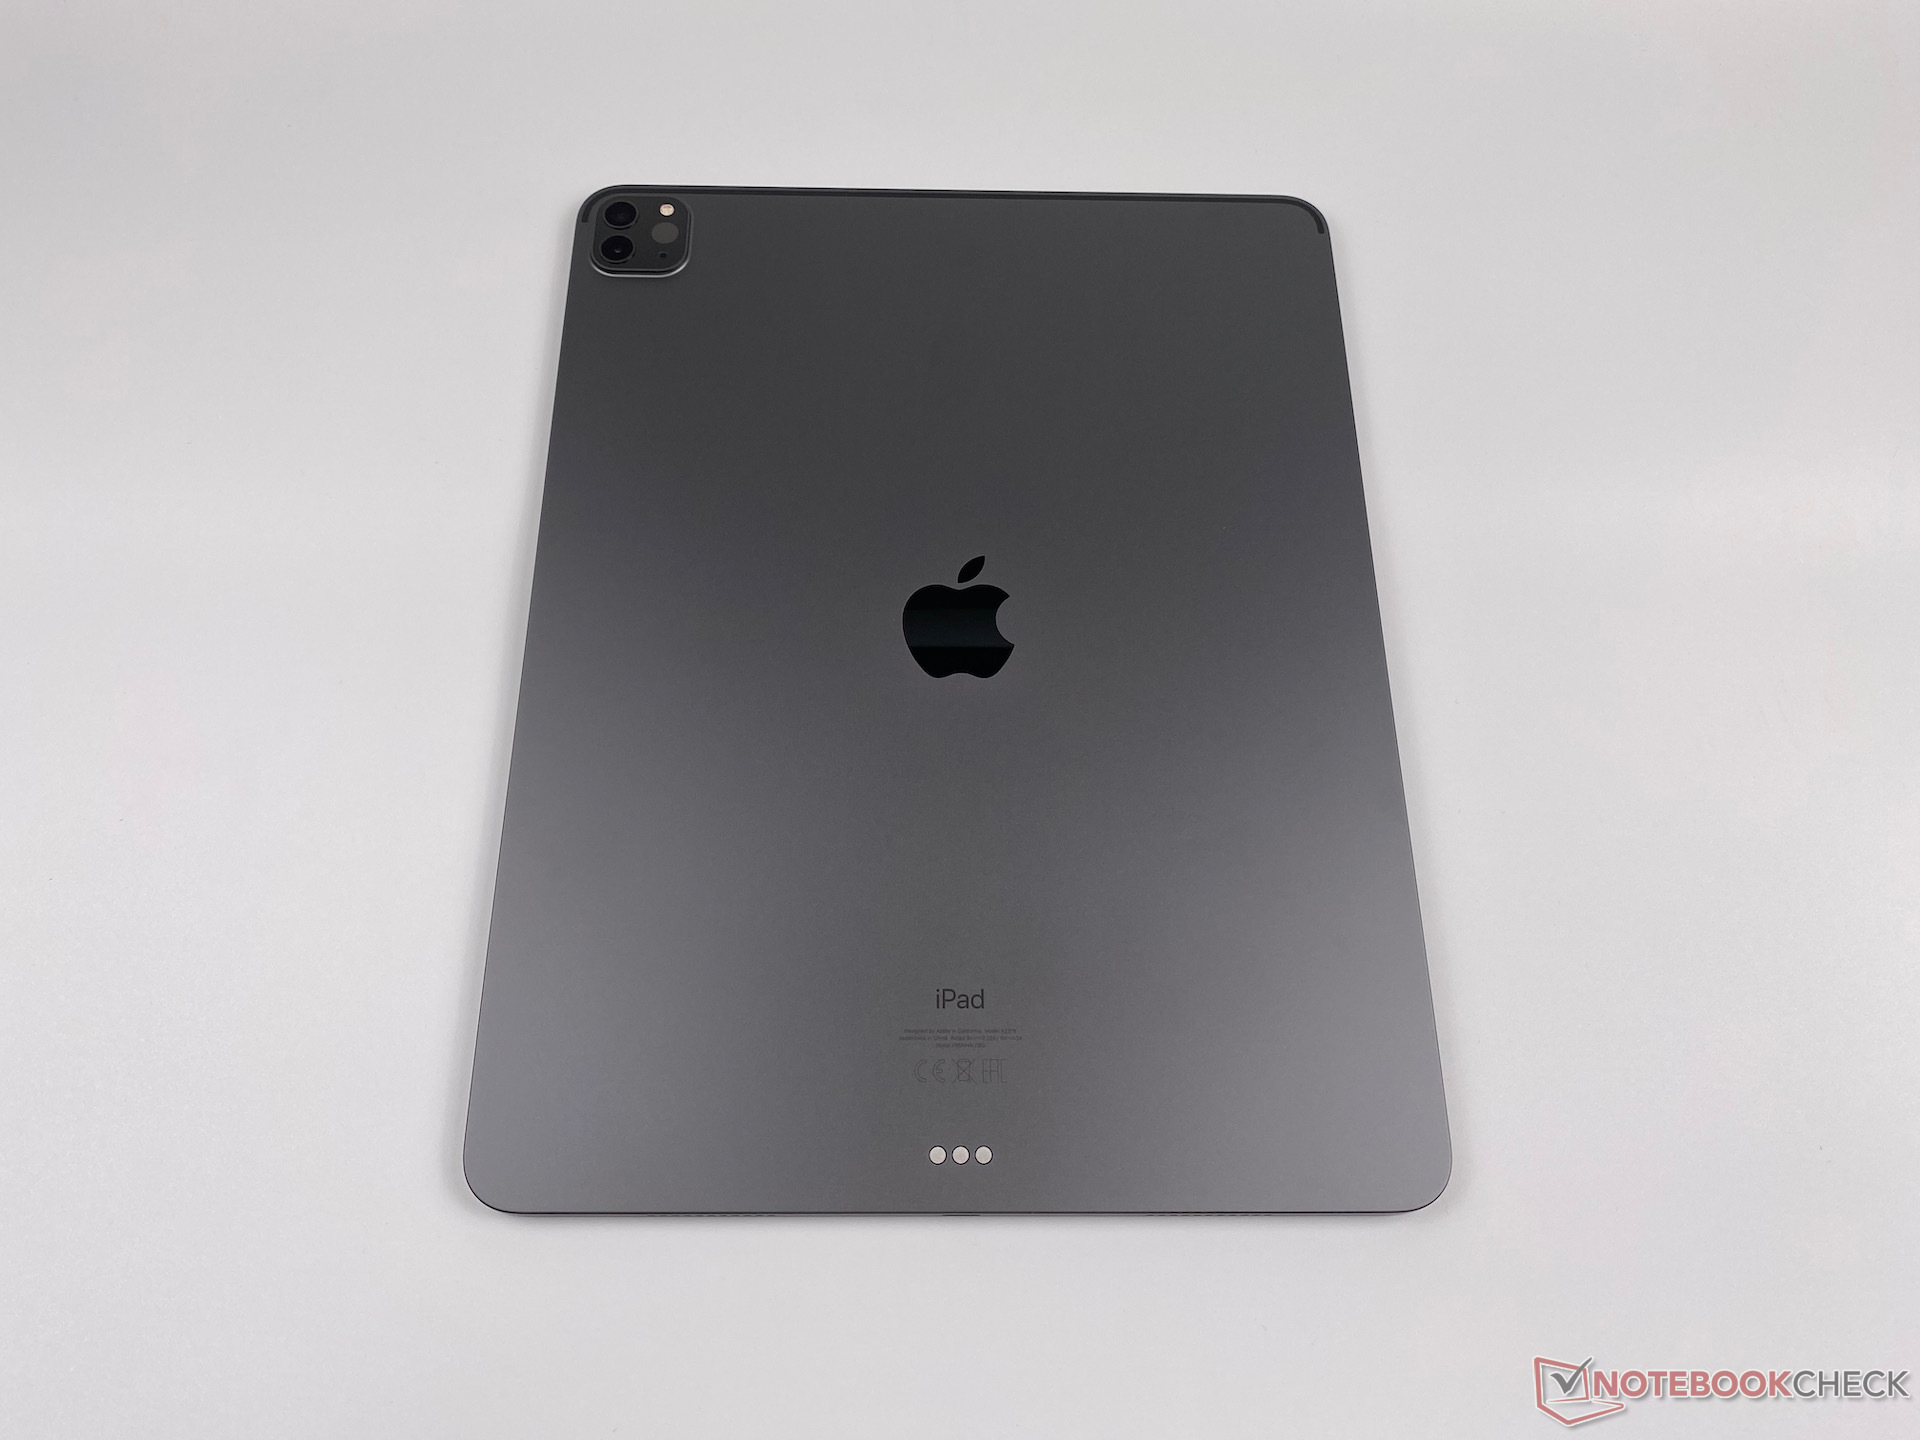
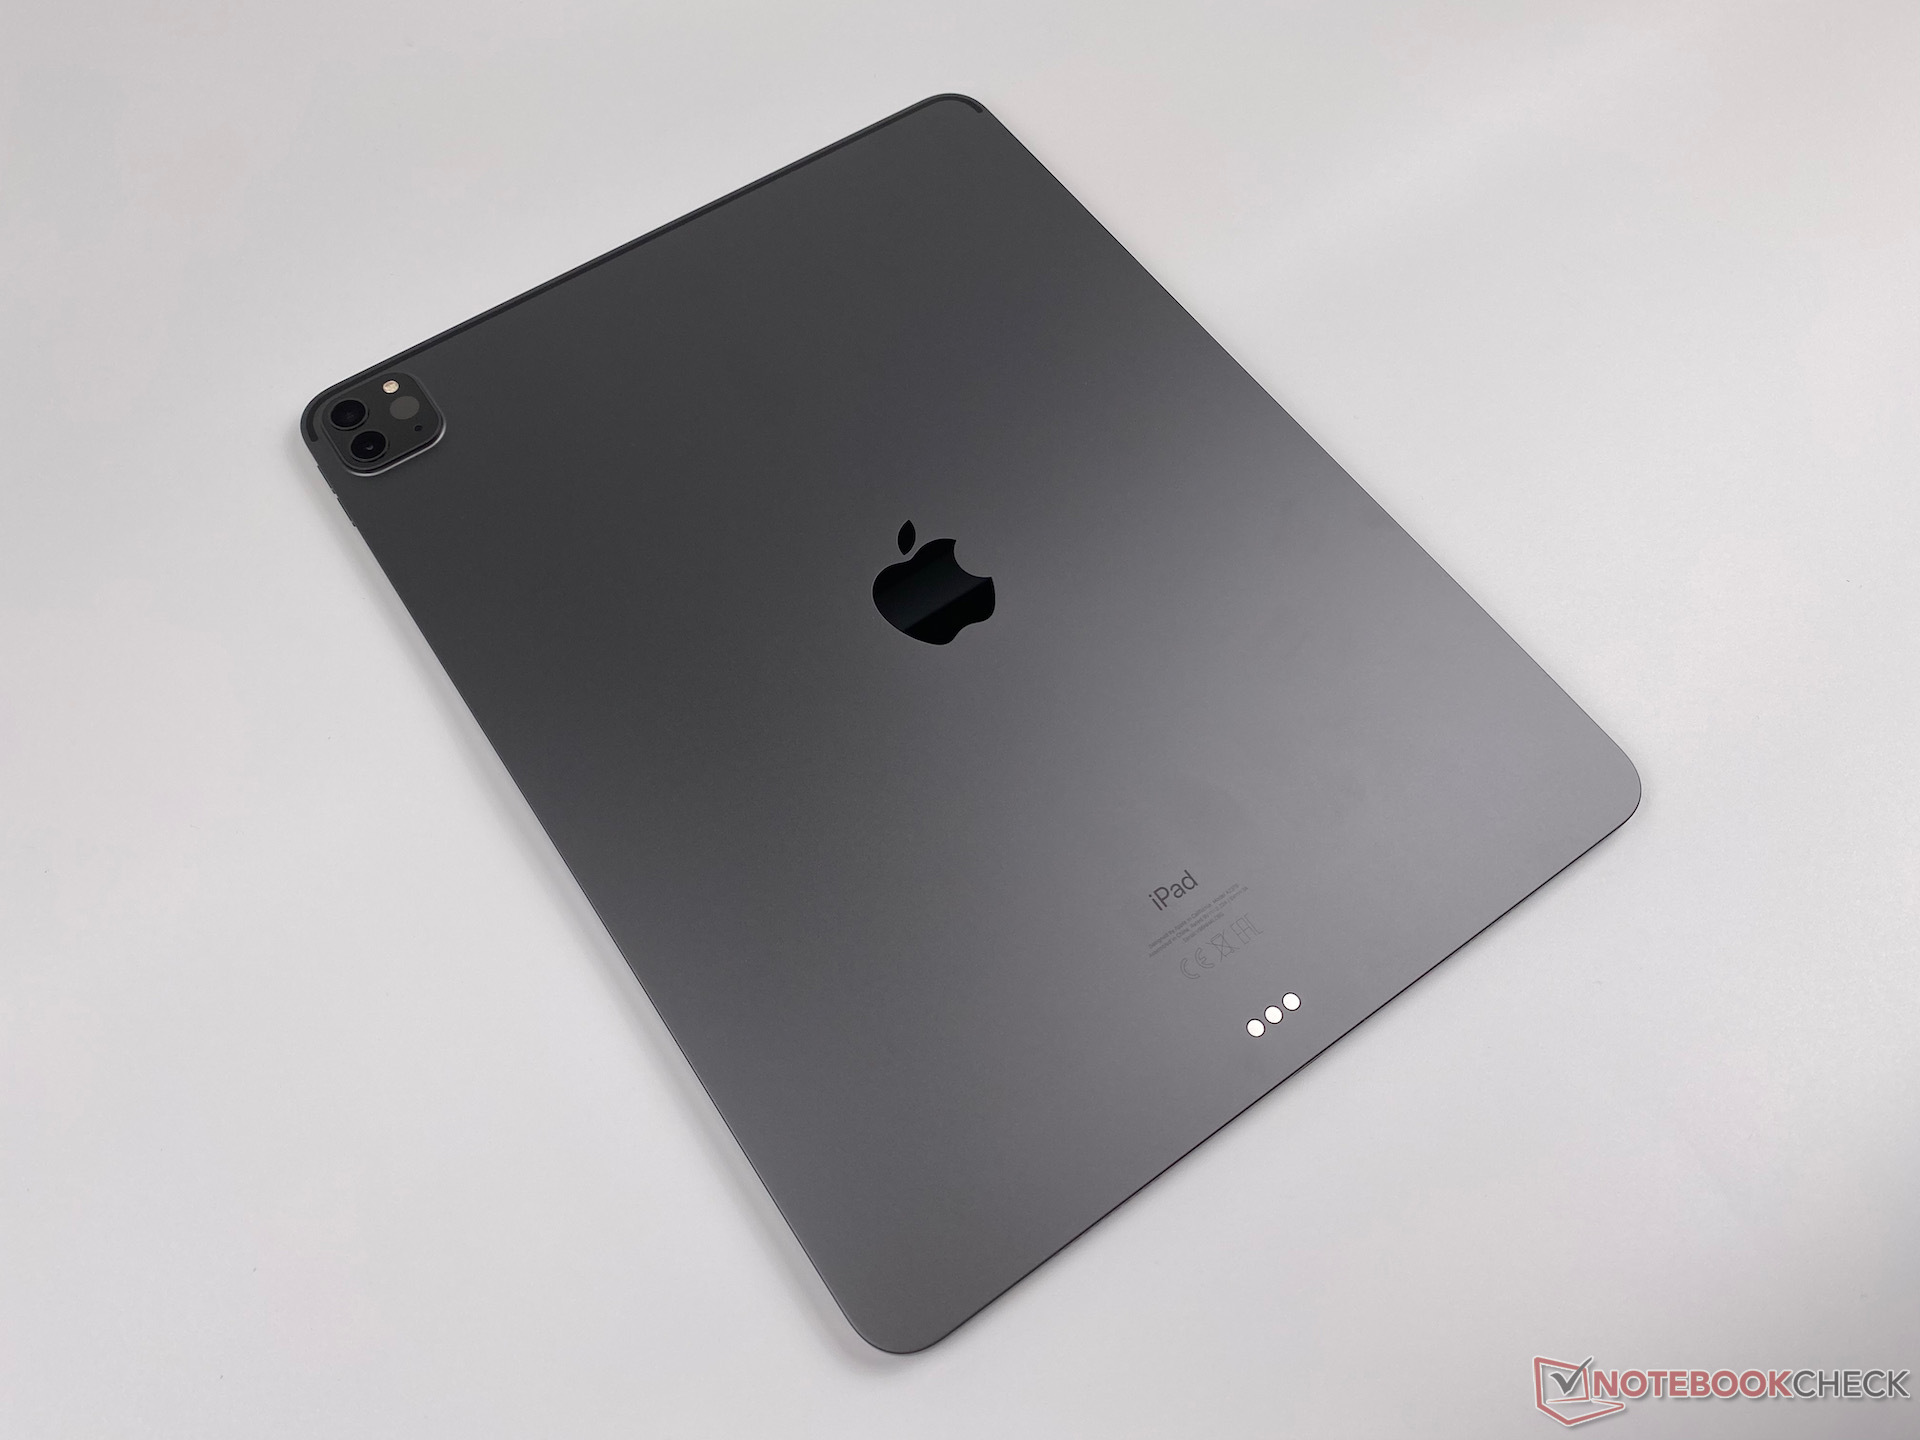
The case design of the 12.9-inch iPad Pro remains unchanged from its predecessor. The Mini LED backlight has made the tablet imperceptibly thicker and heavier, but the stable and perfectly processed aluminium housing is still excellent. Gaps, haptics and optics are, as is the case with Apple, flawless. The display bezels are also unchanged and provide enough space for the tablet's improved front-facing camera. You can hold the tablet comfortably without accidentally triggering the display, too. Moreover, our review unit is stiff; its torsional stiffness is flawless.
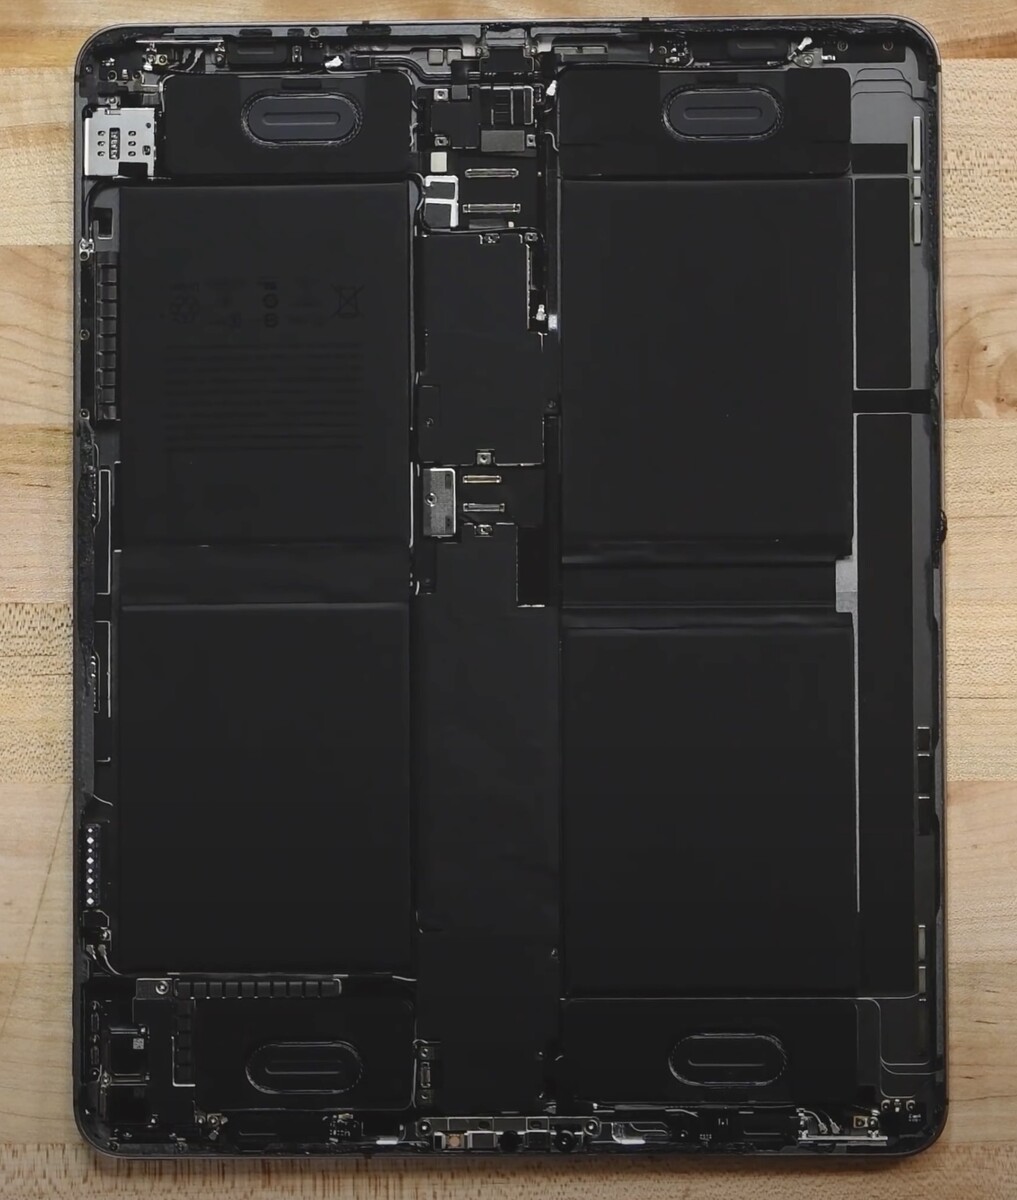
As with the smaller iPad Pro 11, Apple is committed to sustainability in materials and uses, for example, recycled aluminium, tin and valuable metals obtained from rare earths. However, it looks much worse in terms of repairability and upgradeability, as iFixit's teardown video shows. In short, you still need heat and plastic picks to even get inside the tablet because Apple glues the display to the chassis. You could only replace the battery once you are in there, anyway.
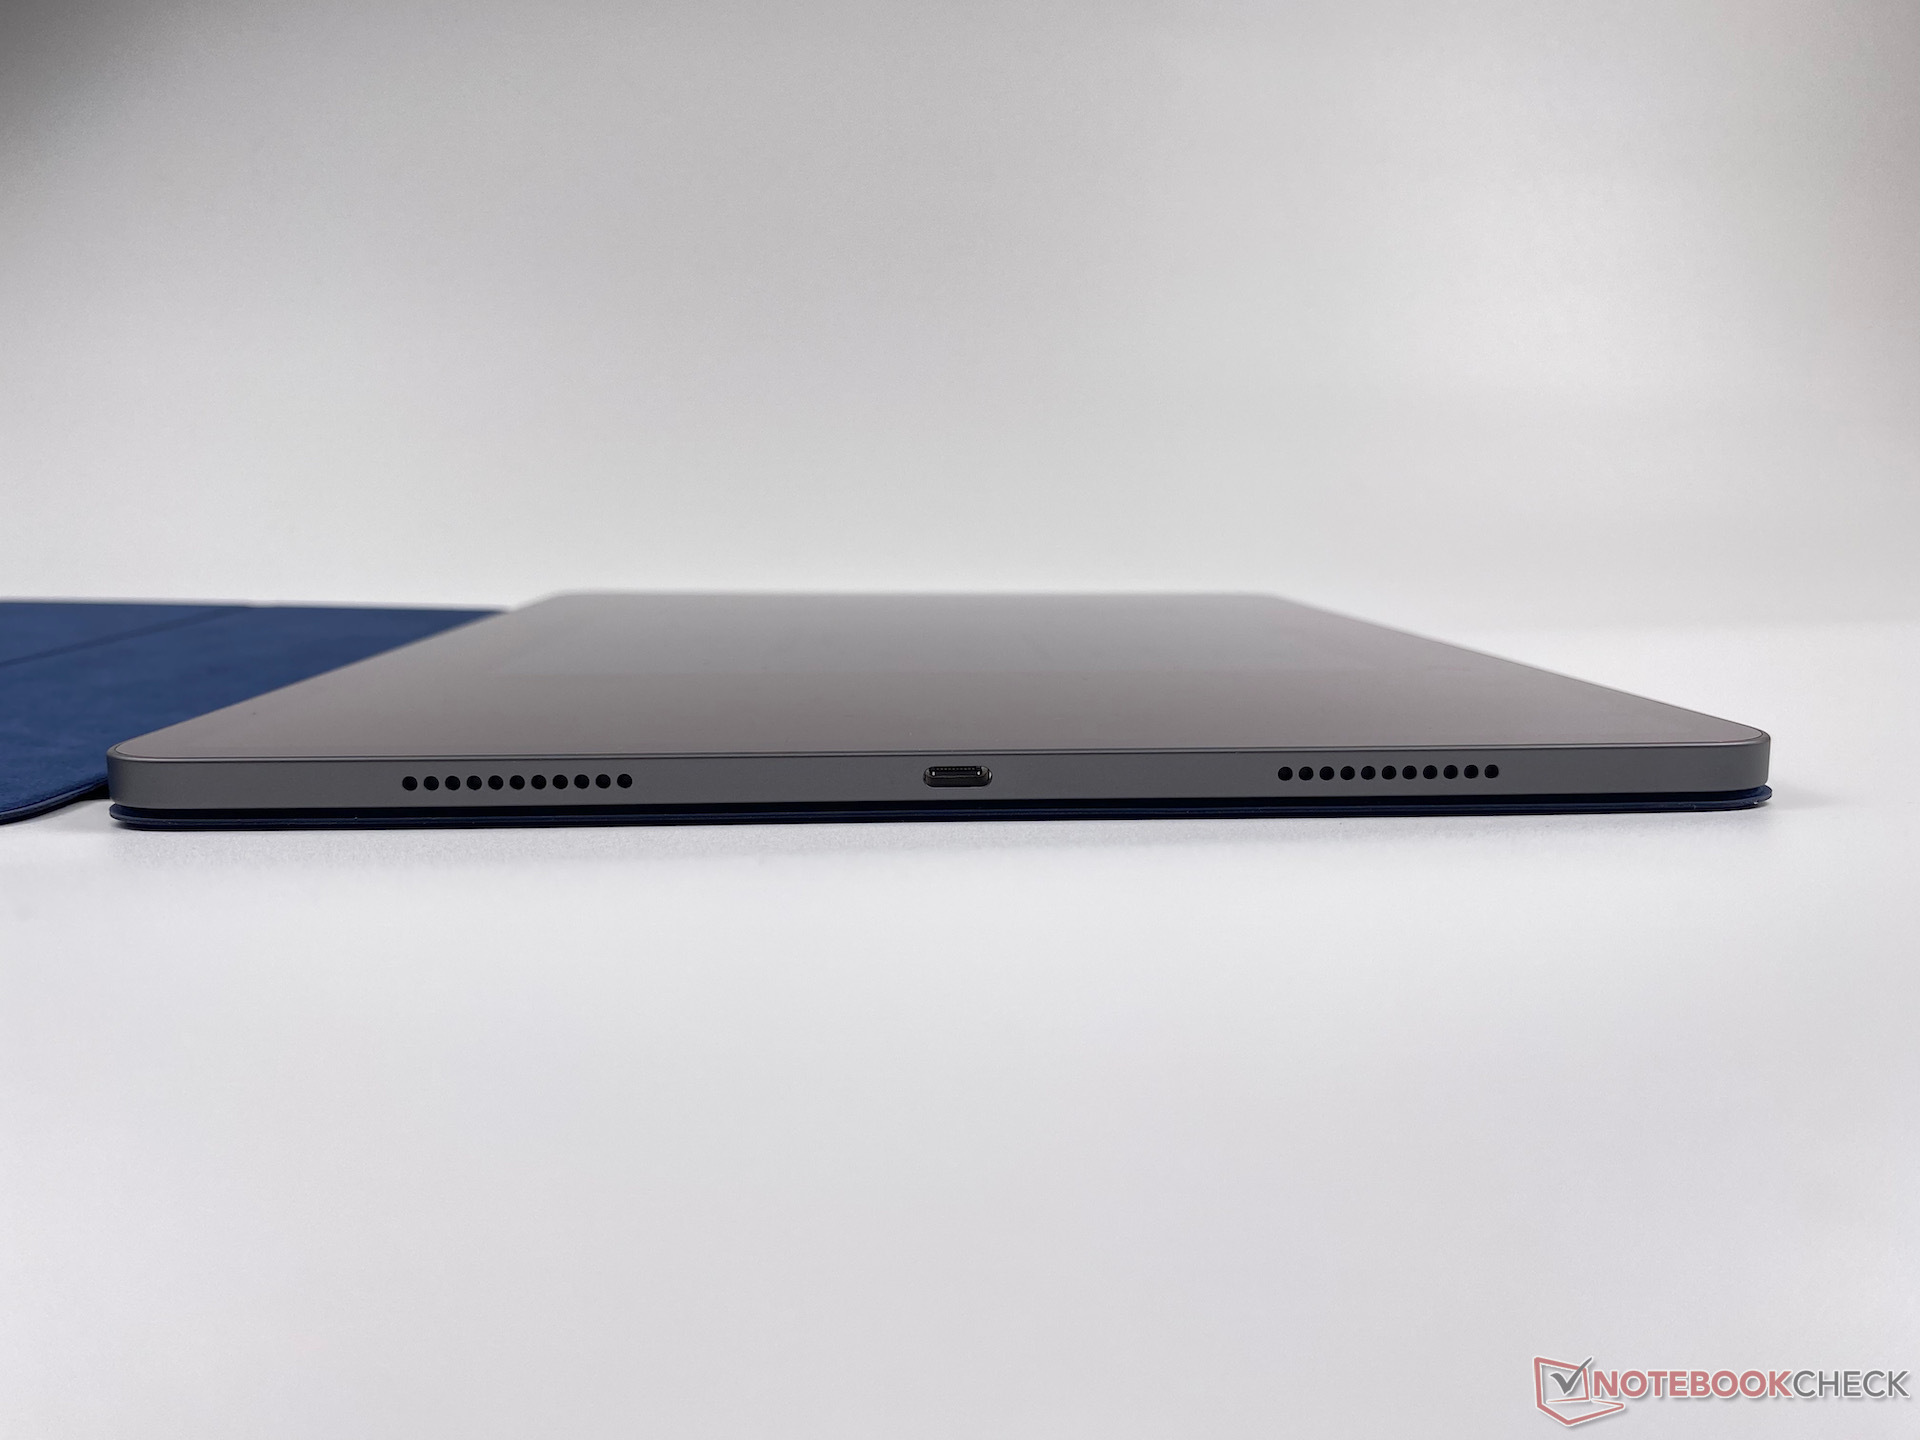
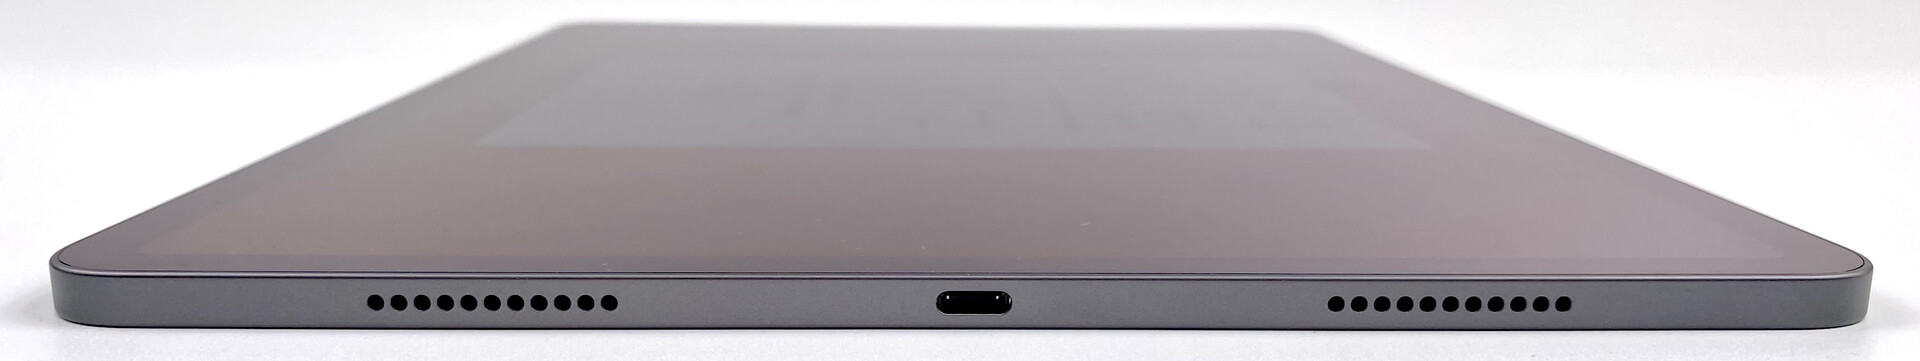
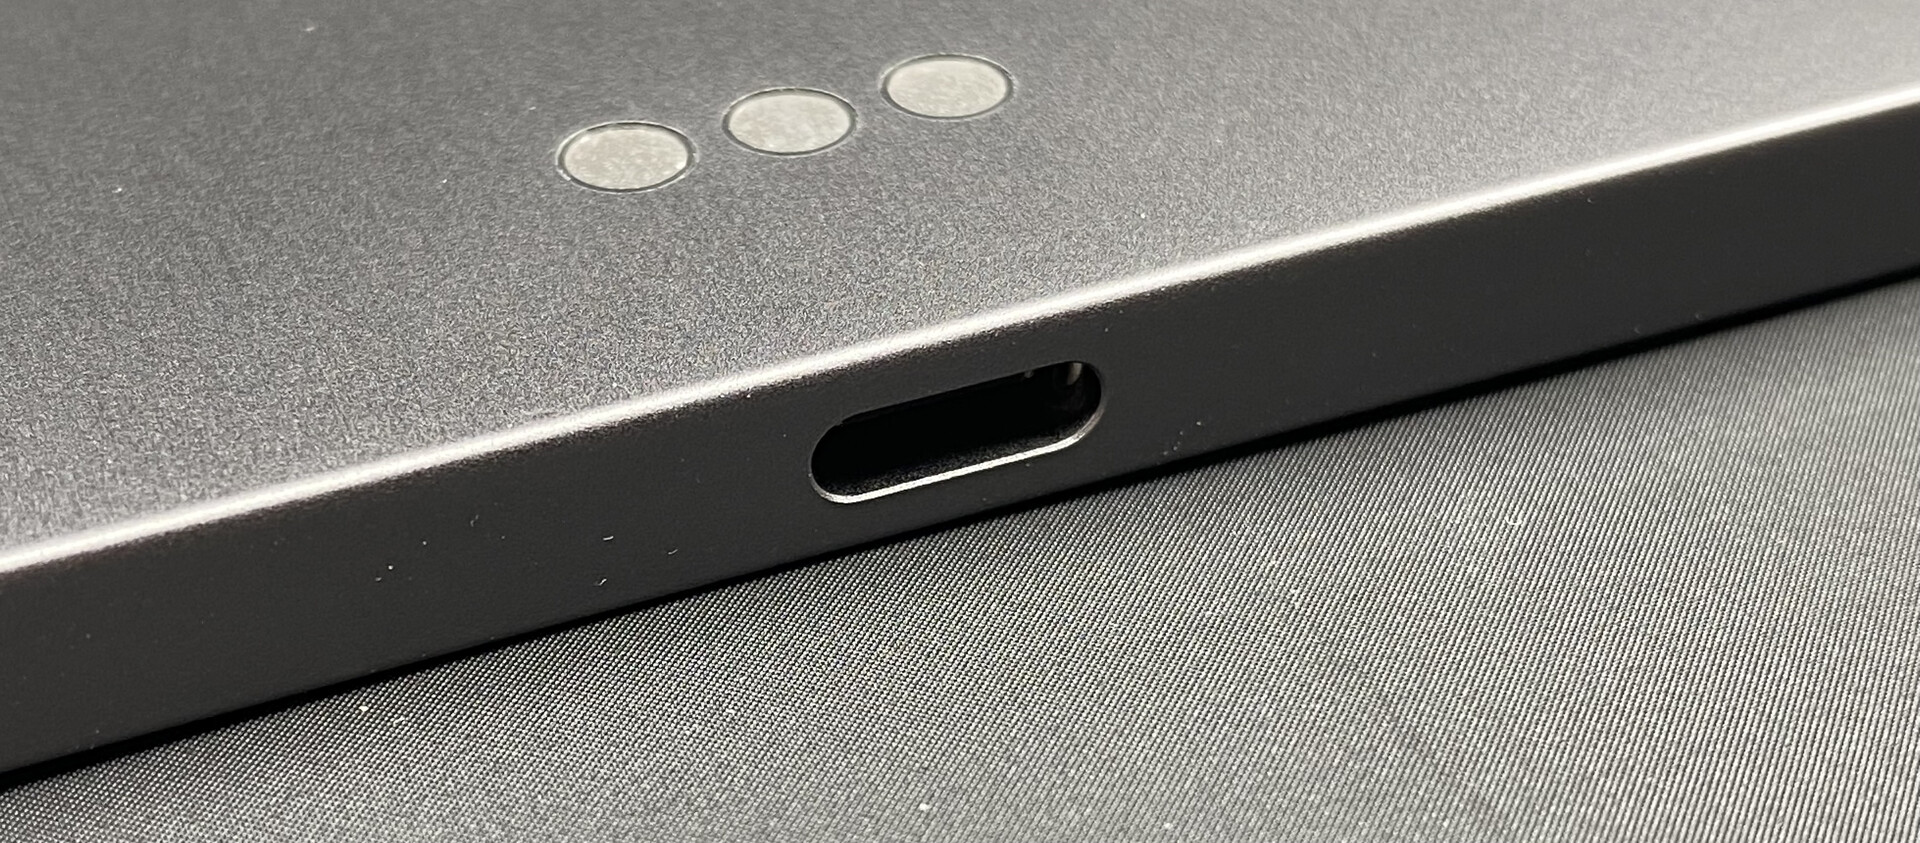
Connectivity - Now with Thunderbolt
There is a slight change in the ports with the latest iPad Pro 12.9 compared to its predecessor. The built-in USB Type-C port now supports the Thunderbolt 3 and USB 4 standards thanks to its M1 SoC, which provides up to 40 Gbit/s transfer speeds. The same port can now even control a 6K panel, although this is rarely useful with iPadOS.
We tested the Thunderbolt port with a Samsung X5 SSD (1 TB) and a 10 GB file. Of course, the write speed of the internal SSD also plays a role here when copying files. Compared to the MacBook Pro 16, the iPad Pro 12.9 cannot score well with a 560 MB/s speed against the 2,200 MB/s that the MacBook offers. The MacBook Air with a 256 GB SSD takes a similar amount of time as the iPad Pro 12.9 to complete our test, which we measured at 19 seconds. This transfer speed corresponds to 530 MB/s, for reference.
Software - Thwarted by iPadOS
The iPad Pro 12.9 is currently shipping with iPadOS 14.6, but Apple has already announced iPadOS 15, an update with an improved home screen and file management system. iPadOS 15 is due to arrive in the autumn. Thanks to the fast M1 SoC, the iPad Pro 12.9 should receive updates for a long time; only Windows-based tablets can keep up with Apple's tablets in this regard. By contrast, the state of updates for Android tablets usually looks bleak after a few years.
In general, however, the simple iPadOS slows down the strong iPad Pro 12.9. File handling, app freedoms, multitasking and external monitors are all limitations of iPadOS, for example. In particular, power users will quickly reach their limits with Apple's tablet OS, to the extent that Apple has designed iPadOS for easy use, like for children, as we mentioned at the beginning. Taking this route restricts flexibility though, and it feels like Apple has added multitasking and window operation unintuitively, in our opinion.
Hence, you should clarify in advance if you can get the right apps for your workflow in the App Store before purchasing an iPad Pro. In saying that, the security of Apple's fenced-in garden is advantageous, with viruses, malware and ransomware still relative unknowns. Apple closes security holes relatively quickly, too.
Communication & GNSS - No 5G mmWave in Europe and slow Wi-Fi speeds
5G and GNSS is optionally available with the 2021 versions of the iPad Pro 11 and iPad Pro 12.9. Unfortunately, the European variants of both models miss out on the 5G mmWave antennas that Apple includes in their US siblings. Our entry-level device does not offer either 5G or GNSS and settles with WiFi 6 connectivity, instead. Sadly, Apple does not support the 160 MHz frequency band, which means that our review unit achieves slower transfer speeds than is possible with WiFi 6 connectivity. We have no reason for complaint about Wi-Fi reliability or range, though.
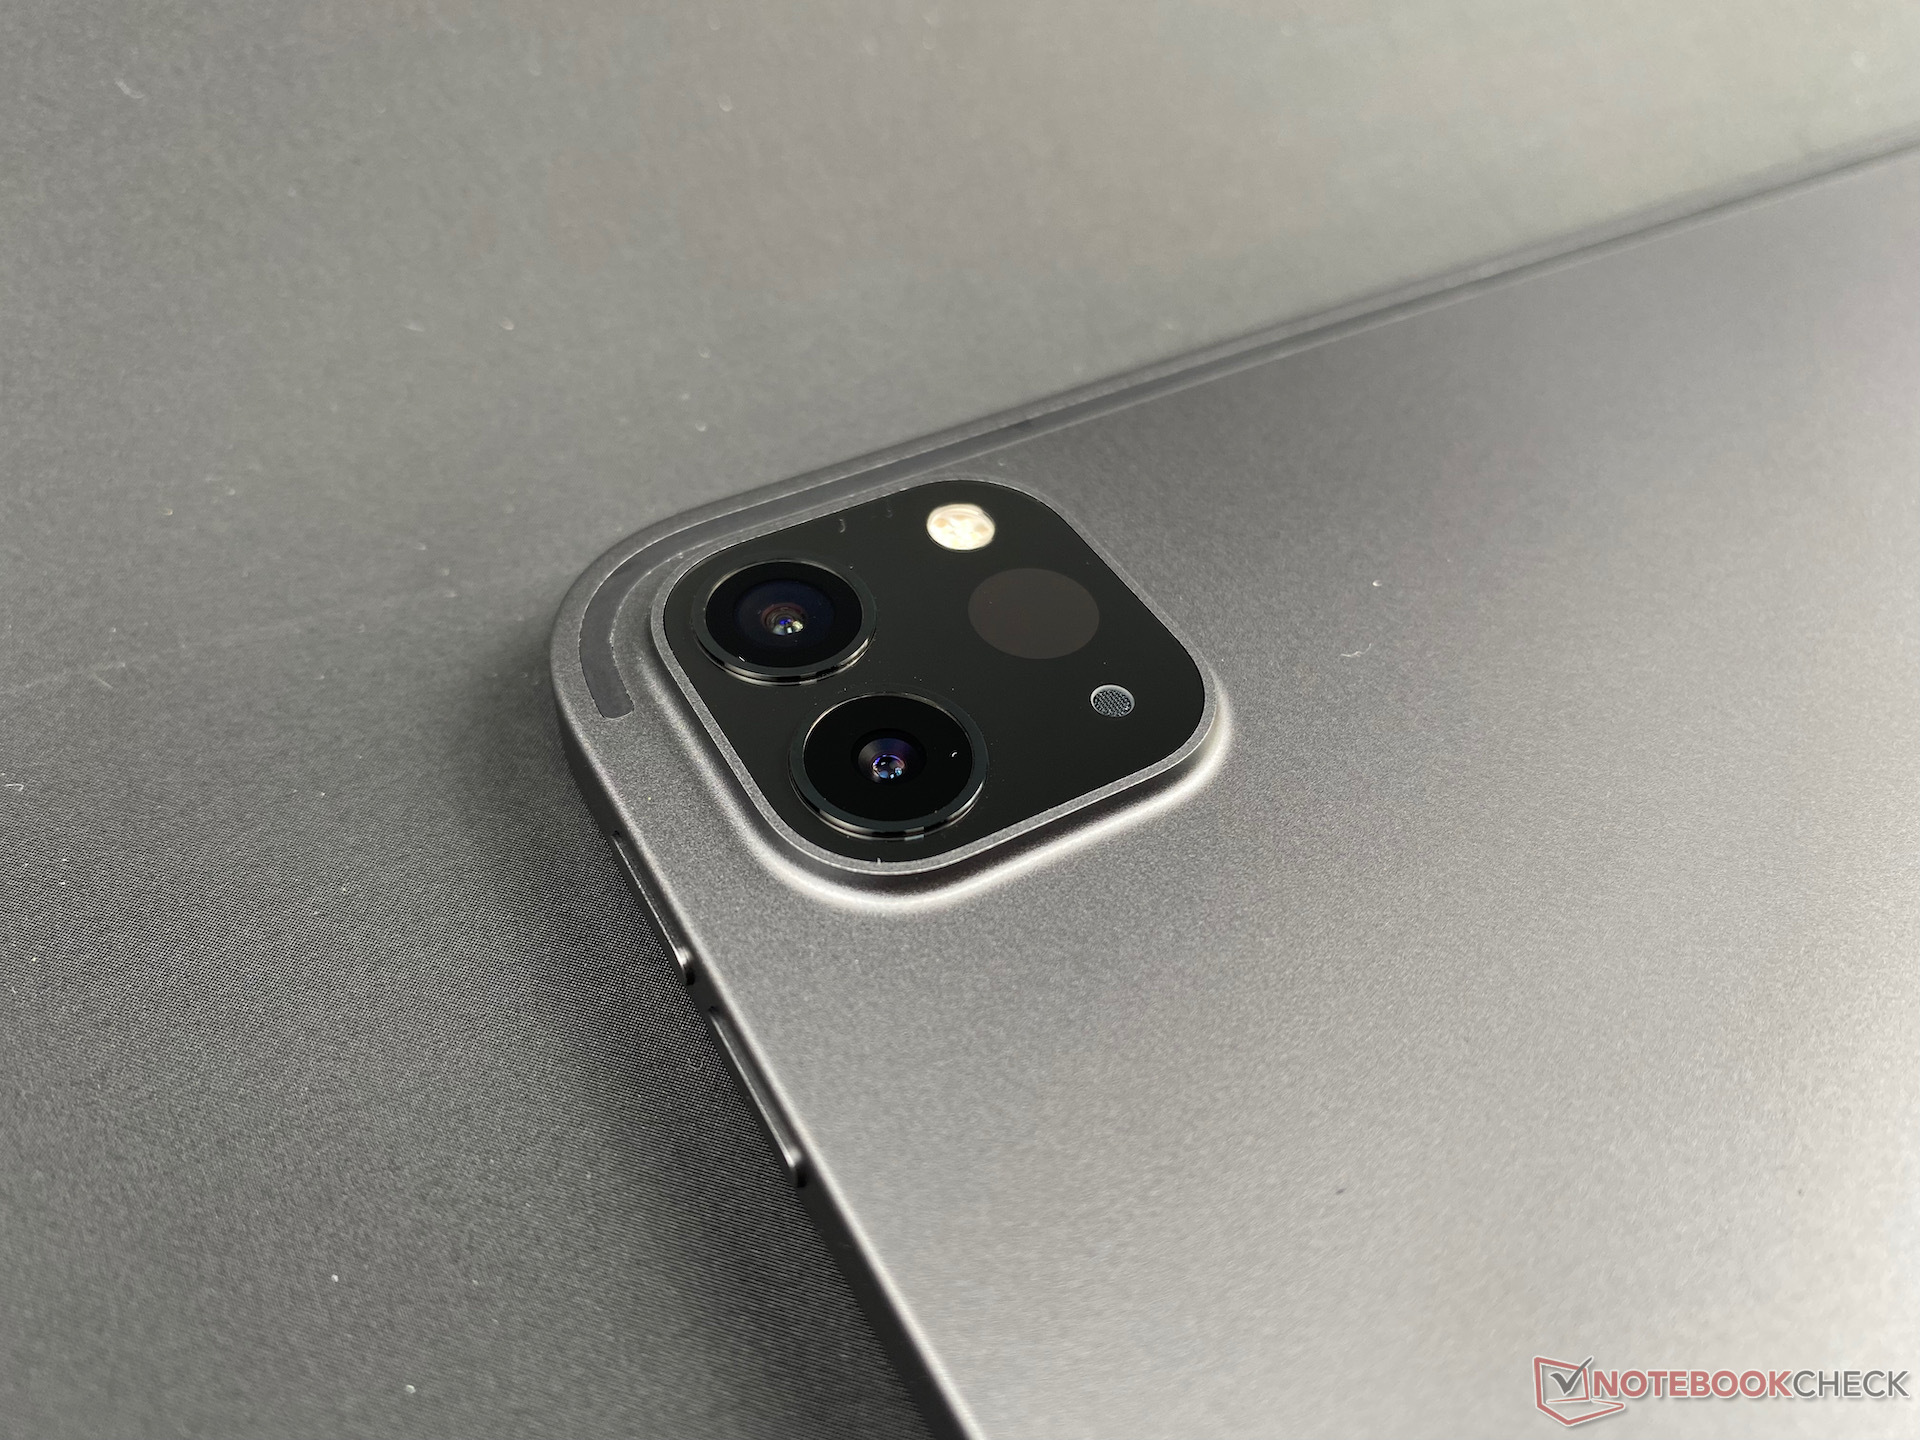
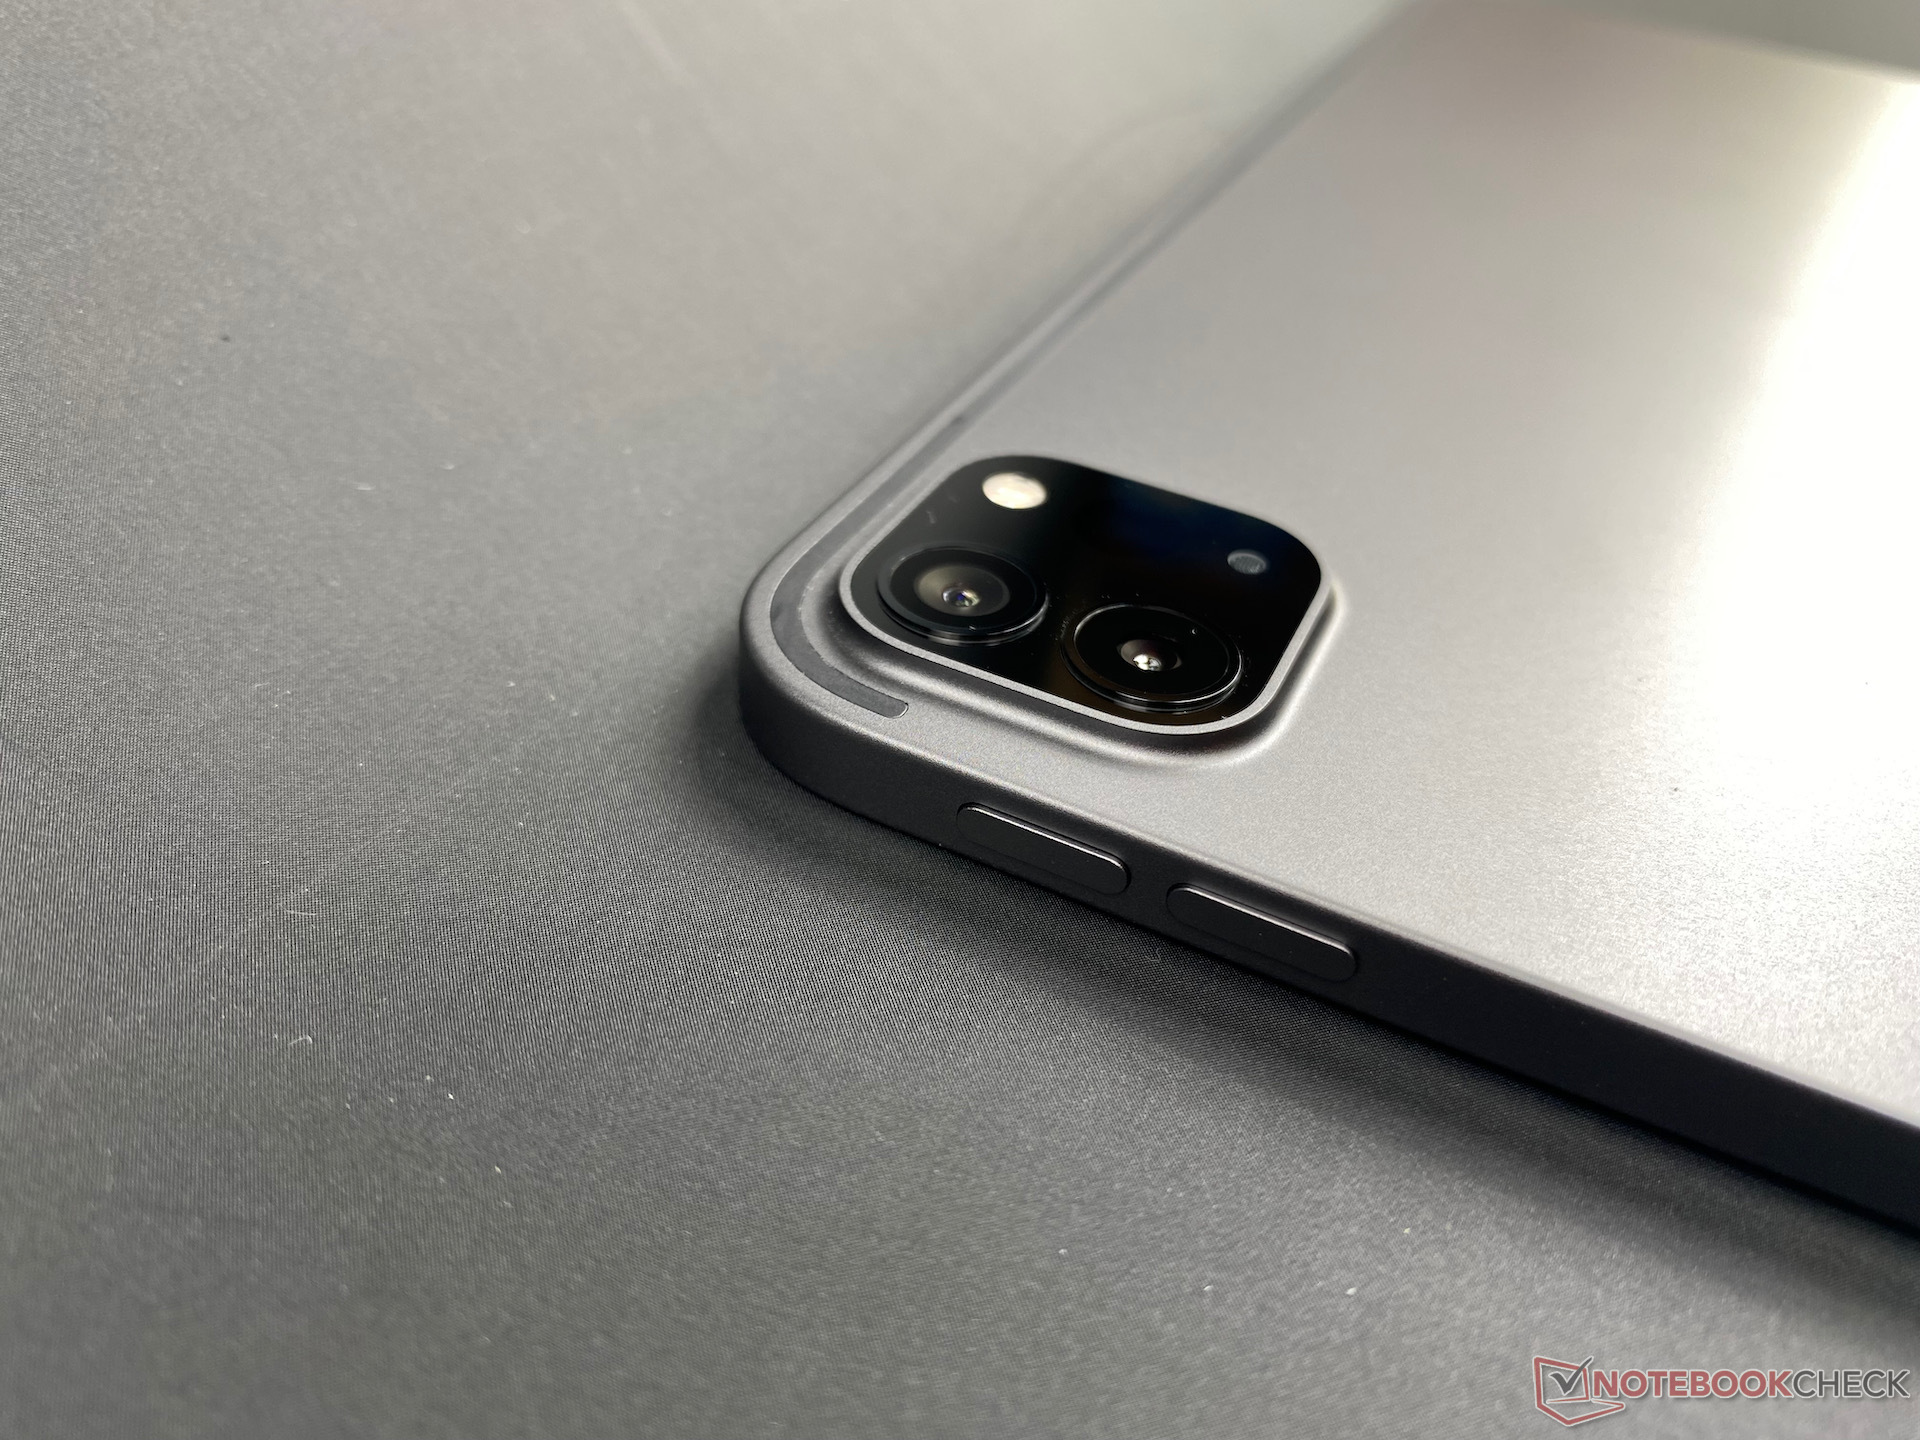
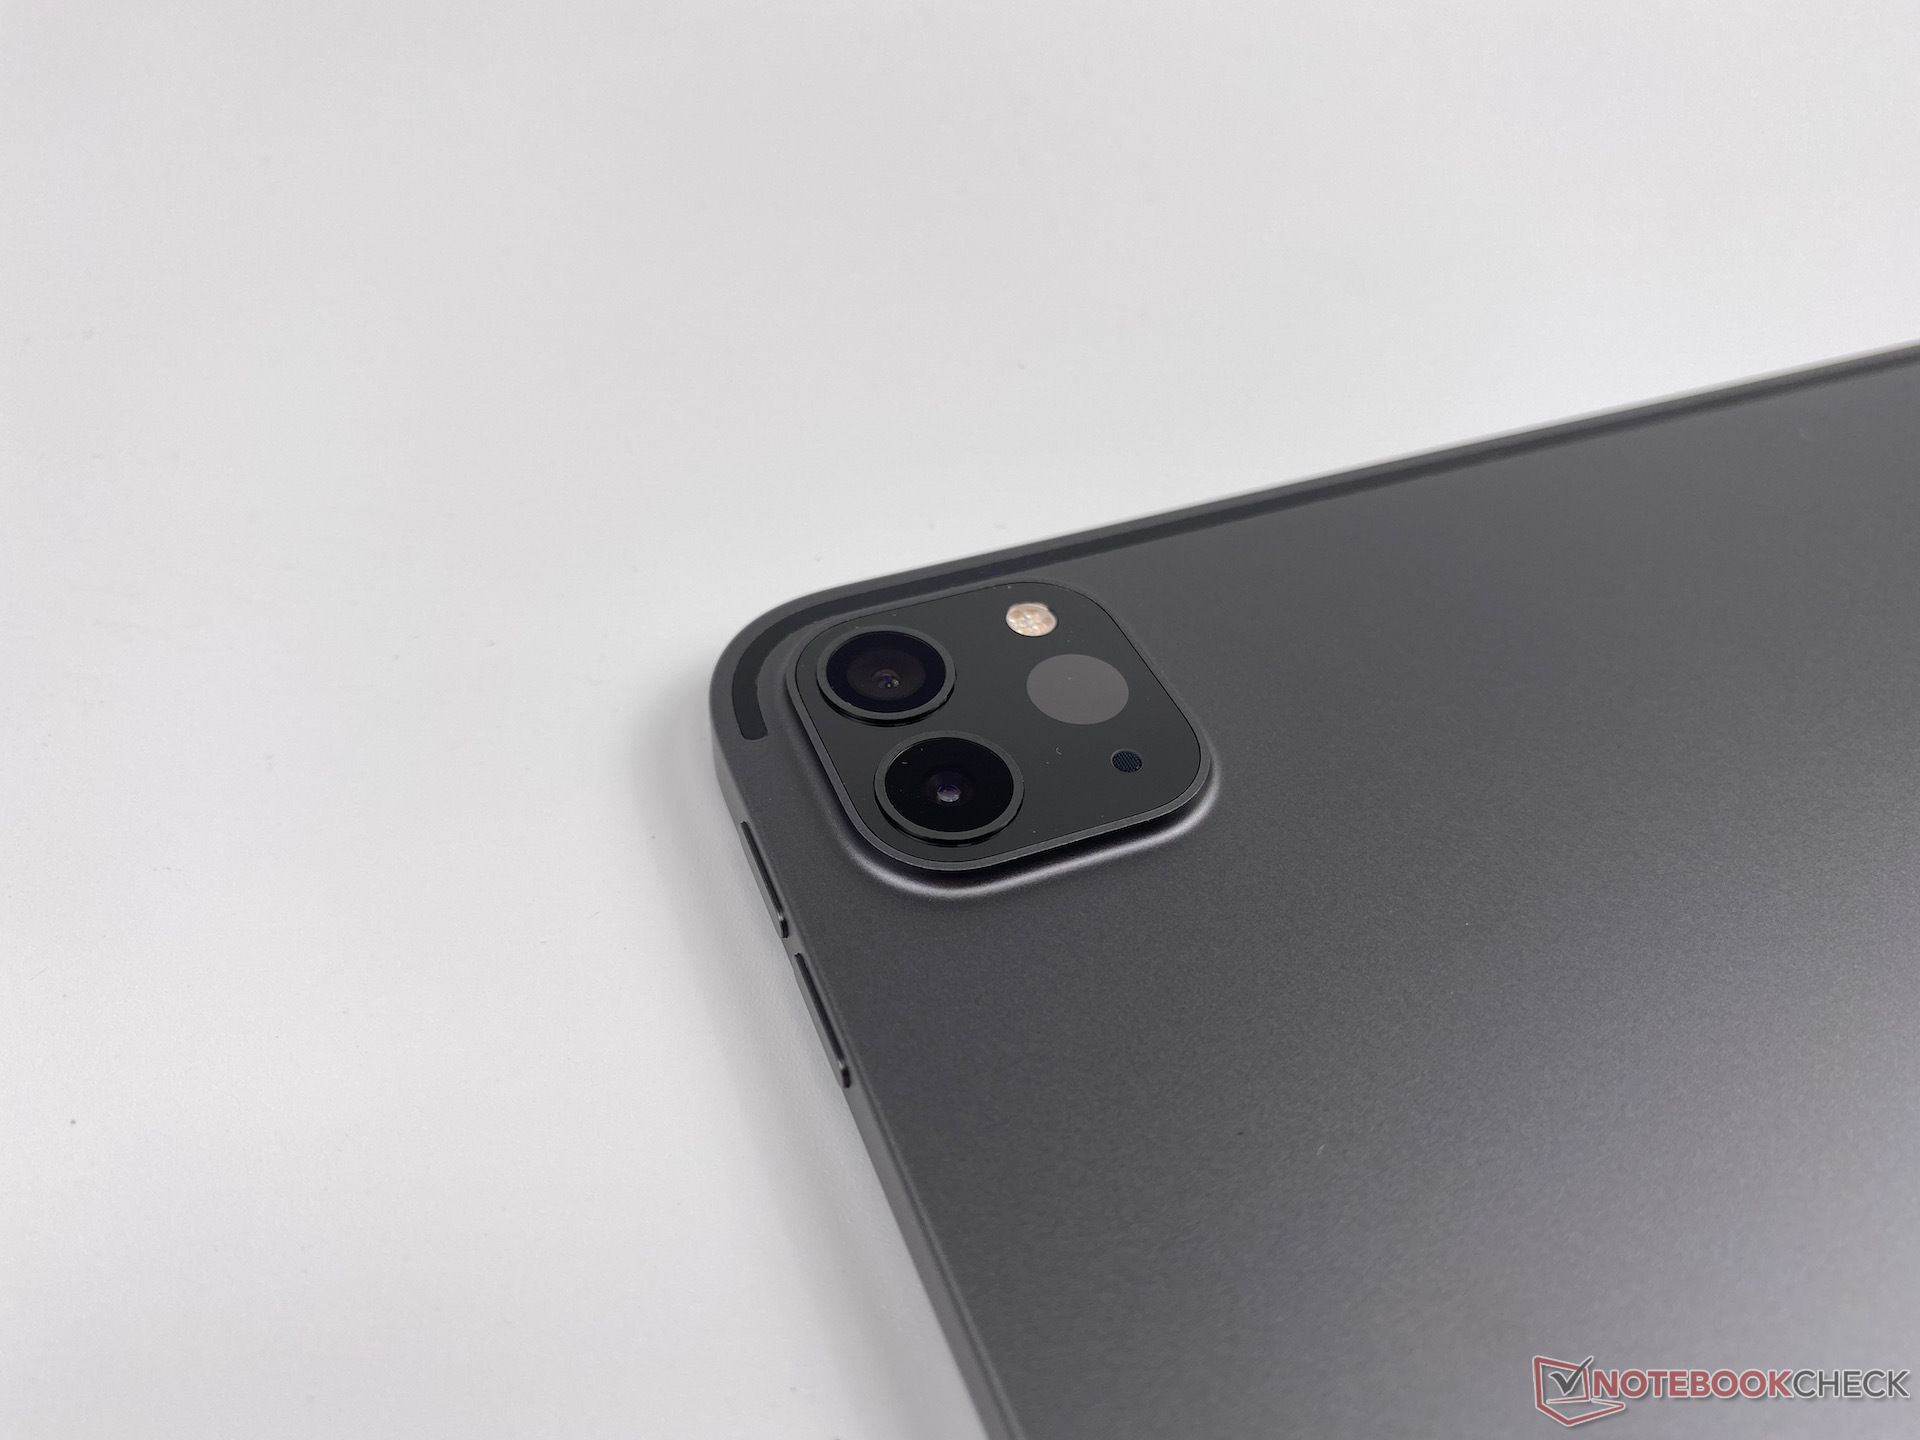
Cameras - Good but rarely used?
In terms of cameras, we refer to our review of the smaller iPad Pro 11 for more details. The sizeable 12.9-inch model has the same camera system with a 12 MP ultra-wide-angle sensor on the front and two sensors plus a LiDAR scanner on the back. The new models include a unique feature for tracking your face when on video calls, which worked flawlessly during our tests. Even if you move around in front of the tablet during a Facetime call, it follows you and up to two other people.
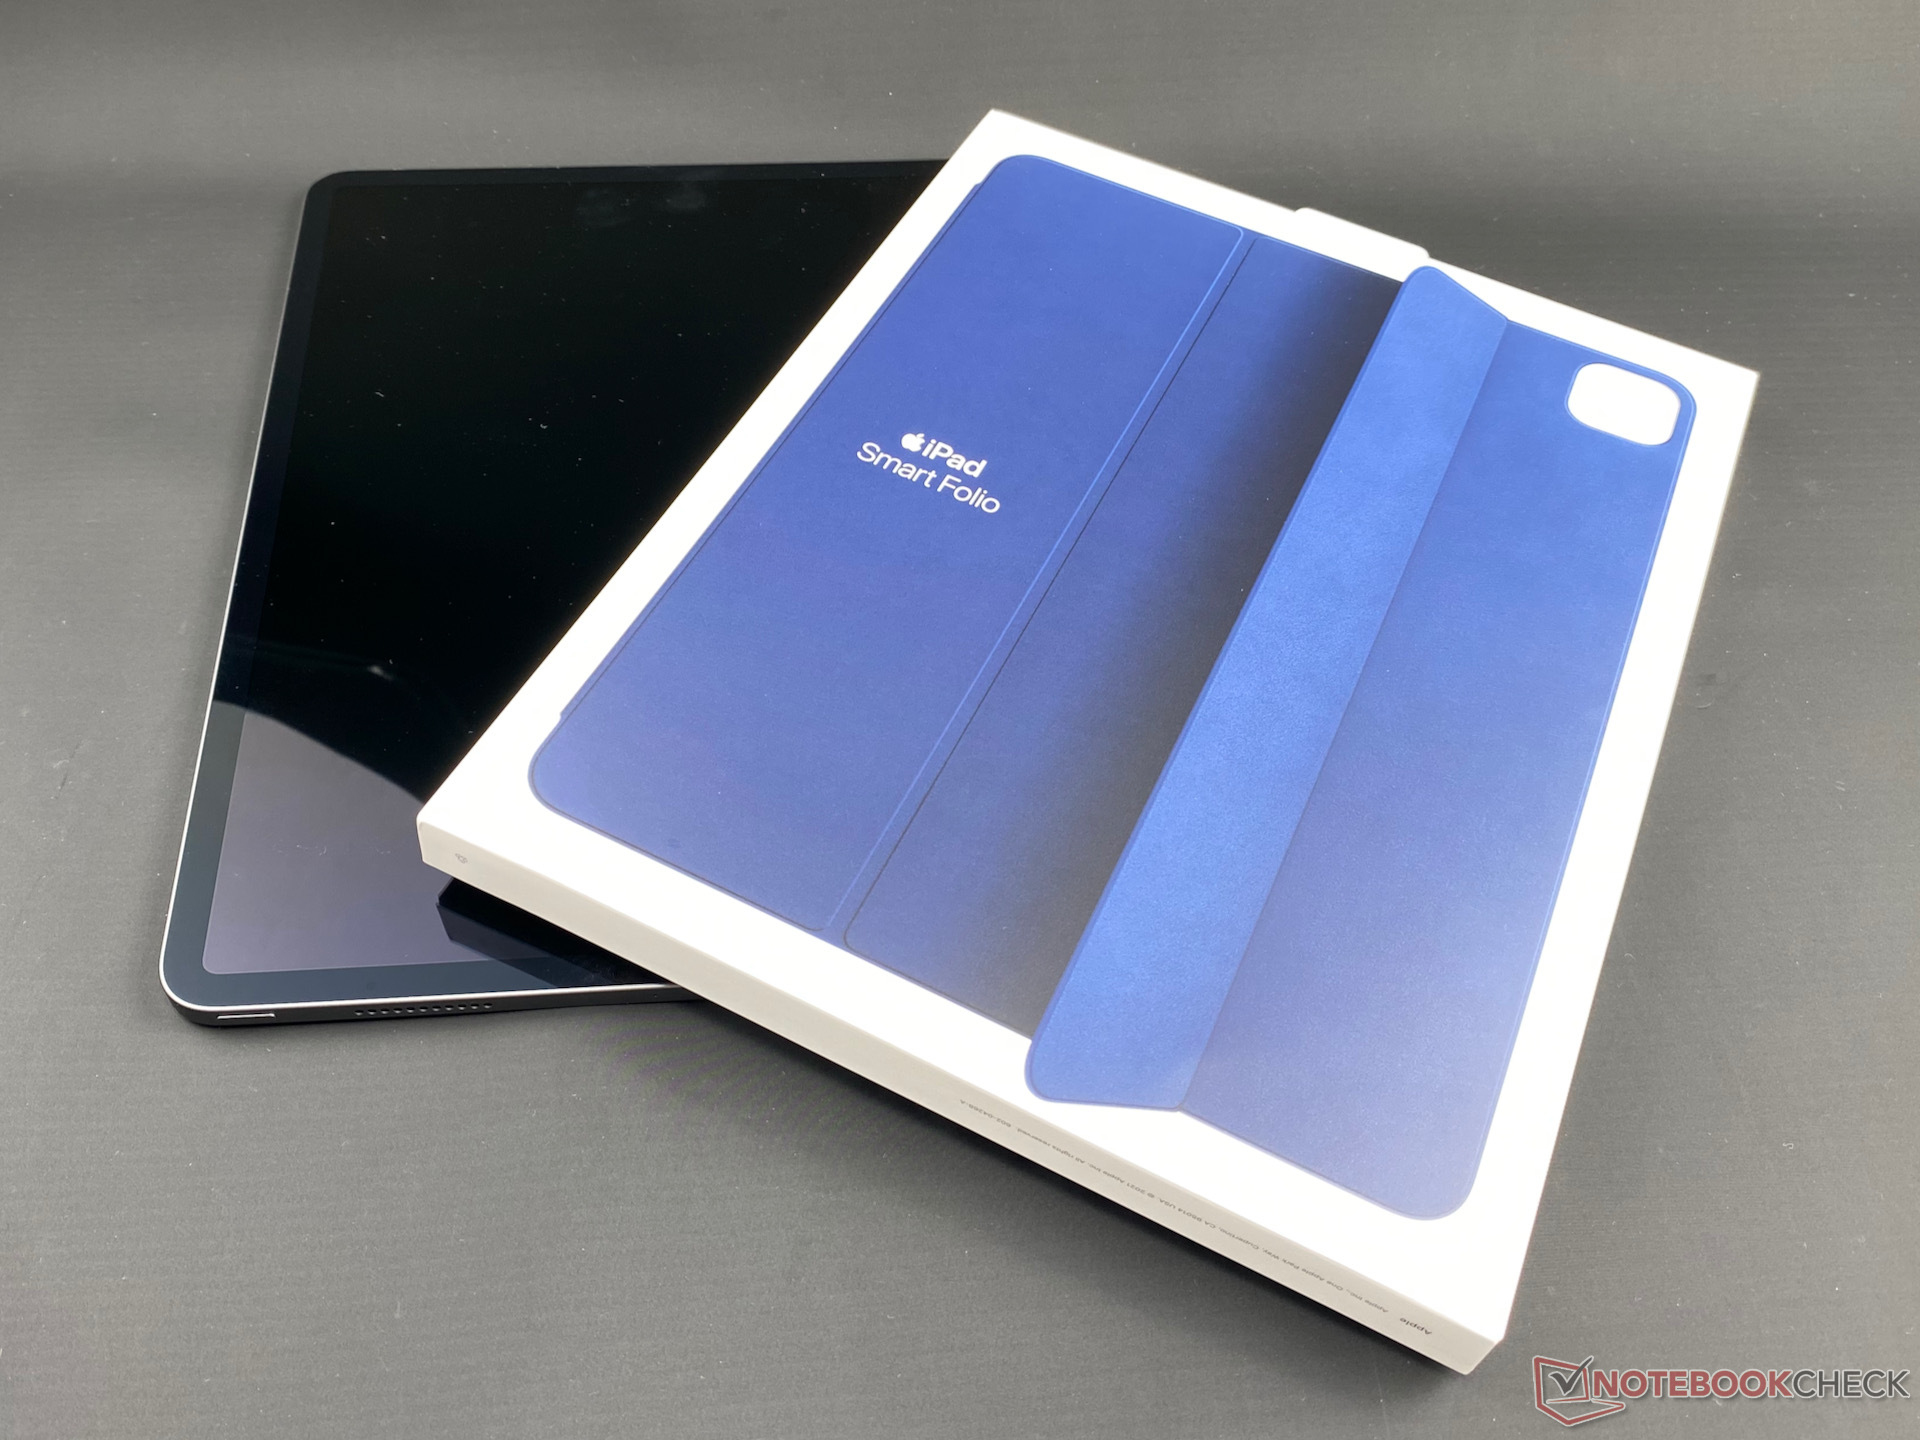
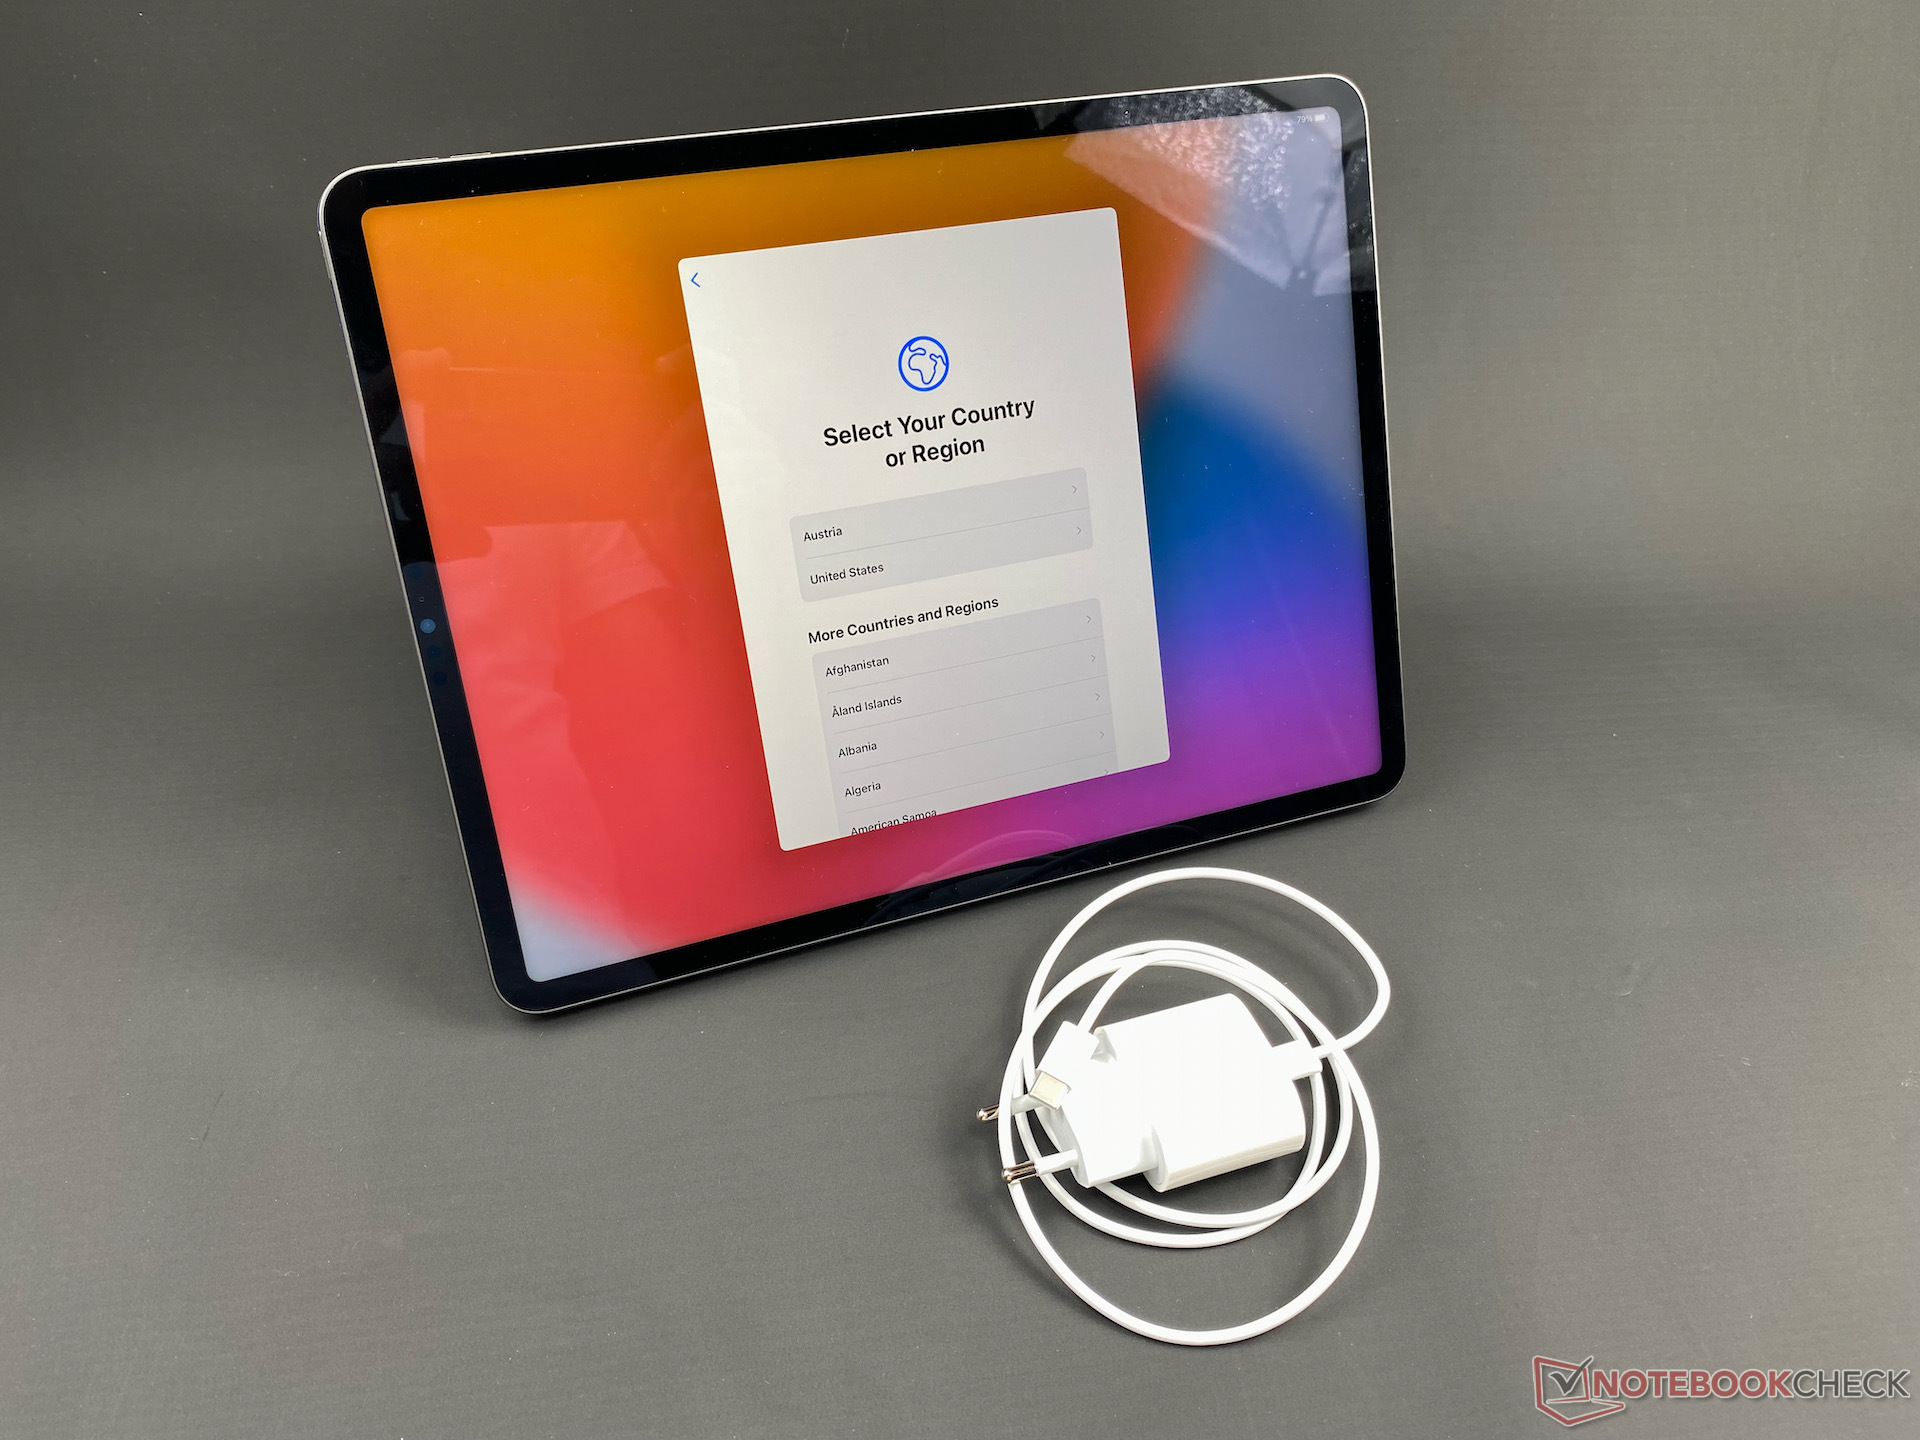
Accessories & Warranty - A slow charger in the box
The included USB Type-C charger is worth mentioning because there is no guarantee that you will get one with an Apple device anymore. However, the bundled charger is relatively small at 20 W and ensures that the iPad Pro 12.9 recharges slowly. In our tests, the power supply that Apple includes with the MacBook Pro 16 supplies the iPad Pro 12.9 with up to 31 W. Correspondingly, recharging the tablet at 31 W significantly reduces its charging times.
As usual, Apple offers a 12-month warranty, including telephone support, with the iPad Pro 12.9. You can extend and expand this coverage with Apple Care+.
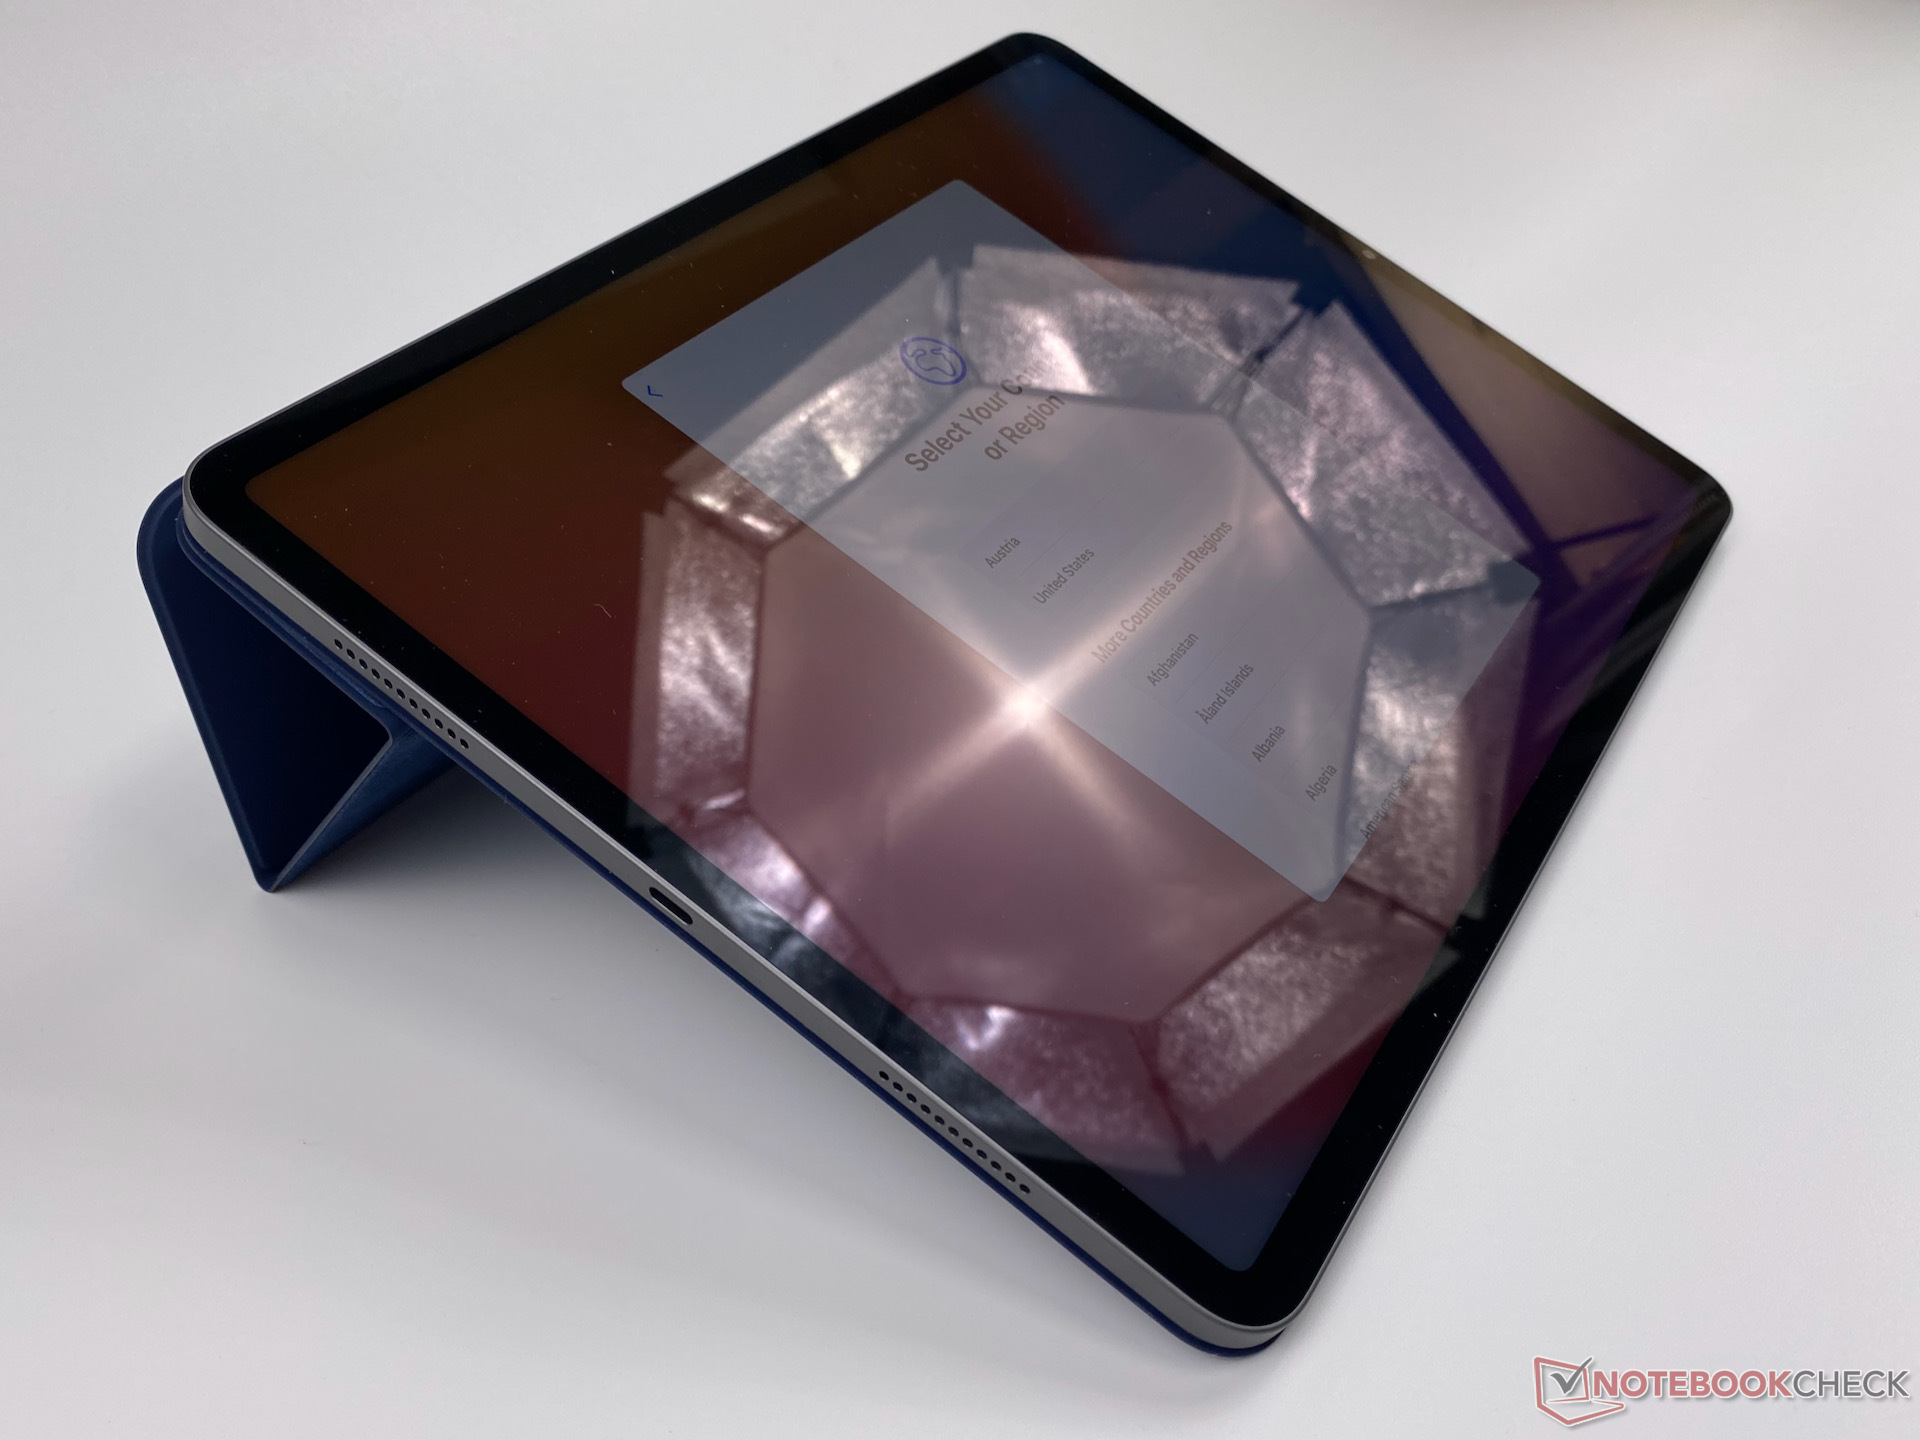
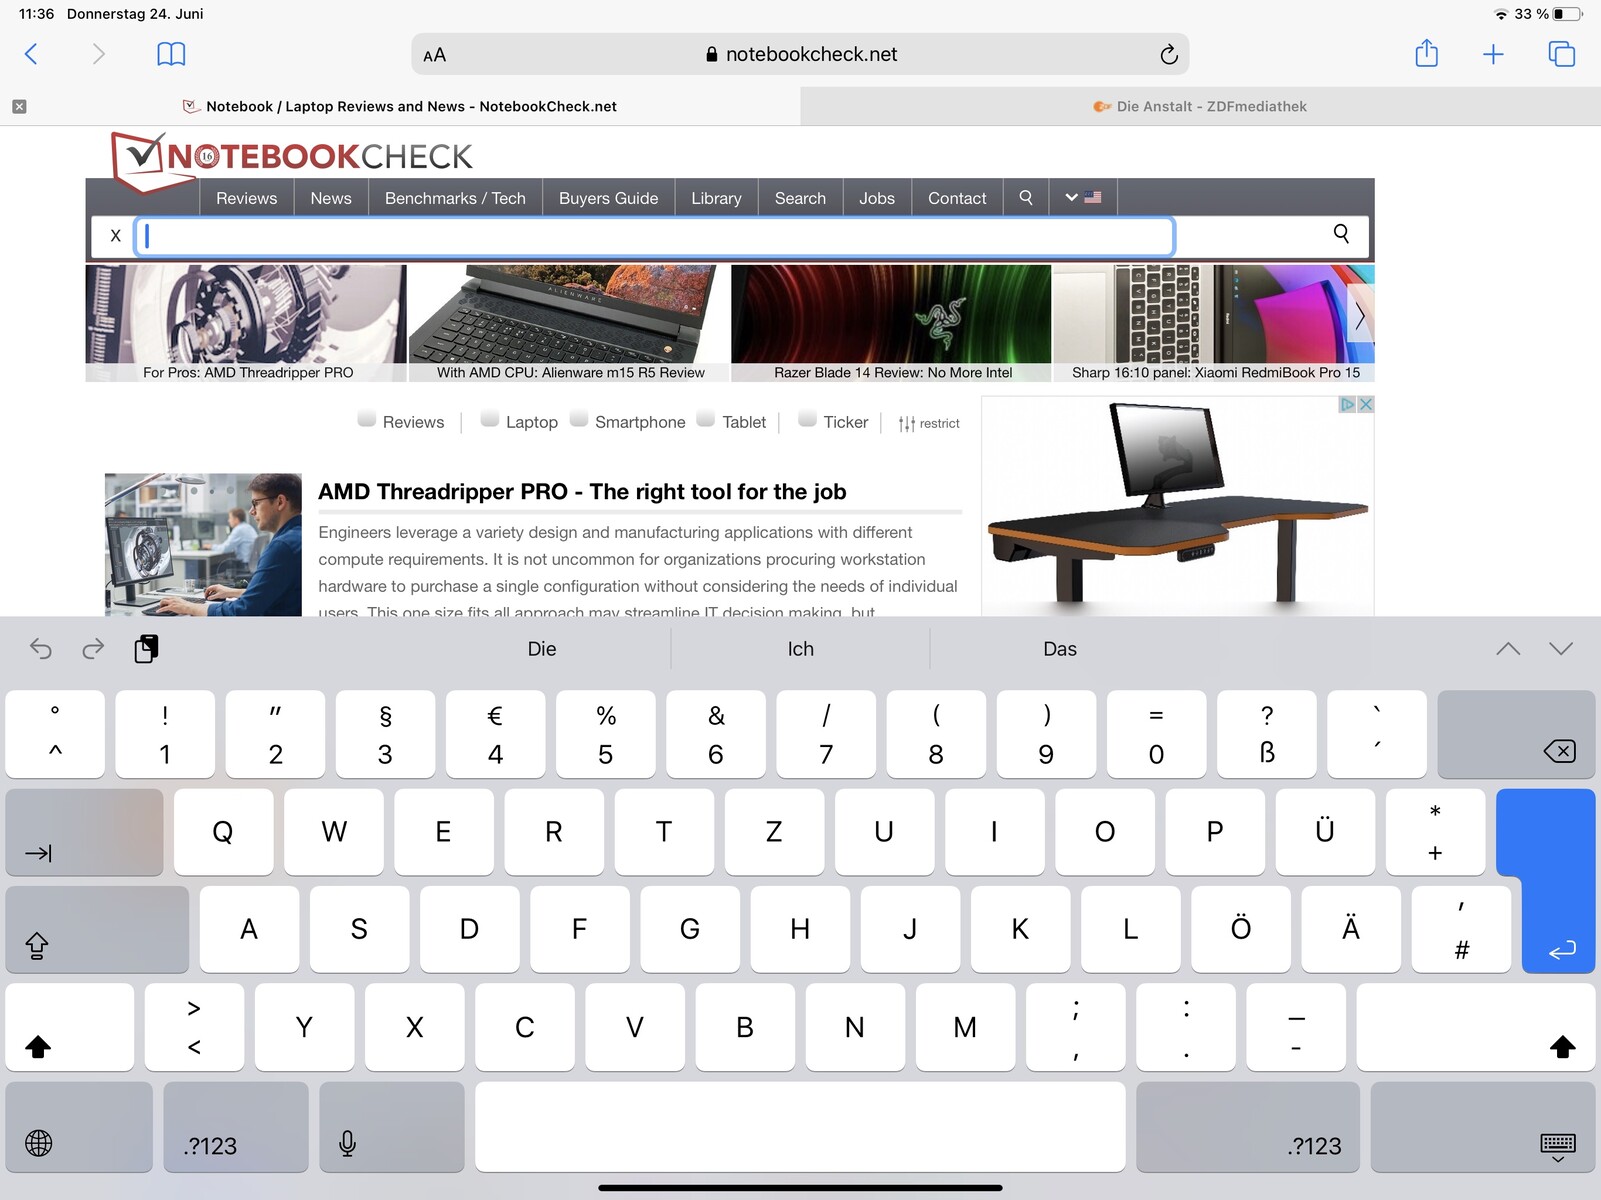
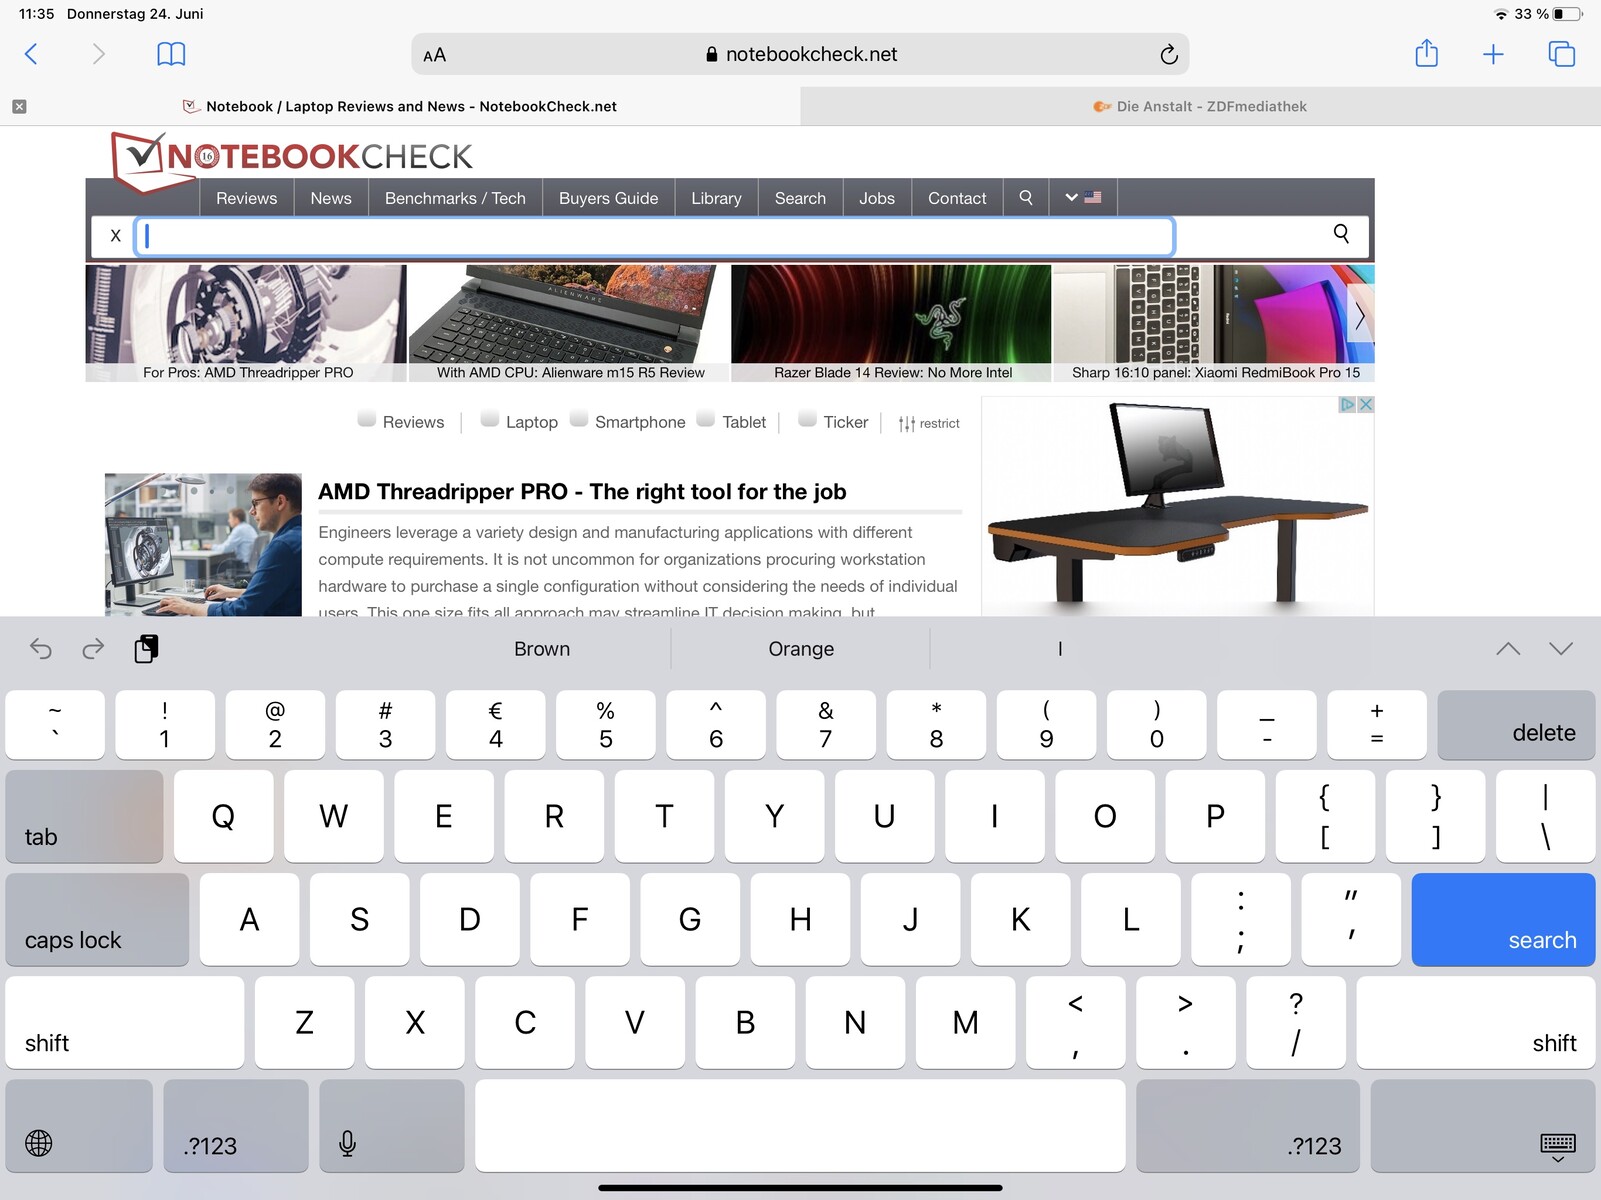
Input Devices & Operation - A precise 120 Hz display with Face ID and support for accessories
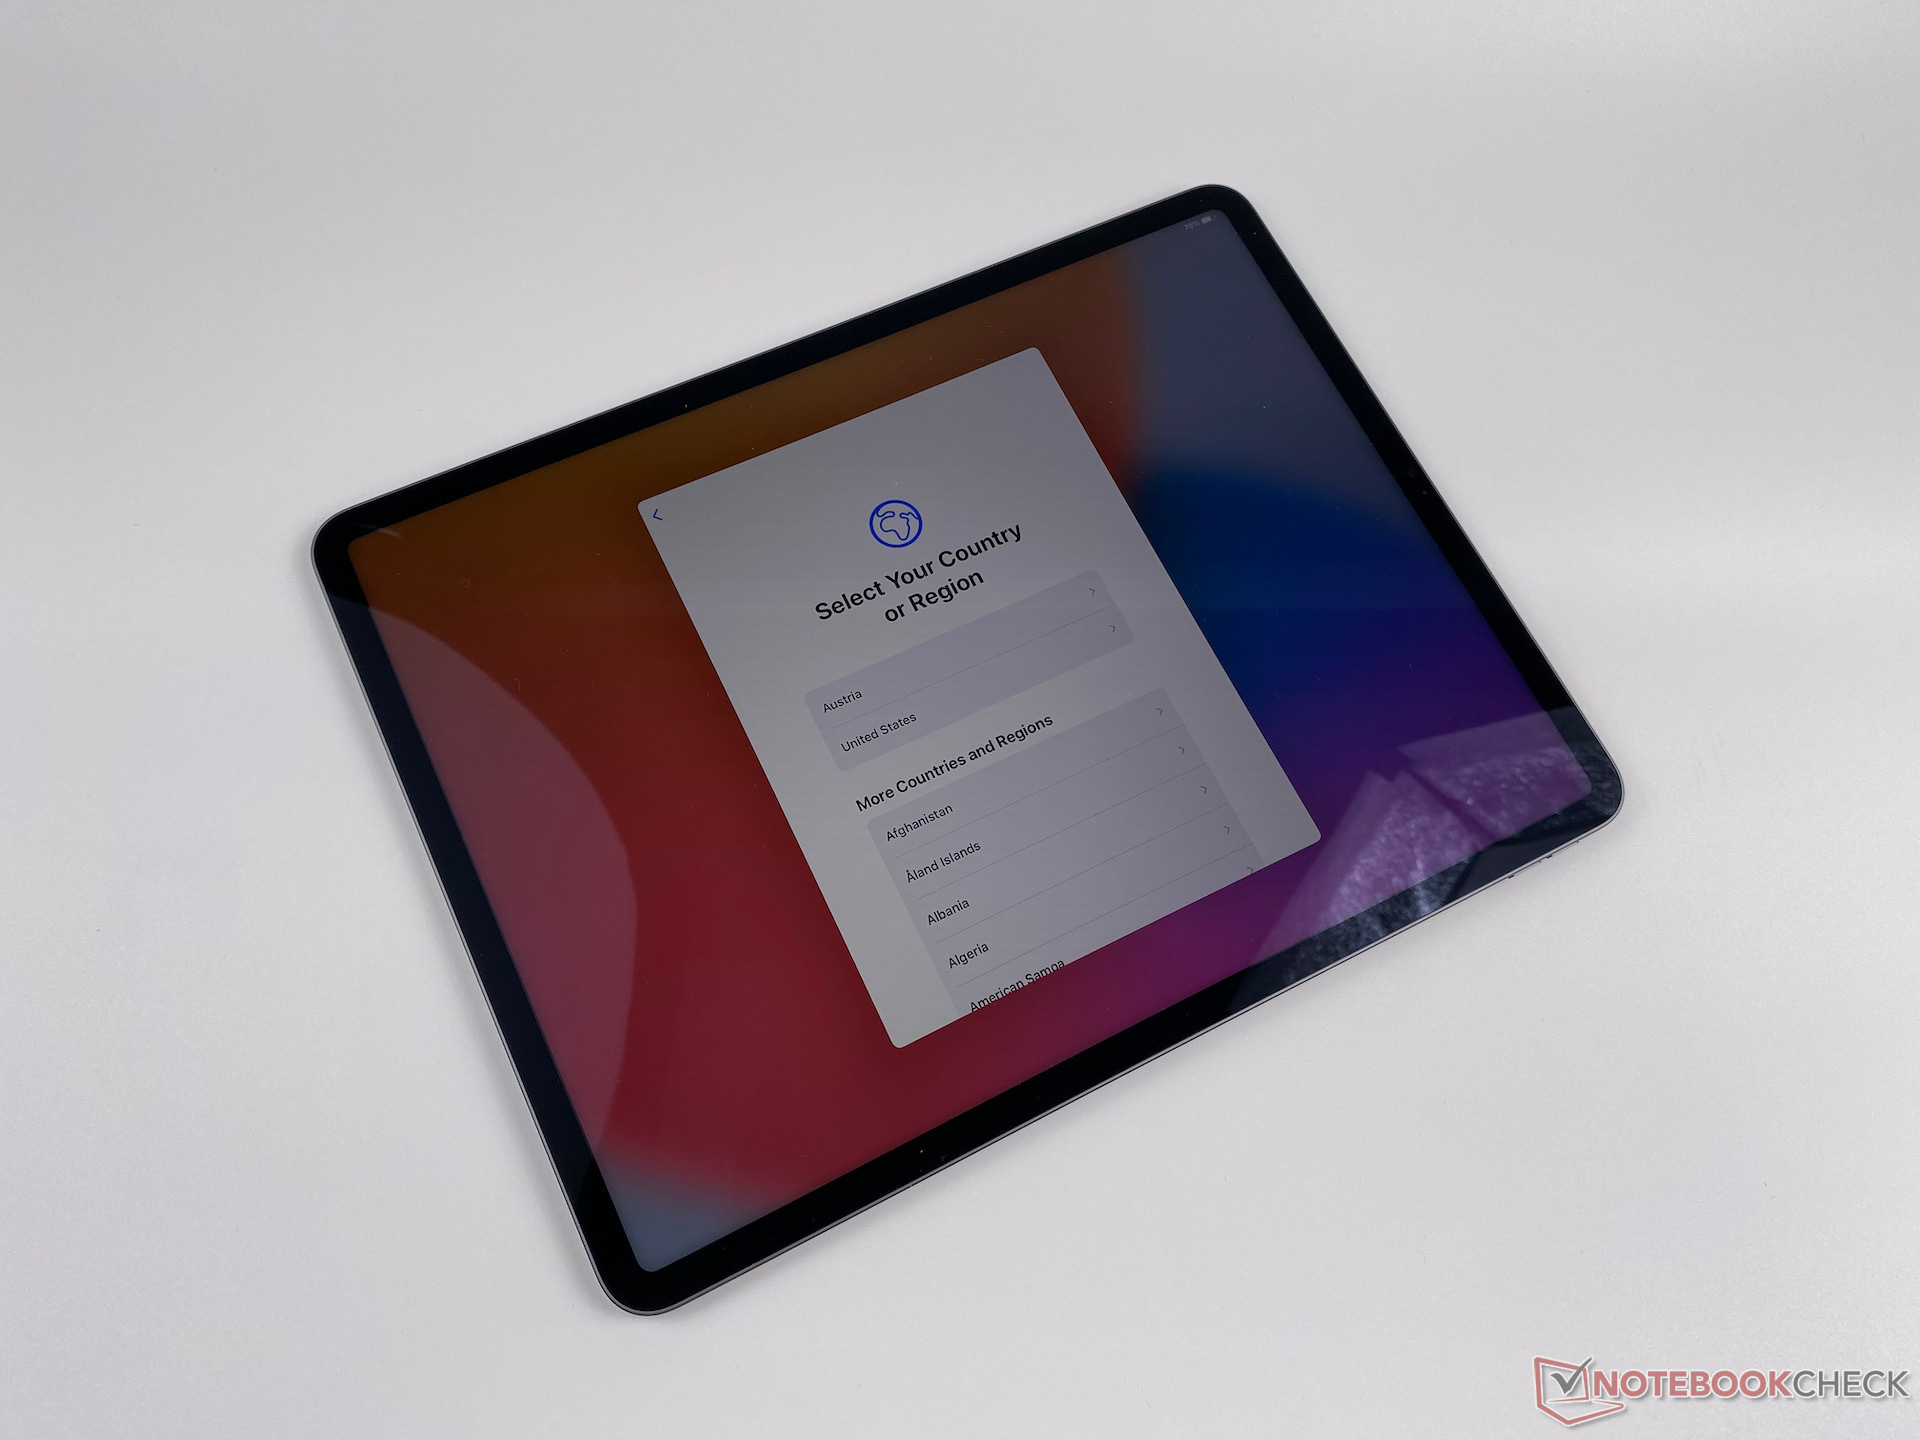
Apple protects the iPad Pro's capacitive touchscreen with an unspecified glass that is smooth, and it provides no resistance when we slide our fingers across it. Apple states that it applies an oleophobic coating atop the glass too, but our review unit's display quickly looks greasy, nonetheless. The device interprets our inputs precisely and promptly, though. Additionally, the system feels fast and fluid, not least because of the device's 120 Hz panel. With the larger display, the 12.9-inch iPad Pro also has a larger on-screen keyboard with a dedicated number row, allowing you to type a little faster than on the 11-inch model.
Face ID, which recognises registered faces reliably and quickly, provides biometric security. The 3D face recognition is also more secure than 2D variants that only use front-facing cameras to capture face data.
The iPad Pro 12.9 is, like its predecessor, compatible with the Apple Pencil (2nd generation). You can also combine the tablet with optional keyboards from Apple and third-party manufacturers.
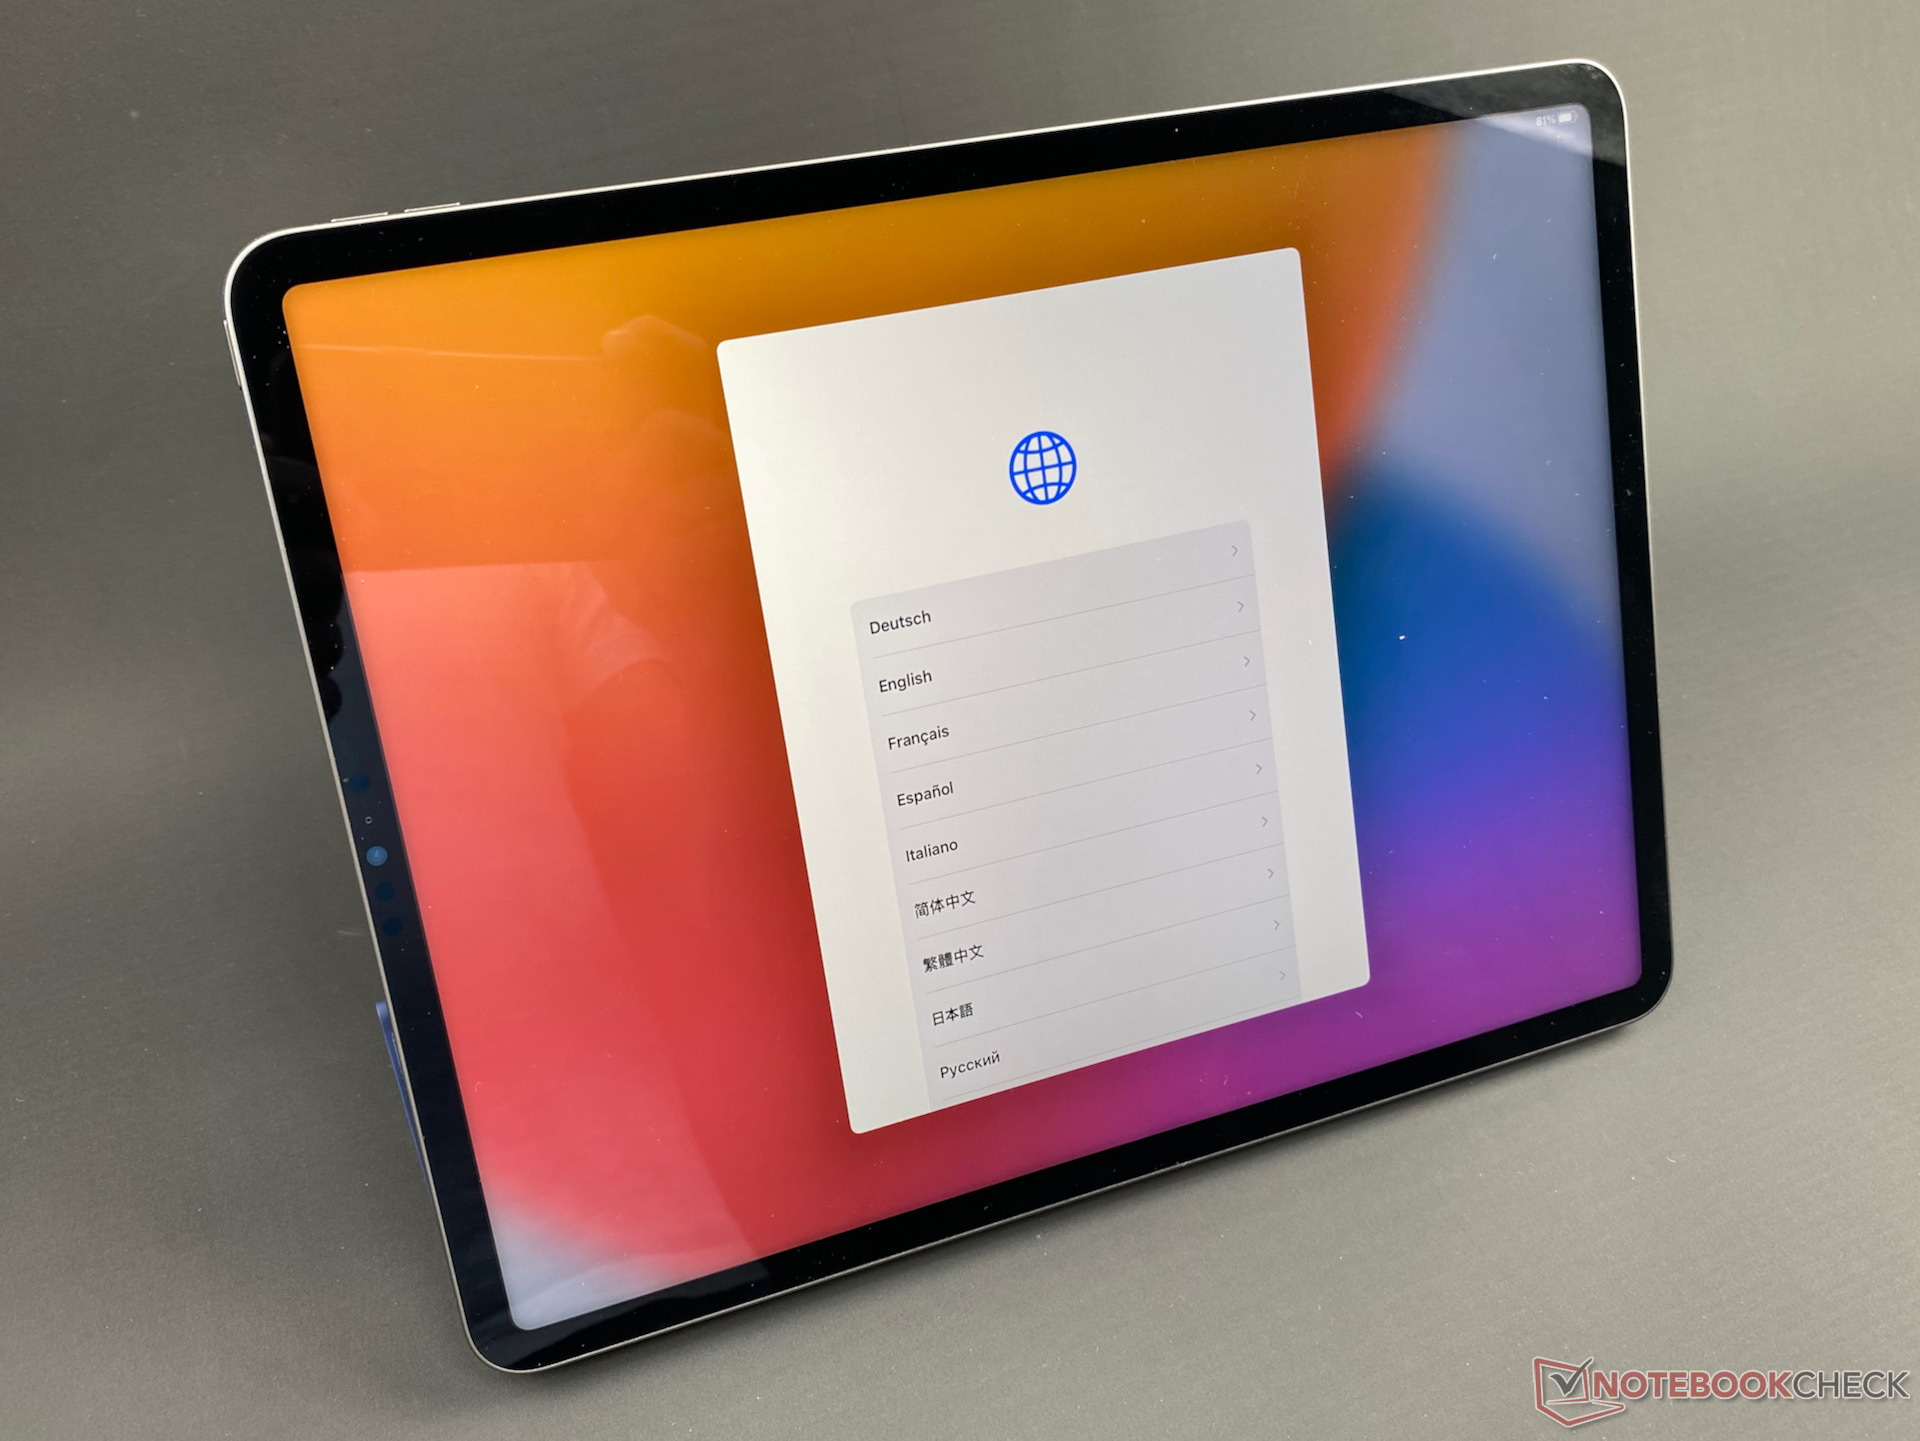
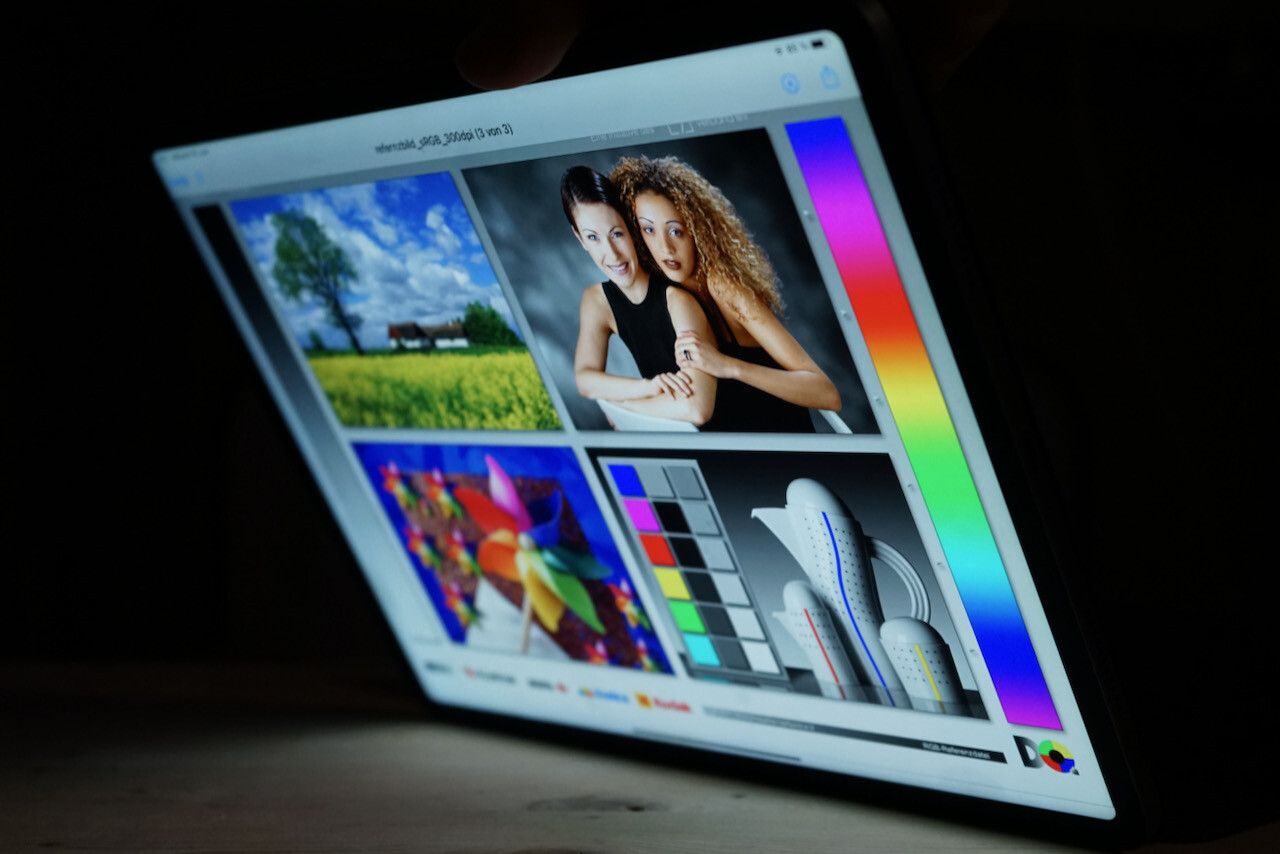
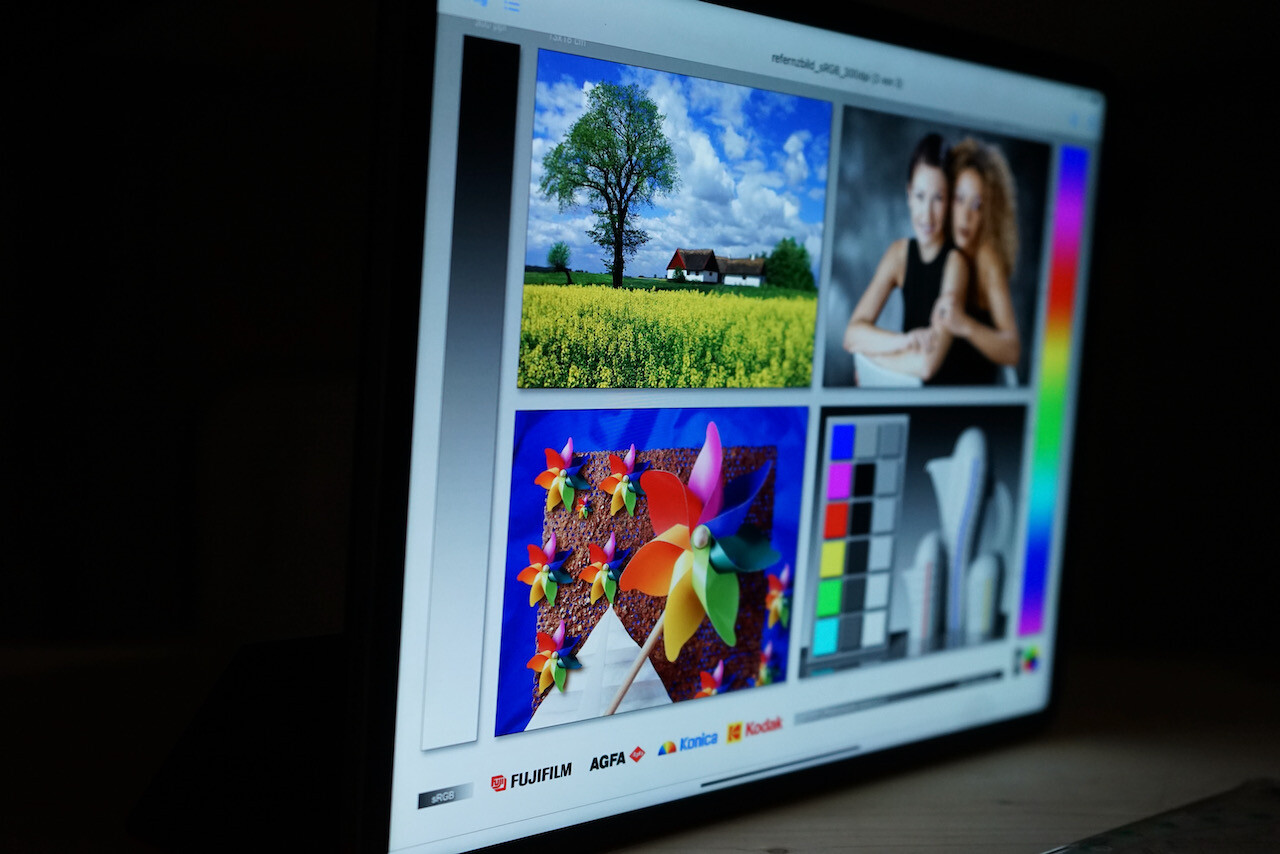
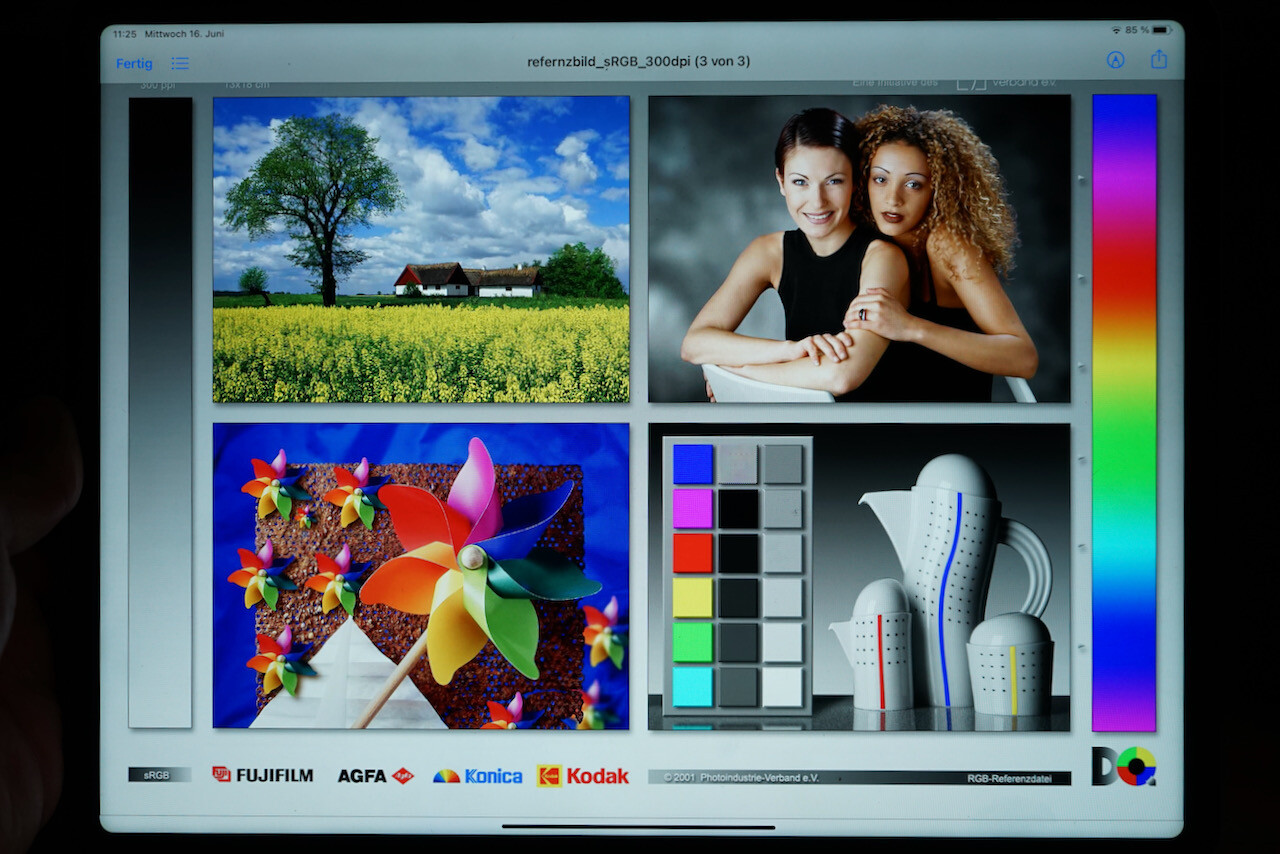
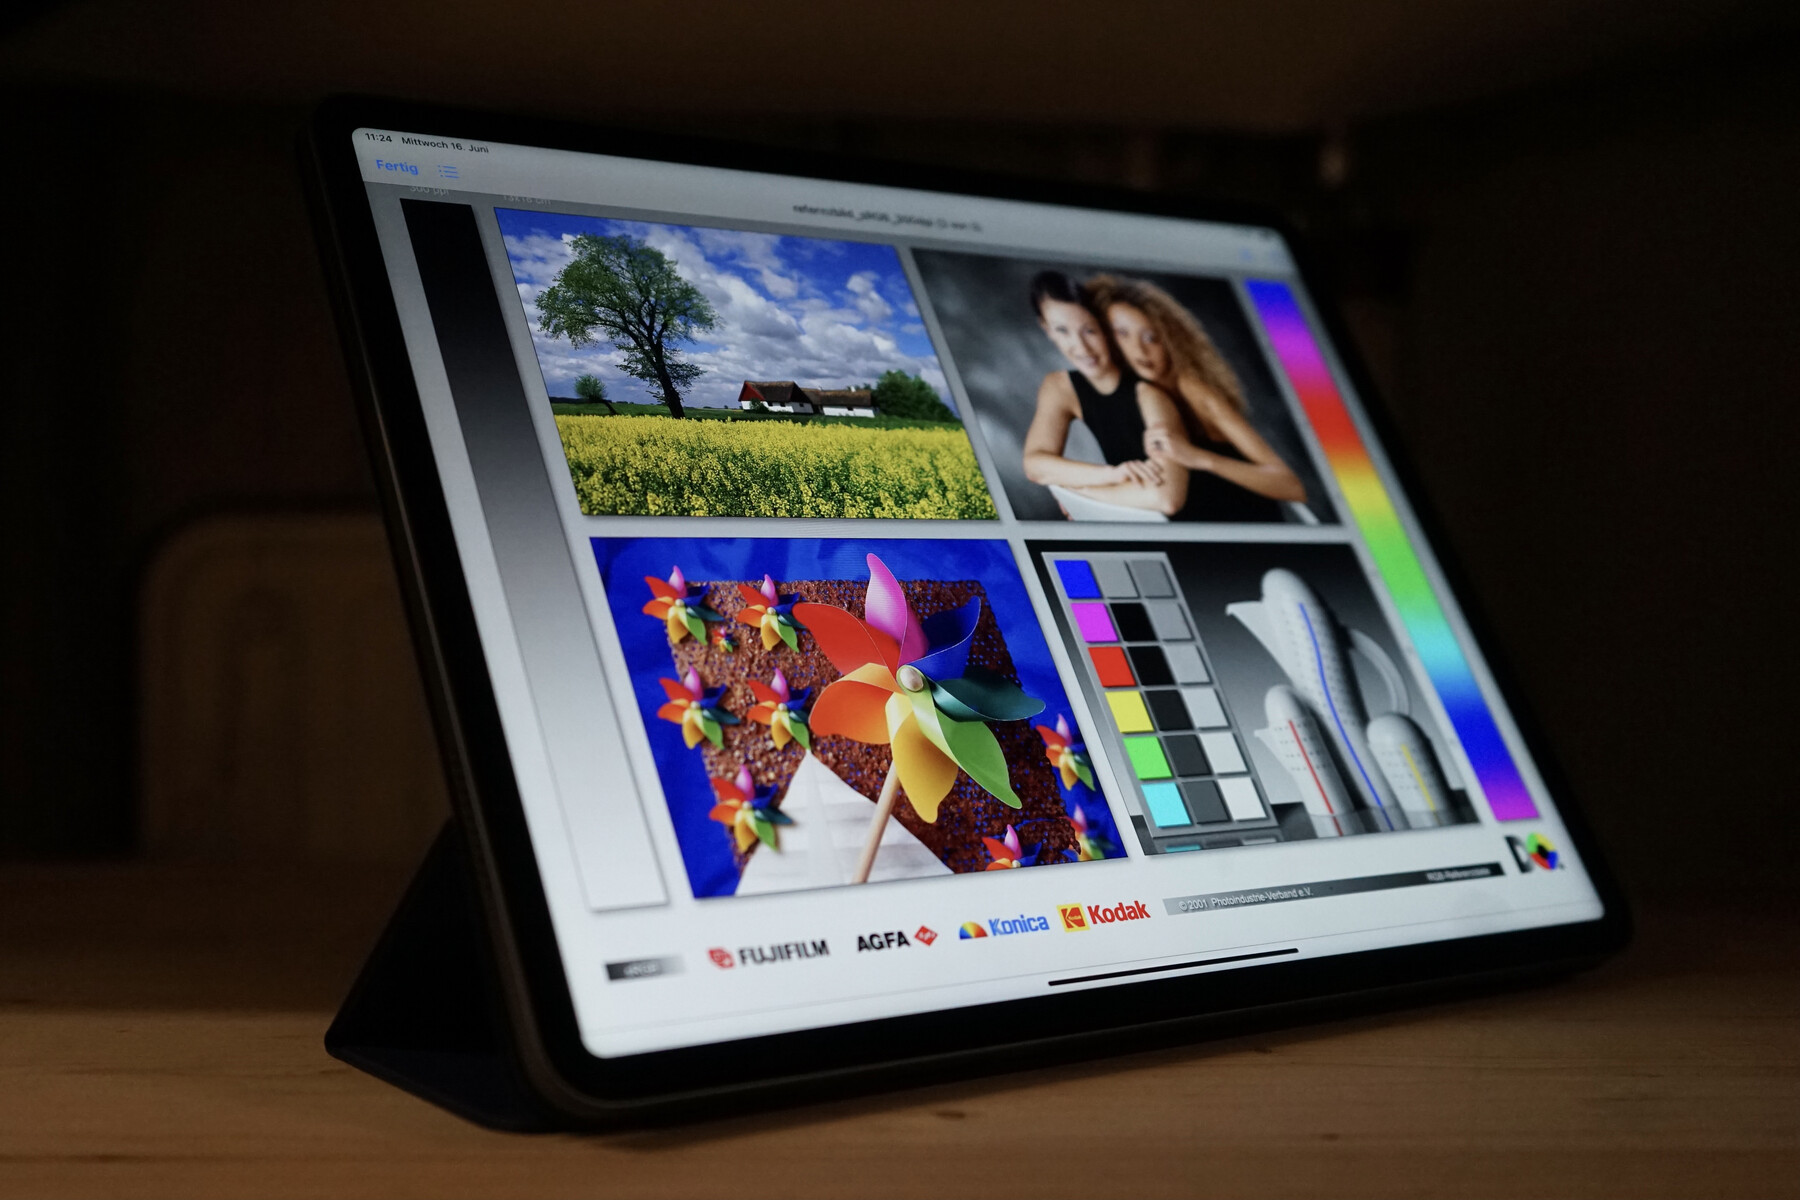
Display - The decisive reason for buying the iPad Pro 12.9?
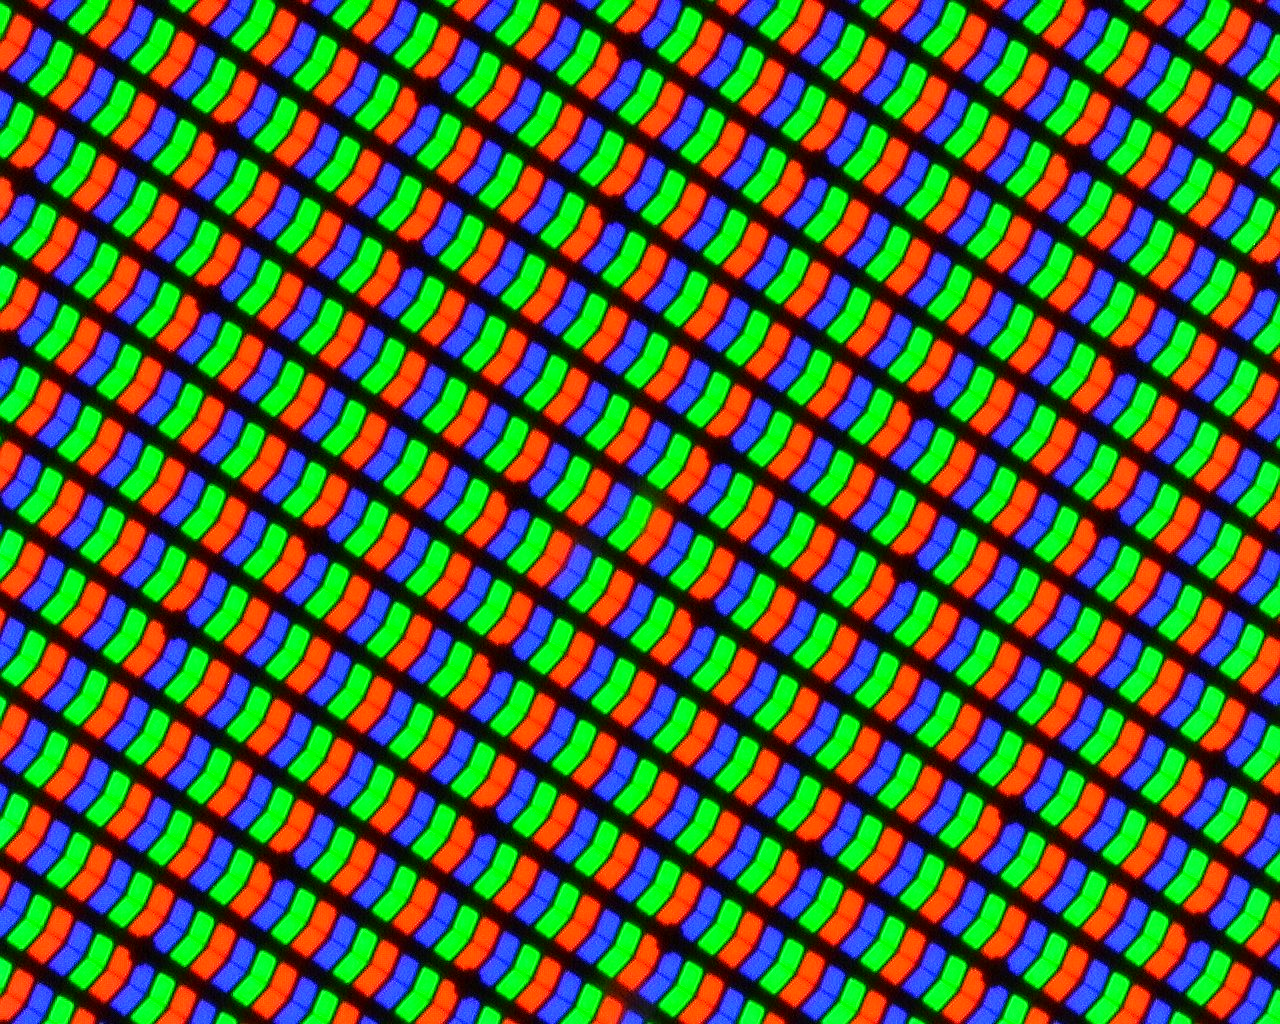
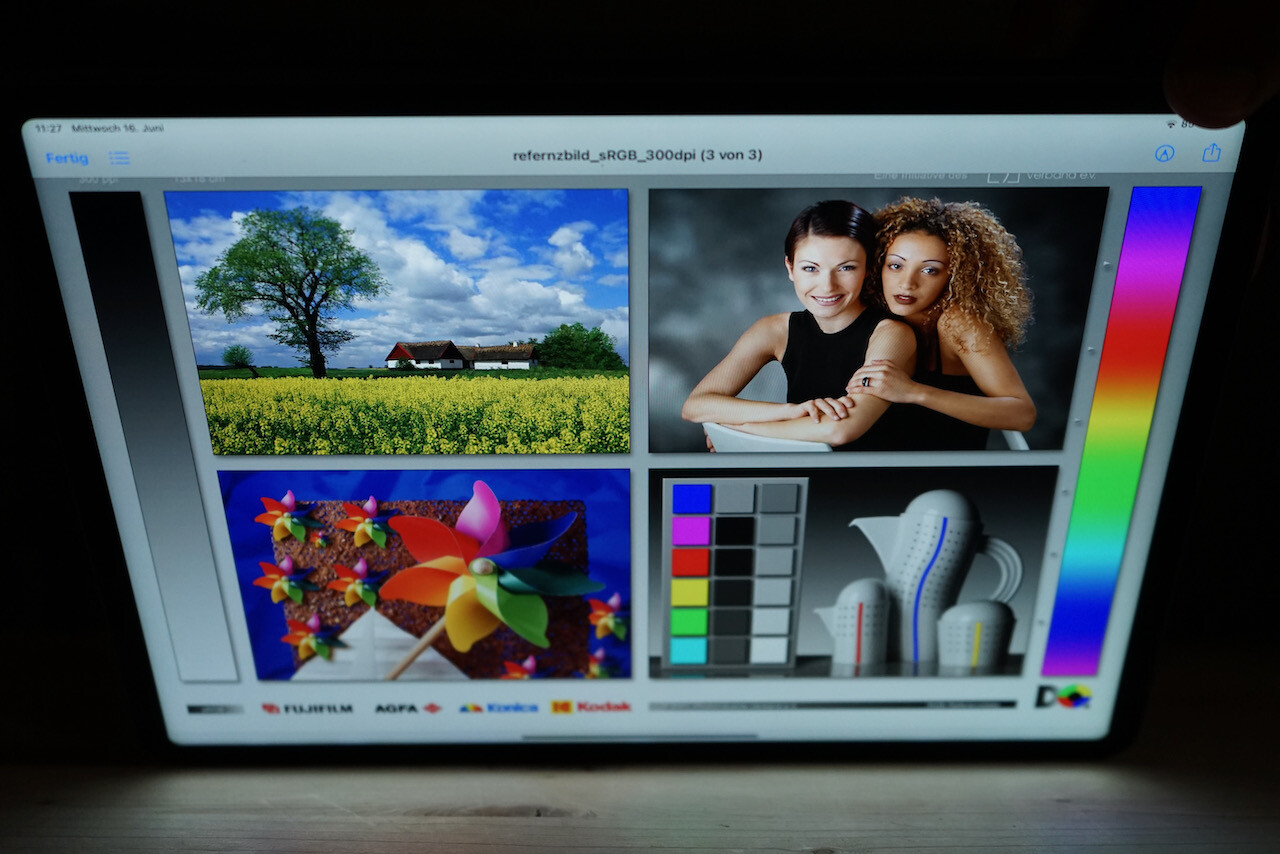
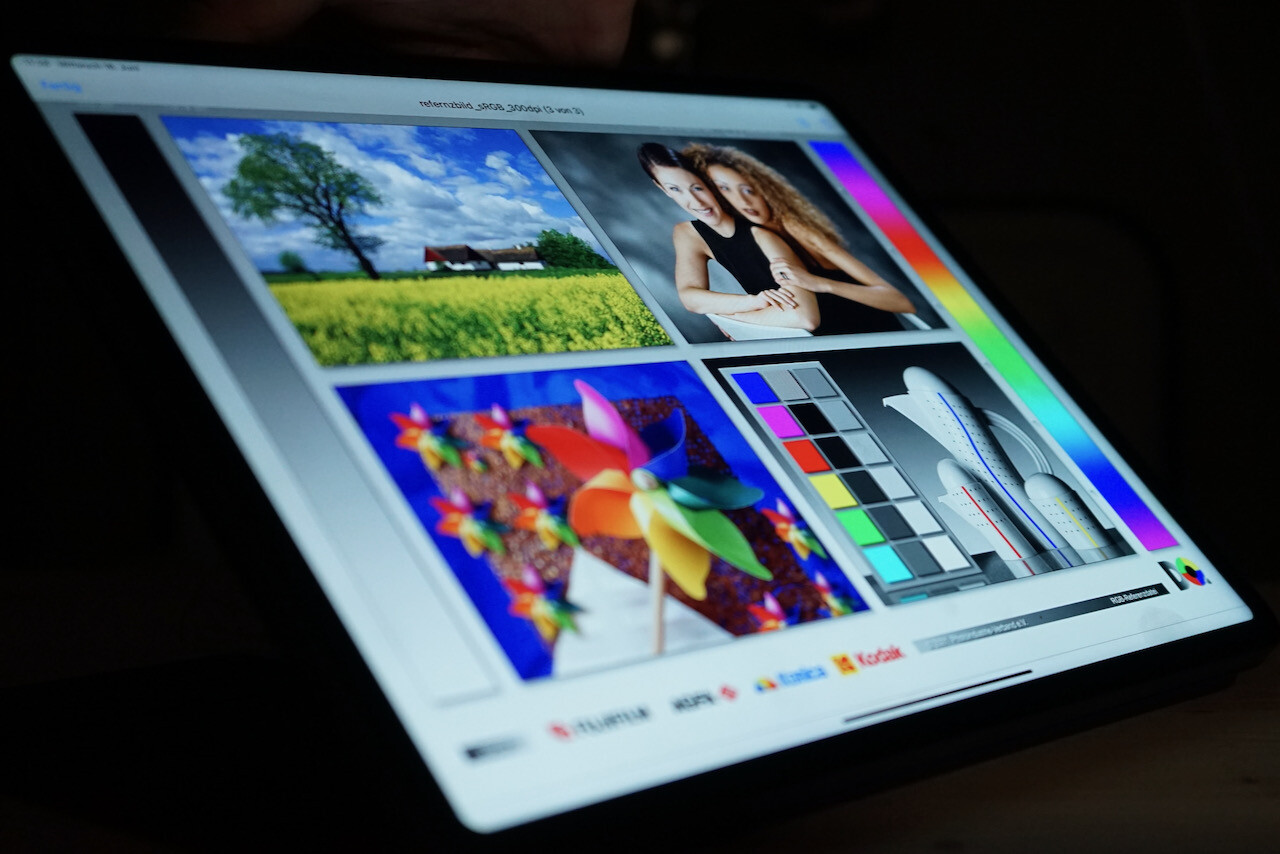
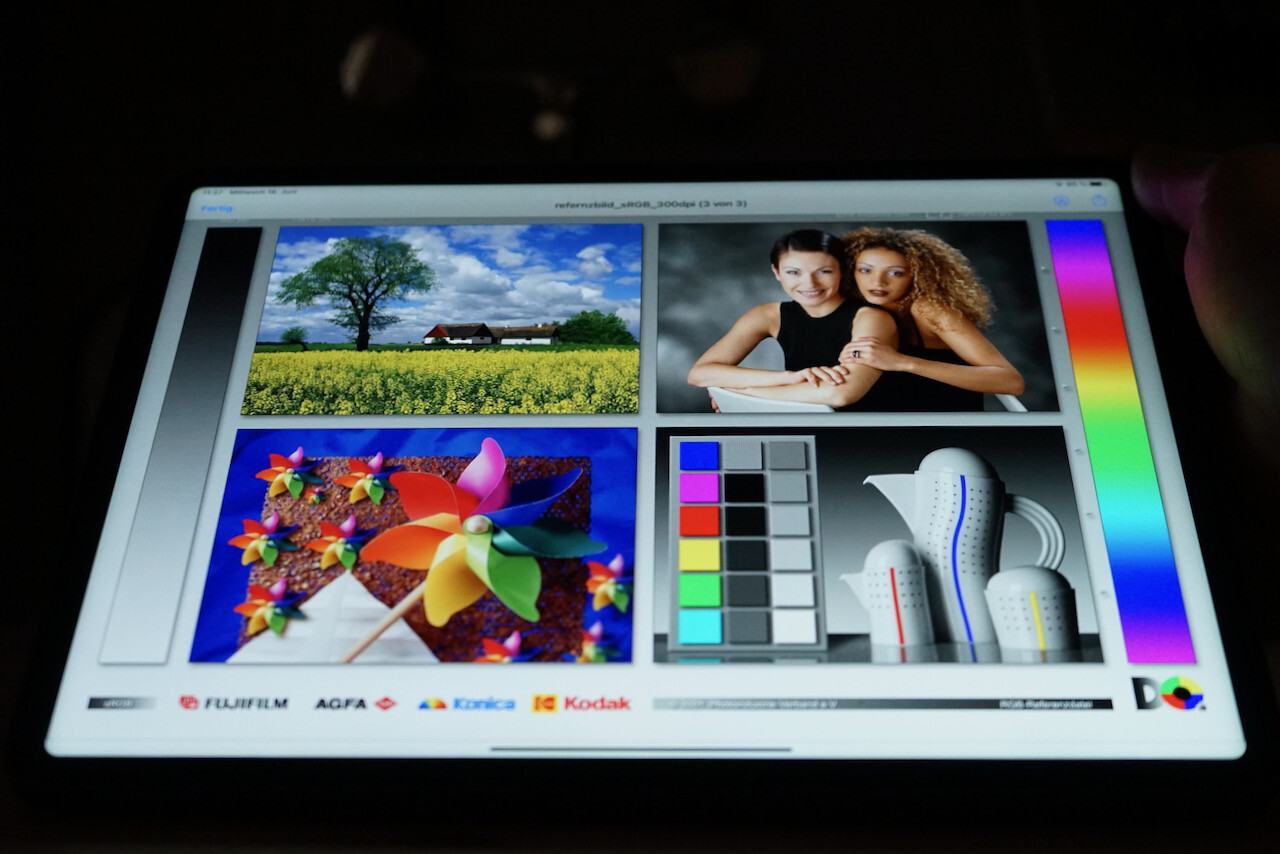
The most significant innovation in the 12.9-inch iPad Pro is its Liquid Retina XDR Display. According to Apple, the display has over 10,000 Mini LEDs directly behind the LCD that create 2,596 local dimming zones. The company claims that the Mini LED panel peaks at 1,600 nits (= 1,600 cd/m²) in HDR, fully covers the DCI-P3 colour space with supported apps and has a 120 Hz refresh rate.
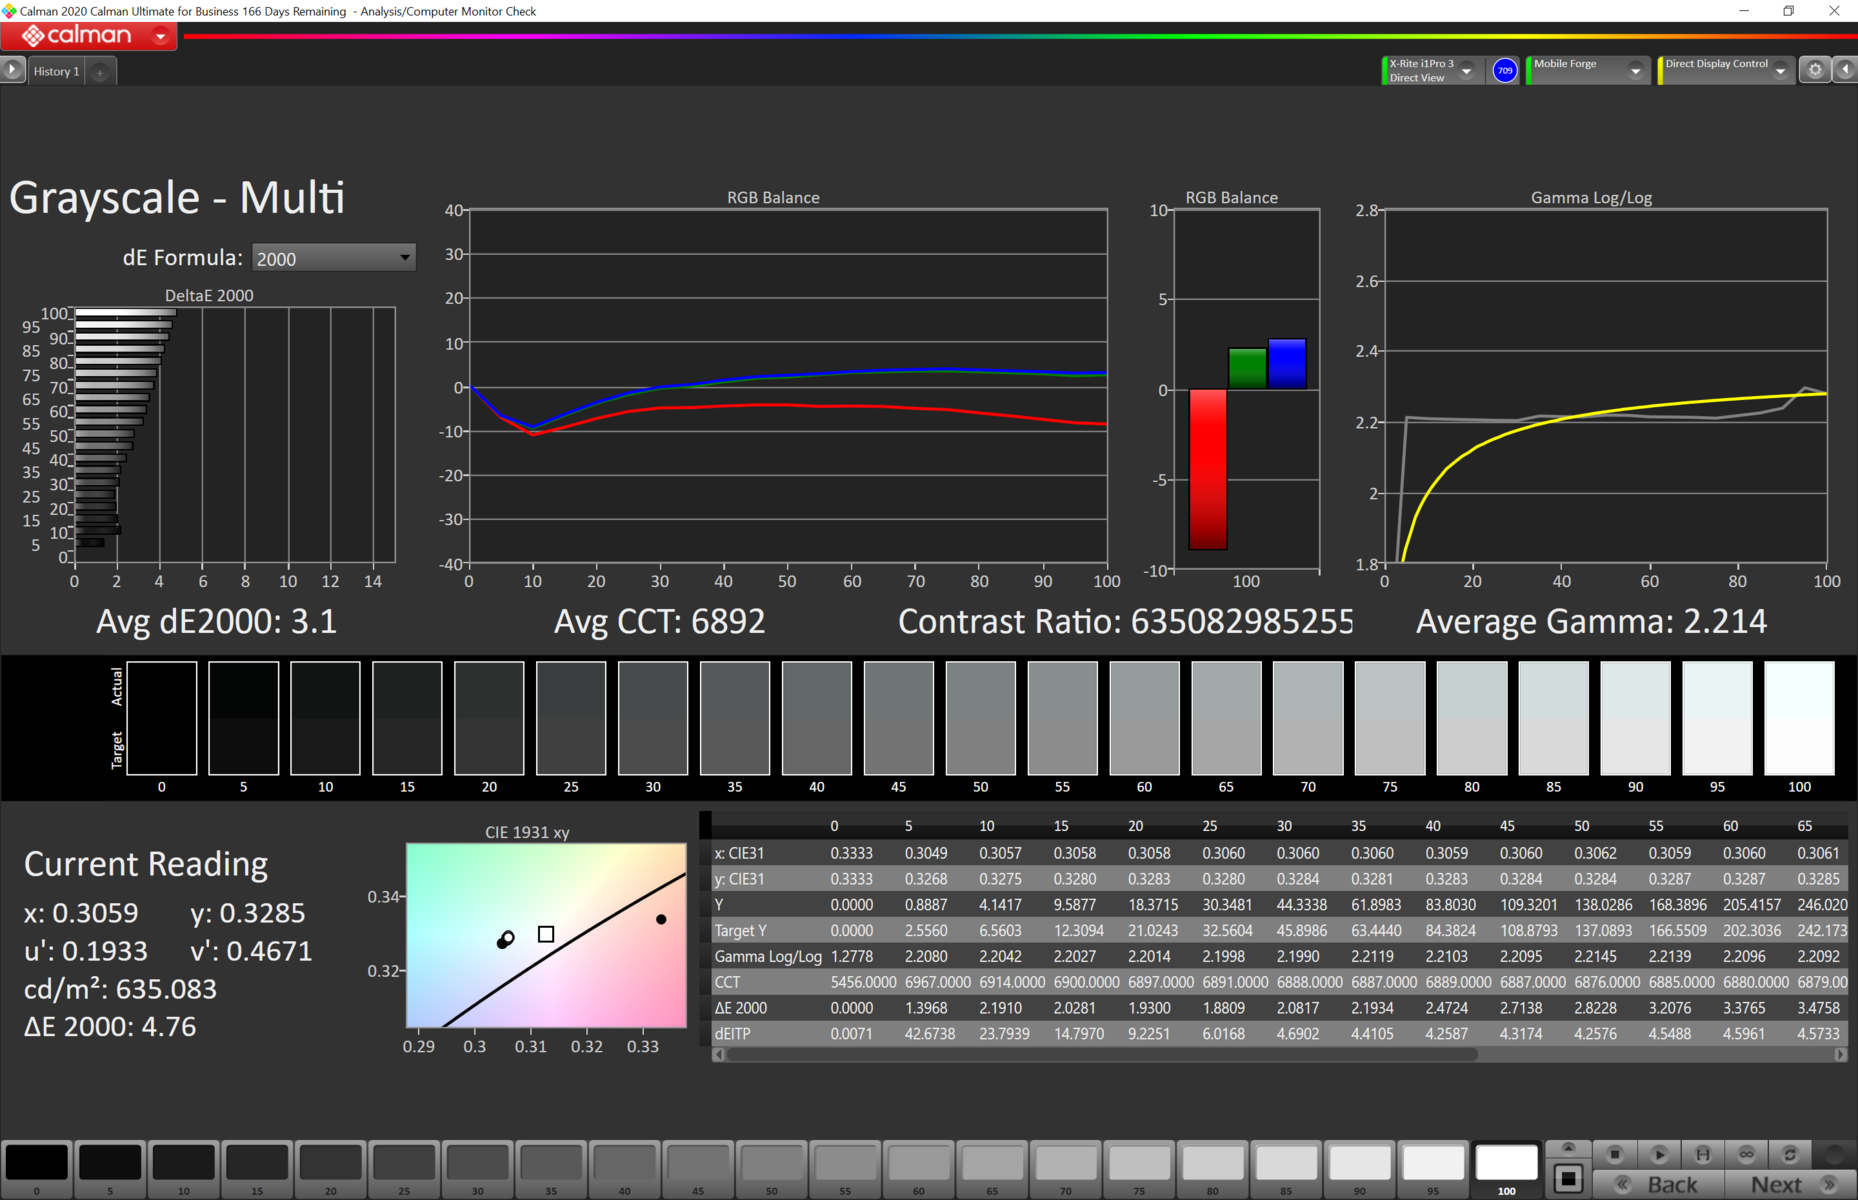
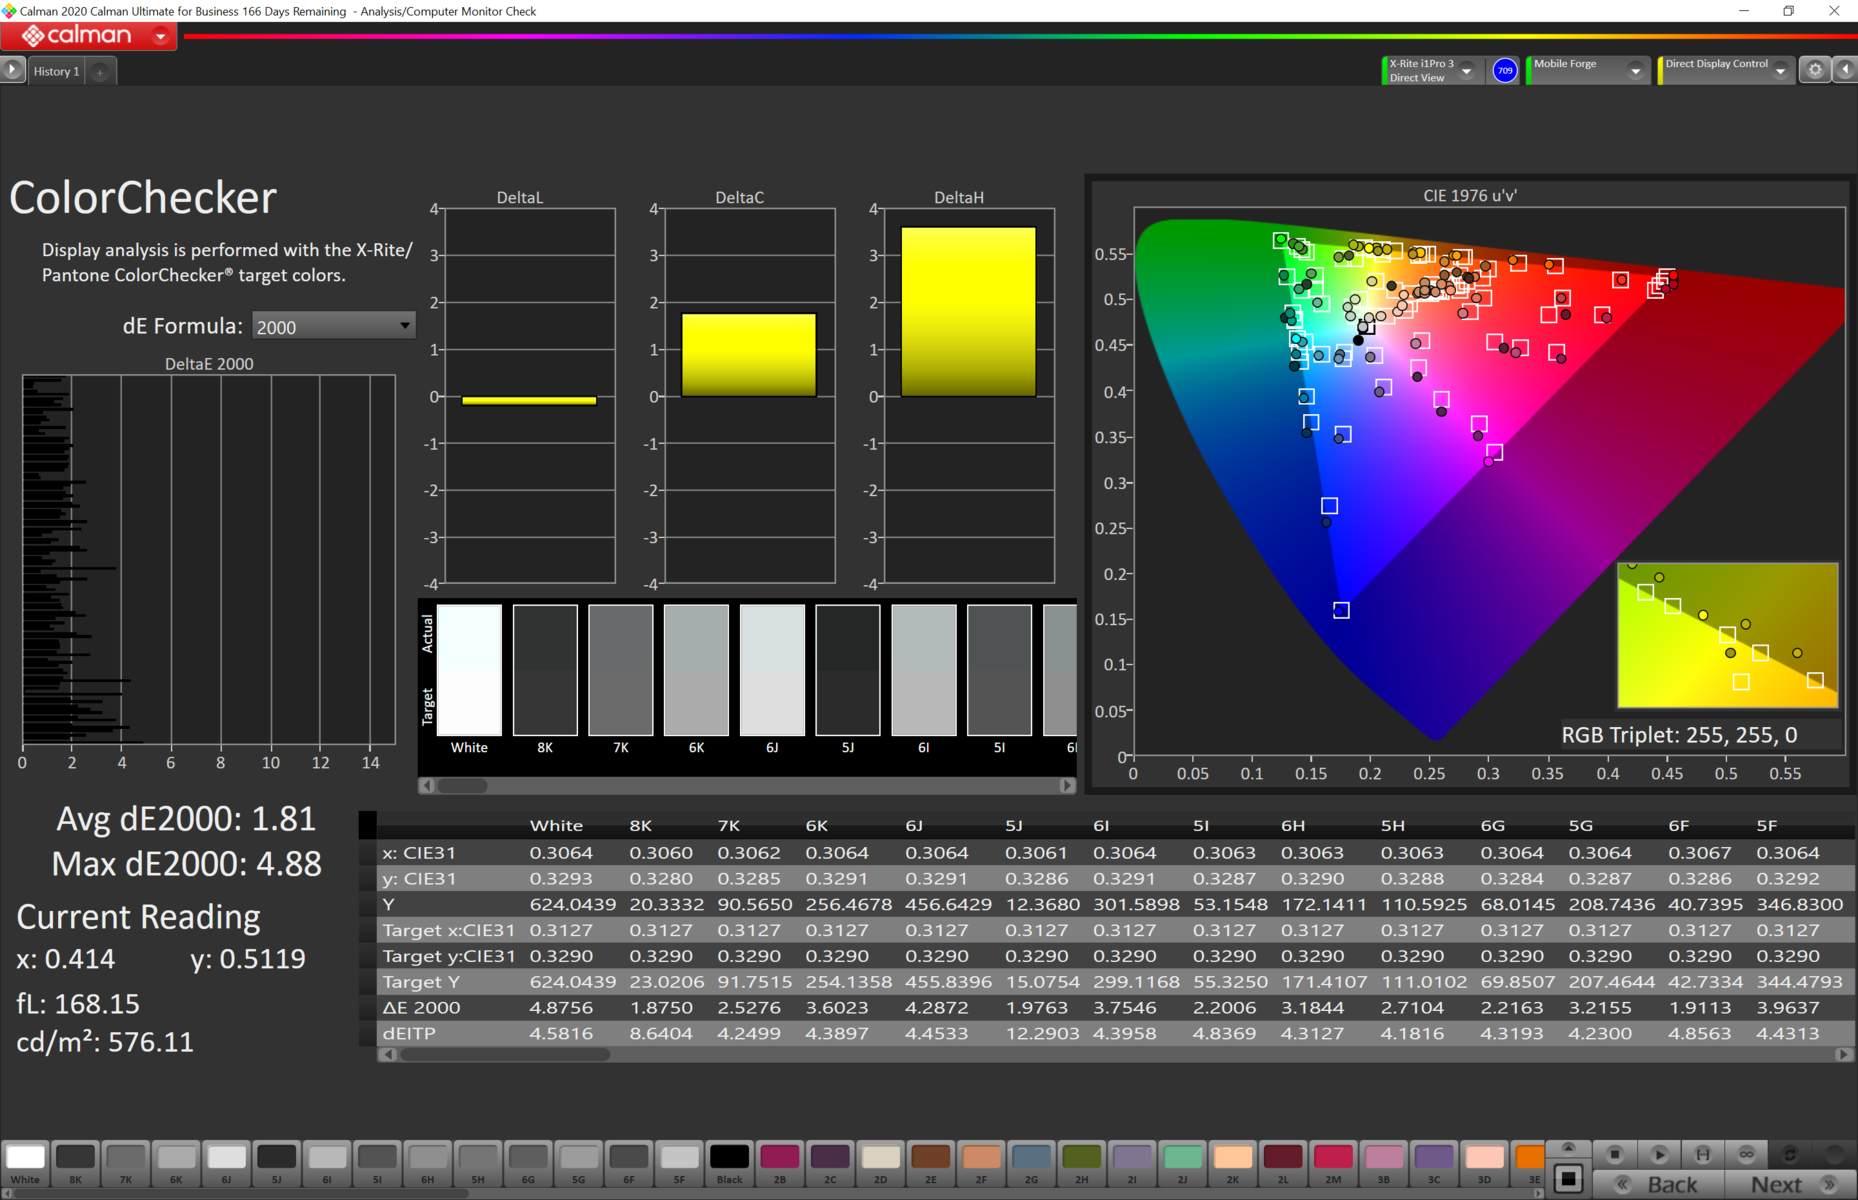
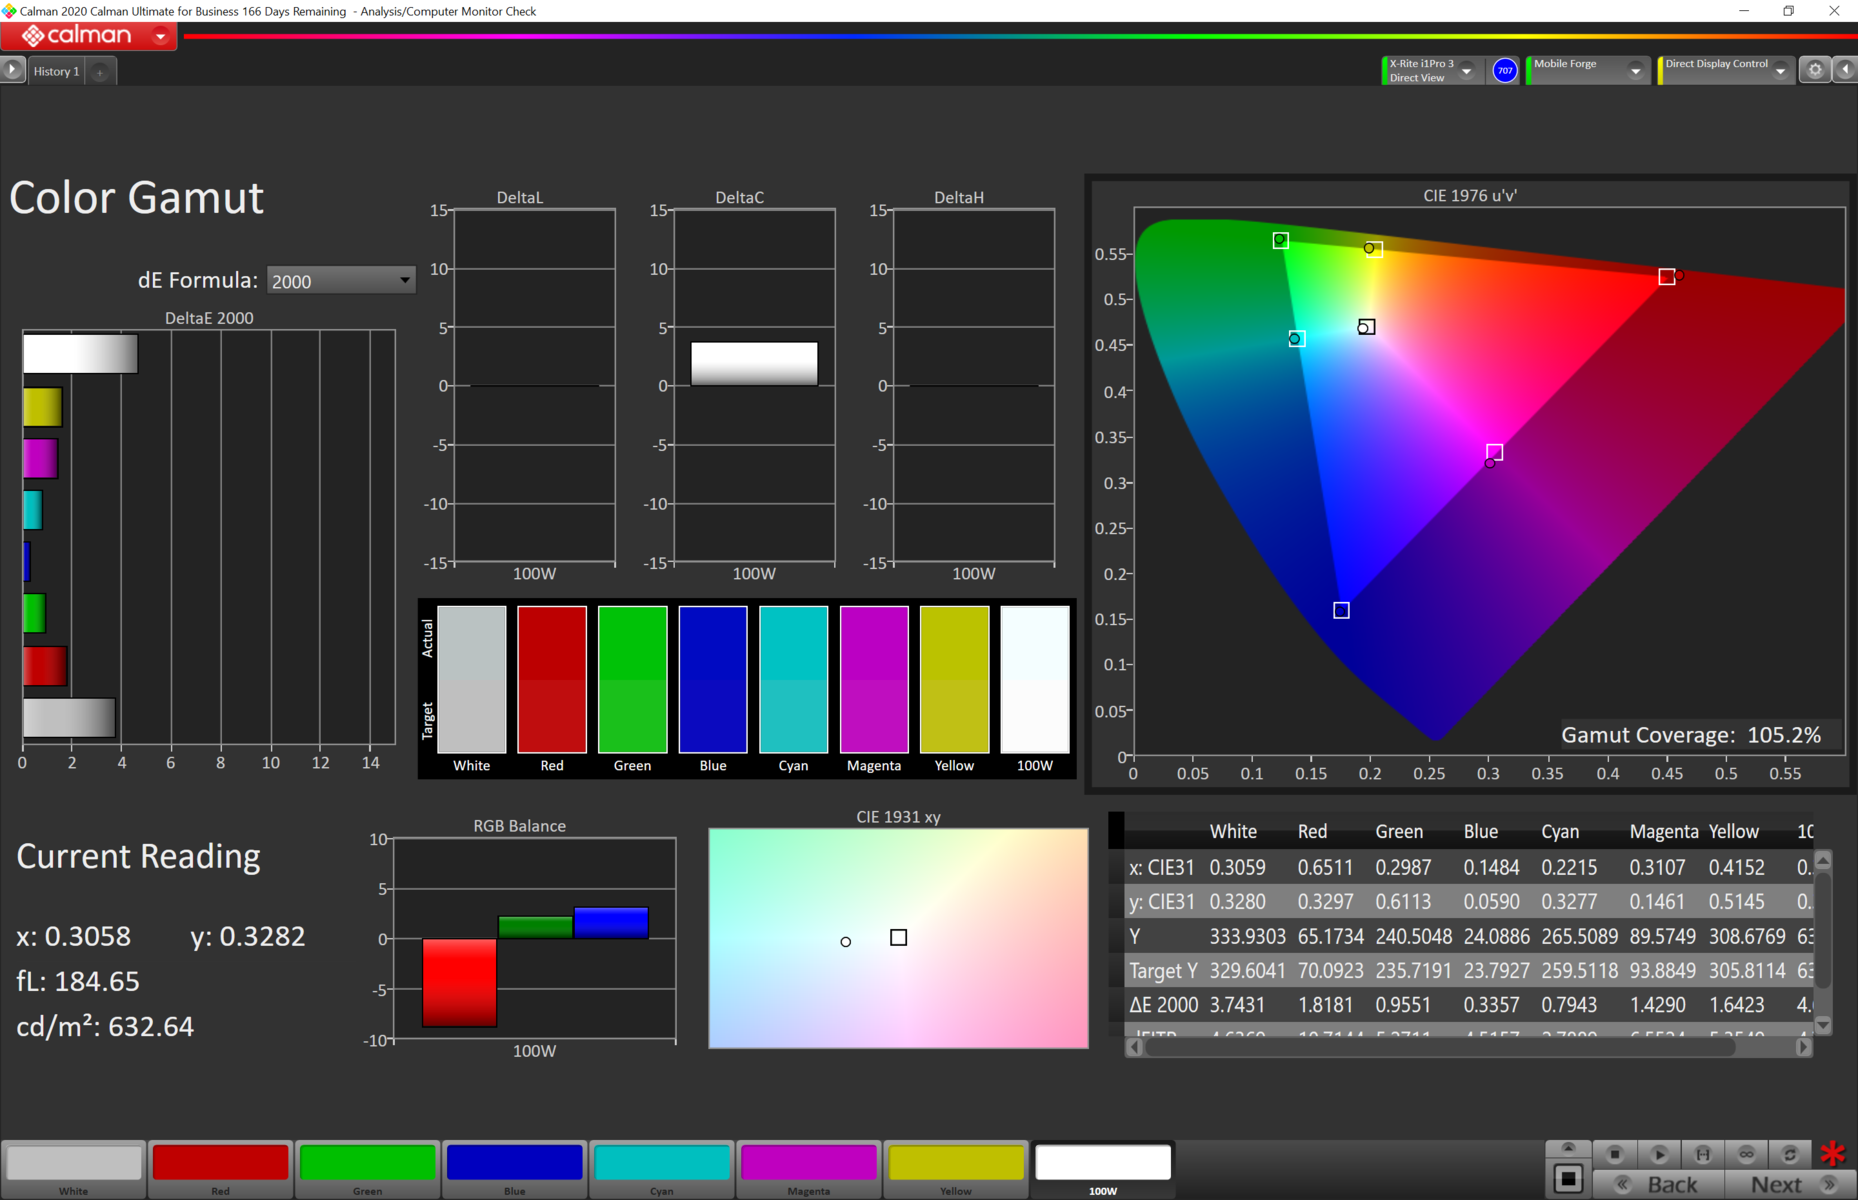
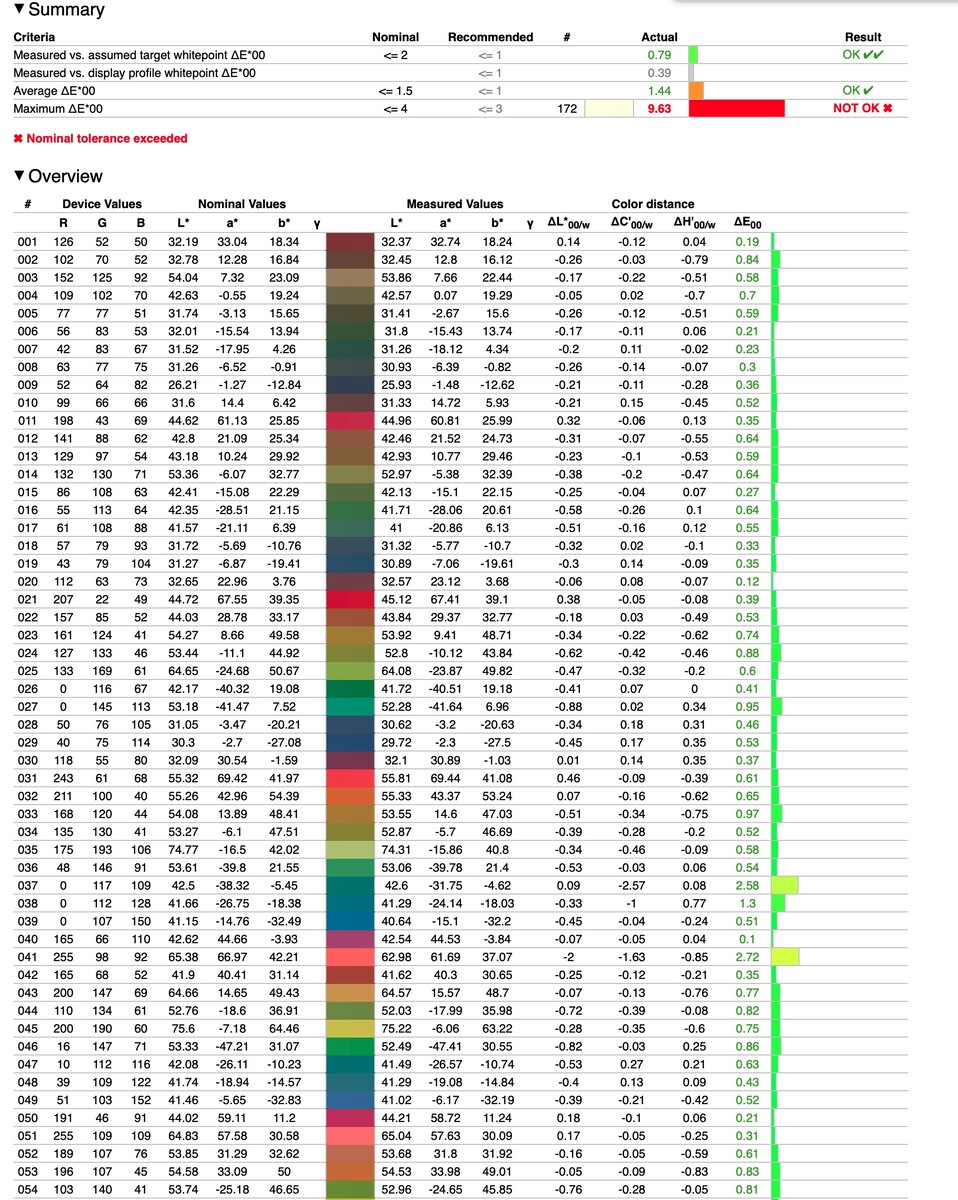
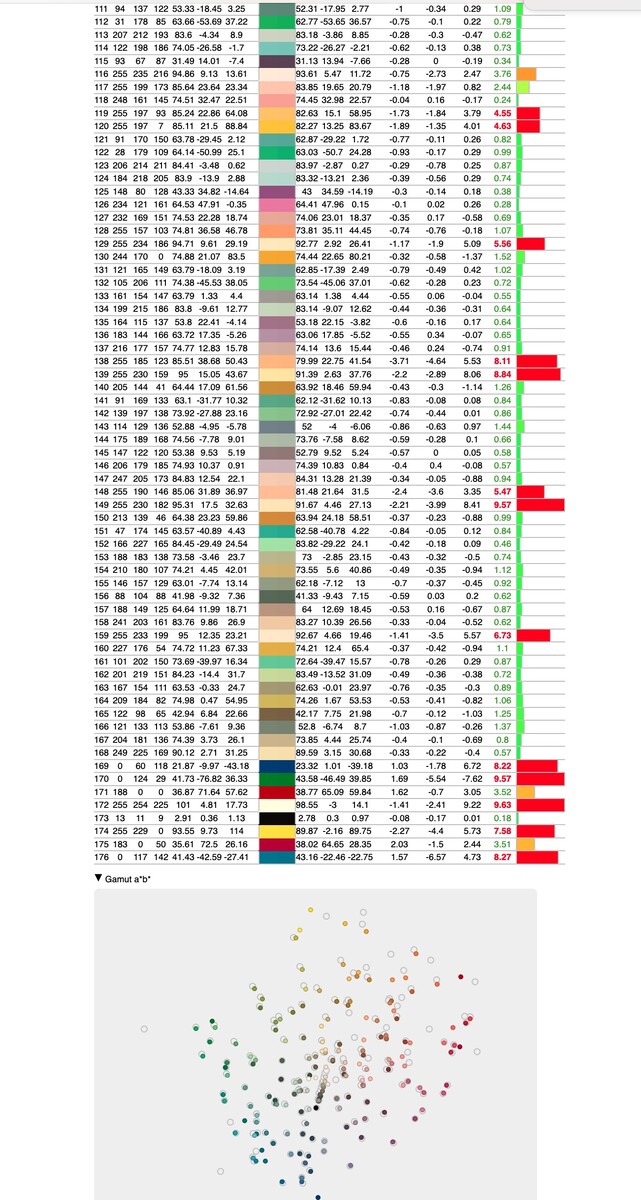
In our display tests with Calman (MobileForge) and DisplayCal/Argyll 2.2.0, we measured a maximum brightness of 620 cd/m², which is 20 cd/m² higher than Apple's stated 600 cd/m² peak for SDR images. Our review unit also has excellent brightness distribution thanks to the use of Mini LEDs. The iPad Pro's 2,732 x 2,048 resolution is sufficiently sharp at 264 DPI, but we cannot confirm its display covers the DCI-P3 colour space with our test apps. When we attempt to do so, iPadOS switches back to the sRGB colour space, which it covers completely. However, the display cannot reproduce colours as perfectly as we would have hoped. Instead, individual colours deviate relatively strongly, even if the average remains outstanding. Overall, the new iPad Pro 12.9 and its Mini LED display offers no improvement compared to previous iPads and MacBooks.
| |||||||||||||||||||||||||
Brightness Distribution: 96 %
Center on Battery: 620 cd/m²
Contrast: ∞:1 (Black: 0 cd/m²)
ΔE ColorChecker Calman: 1.8 | ∀{0.5-29.43 Ø4.73}
ΔE Greyscale Calman: 3.1 | ∀{0.09-98 Ø4.97}
105.2% sRGB (Calman 2D)
70.5% AdobeRGB 1998 (Argyll 3D)
99.9% sRGB (Argyll 3D)
68.7% Display P3 (Argyll 3D)
Gamma: 2214
CCT: 6892 K
| Apple iPad Pro 12.9 2021 A2378 IPS mini-LED, 2732x2048, 12.9" | Apple iPad Pro 11 2021 IPS, 2388x1668, 11" | Apple iPad Pro 12.9 2020 IPS, 2732x2048, 12.9" | Samsung Galaxy Tab S7 Plus Super AMOLED, 2800x1752, 12.4" | Apple MacBook Pro 13 Late 2020 M1 Entry (8 / 256 GB) IPS, 2560x1600, 13.3" | |
|---|---|---|---|---|---|
| Screen | 8% | 18% | -11% | 10% | |
| Brightness middle (cd/m²) | 620 | 627 1% | 625 1% | 441 -29% | 510 -18% |
| Brightness (cd/m²) | 612 | 598 -2% | 599 -2% | 447 -27% | 491 -20% |
| Brightness Distribution (%) | 96 | 88 -8% | 87 -9% | 98 2% | 94 -2% |
| Black Level * (cd/m²) | 0.44 | 0.47 | 0.29 | ||
| Colorchecker dE 2000 * | 1.8 | 1.6 11% | 1.3 28% | 2.4 -33% | 1.3 28% |
| Colorchecker dE 2000 max. * | 4.9 | 3.5 29% | 2.7 45% | 4.1 16% | 3 39% |
| Greyscale dE 2000 * | 3.1 | 2.5 19% | 1.8 42% | 2.9 6% | 2 35% |
| Gamma | 2214 0% | 2.25 98% | 2.23 99% | 2.01 109% | 2.23 99% |
| CCT | 6892 94% | 6969 93% | 6765 96% | 6469 100% | 6933 94% |
| Contrast (:1) | 1425 | 1330 | 1759 | ||
| Color Space (Percent of AdobeRGB 1998) (%) | 88.3 | ||||
| Color Space (Percent of sRGB) (%) | 100 |
* ... smaller is better
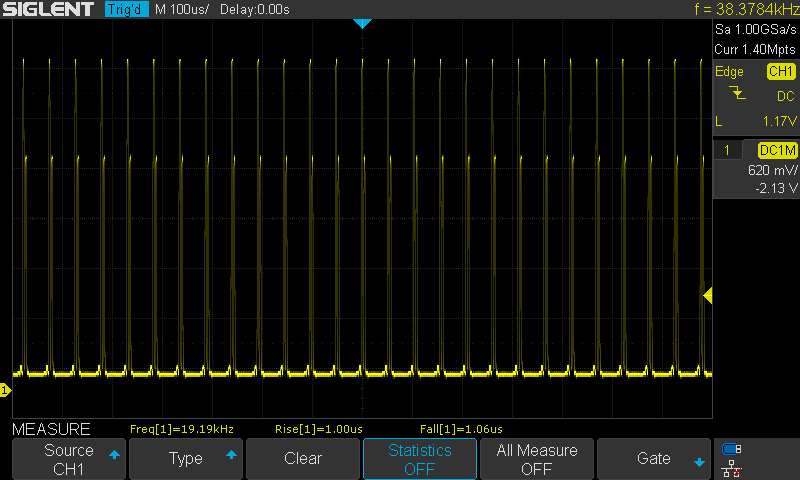
Screen Flickering / PWM (Pulse-Width Modulation)
| Screen flickering / PWM detected | 19190 Hz | ≤ 100 % brightness setting | 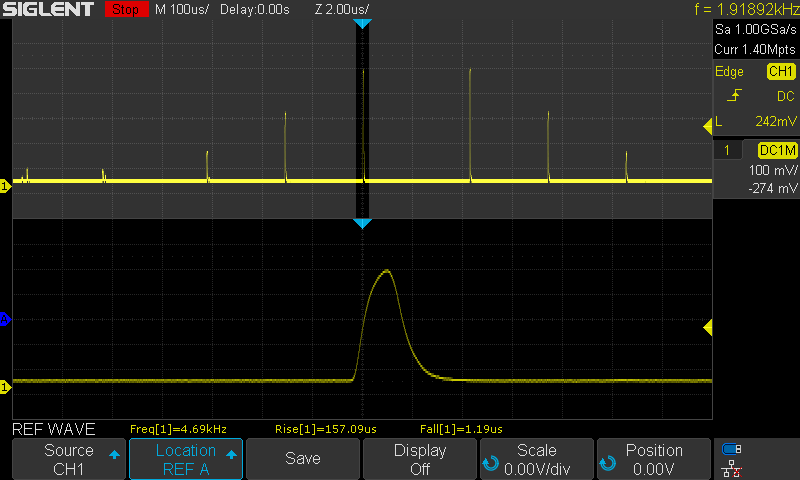 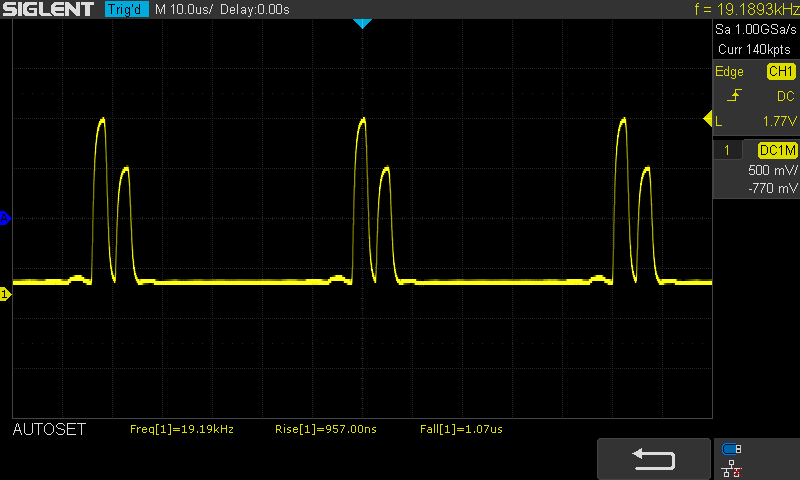 |
The display backlight flickers at 19190 Hz (worst case, e.g., utilizing PWM) Flickering detected at a brightness setting of 100 % and below. There should be no flickering or PWM above this brightness setting. The frequency of 19190 Hz is quite high, so most users sensitive to PWM should not notice any flickering. In comparison: 52 % of all tested devices do not use PWM to dim the display. If PWM was detected, an average of 7810 (minimum: 5 - maximum: 343500) Hz was measured. | |||
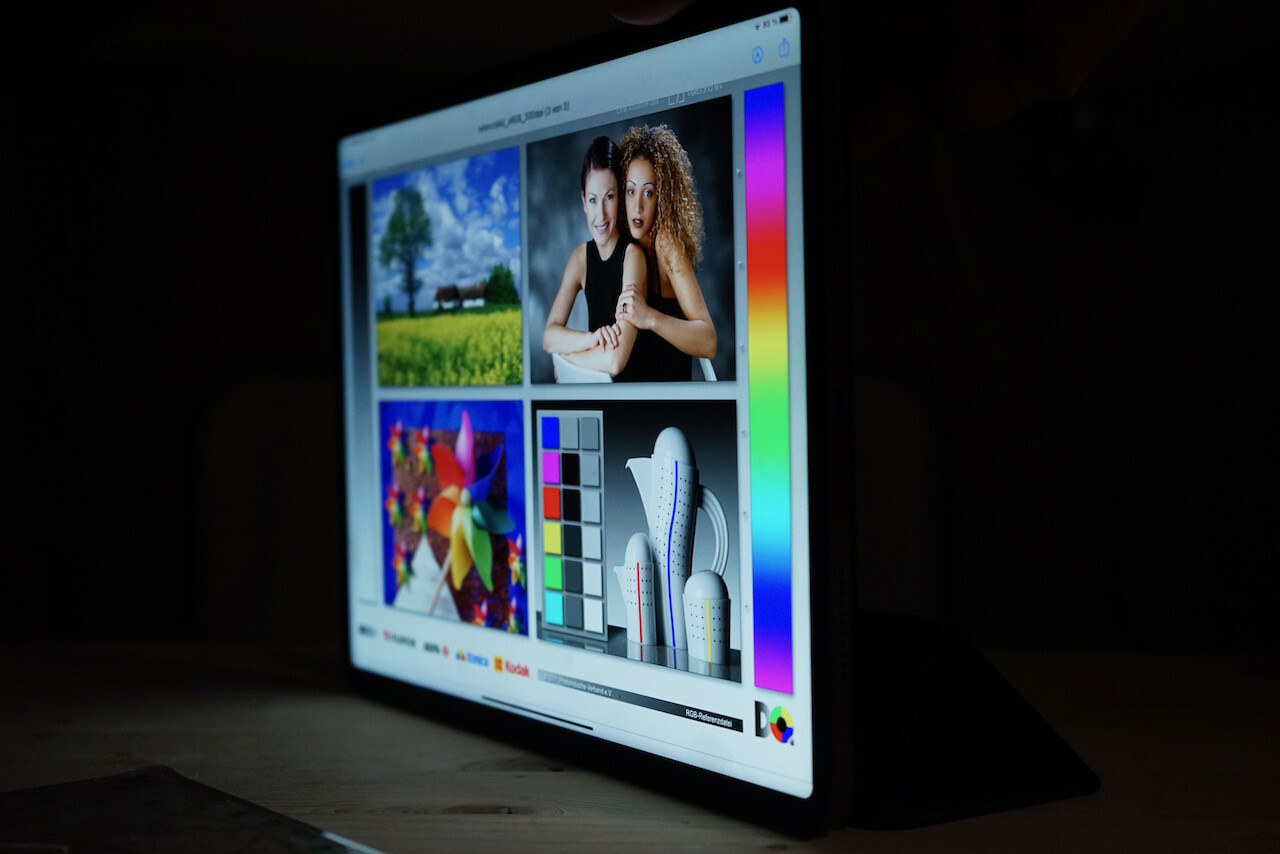
Using Mini LEDs allows Apple to deactivate the backlight for larger black areas. As a result, we measure practically no residual brightness on black surfaces, and the calculated contrast approaches infinity, although Apple states 1,000,000:1. Nevertheless, the 2,596 brightness zones are not enough to achieve a perfect picture in dark conditions. When reading texts with a black background, we notice images looking blotchy, while there is a visible halo around the text itself. OLED screens still have a tangible advantage here as they can control each pixel individually.
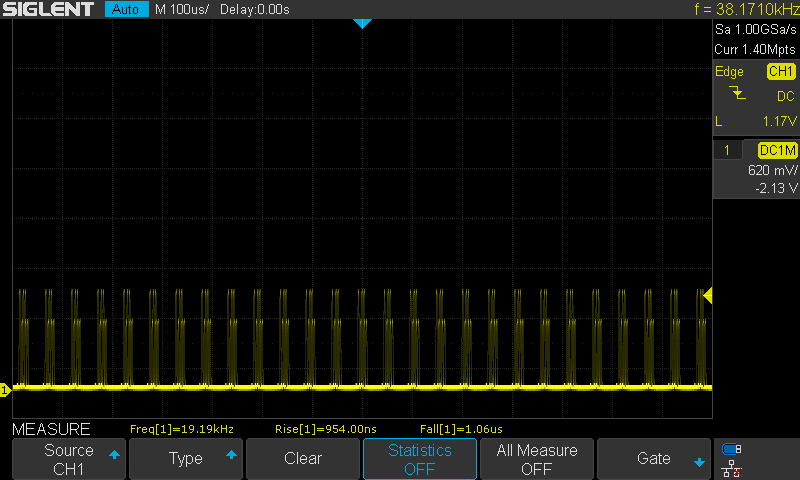
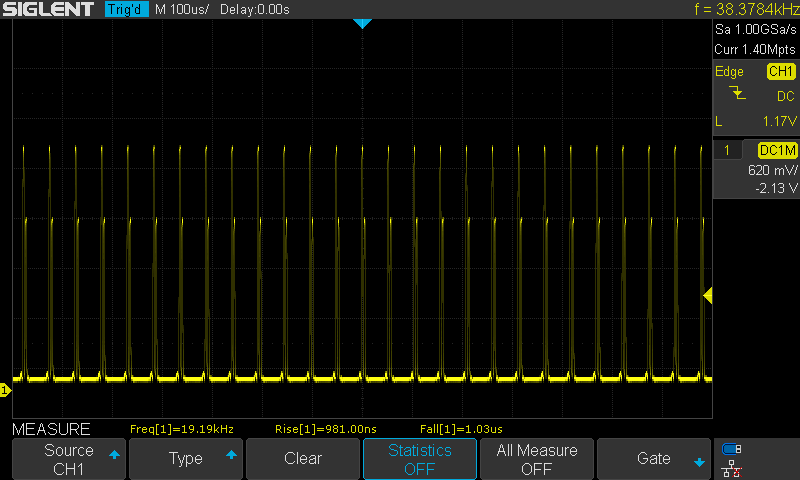
Unfortunately, all currently available Mini LED backlights use pulse-width modulation (PWM) to regulate brightness levels. We measured PWM at 19 kHz on our review unit, which is comparatively high. Hence, the new iPad Pro 12.9 should only cause issues for a few people. However, PWM sensitive people who want to use the device for many hours should be warned.
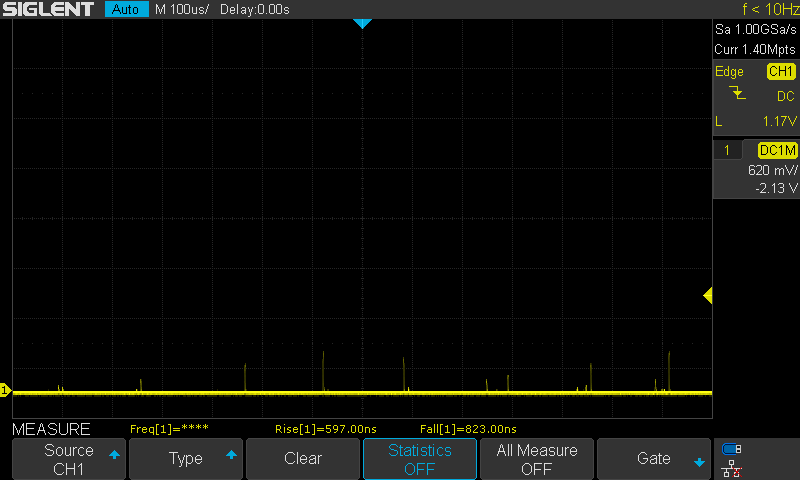
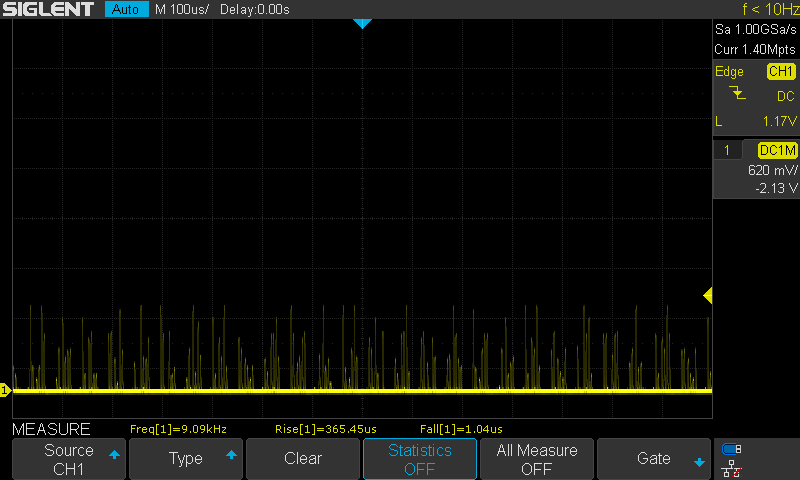
The response times are not particularly fast, either. Additionally, PWM makes measuring response times difficult with our equipment; see screenshots of the light yellow areas below.
Display Response Times
| ↔ Response Time Black to White | ||
|---|---|---|
| 45 ms ... rise ↗ and fall ↘ combined | ↗ 35 ms rise | 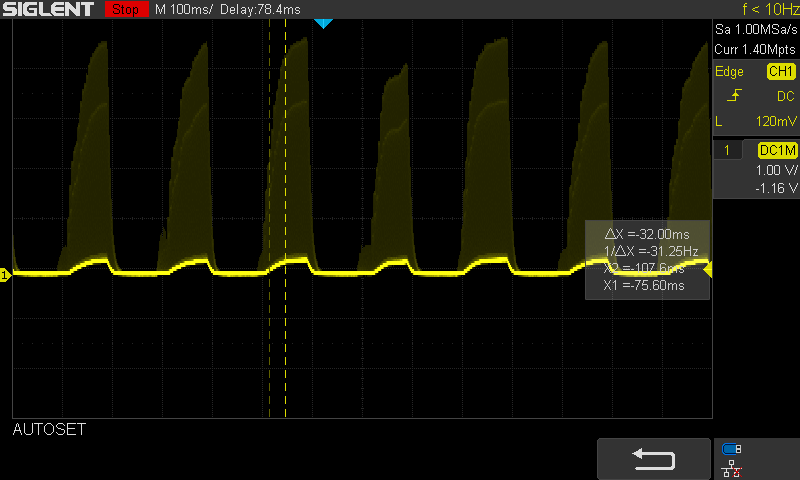 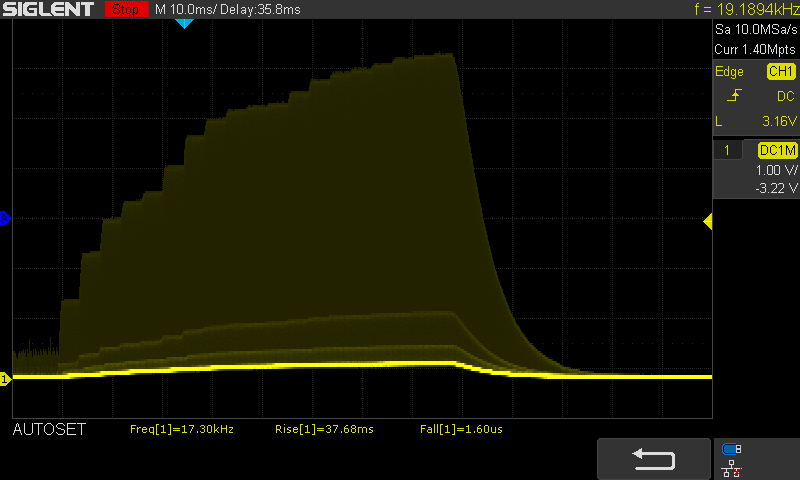 |
| ↘ 10 ms fall | ||
| The screen shows slow response rates in our tests and will be unsatisfactory for gamers. In comparison, all tested devices range from 0.1 (minimum) to 240 (maximum) ms. » 99 % of all devices are better. This means that the measured response time is worse than the average of all tested devices (19.9 ms). | ||
| ↔ Response Time 50% Grey to 80% Grey | ||
| 40 ms ... rise ↗ and fall ↘ combined | ↗ 21 ms rise | 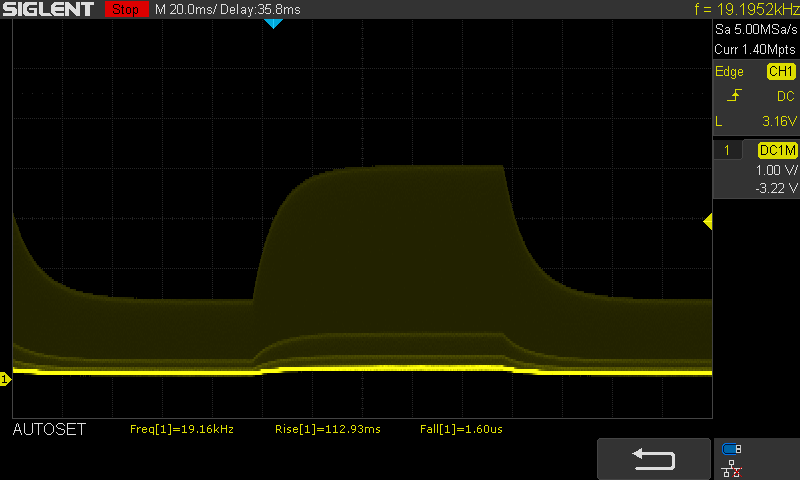 |
| ↘ 19 ms fall | ||
| The screen shows slow response rates in our tests and will be unsatisfactory for gamers. In comparison, all tested devices range from 0.165 (minimum) to 636 (maximum) ms. » 61 % of all devices are better. This means that the measured response time is worse than the average of all tested devices (31.1 ms). | ||
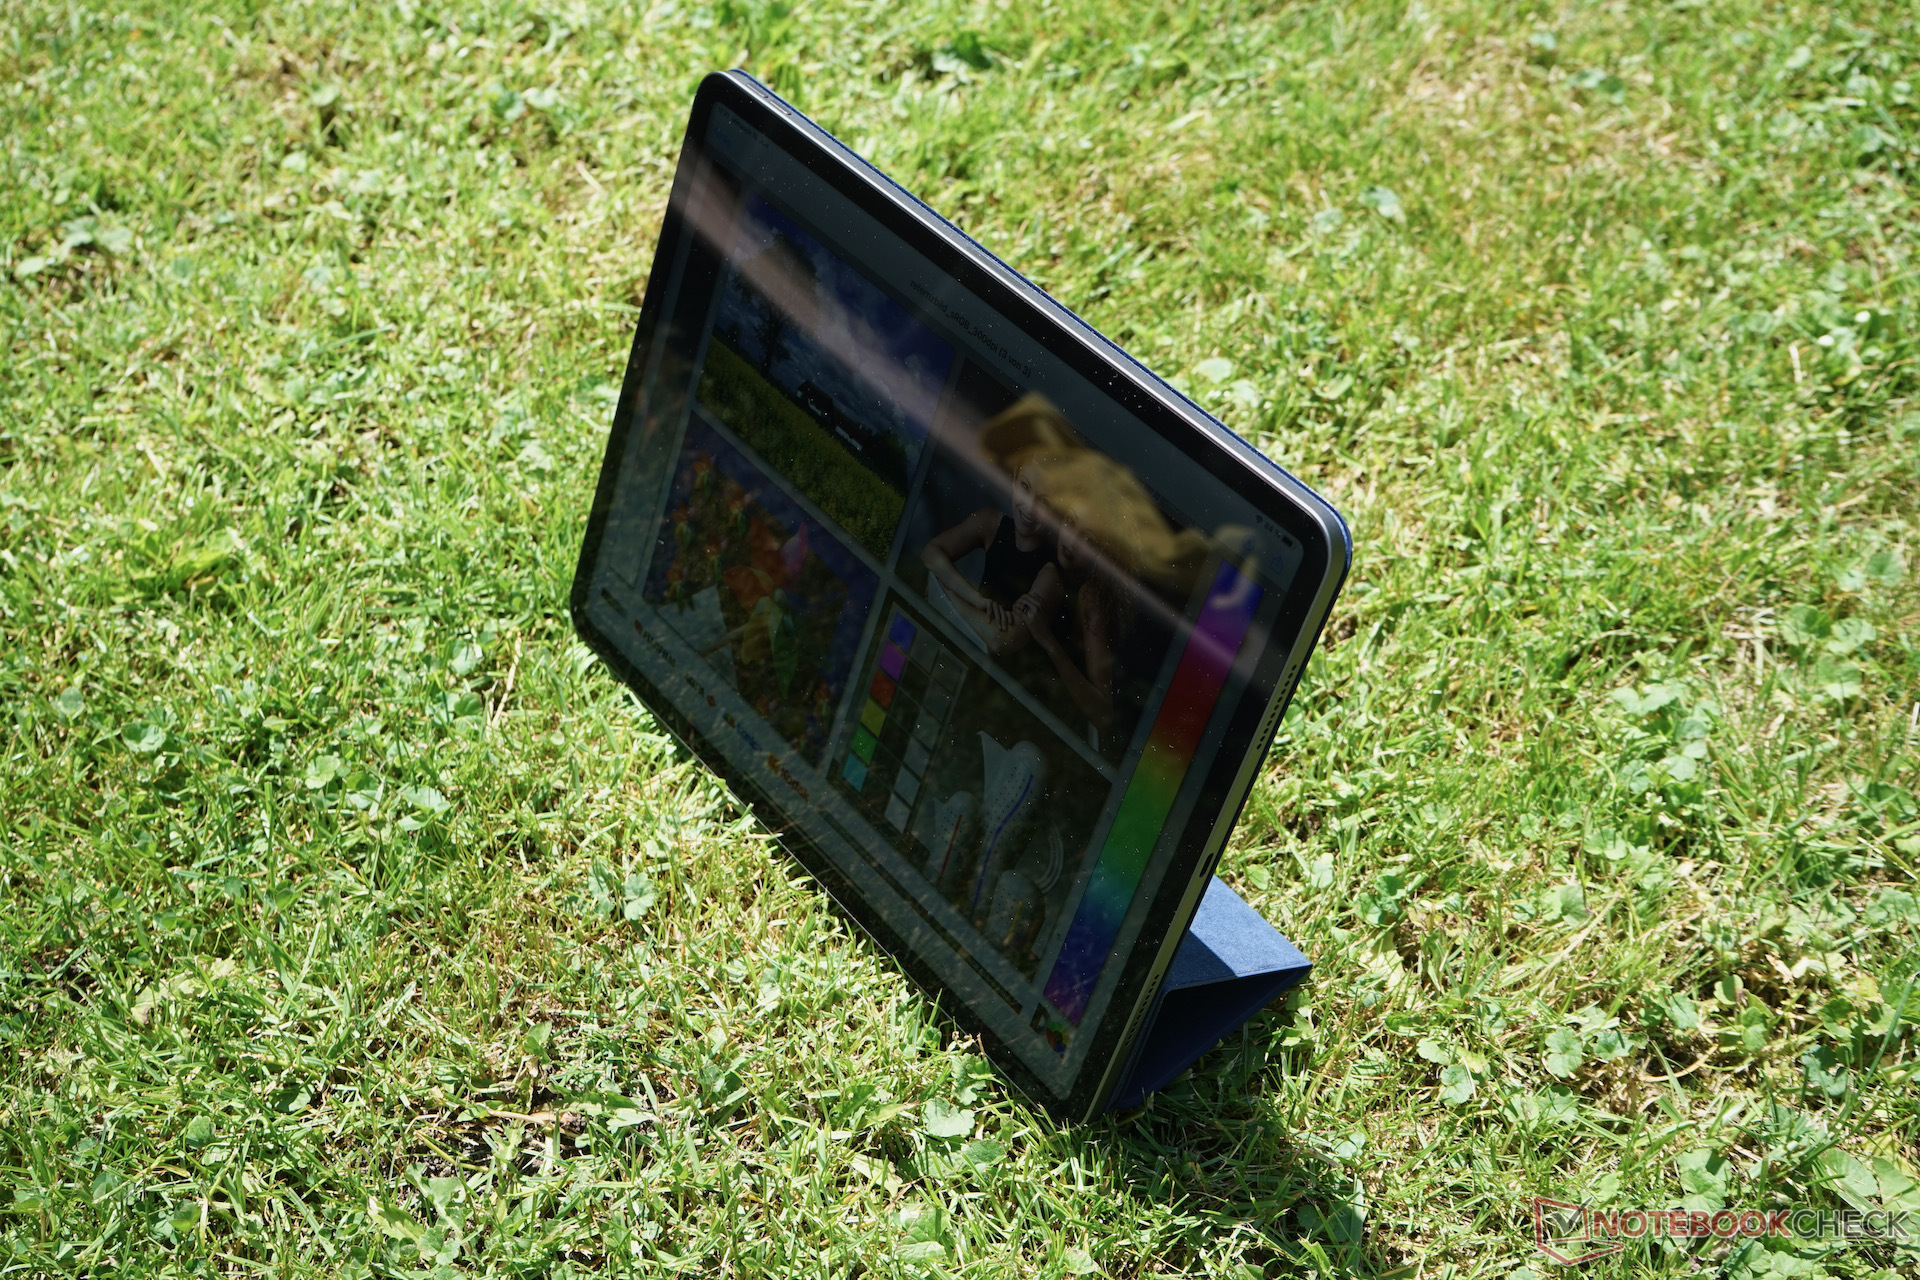
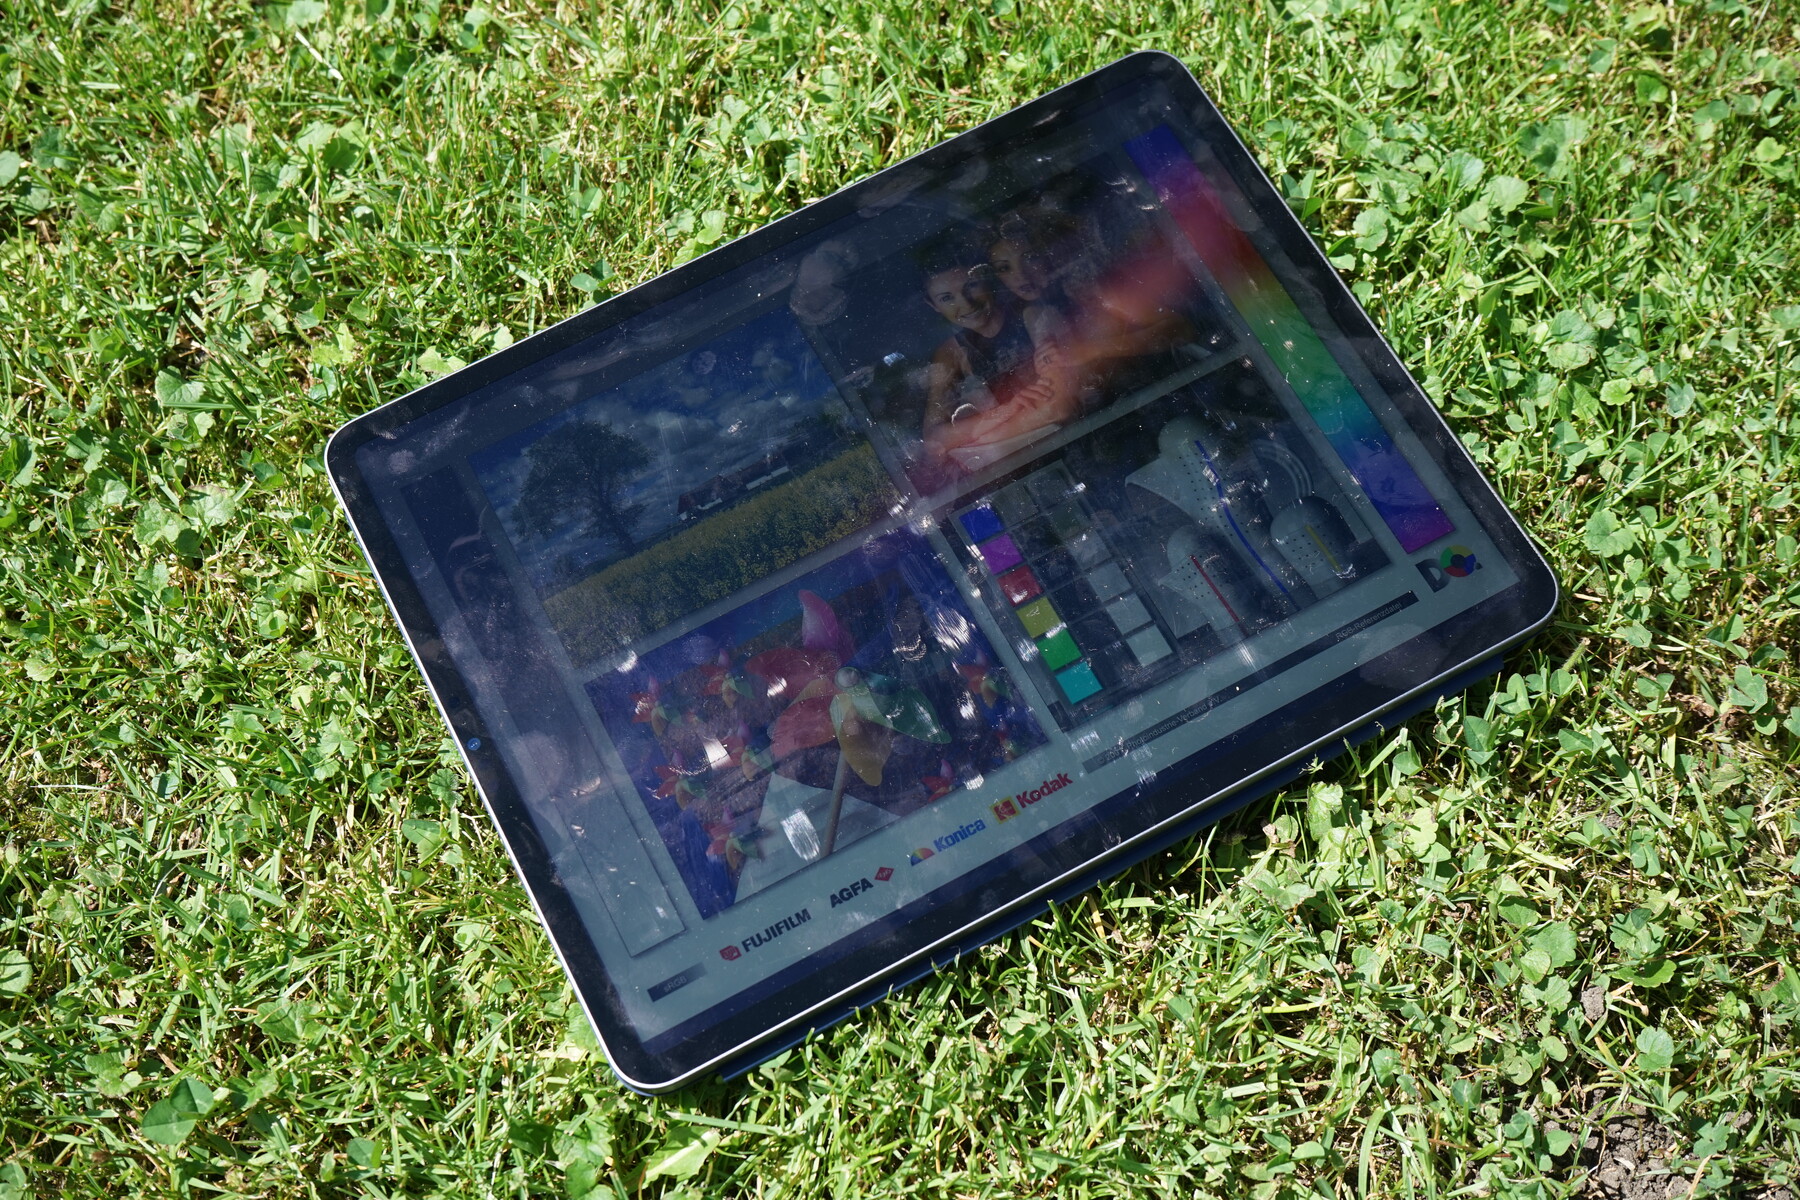
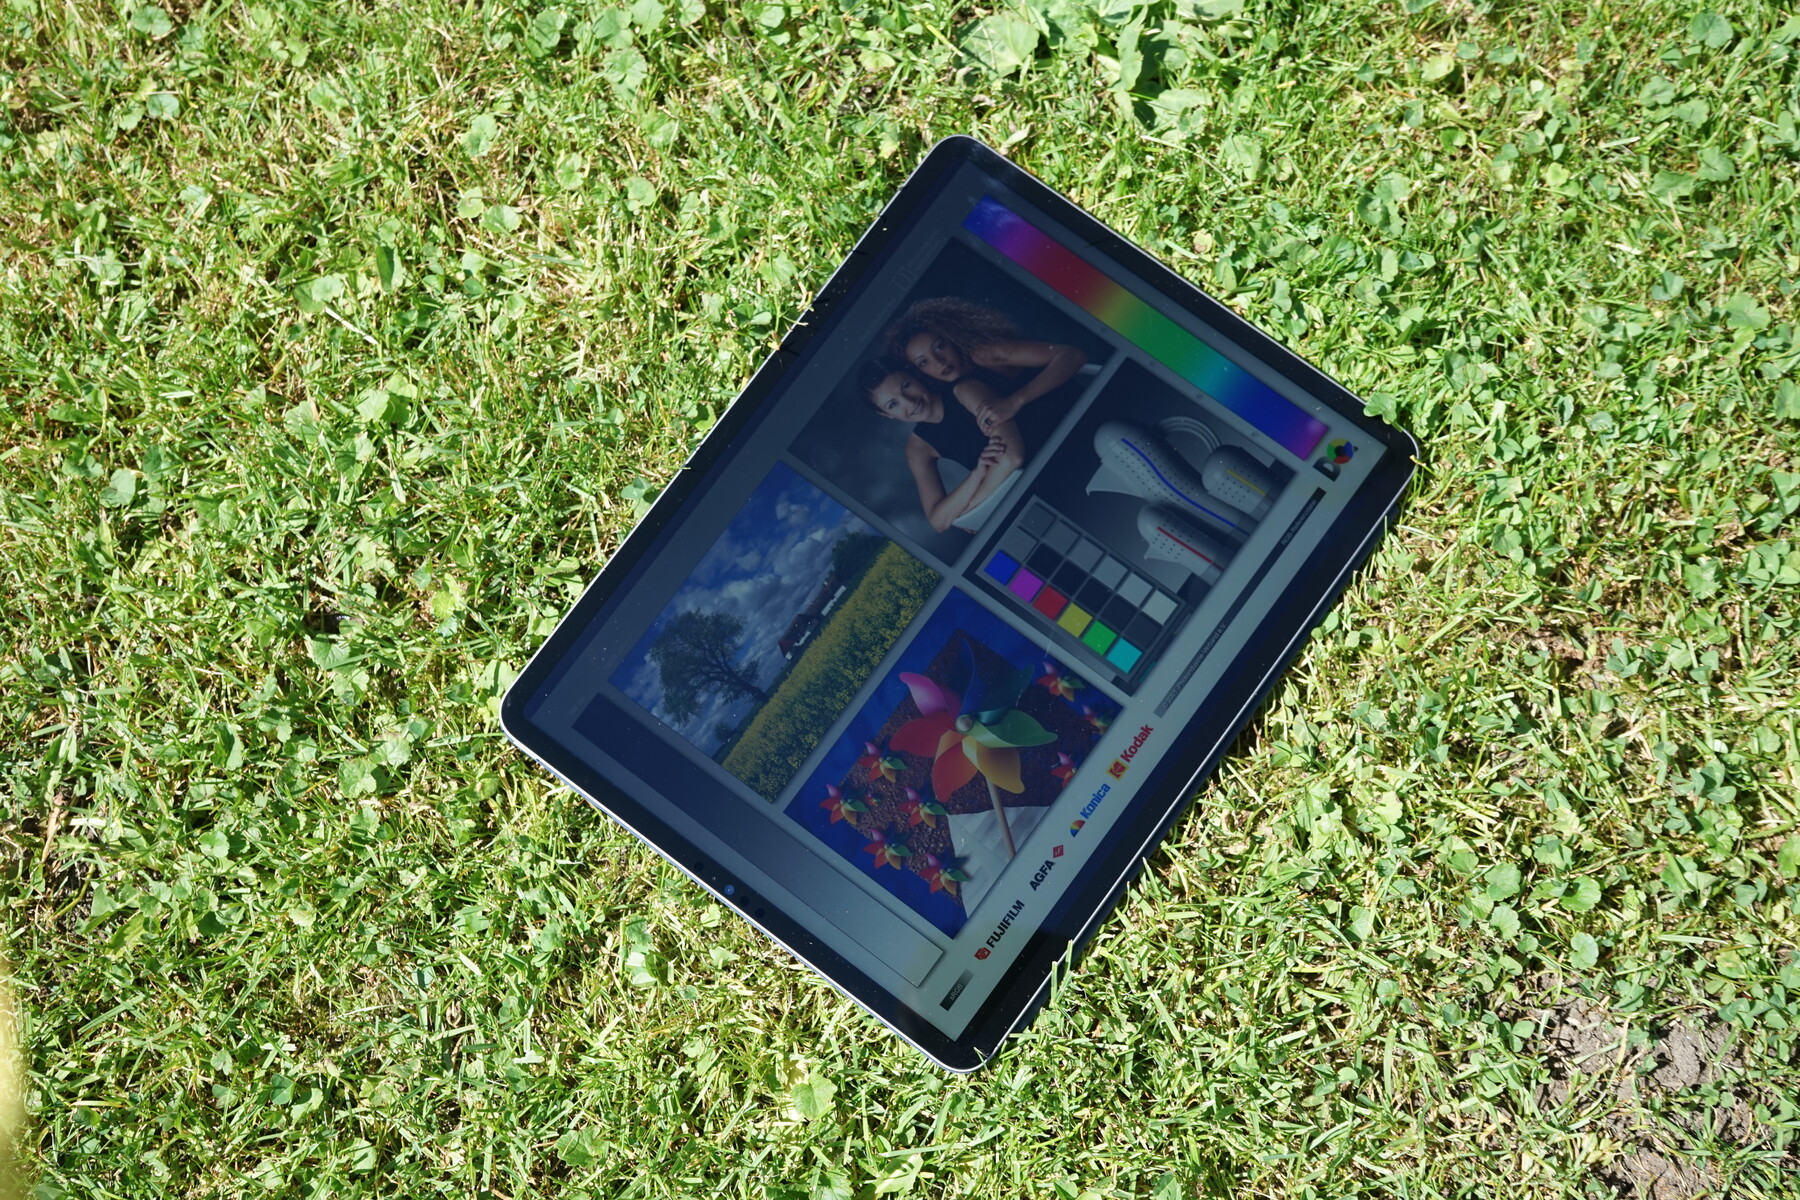
Thanks to the display's high brightness and anti-reflective coating, you can also use the iPad Pro 12.9 outdoors. In direct sunlight, however, 600 nits is not enough. Furthermore, using the iPad Pro 12.9 outside in the blazing sun can quickly lead to the tablet overheating, preventing you from being able to use it anyway.
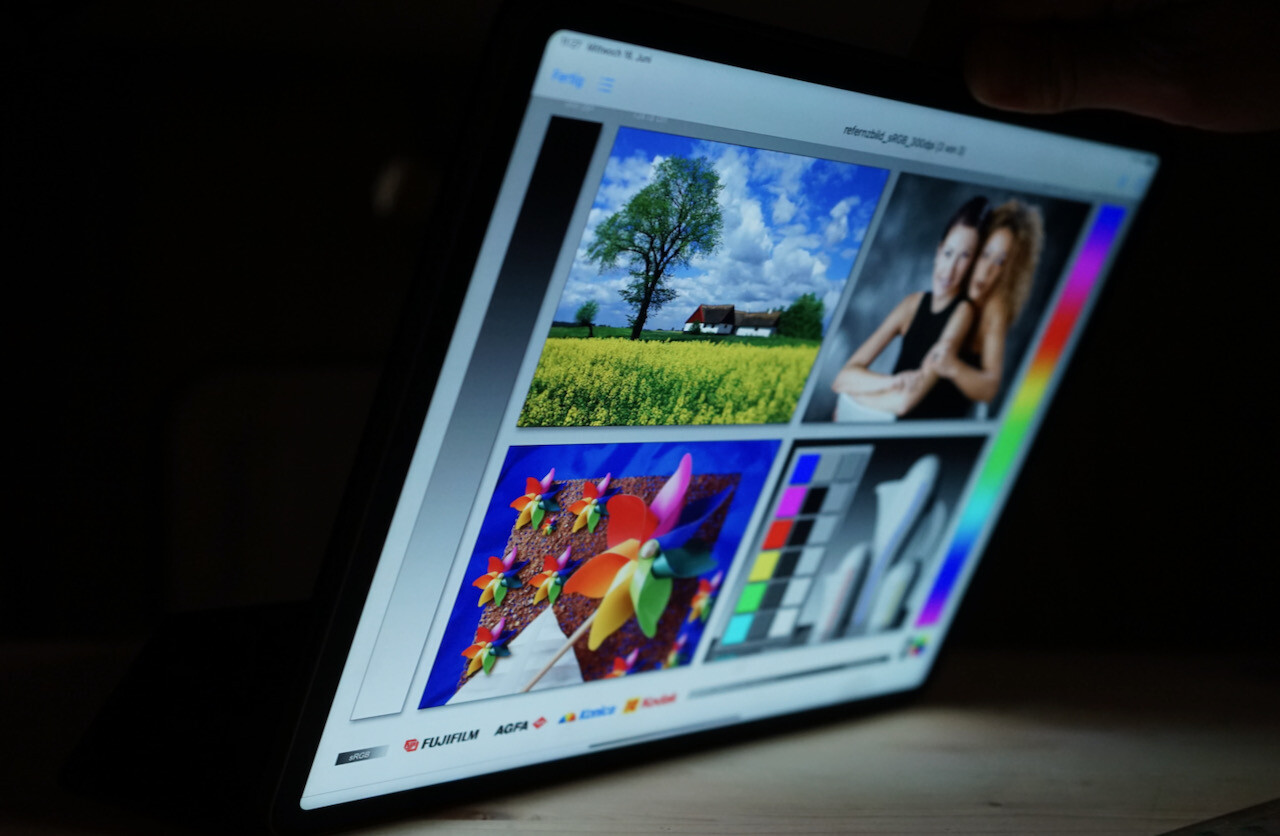
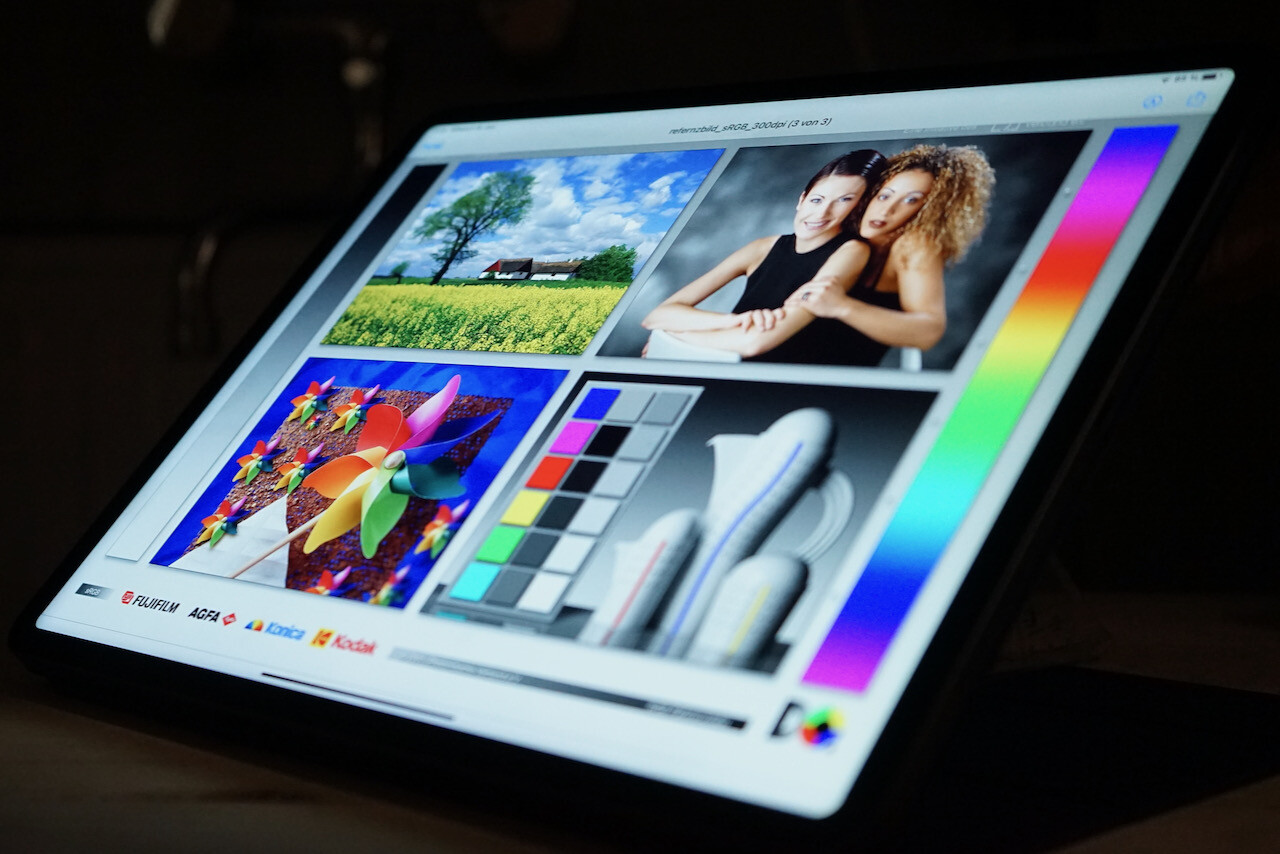
The viewing angle stability of the XDR display is excellent. We only noticed irregularities when looking at the display from about 45°, at which point dark colours would distort, and the brightness level would drop.
Performance - Laptop performance in a tablet
The second big innovation of the 2021 model is the Apple M1 chip, which we already know from last year's MacBook Air and MacBook Pro 13. Apple has equipped the entry-level iPad Pro with all eight GPU cores combined with 8 GB of RAM, unlike on the MacBook Air. The iPad Pro 12.9 also comes with 16 GB of RAM if you choose a 1 TB or 2 TB SSD model. The extra RAM is currently of no use though, as iPadOS only uses up to 5 GB. In addition to the eight-processor and graphics cores, the M1 SoC offers sixteen Neural Engine cores for machine learning (ML). So with the upcoming iPadOS 15, the iPad Pro could, for example, detect text in images more quickly using its system-wide optical character recognition (OCR) system. The sixteen-core Neural Engine could come in use for other applications in the future, too.
With short loads, the M1 in the iPad Pro 12.9 can easily keep up with the same SoC in the MacBook Air and the actively cooled MacBook Pro 13, despite the former's lower TDP setting. CPU throttling is also not an issue in Geekbench, alternating between single and multi-threaded tests in the mobile version. We did not see any reduced results after eleven runs, for instance, which took between fifteen and twenty minutes. The M1 cannot replicate this performance when it comes to GPU performance, though. In the 3D Mark Wild Life Extreme stress test, our review unit lost about 25% of its peak performance. Nevertheless, the tablet's CPU and GPU performance are in the absolute top class for tablets. A Surface Pro 7 Plus with an Intel Core i5-1135G7 and its Iris Xe Graphics G7 (80 Execution Units) integrated GPU lag behind the iPad Pro 12.9 in GFXBench. Most Tiger Lake SoCs achieve worse results too, even with a Core i7 part that has an integrated GPU with 96 EUs.
| Basemark GPU 1.2 | |
| 1920x1080 Metal Medium Offscreen | |
| Apple iPad Pro 12.9 2021 A2378 | |
| Average Apple M1 (276 - 327, n=4) | |
| Apple MacBook Air 2020 M1 Entry | |
| Average of class Tablet (n=1last 2 years) | |
| Apple iPad Pro 11 2018 | |
| Metal Medium Native | |
| Average of class Tablet (n=1last 2 years) | |
| Apple iPad Pro 12.9 2021 A2378 | |
| Average Apple M1 (n=1) | |
| Apple iPad Pro 11 2018 | |
| 3840x2160 Metal High Offscreen | |
| Average of class Tablet (n=1last 2 years) | |
| Apple iPad Pro 12.9 2021 A2378 | |
| Average Apple M1 (19.2 - 21.7, n=4) | |
| Apple MacBook Air 2020 M1 Entry | |
| Geekbench ML | |
| 0.5 TensorFlow Lite NNAPI / Core ML | |
| Average Apple M1 (2601 - 2743, n=3) | |
| Apple iPad Pro 12.9 2021 A2378 | |
| Apple iPad Pro 11 2021 | |
| Apple iPad Pro 11 2018 | |
| 0.5 TensorFlow Lite CPU 0.5 | |
| Apple iPad Pro 12.9 2021 A2378 | |
| Apple iPad Pro 11 2021 | |
| Average Apple M1 (945 - 1041, n=3) | |
| Apple iPad Pro 11 2018 | |
| 0.5 TensorFlow Lite GPU | |
| Apple iPad Pro 11 2021 | |
| Average Apple M1 (2855 - 2868, n=3) | |
| Apple iPad Pro 12.9 2021 A2378 | |
| Apple iPad Pro 11 2018 | |
In the browser tests, the Apple M1, in conjunction with the fast Safari browser, outshines the competition. In less demanding tests, the iPad Pro 12.9 is also on par with Apple's M1-powered MacBooks. Only with the WebXPRT 3 do we see differences, but the MacBook Air and MacBook Pro 13 only eke out a slight advantage over the iPad Pro 12.9, at any rate. Overall, the values below show why surfing on the iPad Pro 12.9 is so much fun.
| Jetstream 2 - 2.0 Total | |
| Apple MacBook Air 2020 M1 Entry (Safari 15.1) | |
| Apple MacBook Air 2020 M1 Entry (Safari 14.0.1) | |
| Apple iPad Pro 12.9 2021 A2378 (Safari 14.1.1) | |
| Average Apple M1 (175.4 - 191.3, n=8) | |
| Apple iPad Pro 11 2021 (Safari 14.1) | |
| Apple MacBook Pro 13 Late 2020 M1 Entry (8 / 256 GB) | |
| Average of class Tablet (35.8 - 395, n=61, last 2 years) | |
| Apple iPad Pro 12.9 2020 (Safari 13) | |
| Microsoft Surface Pro X (Edge 83) | |
| Samsung Galaxy Tab S7 Plus (Samsung Browser 12.1) | |
| Huawei MatePad Pro 10.8 (Huawei Browser V10.1.2) | |
| Lenovo Tab P11 Pro (Chrome 89.0.4389.105) | |
| JetStream 1.1 - 1.1 Total | |
| Apple MacBook Air 2020 M1 Entry (Safari 15.1) | |
| Apple MacBook Air 2020 M1 Entry (Safari 14.0.1) | |
| Average Apple M1 (402 - 436, n=7) | |
| Apple iPad Pro 12.9 2021 A2378 | |
| Apple MacBook Pro 13 Late 2020 M1 Entry (8 / 256 GB) | |
| Apple iPad Pro 11 2021 (Safari 14.1) | |
| Apple iPad Pro 12.9 2020 (Safari 13) | |
| Samsung Galaxy Tab S7 Plus (Samsung Browser 12.1) | |
| Huawei MatePad Pro 10.8 (Huawei Browser V10.1.2) | |
| Lenovo Tab P11 Pro (Chrome 89.0.4389.105) | |
| WebXPRT 3 - Overall | |
| Apple MacBook Air 2020 M1 Entry (Safari 15.1) | |
| Apple MacBook Air 2020 M1 Entry (Safari 14.0.1) | |
| Apple MacBook Pro 13 Late 2020 M1 Entry (8 / 256 GB) | |
| Average of class Tablet (108 - 480, n=12, last 2 years) | |
| Average Apple M1 (216 - 304, n=8) | |
| Apple iPad Pro 12.9 2021 A2378 (Safari 14.1.1) | |
| Apple iPad Pro 11 2021 | |
| Microsoft Surface Pro 7 Plus (Chrome 82) | |
| Apple iPad Pro 12.9 2020 (Safari 13) | |
| Samsung Galaxy Tab S7 Plus (Samsung Browser 12.1) | |
| Microsoft Surface Pro X (Edge 83) | |
| Huawei MatePad Pro 10.8 (Huawei Browser V10.1.2) | |
| Lenovo Tab P11 Pro (Chrome 89.0.4389.105) | |
| Speedometer 2.0 - Result 2.0 | |
| Apple MacBook Air 2020 M1 Entry (Safari 15.1) | |
| Apple MacBook Air 2020 M1 Entry (Safari 14.0.1) | |
| Average of class Tablet (2.59 - 790, n=40, last 2 years) | |
| Average Apple M1 (209 - 265, n=8) | |
| Apple MacBook Pro 13 Late 2020 M1 Entry (8 / 256 GB) | |
| Apple iPad Pro 12.9 2021 A2378 (Safari 14.1.1) | |
| Apple iPad Pro 11 2021 (Safari 14.1) | |
| Apple iPad Pro 12.9 2020 (Safari 13) | |
| Samsung Galaxy Tab S7 Plus (Samsung Browser 12.1) | |
| Huawei MatePad Pro 10.8 (Huawei Browser V10.1.2) | |
| Microsoft Surface Pro X (Edge 83) | |
| Lenovo Tab P11 Pro (Chrome 89.0.4389.105) | |
| Octane V2 - Total Score | |
| Apple MacBook Air 2020 M1 Entry (Safari 15.1.1) | |
| Apple MacBook Air 2020 M1 Entry (Safari 14.0.1) | |
| Average Apple M1 (62055 - 66974, n=8) | |
| Apple iPad Pro 11 2021 (Safari 14.1) | |
| Apple iPad Pro 12.9 2021 A2378 (Safari 14.1.1) | |
| Apple MacBook Pro 13 Late 2020 M1 Entry (8 / 256 GB) | |
| Average of class Tablet (763 - 138481, n=76, last 2 years) | |
| Apple iPad Pro 12.9 2020 (Safari 13) | |
| Microsoft Surface Pro X (Edge 83) | |
| Samsung Galaxy Tab S7 Plus (Samsung Browser 12.1) | |
| Huawei MatePad Pro 10.8 (Huawei Browser V10.1.2) | |
| Lenovo Tab P11 Pro (Chrome 89.0.4389.105) | |
| Mozilla Kraken 1.1 - Total | |
| Lenovo Tab P11 Pro (Chrome 89.0.4389.105) | |
| Huawei MatePad Pro 10.8 (Huawei Browser V10.1.2) | |
| Average of class Tablet (243 - 27101, n=69, last 2 years) | |
| Samsung Galaxy Tab S7 Plus (Samsung Browser 12.1) | |
| Microsoft Surface Pro X (Edge 83) | |
| Microsoft Surface Pro 7 Plus (Chrome 82) | |
| Apple iPad Pro 12.9 2020 (Safari 13) | |
| Apple MacBook Pro 13 Late 2020 M1 Entry (8 / 256 GB) | |
| Apple iPad Pro 12.9 2021 A2378 (Safari 14.1.1) | |
| Apple MacBook Air 2020 M1 Entry (Safari 14.0.1) | |
| Apple MacBook Air 2020 M1 Entry (Safari 15.1) | |
| Apple iPad Pro 11 2021 (Safari 14.1) | |
| Average Apple M1 (418 - 516, n=8) | |
* ... smaller is better
Games - High performance meets a fast display
The eight graphics cores and the 120 Hz display give hope for excellent gaming performance. At the moment, there are hardly any games that take advantage of the performance that the Apple M1 offers. Unfortunately, Gamebench does not currently support recording at greater than 60 FPS either, so we cannot check if many games run at 120 FPS anyway. The internal framerate counters in Armajet and World of Tanks Blitz show that both games run at between 115 and 120 FPS, though. Incidentally, Gamebench reports that Call of Duty Mobile never runs below 60 FPS in our benchmark sequence. According to the settings, Genshin Impact only supports up to 60 FPS, but it remains relatively stable at this limit, despite occasional dips to 57 or 59 FPS. Only with PUBG Mobile (Classic on Karakin) at Ultra HD do we notice the iPad Pro 12.9 averaging 39 FPS. We should stress that this is a PUBG Mobile limitation though, as it only provides between 60 and 90 FPS even at the lowest detail levels.
Emissions - Fast and still silent
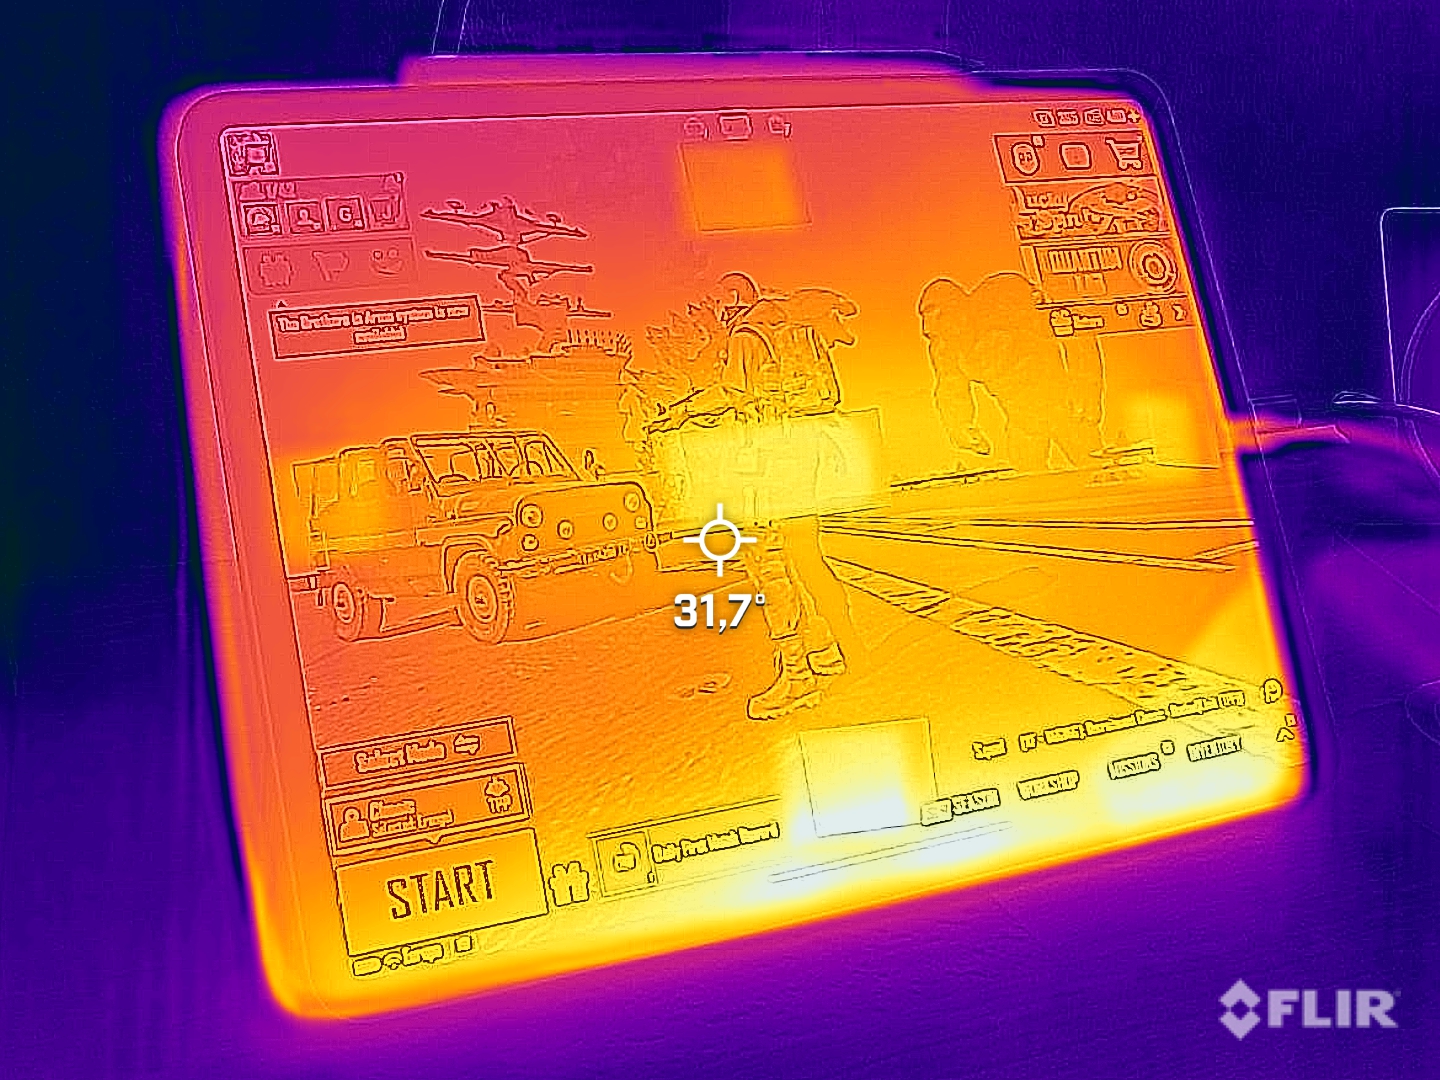
Temperature
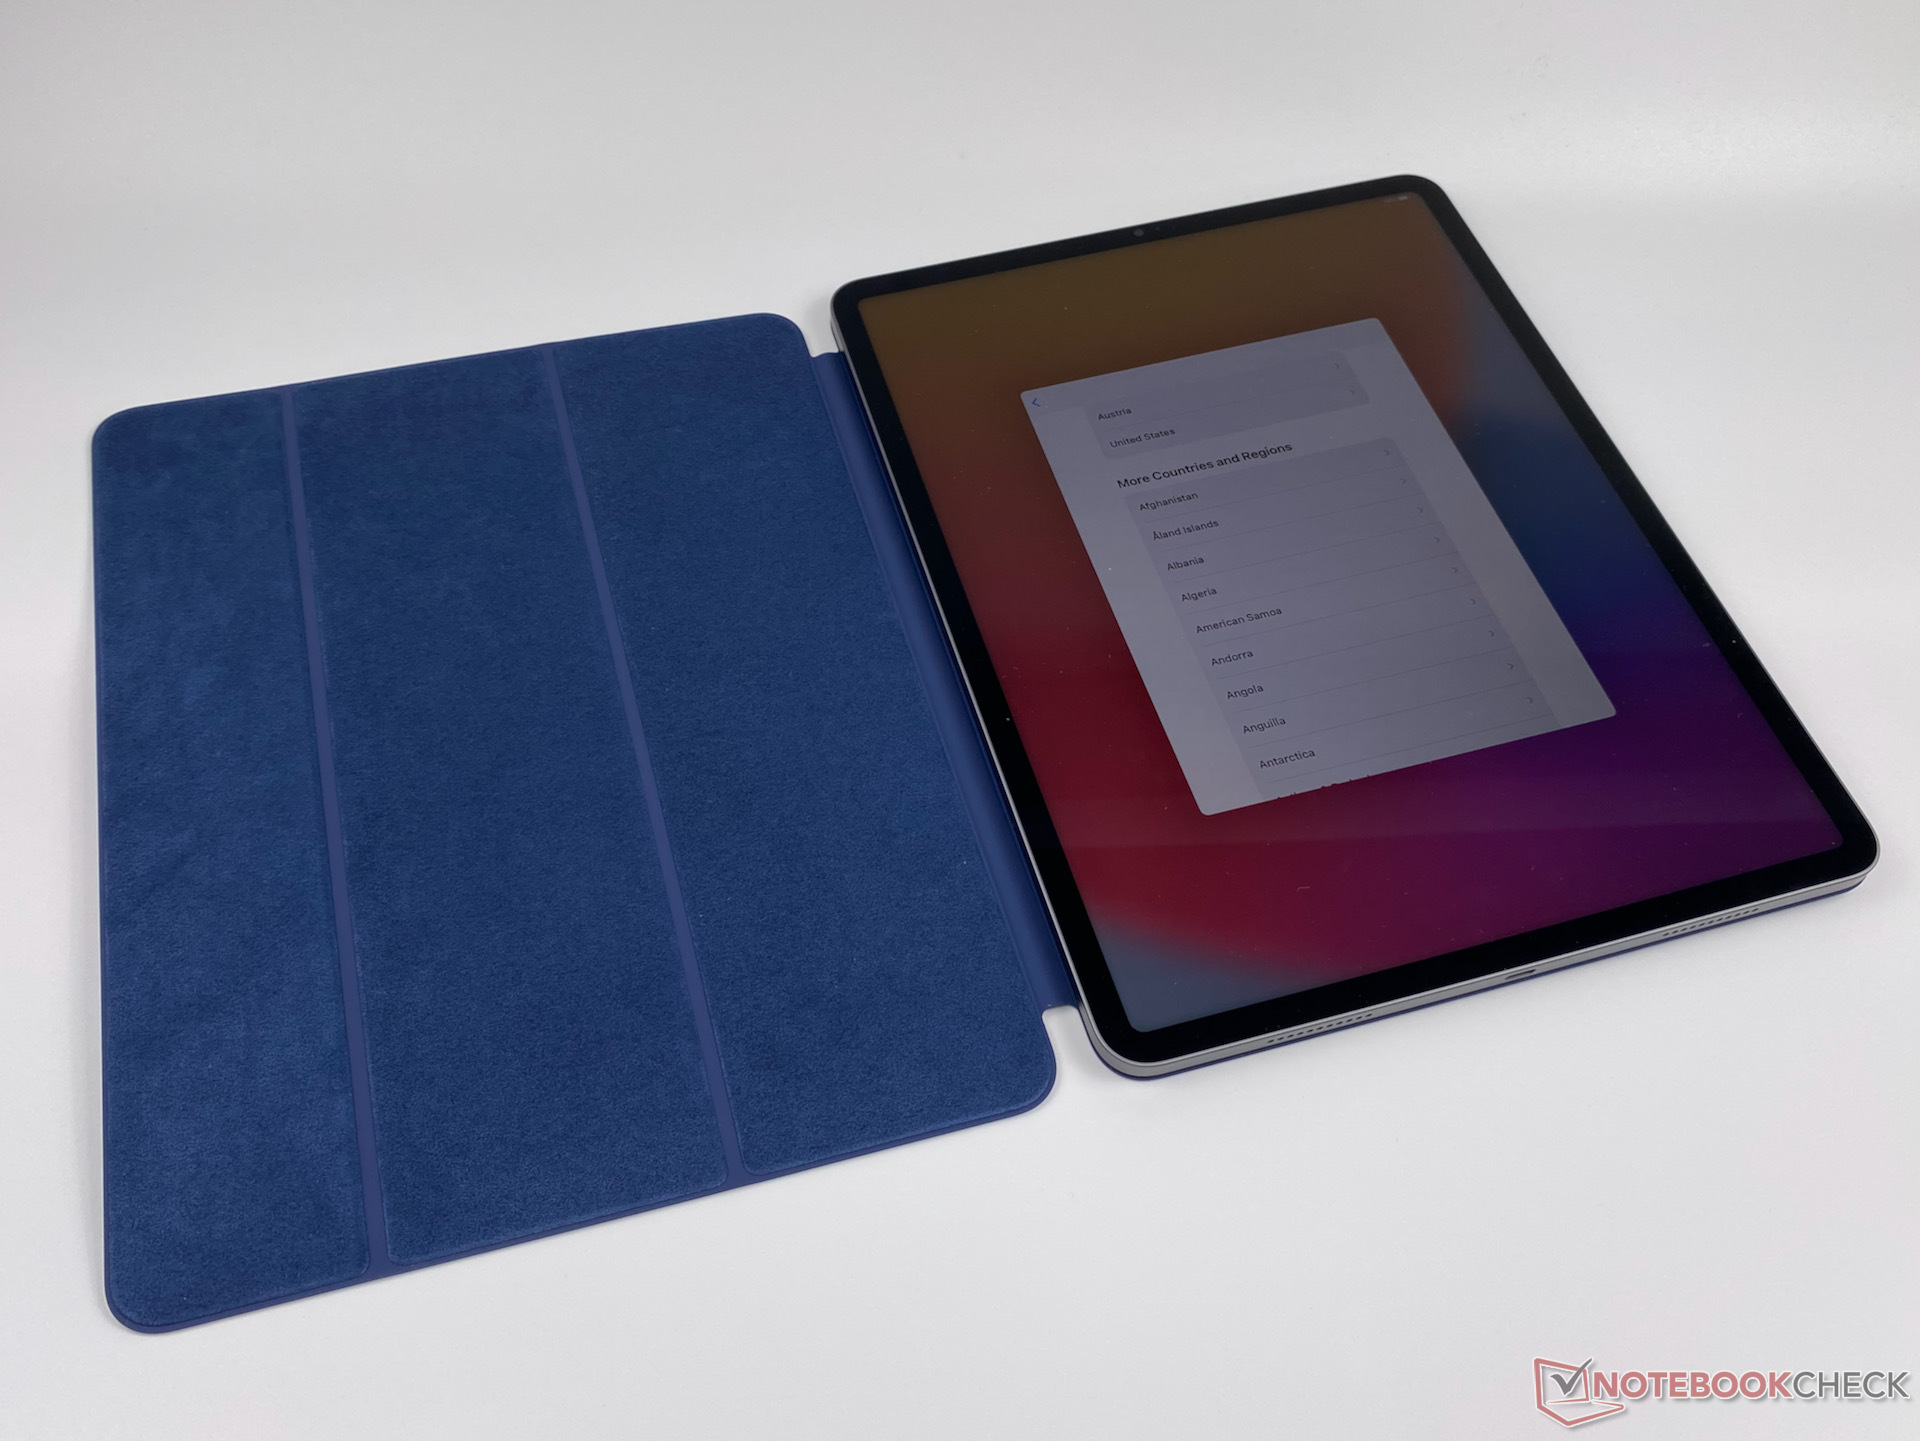
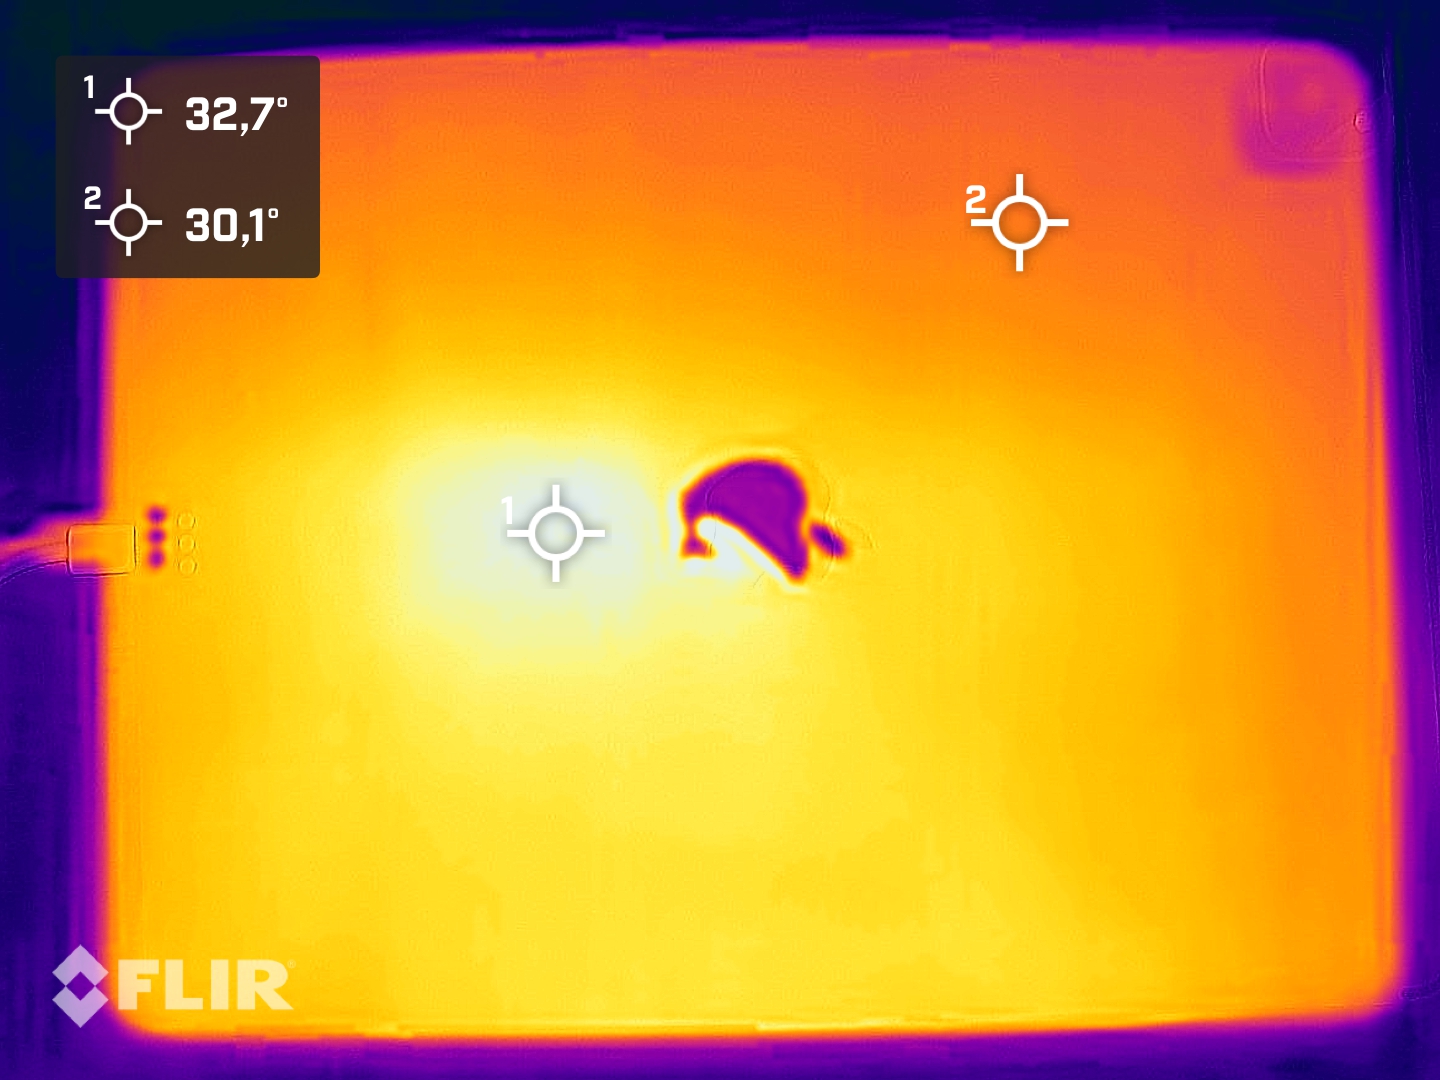
The surface temperatures were always within limits during our tests. The iPad Pro 12.9 does not get uncomfortably hot even during long and demanding gaming sessions, such as in PUBG Mobile or CoD Mobile. This is the case with the tablet connected to the Smart Folio Case, for reference.
However, it is worth noting that the iPad Pro 12.9 throttles the Apple M1 more than the MacBook Air to achieve low case temperatures, even though both machines passively cool their SoC. Presumably, this is because of the iPad Pro's thinner chassis. Accordingly, the smaller iPad Pro 11 throttles the M1 even heavier in the 3DMark Wild Life Extreme stress test than the MacBook Air or the iPad Pro 12.9.
| 3DMark | |
| Wild Life Stress Test Stability | |
| Apple MacBook Air 2020 M1 Entry | |
| Lenovo Tab P11 Pro | |
| Apple iPad Pro 11 2021 | |
| Wild Life Extreme Stress Test | |
| Apple MacBook Air 2020 M1 Entry | |
| Apple iPad Pro 12.9 2021 A2378 | |
| Apple iPad Pro 11 2021 | |
(+) The maximum temperature on the upper side is 37 °C / 99 F, compared to the average of 33.6 °C / 92 F, ranging from 20.7 to 53.2 °C for the class Tablet.
(+) The bottom heats up to a maximum of 35 °C / 95 F, compared to the average of 33.2 °C / 92 F
(+) In idle usage, the average temperature for the upper side is 29.3 °C / 85 F, compared to the device average of 30 °C / 86 F.
Speakers
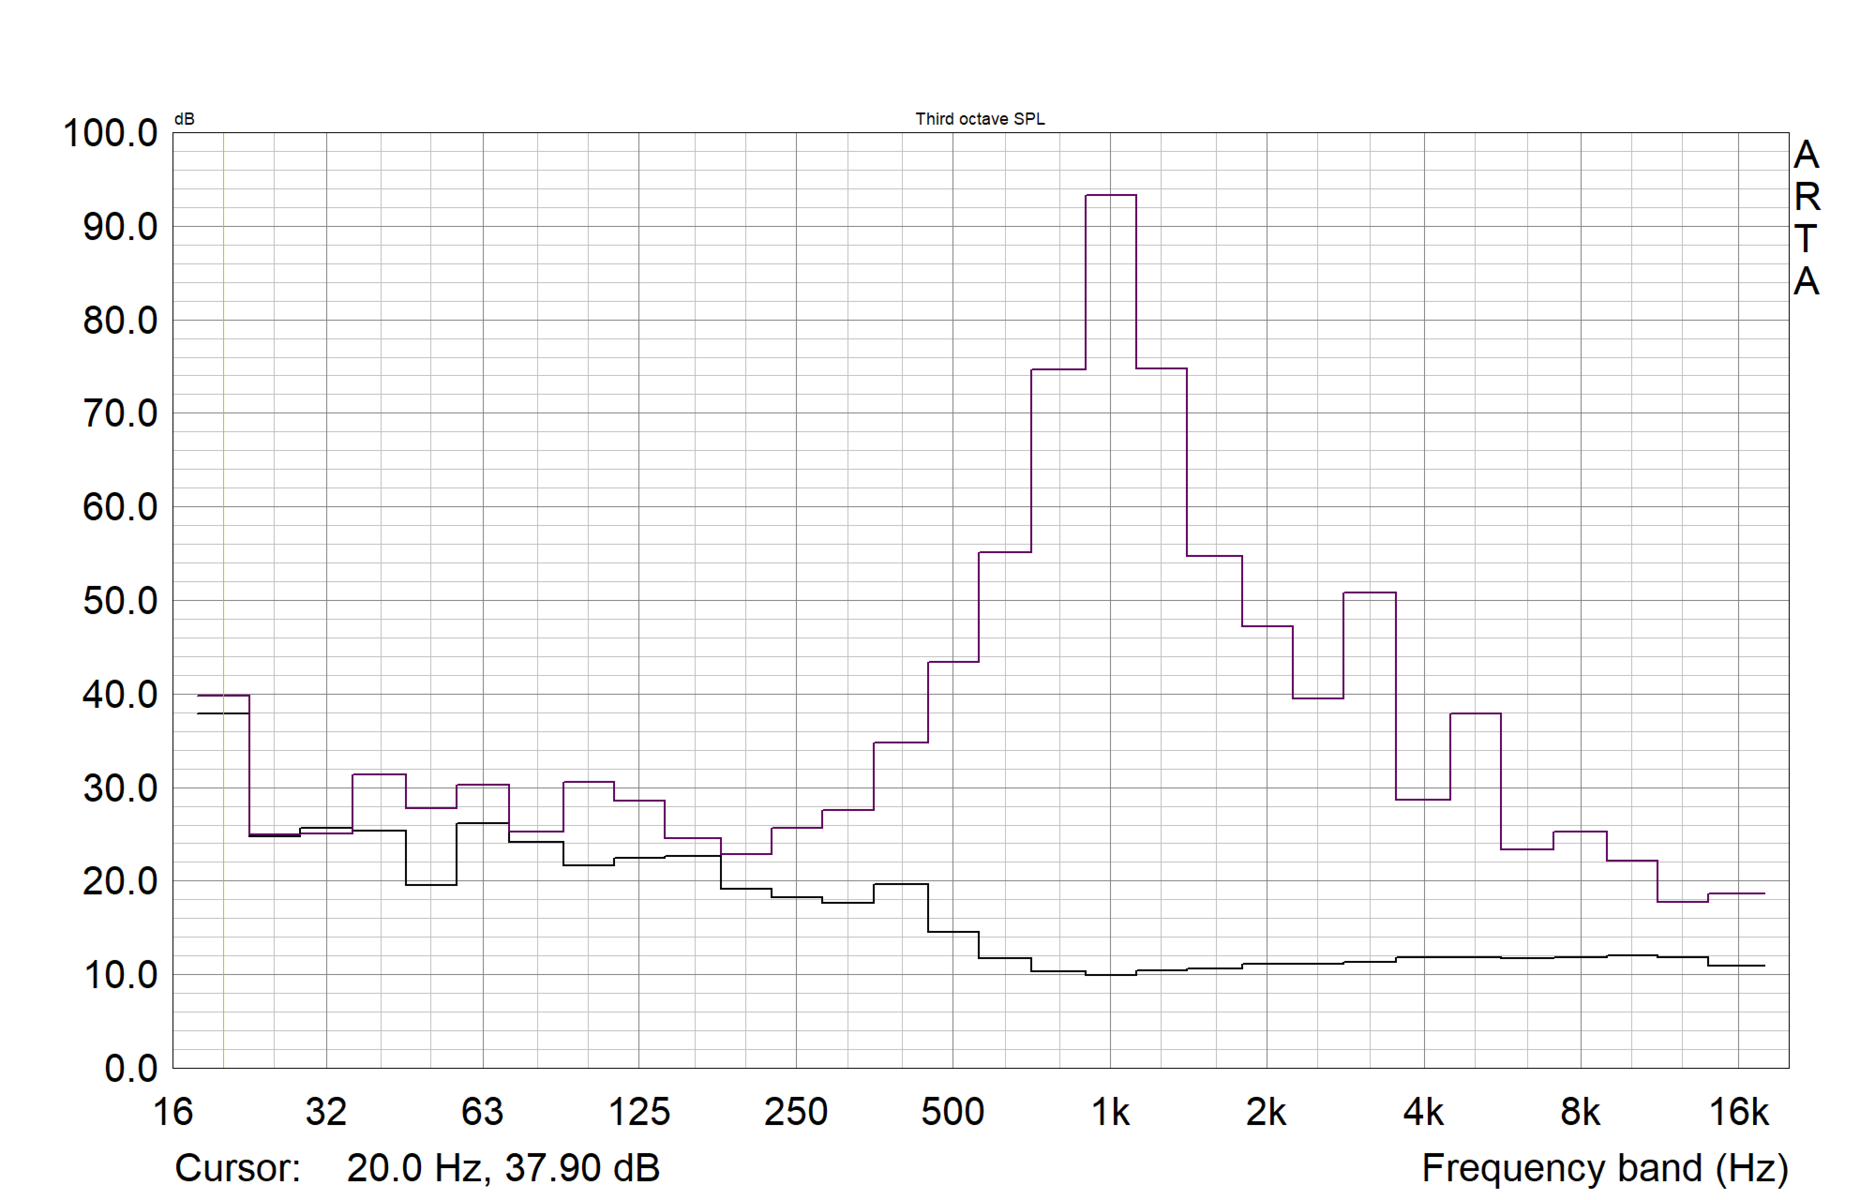
The four speakers in the iPad Pro provide excellent sound, especially given the tablet's size. The speakers in our review unit even beat those in the MacBook Air, and there are measurable differences between the former and the smaller 11-inch iPad Pro. The slightly louder Galaxy Tab S7 Plus has to admit defeat in bass and treble, too.
Apple iPad Pro 12.9 2021 A2378 audio analysis
(+) | speakers can play relatively loud (83.9 dB)
Bass 100 - 315 Hz
(±) | reduced bass - on average 5.8% lower than median
(±) | linearity of bass is average (8.7% delta to prev. frequency)
Mids 400 - 2000 Hz
(+) | balanced mids - only 2.9% away from median
(+) | mids are linear (4.1% delta to prev. frequency)
Highs 2 - 16 kHz
(+) | balanced highs - only 2.9% away from median
(+) | highs are linear (6.9% delta to prev. frequency)
Overall 100 - 16.000 Hz
(+) | overall sound is linear (7.9% difference to median)
Compared to same class
» 1% of all tested devices in this class were better, 0% similar, 99% worse
» The best had a delta of 7%, average was 20%, worst was 129%
Compared to all devices tested
» 2% of all tested devices were better, 1% similar, 98% worse
» The best had a delta of 4%, average was 24%, worst was 134%
Apple MacBook Air 2020 M1 Entry audio analysis
(±) | speaker loudness is average but good (79.6 dB)
Bass 100 - 315 Hz
(±) | reduced bass - on average 7.1% lower than median
(±) | linearity of bass is average (9.5% delta to prev. frequency)
Mids 400 - 2000 Hz
(+) | balanced mids - only 2.2% away from median
(+) | mids are linear (5.3% delta to prev. frequency)
Highs 2 - 16 kHz
(+) | balanced highs - only 2.3% away from median
(+) | highs are linear (4% delta to prev. frequency)
Overall 100 - 16.000 Hz
(+) | overall sound is linear (8.7% difference to median)
Compared to same class
» 3% of all tested devices in this class were better, 1% similar, 96% worse
» The best had a delta of 5%, average was 18%, worst was 53%
Compared to all devices tested
» 3% of all tested devices were better, 1% similar, 97% worse
» The best had a delta of 4%, average was 24%, worst was 134%
Apple iPad Pro 11 2021 audio analysis
(+) | speakers can play relatively loud (83.5 dB)
Bass 100 - 315 Hz
(±) | reduced bass - on average 11.1% lower than median
(±) | linearity of bass is average (13.2% delta to prev. frequency)
Mids 400 - 2000 Hz
(+) | balanced mids - only 4% away from median
(+) | mids are linear (4.6% delta to prev. frequency)
Highs 2 - 16 kHz
(+) | balanced highs - only 2.2% away from median
(+) | highs are linear (5.2% delta to prev. frequency)
Overall 100 - 16.000 Hz
(+) | overall sound is linear (11.4% difference to median)
Compared to same class
» 12% of all tested devices in this class were better, 4% similar, 84% worse
» The best had a delta of 7%, average was 20%, worst was 129%
Compared to all devices tested
» 7% of all tested devices were better, 2% similar, 91% worse
» The best had a delta of 4%, average was 24%, worst was 134%
Samsung Galaxy Tab S7 Plus audio analysis
(+) | speakers can play relatively loud (87.2 dB)
Bass 100 - 315 Hz
(±) | reduced bass - on average 12.9% lower than median
(±) | linearity of bass is average (10.3% delta to prev. frequency)
Mids 400 - 2000 Hz
(+) | balanced mids - only 3.8% away from median
(+) | mids are linear (2.7% delta to prev. frequency)
Highs 2 - 16 kHz
(+) | balanced highs - only 2.9% away from median
(+) | highs are linear (5.5% delta to prev. frequency)
Overall 100 - 16.000 Hz
(+) | overall sound is linear (10.9% difference to median)
Compared to same class
» 10% of all tested devices in this class were better, 3% similar, 87% worse
» The best had a delta of 7%, average was 20%, worst was 129%
Compared to all devices tested
» 6% of all tested devices were better, 2% similar, 92% worse
» The best had a delta of 4%, average was 24%, worst was 134%
Power Management - The iPad 12.9 with an M1 SoC is no runtime miracle
Power Consumption
In terms of power consumption, we see a slightly higher power consumption compared to the 11-inch Pro model, with the larger Mini LED display the culprit. Compared to its predecessor, the new iPad Pro 12.9 is a little more power-hungry in most cases, but it is difficult to say if the M1 SoC or the Mini LED display are behind this increase. However, comparing the iPad Pro 12.9 to the MacBook Pro 13 shows how much the former holds the M1 SoC back.
Incidentally, our test device behaved abnormally when we switched it off. Here, the iPad Pro 12.9 constantly pulled 0.9 W when connected to its bundled charger, significantly more than it consumes in standby mode. Repeated tests confirmed this.
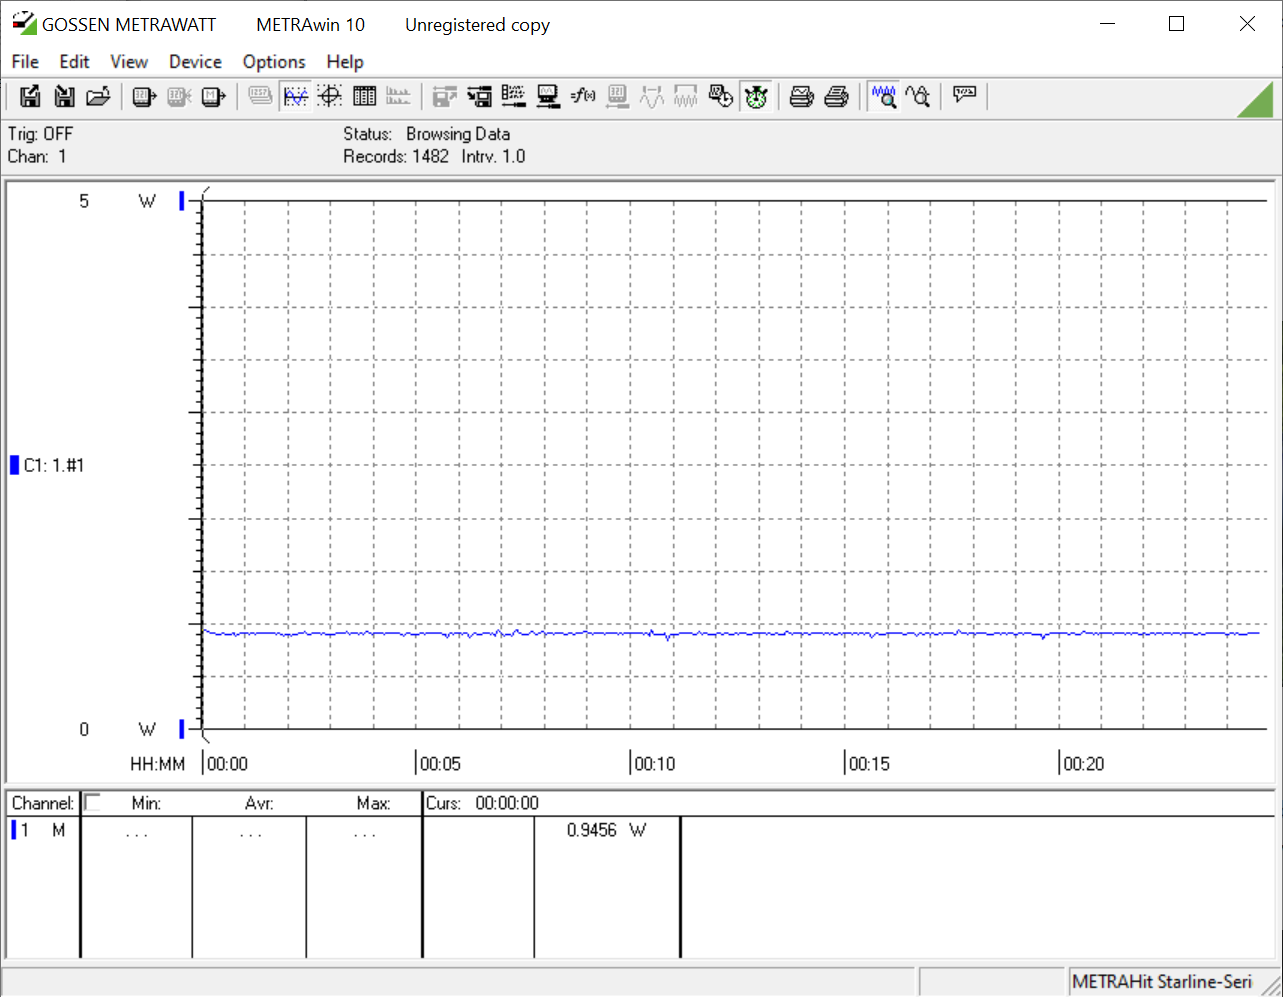
| Off / Standby | |
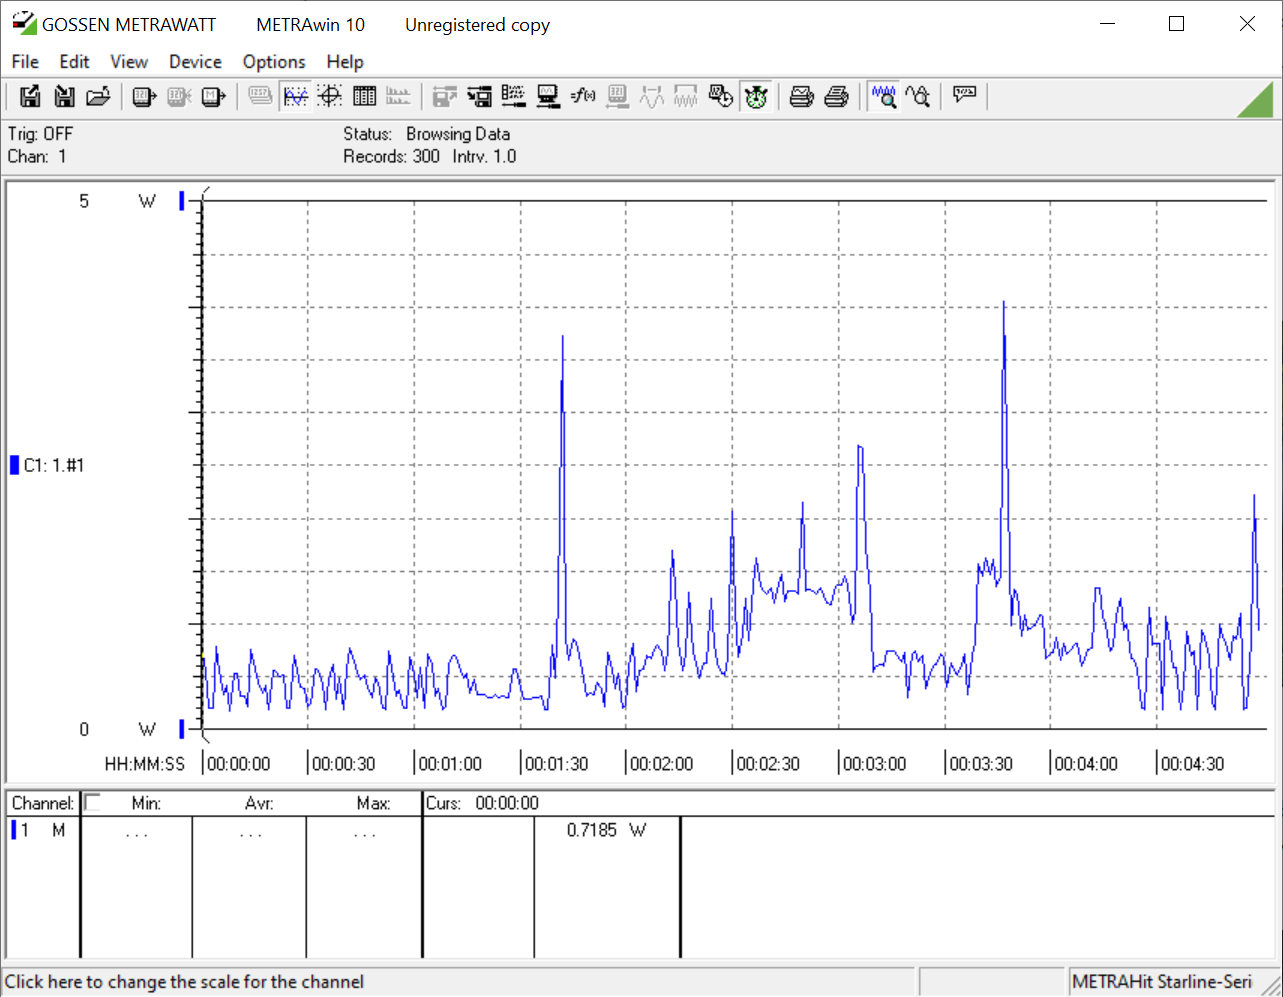
| Idle | |
| Load |
|
Key:
min: | |
| Apple iPad Pro 12.9 2021 A2378 mAh | Apple MacBook Pro 13 Late 2020 M1 Entry (8 / 256 GB) mAh | Apple iPad Pro 12.9 2020 9720 mAh | Apple iPad Pro 11 2021 7538 mAh | |
|---|---|---|---|---|
| Power Consumption | -69% | 7% | 33% | |
| Idle Minimum * (Watt) | 1.8 | 1.67 7% | 1.22 32% | 1.01 44% |
| Idle Average * (Watt) | 9.6 | 6.7 30% | 8.68 10% | 6.2 35% |
| Idle Maximum * (Watt) | 9.8 | 7.4 24% | 8.75 11% | 6.23 36% |
| Load Average * (Watt) | 12.2 | 28 -130% | 11.72 4% | 8.99 26% |
| Load Maximum * (Watt) | 12.6 | 47.5 -277% | 15.25 -21% | 9.89 22% |
* ... smaller is better
The iPad Pro 12.9 yields some interesting results at half brightness when comparing it to the new iPad Pro 11. The former consumes more than the latter when idling, but the pair meet at a similar level under load. The larger display does not play a significant role here, nor the Mini LED backlight. We run GFXBench's off-screen benchmark here, so most areas remain black. Borrowing the 90 W charger from a MacBook Pro 16 does not cause the iPad Pro 12.9 to consume more power either, so the included 20 W power supply does not hold the tablet back, even if it hampers its charging speed.
Power Consumption: Geekbench (150 cd/m²)
Power Consumption: GFXBench (150 cd/m²)
Battery Life
The large iPad has to admit defeat to its competitors, such as the 11-inch iPad Pro and its 2020 predecessor, in terms of battery life. The MacBook Air also plays in a different league. Only the two Surface products are significantly weaker in this regard.
Four hours of gaming at maximum brightness and eleven hours of Wi-Fi surfing at 150 cd/m² are still respectable runtimes though, in our opinion. You do not need to worry about limited performance with the iPad Pro 12.9 when using it in battery mode, either.
The supplied 20 W power adapter charges the iPad Pro 12.9 relatively slowly, as we mentioned earlier. Our review unit takes 4:12 hours to recharge fully in standby mode, and 2:40 hours with the 90 W charger from a MacBook Pro 16, during which the tablet consumes about 30 W.
| Apple iPad Pro 12.9 2021 A2378 mAh | Microsoft Surface Pro X mAh | Apple iPad Pro 12.9 2020 9720 mAh | Apple iPad Pro 11 2021 7538 mAh | Huawei MatePad Pro 10.8 7250 mAh | Lenovo Tab P11 Pro 8600 mAh | Microsoft Surface Pro 7 Plus mAh | Apple MacBook Pro 13 Late 2020 M1 Entry (8 / 256 GB) mAh | Apple MacBook Air Late 2020 (M1, 8 Core GPU, 8 GB RAM) 4380 mAh | Apple MacBook Air 2020 M1 Entry 4380 mAh | |
|---|---|---|---|---|---|---|---|---|---|---|
| Battery runtime | -30% | -3% | 16% | 12% | 11% | -19% | 62% | 39% | 43% | |
| H.264 (h) | 13.6 | 12.3 -10% | 15.5 14% | 15.2 12% | 14.2 4% | 10.8 -21% | 19.2 41% | |||
| WiFi v1.3 (h) | 11.2 | 7.8 -30% | 15.1 35% | 13.7 22% | 14.9 33% | 10.4 -7% | 8.1 -28% | 20.4 82% | 15.6 39% | 16 43% |
| Load (h) | 4.3 | 2.8 -35% | 4.8 12% | 3.9 -9% | 5.8 35% | 3.9 -9% | ||||
| Reader / Idle (h) | 30.5 | 38 | 31.3 | 27.4 | 13.6 |
Pros
Cons
Verdict - Mini LED, and an M1 SoC create almost the perfect tablet
The Apple iPad Pro 12.9 is, once again, an excellent tablet. However, its size, weight, restrictive OS and price continue to render it a niche product. A Mini LED display and the mighty Apple M1 SoC are new this year, with the former convincing us with its contrast, brightness, HDR, and illumination. However, the iPad Pro 12.9 is not always ahead of its 11-inch sibling regarding colour reproduction and dark surroundings. The use of PWM for brightness control in the 12.9-inch model will also upset some people.
There are no points of criticism with the Apple M1, though. The tablet offers outstanding performance, along with decent battery life and temperatures, despite passive cooling in its thin chassis. Furthermore, you now get a fast USB 4 port that should futureproof the tablet.
The iPad does not quite do justice to its Pro name, though. In our opinion, this is because of the lack of software for its excellent hardware and the limited versatility that iPadOS offers.
The 12.9-inch iPad Pro hardly shows any weaknesses, but it cannot (yet) fully exploit its potential.
Most people would be better served with the smaller 11-inch model or the iPad Air. Additionally, you should consider the Samsung Galaxy Tab S7 Plus or the Surface Pro series if you are looking for greater software flexibility. However, in terms of battery life and performance, neither Microsoft's nor Samsung's alternatives can match Apple. Typically, Android tablets like the Galaxy Tab S7 Plus do not offer as many software updates as Apple's tablets do, either.
Price & Availability
At the time of publication, Apple charges US$1,099 for the entry-level version of the Apple iPad Pro 12.9 (2021) tested here (8/128 GB, Wi-Fi). Currently, Amazon matches Apple's price, but the smaller 11-inch model is available at a discount.
Apple iPad Pro 12.9 2021 A2378
- 08/31/2022 v7 (old)
Klaus Hinum
Price comparison

