Apple iPad Pro 11 (2018, WiFi, 64 GB) Tablet Review
")
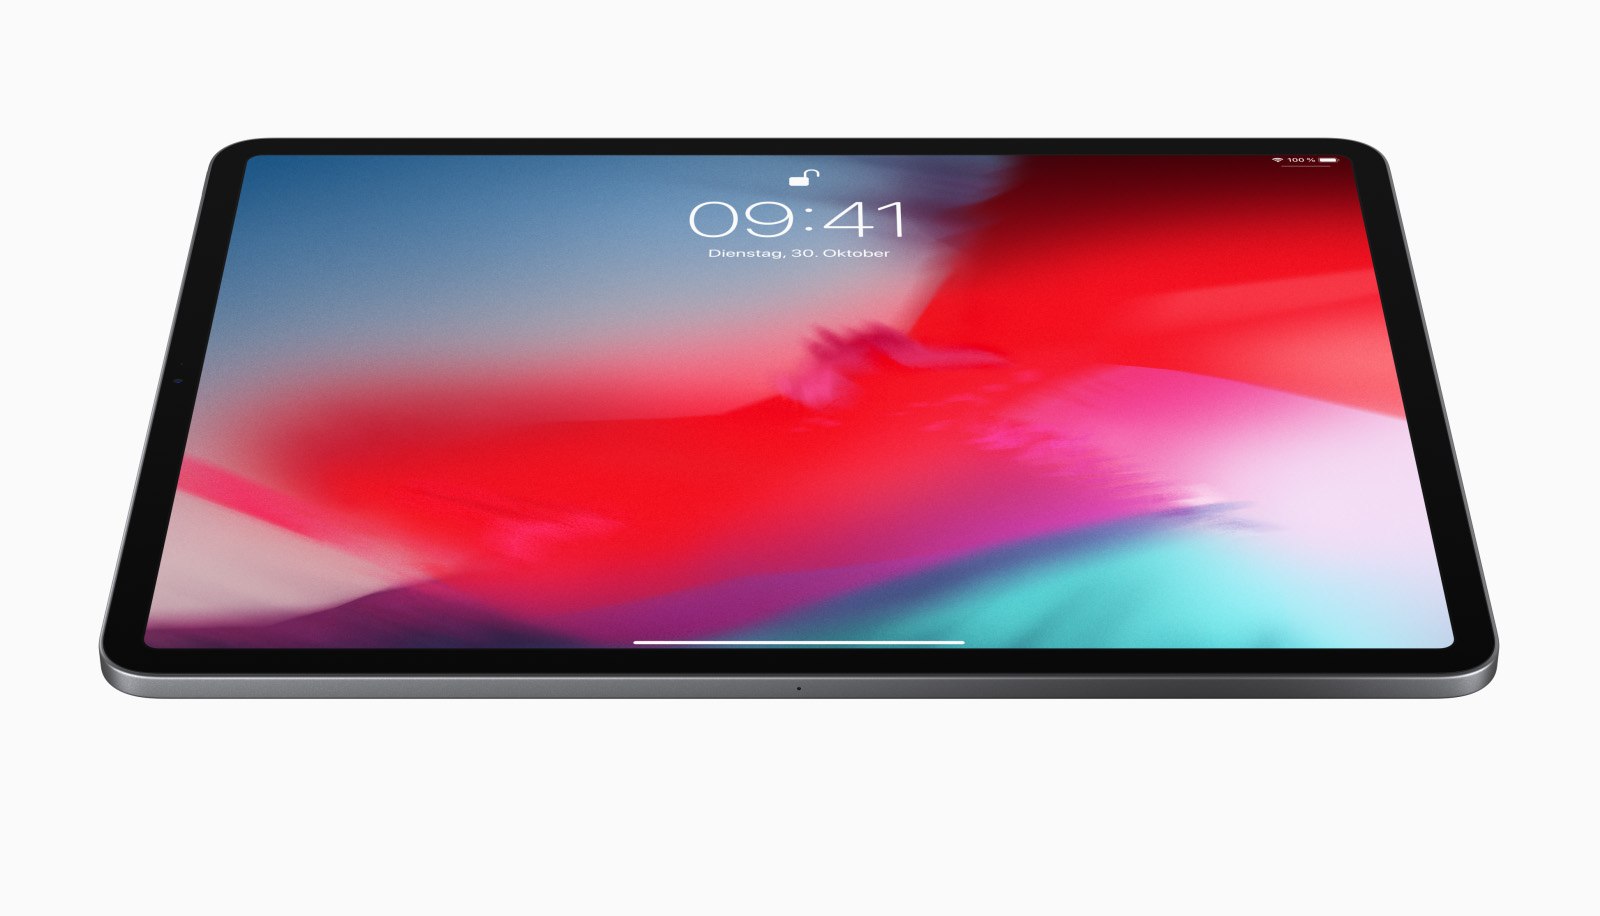
The iPad Pro was a gamble for Apple. The success that Microsoft eventually achieved with the Surface Pro indicated that people may adopt a larger iPad, but would creatives, office workers and photographers adopt the tablet as their work device? Apple first released the iPad Pro two years ago with a huge display, quad-speakers and professional accessories that persuaded many people to part with a lot of money. The series is now in its third iteration and remains focussed on being a laptop replacement for professionals. Apple has redesigned the iPad Pro with strikingly slimmer bezels and has equipped the device with the same Face ID technology that we have seen in the iPhone X, XR and XS to remove the need for a fingerprint sensor.
The smaller version of the new iPad Pro has an 11-inch display with an almost 3:2 aspect ratio. The release of the third generation has coincided with a price increase too, which is now almost a feature of all new Apple devices. The 11-inch iPad Pro starts at $799 (£769) for the 64 GB Wi-Fi version, which rises to $1,828 (£1,798) for the 1 TB LTE model with AppleCare+. Apple continues to sell the last-generation 10.5-inch iPad Pro too, which starts at $649 (£619) for the 64 GB Wi-Fi model.
The iPad Pro has few real competitors besides the Microsoft Surface Pro 6. We have also chosen to compare our test device against the Huawei MediaPad M5 10.8 Pro and the Samsung Galaxy Tab S4. These Android tablets are significantly cheaper than the iPad Pro 11 but also have fewer features too.
Changelog:
- 11.09.2018: Communication and Games sections added, list of benchmarks updated.
- 11.14.2018: Display values and Speaker sections added.
- 11.16.2018: Battery life values adjusted, Heat maps added.
- 11.19.2018: GPS tests, Input Devices & Operation and Accessories sections added.
- 11.20.2018: Review completed.
Case
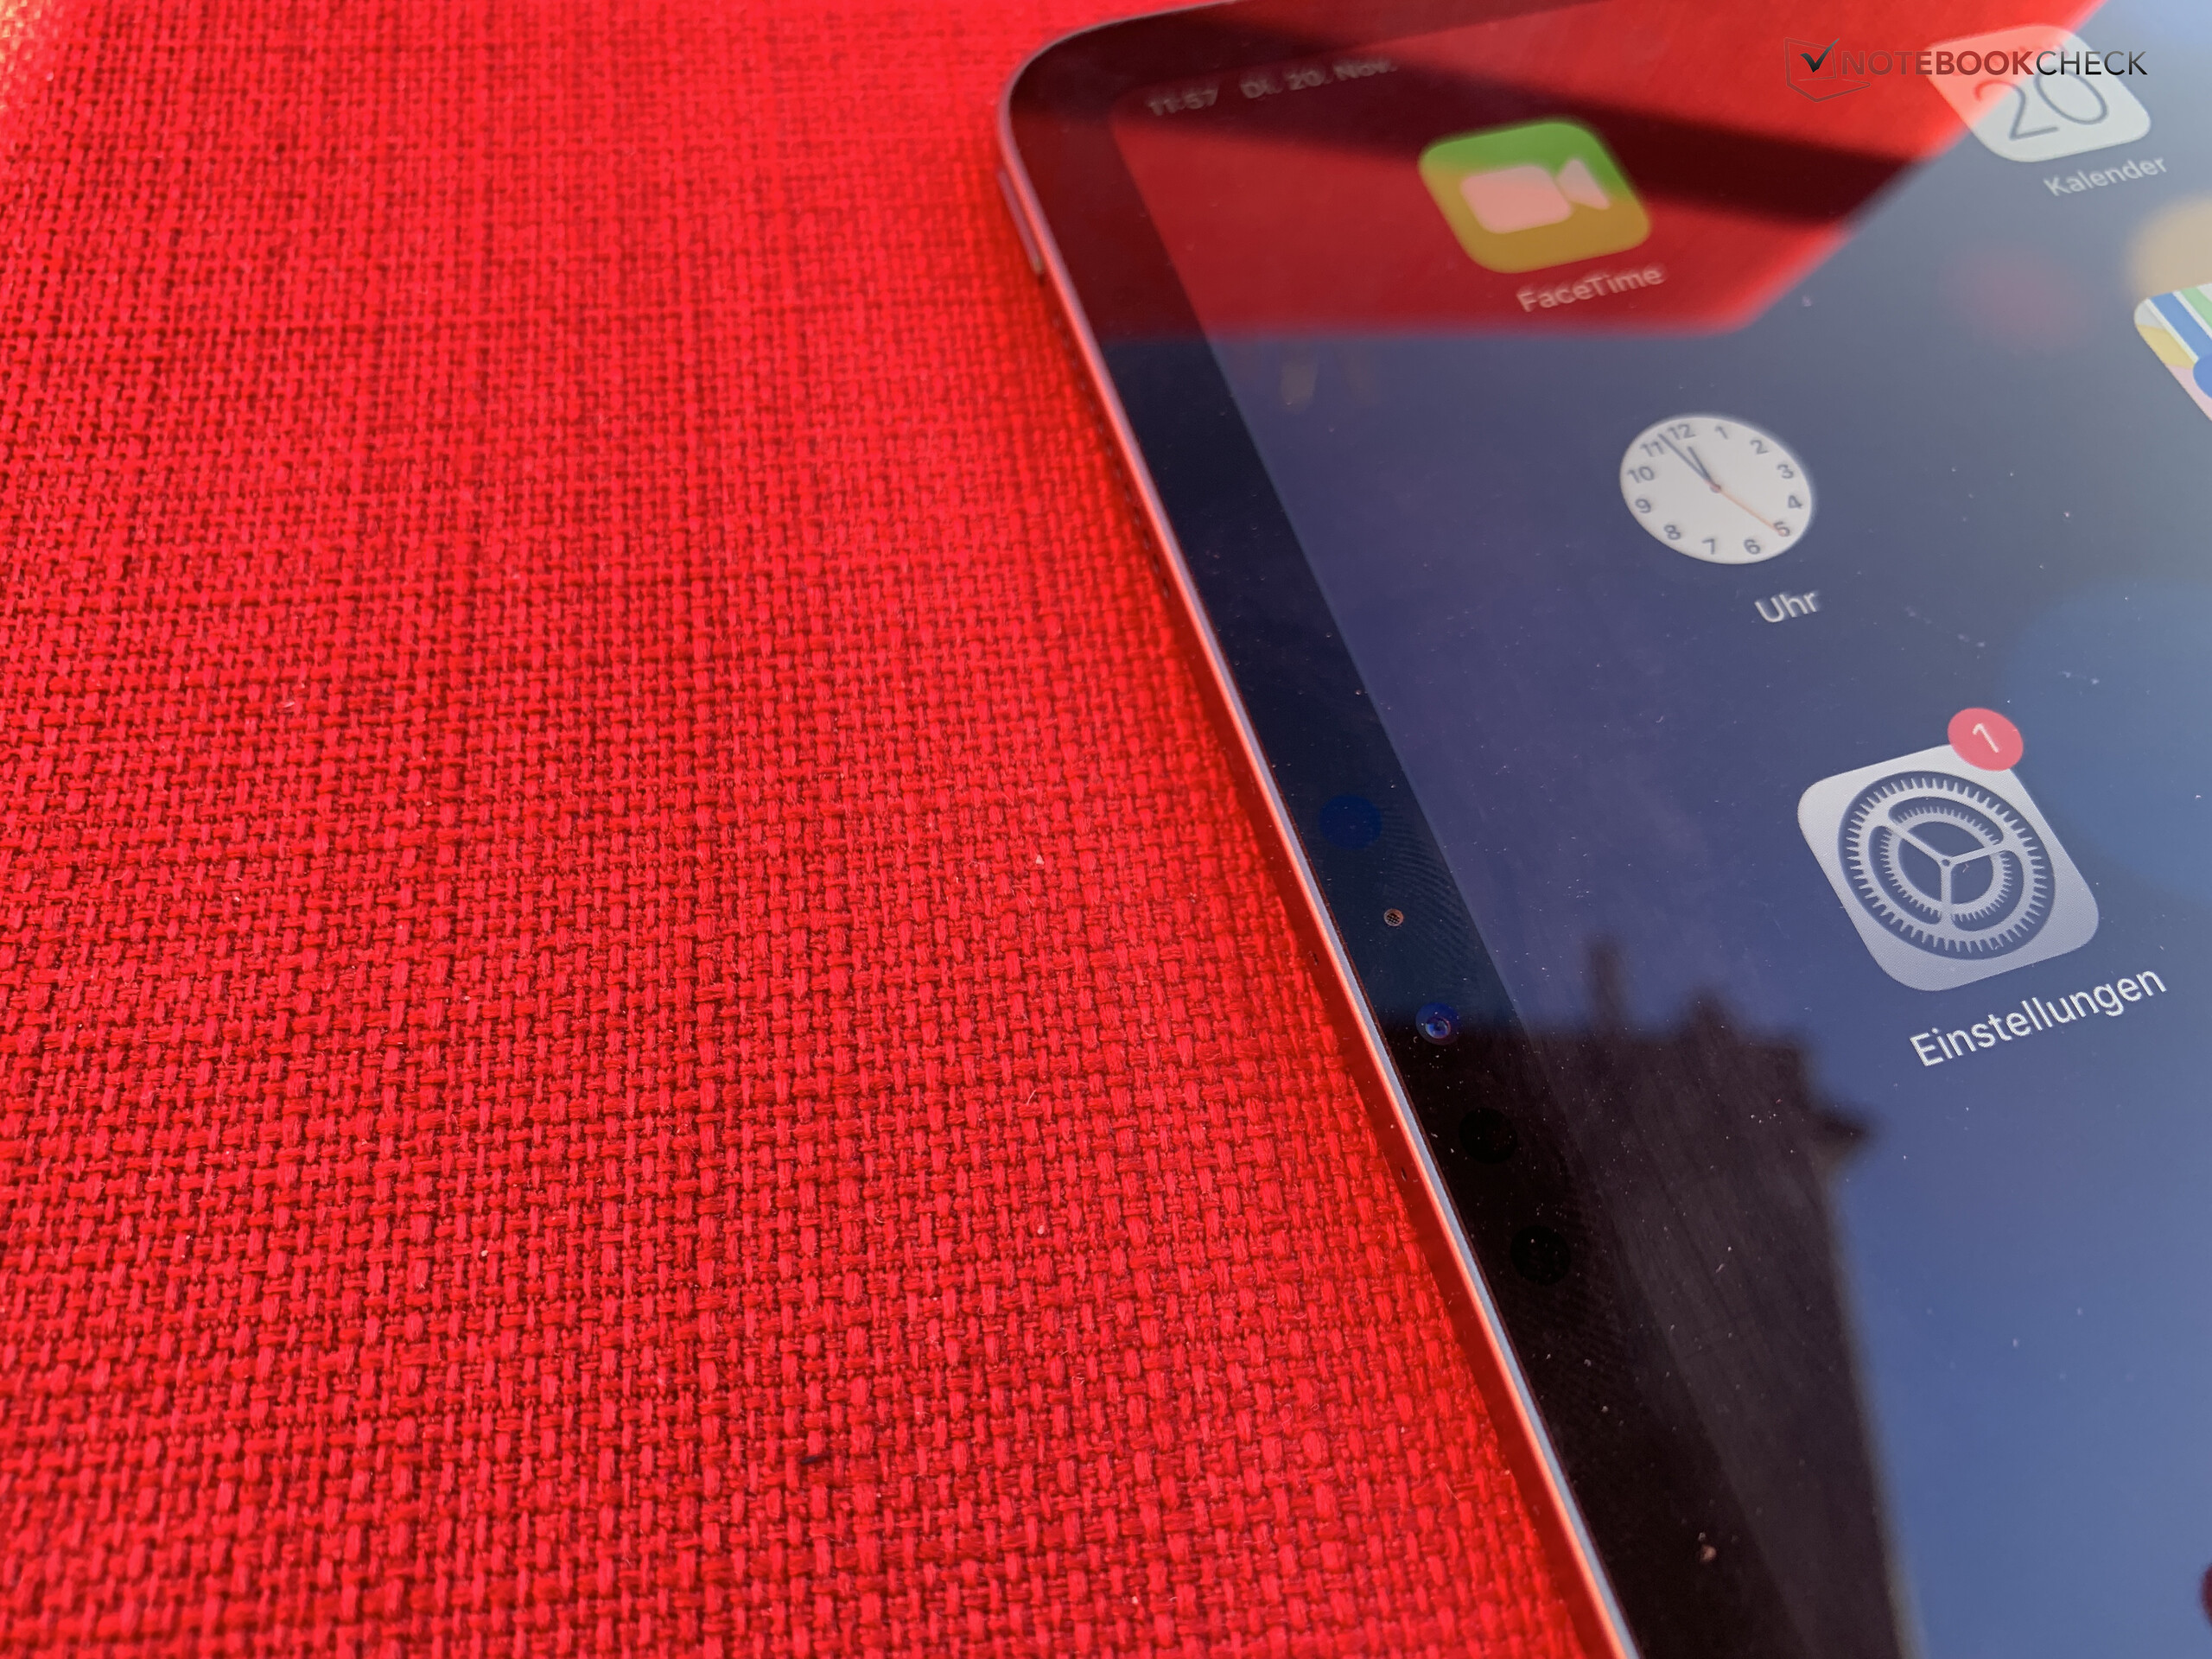
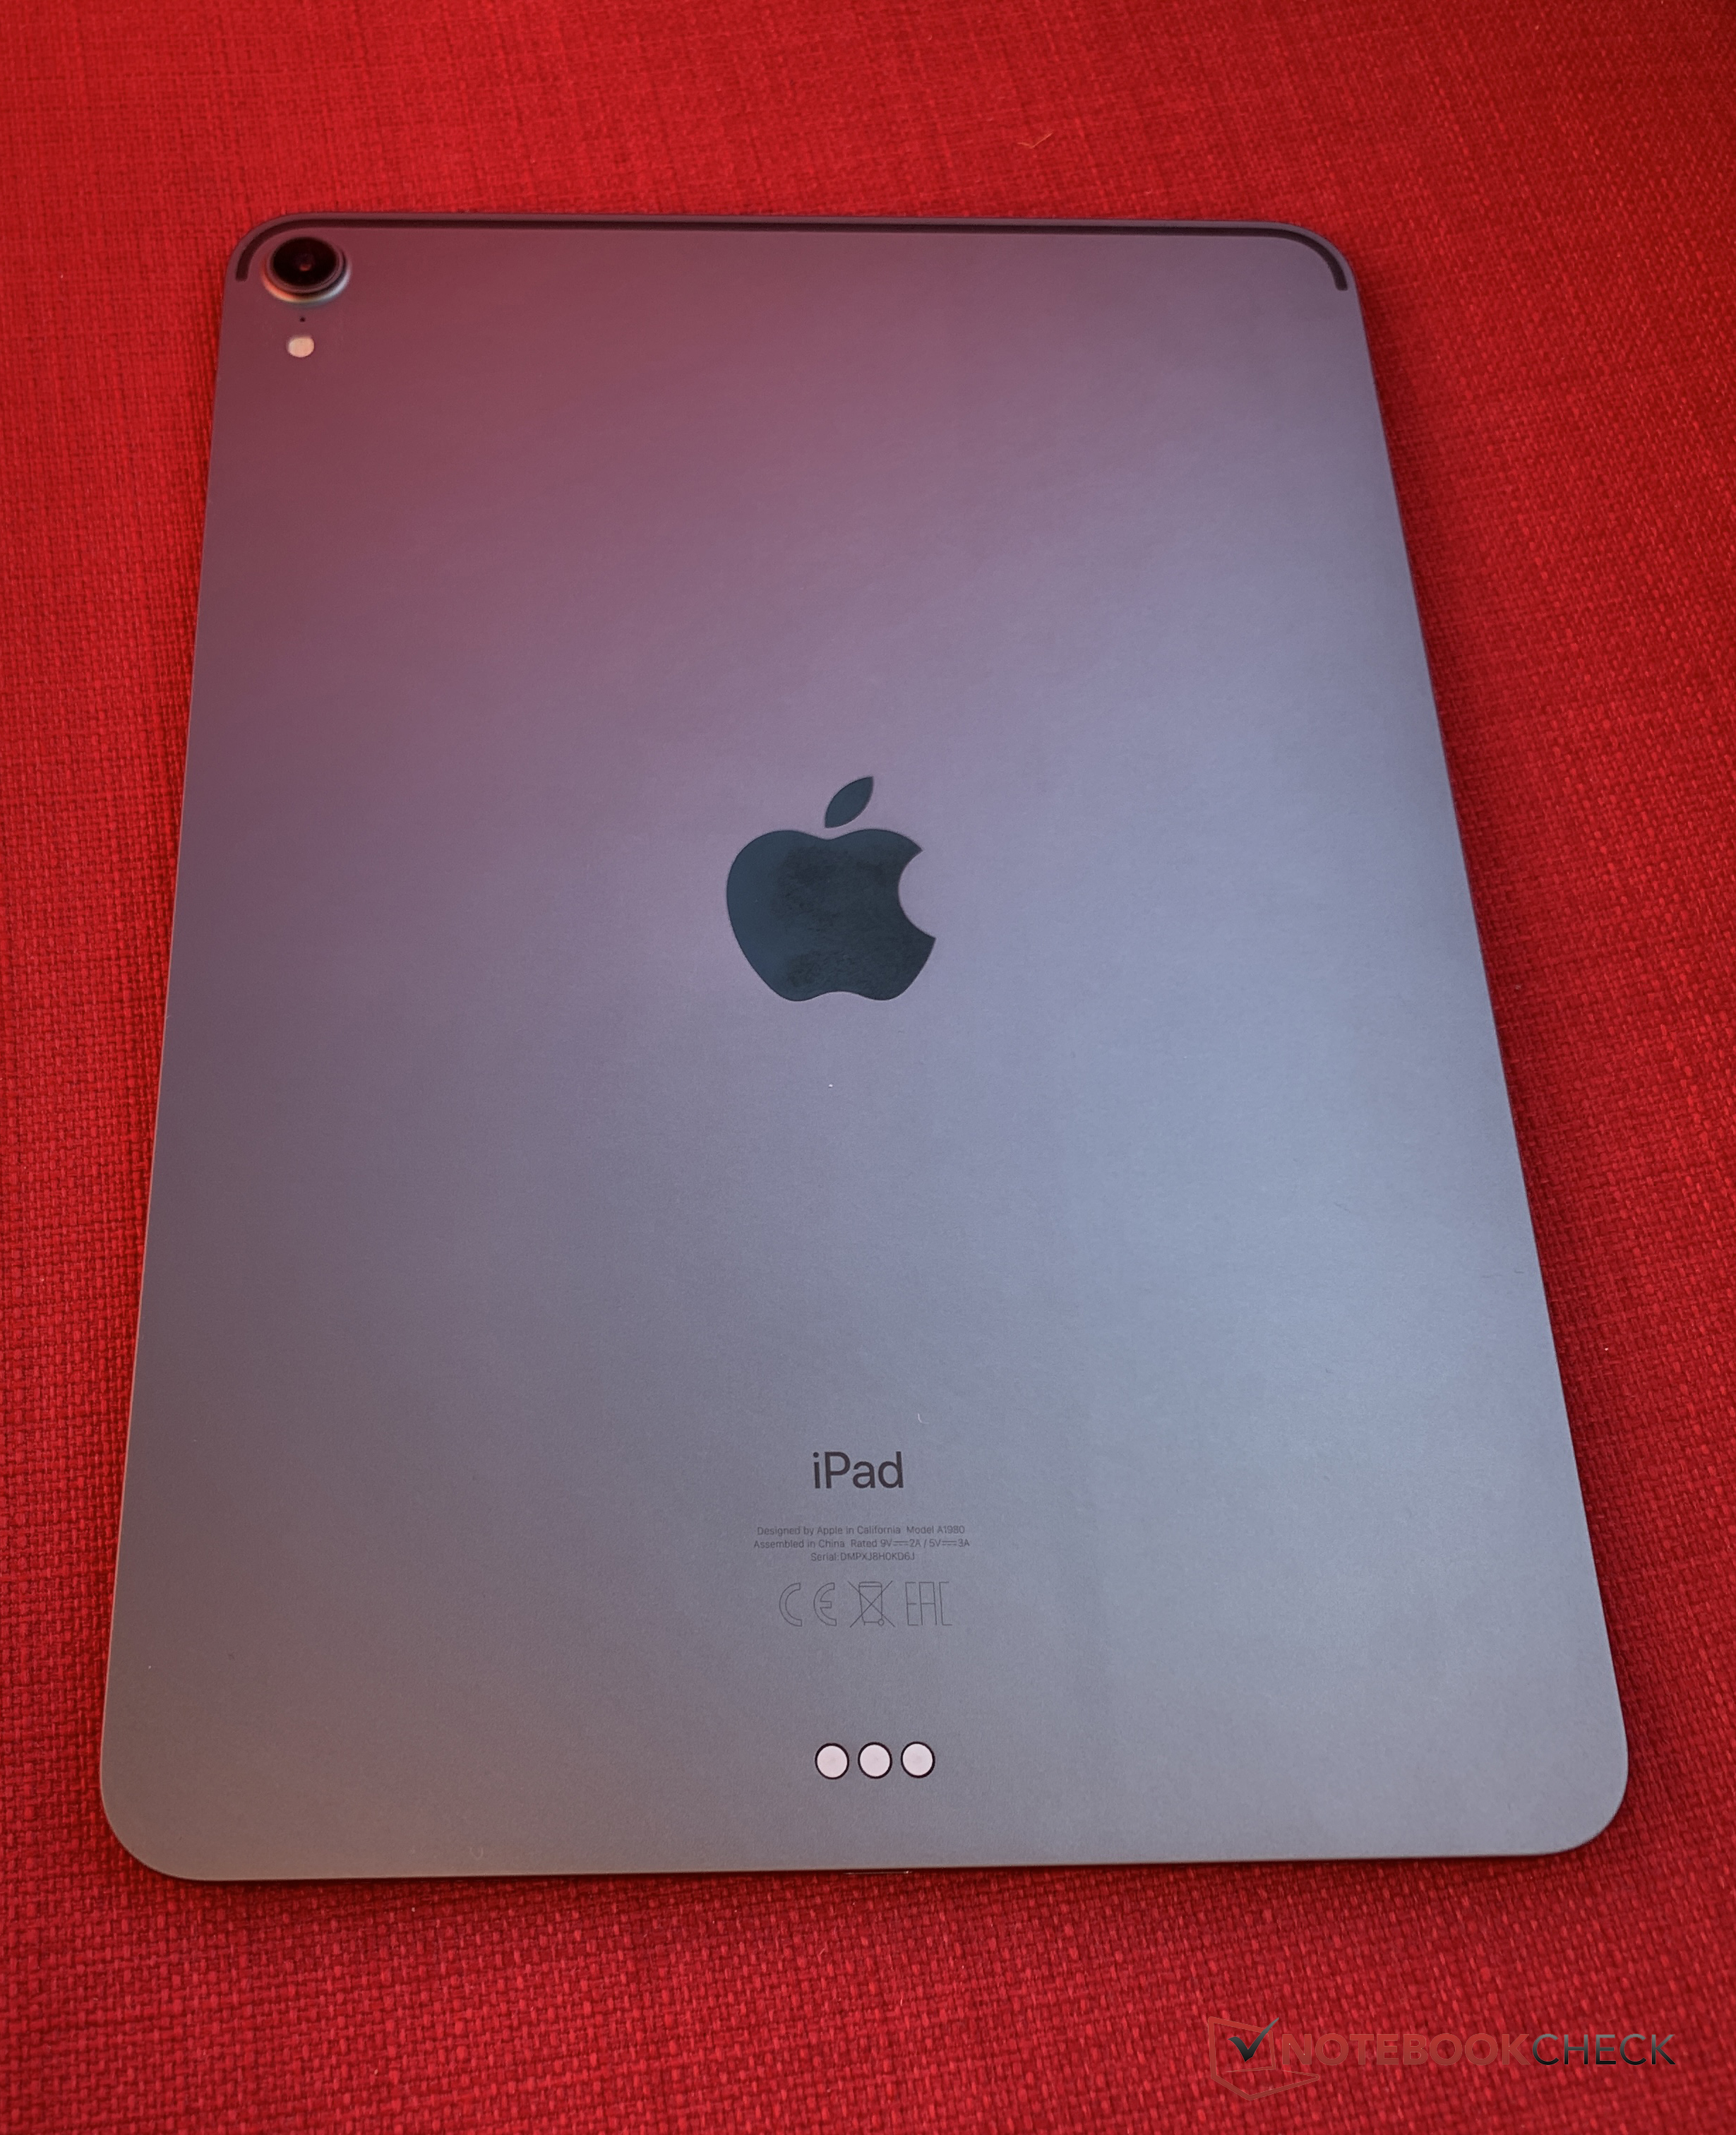
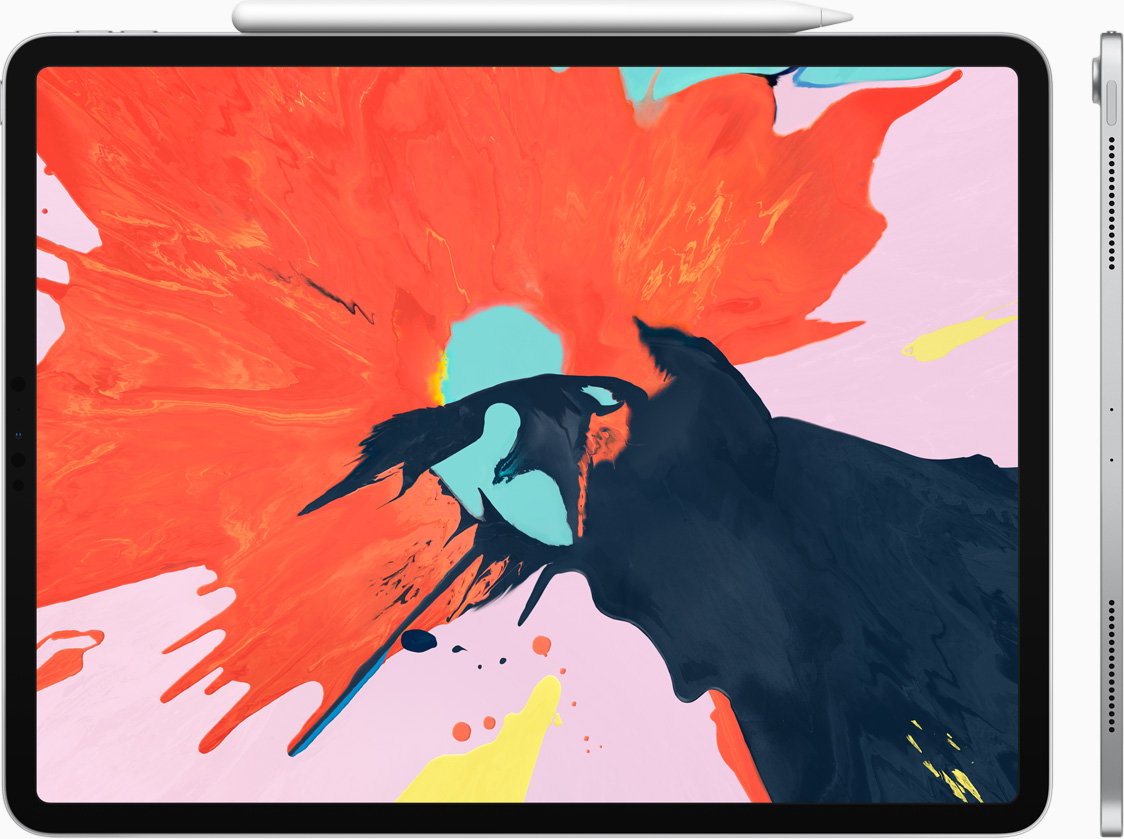
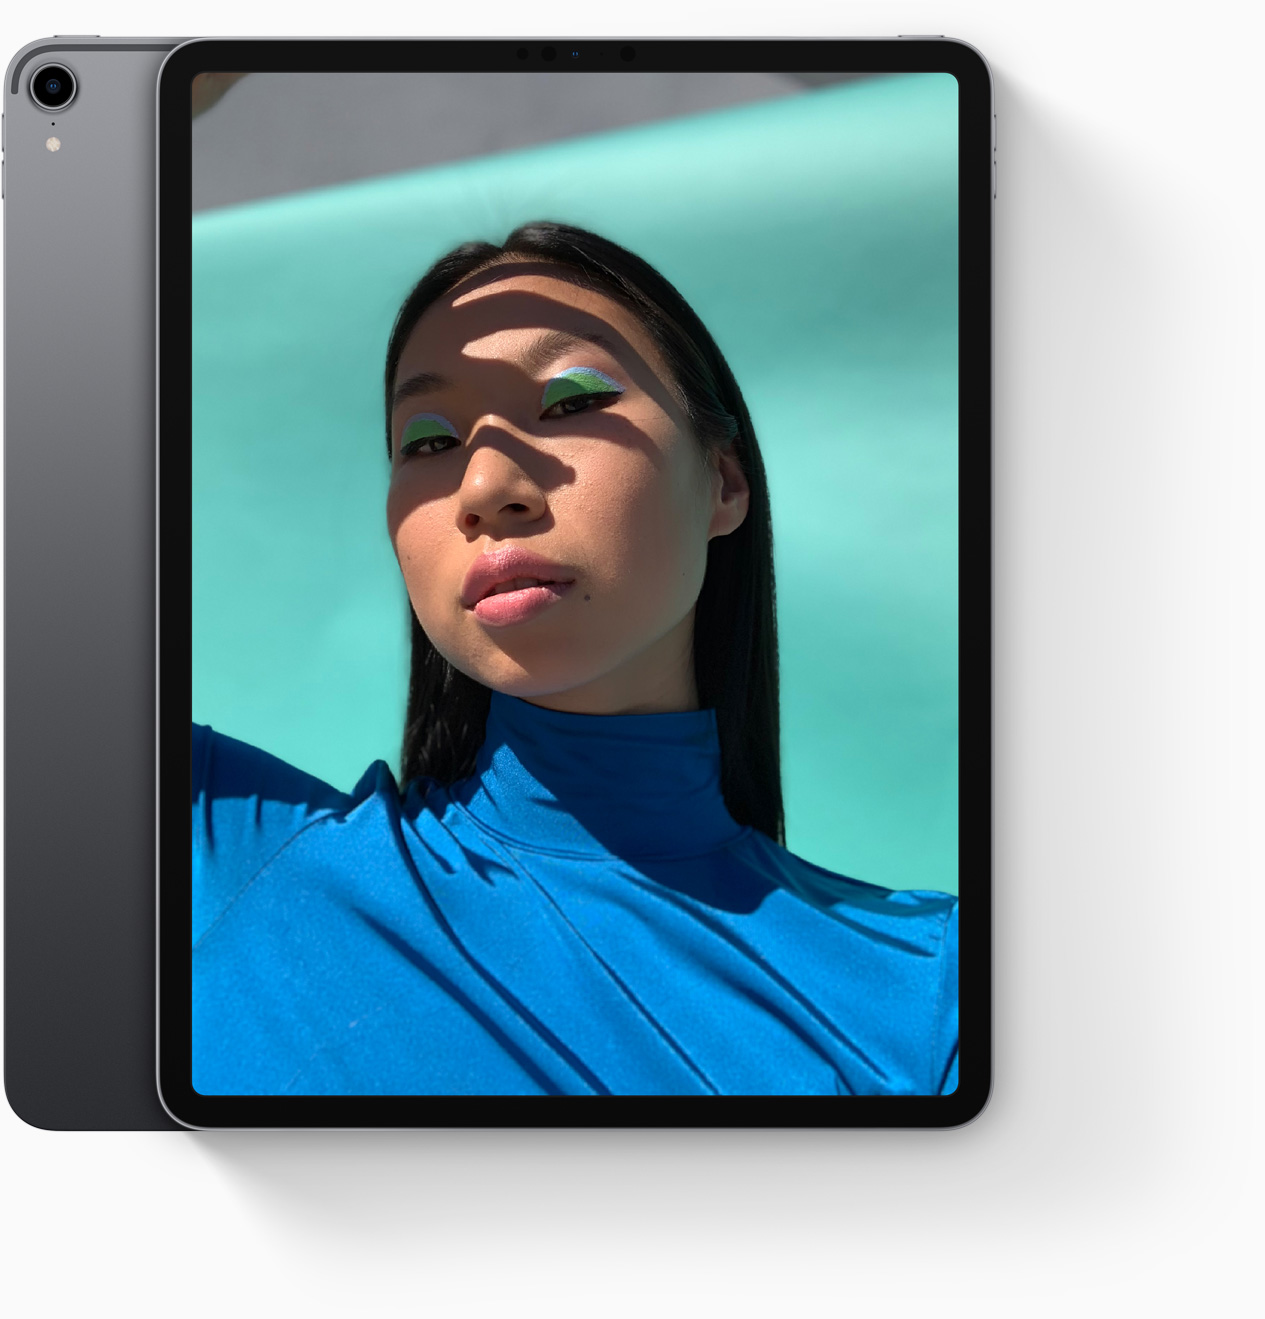
Apple has given the iPad Pro a new look. The new model looks more elegant than its predecessor, although Apple has reduced the colour options to just silver and space grey with a black front; gold and rose gold are passé. The third-generation iPad Pro has noticeably smaller bezels too, while Apple markets the device as having a Liquid Retina display, which essentially means that it has rounded corners. The case has sharper edges too that remind us of the Surface design language.
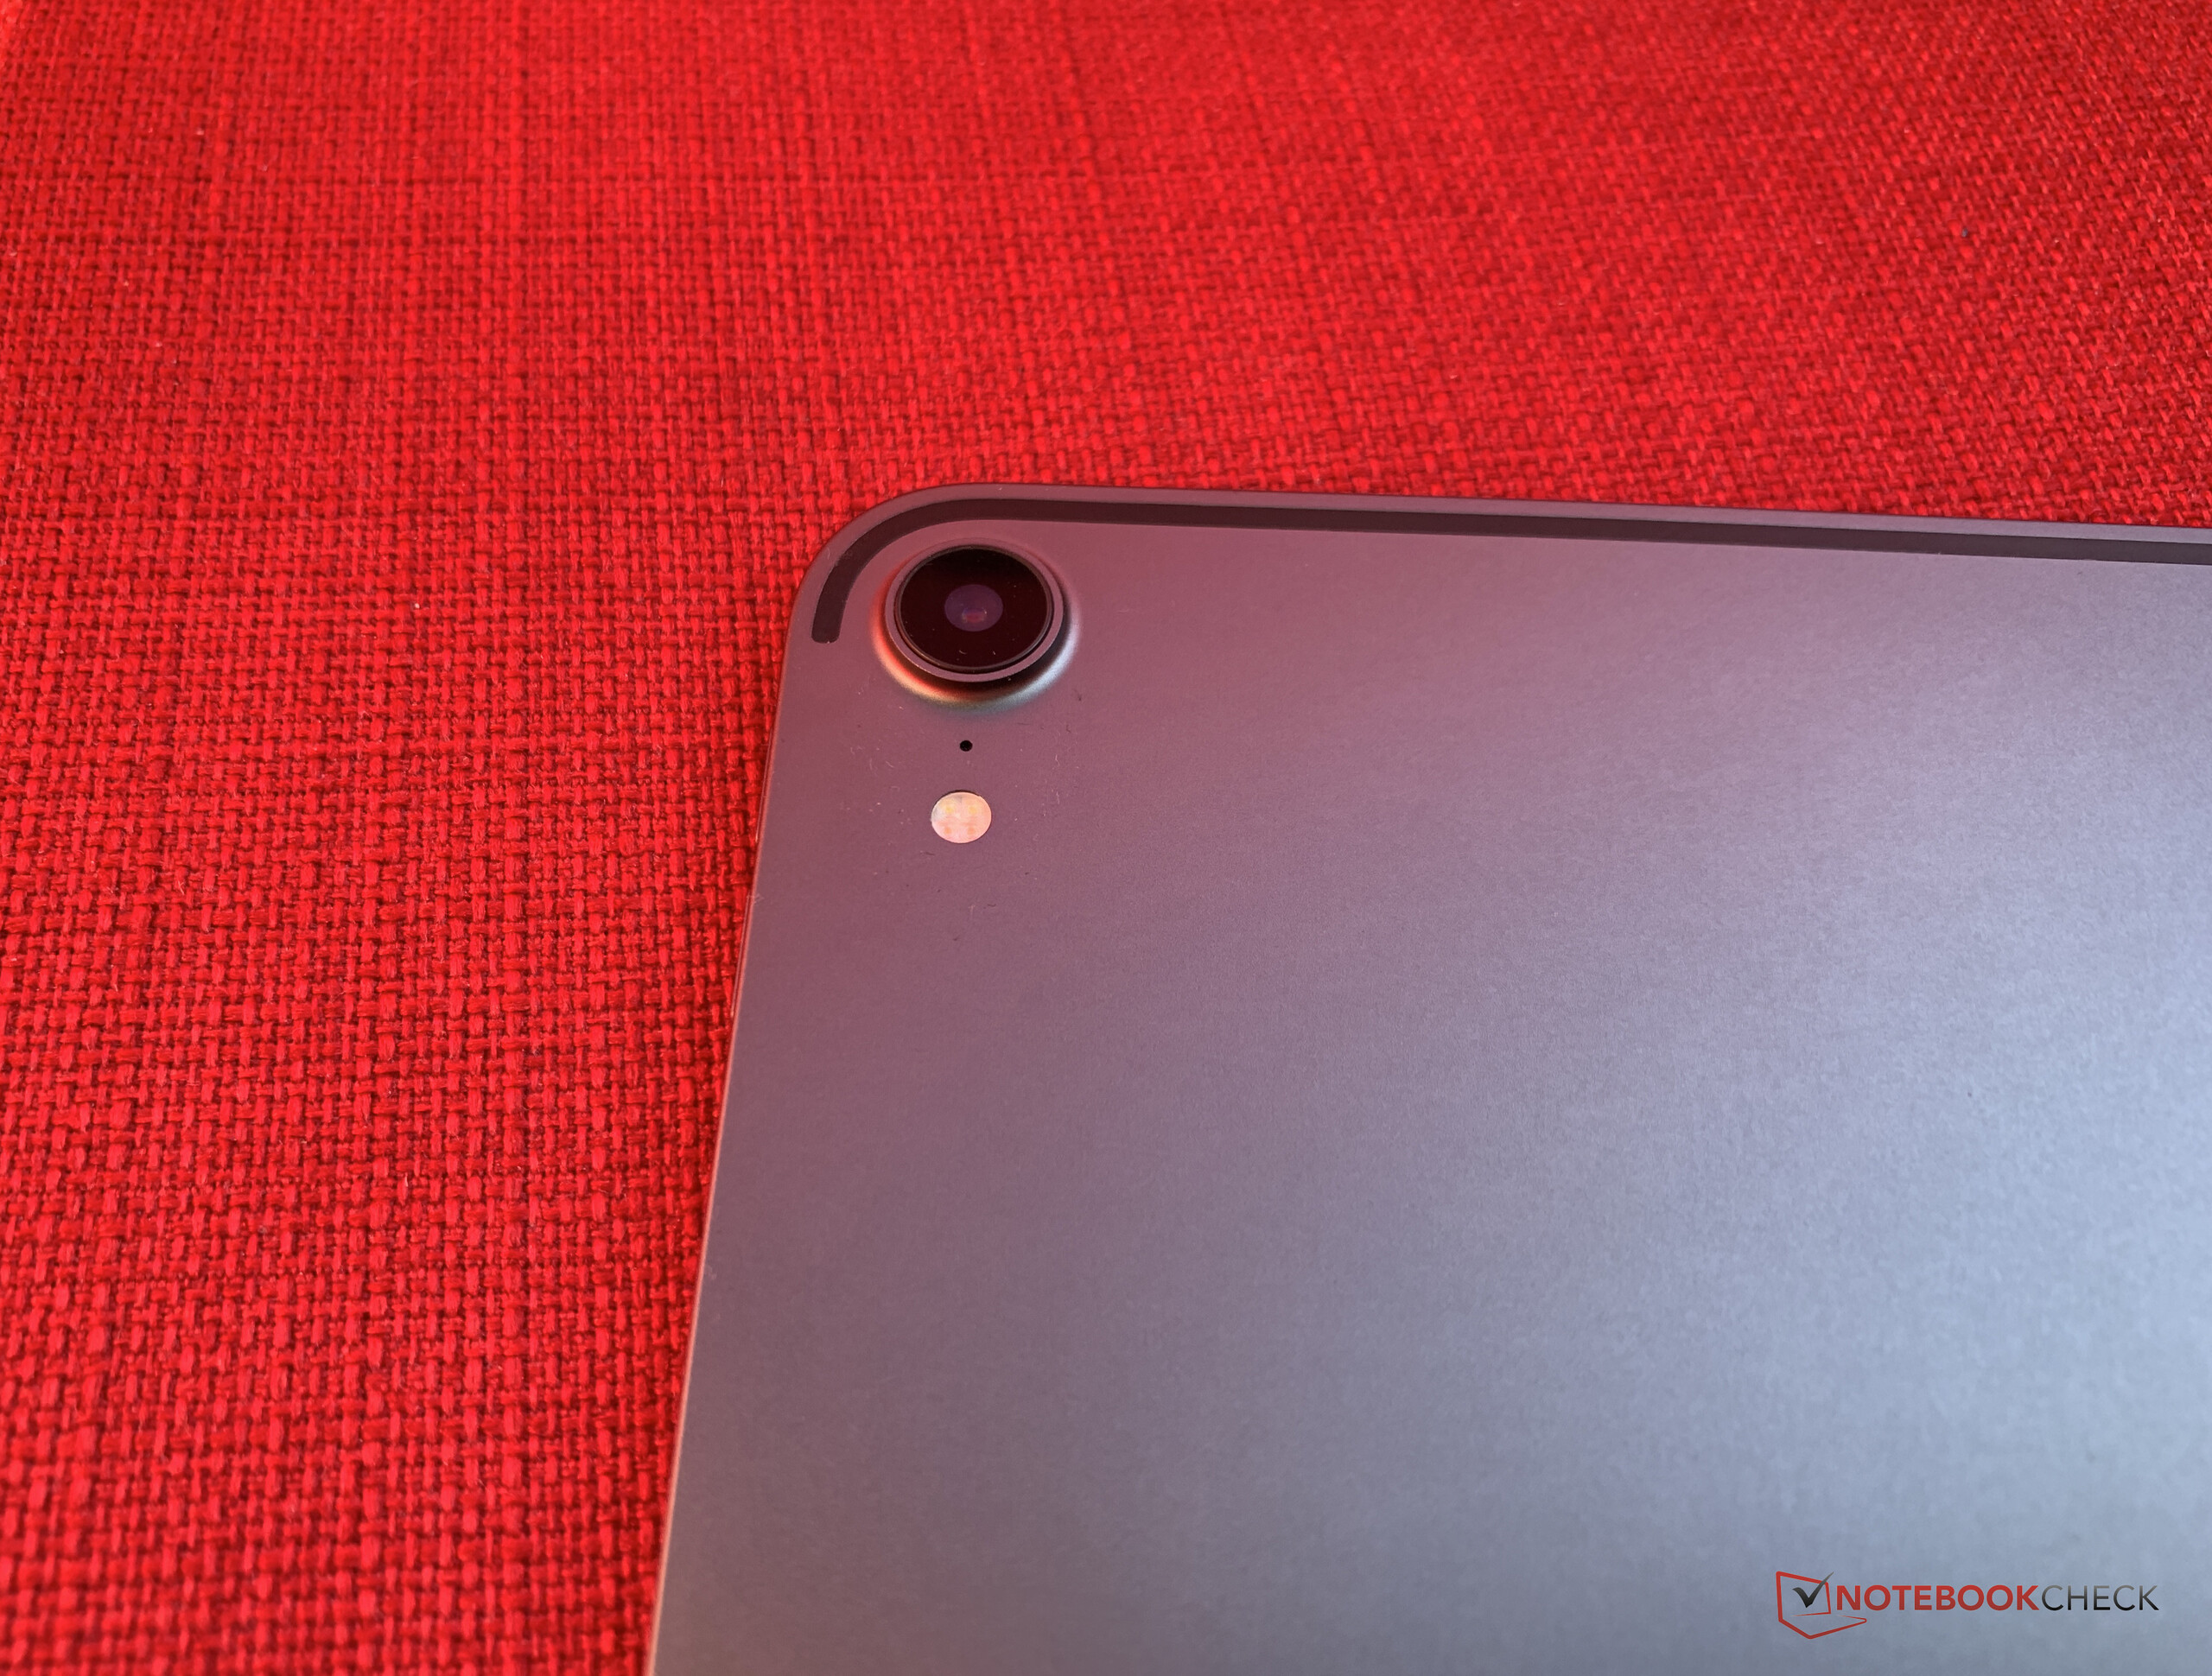
The bezels are significantly narrower than any other iPad, but they remain large enough to hold the device with our thick editorial fingers without obscuring the display. The craftsmanship of our test device is impeccable; we cannot feel any uneven gaps or sharp edges between materials. Moreover, our space grey test device with its shiny, black Apple logo looks stylish. Apple has also made the new iPad Pro just 5.9 mm thick, which is around 1 mm thinner than its predecessor. The rear-camera protrudes more as a result though.
Our test device is relatively robust too, although we can distort the display by applying pressure to either the front or the back of the device. We can also easily twist the case, although it does not creak or emit a noise when we try to do so. Torture tests have demonstrated how weak the iPad Pro 11’s case is.

Connectivity
Apple has added a new storage option to this year’s iPad Pro release. The iPad Pro 11 is available with up to 1 TB of storage. Incidentally, the 1 TB version has 6 GB of RAM while all other models have 4 GB of RAM. Apple has increased the cost of the iPad Pro across all storage options too, the permutations of which we have included in a table below.
| Model | Connectivity | Storage | RAM | Price – US | Price - UK |
|---|---|---|---|---|---|
| iPad Pro 11 | Wi-Fi | 64 GB | 4 GB | $799 | £769 |
| iPad Pro 11 | Wi-Fi & LTE | 64 GB | 4 GB | $949 | £919 |
| iPad Pro 11 | Wi-Fi | 256 GB | 4 GB | $949 | £919 |
| iPad Pro 11 | Wi-Fi & LTE | 256 GB | 4 GB | $1,099 | £1,069 |
| iPad Pro 11 | Wi-Fi | 512 GB | 4 GB | $1,149 | £1,119 |
| iPad Pro 11 | Wi-Fi & LTE | 512 GB | 4 GB | $1,299 | £1,269 |
| iPad Pro 11 | Wi-Fi | 1 TB | 6 GB | $1,549 | £1,519 |
| iPad Pro 11 | Wi-Fi & LTE | 1 TB | 6 GB | $1,699 | £1,669 |
All LTE models have a nano-SIM slot and an eSIM that is soldered to the Logic Board, which brings dual-SIM functionality to an iPad for the first time. Apple has also equipped all-new iPad Pros with a USB Type-C port rather than the Lightning Port to which we have grown accustomed with all recent iPad and iPhone devices. There is a magnetic docking port on the underside of the new iPad Pro too for connecting keyboards and other accessories.
The inclusion of a USB Type-C port has its advantages though. Existing USB Type-C chargers work with our test device as do HDMI adapters, although 16:9 external monitors maintain the iPad Pro’s 3:2 aspect ratio, so the outputted image is flanked by black bars. Unfortunately, iOS currently limits the functionality of the USB Type-C port to the extent that we could only import image files. There is no file manager, so manually transferring files is out of the question. Moreover, iOS does not recognise USB flash storage, which is disappointing.
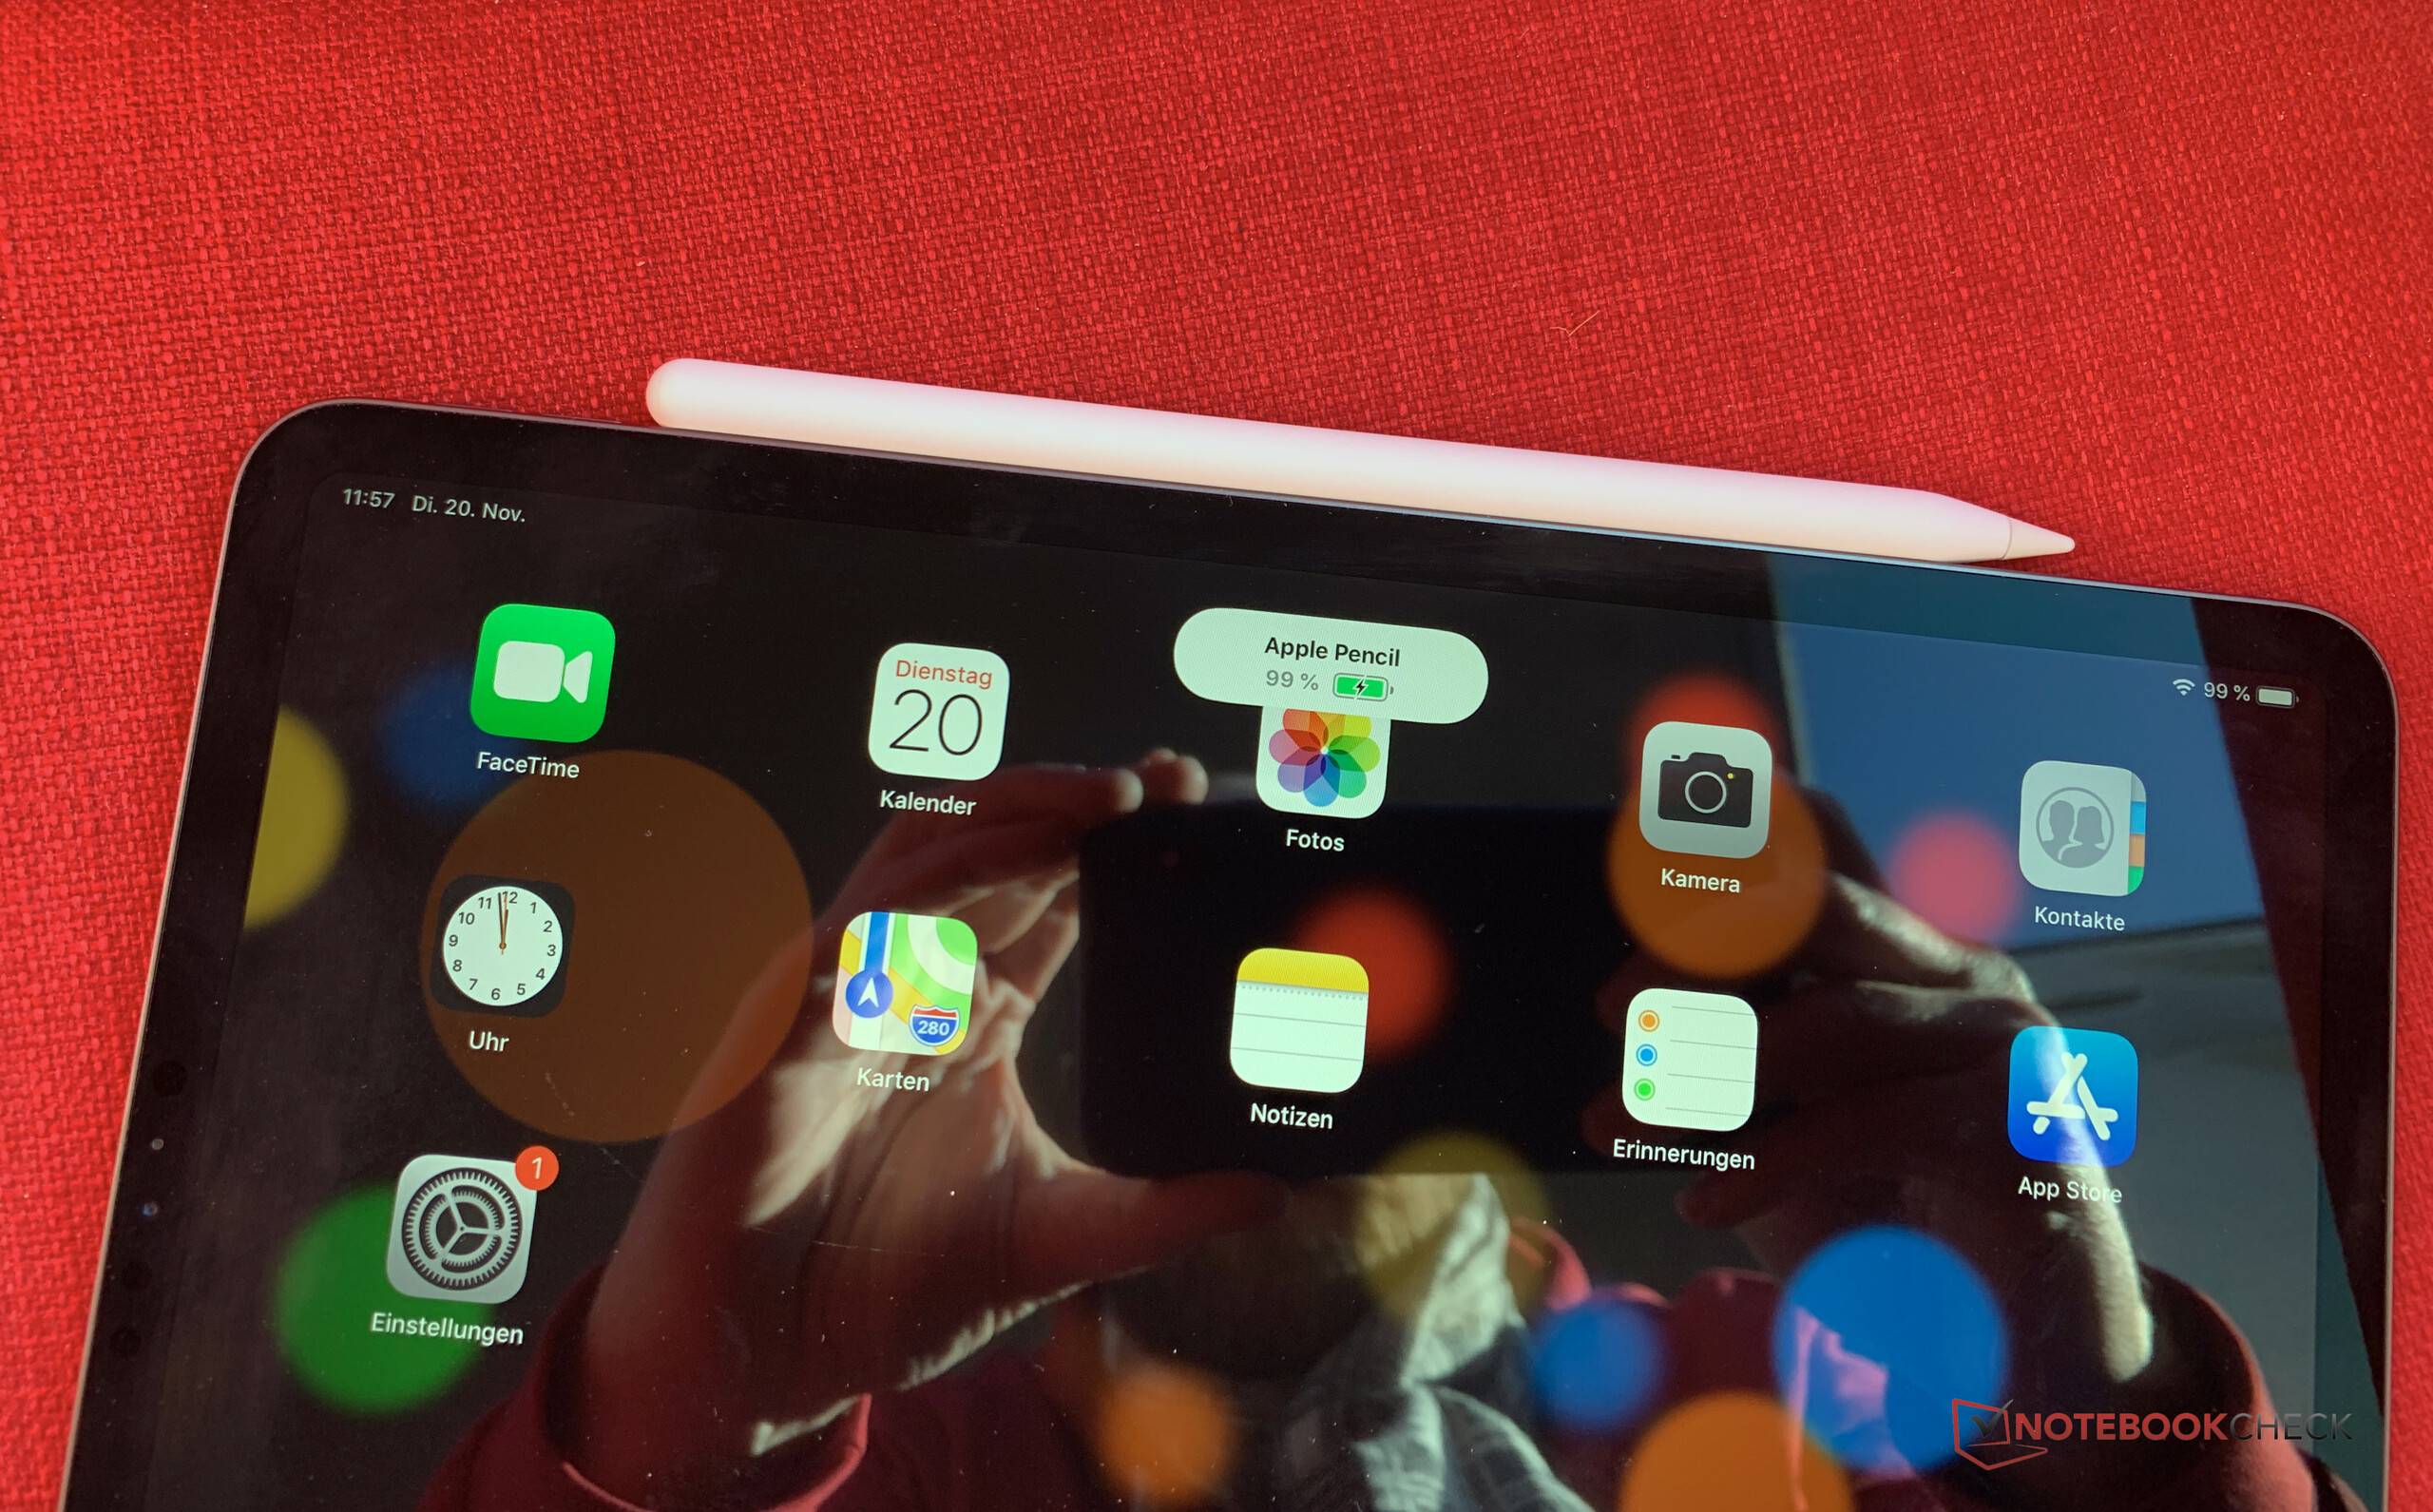
The iPad Pro 11 also has a magnetic docking port for the Apple Pencil 2, which charges inductively when it is docked. There are POGO pins on the back of the device too for connecting accessories like the new Smart Keyboard Folio. Apple has removed the headphone jack though, which is frustrating as the case looks large enough to accommodate a 3.5 mm jack.


Software
Our test device arrived running iOS 12, which feels significantly faster than its predecessors. Moreover, Apple has integrated new camera effects and support for multi-user augmented reality (AR) that allows several people to simultaneously play in one AR world across multiple devices. The technology should be easy to set up and allows for real-time synchronisation between devices, as demonstrated by Apple in a recent demo at their office in Munich. In short, the demo left us sufficiently impressed that we are excited to see how developers utilise the new technology.
Apple has added more advanced account management controls too. Parents can now set how long their children can play games per day, while there is also a new screen time function that informs users of how long they have spent using certain apps. iOS 12 better summarises Messages in the notification shade too and has introduced more intelligent search features to Photos.
Apple continues to call the iPad Pro a laptop replacement and has upped the ante this year by stating that its A12X Bionic SoC is faster than 92% of x86 processors that power laptops released in 2018. We will explore the validity of these claims in the Performance section.
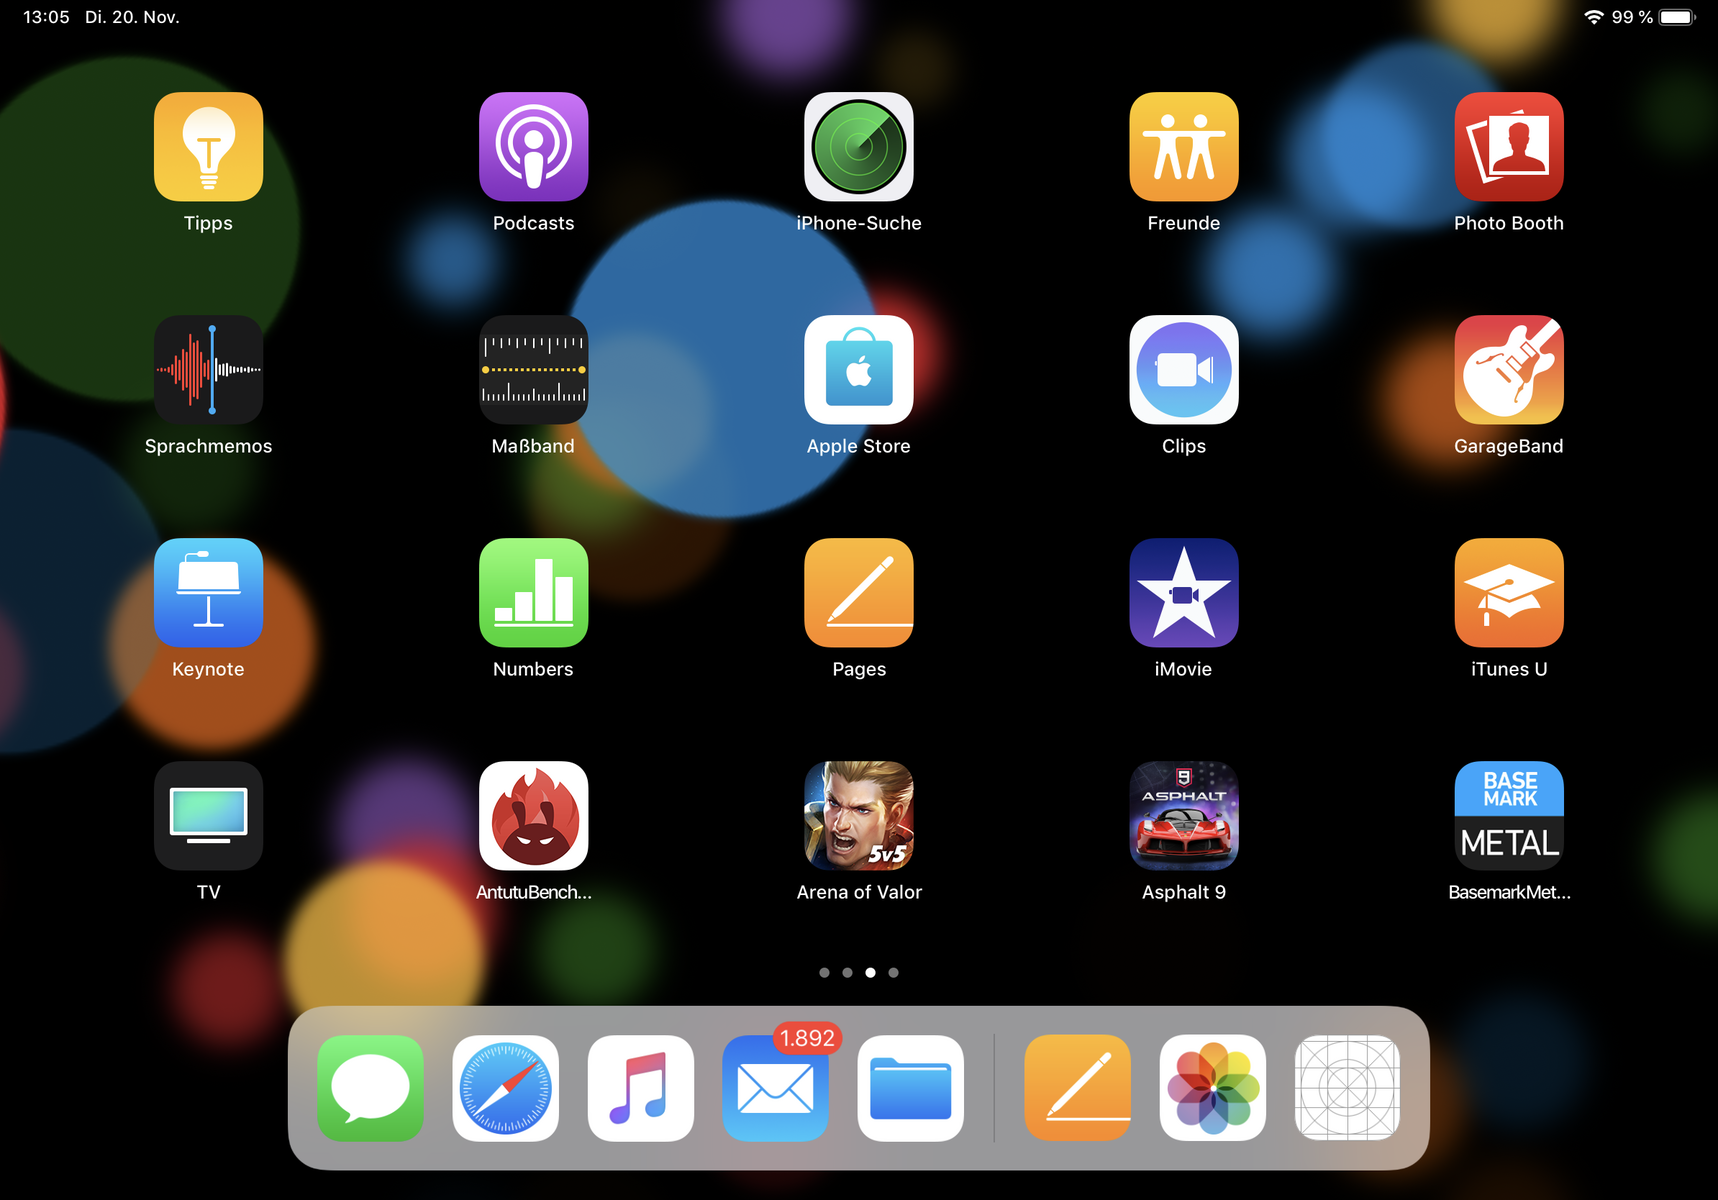
Setting Apple’s marketing aside, iOS still has some serious shortcomings, particularly when running large displays. Some apps lack the scaling for an 11-inch display, and essentially iOS scales everything up, which makes app icons look too large for our liking. As mentioned earlier, iOS 12 has no functioning file manager, which makes transferring files difficult. In short, the iPad Pro 11 is suitable as a secondary or a creative device, but iOS still has too many shortcomings that would prevent us from using the new iPad Pro as our sole work machine. Apple has promised that Adobe will release a full version of Photoshop in 2019 though, about which we are excited because it could represent the start of iOS bridging its gap in functionality to Linux, Mac OS or Windows. Watch this space.
Communication & GPS
The iPad Pro 11 supports all modern Wi-Fi standards up to IEEE 802.11 ac, which we would have expected from such an expensive tablet. Our test device achieved similar transmission speeds as its predecessor did when tested using our Linksys EA8500 router, although the Microsoft Surface Pro 6 tends to average a few MB/s higher than both devices. The iPad Pro 11 generally loads web pages quickly, particularly when we used the device close to a router. The Wi-Fi signal dropped to two-thirds when we tested it 10 metres and three walls away from our router, but this is only a minor criticism as websites still loaded quickly.
The iPad Pro 11 uses Galileo, GLONASS, and GPS including AGPS and QZSS for location services. Apple continues to not use BeiDou, the Chinese location service. Apple Maps located us quickly and precisely throughout testing.
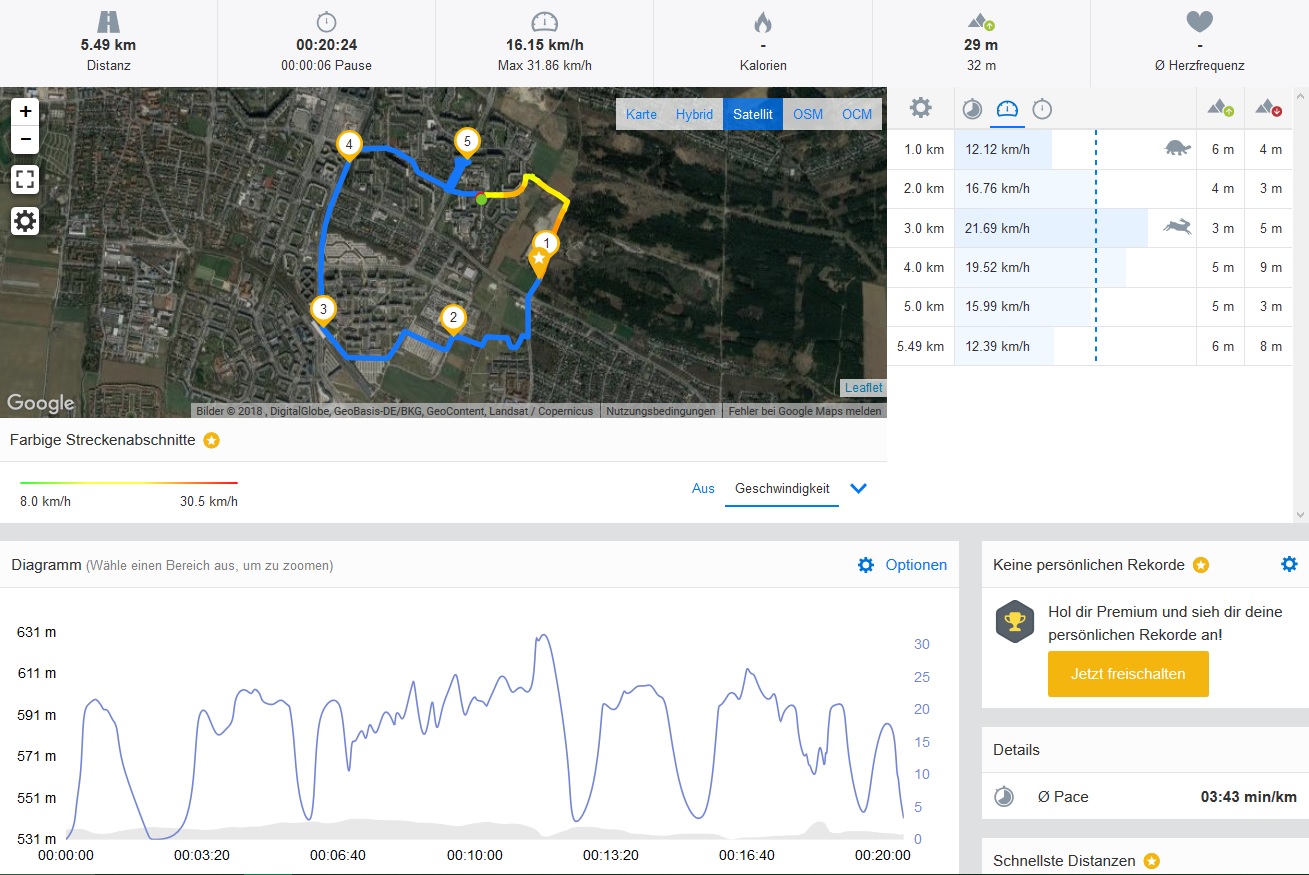
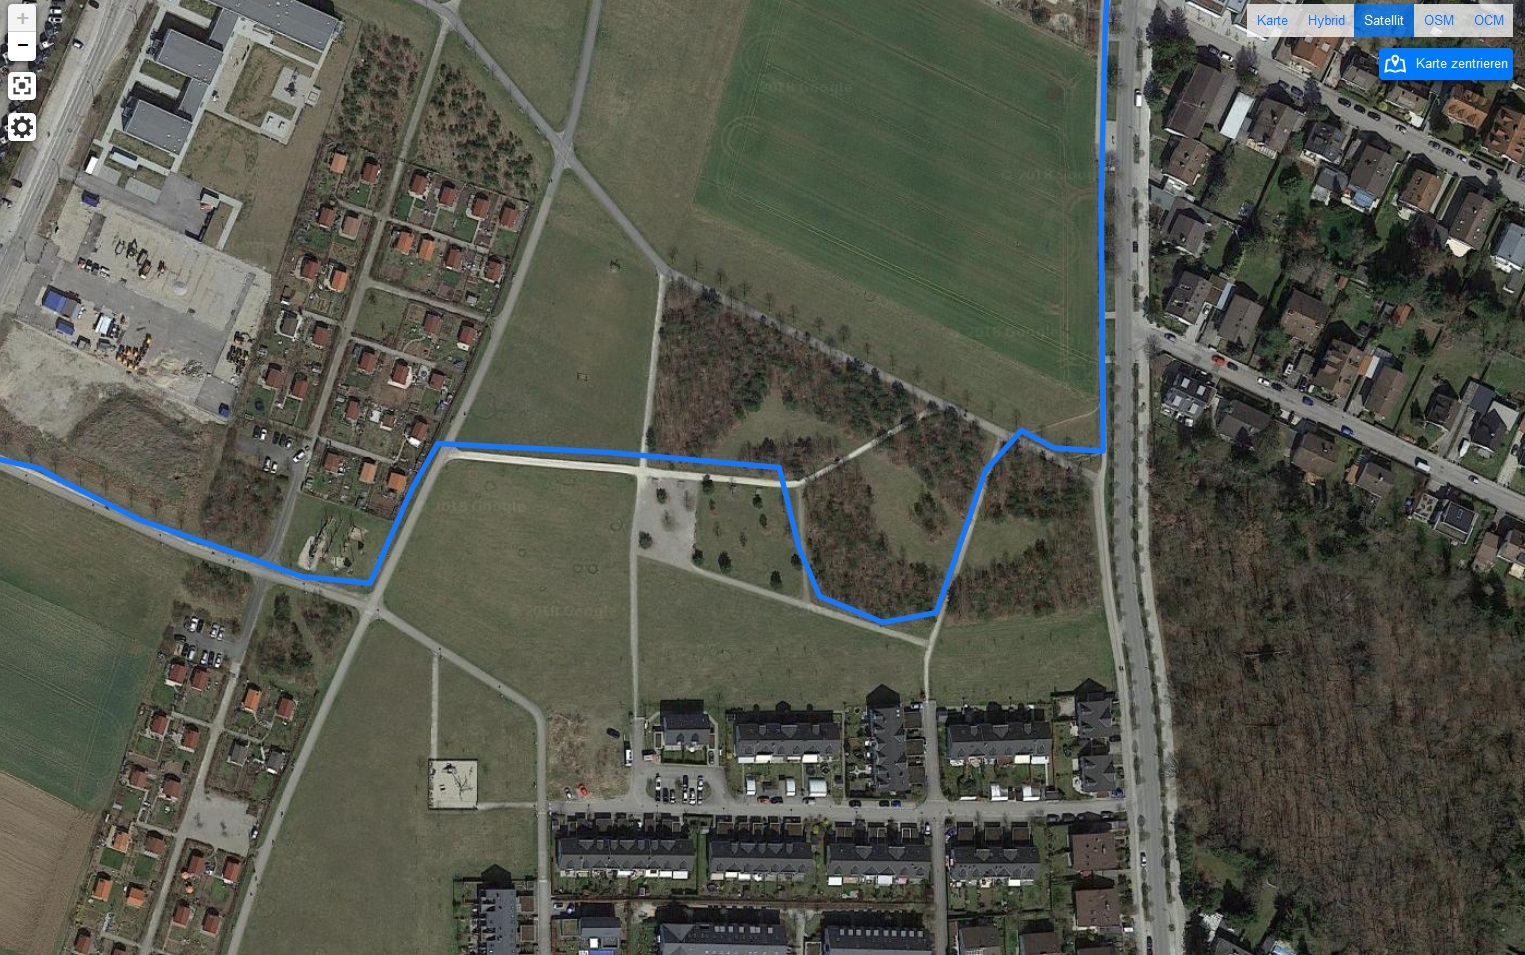
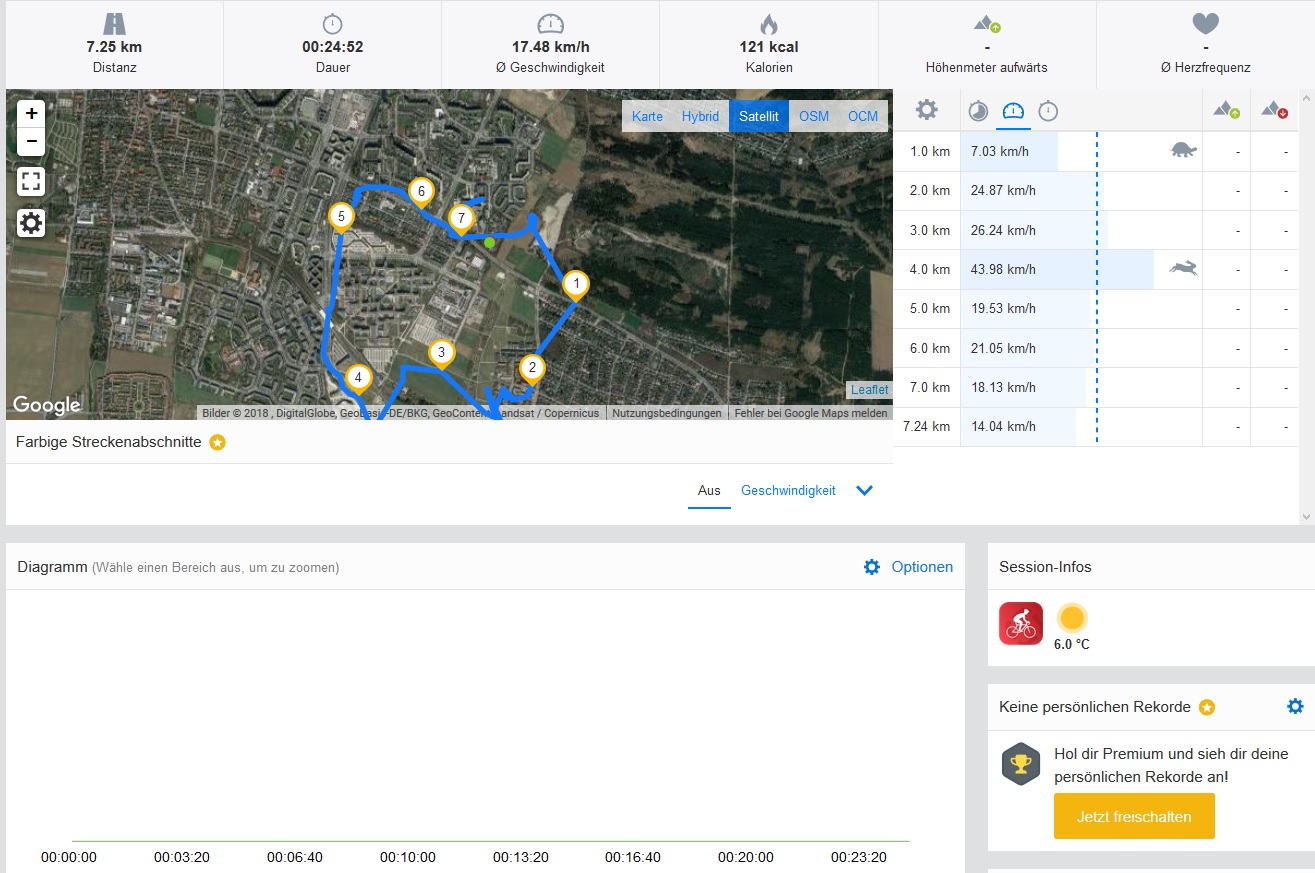
We also took our test device on a bike ride to compare its navigation accuracy against a professional navigation device, the Garmin Edge 520. The iPad Pro 11 plotted a 1.76 km (1.09 miles) longer route than the 5.49 km (3.41 miles) route that the Garmin recorded us having cycled. Looking closer at the data reveals that our test device got out of kilter and plotted wild routes that we did not cycle. The iPad Pro 11 is generally an accurate device, but it regularly plotted us next to the road on which we were cycling. We cannot ignore our practical tests though, so we would advise caution when using the iPad Pro 11 for navigating. The device is probably too large for general use anyway.


Cameras

The cameras in the iPad Pro 11 have remained largely unchanged from last year’s iPad Pro 10.5 and are the same as the ones in the third-generation iPad Pro 12.9. The rear-facing camera is still a 12 MP sensor and a True Tone flash that combines four differently coloured LEDs to create the most natural-looking light for a scene.
Photos taken with our test device look great when compared to those shot with other tablets, although we suspect that Apple continues to use the same optics that it first used on the iPhone 7. This probably says more about how poor most tablet cameras are though because the sensors in the iPad Pro 11 are several steps down from those that Apple uses in its latest iPhones.
The rear-facing camera in our test device produces photos that have strong colours and a generally warm tone to them thanks to dynamic HDR. However, the equivalent camera in the iPhone XS Max captures more details and better exposes low-light scenes than its larger sibling. The differences between the photos produced by the two devices are not huge as demonstrated by our comparison photos below, but they are noticeable. Overall, there is no better rear-facing camera in a tablet than the one in the new iPad Pro, but it does not take better photos than its predecessor.
This year’s model can record 4K videos in up to 60 FPS, which is an improvement over the iPad Pro 10.5. The rear-facing camera can track moving objects smoothly while also producing colour-rich and sharp videos. The sensor adjusted exposure accurately and almost automatically to changing ambient light too. Moreover, the rear-facing camera can record video at 240 FPS in up to 1080p for slow-motion effects.
As for the front-facing camera, it is still a 7 MP sensor that takes decent photos. Selfies are detailed, and objects do not get overwhelmed by bright backlighting as shown in the above photo. The front-facing camera also supports iOS’ portrait mode should you wish to take selfies with your tablet.


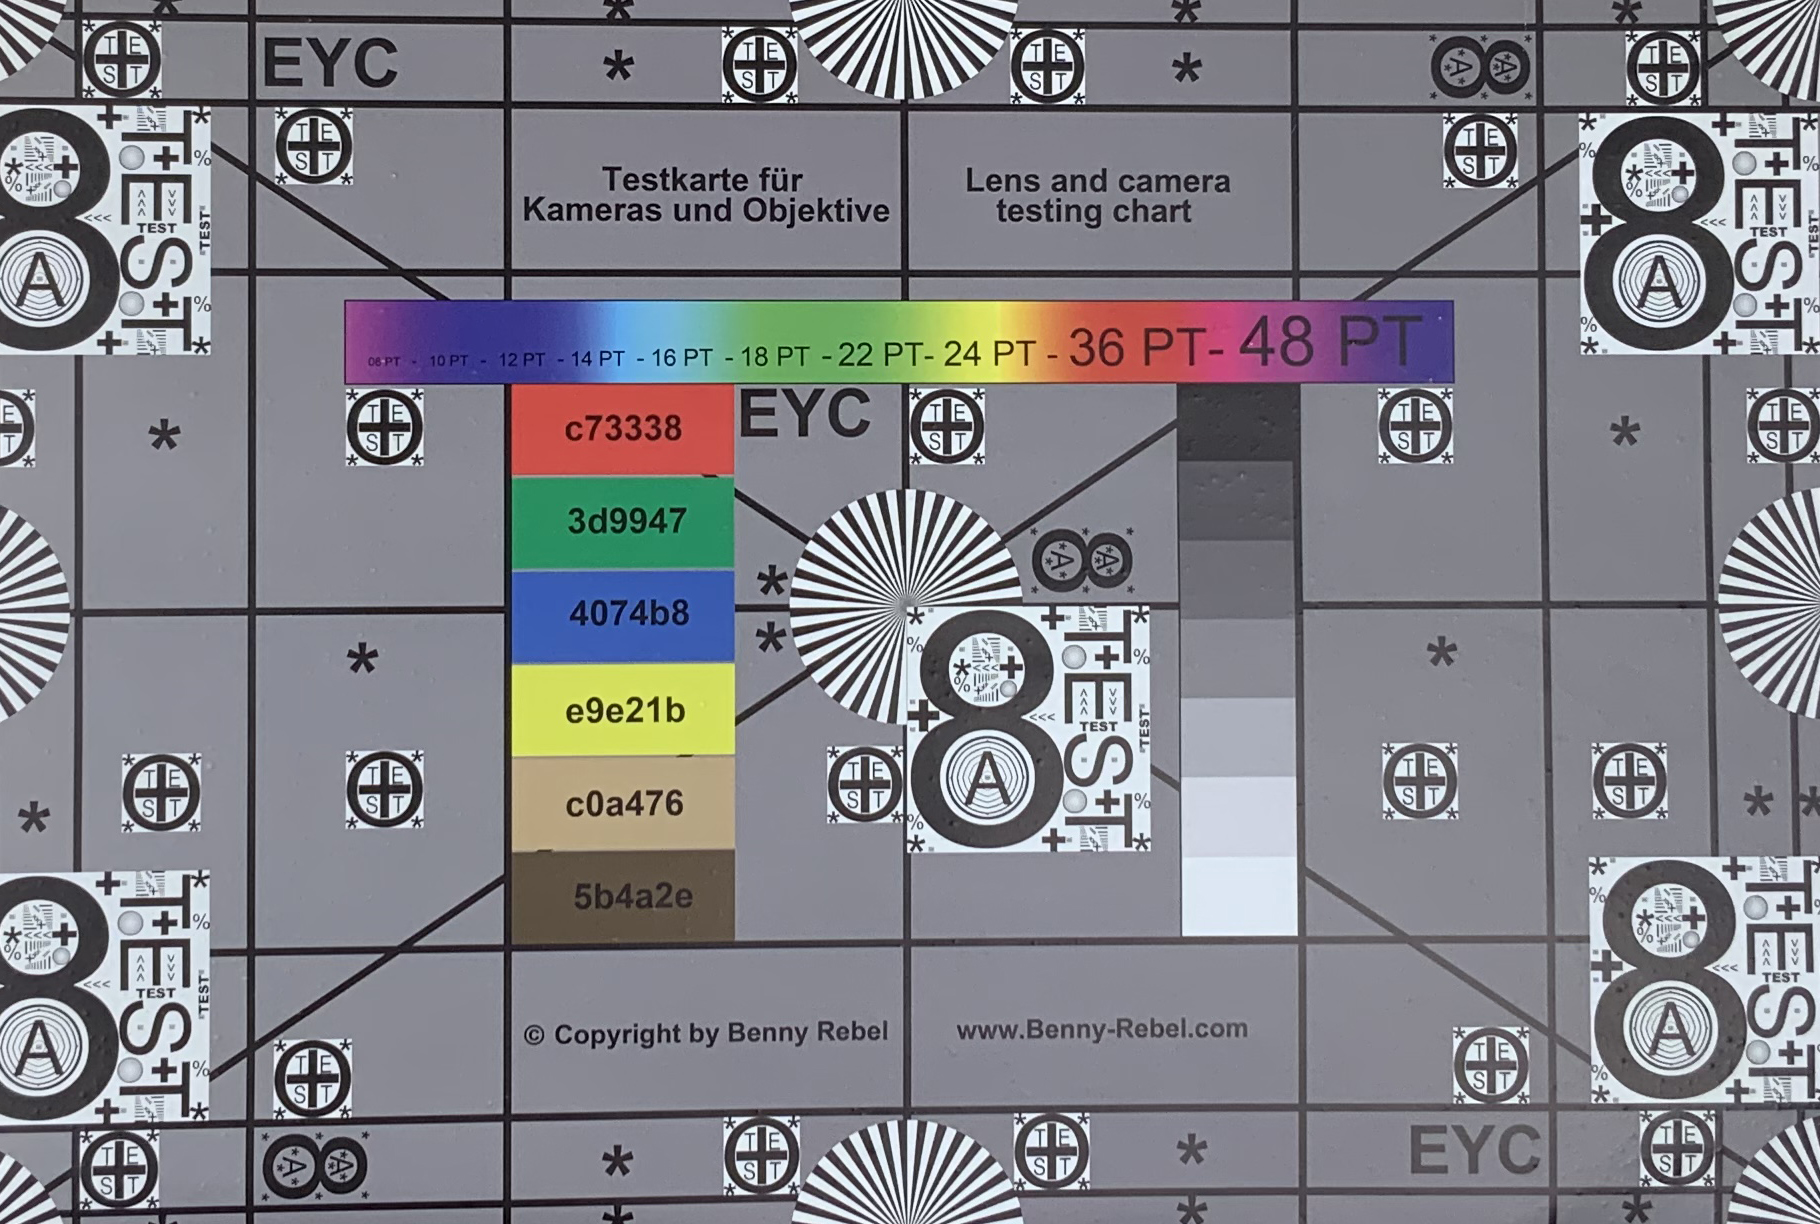
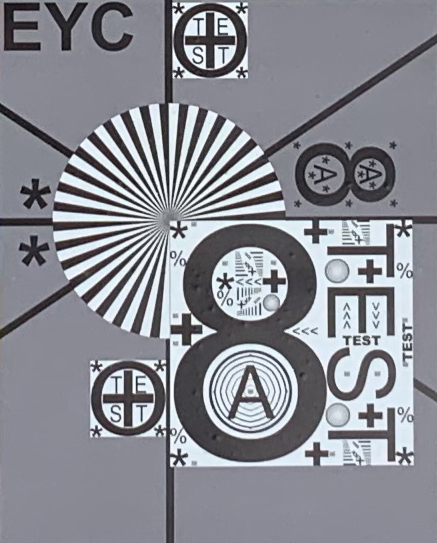
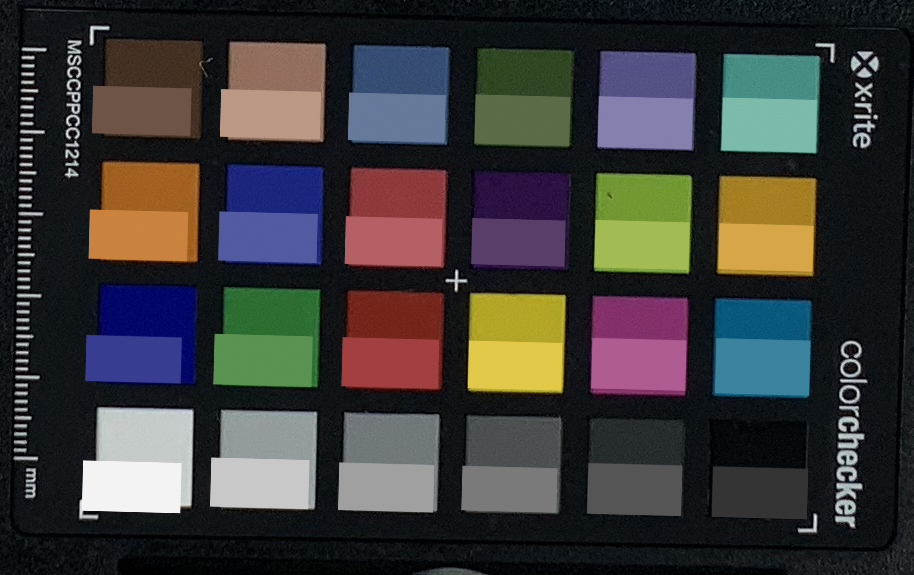
We also subjected the iPad Pro 11 to camera tests under controlled lighting conditions. The results echo what we found during our other camera tests. Our test device cannot render colours as brilliantly as current flagship smartphones, but the rear-facing camera captured out test chart sharply. The camera struggles to reproduce black text against red backgrounds though.
Accessories & Warranty

The iPad Pro 11 comes with a one metre (~ 3.3 feet) USB Type-C cable, an 18 W charger (5 V/3 A, 9 V/2 A), the usual Apple paperwork and two Apple stickers.
The device comes with 12 months manufacturer’s warranty, which is separate from any third-party supplier warranty. Apple continues to sell its AppleCare+, which extends the warranty coverage to two years. The warranty extension now costs $129 (£129) and provides two total loss repairs for a $49 (£39) excess fee. Users must pay a $29 (£25) fee if they break their Apple Pencil too. Please see our Guarantees, Return policies and Warranties FAQ for country-specific information.
However, if you own accessories for older iPad Pros then you can sell them now as they will not work with any third-generation model. The iPad Pro 11 is not only smaller than its predecessors but also Apple has moved the Pogo pins to the back and replaced the Lighting connector with a USB Type-C, rendering all previous accessories obsolete.
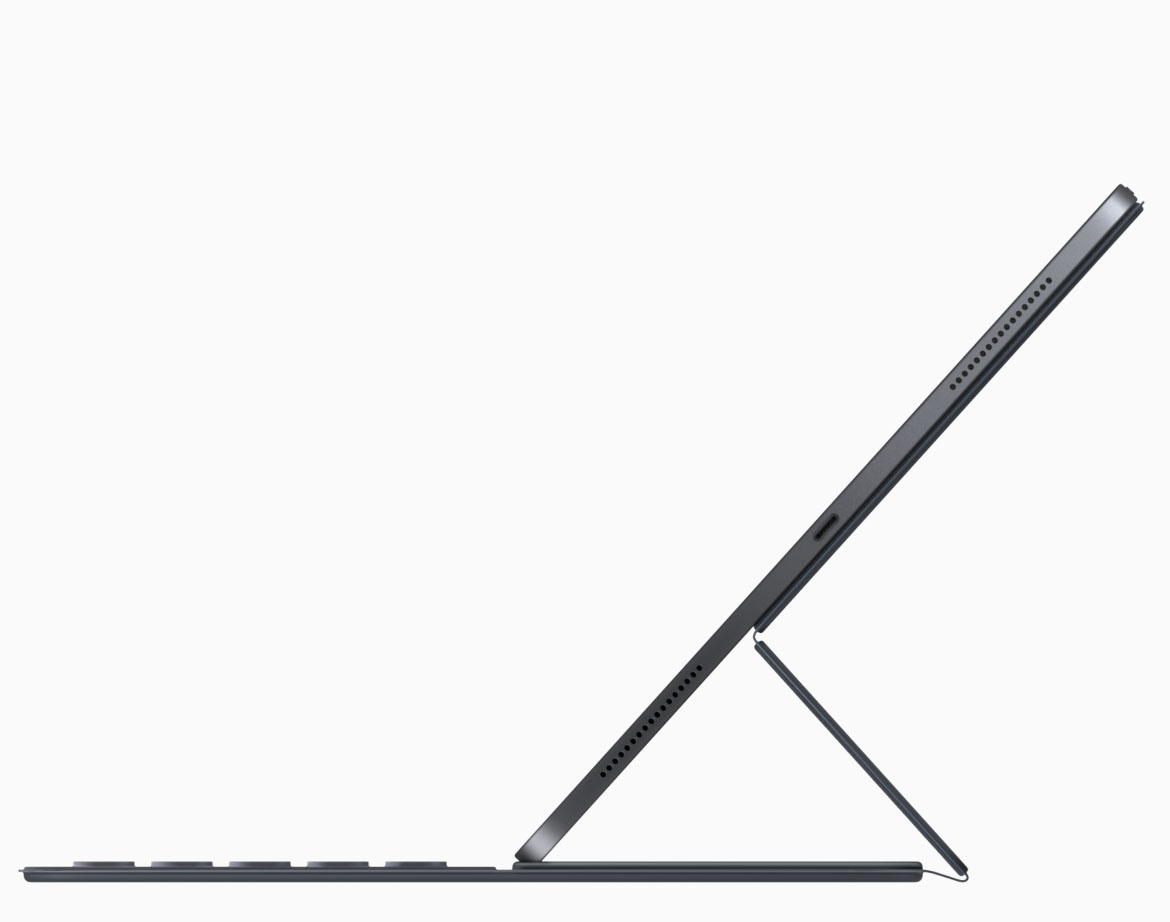
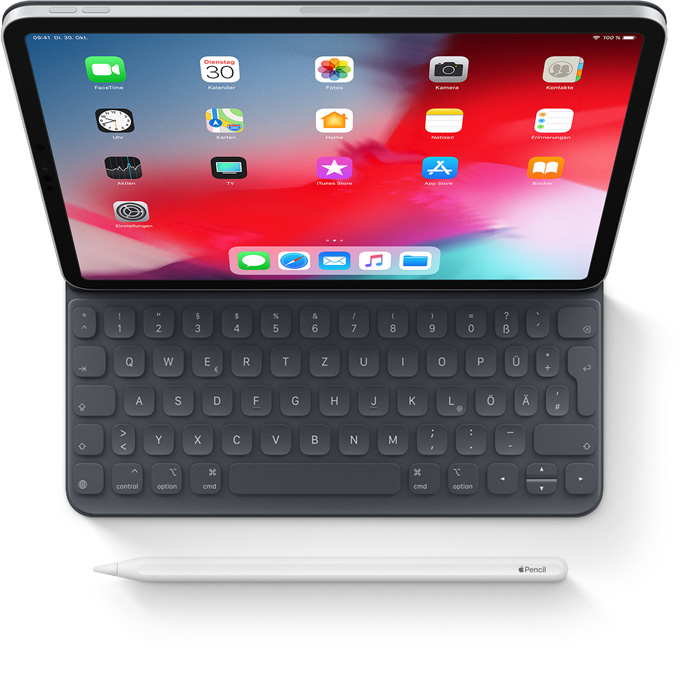
The company has developed an Apple Pencil 2 and a new Smart Keyboard Folio, which cost $129 (£119) and $199 (£199), respectively. The former has an integrated touch-sensitive area that allows users to swipe between tools by just swiping twice. The Smart Keyboard Folio protects the entire rear of the tablet and can be set in two different positions. We should point out though that the Keyboard Folio did not always connect as securely to our test device as we would have liked during our tests.
Input Devices & Operation
The iPad Pro should act as a magical window to the rest of the world, according to Apple. Like other tablets, the iPad Pro 11’s main input method is its capacitive touchscreen, which effectively brings the world to people’s fingertips. The touchscreen in our device worked well in our tests, reacting reliably and accurately to our inputs even at the corners of the display.
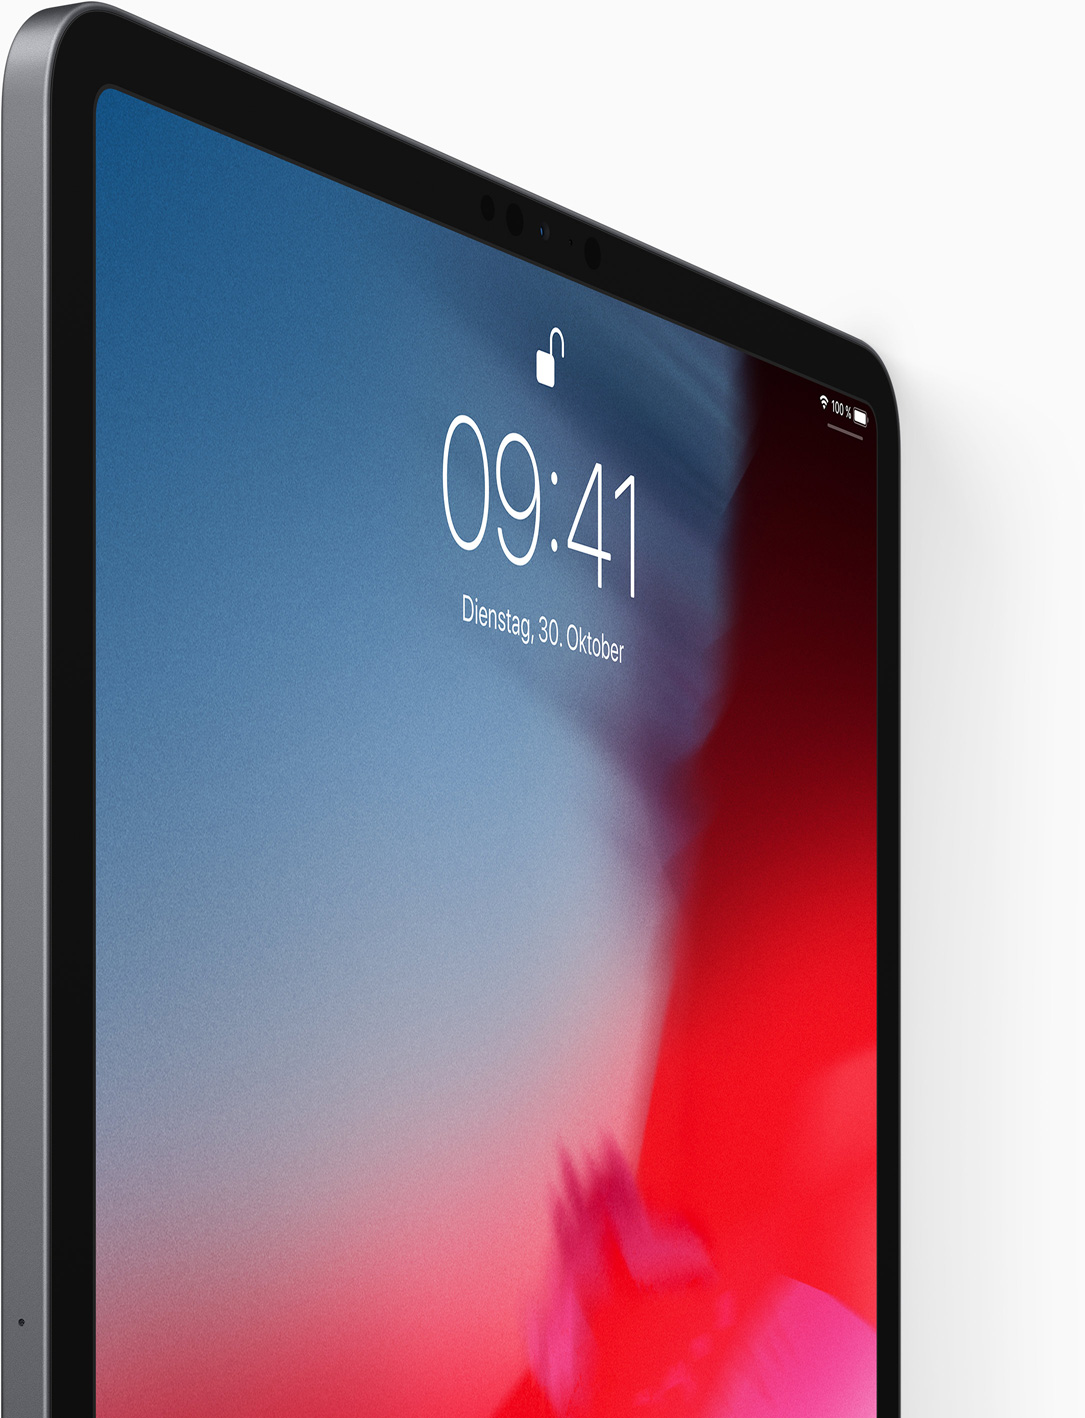
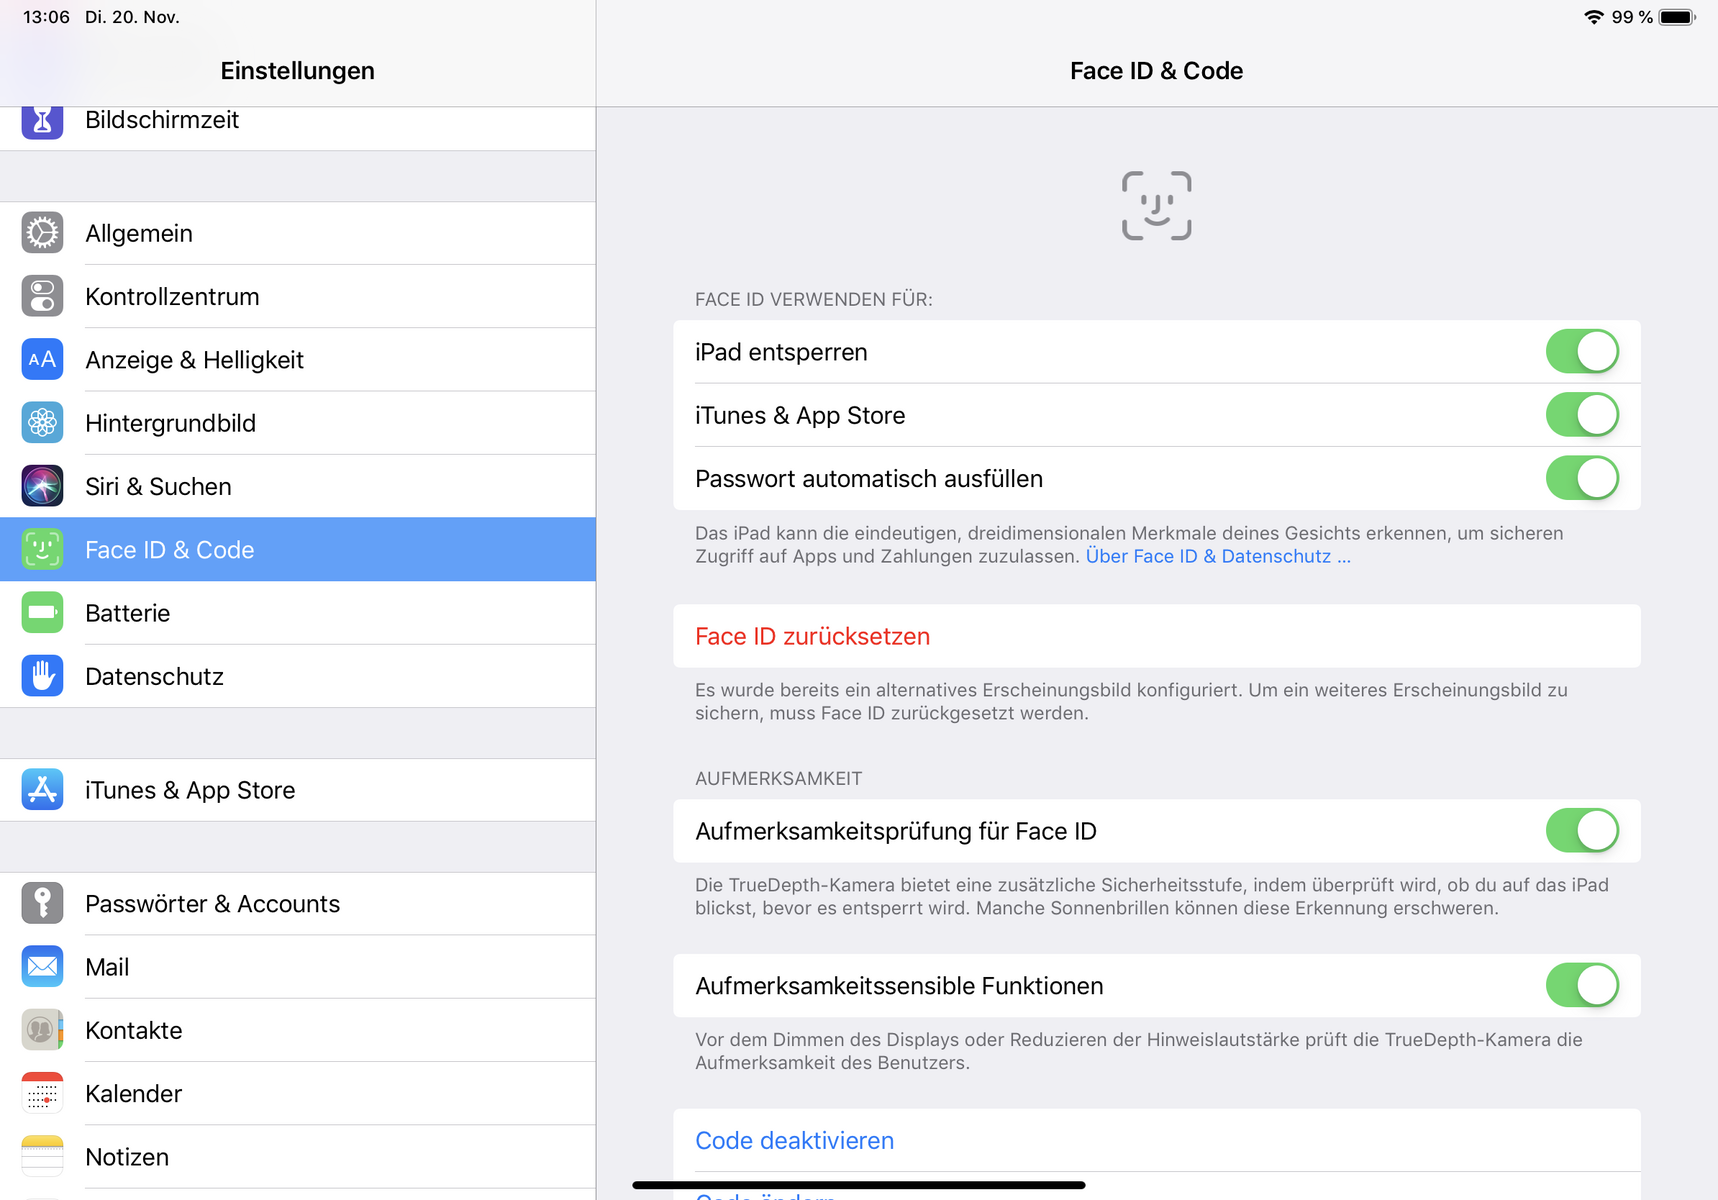
Apple has replaced Touch ID with Face ID, a switch that we have seen the company make with iPhones since the iPhone X. In theory, moving the iPad Pro to Face ID makes more sense to us than it did for iPhones, but its execution is currently lacking. Face ID is great for unlocking the device when it is connected to the Smart Keyboard Folio or when it is lying on a table because we no longer need to touch the device multiple times to unlock it. Moreover, even the smaller iPad Pro has always felt huge in the hand, which invariably meant that we had to shift our grip to unlock any previous model if we were holding it.
However, we find it more difficult to unlock our test device than its predecessors when we have it in our hands. Holding the device in landscape mode with two hands regularly obscures the camera and causes the ‘camera hidden’ message to appear, which effectively forces us to unlock our test device in portrait mode. Having the power button on the same side as the Face ID system makes it difficult to unlock the device one-handed too. We appreciate that this is a minor gripe, but one which could be frustrating to some people. It is worth noting that Face ID can store up to two faces.
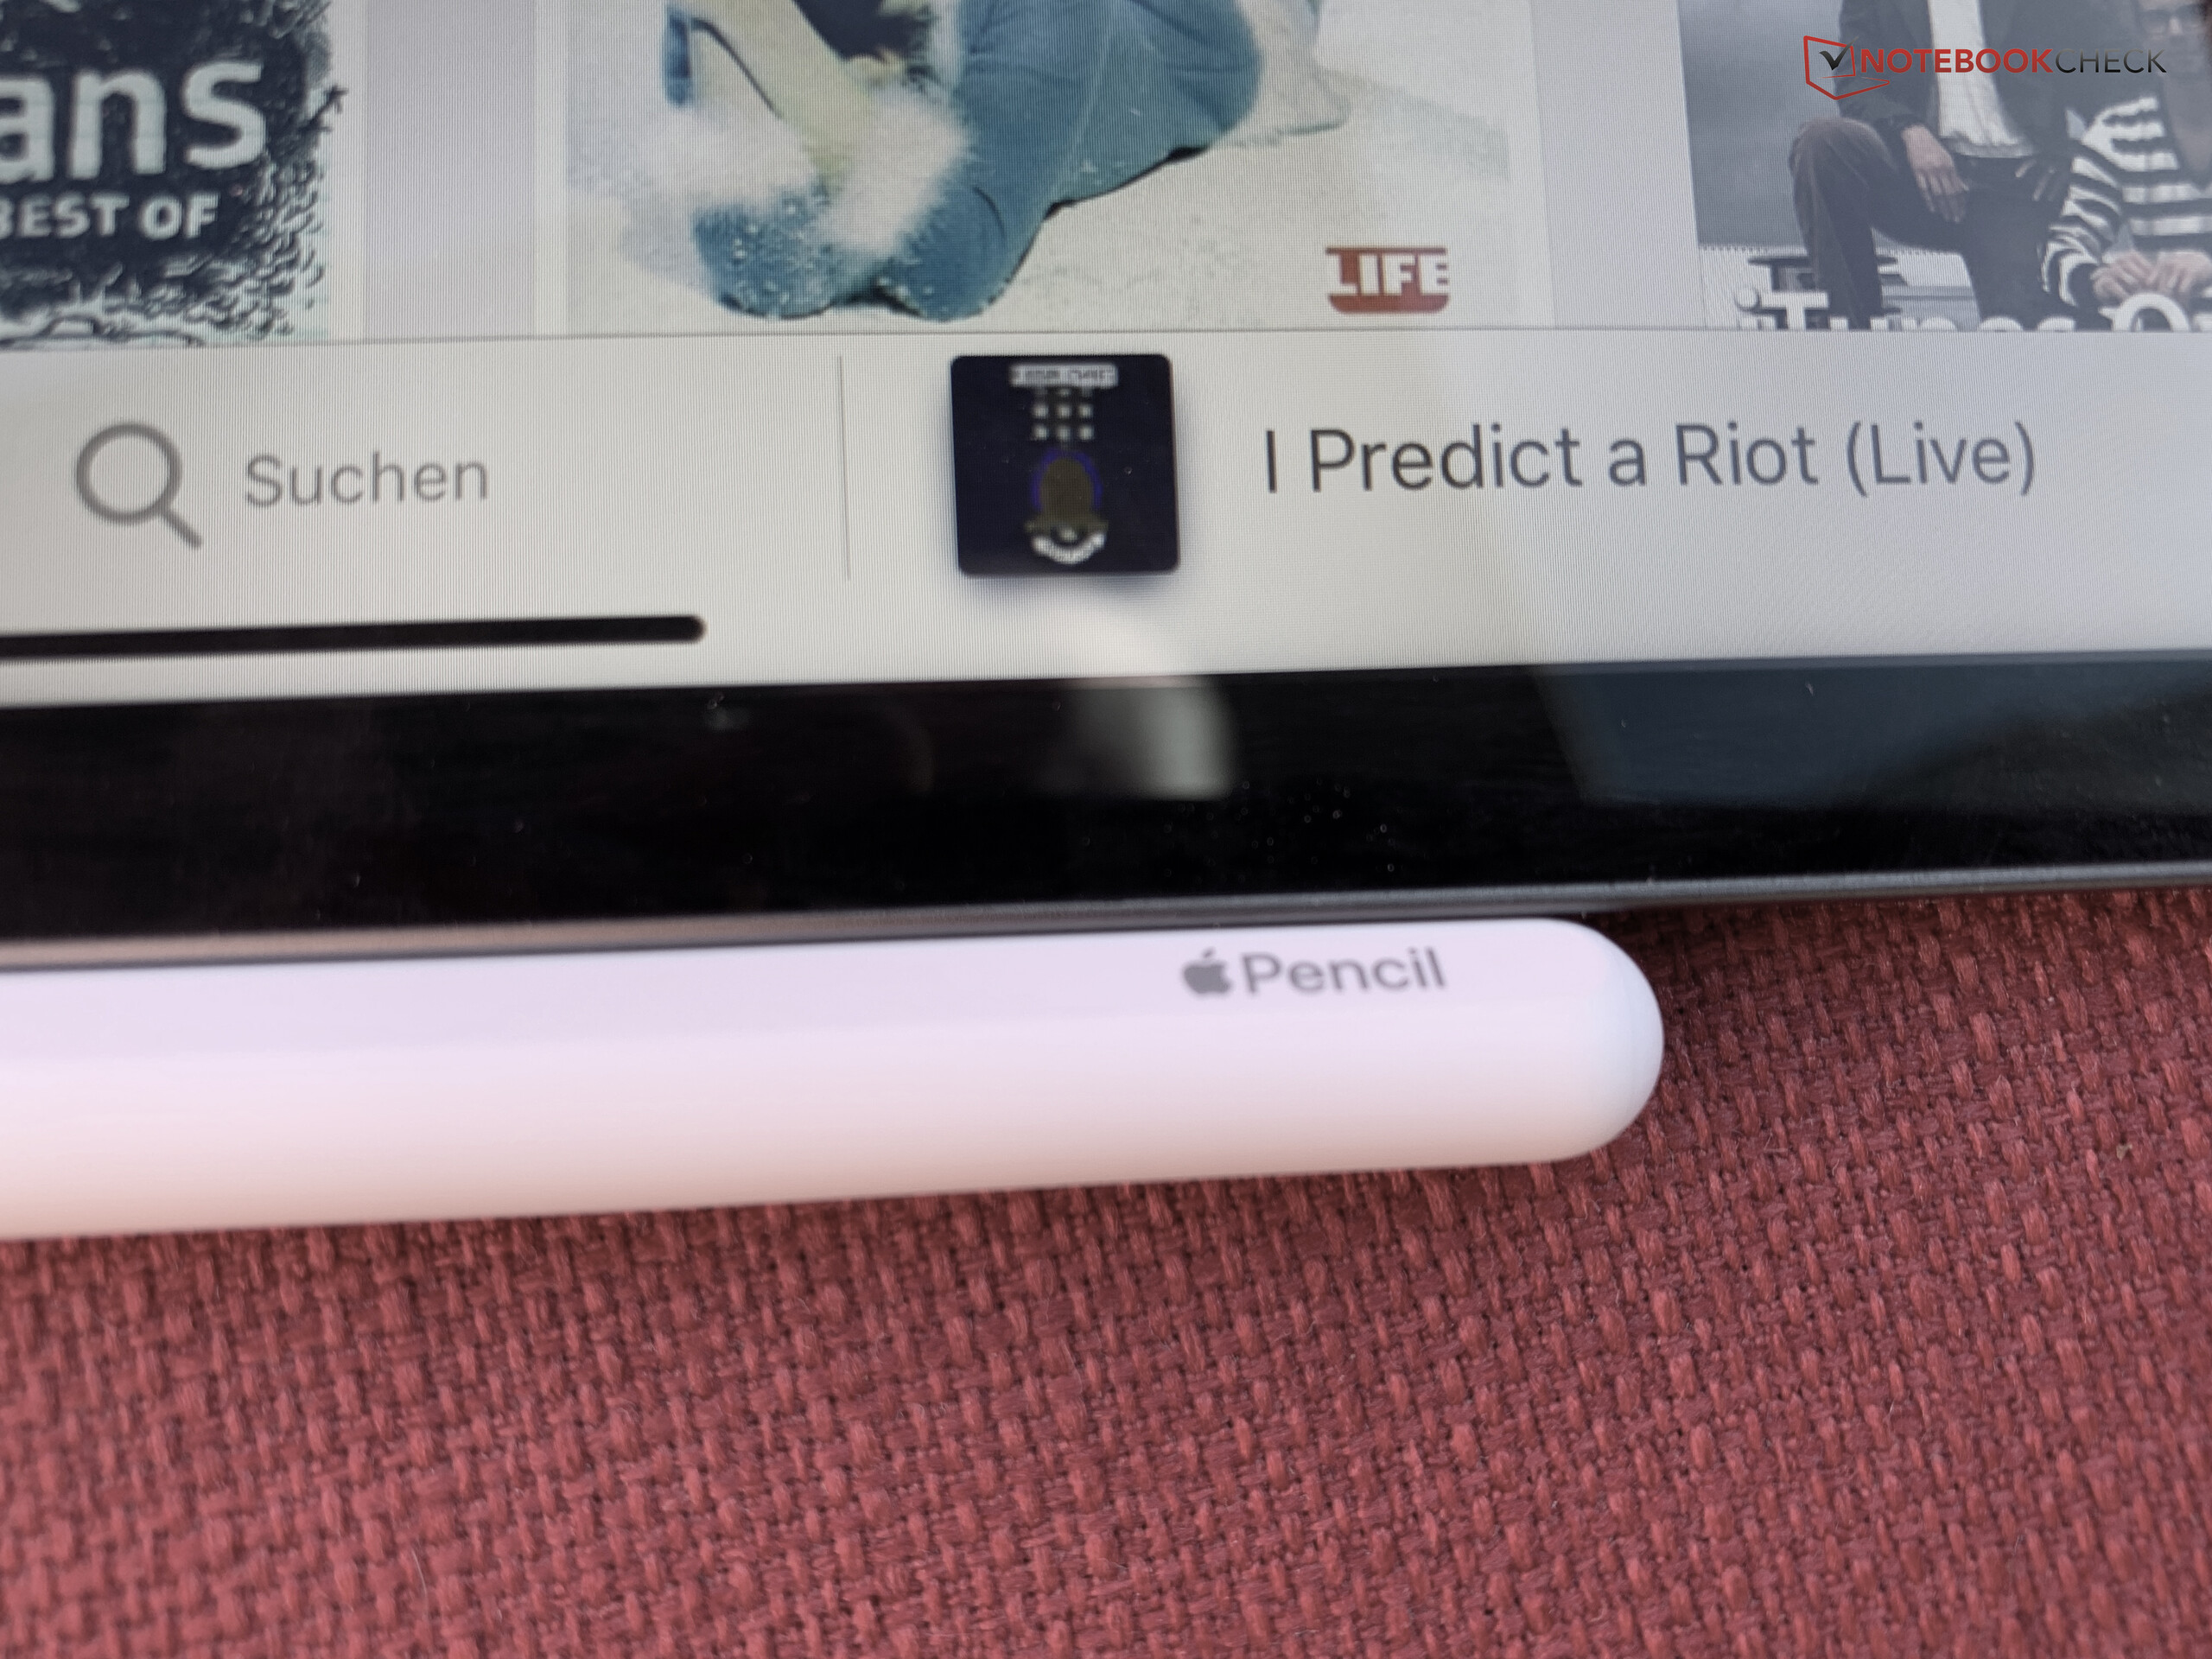
The iPad Pro 11 works well as a tablet, but its potential as a creative device is only realised with the Apple Pencil 2. Unfortunately, the first Apple Pencil will not even pair with any third-generation iPad Pro. The Pencil 2 worked well during testing and is a great tool for creatives. Apple has added a touch-sensitive area to the Pencil too, which allows users to switch between tools by quickly swiping twice with a finger. Overall, Apple has improved the convenience of using its Pencil, especially now that it attaches magnetically to the iPad Pro and charges inductively when it is attached. This is a much better solution than the farcical experience of plugging the original Apple Pencil into a lightning port to charge it. However, the finger is still generally a better tool than the Pencil for everyone but creatives in our opinion.
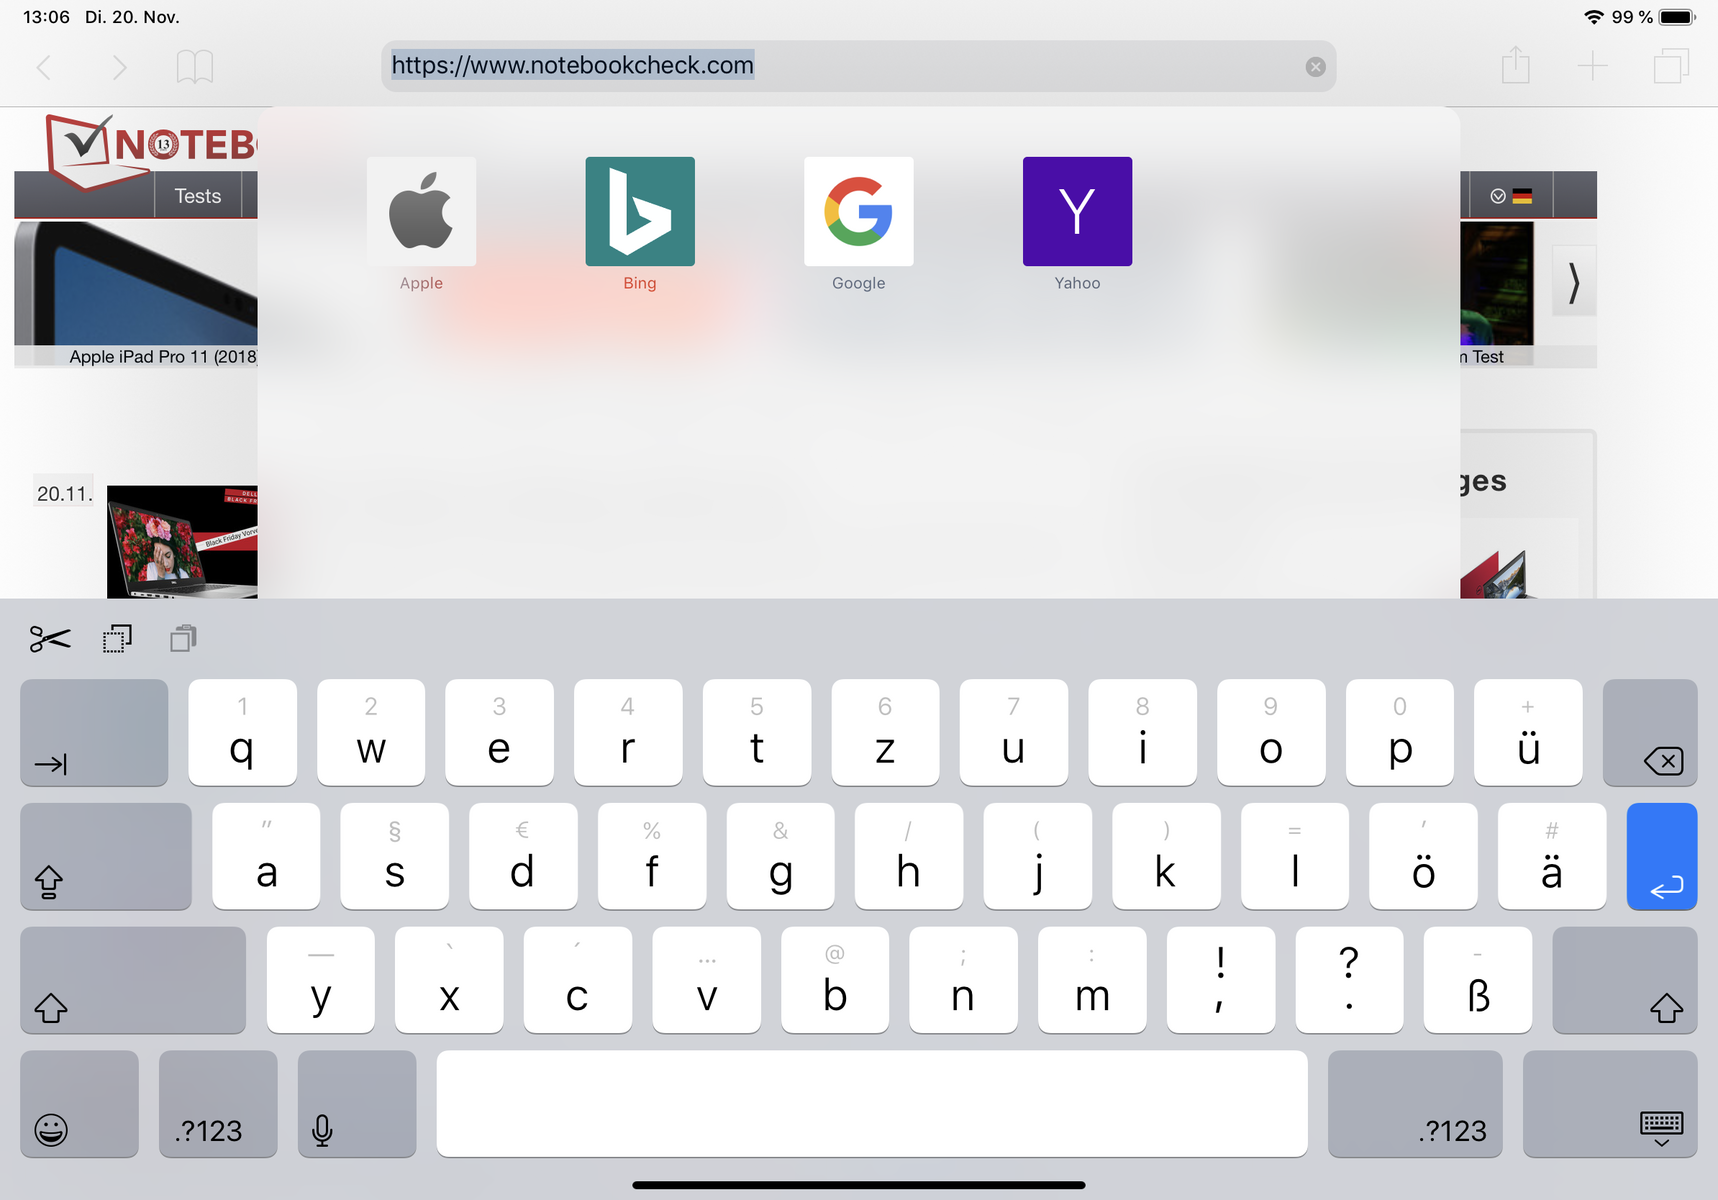
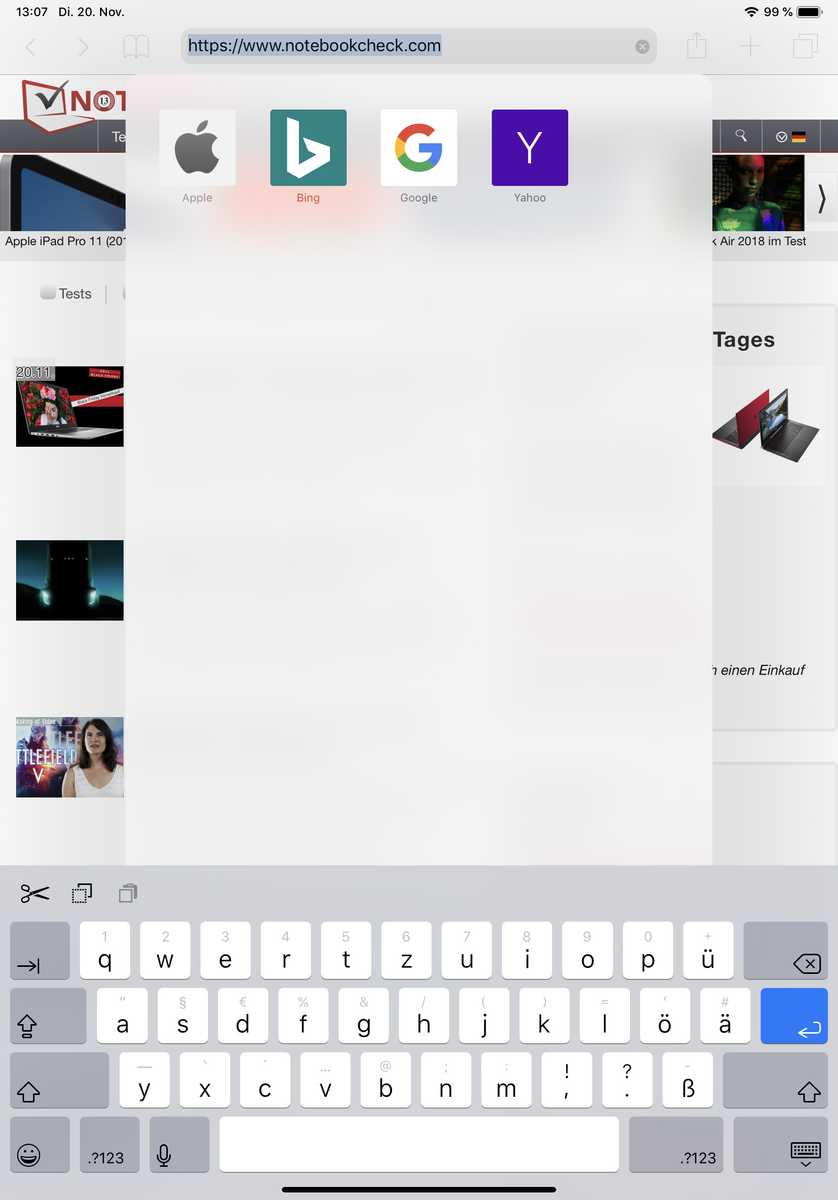
The default virtual keyboard remains unchanged and continues to work well. Apple has updated the Smart Folio Keyboard. The keyboard now magnetically attaches to the iPad and communicates with the device via its Pogo pins. The keyboard case is also thick enough to allow the iPad Pro 11 to lie flat on a table. The cover has a rubberised texture that feels good to the touch. Most keys measure 1.5 cm², while they all have a slightly concave design and emit a faint click when pressed. In short, the keyboard is easy to type on.
Pressing any key wakes up our test device, which then quickly unlocks using Face ID. This is a slick experience, although Face ID did occasionally fail to register our face. The only drawback of the Smart Keyboard Folio is that some of its keys are rather small, but we have this issue with compact notebooks too. Overall, the typing experience is close to matching Apple’s claims of the iPad Pro being a laptop replacement, but those who write a lot may find it easier to type on a full-sized Bluetooth keyboard instead.
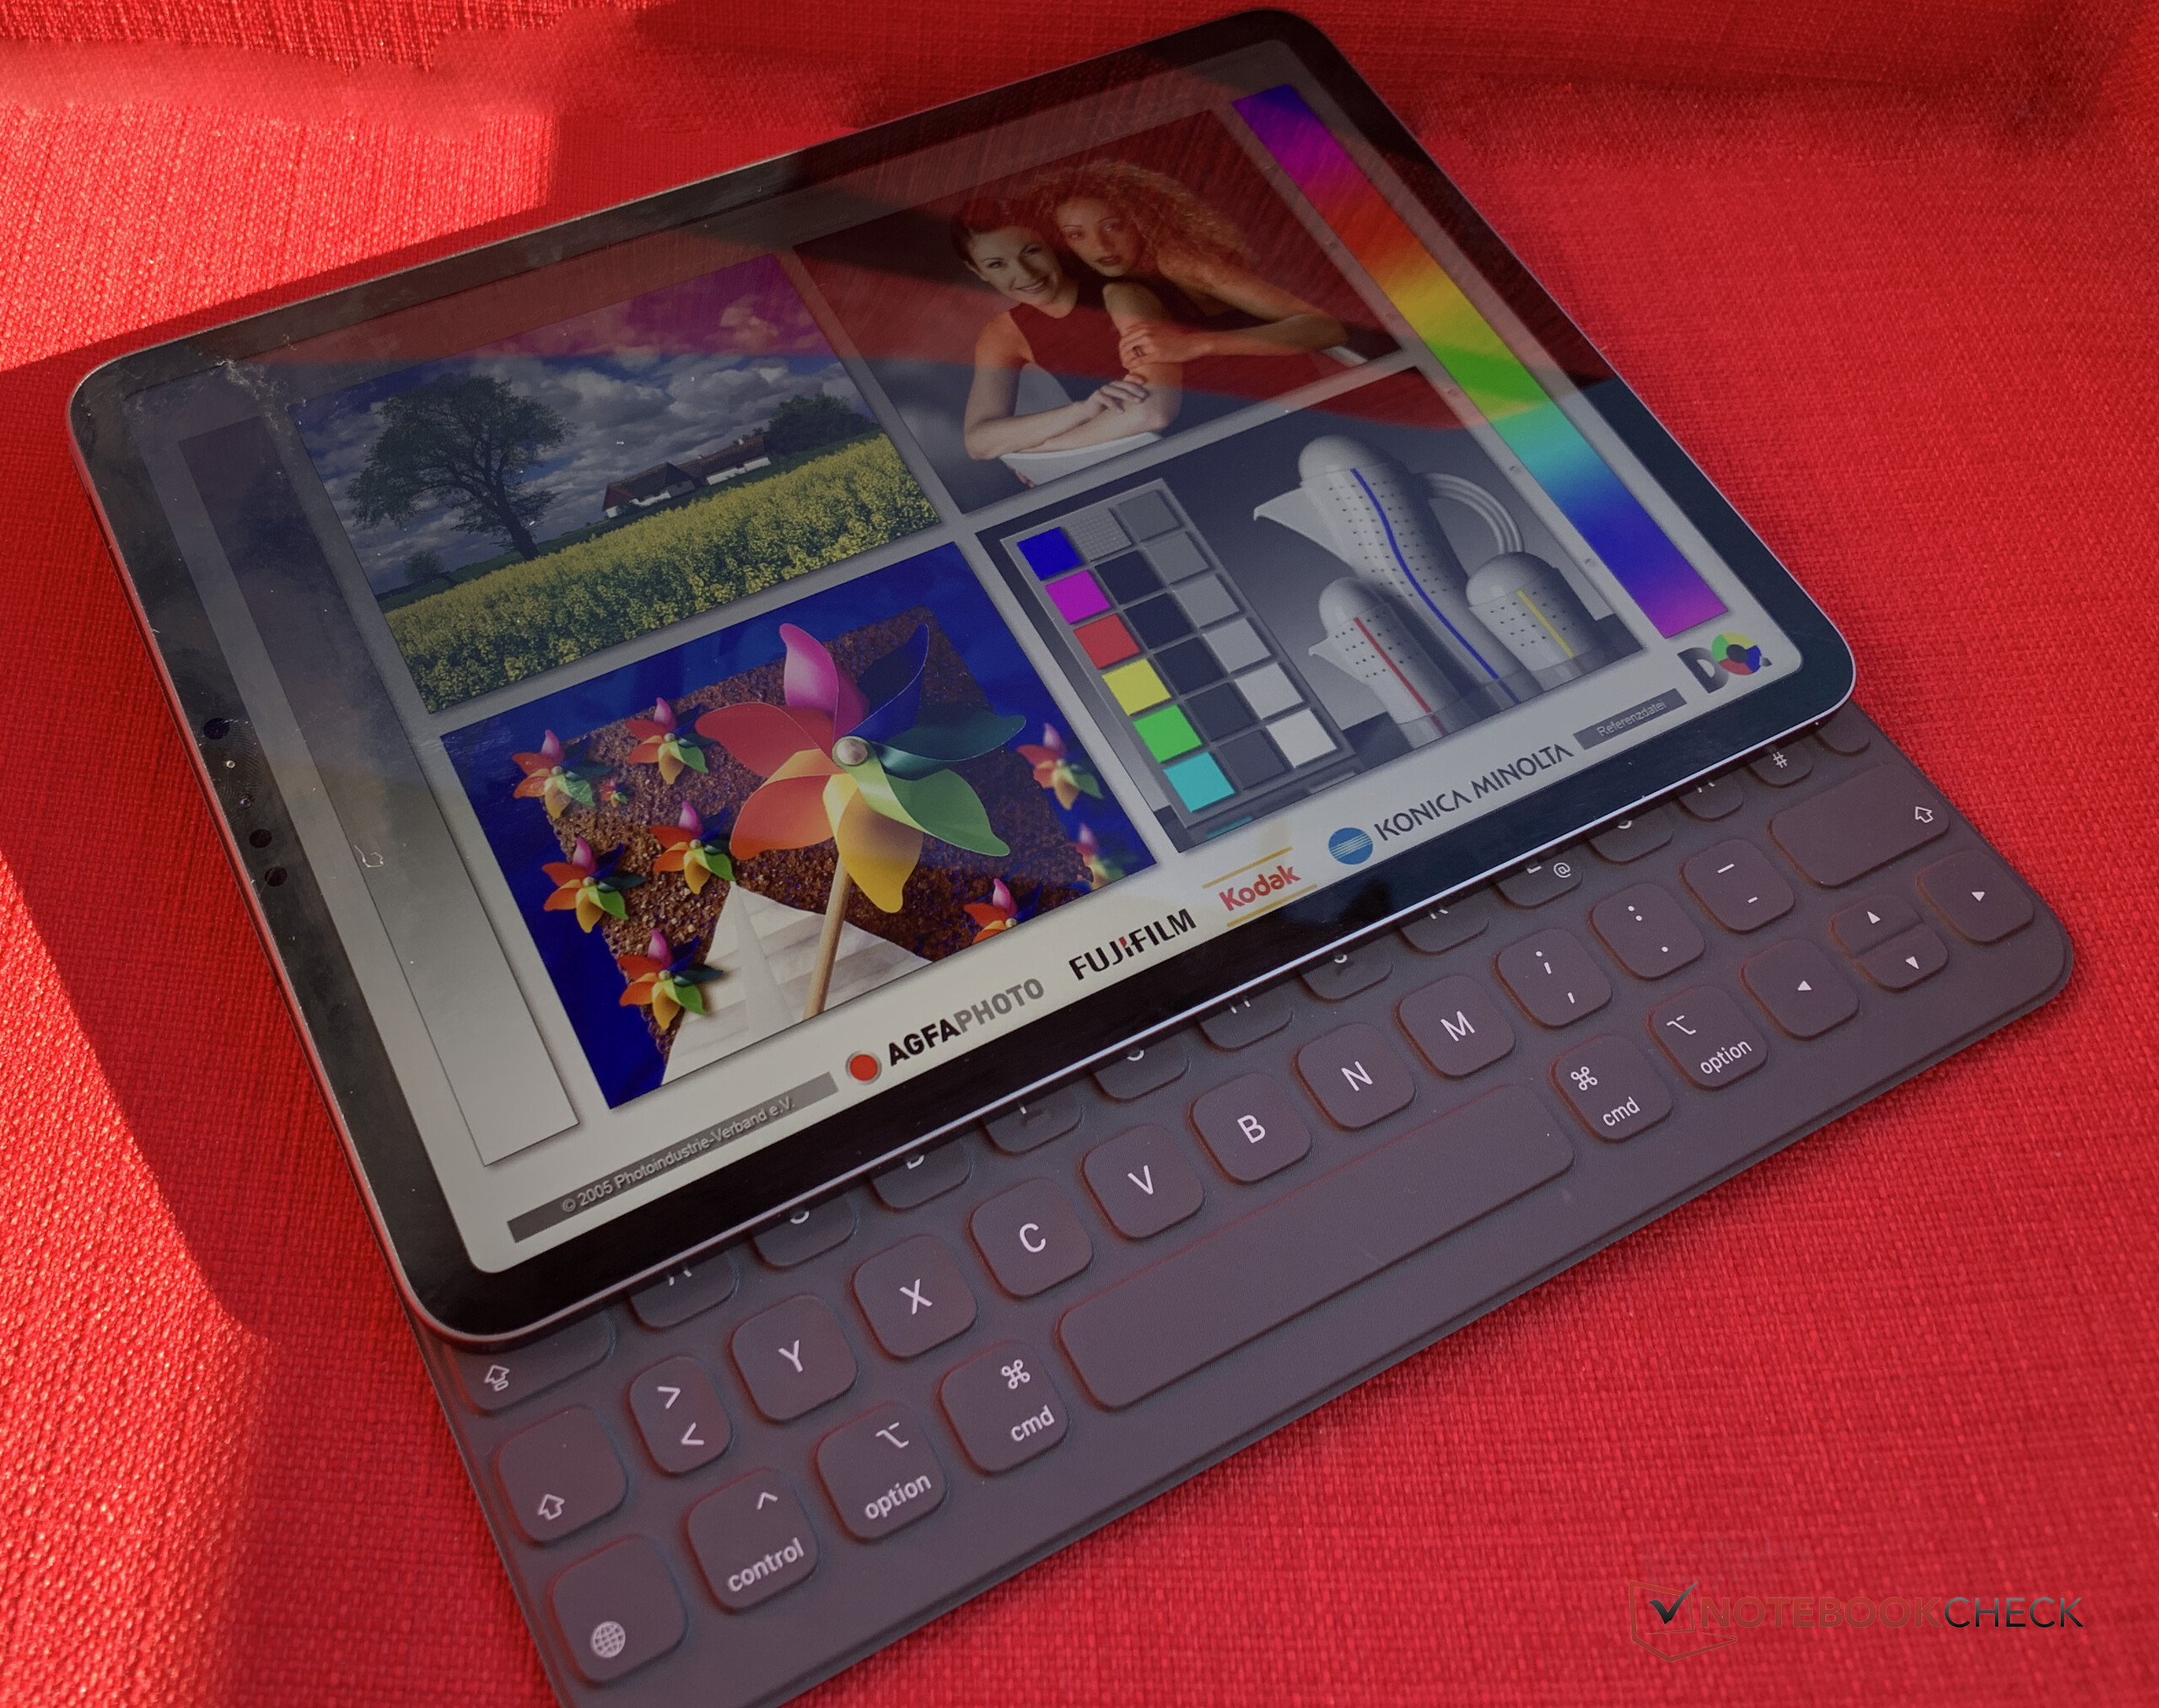
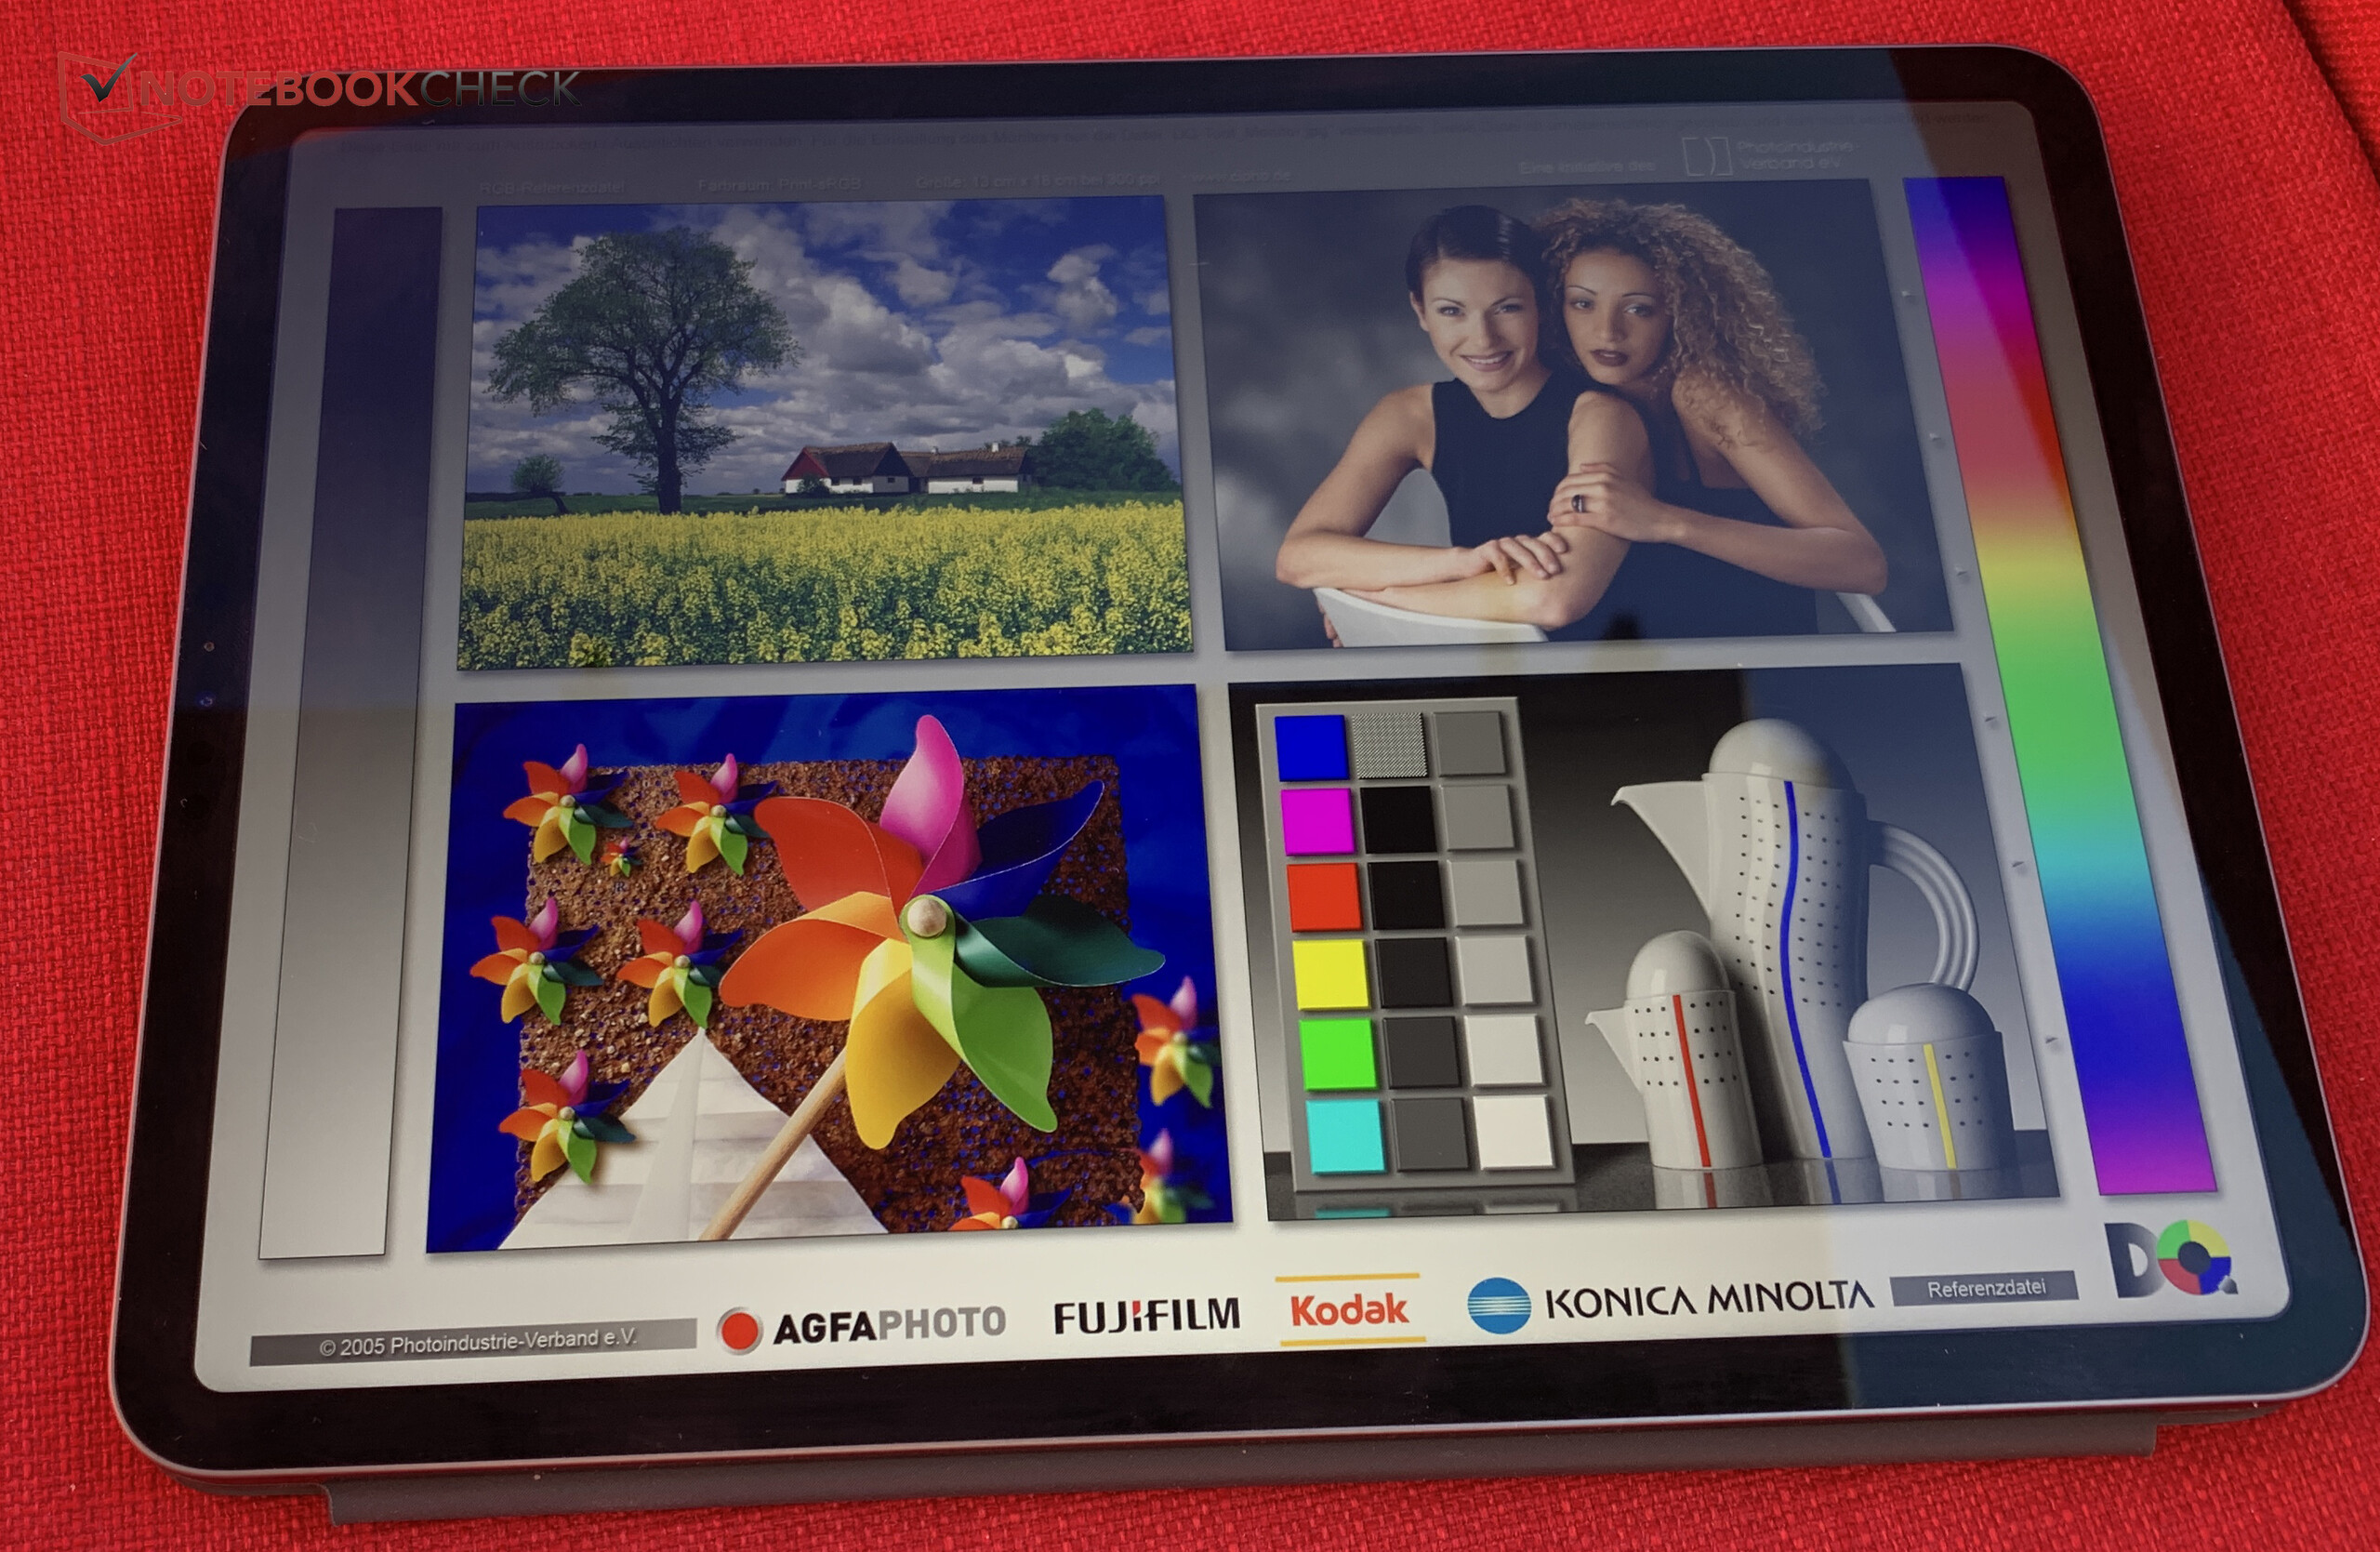
Display
Undoubtedly, one of the iPad Pro 11’s most important features is its display; it is the main method of interacting with the device after all. Apple continues to include its TrueTone sensor that automatically adjusts the display’s colour temperature to suit ambient lighting, and various anti-reflective coatings, which are both welcome additions.
The iPad Pro 11 has a 2.86:2 aspect ratio, which is essentially the 3:2 aspect ratio that we have seen on Surface devices among others. By contrast, the iPad Pro 12.9 has a 4:3 aspect ratio, the difference between which is minimal. 3:2 is a common format in photography, but most people should have no issues with editing photos on a 4:3 display. Both aspect ratios will letterbox 16:9 content though, which is why most laptops have 16:9 or 16:10 aspect ratios.
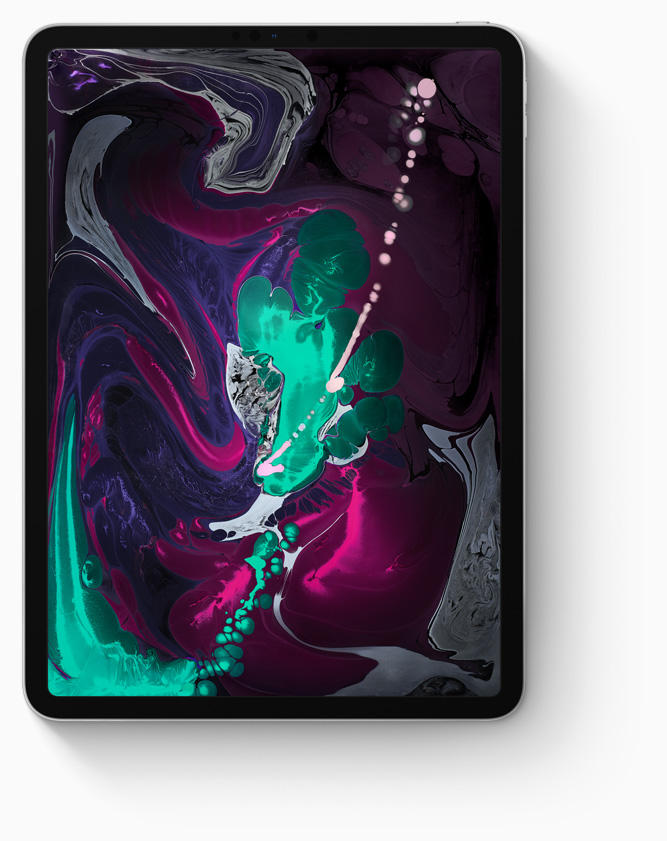
Apple markets its third-generation iPad Pros as having Liquid Retina displays, which is essentially a marketing term for the display’s rounded corners. Incidentally, the iPad Pro 11 has the same 265 PPI pixel density as its larger 12.9 sibling and one which puts both devices on par with other current flagship tablets. Our test device gets brighter than our non-Apple comparison devices, but it falls just short of the average maximum brightness that both the iPad Pro 12.9 and iPad Pro 10.5 achieve.
| |||||||||||||||||||||||||
Brightness Distribution: 87 %
Center on Battery: 639 cd/m²
Contrast: 1420:1 (Black: 0.45 cd/m²)
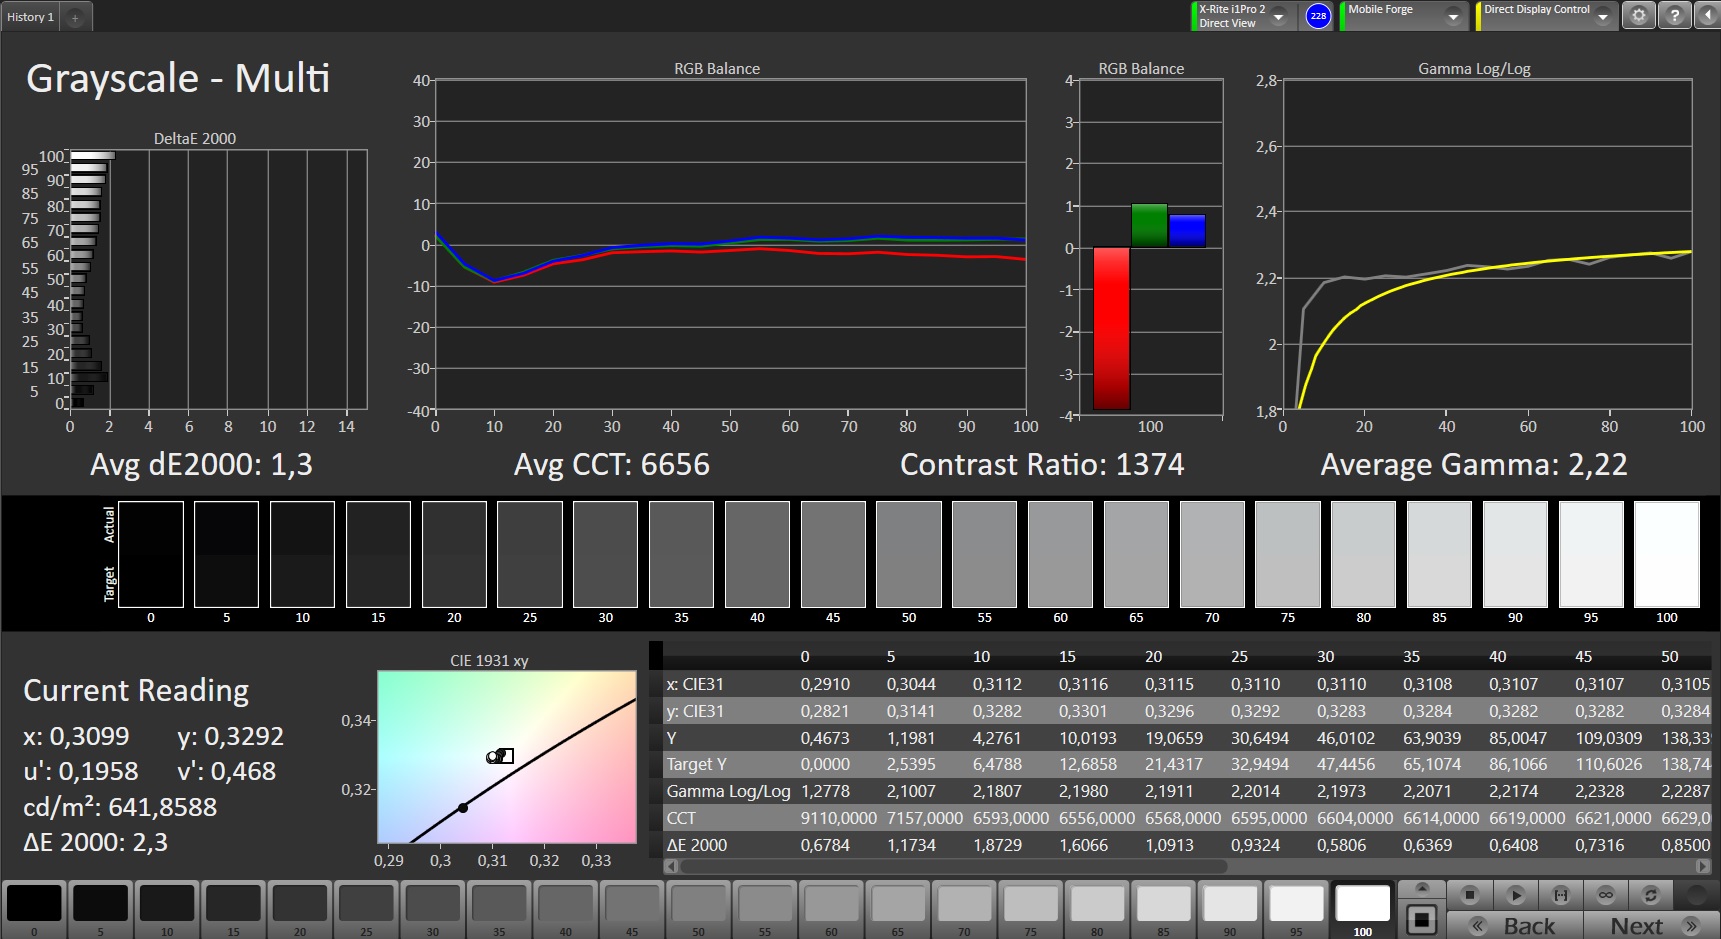
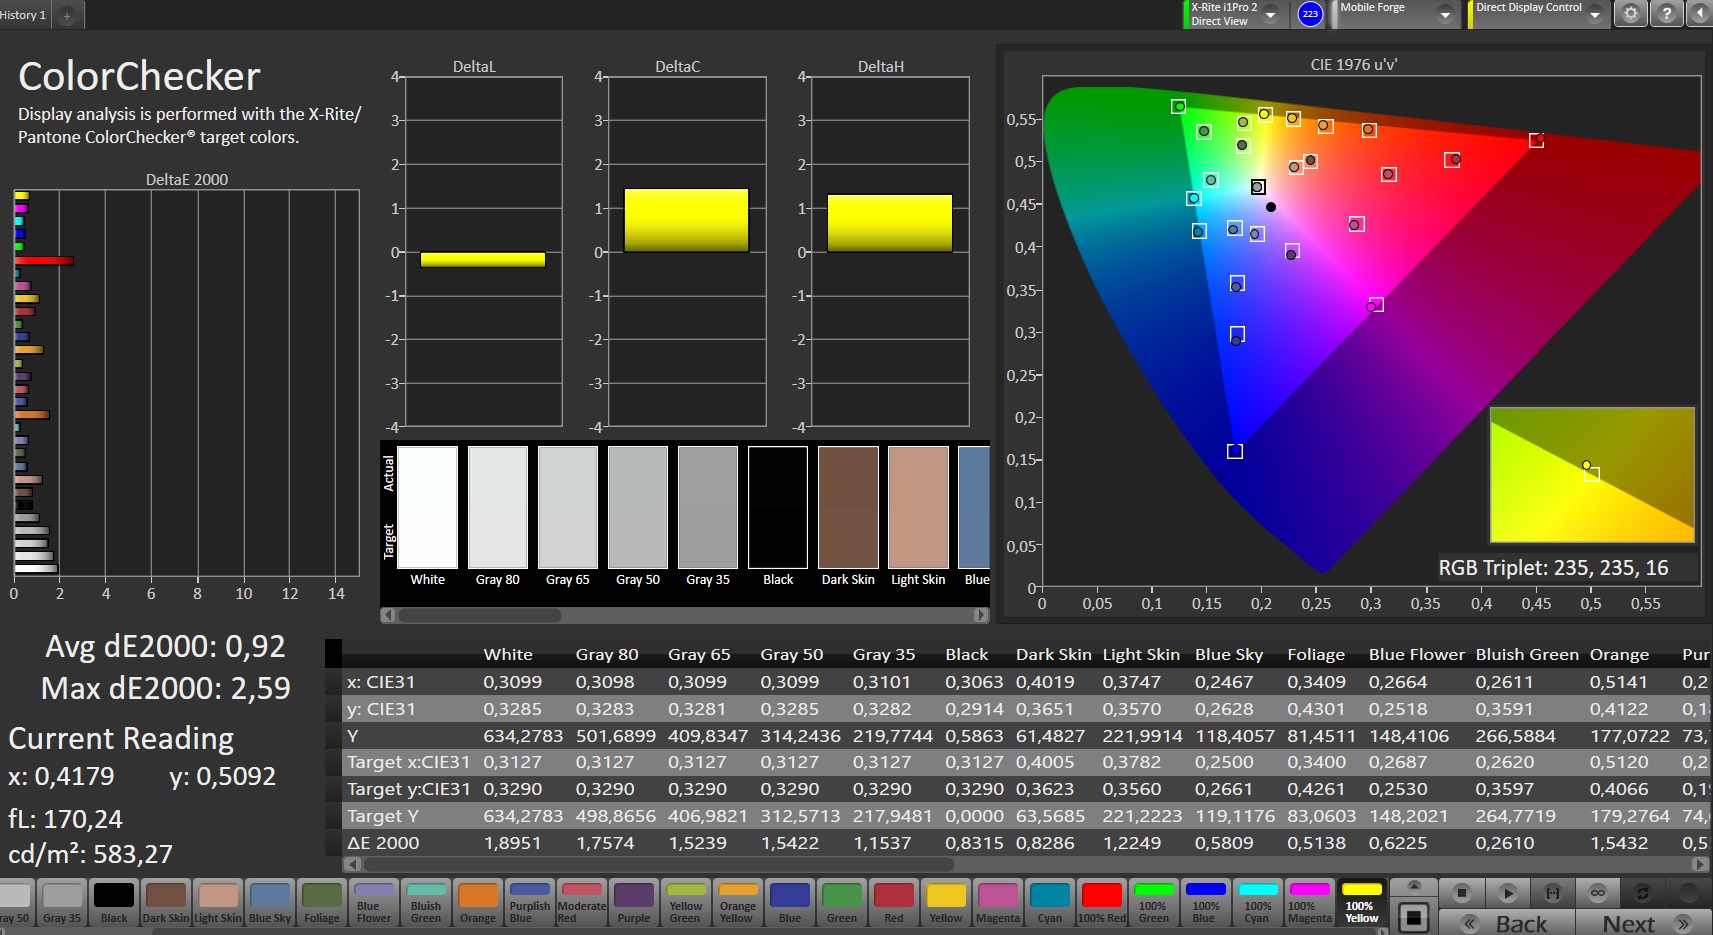
ΔE ColorChecker Calman: 0.92 | ∀{0.5-29.43 Ø4.71}
ΔE Greyscale Calman: 1.3 | ∀{0.09-98 Ø4.96}
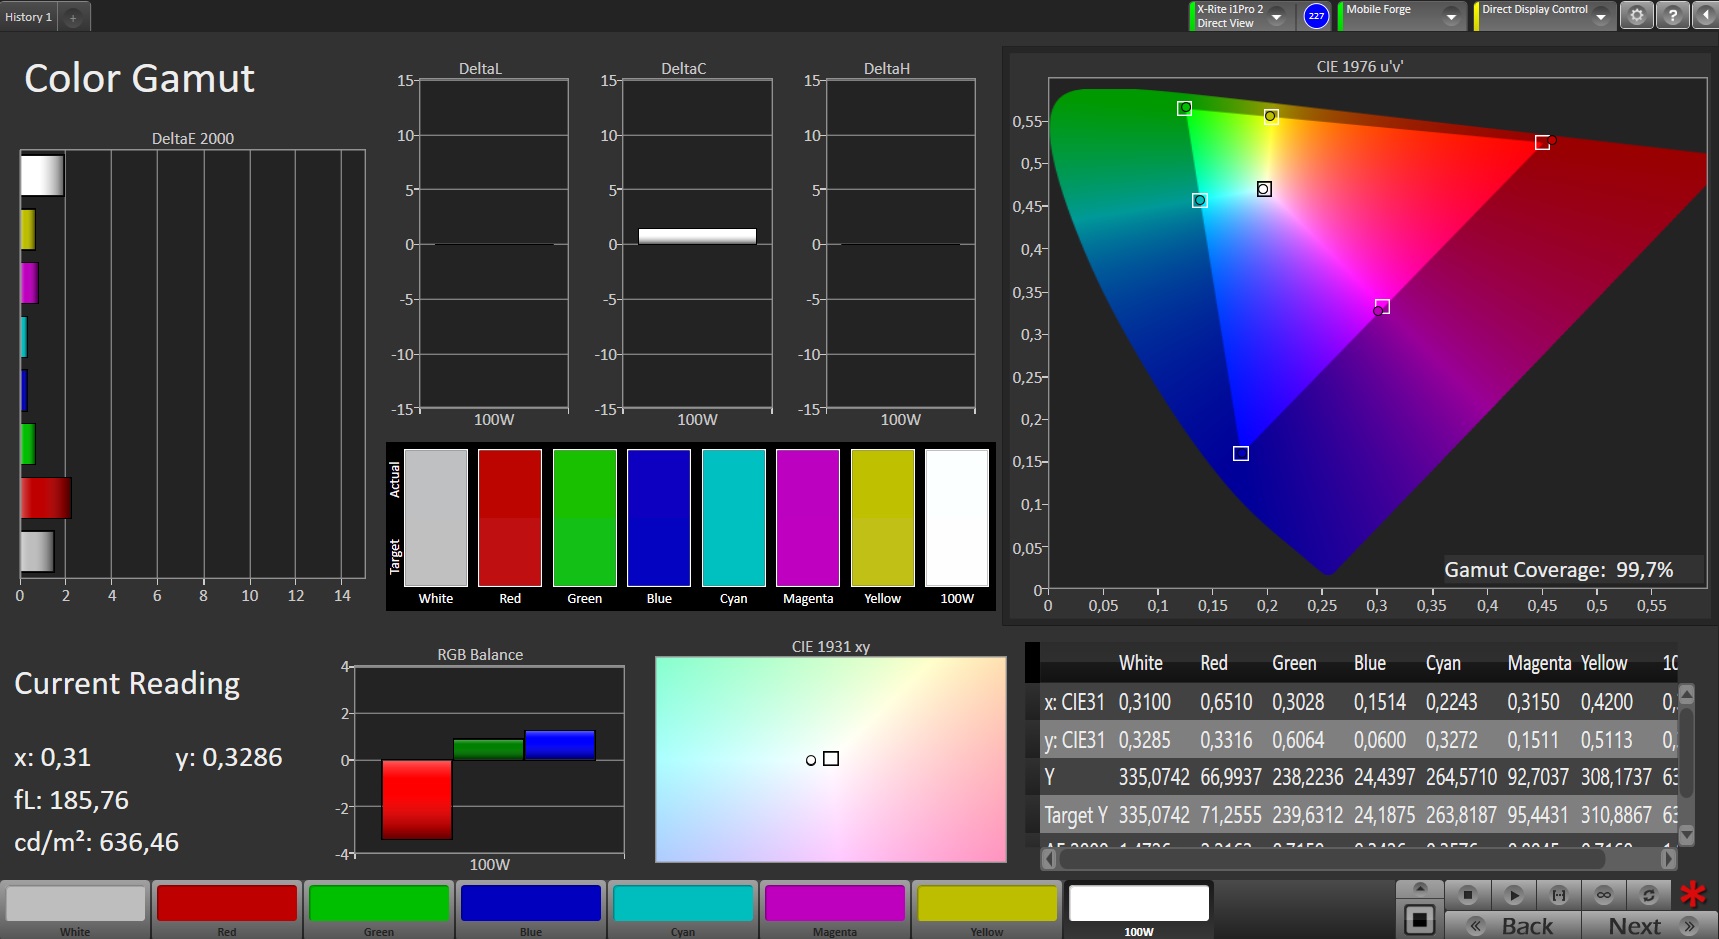
99.7% sRGB (Calman 2D)
Gamma: 2.22
CCT: 6656 K
| Apple iPad Pro 11 2018 IPS, 2388x1668, 11" | Microsoft Surface Pro 6, Core i7, 512 GB IPS, 2736x1824, 12.3" | Apple iPad Pro 10.5 2017 IPS, 2224x1668, 10.5" | Apple iPad Pro 12.9 2018 IPS, 2732x2048, 12.9" | Samsung Galaxy Tab S4 Super AMOLED, 2560x1600, 10.5" | Huawei MediaPad M5 10.8 Pro IPS, 2560x1600, 10.8" | |
|---|---|---|---|---|---|---|
| Screen | -94% | -30% | 4% | -66% | -217% | |
| Brightness middle (cd/m²) | 639 | 484 -24% | 634 -1% | 632 -1% | 474 -26% | 384 -40% |
| Brightness (cd/m²) | 591 | 473 -20% | 625 6% | 605 2% | 477 -19% | 360 -39% |
| Brightness Distribution (%) | 87 | 91 5% | 87 0% | 91 5% | 91 5% | 84 -3% |
| Black Level * (cd/m²) | 0.45 | 0.33 27% | 0.39 13% | 0.32 29% | 0.8 -78% | |
| Contrast (:1) | 1420 | 1467 3% | 1626 15% | 1975 39% | 480 -66% | |
| Colorchecker dE 2000 * | 0.92 | 4.29 -366% | 1.9 -107% | 1.1 -20% | 2.5 -172% | 6.83 -642% |
| Colorchecker dE 2000 max. * | 2.59 | 6.46 -149% | 3.9 -51% | 2.4 7% | 5.8 -124% | 12.7 -390% |
| Greyscale dE 2000 * | 1.3 | 4.3 -231% | 2.8 -115% | 1.7 -31% | 2.1 -62% | 7.5 -477% |
| Gamma | 2.22 99% | 2.51 88% | 2.26 97% | 2.21 100% | 2.08 106% | 2.199 100% |
| CCT | 6656 98% | 7315 89% | 7027 93% | 6794 96% | 6281 103% | 8544 76% |
| Colorchecker dE 2000 calibrated * | 1.34 | |||||
| Color Space (Percent of AdobeRGB 1998) (%) | 62 | |||||
| Color Space (Percent of sRGB) (%) | 95 |
* ... smaller is better
Screen Flickering / PWM (Pulse-Width Modulation)
| Screen flickering / PWM not detected |  | ||
In comparison: 52 % of all tested devices do not use PWM to dim the display. If PWM was detected, an average of 7741 (minimum: 5 - maximum: 343500) Hz was measured. | |||
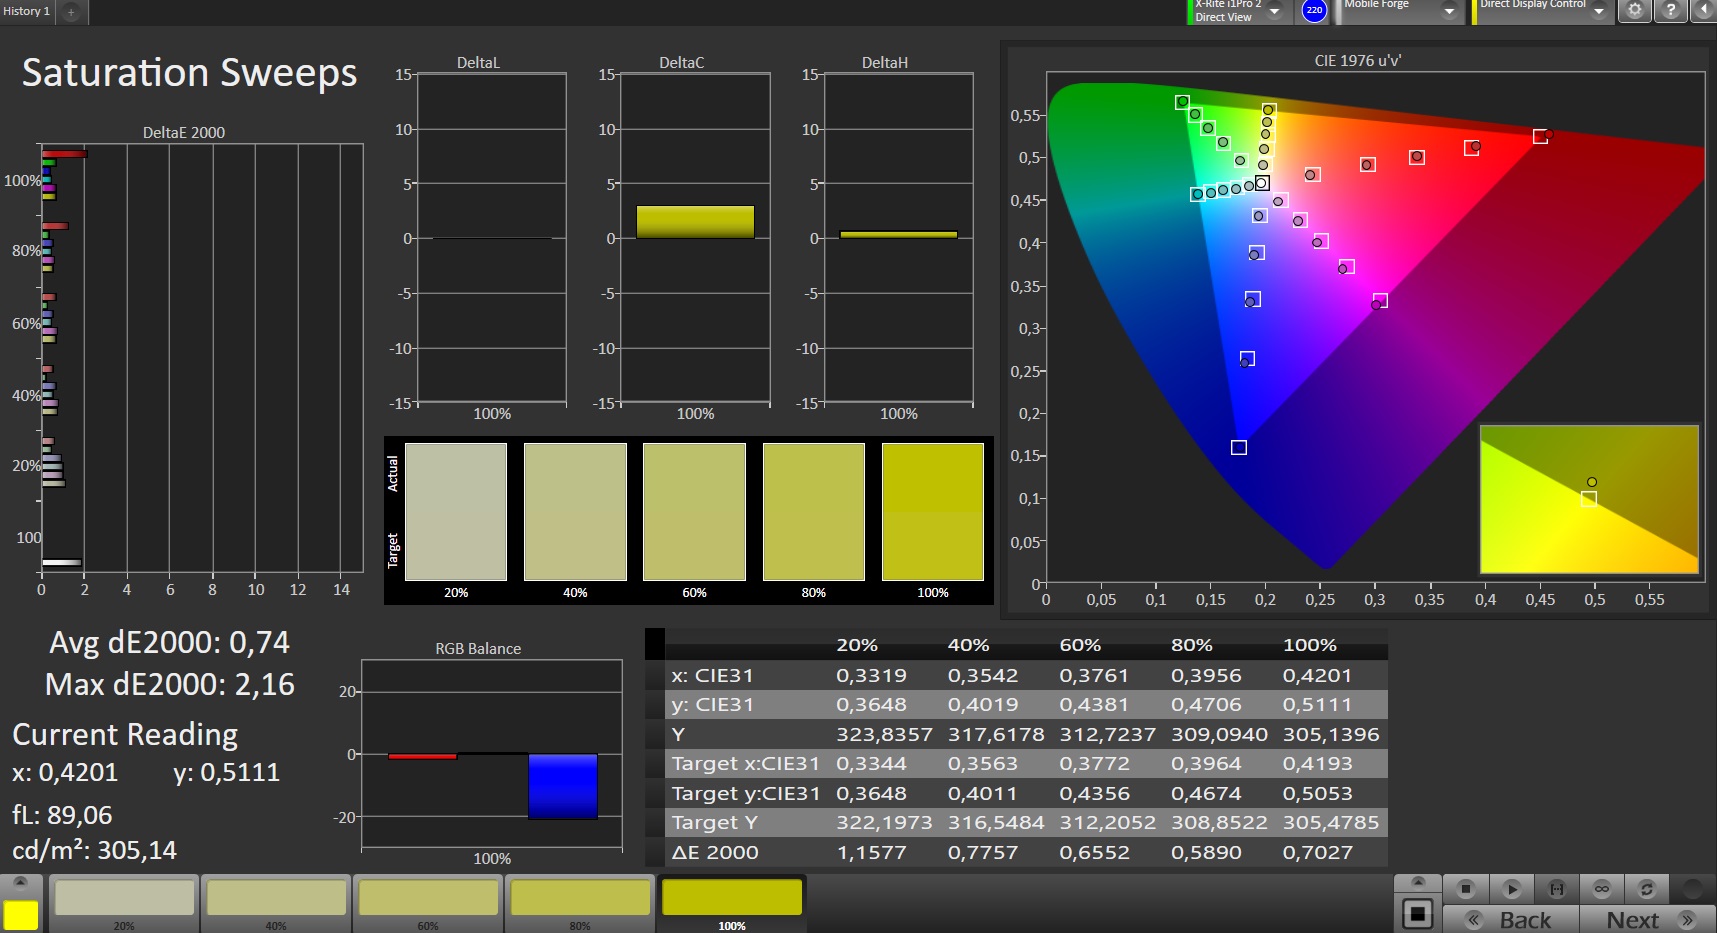
We also tested the iPad Pro 11’s colour accuracy with a spectrophotometer and CalMAN analysis software. Our test device has impressively low DeltaE deviations, which are lower than its predecessor and mostly better than its larger sibling. However, our test device has a comparatively high 0.45 cd/m² black value that results in a 1,420:1 contrast ratio, which is 15% and 39% lower than last year’s iPad Pro 10.5 and the new iPad Pro 12.9, respectively. Moreover, black tones look more like dark grey when the display is at maximum brightness; reducing this eliminates that effect though.
Unfortunately, we cannot currently measure colour-space coverage with CalMAN. Our test device approximately covers almost the entire sRGB colour space, and Apple claims that the device has a large DCI P3 colour-space coverage. We wish that we could put the company’s claims to the test.
Display Response Times
| ↔ Response Time Black to White | ||
|---|---|---|
| 36 ms ... rise ↗ and fall ↘ combined | ↗ 19 ms rise | 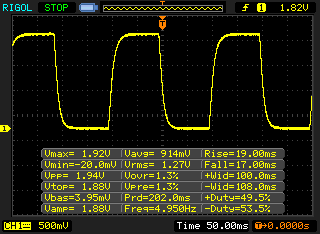 |
| ↘ 17 ms fall | ||
| The screen shows slow response rates in our tests and will be unsatisfactory for gamers. In comparison, all tested devices range from 0.1 (minimum) to 240 (maximum) ms. » 94 % of all devices are better. This means that the measured response time is worse than the average of all tested devices (19.8 ms). | ||
| ↔ Response Time 50% Grey to 80% Grey | ||
| 54 ms ... rise ↗ and fall ↘ combined | ↗ 25 ms rise | 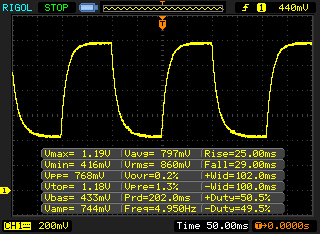 |
| ↘ 29 ms fall | ||
| The screen shows slow response rates in our tests and will be unsatisfactory for gamers. In comparison, all tested devices range from 0.165 (minimum) to 636 (maximum) ms. » 91 % of all devices are better. This means that the measured response time is worse than the average of all tested devices (30.9 ms). | ||
Our test device has strong viewing angles thanks to its IPS display. We noticed no brightness or colour distortions even at acute viewing angles.
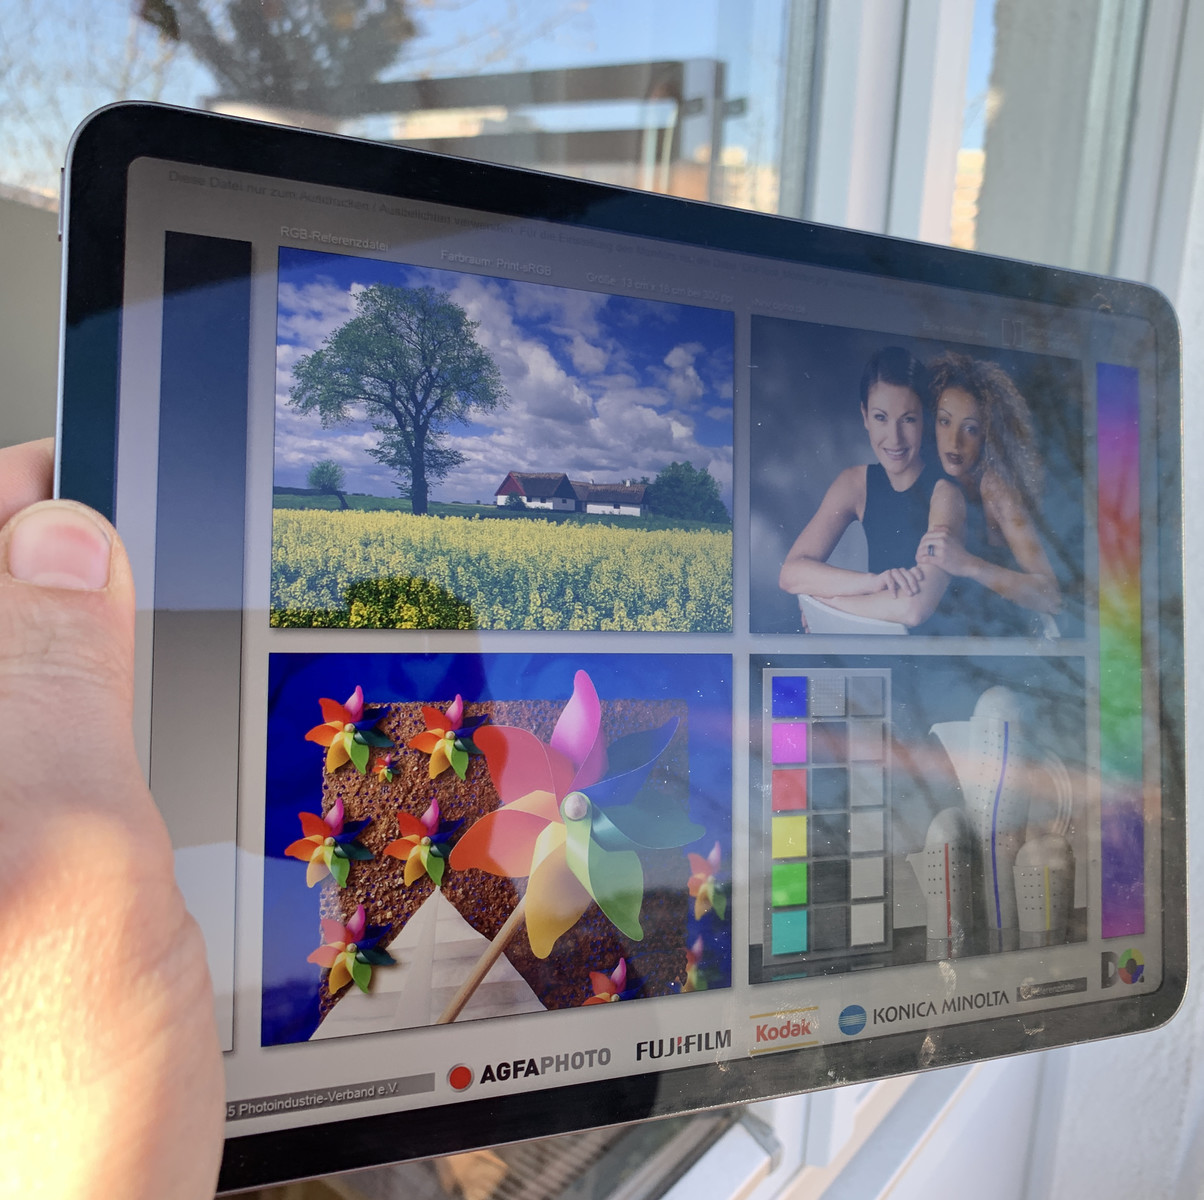
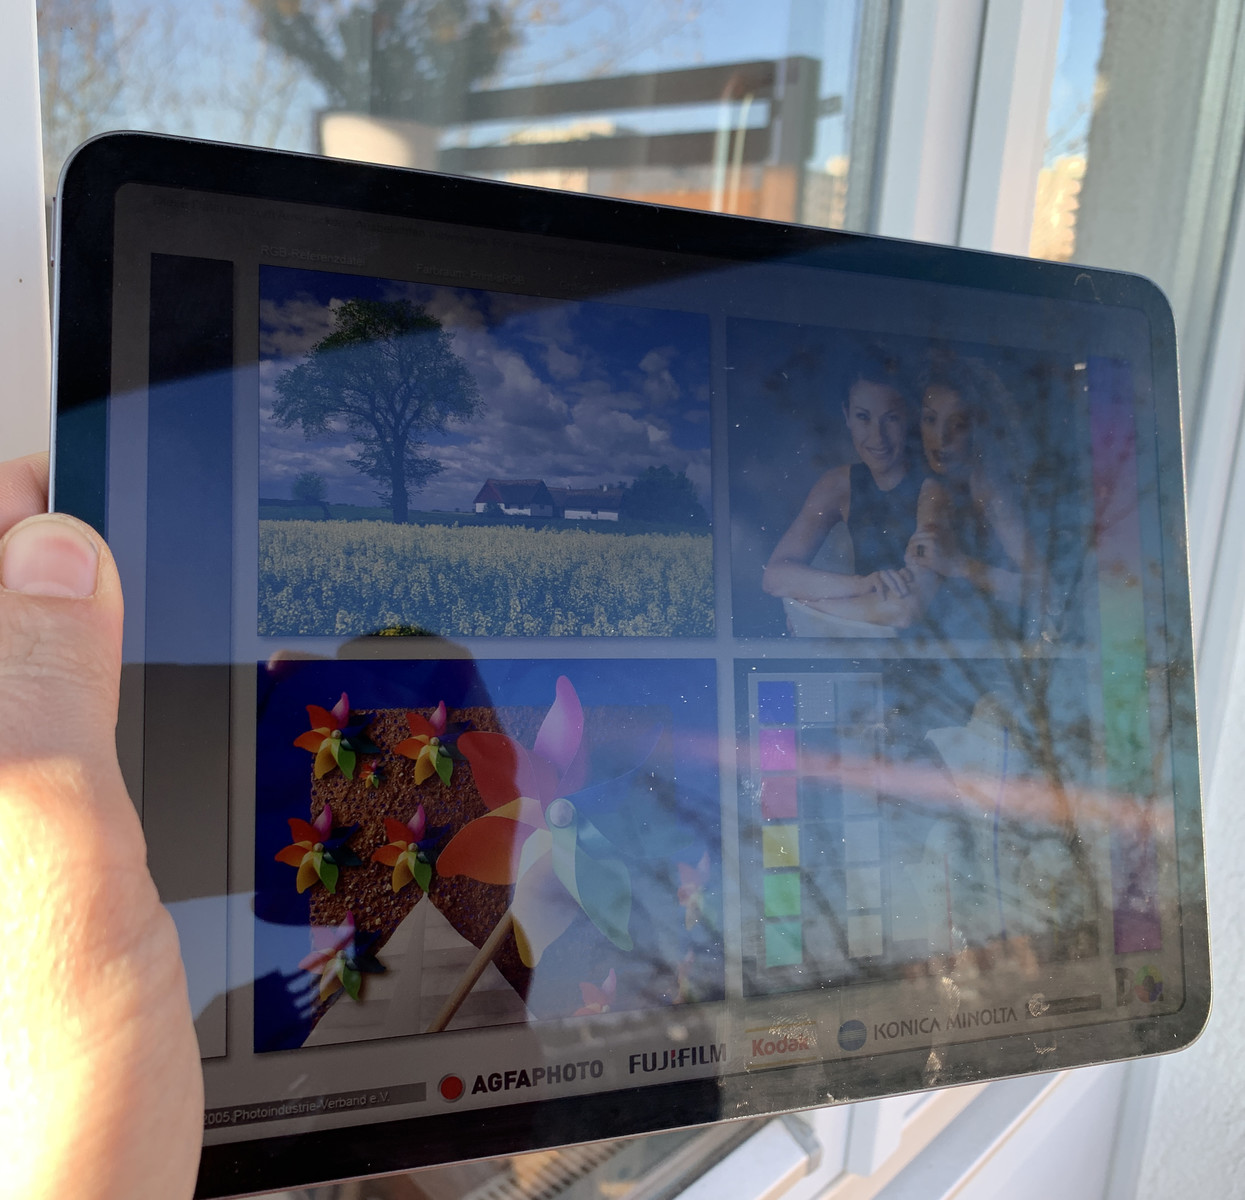
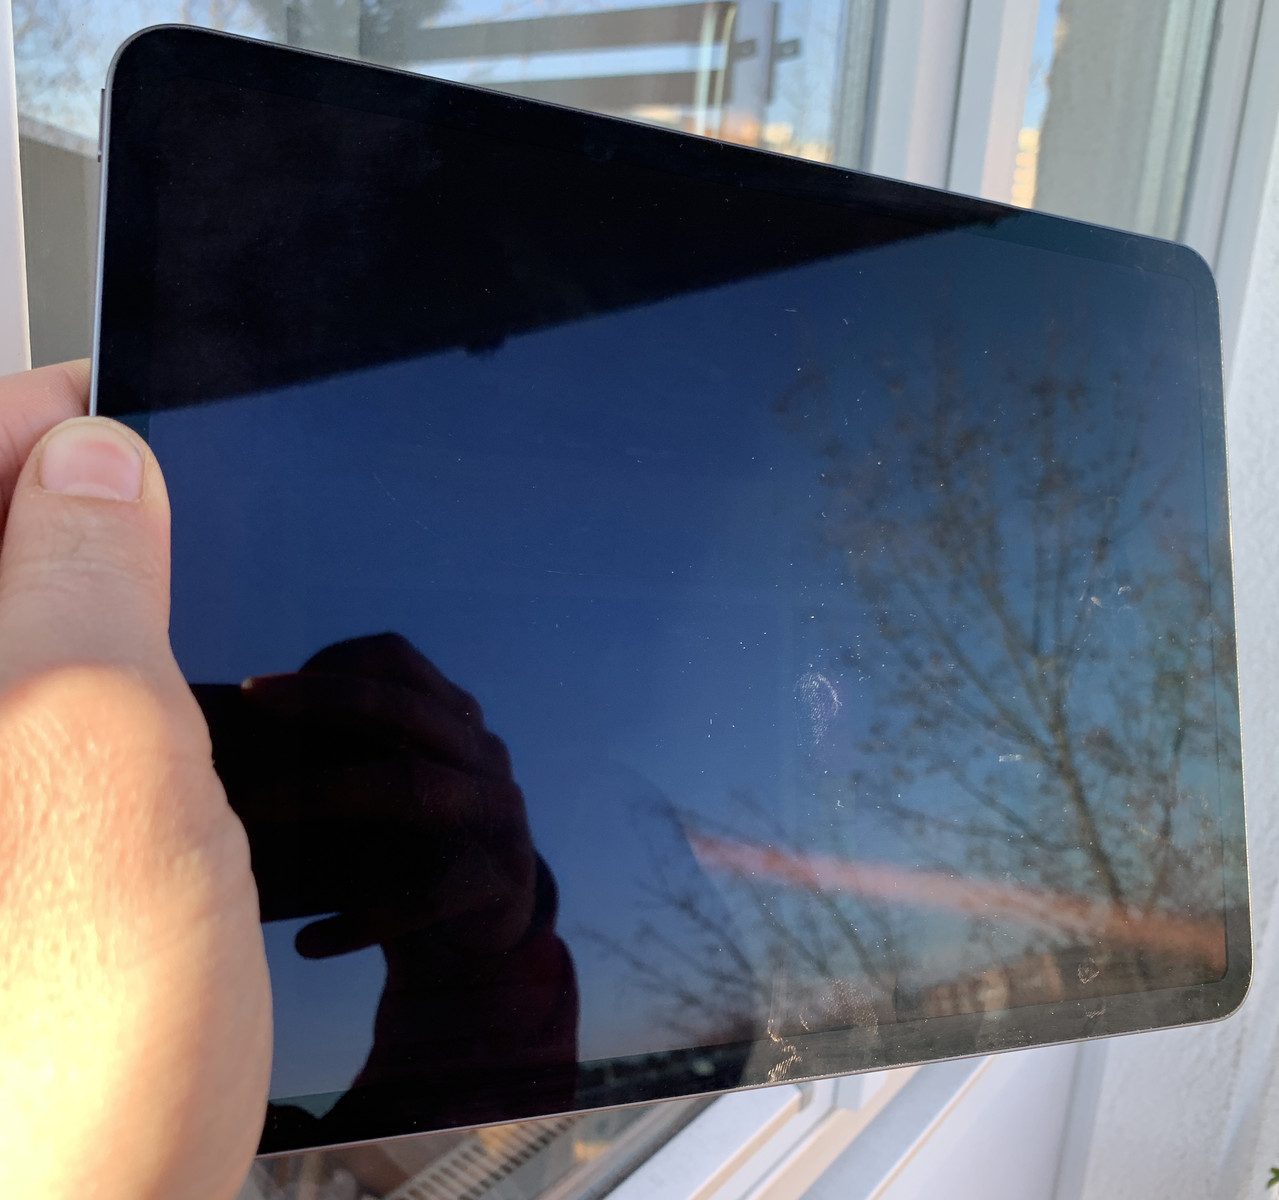
The iPad Pro 11 is easy to use outdoors too. We would recommend maximising screen brightness when using the device outside on a sunny day, as the display is reflective. Using the device in these conditions at medium brightness or lower becomes frustrating quickly, as demonstrated by our photos below.

Performance
Apple has equipped its third-generation iPad Pro with Apple A12X Bionic SoCs. The A12X Bionic may differ slightly from the A12 Bionic in name, but the new SoC powering our test device is considerably more powerful than its similarly named sibling. The A12X Bionic SoC has two more processor cores and countless more transistors, which makes the SoC not only physically larger than the A12 Bionic but also much more powerful.
Moreover, our performance benchmarks demonstrate that the A12X Bionic SoC is a huge step up from the A10X Fusion that Apple used in last year’s iPad Pro 10.5. Our Android comparison devices are not even close to challenging the new iPad Pro 11 in these benchmarks.
Please note: We could not include the Surface Pro 6 in our comparison table as it runs on an x86 architecture, while the iPad Pro and our Android comparison devices are powered by ARM processors. Hence, we could not run the same benchmarks on the Surface Pro 6 as we could on the iPad Pro 11.
The A12X Bionic SoC integrates an A12X Bionic GPU, which has seven cores. The A12X GPU delivers outstanding performance in GPU benchmarks, particularly so in GFXBench Manhattan 3.1 in which our test device scored almost three times the FPS that its predecessor did in a comparable off-screen test.
| PCMark for Android | |
| Work performance score | |
| Samsung Galaxy Tab S4 | |
| Huawei MediaPad M5 10.8 Pro | |
| Work 2.0 performance score | |
| Samsung Galaxy Tab S4 | |
| Huawei MediaPad M5 10.8 Pro | |
| 3DMark | |
| 2560x1440 Sling Shot Extreme (ES 3.1) | |
| Apple iPad Pro 10.5 2017 | |
| Samsung Galaxy Tab S4 | |
| Huawei MediaPad M5 10.8 Pro | |
| 2560x1440 Sling Shot Extreme (ES 3.1) Graphics | |
| Apple iPad Pro 10.5 2017 | |
| Samsung Galaxy Tab S4 | |
| Huawei MediaPad M5 10.8 Pro | |
| 2560x1440 Sling Shot Extreme (ES 3.1) Physics | |
| Samsung Galaxy Tab S4 | |
| Huawei MediaPad M5 10.8 Pro | |
| Apple iPad Pro 10.5 2017 | |
| 2560x1440 Sling Shot Extreme (ES 3.1) Unlimited | |
| Average of class Tablet (800 - 13954, n=12, last 2 years) | |
| Apple iPad Pro 10.5 2017 | |
| Samsung Galaxy Tab S4 | |
| Huawei MediaPad M5 10.8 Pro | |
| 2560x1440 Sling Shot Extreme (ES 3.1) Unlimited Graphics | |
| Average of class Tablet (662 - 21647, n=12, last 2 years) | |
| Apple iPad Pro 10.5 2017 | |
| Samsung Galaxy Tab S4 | |
| Huawei MediaPad M5 10.8 Pro | |
| 2560x1440 Sling Shot Extreme (ES 3.1) Unlimited Physics | |
| Average of class Tablet (2012 - 6786, n=12, last 2 years) | |
| Samsung Galaxy Tab S4 | |
| Huawei MediaPad M5 10.8 Pro | |
| Apple iPad Pro 10.5 2017 | |
| AnTuTu v7 - Total Score | |
| Apple iPad Pro 11 2018 | |
| Average Apple A12X Bionic (552676 - 566378, n=2) | |
| Apple iPad Pro 12.9 2018 | |
| Samsung Galaxy Tab S4 | |
| Huawei MediaPad M5 10.8 Pro | |
| Basemark ES 3.1 / Metal - offscreen Overall Score | |
| Apple iPad Pro 12.9 2018 | |
| Average Apple A12X Bionic (5216 - 5300, n=2) | |
| Apple iPad Pro 11 2018 | |
| Average of class Tablet (255 - 5784, n=6, last 2 years) | |
Our test device outclasses our comparison devices in browser benchmarks too. The iPad Pro 11 is around 30% faster than its predecessor, which is a decent performance boost in a year. Better optimised software plays a role here too, and Apple only develops Safari for a few iOS devices, so the browser may be better optimised as it is developed for fewer devices than browsers that run on Android or Windows 10.
Web-browsing on the iPad Pro 11 is a pleasure in daily use. Websites generally load quickly, and we did not notice any content reloading on pages that we already loaded. Scrolling remained smooth throughout testing too. Moreover, HTML 5 applications like Google Interland ran smoothly and without issue.
| JetStream 1.1 - 1.1 Total | |
| Apple iPad Pro 12.9 2018 (Safari Mobile 12) | |
| Average Apple A12X Bionic (278 - 279, n=2) | |
| Apple iPad Pro 11 2018 (Safari 13) | |
| Microsoft Surface Pro 6, Core i7, 512 GB | |
| Apple iPad Pro 10.5 2017 (Safari Mobile 10) | |
| Samsung Galaxy Tab S4 (Samsung Browser 8.0) | |
| Huawei MediaPad M5 10.8 Pro (Chrome 68.0.3440.91) | |
| Octane V2 - Total Score | |
| Average of class Tablet (1633 - 138481, n=70, last 2 years) | |
| Apple iPad Pro 12.9 2018 (Safari Mobile 12) | |
| Average Apple A12X Bionic (44425 - 45734, n=2) | |
| Apple iPad Pro 11 2018 (Safari 13) | |
| Microsoft Surface Pro 6, Core i7, 512 GB | |
| Apple iPad Pro 10.5 2017 (Safari Mobile 10) | |
| Samsung Galaxy Tab S4 (Samsung Browser 8.0) | |
| Huawei MediaPad M5 10.8 Pro (Chrome 68.0.3440.91) | |
| Mozilla Kraken 1.1 - Total | |
| Huawei MediaPad M5 10.8 Pro (Chrome 68.0.3440.91) | |
| Samsung Galaxy Tab S4 (Samsung Browser 8.0) | |
| Average of class Tablet (243 - 16233, n=65, last 2 years) | |
| Microsoft Surface Pro 6, Core i7, 512 GB | |
| Apple iPad Pro 10.5 2017 (Safari Mobile 10) | |
| Apple iPad Pro 12.9 2018 (Safari Mobile 12) | |
| Average Apple A12X Bionic (603 - 614, n=2) | |
| Apple iPad Pro 11 2018 (Safari 13) | |
| WebXPRT 3 - Overall | |
| Average of class Tablet (168 - 520, n=10, last 2 years) | |
| Apple iPad Pro 12.9 2018 (Safari Mobile 12) | |
| Average Apple A12X Bionic (172 - 182, n=2) | |
| Apple iPad Pro 11 2018 (Safari 13) | |
| Samsung Galaxy Tab S4 (Samsung Browser 8.0) | |
| Huawei MediaPad M5 10.8 Pro (Chrome 68.0.3440.91) | |
| WebXPRT 2015 - Overall | |
| Apple iPad Pro 11 2018 (Safari 13) | |
| Average Apple A12X Bionic (380 - 386, n=2) | |
| Apple iPad Pro 12.9 2018 (Safari Mobile 12) | |
| Apple iPad Pro 10.5 2017 (Safari Mobile 10) | |
| Samsung Galaxy Tab S4 (Samsung Browser 8.0) | |
| Huawei MediaPad M5 10.8 Pro (Chrome 68.0.3440.91) | |
* ... smaller is better
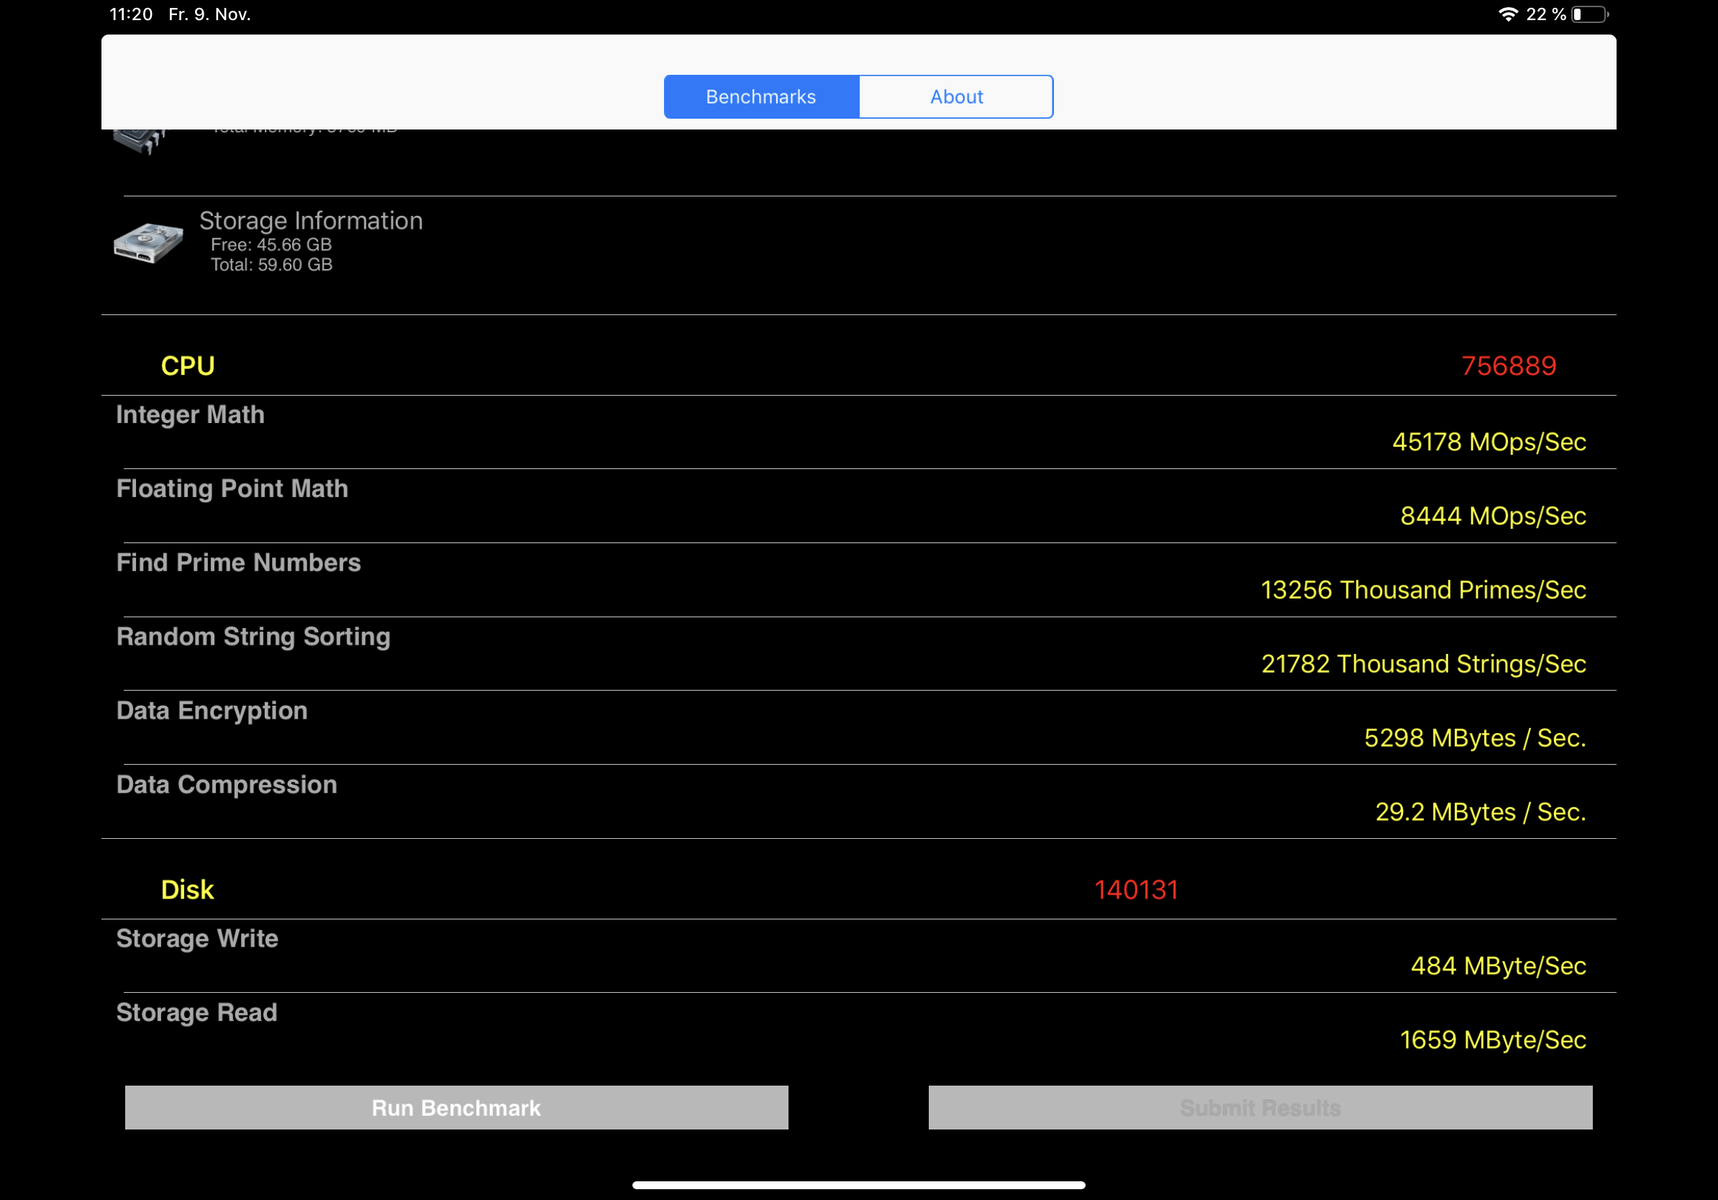
We used PassMark to determine storage transfer speeds, which demonstrated that the iPad Pro 11 has slightly faster read speeds than the XS Max. Our test device achieved up to three times higher write speeds though. We typically use AndroBench to measure storage access speeds, but unfortunately, the app has not been developed for iOS, which limits our comparison table. Loading times felt snappy and data loaded quickly throughout testing.
Games
We initially thought that the iPad Pro 11 would be a great device for working and gaming. Our tests largely proved this, with our test device rendering most games at 60 FPS. Oddly, Asphalt 9: Legends would only run at 30 FPS, the reason for which we could not determine. We measured frame rates with GameBench, for reference.
We expect that the new iPad Pro series will handle all modern games comfortably for the next few years as all models are powered by the powerful A12X Bionic SoC. The touchscreen and positional sensor worked perfectly throughout testing too.


| Asphalt 9: Legends | |||
| Settings | Value | ||
| High Quality | 29 fps | ||
| Shadow Fight 3 | |||
| Settings | Value | ||
| high | 59 fps | ||
| minimal | 59 fps | ||
| Arena of Valor | |||
| Settings | Value | ||
| min | 60 fps | ||
| high HD | 59 fps | ||
Emissions
Temperature
The iPad Pro 11 manages its surface temperatures relatively well, although the centre of the back of the device reaches a noticeably warm 33.3 °C at idle, which is probably where the SoC sits. Surface temperatures on our test device average around 27 °C at idle though, which felt cool to the touch. Predictably, temperatures increase when the device operates under sustained load, but only a few areas on our test device reach above 35 °C and there was one that reached 37.9 °C, both of which are acceptable.
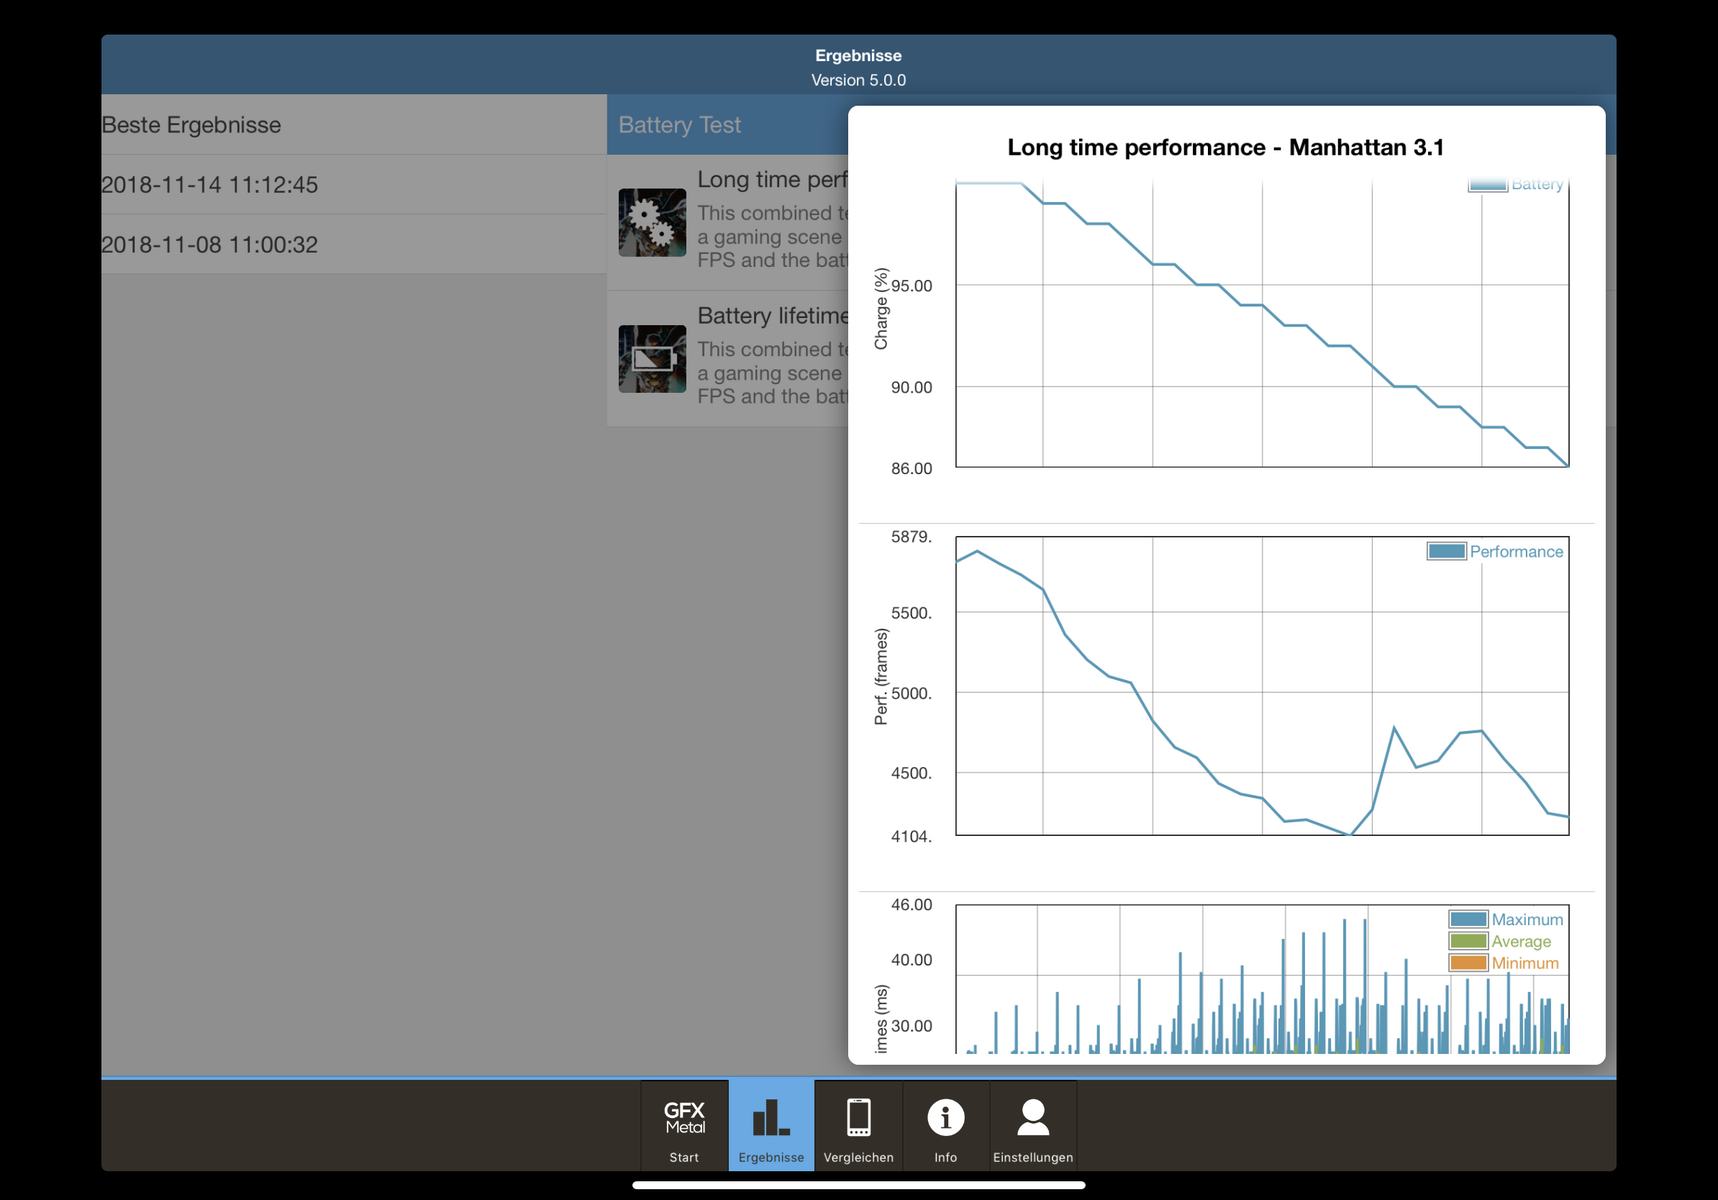
We also subjected the iPad Pro 11 to looped GFXBench Battery Test benchmarks to determine how well it manages performance under load. Disappointingly, performance dropped by around a third after 30 loops of the benchmark, which represents considerable thermal throttling. By contrast, the iPad Pro 12.9 maintained around 80% of its peak performance in the same benchmark.
(+) The maximum temperature on the upper side is 37.9 °C / 100 F, compared to the average of 33.7 °C / 93 F, ranging from 20.7 to 53.2 °C for the class Tablet.
(+) The bottom heats up to a maximum of 36.9 °C / 98 F, compared to the average of 33.2 °C / 92 F
(+) In idle usage, the average temperature for the upper side is 25.9 °C / 79 F, compared to the device average of 30 °C / 86 F.


Speakers
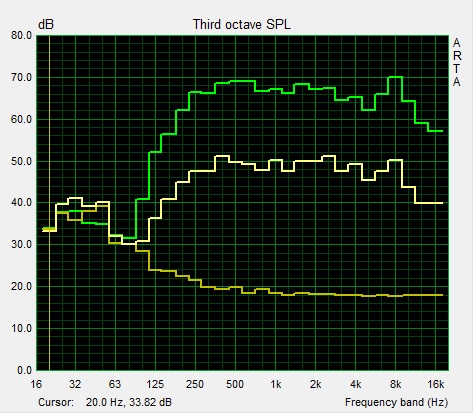
The iPad Pro 11 has four speakers that sound warm and are loud enough for audio playback in most environments. The speakers also have decent bass reproduction compared to other tablets. Occasionally the speakers sounded rather shrill during testing at high volumes, but this is a minor gripe. Moreover, the sound reproduction is even more linear than the quad-speakers in last year’s iPad Pro 10.5. Apple does not include a system-wide equaliser, but there are audio profiles in apps like Apple Music that adjust the sound of what is being played. The iPad Pro 11 will never replace a premium audio system, but it gets loud enough to fill a medium-sized room and gives cheap Bluetooth speakers a run for their money.
The device also supports audio output over Bluetooth or USB Type-C. External speakers and headphones pair quickly with our test device, while the sound quality over Bluetooth is good. The USB Type-C port works well too and even with third-party 3.5 mm jack adapters, which is a surprise. We have been so used to seeing Apple restrict its mobile devices to within its ecosystem that it is pleasant to see the company changing that, albeit probably unintentionally and only because it has adopted a universal standard.
Apple iPad Pro 11 2018 audio analysis
(±) | speaker loudness is average but good (78.7 dB)
Bass 100 - 315 Hz
(±) | reduced bass - on average 8.9% lower than median
(±) | linearity of bass is average (12.2% delta to prev. frequency)
Mids 400 - 2000 Hz
(+) | balanced mids - only 1.9% away from median
(+) | mids are linear (2.4% delta to prev. frequency)
Highs 2 - 16 kHz
(+) | balanced highs - only 1.9% away from median
(+) | highs are linear (6.4% delta to prev. frequency)
Overall 100 - 16.000 Hz
(±) | linearity of overall sound is average (16.5% difference to median)
Compared to same class
» 38% of all tested devices in this class were better, 5% similar, 57% worse
» The best had a delta of 7%, average was 20%, worst was 129%
Compared to all devices tested
» 28% of all tested devices were better, 6% similar, 66% worse
» The best had a delta of 4%, average was 23%, worst was 134%
Apple iPad Pro 10.5 2017 audio analysis
(+) | speakers can play relatively loud (84.6 dB)
Bass 100 - 315 Hz
(±) | reduced bass - on average 10.4% lower than median
(±) | linearity of bass is average (12.3% delta to prev. frequency)
Mids 400 - 2000 Hz
(±) | higher mids - on average 5.8% higher than median
(+) | mids are linear (4.3% delta to prev. frequency)
Highs 2 - 16 kHz
(±) | higher highs - on average 6.6% higher than median
(±) | linearity of highs is average (7% delta to prev. frequency)
Overall 100 - 16.000 Hz
(±) | linearity of overall sound is average (16.1% difference to median)
Compared to same class
» 37% of all tested devices in this class were better, 6% similar, 57% worse
» The best had a delta of 7%, average was 20%, worst was 129%
Compared to all devices tested
» 26% of all tested devices were better, 5% similar, 69% worse
» The best had a delta of 4%, average was 23%, worst was 134%
Power Management
Power Consumption
The iPad Pro 11 consumes more power than its predecessor, particularly when operating under sustained load. Our test device consumes a maximum of 15.2 W, which is more than most of our comparison devices except the power-hungry Surface Pro 6 with its Core i7 processor. However, the iPad Pro 11 is comparatively economical when idling, which helps it finish third overall in our comparison table.
| Off / Standby | |
| Idle | |
| Load |
|
Key:
min: | |
| Apple iPad Pro 11 2018 7736 mAh | Microsoft Surface Pro 6, Core i7, 512 GB mAh | Apple iPad Pro 10.5 2017 8134 mAh | Apple iPad Pro 12.9 2018 mAh | Samsung Galaxy Tab S4 7300 mAh | Huawei MediaPad M5 10.8 Pro 7500 mAh | |
|---|---|---|---|---|---|---|
| Power Consumption | -120% | 3% | -33% | 22% | -27% | |
| Idle Minimum * (Watt) | 1.2 | 3.2 -167% | 1.44 -20% | 1.42 -18% | 1.76 -47% | 3.3 -175% |
| Idle Average * (Watt) | 4.1 | 8.7 -112% | 6.12 -49% | 9.35 -128% | 4.22 -3% | 4.2 -2% |
| Idle Maximum * (Watt) | 7.5 | 10.4 -39% | 6.14 18% | 9.38 -25% | 4.25 43% | 7 7% |
| Load Average * (Watt) | 13.6 | 29.2 -115% | 8.55 37% | 12.75 6% | 4.52 67% | 10.4 24% |
| Load Maximum * (Watt) | 15.2 | 40.8 -168% | 10.62 30% | 14.96 2% | 7.35 52% | 13.8 9% |
* ... smaller is better
Battery Life
Our test device lasted for 15 h 20 m in our Wi-Fi battery life test, which is a record-breaking runtime. By contrast, last year’s model could only manage around two-thirds as long, while our other comparison devices lack our test device’s endurance. Impressively, the iPad Pro 11 has a smaller battery than its predecessor too. We also achieved even longer runtimes with the brightness sensor activated.
The included 18 W charger recharges our test device quickly. However, the charging rate slows down considerably when the iPad is nearing full charge like many other modern devices. Hence, it takes just under three hours to recharge the iPad Pro 11 fully with the included charger.
| Apple iPad Pro 11 2018 7736 mAh | Microsoft Surface Pro 6, Core i7, 512 GB mAh | Apple iPad Pro 10.5 2017 8134 mAh | Apple iPad Pro 12.9 2018 mAh | Samsung Galaxy Tab S4 7300 mAh | Huawei MediaPad M5 10.8 Pro 7500 mAh | |
|---|---|---|---|---|---|---|
| Battery runtime | -43% | -17% | -10% | -24% | -24% | |
| Reader / Idle (h) | 34.3 | 18.1 -47% | 33.9 -1% | 31.5 -8% | 20.5 -40% | 20.9 -39% |
| H.264 (h) | 16.4 | 10.5 -36% | 15 -9% | 12.3 -25% | 10.5 -36% | |
| WiFi v1.3 (h) | 15.3 | 8.5 -44% | 11.6 -24% | 13.3 -13% | 8.3 -46% | 11.2 -27% |
| Load (h) | 3.5 | 2.2 -37% | 3.3 -6% | 3.1 -11% | 4.1 17% | 3.7 6% |
Pros
Cons
Verdict
The third-generation iPad Pro marks a fresh start for the series. Apple has overhauled its design but has kept the colour options more subdued than in previous years. The iPad Pro 11 more closely represents Apple’s design philosophy of being a “magical glass surface” in our opinion than previous generations thanks to its significantly higher screen-to-body ratio.
Battery life and performance have also been significantly improved, but these improvements come at a price. The iPad Pro 11 costs almost $2,000 for the most expensive model, which is eye-wateringly expensive for a tablet. Its larger sibling gets even closer to the $2,000 mark too.
The new smaller iPad Pro is a fascinating tablet for those who can afford it, especially as few competitors can match it on performance.
The device has its downsides though. The case is weaker than we would have liked, which is particularly annoying for such an expensive device. Moreover, its applicability as a laptop replacement remains limited. The iPad Pro 11 could replace a laptop if you do a lot of creative work on the move and you need a stylus or if you mainly do light office work. It may even suit those who mainly work from the cloud. However, iOS currently holds back what is otherwise an incredibly powerful and compact device.
Apple iPad Pro 11 2018
- 09/16/2019 v7 (old)
Florian Schmitt
Price comparison

