Microsoft Surface Pro 6 (2018) (Core i7, 512GB, 16GB) Convertible Review

Microsoft first launched the Surface Pro back in 2013, promising that the device would deliver laptop performance in a tablet form factor. The company came close to realising this vision of the Surface Pro replacing the need for a tablet and a conventional computer in 2015 with the Surface Pro 4, but its execution fell just short of that promise.
Last year’s Surface Pro (2017) went one step further and brought average laptop performance to tablets with its Intel Kaby Lake processors. However, we were not fans of Microsoft making the Core i5 version fanless, which resulted in significantly reduced performance compared to what the processor could achieve. By contrast, the Core i7 model had a fan, just like our test device. Microsoft has equipped the Surface Pro 6 with quad-core Kaby Lake Refresh Intel Core processors though, which have twice the core count of their predecessors. Hence, we are curious how effectively a tablet can cool a quad-core processor when it is operating under sustained load.
How much performance is left on the table? Well, this question is more for those who need a powerful device for image processing, 3D modelling or video editing than those who primarily use Microsoft Office during their workday. In short, Microsoft has done a good job at getting the most from the Core i7-8650U, but we will be covering this in depth, and why you should choose this more expensive variant, in the Performance section.
We have included a table below, detailing the differences among Microsoft’s Surface Pro (2017) and Surface Pro 6 offerings. We have also tested the Core i5-8250U version of the Surface Pro 6, the review of which can be found here.
We will be comparing the Surface Pro 6 against other convertibles and 2-in-1s including the Dell Latitude 5290 2-in-1, the HP Elite x2 1013, the Huawei MateBook E, the Lenovo Miix 520-12IKB and Samsung Galaxy Book 12. We will also see how Microsoft’s latest Surface Pro fares against other Surface devices such as the Surface Book 2 and the Surface Go.
| 2017 i7 | 2018 Entry level | 2018 Midrange | 2018 Midrange | 2018 Midrange | 2018 High End | 2018 High End |
|---|---|---|---|---|---|---|
| i5-7660U | Core m3-7Y30 (fanless) | i5-8250U (fanless) | i5-8250U (fanless) | i7-8650U | i7-8650U | i7-8650U |
| 16 GB RAM | 4 GB RAM | 8 GB RAM | 8 GB RAM | 8 GB RAM | 16 GB RAM | 16 GB RAM |
| 512 GB | 128 GB | 128 GB | 256 GB | 256 GB | 512 GB | 1 TB |
| $1,799 | €900 ~ $1,020 | $899 | $1,199 | $1,499 | $1,899 | $2,299 |
Case
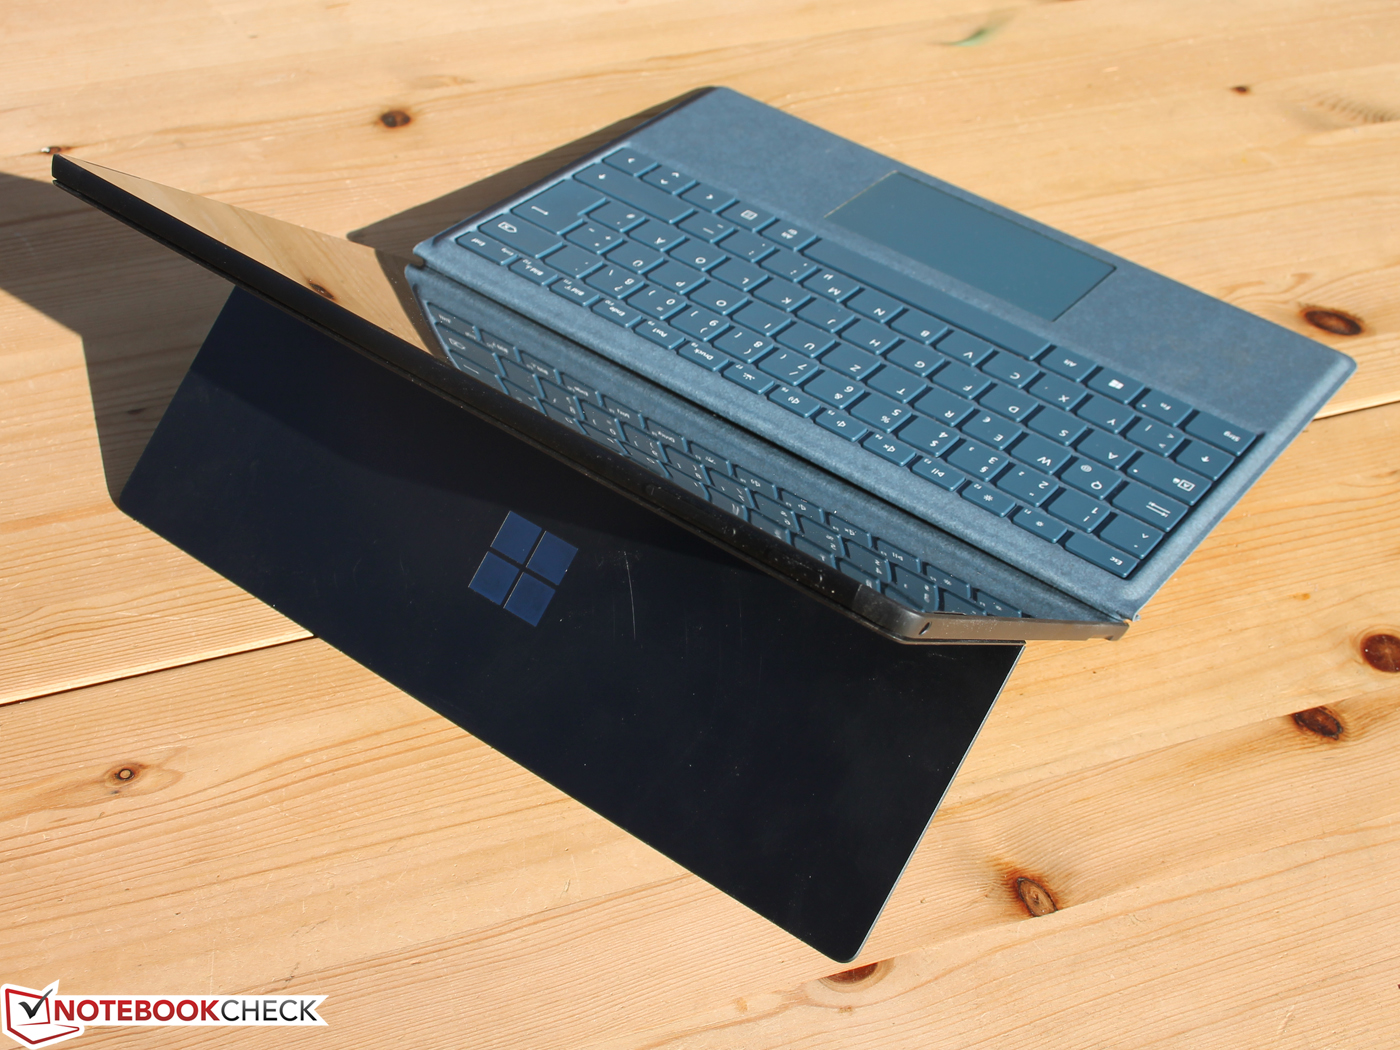
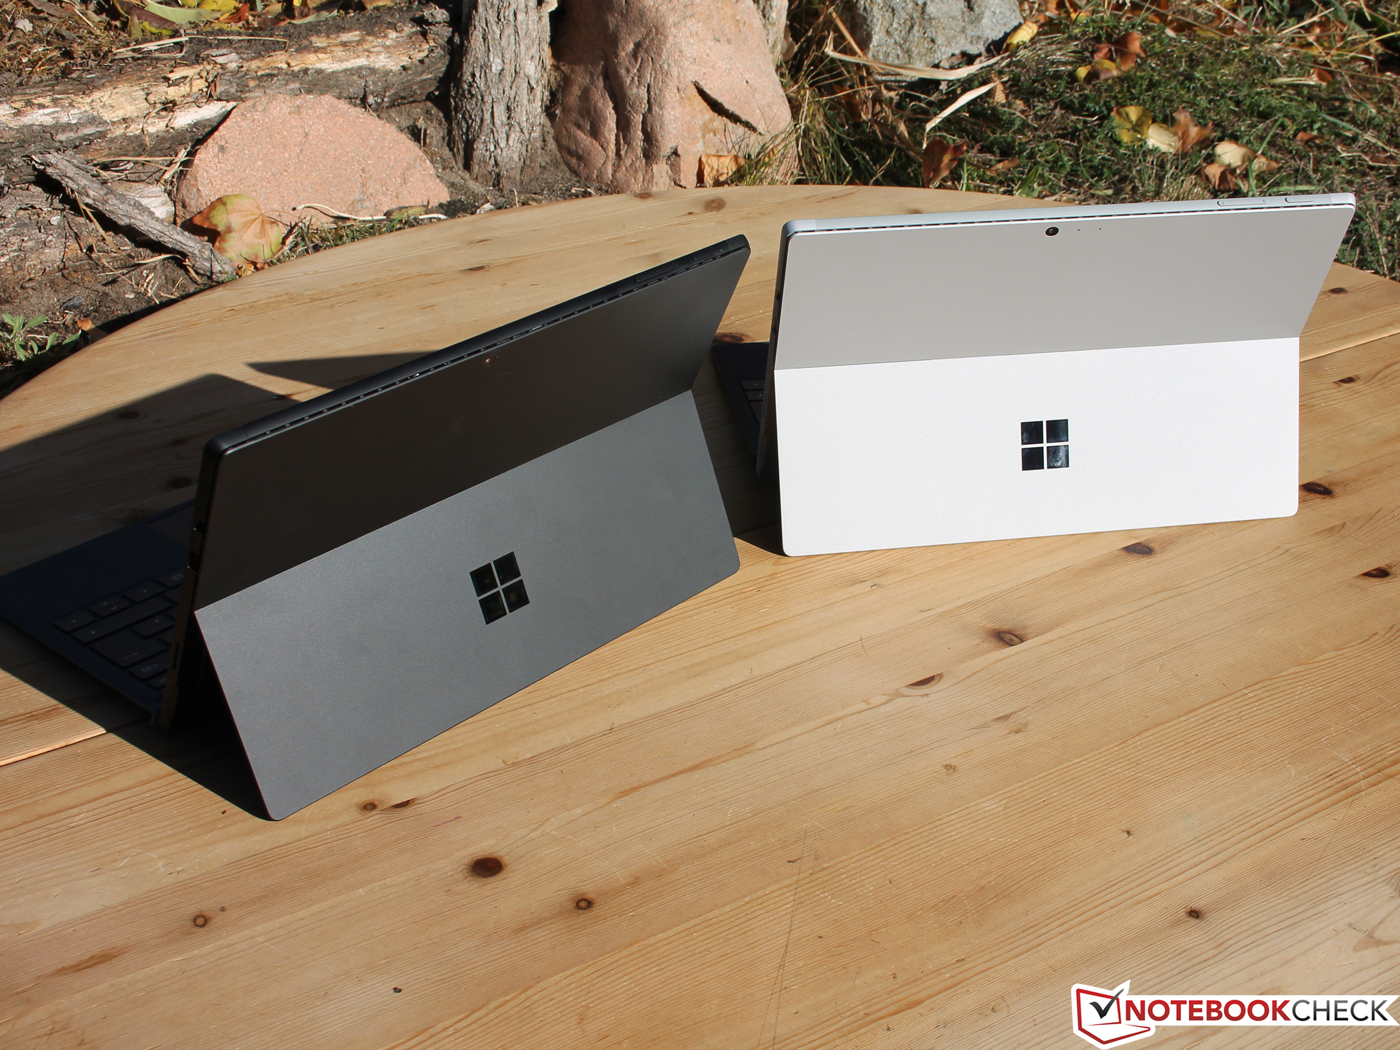
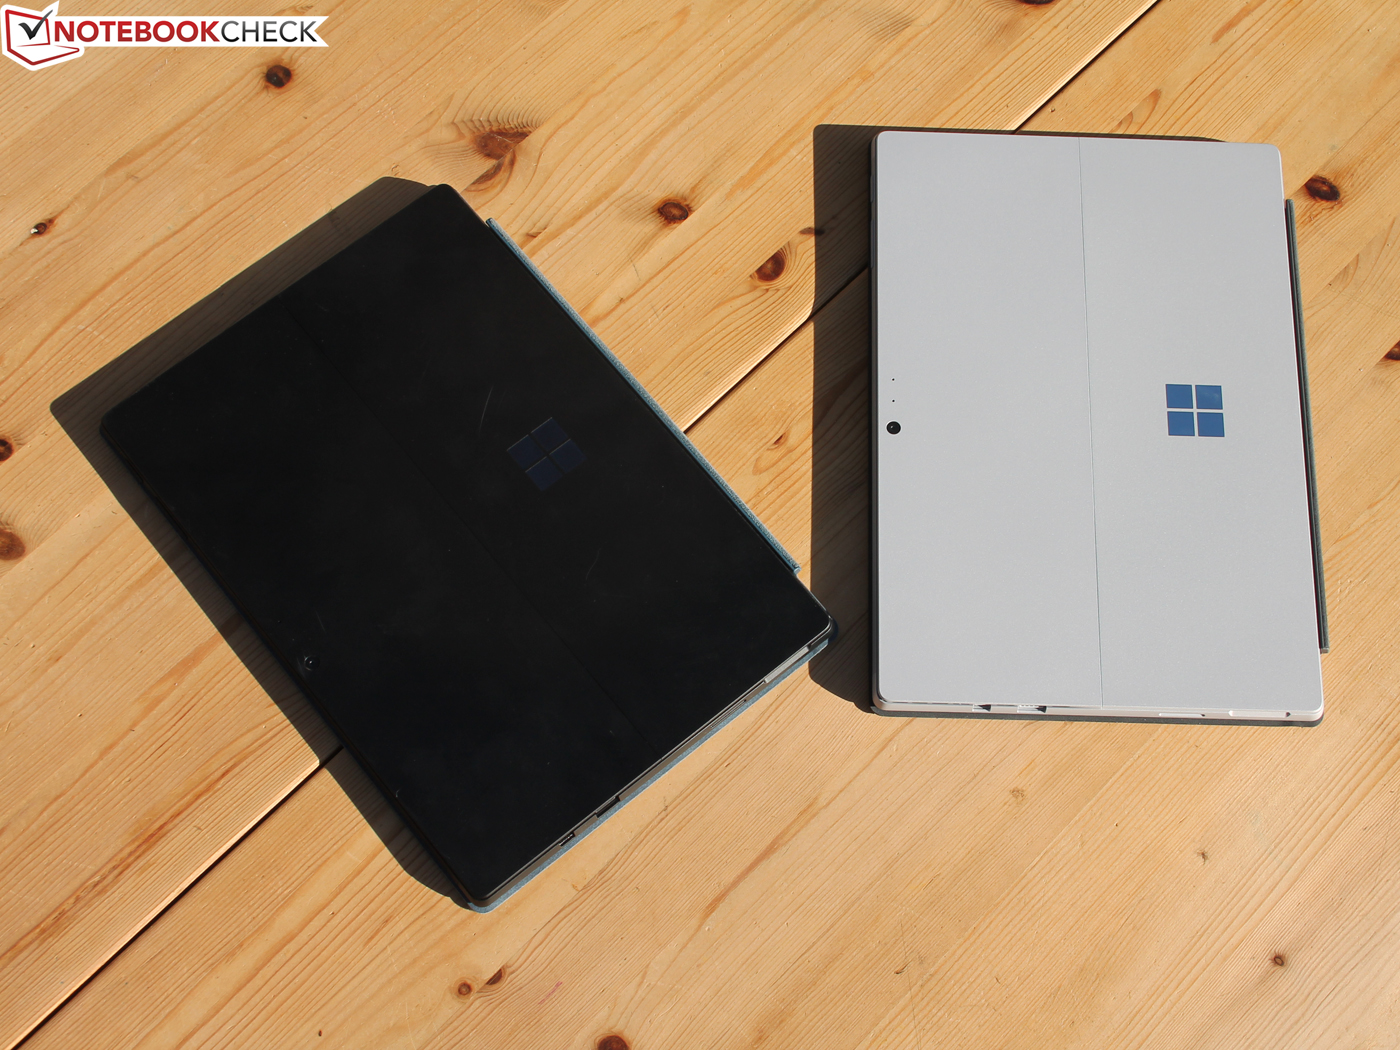
Just like its predecessors, the Surface Pro 6 is made from a single piece of milled aluminium. The case houses all components with the display sitting flush with the frame, the design of which is like a smartphone. Our test device feels premium and is robust; we could not flex the device, regardless of how much pressure we applied to the case.
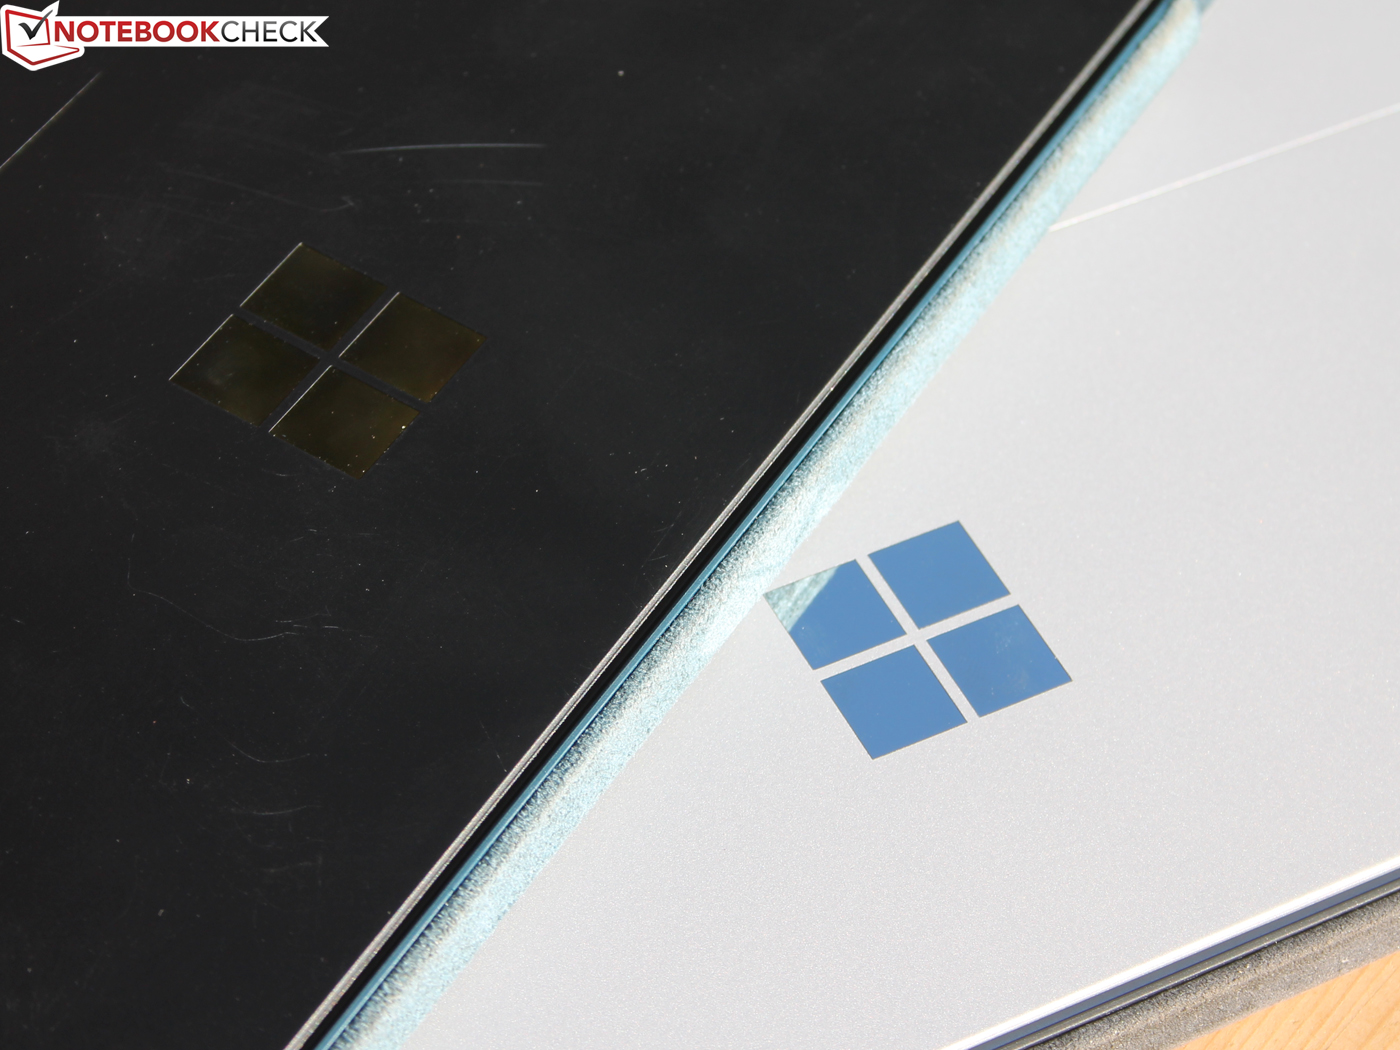
Visually, the Surface Pro 6 looks identical to its predecessor except for the new black colour option. The frame has rounded corners with Microsoft having moved away from the sharper edges associated with the third and fourth generation Surface Pros. The Pro 6 has the same ventilation slot at the top of its case as previous Surface Pros too. Our test device is actively cooled, but the Core i5 version is fanless, the same as last year’s model.
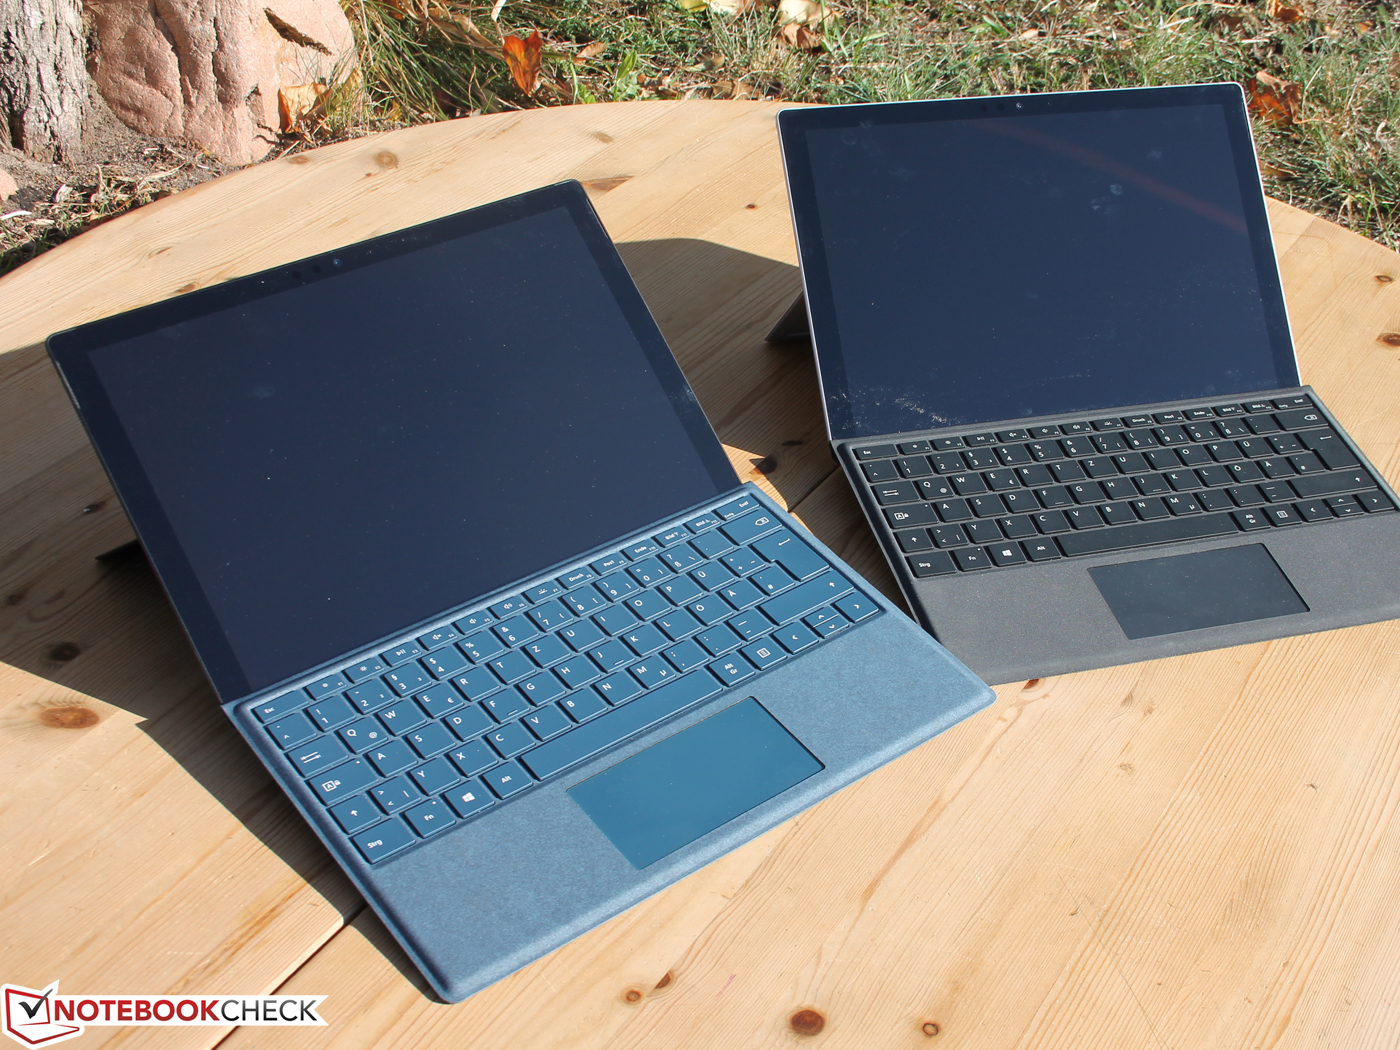
The Surface Pro 6 has retained its predecessor’s kickstand too, which opens to 170° and leaves around a 10% gap from the kickstand lying flat against the tablet.
The new black option has a matte finish that feels relatively grippy when holding it. However, the bottom of the device has a slightly slicker finish to it than the edges, so we would recommend taking greater care when holding the device by its underside.
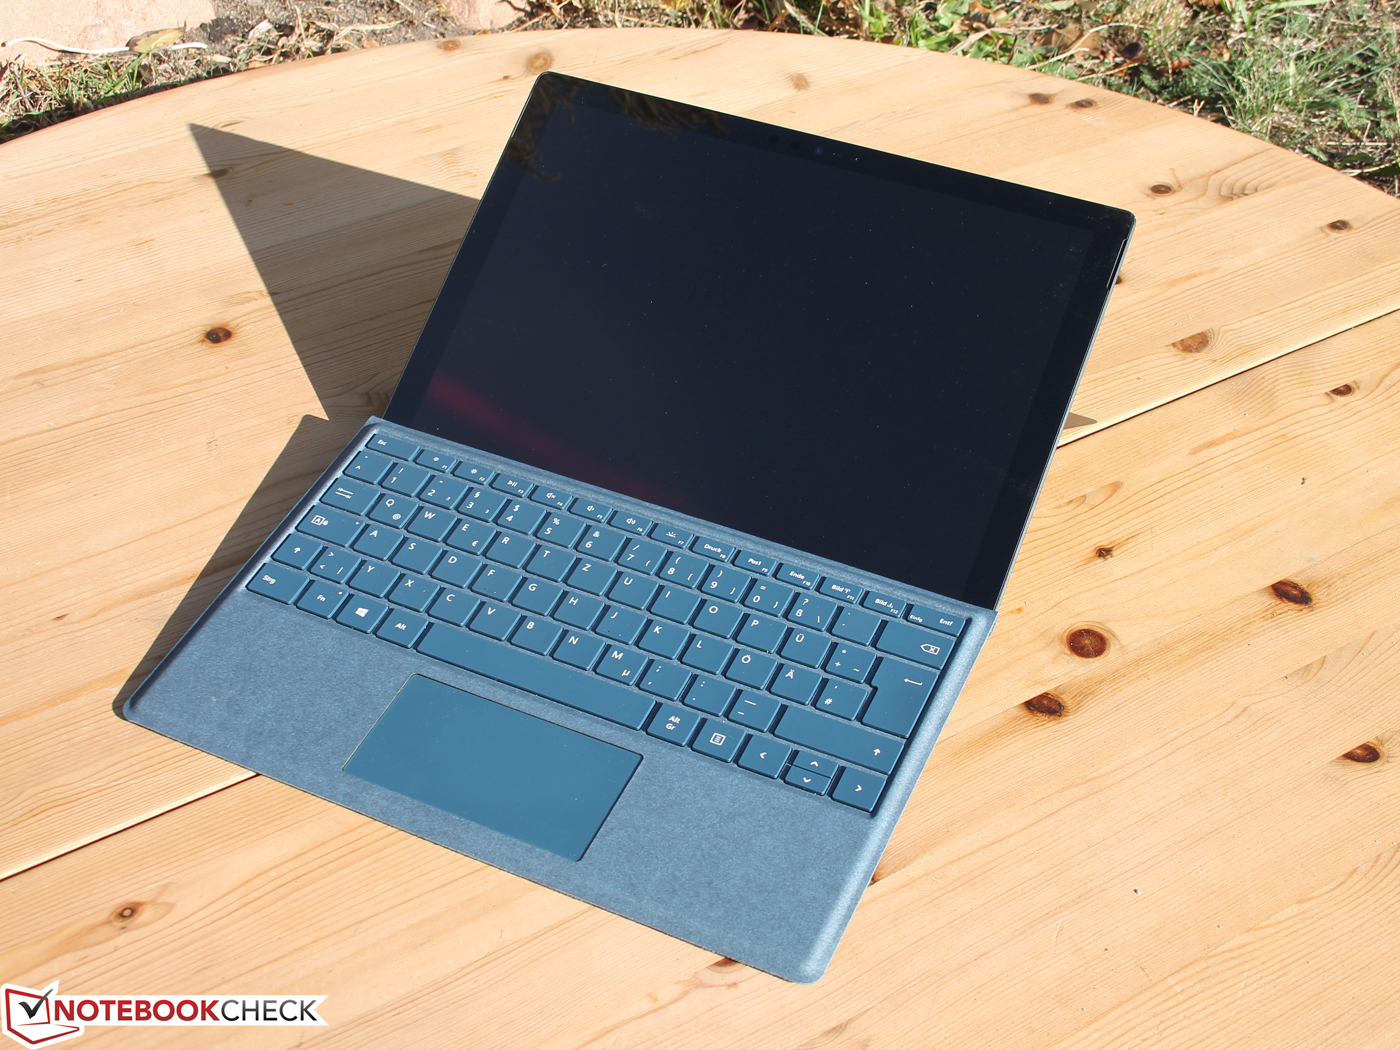
The Type Cover is grippier than the black finish though. This year’s Type Covers are identical to last year's and still connect magnetically to the bottom of the device.
Our test device weighs 786 g (1.73 lbs) without a Type Cover, which is 2 g (0.07 oz) heavier than what Microsoft claims. The Core i5 version is 16 g (0.56 oz) lighter than its more powerful sibling, which is probably due to the weight of the fan.
The Surface Pro 6 is 8.5 mm (0.33-inches) thick, which is 1.1 mm (0.04-inches) thicker than the Samsung Galaxy Book 12 and 1.5 mm (0.06-inches) thicker than the Huawei MateBook E. However, the latter does not have a 15-W CPU. Our test device is 1.4 mm (0.06-inches) and 1.25 mm (0.05-inches) thinner than the Lenovo Miix 520-12IKB and the Dell Latitude 5290 2-in-1 respectively. The Surface Book 2 is the only outlier in this respect.
Incidentally, the Surface Pro 6 is only 0.1 mm (0.0003-inches) thicker than the Core i5 version of the Surface Pro 4. Microsoft has kept the Surface Pro roughly the same thickness for a few generations now.
The Surface Pro 6 weighs 1.1 kg (2.43 lbs) with its Type Cover, which is lighter than all our 15-W CPU equipped comparison devices. Likewise, our test device is around 200 g (0.44 lbs) lighter than both the Miix 520-12IKB and the Latitude 5290 2-in-1, which closely resemble the Pro 6’s design. We chose to compare the Surface Pro 6 against our comparison devices with its Type Cover for a fairer comparison as some devices do not have a detachable keyboard.
Connectivity
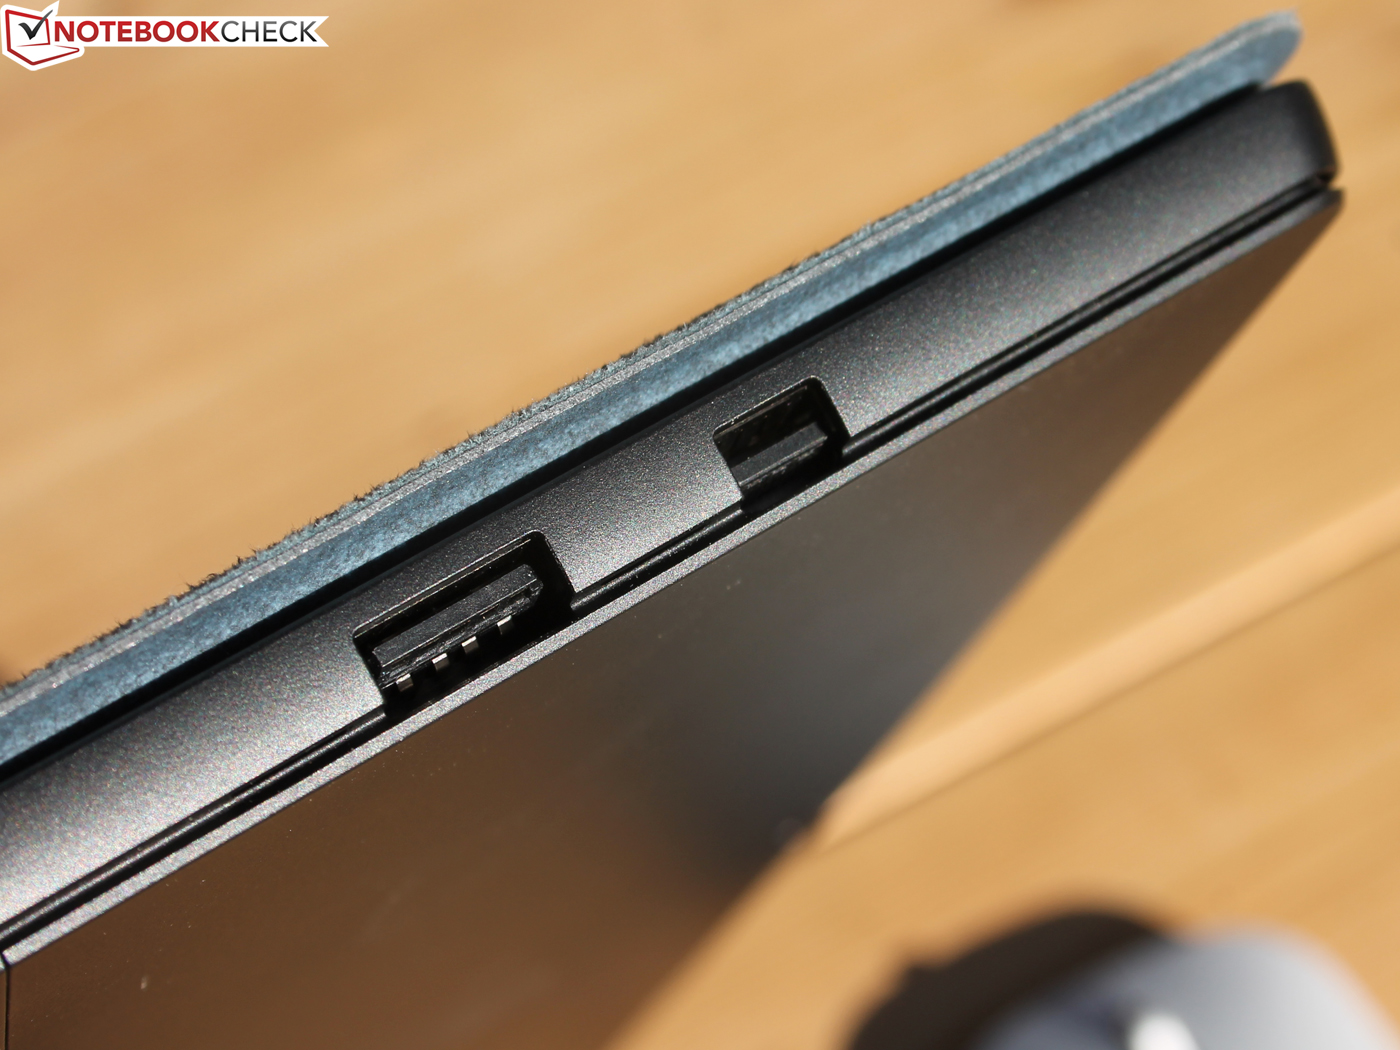
Disappointingly, the Surface Pro 6 has the same ports as its predecessors. The device has a single USB 3.0 Type-A port, a Mini DisplayPort, a Surface Connect port and a microSD card slot under its kickstand. The lack of USB Type-C is shameful for a premium device released in 2018, particularly since some similarly priced devices such as the HP Elite x2 1013 G3 have up to two Thunderbolt 3 ports. USB Type-C has now been adopted by practically all OEMs and it continues to baffle us that Microsoft does not do the same.
Thunderbolt 3 allows devices to be connected to external GPUs, or daisy chain monitors and fast disk drives. Moreover, even just having a USB Type-C port would have given the Surface Pro 6 an additional USB connection and the option of charging the device from a universal USB Type-C charger. In short, the Surface Pro 6 would have been considerably more attractive to many users if it had a USB Type-C port and even more so for some professional users had that Type-C also been Thunderbolt 3.
SD card reader
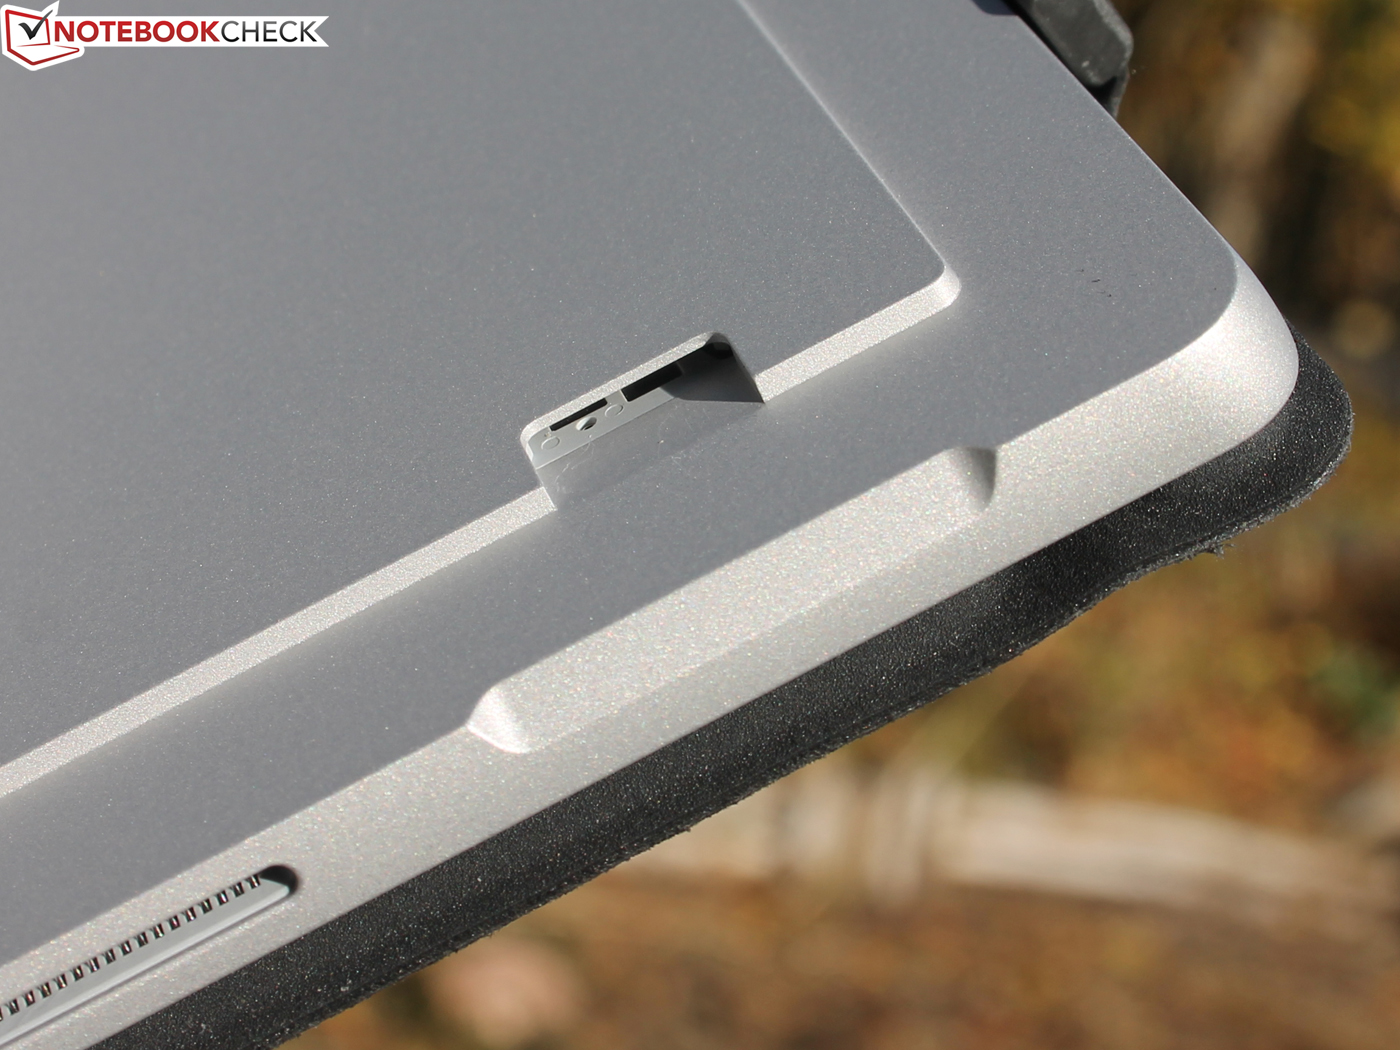
We conducted our microSD card tests with our Toshiba Exceria Pro SDXC 64 GB UHS-II reference card with which we test all the devices that arrive on our desks. Our test device achieved a maximum transfer speed of 86 MB/s when copying large blocks of data in the AS SSD test and 78.5 MB/s when copying 5 MB JPGs. MicroSD card performance is well above average in both tests, but the Surface Pro 6 cannot compete with the Surface Book 2 and the Latitude 5290 2-in-1 in this respect.
| SD Card Reader | |
| average JPG Copy Test (av. of 3 runs) | |
| Microsoft Surface Book 2 (Toshiba Exceria Pro SDXC 64 GB UHS-II) | |
| Dell Latitude 5290 2-in-1 (Toshiba Exceria Pro M501 UHS-II) | |
| Microsoft Surface Pro 6, Core i7, 512 GB (Toshiba Exceria Pro M501 microSDXC 64GB) | |
| Microsoft Surface Go MHN-00003 (Toshiba Exceria Pro M501) | |
| Average of class Convertible (29.4 - 141, n=20, last 2 years) | |
| maximum AS SSD Seq Read Test (1GB) | |
| Microsoft Surface Book 2 (Toshiba Exceria Pro SDXC 64 GB UHS-II) | |
| Dell Latitude 5290 2-in-1 (Toshiba Exceria Pro M501 UHS-II) | |
| Average of class Convertible (67.5 - 254, n=19, last 2 years) | |
| Microsoft Surface Pro 6, Core i7, 512 GB (Toshiba Exceria Pro M501 microSDXC 64GB) | |
| Microsoft Surface Go MHN-00003 (Toshiba Exceria Pro M501) | |
Communication
The Surface Pro 6 is equipped with a Marvell AVASTAR Wireless-AC module, which handles Wi-Fi and Bluetooth. The chip supports Bluetooth 4.1 and all current Wi-Fi standards. Our test device achieved an average of 593 MBit/s in the read portion of iperf3 Client and 559 MBit/s in the transmission test. Both values are above average, with our test device finishing higher in our iperf3 Client (read) comparison table than in our other Wi-Fi test.
Security
Microsoft continues to integrate a TPM 2.0 module, which gives the device a unique identifier that is particularly useful in corporate environments. The Surface Pro 6 has a front-facing camera that supports Windows Hello too for biometric facial authentication.
Cameras
The Surface Pro 6 has two cameras, the same as its predecessors. There is an 8 MP rear-facing sensor that supports autofocus and takes passable photos. Photos lack detail, even when shot in daylight, but overall photos look more detailed than those taken with the Surface Pro 2017.
The same is true of the 5 MP front-facing camera. Photos taken with the camera look good, but its low resolution means that image noise masks fine details. This is particularly striking when comparing photos taken with the front-facing camera to our Canon EOS 1100D reference camera.

Full-sized pictures


Accessories
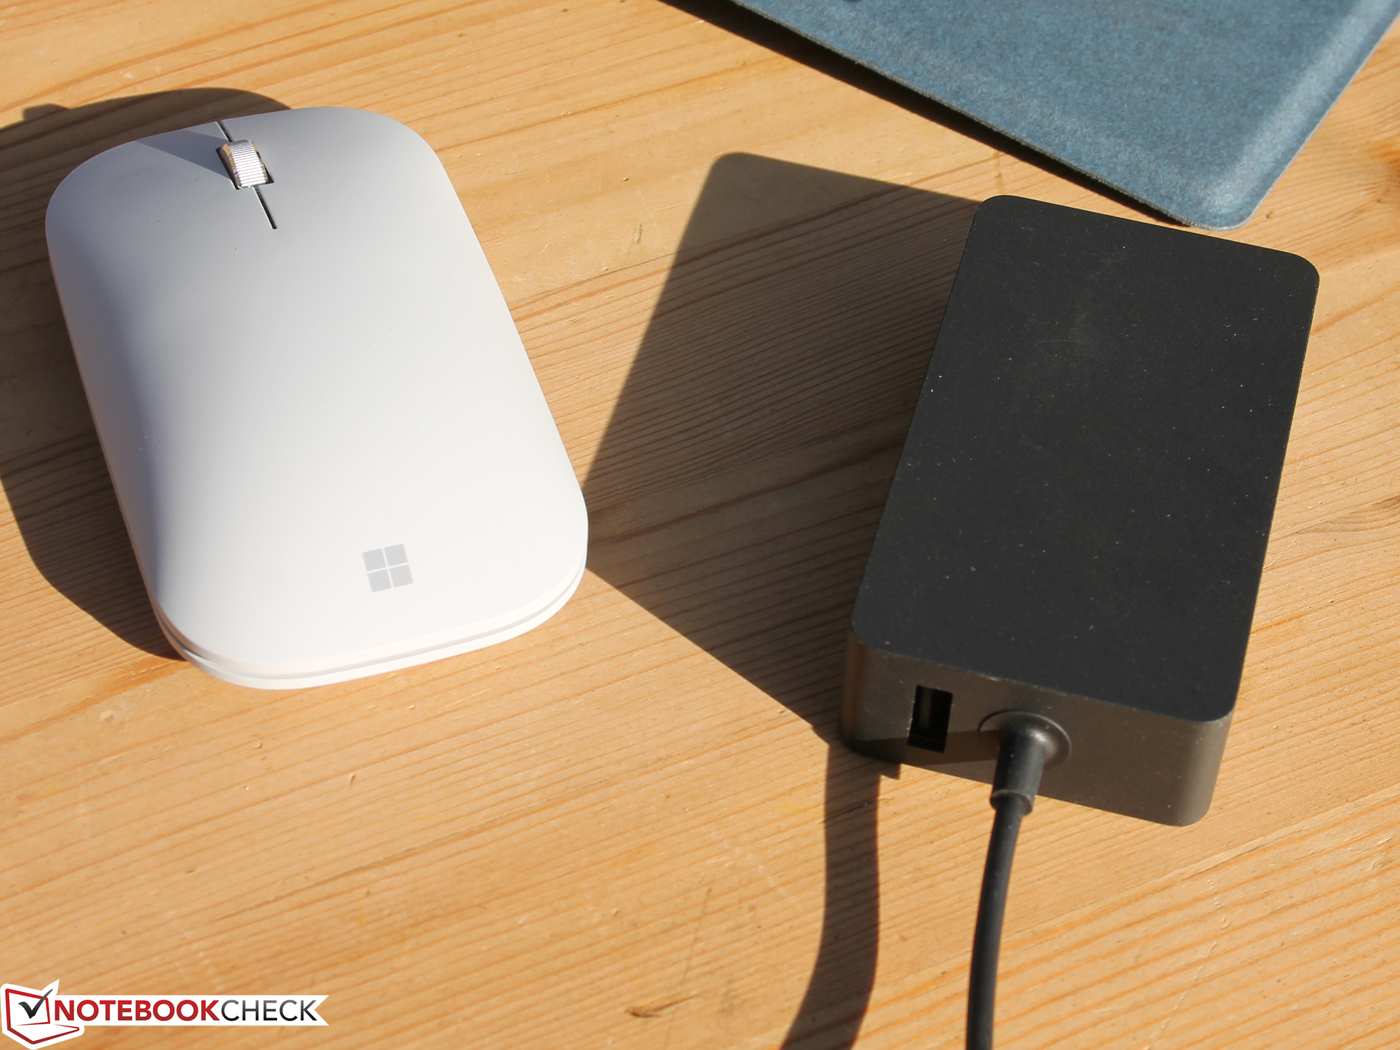
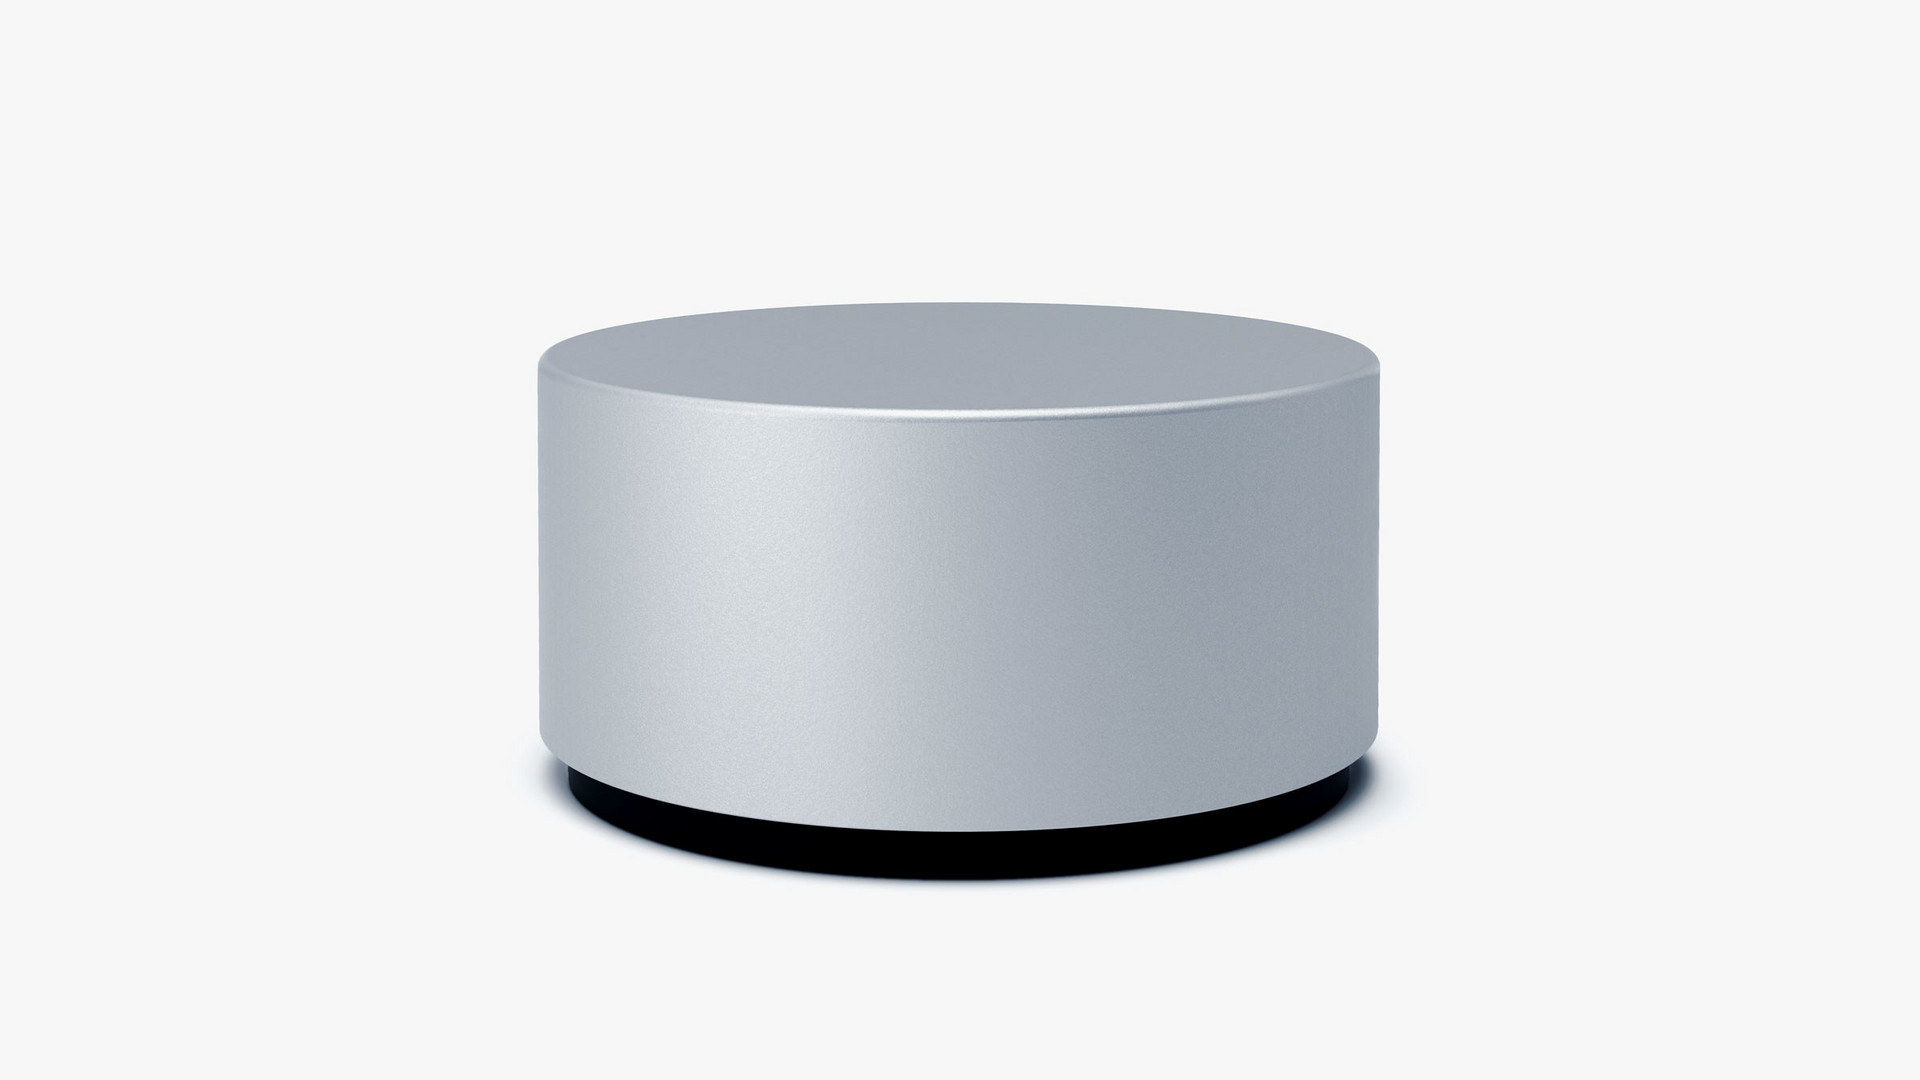
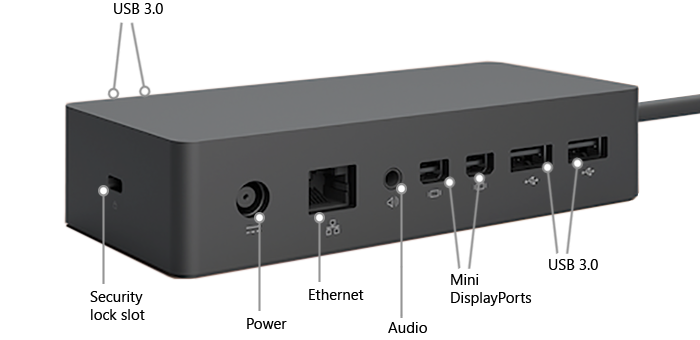
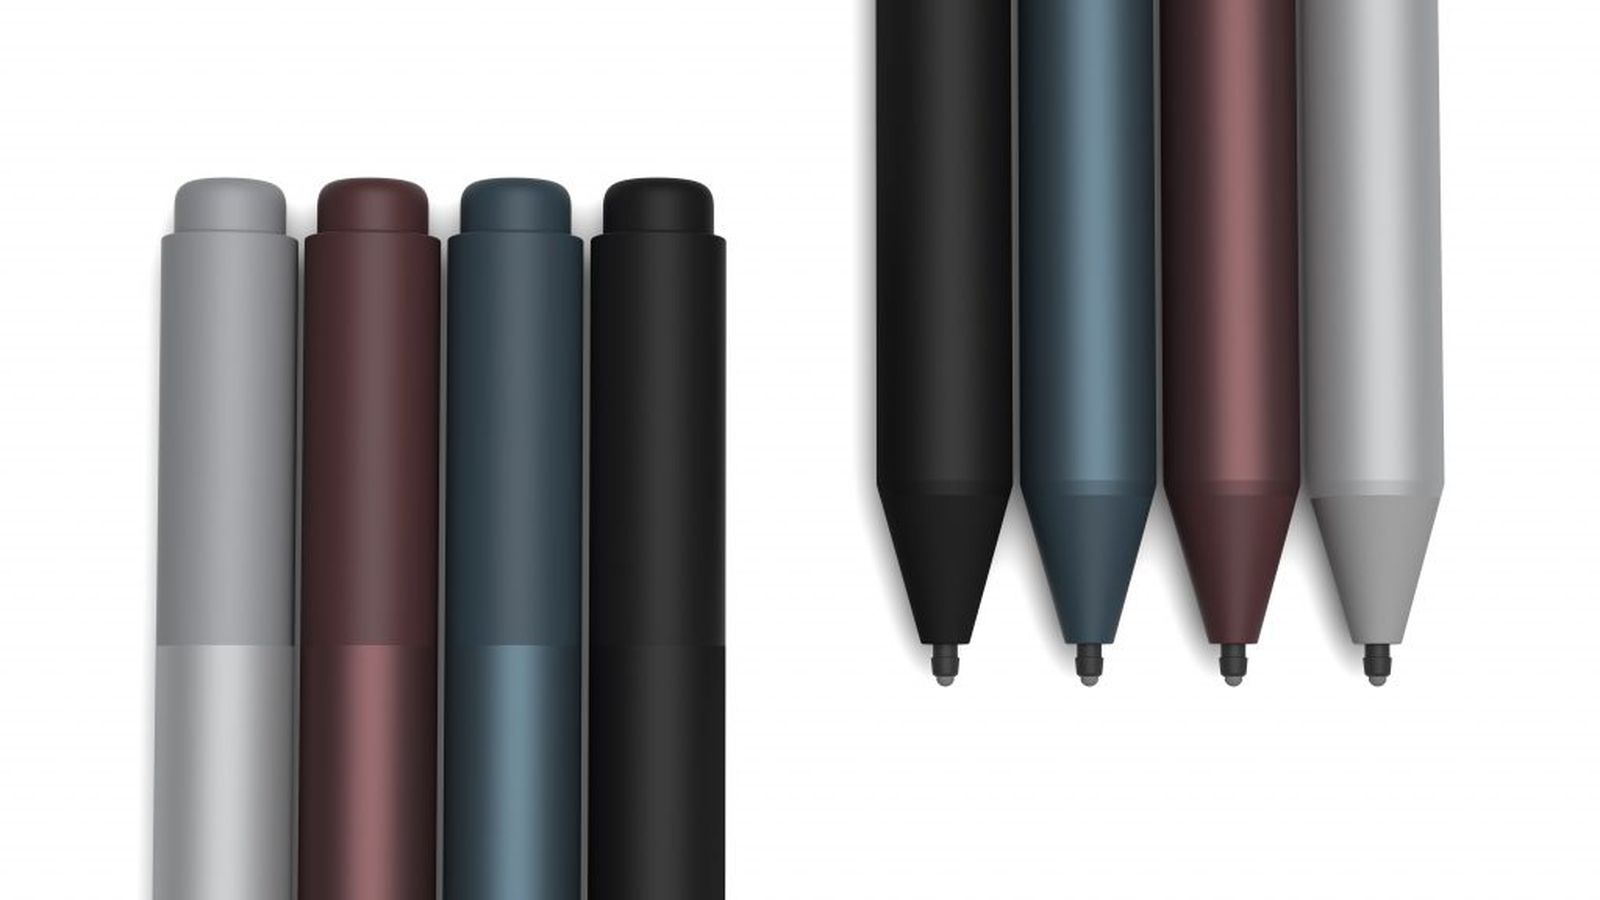
Our test device came with only a charger and a quick start guide. Microsoft instead relies on the strategy of selling Surface-branded accessories separately such as the Dial, Dock, Type Cover or Pen. Some retailers sell Type Cover and Pen bundles, so you need not buy those accessories separately, but by default you will receive no accessories when buying the Surface Pro 6.
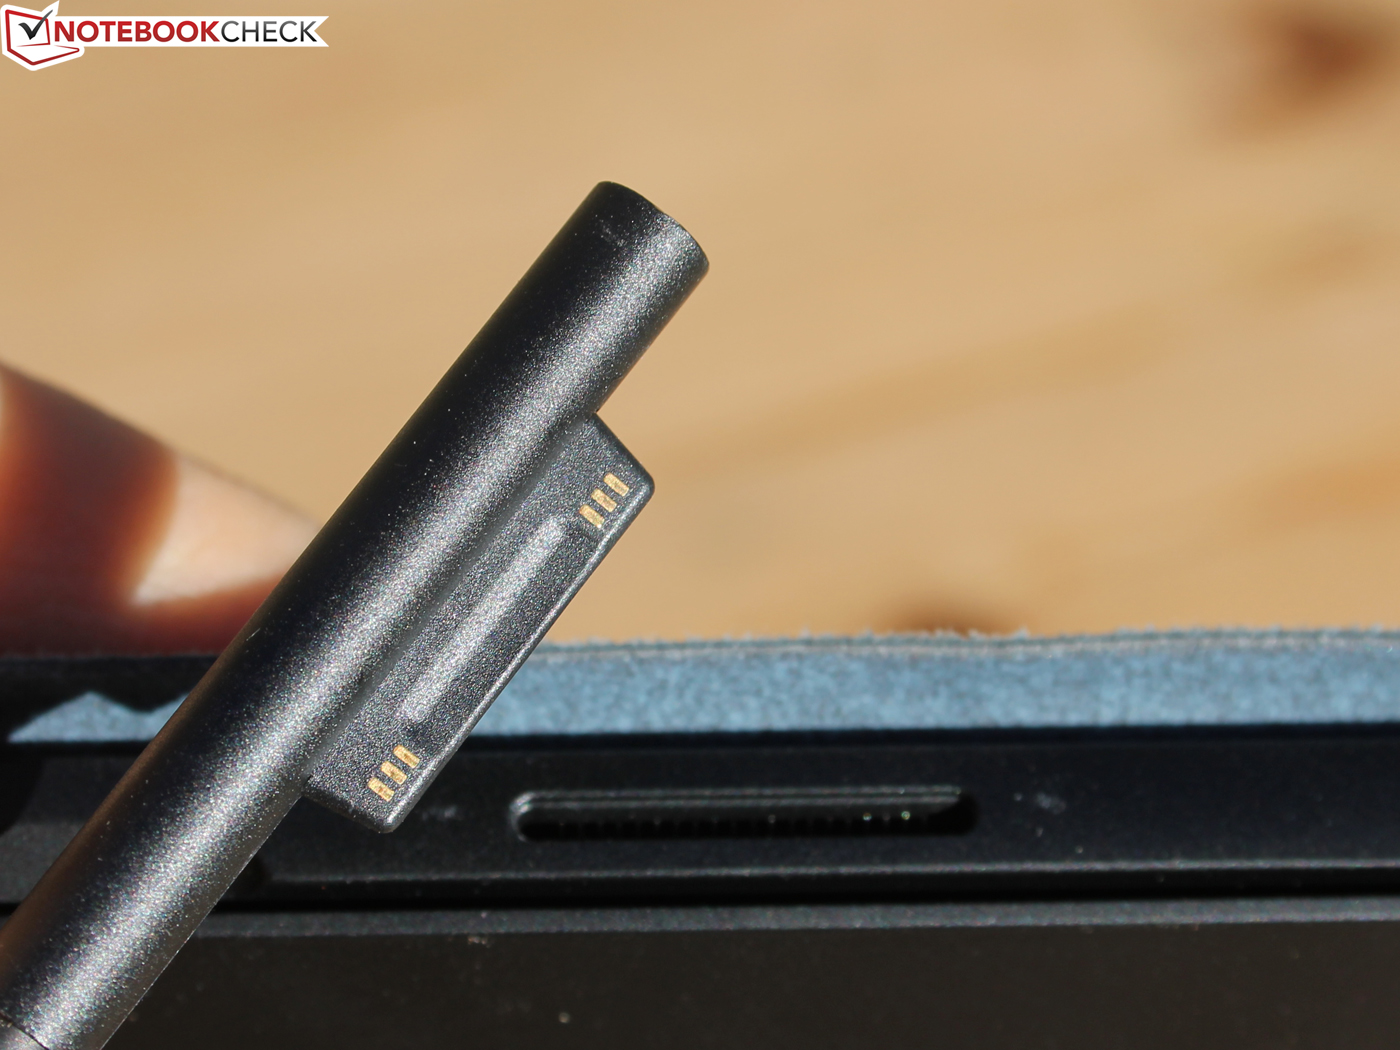
The Surface Pen remains unchanged and costs $99.99 (£99.99) on the Microsoft Store. The pen supports tilt functionality and 4,096 levels of pressure. There is still one button on its side and another at its end both of which are freely customisable within Windows 10. The pen tips are interchangeable too.
Warranty
The Surface Pro 6 comes with twelve months manufacturer's warranty. We find this bafflingly short given how expensive the device is we would expect at least a twenty-four month warranty. Naturally, Microsoft sells its “Microsoft Complete for Surface Pro” warranty extension for $149 (£179), which extends the warranty on Surface devices to two years and offers accidental damage cover among other things. Please see our Guarantees, Return policies and Warranties FAQ for country-specific information.
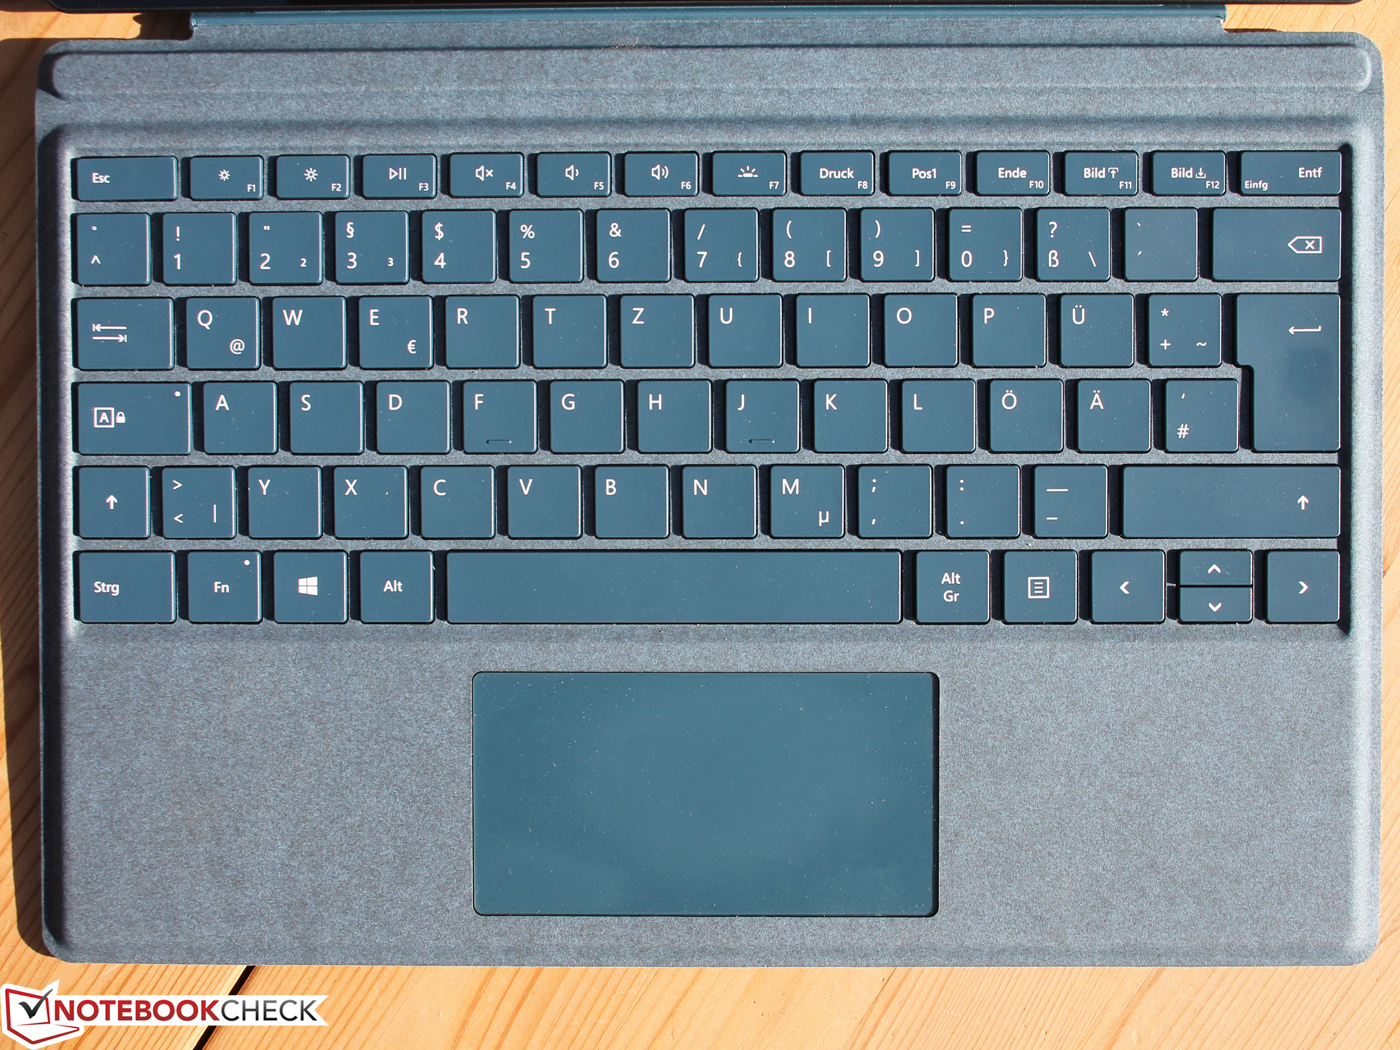
Input Devices
Keyboard
Our test device arrived with a Type Cover and a Signature version, the latter of which costs $30 (£25) more. All Type Covers from the Surface Pro 3 onwards will work with the Surface Pro 6.
The Signature Type Cover has an Alcantara finish and comes in three colours. The Alcantara feels soft to the touch and is wipeable should you spill anything on it. The keys are flat with a medium stroke and a clear pressure point, which feel identical to previous Type Covers. The keys continue to sound unobtrusive when typing too.
The Type Cover connects to a port on the bottom of the Surface and is held in place by magnets. The keyboard can be laid flat or at a 10 ° angle. We would recommend typing with the keyboard at an angle as otherwise, it tends to move back and forth as you type. The Type Cover still has multi-level keyboard backlighting.
Overall, the Surface Type Cover is one of the best detachable keyboards currently on the market.
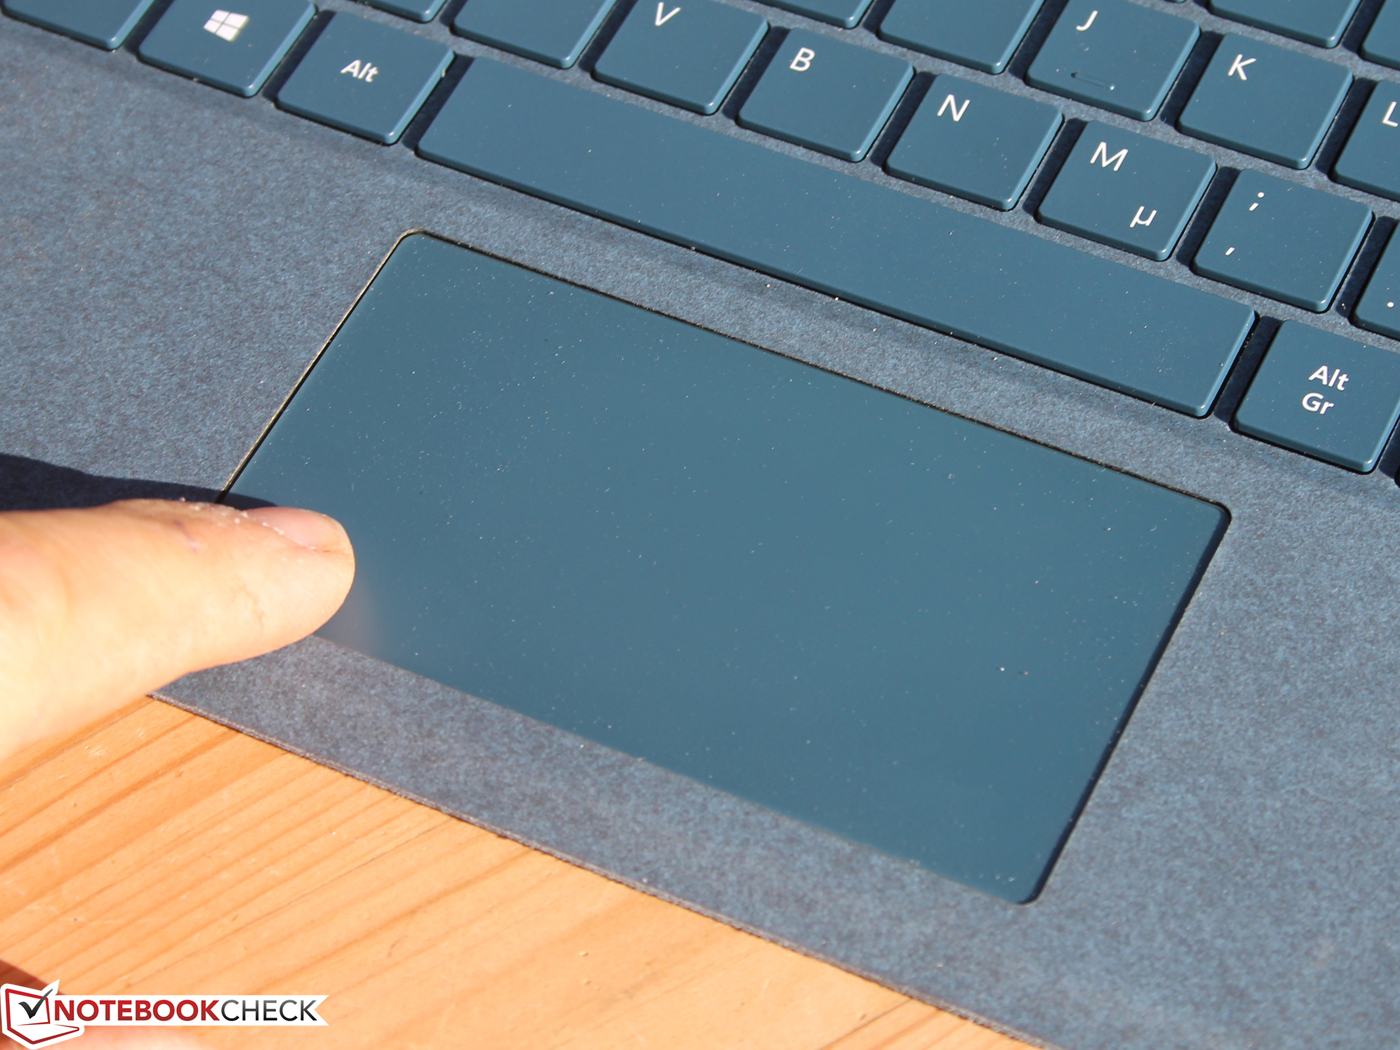
Trackpad
The Signature and normal Type Covers have identically sized trackpads, which are just as comfortable to use as previous versions from the Surface Pro 4 onwards. The trackpad supports Windows Precision drivers for multi-finger gestures, while the integrated buttons have a short stroke with a succinct pressure point and a precise stop.
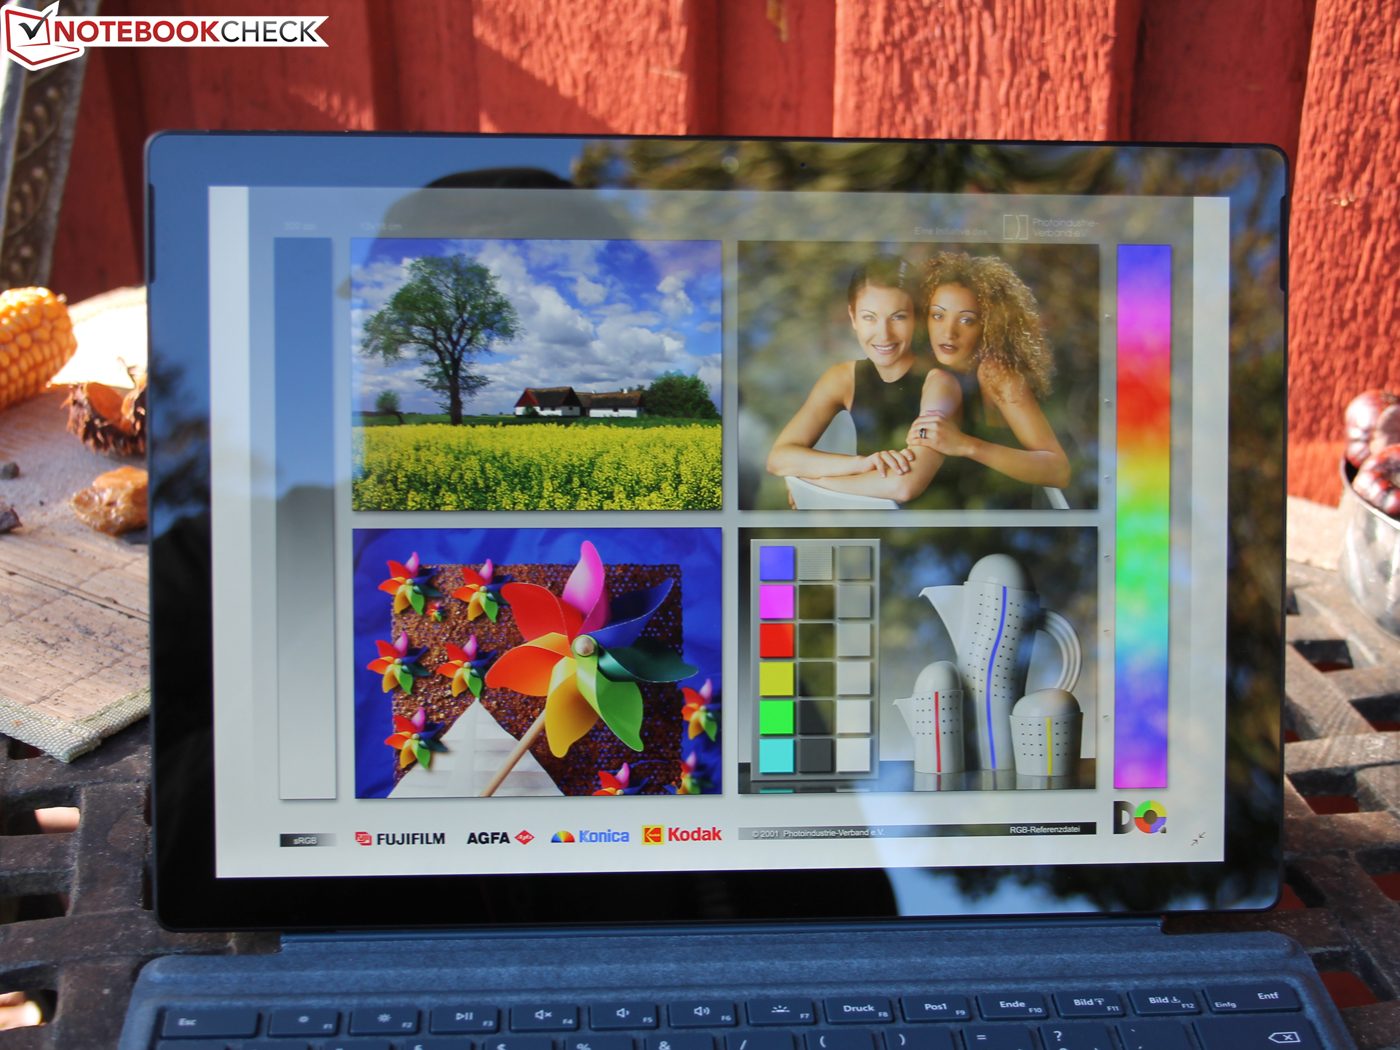
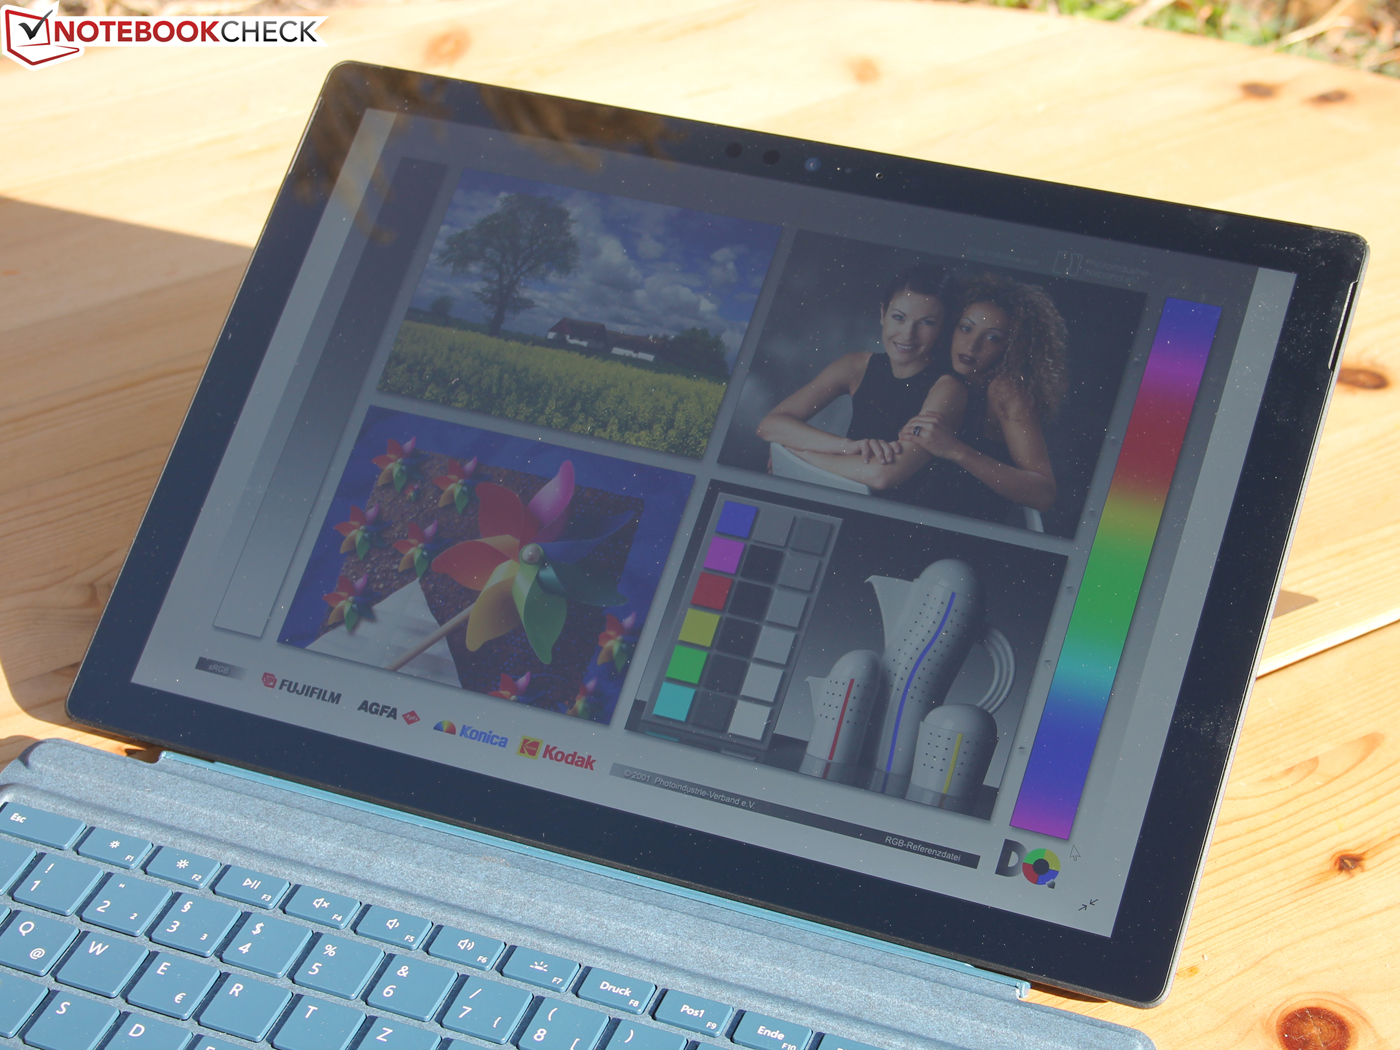
Display
The Surface Pro 6 has a 12.3-inch PixelSense display with a 2,736x1,824 native resolution and a 3:2 aspect ratio that yields a pixel density of 267 PPI. These are identical values to those of last year’s model. The display continues to support 10-point multitouch too.
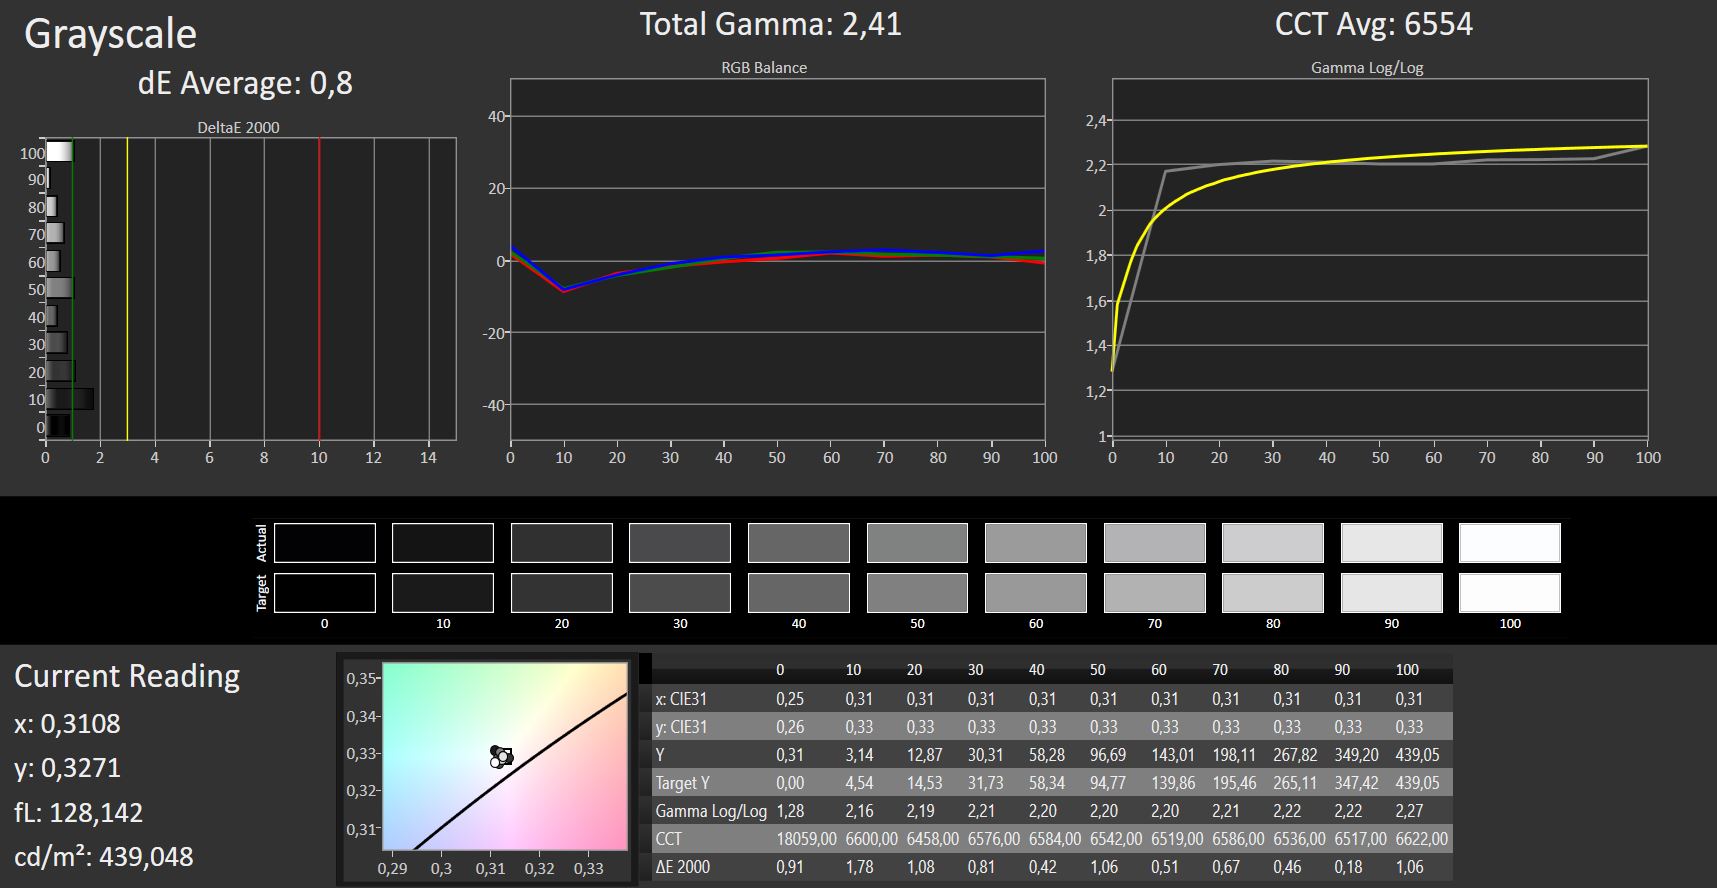
Microsoft has equipped our test device with a brighter display though, but keep in mind that manufacturers tend to use multiple display suppliers, so the display in your Surface Pro 6 may be different to our test device’s. The display reaches a maximum brightness of 484 cd/m² at the centre of the display according to X-Rite i1Pro 2, which is 14% brighter than last year’s model. Our test device averages a maximum luminosity of 473 cd/m² across the entire display and has a 91% evenly lit panel. These values are all higher than those of the Surface Pro (2017) and most of our comparison devices. Only the Latitude 5290 2-in-1 has a brighter display, while the MateBook E has a slightly more evenly lit display.
As with previous Surface Pros our test device uses pulse-width modulation (PWM) to regulate display brightness. We measured a PWM frequency of 22,000 Hz at and below 50% brightness, which fortunately should be high enough to not trouble even those who are PWM sensitive.
| |||||||||||||||||||||||||
Brightness Distribution: 91 %
Center on Battery: 484 cd/m²
Contrast: 1467:1 (Black: 0.33 cd/m²)
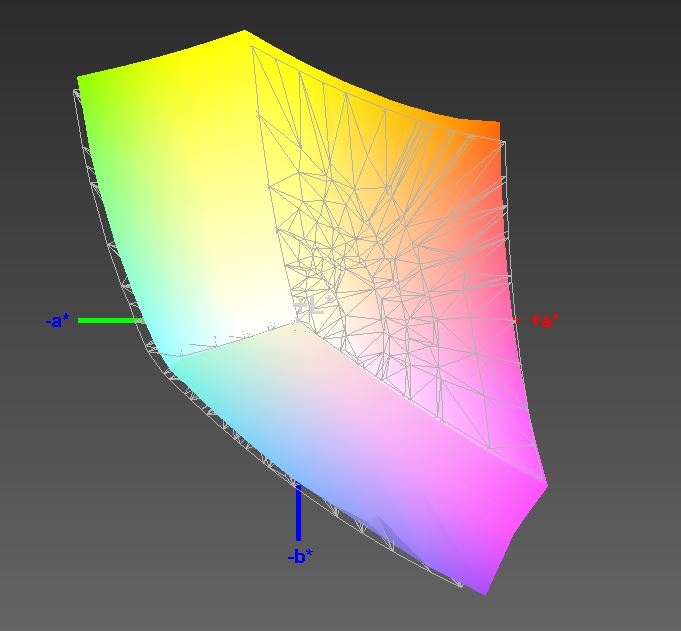
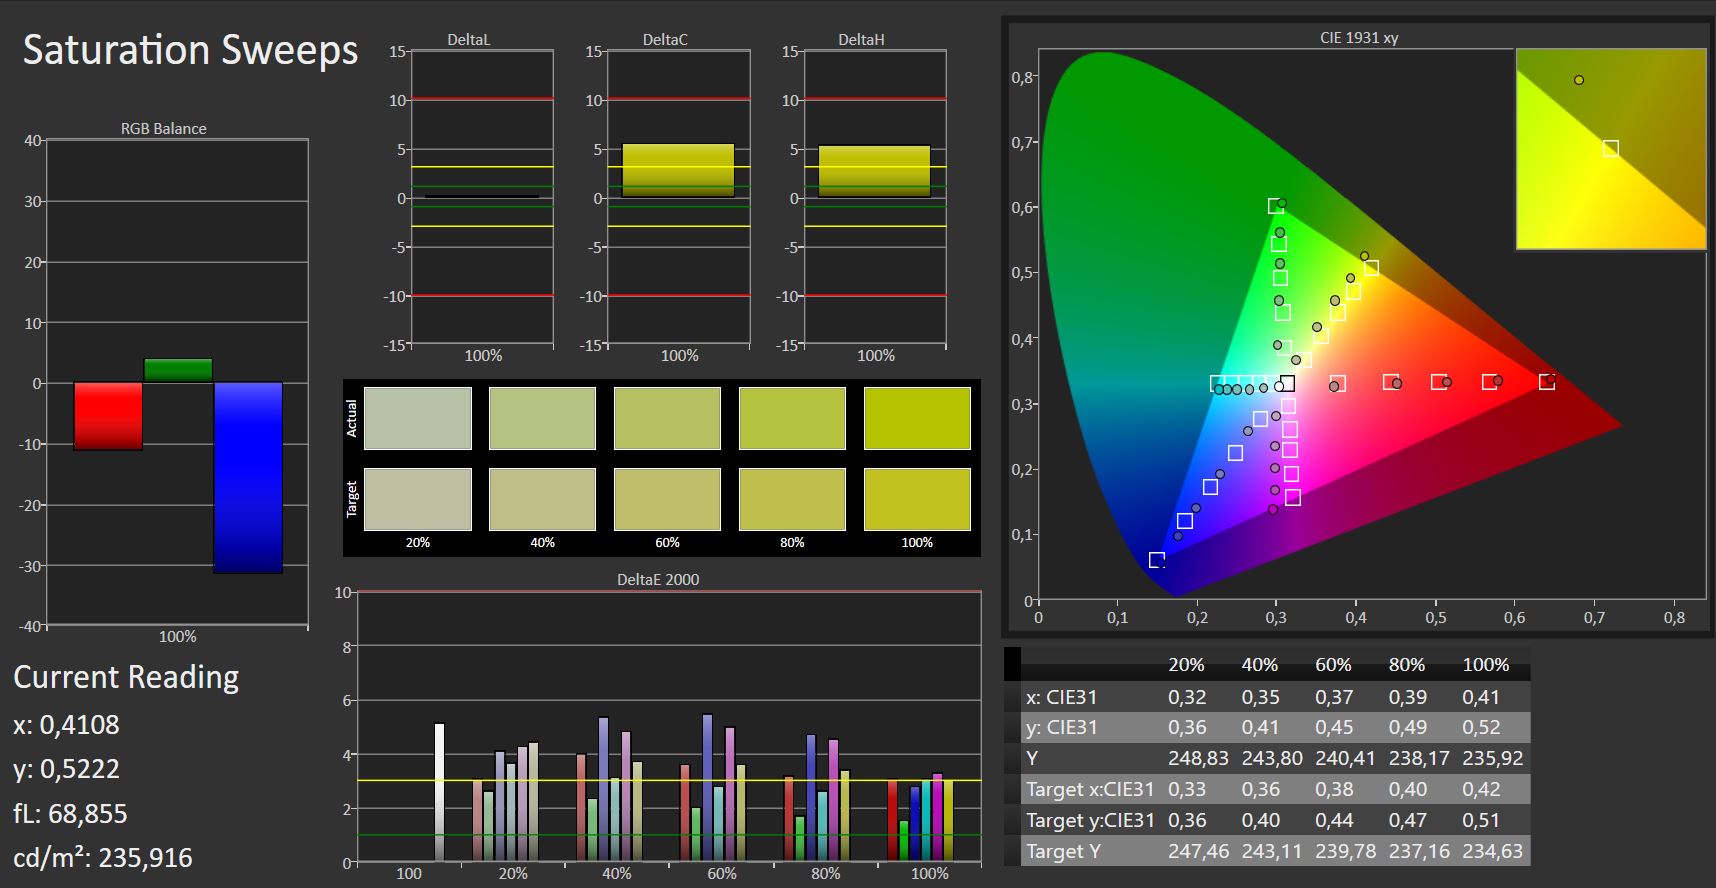
ΔE ColorChecker Calman: 4.29 | ∀{0.5-29.43 Ø4.71}
calibrated: 1.34
ΔE Greyscale Calman: 4.3 | ∀{0.09-98 Ø4.96}
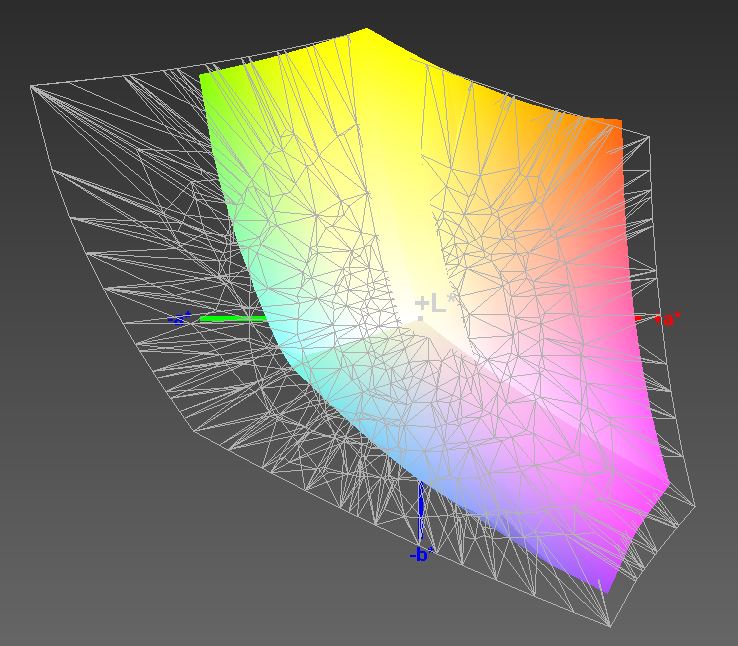
95% sRGB (Argyll 1.6.3 3D)
62% AdobeRGB 1998 (Argyll 1.6.3 3D)
67.9% AdobeRGB 1998 (Argyll 3D)
95.5% sRGB (Argyll 3D)
67.1% Display P3 (Argyll 3D)
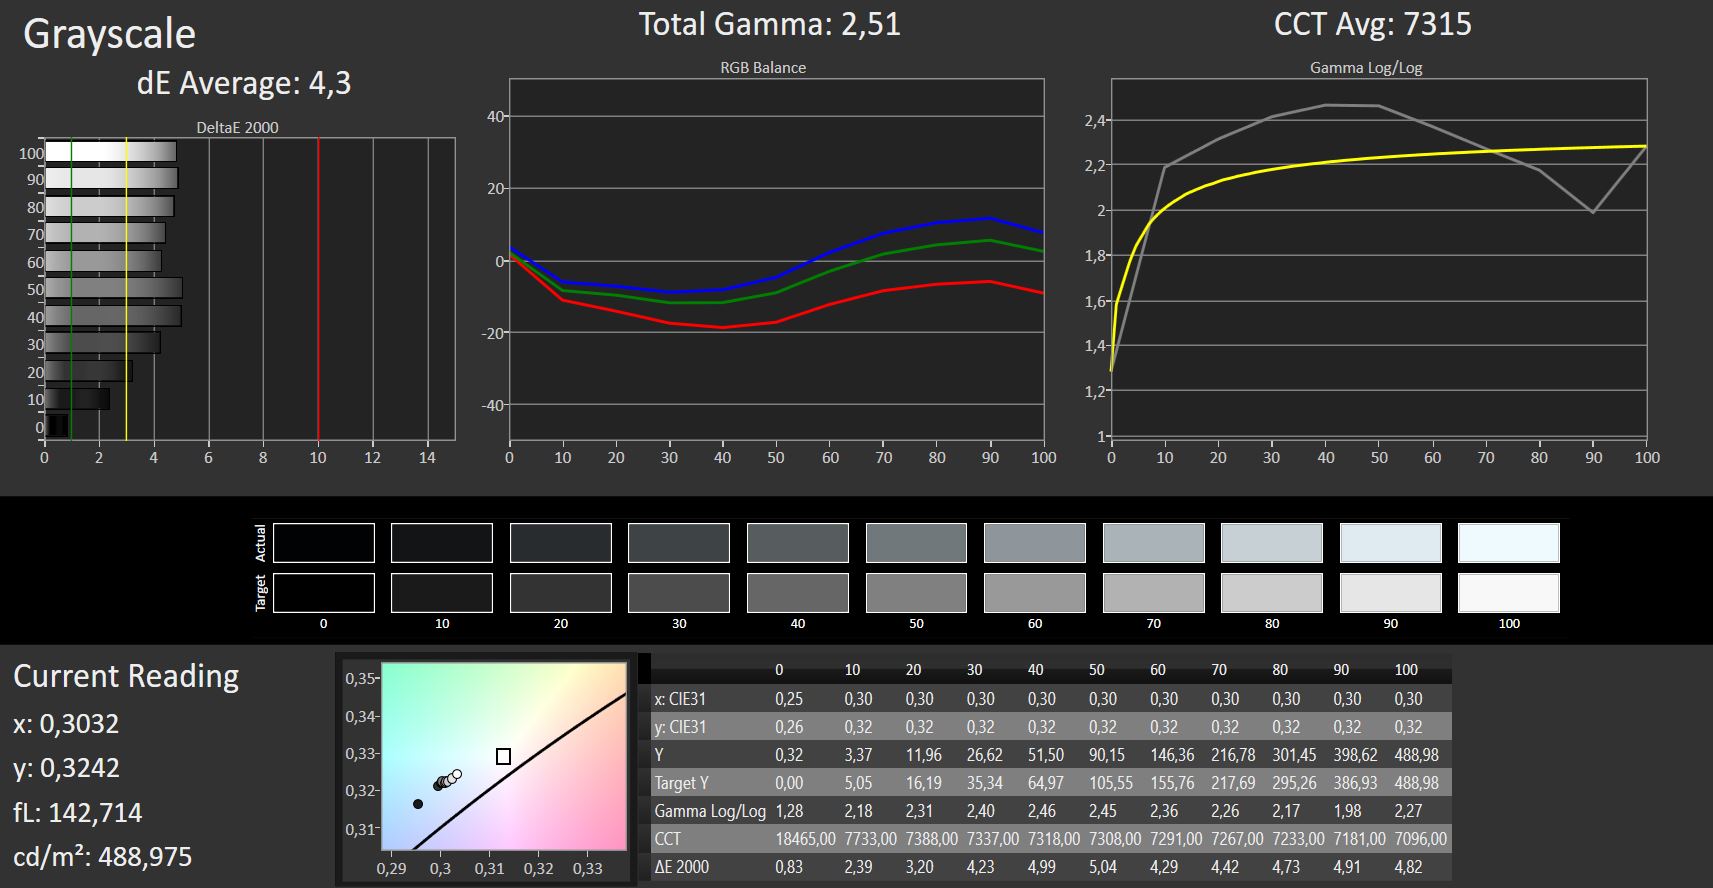
Gamma: 2.51
CCT: 7315 K
| Microsoft Surface Pro 6, Core i7, 512 GB LGPhilips LP123WQ112604, , 2736x1824, 12.3" | Microsoft Surface Pro (2017) i5 LG Display LP123WQ112604, , 2736x1824, 12.3" | Dell Latitude 5290 2-in-1 SHP1479, , 1920x1280, 12.3" | HP Elite x2 1013 G3-2TT14EA AU Optronics AUO101A, , 3000x2000, 13" | Lenovo ThinkPad X1 Tablet G3-20KJ001NGE LP130QP1-SPA1, , 3000x2000, 13" | Samsung Galaxy Book 12 SM-W728 Samsung SDCA029, , 2160x1440, 12" | Microsoft Surface Book 2 Panasonic MEI96A2 , , 3000x2000, 13.5" | Microsoft Surface Go MHN-00003 Sharp SHP14A6, , 1800x1200, 10" | Huawei Matebook E Chi Mei CMN7801, , 2160x1440, 12" | Lenovo Miix 520-12IKB 20M3000LGE Unbekannt, , 1920x1200, 12.2" | |
|---|---|---|---|---|---|---|---|---|---|---|
| Display | 2% | 4% | 1% | 3% | 11% | 1% | 0% | 17% | -2% | |
| Display P3 Coverage (%) | 67.1 | 67.6 1% | 70.5 5% | 67.5 1% | 68.1 1% 67.8 1% | 77.3 15% | 67.9 1% | 66.5 -1% | 84.9 27% | 66.1 -1% |
| sRGB Coverage (%) | 95.5 | 99 4% | 98.6 3% | 96.7 1% | 99.4 4% 99.1 4% | 92.8 -3% | 95.7 0% | 97.5 2% | 99.8 5% | 91.6 -4% |
| AdobeRGB 1998 Coverage (%) | 67.9 | 69.1 2% | 71.5 5% | 68.2 0% | 69.9 3% 69.3 2% | 83.1 22% | 69.4 2% | 67.5 -1% | 79.9 18% | 66.7 -2% |
| Response Times | -7% | -38% | -7% | -40% | 56% | -22% | -2% | 26% | 12% | |
| Response Time Grey 50% / Grey 80% * (ms) | 43 ? | 42 ? 2% | 56.8 ? -32% | 47 ? -9% | 47.2 ? -10% | 4 ? 91% | 52.8 ? -23% | 44 ? -2% | 26 ? 40% | 36 ? 16% |
| Response Time Black / White * (ms) | 25 ? | 29 ? -16% | 36 ? -44% | 26 ? -4% | 42.4 ? -70% | 20 ? 20% | 30 ? -20% | 25.6 ? -2% | 22 ? 12% | 23 ? 8% |
| PWM Frequency (Hz) | 22000 ? | 21000 | 1852 ? | 250 ? | 1020 ? | 200 ? | ||||
| Screen | 4% | -10% | -12% | 3% | 84% | 18% | 18% | -9% | -31% | |
| Brightness middle (cd/m²) | 484 | 417 -14% | 548 13% | 452 -7% | 474 -2% | 376 -22% | 385 -20% | 456 -6% | 439 -9% | 384 -21% |
| Brightness (cd/m²) | 473 | 401 -15% | 545 15% | 412 -13% | 418 -12% | 378 -20% | 372 -21% | 426 -10% | 428 -10% | 355 -25% |
| Brightness Distribution (%) | 91 | 88 -3% | 86 -5% | 85 -7% | 76 -16% | 91 0% | 89 -2% | 88 -3% | 92 1% | 80 -12% |
| Black Level * (cd/m²) | 0.33 | 0.29 12% | 0.51 -55% | 0.48 -45% | 0.33 -0% | 0.03 91% | 0.21 36% | 0.31 6% | 0.35 -6% | 0.56 -70% |
| Contrast (:1) | 1467 | 1438 -2% | 1075 -27% | 942 -36% | 1436 -2% | 12533 754% | 1833 25% | 1471 0% | 1254 -15% | 686 -53% |
| Colorchecker dE 2000 * | 4.29 | 3.63 15% | 3.65 15% | 4.05 6% | 3.2 25% | 4.1 4% | 1.6 63% | 1.3 70% | 5.17 -21% | 4.58 -7% |
| Colorchecker dE 2000 max. * | 6.46 | 6.74 -4% | 7.15 -11% | 6.64 -3% | 6.1 6% | 6.45 -0% | 4.5 30% | 3 54% | 7.68 -19% | 11.63 -80% |
| Colorchecker dE 2000 calibrated * | 1.34 | 1.81 -35% | 1.56 -16% | 0.9 33% | 1.1 18% | |||||
| Greyscale dE 2000 * | 4.3 | 2.18 49% | 5.5 -28% | 4.87 -13% | 4.5 -5% | 3.64 15% | 1.5 65% | 1.4 67% | 5.69 -32% | 5.63 -31% |
| Gamma | 2.51 88% | 3.09 71% | 2.154 102% | 2.71 81% | 2.07 106% | 2.58 85% | 2.22 99% | 2.24 98% | 2.42 91% | 2.45 90% |
| CCT | 7315 89% | 6767 96% | 7052 92% | 7160 91% | 5881 111% | 7113 91% | 6502 100% | 6687 97% | 7999 81% | 7571 86% |
| Color Space (Percent of AdobeRGB 1998) (%) | 62 | 63 2% | 65.2 5% | 62 0% | 64 3% | 74 19% | 64 3% | 62.3 0% | 71 15% | 60 -3% |
| Color Space (Percent of sRGB) (%) | 95 | 99 4% | 99.1 4% | 97 2% | 99.4 5% | 93 -2% | 95.9 1% | 96.8 2% | 100 5% | 92 -3% |
| Total Average (Program / Settings) | -0% /
2% | -15% /
-11% | -6% /
-9% | -11% /
-2% | 50% /
66% | -1% /
9% | 5% /
12% | 11% /
1% | -7% /
-19% |
* ... smaller is better
Our test device has a 0.33 cd/m² black value, which is higher than that which X-Rite i1Pro 2 measured on last year’s Surface Pro. This results in a 1,467:1 contrast ratio, which is only marginally higher than last year’s device. However, both values are considerably better than the Elite x2 1013 G3 and the Latitude 5290 2-in-1. By contrast, the Galaxy Book 12 has an incredibly low black value and an equally impressive contrast ratio.
Surprisingly, the Surface Pro 6 has worse sRGB colour space coverage than its predecessor. Our test device has 95% sRGB coverage, which is 4% lower than the 99% that the Surface Pro (2017) achieved. We suspect that these differences are merely production discrepancies as the two devices carry the same display model number.
Overall, the Surface Pro 6 has a great display for semi-professional image editing that is on par with the best of our comparison devices.
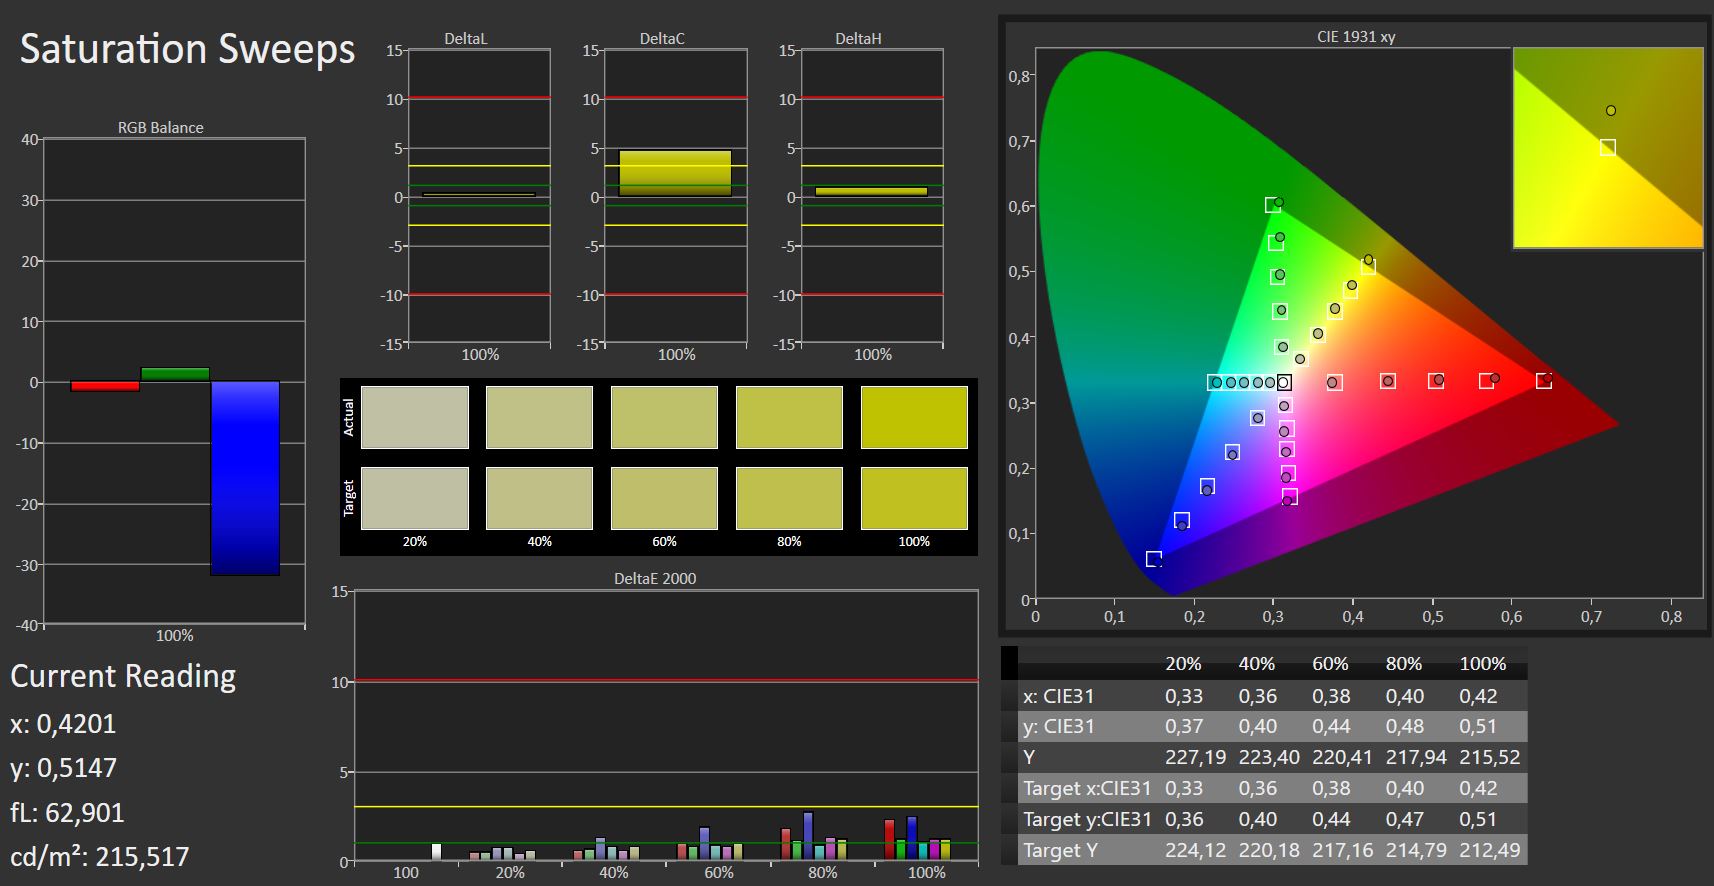
Our test device had a Delta E ColorChecker deviation of 4.29 upon delivery, which is marginally above the ideal value of 3. The display has a noticeable blue tint to it though. Calibrating the display with a photo spectrometer rectified these issues though, while the DeltaE Greyscale deviation also dropped from 4.3 to 0.8. We have included our calibrated ICC profile in the box above our display values comparison table should you wish to use it.


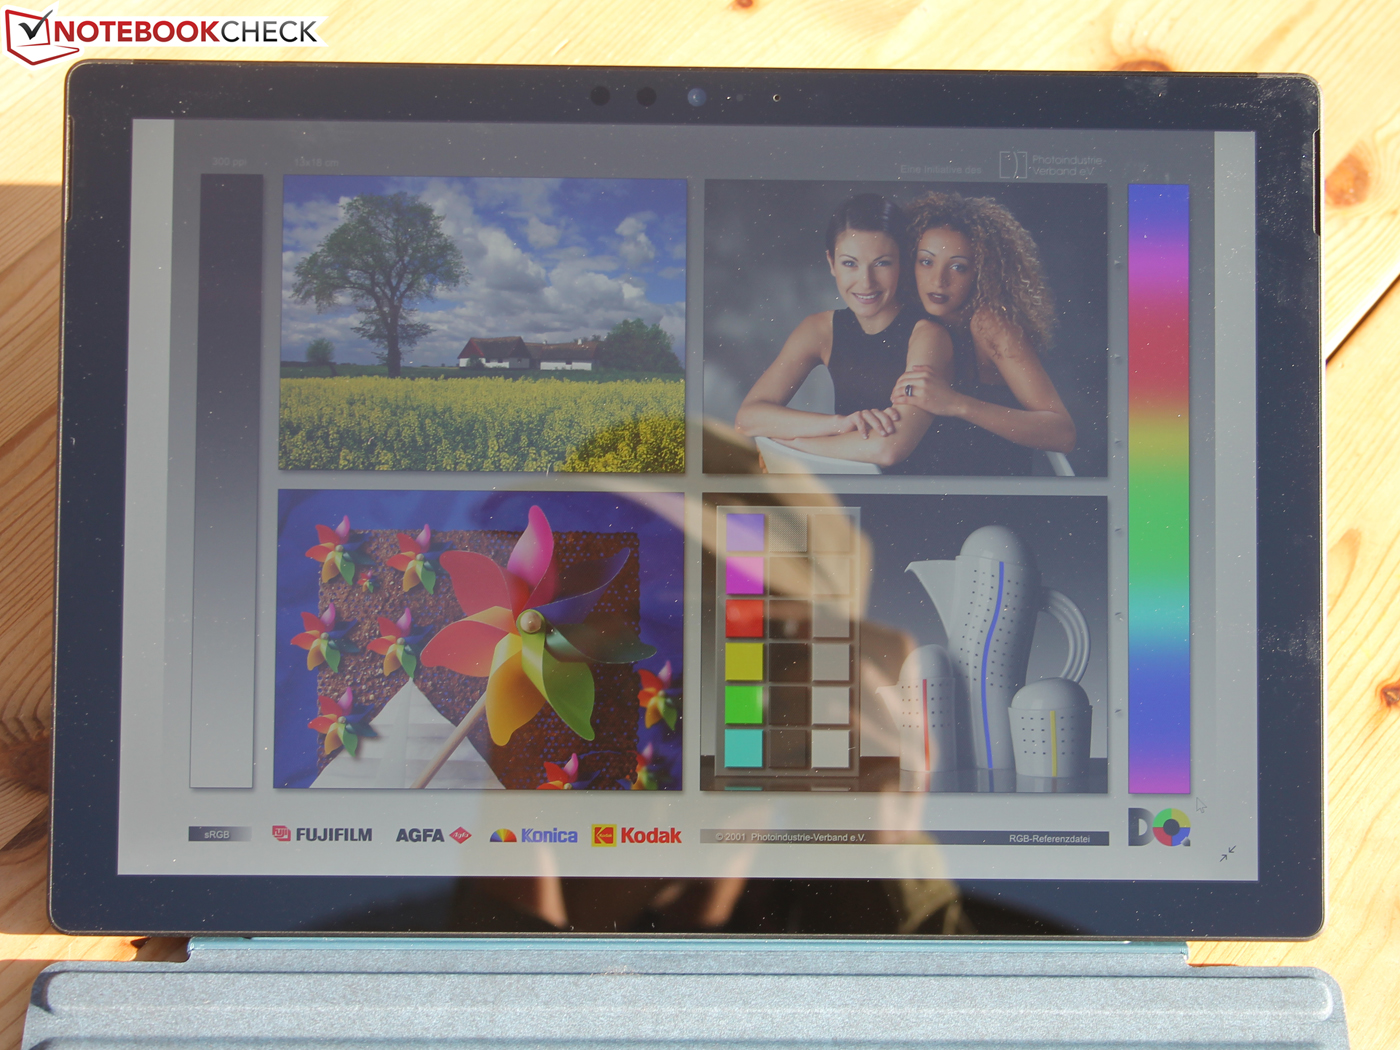
The Surface Pro 6 is usable outdoors thanks to its bright display and good contrast ratio. However, the display has a glossy finish that attracts reflections when using the device in the sun. Hence, we would recommend using the device in the shade where possible for the best viewing experience.
Display Response Times
| ↔ Response Time Black to White | ||
|---|---|---|
| 25 ms ... rise ↗ and fall ↘ combined | ↗ 13 ms rise | 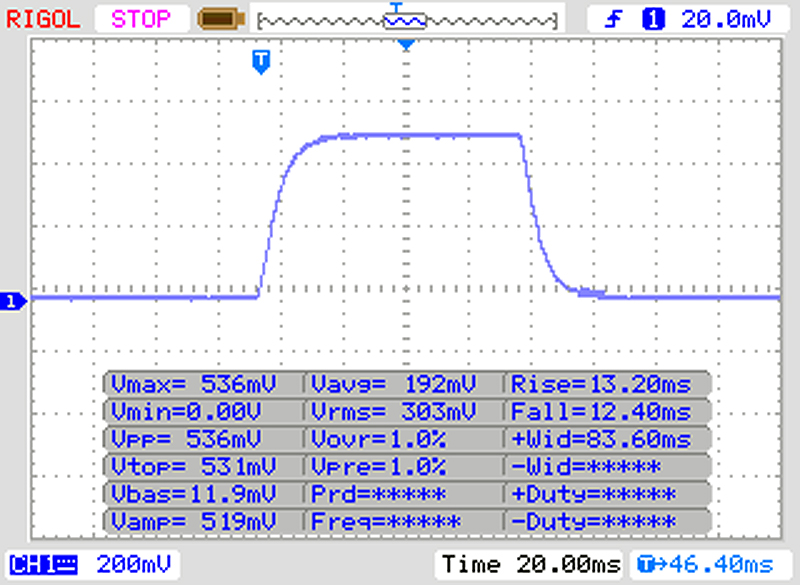 |
| ↘ 12 ms fall | ||
| The screen shows relatively slow response rates in our tests and may be too slow for gamers. In comparison, all tested devices range from 0.1 (minimum) to 240 (maximum) ms. » 59 % of all devices are better. This means that the measured response time is worse than the average of all tested devices (19.8 ms). | ||
| ↔ Response Time 50% Grey to 80% Grey | ||
| 43 ms ... rise ↗ and fall ↘ combined | ↗ 21 ms rise | 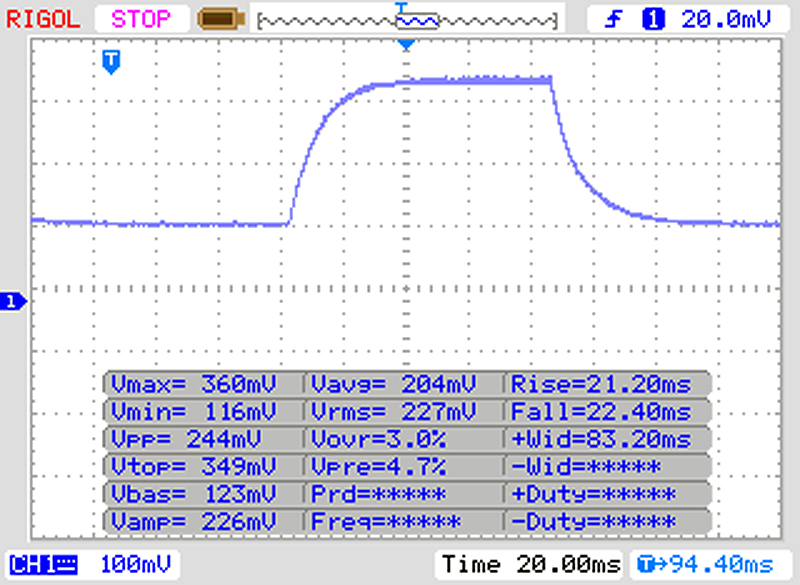 |
| ↘ 22 ms fall | ||
| The screen shows slow response rates in our tests and will be unsatisfactory for gamers. In comparison, all tested devices range from 0.165 (minimum) to 636 (maximum) ms. » 71 % of all devices are better. This means that the measured response time is worse than the average of all tested devices (31 ms). | ||
Screen Flickering / PWM (Pulse-Width Modulation)
| Screen flickering / PWM detected | 22000 Hz | ≤ 50 % brightness setting | 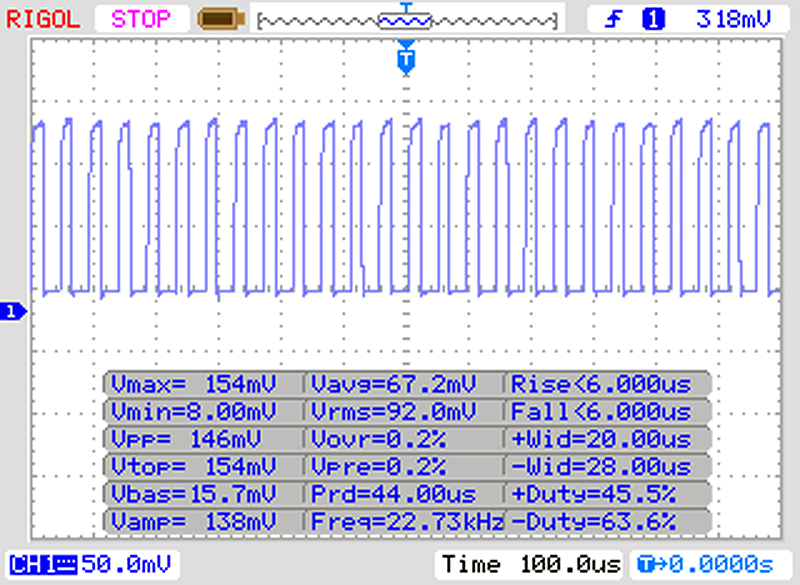 |
The display backlight flickers at 22000 Hz (worst case, e.g., utilizing PWM) Flickering detected at a brightness setting of 50 % and below. There should be no flickering or PWM above this brightness setting. The frequency of 22000 Hz is quite high, so most users sensitive to PWM should not notice any flickering. In comparison: 52 % of all tested devices do not use PWM to dim the display. If PWM was detected, an average of 7754 (minimum: 5 - maximum: 343500) Hz was measured. | |||
Our test device has great viewing angles thanks to its IPS display. We did not notice any brightness or colour distortions even at acute angles.

Performance
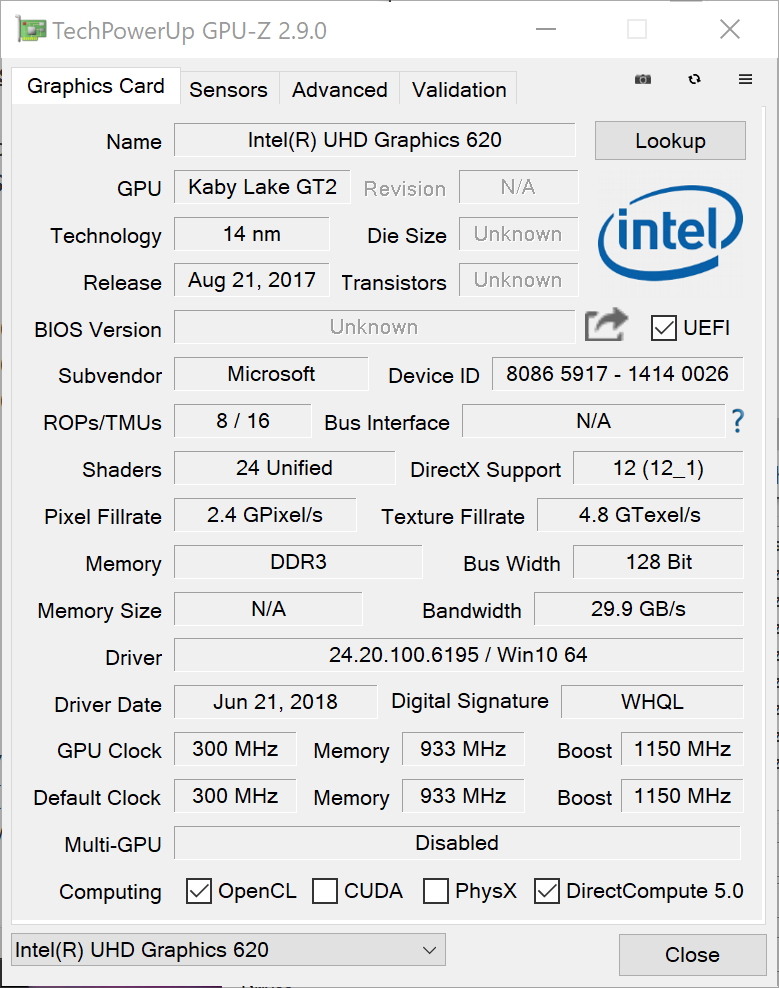
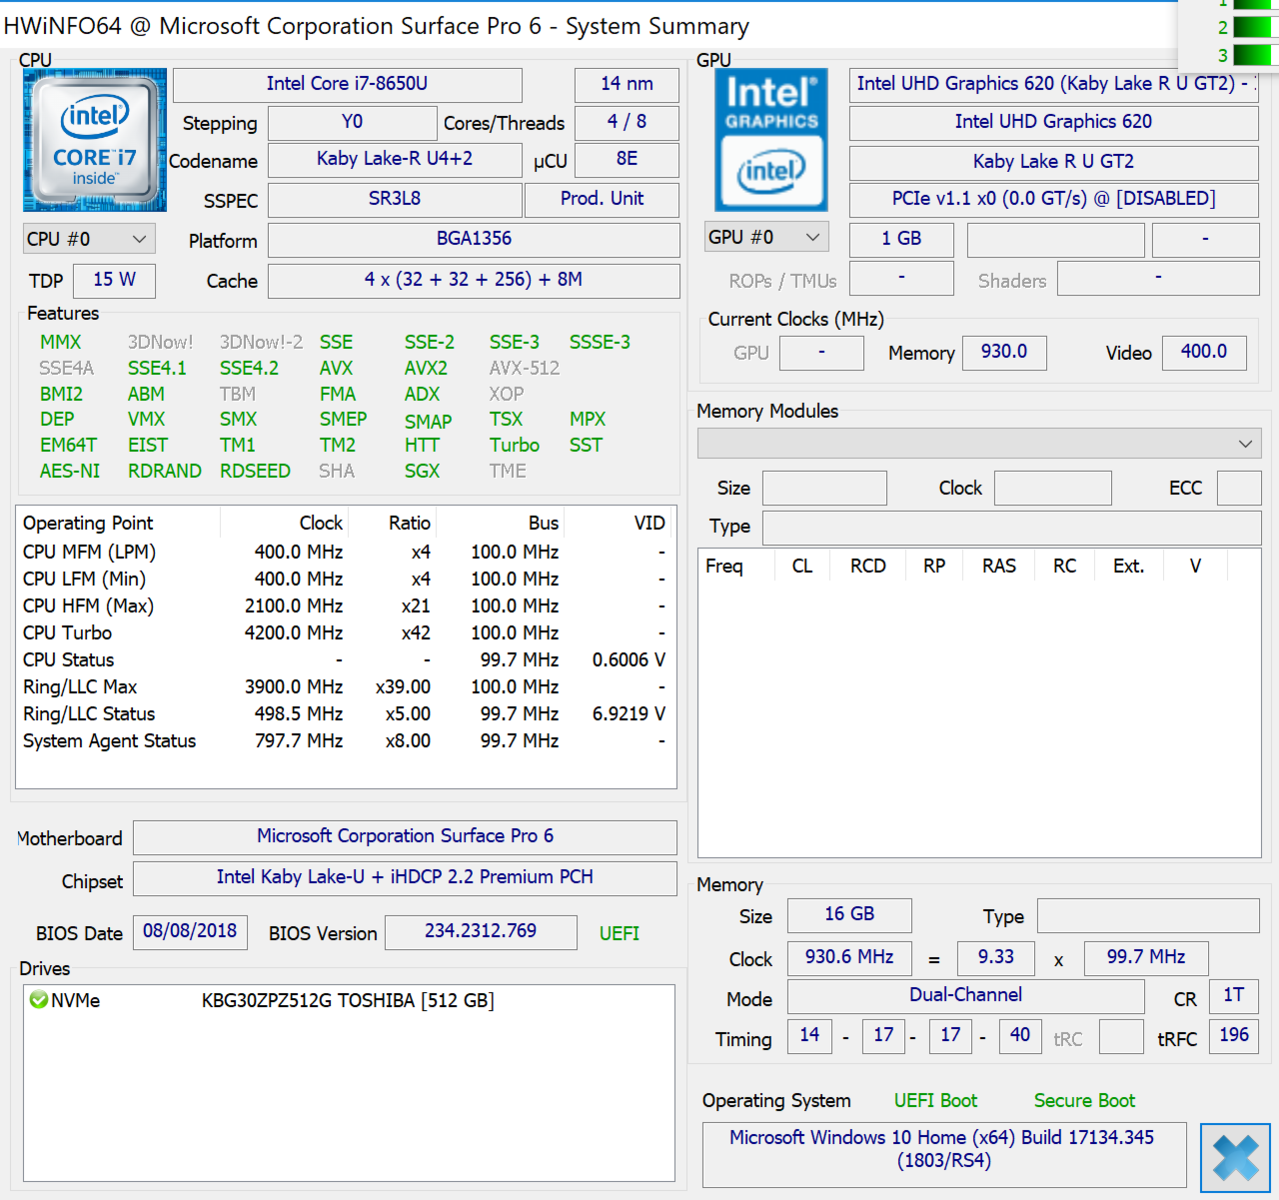
Microsoft has equipped its high-end Surface Pro 6 with an Intel Core i7-8650U processor. The Core i7-8650U is a Kaby Lake-R generation quad-core processor that Intel released in August last year. Microsoft has, therefore, had plenty of time to ensure that the Pro 6’s cooling solution works well with such a powerful CPU. We will be examining this in greater detail below. Microsoft also offers the Pro 6 with either Core i5-8250U or Core M3 7Y30 processors, both of which are fanless. It is worth noting that the latter is the same processor that powered last year’s entry-level model, which makes the cheapest Surface Pro 6 only a minor update over its direct predecessor.
Our test device is also equipped with 16 GB of soldered dual-channel RAM, and a 512 GB Toshiba KBG30ZPZ512G SSD. Microsoft sells the Core i7-8650U version with either 8 GB or 16 GB of RAM and up to 1 TB of storage. However, Microsoft only offers the 8 GB version with a 256 GB SSD, while the 16 GB version is limited to either 512 GB or 1 TB of storage. Curiously, the Black version with 16 GB RAM is currently only available with a 512 TB SSD.
The Surface Pro 6 Core i7-8650U: A tablet with outstanding laptop-level performance
We have included a Lenovo ThinkPad T480 and ThinkPad T580 as part of our performance comparison to demonstrate how good of a job Microsoft has done at cooling the Core i7-8650U. Both ThinkPads have around 20 mm thick cases that accommodate larger cooling systems. Presumably, the larger devices can keep the same processor cooler for longer and thereby extract more performance?
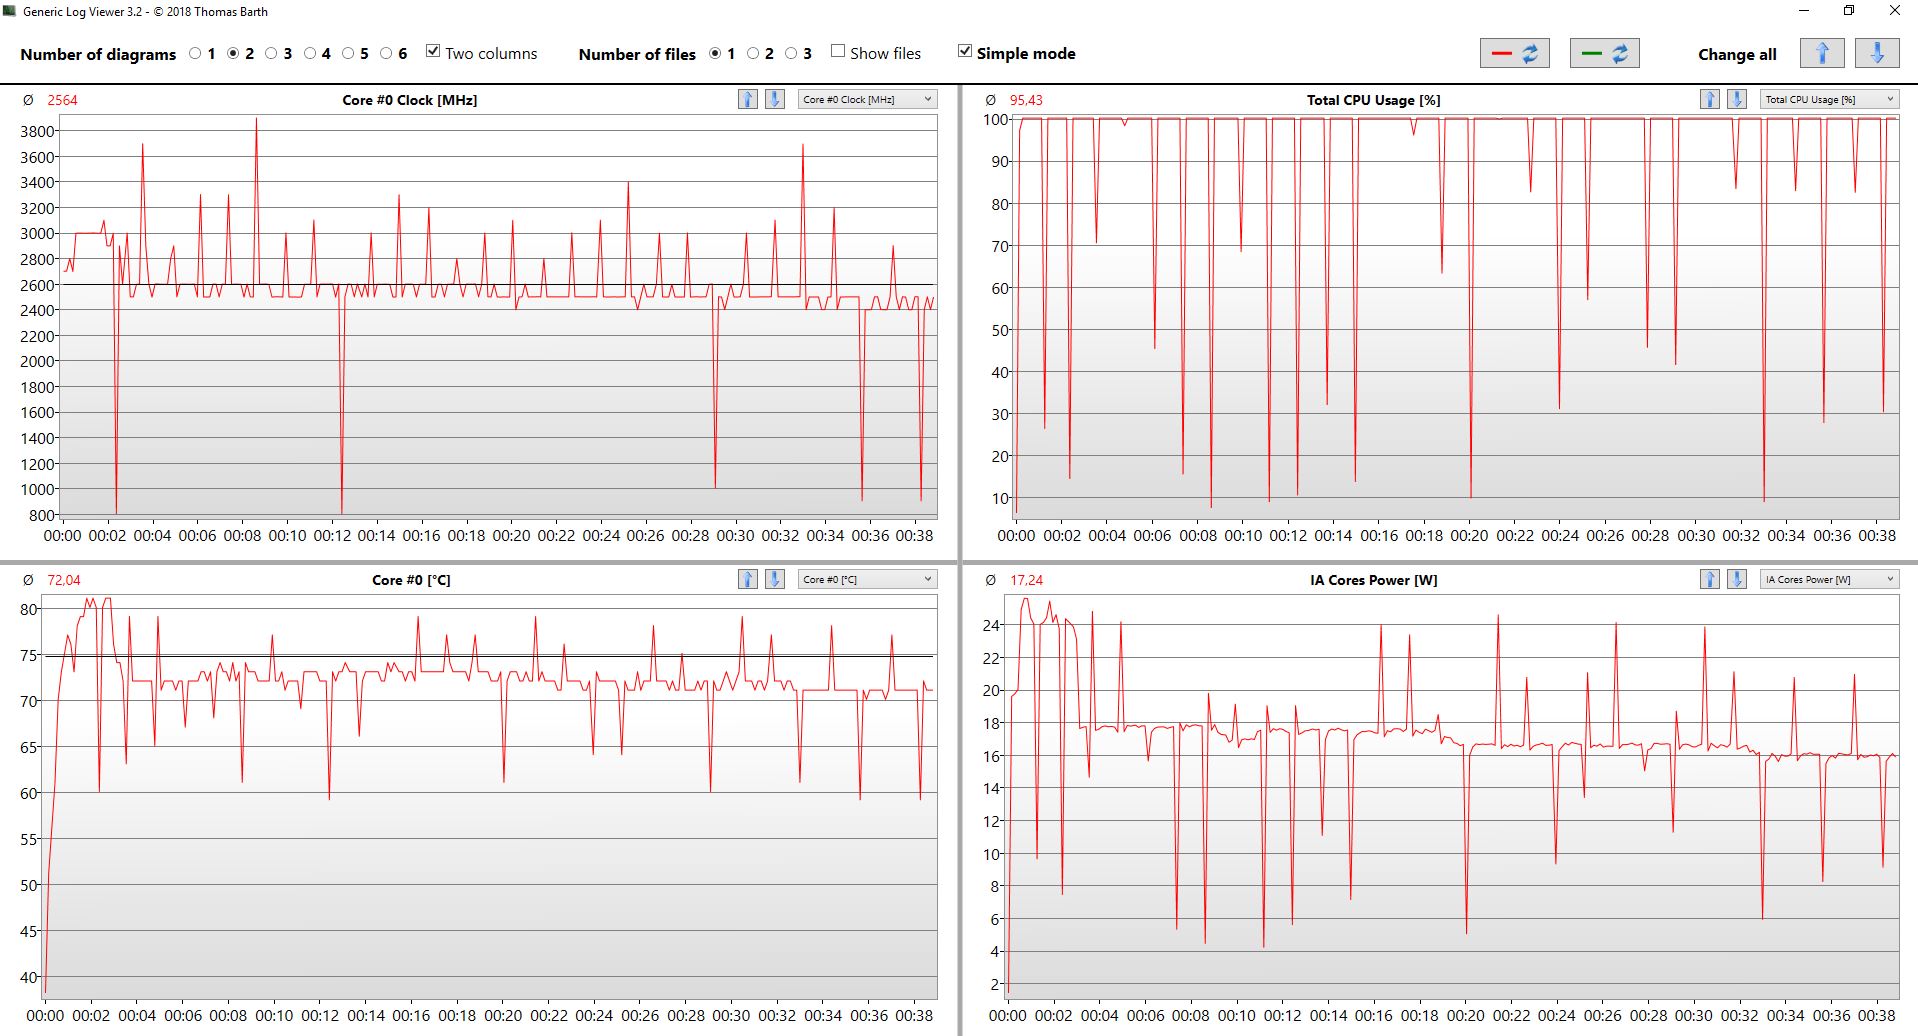
Well, surprisingly our test device initially scored around 6% higher than the ThinkPad T480 in a Cinebench R15 multi-threaded benchmark loop and a whopping 10% more than the larger ThinkPad T580. All three devices could not maintain their initial performance by the end of our thirty-benchmark loop; the ThinkPad T580 fared worse, scoring around 18% lower than it did in the first run through. However, our test device maintained a slender lead of the ThinkPad T480, demonstrating that a thicker device will have a better cooling solution. The Surface Pro 6 even finished its considerably more expensive and larger sibling, the Surface Book 2.
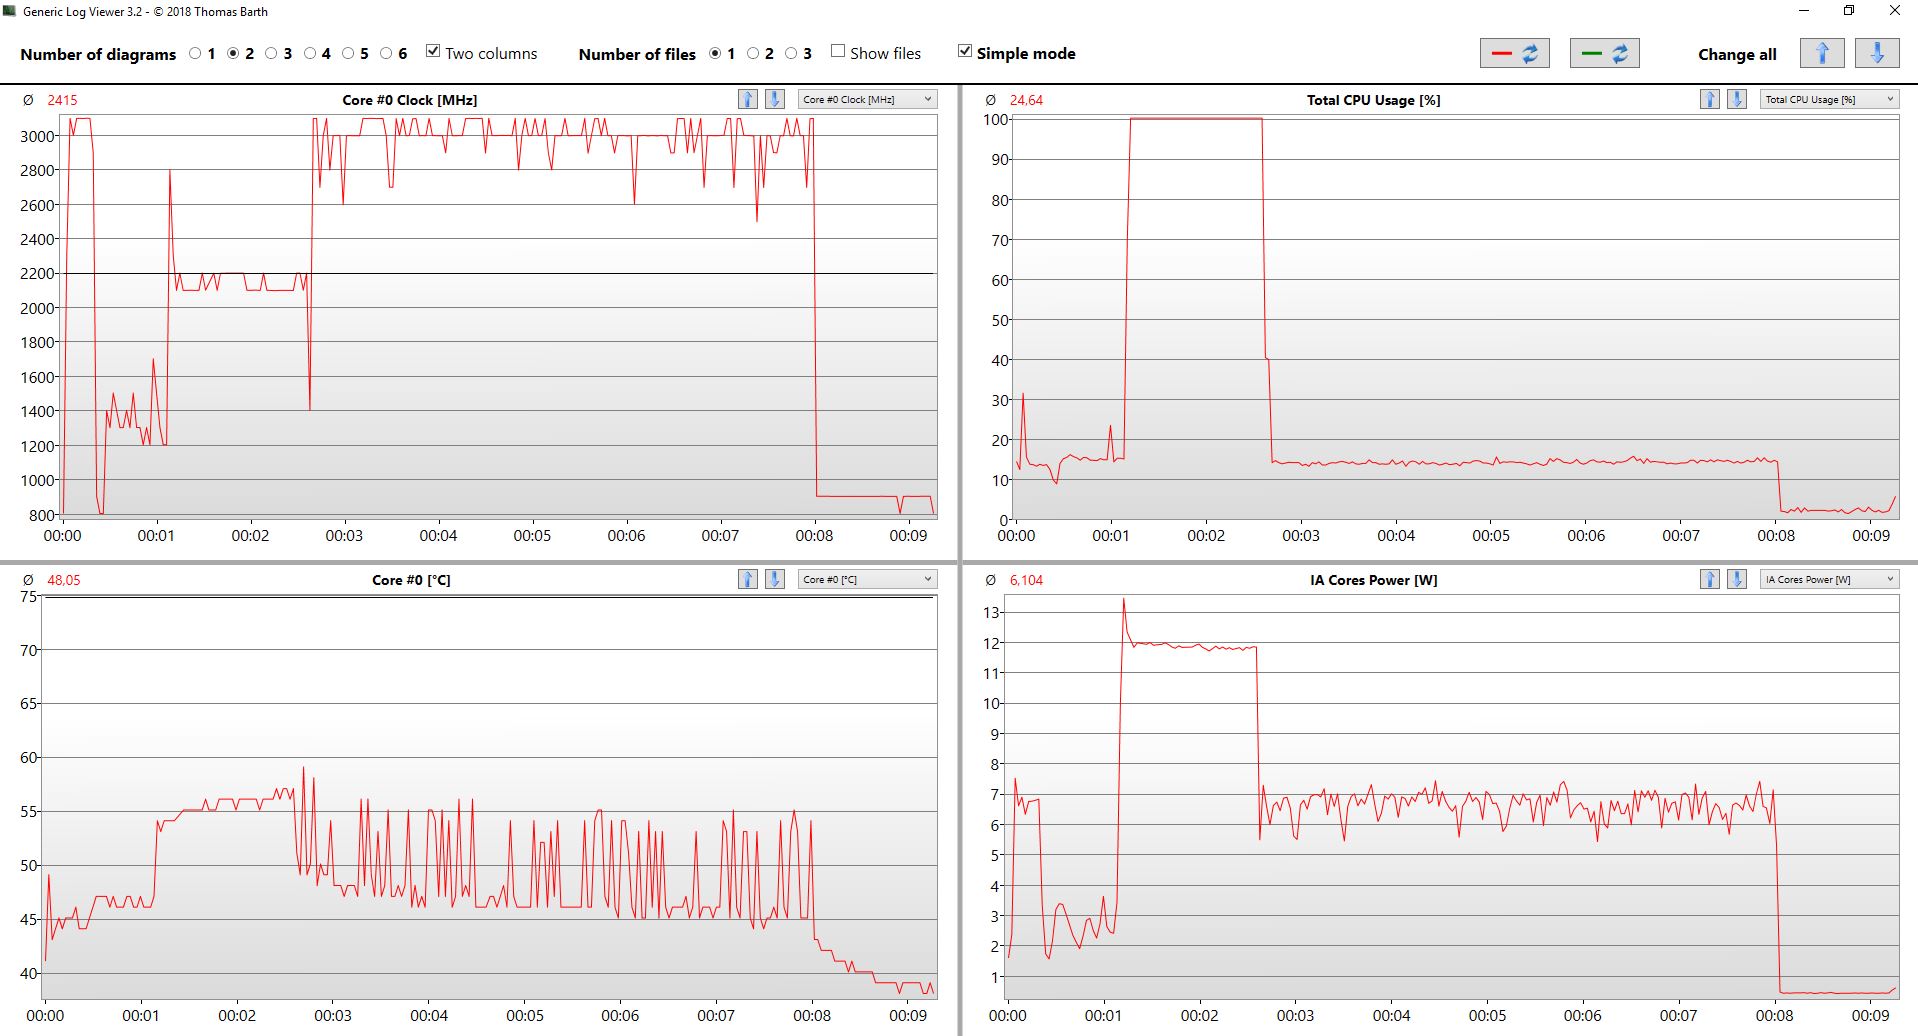
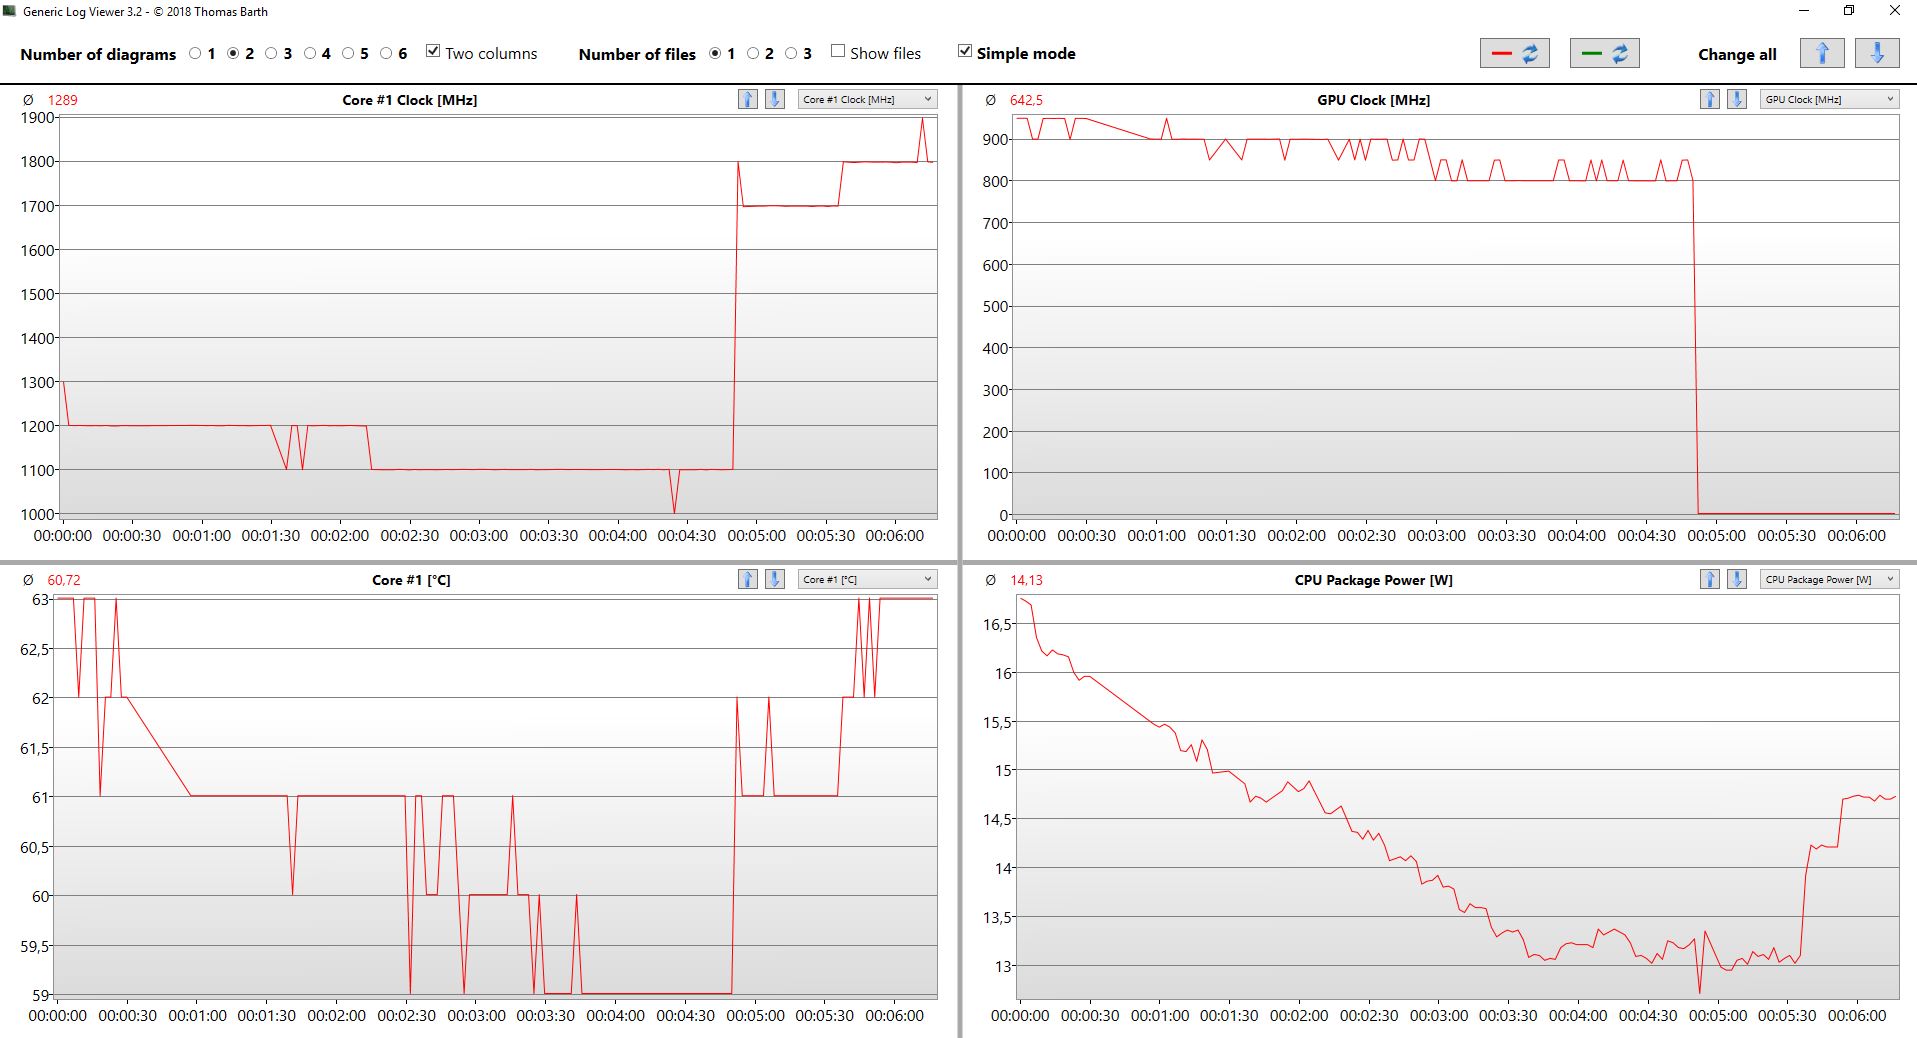
We have also included screenshots below to demonstrate the difference between benchmarking the Surface Pro 6 on mains power compared to on battery power. The second screenshot is our test device operating on battery; we disconnected the charger and started the Cinebench R15 loop at the one-minute mark on those graphs. The CPU initially clocked up to 2.8 GHz before then immediately dropping to 2.1/2.2 GHz where it stayed for the remainder of the benchmark loop. The CPU consumed around 12 W at this lower frequency, so performance is slightly reduced when the device is running on battery. However, the CPU still operates at Turbo Boost frequencies, which start at 1.9 GHz and faster.
Processor
OEMs have been equipping their laptops with Kaby Lake Refresh processors for over a year, so why has Microsoft only now updated their Surface Pro to quad-core processors? We suspect that there are three reasons for this, the primary one being that Microsoft had to keep pace with its OEMs like Dell, HP and Lenovo. However, Microsoft last updated the Surface Pro line-up in June 2017, so releasing the 6th generation only a few months later would not have made much business sense. Moreover, Microsoft may have taken additional time to hone their cooling system rather than merely pushing out a poorly-cooled device to beat other companies to market.
Typically, slim subnotebooks and ultrabooks that are equipped with Intel Core 8th generation processors throttle after a few minutes of stress testing. This is by design to prevent these powerful CPUs from overwhelming the device’s cooling system.
The Core i7-8650U powered Surface Pro 6 does not entirely mimic this behaviour though. Cinebench R15 multi-core scores drop for each successive run of the benchmark until the fifth pass-through where they stabilise. The CPU initially clocks at 3 GHz, which the system maintains for around two minutes. The core temperature quickly rises an untenable 80 °C (~176 °F), which causes the processor to throttle back to between 2.5/2.6 GHz so that it can cool to a manageable 73 °C (~163 °F).
Equally, the CPU initially draws 25 W, which then drops to an average of 18 W as it throttles. We still measured the CPU consuming 17 W even after nineteen minutes of benchmarking, which is particularly impressive given how slim the Surface Pro 6 is.
The Surface Pro 6 finishes marginally behind larger devices in the single-threaded portion of Cinebench R15, but it comes into its own in the multi-threaded benchmark.
In short, the Surface Pro 6 makes outstanding use of its Core i7-8650U processor that outclasses much larger 14-inch and 15-inch laptops. Our test device leaves the Core i7 Surface Pro (2017) in its wake too.
System Performance
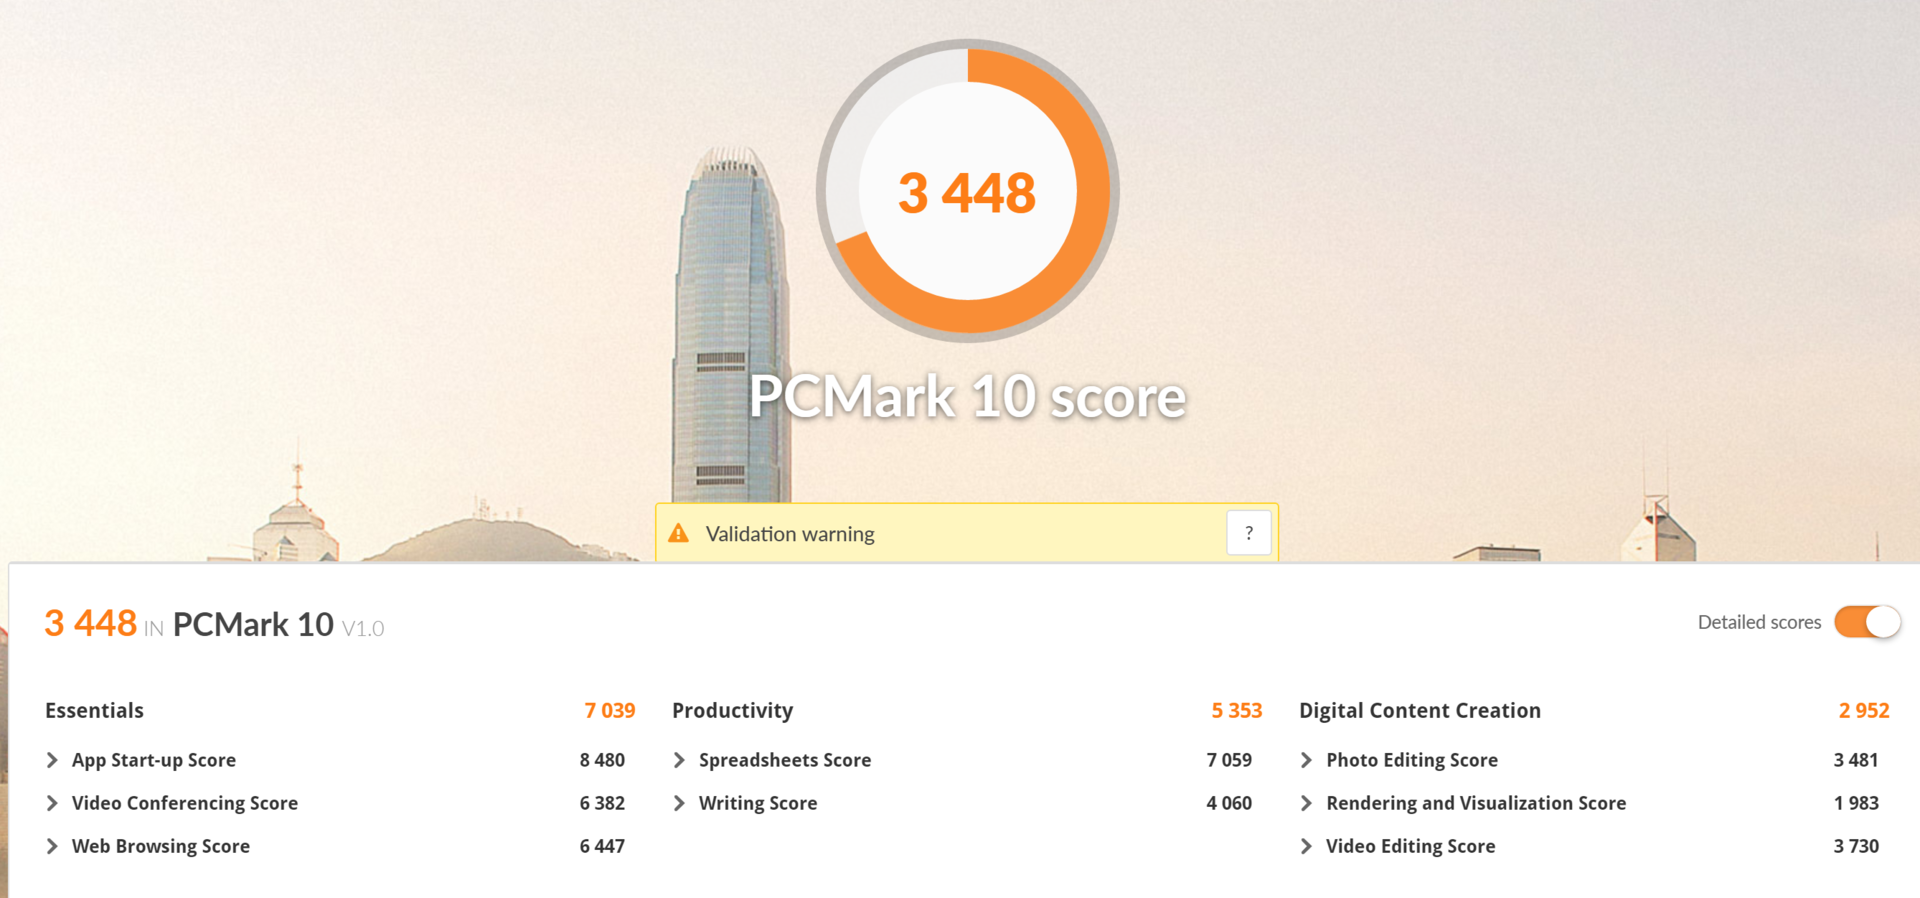
Our test device does not perform as well in system performance benchmarks, but it does not embarrass itself. Predictably, the Surface Book 2 takes the crown in the PCMark 10: Digital Content Creation comparison table because of its dedicated GPU with our test device finishing in third place and around 2% behind the Surface Pro (2017).
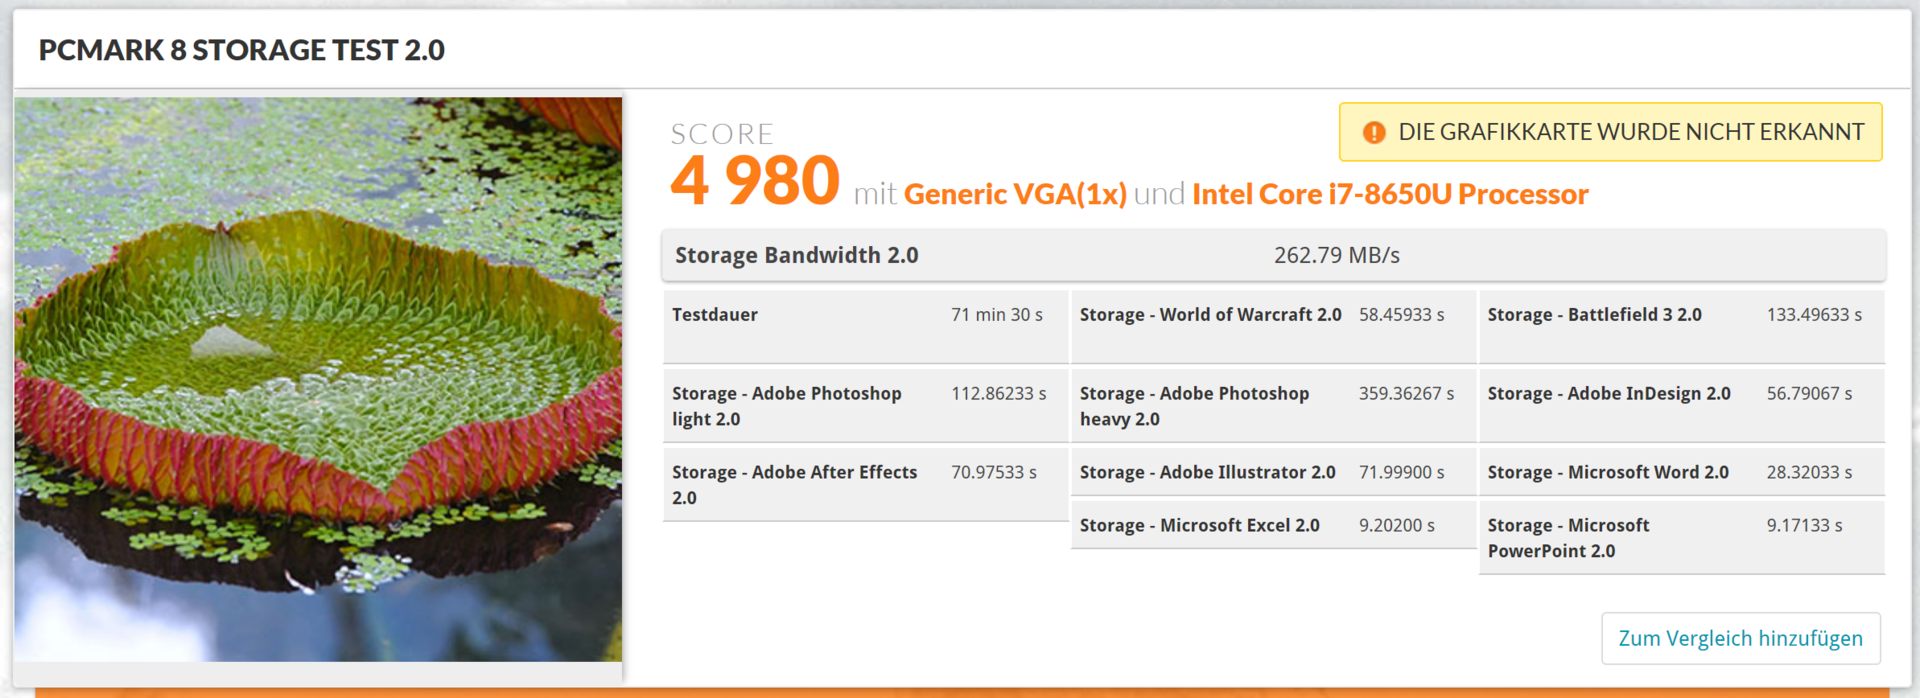
Results vary wildly in PCMark benchmarks though, with the Surface Pro 6 scoring 14% below the Miix 520-12IKB in PCMark 10: Essentials. Likewise, our test device finishes 16% and 12% lower than its predecessor in the PCMark 10 overall benchmark. We suspect that Microsoft has installed a slower SSD. More on that below.
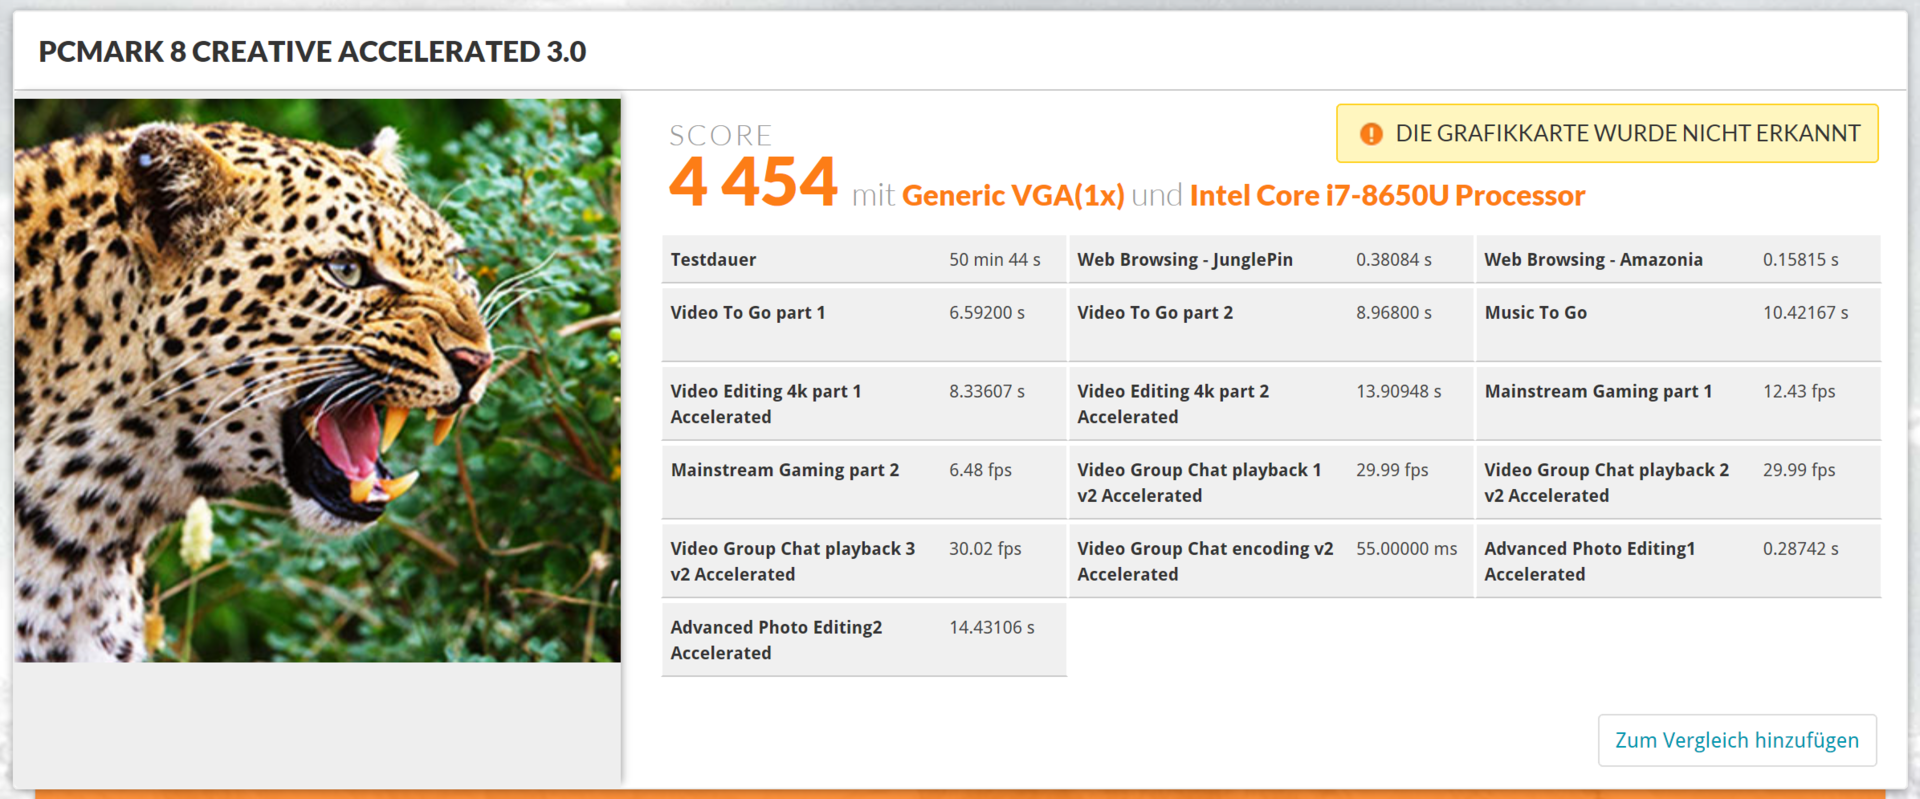
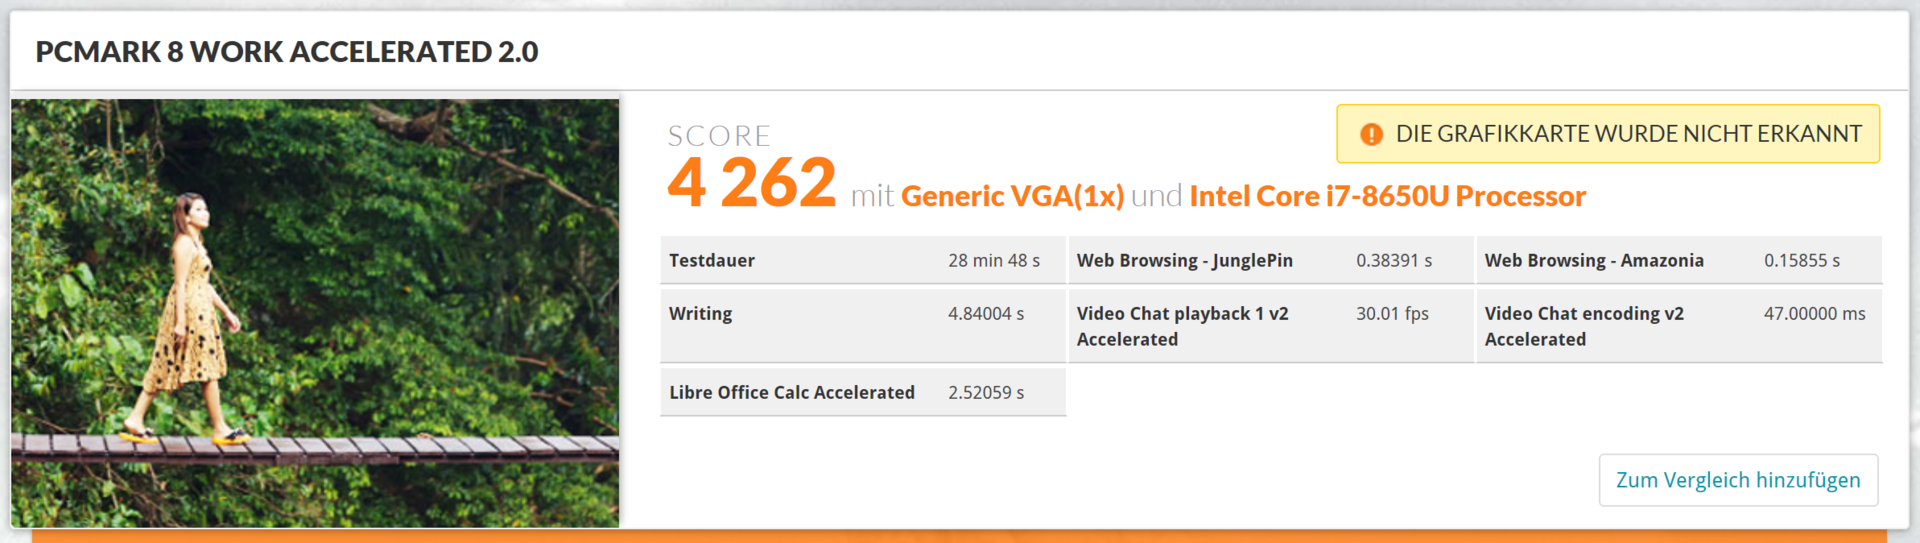
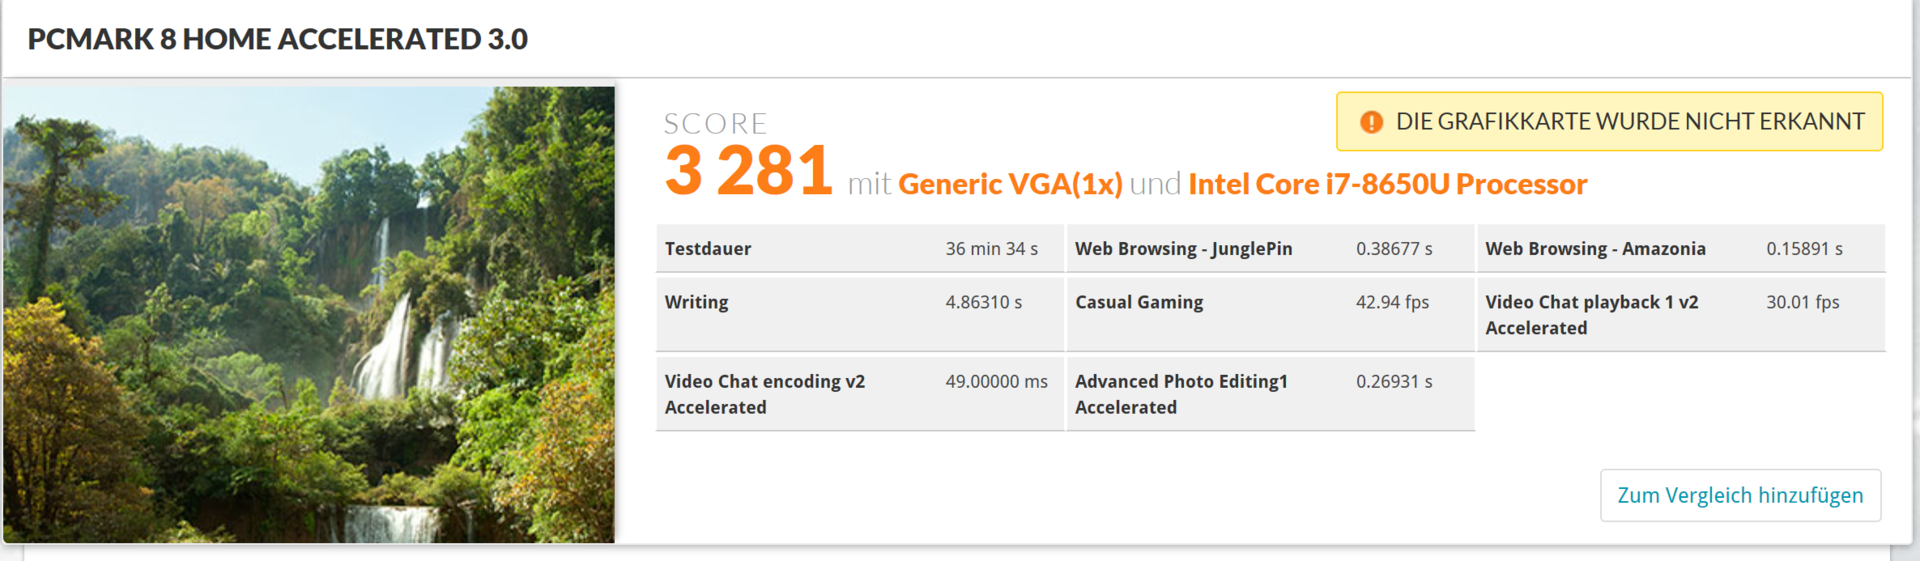
| PCMark 8 Home Score Accelerated v2 | 3281 points | |
| PCMark 8 Creative Score Accelerated v2 | 4454 points | |
| PCMark 8 Work Score Accelerated v2 | 4262 points | |
| PCMark 10 Score | 3448 points | |
Help | ||
Storage Devices
CrystalDiskMark 3.0 confirms our suspicions; the Toshiba SSD in our test device is significantly slower than the Samsung PM971 in the Surface Pro (2017). The PM971 has 40% faster transfer speeds overall than its Toshiba counterpart. Curiously, Microsoft also equipped the Surface Book 2 with an older Samsung PM961 SSD.
Toshiba claims that the drive should reach up to 1,500 MB/s sequential read speeds. However, our tests demonstrate that it does not even reach half those claims.
| Microsoft Surface Pro 6, Core i7, 512 GB Toshiba KBG30ZPZ512G | Microsoft Surface Pro (2017) i7 Samsung PM971 KUS040202M | Microsoft Surface Pro 6, Core i5, 128 GB Toshiba KBG30ZPZ128G | HP Elite x2 1013 G3-2TT14EA Samsung PM961 MZVLW256HEHP | Samsung Galaxy Book 12 SM-W728 Samsung SSD PM871a MZNLN256HMHQ | Microsoft Surface Book 2 Samsung PM961 MZVLW256HEHP | Microsoft Surface Go MHN-00003 64 GB eMMC Flash | Huawei Matebook E SanDisk SD8SN8U256G1027 | Lenovo Miix 520-12IKB 20M3000LGE Samsung SSD PM961 1TB M.2 PCIe 3.0 x4 NVMe (MZVLW1T0) | Average Toshiba KBG30ZPZ512G | |
|---|---|---|---|---|---|---|---|---|---|---|
| CrystalDiskMark 3.0 | 40% | -43% | 49% | -11% | 30% | -73% | -21% | 50% | 0% | |
| Read Seq (MB/s) | 651 | 1308 101% | 748 15% | 1786 174% | 511 -22% | 1370 110% | 259.6 -60% | 506 -22% | 883 36% | 651 ? 0% |
| Write Seq (MB/s) | 792 | 961 21% | 127.6 -84% | 1209 53% | 473.7 -40% | 341.2 -57% | 122.4 -85% | 461 -42% | 932 18% | 792 ? 0% |
| Read 512 (MB/s) | 388.2 | 227.5 -41% | 385.3 -1% | 717 85% | 443.7 14% | 654 68% | 190.6 -51% | 341.9 -12% | 586 51% | 388 ? 0% |
| Write 512 (MB/s) | 575 | 792 38% | 115.8 -80% | 798 39% | 395.4 -31% | 337.9 -41% | 107.1 -81% | 294.7 -49% | 627 9% | 575 ? 0% |
| Read 4k (MB/s) | 43.75 | 53.6 23% | 29.93 -32% | 49.66 14% | 40.46 -8% | 43.64 0% | 19.06 -56% | 32.46 -26% | 54.8 25% | 43.8 ? 0% |
| Write 4k (MB/s) | 97.2 | 136.3 40% | 39.77 -59% | 104.2 7% | 91.9 -5% | 148.5 53% | 24.27 -75% | 65.3 -33% | 139.3 43% | 97.2 ? 0% |
| Read 4k QD32 (MB/s) | 241.2 | 485.6 101% | 192.7 -20% | 286 19% | 289.1 20% | 465.5 93% | 34.45 -86% | 381.8 58% | 607 152% | 241 ? 0% |
| Write 4k QD32 (MB/s) | 304.9 | 421.5 38% | 45.38 -85% | 298.4 -2% | 260.7 -14% | 337.1 11% | 33.64 -89% | 184.4 -40% | 498.5 63% | 305 ? 0% |

Graphics Card
The Intel UHD Graphics 620 handles graphics on our test device and shares its thermal design power (TDP) with the CPU. The Core i7 Surface Pro (2017) had a more powerful Intel Iris Plus Graphics 640, but both graphics solutions are integrated within their respective processors, which is Intel’s decision making and not Microsoft’s.
The UHD Graphics 620 can clock up to 1,150 MHz, which is higher than the older Iris Plus Graphics 640. Performance is more than just clock speed though, hence why the Iris Plus Graphics 640 scores between 10% and 26% in 3DMark benchmarks.
| 3DMark 11 Performance | 2202 points | |
| 3DMark Cloud Gate Standard Score | 9052 points | |
Help | ||
Gaming Performance
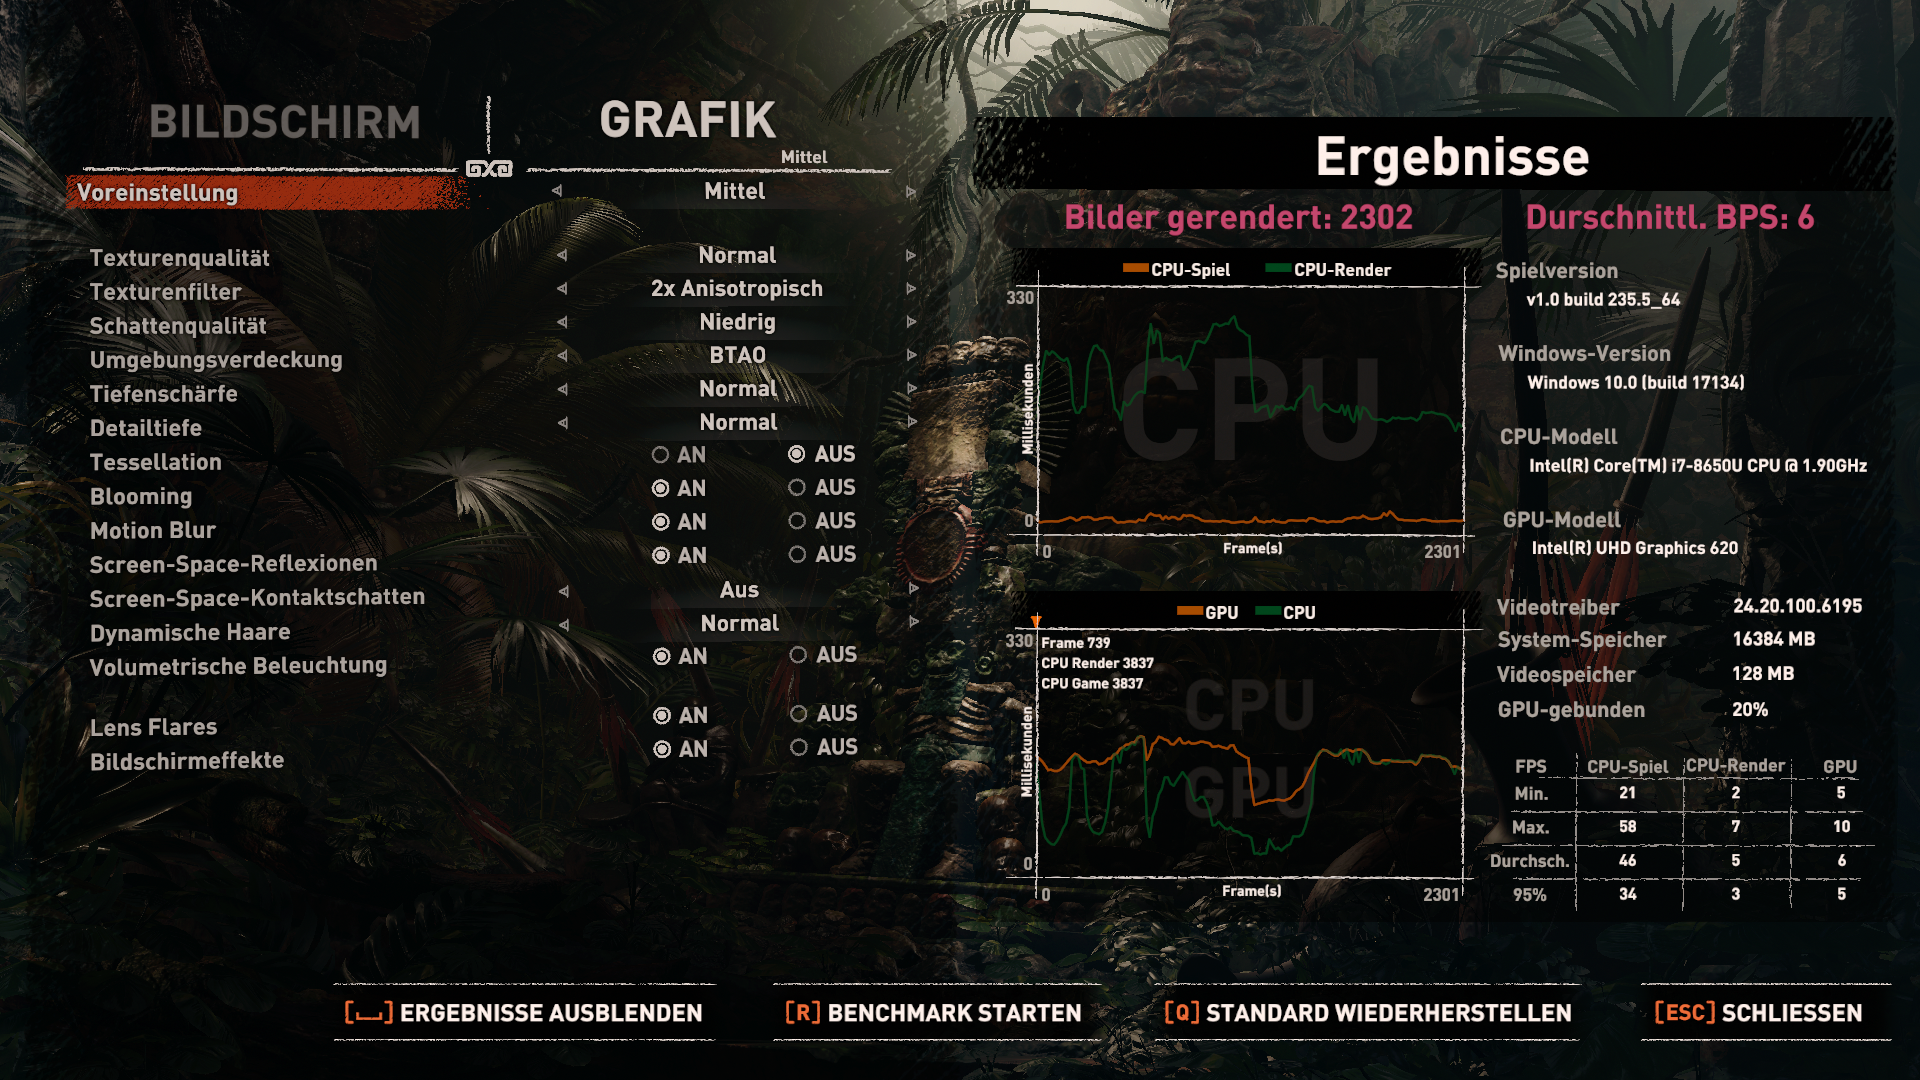
Our test device handles games comparably well though. The Core i7 version achieves around 15% higher frames in games than the Core i5 model, but this will not make a game more playable.
The Surface Pro 6 can play undemanding and older games such as “Farming Simulator 17” and “BioShock Infinite” smoothly, but only at reduced graphics and resolutions. However, more complex games such as “PlayerUnknown's Battlegrounds” were unplayable even at minimum settings.
Please see our gaming and GPU benchmark pages for further information on how the Surface Pro 6 fares against other similarly equipped devices.


| Civilization 6 - 1024x768 Minimum Preset | |
| Microsoft Surface Pro 6, Core i7, 512 GB | |
| Microsoft Surface Pro 6, Core i5, 128 GB | |
| Average Intel UHD Graphics 620 (27.8 - 54.4, n=13) | |
| Farming Simulator 17 - 1366x768 Medium Preset | |
| Microsoft Surface Pro (2017) i7 | |
| Microsoft Surface Pro 6, Core i7, 512 GB | |
| Average Intel UHD Graphics 620 (8 - 67.9, n=12) | |
| Microsoft Surface Pro 6, Core i5, 128 GB | |
| Samsung Galaxy Book 12 SM-W728 | |
| Dirt 4 - 1280x720 Ultra Low Preset | |
| Microsoft Surface Pro 6, Core i7, 512 GB | |
| Average Intel UHD Graphics 620 (46.6 - 50, n=2) | |
| Playerunknown's Battlegrounds (PUBG) - 1280x720 Very Low Preset | |
| Microsoft Surface Pro 6, Core i7, 512 GB | |
| Average Intel UHD Graphics 620 (18 - 21.9, n=2) | |
| Middle-earth: Shadow of War - 1280x720 Lowest Preset | |
| Microsoft Surface Pro 6, Core i7, 512 GB | |
| Average Intel UHD Graphics 620 (18 - 23, n=3) | |
| Microsoft Surface Pro 6, Core i5, 128 GB | |
| F1 2018 - 1280x720 Ultra Low Preset | |
| Microsoft Surface Pro 6, Core i5, 128 GB | |
| Average Intel UHD Graphics 620 (31 - 35.8, n=5) | |
| Microsoft Surface Pro 6, Core i7, 512 GB | |
| Shadow of the Tomb Raider - 1280x720 Lowest Preset | |
| Average of class Convertible (24 - 180, n=2, last 2 years) | |
| Microsoft Surface Pro 6, Core i5, 128 GB | |
| Microsoft Surface Pro 6, Core i7, 512 GB | |
| Average Intel UHD Graphics 620 (12 - 21.7, n=13) | |
| low | med. | high | ultra | QHD | |
|---|---|---|---|---|---|
| BioShock Infinite (2013) | 78.1 | 40.9 | 33.7 | 10.2 | |
| Thief (2014) | 26.5 | 13.3 | 12.1 | ||
| Rise of the Tomb Raider (2016) | 21.7 | 14 | 7.5 | ||
| Civilization 6 (2016) | 45.3 | 16.9 | |||
| Farming Simulator 17 (2016) | 80.5 | 56.9 | 23.9 | ||
| Dirt 4 (2017) | 50 | 13.6 | 11.2 | ||
| Playerunknown's Battlegrounds (PUBG) (2017) | 21.9 | 12 | 9.5 | ||
| Middle-earth: Shadow of War (2017) | 23 | 12 | |||
| F1 2018 (2018) | 32 | 15 | 12 | ||
| Shadow of the Tomb Raider (2018) | 16 | 6 |
Emissions
Fan Noise
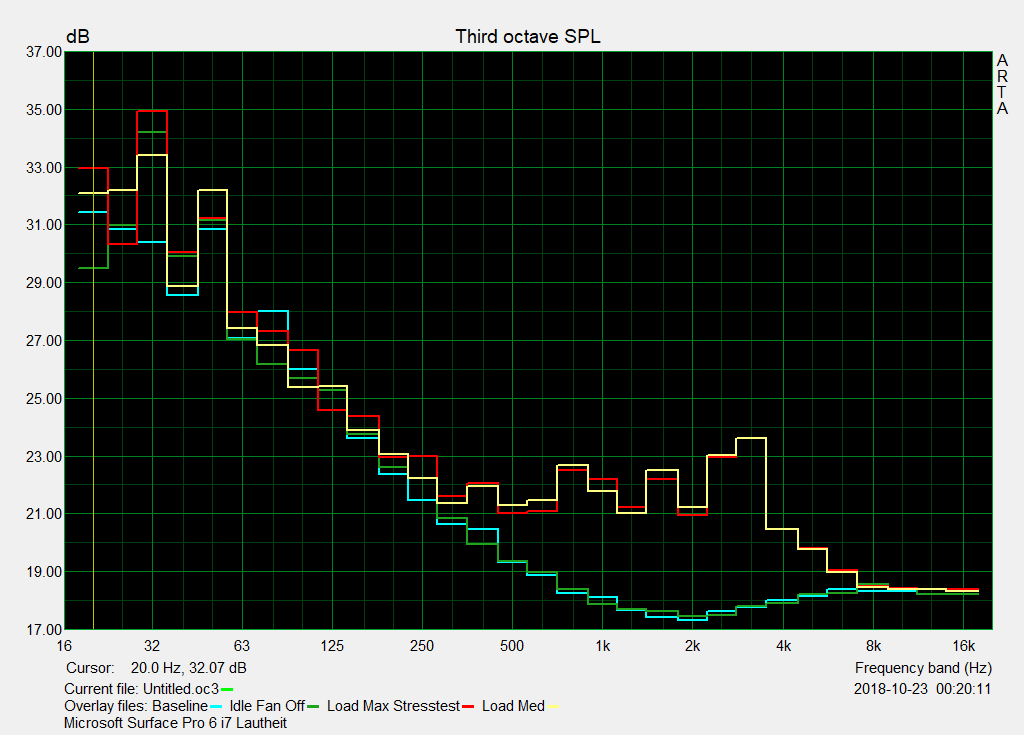
Our test device works silently when idling, with the fan occasionally spinning up to 30.3 dB(A) during light tasks and up to 31.8 dB(A) when operating under moderate load. Short bursts of load like long file transfers causes the fan to reach a maximum 33.5 dB(A), which is also how loud the fan gets during a stress test. The fan does not sound annoying though.
Noise level
| Idle |
| 30.3 / 30.3 / 30.3 dB(A) |
| Load |
| 33.5 / 33.5 dB(A) |
 | ||
30 dB silent 40 dB(A) audible 50 dB(A) loud |
||
min: | ||
Temperature
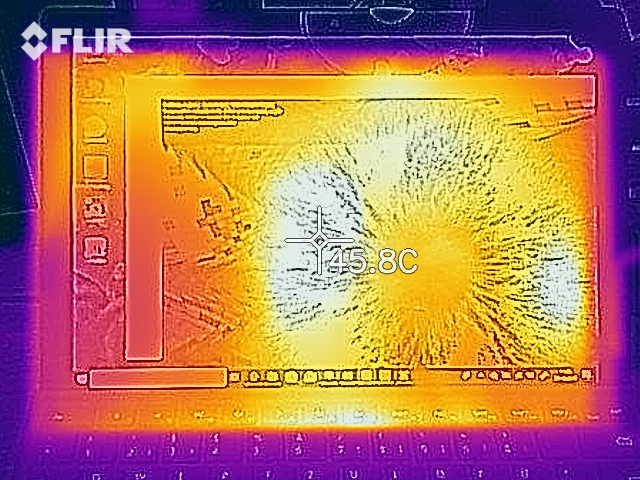
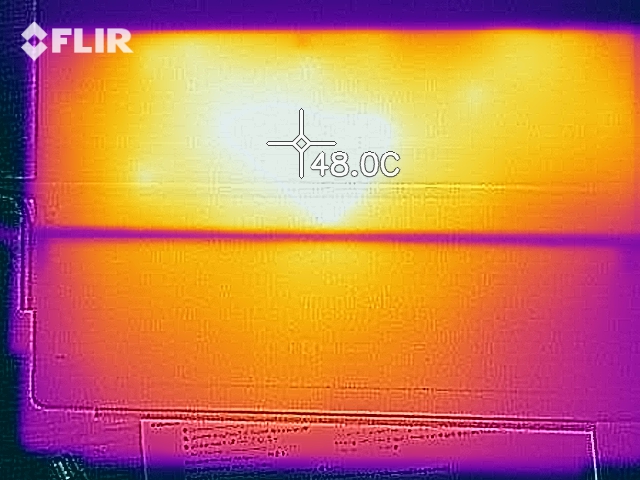
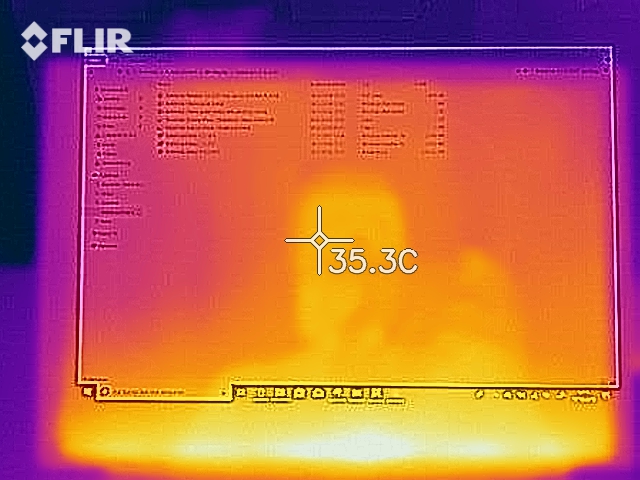
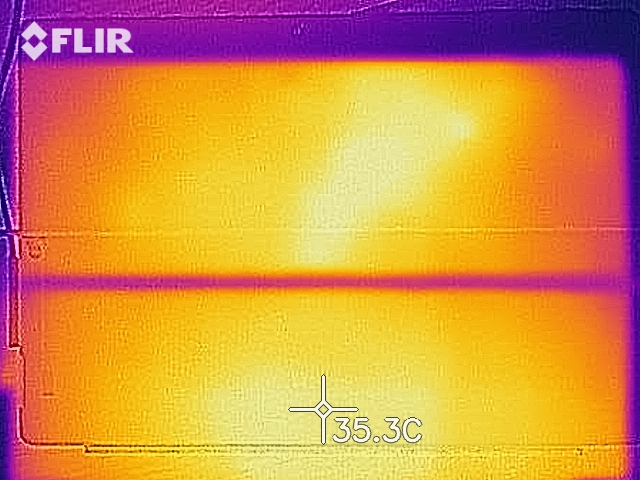
Our test device remains consistently cool at idle. Surface temperatures are evenly distributed too, reaching an average of 29.75 °C (~86 °F) at idle and a maximum of 31.85 °C (~89 °F). Predictably, surface temperatures rise when the device is subjected to sustained load. Three areas on the back of our test device reach above 43 °C (~109 °F) but surface temperatures average 38.95 °C (~102 °F) across the entire device during a stress test. Our thermal imaging camera also shows the back of our test device reaching 48 °C (~118 °F) during a stress test.
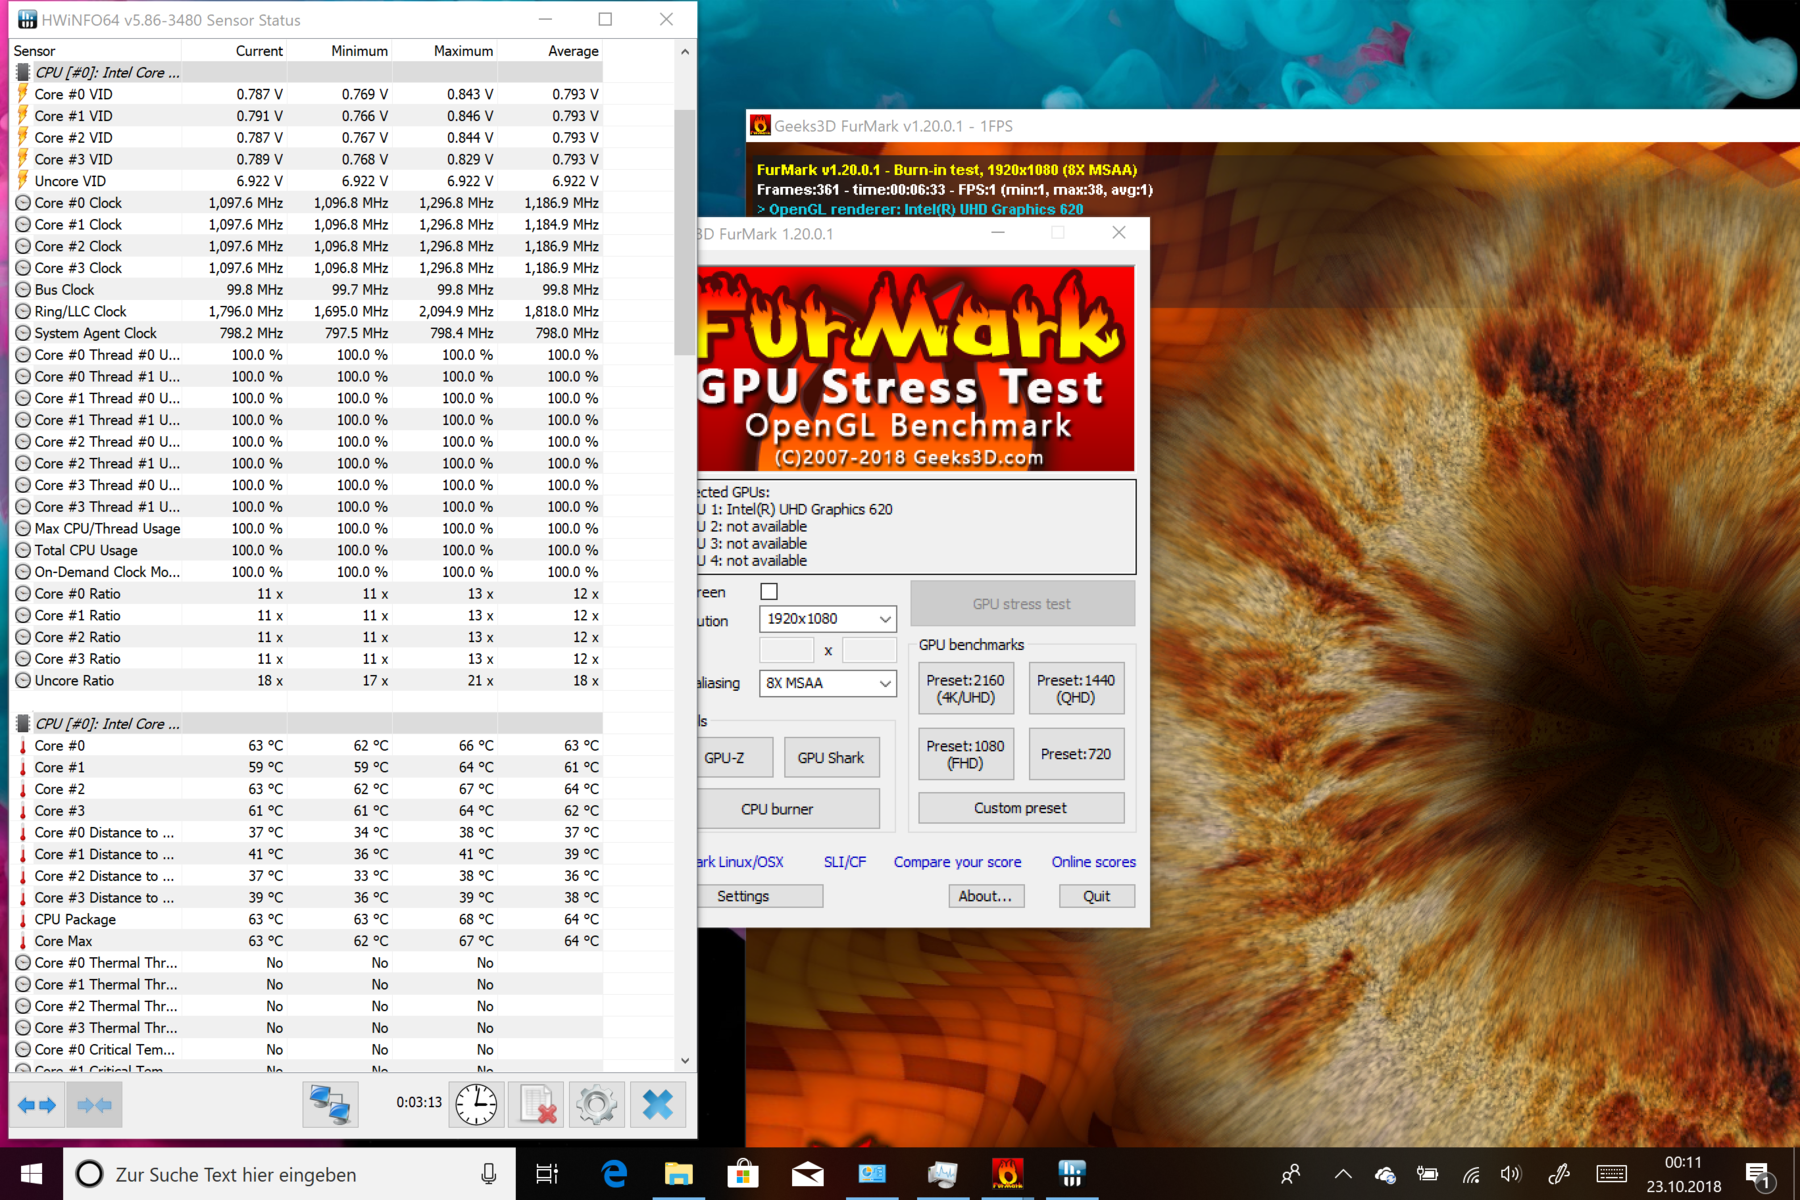
We also subjected our test device to FurMark and Prime95 stress tests, which cause thermal throttling like our Cinebench R15 loop. The CPU clocks down to 1.2 GHz during a combined stress test because it must share its TDP with the GPU and the core temperature stays at between 59 and 61 °C (~138 to ~142 °F).
By contrast, the GPU clocks at between 900 and 950 MHz during a combined stress test, which is much closer to its 1,150 MHz maximum clock speed. Additionally, the TDP started at 16.5 W, but soon dropped to and remained at 13.5 W.
We expected that the Surface Pro 6 would get hot under load because its case is only 8.5 mm thick. Moreover, our stress test is an extreme scenario that is unlikely to occur during daily use. Hence, your Surface Pro 6 should not get this hot unless you push it hard.
(±) The maximum temperature on the upper side is 40.4 °C / 105 F, compared to the average of 35.4 °C / 96 F, ranging from 19.6 to 60 °C for the class Convertible.
(±) The bottom heats up to a maximum of 43.8 °C / 111 F, compared to the average of 36.9 °C / 98 F
(+) In idle usage, the average temperature for the upper side is 30.3 °C / 87 F, compared to the device average of 30.3 °C / 87 F.
(±) The palmrests and touchpad can get very hot to the touch with a maximum of 39 °C / 102.2 F.
(-) The average temperature of the palmrest area of similar devices was 28 °C / 82.4 F (-11 °C / -19.8 F).
Speakers
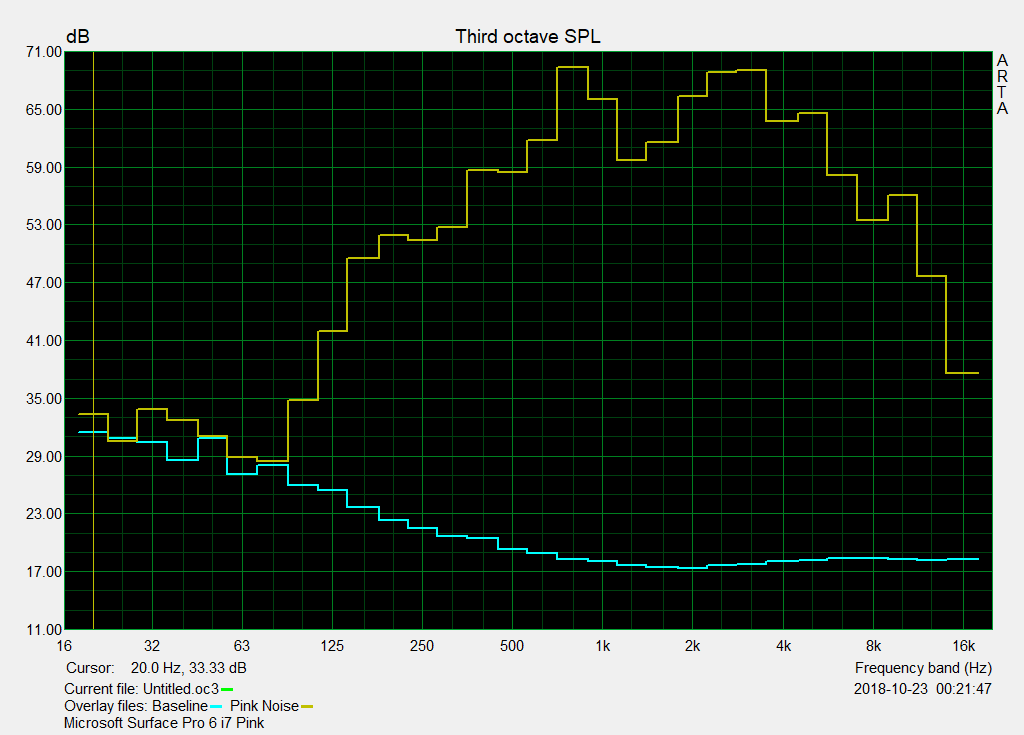
Microsoft has kept the speakers in the same place, which are on the left and right on the front of the device. Music and voices sound loud and clean with the speakers reaching a maximum volume of 77 dB(A). The sound quality is on par with good laptop speakers, particularly in their ability to reproduce mid and high tones. However, they do not sound better than external options like headphones or speakers.
The microphone is excellent at reproducing voices, especially in an office environment. We noticed no background noise or electrical interference during a video call. The microphone picked out our voice equally well when we had it close to us as when we were around two metres (~6.5 ft) away from it. Likewise, we even sounded clear to our call partner when we turned away from our test device. In short, the microphone remains just as good as the one in last year’s device.
Microsoft Surface Pro 6, Core i7, 512 GB audio analysis
(-) | not very loud speakers (69.1 dB)
Bass 100 - 315 Hz
(±) | reduced bass - on average 11.4% lower than median
(±) | linearity of bass is average (10.6% delta to prev. frequency)
Mids 400 - 2000 Hz
(+) | balanced mids - only 4.3% away from median
(±) | linearity of mids is average (10.4% delta to prev. frequency)
Highs 2 - 16 kHz
(±) | higher highs - on average 5.7% higher than median
(±) | linearity of highs is average (8.1% delta to prev. frequency)
Overall 100 - 16.000 Hz
(±) | linearity of overall sound is average (21.4% difference to median)
Compared to same class
» 57% of all tested devices in this class were better, 12% similar, 32% worse
» The best had a delta of 6%, average was 20%, worst was 57%
Compared to all devices tested
» 60% of all tested devices were better, 7% similar, 33% worse
» The best had a delta of 4%, average was 23%, worst was 134%
HP Elite x2 1013 G3-2TT14EA audio analysis
(±) | speaker loudness is average but good (74.4 dB)
Bass 100 - 315 Hz
(-) | nearly no bass - on average 15.1% lower than median
(±) | linearity of bass is average (10.9% delta to prev. frequency)
Mids 400 - 2000 Hz
(±) | higher mids - on average 7.9% higher than median
(±) | linearity of mids is average (11.3% delta to prev. frequency)
Highs 2 - 16 kHz
(±) | higher highs - on average 5.2% higher than median
(+) | highs are linear (6.8% delta to prev. frequency)
Overall 100 - 16.000 Hz
(±) | linearity of overall sound is average (20.8% difference to median)
Compared to same class
» 55% of all tested devices in this class were better, 10% similar, 35% worse
» The best had a delta of 6%, average was 20%, worst was 57%
Compared to all devices tested
» 56% of all tested devices were better, 8% similar, 36% worse
» The best had a delta of 4%, average was 23%, worst was 134%
Power Management
Power Consumption
The Core i7-8650U consumes less power overall than its predecessor, the Core i7-7660U, but their differences are more nuanced than at first glance. The older CPU uses more power at idle than its newer counterpart and 28% more power on average when operating under sustained load. However, the Core i7-8650U consumes a maximum of 6.8 W more under load, which is probably because of the extra cores and less throttling.
Overall, the Core i5-8250U is a more efficient processor than the Core i7-8650U, but only marginally so. The i5 consumes less under load, but 34% more when idling.
The Surface Pro 6 comes with a 44-W charger, which is large enough to charge the device even when it is working under load.
| Off / Standby | |
| Idle | |
| Load |
|
Key:
min: | |
| Microsoft Surface Pro 6, Core i7, 512 GB i7-8650U, UHD Graphics 620, Toshiba KBG30ZPZ512G, IPS, 2736x1824, 12.3" | Microsoft Surface Pro (2017) i7 i7-7660U, Iris Plus Graphics 640, Samsung PM971 KUS040202M, IPS, 2736x1824, 12.3" | Microsoft Surface Pro 6, Core i5, 128 GB i5-8250U, UHD Graphics 620, Toshiba KBG30ZPZ128G, IPS, 2736x1834, 12.3" | Microsoft Surface Pro (2017) i5 i5-7300U, HD Graphics 620, Samsung PM971 KUS030202M, IPS, 2736x1824, 12.3" | Dell Latitude 5290 2-in-1 i5-8350U, UHD Graphics 620, Toshiba XG5 KXG50ZNV256G, IPS, 1920x1280, 12.3" | HP Elite x2 1013 G3-2TT14EA i5-8350U, UHD Graphics 620, Samsung PM961 MZVLW256HEHP, IPS, 3000x2000, 13" | Samsung Galaxy Book 12 SM-W728 i5-7200U, HD Graphics 620, Samsung SSD PM871a MZNLN256HMHQ, Super AMOLED, 2160x1440, 12" | Microsoft Surface Book 2 i7-8650U, GeForce GTX 1050 Mobile, Samsung PM961 MZVLW256HEHP, IPS, 3000x2000, 13.5" | Microsoft Surface Go MHN-00003 Pentium 4415Y, UHD Graphics 615, 64 GB eMMC Flash, IPS, 1800x1200, 10" | Huawei Matebook E i5-7Y54, HD Graphics 615, SanDisk SD8SN8U256G1027, IPS, 2160x1440, 12" | Lenovo Miix 520-12IKB 20M3000LGE i5-8550U, UHD Graphics 620, Samsung SSD PM961 1TB M.2 PCIe 3.0 x4 NVMe (MZVLW1T0), IPS, 1920x1200, 12.2" | Average Intel UHD Graphics 620 | Average of class Convertible | |
|---|---|---|---|---|---|---|---|---|---|---|---|---|---|
| Power Consumption | -19% | 1% | 13% | 1% | -12% | 0% | -82% | 33% | 14% | 5% | -4% | -21% | |
| Idle Minimum * (Watt) | 3.2 | 4.2 -31% | 4.3 -34% | 3.6 -13% | 3 6% | 4.9 -53% | 3.9 -22% | 4.7 -47% | 2.88 10% | 3.9 -22% | 3.9 -22% | 3.81 ? -19% | 4.2 ? -31% |
| Idle Average * (Watt) | 8.7 | 10.1 -16% | 8.7 -0% | 8.1 7% | 7.2 17% | 8.9 -2% | 9 -3% | 10.6 -22% | 4.8 45% | 8.8 -1% | 8.2 6% | 6.94 ? 20% | 6.89 ? 21% |
| Idle Maximum * (Watt) | 10.4 | 14 -35% | 9.4 10% | 8.7 16% | 10 4% | 11 -6% | 11.9 -14% | 12.3 -18% | 7.5 28% | 8.9 14% | 8.4 19% | 8.75 ? 16% | 8.63 ? 17% |
| Load Average * (Watt) | 29.2 | 37.4 -28% | 24.5 16% | 25.5 13% | 37.1 -27% | 32 -10% | 27.3 7% | 81 -177% | 16.9 42% | 20 32% | 25.2 14% | 35 ? -20% | 44.1 ? -51% |
| Load Maximum * (Watt) | 40.8 | 34 17% | 36 12% | 23.5 42% | 38.2 6% | 36 12% | 27.9 32% | 100.3 -146% | 23.8 42% | 21.8 47% | 37 9% | 47.5 ? -16% | 66.5 ? -63% |
| Witcher 3 ultra * (Watt) | 38.1 | 97 |
* ... smaller is better
Battery Life
The Surface Pro 6 has a 45 Wh battery, which is the same capacity as the one in last year’s device. Our test device lasts eight hours and twenty-nine minutes in our Wi-Fi battery life test, which is twenty minutes longer than its Core i7 powered predecessor. Meanwhile, the Core i5 powered Surface Pro 6 lasts thirty-six minutes longer than our test device.
However, the Core i7 powered Surface Pro 6 lasted thirteen minutes longer than the Core i5 version when running under sustained load. Last year’s Core i7 model also ran out of power a few minutes before our test device.
Overall, the Surface Pro 6 has slightly better battery life than its equivalent predecessor and will last a full working day if it is not pushed hard. However, the new Core i7 cannot compete with last year’s Core i5 and Core M models. The Core i5 version lasted for twelve hours and twenty-four minutes in our Wi-Fi battery life test, while the Core M version lasted around an hour less. Both runtimes are around 40% longer than our test device achieves, which will make a difference in daily use.
With that said, our test device has better battery life than many of our comparison devices. The Surface Go, for example, lasted an hour less in our Wi-Fi battery life test than our test device. In short, few equivalently powered Windows tablets can match the Surface Pro 6’s battery life.
| Microsoft Surface Pro 6, Core i7, 512 GB i7-8650U, UHD Graphics 620, 45 Wh | Microsoft Surface Pro (2017) i7 i7-7660U, Iris Plus Graphics 640, 45 Wh | Microsoft Surface Pro 6, Core i5, 128 GB i5-8250U, UHD Graphics 620, 45 Wh | Microsoft Surface Pro (2017) i5 i5-7300U, HD Graphics 620, 45 Wh | Dell Latitude 5290 2-in-1 i5-8350U, UHD Graphics 620, 42 Wh | HP Elite x2 1013 G3-2TT14EA i5-8350U, UHD Graphics 620, 50 Wh | Samsung Galaxy Book 12 SM-W728 i5-7200U, HD Graphics 620, 39 Wh | Microsoft Surface Book 2 i7-8650U, GeForce GTX 1050 Mobile, 75 Wh | Microsoft Surface Go MHN-00003 Pentium 4415Y, UHD Graphics 615, 28 Wh | Huawei Matebook E i5-7Y54, HD Graphics 615, 33.7 Wh | Lenovo Miix 520-12IKB 20M3000LGE i5-8550U, UHD Graphics 620, 38 Wh | Average of class Convertible | |
|---|---|---|---|---|---|---|---|---|---|---|---|---|
| Battery runtime | -9% | -1% | 23% | -39% | -11% | -5% | 37% | -2% | -20% | -34% | 22% | |
| Reader / Idle (h) | 18.1 | 17.8 -2% | 17.6 -3% | 13 -28% | 17.2 -5% | 24.5 35% | 12.9 -29% | 26.7 ? 48% | ||||
| WiFi v1.3 (h) | 8.5 | 8.2 -4% | 9.1 7% | 12.4 46% | 5 -41% | 7.7 -9% | 11.1 31% | 7.5 -12% | 6.8 -20% | 5.6 -34% | 12 ? 41% | |
| Load (h) | 2.2 | 1.9 -14% | 2 -9% | 2.8 27% | 1.4 -36% | 2.3 5% | 3.2 45% | 3 36% | 1.713 ? -22% | |||
| H.264 (h) | 10.2 | 6.5 | 6.8 | 15.6 | 6.4 | 15 ? | ||||||
| Witcher 3 ultra (h) | 1.9 | 3.8 |
Verdict
Pros
Cons
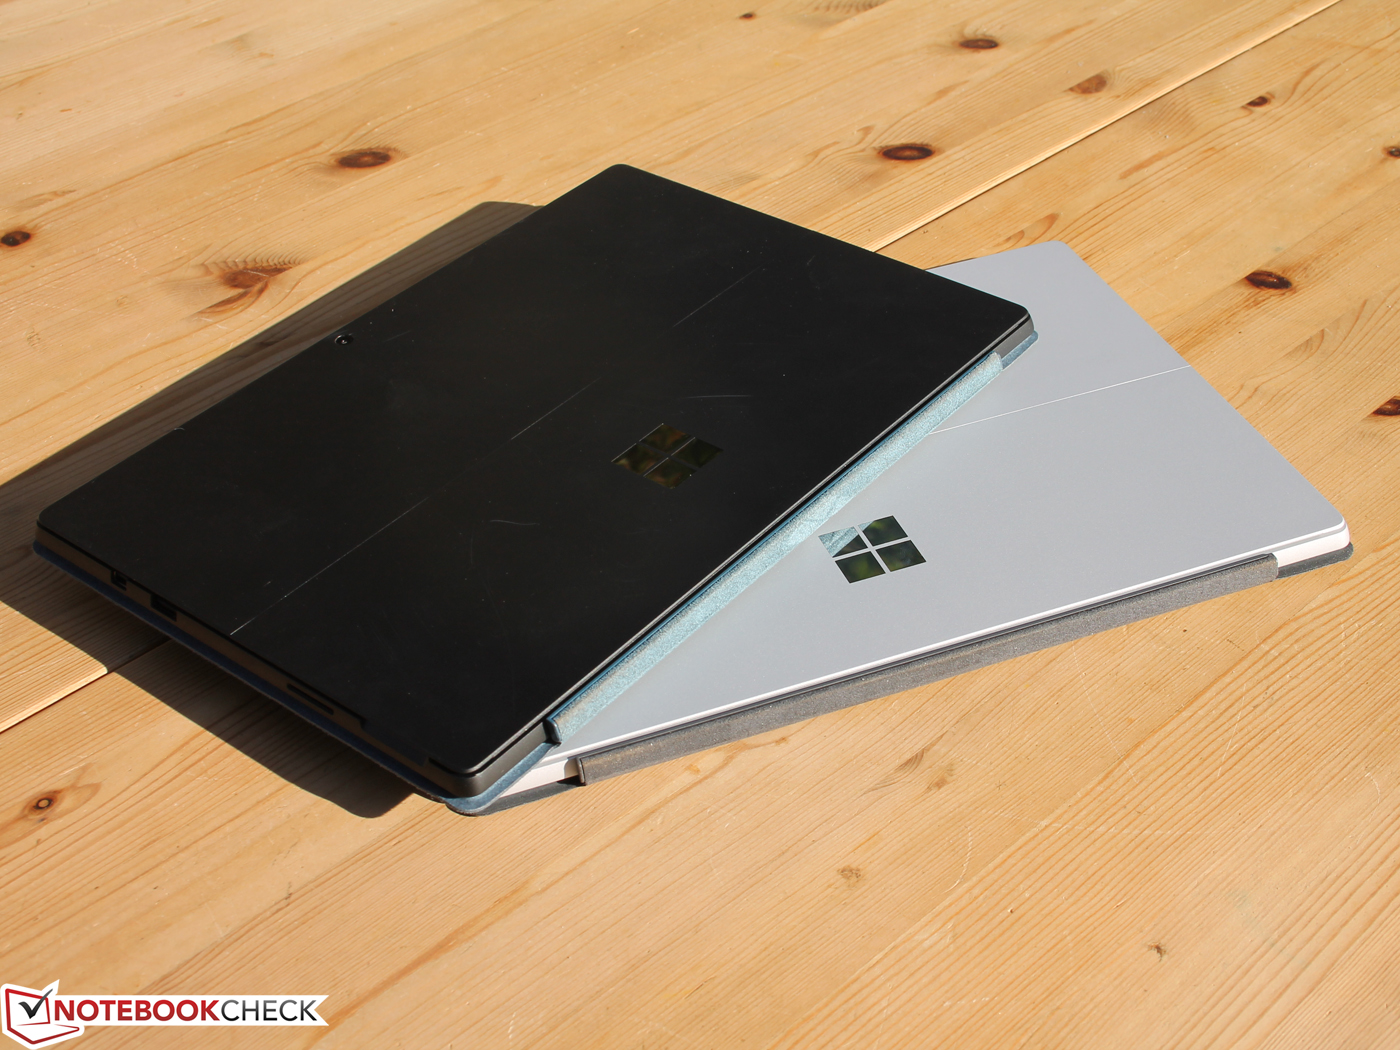
New tricks in an old design? The Surface Pro 6 looks the same as its predecessors save for its new black colour option. The device is a slim, high-quality and robust tablet case that is easy to hold and weighs a comparatively svelte 786 g (~1.7 lb).
Unfortunately, Microsoft has remained intransigent over ports. The Surface Pro 6 has the same sparse offering of a Mini DisplayPort, one USB Type-A port, a microSD card reader and a headphone jack. The device lacks a USB Type-C port, which is outdated. However, its omission is made more frustrating by the fact that the competition has had USB Type-C or Thunderbolt 3 ports for at least two years. It baffles us that Microsoft refuses to adopt this new standard across its product line.
The Core i7 model outscores much larger laptops, despite its diminutive form factor. Notably, the Surface Pro 6 finished higher than the more expensive Surface Book 2 in our Cinebench R15 loop; the Surface Book 2 is near the top of our comparison table too. Moreover, our test device throttles significantly less than its Core i5 powered sibling, primarily because the latter is fanless.
Battery life is less impressive though, with our test device broadly achieving the same runtimes as its predecessor. You should still get a full working’s day use from the Core i7 Surface Pro 6, and there are no other slim Windows tablets that last for eight to nine hours in our Wi-Fi battery life test.
The Surface Pro 6 finally delivers on Microsoft’s promise of creating a tablet with laptop performance. The design remains identical though, and Microsoft’s continued refusal to adopt USB Type-C remains frustrating.
Microsoft is selling the same Type Covers and Pens as last year, while older accessories will still work with the Surface Pro 6. However, we welcome the apparently upgraded cameras. The display is still bright enough to use the device outside and has near full sRGB coverage too.
Our test device’s configuration currently costs $1,899 (£1,799) on the Microsoft website without a Type Cover, which is incredibly expensive for a tablet. However, the price is not as out when compared to how much our top 10 convertibles cost. The Samsung Galaxy Book 12 is considerably cheaper than the Surface Pro 6 and scores 88% overall, but it is powered by the older and weaker Intel Core i5-7200U processor.
We will also shortly be testing another contender, the Lenovo ThinkPad X1 Tablet Gen.3. The device is as expensive as the Surface Pro 6, but comes with a stylus, two Thunderbolt 3 ports, a higher resolution display and an LTE modem. The tablet has a larger 13-inch 3:2 display too, but it is around 180 g (6.34 oz) heavier than the Surface. The ThinkPad X1 is better value for money on paper, but whether this holds true is a matter for our review, which will be ready in a few days.
Microsoft Surface Pro 6, Core i7, 512 GB
- 02/17/2020 v7 (old)
Sebastian Jentsch
Price comparison

