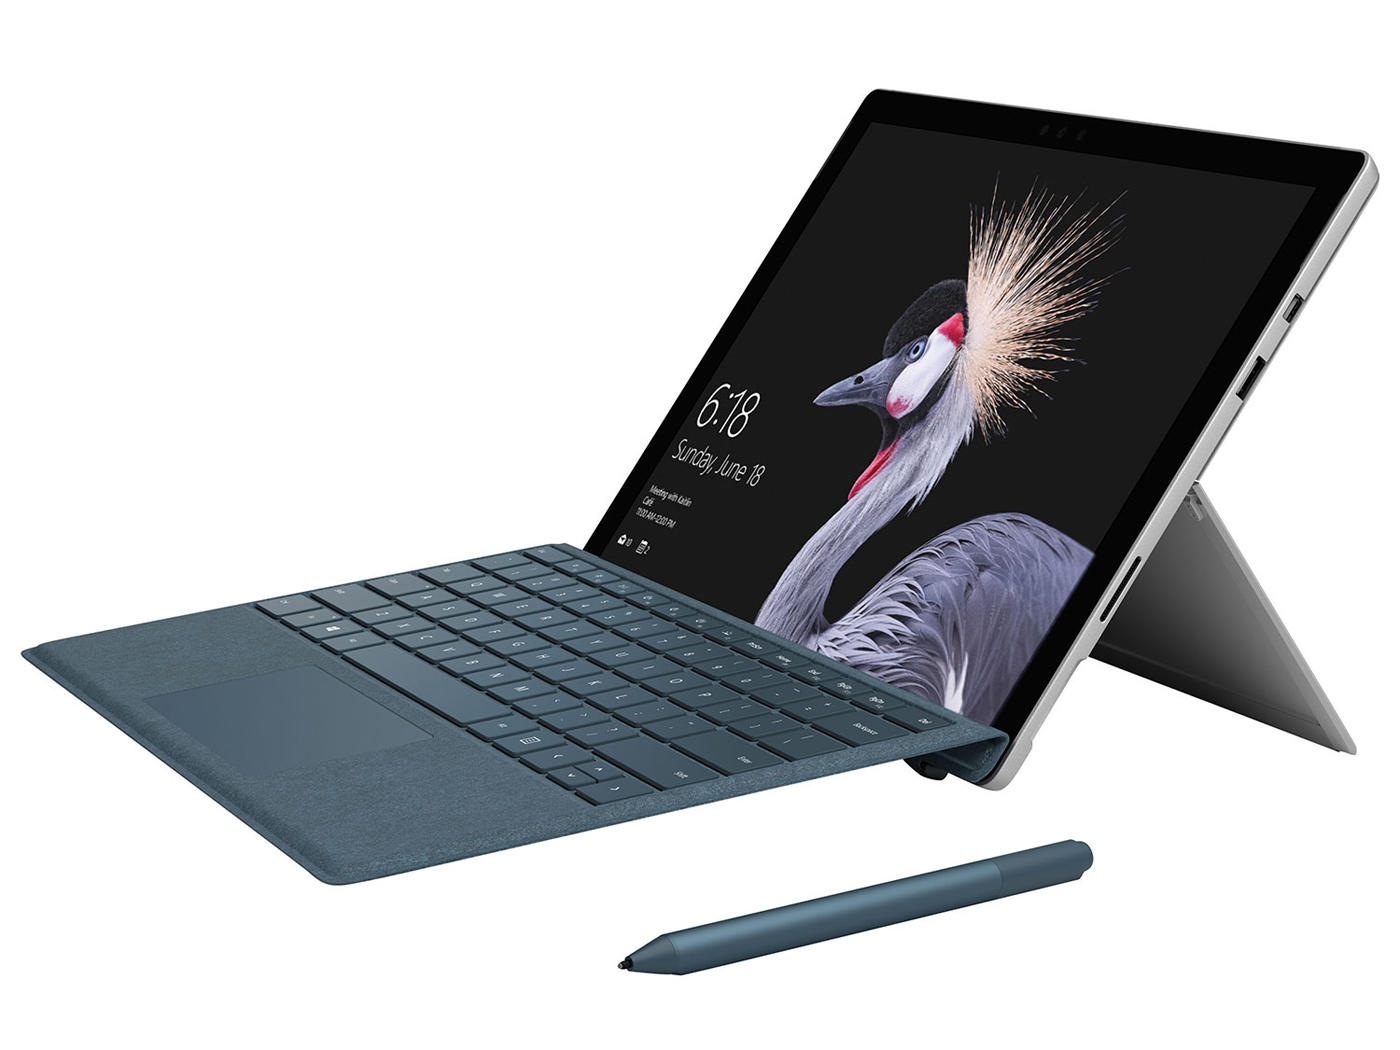
Microsoft Surface Pro (2017) (i7, 512 GB, 16 GB) Convertible Review
")
For the original German review, click here.
After testing the i5 version of the Surface Pro 2017 (i5-7300U), we have now taken a closer look at the i7 version, which is equipped with a cooling fan. One striking result from the first model's review: The device had no constant performance level; it dropped to -33% after only a few minutes of gradual decline.
We want to make it clear from the start that the i7 model is not very different, although its performance drops by only -17% thanks to the cooling fan. Performance-enthusiasts might be disappointed to read that the device's performance is not the native performance of a Core i7-7660U, but rather that of a Core i7-7500U in a subnotebook without throttling. You can read more about this issue in our chapter on performance or in our colleague Douglas Black's article. He talks about the reasons for, examples of and especially his own opinion on throttling, which is a phenomenon that is all too often ignored.
In this review, we will also take a look at the Surface Pro i7's gaming capabilities (it has an Intel Iris Plus 640 graphics card), as well as battery runtime and heat development. We could not resist running our gaming stress test The Witcher 3 in low settings.
For information about case, connectivity, cameras, display details and speakers, please see our review of the Surface Pro i5 (2017). Furthermore, also see our Core m3 review of the entry level model.
Display
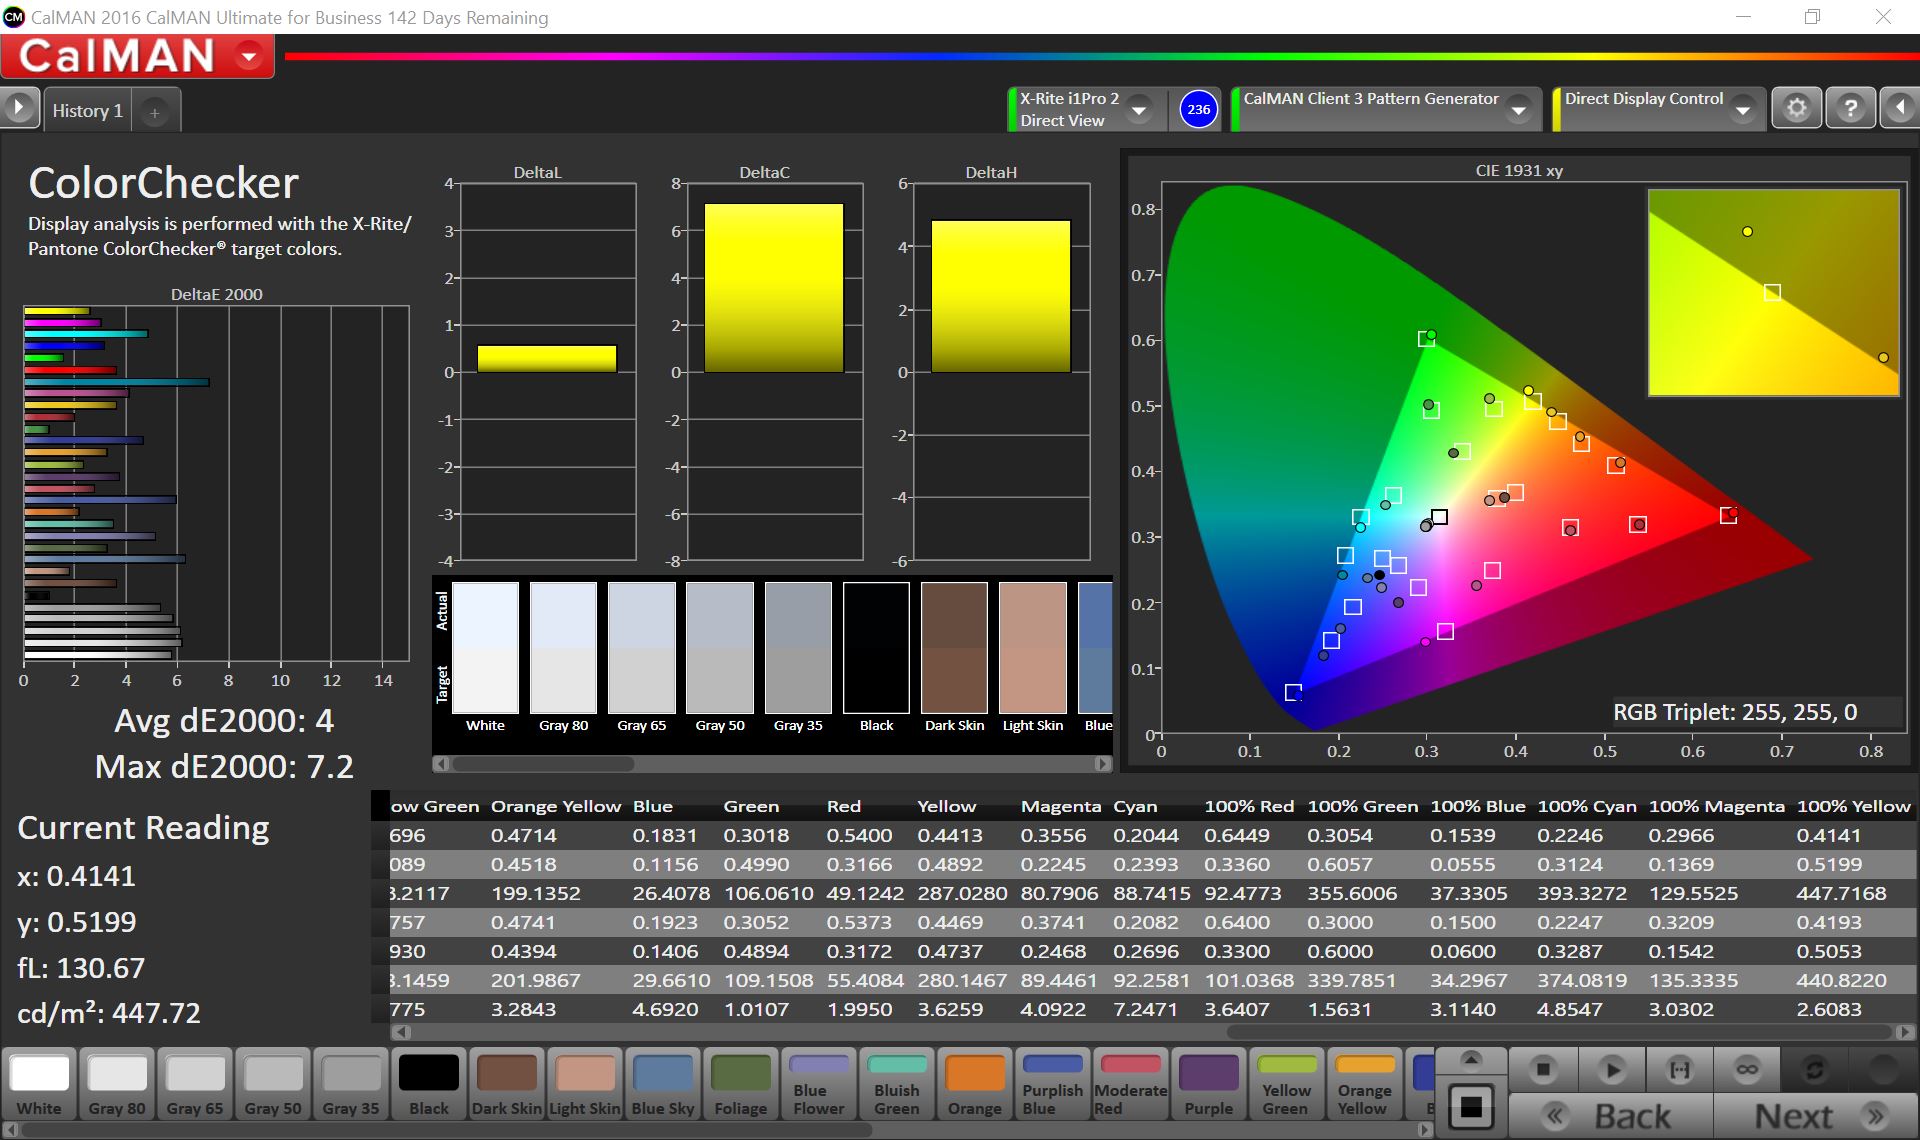
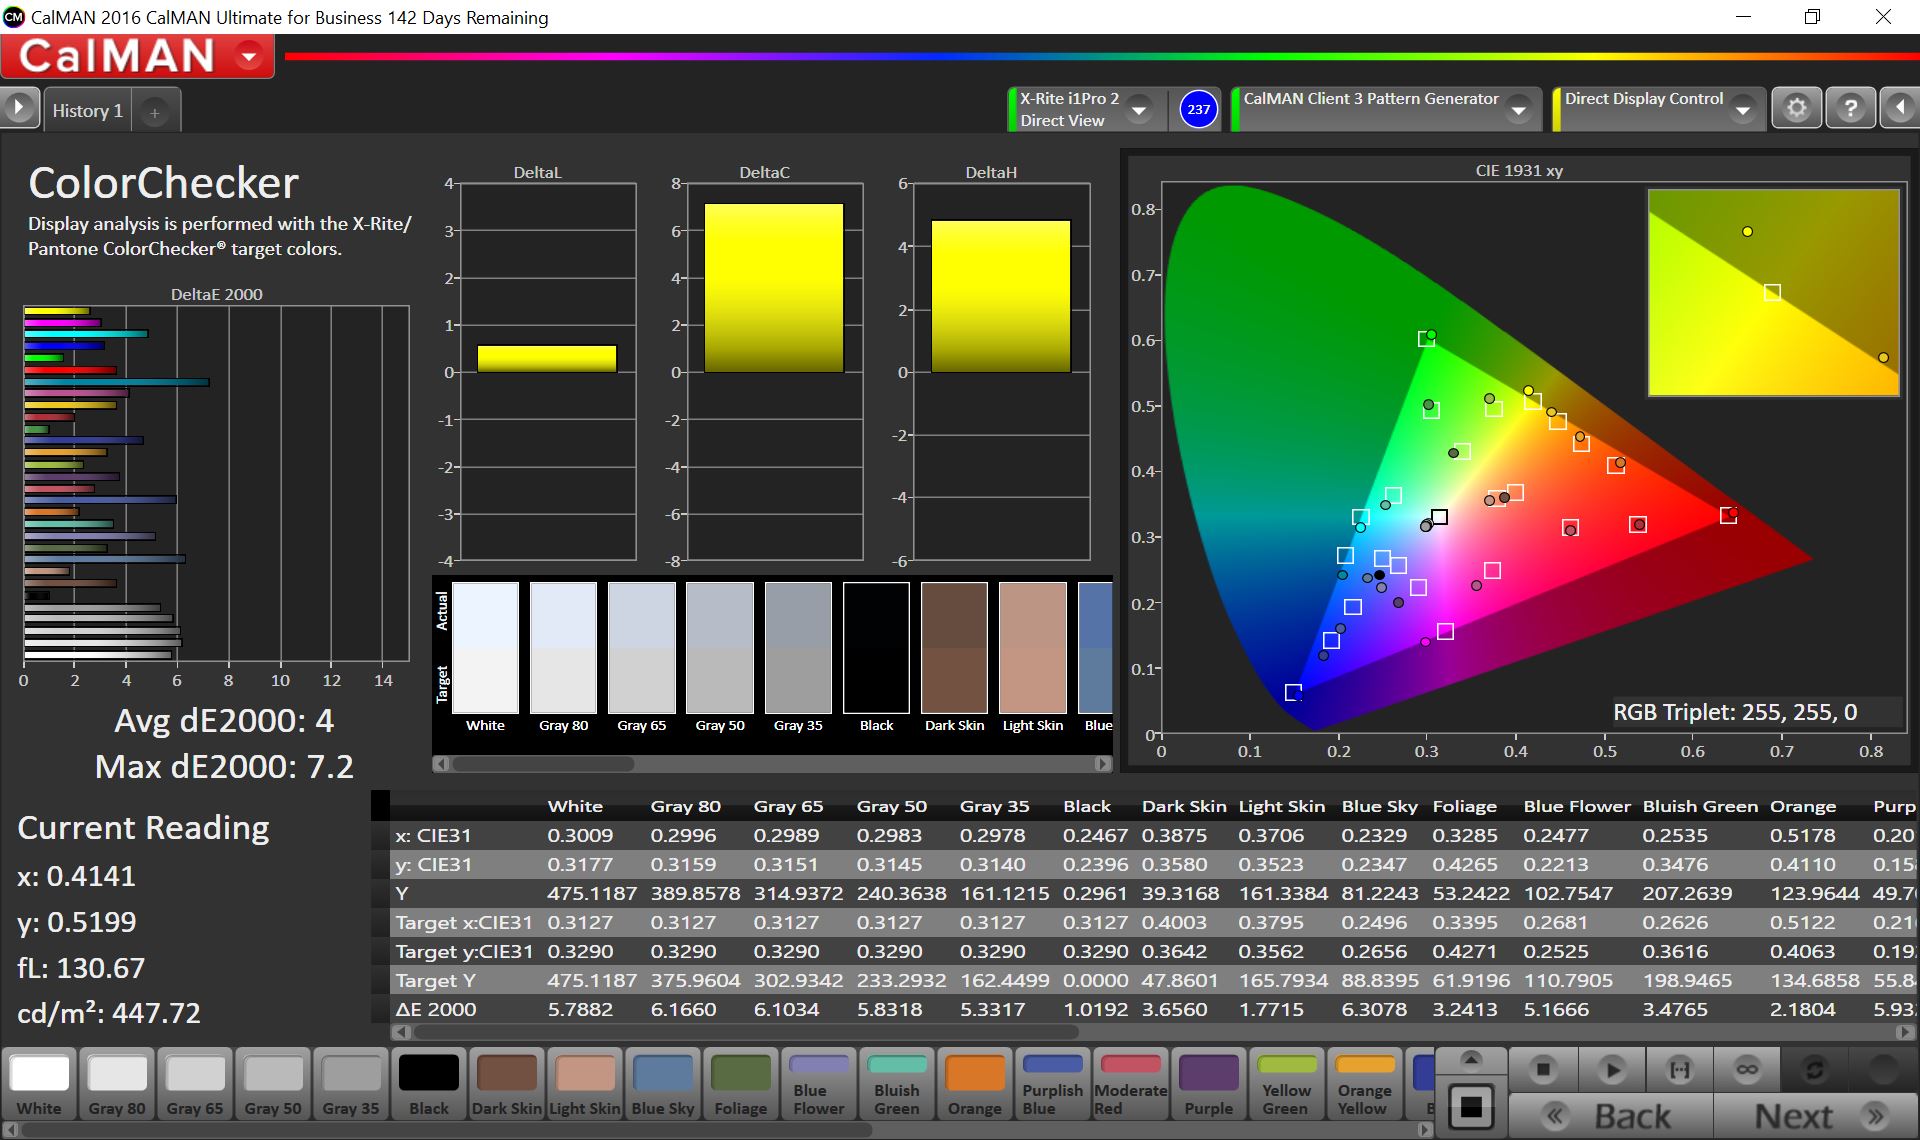
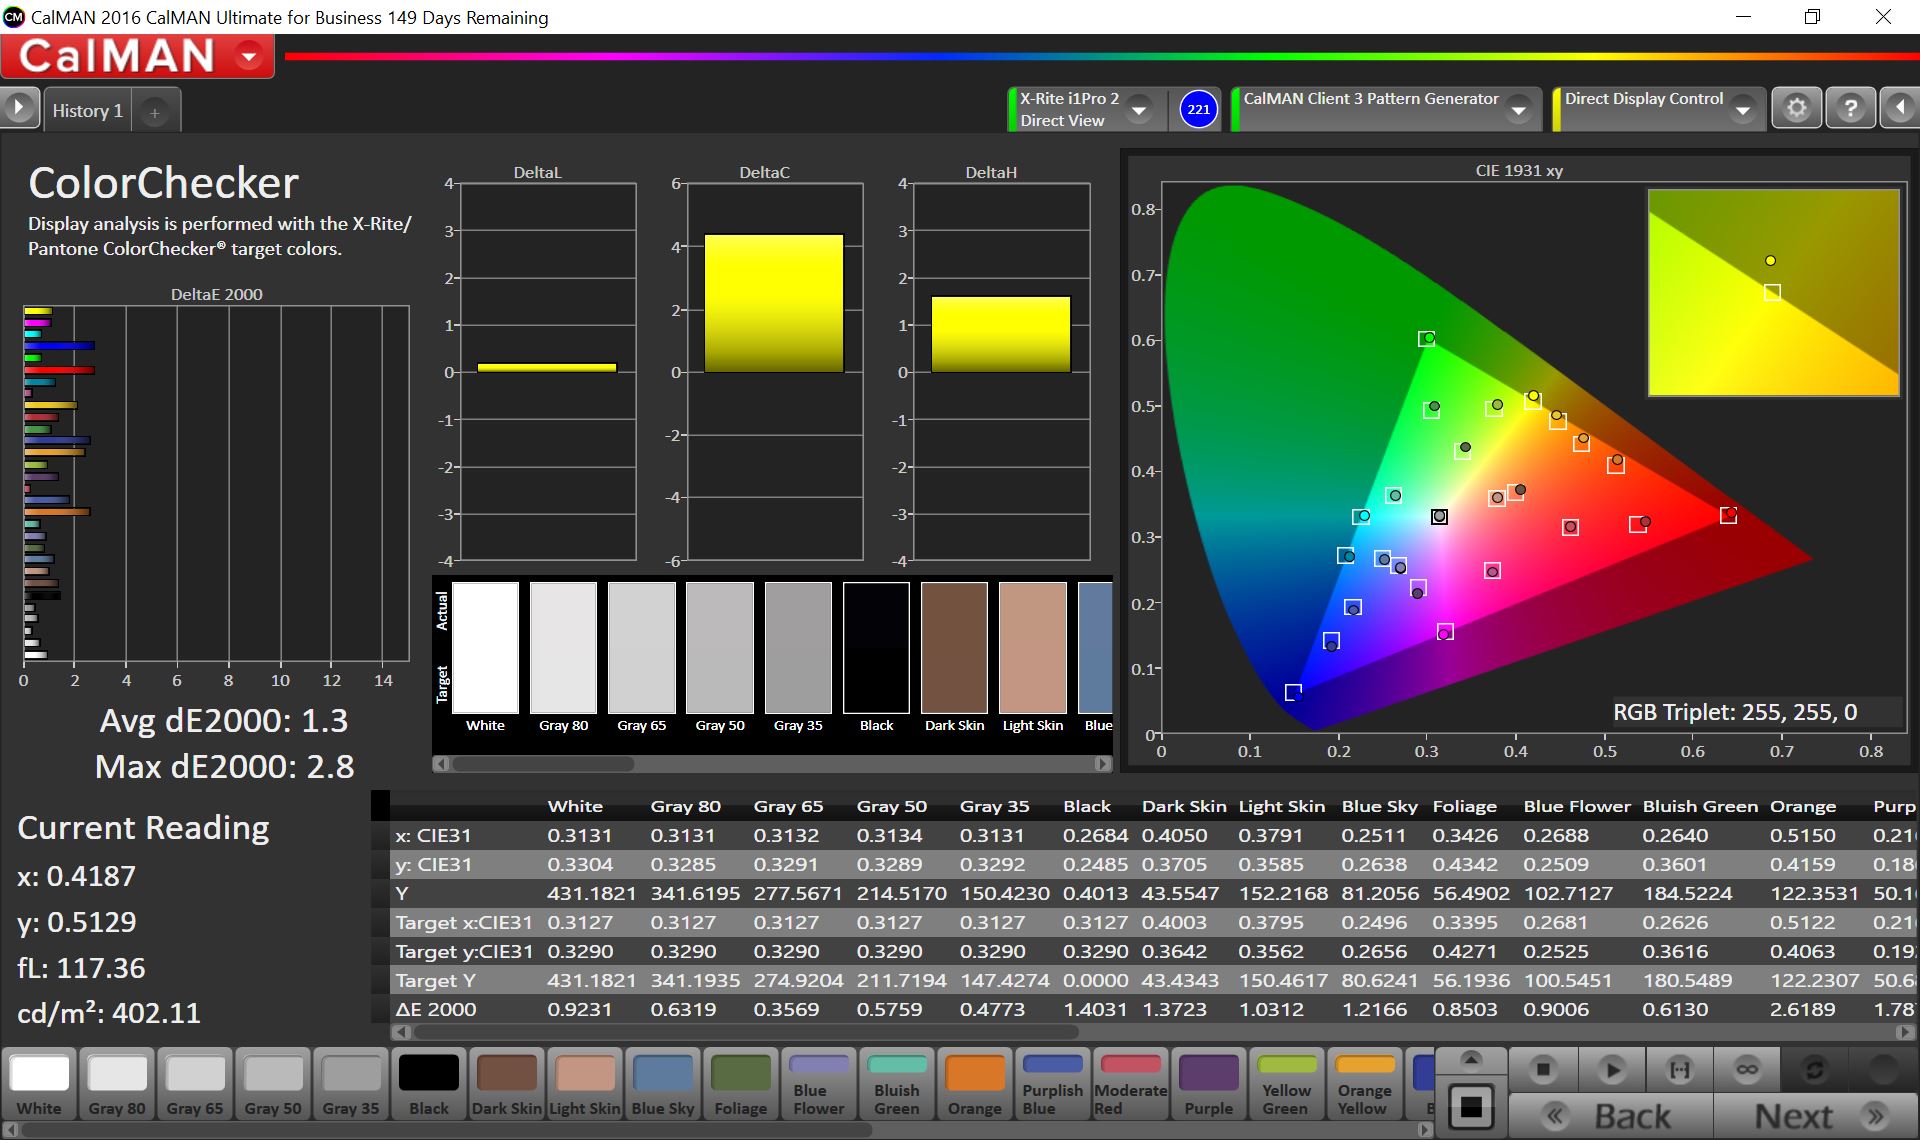
Some of our measurements of the display diverge significantly from those of the i5 model, although various tools have confirmed that they are equipped with identical panels (LG Display LP123WQ112604). We assume that the differences are production-related fluctuations, but we would like to find out more. We will post an update when we know more.

| |||||||||||||||||||||||||
Brightness Distribution: 92 %
Center on Battery: 482 cd/m²
Contrast: 1220:1 (Black: 0.395 cd/m²)
ΔE ColorChecker Calman: 4 | ∀{0.5-29.43 Ø4.72}
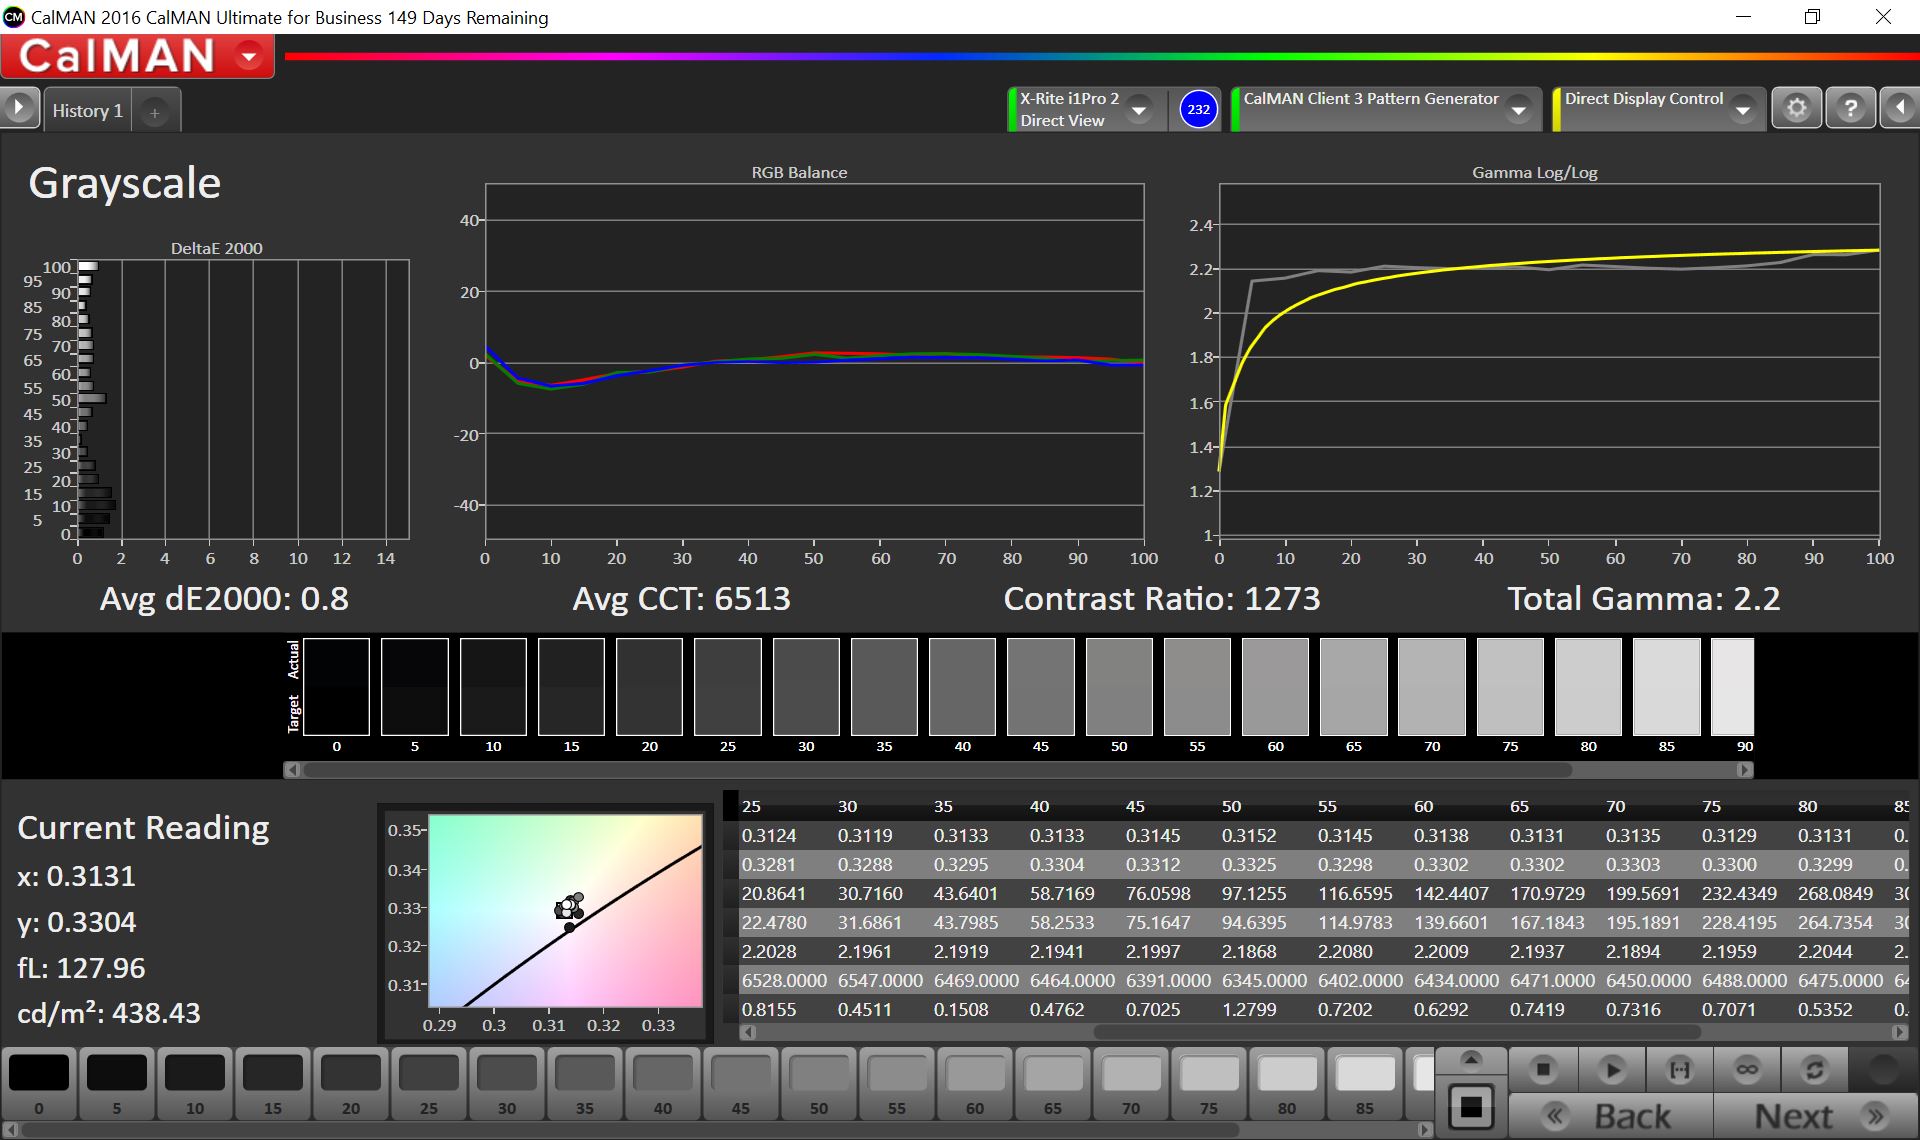
ΔE Greyscale Calman: 5.7 | ∀{0.09-98 Ø4.97}
98.7% sRGB (Calman 2D)
96% sRGB (Argyll 1.6.3 3D)
62% AdobeRGB 1998 (Argyll 1.6.3 3D)
67.8% AdobeRGB 1998 (Argyll 3D)
96.5% sRGB (Argyll 3D)
66.6% Display P3 (Argyll 3D)
Gamma: 2.28
CCT: 7950 K
| Microsoft Surface Pro (2017) i7 LG Display LP123WQ112604, , 2736x1824, 12.3" | Microsoft Surface Pro (2017) i5 LG Display LP123WQ112604, , 2736x1824, 12.3" | Lenovo Ideapad Miix 720-12IKB AUO B120YAN01 / AUO106F, , 2880x1920, 12" | Asus Transformer 3 Pro T303UA-GN050T BOE BOE06AC (NV126A1M-N51), , 2880x1920, 12.6" | Dell Latitude 12 5285 2-in-1 BOE06DC, , 1920x1280, 12.3" | Acer Switch 5 SW512-52-5819 WST KL.1200w.004, , 2160x1440, 12" | Toshiba Portege X30-D (PT274U-01N001) Toshiba TOS508F, , 1920x1080, 13.3" | |
|---|---|---|---|---|---|---|---|
| Display | 2% | -4% | 15% | -5% | -11% | -2% | |
| Display P3 Coverage (%) | 66.6 | 67.6 2% | 65.2 -2% | 81.8 23% | 62.8 -6% | 58.8 -12% | 66.4 0% |
| sRGB Coverage (%) | 96.5 | 99 3% | 91 -6% | 98.3 2% | 94 -3% | 87.5 -9% | 93.5 -3% |
| AdobeRGB 1998 Coverage (%) | 67.8 | 69.1 2% | 66.1 -3% | 82.2 21% | 64.7 -5% | 60.6 -11% | 66.6 -2% |
| Response Times | -15% | -9% | 2% | -19% | -2% | -9% | |
| Response Time Grey 50% / Grey 80% * (ms) | 37 ? | 42 ? -14% | 45 ? -22% | 30 ? 19% | 42.4 ? -15% | 37 ? -0% | 36.8 ? 1% |
| Response Time Black / White * (ms) | 25 ? | 29 ? -16% | 24 ? 4% | 29 ? -16% | 30.8 ? -23% | 26 ? -4% | 29.6 ? -18% |
| PWM Frequency (Hz) | 22130 ? | 21000 | 200 ? | 210.1 ? | |||
| Screen | 10% | -10% | -4% | 0% | -23% | 5% | |
| Brightness middle (cd/m²) | 482 | 417 -13% | 406 -16% | 316 -34% | 523.2 9% | 369 -23% | 332.6 -31% |
| Brightness (cd/m²) | 466 | 401 -14% | 396 -15% | 307 -34% | 522 12% | 331 -29% | 323 -31% |
| Brightness Distribution (%) | 92 | 88 -4% | 88 -4% | 91 -1% | 88 -4% | 75 -18% | 86 -7% |
| Black Level * (cd/m²) | 0.395 | 0.29 27% | 0.3 24% | 0.29 27% | 0.42 -6% | 0.46 -16% | 0.28 29% |
| Contrast (:1) | 1220 | 1438 18% | 1353 11% | 1090 -11% | 1246 2% | 802 -34% | 1188 -3% |
| Colorchecker dE 2000 * | 4 | 3.63 9% | 5.28 -32% | 3.91 2% | 4 -0% | 5.52 -38% | 2.6 35% |
| Colorchecker dE 2000 max. * | 7.2 | 6.74 6% | 9.83 -37% | 7.9 -10% | 8.6 -19% | 9.29 -29% | 6.7 7% |
| Greyscale dE 2000 * | 5.7 | 2.18 62% | 6.71 -18% | 5.37 6% | 5.5 4% | 6.95 -22% | 2.5 56% |
| Gamma | 2.28 96% | 3.09 71% | 2.29 96% | 2.36 93% | 2.16 102% | 2.58 85% | 2.12 104% |
| CCT | 7950 82% | 6767 96% | 6532 100% | 7812 83% | 7546 86% | 7009 93% | 6720 97% |
| Color Space (Percent of AdobeRGB 1998) (%) | 62 | 63 2% | 59 -5% | 72 16% | 64.86 5% | 56 -10% | 62 0% |
| Color Space (Percent of sRGB) (%) | 96 | 99 3% | 91 -5% | 98 2% | 93.97 -2% | 88 -8% | 94 -2% |
| Total Average (Program / Settings) | -1% /
5% | -8% /
-8% | 4% /
1% | -8% /
-3% | -12% /
-18% | -2% /
2% |
* ... smaller is better
Display Response Times
| ↔ Response Time Black to White | ||
|---|---|---|
| 25 ms ... rise ↗ and fall ↘ combined | ↗ 13 ms rise | 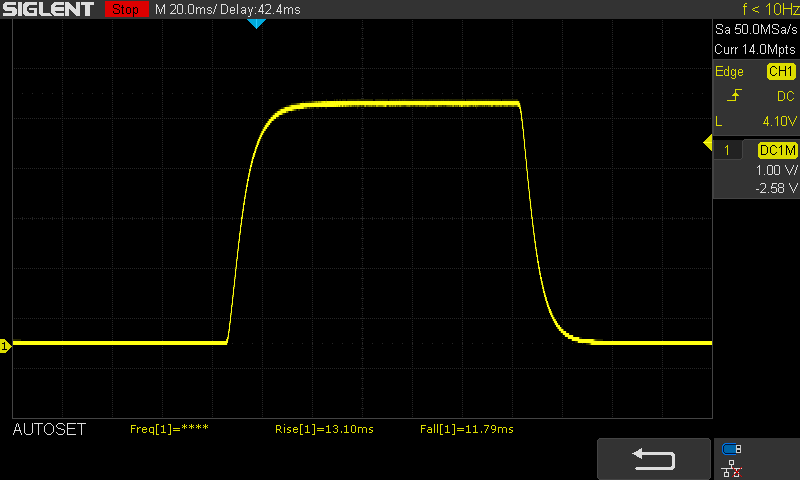 |
| ↘ 12 ms fall | ||
| The screen shows relatively slow response rates in our tests and may be too slow for gamers. In comparison, all tested devices range from 0.1 (minimum) to 240 (maximum) ms. » 59 % of all devices are better. This means that the measured response time is worse than the average of all tested devices (19.8 ms). | ||
| ↔ Response Time 50% Grey to 80% Grey | ||
| 37 ms ... rise ↗ and fall ↘ combined | ↗ 16 ms rise | 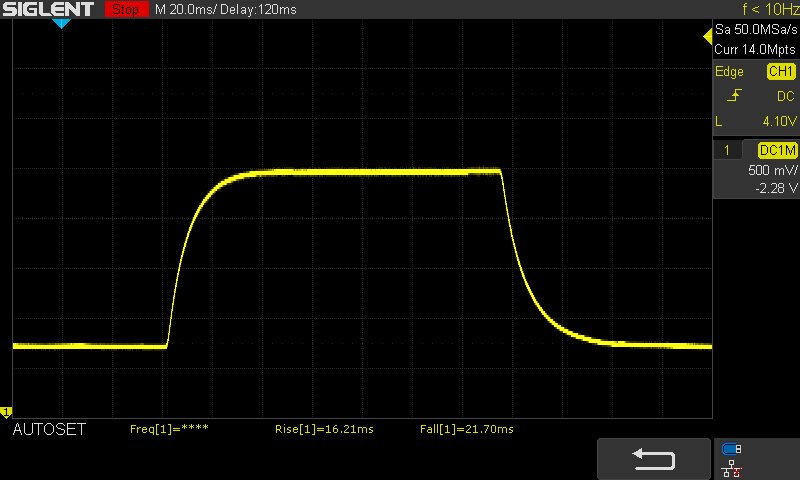 |
| ↘ 21 ms fall | ||
| The screen shows slow response rates in our tests and will be unsatisfactory for gamers. In comparison, all tested devices range from 0.165 (minimum) to 636 (maximum) ms. » 53 % of all devices are better. This means that the measured response time is worse than the average of all tested devices (31 ms). | ||
Screen Flickering / PWM (Pulse-Width Modulation)
| Screen flickering / PWM detected | 22130 Hz | ≤ 55 % brightness setting | 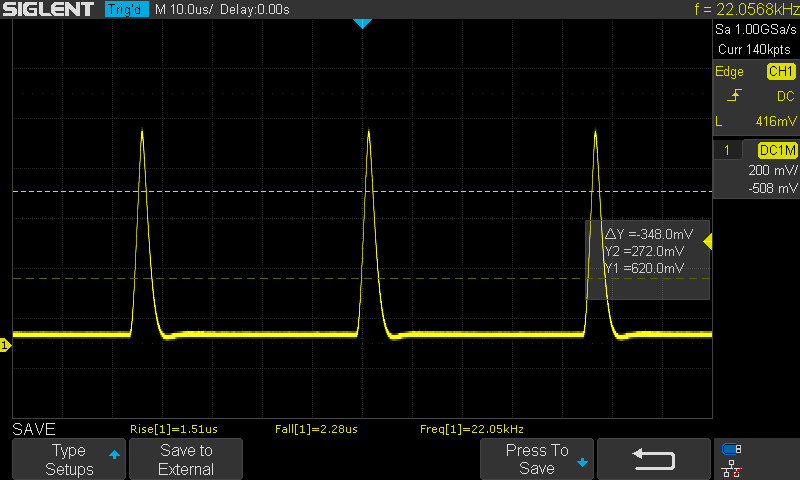 |
The display backlight flickers at 22130 Hz (worst case, e.g., utilizing PWM) Flickering detected at a brightness setting of 55 % and below. There should be no flickering or PWM above this brightness setting. The frequency of 22130 Hz is quite high, so most users sensitive to PWM should not notice any flickering. In comparison: 52 % of all tested devices do not use PWM to dim the display. If PWM was detected, an average of 7763 (minimum: 5 - maximum: 343500) Hz was measured. | |||
Performance
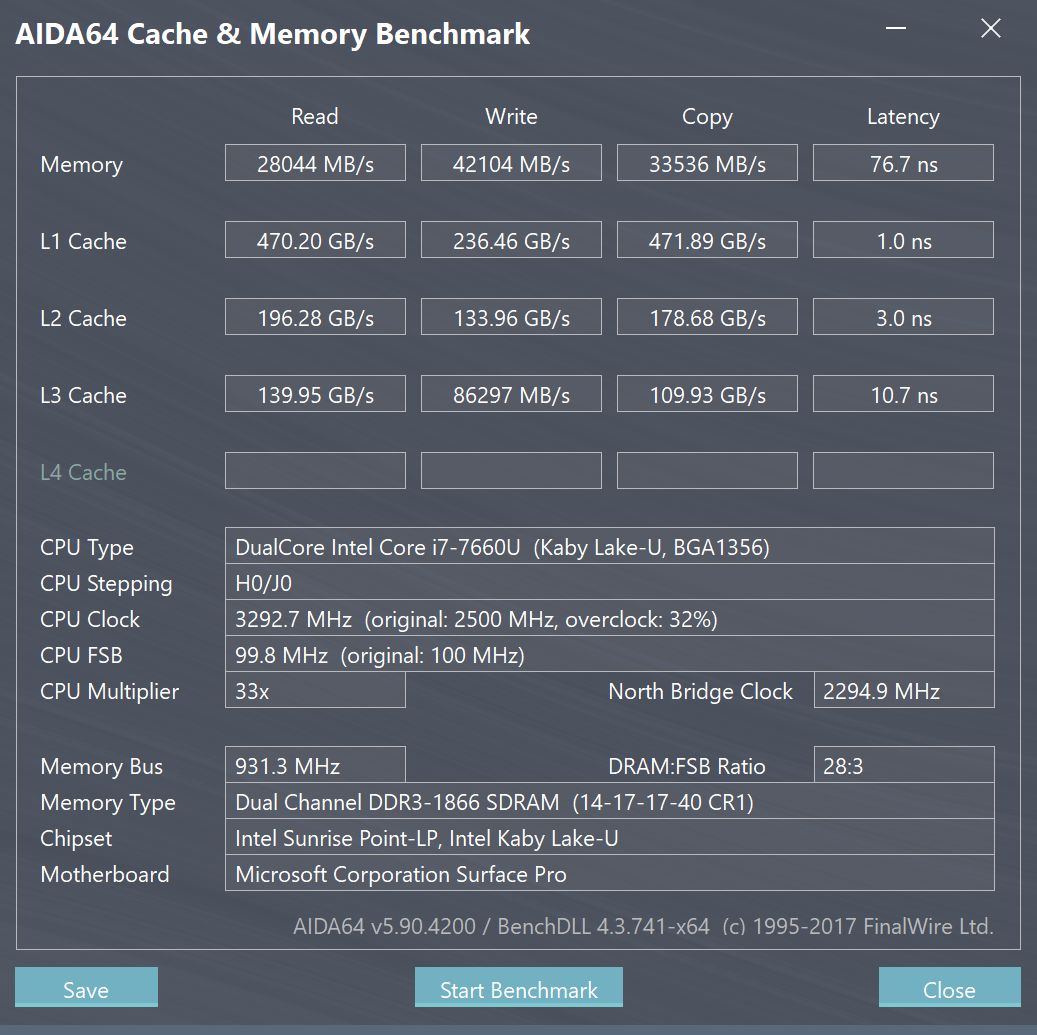
Microsoft has chosen an Intel Core i7-7660U (12 nanometers) with 2.5 - 4 GHz (2 core, turbo 3.8 GHz only) for their flagship model of the Surface Pro 2017. It is a dual-core SoC with an Intel Iris Plus Graphics 640 graphics card with 64 MB eDRAM.
Processor
We ran the Cinebench R15 multi-core test in a loop on the i7-7660U. At first, the 410 points scored seemed fantastic - the result put the Surface Pro into number one in our comparison field. The disillusionment came at the end: after nine loops the result had dropped to 340 points (-17%) and this is where it remained.
The adjusted result puts the i7-7660U exactly 10% below the i7-7500U (Acer TravelMate P658-G2) without throttling.
If we add thinner devices with minimum (Asus Zenbook UX3430UQ: 346/330) or no loop throttle (Toshiba Portege X30-D: 341/340) to the comparison, our Surface Pro i7 is exactly on the constant load level of the i7-7500U or i7-7600U that these devices are equipped with.
This is the first time we have tested the 7660U, so we cannot compare the SoC results to those of a laptop, which might offer better cooling.
Looking at the comparison devices, the Transformer 3 Pro T303UA, which is right at the bottom of our ranking with an i7-6500U, caught our attention. For this device, the manufacturer limited the TPD to 7.5 watts, which leads to a noticeably reduced output ex-works.
Cinebench R15 CPU Multi 64 Bit - Surface Pro 2017 i7-7660U cooling fan
Cinebench R15 CPU Multi 64 Bit - Surface Pro 2017 i5-7300U fanless
It is remarkable that Acer's brand-new Switch 5 SW512 can get 305 points in the loop test with its special Liquid Loop cooling (no fans) and an i7-7500U processor. This is only 10% less than our 7660U (340). The Switch 5 remains constant (330) for the first five rounds and then drops to 305.
Cinebench R15 CPU Multi 64 Bit - Switch 5 SW512 i7-7500U Liquid Loop
System Performance
The device's application performance need not be afraid of faster laptops or its competition according to the PCMark benchmarks. Still, the Surface Pro i7 is not number one among the best convertibles. This place is shared by the Dell Latitude 12 in Home score and the Acer Switch 5 in Work score.
The competition's SSDs are broadly speaking on the same level, so this cannot be the cause. This is where the above-mentioned throttling comes into effect: both the Switch 5 with Liquid Loop and the Latitude 12 5285 (each -9%) can easily beat the -17% of our test unit.
| PCMark 8 Home Score Accelerated v2 | 4095 points | |
| PCMark 8 Creative Score Accelerated v2 | 5540 points | |
| PCMark 8 Work Score Accelerated v2 | 4431 points | |
| PCMark 10 Score | 3909 points | |
Help | ||
Storage Devices
The Samsung PM971 KUS040202M with a gross capacity of 512 GB shows similar results as the 256-GB version in the i5 model. It has a total deviation of only -19%. We noticed that the i7 model has great results in sequential reading.
The table shows that the competition is also equipped with the who's who of the current top SSDs. Lenovo has placed its bet on NVMe in RAID for its Miix 720 and is seeing great results. Its system performance, however, is not faster than our Microsoft test unit.
| Microsoft Surface Pro (2017) i7 Samsung PM971 KUS040202M | Microsoft Surface Pro (2017) i5 Samsung PM971 KUS030202M | Microsoft Surface Pro 4, Core i5, 128GB Samsung MZFLV128 NVMe | Lenovo Ideapad Miix 720-12IKB Samsung SSD PM961 1TB M.2 PCIe 3.0 x4 NVMe (MZVLW1T0) | Lenovo ThinkPad X1 Tablet Gen 2 Samsung PM961 MZVLW256HEHP | Asus Transformer 3 Pro T303UA-GN050T SK Hynix Canvas SC300 512GB M.2 (HFS512G39MND) | Dell Latitude 12 5285 2-in-1 Samsung PM961 MZVLW256HEHP | Acer Switch 5 SW512-52-5819 Intel SSD 600p SSDPEKKW512G7 | |
|---|---|---|---|---|---|---|---|---|
| CrystalDiskMark 3.0 | -19% | -45% | 90% | 22% | -44% | -5% | 7% | |
| Read Seq (MB/s) | 1308 | 723 -45% | 666 -49% | 2408 84% | 1739 33% | 398.9 -70% | 1294 -1% | 1066 -19% |
| Write Seq (MB/s) | 961 | 853 -11% | 154.2 -84% | 1702 77% | 1259 31% | 402 -58% | 865 -10% | 593 -38% |
| Read 512 (MB/s) | 227.5 | 225 -1% | 266.3 17% | 1301 472% | 698 207% | 303.1 33% | 406 78% | 653 187% |
| Write 512 (MB/s) | 792 | 445 -44% | 154.2 -81% | 1288 63% | 869 10% | 320.3 -60% | 589 -26% | 535 -32% |
| Read 4k (MB/s) | 53.6 | 46 -14% | 28.51 -47% | 53.6 0% | 52.3 -2% | 26.11 -51% | 31.75 -41% | 35.92 -33% |
| Write 4k (MB/s) | 136.3 | 125 -8% | 101.5 -26% | 162.2 19% | 120 -12% | 57.7 -58% | 72.2 -47% | 128.3 -6% |
| Read 4k QD32 (MB/s) | 485.6 | 423 -13% | 368.3 -24% | 504 4% | 247.9 -49% | 245.8 -49% | 493.3 2% | 460.6 -5% |
| Write 4k QD32 (MB/s) | 421.5 | 373 -12% | 153.6 -64% | 420.8 0% | 259 -39% | 253.8 -40% | 434.5 3% | 425.4 1% |

Graphics
This is the first time we have tested the Intel Iris Plus Graphics 640. It is part of the Core i7-7660U SoC and shares its TDP. The 48 Execution Units (EUs) clock at up to 1050 MHz and, combined with the fast eDRAM cache, it is supposed to offer GeForce 920MX-level performance.
The Iris graphics card takes the lead in 3DMark 11 and is ahead of Nvidia's 920MX and 940MX. 3DMark 2016, on the other hand, is a little more practical and it places the Iris Plus 640 8% below the 940MX.
| 3DMark 06 Standard Score | 15071 points | |
| 3DMark 11 Performance | 2664 points | |
| 3DMark Cloud Gate Standard Score | 8067 points | |
| 3DMark Fire Strike Score | 1310 points | |
| 3DMark Time Spy Score | 513 points | |
Help | ||
Gaming Performance
One or two games are actually displayed more smoothly by the Iris Plus Graphics 640 than by the HD Graphics 620 or 520. Even a few frames more or less can influence whether a game is playable or not, as you can see from the colorful gaming table below.
In any case, it can at most manage medium settings in old or new, but undemanding games such as Overwatch or Rocket League. Farming Simulator 2017 is very undemanding and therefore an exception. It would not be playable in high settings and Full HD with the HD 620. If you want to play the occasional game on your convertible tablet, the Iris Plus Graphics 640 is your only real option at the moment - and that is only available in the most expensive Surface Pro.
| The Witcher 3 - 1024x768 Low Graphics & Postprocessing | |
| Asus Zenbook UX3430UQ-GV012T | |
| Lenovo Ideapad 310-15ISK | |
| Microsoft Surface Pro (2017) i7 | |
| Microsoft Surface Pro (2017) i5 | |
| Rise of the Tomb Raider - 1024x768 Lowest Preset | |
| Microsoft Surface Pro (2017) i7 | |
| Asus X302UV-FN016T | |
| Asus Transformer 3 Pro T303UA-GN050T | |
| Acer Switch 5 SW512-52-5819 | |
| Lenovo Ideapad Miix 720-12IKB | |
| Microsoft Surface Pro (2017) i5 | |
| Deus Ex Mankind Divided - 1280x720 Low Preset AF:1x | |
| Microsoft Surface Pro (2017) i7 | |
| Battlefield 1 - 1280x720 Low Preset | |
| Microsoft Surface Pro (2017) i7 | |
| Huawei MateBook X | |
| Rocket League - 1920x1080 High Quality AA:High FX | |
| Microsoft Surface Pro (2017) i7 | |
| Acer Switch 5 SW512-52-5819 | |
| Warhammer 40.000: Dawn of War III - 1280x720 Minimum / Off (100 % Gameplay Resolution) | |
| Acer TravelMate P658-G2-MG-7327 | |
| Microsoft Surface Pro (2017) i7 | |
| For Honor - 1280x720 Low Preset | |
| Microsoft Surface Pro (2017) i7 | |
| Huawei MateBook X | |
| Farming Simulator 17 - 1920x1080 High Preset AA:2xMS AF:2x | |
| Asus Zenbook UX3430UQ-GV012T | |
| Microsoft Surface Pro (2017) i7 | |
| Huawei MateBook X | |
| The Division - 1280x720 Low Preset AF:1x | |
| Asus X302UV-FN016T | |
| Microsoft Surface Pro (2017) i7 | |
| Rainbow Six Siege - 1366x768 Medium Preset AA:T AF:2x | |
| Asus X302UV-FN016T | |
| Microsoft Surface Pro (2017) i7 | |
| Thief - 1024x768 Very Low Preset | |
| Lenovo Ideapad Miix 720-12IKB | |
| Microsoft Surface Pro (2017) i5 | |
| Diablo III - 1366x768 High AA:on | |
| Asus Zenbook UX3430UQ-GV012T | |
| Asus X302UV-FN016T | |
| low | med. | high | ultra | |
|---|---|---|---|---|
| Sims 4 (2014) | 20.8 | |||
| GTA V (2015) | 56.7 | 28.9 | 11.8 | |
| The Witcher 3 (2015) | 21.7 | |||
| Dota 2 Reborn (2015) | 92 | 63.7 | 29.5 | 19.8 |
| Rainbow Six Siege (2015) | 45 (windowed) | 30 (windowed) | 16 (windowed) | |
| Rise of the Tomb Raider (2016) | 23.5 | 16.7 | 9.1 | |
| Far Cry Primal (2016) | 28 | 13 | ||
| The Division (2016) | 24.9 | |||
| Overwatch (2016) | 63.3 | 41 | 15.9 | |
| Deus Ex Mankind Divided (2016) | 20.2 | |||
| Battlefield 1 (2016) | 26.6 | 19.6 | 9.2 | |
| Farming Simulator 17 (2016) | 121 | 91 | 31.6 | 17.8 |
| For Honor (2017) | 33.5 | 12.7 | ||
| Ghost Recon Wildlands (2017) | 16 | |||
| Mass Effect Andromeda (2017) | 20.4 | |||
| Warhammer 40.000: Dawn of War III (2017) | 33.8 | |||
| Prey (2017) | 45.4 | 18.1 | ||
| Rocket League (2017) | 103 | 42.6 | 29.3 | |
| Dirt 4 (2017) | 27 |
Emissions
System Noise
The Surface Pro i7 does not make a sound while idling: the cooling fan is deactivated. The cooling system turned on to about 33 dB(A) during the stress test and also after short periods under load, such as when copying files took a little longer. This is audible, but it is not annoying. System noise only increased minimally to 34 dB(A) during our extreme stress test.
Noise level
| Idle |
| 29.6 / 29.6 / 29.6 dB(A) |
| Load |
| 33.4 / 34.1 dB(A) |
 | ||
30 dB silent 40 dB(A) audible 50 dB(A) loud |
||
min: | ||
| Microsoft Surface Pro (2017) i7 Iris Plus Graphics 640, i7-7660U, Samsung PM971 KUS040202M | Microsoft Surface Pro 4, Core i5, 128GB HD Graphics 520, 6300U, Samsung MZFLV128 NVMe | Lenovo Ideapad Miix 720-12IKB HD Graphics 620, i7-7500U, Samsung SSD PM961 1TB M.2 PCIe 3.0 x4 NVMe (MZVLW1T0) | Asus Transformer 3 Pro T303UA-GN050T HD Graphics 520, 6500U, SK Hynix Canvas SC300 512GB M.2 (HFS512G39MND) | Dell Latitude 12 5285 2-in-1 HD Graphics 620, i7-7600U, Samsung PM961 MZVLW256HEHP | Toshiba Portege X30-D (PT274U-01N001) HD Graphics 620, i7-7600U, Samsung PM961 MZVLW256HEHP | |
|---|---|---|---|---|---|---|
| Emissions | ||||||
| Fan Noise (dB(A)) | 36.3 | 37.1 | 38.4 | |||
| Noise | -12% | -6% | -6% | 5% | 1% | |
| off / environment * (dB) | 29.6 | 30.4 -3% | 30.7 -4% | 28.2 5% | 28.4 4% | |
| Idle Minimum * (dB) | 29.6 | 31.5 -6% | 30.4 -3% | 30.7 -4% | 28.2 5% | 28.4 4% |
| Idle Average * (dB) | 29.6 | 31.5 -6% | 32.4 -9% | 30.7 -4% | 28.2 5% | 28.4 4% |
| Idle Maximum * (dB) | 29.6 | 31.5 -6% | 32.4 -9% | 30.7 -4% | 28.2 5% | 28.4 4% |
| Load Average * (dB) | 33.4 | 40.5 -21% | 36 -8% | 37 -11% | 30.4 9% | 33.2 1% |
| Witcher 3 ultra * (dB) | 33.4 | |||||
| Load Maximum * (dB) | 34.1 | 40.7 -19% | 36.3 -6% | 37.1 -9% | 34 -0% | 37.9 -11% |
| Total Average (Program / Settings) | -12% /
-12% | -6% /
-6% | -6% /
-6% | 5% /
5% | 1% /
1% |
* ... smaller is better
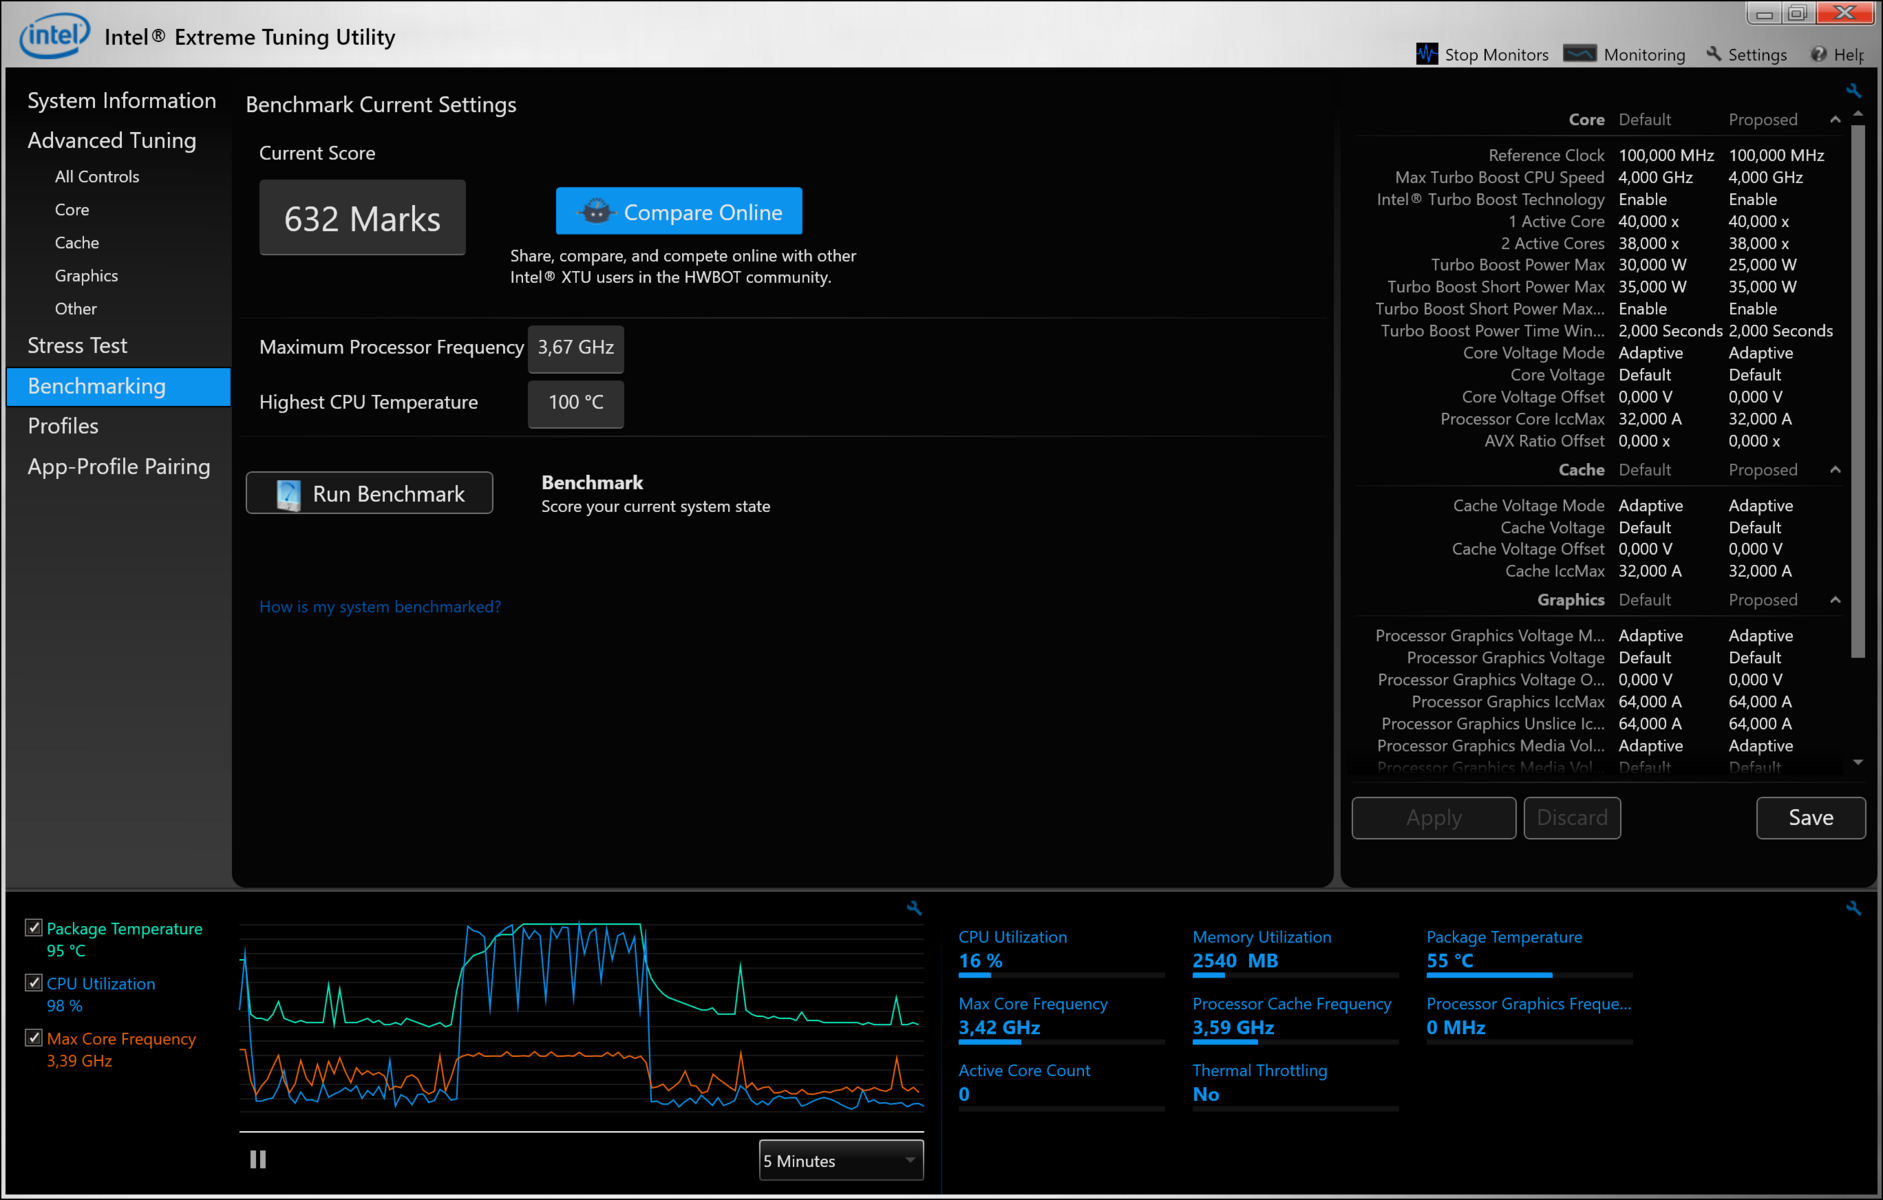
Temperature
We combined the Prime95 and FurMark benchmarks for our stress test, which lead to a reduced clock rate due to thermal limits - similar to what happened during the Cinebench R15 loop. The clock rate dropped to 2.5 GHz after four minutes, and after nine minutes it went even lower to 1.5 GHz. The temperature around the SoC had increased to 80 °C (~176 °F) and was at about 60 °C (~140 °F) at the end.
The graphics card in the SoC works diametrically to the processor: while the latter dropped from 3.5 to 2.5 GHz during the first part of the stress test, our measurements show that the GPU had a clock rate of 0 MHz. As soon as the SoC reaches 1.5 GHz due to throttling, the graphics clock rate increases to 850 MHz and then remains at 800.
(±) The maximum temperature on the upper side is 42 °C / 108 F, compared to the average of 35.4 °C / 96 F, ranging from 19.6 to 60 °C for the class Convertible.
(±) The bottom heats up to a maximum of 42 °C / 108 F, compared to the average of 36.9 °C / 98 F
(+) In idle usage, the average temperature for the upper side is 28.6 °C / 83 F, compared to the device average of 30.3 °C / 87 F.
(±) The palmrests and touchpad can get very hot to the touch with a maximum of 38 °C / 100.4 F.
(-) The average temperature of the palmrest area of similar devices was 28 °C / 82.4 F (-10 °C / -18 F).
We ran The Witcher 3 long-term test (Gaming, GPU/CPU combined load) for about 60 minutes, during which the device showed a decline in performance from an initial 22-23 FPS to 17-19 FPS. This corresponds to the performance loss we measured during the Cinebench loop (only CPU load).
Energy Management
Power Consumption
Power consumption paints a varied picture. The device obviously needs a lot of power while idling - 4 to 14 watts, which is more than any competitor needs. In addition, we also measured high consumption at maximum load, although average load is higher than maximum load. The reason behind this is the throttling of the SoC. We do not measure power consumption at the beginning of the stress test, but after half-an-hour to an hour. The Witcher 3 can also be considered load but seems to not be as demanding on the SoC with a consumption of 38 watts, which is similar to average load.
The Surface Pro i5 (2017) is more energy-efficient (23 instead of 34 watts), which, in the case of maximum load, is due to the strong throttling (-33%).
| Off / Standby | |
| Idle | |
| Load |
|
Key:
min: | |
| Microsoft Surface Pro (2017) i7 i7-7660U, Iris Plus Graphics 640, Samsung PM971 KUS040202M, IPS, 2736x1824, 12.3" | Microsoft Surface Pro (2017) i5 i5-7300U, HD Graphics 620, Samsung PM971 KUS030202M, IPS, 2736x1824, 12.3" | Microsoft Surface Pro 4, Core i5, 128GB 6300U, HD Graphics 520, Samsung MZFLV128 NVMe, IPS, 2736x1824, 12.3" | Lenovo Ideapad Miix 720-12IKB i7-7500U, HD Graphics 620, Samsung SSD PM961 1TB M.2 PCIe 3.0 x4 NVMe (MZVLW1T0), IPS, 2880x1920, 12" | Asus Transformer 3 Pro T303UA-GN050T 6500U, HD Graphics 520, SK Hynix Canvas SC300 512GB M.2 (HFS512G39MND), IPS, 2880x1920, 12.6" | Dell Latitude 12 5285 2-in-1 i7-7600U, HD Graphics 620, Samsung PM961 MZVLW256HEHP, IPS, 1920x1280, 12.3" | Acer Switch 5 SW512-52-5819 i7-7500U, HD Graphics 620, Intel SSD 600p SSDPEKKW512G7, IPS, 2160x1440, 12" | Huawei MateBook X i5-7200U, HD Graphics 620, LITEON CB1-SD256, , 2160x1440, 13.3" | |
|---|---|---|---|---|---|---|---|---|
| Power Consumption | 27% | 24% | 24% | -3% | 24% | 23% | -3% | |
| Idle Minimum * (Watt) | 4.2 | 3.6 14% | 4.4 -5% | 3.5 17% | 6.7 -60% | 2.85 32% | 3.86 8% | 4.6 -10% |
| Idle Average * (Watt) | 10.1 | 8.1 20% | 9 11% | 7.2 29% | 10.3 -2% | 6.76 33% | 6.4 37% | 11 -9% |
| Idle Maximum * (Watt) | 14 | 8.7 38% | 10.7 24% | 7.9 44% | 13.5 4% | 6.91 51% | 7.17 49% | 12 14% |
| Load Average * (Watt) | 37.4 | 25.5 32% | 19.6 48% | 29.6 21% | 26 30% | 32.88 12% | 30.5 18% | 39.5 -6% |
| Witcher 3 ultra * (Watt) | 38.1 | |||||||
| Load Maximum * (Watt) | 34 | 23.5 31% | 19.9 41% | 30.8 9% | 28.8 15% | 37.41 -10% | 32.4 5% | 34.6 -2% |
* ... smaller is better
Battery Runtime
The battery runtimes of the i7 version are not as good as those of the i5 version. Only about 10 hours is left from the 12 h 30 m that the i5 had to offer. As not much has changed regarding resolution, it must be the stronger GPU in the SoC, as well as the cooling fan.
We are currently testing the Core M version of the Surface Pro 2017 and are curious to see what kind of runtimes that version can offer. We will update when we have our first results. What we know already is that there are only very few convertibles at this performance level that can keep up with the Surface Pro 2017: even with "only" 10 hours of Wi-Fi runtime, the convertible can easily beat its competition. Almost, that is. The Dell Latitude 12 5285 can also manage a full workday of 10 hours. There has been a one-hour increase since the last Surface Pro 4 i5. The Core M version should offer higher results, which was already the case with the old Core M.
Under load - whether that is The Witcher 3 gaming stress test or the Battery Eater Classic Test makes little difference - the device turns off after about 115 minutes. Again, the i5 version had better results and lasted 168 minutes. Other manufacturers can also keep up with these runtimes, for example the Huawei MateBook X, which lasts 162 minutes. This device is currently being tested and the review will be online shortly.
| Microsoft Surface Pro (2017) i7 i7-7660U, Iris Plus Graphics 640, 45 Wh | Microsoft Surface Pro (2017) i5 i5-7300U, HD Graphics 620, 45 Wh | Microsoft Surface Pro 4, Core i5, 128GB 6300U, HD Graphics 520, 38 Wh | Lenovo Ideapad Miix 720-12IKB i7-7500U, HD Graphics 620, 41 Wh | Lenovo ThinkPad X1 Tablet Gen 2 i5-7Y54, HD Graphics 615, 37 Wh | Asus Transformer 3 Pro T303UA-GN050T 6500U, HD Graphics 520, 39 Wh | Dell Latitude 12 5285 2-in-1 i7-7600U, HD Graphics 620, 42 Wh | Acer Switch 5 SW512-52-5819 i7-7500U, HD Graphics 620, Wh | Huawei MateBook X i5-7200U, HD Graphics 620, 40 Wh | |
|---|---|---|---|---|---|---|---|---|---|
| Battery runtime | 49% | -7% | -15% | 3% | -44% | -3% | -22% | 5% | |
| H.264 (h) | 10.2 | 3.4 -67% | |||||||
| WiFi v1.3 (h) | 8.2 | 12.4 51% | 7.1 -13% | 5.8 -29% | 7.4 -10% | 3.7 -55% | 8.1 -1% | 5.9 -28% | 5.6 -32% |
| Witcher 3 ultra (h) | 1.9 | ||||||||
| Load (h) | 1.9 | 2.8 47% | 1.9 0% | 1.9 0% | 2.2 16% | 1.7 -11% | 1.8 -5% | 1.6 -16% | 2.7 42% |
| Reader / Idle (h) | 17.6 | 15 | 11.9 | 11 | 7.1 | 17.9 | 11.9 | 8.5 |
Verdict
Pros
Cons
With the i7 2017 Surface Pro, Microsoft has created a convertible tablet that fulfills many, but not all promises. Workmanship, display and battery runtime are, without a doubt, state of the art. Its competitors, such as Acer's Switch 5, cannot keep up here.
Looking at the tablet as a possible laptop replacement, we found similar throttling as in the (fanless) i5 version. It was not quite as bad (-17% in the first round of the i7 vs. -33% in the i5). The throttling becomes noticeable in the PCMarks, however: The Surface Pro i7 (2017) is not at the head of its comparison field in this area with convertibles from Acer and Dell easily overtaking the high-end Surface Pro.
We have nevertheless given the Surface Pro i7 a good rating of 90%, because performance (the minus points are for the throttling) is only one of many aspects that we take into account in our reviews. The system noise is low despite having a cooling system and the fan is turned off while idling. The device has good speakers and the input devices, or rather the Type Cover, are extremely good for a convertible.
Alternatives
The Dell Latitude 12 5285 offers similar performance with less throttling (-9%). The screen is of the same quality (brightness, contrast, brightness distribution, color-space coverage), but it only has Full HD. But then the Dell heats up quite a lot.
The same can be said for the Acer Switch 5 SW512-52, of which the performance drops by only 9% and therefore cannot be considered throttling. But its runtime is considerably lower at six hours. The screen cannot keep up with that of the Surface Pro, nor that of the Latitude 12 5285, despite having 2160x1440 pixels.
If you are looking for runtimes over 10 hours, you should consider the i5 version or even the Core M version of the new Surface Pro 2017. If the SoC cannot deal with constant load anyway, why not buy the cheaper Core M model? It will most probably beat the 12.5 hours Wi-Fi runtime of the i5 model with ease. We are currently testing the device and will update with our results.
Microsoft Surface Pro (2017) i7
- 07/21/2017 v6 (old)
Sebastian Jentsch
Price comparison
