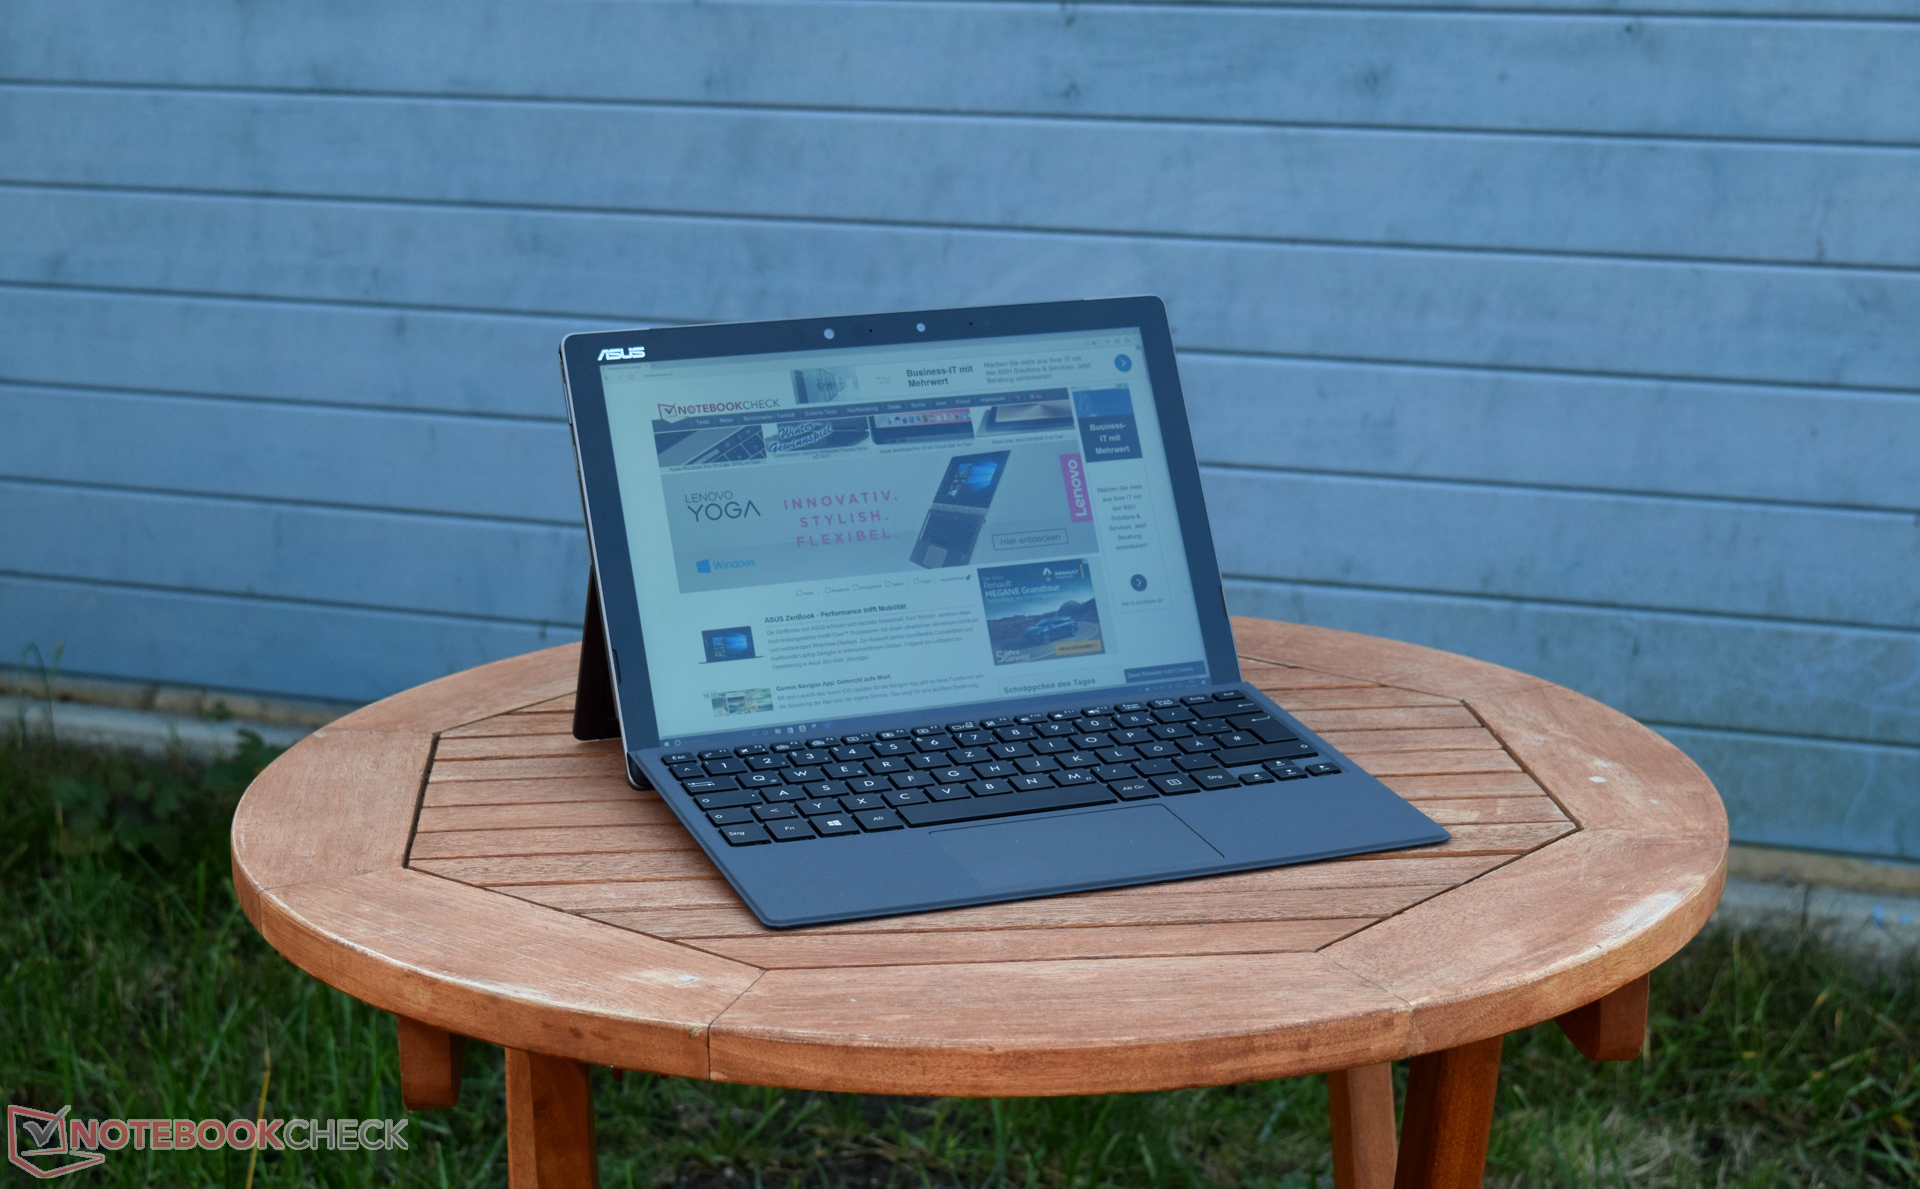
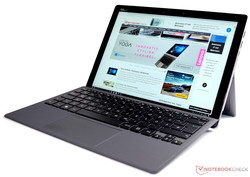
Asus Transformer 3 Pro T303UA-GN050T Convertible Review
For the original German review, see here.
Everyone wants a powerful convertible, but often a compact case falls short of the features offered by a full-sized laptop. In fact, more often than not, tablets and convertibles rely on very conservative processors and a dedicated graphics card is a rare sight in this segment. The latter is true for our test model, the Asus Transformer 3 Pro. The technical specifications of this 12.6-inch convertible are impressive: an Intel Core i7-6500U, 16 GB RAM and a 512 GB SSD. Asus offers alternatives for the storage device and the processor, such as, the weaker Intel Core i5-6200U. The storage devices range from 128 GB to 1 TB. The M.2 SSDs offered by the manufacturer operate with SATA 3 and PCIE Gen3 x4.
Our test model uses a 512 GB SSD at SATA 3 speeds. The model sports the faster processor and 16 GB RAM. The package is listed for 1,599 Euros (~$1668).
We picked out interesting convertibles to compete with the Asus Transformer 3 Pro in our review. We did not limit our search to the convertibles with the same CPU as our test model. In fact, some of our comparison models use very conservative Intel Core m CPUs. This will lead to some interesting performance discrepancies later on in this review.
This is the complete list of comparison devices for this review:
- Microsoft Surface Pro 4 with Intel Core m3 (900 Euros/~$939)
- Microsoft Surface Pro 4 with Intel Core i7 (1,249 Euros/~$1303)
- Lenovo ThinkPad X1 Yoga (2,499 Euros/~$2607)
- HP Elite x2 1012 G1 (1,500 Euros/~$1565)
- Acer Aspire Switch 12 Alpha (800 Euros/~$835)
Case
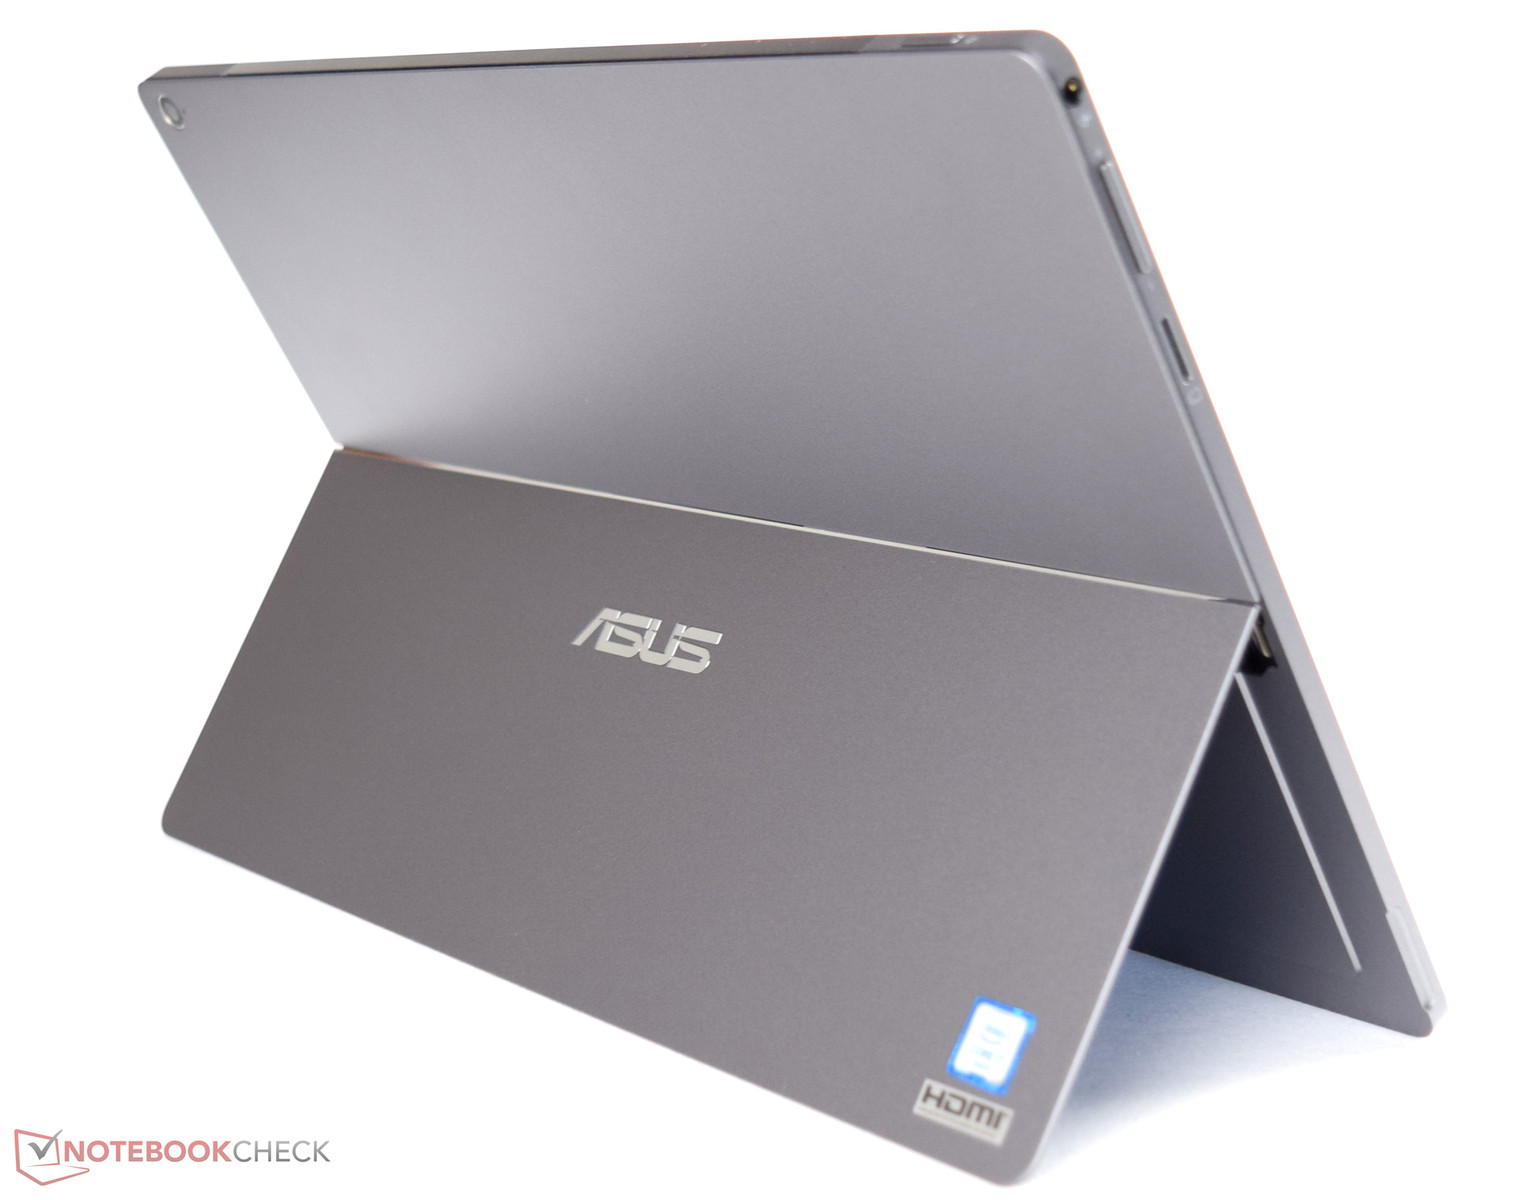
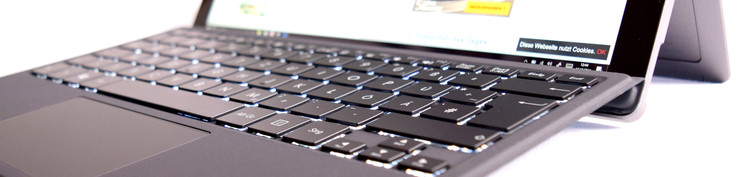
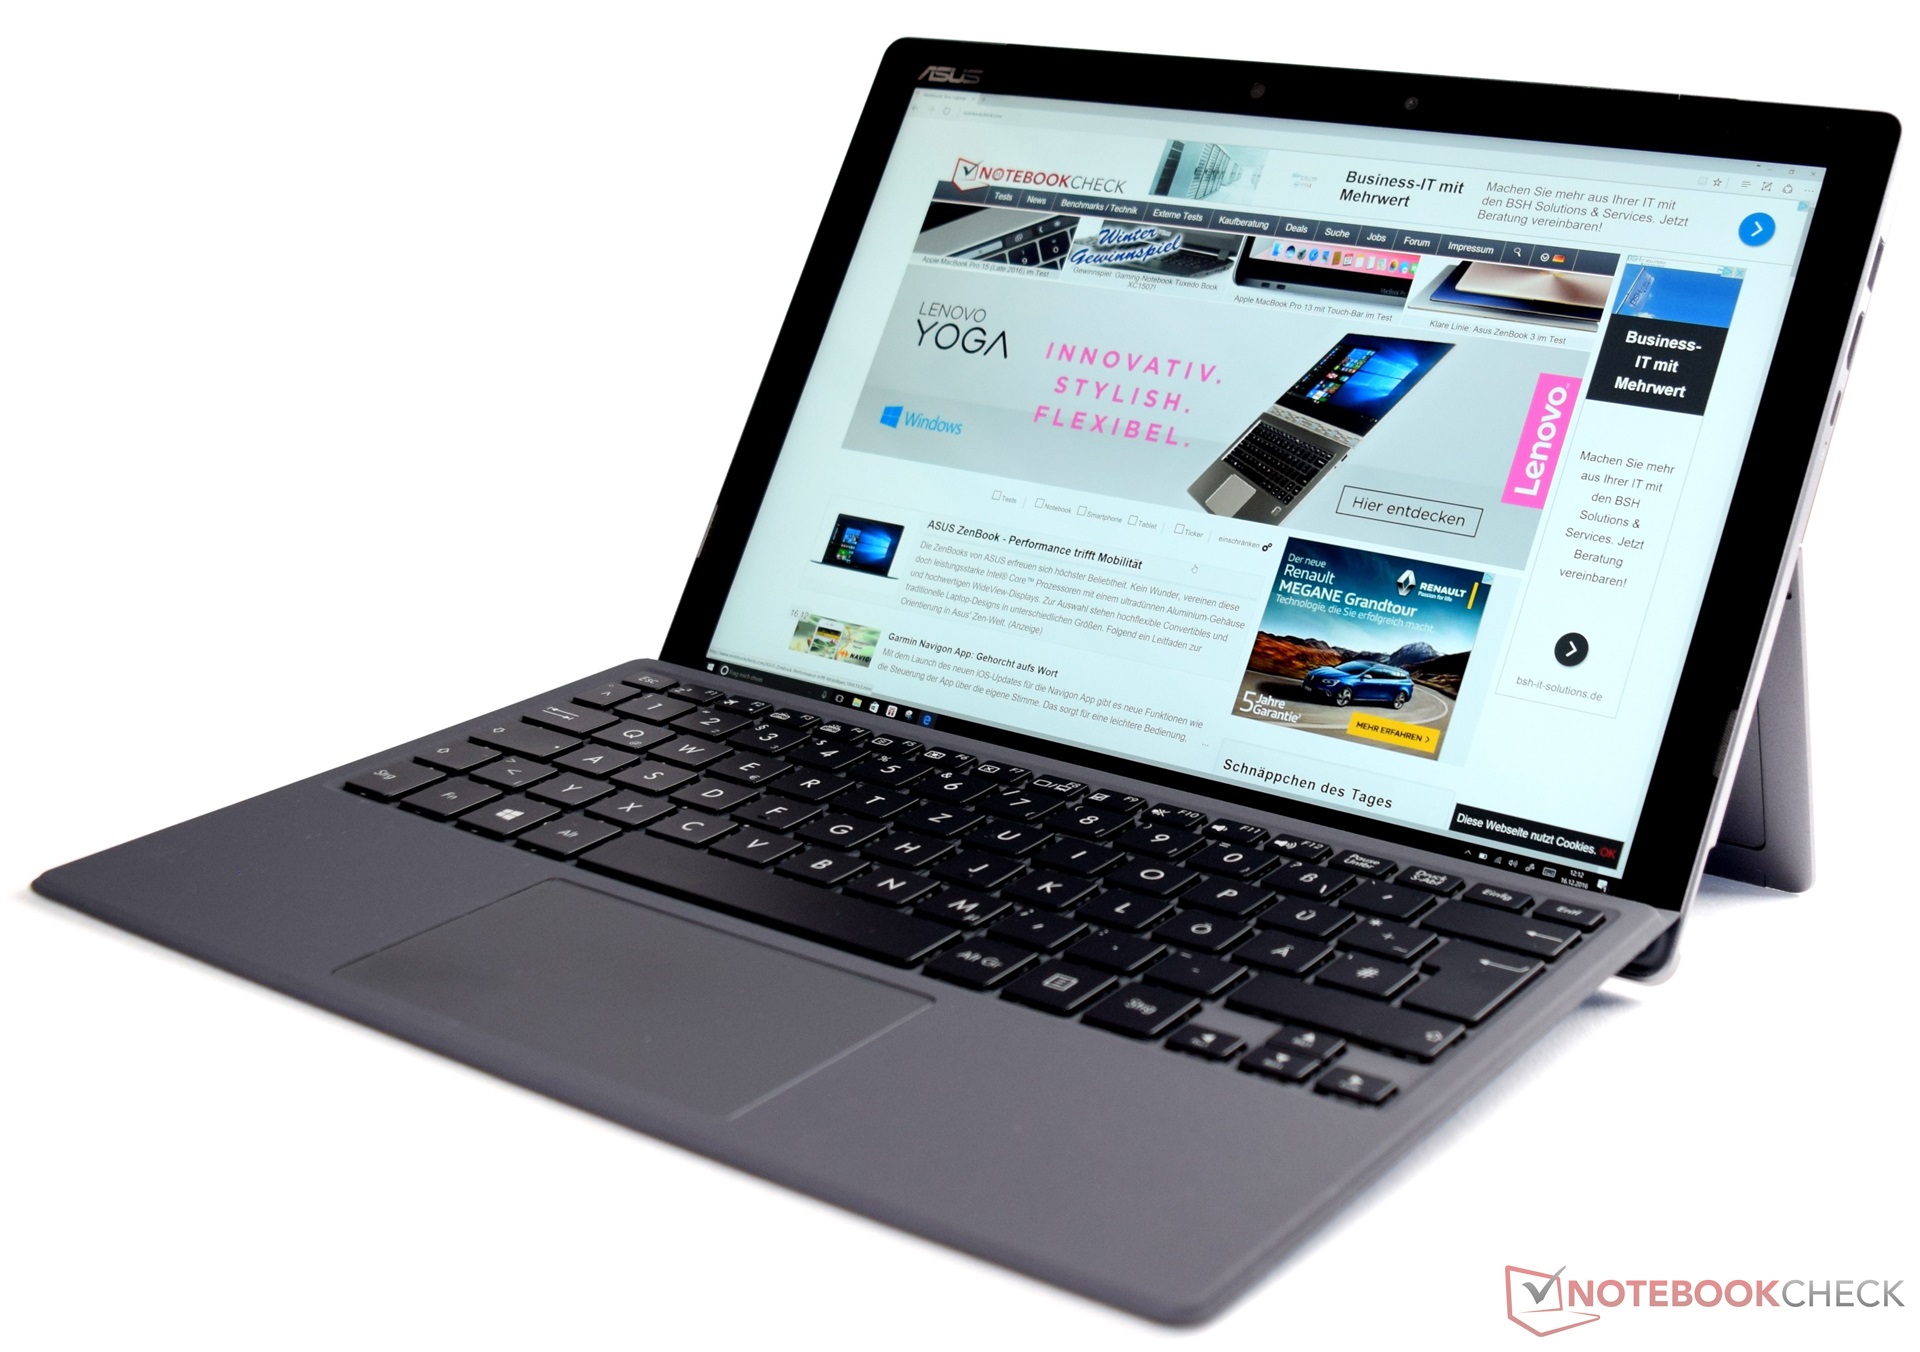
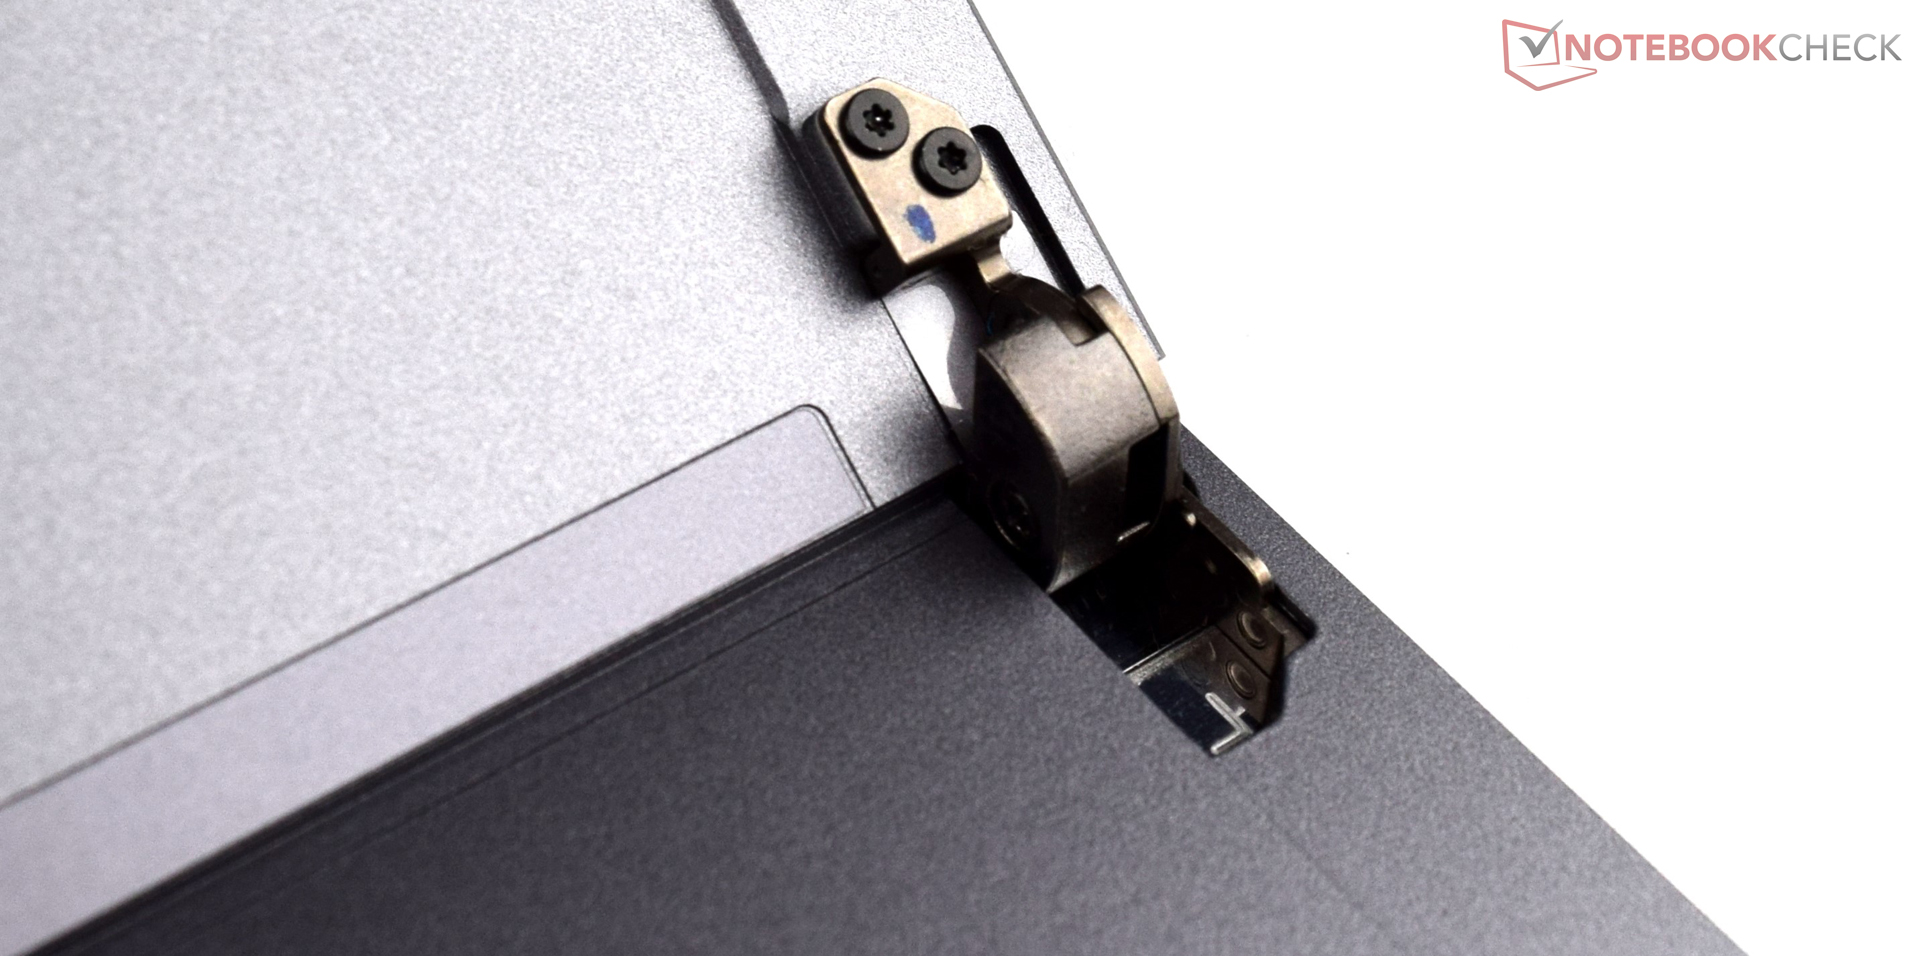
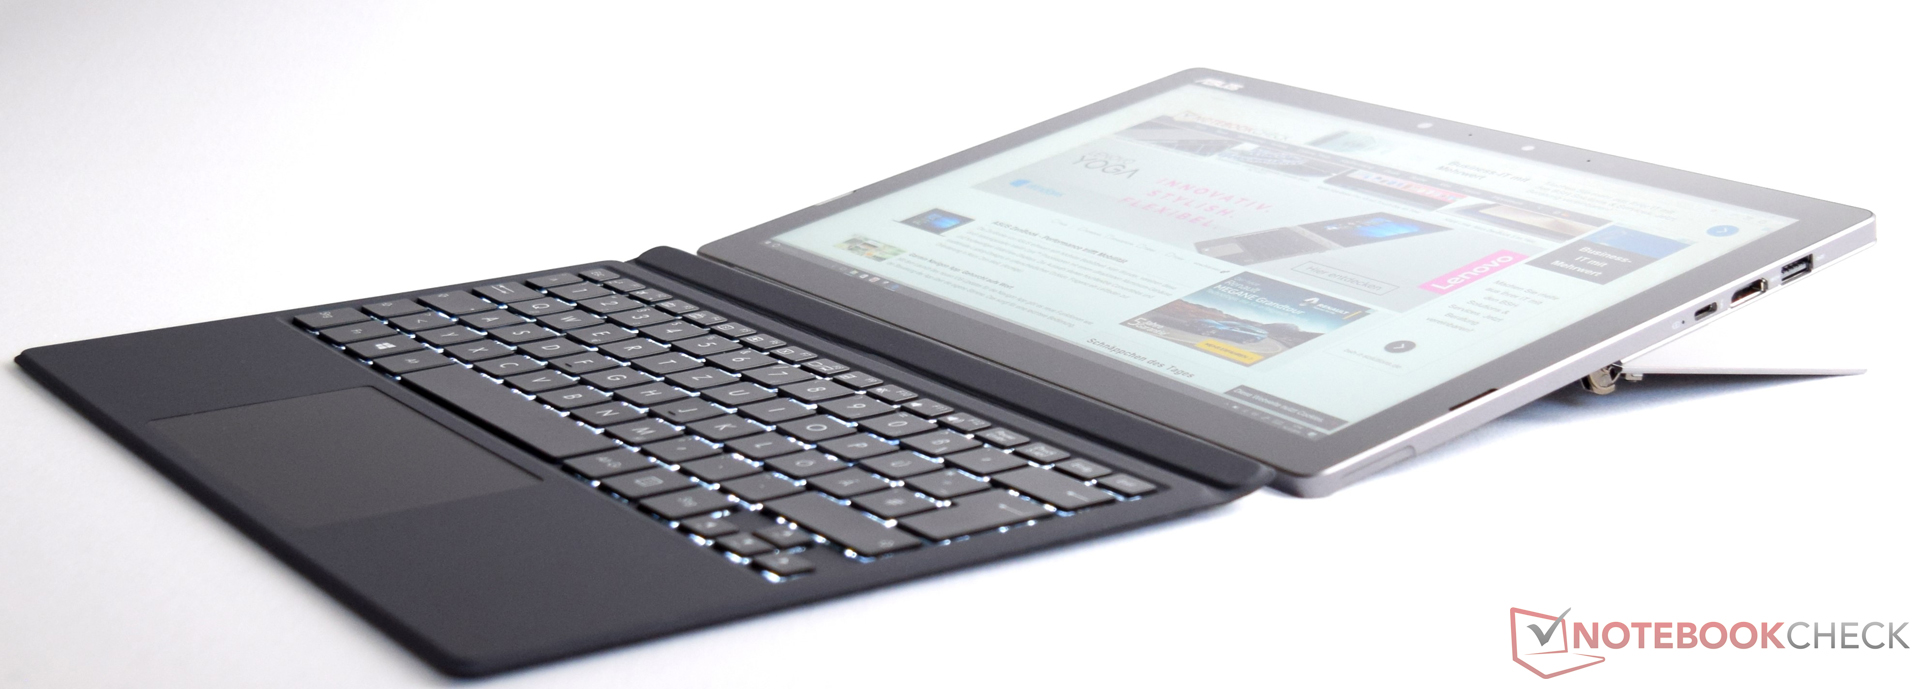
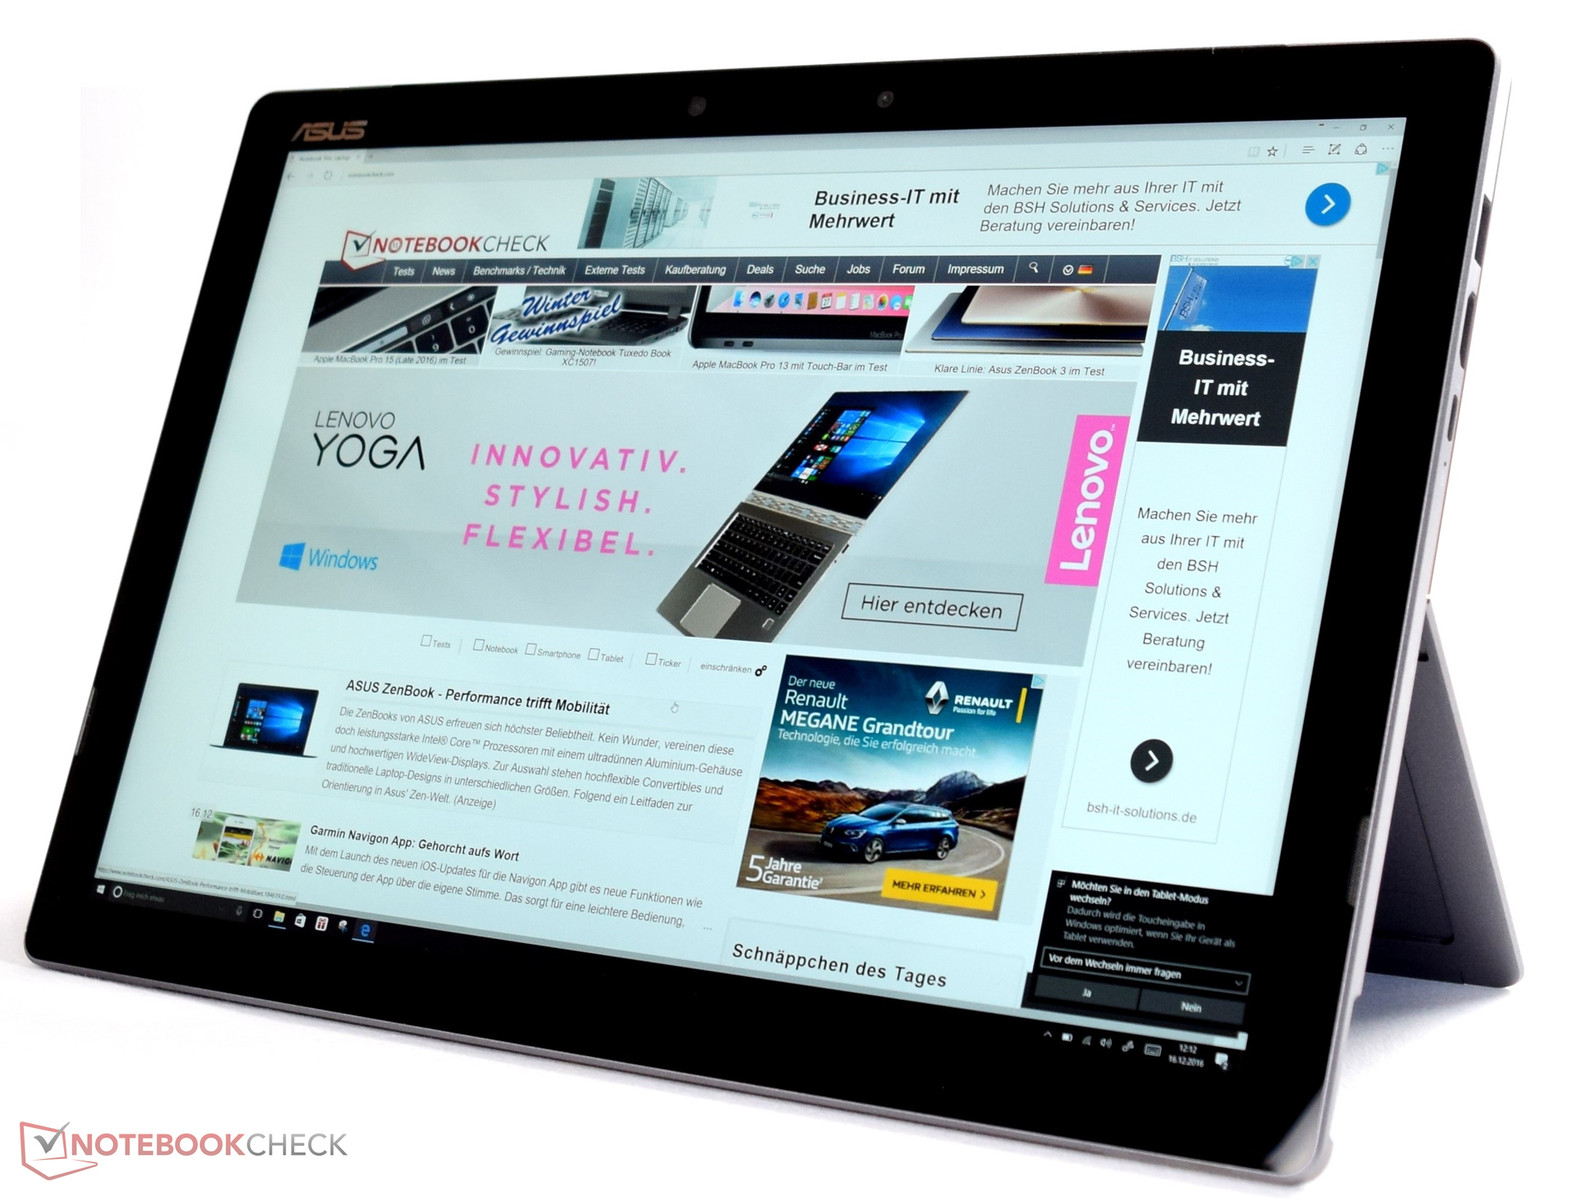
The glass front is stylish and serves as an input medium. The case and the kickstand of the Asus Transformer 3 Pro are made of a very innovative yet robust magnesium-aluminum alloy. This keeps the device very thin (8.35 mm/~0.33 inches) and light, without sacrificing sturdiness. The kickstand can be opened up to 155 degrees, but the two hinges are quite stiff, which means the user will have to use a little force. The Asus Transformer 3 Pro has a very slim keyboard dock, which latches onto the convertible with a magnet connector from below. When the convertible is closed, this dock helps protect the screen.
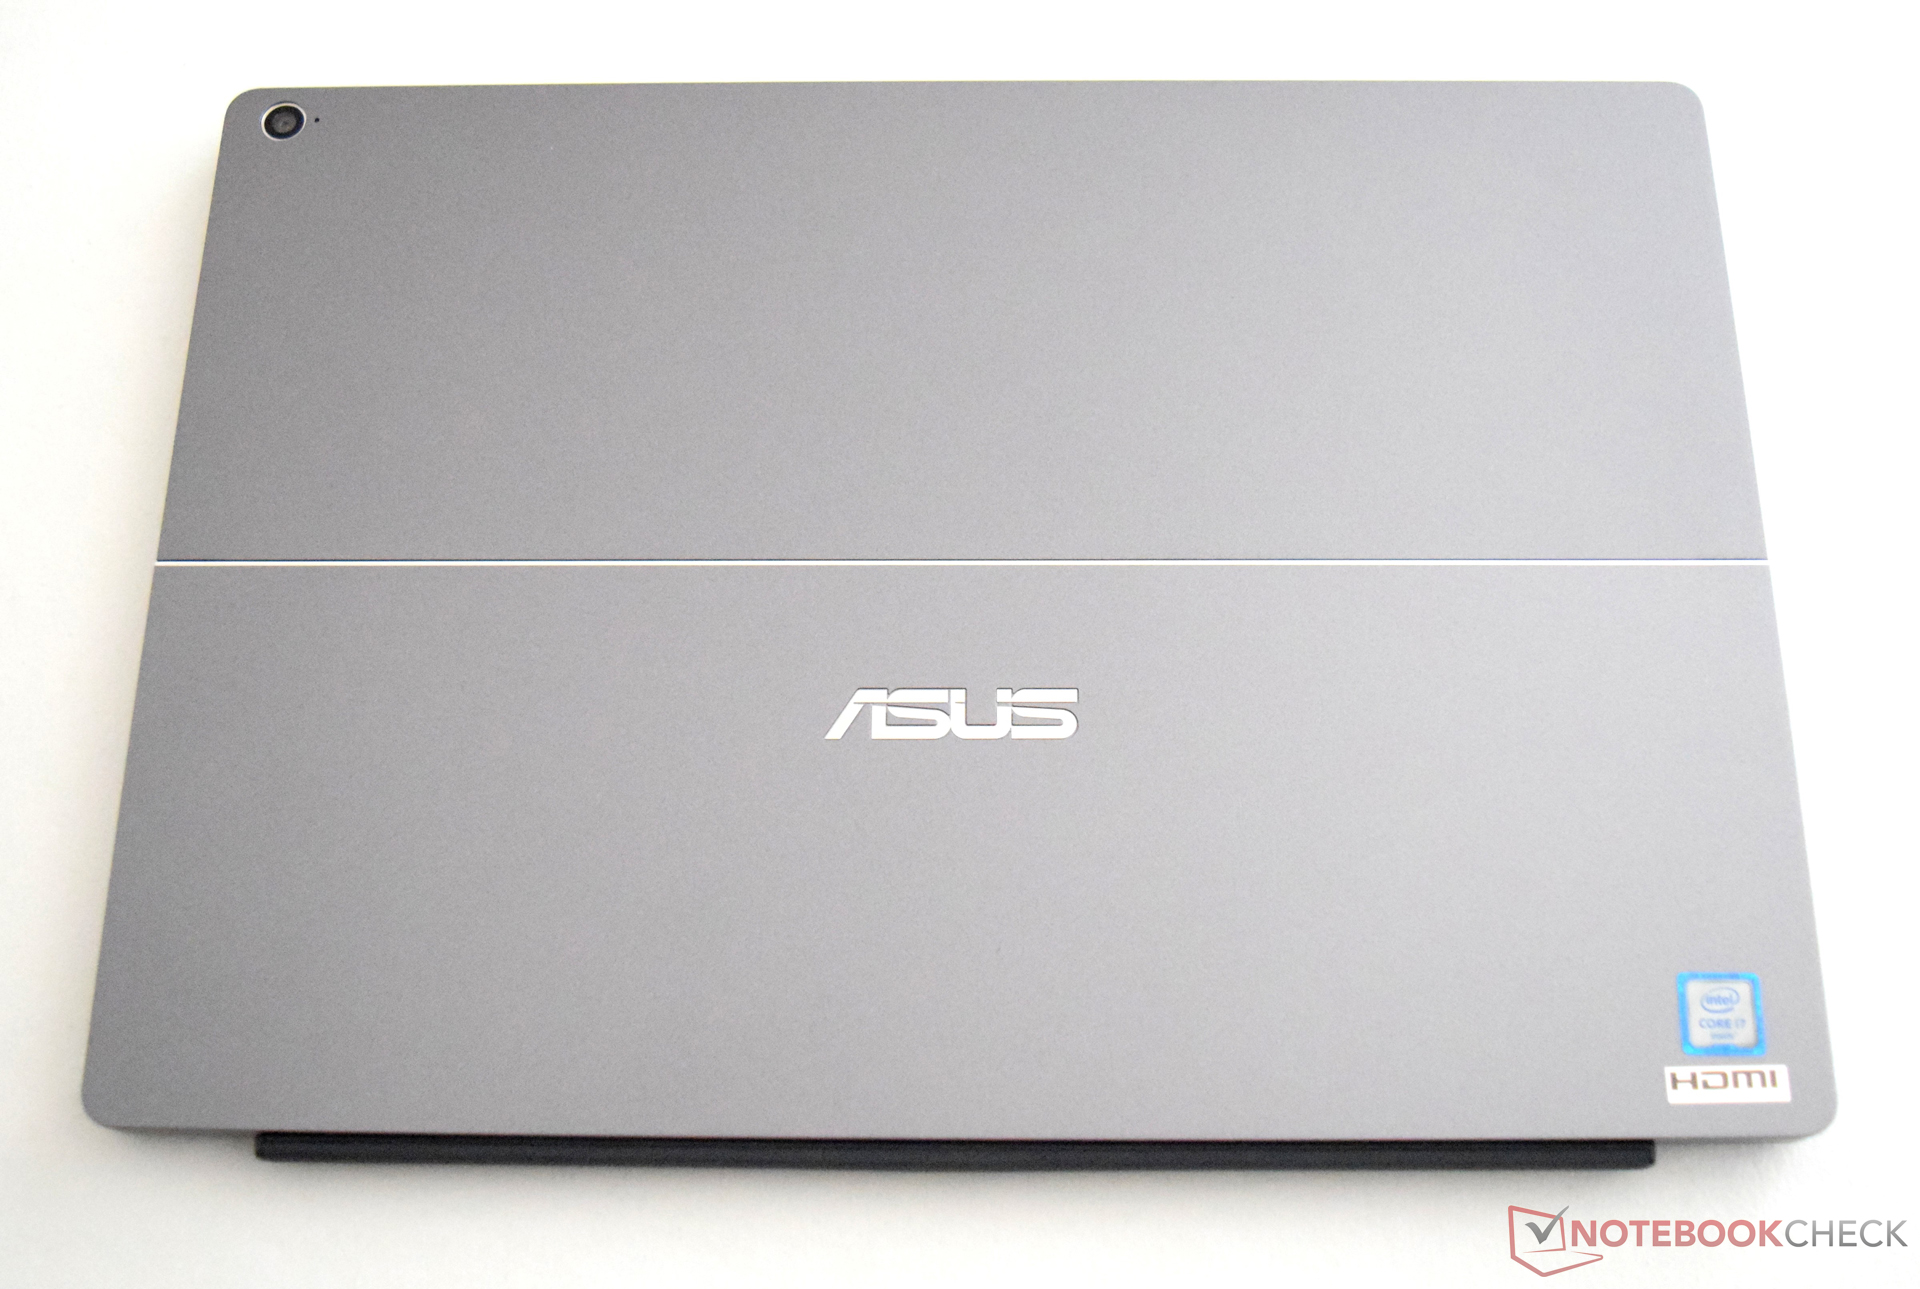
Asus is selling the device with two color schemes: Icicle-Gold and Titanium-Grey. The keyboard dock can be bought in four colors (green, brown, orange and beige), which means there are eight color combinations. The workmanship is very nice: the different components of the device have been installed cleanly and the gaps between the materials are even. Overall, the design is very appealing (subjective), but we must criticize one aspect of this device: the keyboard dock of the Asus Transformer 3 Pro should magnetically secure itself to the top of the convertible when it is closed.


Size Comparison
The size comparison shows that the Asus Transformer 3 Pro is one of the slimmest devices. The HP Elite x2 1012 G1 is a little slimmer (thickness). The weight of our test model is just over 1 kg, so it is relatively light (1,130 grams/~2.5 pounds, including keyboard). Separately, the keyboard dock weighs 340 grams (~0.8 lb) and the tablet weighs merely 790 grams (~1.7 lb).
Connectivity
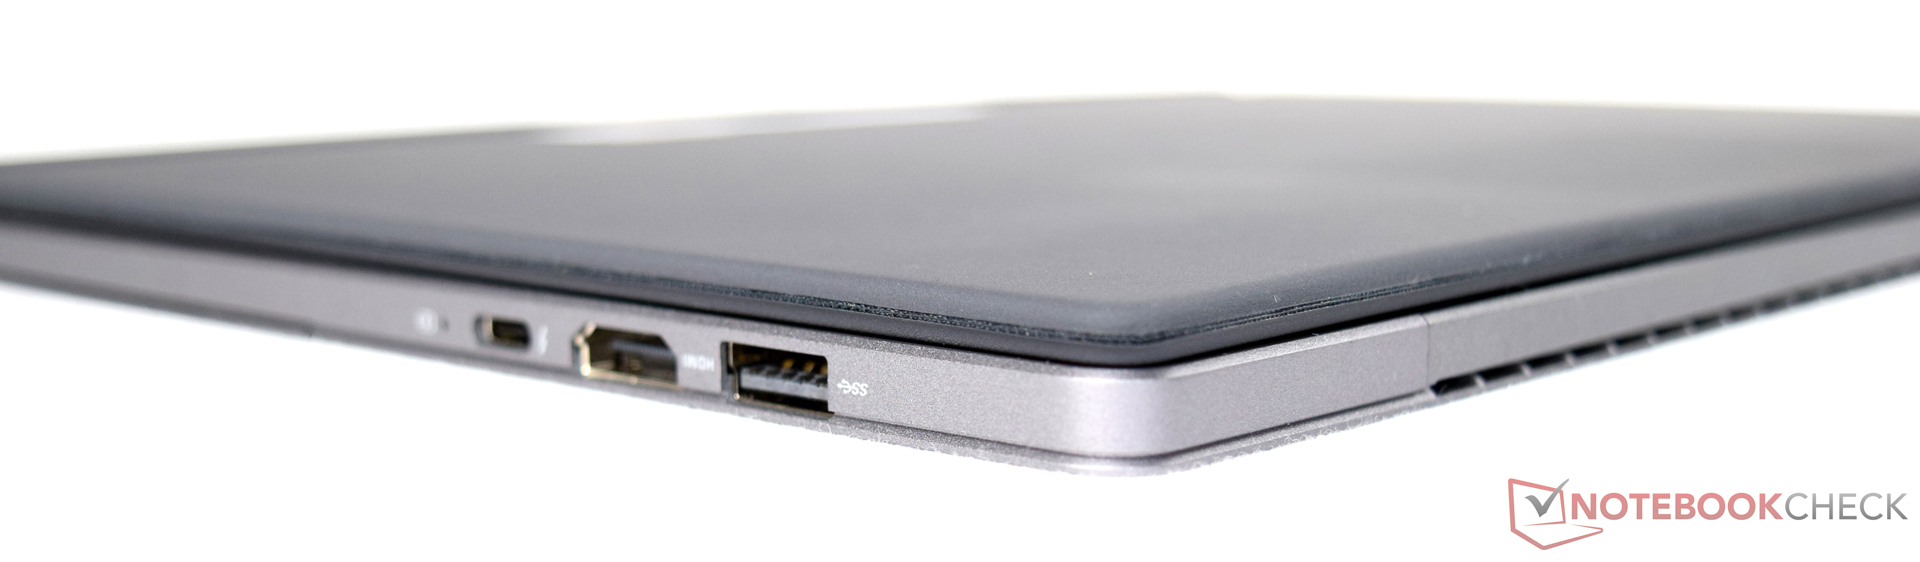
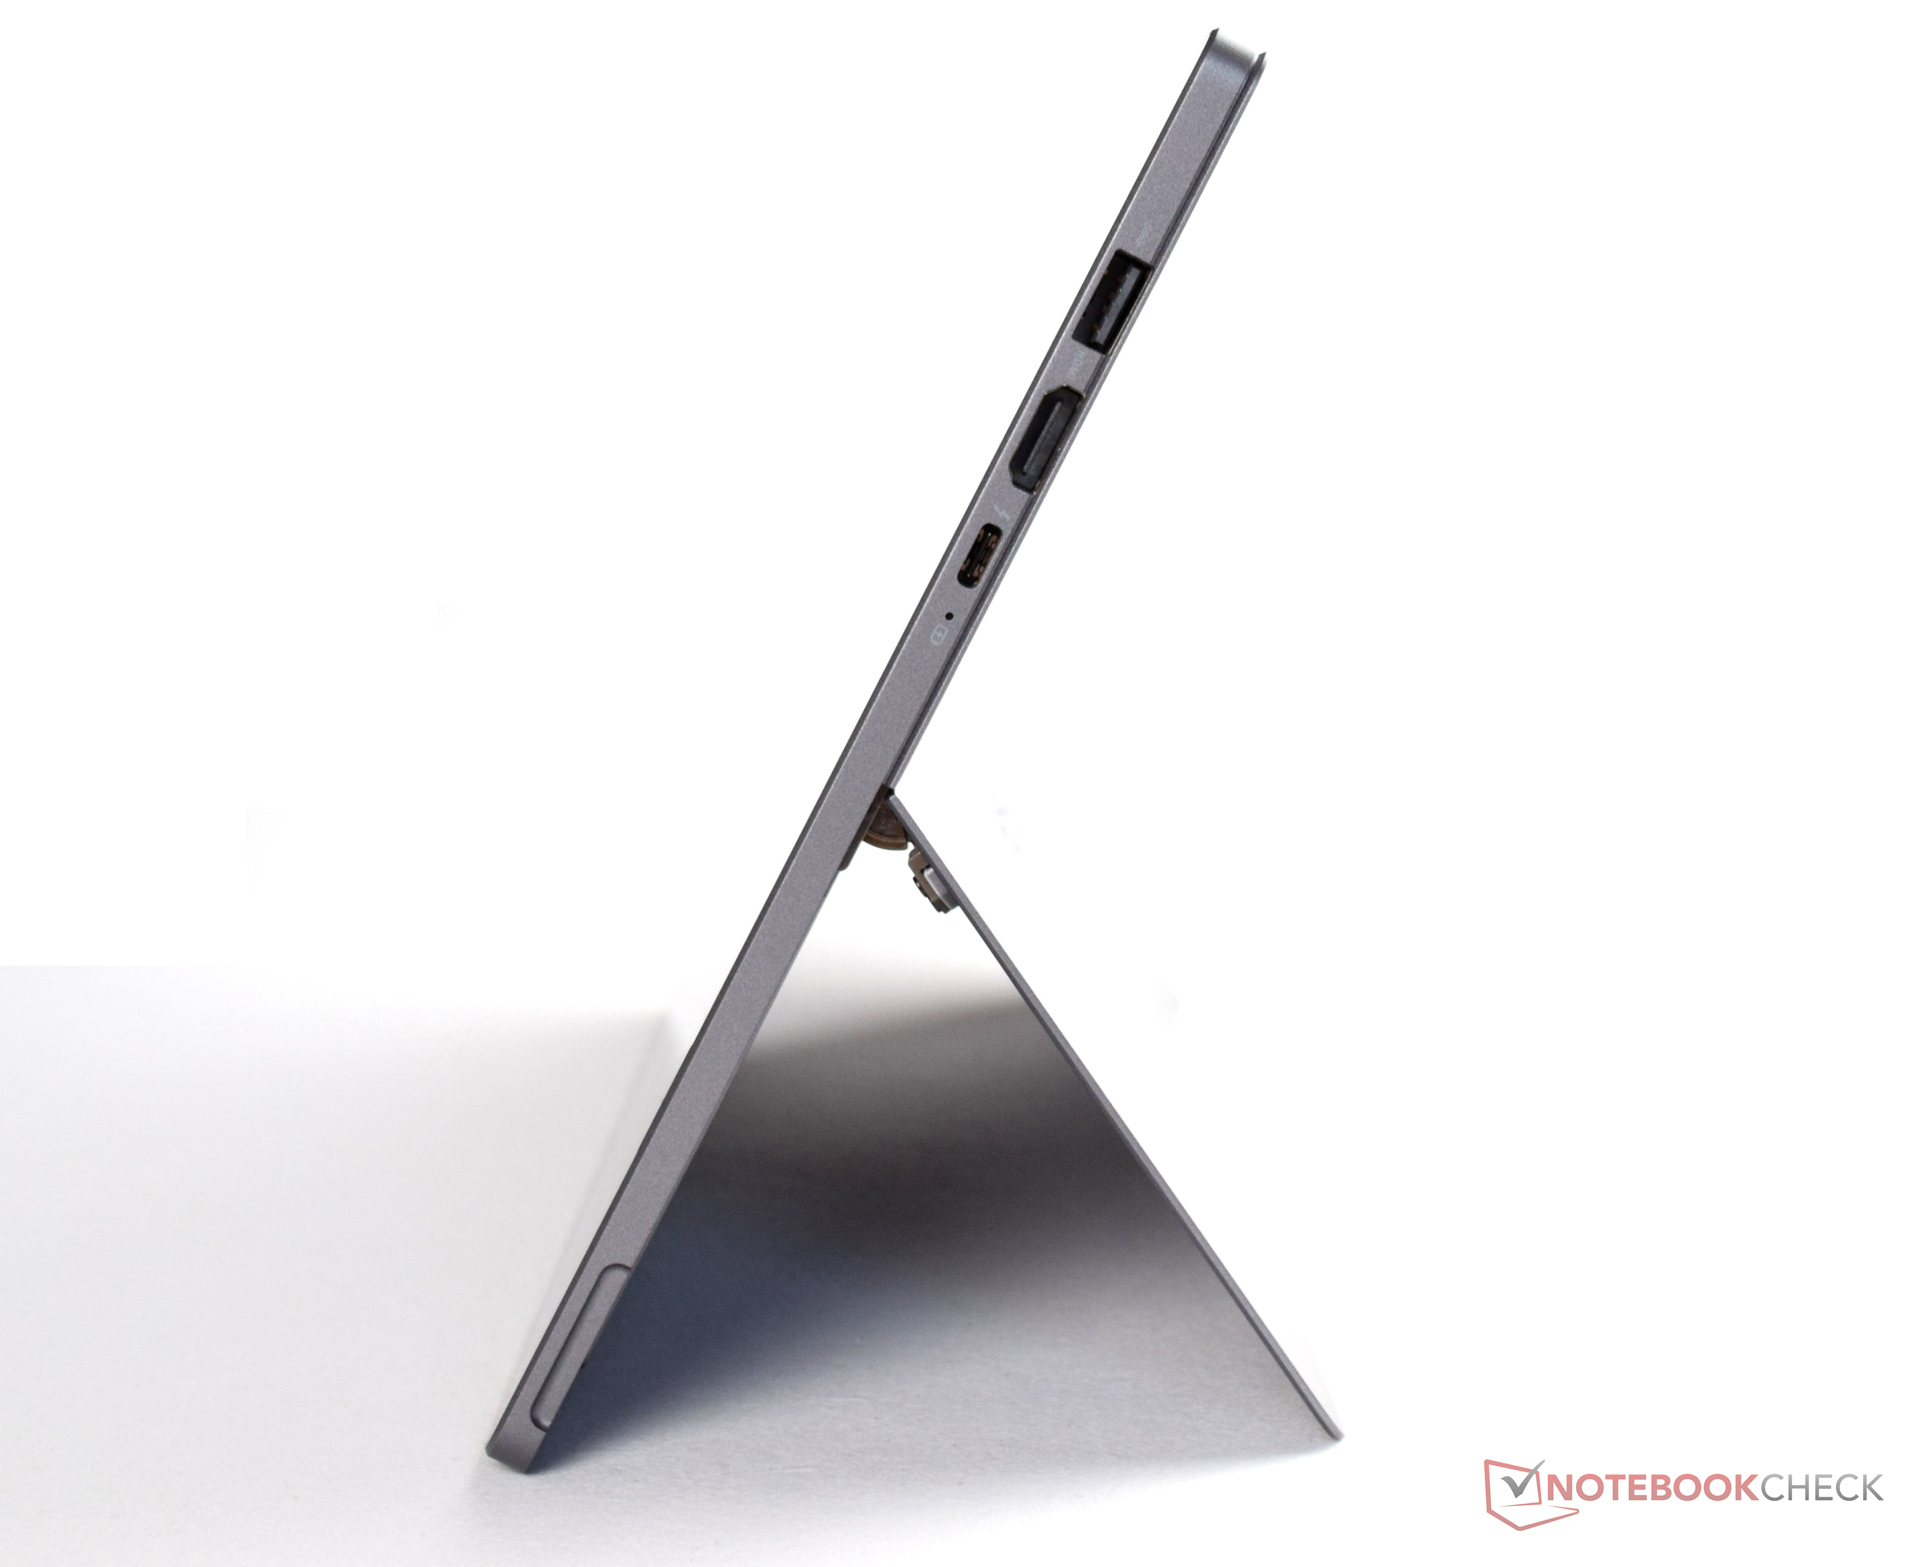
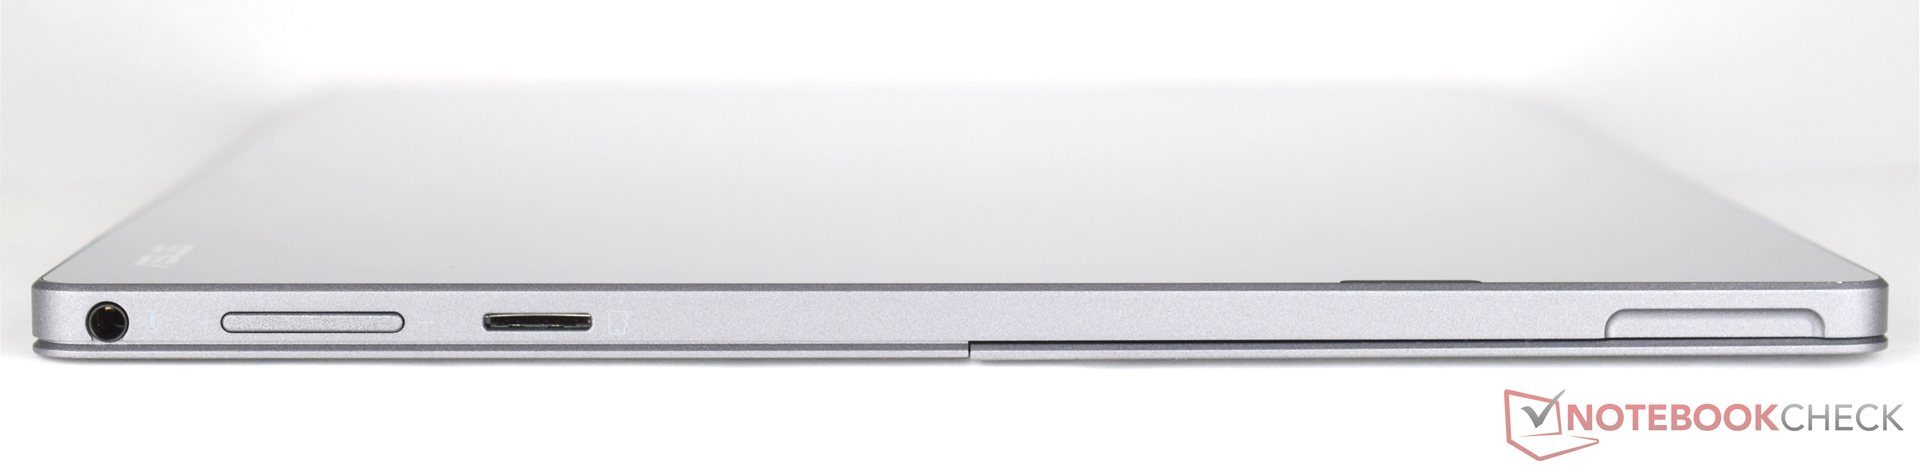
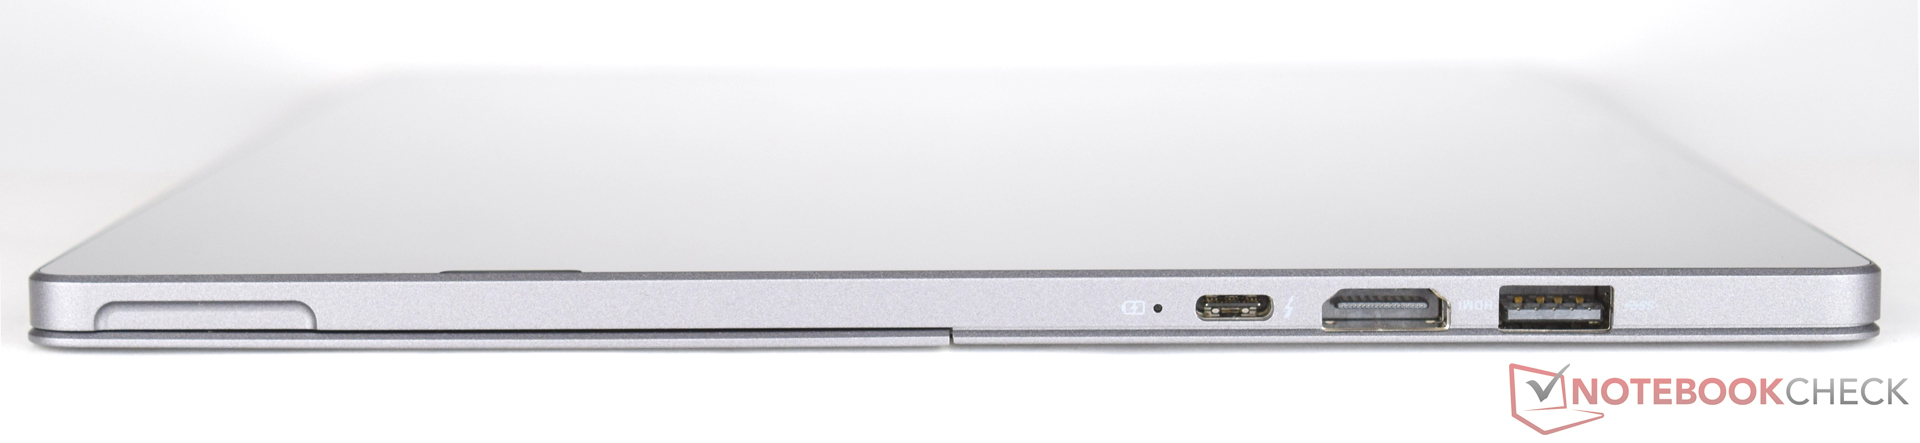
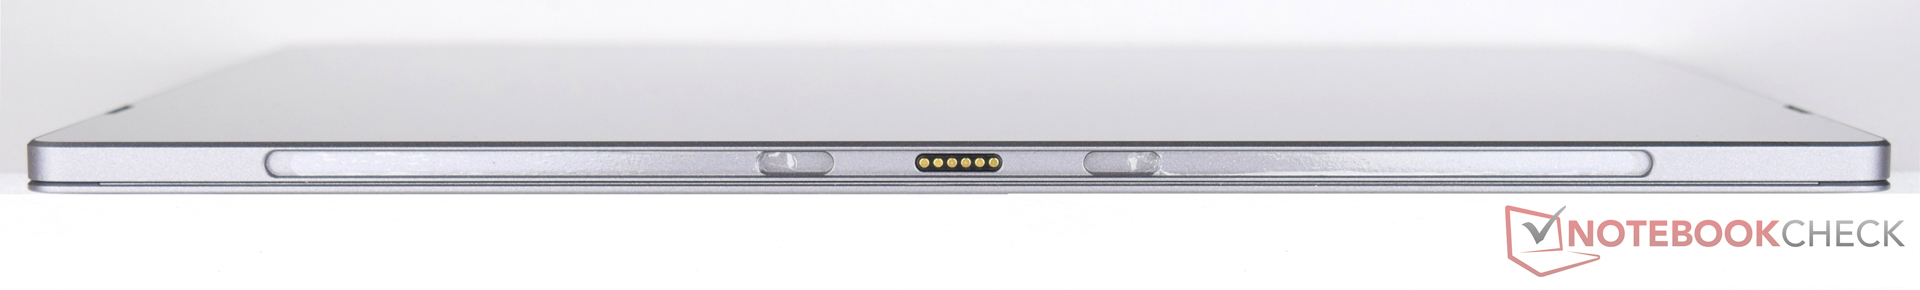
Due to the compact build, the convertible is limited to a certain number of interfaces. On the right side, the user will find a USB 3.0 port alongside an HDMI interface and a USB-C 3.1. The latter is used to charge the convertible. On the opposite side, the case sports a card reader (only MicroSD cards) and an audio jack. This is the full extent of the connectivity offered by the Asus Transformer 3 Pro. The USB-C 3.1 interface supports Thunderbolt 3 and can use various adapters to expand the connectivity of the tablet. One such adapter is available for image output (HDMI) and another offers Ethernet. However, we must note that to use these adapters, one must give up the only charging port of this convertible. The placement of the ports ensures user comfort as they are all quite high.
Communication
The Intel Dual-Band-Wireless-AC-7265 WLAN module of the Asus Transformer 3 Pro supports 2.4 and 5 GHz networks. Theoretically, it offers up to 867 MB/s, but we could not achieve this speed in our review. We set up the optimal conditions, but our test model only reached 685 MB/s (sending) and 560 MB/s (receiving). As the comparison table shows, the Asus Transformer 3 Pro has a slight disadvantage while receiving data. When sending, the test model performs at a similar level to the competition. The Apple MacBook Pro 13 2016 is the best performing model of our comparison.
Security
The Asus Transformer 3 Pro includes the Trusted Platform Module 2.0 (TPM). Furthermore, the Windows login can be unlocked using facial recognition. This is more of a gimmicky feature than a reliable, security feature.
Accessories
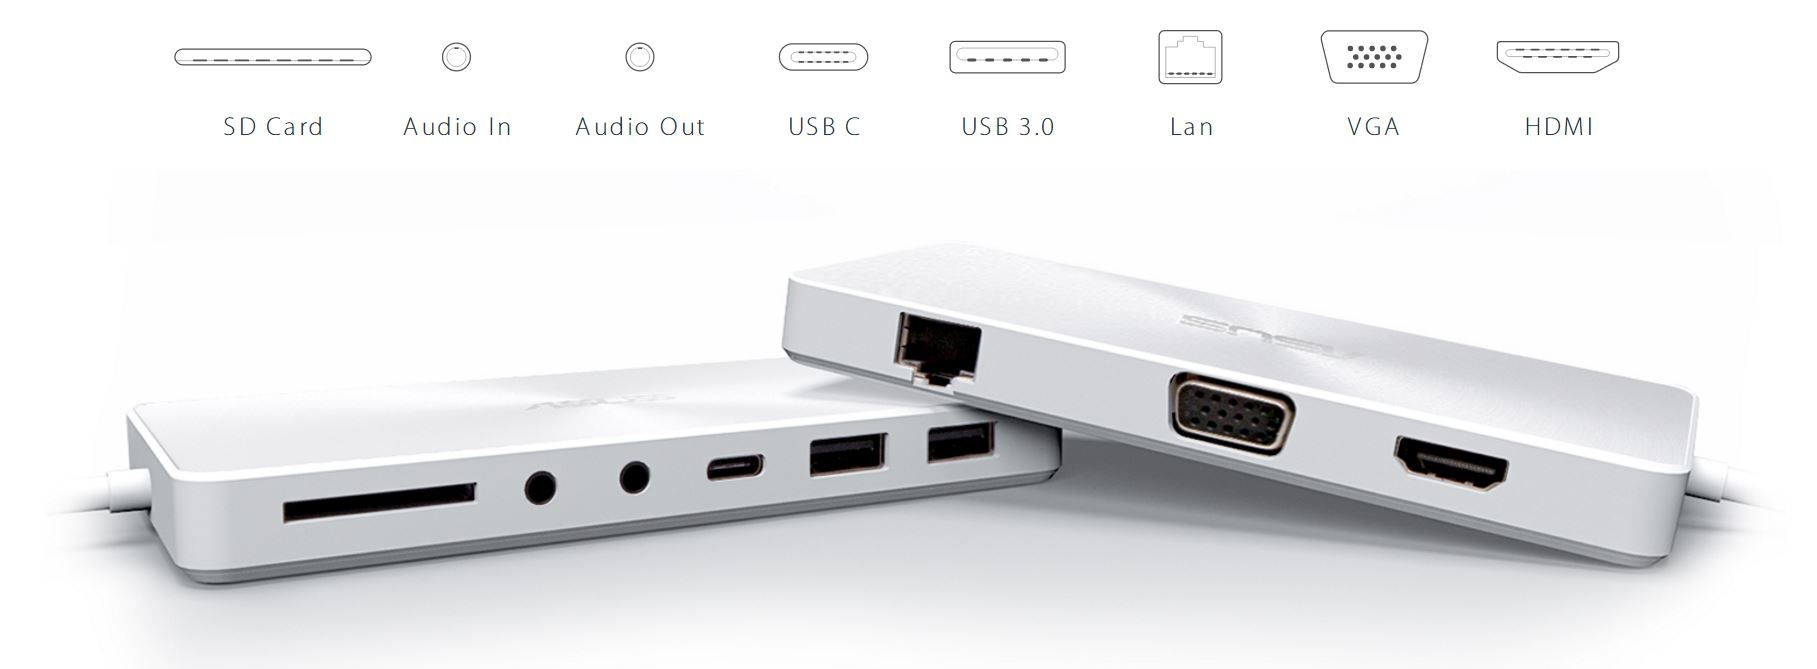
The tablet and a keyboard dock are included in delivery. The package also includes obligatory accessories, such as, the power adapter, warranty information and a short manual. An ASUS Active Stylus Pen can also be found amongst the delivery contents. Optional accessories, like a graphics dock, can be purchased from Asus and directly connected via the Thunderbolt 3 interface. This would boost the graphics performance. Officially, there is no information yet on the pricing of the graphics dock. Furthermore, accessories from 3rd party manufacturers can be used with the Thunderbolt 3 and the USB 3.0 interfaces. Asus offers a very nice extension, the Universal Dock (via the Thunderbolt 3 interface). At the time of testing, this accessory was available for 129 Euros (~$135).
Maintenance
Upgrade options for the Asus Transformer 3 Pro were not part of the plan. As such, it is not possible to swap out the SSD for a bigger one (manually).
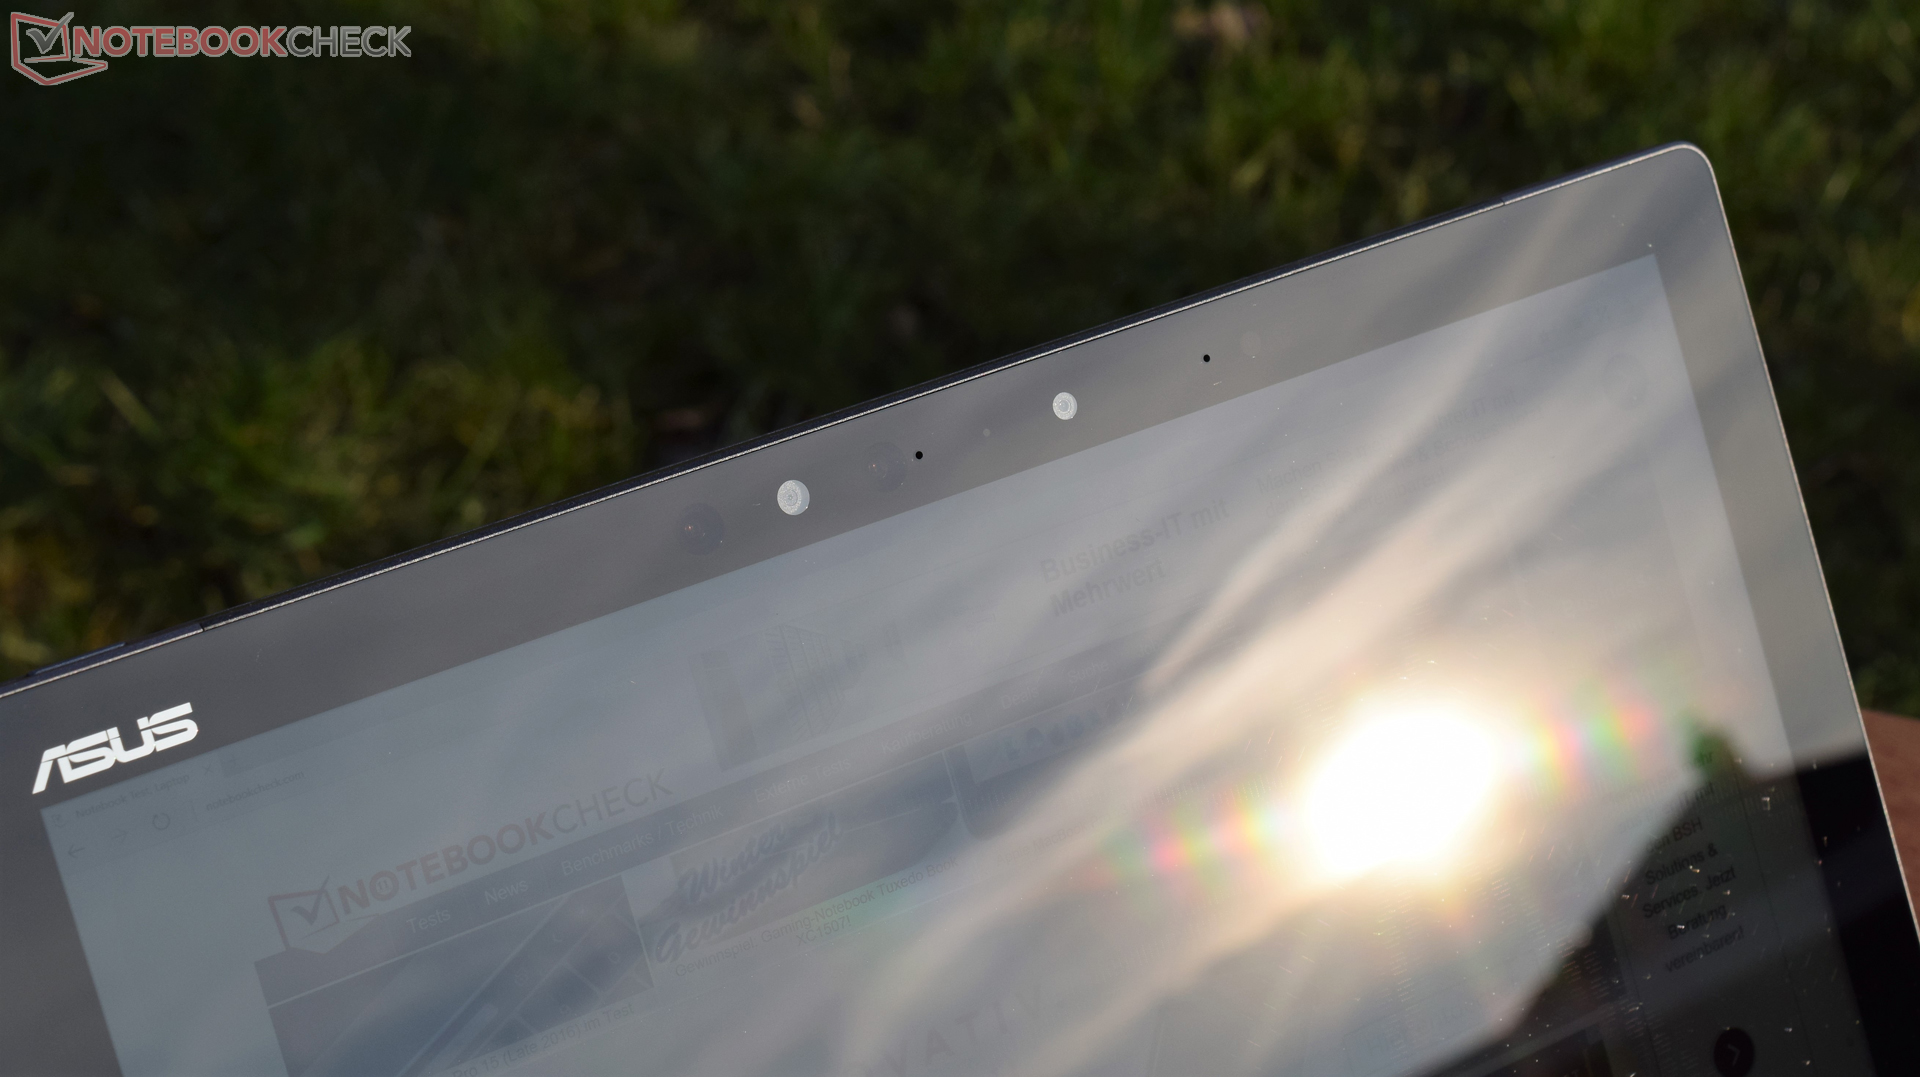
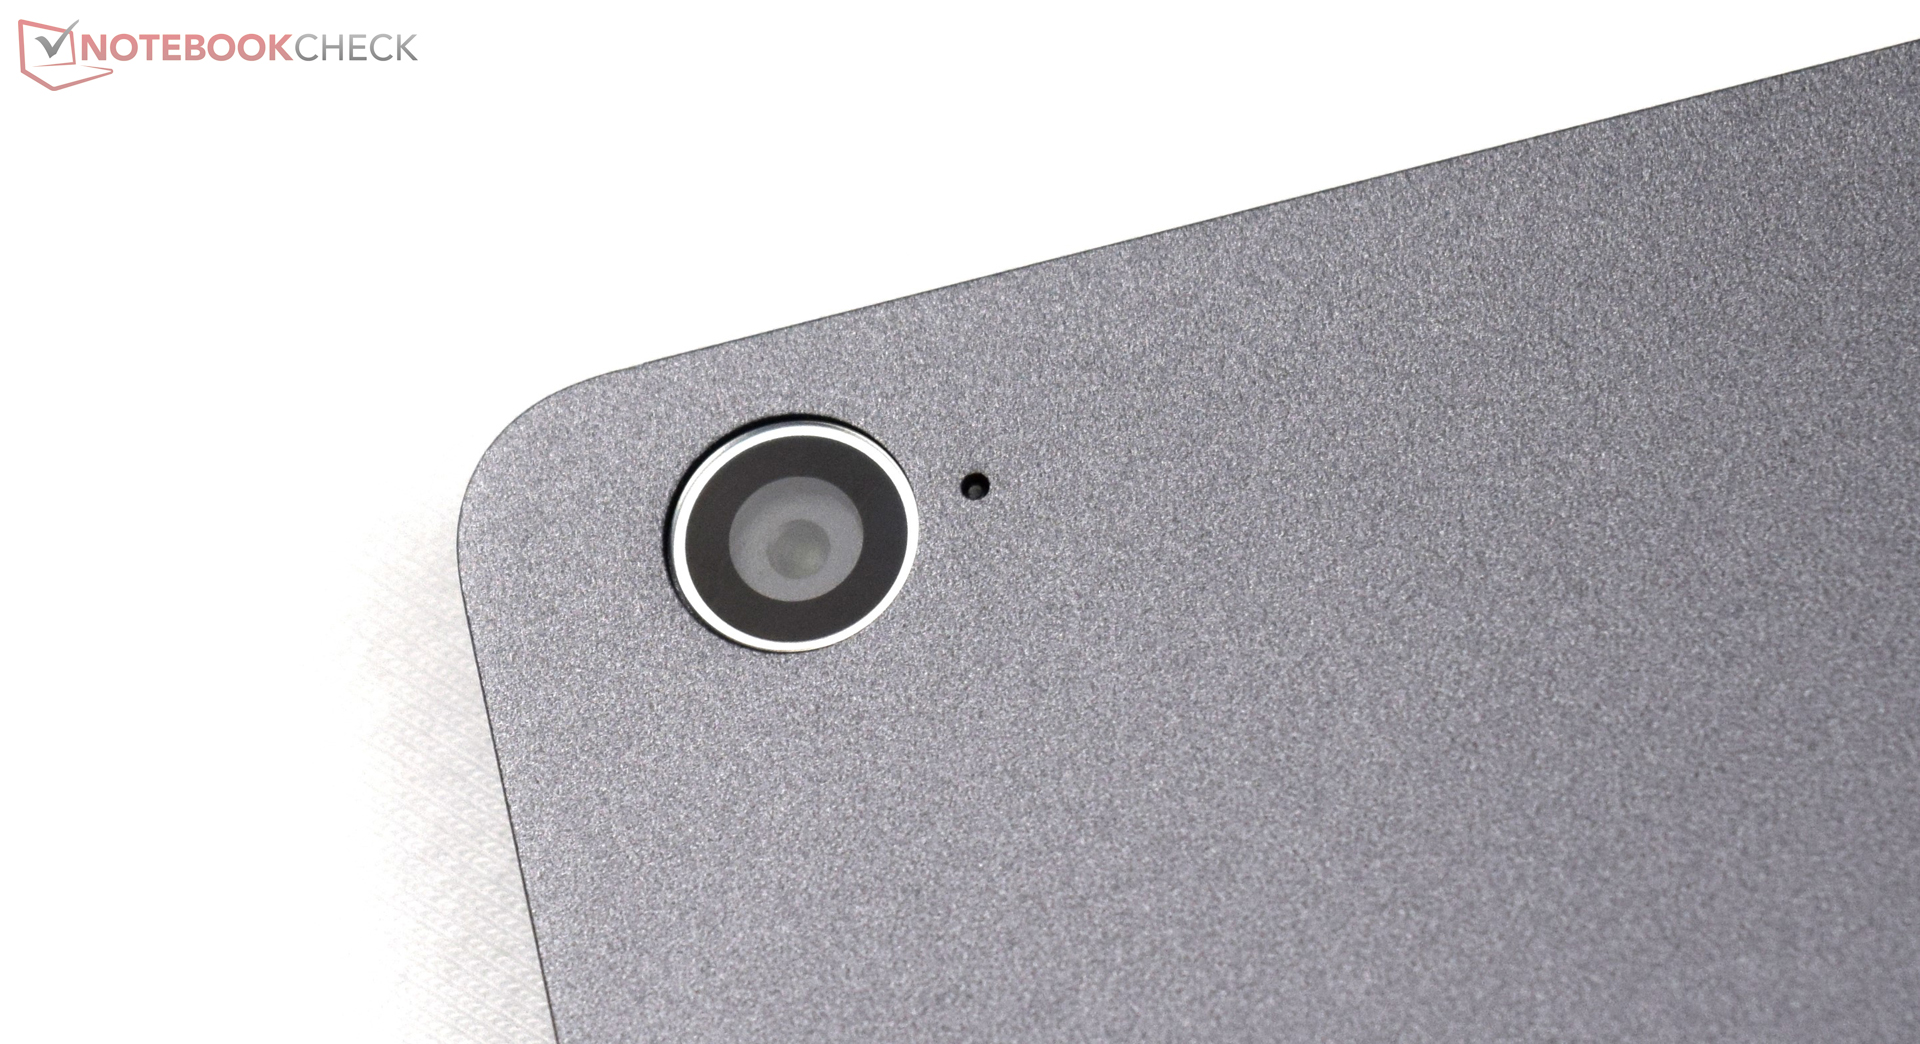
Camera
The Asus Transformer 3 Pro sports a camera on the front and the back. The front camera (2 MP) is primarily used for video transmission, such as, Skype sessions. On the back, the main camera takes pictures up to 13 MP. The OmniVision OV13850 camera sensor offers sufficient quality for snapshots. However, for high-quality shots, we recommend using a DSLR camera instead.

Operating System
According to the information on the Asus website, the Transformer 3 Pro is available with either Windows 10 Home or Pro. Asus does not officially support any other operating systems. In the download sections, all drivers are designed for Windows 10 64-bit.
Warranty
Asus guarantees the Transformer 3 Pro for 24 months. Please see our Guarantees, Return Policies & Warranties FAQ for country-specific information.
Input Devices
Touchscreen
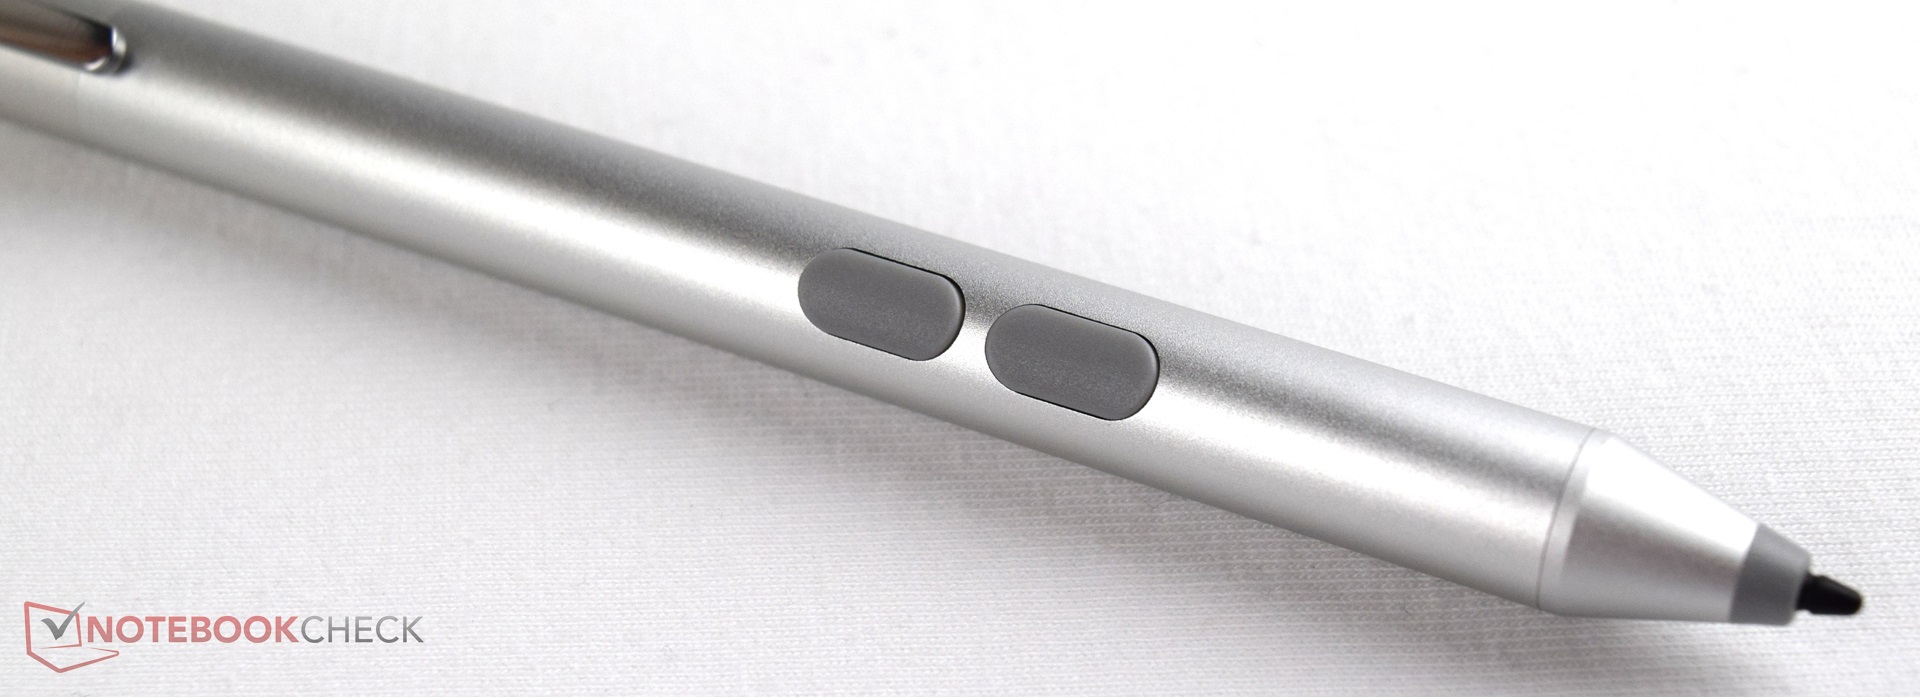
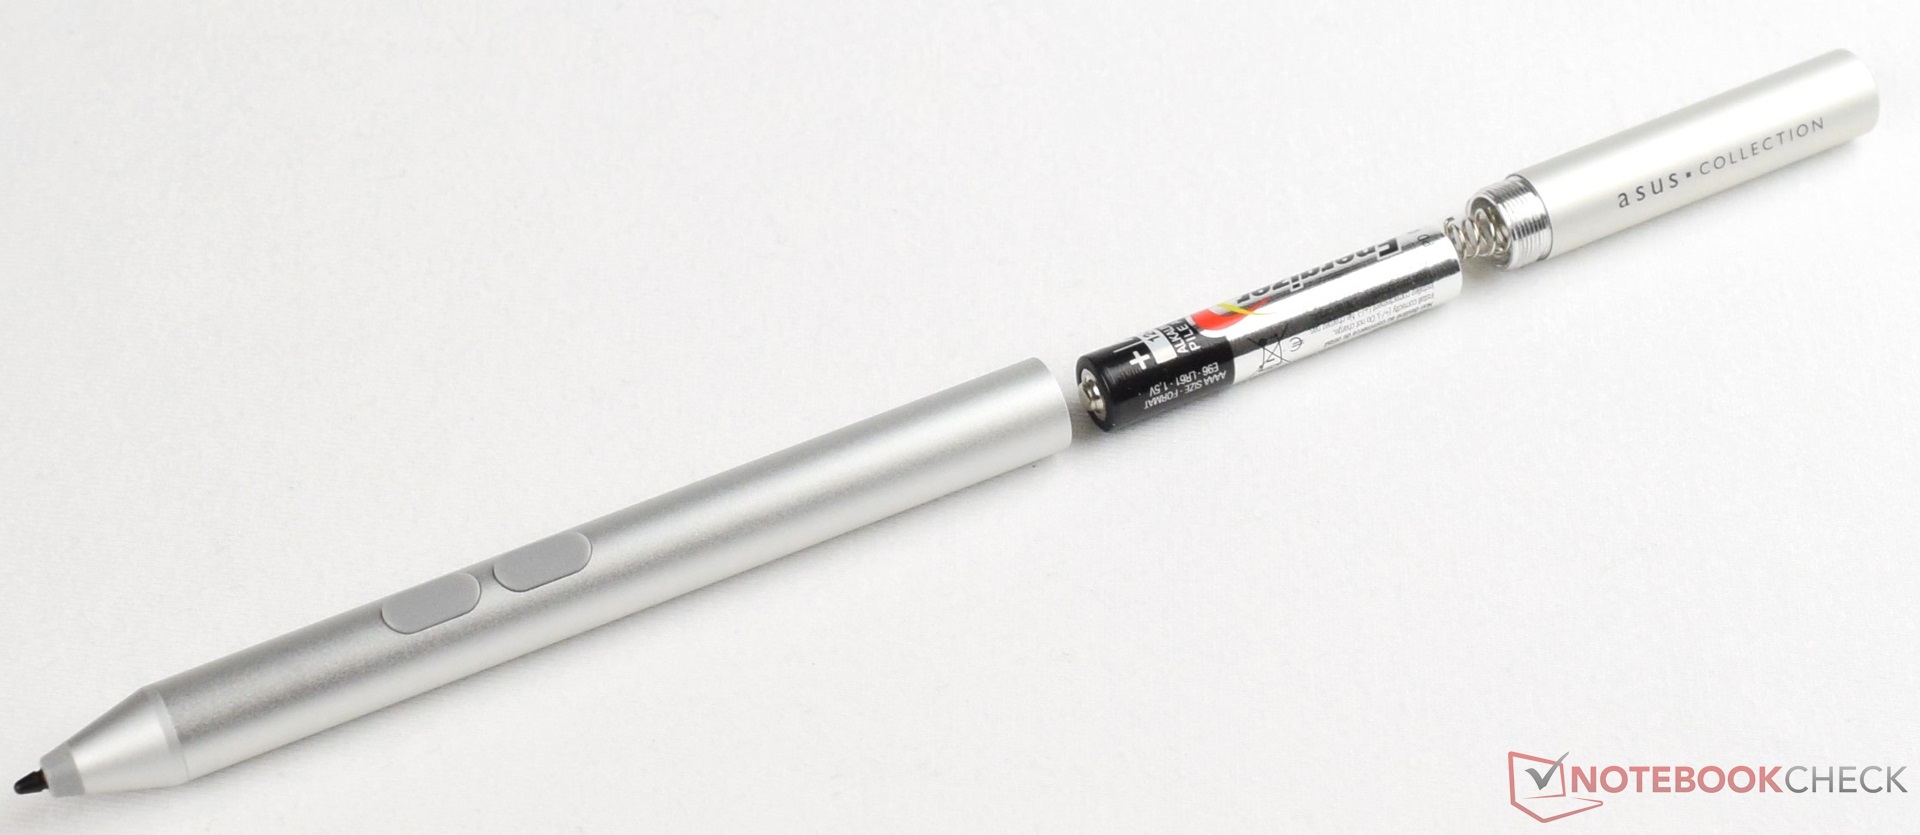
The WQHD+ multi-touch screen does good work. Input is recognized quickly and executed. If you like working with a touchscreen, then you should push the Windows scaling up to 200%. The high resolution of the 12.6-inch screen will make the symbols and captions very fine and small. The ASUS Active Stylus Pen (delivered with the tablet) is a sensible alternative if you want to use the touchscreen. The Active Stylus works nicely, but it cannot be stowed in the convertible.
Keyboard / Touchpad
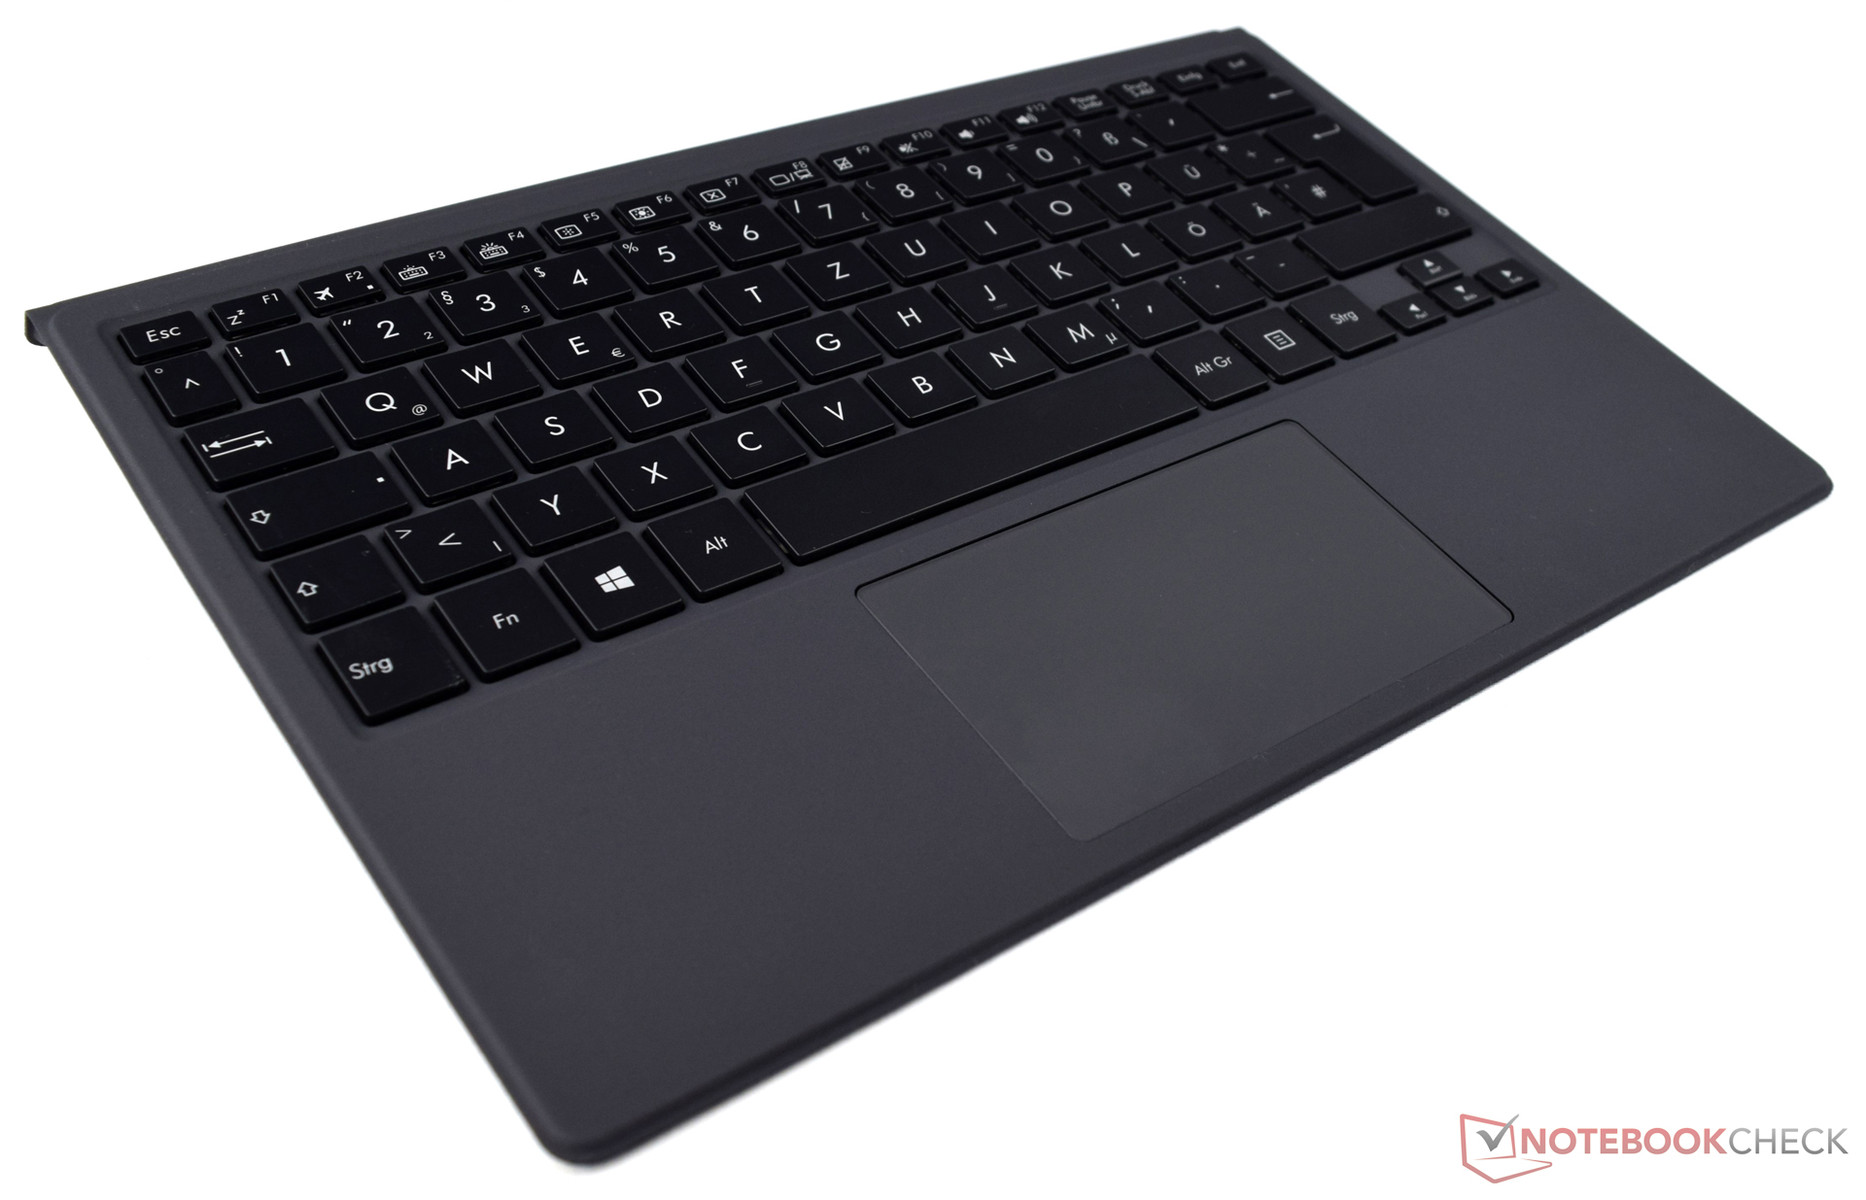
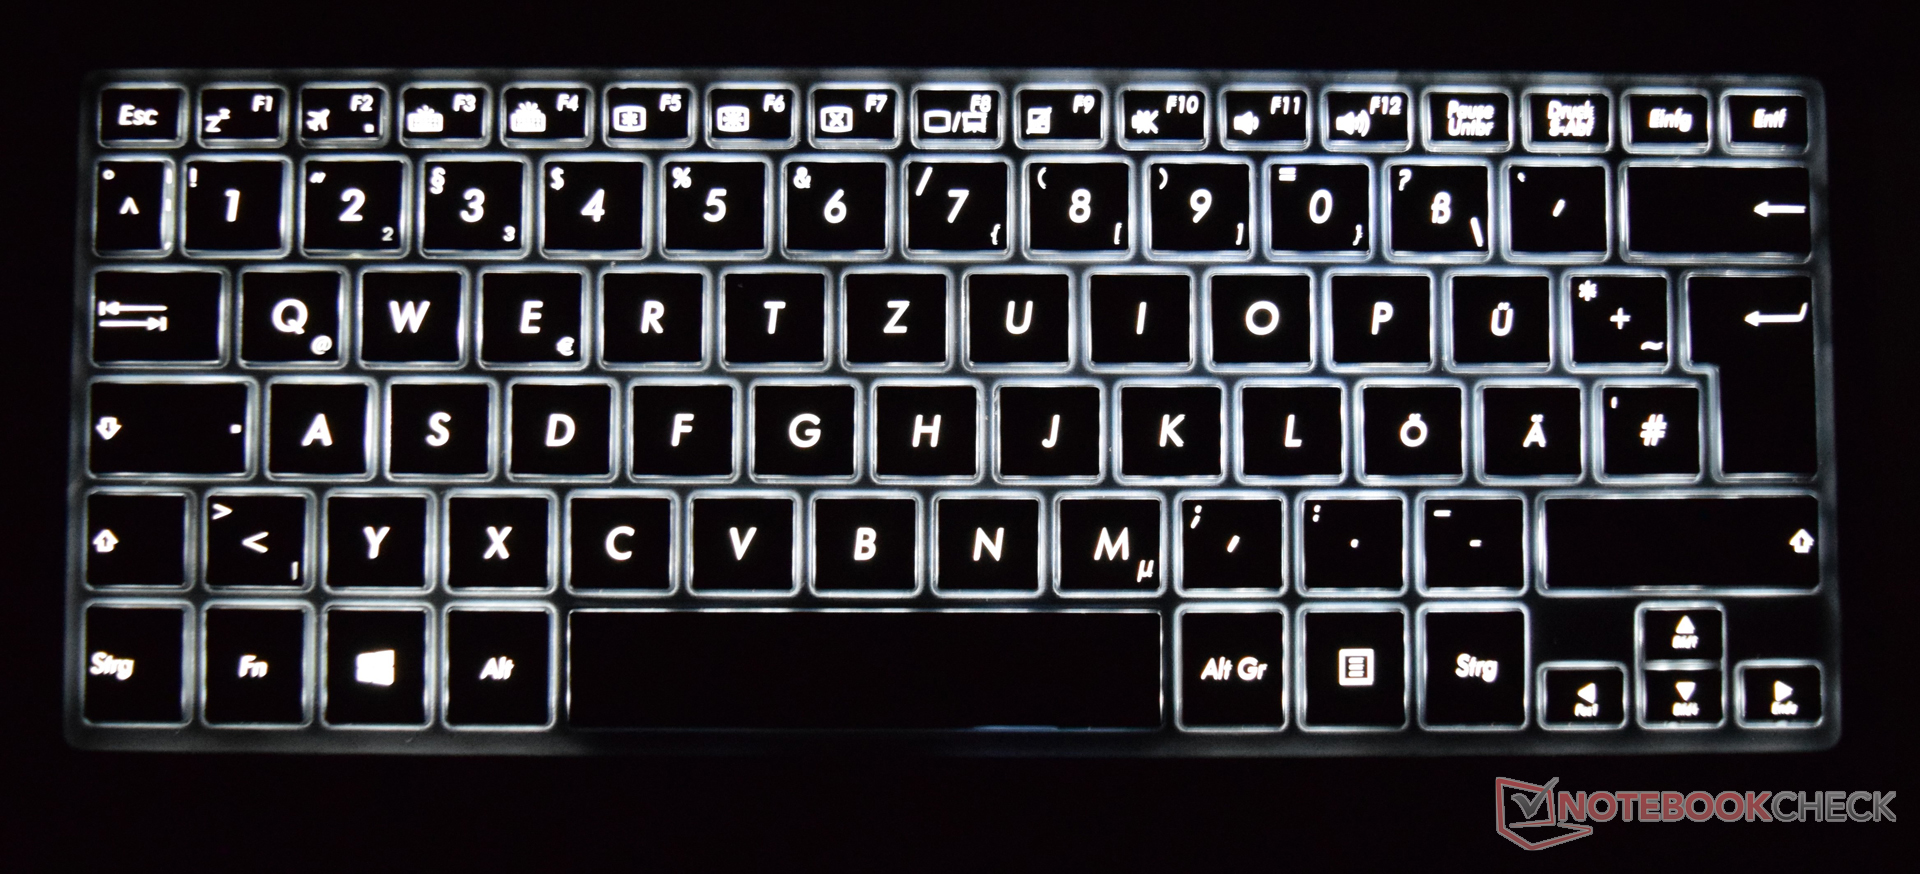
The Asus Transformer 3 Pro offers a nice keyboard dock, which includes a ClickPad. The dock can be connected using the magnetic latch. The keyboard dock comes in four different colors and the individual keys measure 16 x 15 mm (~0.63 x 0.60 inches, width x height). The very slim keyboard has a stroke distance of 1.4 mm. Although the pressure point of each key is tangible, we would have liked it to be a bit stronger. Typists should look for a better keyboard, as the keyboard dock does a decent job, but cannot replace professional keyboards.
The multi-touch ClickPad measures 10.6 x 6.2 cm (~4.2 x 2.4 in) and is nicely integrated in the bottom of the dock. The surface is smooth, which allows the finger to glide over it comfortably. However, in comparison to the quality of the keyboard dock and the case, the ClickPad is very poor. This glass touchpad suffers from various issues and chief among them is the unintentional movement of the cursor. Although the touchpad can score points with its support of Windows 10 gestures, frequently, the cursor will jump to another spot. Furthermore, it is not integrated firmly in the dock, which causes it to clatter slightly in use. An audible clicking noise confirms an executed click (near the bottom of the touchpad).
Display
Asus has installed a WQHD+ display with a resolution of 2880x1920 pixels in the Transformer 3 Pro. The 12.6-inch diagonal of the panel translates to a pixel density of 275 dpi. The multi-touch IPS panel has an average brightness of 307 cd/m². This means our convertible is a little brighter than the Lenovo ThinkPad X1, but the rest of the competitors are definitely brighter than our test model. The great contrast (1,090:1) and the low black value (0.29) ensure that colors remain strong and that the displayed black is satisfactory. We did not find a gray tinge in any scene. The illumination of the panel is very even at 91%.
Considering the price of the test model, the quality of the screen meets our expectations. Asus does not offer any other panels for this model. In our opinion, other panels would not have added additional value to this convertible, as the screen of our test model fits wonderfully to it.
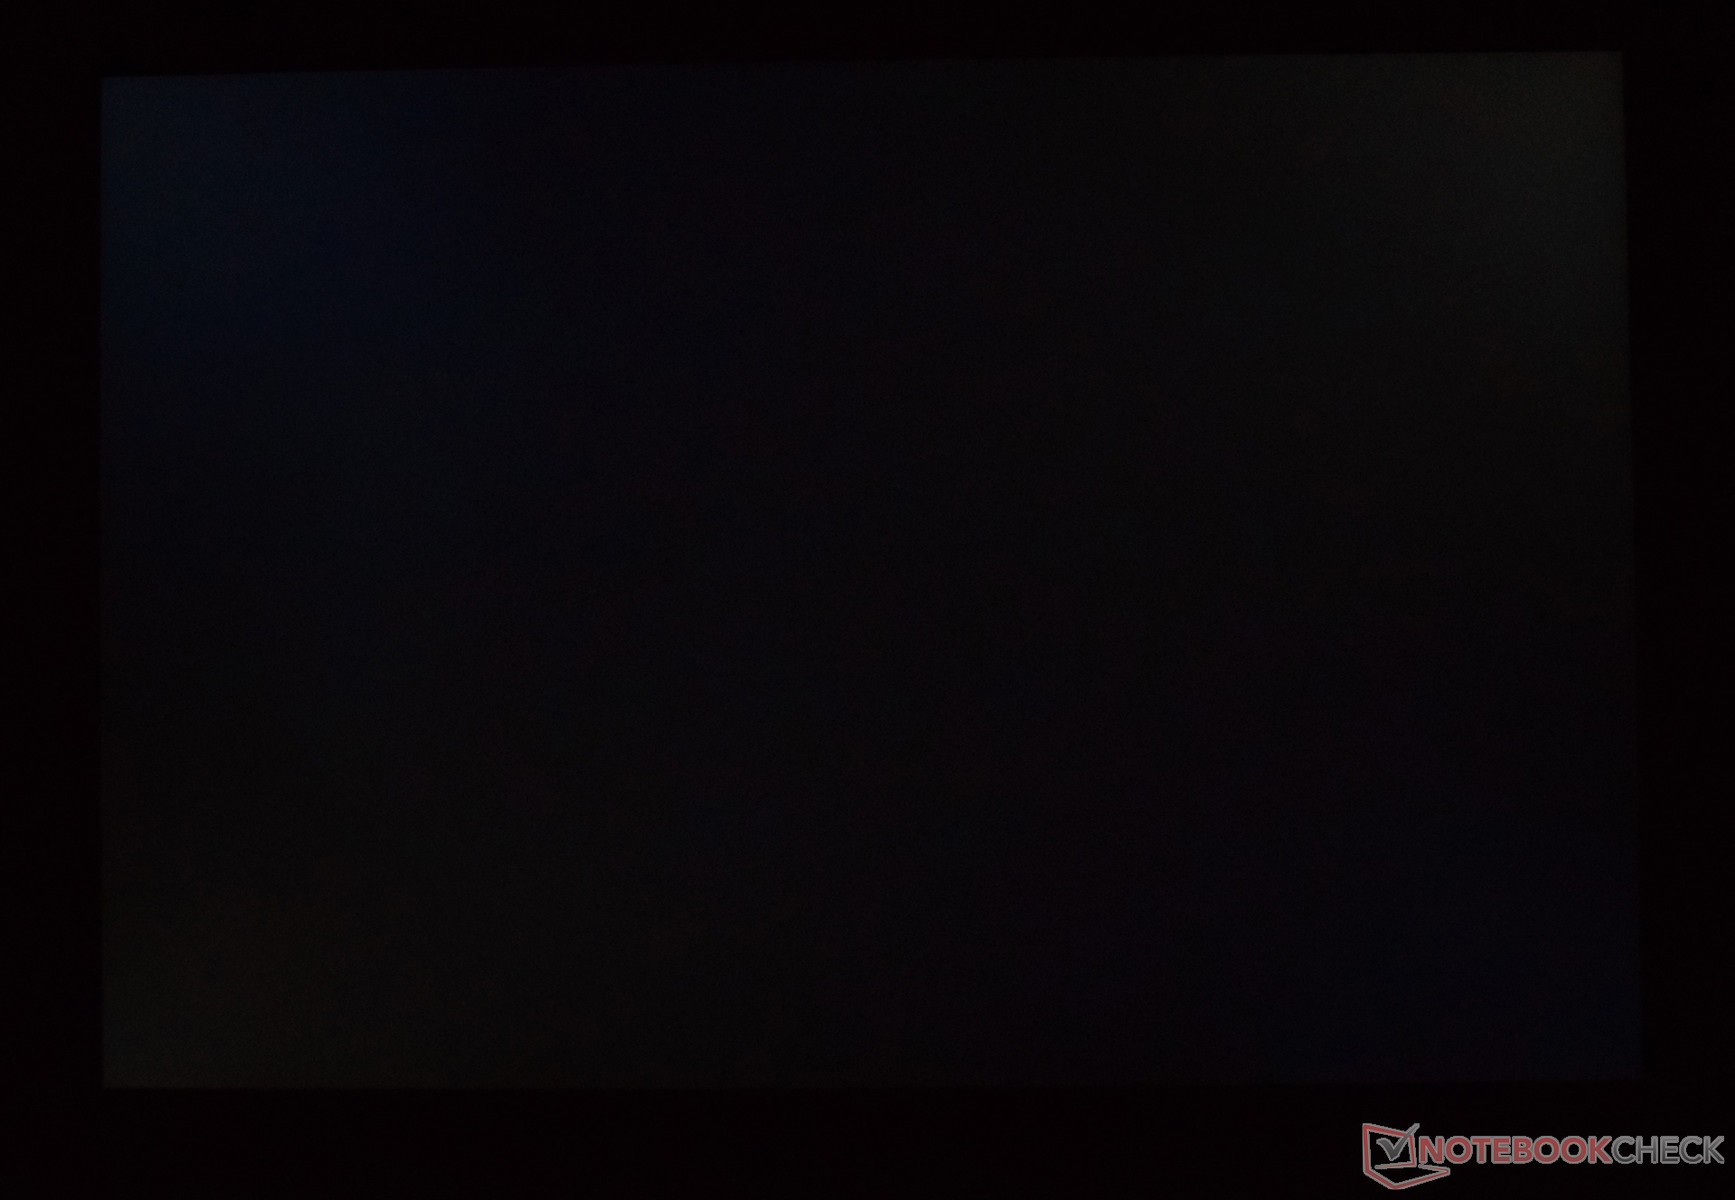
We are happy to note that, during our review, we did not encounter any issues, such as, "Screen Bleeding" (especially in darker scenes).
| |||||||||||||||||||||||||
Brightness Distribution: 91 %
Center on Battery: 316 cd/m²
Contrast: 1090:1 (Black: 0.29 cd/m²)
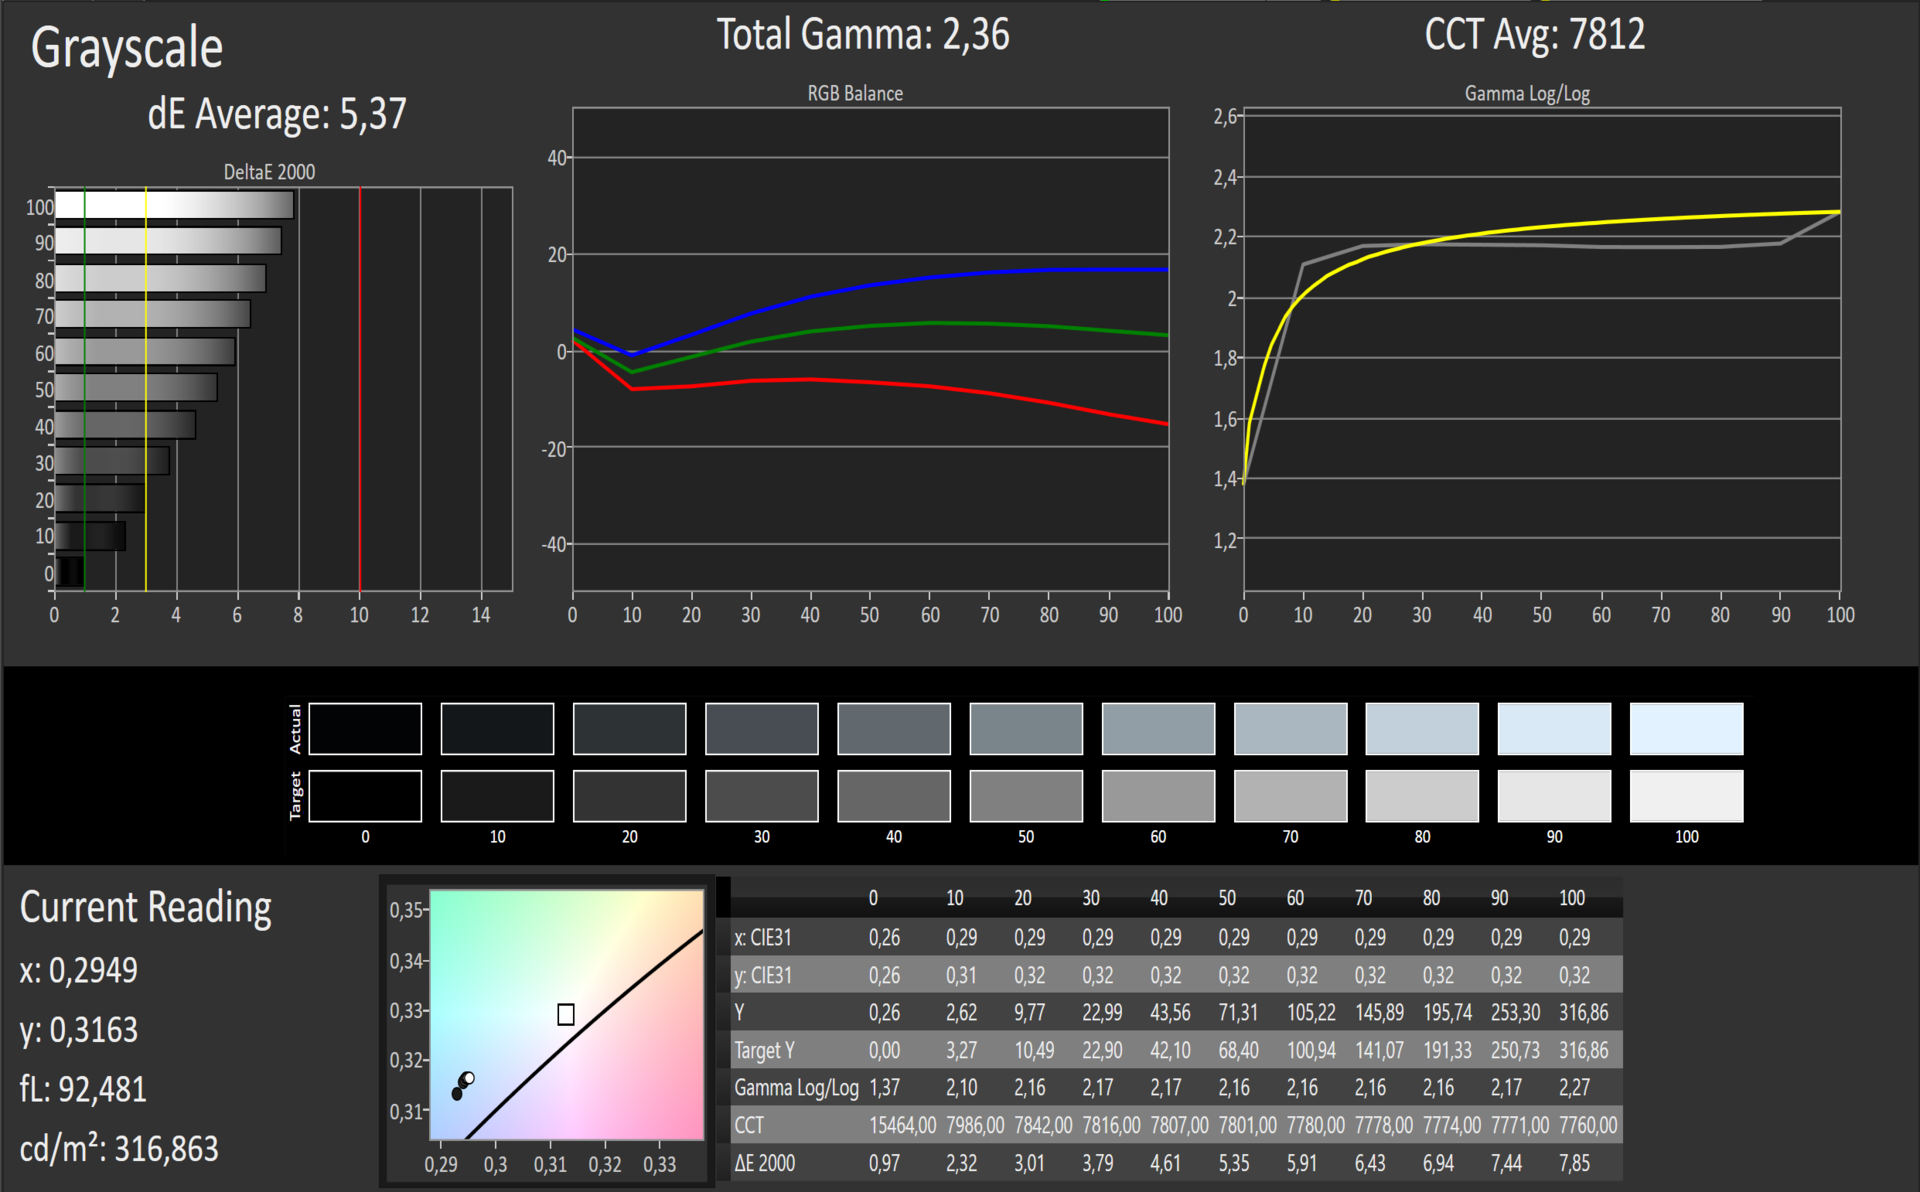
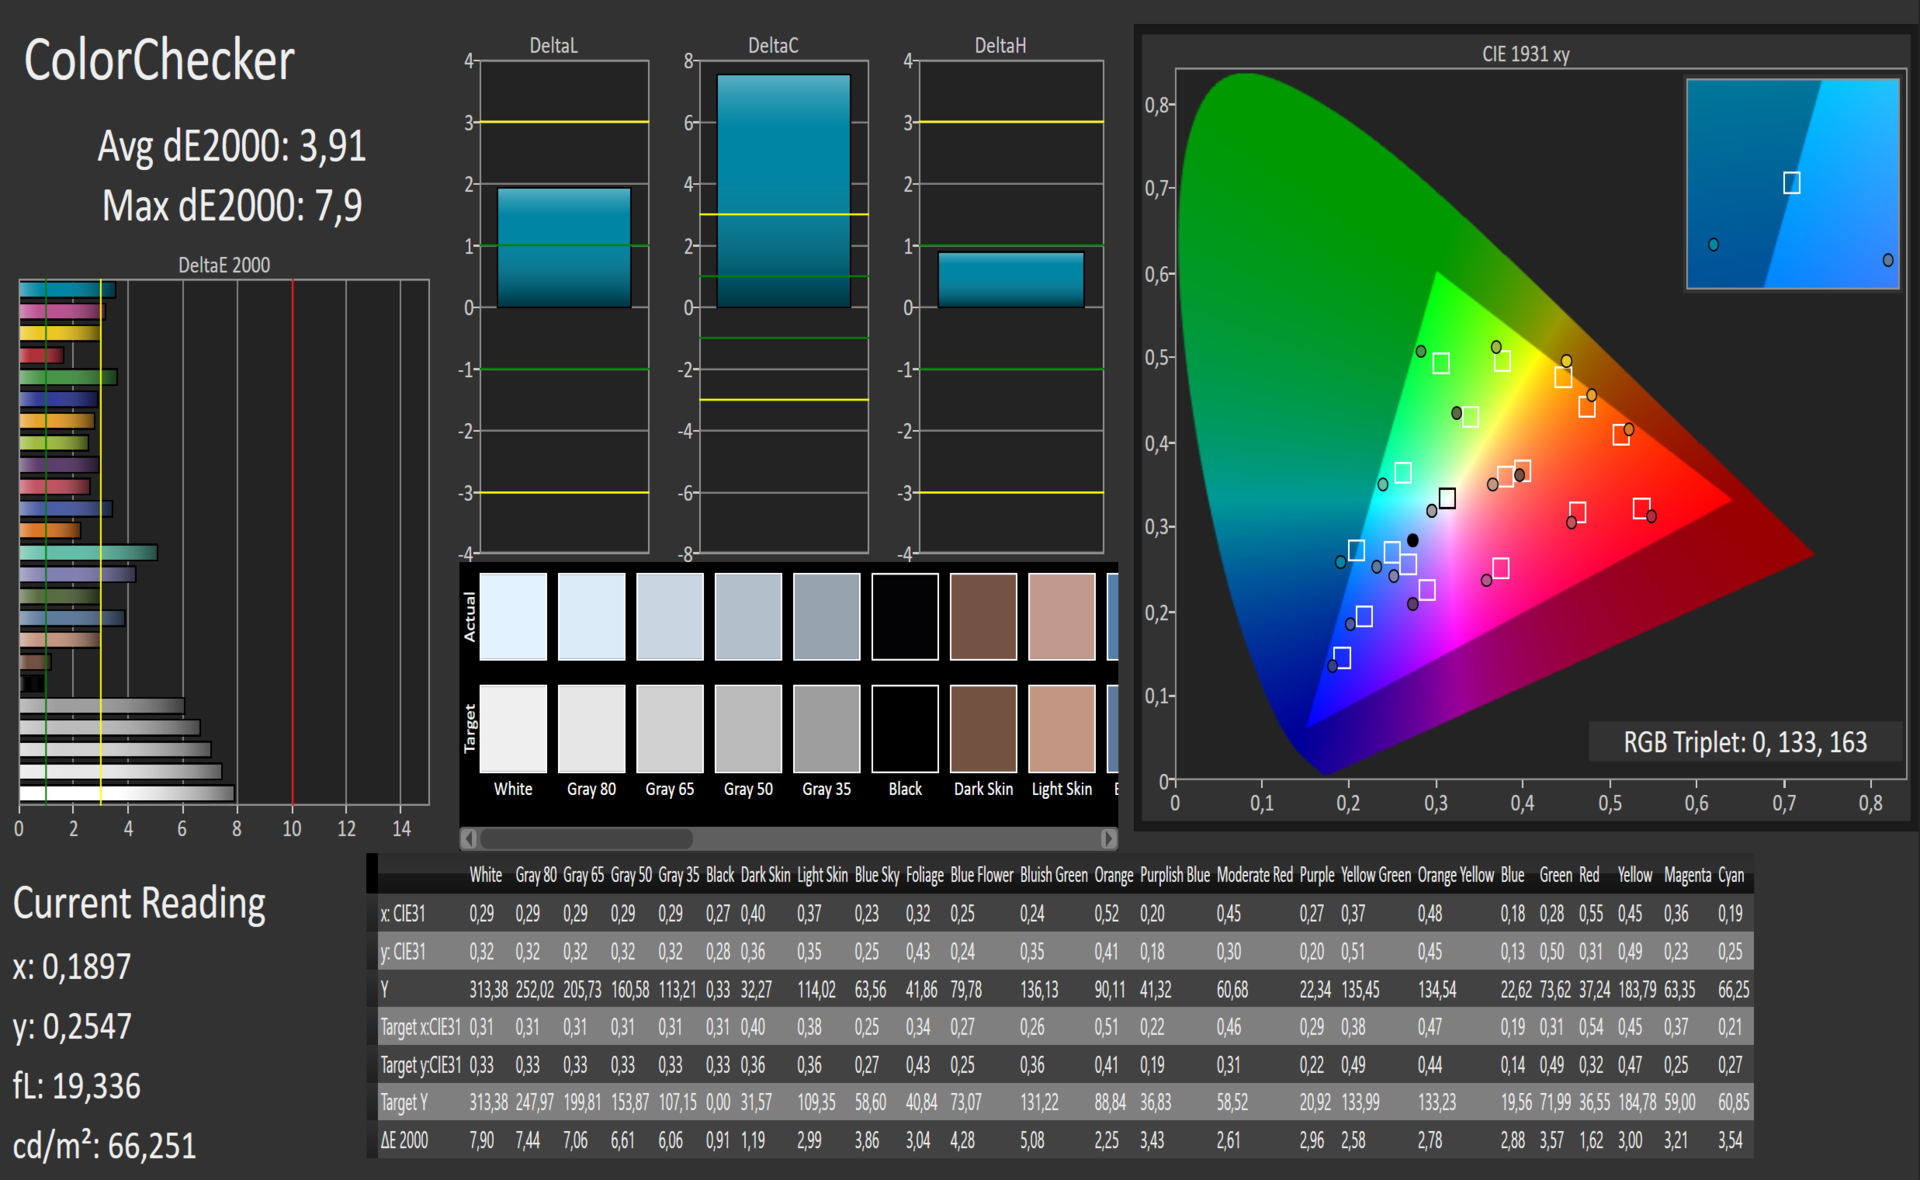
ΔE ColorChecker Calman: 3.91 | ∀{0.5-29.43 Ø4.72}
ΔE Greyscale Calman: 5.37 | ∀{0.09-98 Ø4.97}
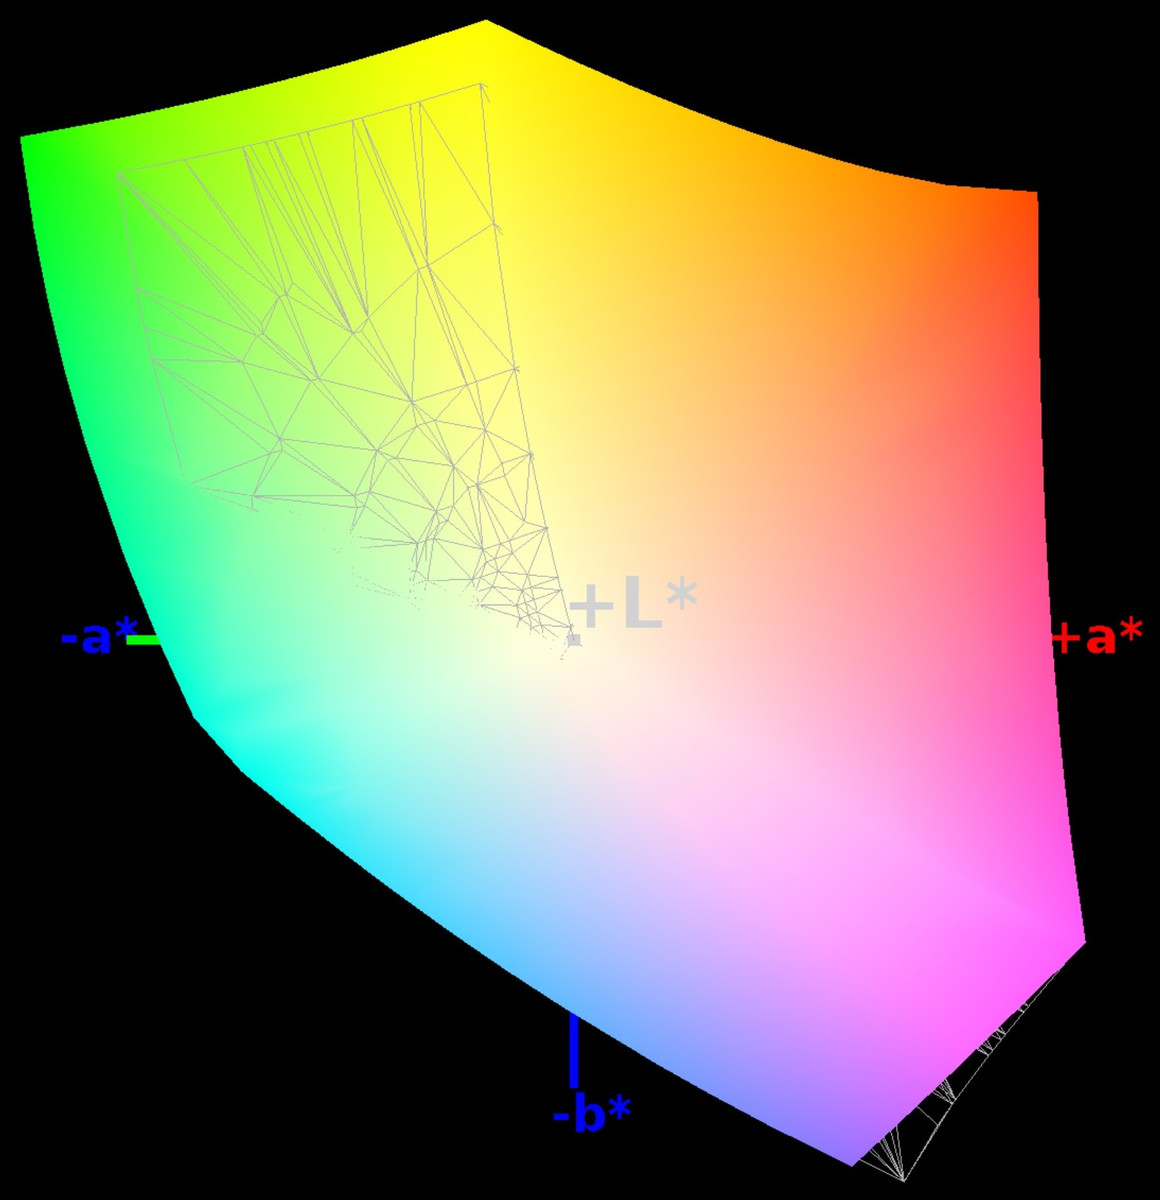
98% sRGB (Argyll 1.6.3 3D)
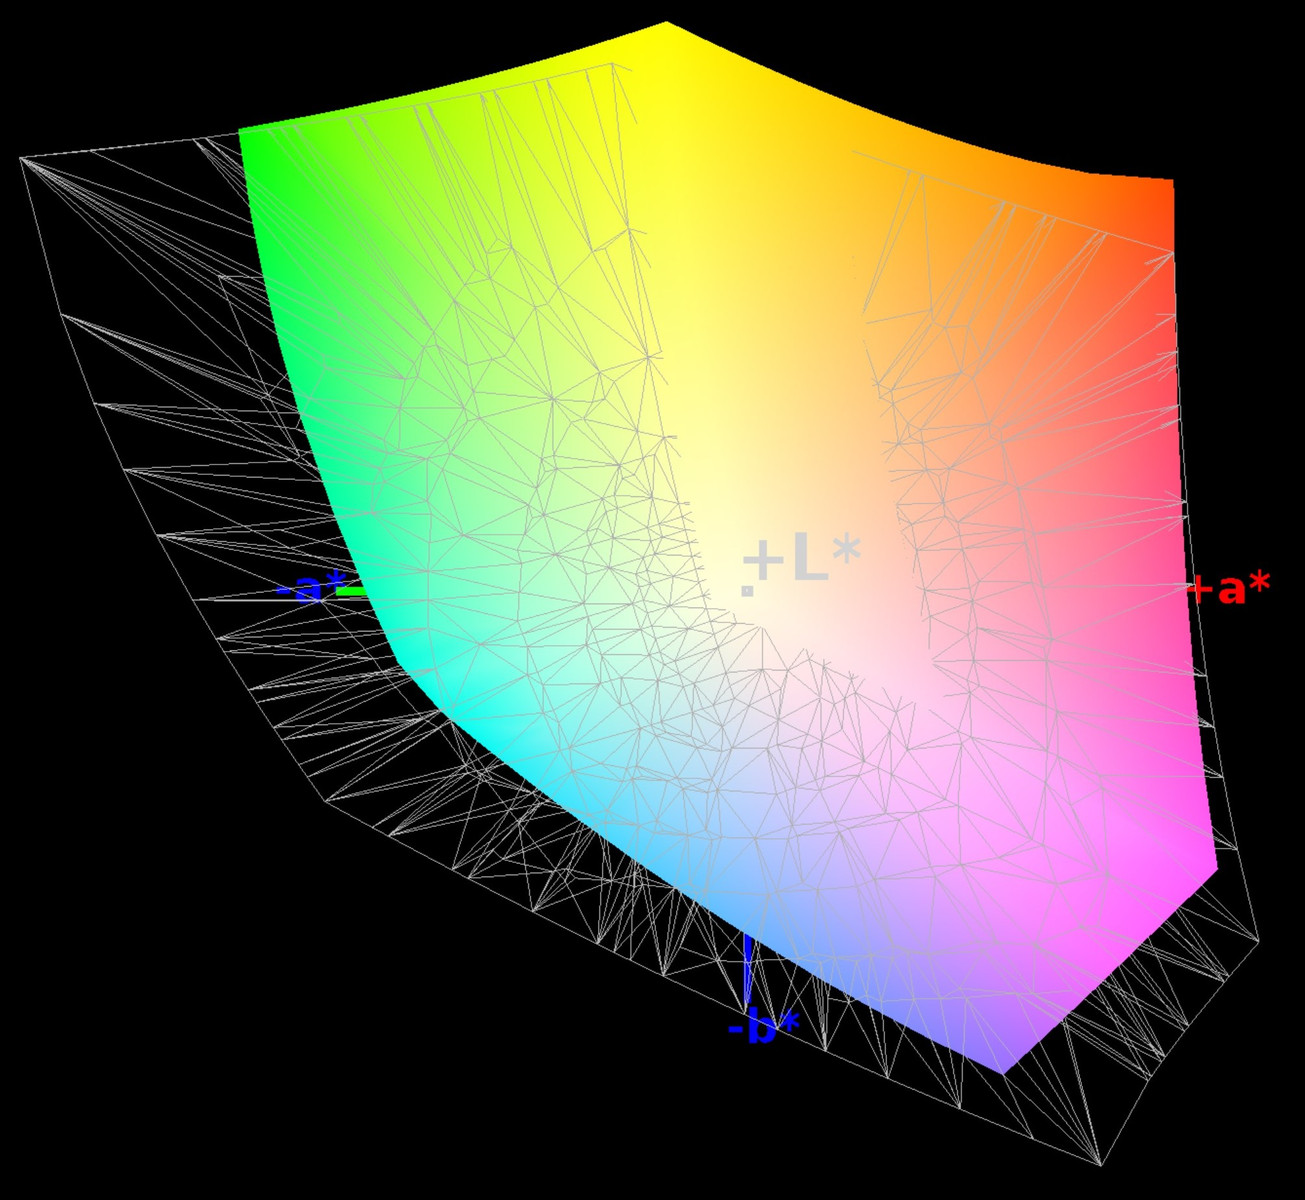
72% AdobeRGB 1998 (Argyll 1.6.3 3D)
82.2% AdobeRGB 1998 (Argyll 3D)
98.3% sRGB (Argyll 3D)
81.8% Display P3 (Argyll 3D)
Gamma: 2.36
CCT: 7812 K
| Asus Transformer 3 Pro T303UA-GN050T BOE BOE06AC (NV126A1M-N51), , 2880x1920, 12.6" | Microsoft Surface Pro 4, Core m3 Samsung SDC3853, , 2736x1824, 12.3" | Lenovo ThinkPad X1 Yoga-20FRS1VS00 Samsung ATNA40JU01-0, , 2560x1440, 14" | HP Elite x2 1012 G1 LG Philips, , 1920x1280, 12.1" | Acer Aspire Switch Alpha 12 SA5-271-56HM Panasonic VVX12T041N00, , 2160x1440, 12" | |
|---|---|---|---|---|---|
| Display | -12% | -31% | -14% | ||
| Display P3 Coverage (%) | 81.8 | 67.5 -17% | 53.8 -34% | 65.5 -20% | |
| sRGB Coverage (%) | 98.3 | 96.6 -2% | 73.7 -25% | 96.1 -2% | |
| AdobeRGB 1998 Coverage (%) | 82.2 | 69 -16% | 53.8 -35% | 66.9 -19% | |
| Response Times | -30% | 97% | 5% | 8% | |
| Response Time Grey 50% / Grey 80% * (ms) | 30 ? | 46 ? -53% | 1 ? 97% | 33.2 ? -11% | 20 ? 33% |
| Response Time Black / White * (ms) | 29 ? | 31 ? -7% | 1 ? 97% | 22.8 ? 21% | 34 ? -17% |
| PWM Frequency (Hz) | 200 ? | 50 ? | 240 ? | 1000 ? | |
| Screen | 13% | -3% | -22% | -21% | |
| Brightness middle (cd/m²) | 316 | 389.2 23% | 279 -12% | 322 2% | 345 9% |
| Brightness (cd/m²) | 307 | 392 28% | 277 -10% | 319 4% | 328 7% |
| Brightness Distribution (%) | 91 | 92 1% | 91 0% | 97 7% | 91 0% |
| Black Level * (cd/m²) | 0.29 | 0.27 7% | 0.42 -45% | 0.38 -31% | |
| Contrast (:1) | 1090 | 1441 32% | 767 -30% | 908 -17% | |
| Colorchecker dE 2000 * | 3.91 | 3.61 8% | 5.15 -32% | 6.02 -54% | 8.4 -115% |
| Colorchecker dE 2000 max. * | 7.9 | 8.28 -5% | 10.06 -27% | 11.9 -51% | |
| Greyscale dE 2000 * | 5.37 | 3.8 29% | 5.44 -1% | 6.29 -17% | 4.3 20% |
| Gamma | 2.36 93% | 2.16 102% | 2.28 96% | 2.4 92% | 2.63 84% |
| CCT | 7812 83% | 5969 109% | 5686 114% | 7712 84% | 7368 88% |
| Color Space (Percent of AdobeRGB 1998) (%) | 72 | 63 -12% | 98 36% | 47.8 -34% | 62 -14% |
| Color Space (Percent of sRGB) (%) | 98 | 97 -1% | 100 2% | 73.2 -25% | |
| Total Average (Program / Settings) | -10% /
1% | 47% /
17% | -16% /
-20% | -9% /
-16% |
* ... smaller is better
Thanks to the great contrast (1,090:1) and black value (0.29), the picture quality is very nice. Although the Delta-E 2000 values are slightly high out-of-the-box (ColorChecker 3.91 and gray levels 5.37), a calibration will fix most issues. A suitable ICC profile is provided and available for download.
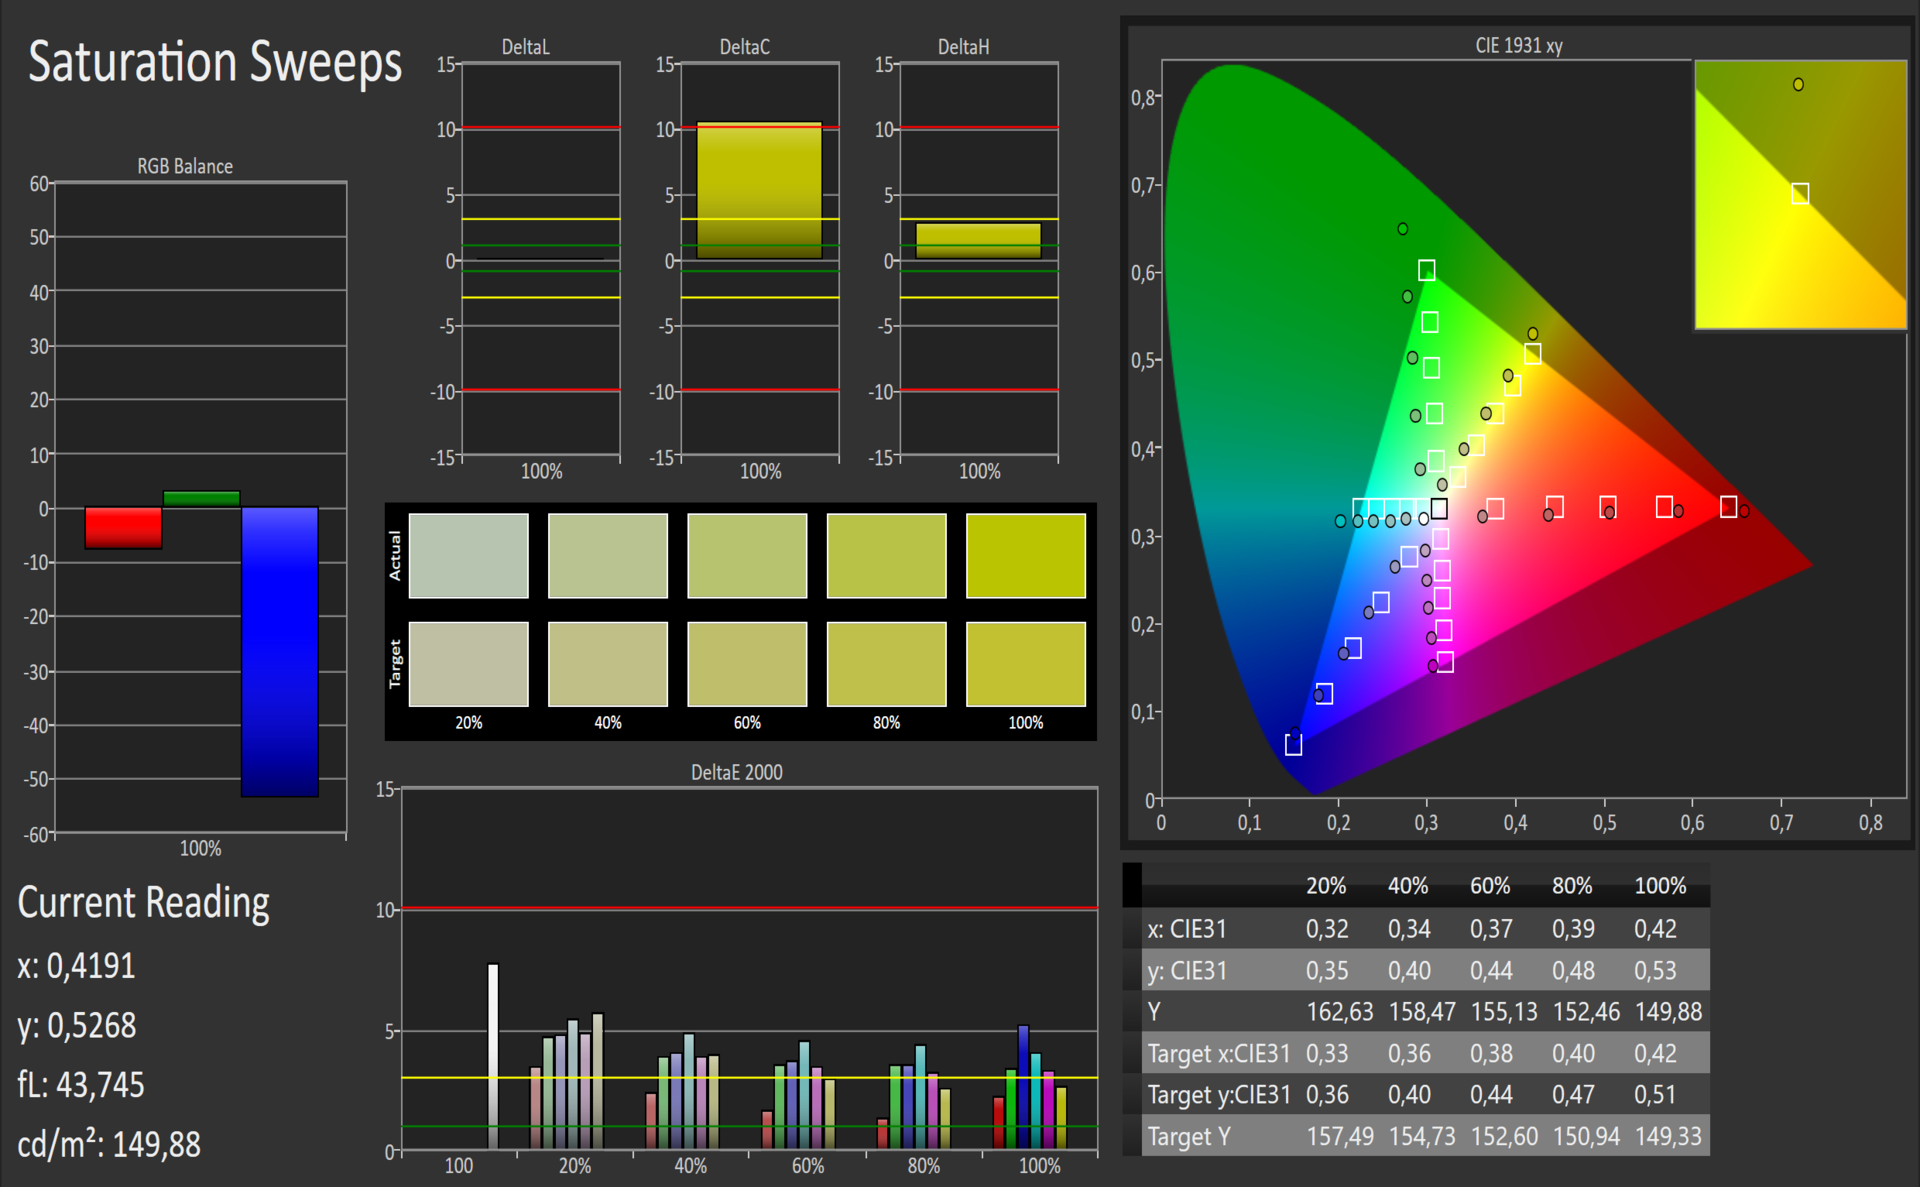
The IPS panel suffers from a blue tinge, but this did not negatively impact our experience. The WQHD+ display is capable of covering 98% of the sRGB color space (great). The AdobeRGB color spectrum is covered up to 72%. This panel is suitable for the work of hobby and professional photographers.
We must criticize another aspect of the Asus Transformer 3 Pro: at a brightness of 90% or lower, the panel is afflicted by PWM flickering at 200 Hz.
Display Response Times
| ↔ Response Time Black to White | ||
|---|---|---|
| 29 ms ... rise ↗ and fall ↘ combined | ↗ 8 ms rise | 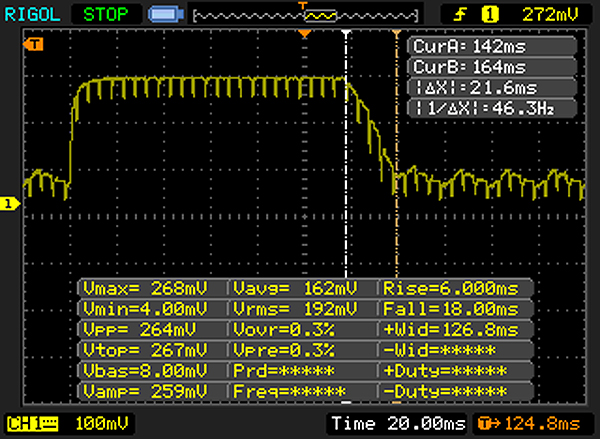 |
| ↘ 21 ms fall | ||
| The screen shows relatively slow response rates in our tests and may be too slow for gamers. In comparison, all tested devices range from 0.1 (minimum) to 240 (maximum) ms. » 77 % of all devices are better. This means that the measured response time is worse than the average of all tested devices (19.8 ms). | ||
| ↔ Response Time 50% Grey to 80% Grey | ||
| 30 ms ... rise ↗ and fall ↘ combined | ↗ 14 ms rise | 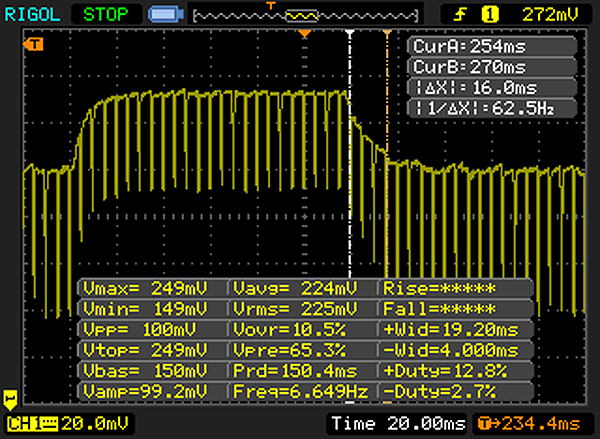 |
| ↘ 16 ms fall | ||
| The screen shows slow response rates in our tests and will be unsatisfactory for gamers. In comparison, all tested devices range from 0.165 (minimum) to 636 (maximum) ms. » 40 % of all devices are better. This means that the measured response time is similar to the average of all tested devices (31 ms). | ||
Screen Flickering / PWM (Pulse-Width Modulation)
| Screen flickering / PWM detected | 200 Hz | ≤ 90 % brightness setting | 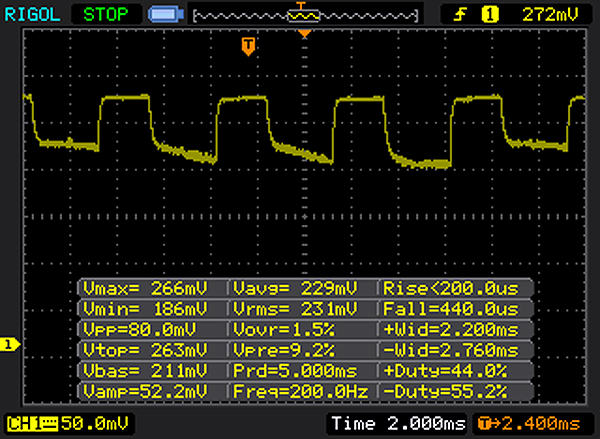 |
The display backlight flickers at 200 Hz (worst case, e.g., utilizing PWM) Flickering detected at a brightness setting of 90 % and below. There should be no flickering or PWM above this brightness setting. The frequency of 200 Hz is relatively low, so sensitive users will likely notice flickering and experience eyestrain at the stated brightness setting and below. In comparison: 52 % of all tested devices do not use PWM to dim the display. If PWM was detected, an average of 7753 (minimum: 5 - maximum: 343500) Hz was measured. | |||
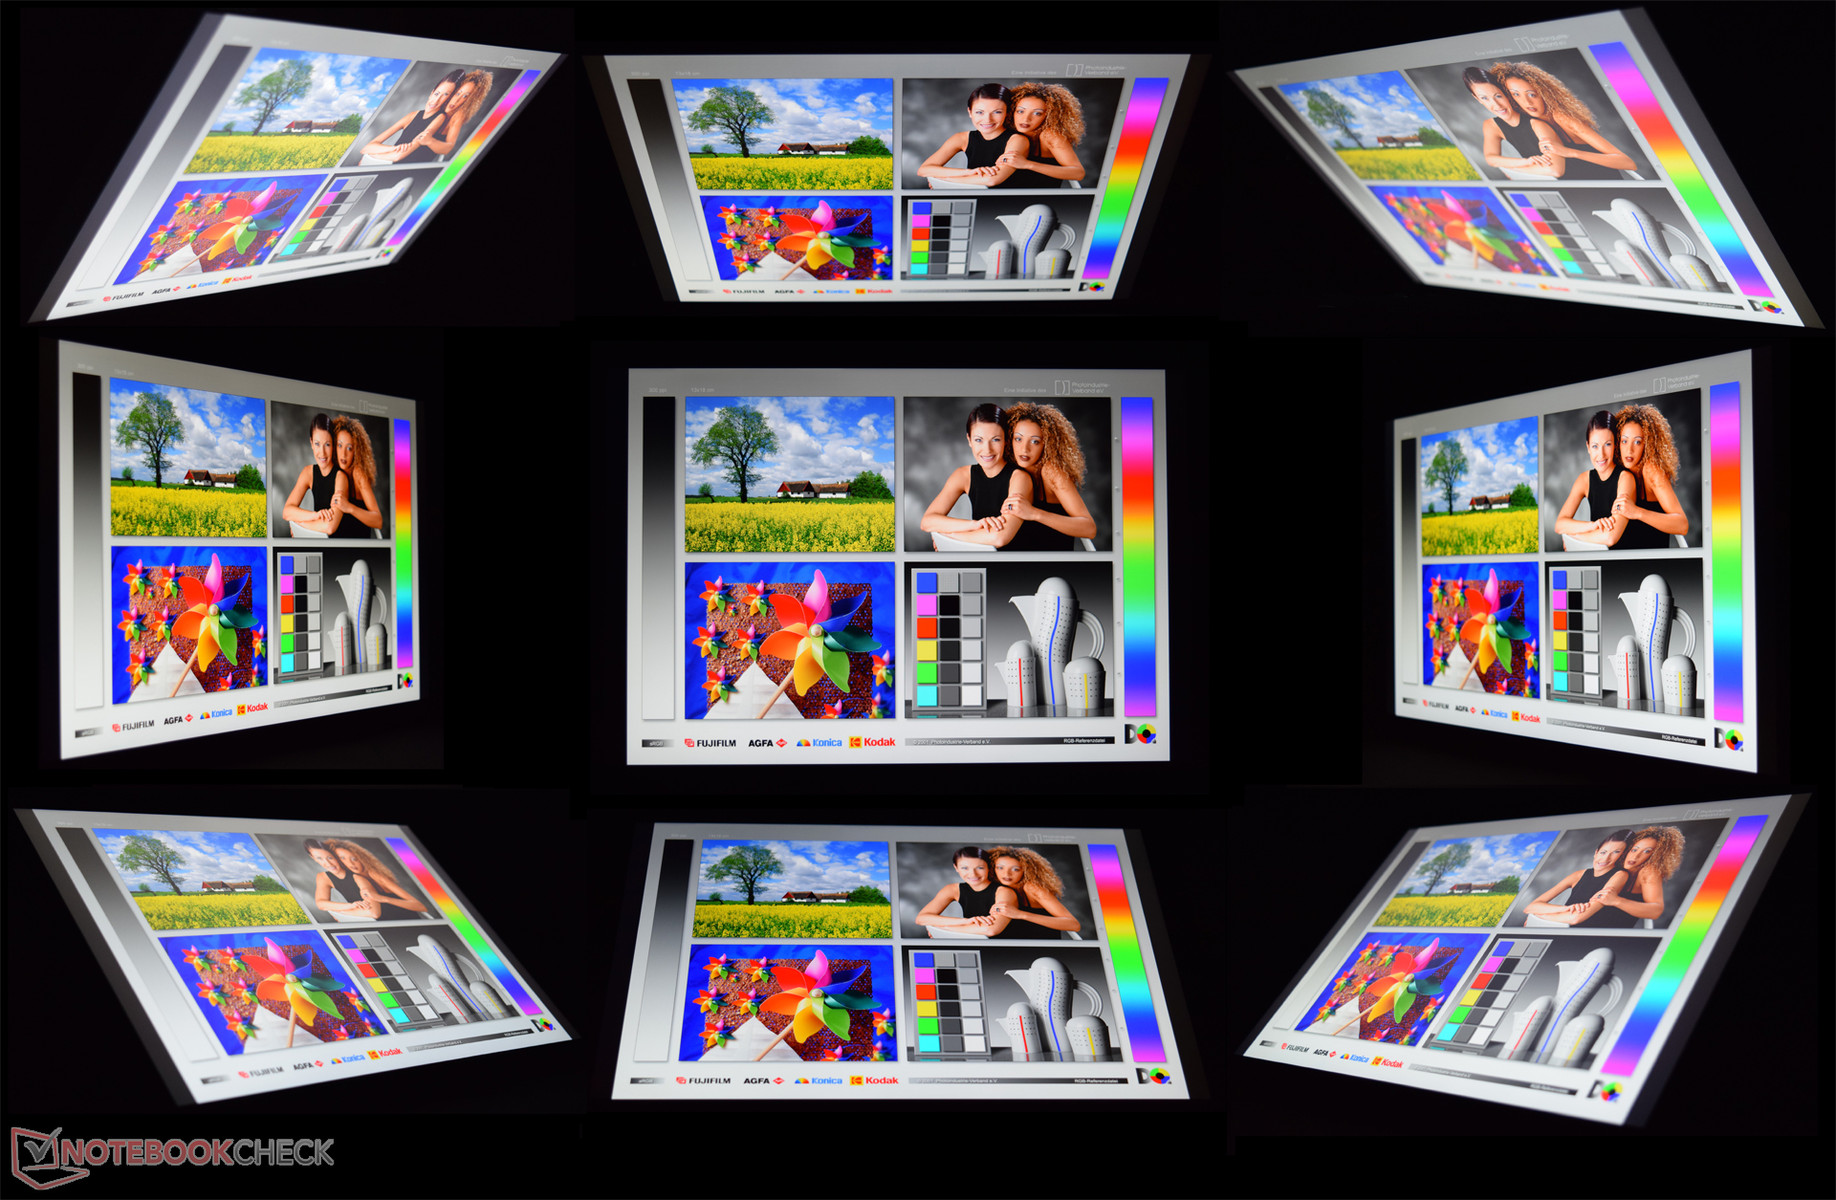
Thanks to the IPS panel, the Asus Transformer 3 Pro can present content nicely. The test picture can be read from almost all angles. The colors are a little pale at extreme angles, but this is an acceptable deviation.
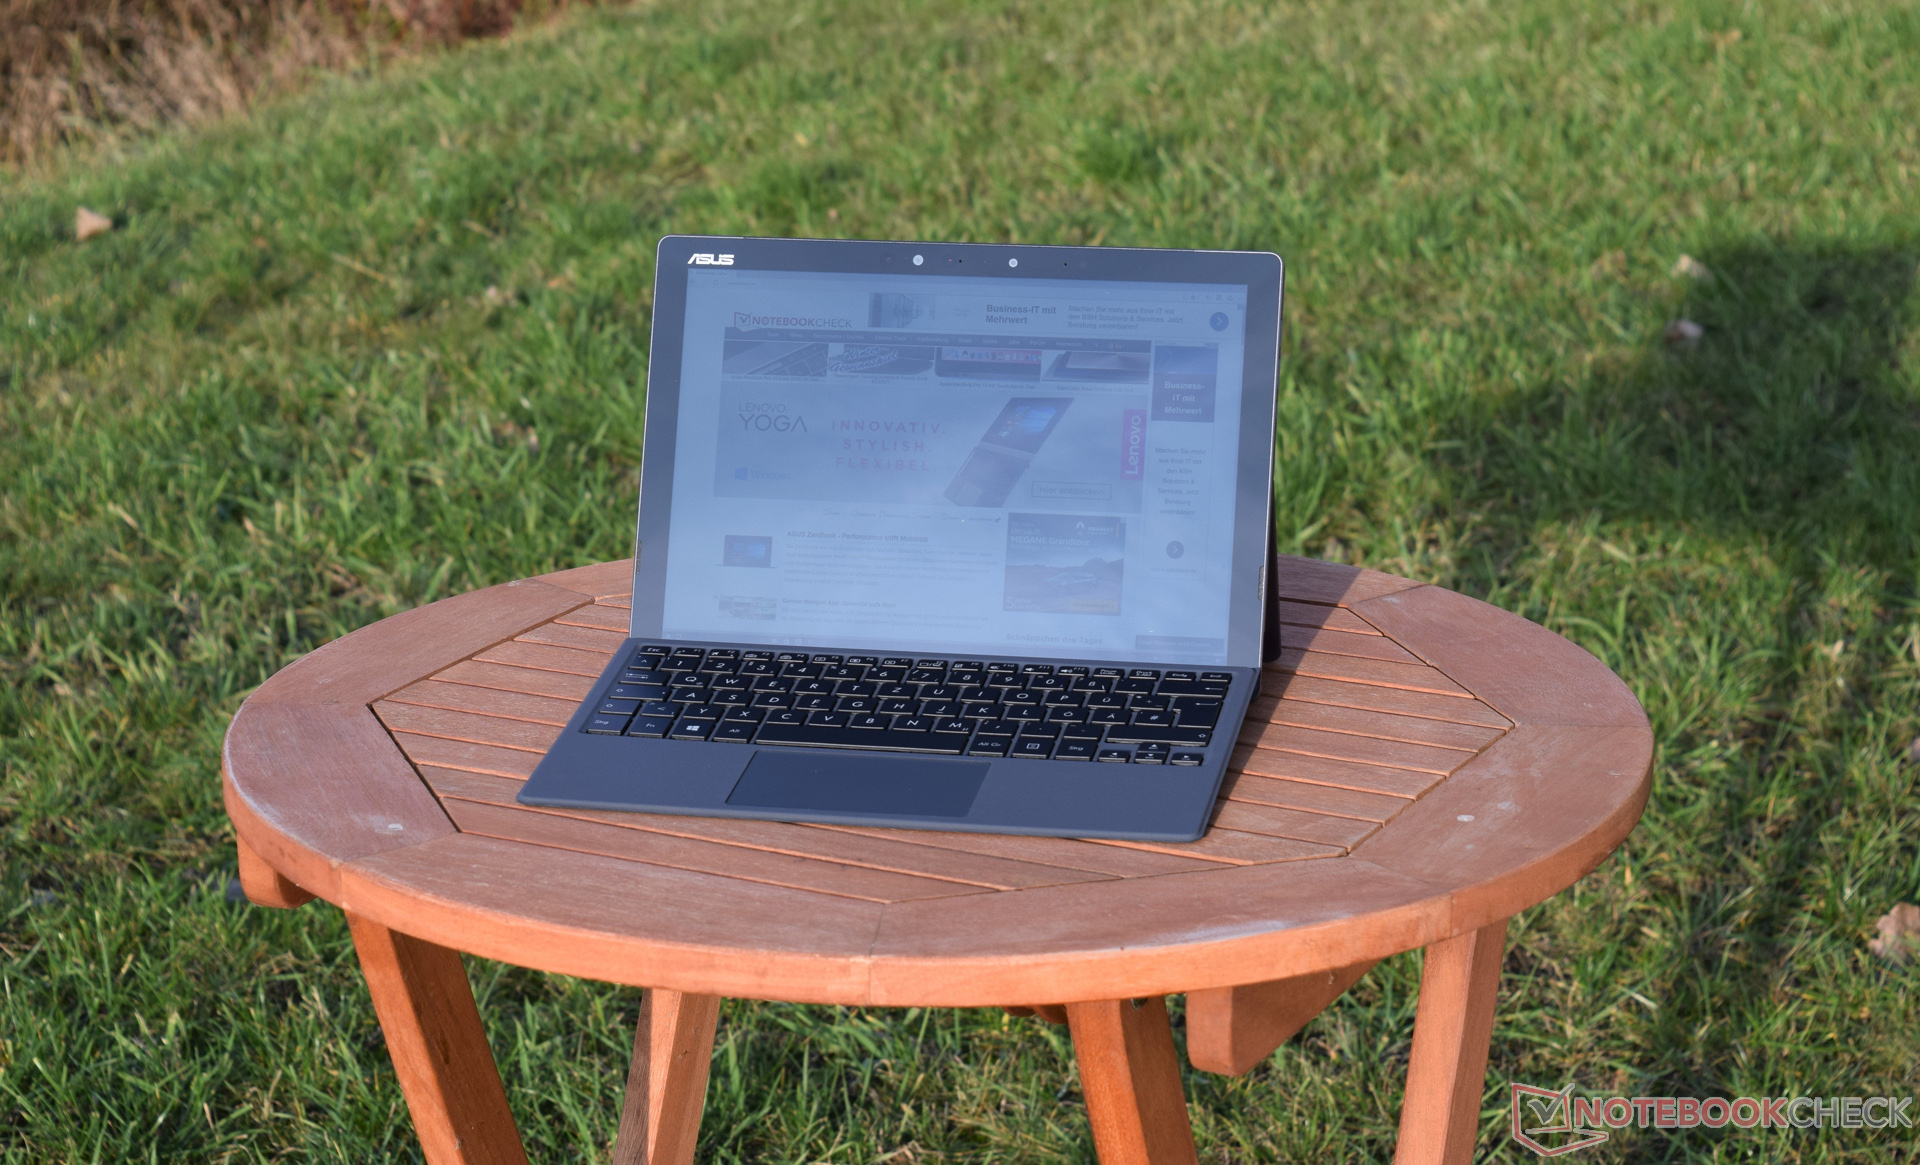
Outdoors, the glossy screen of the Asus Transformer 3 Pro can be a problem. Sitting in direct sunlight is never recommendable. However, shaded areas will allow users to work with the laptop thanks to the brightness of 307 cd/m².
Performance
The Asus Transformer 3 Pro is a tablet, which can transform into a laptop thanks to its keyboard dock. As such, our tablet is constructed for mobile use. Asus has provided an Intel Core i7-6500U for the model and they offer an alternative to this processor: the weaker Intel Core i5-6200U. The RAM of 16 GB is generous and provides a measure of future security.
The storage device can be customized according to the needs of the user. Asus includes different SSDs, which range in capacity up to 1 TB. These SSDs are of the M.2 format and use a PCIe interface. The full range of capacities offered by the manufacturer is extensive (128 GB, 256 GB, 512 GB and 1 TB), but a potential buyer should pay attention to the individual speeds: Asus offers both SATA 3 and PCIe SSDs. A closer look at the technical specifications before the purchase will save you a lot of time later on.
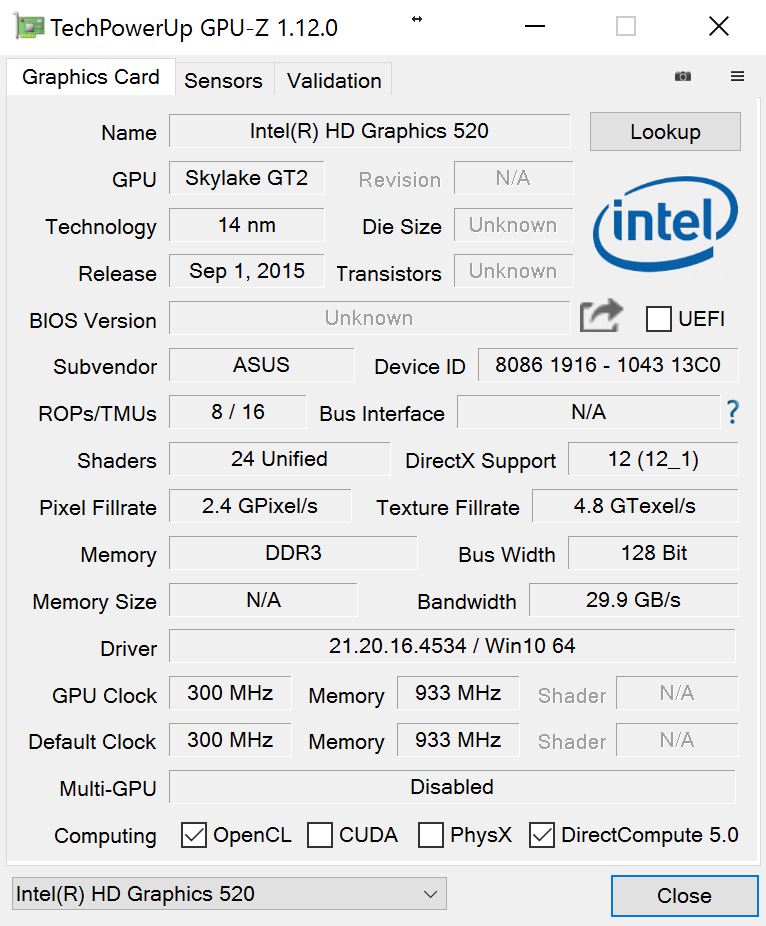
As the convertible does not have a dedicated graphics card, it must rely on the integrated graphics processor, the Intel HD Graphics 520. However, this chip cannot run modern games fluidly.
Processor
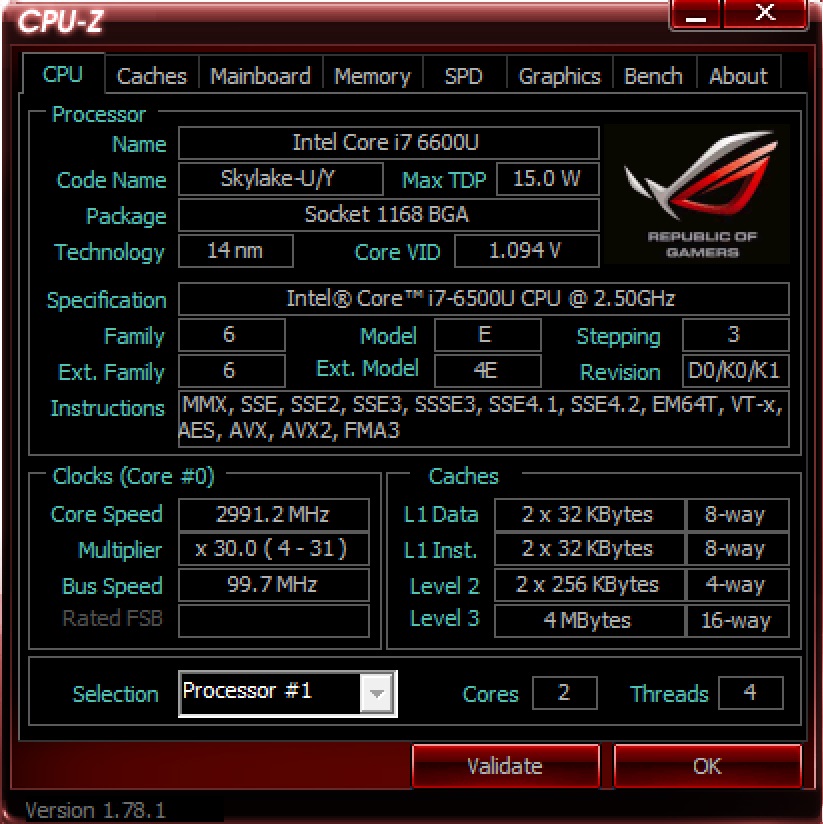
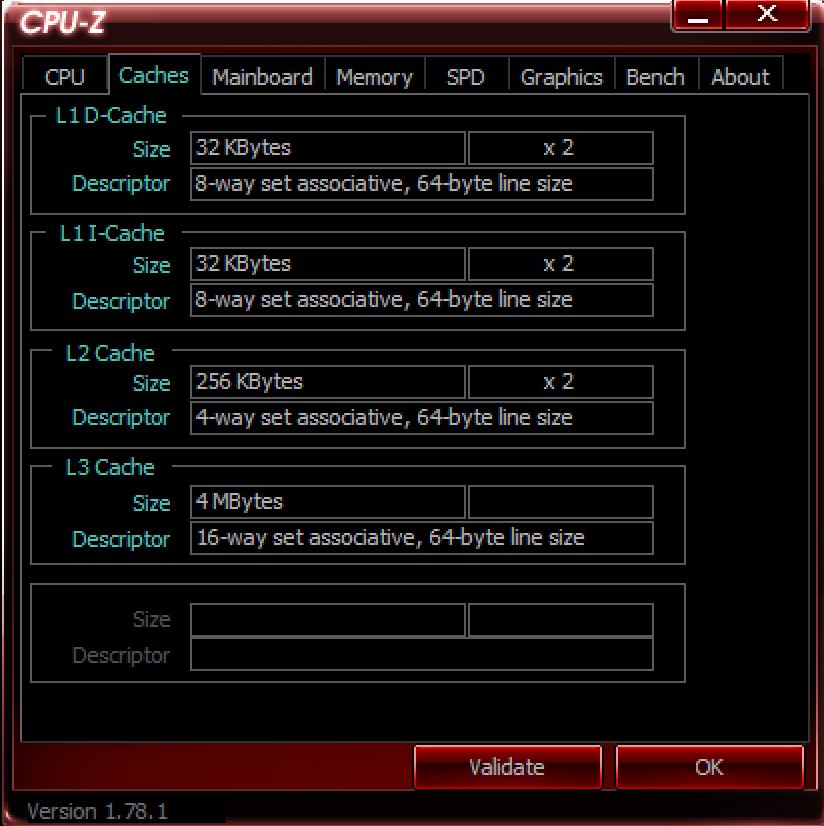
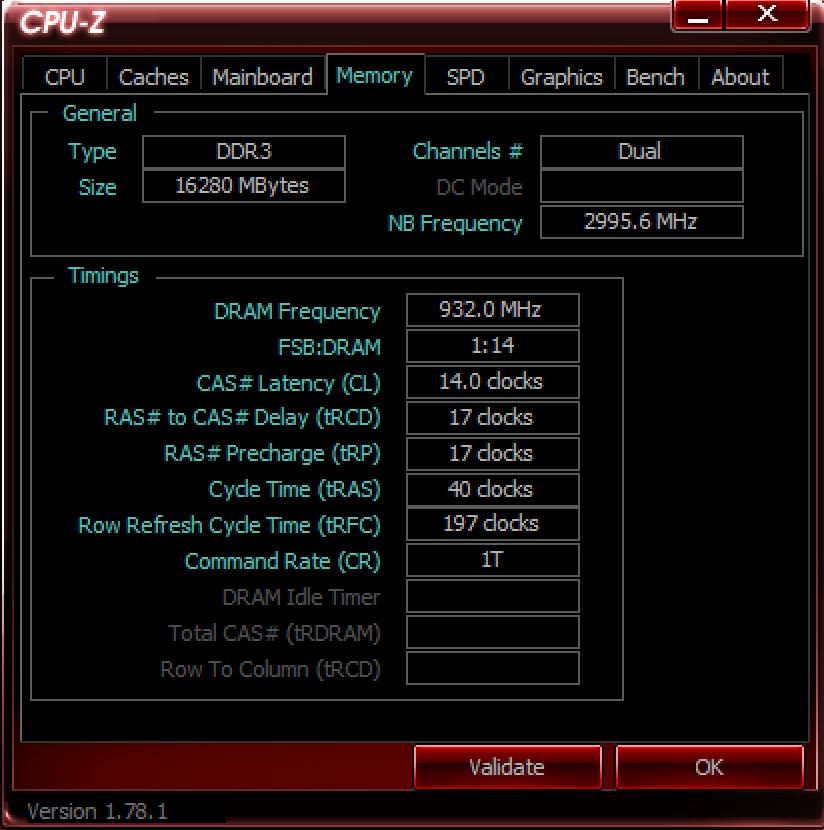
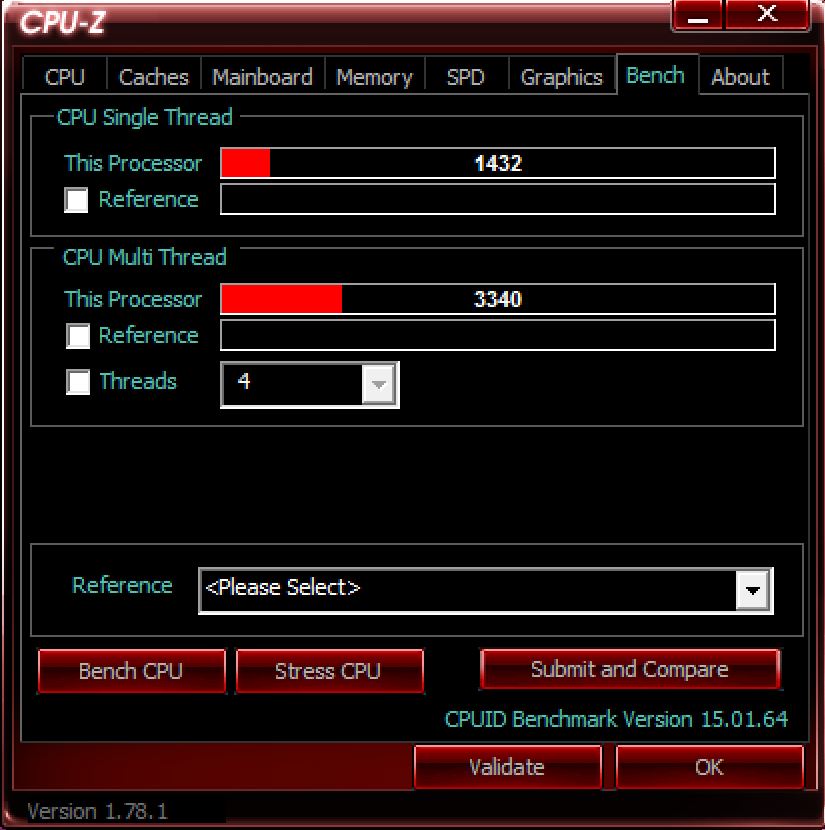
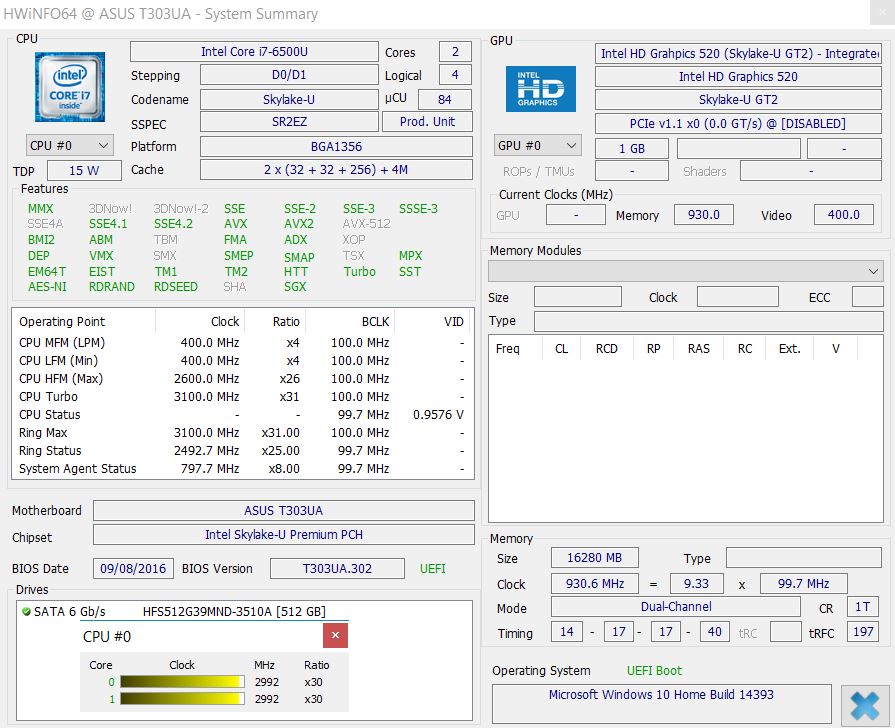
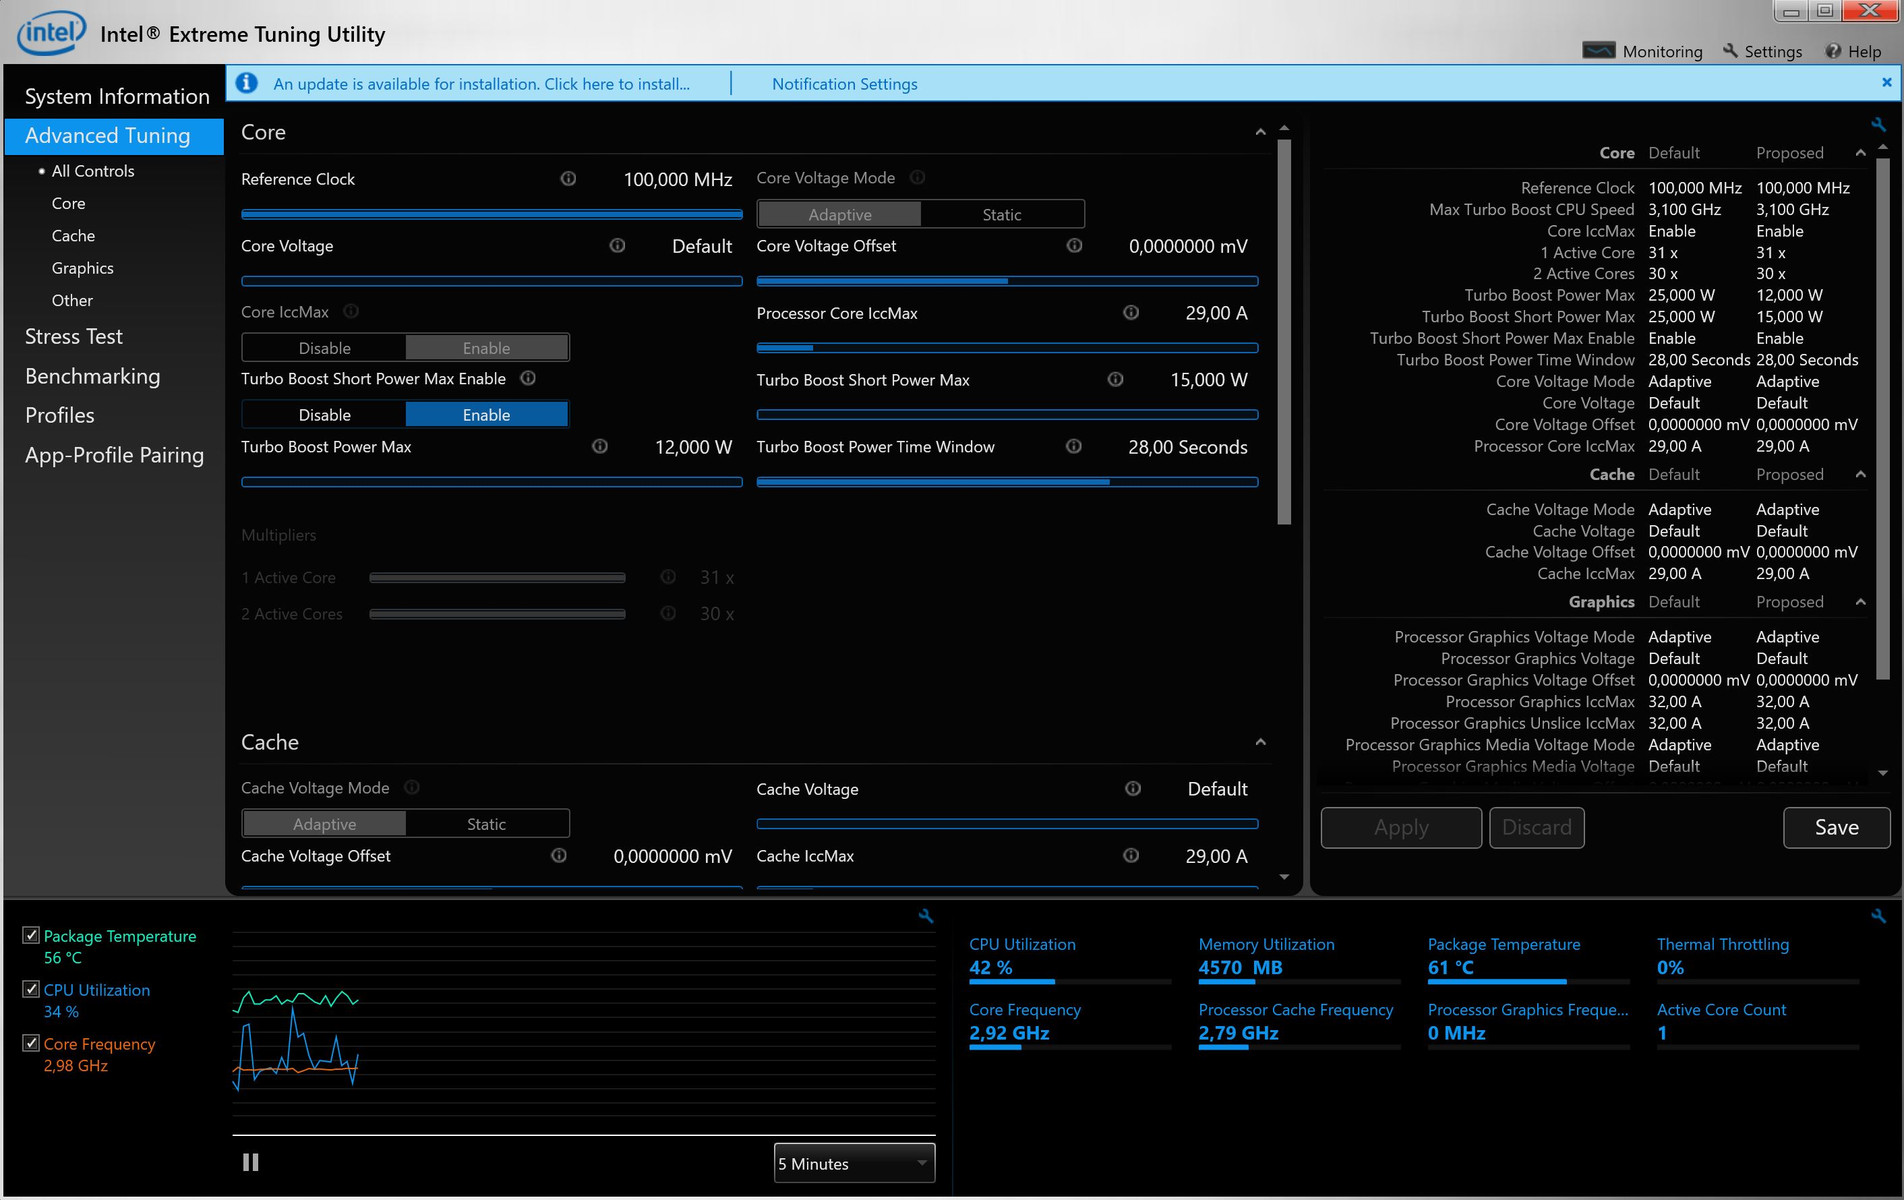
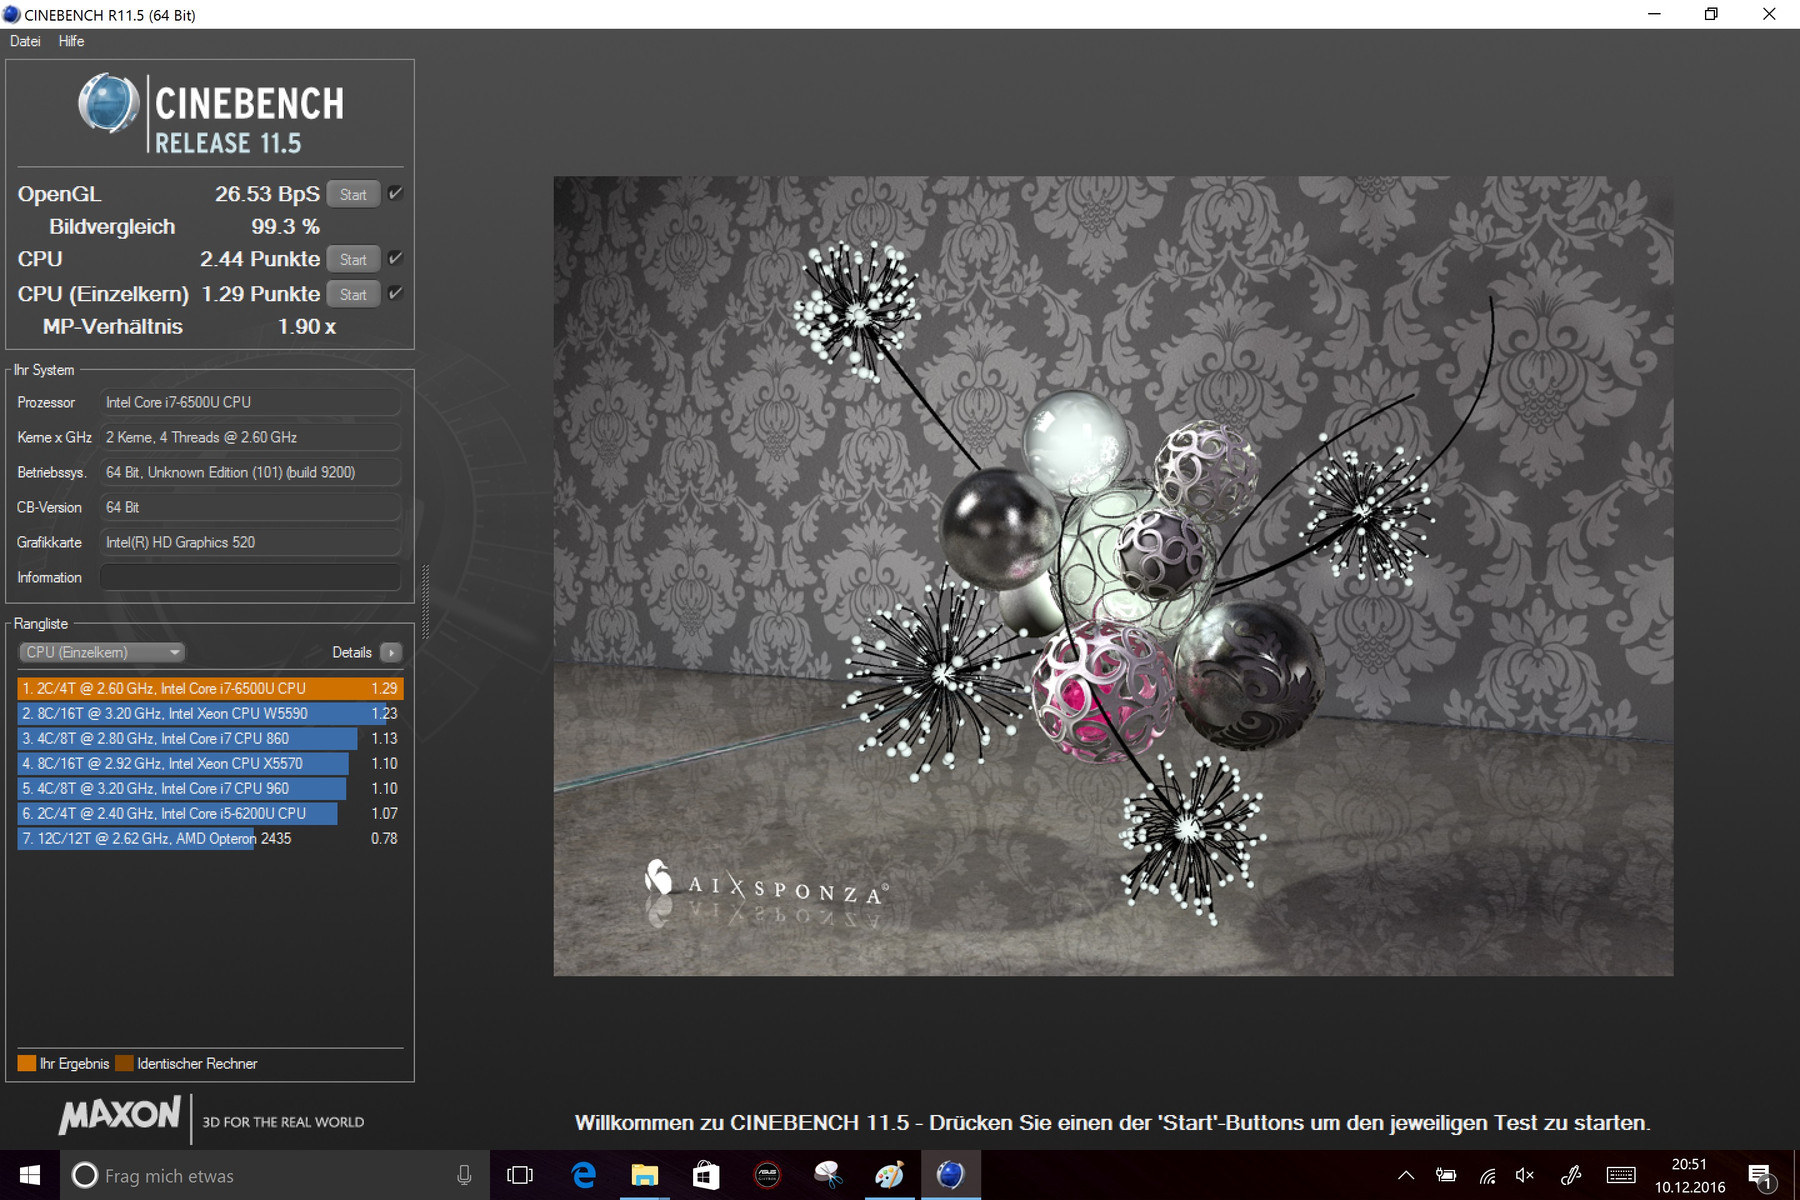
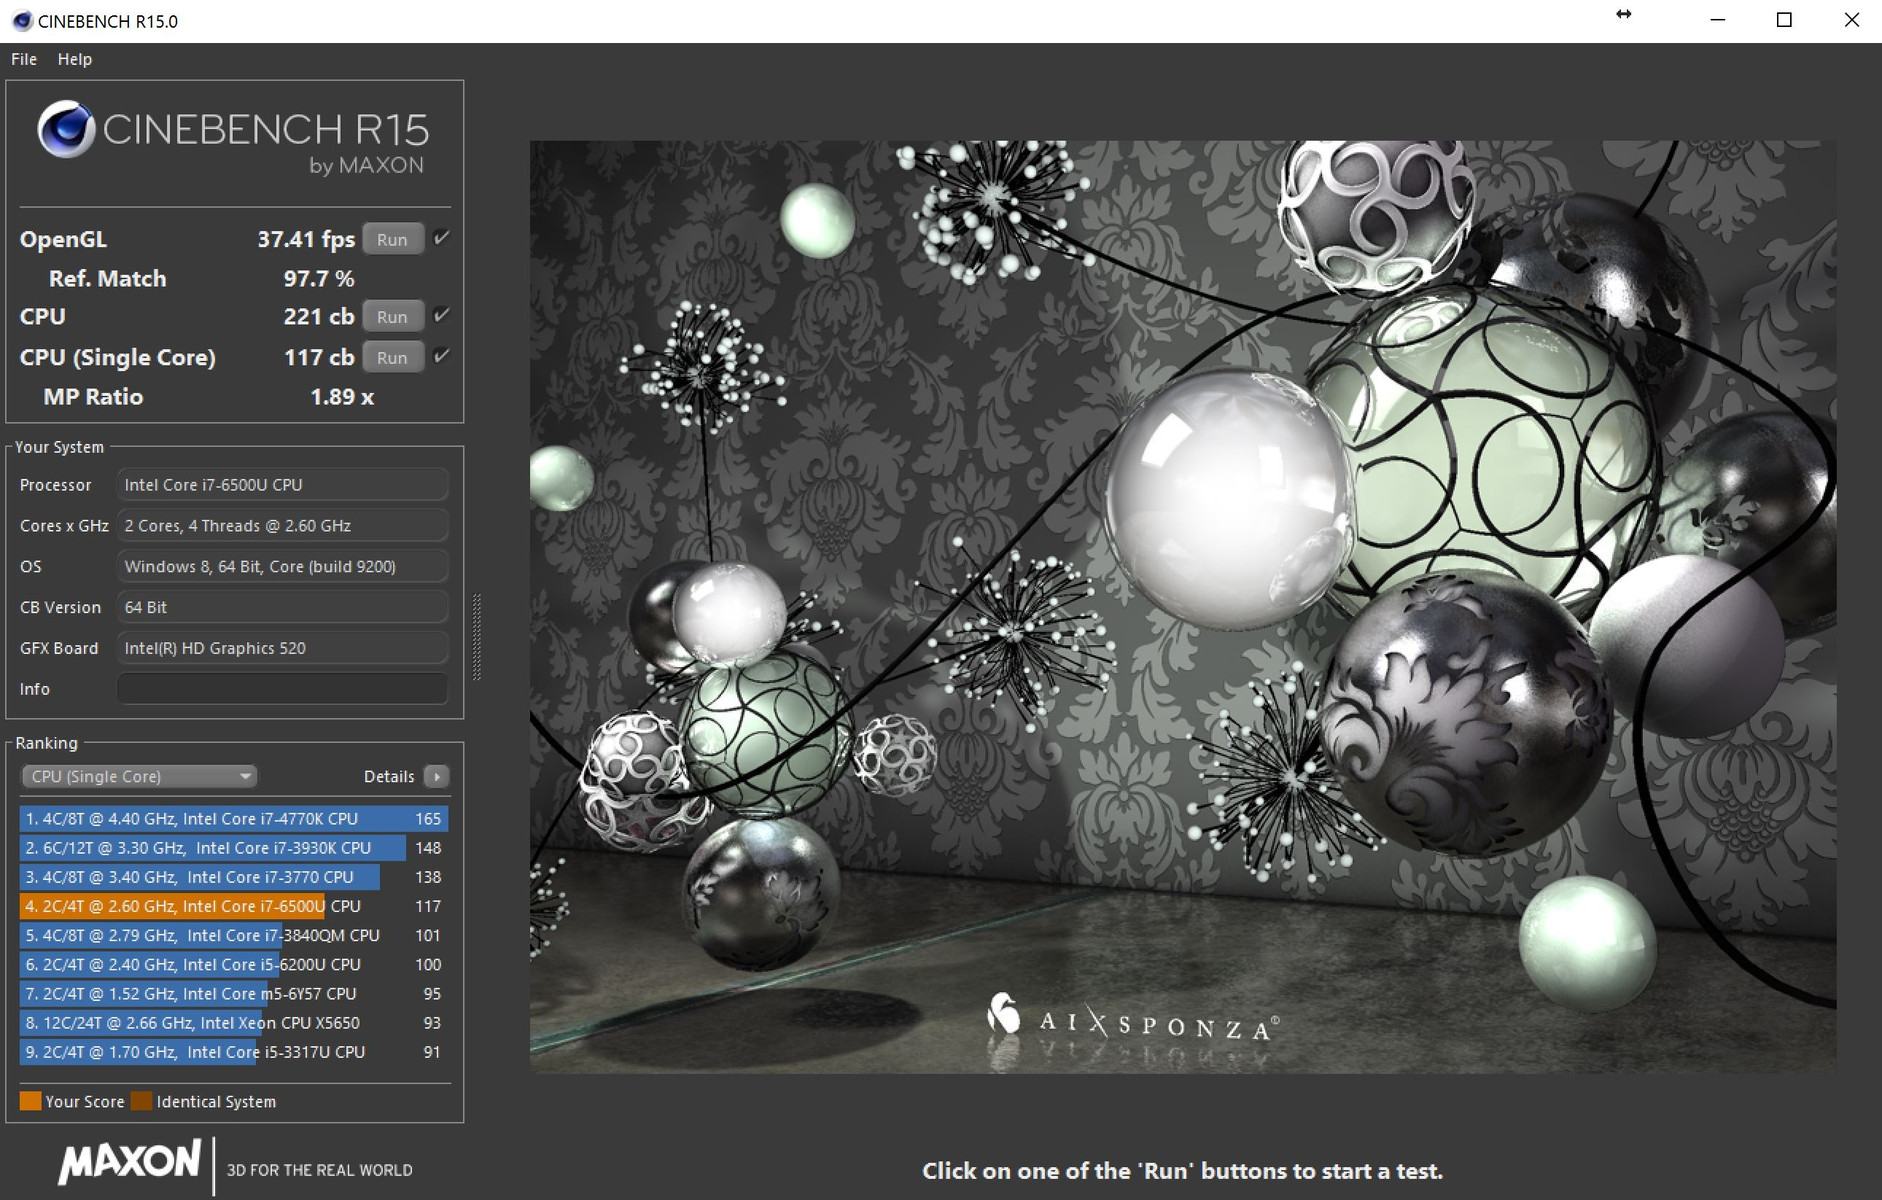
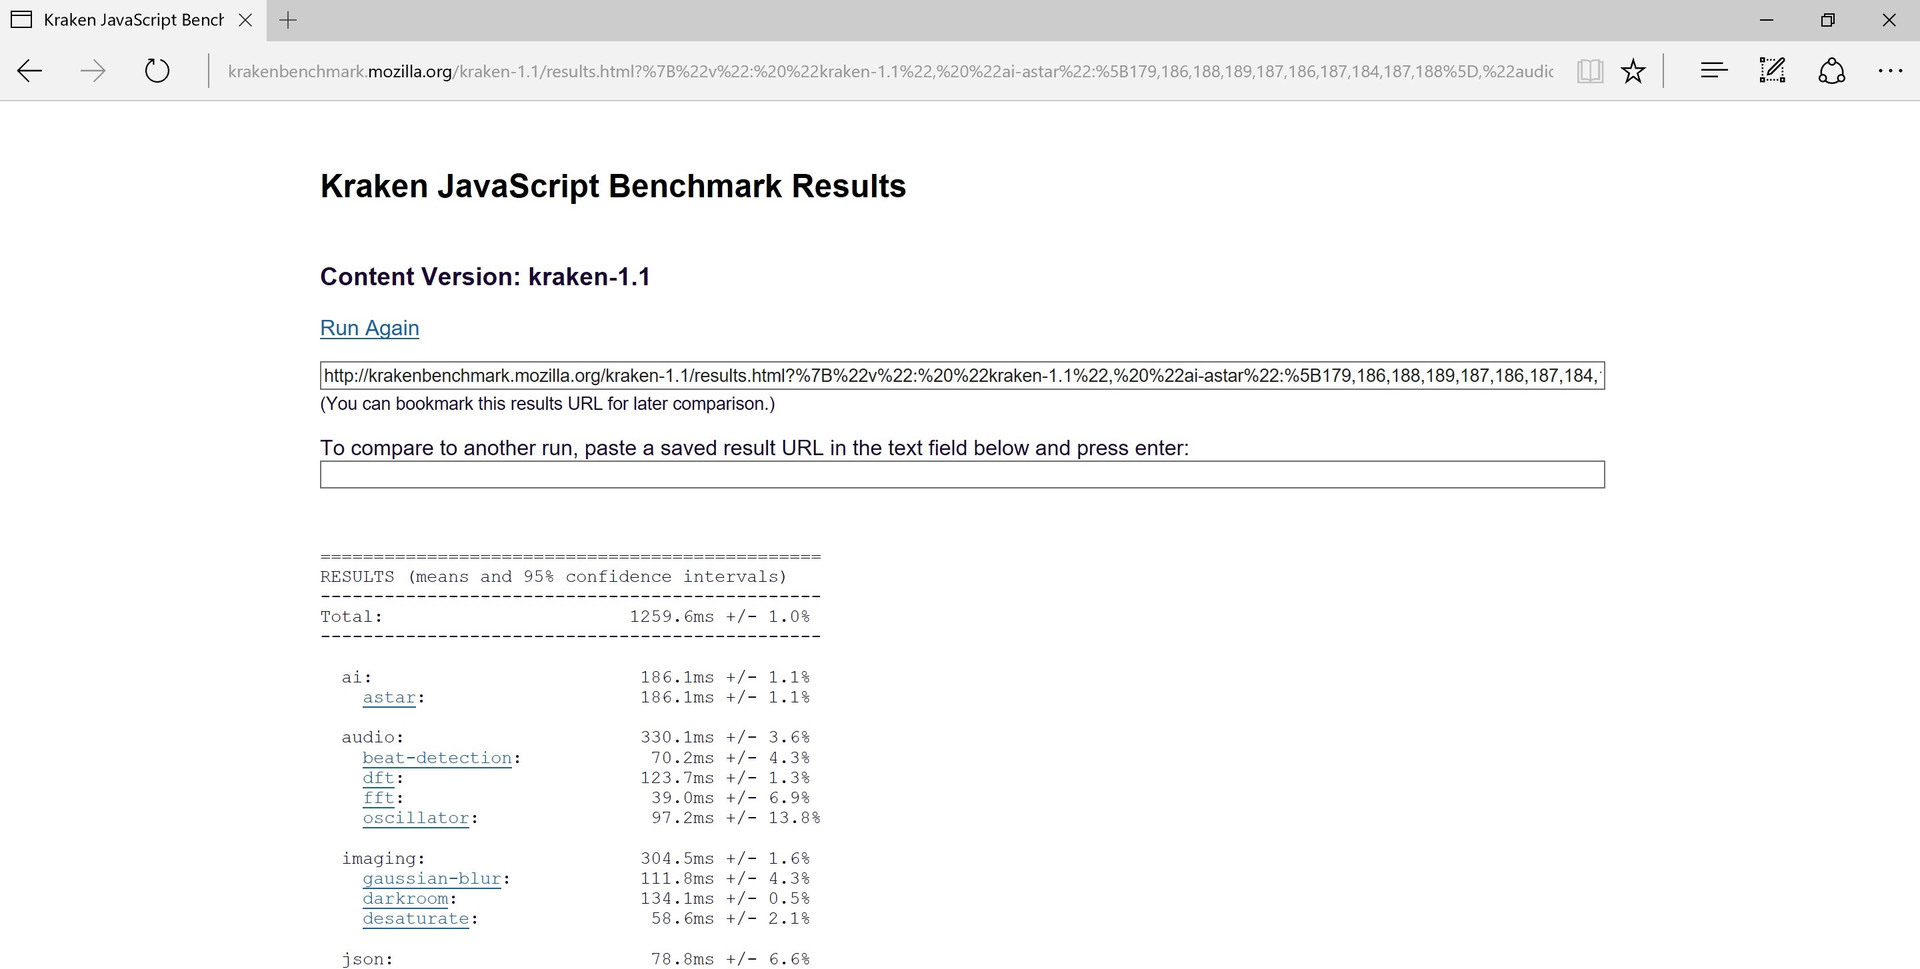
The Intel Core i7-6500U is a dual-core CPU, which uses the Skylake architecture. The processor supports Hyperthreading, which means it can simultaneously process up to four threads. The TDP value of 15 W can be adjusted, as Intel has included options in the form cTDP Down (7.5 W) and cTDP Up (25 W). Asus has decided to go downwards and set the TDP value of the processor to 7.5 W. The base clock speed of the CPU amounts to 2.5 GHz, but this can dynamically change (depending on load) and rise up to 3.1 GHz (1 core) and 3.0 GHz (2 cores). As the TDP value is fixed to 7.5 W, these high speeds are only reached momentarily. The convertible throttles the performance down to control temperatures. This results in a lot of multithread performance being lost. In the Cinebench R15 CPU Single 64-bit benchmark, the Intel Core i7-6500U of the Asus Transformer 3 Pro places right behind the Intel Core i7-6600U of the Lenovo ThinkPad X1. In the Cinebench R15 CPU Multi 64-bit benchmark, our test model is beaten by even an Intel Core m5-6Y54 and an Intel Core i5-6200U. The performance of the processor is not throttled further while the convertible is running on battery.
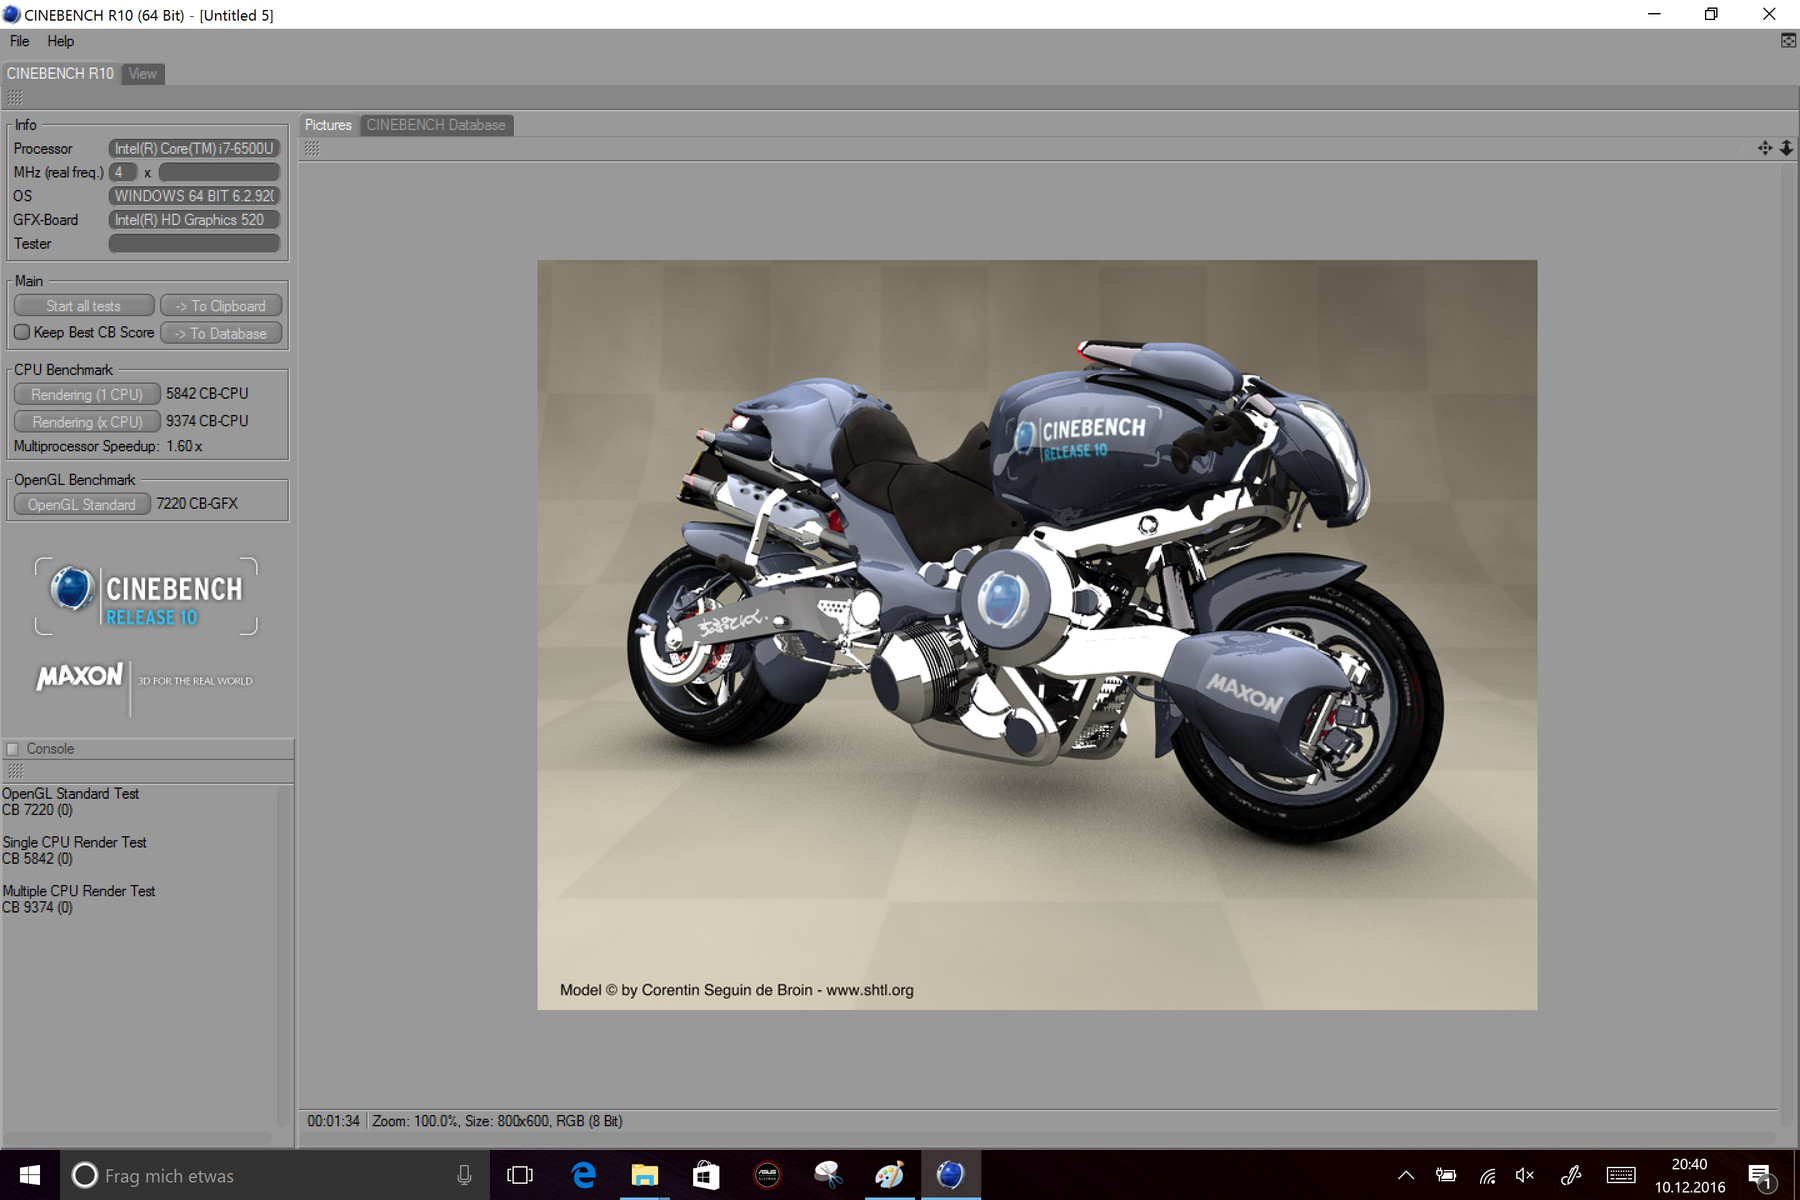
| Cinebench R10 | |
| Rendering Single CPUs 64Bit | |
| Asus Transformer 3 Pro T303UA-GN050T | |
| Microsoft Surface Pro 4, Core m3 | |
| Rendering Multiple CPUs 64Bit | |
| Asus Transformer 3 Pro T303UA-GN050T | |
| Microsoft Surface Pro 4, Core m3 | |
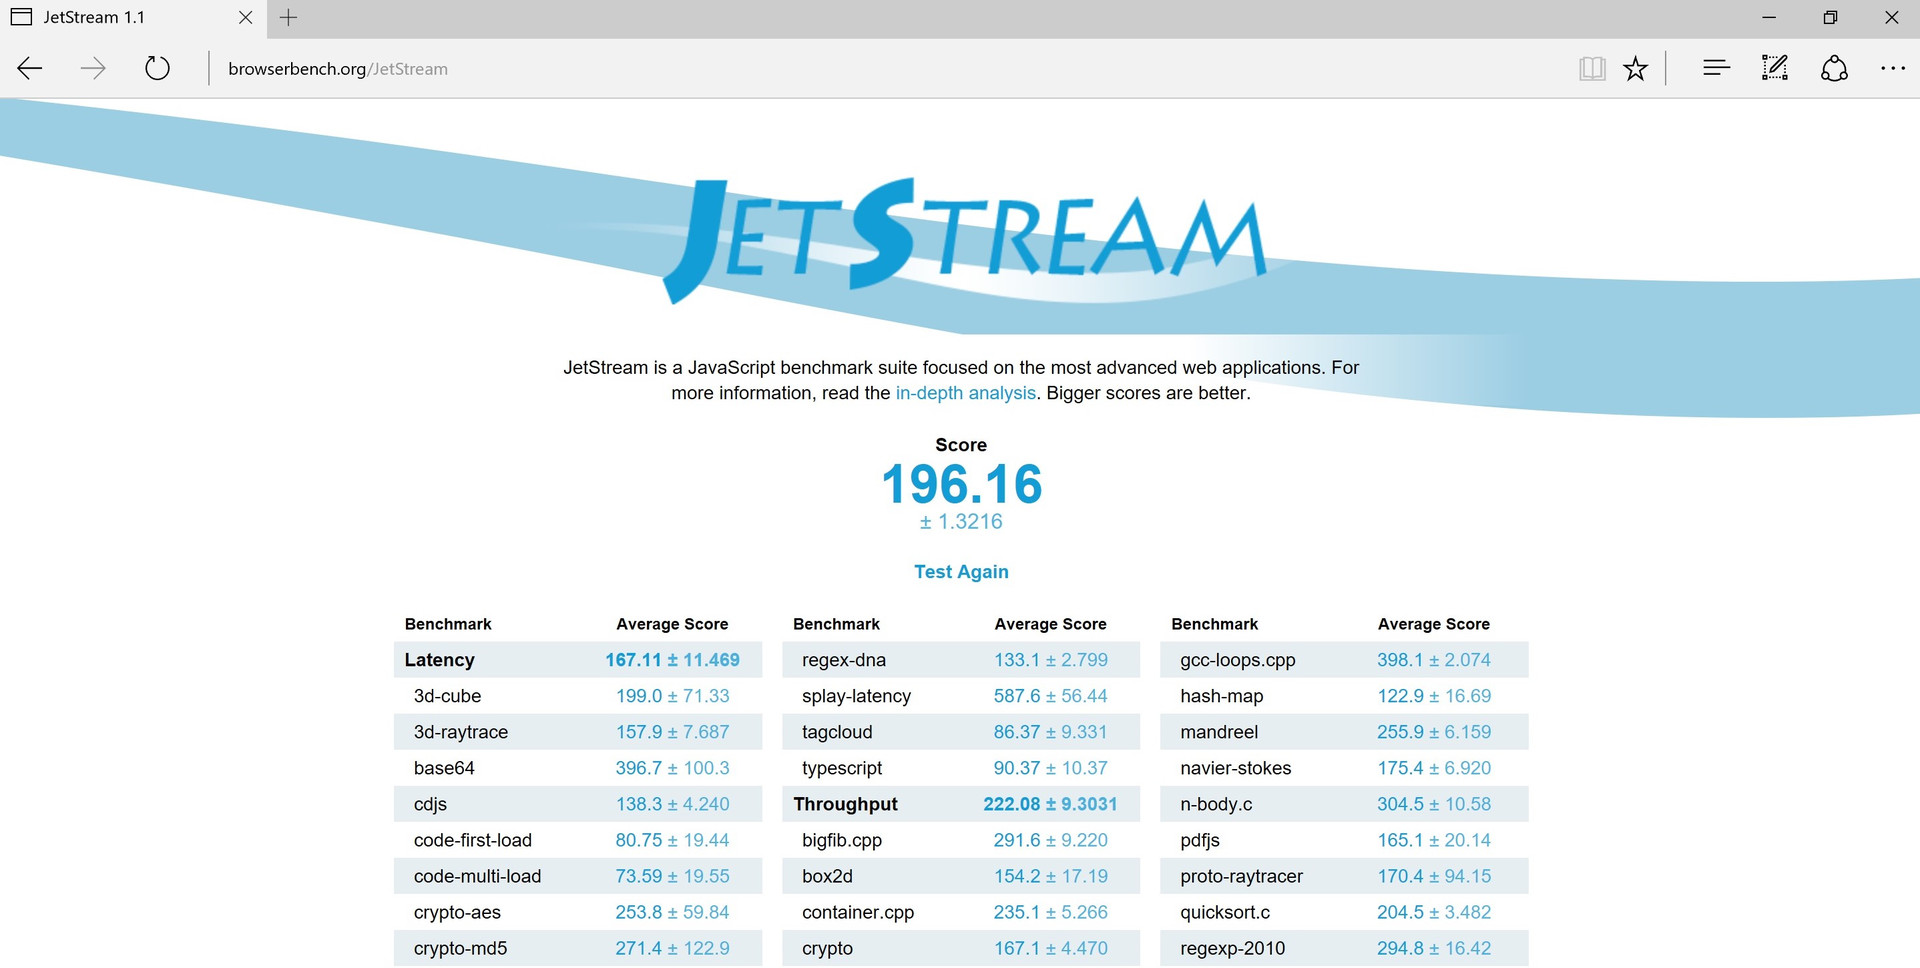
| JetStream 1.1 - 1.1 Total | |
| Asus Transformer 3 Pro T303UA-GN050T | |
| Lenovo ThinkPad X1 Yoga-20FRS1VS00 | |
| HP Elite x2 1012 G1 | |
| Acer Aspire Switch Alpha 12 SA5-271-56HM | |
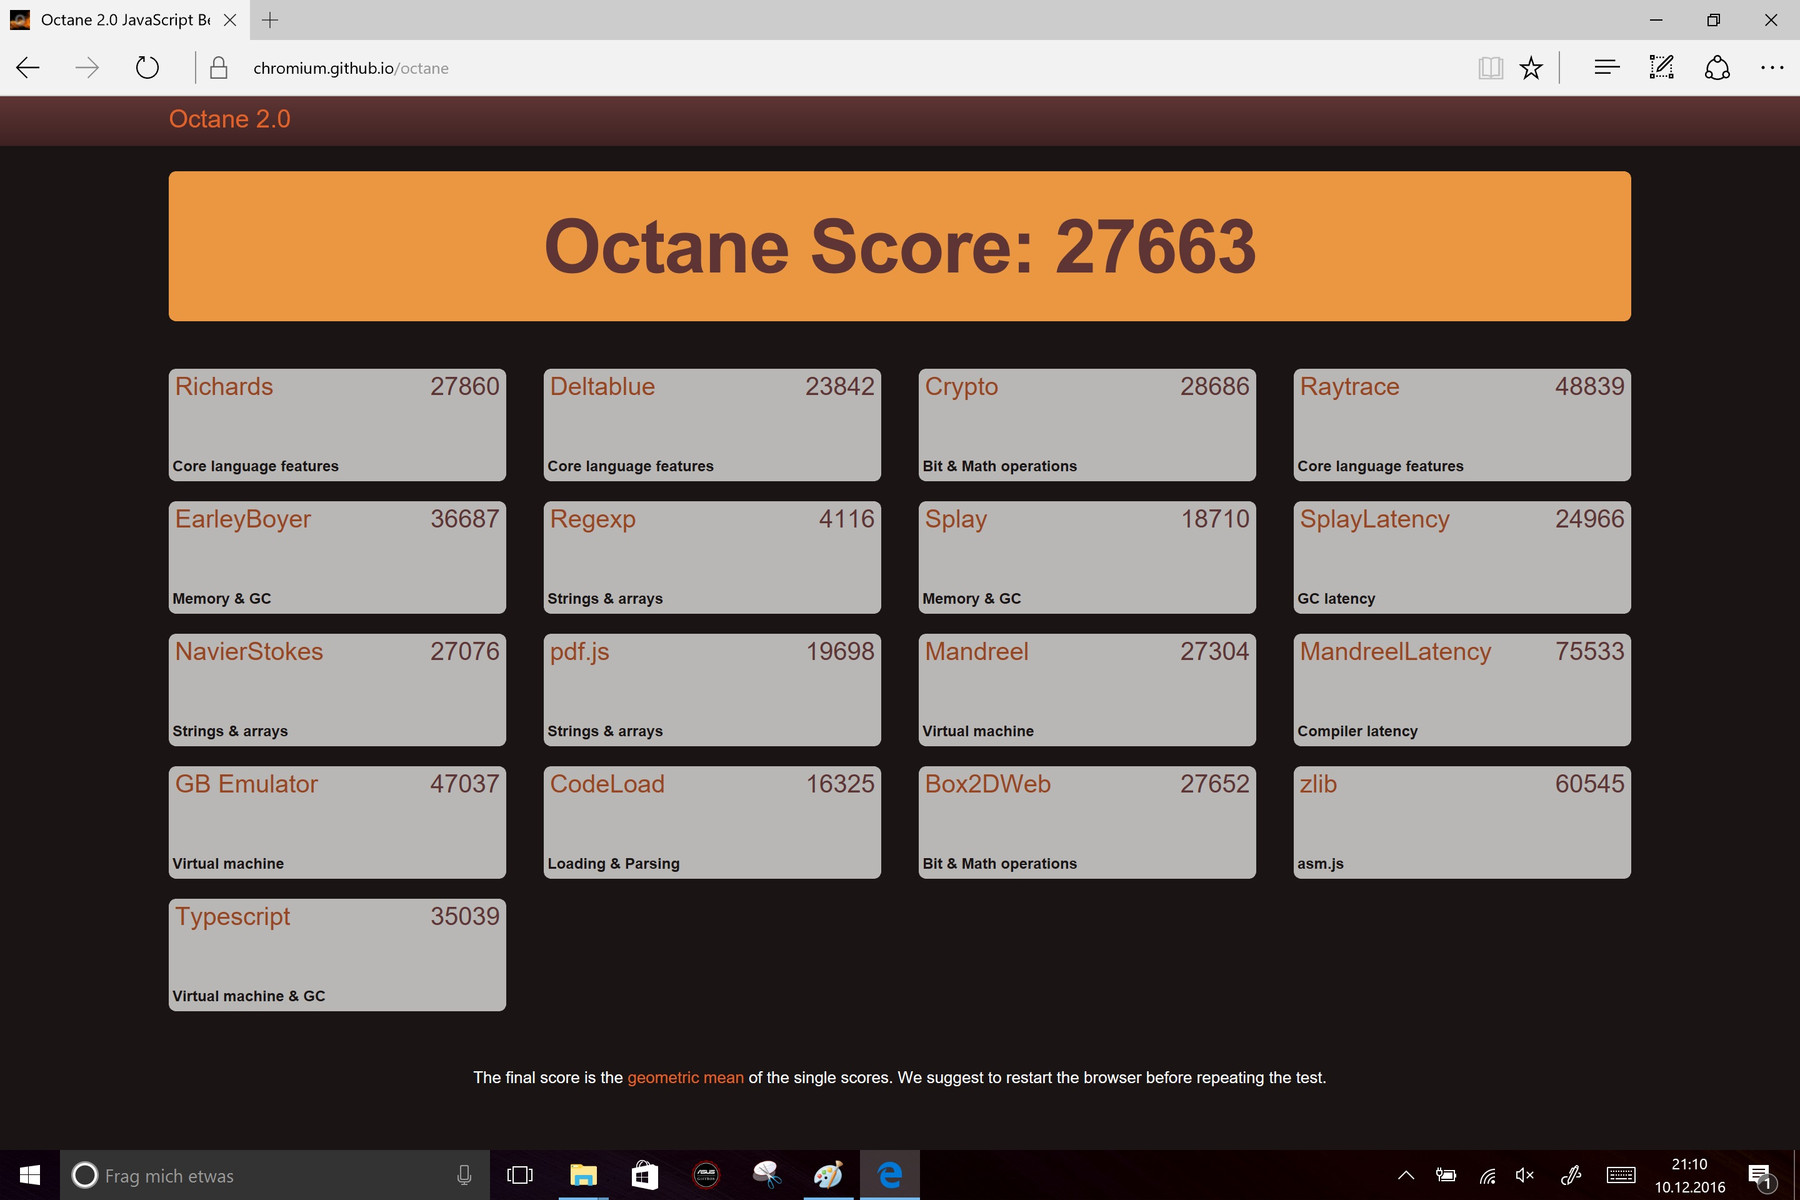
| Octane V2 - Total Score | |
| Lenovo ThinkPad X1 Yoga-20FRS1VS00 | |
| Asus Transformer 3 Pro T303UA-GN050T | |
| HP Elite x2 1012 G1 | |
| Acer Aspire Switch Alpha 12 SA5-271-56HM | |
| Mozilla Kraken 1.1 - Total | |
| Microsoft Surface Pro 4, Core m3 | |
| Acer Aspire Switch Alpha 12 SA5-271-56HM | |
| HP Elite x2 1012 G1 | |
| Asus Transformer 3 Pro T303UA-GN050T | |
| Lenovo ThinkPad X1 Yoga-20FRS1VS00 | |
* ... smaller is better
System Performance
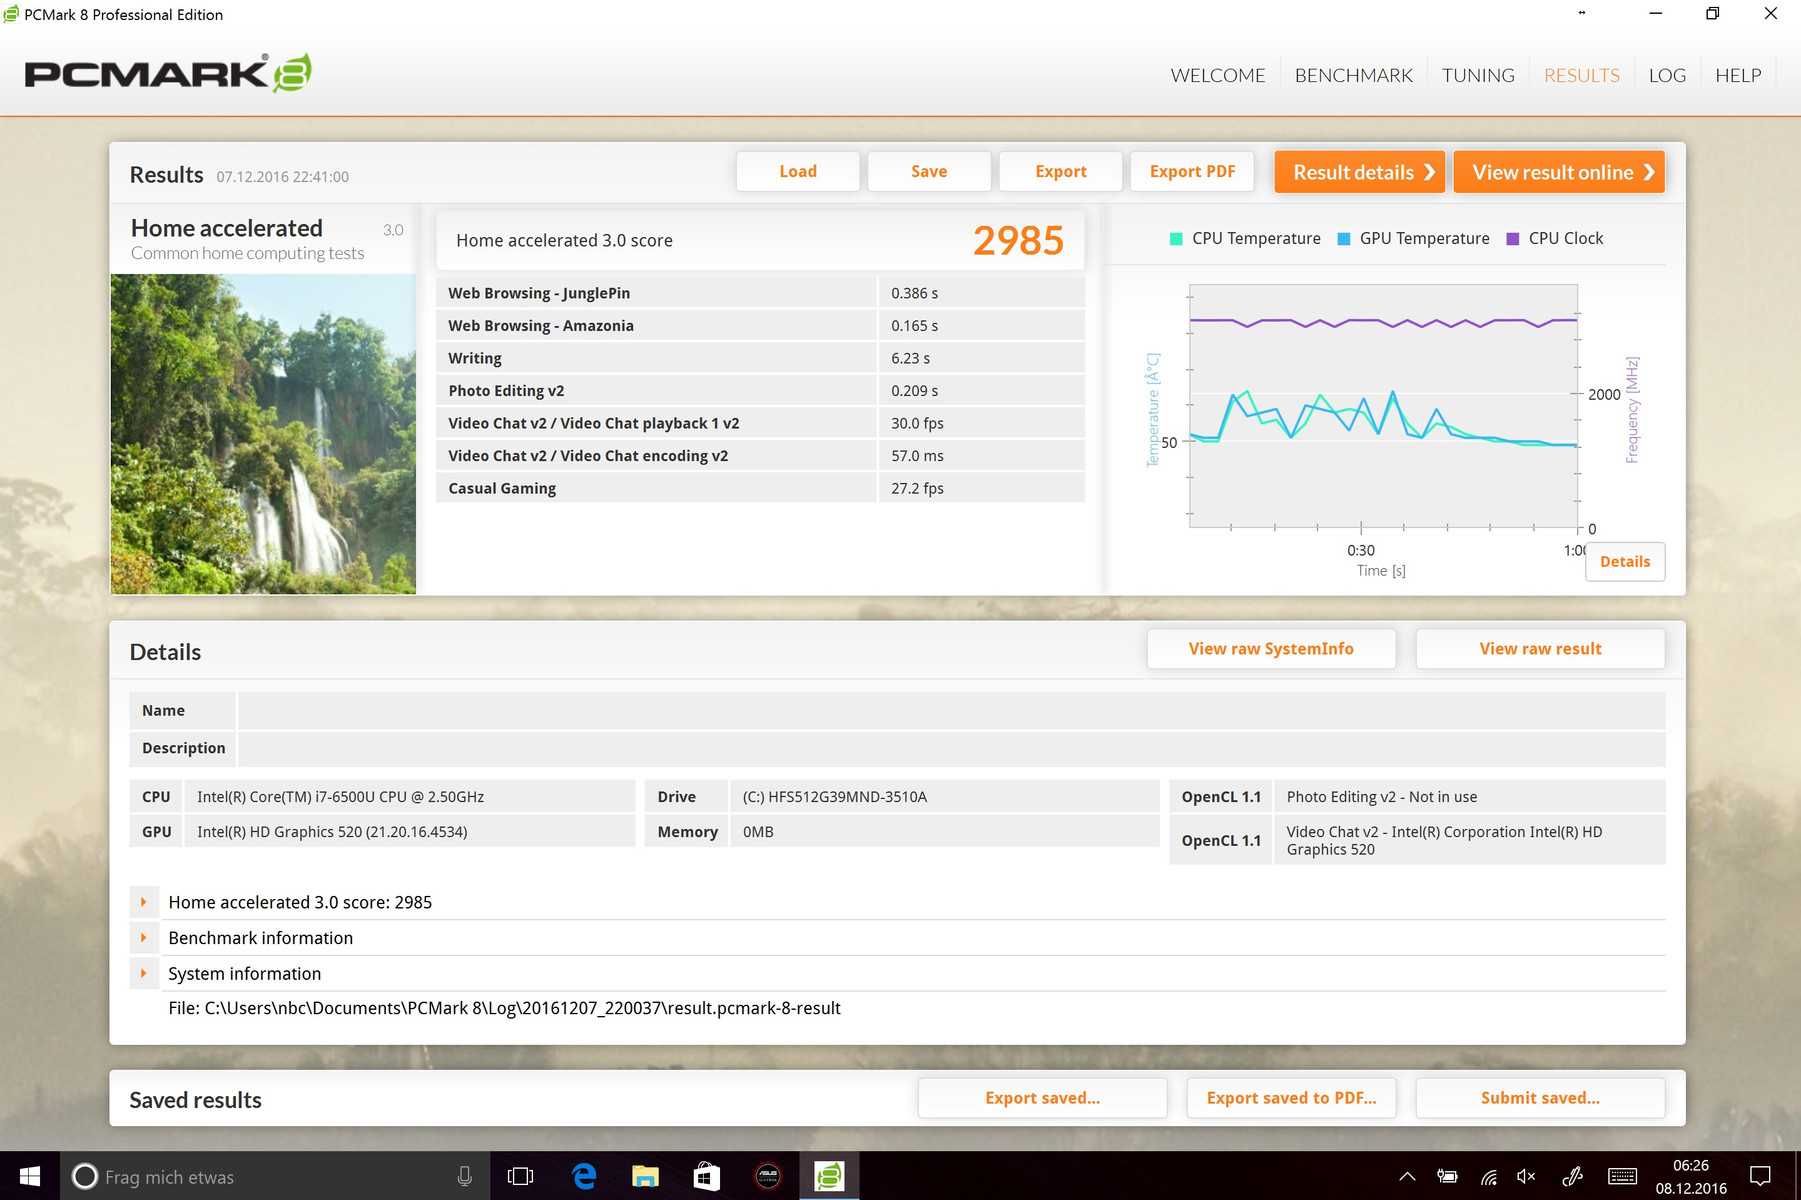
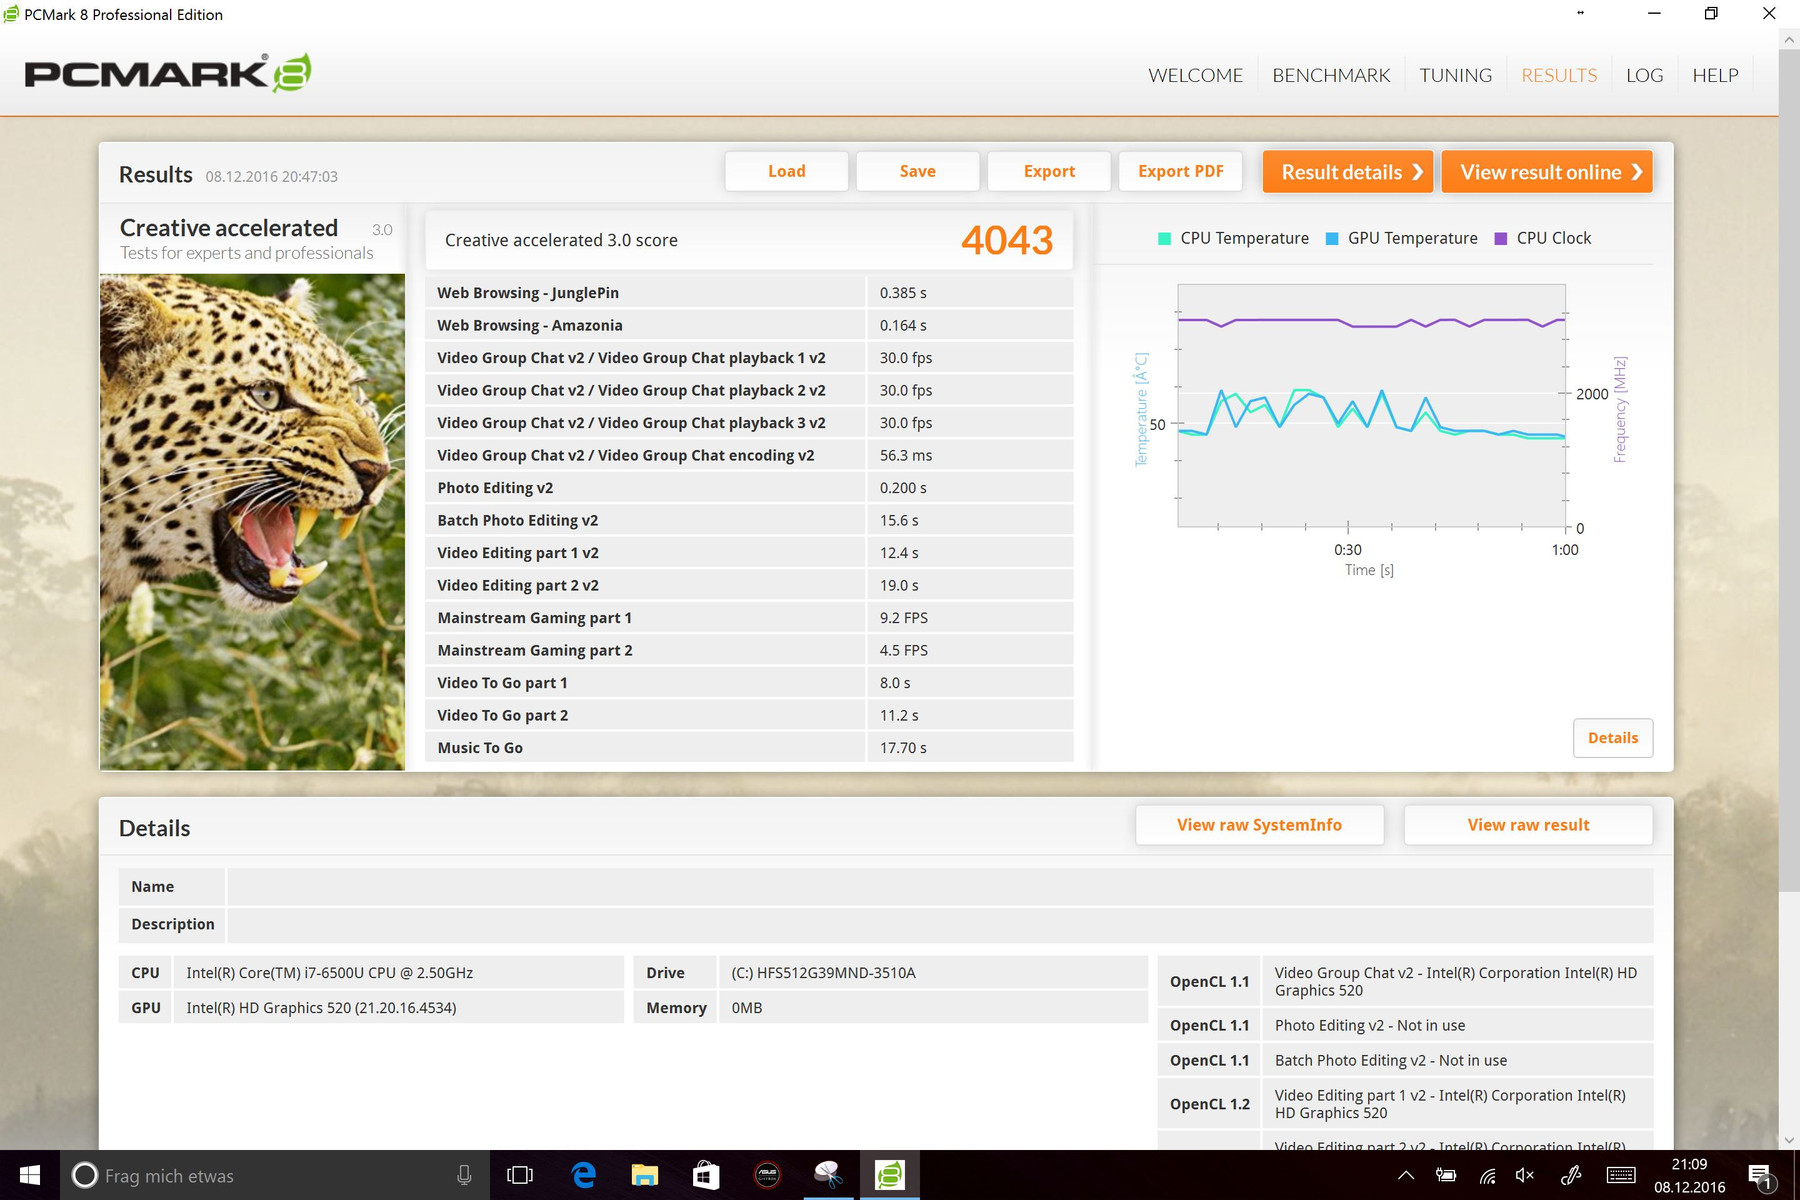
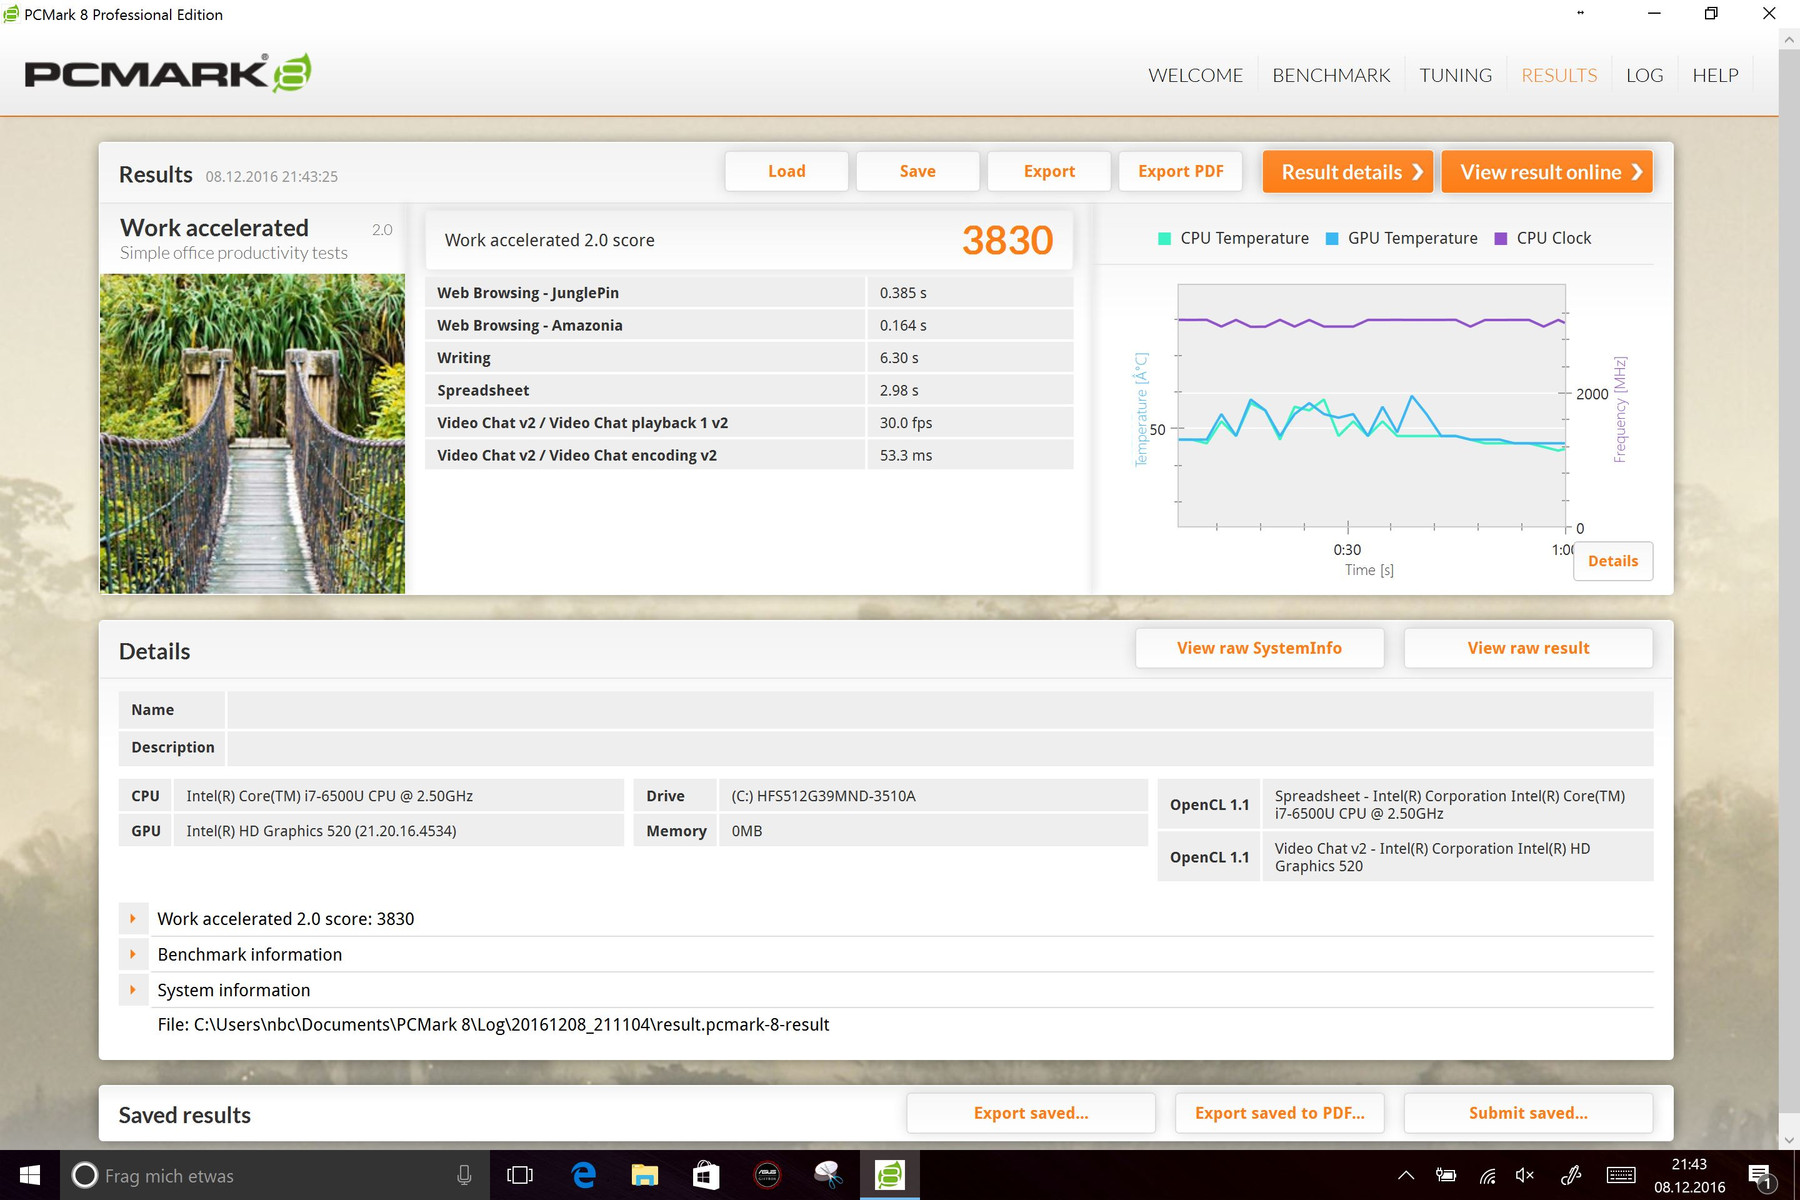
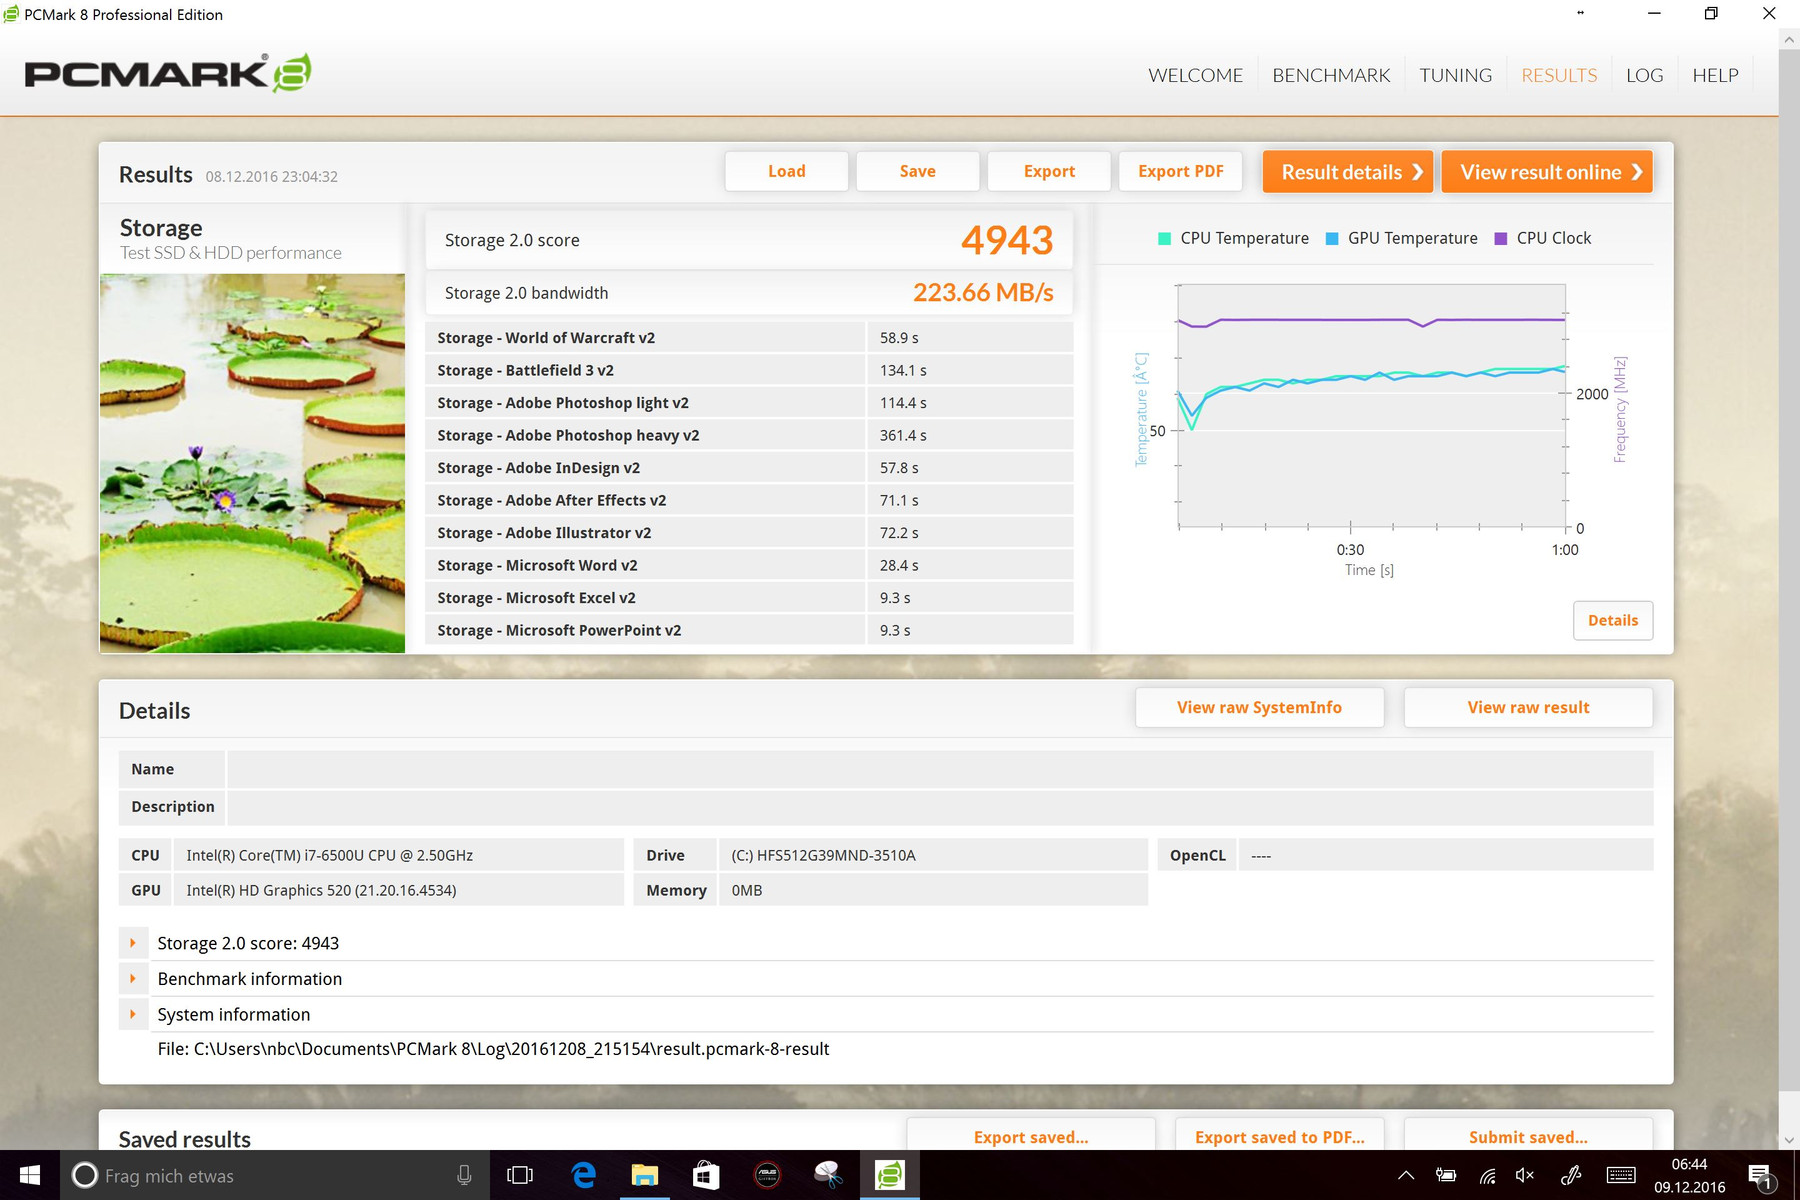
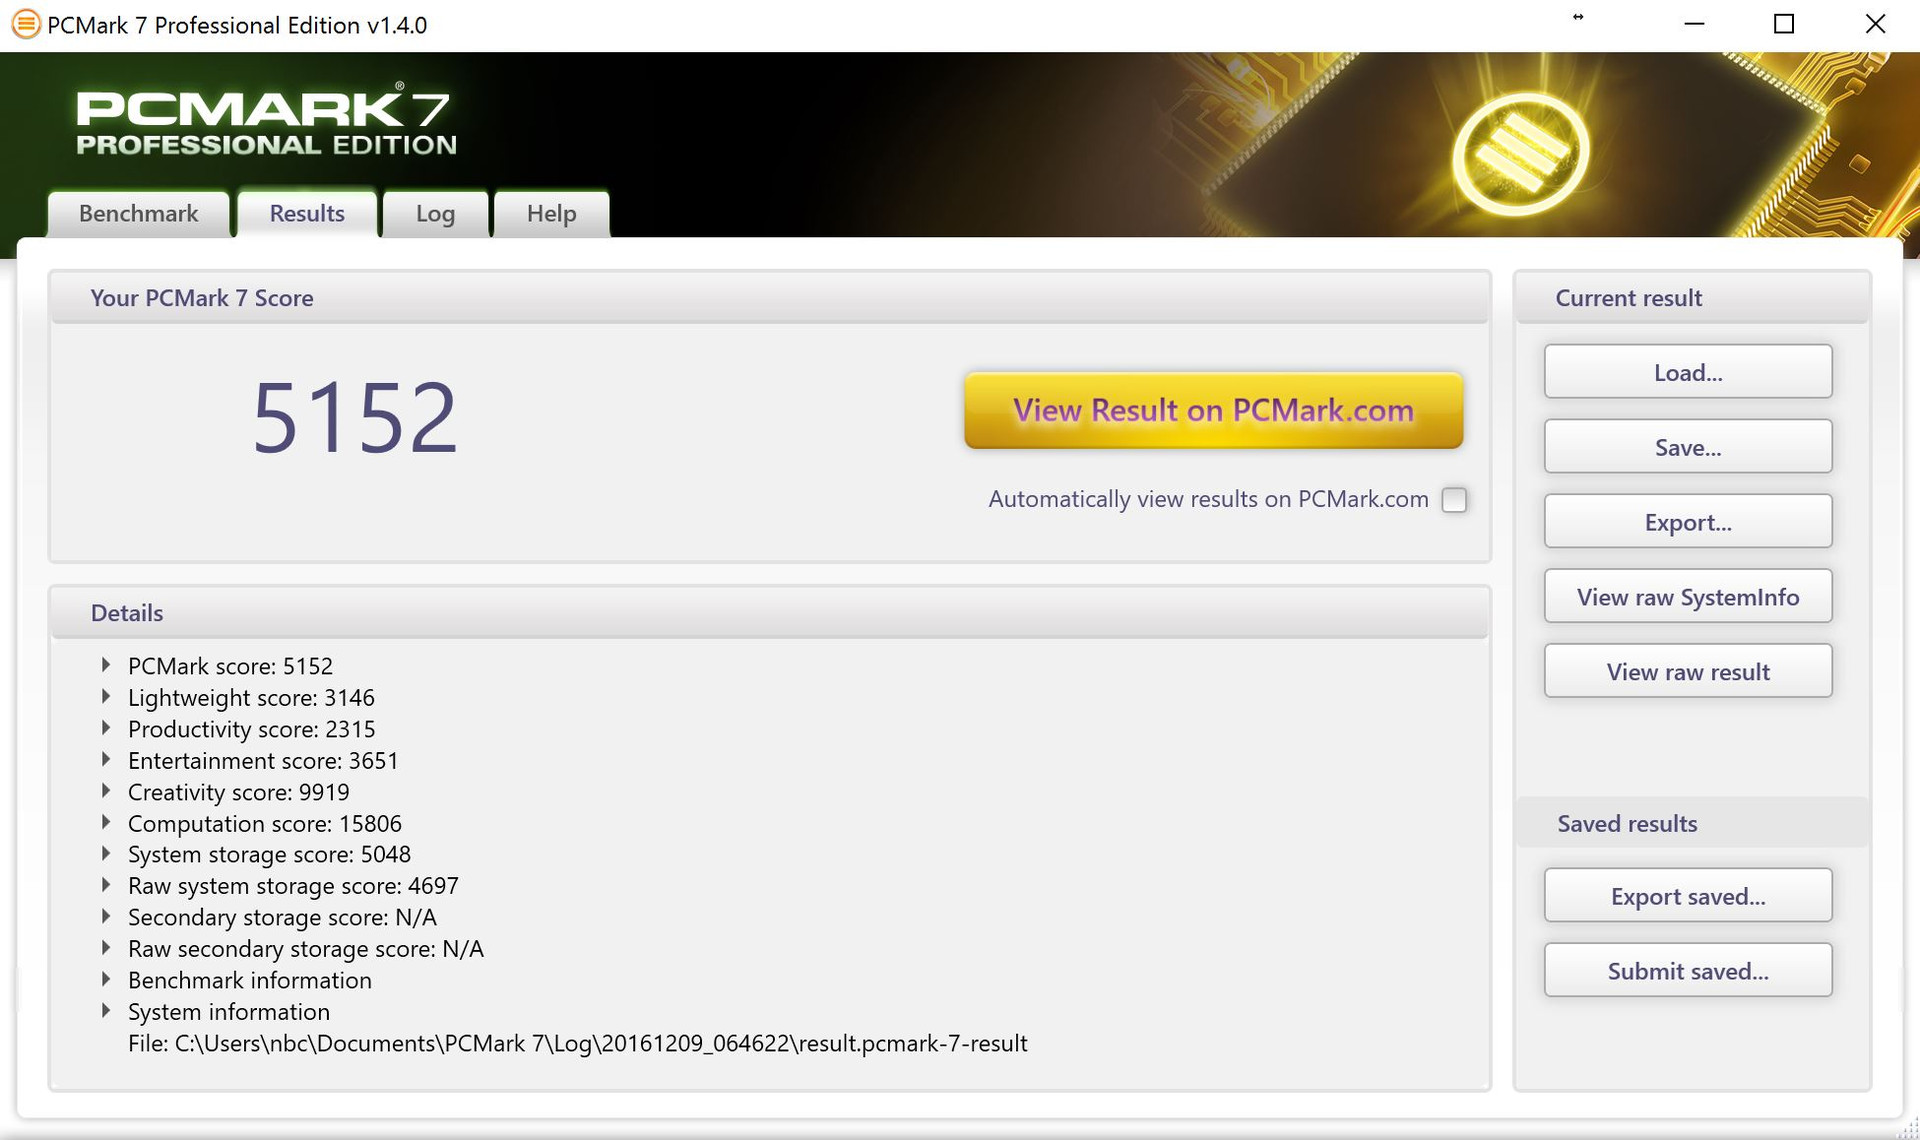
The subjective system performance contradicts the results of the Asus Transformer 3 Pro in the CPU benchmarks. The convertible runs comfortably thanks to the fast SSD and, although the CPU is throttled heavily, the user will not notice much of a difference in everyday use. In the PCMark 8 benchmark, the Asus Transformer 3 Pro cannot keep up with the Acer Aspire Switch Alpha 12. In fact, our test model has to work hard to keep the HP Elite X2 1012 G1 in check (and it often fails).
| PCMark 7 | |
| Score | |
| Asus Transformer 3 Pro T303UA-GN050T | |
| HP Elite x2 1012 G1 | |
| Microsoft Surface Pro 4, Core m3 | |
| Productivity | |
| HP Elite x2 1012 G1 | |
| Asus Transformer 3 Pro T303UA-GN050T | |
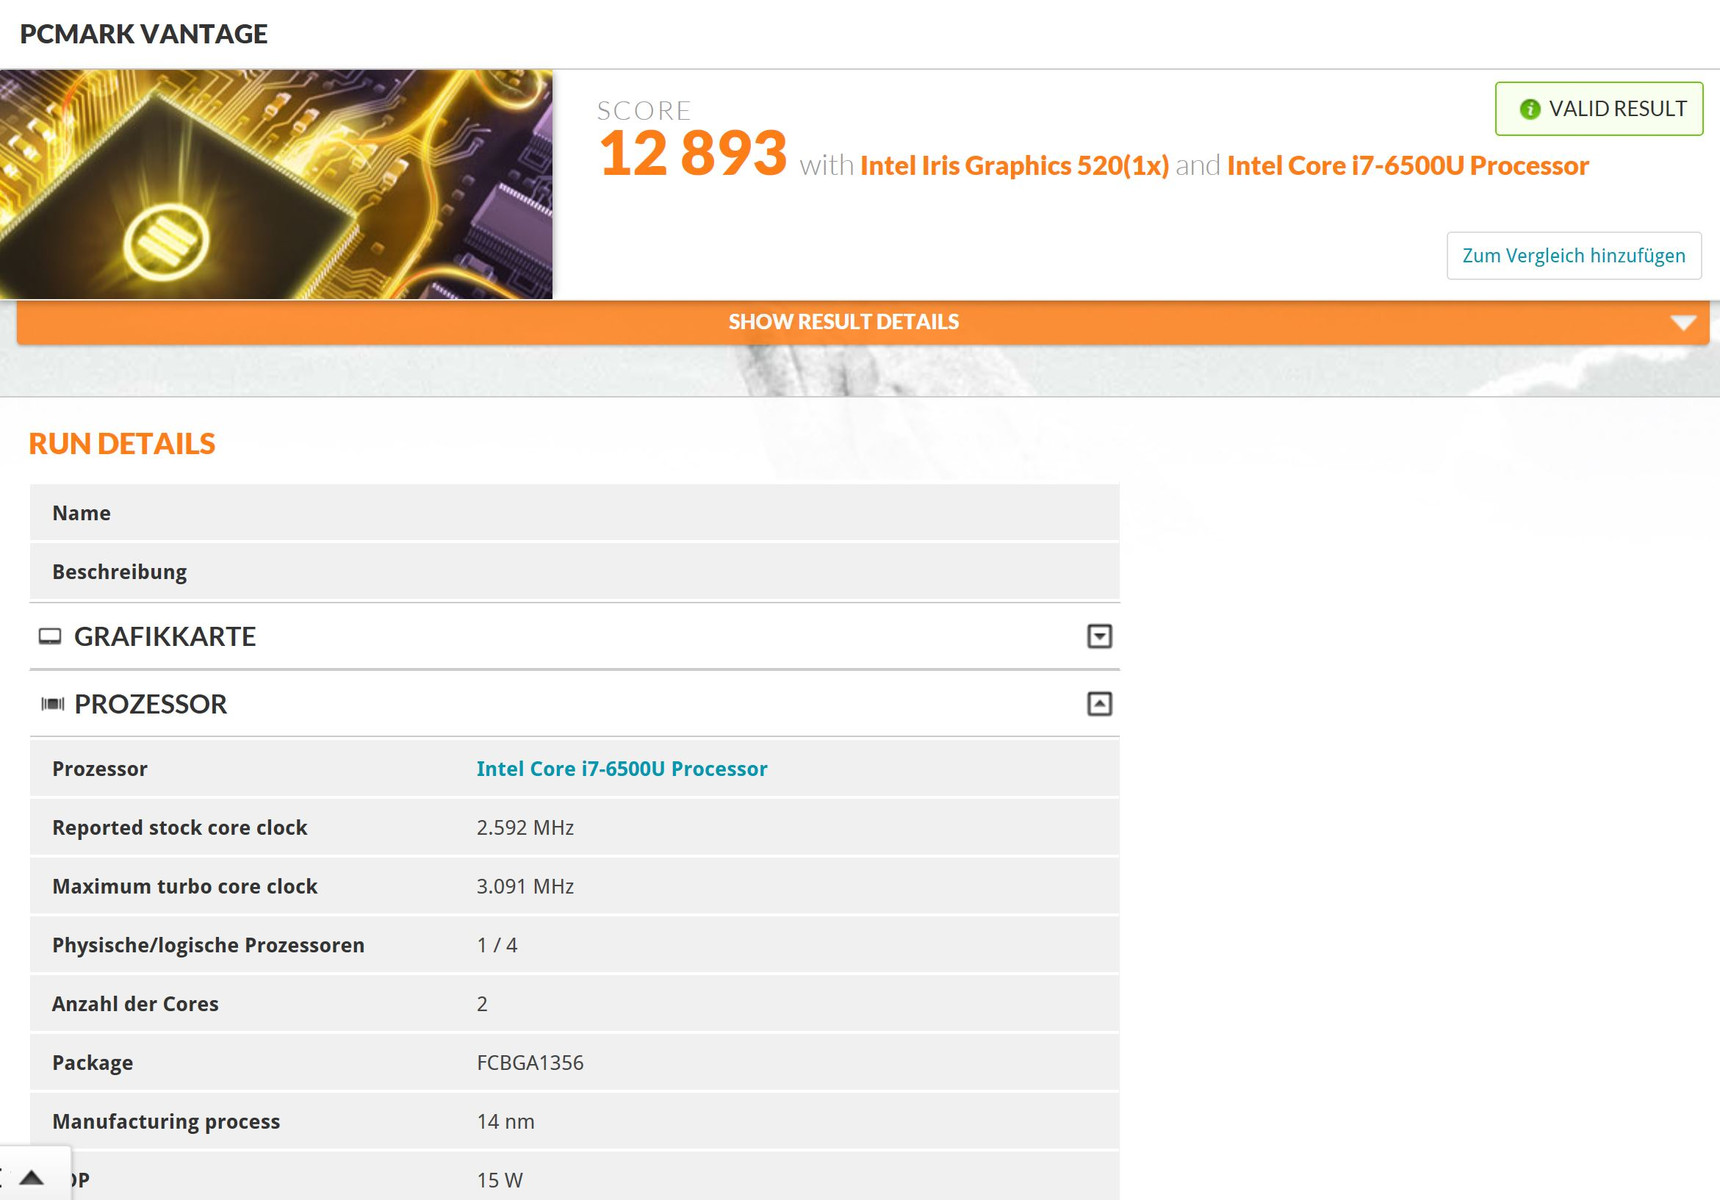
| PCMark Vantage Result | 13886 points | |
| PCMark 7 Score | 5152 points | |
| PCMark 8 Home Score Accelerated v2 | 2985 points | |
| PCMark 8 Creative Score Accelerated v2 | 4043 points | |
| PCMark 8 Work Score Accelerated v2 | 3830 points | |
Help | ||
Storage Device
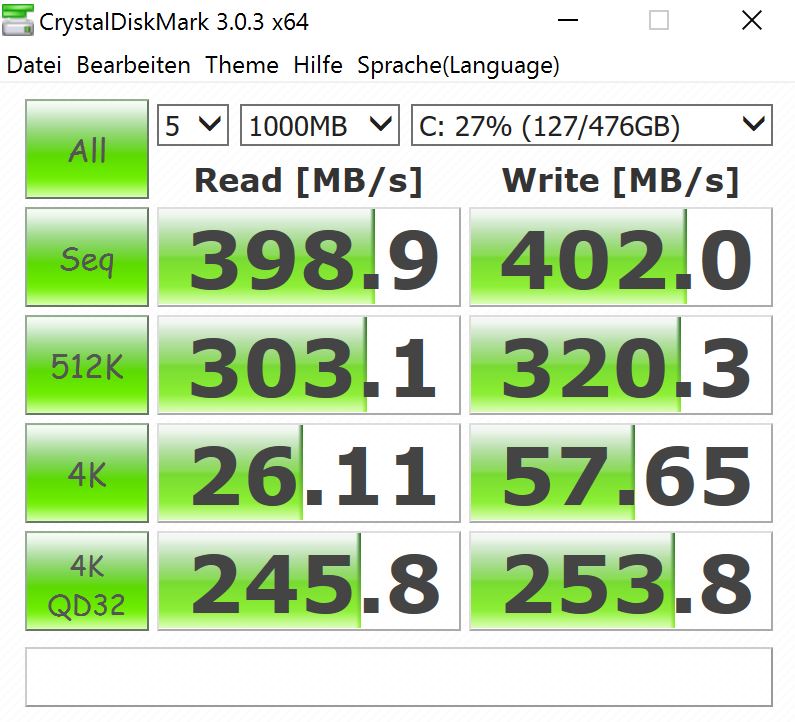
The large 512 GB SSD of the M.2 2280 format originates from SK Hynix. To be more specific, this is the SC300 model with MLC storage cells. According to SK Hynix, the SSD can read at up to 530 MB/s and write at up to 470 MB/s. We checked the performance of the drive with the benchmark program, AS SSD, and found 480 MB/s (sequential read) and 437 MB/s (sequential write). In the performance comparison, the SSD (SATA 3 speeds) has a clear disadvantage against the competition, which use their SSDs with a PCIe 3.0 x4 interface. Despite having a slower SSD, our test model works through everyday tasks quickly. Above all, the 4K read and write speeds are good: at times above 20 MB/s.

| Asus Transformer 3 Pro T303UA-GN050T SK Hynix Canvas SC300 512GB M.2 (HFS512G39MND) | Microsoft Surface Pro 4, Core m3 Samsung MZFLV128 NVMe | Lenovo ThinkPad X1 Yoga-20FRS1VS00 Samsung SSD PM961 1TB M.2 PCIe 3.0 x4 NVMe (MZSLW1T0) | HP Elite x2 1012 G1 Liteon L8H-256V2G | Acer Aspire Switch Alpha 12 SA5-271-56HM Kingston RBU-SNS8152S3256GG2 | |
|---|---|---|---|---|---|
| CrystalDiskMark 3.0 | -7% | 121% | 12% | 0% | |
| Read Seq (MB/s) | 398.9 | 663 66% | 1510 279% | 501 26% | 518 30% |
| Write Seq (MB/s) | 402 | 158.2 -61% | 1193 197% | 297.2 -26% | 199.9 -50% |
| Read 512 (MB/s) | 303.1 | 313.1 3% | 351.7 16% | 374.9 24% | |
| Write 512 (MB/s) | 320.3 | 158.2 -51% | 295.7 -8% | 201 -37% | |
| Read 4k (MB/s) | 26.11 | 30.14 15% | 37 42% | 28.31 8% | 29.3 12% |
| Write 4k (MB/s) | 57.7 | 68 18% | 126 118% | 90.3 56% | 76.8 33% |
| Read 4k QD32 (MB/s) | 245.8 | 243.7 -1% | 404 64% | 285 16% | 272 11% |
| Write 4k QD32 (MB/s) | 253.8 | 149.2 -41% | 319 26% | 268.4 6% | 197.1 -22% |

Graphics Card
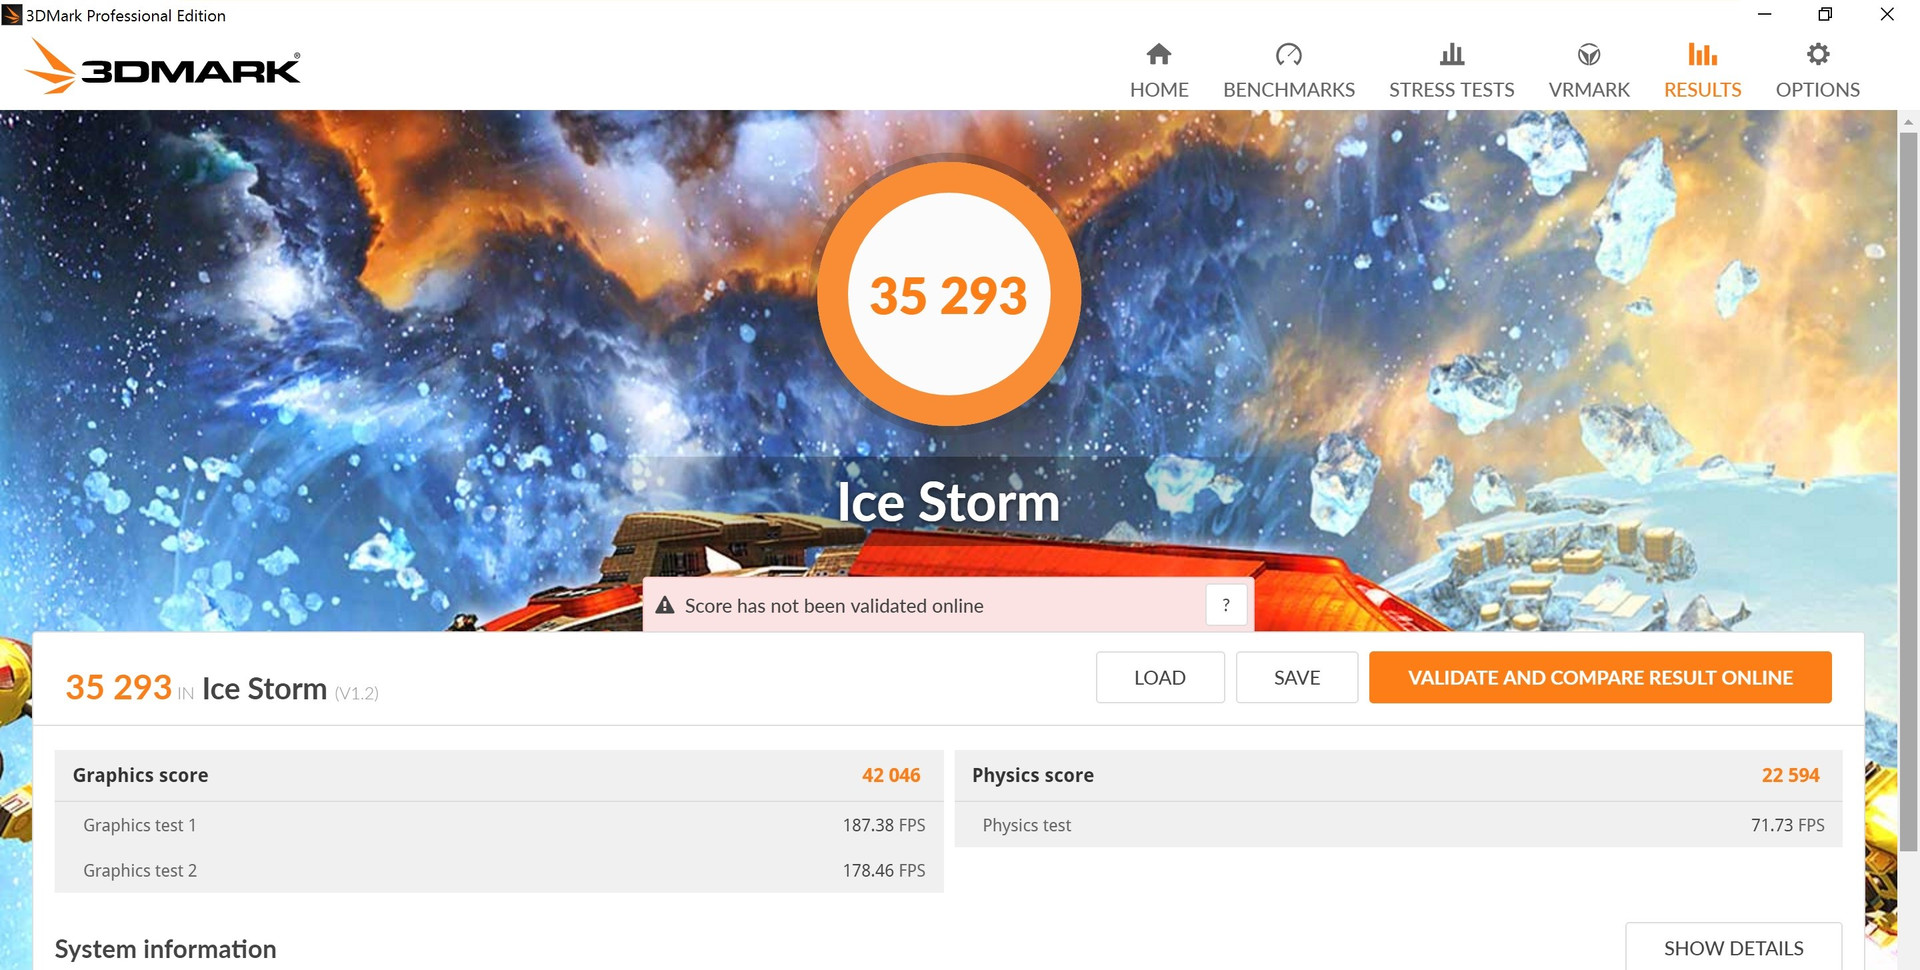
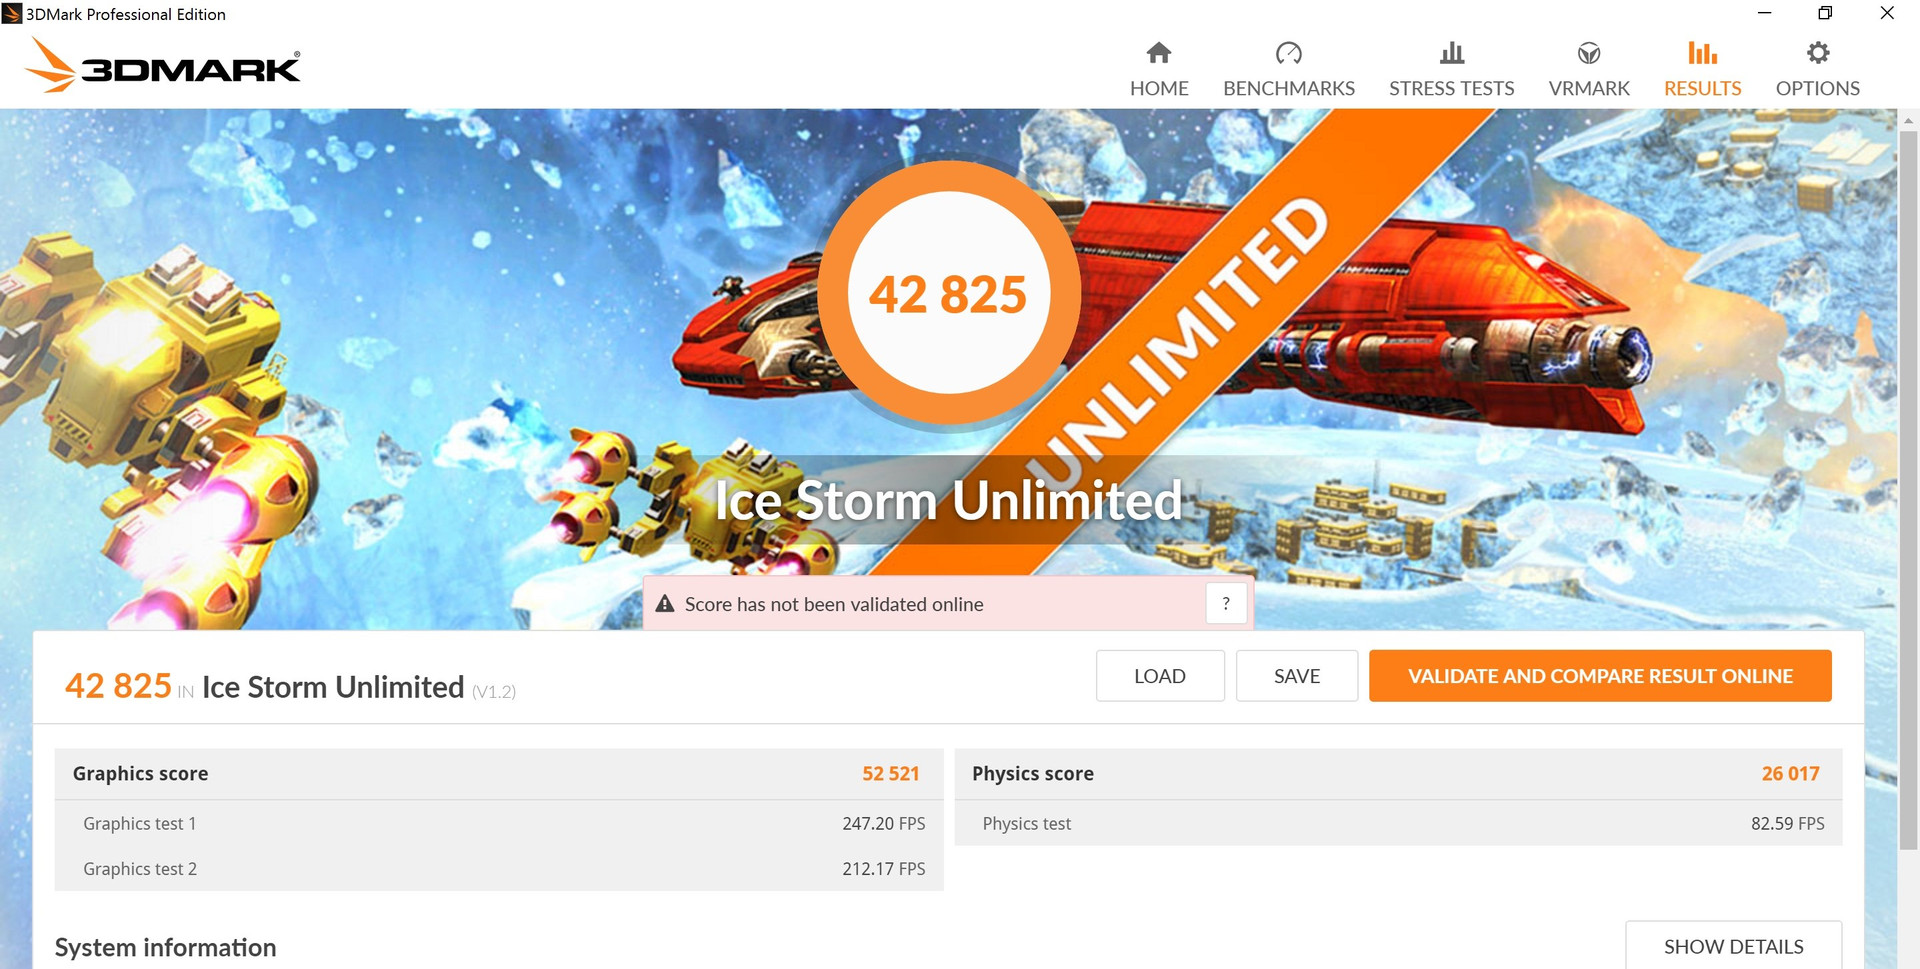
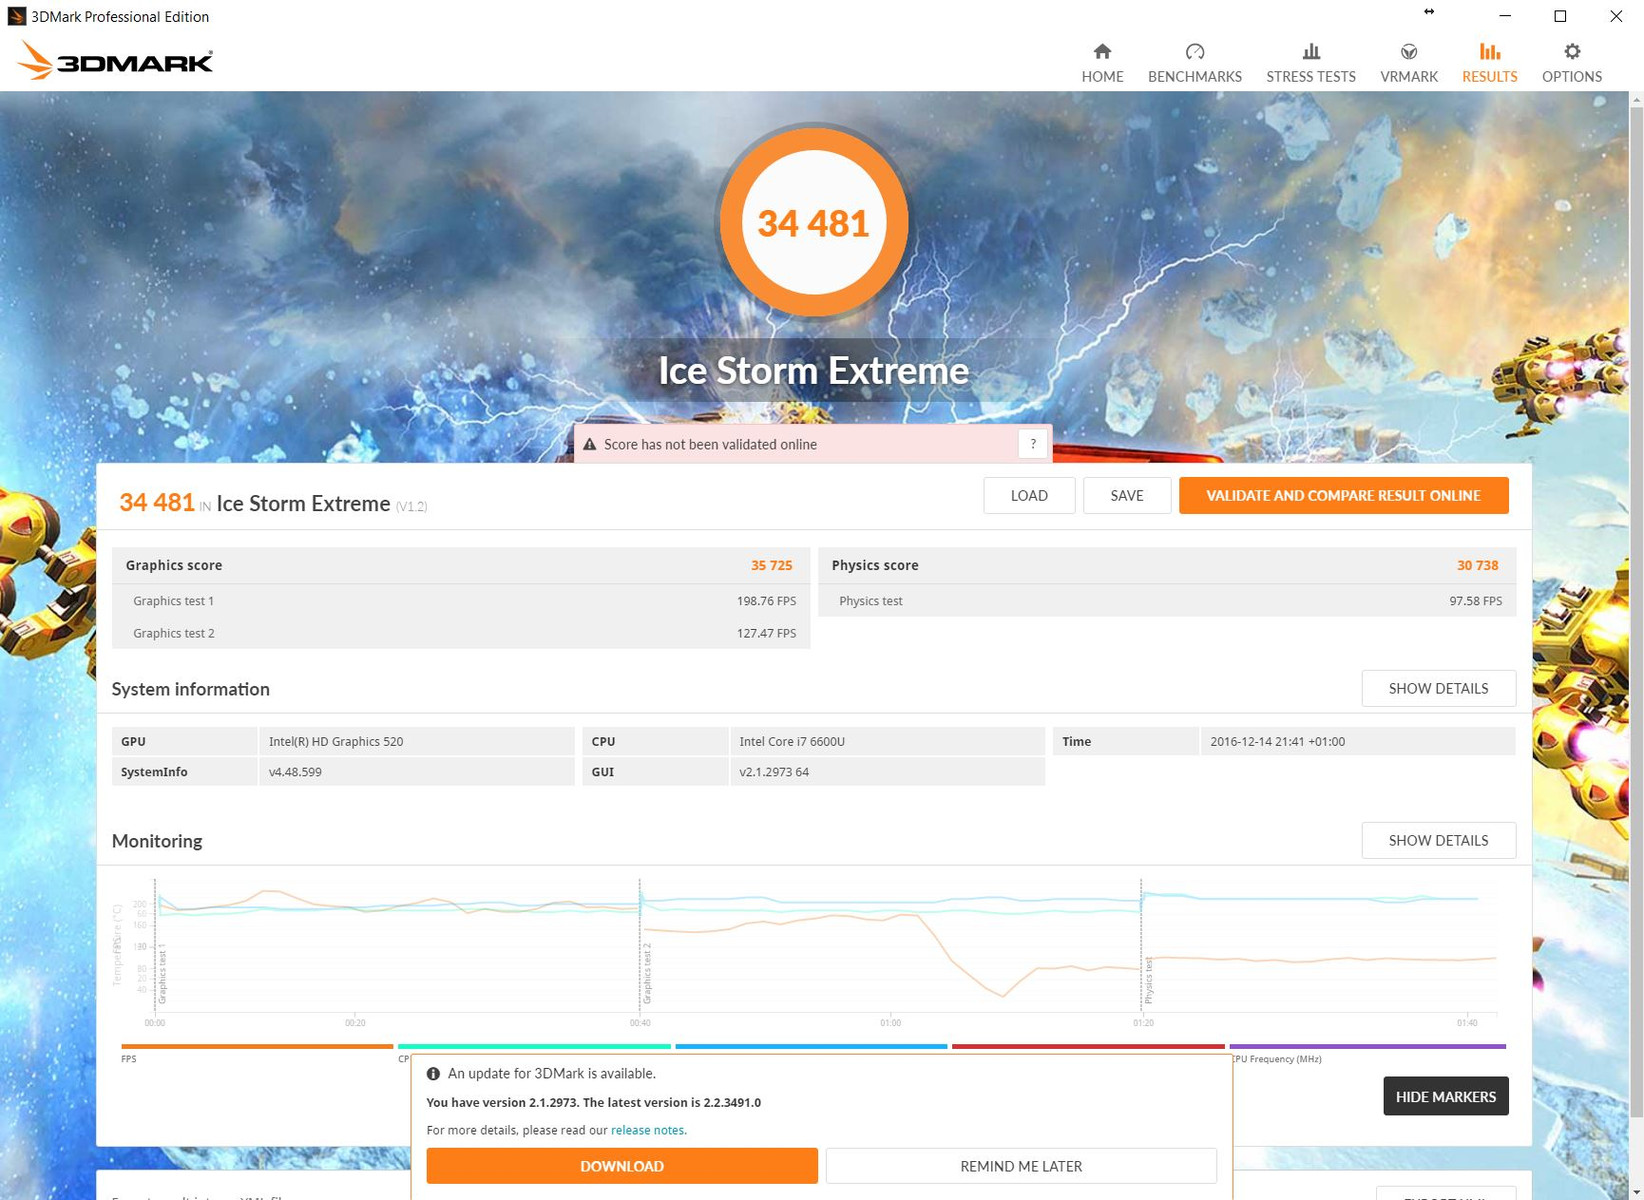
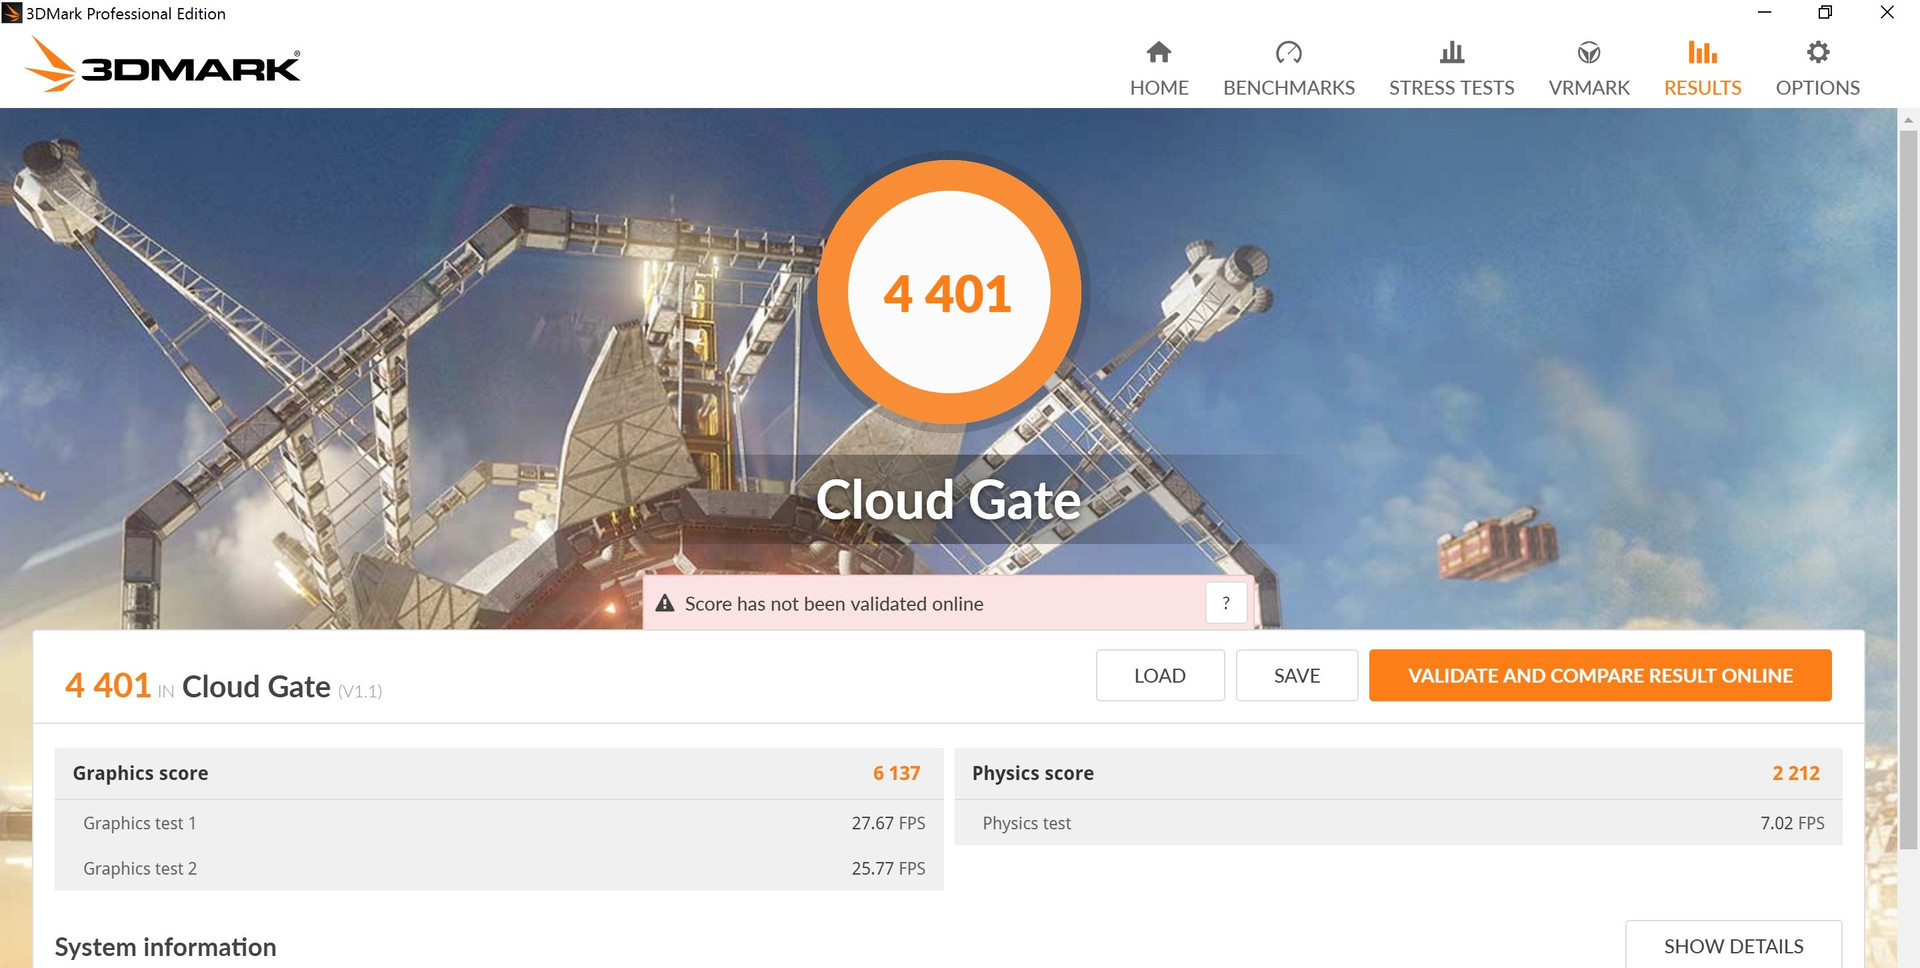
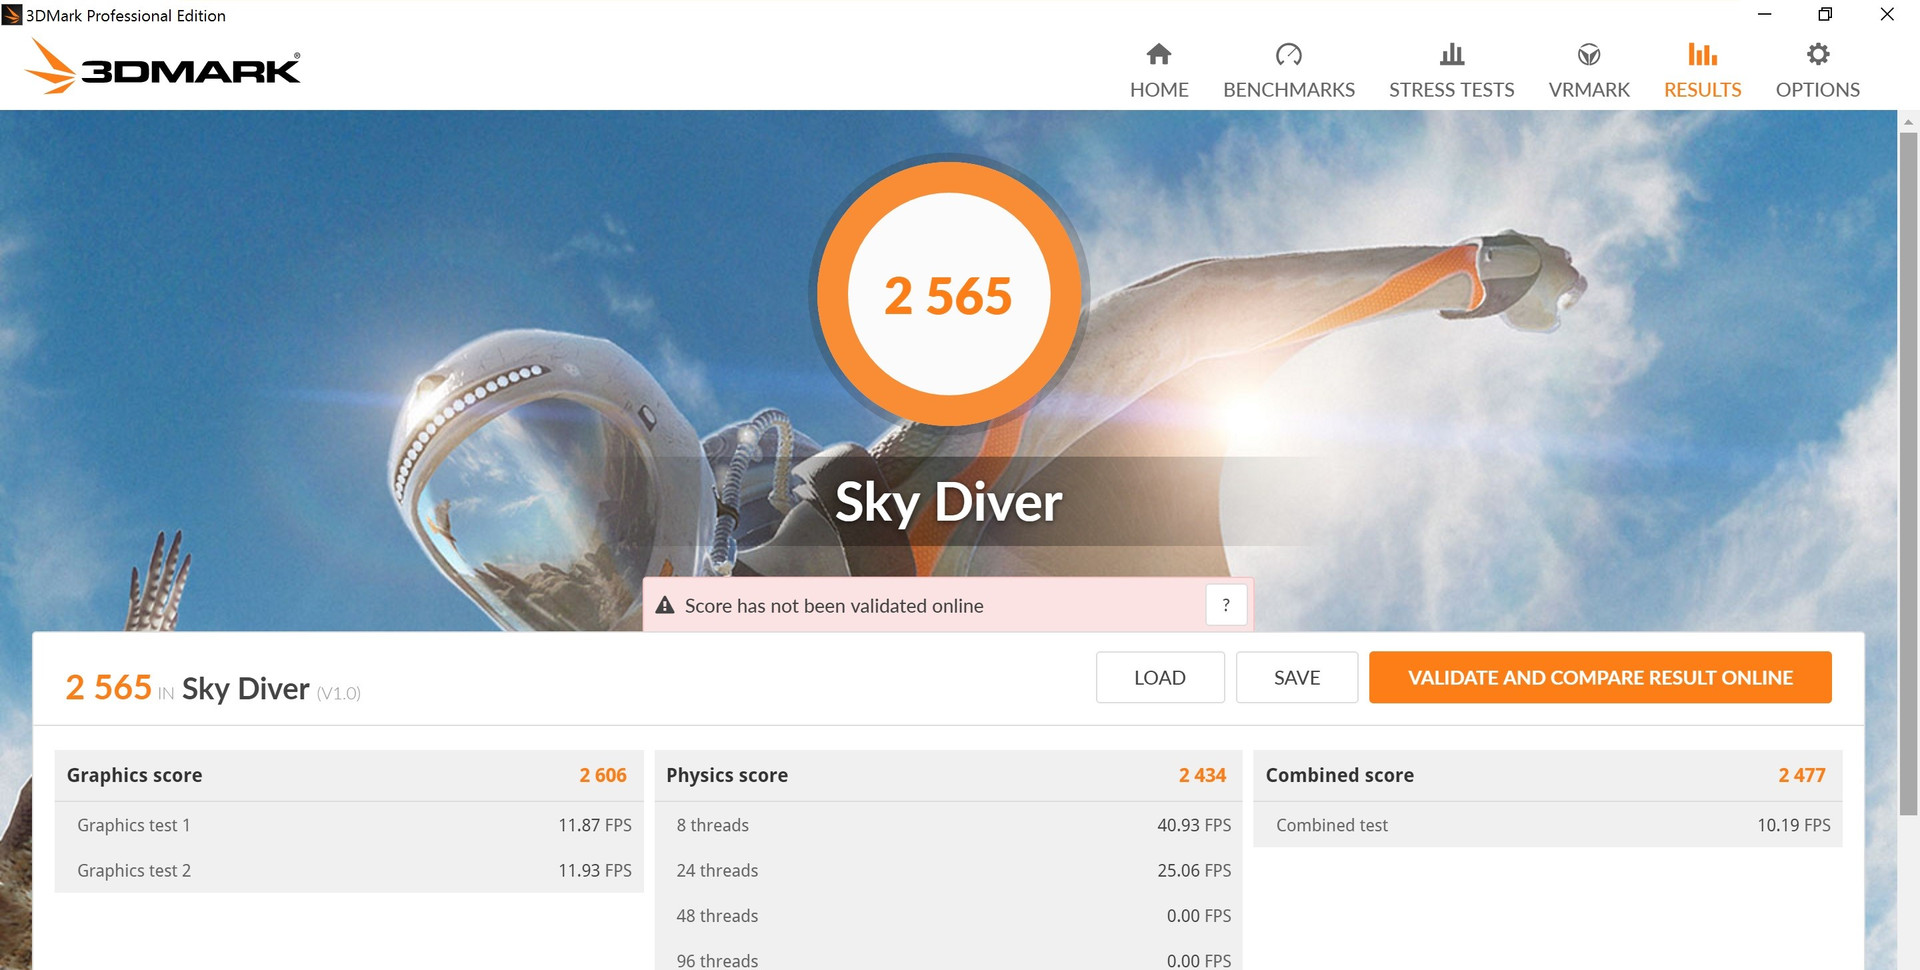
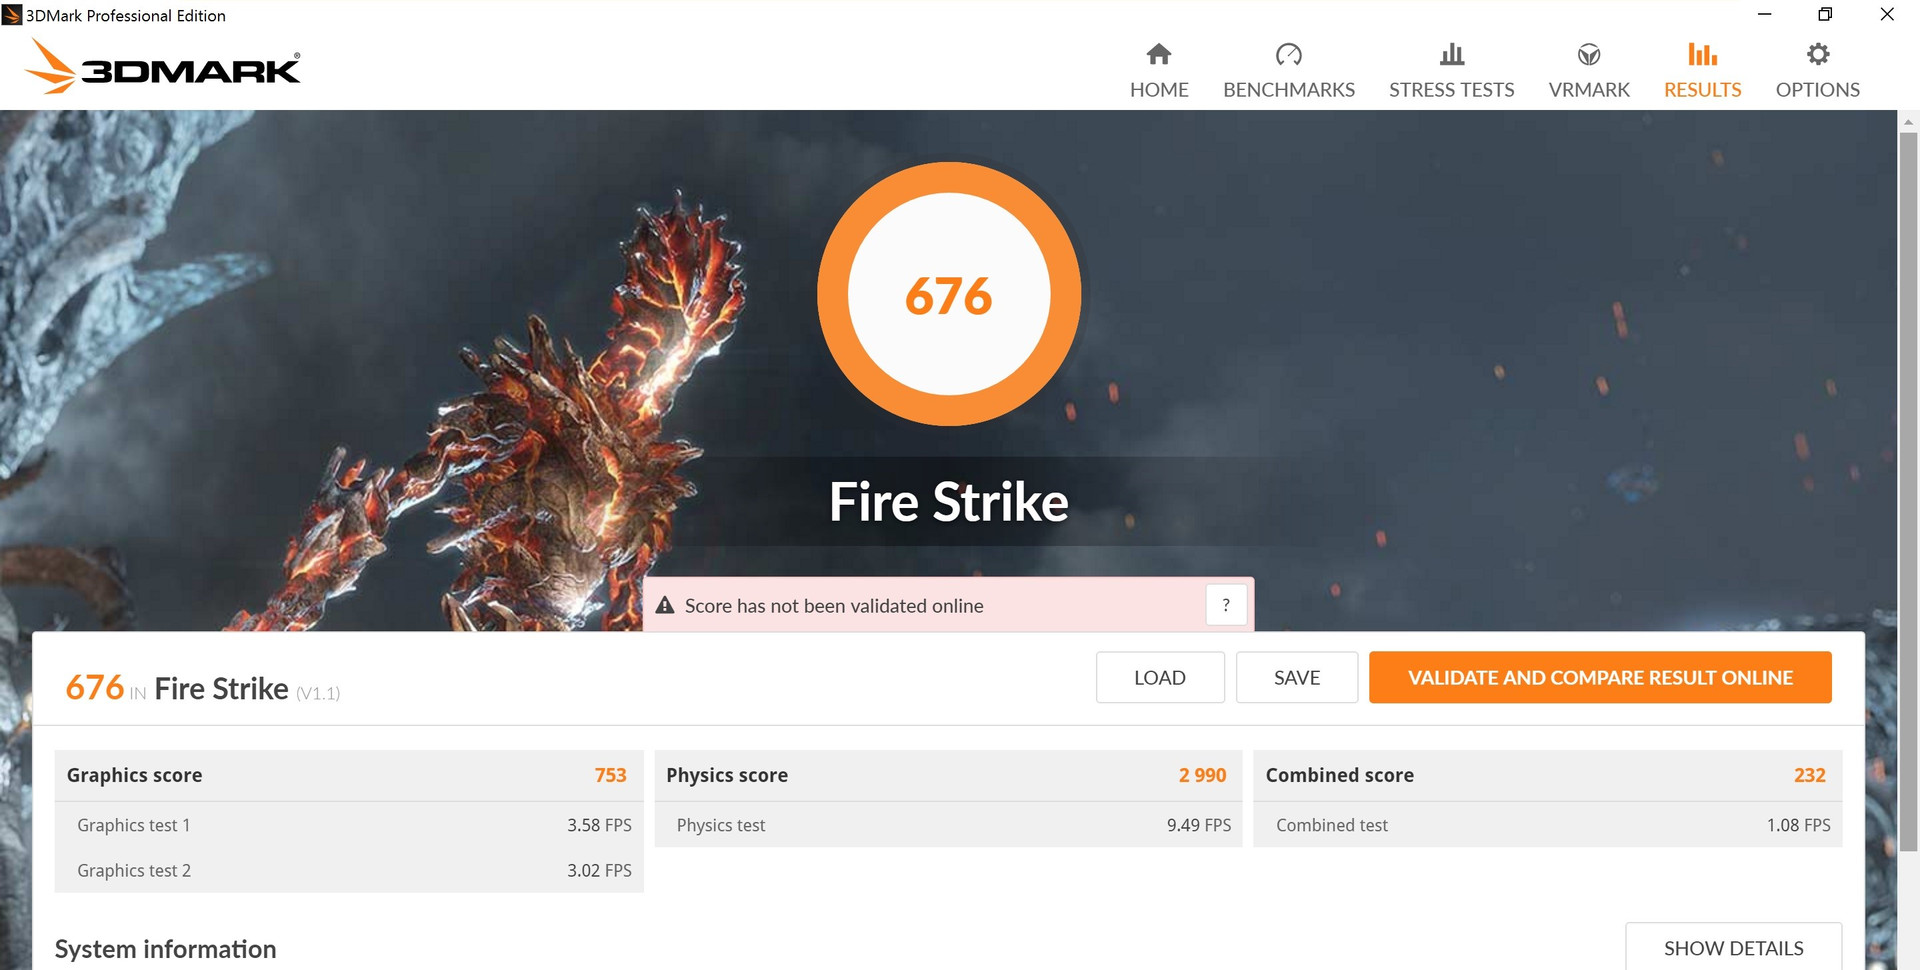
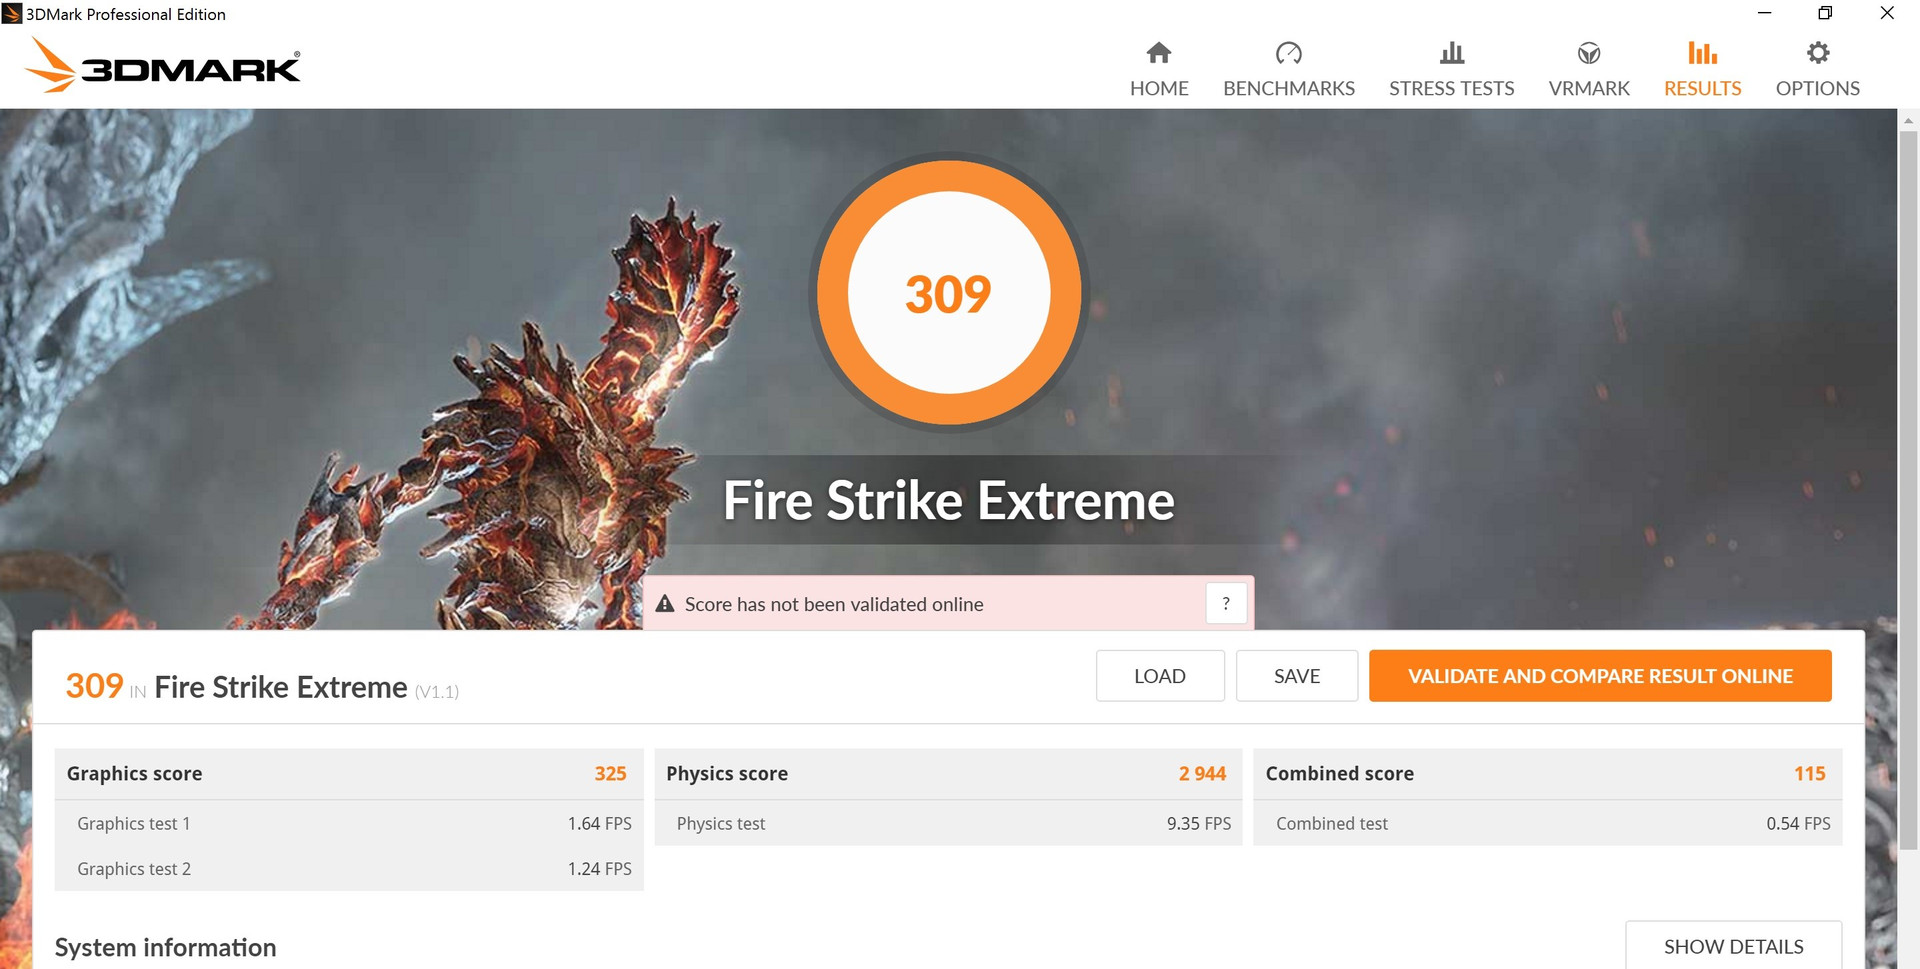
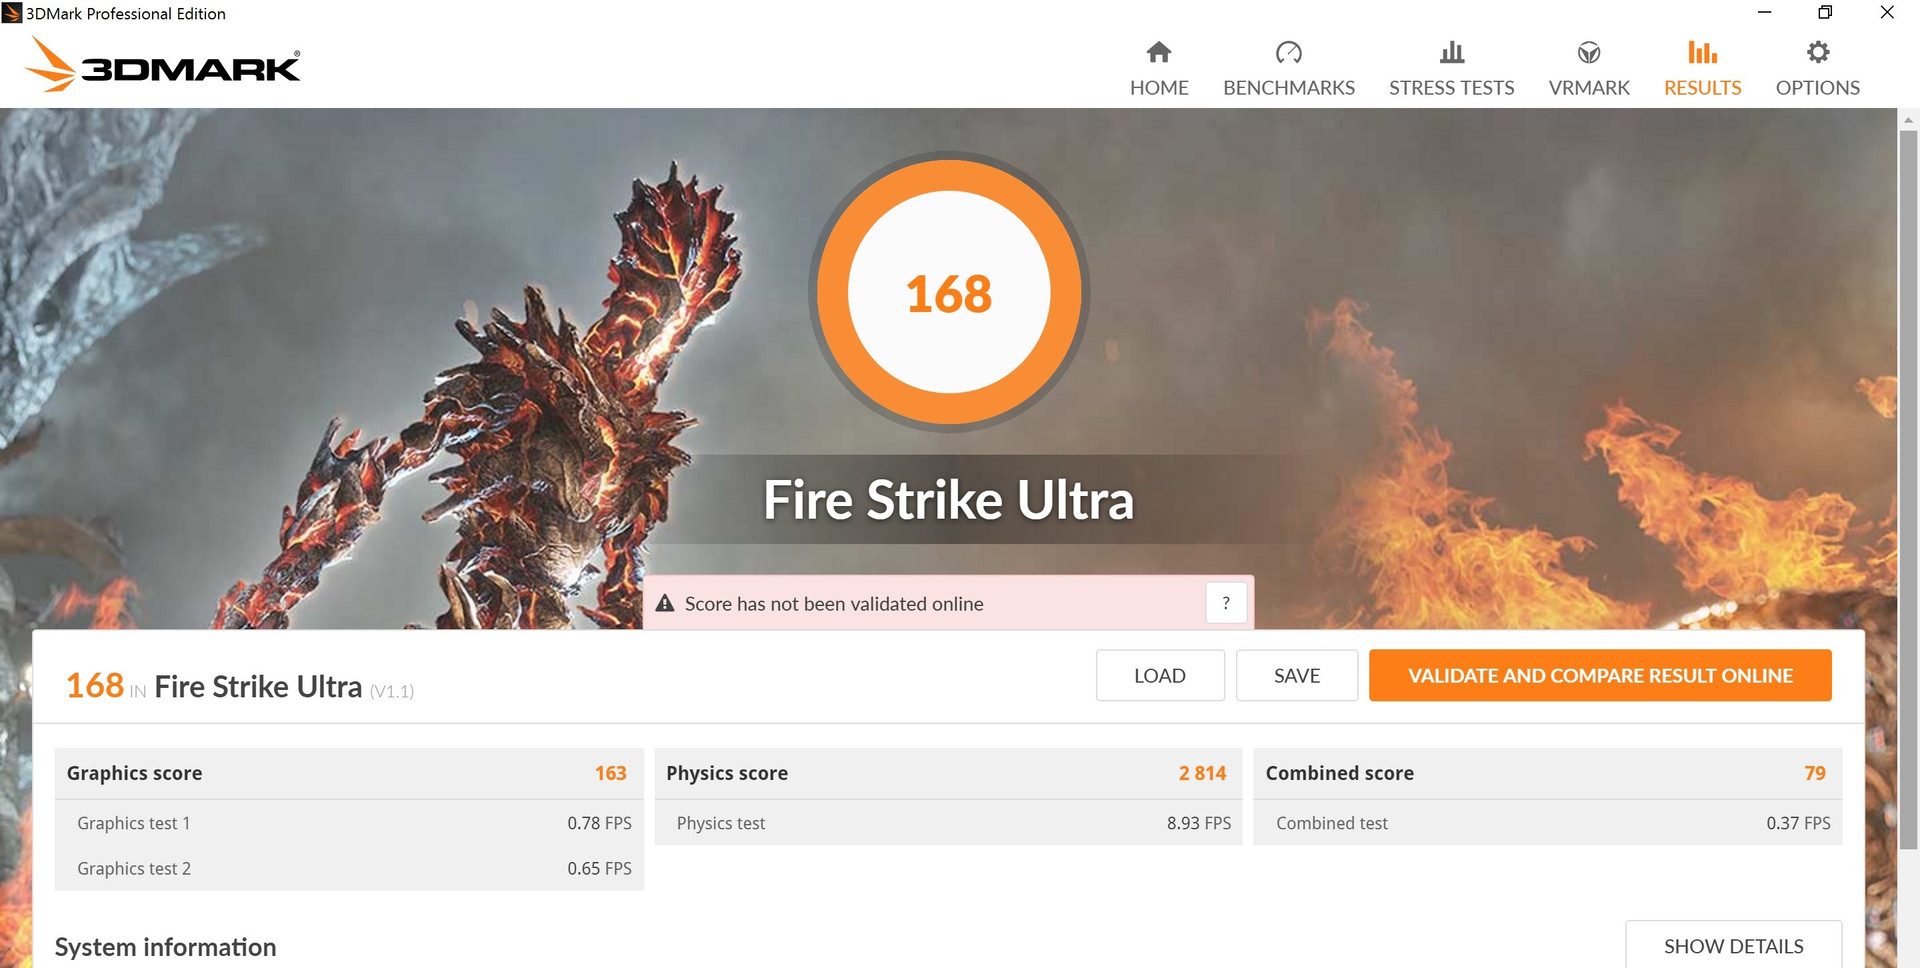
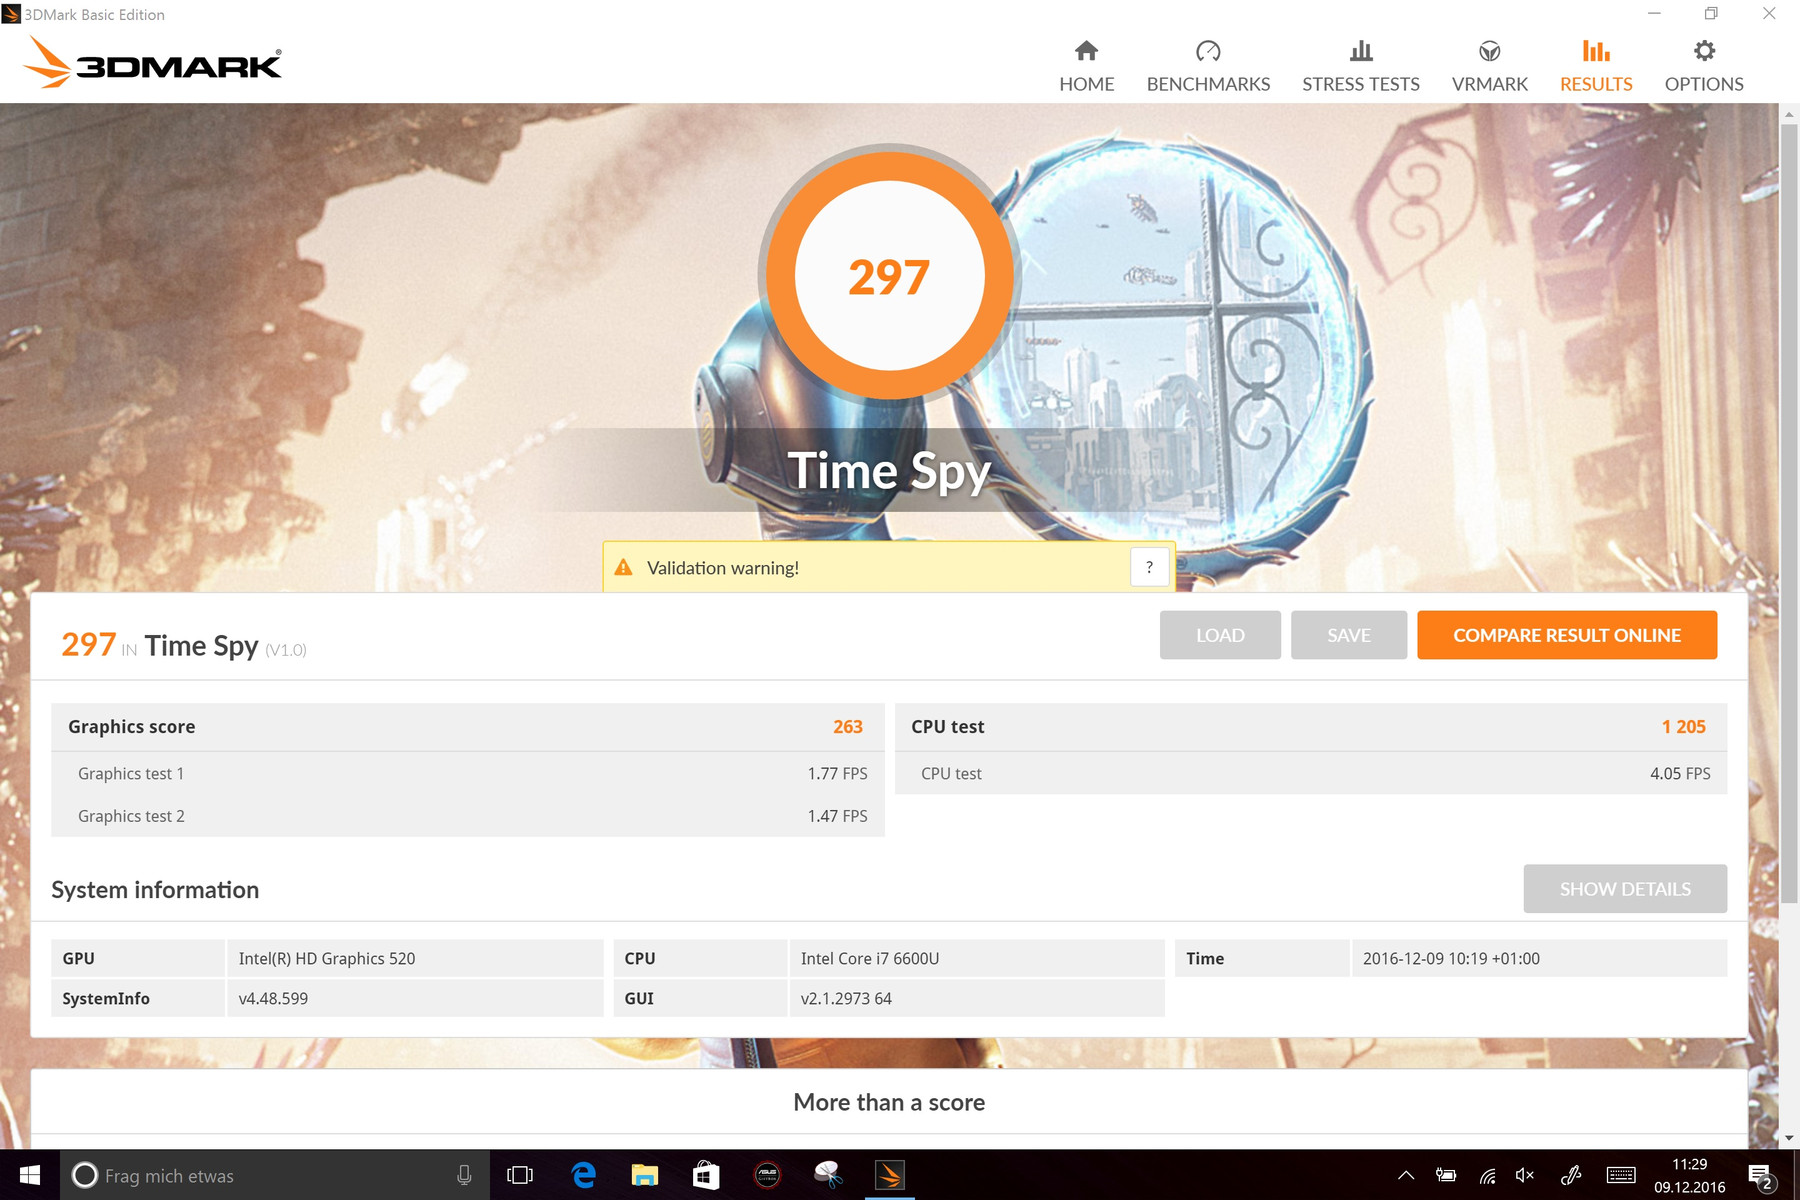
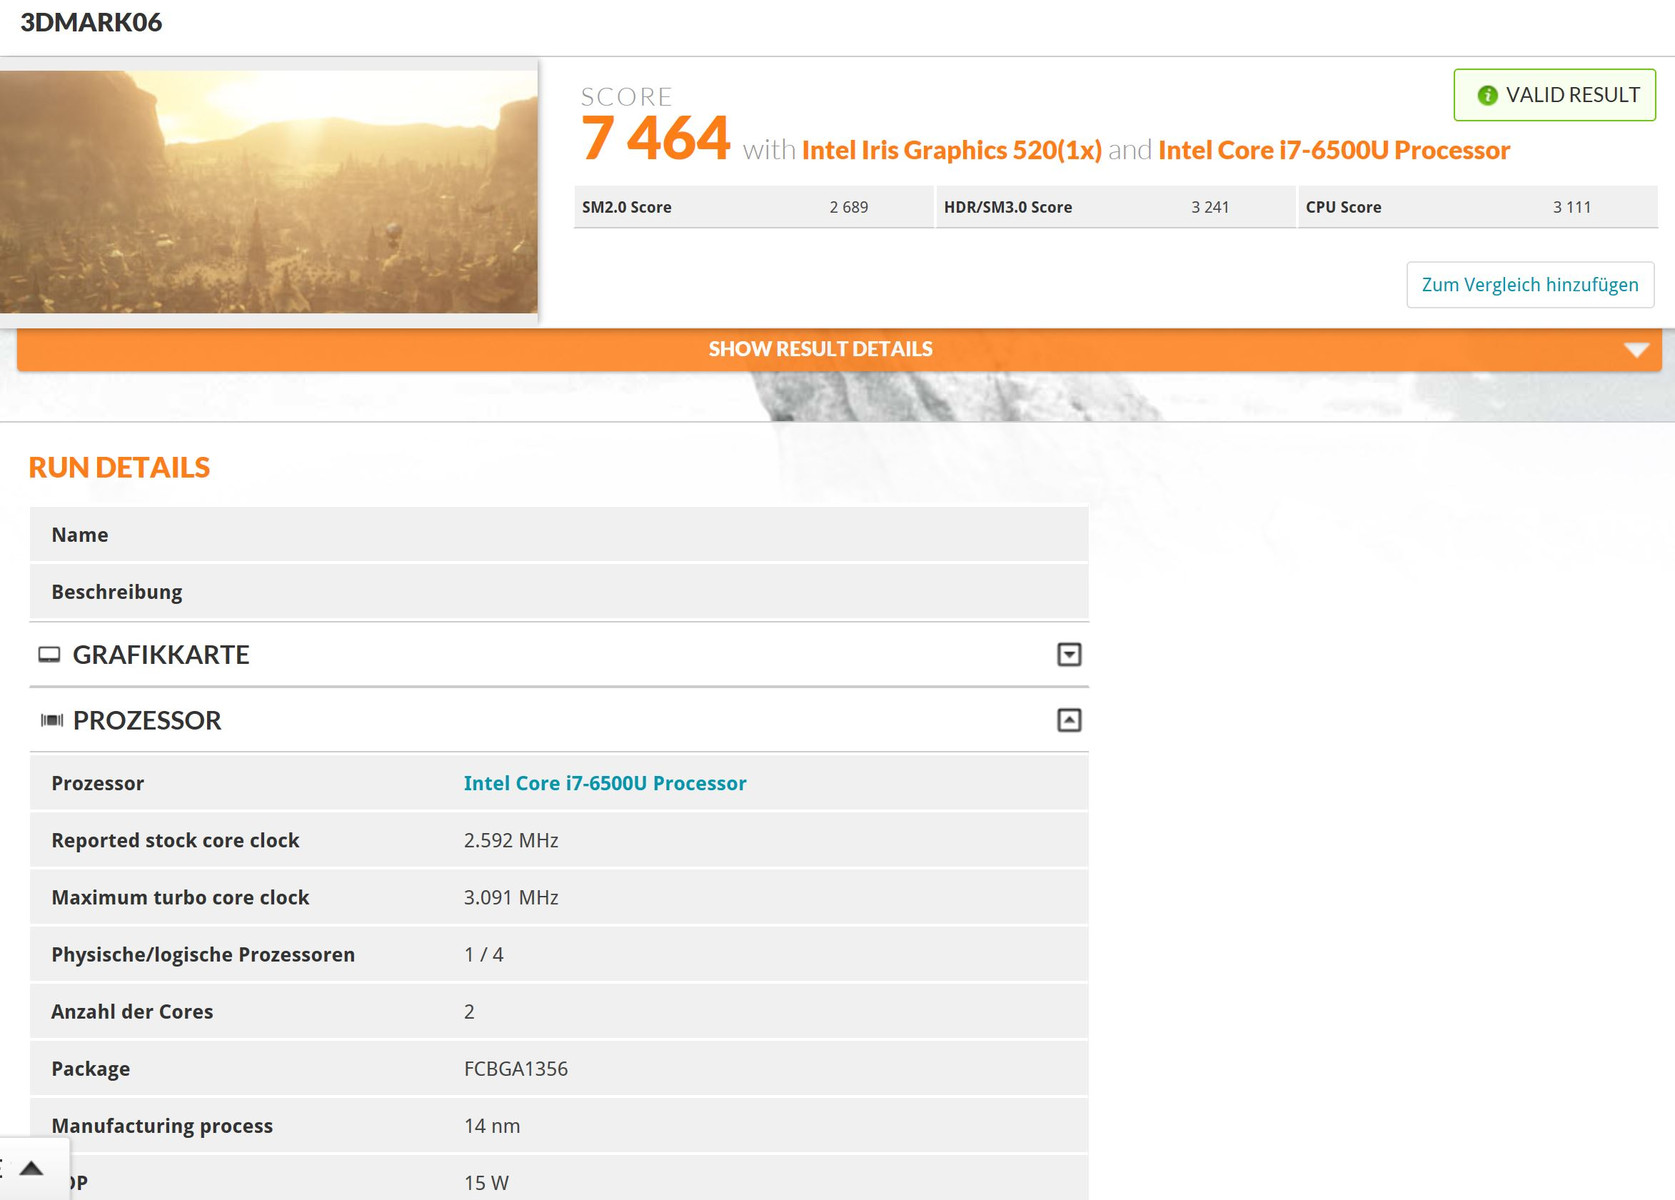
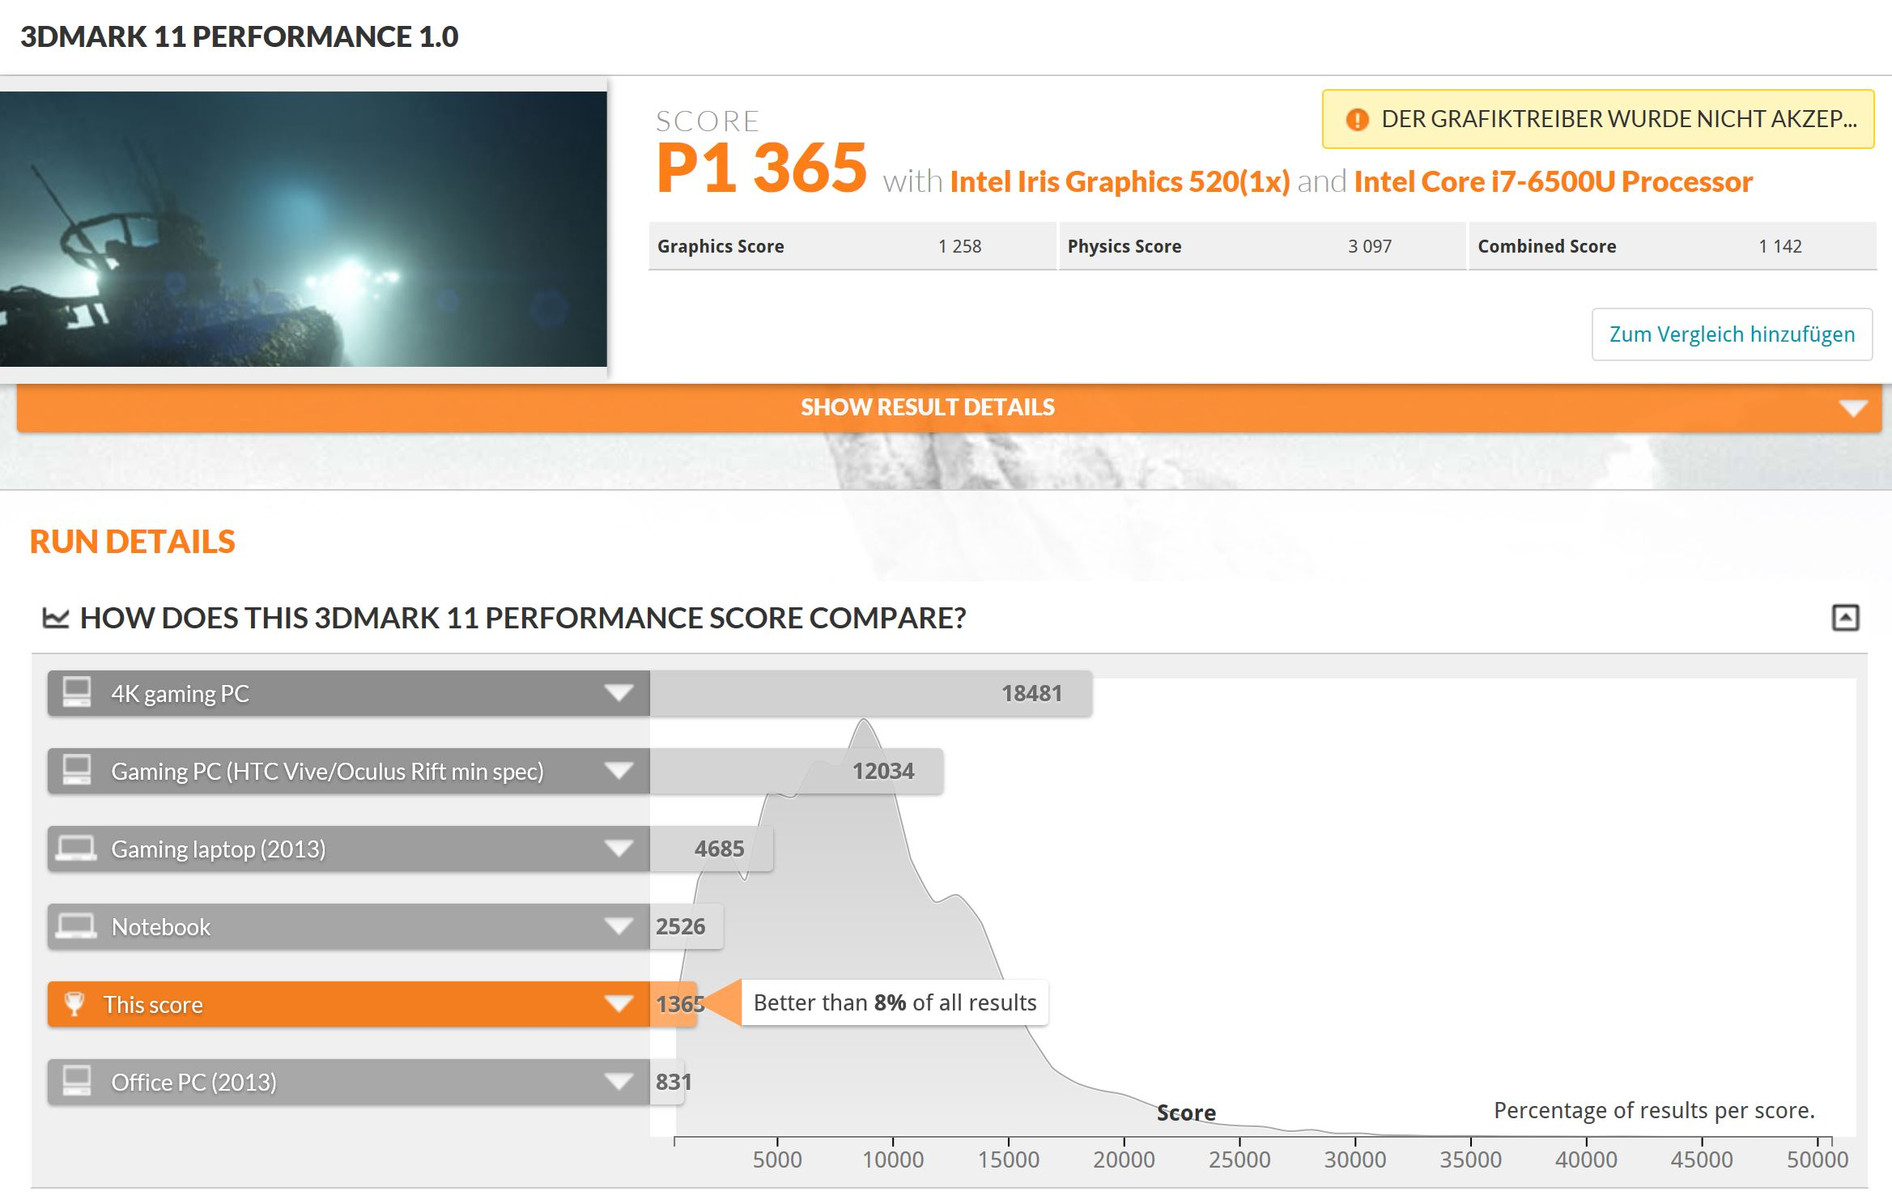
For graphics, users will have to be content with an Intel HD Graphics 520. This convertible is not available with a dedicated graphics card. The integrated graphics processor from Intel relieves the CPU of a lot of work (especially video decoding). It supports DirectX 12 and the H265/HEVC codec. Due to the previously mentioned TDP limitation, the Intel HD Graphics 520 performs a little slower. This places our test model at the last spot in 3DMark. If you want more graphics performance, we recommend looking at the optional graphics dock offered by Asus (via the Thunderbolt 3).

| 3DMark | |
| 1280x720 Cloud Gate Standard Graphics | |
| Lenovo ThinkPad X1 Yoga-20FRS1VS00 | |
| Acer Aspire Switch Alpha 12 SA5-271-56HM | |
| Microsoft Surface Pro 4, Core m3 | |
| HP Elite x2 1012 G1 | |
| Asus Transformer 3 Pro T303UA-GN050T | |
| 1920x1080 Fire Strike Graphics | |
| Lenovo ThinkPad X1 Yoga-20FRS1VS00 | |
| Microsoft Surface Pro 4, Core m3 | |
| HP Elite x2 1012 G1 | |
| Asus Transformer 3 Pro T303UA-GN050T | |
| 1280x720 Ice Storm Standard Score | |
| HP Elite x2 1012 G1 | |
| Microsoft Surface Pro 4, Core m3 | |
| Asus Transformer 3 Pro T303UA-GN050T | |
| 3DMark 06 - 1280x1024 Standard Score AA:0x AF:0x | |
| HP Elite x2 1012 G1 | |
| Microsoft Surface Pro 4, Core m3 | |
| Asus Transformer 3 Pro T303UA-GN050T | |
| 3DMark 03 Standard | 20325 points | |
| 3DMark 05 Standard | 9082 points | |
| 3DMark 06 Standard Score | 7464 points | |
| 3DMark Vantage P Result | 4650 points | |
| 3DMark 11 Performance | 1381 points | |
| 3DMark Ice Storm Standard Score | 35293 points | |
| 3DMark Cloud Gate Standard Score | 4401 points | |
| 3DMark Fire Strike Score | 676 points | |
| 3DMark Fire Strike Extreme Score | 309 points | |
| 3DMark Time Spy Score | 297 points | |
Help | ||
Gaming Performance
As indicated by the benchmark results, the gaming performance is meager. Older games from the year 2013 or earlier can be run fluidly with an HD resolution and minimal details. If you are a serious gamer considering the Asus Transformer 3 Pro, you might want to reconsider. A device with a dedicated graphics card might be a better fit.
| low | med. | high | ultra | |
|---|---|---|---|---|
| BioShock Infinite (2013) | 45.2 | 26.9 | 22.5 | 6.6 |
| Battlefield 4 (2013) | 31.3 | 23.2 | 15.9 | |
| Rise of the Tomb Raider (2016) | 20 | 11 | 9 |
Emissions
System Noise
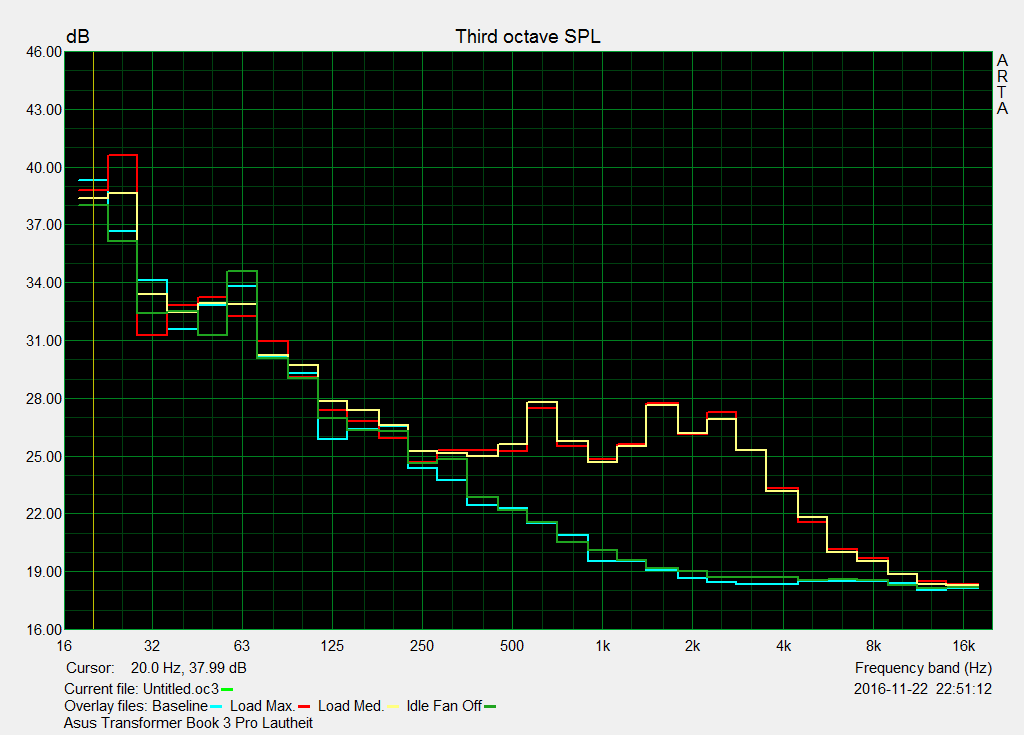
The noise emissions are nothing special. The fan is often off, especially when idle. When it turns off, the convertible is silent. If the convertible is pushed to higher levels of load, the emissions rise up to a maximum of 37 dB(A). The emissions rise slowly yet continuously. The Surface Pro 4 with a Core i7 processor is slightly louder at 41 dB(A). However, in a side-by-side comparison, both are equally loud.
| Asus Transformer 3 Pro T303UA-GN050T HD Graphics 520, 6500U, SK Hynix Canvas SC300 512GB M.2 (HFS512G39MND) | Microsoft Surface Pro 4 Core i7 Iris Graphics 540, 6650U, Samsung MZFLV256 NVMe | Lenovo ThinkPad X1 Yoga-20FRS1VS00 HD Graphics 520, 6600U, Samsung SSD PM961 1TB M.2 PCIe 3.0 x4 NVMe (MZSLW1T0) | Apple MacBook Pro 13 2016 (2.9 GHz) Iris Graphics 550, 6267U, Apple SSD AP0256 | Dell XPS 13 9360 QHD+ i5 HD Graphics 620, i5-7200U, Toshiba NVMe THNSN5256GPUK | |
|---|---|---|---|---|---|
| Noise | -0% | 4% | 4% | 1% | |
| off / environment * (dB) | 30.7 | 28.9 6% | 30.2 2% | 30.3 1% | |
| Idle Minimum * (dB) | 30.7 | 28.4 7% | 28.9 6% | 30.2 2% | 30.6 -0% |
| Idle Average * (dB) | 30.7 | 28.6 7% | 28.9 6% | 30.2 2% | 30.6 -0% |
| Idle Maximum * (dB) | 30.7 | 28.7 7% | 28.9 6% | 30.2 2% | 32.2 -5% |
| Load Average * (dB) | 37 | 40.8 -10% | 35.3 5% | 33 11% | 32.2 13% |
| Load Maximum * (dB) | 37.1 | 41.4 -12% | 38.9 -5% | 36.2 2% | 38.5 -4% |
* ... smaller is better
Noise level
| Idle |
| 30.7 / 30.7 / 30.7 dB(A) |
| Load |
| 37 / 37.1 dB(A) |
 | ||
30 dB silent 40 dB(A) audible 50 dB(A) loud |
||
min: | ||
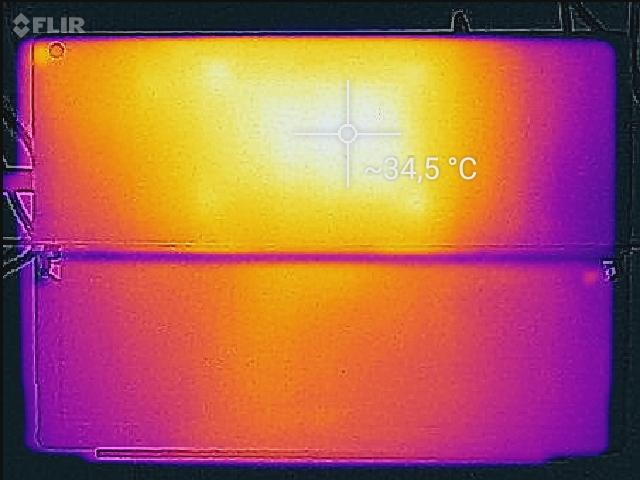
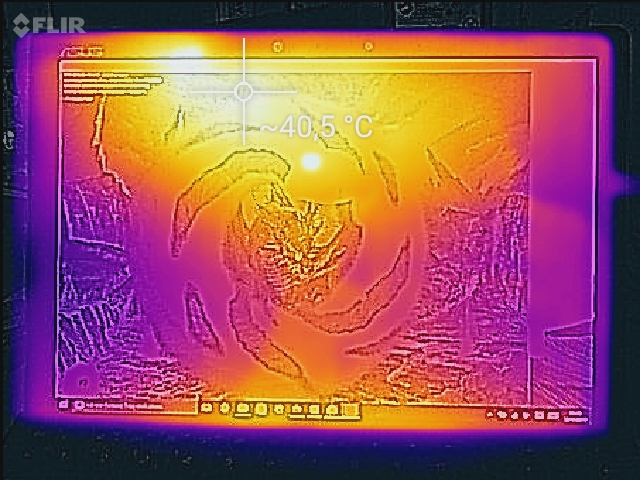
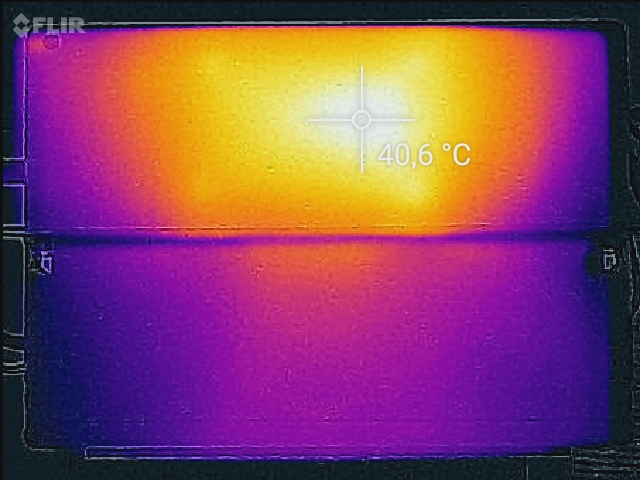
Temperature
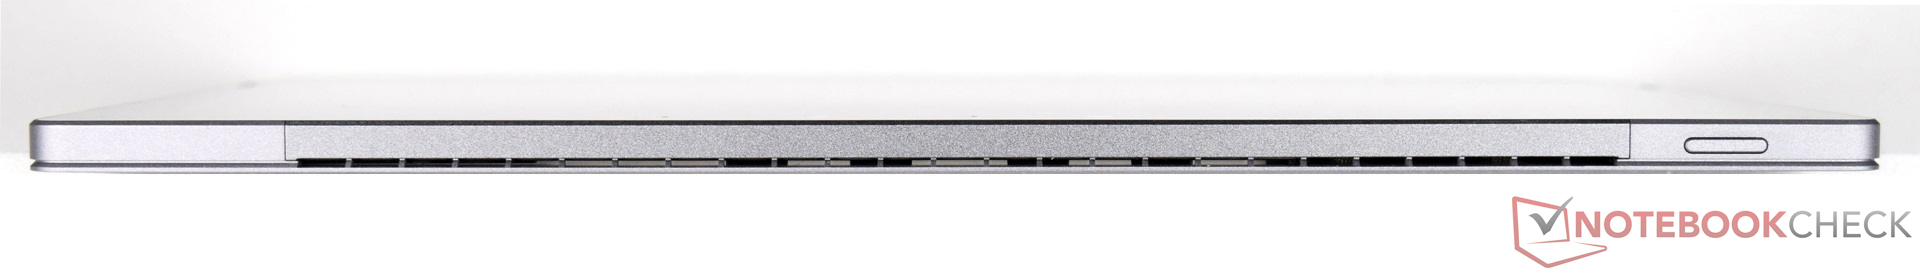
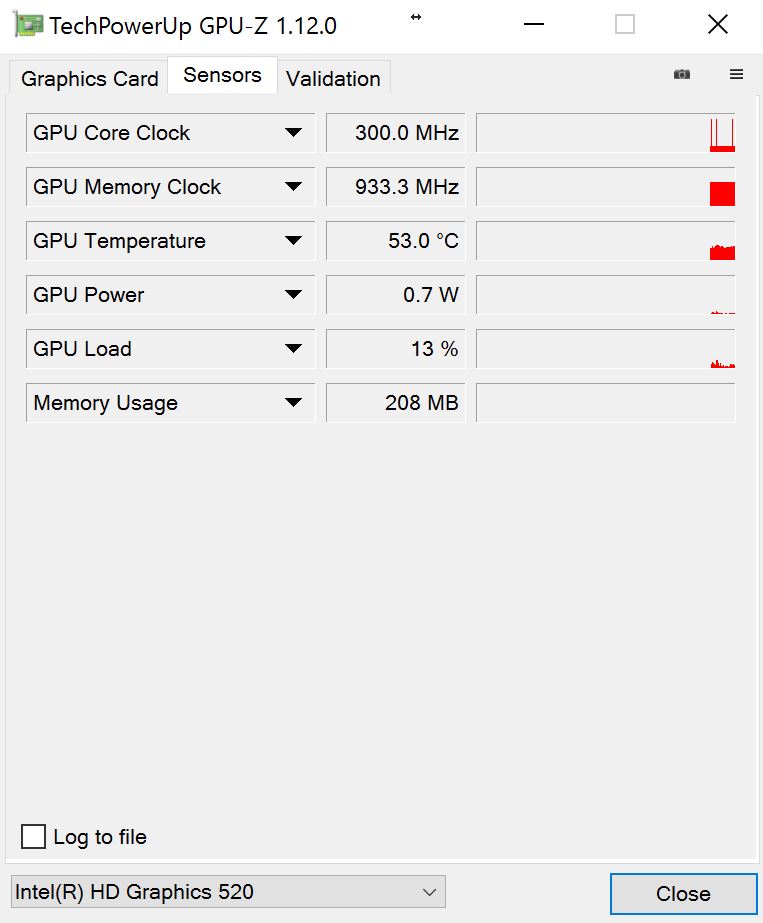
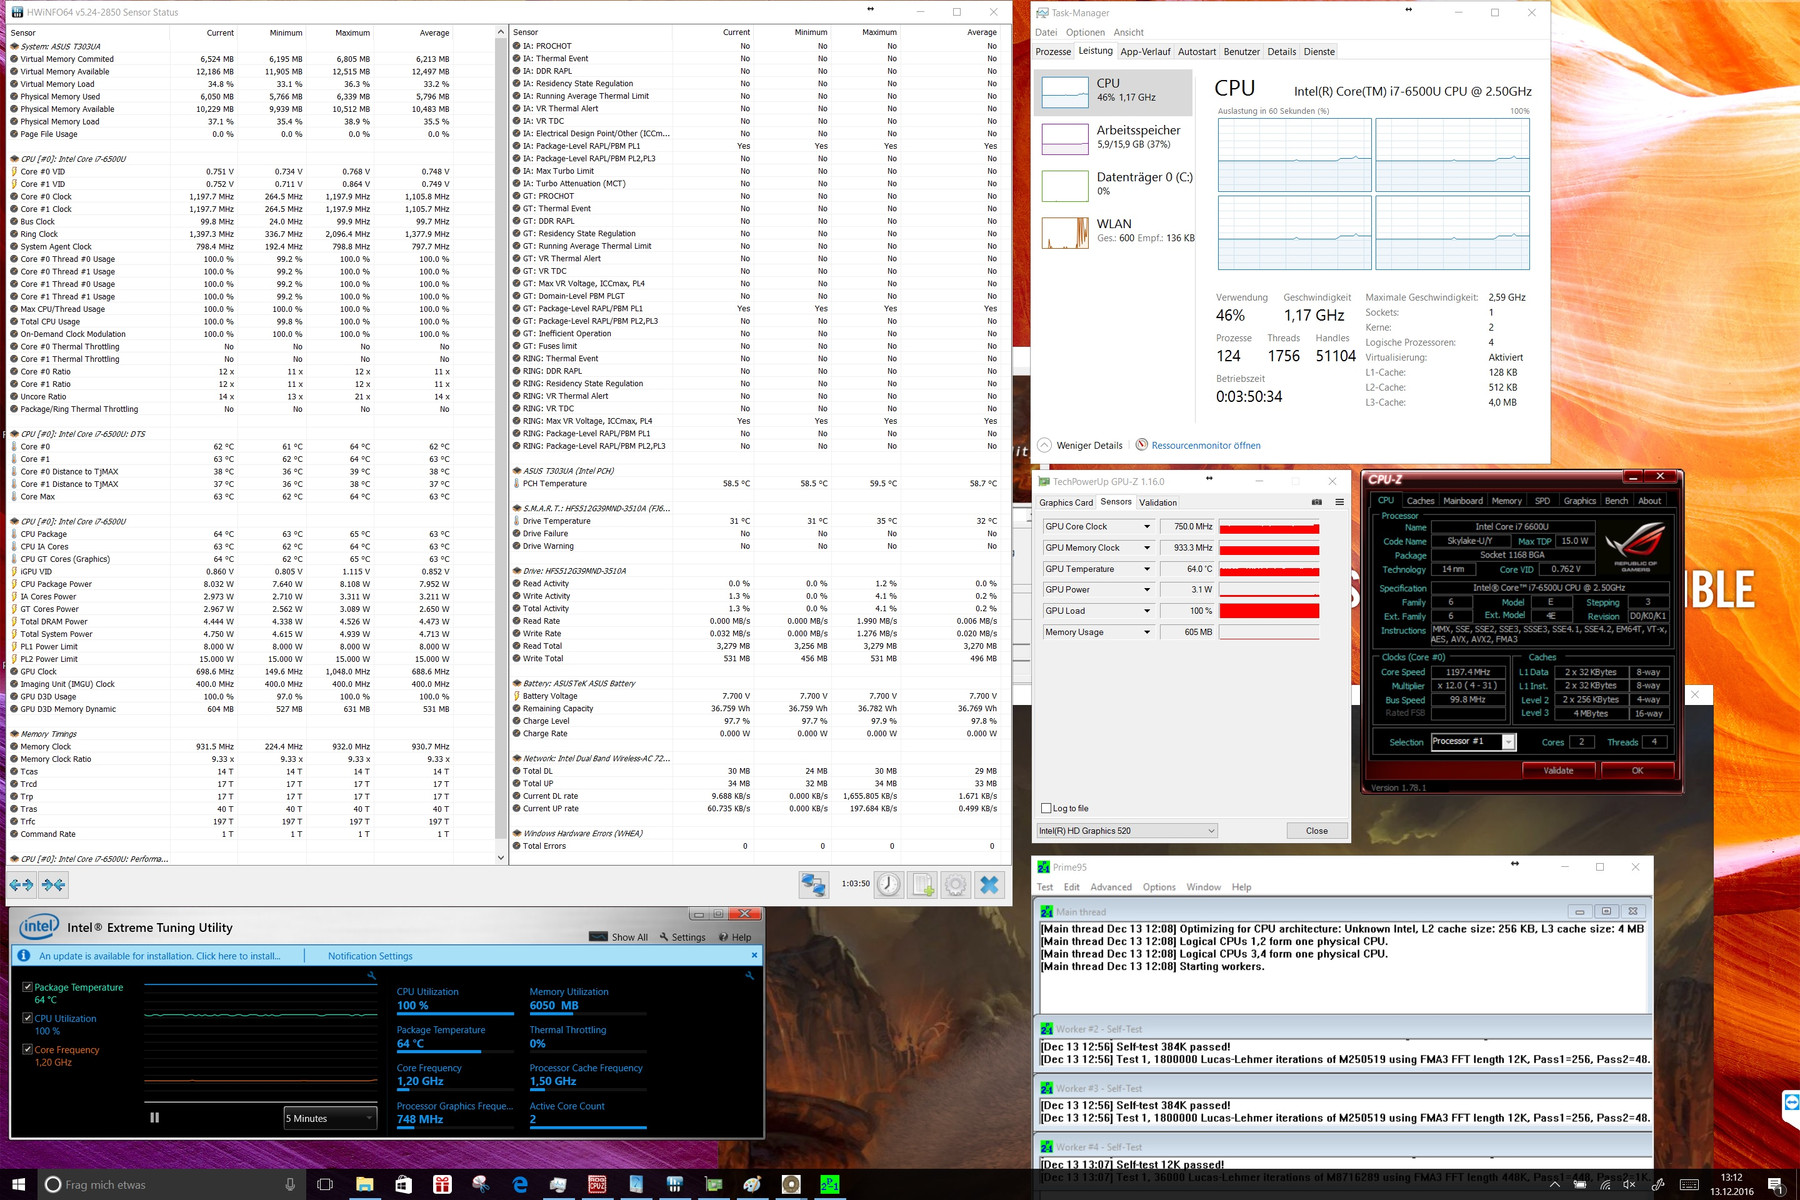
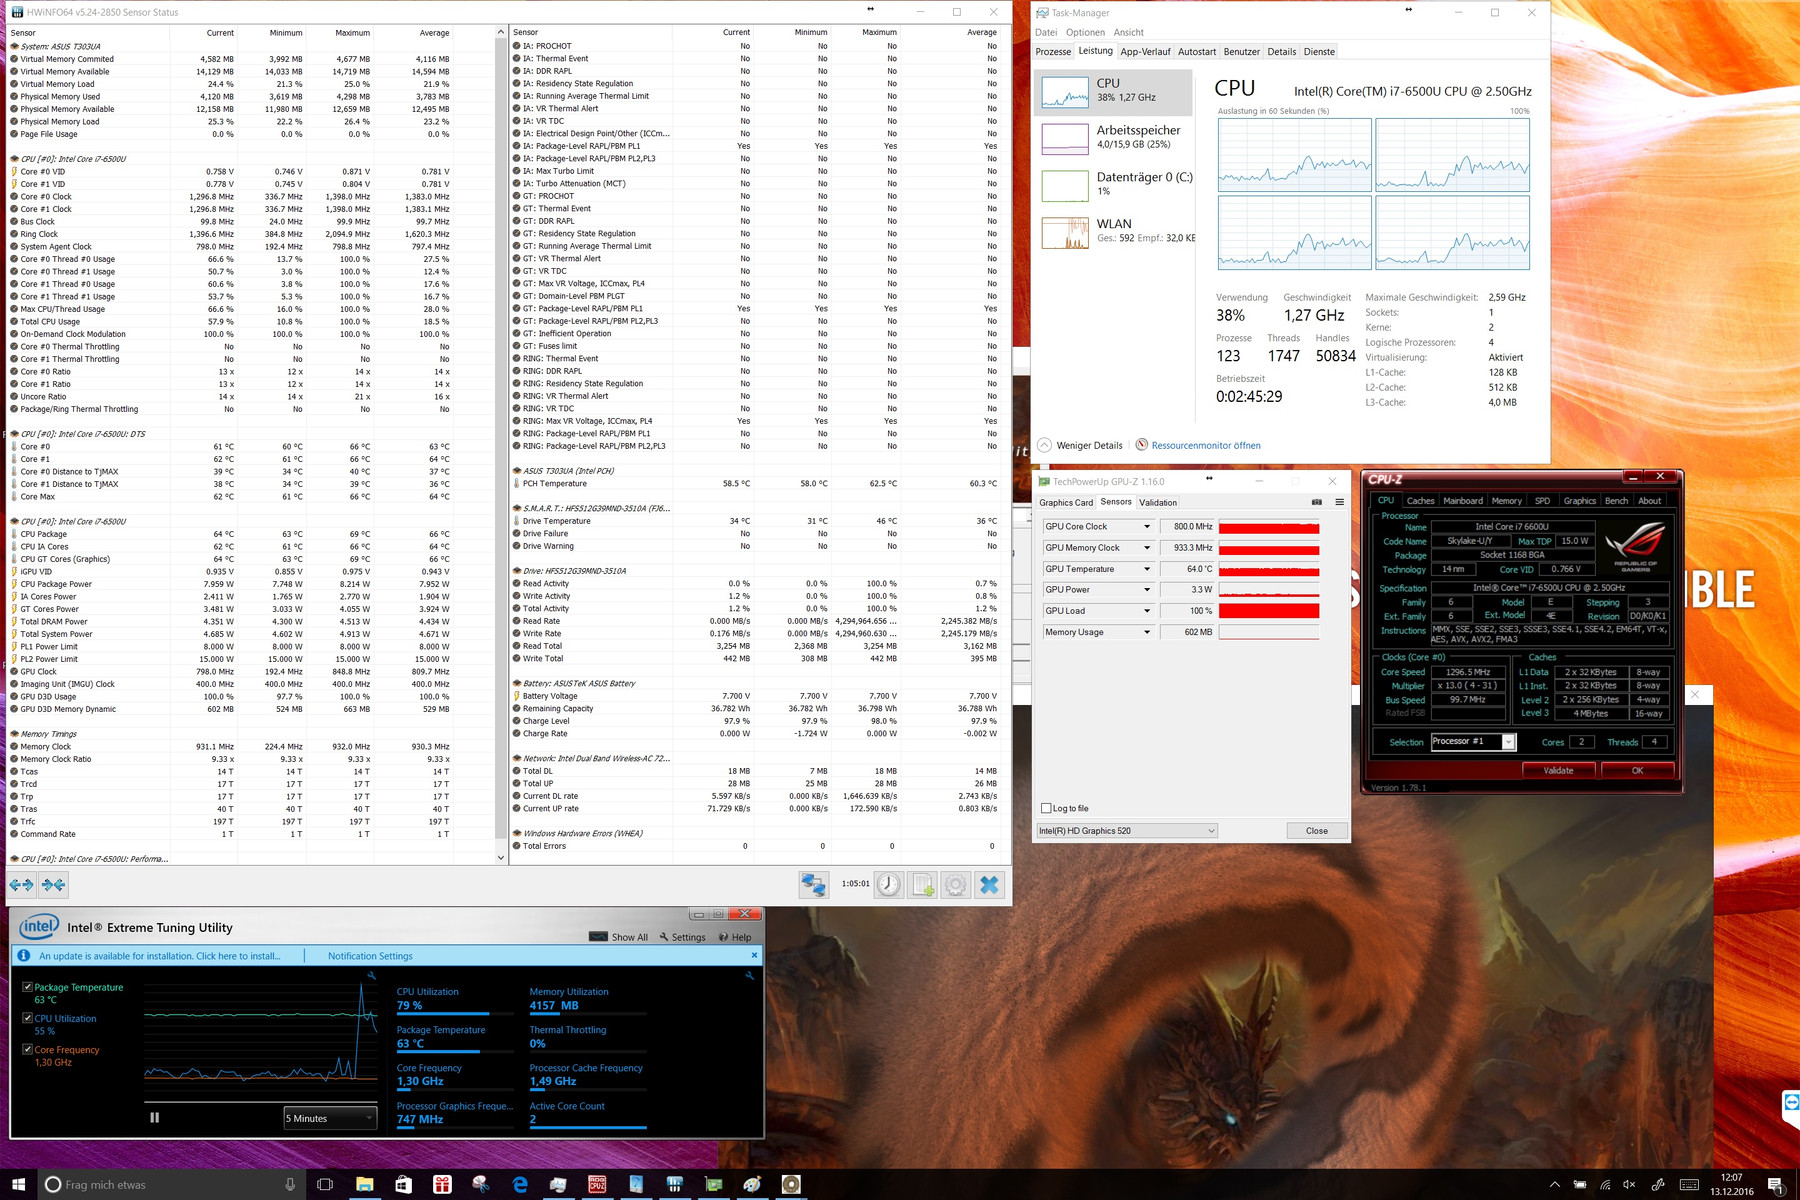
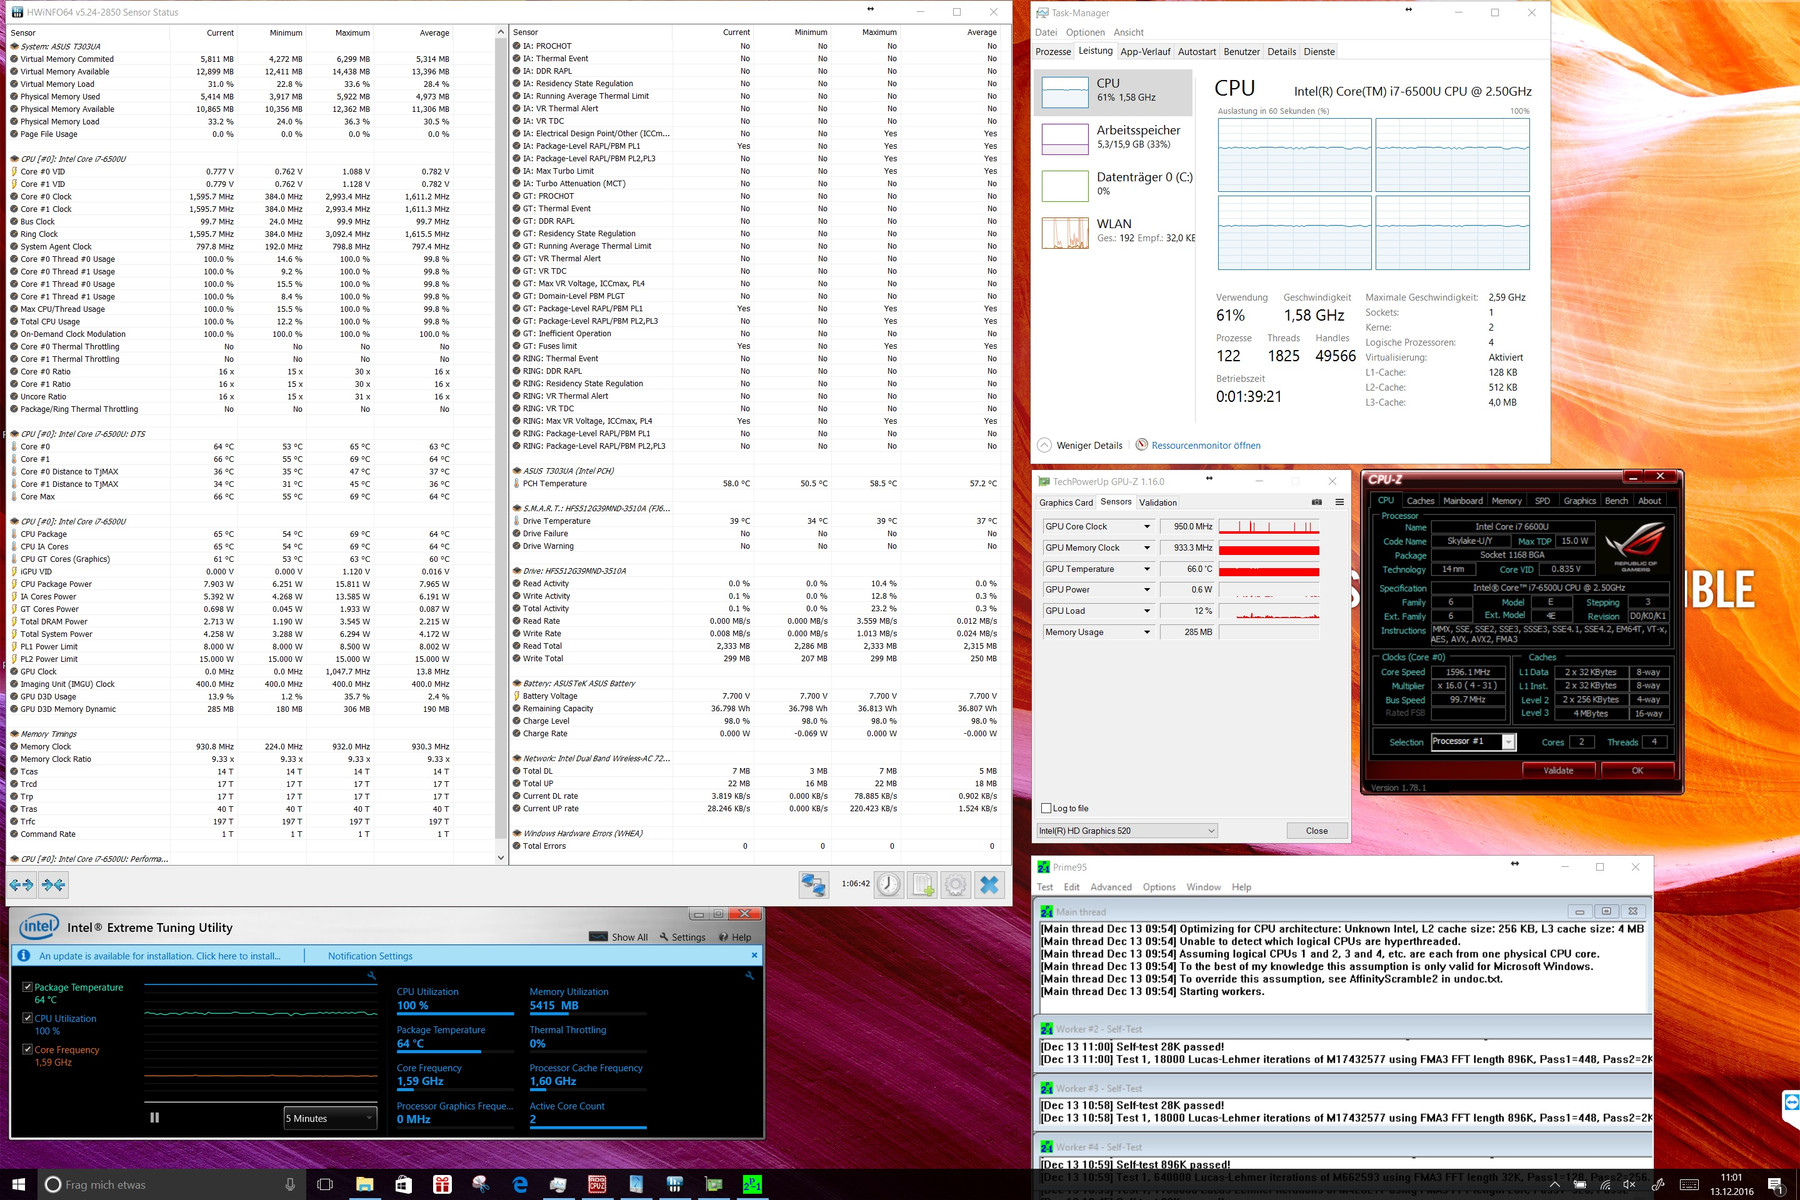
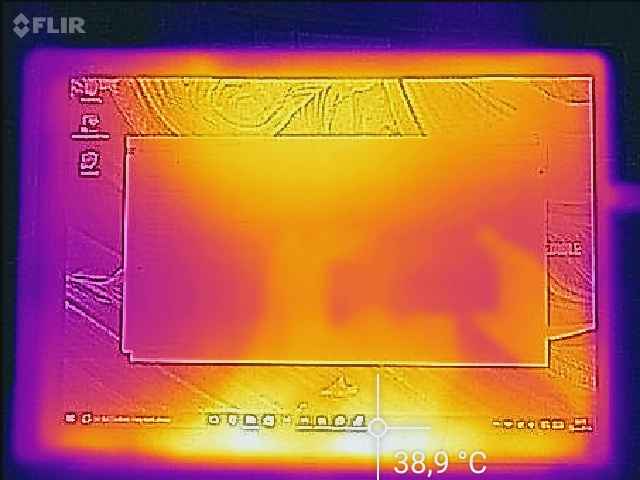
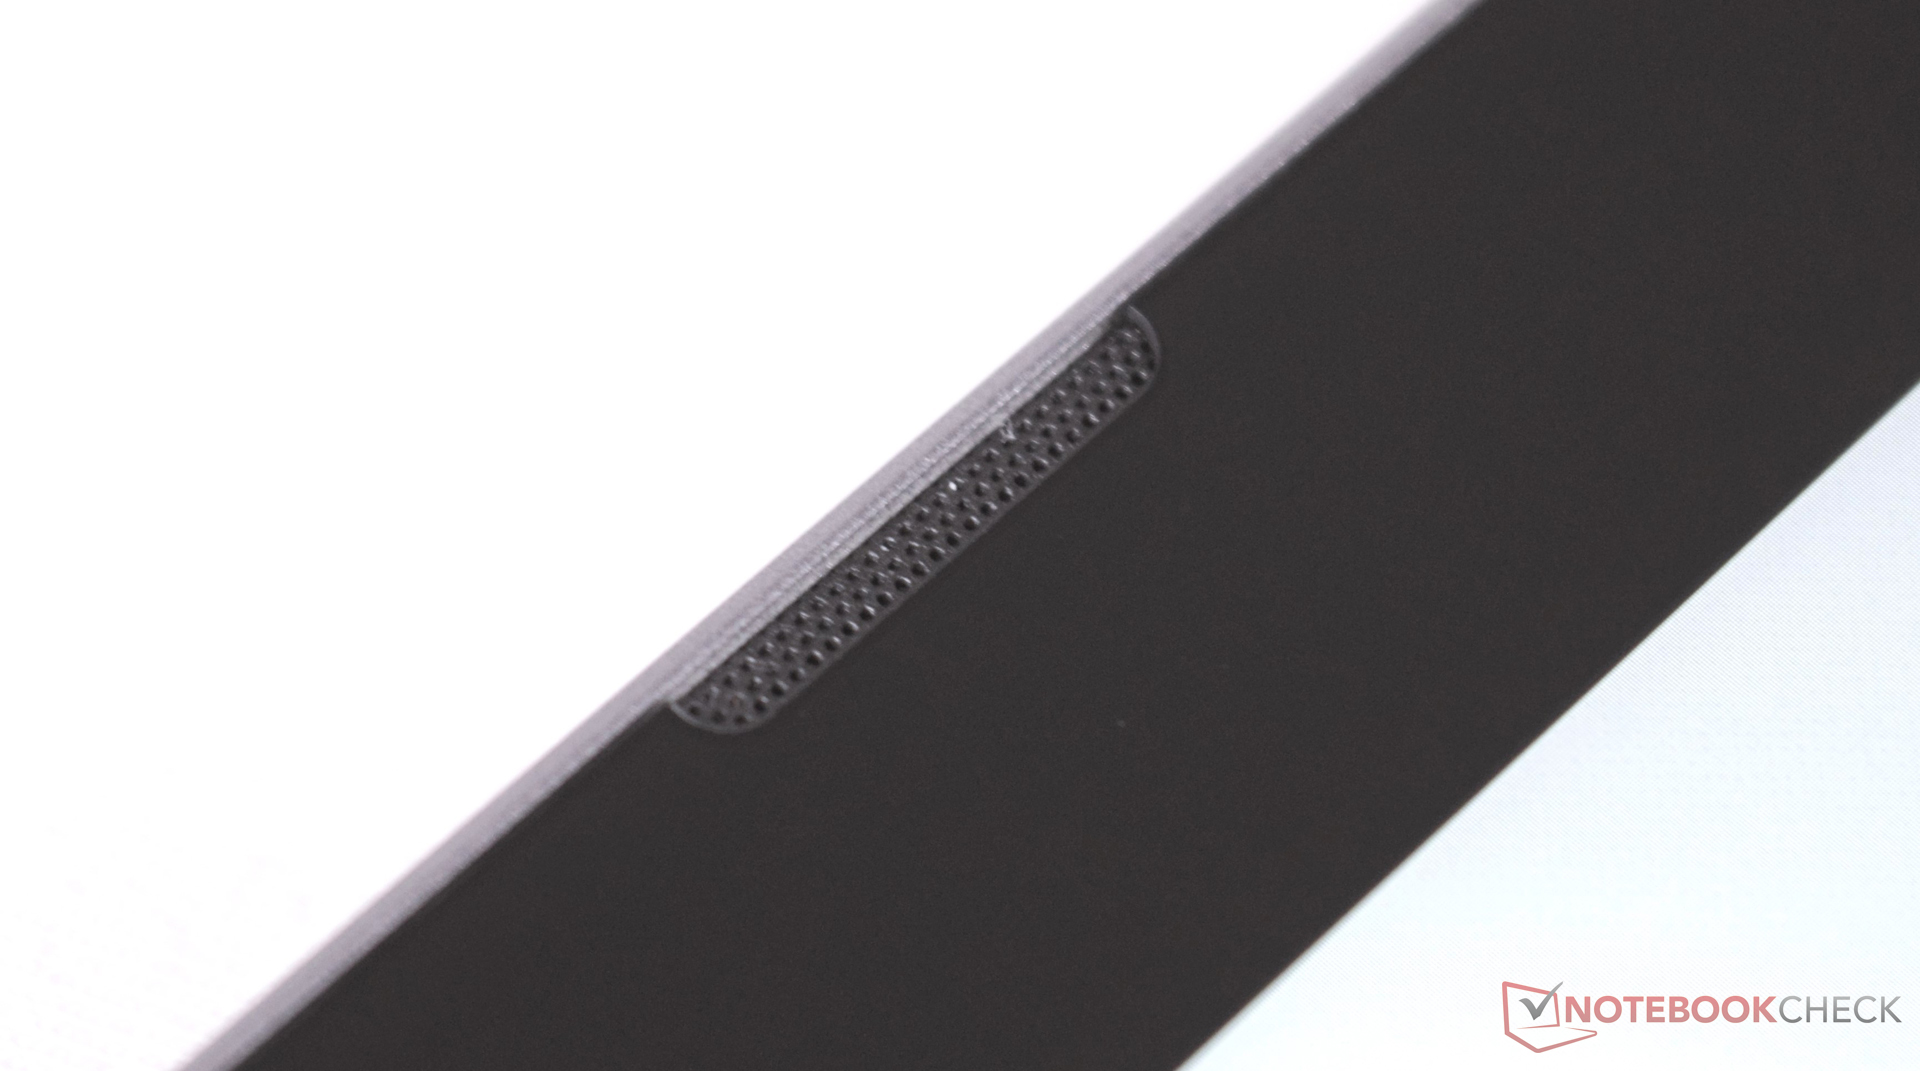
The case temperatures while idling and at load are acceptable. At load, we found a hotspot that hits 36.7 °C (98.06 °F, in the middle of the upper region). Warm air is pushed out at the top edge of the laptop through the ventilation opening. The hardware of the laptop has to deal with other conditions: during the stress test with Prime95, the processor heats up to a maximum of 69 °C (156.2 °F). The clock speed drops quickly from 3.0 GHz to 1.6 GHz. When we ran the stress test only with FurMark, the graphics chip reaches a maximum of 66 °C (150.8 °F). The Intel HD Graphics 520 works continuously at roughly 930 MHz. With both programs running in the stress test, the processor heats up to 64 °C (147.2 °F). The CPU starts and stays at 1.2 GHz, whereas the graphics chip runs at 930 MHz. Right after the stress test, we ran the 3DMark 11 benchmark to measure the performance of the laptop when it is "hot". The performance was a few points lower than the performance we measured in the "cold" state.
| Asus Transformer 3 Pro T303UA-GN050T HD Graphics 520, 6500U, SK Hynix Canvas SC300 512GB M.2 (HFS512G39MND) | Microsoft Surface Pro 4, Core m3 HD Graphics 515, 6Y30, Samsung MZFLV128 NVMe | Lenovo ThinkPad X1 Yoga-20FRS1VS00 HD Graphics 520, 6600U, Samsung SSD PM961 1TB M.2 PCIe 3.0 x4 NVMe (MZSLW1T0) | HP Elite x2 1012 G1 HD Graphics 515, 6Y54, Liteon L8H-256V2G | Acer Aspire Switch Alpha 12 SA5-271-56HM HD Graphics 520, 6200U, Kingston RBU-SNS8152S3256GG2 | |
|---|---|---|---|---|---|
| Heat | -8% | -12% | 1% | -11% | |
| Maximum Upper Side * (°C) | 34.9 | 43.6 -25% | 45.5 -30% | 39 -12% | 46.7 -34% |
| Maximum Bottom * (°C) | 36.7 | 45.2 -23% | 47.1 -28% | 41.2 -12% | 51 -39% |
| Idle Upper Side * (°C) | 35.8 | 32.4 9% | 31.1 13% | 29.5 18% | 29.5 18% |
| Idle Bottom * (°C) | 32.4 | 29.6 9% | 33.1 -2% | 29.8 8% | 28.6 12% |
* ... smaller is better
(+) The maximum temperature on the upper side is 34.9 °C / 95 F, compared to the average of 35.4 °C / 96 F, ranging from 19.6 to 60 °C for the class Convertible.
(+) The bottom heats up to a maximum of 36.7 °C / 98 F, compared to the average of 36.9 °C / 98 F
(±) In idle usage, the average temperature for the upper side is 32 °C / 90 F, compared to the device average of 30.3 °C / 87 F.
(+) The palmrests and touchpad are reaching skin temperature as a maximum (35.8 °C / 96.4 F) and are therefore not hot.
(-) The average temperature of the palmrest area of similar devices was 28 °C / 82.4 F (-7.8 °C / -14 F).
Speakers

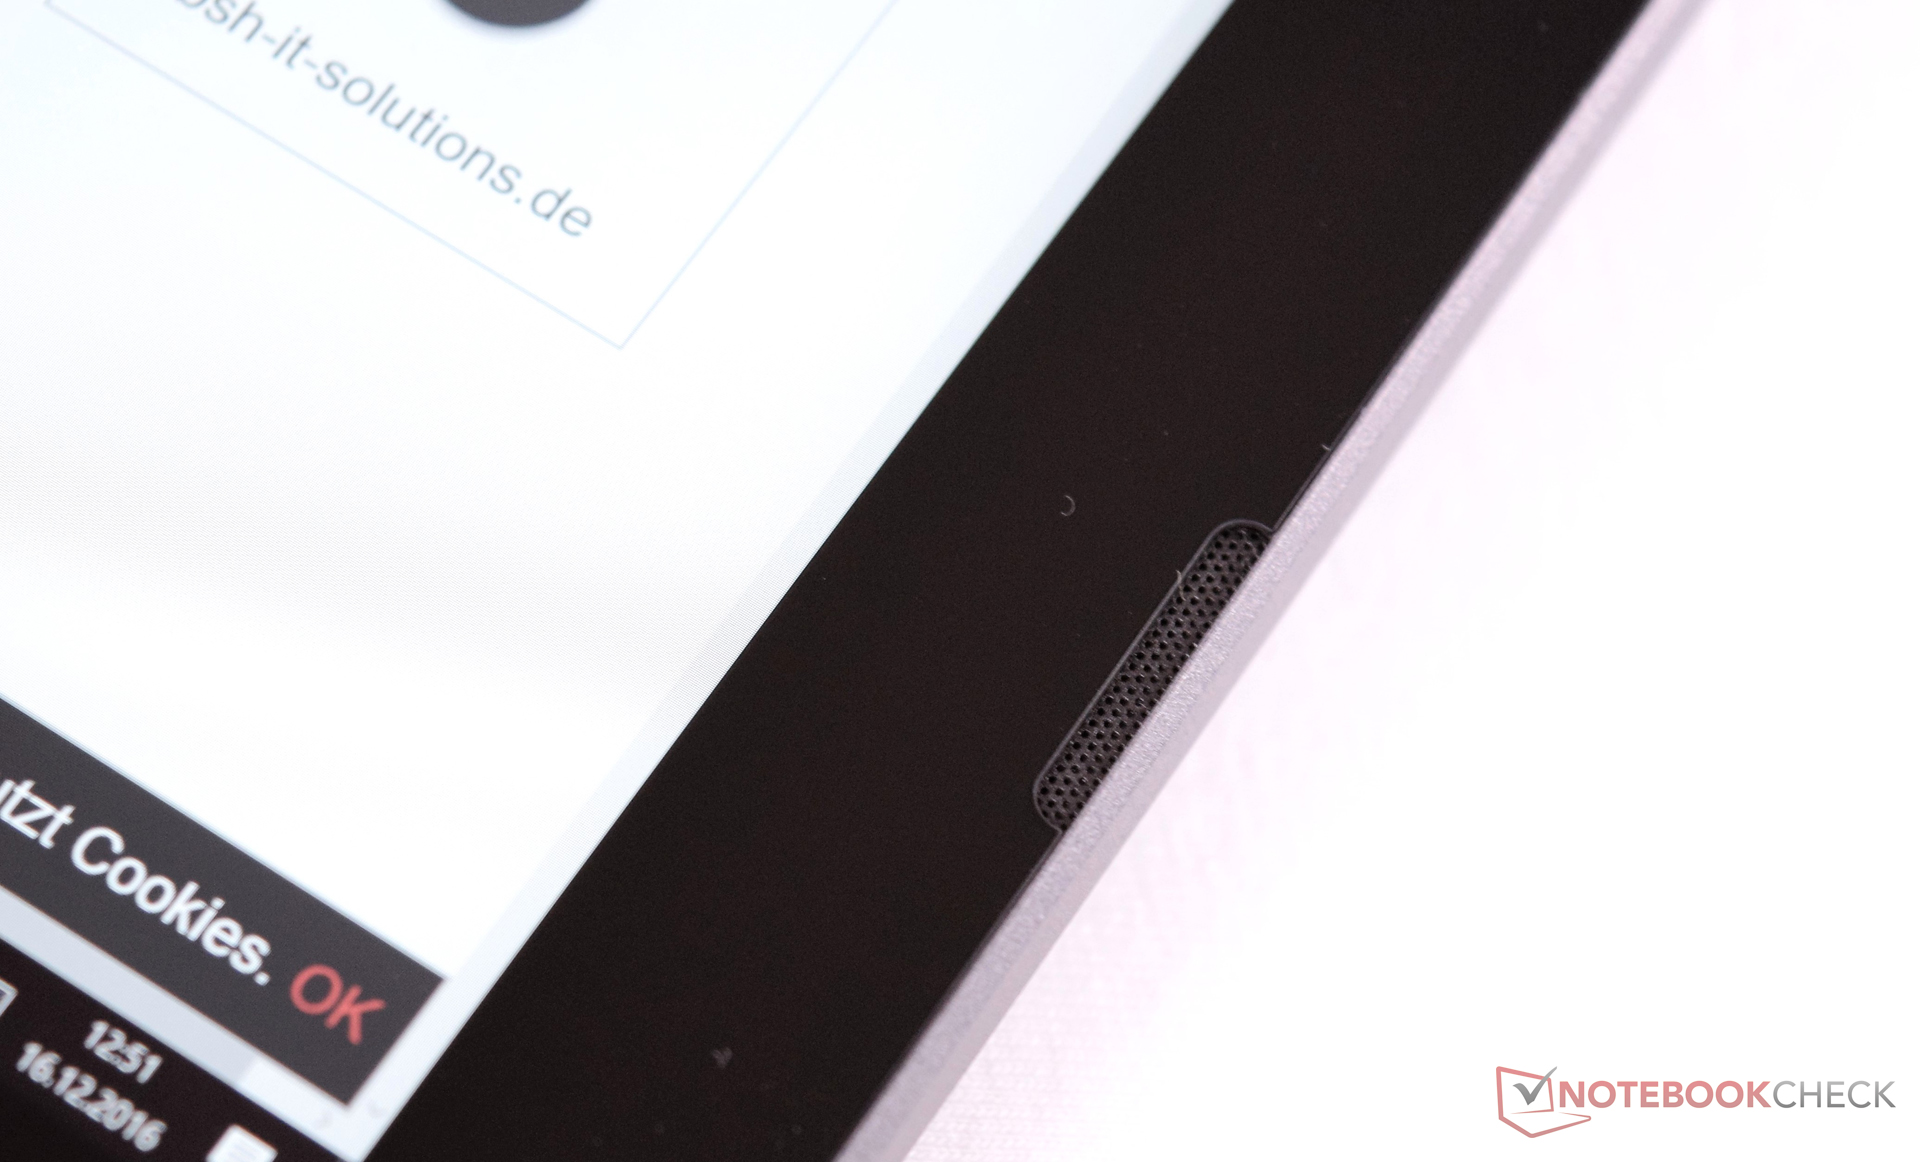
The two speakers from Harman/Kardon are placed on the front edge. Due to the compact build of the case, the speakers cannot produce great sound, but it does provide acceptable performance. The sound output is heavy on the high and middle notes. Bass is not perceptible. For Skype, the tablet speakers do a good job and the array microphones perform reliably. The microphones are placed in the upper end and filters disturbances reliably. Even at full load, the fan emissions will not disturb any video chats of the user. To enjoy the sound output, we recommend the use of an external 2.1 sound system or a headset. A suitable jack can be found on the device.
Asus Transformer 3 Pro T303UA-GN050T audio analysis
(±) | speaker loudness is average but good (73 dB)
Bass 100 - 315 Hz
(±) | reduced bass - on average 11.2% lower than median
(±) | linearity of bass is average (8.2% delta to prev. frequency)
Mids 400 - 2000 Hz
(+) | balanced mids - only 1.8% away from median
(+) | mids are linear (6.7% delta to prev. frequency)
Highs 2 - 16 kHz
(±) | higher highs - on average 9% higher than median
(+) | highs are linear (5.7% delta to prev. frequency)
Overall 100 - 16.000 Hz
(±) | linearity of overall sound is average (19% difference to median)
Compared to same class
» 45% of all tested devices in this class were better, 7% similar, 48% worse
» The best had a delta of 6%, average was 20%, worst was 57%
Compared to all devices tested
» 45% of all tested devices were better, 7% similar, 48% worse
» The best had a delta of 4%, average was 23%, worst was 134%
Apple MacBook 12 (Early 2016) 1.1 GHz audio analysis
(+) | speakers can play relatively loud (83.6 dB)
Bass 100 - 315 Hz
(±) | reduced bass - on average 11.3% lower than median
(±) | linearity of bass is average (14.2% delta to prev. frequency)
Mids 400 - 2000 Hz
(+) | balanced mids - only 2.4% away from median
(+) | mids are linear (5.5% delta to prev. frequency)
Highs 2 - 16 kHz
(+) | balanced highs - only 2% away from median
(+) | highs are linear (4.5% delta to prev. frequency)
Overall 100 - 16.000 Hz
(+) | overall sound is linear (10.2% difference to median)
Compared to same class
» 7% of all tested devices in this class were better, 2% similar, 91% worse
» The best had a delta of 5%, average was 18%, worst was 53%
Compared to all devices tested
» 5% of all tested devices were better, 1% similar, 94% worse
» The best had a delta of 4%, average was 23%, worst was 134%
Frequency diagram in comparison (checkboxes above can be selected!)
Energy Management
Power Consumption
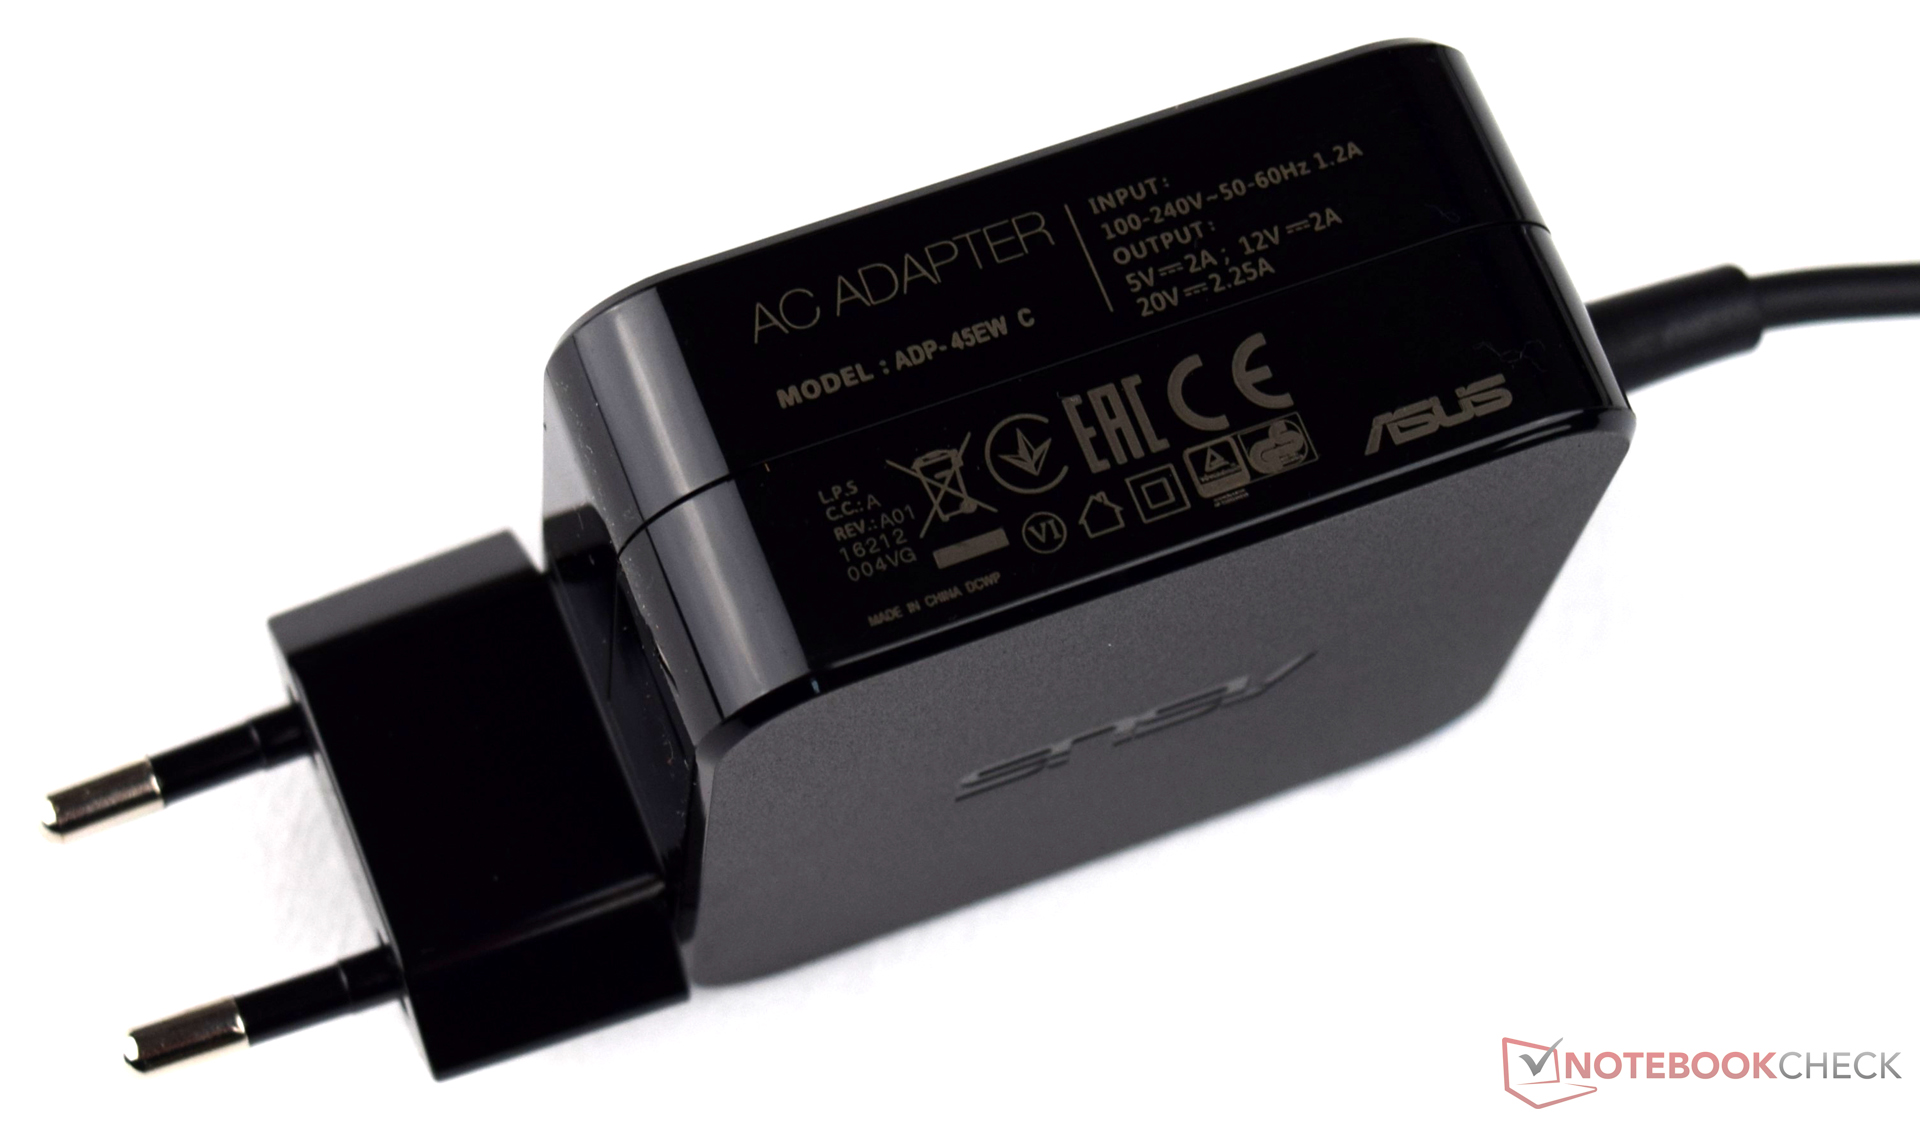
The Asus Transformer 3 Pro is conservative: the average consumption at load is 26 W (due to the throttled TDP). When idle, the laptop needs 6.7-13.5 W, which puts it higher on the consumption list than the competitors. The manufacturer can definitely improve in this area. The compact adapter, which works with the USB-C 3.1, can offer 45 W for the convertible. It can fully charge within 2:30 hours.
| Off / Standby | |
| Idle | |
| Load |
|
Key:
min: | |
| Asus Transformer 3 Pro T303UA-GN050T 6500U, HD Graphics 520, SK Hynix Canvas SC300 512GB M.2 (HFS512G39MND), IPS, 2880x1920, 12.6" | Lenovo ThinkPad X1 Yoga-20FRS1VS00 6600U, HD Graphics 520, Samsung SSD PM961 1TB M.2 PCIe 3.0 x4 NVMe (MZSLW1T0), OLED, 2560x1440, 14" | HP Elite x2 1012 G1 6Y54, HD Graphics 515, Liteon L8H-256V2G, IPS, 1920x1280, 12.1" | Acer Aspire Switch Alpha 12 SA5-271-56HM 6200U, HD Graphics 520, Kingston RBU-SNS8152S3256GG2, IPS, 2160x1440, 12" | Apple MacBook Pro 13 2016 (2.9 GHz) 6267U, Iris Graphics 550, Apple SSD AP0256, , 2560x1600, 13.3" | Dell XPS 13 9360 QHD+ i5 i5-7200U, HD Graphics 620, Toshiba NVMe THNSN5256GPUK, , 3200x1800, 13.3" | |
|---|---|---|---|---|---|---|
| Power Consumption | -6% | 23% | 4% | -18% | 22% | |
| Idle Minimum * (Watt) | 6.7 | 4.7 30% | 3.7 45% | 7.3 -9% | 2.1 69% | 3.7 45% |
| Idle Average * (Watt) | 10.3 | 8.6 17% | 6.8 34% | 10 3% | 7.6 26% | 6.1 41% |
| Idle Maximum * (Watt) | 13.5 | 12.2 10% | 7.6 44% | 10.15 25% | 8.2 39% | 6.5 52% |
| Load Average * (Watt) | 26 | 29.7 -14% | 22.5 13% | 25.2 3% | 56.4 -117% | 29.5 -13% |
| Load Maximum * (Watt) | 28.8 | 50.5 -75% | 34.5 -20% | 29.3 -2% | 59.8 -108% | 33 -15% |
* ... smaller is better
Battery Life
The battery life of the Asus Transformer 3 Pro is not great: while idling, the battery will last a little over 7 hours. The 39 Wh battery does a decent job in a convertible of this size. The competition from Acer, HP and Microsoft offer similar battery capacities but better battery life. At full load, the convertible expends its reserves within 1:42 hours. In the practical WLAN test, the Asus Transformer 3 Pro lasts 3:43 hours. As such, this convertible cannot run all day without needing a recharge. The video playback test ends after 3:26 hours, which will allow users to view two movies (90 minutes each).
| Asus Transformer 3 Pro T303UA-GN050T 6500U, HD Graphics 520, 39 Wh | Microsoft Surface Pro 4, Core m3 6Y30, HD Graphics 515, 38 Wh | Lenovo ThinkPad X1 Yoga-20FRS1VS00 6600U, HD Graphics 520, 56 Wh | HP Elite x2 1012 G1 6Y54, HD Graphics 515, 37 Wh | Acer Aspire Switch Alpha 12 SA5-271-56HM 6200U, HD Graphics 520, 37 Wh | |
|---|---|---|---|---|---|
| Battery runtime | 80% | 80% | 78% | 60% | |
| Reader / Idle (h) | 7.1 | 13.2 86% | 13.7 93% | 12.2 72% | 10.7 51% |
| H.264 (h) | 3.4 | 8.7 156% | 7.2 112% | 7.8 129% | |
| WiFi v1.3 (h) | 3.7 | 8.1 119% | 5.3 43% | 7.4 100% | 5.4 46% |
| Load (h) | 1.7 | 2.3 35% | 2.2 29% | 2.2 29% | 1.9 12% |
Pros
Cons
Verdict
Asus has decided to do a lot to compete with the Microsoft Surface. The Asus Transformer 3 Pro is a step forward: a faster processor, lots of RAM and a large SSD in a convertible. The keyboard dock transforms this packet into a full-featured laptop. At the time of testing, the convertible was priced at 1,599 Euros (~$1668). The buyer will receive a reliable device with sufficient performance to tackle everyday tasks. Sadly, the test model was never able to unleash its full performance. That is why we cannot consider it a serious competitor to the Microsoft Surface Pro 4.
The gap between the potential and real performance can scare off many potential buyers. However, the Asus Transformer 3 Pro is a stylish convertible with perfect workmanship. The great display offers extensive color space coverage and is suitable for professional use.
A faster processor would always be nice. But what is the point when the manufacturer will throttle it into the ground? An Intel Core i5-7Y54 can be passively cooled, yet it offers similar performance to the Intel Core i7-6500U of our test model. The connectivity of the Asus model is typical, but we would like to see two USB 3.1 ports (both supporting Thunderbolt 3) in the future so that the user can use one for charging and the other for adapters to extend the connectivity.
Asus Transformer 3 Pro T303UA-GN050T
- 12/21/2016 v6 (old)
Sebastian Bade
Price comparison
