

Face Off: Microsoft Surface Pro 4 Core i7 vs. Surface Pro 4 Core i5 vs. Surface Pro 4 Core m3
With three Surface Pro 4 SKUs under our belt, we can finally give a comparison between the lowest-end and fanless Core m3 model and the mid-tier and highest-end Core i5 and i7 models, respectively. We suggest checking out our dedicated review pages on the Surface Pro 4 m3 and Core i5 for more details on design quality and the Type Cover detachable keyboard.
Display
Display measurements are largely the same as our Core m3 and Core i5 model, albeit with a few noteworthy differences. Perhaps most significantly, the backlight is actually slightly brighter than our Core m3 configuration while providing about the same contrast levels.
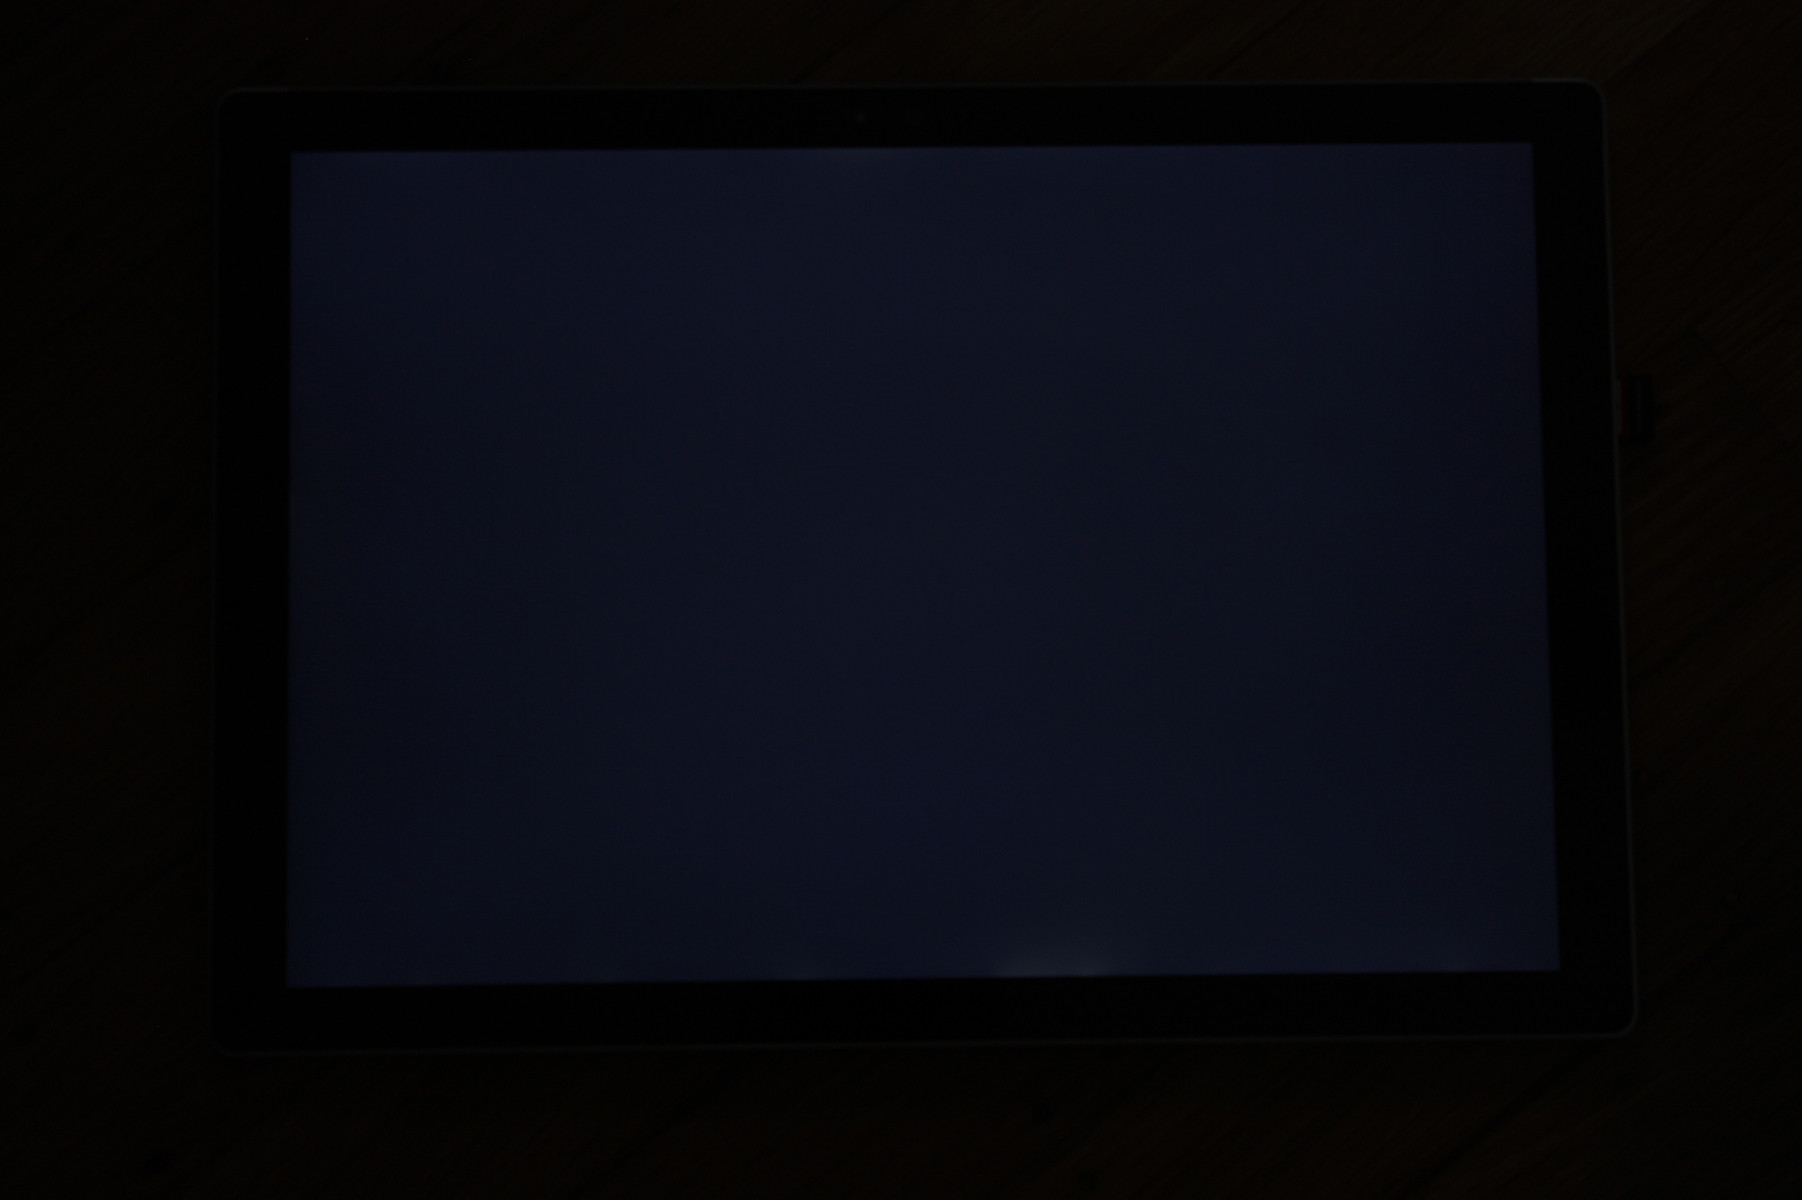
Minor but noticeable backlight bleeding is still present around the top and bottom edges of the tablet especially if the task bar is set to a dark color.
| |||||||||||||||||||||||||
Brightness Distribution: 87 %
Center on Battery: 436.7 cd/m²
Contrast: 1340:1 (Black: 0.326 cd/m²)
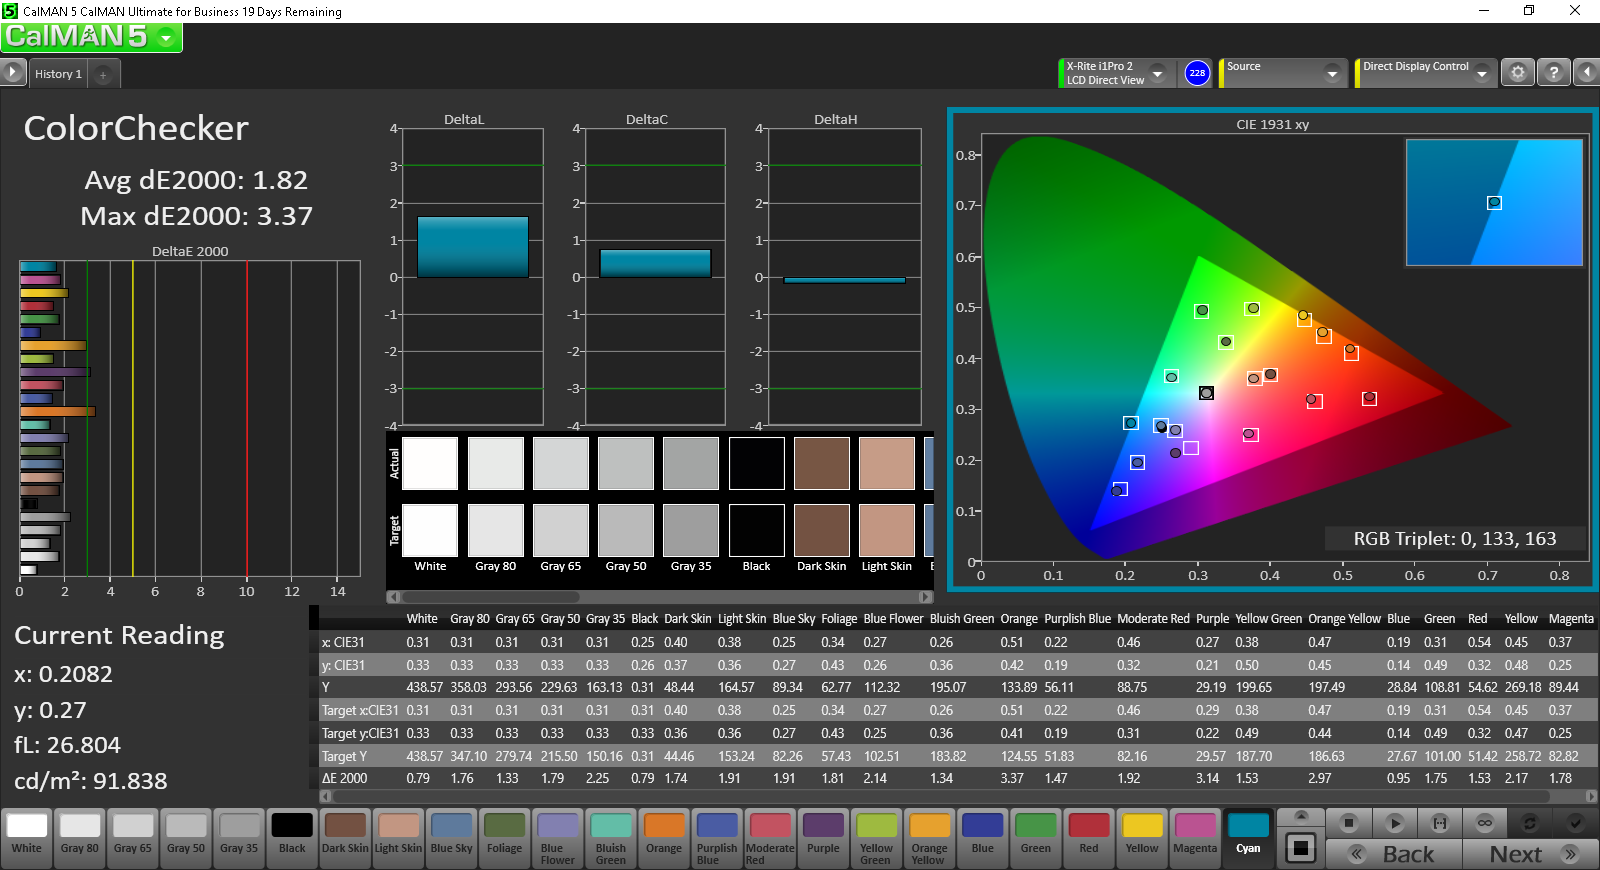
ΔE ColorChecker Calman: 1.82 | ∀{0.5-29.43 Ø4.78}
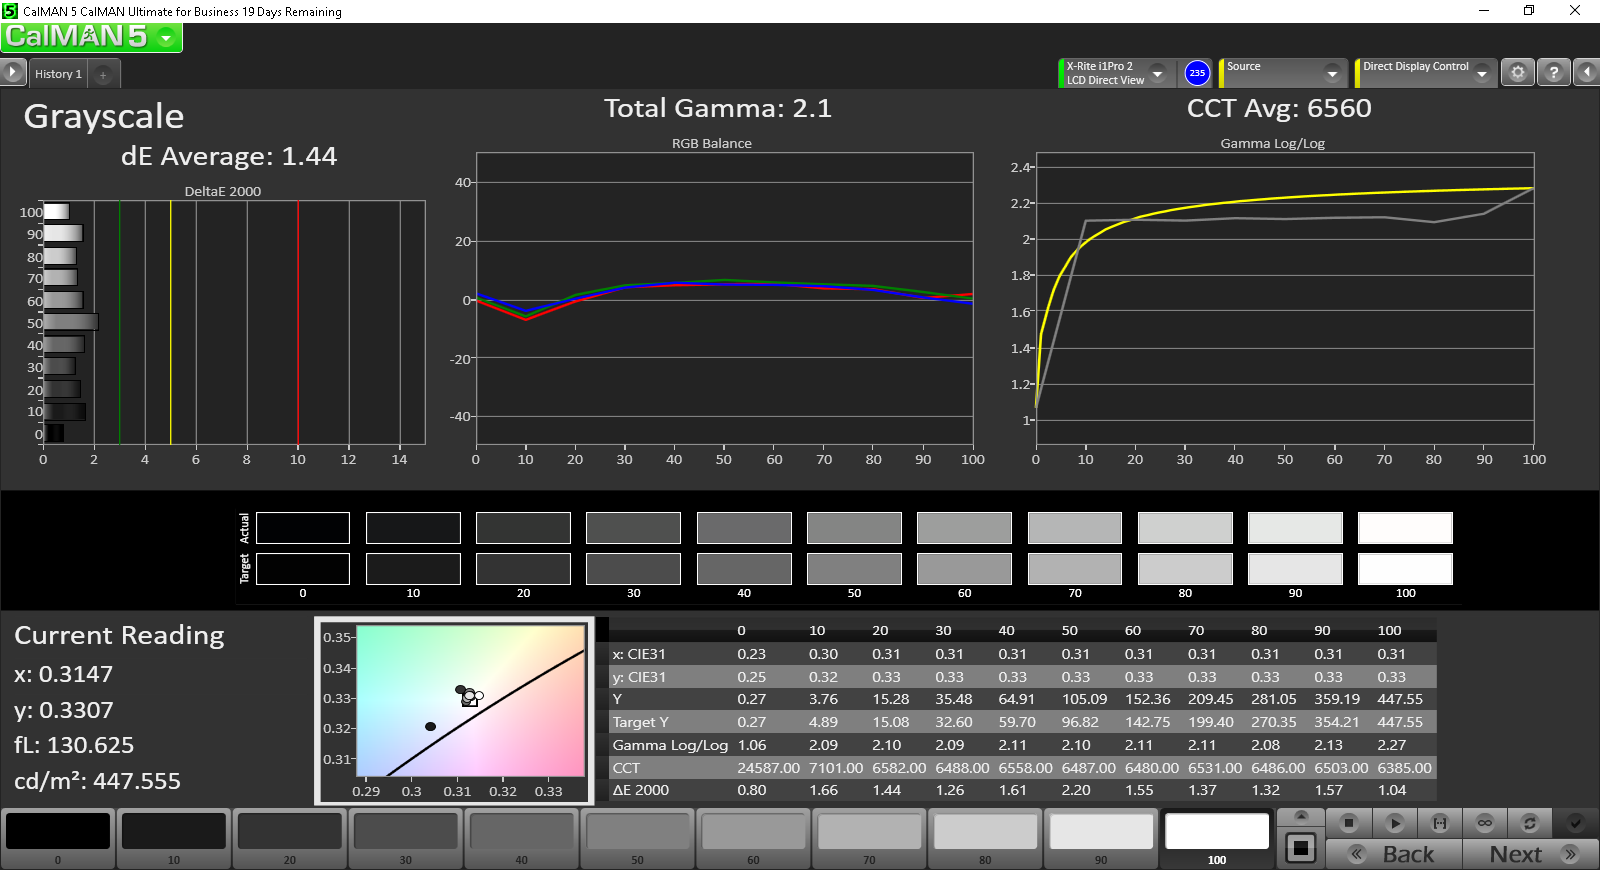
ΔE Greyscale Calman: 1.44 | ∀{0.09-98 Ø5}
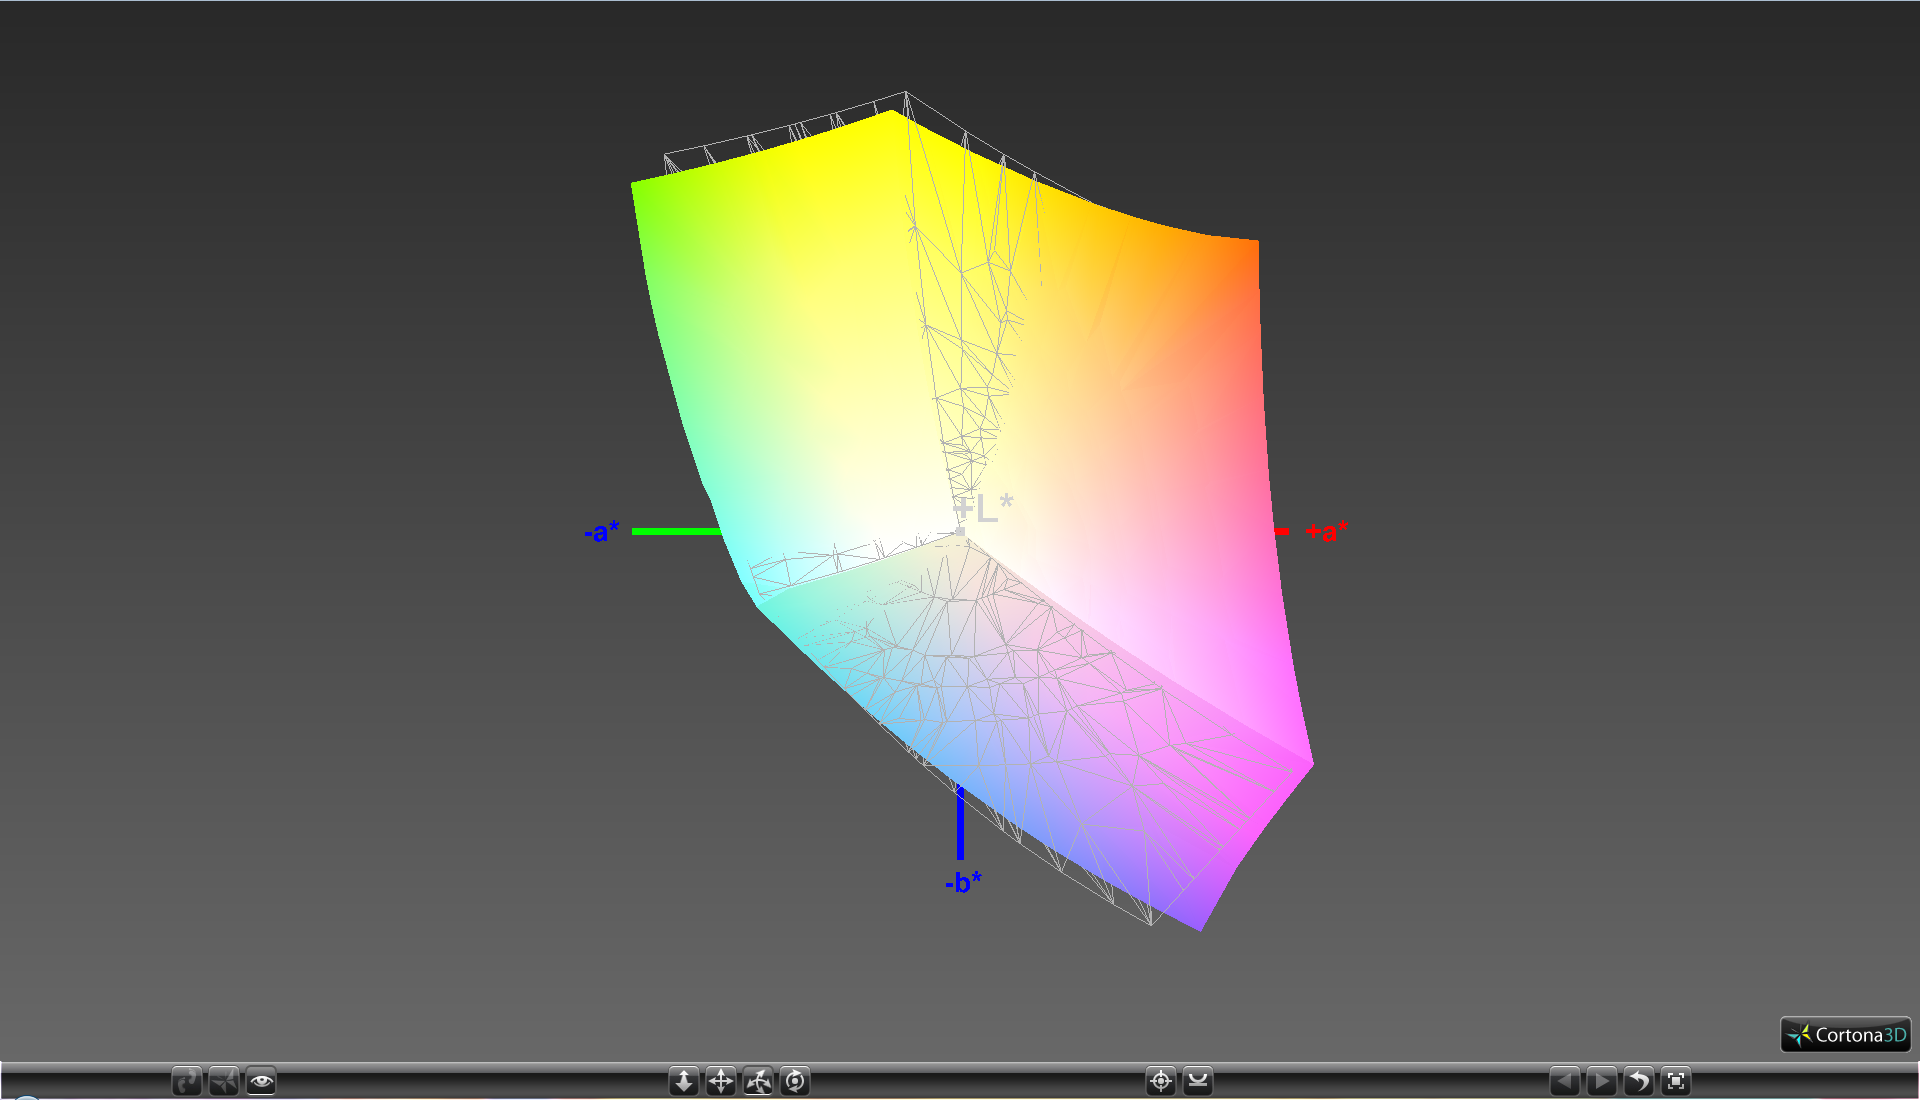
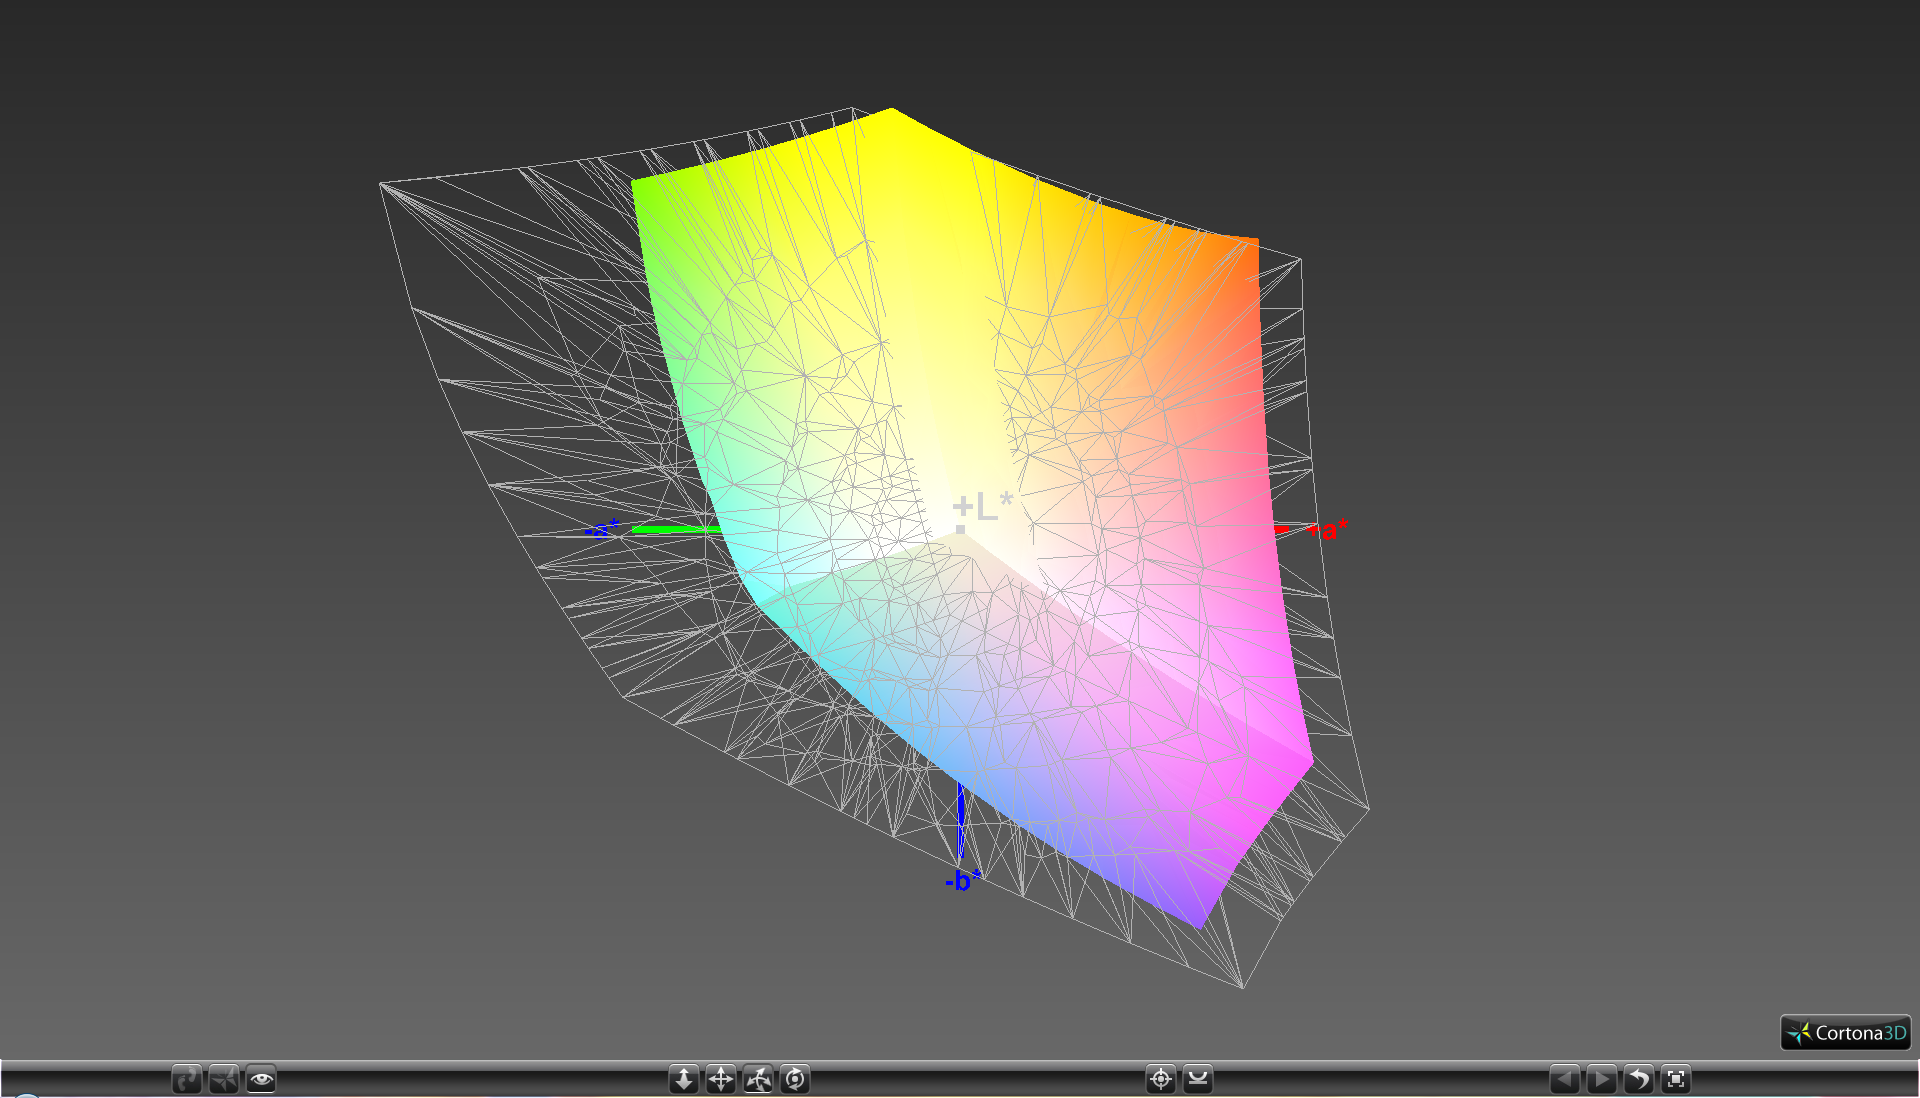
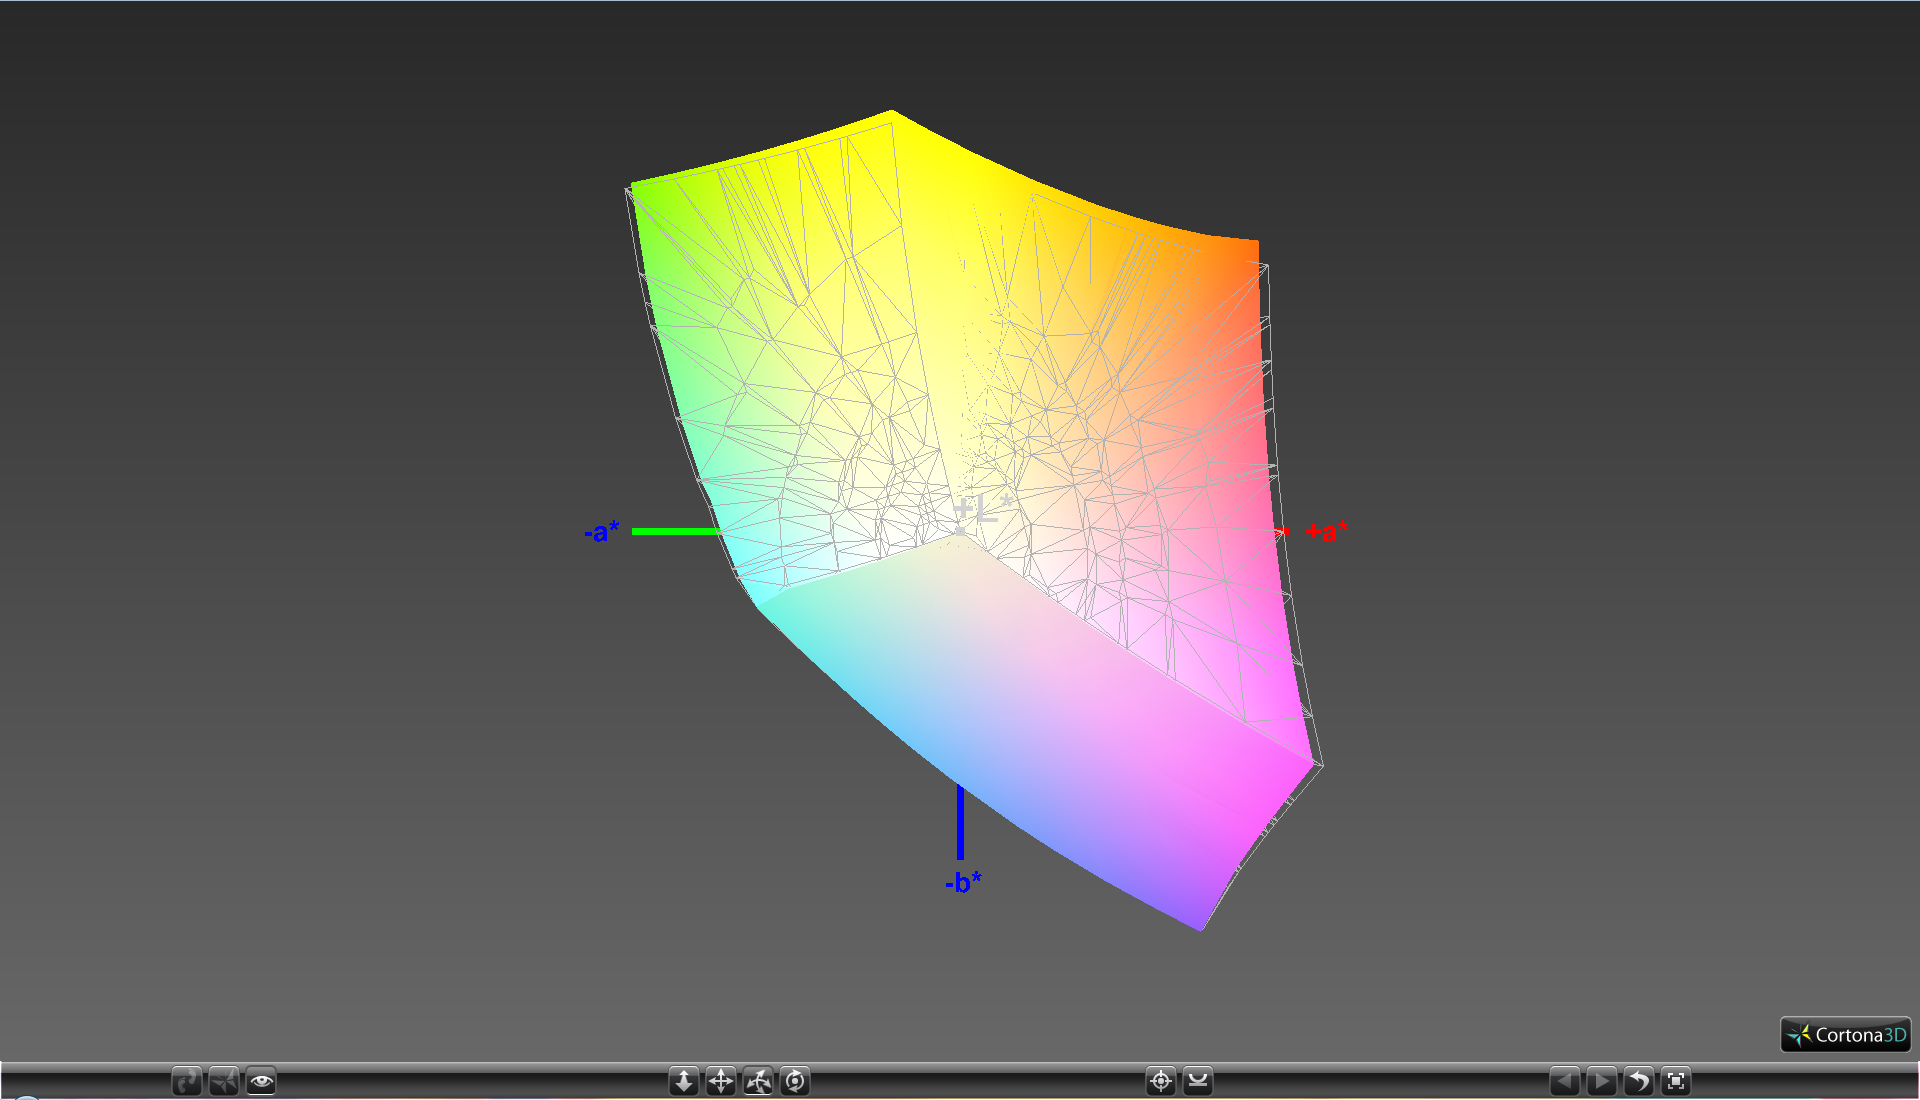
97.5% sRGB (Argyll 1.6.3 3D)
62.3% AdobeRGB 1998 (Argyll 1.6.3 3D)
68.6% AdobeRGB 1998 (Argyll 3D)
97.5% sRGB (Argyll 3D)
66.9% Display P3 (Argyll 3D)
Gamma: 2.1
CCT: 6560 K
| Microsoft Surface Pro 4 Core i7 12.3", 2736x1824 | Microsoft Surface Pro 4, Core i5, 128GB 12.3", 2736x1824 | Microsoft Surface Pro 4, Core m3 12.3", 2736x1824 | Microsoft Surface Pro 3 12", 2160x1440 | Microsoft Surface 3 10.8", 1920x1280 | |
|---|---|---|---|---|---|
| Display | -2% | 0% | -6% | 2% | |
| Display P3 Coverage (%) | 66.9 | 65 -3% | 67.5 1% | 63.6 -5% | 68.8 3% |
| sRGB Coverage (%) | 97.5 | 96.5 -1% | 96.6 -1% | 88.8 -9% | 98.7 1% |
| AdobeRGB 1998 Coverage (%) | 68.6 | 67 -2% | 69 1% | 65.6 -4% | 70.4 3% |
| Response Times | 9% | 9% | |||
| Response Time Grey 50% / Grey 80% * (ms) | 48.4 ? | 46 ? 5% | 46 ? 5% | ||
| Response Time Black / White * (ms) | 35.6 ? | 31.2 ? 12% | 31 ? 13% | ||
| PWM Frequency (Hz) | 10420 | 50 ? | 50 ? | ||
| Screen | -31% | -28% | -72% | -21% | |
| Brightness middle (cd/m²) | 436.7 | 413 -5% | 389.2 -11% | 355.3 -19% | 399 -9% |
| Brightness (cd/m²) | 433 | 396 -9% | 392 -9% | 338 -22% | 380 -12% |
| Brightness Distribution (%) | 87 | 87 0% | 92 6% | 91 5% | 90 3% |
| Black Level * (cd/m²) | 0.326 | 0.36 -10% | 0.27 17% | 0.33 -1% | 0.49 -50% |
| Contrast (:1) | 1340 | 1147 -14% | 1441 8% | 1077 -20% | 814 -39% |
| Colorchecker dE 2000 * | 1.82 | 3.09 -70% | 3.61 -98% | 4.72 -159% | 1.66 9% |
| Greyscale dE 2000 * | 1.44 | 3.92 -172% | 3.8 -164% | 6.53 -353% | 2.75 -91% |
| Gamma | 2.1 105% | 2.3 96% | 2.16 102% | 2.17 101% | 2.22 99% |
| CCT | 6560 99% | 7333 89% | 5969 109% | 6707 97% | 6358 102% |
| Color Space (Percent of AdobeRGB 1998) (%) | 62.3 | 61 -2% | 63 1% | 59.37 -5% | 64.4 3% |
| Color Space (Percent of sRGB) (%) | 97.5 | 97 -1% | 97 -1% | 98.8 1% | |
| Colorchecker dE 2000 max. * | 3.24 | ||||
| Total Average (Program / Settings) | -8% /
-19% | -6% /
-17% | -39% /
-54% | -10% /
-15% |
* ... smaller is better
The Samsung 123YL01-001 panel is identical to the one on the m3 and Core i5 SKUs. Thus, color coverage is about the same across the three models at 97 percent and 62 percent of the sRGB and AdobeRGB standards, respectively.
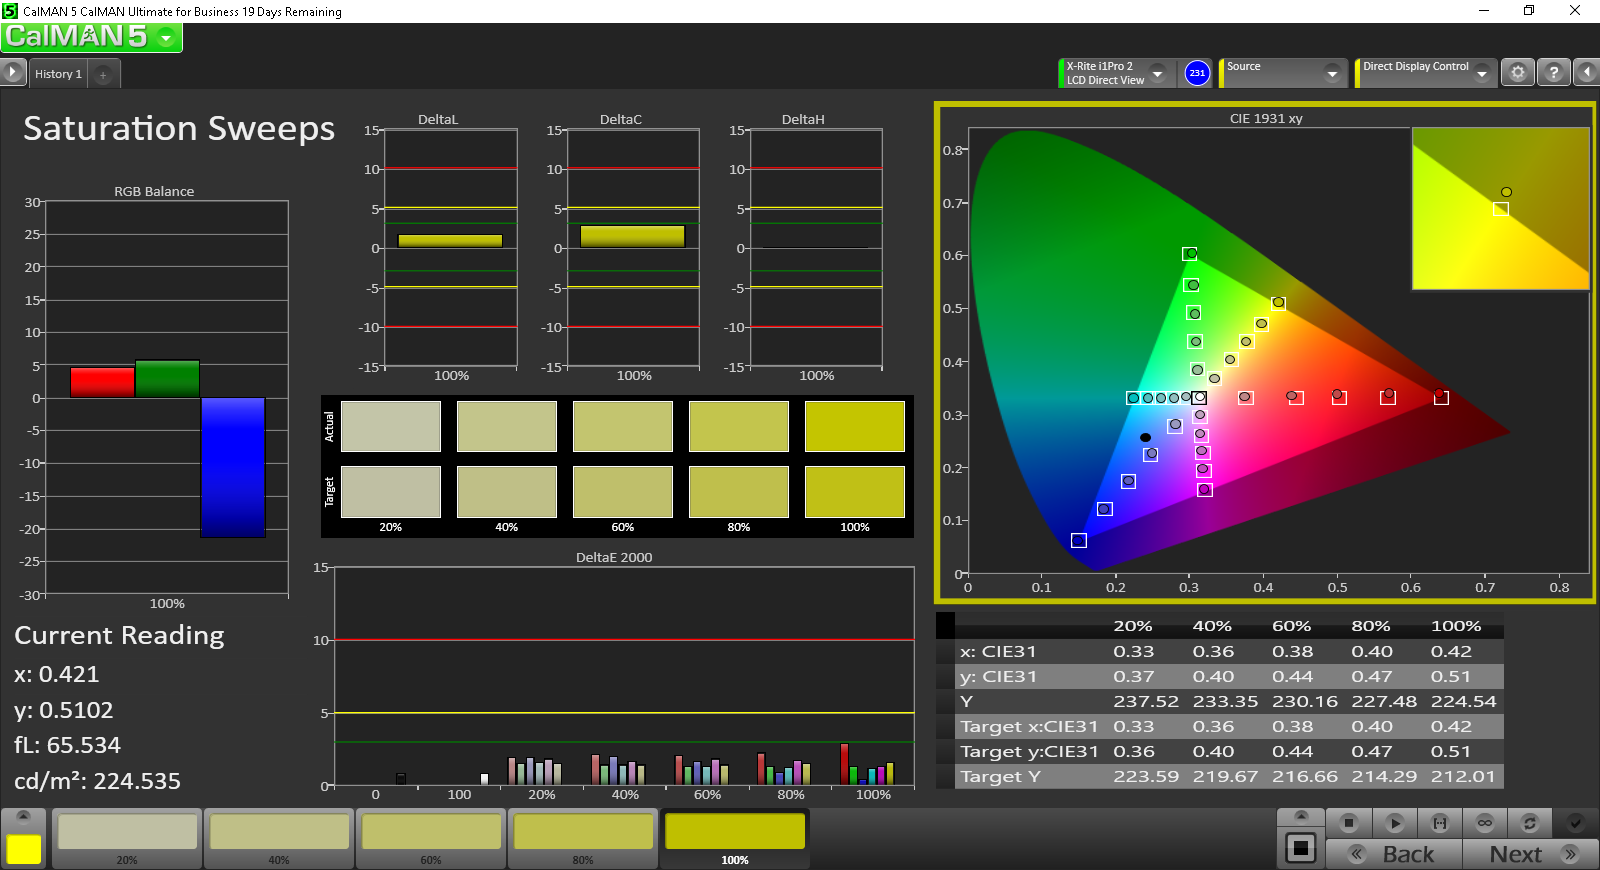
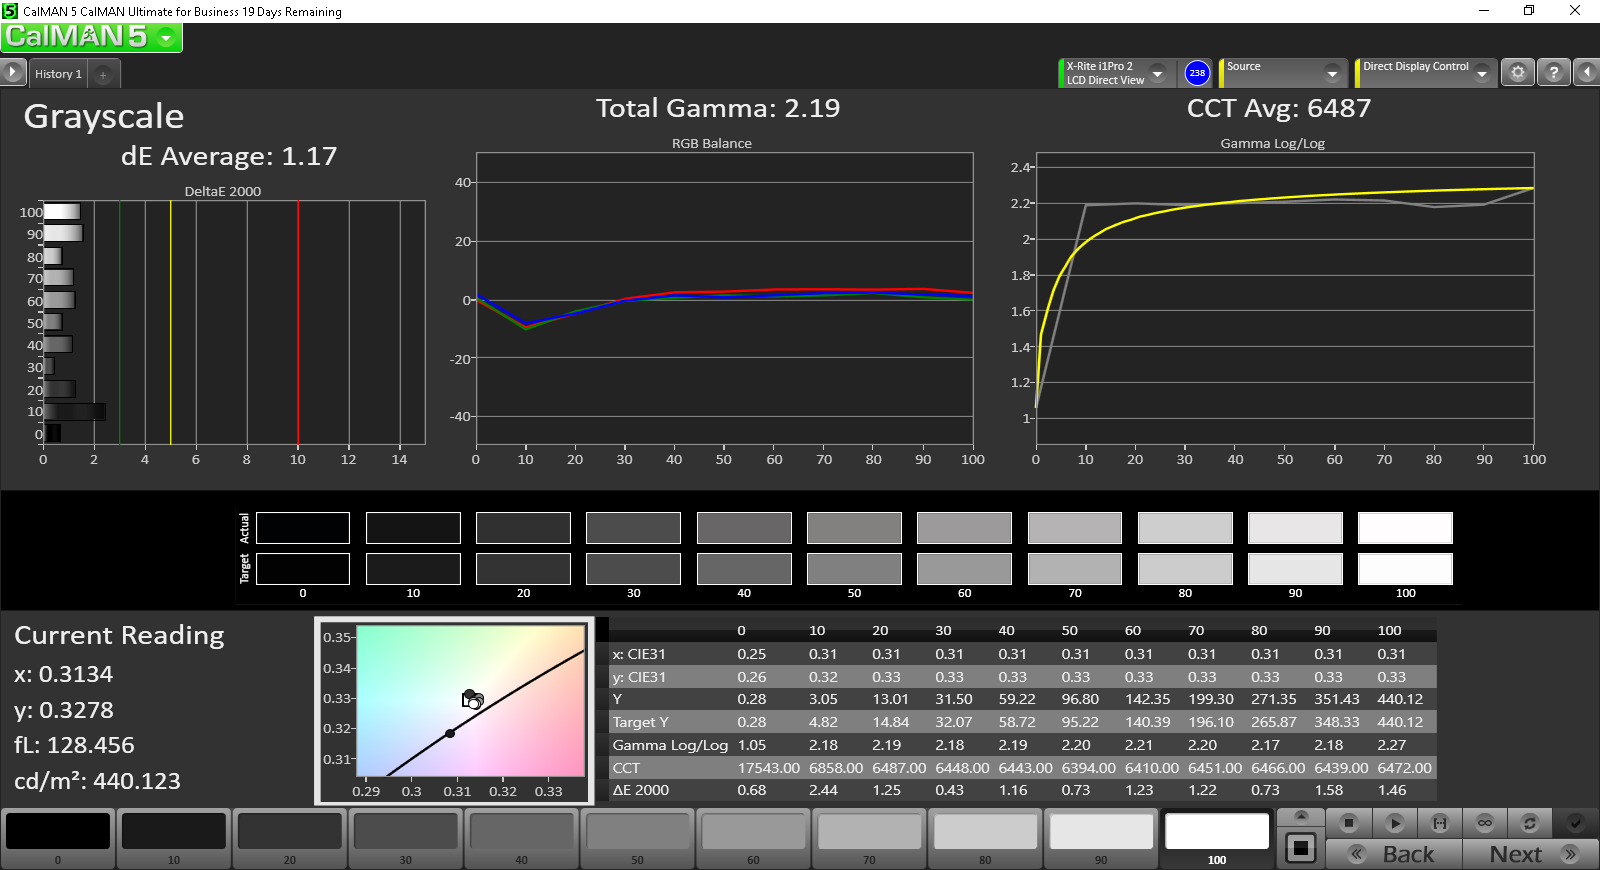
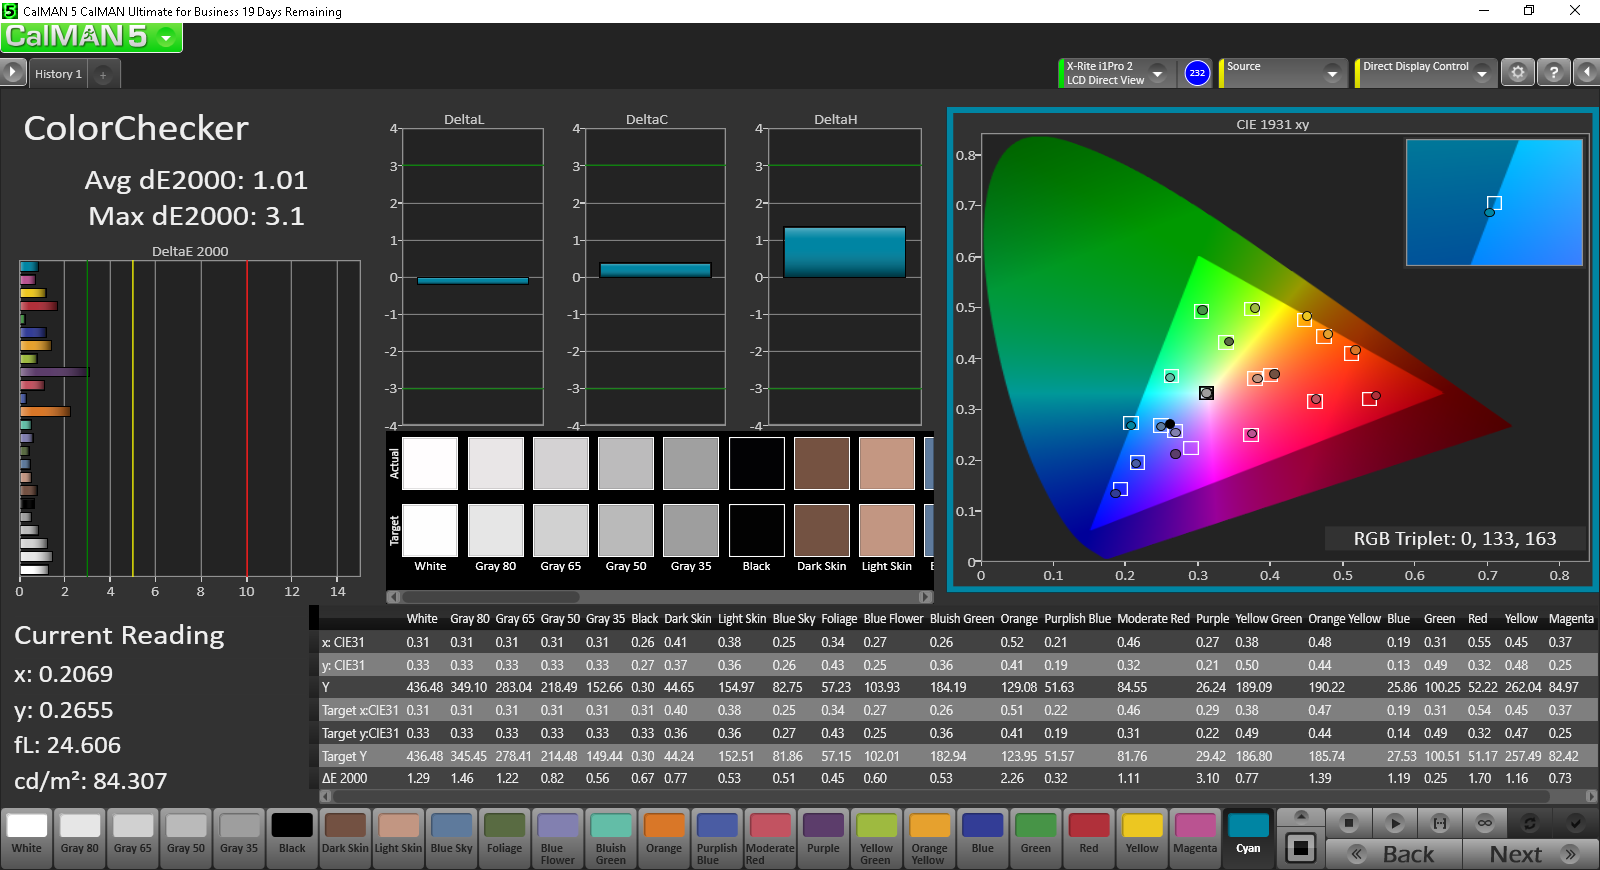
The data starts to get interesting when diving deeper into the color reproduction of the Core i7 model. Here, the display appears to be well-calibrated before it reaches the end-user unlike on the Core m3 or Core i5 models. Grayscale and colors are some of the most accurate we've seen on a Windows tablet. Additional calibration will increase accuracy even further, though not by much.

Display Response Times
| ↔ Response Time Black to White | ||
|---|---|---|
| 35.6 ms ... rise ↗ and fall ↘ combined | ↗ 8 ms rise | 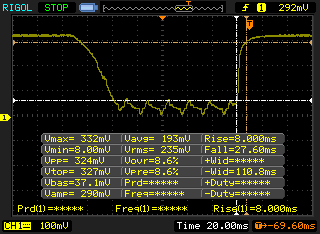 |
| ↘ 27.6 ms fall | ||
| The screen shows slow response rates in our tests and will be unsatisfactory for gamers. In comparison, all tested devices range from 0.1 (minimum) to 240 (maximum) ms. » 93 % of all devices are better. This means that the measured response time is worse than the average of all tested devices (20.2 ms). | ||
| ↔ Response Time 50% Grey to 80% Grey | ||
| 48.4 ms ... rise ↗ and fall ↘ combined | ↗ 20.4 ms rise | 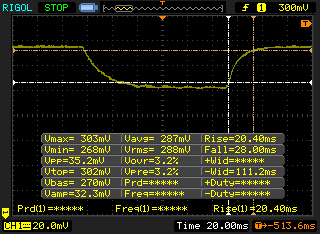 |
| ↘ 28 ms fall | ||
| The screen shows slow response rates in our tests and will be unsatisfactory for gamers. In comparison, all tested devices range from 0.165 (minimum) to 636 (maximum) ms. » 84 % of all devices are better. This means that the measured response time is worse than the average of all tested devices (31.6 ms). | ||
Performance
The Core i7-6650U is one of the fastest dual-core ULV Skylake processors available. Its base clock rate of 2.2 GHz is 1.3 GHz faster than the Core m3-6Y30 and 200 MHz slower than the Core i5-6300U. In turn, it carries the faster Turbo Boost potential of up to 3.2 to 3.4 GHz depending on the system load.
The i7 model also integrates the faster Iris Graphics 540 compared to the HD 520 and HD 515 in the Core i5 and m3, respectively.
As usual, we recommend checking out our dedicated CPU pages on the i7-6650U, i5-6300U, and m3-6Y30 for more technical information and comparisons.
| Surface Pro 4 Core i7-6650U | Surface Pro 4 Core i5-6300U | Surface Pro 4 Core m3-6Y30 | |
Base CPU clock (GHz) |
2.2 | 2.4 | 0.9 |
Maximum theoretical Turbo Boost (GHz) |
3.4 | 3.0 | 2.2 |
Integrated GPU |
Iris Graphics 540 | HD Graphics 520 | HD Graphics 515 |
GPU clock (MHz) |
300 - 1050 | 300 - 1050 | 300 - 850 |
Execution Units (EU) |
48 | 24 | 24 |
TDP |
15 W | 15 W | 4.5 W |
Processor
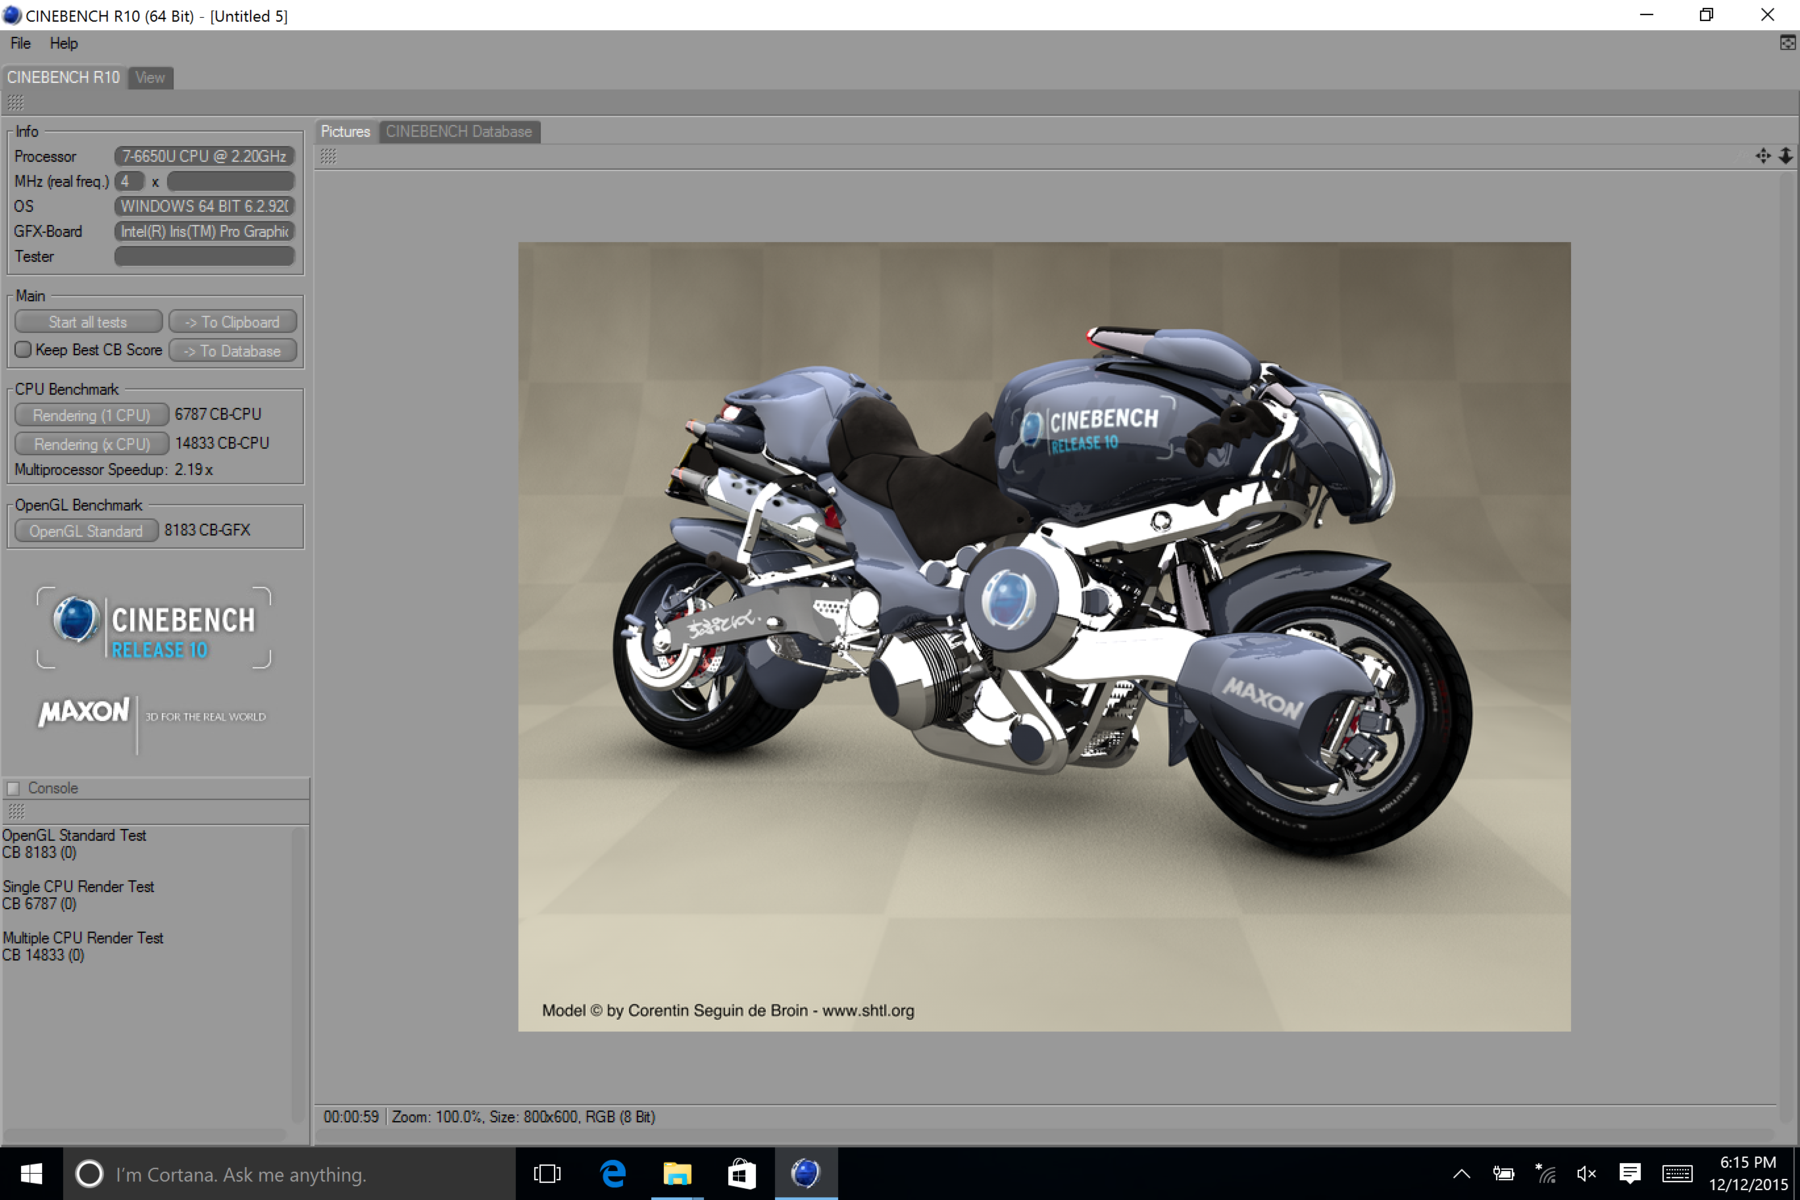
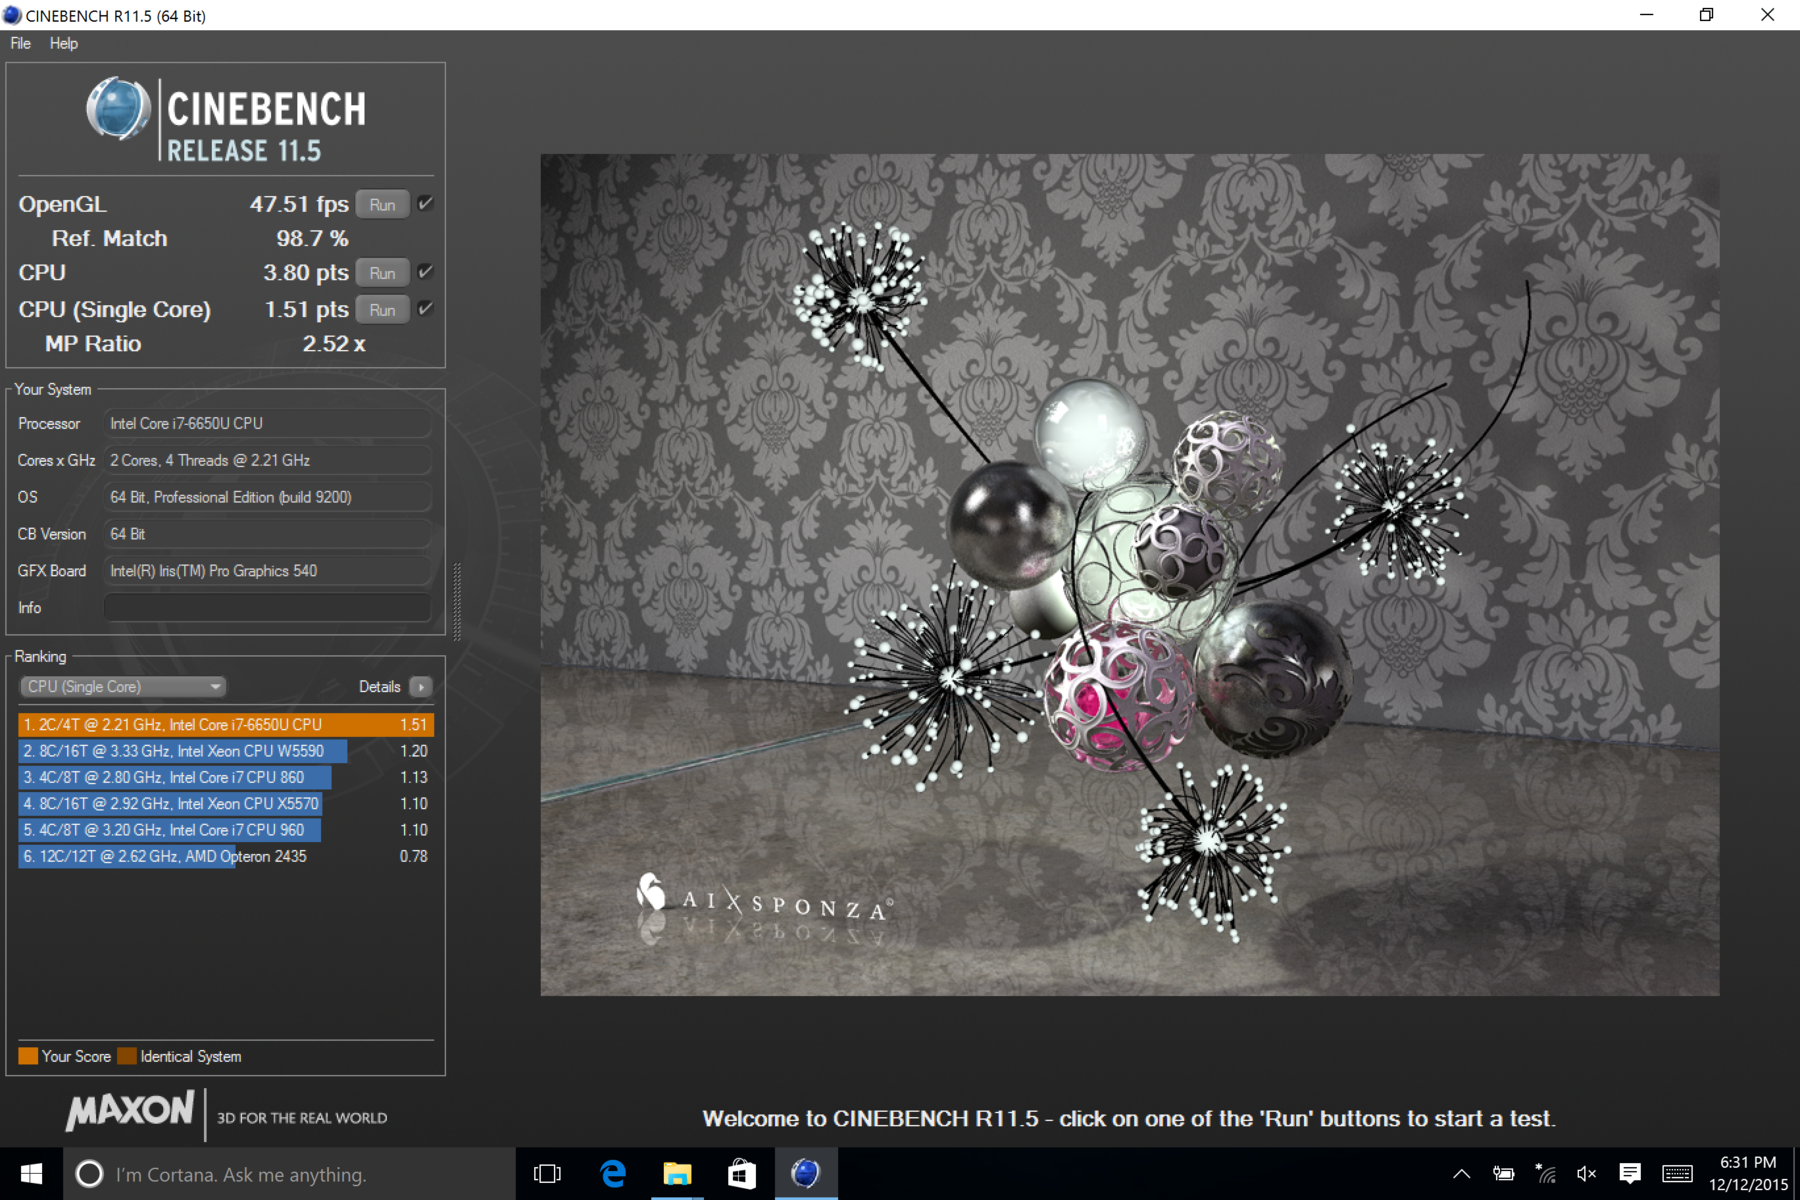
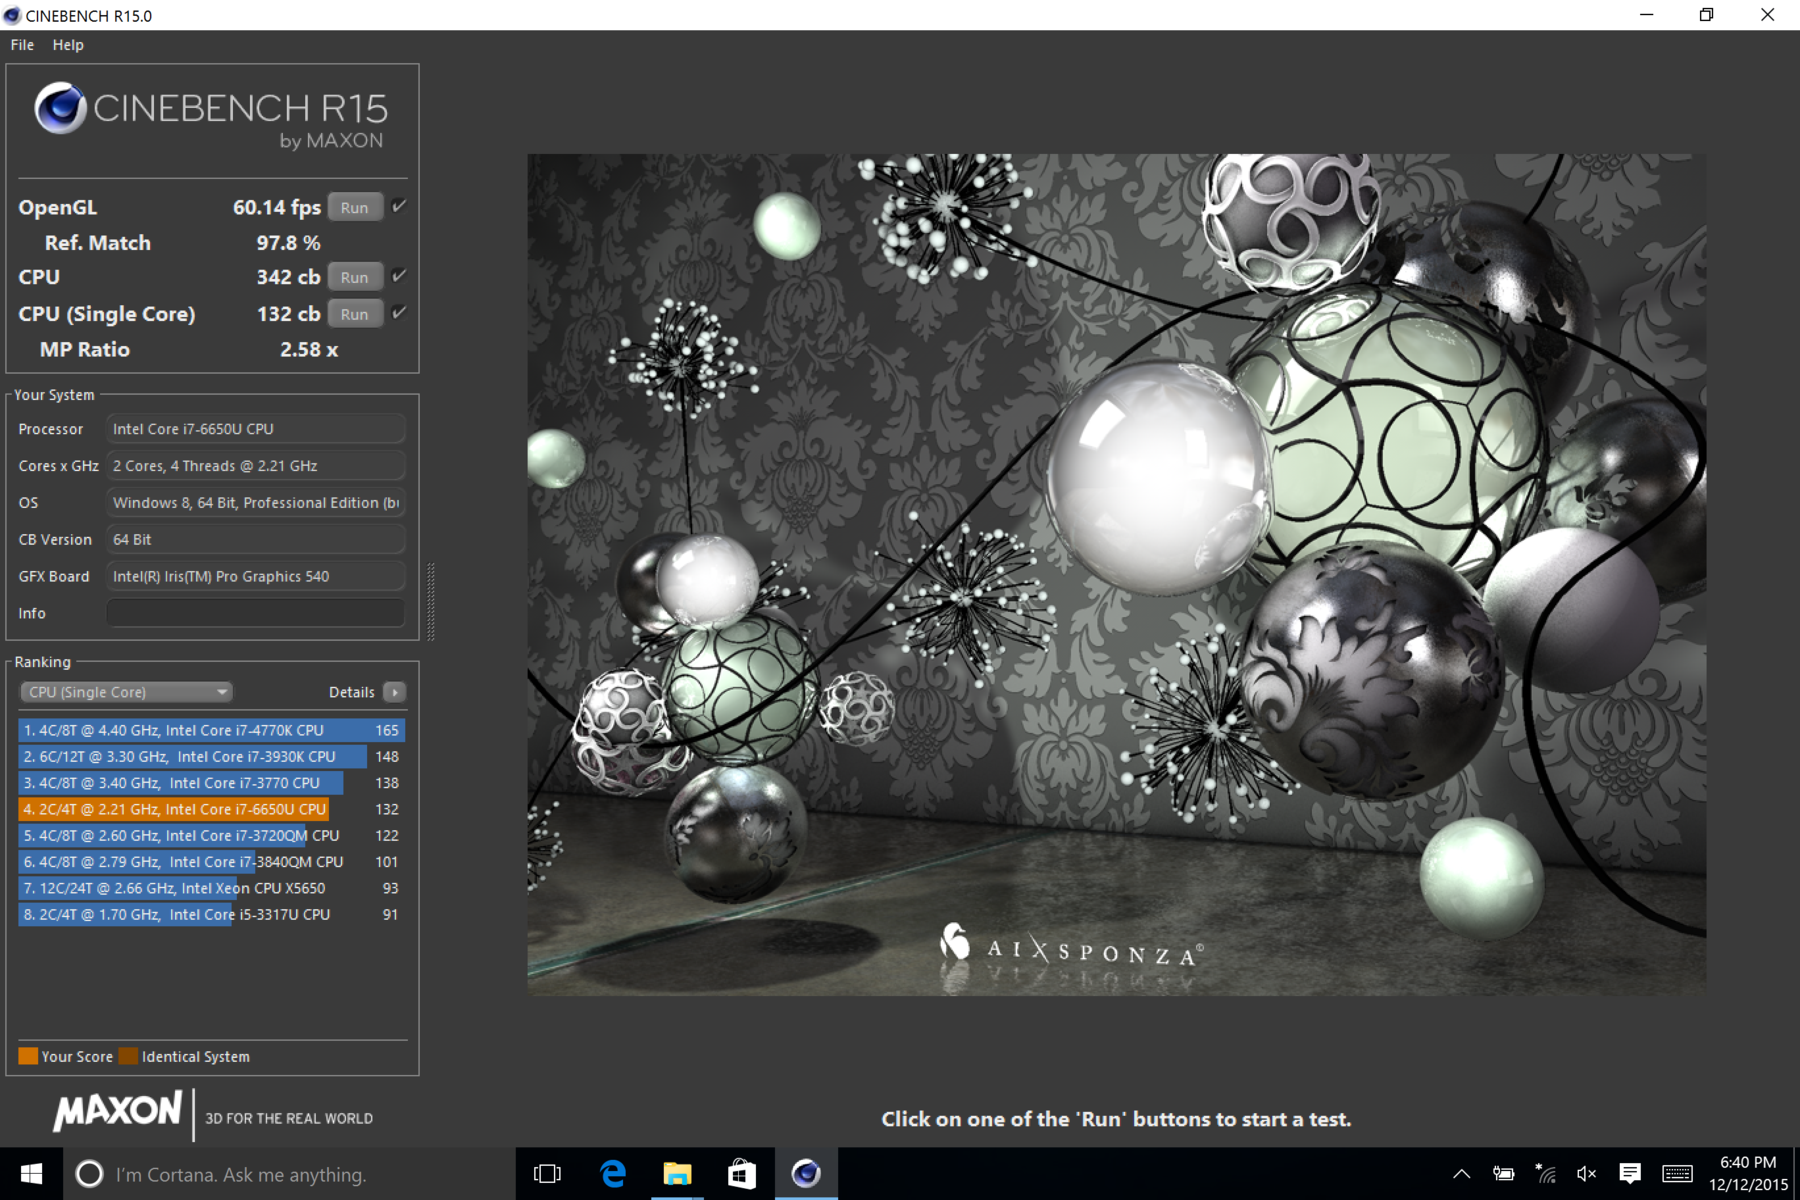
According to CineBench, users can expect about a 10 percent raw performance boost over the Core i5 model and a 30 to 40 percent boost over the Core m3 model. While the advantages in computational power are small over the Core i5, graphics performance is significantly better than the HD Graphics 520 on the Core i5 by about 40 percent.
| wPrime 2.10 - 1024m (sort by value) | |
| Microsoft Surface Pro 4 Core i7 | |
| Microsoft Surface Pro 3 | |
| Microsoft Surface Pro 4, Core m3 | |
| Super Pi Mod 1.5 XS 32M - 32M (sort by value) | |
| Microsoft Surface Pro 4 Core i7 | |
| Microsoft Surface Pro 3 | |
| Microsoft Surface Pro 4, Core m3 | |
* ... smaller is better
System Performance
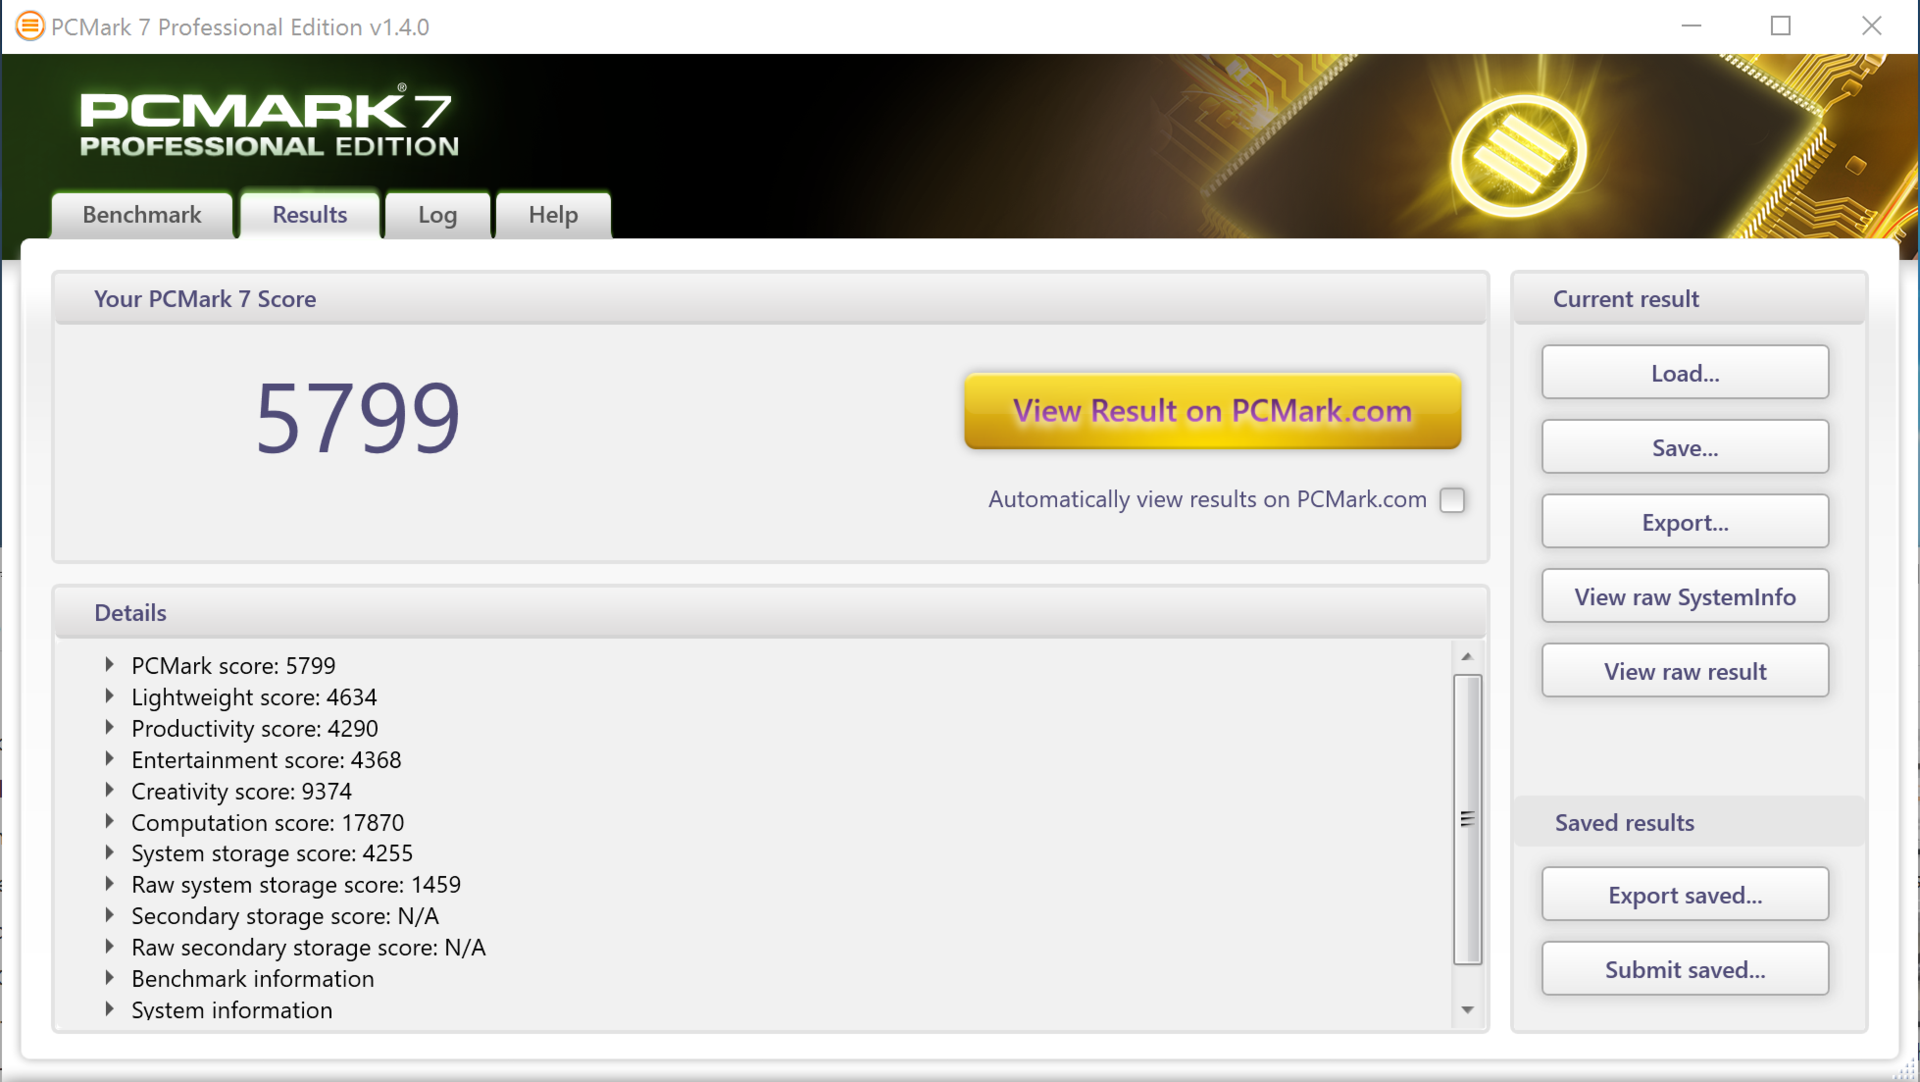
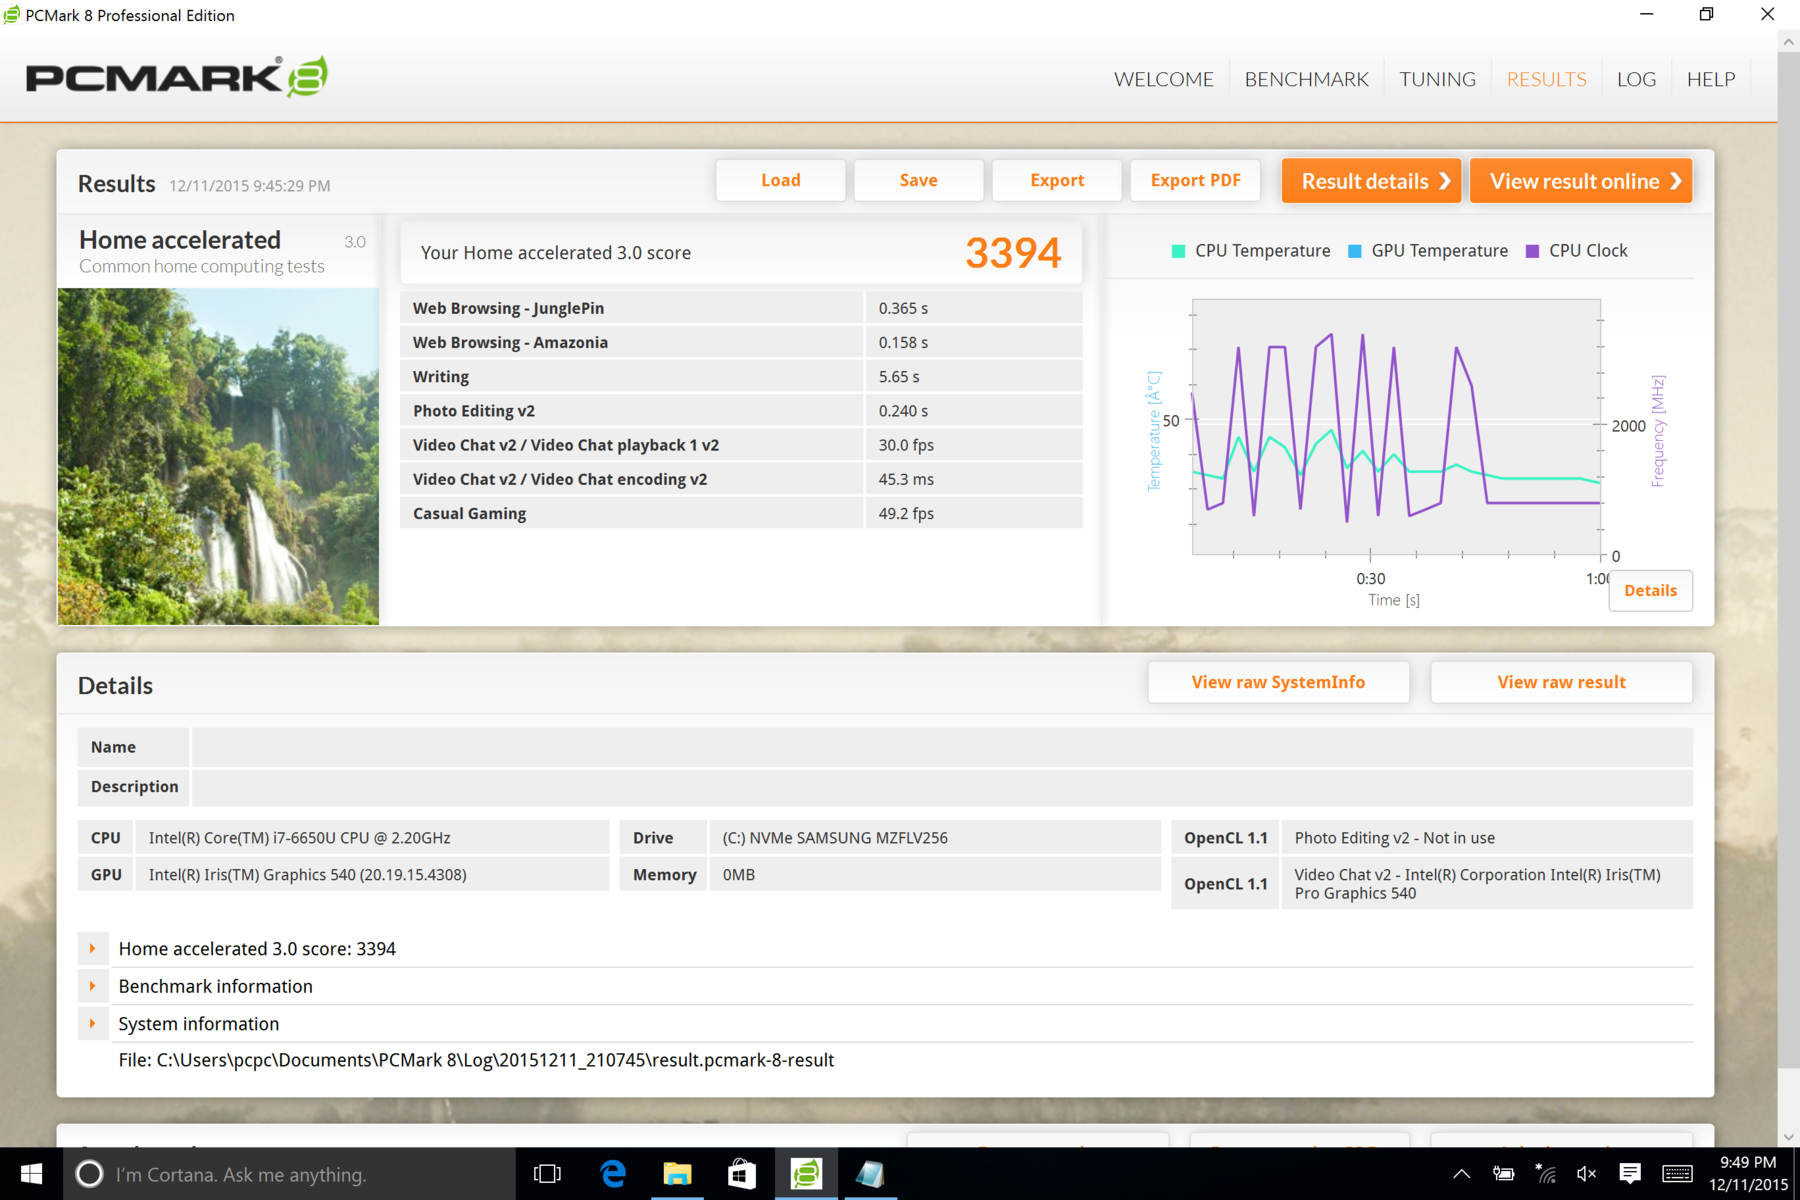
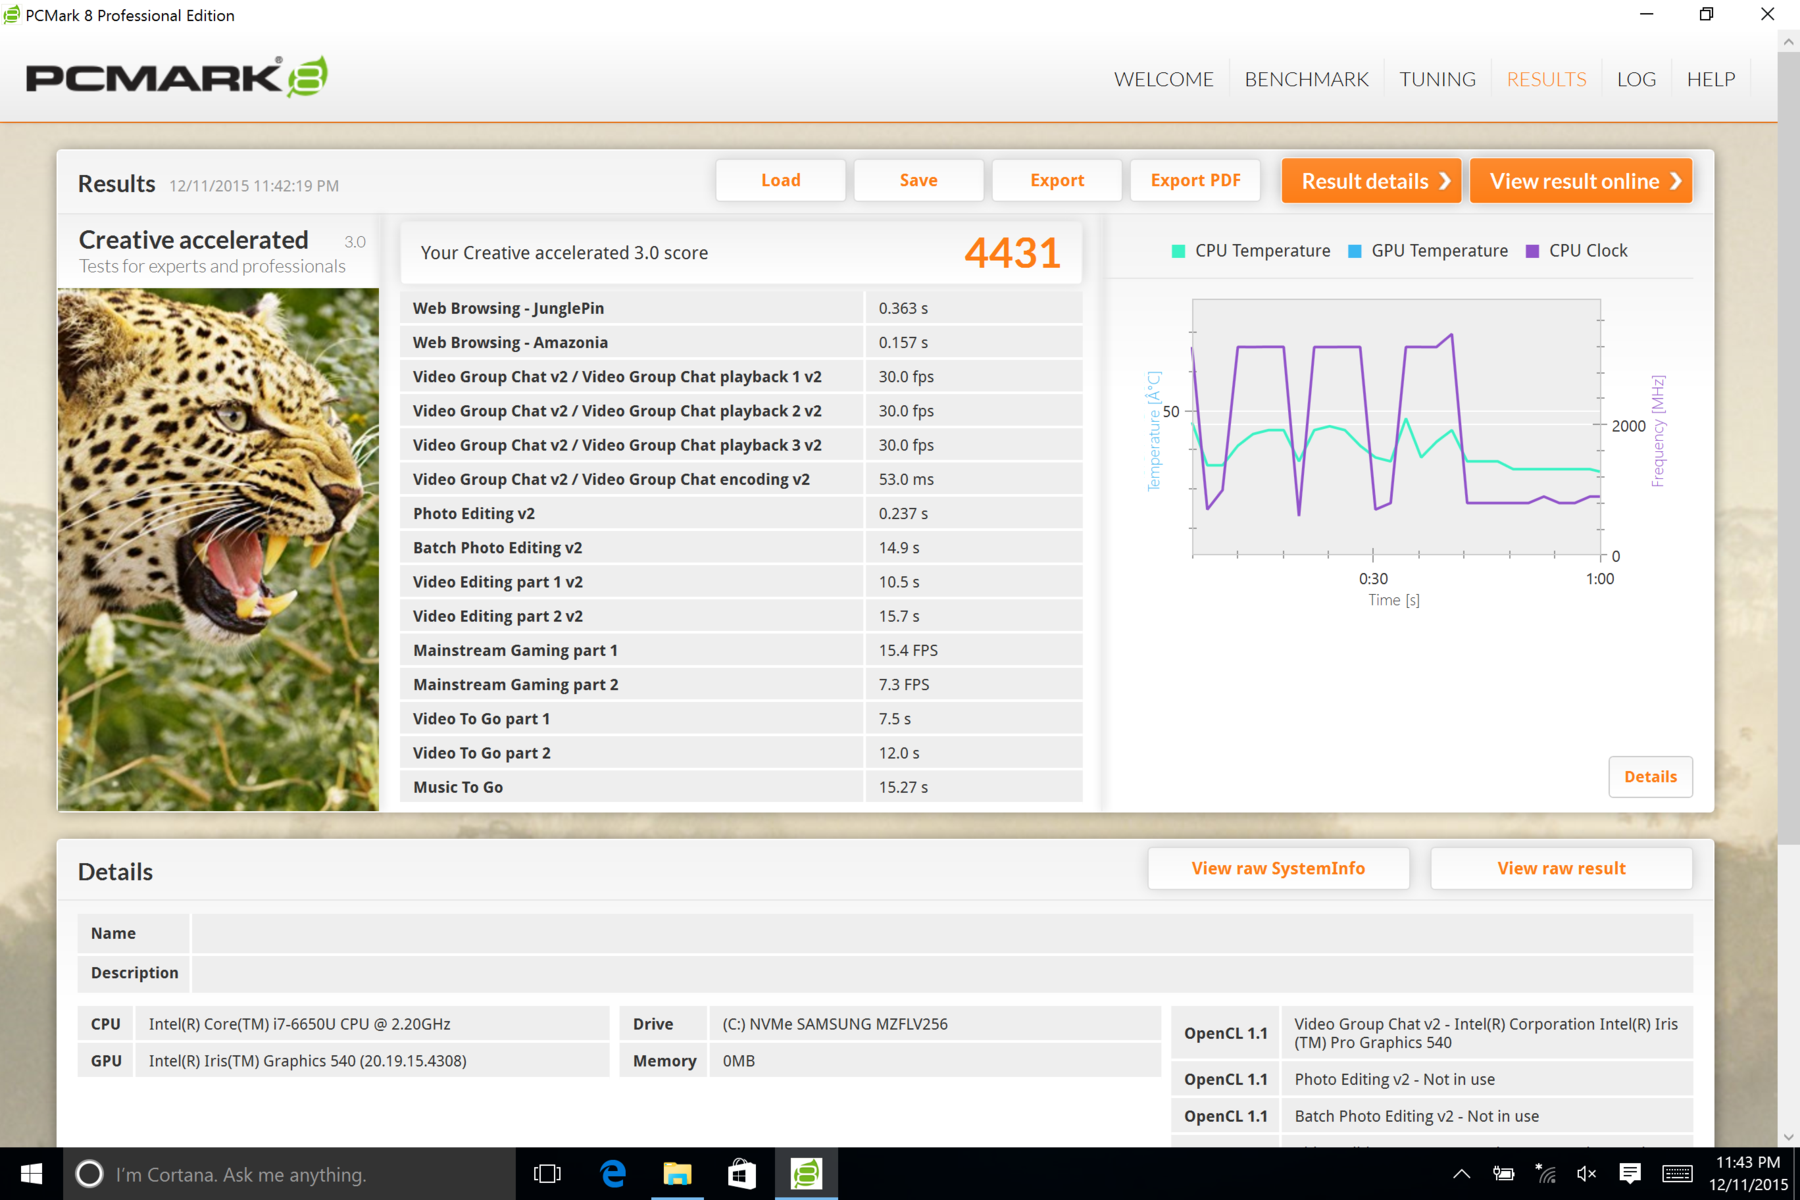
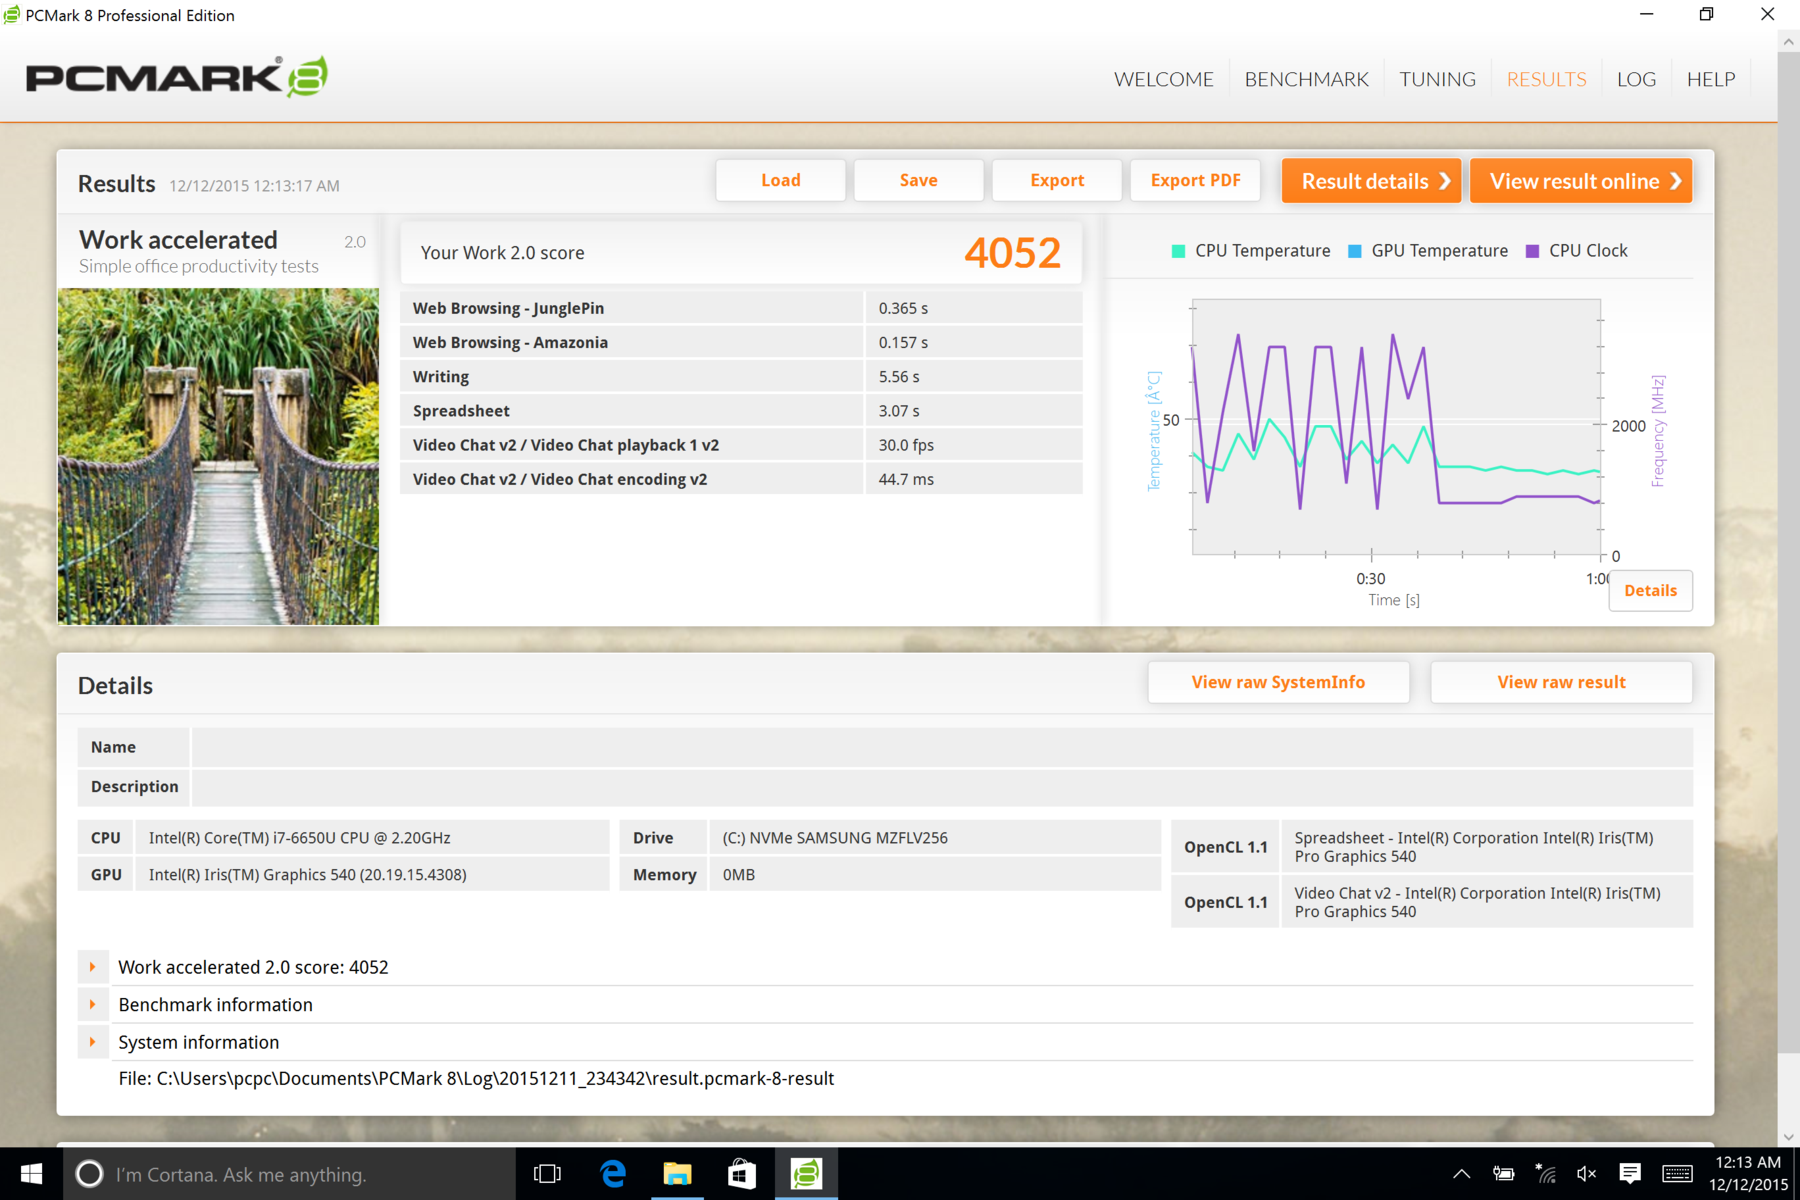
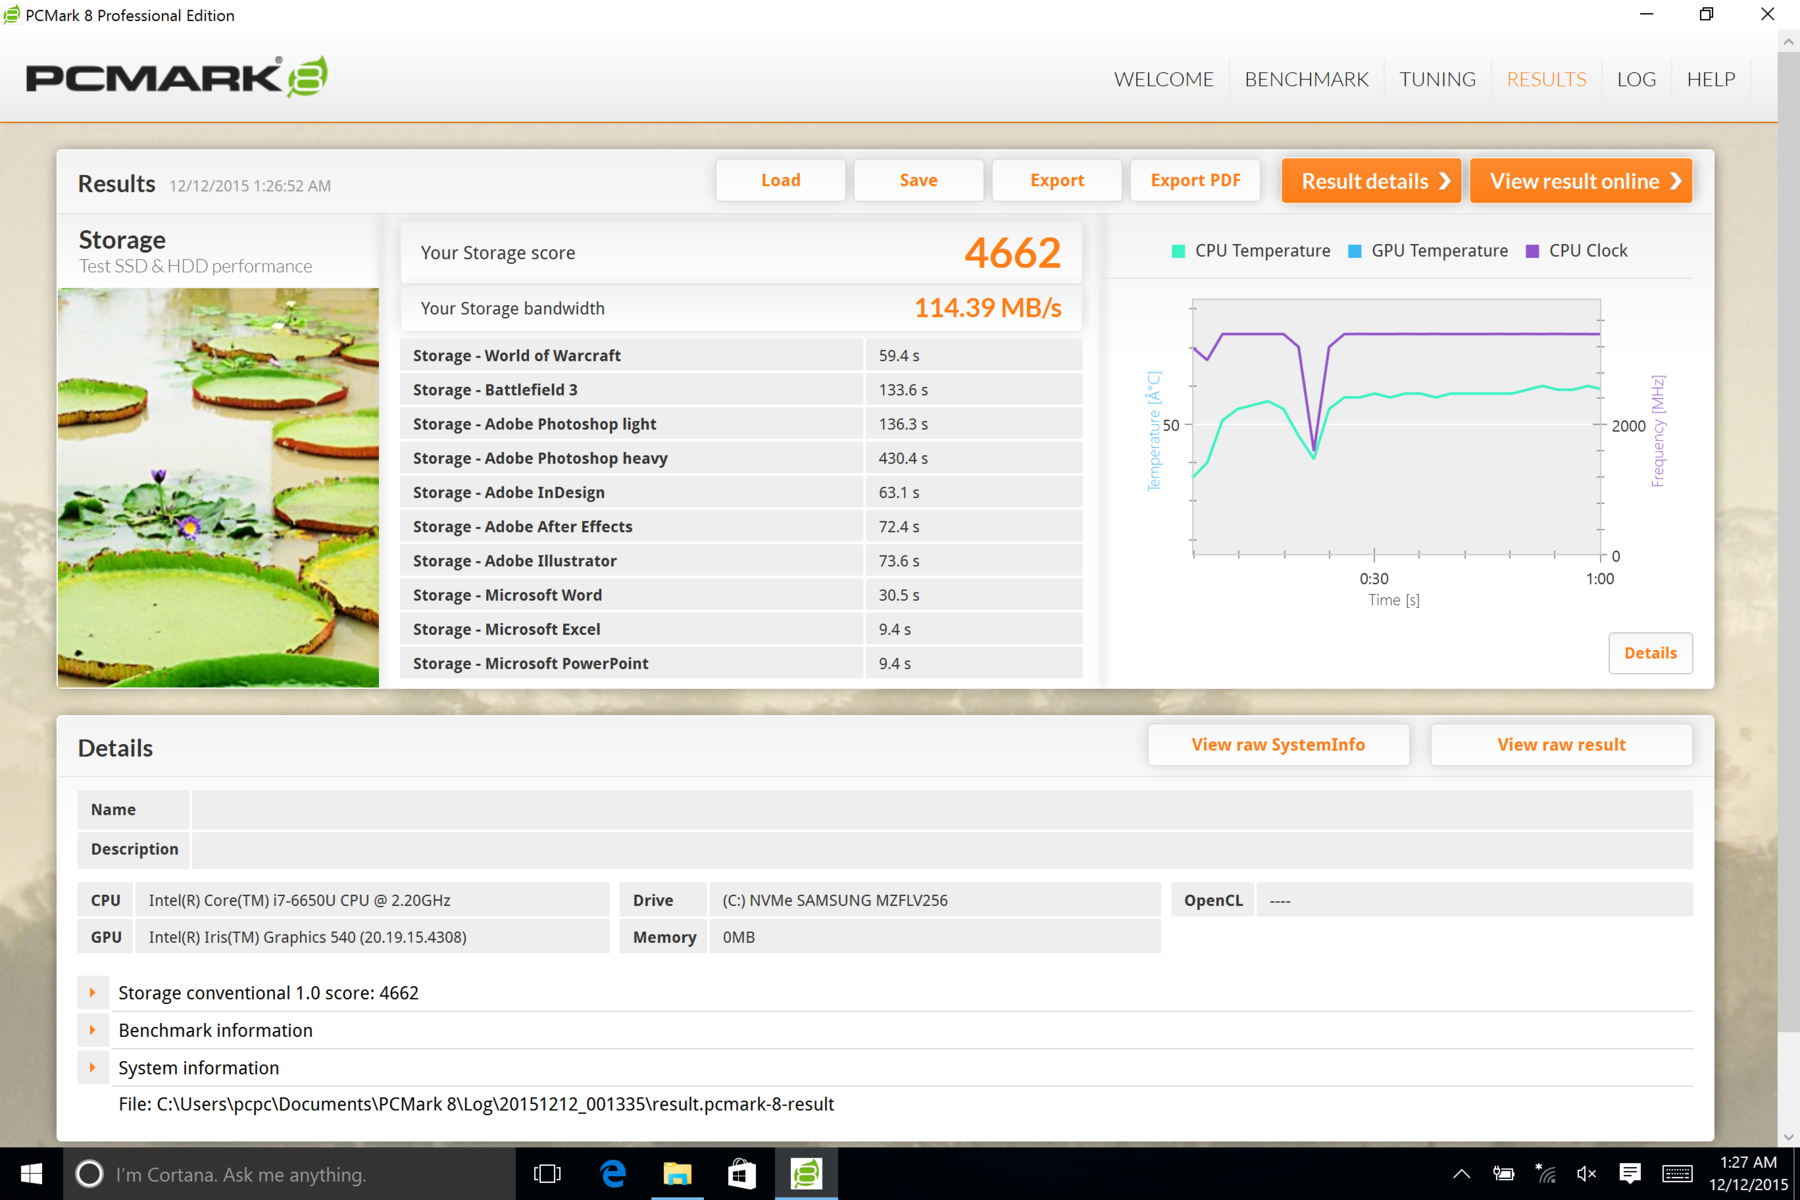
Likewise, raw system performance according to PCMark 7 is about 10 percent ahead of the Core i5 model and about 25 percent ahead of the Core m3 model. The differences are slightly larger in PCMark 8.
Storage Devices
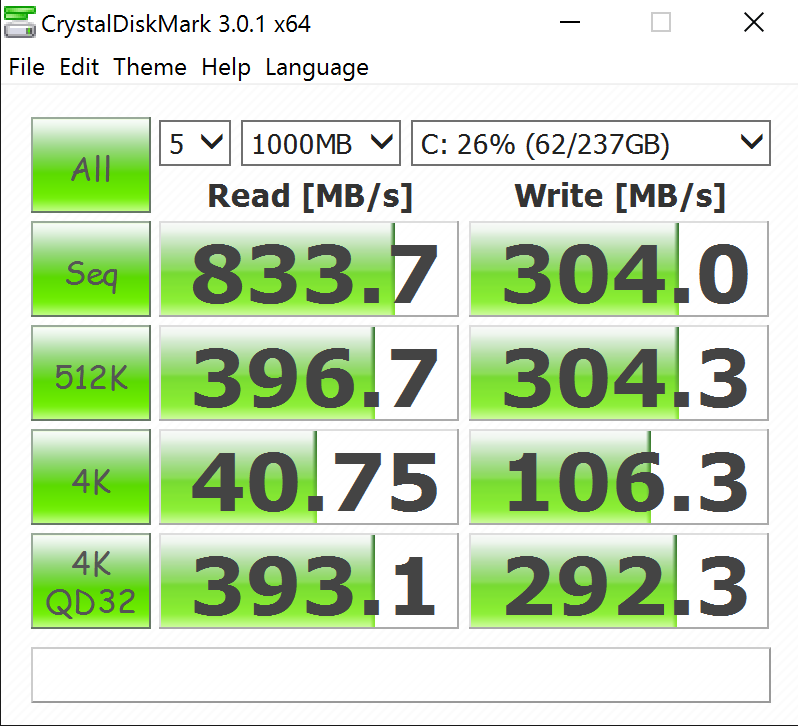
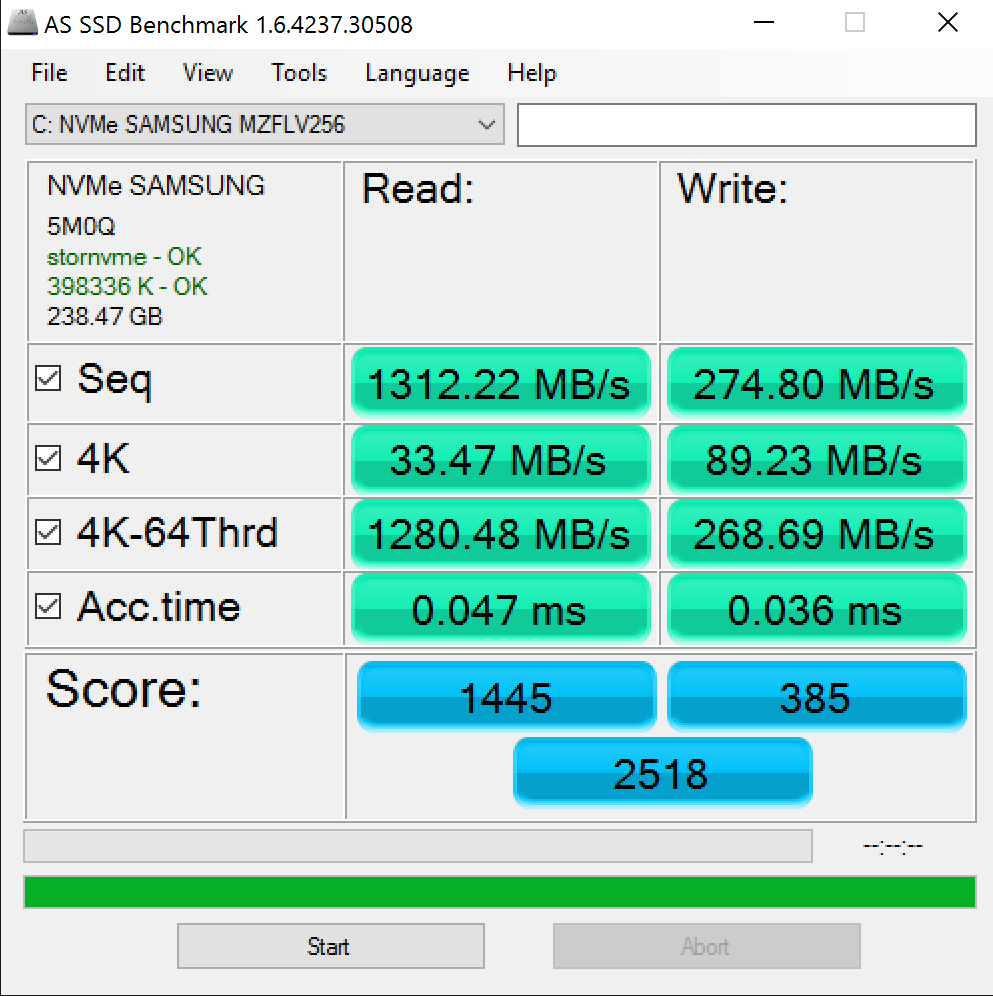
The 256 GB Samsung MZFLV256 M.2 drive in our Core i7 configuration outperforms our 128 GB SSDs in Core i5 and m3 models by noticeable margins across the board. Sequential write speeds in particular are almost twice as fast according to both AS SSD and CDM.
| Microsoft Surface Pro 4 Core i7 | Microsoft Surface Pro 4, Core i5, 128GB | Microsoft Surface Pro 4, Core m3 | Microsoft Surface Pro 3 | Microsoft Surface 3 | |
|---|---|---|---|---|---|
| CrystalDiskMark 3.0 | -30% | -36% | -16% | -84% | |
| Write 4k QD32 (MB/s) | 292.3 | 153.6 -47% | 149.2 -49% | 294.4 1% | 11.2 -96% |
| Read 4k QD32 (MB/s) | 393.1 | 368.3 -6% | 243.7 -38% | 345 -12% | 27.94 -93% |
| Write 4k (MB/s) | 106.3 | 101.5 -5% | 68 -36% | 76.2 -28% | 9.52 -91% |
| Read 4k (MB/s) | 40.75 | 28.51 -30% | 30.14 -26% | 20.81 -49% | 12.64 -69% |
| Write 512 (MB/s) | 304.3 | 154.2 -49% | 158.2 -48% | 324.6 7% | 39.9 -87% |
| Read 512 (MB/s) | 396.7 | 266.3 -33% | 313.1 -21% | 357.8 -10% | 133.7 -66% |
| Write Seq (MB/s) | 304 | 154.2 -49% | 158.2 -48% | 324 7% | 47.99 -84% |
| Read Seq (MB/s) | 834 | 666 -20% | 663 -21% | 501 -40% | 149.3 -82% |
| AS SSD | -44% | -44% | -49% | ||
| Copy Game MB/s (MB/s) | 273.9 | 105.6 -61% | 101.3 -63% | ||
| Copy Program MB/s (MB/s) | 209.8 | 63.5 -70% | 65.8 -69% | ||
| Copy ISO MB/s (MB/s) | 409.9 | 121.9 -70% | 120.9 -71% | ||
| Score Total (Points) | 2518 | 1190 -53% | 1759 -30% | 965 -62% | |
| Score Write (Points) | 385 | 239 -38% | 189 -51% | 319 -17% | |
| Score Read (Points) | 1445 | 645 -55% | 1060 -27% | 430 -70% | |
| Access Time Write * (ms) | 0.036 | 0.037 -3% | 0.043 -19% | 0.075 -108% | |
| Access Time Read * (ms) | 0.047 | 0.079 -68% | 0.083 -77% | 0.087 -85% | |
| 4K-64 Write (MB/s) | 268.7 | 138.5 -48% | 112 -58% | 215 -20% | |
| 4K-64 Read (MB/s) | 1280 | 528 -59% | 944 -26% | 358.3 -72% | |
| 4K Write (MB/s) | 89.2 | 86.5 -3% | 63.2 -29% | 73.7 -17% | |
| 4K Read (MB/s) | 33.47 | 34.24 2% | 31.39 -6% | 22 -34% | |
| Seq Write (MB/s) | 274.8 | 142.5 -48% | 138.1 -50% | 303 10% | |
| Seq Read (MB/s) | 1312 | 832 -37% | 845 -36% | 493.7 -62% | |
| Total Average (Program / Settings) | -37% /
-39% | -40% /
-41% | -33% /
-35% | -84% /
-84% |
* ... smaller is better
GPU Performance
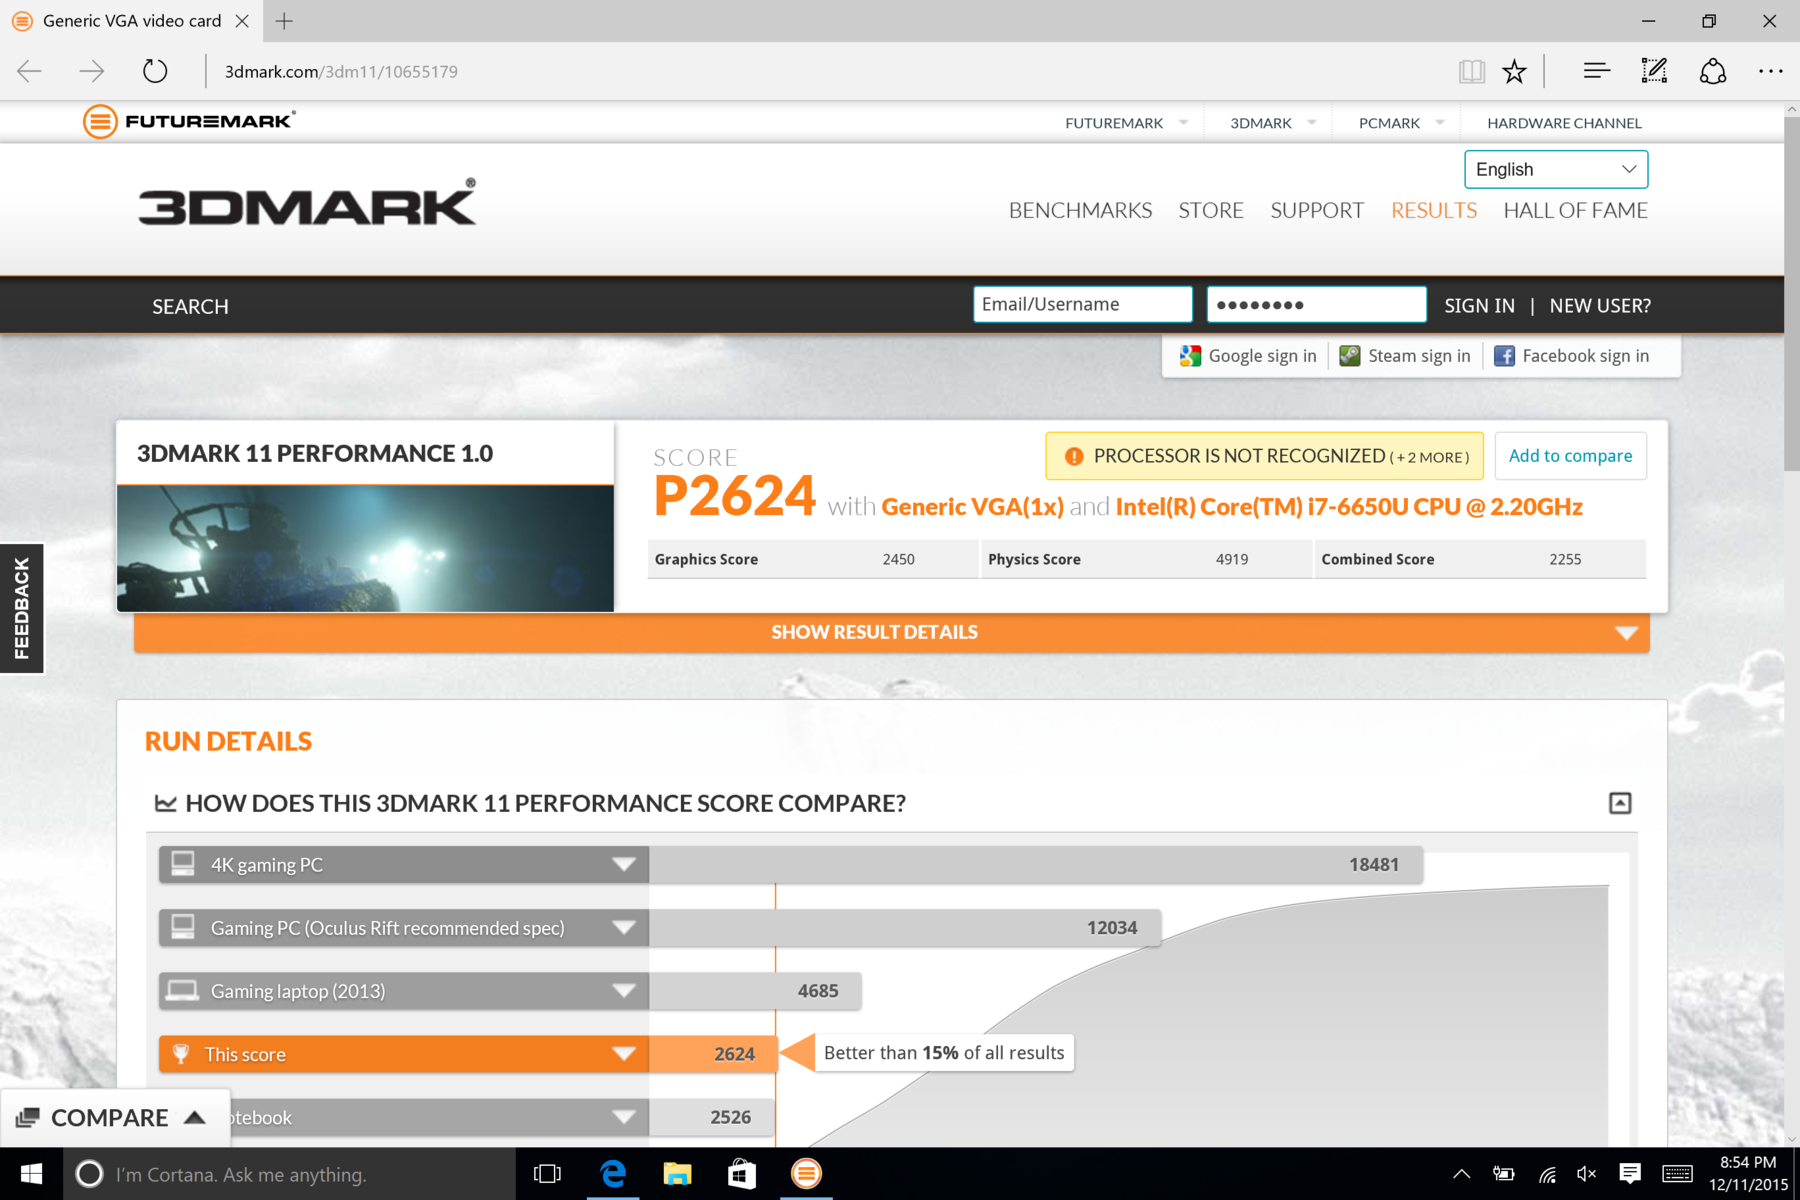
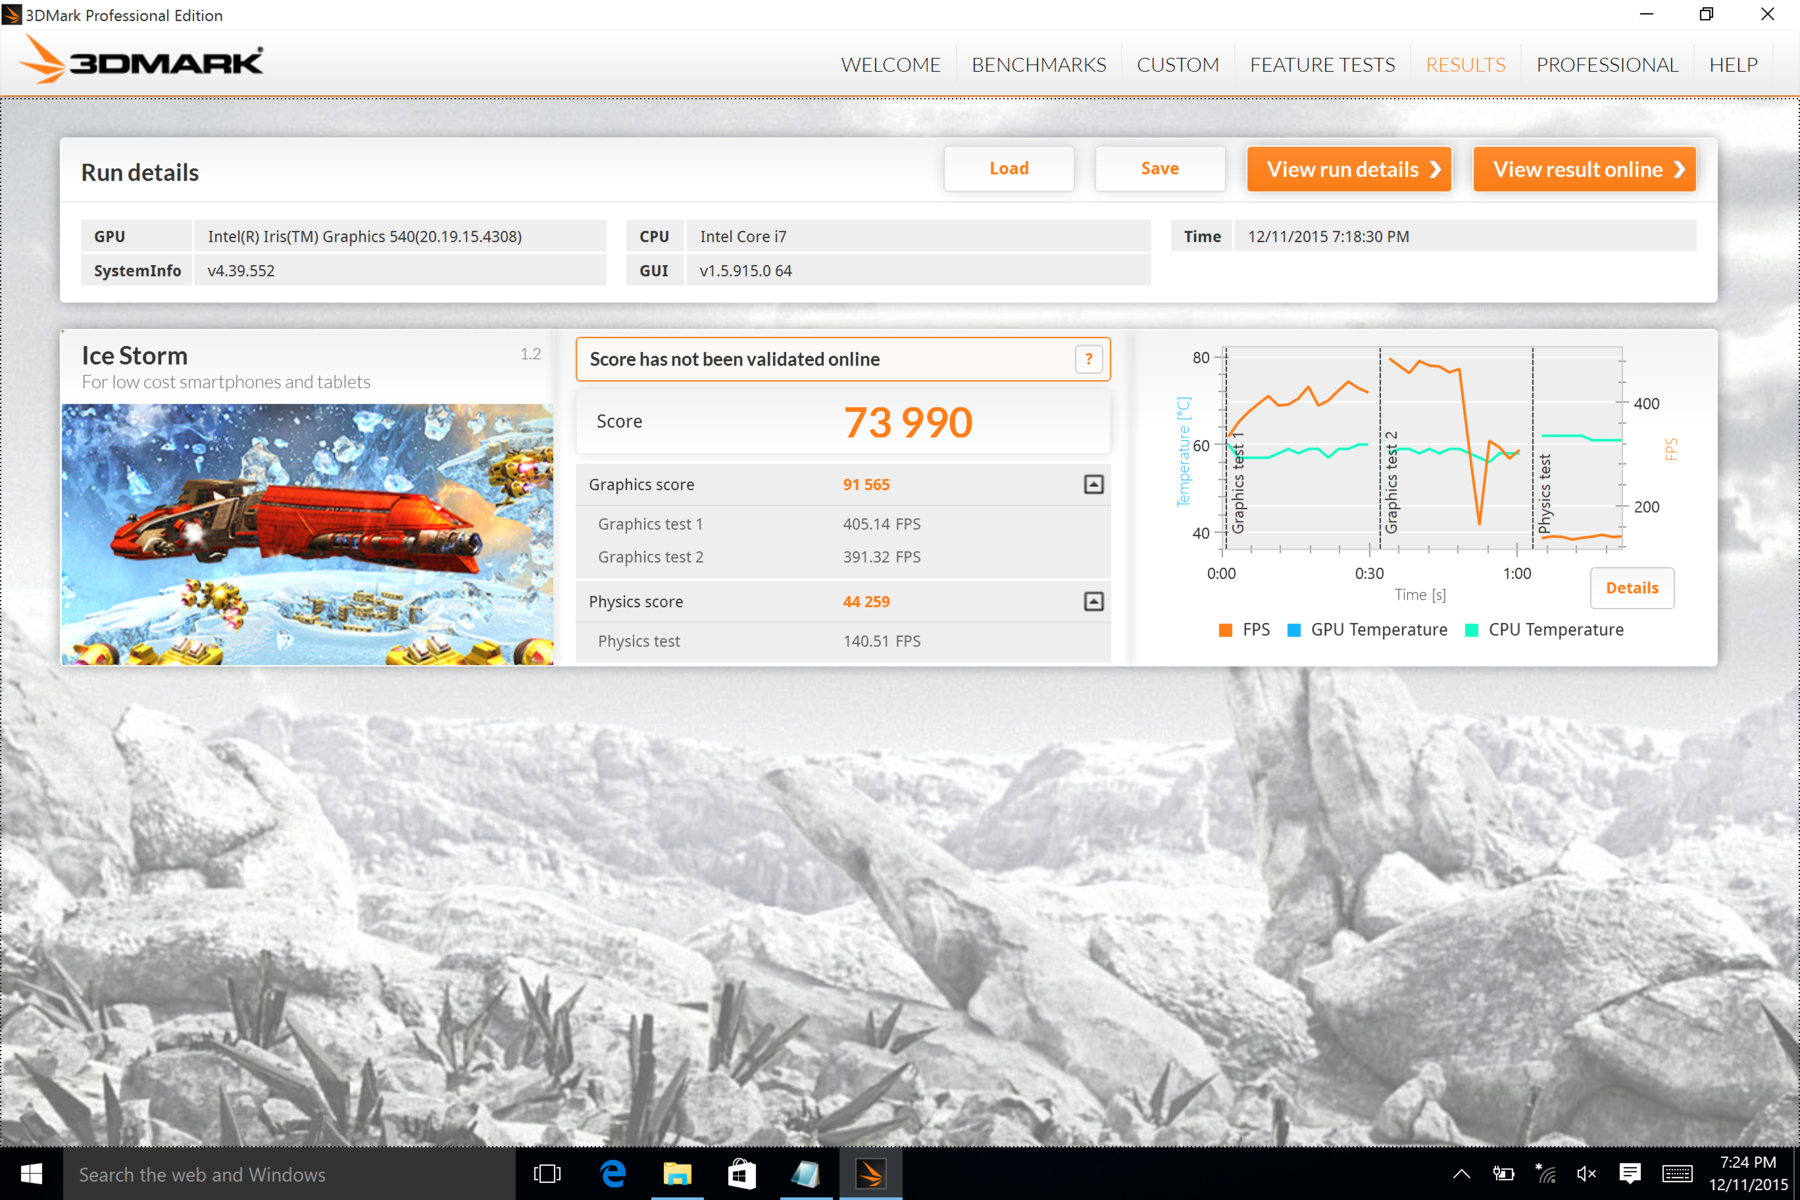
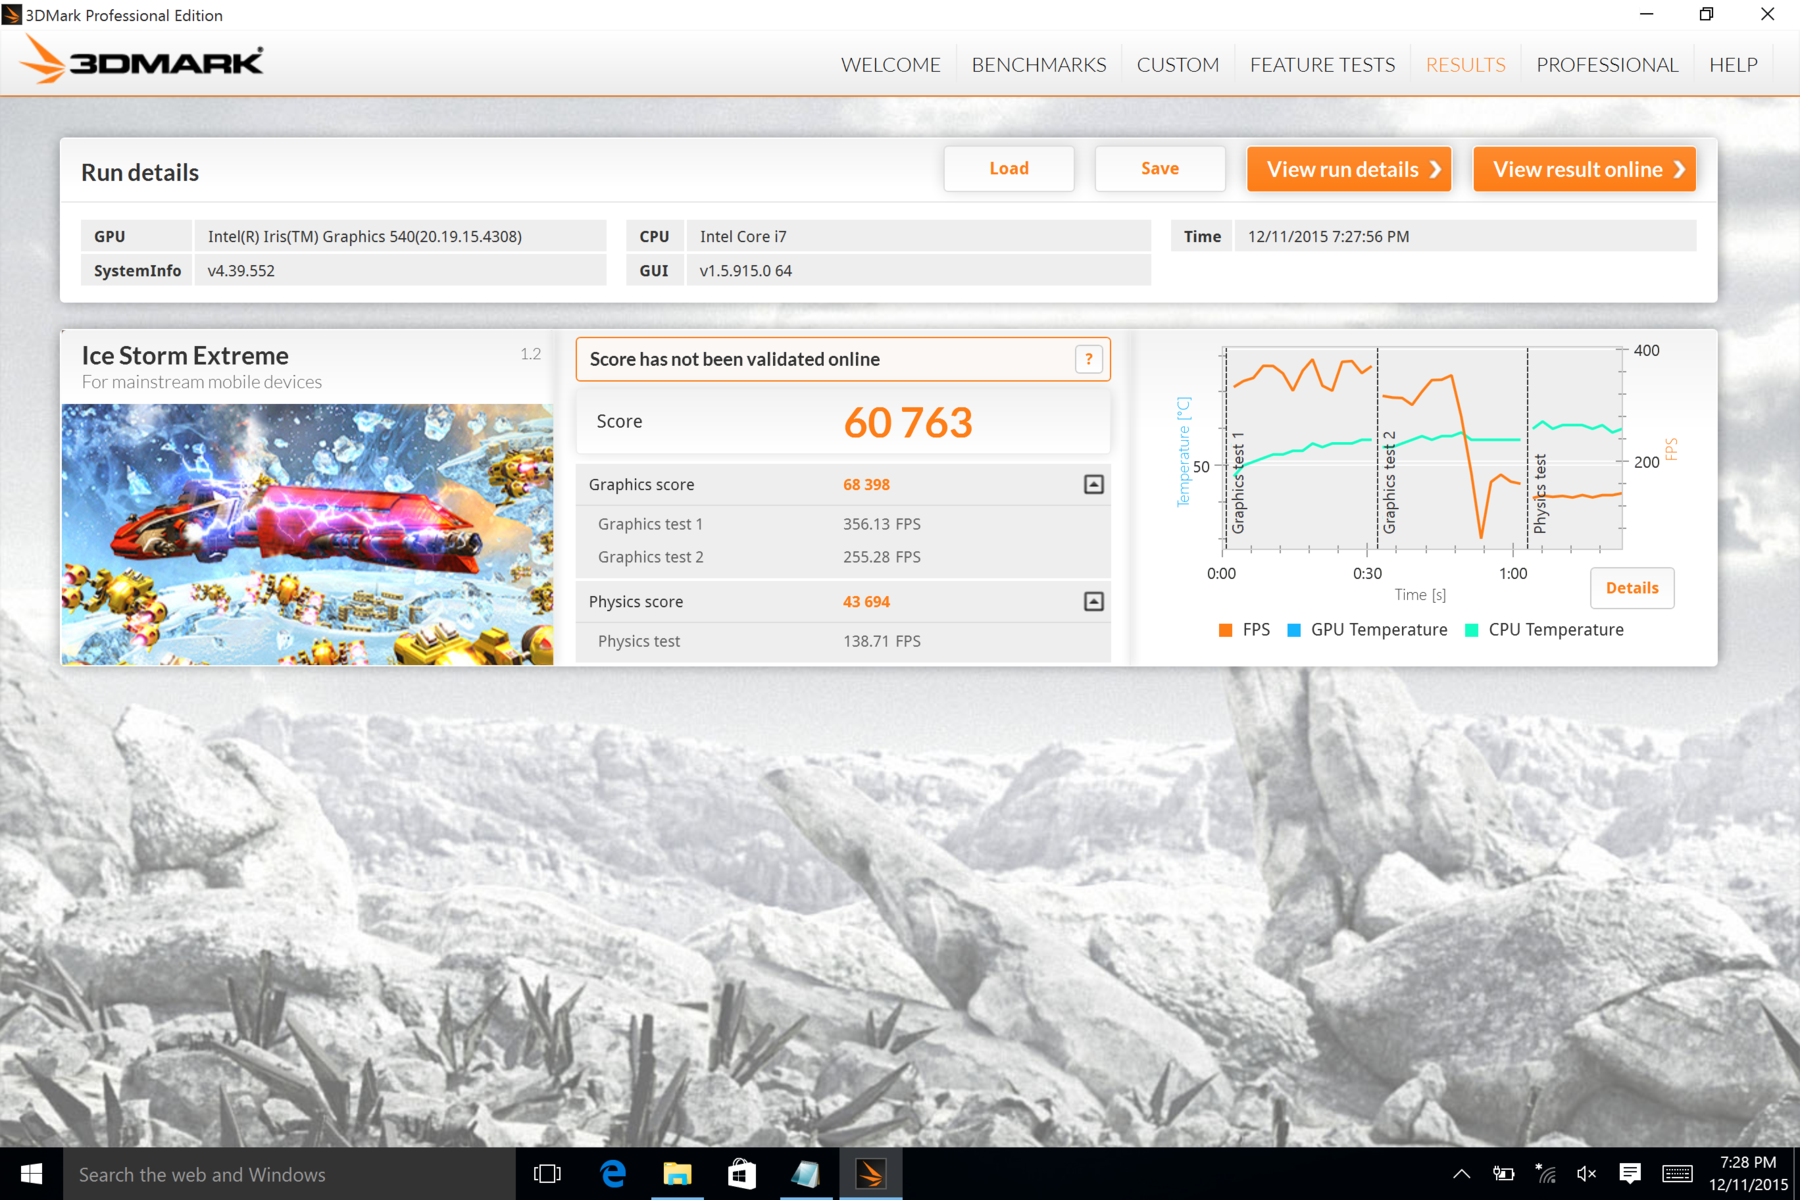
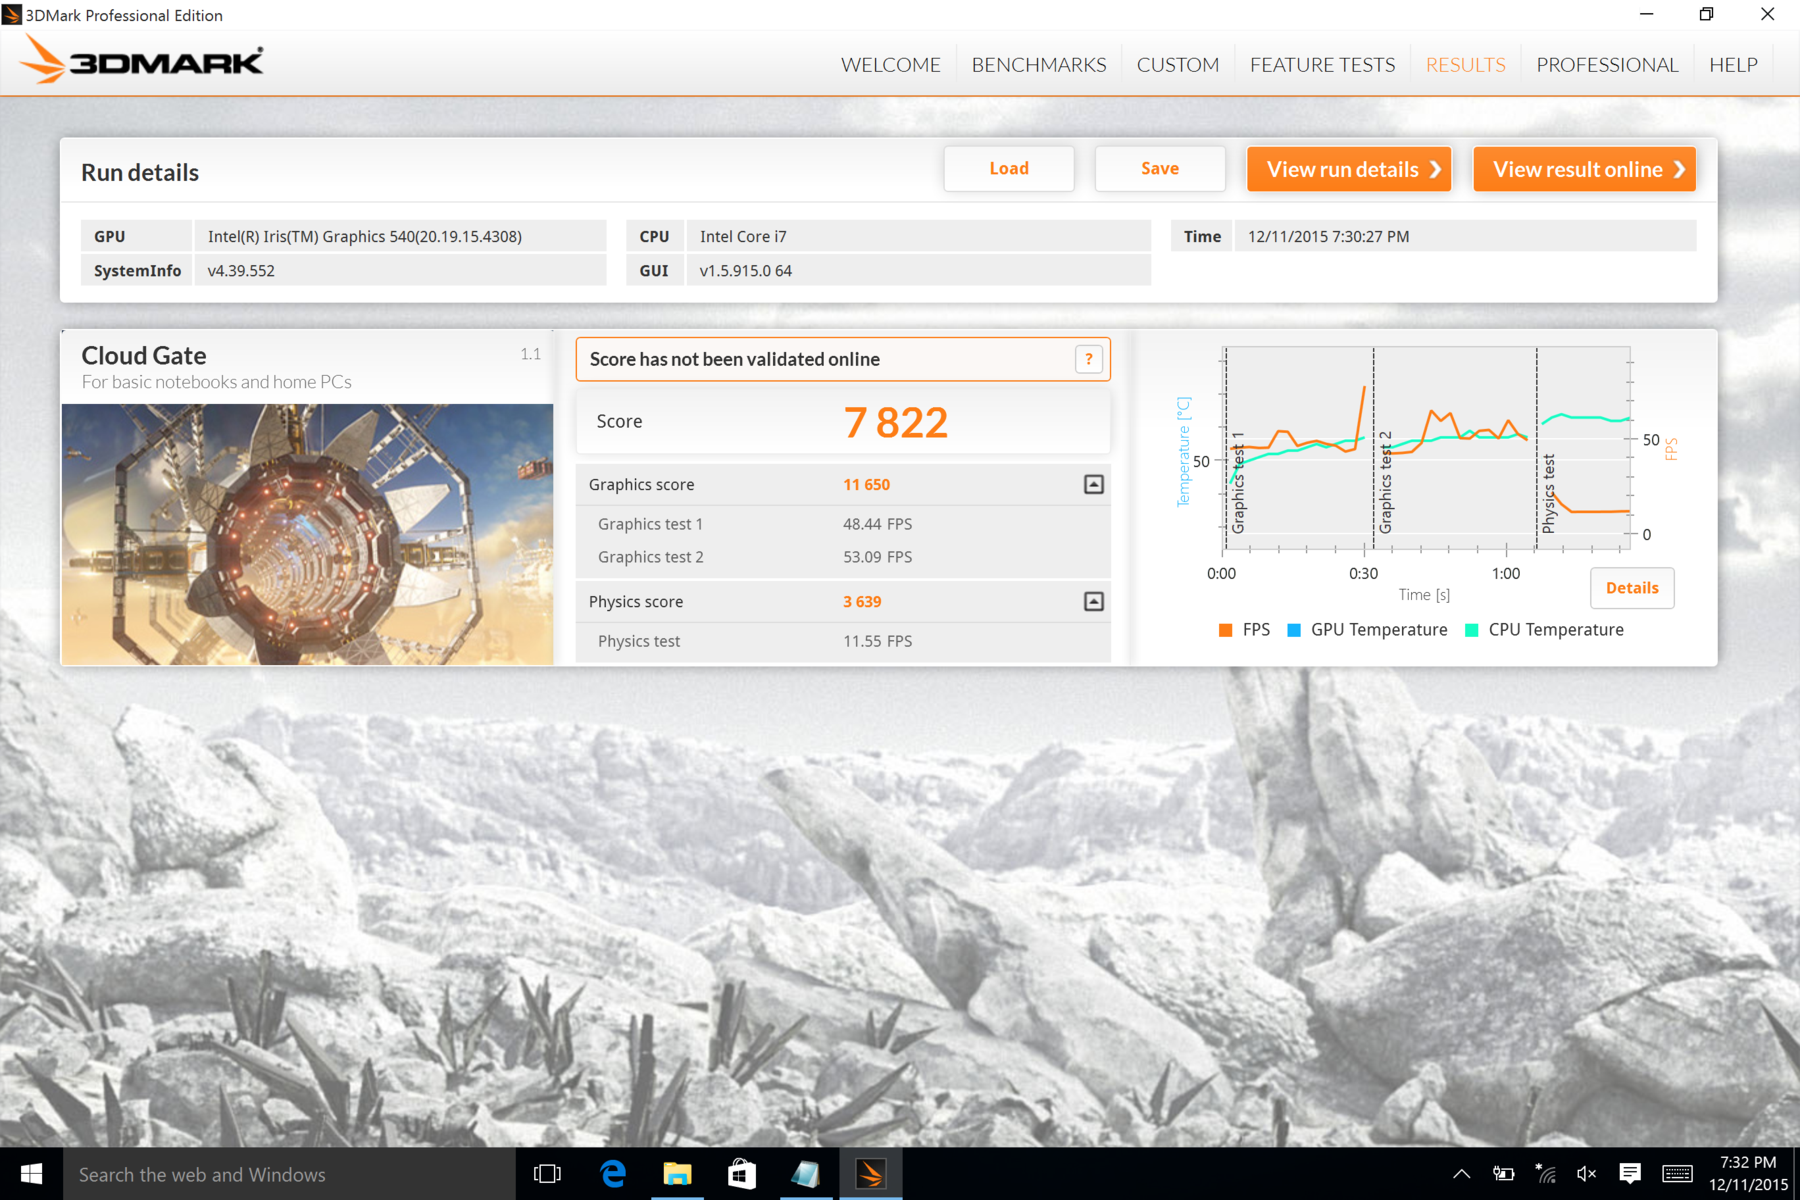
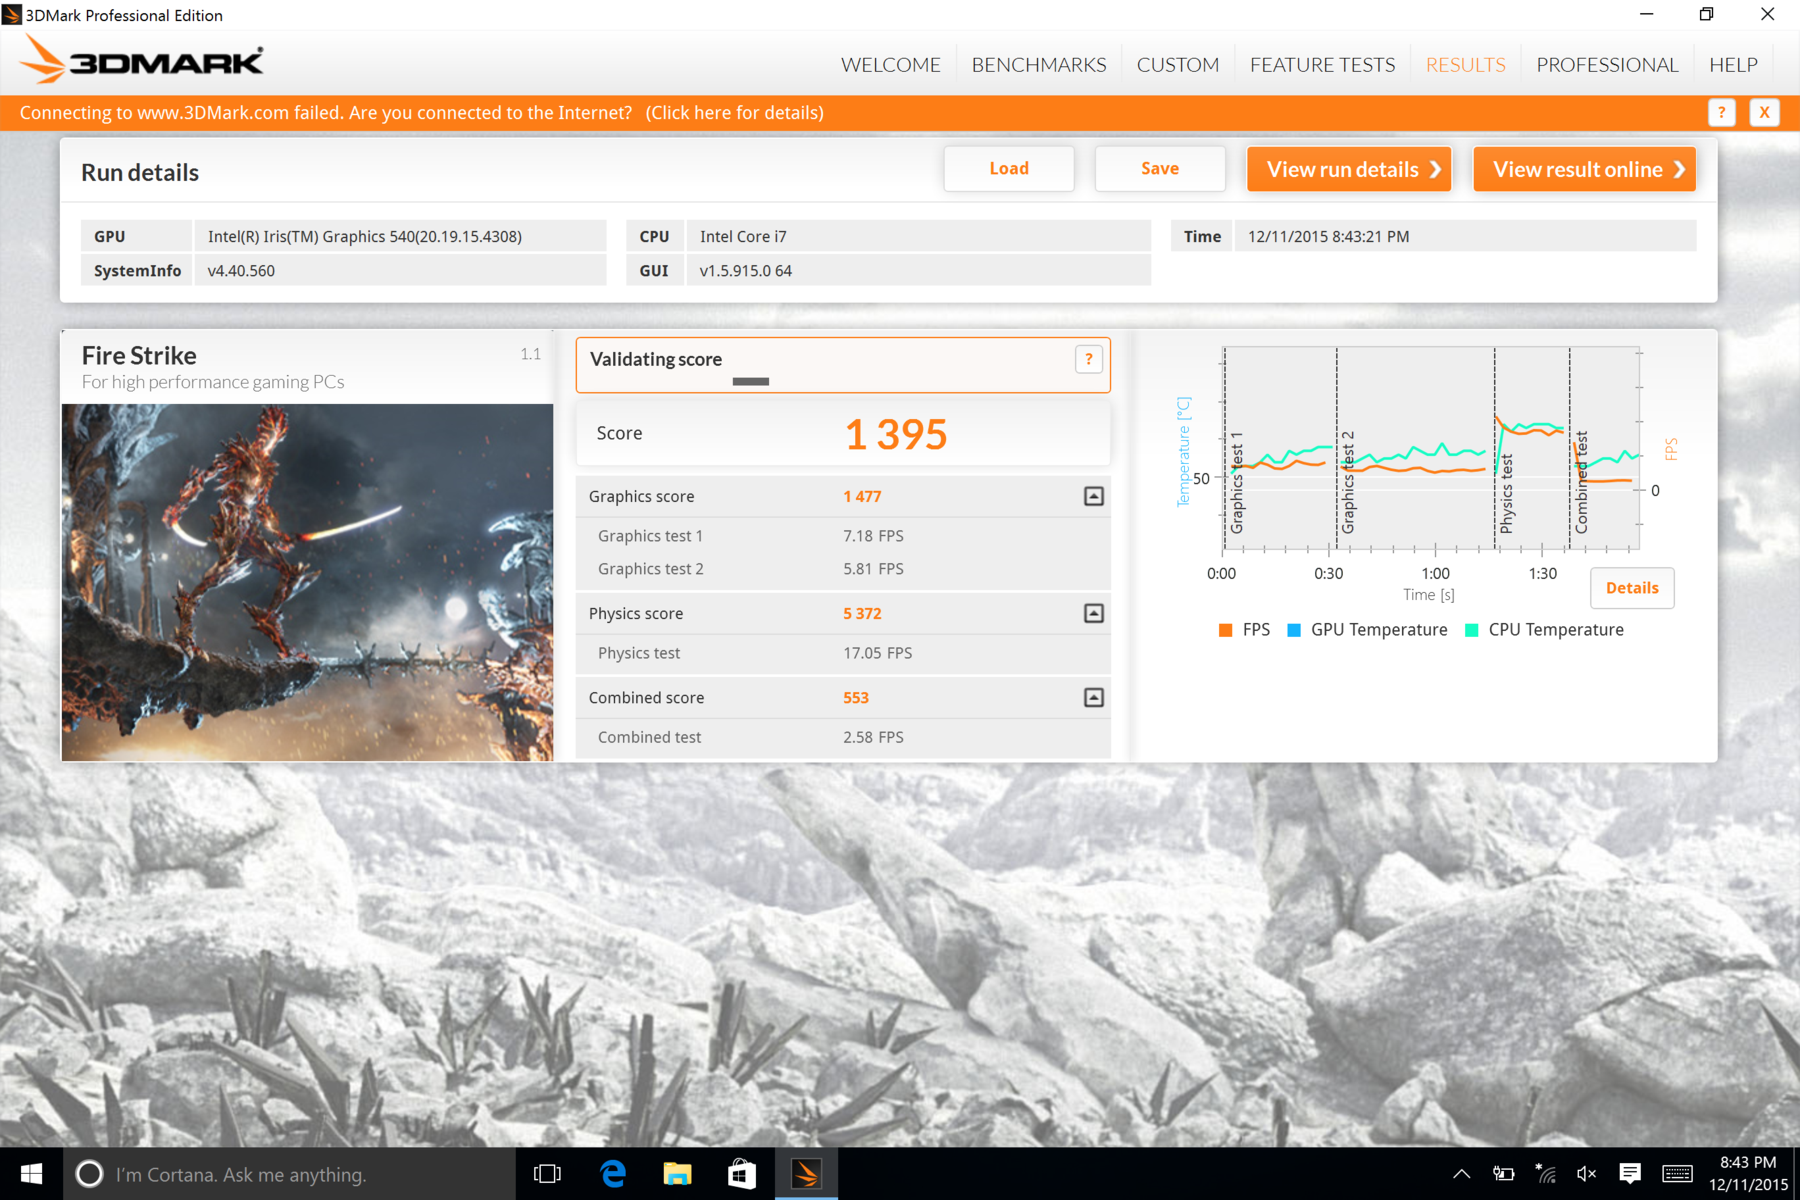
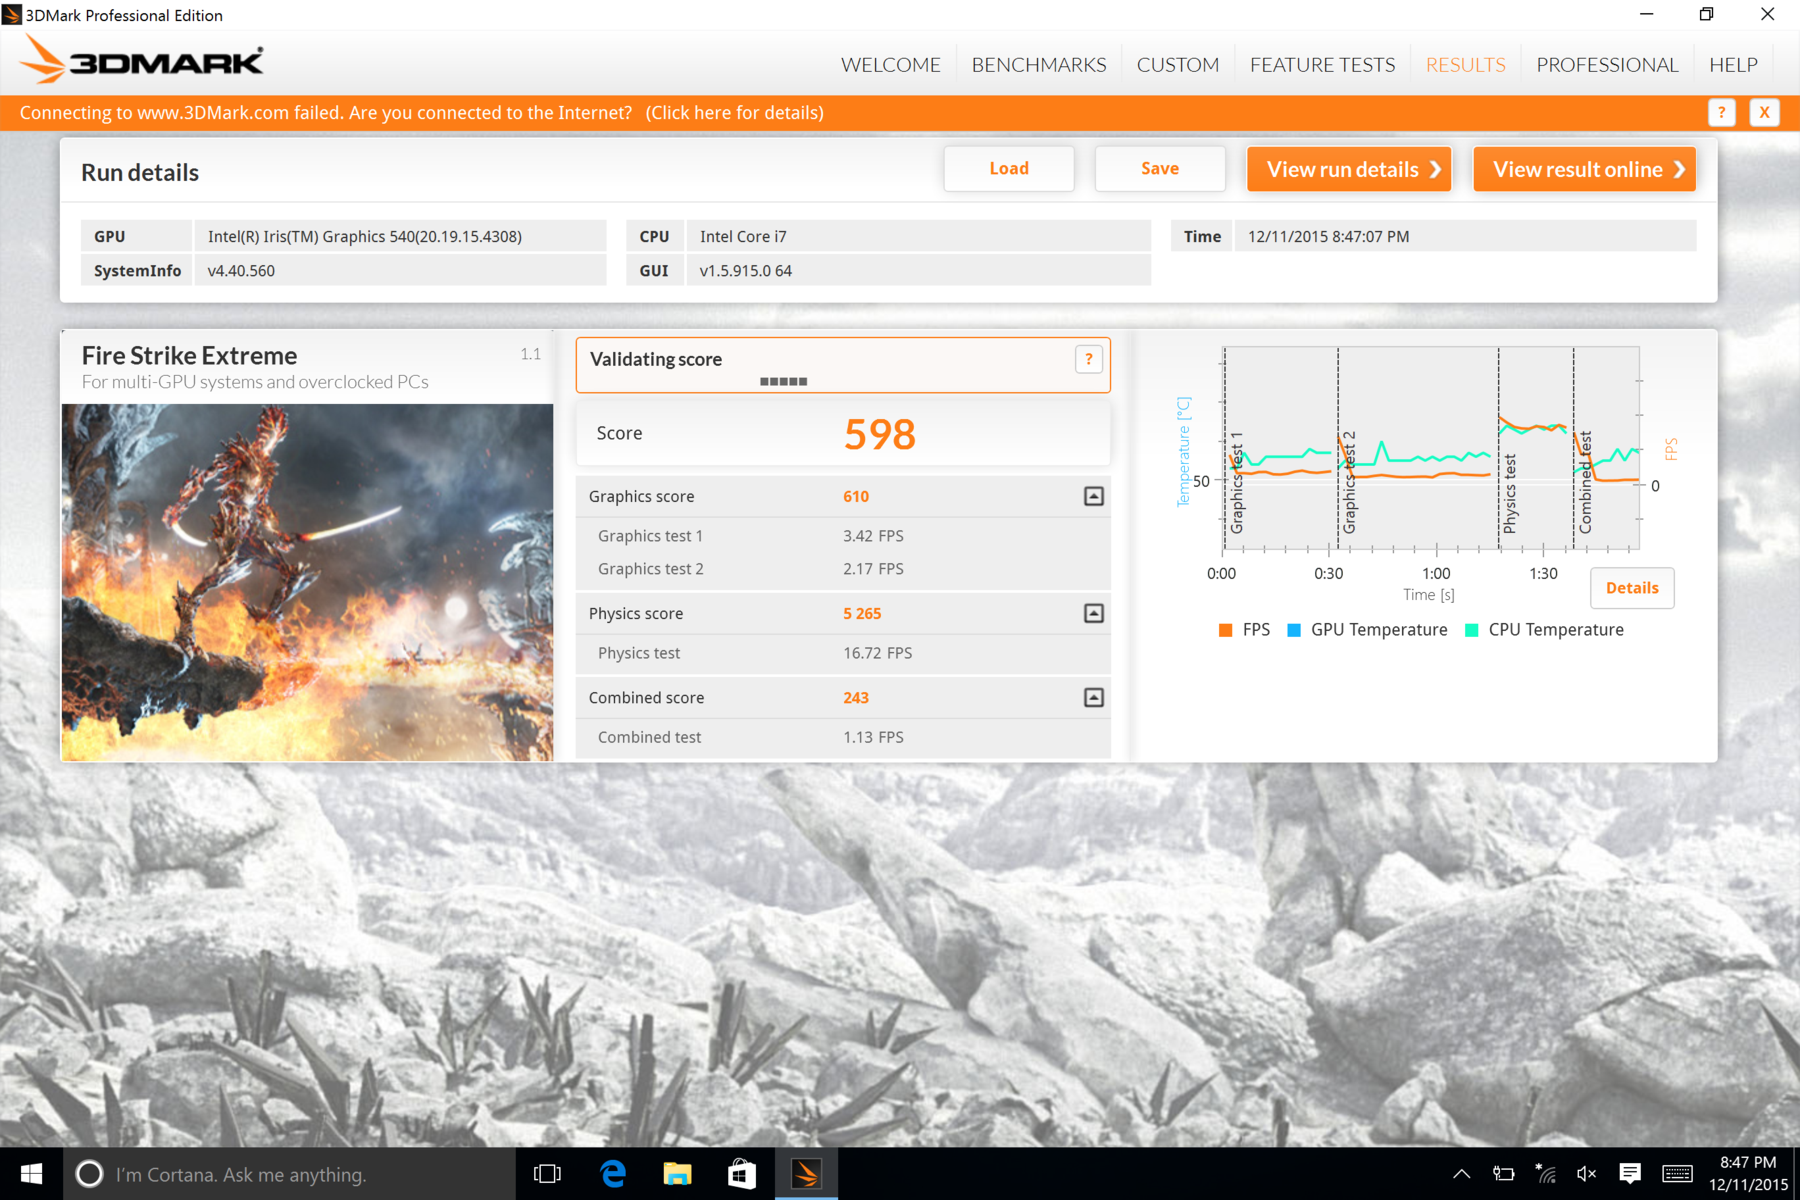
The jump from the Core i5 model to the Core i7 model will bring more GPU power than actual CPU power. Synthetic benchmarks like 3DMark show the Iris 540 to be about 40 percent ahead of the HD 520 in the Core i5 configuration and almost 50 percent ahead of the HD 515 in the Core m3 configuration.
| ComputeMark v2.1 - 1024x600 Normal, Score (sort by value) | |
| Microsoft Surface Pro 4 Core i7 | |
| Microsoft Surface Book Core i5 | |
| Microsoft Surface Pro 4, Core m3 | |
| 3DMark 11 Performance | 2624 points | |
| 3DMark Ice Storm Standard Score | 73990 points | |
| 3DMark Cloud Gate Standard Score | 7822 points | |
| 3DMark Fire Strike Score | 1395 points | |
| 3DMark Fire Strike Extreme Score | 598 points | |
Help | ||
Gaming Performance
Bioshock Infinite shows the Surface Pro 4 Core i7 configuration pumping out 60 to 80 percent higher frame rates than the Core i5 configuration. Overall gaming performance lies comfortably in between the custom Nvidia GPU in the Surface Book and the HD Graphics 520 in the Surface Pro 4 Core i5.
Emissions
System Noise
Users shouldn't be dissuaded by the Surface Pro 4 just because it's one of the few tablets with an actively cooled processor. Like the Core i5 version, this Core i7 version is almost always silent since it takes a consistently heavy load to even begin agitating the fan. The tablet can thus last for quite some time under medium to heavy loads like gaming before fan noise starts to kick in.
The Core i7 fan is otherwise very similar to the Core i5 fan in maximum noise and behavior.
| Microsoft Surface Pro 4 Core i7 | Microsoft Surface Pro 4, Core i5, 128GB | Microsoft Surface Pro 4, Core m3 | Microsoft Surface Pro 3 | Microsoft Surface Book Core i5 | |
|---|---|---|---|---|---|
| Noise | -6% | -1% | -0% | ||
| Idle Minimum * (dB) | 28.4 | 31.5 -11% | 30.1 -6% | 29.5 -4% | |
| Idle Average * (dB) | 28.6 | 31.5 -10% | 30.2 -6% | 29.6 -3% | |
| Idle Maximum * (dB) | 28.7 | 31.5 -10% | 30.4 -6% | 29.7 -3% | |
| Load Average * (dB) | 40.8 | 40.5 1% | 31.9 22% | 37.5 8% | |
| Load Maximum * (dB) | 41.4 | 40.7 2% | 44.4 -7% | 40.9 1% |
* ... smaller is better
Noise level
| Idle |
| 28.4 / 28.6 / 28.7 dB(A) |
| Load |
| 40.8 / 41.4 dB(A) |
 | ||
30 dB silent 40 dB(A) audible 50 dB(A) loud |
||
min: | ||
Temperature
Surface temperatures are flat on both sides when the system is idling on desktop with no obvious hot spots. Maximum load with both Prime95 and FurMark will increase temperatures significantly, especially on the top half of the tablet where the PCB lies. Our average readings are higher than our Core m3 model despite the Core i7 model having a dedicated system fan. Nonetheless, our readings are strangely much lower than our Core i5 model. The Surface Pro devices remain one of the warmest tablets available.
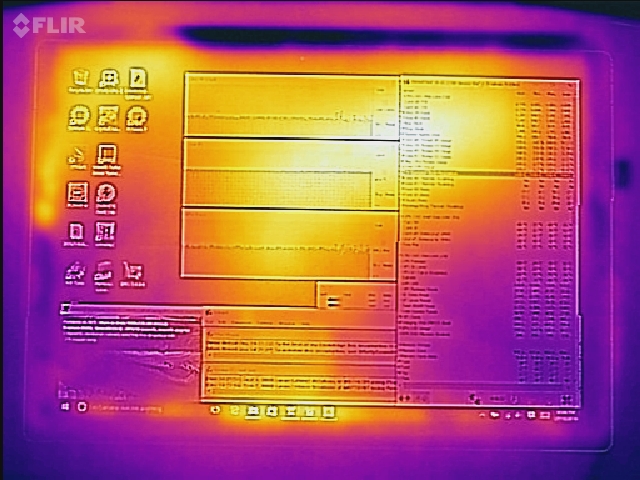
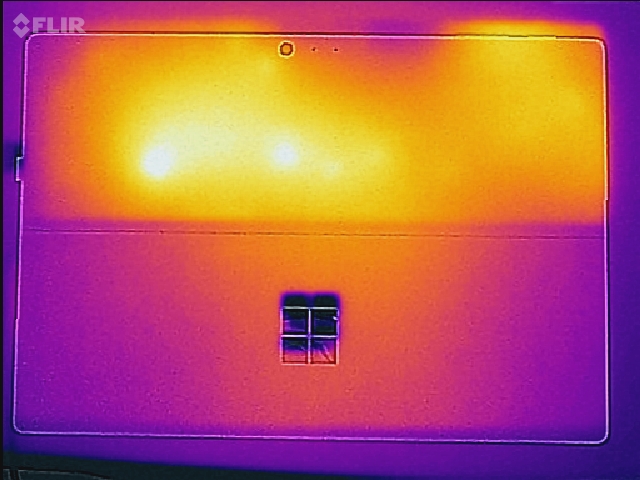
(-) The maximum temperature on the upper side is 45.4 °C / 114 F, compared to the average of 35.4 °C / 96 F, ranging from 19.6 to 60 °C for the class Convertible.
(±) The bottom heats up to a maximum of 43.2 °C / 110 F, compared to the average of 36.8 °C / 98 F
(+) In idle usage, the average temperature for the upper side is 23.5 °C / 74 F, compared to the device average of 30.3 °C / 87 F.
(±) The palmrests and touchpad can get very hot to the touch with a maximum of 39.8 °C / 103.6 F.
(-) The average temperature of the palmrest area of similar devices was 27.9 °C / 82.2 F (-11.9 °C / -21.4 F).
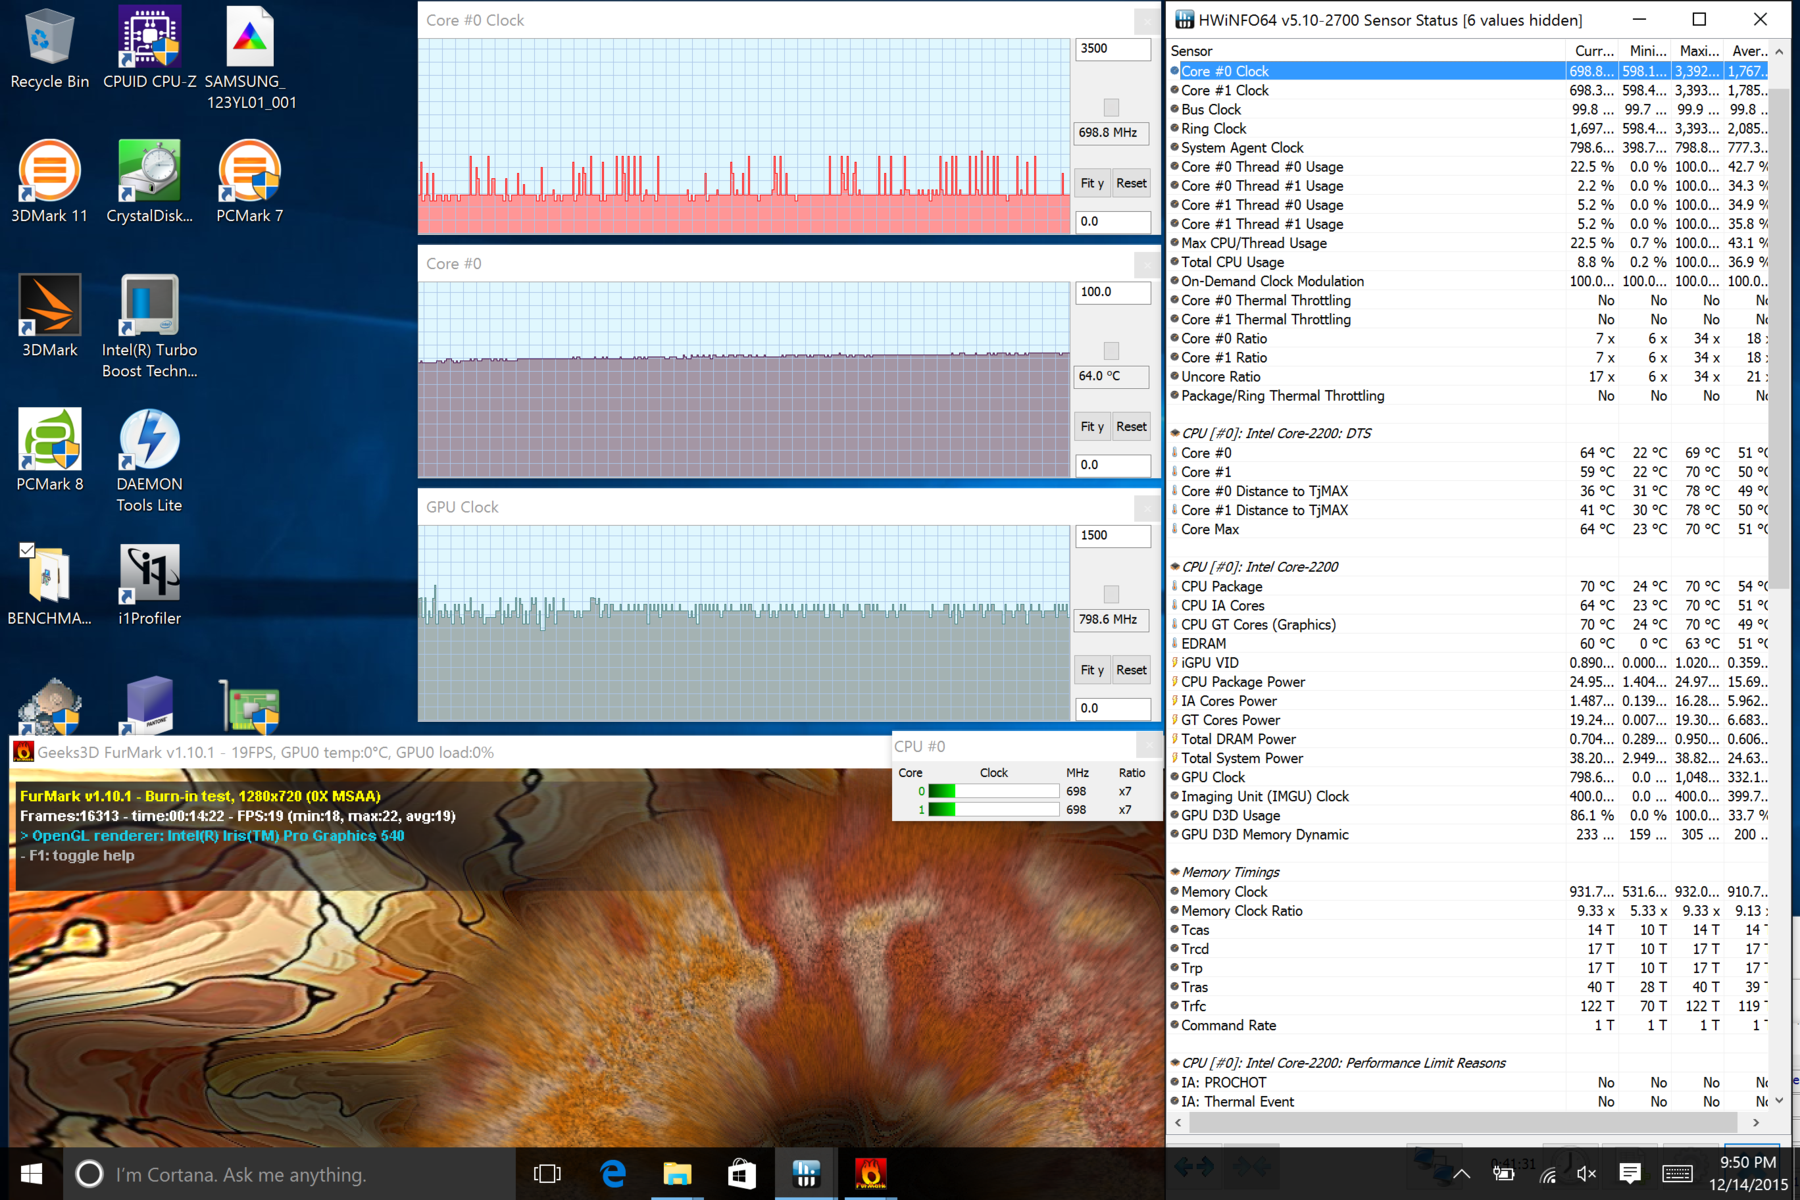
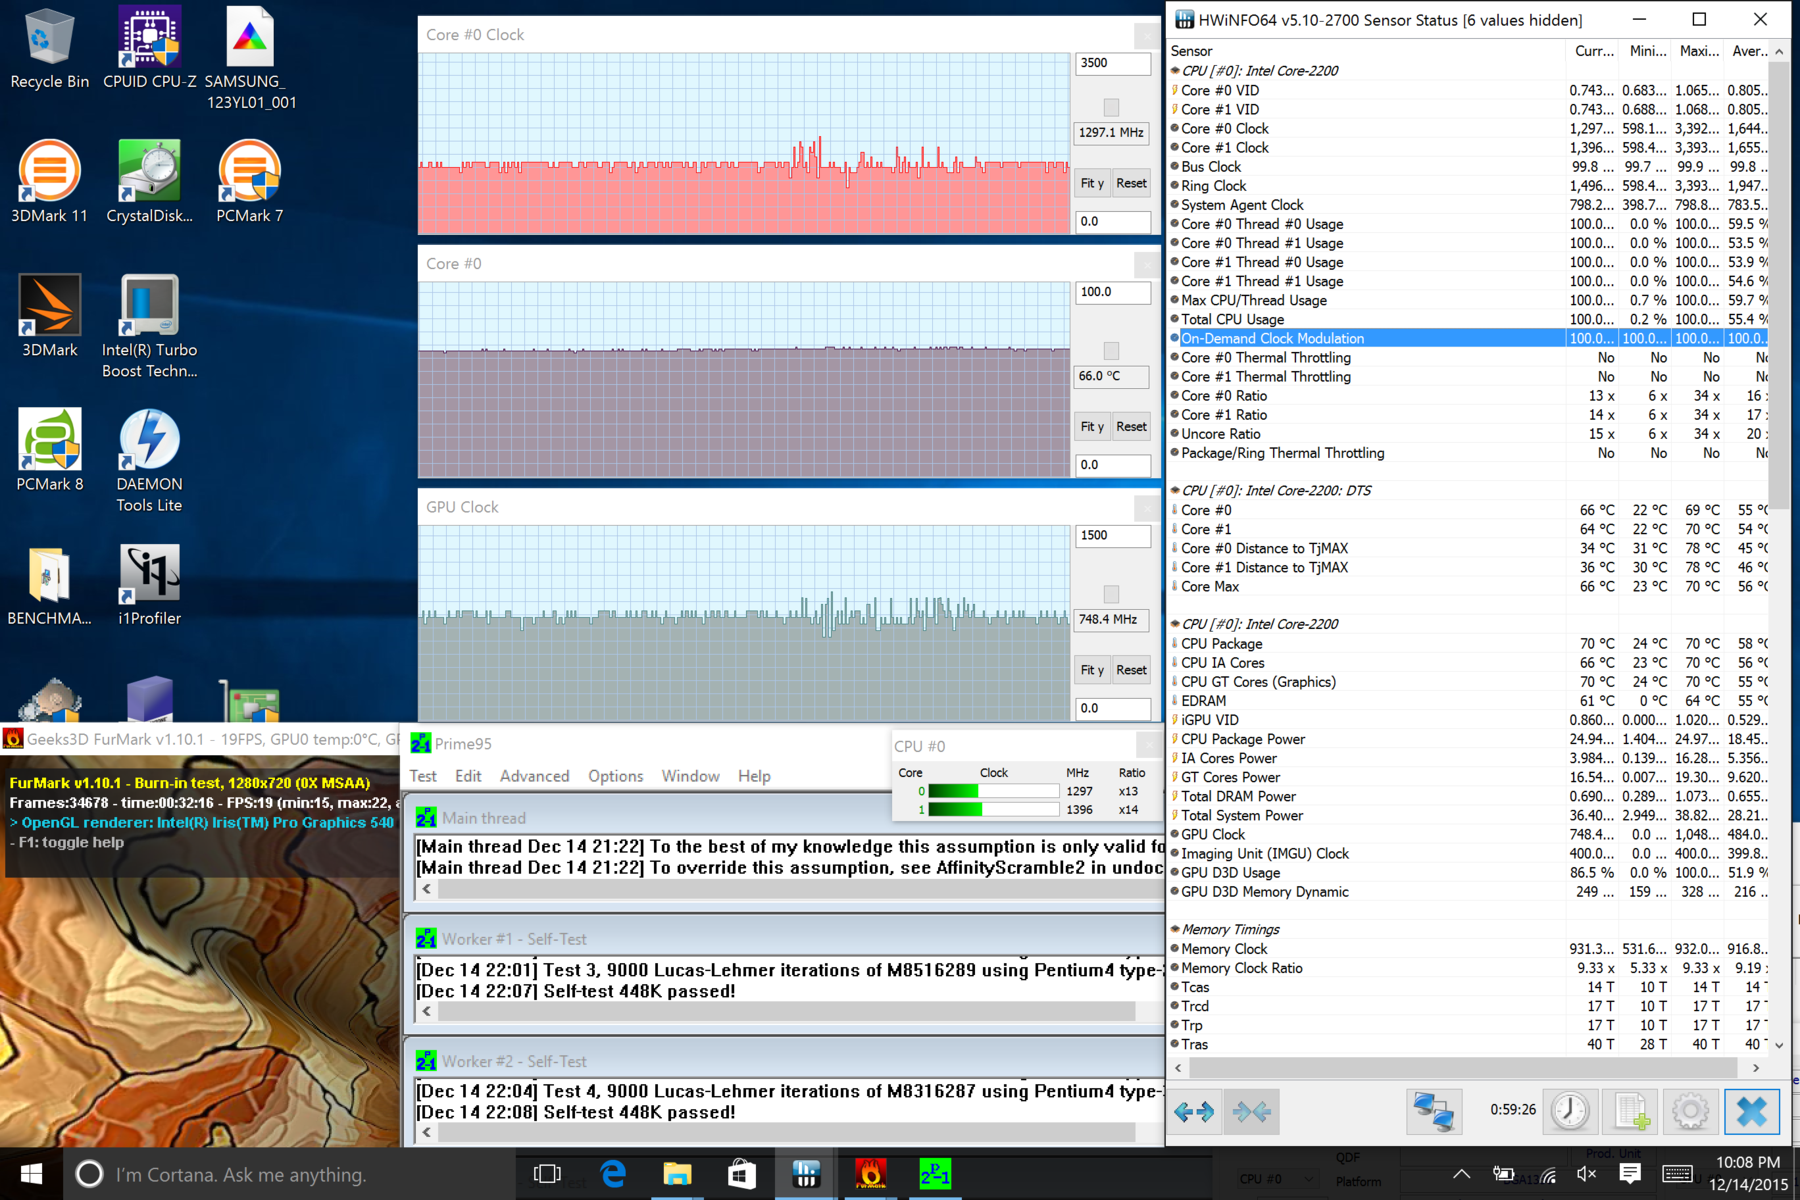
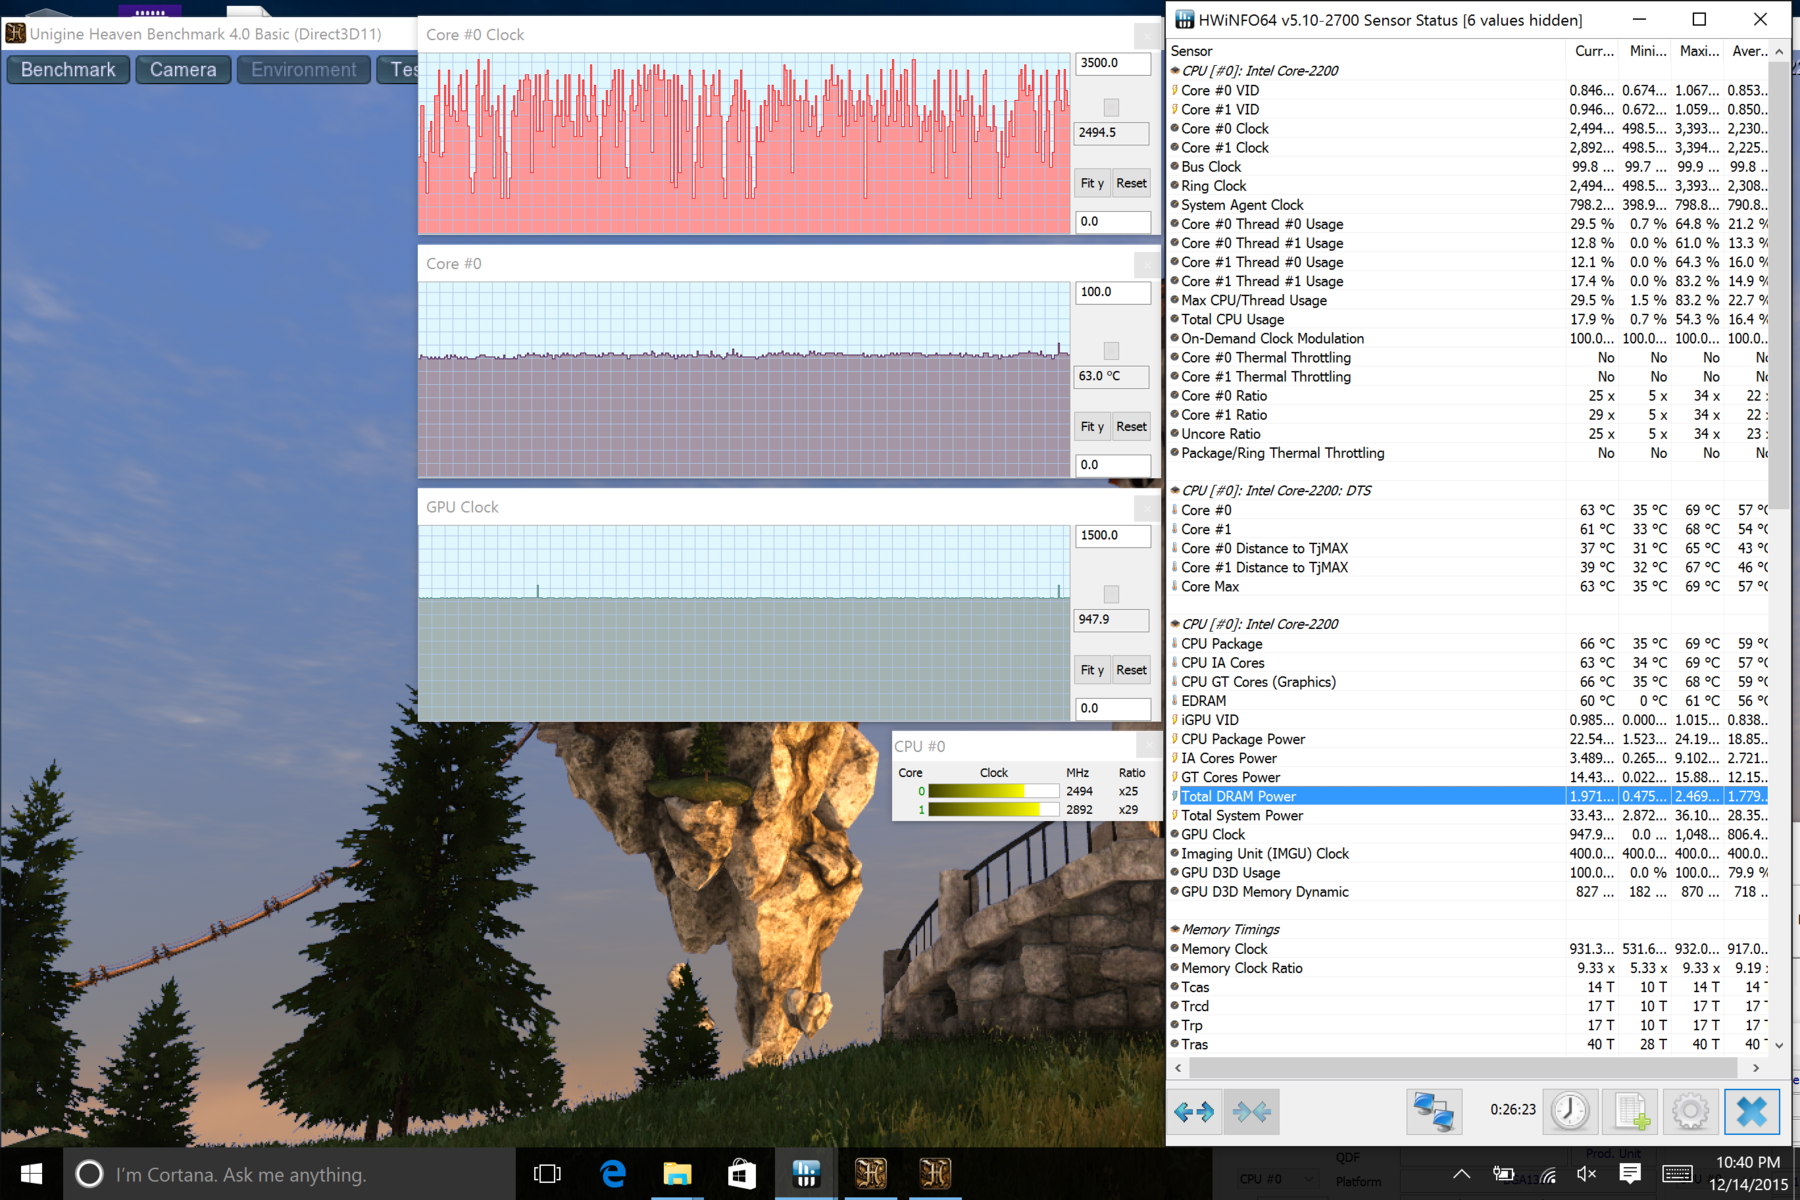
Stress Test
We had our doubts on the performance of the Surface Pro 4 Core i7 configuration considering the throttling issues found on the Surface Pro 3. Luckily, we can observe no major performance issues when under high loads. The tablet is able to maintain its maximum Turbo Boost of 3.2 GHz for both cores when under Prime95 stress and Unigine Heaven stress. The integrated GPU operates at a very steady 950 MHz under similar conditions. Throttling will occur when running both Prime95 and FurMark simultaneously.
Note that the AC adapter is unable to provide enough power to the tablet to maintain such high processing loads. Thus, the tablet will surely but slowly drain battery power even when connected to mains.
Running on battery power only will cause a very slight dip to CPU and GPU performance. A 3DMark 11 run on batteries returns CPU and GPU scores of 2370 and 4761 points, respectively, compared to 2450 and 4919 points when on mains.
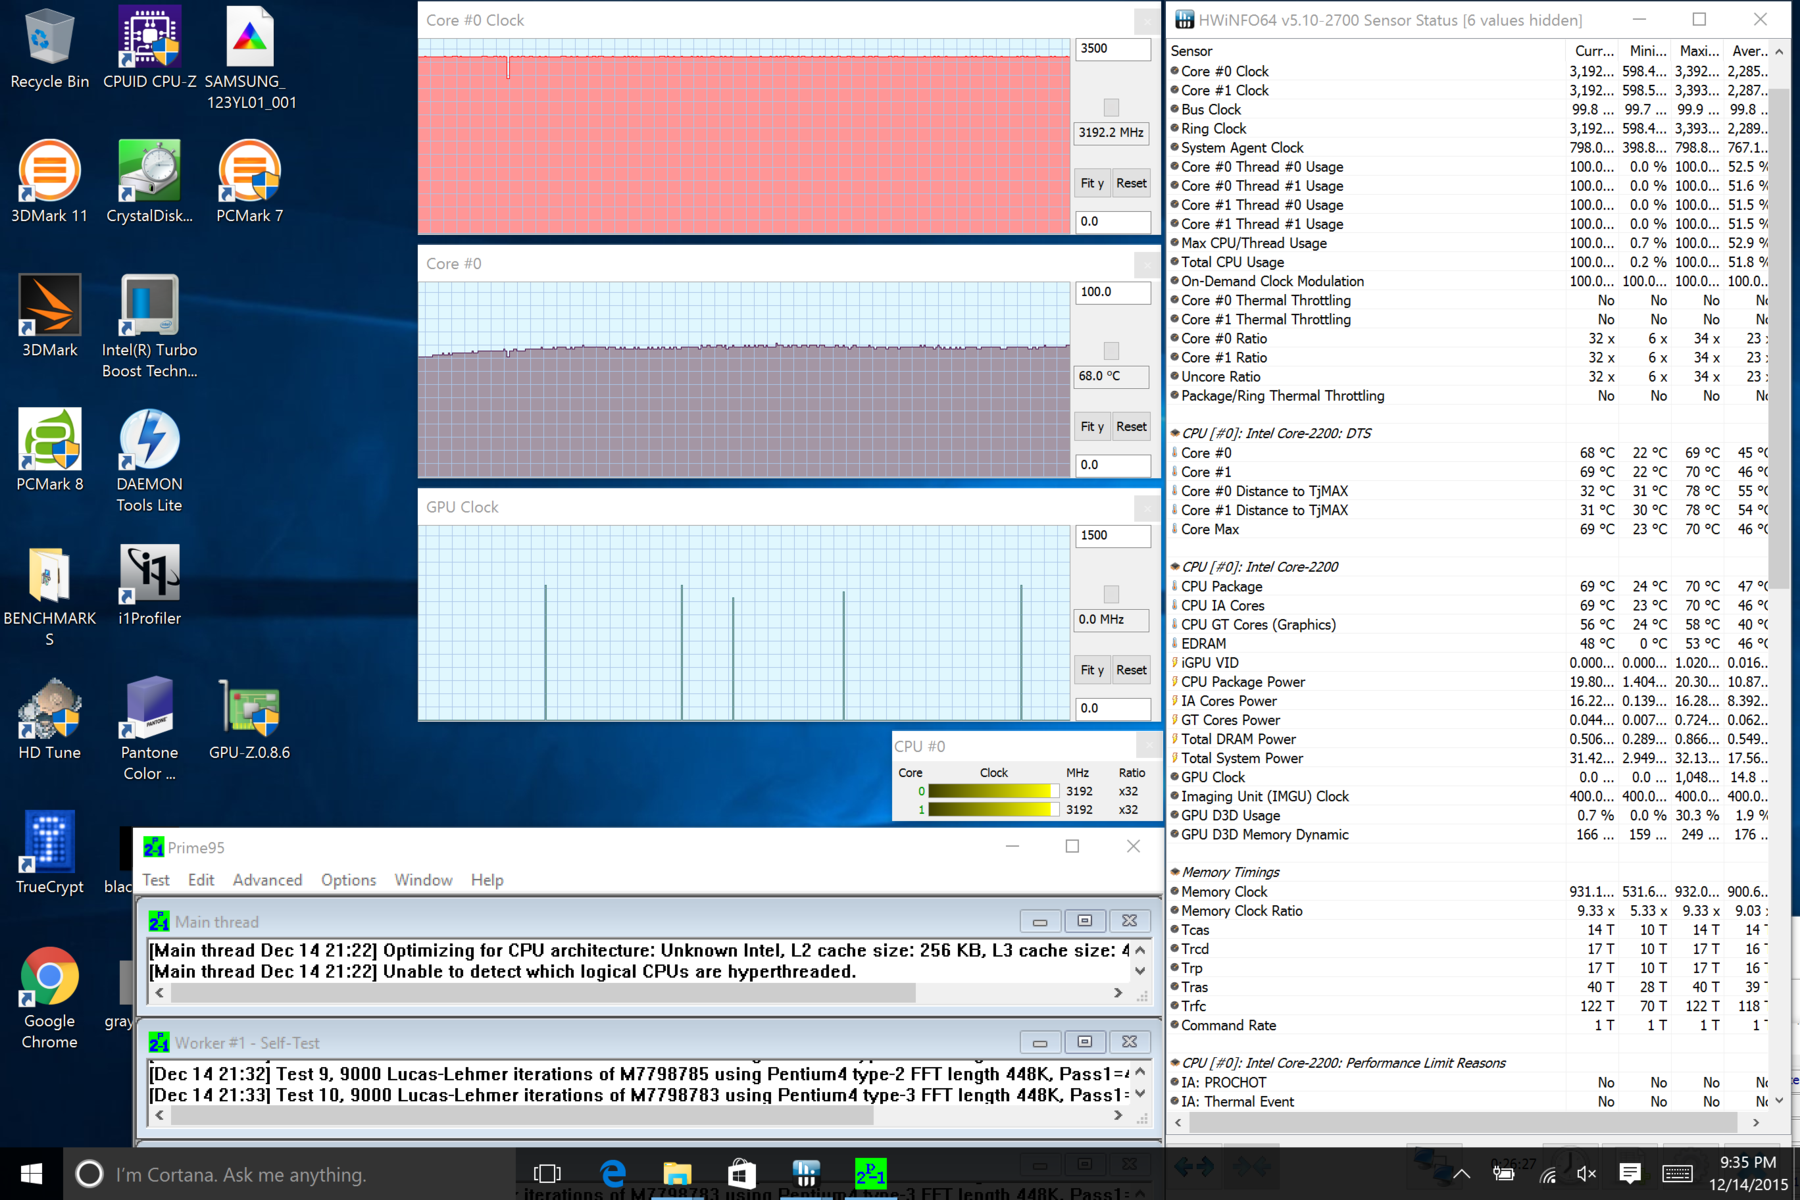
| CPU Clock (GHz) | GPU Clock (MHz) | Average Core Temp. (C) | |
Prime95 Stress |
3.2 | -- | ~68 |
FurMark Stress |
-- | 800 | ~64 |
Prime95 + FurMark Stress |
1.3 - 1.4 | 700 - 750 | ~66 |
Unigine Heaven Stress |
2.5 - 3.2 | 950 | ~63 |
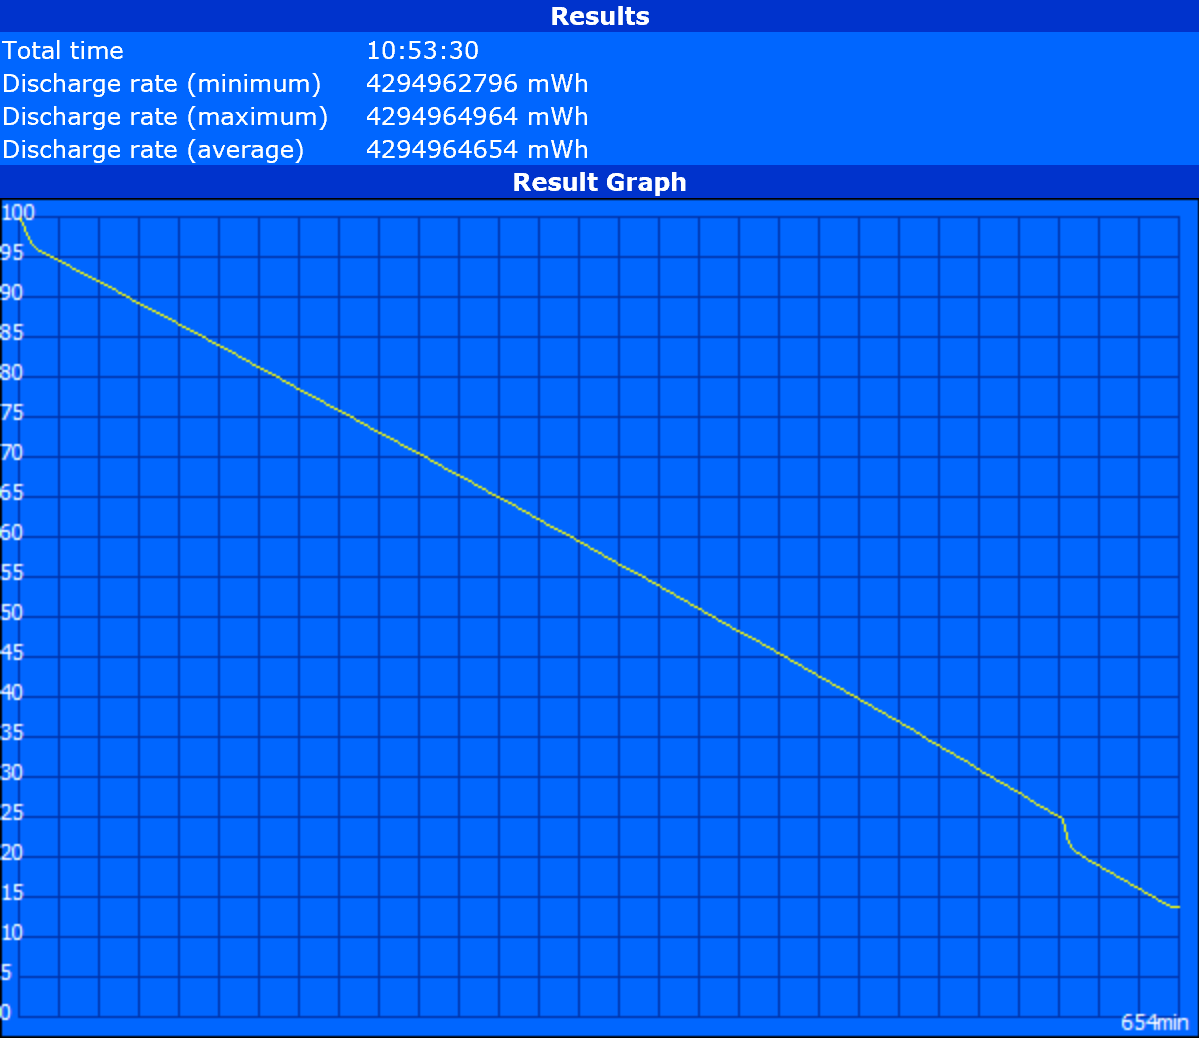
Battery Life
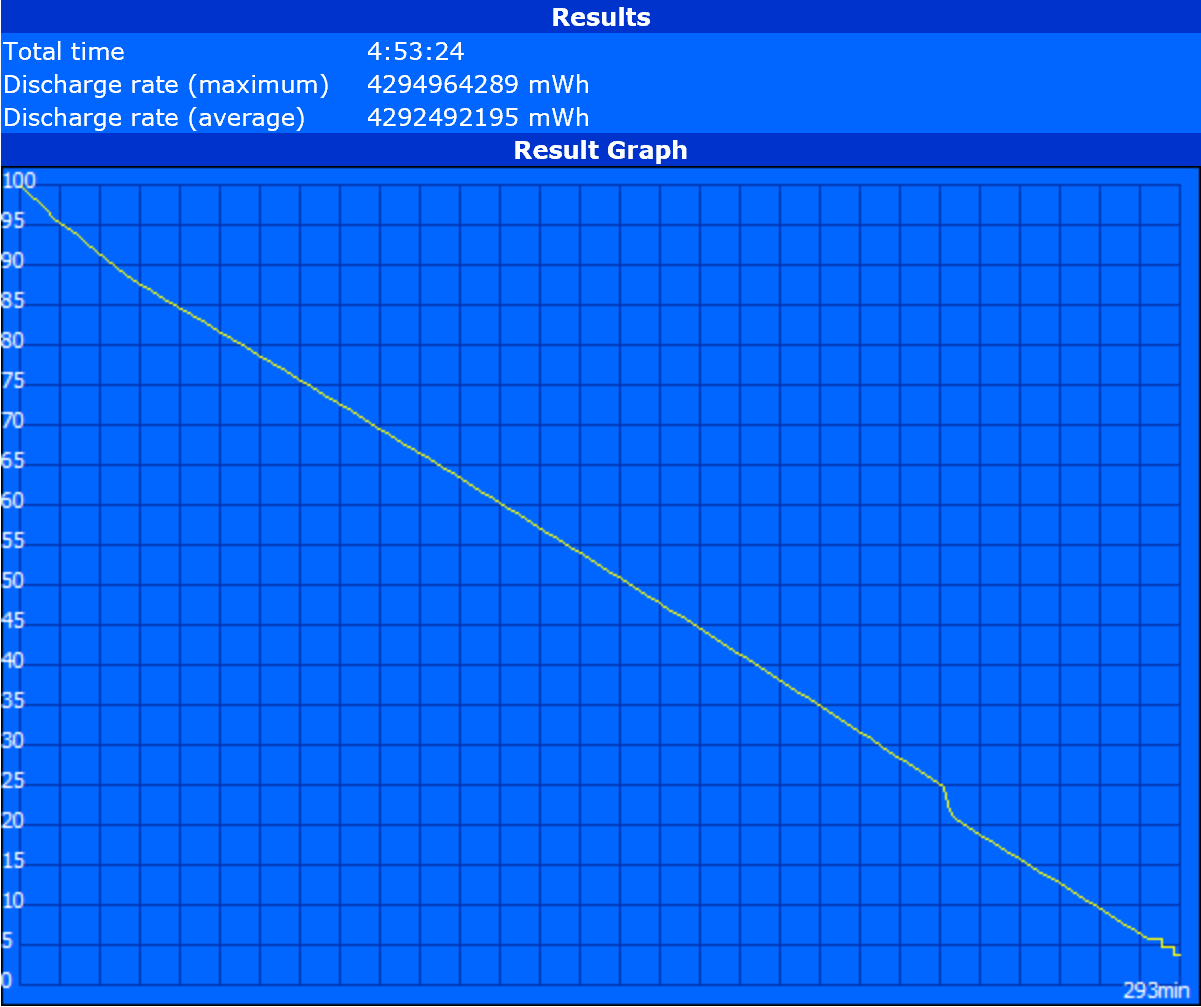
An impact on battery life is expected when moving to more powerful internals without increasing battery capacity. We measured a WLAN runtime of just under five hours compared to seven hours on the Core i5 or eight hours on the Core m3. This is indeed one of the shortest-lasting Surface Pro tablets we've tested.
Note that our WLAN conditions are always set to 150 nit brightness on the Balanced Profile and with no screen timeout while looping our standard browser script.
November 20, 2016 Update: We have since rerun our WLAN tests on the Core i5 SKU to show longer runtimes than what has been recorded in our table below. See our dedicated review page on the tablet for updated battery life results.
| Microsoft Surface Pro 4 Core i7 38 Wh | Microsoft Surface Pro 4, Core i5, 128GB 38 Wh | Microsoft Surface Pro 4, Core m3 38 Wh | Microsoft Surface Pro 3 42 Wh | Microsoft Surface 3 28 Wh | |
|---|---|---|---|---|---|
| Battery runtime | 43% | 54% | 65% | 66% | |
| Reader / Idle (h) | 10.9 | 15 38% | 13.2 21% | 18.3 68% | 13.8 27% |
| WiFi v1.3 (h) | 4.9 | 7.1 45% | 8.1 65% | 7.3 49% | |
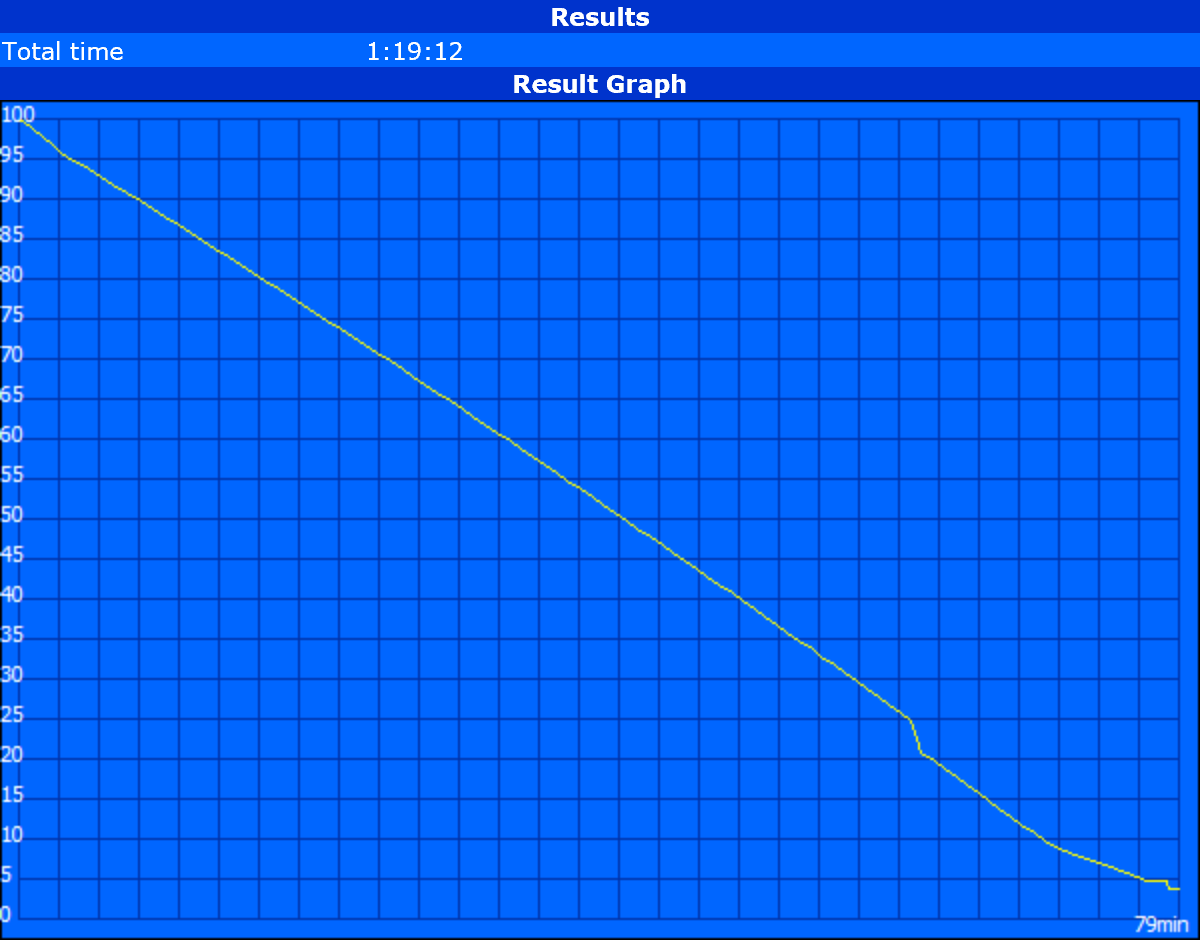
| Load (h) | 1.3 | 1.9 46% | 2.3 77% | 2.1 62% | 2.9 123% |
| WiFi (h) | 8.4 | 7.1 |
Pros
Cons
Verdict
The Surface Pro 4 Core i7 SKU provides only marginally faster CPU performance over its Core i5 counterpart. For word processing and browsing, the performance difference will be negligible to most users.
Instead, the Core i7 configuration should appeal mainly to power users who can make use of the extra GPU power provided by the Iris 540 over the HD 520. Its raw graphics performance is not enough to run modern games smoothly at the native resolution, but the additional overhead will certainly come in handy for light to moderate Photoshop work or video editing. The pre-calibrated screen and faster SSD performance from the 256 GB drive compared to the Core i5 or Core m3 SKUs make the Core i7 model more professional than just a simple CPU upgrade.
The more accurate display, faster SSD performance, and lack of serious throttling issues over the less expensive configurations will appeal to power users, but are otherwise insignificant advantages for light office and PowerPoint users.
Microsoft Surface Pro 4 Core i7
- 04/18/2016 v5.1 (old)
Allen Ngo
Price comparison
