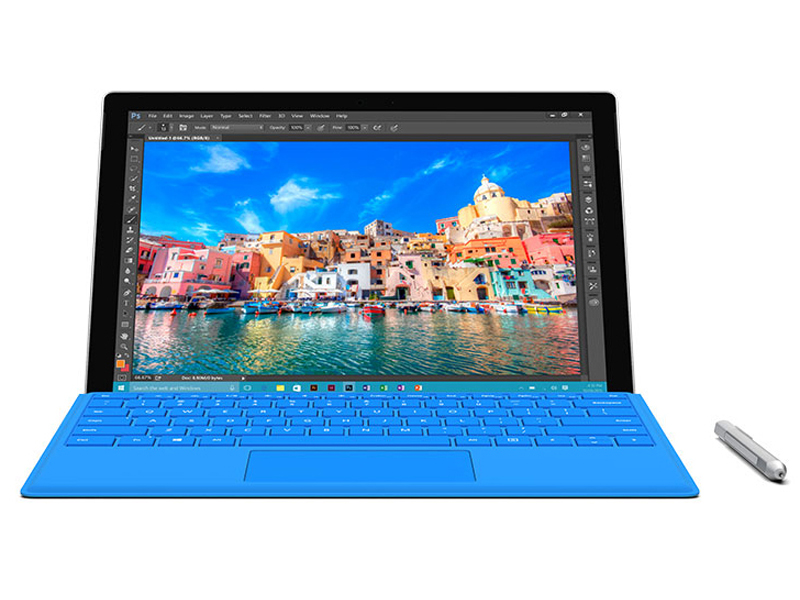
Microsoft Surface Pro 4 (Core i5, 128 GB) Tablet Review

For the original German review, see here.
While the main review of the brand-new Surface Pro 4 has a closer look at the Core m3 version of the 12-inch device, we can now check the Core i5 model. The fanless m3 version entry-level model of the Surface Pro costs almost 1000 Euros (~$1065/128 GB, without Type Cover), while the i5-6300U version starts at 1030 Euros (~$1097/128 GB) without accessories. Obviously, the small price difference raises the question why should anyone choose the m3 configuration?
Maybe the 4.5-watt SoC (TDP) manages much longer battery runtimes compared to "power-hungry" Core i5? If this is the case, how much performance do you have to sacrifice if you want longer runtimes? The Core i5 also affects the power consumption and the temperature development, so we will also cover these sections in this performance update. Both review samples are equipped with the same 128 GB SSD (Samsung MZFL128 NVMe), but we still add the performance figures of the 256 GB drive (Toshiba).
More information about all the other aspects – build quality, input devices (new Type Cover), ports, cameras and speakers – is available in the review of the Microsoft Surface Pro 4 (Core m3).
Display
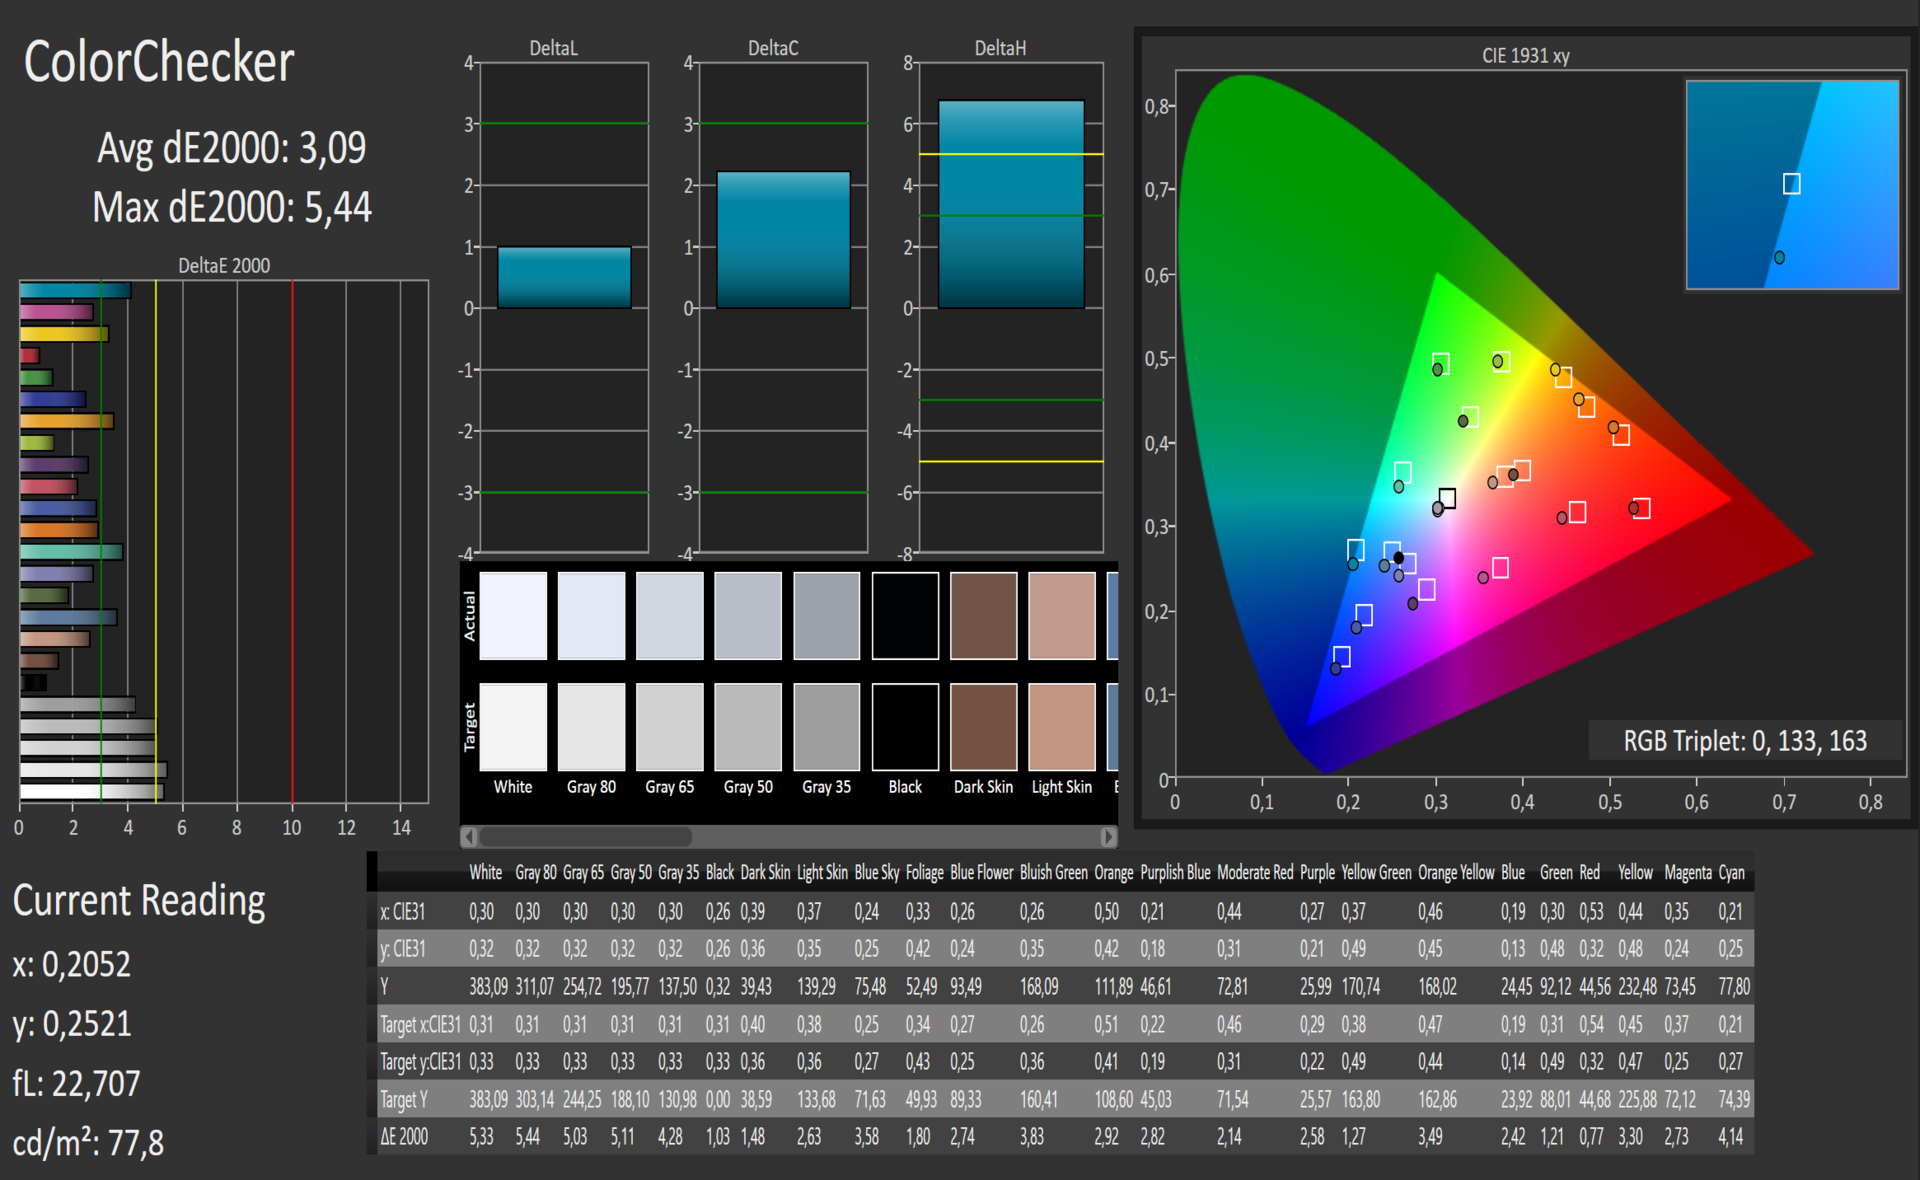
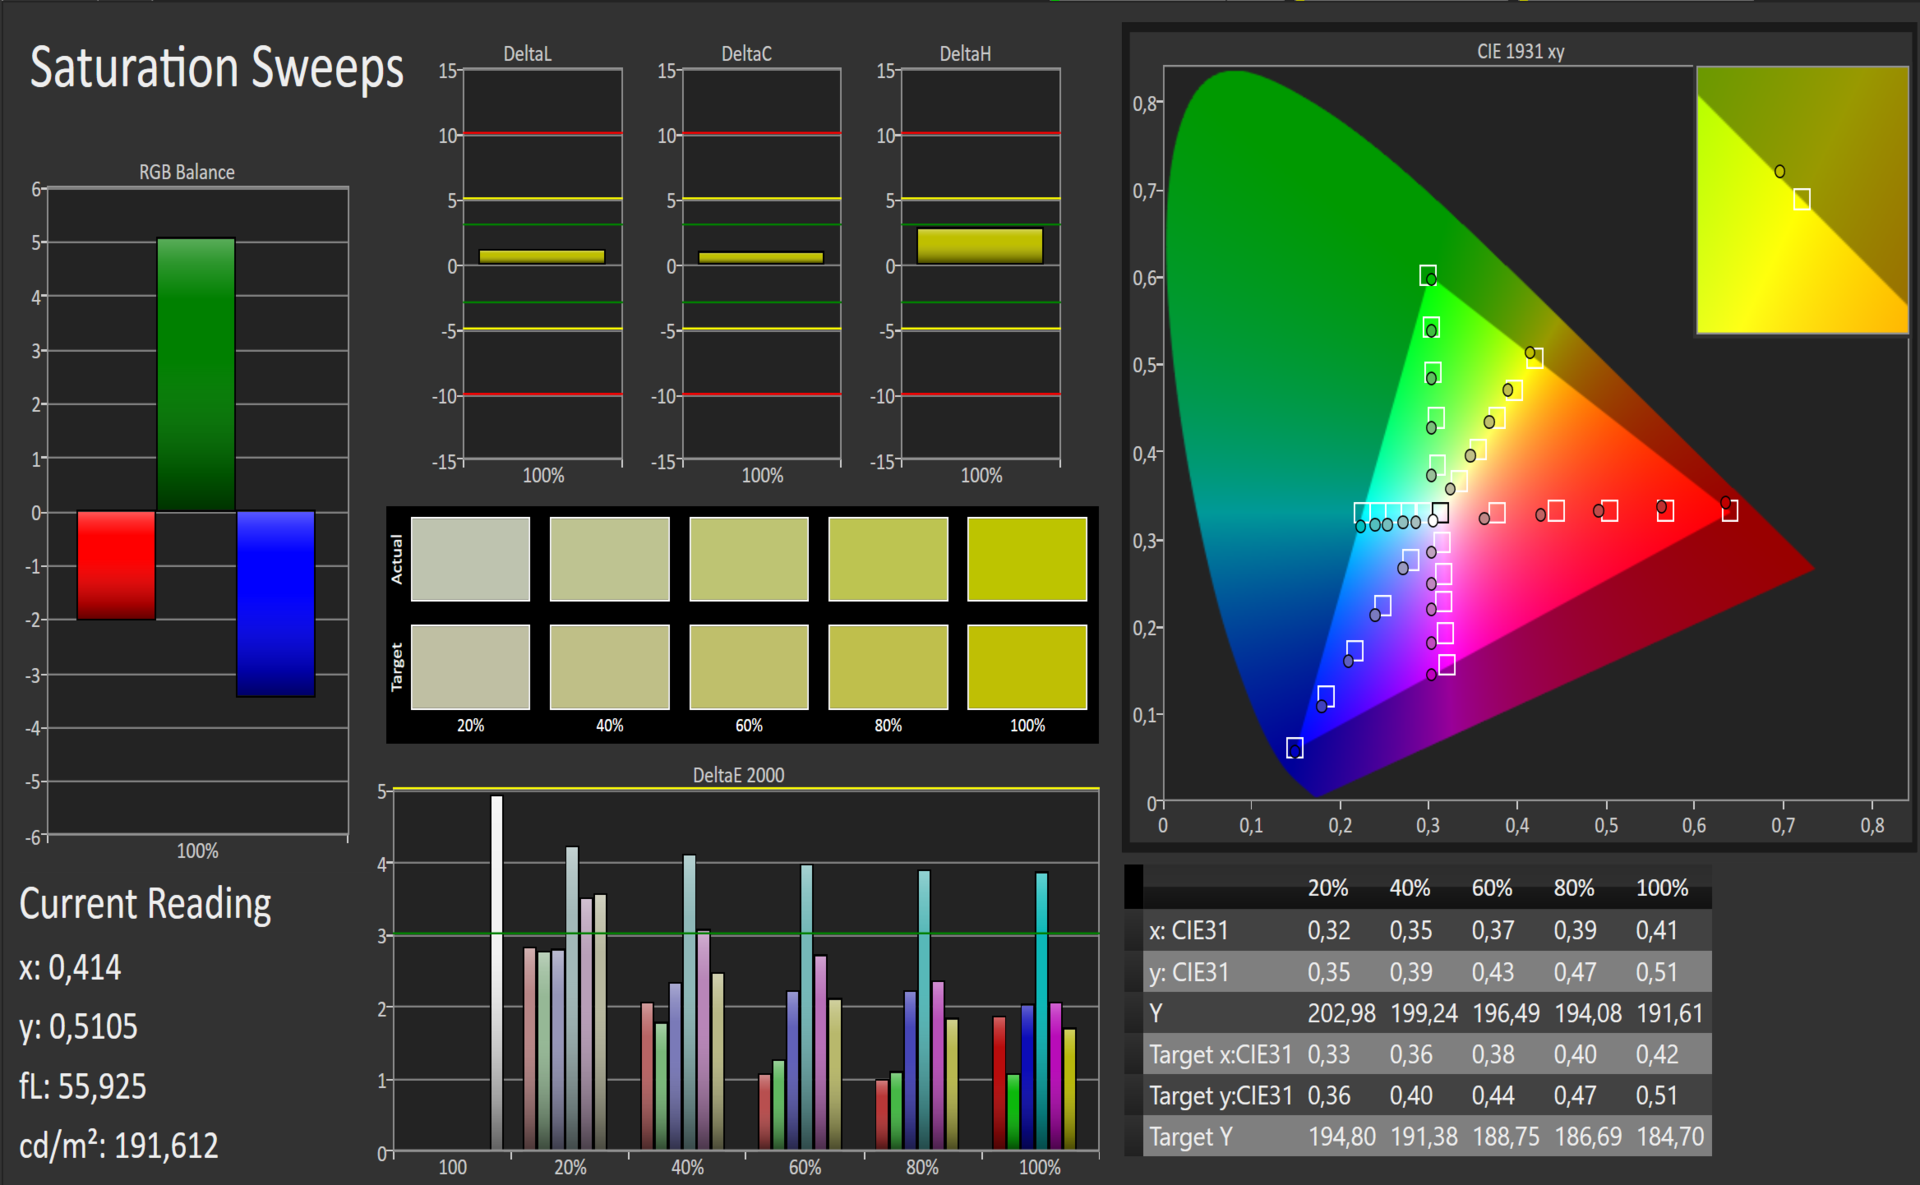
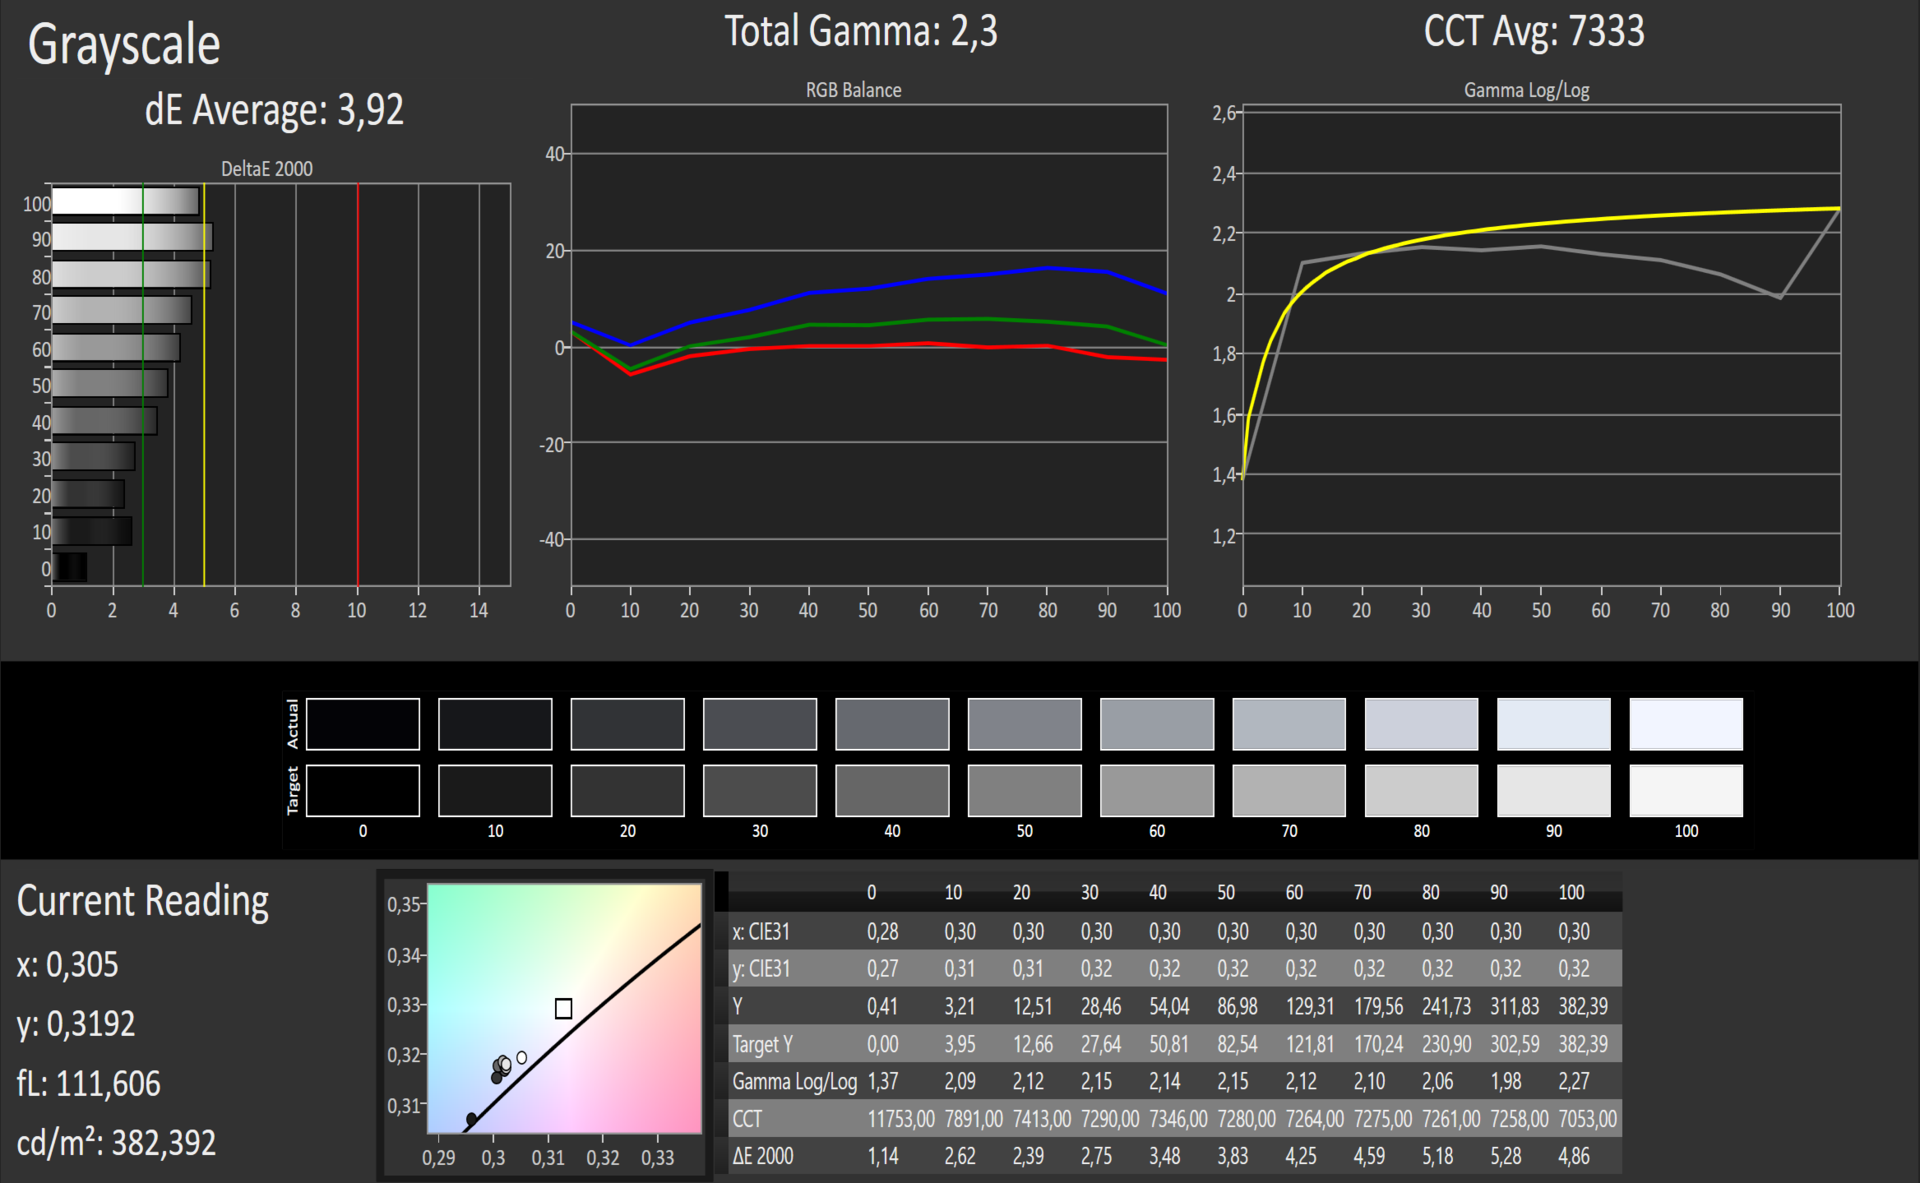
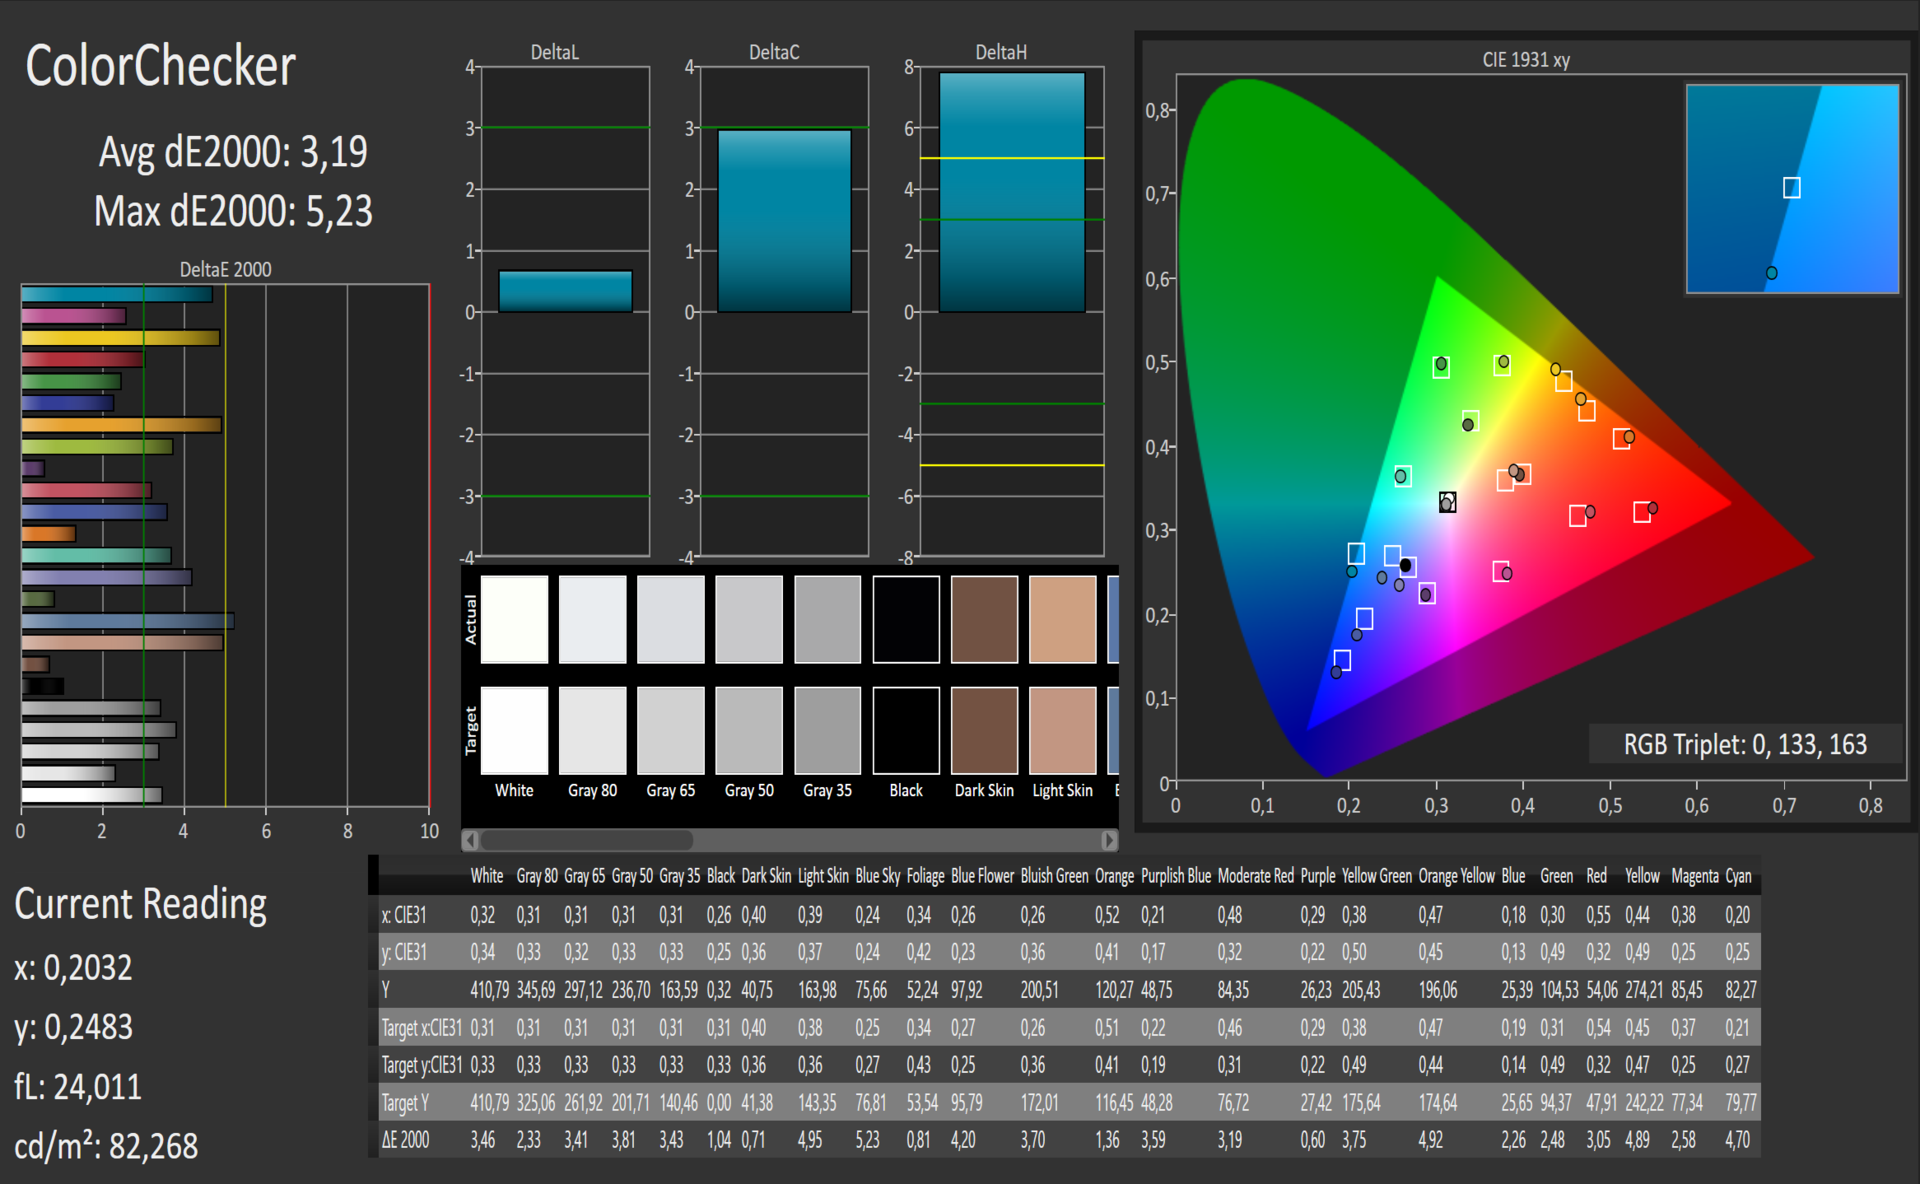
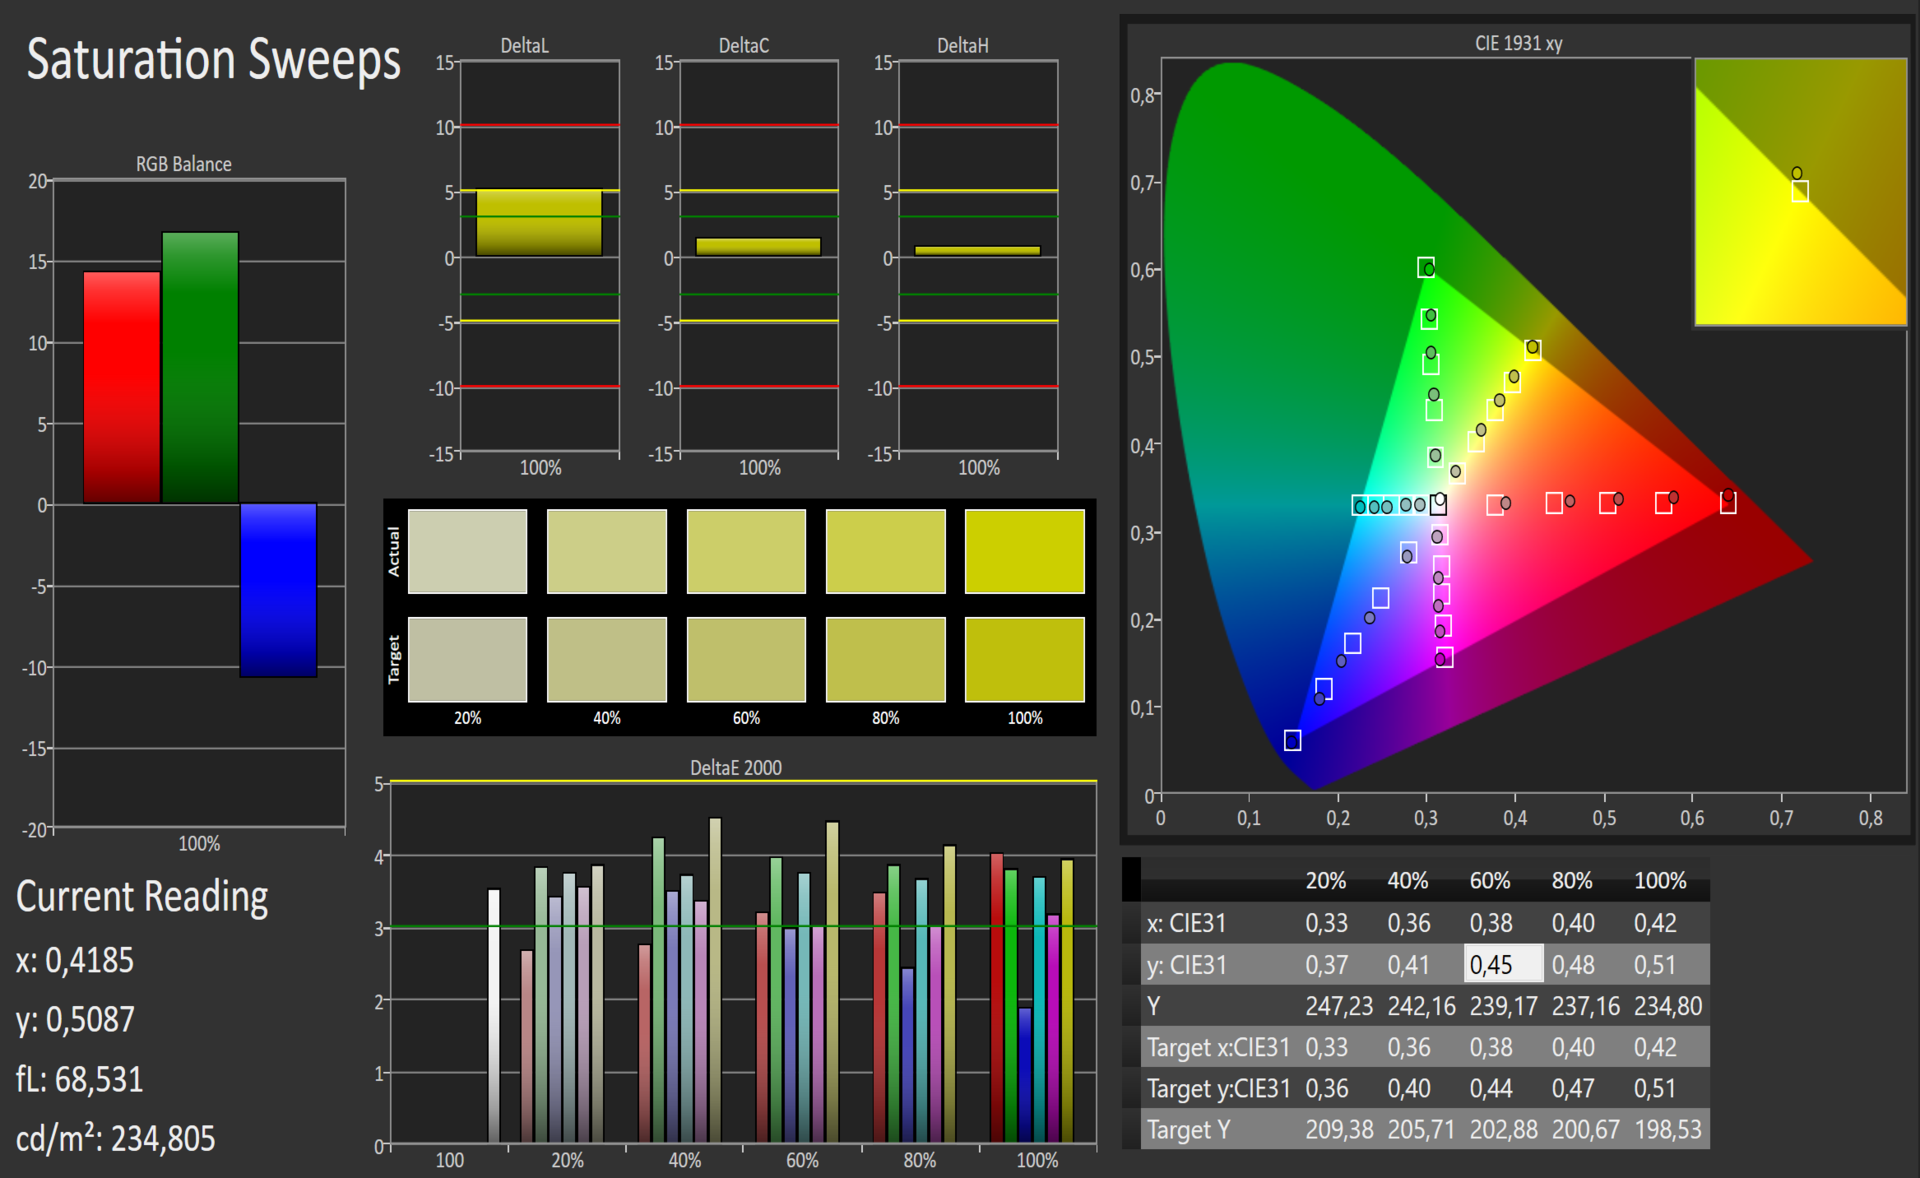
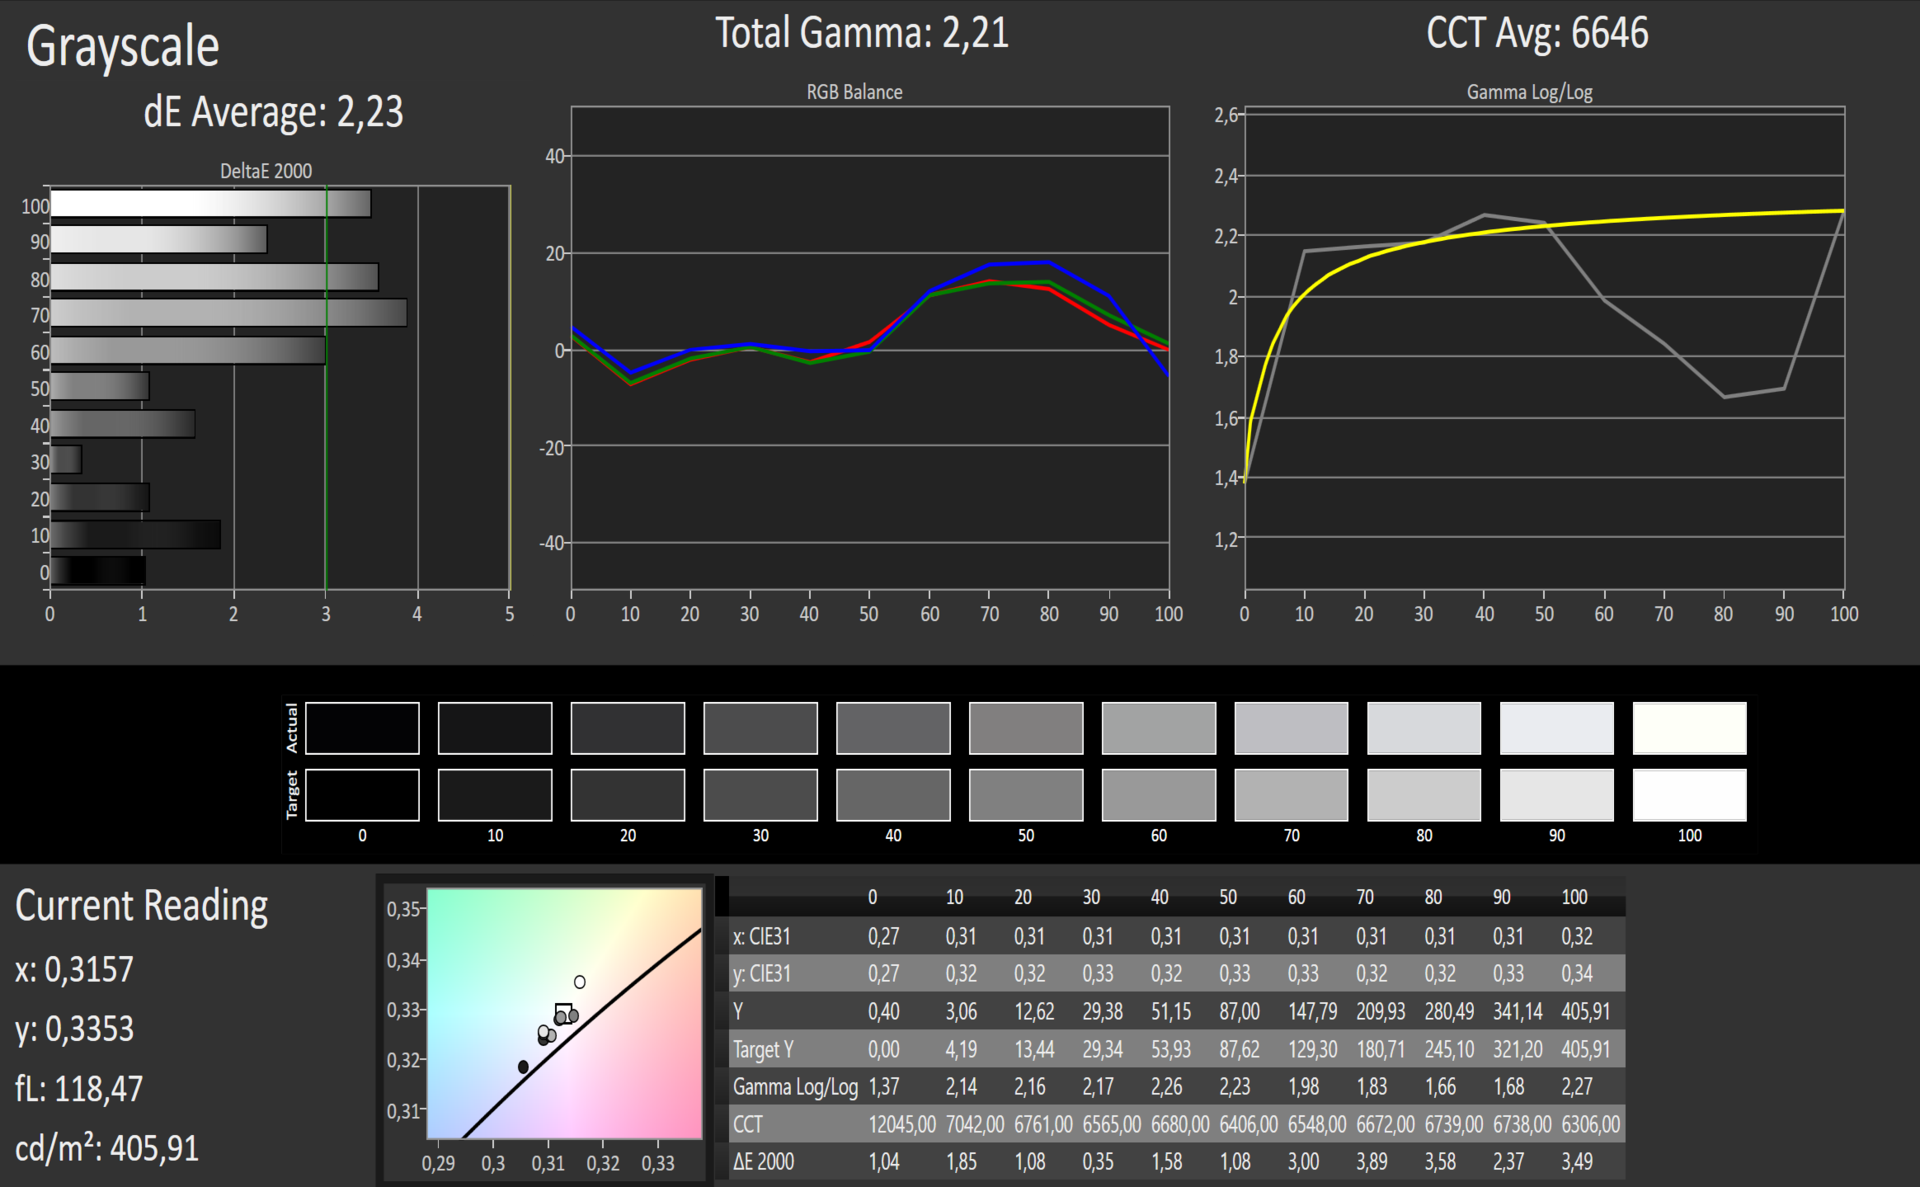
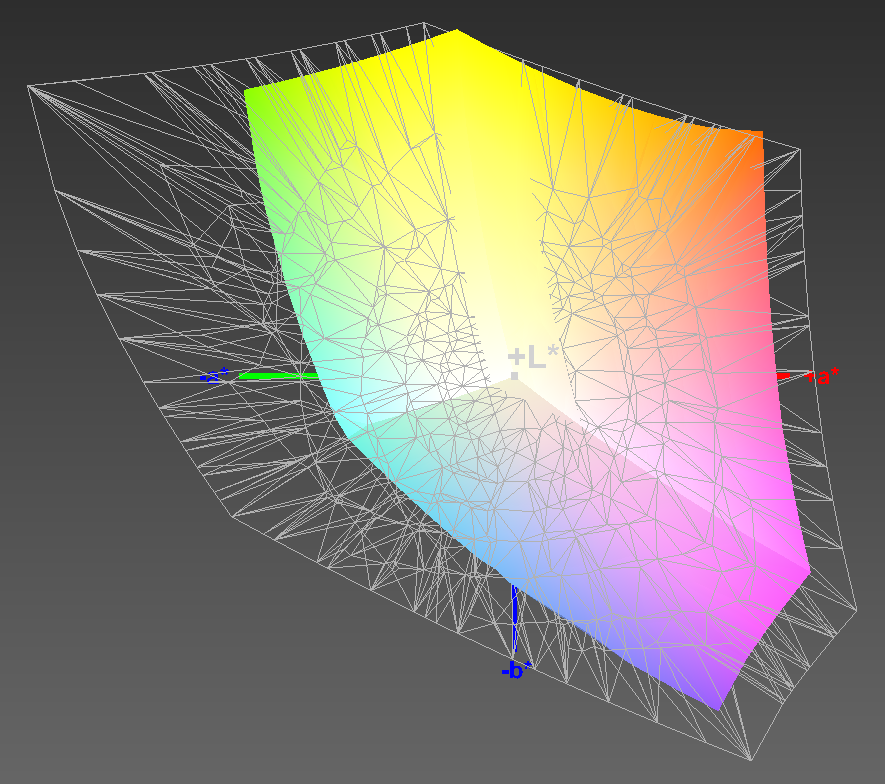
The display is identical to that of the Surface Pro 4 m3 model, so we will just have a brief look at the results. The measurements of the panel with 2734x1824 pixels differ slightly, which is not surprising since both devices use the same panel from Samsung (SDC3853). Calibration hardly improved the color accuracy, only the DeltaE of the grayscale could be reduced by one point. In factory settings, the color accuracy of the Surface Pro is not on a professional level and we could even notice a slight blue cast in the grayscale analysis, which can be removed by the calibration. You will find a link to our color profile for the Surface Pro 4 in the box below.
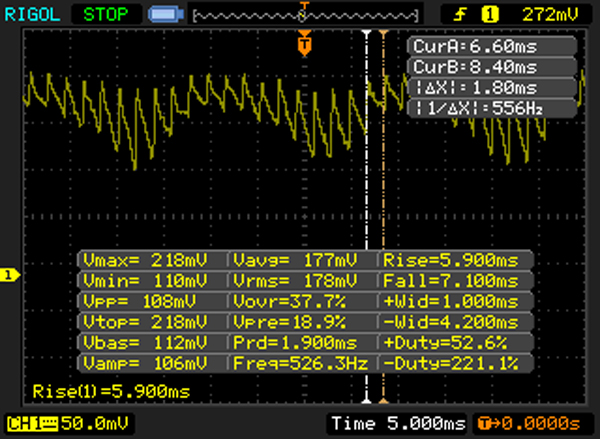
Update 12/01/2015: Thanks to a readers tip, who told us that he is suffering from problems caused by flickering / PWM, we looked at the Core i5 version again with the newest firmware and drivers. Now we could also measure flickering at 50 Hz below 50 percent brightness without a connected power adapter. Analyzing our readings, it does not seem to be classic PWM but some other form of flickering.
| |||||||||||||||||||||||||
Brightness Distribution: 87 %
Center on Battery: 413 cd/m²
Contrast: 1147:1 (Black: 0.36 cd/m²)
ΔE ColorChecker Calman: 3.09 | ∀{0.5-29.43 Ø4.76}
ΔE Greyscale Calman: 3.92 | ∀{0.09-98 Ø5}
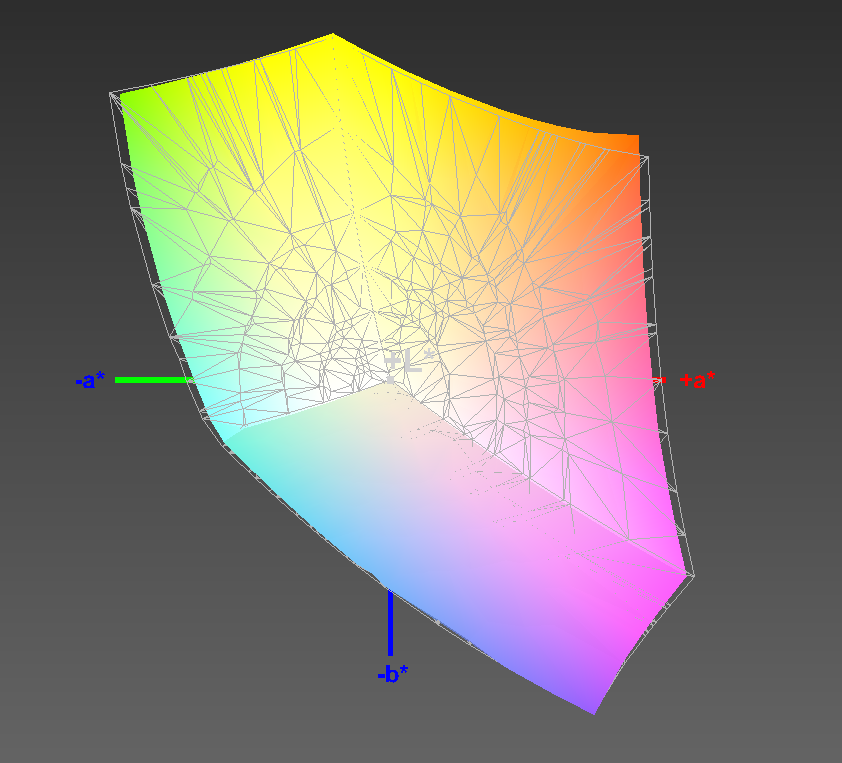
97% sRGB (Argyll 1.6.3 3D)
61% AdobeRGB 1998 (Argyll 1.6.3 3D)
67% AdobeRGB 1998 (Argyll 3D)
96.5% sRGB (Argyll 3D)
65% Display P3 (Argyll 3D)
Gamma: 2.3
CCT: 7333 K
| Surface Pro 4 (Core i5) 12.3 2736x1824 Samsung SDC3853 | Surface Pro 4 (Core m3) 12.3 2736x1824 Samsung SDC3853 | Surface Pro 3 12.0 2160x1440 SEC3542 | Apple iPad Air 2 9.7 2048x1536 | Dell XPS 13-9343 13.3 3200x1800 SHP1421 | Surface Book (i5) 13.5 3000x2000 Panasonic MEI96A2 | |
|---|---|---|---|---|---|---|
| Display | 2% | -4% | 6% | 2% | ||
| Display P3 Coverage (%) | 65 | 67.5 4% | 63.6 -2% | 72 11% | 67 3% | |
| sRGB Coverage (%) | 96.5 | 96.6 0% | 88.8 -8% | 96 -1% | 95.8 -1% | |
| AdobeRGB 1998 Coverage (%) | 67 | 69 3% | 65.6 -2% | 71.6 7% | 68.9 3% | |
| Response Times | 1% | -5% | ||||
| Response Time Grey 50% / Grey 80% * (ms) | 46 ? | 46 ? -0% | 48.4 ? -5% | |||
| Response Time Black / White * (ms) | 31.2 ? | 31 ? 1% | 32.8 ? -5% | |||
| PWM Frequency (Hz) | 50 ? | 50 ? | ||||
| Screen | 4% | -18% | -0% | -1% | 19% | |
| Brightness middle (cd/m²) | 413 | 389.2 -6% | 355.3 -14% | 423 2% | 367.3 -11% | 430.9 4% |
| Brightness (cd/m²) | 396 | 392 -1% | 338 -15% | 427 8% | 372 -6% | 410 4% |
| Brightness Distribution (%) | 87 | 92 6% | 91 5% | 92 6% | 77 -11% | 93 7% |
| Black Level * (cd/m²) | 0.36 | 0.27 25% | 0.33 8% | 0.61 -69% | 0.178 51% | 0.254 29% |
| Contrast (:1) | 1147 | 1441 26% | 1077 -6% | 693 -40% | 2063 80% | 1696 48% |
| Colorchecker dE 2000 * | 3.09 | 3.61 -17% | 4.72 -53% | 2.86 7% | 5.92 -92% | 2.06 33% |
| Greyscale dE 2000 * | 3.92 | 3.8 3% | 6.53 -67% | 2.37 40% | 4.79 -22% | 2.22 43% |
| Gamma | 2.3 96% | 2.16 102% | 2.17 101% | 2.43 91% | 2.42 91% | 2.13 103% |
| CCT | 7333 89% | 5969 109% | 6707 97% | 6941 94% | 7013 93% | 6520 100% |
| Color Space (Percent of AdobeRGB 1998) (%) | 61 | 63 3% | 59.37 -3% | 88 44% | 63 3% | 64 5% |
| Color Space (Percent of sRGB) (%) | 97 | 97 0% | 96.4 -1% | 96 -1% | ||
| Total Average (Program / Settings) | 2% /
3% | -11% /
-14% | 0% /
-0% | 3% /
1% | 5% /
12% |
* ... smaller is better
Display Response Times
| ↔ Response Time Black to White | ||
|---|---|---|
| 31.2 ms ... rise ↗ and fall ↘ combined | ↗ 6 ms rise | 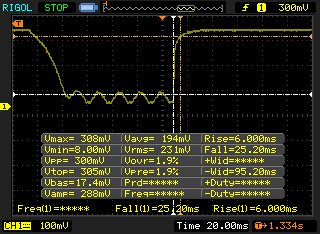 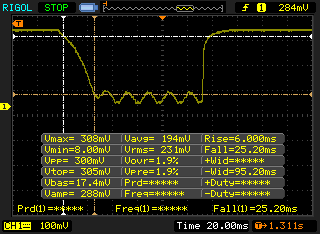 |
| ↘ 25.2 ms fall | ||
| The screen shows slow response rates in our tests and will be unsatisfactory for gamers. In comparison, all tested devices range from 0.1 (minimum) to 240 (maximum) ms. » 84 % of all devices are better. This means that the measured response time is worse than the average of all tested devices (20.1 ms). | ||
| ↔ Response Time 50% Grey to 80% Grey | ||
| 46 ms ... rise ↗ and fall ↘ combined | ↗ 17.2 ms rise | 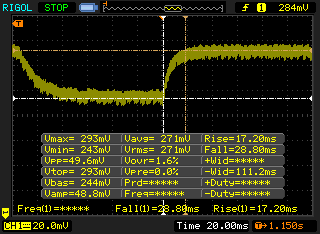  |
| ↘ 28.8 ms fall | ||
| The screen shows slow response rates in our tests and will be unsatisfactory for gamers. In comparison, all tested devices range from 0.165 (minimum) to 636 (maximum) ms. » 78 % of all devices are better. This means that the measured response time is worse than the average of all tested devices (31.4 ms). | ||
Performance
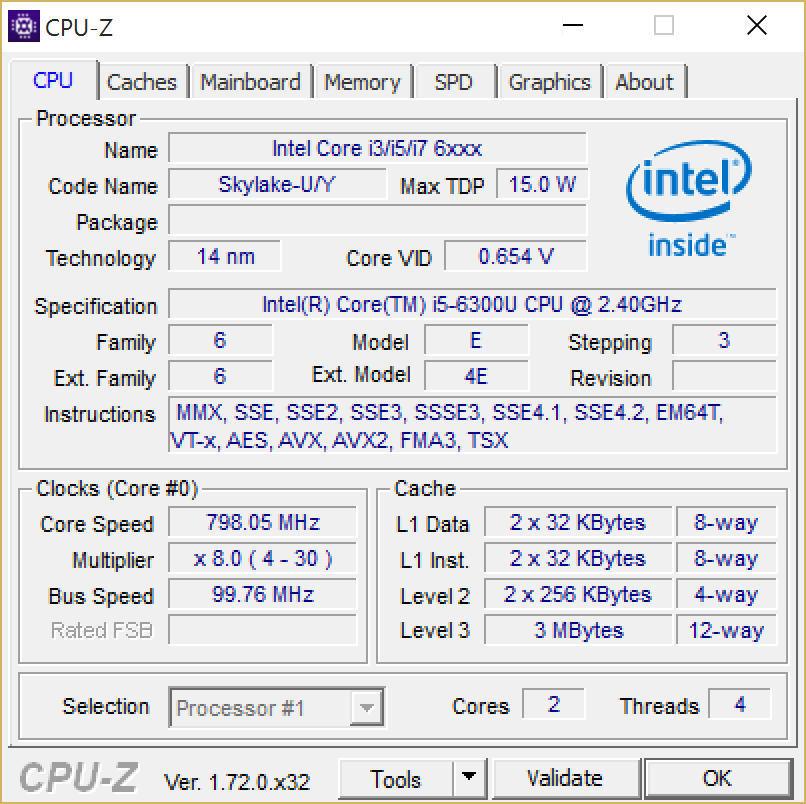
At the heart of our 12-inch device is the Intel Core i5-6300U (2.4 GHz), a dual-core chip that could also be used for subnotebooks or notebooks. A TDP of 15 watts has been the standard for laptops and convertibles for a few years. So far, the 6300U is not available in any other device, only the sibling i5-6200U is used for the new Dell XPS 13-9350 and the HP Spectre x360 13. The small difference: The 6300U of the Surface Pro 4 can (in theory) reach a 200 MHz higher Turbo clock and supports additional features like vPro and TXT. The latter can be used in combination with a TPM chip and prevent data accesses by highly privileged applications (Intel’s "Safer Computing" initiative). You will probably not mistake the 6300U with the Core i5-6300HQ (quad-core) since this SoC has a specified TDP of 45 watts and is used for powerful multimedia and gaming laptops.

Processor
The Intel Core m3-6Y30 (0.9 GHz) also has a Turbo, but it can only reach up to 2.2 GHz. Nevertheless, we praised the steady performance during the review of the m3 model, because the chip could maintain its maximum clock in practical applications (CPU stress @2 GHz), which also resulted in the constant benchmark scores. The performance difference is around 30% in the Cinebench tests, which means that the current fourth generation of the 12-inch device surpasses the predecessor Surface Pro 3 (Core i5-4300U) by 20 to 30%.
Interesting: The Microsoft Surface Book, which is equipped with the same SoC, delivers identical results. It seems that the 13.5-inch device with the detachable GPU in the keyboard dock has exactly the same thermal headroom as our 12.3-inch review sample.
| Cinebench R11.5 | |
| CPU Single 64Bit (sort by value) | |
| Surface Pro 4 (Core i5) | |
| Surface Pro 4 (Core m3) | |
| Surface Pro 3 | |
| Dell XPS 13-9343 | |
| Surface Book (i5) | |
| CPU Multi 64Bit (sort by value) | |
| Surface Pro 4 (Core i5) | |
| Surface Pro 4 (Core m3) | |
| Surface Pro 3 | |
| Dell XPS 13-9343 | |
| Surface Book (i5) | |
| Cinebench R15 | |
| CPU Single 64Bit (sort by value) | |
| Surface Pro 4 (Core i5) | |
| Surface Pro 4 (Core m3) | |
| Dell XPS 13-9343 | |
| Surface Book (i5) | |
| CPU Multi 64Bit (sort by value) | |
| Surface Pro 4 (Core i5) | |
| Surface Pro 4 (Core m3) | |
| Dell XPS 13-9343 | |
| Surface Book (i5) | |
| Cinebench R10 | |
| Rendering Single 32Bit (sort by value) | |
| Surface Pro 4 (Core i5) | |
| Surface Pro 4 (Core m3) | |
| Surface Pro 3 | |
| Dell XPS 13-9343 | |
| Surface Book (i5) | |
| Rendering Multiple CPUs 32Bit (sort by value) | |
| Surface Pro 4 (Core i5) | |
| Surface Pro 4 (Core m3) | |
| Surface Pro 3 | |
| Dell XPS 13-9343 | |
| Surface Book (i5) | |
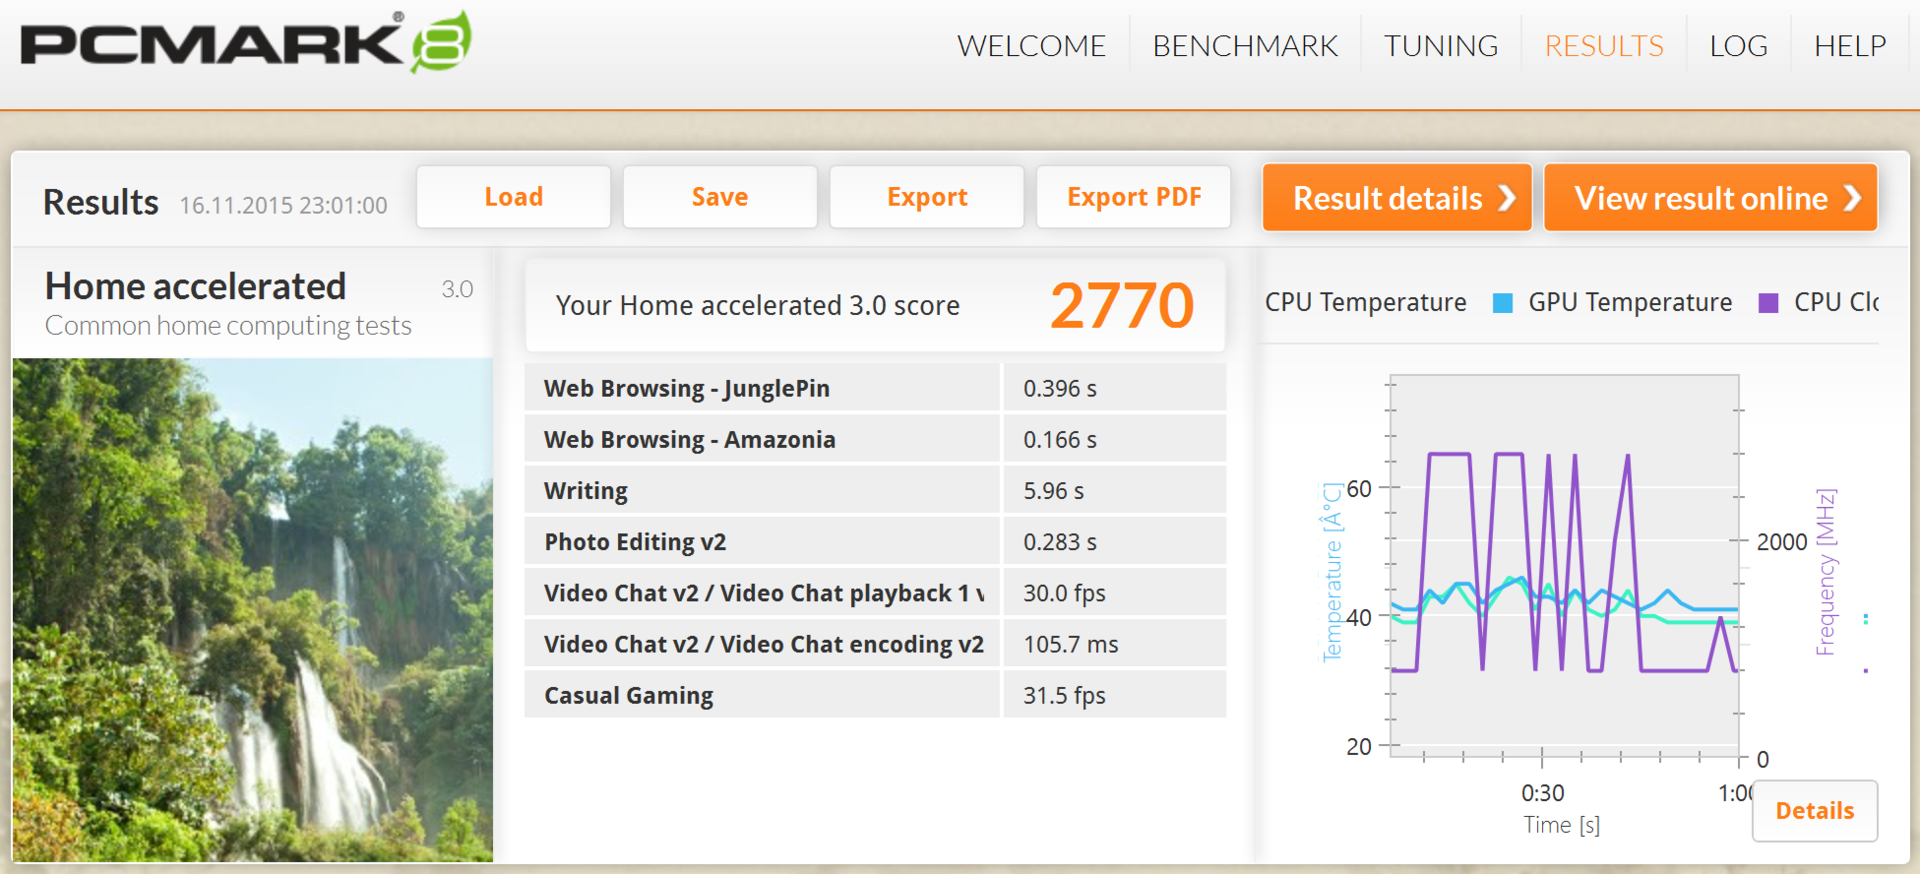
System Performance
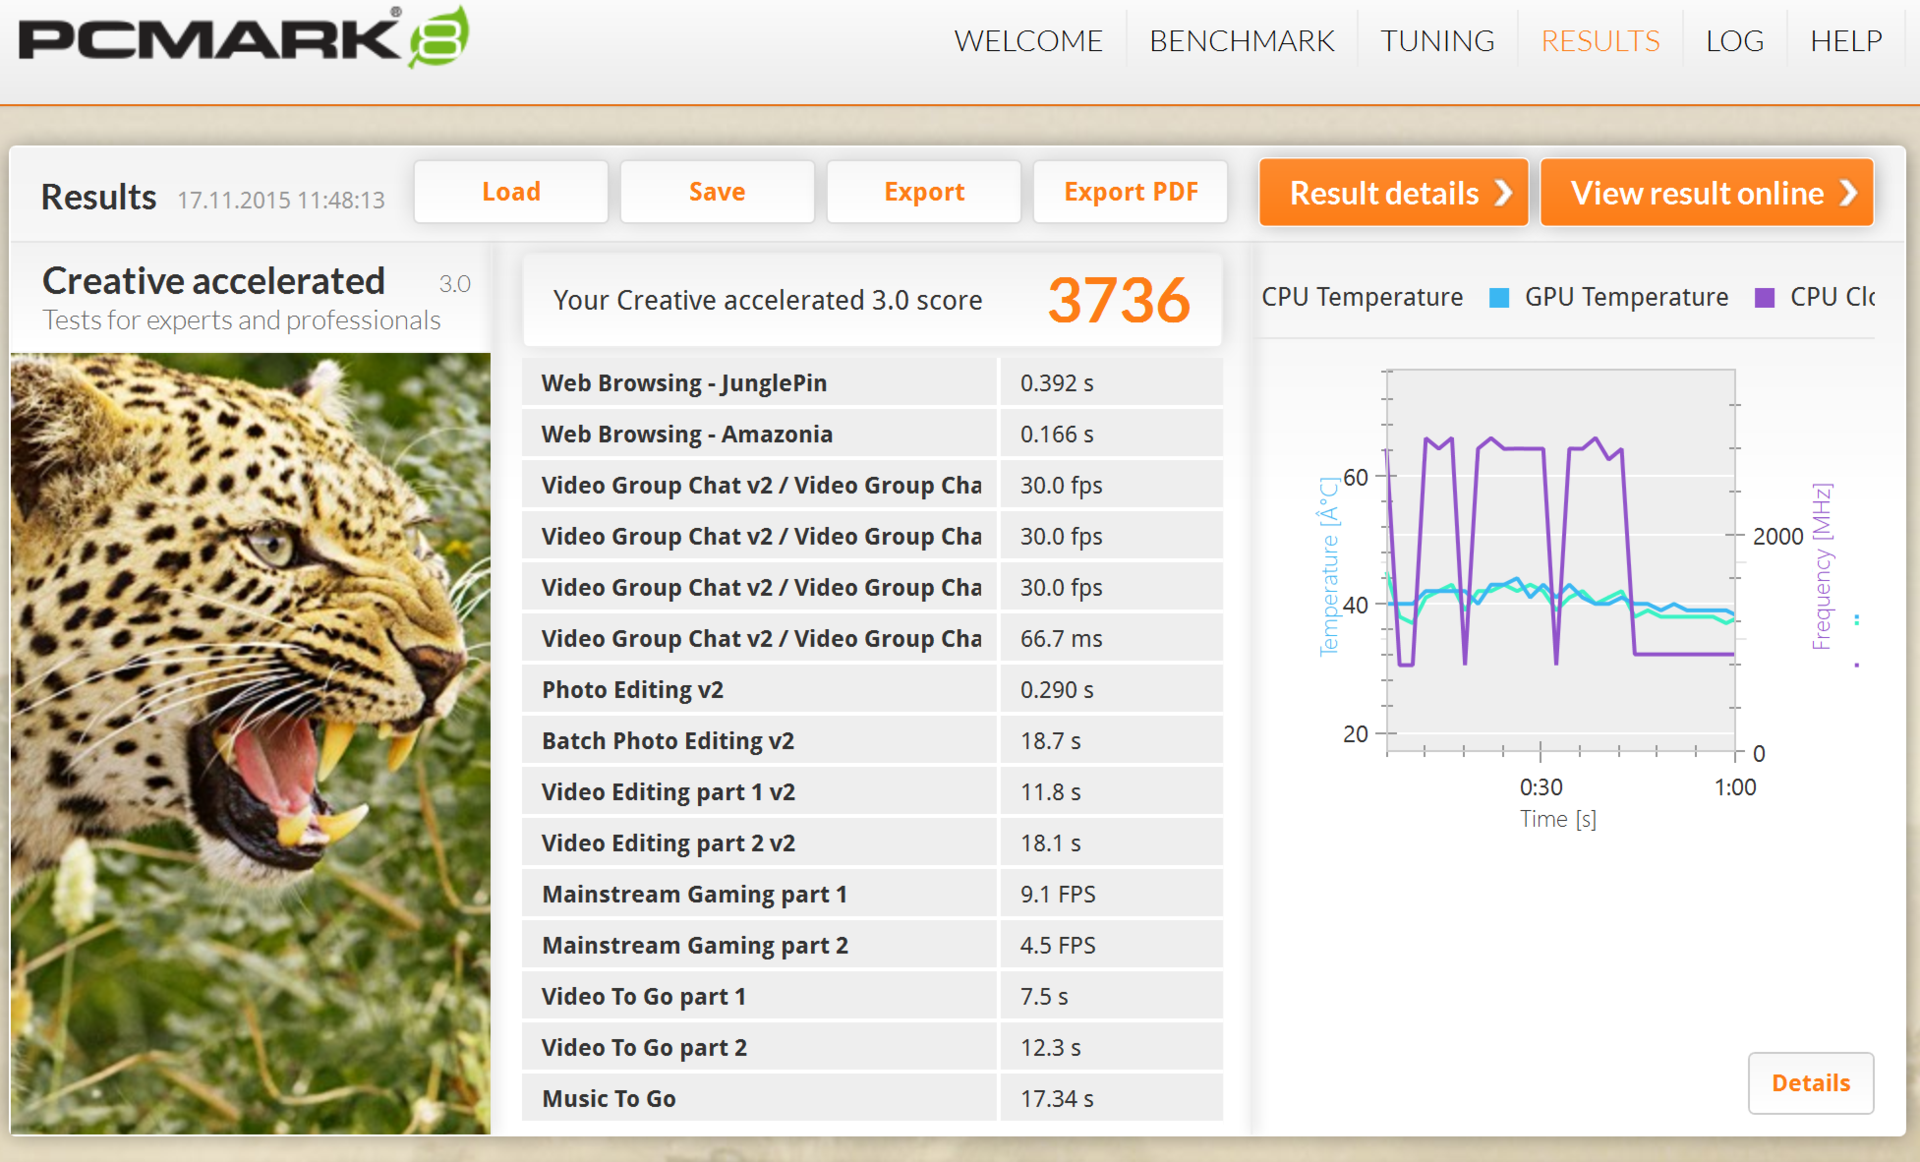
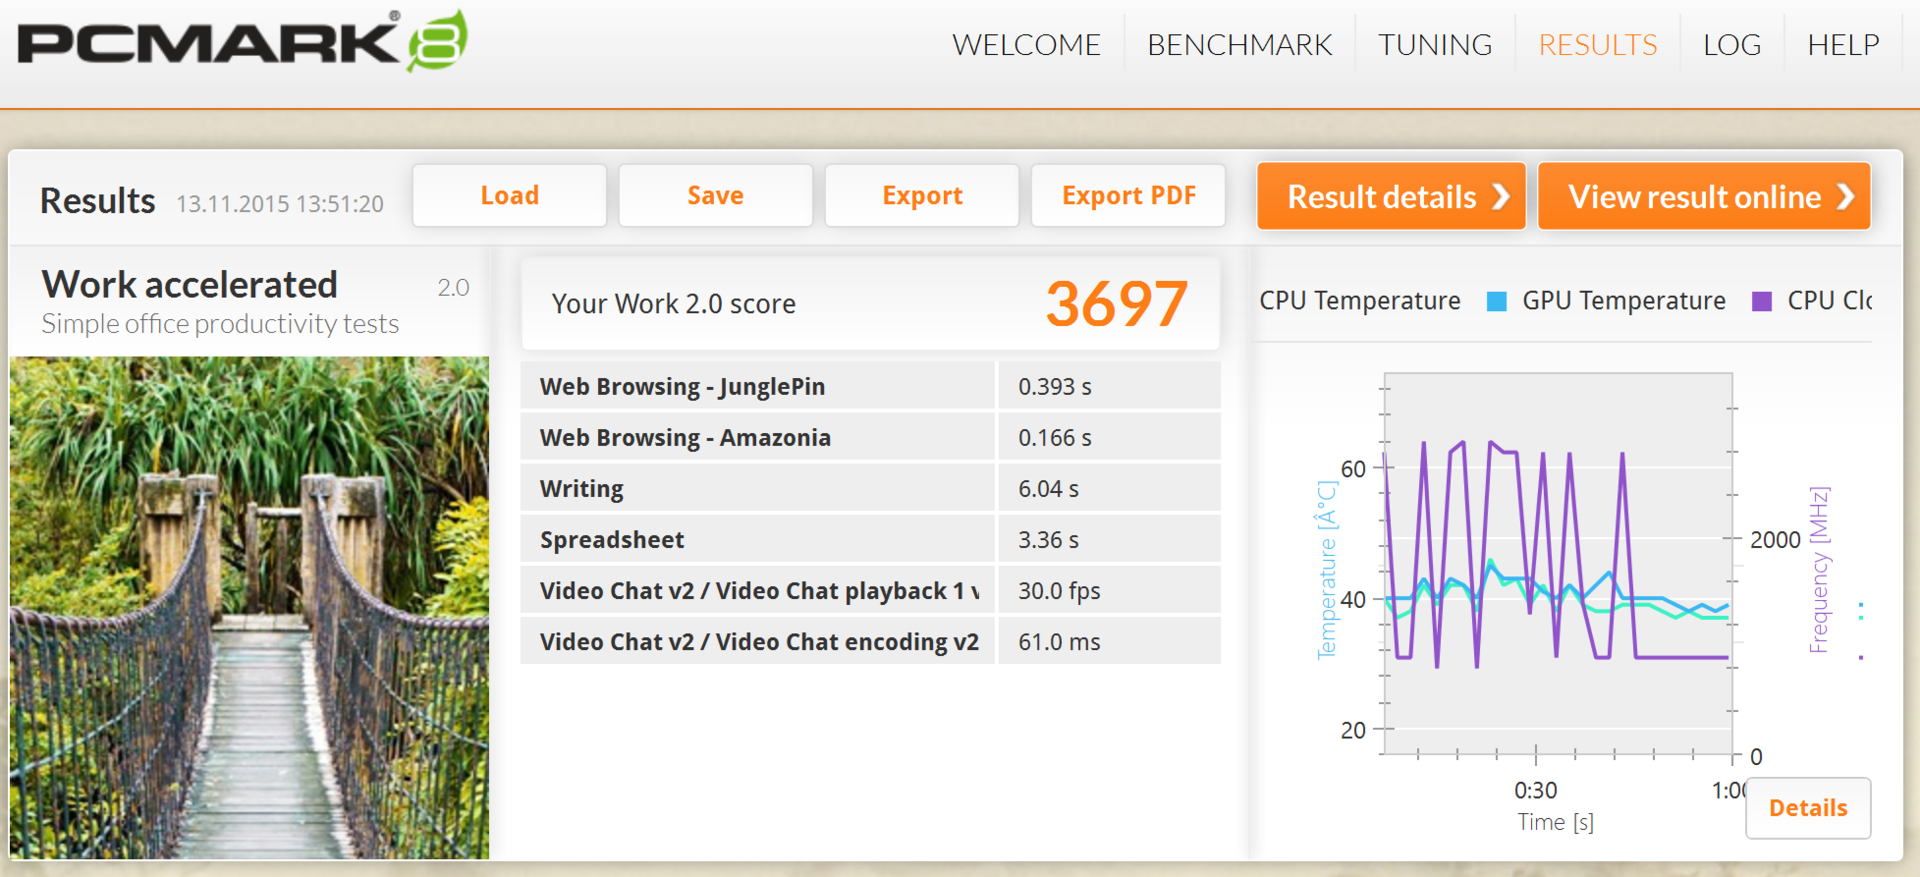
We use the PCMark 7/8 benchmarks for the evaluation of the application performance. The PCM8 Work score is 14% higher and the Home score 12% higher compared to the m3 model of the Surface Pro 4. This is surprising when you consider that the raw processor performance differs by around 30%. The situation is pretty similar in PCMark 7, where the Core m3 falls behind by 18% (overall score).
The SSD does not make a difference, because as we have already mentioned both models use the same drive from Samsung. Once again it is interesting that in these benchmarks the small difference compared to the Surface Book does not seem to benefit from its GeForce GPU at all. With such a high score, we do not really have to mention it, but the subjective impression with the smooth handling and quick application launches or copy processes is very good.
| PCMark 8 | |
| Home Score Accelerated v2 (sort by value) | |
| Surface Pro 4 (Core i5) | |
| Surface Pro 4 (Core m3) | |
| Dell XPS 13-9343 | |
| Surface Book (i5) | |
| Work Score Accelerated v2 (sort by value) | |
| Surface Pro 4 (Core i5) | |
| Surface Pro 4 (Core m3) | |
| Dell XPS 13-9343 | |
| Surface Book (i5) | |
Our review unit can easily beat the Lollipop competition, but it is also significantly heavier and thicker than a Samsung Galaxy Tab S2, for example. The situation is very similar when we look at the iPad Air 2, which clearly falls behind in terms of performance. The browser benchmark certainly plays a role as well; we can see the smallest differences in Peacekeeper.
| Octane V2 - Total Score (sort by value) | |
| Microsoft Surface Pro 4, Core i5, 128GB | |
| Apple iPad Air 2 2014 | |
| Samsung Galaxy Tab S2 9.7 LTE | |
| Apple iPad Mini 4 | |
| Samsung Galaxy Tab S2 8.0 LTE | |
| Peacekeeper - --- (sort by value) | |
| Microsoft Surface Pro 4, Core i5, 128GB | |
| Microsoft Surface Pro 4, Core m3 | |
| Apple iPad Air 2 2014 | |
| Apple iPad Mini 4 | |
* ... smaller is better
| PCMark 7 Score | 5229 points | |
| PCMark 8 Home Score Accelerated v2 | 2770 points | |
| PCMark 8 Creative Score Accelerated v2 | 3736 points | |
| PCMark 8 Work Score Accelerated v2 | 3697 points | |
Help | ||
Storage Devices
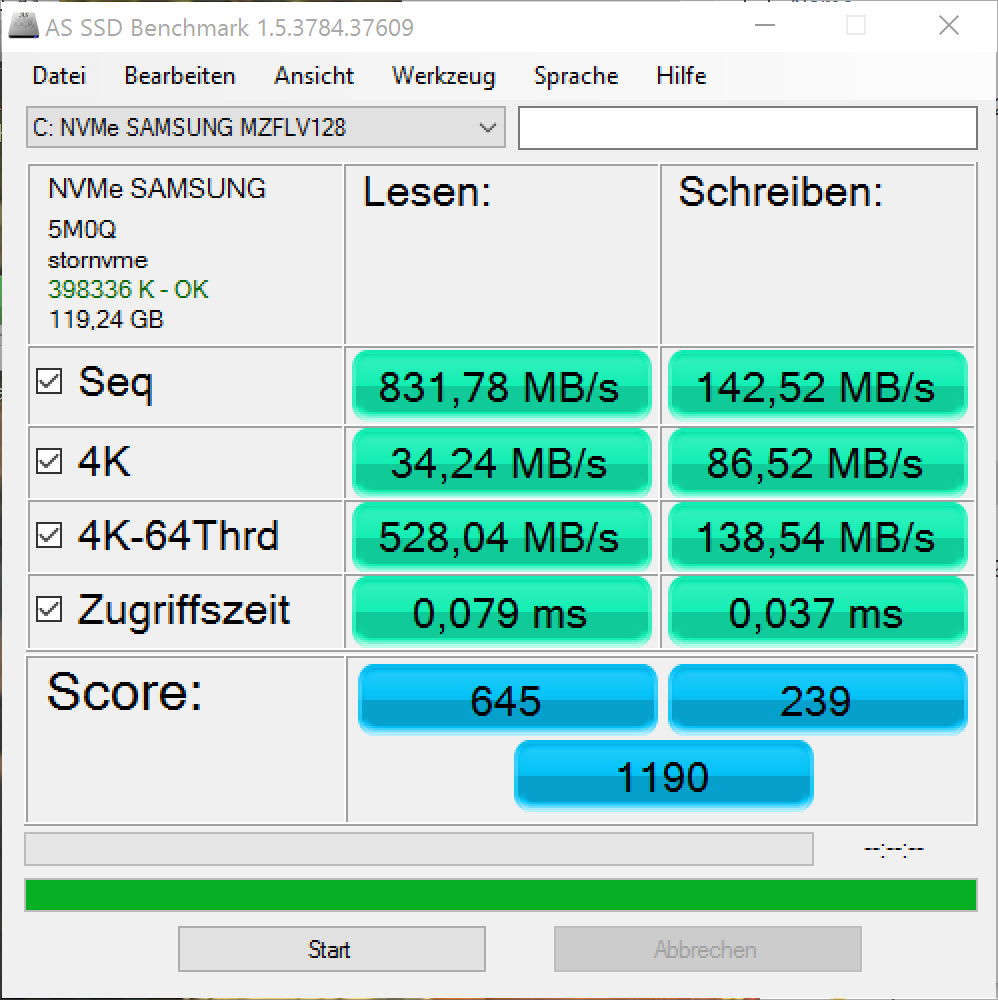
The Samsung MZFLV128 provides 87 GB of free storage, the rest is occupied by Windows 10 and a recovery partition. The NVMe (NVM Express) interface, which was originally designed for server applications, connects the storage via PCI Express with the motherboard. Obviously, the module is soldered onto the motherboard and cannot be replaced. The results are pretty much identical to the Surface Pro 4 with the Core m3, which is equipped with the same Samsung SSD. We use the performance figures with the factory settings in our database; we check the hardware as they are shipped to the user and usually do not install new drivers.
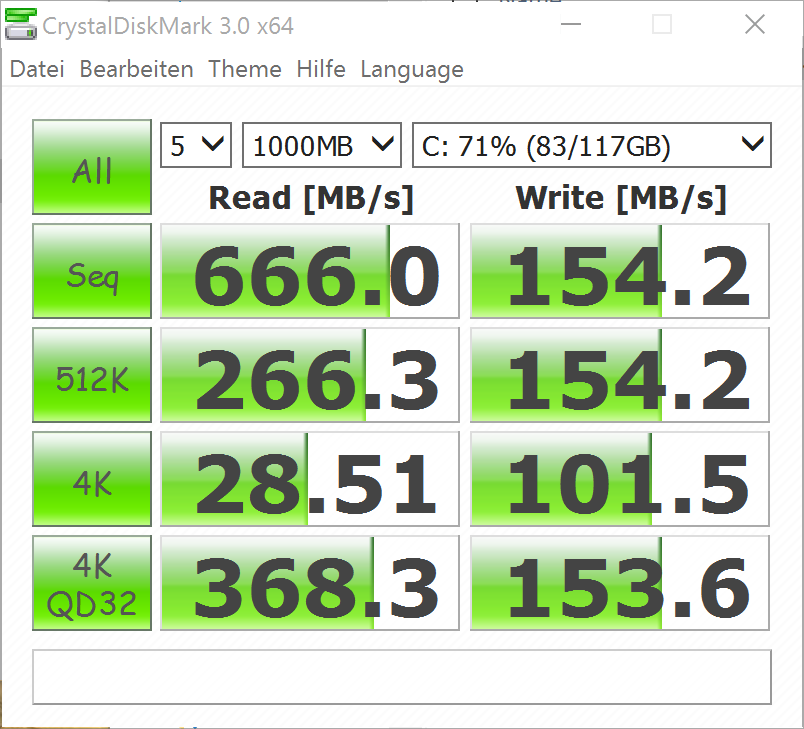
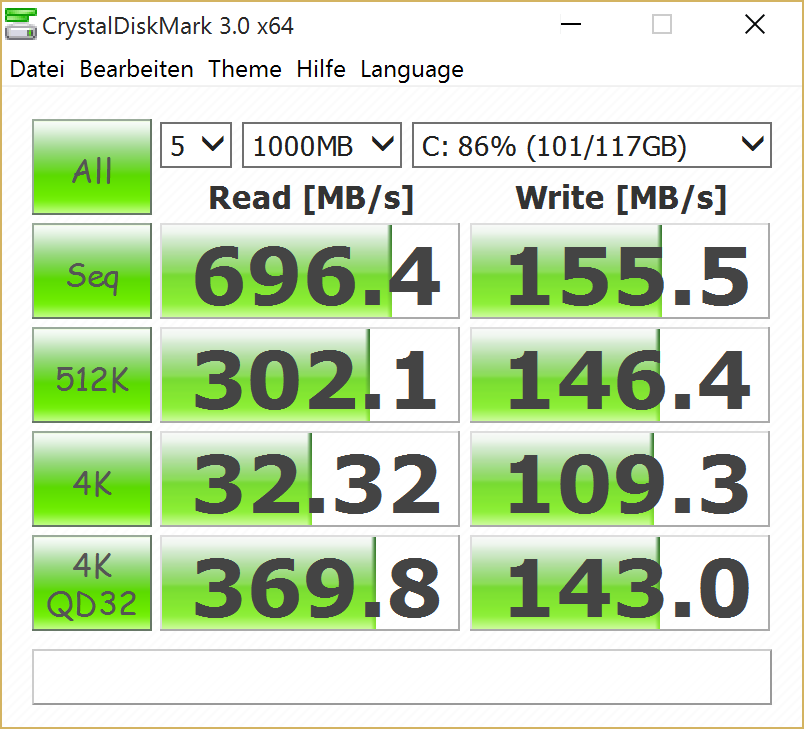
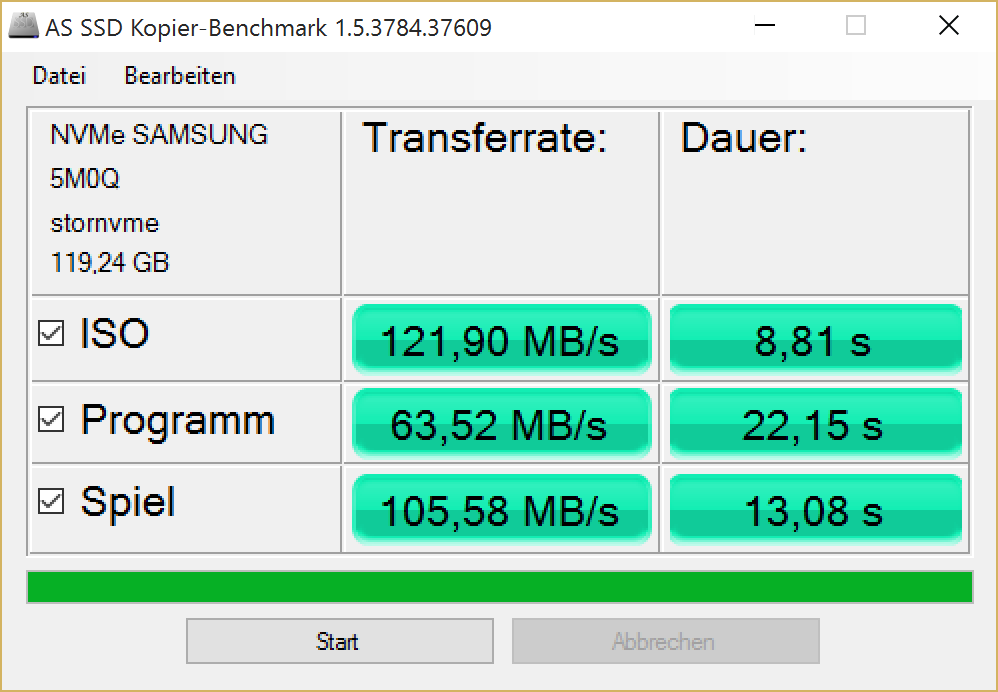
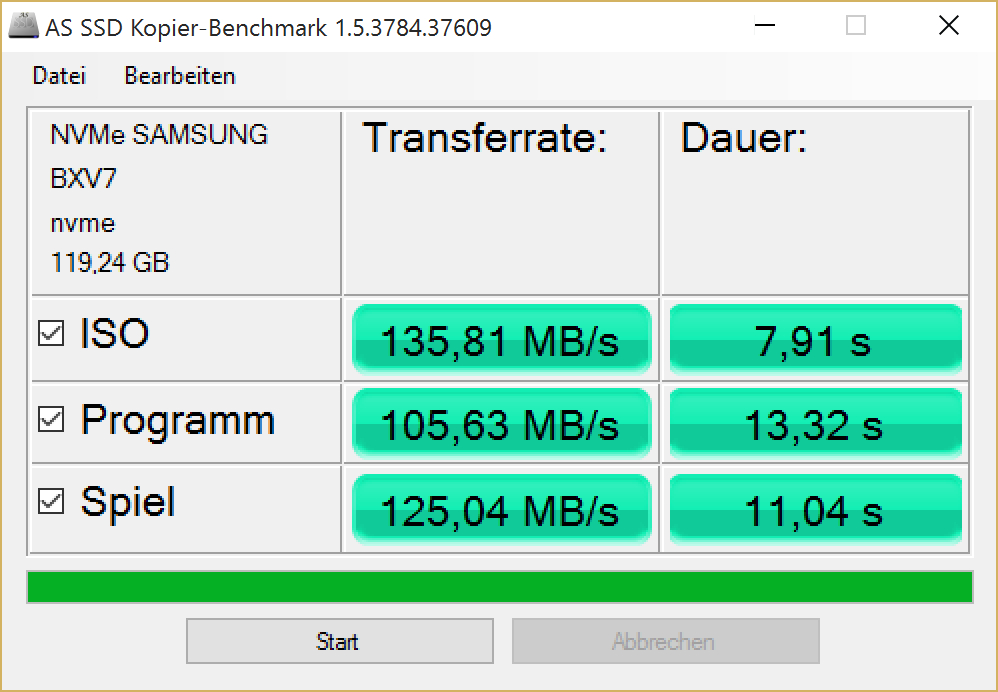
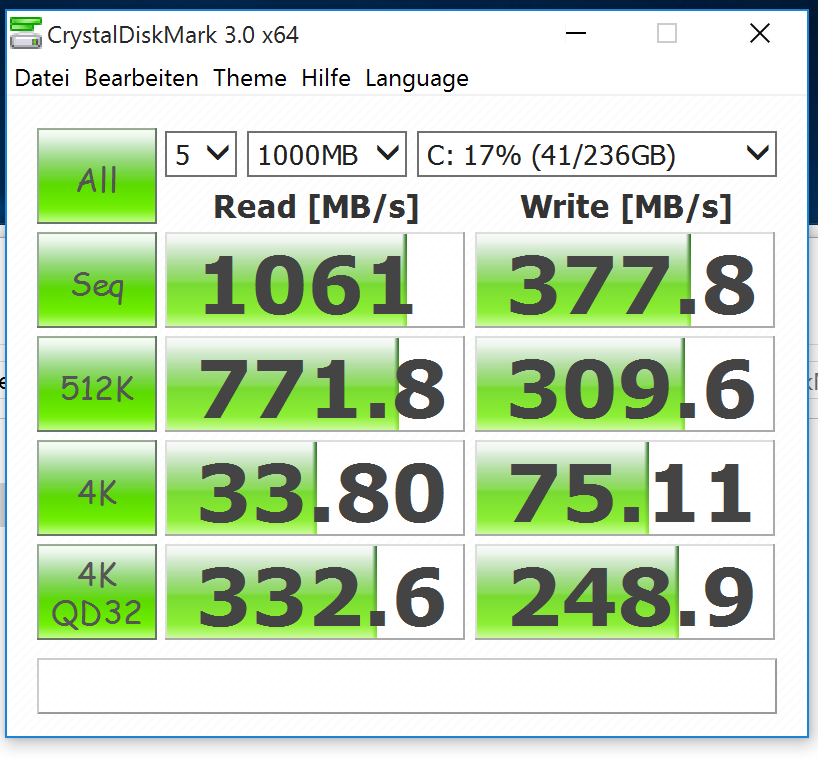
Nevertheless, we tested the Samsung driver for the NVMe SSD 950 Pro and can see small performance improvements (see right screenshot). AS SSD does not show any changes after a restart and the individual scores are pretty much identical. We did not notice the low 4K Write transfer rates of the Surface Pro 4 m3, so it is not really necessary to install the Samsung driver. There are differences between the default drive and the Samsung driver (update) in CrystalDiskMark, but they are so small that it could be a normal variation. That this is not the case is evident when you see the AS SSD copy benchmark, where the transfer rates got a bump from 63 to 105 MB/s.
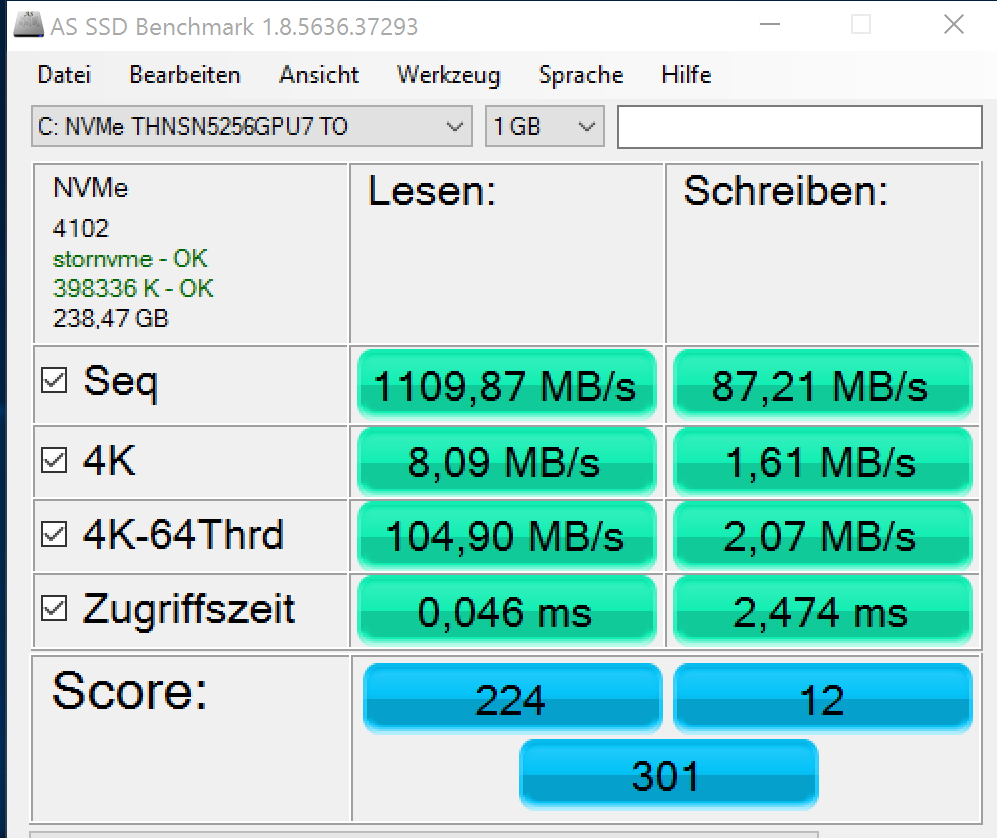
The 256 GB version of the Surface Pro 4 uses an SSD from Toshiba and the scores are shown in the last two screenshots. You can notice the very fast reading results, but the 4K test also shows a low write score that is beaten by every hard drive. The results in CrystalDiskMark are more realistic, where the write transfer rates are almost doubled.

| Surface Pro 4 (Core i5) Samsung MZFLV128 NVMe | Surface Pro 4 (Core m3) Samsung MZFLV128 NVMe | Surface Pro 3 Hynix HFS128G3MNM | Dell XPS 13-9343 Lite-On IT L8T-256L9G | Surface Book (i5) Samsung MZFLV256 NVMe | |
|---|---|---|---|---|---|
| AS SSD | 21% | 11% | 31% | 107% | |
| Seq Read (MB/s) | 832 | 845 2% | 493.7 -41% | 484.7 -42% | 1223 47% |
| Seq Write (MB/s) | 142.5 | 138.1 -3% | 303 113% | 416.8 192% | 275.2 93% |
| 4K-64 Read (MB/s) | 528 | 944 79% | 358.3 -32% | 345.5 -35% | 1409 167% |
| 4K-64 Write (MB/s) | 138.5 | 112 -19% | 215 55% | 268.3 94% | 281.4 103% |
| Score Read (Points) | 645 | 1060 64% | 430 -33% | 425 -34% | 1566 143% |
| Score Write (Points) | 239 | 189 -21% | 319 33% | 369 54% | 394 65% |
| Score Total (Points) | 1190 | 1759 48% | 965 -19% | 1018 -14% | 2712 128% |
| CrystalDiskMark 3.0 | -5% | 33% | 57% | ||
| Read Seq (MB/s) | 666 | 663 0% | 501 -25% | 489.6 -26% | |
| Write Seq (MB/s) | 154.2 | 158.2 3% | 324 110% | 424.2 175% | |
| Read 512 (MB/s) | 266.3 | 313.1 18% | 357.8 34% | 371.9 40% | |
| Write 512 (MB/s) | 154.2 | 158.2 3% | 324.6 111% | 395.5 156% | |
| Read 4k (MB/s) | 28.51 | 30.14 6% | 20.81 -27% | 34.76 22% | |
| Write 4k (MB/s) | 101.5 | 68 -33% | 76.2 -25% | 79.3 -22% | |
| Read 4k QD32 (MB/s) | 368.3 | 243.7 -34% | 345 -6% | 354 -4% | |
| Write 4k QD32 (MB/s) | 153.6 | 149.2 -3% | 294.4 92% | 326.3 112% | |
| Total Average (Program / Settings) | 8% /
7% | 22% /
23% | 44% /
45% | 107% /
107% |

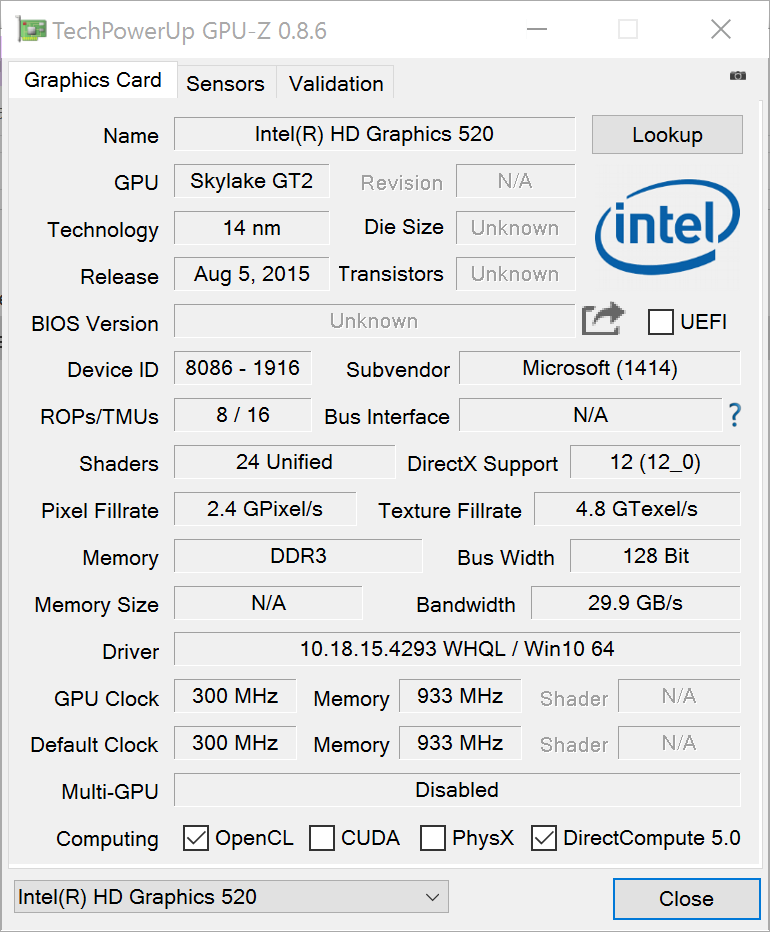
GPU Performance
The graphics card Intel HD Graphics 520 (core clock review unit: 300 – 1000 MHz) is slightly faster than the HD Graphics 515 counterpart in the Surface Pro 4 m3 (core clock review unit: 300 – 850 MHz). Intel's Quick Sync technology can accelerate video rendering when the tool supports it. The manufacturer can influence the maximum turbo clock, as we observed it in the Cinebench R15 OpenGL test. The clock reaches up to 1000 MHz, but there are only small fluctuations and it levels off at 948 MHz.
The table shows GPU differences of around 16%, which is not really a reason to get the Core i5 model. The general performance level is quite low compared to dedicated graphics cards, which is shown by a comparison with the GeForce 940M of the Surface Book. We have also included the Yoga 3 11 and the HP Folio 1040 to show the performance of a Broadwell iGPU.
| 3DMark 11 - 1280x720 Performance (sort by value) | |
| Microsoft Surface Pro 4, Core i5, 128GB | |
| Microsoft Surface Pro 4, Core m3 | |
| Microsoft Surface Pro 3 | |
| Dell XPS 13-9343 | |
| Microsoft Surface Book Core i5 | |
| Lenovo Yoga 3 11 80J8001WGE | |
| HP EliteBook Folio 1040 G2 H7W22EA | |
| 3DMark | |
| 1280x720 Cloud Gate Standard Score (sort by value) | |
| Microsoft Surface Pro 4, Core i5, 128GB | |
| Microsoft Surface Pro 4, Core m3 | |
| Microsoft Surface Pro 3 | |
| Dell XPS 13-9343 | |
| Microsoft Surface Book Core i5 | |
| Lenovo Yoga 3 11 80J8001WGE | |
| HP EliteBook Folio 1040 G2 H7W22EA | |
| 1280x720 Ice Storm Standard Score (sort by value) | |
| Microsoft Surface Pro 4, Core i5, 128GB | |
| Microsoft Surface Pro 4, Core m3 | |
| Microsoft Surface Pro 3 | |
| Dell XPS 13-9343 | |
| Microsoft Surface Book Core i5 | |
| Lenovo Yoga 3 11 80J8001WGE | |
| HP EliteBook Folio 1040 G2 H7W22EA | |
| 1920x1080 Fire Strike Score (sort by value) | |
| Microsoft Surface Pro 4, Core i5, 128GB | |
| Microsoft Surface Pro 4, Core m3 | |
| Microsoft Surface Pro 3 | |
| Dell XPS 13-9343 | |
| Microsoft Surface Book Core i5 | |
| Lenovo Yoga 3 11 80J8001WGE | |
| HP EliteBook Folio 1040 G2 H7W22EA | |
| 3DMark 11 Performance | 1565 points | |
| 3DMark Ice Storm Standard Score | 51010 points | |
| 3DMark Cloud Gate Standard Score | 5853 points | |
| 3DMark Fire Strike Score | 844 points | |
Help | ||
Gaming Performance
The gaming performance is actually not that bad and exceeds the expectations for an integrated GPU. You can even play games in medium details, when the game is slightly older or not that demanding. The Microsoft Surface Book is obviously much faster. Devices with the Broadwell Core M (Yoga 3 11) clearly fall behind and the HD 5500 cannot keep up with the HD Graphics 520, either (see BioShock).
| Tomb Raider | |
| 1024x768 Low Preset (sort by value) | |
| Microsoft Surface Pro 4, Core i5, 128GB | |
| Microsoft Surface Book Core i5 | |
| Lenovo Yoga 3 11 80J8001WGE | |
| 1366x768 Normal Preset AA:FX AF:4x (sort by value) | |
| Microsoft Surface Pro 4, Core i5, 128GB | |
| Microsoft Surface Book Core i5 | |
| Lenovo Yoga 3 11 80J8001WGE | |
| low | med. | high | ultra | |
|---|---|---|---|---|
| Tomb Raider (2013) | 82 | 40.8 | 26.1 | 11.6 |
| BioShock Infinite (2013) | 58.1 | 30 | 22.7 | 7 |
Emissions
System Noise
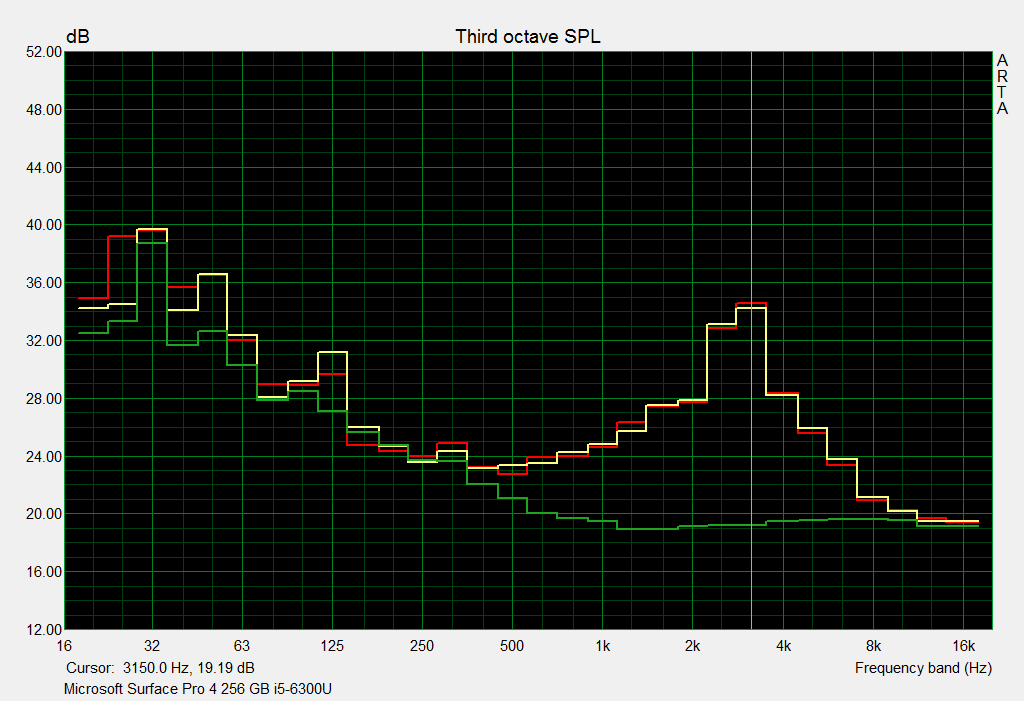
The system noise is pretty restrained, which only gets really loud under sustained load and obviously during the stress test. It is quite audible in this case at up to 41 dB(A), which is pretty high for a tablet. The fan of the Surface Pro 4 is not active (31.5 dB(A)) during normal operation with the web browser, occasional copy transfers or small installations. This is probably the reason why the 12-inch device is pretty warm while idling, even when the room temperature is not very high as in our review.
The cooling solution does not really differentiate between various rpm levels; if the fan starts to spin, it will quickly reach 41 dB(A), it does not matter if we run our stress test for the CPU and GPU simultaneously or a 3DMark. This behavior is different from the Surface Pro 3, which also had a very quiet level at 32 dB(A) under normal load, while it only started to spin up to 44 dB(A) under high sustained load or during the stress test.
| Surface Pro 4 (Core i5) | Surface Pro 3 | Dell XPS 13-9343 | Surface Book (i5) | |
|---|---|---|---|---|
| Noise | 5% | 2% | 5% | |
| Idle Minimum * (dB) | 31.5 | 30.1 4% | 30.2 4% | 29.5 6% |
| Idle Average * (dB) | 31.5 | 30.2 4% | 30.3 4% | 29.6 6% |
| Idle Maximum * (dB) | 31.5 | 30.4 3% | 30.4 3% | 29.7 6% |
| Load Average * (dB) | 40.5 | 31.9 21% | 34.4 15% | 37.5 7% |
| Load Maximum * (dB) | 40.7 | 44.4 -9% | 48 -18% | 40.9 -0% |
* ... smaller is better
Noise level
| Idle |
| 31.5 / 31.5 / 31.5 dB(A) |
| Load |
| 40.5 / 40.7 dB(A) |
 | ||
30 dB silent 40 dB(A) audible 50 dB(A) loud |
||
min: | ||
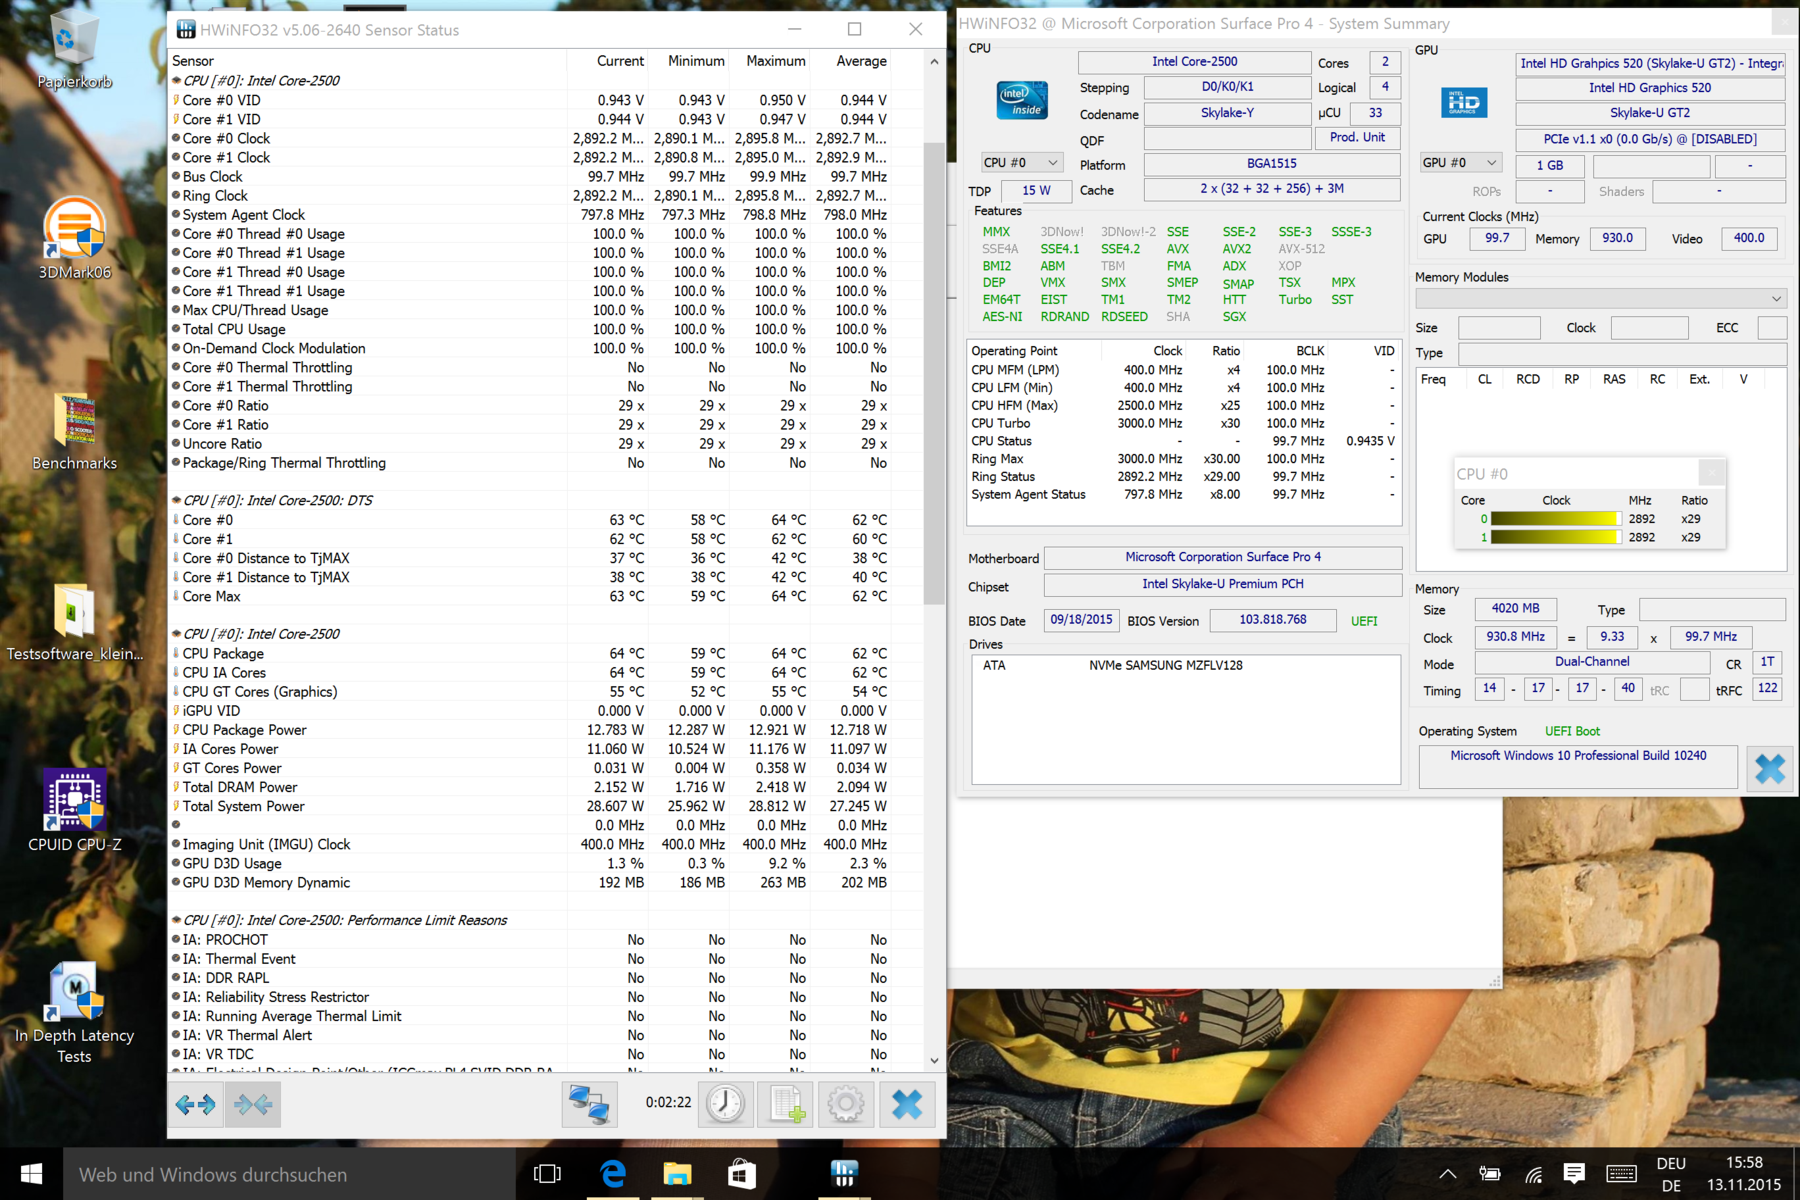
Temperature
The warming of the tablet is always clearly perceptible, which is mainly a result of the passive cooling with the conveniently silent operation. We were able to measure up to 40 °C (~104 °C) at some spots while idling without the fan. The average value is in the mid-30s (~95 °F), which is just okay.
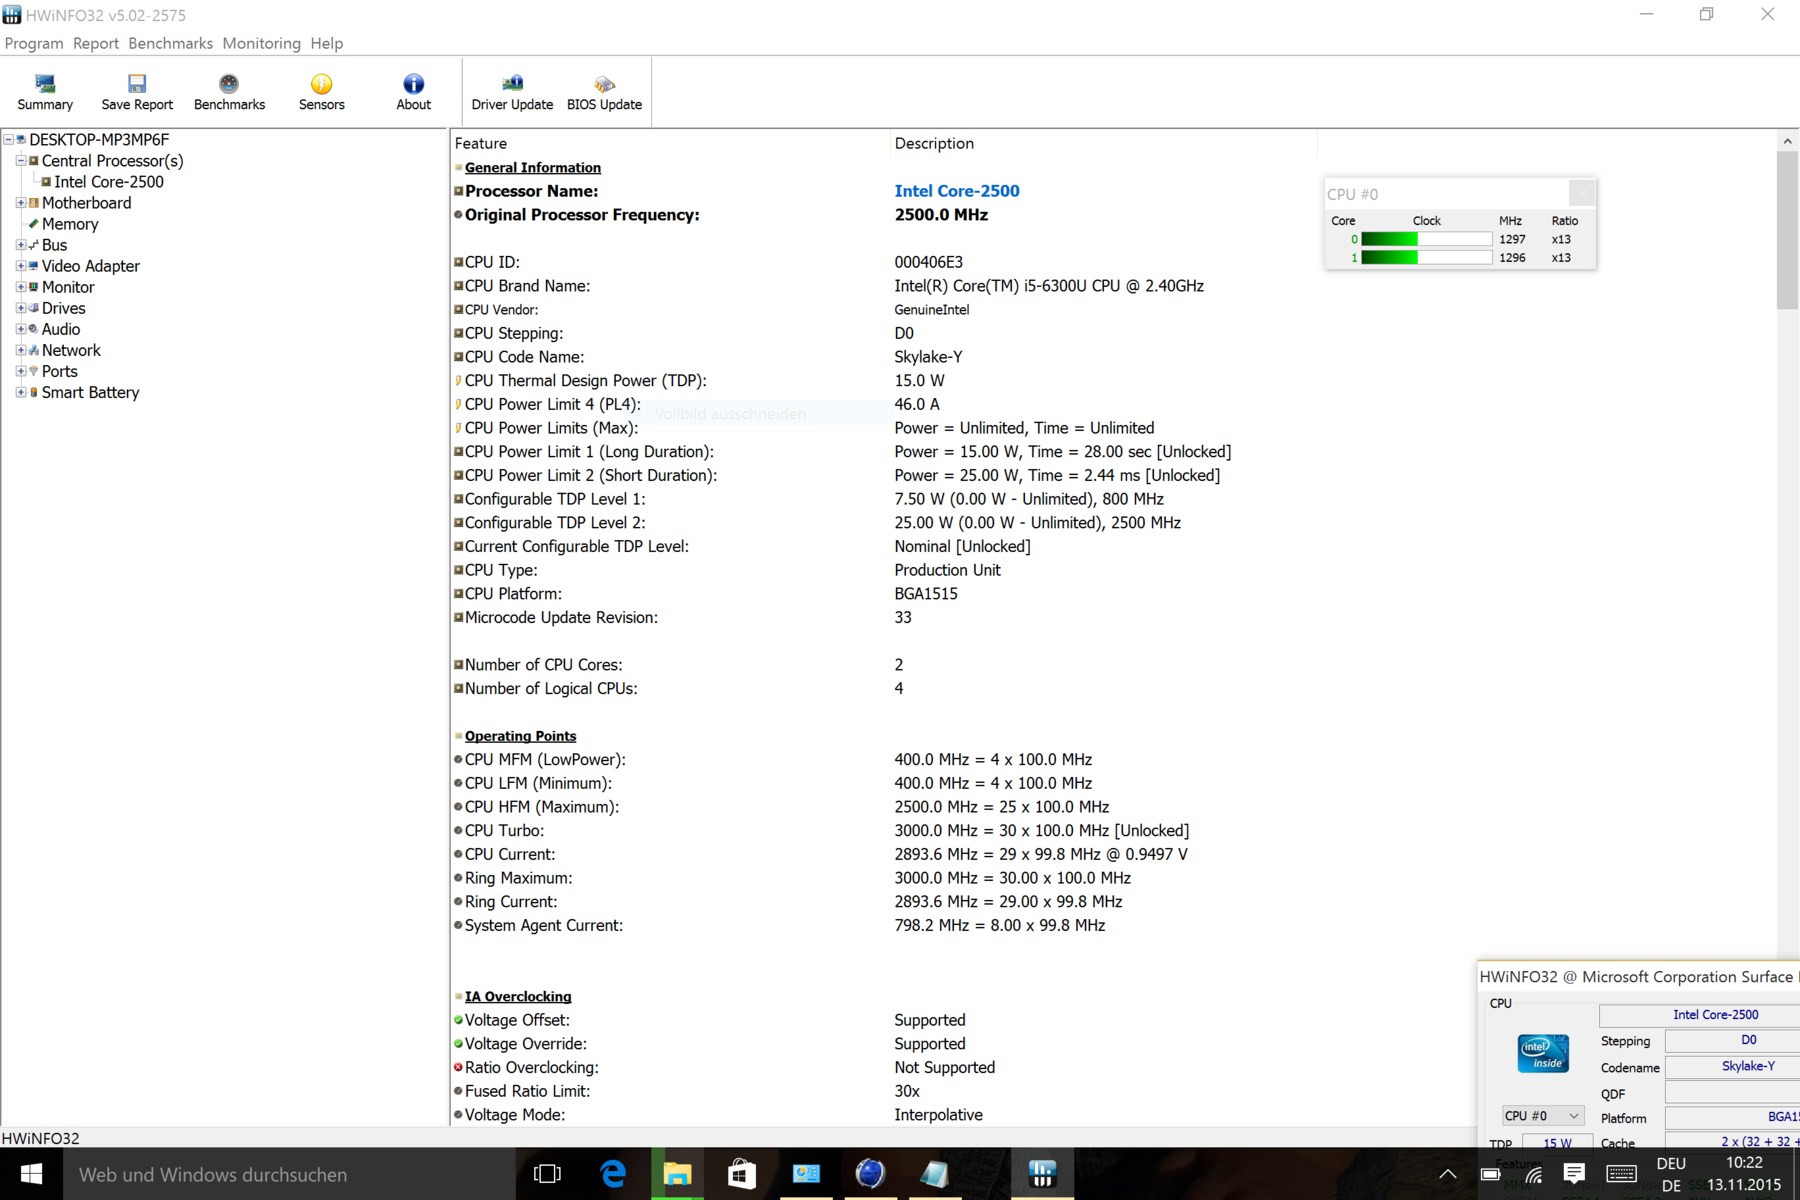
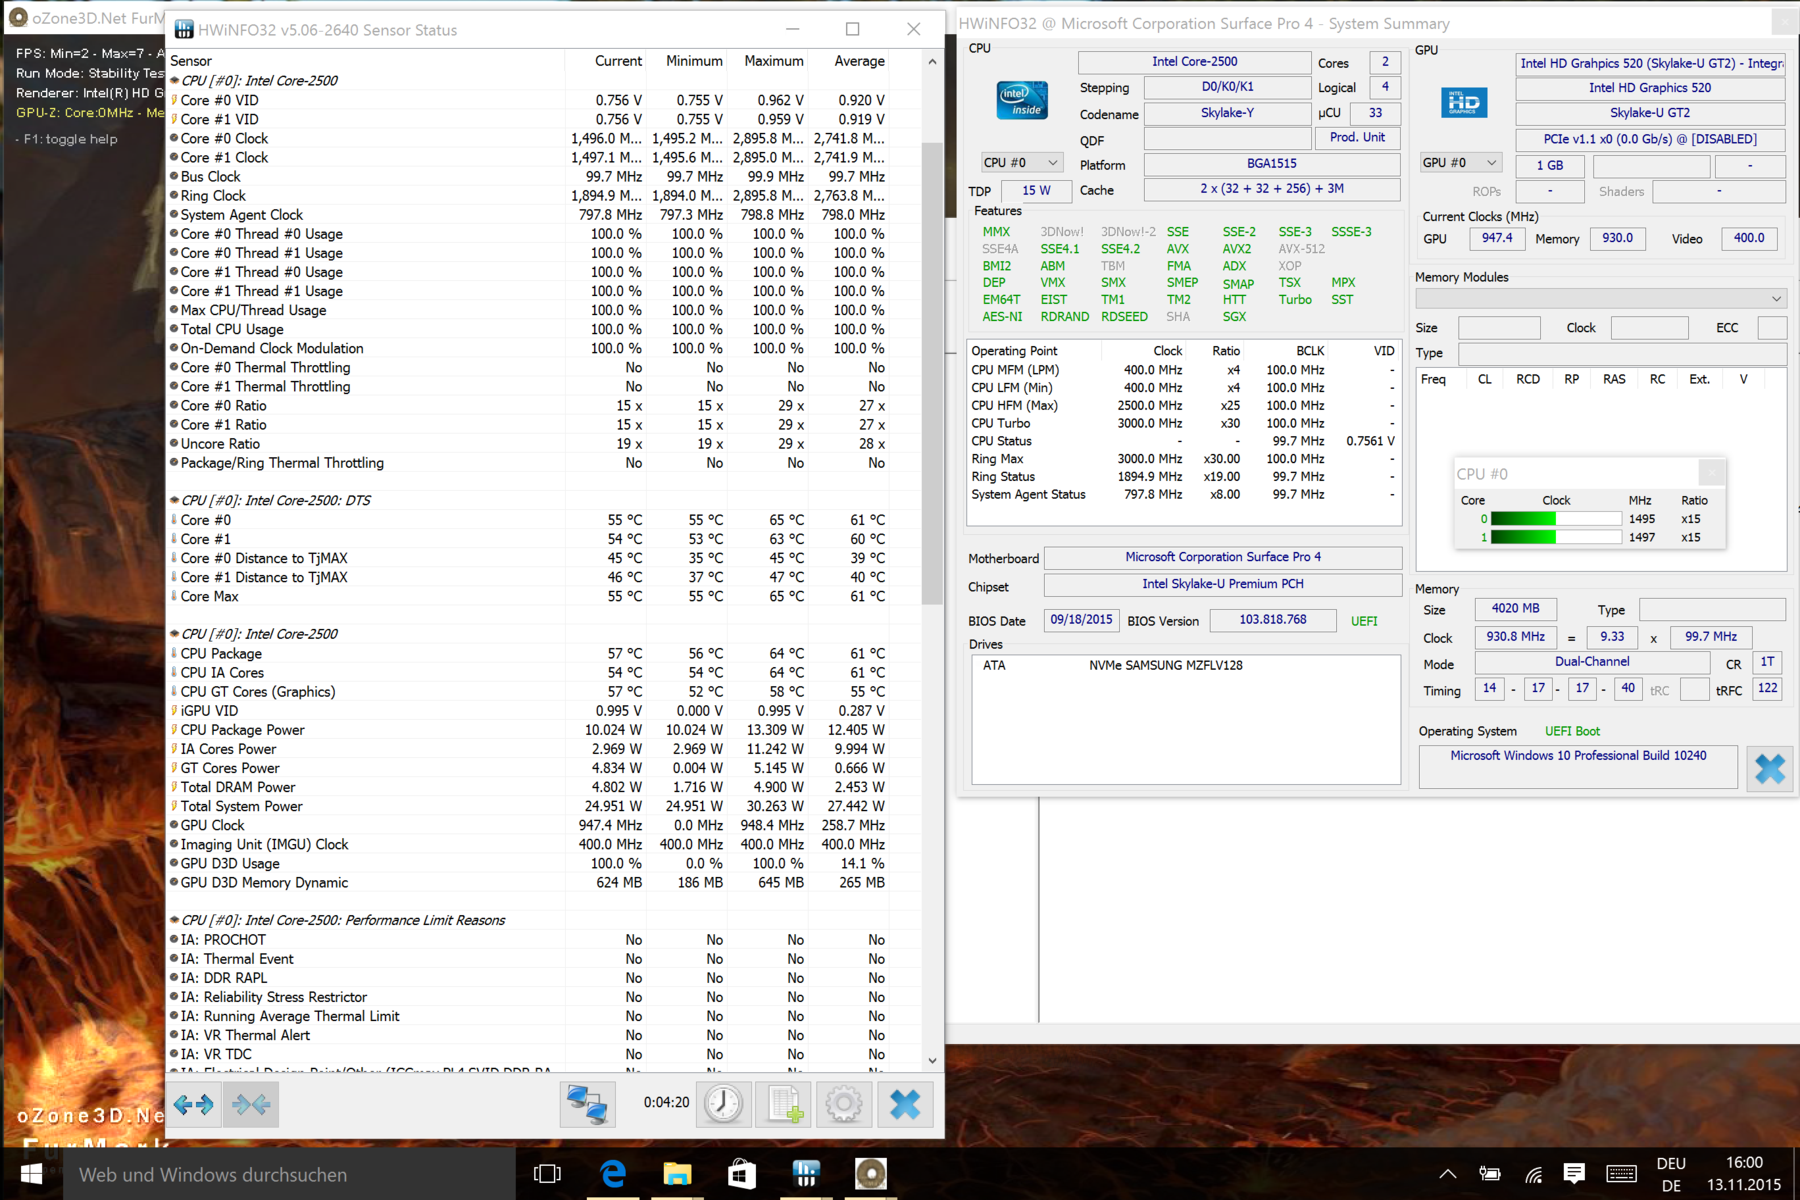
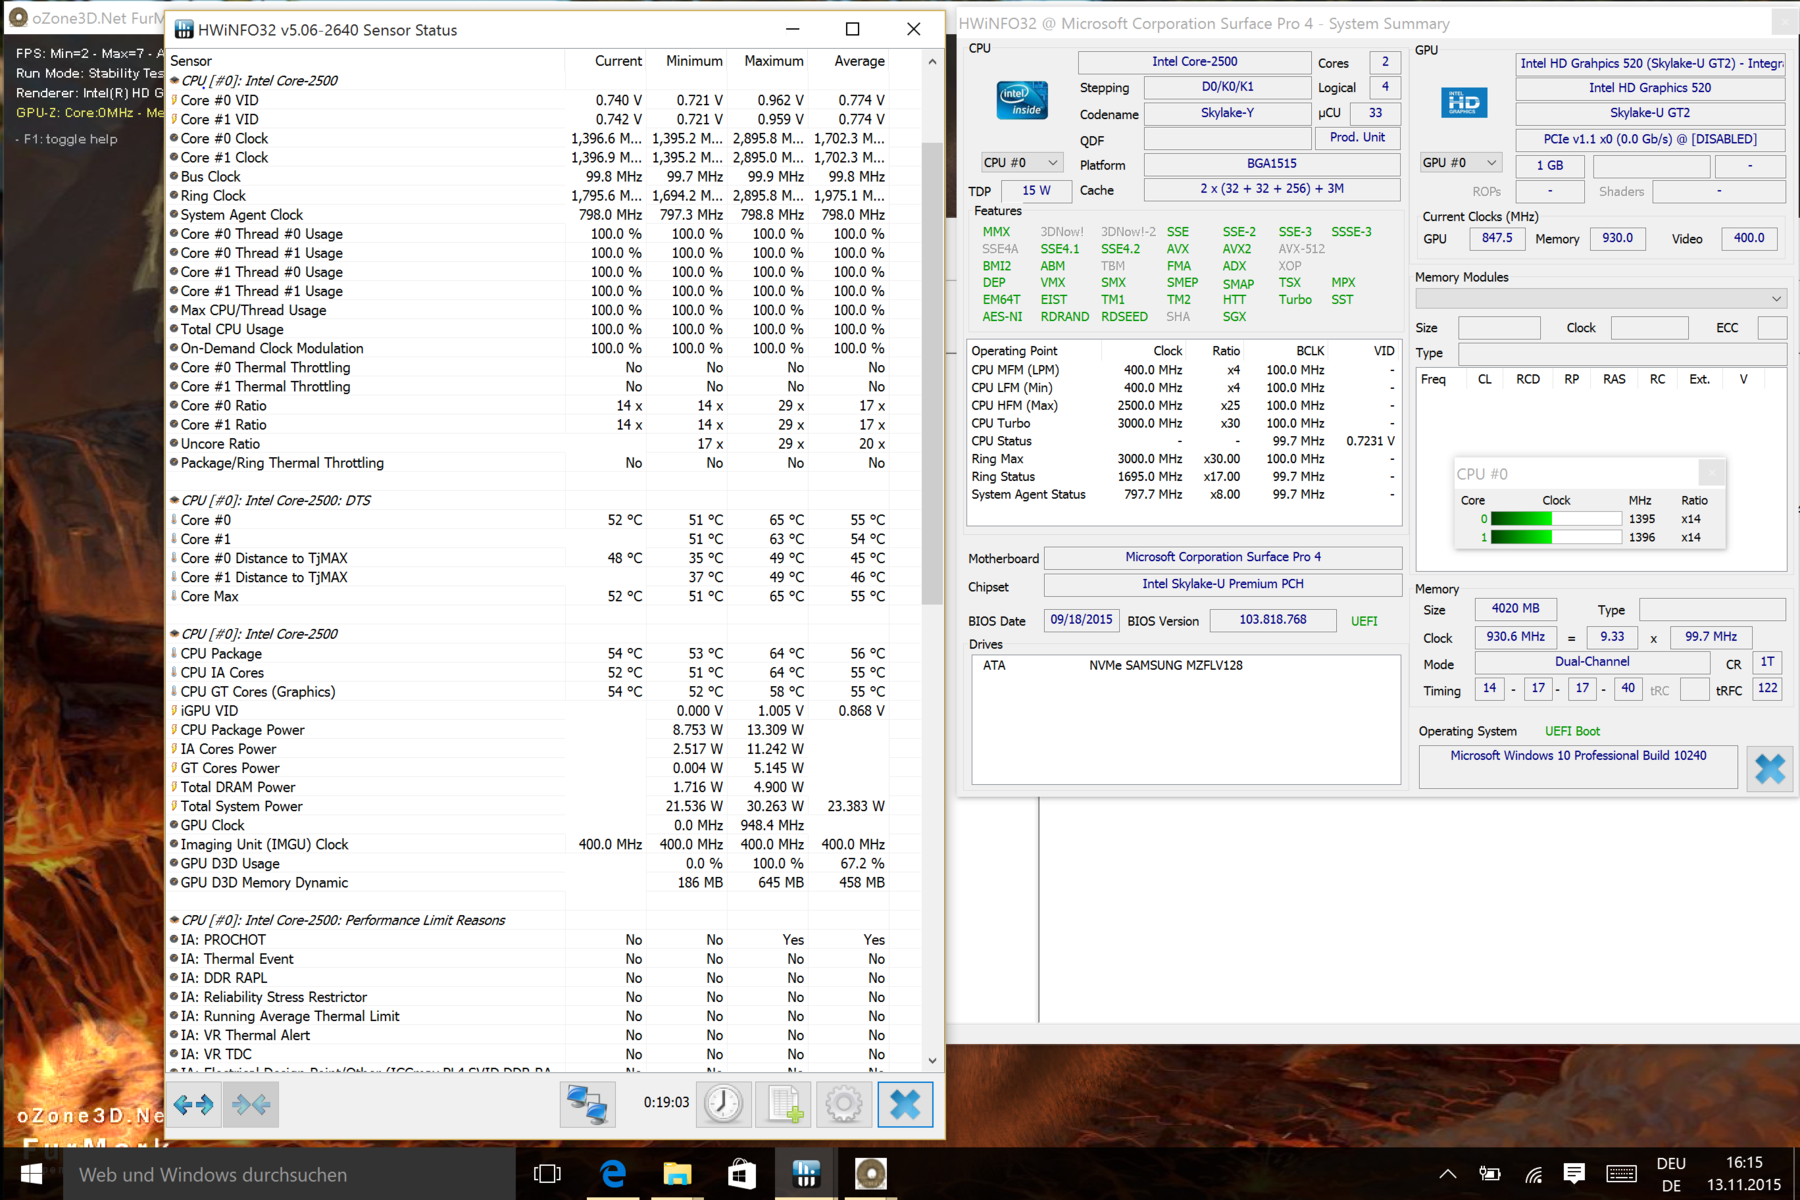
It gets really warm under extreme load; a maximum of 52 °C (~126 °F) at some spots can be uncomfortable on the lap or in the hands. At just 1.4 GHz in this case, the SoC is very far away from its reference clock, so there is strong throttling that starts right away. However, this stress test is designed to find the thermal limits of PCs, and the tablet manages to keep the chip at a steady temperature of 54 °C (~130 °F). It also reached up to 64 °C (~147 °F) at one time and obviously exceeded certain limits, which caused the throttling. We have already mentioned that the chip can maintain 2.9 GHz when you only stress the processor. Therefore, throttling is not a normal scenario but a thermal protection mechanism. This is also the reason for the similar benchmark scores after the stress test and with a cold machine.
(-) The maximum temperature on the upper side is 52.3 °C / 126 F, compared to the average of 35.3 °C / 96 F, ranging from 19.6 to 60 °C for the class Convertible.
(-) The bottom heats up to a maximum of 51.4 °C / 125 F, compared to the average of 36.8 °C / 98 F
(±) In idle usage, the average temperature for the upper side is 36 °C / 97 F, compared to the device average of 30.3 °C / 87 F.
(-) The palmrests and touchpad can get very hot to the touch with a maximum of 52.3 °C / 126.1 F.
(-) The average temperature of the palmrest area of similar devices was 27.9 °C / 82.2 F (-24.4 °C / -43.9 F).
Comparison Surface Pro 4 Core m3
(±) The maximum temperature on the upper side is 43.6 °C / 110 F, compared to the average of 35.3 °C / 96 F, ranging from 19.6 to 60 °C for the class Convertible.
(-) The bottom heats up to a maximum of 45.2 °C / 113 F, compared to the average of 36.8 °C / 98 F
(+) In idle usage, the average temperature for the upper side is 29.8 °C / 86 F, compared to the device average of 30.3 °C / 87 F.
(±) The palmrests and touchpad can get very hot to the touch with a maximum of 36.8 °C / 98.2 F.
(-) The average temperature of the palmrest area of similar devices was 27.9 °C / 82.2 F (-8.9 °C / -16 F).
| Surface Pro 4 (Core i5) HD Graphics 520, 6300U, Samsung MZFLV128 NVMe | Surface Pro 4 (Core m3) HD Graphics 515, 6Y30, Samsung MZFLV128 NVMe | Surface Pro 3 HD Graphics 4400, 4300U, Hynix HFS128G3MNM | Apple iPad Air 2 PowerVR GXA6850, A8X, 128 GB eMMC Flash | Dell XPS 13-9343 HD Graphics 5500, 5200U, Lite-On IT L8T-256L9G | Surface Book (i5) Maxwell GPU (940M, GDDR5), 6300U, Samsung MZFLV256 NVMe | |
|---|---|---|---|---|---|---|
| Heat | 18% | 12% | 22% | 21% | 27% | |
| Maximum Upper Side * (°C) | 52.3 | 43.6 17% | 45.2 14% | 36.2 31% | 40.6 22% | 44.2 15% |
| Maximum Bottom * (°C) | 51.4 | 45.2 12% | 46.4 10% | 42.8 17% | 41.2 20% | 41.2 20% |
| Idle Upper Side * (°C) | 43.2 | 32.4 25% | 35.2 19% | 31 28% | 31.2 28% | 26 40% |
| Idle Bottom * (°C) | 36 | 29.6 18% | 34.4 4% | 32 11% | 30.6 15% | 23.8 34% |
* ... smaller is better
Lautsprecher (copy 1)
Energy Management
Power Consumption
We did not measure the power consumption of the Surface Pro 4 (Core m3). Compared to the iPad Air 2 with an ARM platform, the reviewed Core version has a comparatively high consumption for a tablet in this size. 10 watts while idling at the maximum luminance and with the Type Cover are similar to what we determine for 13/15-inch notebooks. Yes, those devices are usually not as bright, but some devices based on the Broadwell architecture only consume 4 - 5 watts while idling.
| Off / Standby | |
| Idle | |
| Load |
|
Key:
min: | |
Battery Runtime
The rather high power consumption while idling results in poor battery runtimes. The small difference between the maximum idle runtime and the stamina in the Wi-Fi test at 150 nits (60%) is striking. We performed all runtime tests without the Type Cover. The Surface Pro 4 is far away from the advertised 9 hours, it seems that someone just copied the specs from the m3 model. The latter manages more than eight hours in the same test and does not only run for 6 but 13 hours while idling. Our assumptions were correct: If you want a Surface with good battery runtimes, you have to get the m3 model.
Update 10/18/2015: Another attempt resulted in an idle runtime of 8:48 hours (528 minutes).
Update 11/20/2015: Two re-runs of the Wi-Fi test resulted in 7:07 and 7:00 hours, respectively, at a brightness of 60%. This time, we activated the "Energy-Saving mode" of the Surface Pro 4, but with the power profile "Balanced", which is the only one that is available.
| Surface Pro 4 (Core i5) | Surface Pro 4 (Core m3) | Surface Pro 3 | Apple iPad Air 2 | Dell XPS 13-9343 | Surface Book (i5) | |
|---|---|---|---|---|---|---|
| Battery runtime | 8% | 17% | 68% | 11% | 17% | |
| Reader / Idle (h) | 15 | 13.2 -12% | 18.3 22% | 22.7 51% | 15.2 1% | 17.8 19% |
| WiFi v1.3 (h) | 7.1 | 8.1 14% | 6.7 -6% | |||
| Load (h) | 1.9 | 2.3 21% | 2.1 11% | 3.5 84% | 2.3 21% | 2.6 37% |
| WiFi (h) | 8.4 | 10.5 | 9.7 | |||
| H.264 (h) | 9.4 | 10.1 |
Pros
Cons
Verdict
Microsoft makes it actually pretty easy for the customer: The prices for all versions of the Surface Pro 4 are quite high, the m3 version (here in review) is almost as expensive as the comparable Core i5 model with a 128 GB SSD. We now know the reason why: The m3 version is not a low-cost entry-level model, but just manages by far the longest runtimes. If your Surface Pro 4 has to manage a whole day, there is now an alternative to this model.
If you are primarily looking for a Surface to replace a laptop on your desk and just sometimes take it to meetings, then the Core i5 version could be the better choice. The performance (CPU, GPU, and SSD) can easily keep up with good 15-Watt subnotebooks like the Dell XPS 13 (2015). In combination with a docking station and an external monitor (Mini-DisplayPort), you will get a practical overall concept.
It seems that the entry-level model of the series with the Intel Core m3 is the best overall package. The i5 model is more powerful, but the battery runtimes take a serious hit.
You can use our in-depth review of the Surface Pro 4 with the Intel Core m3 for more information about all the other features of the 12-inch device, including the build quality, the connectivity and the cameras.
Microsoft Surface Pro 4, Core i5, 128GB
- 04/18/2016 v5.1 (old)
Sebastian Jentsch
Price comparison

