Surface Book with Performance Base Review – 1 TB SSD Update
For the original German review, see here.
You currently pay a hefty premium of $1100 ($3199; base model $2099) for an additional 768 GB of SSD storage and 8 GB of RAM extra. This is a lot, but not unusual for high-end SKUs with a limited user interest. We will check the performance difference compared to the entry-level version. A comprehensive review for the 256 GB model with measurements for the display as well as the fan noise, speakers, keyboard, and many more, is available here.
1 TB SSD from Samsung
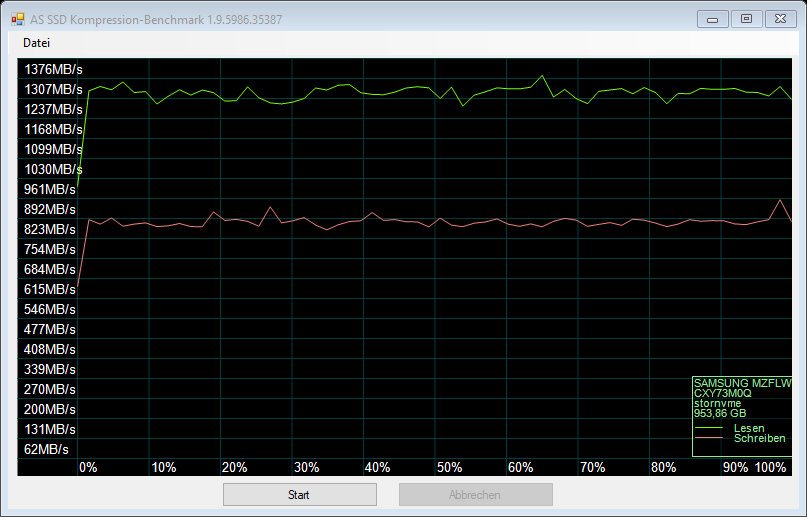
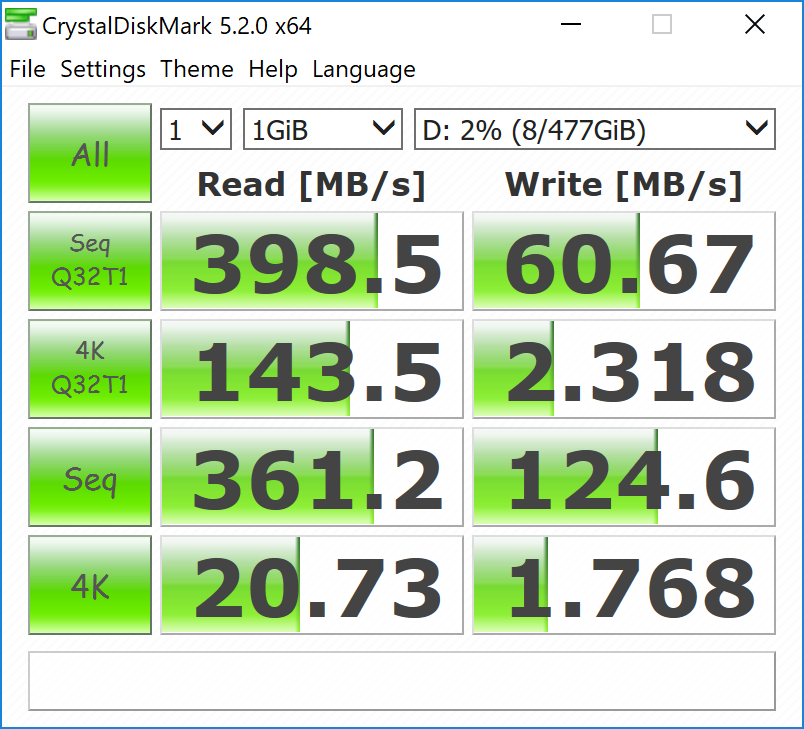
Our test model from Microsoft Austria is equipped with an M.2 SSD from Samsung. It has the designation MZFLW1T0 with a storage capacity of 1 TB. It uses the NVMe protocol just like the 256 GB model in the entry-level and has a similar problem with the write operations in the AS SSD benchmark. CrystalDiskMark on the other hand shows similar performance figures to the entry-level model.
However, the Samsung MZFLW1T0 cannot keep up with fast M.2 NVMe desktop SSDs. Even 950 Pro as well as 960 Pro are about 66% faster in CrystalDiskMark (e.g. Schenker XMG U727). The Samsung is also just behind the 1 TB SSD in the 2016 MacBook Pro models; but is much faster in the important 4K tests in return.
| Microsoft Surface Book with Performance Base GeForce GTX 965M, 6600U, Samsung MZFLW1T0HMLH | Microsoft Surface Book with Performance Base GeForce GTX 965M, 6600U, Toshiba NVMe THNSN5256GPU7 | Eurocom Tornado F5 GeForce GTX 1070 Mobile, i7-7700K, Samsung SSD 960 Pro 512 GB m.2 | Samsung 960 Evo 250GB Titan X Pascal, E5-2680 v4, Samsung SSD 960 Evo 250GB m.2 NVMe | Apple MacBook Pro 15 2016 (2.9 GHz, 460) Radeon Pro 460, 6920HQ, Apple SSD SM1024L | |
|---|---|---|---|---|---|
| CrystalDiskMark 3.0 | 1% | 67% | 44% | 26% | |
| Write 4k QD32 (MB/s) | 376.4 | 347.1 -8% | 634 68% | 410.2 9% | 562 49% |
| Read 4k QD32 (MB/s) | 379.5 | 326.9 -14% | 744 96% | 480.8 27% | 679 79% |
| Write 4k (MB/s) | 120.4 | 108.6 -10% | 180.6 50% | 77.4 -36% | 10.9 -91% |
| Read 4k (MB/s) | 41.79 | 40.91 -2% | 55.9 34% | 34.36 -18% | 9.786 -77% |
| Write 512 (MB/s) | 776 | 698 -10% | 967 25% | 1246 61% | 1058 36% |
| Read 512 (MB/s) | 425.8 | 687 61% | 715 68% | 1088 156% | 914 115% |
| Write Seq (MB/s) | 988 | 861 -13% | 1724 74% | 1563 58% | 1440 46% |
| Read Seq (MB/s) | 990 | 1017 3% | 2145 117% | 1920 94% | 1458 47% |
| AS SSD | -51% | 575% | 401% | 354% | |
| Copy Game MB/s (MB/s) | 721 | 1310 82% | 833 16% | ||
| Copy Program MB/s (MB/s) | 344 | 635 85% | 355.8 3% | ||
| Copy ISO MB/s (MB/s) | 1002 | 1614 61% | 1198 20% | 1478 48% | |
| Score Total (Points) | 2004 | 352 -82% | 3943 97% | 3614 80% | 3320 66% |
| Score Write (Points) | 65 | 14 -78% | 1689 2498% | 1195 1738% | 750 1054% |
| Score Read (Points) | 1318 | 247 -81% | 1512 15% | 1637 24% | 1718 30% |
| Access Time Write * (ms) | 4 | 2.506 37% | 0.024 99% | 0.052 99% | |
| Access Time Read * (ms) | 0.082 | 0.03 | 0.076 | 0.313 | |
| 4K-64 Write (MB/s) | 45 | 2.05 -95% | 1334 2864% | 971 2058% | 551 1124% |
| 4K-64 Read (MB/s) | 1152 | 104.5 -91% | 1179 2% | 1352 17% | 1494 30% |
| 4K Write (MB/s) | 1.63 | 150.5 | 71.4 | 12.93 | |
| 4K Read (MB/s) | 34 | 34.95 3% | 51 50% | 30.59 -10% | 10.53 -69% |
| Seq Write (MB/s) | 198 | 98.6 -50% | 2046 933% | 1522 669% | 1866 842% |
| Seq Read (MB/s) | 1310 | 1072 -18% | 2819 115% | 2549 95% | 2133 63% |
| Total Average (Program / Settings) | -25% /
-26% | 321% /
372% | 223% /
258% | 190% /
200% |
* ... smaller is better
Practical Experiences with the SSD
Unfortunately, we do not have any results in AS SSD's copy benchmark for the 256 GB version, but we can see a big deficit compared to the faster 960 M.2-SSDs. The MacBook Pro 15 is also much faster in the ISO copy test (the only one that worked).
The PCMark 8 Storage Test simulates typical load scenarios. The performance is a bit better than the 256 GB model (-1%) and just behind the Apple SSD inside the MBP 15 (+1%).
| Microsoft Surface Book with Performance Base GeForce GTX 965M, 6600U, Samsung MZFLW1T0HMLH | Microsoft Surface Book with Performance Base GeForce GTX 965M, 6600U, Toshiba NVMe THNSN5256GPU7 | Apple MacBook Pro 15 2016 (2.9 GHz, 460) Radeon Pro 460, 6920HQ, Apple SSD SM1024L | Microsoft Surface Pro 4 Core i7 Iris Graphics 540, 6650U, Samsung MZFLV256 NVMe | |
|---|---|---|---|---|
| Cinebench R15 | -4% | 57% | -6% | |
| CPU Single 64Bit (Points) | 140 | 139 -1% | 163 16% 156 11% | 132 -6% |
| CPU Multi 64Bit (Points) | 310.3 | 324 4% | 740 138% 729 135% | 342 10% |
| Ref. Match 64Bit (%) | 99.6 | 99.6 0% | 98 -2% | 97.8 -2% |
| OpenGL 64Bit (fps) | 79.2 | 64.9 -18% | 114.7 45% | 60.1 -24% |
| PCMark 8 | -6% | 12% | -1% | |
| Storage Score v2 (Points) | 4988 | 4927 -1% | 5061 1% | |
| Storage Score (Points) | 4662 | |||
| Work Score Accelerated v2 (Points) | 3964 | 3949 0% | 4755 20% | 4052 2% |
| Creative Score Accelerated v2 (Points) | 5033 | 4136 -18% | 4984 -1% | 4431 -12% |
| Home Score Accelerated v2 (Points) | 3188 | 3040 -5% | 4066 28% | 3394 6% |
| Total Average (Program / Settings) | -5% /
-5% | 35% /
39% | -4% /
-4% |
Application Performance
The second upgrade is the RAM equipment with a total of 16 GB. The combination with the SSD should also influence the application performance of the Surface Book. The Cinebench results are a bit surprising. The single-core performance is, as expected, on par, but the 256 GB model is 4% faster in the multi-core test. This should be a result of usual variances within the series as well as the cooling (maybe bad thermal paste application).
The lower multi-core performance should also affect the PCMark 8 performance, but the 16 GB model can still beat the 8 GB entry-level system. Both systems are on par in the Work test, while the 256 GB model is 18% slower in the Creative test.
| Microsoft Surface Book with Performance Base GeForce GTX 965M, 6600U, Samsung MZFLW1T0HMLH | Microsoft Surface Book with Performance Base GeForce GTX 965M, 6600U, Toshiba NVMe THNSN5256GPU7 | Apple MacBook Pro 15 2016 (2.9 GHz, 460) Radeon Pro 460, 6920HQ, Apple SSD SM1024L | Microsoft Surface Pro 4 Core i7 Iris Graphics 540, 6650U, Samsung MZFLV256 NVMe | |
|---|---|---|---|---|
| Cinebench R15 | 2% | 75% | 2% | |
| CPU Single 64Bit (Points) | 140 | 139 -1% | 163 16% 156 11% | 132 -6% |
| CPU Multi 64Bit (Points) | 310.3 | 324 4% | 740 138% 729 135% | 342 10% |
| PCMark 8 | -8% | 16% | -1% | |
| Work Score Accelerated v2 (Points) | 3964 | 3949 0% | 4755 20% | 4052 2% |
| Creative Score Accelerated v2 (Points) | 5033 | 4136 -18% | 4984 -1% | 4431 -12% |
| Home Score Accelerated v2 (Points) | 3188 | 3040 -5% | 4066 28% | 3394 6% |
| Total Average (Program / Settings) | -3% /
-4% | 46% /
50% | 1% /
0% |
Verdict
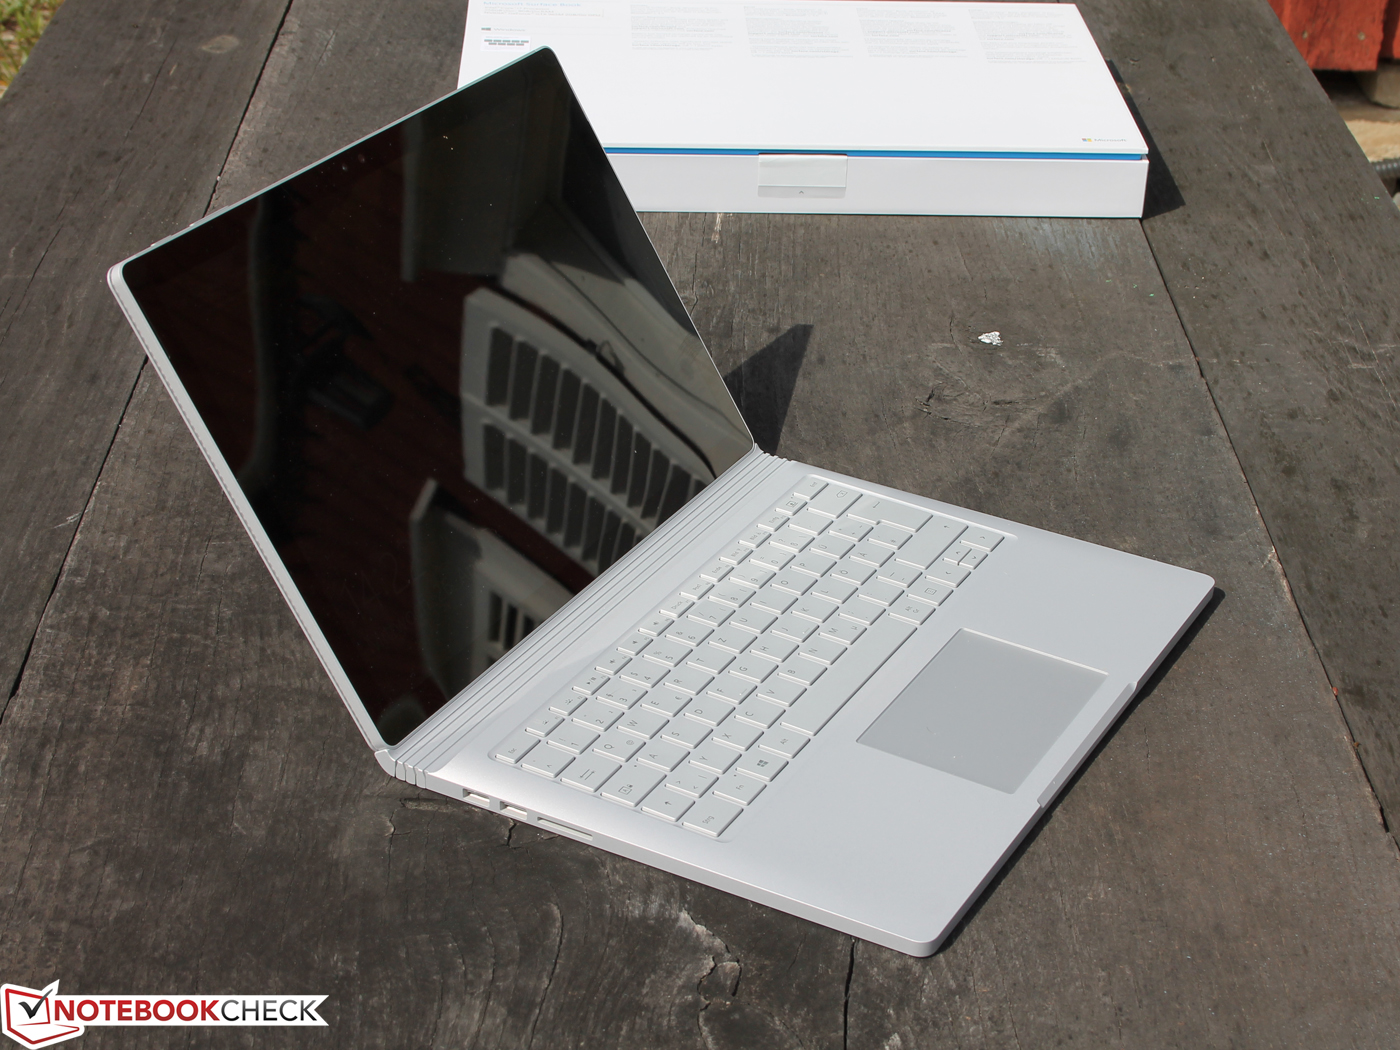
The top model of the Surface Book with Performance Base offers more storage capacity and twice as much RAM compared to the entry-level model. The performance of the SSD is on par with the base 256 GB model from Toshiba, so no gains in this respect. We can, however, notice the upgrade to 16 GB RAM in two out of three PCMark 8 tests. Still, this does not justify the hefty additional price of $1100. You should only get the high-end SKU if you really need 1 TB of storage capacity.
Please see our in-depth review for more information about the Microsoft Surface Book.
