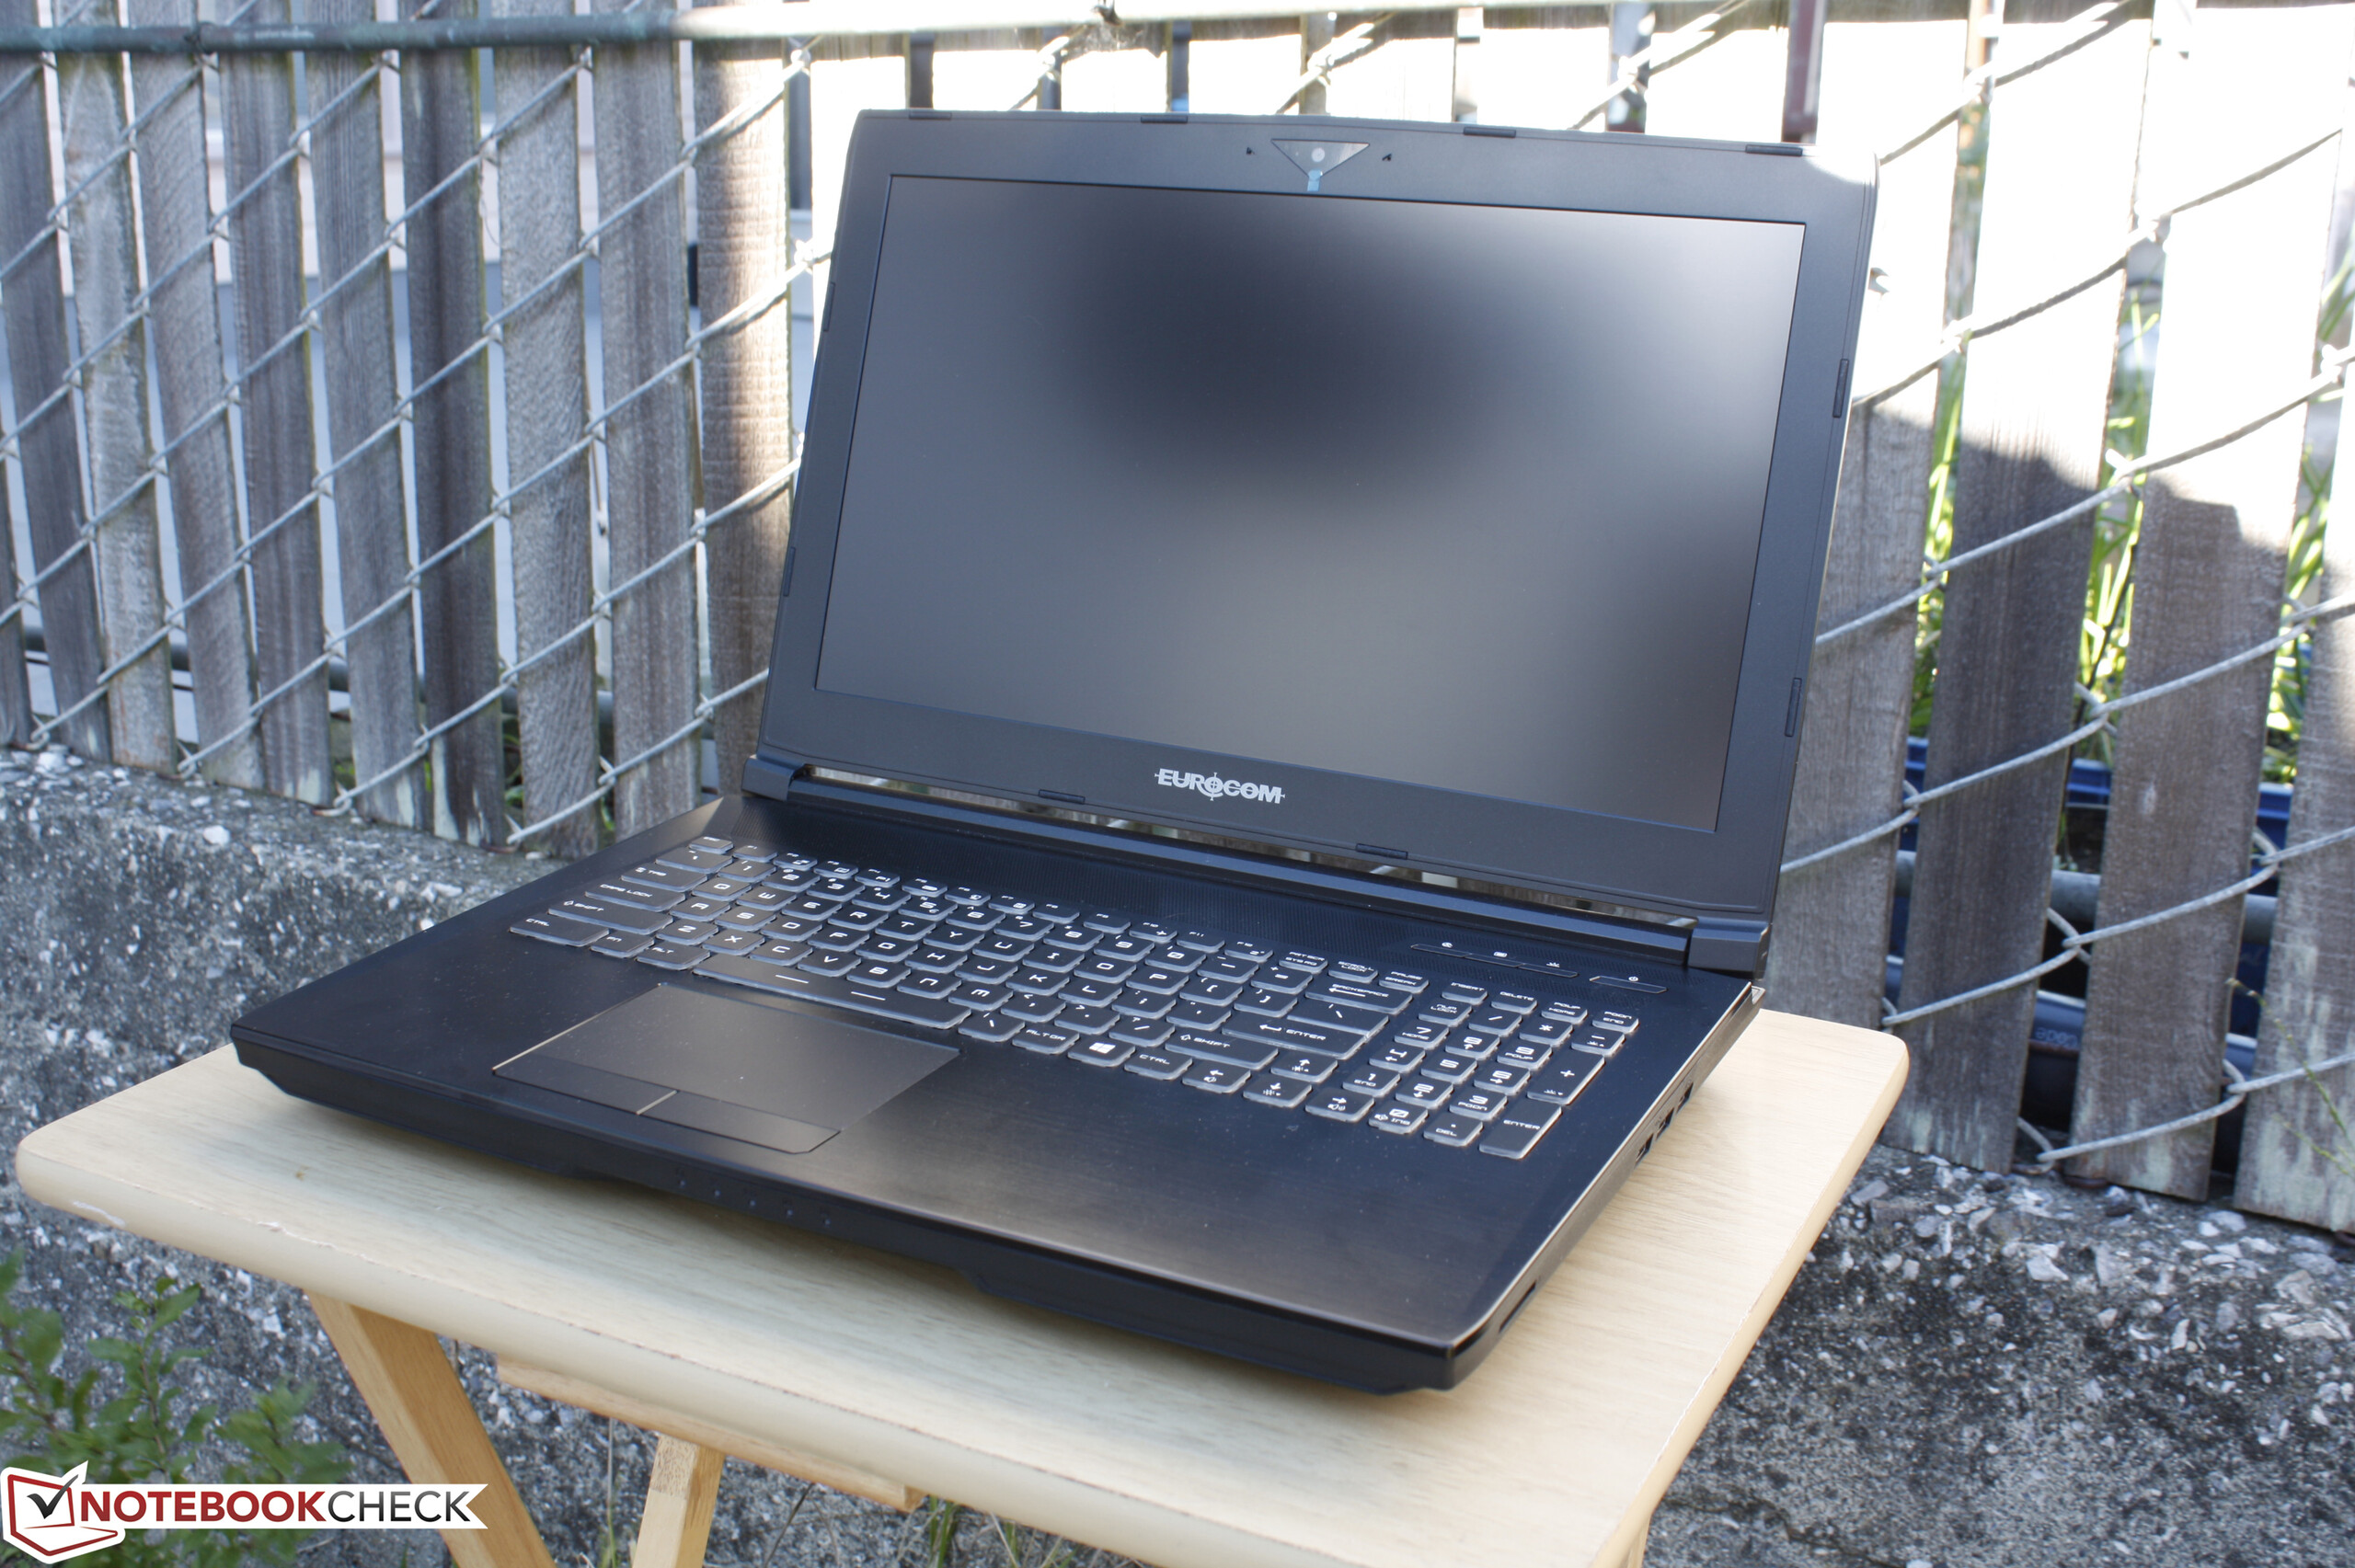
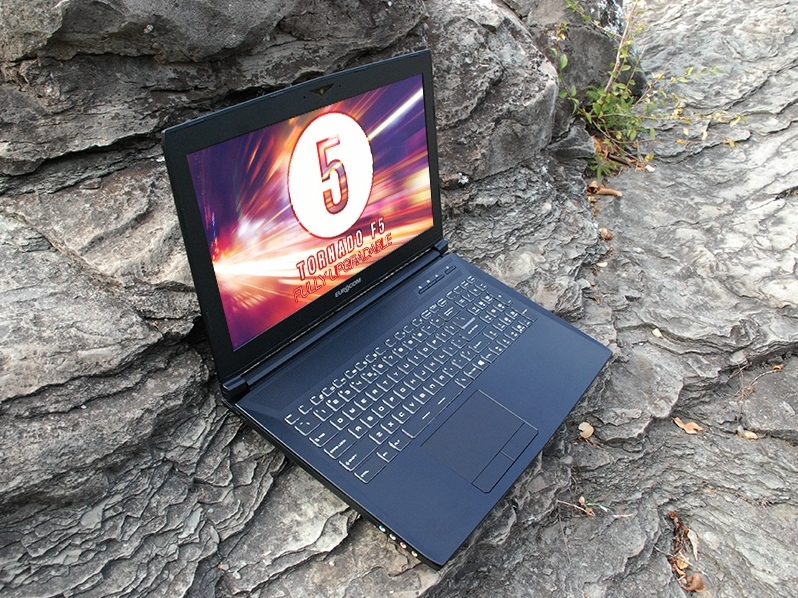
Eurocom Tornado F5 Notebook Review

The Tornado F5 is a unique series from Eurocom as it uses an in-house chassis design not derived from an existing barebones. Nonetheless, the notebook takes several cues from both Clevo and MSI in numerous aspects as the final product has the "feel" of an MSI system whilst having the vast internal options of a Clevo system.
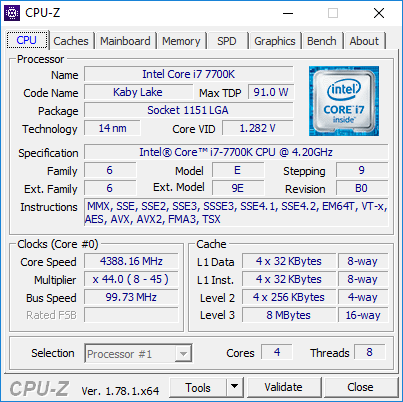
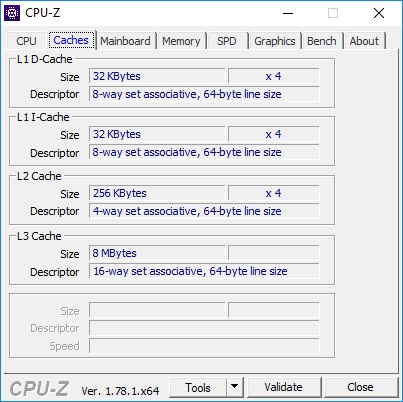
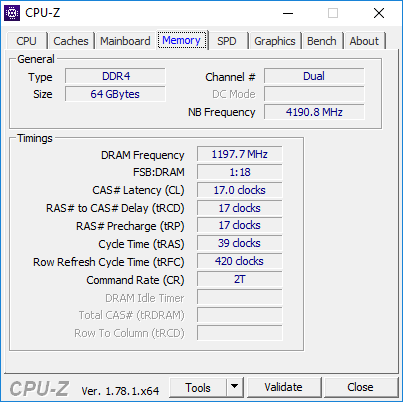
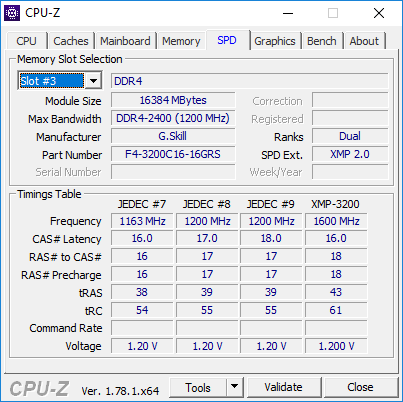
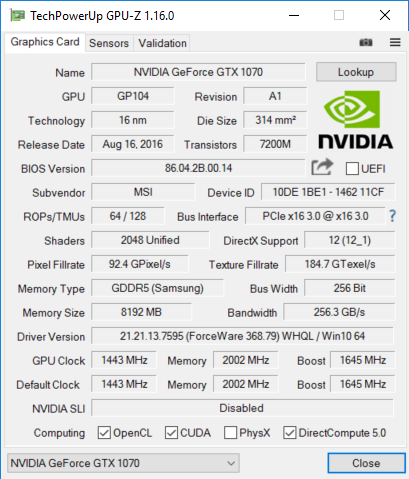
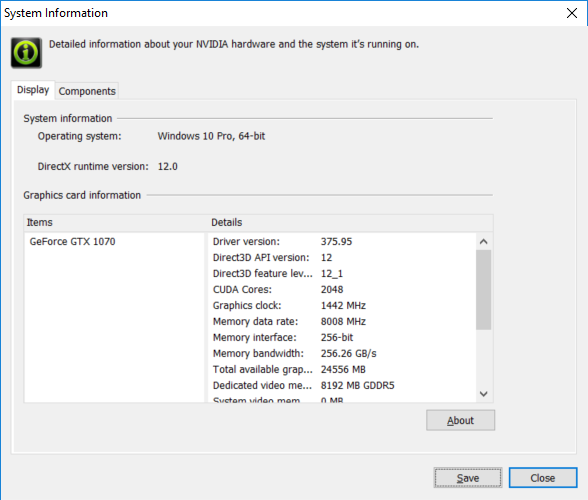
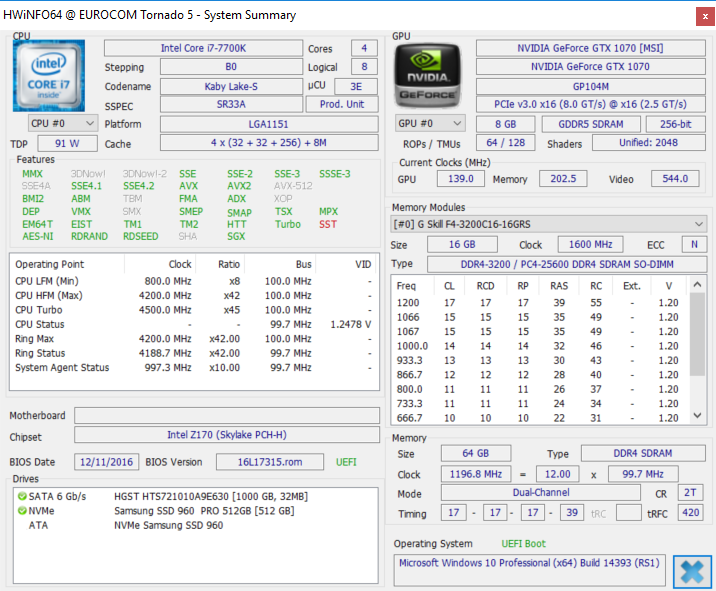
Our test unit is one of the first notebooks to ship pre-configured with an unlocked Core i7-7700K Kaby Lake CPU. Other core specifications and features are just as impressive including the removable GTX 1070 GPU, 64 GB of DDR4 RAM, and NVMe M.2 Samsung SSD. For this review, we want to see how well the new design compares against the competition in addition to how efficiently it can cool both a 91 W desktop CPU and an MXM Nvidia GPU.
Other 15.6-inch alternatives include:
Case
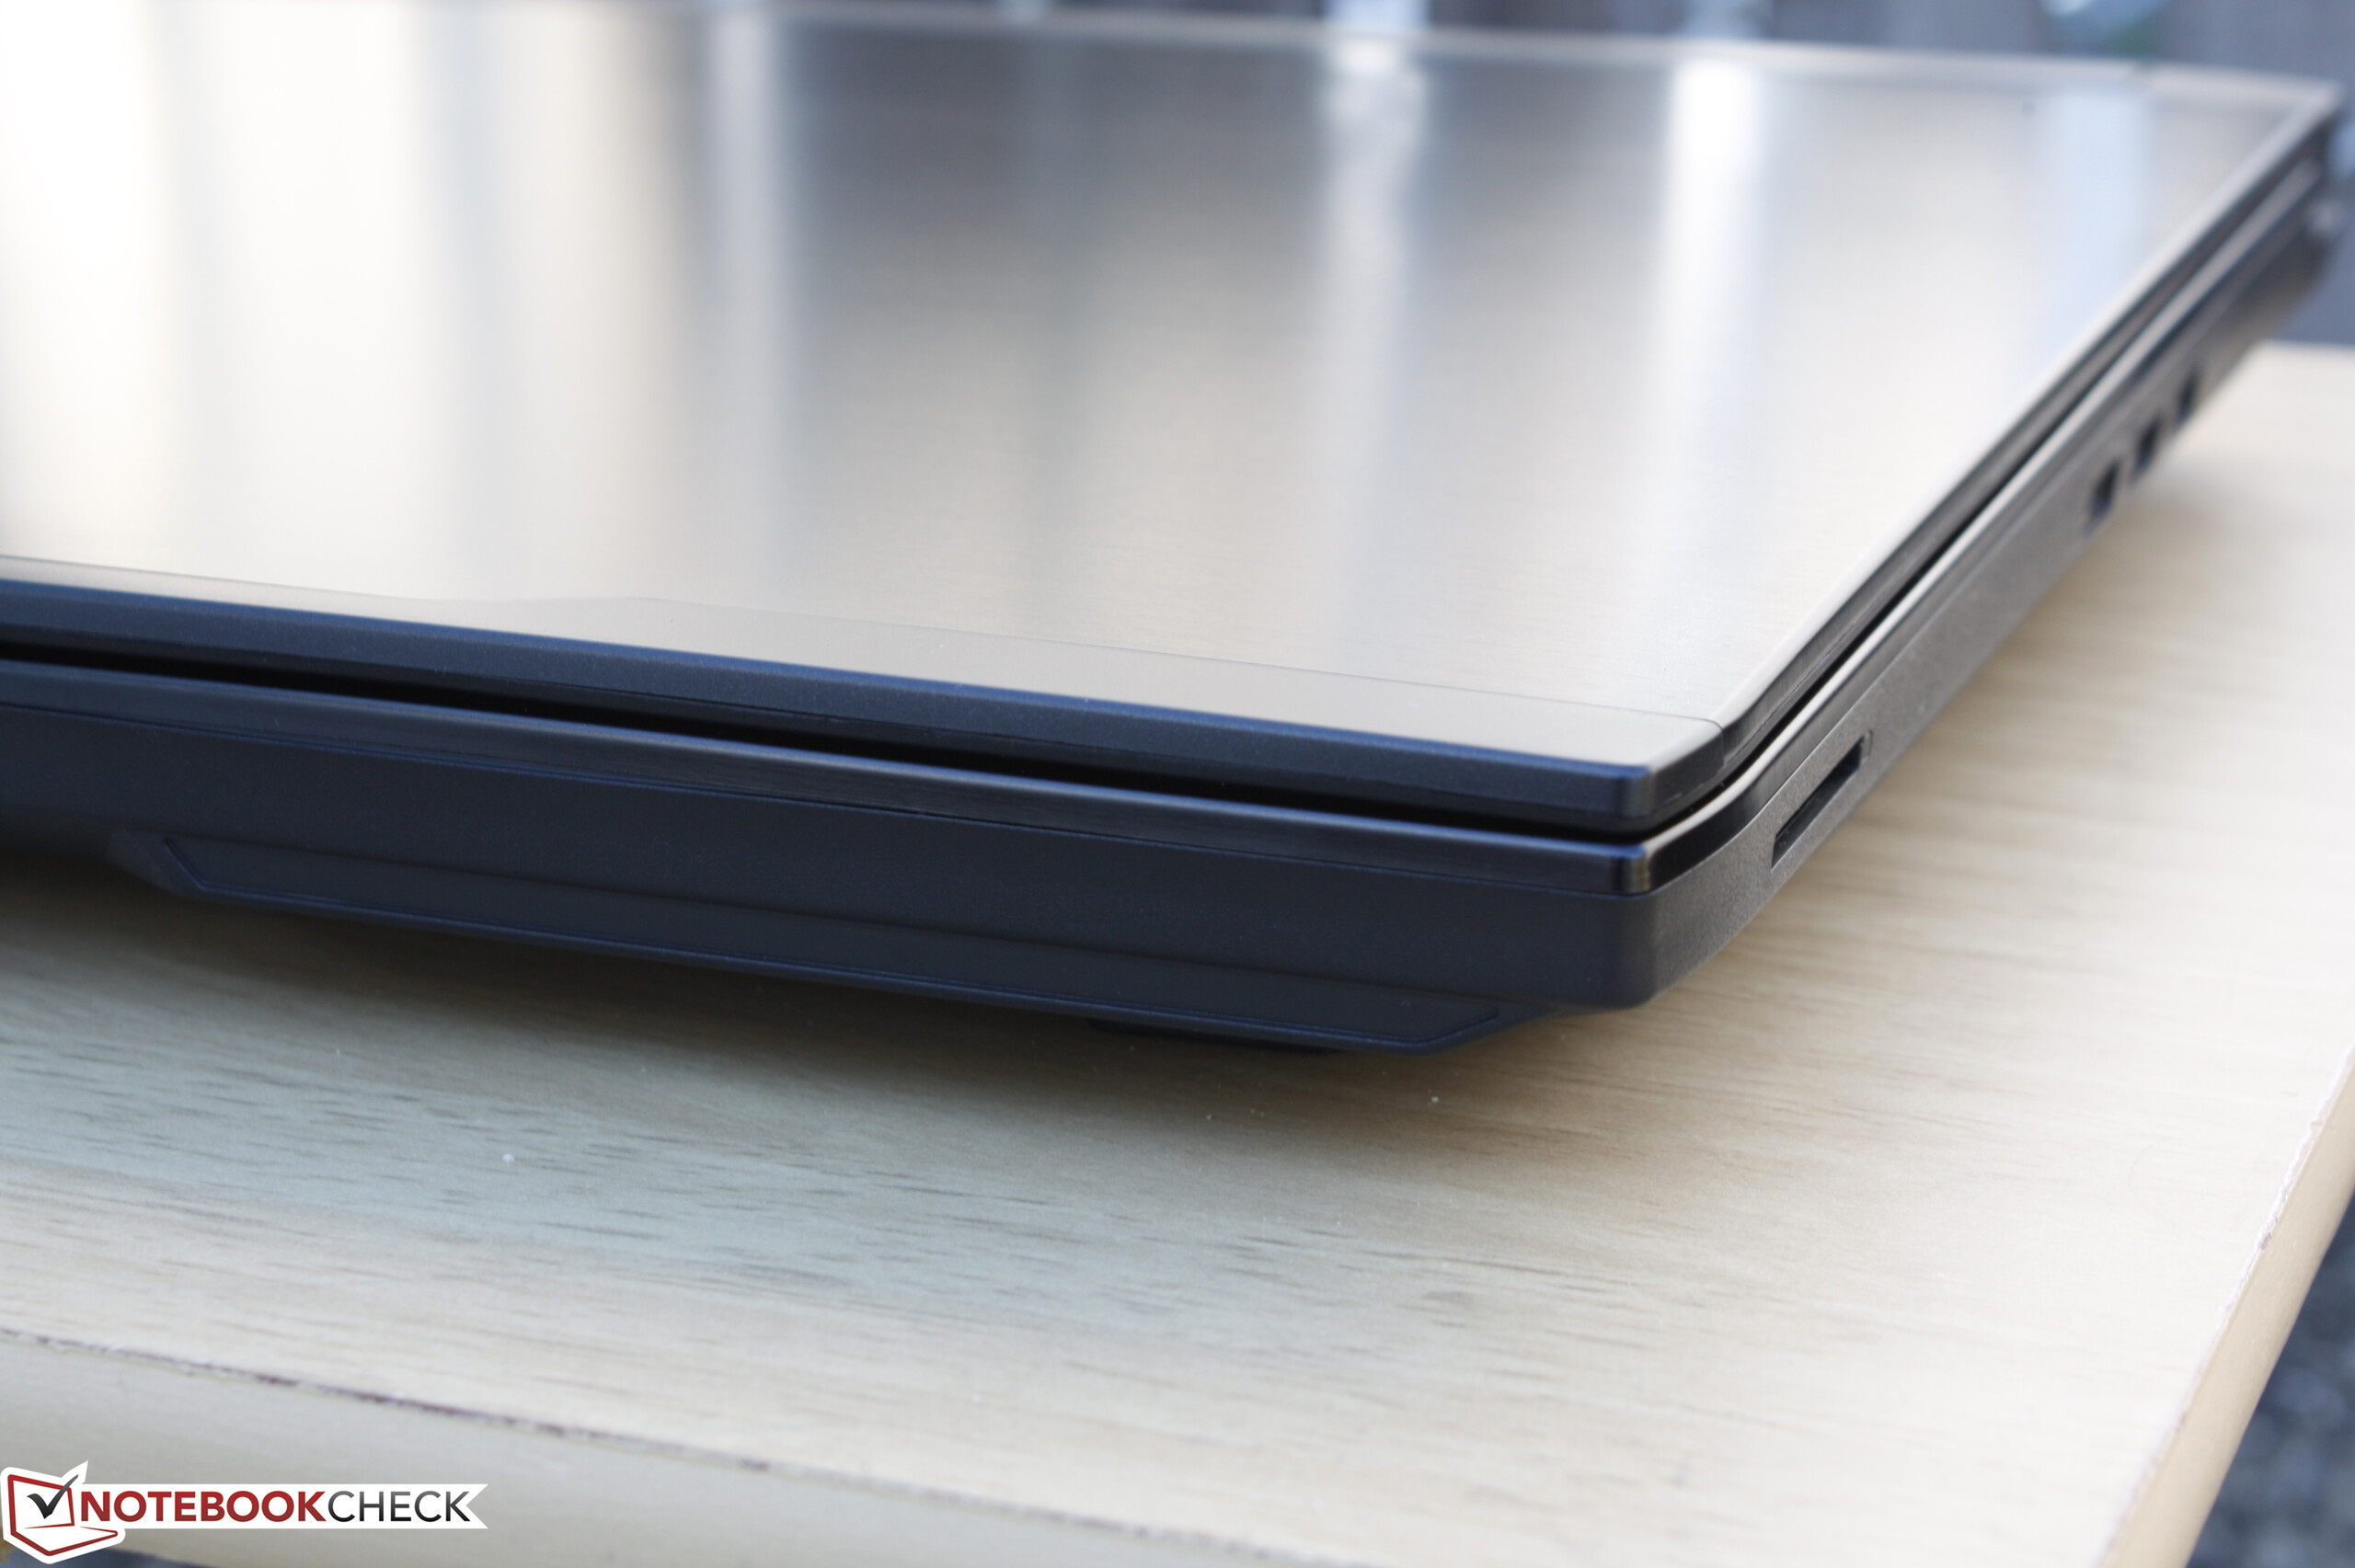
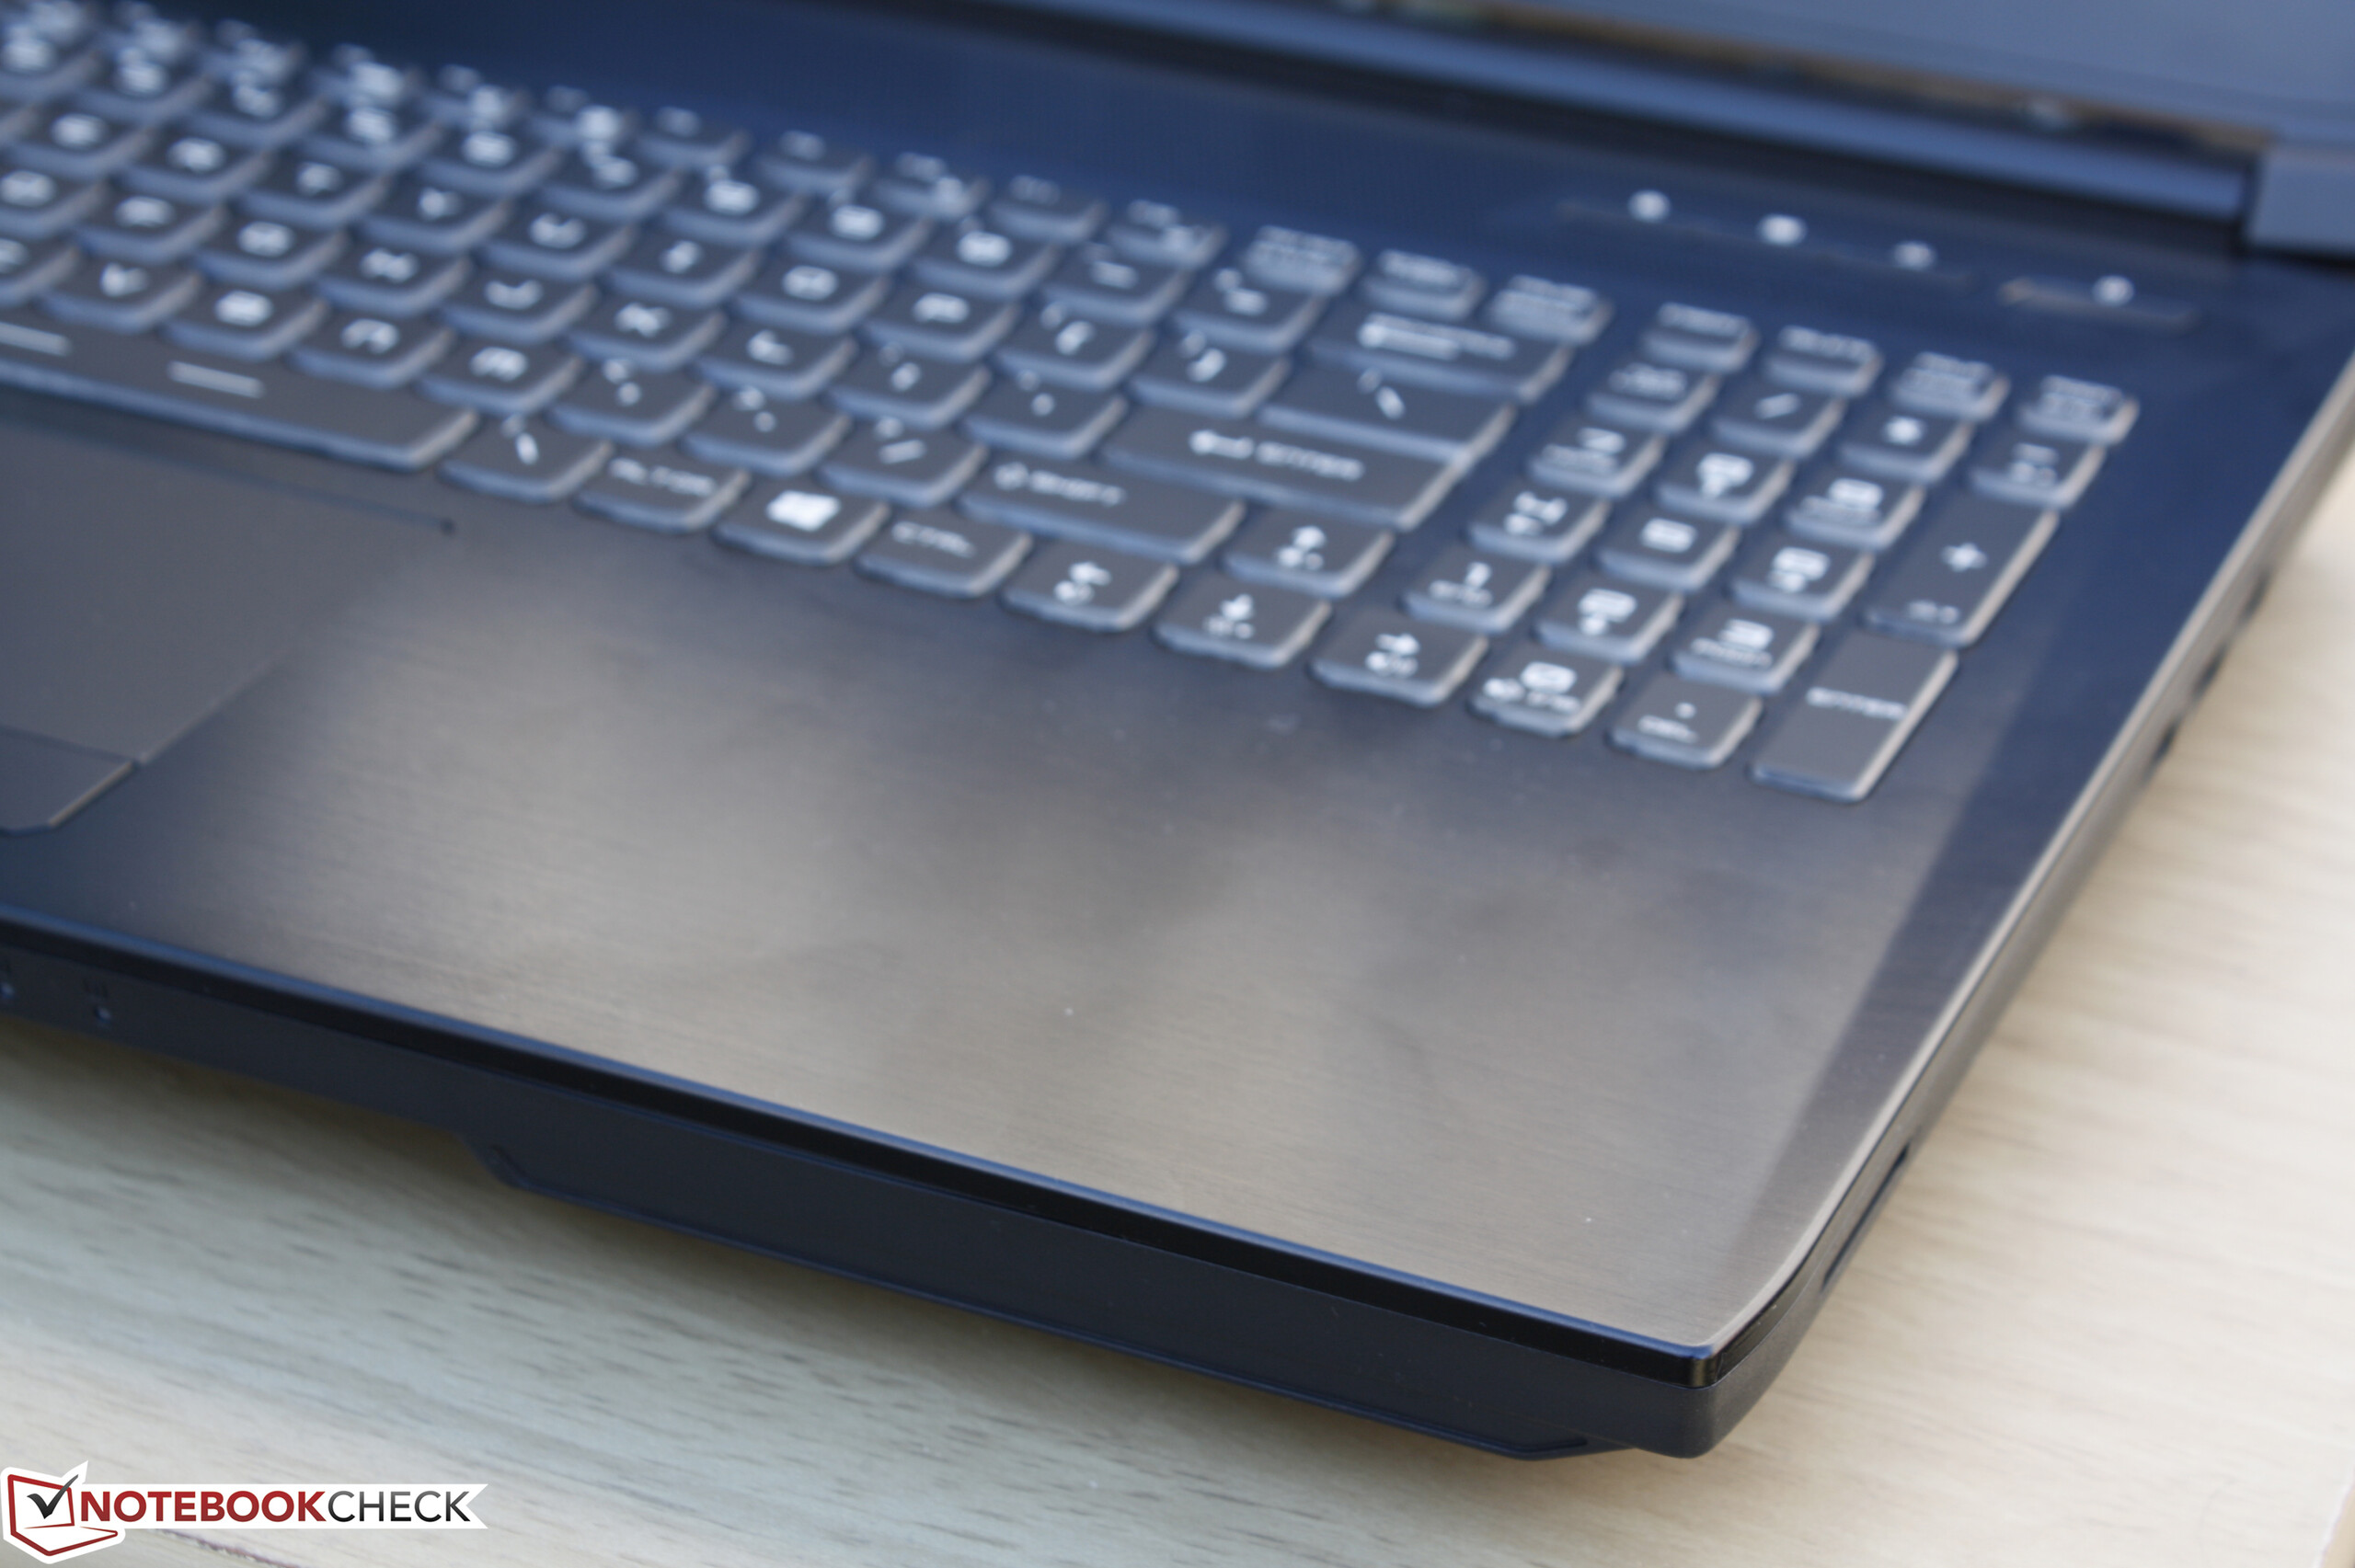
The chassis design is best described as a hybrid between the MSI GE62 and Eurocom P5 Pro Extreme. It's boxier than the GE62 with flatter edges and corners while incorporating many internal features of the P5 Pro such as the ability to run on desktop LGA 1151 CPUs and removable MXM 3.0 GPUs. The aluminum and plastic chassis is generally stable around the base, albeit weaker than on the P5 Pro as it is possible to slightly warp the keyboard or palm rest surfaces with a solid push of a finger. Otherwise, the base is resistant to twists with only very minimal creaking when attempting to bend its corners.
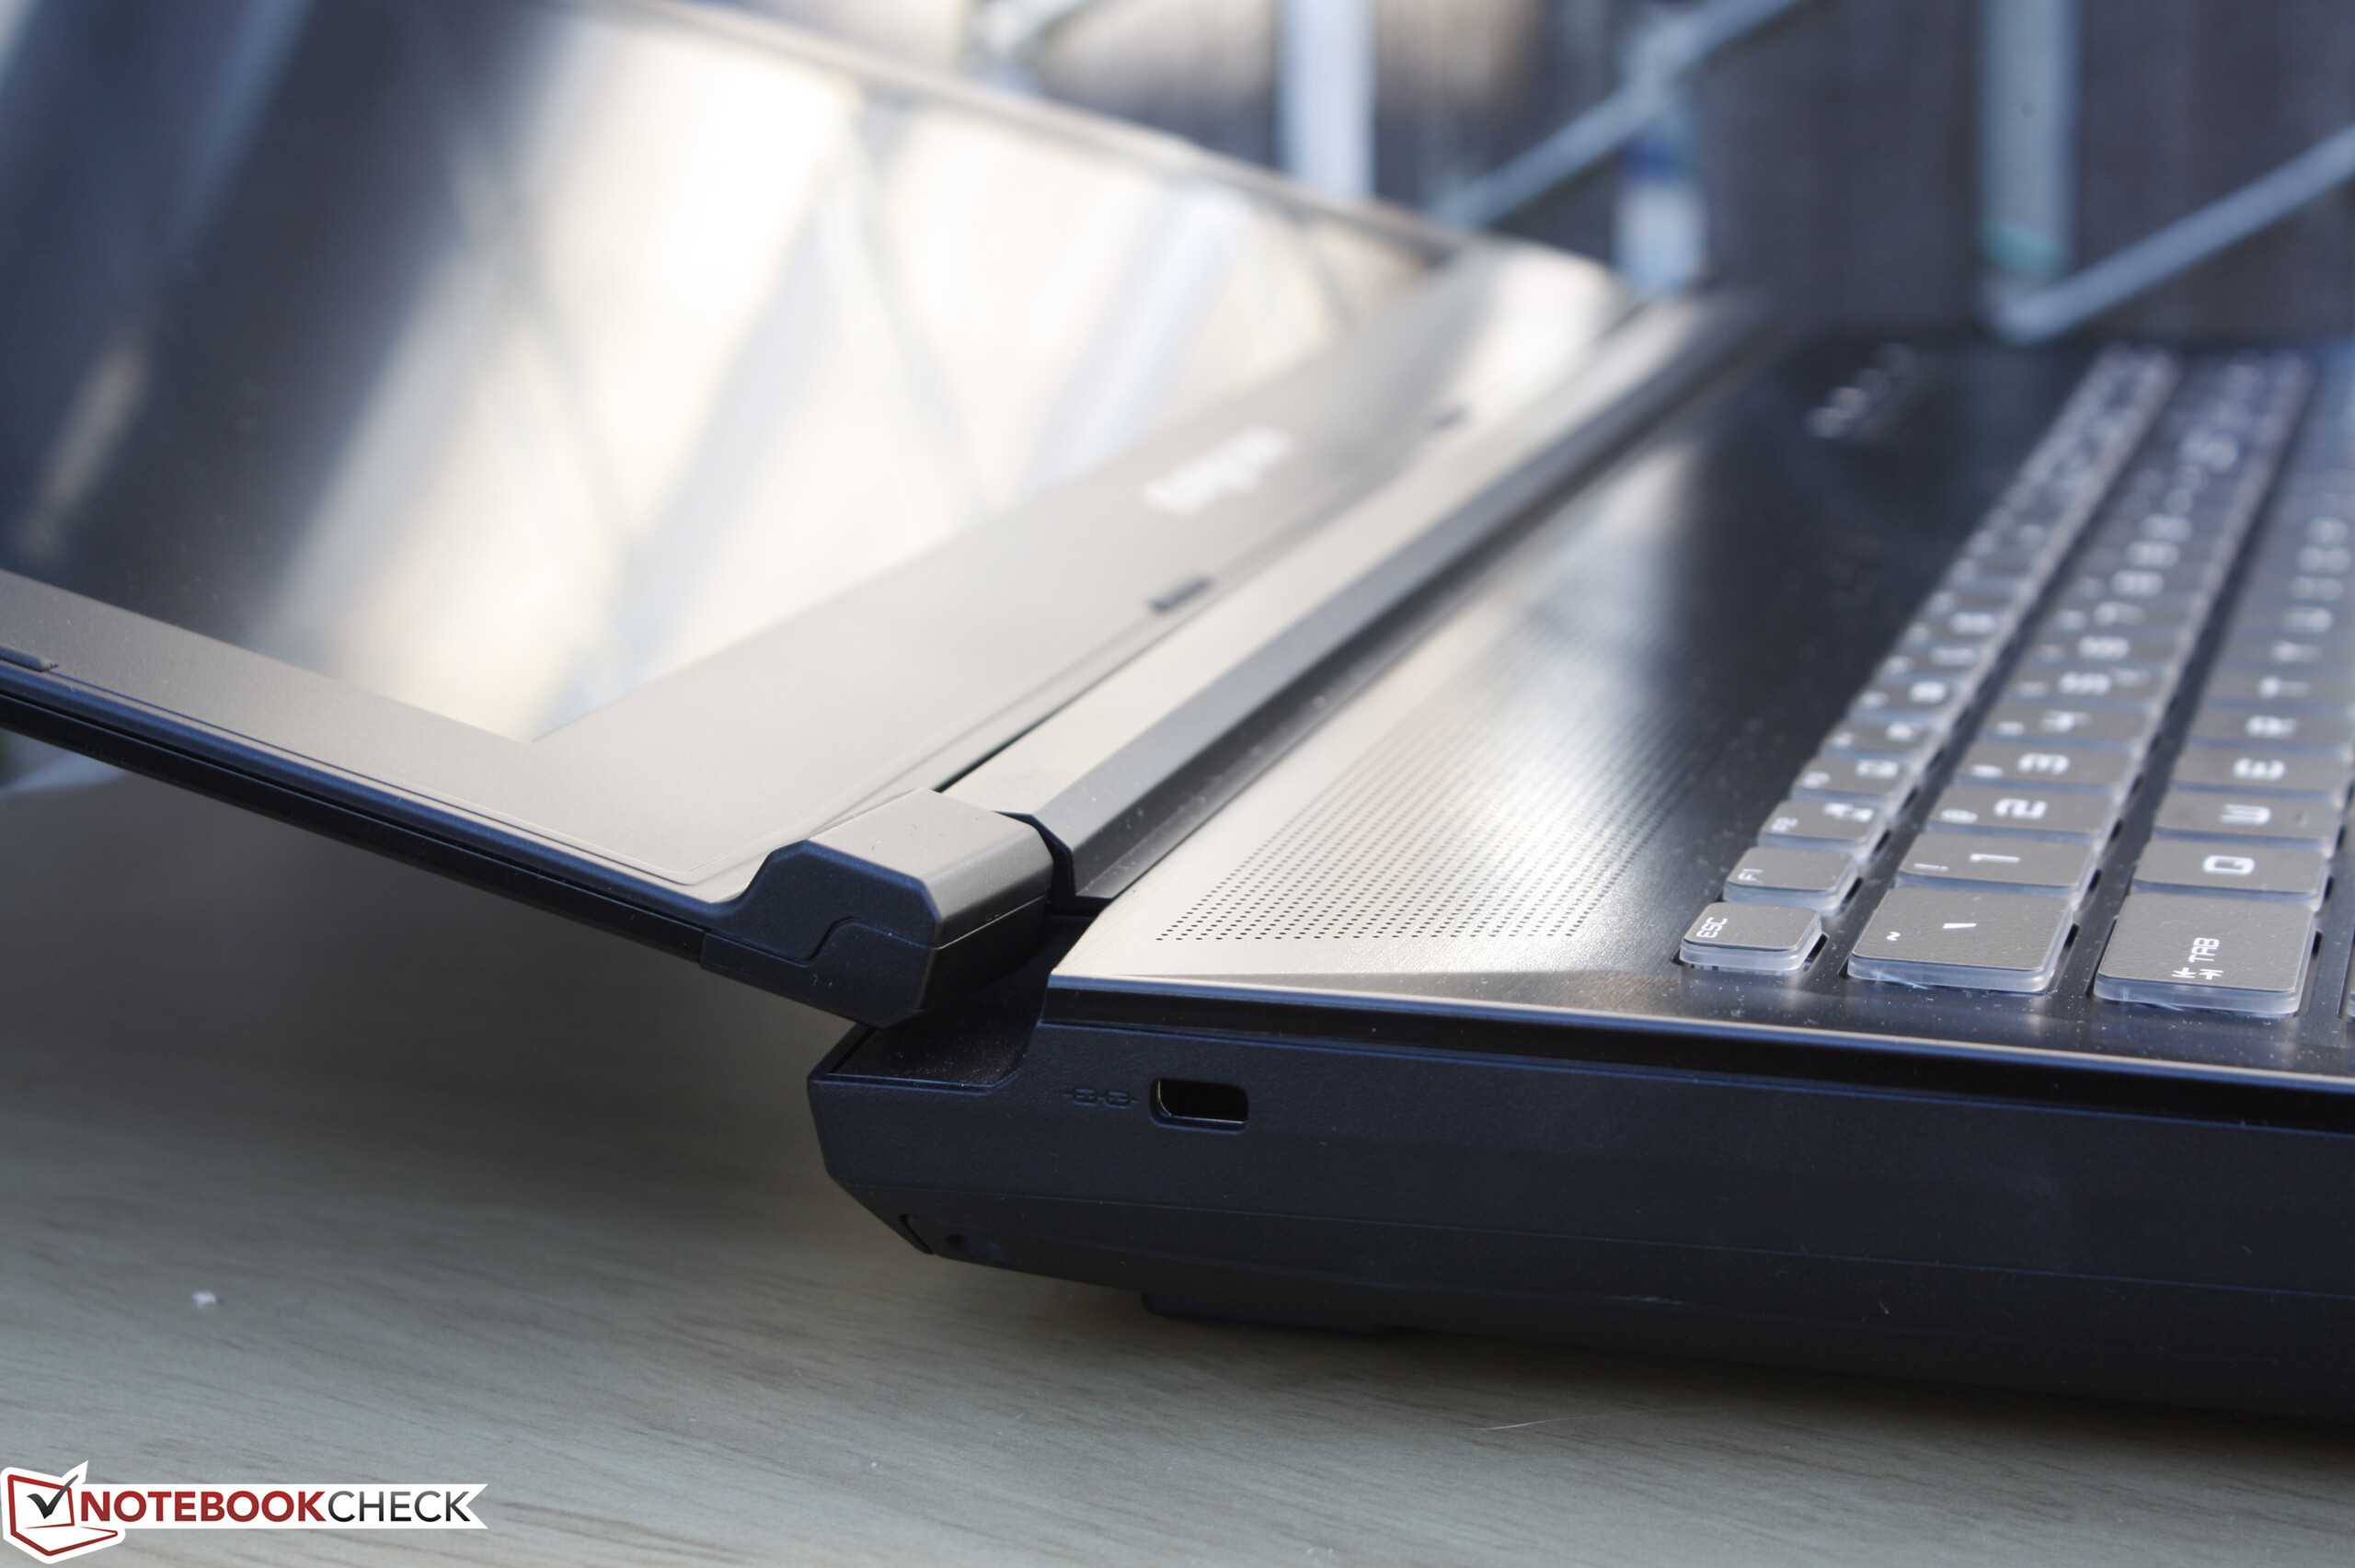
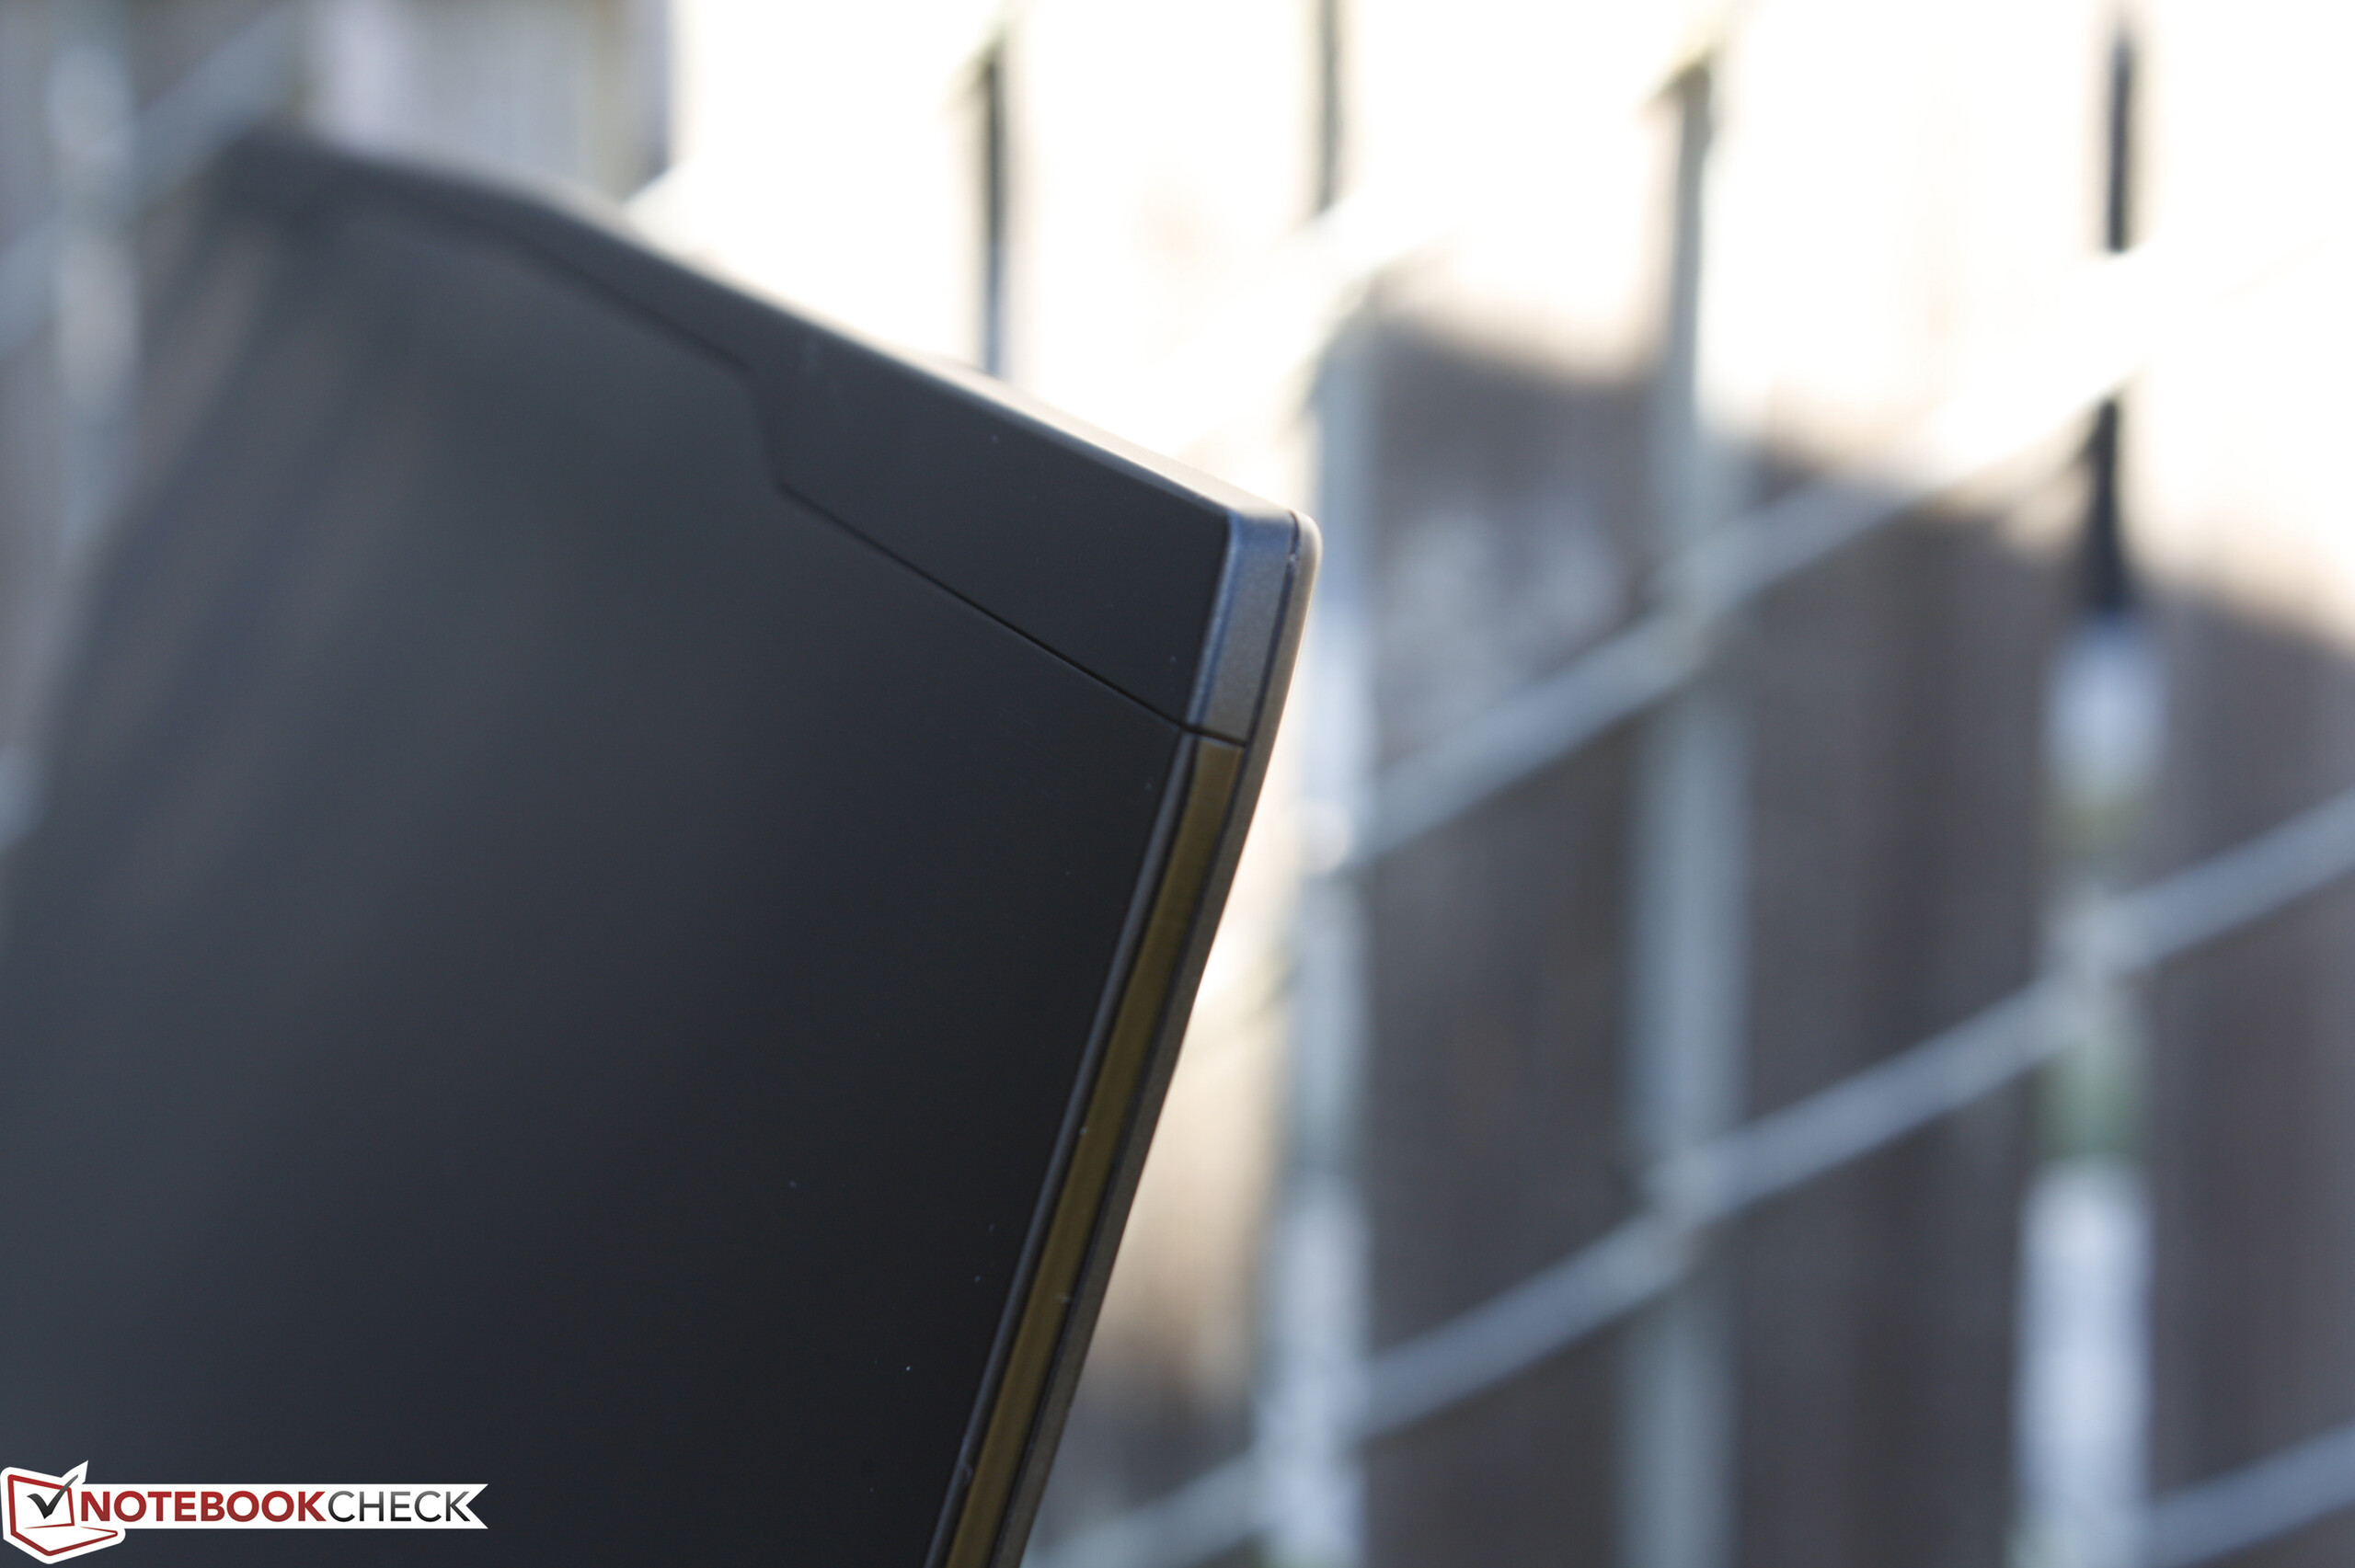
The lid is the most fragile part of the Tornado F5. It's unfortunately more flexible and prone to damage compared to other notebooks of its size class as its thin surfaces bend and warp a little too easily. Part of this can be attributed to the small corner hinges (as opposed to the single-bar solution on the Clevo P870DM3) as the lid is subsequently weaker down its center. The hinges are otherwise rigid enough to prevent teetering when typing and can allow the display to open up to 170 degrees.
Workmanship is excellent from top to bottom with no unintended gaps or openings between materials. This includes the inner bezel where the plastic meets the edges of the screen as we found issues around this particular area on our last MSI GE62 test unit.
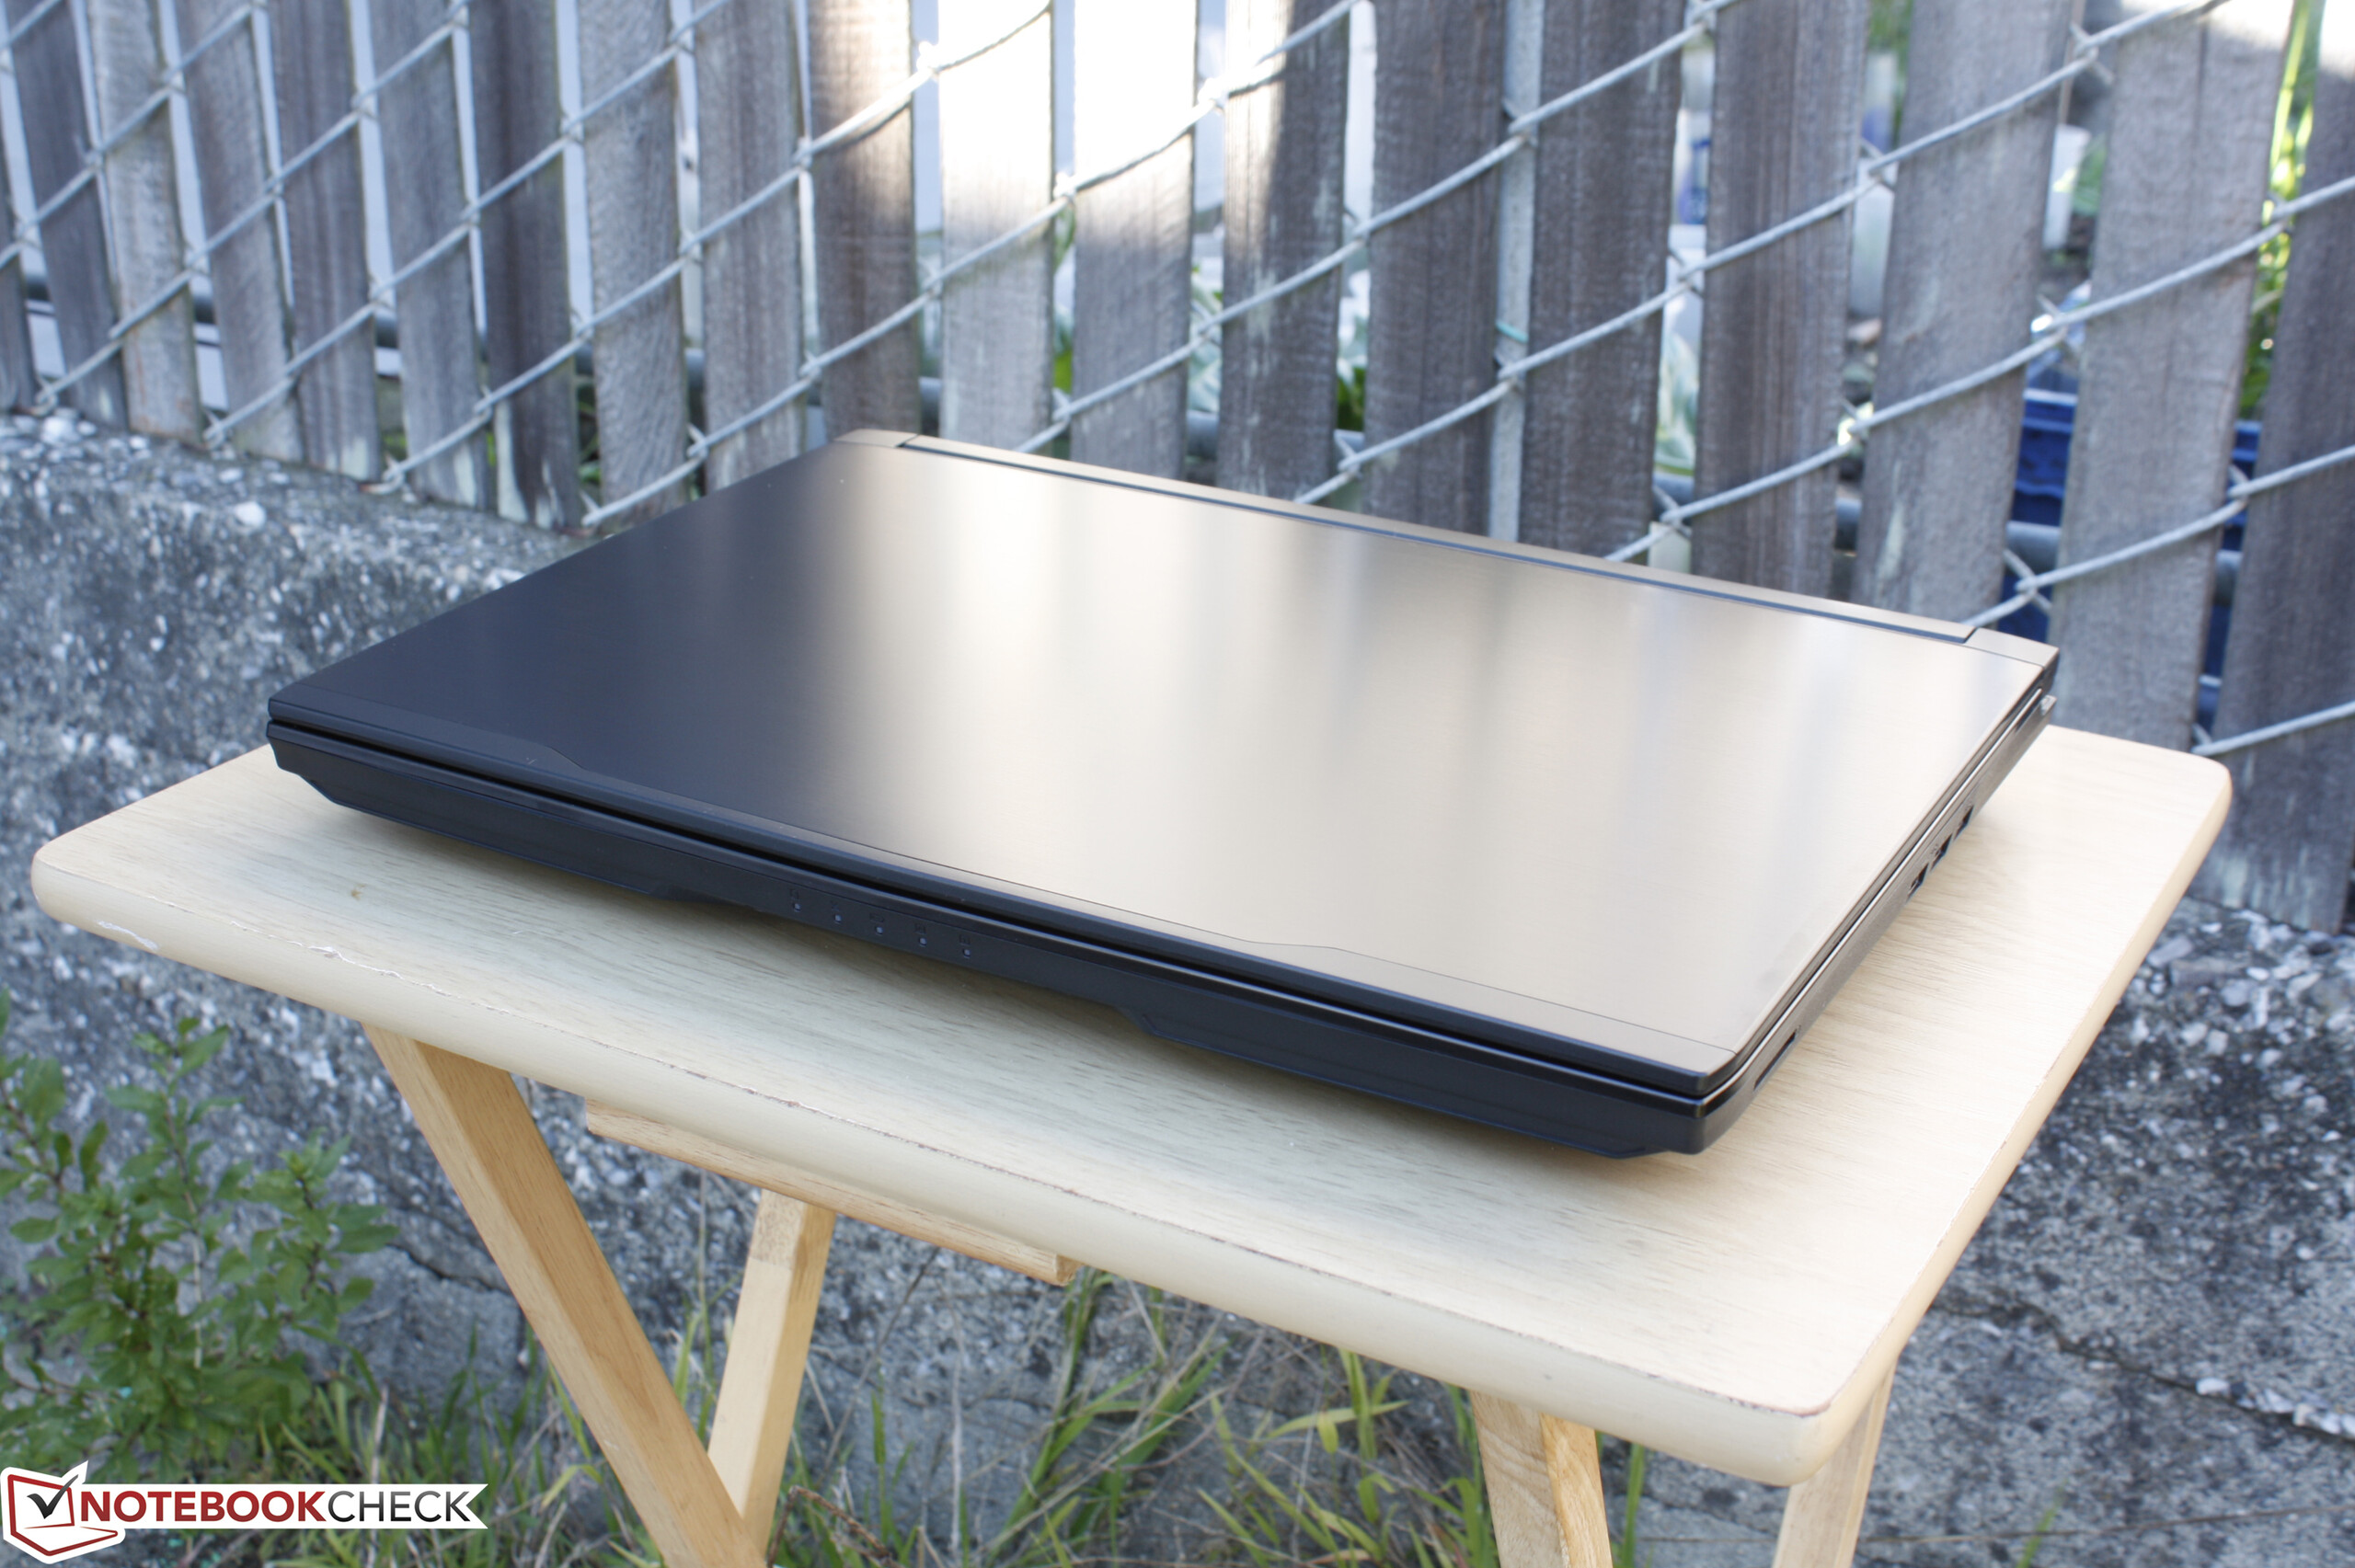
As for size and weight, the Tornado F5 is thicker and heavier than most other gaming notebooks in its size class with the bulky Acer Predator 15 being a notable exception. The entire system feels quite dense and much of its girth can be attributed to the substantial cooling requirements to run the demanding CPU and GPU in addition to all of its other expandable features. The super-thin MSI GS63VR is less than half the thickness and over a full kilogram lighter than the more powerful Eurocom.
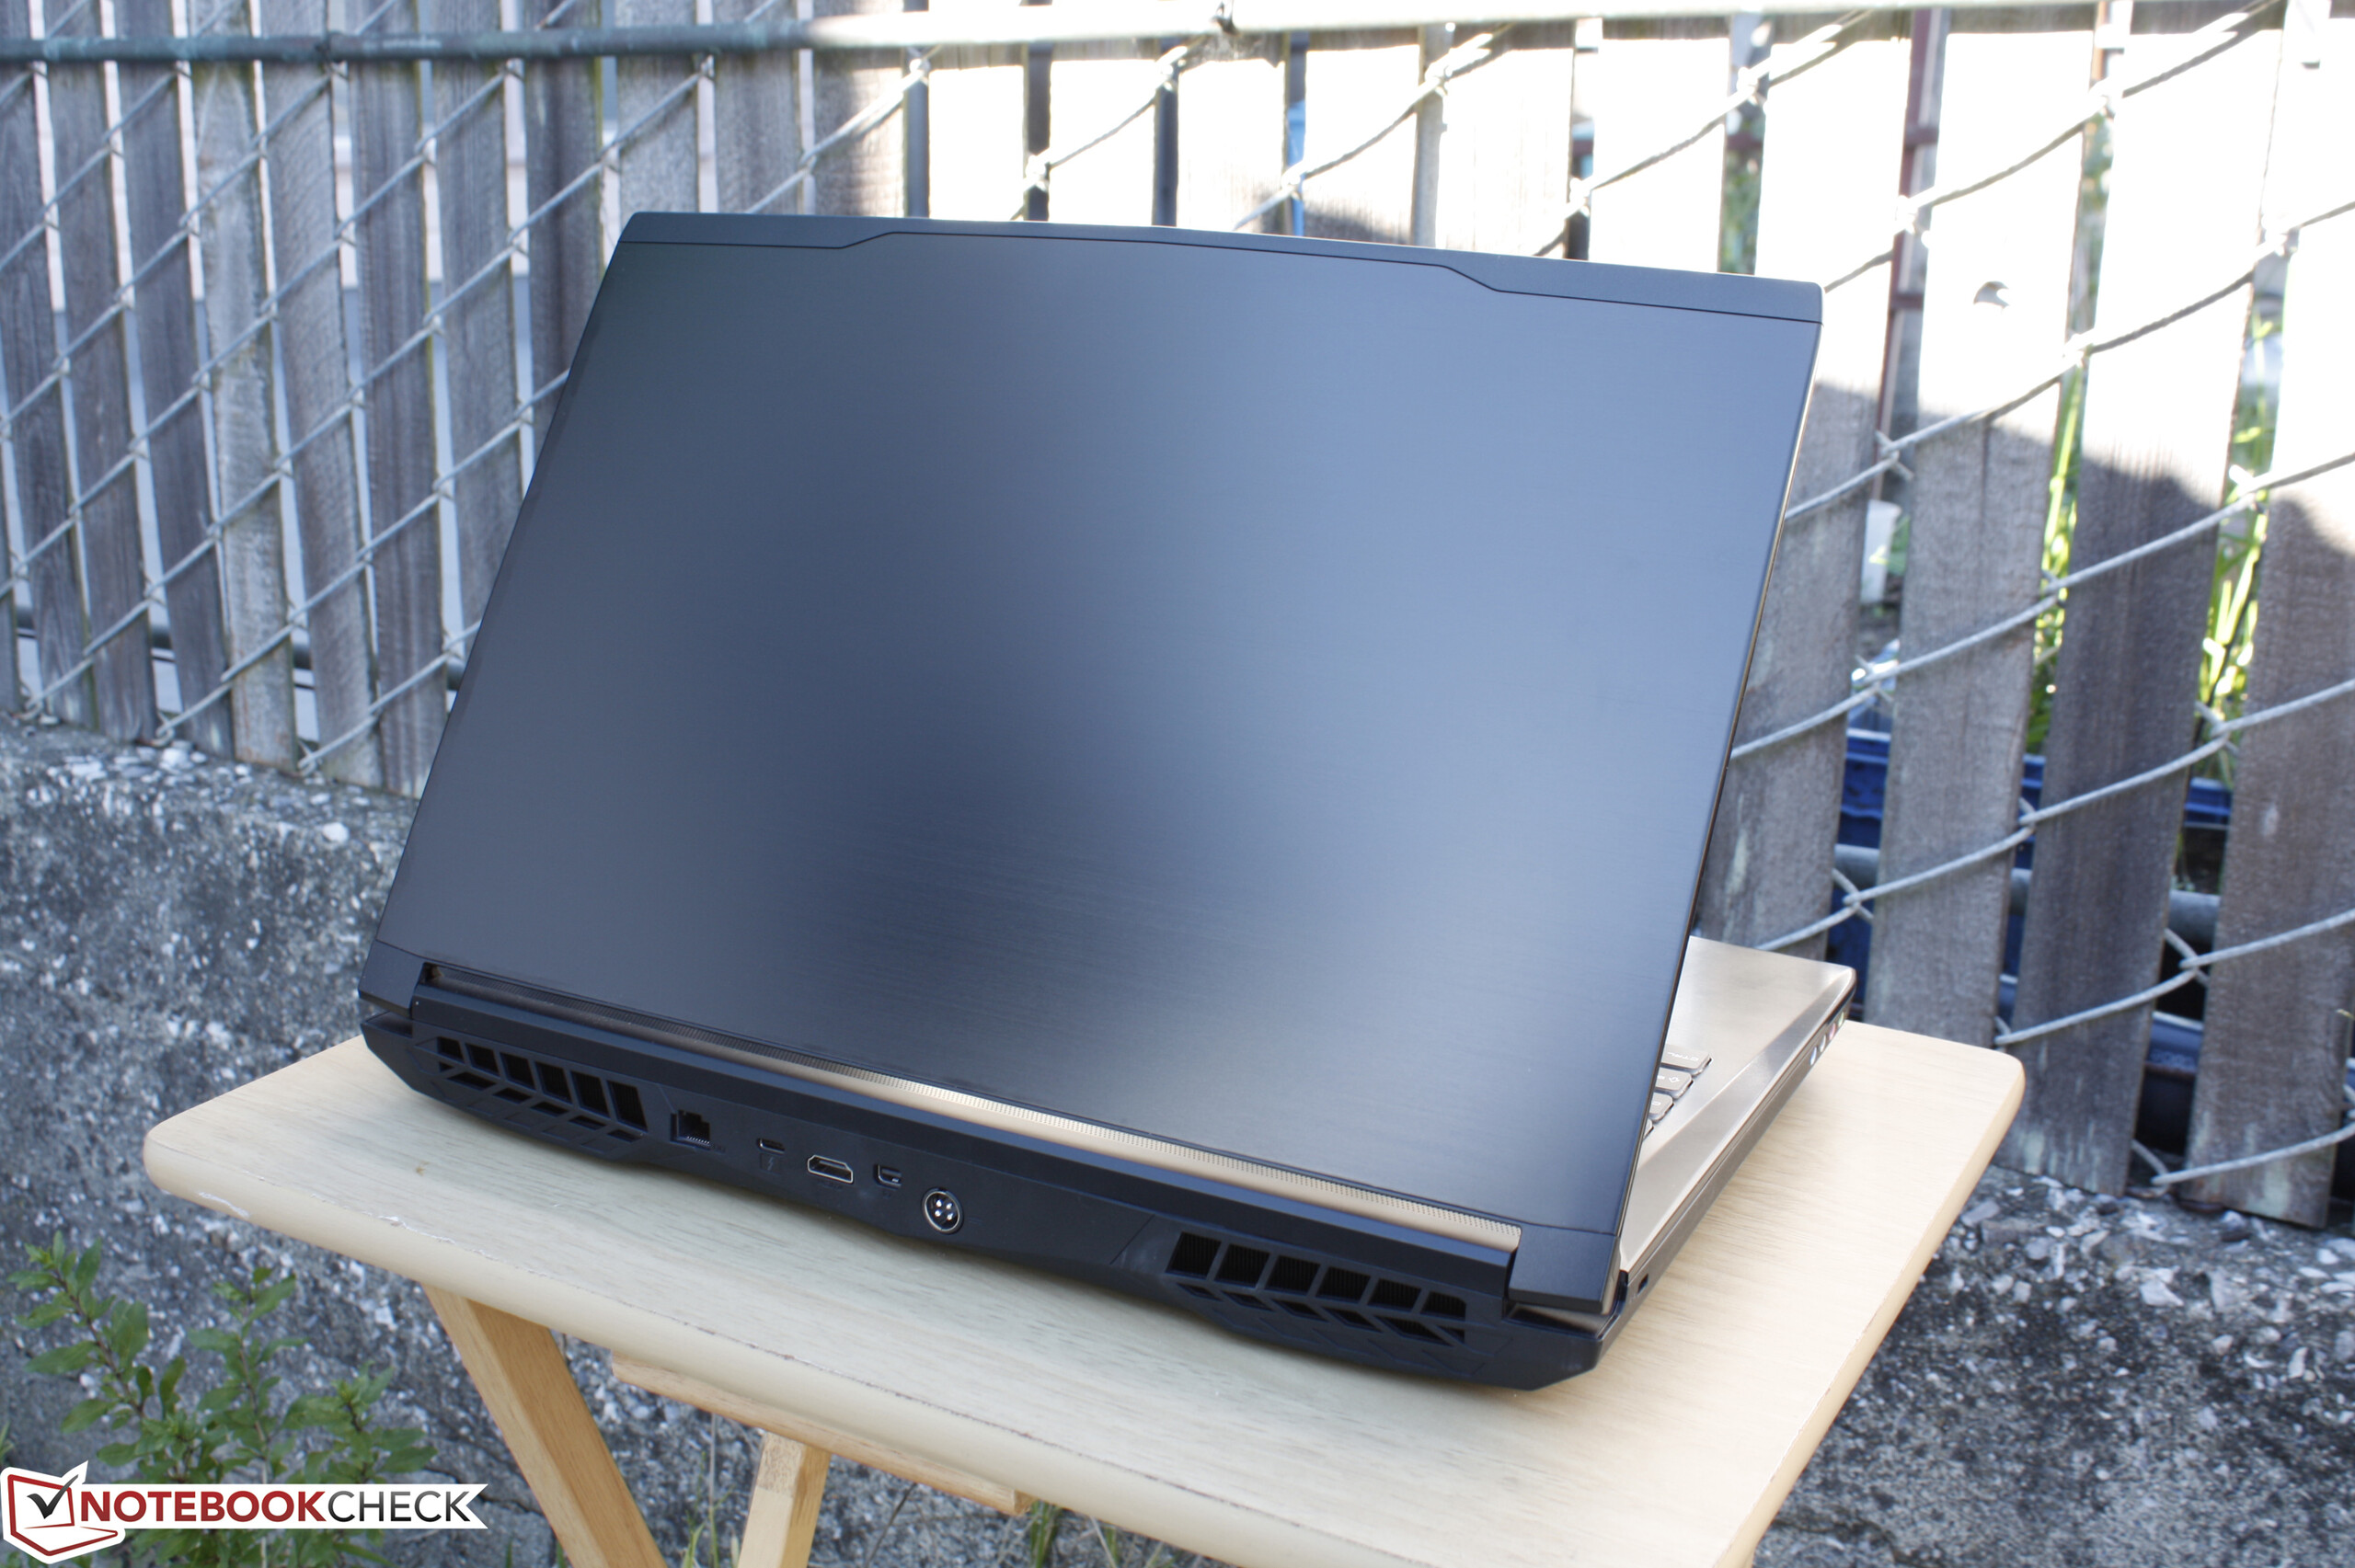
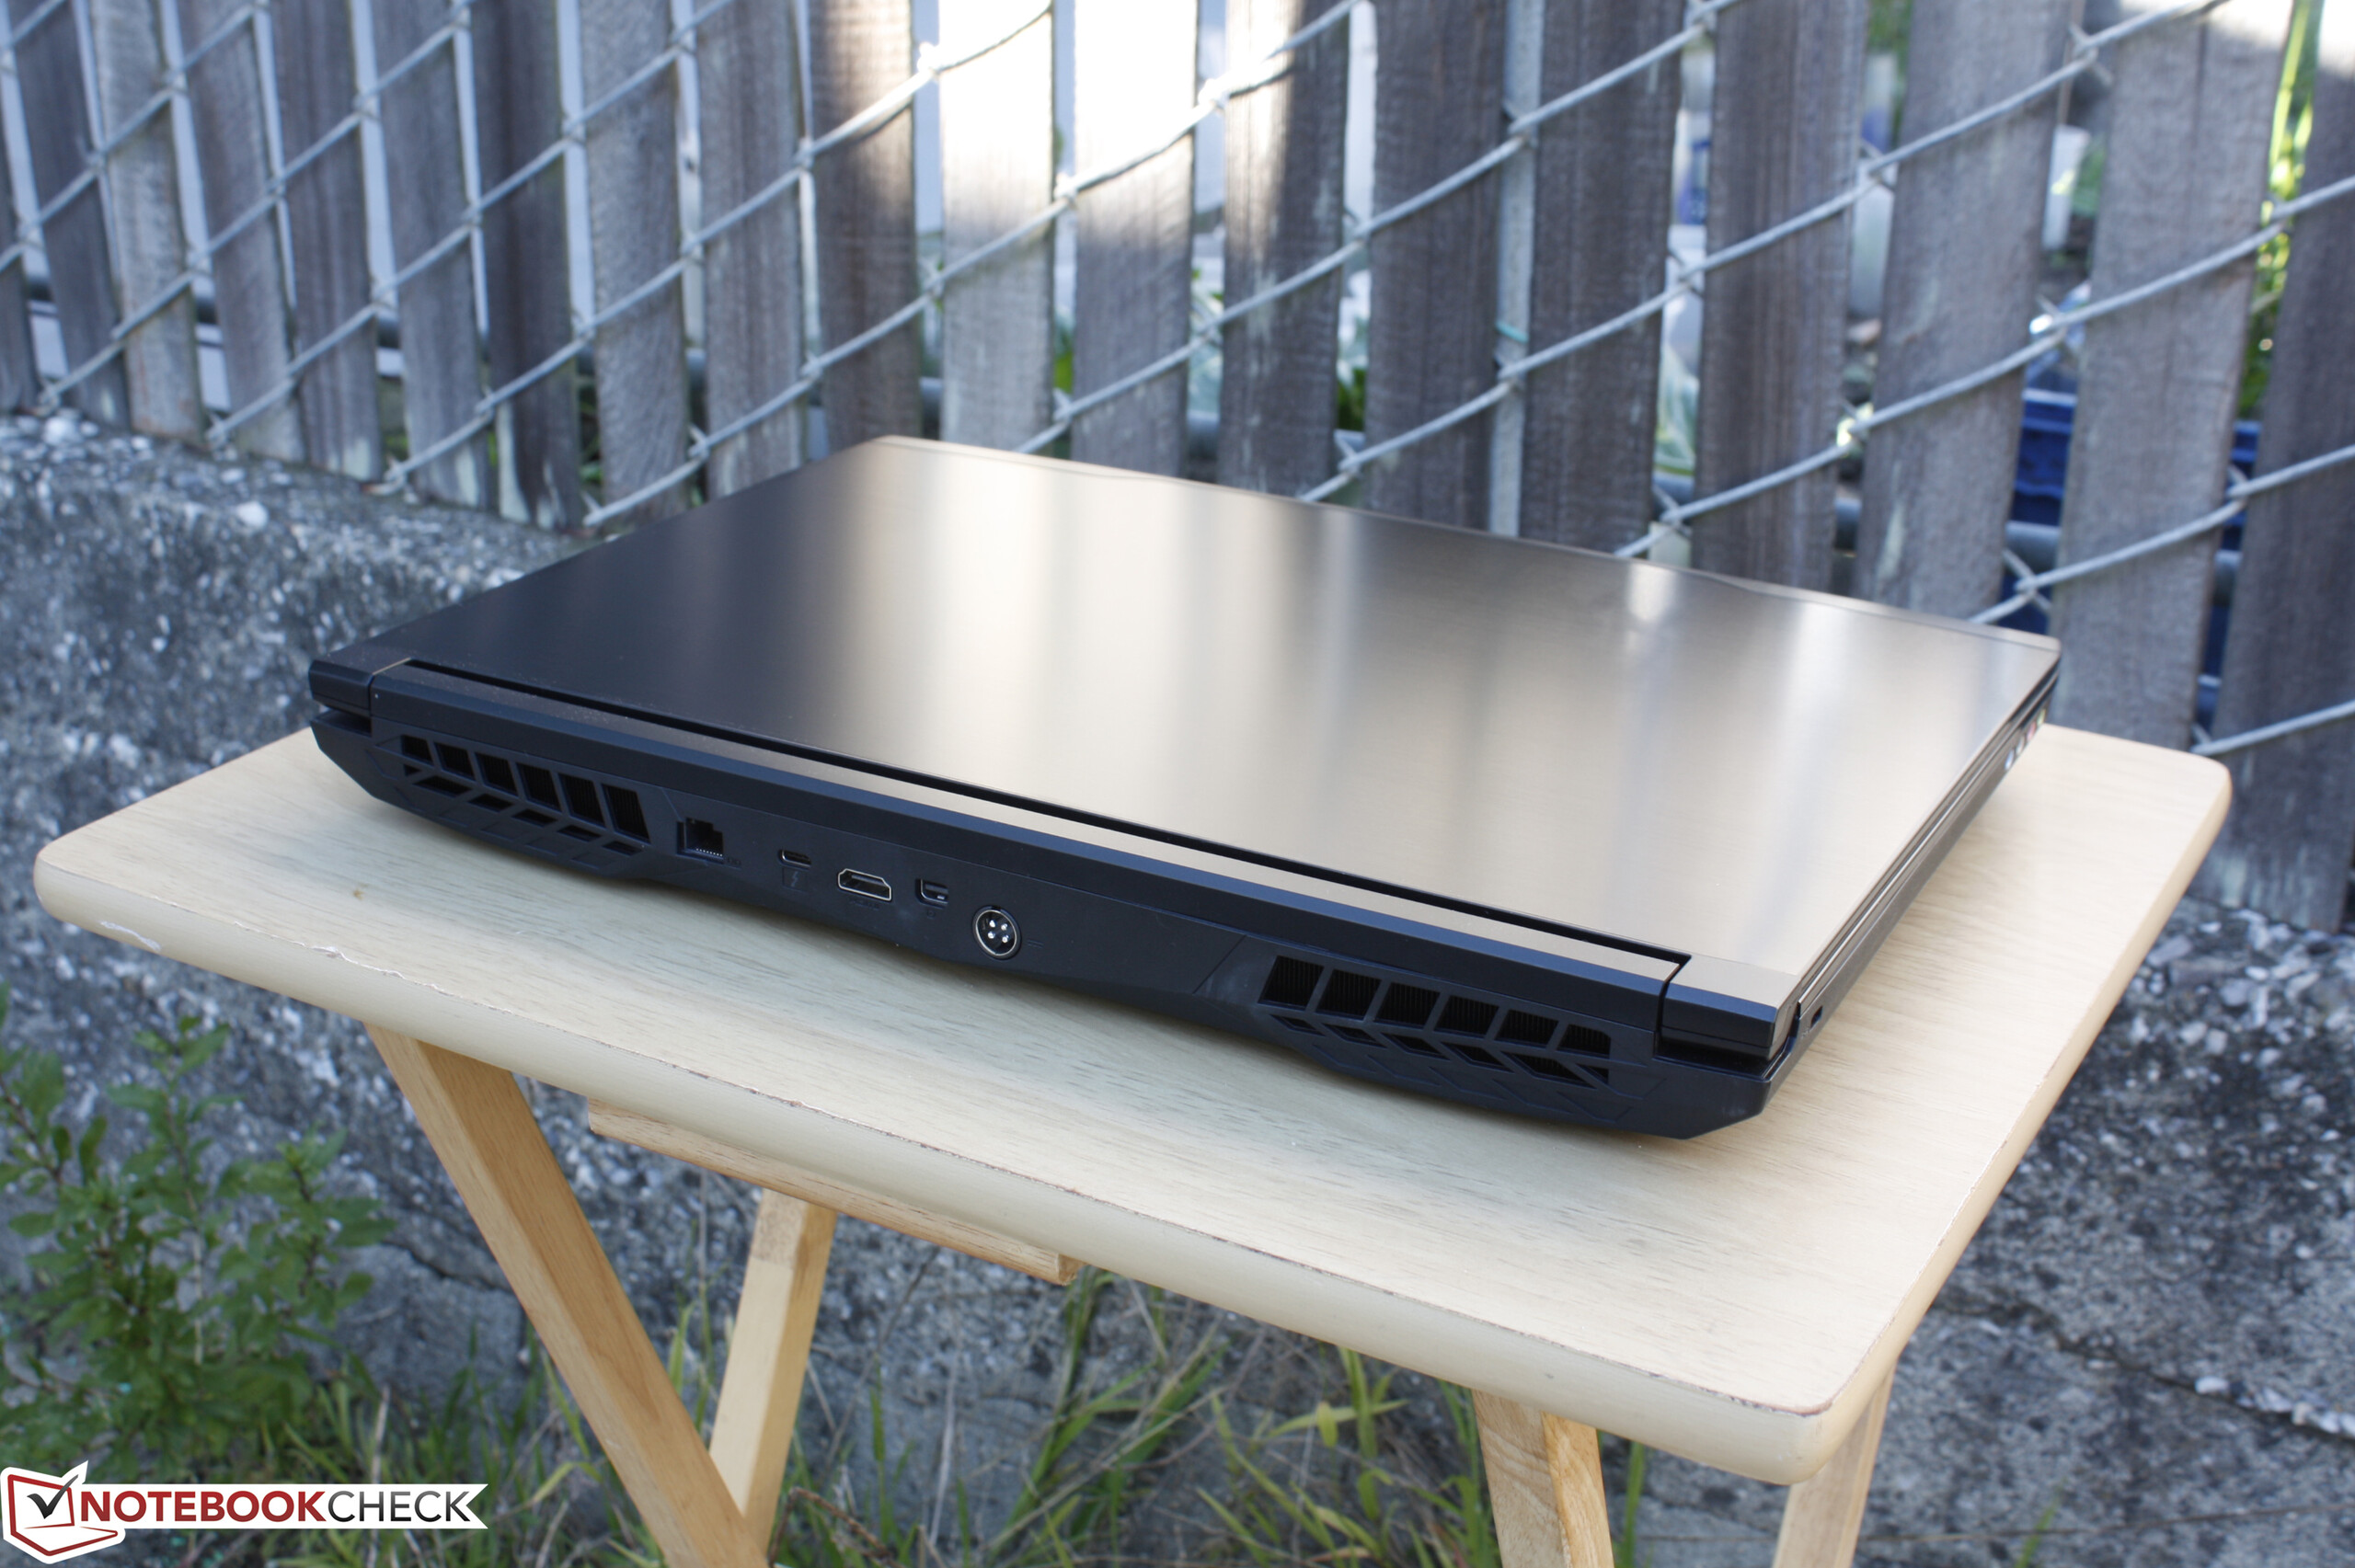
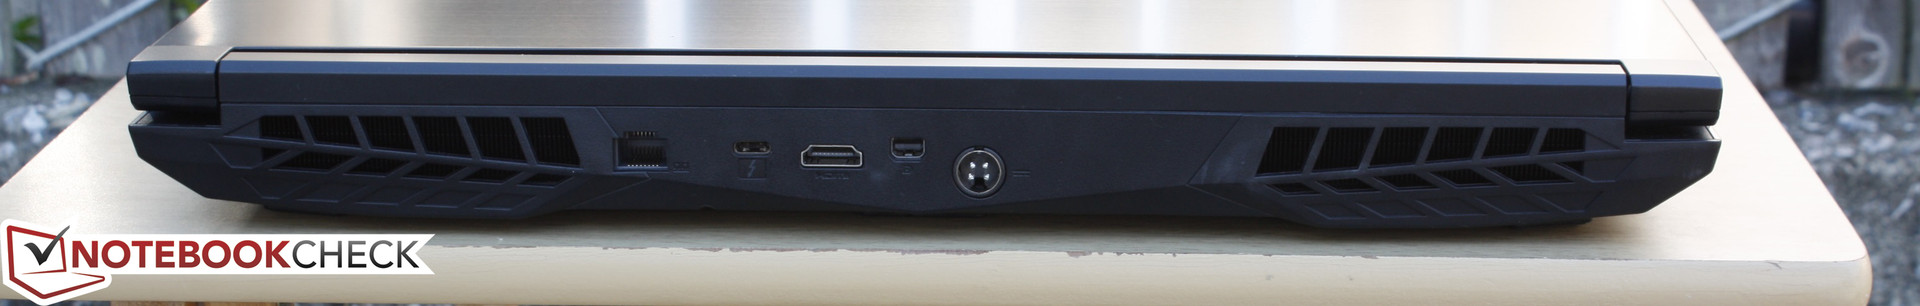
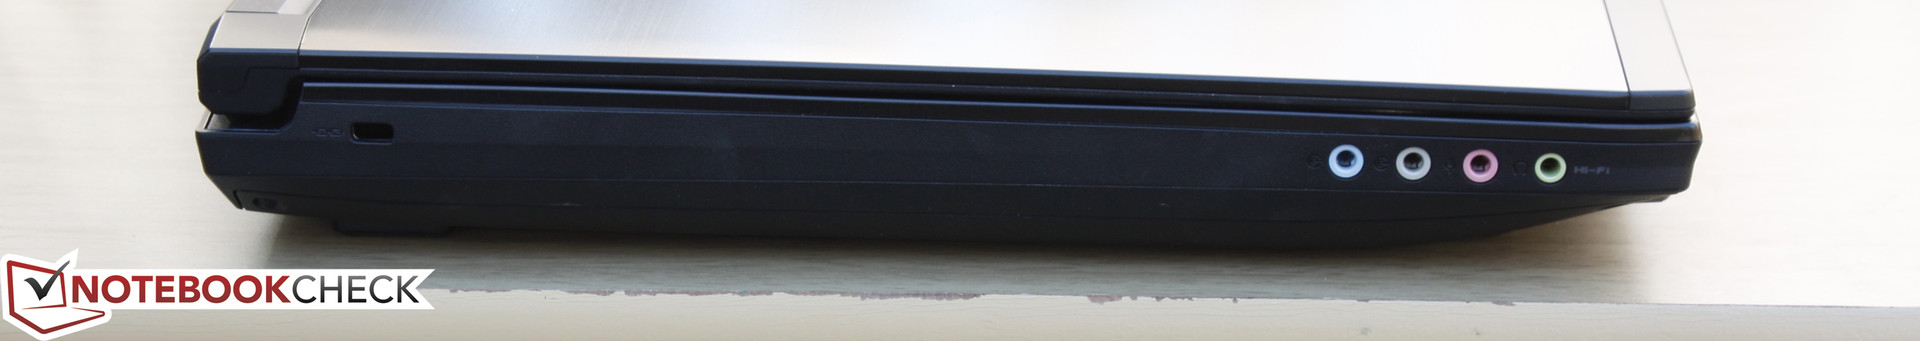
Connectivity
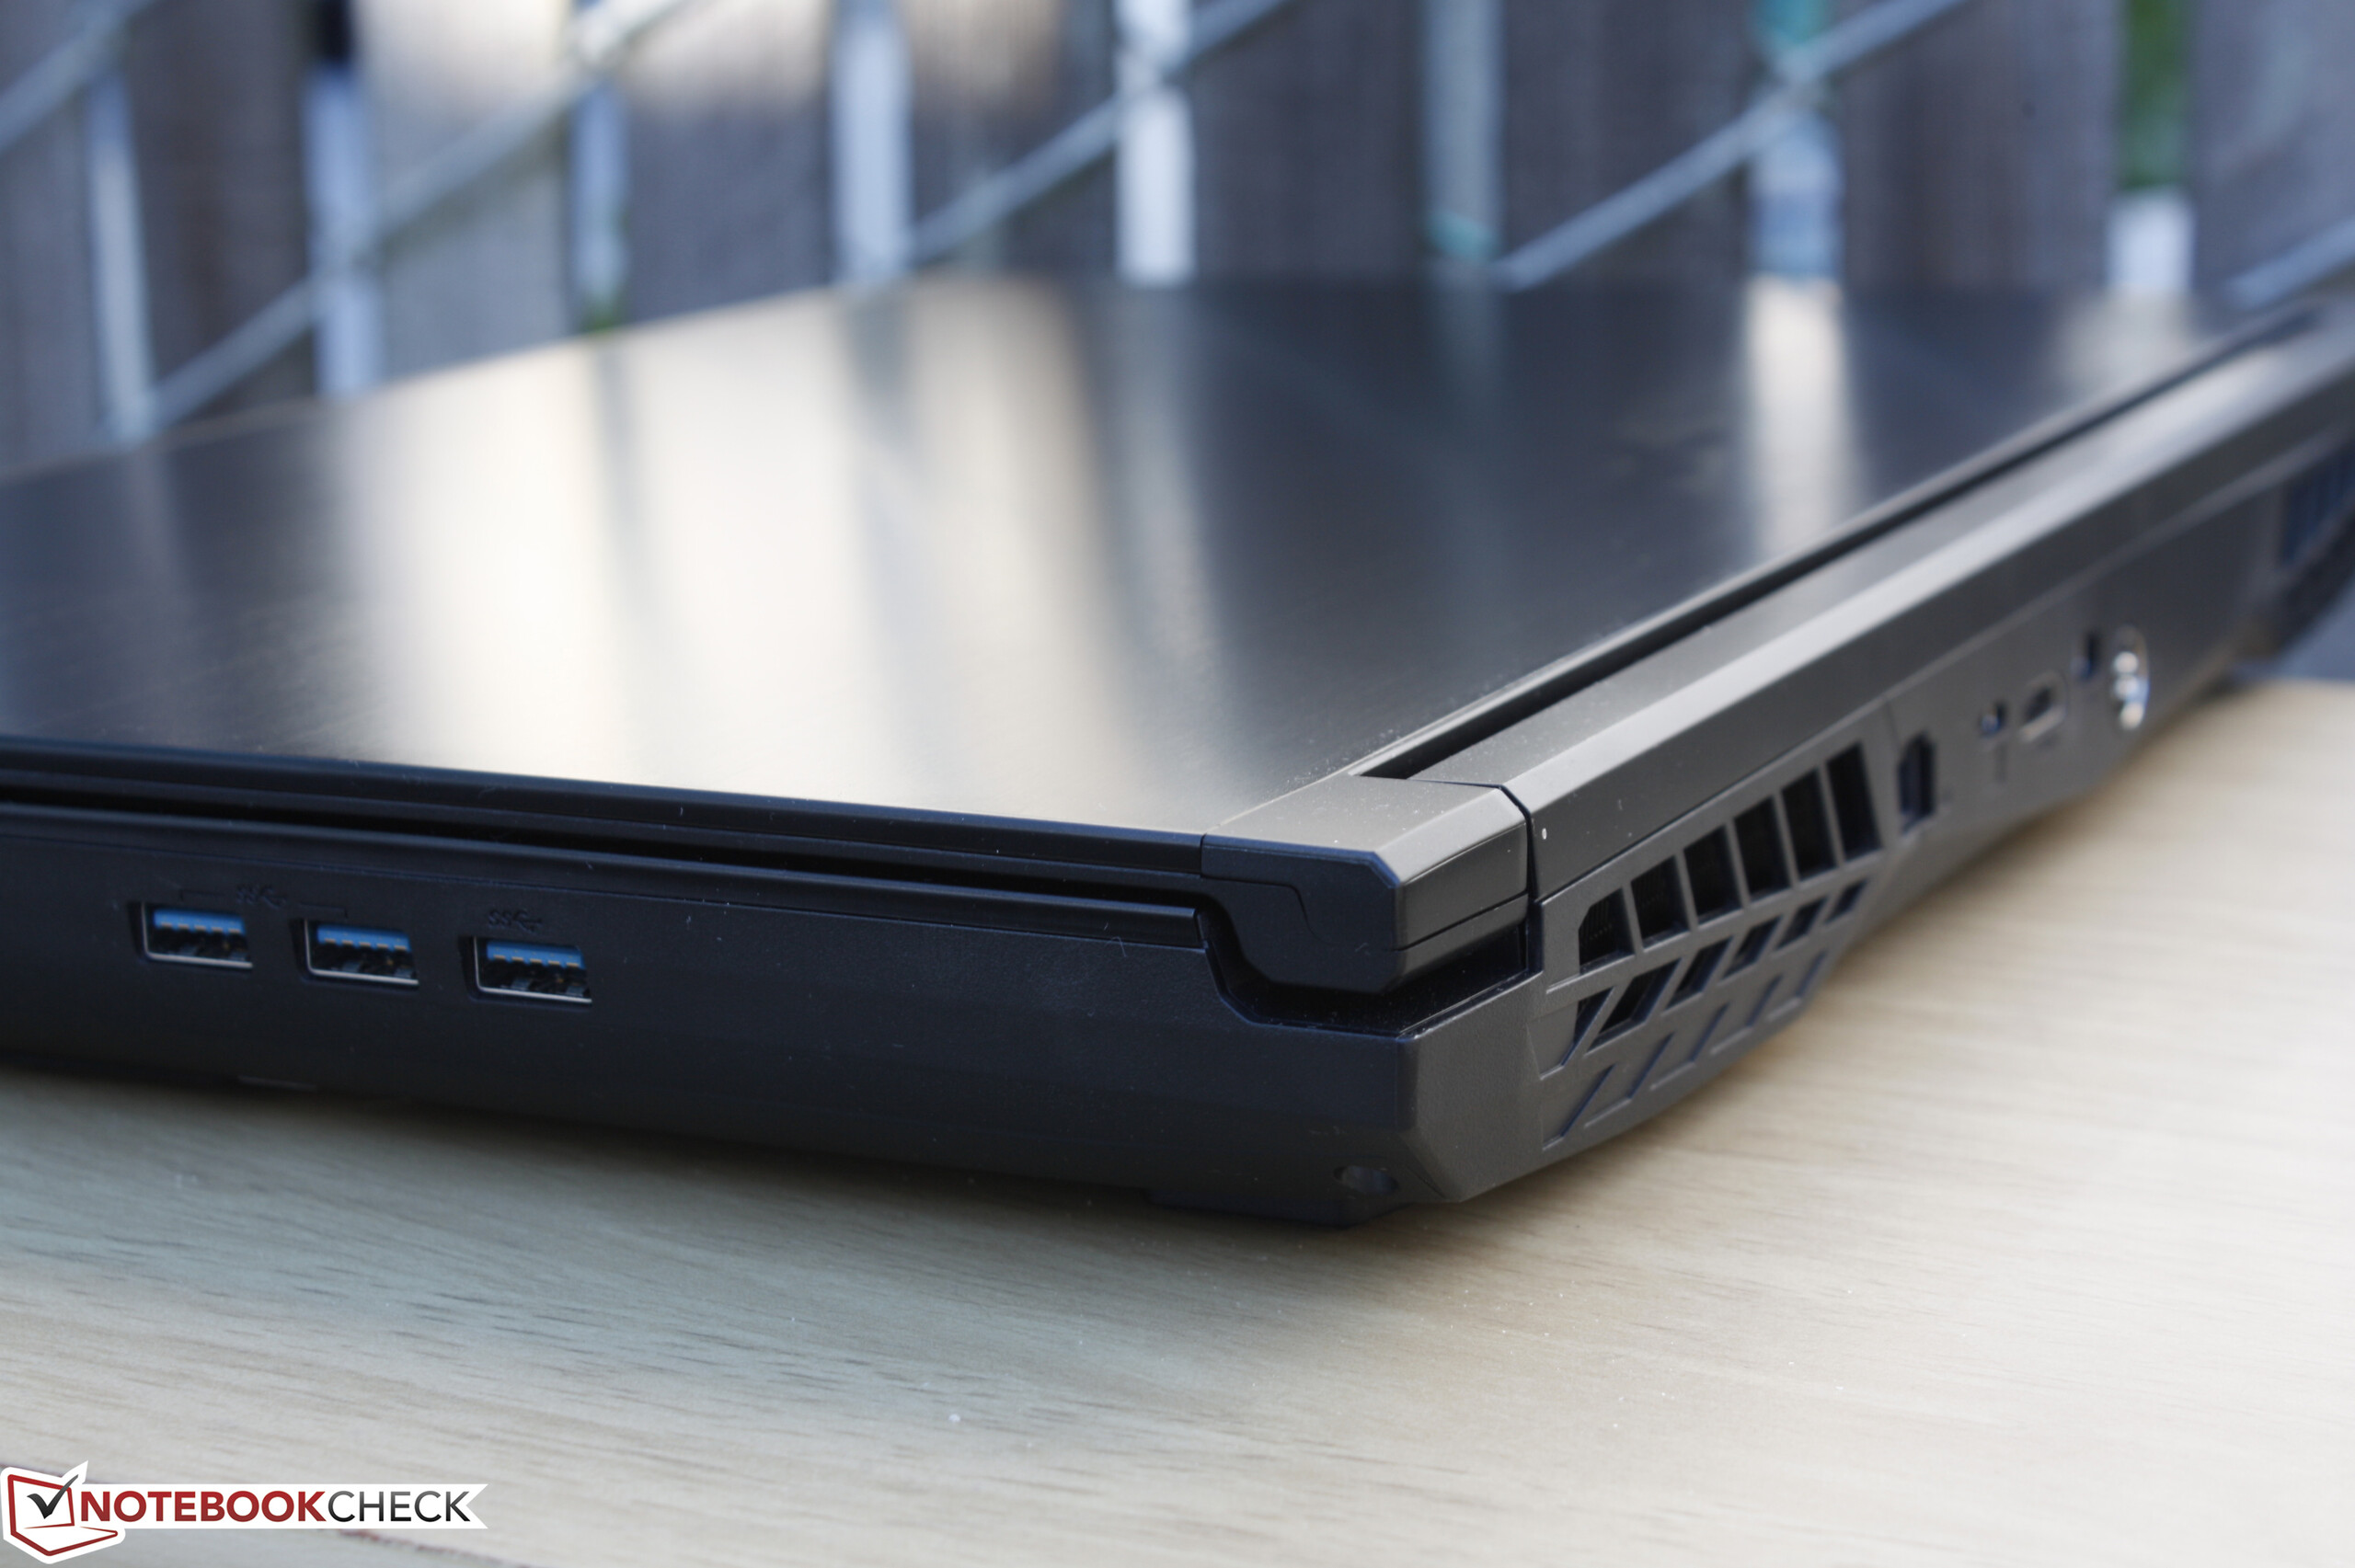
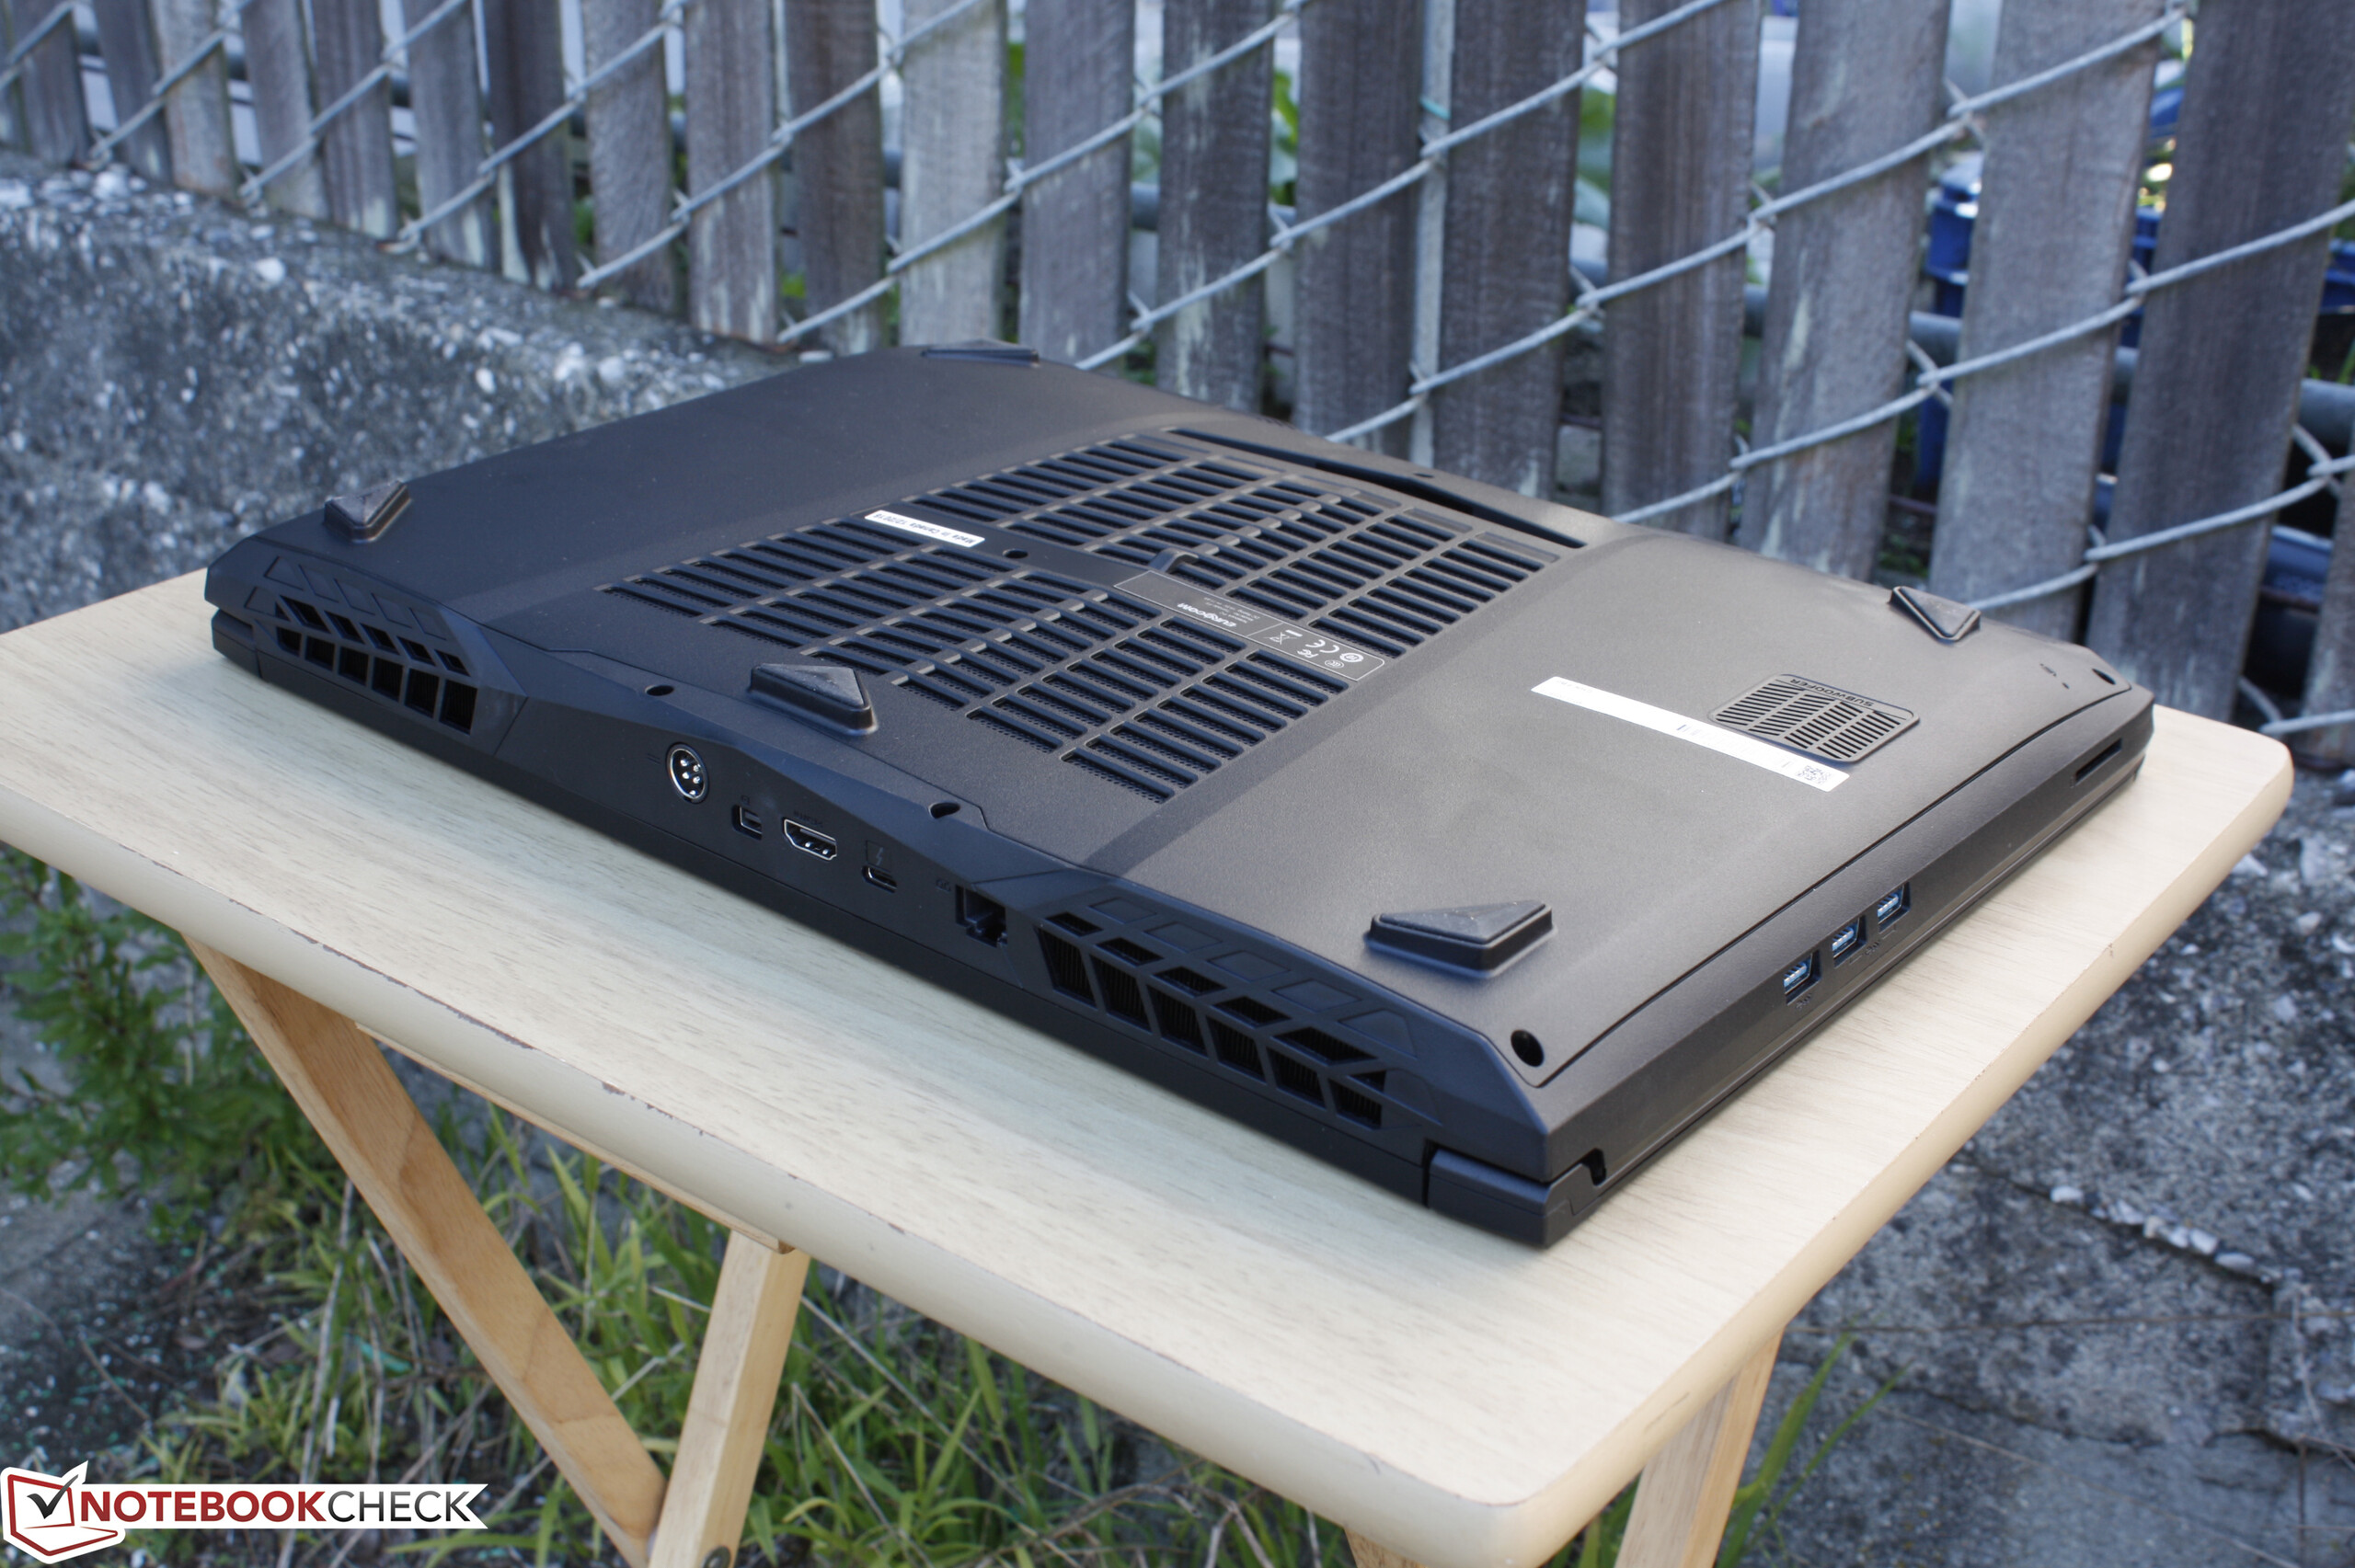
While the selection of ports is decent with mDP, HDMI 2.0, Thunderbolt 3, and 4x audio, the placement of them in less than ideal. In particular, all three USB Type-A ports are on the right edge with none on the left. The rear ports can also be difficult to reach without taking a peek especially for the smaller USB Type-C port. Lastly, the left audio ports are quite close to the front edge and can potentially occupy valuable desk space. It's unfortunate that some of the rear ports couldn't be moved to the more accessible left edge since this side is quite empty.

SD Card Reader
The integrated SDXC card reader offers a transfer rate of up to 192 MB/s with our Toshiba Exceria Pro UHS-II test card. Moving 1 GB worth of pictures from our card to desktop will take just over 6 seconds.
| SD Card Reader | |
| average JPG Copy Test (av. of 3 runs) | |
| MSI GT73VR 7RF-296 | |
| Eurocom Tornado F5 | |
| MSI GT72VR 7RE-433 | |
| maximum AS SSD Seq Read Test (1GB) | |
| MSI GT73VR 7RF-296 | |
| MSI GT72VR 7RE-433 | |
| Eurocom Tornado F5 | |
Communication
The Killer 1535 M.2 2242 module is included for theoretical transfer rates of up to 867 Mbps on an 802.11ac network. The card is a popular option amongst high-end gaming notebooks as it also offers special features like DoubleShot Pro and the handy Network Manager software. We experienced no connectivity issues with our specific test unit.
Check out our standalone review on the Killer 1535 for more benchmarks and an overview of the technology.
| Networking | |
| iperf3 receive AX12 | |
| MSI GT73VR 7RF-296 | |
| EVGA SC17 GTX 1070 | |
| Eurocom Tornado F5 | |
| iperf3 transmit AX12 | |
| MSI GT73VR 7RF-296 | |
| Eurocom Tornado F5 | |
| EVGA SC17 GTX 1070 | |
Accessories
Eurocom includes a couple more extras than most other manufacturers to encourage end-user tinkering and upgrading. Aside from the usual Quick Start guide, service manual, and Drivers/Utilities disc, the reseller throws in additional screws, HDD padding, and a small tube of thermal paste. An optional external optical drive will be needed to read the Drivers disc.
Maintenance
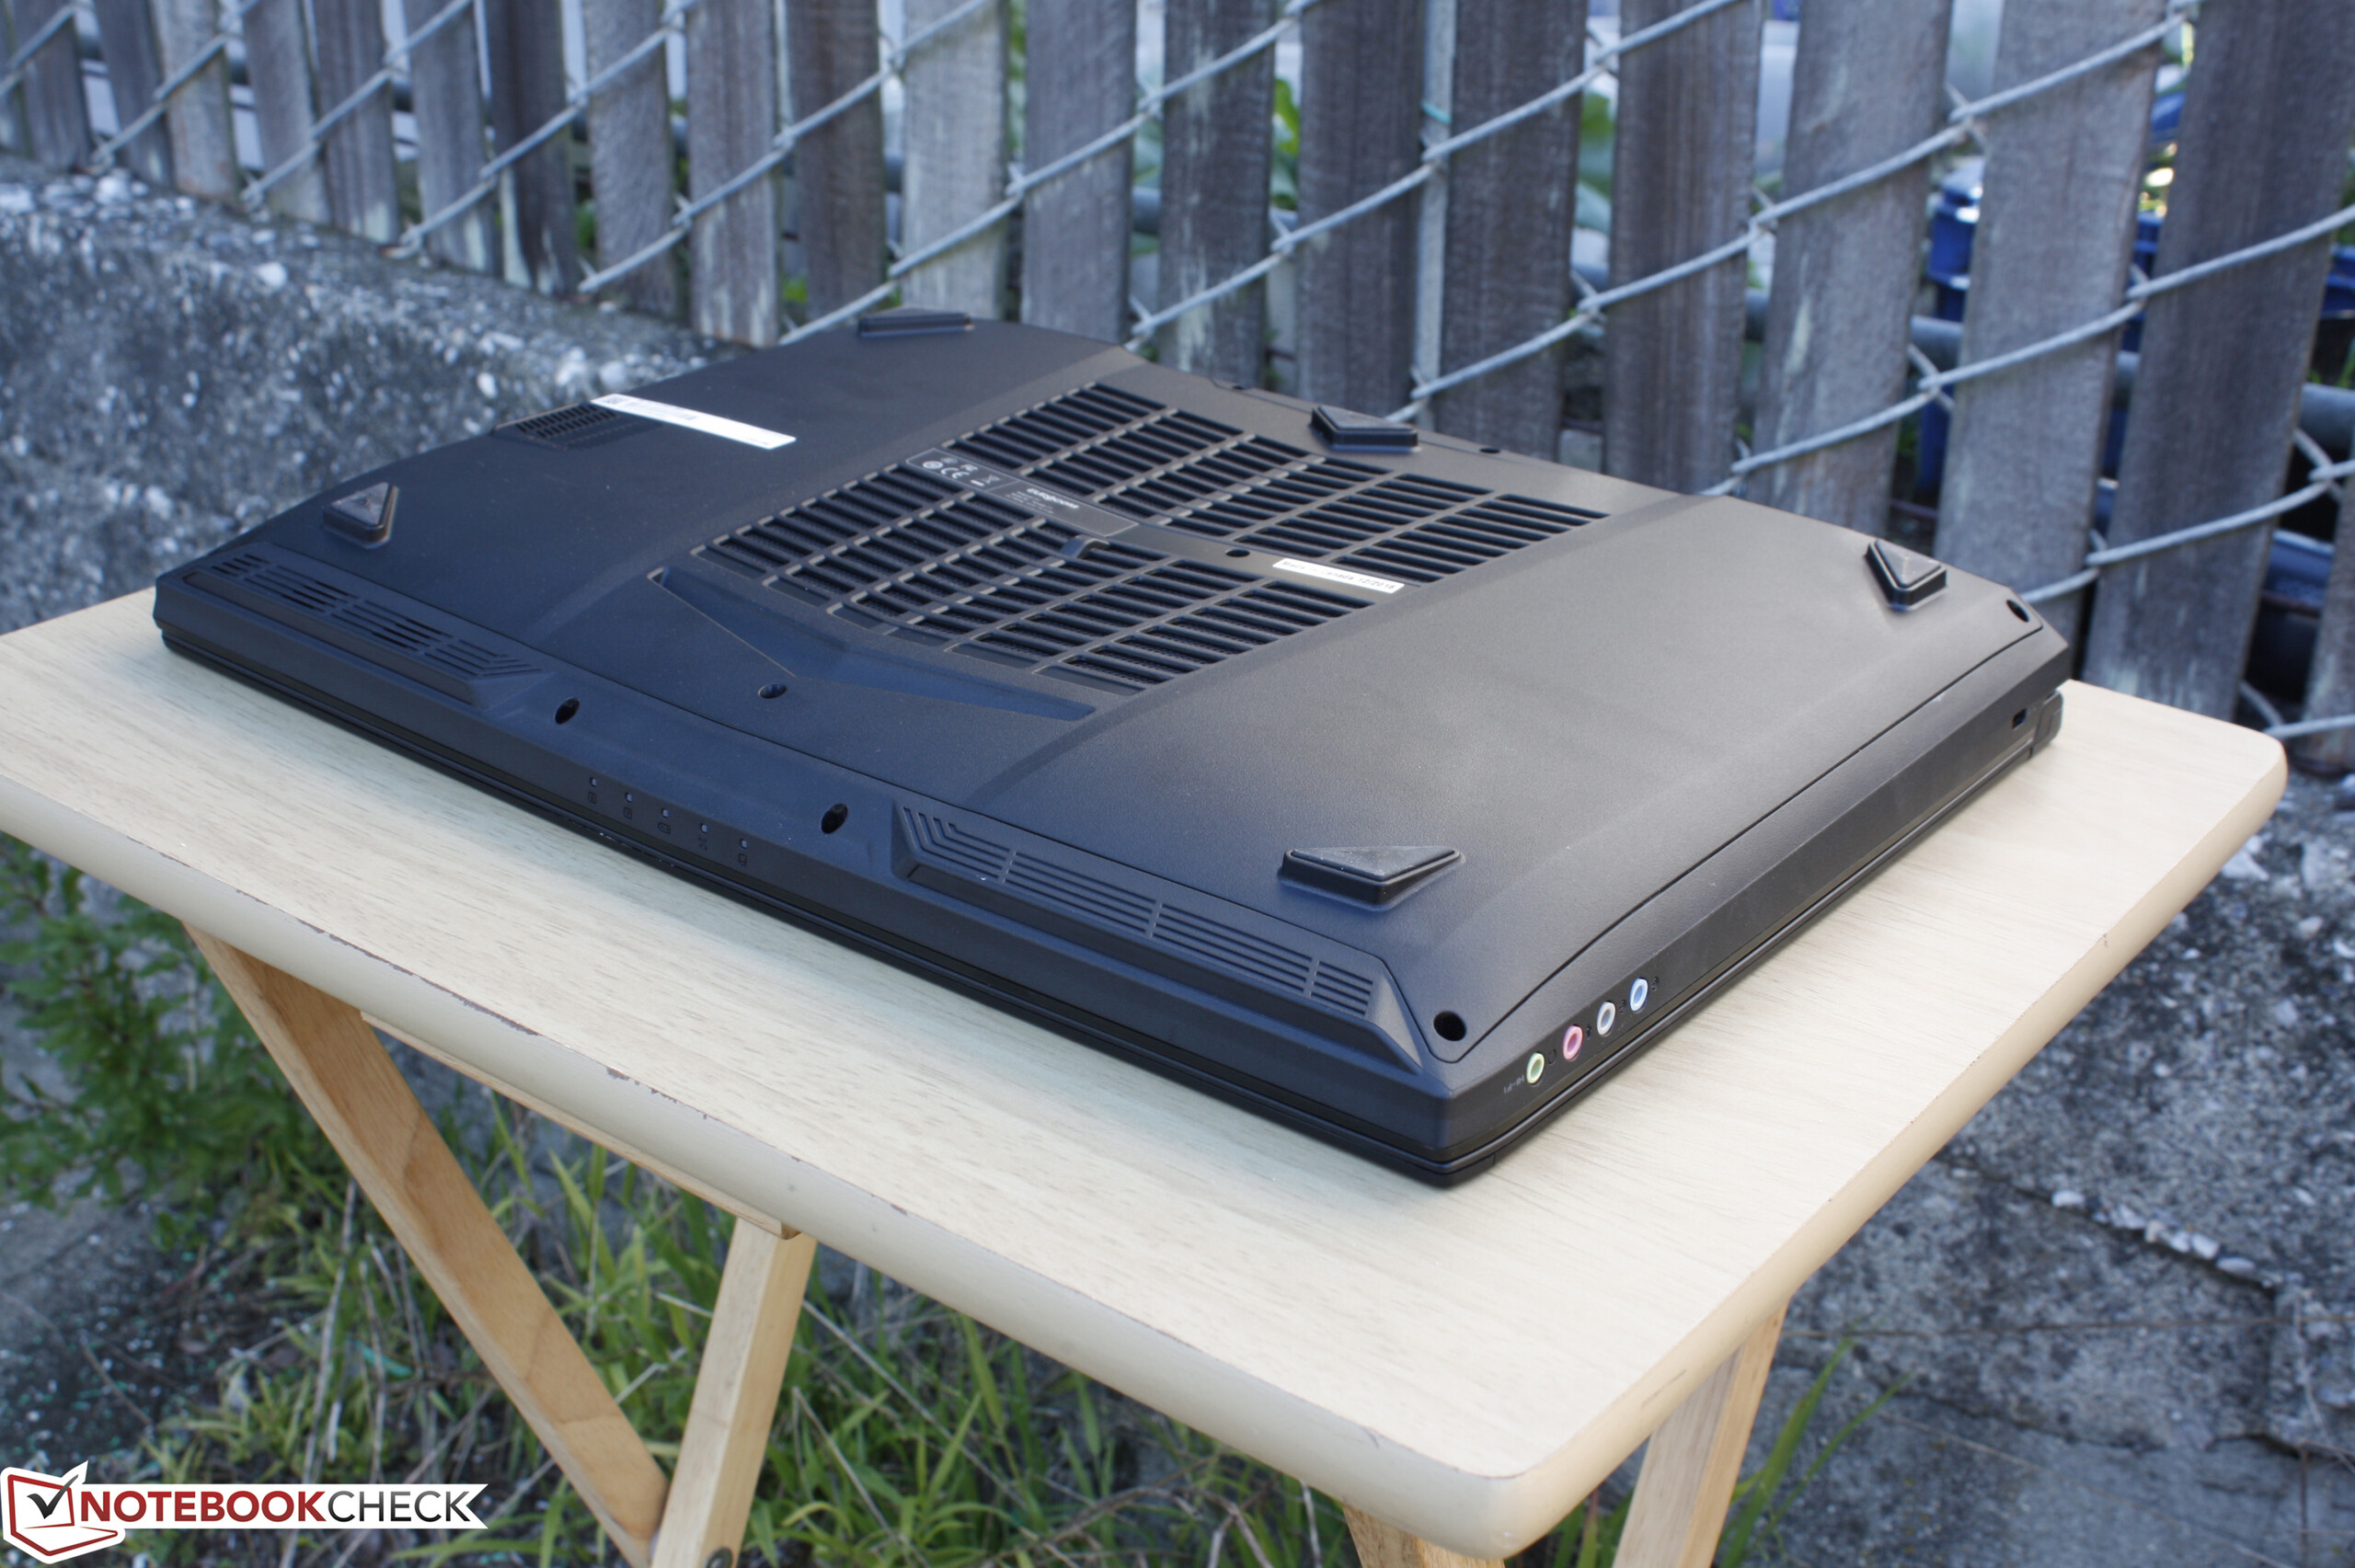
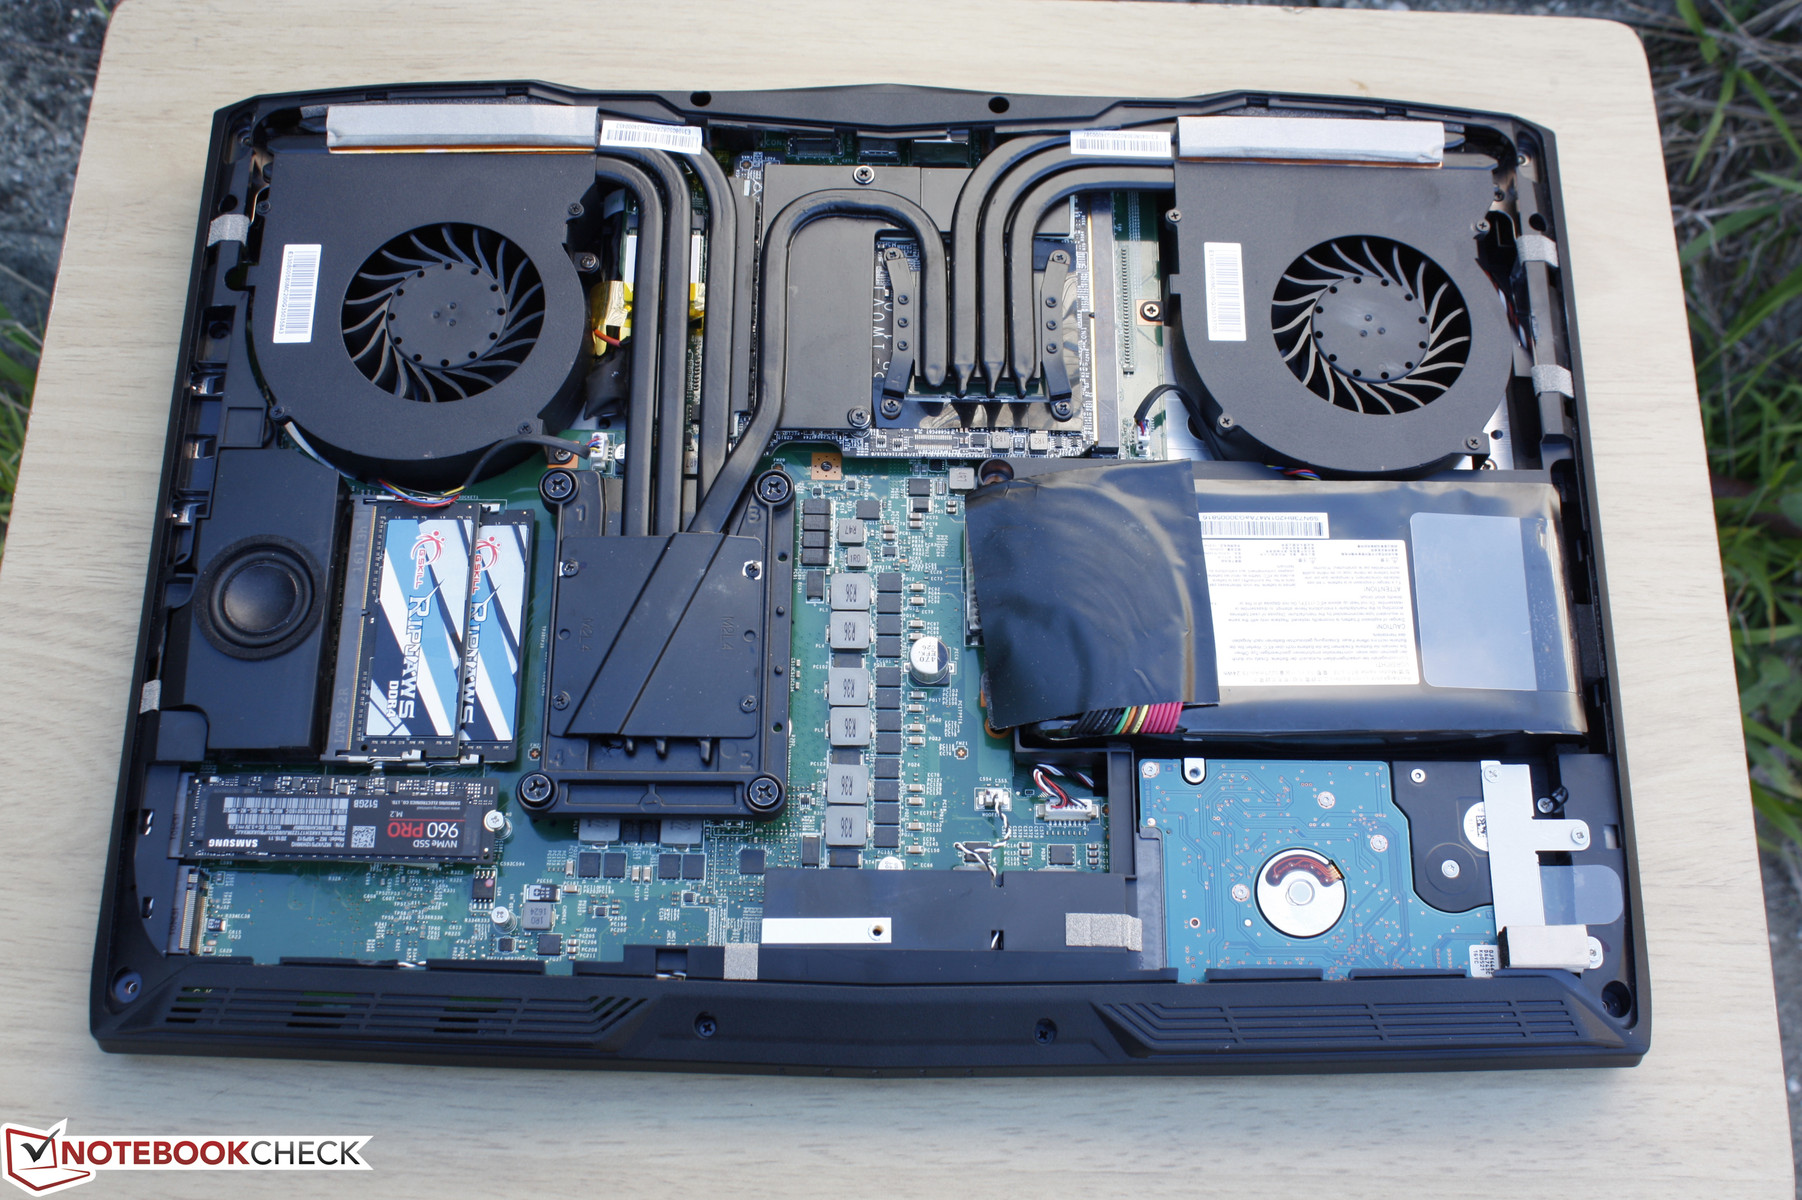
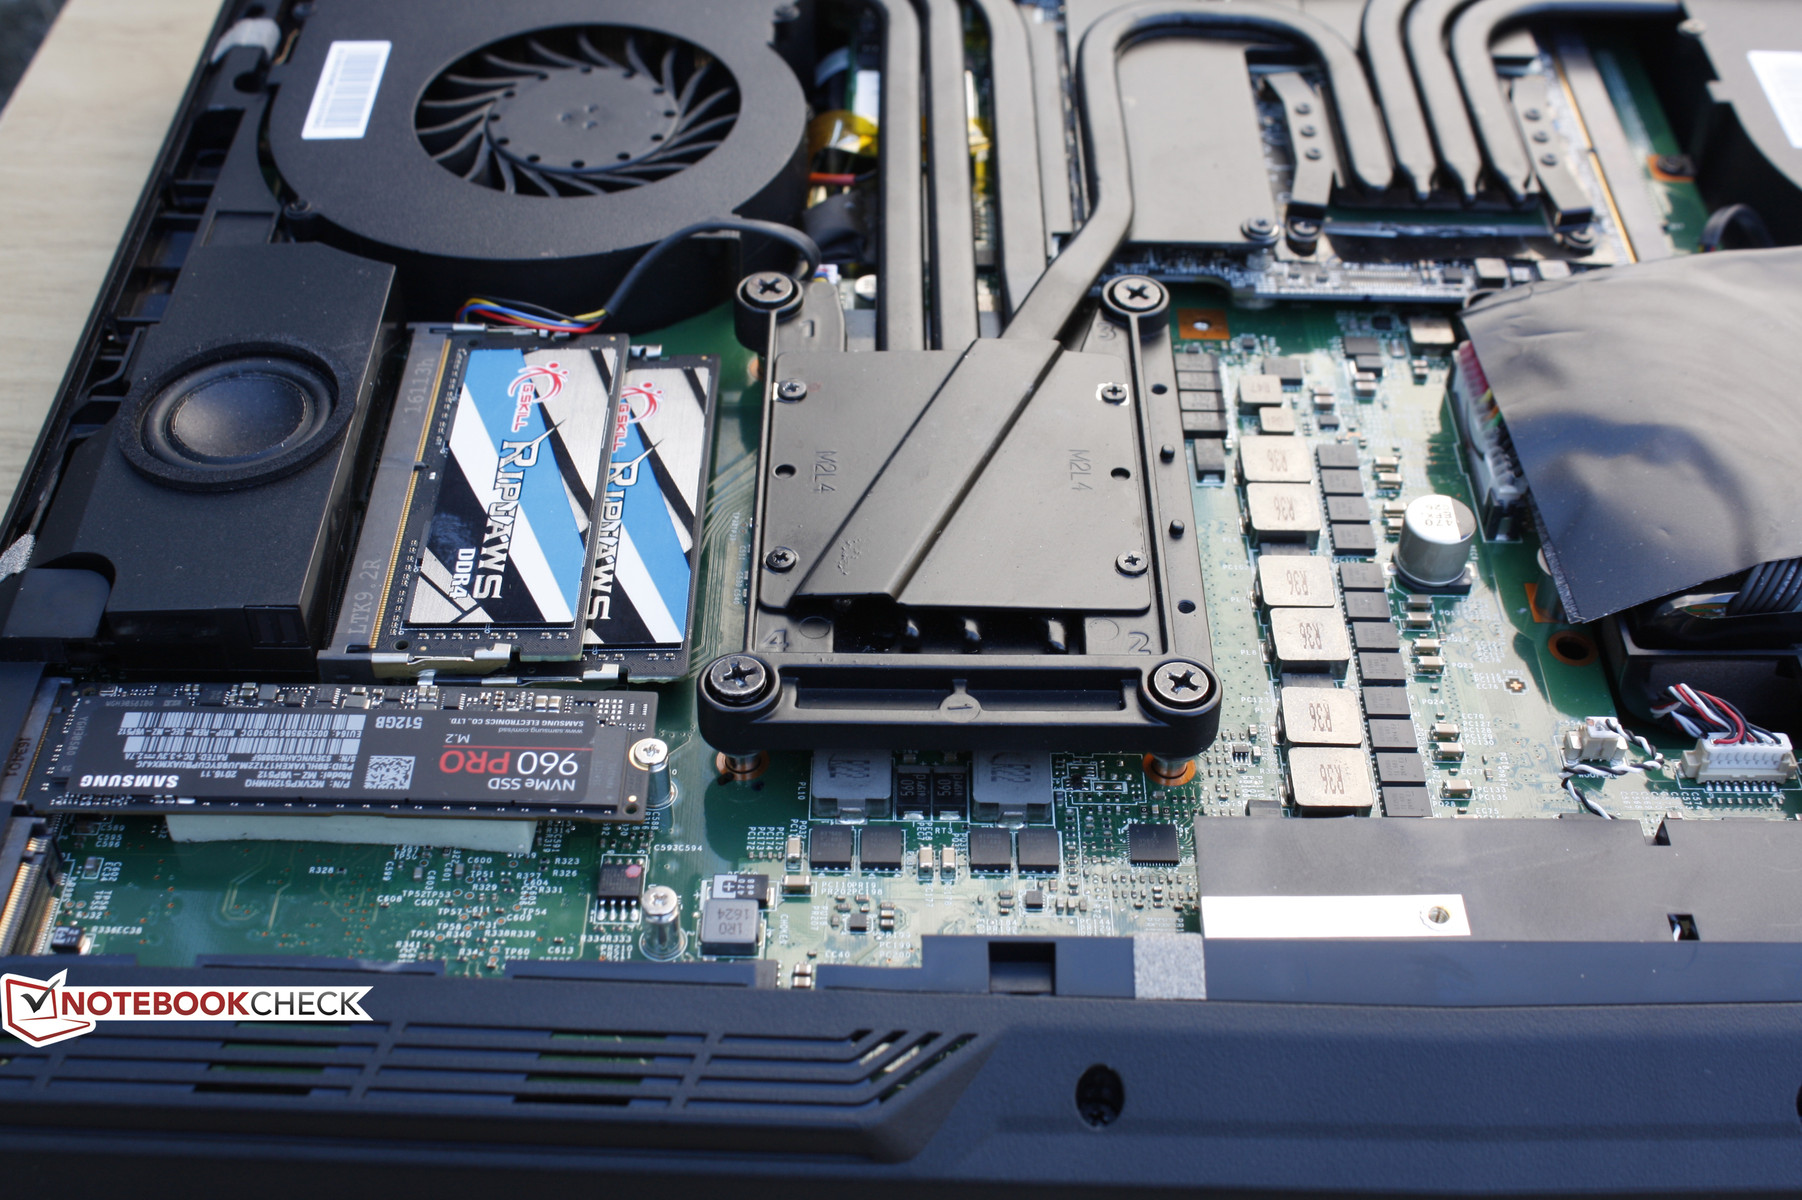
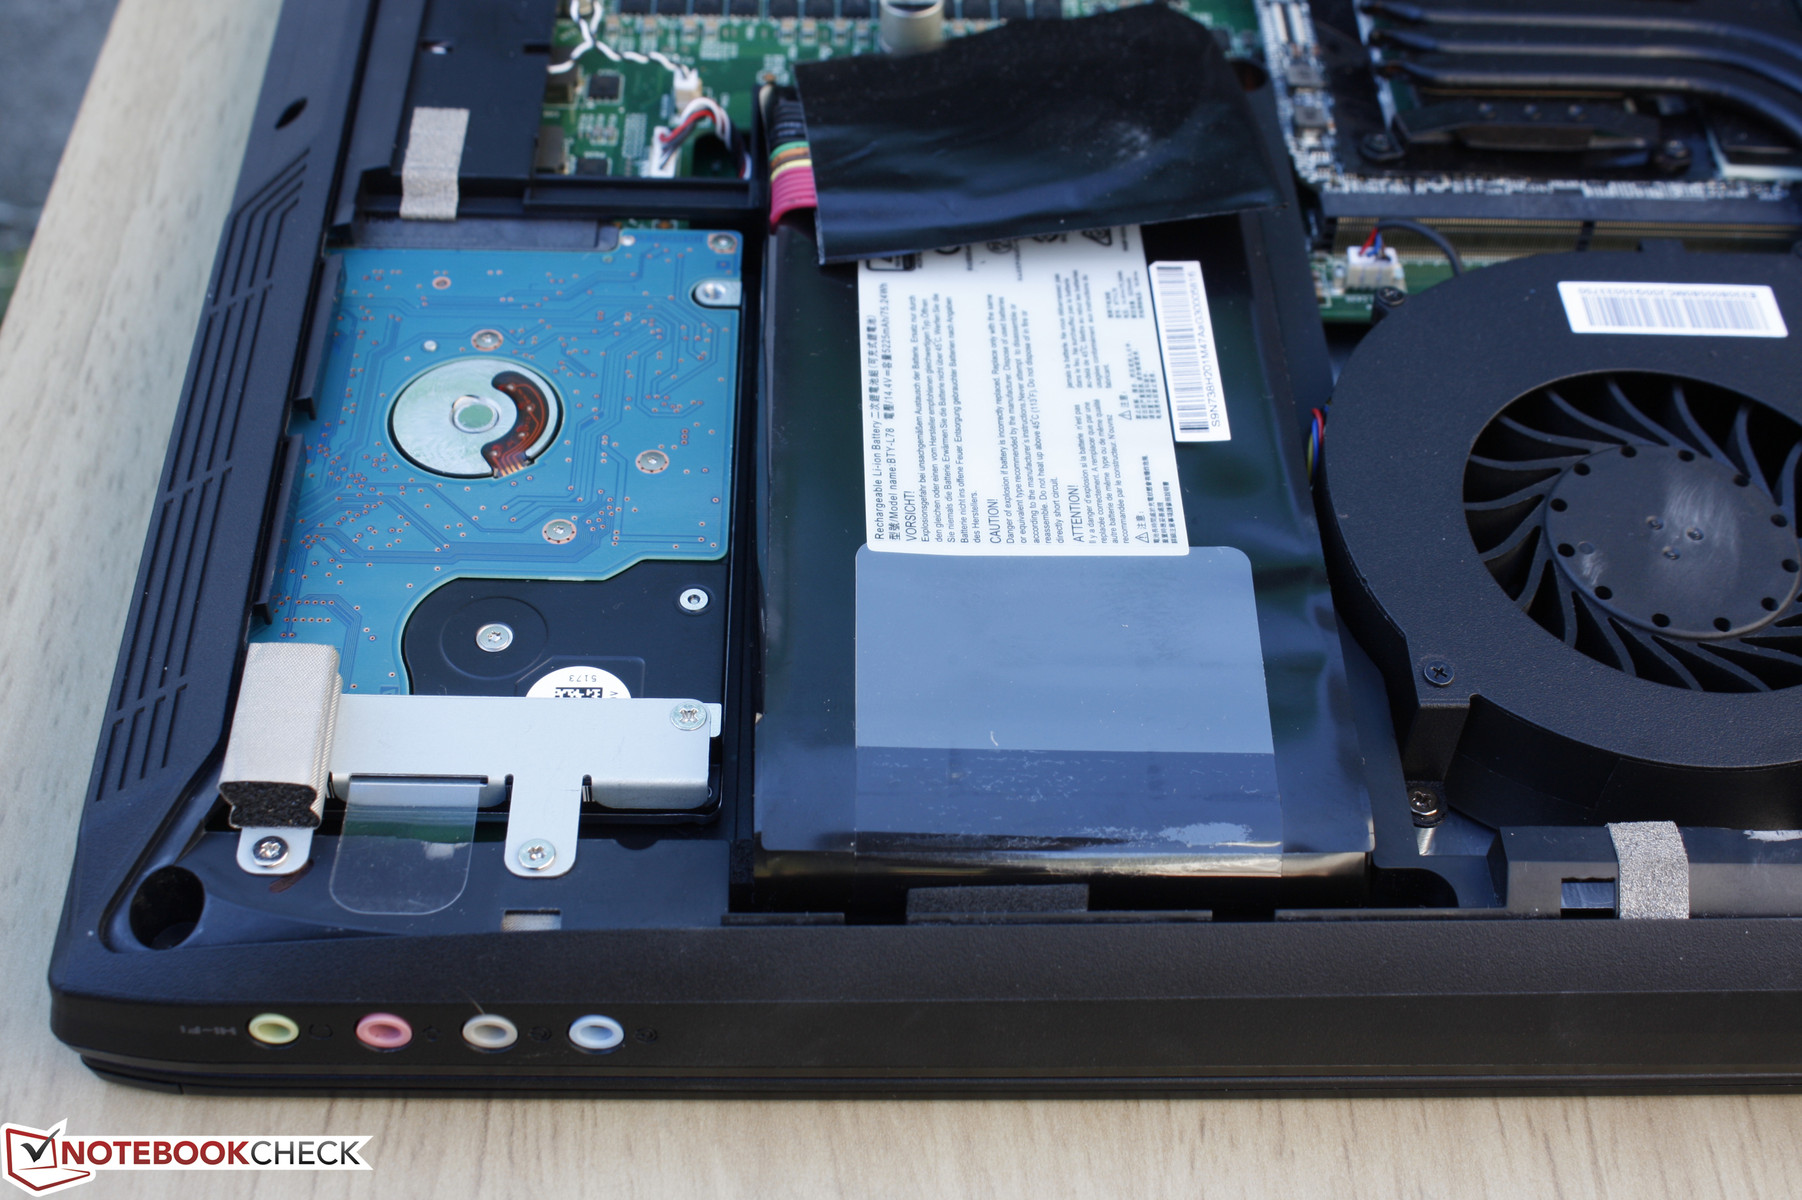
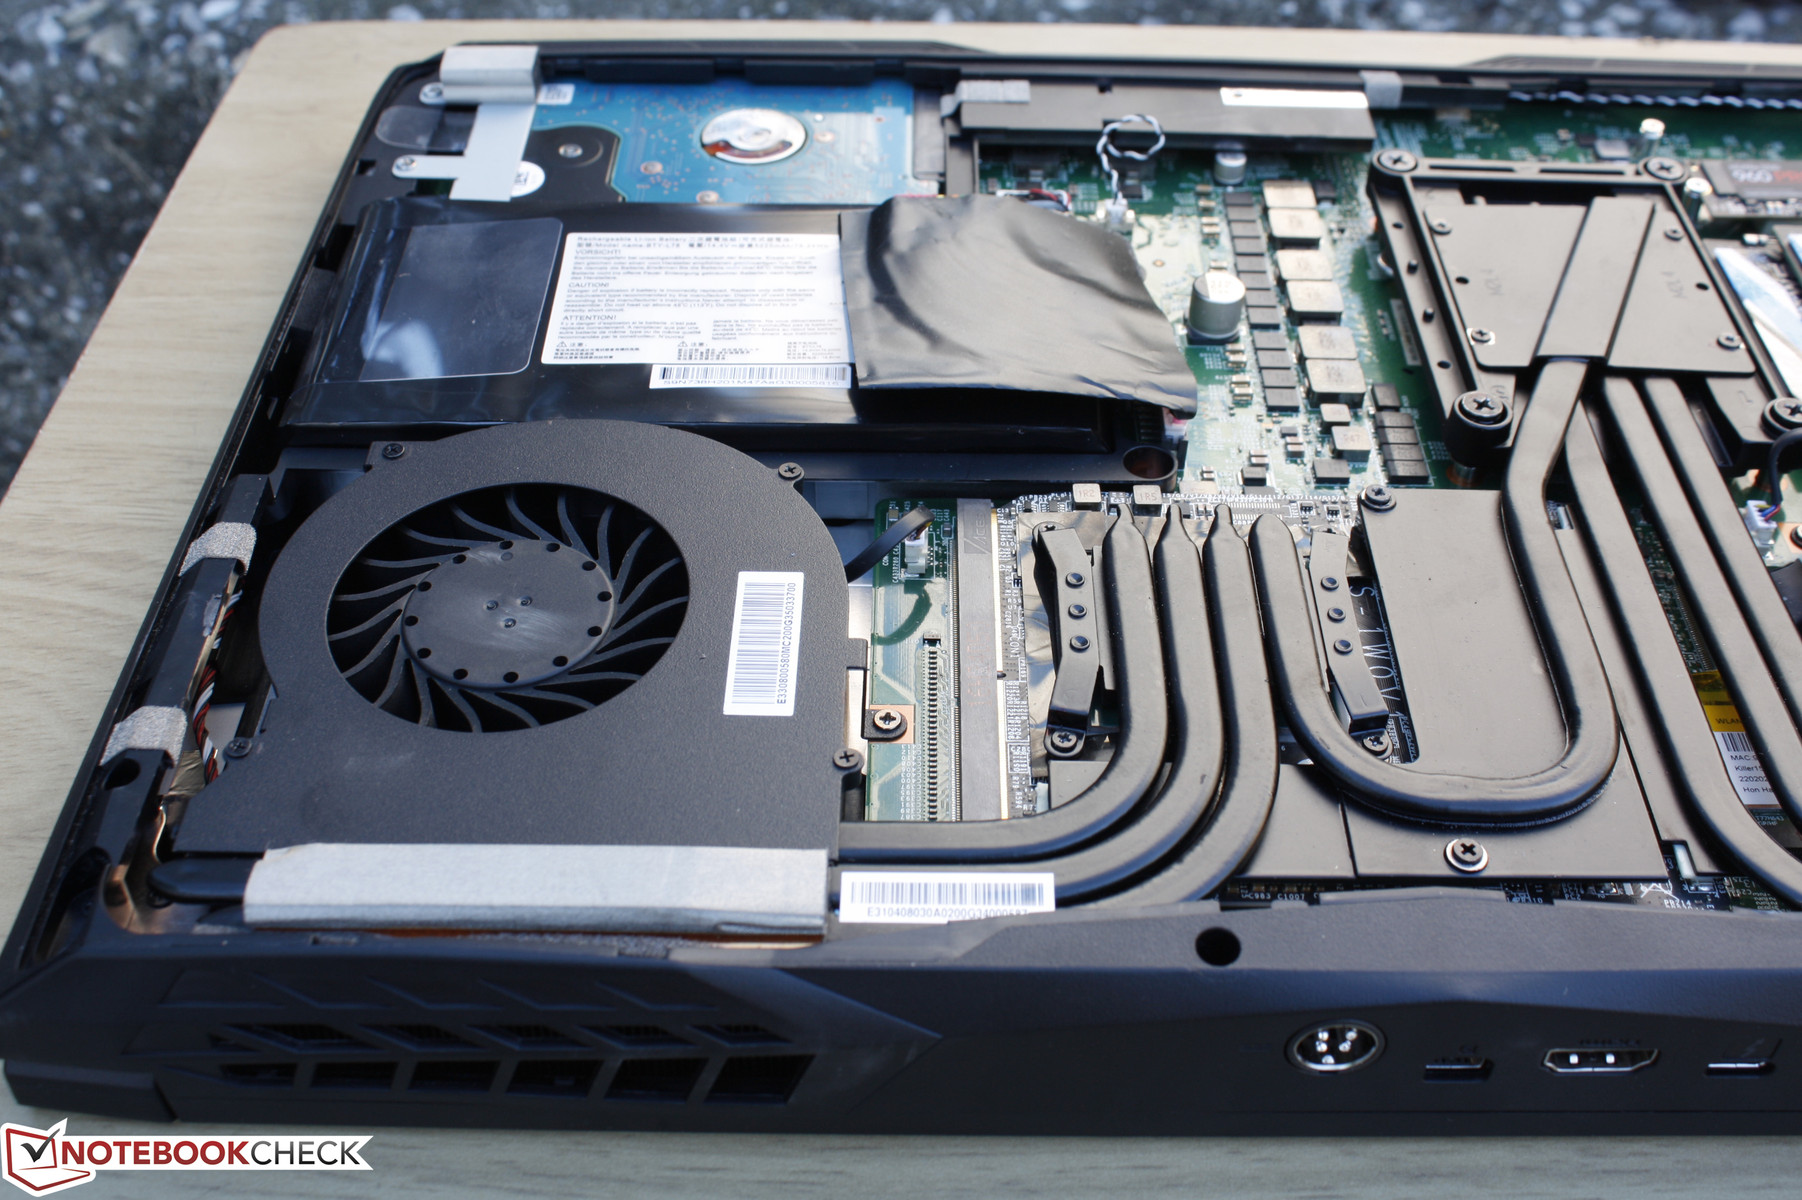
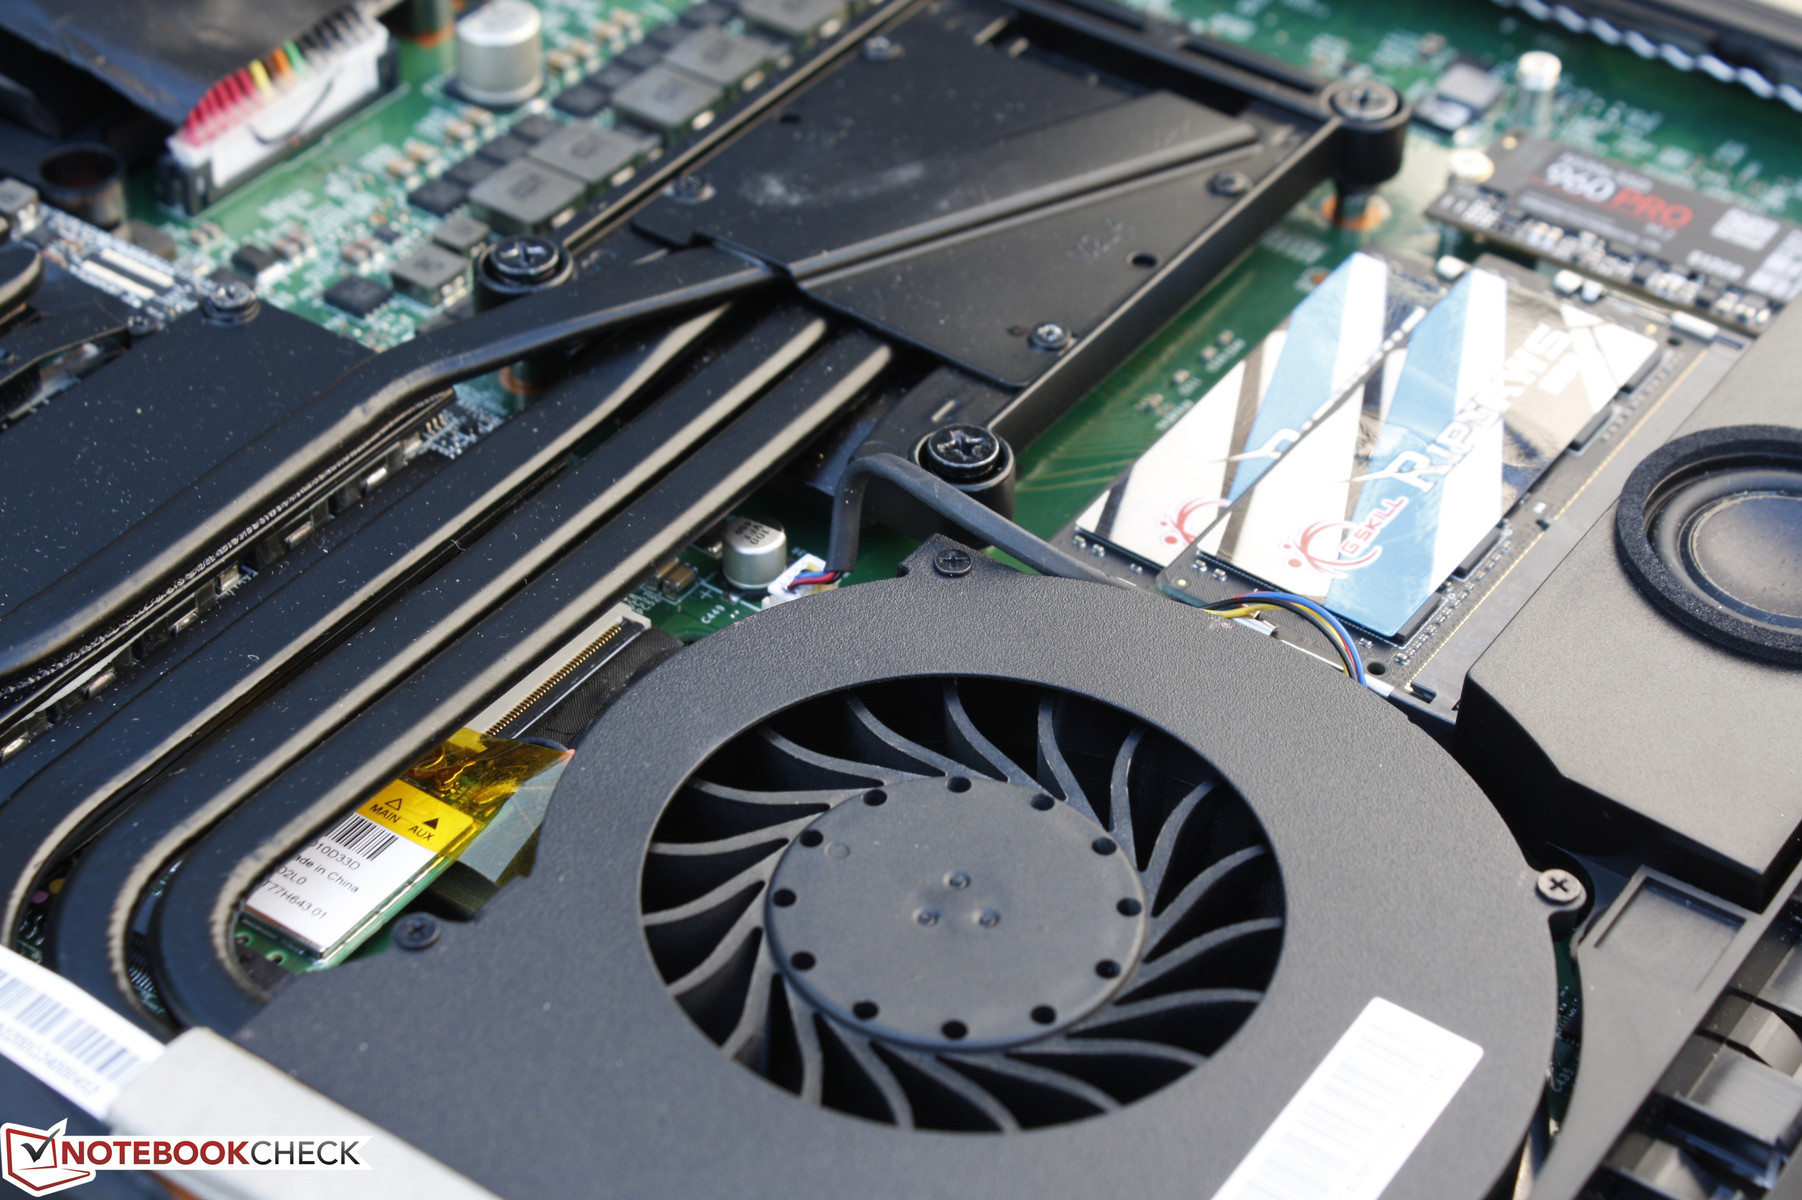
The bottom panel can be removed with a simple Philips screwdriver to reveal the core internals of the notebook such as its 2x SODIMM slots, 2x M.2 2280 slots, 2.5-inch SATA III bay, battery, system fans, and the all-important LGA 1151 and MXM 3.0 sockets. The WLAN module is hidden underneath the heat pipes while the other two SODIMM slots are on the other side of the motherboard and will require additional disassembly to access.
Warranty
The standard one-year limited warranty applies to new purchases of the Tornado F5 compared to two years from the likes of MSI or Gigabyte. Additional coverage is available at up to three years.
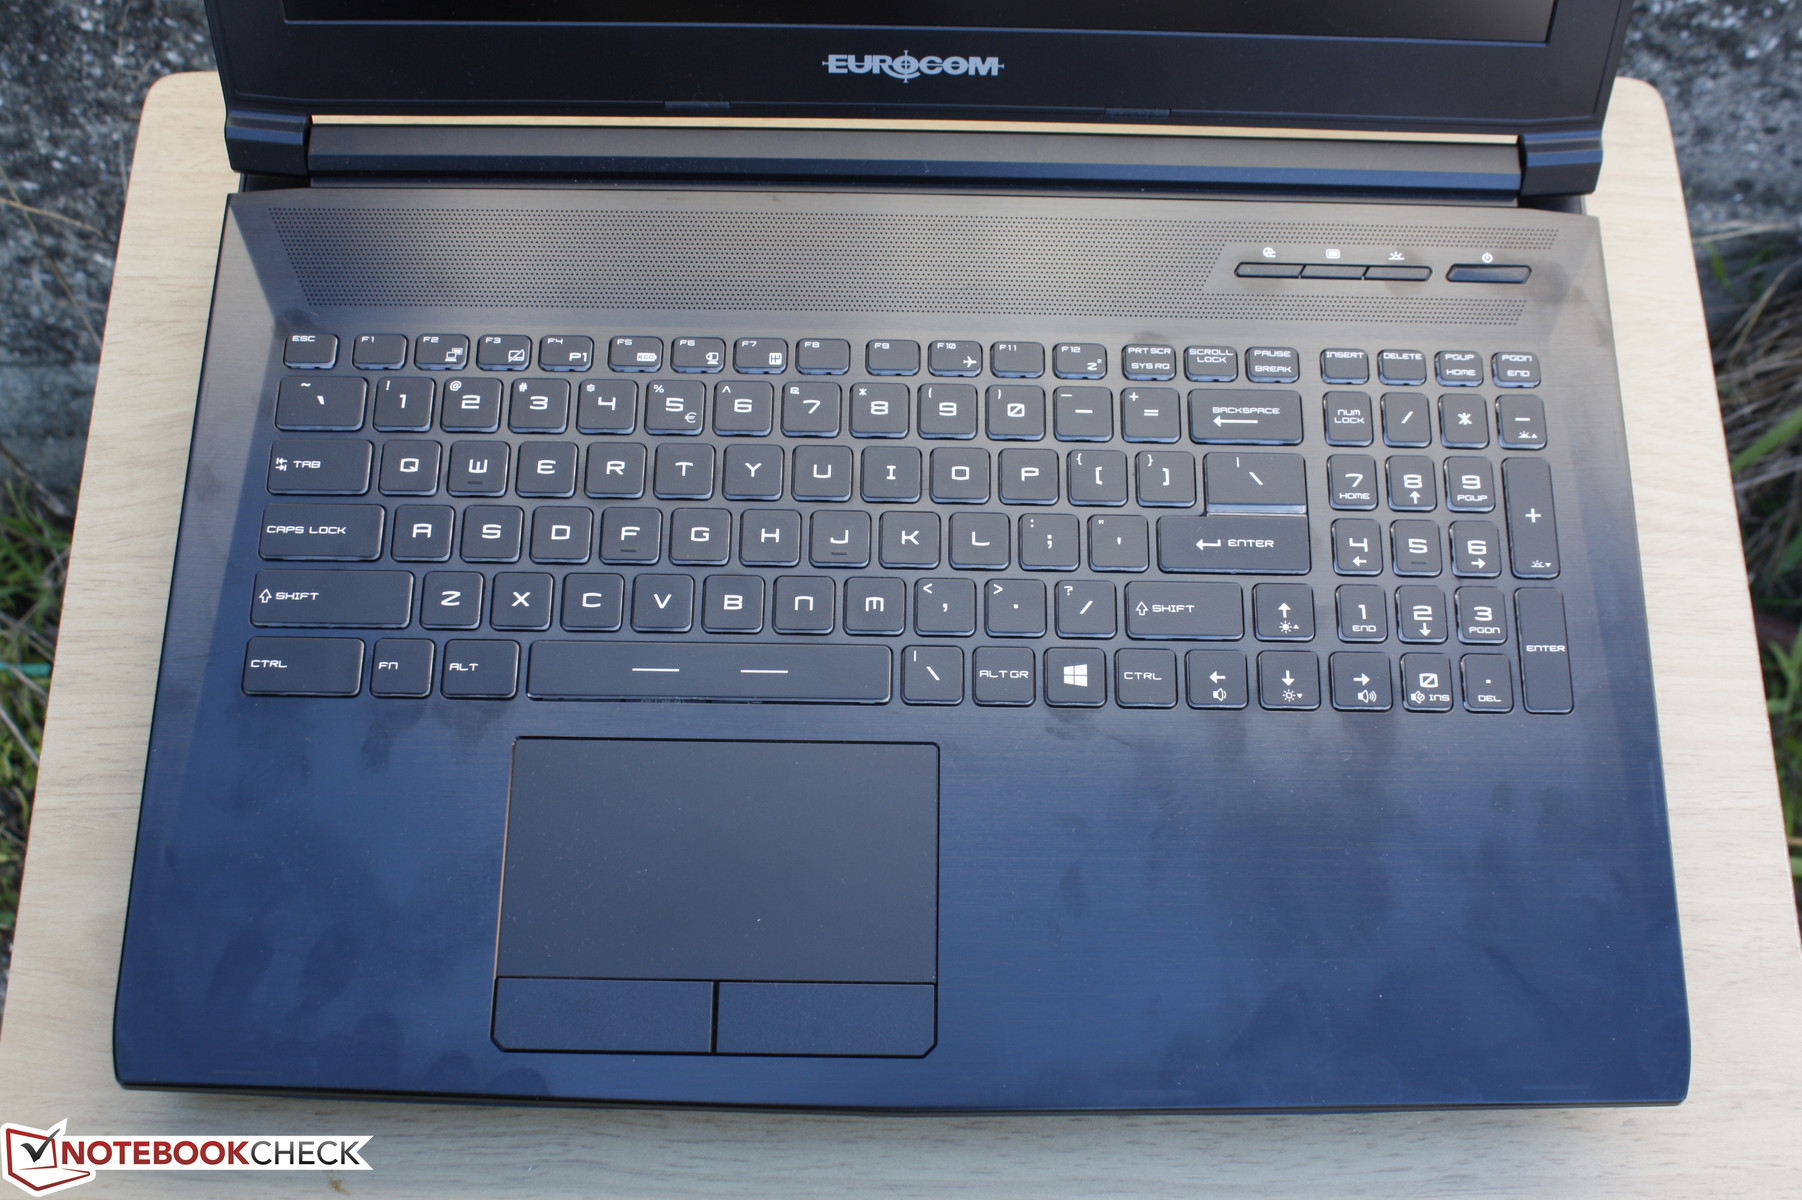
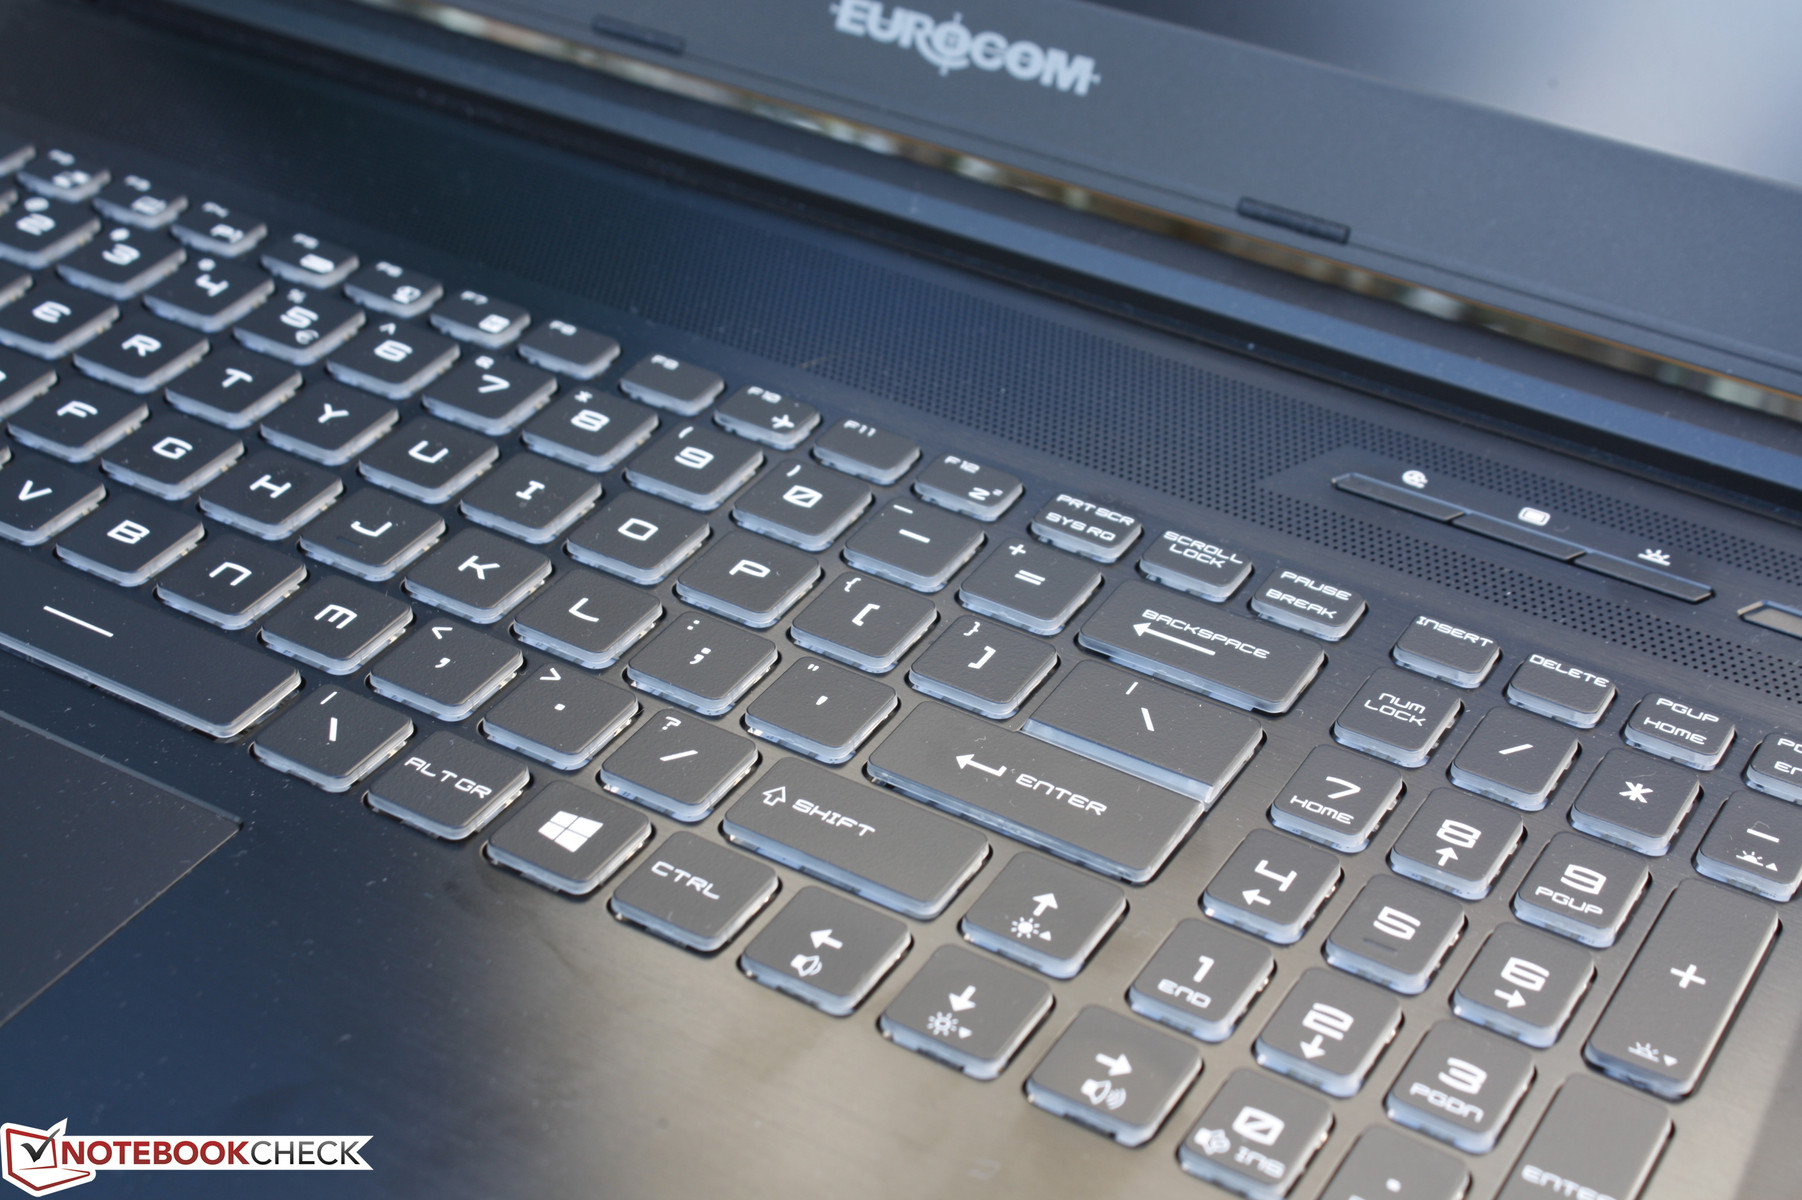
Input Devices
Keyboard
Readers who follow gaming notebooks closely will notice that the layout and design of the backlit keyboard is identical to the SteelSeries keyboard on MSI gaming notebooks. This is true down to the feel and feedback of the keys as well, so users can expect the same outstanding experience as on the MSI GT or GS series of notebooks that we've covered numerous times in the past. Keystroke is firm and even between the keys with minimal clatter. There is little to complain as far as Chiclet keyboard go, although certain Gigabyte notebooks offer deeper key travel to avoid keys from feeling too shallow.
A minor complaint is the lack of a dedicated Caps Lock light indicator, so users must rely on software-based onscreen notifications for Caps Lock status.
Touchpad
Likewise, the rigid touchpad (~10.8 x 6 cm) surface provides a smooth and even glide with no noticeable issues regarding responsiveness or reliability for simple cursor movement. The Synaptics V7.5 software is able to recognize gestures of up to three fingers. In this case, the software isn't always perfect in registering multi-touch actions like pinch-to-zoom.
The two dedicated mouse keys are firm, very shallow in travel, and easy to use. Not much force is required to input a click, so clicking multiple times in rapid succession will not result in fatigue as quickly.
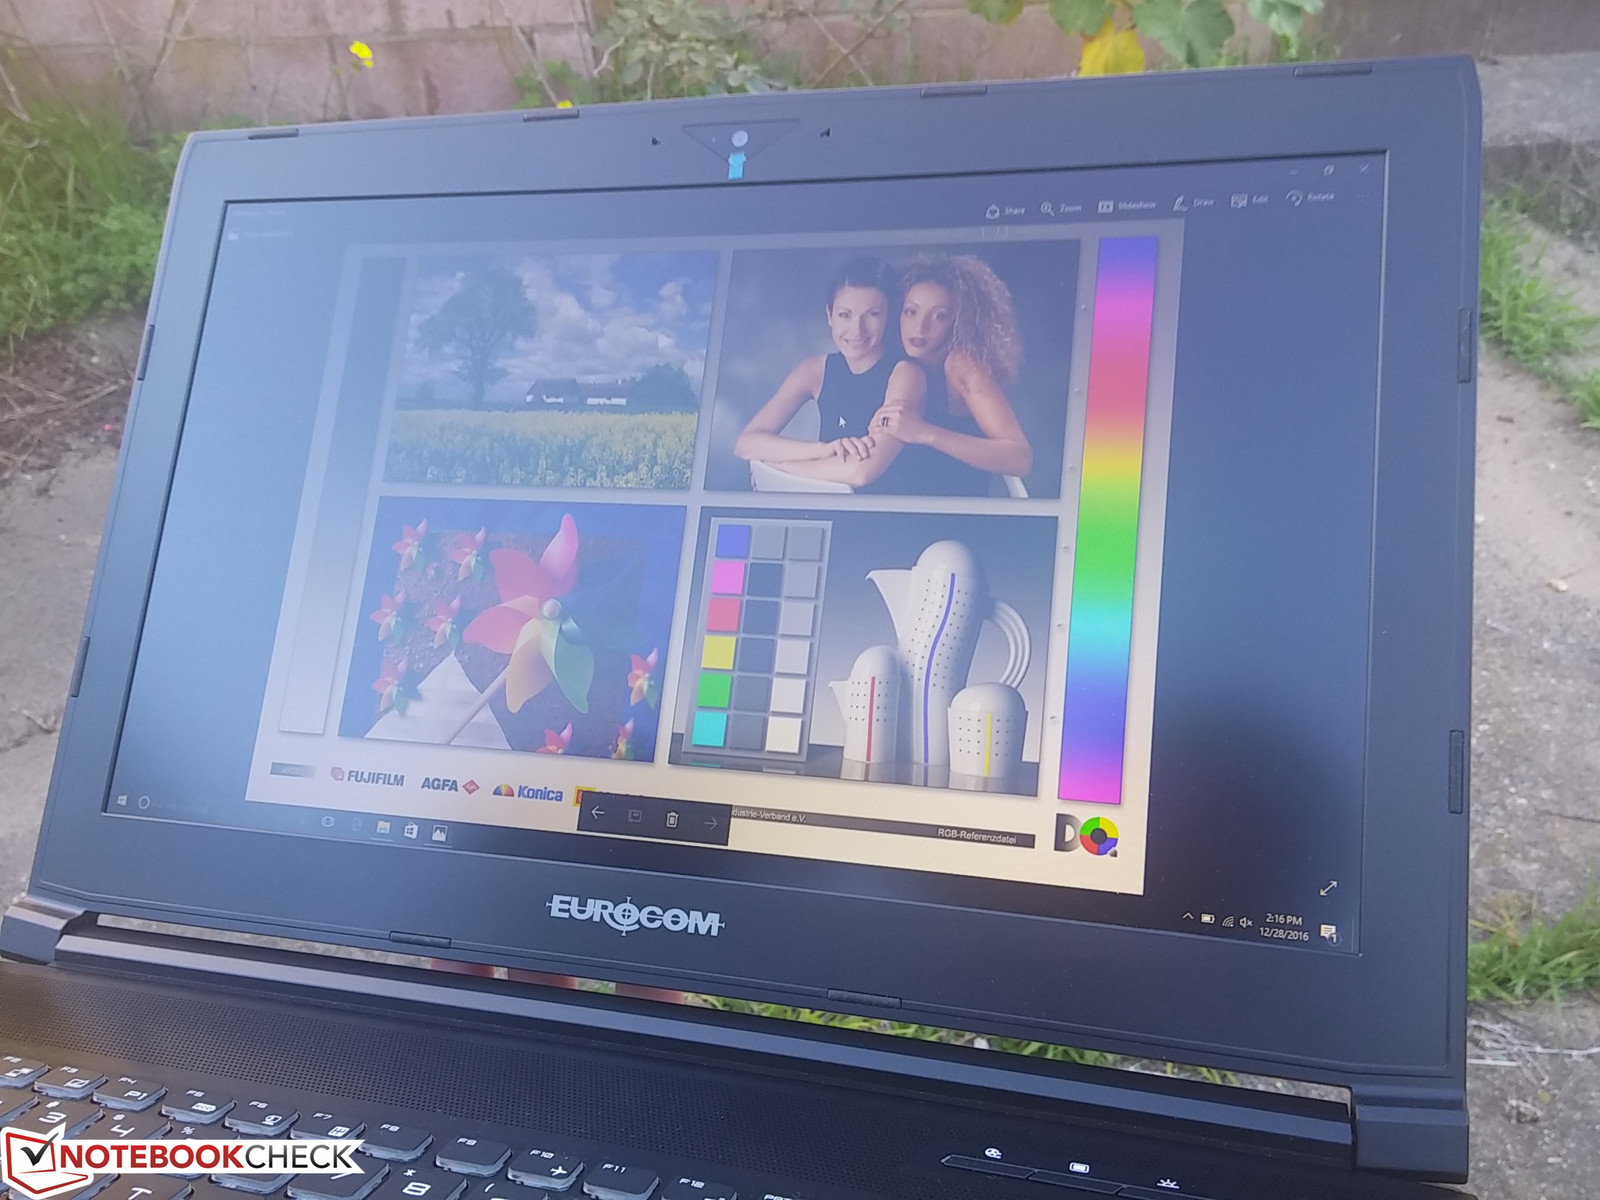
Display
The Tornado F5 can be configured with either a FHD or 4K UHD panel. There are no options in between including 5 ms/120 Hz panels as found on certain MSI or Aorus systems or even wider color gamut choices. The latter is a bit surprising as many Eurocom systems have full sRGB or AdobeRGB display options to better appeal to graphic artists. G-Sync comes standard since the chassis is catered more towards gamers instead.
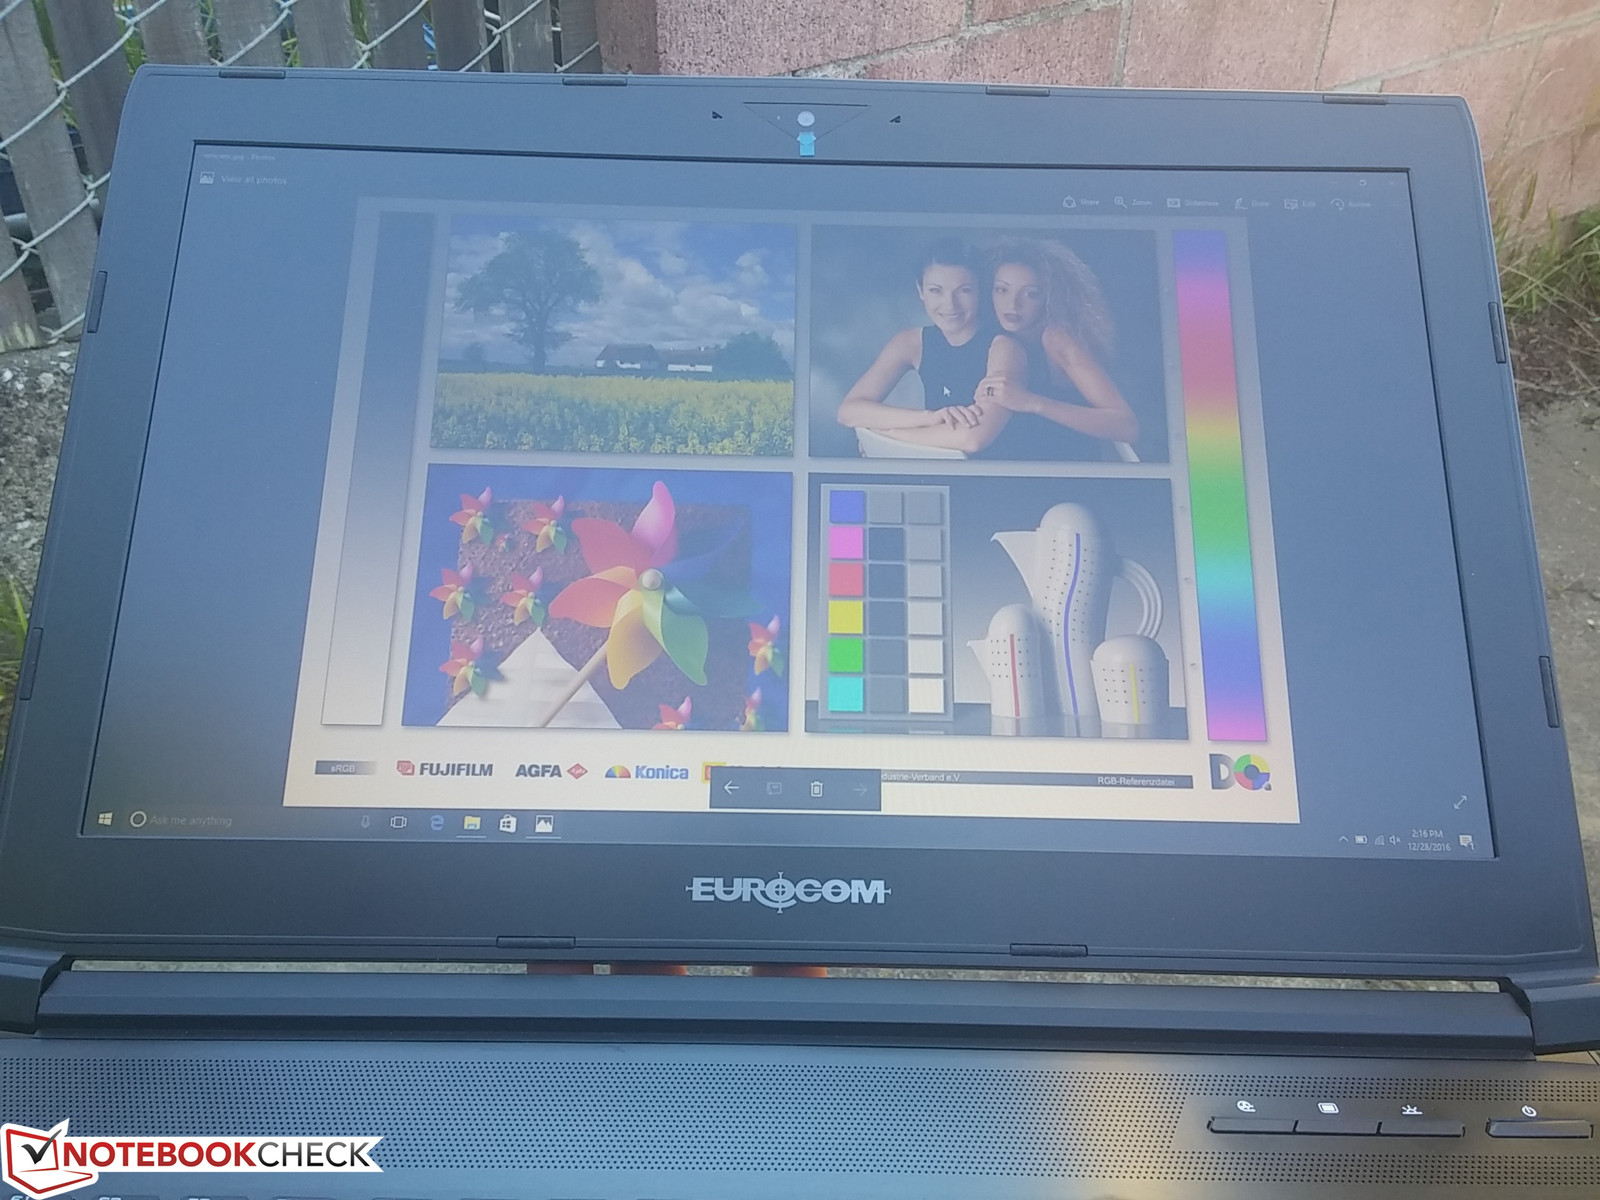
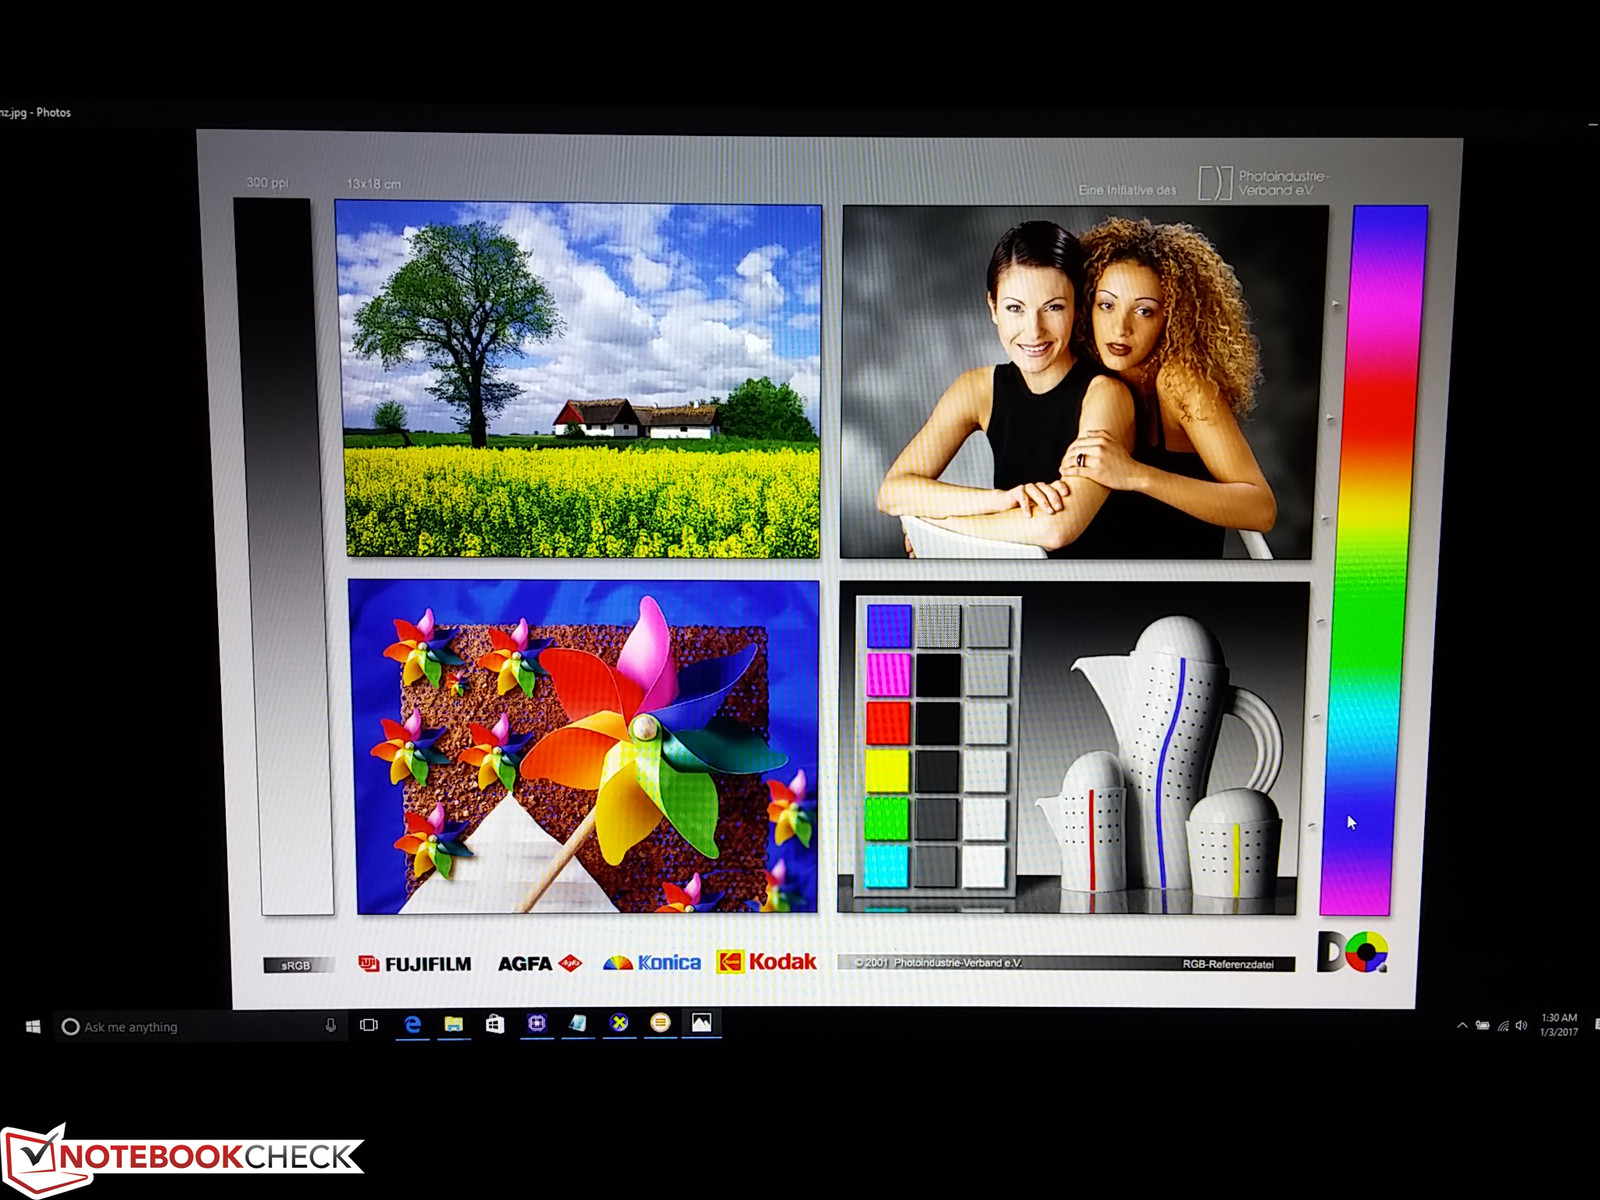
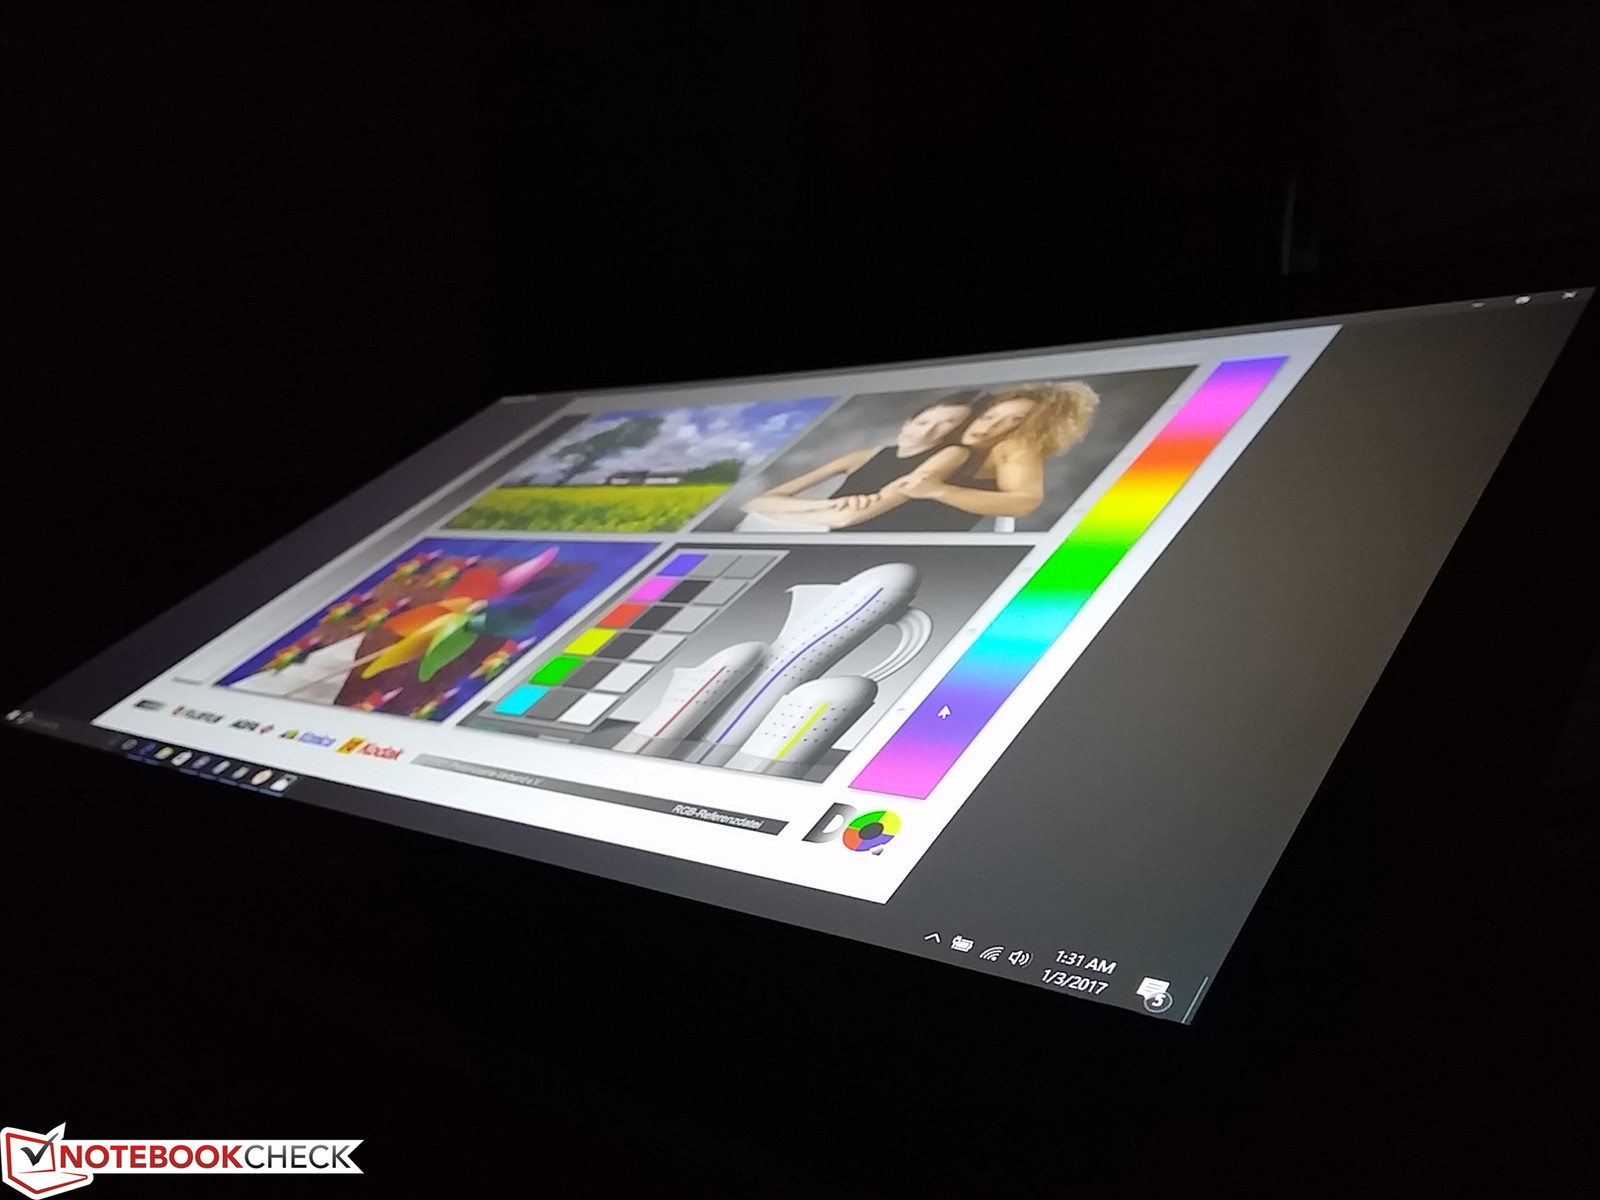
Our FHD SKU utilizes a very similar LG Philips LP156WF6-SPP1 IPS panel as on the Asus Strix GL502VM, Acer Predator 15 G9, and Asus Zenbook UX510UW. Unsurprisingly, the Eurocom display shares many qualities with these three notebooks including similar contrast levels and color space coverage. Black-White response times, however, are slightly slower on the Eurocom even after rechecking measurements. Subjectively, the matte screen is crisp and clean with no noticeable graininess or artifacts when viewing from a normal distance.
Backlight bleeding is very even across the entirety of the screen on our test unit. The slight bleeding on the top corners are difficult to notice even during movie playback with black borders.
| |||||||||||||||||||||||||
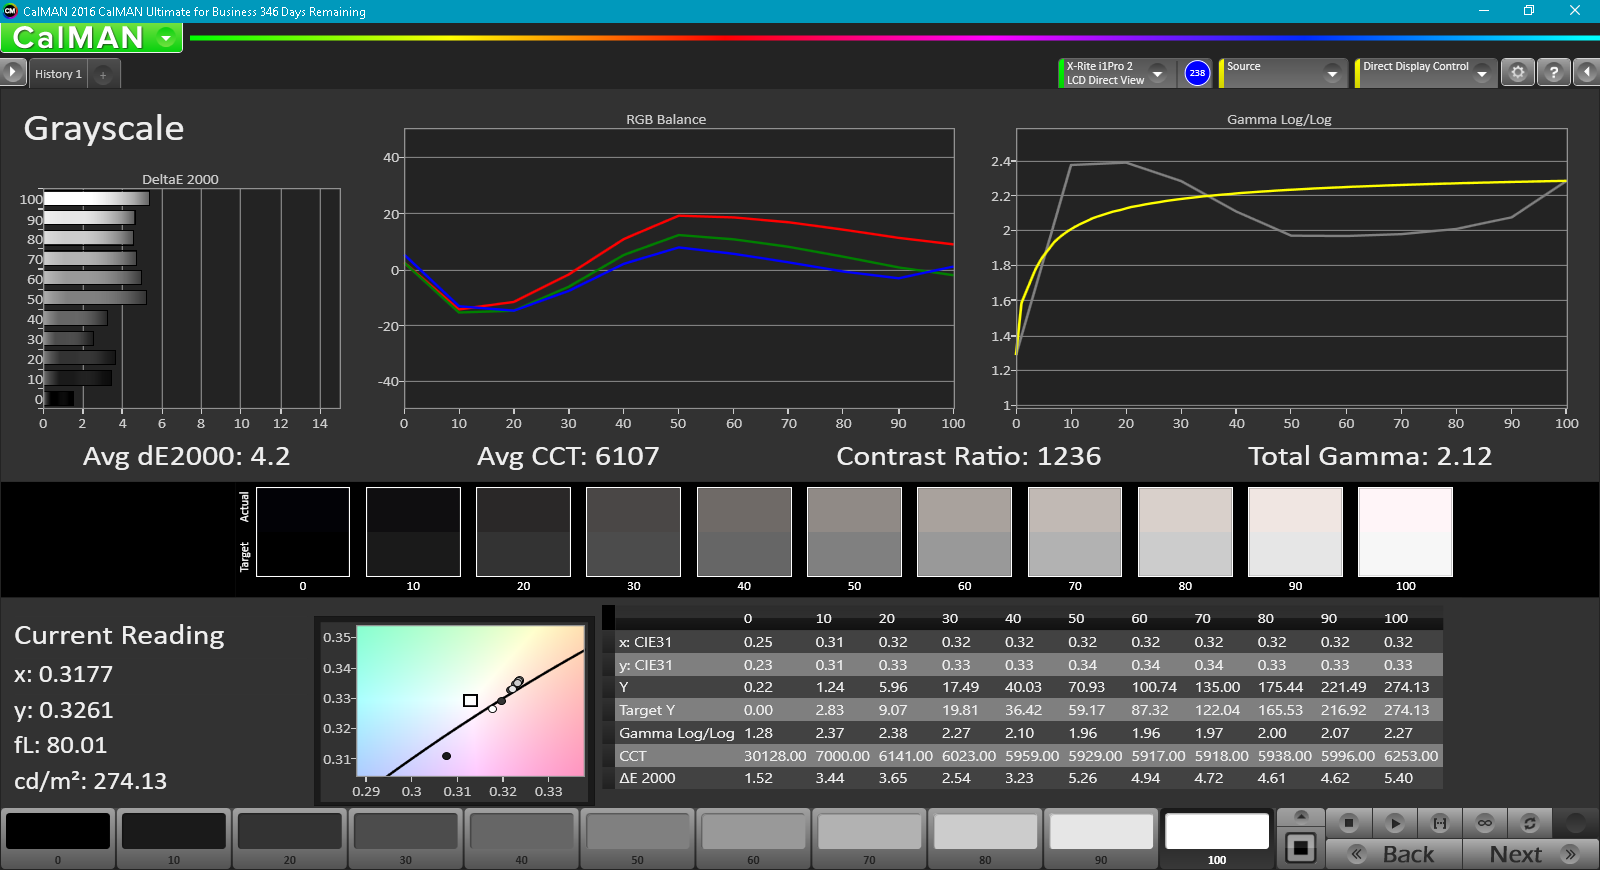
Brightness Distribution: 90 %
Center on Battery: 315.8 cd/m²
Contrast: 957:1 (Black: 0.33 cd/m²)
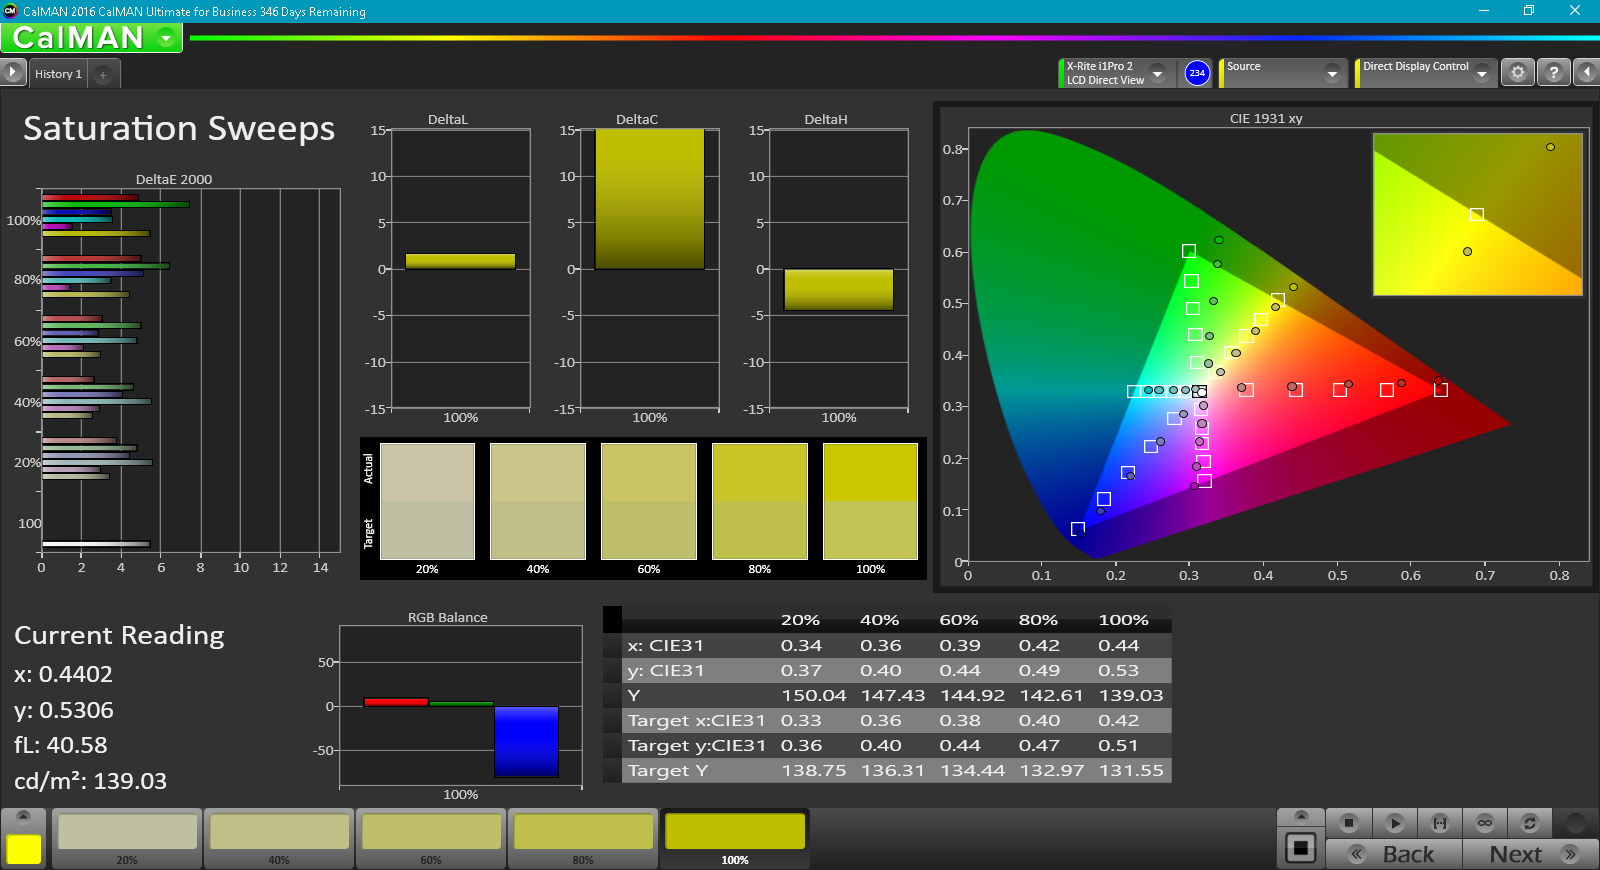
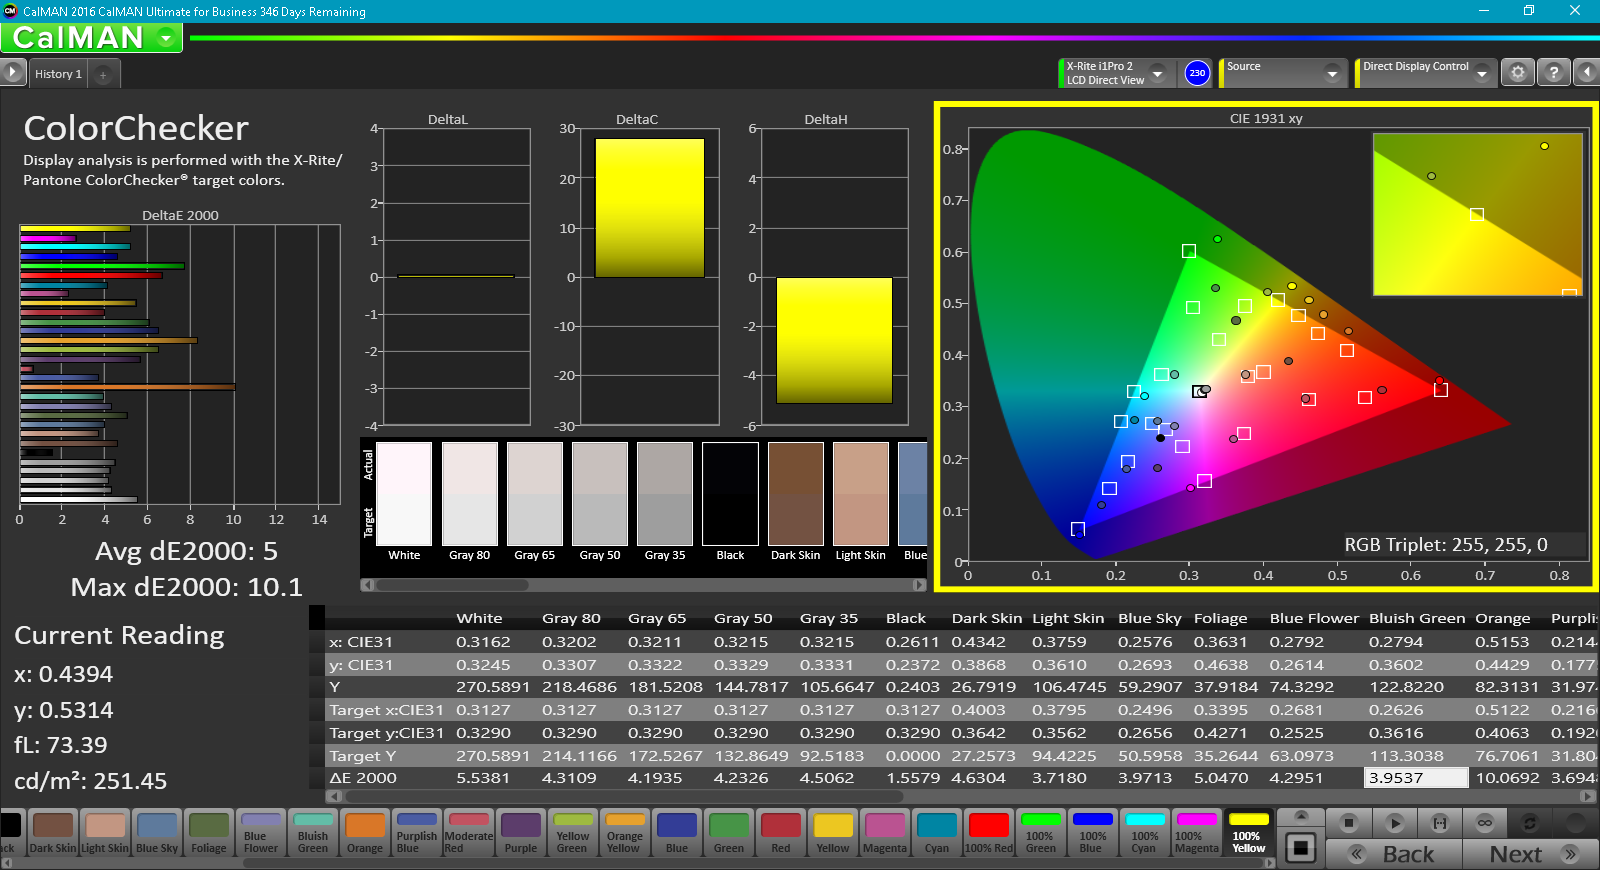
ΔE ColorChecker Calman: 5 | ∀{0.5-29.43 Ø4.71}
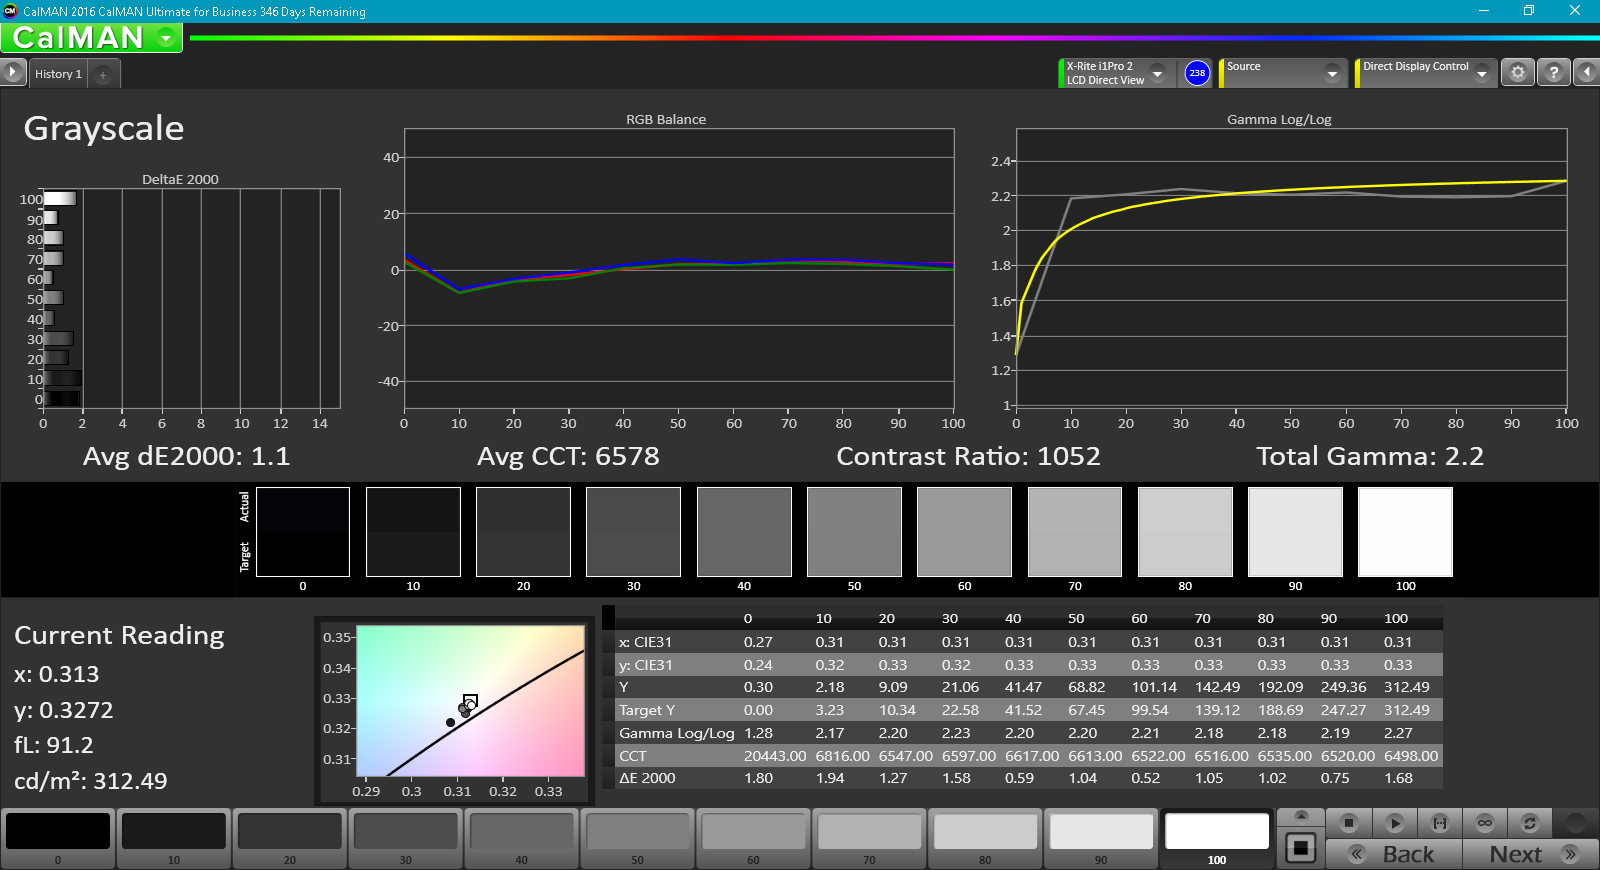
ΔE Greyscale Calman: 4.2 | ∀{0.09-98 Ø4.96}
83% sRGB (Argyll 1.6.3 3D)
54.5% AdobeRGB 1998 (Argyll 1.6.3 3D)
60.7% AdobeRGB 1998 (Argyll 3D)
83% sRGB (Argyll 3D)
64.5% Display P3 (Argyll 3D)
Gamma: 2.12
CCT: 6107 K
| Eurocom Tornado F5 IPS, 15.6", 1920x1080 | Asus Strix GL502VM-FY039T LG Philips LP156WF6-SPB6 (LGD046F), IPS, 15.6", 1920x1080 | Acer Predator 15 G9-593-765Q LG Philips LP156WF6-SPP1 (LGD04D5), IPS, 15.6", 1920x1080 | Asus Zenbook UX510UW-CN044T LG Philips LP156WF6-SPB6, IPS, 15.6", 1920x1080 | MSI GS63VR-6RF16H22 Stealth Pro Samsung 156HL01-104 (SDC324C) , IPS, 15.6", 1920x1080 | |
|---|---|---|---|---|---|
| Display | 0% | 0% | -4% | 12% | |
| Display P3 Coverage (%) | 64.5 | 64.5 0% | 63.6 -1% | 61.5 -5% | 67.8 5% |
| sRGB Coverage (%) | 83 | 83.4 0% | 83.9 1% | 80.4 -3% | 97.4 17% |
| AdobeRGB 1998 Coverage (%) | 60.7 | 60.9 0% | 61.3 1% | 58.8 -3% | 69.7 15% |
| Response Times | 1% | 8% | -1% | 17% | |
| Response Time Grey 50% / Grey 80% * (ms) | 33.6 ? | 40 ? -19% | 35 ? -4% | 40 ? -19% | |
| Response Time Black / White * (ms) | 31.2 ? | 25 ? 20% | 25 ? 20% | 26 ? 17% | 26 ? 17% |
| PWM Frequency (Hz) | 202 ? | ||||
| Screen | 3% | 5% | -6% | 8% | |
| Brightness middle (cd/m²) | 315.8 | 321 2% | 273 -14% | 326 3% | 293 -7% |
| Brightness (cd/m²) | 310 | 296 -5% | 267 -14% | 316 2% | 279 -10% |
| Brightness Distribution (%) | 90 | 88 -2% | 83 -8% | 80 -11% | 84 -7% |
| Black Level * (cd/m²) | 0.33 | 0.33 -0% | 0.27 18% | 0.35 -6% | 0.33 -0% |
| Contrast (:1) | 957 | 973 2% | 1011 6% | 931 -3% | 888 -7% |
| Colorchecker dE 2000 * | 5 | 4.42 12% | 3.77 25% | 5.49 -10% | 3.59 28% |
| Colorchecker dE 2000 max. * | 10.1 | 9.78 3% | 10.64 -5% | 11.36 -12% | 5.79 43% |
| Greyscale dE 2000 * | 4.2 | 3.34 20% | 2.48 41% | 4.84 -15% | 3.86 8% |
| Gamma | 2.12 104% | 2.4 92% | 2.37 93% | 2.23 99% | 2.53 87% |
| CCT | 6107 106% | 6213 105% | 6854 95% | 5971 109% | 7229 90% |
| Color Space (Percent of AdobeRGB 1998) (%) | 54.5 | 55 1% | 55 1% | 53 -3% | 63 16% |
| Color Space (Percent of sRGB) (%) | 83 | 83 0% | 84 1% | 80 -4% | 97 17% |
| Total Average (Program / Settings) | 1% /
2% | 4% /
5% | -4% /
-5% | 12% /
10% |
* ... smaller is better
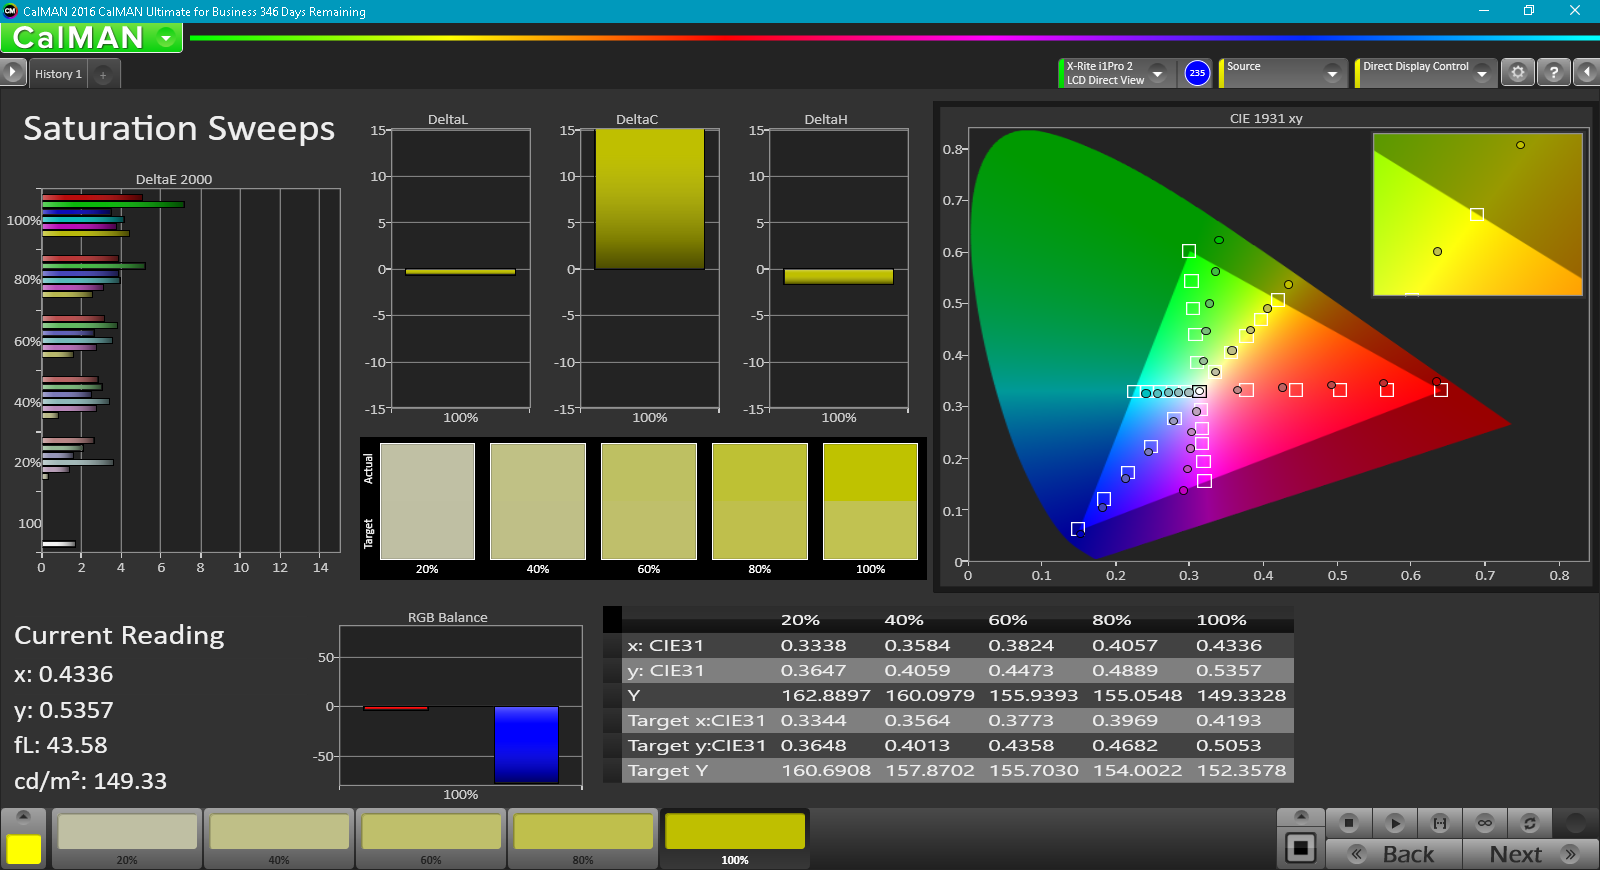
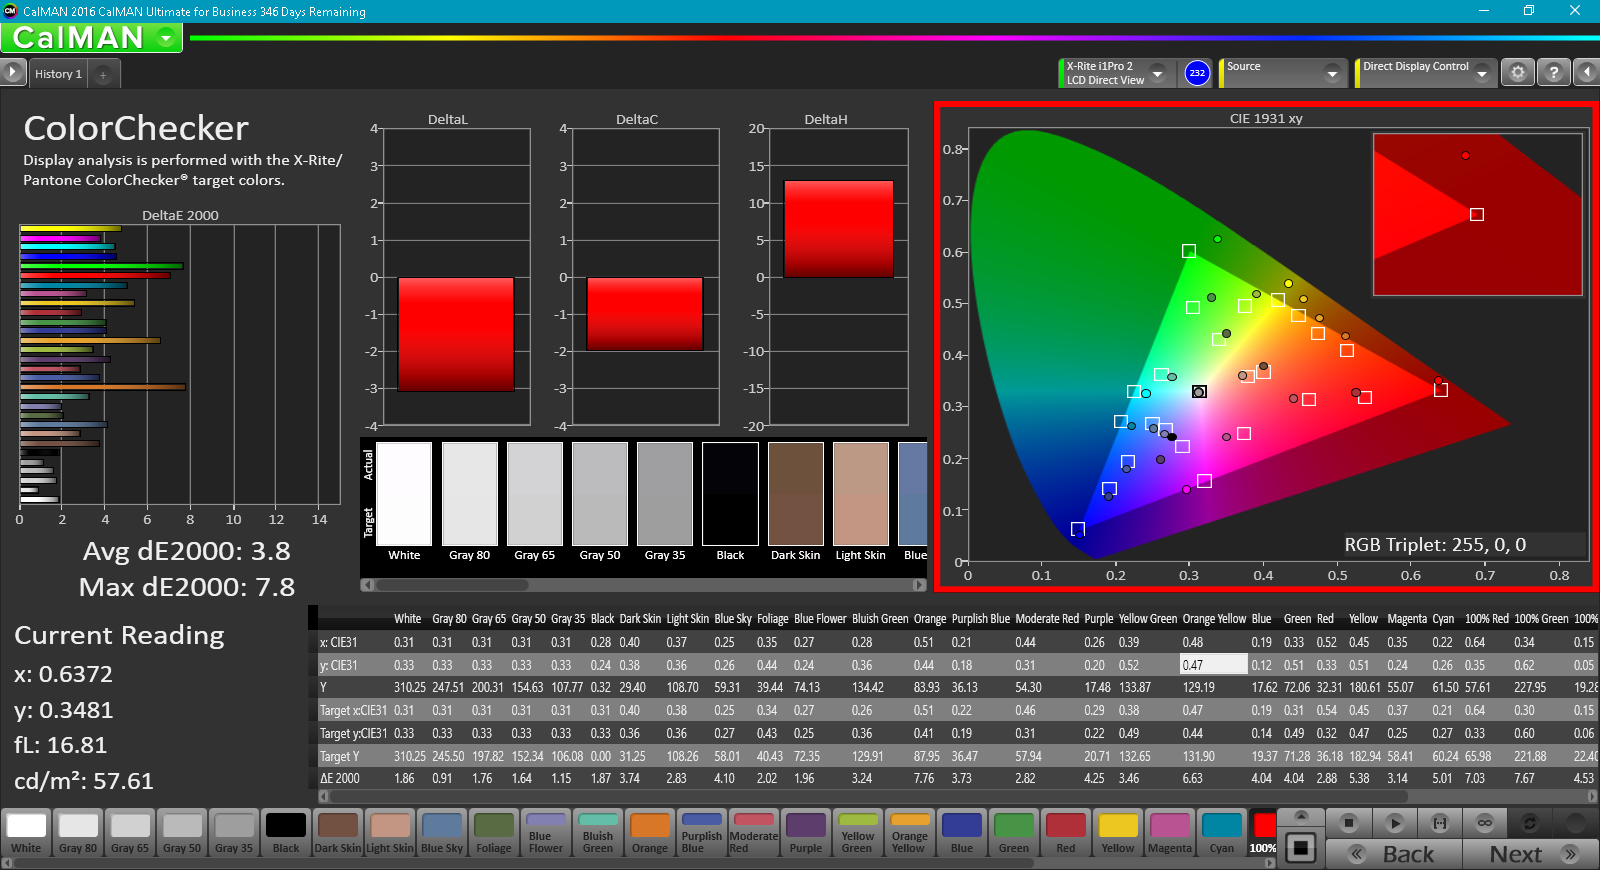
Our FHD panel covers an estimated 83 percent and 55 percent of the sRGB and AdobeRGB standards, respectively. Exceptional color accuracy is not usually a deal breaker for gamers while professional digital artists may be out of luck.
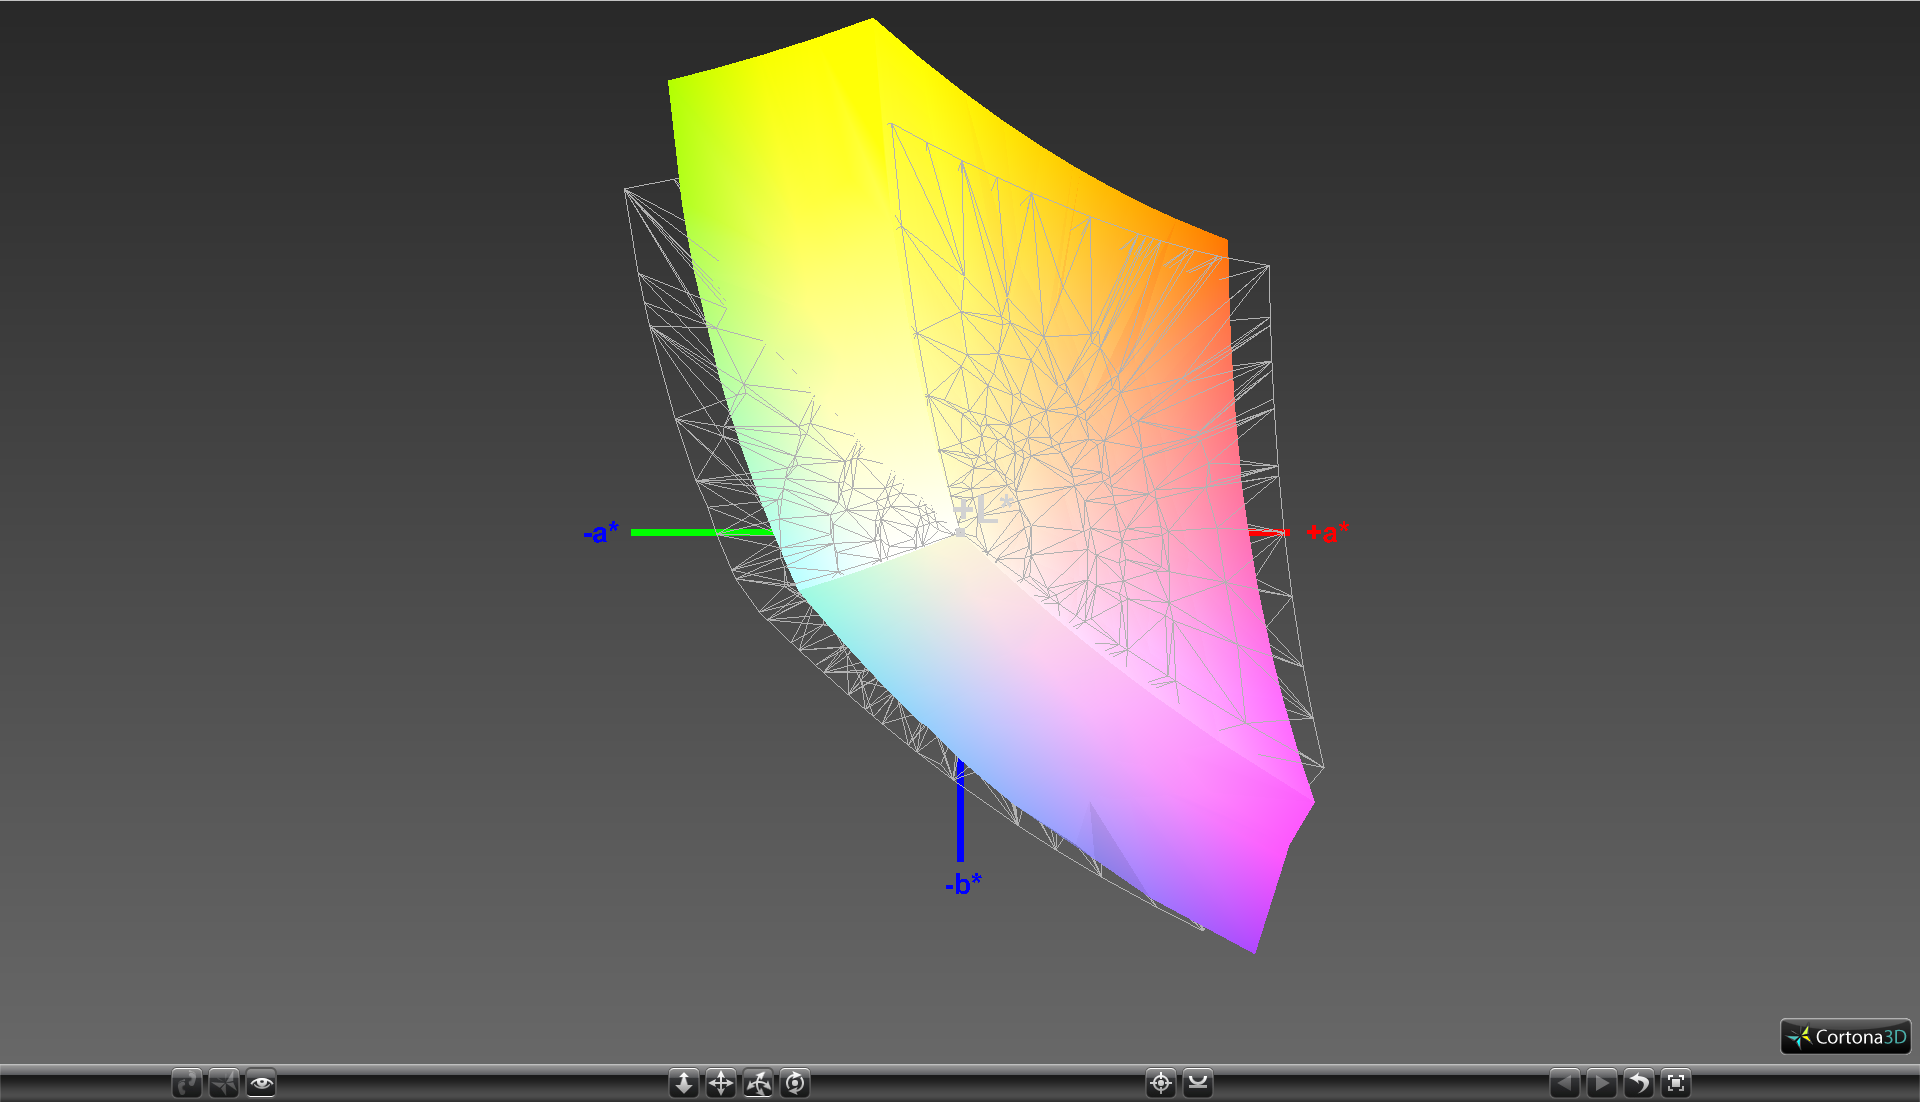
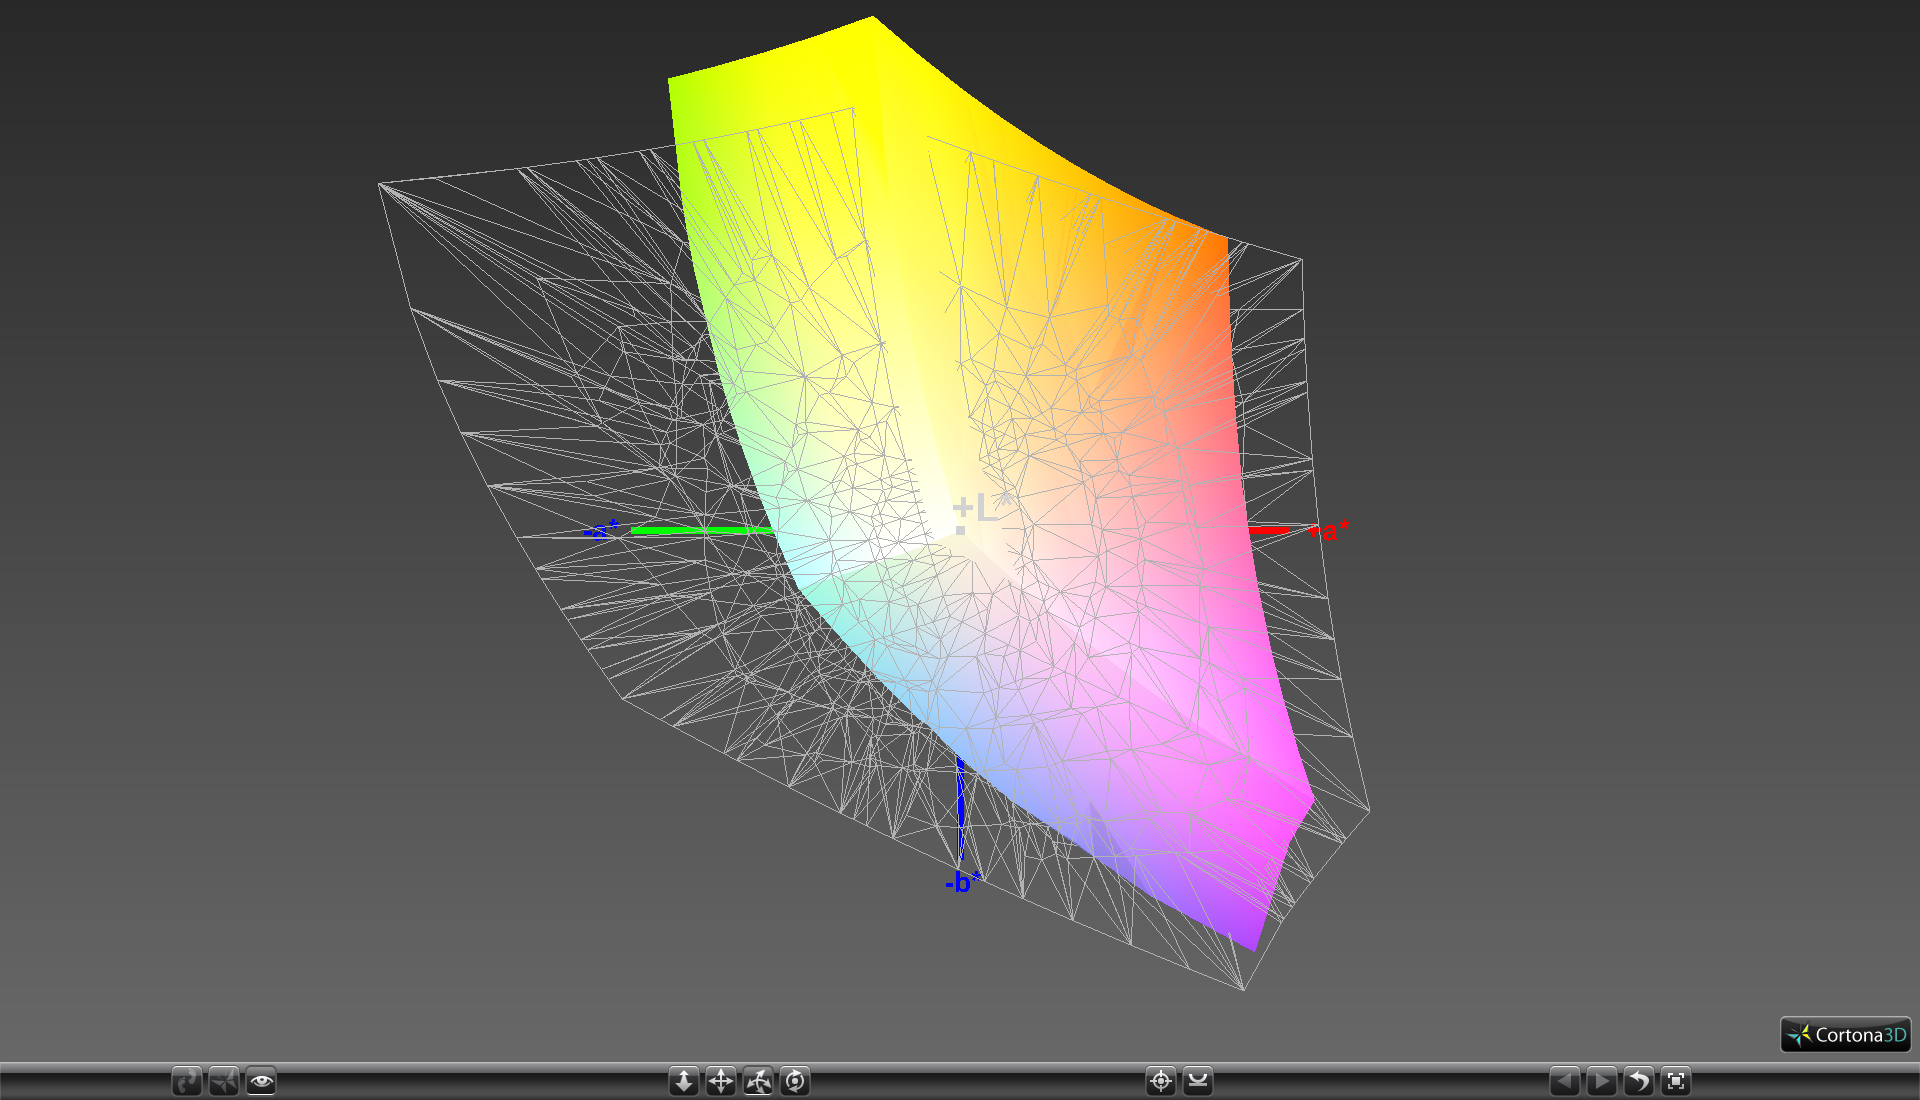

Colors and grayscale are already quite accurate out of the box. Calibration with an X-Rite spectrophotometer will improve both even further including an almost perfect RGB balance. Colors become less accurate at higher levels due to the imperfect sRGB coverage of the panel.
Display Response Times
| ↔ Response Time Black to White | ||
|---|---|---|
| 31.2 ms ... rise ↗ and fall ↘ combined | ↗ 4.4 ms rise | 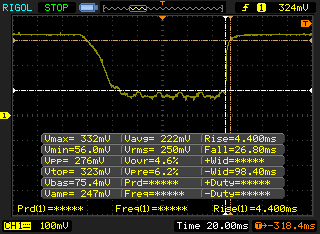 |
| ↘ 26.8 ms fall | ||
| The screen shows slow response rates in our tests and will be unsatisfactory for gamers. In comparison, all tested devices range from 0.1 (minimum) to 240 (maximum) ms. » 84 % of all devices are better. This means that the measured response time is worse than the average of all tested devices (19.8 ms). | ||
| ↔ Response Time 50% Grey to 80% Grey | ||
| 33.6 ms ... rise ↗ and fall ↘ combined | ↗ 8.4 ms rise | 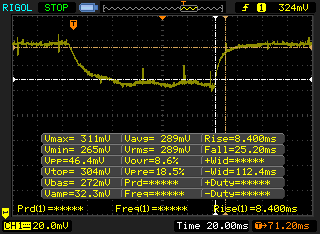 |
| ↘ 25.2 ms fall | ||
| The screen shows slow response rates in our tests and will be unsatisfactory for gamers. In comparison, all tested devices range from 0.165 (minimum) to 636 (maximum) ms. » 46 % of all devices are better. This means that the measured response time is similar to the average of all tested devices (30.9 ms). | ||
Screen Flickering / PWM (Pulse-Width Modulation)
| Screen flickering / PWM not detected | 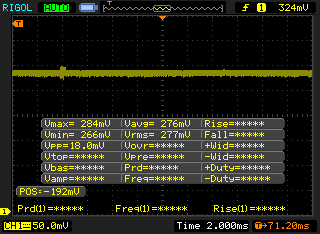 | ||
In comparison: 52 % of all tested devices do not use PWM to dim the display. If PWM was detected, an average of 7741 (minimum: 5 - maximum: 343500) Hz was measured. | |||
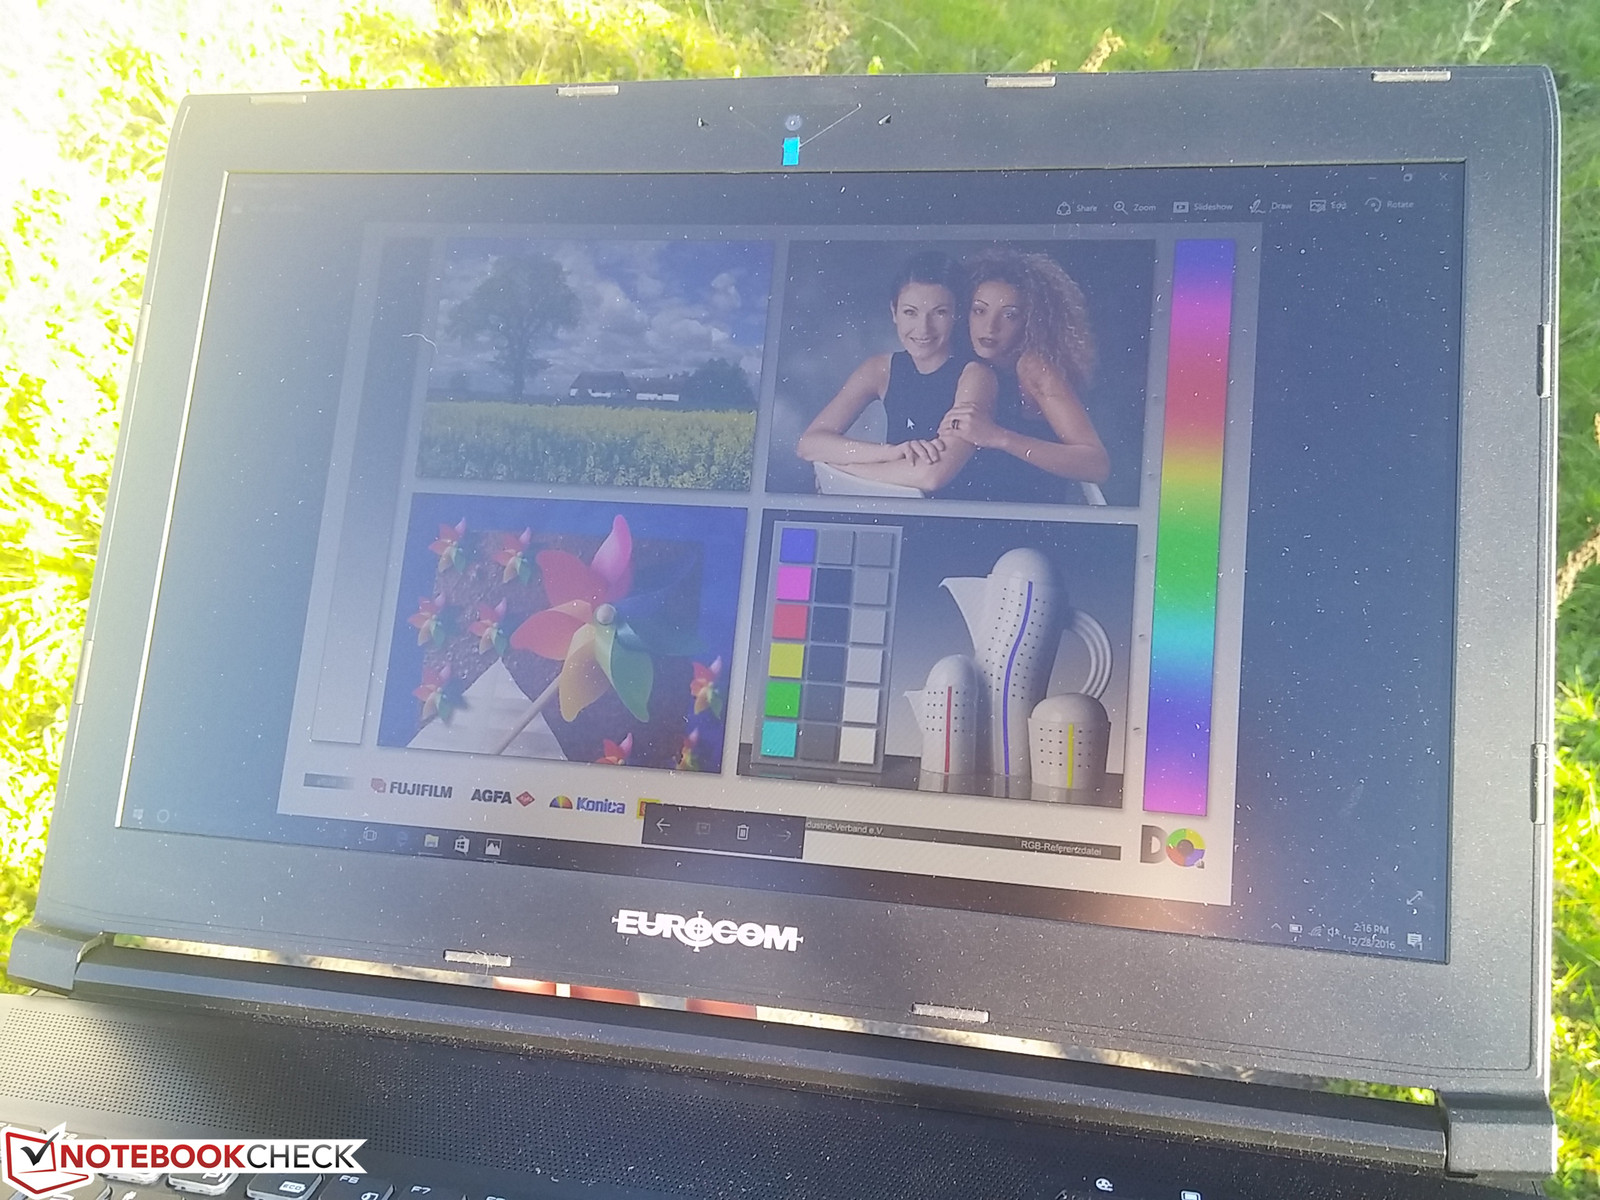
Outdoor visibility is average under shade and below average when under direct sunlight. The notebook was not designed for outdoor use with bright ambient lighting despite the matte IPS panel to reduce glare. Viewing angles are wide with no major color degradation at extreme angles save for a slight reduction in apparent brightness and contrast.
Performance
The brand new Kaby Lake Core i7-7700K is the star of the show as it directly supplants the popular Skylake i7-6700K. Part of its speed boost over the i7-6700K is due to its higher base clock rate of 4.2 GHz versus 4 GHz from the outgoing Skylake processor. Turbo Boost frequency is slightly faster as well from 4.2 GHz on the i7-6700K to 4.4 - 4.5 GHz on the i7-7700K. As a result, the overclocking overhead is actually quite minimal since the base clock rate is already very close to the rated Turbo Boost potential of the new CPU. Our next sections show that the i7-7700K can struggle to maintain clock rates above its base frequency when under extreme stress in order to sustain safe operating temperatures.
Outside of the CPU, users can configure between GeForce Pascal (GTX 1060/1070/1080), Maxwell (GTX 970M/980M), and Quadro (Mx000M) options. There are no integrated GPU options since G-Sync comes standard.

Processor
How much faster is the i7-7700K than the i7-6700K? According to CineBench benchmarks, the Kaby Lake CPU scores about 15 percent and 25 percent higher in multi-threaded and single-threaded operations, respectively. Additionally, it is able to complete Super Pi and wPrime calculations faster as well by about 10 to 15 percent. The margins here are noticeably wider than our comparisons between the ULV Kaby Lake i7-7500U and the Skylake i7-6500U, so enthusiasts who can utilize the additional horsepower will notice faster speed improvements.
Interestingly, the final score for CineBench R15 multi-thread is much closer to the i7-6700K than on other benchmarks even after multiple reruns.
See our dedicated CPU page on the Core i7-7700K for more technical information and benchmark comparisons.
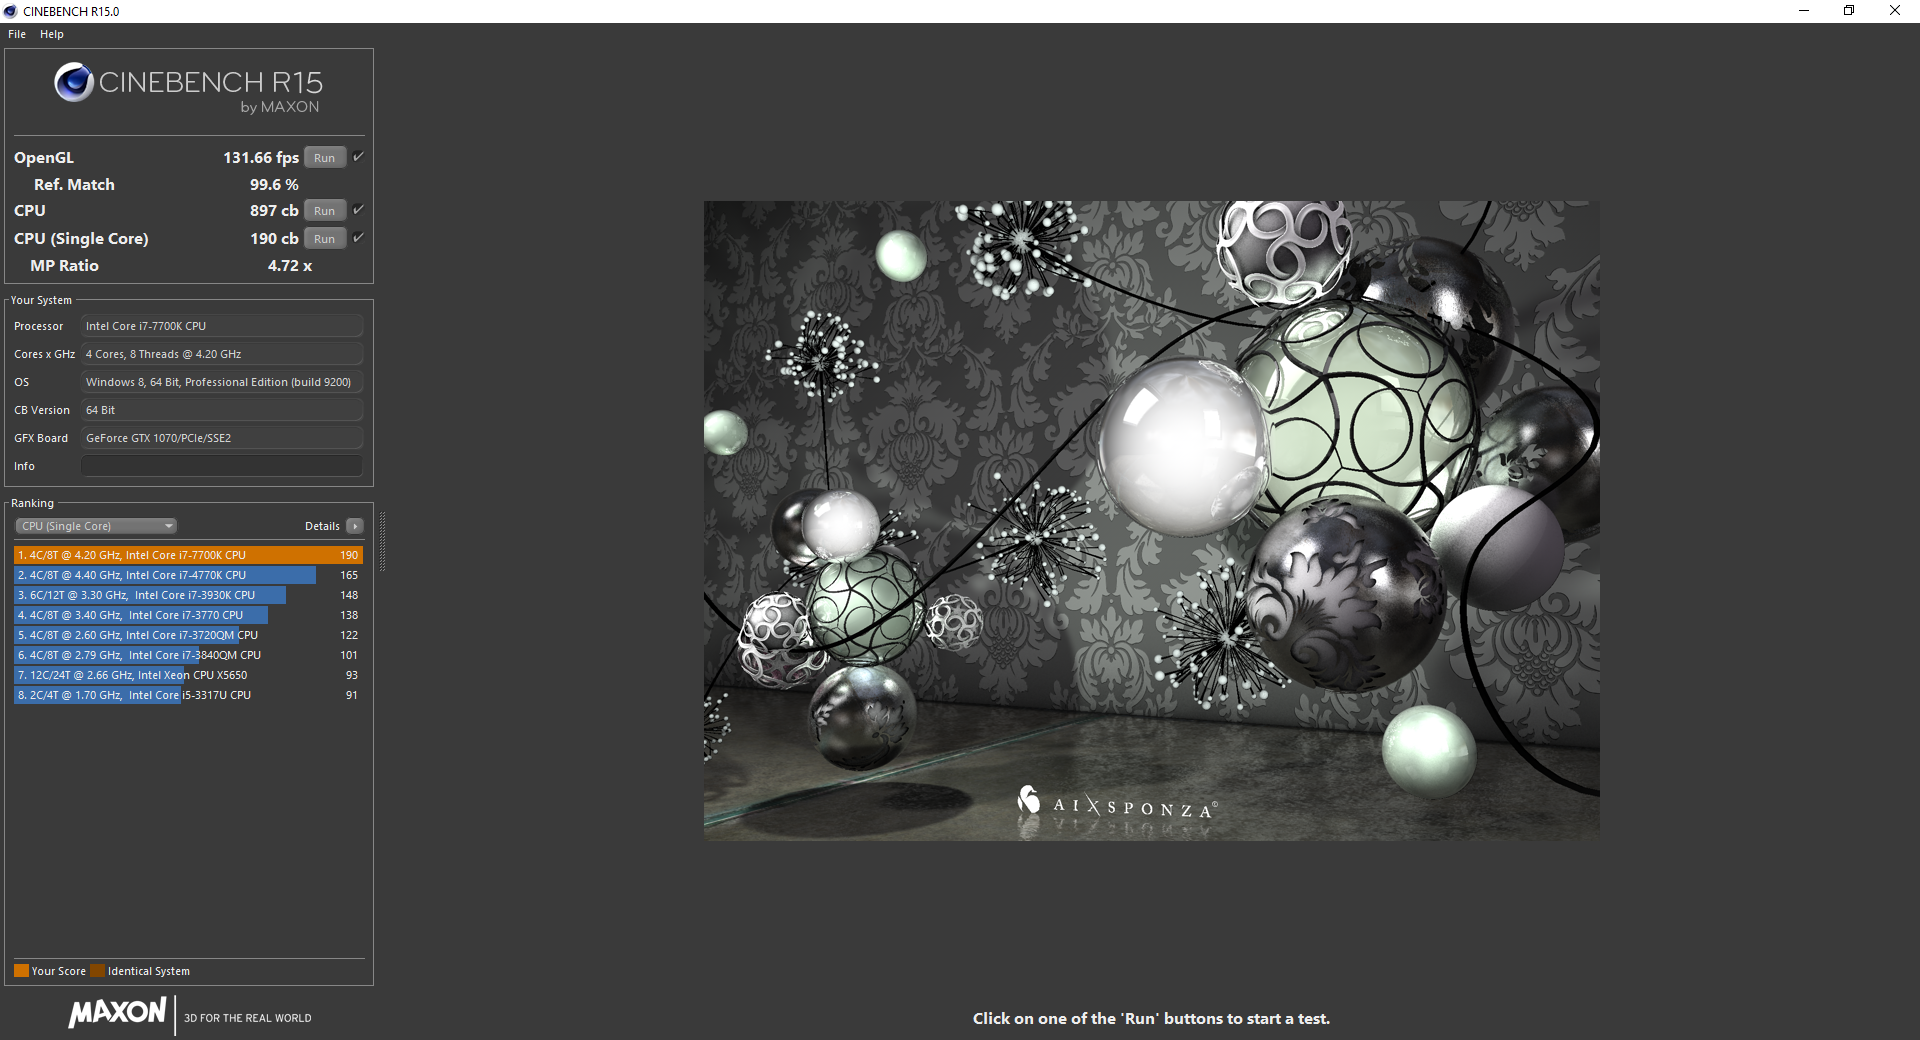
| Cinebench R15 | |
| CPU Single 64Bit | |
| Eurocom Tornado F5 | |
| Eurocom Sky X7E2 | |
| EVGA SC17 GTX 1070 | |
| MSI GE62 2QC-468XPL | |
| MSI GE72VR-6RF16H21 | |
| Eurocom Shark 4 | |
| CPU Multi 64Bit | |
| Eurocom Tornado F5 | |
| Eurocom Sky X7E2 | |
| MSI GE62 2QC-468XPL | |
| EVGA SC17 GTX 1070 | |
| MSI GE72VR-6RF16H21 | |
| Eurocom Shark 4 | |
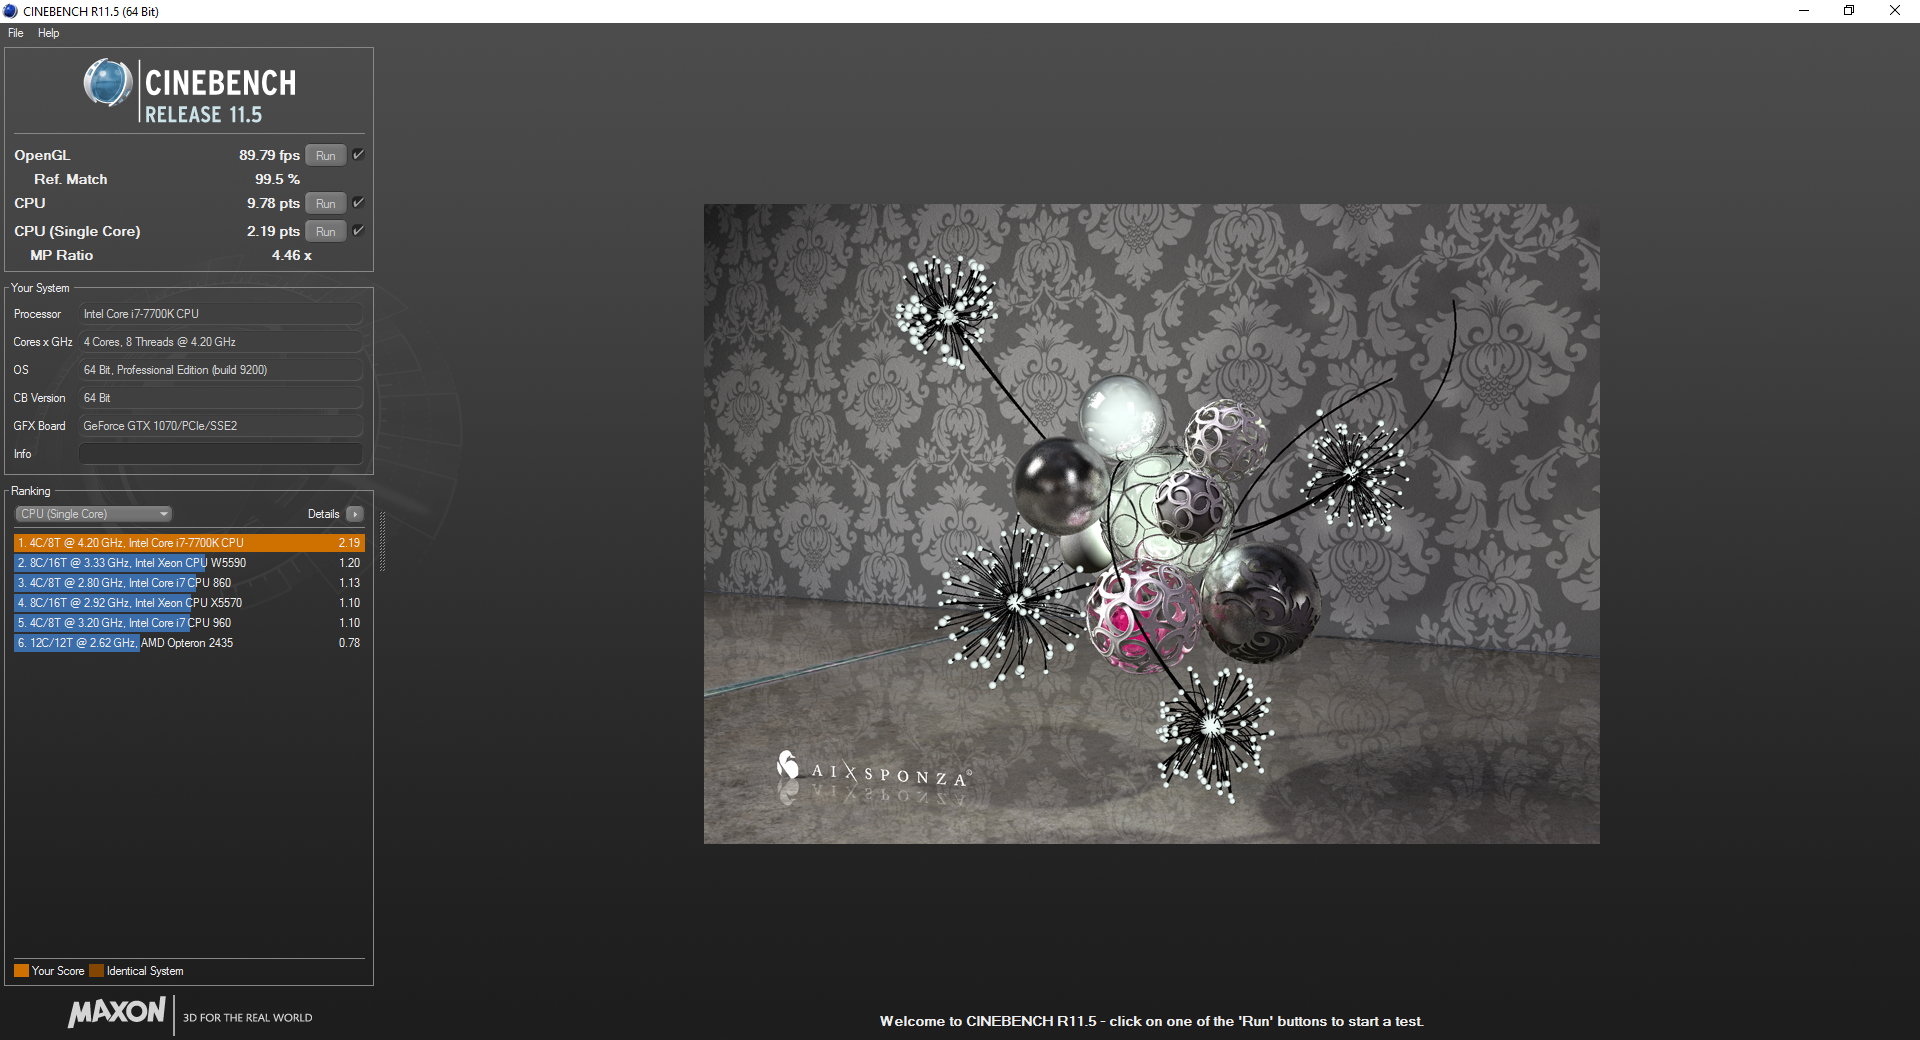
| Cinebench R11.5 | |
| CPU Single 64Bit | |
| Eurocom Tornado F5 | |
| Eurocom Sky X7E2 | |
| MSI GE62 2QC-468XPL | |
| EVGA SC17 GTX 1070 | |
| Eurocom Shark 4 | |
| MSI GE72VR-6RF16H21 | |
| CPU Multi 64Bit | |
| Eurocom Tornado F5 | |
| Eurocom Sky X7E2 | |
| MSI GE62 2QC-468XPL | |
| EVGA SC17 GTX 1070 | |
| MSI GE72VR-6RF16H21 | |
| Eurocom Shark 4 | |
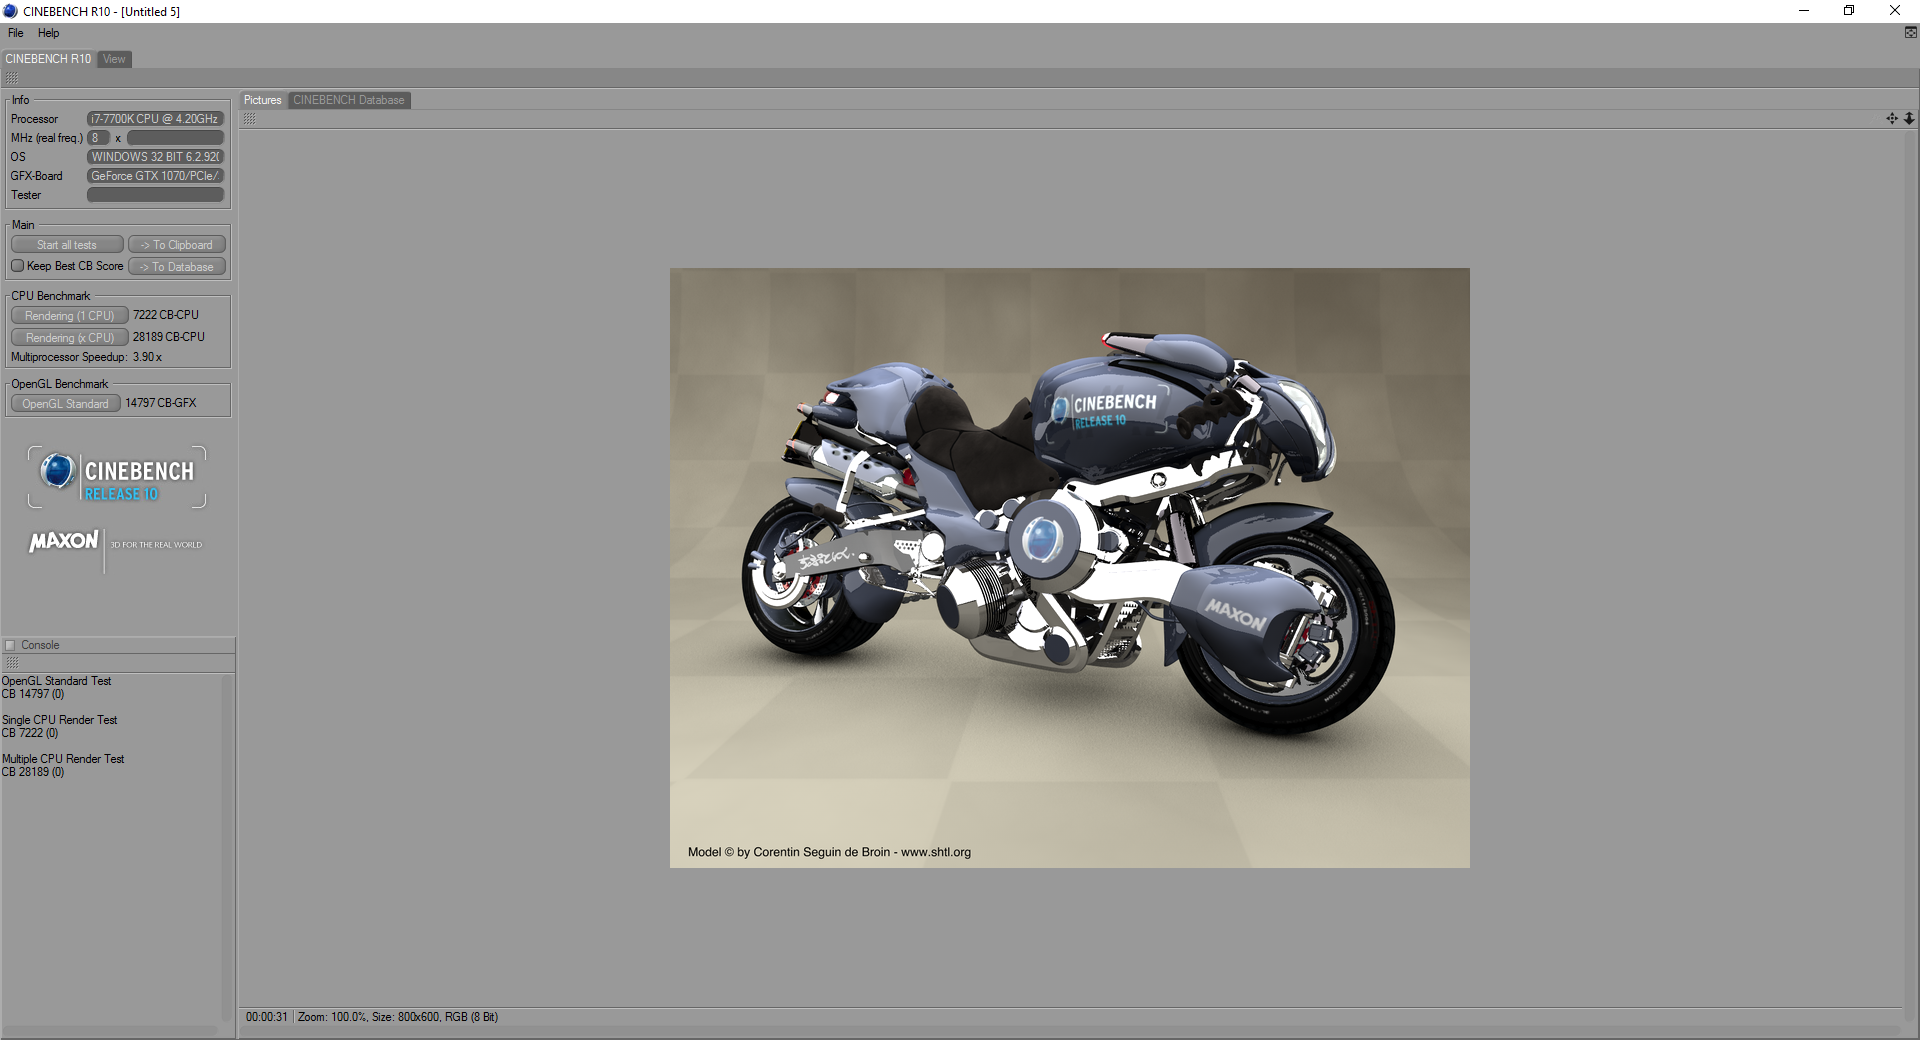
| Cinebench R10 | |
| Rendering Multiple CPUs 32Bit | |
| Eurocom Tornado F5 | |
| Eurocom Sky X7E2 | |
| MSI GE62 2QC-468XPL | |
| EVGA SC17 GTX 1070 | |
| MSI GE72VR-6RF16H21 | |
| Eurocom Shark 4 | |
| Rendering Single 32Bit | |
| Eurocom Tornado F5 | |
| Eurocom Sky X7E2 | |
| EVGA SC17 GTX 1070 | |
| MSI GE62 2QC-468XPL | |
| Eurocom Shark 4 | |
| MSI GE72VR-6RF16H21 | |
| wPrime 2.10 - 1024m | |
| Eurocom Shark 4 | |
| EVGA SC17 GTX 1070 | |
| MSI GE62 2QC-468XPL | |
| Eurocom Sky X7E2 | |
| Eurocom Tornado F5 | |
| Super Pi Mod 1.5 XS 32M - 32M | |
| MSI GE62 2QC-468XPL | |
| EVGA SC17 GTX 1070 | |
| Eurocom Shark 4 | |
| Eurocom Sky X7E2 | |
| Eurocom Tornado F5 | |
* ... smaller is better
System Performance
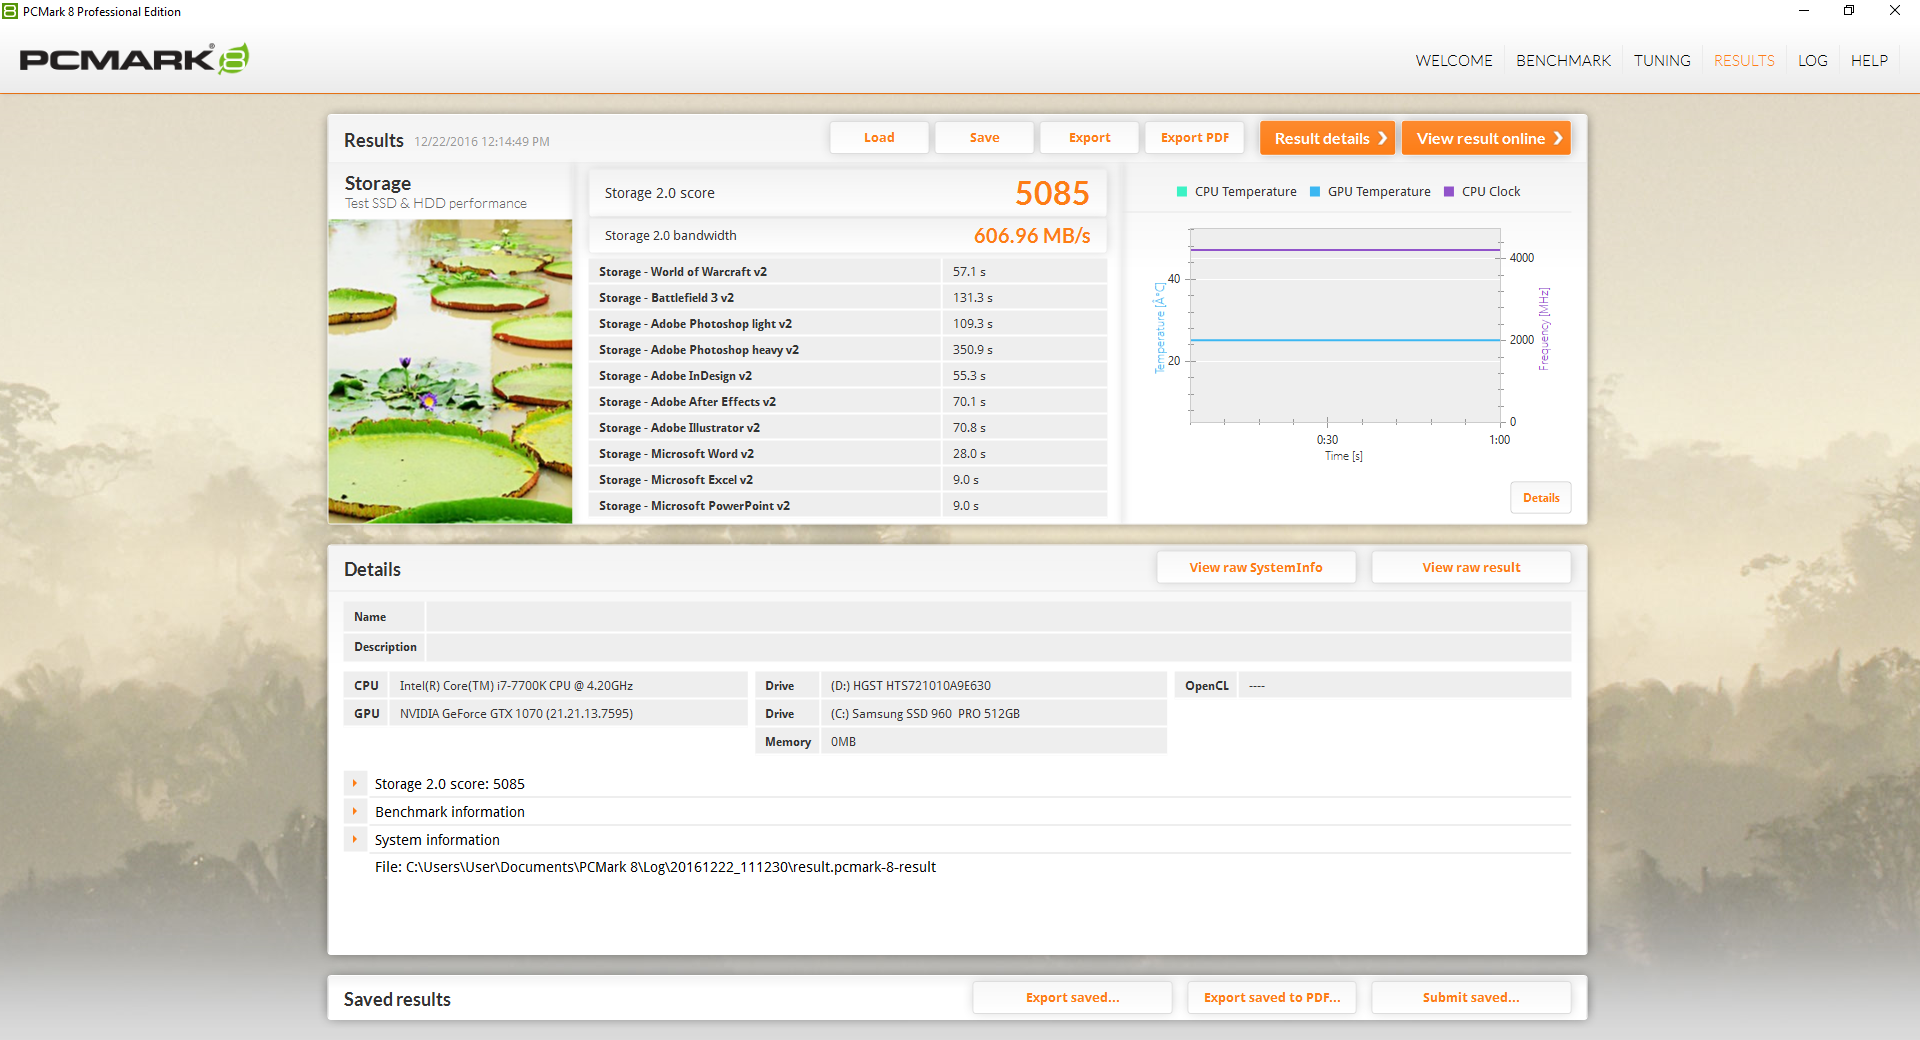
PCMark 8 benchmarks rank the Tornado F5 faster than the Eurocom Sky X7E2 with the i7-6700K and GTX 1080 GPU. This could be partly due to the faster M.2 SSD in the Tornado F5 since the performance of storage drives have traditionally had larger impacts on PCMark results. Subjectively, system performance is fast when multi-tasking or launching applications and we experienced no major software or hardware related issues during our time with the test unit.
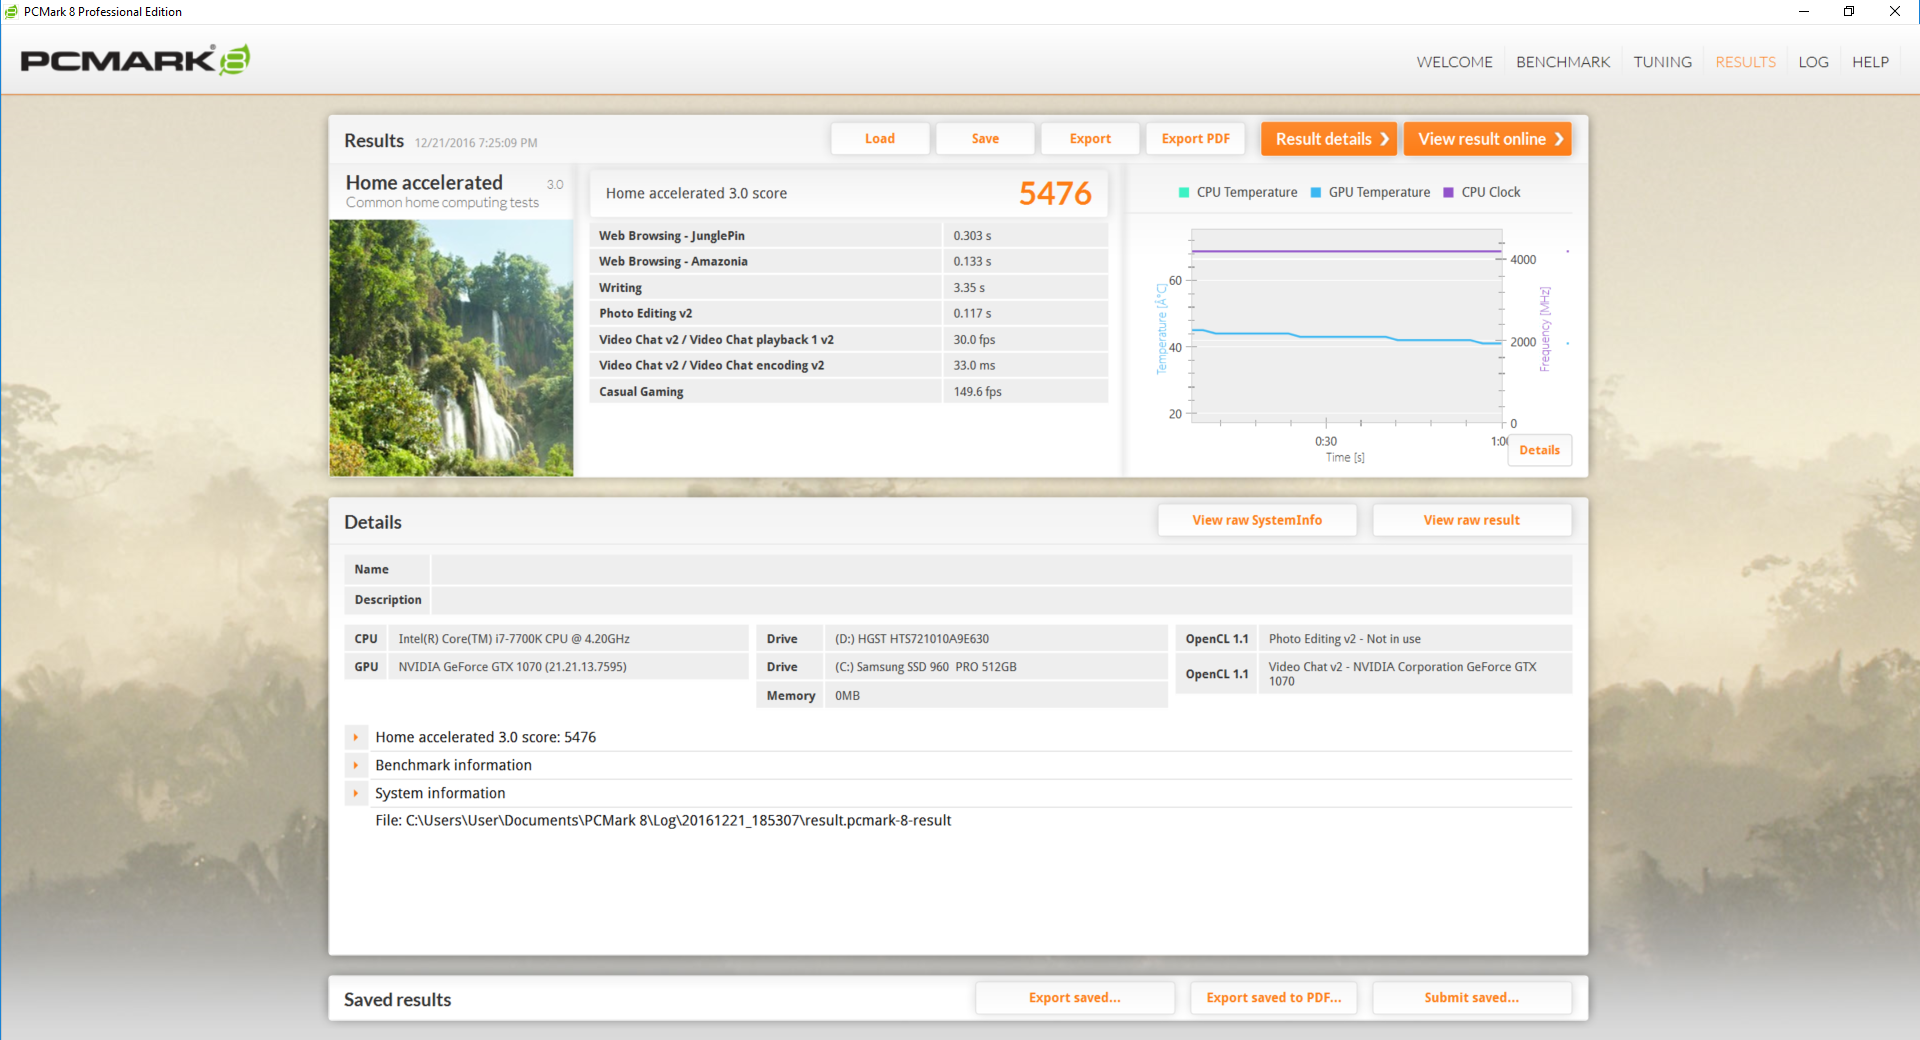
| PCMark 8 | |
| Home Score Accelerated v2 | |
| Eurocom Tornado F5 | |
| Eurocom Sky X7E2 | |
| EVGA SC17 GTX 1070 | |
| Eurocom Shark 4 | |
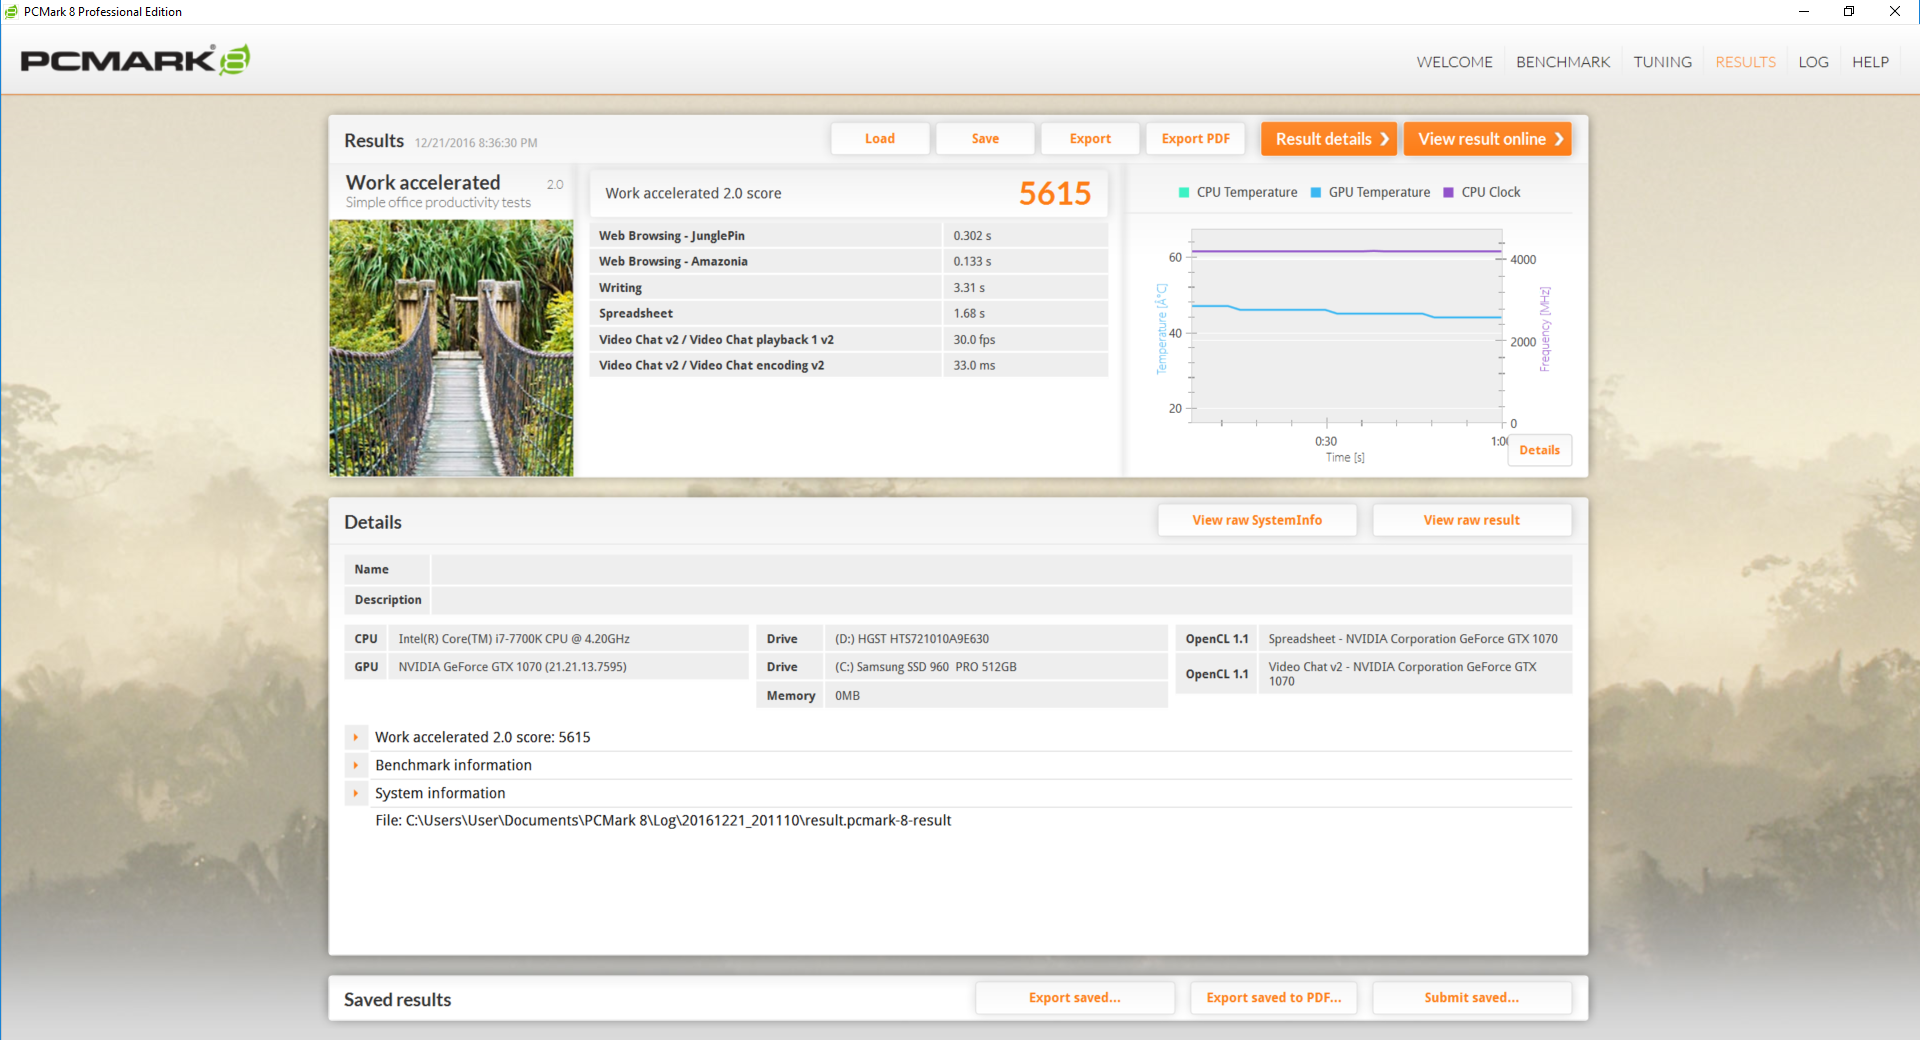
| Work Score Accelerated v2 | |
| Eurocom Tornado F5 | |
| Eurocom Shark 4 | |
| Eurocom Sky X7E2 | |
| EVGA SC17 GTX 1070 | |
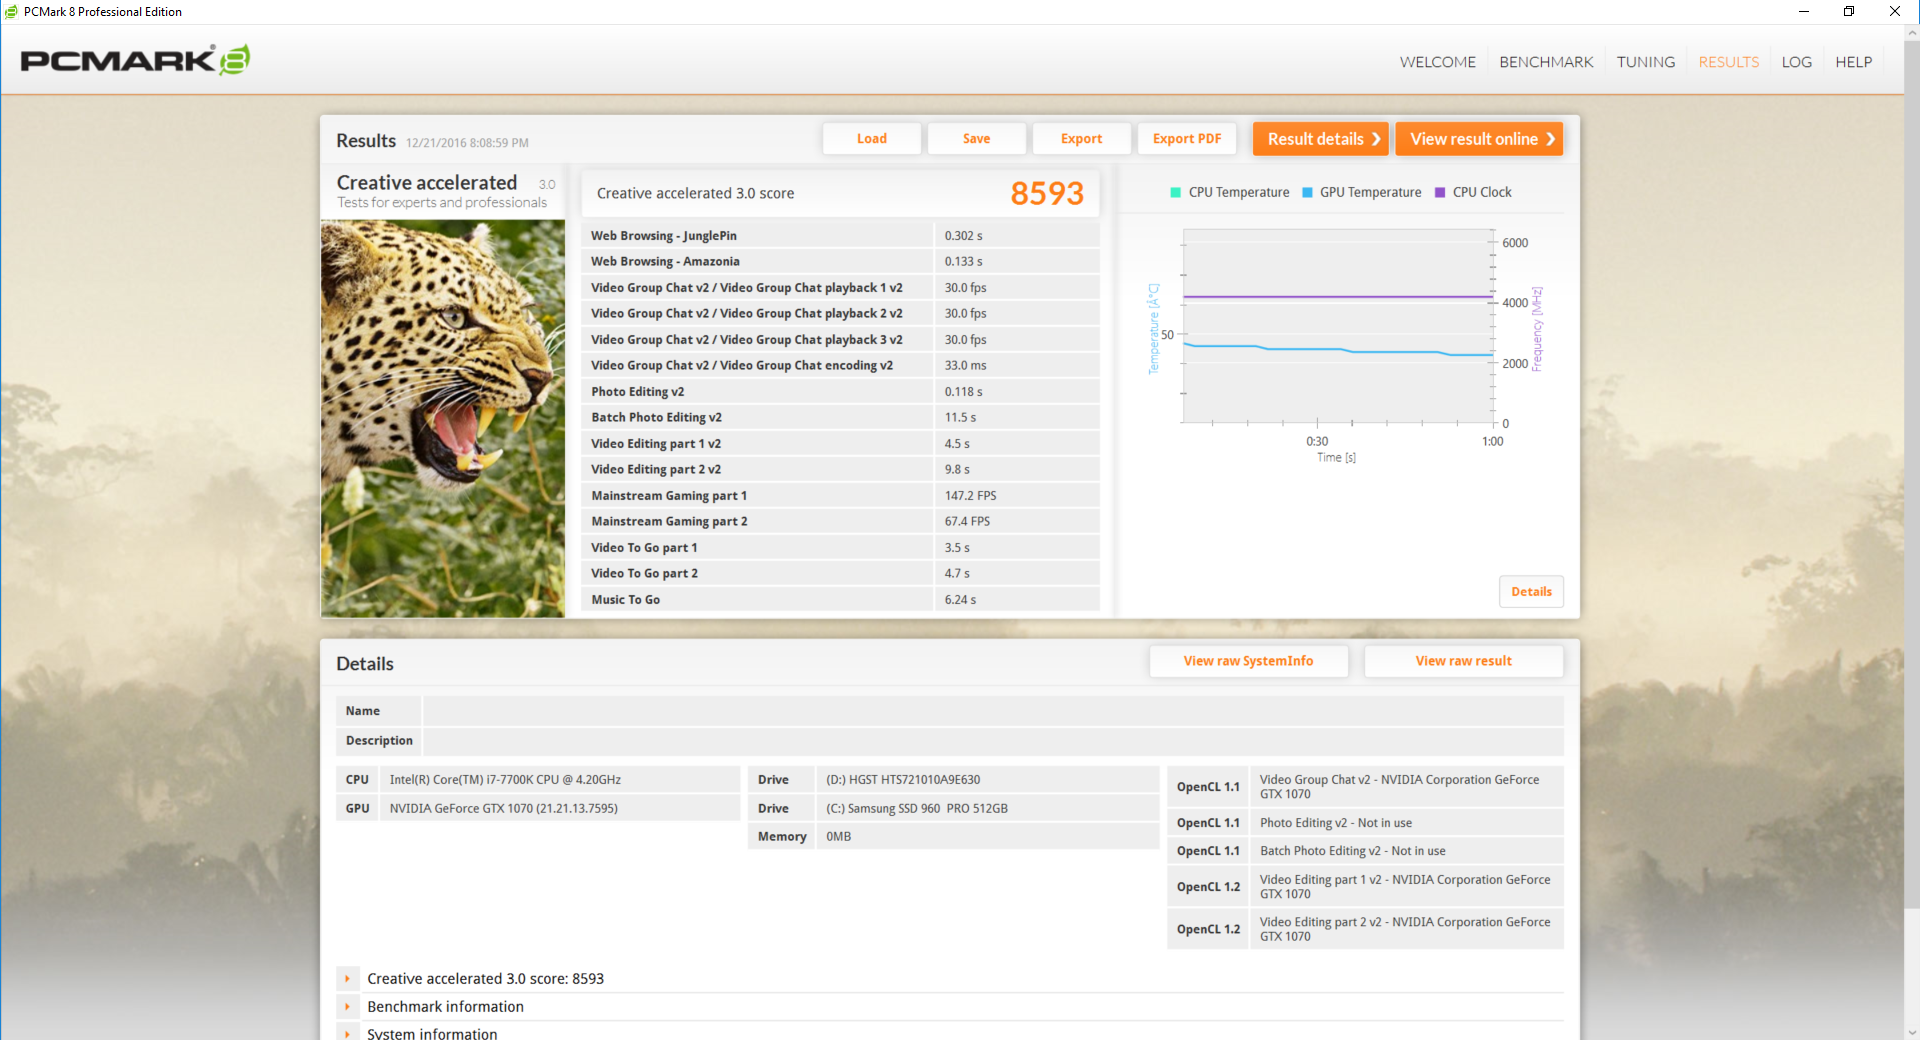
| Creative Score Accelerated v2 | |
| Eurocom Tornado F5 | |
| Eurocom Sky X7E2 | |
| EVGA SC17 GTX 1070 | |
| Eurocom Shark 4 | |
| PCMark 8 Home Score Accelerated v2 | 5476 points | |
| PCMark 8 Creative Score Accelerated v2 | 8593 points | |
| PCMark 8 Work Score Accelerated v2 | 6515 points | |
Help | ||
Storage Devices
A total of three internal storage bays are available (2x M.2 2280 + 1x 2.5-inch SATA III) and all are easily accessible. The two M.2 slots also support NVMe speeds and are RAID compatible, albeit not RAID compatible with NVMe SSDs. This means owners can only pair PCIe/SATA III SSDs in RAID formation if so desired. Furthermore, the HDD bay is squeezed in tightly near the corner of the chassis adjacent to the battery and will require some wiggling to properly replace.
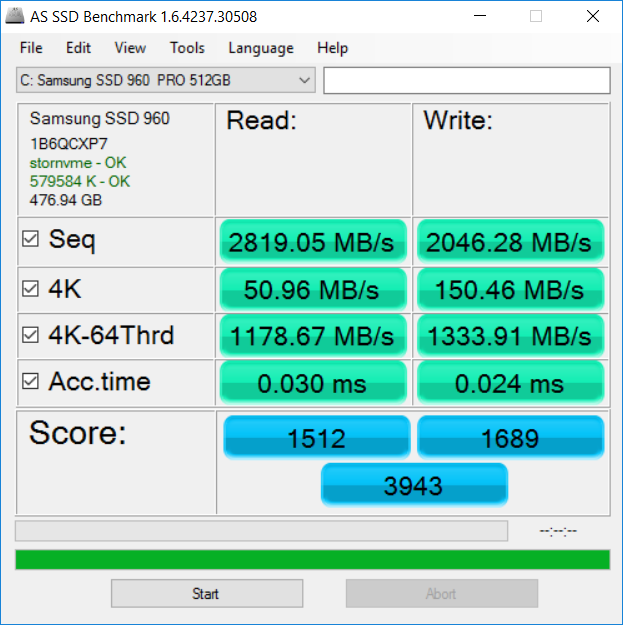
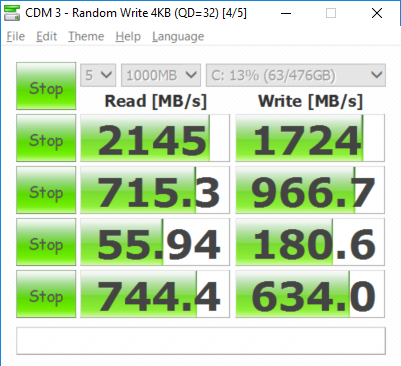
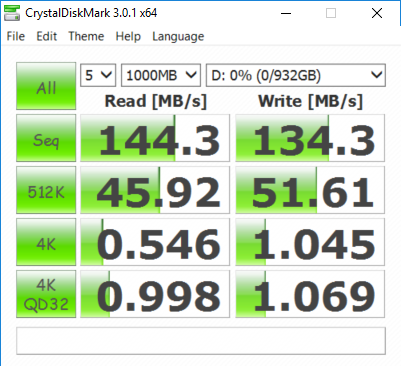
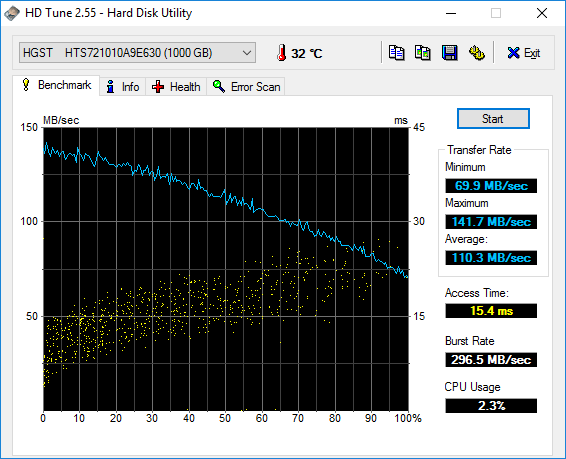
Our test unit shipped with a primary 512 GB Samsung M.2 NVMe SSD and secondary 1 TB Hitachi Travelstar HDD. Sequential read and write rates are measurably faster than the Samsung SM951 NVMe SSDs in the Sky X7E2 and EVGA SC17 while a pair of NVMe SSDs in RAID 0 will still outperform the single SSD in our configuration. Meanwhile, the secondary 7200 RPM HDD returns a respectable average transfer rate of 110 MB/s according to HD Tune.
See our table of SSDs and HDDs for more benchmark comparisons.
| Eurocom Tornado F5 Samsung SSD 960 Pro 512 GB m.2 | MSI GT73VR 7RF-296 2x Samsung SM951 MZVPV256HDGL (RAID 0) | Eurocom Sky X7E2 Samsung SM951 MZVPV512HDGL m.2 PCI-e | EVGA SC17 GTX 1070 Samsung SM951 MZVPV256 m.2 | MSI GE72VR-6RF16H21 Toshiba HG6 THNSNJ256G8NY | |
|---|---|---|---|---|---|
| CrystalDiskMark 3.0 | 43% | 3% | -8% | -64% | |
| Read Seq (MB/s) | 2145 | 3219 50% | 1673 -22% | 1658 -23% | 510 -76% |
| Write Seq (MB/s) | 1724 | 2572 49% | 1576 -9% | 1249 -28% | 274.6 -84% |
| Read 512 (MB/s) | 715 | 1776 148% | 1180 65% | 1044 46% | 427.2 -40% |
| Write 512 (MB/s) | 967 | 2445 153% | 1561 61% | 1254 30% | 247.2 -74% |
| Read 4k (MB/s) | 55.9 | 51.1 -9% | 51.5 -8% | 51.6 -8% | 21.23 -62% |
| Write 4k (MB/s) | 180.6 | 141.3 -22% | 144 -20% | 145.2 -20% | 86.8 -52% |
| Read 4k QD32 (MB/s) | 744 | 658 -12% | 694 -7% | 601 -19% | 335.4 -55% |
| Write 4k QD32 (MB/s) | 634 | 554 -13% | 422.1 -33% | 386.8 -39% | 178.1 -72% |

GPU Performance
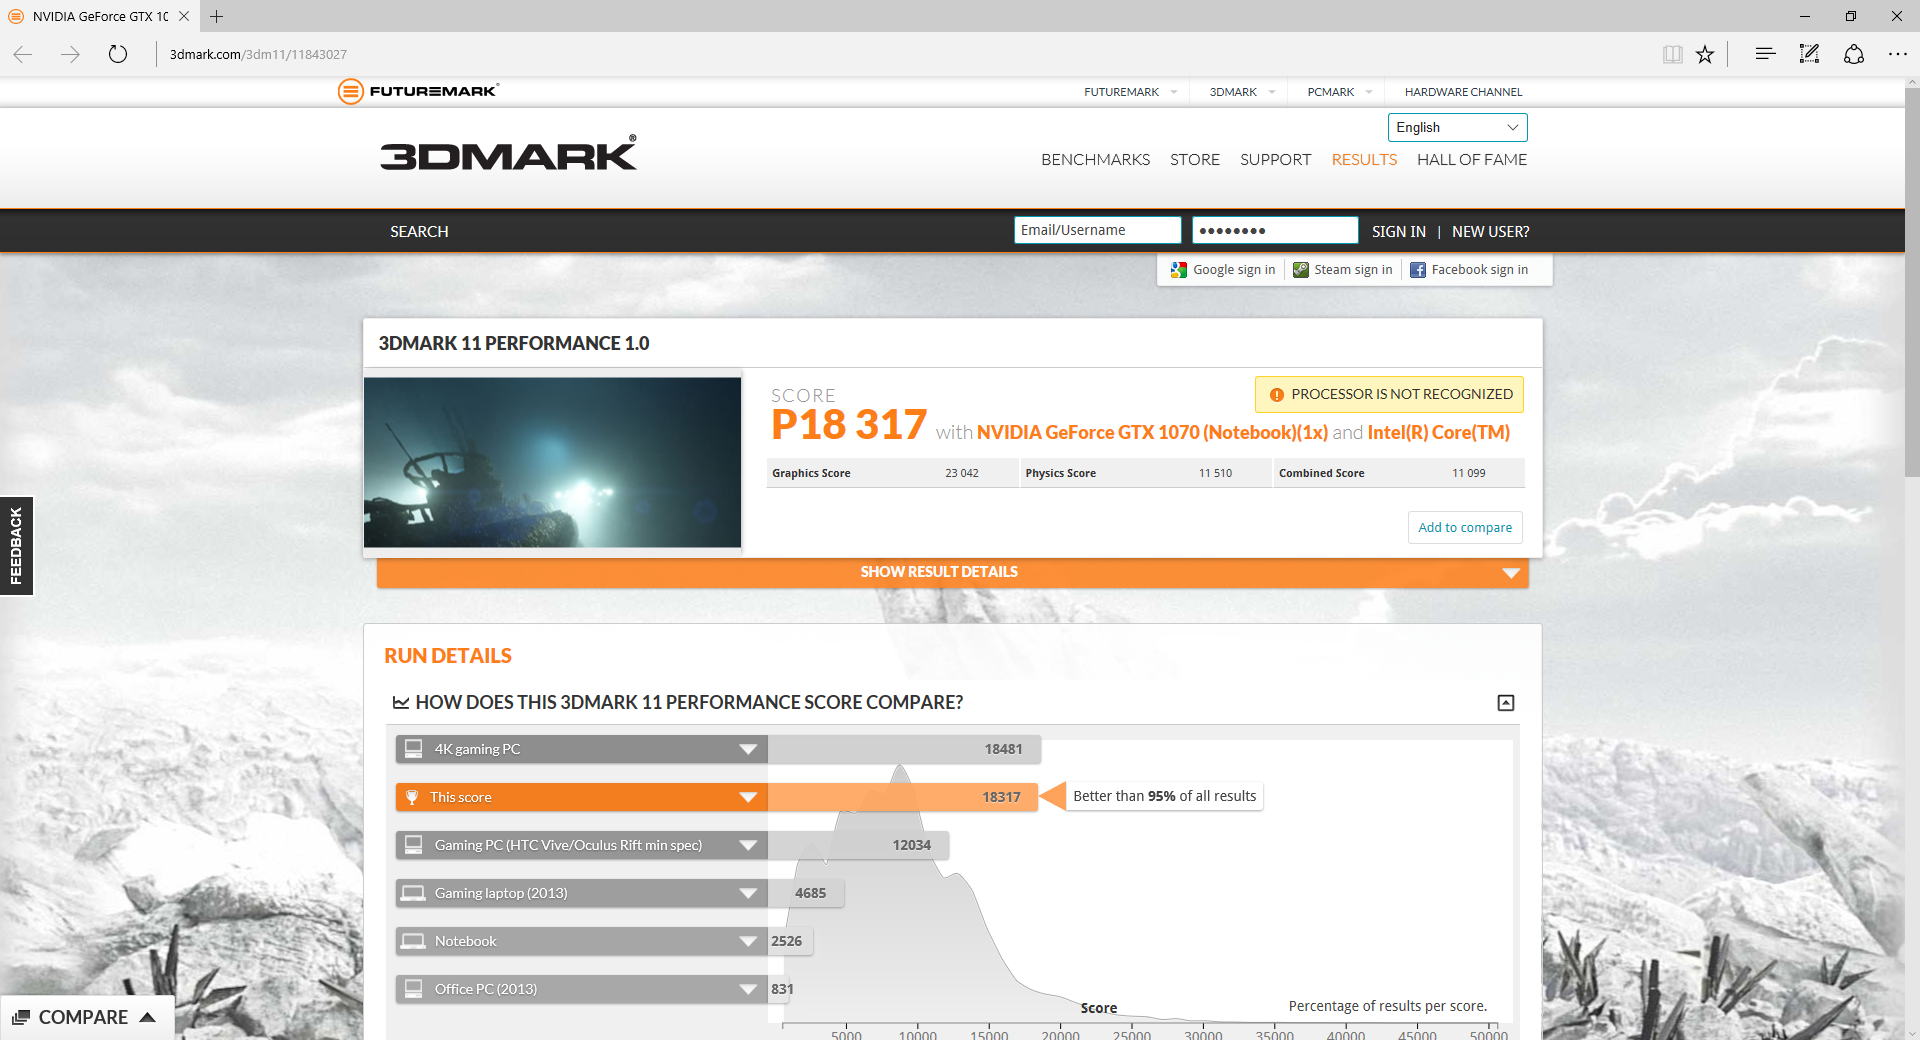
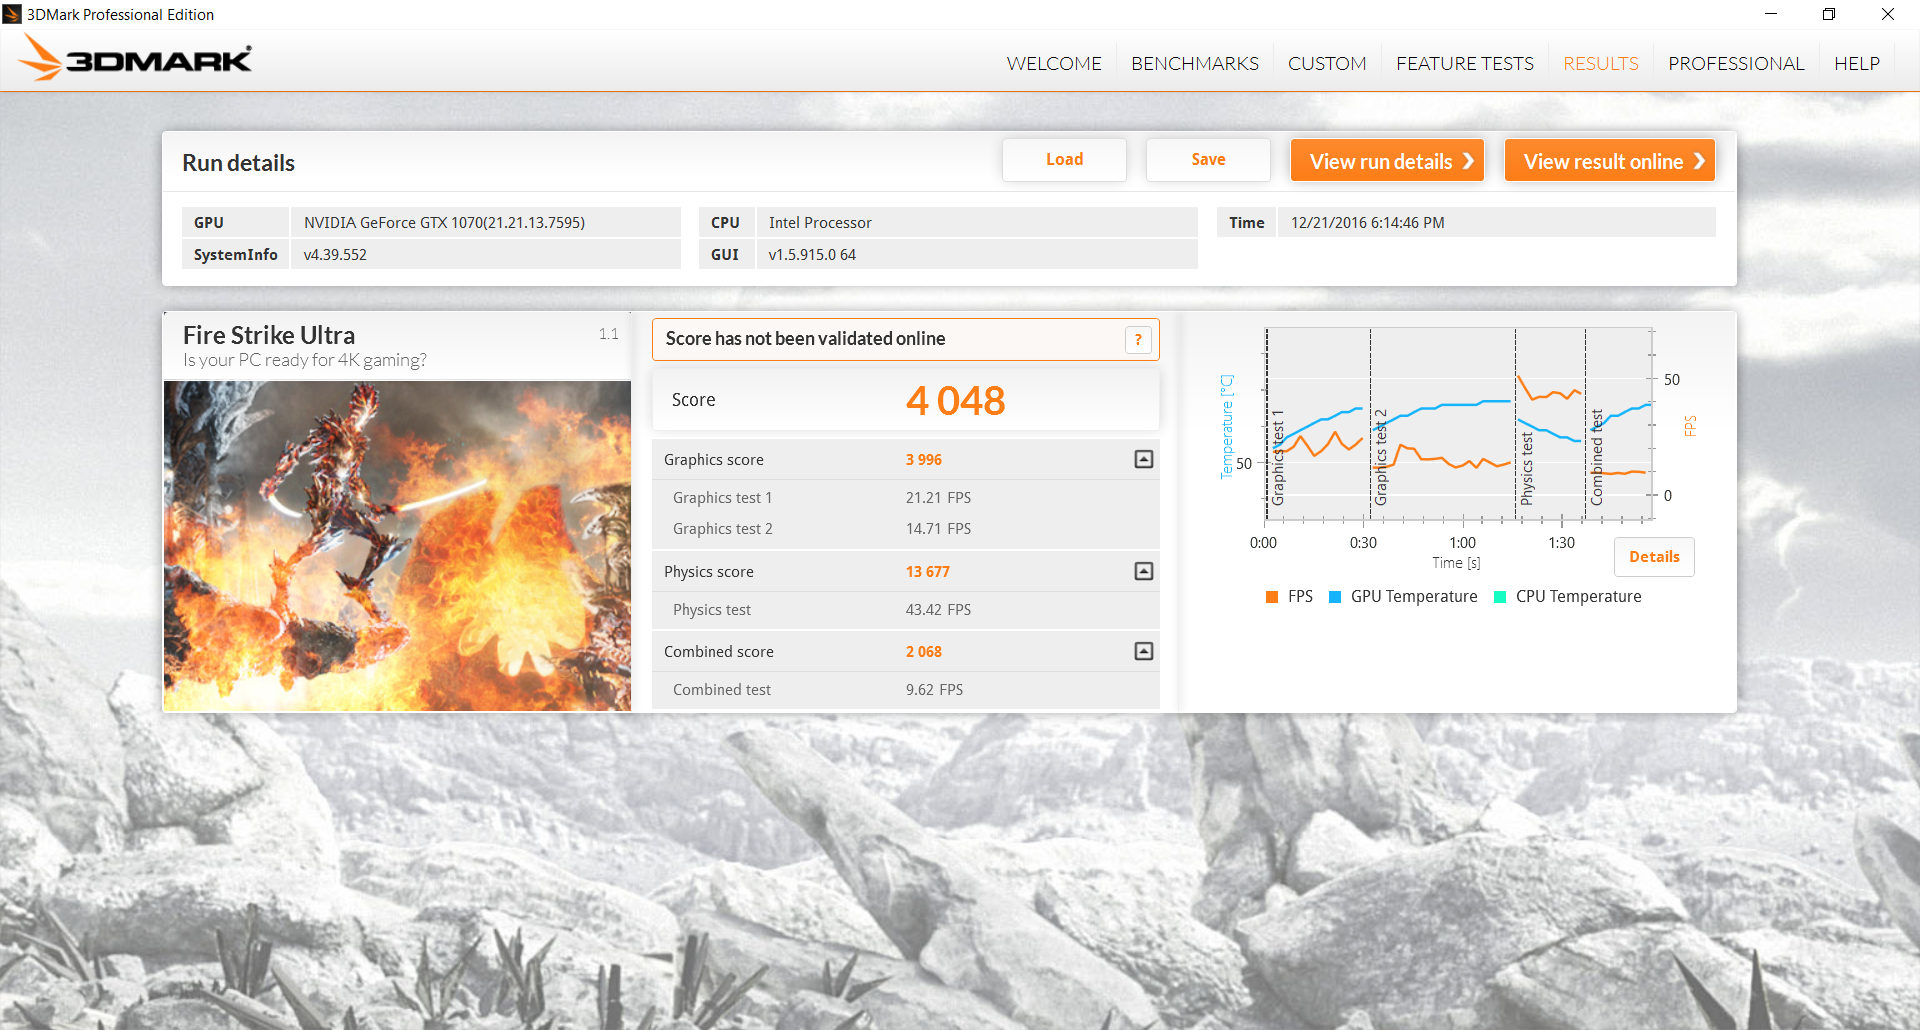
3DMark benchmarks rank the GTX 1070 in the Tornado F5 about 35 percent ahead of the GTX 980 for notebooks and about 25 percent behind the GTX 1080. The jump from a GTX 1060 to a GTX 1070 is about 50 percent, which is significant enough to be able to run most games in native 4K. It's worth noting that our desktop setup with the i7-4790K and GTX 1070 outscores our Eurocom by about 13 percent in Fire Strike Ultra Graphics.
See our dedicated review on the GTX 1070 for more technical information and comparisons.
| 3DMark | |
| 3840x2160 Fire Strike Ultra Graphics | |
| MSI Gaming Z GeForce GTX 1070 OC Bios Desktop PC | |
| Eurocom Tornado F5 | |
| Asus G701VO-CS74K | |
| MSI GE72VR-6RF16H21 | |
| Asus Strix GL502VY-DS71 | |
| Fire Strike Extreme Graphics | |
| Aorus X7 DT v6 | |
| Eurocom Tornado F5 | |
| Asus G701VO-CS74K | |
| MSI GE72VR-6RF16H21 | |
| Asus Strix GL502VY-DS71 | |
| 1920x1080 Fire Strike Graphics | |
| Aorus X7 DT v6 | |
| MSI Gaming Z GeForce GTX 1070 OC Bios Desktop PC | |
| Eurocom Tornado F5 | |
| Asus G701VO-CS74K | |
| MSI GE72VR-6RF16H21 | |
| Asus Strix GL502VY-DS71 | |
| 3DMark 11 Performance | 18317 points | |
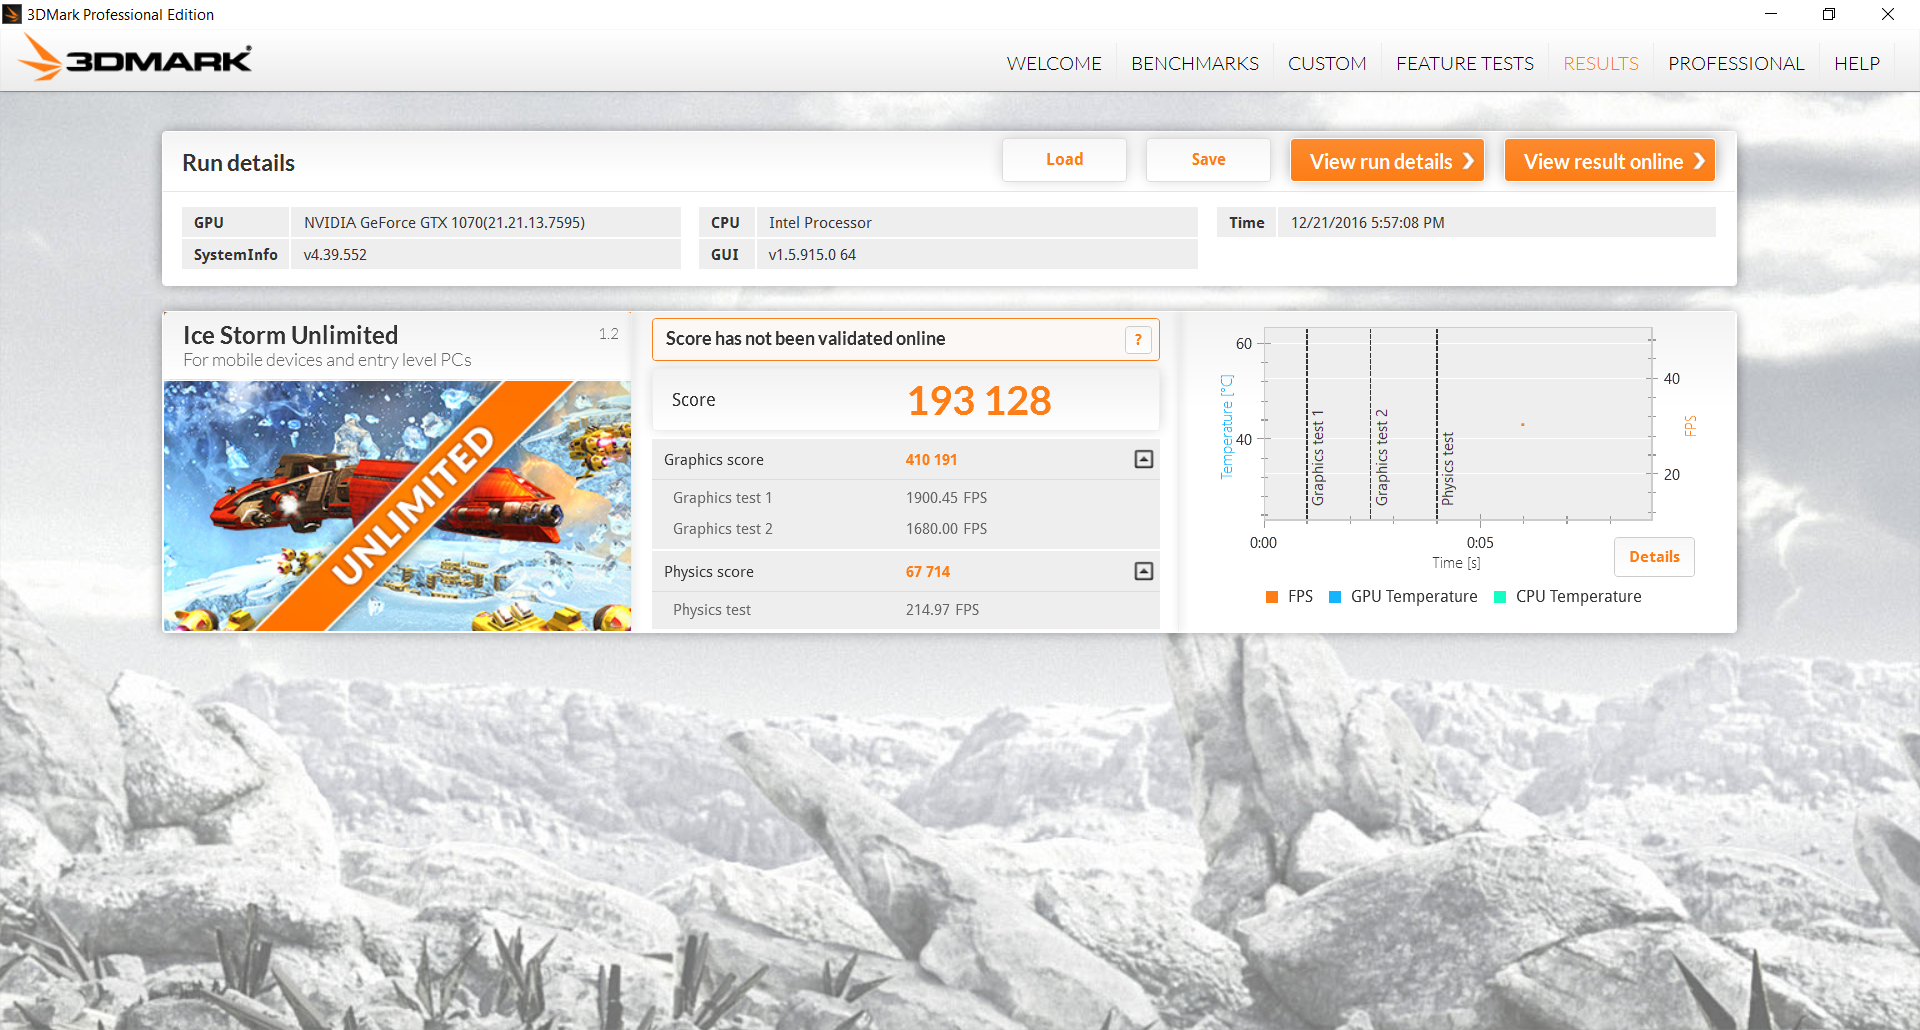
| 3DMark Ice Storm Standard Score | 174858 points | |
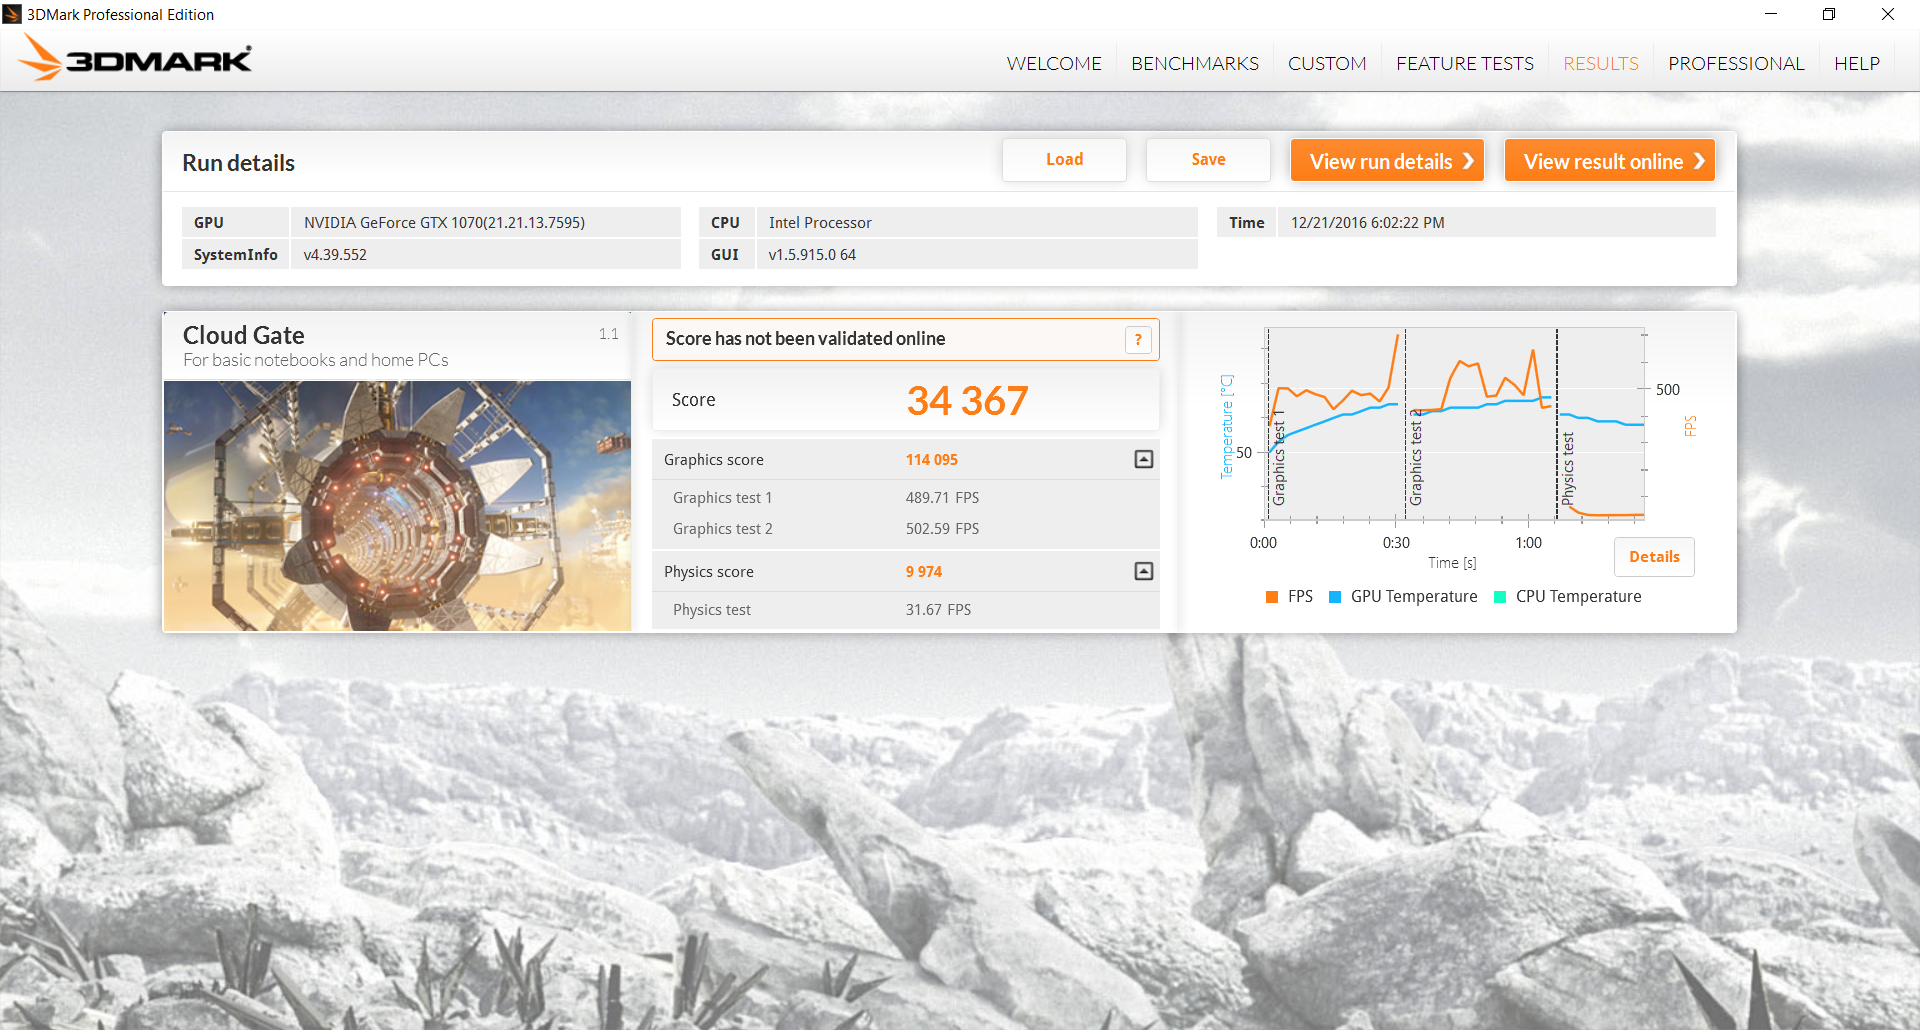
| 3DMark Cloud Gate Standard Score | 34367 points | |
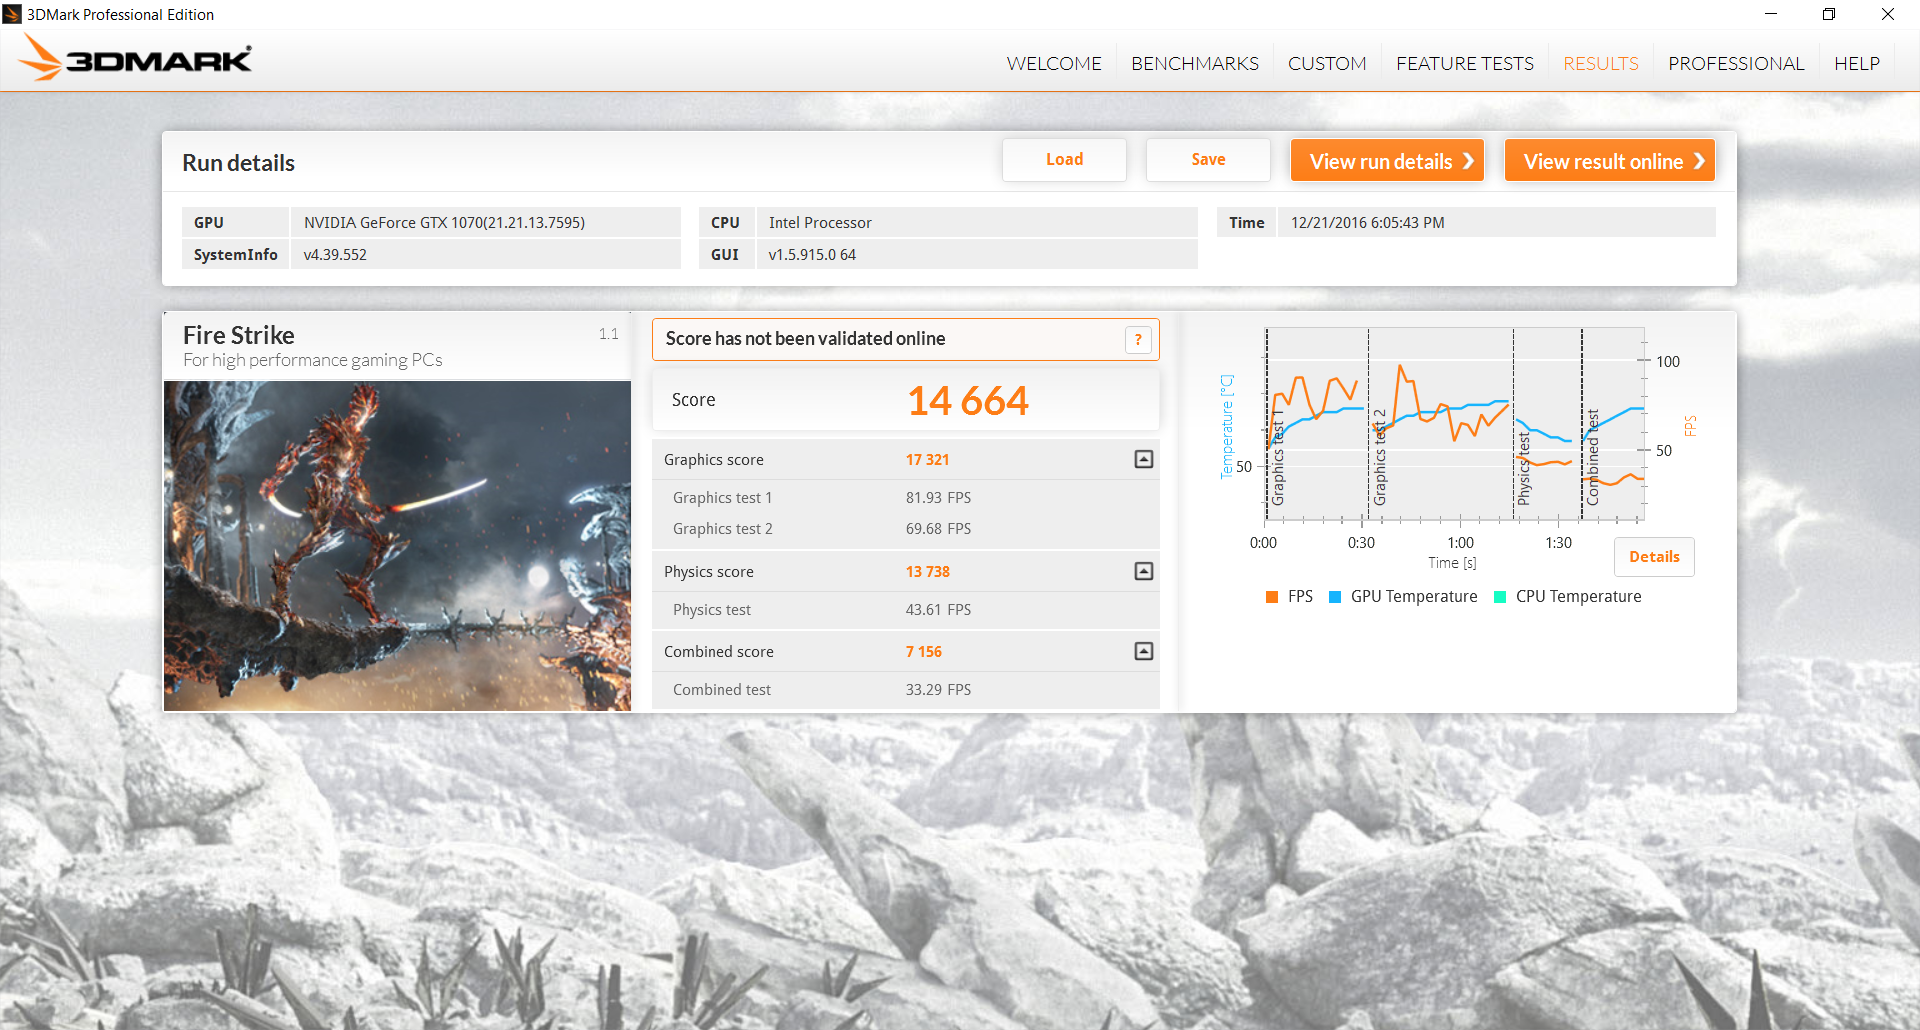
| 3DMark Fire Strike Score | 14664 points | |
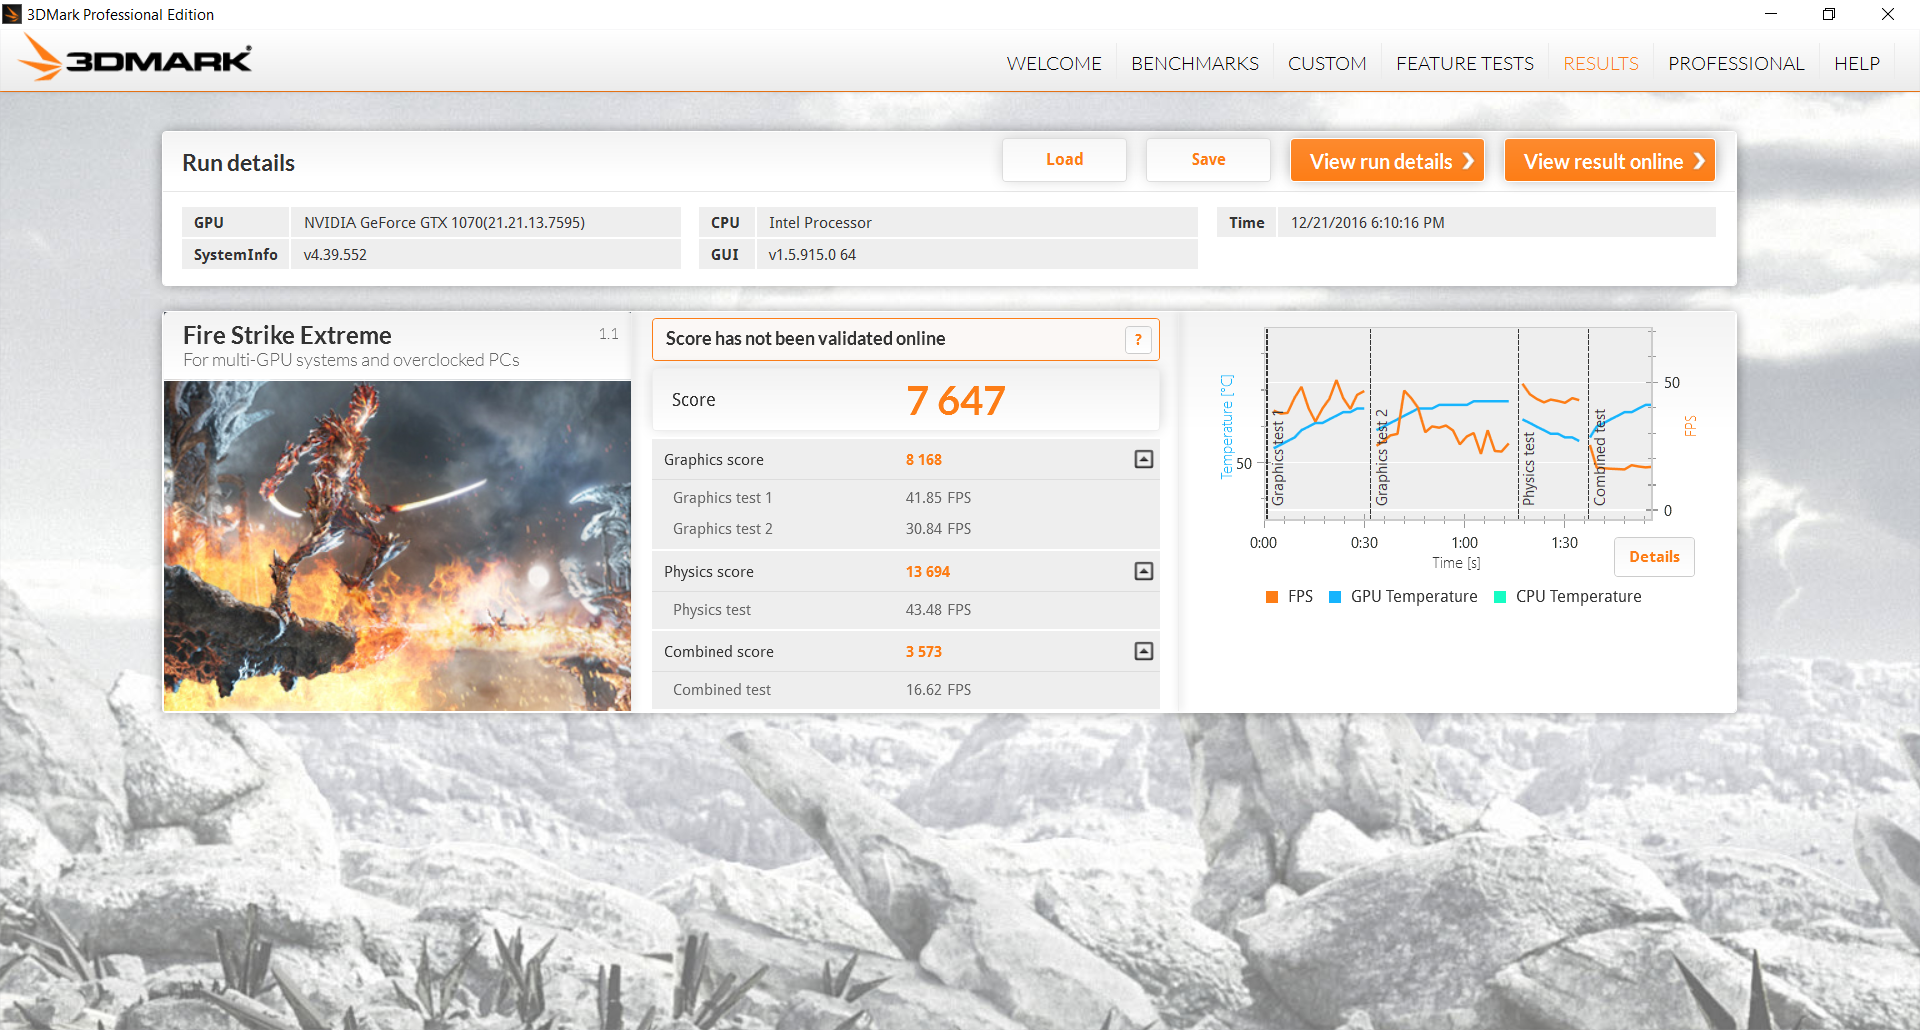
| 3DMark Fire Strike Extreme Score | 7647 points | |
Help | ||
Gaming Performance
Real-world performance in our tested games is thankfully about the same as our desktop GTX 1070 reference in 1080p despite the consistently slower 3DMark Fire Strike scores above. Users will be able play most if not all games as of 2016 at native 1080p and on the maximum settings with this particular GPU. We suggest enabling supersampling on older titles for an even crisper image with far less aliasing since G-Sync is already available. The GTX 1070 was, after all, designed with native 4K rendering in mind.
See our dedicated GPU page on the GTX 1070 for more gaming benchmarks.
| Rise of the Tomb Raider - 1920x1080 Very High Preset AA:FX AF:16x | |
| Aorus X7 DT v6 | |
| Eurocom Tornado F5 | |
| Nvidia GeForce GTX 1070 Founders Edition | |
| MSI GT72VR 6RD-063US | |
| Asus G701VO-CS74K | |
| Asus Strix GL502VT-DS74 | |
| Sleeping Dogs - 1920x1080 Extreme Preset AA:Extreme | |
| Aorus X7 DT v6 | |
| Eurocom Tornado F5 | |
| Asus G701VO-CS74K | |
| Asus Strix GL502VT-DS74 | |
| Guild Wars 2 - 1920x1080 All Maximum / On AA:FX | |
| Eurocom Tornado F5 | |
| MSI GT72VR 6RD-063US | |
| BioShock Infinite - 1920x1080 Ultra Preset, DX11 (DDOF) | |
| Aorus X7 DT v6 | |
| Nvidia GeForce GTX 1070 Founders Edition | |
| Eurocom Tornado F5 | |
| Asus G701VO-CS74K | |
| MSI GT72VR 6RD-063US | |
| Asus Strix GL502VT-DS74 | |
| Metro: Last Light - 1920x1080 Very High (DX11) AF:16x | |
| Aorus X7 DT v6 | |
| Nvidia GeForce GTX 1070 Founders Edition | |
| Eurocom Tornado F5 | |
| Asus G701VO-CS74K | |
| MSI GT72VR 6RD-063US | |
| Asus Strix GL502VT-DS74 | |
| Batman: Arkham Knight - 1920x1080 High / On AA:SM AF:16x | |
| Aorus X7 DT v6 | |
| Eurocom Tornado F5 | |
| Asus G701VO-CS74K | |
| MSI GT72VR 6RD-063US | |
| Asus Strix GL502VT-DS74 | |
| Fallout 4 - 1920x1080 Ultra Preset AA:T AF:16x | |
| Aorus X7 DT v6 | |
| Nvidia GeForce GTX 1070 Founders Edition | |
| Eurocom Tornado F5 | |
| Asus G701VO-CS74K | |
| MSI GT72VR 6RD-063US | |
| Asus Strix GL502VT-DS74 | |
| Doom - 1920x1080 Ultra Preset AA:SM | |
| Aorus X7 DT v6 | |
| Eurocom Tornado F5 | |
| Nvidia GeForce GTX 1070 Founders Edition | |
| MSI GT72VR 6RD-063US | |
| Asus G701VO-CS74K | |
| Overwatch - 1920x1080 Epic (Render Scale 100 %) AA:SM AF:16x | |
| Nvidia GeForce GTX 1070 Founders Edition | |
| Eurocom Tornado F5 | |
| Asus G701VO-CS74K | |
| MSI GT72VR 6RD-063US | |
| Mafia 3 - 1920x1080 High Preset | |
| Eurocom Tornado F5 | |
| Ashes of the Singularity - 1920x1080 high | |
| Eurocom Tornado F5 | |
| Nvidia GeForce GTX 1070 Founders Edition | |
| low | med. | high | ultra | |
|---|---|---|---|---|
| Sleeping Dogs (2012) | 117.1 | |||
| Guild Wars 2 (2012) | 91.7 | |||
| BioShock Infinite (2013) | 149.6 | |||
| Metro: Last Light (2013) | 117.6 | |||
| Batman: Arkham Knight (2015) | 87 | |||
| Metal Gear Solid V (2015) | 60 | |||
| Fallout 4 (2015) | 107.6 | |||
| Rise of the Tomb Raider (2016) | 98 | |||
| Ashes of the Singularity (2016) | 78.2 | |||
| Doom (2016) | 136.5 | |||
| Overwatch (2016) | 160.5 | |||
| Mafia 3 (2016) | 66 |
Stress Test
We stress the notebook with synthetic benchmarks to identify for any throttling or system stability issues. When under Prime95 load, the i7-7700K can be observed alternating between 2.4 GHz and 4.3 GHz compared to its base 4.2 GHz clock rate. This throttling is a bit unusual as it occurs when under Prime95 load only. On the other hand, this behavior may also be purposeful in order to keep core temperature in check as we can observe the CPU operating in the low 90 C range when under such conditions. We reran our Prime95 stress test with Turbo Fan active as well to see if it would improve performance, but the same 2.4/4.3 GHz alternating clock rates continue. In other words, the CPU overclocking headroom on the Tornado F5 is minimal at least with the i7-7700K option.
Running FurMark to stress the GPU will bring its core temperature up to 74 C. This is a very acceptable range for a GPU under load especially for a gaming notebook where 80+ C operating temperatures are common. Running both Prime95 and FurMark will throttle the CPU to a stable 3.8 GHz with CPU and GPU temperatures at 97 C and 77 C, respectively. Interestingly, activating Turbo Fan will not reduce the CPU temperature and will instead raise its core clock rate by 100 MHz. This suggests that the cooling system is at its limits for the CPU while the GPU stabilizes at a much lower 68 C. For hardcore gamers, it may be worth considering a less powerful CPU option and the more powerful GTX 1080 for a better temperature balance.
Running Unigine Valley is more representative of in-game loads and, when under these conditions, both the CPU and GPU can maintain steady levels of Boost at 4.4 GHz and 1557 to 1595 MHz, respectively. Core temperatures are warm and steady in the 75 to 85 C range and can fall by as much as 10 C each when Turbo Fan is activated.
Operating on battery power will throttle both CPU and GPU power. A 3DMark 11 run on battery returns Physics and Graphics scores of 7882 and 4626 points, respectively, compared to 11510 and 23042 points when on mains.
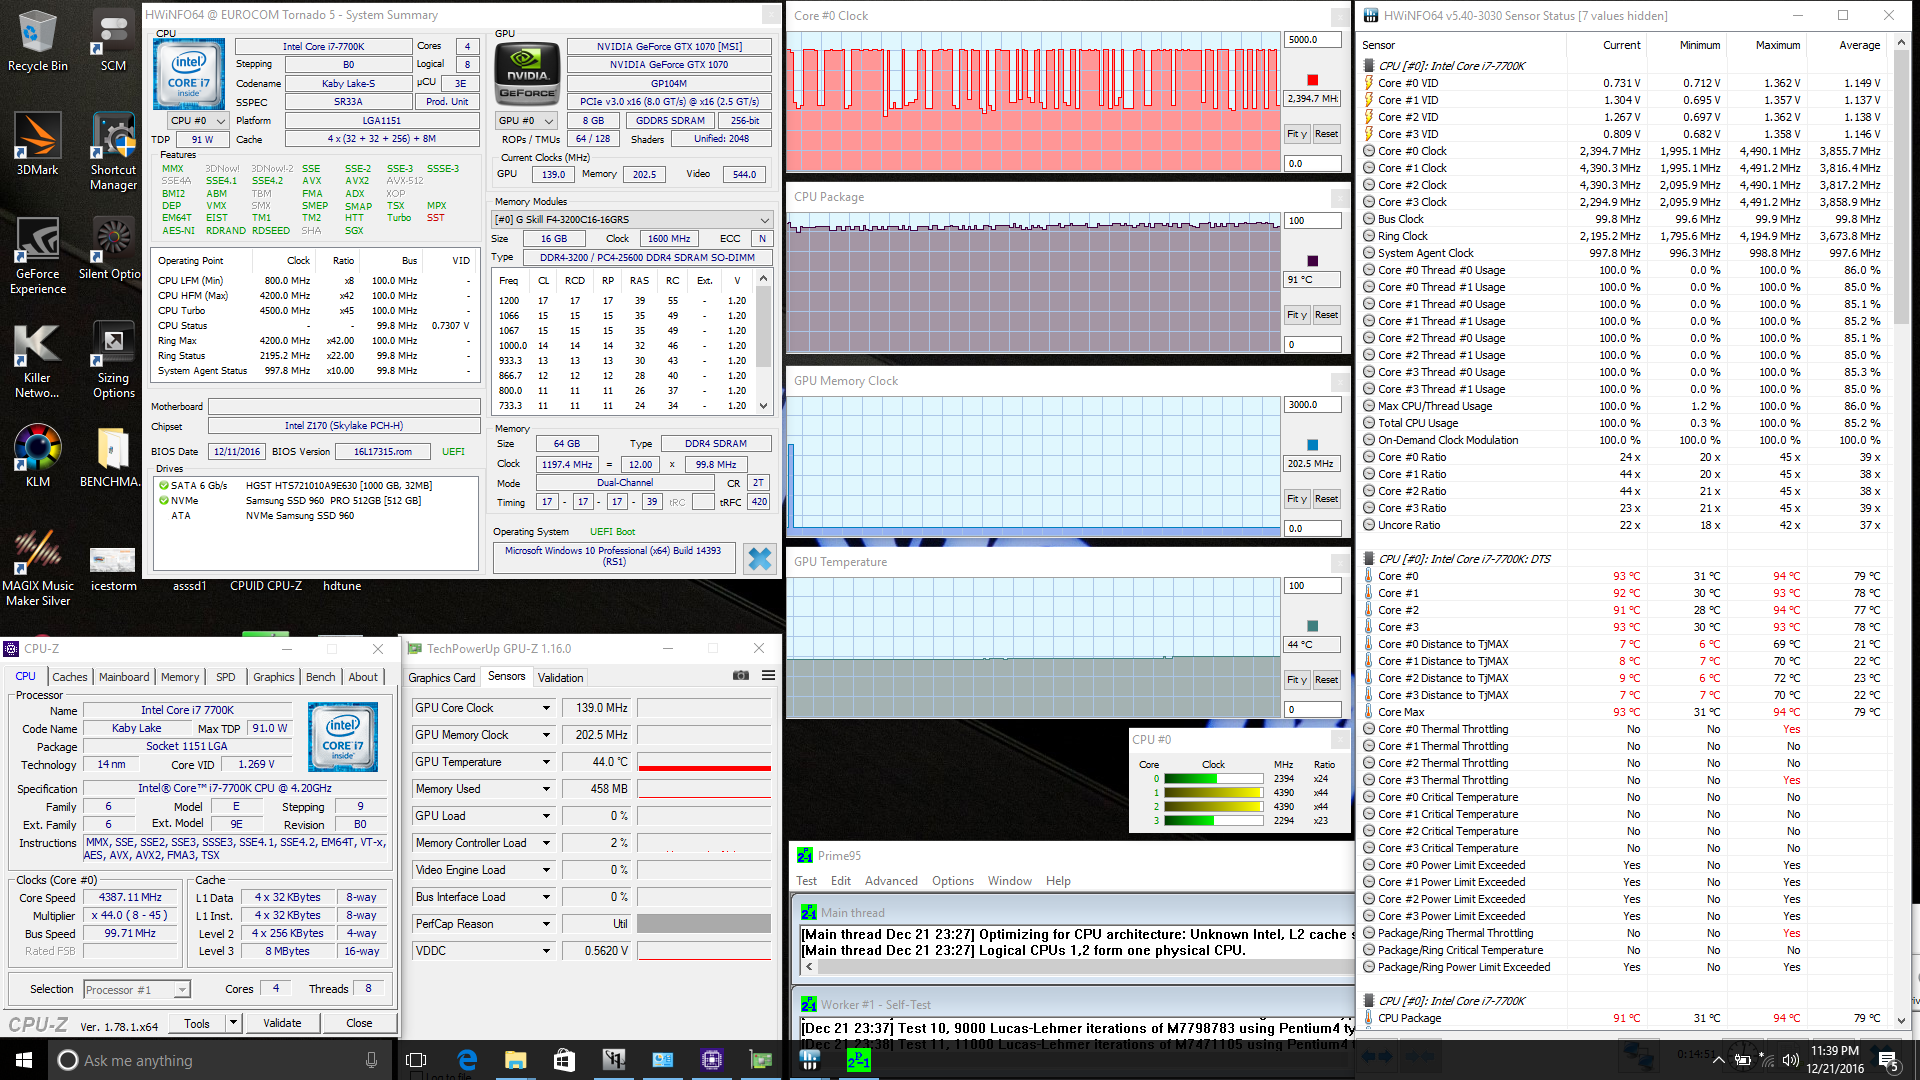
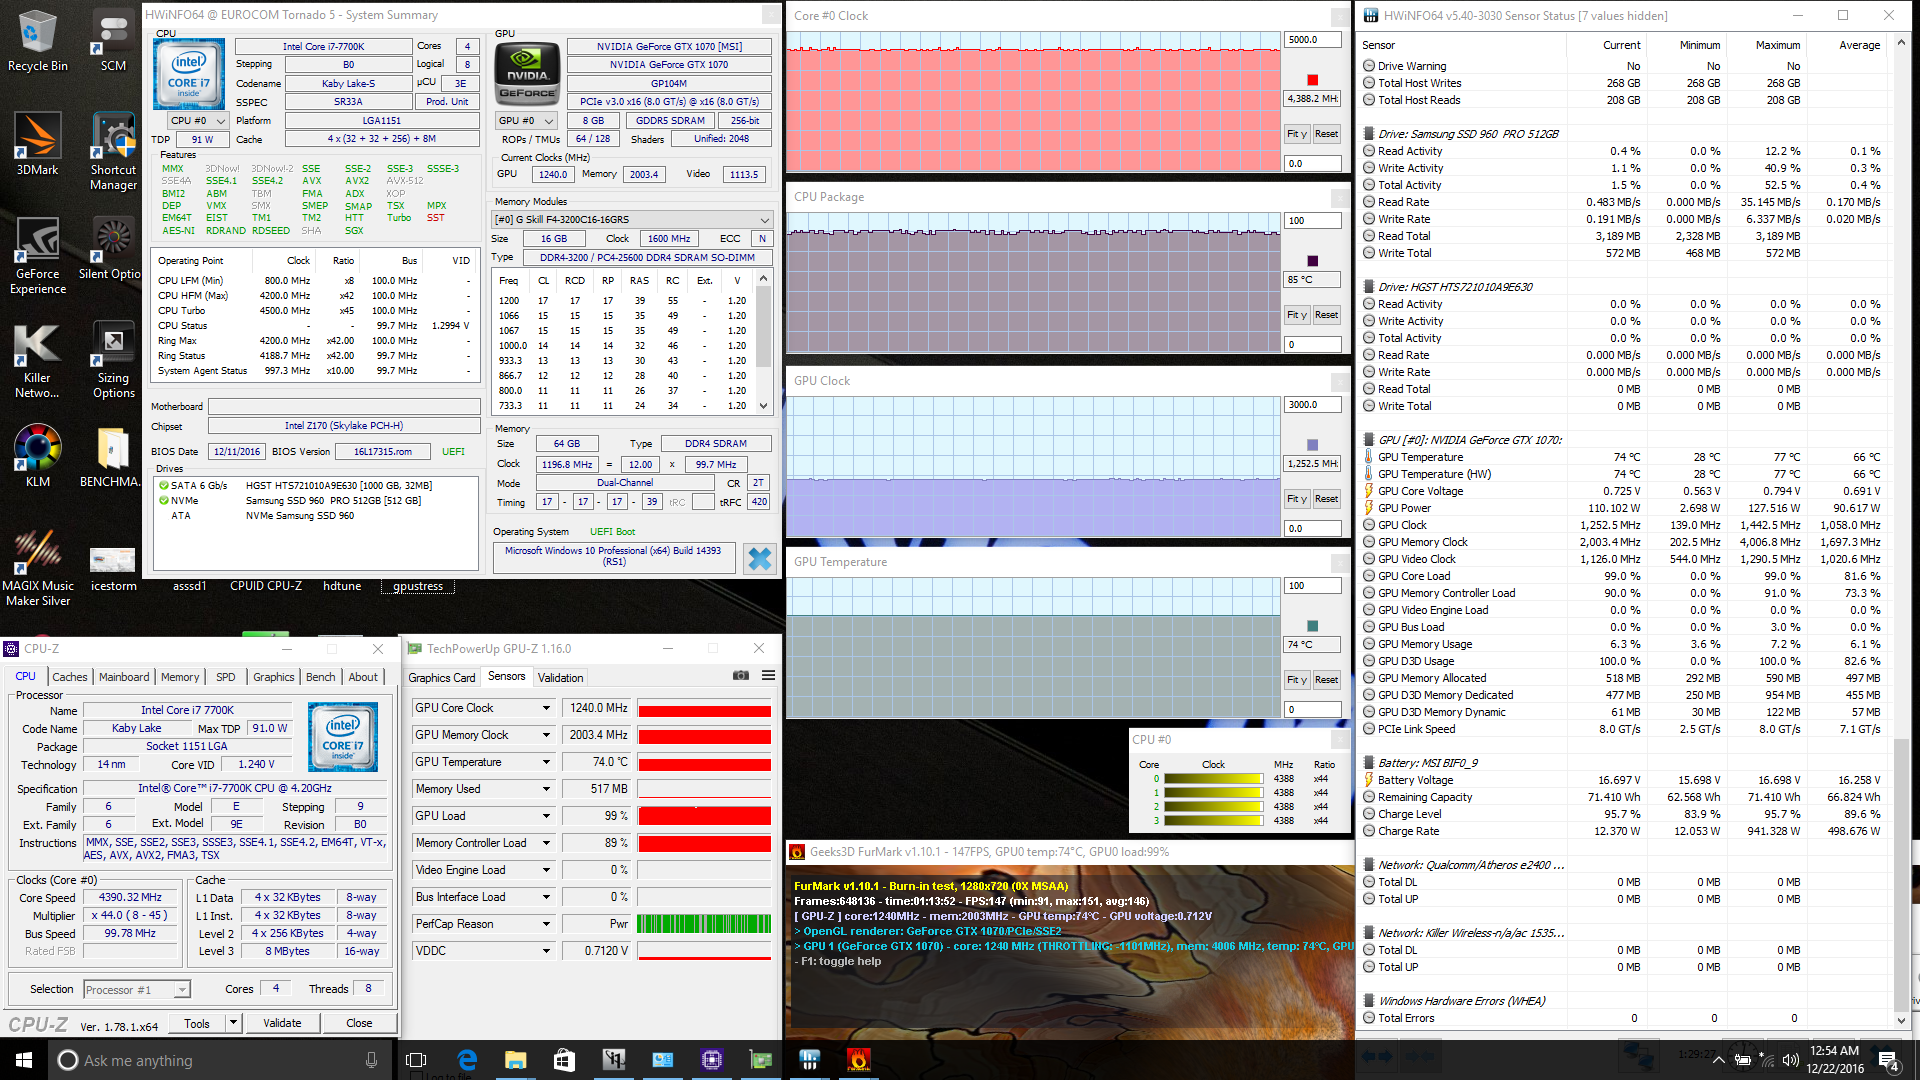
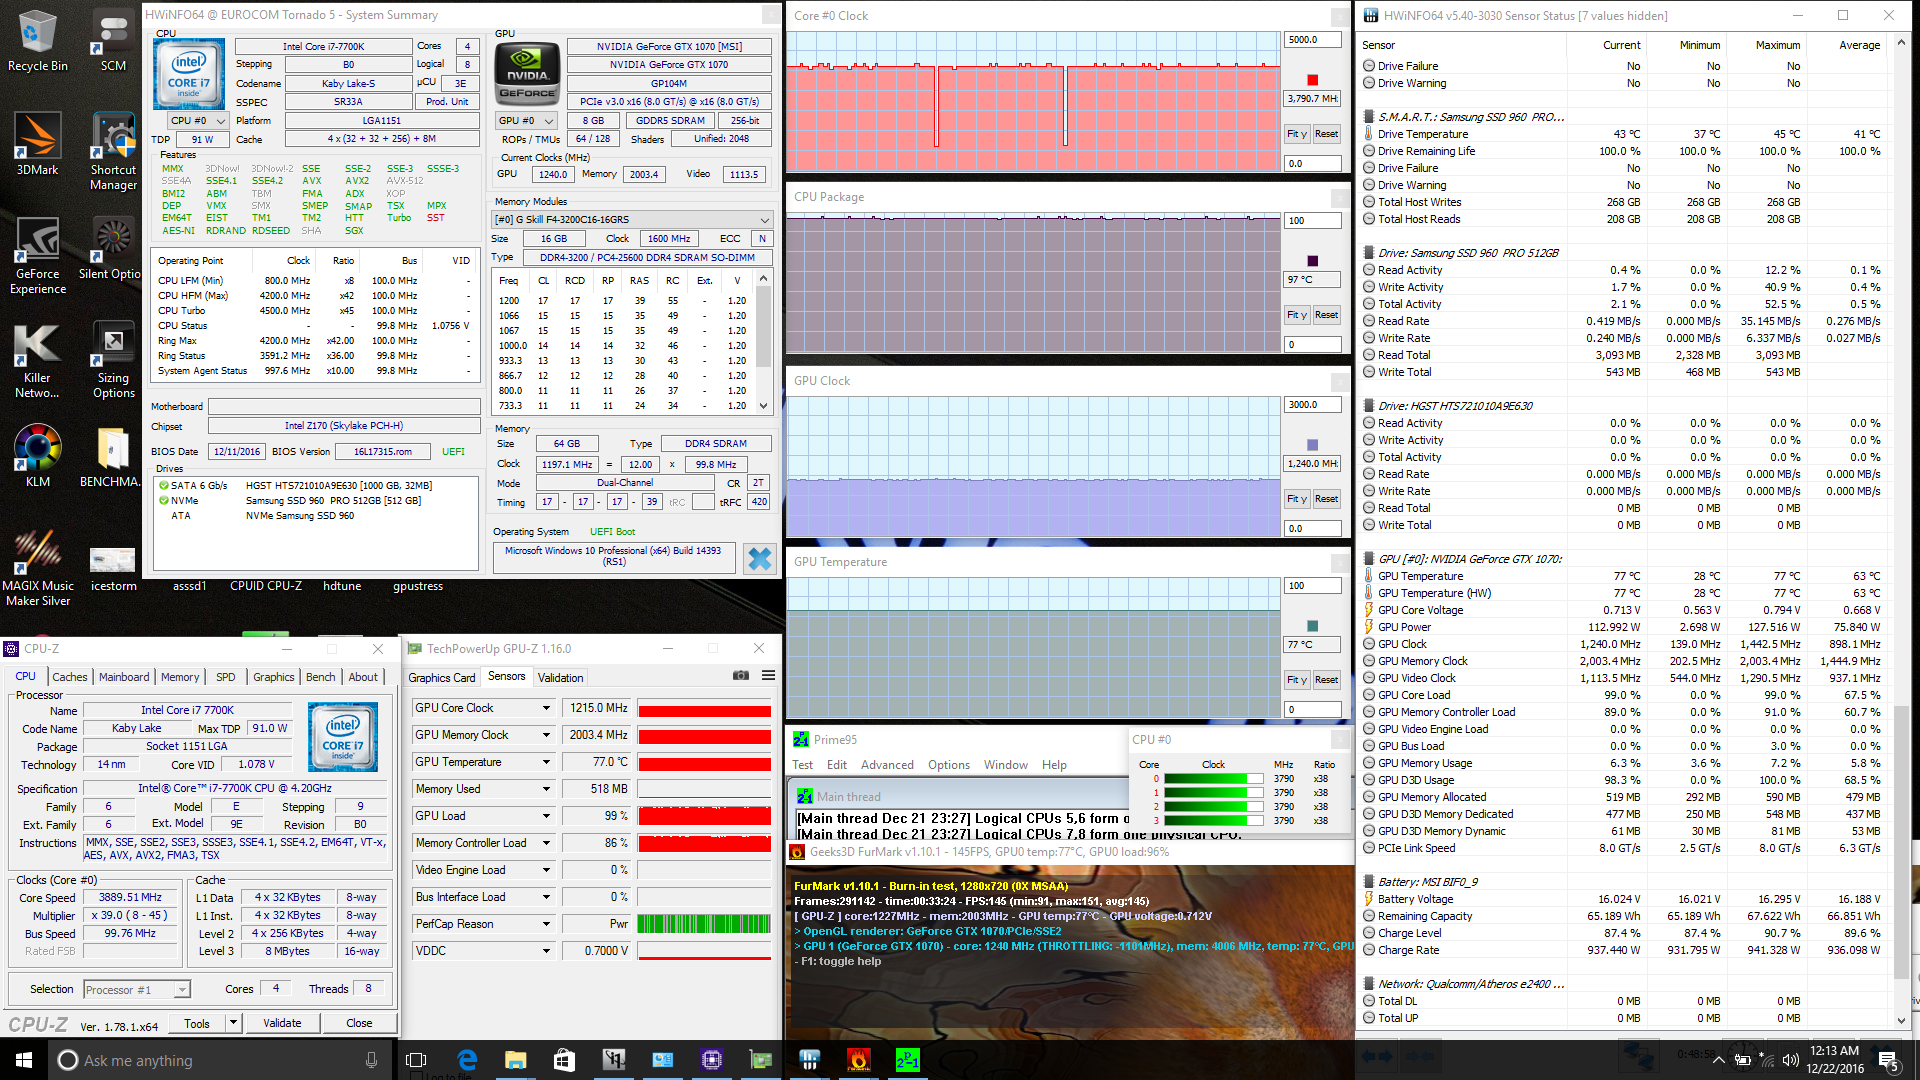
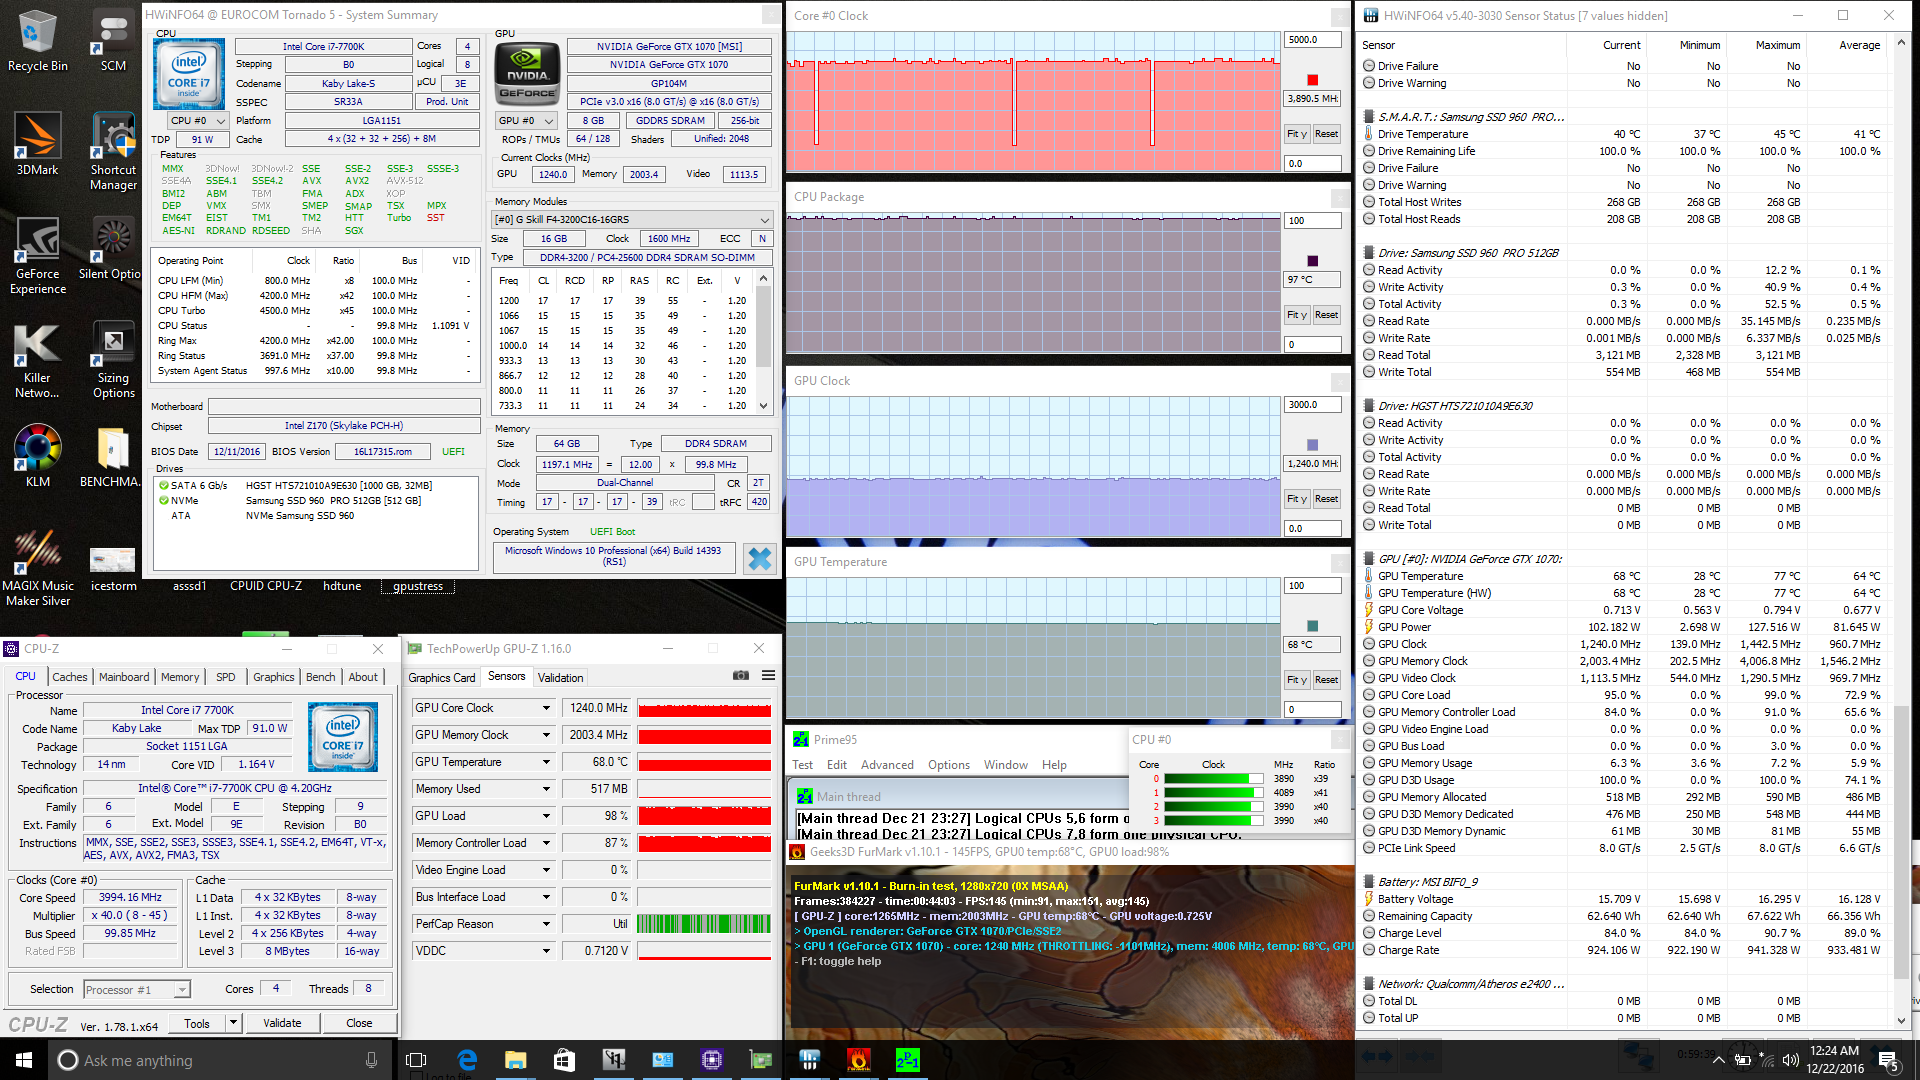
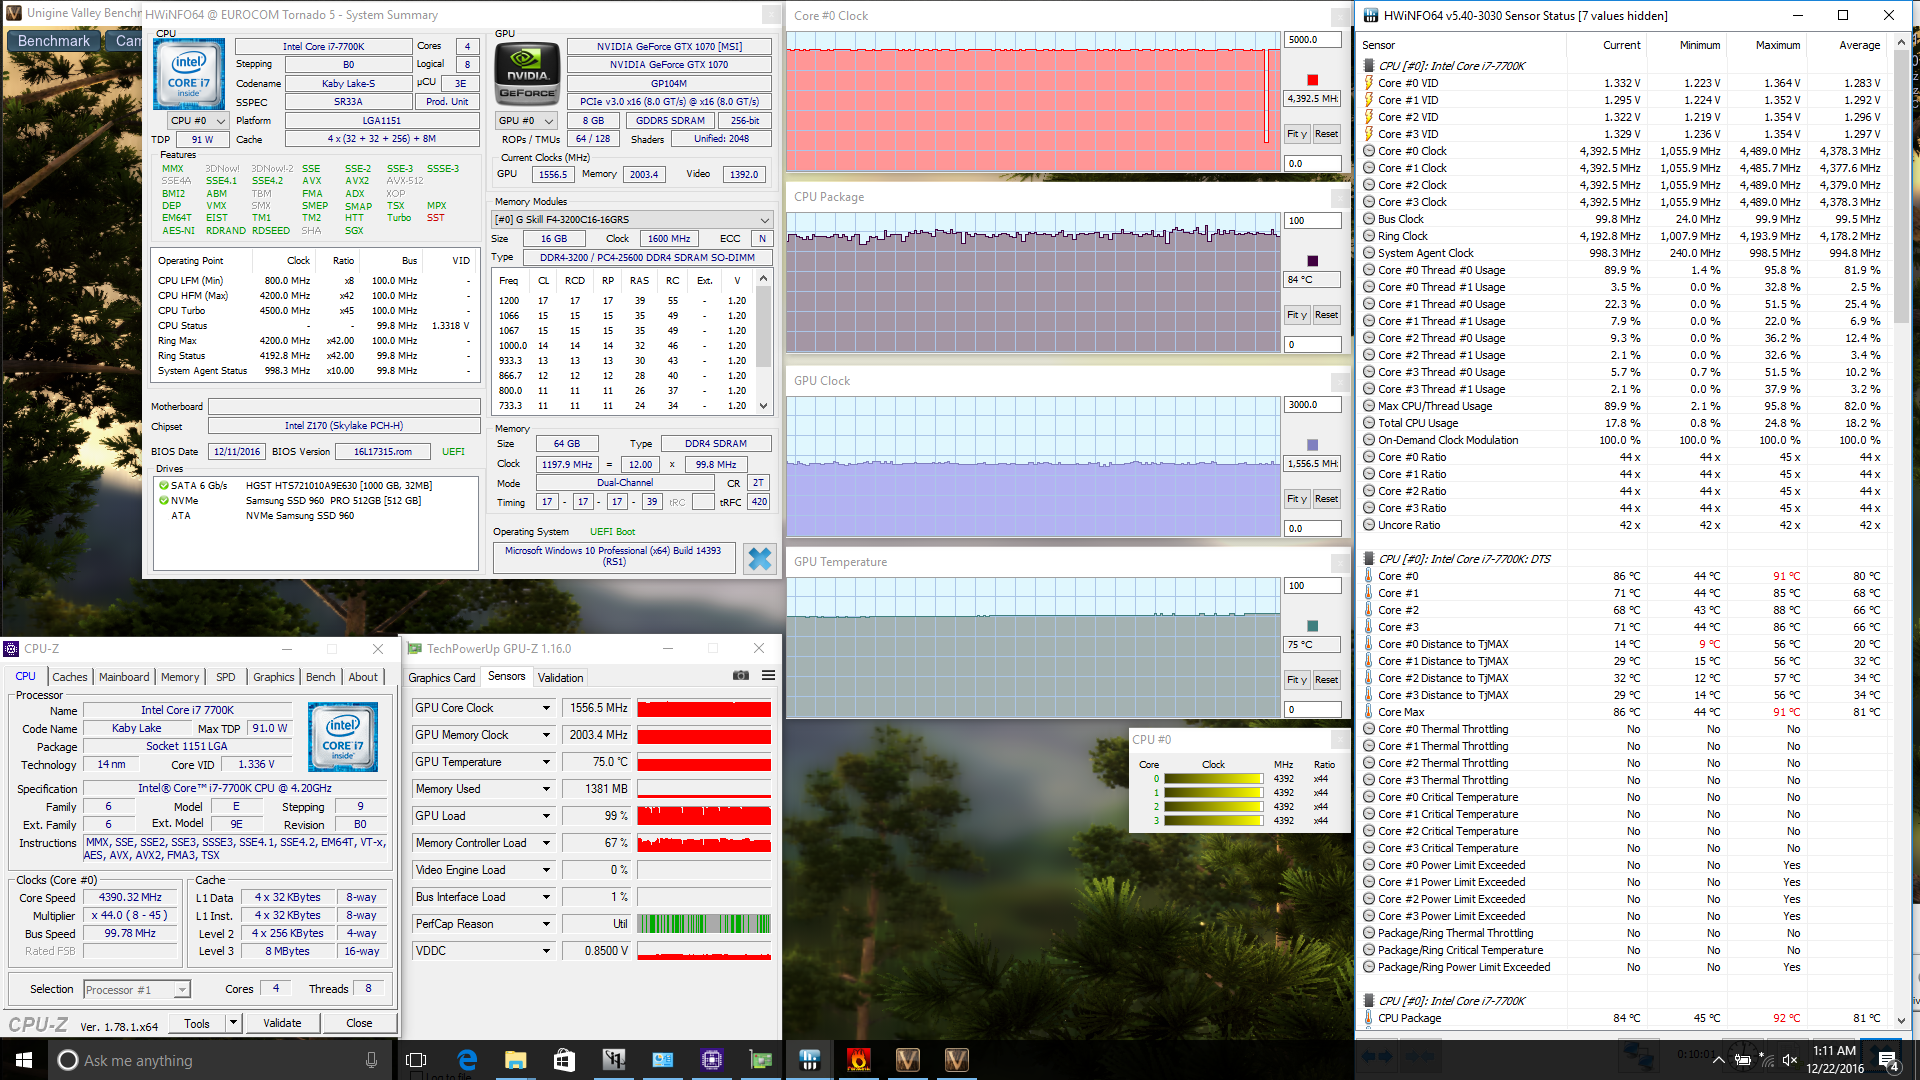
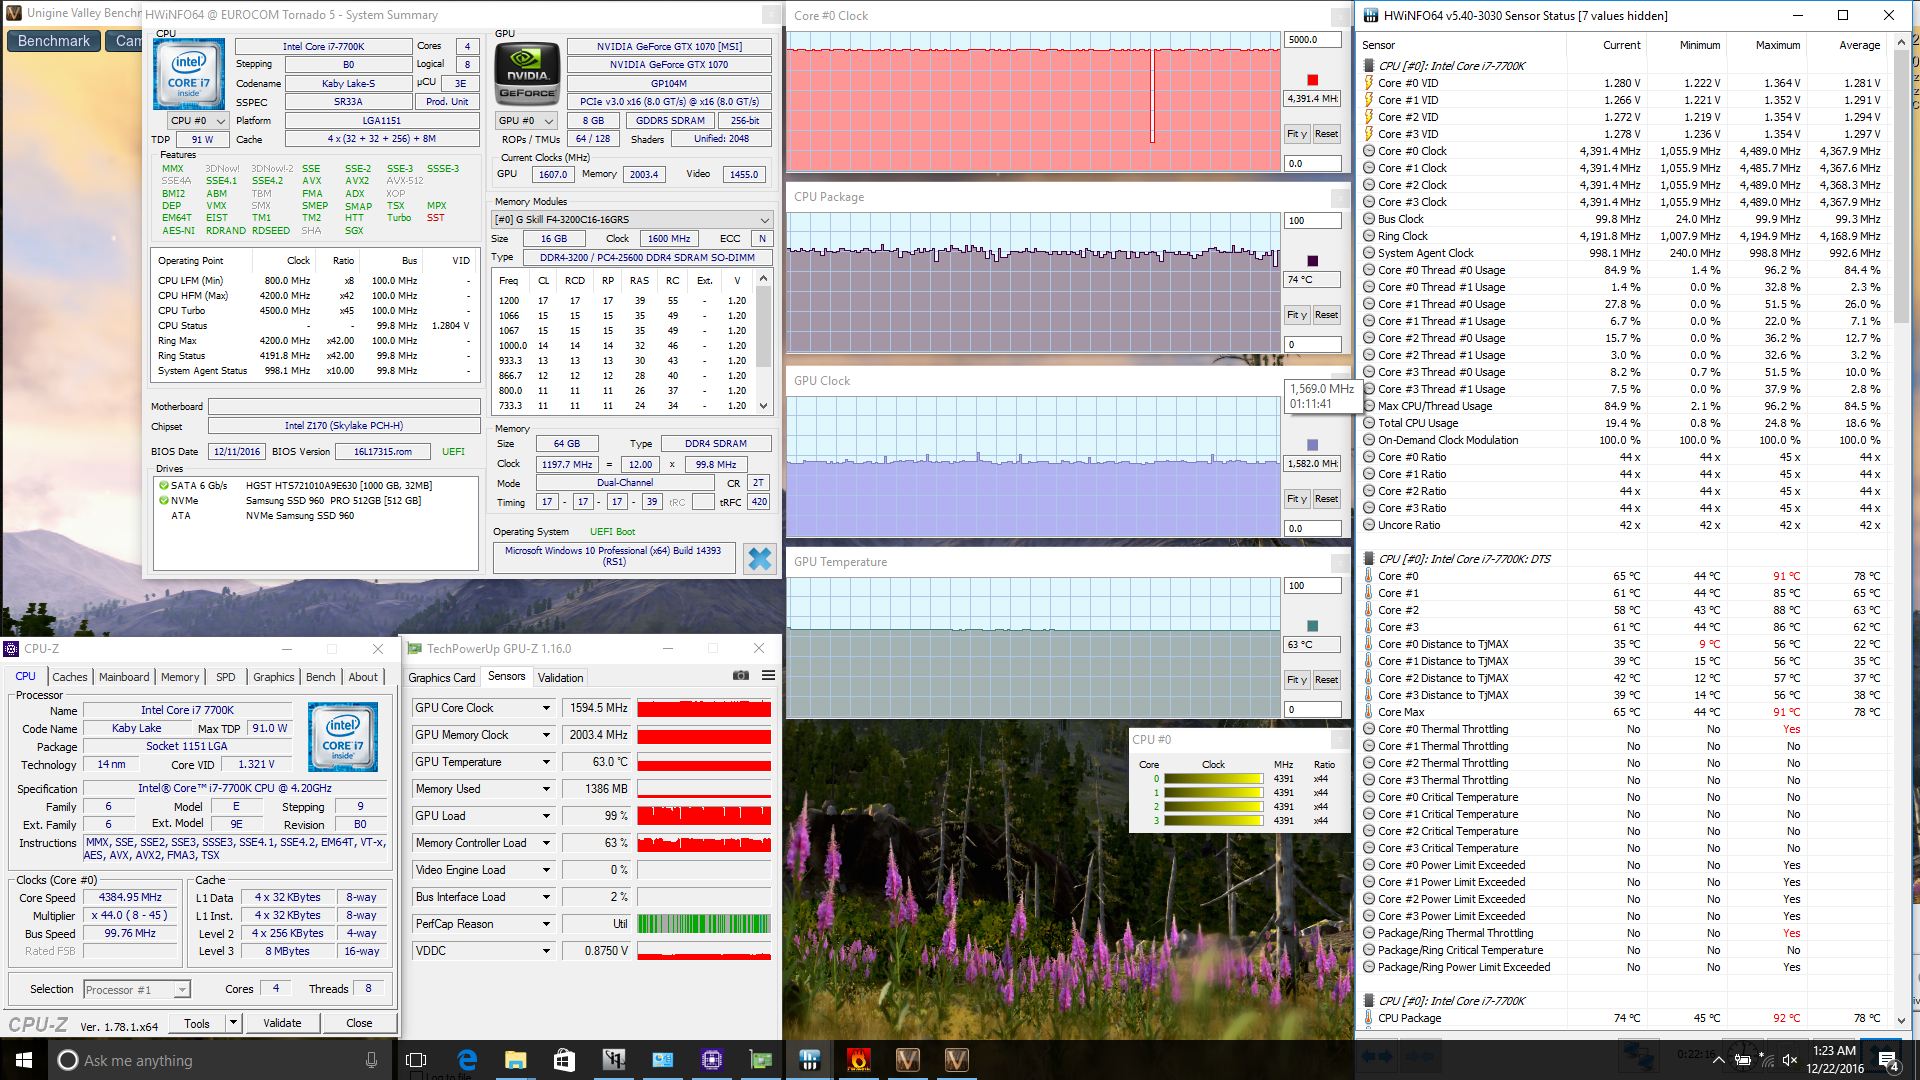
| CPU Clock (GHz) | GPU Clock (MHz) | Average CPU Temperature (°C) | Average GPU Temperature (°C) | |
| Prime95 Stress | 2.4 - 4.3 | -- | 91 | 44 |
| FurMark Stress | -- | 1240 | 85 | 74 |
| Prime95 + FurMark Stress | 3.8 | 1215 | 97 | 77 |
| Prime95 + FurMark Stress (Turbo Fan) | 3.9 | 1240 | 97 | 68 |
| Unigine Valley Stress | 4.4 | 1557 | 84 | 75 |
| Unigine Valley Stress (Turbo Fan) | 4.4 | 1595 | 74 | 63 |
Emissions
System Noise
The cooling system consists of seven heat pipes and twin 70 mm fans in an asymmetrical arrangement. More affordable and popular gaming notebooks like the GS63VR or Aspire VX5 have smaller fans and only two or three heat pipes due to their thinner profiles, cost-cutting measures, and less powerful CPUs.
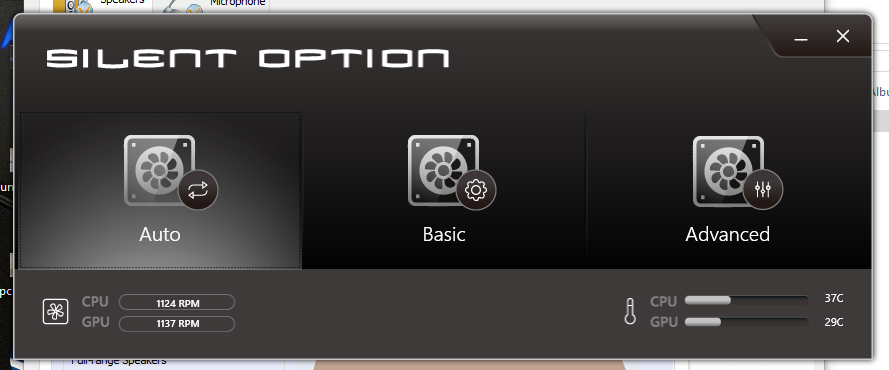
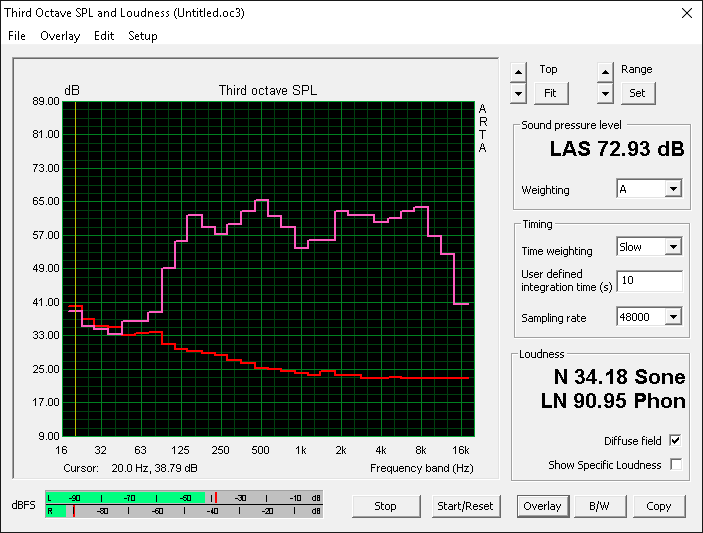
The fans are always active in the low 33 dB(A) range no matter the processing load. This is audible in a quiet room, but the low hum can be easily ignored and is generally stable under low loads with no aggravating pulsing behavior. When gaming, the Tornado F5 will run significantly louder than many 17-inch alternatives including the GT73VR. While certainly not as loud as Razer or Aorus notebooks, gaming with headphones is still recommended since anything above the 40 dB(A) mark is quite loud for a notebook.
Maximum stress with both Prime95 and FurMark will induce a fan noise of 47.5 dB(A) and activating Turbo Fan will raise this even further to 52.5 dB(A).
Noise level
| Idle |
| 33.3 / 33.5 / 33.5 dB(A) |
| Load |
| 44.2 / 52.5 dB(A) |
 | ||
30 dB silent 40 dB(A) audible 50 dB(A) loud |
||
min: | ||
| Eurocom Tornado F5 GeForce GTX 1070 Mobile, i7-7700K, Samsung SSD 960 Pro 512 GB m.2 | MSI GT73VR 7RF-296 GeForce GTX 1080 Mobile, i7-7820HK, 2x Samsung SM951 MZVPV256HDGL (RAID 0) | MSI GT72VR 7RE-433 GeForce GTX 1070 Mobile, i7-7700HQ, Kingston RBU-SNS8152S3256GG5 | EVGA SC17 GTX 1070 GeForce GTX 1070 Mobile, 6820HK, Samsung SM951 MZVPV256 m.2 | Aorus X7 DT v6 GeForce GTX 1080 Mobile, 6820HK, Samsung SM951 MZVPV512HDGL m.2 PCI-e | |
|---|---|---|---|---|---|
| Noise | -2% | 2% | -1% | -5% | |
| off / environment * (dB) | 29.4 | 30 -2% | 31 -5% | 29.2 1% | 28.6 3% |
| Idle Minimum * (dB) | 33.3 | 34 -2% | 34 -2% | 33.9 -2% | 32.2 3% |
| Idle Average * (dB) | 33.5 | 35 -4% | 35 -4% | 33.9 -1% | 35.2 -5% |
| Idle Maximum * (dB) | 33.5 | 37 -10% | 37 -10% | 33.9 -1% | 35.2 -5% |
| Load Average * (dB) | 44.2 | 39 12% | 37 16% | 43.8 1% | 51.7 -17% |
| Load Maximum * (dB) | 52.5 | 56 -7% | 44 16% | 53.4 -2% | 55.7 -6% |
* ... smaller is better
Temperature
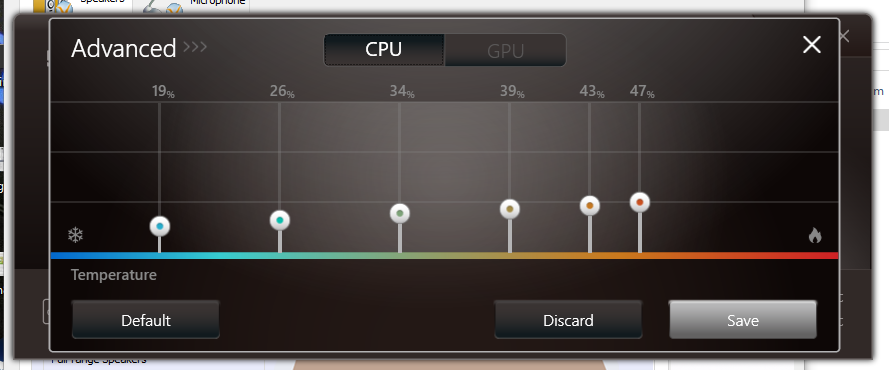
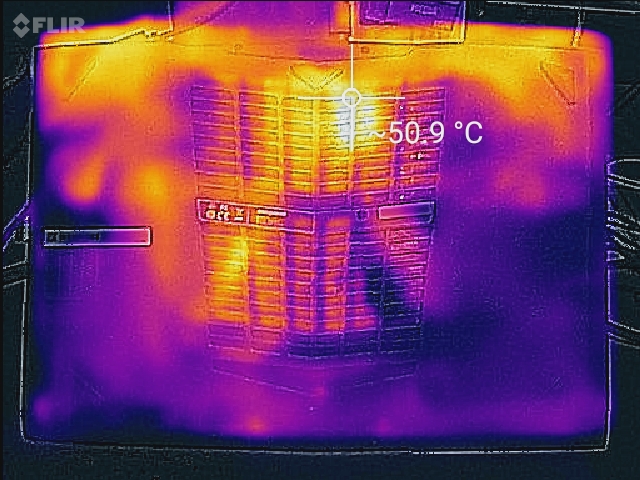
Surface temperatures are generally cool for a gaming notebook. Hot spots are on the areas above the first row of keys where hands and fingers are less likely to touch as shown by the temperature maps below. Keyboard keys remain comfortable in the low 30 C range even when under extreme processing loads while the palm rests are even cooler. The bottom surface has warmer hot spots, but this is not bothersome during regular use on a flat desk.
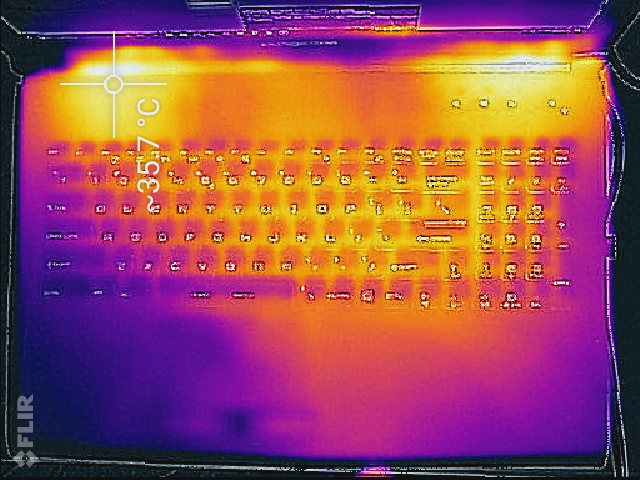
(+) The maximum temperature on the upper side is 37.4 °C / 99 F, compared to the average of 40.4 °C / 105 F, ranging from 21.2 to 68.8 °C for the class Gaming.
(±) The bottom heats up to a maximum of 44.8 °C / 113 F, compared to the average of 43.2 °C / 110 F
(+) In idle usage, the average temperature for the upper side is 23.8 °C / 75 F, compared to the device average of 33.9 °C / 93 F.
(+) The palmrests and touchpad are cooler than skin temperature with a maximum of 28.8 °C / 83.8 F and are therefore cool to the touch.
(±) The average temperature of the palmrest area of similar devices was 28.8 °C / 83.8 F (0 °C / 0 F).
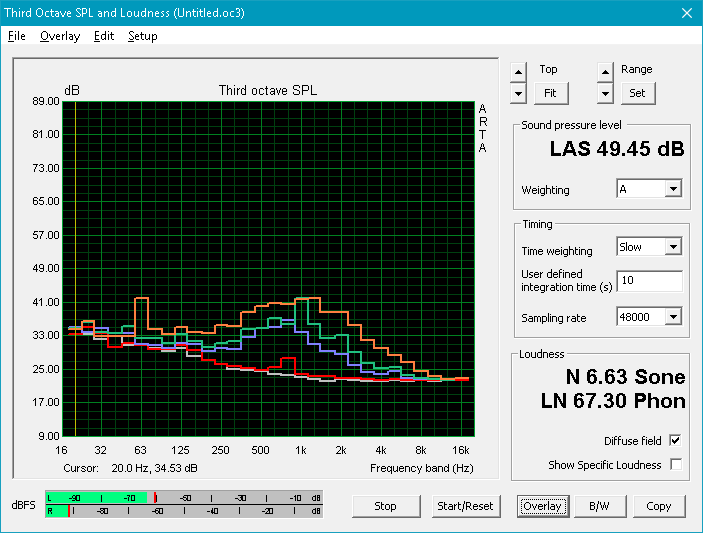
Speakers

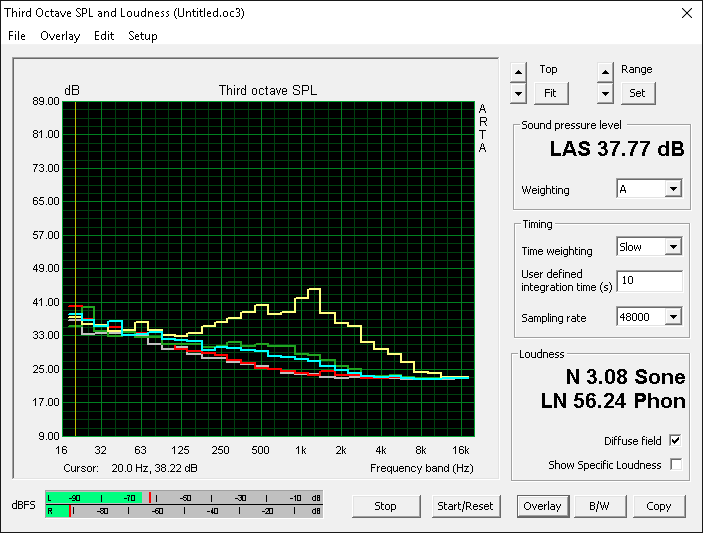
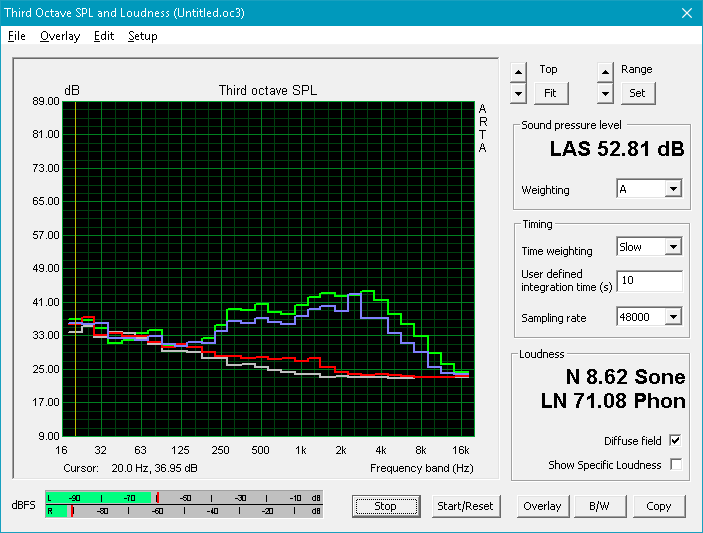
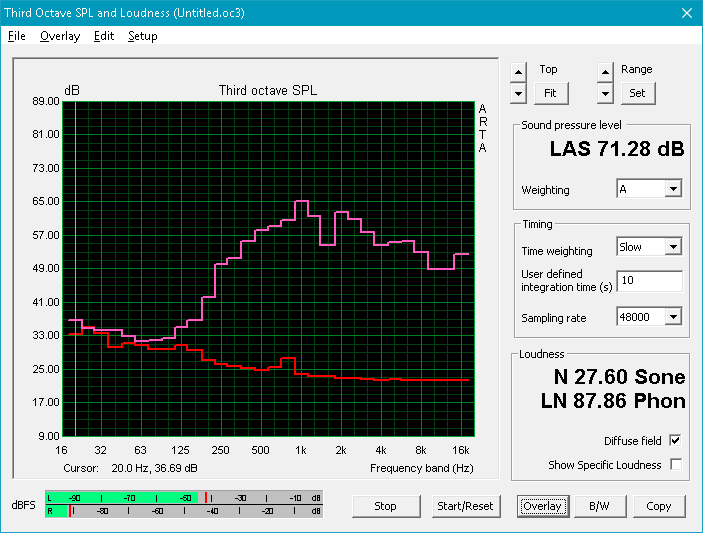
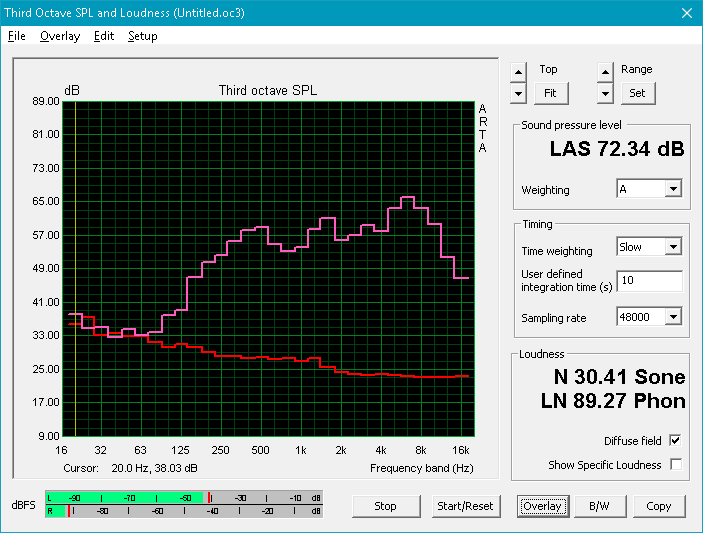
The built-in 2 W stereo speakers output satisfactory sound at their default settings. Higher volume settings will not introduce any static or reverberations throughout the chassis. The dedicated subwoofer could have been a little more powerful as our microphone measurements below show a drop off at around 250 Hz versus 125 Hz on the GT72VR. The frequency range on the Tornado F5 is not as evenly reproduced or wide as its larger MSI counterpart.
The included Sound Blaster X-Fi MB3 software and support for external 7.1 surround systems can help improve sound quality or bypass the internal speakers altogether, respectively. There appears to be no dedicated DAC to fully support high-impedance studio-grade headphones.
Eurocom Tornado F5 audio analysis
(-) | not very loud speakers (71.3 dB)
Bass 100 - 315 Hz
(±) | reduced bass - on average 13.2% lower than median
(±) | linearity of bass is average (10.6% delta to prev. frequency)
Mids 400 - 2000 Hz
(±) | higher mids - on average 5.1% higher than median
(±) | linearity of mids is average (12.8% delta to prev. frequency)
Highs 2 - 16 kHz
(+) | balanced highs - only 2.7% away from median
(±) | linearity of highs is average (7.2% delta to prev. frequency)
Overall 100 - 16.000 Hz
(±) | linearity of overall sound is average (24.4% difference to median)
Compared to same class
» 88% of all tested devices in this class were better, 3% similar, 8% worse
» The best had a delta of 6%, average was 18%, worst was 132%
Compared to all devices tested
» 74% of all tested devices were better, 6% similar, 20% worse
» The best had a delta of 4%, average was 23%, worst was 134%
Apple MacBook 12 (Early 2016) 1.1 GHz audio analysis
(+) | speakers can play relatively loud (83.6 dB)
Bass 100 - 315 Hz
(±) | reduced bass - on average 11.3% lower than median
(±) | linearity of bass is average (14.2% delta to prev. frequency)
Mids 400 - 2000 Hz
(+) | balanced mids - only 2.4% away from median
(+) | mids are linear (5.5% delta to prev. frequency)
Highs 2 - 16 kHz
(+) | balanced highs - only 2% away from median
(+) | highs are linear (4.5% delta to prev. frequency)
Overall 100 - 16.000 Hz
(+) | overall sound is linear (10.2% difference to median)
Compared to same class
» 7% of all tested devices in this class were better, 2% similar, 90% worse
» The best had a delta of 5%, average was 18%, worst was 53%
Compared to all devices tested
» 5% of all tested devices were better, 1% similar, 94% worse
» The best had a delta of 4%, average was 23%, worst was 134%
Frequency Comparison (Checkbox selectable!)
Graph 1: Pink Noise 100% Vol.; Graph 2: Audio off
Energy Management
Power Consumption
Our Eurocom is generally more power efficient than some larger 17-inch alternatives when idling on desktop or during low loads which helps to explain its longer runtimes as shown in our next section below. Gaming will draw about 170 W while maximum load will demand just over 200 W. In comparison, systems with the GTX 1080 like the Aorus X7 DT or GT73VR can demand over 250 W or 300 W, respectively.
The external power adapter (~17 x 8.5 x 3.5 cm) is rated for up to 230 W or about 30 W higher than our measurement when under maximum load. Thus, users intending to upgrade the Tornado F5 with a GTX 1080 may need to consider the optional and more capable 330 W power adapter.
| Off / Standby | |
| Idle | |
| Load |
|
Key:
min: | |
| Eurocom Tornado F5 i7-7700K, GeForce GTX 1070 Mobile, Samsung SSD 960 Pro 512 GB m.2, IPS, 1920x1080, 15.6" | MSI GT73VR 7RF-296 i7-7820HK, GeForce GTX 1080 Mobile, 2x Samsung SM951 MZVPV256HDGL (RAID 0), TN LED, 1920x1080, 17.3" | MSI GT72VR 7RE-433 i7-7700HQ, GeForce GTX 1070 Mobile, Kingston RBU-SNS8152S3256GG5, TN LED, 1920x1080, 17.3" | MSI GE62 2QC-468XPL 5700HQ, GeForce GTX 960M, Samsung SSD PM851 256 GB MZNTE256HMHP, TN, 1920x1080, 15.6" | Aorus X7 DT v6 6820HK, GeForce GTX 1080 Mobile, Samsung SM951 MZVPV512HDGL m.2 PCI-e, TN LED, 2560x1440, 17.3" | |
|---|---|---|---|---|---|
| Power Consumption | -28% | 8% | 7% | -32% | |
| Idle Minimum * (Watt) | 21.2 | 29 -37% | 20 6% | 15.5 27% | 31.5 -49% |
| Idle Average * (Watt) | 25.1 | 35 -39% | 27 -8% | 22.5 10% | 33.9 -35% |
| Idle Maximum * (Watt) | 26.3 | 40 -52% | 31 -18% | 44.9 -71% | 34.6 -32% |
| Load Average * (Watt) | 169.4 | 94 45% | 86 49% | 122.4 28% | 205.6 -21% |
| Load Maximum * (Watt) | 202.4 | 315 -56% | 184 9% | 122.6 39% | 250.8 -24% |
* ... smaller is better
Battery Life
Runtimes are decent for a system with a desktop-class CPU and no Optimus graphics switching. We were able to clock in just over 3.5 hours of WLAN runtime compared to 1.5 to 2 hours on the larger Eurocom X7E2 and Aorus X7 DT v6 notebooks. Simply idling on desktop on the Power Saver mode and at the minimum screen brightness will last for just under 5 hours.
The 75 Wh battery is non-removable this time unlike on many other Clevo configurations from Eurocom.
| Eurocom Tornado F5 i7-7700K, GeForce GTX 1070 Mobile, 75.24 Wh | MSI GT73VR 7RF-296 i7-7820HK, GeForce GTX 1080 Mobile, 75.2 Wh | Eurocom Sky X7E2 6700K, GeForce GTX 1080 Mobile, 89 Wh | EVGA SC17 GTX 1070 6820HK, GeForce GTX 1070 Mobile, 74.48 Wh | Aorus X7 DT v6 6820HK, GeForce GTX 1080 Mobile, 94 Wh | |
|---|---|---|---|---|---|
| Battery runtime | -25% | -26% | -20% | -9% | |
| Reader / Idle (h) | 4.9 | 2.3 -53% | 4 -18% | 3 -39% | |
| WiFi v1.3 (h) | 3.6 | 2.7 -25% | 1.7 -53% | 2.7 -25% | 2.4 -33% |
| Load (h) | 1.1 | 1.4 27% | 0.9 -18% | 1.6 45% |
Pros
Cons
Verdict
The Tornado F5 continues the Eurocom tradition of offering faster performance, more customization, and longer legs than the popular equivalents from big name manufacturers. There's no denying that its ability to run on standard desktop processors and removable GPUs without voiding a warranty seal is one of the best aspects of owning a Eurocom system.
If the above advantages are not appealing, then there's little reason to prefer the enthusiast Tornado F5 over something more mainstream like the MSI GE62, Asus GL502, or new HP Omen 17. These systems are less expensive and far less bulky while carrying the same GTX 1070 GPU. Overall system performance may be slower, but gaming performance will be nearly identical since the raw CPU performance of an i7-5700HQ or i7-6700HQ processor on most gaming notebooks is already more than enough for most titles.
The system does not appear to suffer from any major throttling when under gaming loads. More extreme loads with Prime95, however, pushes temperatures to almost 100 C even after throttling core clock rates. Thus, users hoping for ample overclocking headroom from the i7-7700K may be disappointed. The GTX 1070 operating temperatures are more acceptable since the system can be configured with the more demanding GTX 1080. In either case, Eurocom is riding a fine line in terms of thermal limits and configurable options in order to offer one of the fastest notebooks yet in this screen size.
The chassis could be stronger and core temperatures could be lower. Otherwise, the Tornado F5 trumps the competition in raw power and customization so long as its high price isn't a deterring factor.
Eurocom Tornado F5
- 01/03/2017 v6 (old)
Allen Ngo
Price comparison
