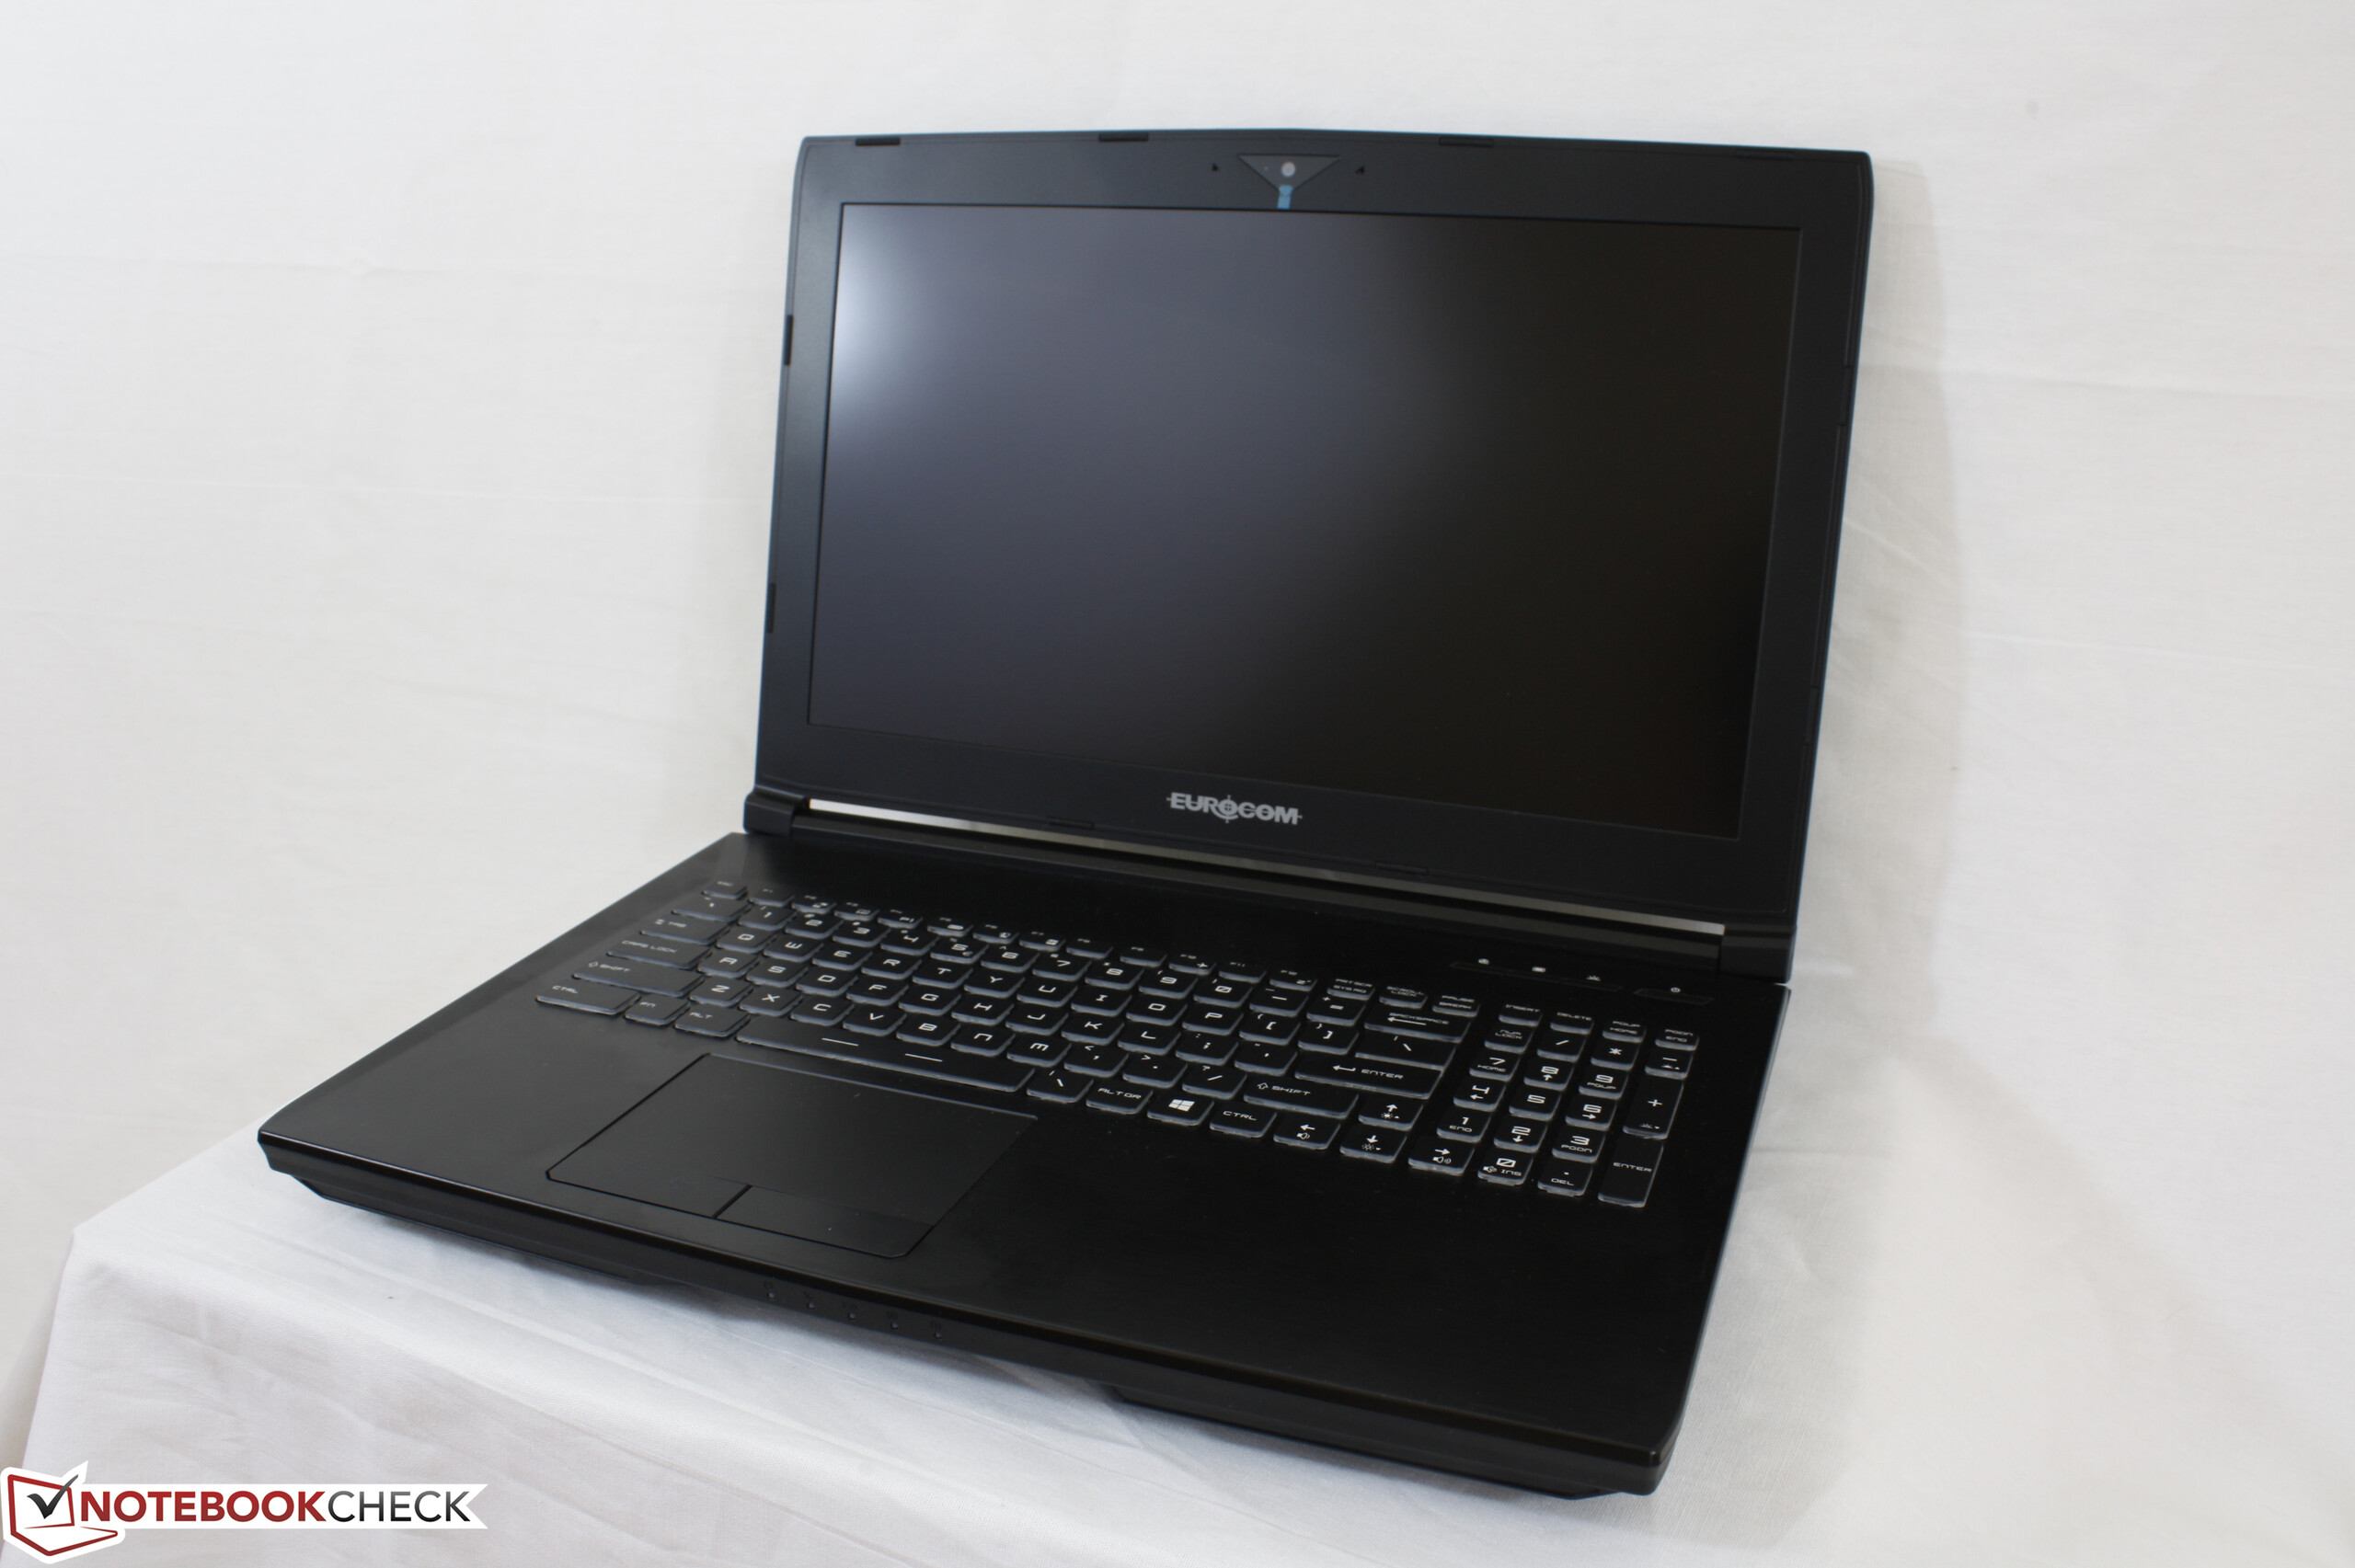
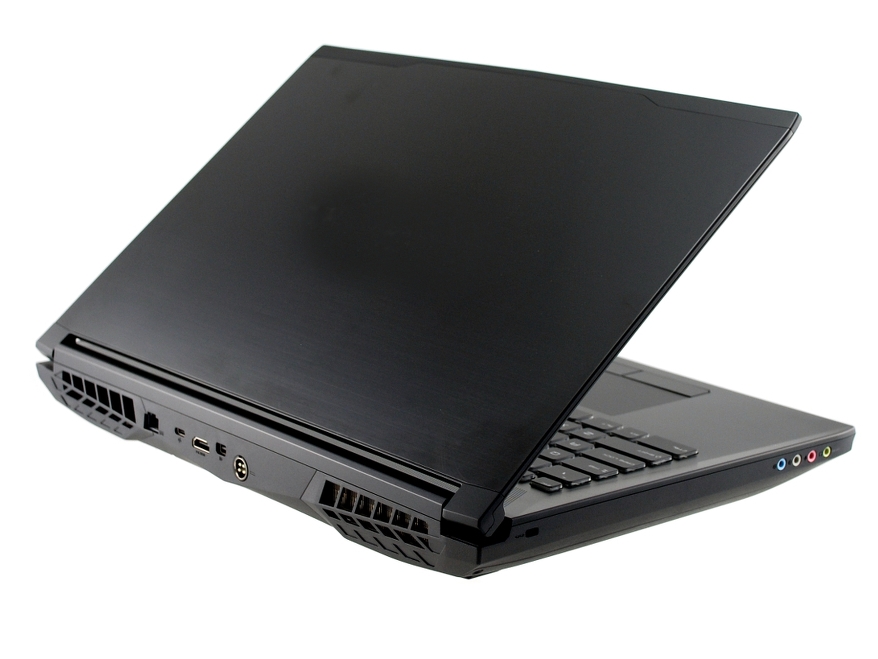
Eurocom Tornado F5 Killer Edition (i5-7600K, 4K UHD, GTX 1080, MSI 16L13) Laptop Review
Eurocom has updated its existing enthusiast-level Tornado F5 series from Skylake to Kaby Lake. We had published on the original Tornado F5 with the i7-6700K CPU, FHD display, and GTX 1070 GPU earlier this year and our latest configuration today is equipped with the i5-7600K CPU, 4K UHD display, and GTX 1080 GPU. Beyond these core differences, both SKUs share the same chassis, connectivity features, and input devices and we recommend checking out our original Tornado F5 review as nearly all of our comments still apply.
It's also worth keeping in mind that the Tornado F5 chassis is based off of the MSI GT62VR with heavily modified internals. Consequently, our comments on the external features of the GT62VR apply to the Tornado F5 as well. Does the inclusion of a desktop K-class processor bring any benefits to gamers compared to more "standard" options from Alienware, Asus, or MSI?
Case
We won't dive too deeply on case quality as we've covered this on both the existing Tornado F5 and GT62VR pages. Our Tornado F5 Killer Edition test unit exhibits no unintended gaps or crevices between materials including around the edges of the screen where bezels can sometimes be uneven. The rear ventilation grilles are also thicker and more rigid than on the older Eurocom P7 Pro to prevent accidental chipping. The base is extremely resistant to twists and depressions even down the center of the keyboard where notebooks are usually weaker. Very slight creaking is noticeable only if attempting to twist the base with an impractical amount of force. The lid continues to be the weakest quality of the Tornado F5 as it warps and bends easily down its center and corners, respectively,
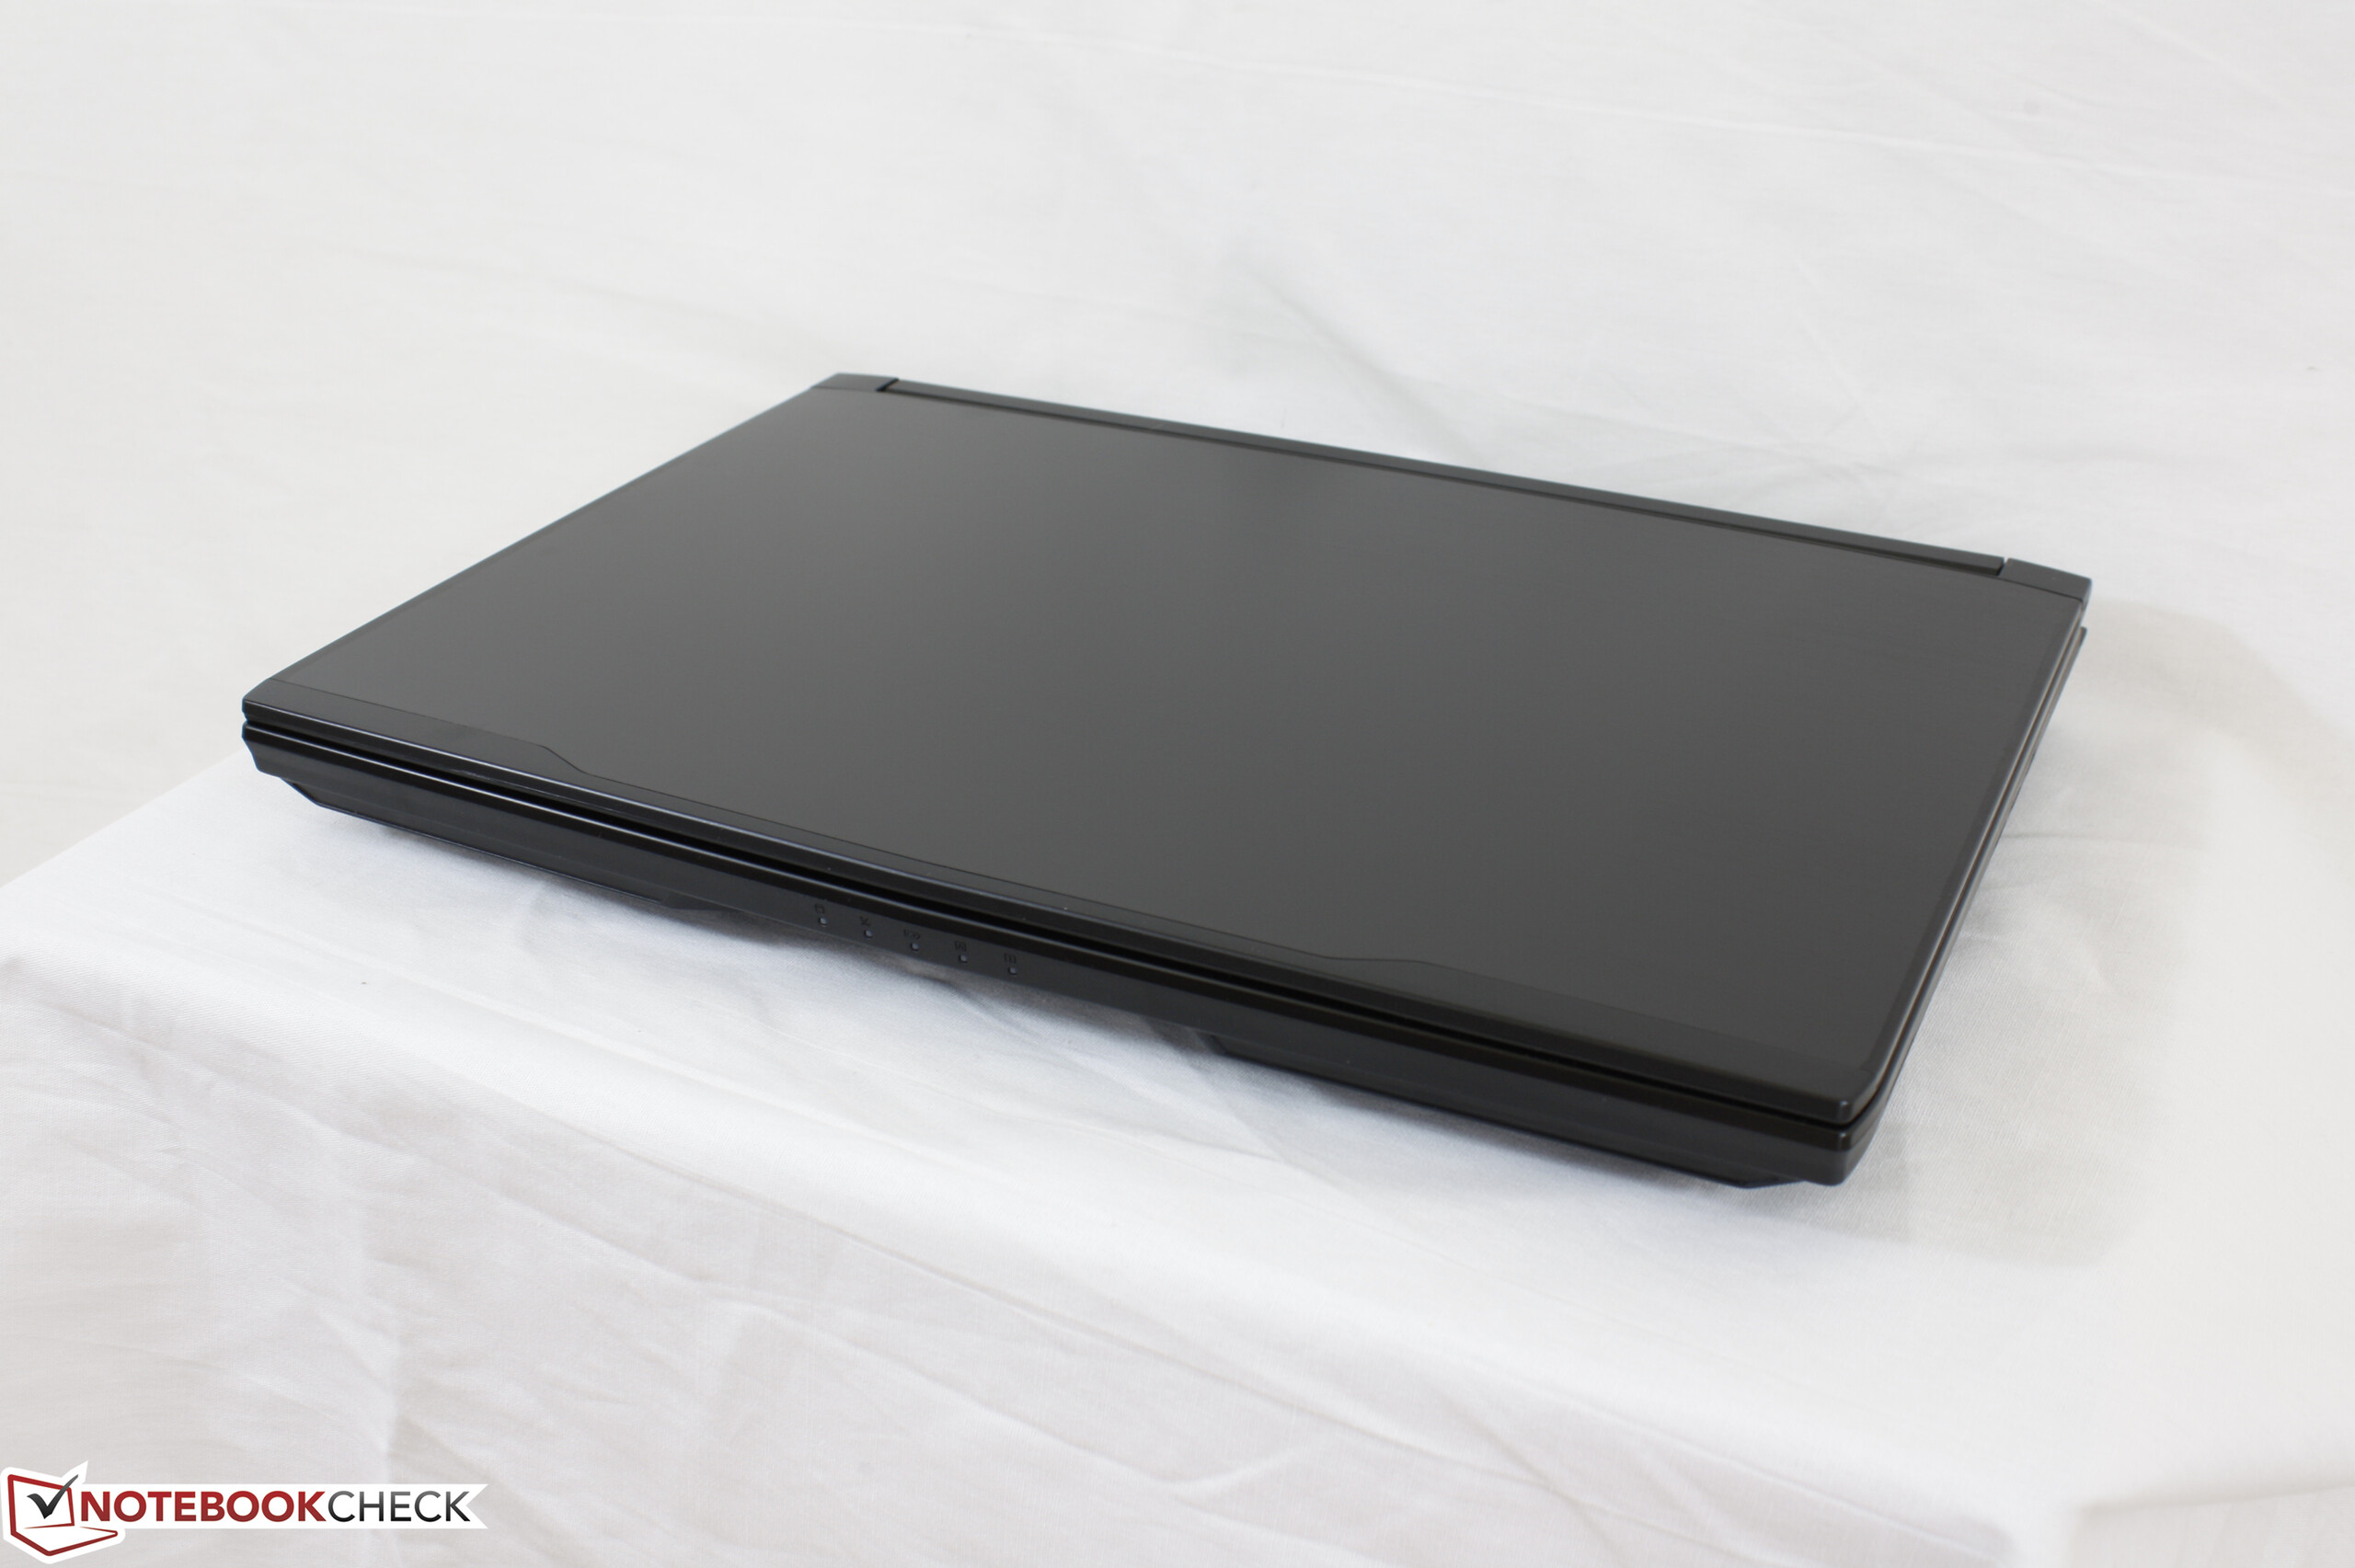

Footprint is small considering the powerful internals. The Alienware 15 and Acer Predator 15, for example, are longer in length due to their rear "jet engine" ventilation grilles. The Eurocom is also relatively light at 3.1 kg or about 200 g heavier than the GT62VR. The extra weight can be contributed to the heavier cooling system and implementation of the LGA 1151 and MXM 3.0 slots.
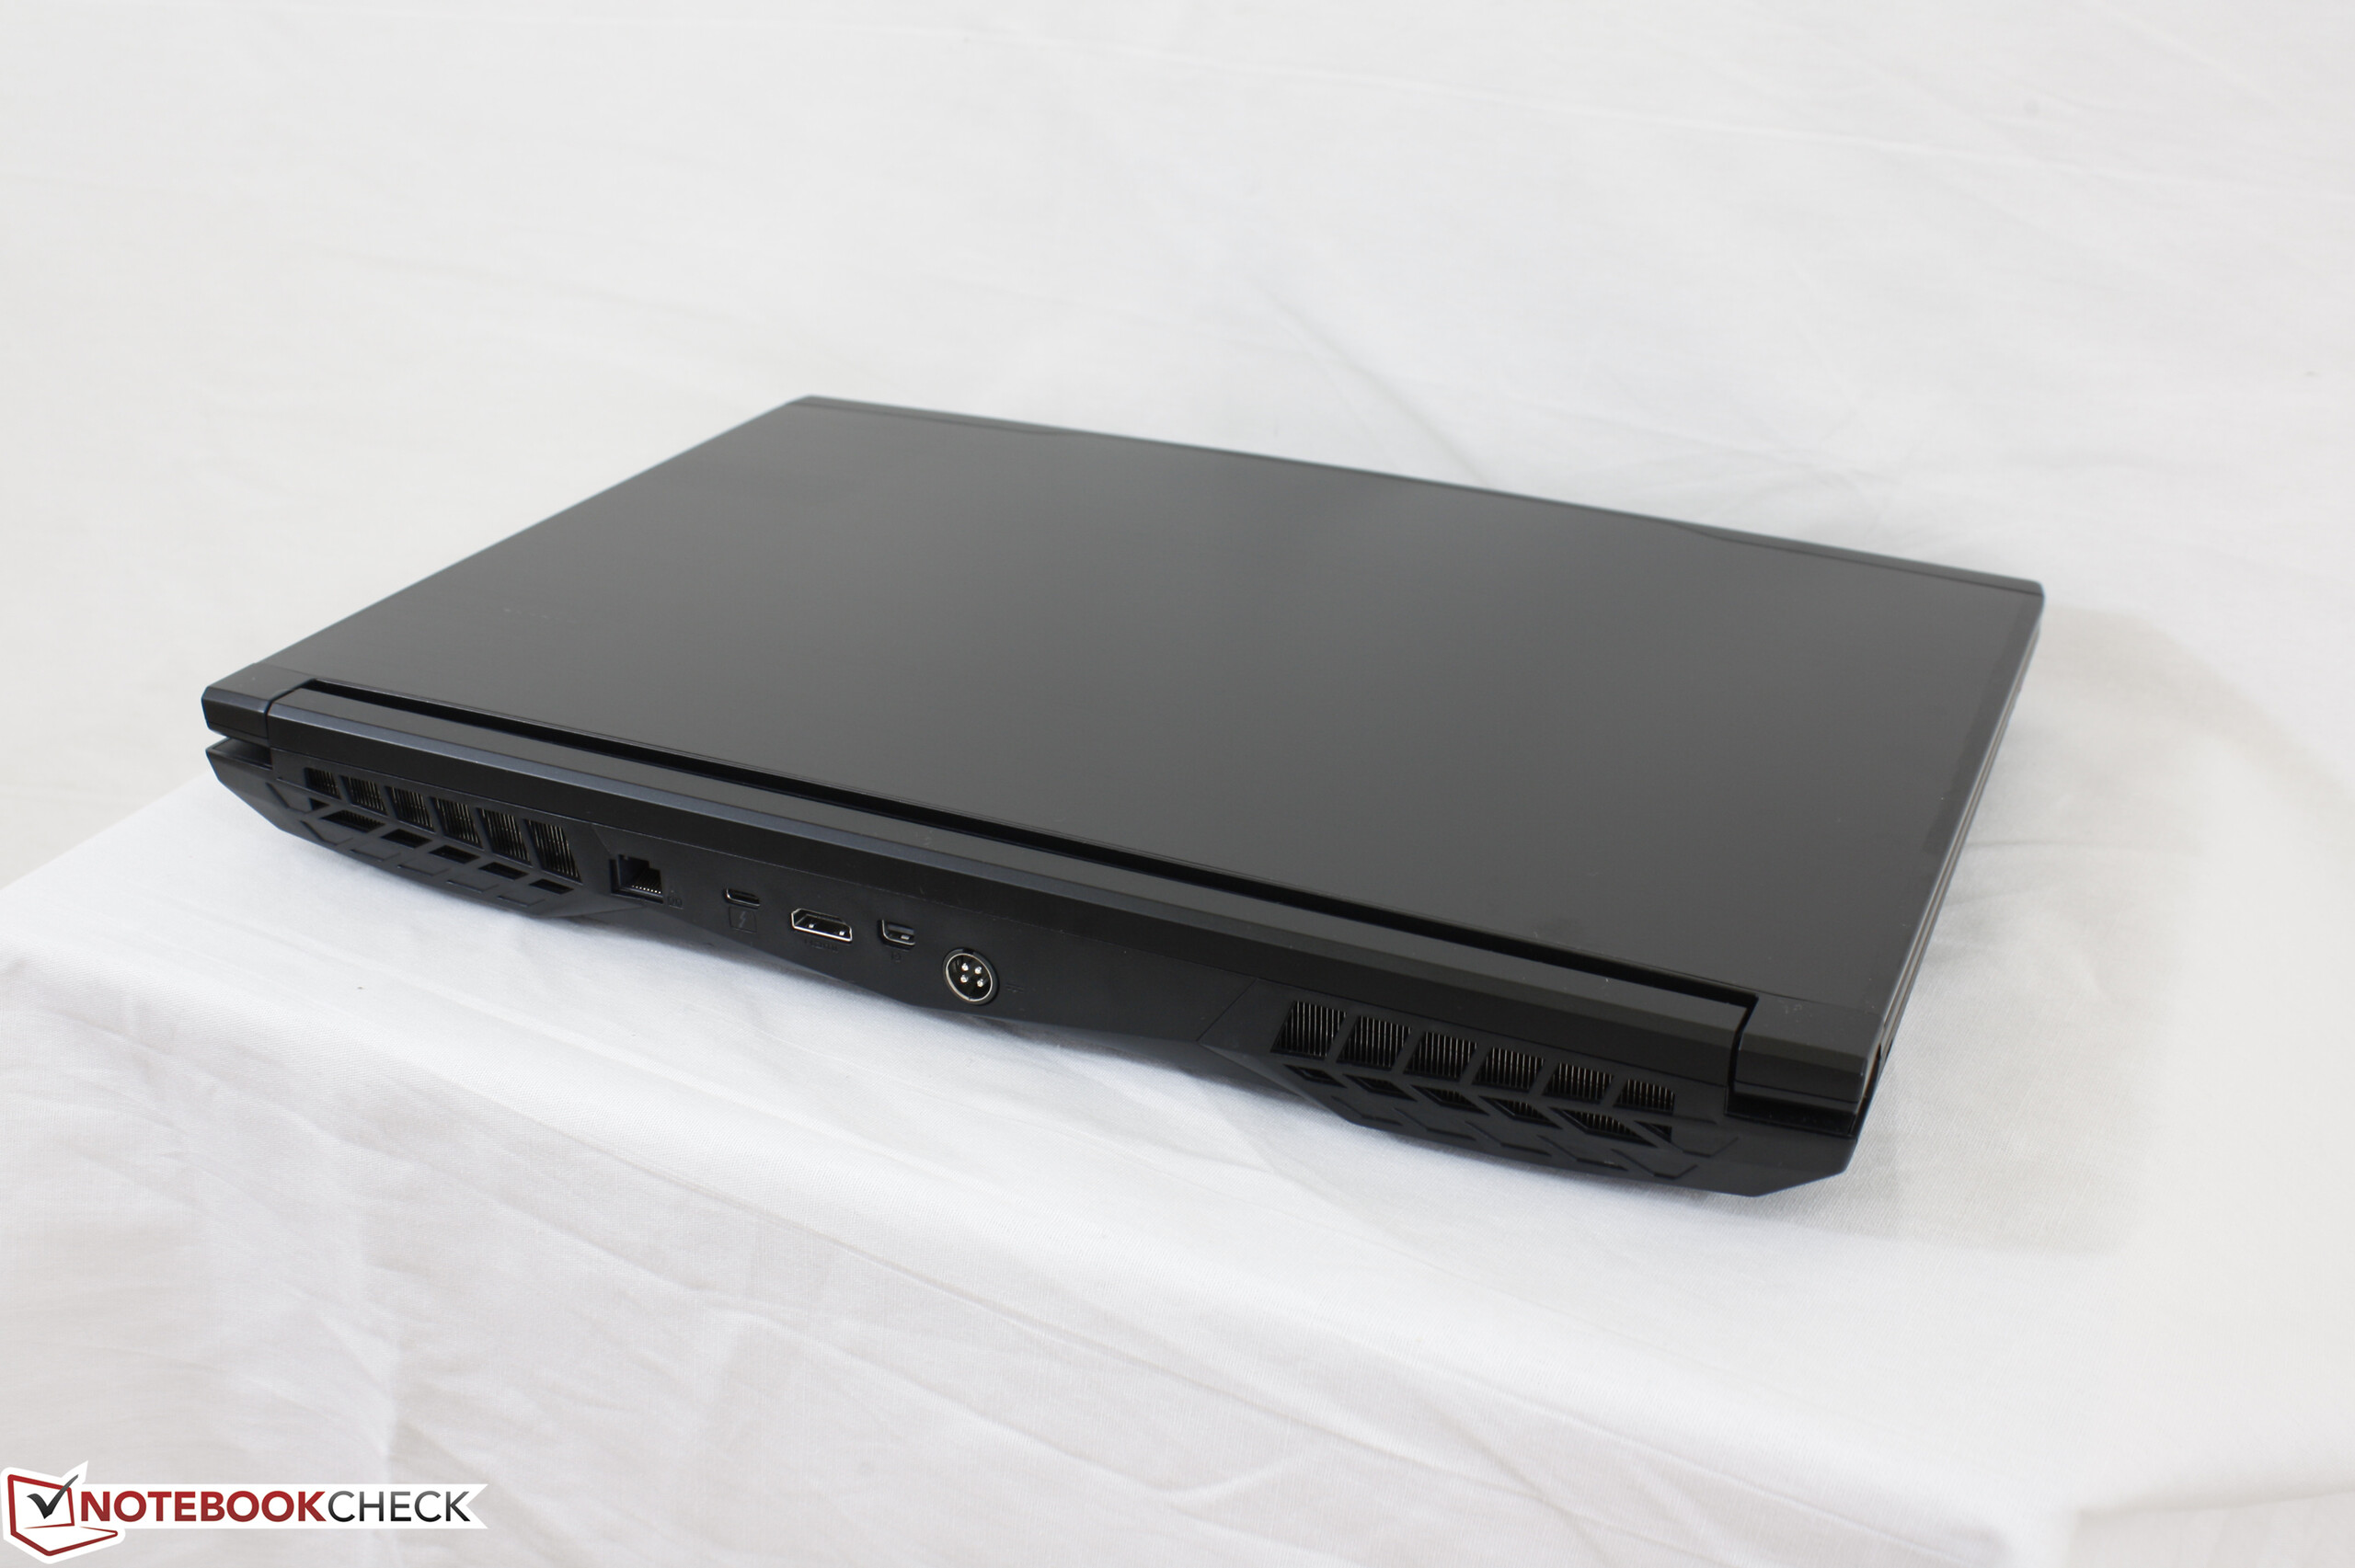
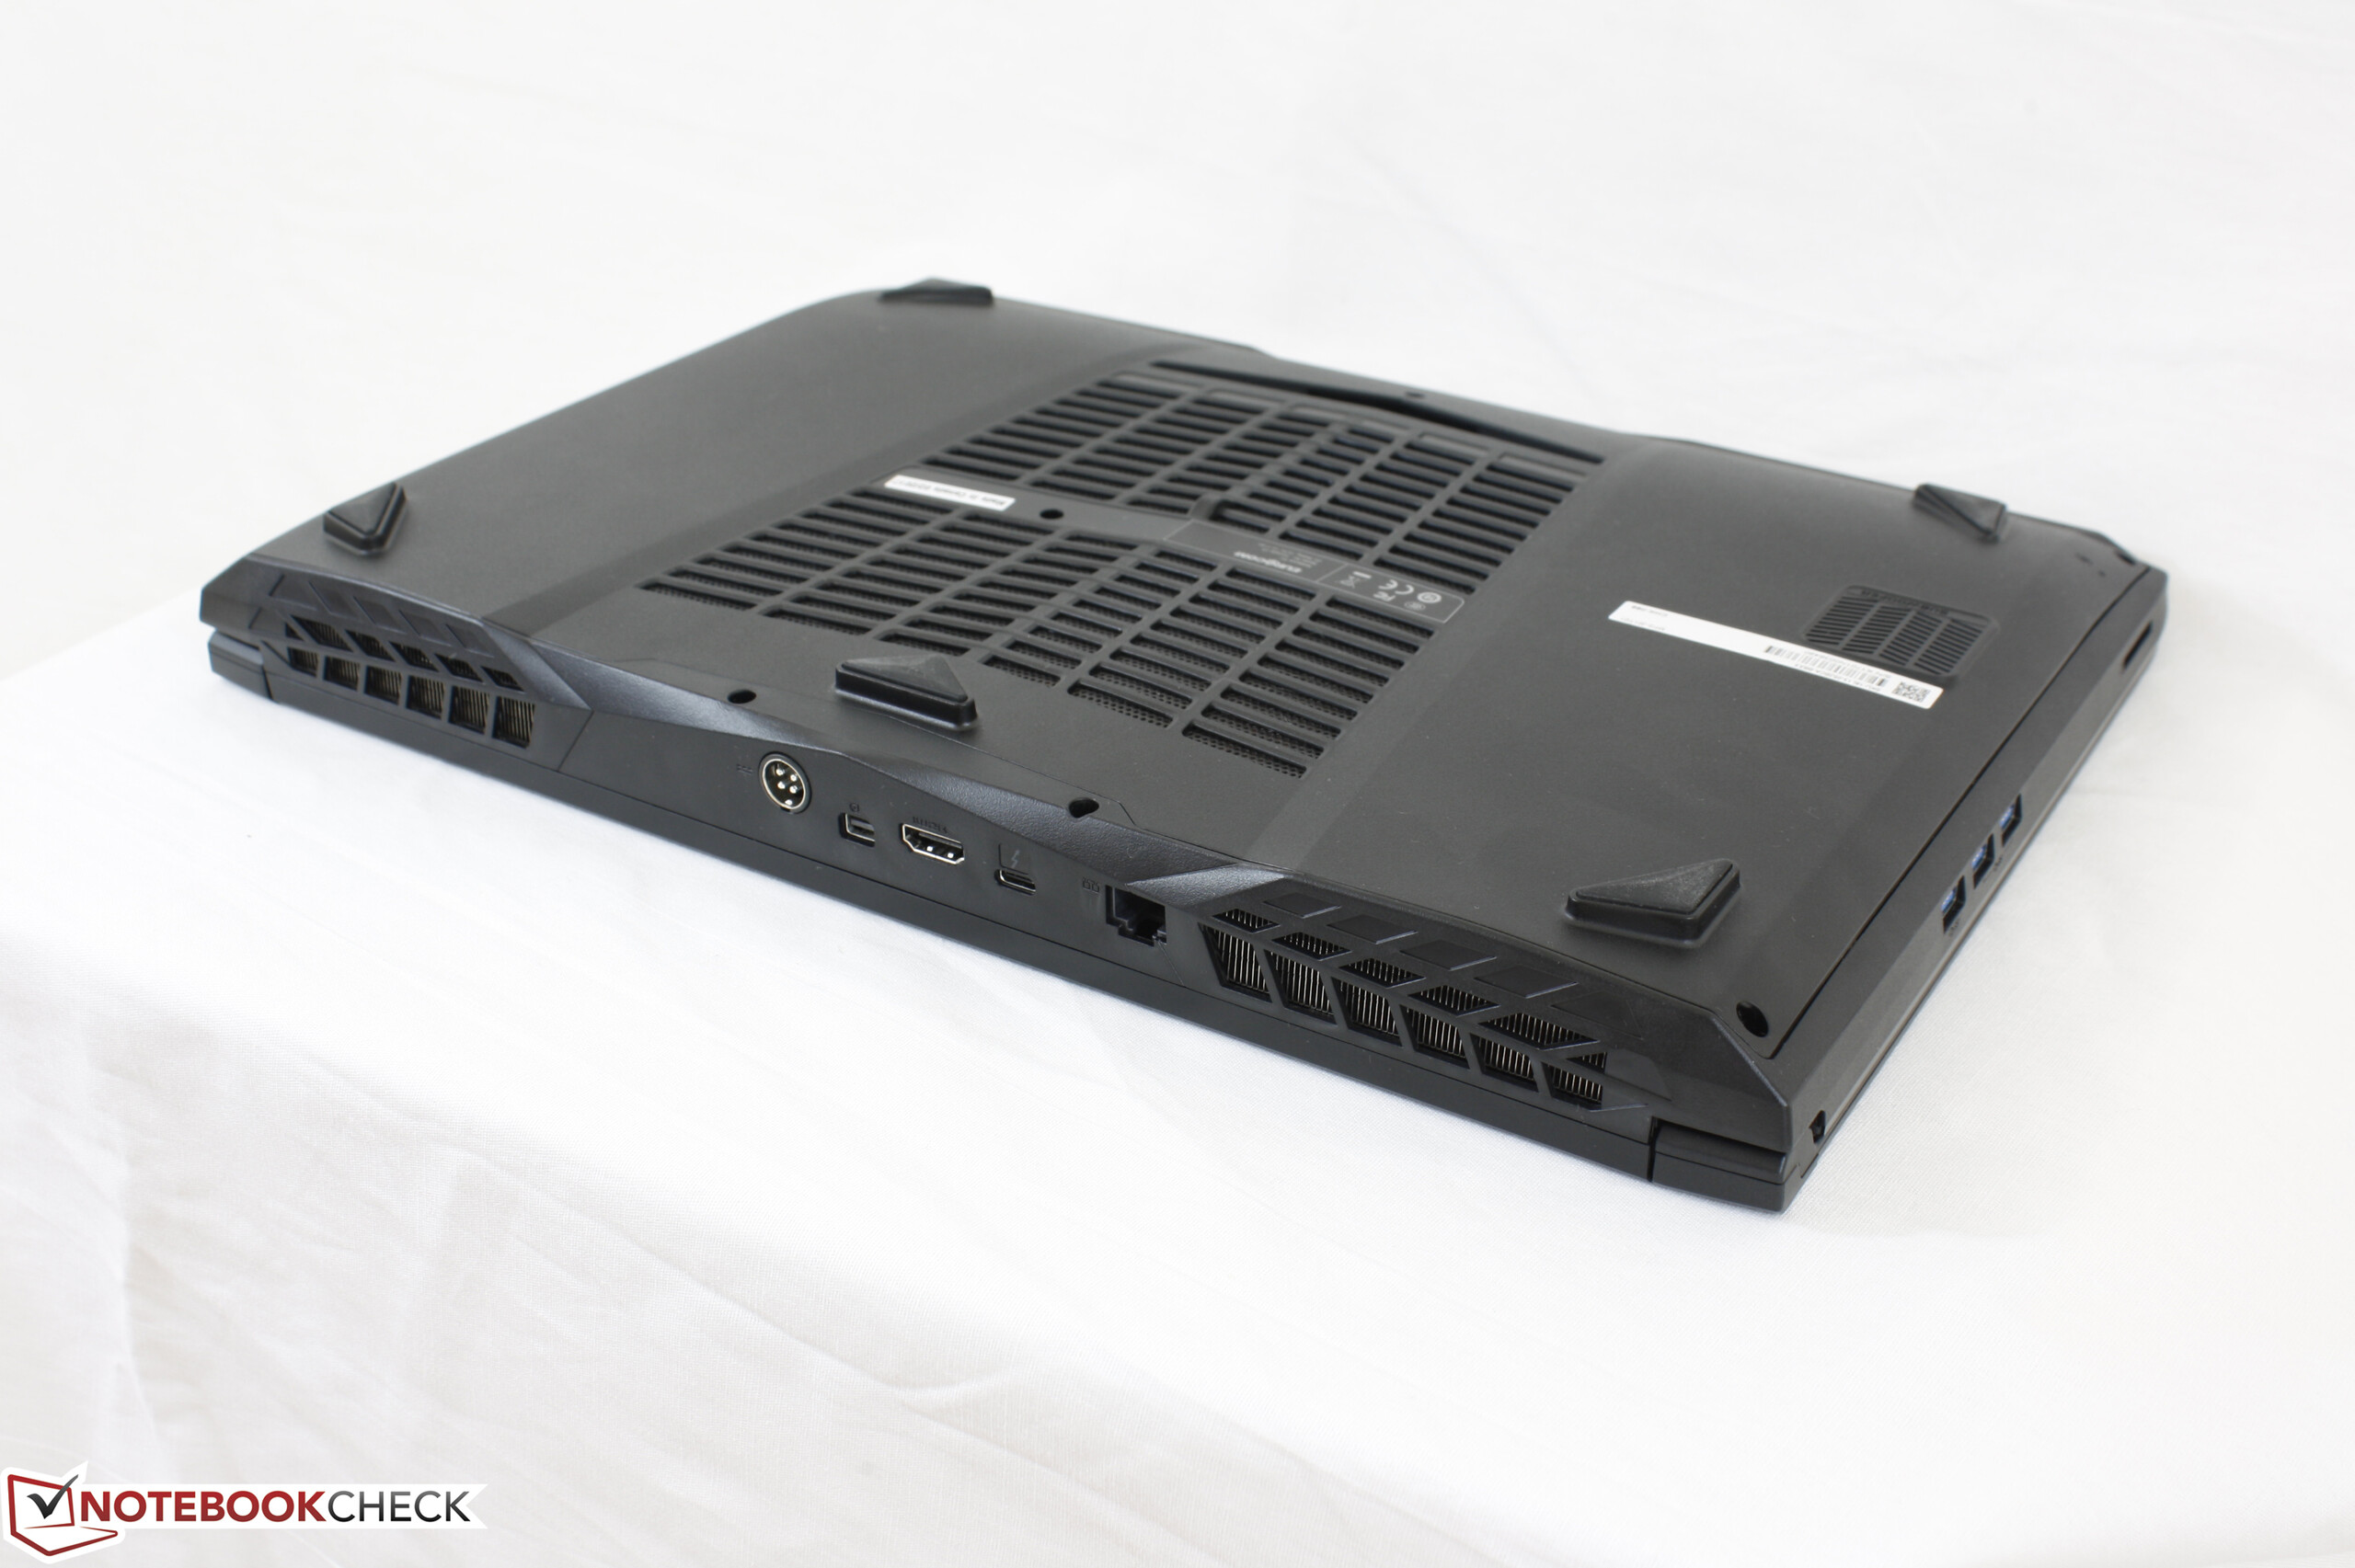
Connectivity
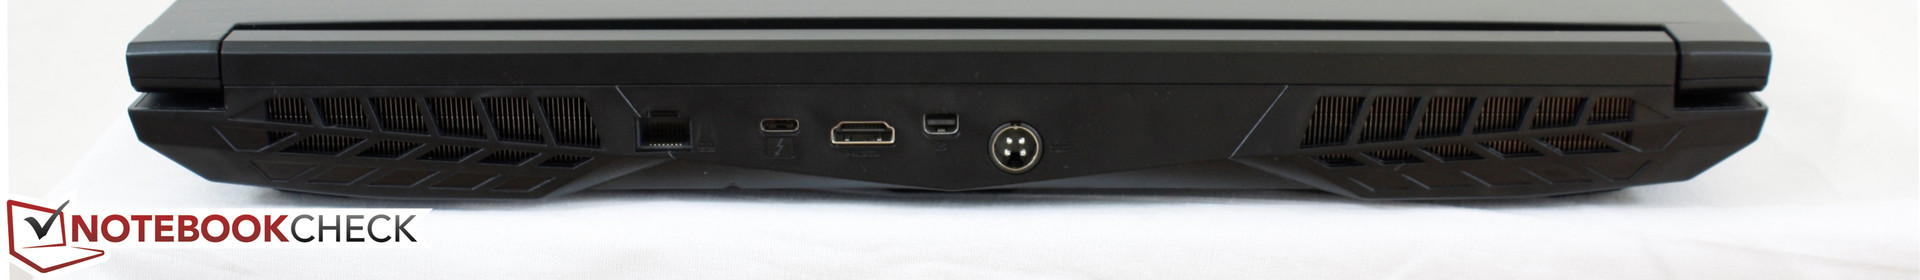
Available ports include full-size DisplayPort 1.2 and the all-important USB Type-C with Thunderbolt 3. The HDMI port is version 2.0 for external monitor support up to 4K60 whereas some gaming notebooks are still shipping with version 1.4 including the GS63VR.
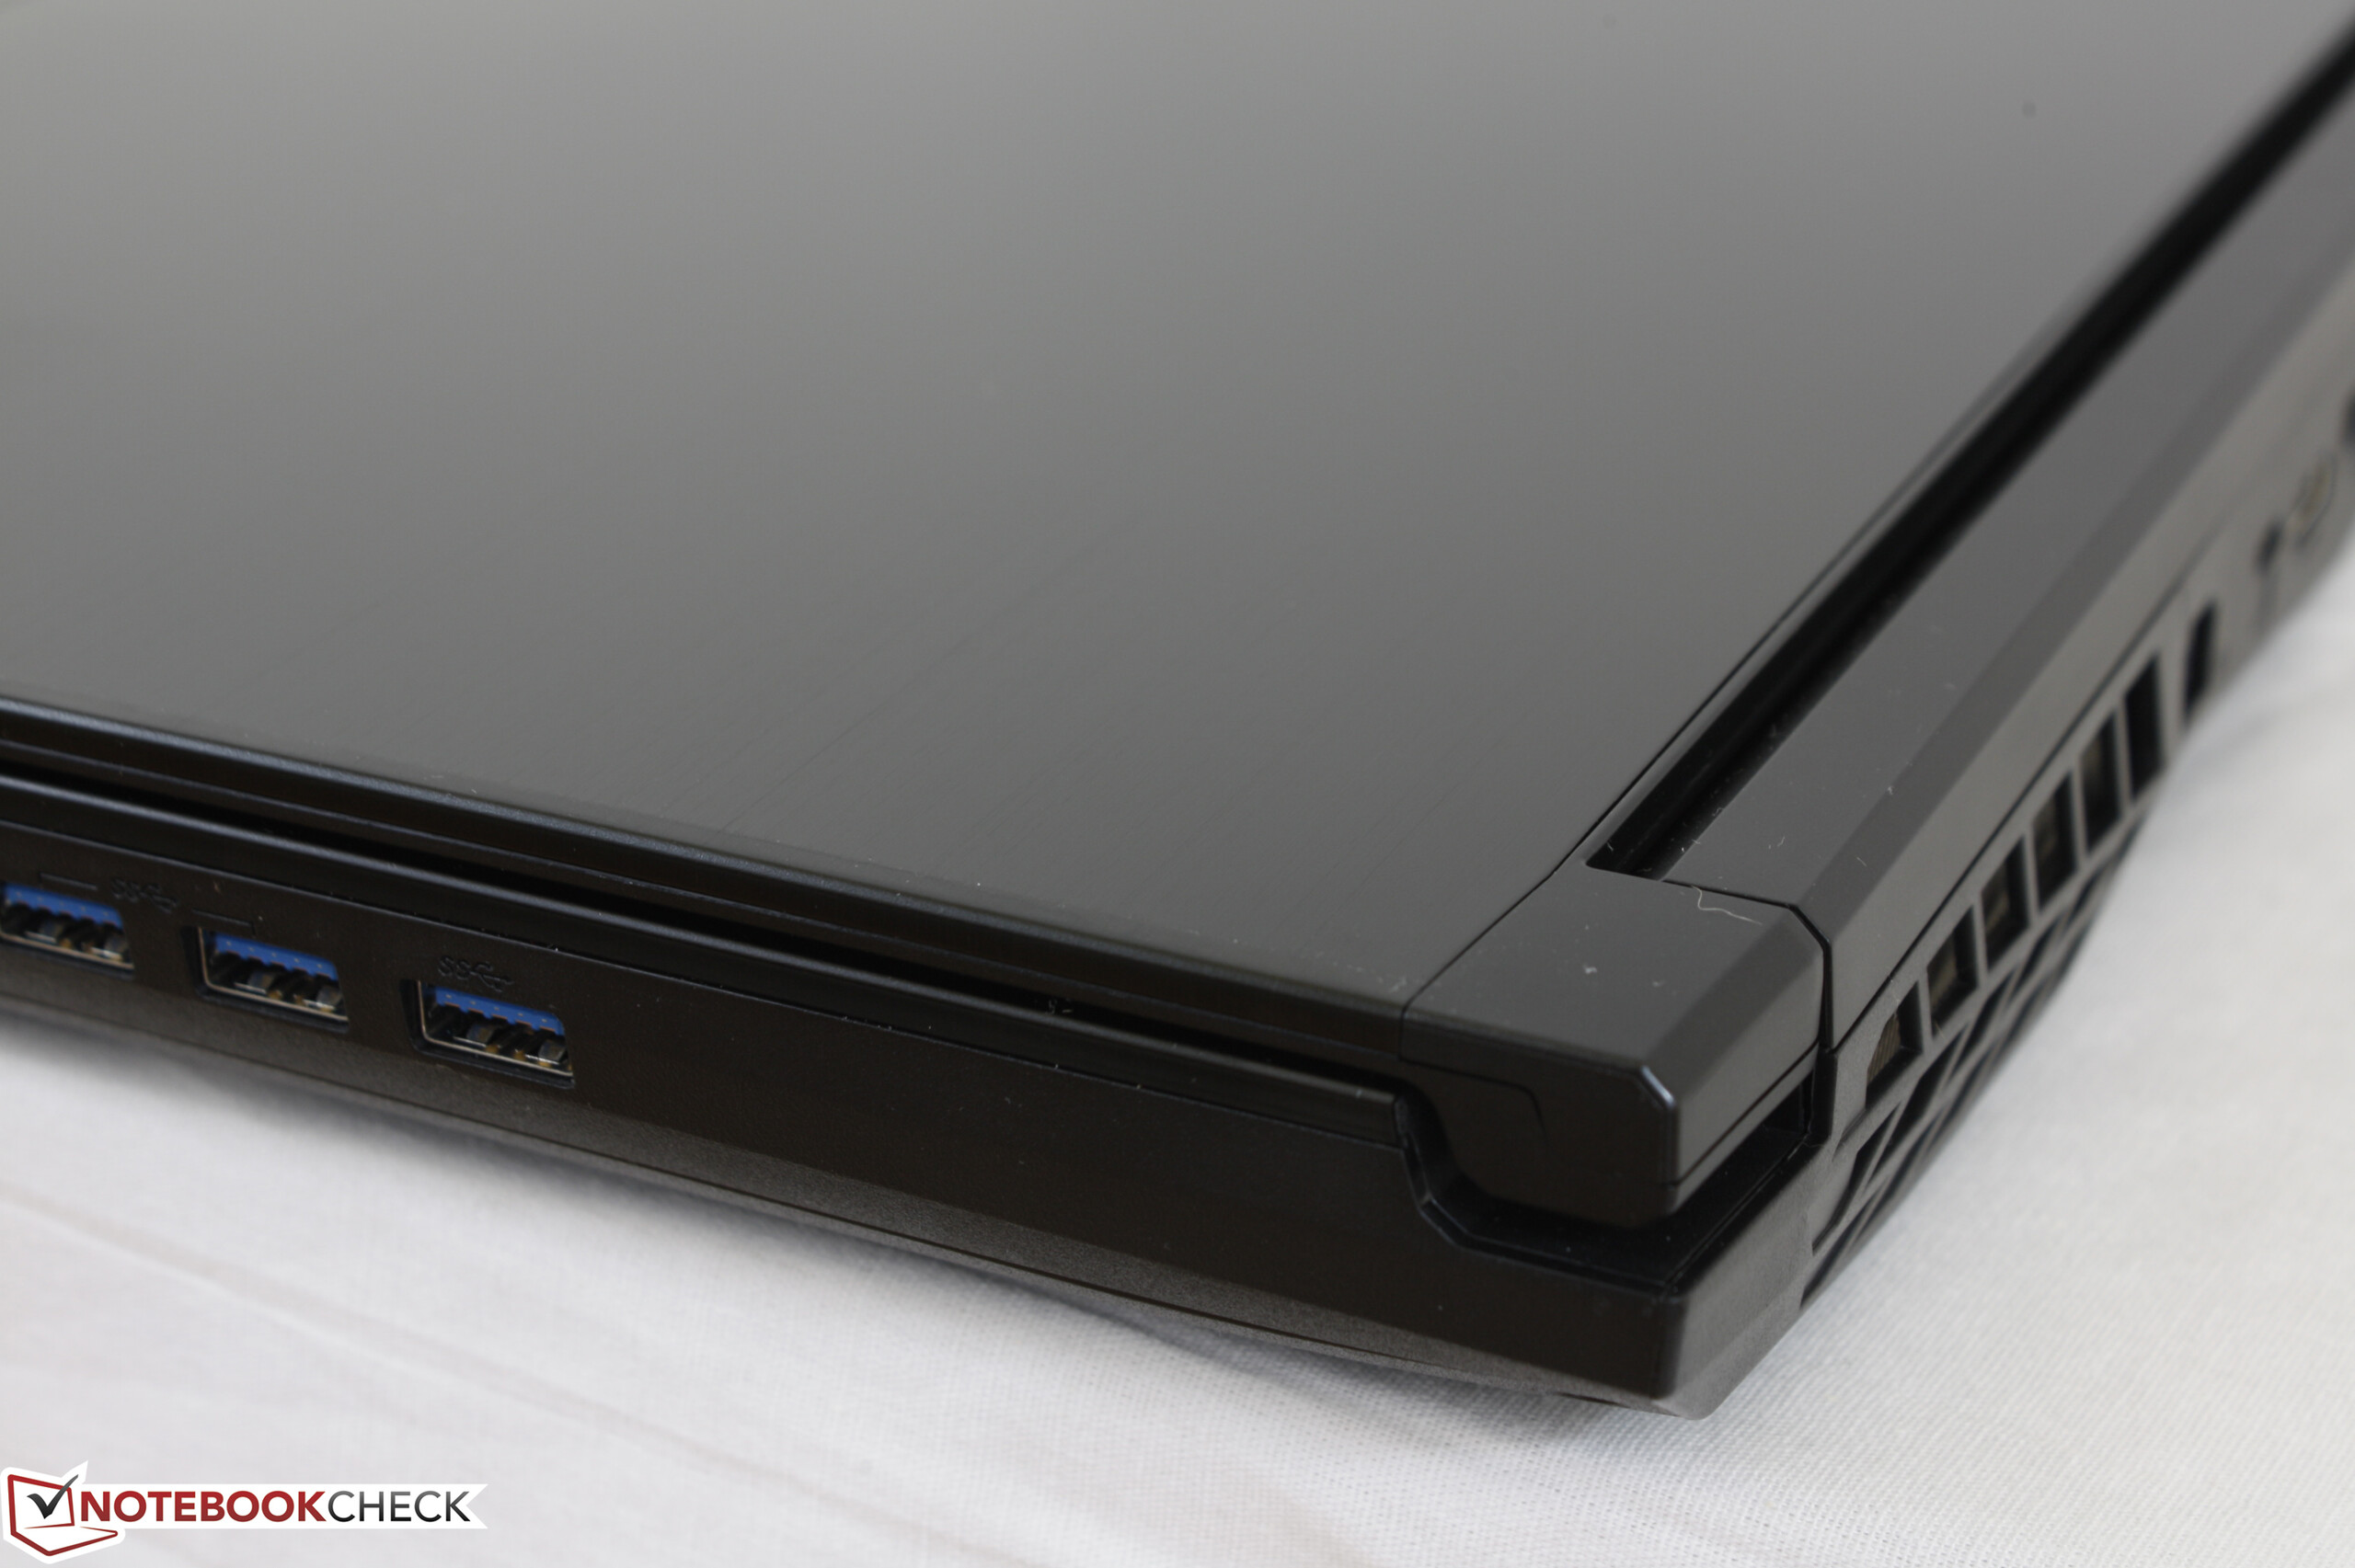
The fact that all three USB ports are on the right edge of the notebook is both an oversight and a huge inconvenience. The GT62VR chassis includes a fourth USB port on the left edge that the Tornado F5 has completely omitted.


SD Card Reader
We're able to record an impressive read rate of just over 256 MB/s from the integrated UHS-II card reader compared to ~200 MB/s and ~90 MB/s on the GT72VR and Alienware 17 R3, respectively. Our Toshiba SD test card is rated for up to 260 MB/s, so we are essentially getting the full performance out of the card from the Eurocom machine. Transferring 1 GB worth of photos from the card to desktop will take about 6 seconds.
The card reader itself is spring loaded. A fully inserted SD card will protrude by only 2 to 3 mm.
| SD Card Reader | |
| average JPG Copy Test (av. of 3 runs) | |
| Eurocom Tornado F5 Killer Edition | |
| MSI GT72VR 7RE-433 | |
| Alienware 17 R3 (A17-9935) | |
| maximum AS SSD Seq Read Test (1GB) | |
| Eurocom Tornado F5 Killer Edition | |
| MSI GT72VR 7RE-433 | |
| Alienware 17 R3 (A17-9935) | |
Communication
Our configuration is equipped with the same dual-band Intel 8265 M.2 2230 module as found on the recent HP Spectre x360 15. While we experienced no wireless issues, the Tornado F5 can also be configured with the Killer 1535 card for just $8 USD more. The Killer WLAN option comes with special software features that may appeal to enthusiasts and gamers as opposed to the barebone Intel offering. Bluetooth 4.0, 4.1, or 4.2 is integrated depending on the WLAN card.
| Networking | |
| iperf3 transmit AX12 | |
| Dell XPS 15 9560 (i7-7700HQ, UHD) | |
| Eurocom Tornado F5 Killer Edition | |
| HP Spectre x360 15-bl002xx | |
| iperf3 receive AX12 | |
| Dell XPS 15 9560 (i7-7700HQ, UHD) | |
| HP Spectre x360 15-bl002xx | |
| Eurocom Tornado F5 Killer Edition | |
Accessories
Eurocom throws in more extras than other gaming manufacturers including thermal paste, additional screws, and a Utilities/Drivers disc. We're hoping that the reseller will move on from DVDs to flash drives in the near future since not all systems are equipped with optical drives.
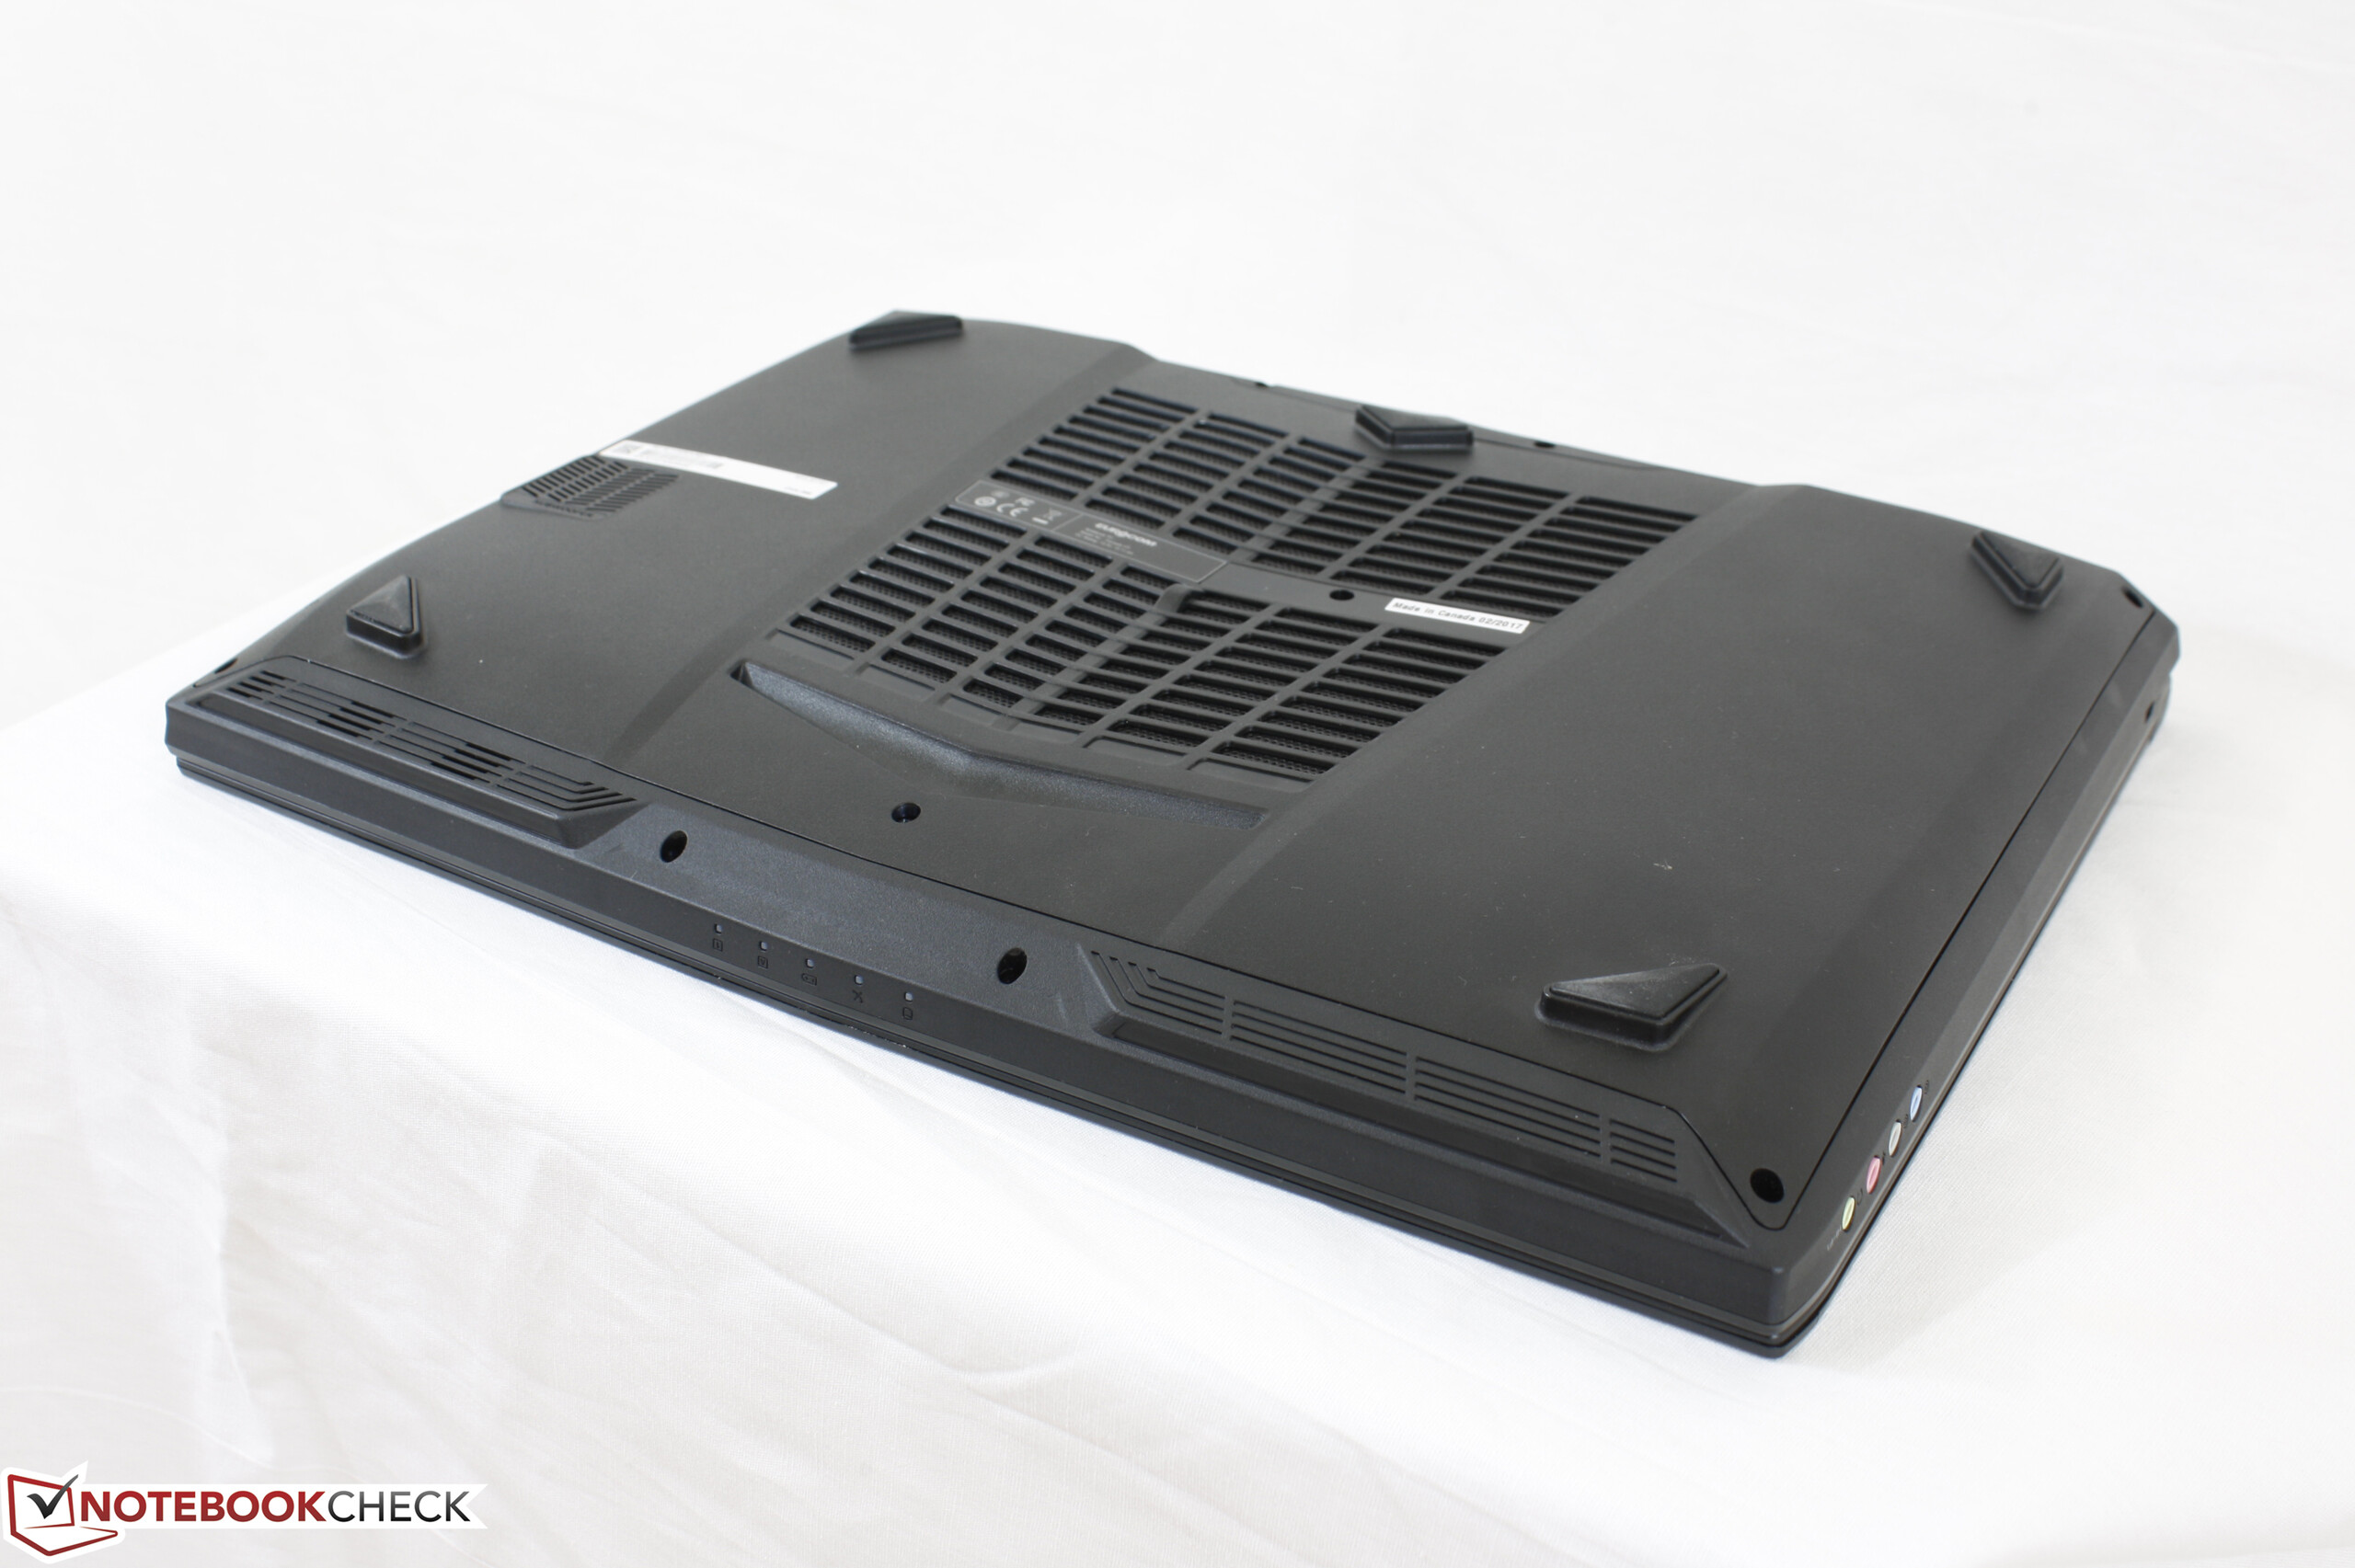
Maintenance
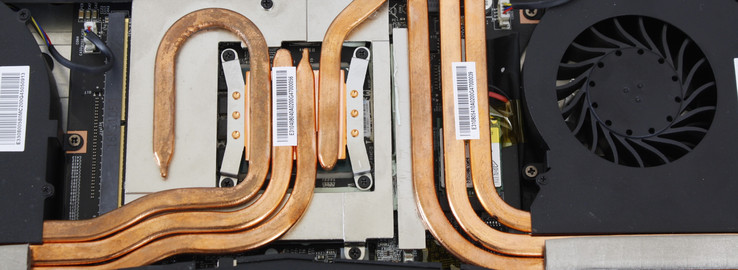
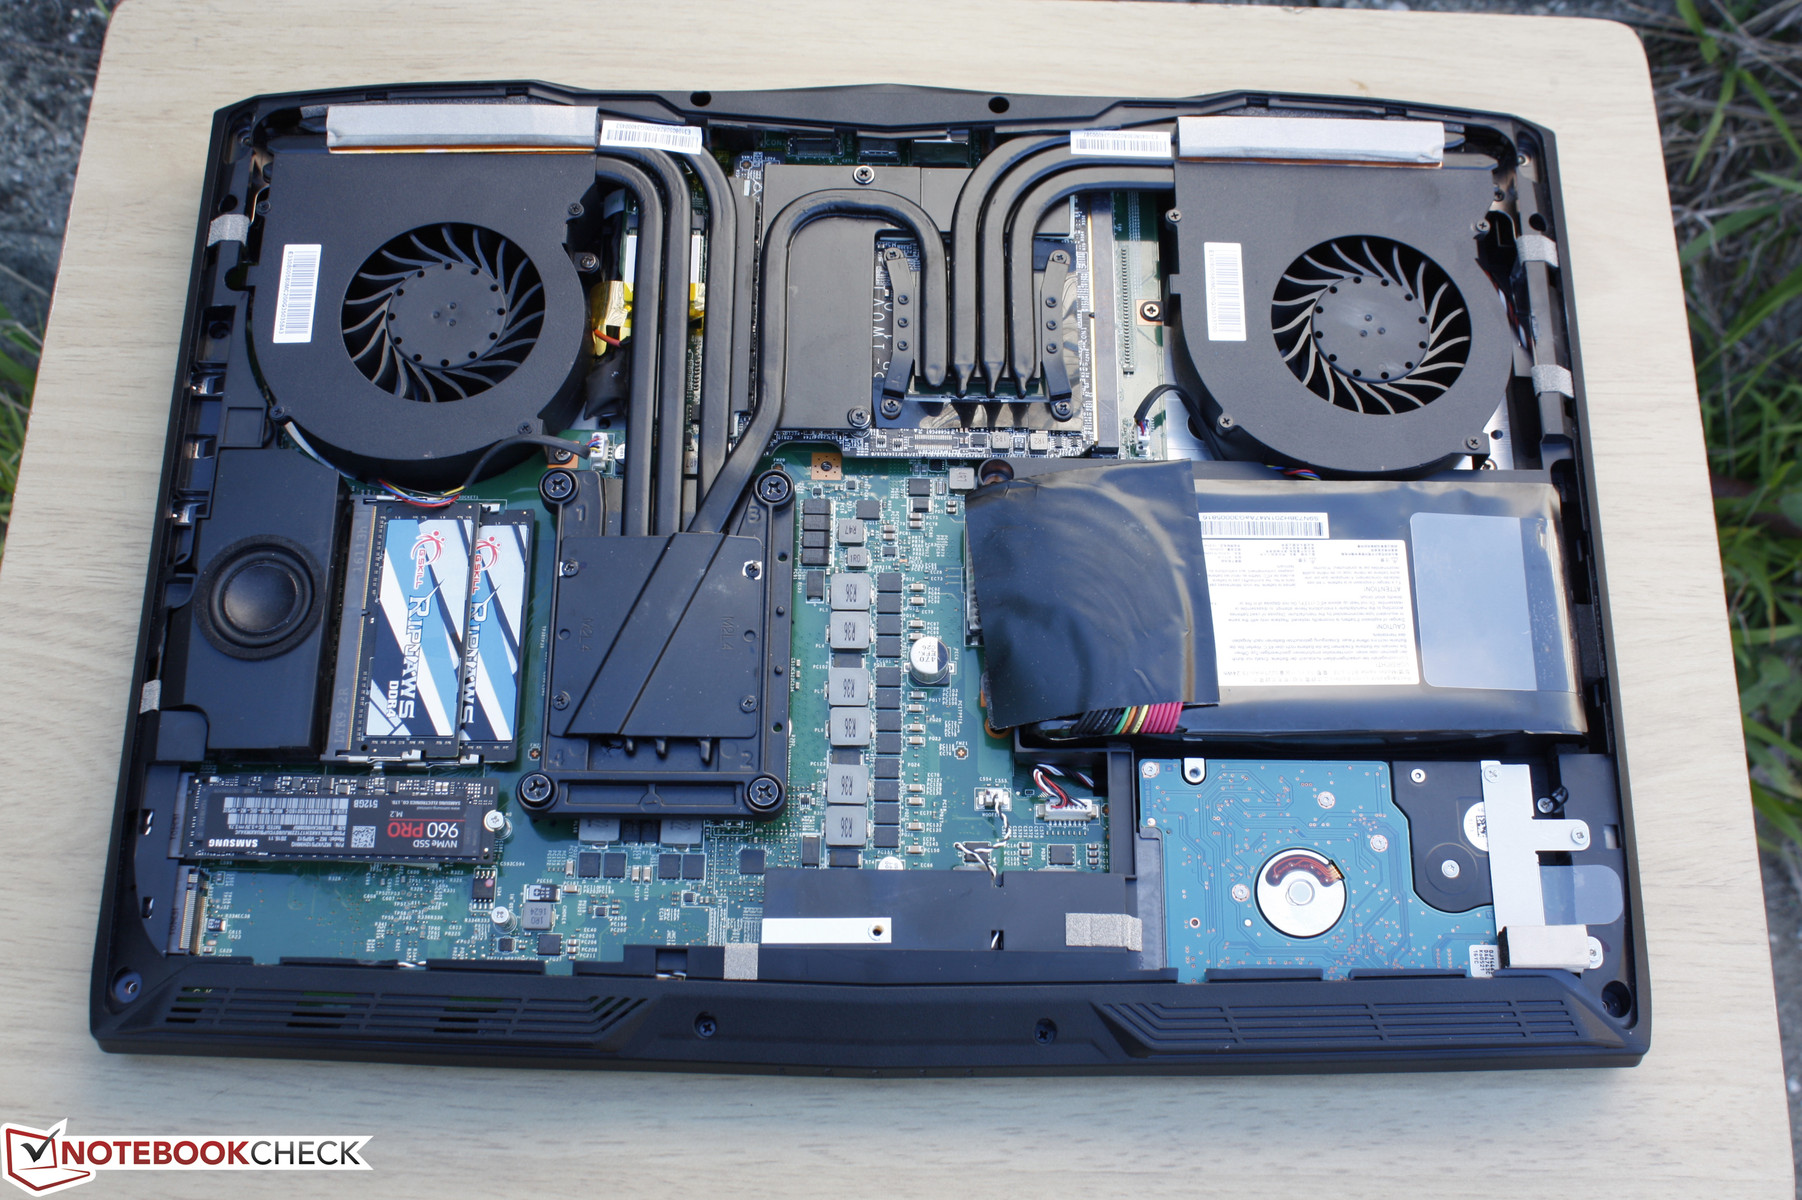
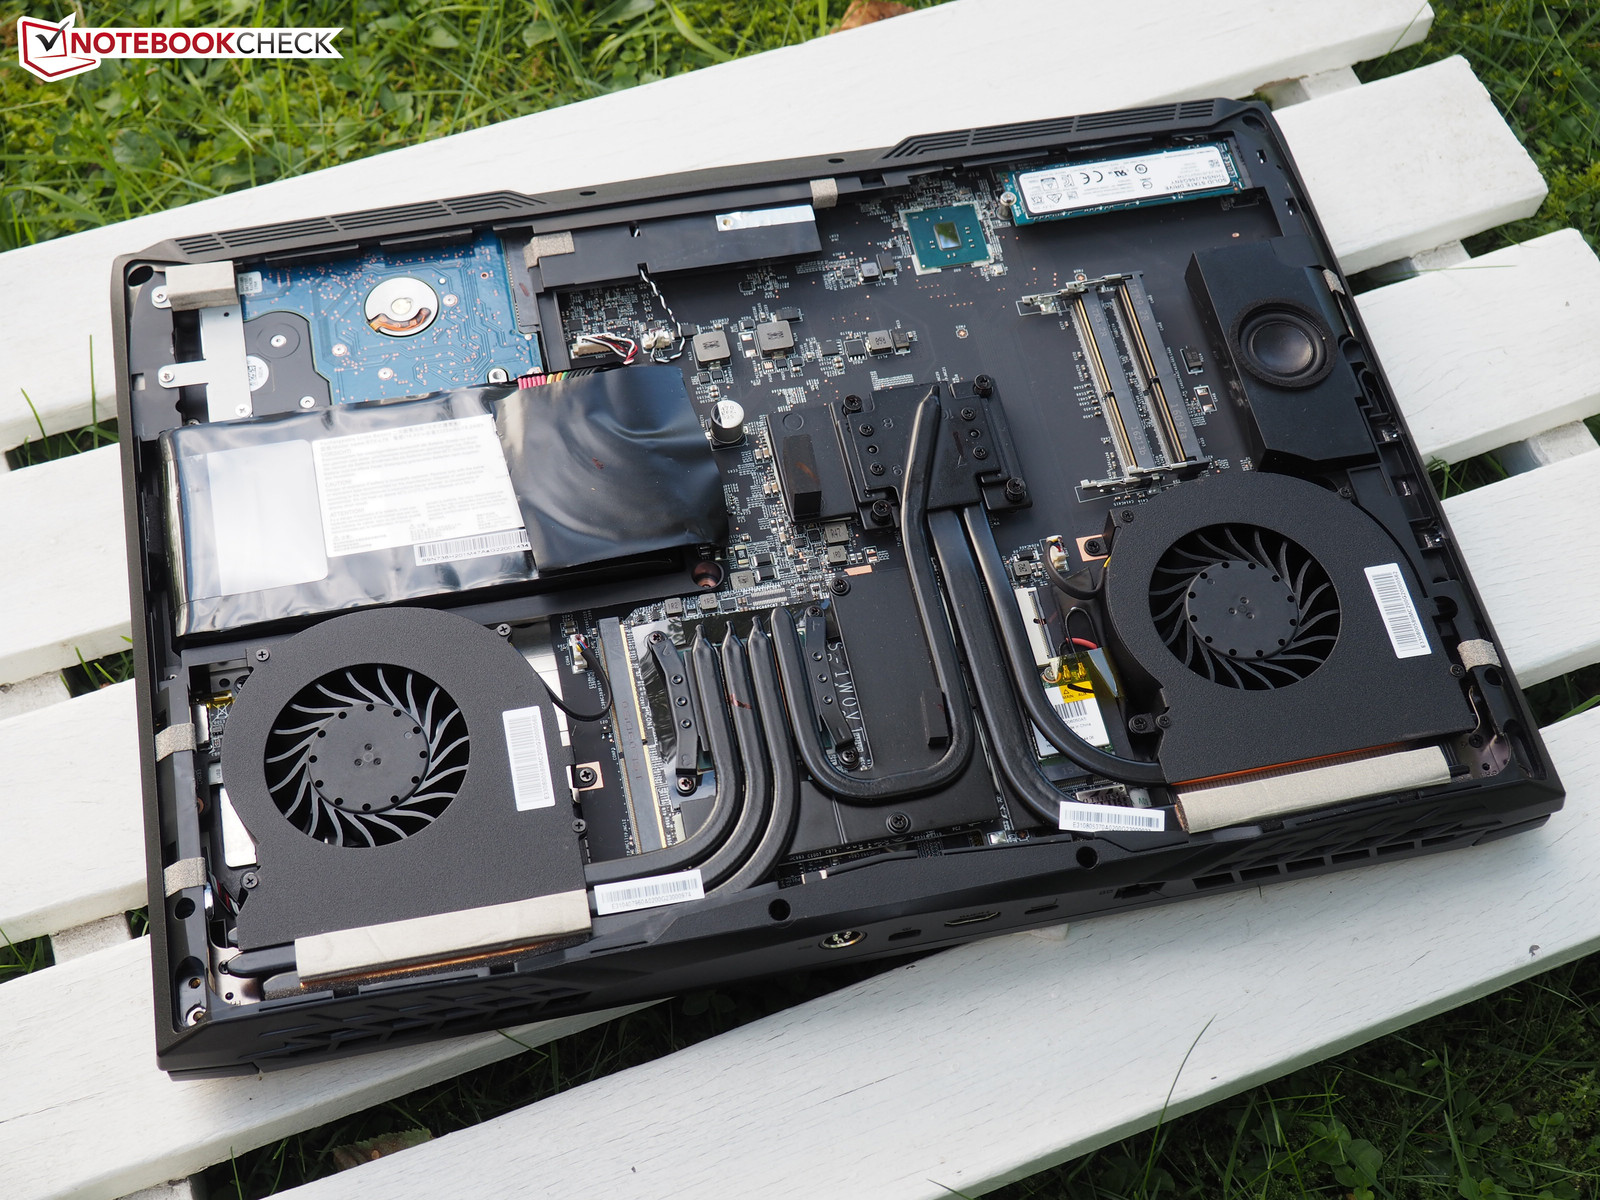
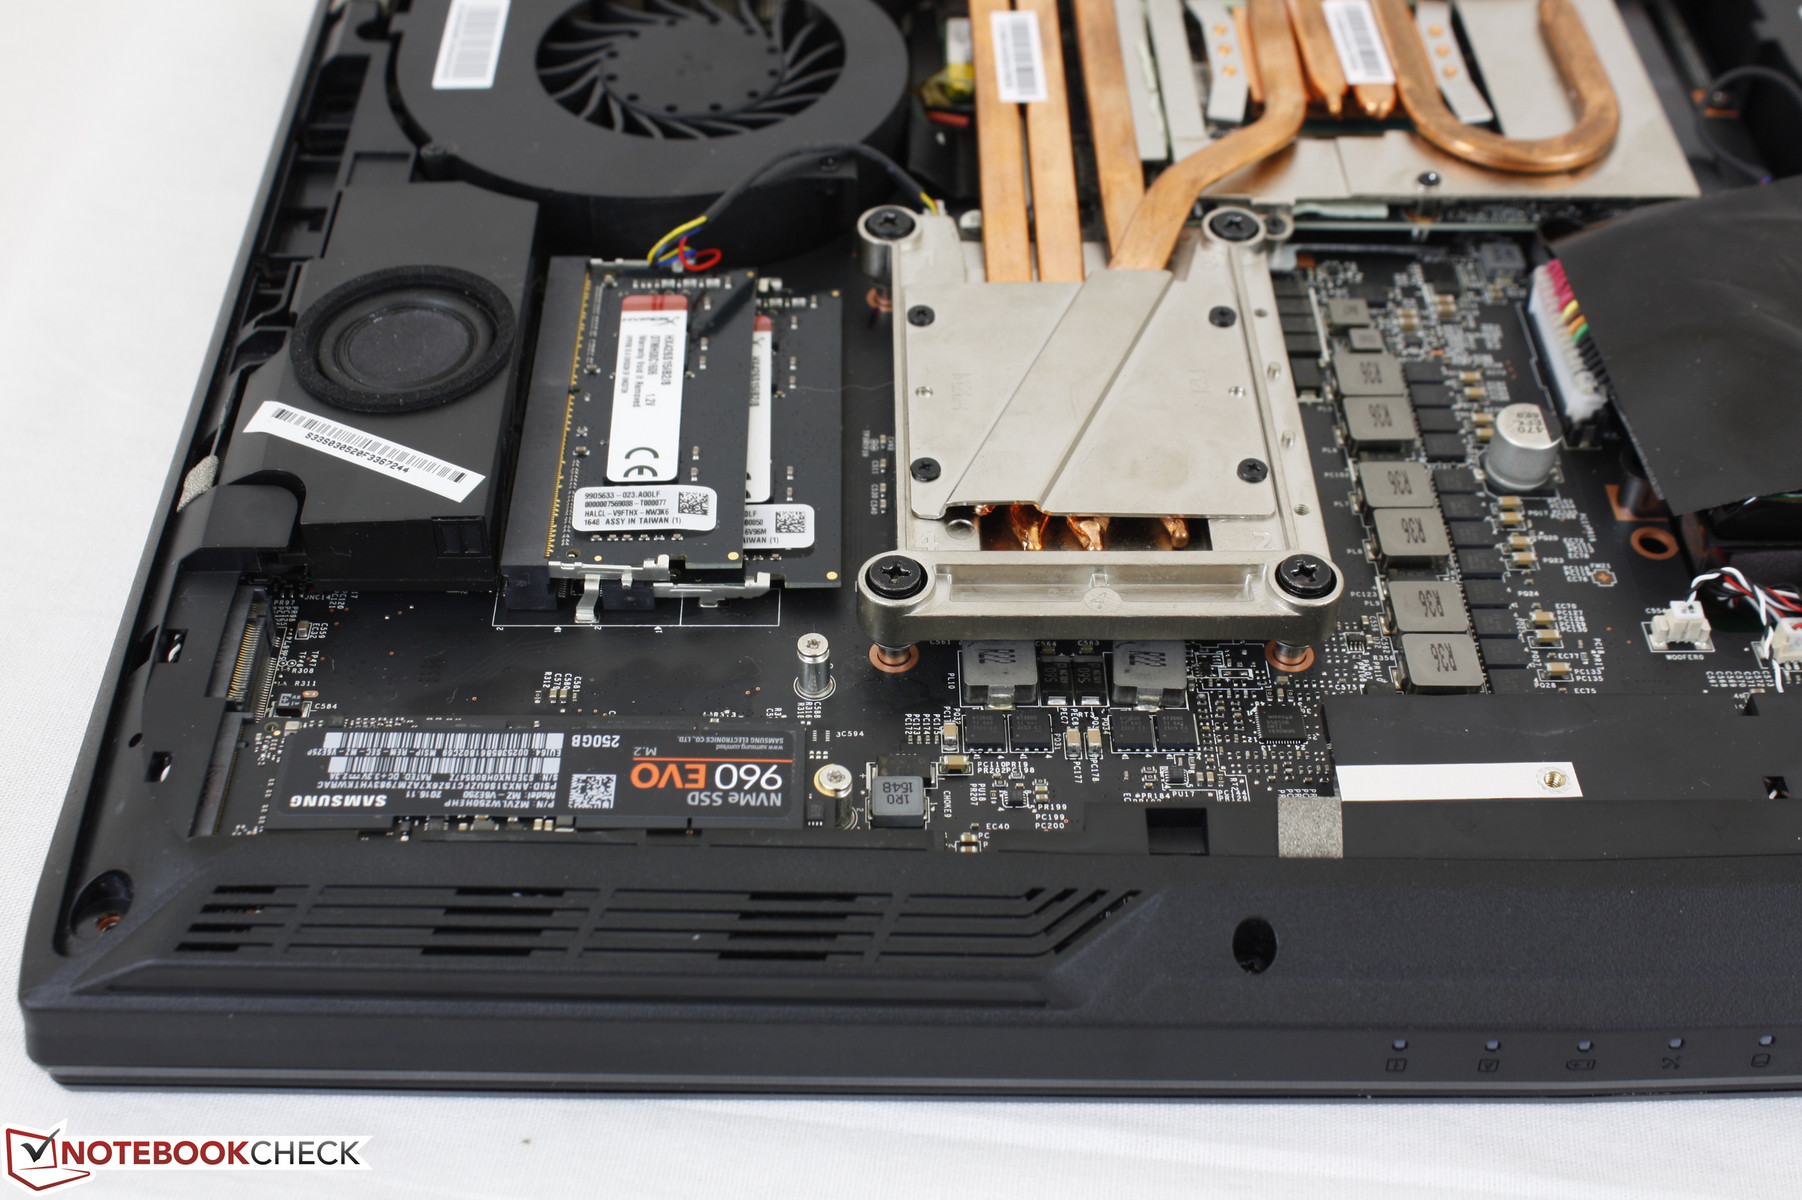
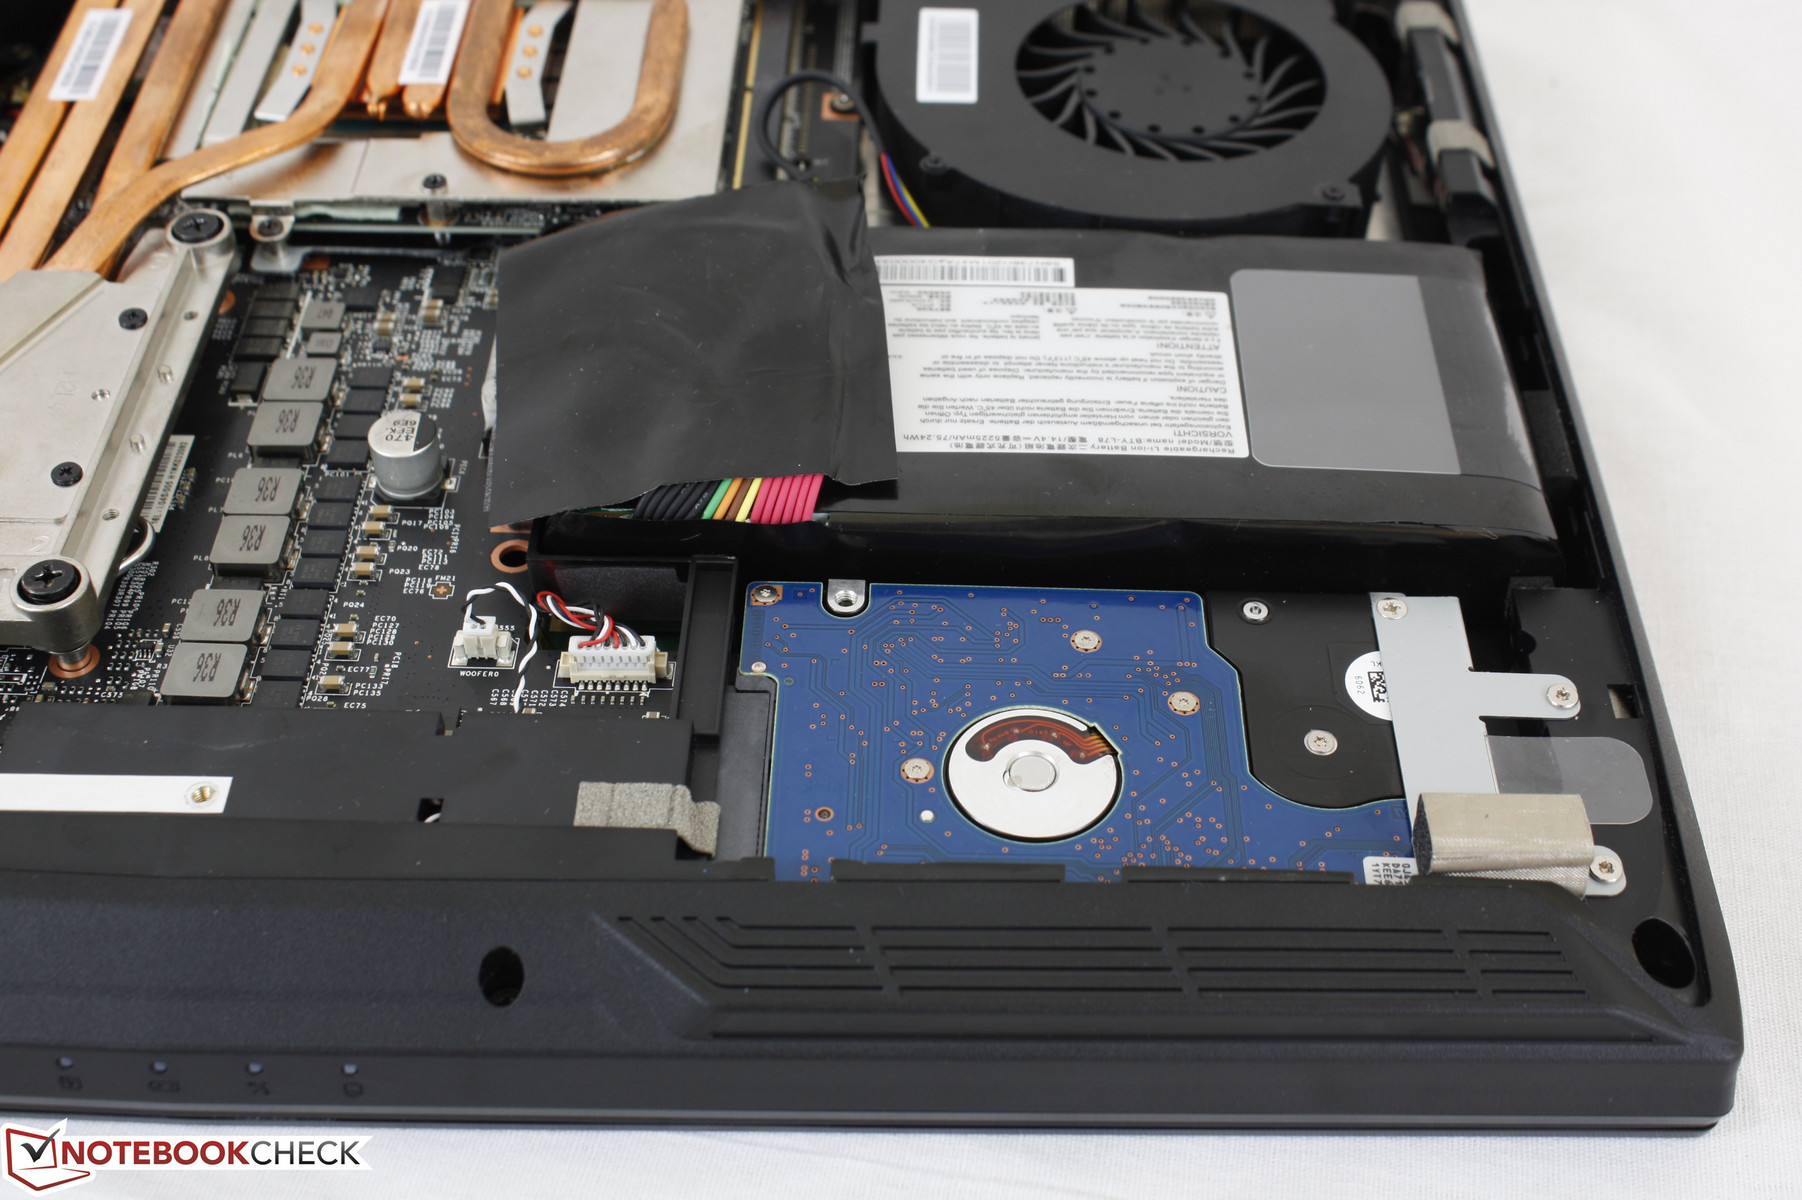
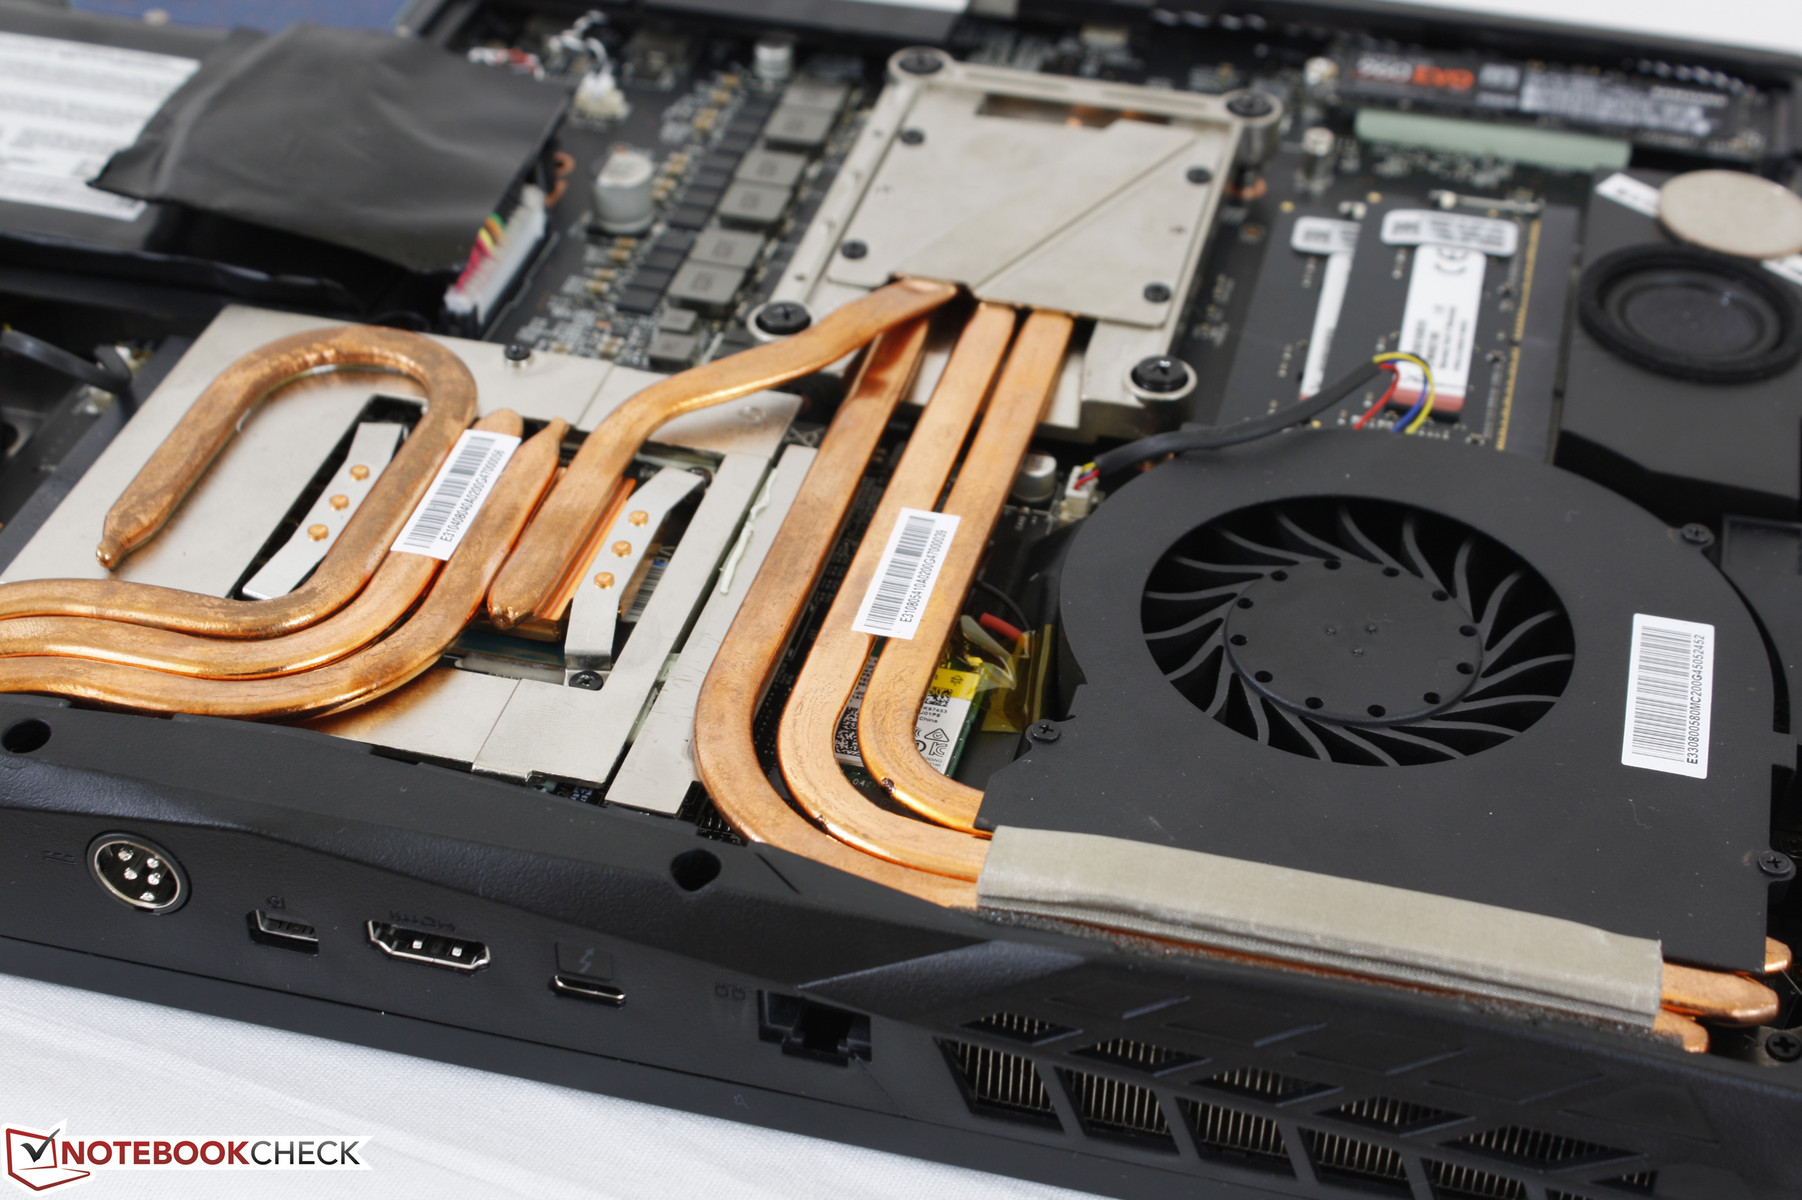
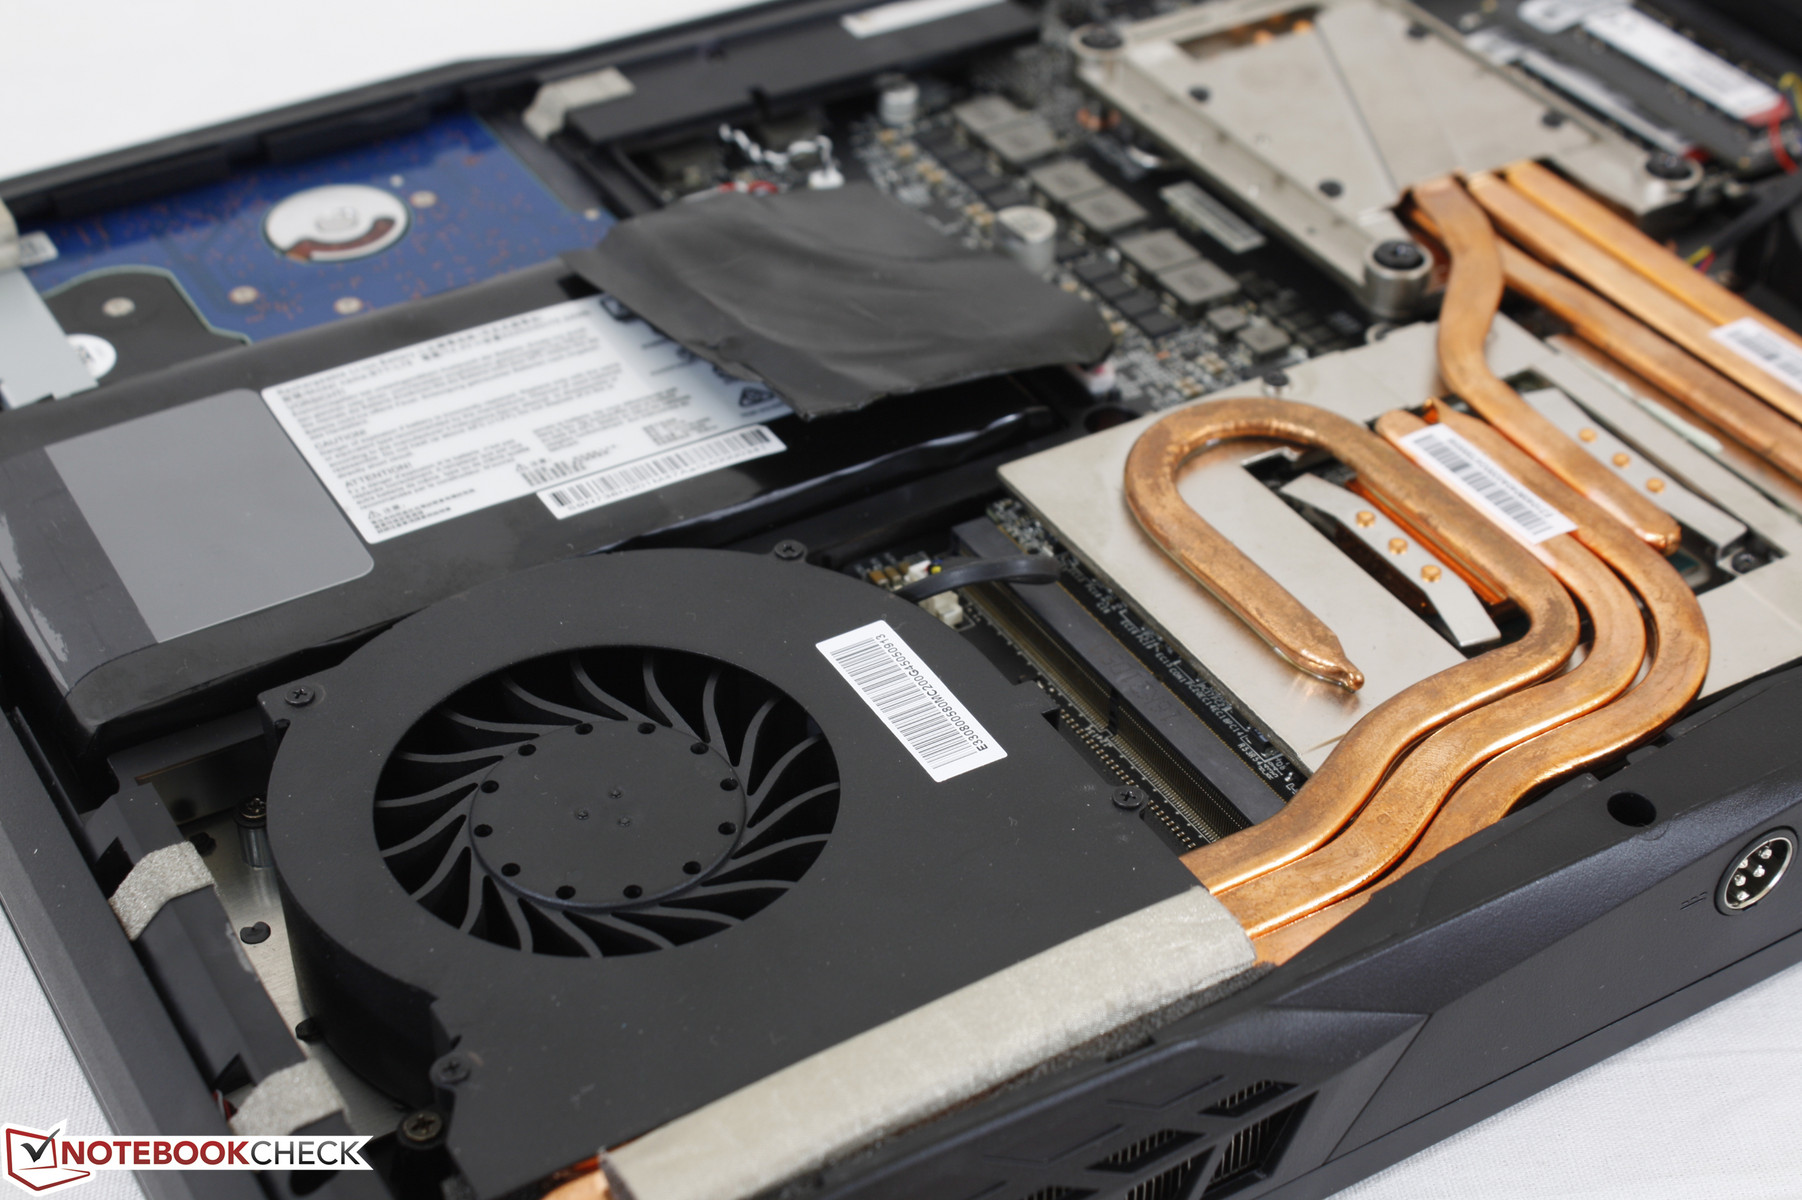
The bottom panel pops off without much effort to reveal core upgradeable components. The arrangement of the heat pipes in the Killer Edition has changed slightly from the GTX 1070-equipped Tornado F5. The physically larger LGA 1151 socket can also be observed on both Eurocom systems compared to the soldered HQ solution on the GT62VR. The M.2 WLAN card is hidden underneath the heat pipes and access to the last two SODIMM slots will require additional disassembly.

Warranty
The standard one-year limited warranty applies to new laptop purchases from Eurocom with options to extend up to two or three years. Some competing manufacturers like Gigabyte offer two-year warranty as standard instead of just one to draw in more buyers.
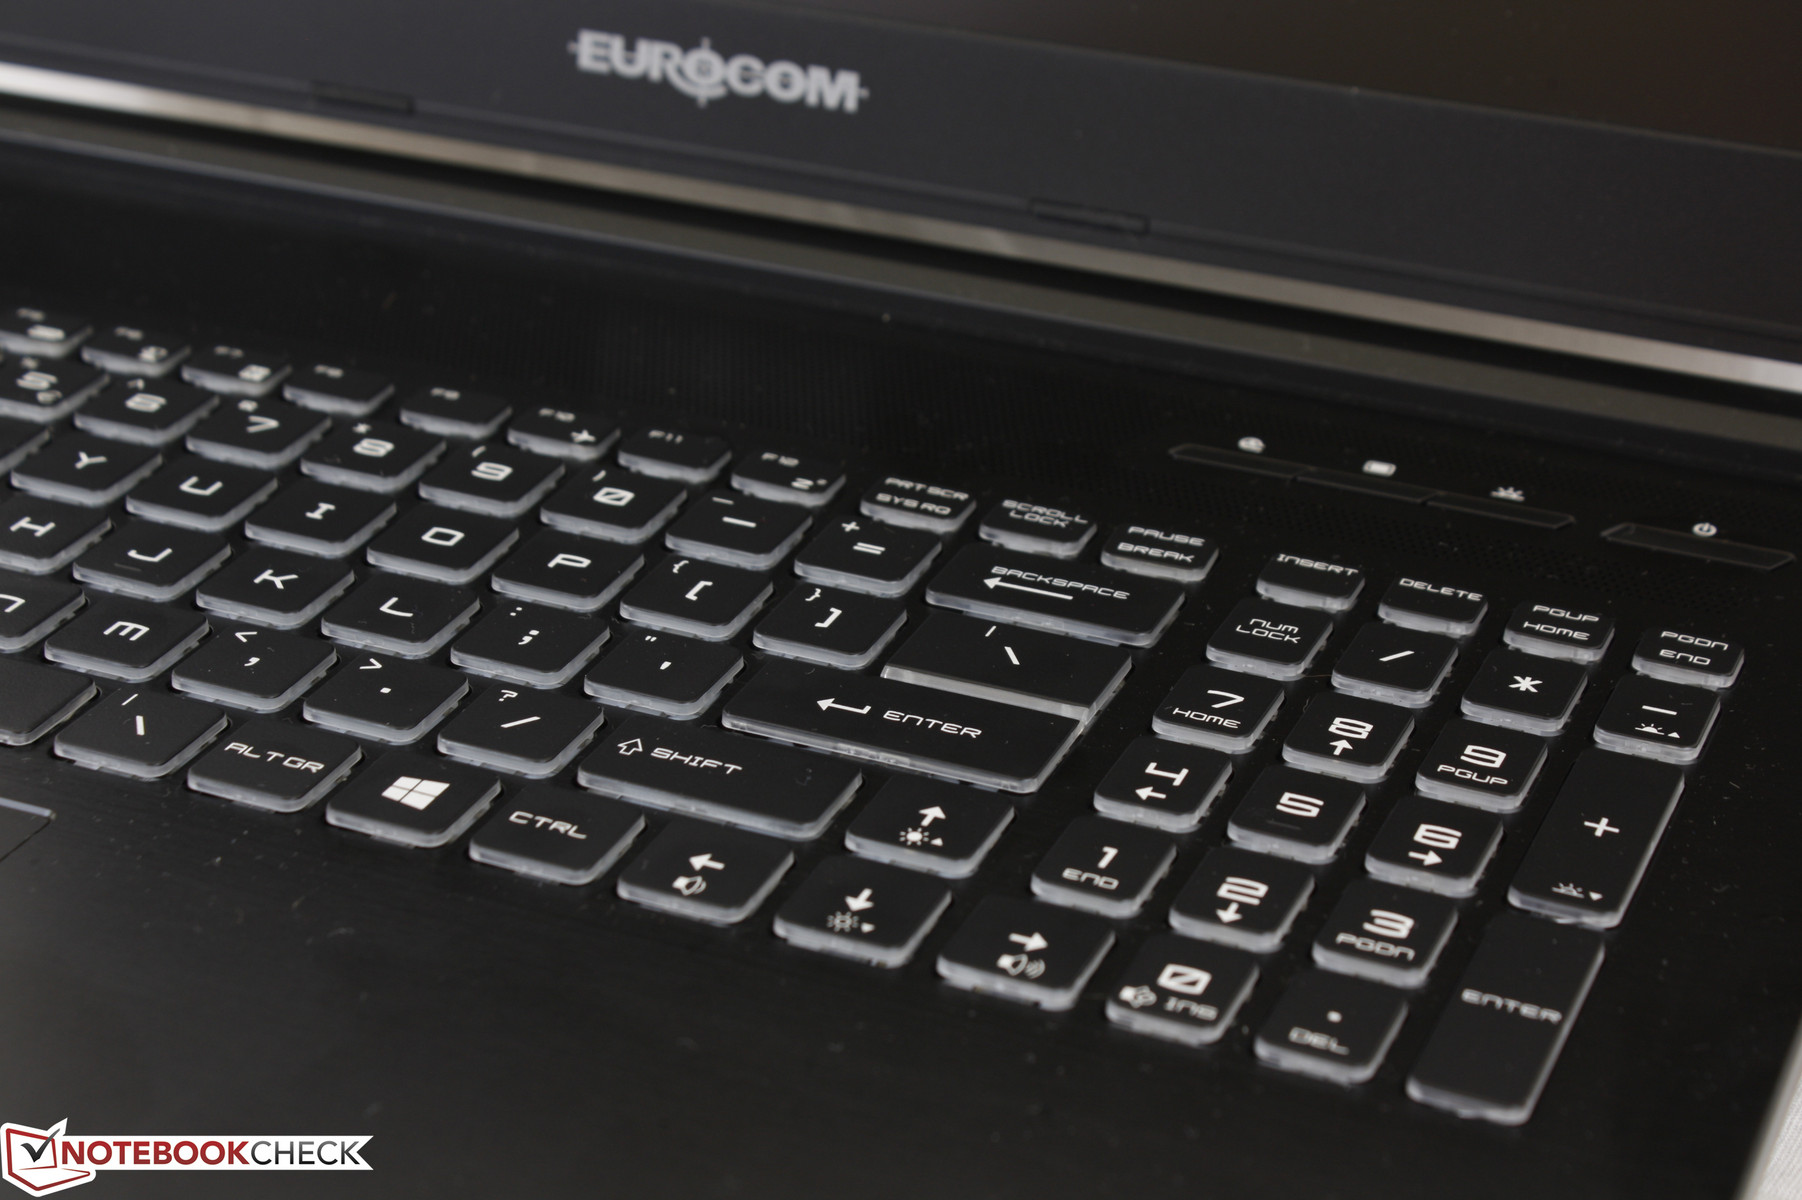
Input Devices
Keyboard and Touchpad
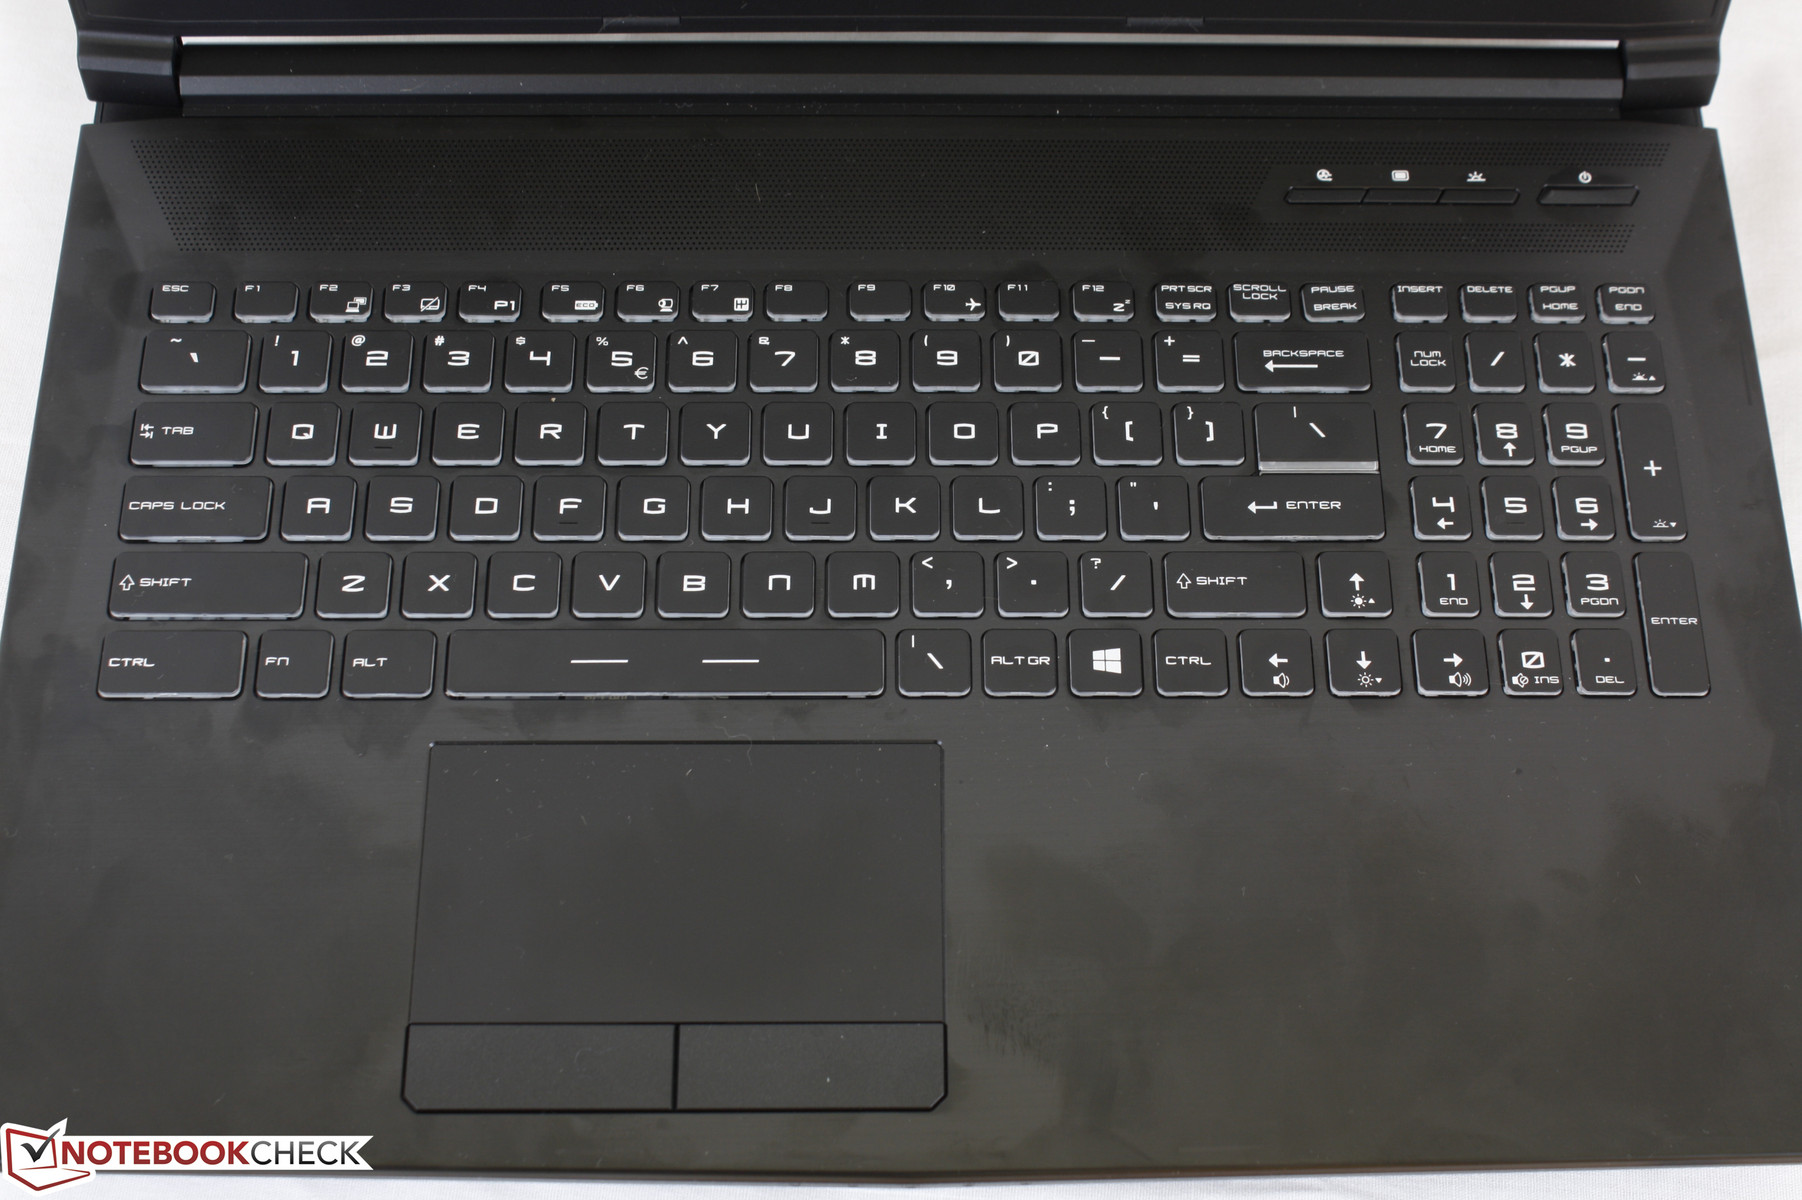
Users who have handled any MSI GT series notebook in the past should feel right at home with the keyboard and touchpad here on the Tornado F5. The keyboard keys are firm and do not wiggle or clatter in place with relatively quiet feedback due to the unyielding base. Typists who are accustomed to mechanical keyboards will find the Tornado F5 to be much quieter and softer. The keyboards on Aorus systems and the XPS 15 clatter more loudly in comparison.
Whereas most gaming notebooks have moved on to clickpads, we're pleased to see that this particular Tornado F5 chassis is sticking to the classic touchpad setup with dedicated mouse keys. This works much more smoothly and accurately for cursor control at the expense of a larger surface area. The rigid and matte touchpad surface is slightly textured against a brushed aluminum base and the mouse keys themselves are shallow in travel with a satisfyingly loud click when pressed.
Display
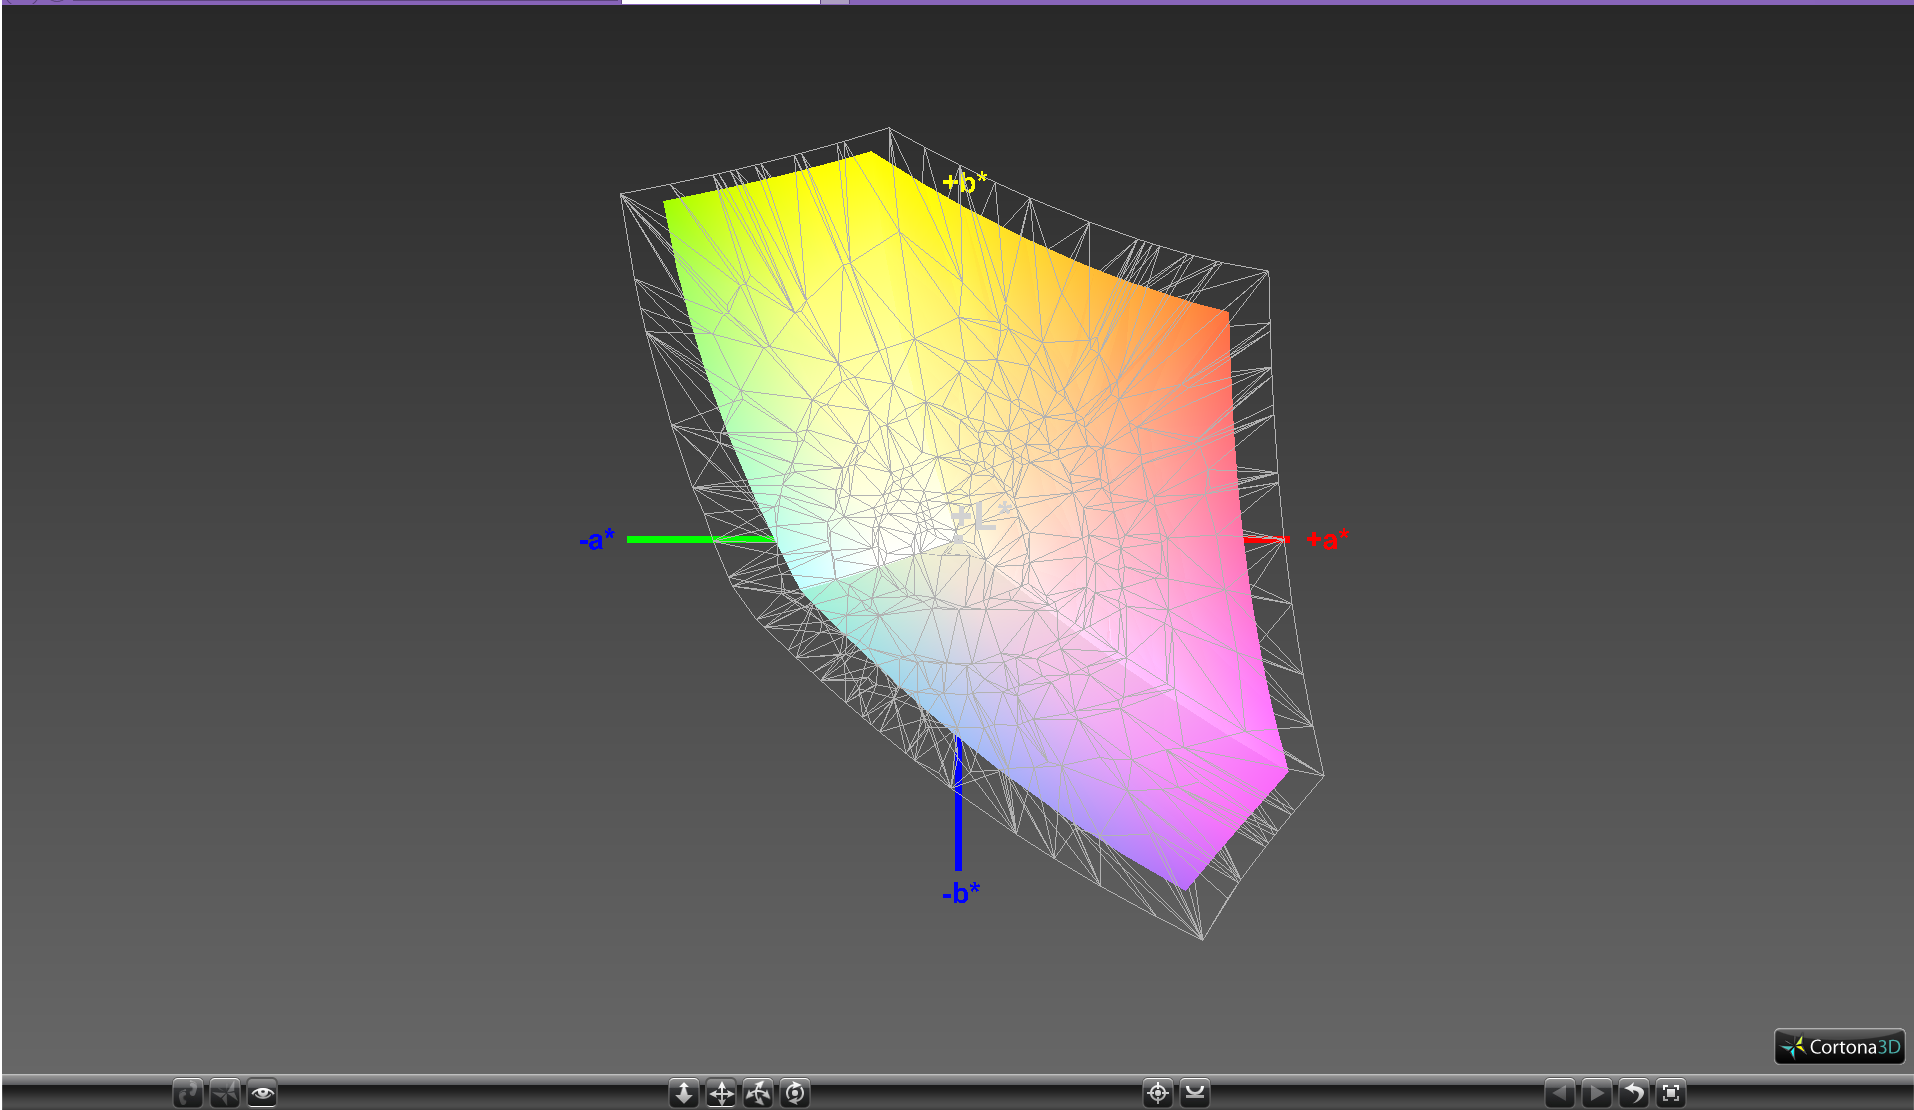
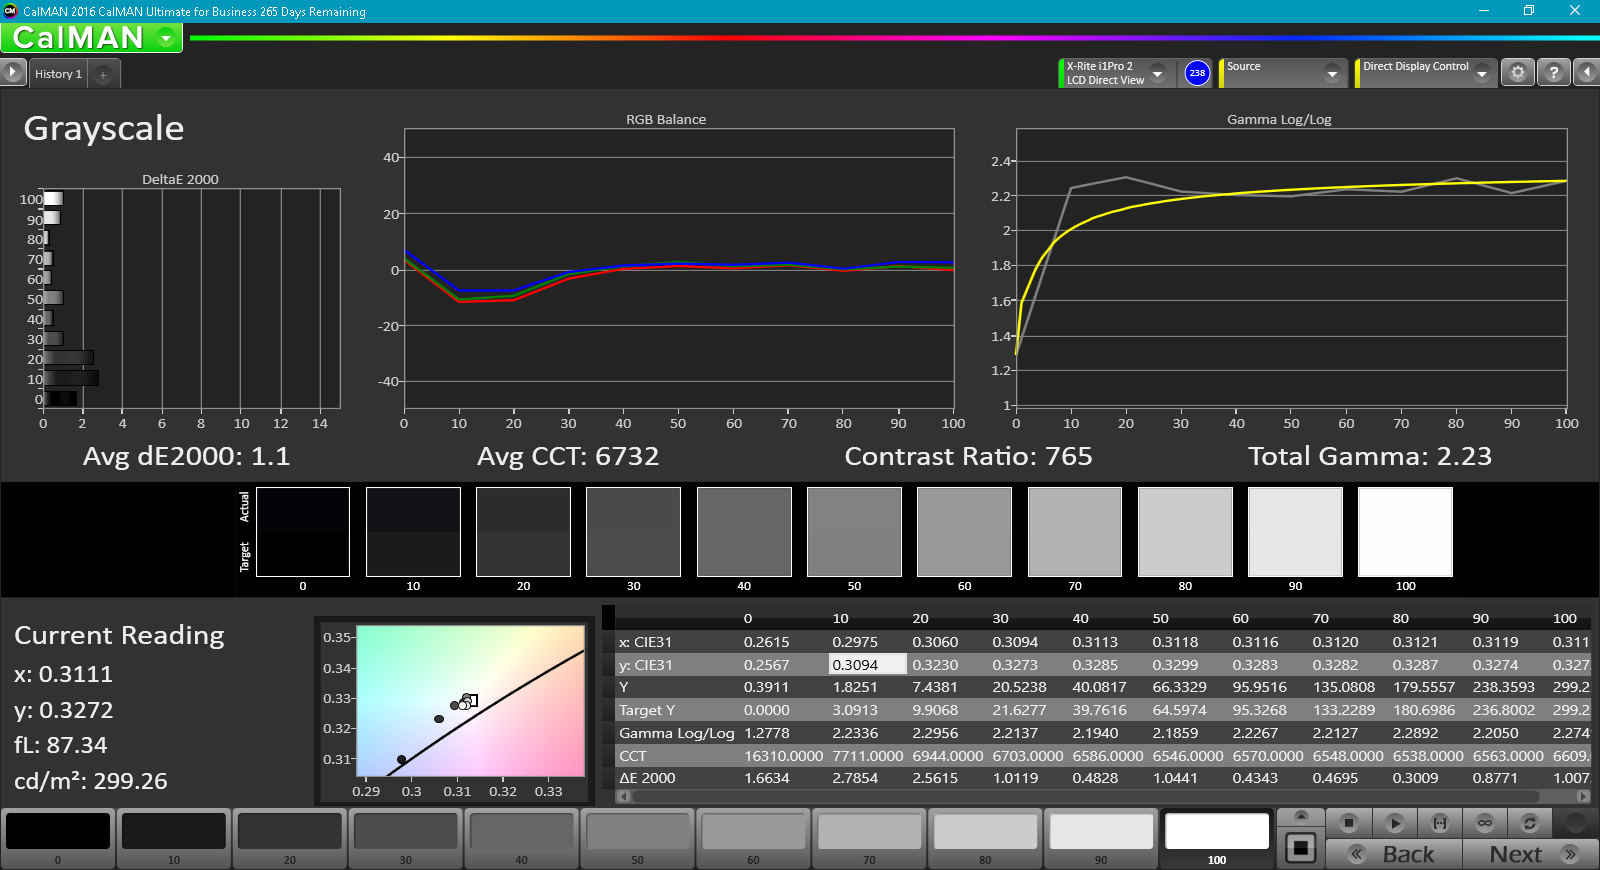
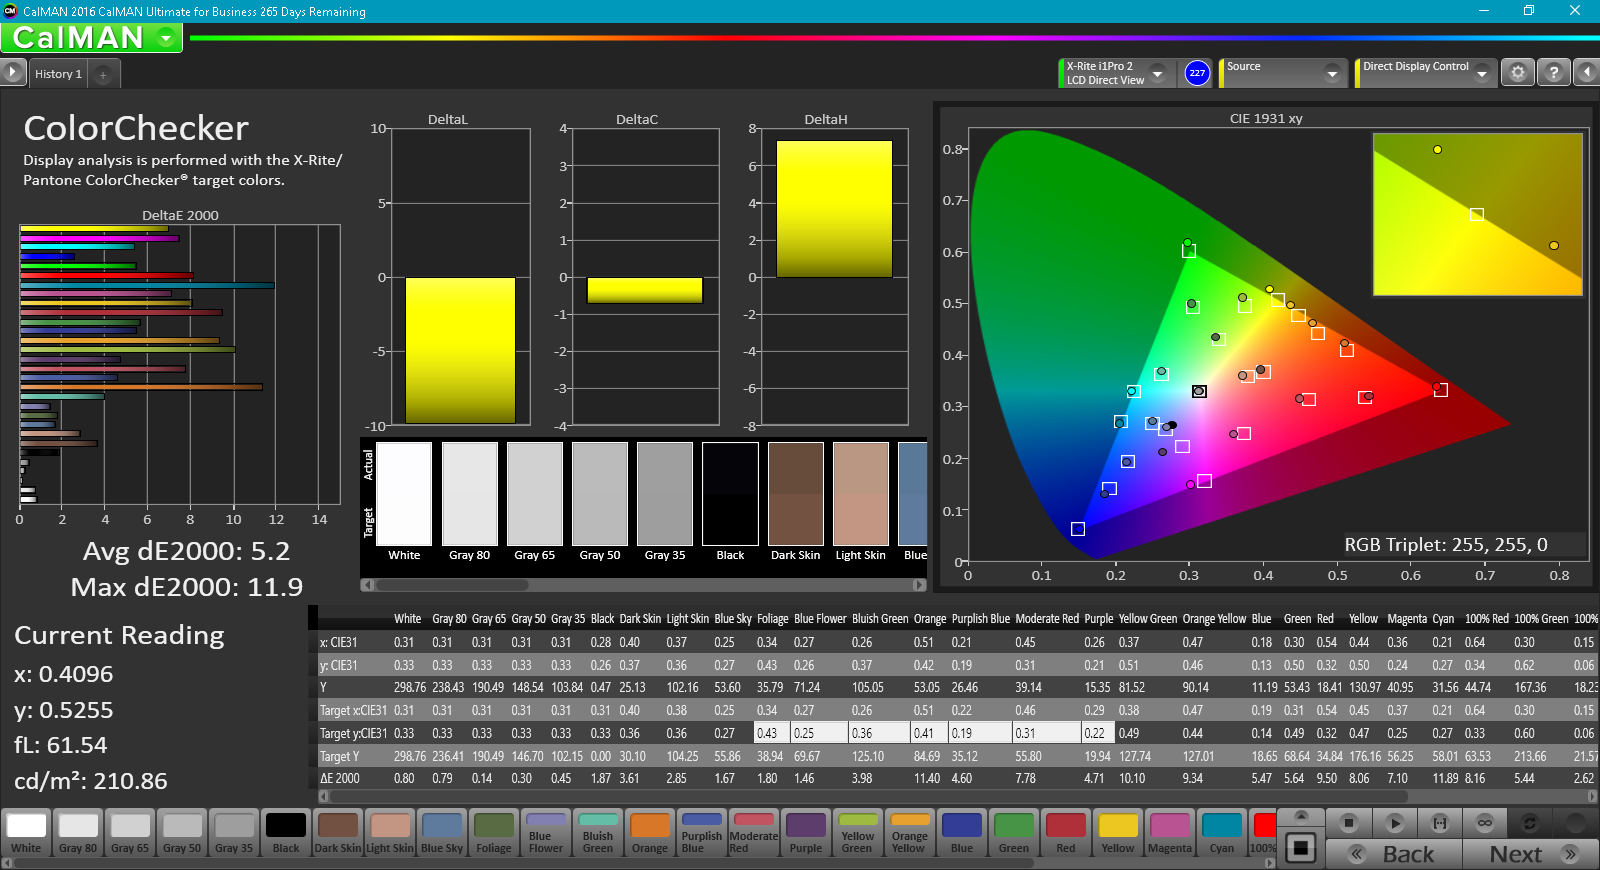
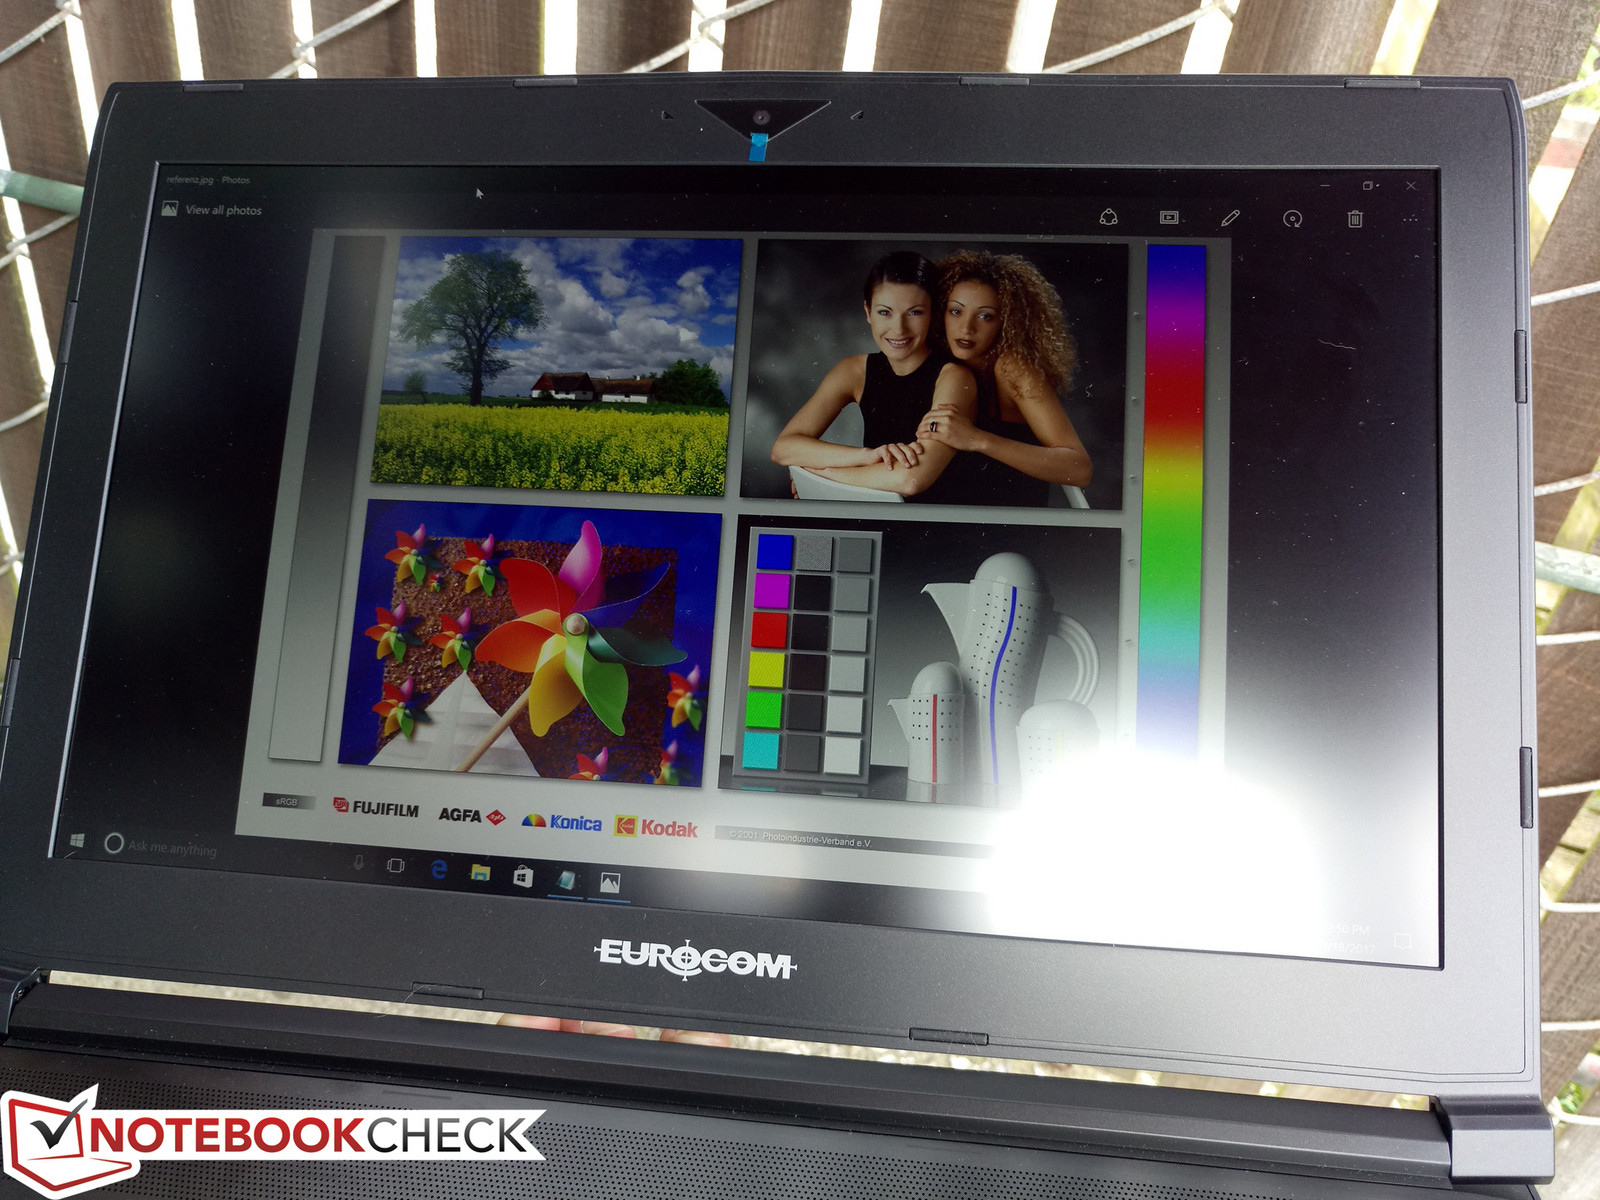
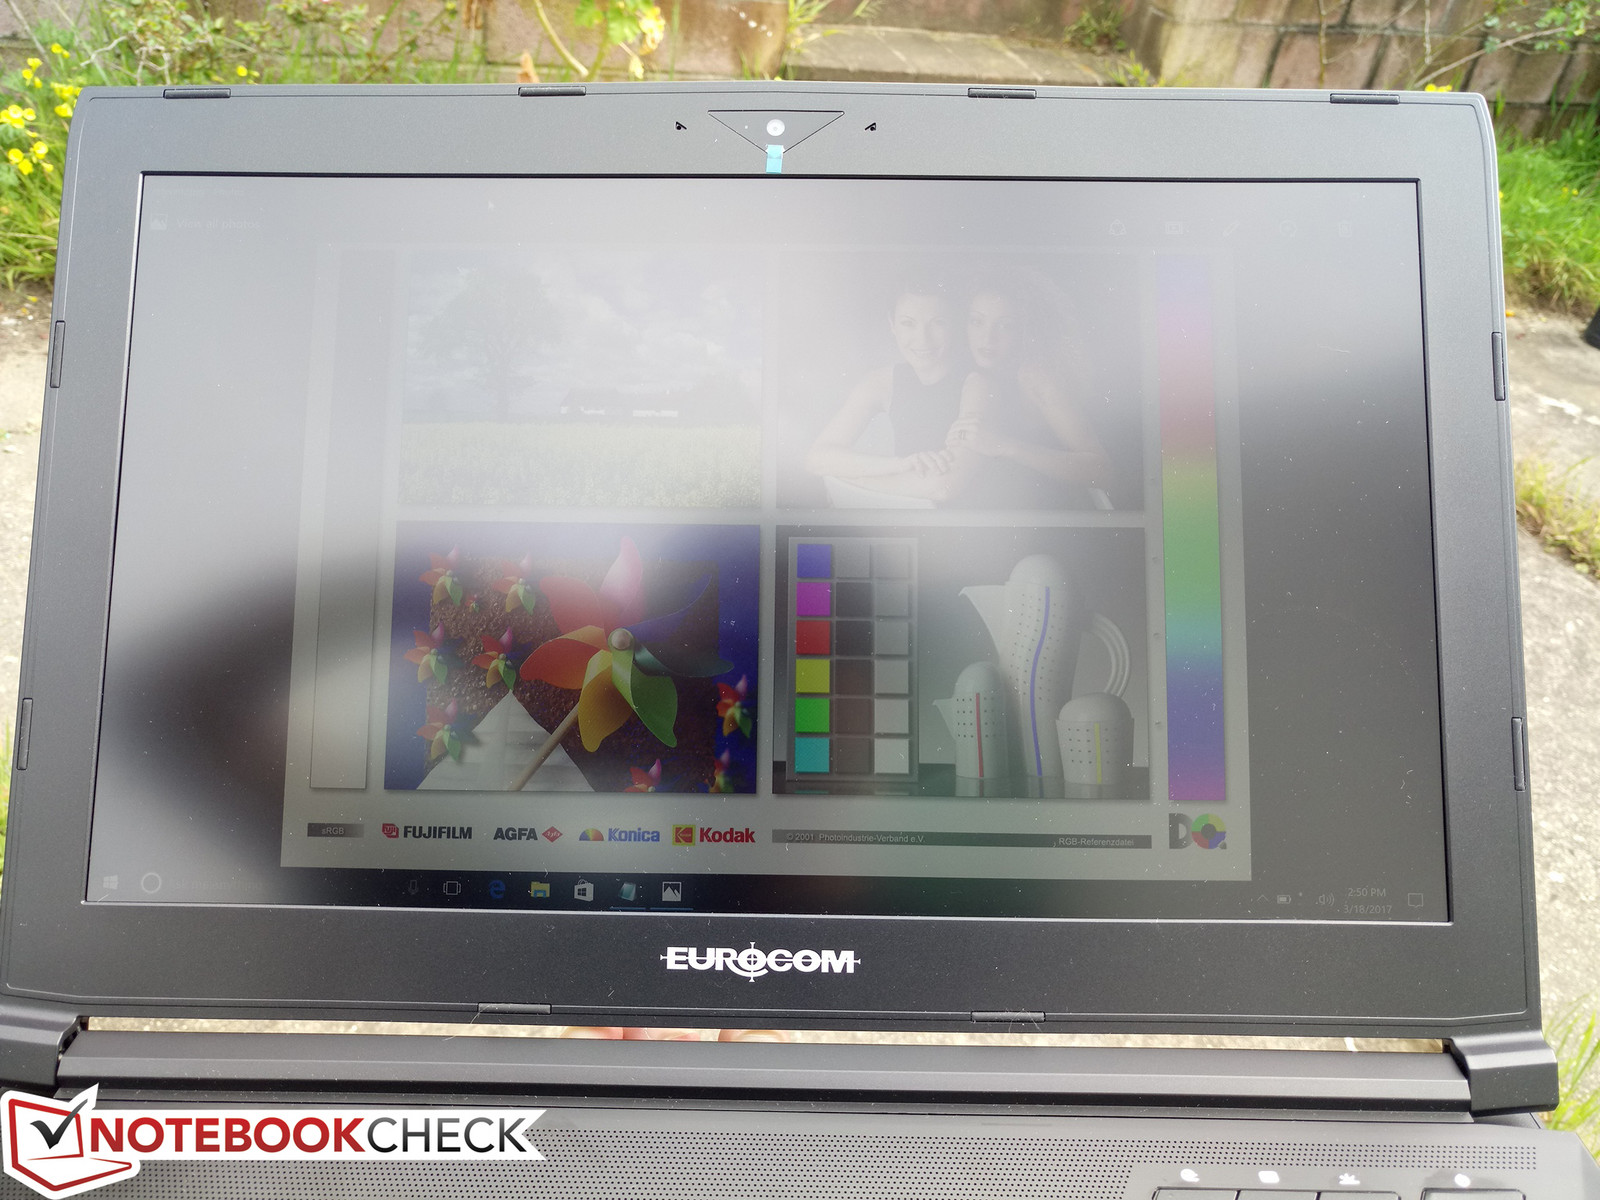
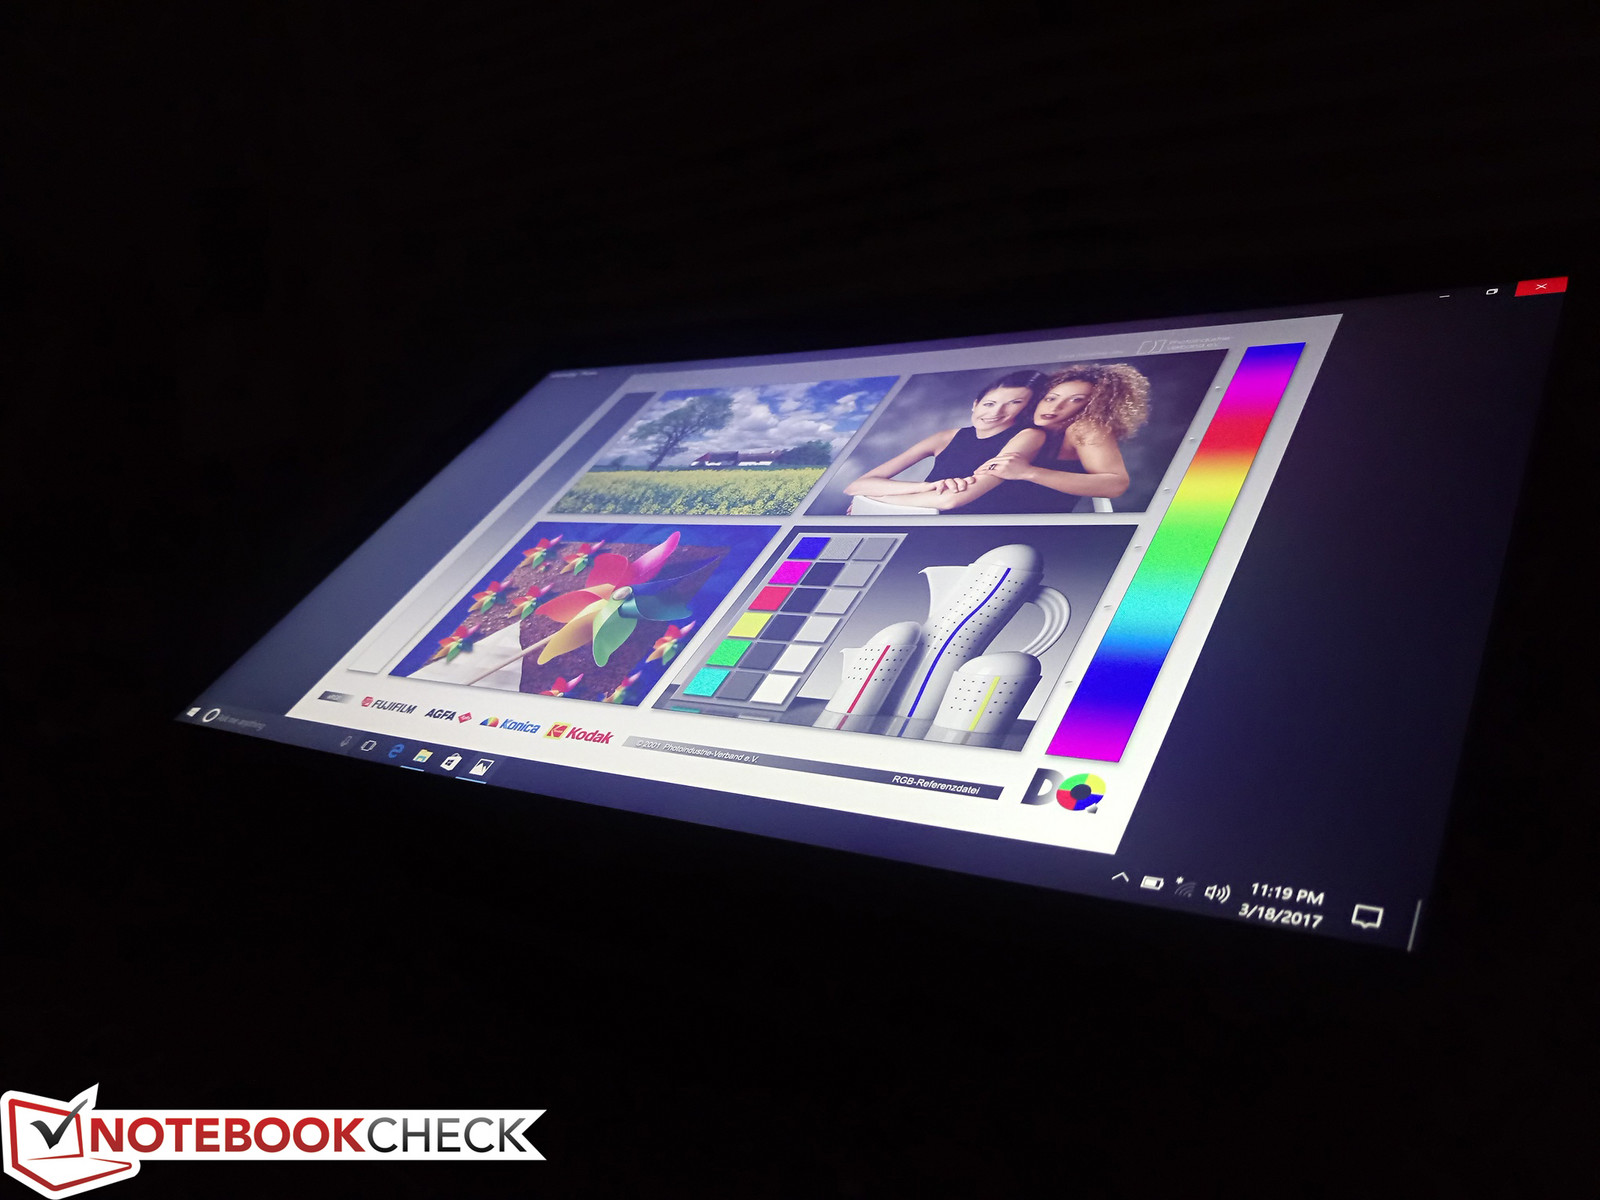
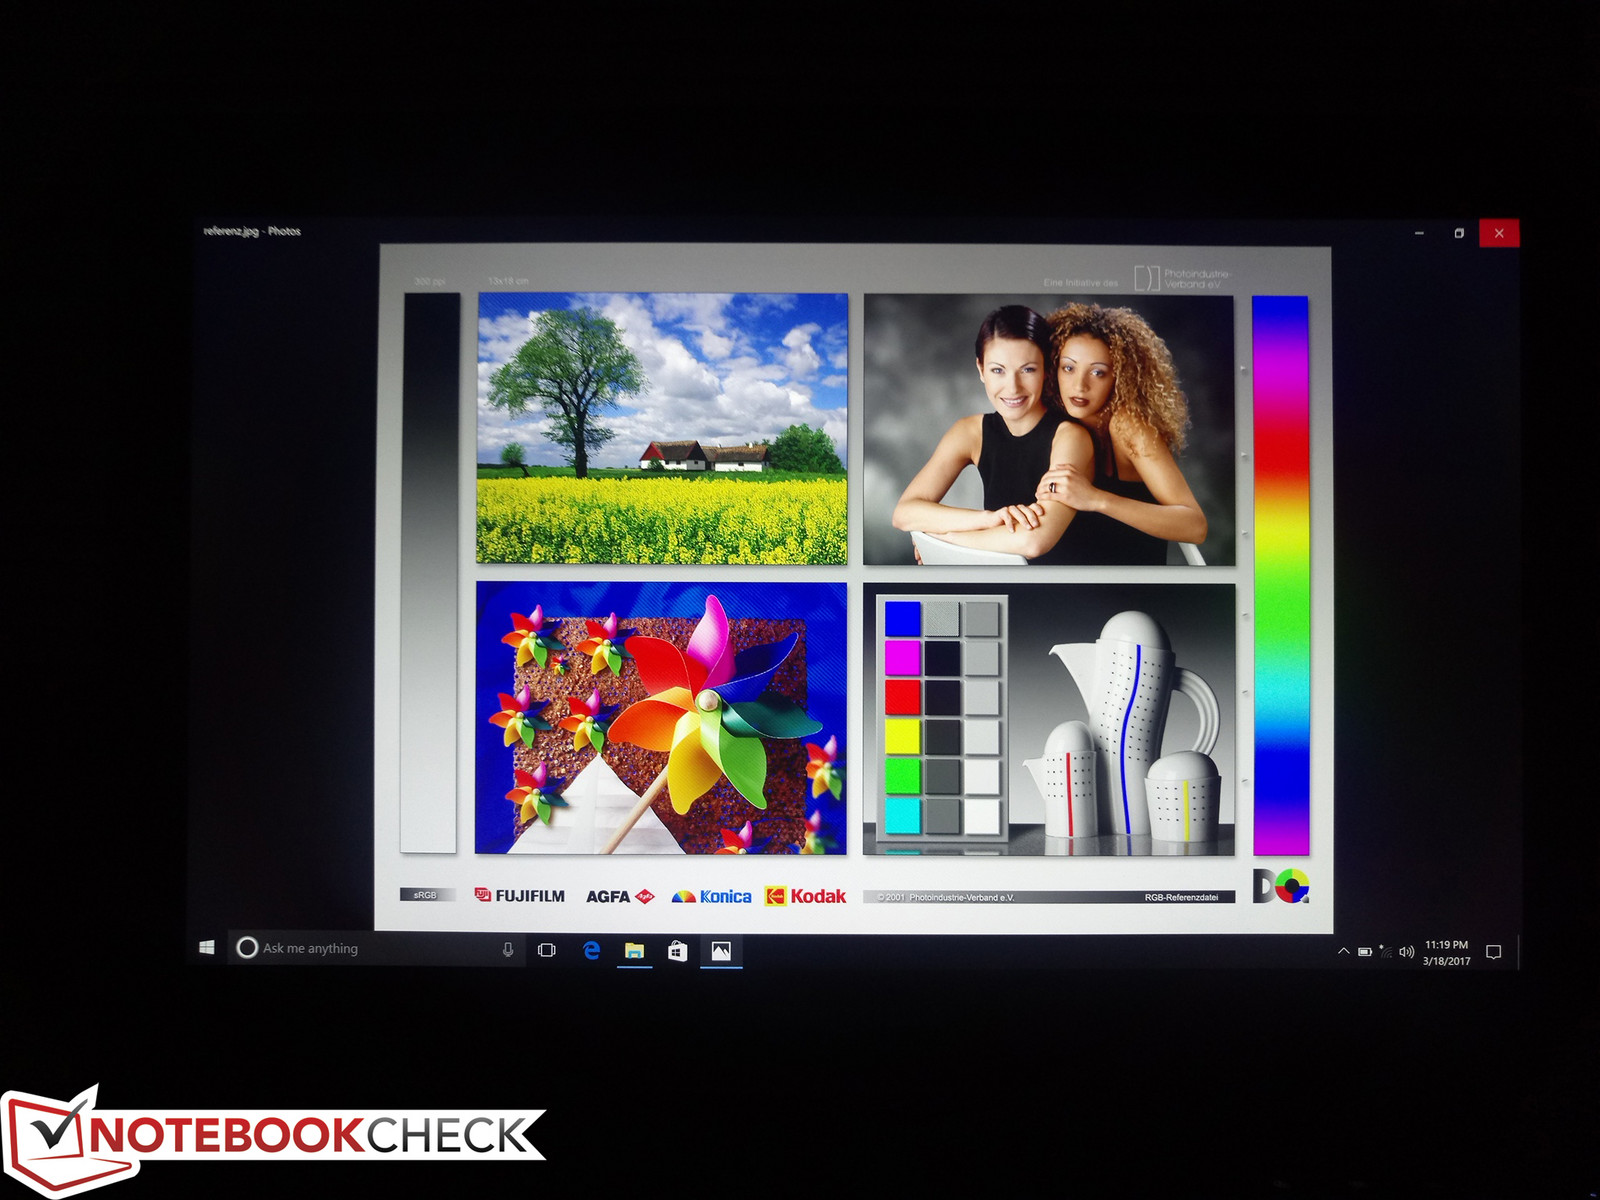
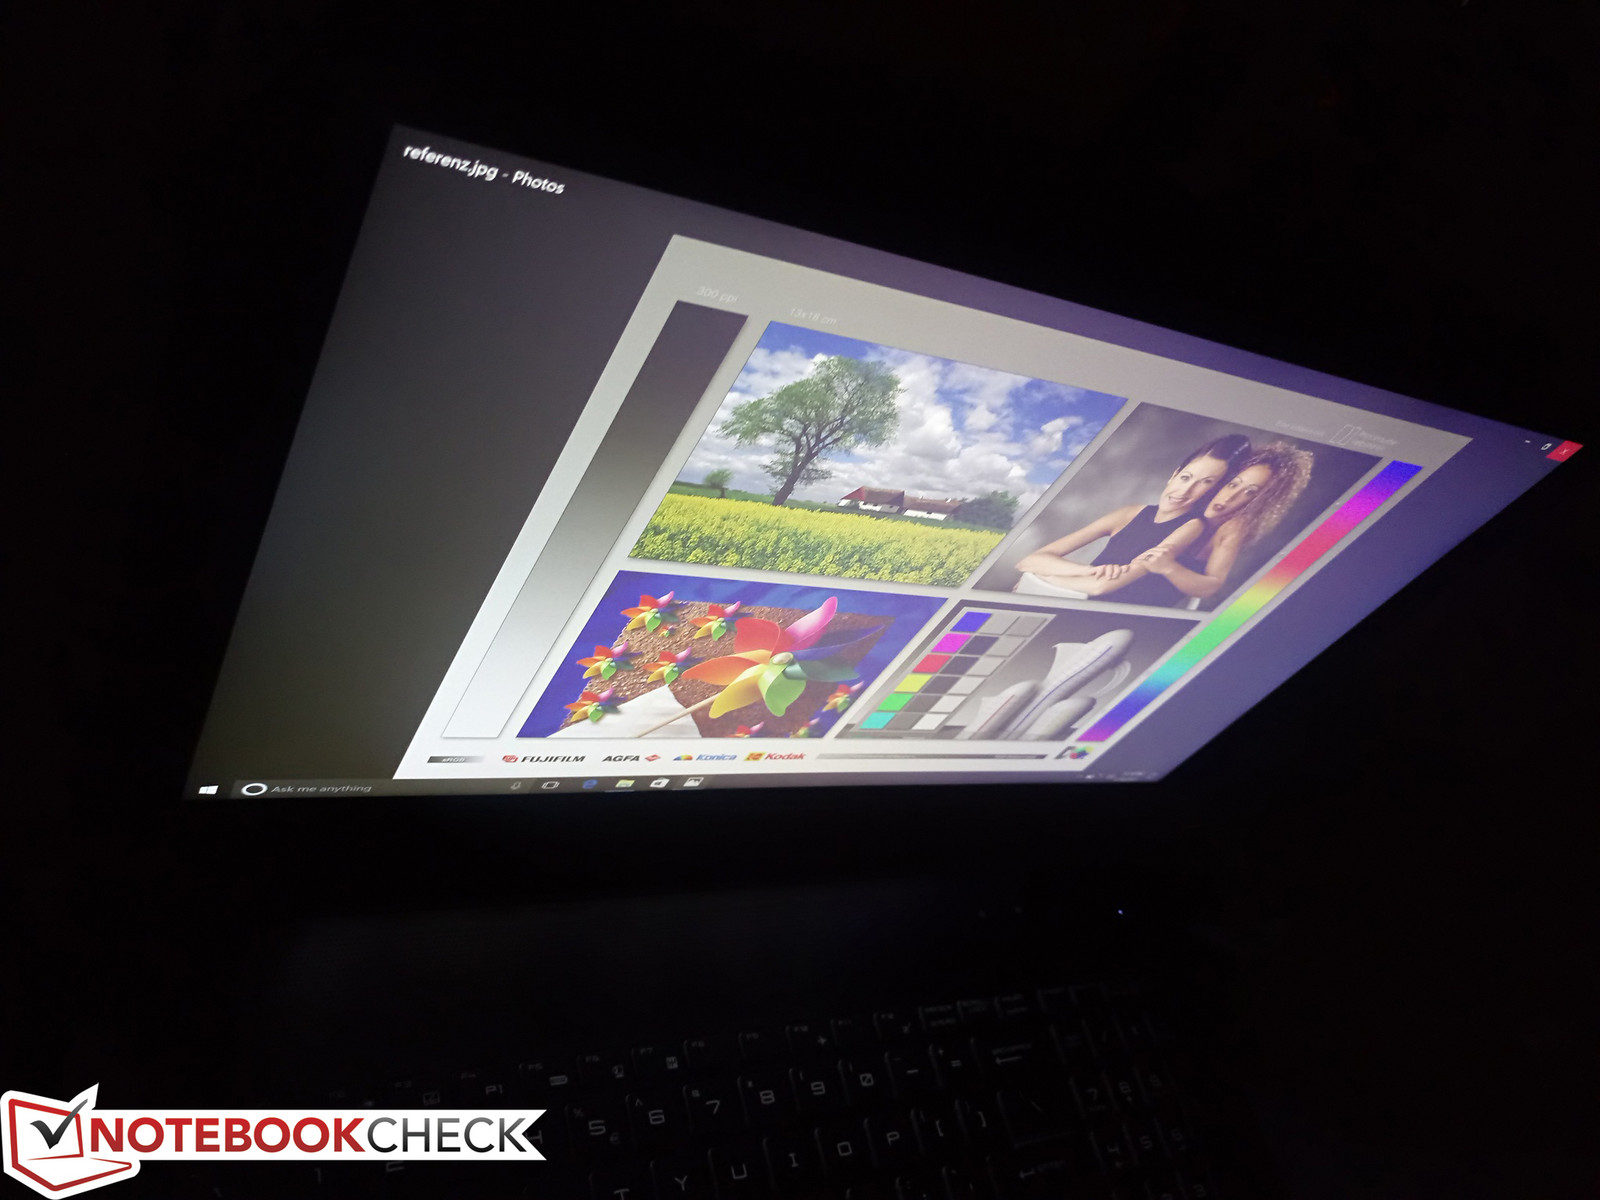
Display options for the Tornado F5 include 1080p TN 120 Hz/5 ms, 1080p IPS 60 Hz, and 4K UHD IPS 60 Hz. Our Killer Edition configuration uses the latter and results are mixed. Black levels (and thus contrast) are poorer when compared to the competition and this is directly due to the RGBW subpixel array. Manufacturers like HP have completely dropped the "faux-K" panel in favor of standard 4K UHD RGB on its latest Spectre x360 15 series because of the perceived drawbacks of squeezing in a dedicated white pixel. Subjectively, however, texts and images still appear crisp if not overly small on a 15.6-inch screen. There is a slight graininess to the matte panel that can be noticeable when displaying a bright white background.
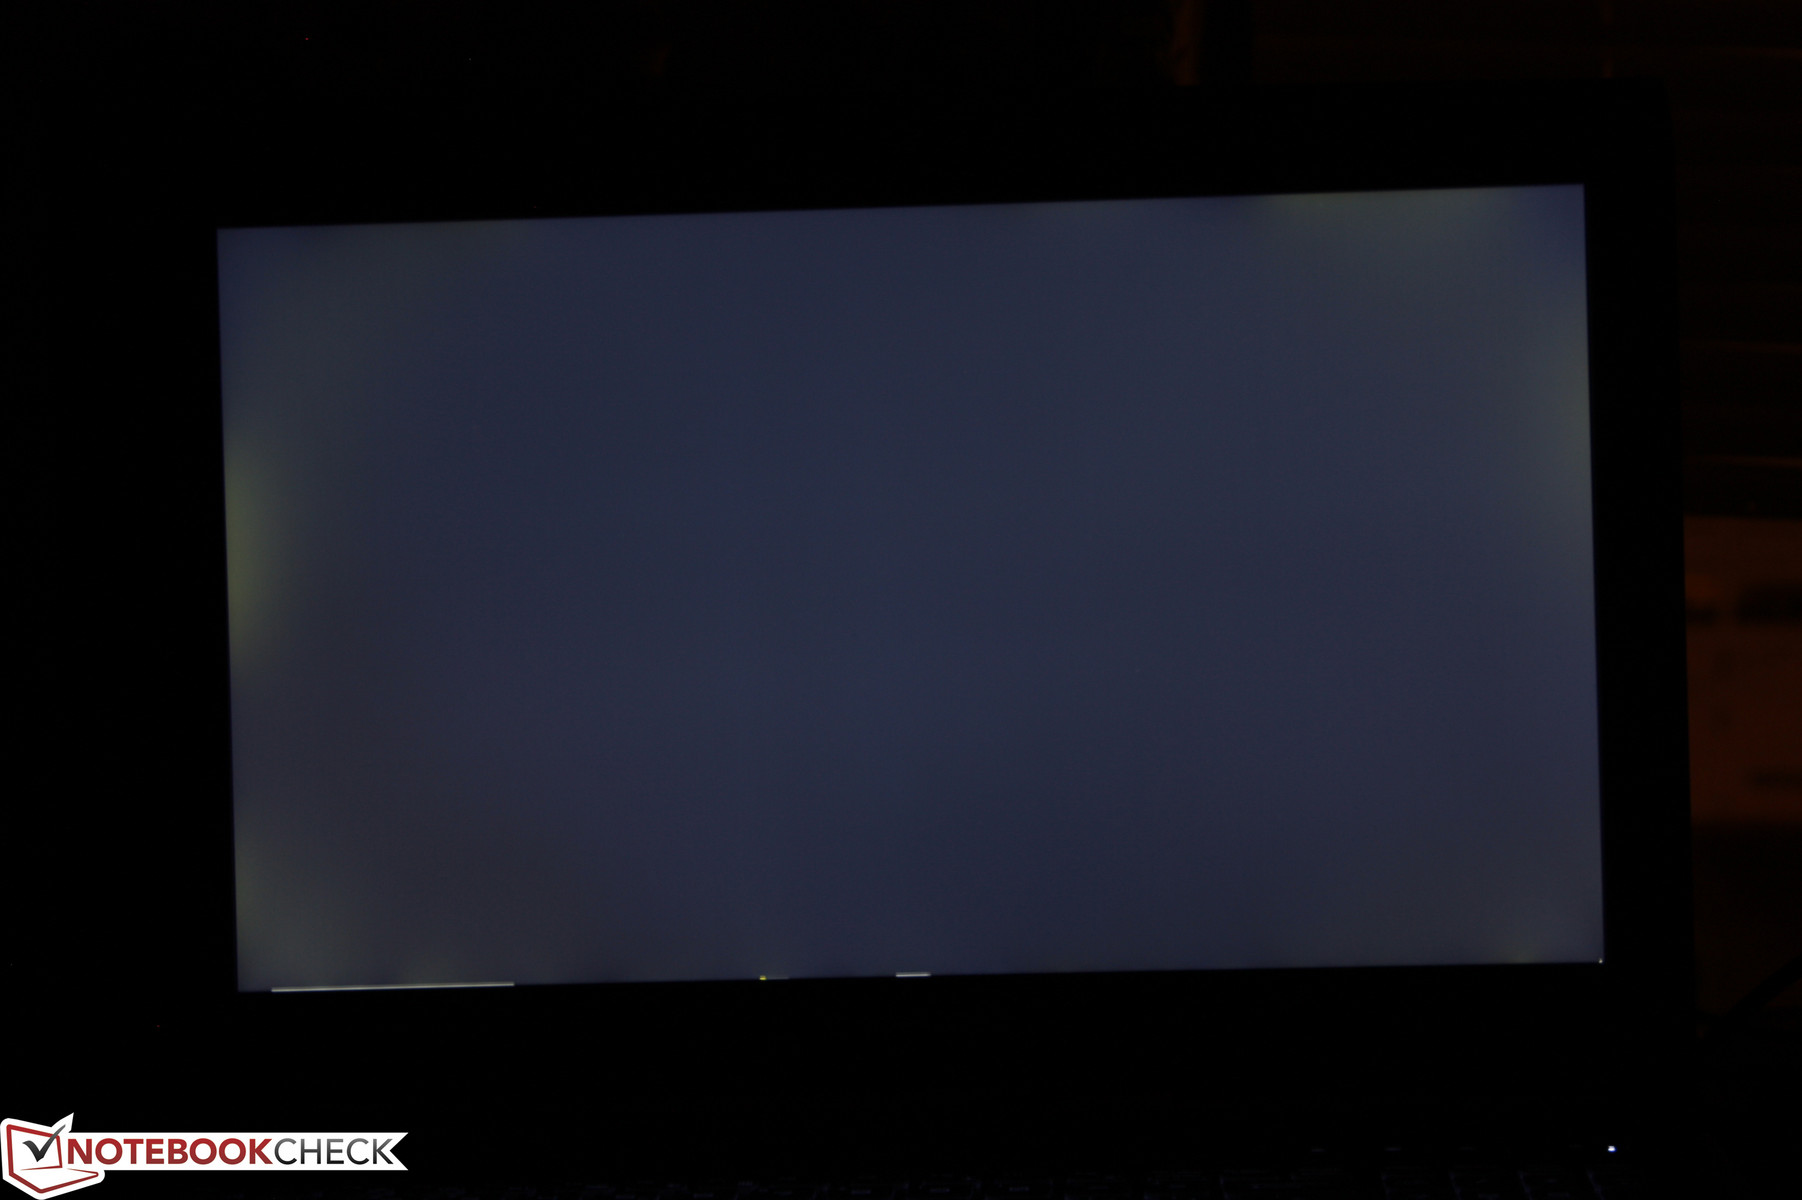
Uneven backlight bleeding occurs on the left and right edges of the screen. This is most noticeable during gameplay in dark in-game areas or during video playback with black borders. Very slight backlight bleeding is acceptable, but we're disappointed to see that many Eurocom and MSI systems are still shipping with this level of bleeding especially at this price range. Our first Tornado F5 SKU with the base 1080p IPS panel exhibited significantly less backlight bleeding issues.

| |||||||||||||||||||||||||
Brightness Distribution: 84 %
Center on Battery: 305.8 cd/m²
Contrast: 665:1 (Black: 0.46 cd/m²)
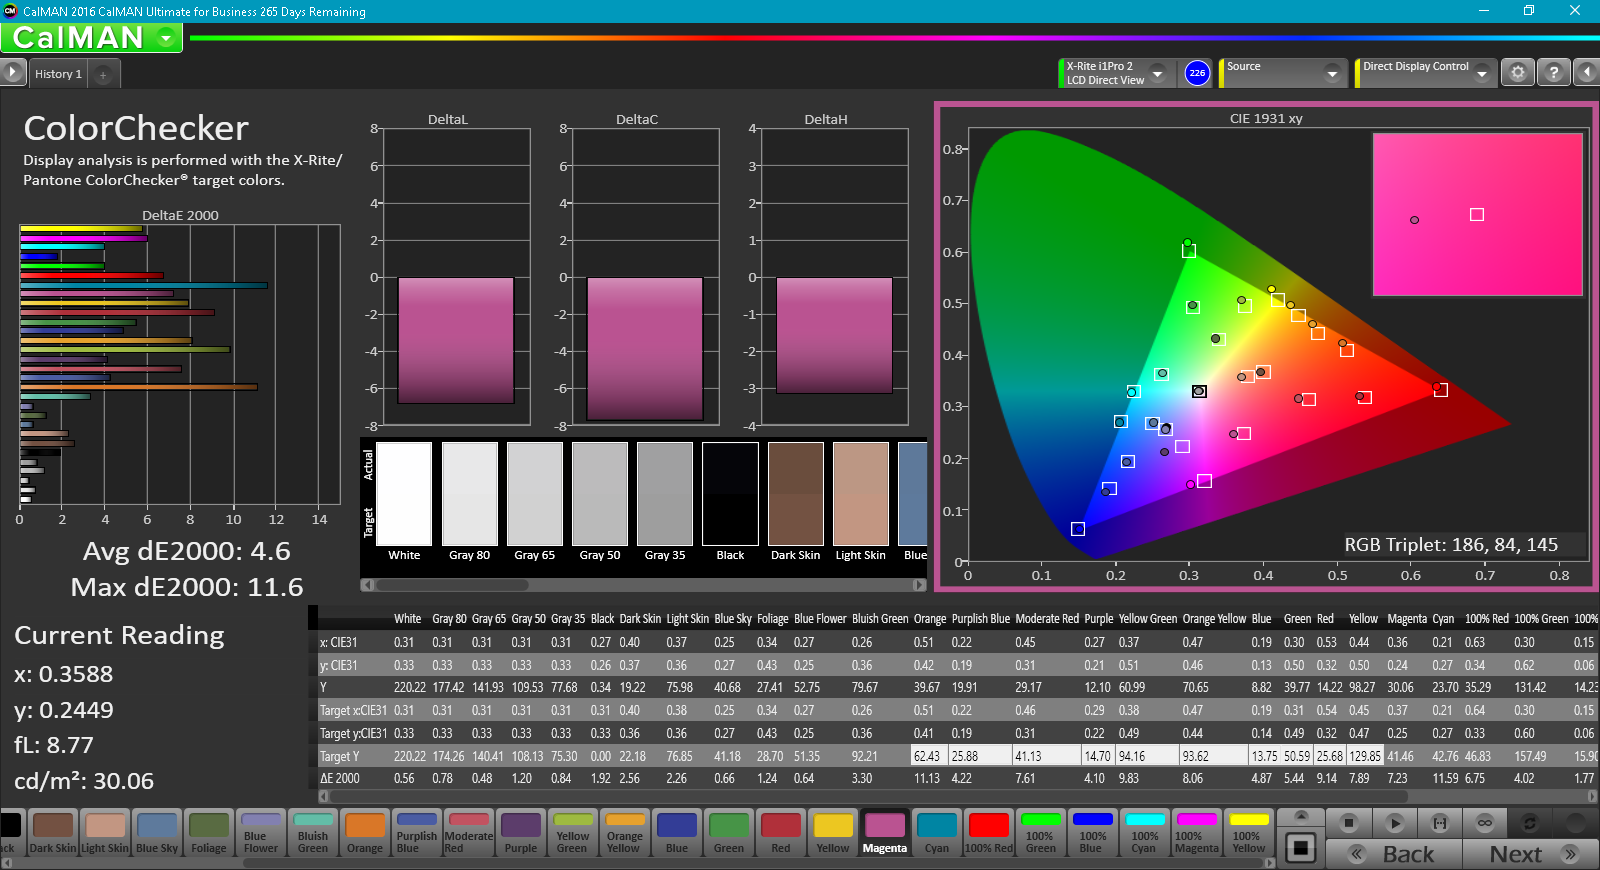
ΔE ColorChecker Calman: 5.2 | ∀{0.5-29.43 Ø4.71}
ΔE Greyscale Calman: 1.1 | ∀{0.09-98 Ø4.96}
75.5% sRGB (Argyll 1.6.3 3D)
47.3% AdobeRGB 1998 (Argyll 1.6.3 3D)
51.5% AdobeRGB 1998 (Argyll 3D)
75% sRGB (Argyll 3D)
49.9% Display P3 (Argyll 3D)
Gamma: 2.23
CCT: 6732 K
| Eurocom Tornado F5 Killer Edition IPS, 15.6", 3840x2160 | Dell XPS 15 9560 (i7-7700HQ, UHD) IGZO IPS, 15.6", 3840x2160 | Alienware 15 R3 HPJGK_B156HTN (AUO51ED), TN, 15.6", 1920x1080 | Acer Predator 15 G9-593-765Q LG Philips LP156WF6-SPP1 (LGD04D5), IPS, 15.6", 1920x1080 | Eurocom Tornado F5 IPS, 15.6", 1920x1080 | |
|---|---|---|---|---|---|
| Display | 69% | 27% | 19% | 19% | |
| Display P3 Coverage (%) | 49.9 | 89.7 80% | 66 32% | 63.6 27% | 64.5 29% |
| sRGB Coverage (%) | 75 | 100 33% | 90.5 21% | 83.9 12% | 83 11% |
| AdobeRGB 1998 Coverage (%) | 51.5 | 100 94% | 66.2 29% | 61.3 19% | 60.7 18% |
| Response Times | -40% | 48% | 13% | 4% | |
| Response Time Grey 50% / Grey 80% * (ms) | 38.8 ? | 57.2 ? -47% | 25 ? 36% | 35 ? 10% | 33.6 ? 13% |
| Response Time Black / White * (ms) | 29.6 ? | 39.2 ? -32% | 12 ? 59% | 25 ? 16% | 31.2 ? -5% |
| PWM Frequency (Hz) | 1351 ? | 962 | |||
| Screen | -6% | -87% | 2% | -15% | |
| Brightness middle (cd/m²) | 305.8 | 370.1 21% | 386 26% | 273 -11% | 315.8 3% |
| Brightness (cd/m²) | 282 | 356 26% | 382 35% | 267 -5% | 310 10% |
| Brightness Distribution (%) | 84 | 87 4% | 93 11% | 83 -1% | 90 7% |
| Black Level * (cd/m²) | 0.46 | 0.37 20% | 0.39 15% | 0.27 41% | 0.33 28% |
| Contrast (:1) | 665 | 1000 50% | 990 49% | 1011 52% | 957 44% |
| Colorchecker dE 2000 * | 5.2 | 5.3 -2% | 10.2 -96% | 3.77 27% | 5 4% |
| Colorchecker dE 2000 max. * | 11.9 | 9.9 17% | 15.81 -33% | 10.64 11% | 10.1 15% |
| Greyscale dE 2000 * | 1.1 | 4.6 -318% | 11.28 -925% | 2.48 -125% | 4.2 -282% |
| Gamma | 2.23 99% | 2.31 95% | 2.23 99% | 2.37 93% | 2.12 104% |
| CCT | 6732 97% | 6284 103% | 11383 57% | 6854 95% | 6107 106% |
| Color Space (Percent of AdobeRGB 1998) (%) | 47.3 | 88.3 87% | 59 25% | 55 16% | 54.5 15% |
| Color Space (Percent of sRGB) (%) | 75.5 | 100 32% | 90 19% | 84 11% | 83 10% |
| Total Average (Program / Settings) | 8% /
4% | -4% /
-46% | 11% /
7% | 3% /
-5% |
* ... smaller is better
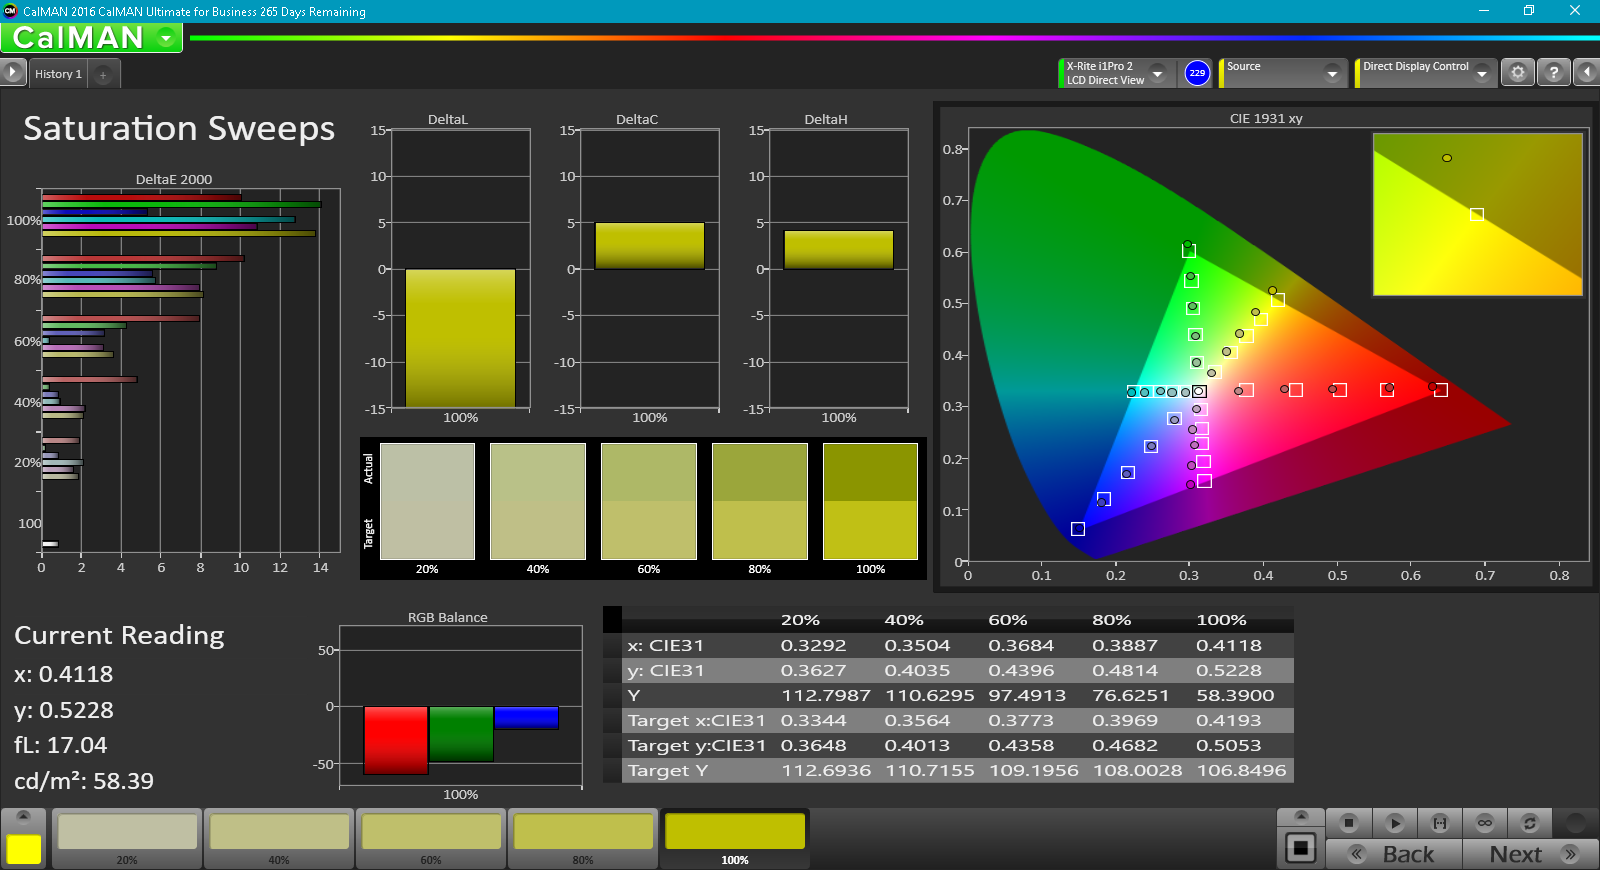
Color space is approximately 76 percent and 47 percent of the sRGB and AdobeRGB standards, respectively. This is narrower than on our earlier Tornado F5 with the FHD panel and nowhere near as wide as the 4K UHD IGZO panel found as found on the XPS 15. Response times are faster than on the IGZO panel and are not significantly different than on the Tornado F5 FHD configuration, so the gaming capabilities of this particular 4K UHD option have been given priority over color accuracy.
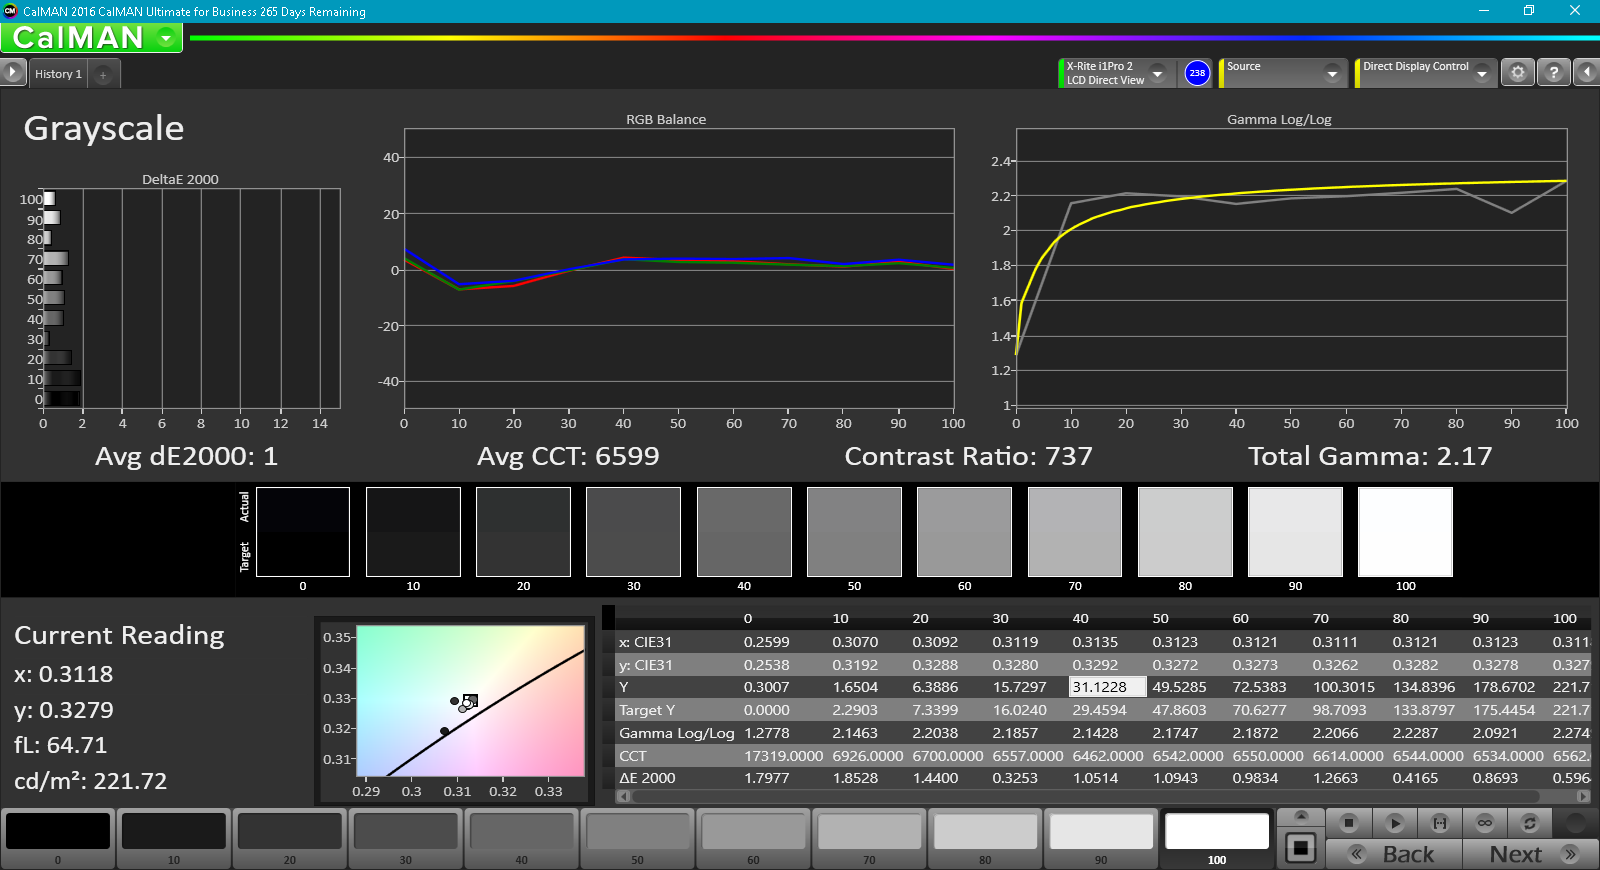
Further measurements with a X-Rite spectrophotometer reveal very accurate grayscale and RGB balance out of the box. We reran the same tests after calibration and the results were essentially identical. Eurocom offers pre-calibration services for buyers and so it's unsurprising that our own calibration efforts had minimal impact on the display.
The relatively average sRGB coverage mentioned above can be observed here as colors become measurably more inaccurate the higher the saturation level. This is hardly a concern for gamers, but professional digital artists may want to consider another notebook with wider gamut options.

Display Response Times
| ↔ Response Time Black to White | ||
|---|---|---|
| 29.6 ms ... rise ↗ and fall ↘ combined | ↗ 19.6 ms rise | 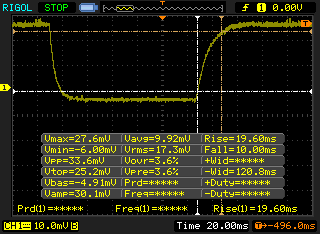 |
| ↘ 10 ms fall | ||
| The screen shows relatively slow response rates in our tests and may be too slow for gamers. In comparison, all tested devices range from 0.1 (minimum) to 240 (maximum) ms. » 79 % of all devices are better. This means that the measured response time is worse than the average of all tested devices (19.8 ms). | ||
| ↔ Response Time 50% Grey to 80% Grey | ||
| 38.8 ms ... rise ↗ and fall ↘ combined | ↗ 17.2 ms rise | 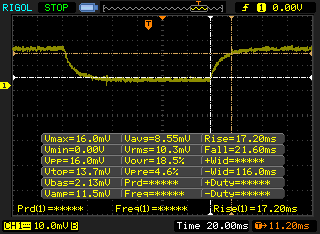 |
| ↘ 21.6 ms fall | ||
| The screen shows slow response rates in our tests and will be unsatisfactory for gamers. In comparison, all tested devices range from 0.165 (minimum) to 636 (maximum) ms. » 58 % of all devices are better. This means that the measured response time is worse than the average of all tested devices (30.9 ms). | ||
Screen Flickering / PWM (Pulse-Width Modulation)
| Screen flickering / PWM detected | 1351 Hz | ≤ 19 % brightness setting | 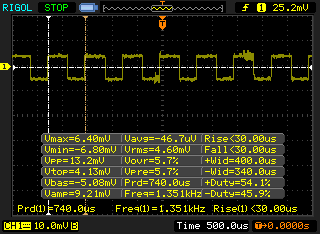 |
The display backlight flickers at 1351 Hz (worst case, e.g., utilizing PWM) Flickering detected at a brightness setting of 19 % and below. There should be no flickering or PWM above this brightness setting. The frequency of 1351 Hz is quite high, so most users sensitive to PWM should not notice any flickering. In comparison: 52 % of all tested devices do not use PWM to dim the display. If PWM was detected, an average of 7741 (minimum: 5 - maximum: 343500) Hz was measured. | |||
Outdoor visibility is limited to areas with lots of shade. A sunny, bright, or otherwise cloudy overcast day will instantly wash out onscreen texts and images. The matte screen, wide IPS viewing angles, and wide 170-degree hinges all help in reducing glare, but this can only compensate so much for the average backlight brightness. Slight shifts to contrast and colors are observed only if viewing from unrealistically sharp and obtuse angles.
Performance
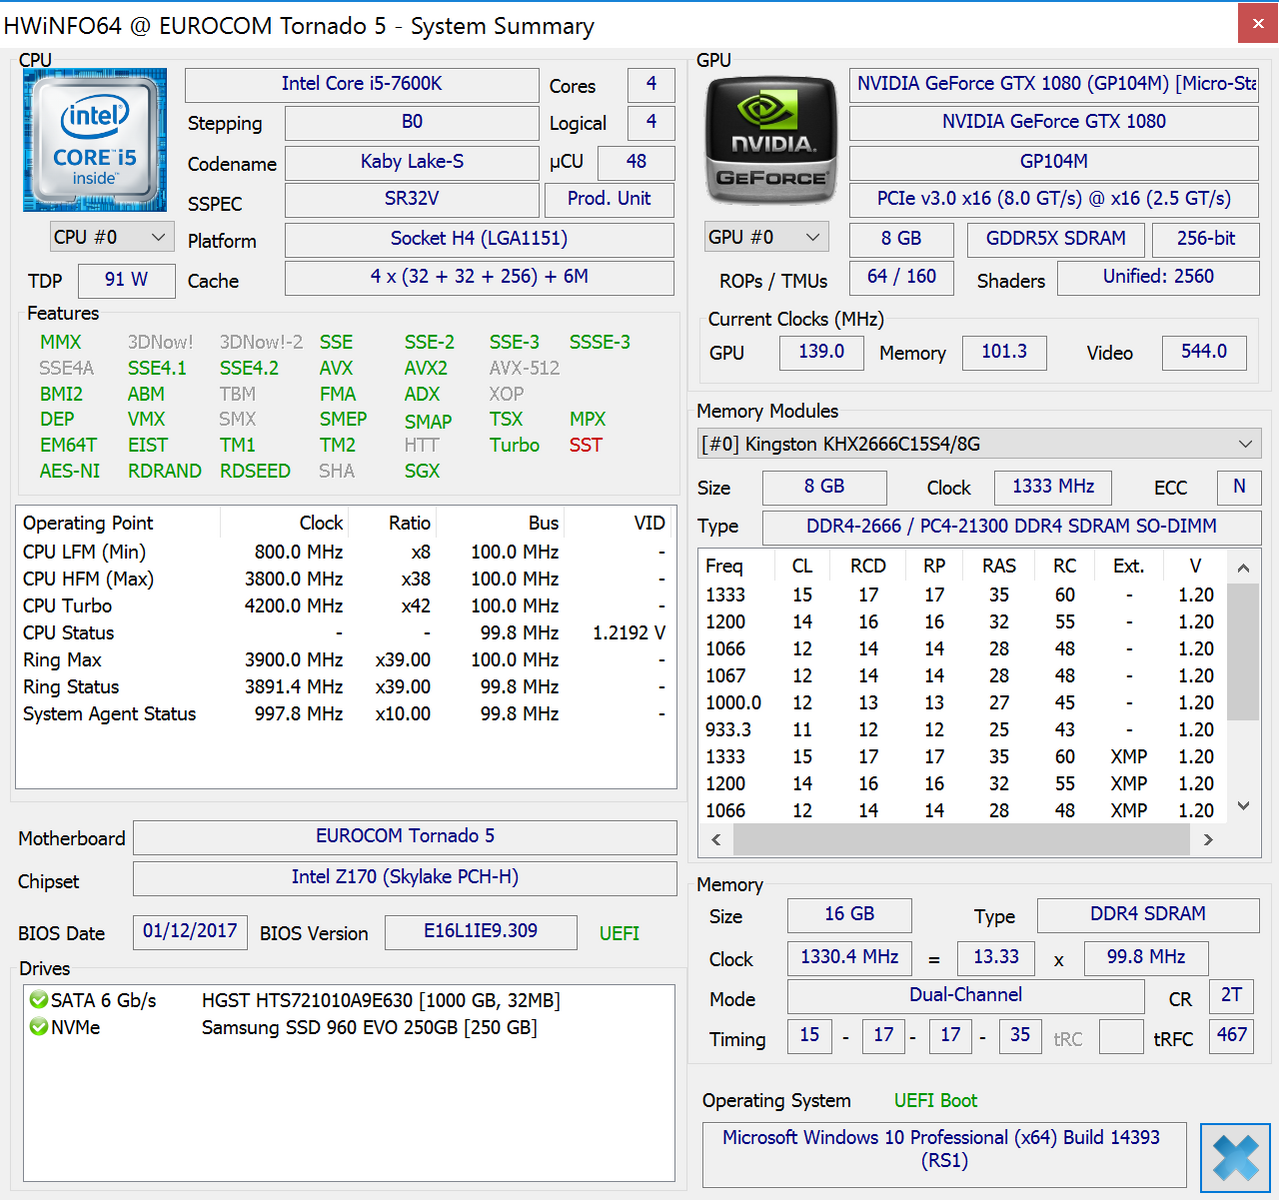
Eurocom notebooks are some of the most customizable mobile systems available due to the versatility of a barebone chassis. The CPU in particular can be swapped out with any LGA 1151 CPU up to a 91 W TDP while the MXM 3.0 GPU can be swapped between any Quadro or GeForce card of up to 150 W. A multitude of RAM and storage options exist as well, though a factory unlocked BIOS for end-user overclocking will cost users another $100 USD. G-Sync comes standard across all SKUs at the expense of any Optimus options.
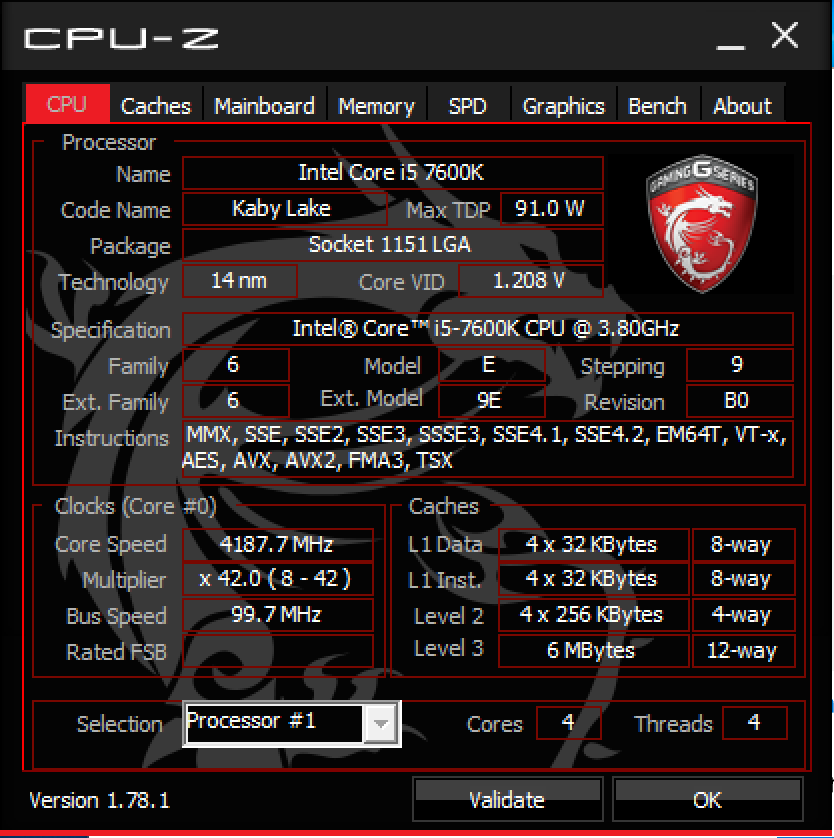
Processor
CPU performance from the quad-core i5-7600K is strong, but we can't help but feel somewhat disappointed. While single-threaded performance is good with a consistent Turbo Boost of 4.0 GHz (out of the rated maximum of 4.2 GHz), multi-threaded performance is weaker than even the older Haswell i7-5700HQ due to the lack of Hyper-Threading. The i7-5700HQ in the GT80 Titan outscores the i7-7600K by about 10 percent in CineBench R15 Multi-Thread, so the performance gap between the i5 and i7 families is well-defined. The fact that a 47 W Core i7 mobile CPU can outscore a 91 W Core i5 desktop CPU in multi-threaded workloads at base clock rates means laptop gamers may be better off with the lower-power solution.
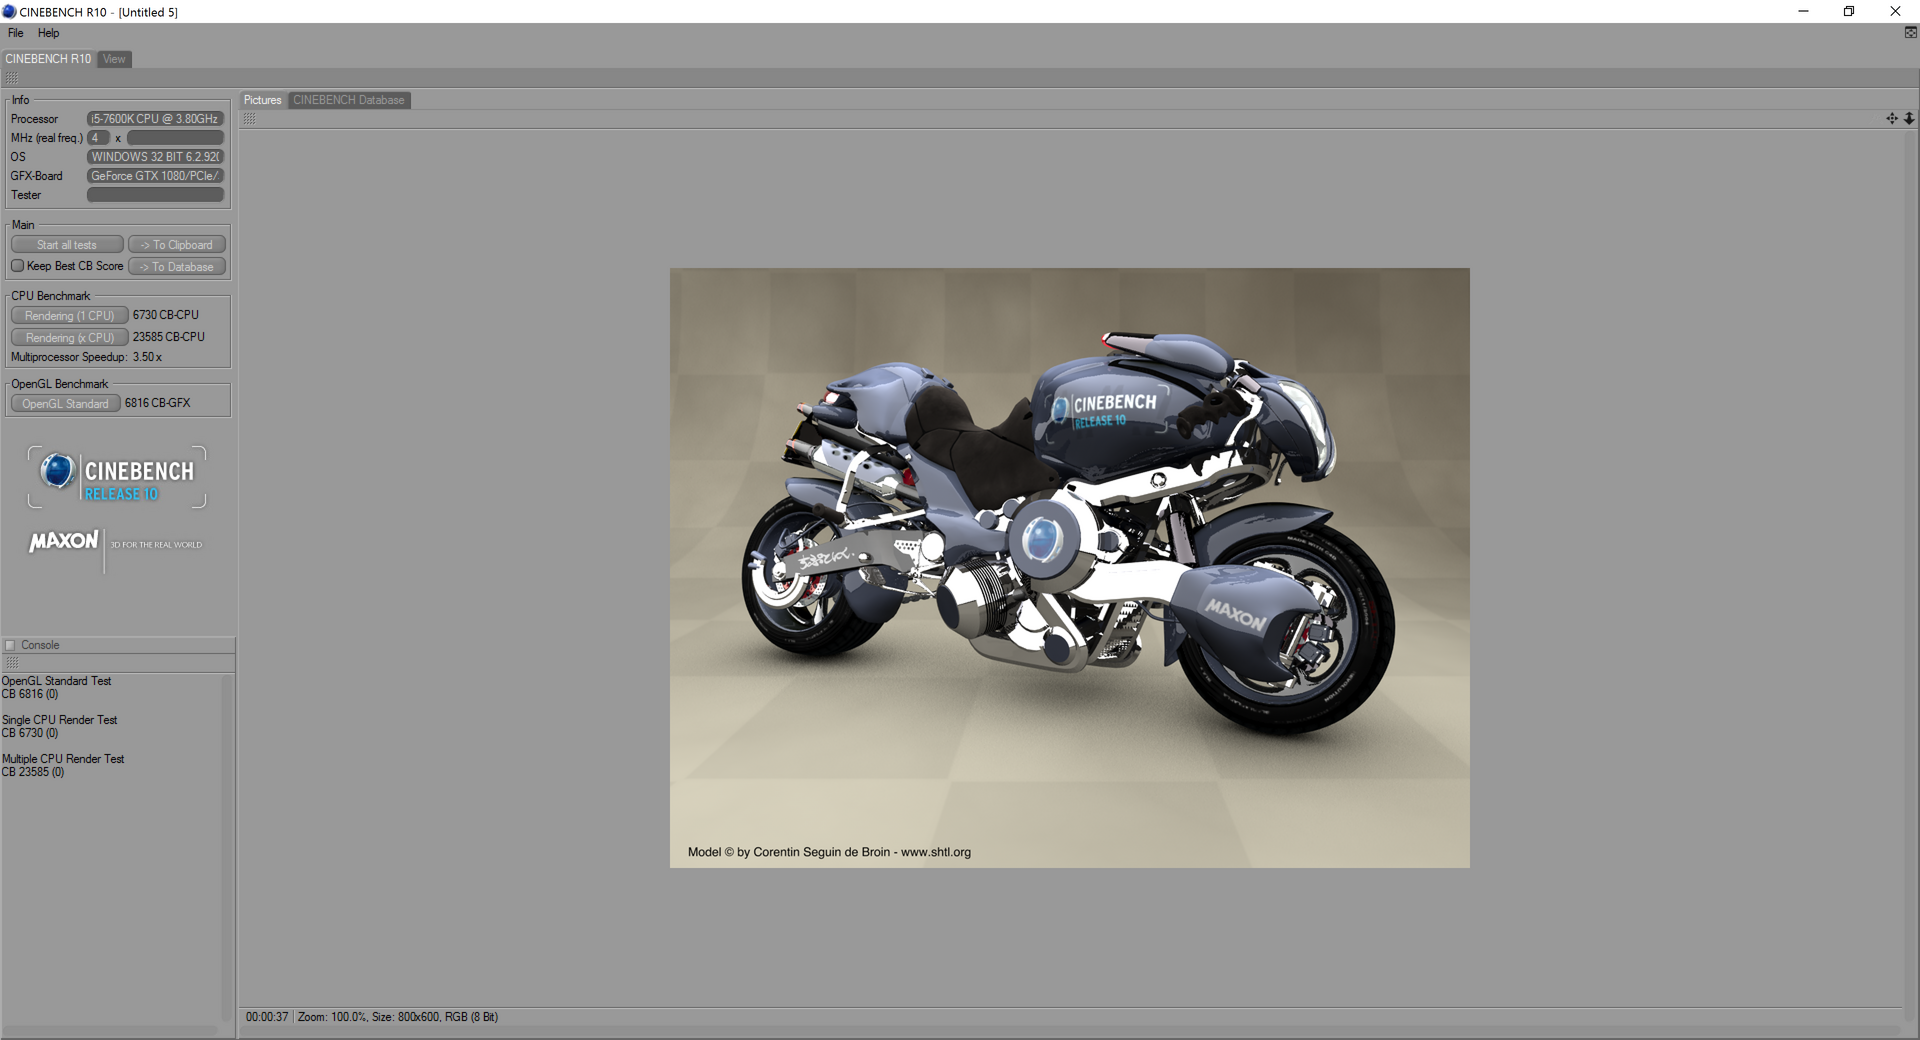
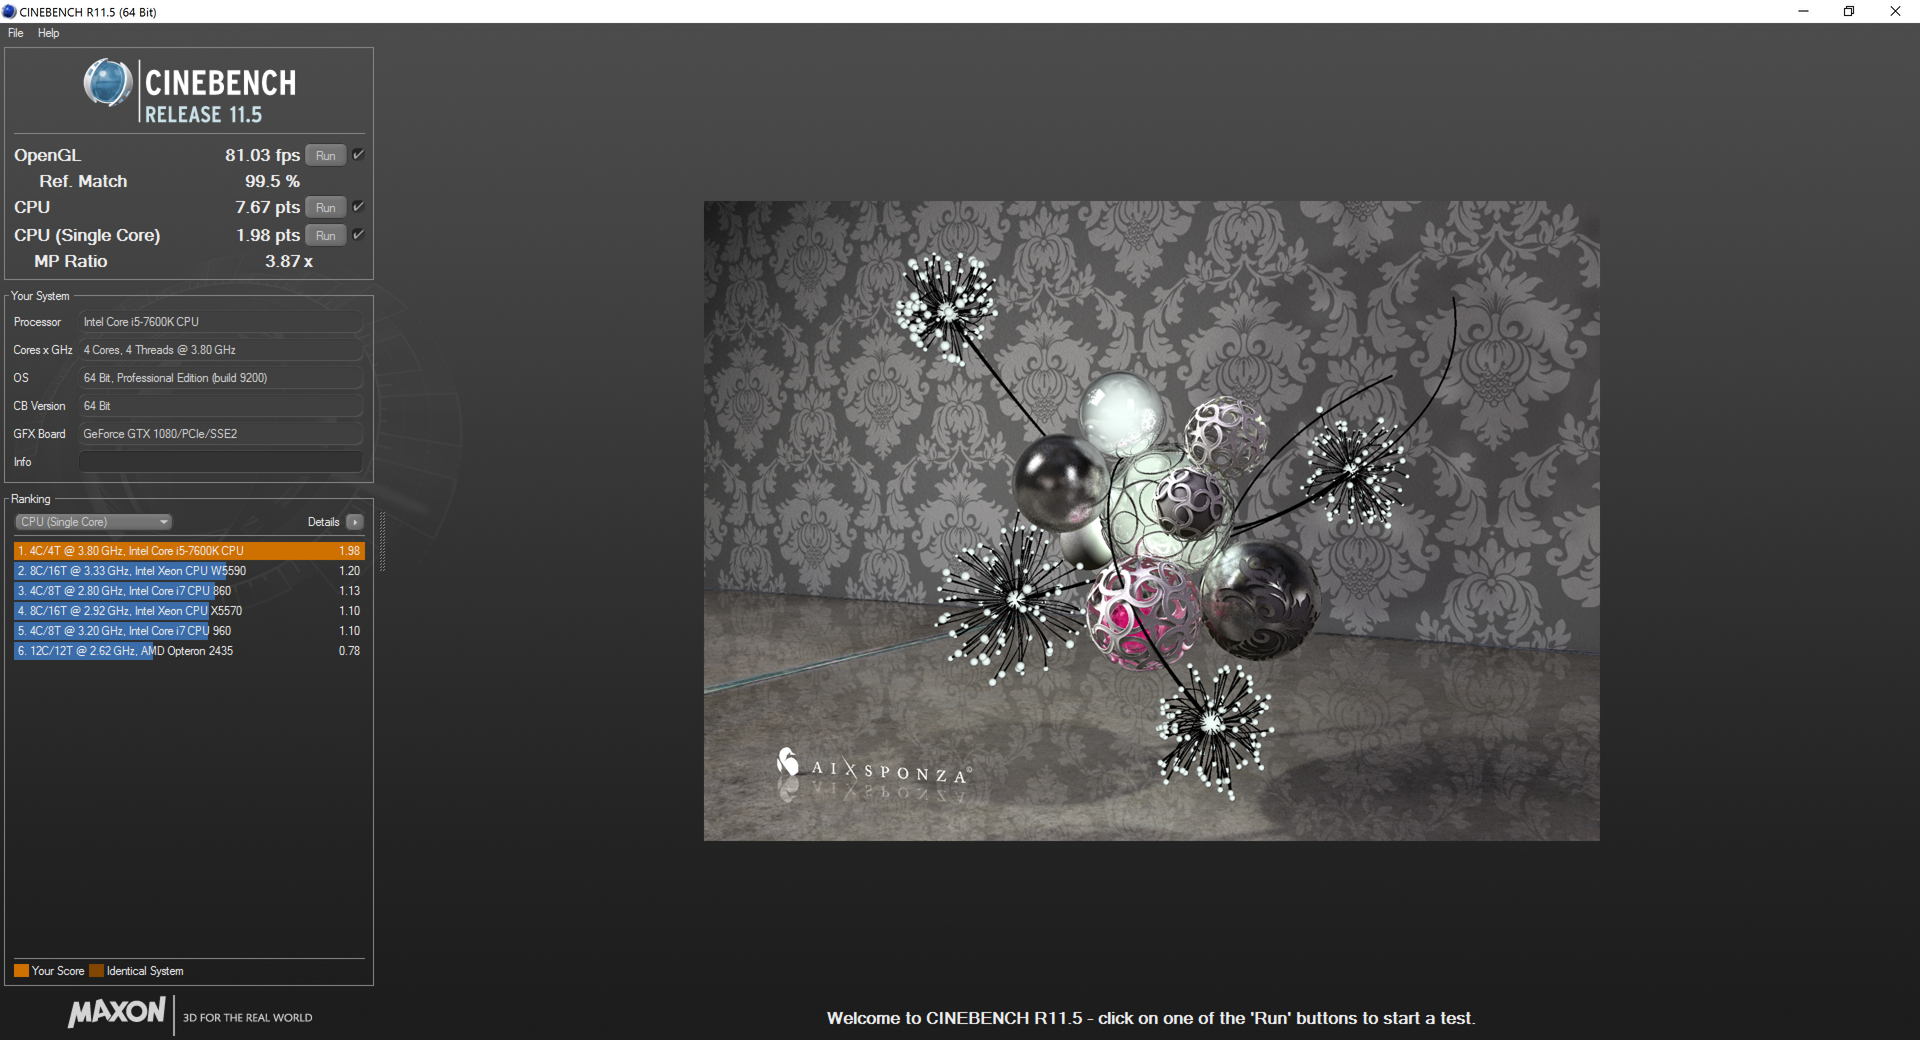
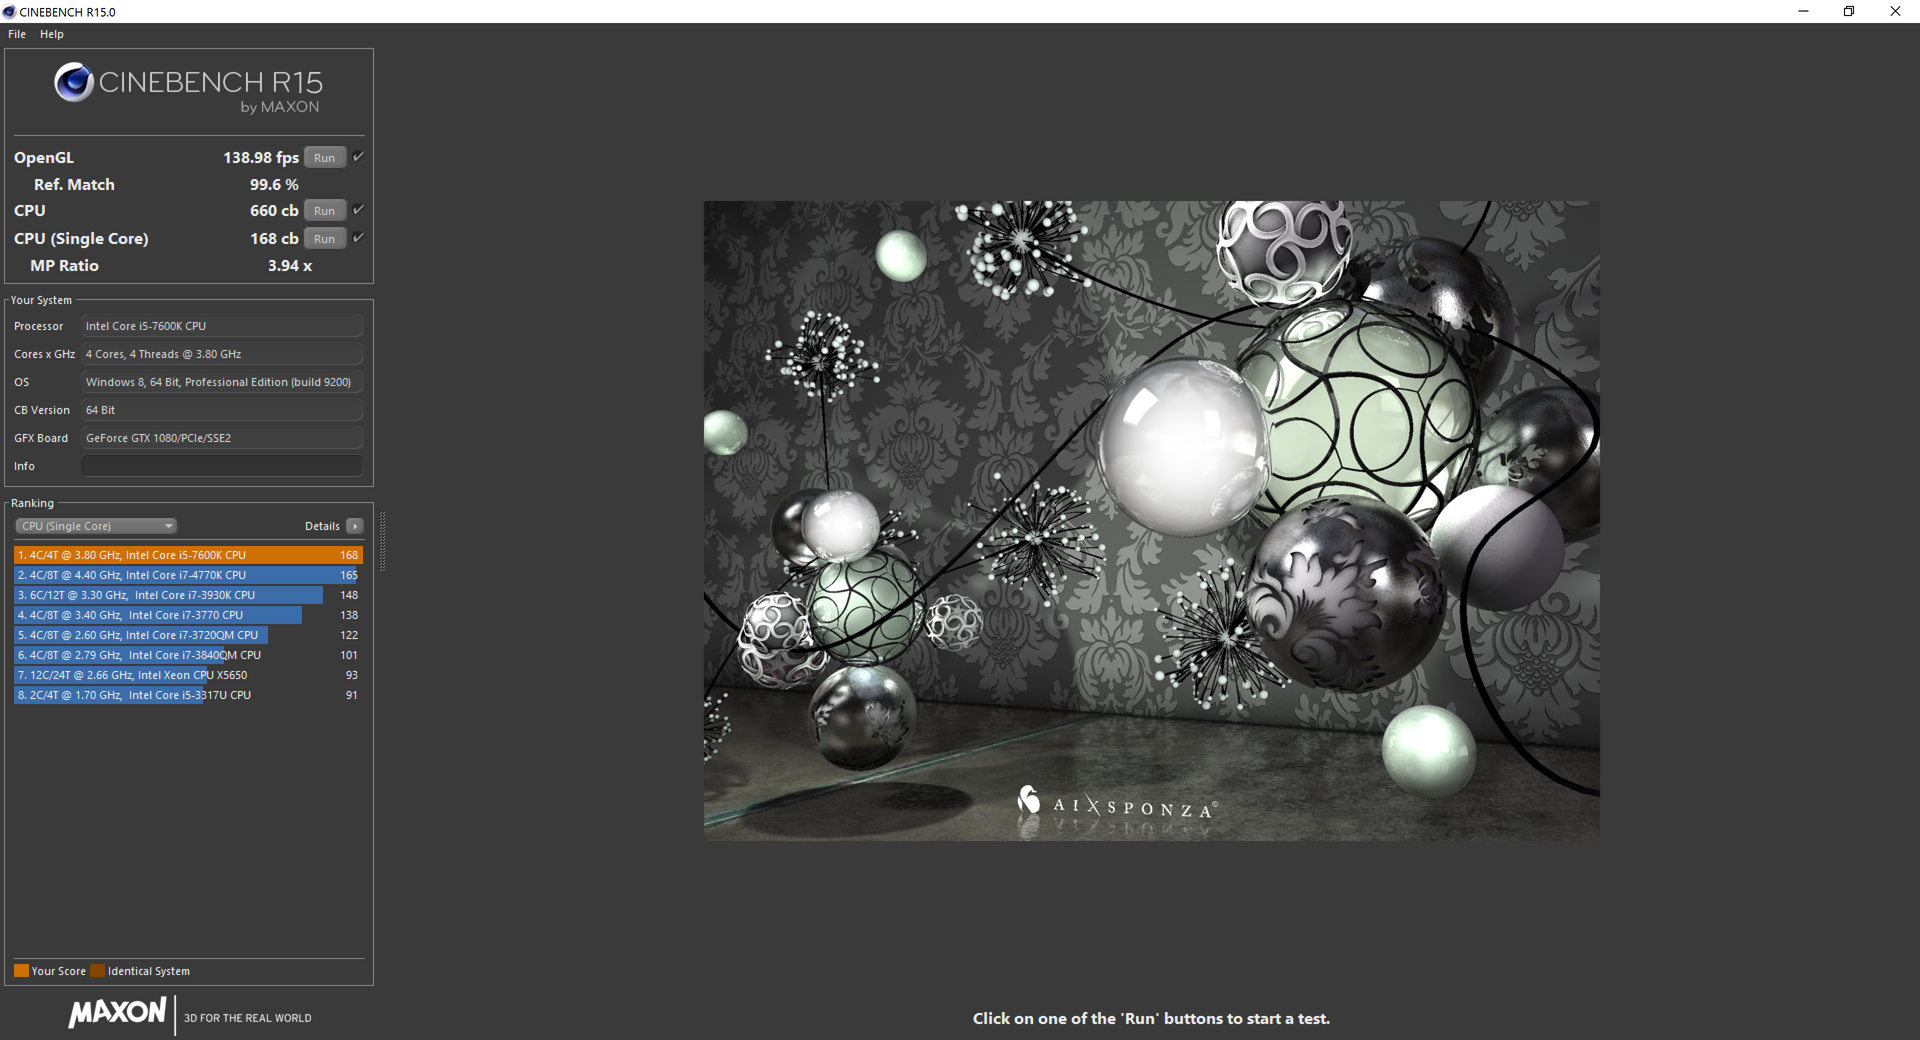
Running CineBench R15 Multi-Thread in a loop results in consistently lower scores than our initial score of 660 points. Scores hover in the 640 to 650 range due to the inability to maintain absolute maximum Turbo Boost for extended periods. Fortunately, this only represents a 5 percent decrease in CPU performance over time at most.
| Cinebench R15 | |
| CPU Single 64Bit | |
| i5-7600K Gigabyte Z270-Gaming K3 | |
| Eurocom Tornado F5 | |
| Asus G701VIK-BA049T | |
| Eurocom Tornado F5 Killer Edition | |
| Eurocom Sky X7E2 | |
| Dell XPS 15 9560 (i7-7700HQ, UHD) | |
| MSI GT80 Titan SLI | |
| Asus GL702VM-GC102D | |
| Lenovo IdeaPad Y50 | |
| CPU Multi 64Bit | |
| Asus G701VIK-BA049T | |
| Eurocom Tornado F5 | |
| Eurocom Sky X7E2 | |
| Dell XPS 15 9560 (i7-7700HQ, UHD) | |
| MSI GT80 Titan SLI | |
| i5-7600K Gigabyte Z270-Gaming K3 | |
| Asus GL702VM-GC102D | |
| Eurocom Tornado F5 Killer Edition | |
| Lenovo IdeaPad Y50 | |
| Cinebench R11.5 | |
| CPU Single 64Bit | |
| Eurocom Tornado F5 | |
| Asus G701VIK-BA049T | |
| i5-7600K Gigabyte Z270-Gaming K3 | |
| Eurocom Tornado F5 Killer Edition | |
| Dell XPS 15 9560 (i7-7700HQ, UHD) | |
| Eurocom Sky X7E2 | |
| MSI GT80 Titan SLI | |
| Asus GL702VM-GC102D | |
| Lenovo IdeaPad Y50 | |
| CPU Multi 64Bit | |
| Asus G701VIK-BA049T | |
| Eurocom Tornado F5 | |
| Eurocom Sky X7E2 | |
| Dell XPS 15 9560 (i7-7700HQ, UHD) | |
| i5-7600K Gigabyte Z270-Gaming K3 | |
| MSI GT80 Titan SLI | |
| Eurocom Tornado F5 Killer Edition | |
| Asus GL702VM-GC102D | |
| Lenovo IdeaPad Y50 | |
| Cinebench R10 | |
| Rendering Multiple CPUs 32Bit | |
| Eurocom Tornado F5 | |
| i5-7600K Gigabyte Z270-Gaming K3 | |
| Eurocom Sky X7E2 | |
| Eurocom Tornado F5 Killer Edition | |
| MSI GT80 Titan SLI | |
| Dell XPS 15 9560 (i7-7700HQ, UHD) | |
| Asus GL702VM-GC102D | |
| Lenovo IdeaPad Y50 | |
| Rendering Single 32Bit | |
| Eurocom Tornado F5 | |
| i5-7600K Gigabyte Z270-Gaming K3 | |
| Eurocom Tornado F5 Killer Edition | |
| Eurocom Sky X7E2 | |
| Dell XPS 15 9560 (i7-7700HQ, UHD) | |
| MSI GT80 Titan SLI | |
| Asus GL702VM-GC102D | |
| Lenovo IdeaPad Y50 | |
| wPrime 2.10 - 1024m | |
| Lenovo IdeaPad Y50 | |
| i5-7600K Gigabyte Z270-Gaming K3 | |
| Eurocom Tornado F5 Killer Edition | |
| Dell XPS 15 9560 (i7-7700HQ, UHD) | |
| Eurocom Sky X7E2 | |
| Eurocom Tornado F5 | |
| 3DMark | |
| 3840x2160 Fire Strike Ultra Physics | |
| Eurocom Tornado F5 | |
| Eurocom Sky X7E2 | |
| Dell XPS 15 9560 (i7-7700HQ, UHD) | |
| Asus GL702VM-GC102D | |
| Eurocom Tornado F5 Killer Edition | |
| Fire Strike Extreme Physics | |
| Eurocom Tornado F5 | |
| Eurocom Sky X7E2 | |
| MSI GT80 Titan SLI | |
| Dell XPS 15 9560 (i7-7700HQ, UHD) | |
| Asus GL702VM-GC102D | |
| Eurocom Tornado F5 Killer Edition | |
| Lenovo IdeaPad Y50 | |
| 1920x1080 Fire Strike Physics | |
| Eurocom Tornado F5 | |
| Eurocom Sky X7E2 | |
| Asus G701VIK-BA049T | |
| MSI GT80 Titan SLI | |
| Dell XPS 15 9560 (i7-7700HQ, UHD) | |
| i5-7600K Gigabyte Z270-Gaming K3 | |
| Asus GL702VM-GC102D | |
| Eurocom Tornado F5 Killer Edition | |
| Lenovo IdeaPad Y50 | |
* ... smaller is better
System Performance
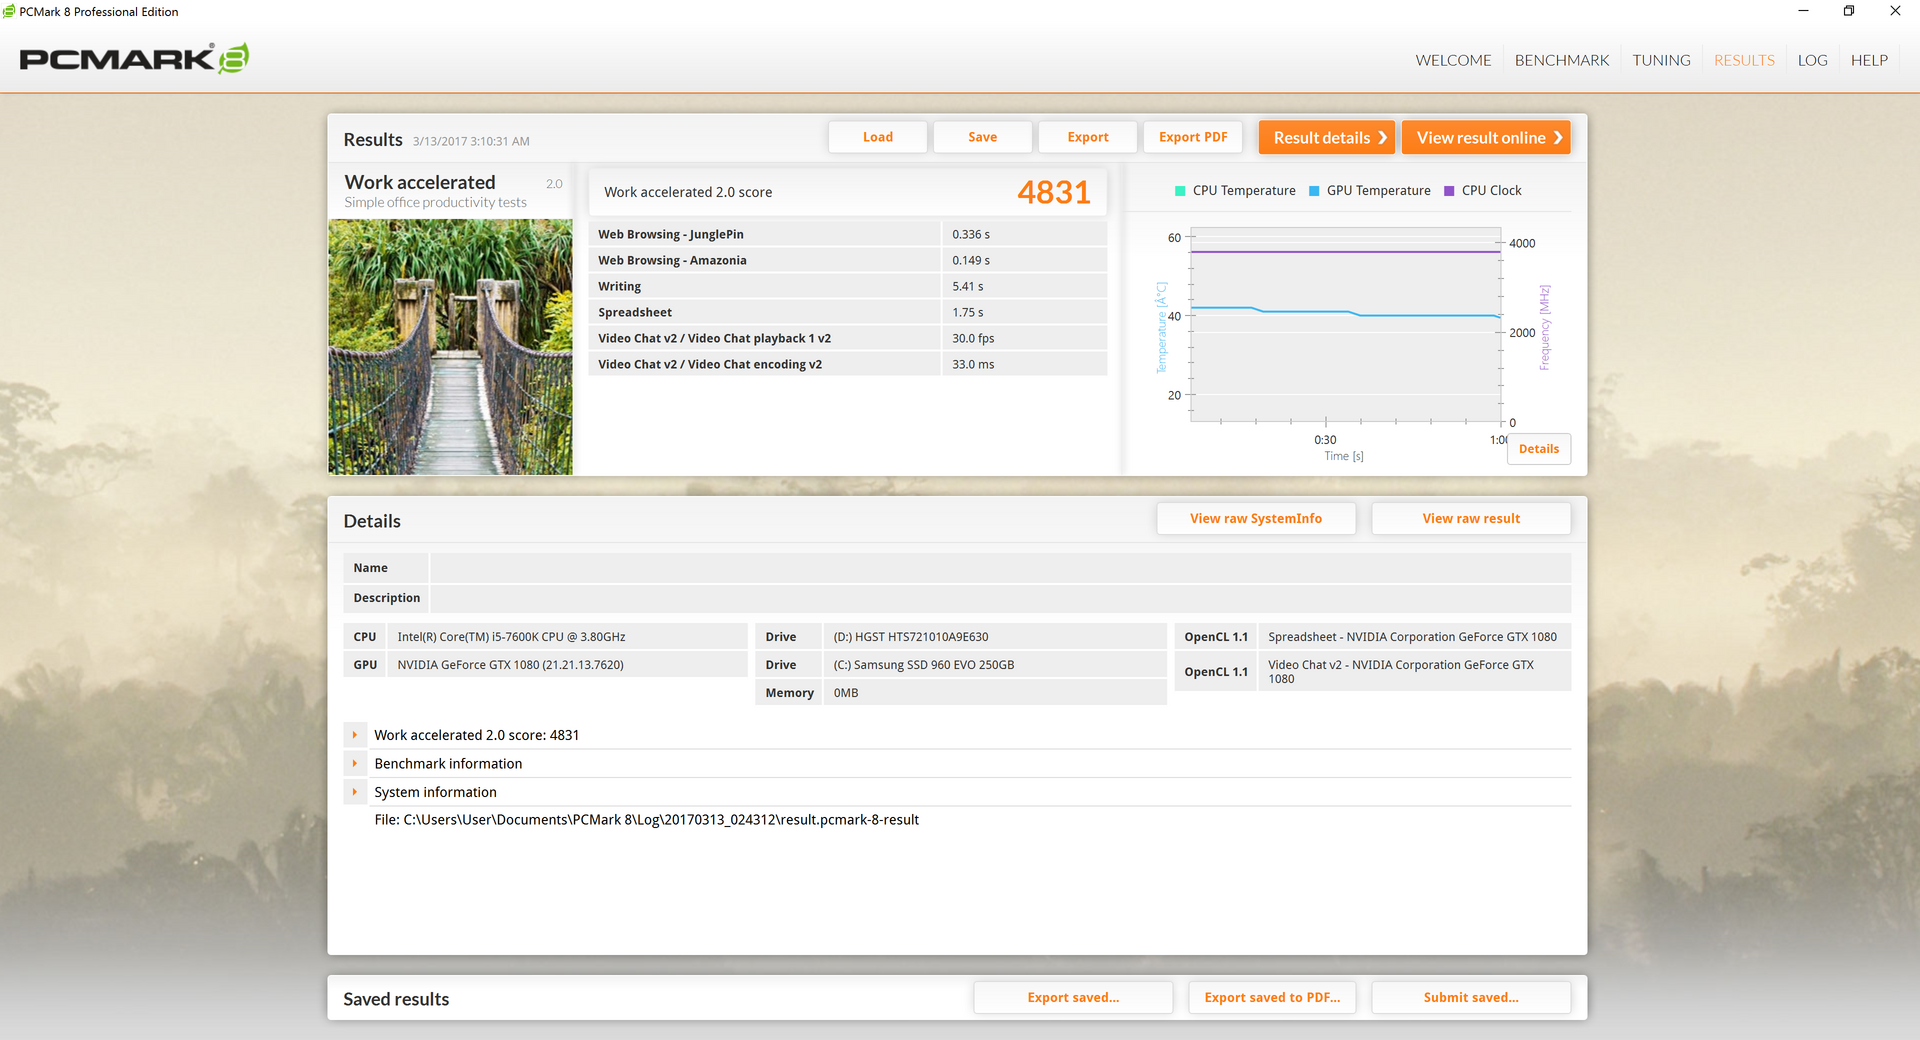
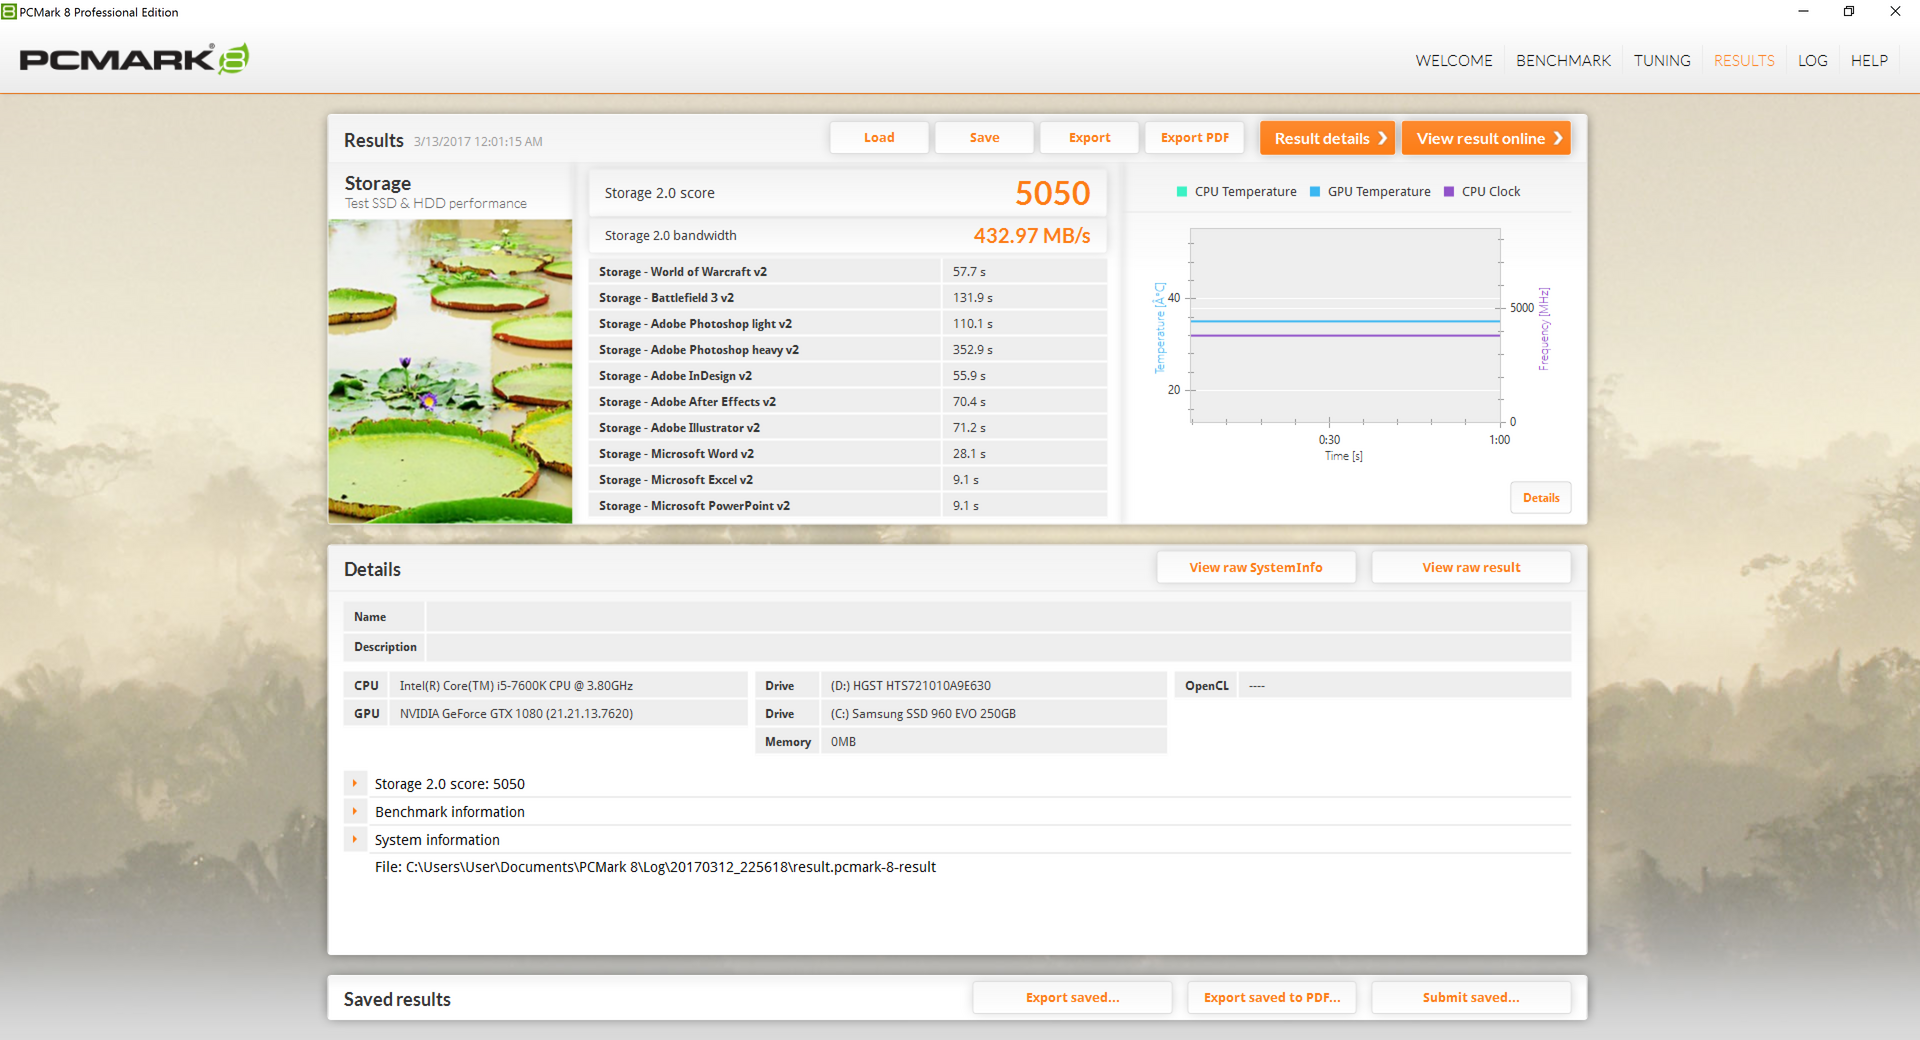
PCMark 8 ranks our system in the same ballpark as other gaming notebooks if not slightly lower despite the high-power Kaby Lake desktop processor. Our original Tornado F5 configuration outscores this particular Tornado F5 Killer Edition due to the faster i7-7700K CPU and faster primary NVMe SSD.
We experienced no software or hardware related issues during our time with the Eurocom test unit.
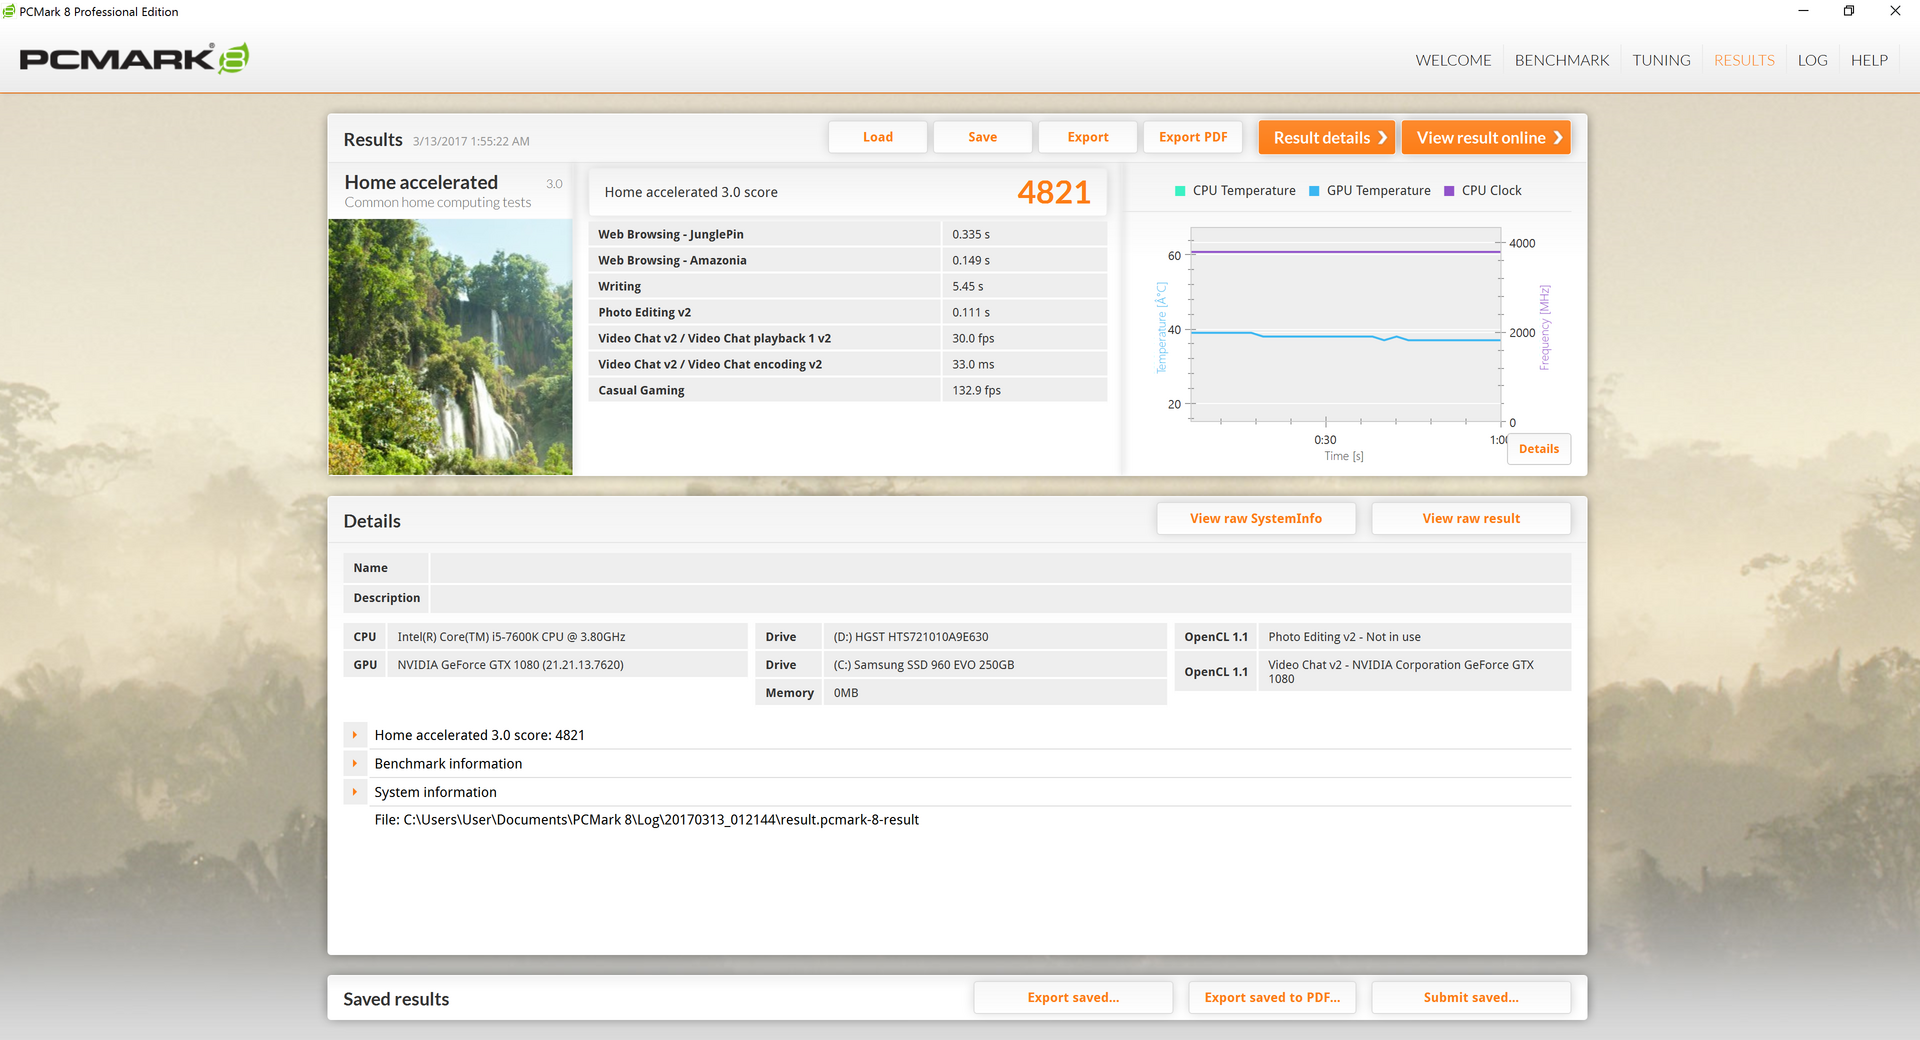
| PCMark 8 | |
| Home Score Accelerated v2 | |
| Asus G701VIK-BA049T | |
| Eurocom Tornado F5 | |
| Alienware 15 R3 | |
| Eurocom Tornado F5 Killer Edition | |
| Dell XPS 15 9560 (i7-7700HQ, UHD) | |
| Work Score Accelerated v2 | |
| Eurocom Tornado F5 | |
| Asus G701VIK-BA049T | |
| Alienware 15 R3 | |
| Eurocom Tornado F5 Killer Edition | |
| Dell XPS 15 9560 (i7-7700HQ, UHD) | |
| Creative Score Accelerated v2 | |
| Eurocom Tornado F5 | |
| Eurocom Tornado F5 Killer Edition | |
| Alienware 15 R3 | |
| Dell XPS 15 9560 (i7-7700HQ, UHD) | |
| PCMark 8 Home Score Accelerated v2 | 4821 points | |
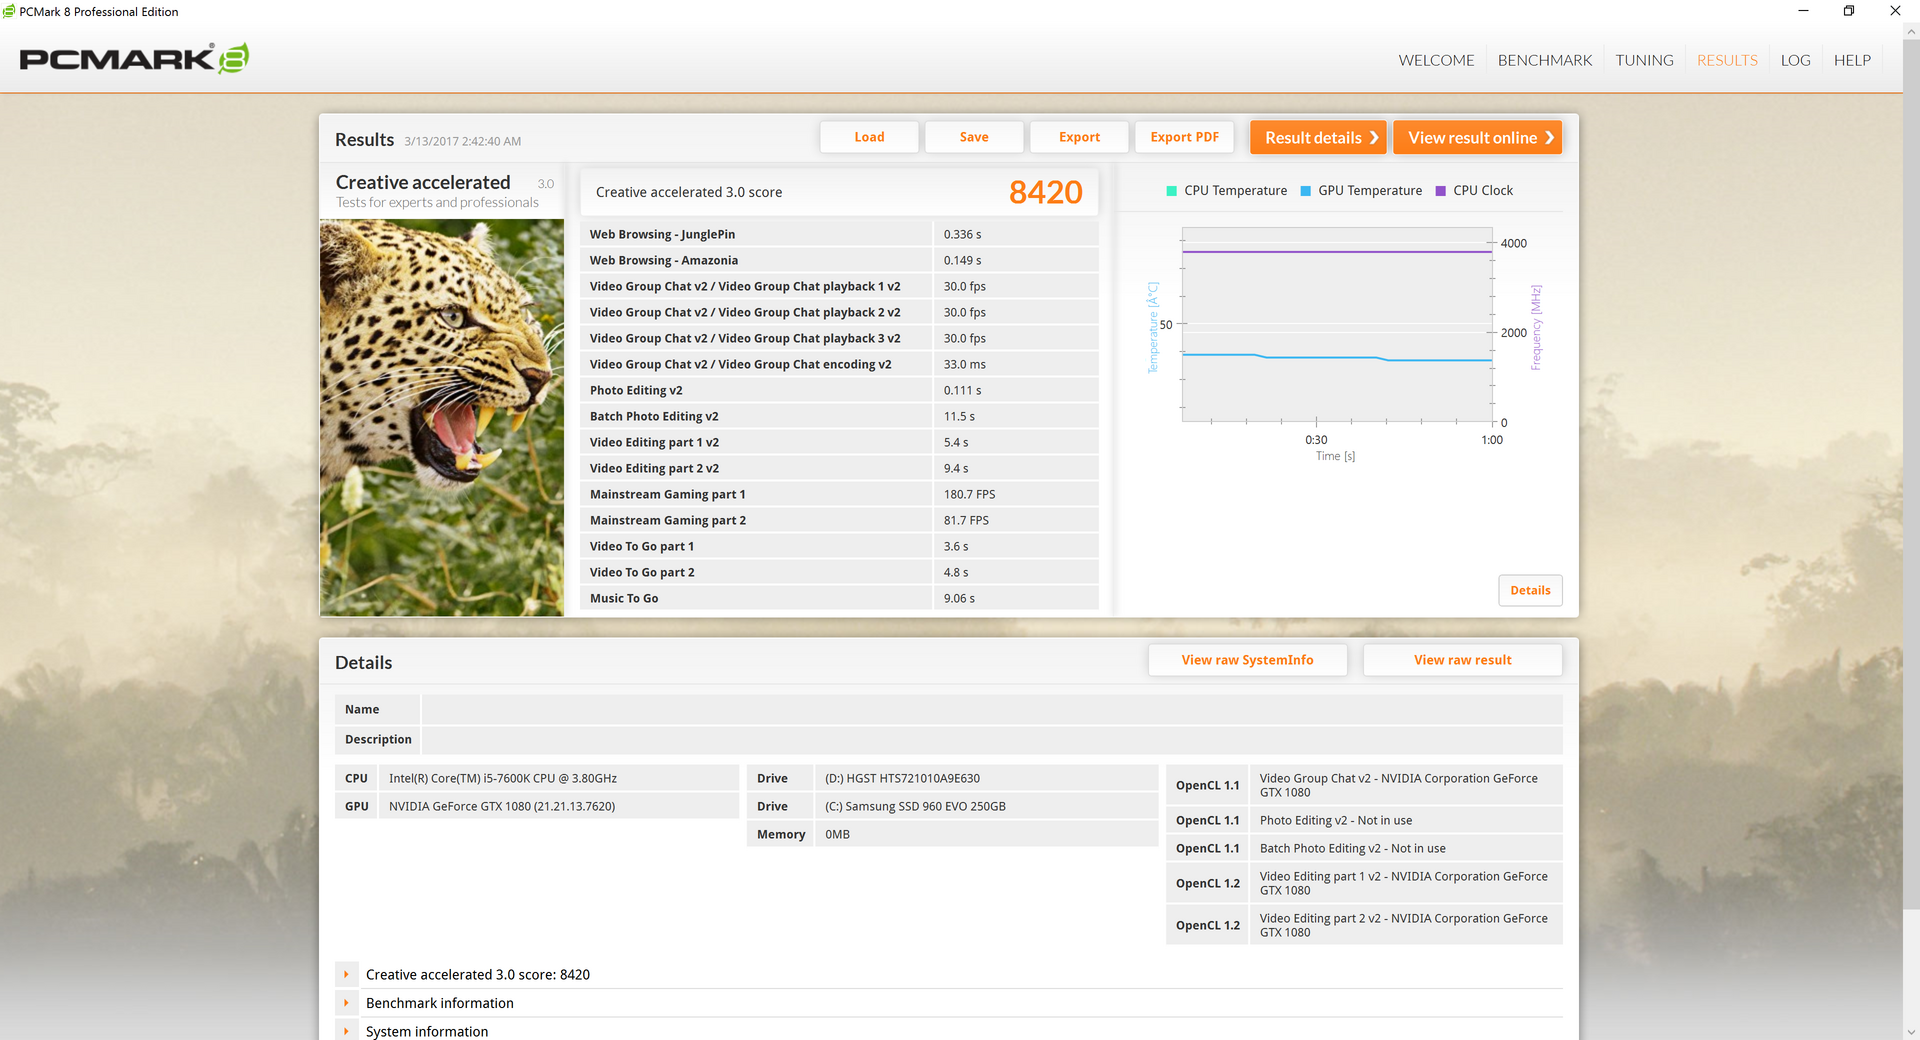
| PCMark 8 Creative Score Accelerated v2 | 8420 points | |
| PCMark 8 Work Score Accelerated v2 | 4831 points | |
Help | ||
Storage Devices
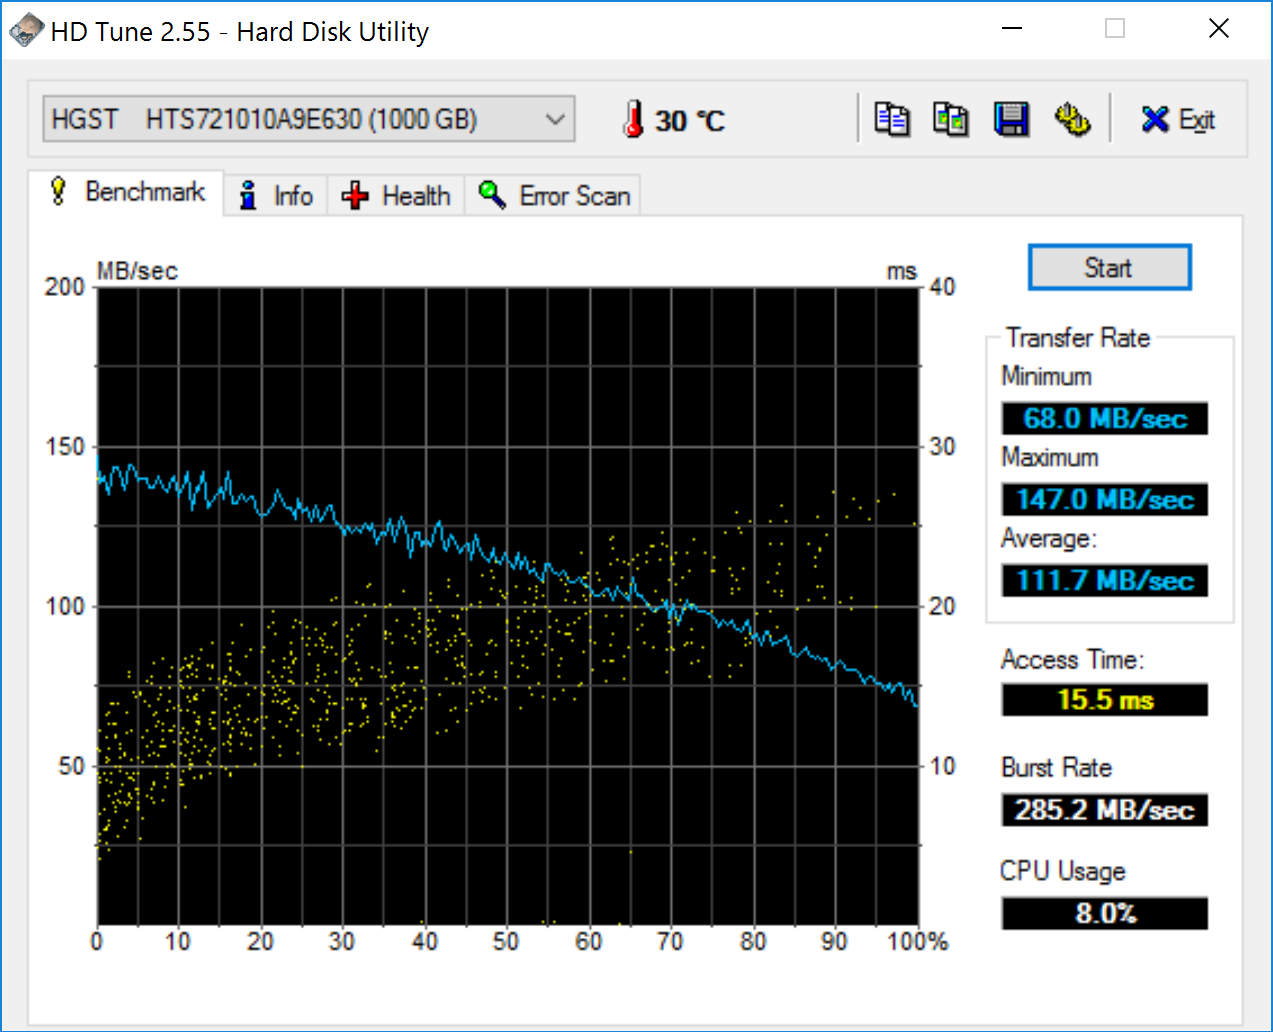
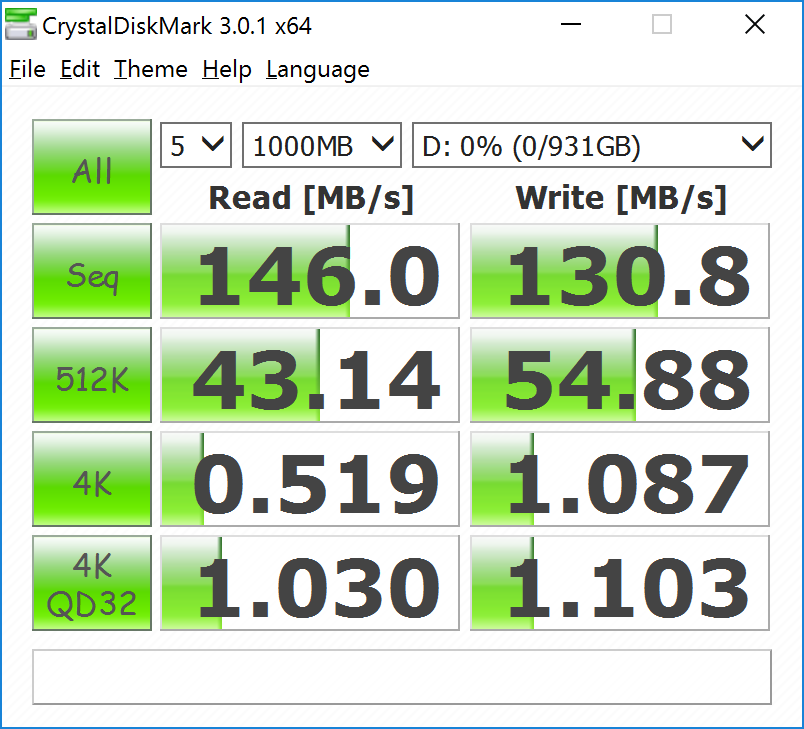
15-inch gaming notebooks are typically equipped with a single M.2 slot for fast SSD storage alongside a secondary 2.5-inch SATA III bay for additional storage. The Tornado F5 adds in one more M.2 slot for NVMe with RAID compatibility. The Samsung SSD 960 Evo in our test unit is slower than the Samsung SSD 960 Pro SSD in our initial Tornado F5 configuration especially in sequential read speeds according to CDM. Sequential write rates are still excellent for a NVMe SSD as it easily outpaces both the Lite-on CX2 in the XPS 15 and the SK Hynix PC300 in the Alienware 15. Meanwhile, the secondary 7200 RPM Toshiba HGST HDD returns a respectable average transfer rate of over 111 MB/s according to HD Tune.
See our growing list of HDDs and SSDs for more benchmark comparisons.
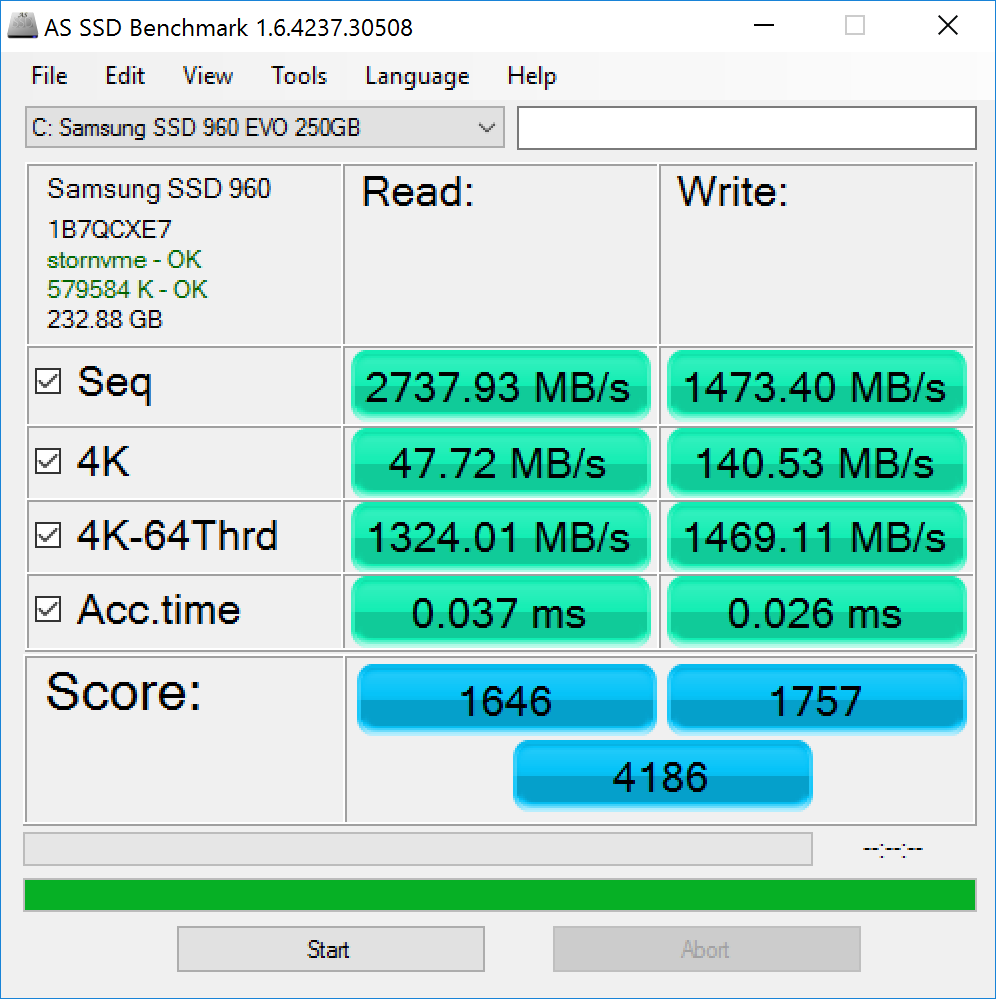
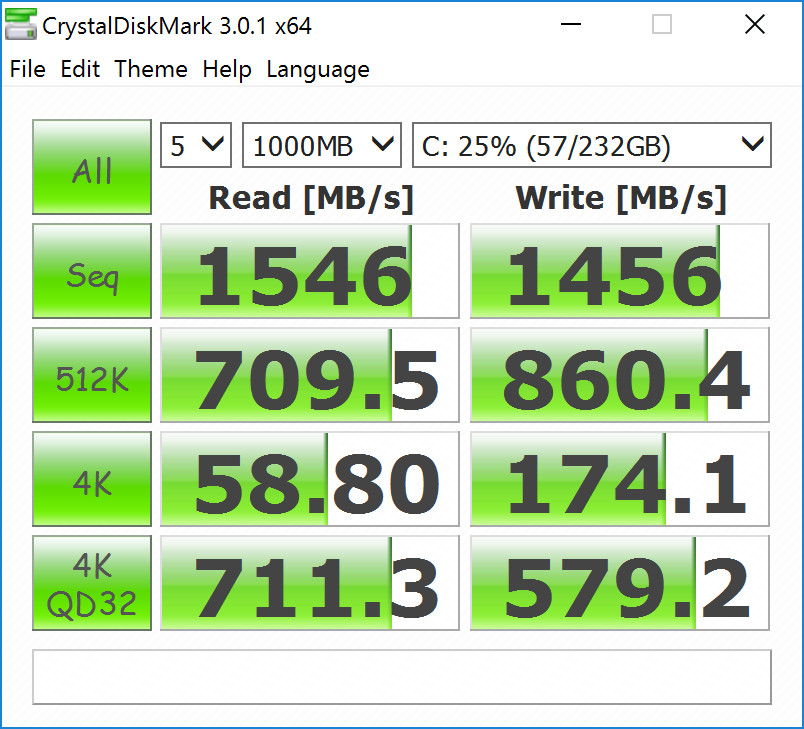
| Eurocom Tornado F5 Killer Edition Samsung SSD 960 Evo 250GB m.2 NVMe | Dell XPS 15 9560 (i7-7700HQ, UHD) Lite-On CX2-8B512-Q11 | Alienware 15 R3 | Eurocom Tornado F5 Samsung SSD 960 Pro 512 GB m.2 | MSI GT62VR 7RE-223 Samsung SSD PM871a MZNLN256HMHQ | |
|---|---|---|---|---|---|
| CrystalDiskMark 3.0 | -7% | -31% | 10% | -50% | |
| Read Seq (MB/s) | 1546 | 1684 9% | 1123 -27% | 2145 39% | 521 -66% |
| Write Seq (MB/s) | 1456 | 1106 -24% | 429.2 -71% | 1724 18% | 422.8 -71% |
| Read 512 (MB/s) | 710 | 977 38% | 833 17% | 715 1% | 462 -35% |
| Write 512 (MB/s) | 860 | 1119 30% | 428.1 -50% | 967 12% | 286.9 -67% |
| Read 4k (MB/s) | 58.8 | 45.14 -23% | 37.8 -36% | 55.9 -5% | 38.55 -34% |
| Write 4k (MB/s) | 174.1 | 134.1 -23% | 122.9 -29% | 180.6 4% | 122.8 -29% |
| Read 4k QD32 (MB/s) | 711 | 509 -28% | 542 -24% | 744 5% | 388.4 -45% |
| Write 4k QD32 (MB/s) | 579 | 398.1 -31% | 429.8 -26% | 634 9% | 257.9 -55% |

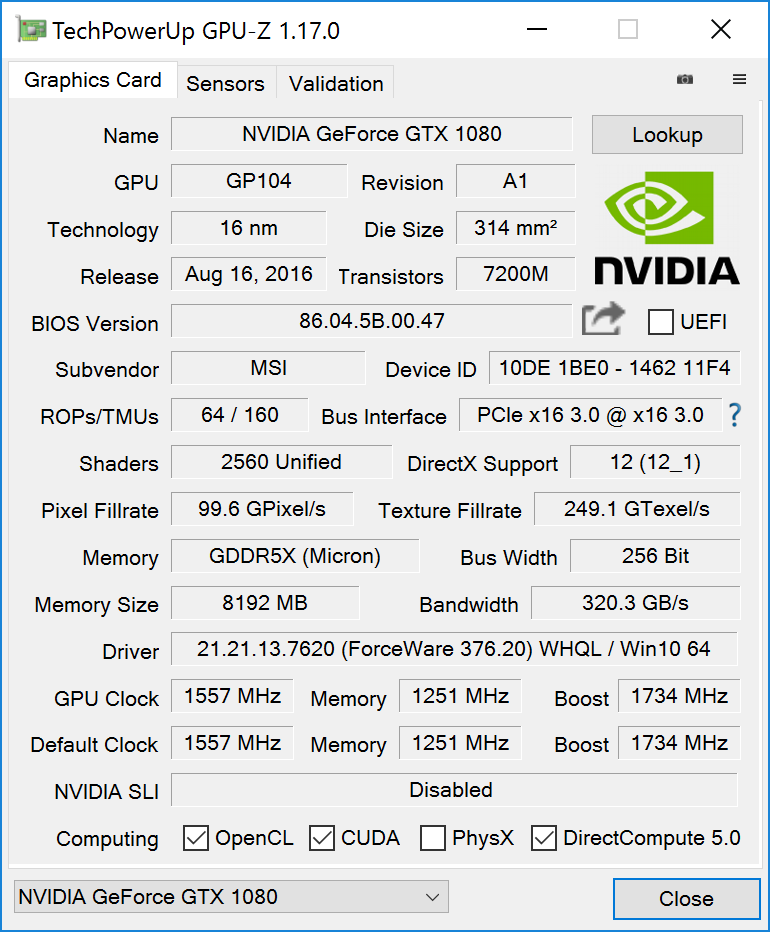
GPU Performance
3DMark results are essentially identical to our desktop GTX 1080 Founder's Edition reference card. In other words, the Tornado F5 offers the same raw graphics power as a loaded desktop without noticeable cut corners if assuming base clock rates. The all-mighty GTX 980M SLI in the older Eurocom X8 is about 10 to 15 percent slower than our much more efficient Tornado F5 configuration. The newly launched GTX 1080 Ti for desktops provides a 35 percent boost over the GTX 1080 according to Fire Strike.
See our review on the GTX 1080 for more technical details and benchmarks.
| 3DMark | |
| 1920x1080 Fire Strike Graphics | |
| i7-6950X Asus X99-E | |
| Schenker XMG U727 2017 | |
| MSI GT73VR 6RF | |
| Eurocom Tornado F5 Killer Edition | |
| Nvidia GeForce GTX 1080 Founders Edition | |
| Eurocom X8 | |
| Eurocom Tornado F5 | |
| Asus FX502VM-AS73 | |
| Asus Strix GL502VY-DS71 | |
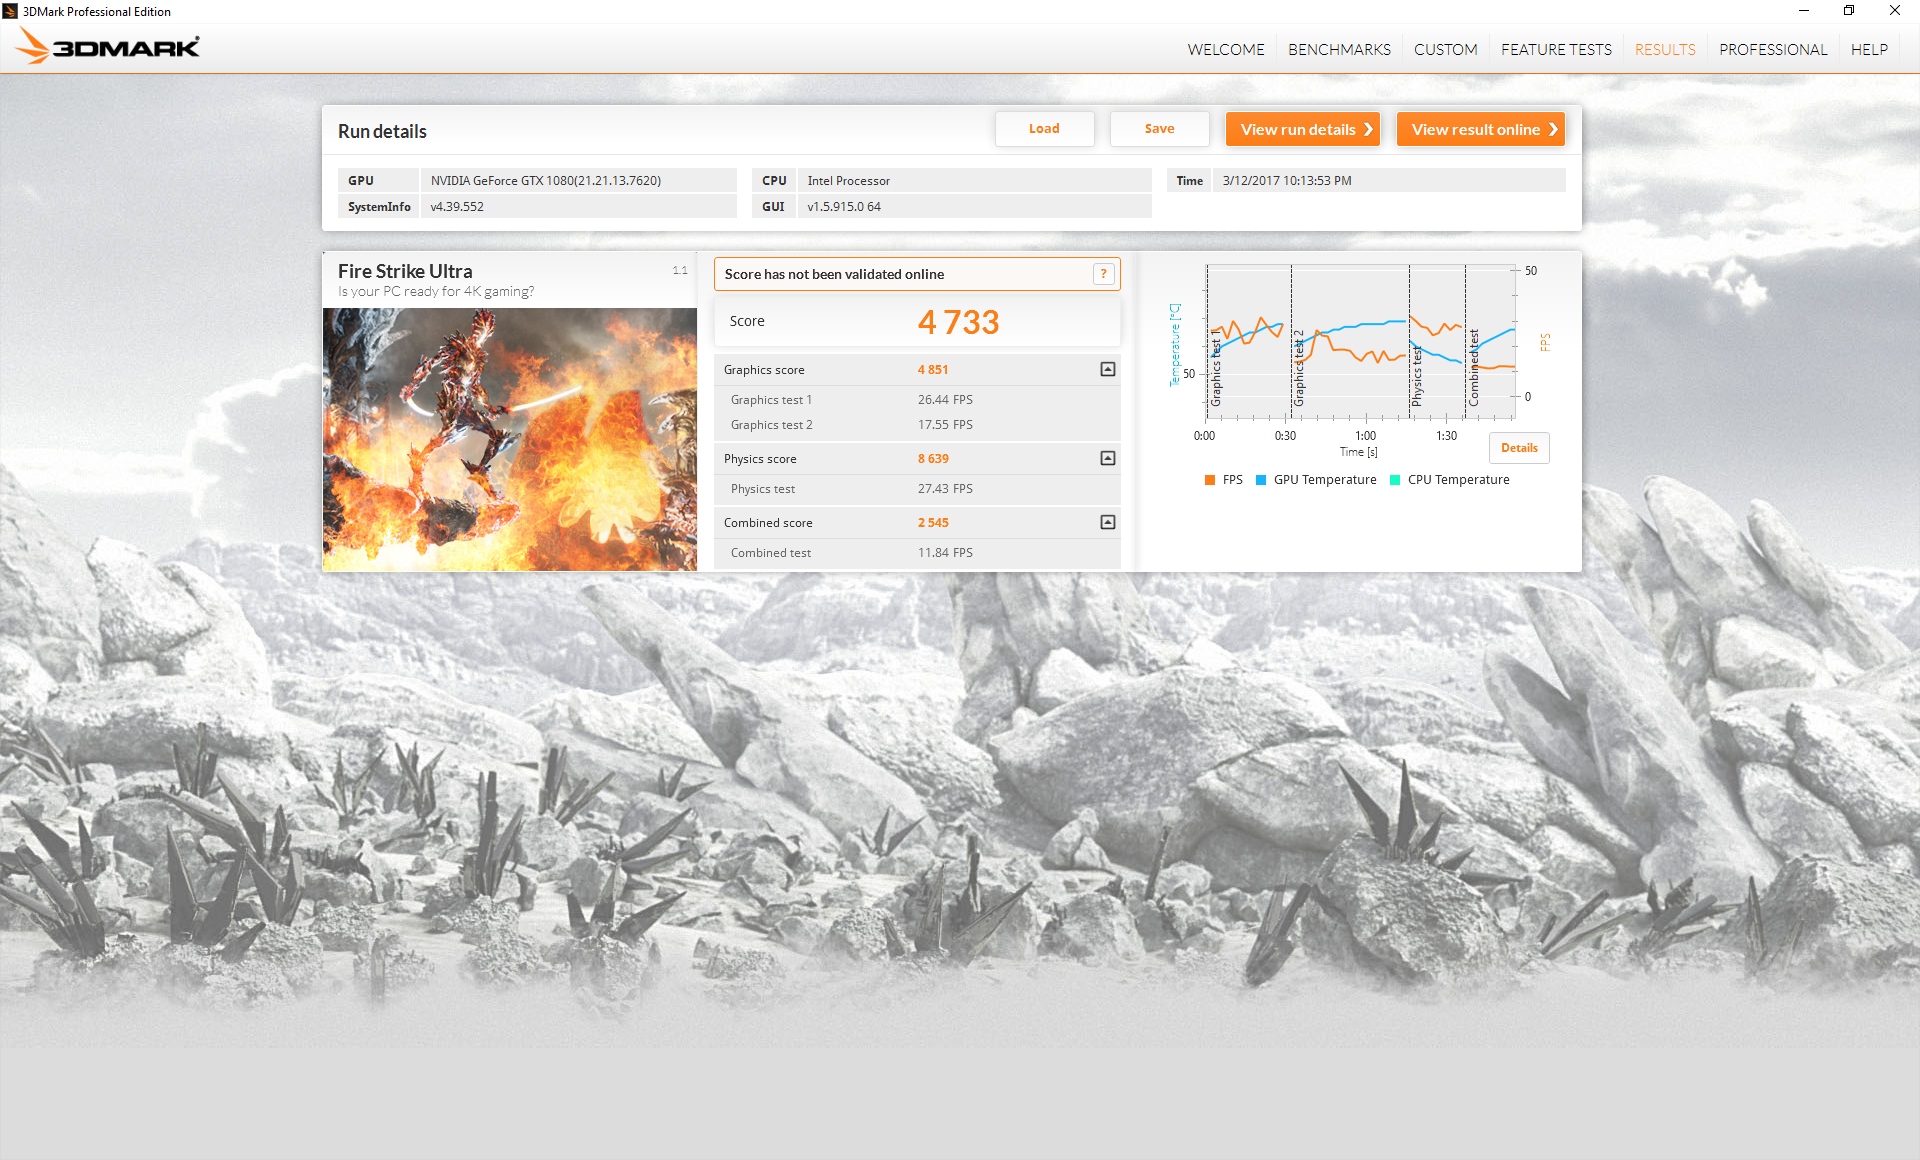
| 3840x2160 Fire Strike Ultra Graphics | |
| i7-6950X Asus X99-E | |
| MSI GT73VR 6RF | |
| Eurocom Tornado F5 Killer Edition | |
| Nvidia GeForce GTX 1080 Founders Edition | |
| Eurocom Tornado F5 | |
| Asus FX502VM-AS73 | |
| Asus Strix GL502VY-DS71 | |
| Fire Strike Extreme Graphics | |
| i7-6950X Asus X99-E | |
| MSI GT73VR 6RF | |
| Nvidia GeForce GTX 1080 Founders Edition | |
| Eurocom Tornado F5 Killer Edition | |
| Eurocom X8 | |
| Eurocom Tornado F5 | |
| Asus FX502VM-AS73 | |
| Asus Strix GL502VY-DS71 | |
| 3DMark 11 | |
| 1280x720 Performance GPU | |
| i7-6950X Asus X99-E | |
| Nvidia GeForce GTX 1080 Founders Edition | |
| Schenker XMG U727 2017 | |
| MSI GT73VR 6RF | |
| Eurocom Tornado F5 Killer Edition | |
| Eurocom Tornado F5 | |
| Eurocom X8 | |
| Asus FX502VM-AS73 | |
| Asus Strix GL502VY-DS71 | |
| 1280x720 Performance Combined | |
| i7-6950X Asus X99-E | |
| Nvidia GeForce GTX 1080 Founders Edition | |
| Schenker XMG U727 2017 | |
| Eurocom Tornado F5 | |
| Asus FX502VM-AS73 | |
| MSI GT73VR 6RF | |
| Eurocom X8 | |
| Eurocom Tornado F5 Killer Edition | |
| Asus Strix GL502VY-DS71 | |
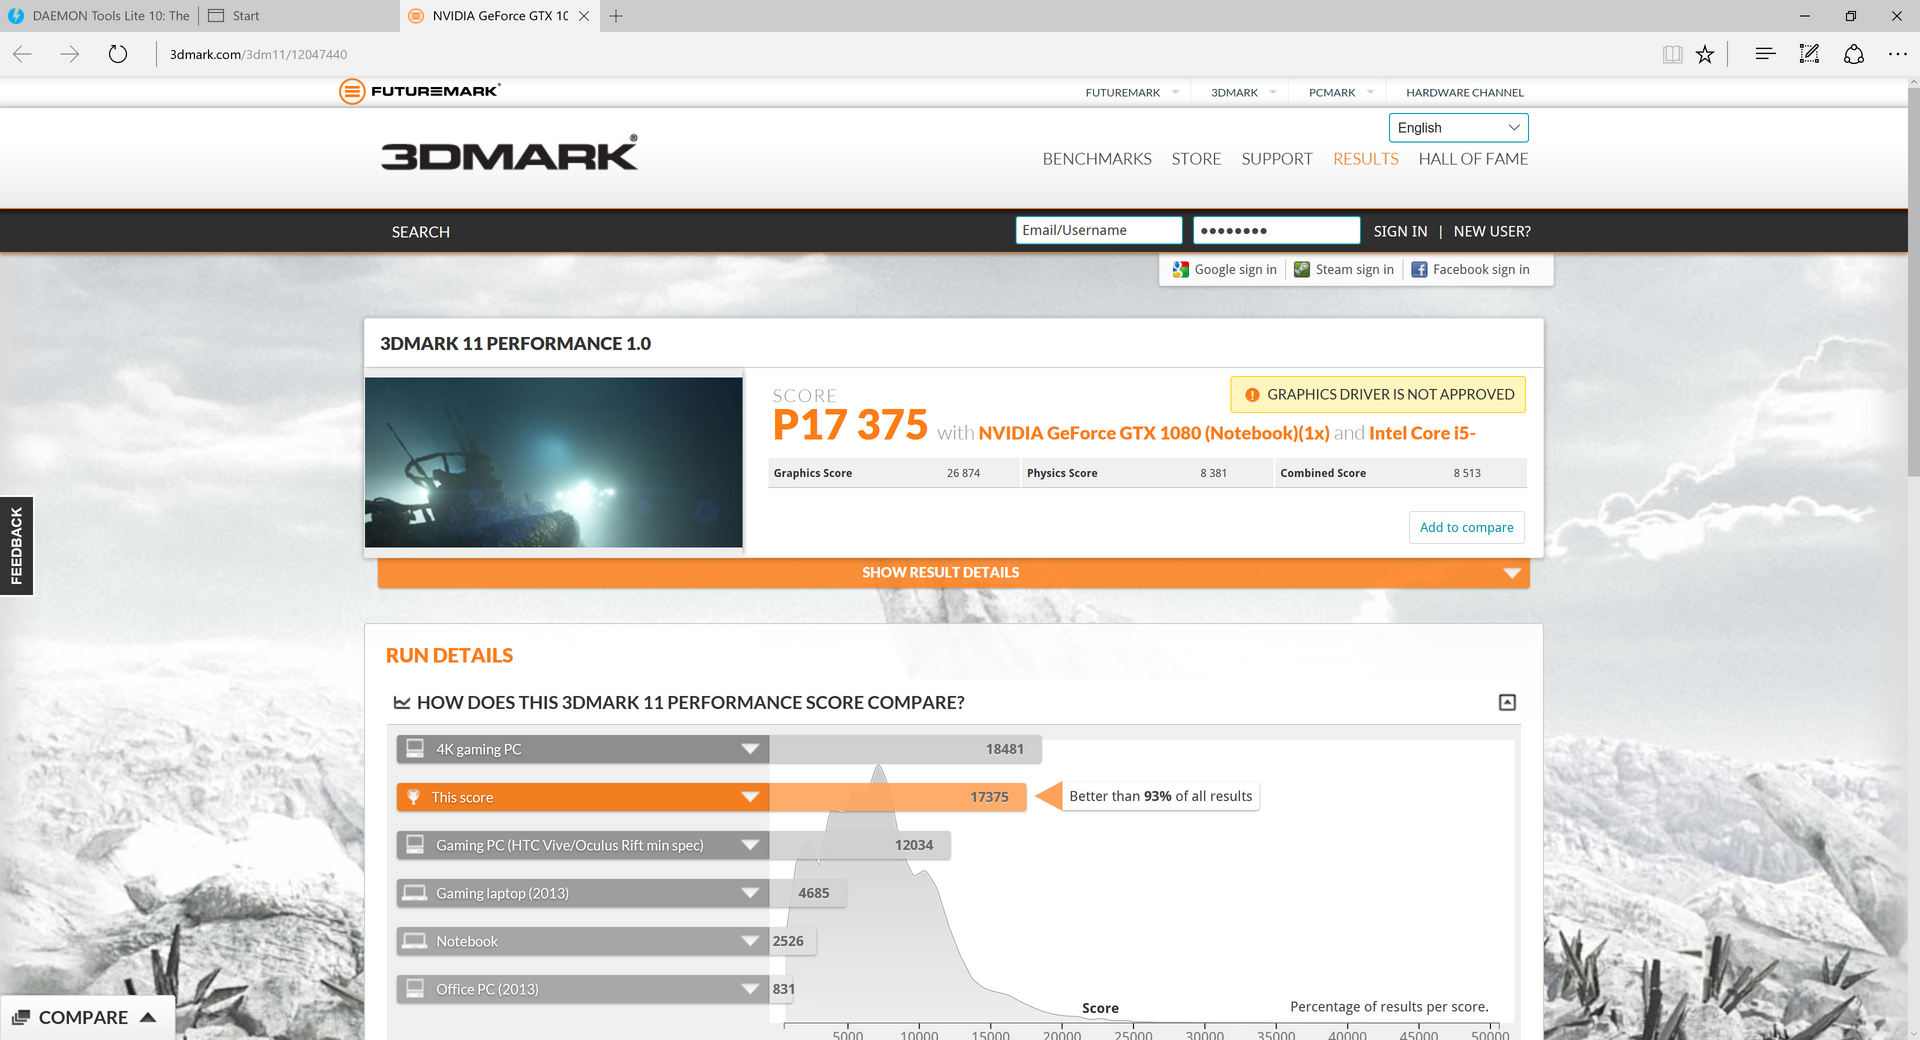
| 3DMark 11 Performance | 17375 points | |
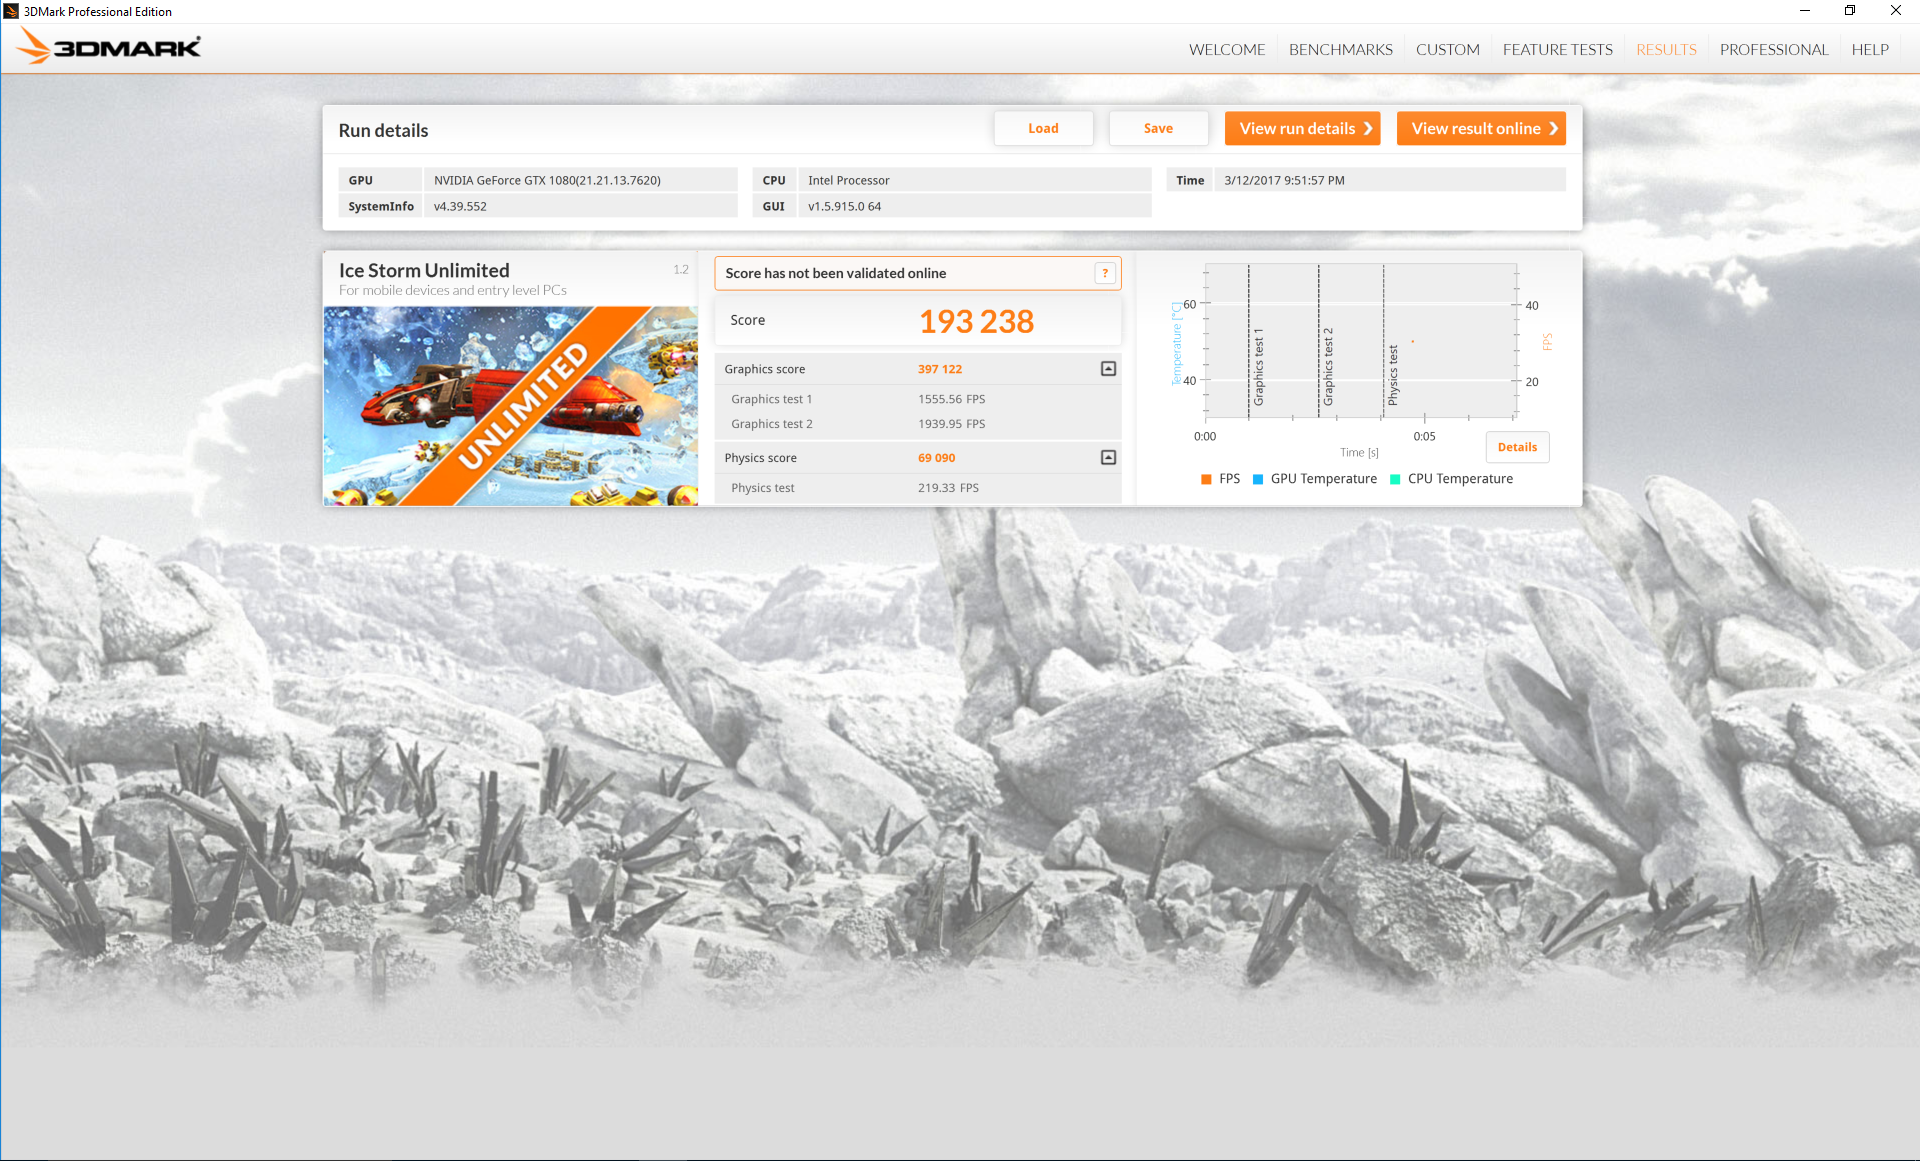
| 3DMark Ice Storm Standard Score | 153604 points | |
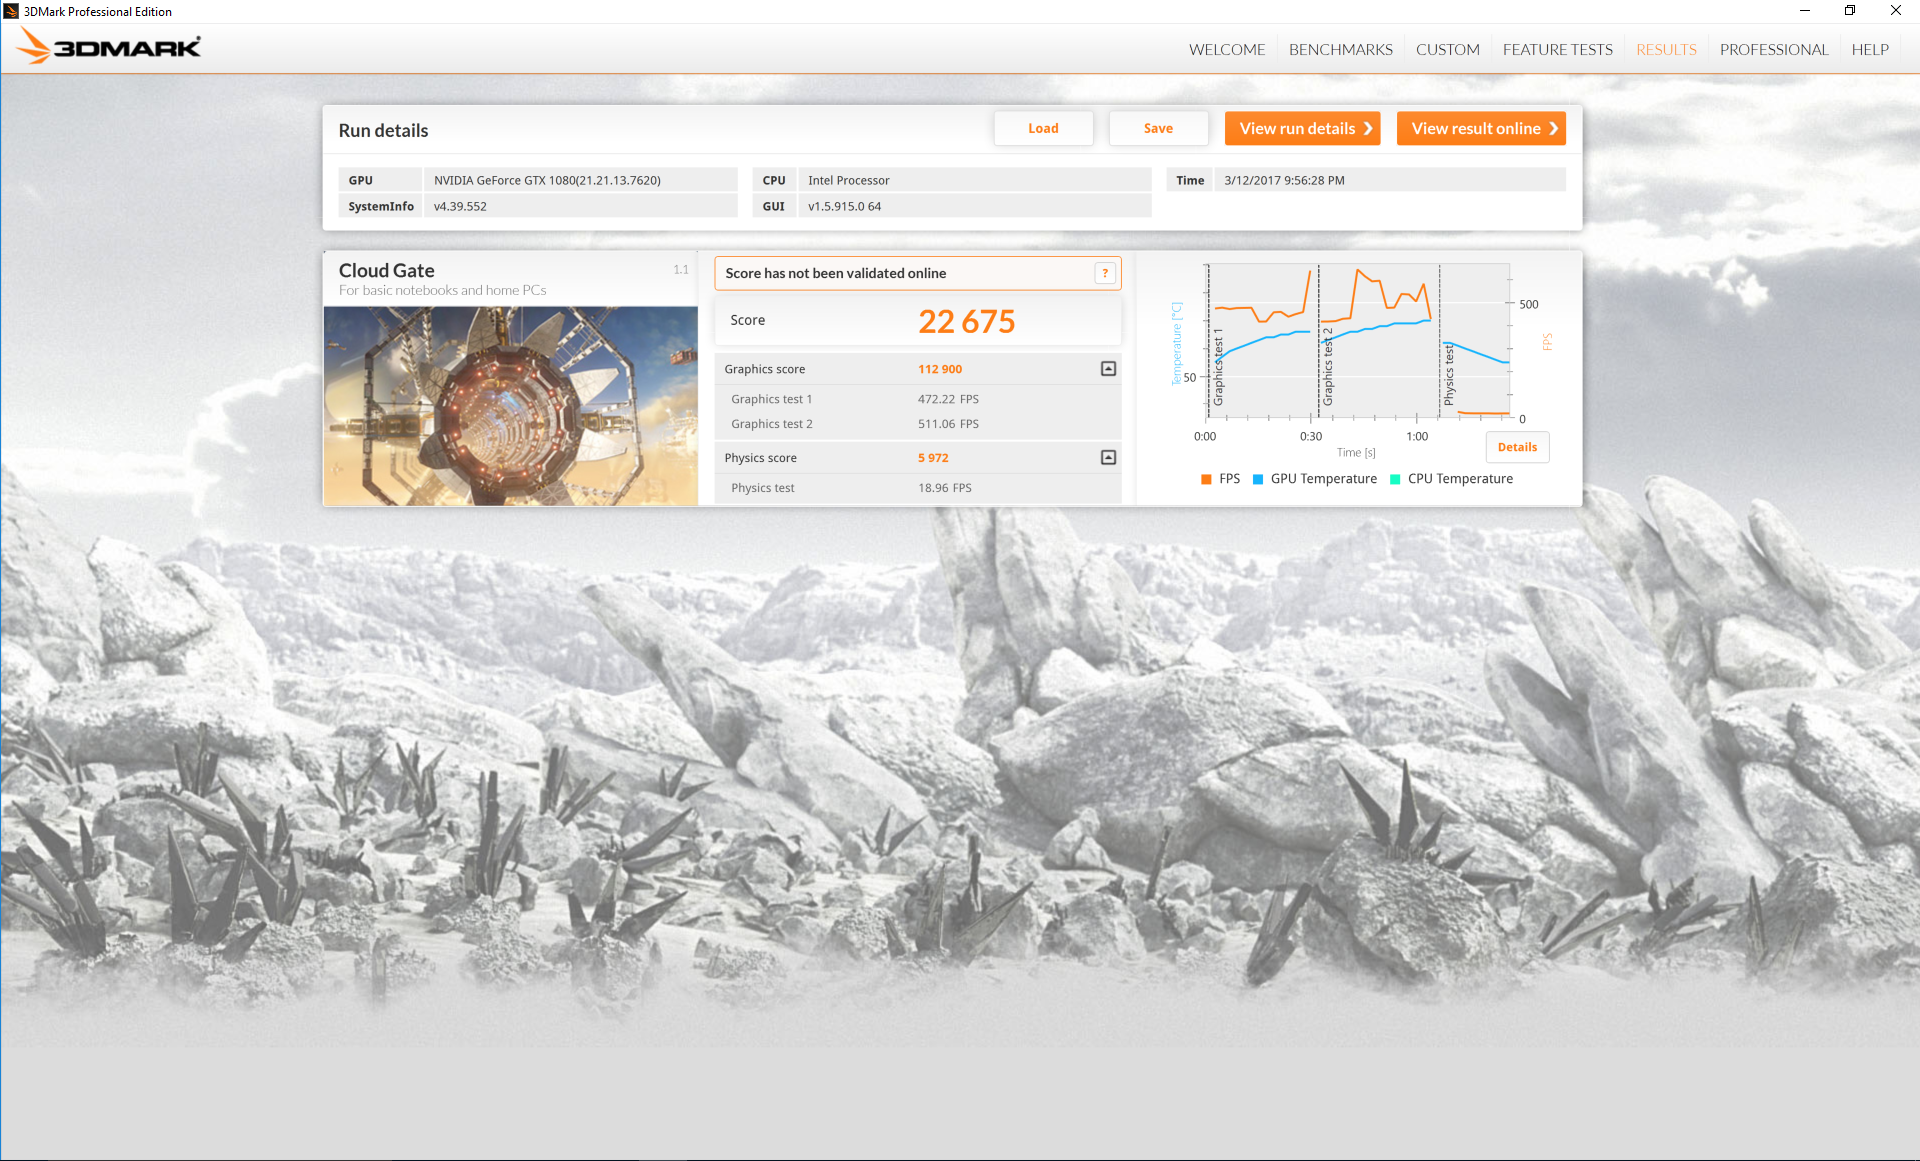
| 3DMark Cloud Gate Standard Score | 22675 points | |
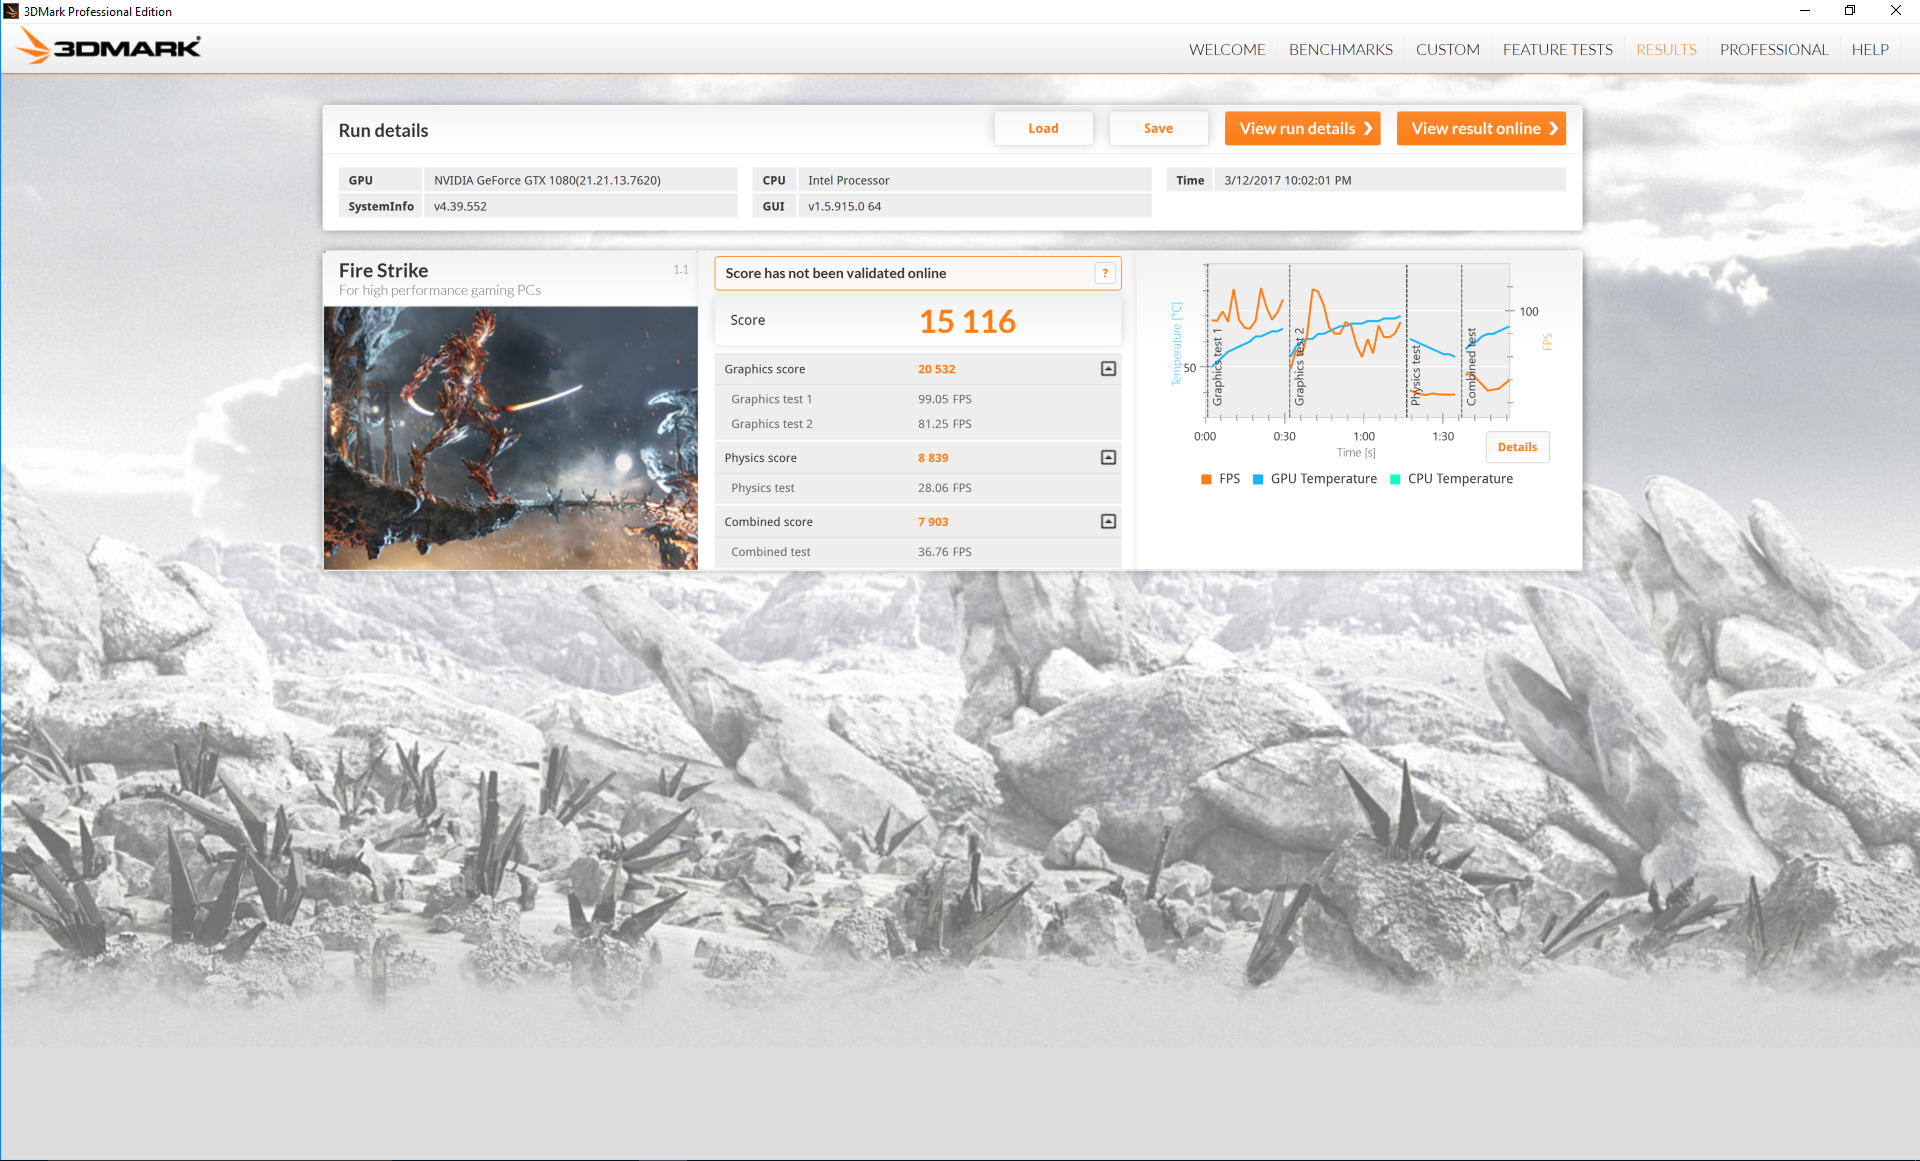
| 3DMark Fire Strike Score | 15116 points | |
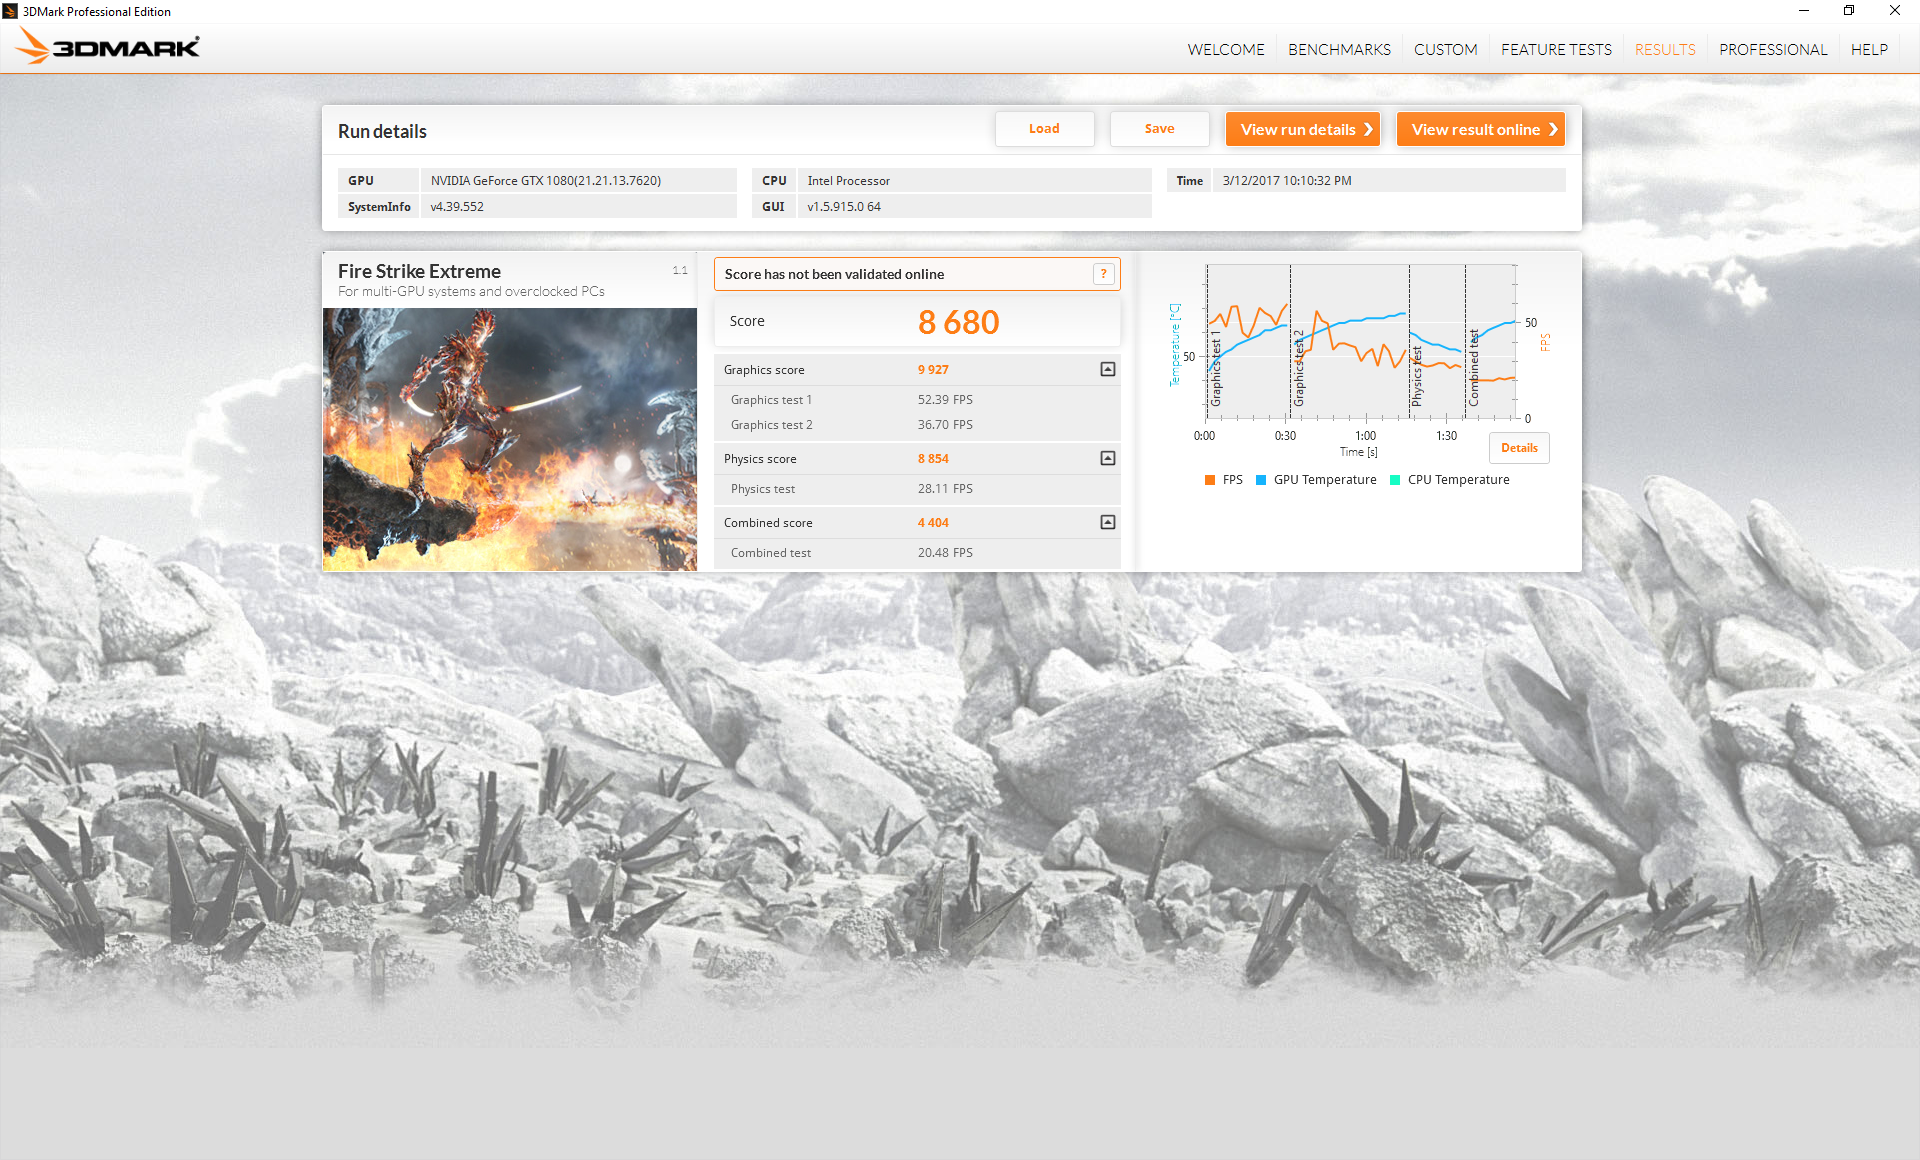
| 3DMark Fire Strike Extreme Score | 8680 points | |
Help | ||
Gaming Performance
Unsurprisingly, the GTX 1080 is a monster of a card for native 4K gaming. Most titles hover in the 50 to 60 FPS range when on 4K High settings where G-Sync works wonders. Users with external gaming monitors capable of 120/144 Hz refresh rates will still want to game in 1080p for those triple-digit frame rates.
The synthetic 3DMark benchmark results above translate well to real-world gaming conditions. The GTX 1080 Ti is able to pump out 30 to 40 percent higher frame rates than our Tornado F5 across all tested games. Otherwise, our Eurocom system is comparable to both our GTX 1080 desktop reference PC and other high-end notebooks with the GTX 1080 such as the the Eurocom Sky X7E2.
See our dedicated page on the GTX 1080 for more gaming benchmarks and comparisons.
| The Witcher 3 - 3840x2160 High Graphics & Postprocessing (Nvidia HairWorks Off) | |
| Nvidia GeForce GTX 1080 Ti Founders Edition | |
| Eurocom Tornado F5 Killer Edition | |
| Nvidia GeForce GTX 1080 Founders Edition | |
| Schenker XMG U727 2017 | |
| Metal Gear Solid V - 3840x2160 High / On | |
| Nvidia GeForce GTX 1080 Founders Edition | |
| Eurocom Sky X7E2 | |
| Eurocom Tornado F5 Killer Edition | |
| Fallout 4 - 3840x2160 High Preset AA:T AF:16x | |
| Nvidia GeForce GTX 1080 Ti Founders Edition | |
| Eurocom Sky X7E2 | |
| Nvidia GeForce GTX 1080 Founders Edition | |
| Eurocom Tornado F5 Killer Edition | |
| Gigabyte P57X v7 | |
| Rise of the Tomb Raider - 3840x2160 High Preset AA:FX AF:4x | |
| Nvidia GeForce GTX 1080 Ti Founders Edition | |
| Nvidia GeForce GTX 1080 Ti Founders Edition | |
| Eurocom Sky X7E2 | |
| Eurocom Tornado F5 Killer Edition | |
| Nvidia GeForce GTX 1080 Founders Edition | |
| Nvidia GeForce GTX 1080 Founders Edition | |
| Gigabyte P57X v7 | |
| Ashes of the Singularity - 3840x2160 crazy | |
| Nvidia GeForce GTX 1080 Ti Founders Edition | |
| Eurocom Tornado F5 Killer Edition | |
| Nvidia GeForce GTX 1080 Founders Edition | |
| Overwatch - 3840x2160 High (Render Scale 100 %) AA:SM AF:4x | |
| Nvidia GeForce GTX 1080 Ti Founders Edition | |
| Eurocom Sky X7E2 | |
| Eurocom Tornado F5 Killer Edition | |
| Nvidia GeForce GTX 1080 Founders Edition | |
| Mafia 3 - 3840x2160 High Preset | |
| Nvidia GeForce GTX 1080 Ti Founders Edition | |
| Eurocom Tornado F5 Killer Edition | |
| Asus G701VIK-BA049T | |
| Schenker XMG U727 2017 | |
| Nvidia GeForce GTX 1080 Founders Edition | |
| low | med. | high | ultra | 4K | |
|---|---|---|---|---|---|
| Guild Wars 2 (2012) | 90.5 | ||||
| BioShock Infinite (2013) | 152.3 | ||||
| Metro: Last Light (2013) | 110.2 | ||||
| Thief (2014) | 115 | ||||
| The Witcher 3 (2015) | 74.2 | 55.8 | |||
| Batman: Arkham Knight (2015) | 92 | 56 | |||
| Metal Gear Solid V (2015) | 60 | ||||
| Fallout 4 (2015) | 52.6 | ||||
| Rise of the Tomb Raider (2016) | 112.2 | 50.2 | |||
| Ashes of the Singularity (2016) | 65.9 | 44.2 | |||
| Doom (2016) | 66.9 | ||||
| Overwatch (2016) | 104.9 | ||||
| Mafia 3 (2016) | 95.1 | 29.1 |
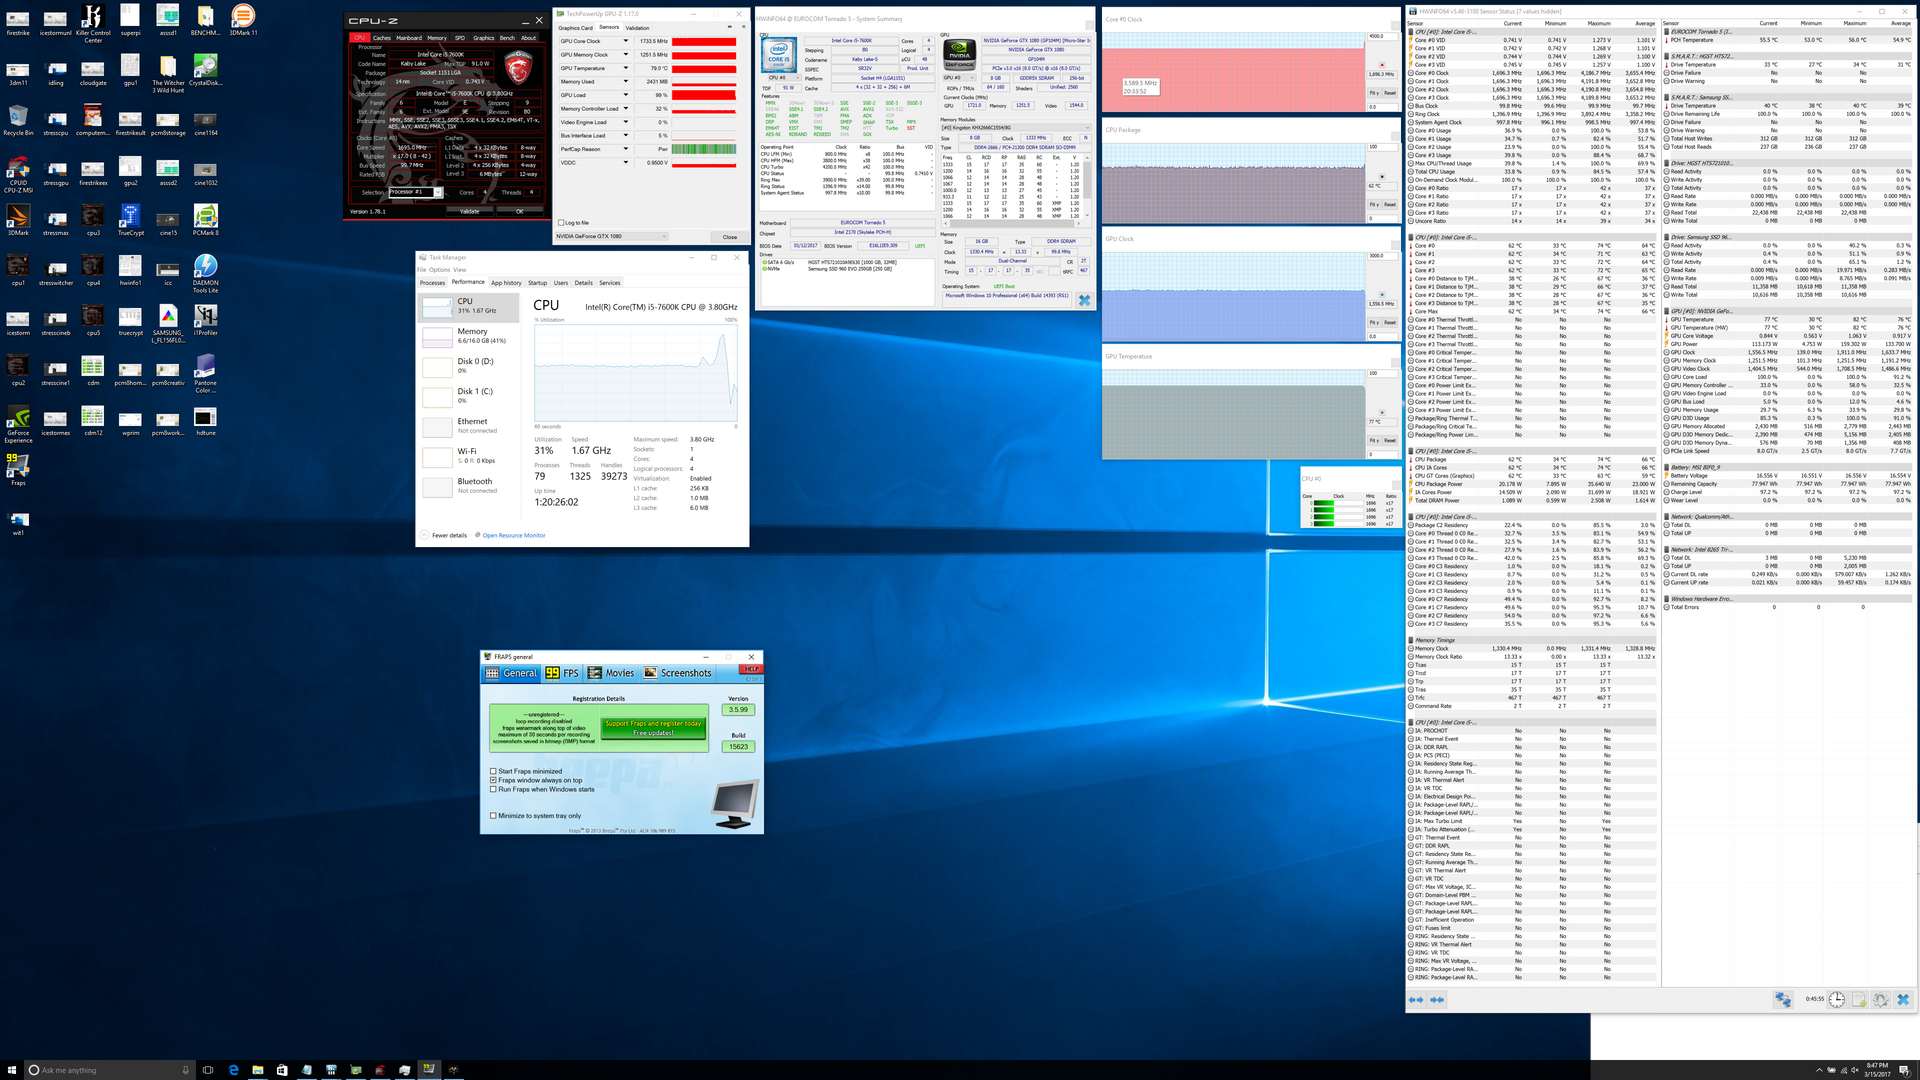
Stress Test
The Eurocom system performs very well when under stress. The processor is able to maintain a Turbo Boost clock rate of 4.0 GHz no matter the condition including when under both Prime95 and FurMark stress. This alone is impressive considering that the system is able to house a fully-featured desktop K-class CPU without any major throttling issues. The CPU stabilizes at a high 92 C, however, so any overclocking headroom will be quite thin and this will only be warmer if configured with the faster i7-7700K. In comparison, the less powerful i7-7700HQ CPU in the 15-inch Asus FX502VM stabilizes at 87 C when under the same stressful conditions. It's not uncommon to find warmer core temperatures on Eurocom notebooks when compared to the competition.
Running on battery power will impact both the CPU and GPU. A 3DMark 11 run on batteries returns Physics and Graphics scores of 8031 and 8735 points, respectively, compared to 8381 and 26874 points when on mains.
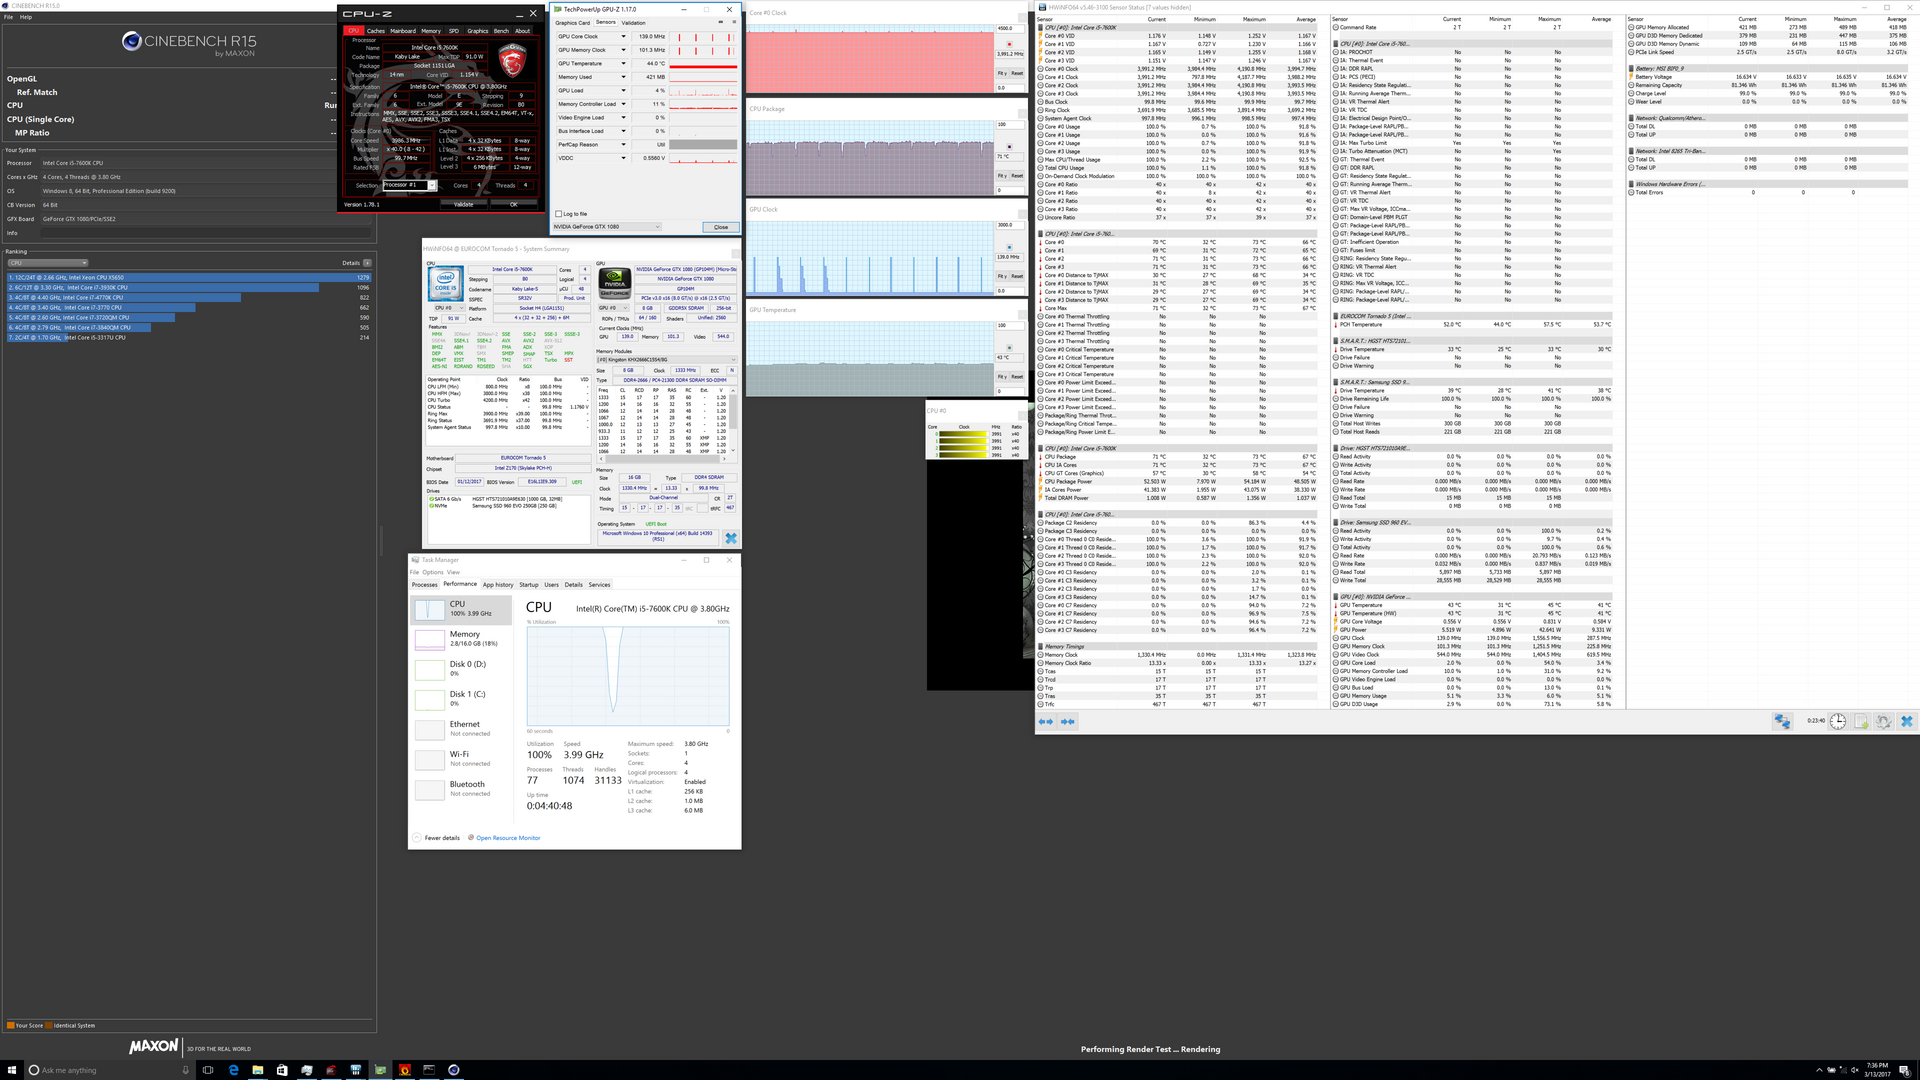
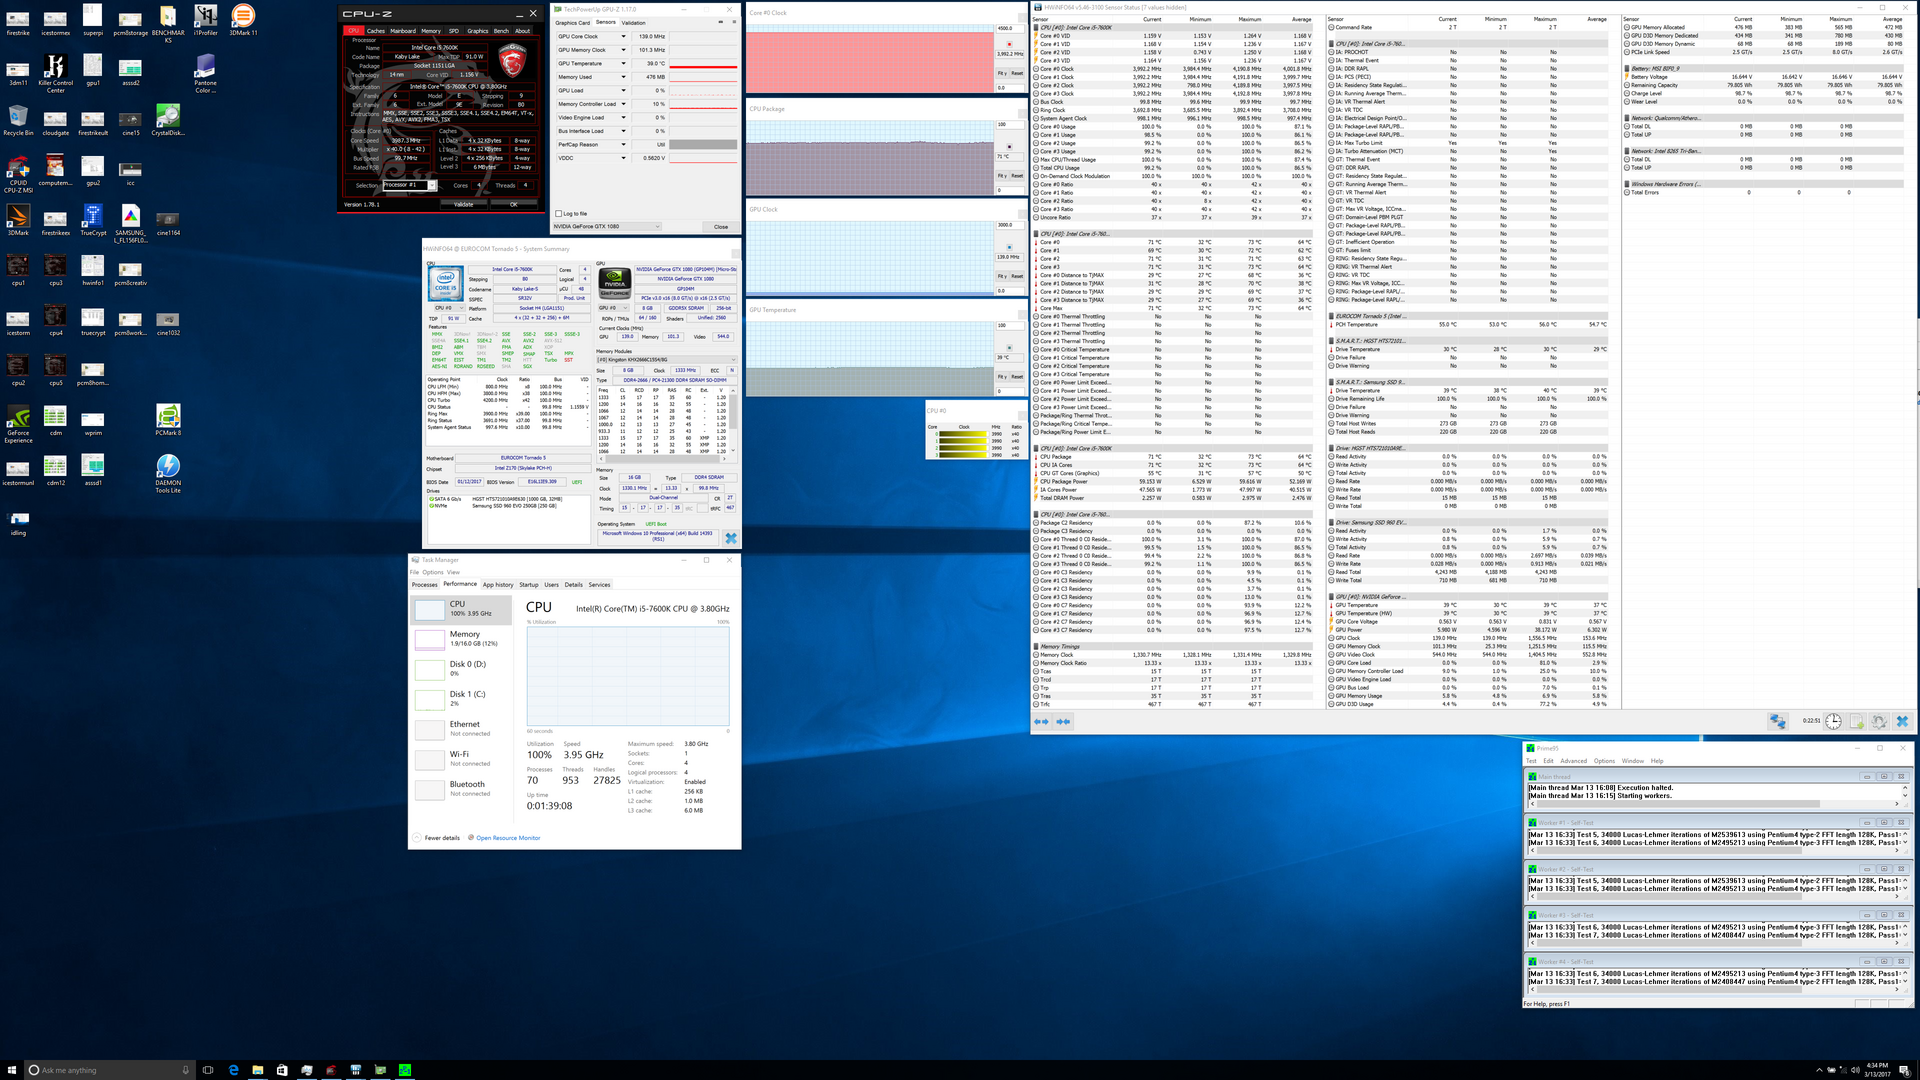
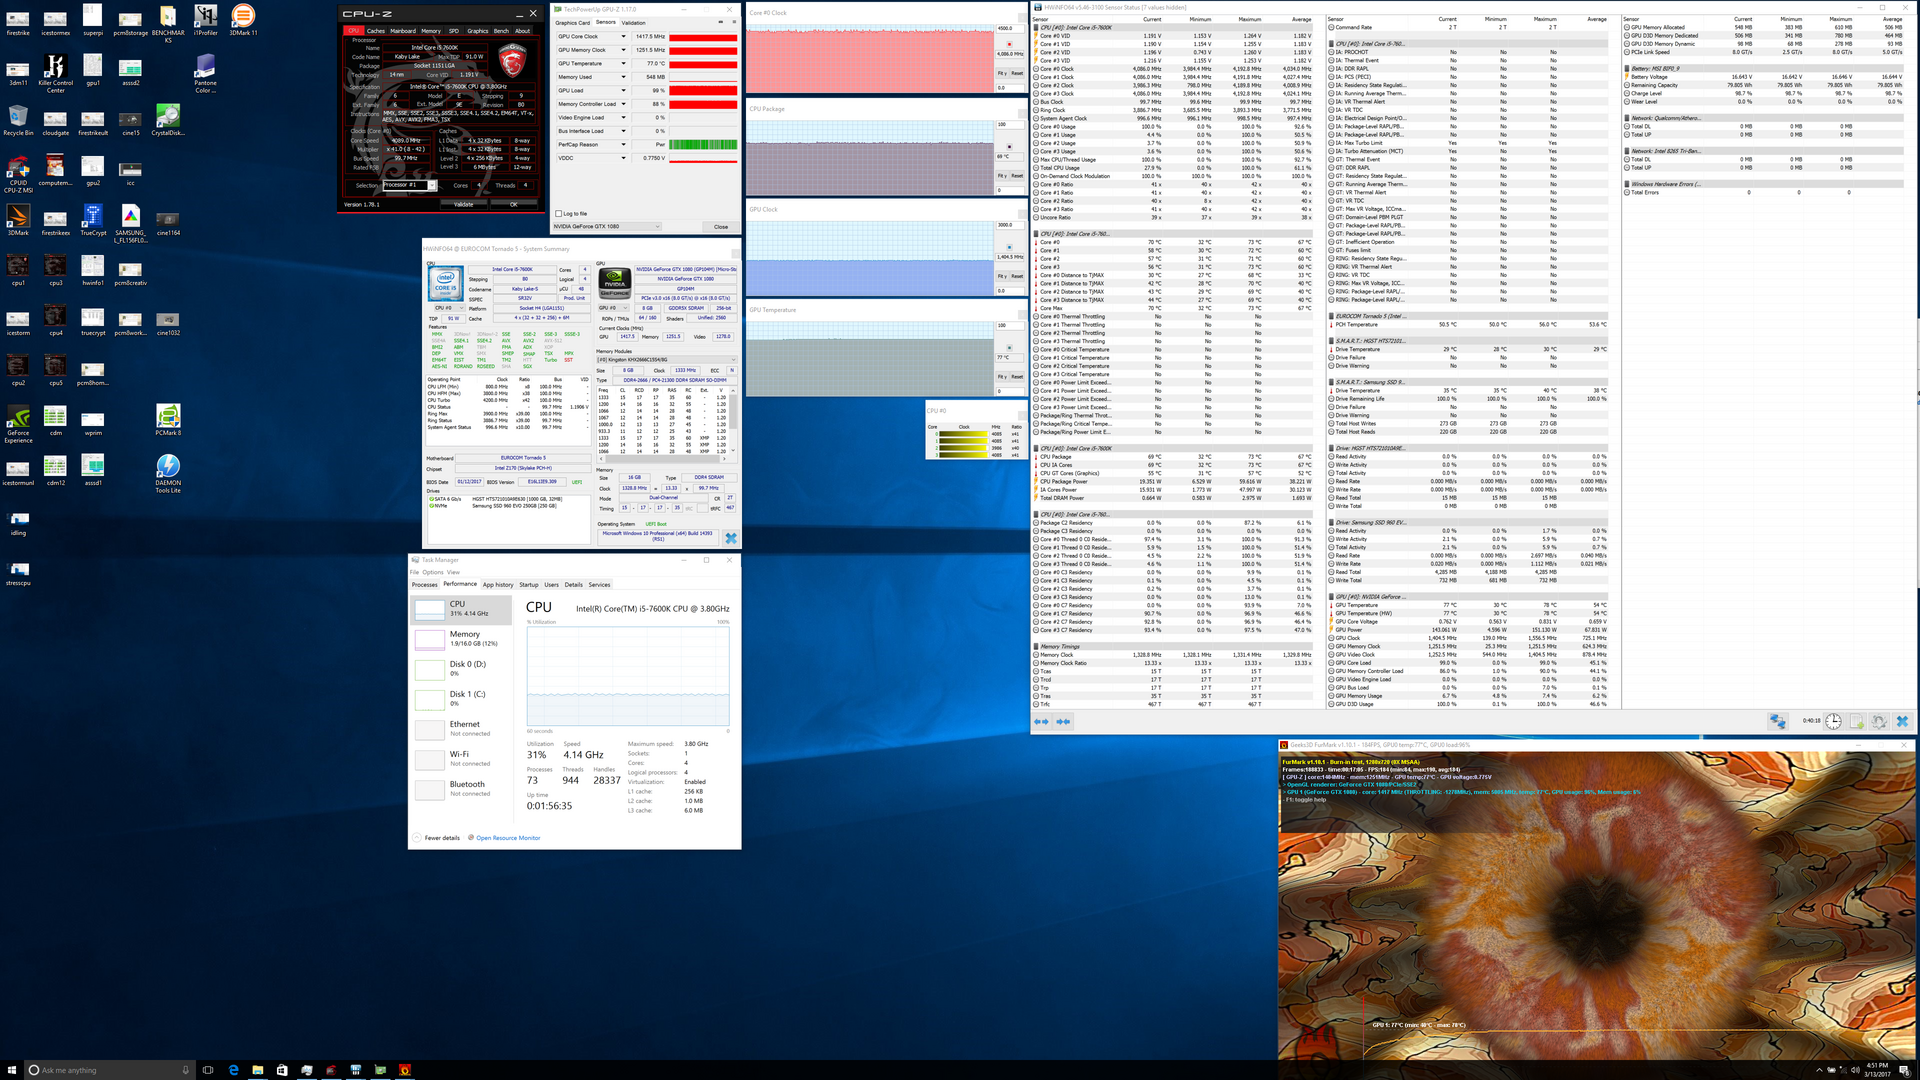
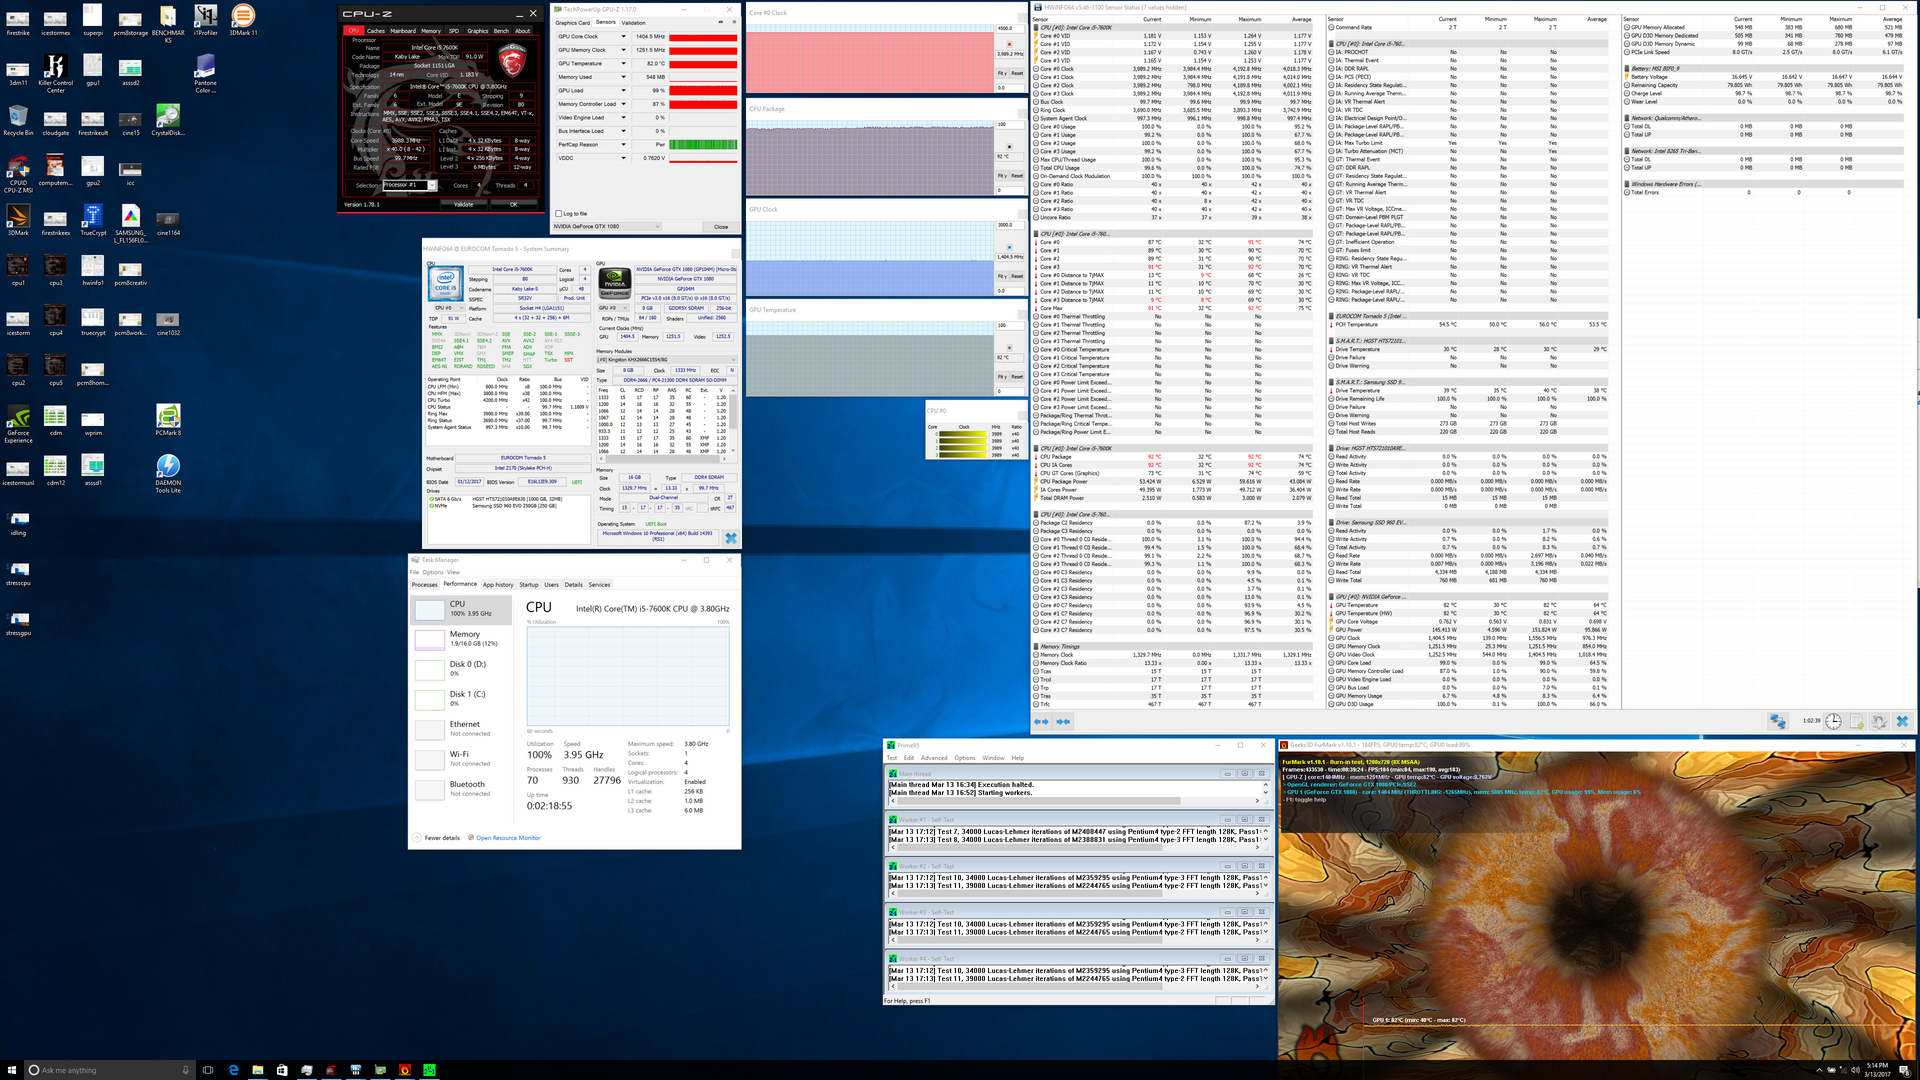
| CPU Clock (GHz) | GPU Clock (MHz) | Average CPU Temperature (°C) | Average GPU Temperature (°C) | |
| Prime95 Stress | 4.0 | -- | 71 | 39 |
| FurMark Stress | -- | 1405 | 69 | 77 |
| Prime95 + FurMark Stress | 4.0 | 1405 | 92 | 82 |
| Witcher 3 stress | 3.6 | 1734 | 65 | 80 |
We run Witcher 3 for one hour to stress the notebook under real-world gaming scenarios. When subjected to these conditions, the GPU is able to maintain a steady Boost clock rate of 1734 MHz and a warm core temperature of 80 C. The CPU remains steady at 3.6 GHz or 200 MHz below its base clock rate. CPU temperature is subsequently quite low for a gaming notebook under high load at 65 C. Frame rates stabilize quickly at about 73 FPS with very little variance throughout the hour-long test. We recorded no major throttling issues when under gaming stress.
Emissions
System Noise
The dual fans are always active no matter the onscreen workload. We recorded a steady fan noise of 36 dB(A) simply from sitting idle for at least half an hour on Power Saver mode. Running 3DMark to simulate average load will bump fan noise up to 44 dB(A) and gaming load with Witcher 3 will be even louder at up to a recorded 49 dB(A). The Eurocom is undeniably louder than the GT62VR and most larger 17-inch gaming notebooks for that matter, so headphones are recommended when gaming. While this is to be expected considering the hardware inside a 15-inch chassis, the always-audible minimum fan noise is perhaps the more disappointing aspect.
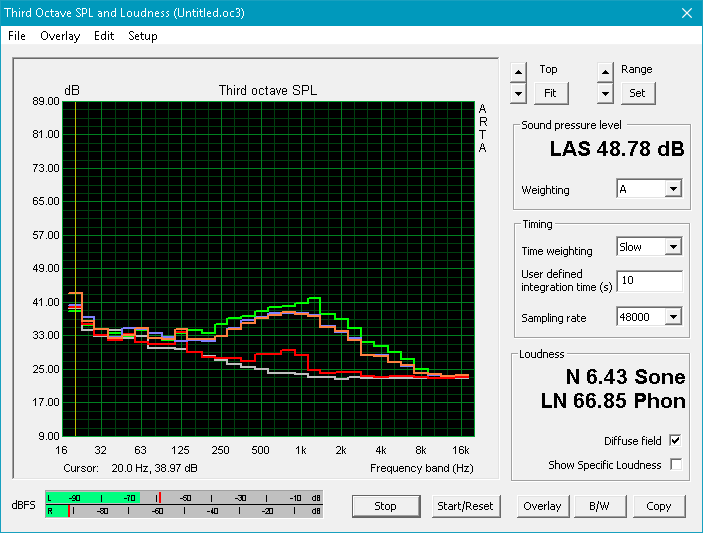
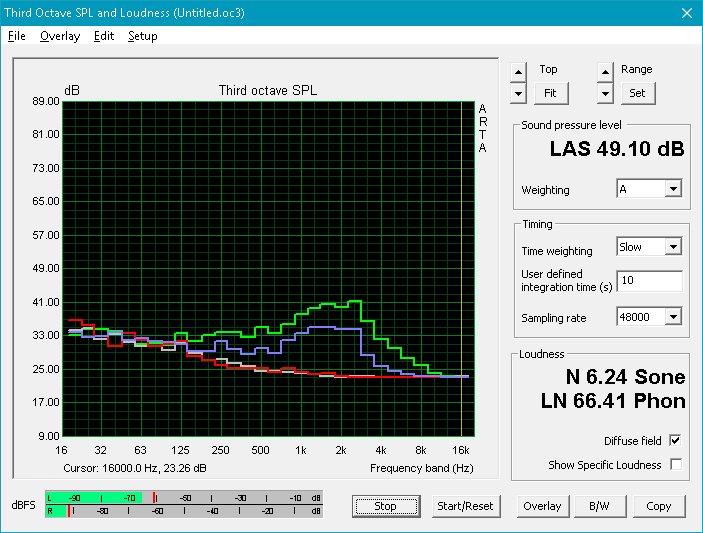
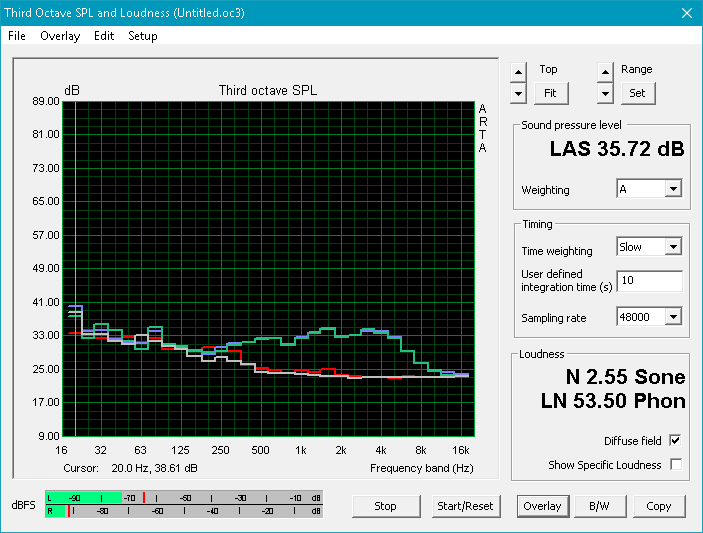
Noise level
| Idle |
| 36.1 / 36.1 / 36.1 dB(A) |
| Load |
| 44.3 / 51.7 dB(A) |
 | ||
30 dB silent 40 dB(A) audible 50 dB(A) loud |
||
min: | ||
| Eurocom Tornado F5 Killer Edition GeForce GTX 1080 Mobile, i5-7600K, Samsung SSD 960 Evo 250GB m.2 NVMe | Dell XPS 15 9560 (i7-7700HQ, UHD) GeForce GTX 1050 Mobile, i7-7700HQ, Lite-On CX2-8B512-Q11 | Alienware 15 R3 GeForce GTX 1070 Mobile, i7-7700HQ | Eurocom Tornado F5 GeForce GTX 1070 Mobile, i7-7700K, Samsung SSD 960 Pro 512 GB m.2 | MSI GT62VR 7RE-223 GeForce GTX 1070 Mobile, i7-7700HQ, Samsung SSD PM871a MZNLN256HMHQ | |
|---|---|---|---|---|---|
| Noise | 9% | -1% | 3% | 4% | |
| off / environment * (dB) | 28.8 | 28.4 1% | 30 -4% | 29.4 -2% | 30 -4% |
| Idle Minimum * (dB) | 36.1 | 29 20% | 31 14% | 33.3 8% | 34 6% |
| Idle Average * (dB) | 36.1 | 29 20% | 32 11% | 33.5 7% | 35 3% |
| Idle Maximum * (dB) | 36.1 | 32.2 11% | 42 -16% | 33.5 7% | 36 -0% |
| Load Average * (dB) | 44.3 | 47.1 -6% | 49 -11% | 44.2 -0% | 40 10% |
| Load Maximum * (dB) | 51.7 | 47.1 9% | 50 3% | 52.5 -2% | 46 11% |
| Witcher 3 ultra * (dB) | 52 |
* ... smaller is better
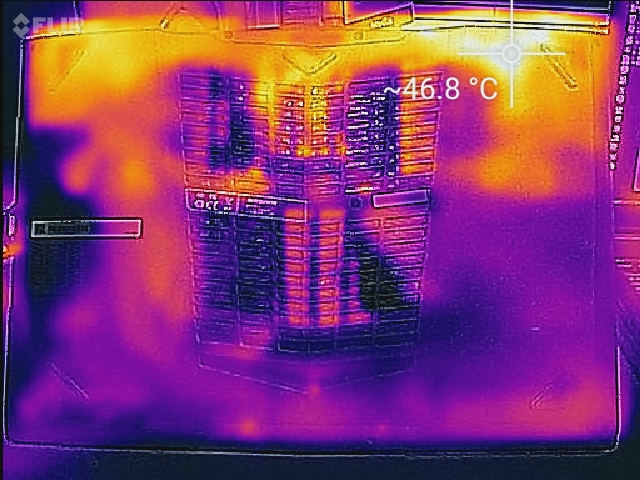
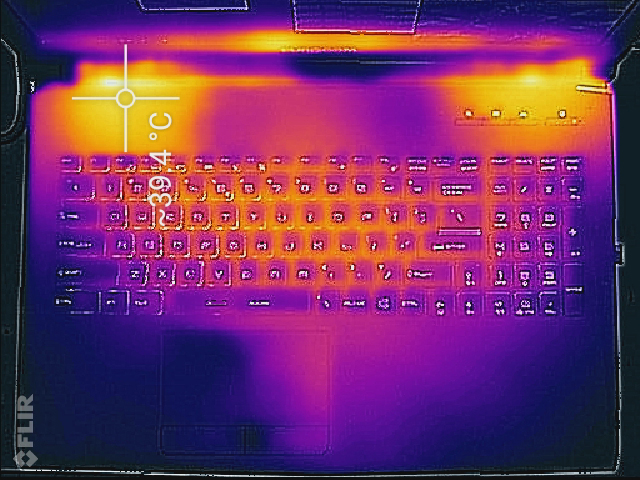
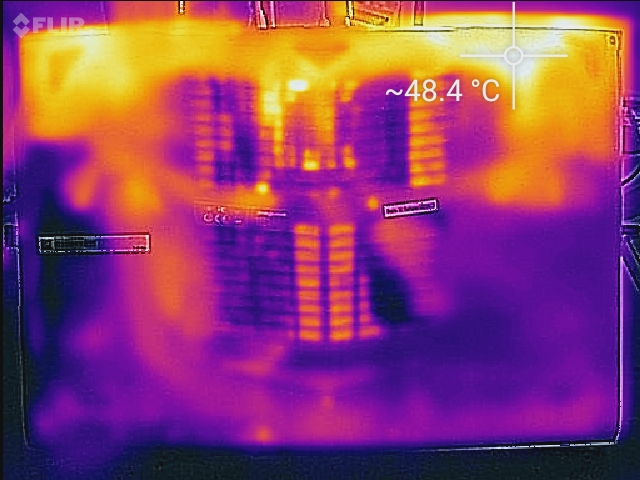
Temperature
Surface temperatures are quite cool as far as gaming notebooks go. When gaming or under extreme stress, the center of the keyboard plateaus at about 36 C while the WASD keys and NumPad are much cooler in the low 30 C range. Our temperature maps below show that the hot spots are above the first row of keyboard keys and well away from the front palm rests. In comparison, the Alienware 15 will be warmer at up to the mid 40 C range while thinner 15-inch notebooks like the XPS 15 9560 or GS63VR can reach surface temperatures as high as 50 C when under similar load conditions.
The bottom surface of the Eurocom is also relatively cool due to the large ventilation grilles on the center and the wide air gaps between the maintenance plate and the rear heat pipes.
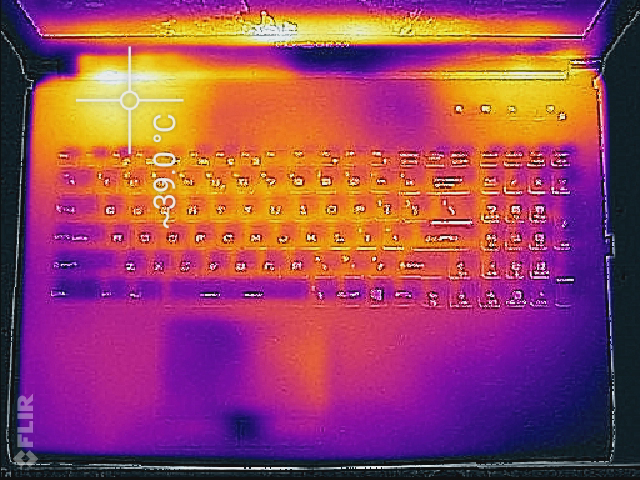
(+) The maximum temperature on the upper side is 39.4 °C / 103 F, compared to the average of 40.4 °C / 105 F, ranging from 21.2 to 68.8 °C for the class Gaming.
(-) The bottom heats up to a maximum of 48.6 °C / 119 F, compared to the average of 43.2 °C / 110 F
(+) In idle usage, the average temperature for the upper side is 24.1 °C / 75 F, compared to the device average of 33.9 °C / 93 F.
(+) The palmrests and touchpad are reaching skin temperature as a maximum (32.2 °C / 90 F) and are therefore not hot.
(-) The average temperature of the palmrest area of similar devices was 28.8 °C / 83.8 F (-3.4 °C / -6.2 F).
Speakers

We remeasured the stereo 2 W speakers with our microphone setup and results are essentially identical to our last Tornado F5 configuration, so users can expect reasonably loud volume with no reverberations and an average bass. Larger MSI models continue to have a wider range of reproducible frequencies. A dedicated DAC is not present to fully support studio-grade headphones.
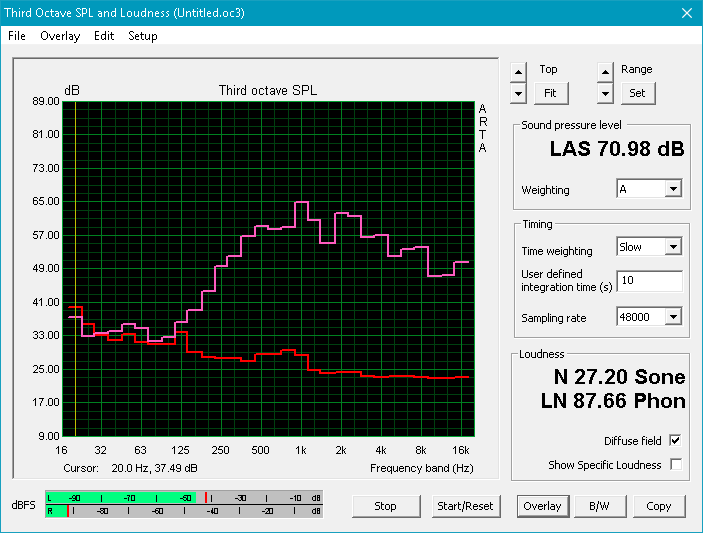

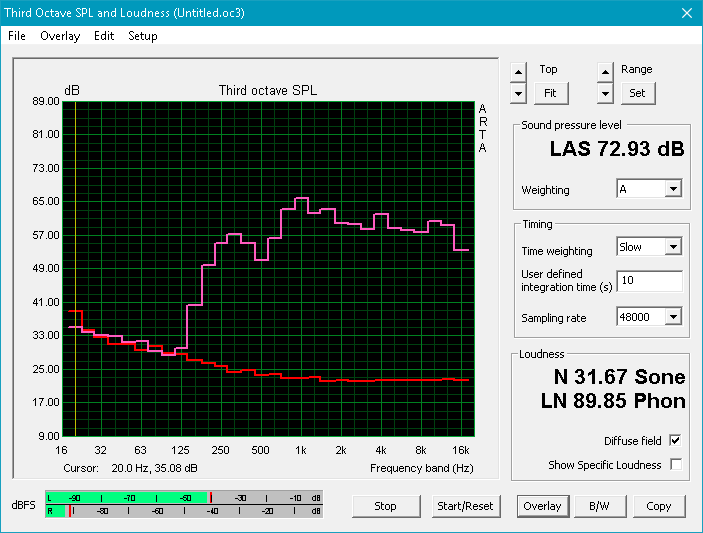
Eurocom Tornado F5 Killer Edition audio analysis
(-) | not very loud speakers (64.8 dB)
Bass 100 - 315 Hz
(±) | reduced bass - on average 11.8% lower than median
(±) | linearity of bass is average (11.6% delta to prev. frequency)
Mids 400 - 2000 Hz
(±) | higher mids - on average 5.5% higher than median
(±) | linearity of mids is average (13.5% delta to prev. frequency)
Highs 2 - 16 kHz
(+) | balanced highs - only 3.2% away from median
(±) | linearity of highs is average (9.8% delta to prev. frequency)
Overall 100 - 16.000 Hz
(±) | linearity of overall sound is average (26.1% difference to median)
Compared to same class
» 92% of all tested devices in this class were better, 1% similar, 7% worse
» The best had a delta of 6%, average was 18%, worst was 132%
Compared to all devices tested
» 80% of all tested devices were better, 4% similar, 16% worse
» The best had a delta of 4%, average was 23%, worst was 134%
Apple MacBook 12 (Early 2016) 1.1 GHz audio analysis
(+) | speakers can play relatively loud (83.6 dB)
Bass 100 - 315 Hz
(±) | reduced bass - on average 11.3% lower than median
(±) | linearity of bass is average (14.2% delta to prev. frequency)
Mids 400 - 2000 Hz
(+) | balanced mids - only 2.4% away from median
(+) | mids are linear (5.5% delta to prev. frequency)
Highs 2 - 16 kHz
(+) | balanced highs - only 2% away from median
(+) | highs are linear (4.5% delta to prev. frequency)
Overall 100 - 16.000 Hz
(+) | overall sound is linear (10.2% difference to median)
Compared to same class
» 7% of all tested devices in this class were better, 2% similar, 90% worse
» The best had a delta of 5%, average was 18%, worst was 53%
Compared to all devices tested
» 5% of all tested devices were better, 1% similar, 94% worse
» The best had a delta of 4%, average was 23%, worst was 134%
Frequency Comparison (Checkbox selectable!)
Graph 1: Pink Noise 100% Vol.; Graph 2: Audio off
Energy Management
Power Consumption
Our Tornado F5 configuration is significantly more power hungry when idling compared to lesser-equipped 15-inch notebooks. The Alienware 15 and even our older Tornado F5 configuration can consume up to 33 percent and 25 percent less energy, respectively, when under the same idling loads. Running 3DMark 11 will demand about 190 W compared to 170 W on our first Tornado F5 with the GTX 1070.
Running both Prime95 and FurMark simultaneously will draw about 260 W from a large power adapter (~20 x 10 x 4.5 cm) rated for up to 330 W. In comparison, our last Tornado F5 SKU shipped with the smaller 230 W adapter. The healthy power overhead means the adapter is more than capable at running a fully-loaded configuration and shouldn't be a source for any throttling issues.
| Off / Standby | |
| Idle | |
| Load |
|
Key:
min: | |
| Eurocom Tornado F5 Killer Edition i5-7600K, GeForce GTX 1080 Mobile, Samsung SSD 960 Evo 250GB m.2 NVMe, IPS, 3840x2160, 15.6" | Dell XPS 15 9560 (i7-7700HQ, UHD) i7-7700HQ, GeForce GTX 1050 Mobile, Lite-On CX2-8B512-Q11, IGZO IPS, 3840x2160, 15.6" | Alienware 15 R3 i7-7700HQ, GeForce GTX 1070 Mobile, , TN, 1920x1080, 15.6" | Eurocom Tornado F5 i7-7700K, GeForce GTX 1070 Mobile, Samsung SSD 960 Pro 512 GB m.2, IPS, 1920x1080, 15.6" | Asus G701VIK-BA049T i7-7820HK, GeForce GTX 1080 Mobile, 2x Samsung SM961 MZVPW256HEGL NVMe (RAID 0), IPS, 1920x1080, 17.3" | |
|---|---|---|---|---|---|
| Power Consumption | 51% | 31% | 20% | 6% | |
| Idle Minimum * (Watt) | 28.4 | 11.9 58% | 19 33% | 21.2 25% | 24 15% |
| Idle Average * (Watt) | 32 | 17.1 47% | 23 28% | 25.1 22% | 31 3% |
| Idle Maximum * (Watt) | 33.5 | 17.3 48% | 29 13% | 26.3 21% | 38 -13% |
| Load Average * (Watt) | 190.9 | 94.7 50% | 85 55% | 169.4 11% | 98 49% |
| Load Maximum * (Watt) | 259.4 | 122 53% | 192 26% | 202.4 22% | 320 -23% |
| Witcher 3 ultra * (Watt) | 104.8 |
* ... smaller is better
Battery Life
Battery life is not significantly different than our previous Tornado F5 configuration even after considering the updated CPU, GPU, and display resolution. Users can expect about 3.5 hours of real-world WLAN use compared to 4+ hours on less powerful gaming notebooks. The Eurocom clocks in at just over 4 hours even when set to its most conservative settings (Power Saver mode, minimum brightness setting, idling on desktop) due in part to its demanding K-class CPU. Traditional gaming systems with HQ-class processors and Optimus can last for 6 hours or more under similar Power Saver conditions. Battery capacity is not as large as on the Alienware 15 or the MacBook Pro 15.
Charging from near empty to full capacity will take 2 to 2.5 hours.
| Eurocom Tornado F5 Killer Edition i5-7600K, GeForce GTX 1080 Mobile, 75.24 Wh | Dell XPS 15 9560 (i7-7700HQ, UHD) i7-7700HQ, GeForce GTX 1050 Mobile, 97 Wh | Alienware 15 R3 i7-7700HQ, GeForce GTX 1070 Mobile, 99 Wh | Eurocom Tornado F5 i7-7700K, GeForce GTX 1070 Mobile, 75.24 Wh | MSI GT62VR 7RE-223 i7-7700HQ, GeForce GTX 1070 Mobile, 75 Wh | |
|---|---|---|---|---|---|
| Battery runtime | 115% | 29% | -3% | 24% | |
| Reader / Idle (h) | 4.2 | 13.9 231% | 6.4 52% | 4.9 17% | 6.3 50% |
| WiFi v1.3 (h) | 3.6 | 7.2 100% | 4.4 22% | 3.6 0% | 4.1 14% |
| Load (h) | 1.5 | 1.7 13% | 1.7 13% | 1.1 -27% | 1.6 7% |
Pros
Cons
Verdict
The Tornado F5 should be commended for incorporating an accessible LGA 1151 socket and MXM 3.0 slot onto a 15-inch chassis that is smaller and even lighter than many popular and less powerful alternatives. From this perspective, the system is not unlike the Razer Blade Pro - larger-than-life hardware in as compact of a chassis as possible. The fact that we can record no major throttling issues or hidden cut corners that directly affect performance is another notable accomplishment.
The usual drawbacks apply including the loud fans and poor battery life. While both are unsurprising, we feel that fan noise could be improved during low loads to make the notebook less distracting to use in quieter environments. The lid flexes more easily than we would like and the quality control on backlight bleeding could be better.
As for the 4K UHD display, there are definite pros and cons that don't make it an absolute recommendation. Color space is narrower and contrast is lower than even the base 1080p option. Additionally, users may even want to consider the third 1080p 120 Hz/5 ms option as the fast response times and doubled refresh rate make a world of difference in notebook gaming arguably more than a 4K UHD 60 Hz panel.
Perhaps the biggest reason why an enthusiast might prefer the Eurocom over an Asus, MSI, or Alienware is its modular components and support for desktop processors. The ability to easily upgrade and troubleshoot both the CPU and GPU is indubitably an attractive prospect, but its impact on gaming performance is marginal at best as most modern titles are GPU-bound. When a mobile i7-7700HQ can run the same titles just as well as an i5-7600K or i7-7700K at nearly half the TDP, it becomes harder to see the practical benefits of having a desktop CPU in a laptop from a purely gamer perspective.
The Tornado F5 is the most versatile 15-inch gaming notebook available if the accessible LGA 1151 socket and MXM 3.0 slot are of utmost importance. Otherwise, a more traditional gaming notebook with an equivalent soldered GPU can net users the same gaming results at likely lower prices.
Eurocom Tornado F5 Killer Edition
- 03/18/2017 v6 (old)
Allen Ngo
Price comparison
