MSI GeForce GTX 1080 Gaming X 8G Review
For the original German review, see here.
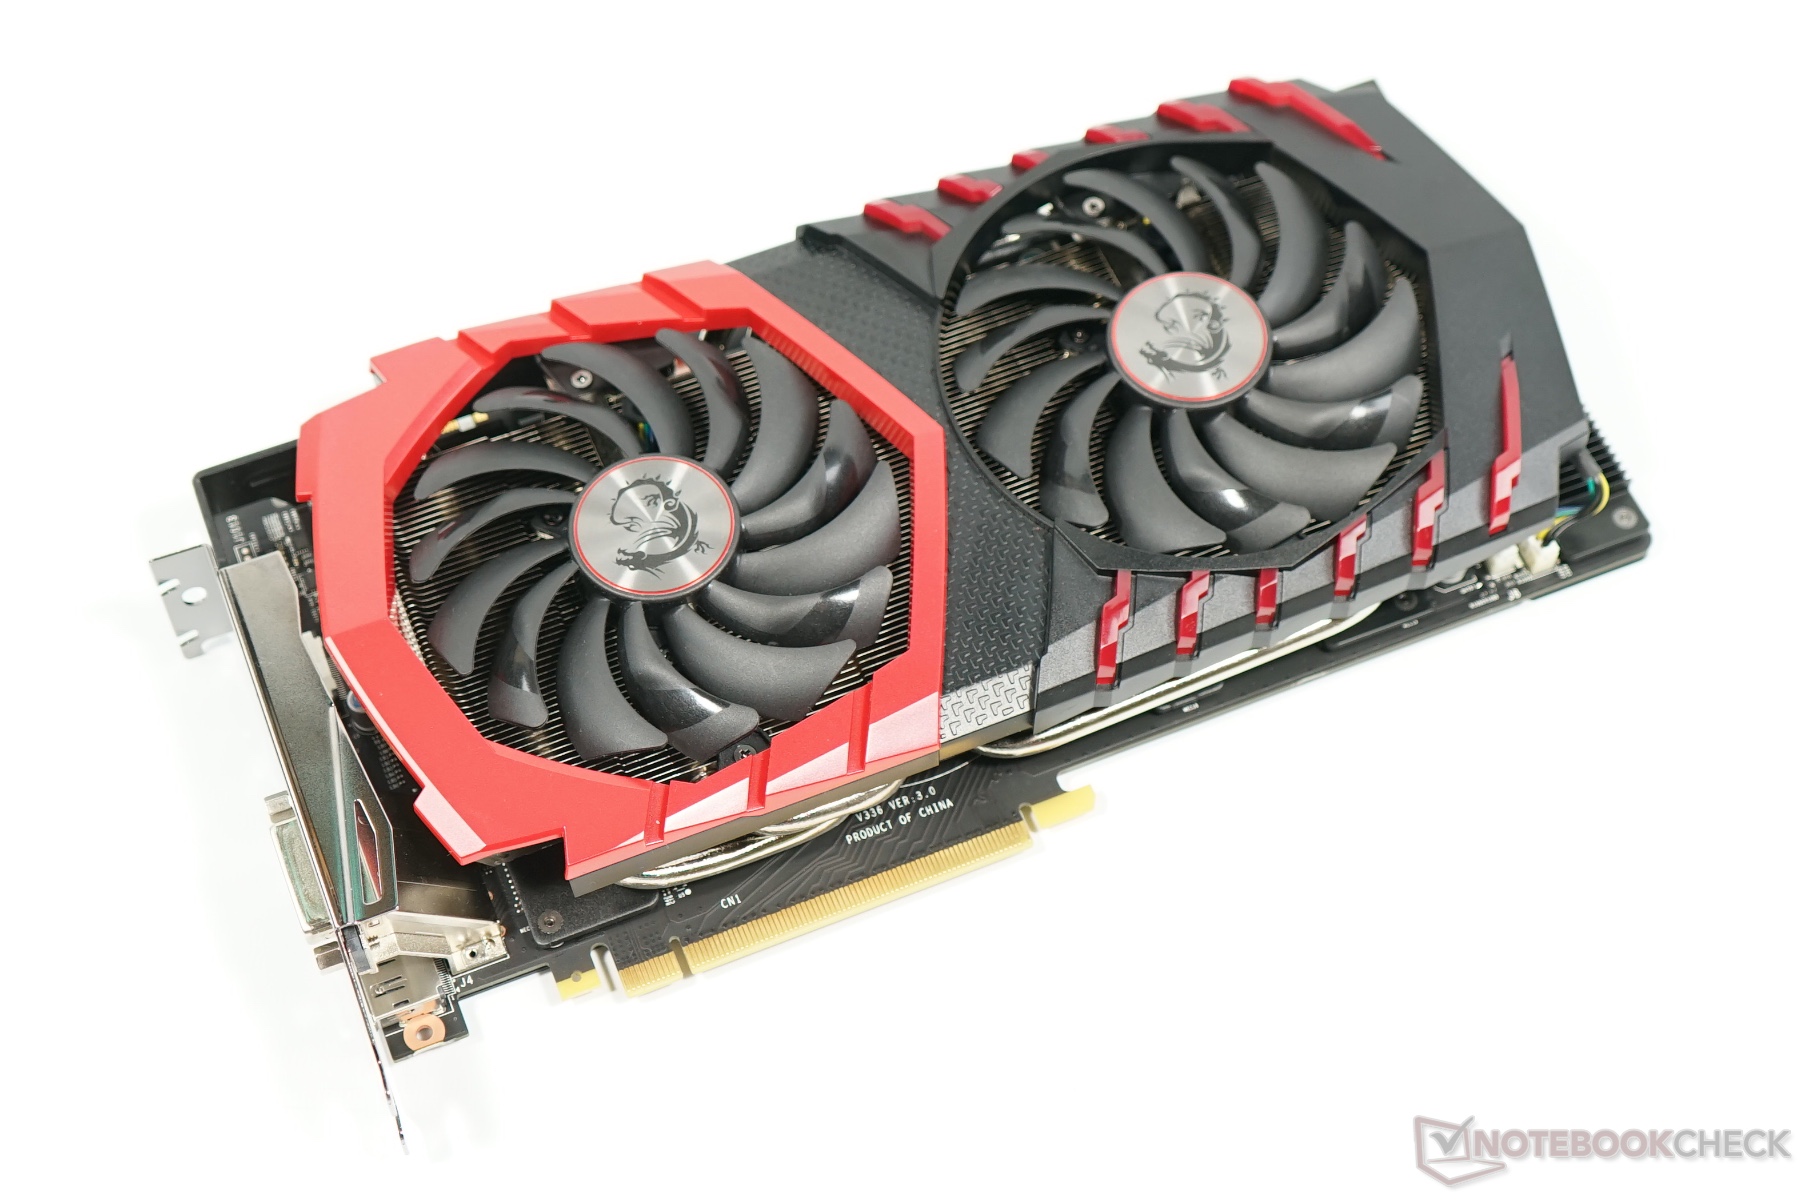
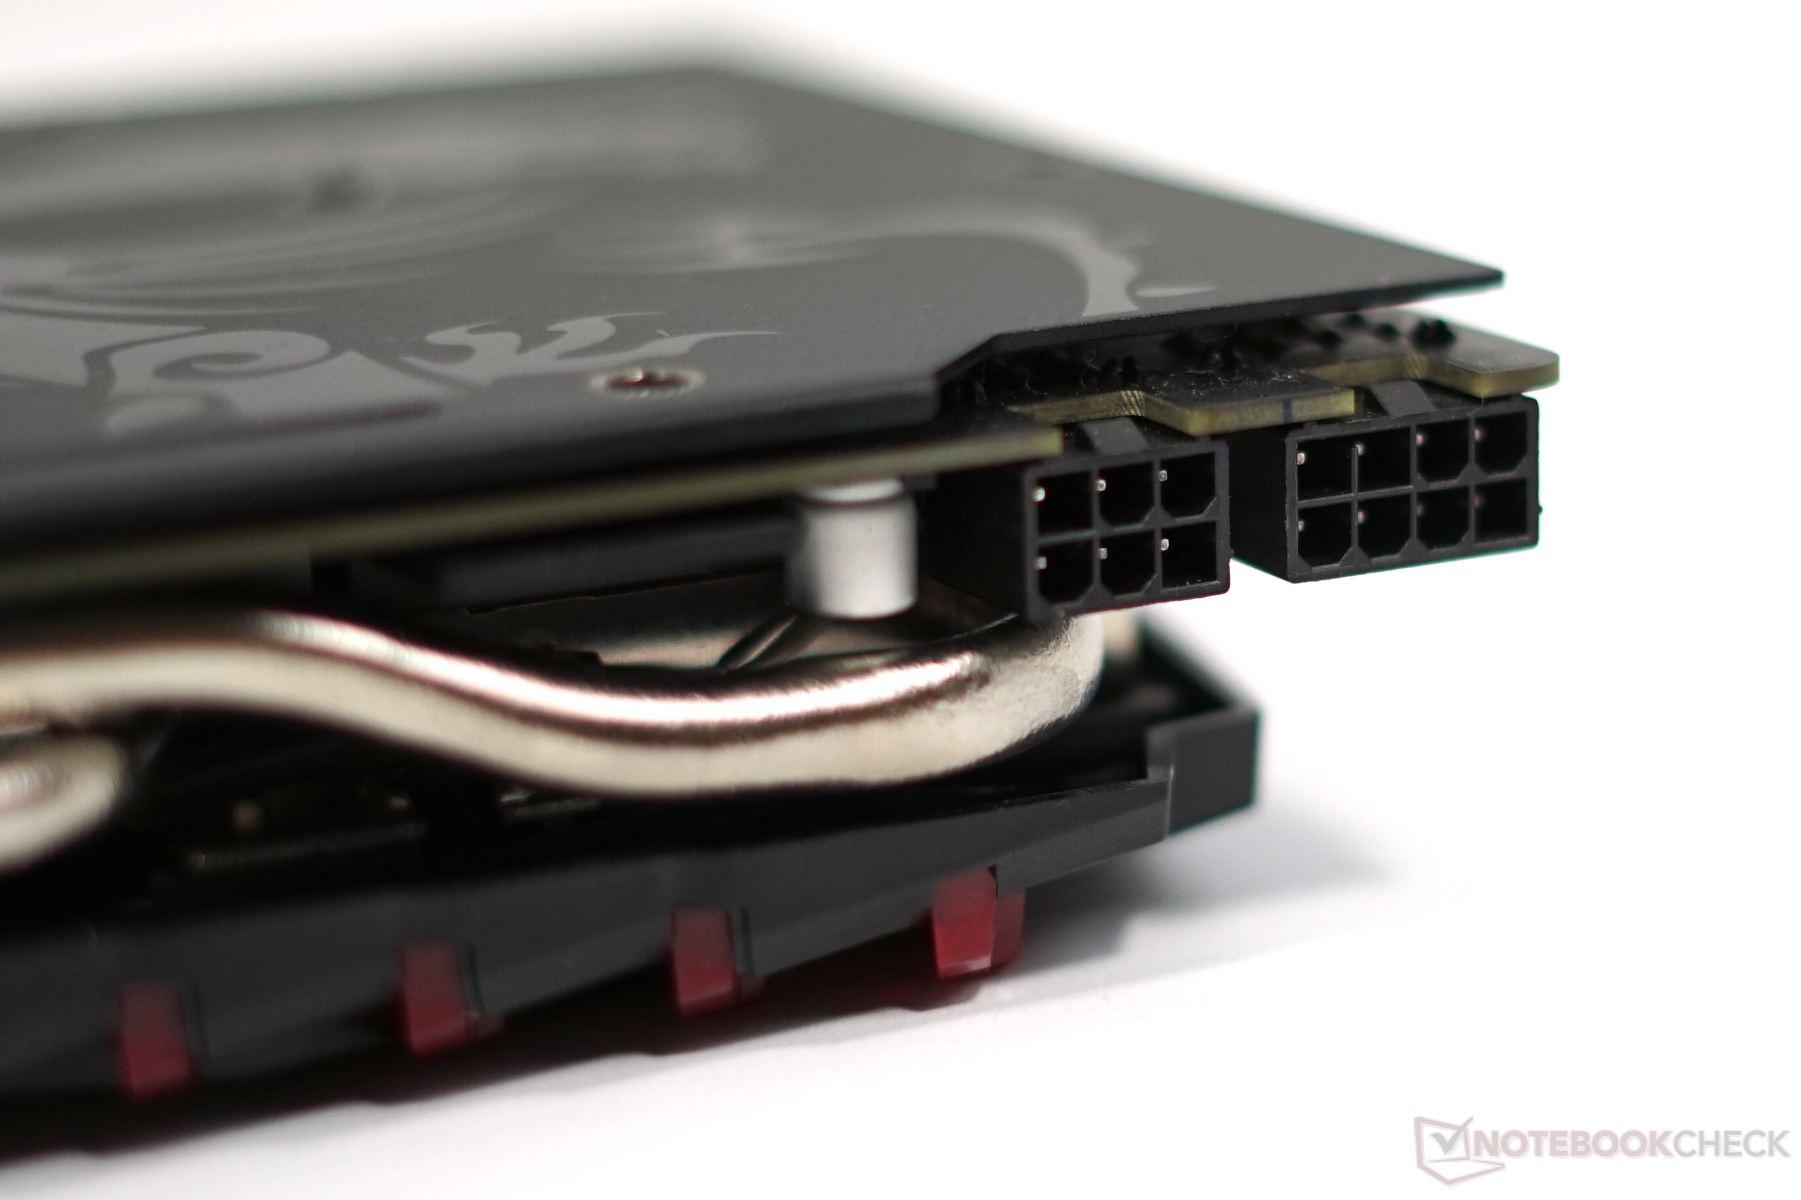
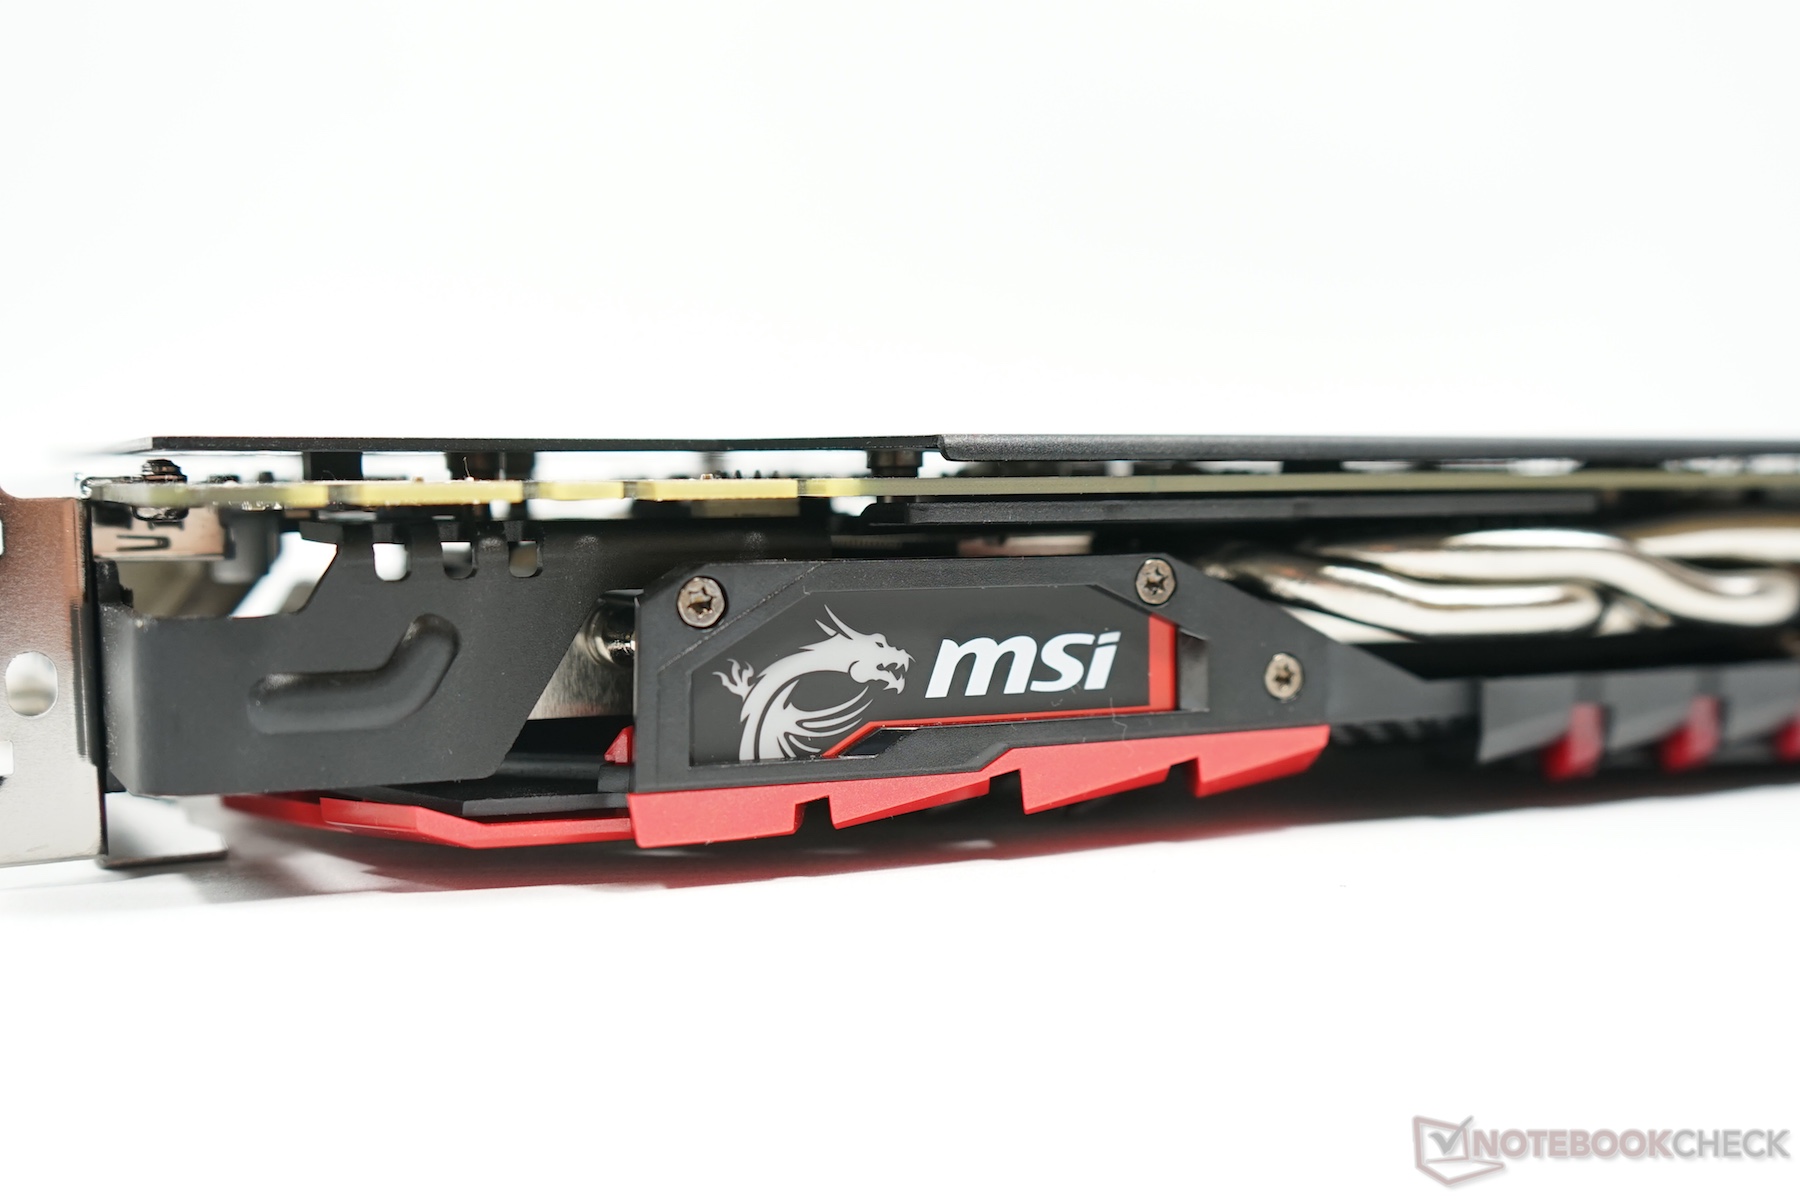
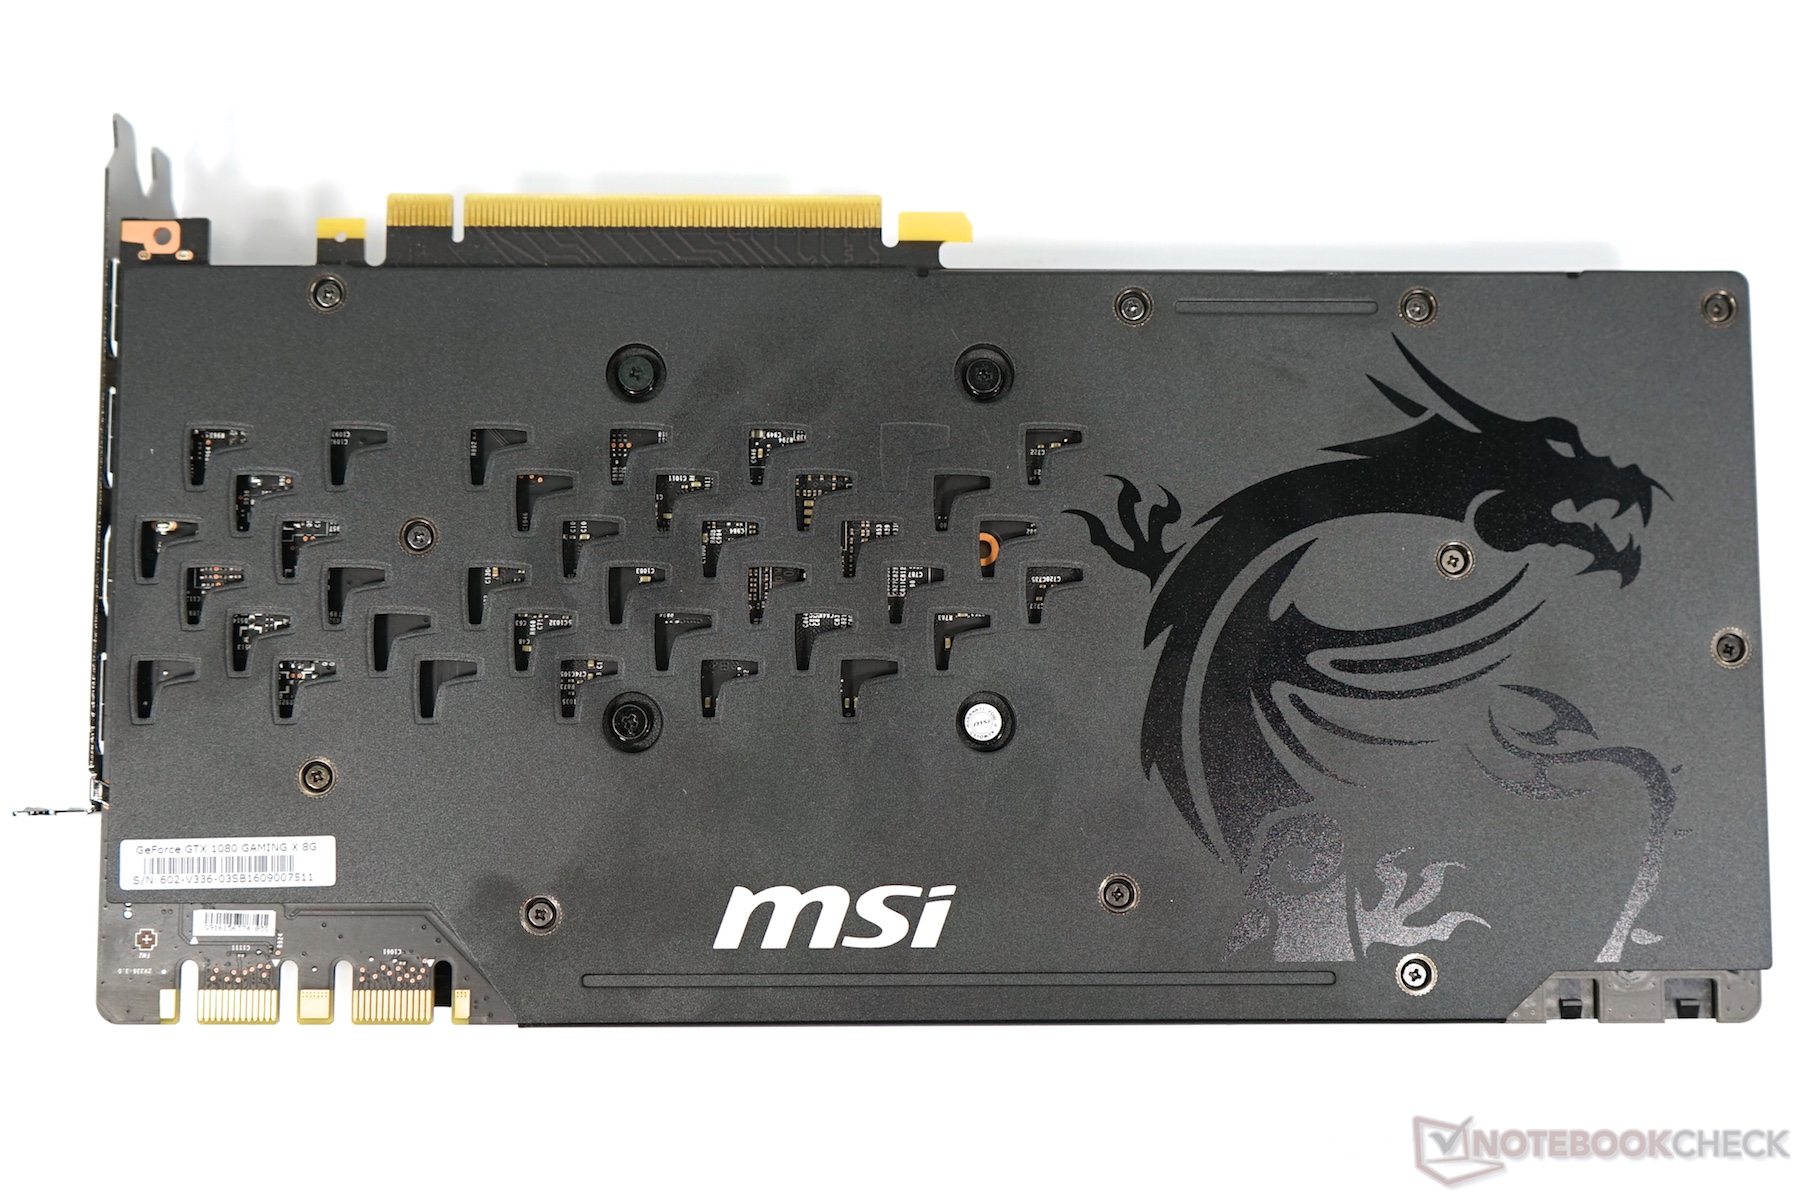
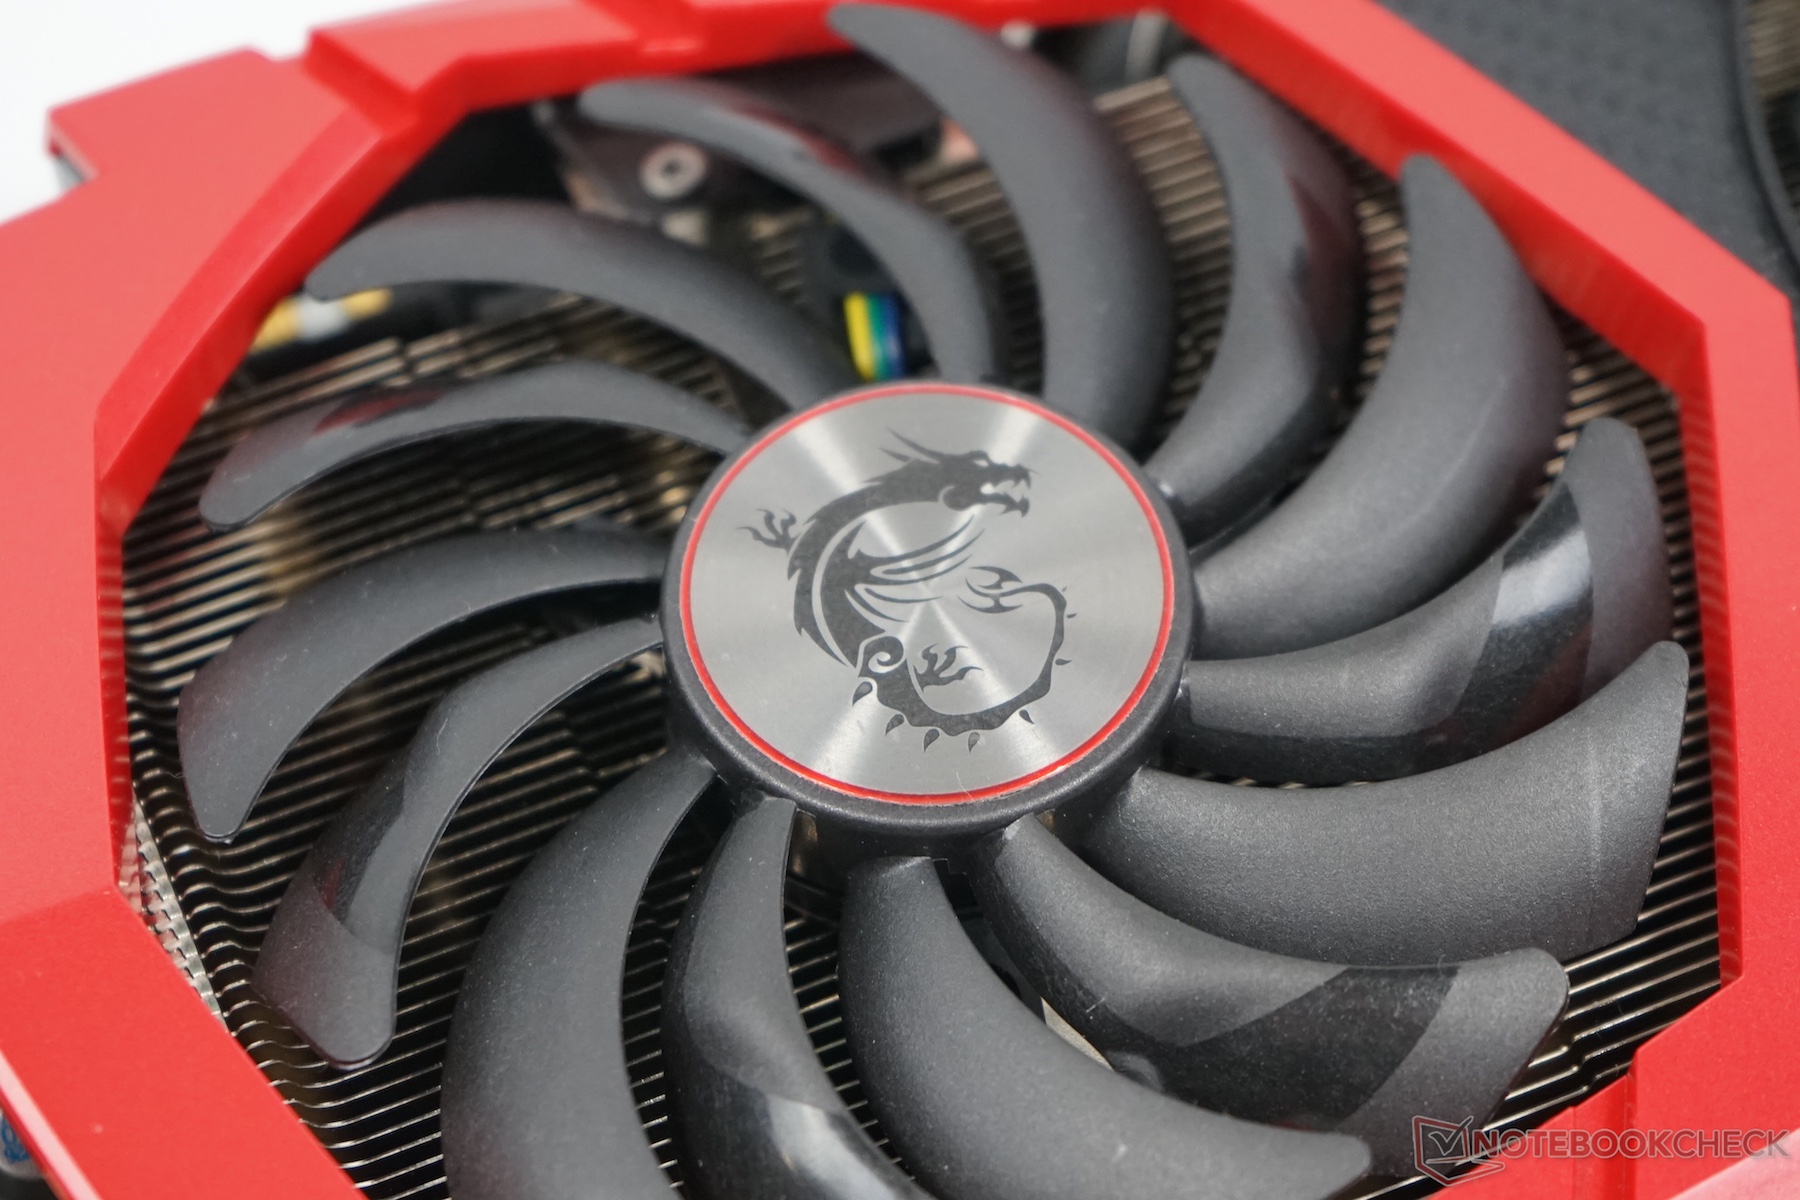
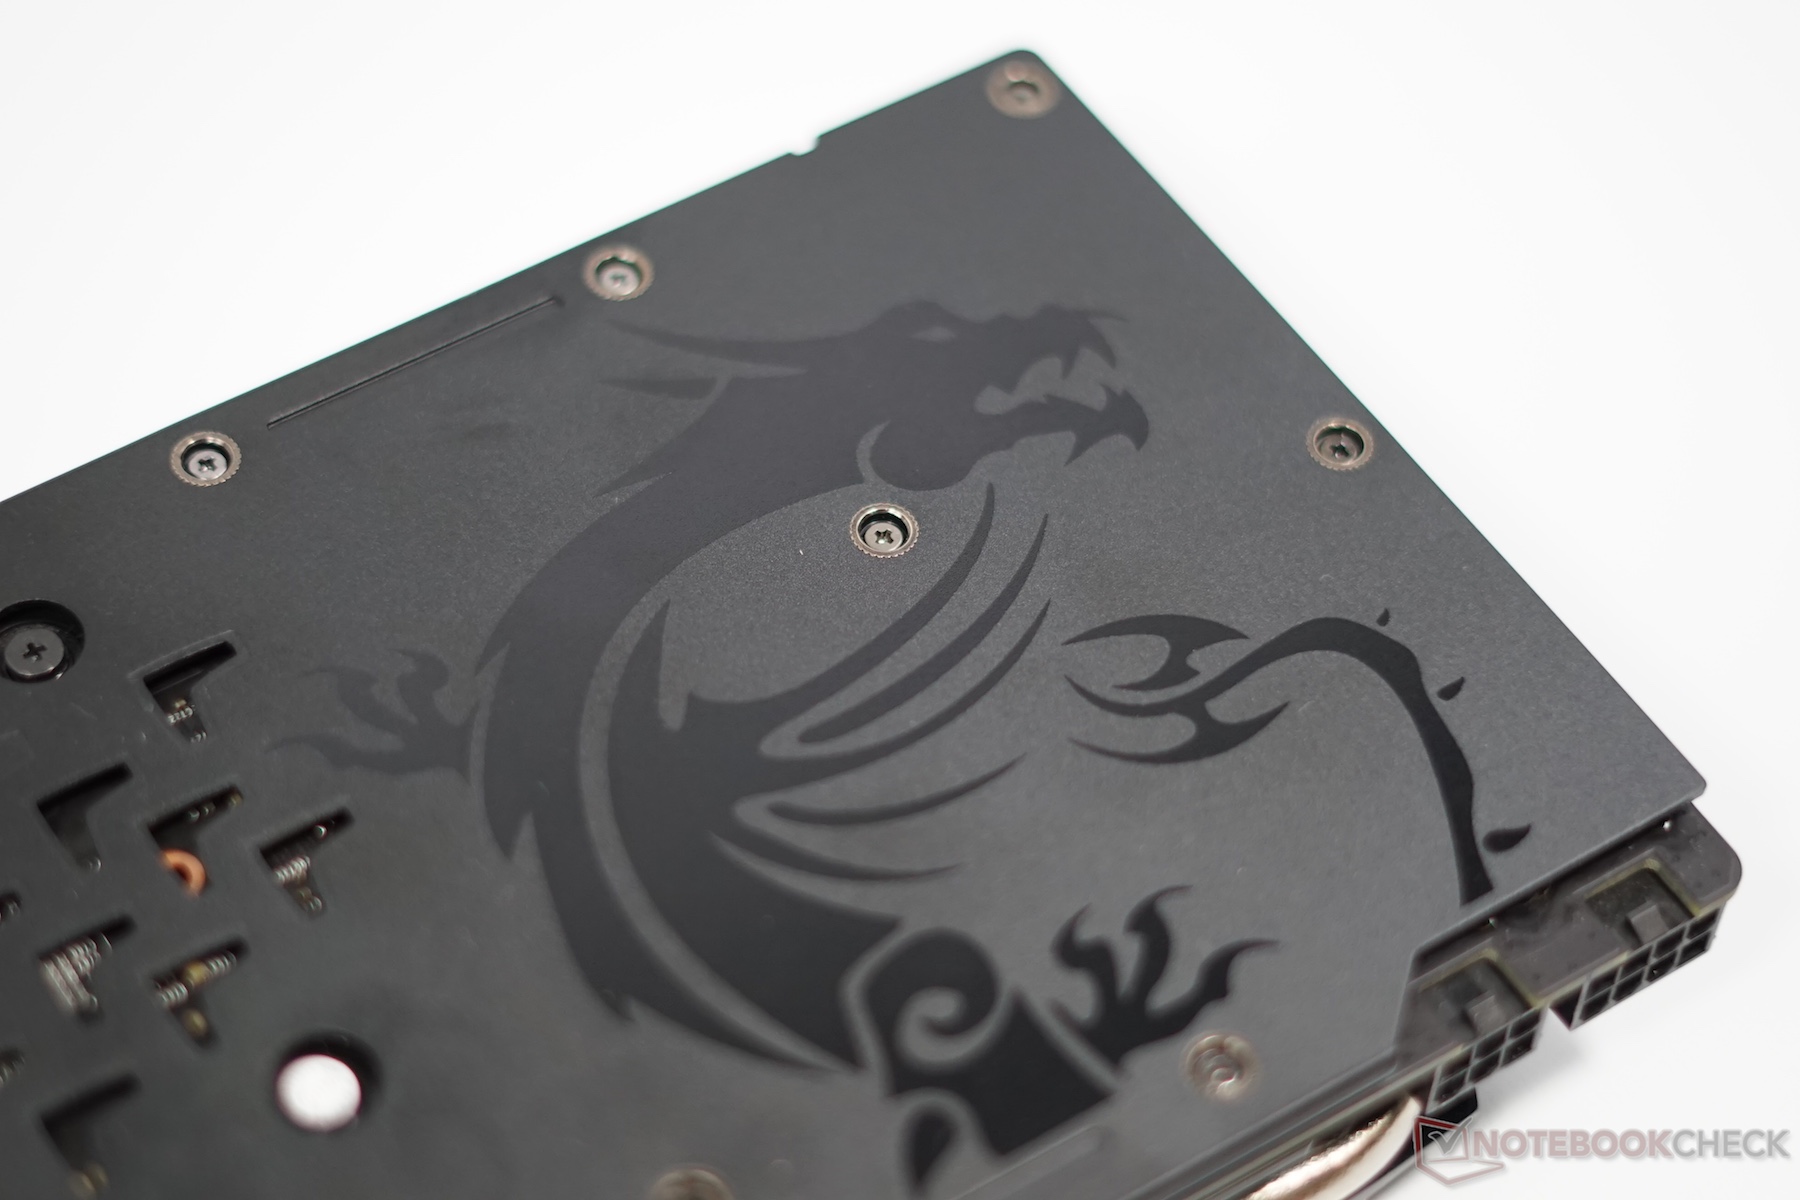
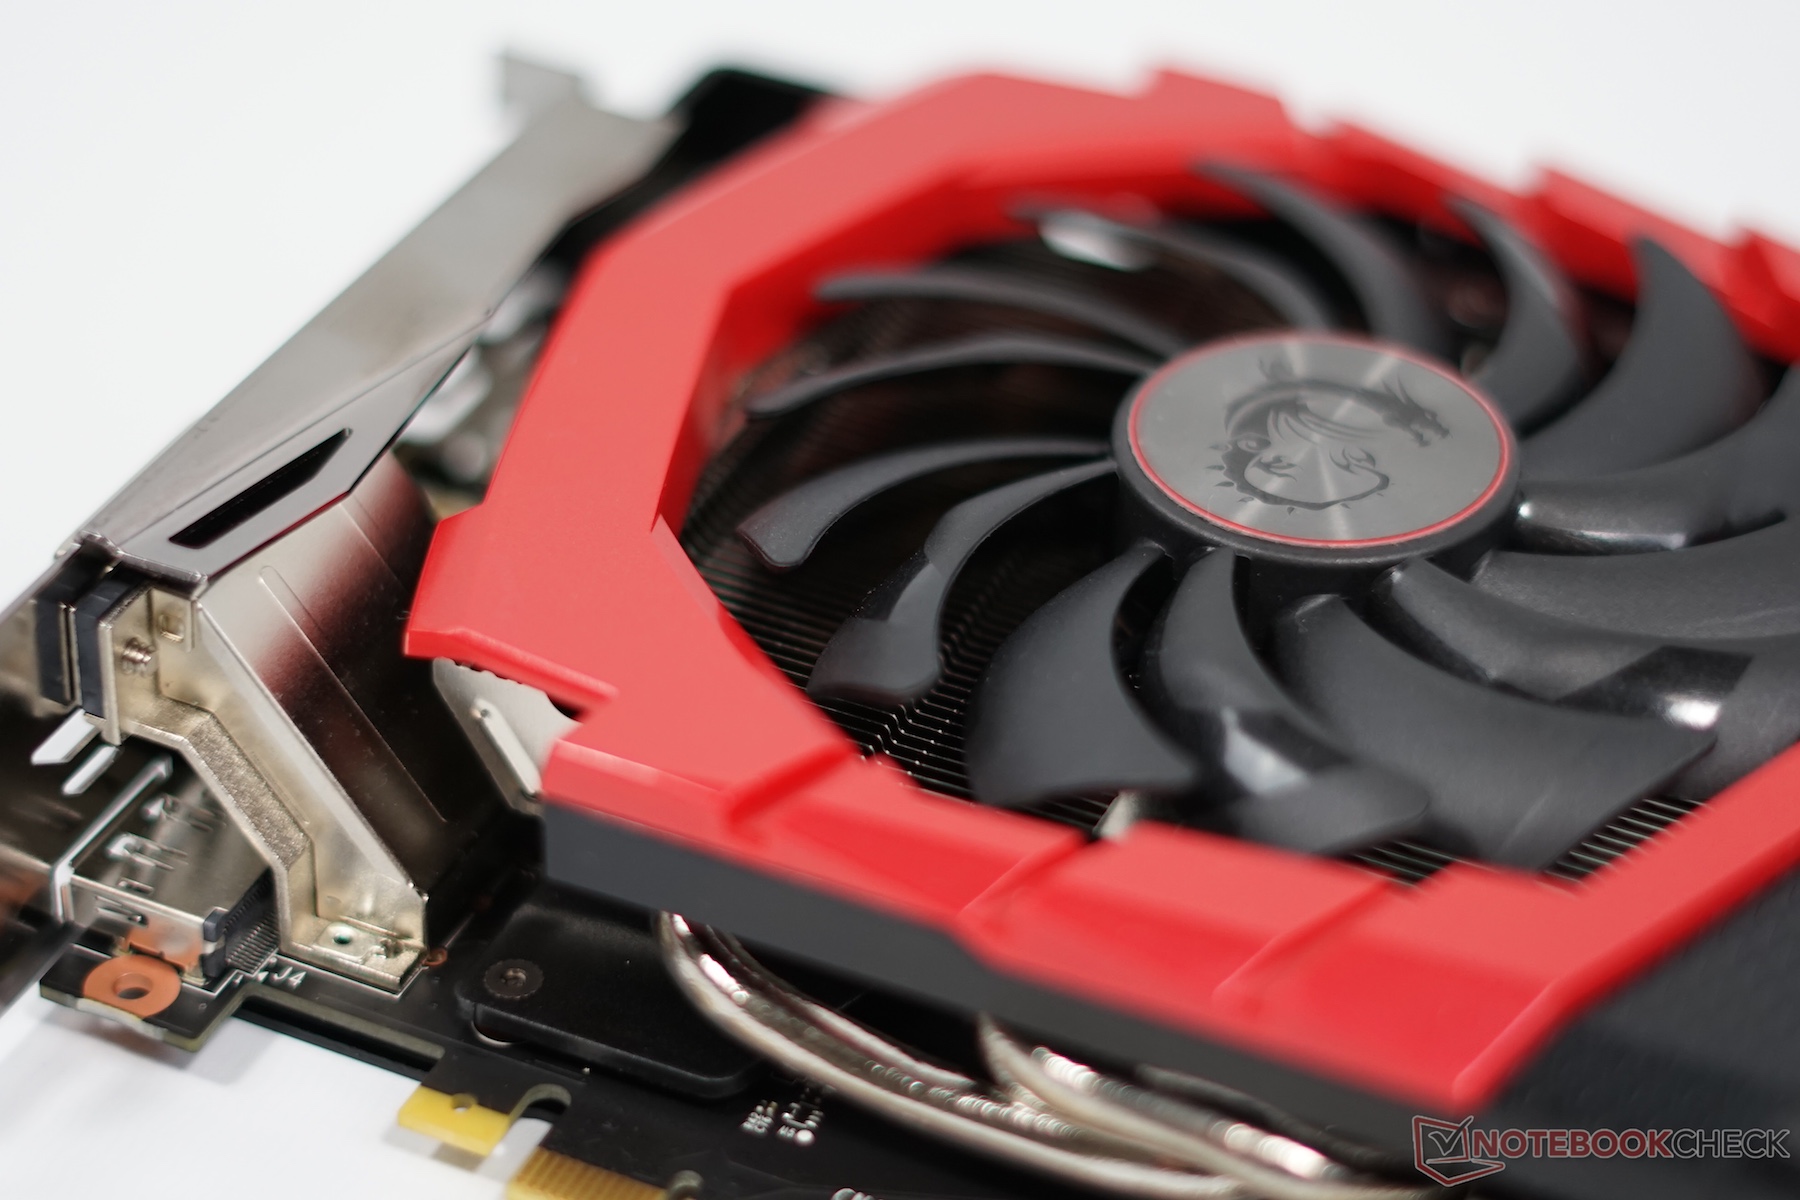
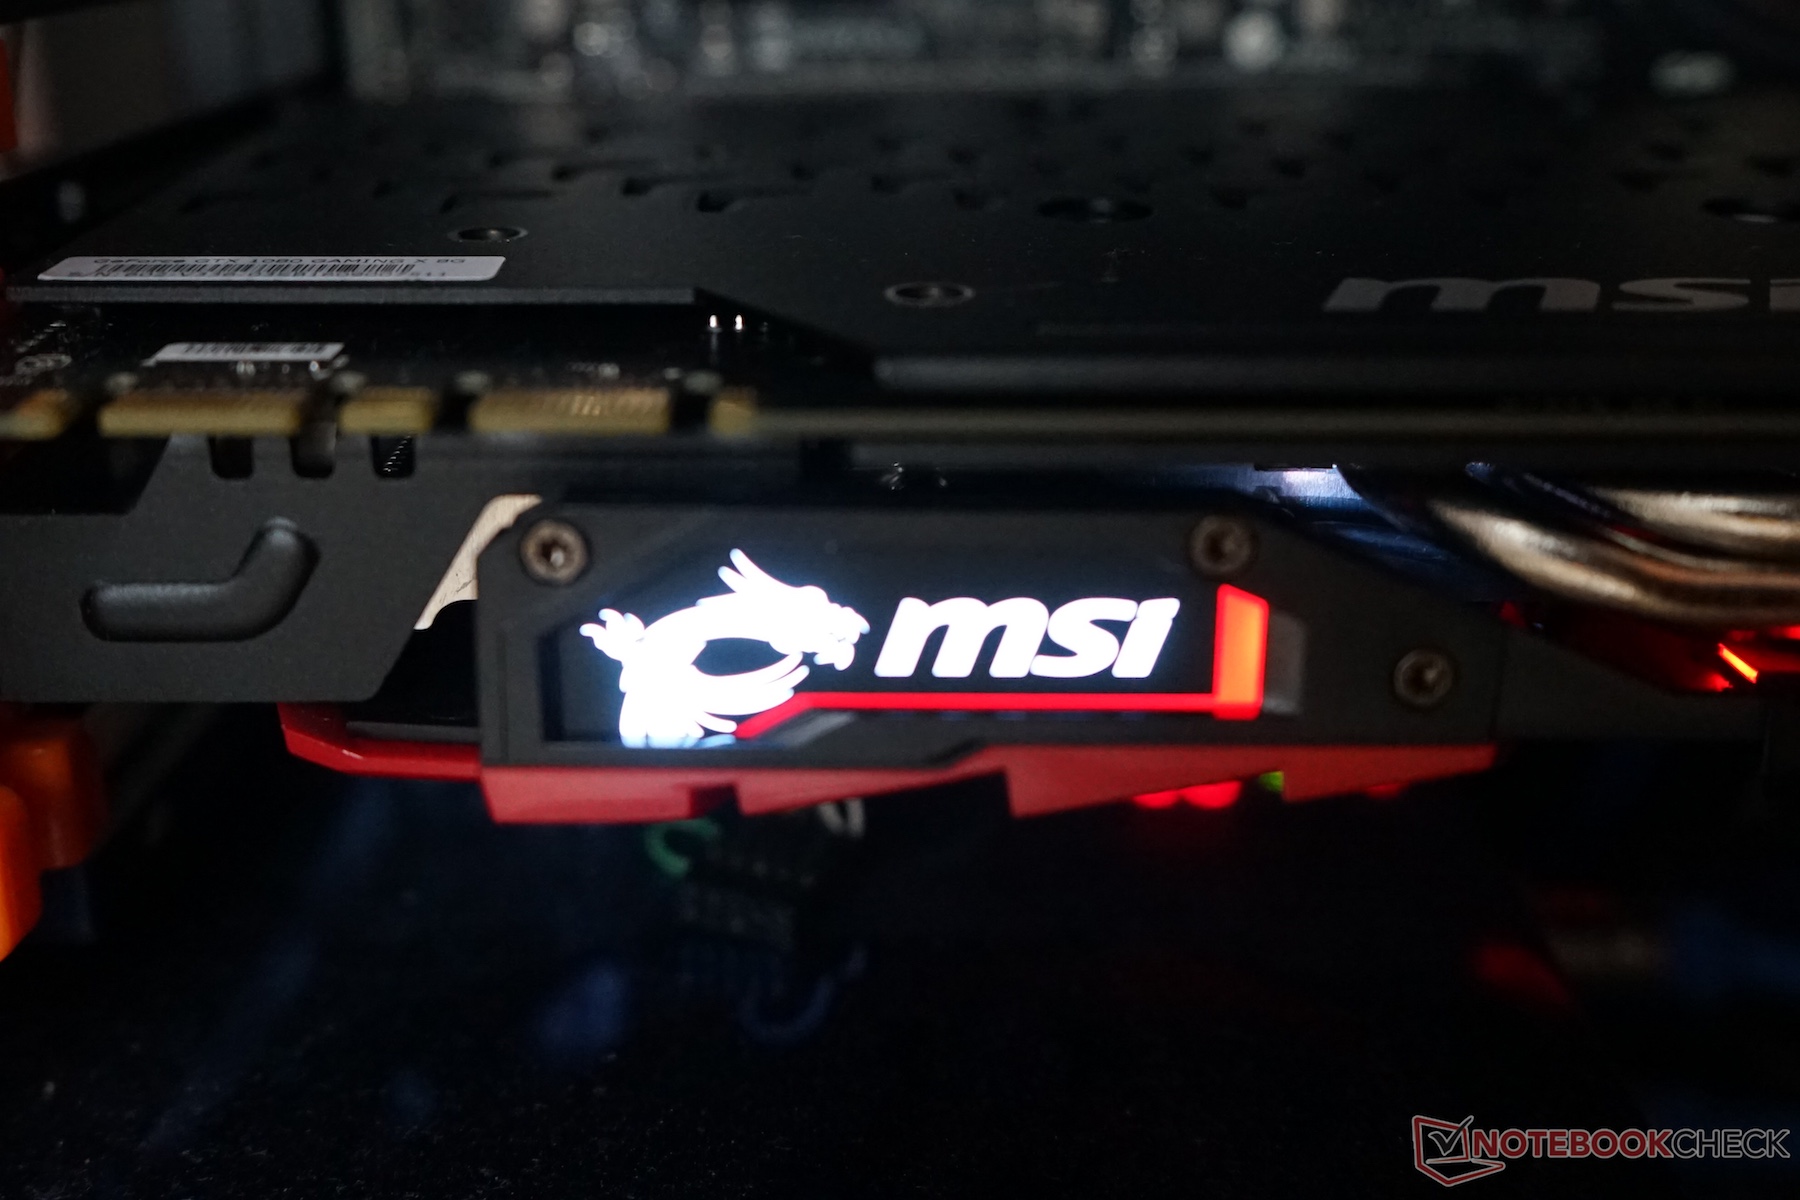
For the GeForce GTX 1080 Gaming X, MSI utilizes their Twin Frozr VI cooling system, which differs greatly from Nvidia's implementation. Two 100 mm axial fans with dual ball bearings blow air from above onto the generously-sized heatsink. This heatsink features four 8 mm copper pipes, which distribute the generated heat to the cooling fins. The RAM chips and the voltage converters are equipped with an additional heatsink. To increase the stability, the back of the graphics card features a massive backplate, which is adorned with a decorative dragon motive. An RGB LED "dragon" design on the side is visible in the dark. Various decorative elements up front are also lighted. The overall design is very high-end and looks quite appealing. MSI mentions using premium-quality, "Military Class 4 Components (Hi-C Caps, Super Ferrite Chokes, Japanese Solid Caps)," which should increase the longevity of the card.
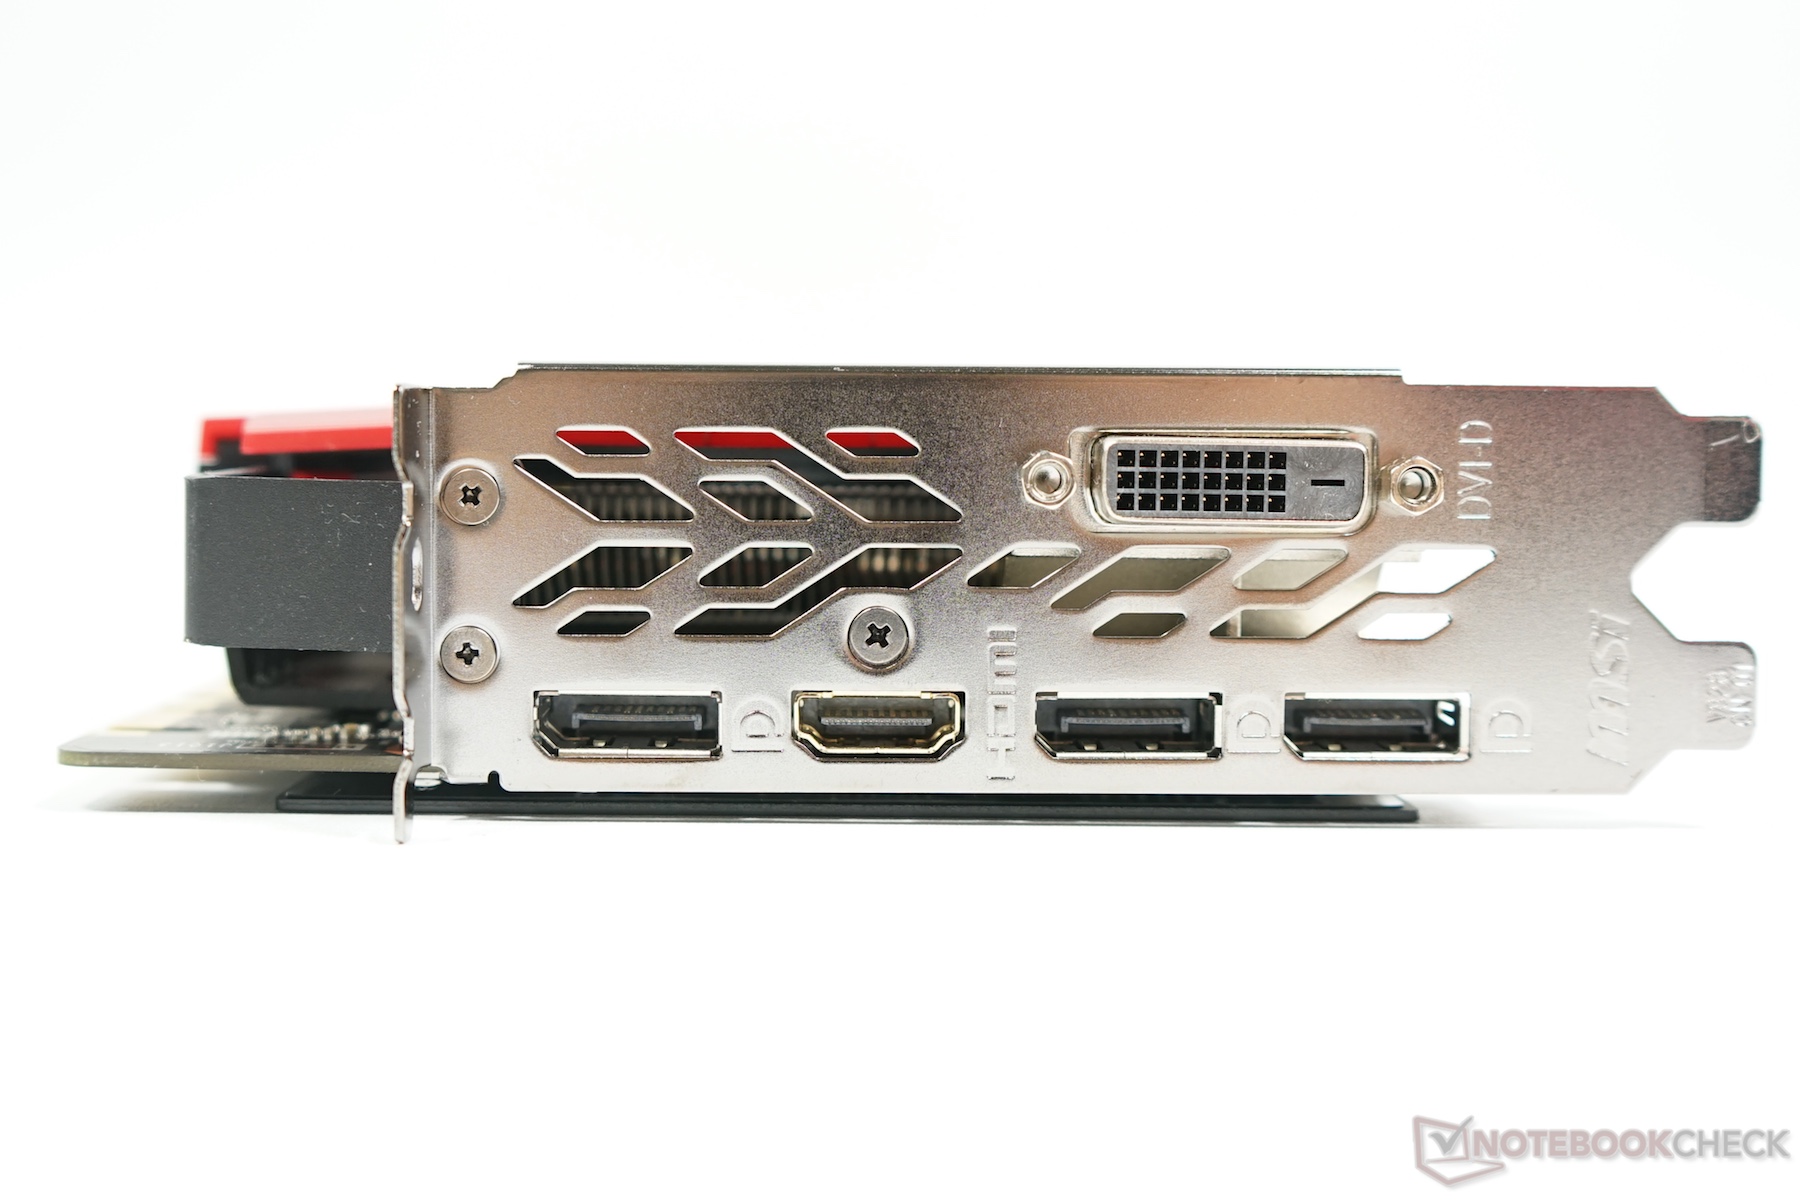
The GPU measures 279 (l) x 140 (w) x 42 (h) mm and takes up two card slots in our test system. The GPU weighs - thanks to the massive heatsink complement - a hefty 1112 grams (39 oz). The card features a Dual-Link DVI-D port (no analog signal), HDMI 2.0 (HDCP 2.2), and three DisplayPort 1.4 ports. Of the five video-outs, up to four can be used simultaneously.
| Specifications | GTX 980 | GTX 1060 6 GB | GTX 1070 FE | GTX 1080 FE | MSI GTX 1080 Gaming X |
|---|---|---|---|---|---|
| Chip | GM204 | GP106 | GP104 | GP104 | GP104 |
| Manufactured | 28 nm | 16 nm | 16 nm | 16 nm | 16 nm |
| Shader | 2.048 | 1.280 | 1.920 | 2.560 | 2.560 |
| Texture Units | 128 | 80 | 120 | 160 | 160 |
| GPU Base Clock | 1127 MHz | 1506 MHz | 1506 MHz | 1607 MHz | 1683 MHz |
| GPU Boost Clock | 1216 MHz | 1848 MHz | 1683 MHz | 1733 MHz | 1822 MHz |
| L2 Cache | 2 MB | 1.5 MB | 2 MB | 2 MB | 2 MB |
| Memory Bus | 256 Bit | 192 Bit | 256 Bit | 256 Bit | 256 Bit |
| Memory Bandwidth | 224 GB/s | 192 GB/s | 256 GB/s | 320 GB/s | 323 GB/s |
| Memory Size | 4 GB | 6 GB | 8 GB | 8 GB | 8 GB |
| Power (Watt) | 165 W | 120 W | 150 W | 180 W | 180 W |
Software
MSI supplies a comprehensive software package specifically designed for gamers. The "Gaming APP" allows for the easy selection of three one-click performance profiles (OC, Gaming, and Silent Mode). The image quality can be changed using the "Eye Rest Mode". The software also allows users to tailor the RGB LED lighting to their liking. An on-screen function allows for monitoring of various parameters (clock speed, temperature, FPS, etc.) within 3D applications. The Android application makes it possible to control these functions independently from Windows. The tool "MSI Afterburner" makes it possible to change the clock frequency, the power consumption, and control the fan systems. All settings can be saved in a profile so they can be recalled at a later time.
"MSI Dragon Eye“ allows watching YouTube videos or Twitch Stream while playing a game. A one-year subscription of XSplit Gamecaster is included as well, so the user can record videos or share them using UStream, Twitch, or YouTube.
Clock Speeds
The MSI GeForce GTX 1080 Gaming X offers three different performance settings. In Gaming Mode - which is the default - the GPU runs at 1687 MHz (Boost: 1847 MHz). In OC Mode, the clock speed increases to 1708 MHz (Boost: 1847 MHz). The RAM runs at 10108 MHz in either case. In Silent Mode we observed speeds of 1607 MHz (Boost: 1733 MHz) for the GPU and 10010 MHz for the GDDR5X RAM, which is exactly what Nvidia states in the specs. For our test sequence we used Default Mode.
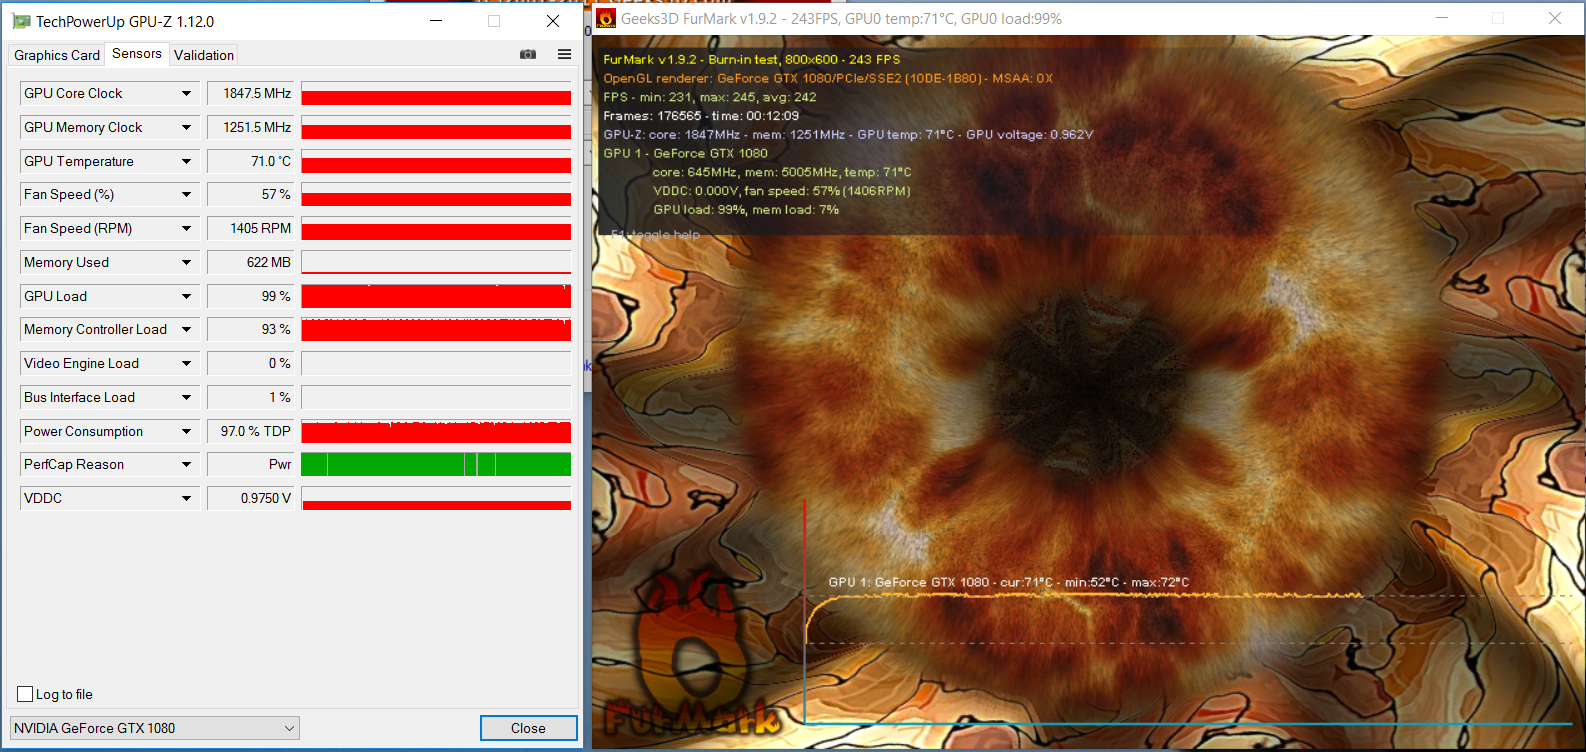
To save energy, the clock speed drops to 214 MHz for the core and 101 MHz for the RAM during idle. Thanks to "Boost 2.0", we frequently encountered higher frequencies than promised when running 3D applications. Case in point: when playing Witcher 3, we recorded a stable 1936 MHz; in World of Warships we recorded 1924 MHz and in FurMark 1860 MHz before the GPU limited a further frequency increase because of power constraints.
Our test systems are equipped with the following components:
Intel Core i7-4790K (not overclocked), 16 GB DDR3, Asus ZU97 Deluxe, Asus PB287Q 4K Monitor, Samsung SSD 840 Pro (256 GB, system), OCZ Trion 150 SSD (960 GB, benchmarks), Windows 10 64-bit with all updates as of middle of October. Our driver: GeForce 376.09 (WHQL).
Synthetic Benchmarks
When running the synthetic benchmarks, the MSI Gaming X makes use of the 5% increase in clock speed and places ahead of the GTX 1080 Founders Edition in all tests. The performance difference between the MSI Gaming X and the MSI GeForce 1070 Gaming Z is about 20%. The performance gains over the Maxwell-generation GTX 980 Ti fluctuate depending on the benchmark. The difference when running Unigine Valley is only 21%, but for 3DMark 11 we recorded a more substantial difference of 39%. AMD's fastest current card, the R9 Fury, trails the review GPU by an average of about 40%. The MSI Gaming X performs at a very high level and is only outgunned by an SLI combo or the Titan X (Pascal).
| Performance rating - Percent | |
| NVIDIA GeForce GTX 1080 (Desktop) | |
| NVIDIA GeForce GTX 1080 (Desktop) | |
| NVIDIA GeForce GTX 1070 (Desktop) | |
| NVIDIA GeForce GTX 1070 (Desktop) | |
| NVIDIA GeForce GTX 980 Ti | |
| AMD Radeon R9 Fury | |
| NVIDIA GeForce GTX 1060 (Desktop) -1! | |
| AMD Radeon RX 480 (Desktop) | |
| AMD Radeon RX 470 (Desktop) | |
| 3DMark | |
| 1920x1080 Fire Strike Graphics | |
| NVIDIA GeForce GTX 1080 (Desktop) | |
| NVIDIA GeForce GTX 1080 (Desktop) | |
| NVIDIA GeForce GTX 1070 (Desktop) | |
| NVIDIA GeForce GTX 980 Ti | |
| NVIDIA GeForce GTX 1070 (Desktop) | |
| AMD Radeon R9 Fury | |
| NVIDIA GeForce GTX 1060 (Desktop) | |
| AMD Radeon RX 480 (Desktop) | |
| AMD Radeon RX 470 (Desktop) | |
| 1280x720 Cloud Gate Standard Graphics | |
| NVIDIA GeForce GTX 1080 (Desktop) | |
| NVIDIA GeForce GTX 1080 (Desktop) | |
| NVIDIA GeForce GTX 1070 (Desktop) | |
| NVIDIA GeForce GTX 1070 (Desktop) | |
| NVIDIA GeForce GTX 980 Ti | |
| NVIDIA GeForce GTX 1060 (Desktop) | |
| AMD Radeon R9 Fury | |
| AMD Radeon RX 480 (Desktop) | |
| AMD Radeon RX 470 (Desktop) | |
| 3DMark 11 - 1280x720 Performance GPU | |
| NVIDIA GeForce GTX 1080 (Desktop) | |
| NVIDIA GeForce GTX 1080 (Desktop) | |
| NVIDIA GeForce GTX 1070 (Desktop) | |
| NVIDIA GeForce GTX 1070 (Desktop) | |
| NVIDIA GeForce GTX 980 Ti | |
| AMD Radeon RX 480 (Desktop) | |
| AMD Radeon RX 470 (Desktop) | |
| AMD Radeon R9 Fury | |
| NVIDIA GeForce GTX 1060 (Desktop) | |
| Unigine Heaven 4.0 - Extreme Preset DX11 | |
| NVIDIA GeForce GTX 1080 (Desktop) | |
| NVIDIA GeForce GTX 1080 (Desktop) | |
| NVIDIA GeForce GTX 1070 (Desktop) | |
| NVIDIA GeForce GTX 1070 (Desktop) | |
| NVIDIA GeForce GTX 980 Ti | |
| NVIDIA GeForce GTX 1060 (Desktop) | |
| AMD Radeon R9 Fury | |
| AMD Radeon RX 480 (Desktop) | |
| AMD Radeon RX 470 (Desktop) | |
| Unigine Valley 1.0 - 1920x1080 Extreme HD DirectX AA:x8 | |
| NVIDIA GeForce GTX 1080 (Desktop) | |
| NVIDIA GeForce GTX 1080 (Desktop) | |
| NVIDIA GeForce GTX 1070 (Desktop) | |
| NVIDIA GeForce GTX 1070 (Desktop) | |
| NVIDIA GeForce GTX 980 Ti | |
| AMD Radeon R9 Fury | |
| AMD Radeon RX 480 (Desktop) | |
| AMD Radeon RX 470 (Desktop) | |
Gaming Benchmarks
The MSI Gaming X takes the top spot in the gaming benchmarks as well. The actual performance difference is just a few percentage points in most cases - except for Hitman 2016, to name an example. In some cases, like Mirror’s Edge Catalyst, the GTX 1080 Founders Edition offers about the same performance. The difference between the review GPU and the AMD R9 Fury is still a very impressive 45%.
Note: the results in the section "Performance Rating" are slightly distorted if a GPU didn't run all of the benchmarks.
| Performance rating - Percent | |
| NVIDIA GeForce GTX 1080 (Desktop) -3! | |
| NVIDIA GeForce GTX 1080 (Desktop) | |
| NVIDIA GeForce GTX 1070 (Desktop) -1! | |
| NVIDIA GeForce GTX 1070 (Desktop) -1! | |
| NVIDIA GeForce GTX 980 Ti | |
| AMD Radeon R9 Fury -2! | |
| NVIDIA GeForce GTX 1060 (Desktop) -4! | |
| NVIDIA GeForce GTX 970 | |
| AMD Radeon R9 390X -8! | |
| AMD Radeon RX 480 (Desktop) -1! | |
| AMD Radeon RX 470 (Desktop) -3! | |
| Overwatch - 1920x1080 Epic (Render Scale 100 %) AA:SM AF:16x | |
| NVIDIA GeForce GTX 1080 (Desktop) | |
| NVIDIA GeForce GTX 1070 (Desktop) | |
| NVIDIA GeForce GTX 1070 (Desktop) | |
| NVIDIA GeForce GTX 980 Ti | |
| AMD Radeon RX 480 (Desktop) | |
| AMD Radeon R9 Fury | |
| NVIDIA GeForce GTX 1060 (Desktop) | |
| NVIDIA GeForce GTX 970 | |
| AMD Radeon RX 470 (Desktop) | |
| Doom - 1920x1080 Ultra Preset AA:SM | |
| NVIDIA GeForce GTX 1080 (Desktop) | |
| NVIDIA GeForce GTX 1080 (Desktop) | |
| NVIDIA GeForce GTX 1070 (Desktop) | |
| NVIDIA GeForce GTX 1070 (Desktop) | |
| NVIDIA GeForce GTX 980 Ti | |
| NVIDIA GeForce GTX 1060 (Desktop) | |
| NVIDIA GeForce GTX 970 | |
| AMD Radeon R9 Fury | |
| AMD Radeon RX 480 (Desktop) | |
| AMD Radeon RX 470 (Desktop) | |
| Hitman 2016 - 1920x1080 Ultra / On AA:SM AF:16x | |
| NVIDIA GeForce GTX 1080 (Desktop) | |
| NVIDIA GeForce GTX 1080 (Desktop) | |
| NVIDIA GeForce GTX 1070 (Desktop) | |
| NVIDIA GeForce GTX 1070 (Desktop) | |
| NVIDIA GeForce GTX 980 Ti | |
| AMD Radeon RX 480 (Desktop) | |
| AMD Radeon RX 480 (Desktop) | |
| AMD Radeon R9 Fury | |
| AMD Radeon R9 Fury | |
| AMD Radeon RX 470 (Desktop) | |
| NVIDIA GeForce GTX 1060 (Desktop) | |
| NVIDIA GeForce GTX 1060 (Desktop) | |
| NVIDIA GeForce GTX 970 | |
| Far Cry Primal - 1920x1080 Ultra Preset AA:SM | |
| NVIDIA GeForce GTX 1080 (Desktop) | |
| NVIDIA GeForce GTX 1080 (Desktop) | |
| NVIDIA GeForce GTX 1070 (Desktop) | |
| NVIDIA GeForce GTX 1070 (Desktop) | |
| NVIDIA GeForce GTX 980 Ti | |
| AMD Radeon R9 Fury | |
| NVIDIA GeForce GTX 1060 (Desktop) | |
| AMD Radeon RX 480 (Desktop) | |
| NVIDIA GeForce GTX 970 | |
| AMD Radeon RX 470 (Desktop) | |
| Rise of the Tomb Raider - 1920x1080 Very High Preset AA:FX AF:16x | |
| NVIDIA GeForce GTX 1080 (Desktop) | |
| NVIDIA GeForce GTX 1080 (Desktop) | |
| NVIDIA GeForce GTX 1080 (Desktop) | |
| NVIDIA GeForce GTX 1080 (Desktop) | |
| NVIDIA GeForce GTX 1070 (Desktop) | |
| NVIDIA GeForce GTX 1070 (Desktop) | |
| NVIDIA GeForce GTX 980 Ti | |
| NVIDIA GeForce GTX 1060 (Desktop) | |
| NVIDIA GeForce GTX 1060 (Desktop) | |
| NVIDIA GeForce GTX 970 | |
| AMD Radeon R9 Fury | |
| AMD Radeon RX 480 (Desktop) | |
| AMD Radeon RX 470 (Desktop) | |
| Rainbow Six Siege - 1920x1080 Ultra Preset AA:T AF:16x | |
| NVIDIA GeForce GTX 1080 (Desktop) | |
| NVIDIA GeForce GTX 1080 (Desktop) | |
| NVIDIA GeForce GTX 1070 (Desktop) | |
| NVIDIA GeForce GTX 1070 (Desktop) | |
| NVIDIA GeForce GTX 980 Ti | |
| NVIDIA GeForce GTX 1060 (Desktop) | |
| AMD Radeon RX 480 (Desktop) | |
| NVIDIA GeForce GTX 970 | |
| AMD Radeon RX 470 (Desktop) | |
| AMD Radeon R9 Fury | |
| AMD Radeon R9 390X | |
| Fallout 4 - 1920x1080 Ultra Preset AA:T AF:16x | |
| NVIDIA GeForce GTX 1080 (Desktop) | |
| NVIDIA GeForce GTX 1070 (Desktop) | |
| NVIDIA GeForce GTX 1070 (Desktop) | |
| NVIDIA GeForce GTX 980 Ti | |
| AMD Radeon R9 Fury | |
| NVIDIA GeForce GTX 1060 (Desktop) | |
| NVIDIA GeForce GTX 970 | |
| AMD Radeon R9 390X | |
| AMD Radeon RX 480 (Desktop) | |
| AMD Radeon RX 470 (Desktop) | |
| Anno 2205 - 1920x1080 Ultra High Preset AA:8x | |
| NVIDIA GeForce GTX 1080 (Desktop) | |
| NVIDIA GeForce GTX 1080 (Desktop) | |
| NVIDIA GeForce GTX 1070 (Desktop) | |
| NVIDIA GeForce GTX 1070 (Desktop) | |
| NVIDIA GeForce GTX 980 Ti | |
| AMD Radeon R9 Fury | |
| NVIDIA GeForce GTX 1060 (Desktop) | |
| AMD Radeon RX 480 (Desktop) | |
| AMD Radeon R9 390X | |
| NVIDIA GeForce GTX 970 | |
| World of Warships - 1920x1080 Very High Preset AA:High FX AF:16x | |
| NVIDIA GeForce GTX 1070 (Desktop) | |
| NVIDIA GeForce GTX 1080 (Desktop) | |
| NVIDIA GeForce GTX 980 Ti | |
| NVIDIA GeForce GTX 1070 (Desktop) | |
| NVIDIA GeForce GTX 970 | |
| AMD Radeon RX 470 (Desktop) | |
| AMD Radeon R9 Fury | |
| AMD Radeon R9 390X | |
| The Witcher 3 - 1920x1080 Ultra Graphics & Postprocessing (HBAO+) | |
| NVIDIA GeForce GTX 1080 (Desktop) | |
| NVIDIA GeForce GTX 1080 (Desktop) | |
| NVIDIA GeForce GTX 1070 (Desktop) | |
| NVIDIA GeForce GTX 980 Ti | |
| AMD Radeon R9 Fury | |
| NVIDIA GeForce GTX 1060 (Desktop) | |
| AMD Radeon RX 480 (Desktop) | |
| NVIDIA GeForce GTX 970 | |
| AMD Radeon R9 390X | |
| AMD Radeon RX 470 (Desktop) | |
| GTA V - 1920x1080 Highest AA:4xMSAA + FX AF:16x | |
| NVIDIA GeForce GTX 1080 (Desktop) | |
| NVIDIA GeForce GTX 1080 (Desktop) | |
| NVIDIA GeForce GTX 1070 (Desktop) | |
| NVIDIA GeForce GTX 1070 (Desktop) | |
| NVIDIA GeForce GTX 980 Ti | |
| NVIDIA GeForce GTX 970 | |
| AMD Radeon RX 480 (Desktop) | |
| BioShock Infinite - 1920x1080 Ultra Preset, DX11 (DDOF) | |
| NVIDIA GeForce GTX 1080 (Desktop) | |
| NVIDIA GeForce GTX 1080 (Desktop) | |
| NVIDIA GeForce GTX 980 Ti | |
| NVIDIA GeForce GTX 1070 (Desktop) | |
| NVIDIA GeForce GTX 1070 (Desktop) | |
| NVIDIA GeForce GTX 970 | |
| AMD Radeon R9 390X | |
| AMD Radeon RX 480 (Desktop) | |
| Battlefield 1 - 1920x1080 Ultra Preset AA:T | |
| NVIDIA GeForce GTX 1080 (Desktop) | |
| NVIDIA GeForce GTX 1080 (Desktop) | |
| NVIDIA GeForce GTX 1070 (Desktop) | |
| NVIDIA GeForce GTX 980 Ti | |
| AMD Radeon R9 Fury | |
| AMD Radeon RX 480 (Desktop) | |
| AMD Radeon RX 480 (Desktop) | |
| NVIDIA GeForce GTX 970 | |
| AMD Radeon RX 470 (Desktop) | |
| Mirror's Edge Catalyst - 1920x1080 Ultra Preset AF:16x | |
| NVIDIA GeForce GTX 1080 (Desktop) | |
| NVIDIA GeForce GTX 1080 (Desktop) | |
| NVIDIA GeForce GTX 1070 (Desktop) | |
| NVIDIA GeForce GTX 1070 (Desktop) | |
| NVIDIA GeForce GTX 980 Ti | |
| AMD Radeon R9 Fury | |
| NVIDIA GeForce GTX 1060 (Desktop) | |
| NVIDIA GeForce GTX 970 | |
| AMD Radeon RX 480 (Desktop) | |
| AMD Radeon RX 470 (Desktop) | |
The MSI Gaming X placed 7% ahead of the GTX 1080 Founders Edition during the 4K benchmark tests, with Doom showing the biggest increase of 17%. Driver optimizations likely play a role here as well. Only Battlefield doesn't seem to be able to take advantage of the additional performance and runs about equally well on both cards. The difference between the MSI Gaming X and the R9 Fury increases further at 4K resolution to 53%.
| Performance rating - Percent | |
| NVIDIA GeForce GTX 1080 (Desktop) | |
| NVIDIA GeForce GTX 1080 (Desktop) | |
| NVIDIA GeForce GTX 1070 (Desktop) | |
| NVIDIA GeForce GTX 980 Ti | |
| NVIDIA GeForce GTX 1070 (Desktop) -1! | |
| AMD Radeon R9 Fury | |
| AMD Radeon R9 390X -5! | |
| NVIDIA GeForce GTX 1060 (Desktop) -1! | |
| NVIDIA GeForce GTX 970 | |
| AMD Radeon RX 480 (Desktop) | |
| AMD Radeon RX 470 (Desktop) -1! | |
| Overwatch - 3840x2160 High (Render Scale 100 %) AA:SM AF:4x | |
| NVIDIA GeForce GTX 1080 (Desktop) | |
| NVIDIA GeForce GTX 1080 (Desktop) | |
| NVIDIA GeForce GTX 1070 (Desktop) | |
| NVIDIA GeForce GTX 980 Ti | |
| NVIDIA GeForce GTX 1070 (Desktop) | |
| AMD Radeon R9 Fury | |
| NVIDIA GeForce GTX 1060 (Desktop) | |
| NVIDIA GeForce GTX 970 | |
| AMD Radeon RX 480 (Desktop) | |
| AMD Radeon RX 470 (Desktop) | |
| Doom - 3840x2160 High Preset AA:FX | |
| NVIDIA GeForce GTX 1080 (Desktop) | |
| NVIDIA GeForce GTX 1080 (Desktop) | |
| NVIDIA GeForce GTX 1070 (Desktop) | |
| NVIDIA GeForce GTX 1070 (Desktop) | |
| NVIDIA GeForce GTX 980 Ti | |
| AMD Radeon R9 Fury | |
| NVIDIA GeForce GTX 970 | |
| NVIDIA GeForce GTX 1060 (Desktop) | |
| AMD Radeon RX 480 (Desktop) | |
| AMD Radeon RX 470 (Desktop) | |
| Battlefield 1 - 3840x2160 High Preset AA:T | |
| NVIDIA GeForce GTX 1080 (Desktop) | |
| NVIDIA GeForce GTX 1080 (Desktop) | |
| NVIDIA GeForce GTX 1070 (Desktop) | |
| NVIDIA GeForce GTX 980 Ti | |
| AMD Radeon R9 Fury | |
| AMD Radeon RX 480 (Desktop) | |
| NVIDIA GeForce GTX 970 | |
| AMD Radeon RX 470 (Desktop) | |
| Far Cry Primal - 3840x2160 High Preset AA:SM | |
| NVIDIA GeForce GTX 1080 (Desktop) | |
| NVIDIA GeForce GTX 1080 (Desktop) | |
| NVIDIA GeForce GTX 1070 (Desktop) | |
| NVIDIA GeForce GTX 980 Ti | |
| NVIDIA GeForce GTX 1070 (Desktop) | |
| AMD Radeon R9 Fury | |
| AMD Radeon RX 480 (Desktop) | |
| NVIDIA GeForce GTX 1060 (Desktop) | |
| NVIDIA GeForce GTX 970 | |
| AMD Radeon RX 470 (Desktop) | |
| Rise of the Tomb Raider - 3840x2160 High Preset AA:FX AF:4x | |
| NVIDIA GeForce GTX 1080 (Desktop) | |
| NVIDIA GeForce GTX 1080 (Desktop) | |
| NVIDIA GeForce GTX 1080 (Desktop) | |
| NVIDIA GeForce GTX 1070 (Desktop) | |
| NVIDIA GeForce GTX 980 Ti | |
| NVIDIA GeForce GTX 1070 (Desktop) | |
| AMD Radeon R9 Fury | |
| NVIDIA GeForce GTX 1060 (Desktop) | |
| NVIDIA GeForce GTX 1060 (Desktop) | |
| AMD Radeon RX 480 (Desktop) | |
| AMD Radeon RX 480 (Desktop) | |
| NVIDIA GeForce GTX 970 | |
| AMD Radeon RX 470 (Desktop) | |
| Rainbow Six Siege - 3840x2160 High Preset AA:T AF:4x | |
| NVIDIA GeForce GTX 1080 (Desktop) | |
| NVIDIA GeForce GTX 1080 (Desktop) | |
| NVIDIA GeForce GTX 1070 (Desktop) | |
| NVIDIA GeForce GTX 1070 (Desktop) | |
| NVIDIA GeForce GTX 980 Ti | |
| AMD Radeon R9 Fury | |
| AMD Radeon R9 390X | |
| AMD Radeon RX 480 (Desktop) | |
| NVIDIA GeForce GTX 1060 (Desktop) | |
| NVIDIA GeForce GTX 970 | |
| AMD Radeon RX 470 (Desktop) | |
| The Witcher 3 - 3840x2160 High Graphics & Postprocessing (Nvidia HairWorks Off) | |
| NVIDIA GeForce GTX 1080 (Desktop) | |
| NVIDIA GeForce GTX 1080 (Desktop) | |
| NVIDIA GeForce GTX 1070 (Desktop) | |
| NVIDIA GeForce GTX 980 Ti | |
| NVIDIA GeForce GTX 1070 (Desktop) | |
| AMD Radeon R9 Fury | |
| AMD Radeon R9 390X | |
| NVIDIA GeForce GTX 970 | |
| NVIDIA GeForce GTX 1060 (Desktop) | |
| AMD Radeon RX 480 (Desktop) | |
The card handles all current games with aplomb. Maximum details and Full HD are no problem and the frame rate stays above 100 fps in most cases. Even 4K gaming at reduced details (high) is possible. Only a few games drop to below 50 fps. Of all the games, only Deus Ex Mankind Divided (with some reservation) and Mafia 3 can be considered unplayable at 4K resolution and high graphics settings.
| low | med. | high | ultra | 4K | |
|---|---|---|---|---|---|
| Supreme Commander - FA Bench (2007) | 91 | ||||
| BioShock Infinite (2013) | 360 | 319 | 307 | 184 | |
| Dragon Age: Inquisition (2014) | 129 | ||||
| GTA V (2015) | 86 | 73.9 | |||
| The Witcher 3 (2015) | 82 | 56.5 | |||
| Dota 2 Reborn (2015) | 177 | 149 | 142 | 141 | 129 |
| World of Warships (2015) | 112 | ||||
| Anno 2205 (2015) | 61 | 75 | |||
| Fallout 4 (2015) | 57 | ||||
| Rainbow Six Siege (2015) | 211 | 85 | |||
| Rise of the Tomb Raider (2016) | 125 | 53 | |||
| Far Cry Primal (2016) | 107 | 50 | |||
| The Division (2016) | 102 | 51.2 | |||
| Hitman 2016 (2016) | 90 | 52 | |||
| Doom (2016) | 160 | 72 | |||
| Overwatch (2016) | 113 | ||||
| Mirror's Edge Catalyst (2016) | 121 | 49 | |||
| Deus Ex Mankind Divided (2016) | 55.9 | 36.9 | |||
| FIFA 17 (2016) | 219 | ||||
| Mafia 3 (2016) | 63 | 27.8 | |||
| Battlefield 1 (2016) | 148 | 70.7 | |||
| Farming Simulator 17 (2016) | 160 | ||||
| Titanfall 2 (2016) | 144 | 144 | 144 | 143 | 65 |
| Call of Duty Infinite Warfare (2016) | 124 | 116 | 83 | ||
| Dishonored 2 (2016) | 121 | 113 | 96 | 82 | 47.3 |
| Watch Dogs 2 (2016) | 148 | 140 | 110 | 73.5 | 46.7 |
Compute Performance
The Nvidia GeForce GTX 1080 features 8 Compute Units for general calculations, which are addressed using OpenCL, DirectCompute and CUDA. The MSI Gaming X maintains its lead compared to the GTX 1080 Founders Edition and still manages to outperform the other cards as well. The lead over the AMD R9 Fury shrinks to 40%, however. Overall it can be said that AMD GPUs generally do better in this discipline than the competition from Nvidia. Surprisingly enough, no graphics card could compete with the GTX 980 Ti when running the LuxMark Room test.
| Performance rating - Percent | |
| NVIDIA GeForce GTX 1080 (Desktop) | |
| NVIDIA GeForce GTX 1080 (Desktop) | |
| NVIDIA GeForce GTX 1070 (Desktop) | |
| NVIDIA GeForce GTX 1070 (Desktop) | |
| NVIDIA GeForce GTX 980 Ti | |
| AMD Radeon R9 Fury | |
| AMD Radeon R9 390X | |
| AMD Radeon RX 480 (Desktop) | |
| NVIDIA GeForce GTX 1060 (Desktop) | |
| AMD Radeon RX 470 (Desktop) | |
| NVIDIA GeForce GTX 970 | |
| LuxMark v2.0 64Bit | |
| Room GPUs-only | |
| NVIDIA GeForce GTX 980 Ti | |
| NVIDIA GeForce GTX 1070 (Desktop) | |
| NVIDIA GeForce GTX 1070 (Desktop) | |
| NVIDIA GeForce GTX 1080 (Desktop) | |
| NVIDIA GeForce GTX 1080 (Desktop) | |
| NVIDIA GeForce GTX 970 | |
| NVIDIA GeForce GTX 1060 (Desktop) | |
| AMD Radeon RX 480 (Desktop) | |
| AMD Radeon R9 390X | |
| AMD Radeon R9 Fury | |
| AMD Radeon RX 470 (Desktop) | |
| Sala GPUs-only | |
| NVIDIA GeForce GTX 1070 (Desktop) | |
| NVIDIA GeForce GTX 1080 (Desktop) | |
| NVIDIA GeForce GTX 1080 (Desktop) | |
| NVIDIA GeForce GTX 980 Ti | |
| NVIDIA GeForce GTX 1070 (Desktop) | |
| AMD Radeon RX 480 (Desktop) | |
| AMD Radeon R9 390X | |
| AMD Radeon R9 Fury | |
| NVIDIA GeForce GTX 970 | |
| AMD Radeon RX 470 (Desktop) | |
| NVIDIA GeForce GTX 1060 (Desktop) | |
Noise Level
The Twin Frozr VI cooling system is one of the quieter systems of its kind. During idle, the fans aren't spinning and the GPU remains completely silent. At a temperature of 60 °C, the fans start kicking in. Prolonged load results in a subjectively very acceptable whooshing sound in the medium frequency band. During the stress test, we recorded a maximum of 1400 RPM, although the fan noise was never annoying. At times, we noticed a high-frequency coil whine, which was especially pronounced during 3D gaming in the triple-digit FPS range.
Temperature
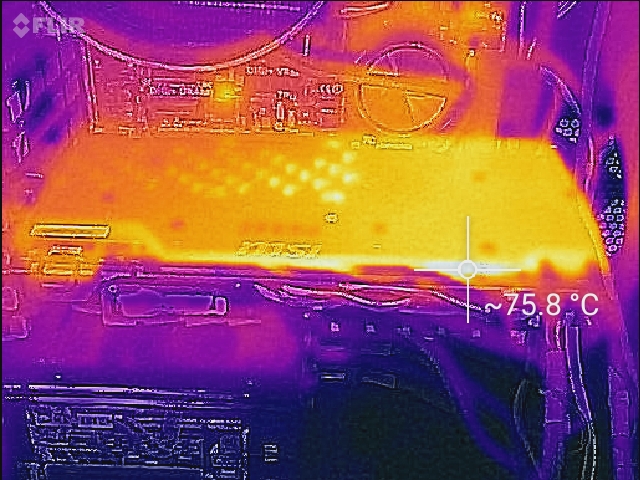
We use FurMark to check the stability and performance (throttling) of our review GPUs under load. We recorded a maximum temperature of 72 °C, which is far from critical. The Boost maintained the maximum of 1848 MHz. The temperature on the back is also not critical at 50 °C. We observed a small hotspot at the power supply lines of 76 °C.
Power Consumption
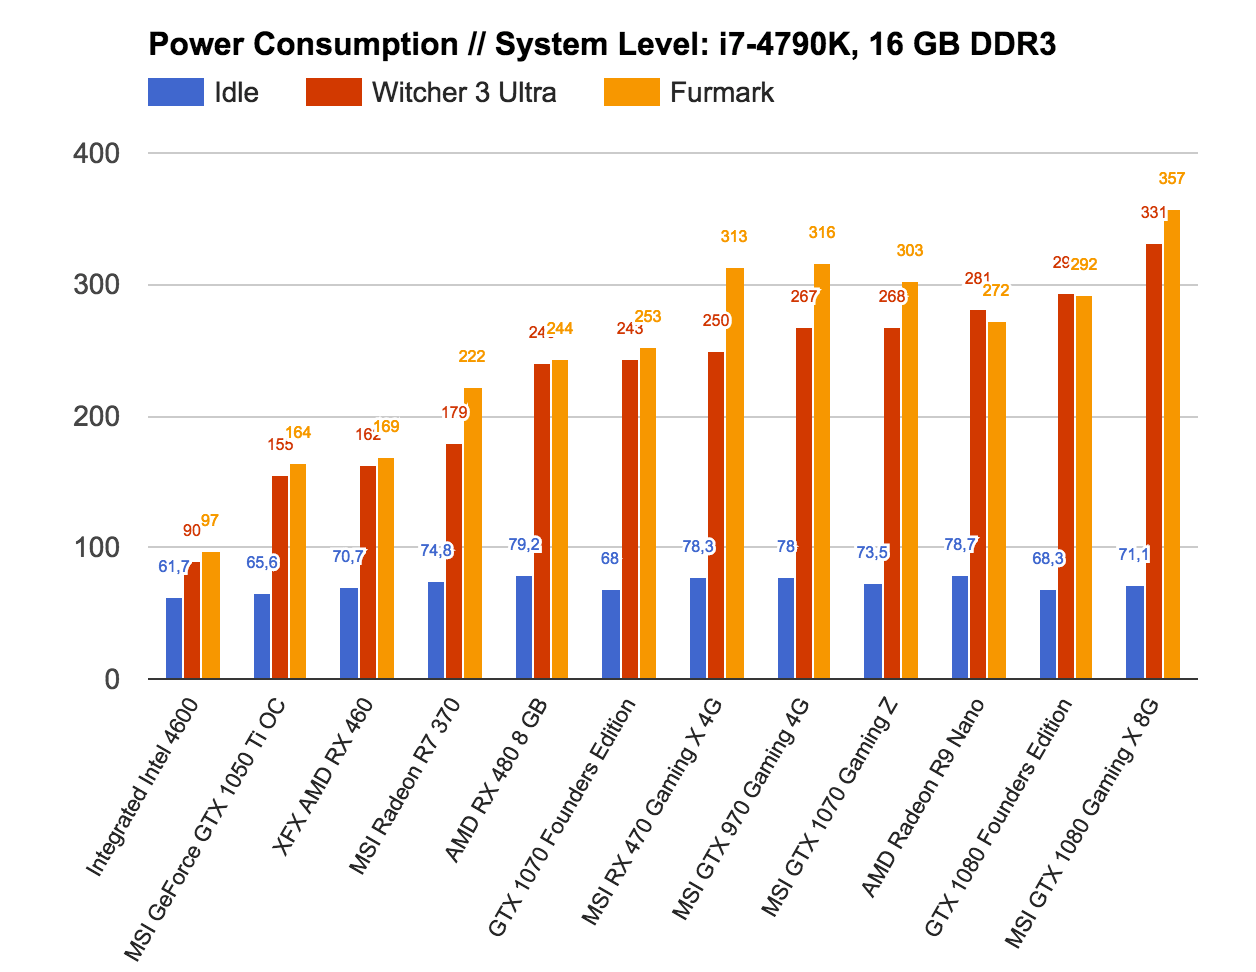
The power consumption is quite moderate, which is typical for Pascal-based GPUs. When we connected a 4K monitor using DisplayPort, the review GPU consumed 3 watts more than the GTX 1080 Founders edition (which, according to Nvidia, was optimized for a lower power draw) with just the desktop displayed; it didn't consume nearly as much as the RX480 (79 watts). When subjected to continuous gaming load - we used Witcher 3 - the Gaming X required 39 watts more (+ 13%) than Nvidia's GPU, but its performance was also slightly higher. The competitor RX 480 draws 243 watts. According to those measurements, the MSI GTX 1080 Gaming X allows for a frame rate plus of 87%, while consuming 36% more power.
Verdict
Save for the Titan X, the Nvidia GeForce GTX 1080 is the fastest available Pascal-based graphics card at this time. Despite the top-notch performance, the card surpasses its competitors as far as the efficiency at idle and under load is concerned. Even 4K gaming seems possible, as long as the details and anti-aliasing are not set to their respective maximums. At this time, there isn't a true alternative - only SLI GPUs at the same price point are contenders.
The MSI GTX 1080 Gaming X 8G is an outstanding partner-card. The cooling system is quiet and effective; the design is appealing and upscale. Despite the higher clock speeds, the GTX 1080 Gaming X is only slightly faster than the 1080 Founders Edition, however, and it costs 50 Euros (~$53) more. In return, the user gets a quieter, cooler, and slightly more powerful GPU.