MSI GeForce GTX 1070 Gaming Z 8G Review
For the original German review, see here.
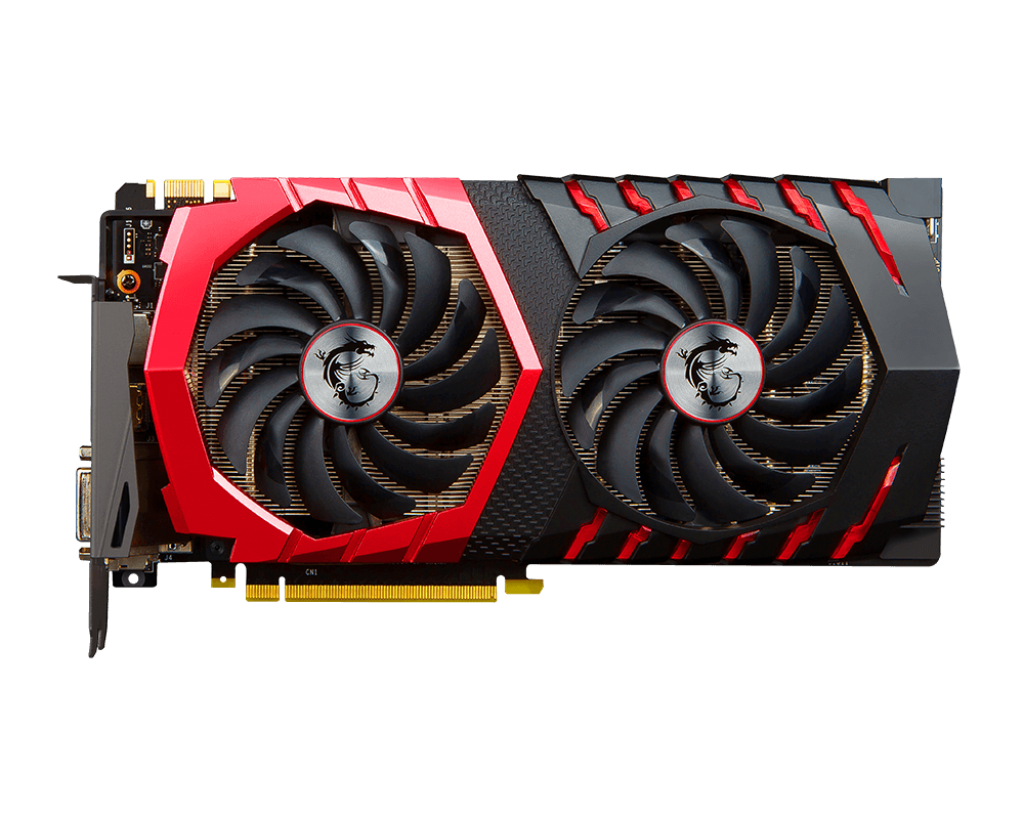
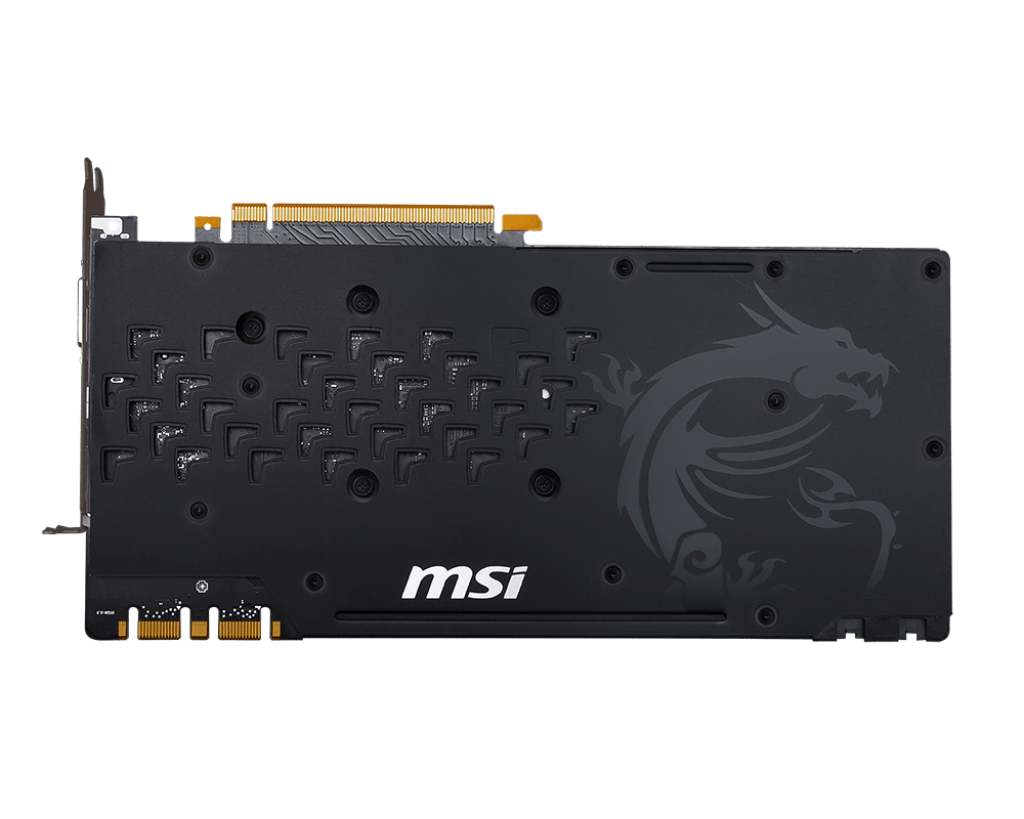
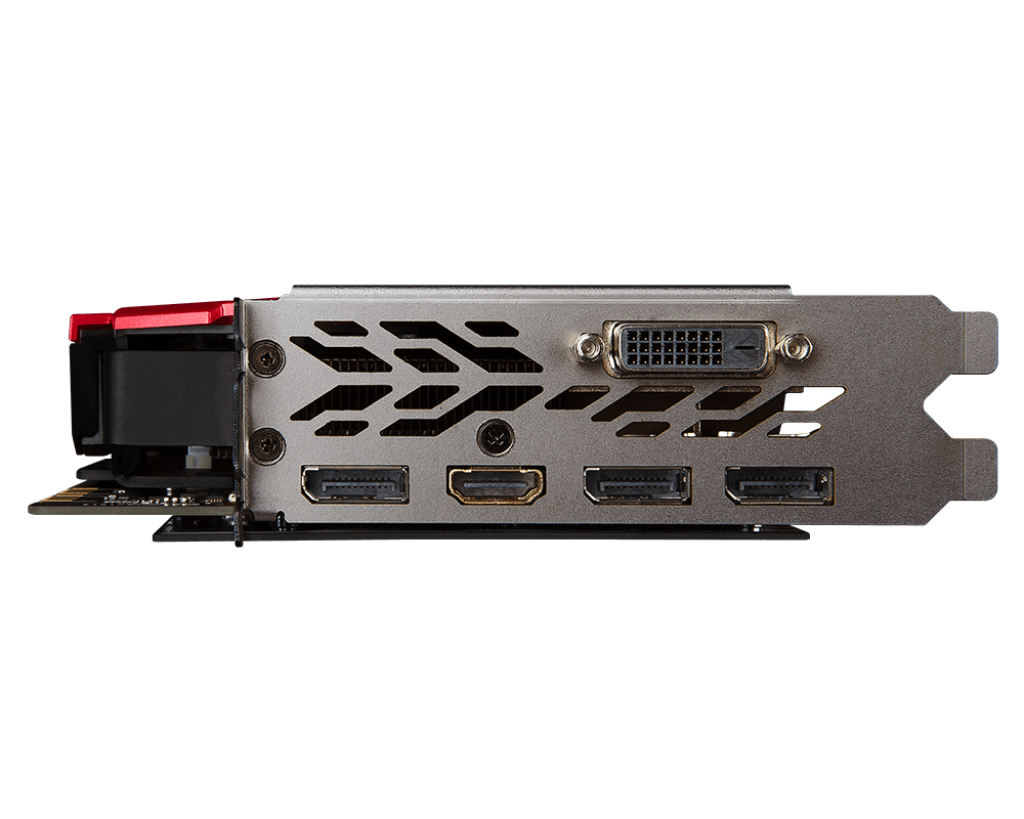
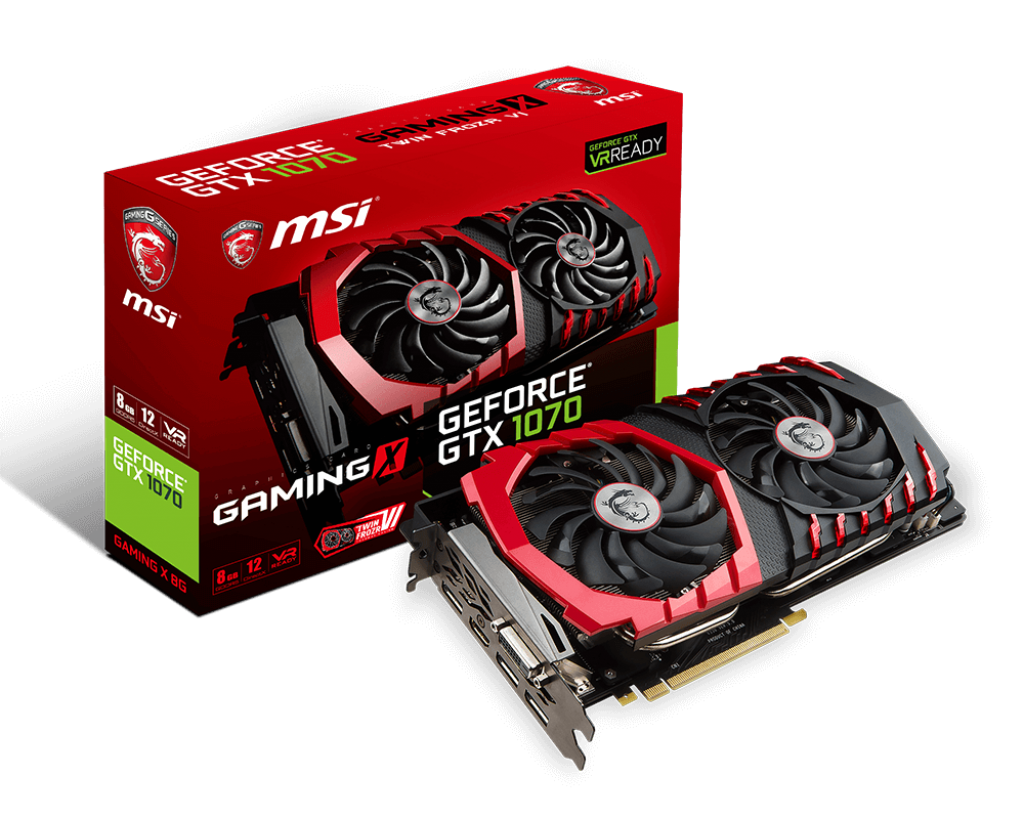
The MSI GTX 1070 is relatively heavy at 1 kilogram. The graphics card weighs so much due to its massive frame and back plate. The Gaming Z model offers a Dual-Link-DVI-D port (without analogue signal), an HDMI-2.0 port and three DisplayPort-1.4 interfaces. Overall, the test model gave us a great first impression. The red-black color scheme with the "Dragon" design and customizable RGB LED lighting is also quite appealing.
Our graphics card uses a BIOS specially customized for the press, which clocks the card at a slightly higher speed than the original BIOS. Additional testing with the original BIOS revealed that there is hardly any difference between the two versions. The drivers we used for the game tests and benchmarks were 368.69 and 368.81.
Compared to the similar named MSI GTX 1070 Gaming X (which we previously falsely called this card), the Gaming Z is offering a 63 MHz higher Boost clock.
Our test system:
Intel Core i7-4790K (no overclocking), 16 GB DDR3, Asus ZU97-Deluxe, Asus PB287Q 4K Monitor, Intel SSD 530 (240 GB, System), OCZ Trion 100 SSD (480 GB, Benchmarks), Windows 10 64-bit
Clock Speeds
Our clock speed reached a max of 2,025 MHz core clock speed (GPU-Z Render Test in the first few seconds) and 8,050 MHz memory clock speed. After a long time at high load (The Witcher 3 Ultra windowed) the clock speed drops to 1,962 MHz. In the Heaven 4.0 benchmark, the clock speed reached 1,987 MHz at a max core temperature of 67 °C. Officially the base clock speed is 1,633 MHz and the Boost measures 1,835 MHz according to the Gaming BIOS.
Synthetic Benchmarks
The graphics card places between the GTX 980 Ti and the new GTX 1080 Founders Edition in the Futuremark and Unigine benchmarks.
| 3DMark | |
| 3840x2160 Fire Strike Ultra Graphics | |
| NVIDIA GeForce GTX 1080 (Desktop) | |
| NVIDIA GeForce GTX 1070 (Desktop) | |
| NVIDIA GeForce GTX 980 Ti | |
| AMD Radeon R9 Fury | |
| NVIDIA GeForce GTX 980 | |
| NVIDIA GeForce GTX 970 | |
| AMD Radeon RX 480 (Desktop) | |
| 1920x1080 Fire Strike Graphics | |
| NVIDIA GeForce GTX 1080 (Desktop) | |
| NVIDIA GeForce GTX 1070 (Desktop) | |
| NVIDIA GeForce GTX 980 Ti | |
| AMD Radeon R9 Fury | |
| NVIDIA GeForce GTX 980 | |
| AMD Radeon RX 480 (Desktop) | |
| NVIDIA GeForce GTX 970 | |
| NVIDIA GeForce GTX 970 | |
| 1280x720 Sky Diver Graphics | |
| NVIDIA GeForce GTX 1080 (Desktop) | |
| NVIDIA GeForce GTX 1070 (Desktop) | |
| NVIDIA GeForce GTX 980 Ti | |
| AMD Radeon R9 Fury | |
| NVIDIA GeForce GTX 970 | |
| AMD Radeon RX 480 (Desktop) | |
| NVIDIA GeForce GTX 970 | |
| 1280x720 Cloud Gate Standard Graphics | |
| NVIDIA GeForce GTX 1080 (Desktop) | |
| NVIDIA GeForce GTX 1070 (Desktop) | |
| NVIDIA GeForce GTX 980 Ti | |
| AMD Radeon R9 Fury | |
| NVIDIA GeForce GTX 970 | |
| AMD Radeon RX 480 (Desktop) | |
| NVIDIA GeForce GTX 970 | |
| 2560x1440 Time Spy Graphics | |
| NVIDIA GeForce GTX 1080 (Desktop) | |
| NVIDIA GeForce GTX 1070 (Desktop) | |
| NVIDIA GeForce GTX 980 Ti | |
| AMD Radeon R9 Fury | |
| AMD Radeon RX 480 (Desktop) | |
| NVIDIA GeForce GTX 970 | |
| 3DMark 11 - 1280x720 Performance GPU | |
| NVIDIA GeForce GTX 1080 (Desktop) | |
| NVIDIA GeForce GTX 1070 (Desktop) | |
| NVIDIA GeForce GTX 980 Ti | |
| AMD Radeon RX 480 (Desktop) | |
| NVIDIA GeForce GTX 980 | |
| AMD Radeon R9 Fury | |
| NVIDIA GeForce GTX 970 | |
| NVIDIA GeForce GTX 970 | |
| Unigine Heaven 4.0 - Extreme Preset DX11 | |
| NVIDIA GeForce GTX 1080 (Desktop) | |
| NVIDIA GeForce GTX 1070 (Desktop) | |
| NVIDIA GeForce GTX 980 Ti | |
| NVIDIA GeForce GTX 980 | |
| AMD Radeon R9 Fury | |
| NVIDIA GeForce GTX 970 | |
| AMD Radeon RX 480 (Desktop) | |
| Unigine Valley 1.0 - 1920x1080 Extreme HD DirectX AA:x8 | |
| NVIDIA GeForce GTX 1080 (Desktop) | |
| NVIDIA GeForce GTX 1070 (Desktop) | |
| NVIDIA GeForce GTX 980 Ti | |
| AMD Radeon R9 Fury | |
| NVIDIA GeForce GTX 970 | |
| AMD Radeon RX 480 (Desktop) | |
Gaming Performance
The GTX 1070 places above the GTX 980 Ti in games as well. The 1070 is only slightly slower in the BioShock Infinite benchmark. If you look at the 4K performance, then the GTX 1070 is a good choice for 4K settings with high detail levels. Demanding games, like XCOM 2, drop the rates on this graphics card down to 30 fps. However, in Full HD with max details, the card has enough power left over to provide a smooth experience.
| Mirror's Edge Catalyst | |
| 1920x1080 Ultra Preset AF:16x | |
| NVIDIA GeForce GTX 1080 (Desktop) | |
| NVIDIA GeForce GTX 1070 (Desktop) | |
| NVIDIA GeForce GTX 980 Ti | |
| AMD Radeon R9 Fury | |
| NVIDIA GeForce GTX 980 | |
| NVIDIA GeForce GTX 970 | |
| AMD Radeon RX 480 (Desktop) | |
| AMD Radeon R9 290X | |
| 3840x2160 High Preset AF:16x | |
| NVIDIA GeForce GTX 1080 (Desktop) | |
| NVIDIA GeForce GTX 1070 (Desktop) | |
| NVIDIA GeForce GTX 980 Ti | |
| AMD Radeon R9 Fury | |
| AMD Radeon R9 290X | |
| NVIDIA GeForce GTX 980 | |
| NVIDIA GeForce GTX 970 | |
| AMD Radeon RX 480 (Desktop) | |
| Overwatch | |
| 1920x1080 Epic (Render Scale 100 %) AA:SM AF:16x | |
| NVIDIA GeForce GTX 1080 (Desktop) | |
| NVIDIA GeForce GTX 1070 (Desktop) | |
| NVIDIA GeForce GTX 980 Ti | |
| AMD Radeon RX 480 (Desktop) | |
| AMD Radeon R9 Fury | |
| NVIDIA GeForce GTX 980 | |
| NVIDIA GeForce GTX 970 | |
| AMD Radeon R9 290X | |
| 3840x2160 High (Render Scale 100 %) AA:SM AF:4x | |
| NVIDIA GeForce GTX 1080 (Desktop) | |
| NVIDIA GeForce GTX 1070 (Desktop) | |
| NVIDIA GeForce GTX 980 Ti | |
| AMD Radeon R9 Fury | |
| AMD Radeon R9 290X | |
| NVIDIA GeForce GTX 980 | |
| NVIDIA GeForce GTX 970 | |
| AMD Radeon RX 480 (Desktop) | |
| Doom | |
| 1920x1080 Ultra Preset AA:SM | |
| NVIDIA GeForce GTX 1080 (Desktop) | |
| NVIDIA GeForce GTX 1070 (Desktop) | |
| NVIDIA GeForce GTX 980 Ti | |
| NVIDIA GeForce GTX 980 | |
| NVIDIA GeForce GTX 970 | |
| AMD Radeon R9 Fury | |
| AMD Radeon RX 480 (Desktop) | |
| 3840x2160 High Preset AA:FX | |
| NVIDIA GeForce GTX 1080 (Desktop) | |
| NVIDIA GeForce GTX 1070 (Desktop) | |
| NVIDIA GeForce GTX 980 Ti | |
| AMD Radeon R9 Fury | |
| NVIDIA GeForce GTX 980 | |
| NVIDIA GeForce GTX 970 | |
| AMD Radeon RX 480 (Desktop) | |
| Need for Speed 2016 | |
| 1920x1080 Ultra / On AA:T | |
| NVIDIA GeForce GTX 1080 (Desktop) | |
| NVIDIA GeForce GTX 1070 (Desktop) | |
| NVIDIA GeForce GTX 980 Ti | |
| NVIDIA GeForce GTX 980 | |
| NVIDIA GeForce GTX 970 | |
| AMD Radeon RX 480 (Desktop) | |
| AMD Radeon R9 Fury | |
| AMD Radeon R9 290X | |
| 3840x2160 High / On AA:FX | |
| NVIDIA GeForce GTX 1080 (Desktop) | |
| NVIDIA GeForce GTX 1070 (Desktop) | |
| NVIDIA GeForce GTX 980 Ti | |
| AMD Radeon R9 Fury | |
| NVIDIA GeForce GTX 980 | |
| AMD Radeon R9 290X | |
| AMD Radeon RX 480 (Desktop) | |
| NVIDIA GeForce GTX 970 | |
| Hitman 2016 | |
| 1920x1080 Ultra / On AA:SM AF:16x | |
| NVIDIA GeForce GTX 1080 (Desktop) | |
| NVIDIA GeForce GTX 1070 (Desktop) | |
| NVIDIA GeForce GTX 980 Ti | |
| AMD Radeon RX 480 (Desktop) | |
| AMD Radeon RX 480 (Desktop) | |
| AMD Radeon R9 Fury | |
| AMD Radeon R9 Fury | |
| AMD Radeon R9 290X | |
| NVIDIA GeForce GTX 980 | |
| NVIDIA GeForce GTX 970 | |
| 3840x2160 High / On AA:FX AF:8x | |
| NVIDIA GeForce GTX 1080 (Desktop) | |
| NVIDIA GeForce GTX 1070 (Desktop) | |
| AMD Radeon R9 Fury | |
| AMD Radeon R9 Fury | |
| NVIDIA GeForce GTX 980 Ti | |
| AMD Radeon R9 290X | |
| AMD Radeon RX 480 (Desktop) | |
| AMD Radeon RX 480 (Desktop) | |
| NVIDIA GeForce GTX 980 | |
| NVIDIA GeForce GTX 970 | |
| The Division | |
| 1920x1080 Ultra Preset AF:16x | |
| NVIDIA GeForce GTX 1080 (Desktop) | |
| NVIDIA GeForce GTX 1070 (Desktop) | |
| NVIDIA GeForce GTX 980 Ti | |
| AMD Radeon R9 Fury | |
| NVIDIA GeForce GTX 980 | |
| AMD Radeon RX 480 (Desktop) | |
| NVIDIA GeForce GTX 970 | |
| AMD Radeon R9 290X | |
| 3840x2160 High Preset AF:8x | |
| NVIDIA GeForce GTX 1080 (Desktop) | |
| NVIDIA GeForce GTX 1070 (Desktop) | |
| NVIDIA GeForce GTX 980 Ti | |
| AMD Radeon R9 Fury | |
| AMD Radeon R9 290X | |
| AMD Radeon RX 480 (Desktop) | |
| NVIDIA GeForce GTX 980 | |
| NVIDIA GeForce GTX 970 | |
| Far Cry Primal | |
| 1920x1080 Ultra Preset AA:SM | |
| NVIDIA GeForce GTX 1080 (Desktop) | |
| NVIDIA GeForce GTX 1070 (Desktop) | |
| NVIDIA GeForce GTX 980 Ti | |
| AMD Radeon R9 Fury | |
| NVIDIA GeForce GTX 980 | |
| AMD Radeon RX 480 (Desktop) | |
| NVIDIA GeForce GTX 970 | |
| 3840x2160 High Preset AA:SM | |
| NVIDIA GeForce GTX 1080 (Desktop) | |
| NVIDIA GeForce GTX 1070 (Desktop) | |
| NVIDIA GeForce GTX 980 Ti | |
| AMD Radeon R9 Fury | |
| NVIDIA GeForce GTX 980 | |
| AMD Radeon RX 480 (Desktop) | |
| NVIDIA GeForce GTX 970 | |
| XCOM 2 | |
| 1920x1080 Maximum Preset (8xMSAA instead of FXAA) AA:8xMS AF:16x | |
| NVIDIA GeForce GTX 1080 (Desktop) | |
| NVIDIA GeForce GTX 1070 (Desktop) | |
| NVIDIA GeForce GTX 980 Ti | |
| AMD Radeon R9 Fury | |
| NVIDIA GeForce GTX 980 | |
| NVIDIA GeForce GTX 970 | |
| AMD Radeon RX 480 (Desktop) | |
| 3840x2160 High Preset AA:FX AF:8x | |
| NVIDIA GeForce GTX 1080 (Desktop) | |
| NVIDIA GeForce GTX 1070 (Desktop) | |
| NVIDIA GeForce GTX 980 Ti | |
| AMD Radeon R9 Fury | |
| NVIDIA GeForce GTX 980 | |
| AMD Radeon RX 480 (Desktop) | |
| NVIDIA GeForce GTX 970 | |
| Rise of the Tomb Raider | |
| 3840x2160 High Preset AA:FX AF:4x | |
| NVIDIA GeForce GTX 1080 (Desktop) | |
| NVIDIA GeForce GTX 1080 (Desktop) | |
| NVIDIA GeForce GTX 1070 (Desktop) | |
| NVIDIA GeForce GTX 980 Ti | |
| AMD Radeon R9 Fury | |
| NVIDIA GeForce GTX 980 | |
| AMD Radeon R9 290X | |
| AMD Radeon RX 480 (Desktop) | |
| AMD Radeon RX 480 (Desktop) | |
| NVIDIA GeForce GTX 970 | |
| 1920x1080 Very High Preset AA:FX AF:16x | |
| NVIDIA GeForce GTX 1080 (Desktop) | |
| NVIDIA GeForce GTX 1080 (Desktop) | |
| NVIDIA GeForce GTX 1080 (Desktop) | |
| NVIDIA GeForce GTX 1070 (Desktop) | |
| NVIDIA GeForce GTX 980 Ti | |
| NVIDIA GeForce GTX 980 | |
| NVIDIA GeForce GTX 970 | |
| AMD Radeon R9 Fury | |
| AMD Radeon RX 480 (Desktop) | |
| AMD Radeon R9 290X | |
| Just Cause 3 | |
| 3840x2160 High / On AA:FX AF:8x | |
| NVIDIA GeForce GTX 1080 (Desktop) | |
| NVIDIA GeForce GTX 1070 (Desktop) | |
| NVIDIA GeForce GTX 980 Ti | |
| NVIDIA GeForce GTX 980 | |
| AMD Radeon R9 Fury | |
| NVIDIA GeForce GTX 970 | |
| AMD Radeon RX 480 (Desktop) | |
| AMD Radeon R9 390X | |
| 1920x1080 Very High / On AA:SM AF:16x | |
| NVIDIA GeForce GTX 1080 (Desktop) | |
| NVIDIA GeForce GTX 1070 (Desktop) | |
| NVIDIA GeForce GTX 980 Ti | |
| NVIDIA GeForce GTX 980 | |
| AMD Radeon RX 480 (Desktop) | |
| NVIDIA GeForce GTX 970 | |
| AMD Radeon R9 Fury | |
| AMD Radeon R9 390X | |
| Rainbow Six Siege | |
| 1920x1080 Ultra Preset AA:T AF:16x | |
| NVIDIA GeForce GTX 1080 (Desktop) | |
| NVIDIA GeForce GTX 1070 (Desktop) | |
| NVIDIA GeForce GTX 980 Ti | |
| AMD Radeon RX 480 (Desktop) | |
| NVIDIA GeForce GTX 970 | |
| AMD Radeon R9 Fury | |
| NVIDIA GeForce GTX 980 | |
| AMD Radeon R9 390X | |
| 3840x2160 High Preset AA:T AF:4x | |
| NVIDIA GeForce GTX 1080 (Desktop) | |
| NVIDIA GeForce GTX 1070 (Desktop) | |
| NVIDIA GeForce GTX 980 Ti | |
| AMD Radeon R9 Fury | |
| AMD Radeon R9 390X | |
| NVIDIA GeForce GTX 980 | |
| AMD Radeon RX 480 (Desktop) | |
| NVIDIA GeForce GTX 970 | |
| Assassin's Creed Syndicate | |
| 1920x1080 Ultra High Preset AA:4x MSAA + FX | |
| NVIDIA GeForce GTX 1080 (Desktop) | |
| NVIDIA GeForce GTX 1070 (Desktop) | |
| NVIDIA GeForce GTX 980 Ti | |
| NVIDIA GeForce GTX 980 | |
| NVIDIA GeForce GTX 980 (Laptop) | |
| NVIDIA GeForce GTX 970 | |
| AMD Radeon RX 480 (Desktop) | |
| AMD Radeon R9 Fury | |
| AMD Radeon R9 390X | |
| AMD Radeon R9 290X | |
| 3840x2160 High Preset AA:FX | |
| NVIDIA GeForce GTX 1080 (Desktop) | |
| NVIDIA GeForce GTX 1070 (Desktop) | |
| NVIDIA GeForce GTX 980 Ti | |
| AMD Radeon R9 Fury | |
| NVIDIA GeForce GTX 980 (Laptop) | |
| NVIDIA GeForce GTX 980 | |
| AMD Radeon R9 390X | |
| AMD Radeon R9 290X | |
| AMD Radeon RX 480 (Desktop) | |
| NVIDIA GeForce GTX 970 | |
| Star Wars Battlefront | |
| 1920x1080 Ultra Preset AA:FX | |
| NVIDIA GeForce GTX 1080 (Desktop) | |
| NVIDIA GeForce GTX 1070 (Desktop) | |
| NVIDIA GeForce GTX 980 Ti | |
| AMD Radeon R9 Fury | |
| NVIDIA GeForce GTX 980 | |
| AMD Radeon R9 290X | |
| AMD Radeon R9 390X | |
| NVIDIA GeForce GTX 980 (Laptop) | |
| AMD Radeon RX 480 (Desktop) | |
| NVIDIA GeForce GTX 970 | |
| 3840x2160 High Preset AA:FX | |
| NVIDIA GeForce GTX 1080 (Desktop) | |
| NVIDIA GeForce GTX 1070 (Desktop) | |
| NVIDIA GeForce GTX 980 Ti | |
| AMD Radeon R9 Fury | |
| AMD Radeon R9 290X | |
| AMD Radeon R9 390X | |
| NVIDIA GeForce GTX 980 | |
| NVIDIA GeForce GTX 980 (Laptop) | |
| AMD Radeon RX 480 (Desktop) | |
| NVIDIA GeForce GTX 970 | |
| Fallout 4 | |
| 1920x1080 Ultra Preset AA:T AF:16x | |
| NVIDIA GeForce GTX 1080 (Desktop) | |
| NVIDIA GeForce GTX 1070 (Desktop) | |
| NVIDIA GeForce GTX 980 Ti | |
| AMD Radeon R9 Fury | |
| NVIDIA GeForce GTX 980 (Laptop) | |
| NVIDIA GeForce GTX 970 | |
| AMD Radeon R9 390X | |
| AMD Radeon RX 480 (Desktop) | |
| AMD Radeon R9 290X | |
| 3840x2160 High Preset AA:T AF:16x | |
| NVIDIA GeForce GTX 1080 (Desktop) | |
| NVIDIA GeForce GTX 1070 (Desktop) | |
| NVIDIA GeForce GTX 980 Ti | |
| AMD Radeon R9 Fury | |
| NVIDIA GeForce GTX 980 (Laptop) | |
| AMD Radeon R9 390X | |
| AMD Radeon R9 290X | |
| NVIDIA GeForce GTX 970 | |
| AMD Radeon RX 480 (Desktop) | |
| Call of Duty: Black Ops 3 | |
| 1920x1080 Extra / On AA:T2x SM | |
| NVIDIA GeForce GTX 1080 (Desktop) | |
| NVIDIA GeForce GTX 1070 (Desktop) | |
| NVIDIA GeForce GTX 980 Ti | |
| AMD Radeon RX 480 (Desktop) | |
| NVIDIA GeForce GTX 980 (Laptop) | |
| AMD Radeon R9 390X | |
| AMD Radeon R9 Fury | |
| AMD Radeon R9 290X | |
| 3840x2160 High / On AA:FX | |
| NVIDIA GeForce GTX 1080 (Desktop) | |
| NVIDIA GeForce GTX 1070 (Desktop) | |
| NVIDIA GeForce GTX 980 Ti | |
| AMD Radeon R9 390X | |
| AMD Radeon R9 Fury | |
| AMD Radeon RX 480 (Desktop) | |
| NVIDIA GeForce GTX 980 (Laptop) | |
| AMD Radeon R9 290X | |
| NVIDIA GeForce GTX 970 | |
| Anno 2205 | |
| 1920x1080 Ultra High Preset AA:8x | |
| NVIDIA GeForce GTX 1080 (Desktop) | |
| NVIDIA GeForce GTX 1070 (Desktop) | |
| NVIDIA GeForce GTX 980 Ti | |
| AMD Radeon R9 Fury | |
| NVIDIA GeForce GTX 980 (Laptop) | |
| AMD Radeon RX 480 (Desktop) | |
| AMD Radeon R9 390X | |
| NVIDIA GeForce GTX 970 | |
| AMD Radeon R9 290X | |
| 3840x2160 High Preset AA:4x | |
| NVIDIA GeForce GTX 1080 (Desktop) | |
| NVIDIA GeForce GTX 1070 (Desktop) | |
| NVIDIA GeForce GTX 980 Ti | |
| AMD Radeon R9 Fury | |
| NVIDIA GeForce GTX 980 (Laptop) | |
| NVIDIA GeForce GTX 970 | |
| AMD Radeon R9 390X | |
| AMD Radeon R9 290X | |
| AMD Radeon RX 480 (Desktop) | |
| World of Warships | |
| 1920x1080 Very High Preset AA:High FX AF:16x | |
| NVIDIA GeForce GTX 1080 (Desktop) | |
| NVIDIA GeForce GTX 980 Ti | |
| NVIDIA GeForce GTX 1070 (Desktop) | |
| NVIDIA GeForce GTX 970 | |
| AMD Radeon R9 290X | |
| AMD Radeon R9 Fury | |
| AMD Radeon R9 390X | |
| 3840 x 2160 Very High Preset AA:High FX AF:16x | |
| NVIDIA GeForce GTX 1080 (Desktop) | |
| NVIDIA GeForce GTX 1070 (Desktop) | |
| NVIDIA GeForce GTX 980 Ti | |
| AMD Radeon R9 Fury | |
| NVIDIA GeForce GTX 970 | |
| AMD Radeon R9 290X | |
| AMD Radeon R9 390X | |
| AMD Radeon RX 480 (Desktop) | |
| Mad Max | |
| 1920x1080 Very High Preset AF:12x | |
| NVIDIA GeForce GTX 1080 (Desktop) | |
| NVIDIA GeForce GTX 1070 (Desktop) | |
| NVIDIA GeForce GTX 980 Ti | |
| AMD Radeon R9 Fury | |
| NVIDIA GeForce GTX 980 (Laptop) | |
| NVIDIA GeForce GTX 970 | |
| AMD Radeon R9 290X | |
| AMD Radeon RX 480 (Desktop) | |
| AMD Radeon R9 390X | |
| 3840x2160 High Preset AF:6x | |
| NVIDIA GeForce GTX 1080 (Desktop) | |
| NVIDIA GeForce GTX 1070 (Desktop) | |
| NVIDIA GeForce GTX 980 Ti | |
| AMD Radeon R9 Fury | |
| NVIDIA GeForce GTX 980 (Laptop) | |
| AMD Radeon R9 290X | |
| AMD Radeon R9 390X | |
| NVIDIA GeForce GTX 970 | |
| AMD Radeon RX 480 (Desktop) | |
| Metal Gear Solid V - 3840x2160 High / On | |
| NVIDIA GeForce GTX 1080 (Desktop) | |
| NVIDIA GeForce GTX 1070 (Desktop) | |
| AMD Radeon R9 Fury | |
| NVIDIA GeForce GTX 980 (Laptop) | |
| AMD Radeon R9 390X | |
| AMD Radeon R9 290X | |
| NVIDIA GeForce GTX 970 | |
| AMD Radeon RX 480 (Desktop) | |
| Dirt Rally | |
| 1920x1080 Ultra Preset AA:4x MS | |
| NVIDIA GeForce GTX 980 Ti | |
| NVIDIA GeForce GTX 1080 (Desktop) | |
| NVIDIA GeForce GTX 1070 (Desktop) | |
| AMD Radeon R9 290X | |
| NVIDIA GeForce GTX 980 (Laptop) | |
| NVIDIA GeForce GTX 970 | |
| AMD Radeon R9 Fury | |
| AMD Radeon R9 390X | |
| AMD Radeon RX 480 (Desktop) | |
| 3840x2160 High Preset | |
| NVIDIA GeForce GTX 1070 (Desktop) | |
| NVIDIA GeForce GTX 970 | |
| NVIDIA GeForce GTX 1080 (Desktop) | |
| NVIDIA GeForce GTX 980 Ti | |
| NVIDIA GeForce GTX 980 (Laptop) | |
| AMD Radeon R9 Fury | |
| AMD Radeon R9 290X | |
| AMD Radeon R9 390X | |
| AMD Radeon RX 480 (Desktop) | |
| The Witcher 3 | |
| 1920x1080 Ultra Graphics & Postprocessing (HBAO+) | |
| NVIDIA GeForce GTX 1080 (Desktop) | |
| NVIDIA GeForce GTX 980 Ti | |
| AMD Radeon R9 Fury | |
| NVIDIA GeForce GTX 980 (Laptop) | |
| AMD Radeon RX 480 (Desktop) | |
| NVIDIA GeForce GTX 970 | |
| AMD Radeon R9 390X | |
| AMD Radeon R9 290X | |
| 3840x2160 High Graphics & Postprocessing (Nvidia HairWorks Off) | |
| NVIDIA GeForce GTX 1080 (Desktop) | |
| NVIDIA GeForce GTX 1070 (Desktop) | |
| NVIDIA GeForce GTX 980 Ti | |
| AMD Radeon R9 Fury | |
| NVIDIA GeForce GTX 980 (Laptop) | |
| AMD Radeon R9 390X | |
| NVIDIA GeForce GTX 970 | |
| AMD Radeon R9 290X | |
| AMD Radeon RX 480 (Desktop) | |
| GTA V | |
| 1920x1080 Highest AA:4xMSAA + FX AF:16x | |
| NVIDIA GeForce GTX 1080 (Desktop) | |
| NVIDIA GeForce GTX 1070 (Desktop) | |
| NVIDIA GeForce GTX 980 Ti | |
| NVIDIA GeForce GTX 980 (Laptop) | |
| NVIDIA GeForce GTX 970 | |
| AMD Radeon RX 480 (Desktop) | |
| AMD Radeon R9 290X | |
| NVIDIA GeForce GTX 970 | |
| 3840x2160 High/On (Advanced Graphics Off) AA:FX AF:8x | |
| NVIDIA GeForce GTX 980 Ti | |
| NVIDIA GeForce GTX 1080 (Desktop) | |
| NVIDIA GeForce GTX 1070 (Desktop) | |
| NVIDIA GeForce GTX 980 (Laptop) | |
| AMD Radeon R9 290X | |
| NVIDIA GeForce GTX 970 | |
| AMD Radeon R9 Fury | |
| NVIDIA GeForce GTX 970 | |
| AMD Radeon RX 480 (Desktop) | |
| Dragon Age: Inquisition - 1920x1080 Ultra Graphics Quality AA:2x MS | |
| NVIDIA GeForce GTX 1080 (Desktop) | |
| NVIDIA GeForce GTX 1070 (Desktop) | |
| NVIDIA GeForce GTX 980 Ti | |
| AMD Radeon R9 390X | |
| NVIDIA GeForce GTX 970 | |
| NVIDIA GeForce GTX 980 (Laptop) | |
| AMD Radeon RX 480 (Desktop) | |
| AMD Radeon RX 480 (Desktop) | |
| AMD Radeon R9 Fury | |
| NVIDIA GeForce GTX 970 | |
| Alien: Isolation - 1920x1080 Ultra, On, Shadow Map 2048, HDAO AA:2x SM AF:16x | |
| NVIDIA GeForce GTX 1080 (Desktop) | |
| NVIDIA GeForce GTX 1070 (Desktop) | |
| AMD Radeon R9 Fury | |
| NVIDIA GeForce GTX 980 (Laptop) | |
| AMD Radeon RX 480 (Desktop) | |
| NVIDIA GeForce GTX 970 | |
| Middle-earth: Shadow of Mordor - 1920x1080 Ultra Preset (HD Package) | |
| NVIDIA GeForce GTX 1070 (Desktop) | |
| AMD Radeon R9 Fury | |
| AMD Radeon R9 390X | |
| NVIDIA GeForce GTX 980 (Laptop) | |
| AMD Radeon RX 480 (Desktop) | |
| NVIDIA GeForce GTX 970 | |
| NVIDIA GeForce GTX 970 | |
| Battlefield 4 | |
| 3840x2160 High Preset | |
| NVIDIA GeForce GTX 1080 (Desktop) | |
| NVIDIA GeForce GTX 1070 (Desktop) | |
| NVIDIA GeForce GTX 980 Ti | |
| AMD Radeon R9 Fury | |
| NVIDIA GeForce GTX 980 (Laptop) | |
| AMD Radeon R9 390X | |
| NVIDIA GeForce GTX 970 | |
| AMD Radeon R9 290X | |
| NVIDIA GeForce GTX 970 | |
| AMD Radeon RX 480 (Desktop) | |
| 1920x1080 Ultra Preset AA:4x MS | |
| NVIDIA GeForce GTX 1080 (Desktop) | |
| NVIDIA GeForce GTX 1070 (Desktop) | |
| NVIDIA GeForce GTX 980 Ti | |
| AMD Radeon R9 Fury | |
| NVIDIA GeForce GTX 980 (Laptop) | |
| NVIDIA GeForce GTX 970 | |
| AMD Radeon R9 390X | |
| NVIDIA GeForce GTX 970 | |
| AMD Radeon RX 480 (Desktop) | |
| Metro: Last Light - 1920x1080 Very High (DX11) AF:16x | |
| NVIDIA GeForce GTX 1080 (Desktop) | |
| NVIDIA GeForce GTX 1070 (Desktop) | |
| NVIDIA GeForce GTX 980 Ti | |
| NVIDIA GeForce GTX 980 (Laptop) | |
| NVIDIA GeForce GTX 970 | |
| AMD Radeon R9 Fury | |
| AMD Radeon R9 390X | |
| AMD Radeon RX 480 (Desktop) | |
| NVIDIA GeForce GTX 970 | |
| BioShock Infinite - 1920x1080 Ultra Preset, DX11 (DDOF) | |
| NVIDIA GeForce GTX 1080 (Desktop) | |
| NVIDIA GeForce GTX 980 Ti | |
| NVIDIA GeForce GTX 1070 (Desktop) | |
| NVIDIA GeForce GTX 980 (Laptop) | |
| NVIDIA GeForce GTX 970 | |
| AMD Radeon R9 390X | |
| AMD Radeon RX 480 (Desktop) | |
| NVIDIA GeForce GTX 970 | |
| Crysis 3 - 1920x1080 Very High Preset AA:2xSM AF:16x | |
| NVIDIA GeForce GTX 1080 (Desktop) | |
| NVIDIA GeForce GTX 1070 (Desktop) | |
| NVIDIA GeForce GTX 980 Ti | |
| AMD Radeon R9 Fury | |
| NVIDIA GeForce GTX 980 (Laptop) | |
| AMD Radeon R9 390X | |
| NVIDIA GeForce GTX 970 | |
| AMD Radeon RX 480 (Desktop) | |
| NVIDIA GeForce GTX 970 | |
Stress Test
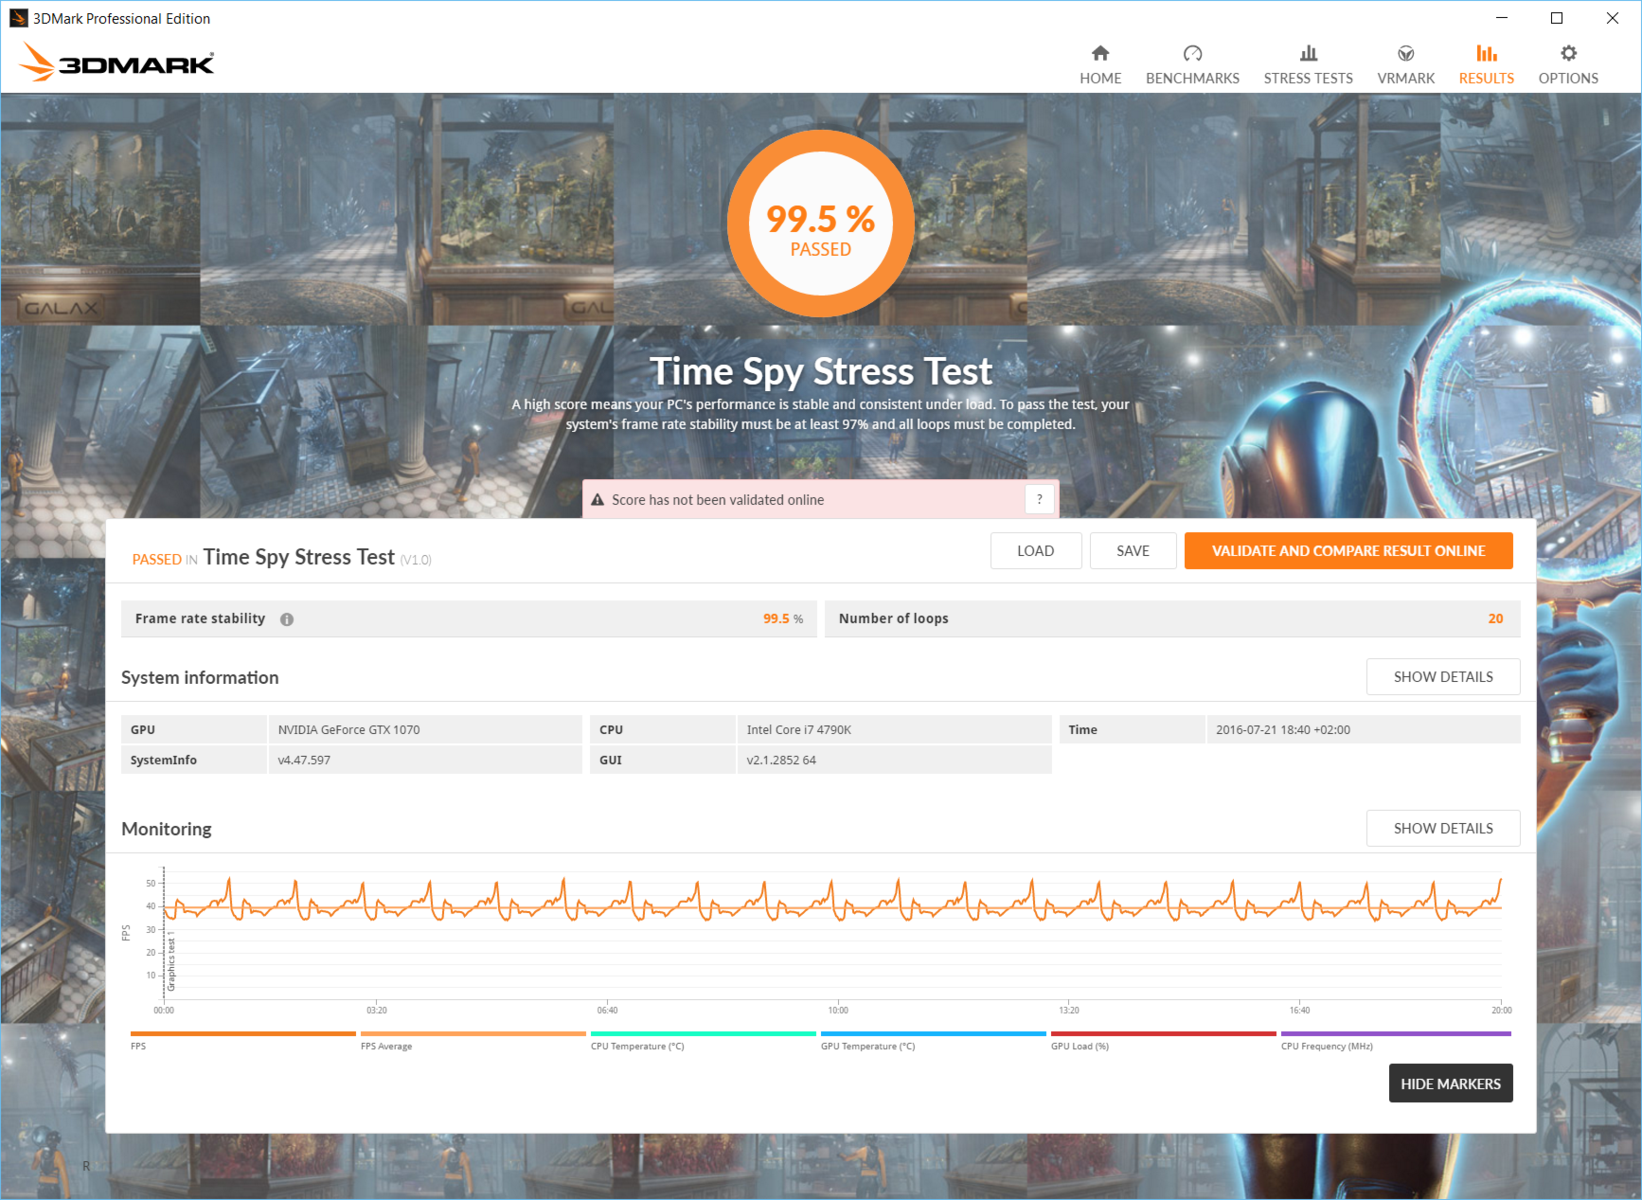
The MSI GTX 1070 is stable even during long periods of high load. In the stress test of 3DMark (Time Spy DX12 Test), the card offer 99.5% stability in 20 runs. Thanks to the stable inner core temperatures, the user will not suffer from any unexpected performance drops.
Compute Performance
The Nvidia GeForce GTX 1070 offers 8 Compute Units for general calculations. These units support OpenCL, DirectCompute and CUDA. The LuxMark Room test does not surprise us. The GTX 980 Ti barely surpasses the 1070, which has a processing time similar to that of the GTX 1080. The 980 Ti is faster than our test model in the Sala scene as well, but the 1080 takes the throne in this test. Order is restored in ComputeMark, where the graphics card line up as: 1080, 1070 and 980 Ti.
| LuxMark v2.0 64Bit | |
| Room GPUs-only | |
| NVIDIA GeForce GTX 980 Ti | |
| NVIDIA GeForce GTX 1070 (Desktop) | |
| NVIDIA GeForce GTX 1080 (Desktop) | |
| NVIDIA GeForce GTX 970 | |
| AMD Radeon RX 480 (Desktop) | |
| AMD Radeon R9 Fury | |
| Sala GPUs-only | |
| NVIDIA GeForce GTX 1080 (Desktop) | |
| NVIDIA GeForce GTX 980 Ti | |
| NVIDIA GeForce GTX 1070 (Desktop) | |
| AMD Radeon RX 480 (Desktop) | |
| AMD Radeon R9 Fury | |
| NVIDIA GeForce GTX 970 | |
| ComputeMark v2.1 | |
| 1024x600 Normal, QJuliaRayTrace | |
| NVIDIA GeForce GTX 1080 (Desktop) | |
| NVIDIA GeForce GTX 1070 (Desktop) | |
| NVIDIA GeForce GTX 980 Ti | |
| AMD Radeon R9 Fury | |
| NVIDIA GeForce GTX 970 | |
| AMD Radeon RX 480 (Desktop) | |
| 1024x600 Normal, Mandel Scalar | |
| NVIDIA GeForce GTX 1080 (Desktop) | |
| AMD Radeon R9 Fury | |
| NVIDIA GeForce GTX 1070 (Desktop) | |
| NVIDIA GeForce GTX 980 Ti | |
| AMD Radeon RX 480 (Desktop) | |
| NVIDIA GeForce GTX 970 | |
| 1024x600 Normal, Mandel Vector | |
| NVIDIA GeForce GTX 1080 (Desktop) | |
| NVIDIA GeForce GTX 1070 (Desktop) | |
| AMD Radeon R9 Fury | |
| NVIDIA GeForce GTX 980 Ti | |
| AMD Radeon RX 480 (Desktop) | |
| NVIDIA GeForce GTX 970 | |
| 1024x600 Normal, Fluid 2DTexArr | |
| NVIDIA GeForce GTX 1080 (Desktop) | |
| NVIDIA GeForce GTX 980 Ti | |
| NVIDIA GeForce GTX 1070 (Desktop) | |
| AMD Radeon R9 Fury | |
| AMD Radeon RX 480 (Desktop) | |
| NVIDIA GeForce GTX 970 | |
| 1024x600 Normal, Fluid 3DTex | |
| AMD Radeon R9 Fury | |
| NVIDIA GeForce GTX 1080 (Desktop) | |
| NVIDIA GeForce GTX 980 Ti | |
| NVIDIA GeForce GTX 1070 (Desktop) | |
| AMD Radeon RX 480 (Desktop) | |
| NVIDIA GeForce GTX 970 | |
| 1024x600 Normal, Score | |
| NVIDIA GeForce GTX 1080 (Desktop) | |
| NVIDIA GeForce GTX 1070 (Desktop) | |
| NVIDIA GeForce GTX 980 Ti | |
| AMD Radeon R9 Fury | |
| AMD Radeon RX 480 (Desktop) | |
| NVIDIA GeForce GTX 970 | |
Emissions
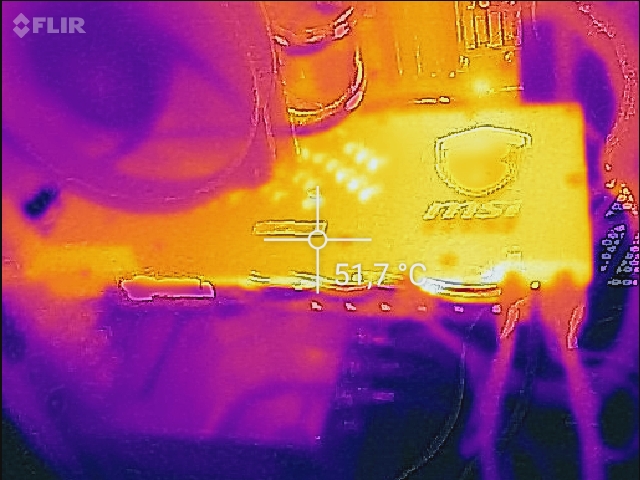
The volume of the fan is comfortably low. When the card is idle, both fans are silent. After about 2 minutes of load, the fans start up at 800 RPM (rotations per minute). Even with long periods of high load, the fans are relatively quiet and can be compared to noise emission levels of be-quiet CPU coolers. Despite the relatively quiet emissions and low speeds of the fans, the GPU stays well within acceptable temperature limits. In Heaven 4.0, the GPU reaches a mere 67 °C and does not suffer from any form of throttling.
The surface temperatures were also acceptable in the test. We measured a max of 58 °C on the back with the thermal imaging camera and 50 °C with the infrared tool.
The power consumption of the GTX 1070 is good, similar to that of the GTX 1080. The MSI card is roughly 5 W higher than the GTX 1080 Founders Edition (73 vs. 68 W) on a Windows desktop with a 4K monitor. However, the Founders Editions was specifically optimized to be conservative (according to the manufacturer). Furthermore, the test model requires a lot less than the RX 480 (79 W). Our test system needs 60 W just with the HD 4600 IGP. The old MSI GTX 970 needs around 78 W.
At load (Furmark), the test system needs 290 W with the 1070 (230 fps - 1.26 W per frame). The GTX 1080 needs 10 W more, but due to throttling offers less fps (211 fps, which means 1.42 W per frame). The GTX 970 of the MSI falls quite far behind due to its old 28 nm finish and requires 315 W for 135 fps (2.33 W per frame). In fact, even the XFX Fury Pro is better in comparison at 2.15 W per frame (340 W, 158 fps). The new RX 480 of AMD lands between all these cards with 124 fps and 246 W (1.98 W per frame).
Verdict
The Nvidia GeForce GTX 1070 is definitely a success. In terms of efficiency, it can match the GTX 1080 and its performance can surpass the old top model, the GTX 980 Ti. The test model is suitable even for 4K gaming, as long as the settings are not set to max. Until AMD Vega is launched, only the 980 Ti can be considered a competitor to the 1070.
The MSI GTX 1070 Gaming Z 8 GB has some great features. The cooling system works quietly and efficiently. The design is appealing and high-quality. The higher clock speeds of the MSI GTX 1070 Gaming Z 8 GB can surpass the 1070 Founders Edition. The price for this MSI card places it in the same range as the Founders Edition, which means we can comfortably recommend it. For 40 Euros (~$44) less, the buyer can find the cheapest variation of the 1070, named Aero. The user must decide themselves whether the extra money is worth the quiet cooling fans, design, lighting and (potentially) higher performance.
Update 4-Aug-2016: corrected Gaming X to Gaming Z