Gigabyte P57X v7 Gaming Notebook Review
A few months ago, we evaluated Gigabyte’s P57X v6, which was a surprisingly portable 17.3-inch gaming machine that was born out of the P57W before it. While—in addition to the uncommon portability for its class—we appreciated the strong performance and extensive system management software, we also lamented its pedestrian 1080p display resolution, excessive heat and noise development, poor touchpad, and plastic casing. Today, we will be examining the P57X v7 in great detail, which is a very similar machine overall—with hardly any changes in the realm of casing or design—but which adopts the new Kaby Lake chipset, packs a beautiful 4K display panel, and doubles the RAM.
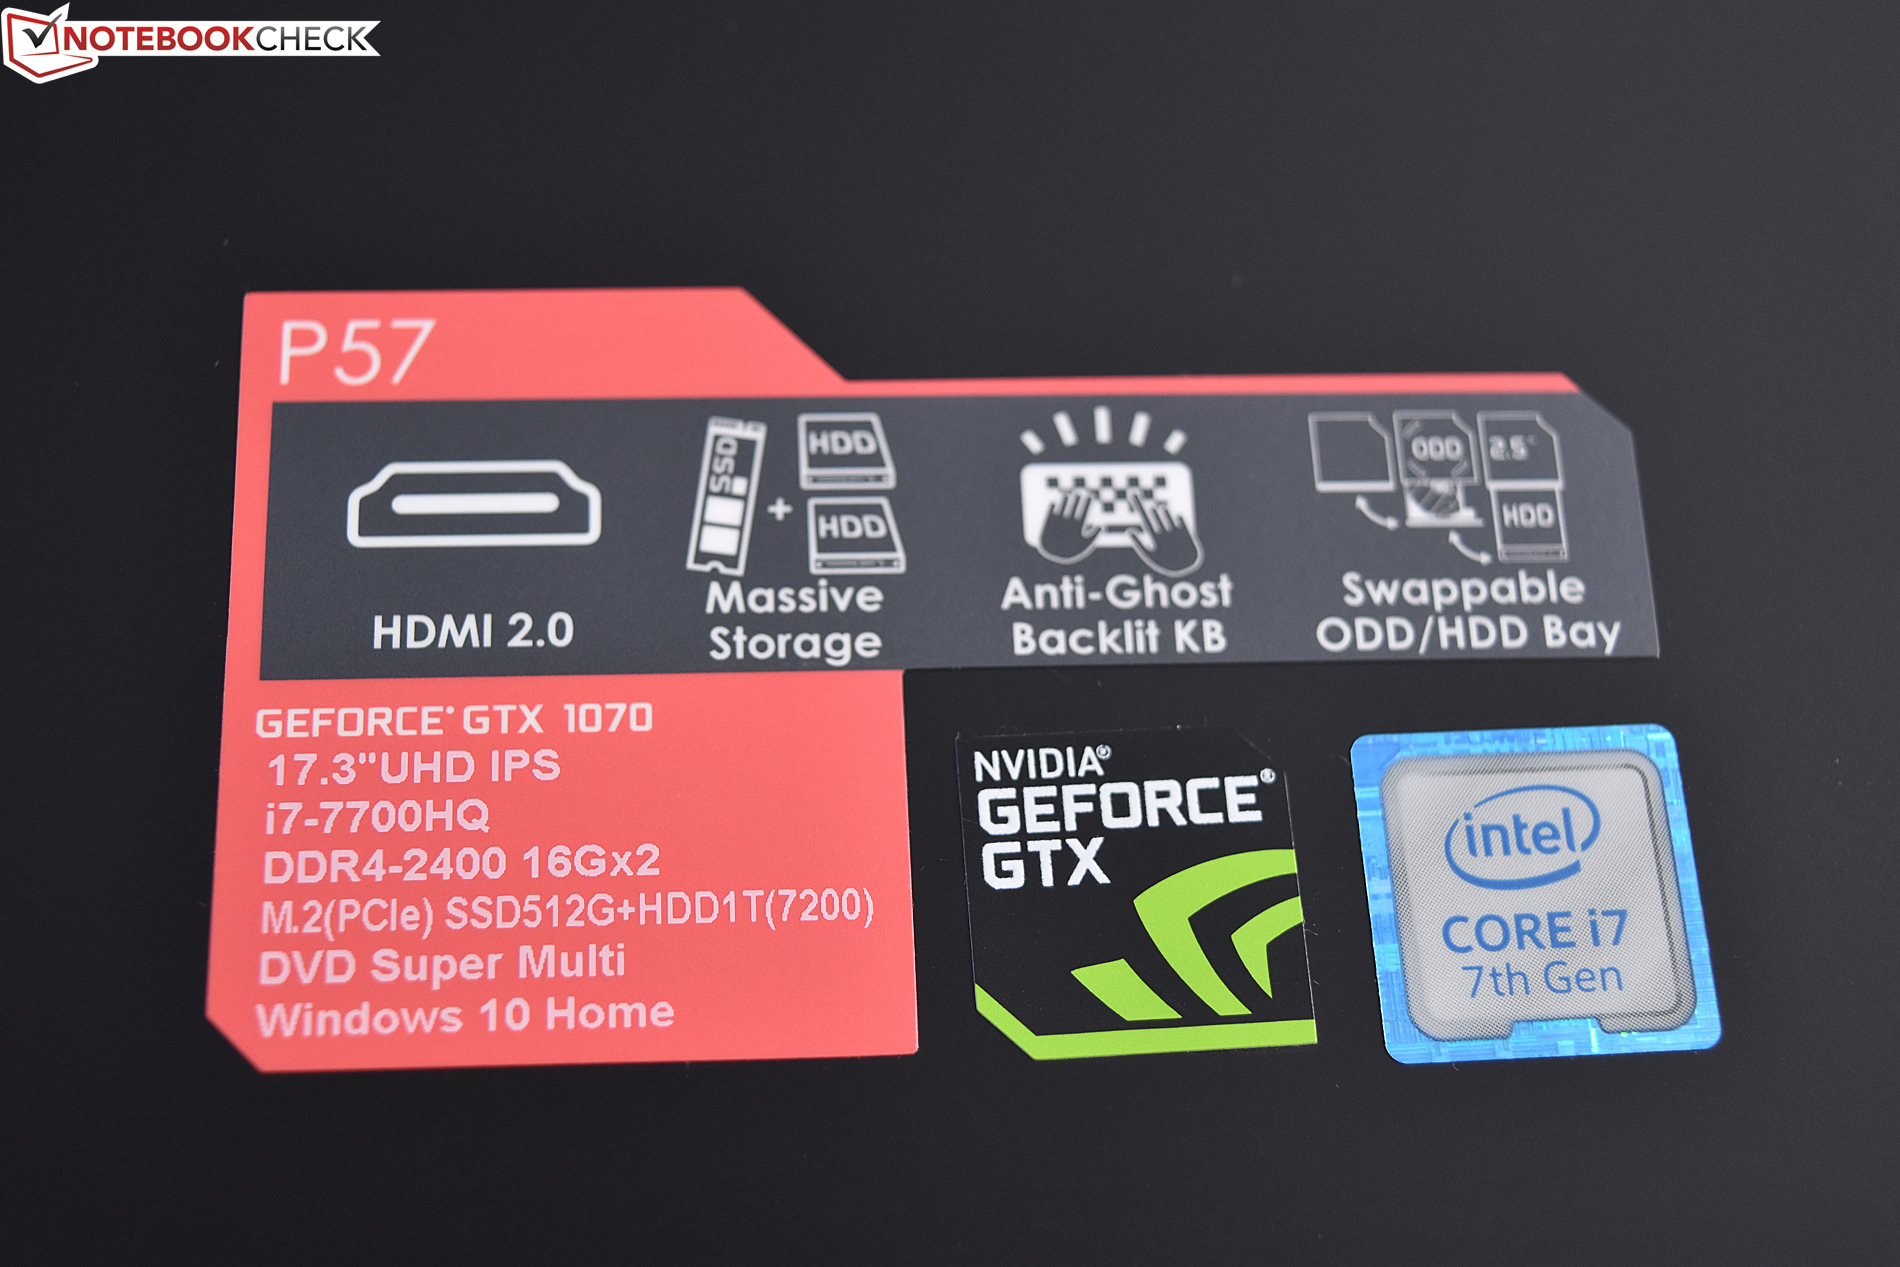
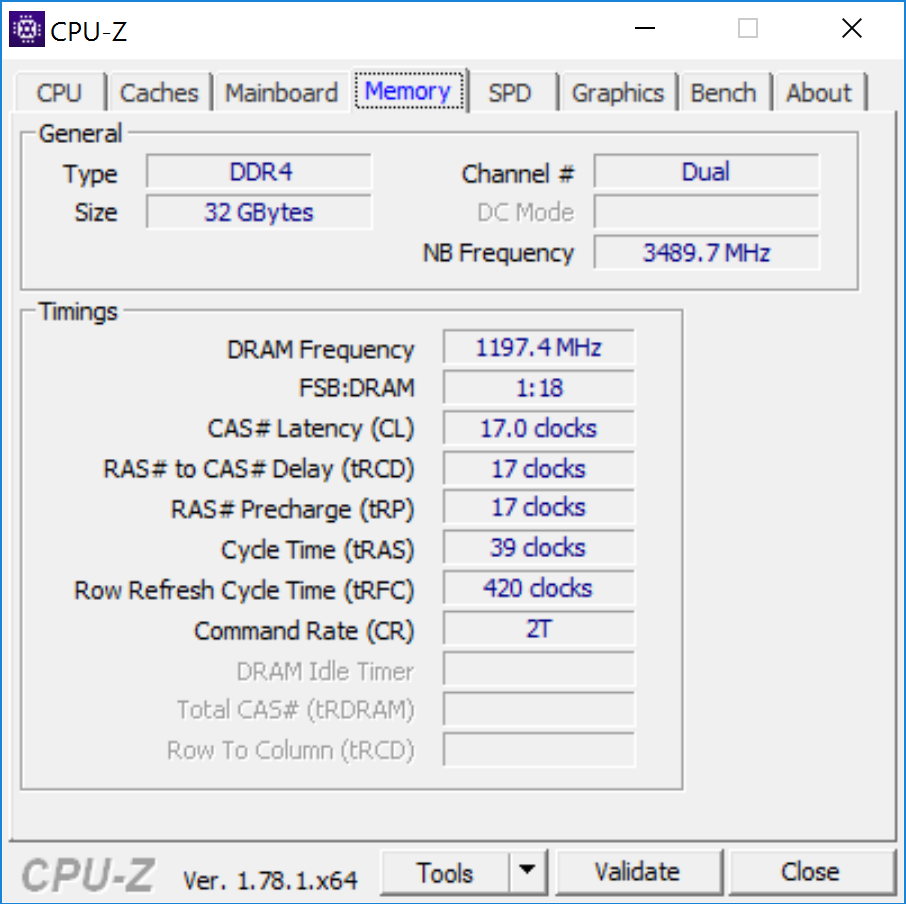
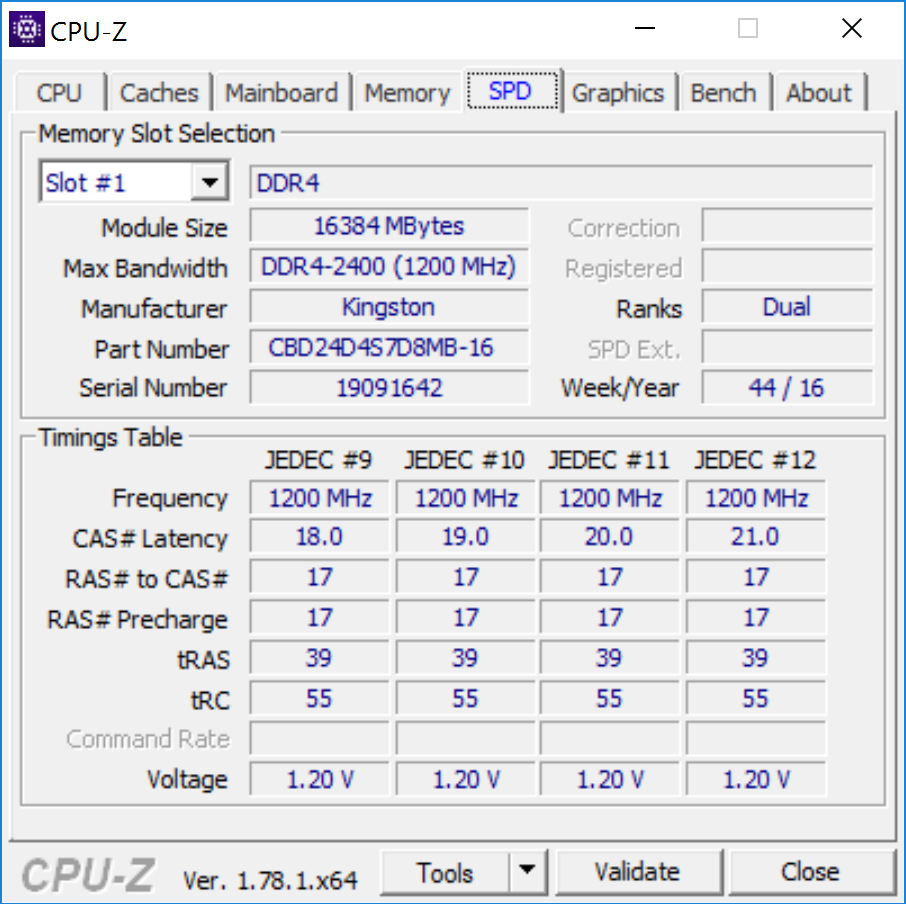
Specifically, this beast features an Intel Core i7-7700HQ paired with an NVIDIA GeForce GTX 1070, a 256 GB M.2 SSD, and 32 GB of DDR4-2400 RAM. There are a few other alterations here and there, but it’s nothing substantial. The biggest differences we’ll be interested in exploring today will be those related to performance, heat, and the display panel specifically.
Let’s get started!
Case
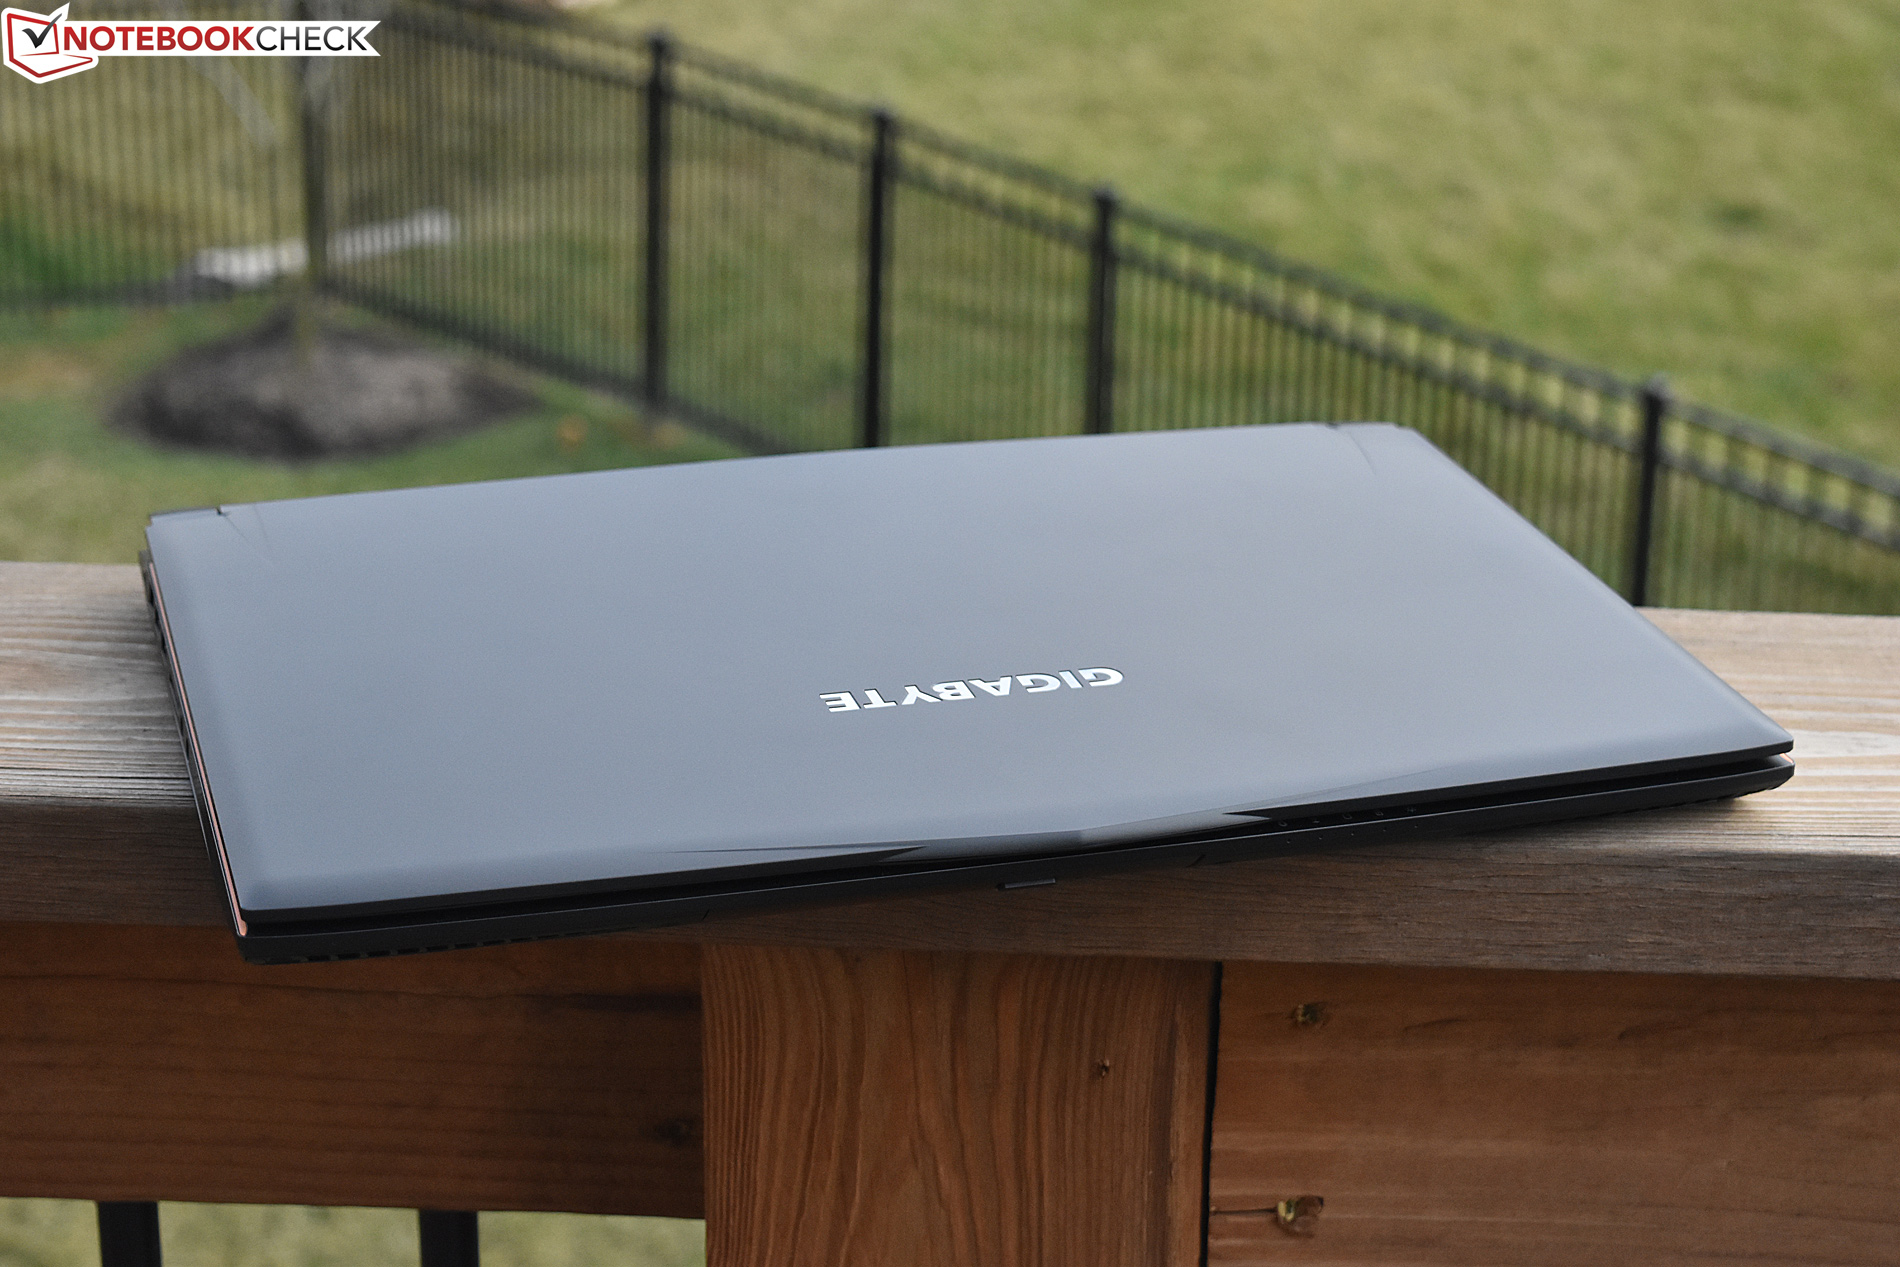
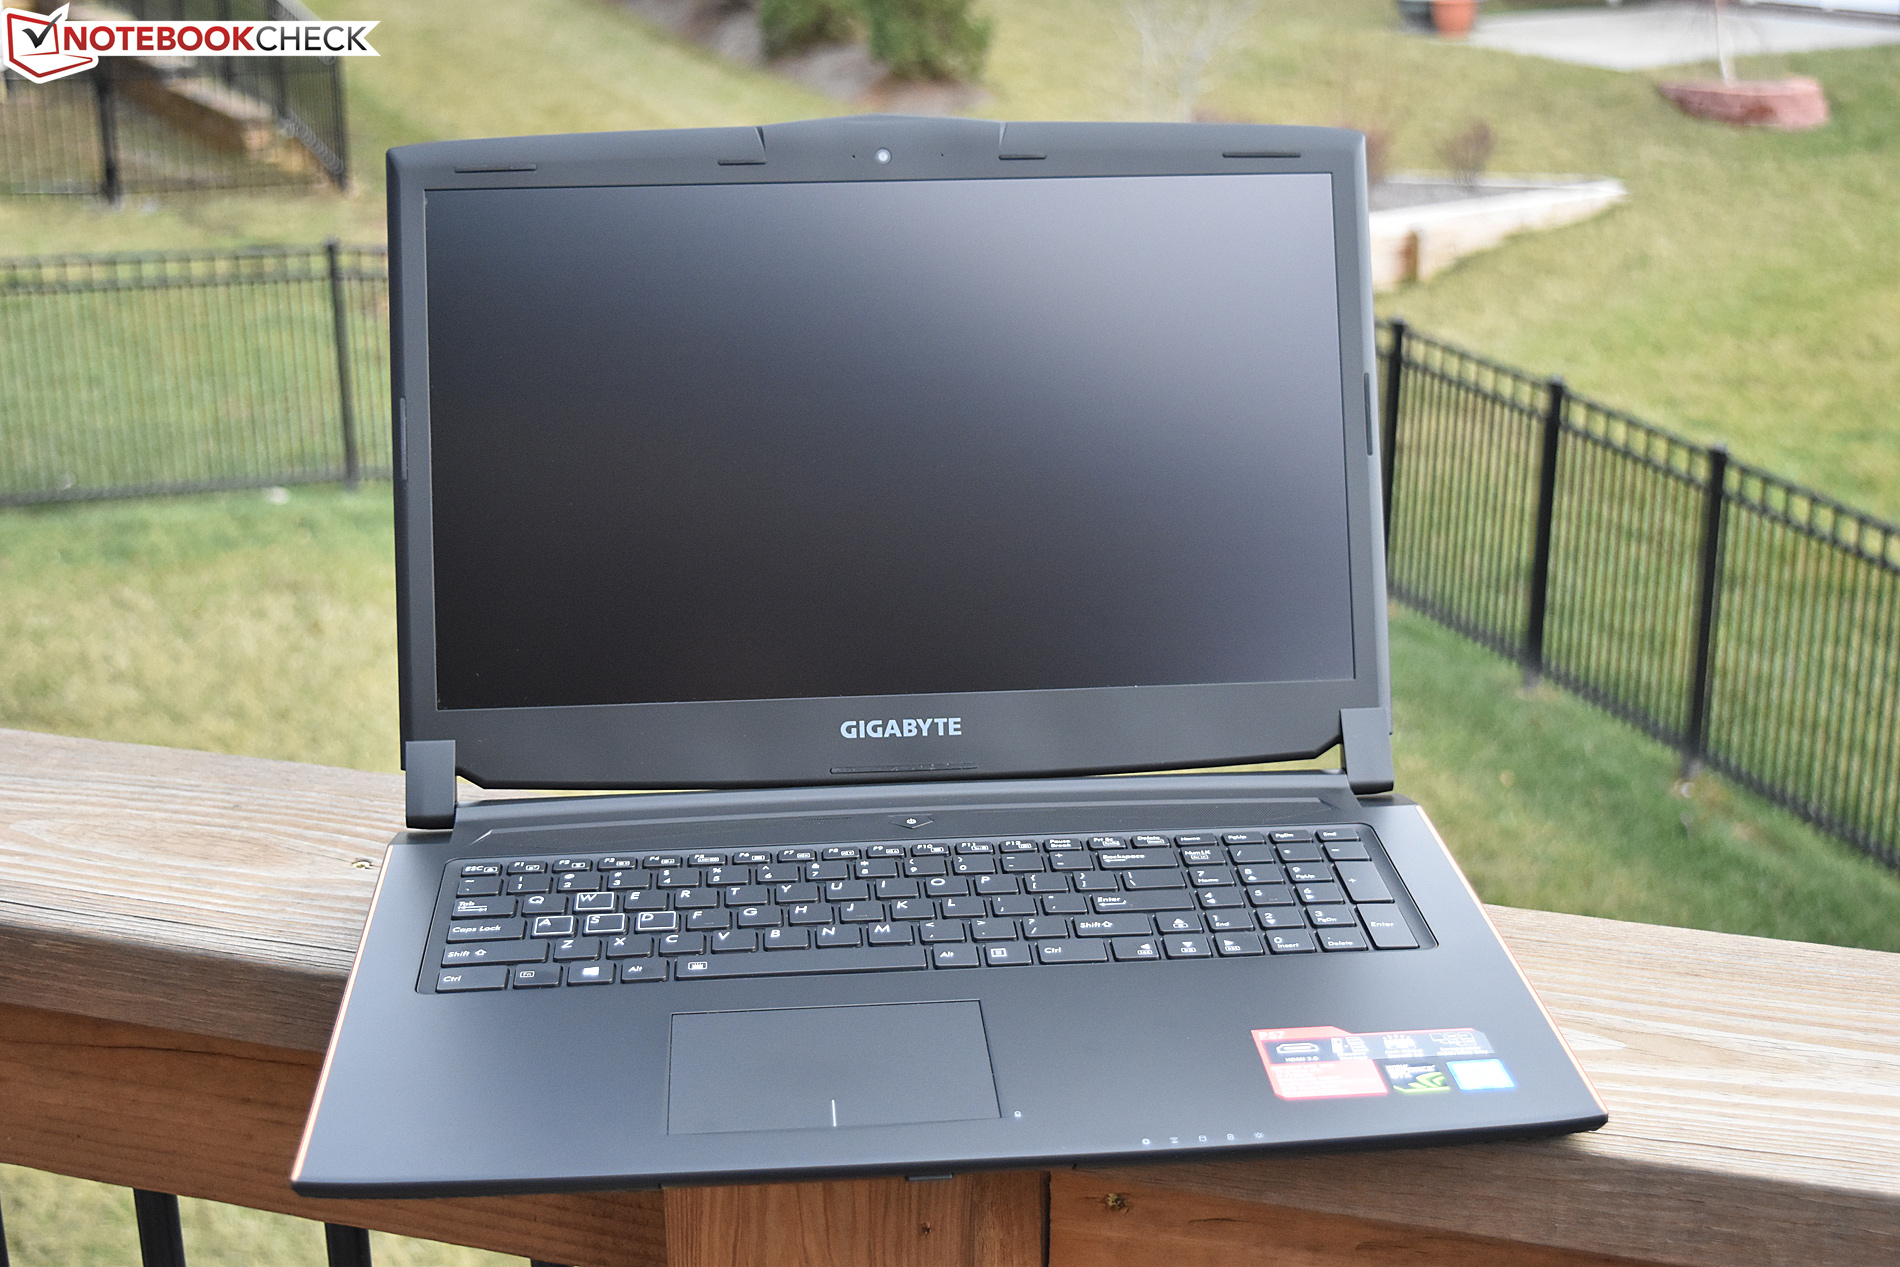
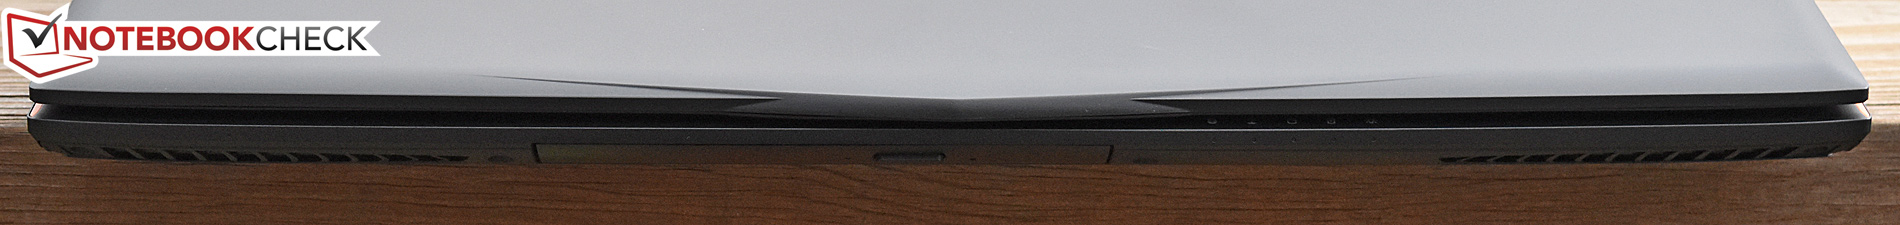
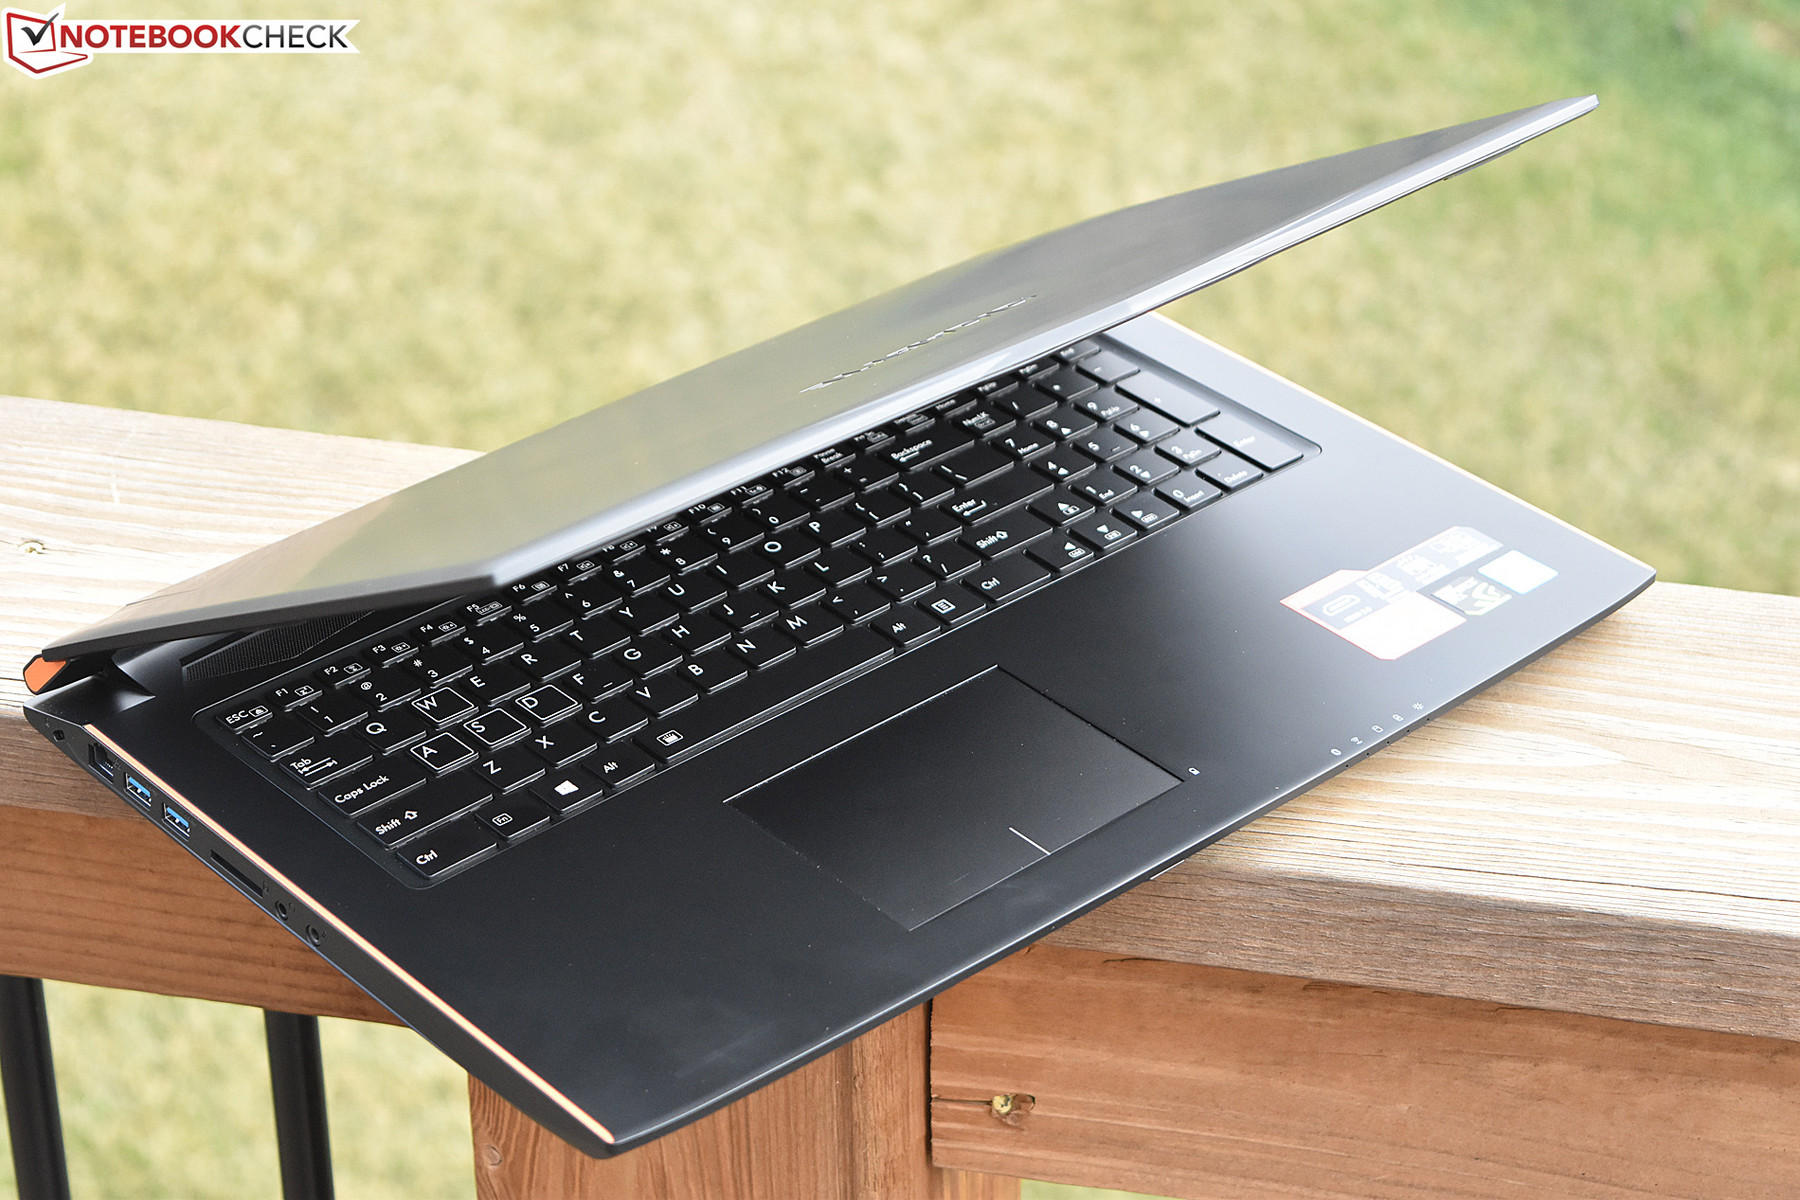
The P57X v7 maintains the extremely portable form factor (in context with the 17.3-inch screen notebook class) and case design of its predecessors. Weighing just 3.412 kg with the optical drive insert and featuring a smaller footprint and thinner design than any of the competitors in our field apart from the (quite dense) EVGA SC17, this truly is the closest thing to a somewhat portable 17.3-inch gaming notebook that you’re likely to find anywhere.
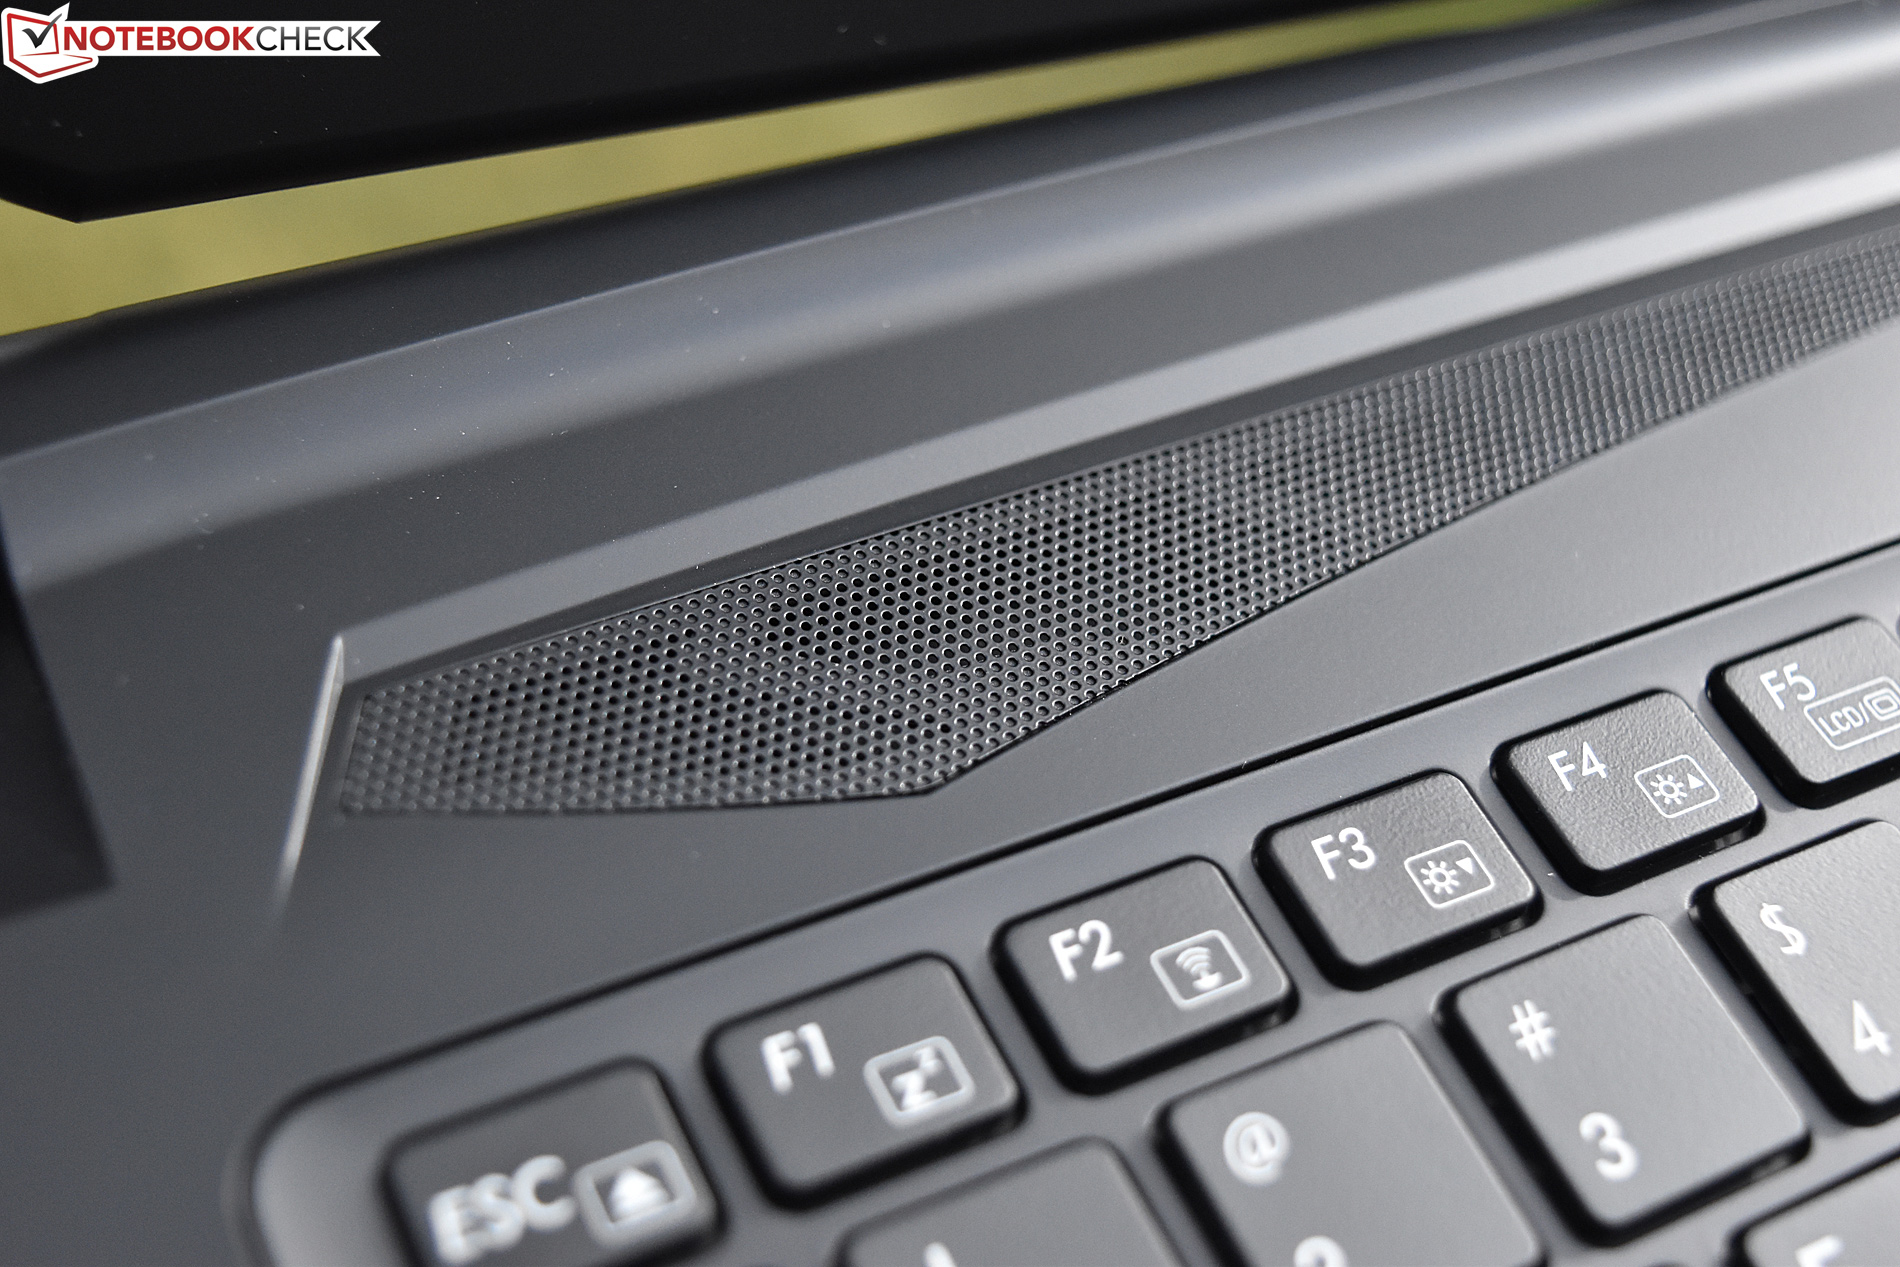
Although it’s still primarily plastic, the case does carry a nice aesthetic which, while understated, works well for a gaming PC. It’s mostly matte black with the exception of neon orange highlights on either side of the base unit. The material isn’t overly receptive to fingerprints, and the matte finish focuses interest where it matters most—on the screen and the key labels.
In terms of stability, the machine sits securely on flat surfaces due to the large rubber feet on the bottom. However, there is a decent amount of flex near the center of the base unit (thanks primarily to the plastic casing), and although it’s likely an anomaly, our particular unit exhibits an irritating squeaking noise when any sort of light pressure is applied to the right palm rest area (such as even resting one’s hand on the surface). We were unsuccessful in eliminating the noise even after removing and resecuring the bottom cover.
The hinges are well-tuned and do a fine job of supporting the large and attractive display panel. The lid itself, meanwhile, is also plastic however, and is vulnerable to torsion and pressure from behind, both of which produce distortions on the panel. The screen can be opened to around a 135 degree angle, providing for a relatively versatile viewing experience, especially when coupled with the wide viewing angles of the IPS display (which we’ll cover in a bit).
Connectivity
Ports and connectivity haven’t changed at all since our previous review. You still receive four total USB ports, three of which are USB 3.0 and the last of which is 3.1 Gen 2/USB Type-C. The same three video output options also remain (VGA, HDMI, and mini-DP), and even the layout is consistent. Seeing as we had no complaints in this area, that’s not a problem in our book.


| SD Card Reader | |
| average JPG Copy Test (av. of 3 runs) | |
| MSI GT73VR 7RF-296 | |
| Gigabyte P57X v7 | |
| Acer Predator 17 G9-793-77LG | |
| Gigabyte P57X v6 | |
| maximum AS SSD Seq Read Test (1GB) | |
| MSI GT73VR 7RF-296 | |
| Gigabyte P57X v7 | |
| Gigabyte P57X v6 | |
| Acer Predator 17 G9-793-77LG | |
Communication

Wireless communication and networking options are also still the same as the P57X v6. Included is a Realtek GBE Gaming Ethernet Adapter alongside an Intel Dual-Band Wireless-AC 8260 WLAN adapter (which also includes Bluetooth functionality). We measured transmit and receive speeds of 619 MB/s and 487 MB/s respectively in our WLAN testing.
| Networking | |
| iperf Server (receive) TCP 1 m 512KB | |
| Gigabyte P57X v6 | |
| Gigabyte P57X v7 | |
| iperf Client (transmit) TCP 1 m 512KB | |
| Gigabyte P57X v7 | |
| Gigabyte P57X v6 | |
Accessories
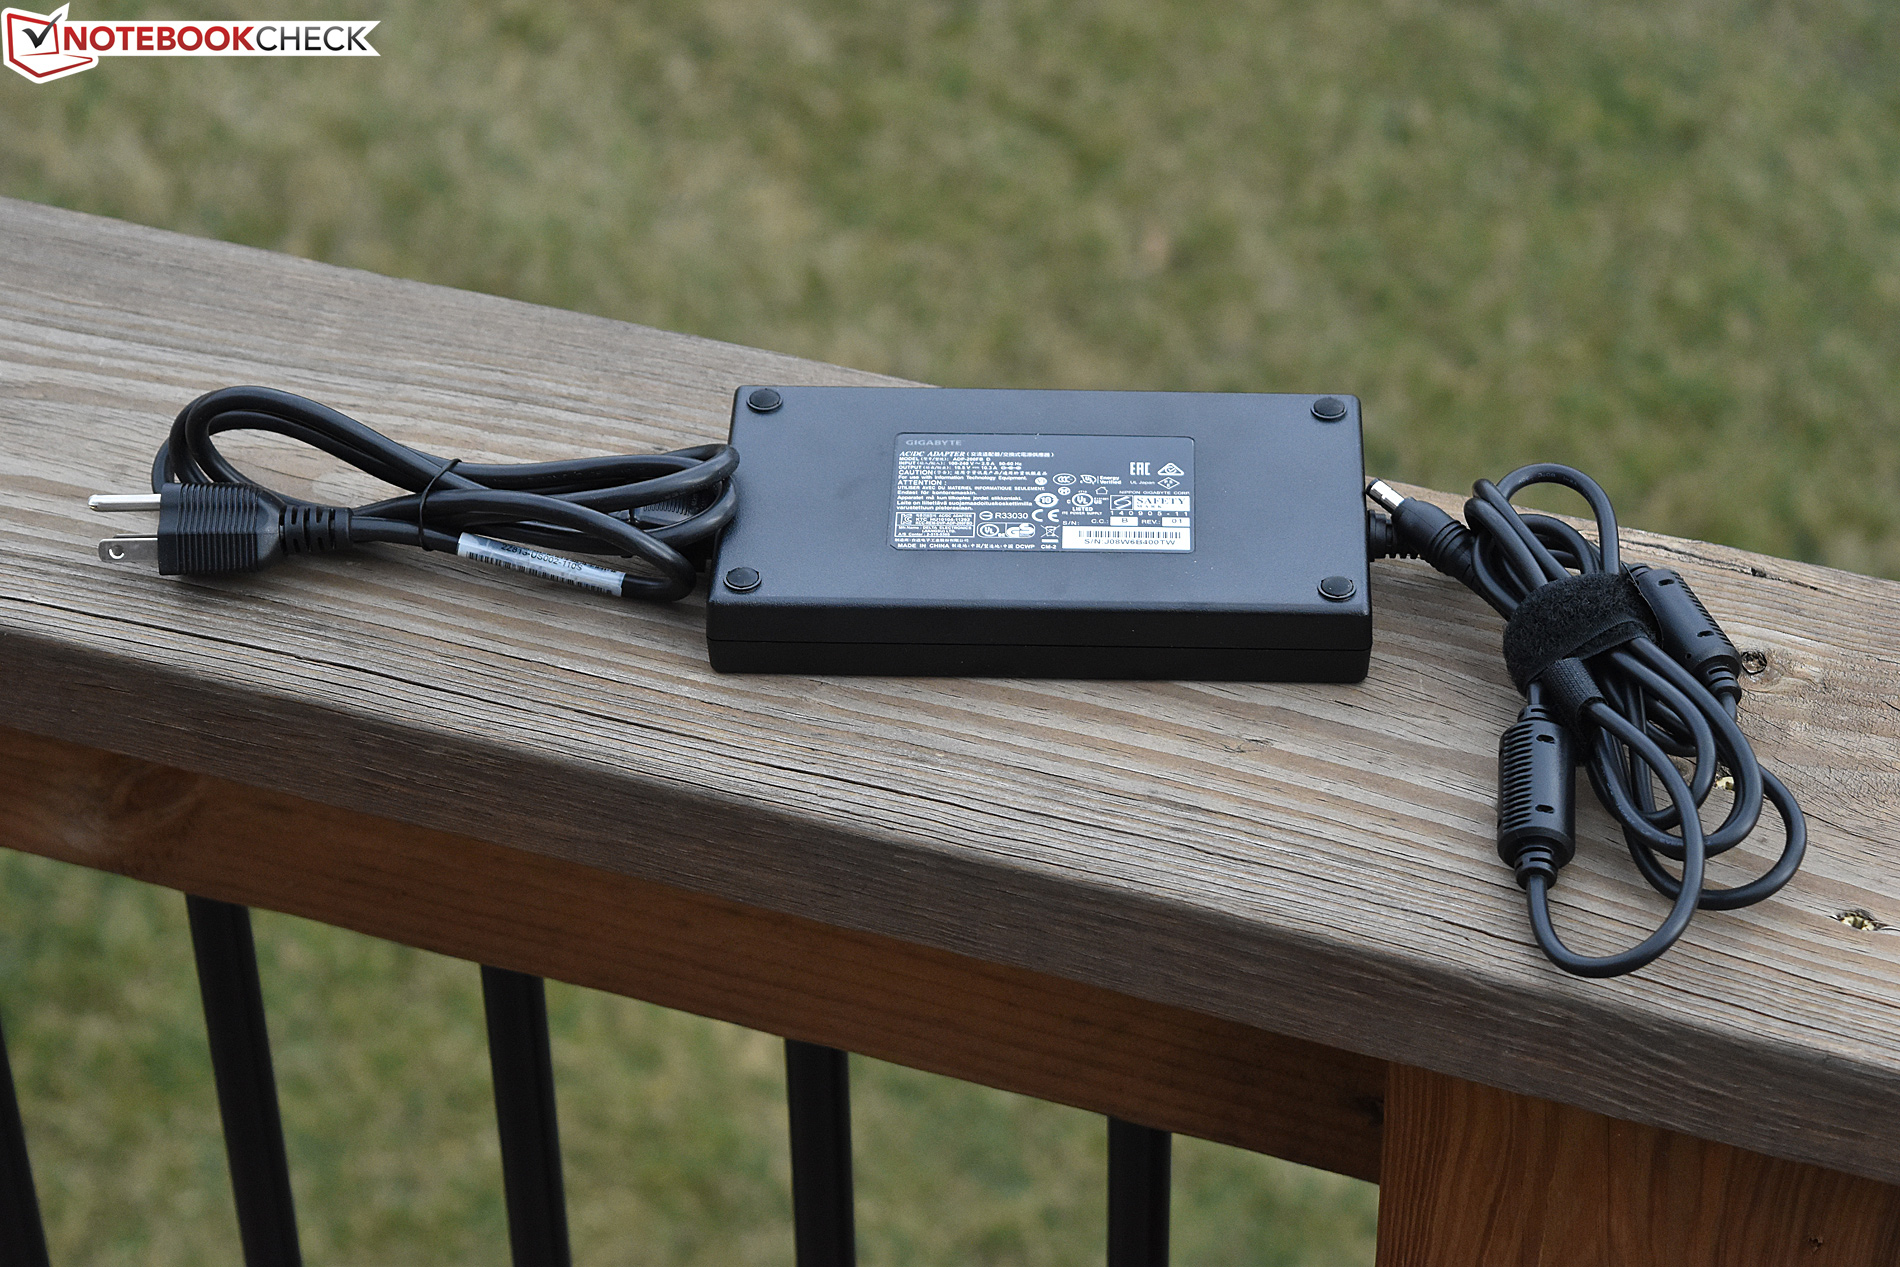
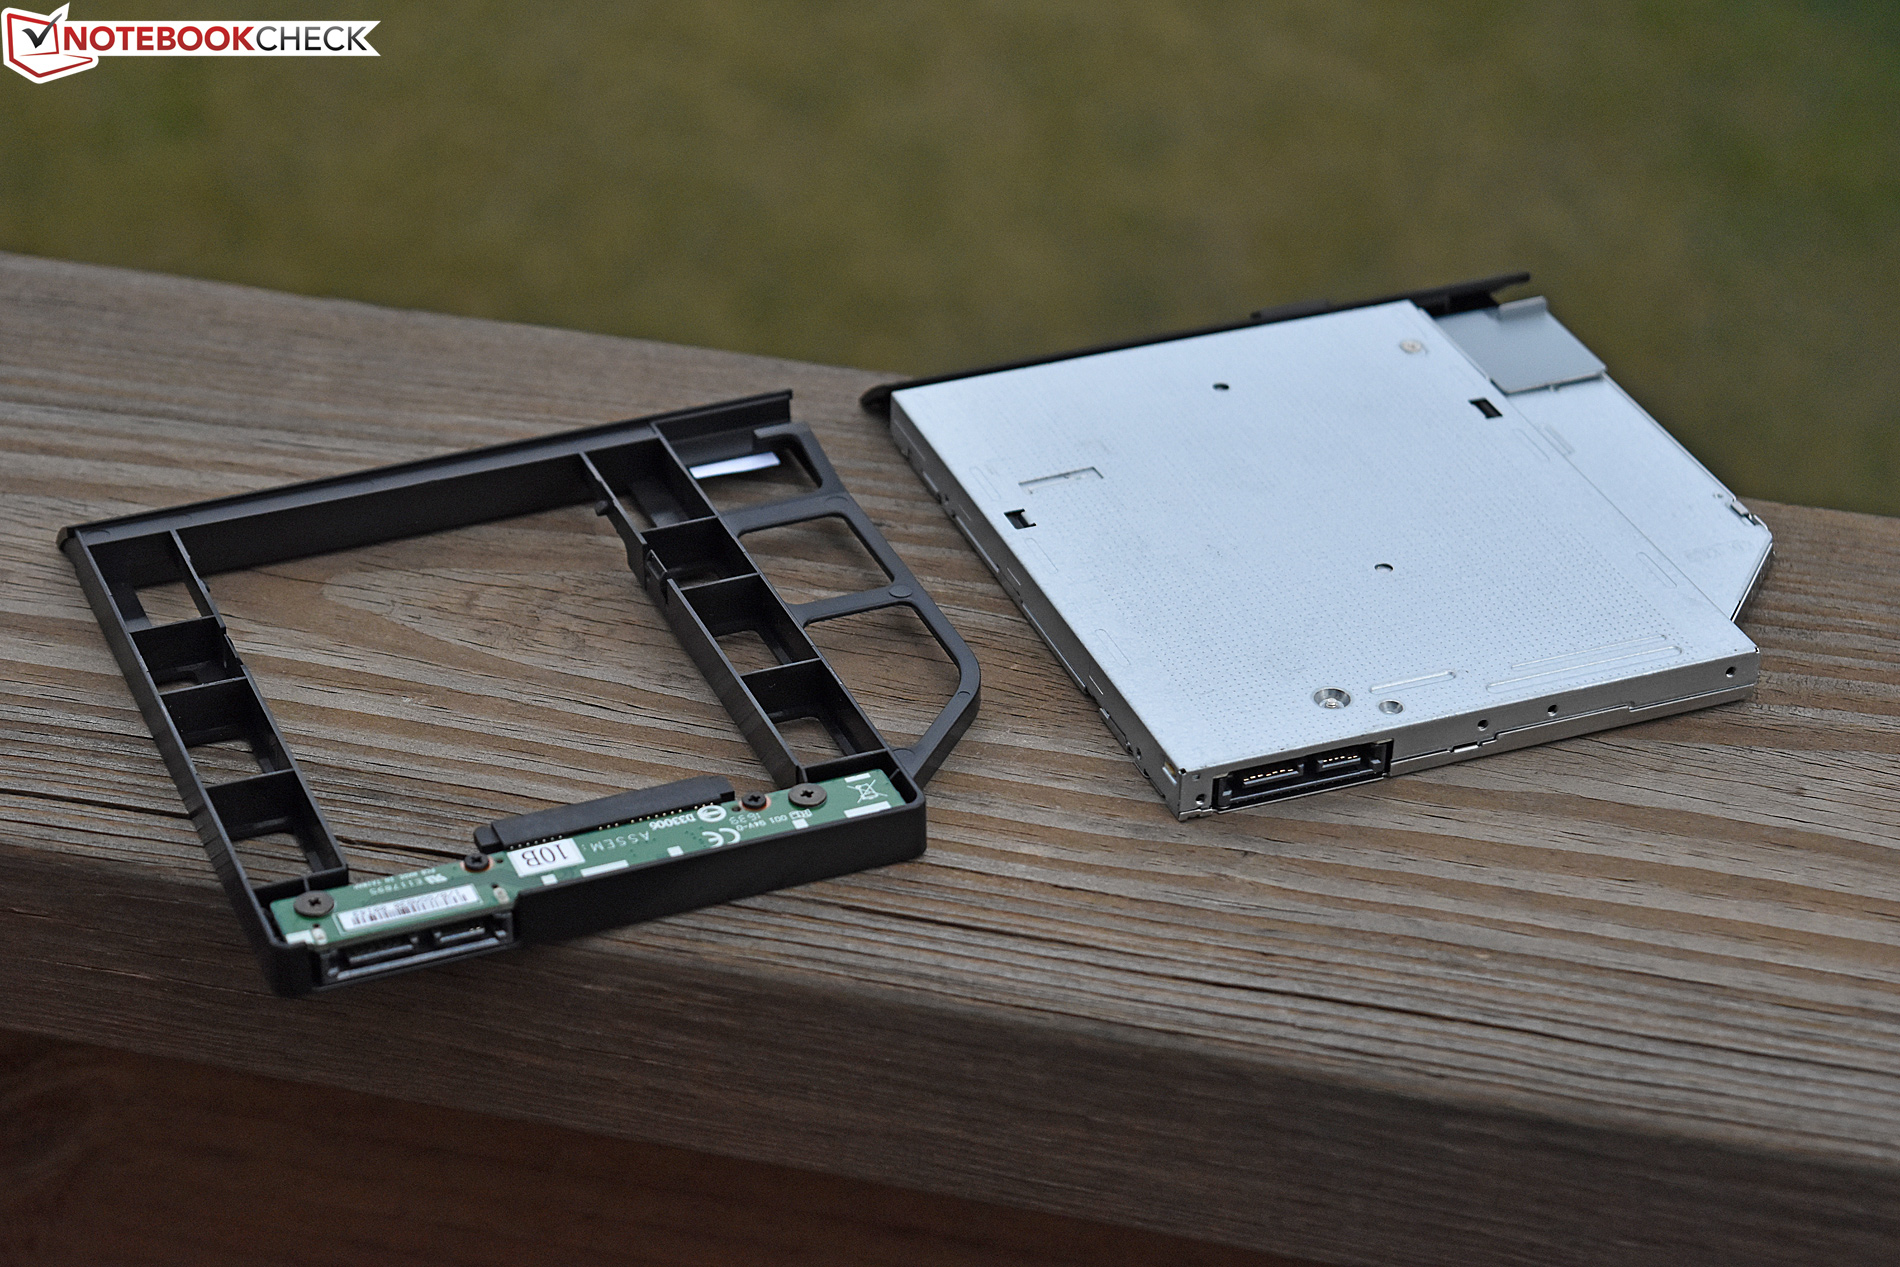
The Gigabyte P57X v7 includes a large 200W power adapter weighing 938 g. It’s the same adapter we saw included with the v6, and it brings the total carry weight to around 4.35 kg. Apart from that, users also receive a 2.5-inch drive bay adapter which can be swapped in to replace the optical drive. Without any drive installed, this also doubles as a bit of a weight saver. The final thing you’ll find in the package is a small microfiber cleaning cloth.
Software
The same useful Gigabyte software suite for fan speed management, GPU overclocking, and control over other aspects of the system (the core of which is called SmartManager) is included with the P57X v7. The other apps remain alongside it, including Smart Update and Smart USB Backup. For more information on the functionality of these programs, check out our previous review.
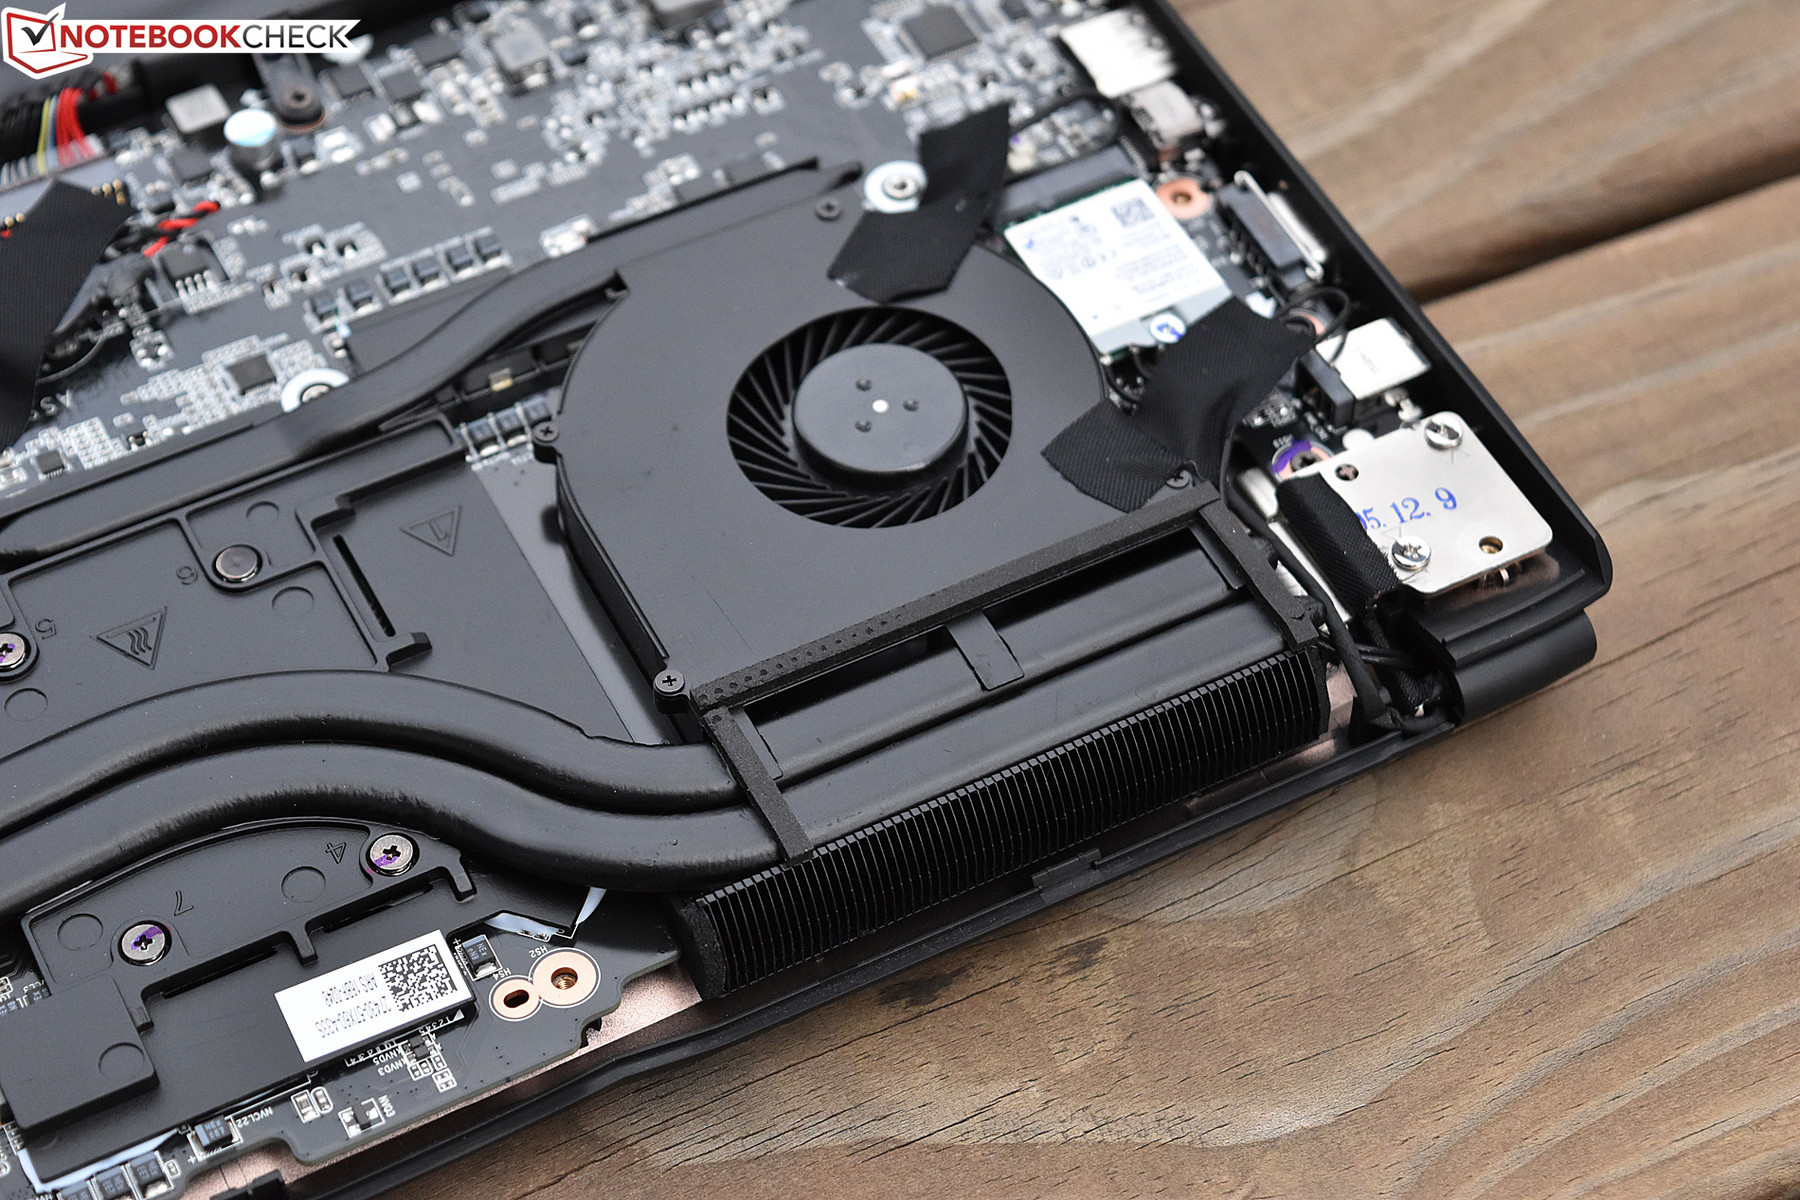
Maintenance
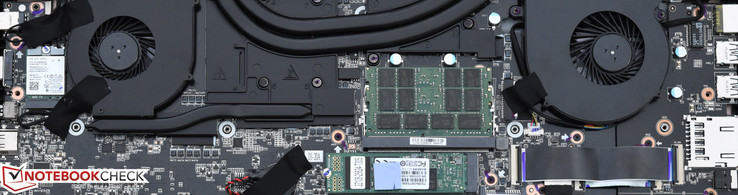
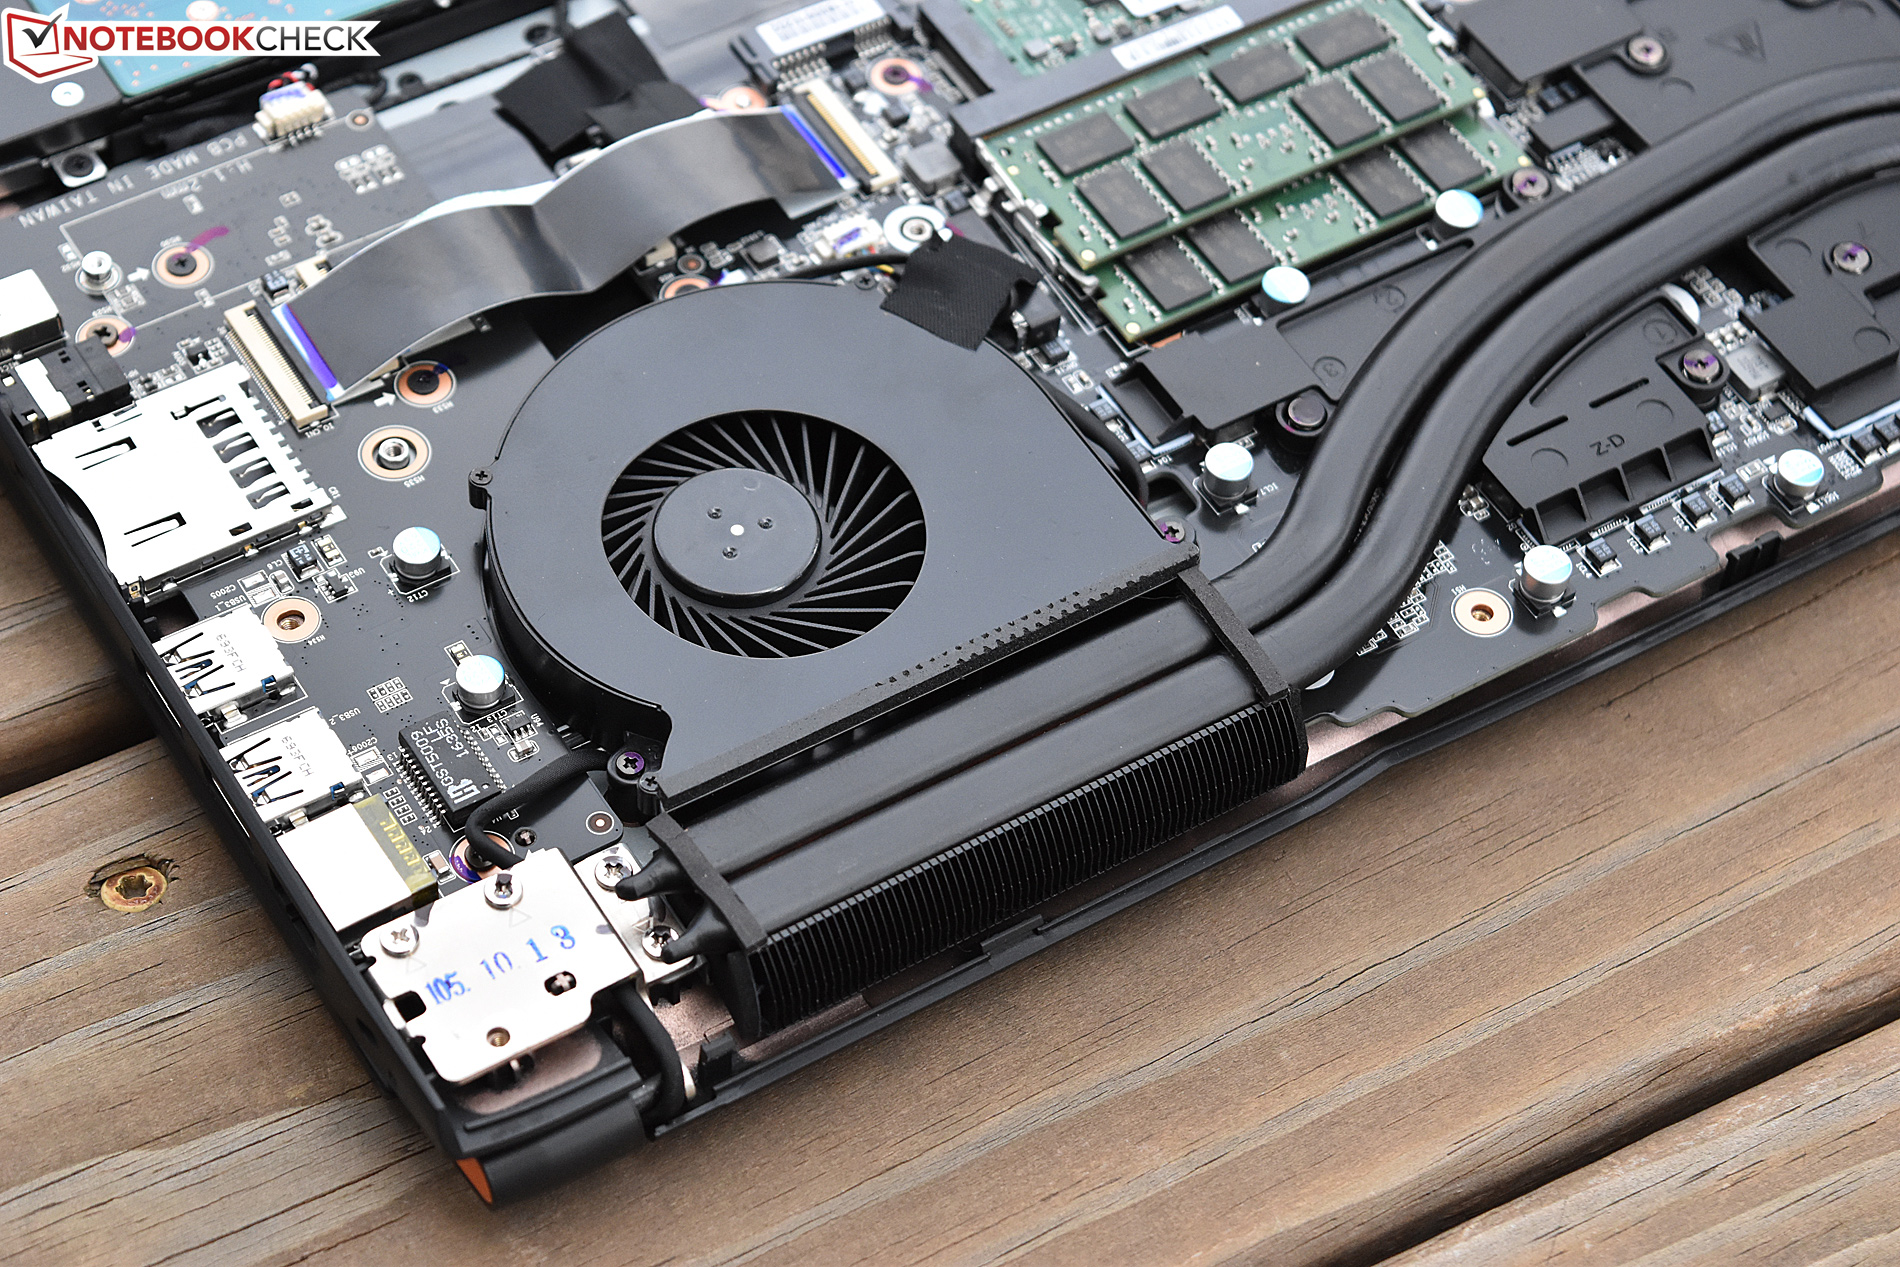
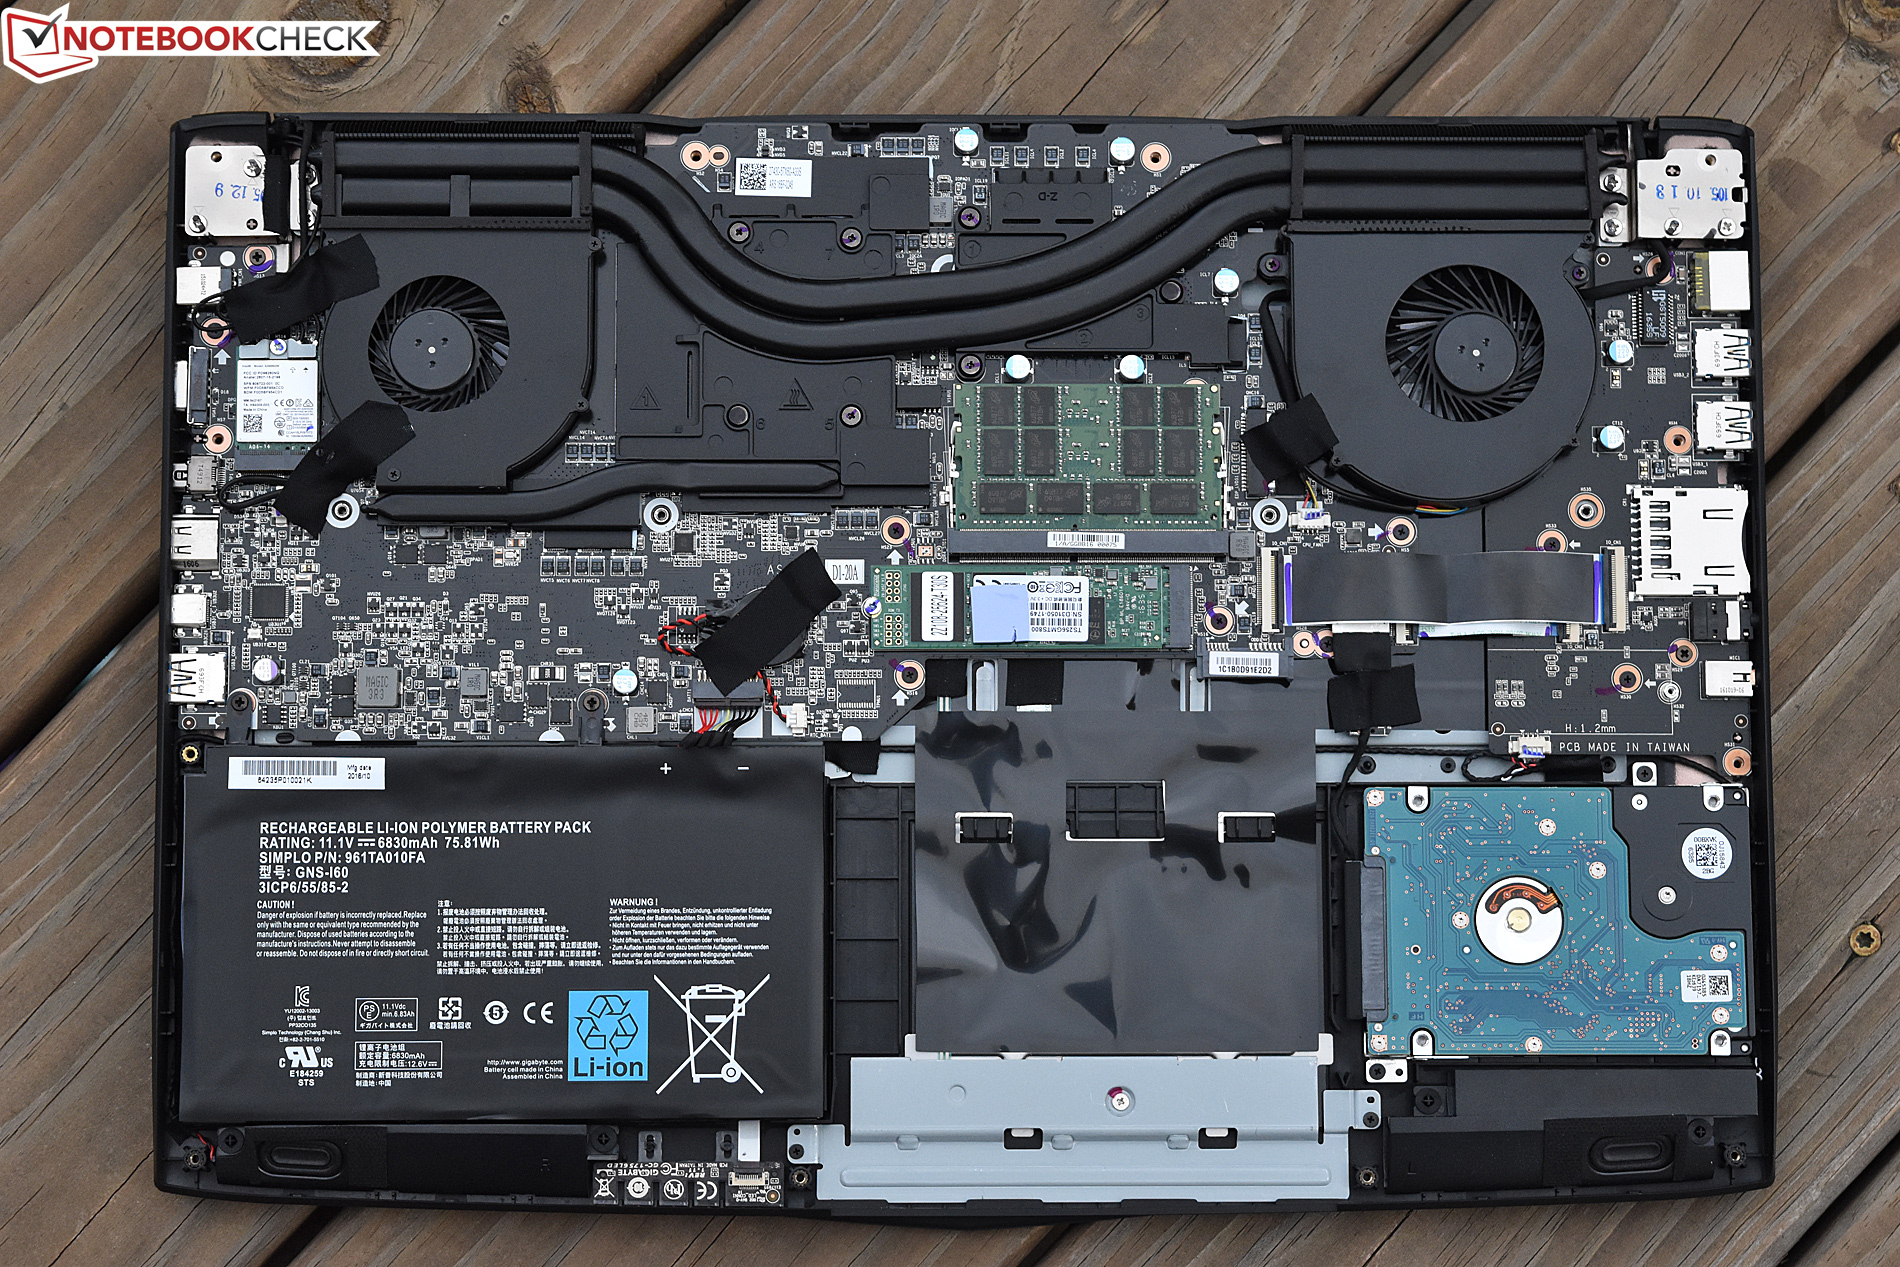
Maintenance procedures also remain unchanged from the previous P57X v6. Although a lot of screws are involved (sixteen in total), the bottom cover provides access to the vast majority of replaceable components, including all storage devices (up to 3—or 4 if you include the swappable expansion bay in lieu of the optical drive), the battery, both RAM SODIMMs, the cooling fans, and the CMOS battery.
Warranty
The Gigabyte P57X v7 includes a two-year depot warranty. Please see our Guarantees, Return Policies and Warranties FAQ for country-specific information.
Input Devices
Keyboard
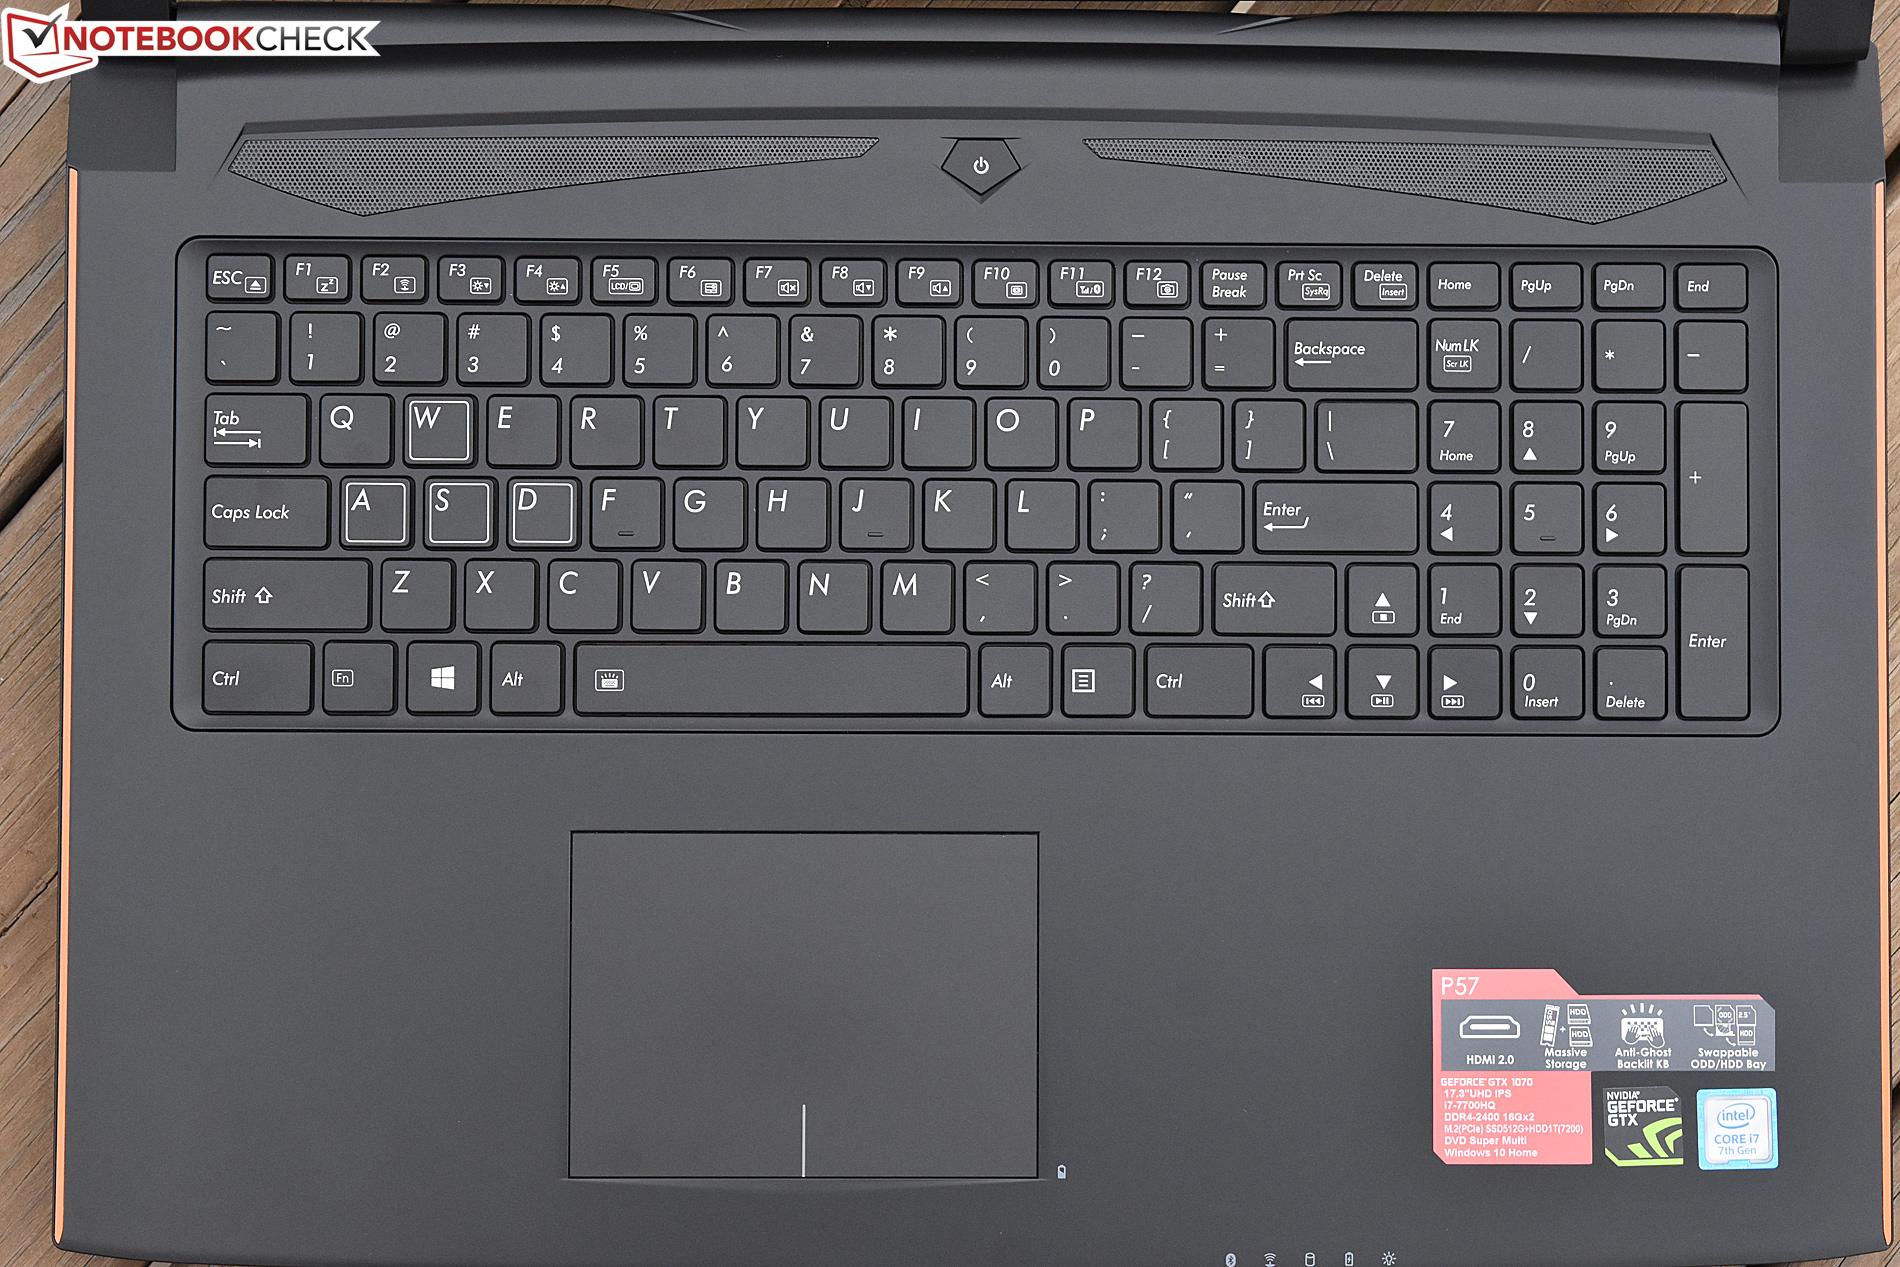
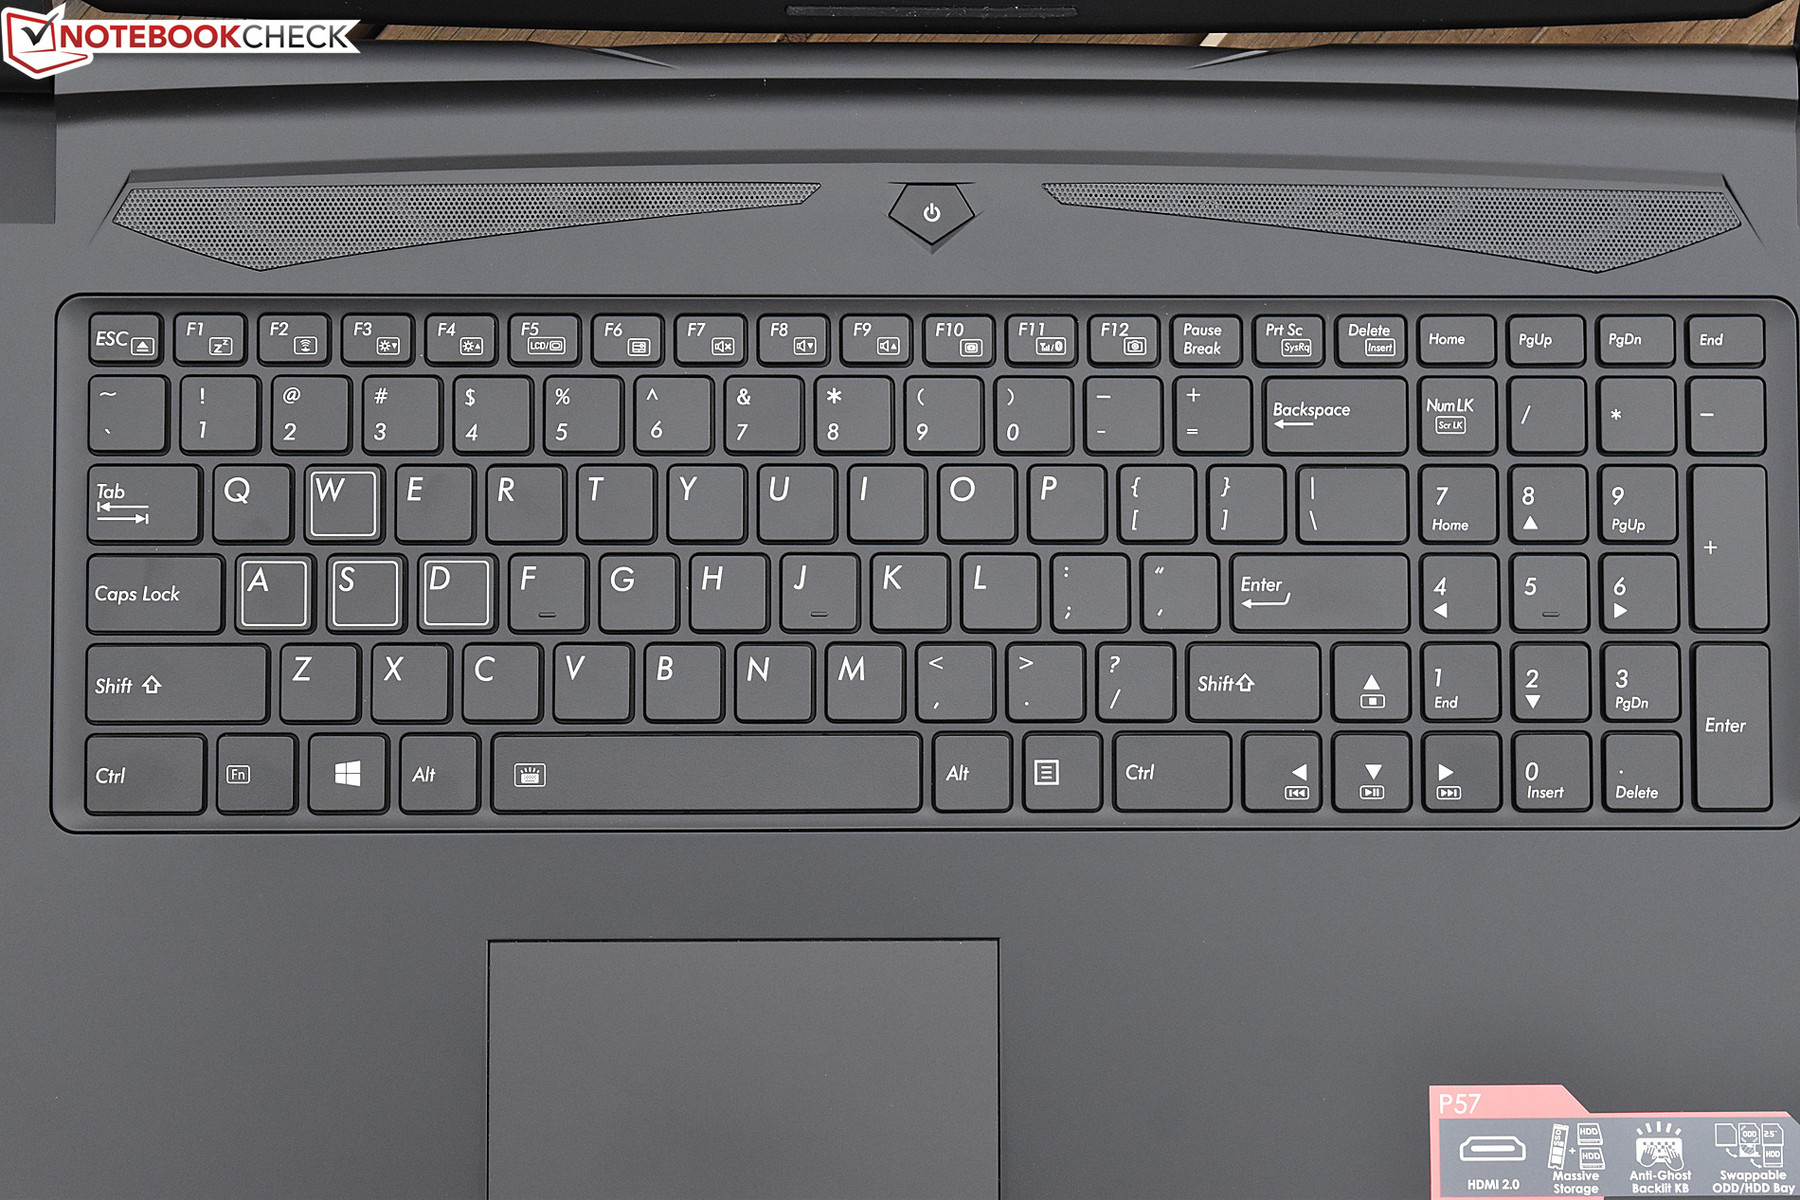
Seemingly consistent with that of the v6, the P57X v7 keyboard is nothing to write home about. Key travel is still quite short, though feedback and actuation force are comfortable. The spacing and layout is fine, and the backlight is easy to read in the dark. This is partially a factor of the extremely thin (for a 17.3-inch notebook) case, but it’s still a bit of a bummer considering how frequently gamers depend on their keyboard. At least the “anti-ghosting” technology once again applies, and it works well.
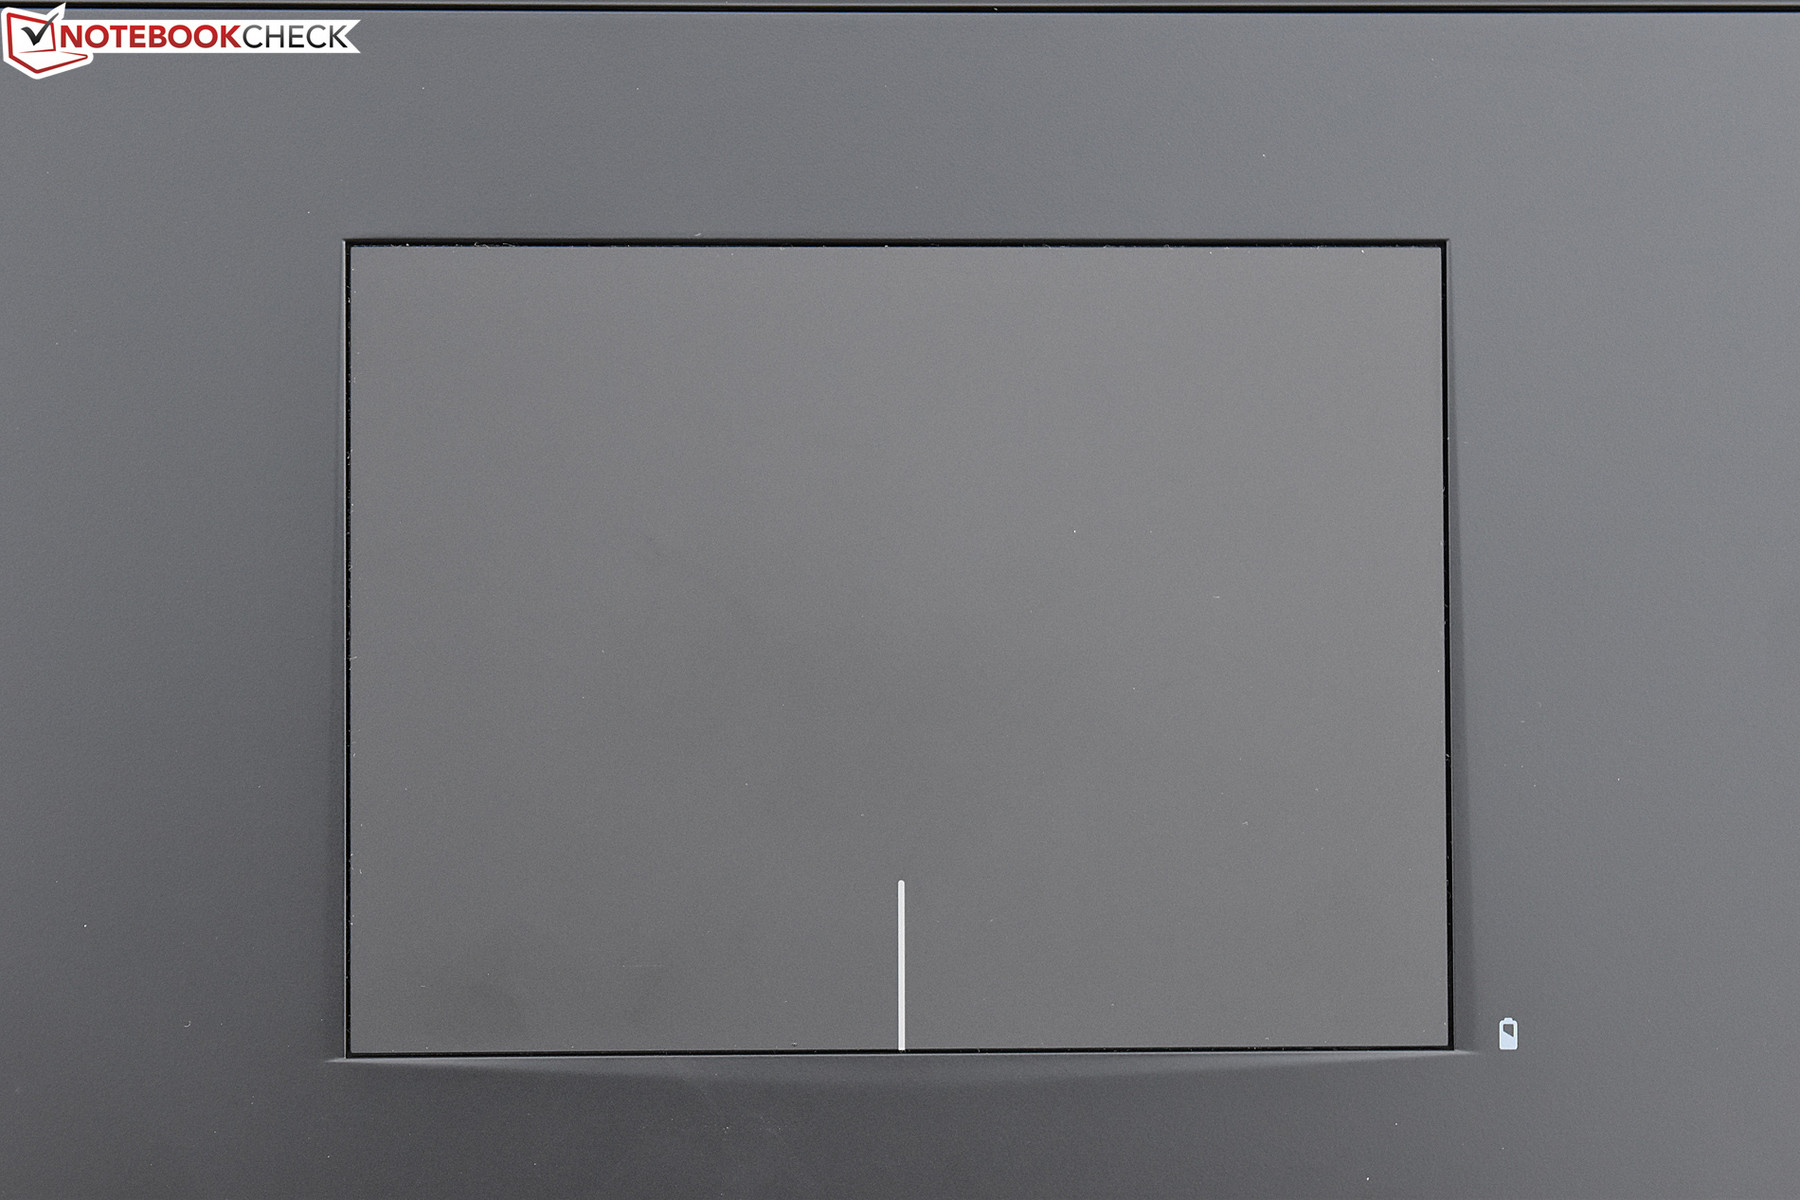
Touchpad
While the keyboard is passable, the ELAN touchpad remains poor. The actual pointing performance isn’t really the issue; we encountered no issues with that. Rather, it’s the integrated buttons which are to blame. They still provide the same mushy, uncertain feedback of their predecessor, and right-clicking and drag-and-drop operations are still a chore.
Although gestures work mostly as intended, two-finger scrolling, for instance, doesn’t feel nearly as intuitively tuned as it does on the typical Synaptics or even Alps Electric drivers.
Display
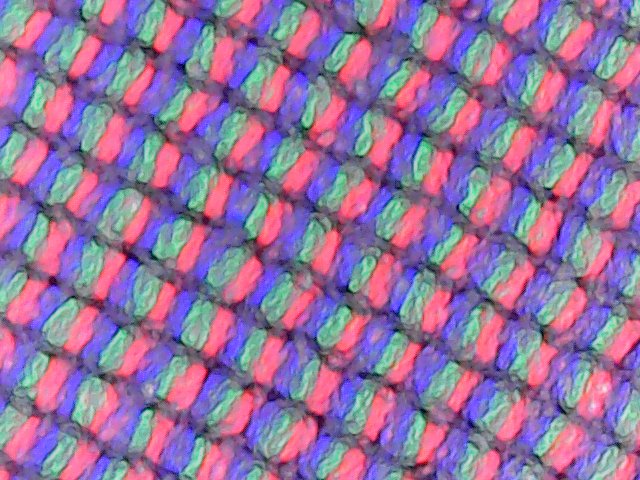
One of the biggest upgrades coming from the P57X v6 to the v7 is the display. Whereas the v6 included a solid, yet relatively mundane 1080p panel, the v7 features a 4K (3840x2160) resolution screen. It’s also an IPS display sporting a matte finish (although Gigabyte oddly does not list IPS on the spec sheet for this option), and it’s noticeably brighter than that of the v6 as well. Subjectively, color appears quite vivid also. We’ll see how this translates to some hard numbers next during our professional measurements.
While the display does look very good, we should point out that on dark/black screens, some pretty severe backlight bleed is evident in the lower left corner of the screen. Pressure on that portion of the display bezel for any reason (such as when adjusting the lid angle), by the way, also further exacerbates the problem.
| |||||||||||||||||||||||||
Brightness Distribution: 86 %
Center on Battery: 441.3 cd/m²
Contrast: 1003:1 (Black: 0.44 cd/m²)
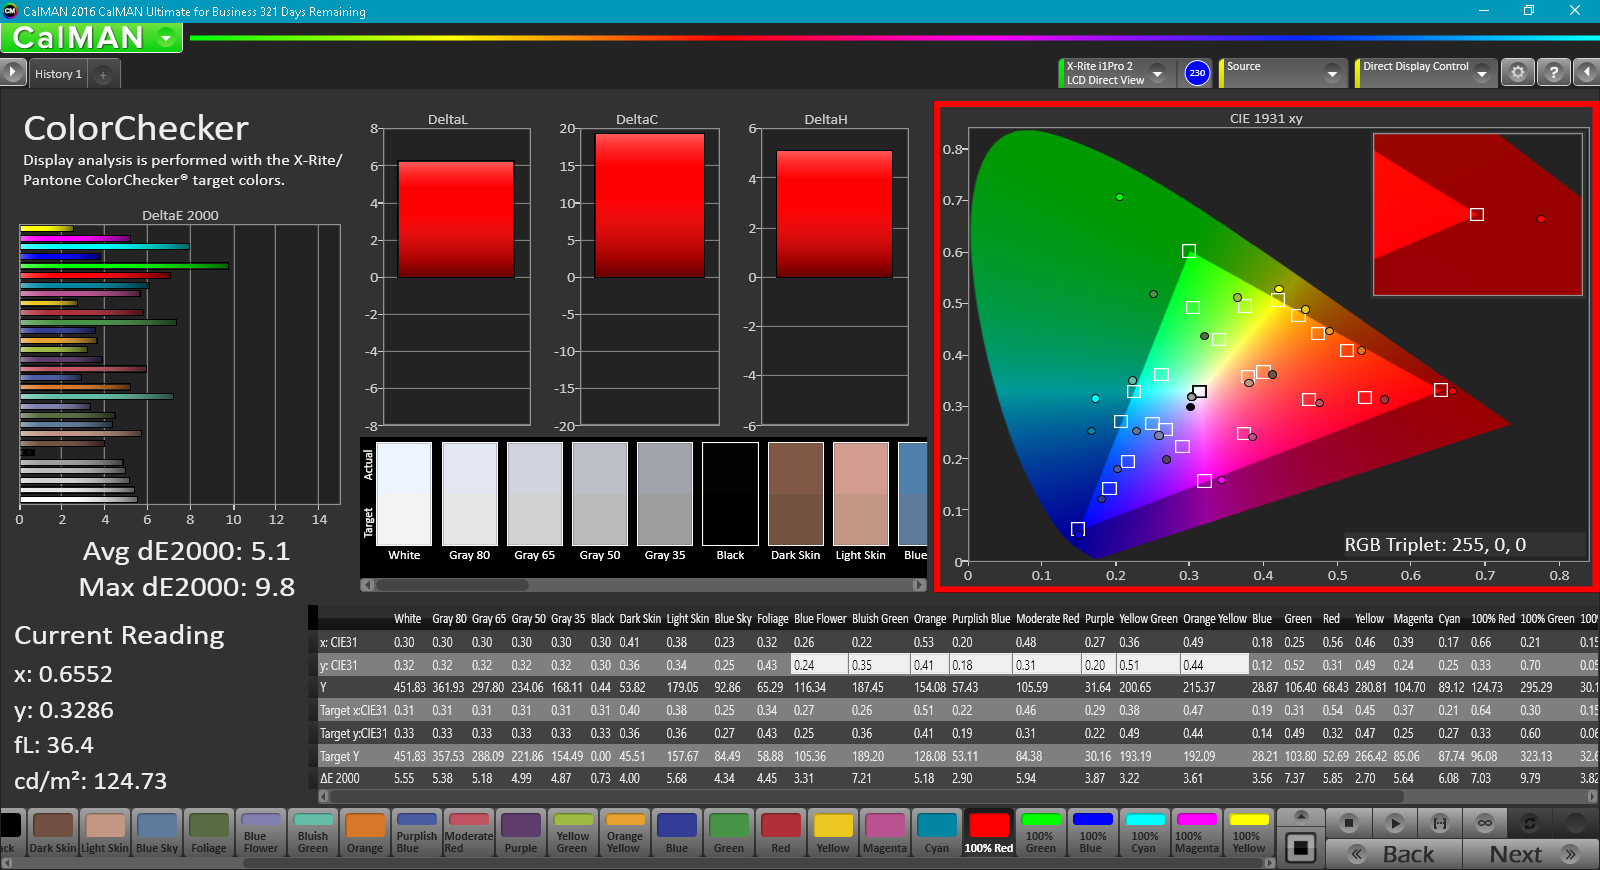
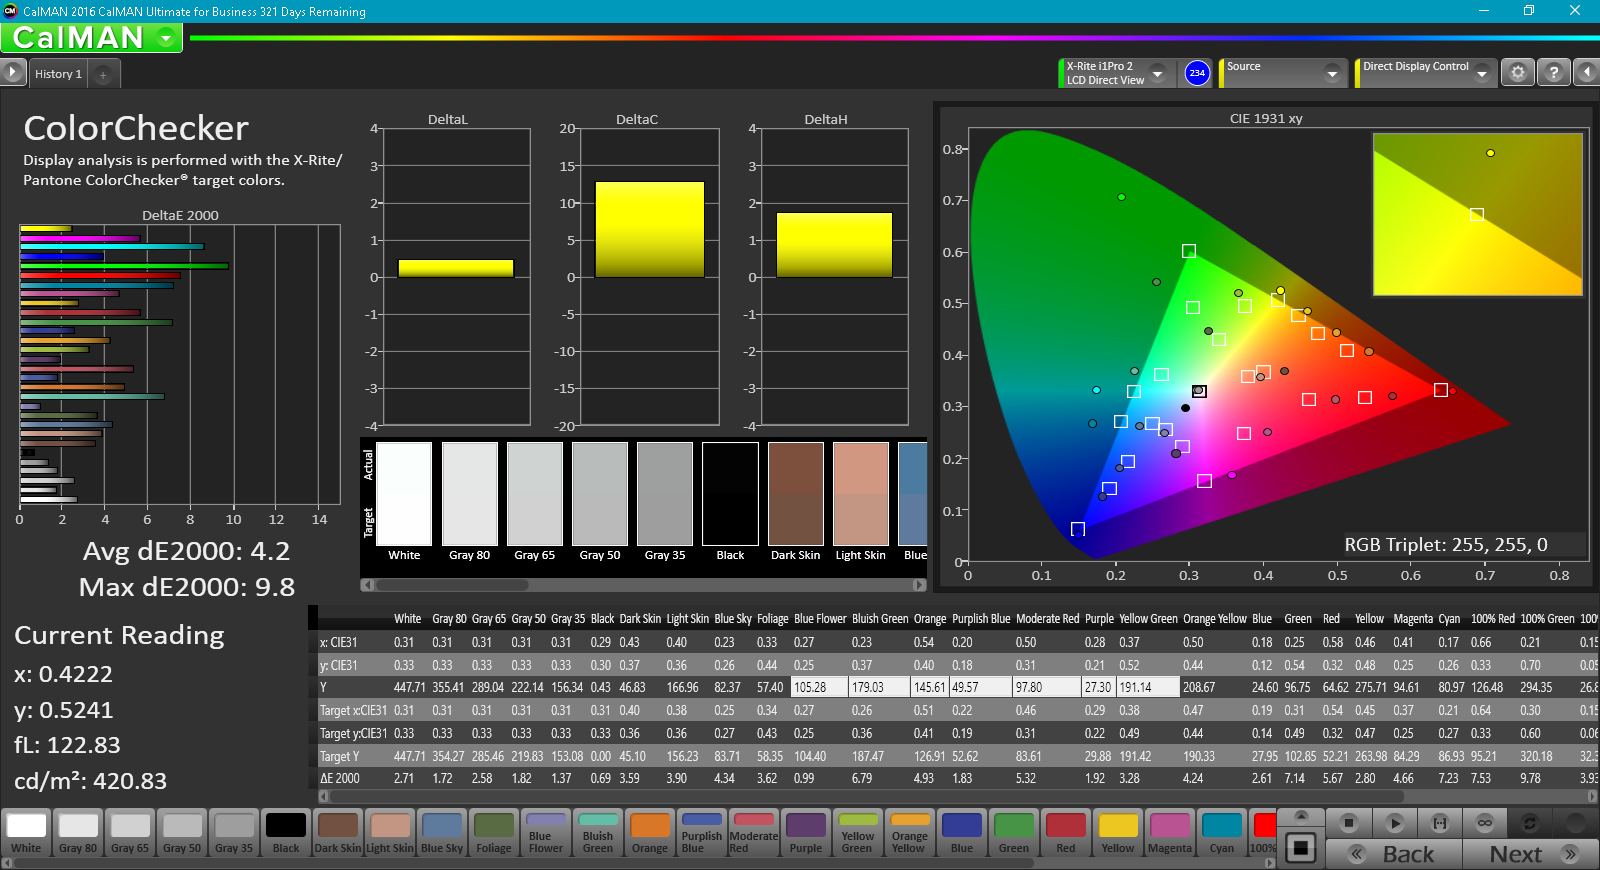
ΔE ColorChecker Calman: 5.1 | ∀{0.5-29.43 Ø4.72}
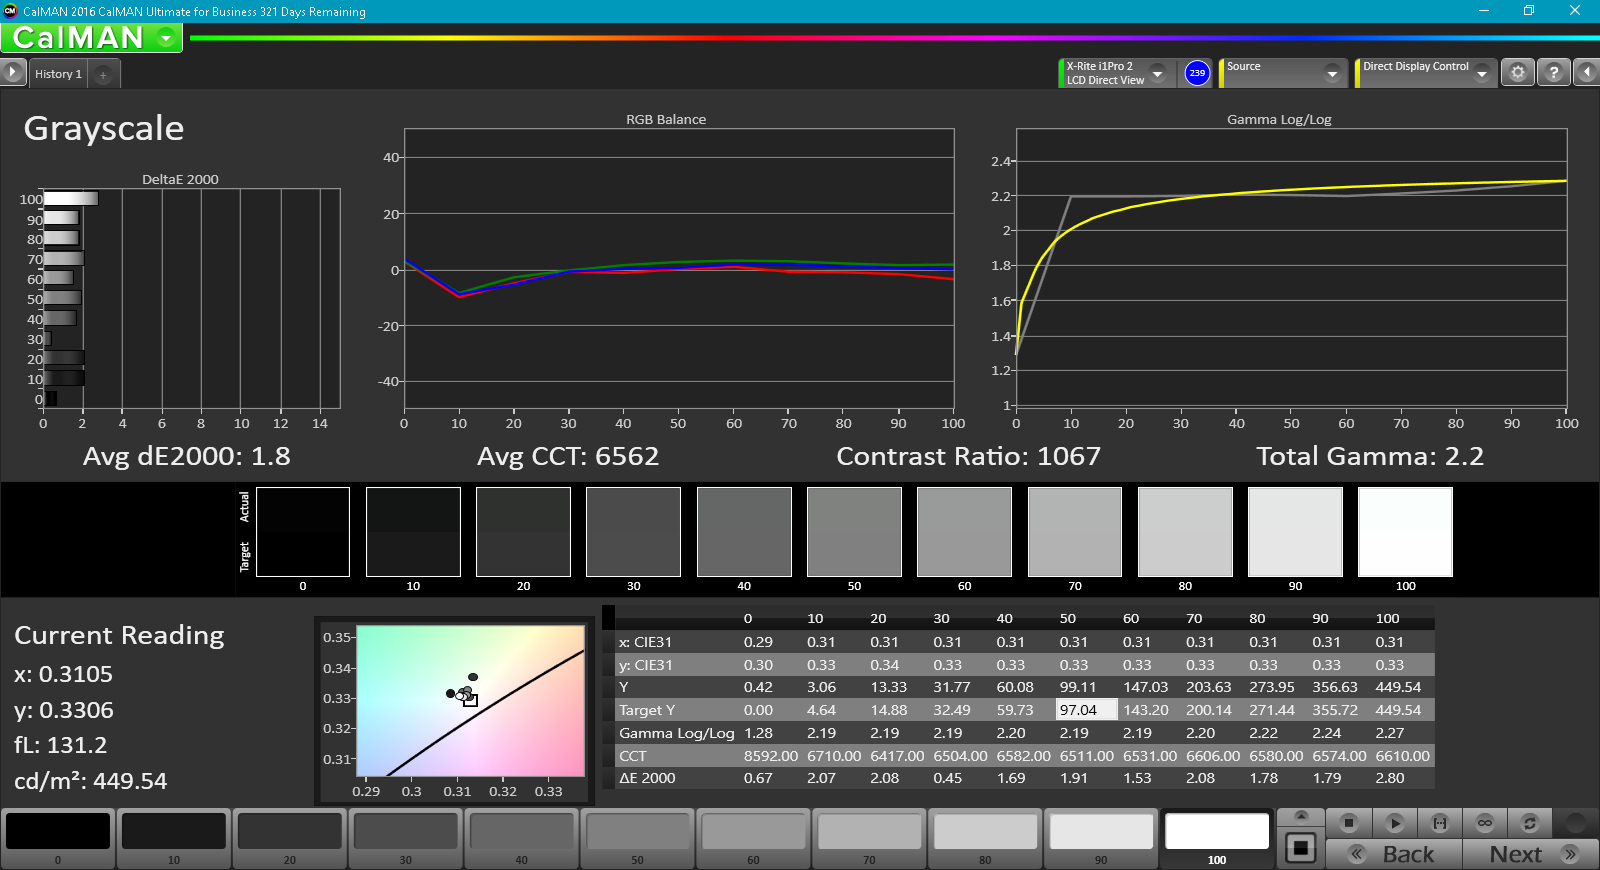
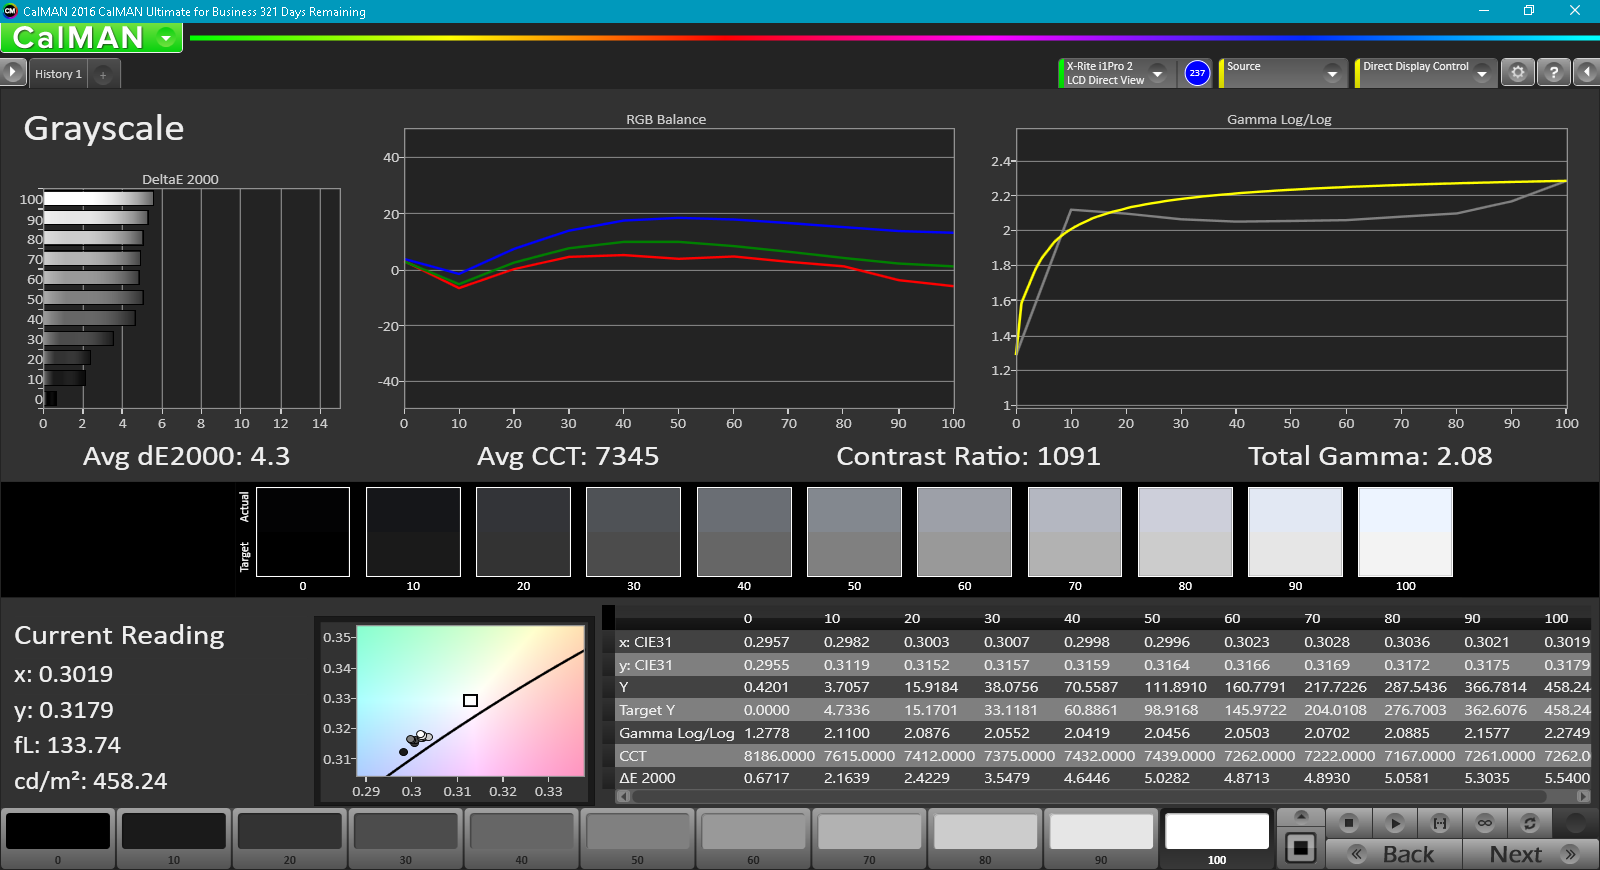
ΔE Greyscale Calman: 4.3 | ∀{0.09-98 Ø4.97}
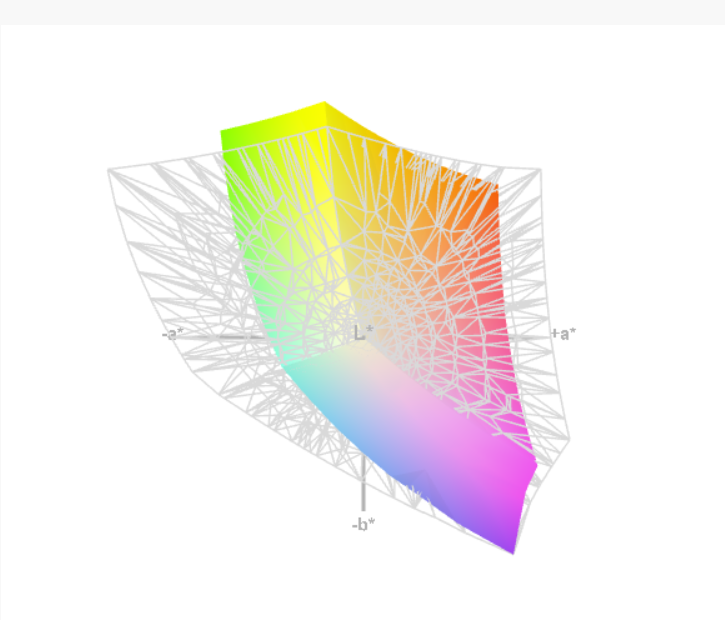
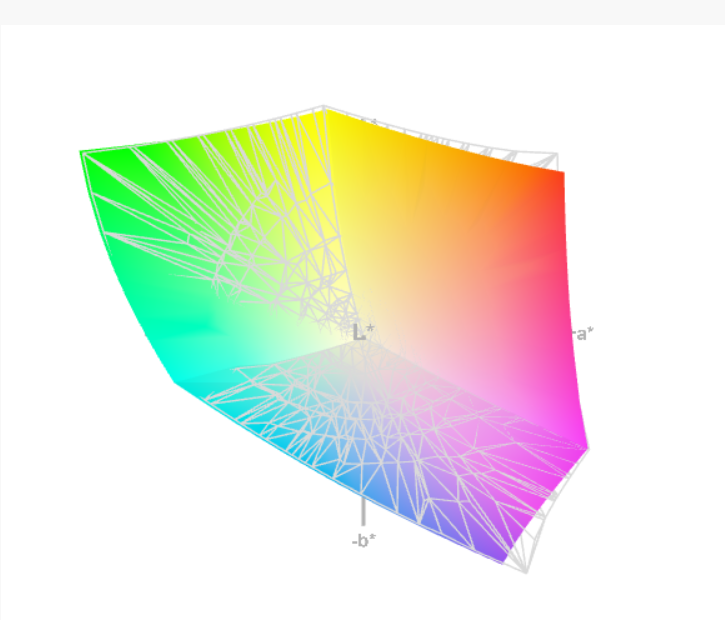
100% sRGB (Argyll 1.6.3 3D)
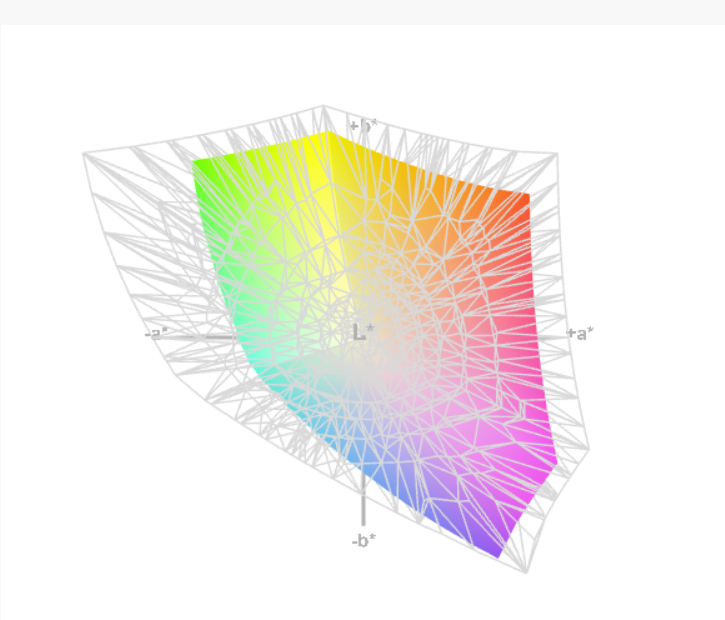
87% AdobeRGB 1998 (Argyll 1.6.3 3D)
98.9% AdobeRGB 1998 (Argyll 3D)
100% sRGB (Argyll 3D)
87.8% Display P3 (Argyll 3D)
Gamma: 2.08
CCT: 7345 K
| Gigabyte P57X v7 SHP145E, IPS, 17.3", 3840x2160 | Gigabyte P57X v6 LGD0469, IPS, 17.3", 1920x1080 | Acer Predator 17 G9-793-77LG AU Optronics B173ZAN01.0 (AUO109B), IPS, 17.3", 3840x2160 | MSI GT73VR 7RF-296 N173HHE-G32 (CMN1747), TN LED, 17.3", 1920x1080 | EVGA SC17 GTX 1070 Sharp LQ173D1JW31, IPS, 17.3", 3840x2160 | |
|---|---|---|---|---|---|
| Display | -23% | 0% | -4% | -0% | |
| Display P3 Coverage (%) | 87.8 | 68 -23% | 86.9 -1% | 90.6 3% | 87.3 -1% |
| sRGB Coverage (%) | 100 | 87.5 -12% | 100 0% | 99.9 0% | 100 0% |
| AdobeRGB 1998 Coverage (%) | 98.9 | 64 -35% | 99.4 1% | 84.7 -14% | 98.8 0% |
| Response Times | 43% | 41% | 69% | 22% | |
| Response Time Grey 50% / Grey 80% * (ms) | 55.6 ? | 33.6 ? 40% | 37 ? 33% | 26 ? 53% | 45.6 ? 18% |
| Response Time Black / White * (ms) | 46.8 ? | 25.6 ? 45% | 24 ? 49% | 7 ? 85% | 35.2 ? 25% |
| PWM Frequency (Hz) | 1000 ? | 1042 ? | |||
| Screen | -11% | 9% | -30% | 2% | |
| Brightness middle (cd/m²) | 441.3 | 329.2 -25% | 336 -24% | 307 -30% | 399.1 -10% |
| Brightness (cd/m²) | 408 | 321 -21% | 320 -22% | 284 -30% | 360 -12% |
| Brightness Distribution (%) | 86 | 93 8% | 88 2% | 85 -1% | 81 -6% |
| Black Level * (cd/m²) | 0.44 | 0.267 39% | 0.25 43% | 0.25 43% | 0.4 9% |
| Contrast (:1) | 1003 | 1233 23% | 1344 34% | 1228 22% | 998 0% |
| Colorchecker dE 2000 * | 5.1 | 5.93 -16% | 3.61 29% | 9.65 -89% | 4.78 6% |
| Colorchecker dE 2000 max. * | 9.8 | 11.07 -13% | 6.02 39% | 16.36 -67% | 7.65 22% |
| Greyscale dE 2000 * | 4.3 | 6.72 -56% | 4.78 -11% | 10.07 -134% | 3.8 12% |
| Gamma | 2.08 106% | 2.12 104% | 2.32 95% | 2.12 104% | 2.03 108% |
| CCT | 7345 88% | 7611 85% | 6185 105% | 12145 54% | 7288 89% |
| Color Space (Percent of AdobeRGB 1998) (%) | 87 | 57 -34% | 88 1% | 75 -14% | 86.9 0% |
| Color Space (Percent of sRGB) (%) | 100 | 87 -13% | 100 0% | 100 0% | 100 0% |
| Total Average (Program / Settings) | 3% /
-6% | 17% /
12% | 12% /
-12% | 8% /
4% |
* ... smaller is better
We recorded an average brightness of 407.7 cd/m²—21% brighter than the P57X v6, and the brightest of any of the screens we measured across the laptops in our comparison field. Distribution is decent (slightly lower than that of the v6) at 86%, though the center of the screen is the brightest region (at 441.3 cd/m²), so it’s not as noticeable a difference as in some other situations. Meanwhile, the contrast ratio of 1003:1 is a good overall result, even if it’s a ways below most of the competitors, including that of the v6 (1233:1, 23% better). All things considered, these are good numbers.
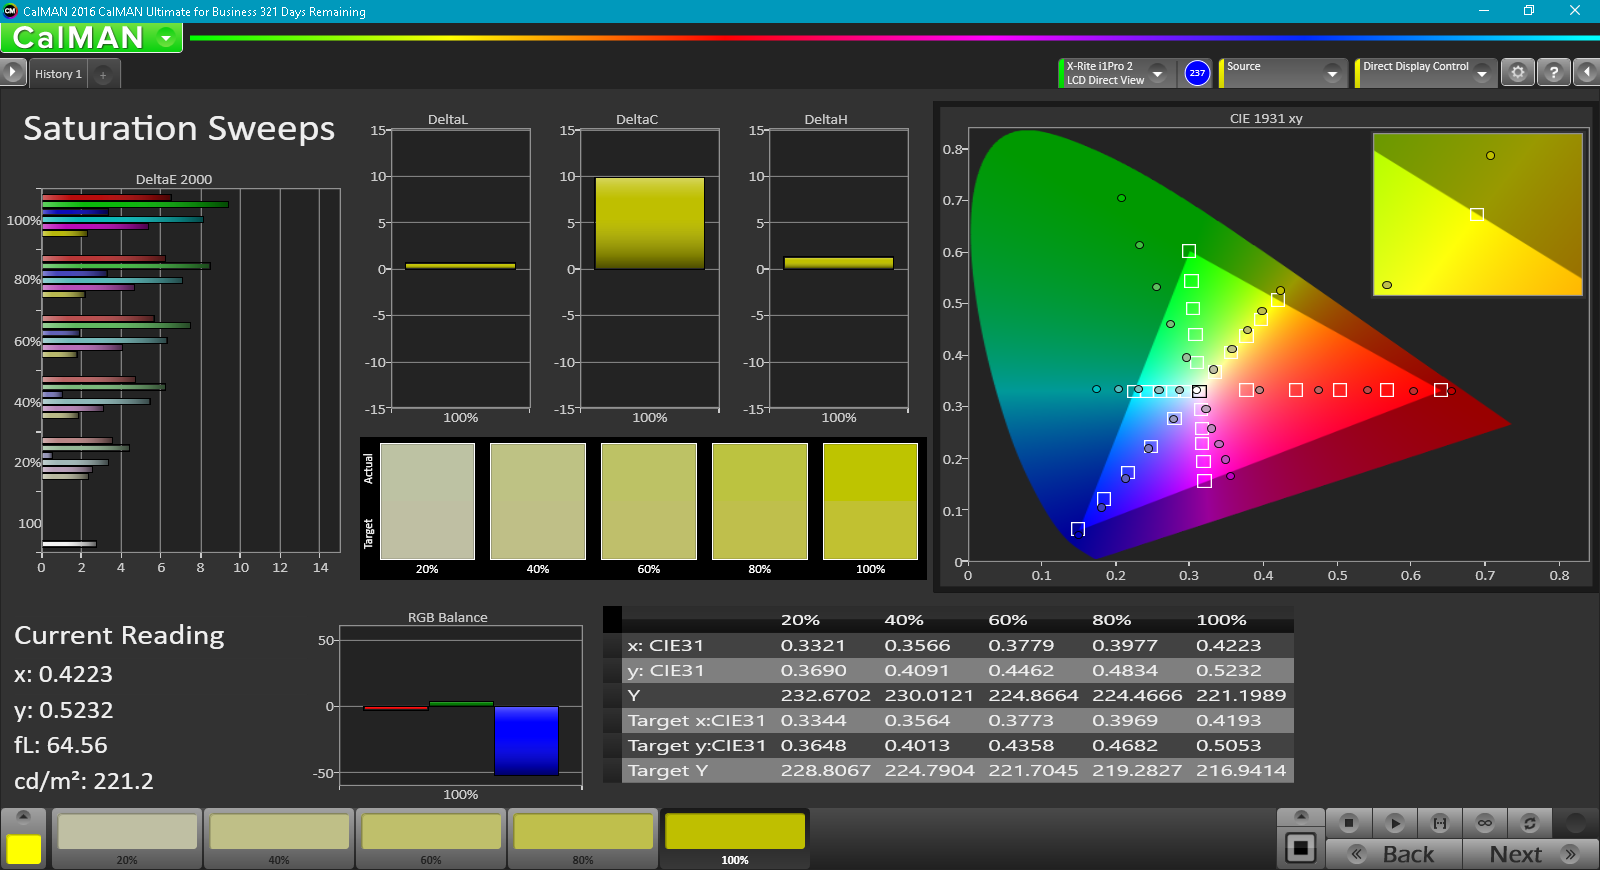
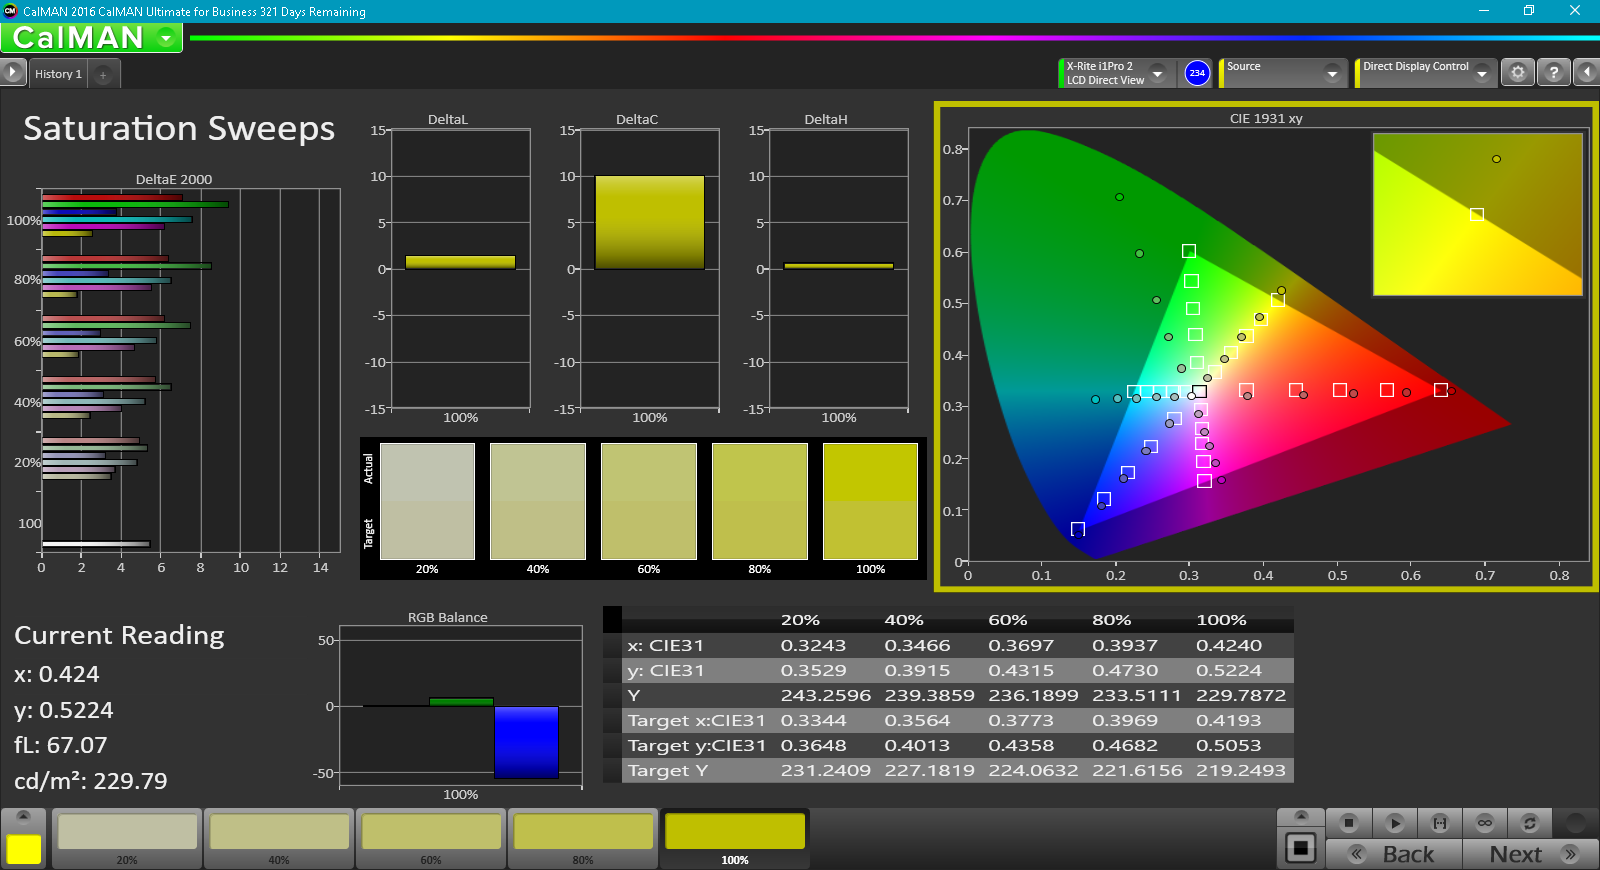
Turning to our color measurements, we came away with 100 percent sRGB coverage, and a very good 87 percent of AdobeRGB 1998, to boot. This is nearly identical to the performance of the Acer Predator 17 G9-793-77LG (88%) and EVGA SC17 GTX 1070 (87%), and it’s well beyond the P57X v6’s 57% coverage. Along with the brightness and resolution, this improved color reproduction adds up to a much nicer display panel that on the v6 review unit we assessed.
The CalMAN 5 results hardly diminish this performance. A total gamma of 2.08 (ideal: 2.2) and CCT Average of 7345 (ideal: 6500) aren’t perfect, but they’re inoffensive nonetheless. The same goes for the DeltaE measurements of 5.1 and 4.3 for Colorchecker and Greyscale (respectively). While none of these are excellent, they’re right in line with the rest of the competition, and they’re certainly good enough.
Display Response Times
| ↔ Response Time Black to White | ||
|---|---|---|
| 46.8 ms ... rise ↗ and fall ↘ combined | ↗ 10.4 ms rise | 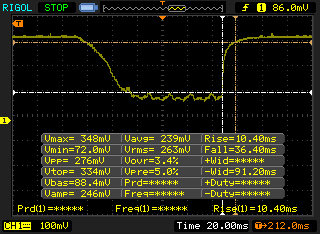 |
| ↘ 36.4 ms fall | ||
| The screen shows slow response rates in our tests and will be unsatisfactory for gamers. In comparison, all tested devices range from 0.1 (minimum) to 240 (maximum) ms. » 99 % of all devices are better. This means that the measured response time is worse than the average of all tested devices (19.8 ms). | ||
| ↔ Response Time 50% Grey to 80% Grey | ||
| 55.6 ms ... rise ↗ and fall ↘ combined | ↗ 18.4 ms rise | 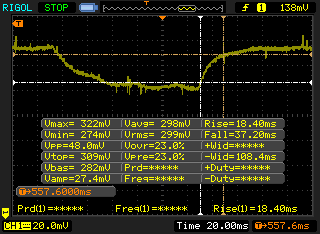 |
| ↘ 37.2 ms fall | ||
| The screen shows slow response rates in our tests and will be unsatisfactory for gamers. In comparison, all tested devices range from 0.165 (minimum) to 636 (maximum) ms. » 92 % of all devices are better. This means that the measured response time is worse than the average of all tested devices (31 ms). | ||
Screen Flickering / PWM (Pulse-Width Modulation)
| Screen flickering / PWM detected | 1000 Hz | ≤ 29 % brightness setting | 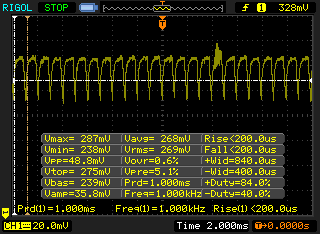 |
The display backlight flickers at 1000 Hz (worst case, e.g., utilizing PWM) Flickering detected at a brightness setting of 29 % and below. There should be no flickering or PWM above this brightness setting. The frequency of 1000 Hz is quite high, so most users sensitive to PWM should not notice any flickering. In comparison: 52 % of all tested devices do not use PWM to dim the display. If PWM was detected, an average of 7781 (minimum: 5 - maximum: 343500) Hz was measured. | |||
The response times on the panel are below what we would like to see for gaming, which is perhaps the sole disappointment conjured by the 4K panel. PWM was also detected (as shown above) at all brightnesses below 29 percent—but on the bright side, that's pretty low, and the frequency of 1 kHz is high enough that most people will not notice the flickering.
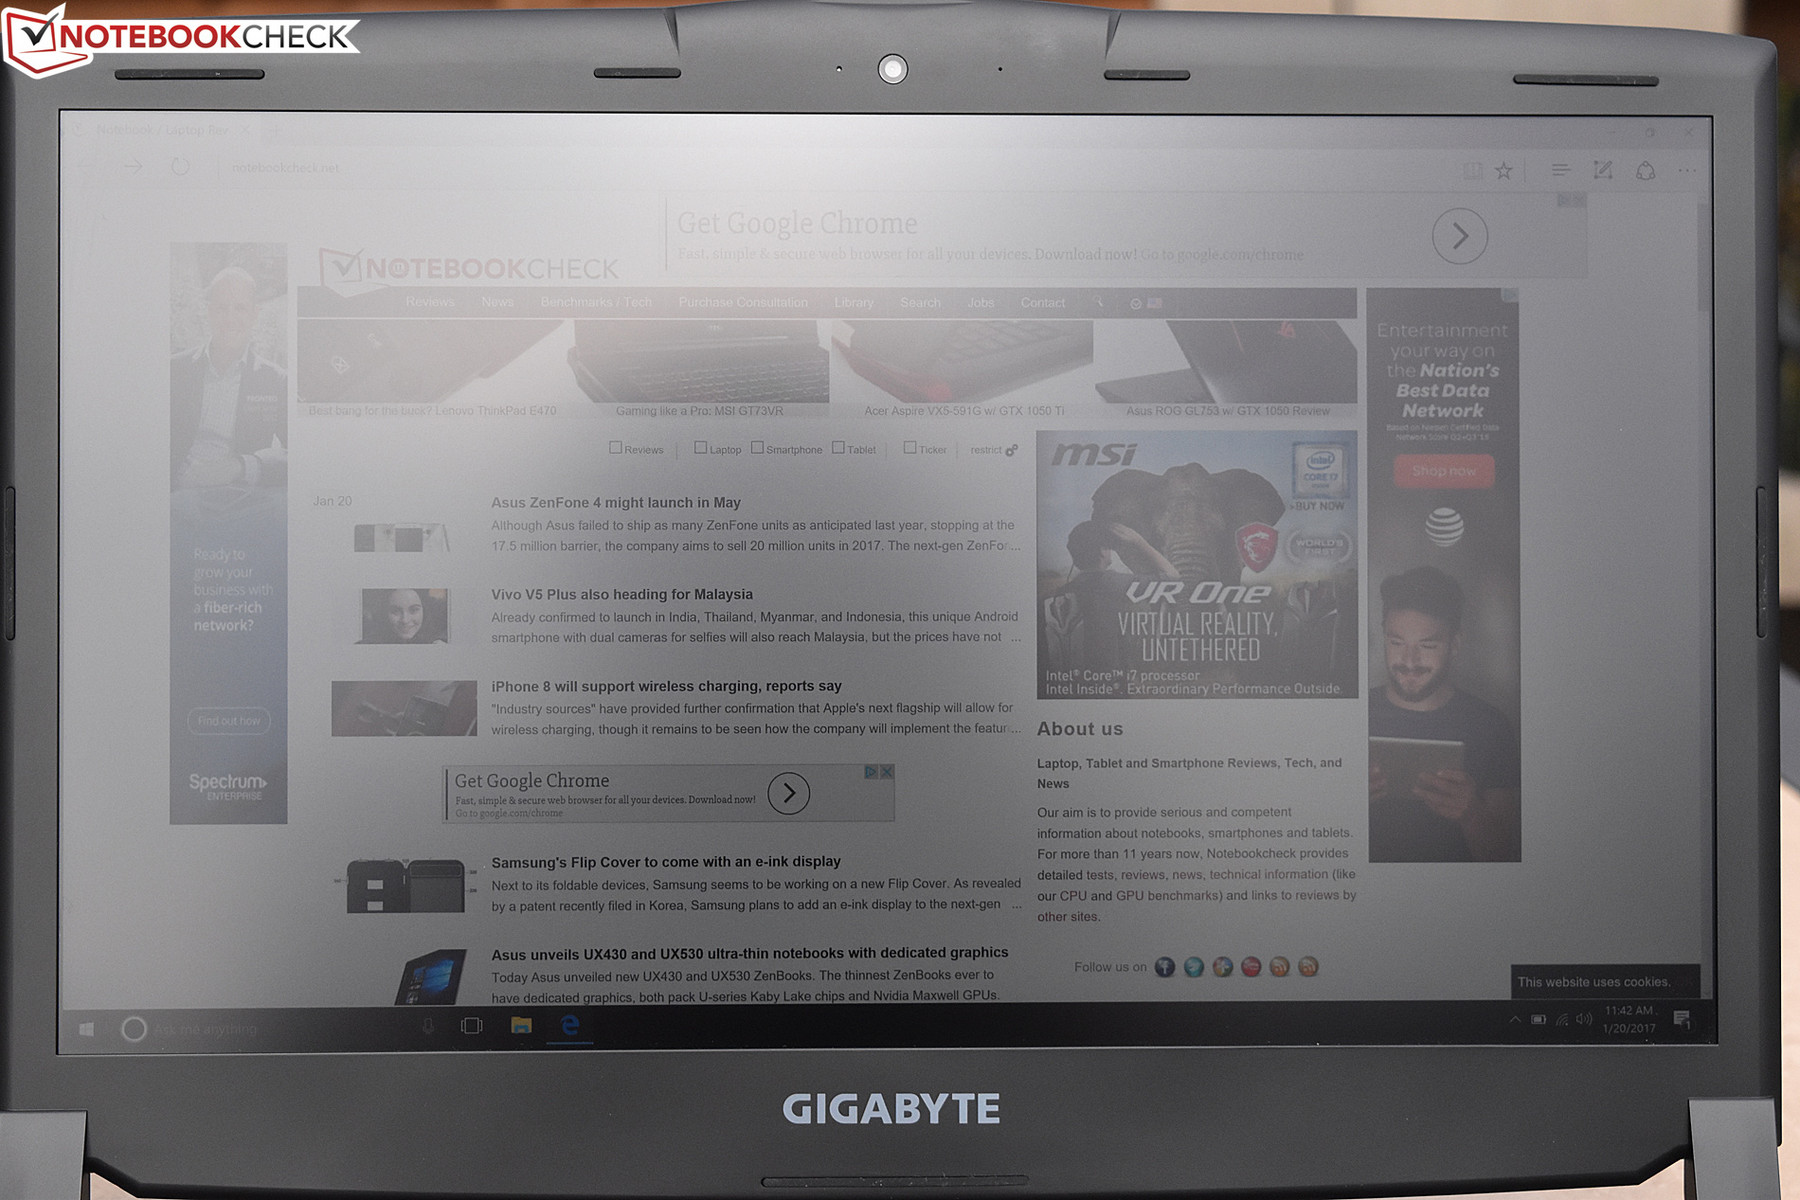
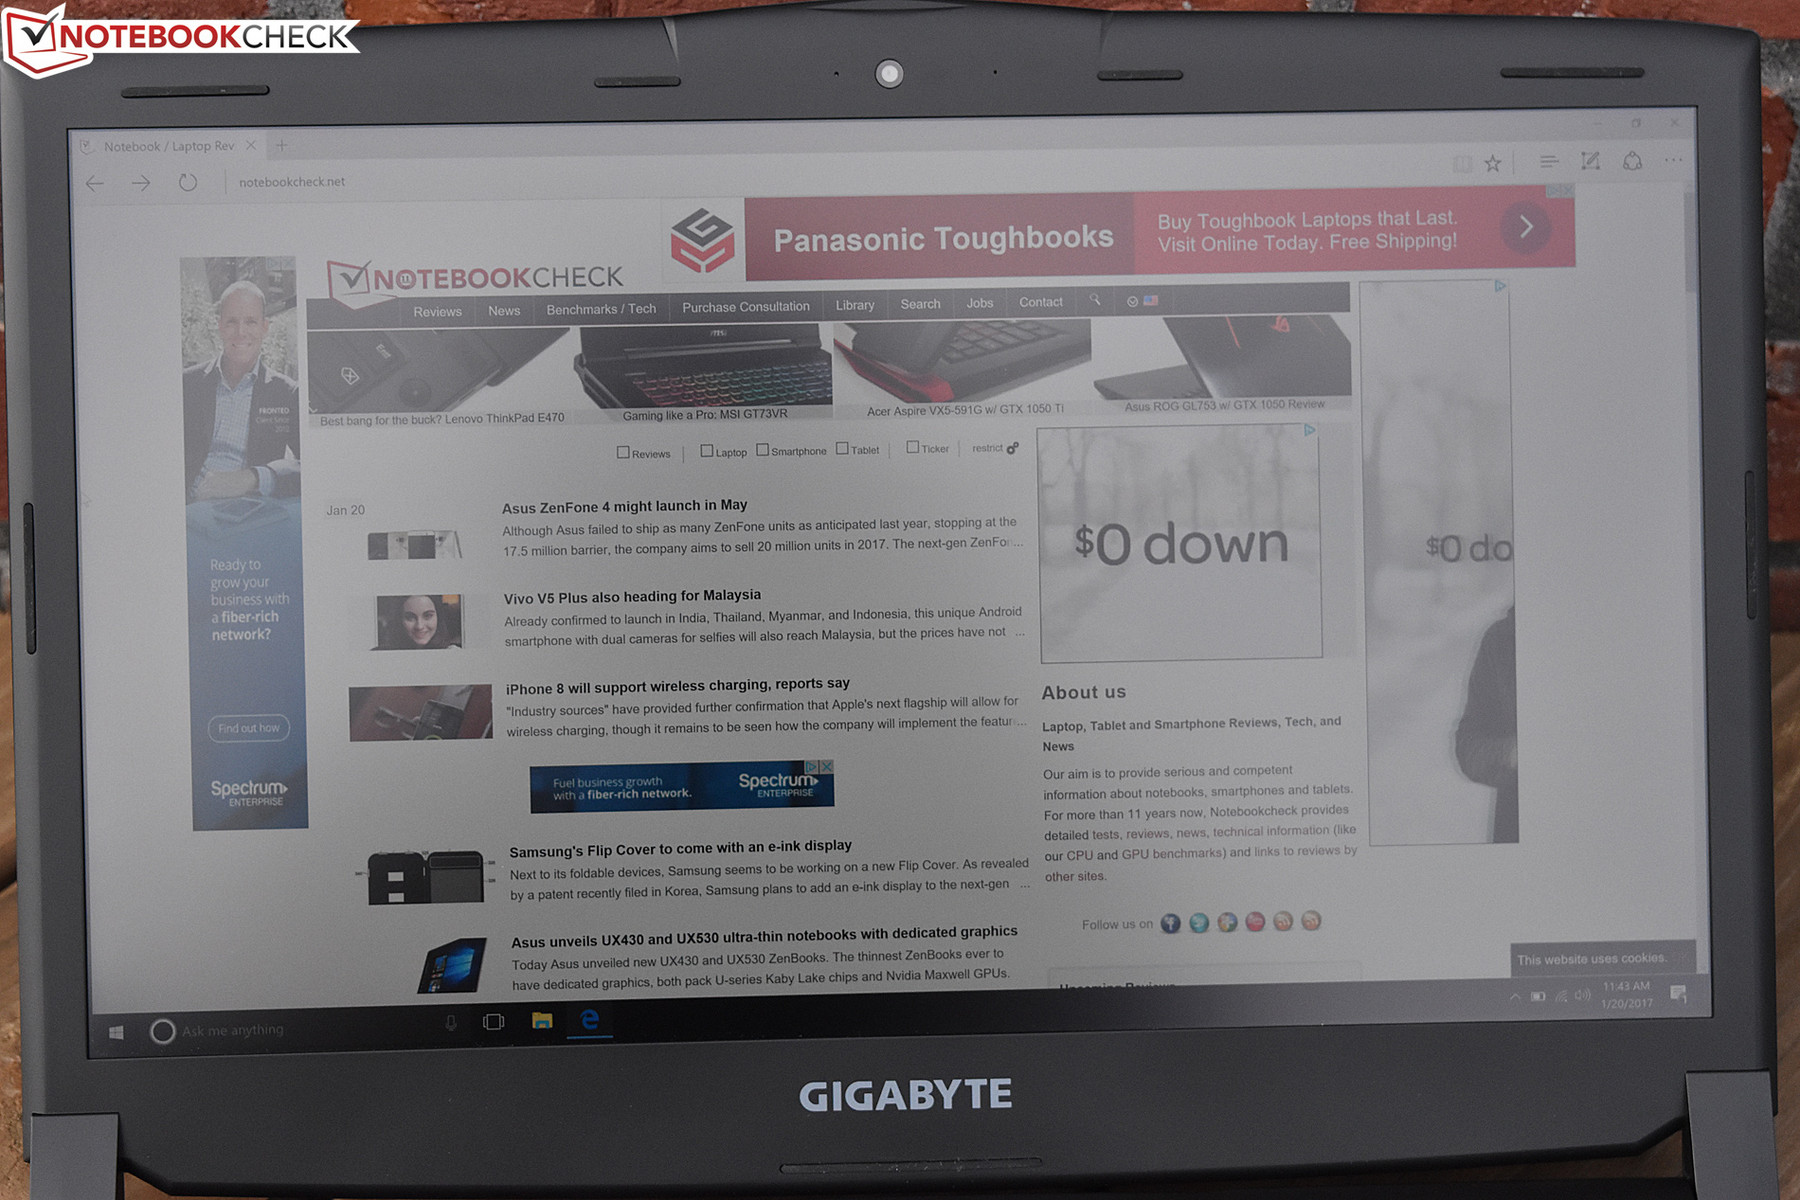
Outdoors, the machine performs admirably. Thanks to the matte screen finish, extremely bright (400+ cd/m²) panel, and high contrast, screen contents remain visible in even the brightest environments. Viewing angles are also very good, thanks to the fact that the display uses IPS technology.
Performance
All P57X v7 models ship with the same CPU: a quad-core Kaby Lake Intel Core i7-7700HQ . In our review unit specifically, we also received 32 GB of DDR4-2400 RAM, an NVIDIA GeForce GTX 1070, and a storage combo featuring both a 256 GB SSD and a 1 TB storage drive. That’s a pretty optimal setup for just about any gamer, with really only a little bit of room for any significant improvement in the realm of GPU and CPU.
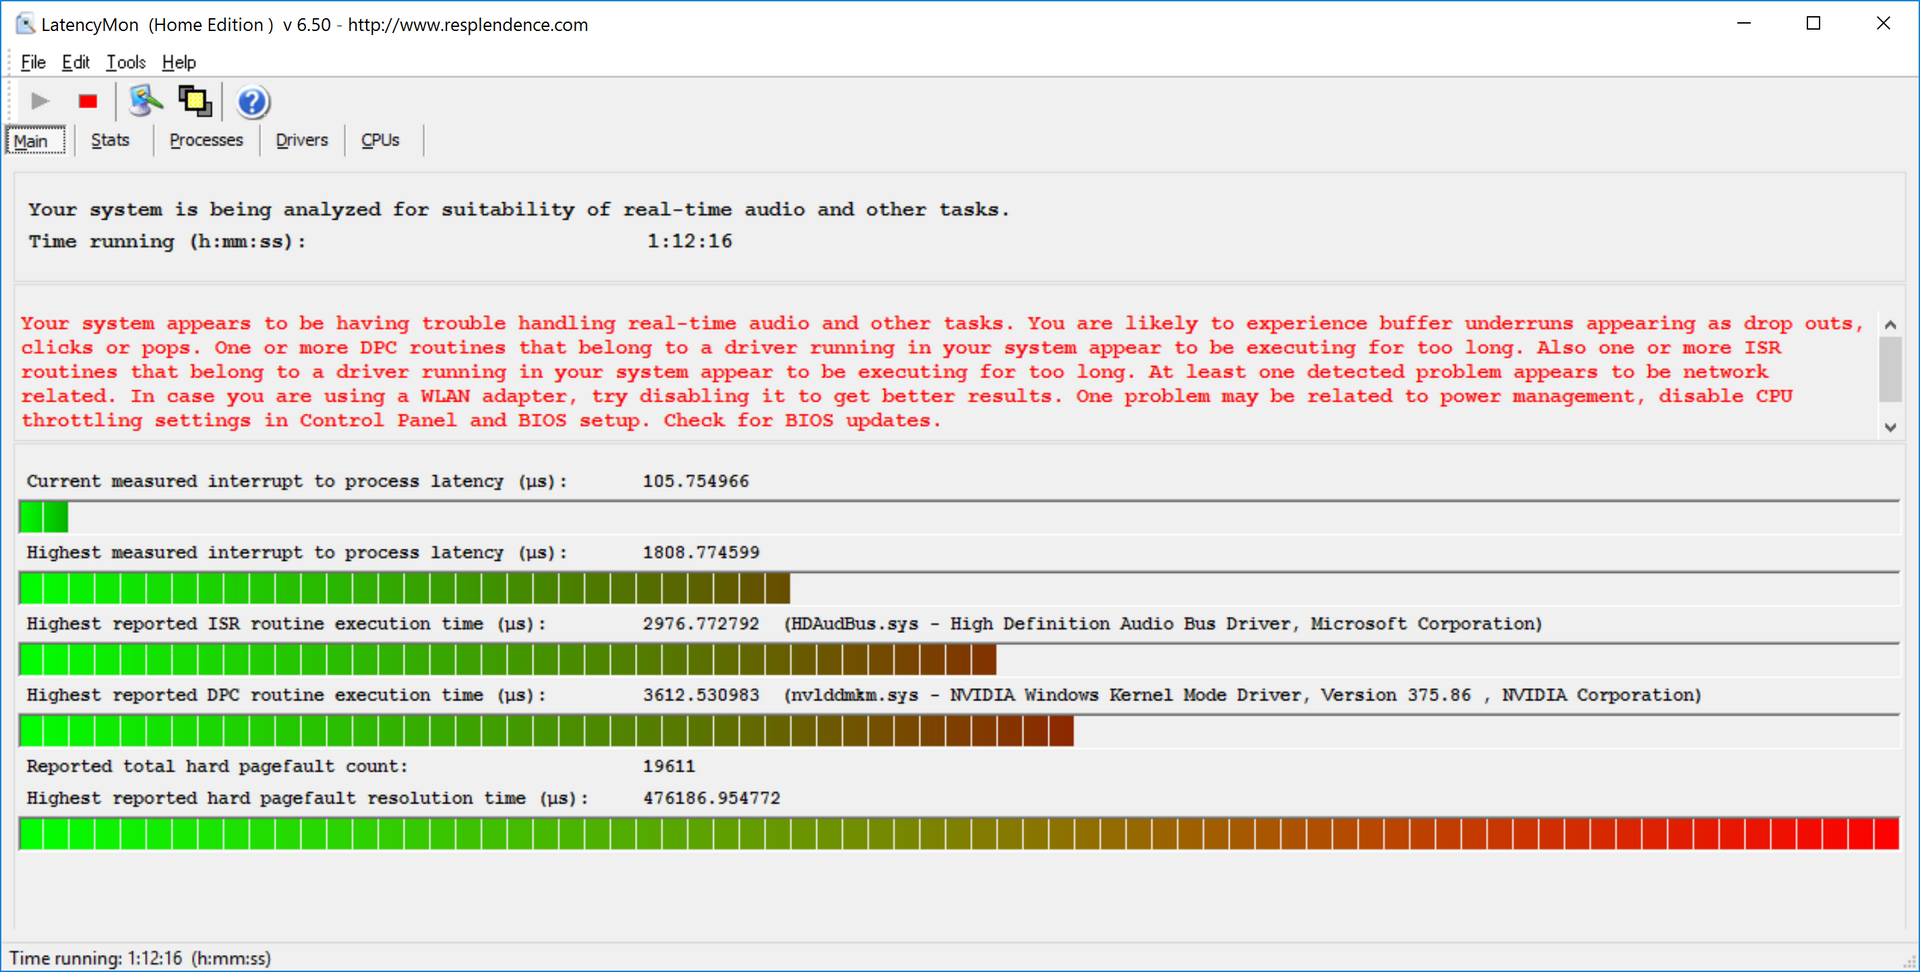
Of course, the P57X v7 requires AC power for full performance; a secondary run of 3DMark 11 while unplugged produced a meager P6764 final score. We did experience some issues in LatencyMon as well, which reported higher than normal DPC latencies possibly specific to a device driver. Disabling the WLAN adapter did not appear to resolve this.
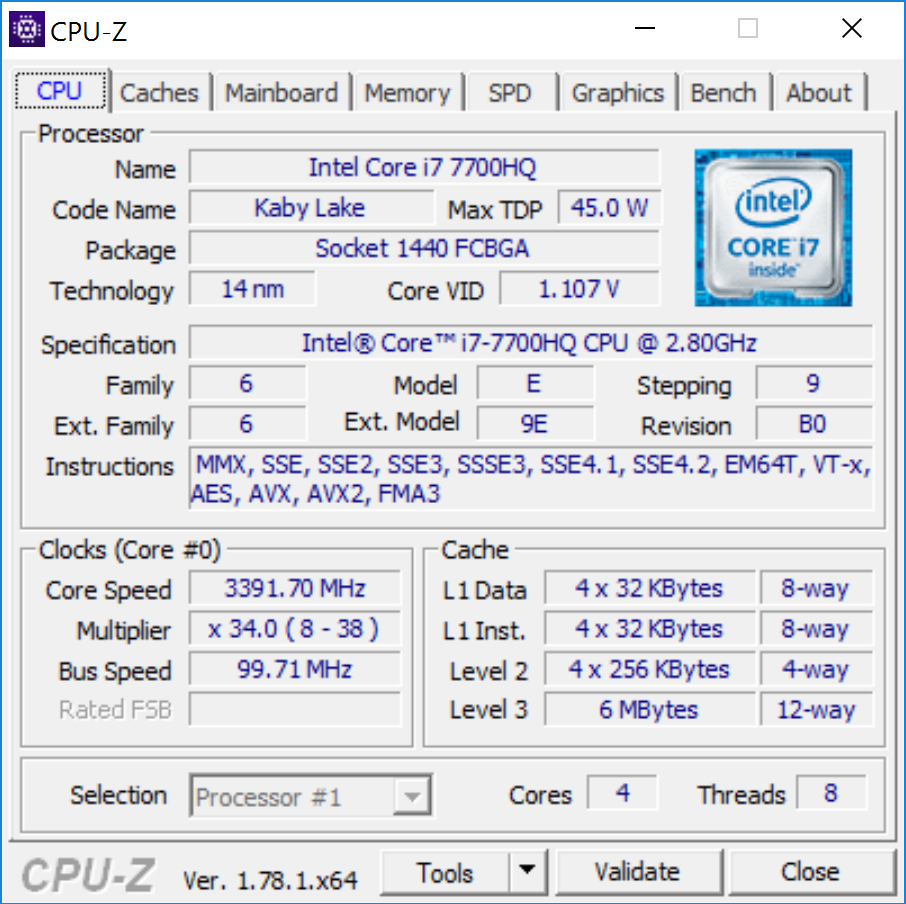
Processor
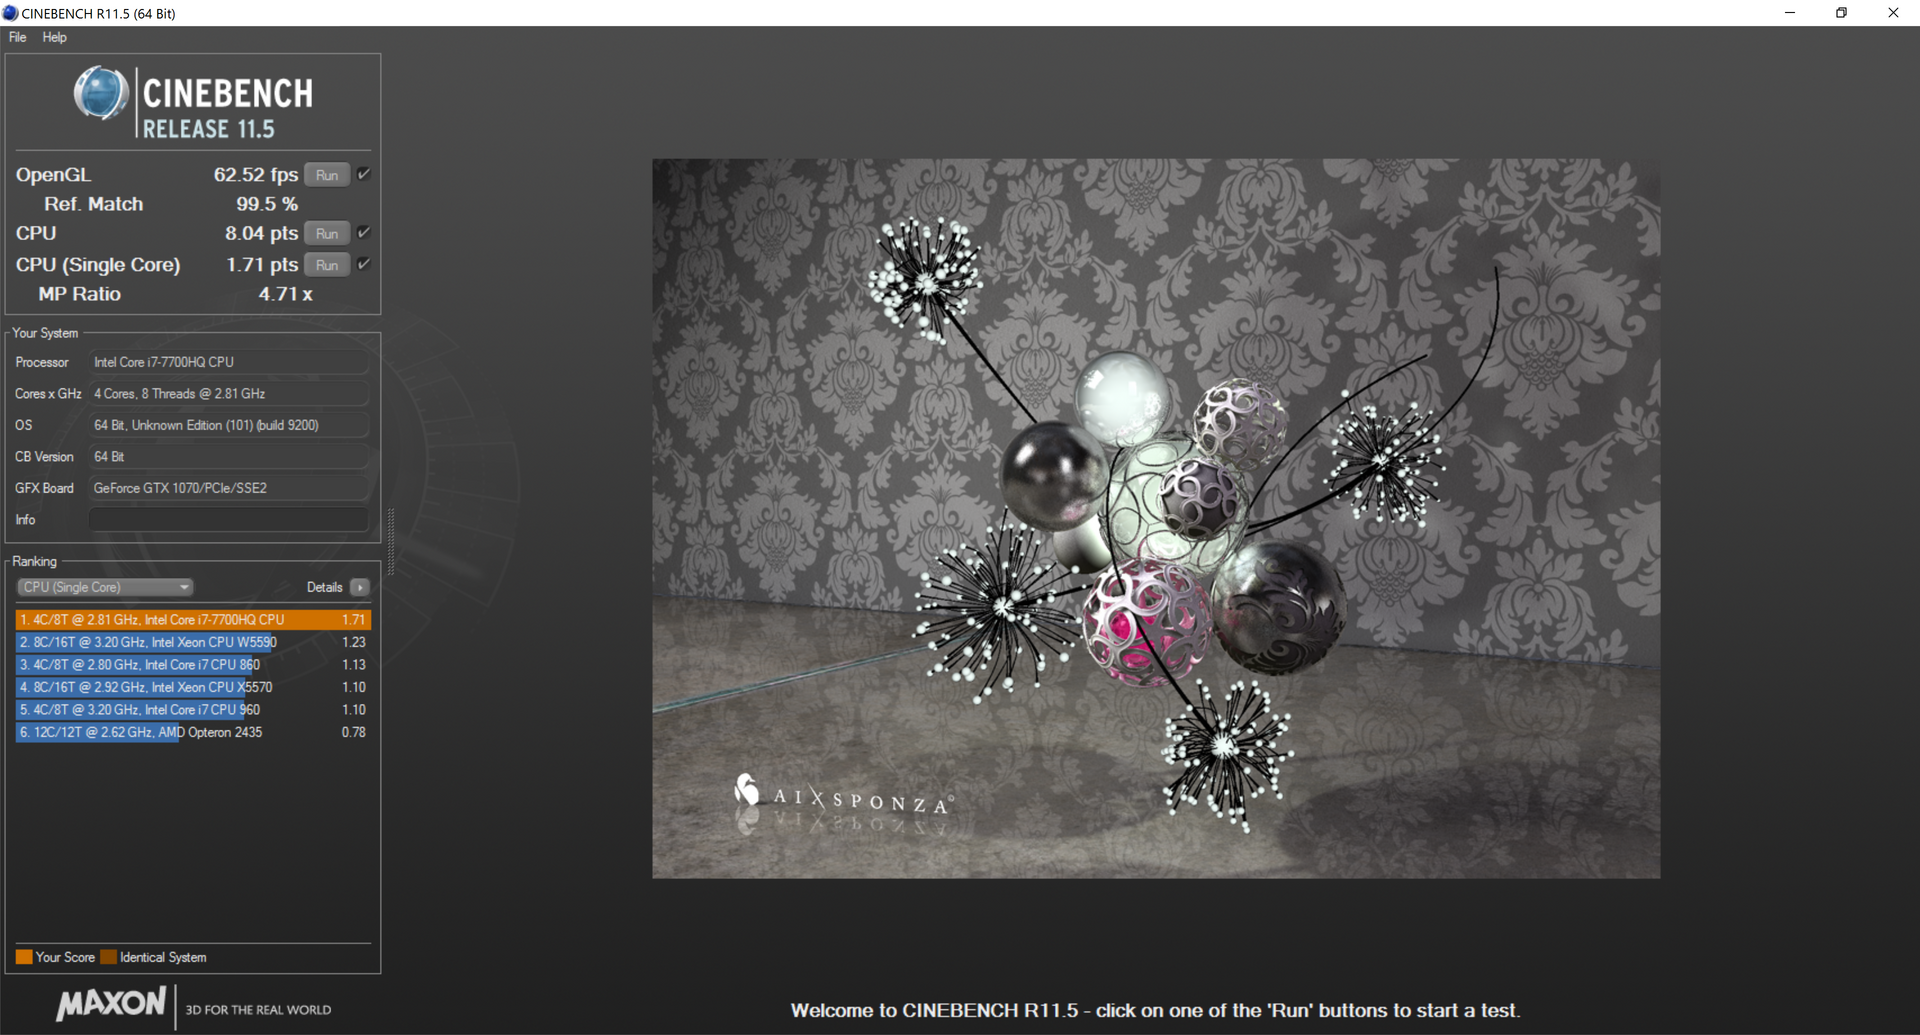
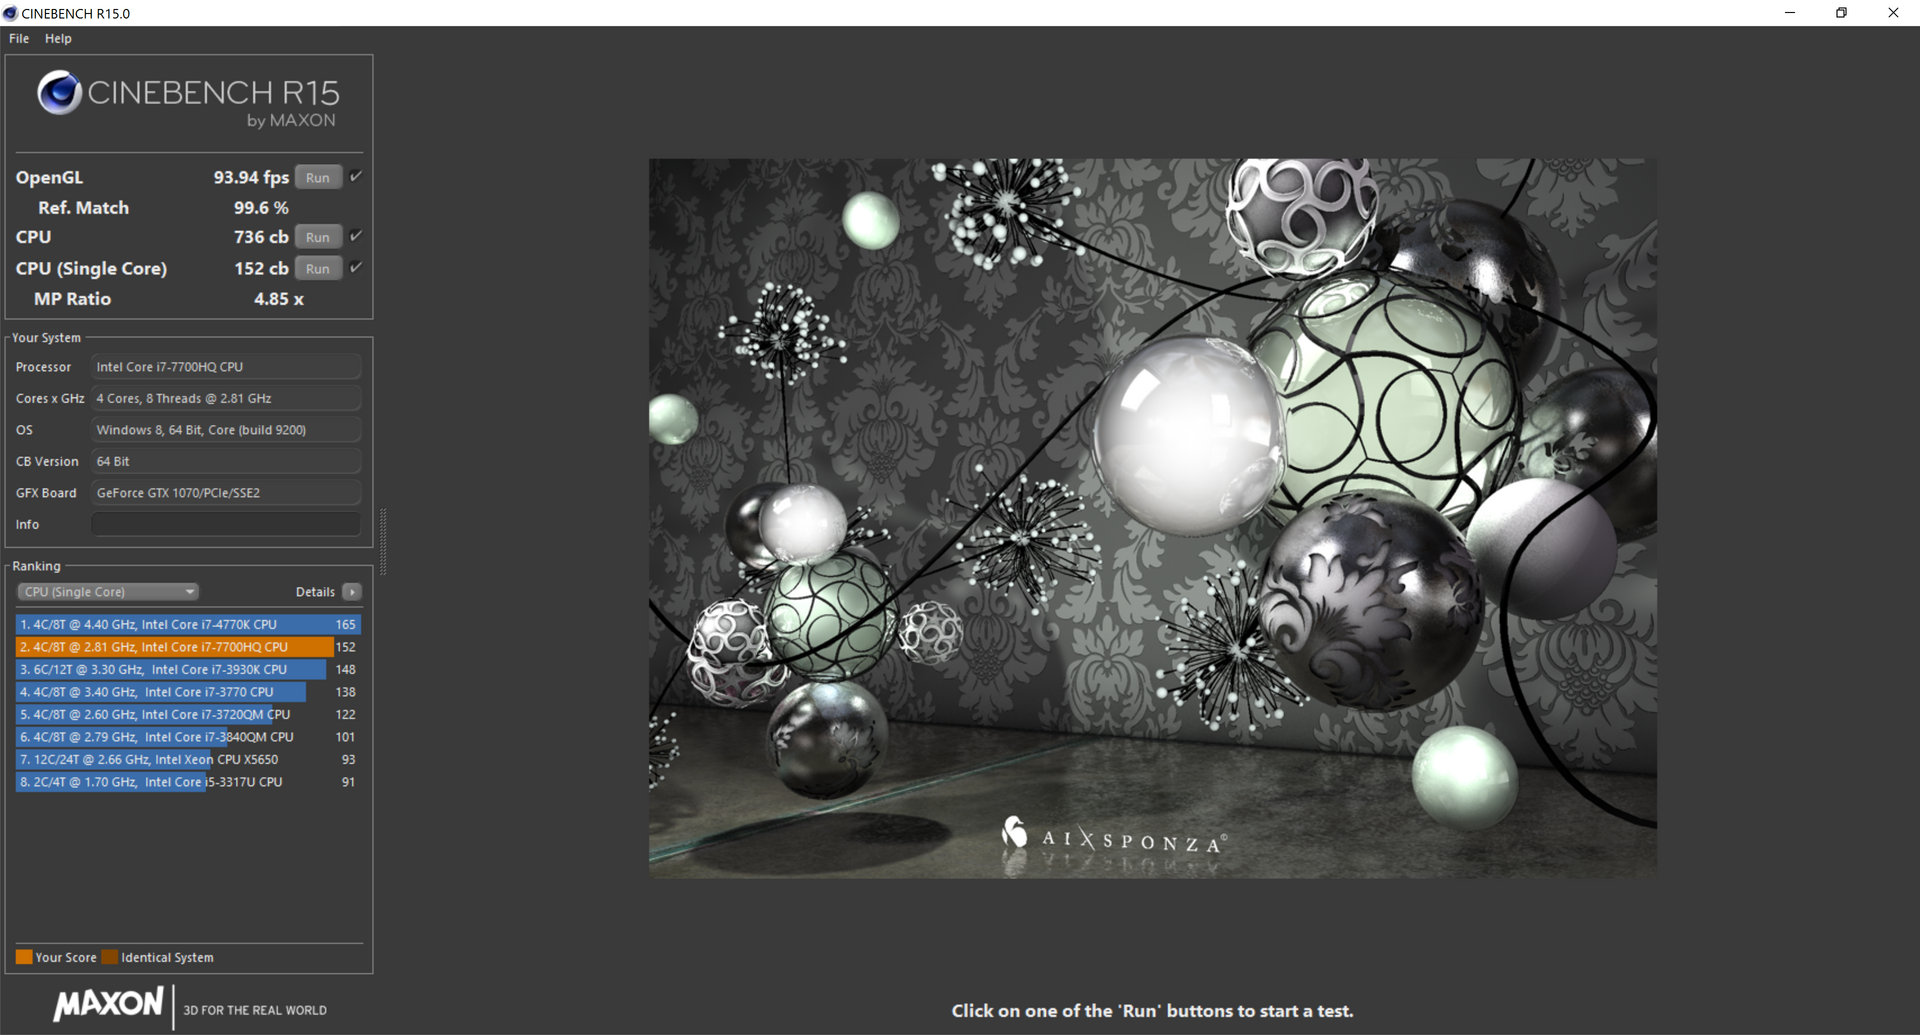
The Kaby Lake Intel Core i7-7700HQ is a very powerful quad-core chip. It features a base clock rate of 2.8 GHz and can achieve Turbo frequencies of up to 3.8 GHz single core max Turbo (3.6 GHz for two cores, 3.2 GHz four cores). Its performance is roughly on par with the Core i7-6970HQ from last generation, and in some of our tests today (specifically, Cinebench R11.5 and R15), we also saw it hanging around the Core i7-6820HK quite often. It carries a TDP of 45 W, so it’s no more power hungry than its predecessors, in spite of higher frequencies made possible by a more efficient 14 nm+ manufacturing process.
In our synthetic benchmarks, the P57X v7 did not disappoint. Most of the time it’s near the top of the field, with only the MSI GT73VR (packing an overclocked Intel Core i7-7820HK) managing to beat it, generally by a margin of around 10 to 20% (though in wPrime the MSI absolutely decimates the rest of the competition).
| Cinebench R11.5 | |
| CPU Single 64Bit | |
| MSI GT73VR 7RF-296 | |
| Gigabyte P57X v7 | |
| EVGA SC17 GTX 1070 | |
| Gigabyte P57X v6 | |
| CPU Multi 64Bit | |
| MSI GT73VR 7RF-296 | |
| Gigabyte P57X v7 | |
| EVGA SC17 GTX 1070 | |
| Gigabyte P57X v6 | |
| wPrime 2.10 - 1024m | |
| Gigabyte P57X v6 | |
| Gigabyte P57X v7 | |
| EVGA SC17 GTX 1070 | |
| Super Pi Mod 1.5 XS 32M - 32M | |
| EVGA SC17 GTX 1070 | |
| Gigabyte P57X v6 | |
| Gigabyte P57X v7 | |
* ... smaller is better
System Performance
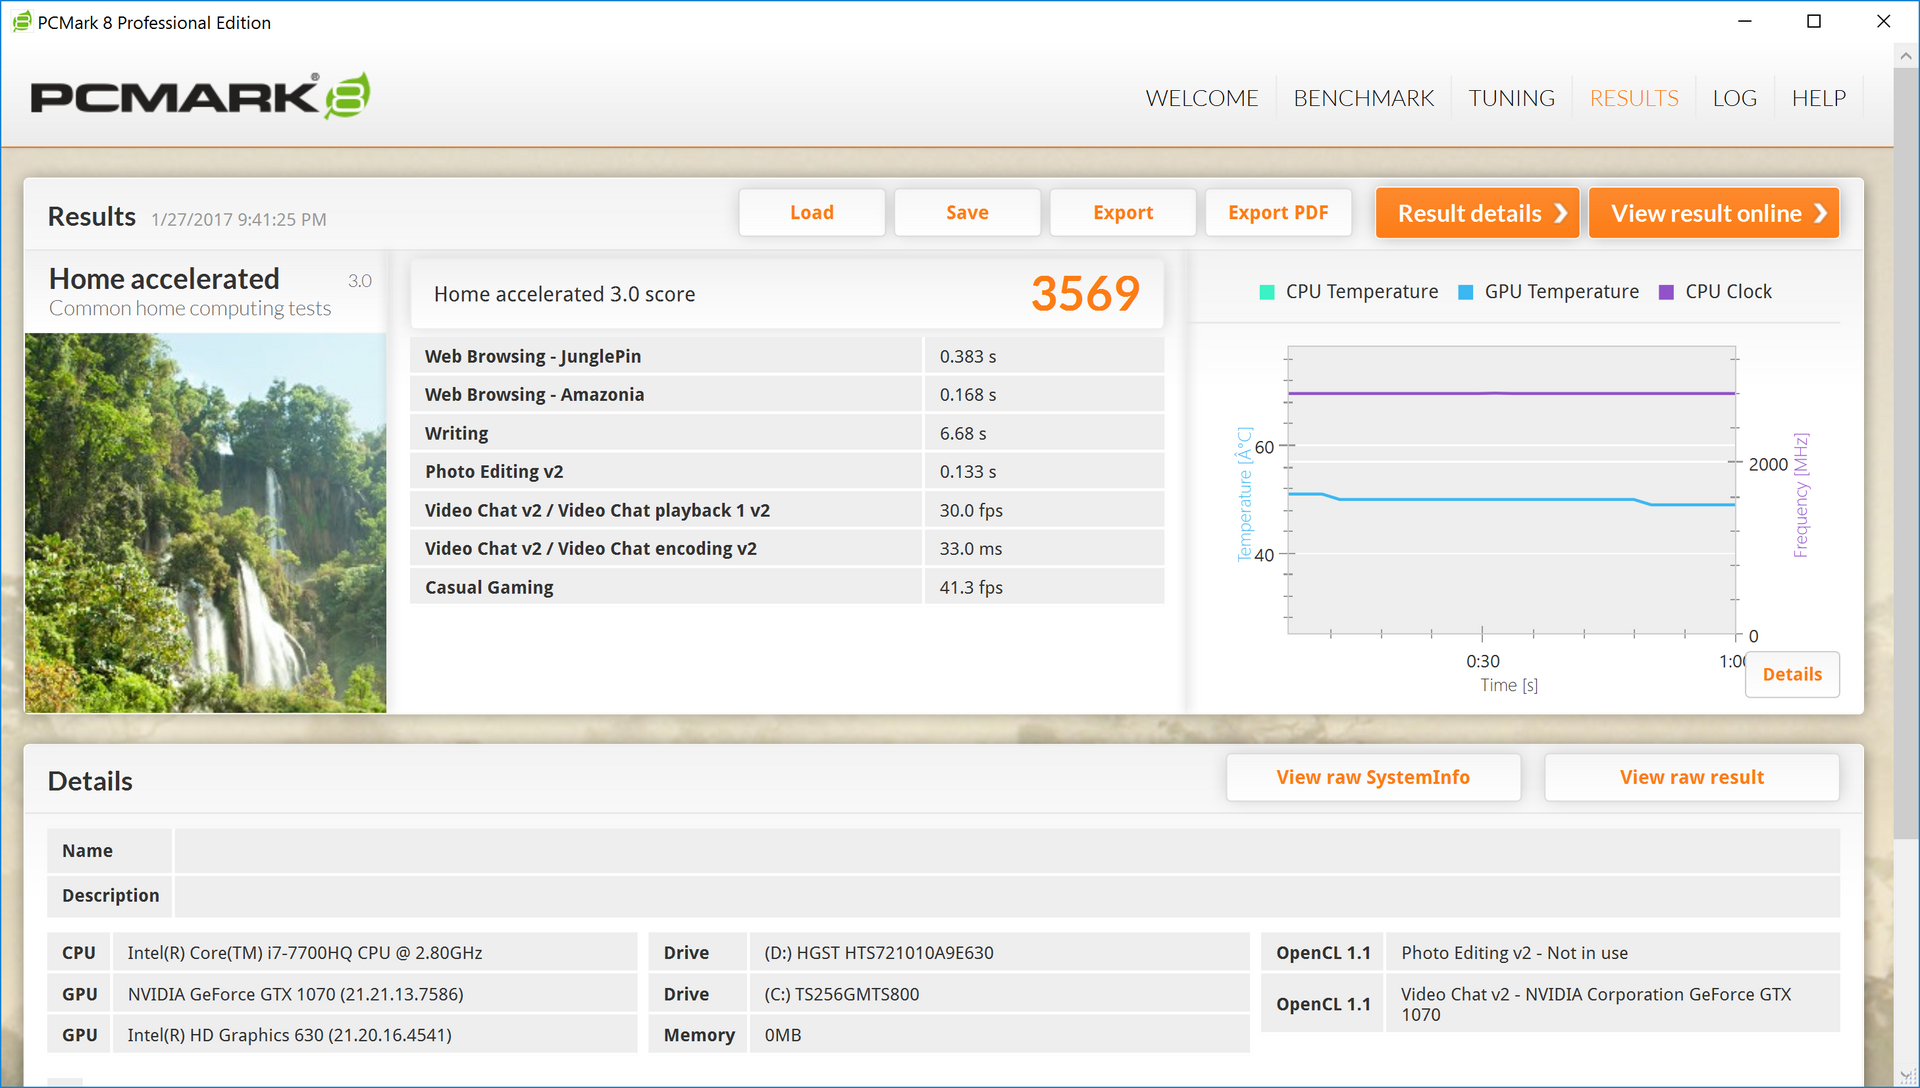
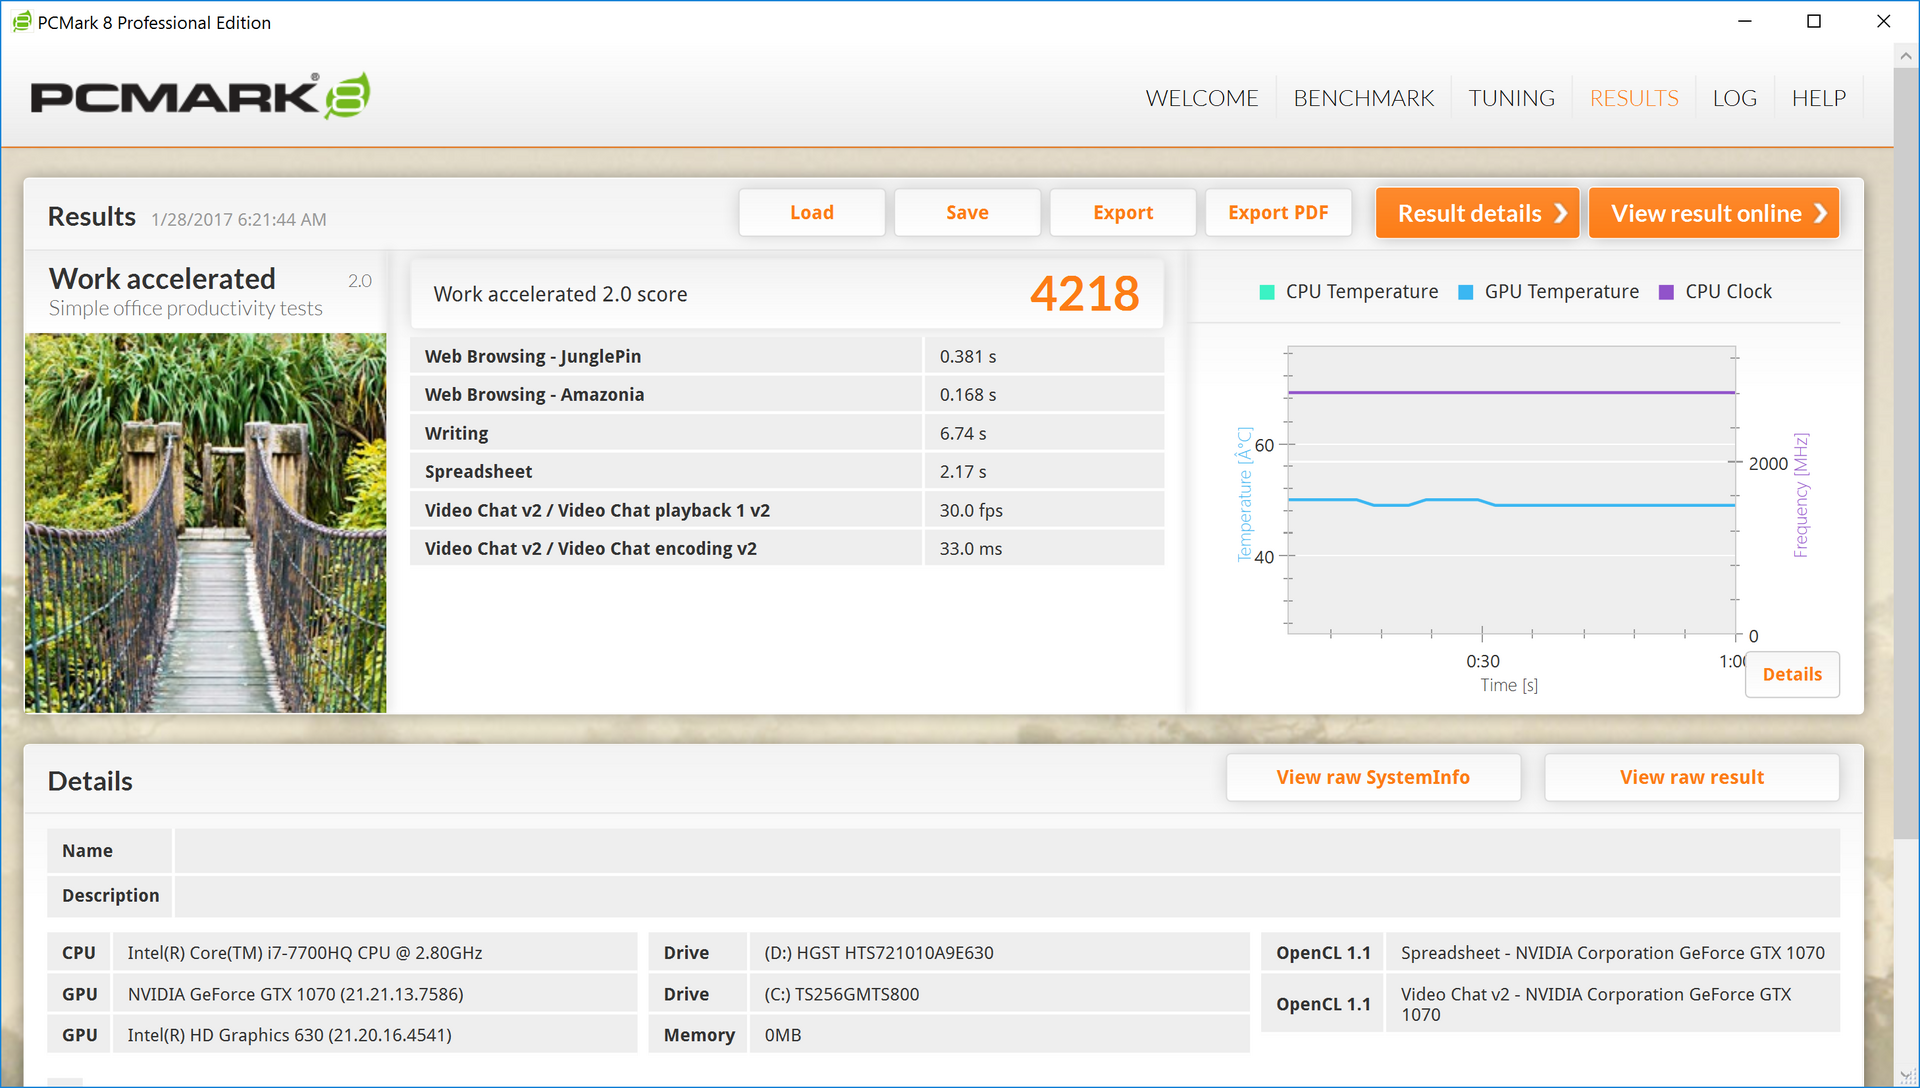
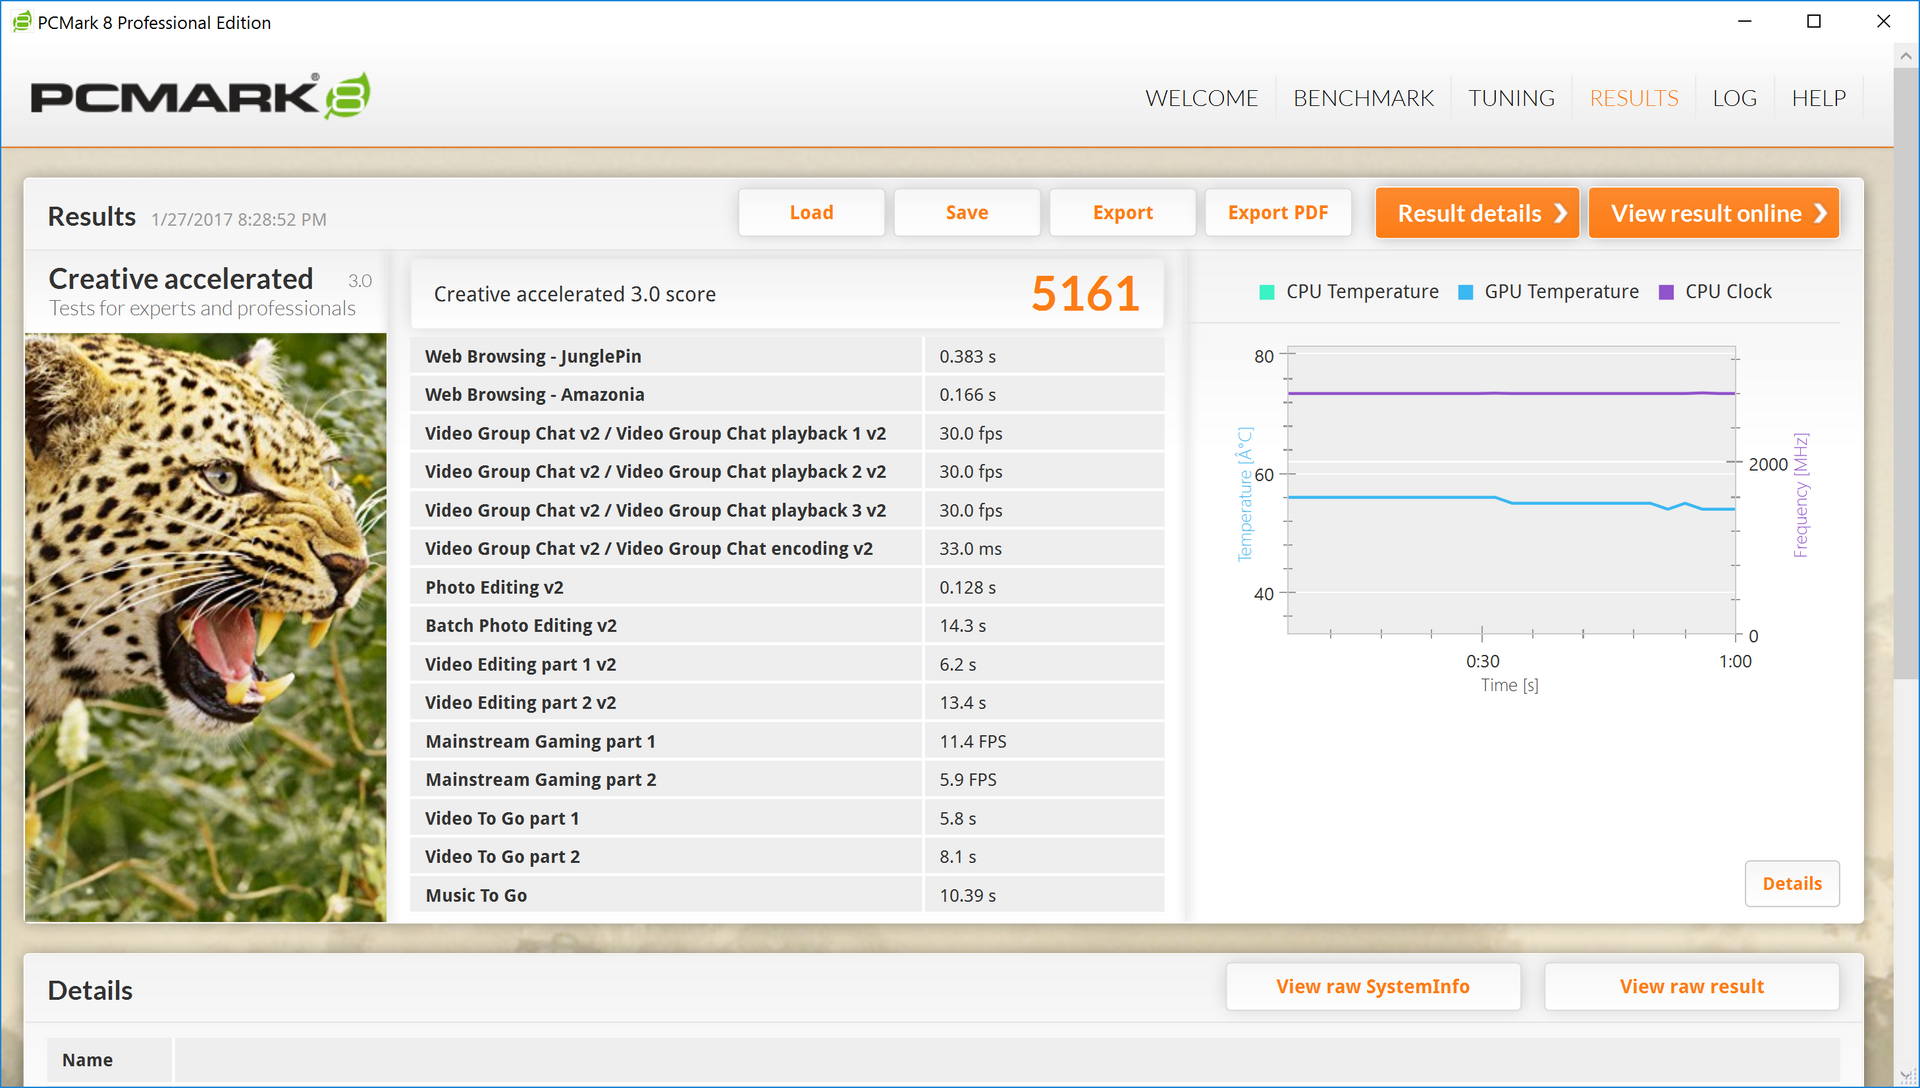
The Gigabyte P57X v7 seems nimble in operation across the board, with quick boot speeds and general operation common to systems equipped with solid-state storage. Synthetic tests corroborate these impressions with good scores across the board, though below that of its predecessor—likely thanks to the difference in screen resolution (the jump from 1080p to 4K does affect benchmark results) and nothing more. Scores of 4218 and 5161 in PCMark 8 Work and Creative respectively are very good. Most importantly however, the machine handled well during our time we spent with it, and our observations left us with no reservations about its general performance.
| PCMark 8 | |
| Home Score Accelerated v2 | |
| EVGA SC17 GTX 1070 | |
| Gigabyte P57X v6 | |
| Acer Predator 17 G9-793-77LG | |
| Gigabyte P57X v7 | |
| Work Score Accelerated v2 | |
| Gigabyte P57X v6 | |
| EVGA SC17 GTX 1070 | |
| Gigabyte P57X v7 | |
| Creative Score Accelerated v2 | |
| EVGA SC17 GTX 1070 | |
| Gigabyte P57X v6 | |
| Gigabyte P57X v7 | |
| Acer Predator 17 G9-793-77LG | |
| PCMark 8 Home Score Accelerated v2 | 3569 points | |
| PCMark 8 Creative Score Accelerated v2 | 5161 points | |
| PCMark 8 Work Score Accelerated v2 | 4218 points | |
Help | ||
Storage Devices
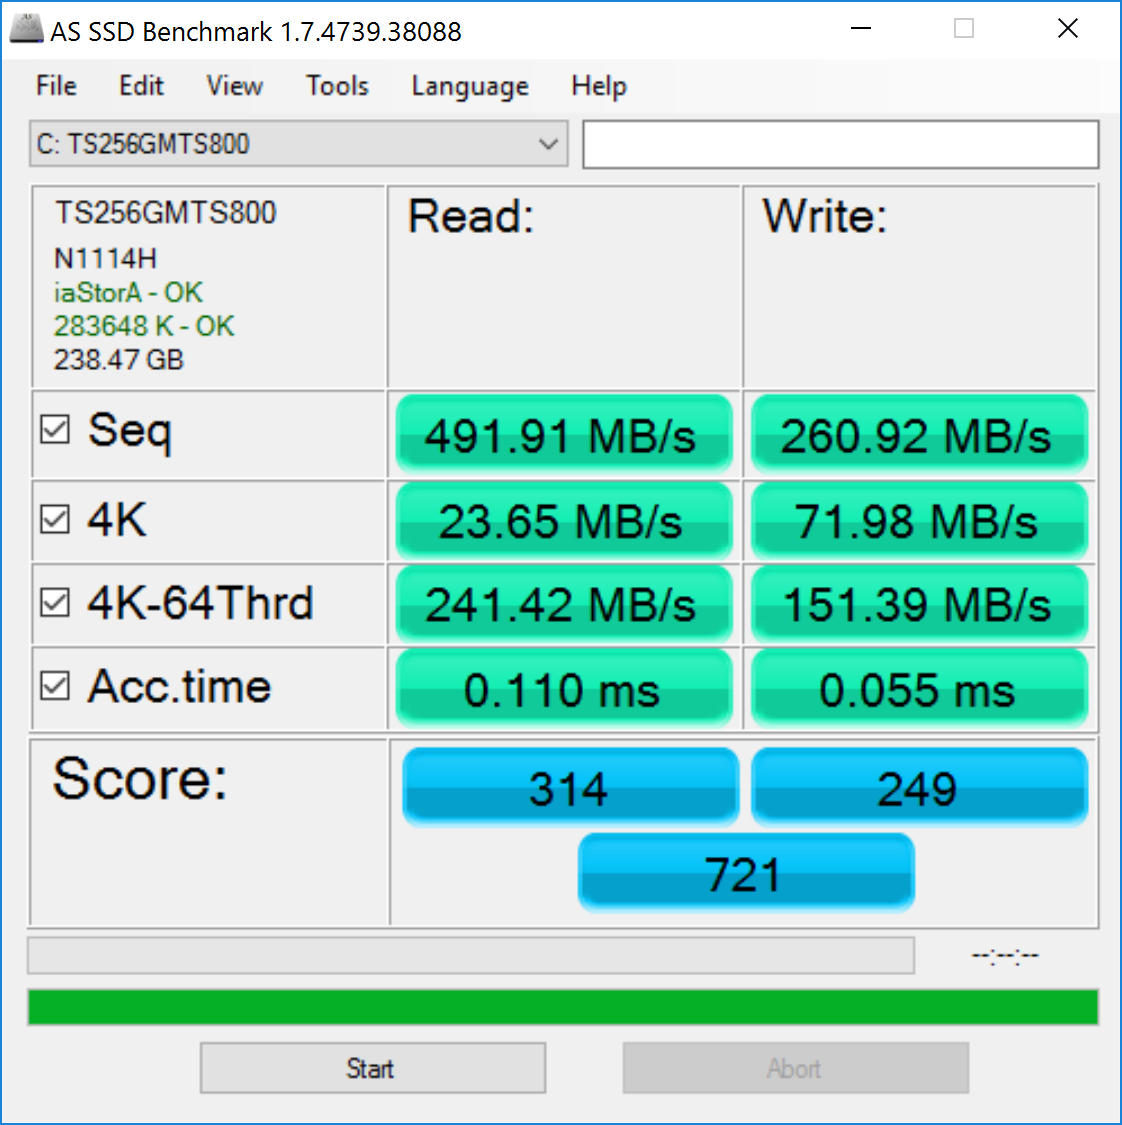
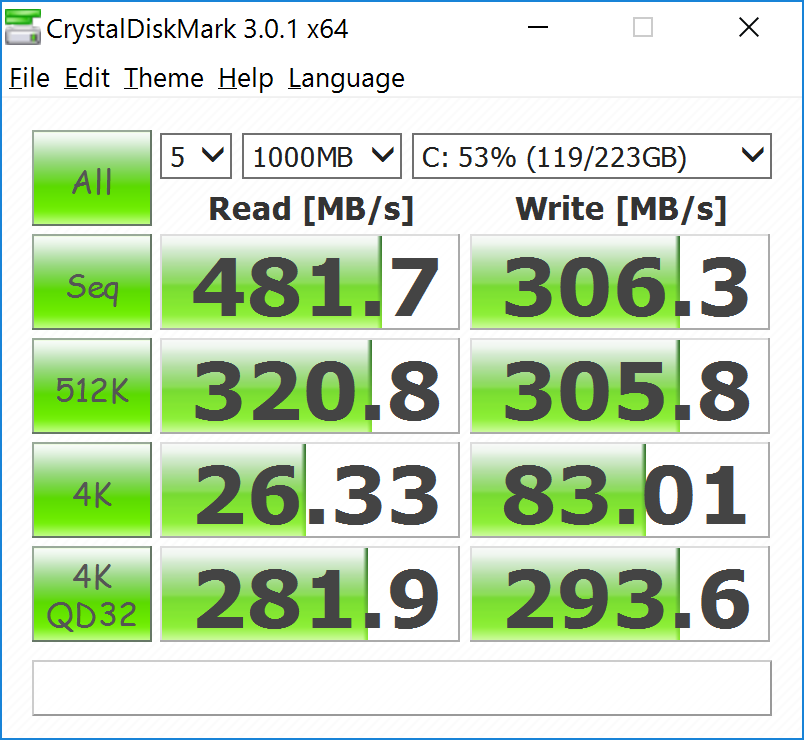
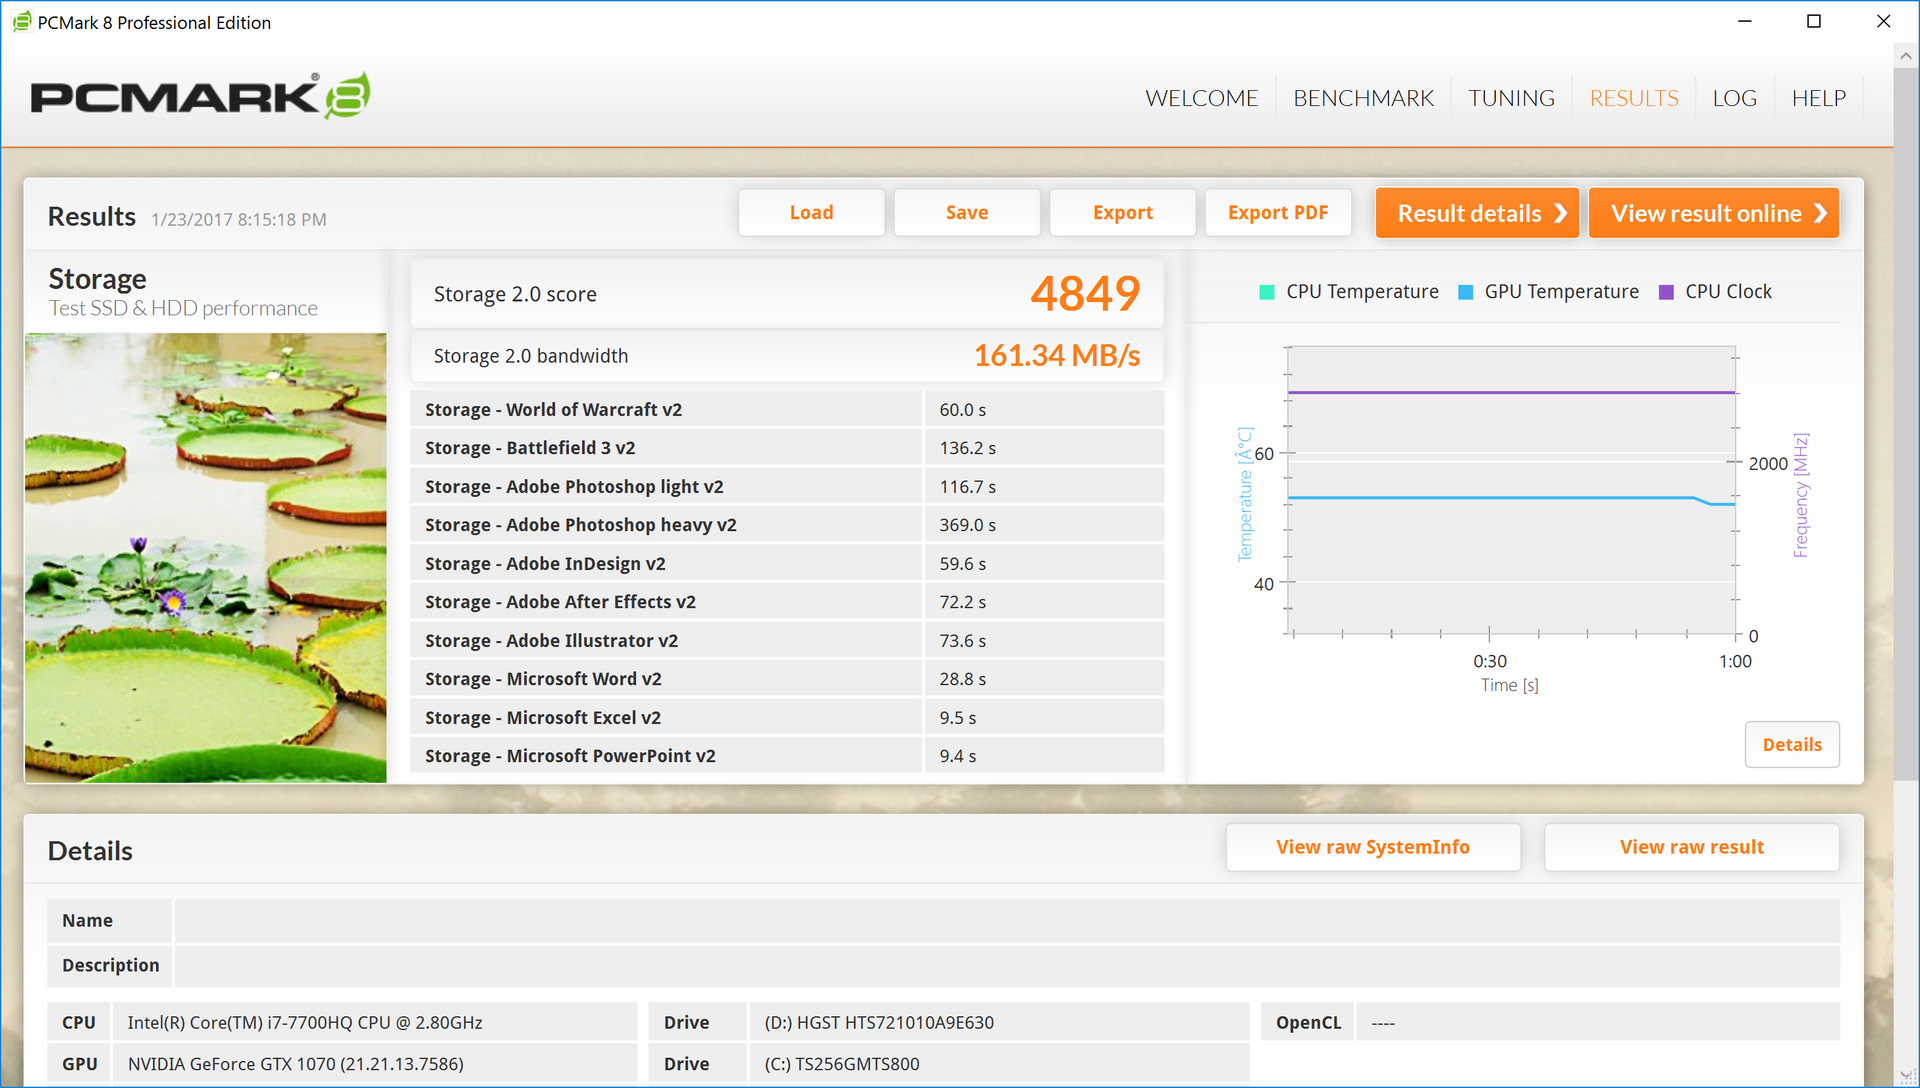
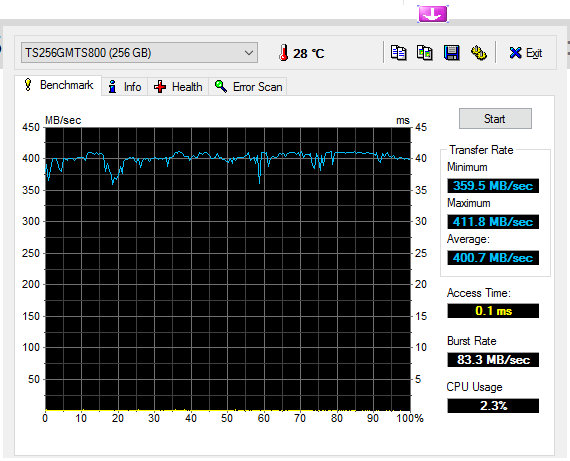
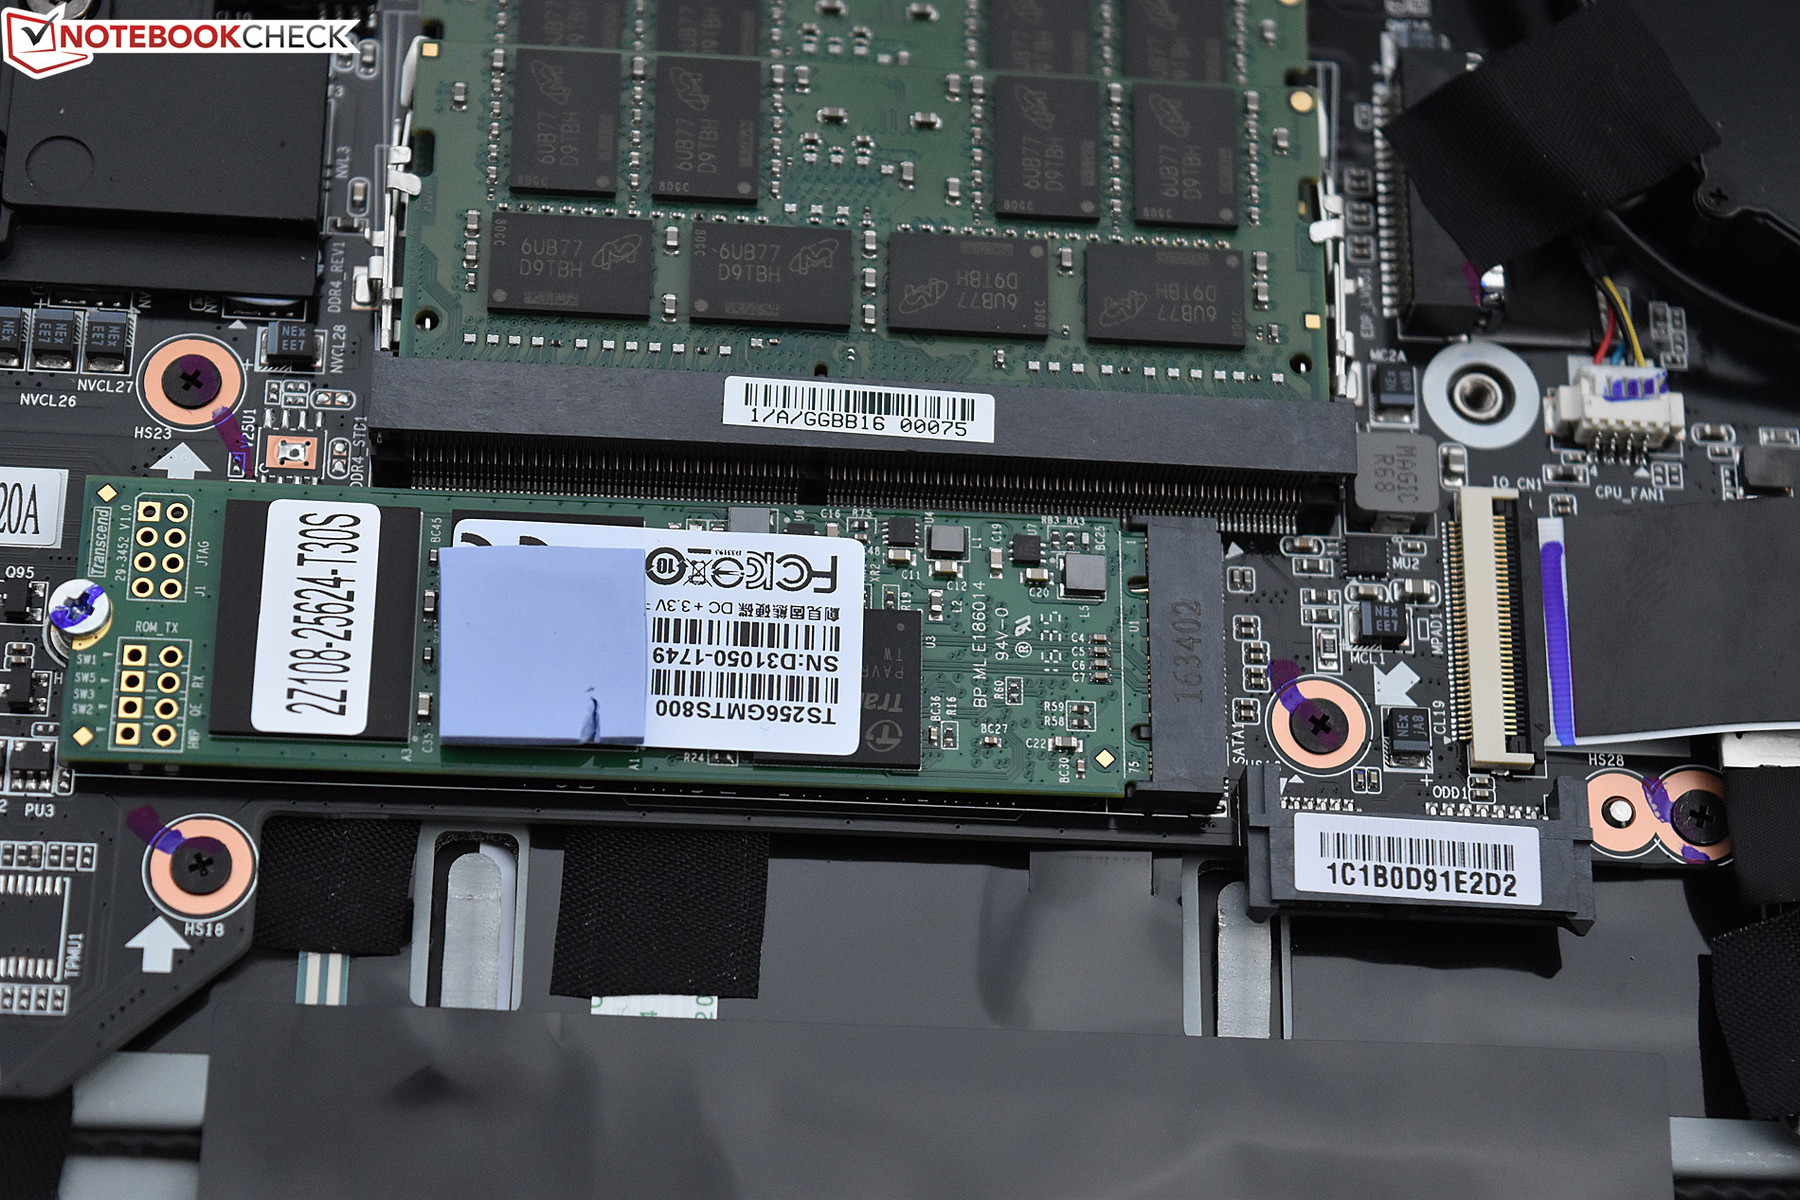
The Gigabyte P57X v7 features a dual storage configuration with a 256 GB M.2 SSD and a 1 TB 7200 RPM conventional hard drive. The SSD—a Transcend MTS800—is actually the same model we evaluated in the P57X v6, and it’s not the fastest drive around. Although the P57X v7 actually supports two PCIe (NVMe) SSDs, the MTS800 is a conventional M.2 drive. We measured sequential read/write speeds of 305.7 MB/s and 516.8 MB/s, which were close to the values we received when reviewing the v6. Overall, performance is a mere fraction of the NVMe competitors, but the average consumer will never notice in everyday use. Besides, replacement/upgrades are relatively easy on the P57X.
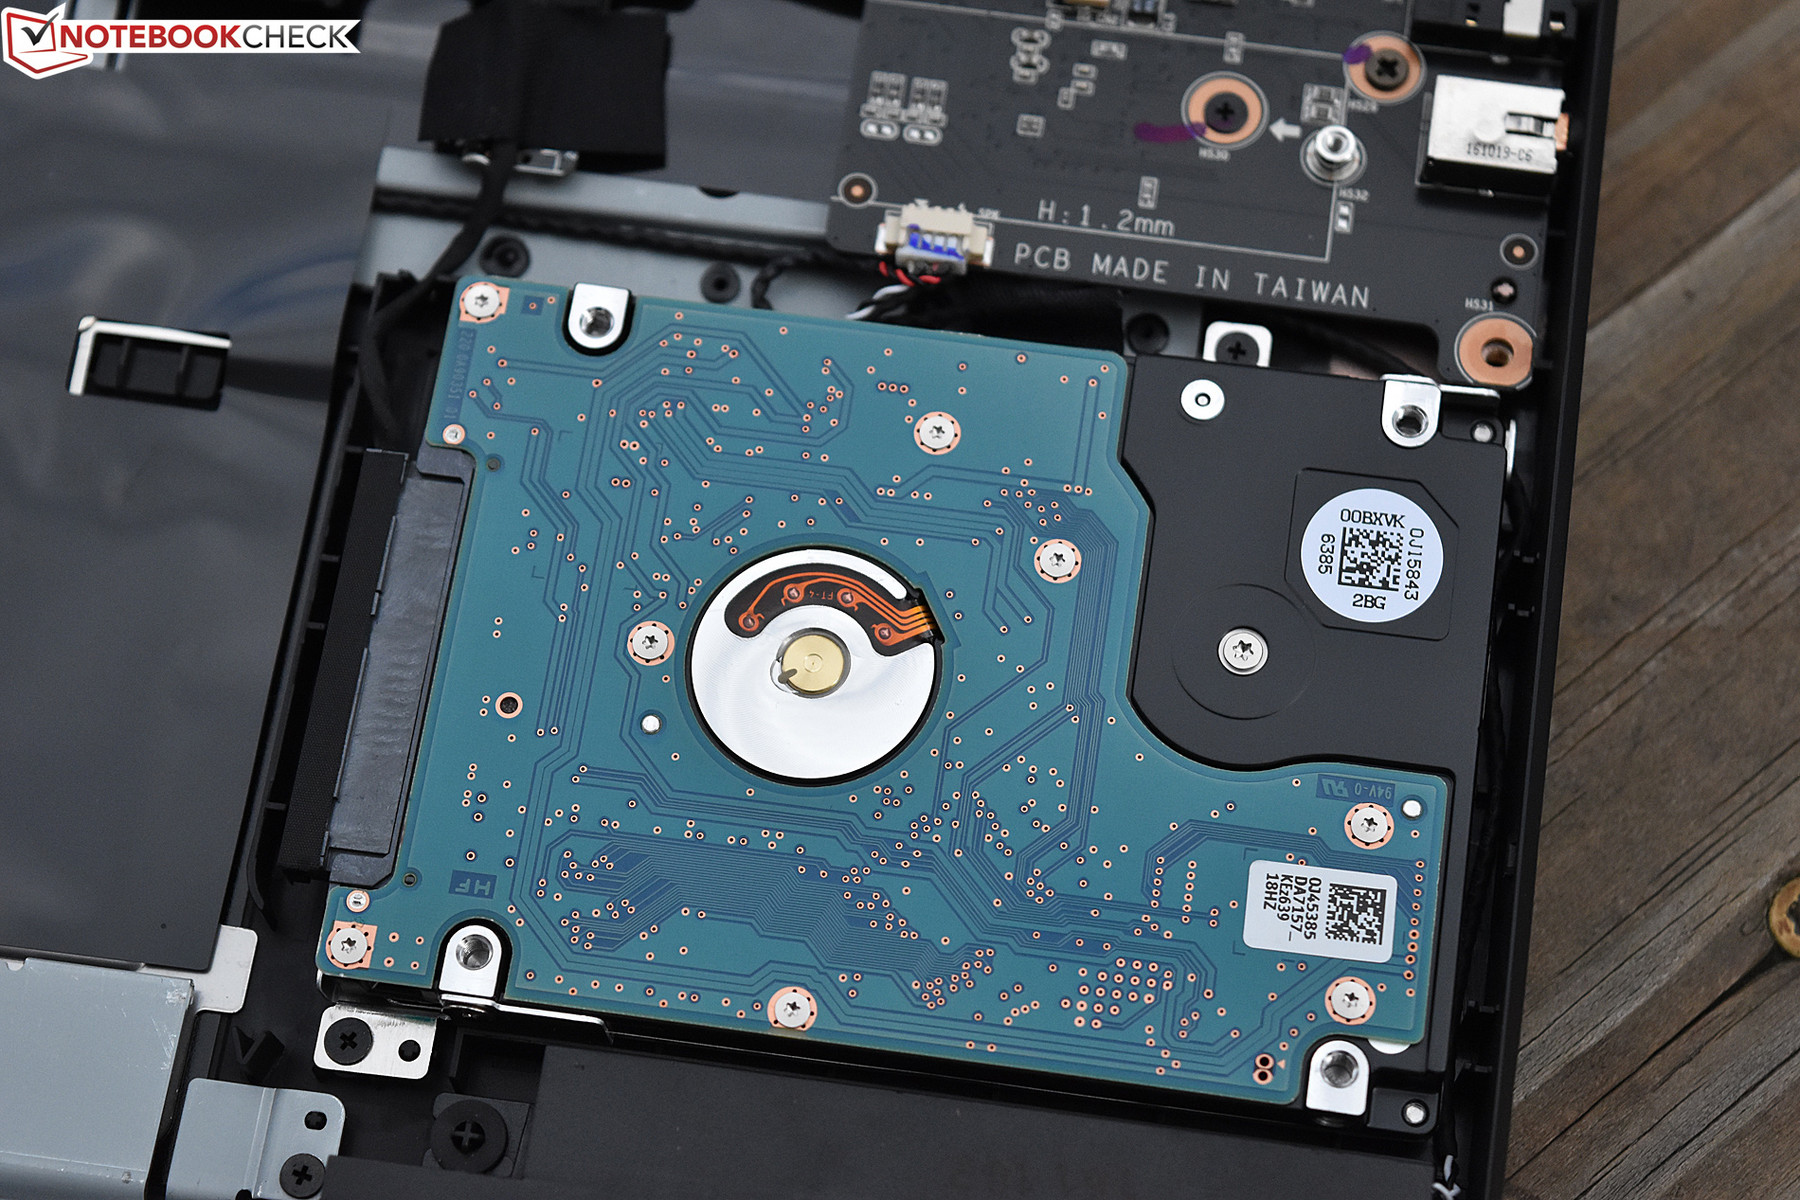
These two M.2 slots are also in addition to the internal 2.5-inch drive bay plus the swappable expansion bay. One of these bays was populated in our review unit by a 1 TB 7200 RPM HGST Travelstar 7K1000. This is a good drive for storage of additional games or less critical data which doesn’t require the same access speed as provided by the SSD. It’s appreciated that Gigabyte chose a 7200 RPM model instead of the 5400 RPM drives we so frequently see in this application.
| Gigabyte P57X v7 Transcend MTS800 256GB M.2 (TS256GMTS800) | Gigabyte P57X v6 Transcend MTS800 256GB M.2 (TS256GMTS800) | MSI GT73VR 7RF-296 2x Samsung SM951 MZVPV256HDGL (RAID 0) | EVGA SC17 GTX 1070 Samsung SM951 MZVPV256 m.2 | |
|---|---|---|---|---|
| CrystalDiskMark 3.0 | -2% | 352% | 174% | |
| Read Seq (MB/s) | 517 | 481.7 -7% | 3219 523% | 1658 221% |
| Write Seq (MB/s) | 305.7 | 315.4 3% | 2572 741% | 1249 309% |
| Read 512 (MB/s) | 315 | 303.1 -4% | 1776 464% | 1044 231% |
| Write 512 (MB/s) | 306.1 | 314.4 3% | 2445 699% | 1254 310% |
| Read 4k (MB/s) | 26.04 | 25.93 0% | 51.1 96% | 51.6 98% |
| Write 4k (MB/s) | 82.3 | 84.6 3% | 141.3 72% | 145.2 76% |
| Read 4k QD32 (MB/s) | 281.3 | 273.9 -3% | 658 134% | 601 114% |
| Write 4k QD32 (MB/s) | 296 | 274.9 -7% | 554 87% | 386.8 31% |

GPU Performance
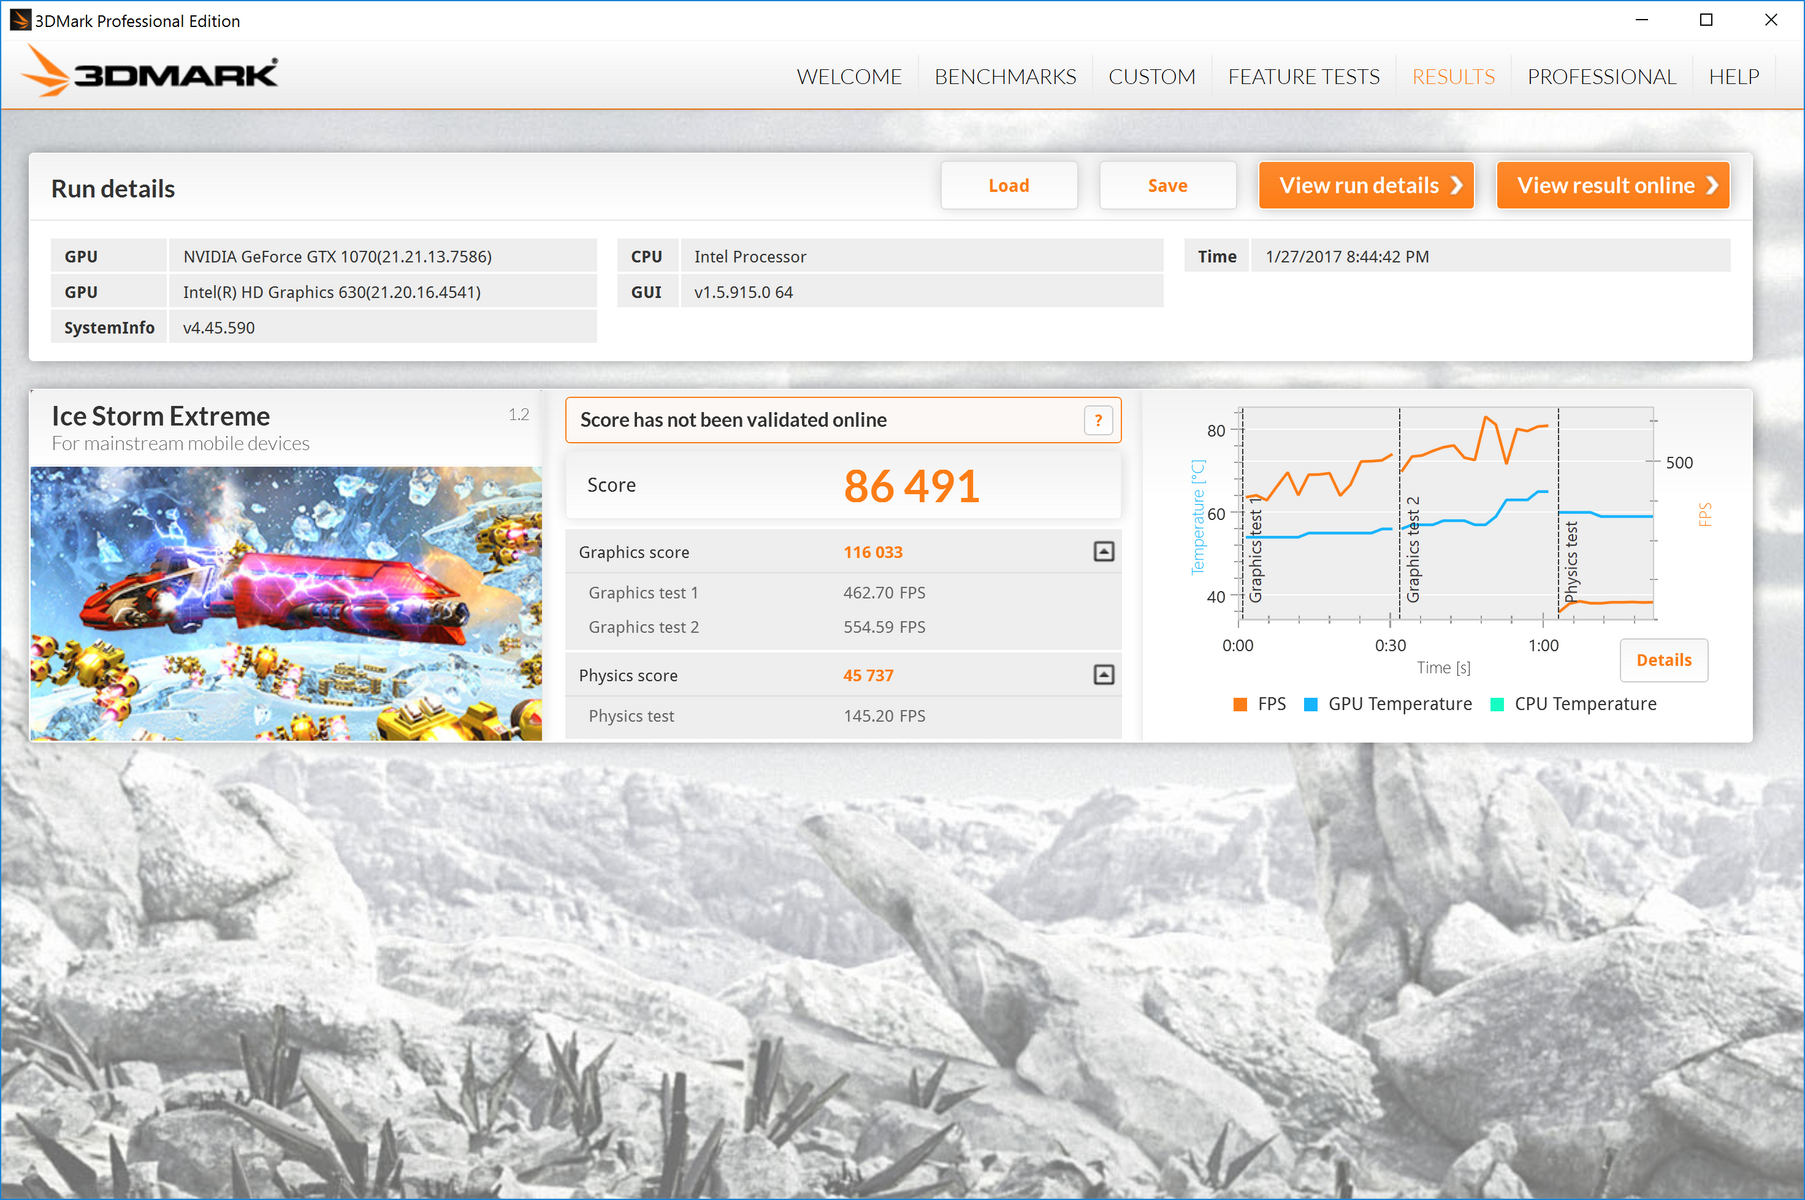
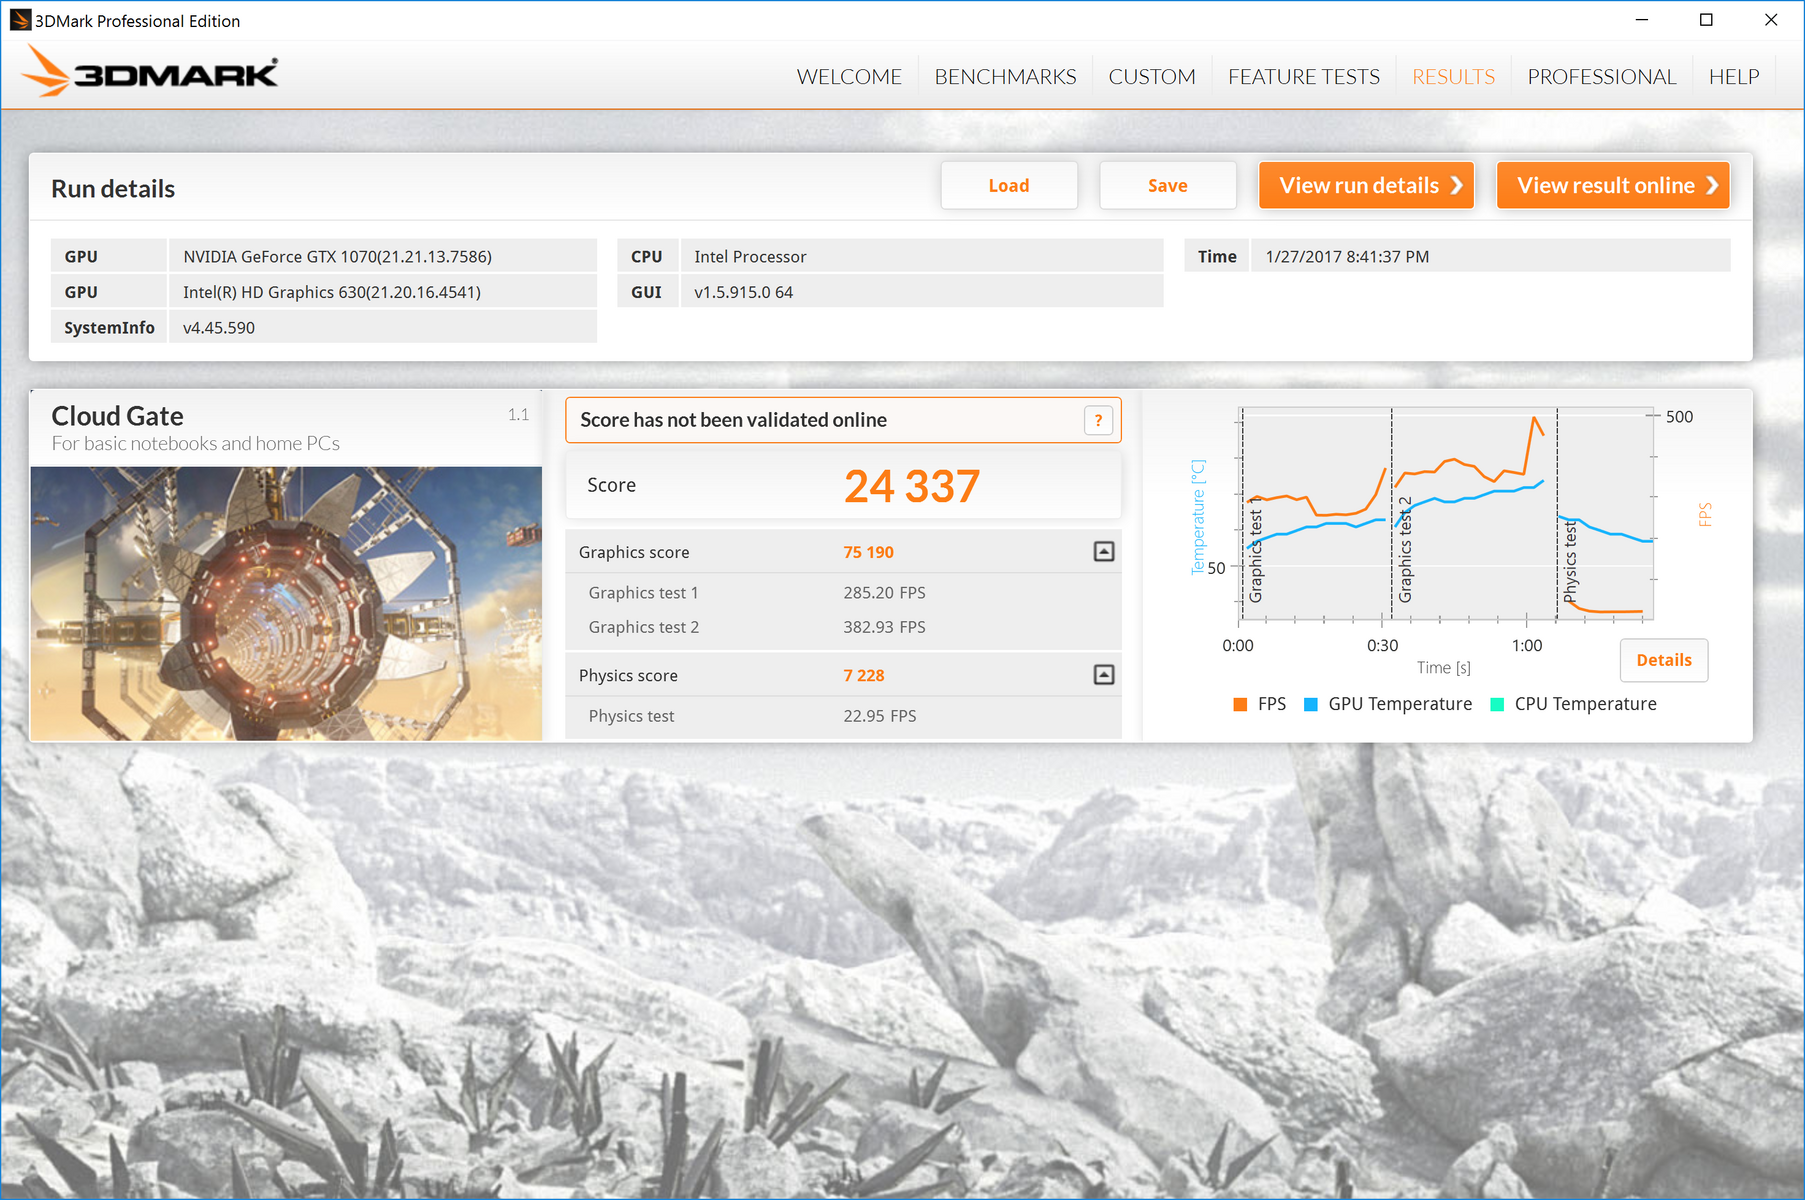
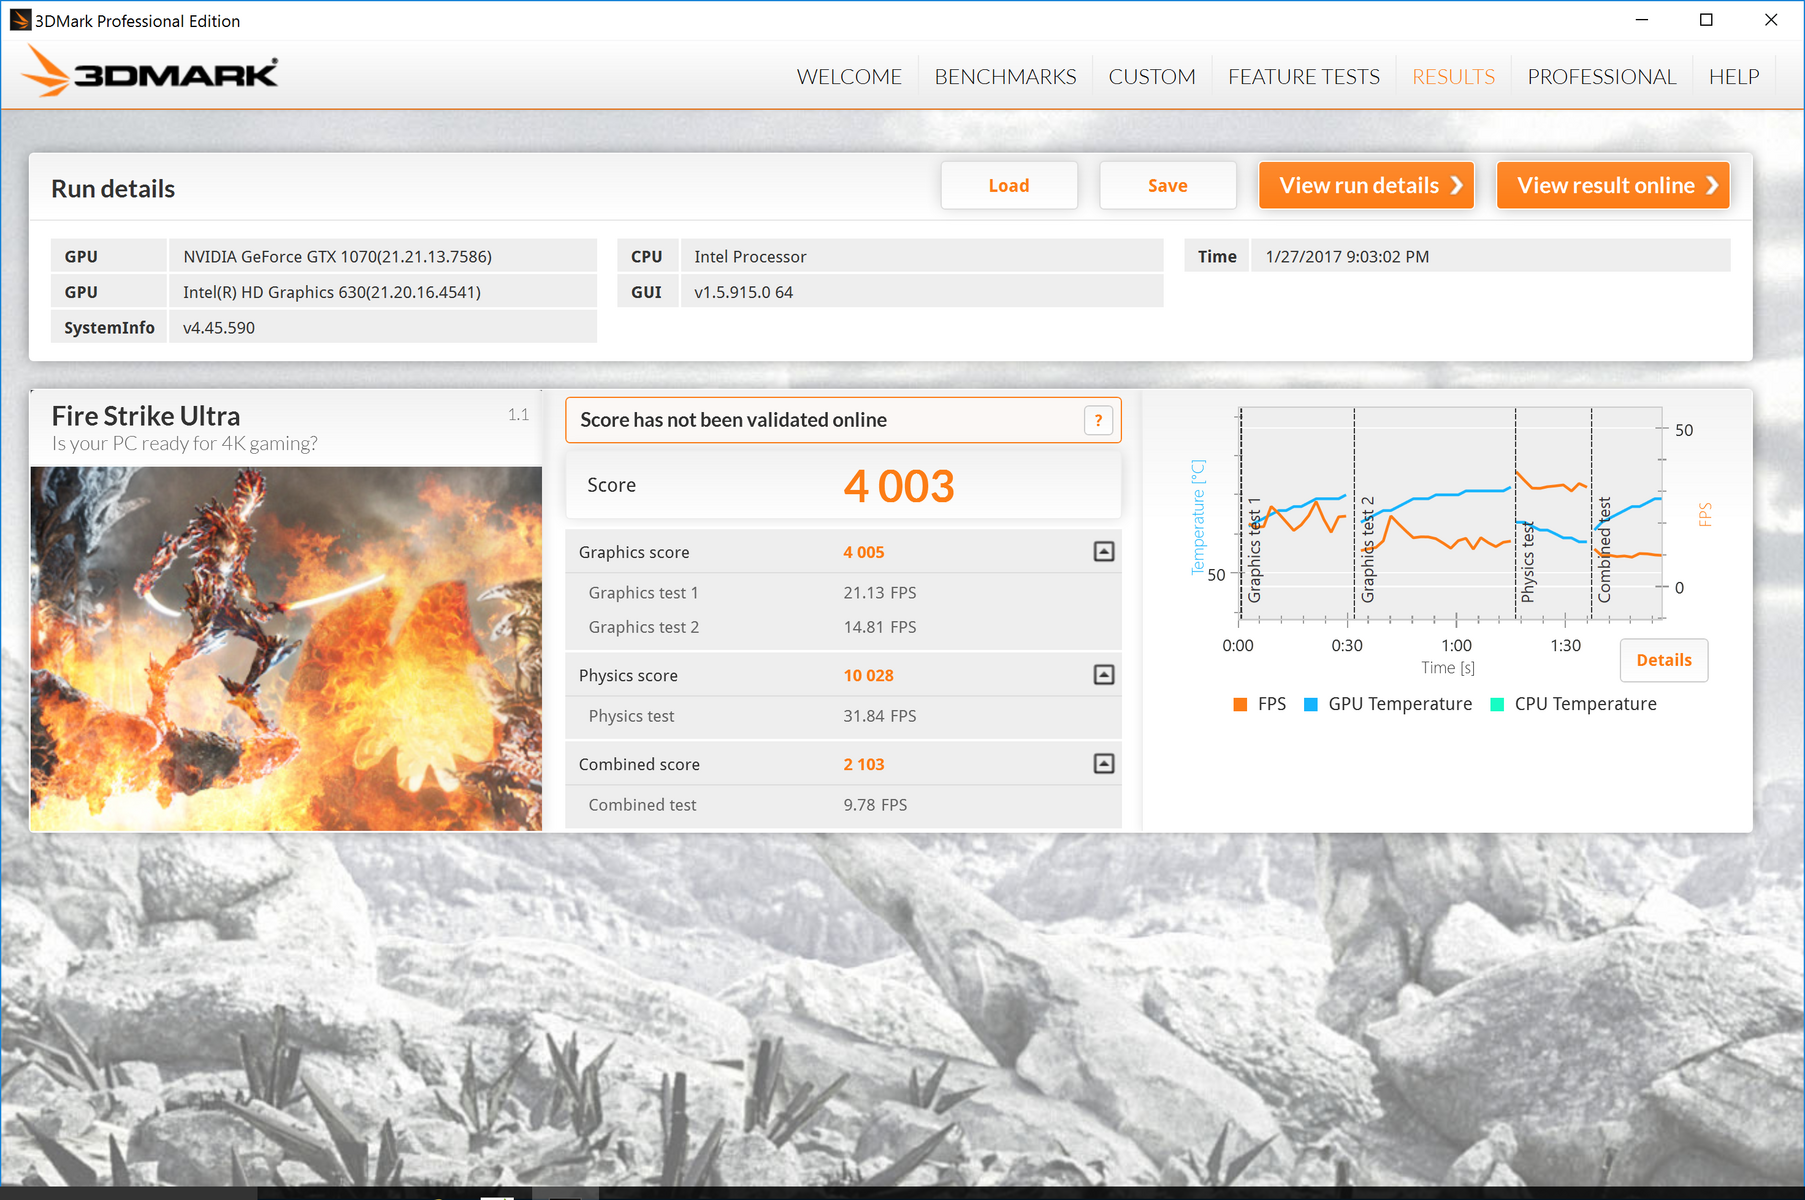
Graphical performance is the big story here, of course, and the NVIDIA GeForce GTX 1070 in the P57X doesn’t disappoint. We should mention before continuing that we performed all graphical benchmarks on this machine with the SmartManager GPU overclock set to Level 5 (highest) to squeeze as much power out of the notebook as possible for the purposes of the tests. We also forced the output resolution in the 3DMark Cloud Gate and Ice Storm Extreme tests to 1080p (as suggested by Futuremark) to help compensate for the challenges introduced by upscaling output video to 4K/UHD resolution.
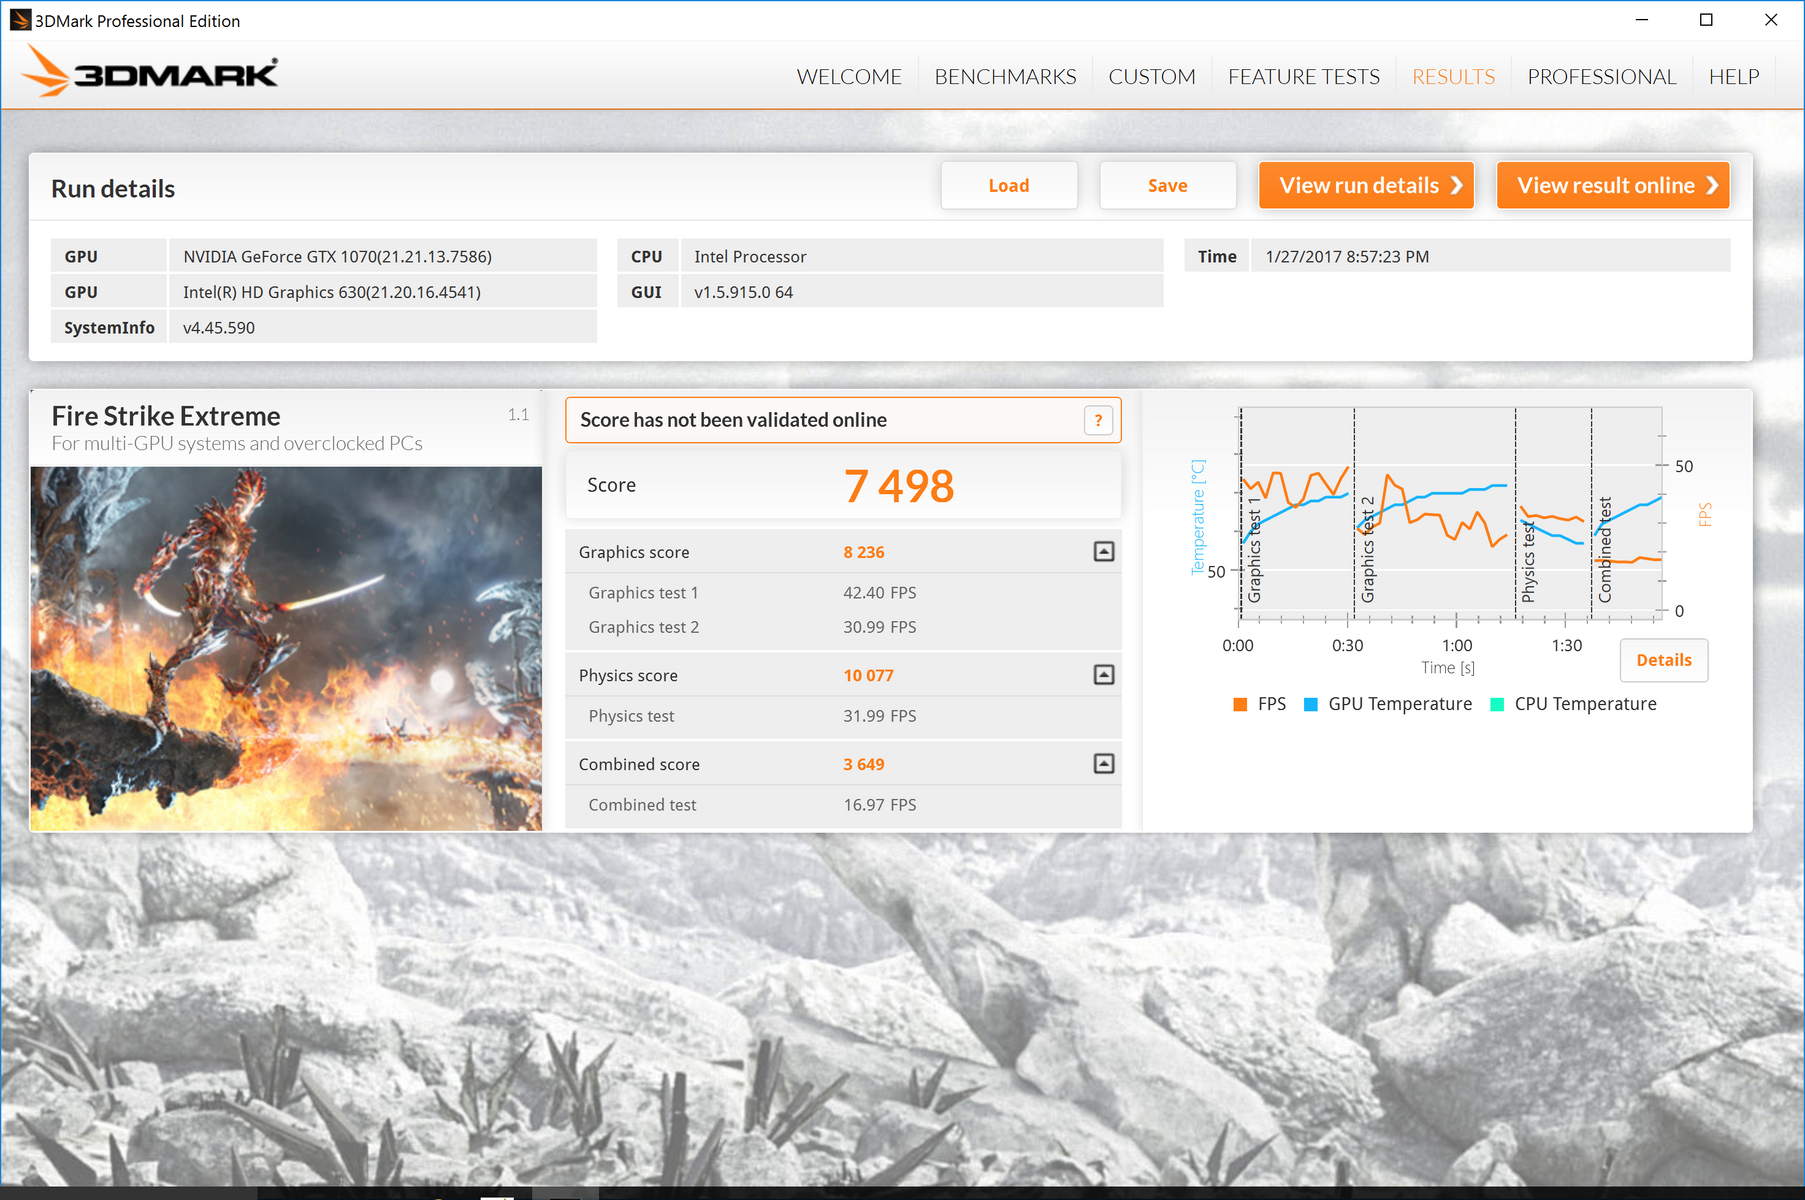
We really shouldn’t expect to see much of a difference in terms of graphical performance between the P57X v7 and its predecessor, and we don’t. In 3DMark Fire Strike Graphics, we received a score of 17170, almost identical to the 17106 we received from the v6. The rest of the hierarchy is just as we’d expect, with the MSI GT73VR (and its GTX 1080) taking the top spot in this test by a margin of 22%. The Acer Predator struggles a bit here and lags behind the two P57X notebooks by around 8%. The P57X v7 also achieved a score of 8236 in 3DMark Fire Strike Extreme Graphics and a 3957 in Ultra, both of which are very respectable scores.
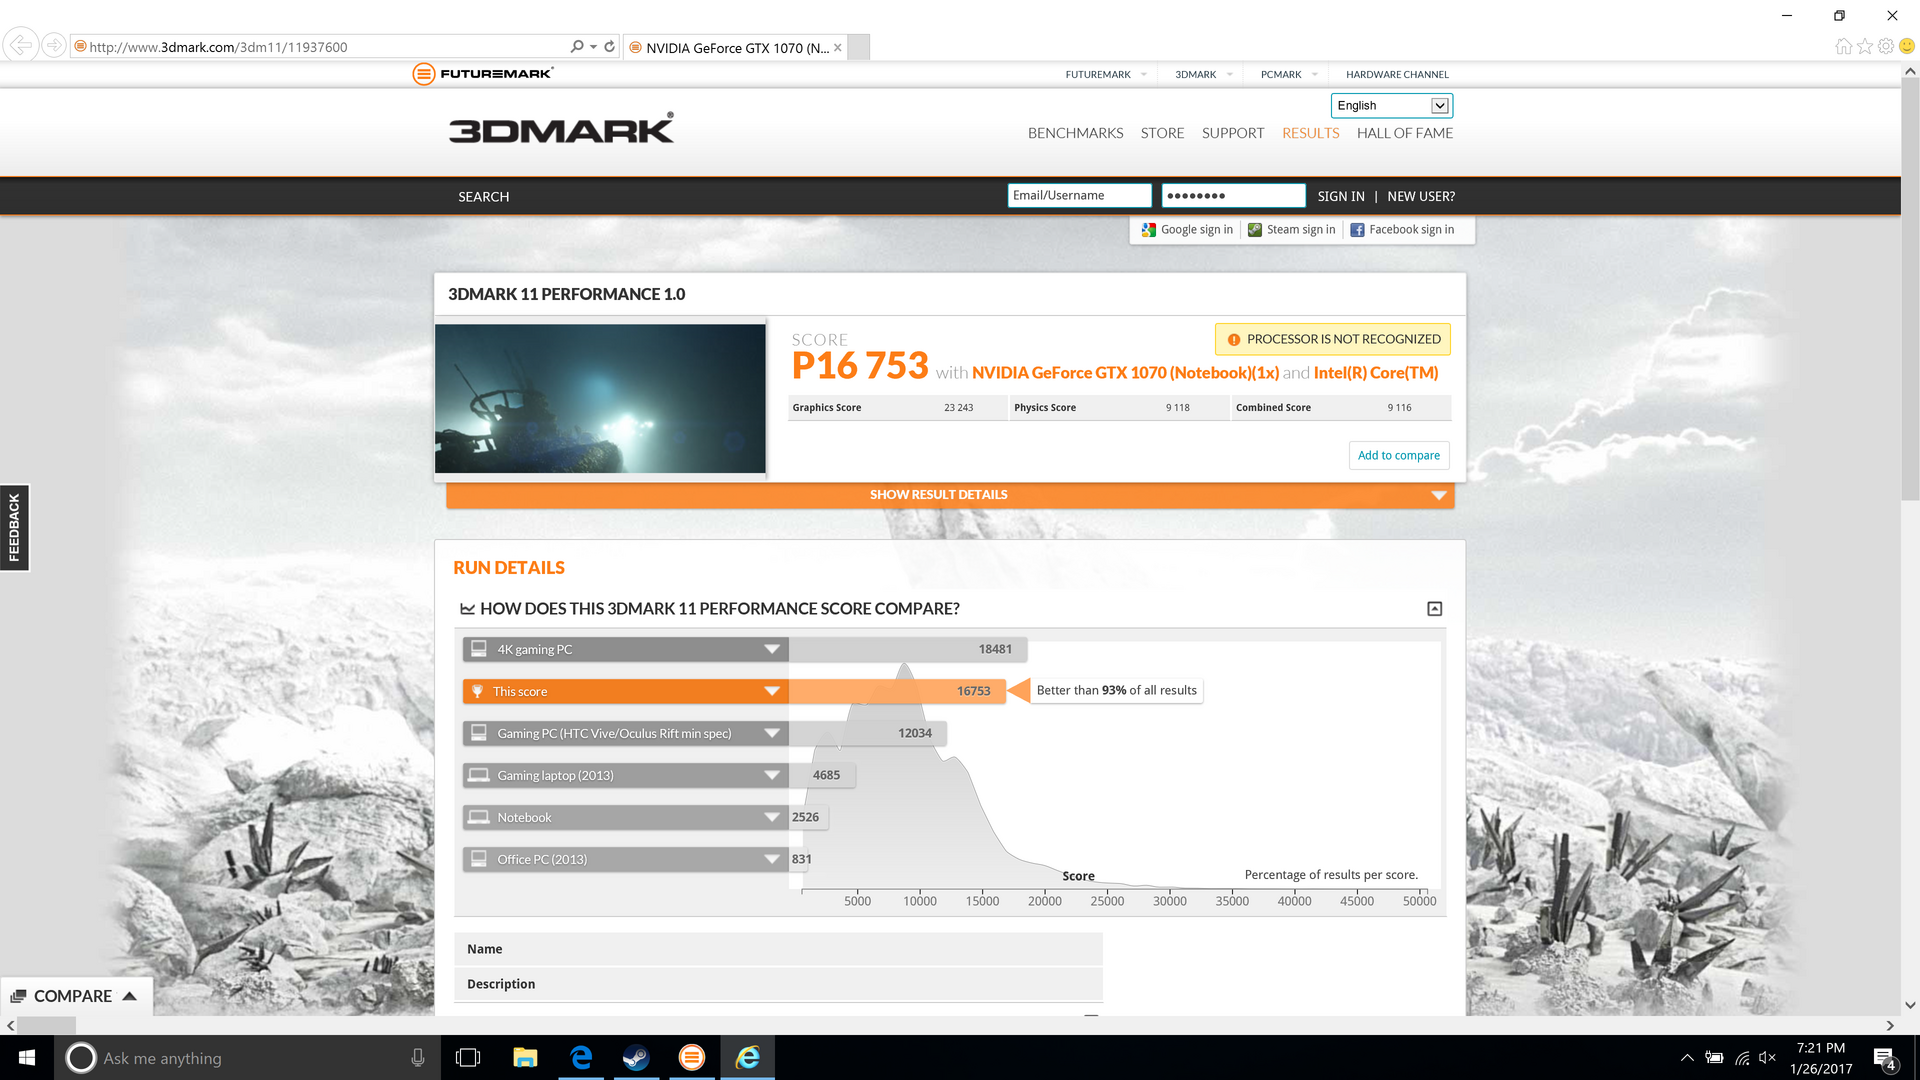
3DMark 11 scores are much the same, though the P57X sees a little bit of a boost from its newer CPU and better RAM configuration in the Performance Combined benchmark (9116 vs. 8366). Scores in Performance GPU, meanwhile, are nearly identical (as we’d expect them to be—23243 vs. the v6’s 23356). Again, in all of these tests, the MSI GT73VR is around 20-23% faster, thanks to its much more powerful GTX 1080 GPU and Core i7-7820HK CPU. Of course, that notebook is also much larger and more expensive.
| 3DMark 11 | |
| 1280x720 Performance GPU | |
| MSI GT73VR 7RF-296 | |
| Gigabyte P57X v6 | |
| Gigabyte P57X v7 | |
| EVGA SC17 GTX 1070 | |
| Acer Predator 17 G9-793-77LG | |
| 1280x720 Performance Combined | |
| MSI GT73VR 7RF-296 | |
| EVGA SC17 GTX 1070 | |
| Gigabyte P57X v7 | |
| Gigabyte P57X v6 | |
| Acer Predator 17 G9-793-77LG | |
| 3DMark | |
| 1280x720 Cloud Gate Standard Graphics | |
| MSI GT73VR 7RF-296 | |
| EVGA SC17 GTX 1070 | |
| Acer Predator 17 G9-793-77LG | |
| Gigabyte P57X v6 | |
| Gigabyte P57X v7 | |
| 1920x1080 Fire Strike Graphics | |
| MSI GT73VR 7RF-296 | |
| Gigabyte P57X v7 | |
| EVGA SC17 GTX 1070 | |
| Acer Predator 17 G9-793-77LG | |
| Fire Strike Extreme Graphics | |
| Gigabyte P57X v6 | |
| Gigabyte P57X v7 | |
| EVGA SC17 GTX 1070 | |
| 3840x2160 Fire Strike Ultra Graphics | |
| Gigabyte P57X v7 | |
| EVGA SC17 GTX 1070 | |
| 1920x1080 Ice Storm Extreme Graphics | |
| EVGA SC17 GTX 1070 | |
| Gigabyte P57X v6 | |
| Gigabyte P57X v7 | |
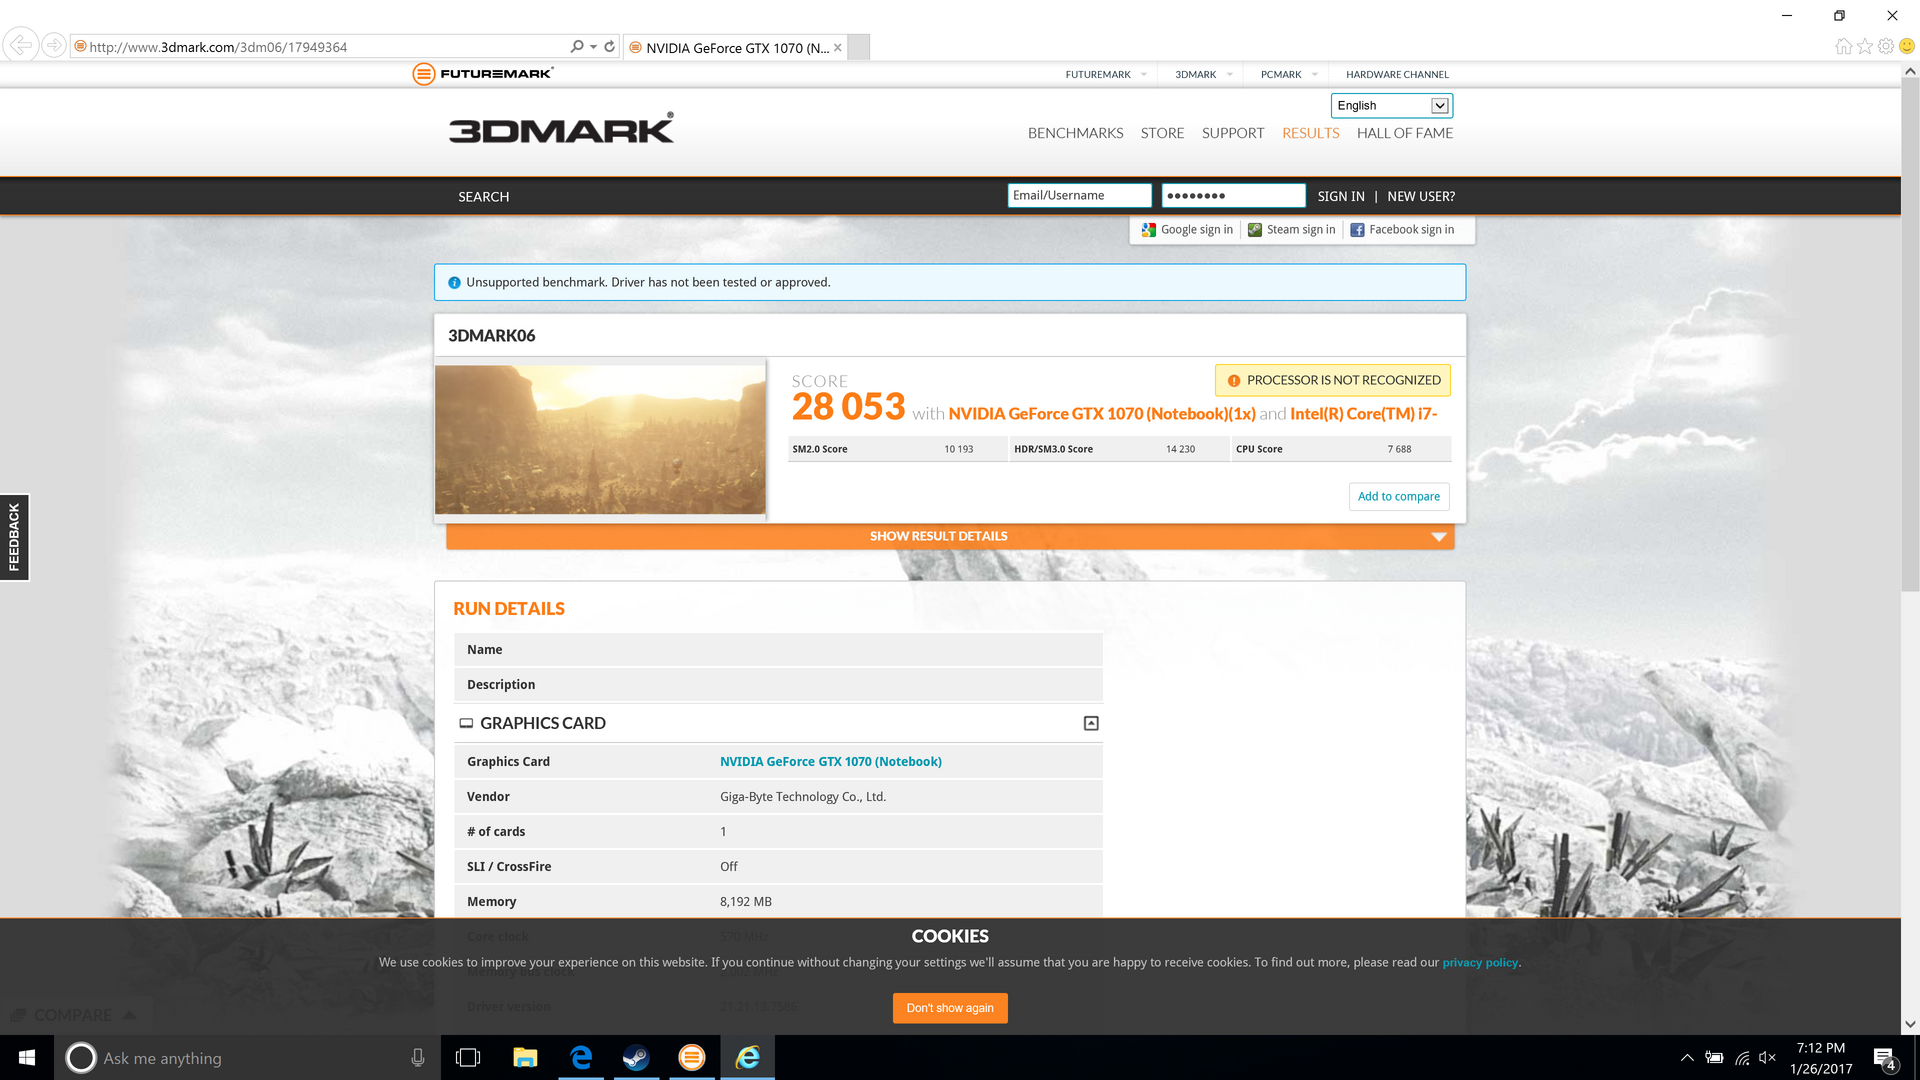
| 3DMark 06 Standard Score | 28053 points | |
| 3DMark 11 Performance | 16753 points | |
| 3DMark Cloud Gate Standard Score | 24337 points | |
| 3DMark Fire Strike Score | 13444 points | |
| 3DMark Fire Strike Extreme Score | 7498 points | |
Help | ||
Gaming Performance
It should be no surprise that gaming performance, then, is also quite similar to that of the predecessor P57X v6. However, what we find more interesting in our results today—given the upgrade to a 4K-resolution display—is how well the P57X v7 handles 4K gaming.
Whereas the v6 was able to chew through practically anything we threw at it in 1080p, the v7 does find its limits in the 4K category. For instance, although it cruises through Mafia 2 and Sleeping Dogs in 1080p with frame rates of 156 fps and 116 fps respectively, in 4K, only Mafia 2 sees great performance (with 101.6 fps), while Sleeping Dogs drops to a far more modest 31.4 fps.
Other games still see good performance in 4K: averages of 47 fps in Batman: Arkham Knight and 43 fps in Rise of the Tomb Raider are both very good results overall and are absolutely playable. Both results also beat the similarly-equipped competition by a small margin.
Game benchmarks @ 3840x2160 (4K), Ultra settings
| Average FPS | |
|---|---|
| Sleeping Dogs | 31 |
| Mafia 2 | 102 |
| Batman: Arkham Knight | 47 |
| Rise of the Tomb Raider | 43 |
| BioShock Infinite | 126 |
| Metro: Last Light | 103 |
| Thief | 42 |
| Fallout 4 | 42 |
| Batman: Arkham Knight - 3840x2160 High / On (Interactive Smoke & Paper Debris Off) AA:SM AF:8x (sort by value) | |
| Gigabyte P57X v7 | |
| EVGA SC17 GTX 1070 | |
| Mafia 2 - 1920x1080 high AA:0x AF:16x (sort by value) | |
| Gigabyte P57X v7 | |
| Rise of the Tomb Raider - 3840x2160 High Preset AA:FX AF:4x (sort by value) | |
| Gigabyte P57X v7 | |
| Acer Predator 17 G9-793-77LG | |
| EVGA SC17 GTX 1070 | |
| Sleeping Dogs - 1920x1080 Extreme Preset AA:Extreme (sort by value) | |
| Gigabyte P57X v7 | |
| Fallout 4 - 3840x2160 High Preset AA:T AF:16x (sort by value) | |
| Gigabyte P57X v7 | |
| EVGA SC17 GTX 1070 | |
| BioShock Infinite - 1920x1080 Ultra Preset, DX11 (DDOF) (sort by value) | |
| Gigabyte P57X v7 | |
| Gigabyte P57X v6 | |
| EVGA SC17 GTX 1070 | |
| low | med. | high | ultra | 4K | |
|---|---|---|---|---|---|
| Mafia 2 (2010) | 156.3 | ||||
| Sleeping Dogs (2012) | 116.3 | ||||
| BioShock Infinite (2013) | 130 | ||||
| Batman: Arkham Knight (2015) | 47 | ||||
| Fallout 4 (2015) | 42 | ||||
| Rise of the Tomb Raider (2016) | 43 |
Stress Test
We use Prime95 and FurMark to simulate synthetic maximum load conditions as part of our review process. While these conditions aren’t likely to be encountered often (if ever) during real-world use, this section is of particular interest during gaming and workstation notebook reviews thanks to their intended use. We should note that during these tests, we had the fan profile set to Gaming and the GPU overclock at defaults (Level 1).
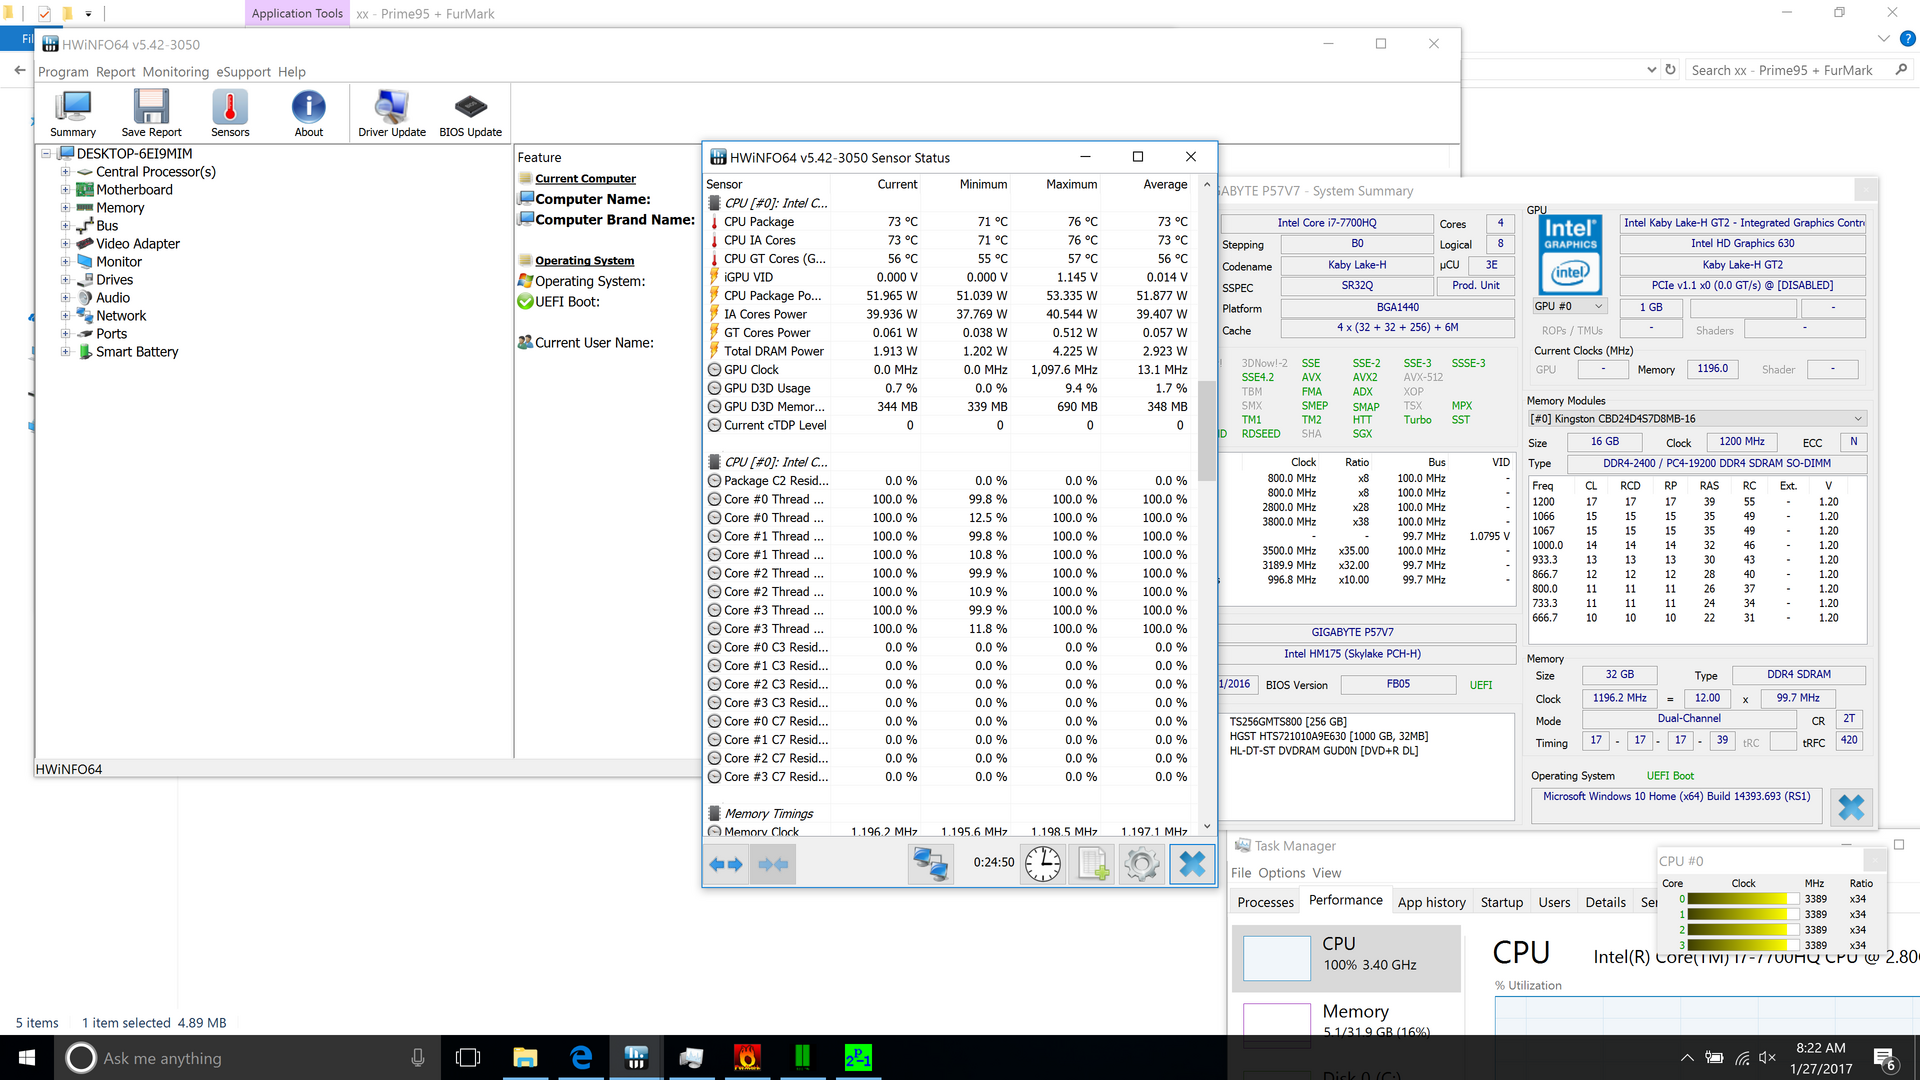
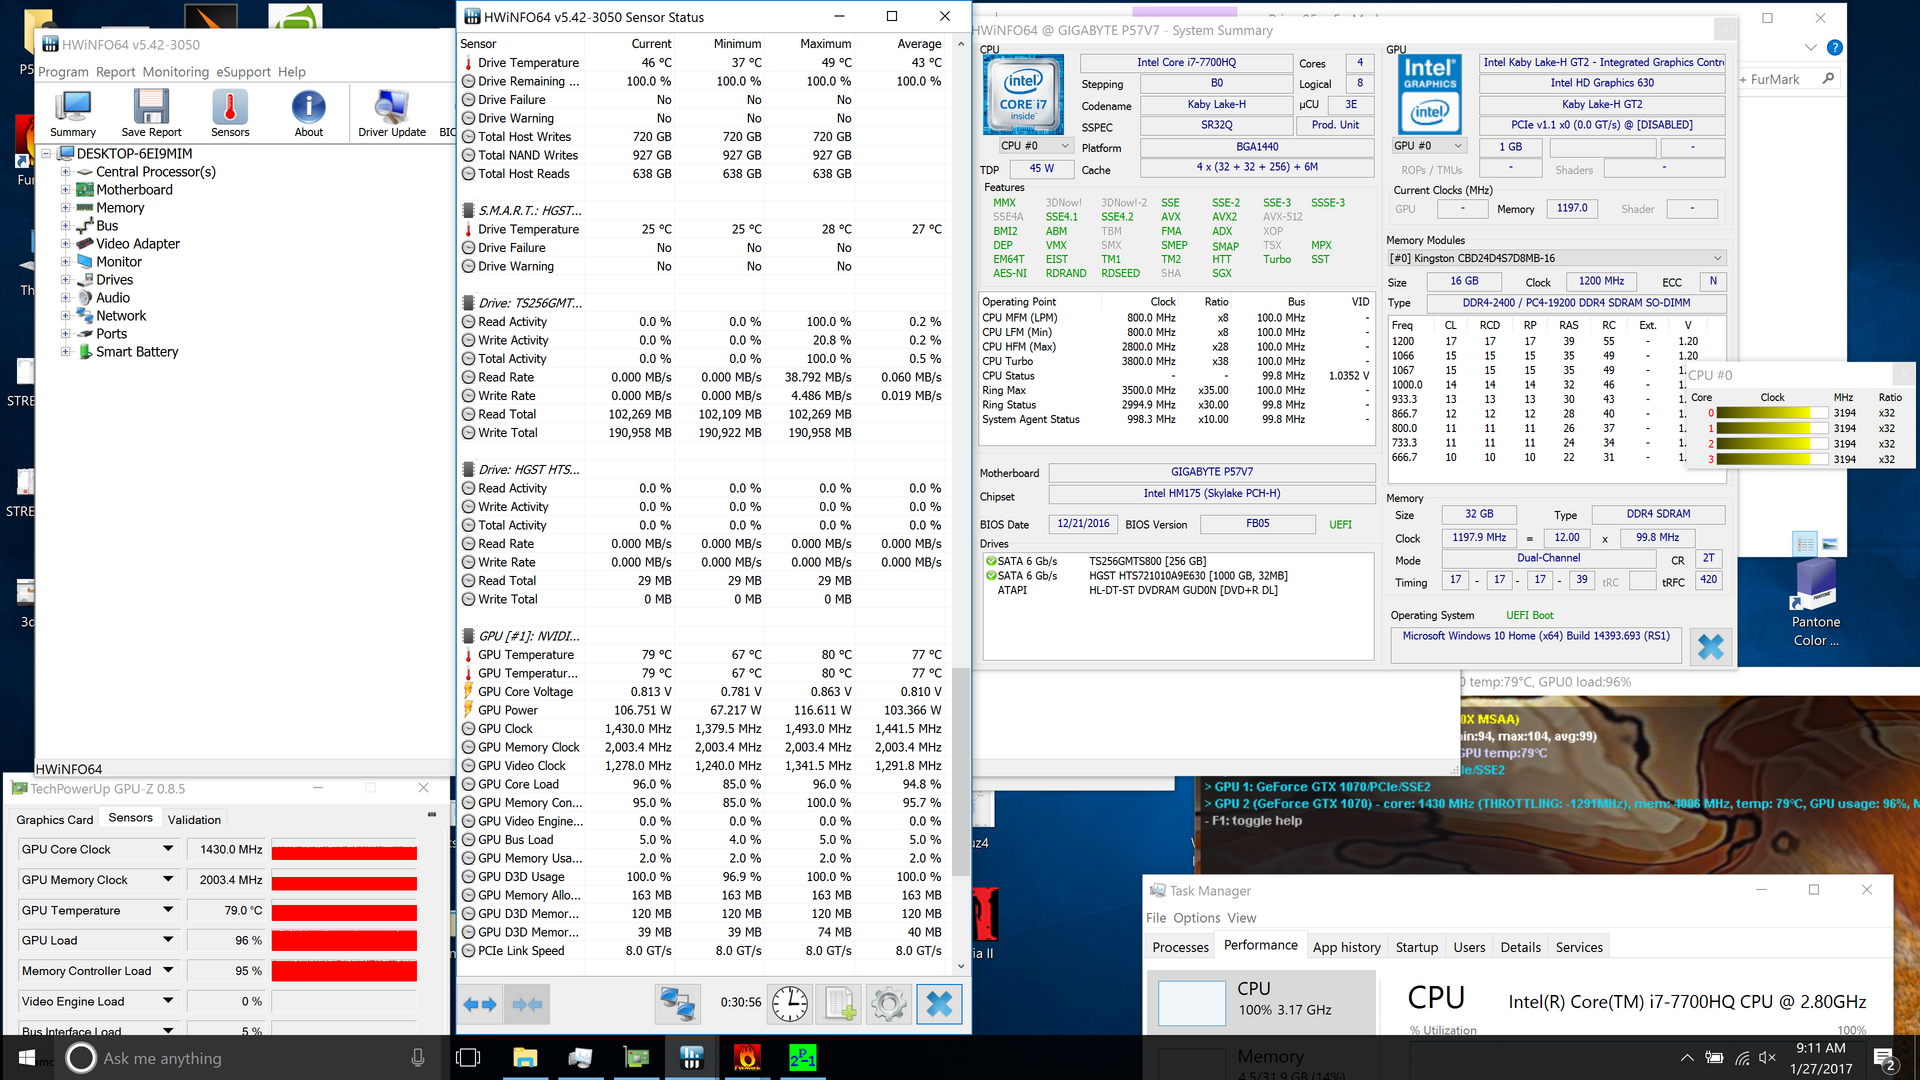
The P57X passed our CPU load test with flying colors. We witnessed solid 3.4 GHz frequencies across all four CPU cores for the entirety of the test duration (30 minutes), and temperatures never exceeded 76 °C during that time. This machine should never struggle to meet CPU processing demands. GPU stress similarly did not produce worrisome thermal conditions, however we did not witness turbo clock rates (rather, base clock rates of around 1430 MHz) during the GPU load test using FurMark.
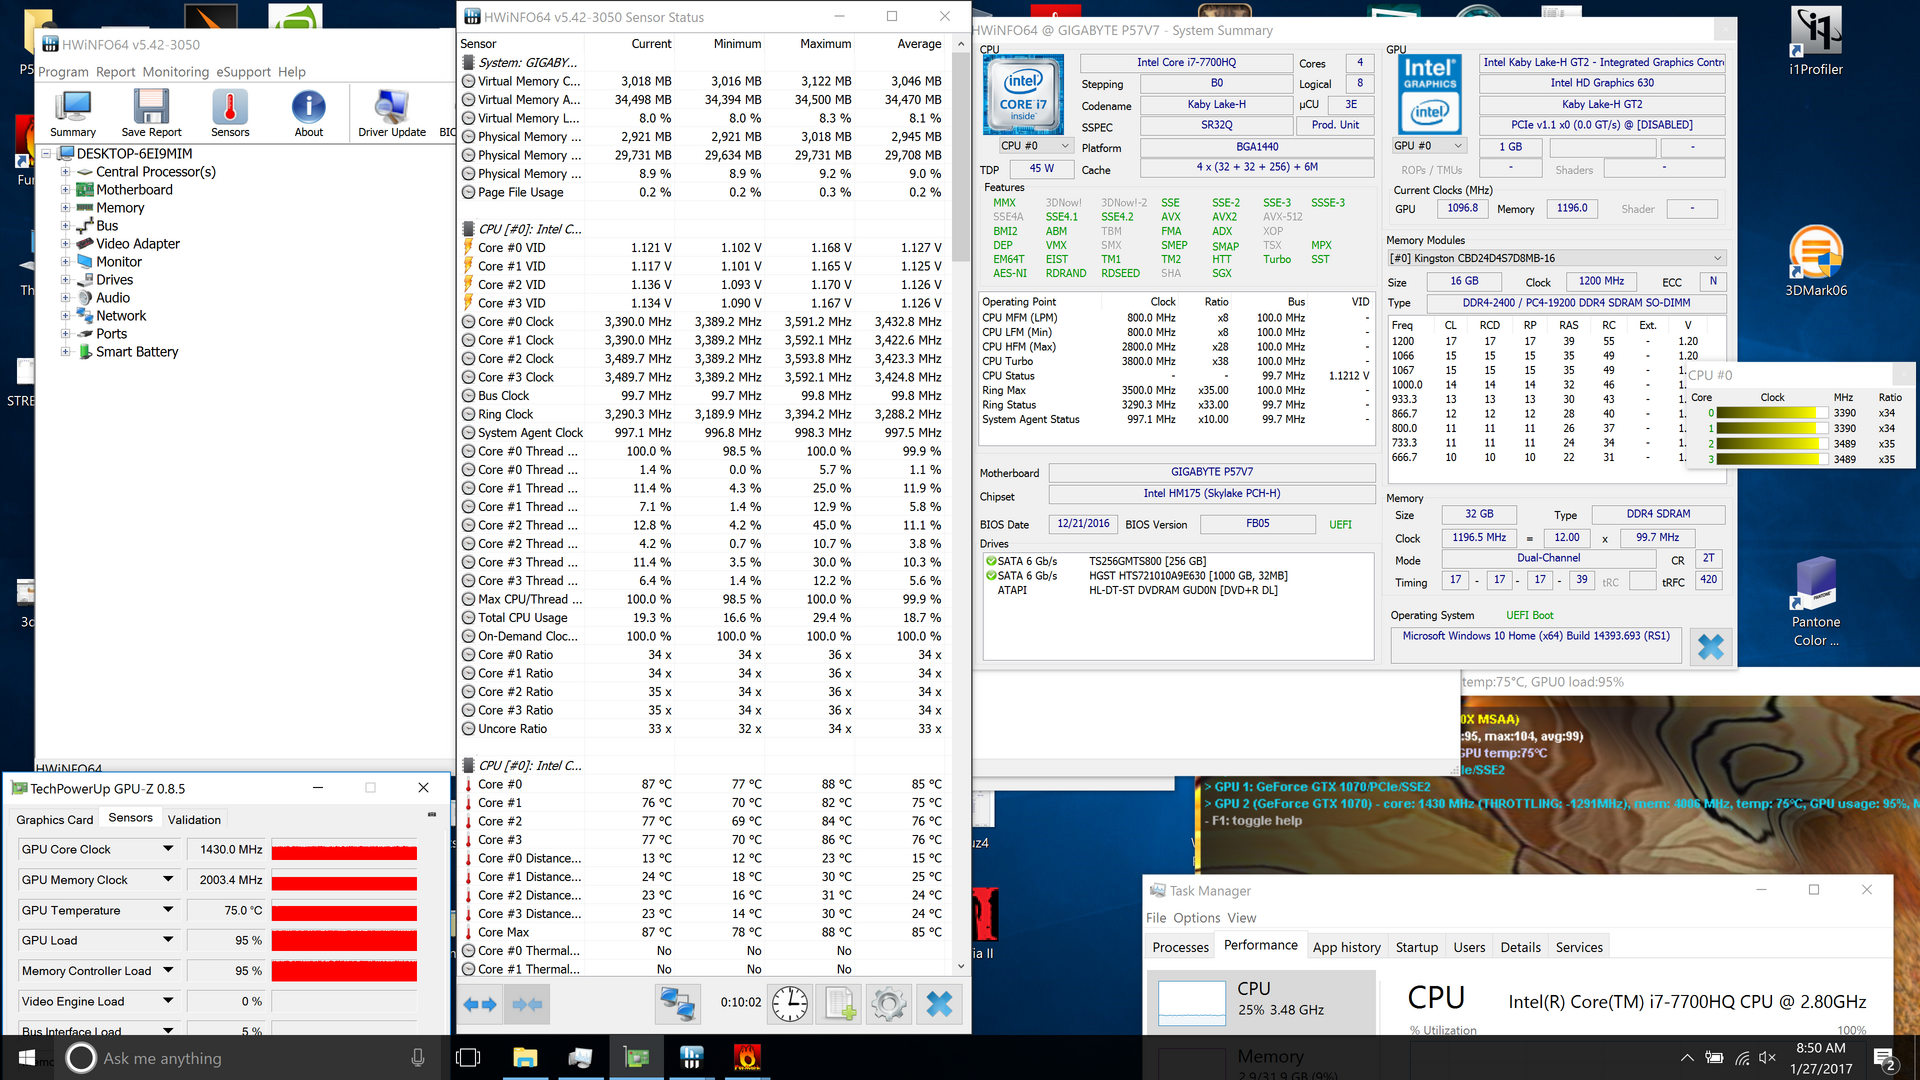
Combined system stress sees GPU performance prioritized (and still stable at 1430 MHz), but CPU performance cut slightly to the 3.2 GHz mark. This is really only a loss of 200 MHz, however, and thermals still are not bad—never exceeding 80 °C at any point during our test, which is certainly not a concern.
| CPU Clock (GHz) | GPU Clock (MHz) | Average CPU Temperature (°C) | Average GPU Temperature (°C) | |
| Prime95 Stress | 3.4 | - | 76 | - |
| FurMark Stress | - | 1430 | - | 75 |
| Prime95 + FurMark Stress | 3.2 | 1430 | 79 | 80 |
Emissions
System Noise
High-powered gaming notebooks and low noise profiles are basically mutually exclusive concepts, but the P57X performs surprisingly well in this category in spite of its relatively compact form factor. It’s still significant, but with a load maximum of 51.5 dB(A) and an average of 45.6 dB(A), it’s a couple of decibels quieter than the v6 was, and right in line with the rest of the competition. Idle values are predictably low; the fan is inaudible under many circumstances here unless the fan profile is set to one of the more powerful options. Speaking of which, we should take this opportunity to remind you that, should you disagree with the system’s choice of fan speed management parameters, you can adjust them at will using the SmartManager application.
Noise level
| Idle |
| 30.4 / 32.1 / 32.1 dB(A) |
| Load |
| 45.6 / 51.5 dB(A) |
 | ||
30 dB silent 40 dB(A) audible 50 dB(A) loud |
||
min: | ||
| Gigabyte P57X v7 GeForce GTX 1070 Mobile, i7-7700HQ, Transcend MTS800 256GB M.2 (TS256GMTS800) | Gigabyte P57X v6 GeForce GTX 1070 Mobile, 6700HQ, Transcend MTS800 256GB M.2 (TS256GMTS800) | Acer Predator 17 G9-793-77LG GeForce GTX 1070 Mobile, 6700HQ, Toshiba NVMe THNSN5256GPU7 | MSI GT73VR 7RF-296 GeForce GTX 1080 Mobile, i7-7820HK, 2x Samsung SM951 MZVPV256HDGL (RAID 0) | EVGA SC17 GTX 1070 GeForce GTX 1070 Mobile, 6820HK, Samsung SM951 MZVPV256 m.2 | |
|---|---|---|---|---|---|
| Noise | -4% | -7% | -6% | -4% | |
| off / environment * (dB) | 29 | 29.7 -2% | 31 -7% | 30 -3% | 29.2 -1% |
| Idle Minimum * (dB) | 30.4 | 33.2 -9% | 33 -9% | 34 -12% | 33.9 -12% |
| Idle Average * (dB) | 32.1 | 33.2 -3% | 34 -6% | 35 -9% | 33.9 -6% |
| Idle Maximum * (dB) | 32.1 | 33.2 -3% | 40 -25% | 37 -15% | 33.9 -6% |
| Load Average * (dB) | 45.6 | 47.5 -4% | 44 4% | 39 14% | 43.8 4% |
| Load Maximum * (dB) | 51.5 | 52.5 -2% | 50 3% | 56 -9% | 53.4 -4% |
* ... smaller is better
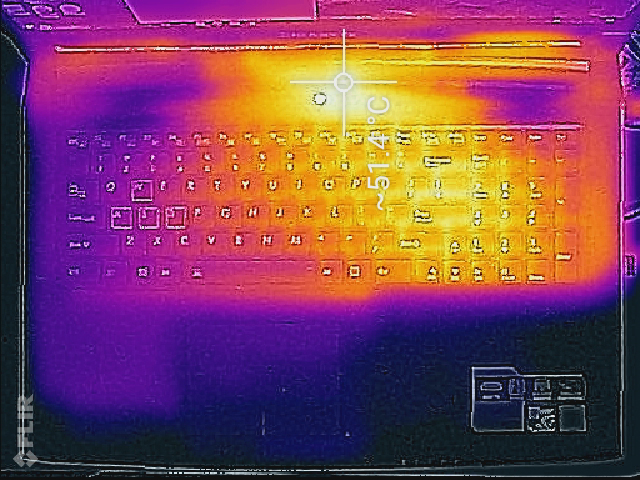
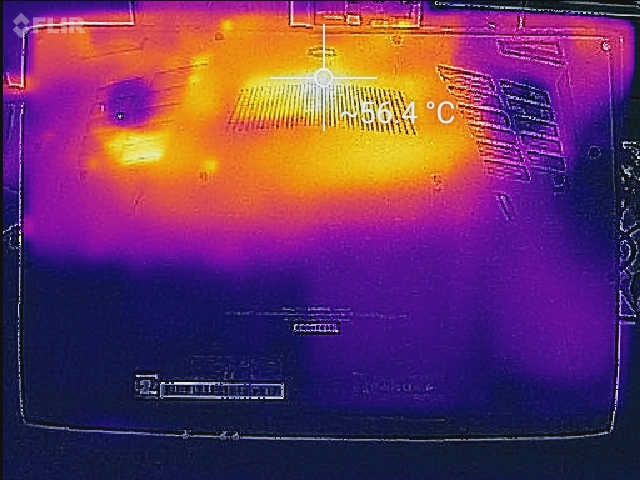
Temperature
Although the previous P57X v6 was far more afflicted by this, the v7 maintains the same conspicuous hot spots as before. These are the top center quadrants on both the top and bottom of the base unit, and they reach quite hot temperatures of 51.2 °C and 56.8 °C. Still, again, that’s well below the v6’s scorching 59 °C and 66 °C in those same regions, so it’s a definite improvement—especially when taking into account the lower noise levels (ambient testing room temperature favors the v7 by around 2 degrees, but that isn’t enough to throw off the results here). There is one other annoyance introduced by the heat development: the right side of the keyboard, which also reaches a balmy 41.4 °C—enough to make your palms sweat pretty quickly, which is sure to irritate any avid gamer. Fortunately, it’s the right side of the keyboard and not the left, so it should see substantially less use.
If you can stand the hot spots, the rest of the thermal picture is overwhelmingly positive. Somehow, the P57X v7 manages to get away with lower average casing temperatures than all other units in our field—especially the EVGA SC17 (which is the only unit that was more compact than the P57X) and its uncomfortable 40.2/43.5 °C. In contrast, the P57X v7 posts fairly remarkable scores of 32.3 °C and 29 °C. As always, we call attention to differences in testing room temperatures, as noted at the bottom of each review’s corresponding section. The sole outlier here would be the Acer Predator, where the room temperature was a full 4 degrees higher than that of the P57X. But even still, the P57X roughly matches its thermal performance—impressive for such a portable gaming notebook.
(-) The maximum temperature on the upper side is 51.2 °C / 124 F, compared to the average of 40.4 °C / 105 F, ranging from 21.2 to 68.8 °C for the class Gaming.
(-) The bottom heats up to a maximum of 56.8 °C / 134 F, compared to the average of 43.2 °C / 110 F
(+) In idle usage, the average temperature for the upper side is 24.7 °C / 76 F, compared to the device average of 33.9 °C / 93 F.
(+) The palmrests and touchpad are cooler than skin temperature with a maximum of 23.6 °C / 74.5 F and are therefore cool to the touch.
(+) The average temperature of the palmrest area of similar devices was 28.8 °C / 83.8 F (+5.2 °C / 9.3 F).
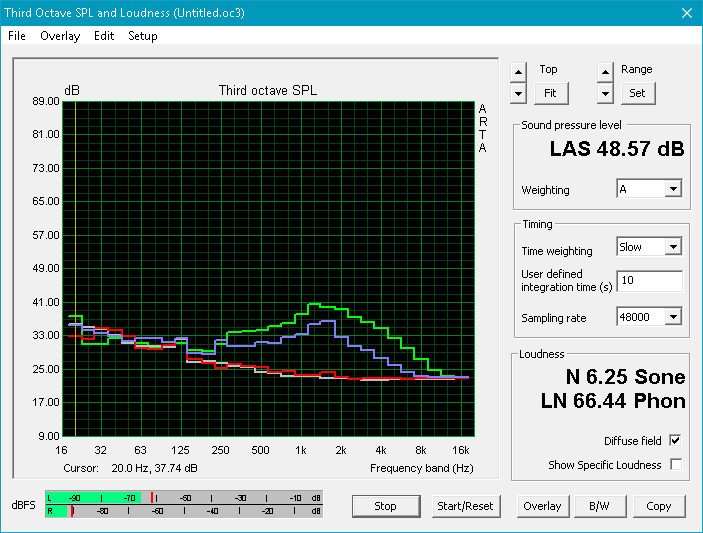
Speakers
The P57X v7’s thin profile and predominantly plastic casing materials do it no favors when it comes to audio quality. The integrated speakers are small and incapable of producing any great level of volume (we measured a maximum loudness of 70.46 dB). They also are fundamentally lacking in any sort of low-frequency reproduction; our database places the bass reproduction at 13.5% lower than the category median. Overall, the sound quality is still rather poor regardless of the Dolby post-processing status (on or off; it is on by default). The highs are at least crisp and clear with post-processing disabled, but the machine is still well off the mark when it comes to competing with category leaders—roughly 70% of the devices we tested fared better. With Dolby enabled, although the frequency response becomes perceptibly better balanced, the overall volume decreases and the sound comes off as somewhat muffled at louder volume settings while the software attempts to synthetically boost the low-frequency side of the spectrum.

Gigabyte P57X v7 audio analysis
(-) | not very loud speakers (70.5 dB)
Bass 100 - 315 Hz
(±) | reduced bass - on average 13.5% lower than median
(±) | linearity of bass is average (9.2% delta to prev. frequency)
Mids 400 - 2000 Hz
(+) | balanced mids - only 4.1% away from median
(±) | linearity of mids is average (8.8% delta to prev. frequency)
Highs 2 - 16 kHz
(±) | higher highs - on average 7% higher than median
(±) | linearity of highs is average (11.2% delta to prev. frequency)
Overall 100 - 16.000 Hz
(-) | overall sound is not linear (30.3% difference to median)
Compared to same class
» 96% of all tested devices in this class were better, 2% similar, 3% worse
» The best had a delta of 6%, average was 18%, worst was 132%
Compared to all devices tested
» 89% of all tested devices were better, 3% similar, 9% worse
» The best had a delta of 4%, average was 24%, worst was 134%
Acer Predator 17 G9-793-77LG audio analysis
(+) | speakers can play relatively loud (83 dB)
Bass 100 - 315 Hz
(±) | reduced bass - on average 7.8% lower than median
(±) | linearity of bass is average (8.2% delta to prev. frequency)
Mids 400 - 2000 Hz
(+) | balanced mids - only 4% away from median
(+) | mids are linear (4.6% delta to prev. frequency)
Highs 2 - 16 kHz
(+) | balanced highs - only 3.7% away from median
(±) | linearity of highs is average (7.1% delta to prev. frequency)
Overall 100 - 16.000 Hz
(+) | overall sound is linear (12% difference to median)
Compared to same class
» 12% of all tested devices in this class were better, 4% similar, 84% worse
» The best had a delta of 6%, average was 18%, worst was 132%
Compared to all devices tested
» 9% of all tested devices were better, 2% similar, 88% worse
» The best had a delta of 4%, average was 24%, worst was 134%
Frequency Comparison (Checkbox selectable!)
Graph 1: Pink Noise 100% Vol.; Graph 2: Audio off
Energy Management
Power Consumption
Surprisingly, while idling, the P57X v7 is more power-efficient than every other notebook against which we’re comparing today. This includes the Acer Predator 17 and EVGA SC17, both which feature 4K screens and the same video card, but which also have Skylake CPUs (as compared to the newer Kaby Lake iteration in the v7). However, both of those notebooks also use slightly less energy under load; only the MSI GT73VR, with its GTX 1080 and dual SSD RAID configuration, uses more energy (35% more in fact, entirely attributable to the GPU). Even the Gigabyte P57X v6, with its lower-resolution 1080p panel, older CPU, and identical parts otherwise, sees only 2% lower usage under max load. That’s a great result considering the upgrade to a 4K panel with much better color quality and brightness.
| Off / Standby | |
| Idle | |
| Load |
|
Key:
min: | |
| Gigabyte P57X v7 i7-7700HQ, GeForce GTX 1070 Mobile, Transcend MTS800 256GB M.2 (TS256GMTS800), IPS, 3840x2160, 17.3" | Gigabyte P57X v6 6700HQ, GeForce GTX 1070 Mobile, Transcend MTS800 256GB M.2 (TS256GMTS800), IPS, 1920x1080, 17.3" | Acer Predator 17 G9-793-77LG 6700HQ, GeForce GTX 1070 Mobile, Toshiba NVMe THNSN5256GPU7, IPS, 3840x2160, 17.3" | MSI GT73VR 7RF-296 i7-7820HK, GeForce GTX 1080 Mobile, 2x Samsung SM951 MZVPV256HDGL (RAID 0), TN LED, 1920x1080, 17.3" | EVGA SC17 GTX 1070 6820HK, GeForce GTX 1070 Mobile, Samsung SM951 MZVPV256 m.2, IPS, 3840x2160, 17.3" | |
|---|---|---|---|---|---|
| Power Consumption | -2% | -31% | -38% | -32% | |
| Idle Minimum * (Watt) | 15.7 | 18.4 -17% | 25 -59% | 29 -85% | 27.3 -74% |
| Idle Average * (Watt) | 23.4 | 22.8 3% | 35 -50% | 35 -50% | 34.9 -49% |
| Idle Maximum * (Watt) | 23.5 | 24 -2% | 46 -96% | 40 -70% | 37.6 -60% |
| Load Average * (Watt) | 184.6 | 175.5 5% | 103 44% | 94 49% | 164.4 11% |
| Load Maximum * (Watt) | 233.1 | 229.5 2% | 223 4% | 315 -35% | 202.5 13% |
* ... smaller is better
Battery Life
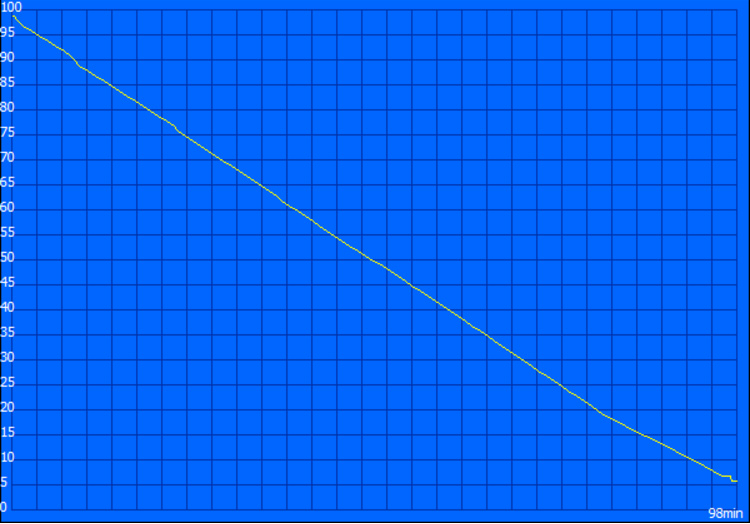
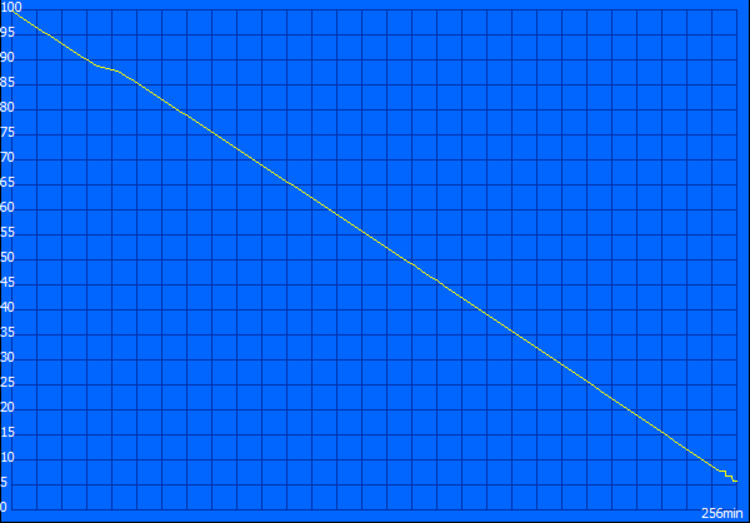
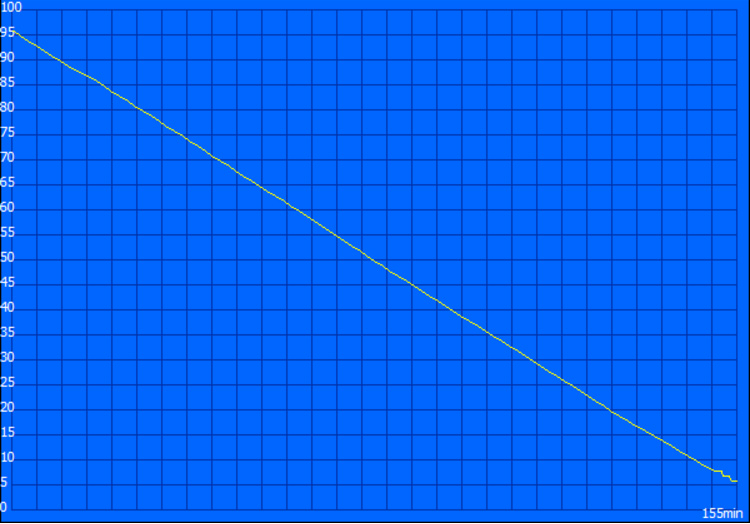
Oddly enough, in spite of the lower measured power consumption, our battery life results on the P57X v7 still were a bit disappointing at first glance. However, actually, only the idle test results seem a little bit off (63% shorter runtime than the v6 recorded); the other two values (load: 5% less, WiFi Surfing: 30% less) may make sense if you take into account otherwise heightened power usage while the computer is actually in use. Again, much of this is likely due to the bump in screen resolution, which in our opinion provides far more value in the way of usability and sheer luxury than would any marginally improved battery runtime numbers. As we’ve said before many times in the past, after all, this is a gaming notebook, and as such, perhaps the least important item on the list of most prospective consumers of the P57X is battery longevity.
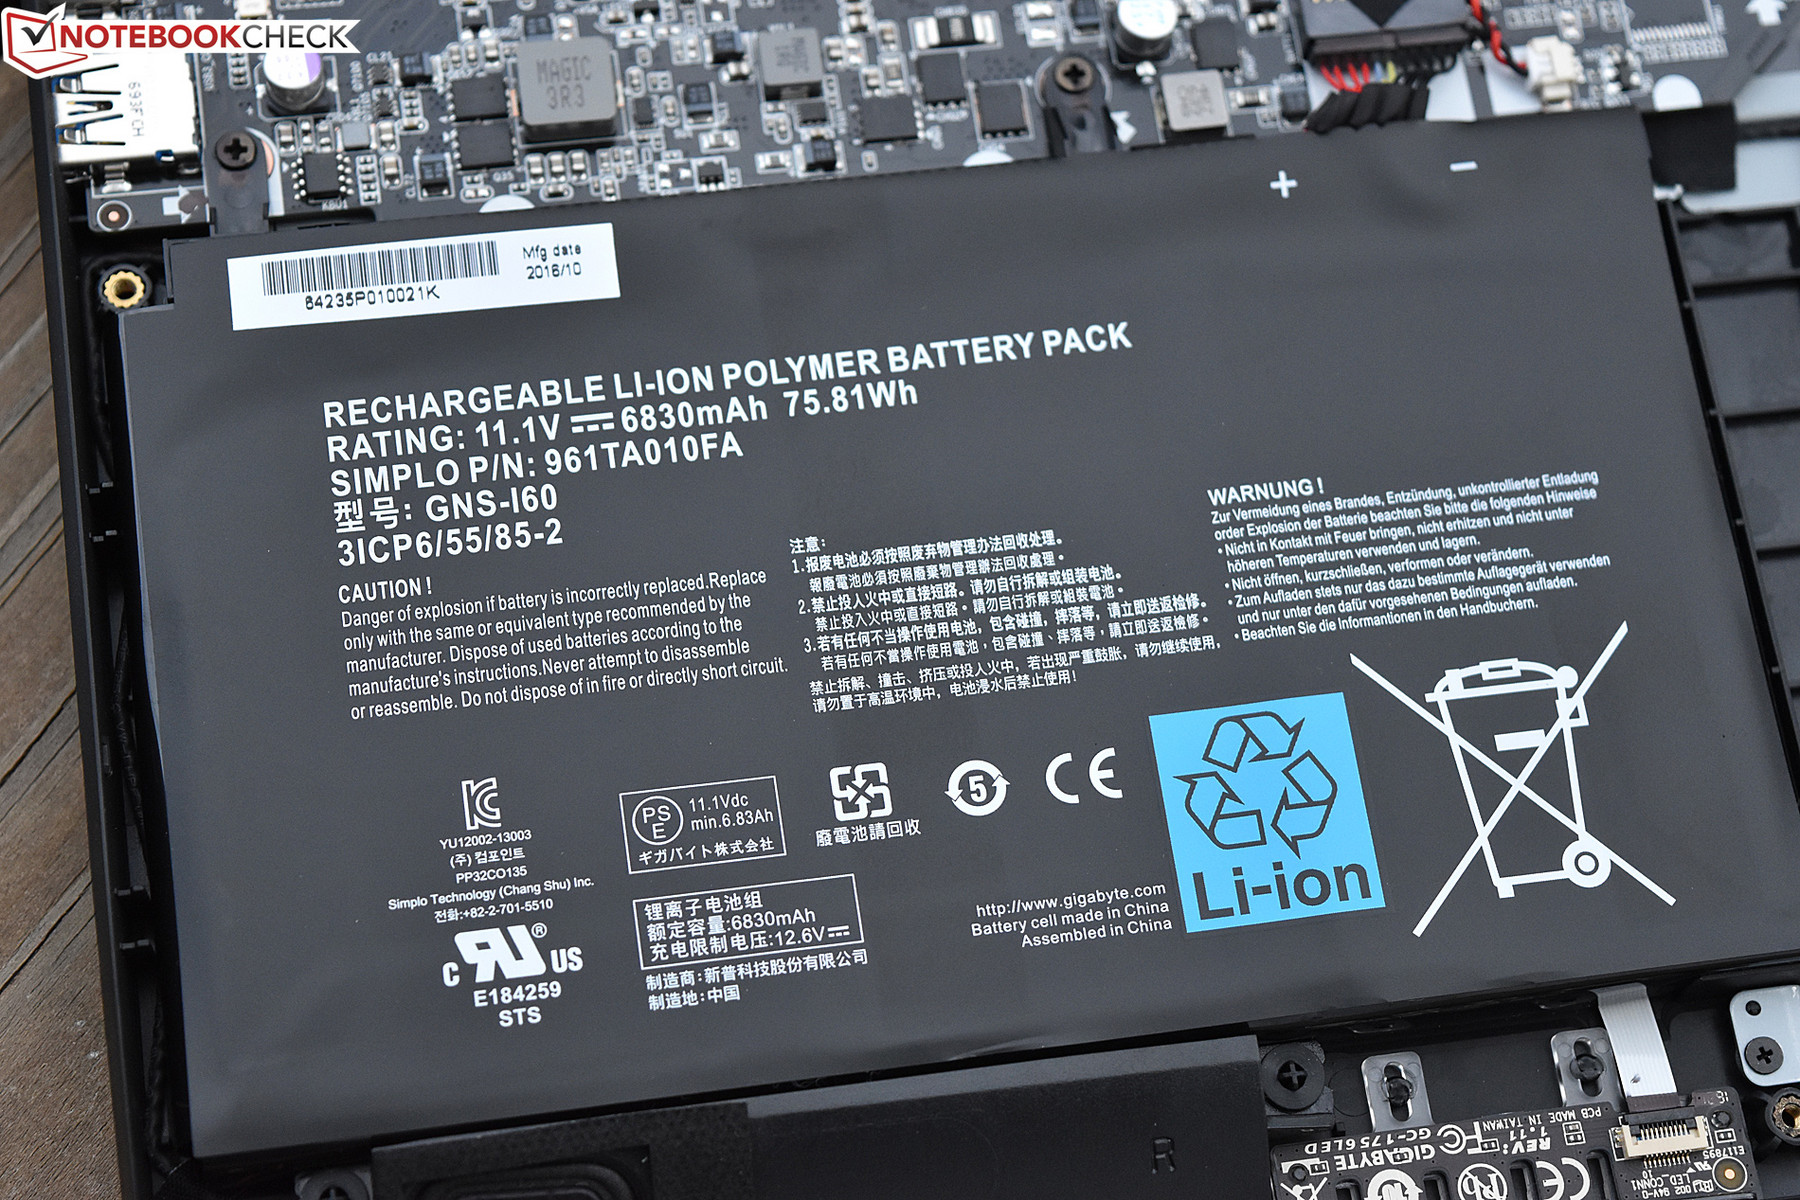
| Gigabyte P57X v7 i7-7700HQ, GeForce GTX 1070 Mobile, 75.81 Wh | Gigabyte P57X v6 6700HQ, GeForce GTX 1070 Mobile, 75.81 Wh | Acer Predator 17 G9-793-77LG 6700HQ, GeForce GTX 1070 Mobile, 88 Wh | MSI GT73VR 7RF-296 i7-7820HK, GeForce GTX 1080 Mobile, 75.2 Wh | EVGA SC17 GTX 1070 6820HK, GeForce GTX 1070 Mobile, 74.48 Wh | |
|---|---|---|---|---|---|
| Battery runtime | 33% | 9% | 4% | -16% | |
| Reader / Idle (h) | 4.3 | 7 63% | 4.6 7% | 4 -7% | |
| WiFi v1.3 (h) | 2.6 | 3.4 31% | 3.3 27% | 2.7 4% | 2.7 4% |
| Load (h) | 1.6 | 1.7 6% | 1.5 -6% | 0.9 -44% |
Pros
Cons
Verdict
Truthfully, not a lot has changed between the P57X v6 and the newer v7 we’re reviewing today. Both feature identical (plastic, yet relatively portable) cases, similar board layouts and internal components, the same port selection, and even the same GPU and SSD. The biggest (and perhaps only notable) differences with the v7 are its inclusion of a Kaby Lake Core i7-7700HQ CPU, a higher-resolution, better quality 4K display, and double the RAM (at faster memory speed, also).
Overall, though quicker and better-built gaming machines most certainly exist, the Gigabyte P57X v7 is still a powerful option with a beautiful display.
All of this adds up to lower fan noise levels, less heat development (though still quite hot in a couple of areas), and a much nicer visual experience thanks to the greatly improved display panel (better brightness, color coverage, and of course, resolution). However, many of the same gripes still apply elsewhere. The case is nothing to write home about, and the display lid actually seems a bit flimsy. It’s also still pretty loud (though easy-to-use fan control software is included), and the touchpad remains downright poor. Battery life also has seen a curious dip since the last model, which wouldn’t really be much of a surprise given the bump in display resolution/brightness and RAM amount, if it weren’t for the fact that our power consumption measurements seem to suggest otherwise. Still, it’s a gaming notebook, so we’ll take what we can get as it applies to battery runtimes and focus on the stuff that really matters most.
Response times for the display are really the only other true negative here, and that could prove problematic for those really into FPS games and other quick-reflex experiences. For other types of games, it may not be as much of an issue (as it would be comparable to gaming on many televisions anyway). Choosing the 1080p panel would likely mitigate these issues (as response times were better on the v6’s panel), but you can’t have the best of both worlds it seems.
Overall, though quicker and better-built gaming machines most certainly exist, the Gigabyte P57X v7 is still a powerful option with a beautiful display. It handles heavy loads in stride and it features plenty of opportunity for expansion or improvement for those interested in some aftermarket customization. Provided you aren’t planning on going unplugged and you aren’t bothered by the casing and touchpad deficiencies, it’s not a bad choice.
Gigabyte P57X v7
- 04/25/2017 v6 (old)
Steve Schardein
Price comparison
