Notebook reviews with NVIDIA GeForce GTX 1070 Mobile graphics card
Alienware 17 R5 (i7-8750H, GTX 1070, QHD) Laptop Review
Now with a hexa-core CPU. Despite using the most current components, the former top-gaming brand Alienware has had more and more difficulties standing up against the competitors. Find out in our review why this effort is not quite sufficient anymore for being a winner.
Intel Core i7-8750H, NVIDIA GeForce GTX 1070 Mobile, 17.3", 4.4 kgAcer Predator Helios 500 (GTX 1070, i9-8950HK) Laptop Review
This hunk of a laptop enters the second round: We already reviewed the lower-priced version of the Acer Predator Helios 500 not so long ago - now here comes the sequel. Is the expensive high-end version able to convince us? Find out in this detailed review!
Intel Core i9-8950HK, NVIDIA GeForce GTX 1070 Mobile, 17.3", 4 kgHP Omen 17t (i7-8750H, GTX 1070) Laptop Review
Quiet Giant. The Omen 17t is a well-balanced notebook. Its internals are consistently powerful, its 144 Hz G-Sync display is one of the best on the market, and it manages heat and noise with aplomb. With its competitive pricing, the Omen 17t is one of the best overall packages in the gaming laptop market.
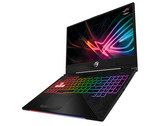
Intel Core i7-8750H, NVIDIA GeForce GTX 1070 Mobile, 17.3", 3.7 kgAsus ROG Strix GL504 Scar II (i7-8750H, GTX 1070, FHD) Laptop Review
With the ROG Strix GL504, Asus introduces a 15-inch high-end notebook that brings almost all the features you could wish for in a gaming platform. A 144-Hz panel? Check. Thin display bezel? Check. RGB keyboard? Check. Hexa-core CPU and DirectX-12 GPU? Check. We explain in our test why this is still not quite sufficient for a "very good" evaluation.
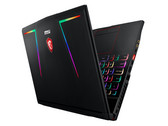
Intel Core i7-8750H, NVIDIA GeForce GTX 1070 Mobile, 15.6", 2.5 kgMSI GE63 Raider RGB 8RF (i7-8750H, GTX 1070, FHD) Laptop Review
Let there be light. MSI adorns its GE series laptops discreetly, with just some RGB lighting on the device’s display lid. The GE63 8RF Raider is equipped with Intel Coffee Lake processors, a generational improvement from its GE predecessors. Find out in this review how the GE63 8RF Raider performs, and about its fan noise, its power consumption and its battery life.
Intel Core i7-8750H, NVIDIA GeForce GTX 1070 Mobile, 15.6", 2.5 kgAlienware 15 R4: Intel Core i9-8950HK, 15.60", 3.5 kg
Review » Alienware 15 R4 (i9-8950HK, GTX 1070, FHD) Laptop Review
Eurocom Q8: Intel Core i9-8950HK, 17.30", 3 kg
Review » Eurocom Q8 (i9-8950HK, GTX 1070, QHD) Laptop Review
MSI GE73 8RF-008 Raider RGB: Intel Core i7-8750H, 17.30", 2.9 kg
Review » MSI GE73 8RF Raider RGB (i7-8750H, GTX 1070, Full-HD) Laptop Review
Acer Predator Helios 500 PH517-51-79BY: Intel Core i7-8750H, 17.30", 3.8 kg
Review » Acer Predator Helios 500 (GTX 1070, i7-8750H) Laptop Review
Aorus X5 v8: Intel Core i7-8850H, 15.60", 2.7 kg
Review » Aorus X5 v8 (i7-8850H, GTX 1070, Full HD) Laptop Review
Asus Zephyrus M GM501: Intel Core i7-8750H, 15.60", 2.5 kg
Review » Asus ROG Zephyrus M GM501 (i7-8750H, GTX 1070, Full-HD) Laptop Review
Schenker XMG Ultra 15: Intel Core i5-8600K, 15.60", 3.5 kg
Review » Schenker XMG Ultra 15 (Clevo P751TM1-G) Laptop Review
Schenker XMG Pro 17: Intel Core i7-7700HQ, 17.30", 3.1 kg
Review » Schenker Technologies XMG Pro 17 (Clevo PA71HS-G) Laptop Review
MSI GE63VR 7RF Raider: Intel Core i7-7700HQ, 15.60", 2.4 kg
Review » MSI GE63VR Raider-075 (i7-7700HQ, GTX 1070, Full HD) Laptop Review
MSI GE73VR 7RF Raider: Intel Core i7-7700HQ, 17.30", 2.9 kg
Review » MSI GE73VR 7RF Raider (i7-7700HQ, GTX 1070, Full HD) Laptop Review
Aorus X5 v7: Intel Core i7-7820HK, 15.60", 2.6 kg
Review » Aorus X5 v7 (i7-7820HK, GTX 1070, UHD) Laptop Review
Lenovo Legion Y920-17IKB: Intel Core i7-7820HK, 17.30", 4.4 kg
Review » Lenovo Legion Y920-17IKB (i7-7820HK, GTX 1070) Laptop Review
Aorus X7 v7: Intel Core i7-7820HK, 17.30", 3.4 kg
Review » Aorus X7 v7 (7820HK, GTX 1070, QHD) Laptop Review
HP Omen 17-an014ng: Intel Core i7-7700HQ, 17.30", 3.8 kg
Review » HP Omen 17 (7700HQ, GTX 1070, Full-HD) Laptop Review
Gigabyte P56XT: Intel Core i7-7700HQ, 15.60", 2.7 kg
Review » Gigabyte P56XT (7700HQ, GTX 1070, Full HD) Laptop
Eurocom Sky MX5 R3: Intel Core i7-7820HK, 15.60", 2.9 kg
Review » Eurocom Sky MX5 R3 (i7-7820HK, FHD, Clevo P650HS-G) Laptop Review
Asus G752VS-BA338T: Intel Core i7-7700HQ, 17.30", 4.5 kg
Review » Asus ROG G752VS (7700HQ, GTX 1070, FHD) Laptop Review
Acer Predator 15 G9-593-751X: Intel Core i7-7700HQ, 15.60", 3.7 kg
Review » Acer Predator 15 (7700HQ, GTX 1070, Full HD) Laptop Review
Acer Predator 17 G9-793-70PJ: Intel Core i7-7700HQ, 17.30", 4.3 kg
Review » Acer Predator 17 (7700HQ, GTX 1070, UHD) Laptop Review
Schenker XMG U507 2017: Intel Core i7-7700K, 15.60", 3.6 kg
Review » Schenker XMG U507 (Clevo P751DM2-G) Laptop Review
Asus Strix GL702VSK: Intel Core i7-7700HQ, 17.30", 2.9 kg
Review » Asus Strix GL702VS (7700HQ, FHD, GTX 1070) Xotic PC Edition Notebook Review
Nexoc G734IV: Intel Core i7-7700HQ, 17.30", 3.3 kg
Review » Nexoc G734IV (Clevo P670HS-G) Notebook Review
Alienware 15 R3: Intel Core i7-7700HQ, 15.60", 3.5 kg
Review » Alienware 15 R3 Notebook Review
MSI GT62VR 7RE-223: Intel Core i7-7700HQ, 15.60", 2.9 kg
Review » MSI GT62VR 7RE Dominator Pro Notebook Review
Gigabyte P57X v7: Intel Core i7-7700HQ, 17.30", 3.4 kg
Review » Gigabyte P57X v7 Gaming Notebook Review
Schenker XMG P507 PRO: Intel Core i7-7700HQ, 15.60", 2.9 kg
Review » Schenker XMG P507 (Clevo P651HS-G) Notebook Review
MSI GT72VR 7RE-433: Intel Core i7-7700HQ, 17.30", 3.8 kg
Review » MSI GT72VR 7RE Dominator Pro Notebook Review
Eurocom Tornado F5: Intel Core i7-7700K, 15.60", 3.1 kg
Review » Eurocom Tornado F5 Notebook Review
Acer Predator 15 G9-593-765Q: Intel Core i7-6700HQ, 15.60", 3.7 kg
Review » Acer Predator 15 G9-593 Notebook Review
EVGA SC17 GTX 1070: Intel Core i7-6820HK, 17.30", 4.1 kg
Review » EVGA SC17 GTX 1070 Notebook Review
Aorus X7 v6: Intel Core i7-6820HK, 17.30", 3.2 kg
Review » Aorus X7 v6 Notebook Review
HP Omen 17-w110ng: Intel Core i7-6700HQ, 17.30", 3.3 kg
Review » HP Omen 17 (i7-6700HQ, GTX 1070) Notebook Review
Aorus X5 v6: Intel Core i7-6820HK, 15.60", 2.6 kg
Review » Aorus X5 v6 Notebook Review
Gigabyte P57X v6: Intel Core i7-6700HQ, 17.30", 3.2 kg
Review » Gigabyte P57X v6 Notebook Review
Nexoc G734III: Intel Core i7-6700HQ, 17.30", 3.3 kg
Review » Nexoc G734III (Clevo P670RS-G) Notebook Review
Acer Predator 17 G9-793-77LG: Intel Core i7-6700HQ, 17.30", 4.2 kg
Review » Acer Predator 17 G9-793 Notebook Review
MSI GT73VR-6RE16SR451: Intel Core i7-6820HK, 17.30", 4.1 kg
Review » MSI GT73VR 6RE Titan Notebook Review
Asus Strix GL502VS-FY032T: Intel Core i7-6700HQ, 15.60", 2.6 kg
Review » Asus ROG Strix GL502VS Notebook Review
Asus G752VS-XB78K: Intel Core i7-6820HK, 17.30", 4.5 kg
Review » Asus ROG G752VS Notebook Review
MSI GT72VR 6RE-015US: Intel Core i7-6700HQ, 17.30", 3.9 kg
Review » MSI GT72VR 6RE-015US Notebook Review
MSI GT62VR-6RE16H21: Intel Core i7-6700HQ, 15.60", 2.9 kg
Review » MSI GT62VR 6RE Dominator Pro Notebook Review
Acer Predator Helios 500 PH517-51-79T5: Intel Core i7-8750H, 17.30", 4 kg
External Review » Acer Predator Helios 500 PH517-51-79T5
HP Omen 17-an105ns: Intel Core i7-8750H, 17.30", 3.8 kg
External Review » HP OMEN 17-an105ns
HP Omen 15-dc0006ur: Intel Core i7-8750H, 15.60", 2.5 kg
External Review » HP Omen 15-dc0006ur
MSI GE63 Raider 8RF-040ES: Intel Core i7-8750H, 15.60", 2.4 kg
External Review » MSI GE63 Raider 8RF-040ES
Medion Erazer X7861: Intel Core i7-8750H, 17.30", 3.4 kg
External Review » Medion Erazer X7861
Acer Predator Helios 500 PH517-51-960K: Intel Core i9-8950HK, 17.30", 4 kg
External Review » Acer Predator Helios 500 PH517-51-960K
MSI P65 Creator 8RF-442: Intel Core i7-8750H, 15.60", 1.9 kg
External Review » MSI P65 Creator 8RF-442
Origin PC EVO-17S, GTX 1070, i9-8950HK: Intel Core i9-8950HK, 17.30", 3 kg
External Review » Origin PC EVO-17S, GTX 1070, i9-8950HK
HP Omen 15-dc0805no: Intel Core i7-8750H, 15.60", 2.5 kg
External Review » HP Omen 15-dc0805no
Acer Predator Helios 500 517-51-59BH: Intel Core i7-8750H, 17.30", 4 kg
External Review » Acer Predator Helios 500 517-51-59BH
MSI GE73 Raider 8RF-029ES: Intel Core i7-8750H, 17.30", 2.8 kg
External Review » MSI GE73 Raider 8RF-029ES
MSI GE75 Raider 8RF-012XES: Intel Core i7-8750H, 17.30", 2.6 kg
External Review » MSI GE75 Raider 8RF-012XES
Alienware M15, GTX 1070: Intel Core i7-8750H, 15.60", 2.2 kg
External Review » Alienware M15, GTX 1070
Acer Predator Helios 500 PH517-51-98Y7: Intel Core i9-8950HK, 17.30", 4 kg
External Review » Acer Predator Helios 500 PH517-51-98Y7
MSI GS73 Stealth 8RF-007XES: Intel Core i3-7020U, 17.30", 2.4 kg
External Review » MSI GS73 Stealth 8RF-007XES
Asus Strix Scar II GL504GS-ES082T: Intel Core i7-8750H, 15.60", 2.5 kg
External Review » Asus Strix Scar II GL504GS-ES082T
Acer Predator Helios 500 PH517-51-90BK: Intel Core i9-8950HK, 17.30", 3.8 kg
External Review » Acer Predator Helios 500 PH517-51-90BK
Medion Erazer X7853-MD60707: Intel Core i7-7700HQ, 17.30", 3.8 kg
External Review » Medion Erazer X7853-MD60707
Medion Erazer X7853-MD60709: Intel Core i7-7820HK, 17.30", 3.5 kg
External Review » Medion Erazer X7853-MD60709
Alienware 17 R5: Intel Core i7-8750H, 17.30", 4.4 kg
External Review » Alienware 17 R5
Asus ROG Strix Scar II GL504GS-ES056T: Intel Core i7-8750H, 15.60", 2.4 kg
External Review » Asus ROG Strix Scar II GL504GS-ES056T
MSI GS65 Stealth Thin 8RF-086TR: Intel Core i7-8750H, 15.60", 1.9 kg
External Review » MSI GS65 Stealth Thin 8RF-086TR
HP Omen 17-an113NS: Intel Core i7-8750H, 17.30", 3.8 kg
External Review » HP Omen 17-AN113NS
MSI GT62VR 7RE-456XES: Intel Core i7-7700HQ, 15.60", 2.9 kg
External Review » MSI GT62VR 7RE-456XES
HP Omen 17-an104nd: Intel Core i7-8750H, 17.30", 3.8 kg
External Review » HP Omen 17-an104nd
HP Omen 15-dc0982nd: Intel Core i7-8750H, 15.60", 2.4 kg
External Review » HP Omen 15-dc0982nd
Acer Predator Helios 500 PH517-51-72NU: Intel Core i7-8750H, 17.30", 3.8 kg
External Review » Acer Predator Helios 500 PH517-51-72NU
Asus Zephyrus M GM501GS-EI004T: Intel Core i7-8750H, 15.60", 2.5 kg
External Review » Asus Zephyrus M GM501GS-EI004T
MSI Raider GE73VR 7RF-258XES: Intel Core i7-7700HQ, 17.30", 2.8 kg
External Review » MSI Raider GE73VR 7RF-258XES
MSI Raider GE63VR 7RF-227XES: Intel Core i7-7700HQ, 15.60", 2 kg
External Review » MSI Raider GE63VR 7RF-227XES
MSI GS63VR 7RG-084XES: Intel Core i7-7700HQ, 15.60", 1.8 kg
External Review » MSI GS63VR 7RG-084XES
Alienware 15 R4: Intel Core i9-8950HK, 15.60", 3.5 kg
External Review » Alienware 15 R4
Asus ROG Strix GL504GM Scar II Edition: Intel Core i7-8750H, 15.60", 2.4 kg
External Review » Asus ROG Strix GL504GM Scar II Edition
HP Omen 15-dc0015ng: Intel Core i7-8750H, 15.60", 2.5 kg
External Review » HP Omen 15-dc0015ng
Asus Zephyrus M GM501GS-90NR0031-M00420: Intel Core i7-8750H, 15.60", 2.5 kg
External Review » Asus Zephyrus M GM501GS-90NR0031-M00420
MSI GE63 Raider RGB-010: Intel Core i7-8750H, 15.60", 2.5 kg
External Review » MSI GE63 Raider RGB-010
Alienware 15 R4-9PTN3: Intel Core i7-8750H, 15.60", 3.5 kg
External Review » Alienware 15 R4-9PTN3
Acer Predator Helios 500 PH517-51-99UR: Intel Core i9-8950HK, 17.30", 3.8 kg
External Review » Acer Predator Helios 500 PH517-51-99UR
Asus GL504GS: Intel Core i7-8750H, 15.60", 2.5 kg
External Review » Asus GL504
MSI GP73 Leopard 8RF-415XES: Intel Core i7-8750H, 17.30", 2.2 kg
External Review » MSI GP73 Leopard 8RF-415XES
MSI GS65 Stealth Thin 8RE-016NE: Intel Core i7-8750H, 15.60", 1.8 kg
External Review » MSI GS65 Stealth Thin 8RE-016NE
Lenovo Legion Y920-80YW001DGE: Intel Core i7-7820HK, 17.30", 4.5 kg
External Review » Lenovo Legion Y920-80YW001DGE
Acer Predator Helios 500 PH517-51-93LS: Intel Core i9-8950HK, 17.30", 4 kg
External Review » Acer Predator Helios 500 PH517-51-93LS
Gigabyte Aorus X5 V8 : Intel Core i7-8850H, 15.60", 2.5 kg
External Review » Gigabyte Aorus X5 V8
Asus GL703GS Strix Scar Edition 90NR00E1-M00160: Intel Core i7-8750H, 17.30", 2.9 kg
External Review » Asus GL703GS Strix Scar Edition 90NR00E1-M00160
MSI GE63 Raider RGB 8RF-039XES: Intel Core i7-8750H, 15.60", 2.5 kg
External Review » MSI GE63 Raider RGB 8RF-039XES
MSI GF72 7RE-1055XES: Intel Core i7-7700HQ, 17.30", 2.7 kg
External Review » MSI GF72 7RE-1055XES
Asus GL502VS-GZ226T: Intel Core i7-7700HQ, 15.60", 2.3 kg
External Review » Asus GL502VS-GZ226T
MSI GS65 8RF-040NL: Intel Core i7-8750H, 15.60", 1.9 kg
External Review » MSI GS65 8RF-040NL
Asus Zephyrus GM501G: Intel Core i7-8750H, 15.60", 2.5 kg
External Review » Asus Zephyrus GM501G
MSI GE73 8RF-211DE - Raider RGB: Intel Core i7-8750H, 17.30", 2.9 kg
External Review » MSI GE73 8RF-211DE - Raider RGB
HP Omen X 17-ap000nf: Intel Core i7-7820HK, 17.30", 4.4 kg
External Review » HP Omen X 17-ap000nf
Acer Predator Helios 500 PH517-51-79BY: Intel Core i7-8750H, 17.30", 3.8 kg
External Review » Acer Predator Helios 500 PH517-51-79BY
MSI GE73 8RF-008 Raider RGB: Intel Core i7-8750H, 17.30", 2.9 kg
External Review » MSI GE73 8RF-008 Raider RGB
MSI GE73-008 8RF Raider RGB: Intel Core i7-8750H, 17.30", 2.9 kg
External Review » MSI GE73-008 8RF Raider RGB
Aorus X5 v8: Intel Core i7-8850H, 15.60", 2.7 kg
External Review » Aorus X5 v8
Asus G752VS-GC310T: Intel Core i7-7700HQ, 17.30", 4.3 kg
External Review » Asus G752VS-GC310T
MSI GE63 Raider RGB 8RF-008: Intel Core i7-8750H, 15.60", 2.5 kg
External Review » MSI GE63 Raider 8RF-008
Asus Zephyrus M GM501: Intel Core i7-8750H, 15.60", 2.5 kg
External Review » Asus Zephyrus M GM501
MSI GE63VR 7RF-252XES: Intel Core i7-7700HQ, 15.60", 2.4 kg
External Review » MSI GE63VR 7RF-252XES
Aorus X9 v7: Intel Core i7-7820HQ, 17.30", 3.6 kg
External Review » Aorus X9 v7
HP Omen 17-an014ng: Intel Core i7-7700HQ, 17.30", 3.8 kg
External Review » HP Omen 17-an014ng
MSI GE63VR Raider 4K-212: Intel Core i7-7700HQ, 15.60", 2.4 kg
External Review » MSI GE63VR Raider 4K-212
MSI GE63VR Raider-213: Intel Core i7-7700HQ, 15.60", 2.4 kg
External Review » MSI GE63VR Raider-213
Asus GL503VS-EI011T Strix Scar Edition: Intel Core i7-7700HQ, 15.60", 2.5 kg
External Review » Asus GL503VS-EI011T Strix Scar Edition
HP Omen 17-an090nz: Intel Core i7-7700HQ, 17.30", 3.8 kg
External Review » HP Omen 17-an090nz
Asus Strix GL503VS-DH74 Scar Edition: Intel Core i7-7700HQ, 15.60", 2.4 kg
External Review » Asus Strix GL503VS-DH74 Scar Edition
HP Omen 17-an010ns: Intel Core i7-7700HQ, 17.30", 3.8 kg
External Review » HP OMEN 17-an010ns
HP Omen 17-an009tx: Intel Core i7-7700HQ, 17.30", 3.8 kg
External Review » HP Omen 17-an009tx
MSI GS63VR Stealth Pro-078: Intel Core i7-7700HQ, 15.60", 1.8 kg
External Review » MSI GS63VR Stealth Pro-078
MSI GE63VR 7RF-039 Raider: Intel Core i7-7700HQ, 15.60", 2.2 kg
External Review » MSI GE63VR 7RF-039 Raider
HP Omen X 17-ap000na: Intel Core i7-7820HK, 17.30", 4.5 kg
External Review » HP Omen X 17-ap000na
Asus Strix GL503VS-EI012T: Intel Core i7-7700HQ, 15.60", 2.5 kg
External Review » Asus Strix GL503VS-EI012T
MSI GT72VR 7RE-629XES Dominator Pro: Intel Core i7-7700HQ, 17.30", 3.8 kg
External Review » MSI GT72VR 7RE-629XES Dominator Pro
MSI GT72VR 7RE-487FR Dominator Pro Dragon Edition: Intel Core i7-7820HK, 17.30", 3.8 kg
External Review » MSI GT72VR 7RE-487FR Dominator Pro Dragon Edition
Alienware 17 R4-A17-0289: Intel Core i7-7700HQ, 17.30", 4.4 kg
External Review » Alienware 17 R4-A17-0289
MSI GT75VR 7RE Titan-018AU: Intel Core i7-7700HQ, 17.30", 4.5 kg
External Review » MSI GT75VR 7RE Titan-018AU
MSI GE63VR-001 Raider: Intel Core i7-7700HQ, 15.60", 2.4 kg
External Review » MSI GE63VR-001 Raider
MSI GT73VR 6RE-053NL: Intel Core i7-6820HK, 17.30", 3.9 kg
External Review » MSI GT73VR 6RE-053NL
Asus GL502VS-FY313T: Intel Core i7-7700HQ, 15.60", 2.3 kg
External Review » Asus GL502VS-FY313T
MSI GE72MVR 7RG-050XES: Intel Core i7-7700HQ, 17.30", 2.9 kg
External Review » MSI GE72MVR 7RG-050XES
MSI GE73VR 7RF-031ES: Intel Core i7-7700HQ, 17.30", 2.8 kg
External Review » MSI GE73VR 7RF-031ES
MSI GE63VR 7RF-005NL: Intel Core i7-7700HQ, 15.60", 2.2 kg
External Review » MSI GE63VR 7RF-005NL
Medion Erazer X7853: Intel Core i7-7700HQ, 17.30", 3.5 kg
External Review » Medion Erazer X7853
Aorus X5 V7-KL3K3D: Intel Core i7-7820HK, 15.60", 2.5 kg
External Review » Aorus X5 V7-KL3K3D
Medion Erazer X7857: Intel Core i7-7820HK, 17.30", 3.1 kg
External Review » Medion Erazer X7857
Lenovo Legion Y920-17IKB 80YW0009RK: Intel Core i7-7700HQ, 17.30", 4.4 kg
External Review » Lenovo Legion Y920-17IKB 80YW0009RK
Asus G752VS-BA263T: Intel Core i7-7700HQ, 17.30", 4.4 kg
External Review » Asus G752VS-BA263T
Aorus X7 v7: Intel Core i7-7820HK, 17.30", 3.4 kg
External Review » Aorus X7 v7
MSI GE73VR 7RF-039 Raider: Intel Core i7-7700HQ, 17.30", 2.8 kg
External Review » MSI GE73VR 7RF-039 Raider
MSI GE62MVR 7RG-033XES: Intel Core i7-7700HQ, 15.60", 2.3 kg
External Review » MSI GE62MVR 7RG-033XES
MSI GE73VR 7RE Raider-042: Intel Core i7-7700HQ, 17.30", 2.8 kg
External Review » MSI GE73VR 7RE Raider-042
MSI GE72MVR 7RE Apache Pro-044: Intel Core i7-7700HQ, 17.30", 2.7 kg
External Review » MSI GE72MVR 7RE Apache Pro-044
MSI GE63VR 7RF-014CZ: Intel Core i7-7700HQ, 15.60", 2.4 kg
External Review » MSI GE63VR 7RF-014CZ
HP Omen 17-w200nu: Intel Core i7-7700HQ, 17.30", 3.4 kg
External Review » HP Omen 17-w200nu
Aorus X5 v7: Intel Core i7-7820HK, 15.60", 2.6 kg
External Review » Aorus X5 v7
Medion Erazer X7849-MD60426: Intel Core i7-6700HQ, 17.30", 3.5 kg
External Review » Medion Erazer X7849-MD60426
Gigabyte P56XT: Intel Core i7-7700HQ, 15.60", 2.7 kg
External Review » Gigabyte P56XT
MSI GE63VR 7RF Raider: Intel Core i7-7700HQ, 15.60", 2.4 kg
External Review » MSI GE63VR 7RF Raider
Acer Predator 17 G9-793-718K: Intel Core i7-7700HQ, 17.30", 3.9 kg
External Review » Acer Predator 17 G9-793-718K
Alienware 15 R3-A571610S2NDW-61: Intel Core i7-6700HQ, 15.60", 3.5 kg
External Review » Alienware 15 R3-A571610S2NDW-61
EVGA SC17 GTX 1070: Intel Core i7-6820HK, 17.30", 4.1 kg
External Review » EVGA SC17 GTX 1070
Asus Strix GL502VS-FY030T: Intel Core i7-6700HQ, 15.60", 2.6 kg
External Review » Asus Strix GL502VS-FY030T
HP Omen 17-an016ng: Intel Core i7-7700HQ, 17.30", 3.8 kg
External Review » HP Omen 17-an016ng
Lenovo Legion Y920-17IKB: Intel Core i7-7820HK, 17.30", 4.4 kg
External Review » Lenovo Legion Y920-17IKB
MSI GE73VR 7RF Raider: Intel Core i7-7700HQ, 17.30", 2.9 kg
External Review » MSI GE73VR 7RF Raider
Asus GL702VS-GC095T: Intel Core i7-7700HQ, 17.30", 2.9 kg
External Review » Asus GL702VS-GC095T
HP Omen 17-an015ng: Intel Core i7-7700HQ, 17.30", 3.8 kg
External Review » HP Omen 17-an015ng
Alienware 15 R3 (2016): Intel Core i7-6820HK, 15.60", 3.5 kg
External Review » Alienware 15 R3 (2016)
Acer Predator 15 G9-593-74BY: Intel Core i7-6700HQ, 15.60", 3.7 kg
External Review » Acer Predator 15 G9-593-74BY
Lenovo Legion Y920: Intel Core i7-7820HK, 17.30", 4.6 kg
External Review » Lenovo Legion Y920
MSI GT72VR 6RE-266NL: Intel Core i7-6820HK, 17.30", 3.8 kg
External Review » MSI GT72VR 6RE-266NL
MSI GE72MVR 7RG-046: Intel Core i7-7700HQ, 17.30", 2.7 kg
External Review » MSI GE72MVR 7RG-046
MSI GS63VR 7RG-006DE: Intel Core i7-7700HQ, 15.60", 1.8 kg
External Review » MSI GS63VR 7RG-006DE
HP Omen 17-w216ng: Intel Core i7-7700HQ, 17.30", 3.4 kg
External Review » HP Omen 17-w216ng
Asus G752VS-GC074T: Intel Core i7-6700HQ, 17.30", 4.5 kg
External Review » Asus G752VS-GC074T
HP Omen 17-w107ng: Intel Core i7-6700HQ, 17.30", 3.4 kg
External Review » HP Omen 17-w107ng
HP Omen 17-w270nd: Intel Core i7-7700HQ, 17.30", 3.4 kg
External Review » HP Omen 17-w270nd
HP Omen 17-w201ns: Intel Core i7-7700HQ, 17.30", 3.4 kg
External Review » HP Omen 17-w201ns
MSI GE62MVR 7RG-012 Apache Pro: Intel Core i7-7700HQ, 15.60", 2.4 kg
External Review » MSI GE62MVR 7RG-012 Apache Pro
Asus Strix GL702VSK: Intel Core i7-7700HQ, 17.30", 2.9 kg
External Review » Asus Strix GL702VSK
HP Omen 17-w203no: Intel Core i7-7700HQ, 17.30", 3.4 kg
External Review » HP Omen 17-w203no
MSI GT62VR 7RE-246XES: Intel Core i7-7700HQ, 15.60", 2.9 kg
External Review » MSI GT62VR 7RE-246XES
HP Omen 17-w120no: Intel Core i7-6700HQ, 17.30", 3.3 kg
External Review » HP Omen 17-w120no
HP Omen 17-w110ng: Intel Core i7-6700HQ, 17.30", 3.3 kg
External Review » HP Omen 17-w110ng
HP Omen 17-w172nw: Intel Core i7-6700HQ, 17.30", 3.4 kg
External Review » HP Omen 17-w172nw
Asus G752VSK-77B07SB1: Intel Core i7-7700HQ, 17.30", 3.9 kg
External Review » Asus G752VSK-77B07SB1
MSI GT72VR 7RE-469XTR Dominator Pro: Intel Core i7-7700HQ, 17.30", 3.8 kg
External Review » MSI GT72VR 7RE-469XTR Dominator Pro
MSI GT62VR Dominator Pro-238: Intel Core i7-7700HQ, 15.60", 2.9 kg
External Review » MSI GT62VR Dominator Pro-238
Eurocom Sky X4E2: Intel Core i7-7700K, 15.60", 3.4 kg
External Review » Eurocom Sky X4E2
HP Omen 17-w250tx: Intel Core i7-7700HQ, 17.30", 3.4 kg
External Review » HP Omen 17-w250tx
HP Omen 17-w106na: Intel Core i7-6700HQ, 17.30", 2.8 kg
External Review » HP Omen 17-w106na
MSI GE72MVR 7RG-008: Intel Core i7-7700HQ, 17.30", 2.7 kg
External Review » MSI GE72MVR 7RG-008
HP Omen 17-w212ng: Intel Core i7-7700HQ, 17.30", 3.4 kg
External Review » HP Omen 17-w212ng
MSI GT72VR 7RE Dominator Pro 483RU: Intel Core i7-7700HQ, 17.30", 3.8 kg
External Review » MSI GT72VR 7RE Dominator Pro 483RU
Asus Strix GL502VS-GZ120T: Intel Core i7-7700HQ, 15.60", 2.3 kg
External Review » Asus Strix GL502VS-GZ120T
HP Omen 17-w100nc: Intel Core i7-6700HQ, 17.30", 3.4 kg
External Review » HP Omen 17-w100nc
Alienware 15 R3: Intel Core i7-7700HQ, 15.60", 3.5 kg
External Review » Alienware 15 R3
Gigabyte P57X v7: Intel Core i7-7700HQ, 17.30", 3.4 kg
External Review » Gigabyte P57X v7
Acer Predator 17 G9-793-76Z1: Intel Core i7-6700HQ, 17.30", 4.4 kg
External Review » Acer Predator 17 G9-793-76Z1
Asus GL502VS-DS71: Intel Core i7-7700HQ, 15.60", 2.2 kg
External Review » Asus GL502VS-DS71
Asus G752VS-XS74K: Intel Core i7-7820HK, 17.30", 4.3 kg
External Review » Asus G752VS-XS74K
Acer Predator 17 G9-793-78RN: Intel Core i7-6700HQ, 17.30", 4.2 kg
External Review » Acer Predator 17 G9-793-78RN
HP Omen 17-w102nl: Intel Core i7-6700HQ, 17.30", 3.4 kg
External Review » HP Omen 17-w102nl
Acer Predator 15 G9-593-71EB: Intel Core i7-7700HQ, 15.60", 3.6 kg
External Review » Acer Predator 15 G9-593-71EB
Acer Predator 17 G9-793-71A3: Intel Core i7-6700HQ, 17.30", 4.2 kg
External Review » Acer Predator 17 G9-793-71A3
MSI GT62VR 7RE-261RU Dominator Pro: Intel Core i7-7700HQ, 15.60", 2.9 kg
External Review » MSI GT62VR 7RE-261RU Dominator Pro
Asus G752VS (KBL)-BA326T: Intel Core i7-7700HQ, 17.30", 4.3 kg
External Review » Asus G752VS (KBL)-BA326T
Asus Strix GL502VS-FY038T: Intel Core i7-6700HQ, 15.60", 2.2 kg
External Review » Asus Strix GL502VS-FY038T
HP Omen 17-w240ng: Intel Core i7-7700HQ, 17.30", 3.4 kg
External Review » HP Omen 17-w240ng
MSI GT72VR 7RE-461XES: Intel Core i7-7700HQ, 17.30", 3.8 kg
External Review » MSI GT72VR 7RE-461XES
Eurocom Tornado F5: Intel Core i7-7700K, 15.60", 3.1 kg
External Review » Eurocom Tornado F5
MSI GT73VR 7RE Titan - 7RE-298: Intel Core i7-7820HK, 17.30", 4.1 kg
External Review » MSI GT73VR 7RE Titan - 7RE-298
MSI GT72VR 7RE-433: Intel Core i7-7700HQ, 17.30", 3.8 kg
External Review » MSI GT72VR 7RE-433
Asus Strix GL502VS-FY030D: Intel Core i7-6700HQ, 15.60", 2.6 kg
External Review » Asus Strix GL502VS-FY030D
Asus G752VS-GC087T: Intel Core i7-6700HQ, 17.30", 4.4 kg
External Review » Asus G752VS-GC087T
MSI GT62VR 7RE Dominator Pro - 7RE-223: Intel Core i7-7700HQ, 15.60", 2.9 kg
External Review » MSI GT62VR 7RE Dominator Pro - 7RE-223
Alienware 17 R4-HID55-AUK2: Intel Core i7-6820HK, 17.30", 4.4 kg
External Review » Alienware 17 R4-HID55-AUK2
HP Omen 17-w109ng: Intel Core i7-6700HQ, 17.30", 3.3 kg
External Review » HP Omen 17-w109ng
Medion Erazer X7849-MD60291: Intel Core i7-6700HQ, 17.30", 3.5 kg
External Review » Medion Erazer X7849-MD60291
Gigabyte P35X v6-DE022T: Intel Core i7-6700HQ, 15.60", 2.4 kg
External Review » Gigabyte P35X v6-DE022T
Asus G752VS-GC064T: Intel Core i7-6700HQ, 17.30", 4 kg
External Review » Asus G752VS-GC064T
HP Omen 17-w103nf: Intel Core i7-6700HQ, 17.30", 3.4 kg
External Review » HP Omen 17-w103nf
Acer Predator 17 G9-793-78AU: Intel Core i7-6700HQ, 17.30", 4.2 kg
External Review » Acer Predator 17 G9-793-78AU
MSI GT73VR 6RE-030PL: Intel Core i7-6820HK, 17.30", 4.1 kg
External Review » MSI GT73VR 6RE-030PL
HP Omen 17-w104ns: Intel Core i7-6700HQ, 17.30", 3.4 kg
External Review » HP Omen 17-w104ns
Asus G752VS-GC003T: Intel Core i7-6700HQ, 17.30", 4.3 kg
External Review » Asus G752VS-GC003T
Gigabyte P57X v6: Intel Core i7-6700HQ, 17.30", 3.2 kg
External Review » Gigabyte P57X v6
Alienware 15 R3-10881SLV: Intel Core i7-6700HQ, 15.60", 3.5 kg
External Review » Alienware 15 R3-10881SLV
Asus ROG G752VS-BA185T: Intel Core i7-6700HQ, 17.30", 4.4 kg
External Review » Asus ROG G752VS-BA185T
Aorus X7 v6: Intel Core i7-6820HK, 17.30", 3.2 kg
External Review » Aorus X7 v6
MSI GT62VR-6REAC16H21: Intel Core i7-6700HQ, 15.60", 2.9 kg
External Review » MSI GT62VR-6REAC16H21
Acer Predator 17 G9-793-79NC: Intel Core i7-6700HQ, 17.30", 4.2 kg
External Review » Acer Predator 17 G9-793-79NC
MSI GT73VR 6RE-022ES TITAN: Intel Core i7-6820HK, 17.30", 3.9 kg
External Review » MSI GT73VR 6RE-022ES TITAN
Asus G752VS-GC026T: Intel Core i7-6820HK, 17.30", 4.4 kg
External Review » Asus G752VS-GC026T
Asus Strix GL502VS-DB71: Intel Core i7-6700HQ, 15.60", 2.6 kg
External Review » Asus Strix GL502VS-DB71
Aorus X5 v6: Intel Core i7-6820HK, 15.60", 2.6 kg
External Review » Aorus X5 v6
MSI GT72VR-6REAC16H51: Intel Core i7-6700HQ, 17.30", 3.9 kg
External Review » MSI GT72VR-6REAC16H51
Asus G752VS-BA191T: Intel Core i7-6700HQ, 17.30", 4.5 kg
External Review » Asus G752VS-BA191T
HP Omen 17-w106ng: Intel Core i7-6700HQ, 17.30", 2.8 kg
External Review » HP Omen 17-w106ng
HP Omen 17-w104ng: Intel Core i7-6700HQ, 17.30", 2.8 kg
External Review » HP Omen 17-w104ng
MSI GT62VR 6RE-016NL: Intel Core i7-6820HK, 15.60", 4 kg
External Review » MSI GT62VR 6RE-016NL
Gigabyte P37X v6-DE426T: Intel Core i7-6700HQ, 17.30", 2.8 kg
External Review » Gigabyte P37X v6-DE426T
MSI GT72VR Tobii-031: Intel Core i7-6700HQ, 17.30", 3.9 kg
External Review » MSI GT72VR Tobii-031
MSI GT73VR-6RF-095FR: Intel Core i7-6820HK, 17.30", 3.9 kg
External Review » MSI GT73VR-6RF-095FR
Asus G752VS-GC123T: Intel Core i7-6700HQ, 17.30", 4.5 kg
External Review » Asus G752VS-GC123T
Acer Predator 17 G9-793-77LG: Intel Core i7-6700HQ, 17.30", 4.2 kg
External Review » Acer Predator 17 G9-793-77LG
Acer Predator 17 G9-793-70F3: Intel Core i7-6700HQ, 17.30", 4.2 kg
External Review » Acer Predator 17 G9-793-70F3
MSI GT62VR-6RE-022UK: Intel Core i7-6700HQ, 15.60", 2.9 kg
External Review » MSI GT62VR-6RE-022UK
Asus Strix GL502VS-FY042T: Intel Core i7-6700HQ, 15.60", 2.6 kg
External Review » Asus Strix GL502VS-FY042T
Lenovo Ideapad Y910: Intel Core i7-6820HK, 17.30", 4.6 kg
External Review » Lenovo Ideapad Y910
Acer Predator 15 G9-593-765Q: Intel Core i7-6700HQ, 15.60", 3.7 kg
External Review » Acer Predator 15 G9-593-765Q
MSI GT72VR-6RE16H51: Intel Core i7-6700HQ, 17.30", 3.9 kg
External Review » MSI GT72VR-6RE16H51
MSI GT72VR 6RE Dominator Pro Tobii: Intel Core i7-6700HQ, 17.30", 3.8 kg
External Review » MSI GT72VR 6RE Dominator Pro Tobii
MSI GT73VR-6RE16SR451: Intel Core i7-6820HK, 17.30", 4.1 kg
External Review » MSI GT73VR-6RE16SR451
Medion Erazer X7849 MD 60292: Intel Core i7-6820HK, 17.30", 3.6 kg
External Review » Medion Erazer X7849 MD 60292
Asus Strix GL502VS-FY032T: Intel Core i7-6700HQ, 15.60", 2.6 kg
External Review » Asus Strix GL502VS-FY032T
Gigabyte P57x V6-CF2: Intel Core i7-6700HQ, 17.30", 3 kg
External Review » Gigabyte P57x V6-CF2
Acer Predator 17 G9-793-77LN: Intel Core i7-6700HQ, 17.30", 4.2 kg
External Review » Acer Predator 17 G9-793-77LN
Gigabyte P35X v6-PC4K4D: Intel Core i7-6700HQ, 15.60", 2.3 kg
External Review » Gigabyte P35X v6-PC4K4D
MSI GT72VR 6RE-015US: Intel Core i7-6700HQ, 17.30", 3.9 kg
External Review » MSI GT72VR 6RE-015US
Asus G752VS-XB72K: Intel Core i7-6820HK, 17.30", 4.3 kg
External Review » Asus G752VS-XB72K
MSI GT62VR-6RE16H21: Intel Core i7-6700HQ, 15.60", 2.9 kg
External Review » MSI GT62VR-6RE16H21
Asus G752VS-XB78K: Intel Core i7-6820HK, 17.30", 4.5 kg
External Review » Asus G752VS-XB78K
Asus Zephyrus M GM501: Intel Core i7-8750H, 15.60", 2.5 kg
Article » Intel 'Coffee Lake-H' Performance Comparison: A worthy upgrade from 'Kaby Lake'?
MSI VR One: Intel Core i7-6820HK, 0.00", 3.6 kg
Article » MSI VR One