MSI GE63VR Raider-075 (i7-7700HQ, GTX 1070, Full HD) Laptop Review
For the original German review, click here.
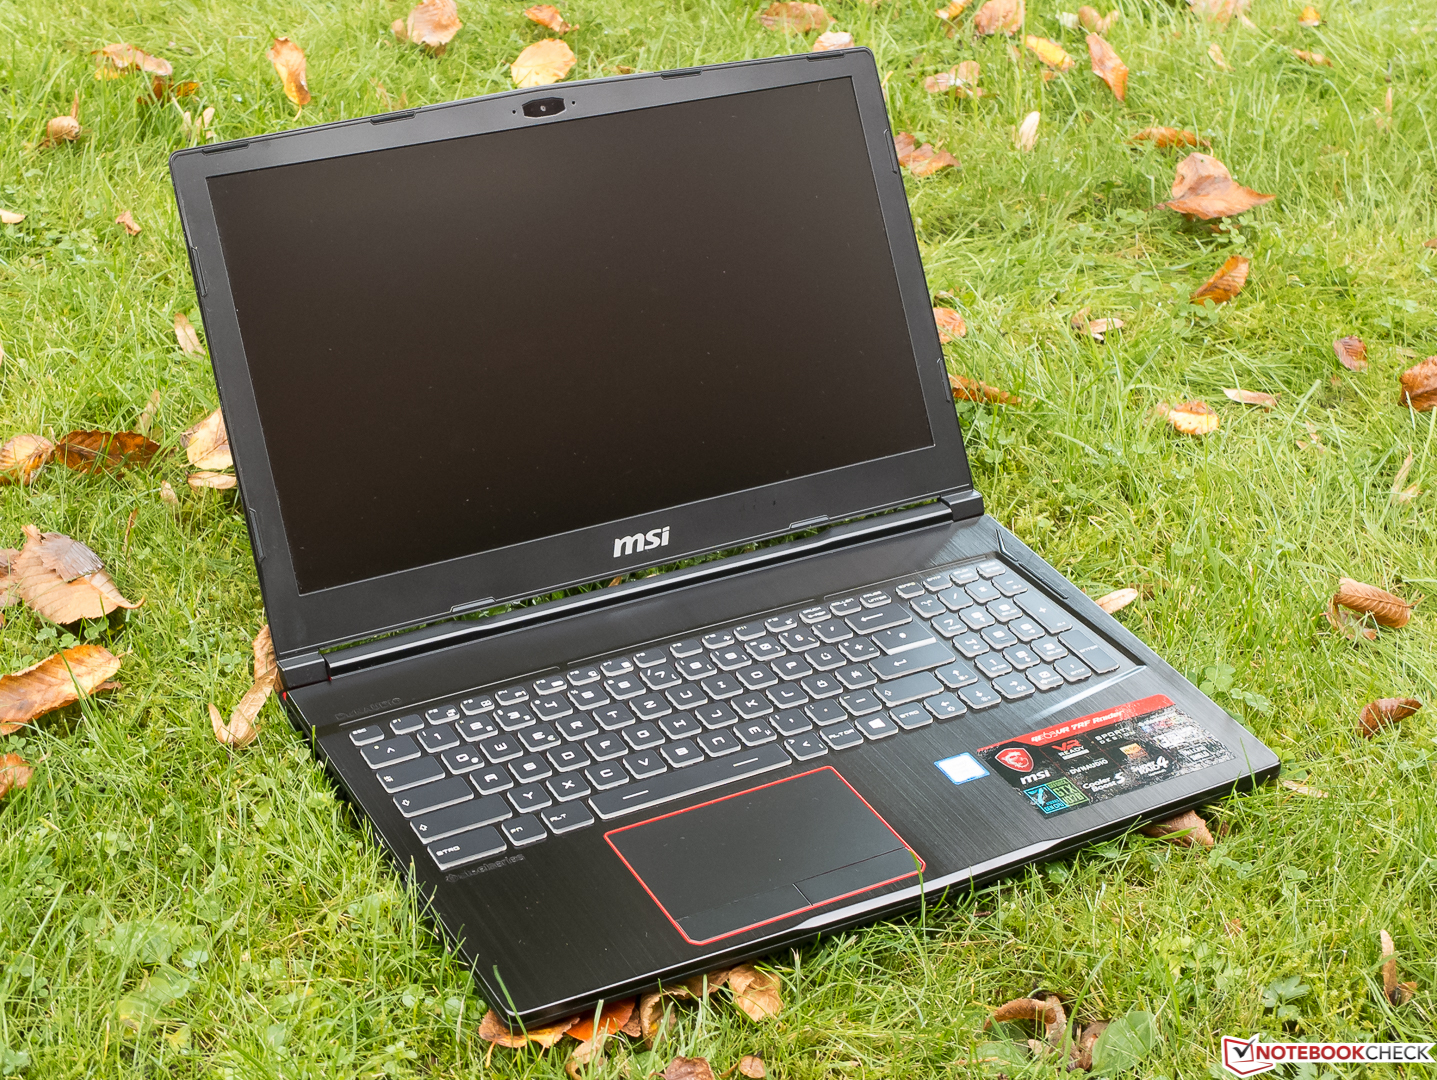
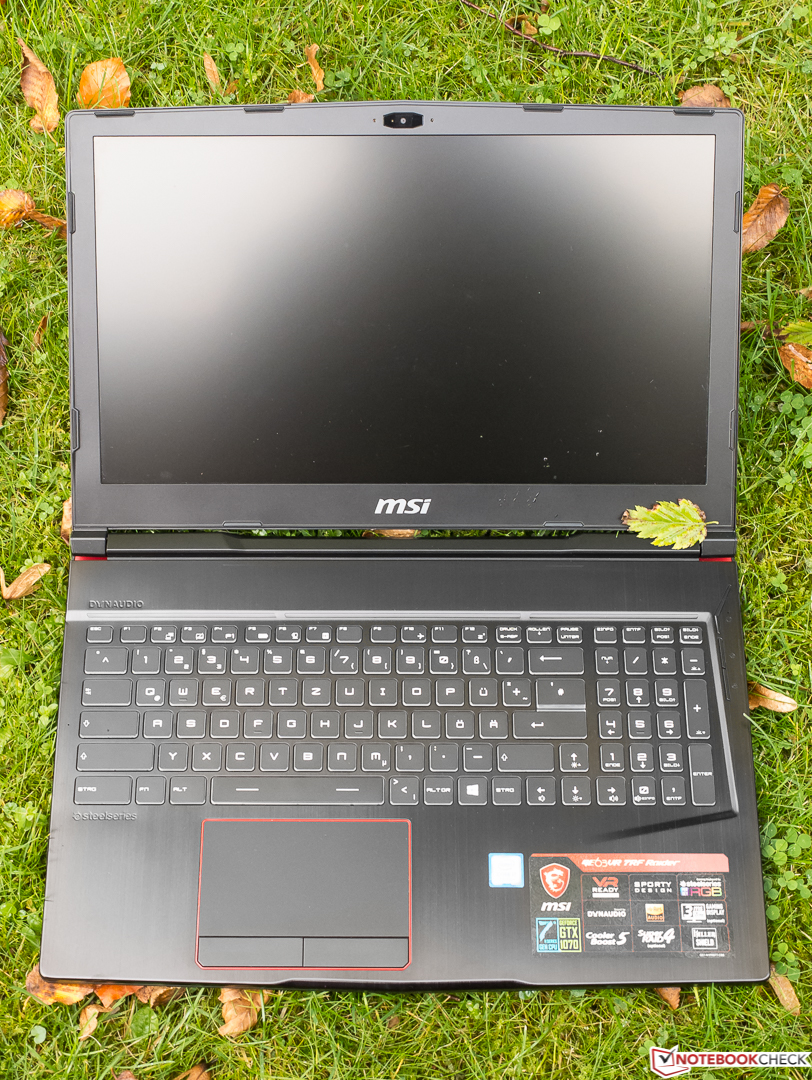
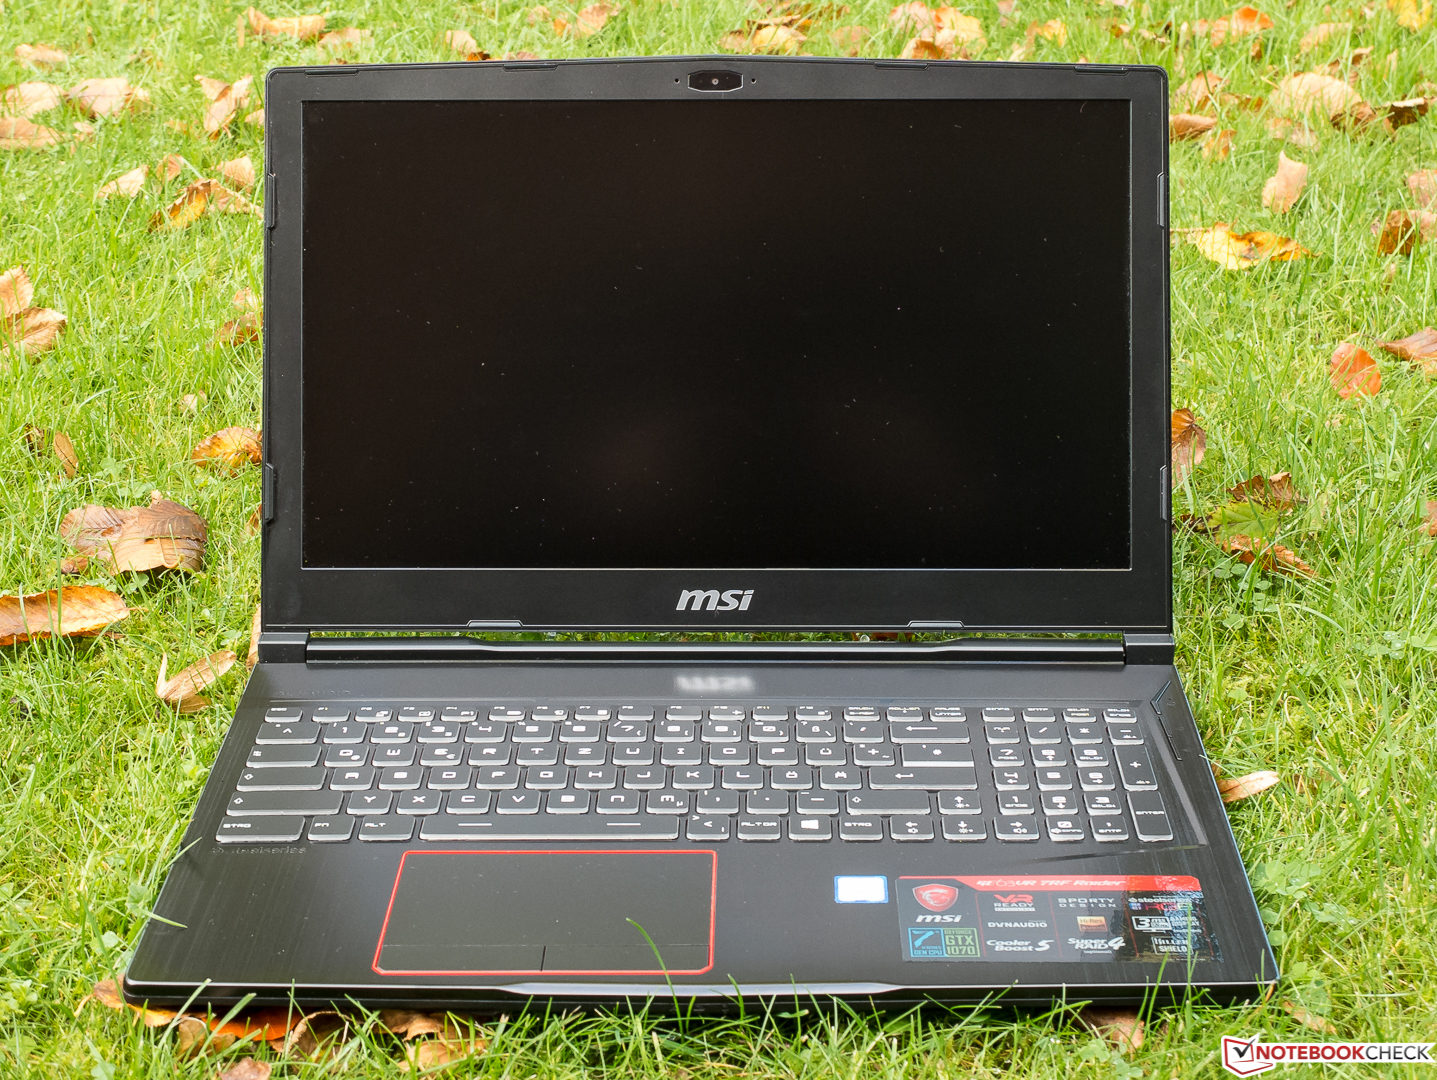
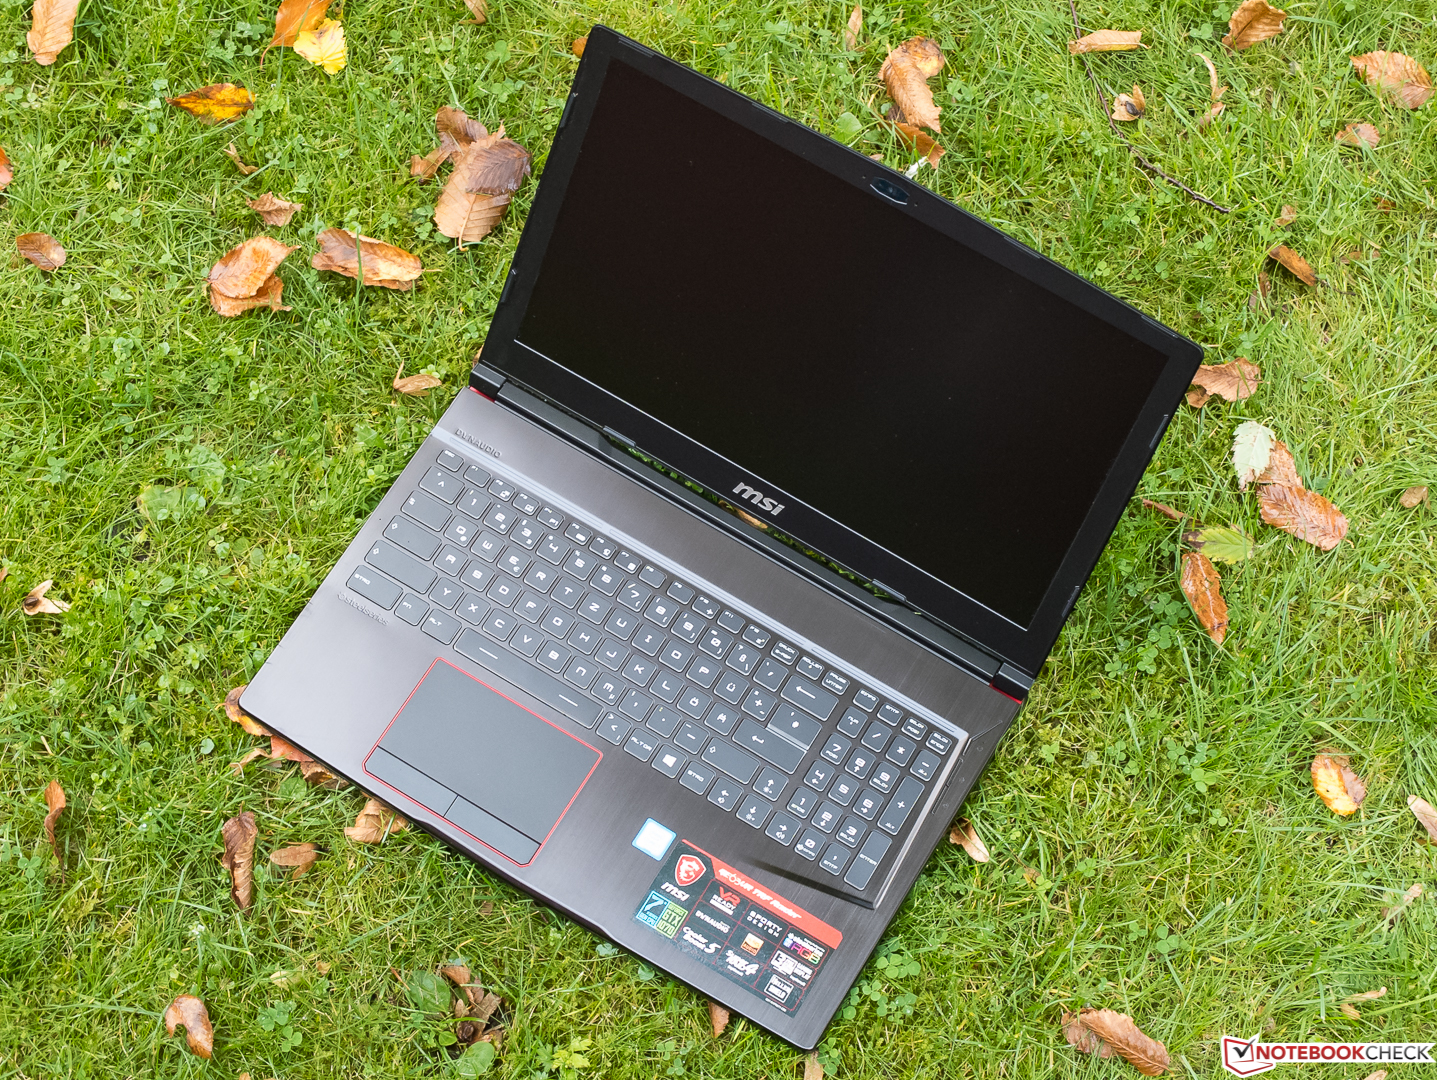
The new MSI GE63VR Raider-075 is a 15.6-inch gaming notebook that weighs about 2.4 kg (~5.3 lbs). At the time of testing, our test version was available for $1700. It is a successor of the GE62VR 6RF, another model of the affordable GE series that we reviewed in September last year.
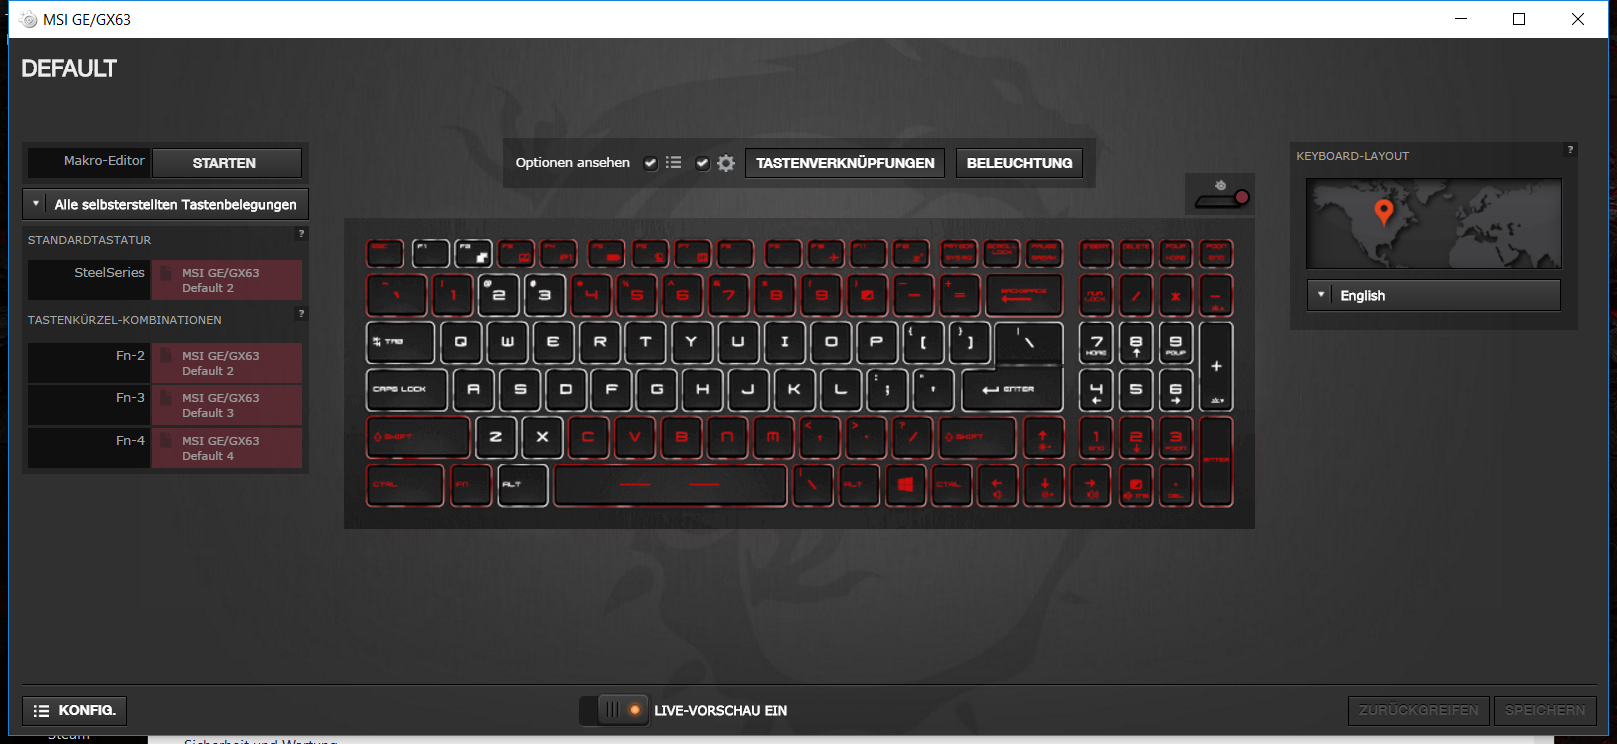
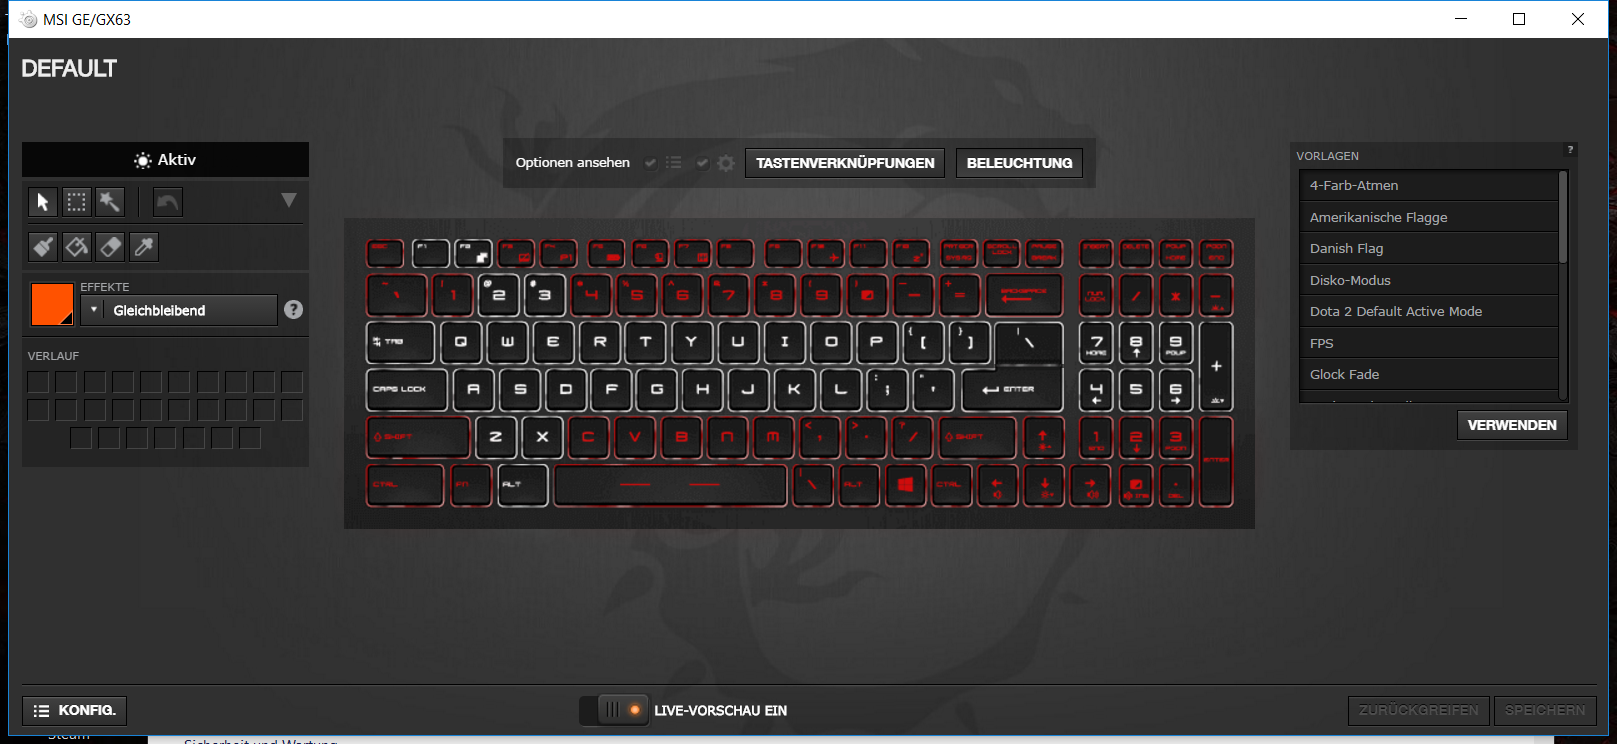
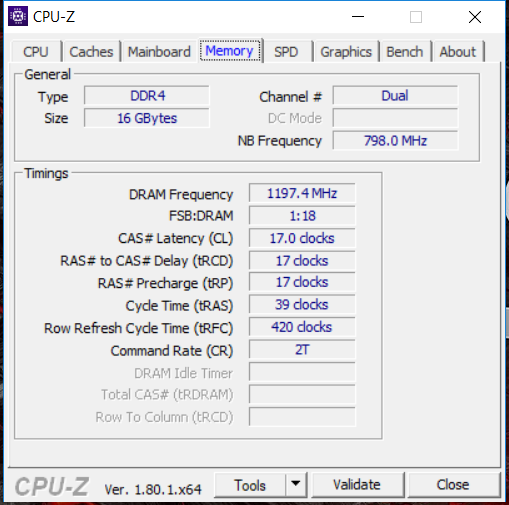
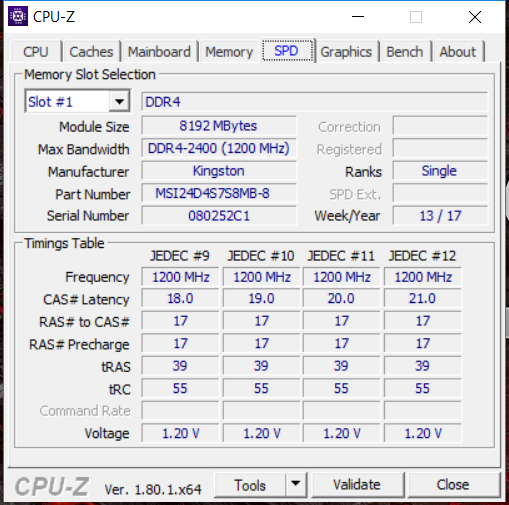
The device is powered by a quad-core Intel Core i7-7700HQ accompanied by 16 GB of DDR4 RAM and an Nvidia GeForce GTX 1070 with 8GB of dedicated VRAM. Its special feature is a 120-Hz TN screen that has chosen Nvidia Optimus technology over G-Sync. Windows 10 Home is preinstalled on the device, which is equipped with a 256-GB SSD and a 1-TB HDD. Of course, it still features a SteelSeries keyboard, with individual key backlighting instead of the successor's zoned backlighting. MSI has also installed the usual Gamer software package including Dragon Center, SteelSeries Engine and MSI True Color etc.
A large-scale Berlin-based price comparison found five alternative devices in the same price range, which are equipped with a GTX 1060 and might have different RAM, storage devices and operating systems. None of these models seem to have an IPS screen. We decided to focus on 15-inch devices with comparable configurations and a GTX 1070 (Max-Q) for this review. The chosen devices are:
Case
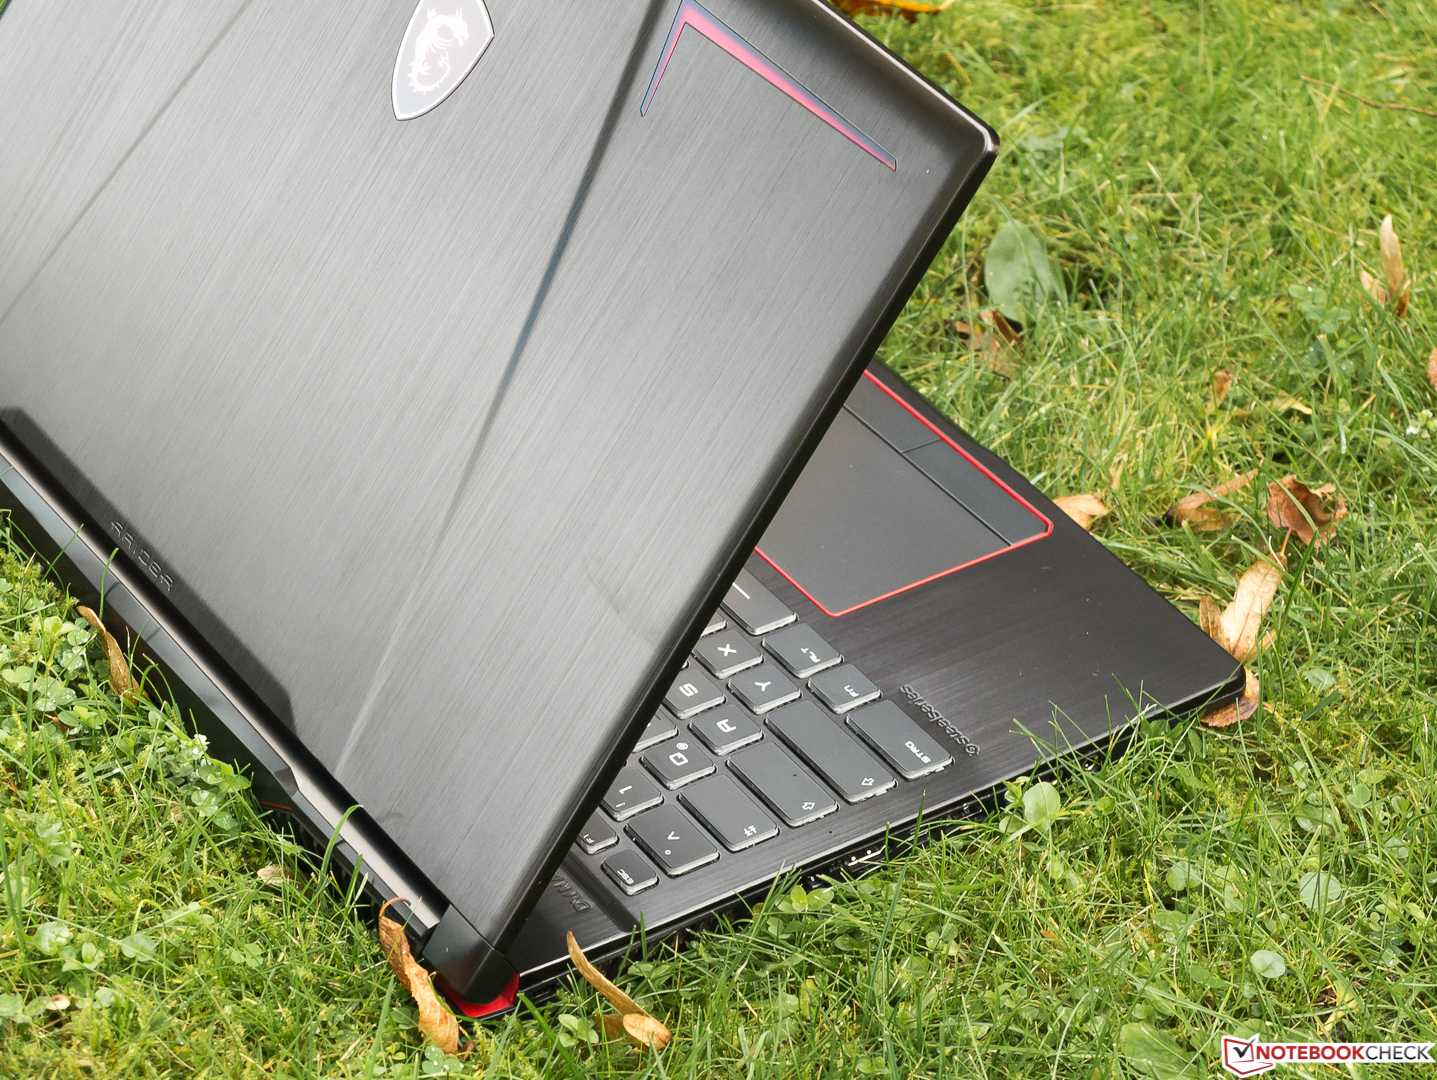
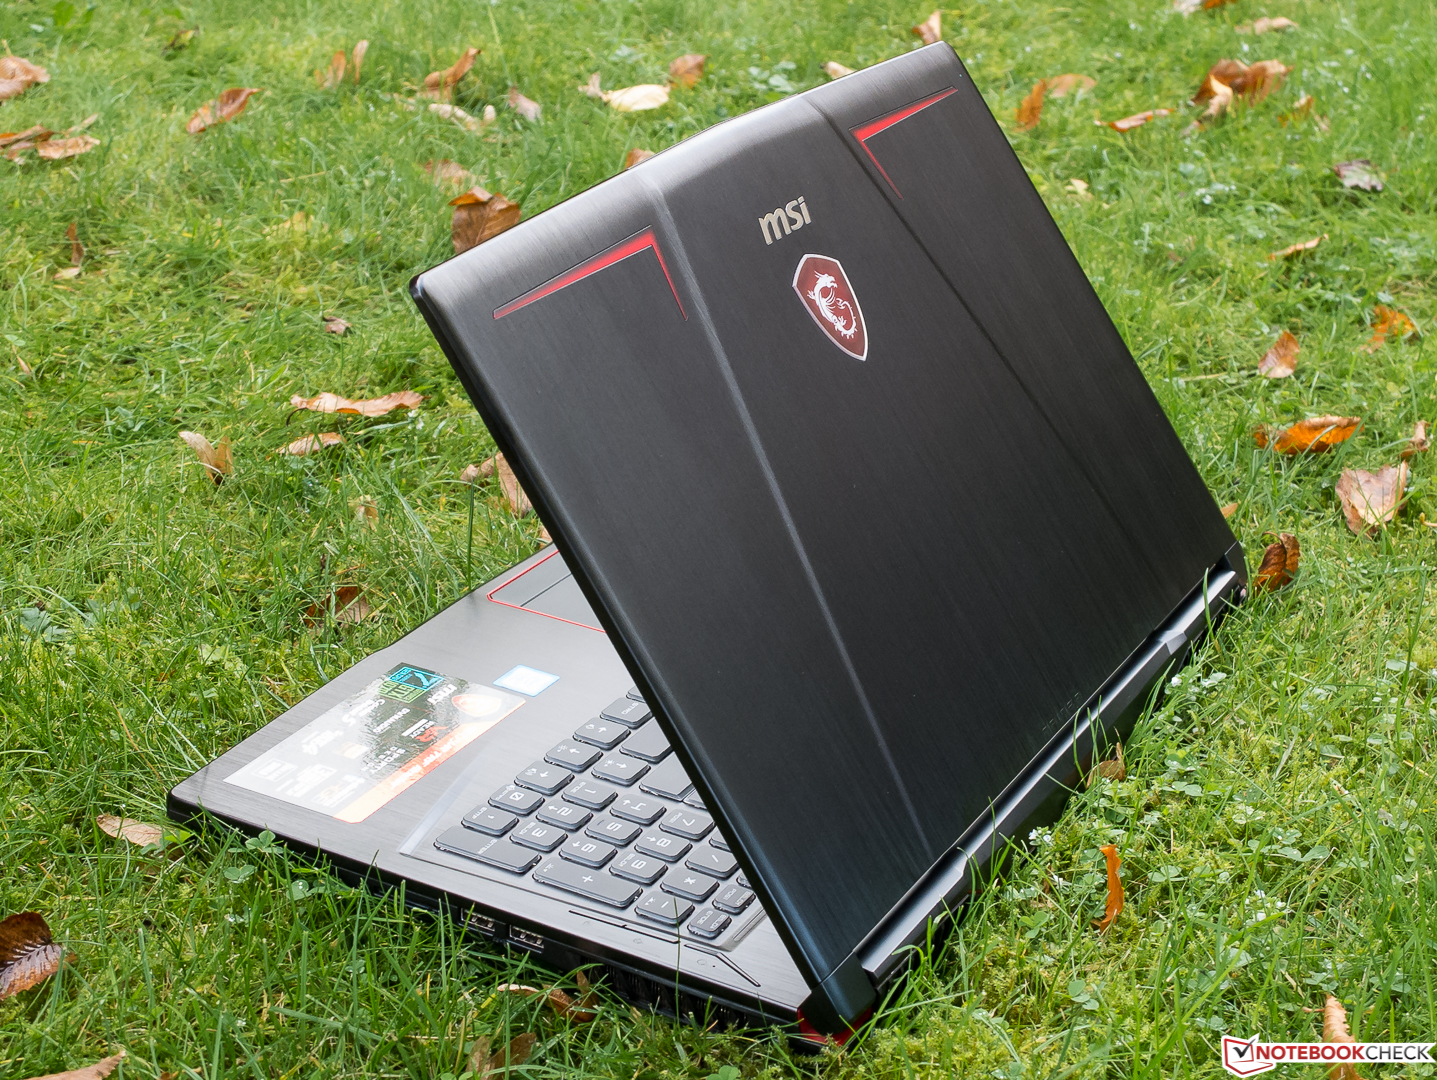
The GE63VR is completely black apart from a few red highlights. This masculine/futuristic look makes the notebook instantly recognizable as an MSI device. The top of the base unit and display cover seem to be made of aluminum and the brushed-metal finish is very receptive to fingerprints. A relief and the striking backlit MSI logo further highlight the rugged-looking device.
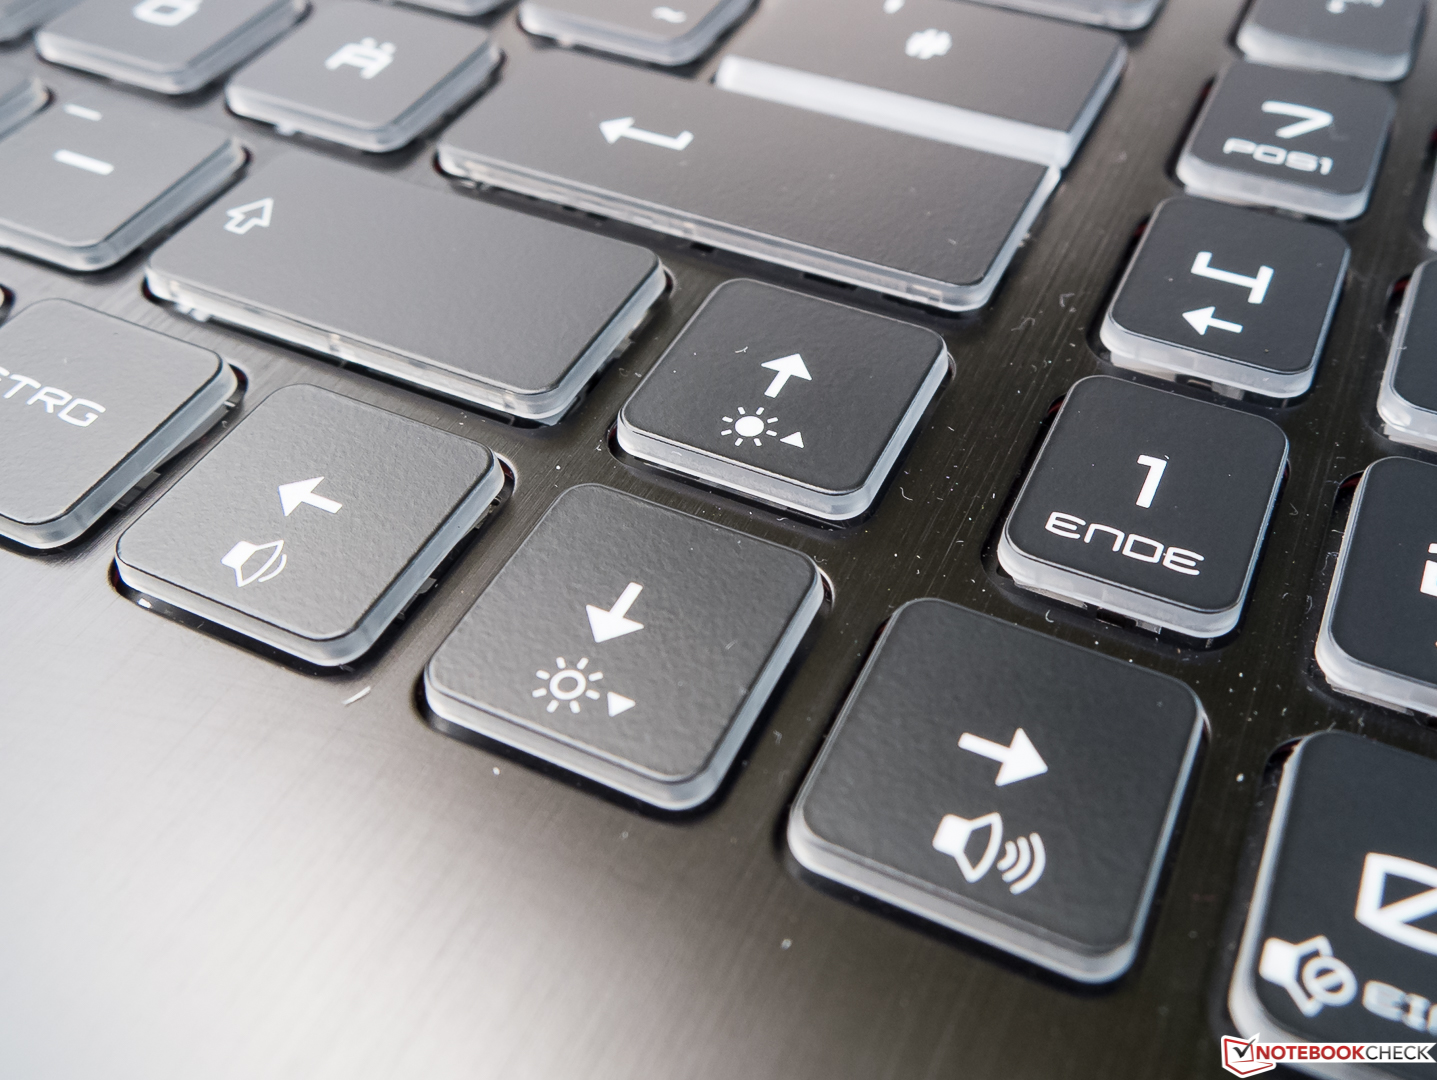
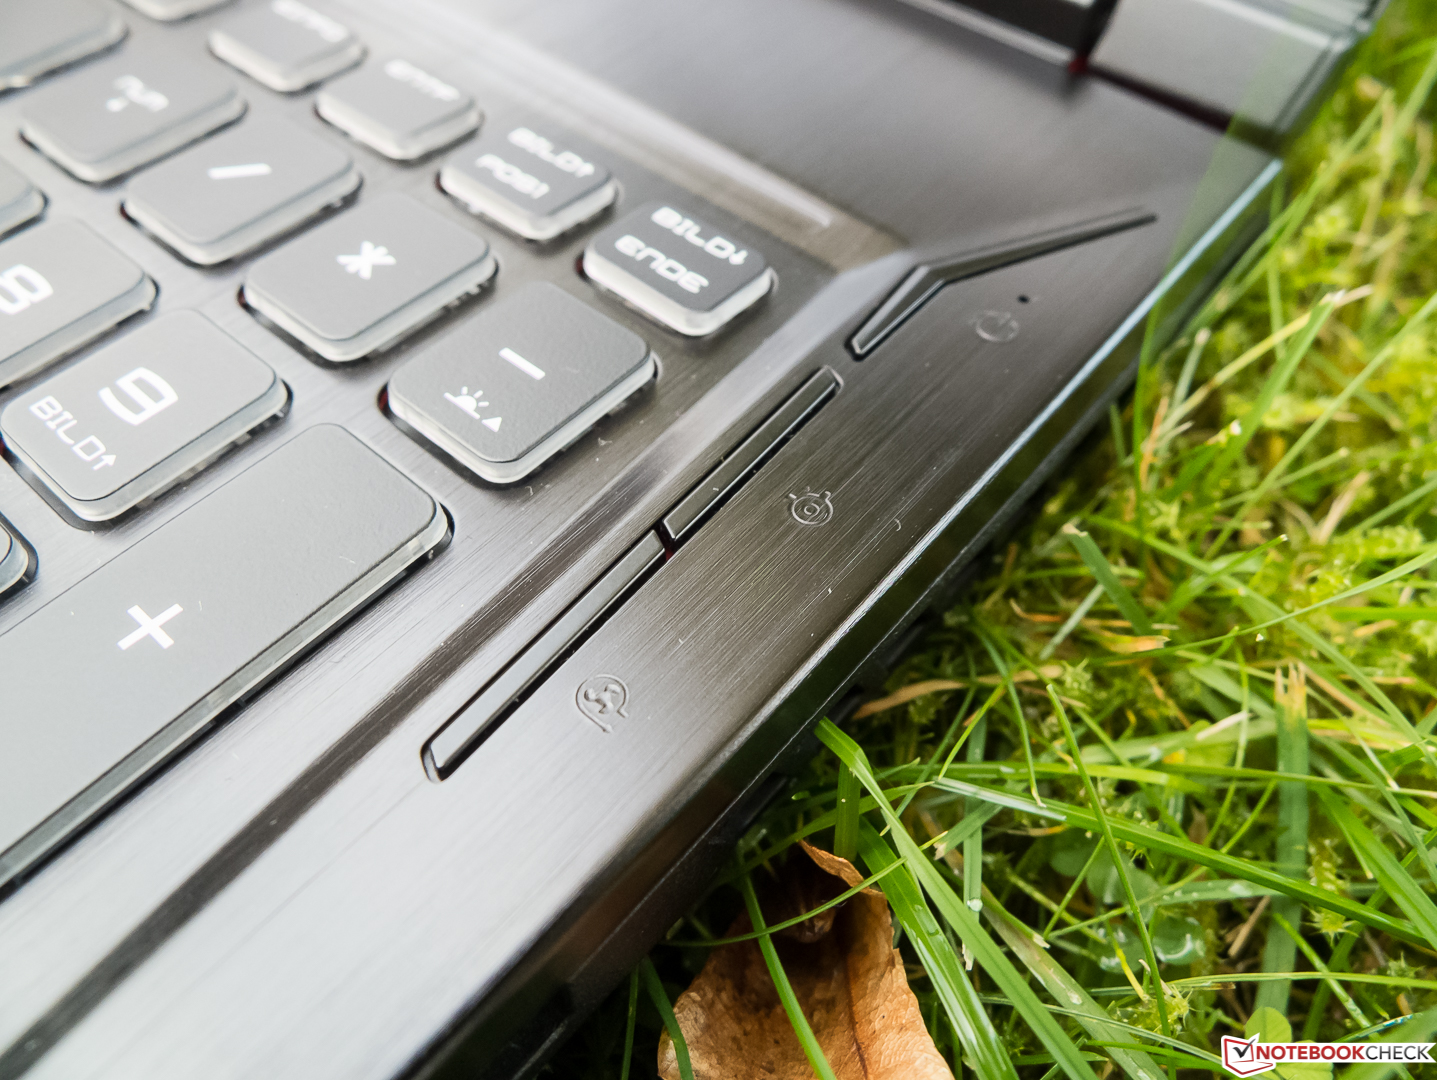
There are three narrow additional keys at the top right, beside the number block. The top key functions as the on/off button while the bottom activates the Cooler-Boost mode. You can turn on backlighting for the USB 3.0 ports, which is quite useful. We took 3% off our overall rating because of the much-too-slippery "feet" which were very annoying.
The base unit can be warped a little under very high pressure and creaks slightly. It took significantly less pressure to warp the display cover, which is not resistant to pressure in all areas. The fact that the base unit lifts up at first when opening the lid with one hand is not acceptable for a gaming notebook. We did not notice any significant deficiencies such as irregular gap dimensions. Overall, the build seems to be stable and appropriate for this price range.

Our candidates can be divided into two groups. On the one hand, we have our test unit and the even slimmer Asus Zephyrus with their relatively small and almost identical dimensions and weights below 2.5 kg (~5.5 lbs); on the other, we have the larger and noticeably thicker competitors Alienware and Acer, which both weigh over 3.5 kg (~7.7 lbs) and are up to 3.9 cm (~1.5 in) thick.
Connectivity
Ports
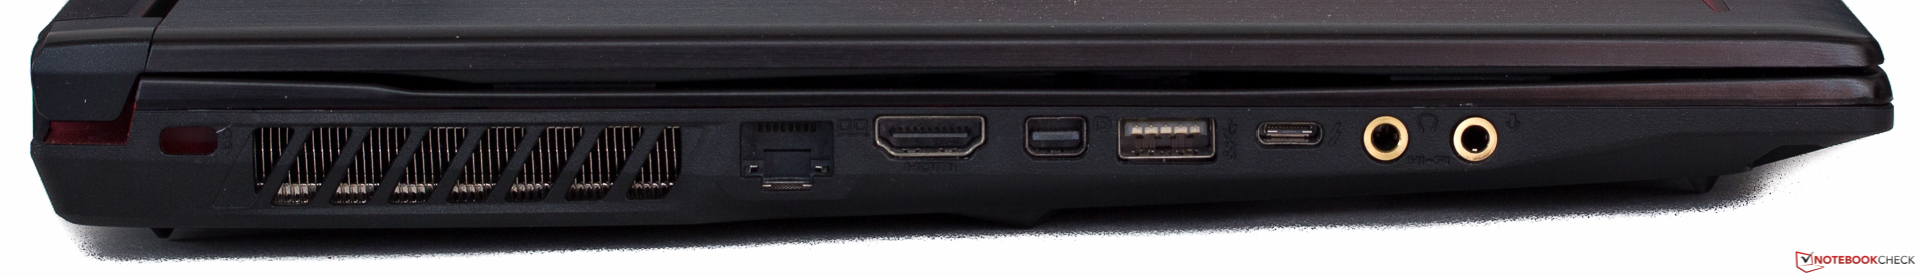
MSI was liberal concerning connectivity and has included every port a gamer might need - except for Thunderbolt 3. There is an HDMI 2.0 port as well as a Mini-Display Port and three USB 3.0 Type-A ports plus one USB 3.1 Gen2 Type-C port. Gamers do not require VGA, which is not available. There is sufficient space between the ports, although we would have preferred them to be placed further to the back for ergonomic reasons. This area is occupied by ventilation slots.
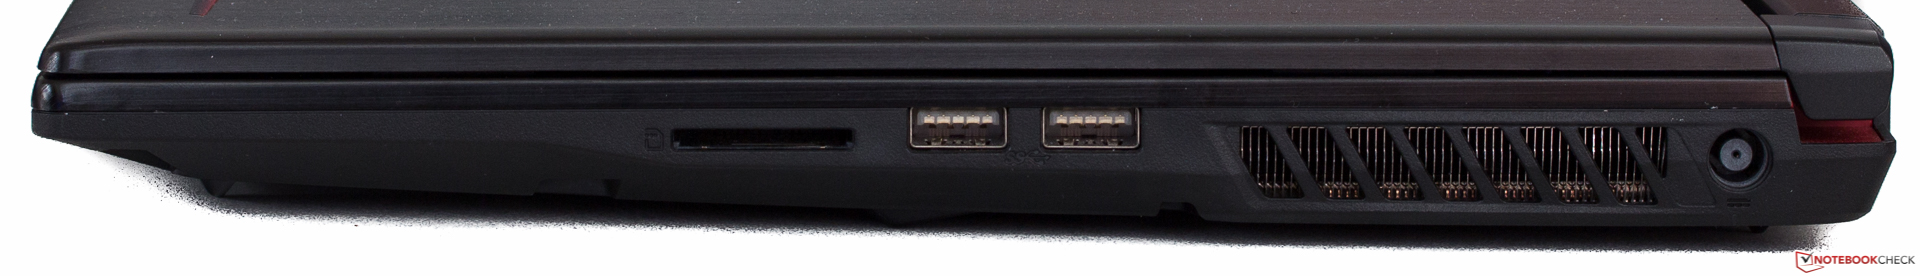
SD-card reader
Thanks to the card-reader's PCIe interface, which we tested with our reference memory card Toshiba Exceria Pro SCXC 64 GB UHS-II, copying files is very fast. The transfer rates are in the top level of all card-readers we have tested until now. Photographers will be very thankful to MSI. The Acer Predator 15 card-reader is connected via USB 3.0, but it is still not even half as fast as that of our test unit.
| SD Card Reader | |
| average JPG Copy Test (av. of 3 runs) | |
| MSI GE63VR 7RF Raider (Toshiba Exceria Pro SDXC 64 GB UHS-II) | |
| Acer Predator 15 G9-593-751X (Toshiba Exceria Pro SDXC 64 GB UHS-II) | |
| maximum AS SSD Seq Read Test (1GB) | |
| MSI GE63VR 7RF Raider (Toshiba Exceria Pro SDXC 64 GB UHS-II) | |
| Acer Predator 15 G9-593-751X (Toshiba Exceria Pro SDXC 64 GB UHS-II) | |
Communication
The Gigabit-Ethernet-Controller Killer E2500 is currently very common in gaming notebooks and is responsible for the Internet connection via cable in our test unit. Unfortunately, we were not able to open the Killer Control Center, which offers very detailed configuration and network prioritization options.
The MSI GE63VR Raider-075 is also equipped with the Wi-Fi chip Killer 1435 that wirelessly connects to the network and Internet. The theoretically available gross data transfer rate with the current ac standard and in the 5-GHz band is 867 MBit/s. Subtract the usual overhead of about 200 MBit/s and the device reaches its full potential when receiving data but falls behind the Acer and Alienware when sending data. We measured these transfer rates at one meter from our reference router Linksys EA8500.
| Networking | |
| iperf3 transmit AX12 | |
| Acer Predator 15 G9-593-751X | |
| Alienware 15 R3 | |
| MSI GE63VR 7RF Raider | |
| Asus Zephyrus GX501VS | |
| iperf3 receive AX12 | |
| Acer Predator 15 G9-593-751X | |
| MSI GE63VR 7RF Raider | |
| Alienware 15 R3 | |
| Asus Zephyrus GX501VS | |
Security
To our surprise, the GE63VR offers a Trusted Platform Module (TPM) version 2.0. It might come in handy, after all.
Accessories
Apart from the 230-watt power supply with a nicely long cable, the device comes with the usual quick-start guide and warranty information. MSI does not offer any accessories that are made specifically for the GE63VR.
Maintenance
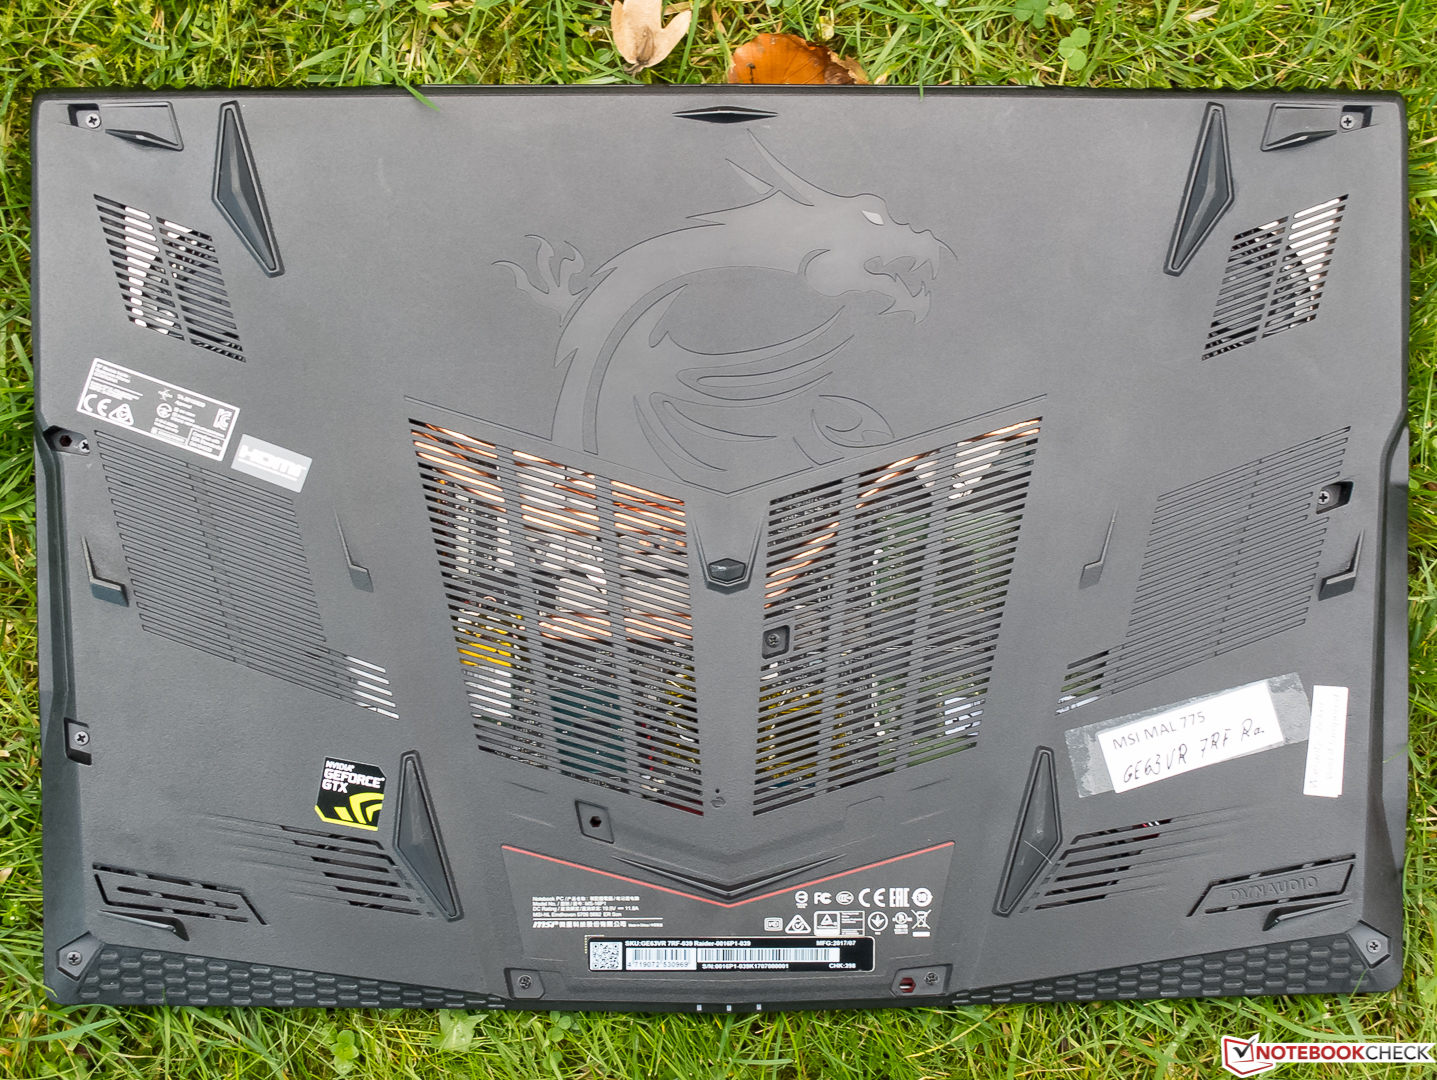
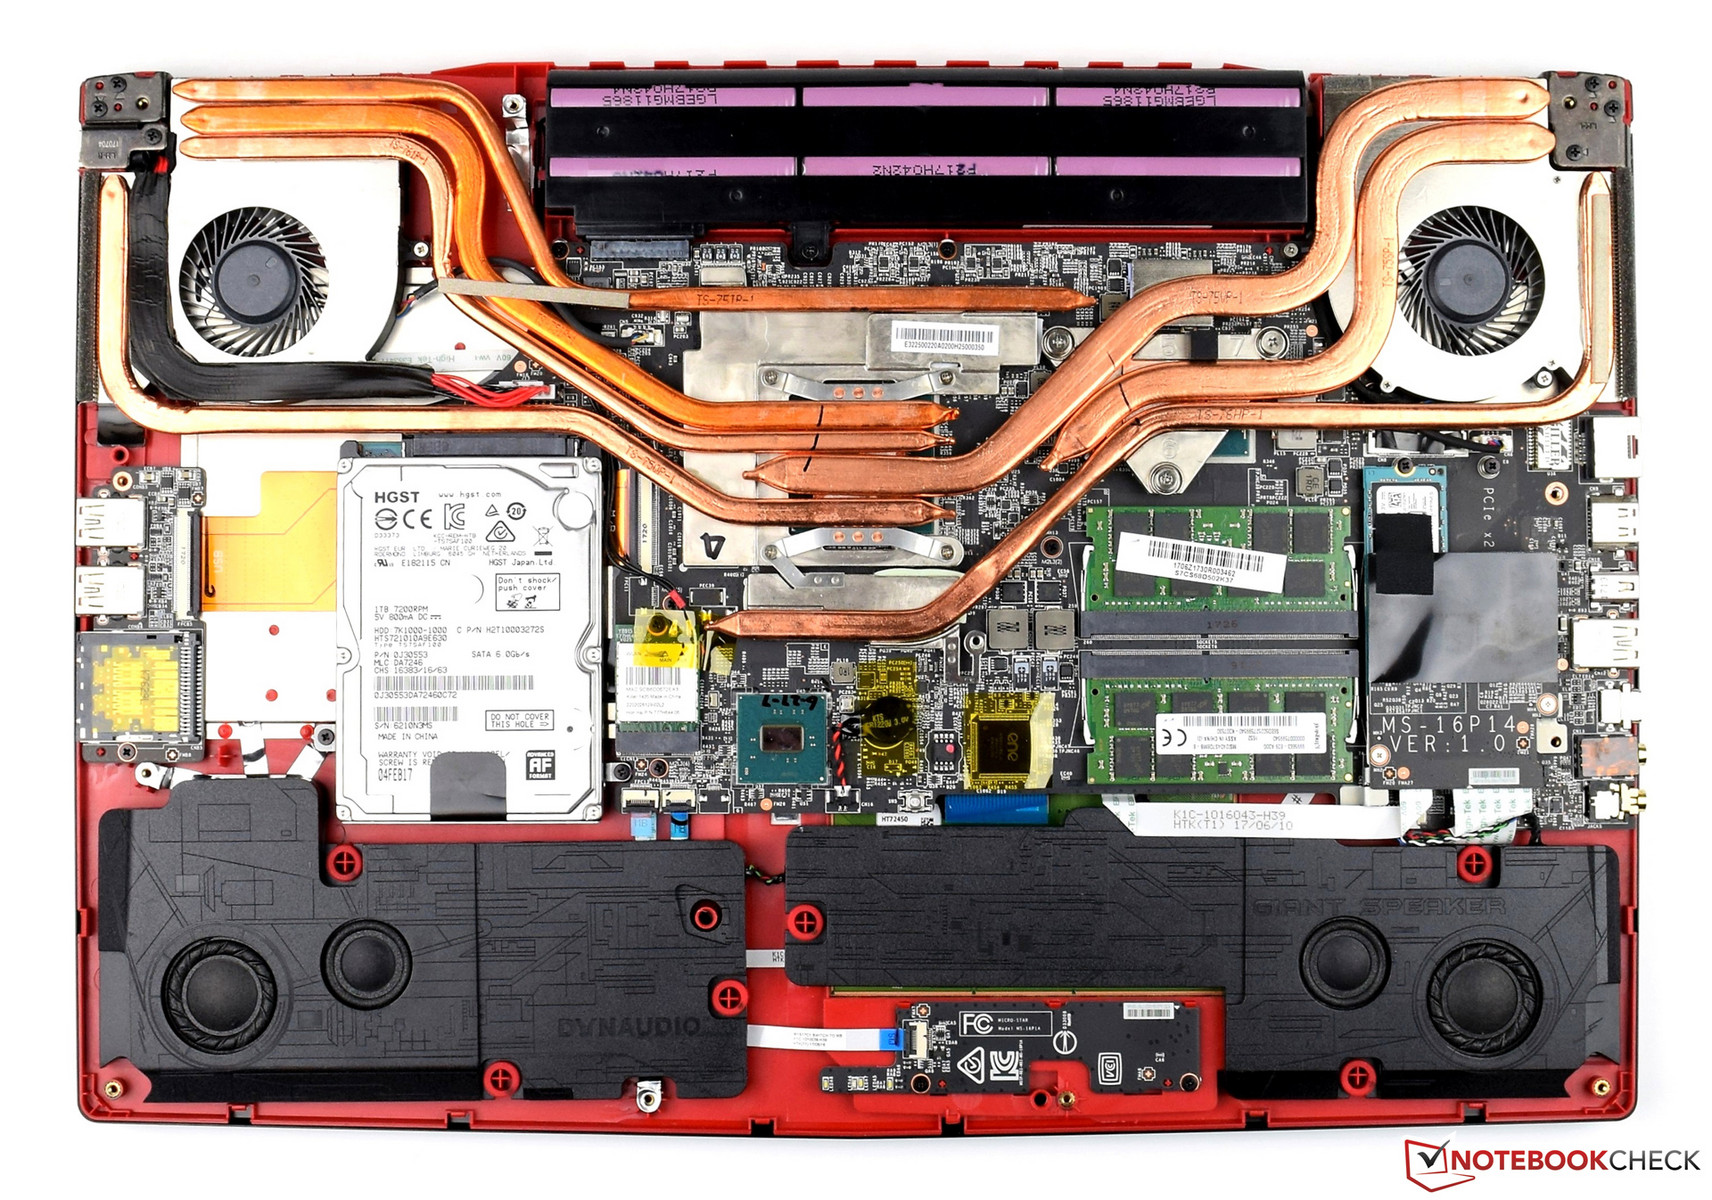
Despite the missing maintenance hatch and access to the battery from outside, maintenance should not be too difficult on the MSI GE63VR. You only have to unscrew 11 Phillips screws to release the bottom of the base unit, which was no problem on the (almost) identical 17-inch model GE73VR 7RF Raider. Unfortunately, there was a mishap and we can only show you photos of the insides of the 17-inch model.
Warranty
MSI offers two years warranty. For more information, click here. Please see our Guarantees, Return Policies & Warranties FAQ for country-specific information.
Input Devices
Keyboard
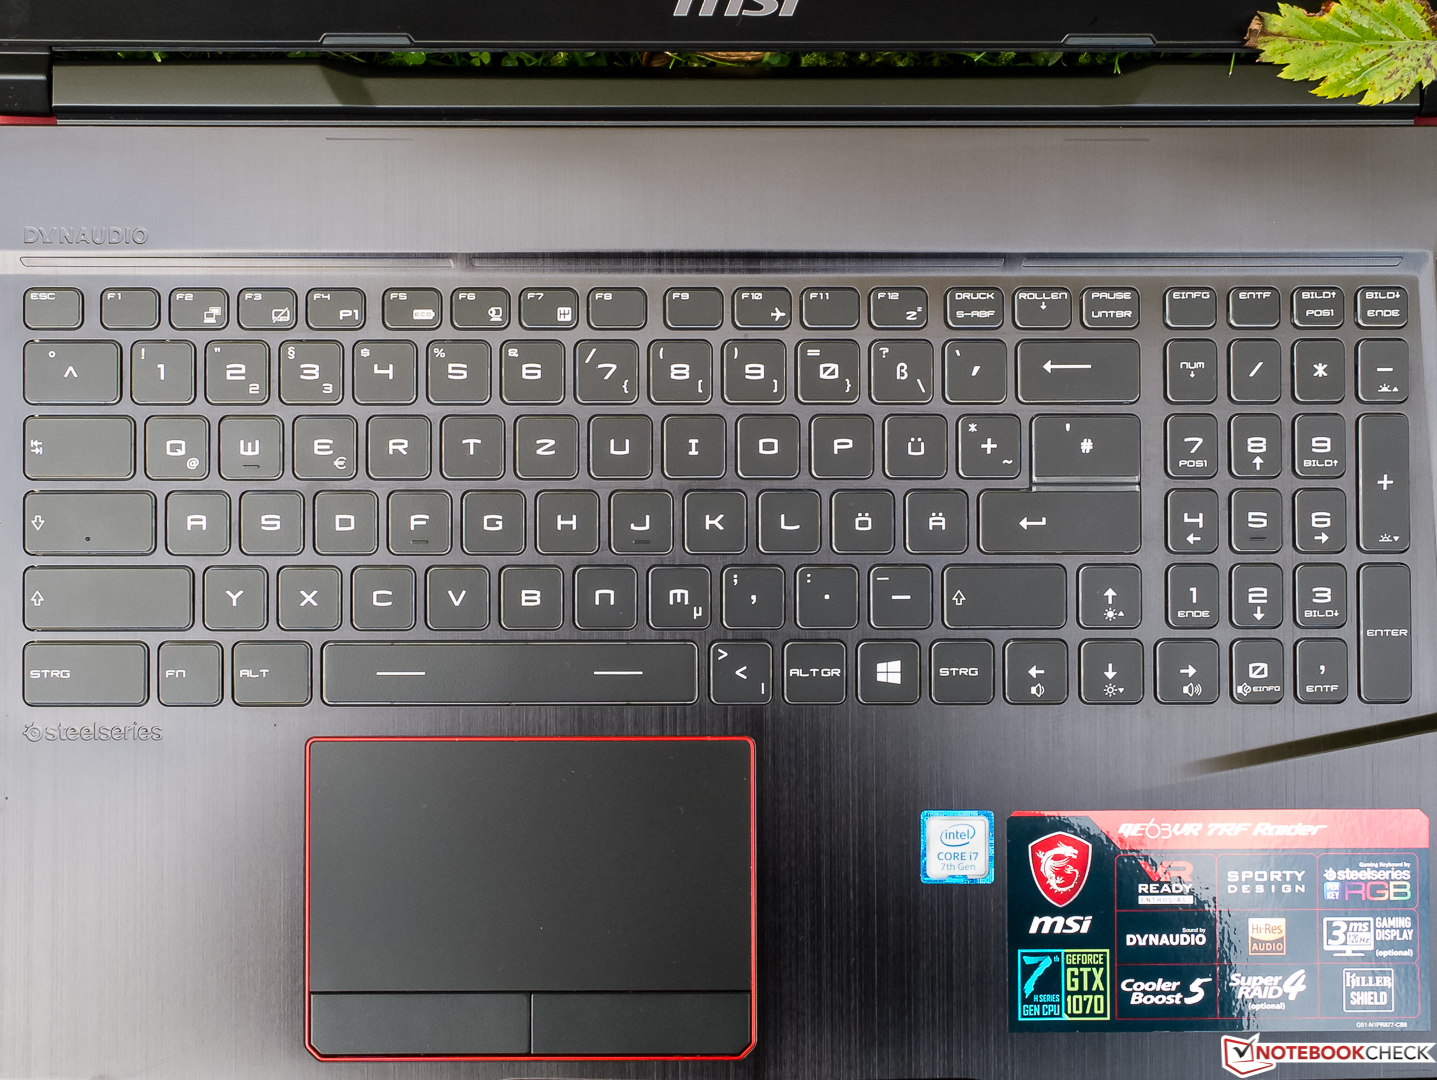
Like all G-series notebooks, the GE63VR Raider is equipped with one of the tried and tested SteelSeries keyboards (not the mechanical version). Its keys can be backlit in RGB colors individually or in zones. The manufacturer has decided not to include separate macro keys. While the main part of the keyboard is about as wide as that of a standard desktop keyboard, the number block is a little narrower than usual. The largest pitfall of the layout is the missing left Windows key. MSI has also given some keys two uses, which is typical for the manufacturer. It did not take long for us to get used to the keyboard.
The sizes and gaps of the flat keys make them easy to use. The pressure-resistant keyboard has sufficient travel, a nice pressure point and soft stop, making typing a good experience. As particularly the larger keys are quite audible when hit, we would not recommend typing in noise-sensitive surroundings. The backlighting has four levels but can only be changed for all keys at once. The light is even and offers decent brightness. The keys that have small writing on them, such as the INSERT key, are sometimes hard to read while the backlight is turned on.
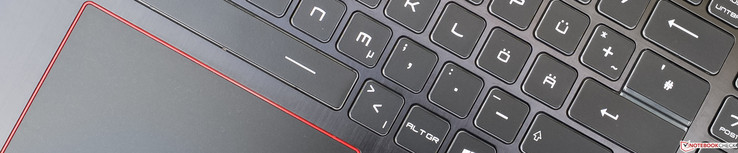
Touchpad
The classic touchpad is comfortably large but does not respond straight away at the outer edges. It has a smooth surface with very good gliding properties for dry fingers and decent gliding properties for damp fingers. We were not so happy with the touchpad's response as it occasionally ignored a touch, and drag-&-drop with a double click works better on the other laptops as well. It responds well to fast movements, however.
The replacement mouse keys have very short travel and strong feedback that you can both feel and hear. They do their job well, although feedback varied depending on where we clicked for the right key. You can configure gestures with up to two fingers via the comprehensive Synaptics driver menu. Overall, office users should be happy with the input devices.
Display
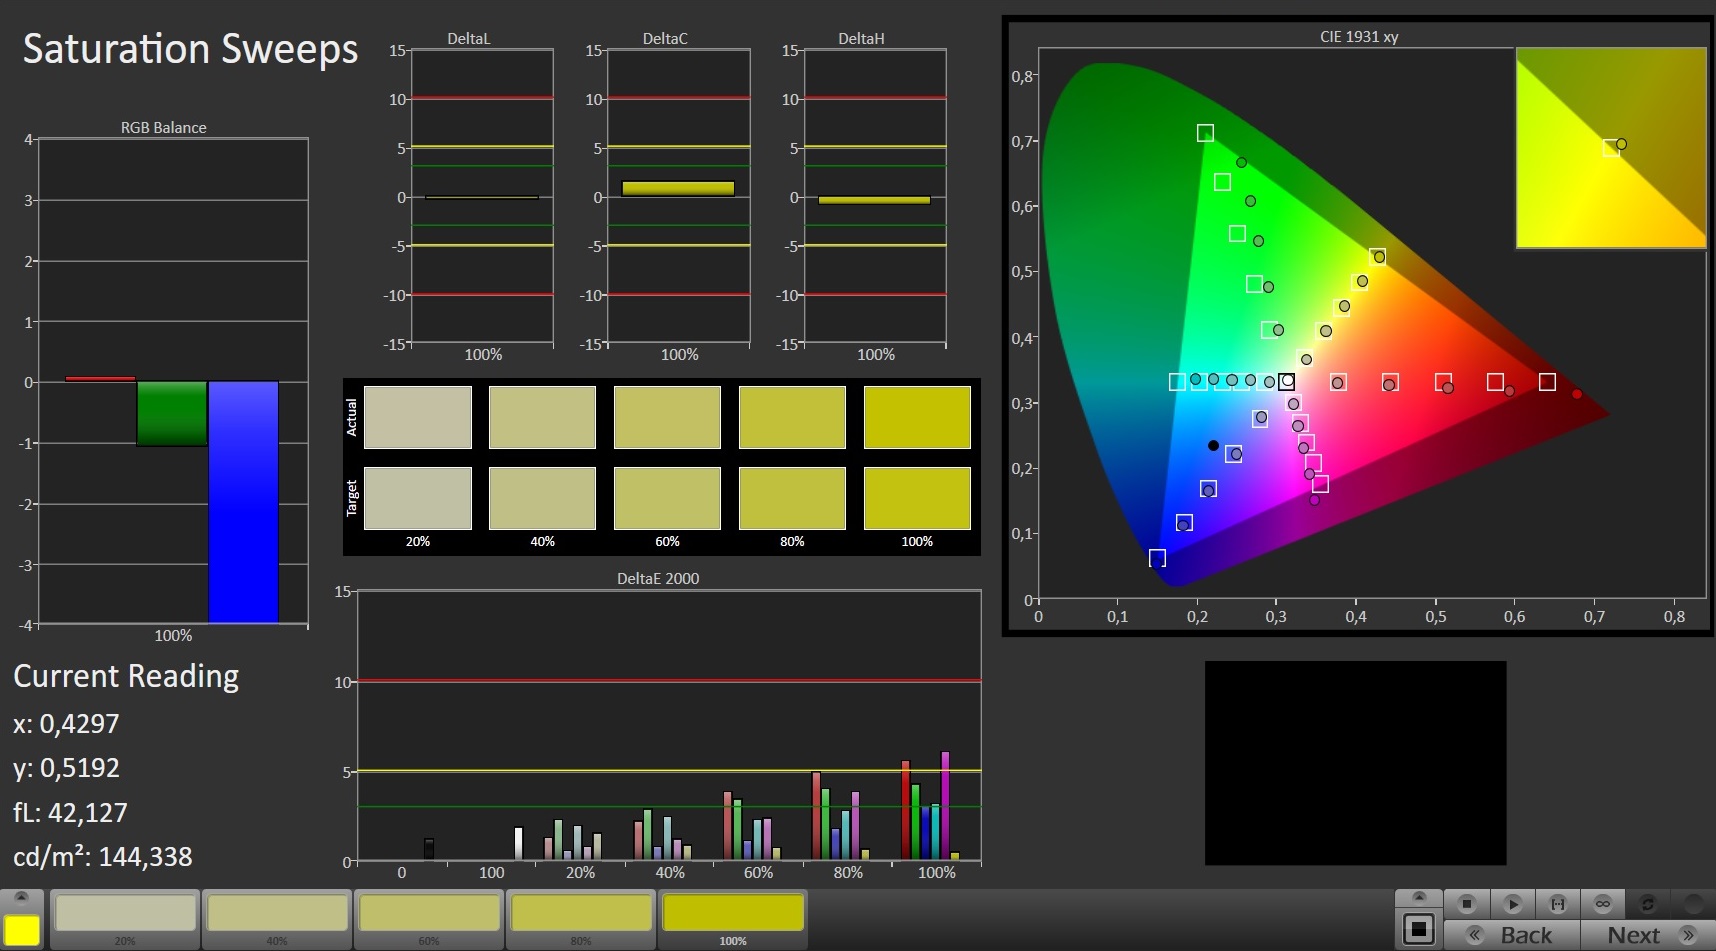
MSI has chosen the road less travelled for the GE63VR Raider-075 and opted for a matte TN display with instable viewing angles, but it has a refresh rate of 120 Hz and very fast response times - sadly without G-Sync. The Full HD resolution (the best resolution for gamers) has a pixel density of 141 ppi on the 15.6-inch screen.
As gaming notebooks are rarely used outdoors, high brightness is not so important. In our comparison field, only the Alienware 15 R3 offers reasonably high brightness while our test unit and the Acer Predator cannot even reach the 300 cd/m² mark. The measured brightness distribution of 84% is below average, but subjectively black images looked rich and uniform with no trace of screen-bleeding. We cannot criticize image sharpness.
MSI mentions another screen alternative on its website:
- 15.6-inch Full HD (1920x1080), IPS-Level
| |||||||||||||||||||||||||
Brightness Distribution: 84 %
Center on Battery: 285 cd/m²
Contrast: 1239:1 (Black: 0.23 cd/m²)
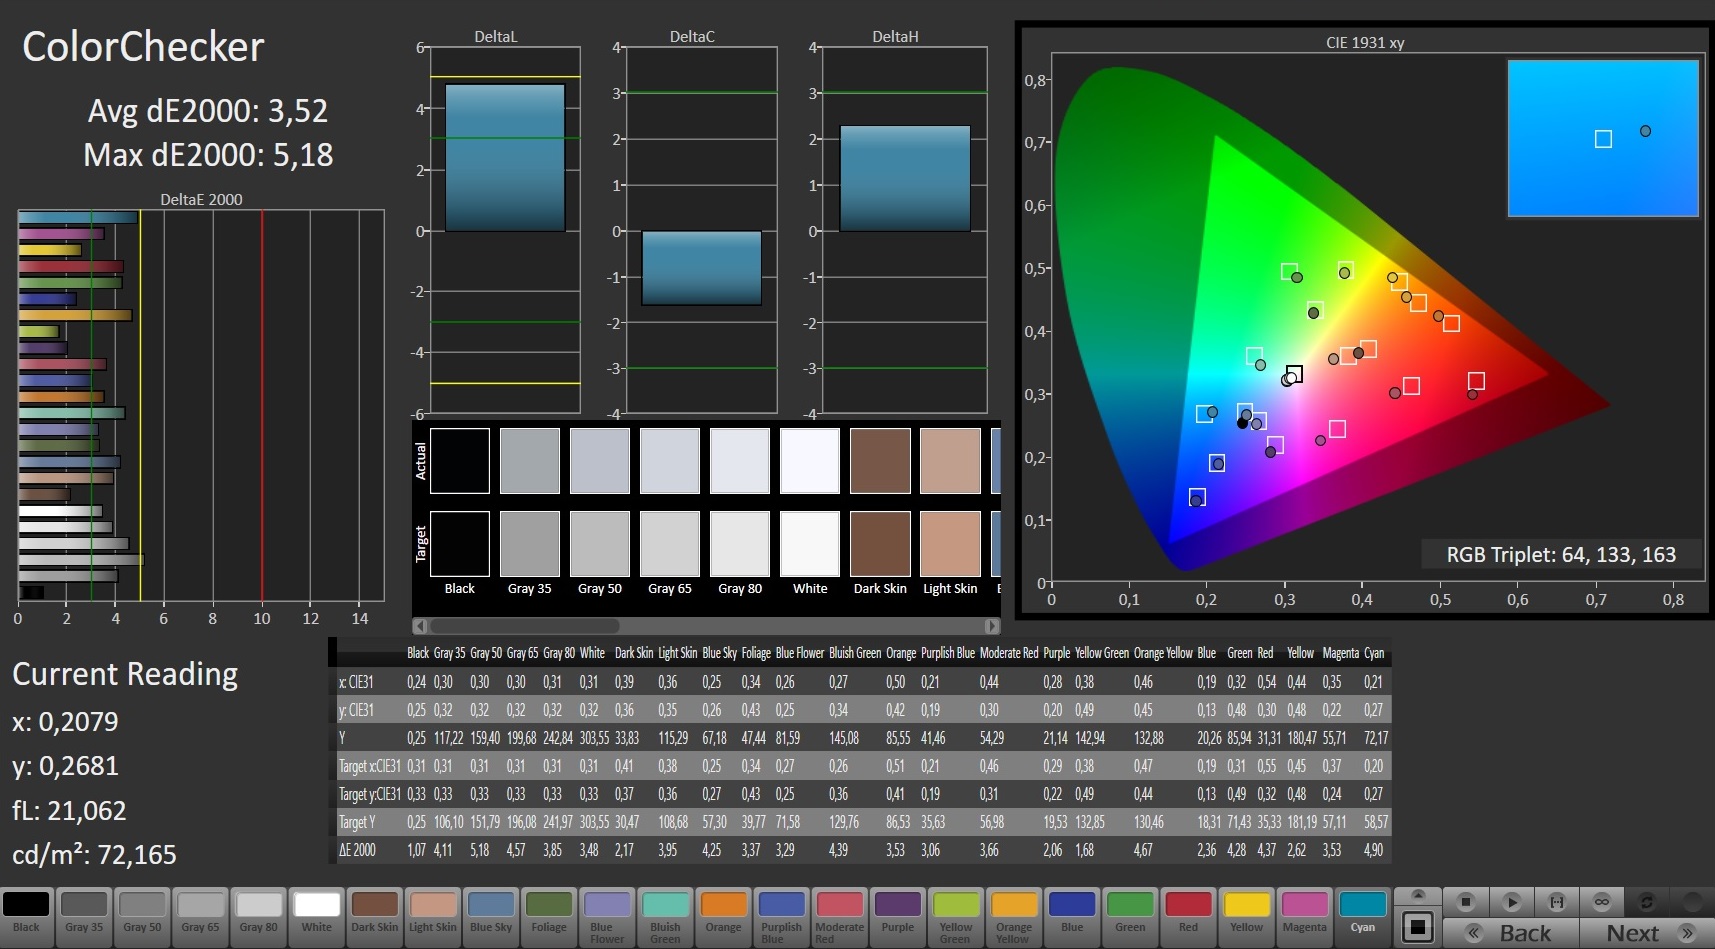
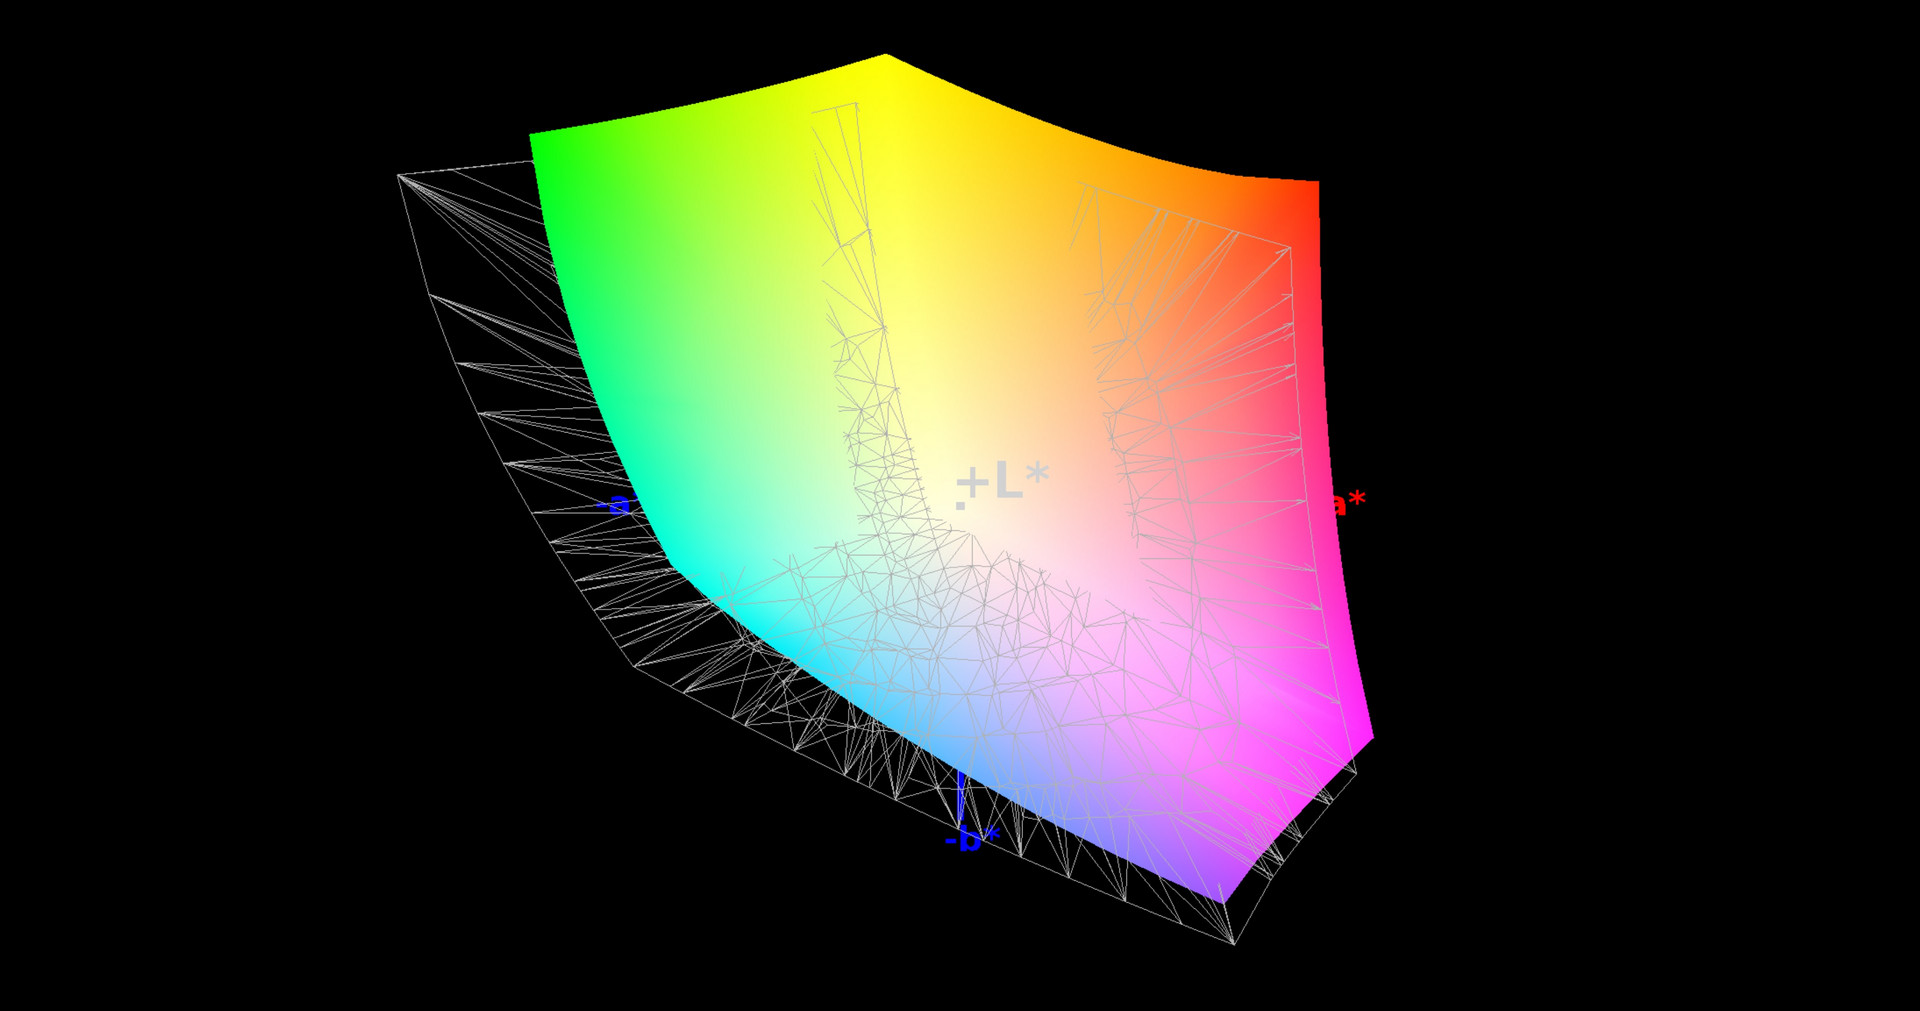
ΔE ColorChecker Calman: 3.52 | ∀{0.5-29.43 Ø4.73}
ΔE Greyscale Calman: 3.41 | ∀{0.09-98 Ø4.97}
100% sRGB (Argyll 1.6.3 3D)
77% AdobeRGB 1998 (Argyll 1.6.3 3D)
86.7% AdobeRGB 1998 (Argyll 3D)
100% sRGB (Argyll 3D)
91.3% Display P3 (Argyll 3D)
Gamma: 2.05
CCT: 7077 K
| MSI GE63VR 7RF Raider Chi Mei N156HHE-GA1 (CMN15F4), 1920x1080, 15.6" | Acer Predator 15 G9-593-751X LG Philips LP156WF6-SPP1 (LGD04D5), 1920x1080, 15.6" | Alienware 15 R3 HPJGK_B156HTN (AUO51ED), 1920x1080, 15.6" | Asus Zephyrus GX501VS ID: AUO42ED, Name: AU Optronics B156HAN04.2, 1920x1080, 15.6" | |
|---|---|---|---|---|
| Display | -23% | -20% | -25% | |
| Display P3 Coverage (%) | 91.3 | 65.4 -28% | 66 -28% | 62.1 -32% |
| sRGB Coverage (%) | 100 | 85.5 -14% | 90.5 -9% | 85.6 -14% |
| AdobeRGB 1998 Coverage (%) | 86.7 | 62.5 -28% | 66.2 -24% | 62.4 -28% |
| Response Times | -271% | -114% | -268% | |
| Response Time Grey 50% / Grey 80% * (ms) | 9.6 ? | 36 ? -275% | 25 ? -160% | 33.2 ? -246% |
| Response Time Black / White * (ms) | 7.2 ? | 26.4 ? -267% | 12 ? -67% | 28 ? -289% |
| PWM Frequency (Hz) | 26000 ? | 20830 ? | ||
| Screen | -26% | -66% | -10% | |
| Brightness middle (cd/m²) | 285 | 295 4% | 386 35% | 307.1 8% |
| Brightness (cd/m²) | 273 | 274 0% | 382 40% | 309 13% |
| Brightness Distribution (%) | 84 | 88 5% | 93 11% | 86 2% |
| Black Level * (cd/m²) | 0.23 | 0.32 -39% | 0.39 -70% | 0.35 -52% |
| Contrast (:1) | 1239 | 922 -26% | 990 -20% | 877 -29% |
| Colorchecker dE 2000 * | 3.52 | 4.59 -30% | 10.2 -190% | 3.4 3% |
| Colorchecker dE 2000 max. * | 5.18 | 11 -112% | 15.81 -205% | 8.2 -58% |
| Greyscale dE 2000 * | 3.41 | 4.03 -18% | 11.28 -231% | 1.4 59% |
| Gamma | 2.05 107% | 2.3 96% | 2.23 99% | 2.19 100% |
| CCT | 7077 92% | 7229 90% | 11383 57% | 6558 99% |
| Color Space (Percent of AdobeRGB 1998) (%) | 77 | 56 -27% | 59 -23% | 55.6 -28% |
| Color Space (Percent of sRGB) (%) | 100 | 85 -15% | 90 -10% | 85 -15% |
| Total Average (Program / Settings) | -107% /
-58% | -67% /
-63% | -101% /
-47% |
* ... smaller is better
None of our comparison units has a bad black value and MSI actually does a good job with 0.23 cd/m² which means the best contrast ratio of 1239:1 despite its low brightness.
The GE63VR can also offer good color accuracy: Its Delta-E value is only slightly over the ideal (below 3) ex-works. The minimal (!) blue cast can be removed with our color profile (link above). The Asus Zephyrus is even more accurate while the Alienware desperately needs calibrating and profiling with Delta-E values of 10 and 11.
As the small standard color space sRGB is fully covered, the MSI is also suitable for ambitious image-processing - unlike its competitors. But there are some limitations, as we will see later on. We took our measurements in the "sRGB" True Color mode.
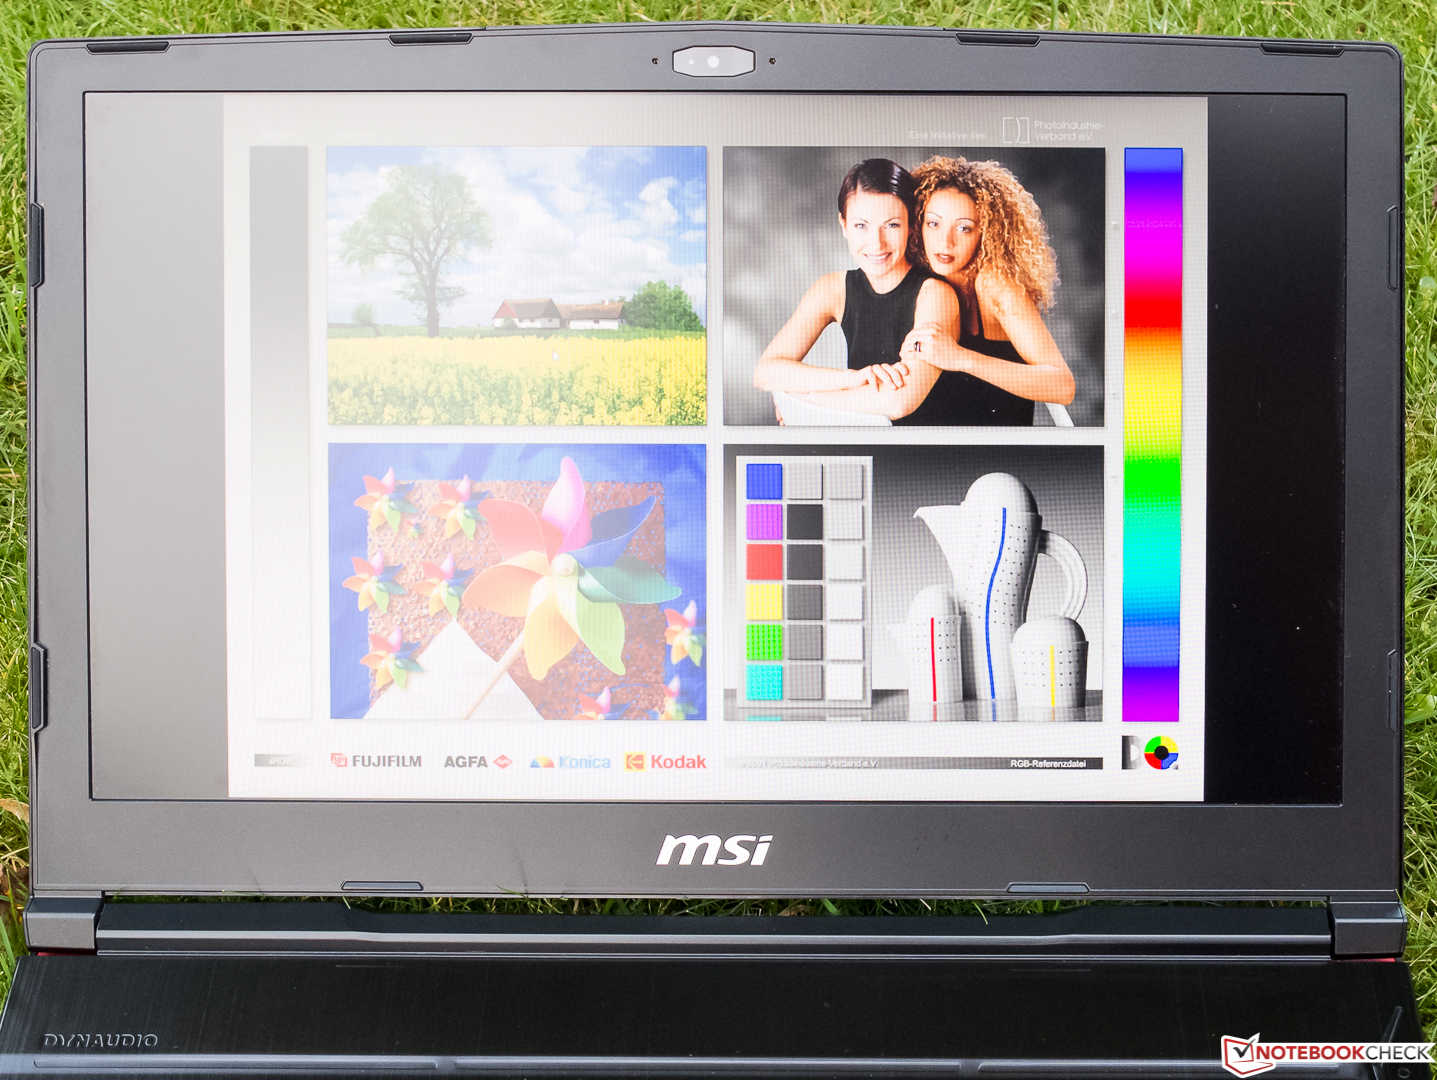
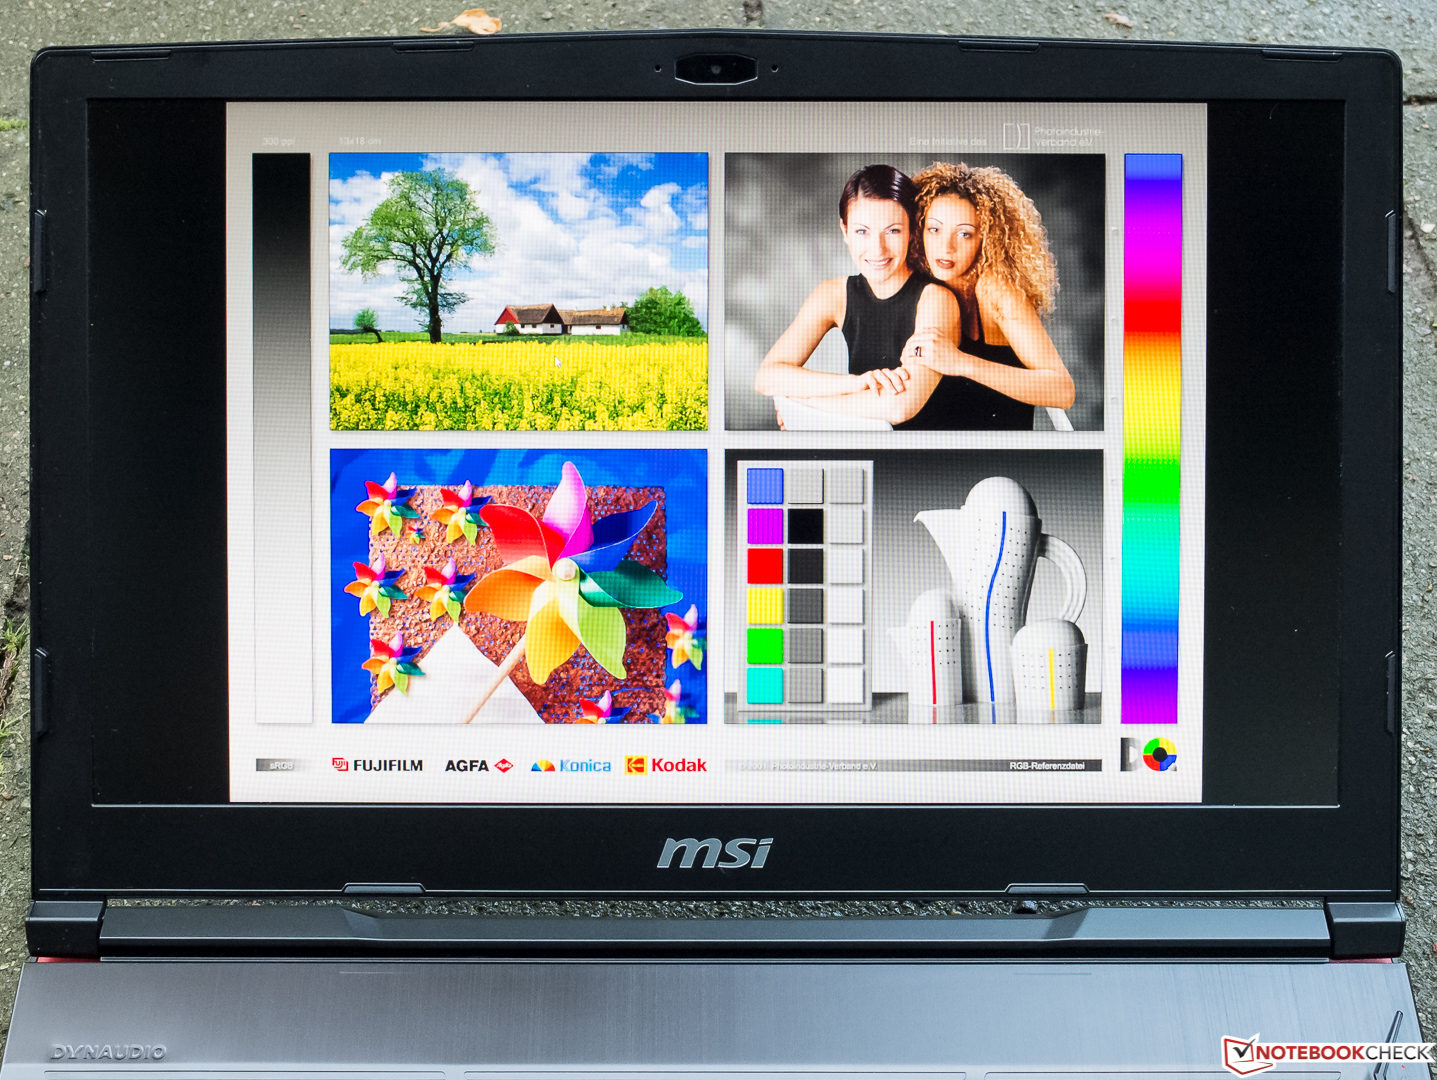
We tested the outdoor functionality of the GE63VR Raider-075 on a dark fall day with overcast sky - which was lucky as the screen could be read even when it was directed at the sky (left photo). The right photo shows an ideal position with the house behind us. On bright, sunny days, the matte but not particularly bright screen should still be legible in the shade, provided you do not place it in front of something light. But this quality is not particularly important for a gamer, anyway.
Display Response Times
| ↔ Response Time Black to White | ||
|---|---|---|
| 7.2 ms ... rise ↗ and fall ↘ combined | ↗ 5 ms rise | 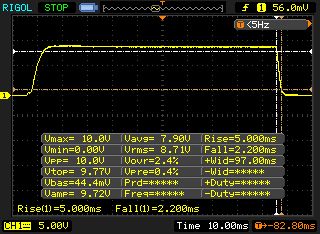 |
| ↘ 2.2 ms fall | ||
| The screen shows very fast response rates in our tests and should be very well suited for fast-paced gaming. In comparison, all tested devices range from 0.1 (minimum) to 240 (maximum) ms. » 21 % of all devices are better. This means that the measured response time is better than the average of all tested devices (19.9 ms). | ||
| ↔ Response Time 50% Grey to 80% Grey | ||
| 9.6 ms ... rise ↗ and fall ↘ combined | ↗ 5.2 ms rise | 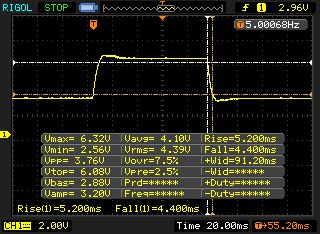 |
| ↘ 4.4 ms fall | ||
| The screen shows fast response rates in our tests and should be suited for gaming. In comparison, all tested devices range from 0.165 (minimum) to 636 (maximum) ms. » 23 % of all devices are better. This means that the measured response time is better than the average of all tested devices (31.1 ms). | ||
Screen Flickering / PWM (Pulse-Width Modulation)
| Screen flickering / PWM detected | 26000 Hz | ≤ 25 % brightness setting | 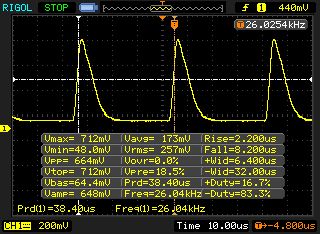 |
The display backlight flickers at 26000 Hz (worst case, e.g., utilizing PWM) Flickering detected at a brightness setting of 25 % and below. There should be no flickering or PWM above this brightness setting. The frequency of 26000 Hz is quite high, so most users sensitive to PWM should not notice any flickering. In comparison: 52 % of all tested devices do not use PWM to dim the display. If PWM was detected, an average of 7798 (minimum: 5 - maximum: 343500) Hz was measured. | |||
MSI has called the display a "Wide-View" display, but this is not the case if you compare it to a typical IPS screen. However, the horizontal viewing angle is quite wide for a TN screen without losing brightness, contrast and colors. But take a look at the screen from above and you will soon see a white film spread over the entire screen. Looking at the screen from below creates a very strong and bothersome inversion of colors.

Performance
Processor
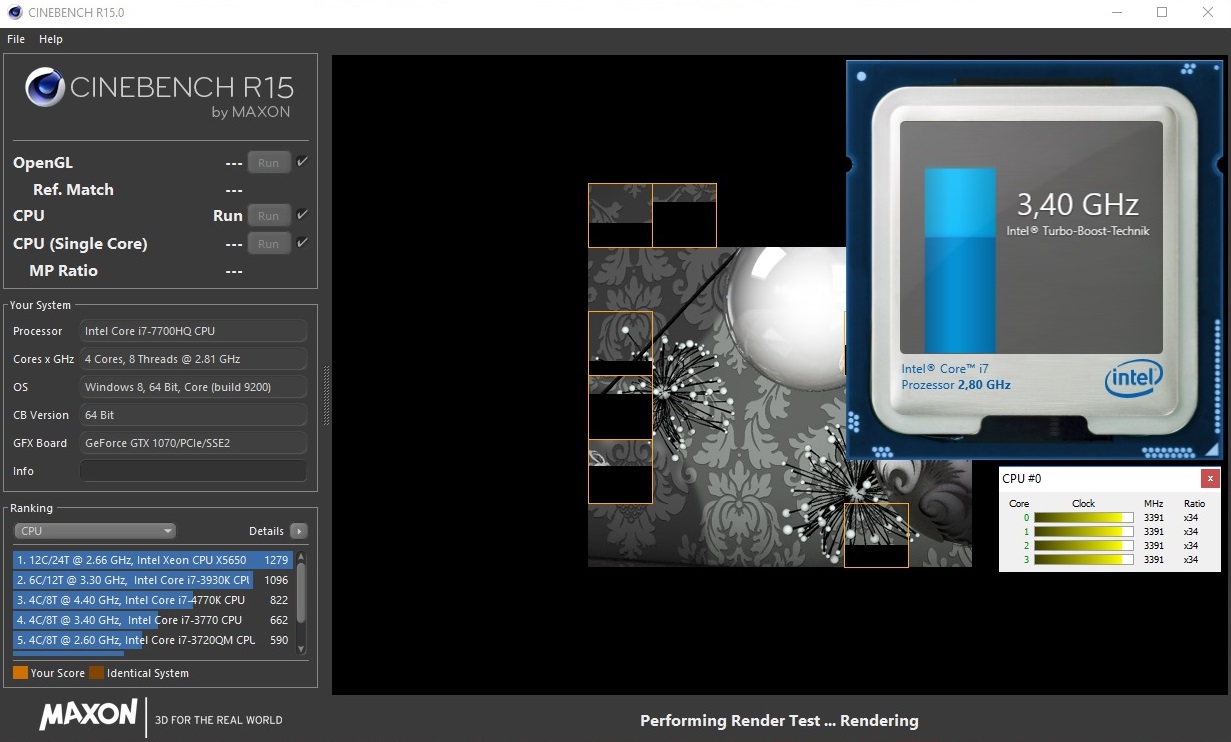
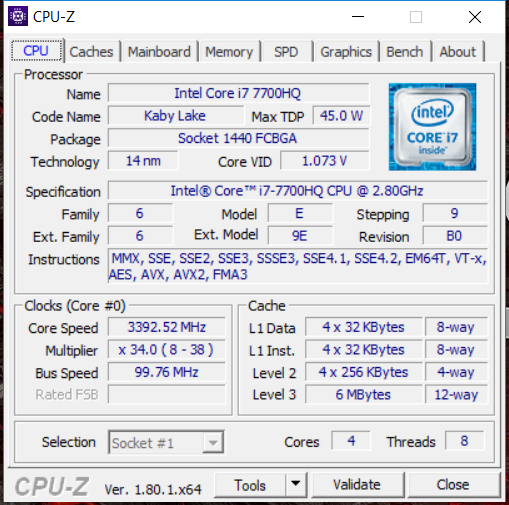
Similar to the Intel Core i5-7200U in the office segment, the Hyper-Threading quad-core i7-7700HQ (4x 2.8 - 3.8 GHz, TDP 45 watts) used in our test unit can be considered the "bread-and-butter" chip of gaming. Like its direct predecessor, this chip can be found in many gaming notebooks and no current game has yet brought it to its limits. Therefore, the processor can also handle other everyday software with ease - including strongly parallelized software, thanks to Hyper-Threading.
The CPU ran the single-thread Cinebench R15 benchmark at 3.4 - 3.8 GHz and the multithread load at a constant 3.4 GHz. The scores only varied slightly and did not seem to drop in the Cinebench loop. However, the Acer's result was 2% better, which indicates that the latter's i7-7700HQ can make slightly better use of the turbo than our MSI. There were no changes on battery.

| Cinebench R15 | |
| CPU Single 64Bit | |
| Alienware 15 R3 | |
| Acer Predator 15 G9-593-751X | |
| MSI GE63VR 7RF Raider | |
| Asus Zephyrus GX501VS | |
| CPU Multi 64Bit | |
| Acer Predator 15 G9-593-751X | |
| Alienware 15 R3 | |
| Asus Zephyrus GX501VS | |
| MSI GE63VR 7RF Raider | |
System Performance
Although the device is not even equipped with an NVMe SSD, we personally felt that the GE63VR's performance topped that of a typical office notebook with ULV dual-core and SSD, which might be due to its four physical cores and generous working memory. There are hardly any lags, and programs and operating systems boot very quickly.
All laptops in our review are equipped with the same CPU and (except for the Asus) the same graphics card but have different SSDs. The fact that the SSD in our test unit is the slowest of them all only shows in the Home test of PCMark 8.
| PCMark 8 | |
| Home Score Accelerated v2 | |
| Acer Predator 15 G9-593-751X | |
| Asus Zephyrus GX501VS | |
| Alienware 15 R3 | |
| MSI GE63VR 7RF Raider | |
| Work Score Accelerated v2 | |
| Acer Predator 15 G9-593-751X | |
| Asus Zephyrus GX501VS | |
| Alienware 15 R3 | |
| MSI GE63VR 7RF Raider | |
| PCMark 8 Home Score Accelerated v2 | 4406 points | |
| PCMark 8 Work Score Accelerated v2 | 5270 points | |
Help | ||
Storage Devices
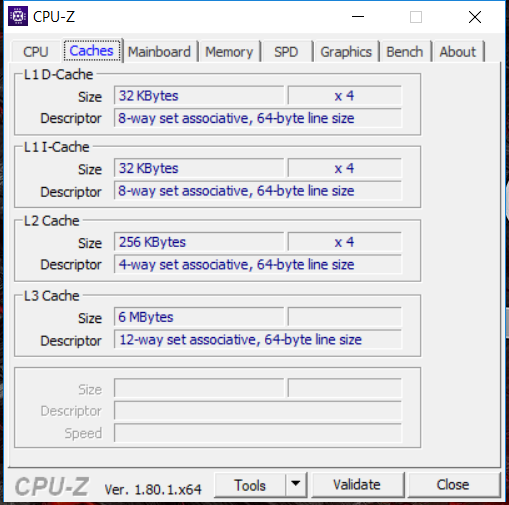
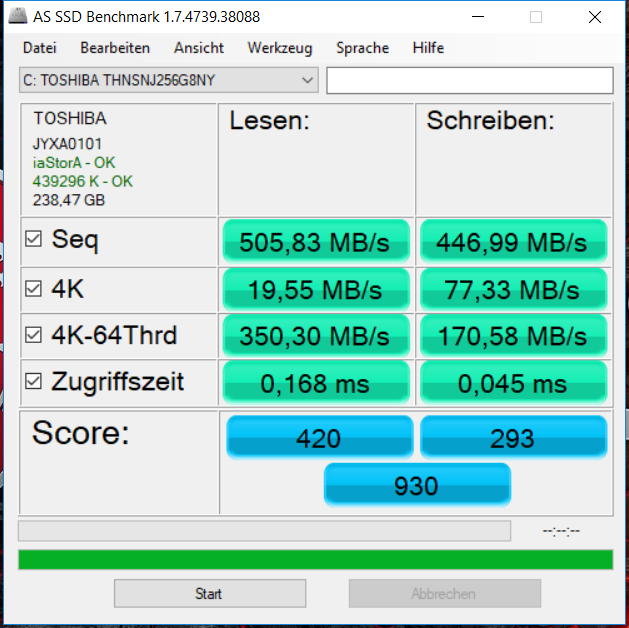
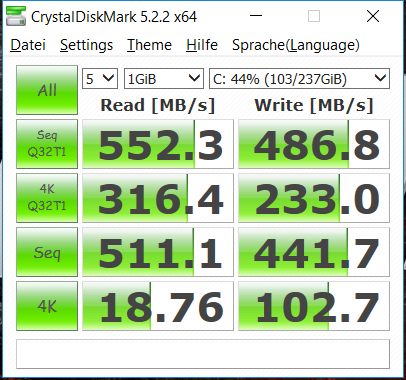
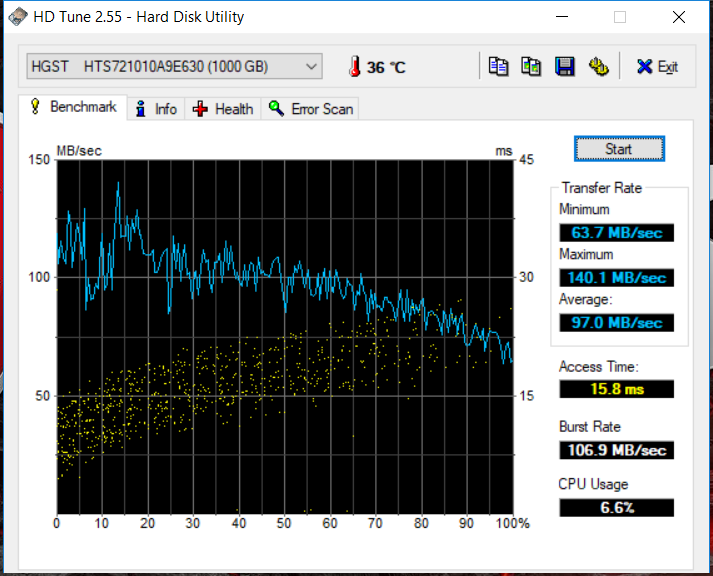
The device has a SATA-III 256-GB SSD from Toshiba and a 1-TB HDD from HGST that runs at 7200 RPM. The SSD has typical sequential read speeds of 500 MB/s but is a little behind the maximum in sequential reading. Its performance with 4K reading (important for starting the operation system and software) was not so good. Nowadays, we would expect a minimum of 30 MB/s.
The competitor's SSDs that are connected via PCIe easily leave the SSD of our GE63VR behind. The comparison devices should be noticeably faster at loading large games and their better 4K-read values might be noticeable a little in day-to-day use. The additional 1-TB HDD has good access rates thanks to its speed of 7200 RPM and performs well.
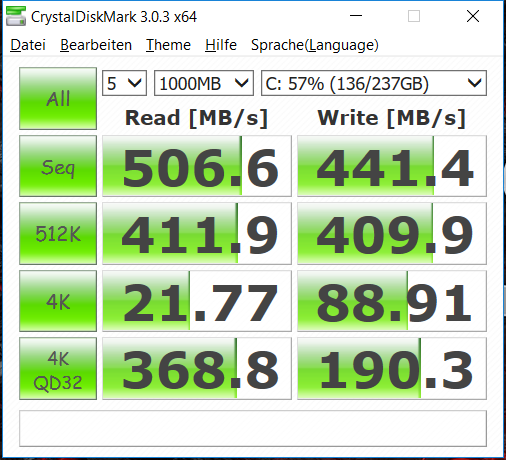
| MSI GE63VR 7RF Raider Toshiba HG6 THNSNJ256G8NY | Acer Predator 15 G9-593-751X Samsung SM951 MZVPV256HDGL m.2 PCI-e | Alienware 15 R3 | Asus Zephyrus GX501VS Samsung SM961 MZVPW256HEGL | |
|---|---|---|---|---|
| CrystalDiskMark 3.0 | 146% | 64% | ||
| Read Seq (MB/s) | 507 | 1939 282% | 1123 121% | |
| Write Seq (MB/s) | 441.4 | 1262 186% | 429.2 -3% | |
| Read 512 (MB/s) | 411.9 | 1078 162% | 833 102% | |
| Write 512 (MB/s) | 409.9 | 1192 191% | 428.1 4% | |
| Read 4k (MB/s) | 21.77 | 50.8 133% | 37.8 74% | |
| Write 4k (MB/s) | 88.9 | 141.9 60% | 122.9 38% | |
| Read 4k QD32 (MB/s) | 368.8 | 573 55% | 542 47% | |
| Write 4k QD32 (MB/s) | 190.3 | 375.3 97% | 429.8 126% |

Graphics
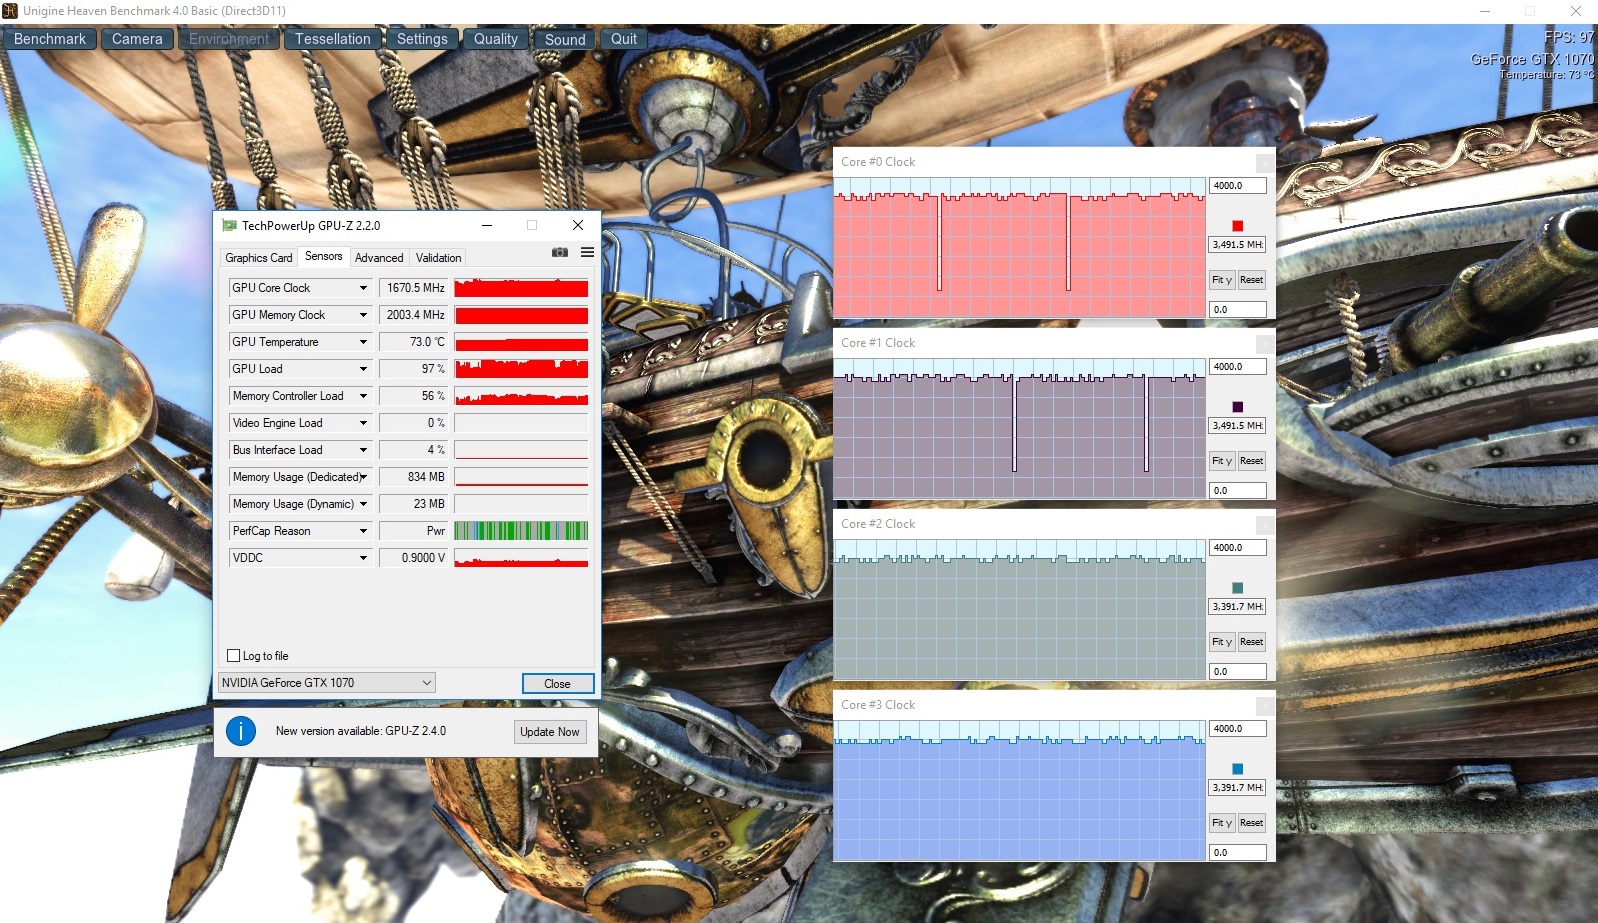
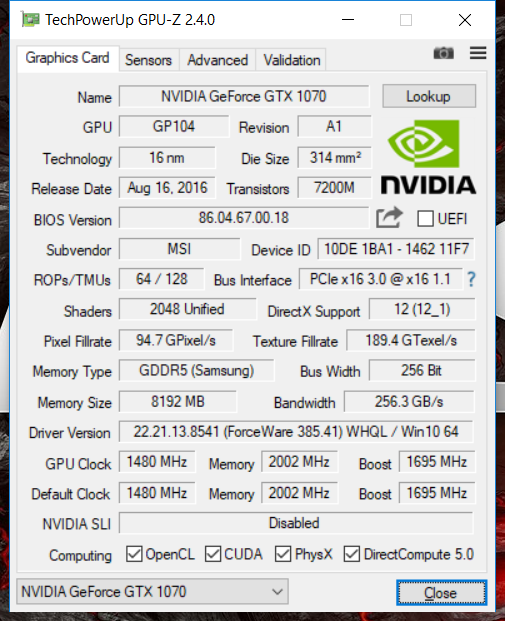
If you forget the Max-Q version of the GTX 1080 (that does not really make sense), the Nvidia GeForce GTX 1070 is currently the second-fastest mobile graphics card available after the GTX 1080. The GP104 chip offers 2048 shaders that run at a base clock rate of 1480 MHz and a nominal turbo rate of up to 1695 MHz in this device. The chip is only available with 8 GB of GDDR5 VRAM that has a 256-bit bus. For more information on the changes in Pascal architecture, click here.
If you compare the scores of 3DMark 11 and 3DMark 13, the GTX 1070 chips in our test unit and comparison devices offer the expected performance while the Max-Q version in the Asus Zephyrus lags behind a little. With the help of the Unigine Heaven benchmark, we created a graphics load typical for gaming, with which we measured average GPU rates of 1670 MHz. The Render test from GPU-Z even brought 1900 MHz. A second run of the Fire-Strike benchmark on battery resulted in 4472 points - 32% of the result on power supply.
| 3DMark 11 - 1280x720 Performance GPU | |
| MSI GE63VR 7RF Raider | |
| Alienware 15 R3 | |
| Acer Predator 15 G9-593-751X | |
| Asus Zephyrus GX501VS | |
| 3DMark - 1920x1080 Fire Strike Graphics | |
| MSI GE63VR 7RF Raider | |
| Alienware 15 R3 | |
| Acer Predator 15 G9-593-751X | |
| Asus Zephyrus GX501VS | |
| 3DMark 11 Performance | 16625 points | |
| 3DMark Cloud Gate Standard Score | 27629 points | |
| 3DMark Fire Strike Score | 13917 points | |
Help | ||
Gaming Performance
The Nvidia GeForce GTX 1070 can display all current games smoothly in Full HD and QHD at the highest settings and even UHD at medium to high settings. Overall, the device performed as expected, if not a little better - except for the relatively (!) low fps in Battlefield 1.
To find out whether frame rates remain the same over a long period of time, we ran the game The Witcher 3 in Full HD resolution and maximum quality settings for 60 minutes. The game character did not move during the entire period. It looks like there is a slight reduction of the GPU turbo under constant GPU load, but this is quite natural.
| The Witcher 3 - 1920x1080 Ultra Graphics & Postprocessing (HBAO+) | |
| MSI GE63VR 7RF Raider | |
| Acer Predator 15 G9-593-751X | |
| Asus Zephyrus GX501VS | |
| Rise of the Tomb Raider | |
| 1920x1080 Very High Preset AA:FX AF:16x | |
| MSI GE63VR 7RF Raider | |
| Asus Zephyrus GX501VS | |
| 1920x1080 High Preset AA:FX AF:4x | |
| MSI GE63VR 7RF Raider | |
| Battlefield 1 | |
| 1920x1080 Ultra Preset AA:T | |
| Acer Predator 15 G9-593-751X | |
| Alienware 15 R3 | |
| MSI GE63VR 7RF Raider | |
| 1920x1080 High Preset AA:T | |
| Acer Predator 15 G9-593-751X | |
| Alienware 15 R3 | |
| MSI GE63VR 7RF Raider | |
| For Honor | |
| 1920x1080 Extreme Preset AA:T AF:16x | |
| MSI GE63VR 7RF Raider | |
| Acer Predator 15 G9-593-751X | |
| 1920x1080 High Preset AA:T AF:8x | |
| MSI GE63VR 7RF Raider | |
| Acer Predator 15 G9-593-751X | |
| Ghost Recon Wildlands | |
| 1920x1080 Ultra Preset AA:T AF:16x | |
| MSI GE63VR 7RF Raider | |
| Acer Predator 15 G9-593-751X | |
| 1920x1080 High Preset AA:T AF:4x | |
| MSI GE63VR 7RF Raider | |
| Acer Predator 15 G9-593-751X | |
| low | med. | high | ultra | |
|---|---|---|---|---|
| The Witcher 3 (2015) | 62.2 | |||
| Rise of the Tomb Raider (2016) | 118.8 | 102.5 | ||
| Far Cry Primal (2016) | 76 | 74 | ||
| Deus Ex Mankind Divided (2016) | 83.1 | 45.6 | ||
| Battlefield 1 (2016) | 110.5 | 103.2 | ||
| For Honor (2017) | 144.4 | 113 | ||
| Ghost Recon Wildlands (2017) | 90.8 | 52.2 |
Emissions
System Noise
The cooling fans are usually silent while idling, although the CPU does turn up for a short time during system startup and under peak loads. If you are close-by, you can occasionally hear the 7200-RPM HDD.
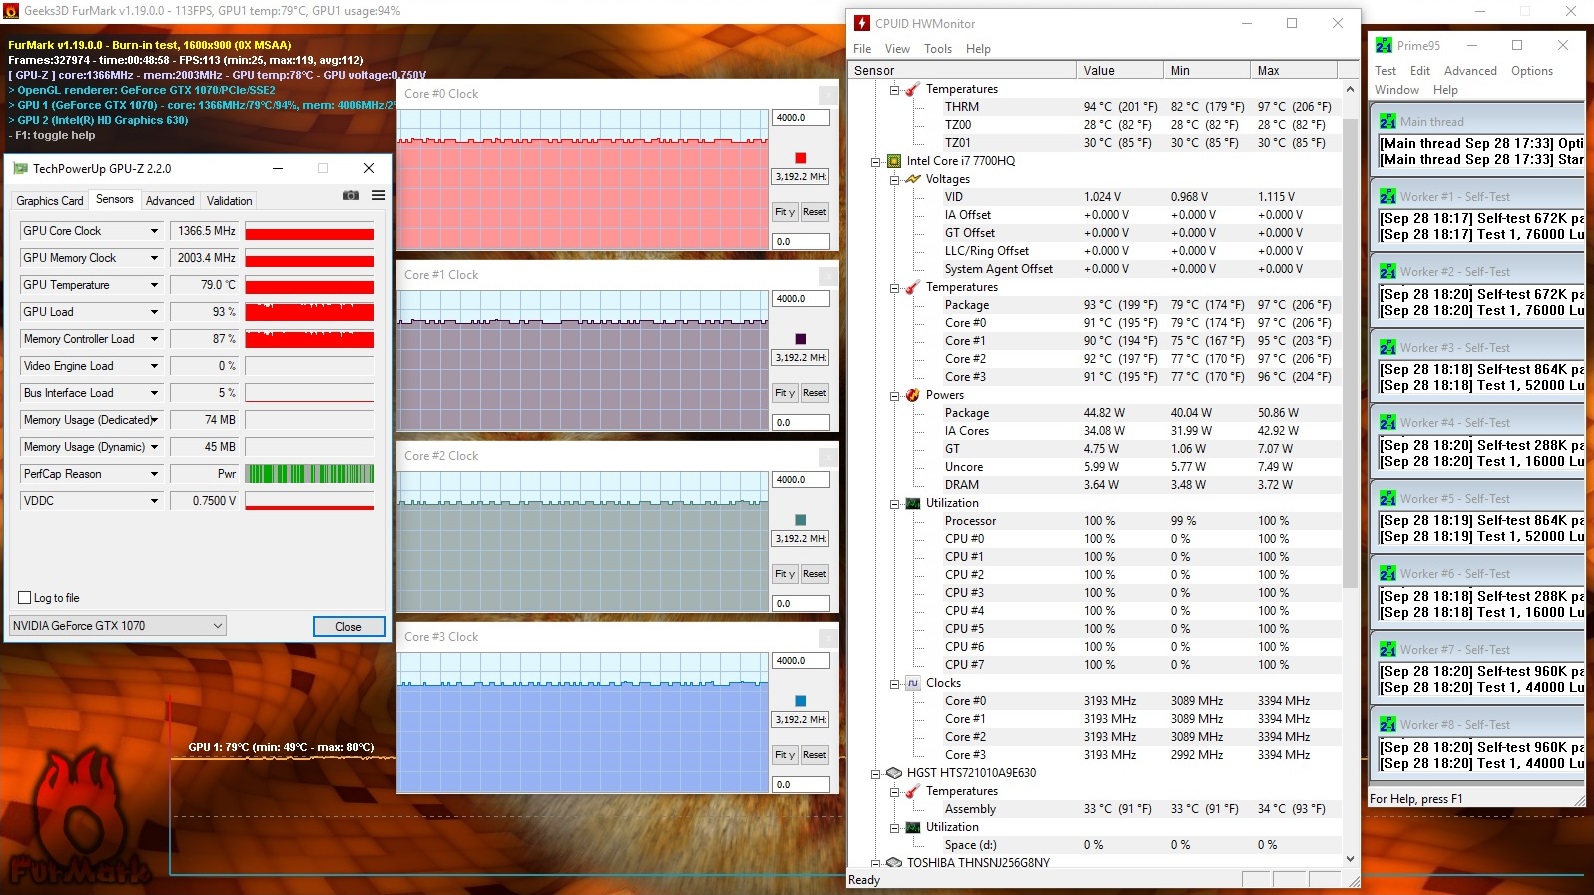
After starting our Prime95 + FurMark stress test, the cooling fan started up within a few seconds and slowly increased its rotation speed until it reached a clearly noticeable noise level that could even be heard from further away. Luckily, users are spared from other annoying noises such as whistling or whining. It is possible to further increase the RPM of the cooler by pressing the Cooler-Boost key. We did our measurements with the cooling mode set to automatic. You do not absolutely need headphones, but they might be more comfortable in the long run.
Noise level
| Idle |
| 33 / 35 / 40 dB(A) |
| HDD |
| 34 dB(A) |
| Load |
| 48 / 55 dB(A) |
 | ||
30 dB silent 40 dB(A) audible 50 dB(A) loud |
||
min: | ||
Temperature
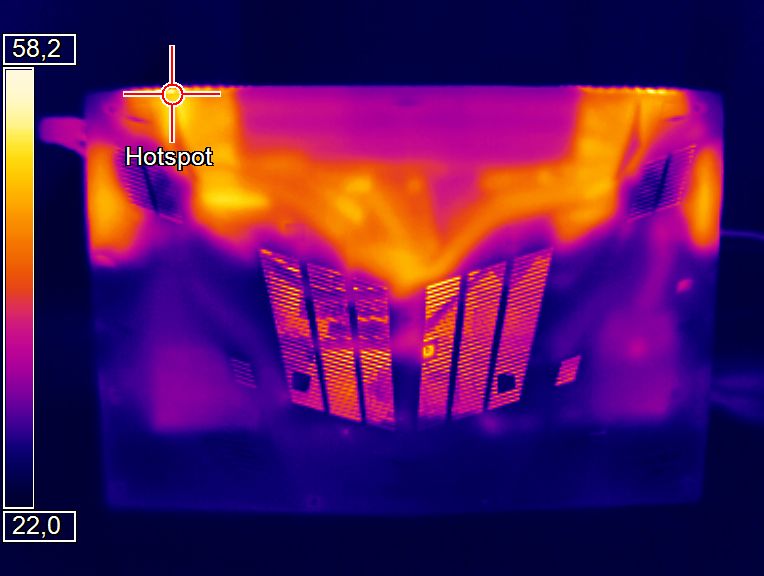
There are no issues concerning surface temperature when idling, while the area at the back can heat up to a slightly uncomfortable but not yet hot 48 °C (~118.4 °F) under load and when playing graphically demanding games (The Witcher 3). The area around the wrist rest becomes only slightly warmer than body temperature.
The processor heated up to a maximum of 97 °C (~206.6 °F) during our stress test (Prime95 + FurMark) and clocked between 3.1 and 3.2 GHz, which means there is no throttling. The GTX 1070's results were not as good in this unrealistic scenario. Its clock rate dropped to 1366 MHz after a while, which is just below its base clock rate. The GPU did not reach critical temperatures at a maximum of 97 °C (~206.6 °F).
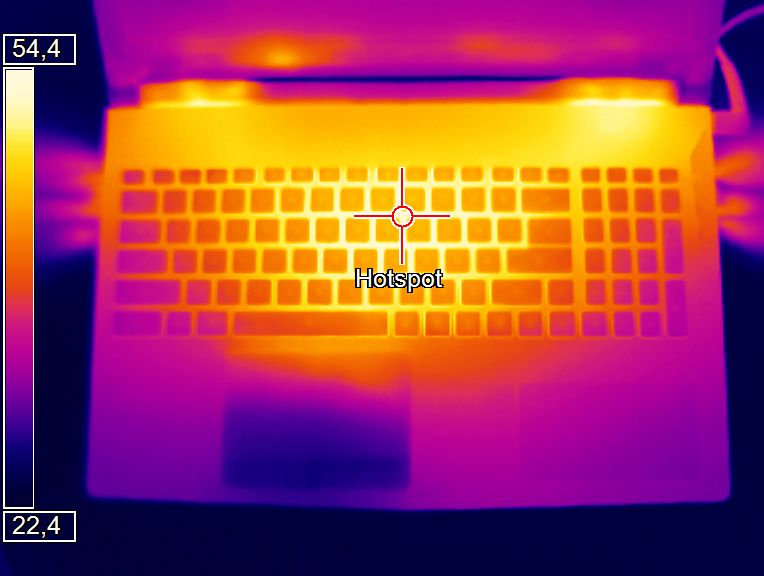
(-) The maximum temperature on the upper side is 48 °C / 118 F, compared to the average of 40.4 °C / 105 F, ranging from 21.2 to 68.8 °C for the class Gaming.
(-) The bottom heats up to a maximum of 47 °C / 117 F, compared to the average of 43.2 °C / 110 F
(+) In idle usage, the average temperature for the upper side is 28.4 °C / 83 F, compared to the device average of 33.9 °C / 93 F.
(-) Playing The Witcher 3, the average temperature for the upper side is 42 °C / 108 F, compared to the device average of 33.9 °C / 93 F.
(±) The palmrests and touchpad can get very hot to the touch with a maximum of 39 °C / 102.2 F.
(-) The average temperature of the palmrest area of similar devices was 28.8 °C / 83.8 F (-10.2 °C / -18.4 F).
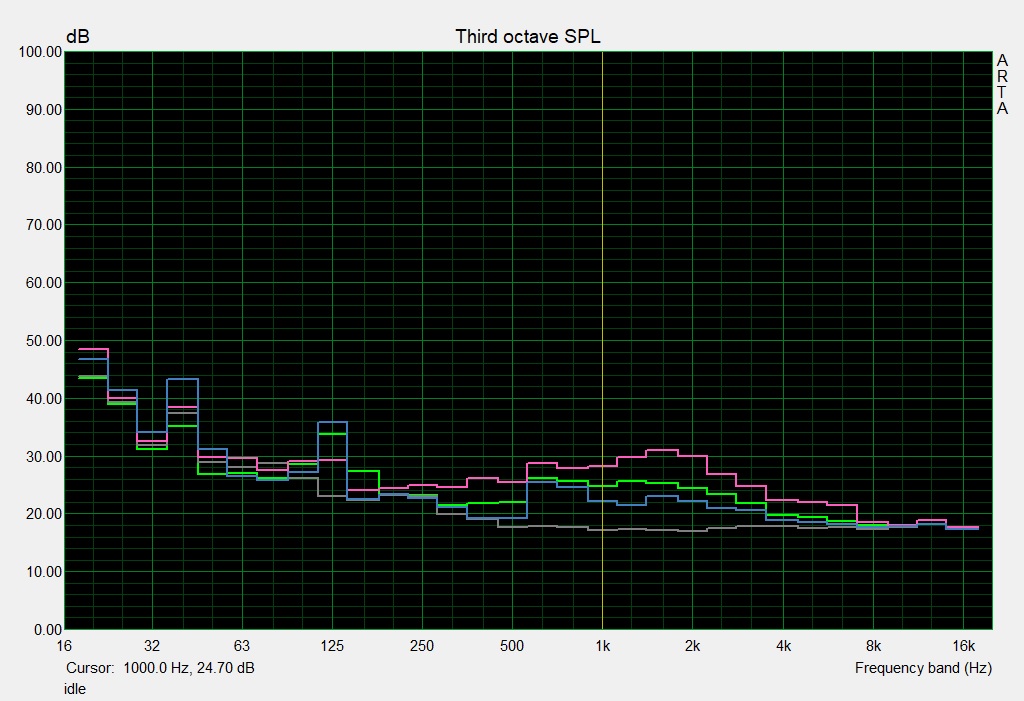
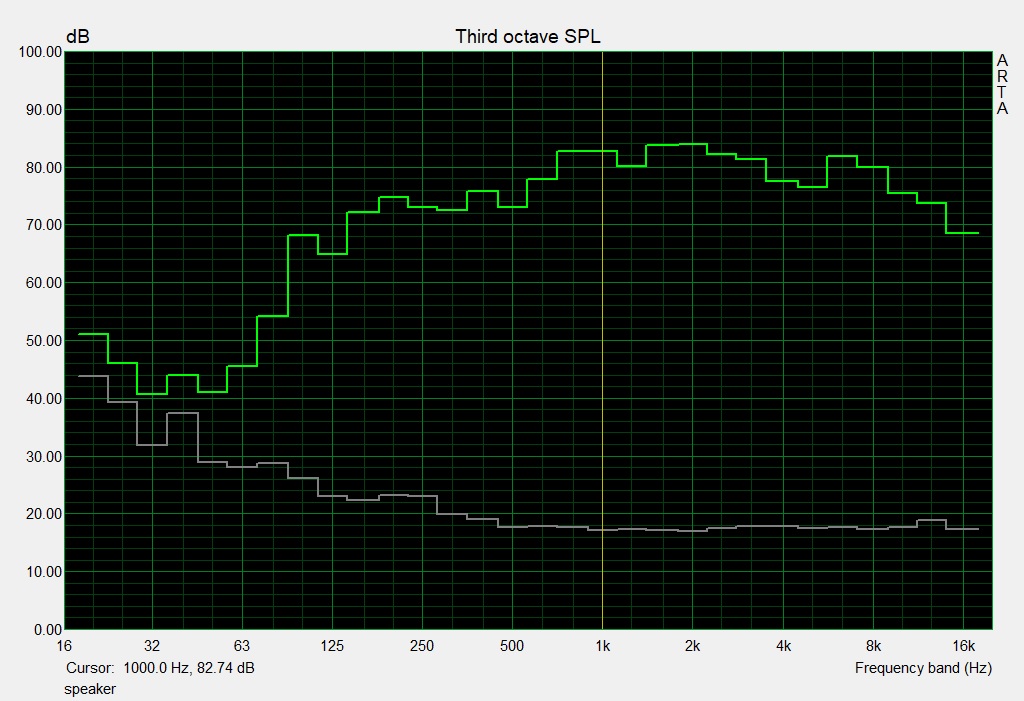
Speakers
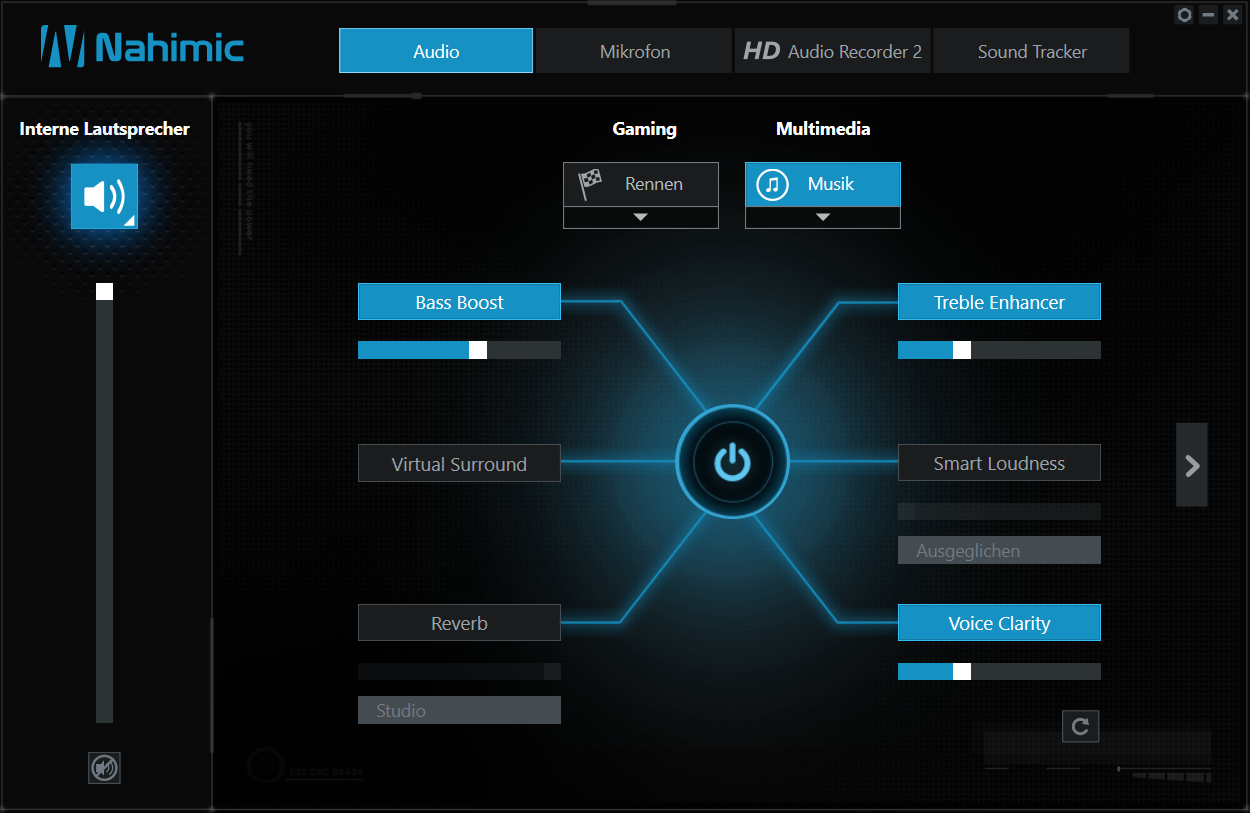
If you the turn the sound improvement feature of the music preset off (see the screenshot), the two speakers positioned at the bottom of the device sound like a biscuit tin. We reactivated the tweaks and played the usual song to test the sound system. The maximum volume is loud enough for medium-sized rooms and the sound is full, rather natural and quite well-balanced with well-emulated bass frequencies. But the results of the necessary compression (despite relatively large speakers) will be audible to trained ears - it remains a typical FM-radio sound.
Highs can sound a little piercing in some songs and you might notice slight changes in volume at high levels, which come from the system. These problems disappear if you reduce the volume slightly. We did not notice any distortions and the speakers sounded good enough while gaming to not need to use headphones for short sessions.
MSI GE63VR 7RF Raider audio analysis
(+) | speakers can play relatively loud (93 dB)
Bass 100 - 315 Hz
(±) | reduced bass - on average 6.6% lower than median
(±) | linearity of bass is average (8.2% delta to prev. frequency)
Mids 400 - 2000 Hz
(+) | balanced mids - only 4.1% away from median
(+) | mids are linear (4.7% delta to prev. frequency)
Highs 2 - 16 kHz
(+) | balanced highs - only 2.6% away from median
(+) | highs are linear (4.6% delta to prev. frequency)
Overall 100 - 16.000 Hz
(+) | overall sound is linear (9.9% difference to median)
Compared to same class
» 5% of all tested devices in this class were better, 2% similar, 94% worse
» The best had a delta of 6%, average was 18%, worst was 132%
Compared to all devices tested
» 4% of all tested devices were better, 1% similar, 95% worse
» The best had a delta of 4%, average was 24%, worst was 134%
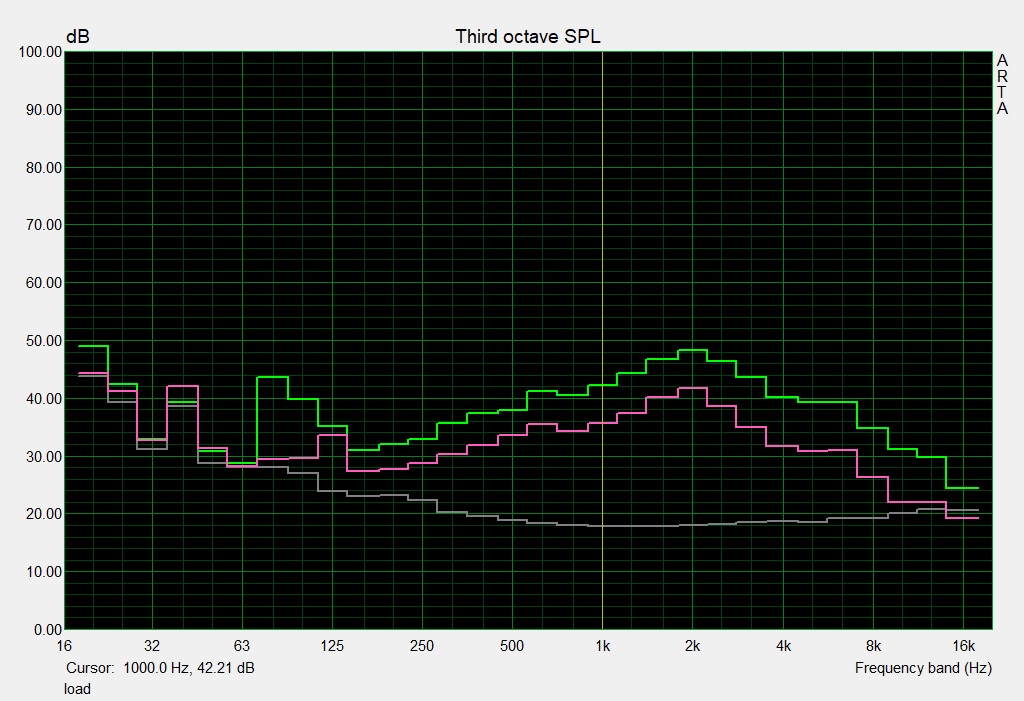
Alienware 15 R3 audio analysis
(+) | speakers can play relatively loud (82 dB)
Bass 100 - 315 Hz
(-) | nearly no bass - on average 19.1% lower than median
(±) | linearity of bass is average (10.4% delta to prev. frequency)
Mids 400 - 2000 Hz
(±) | higher mids - on average 6.7% higher than median
(±) | linearity of mids is average (7.5% delta to prev. frequency)
Highs 2 - 16 kHz
(+) | balanced highs - only 3.6% away from median
(+) | highs are linear (5.2% delta to prev. frequency)
Overall 100 - 16.000 Hz
(±) | linearity of overall sound is average (21.6% difference to median)
Compared to same class
» 77% of all tested devices in this class were better, 5% similar, 18% worse
» The best had a delta of 6%, average was 18%, worst was 132%
Compared to all devices tested
» 61% of all tested devices were better, 7% similar, 32% worse
» The best had a delta of 4%, average was 24%, worst was 134%
Acer Predator 15 G9-593-751X audio analysis
(+) | speakers can play relatively loud (91 dB)
Bass 100 - 315 Hz
(±) | reduced bass - on average 14.1% lower than median
(±) | linearity of bass is average (10.6% delta to prev. frequency)
Mids 400 - 2000 Hz
(+) | balanced mids - only 3.2% away from median
(+) | mids are linear (4.9% delta to prev. frequency)
Highs 2 - 16 kHz
(+) | balanced highs - only 3.7% away from median
(+) | highs are linear (5.3% delta to prev. frequency)
Overall 100 - 16.000 Hz
(+) | overall sound is linear (14.1% difference to median)
Compared to same class
» 24% of all tested devices in this class were better, 8% similar, 68% worse
» The best had a delta of 6%, average was 18%, worst was 132%
Compared to all devices tested
» 17% of all tested devices were better, 4% similar, 80% worse
» The best had a delta of 4%, average was 24%, worst was 134%
Asus Zephyrus GX501VS audio analysis
(-) | not very loud speakers (71.4 dB)
Bass 100 - 315 Hz
(-) | nearly no bass - on average 18.8% lower than median
(±) | linearity of bass is average (11.3% delta to prev. frequency)
Mids 400 - 2000 Hz
(+) | balanced mids - only 1.2% away from median
(+) | mids are linear (6.3% delta to prev. frequency)
Highs 2 - 16 kHz
(±) | higher highs - on average 6.5% higher than median
(+) | highs are linear (6.3% delta to prev. frequency)
Overall 100 - 16.000 Hz
(±) | linearity of overall sound is average (23.4% difference to median)
Compared to same class
» 85% of all tested devices in this class were better, 5% similar, 11% worse
» The best had a delta of 6%, average was 18%, worst was 132%
Compared to all devices tested
» 70% of all tested devices were better, 6% similar, 24% worse
» The best had a delta of 4%, average was 24%, worst was 134%
Frequency diagram in comparison (checkboxes can be turned on/off!)
Energy Management
Power Consumption
The MSI GE63VR is the only notebook in our comparison field that has foregone G-Sync in order to use Nvidia Optimus - which has an effect on the three levels of idle load. Our test unit consumes significantly less power here. The fact that the Acer and Alienware consume up to 14% less power under load might be connected to their conservative clocking. This is obvious in the Asus if you consider the reduced clock rate of the Max-Q version of the GT 1070.
| Off / Standby | |
| Idle | |
| Load |
|
Key:
min: | |
| MSI GE63VR 7RF Raider i7-7700HQ, GeForce GTX 1070 Mobile | Acer Predator 15 G9-593-751X i7-7700HQ, GeForce GTX 1070 Mobile | Alienware 15 R3 i7-7700HQ, GeForce GTX 1070 Mobile | Asus Zephyrus GX501VS i7-7700HQ, GeForce GTX 1070 Max-Q | |
|---|---|---|---|---|
| Power Consumption | -22% | -27% | -6% | |
| Idle Minimum * (Watt) | 11 | 18 -64% | 19 -73% | 19.1 -74% |
| Idle Average * (Watt) | 16 | 23 -44% | 23 -44% | 20.8 -30% |
| Idle Maximum * (Watt) | 21 | 30 -43% | 29 -38% | 21.8 -4% |
| Load Average * (Watt) | 92 | 89 3% | 85 8% | 73.7 20% |
| Witcher 3 ultra * (Watt) | 185 | 168 9% | 130.2 30% | |
| Load Maximum * (Watt) | 224 | 213 5% | 192 14% | 173.1 23% |
* ... smaller is better
Battery Runtime
Despite the almost equally dimensioned 50-Wh battery, the runtimes of the Zephyrus are 30% behind those of our MSI in our maximum runtime (idle) tests and our practical Wi-Fi surfing tests at reduced brightness. Things change under load, where the Zephyrus lasts 17% longer with its Max-Q processor.
The capacity of the batteries of the two significantly heavier laptops by Acer and Alienware is 76 - 94% higher than that of our test unit. Their average runtimes show paradoxical results. While the Acer with the smaller 90-Wh battery can run for twice as long as our test unit, the Alienware with the larger 99-Wh battery only manages 64% more than our GE63VR.
| MSI GE63VR 7RF Raider i7-7700HQ, GeForce GTX 1070 Mobile, 51 Wh | Acer Predator 15 G9-593-751X i7-7700HQ, GeForce GTX 1070 Mobile, 90 Wh | Alienware 15 R3 i7-7700HQ, GeForce GTX 1070 Mobile, 99 Wh | Asus Zephyrus GX501VS i7-7700HQ, GeForce GTX 1070 Max-Q, 50 Wh | |
|---|---|---|---|---|
| Battery runtime | 101% | 64% | -14% | |
| Reader / Idle (h) | 5.4 | 8.4 56% | 6.4 19% | 3.8 -30% |
| WiFi v1.3 (h) | 3.4 | 5.5 62% | 4.4 29% | 2.5 -26% |
| Load (h) | 0.7 | 2 186% | 1.7 143% | 0.8 14% |
| H.264 (h) | 4.9 | 4.4 |
Verdict
Pros
Cons
MSI has taken a step away from the general IPS trend and dared to be imperfect. If you do not require too much free space around your notebook and can avoid looking at the display from below, you will appreciate this notebook for its fast response times, accurate color display, 100% sRGB coverage and 120 Hz - although this would have made more sense if MSI had not left out G-Sync in favor of low power consumption.
The well-made MSI GE63VR Raider-075 gave us a great impression during testing - only their decision to forego G-Sync is rather surprising.
The MSI GE63VR Raider-075 is available from $1700 and is a compact, light-weight, well-constructed and high-performing gaming notebook with a headstrong display whose few disadvantages will hardly bother ambitious gamers. We can clearly recommend this device.
MSI GE63VR 7RF Raider
- 10/28/2017 v6 (old)
Sven Kloevekorn
Price comparison
