Acer Predator 15 (7700HQ, GTX 1070, Full HD) Laptop Review

For the original German review, see here.
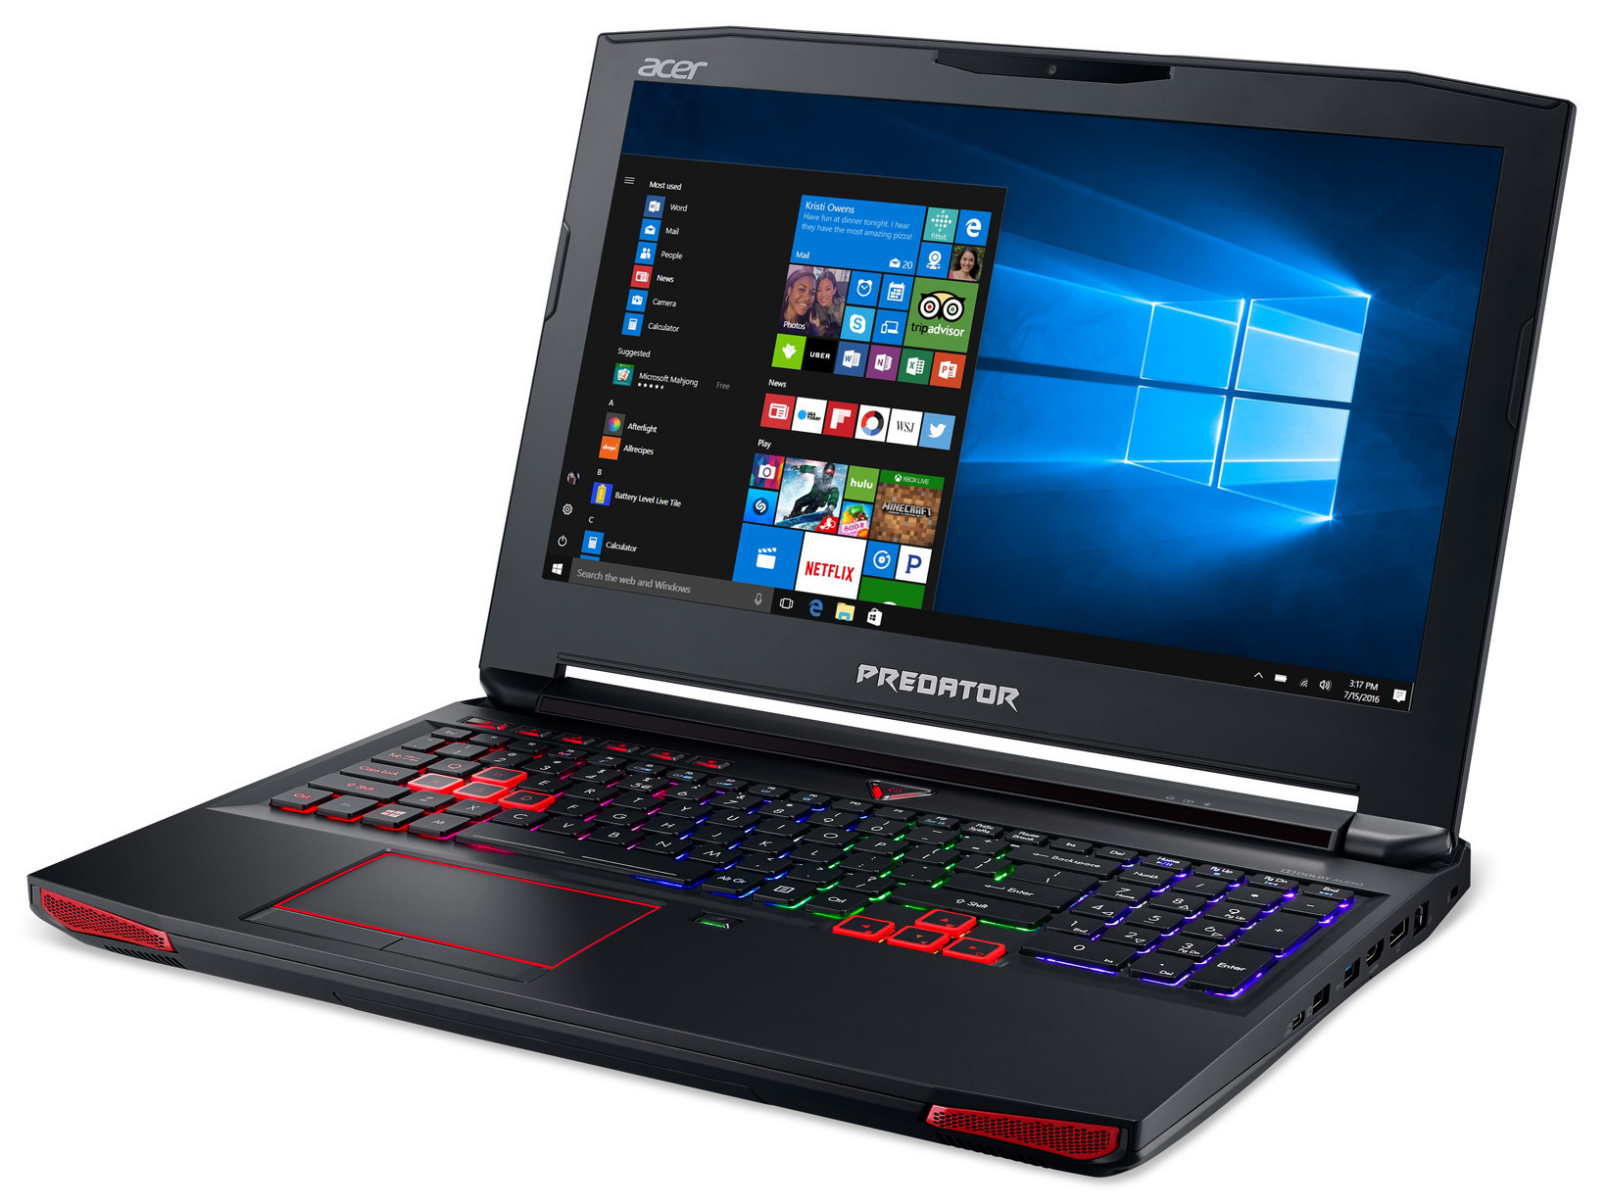
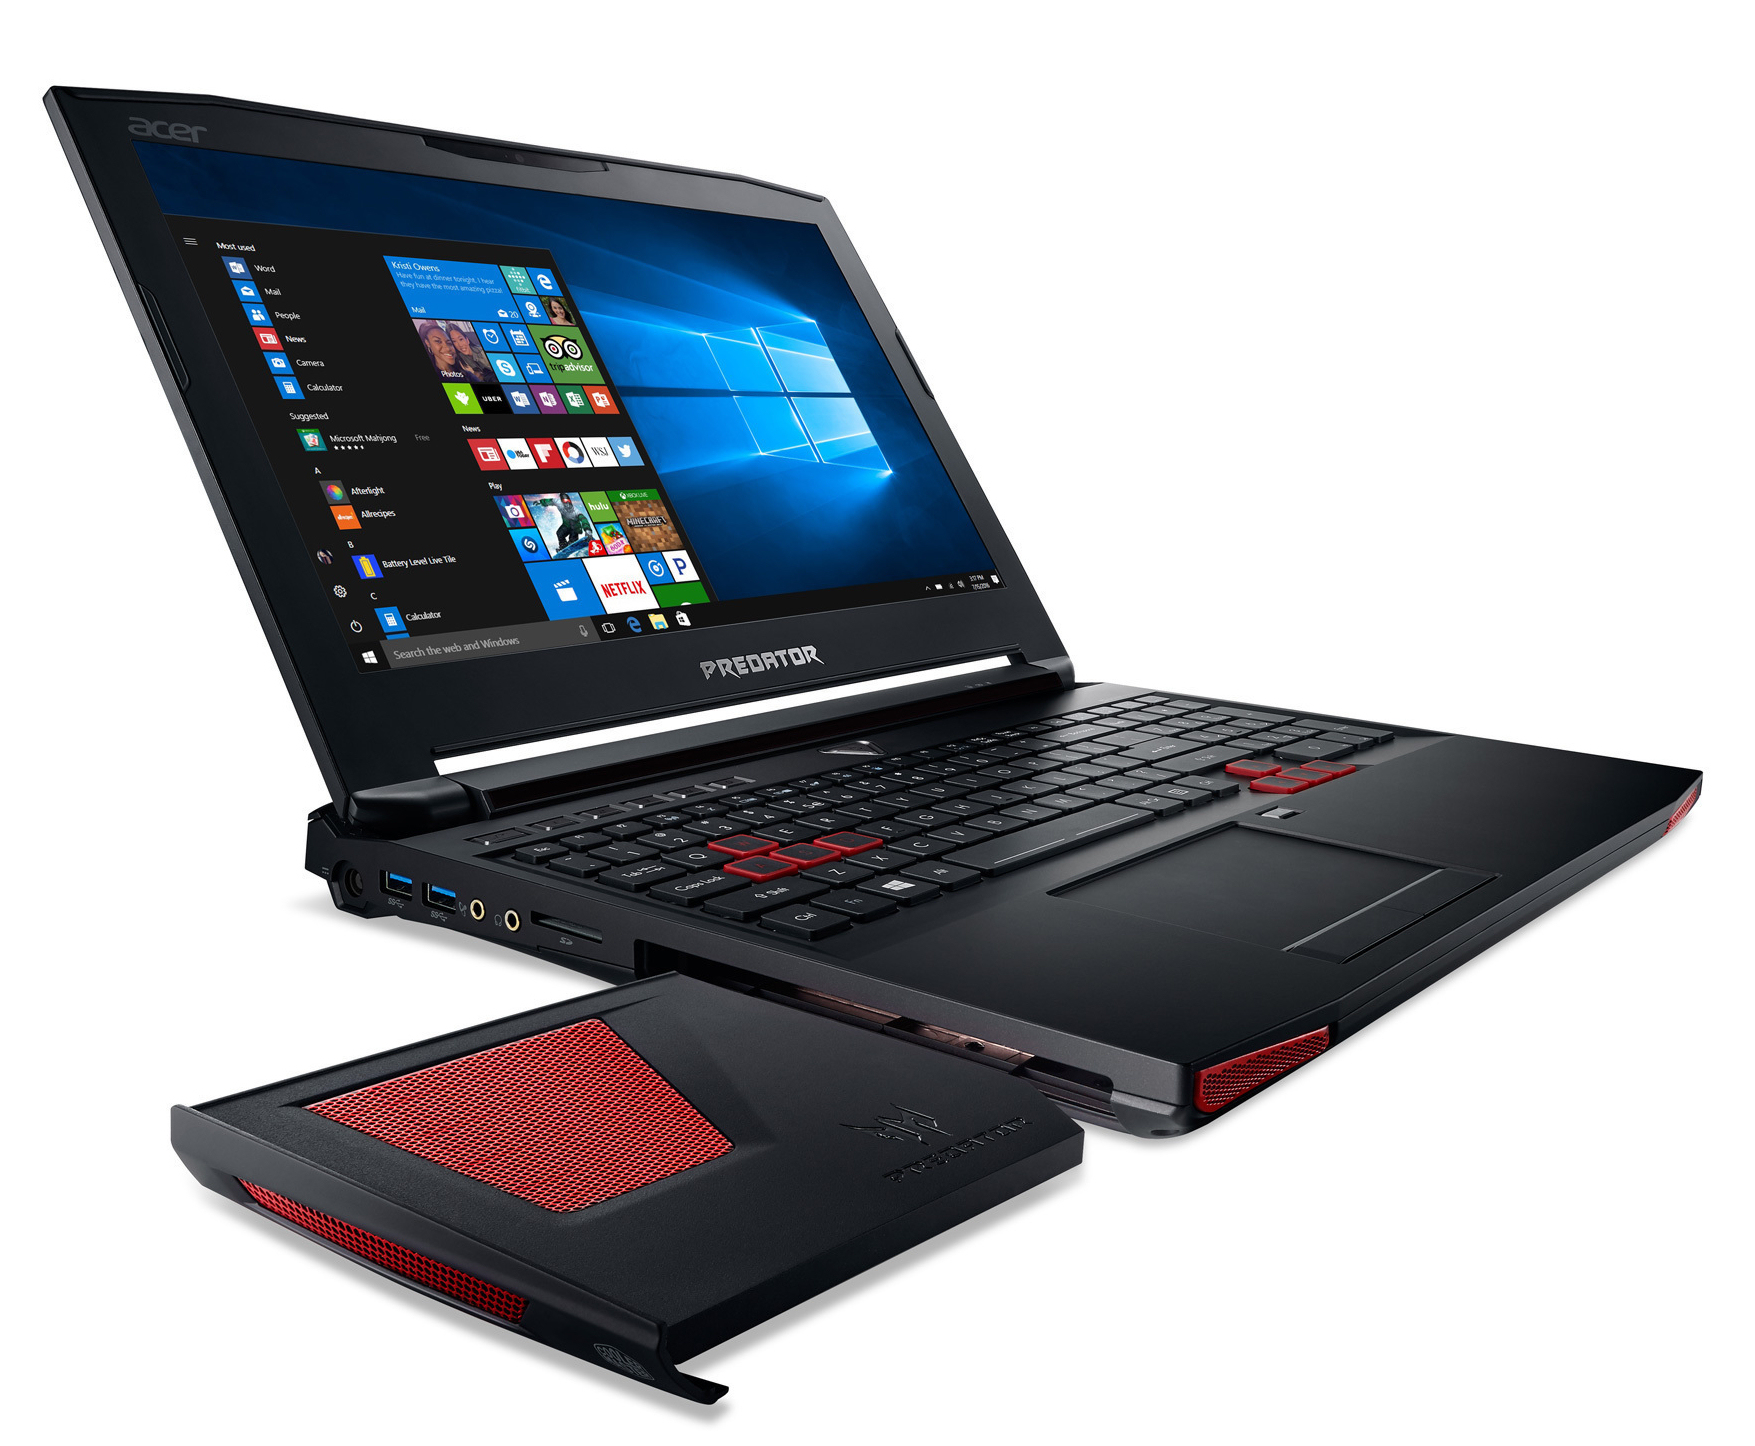
The Predator 15 G9-593-751X is the newest representative of Acer's gaming notebook series. This is a sibling model of the Predator 15 G9-593-765Q that has an identical build and we have already tested. Differences between the computers can only be found inside: The new model brings a Kaby Lake processor. In terms of the graphics core, nothing has changed. Both racers have a GeForce GTX 1070 on board. The competitors of the Predator include computers such as the MSI GT62VR 7RE-223, the Alienware 15 R3, and the Asus Strix GL502VS.
Since both of the Predator models have an identical build, we will not further discuss the case, features, input devices, display, and speakers here. That information can be found in the Predator 15 G9-593-765Q Review.
| SD Card Reader | |
| average JPG Copy Test (av. of 3 runs) | |
| MSI GT62VR 7RE-223 | |
| Acer Predator 15 G9-593-751X | |
| Acer Predator 15 G9-593-765Q | |
| Asus Strix GL502VS-FY032T | |
| maximum AS SSD Seq Read Test (1GB) | |
| MSI GT62VR 7RE-223 | |
| Acer Predator 15 G9-593-765Q | |
| Acer Predator 15 G9-593-751X | |
| Asus Strix GL502VS-FY032T | |
| Networking | |
| iperf3 transmit AX12 | |
| Acer Predator 15 G9-593-751X | |
| Acer Predator 15 G9-593-765Q | |
| MSI GT62VR 7RE-223 | |
| Alienware 15 R3 | |
| iperf3 receive AX12 | |
| Acer Predator 15 G9-593-751X | |
| Alienware 15 R3 | |
| Acer Predator 15 G9-593-765Q | |
| MSI GT62VR 7RE-223 | |
Display
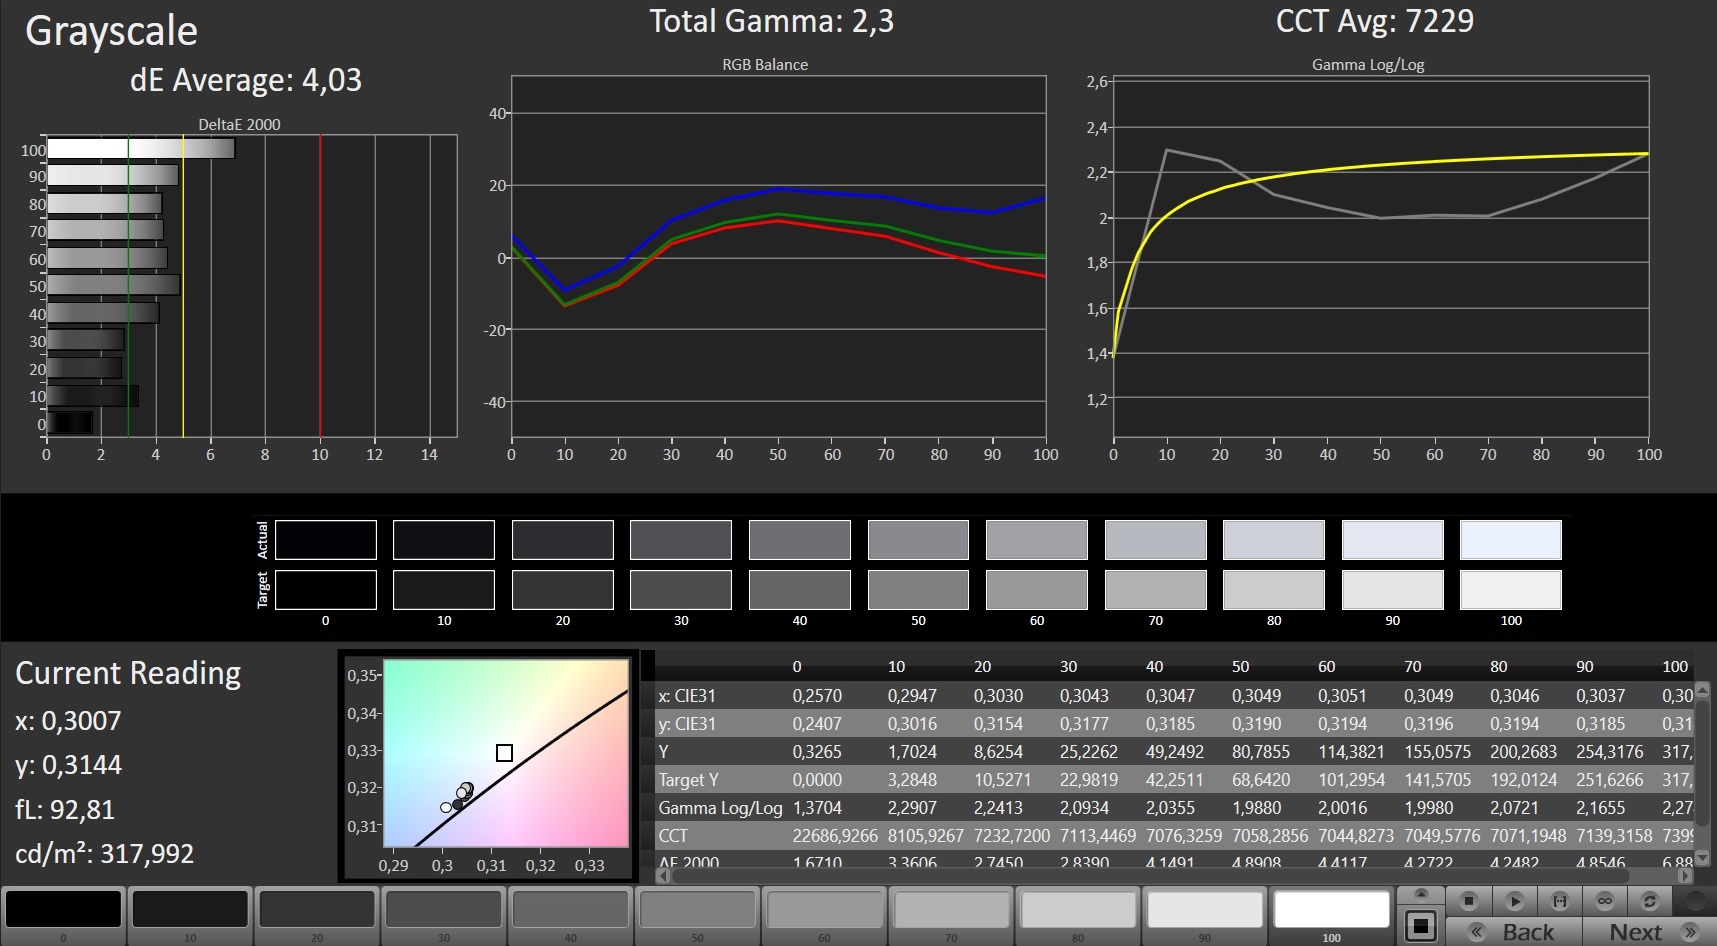
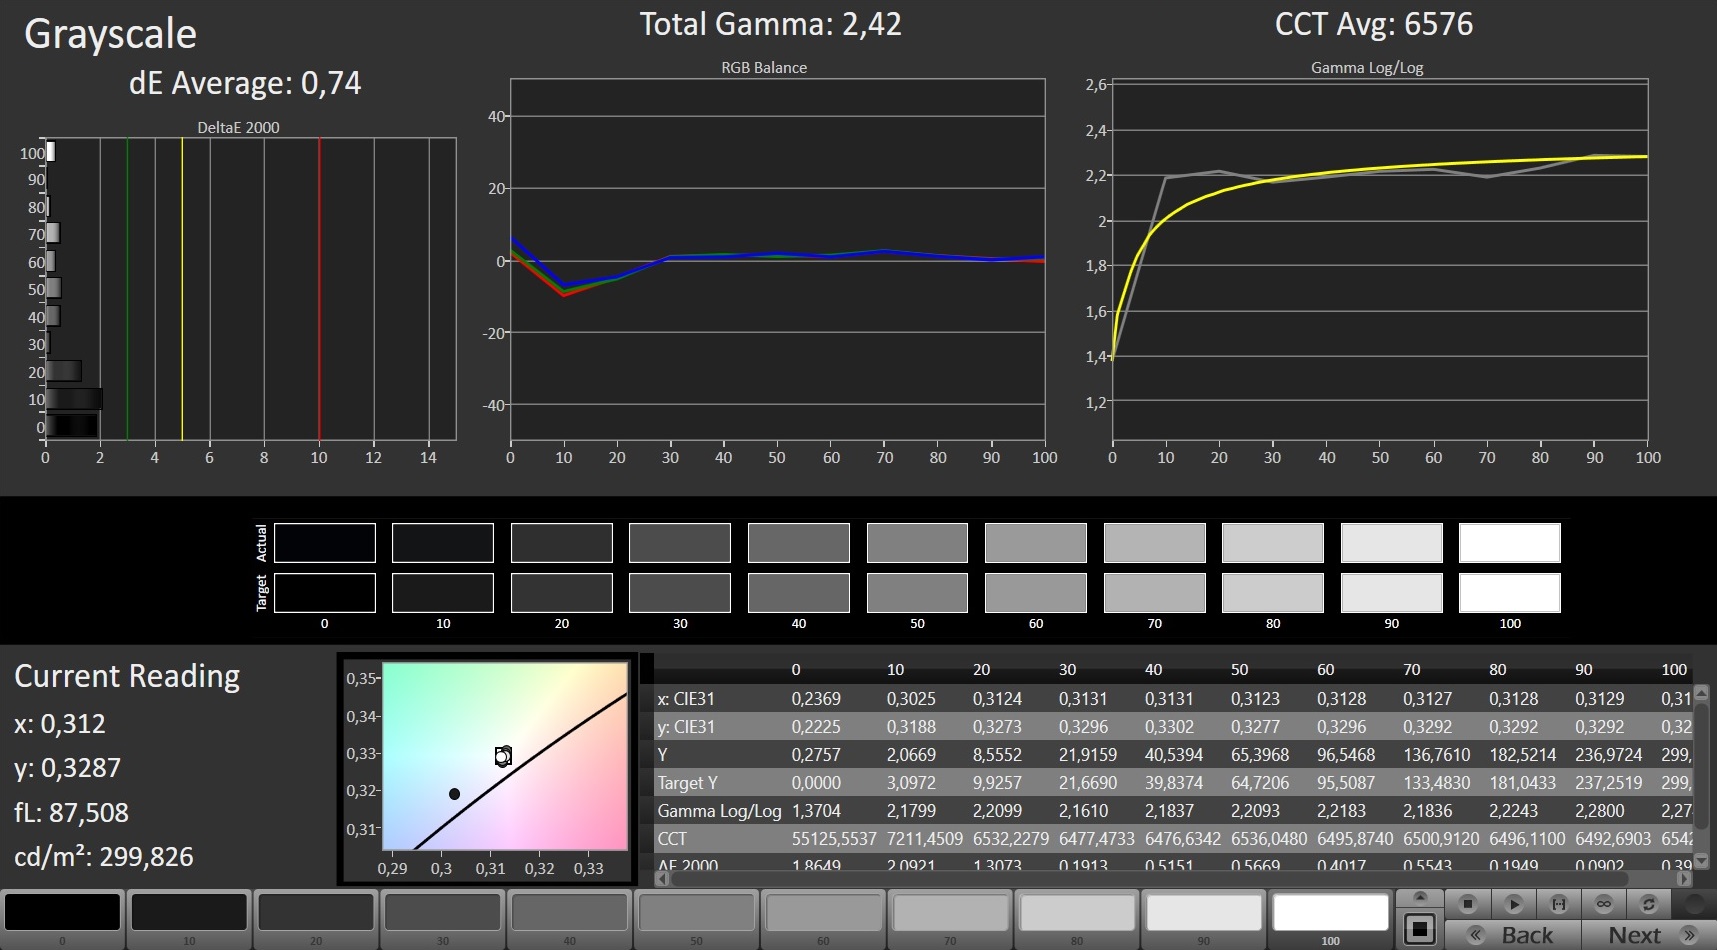
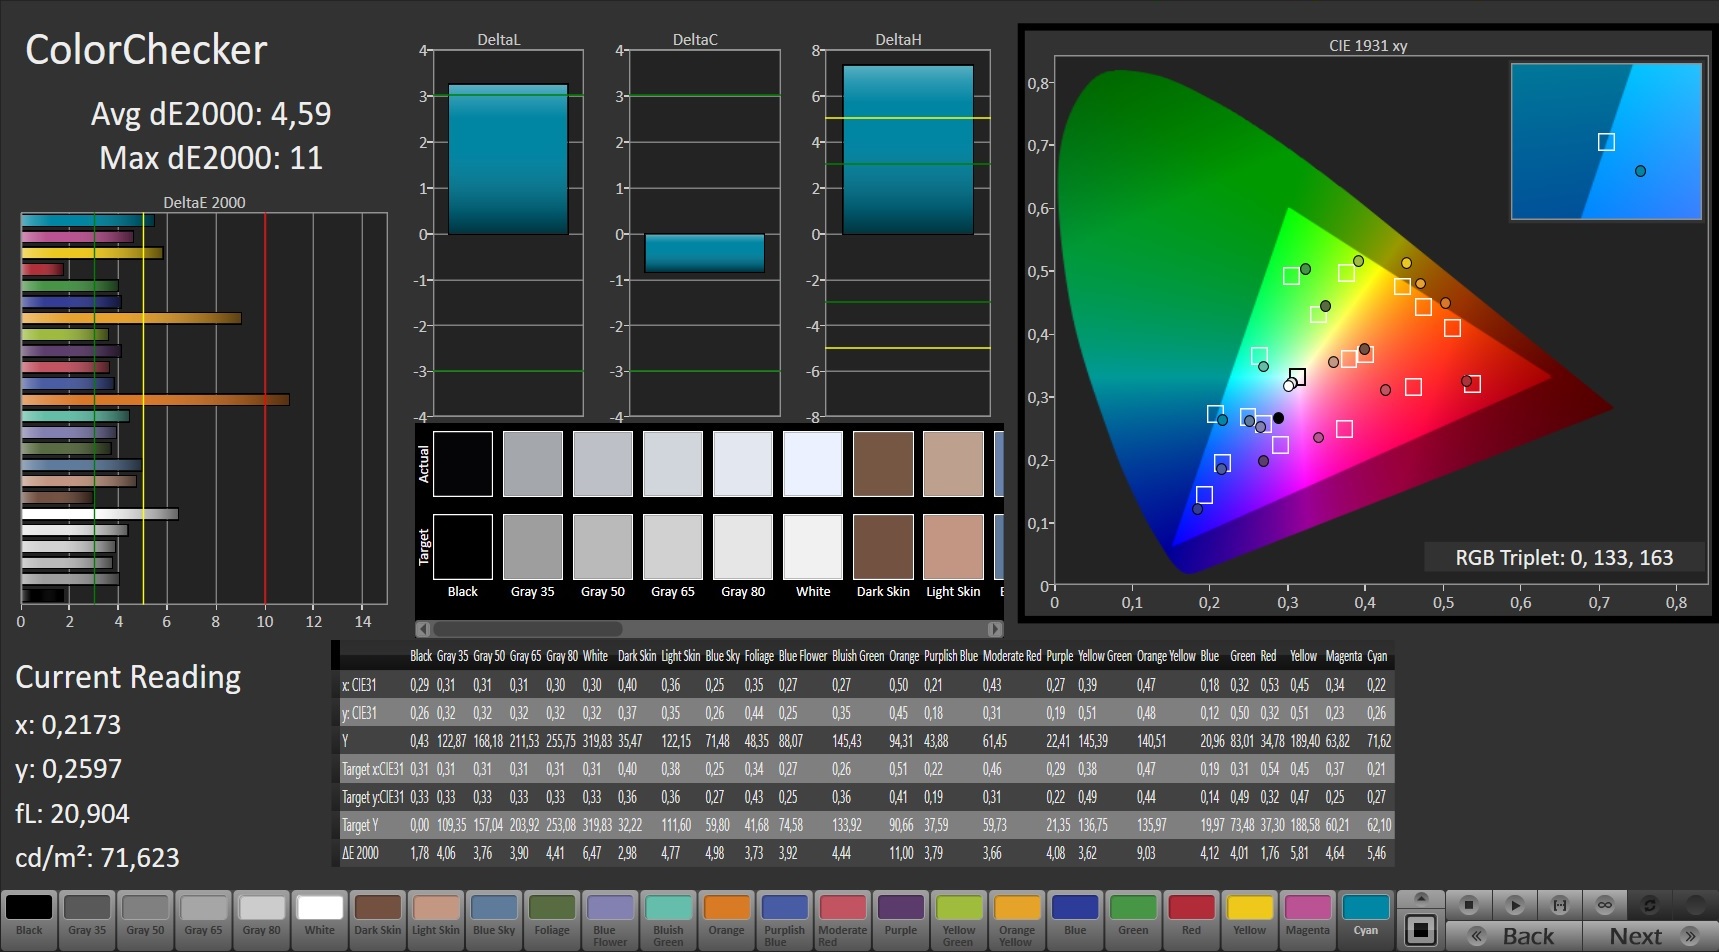
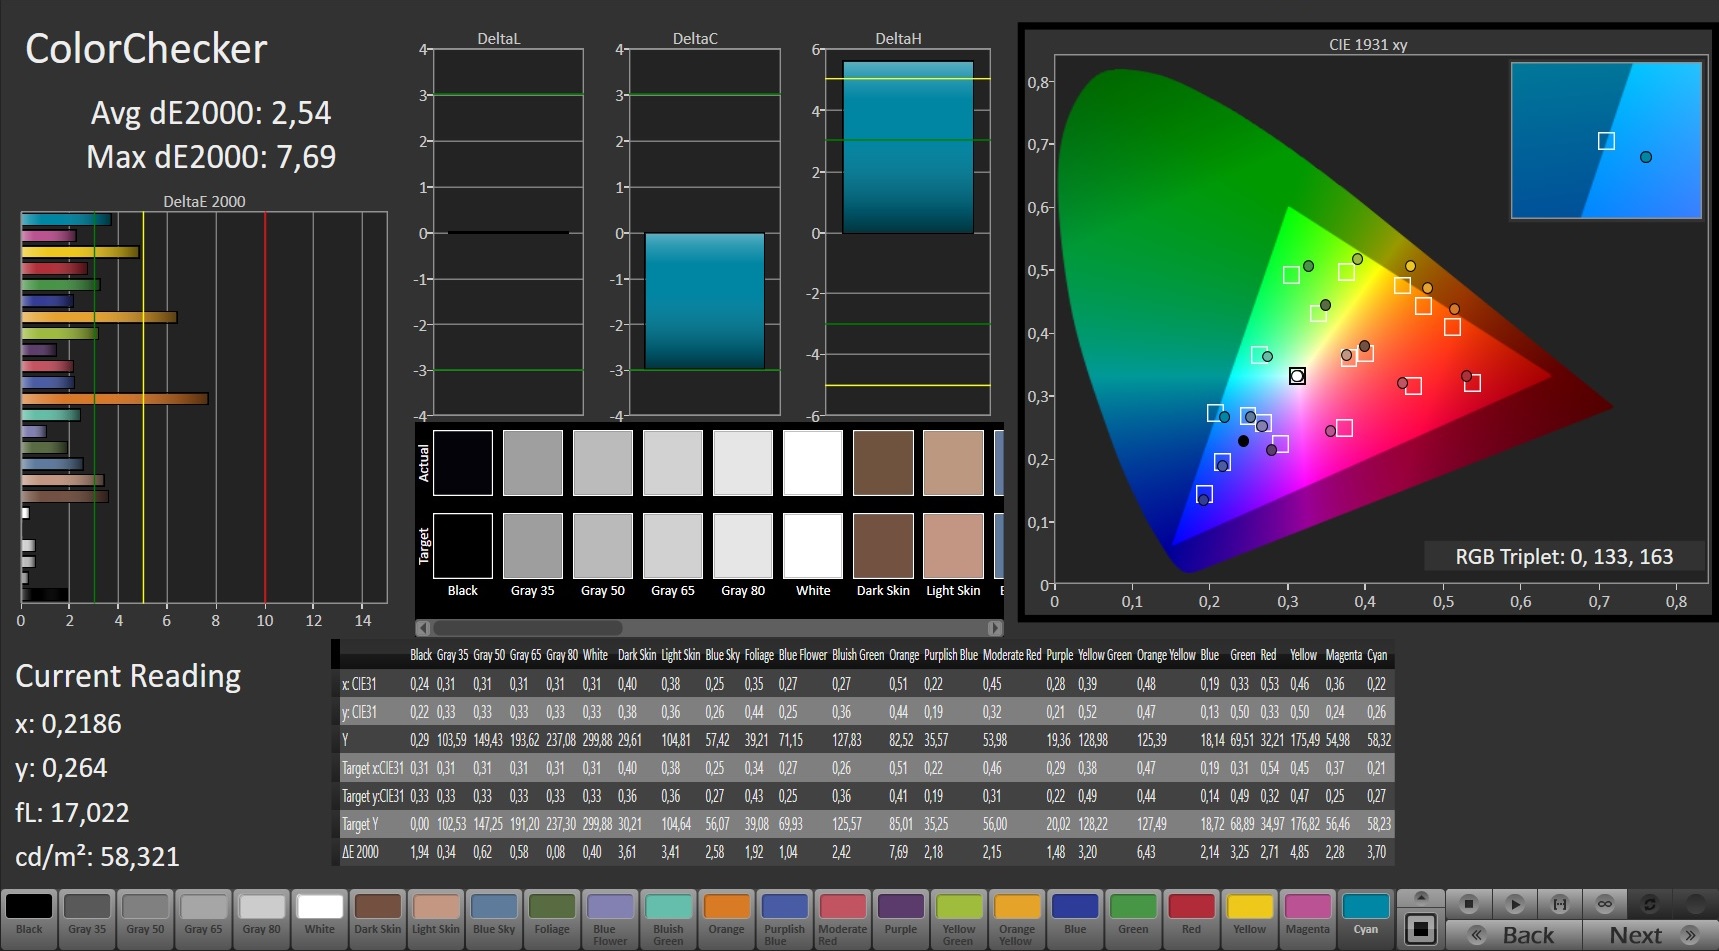
The Predator 15 is equipped with a matte IPS display, which offers a good contrast and a decent brightness value. This is the same display as that of the Predator 15 model we have already tested. Nonetheless, the measurements come out slightly different. This is normal since two similar panels will never have values that are 100% identical.
| |||||||||||||||||||||||||
Brightness Distribution: 88 %
Center on Battery: 295 cd/m²
Contrast: 922:1 (Black: 0.32 cd/m²)
ΔE ColorChecker Calman: 4.59 | ∀{0.5-29.43 Ø4.73}
ΔE Greyscale Calman: 4.03 | ∀{0.09-98 Ø4.97}
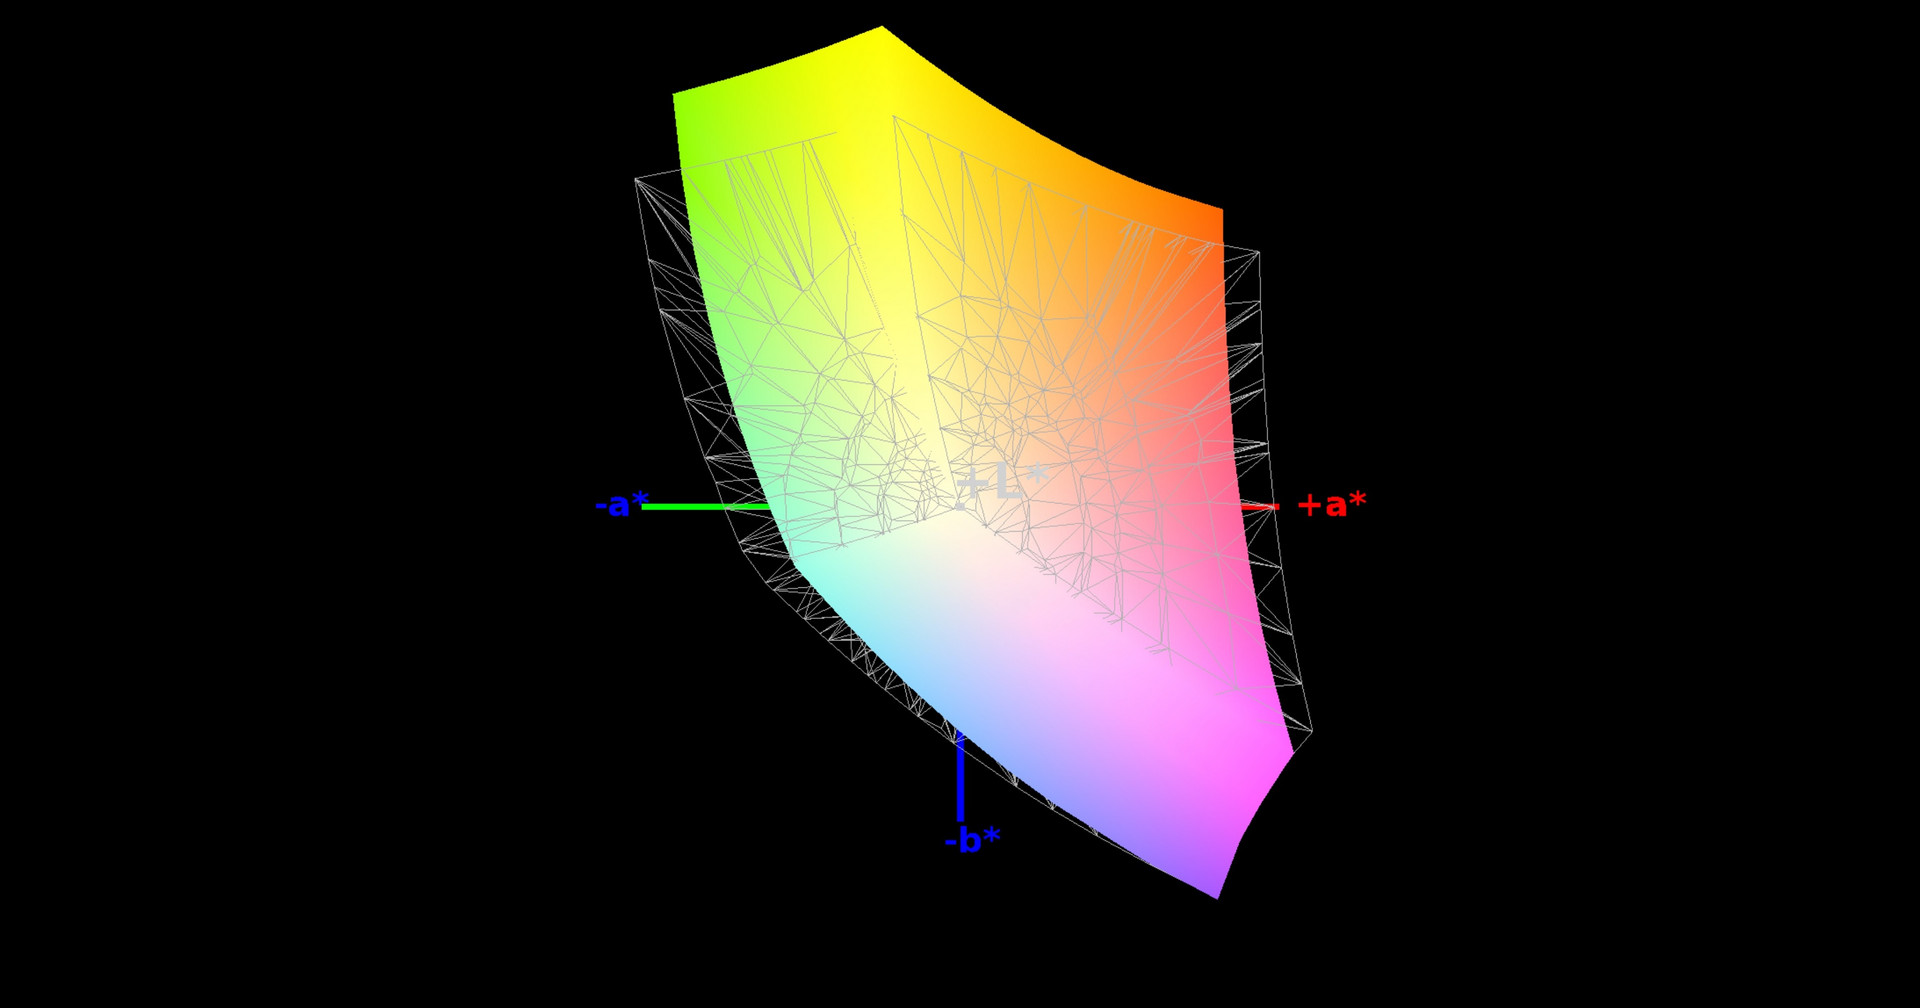
85% sRGB (Argyll 1.6.3 3D)
56% AdobeRGB 1998 (Argyll 1.6.3 3D)
62.5% AdobeRGB 1998 (Argyll 3D)
85.5% sRGB (Argyll 3D)
65.4% Display P3 (Argyll 3D)
Gamma: 2.3
CCT: 7229 K
| Acer Predator 15 G9-593-751X LG Philips LP156WF6-SPP1 (LGD04D5), 1920x1080 | Acer Predator 15 G9-593-765Q LG Philips LP156WF6-SPP1 (LGD04D5), 1920x1080 | Alienware 15 R3 HPJGK_B156HTN (AUO51ED), 1920x1080 | MSI GT62VR 7RE-223 LG Philips LP156WF6 (LGD046F), 1920x1080 | Asus Strix GL502VS-FY032T LG Philips LP156WF6-SPB6 (LGD046F), 1920x1080 | |
|---|---|---|---|---|---|
| Display | -2% | 4% | -3% | -2% | |
| Display P3 Coverage (%) | 65.4 | 63.6 -3% | 66 1% | 63.9 -2% | 64.5 -1% |
| sRGB Coverage (%) | 85.5 | 83.9 -2% | 90.5 6% | 83.1 -3% | 83.1 -3% |
| AdobeRGB 1998 Coverage (%) | 62.5 | 61.3 -2% | 66.2 6% | 60.8 -3% | 60.8 -3% |
| Response Times | 4% | 43% | 1% | 4% | |
| Response Time Grey 50% / Grey 80% * (ms) | 36 ? | 35 ? 3% | 25 ? 31% | 37 ? -3% | 38 ? -6% |
| Response Time Black / White * (ms) | 26.4 ? | 25 ? 5% | 12 ? 55% | 25 ? 5% | 23 ? 13% |
| PWM Frequency (Hz) | 20830 ? | ||||
| Screen | 7% | -27% | 3% | 2% | |
| Brightness middle (cd/m²) | 295 | 273 -7% | 386 31% | 310 5% | 315 7% |
| Brightness (cd/m²) | 274 | 267 -3% | 382 39% | 311 14% | 290 6% |
| Brightness Distribution (%) | 88 | 83 -6% | 93 6% | 85 -3% | 85 -3% |
| Black Level * (cd/m²) | 0.32 | 0.27 16% | 0.39 -22% | 0.3 6% | 0.32 -0% |
| Contrast (:1) | 922 | 1011 10% | 990 7% | 1033 12% | 984 7% |
| Colorchecker dE 2000 * | 4.59 | 3.77 18% | 10.2 -122% | 4.82 -5% | 4.88 -6% |
| Colorchecker dE 2000 max. * | 11 | 10.64 3% | 15.81 -44% | 10.14 8% | 8.88 19% |
| Greyscale dE 2000 * | 4.03 | 2.48 38% | 11.28 -180% | 3.94 2% | 4.17 -3% |
| Gamma | 2.3 96% | 2.37 93% | 2.23 99% | 2.45 90% | 2.53 87% |
| CCT | 7229 90% | 6854 95% | 11383 57% | 6877 95% | 6683 97% |
| Color Space (Percent of AdobeRGB 1998) (%) | 56 | 55 -2% | 59 5% | 54 -4% | 55 -2% |
| Color Space (Percent of sRGB) (%) | 85 | 84 -1% | 90 6% | 83 -2% | 83 -2% |
| Total Average (Program / Settings) | 3% /
4% | 7% /
-12% | 0% /
2% | 1% /
2% |
* ... smaller is better
Screen Flickering / PWM (Pulse-Width Modulation)
| Screen flickering / PWM detected | 20830 Hz | ≤ 90 % brightness setting | 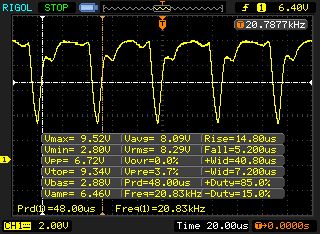 |
The display backlight flickers at 20830 Hz (worst case, e.g., utilizing PWM) Flickering detected at a brightness setting of 90 % and below. There should be no flickering or PWM above this brightness setting. The frequency of 20830 Hz is quite high, so most users sensitive to PWM should not notice any flickering. In comparison: 52 % of all tested devices do not use PWM to dim the display. If PWM was detected, an average of 7798 (minimum: 5 - maximum: 343500) Hz was measured. | |||

Display Response Times
| ↔ Response Time Black to White | ||
|---|---|---|
| 26.4 ms ... rise ↗ and fall ↘ combined | ↗ 15.2 ms rise | 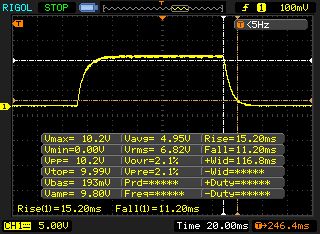 |
| ↘ 11.2 ms fall | ||
| The screen shows relatively slow response rates in our tests and may be too slow for gamers. In comparison, all tested devices range from 0.1 (minimum) to 240 (maximum) ms. » 66 % of all devices are better. This means that the measured response time is worse than the average of all tested devices (19.9 ms). | ||
| ↔ Response Time 50% Grey to 80% Grey | ||
| 36 ms ... rise ↗ and fall ↘ combined | ↗ 18 ms rise | 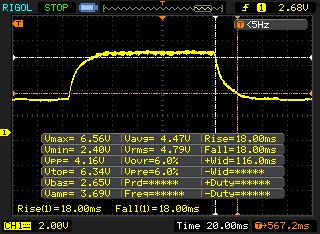 |
| ↘ 18 ms fall | ||
| The screen shows slow response rates in our tests and will be unsatisfactory for gamers. In comparison, all tested devices range from 0.165 (minimum) to 636 (maximum) ms. » 50 % of all devices are better. This means that the measured response time is worse than the average of all tested devices (31.1 ms). | ||
Performance
With the Predator 15 series, Acer presents a series of gaming notebooks in the 15.6-inch format. Our test unit costs about 2100 Euros (~$2352). Other options are available. The prices start at around 1800 Euros (~$2016). (Note that while the exact same G9-593-751X model is not available in the US, many similar models with other designations and options are available. For example, the Acer Predator 15 G9-593-71EH with Core i7-7700HQ, GeForce GTX 1070, 15.6” Full HD, 16 GB DDR4, 256 GB SSD, and 1 TB HDD costs around $2075 in the US.)
Processor
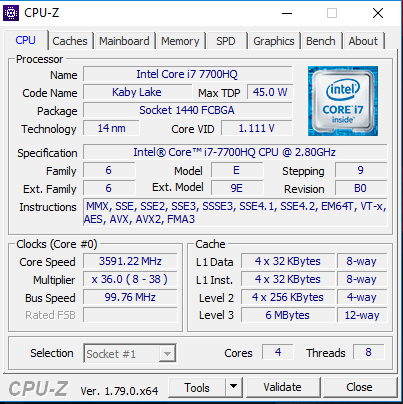
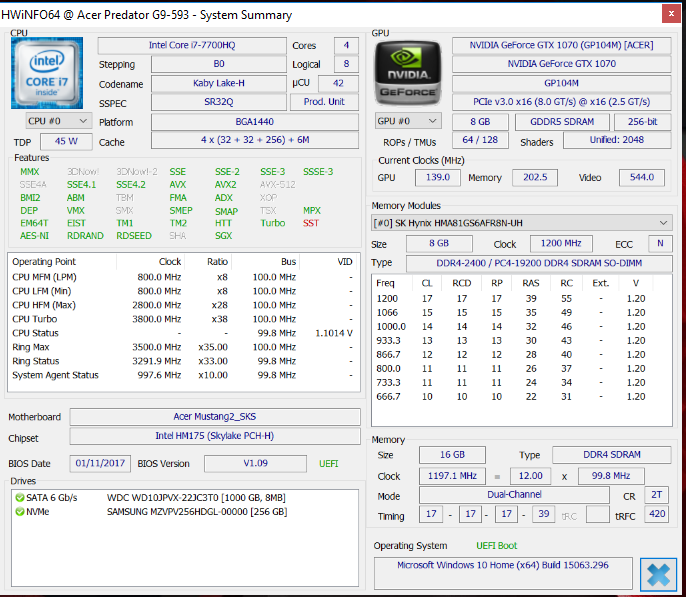
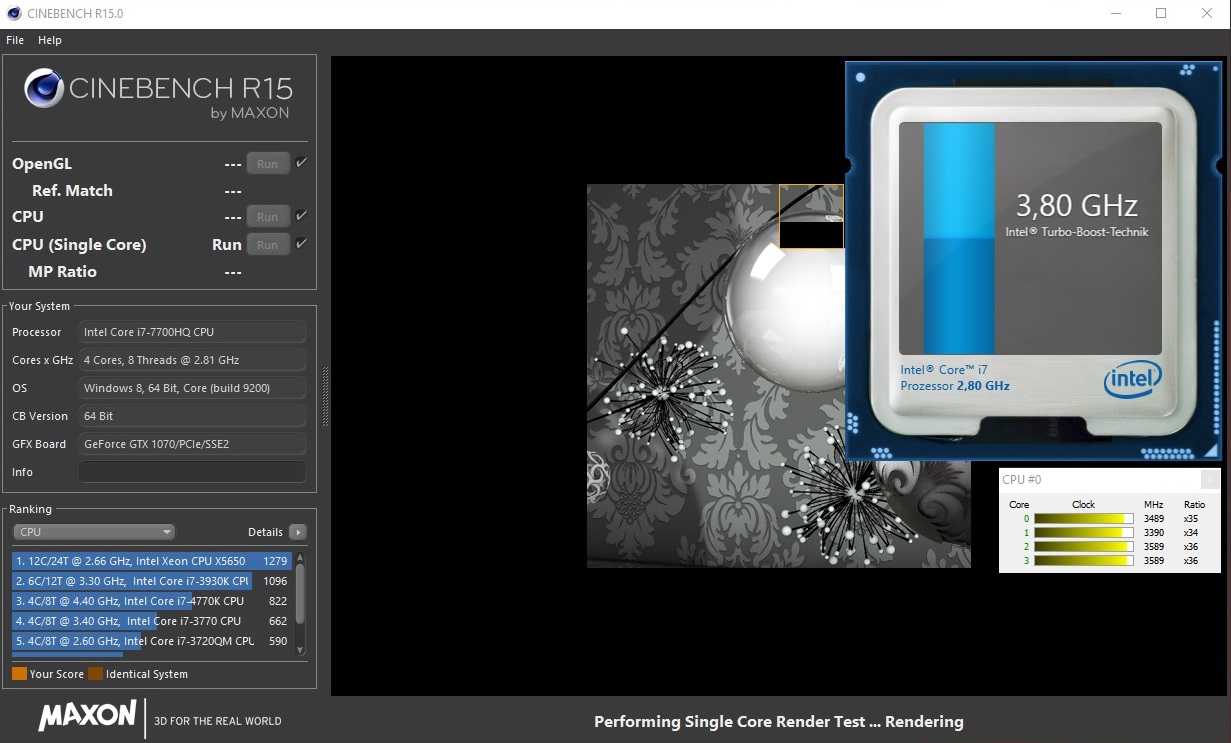
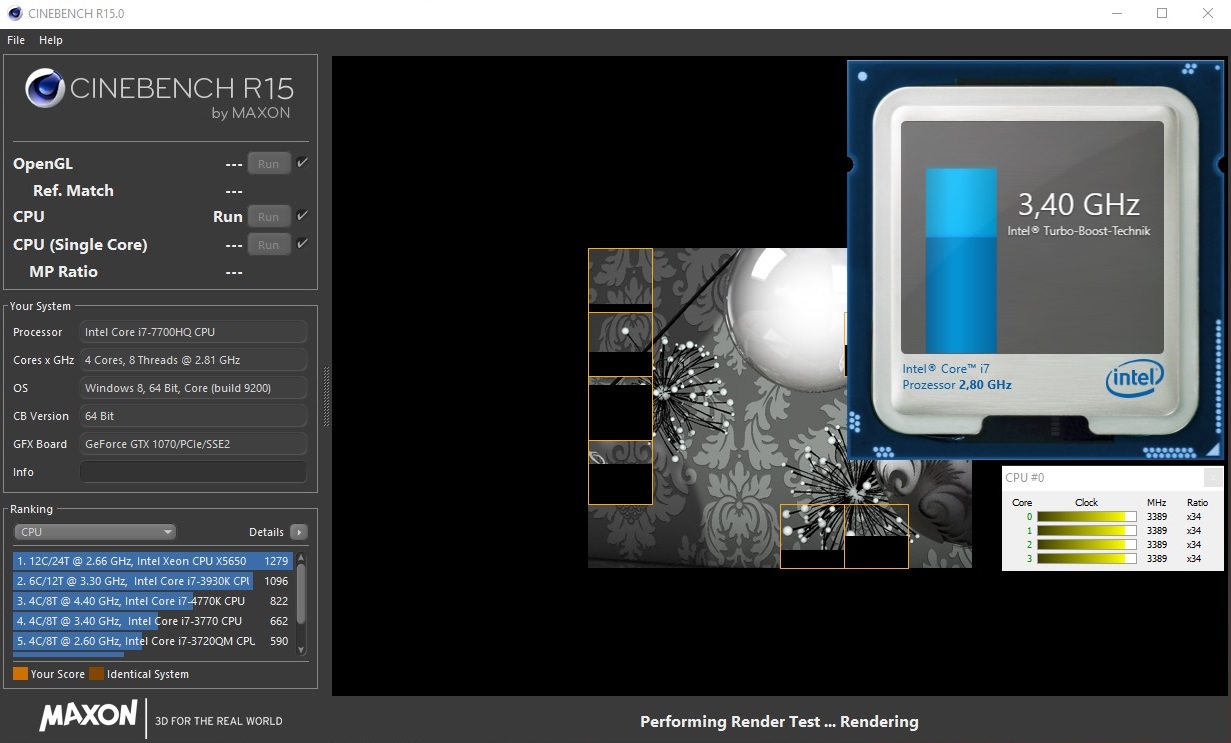
As most of the gaming notebooks we tested recently, the Predator 15 is also equipped with the Core i7-7700HQ (Kaby Lake) four-core processor. Since this CPU offers a good compromise between computing power and power demands, it offers the best choice for (mobile) gaming notebooks. It runs at a basic clock speed of 2.8 GHz, which can be increased via Turbo to 3.4 GHz (four cores), 3.6 GHz (two cores), or 3.8 GHz (single core). With that, the clock speeds are between 200 and 300 MHz higher than those of the Skylake predecessor (Core i7-6700HQ). Accordingly, the 7700HQ achieves results that are up to 10% better in the CPU tests we ran. There are no performance improvements through architectural changes since there are hardly any technical differences between Kaby Lake and Skylake.
In mains and battery operation, the CPU runs through our tests with 4 GHz (Multi-thread) and 3.4 to 3.8 GHz (Single thread). We test whether the Turbo is used over a longer duration by running the Multi-thread test of Cinebench R15 in continuous loops for about 30 minutes. After the first run, the result drops minimally (1% - 2%) and then remains on that level, so there is no drop in performance.
| Cinebench R10 | |
| Rendering Multiple CPUs 32Bit | |
| MSI GT62VR 7RE-223 | |
| Acer Predator 15 G9-593-751X | |
| Rendering Single 32Bit | |
| Acer Predator 15 G9-593-751X | |
| MSI GT62VR 7RE-223 | |
| Geekbench 3 | |
| 32 Bit Multi-Core Score | |
| Acer Predator 15 G9-593-751X | |
| MSI GT62VR 7RE-223 | |
| 32 Bit Single-Core Score | |
| Acer Predator 15 G9-593-751X | |
| MSI GT62VR 7RE-223 | |
| Geekbench 4.0 | |
| 64 Bit Multi-Core Score | |
| Acer Predator 15 G9-593-751X | |
| MSI GT62VR 7RE-223 | |
| 64 Bit Single-Core Score | |
| MSI GT62VR 7RE-223 | |
| Acer Predator 15 G9-593-751X | |
| Geekbench 4.4 | |
| 64 Bit Multi-Core Score | |
| Acer Predator 15 G9-593-751X | |
| 64 Bit Single-Core Score | |
| Acer Predator 15 G9-593-751X | |
| JetStream 1.1 - 1.1 Total | |
| MSI GT62VR 7RE-223 | |
| Acer Predator 15 G9-593-751X | |
| Asus Strix GL502VS-FY032T | |
System Performance
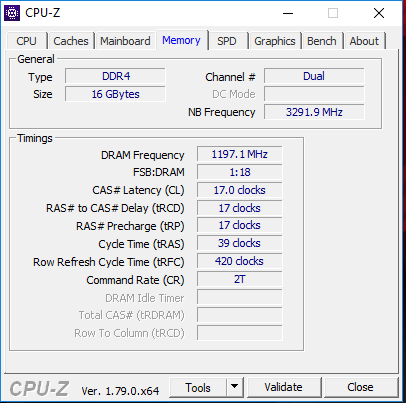
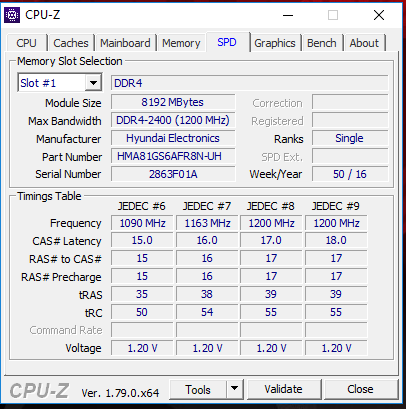
A powerful processor and an extremely fast NVMe SSD assure a system that will run very fast. This is accompanied by excellent results in the PCMark benchmarks, which attest that the Predator 15 will also cut a fine figure in applications beyond gaming, such as image processing and video editing. The overall performance of the computer can be increased slightly by adding two further memory storage modules to the notebook.
| PCMark 7 Score | 7004 points | |
| PCMark 8 Home Score Accelerated v2 | 5169 points | |
| PCMark 8 Creative Score Accelerated v2 | 8034 points | |
| PCMark 8 Work Score Accelerated v2 | 5426 points | |
Help | ||
| PCMark 8 | |
| Home Score Accelerated v2 | |
| Acer Predator 15 G9-593-751X | |
| MSI GT62VR 7RE-223 | |
| Alienware 15 R3 | |
| Acer Predator 15 G9-593-765Q | |
| Asus Strix GL502VS-FY032T | |
| Work Score Accelerated v2 | |
| Acer Predator 15 G9-593-751X | |
| MSI GT62VR 7RE-223 | |
| Alienware 15 R3 | |
| Acer Predator 15 G9-593-765Q | |
| Asus Strix GL502VS-FY032T | |
Storage Solutions
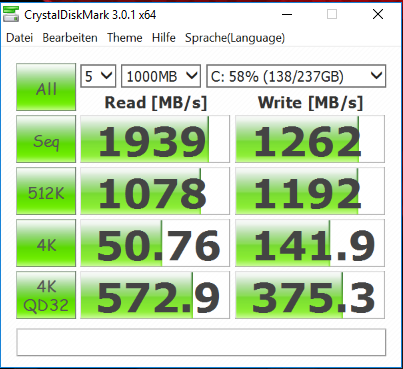
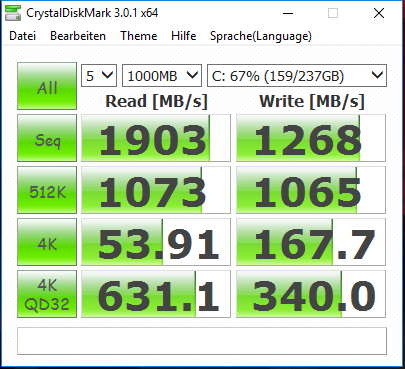
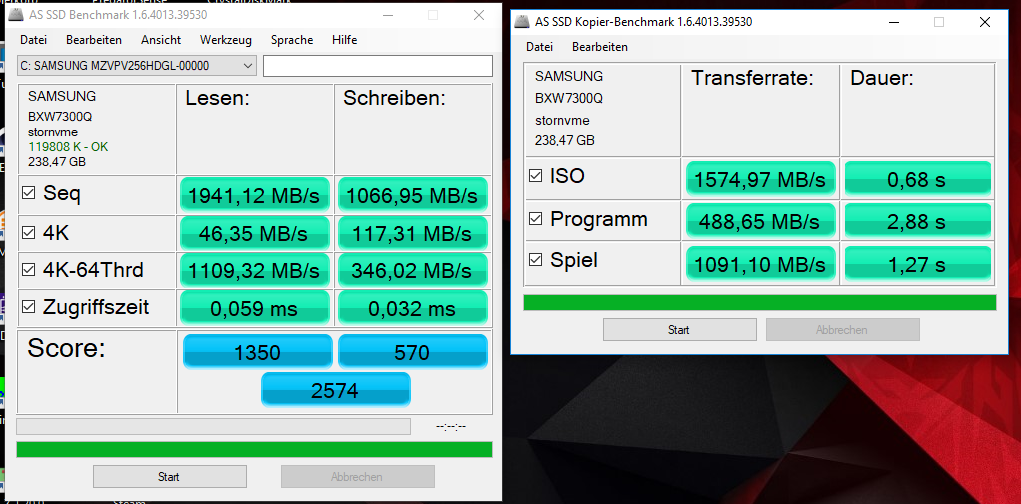
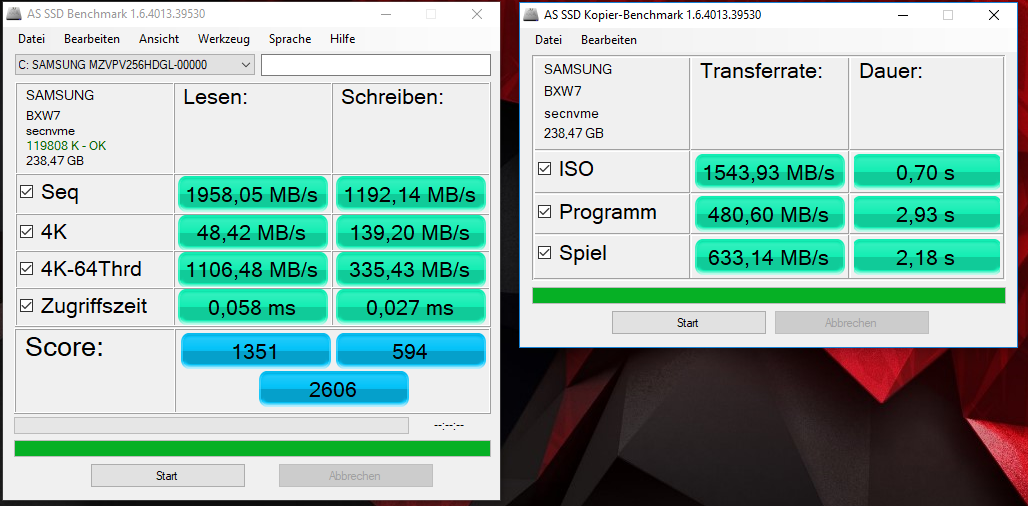
For the system drive, Acer bets on the extremely fast PCIe/NVMe SSD by Samsung. This is an M.2 model (2280) with a total capacity of 256 GB. The transfer rates of the SSD are excellent. We used the standard NVMe driver by Microsoft. Samsung's NVMe driver does not lead to any increase in the transfer rates.
The Predator also offers a second M.2 slot, which is unoccupied. There is also a conventional 2.5-inch hard drive (1 TB, 5400 rpm), which serves as data storage.

| Acer Predator 15 G9-593-751X Samsung SM951 MZVPV256HDGL m.2 PCI-e | Acer Predator 15 G9-593-765Q LiteOn CV1-8B512 | Alienware 15 R3 | MSI GT62VR 7RE-223 Samsung SSD PM871a MZNLN256HMHQ | Asus Strix GL502VS-FY032T SanDisk SD8SNAT256G1002 | |
|---|---|---|---|---|---|
| CrystalDiskMark 3.0 | -55% | -28% | -47% | -64% | |
| Read Seq (MB/s) | 1939 | 517 -73% | 1123 -42% | 521 -73% | 485.4 -75% |
| Write Seq (MB/s) | 1262 | 449.7 -64% | 429.2 -66% | 422.8 -66% | 312.4 -75% |
| Read 512 (MB/s) | 1078 | 355.3 -67% | 833 -23% | 462 -57% | 294.8 -73% |
| Write 512 (MB/s) | 1192 | 433.7 -64% | 428.1 -64% | 286.9 -76% | 287.8 -76% |
| Read 4k (MB/s) | 50.8 | 27.69 -45% | 37.8 -26% | 38.55 -24% | 21.44 -58% |
| Write 4k (MB/s) | 141.9 | 72.9 -49% | 122.9 -13% | 122.8 -13% | 75.7 -47% |
| Read 4k QD32 (MB/s) | 573 | 290.9 -49% | 542 -5% | 388.4 -32% | 149.4 -74% |
| Write 4k QD32 (MB/s) | 375.3 | 273.8 -27% | 429.8 15% | 257.9 -31% | 256.3 -32% |
Graphics Card
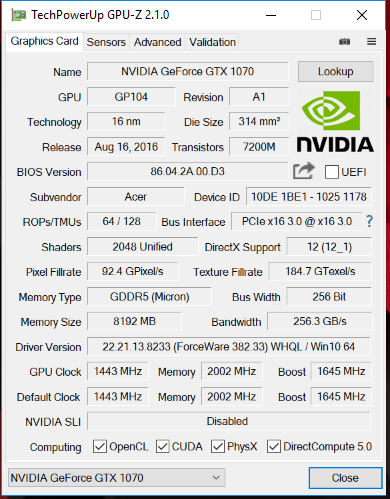
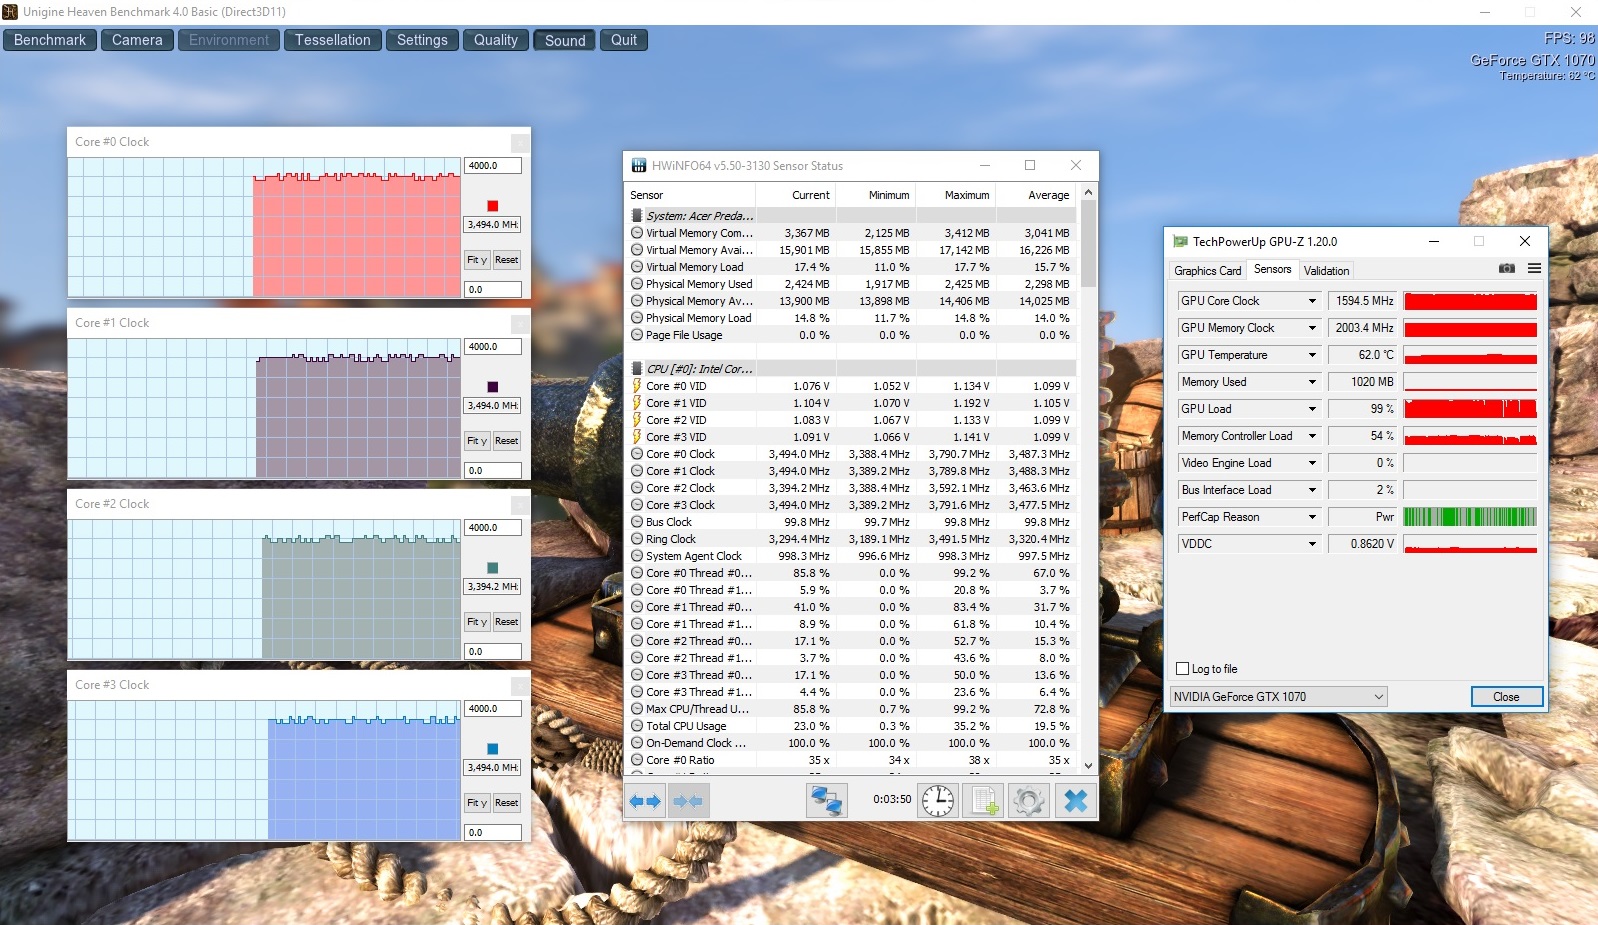
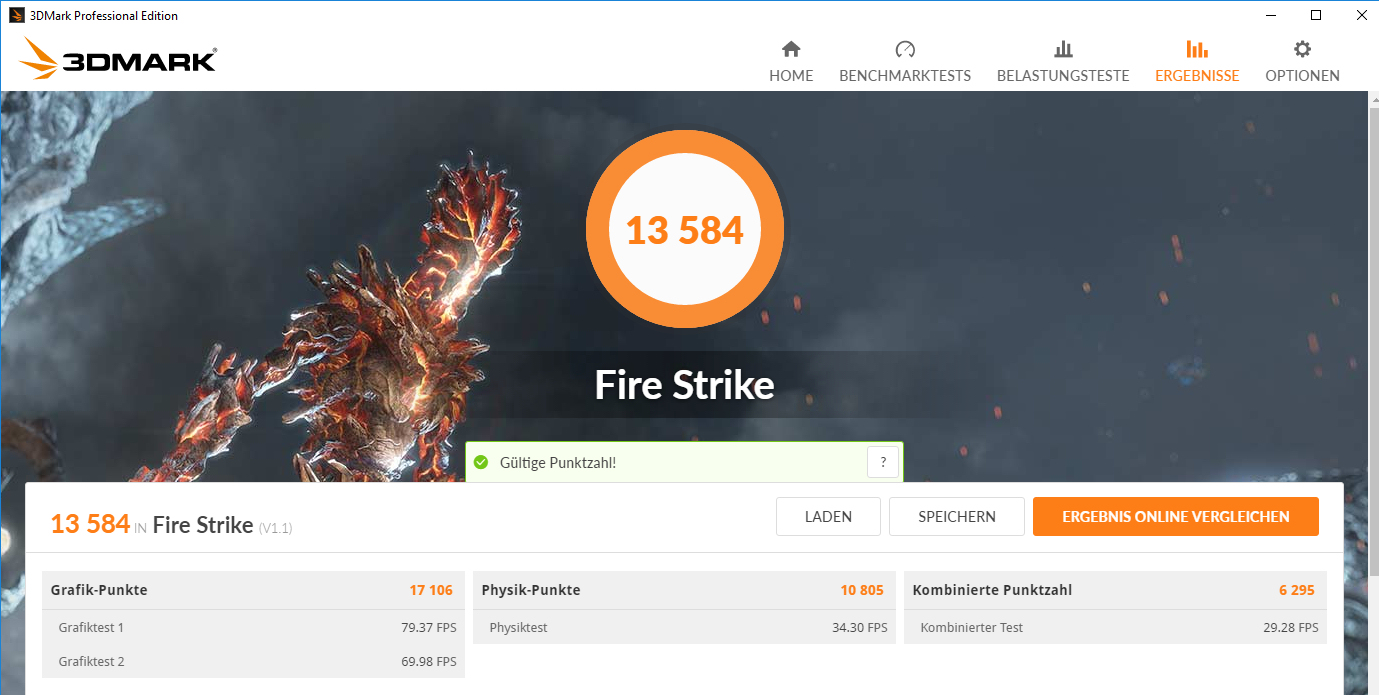
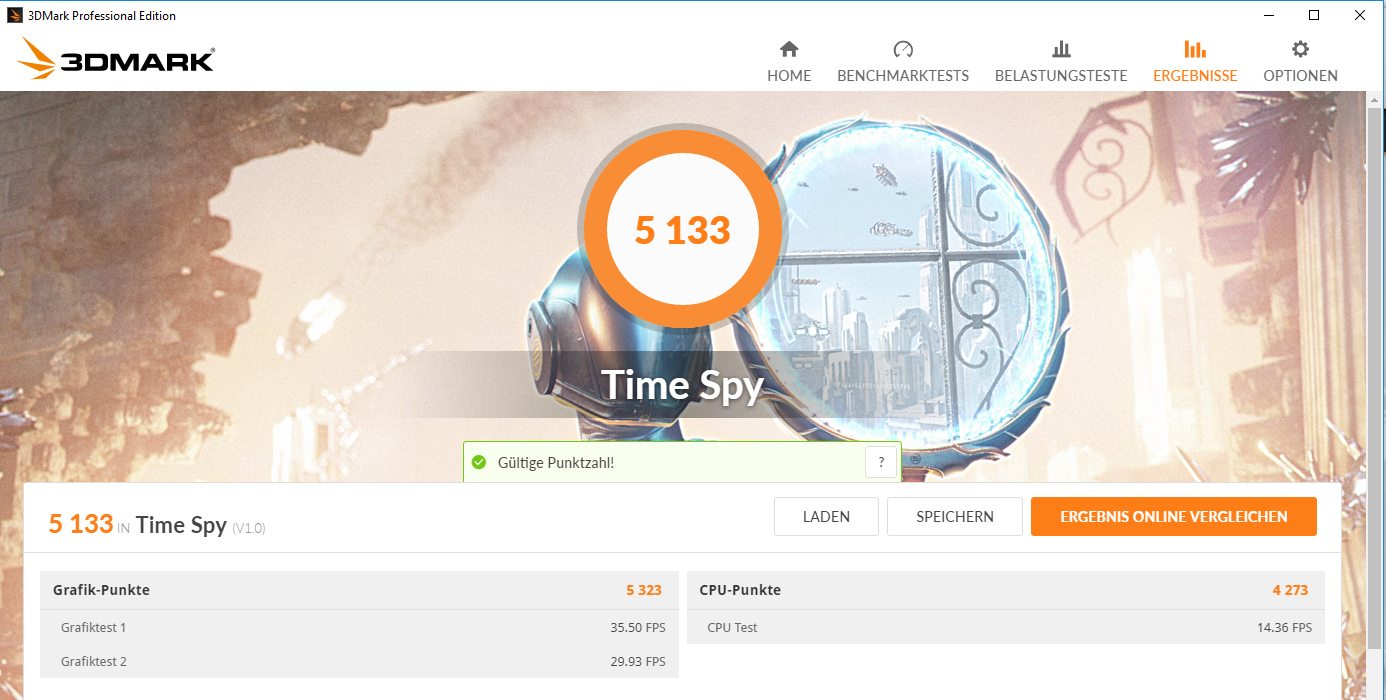
The Predator 15 does not offer a switching graphics solution. The integrated HD Graphics 630 GPU is turned off and cannot be activated. Thus the dedicated Nvidia GeForce GTX 1070 is always running. The GPU lies in the middle of the upper range of the current GPUs. The Pascal core supports DirectX 12 and reaches speeds up to 1898 MHz. However, this value cannot be maintained for a long time. During our tests, we measured an average operating speed of about 1600 MHz. The GPU has a total of 8192 MB of GDDR5 graphics storage. The results in the 3DMark benchmarks range on a normal level for this graphics core.
| 3DMark 06 Standard Score | 29731 points | |
| 3DMark 11 Performance | 16110 points | |
| 3DMark Ice Storm Standard Score | 139109 points | |
| 3DMark Cloud Gate Standard Score | 28014 points | |
| 3DMark Fire Strike Score | 13584 points | |
| 3DMark Fire Strike Extreme Score | 7411 points | |
| 3DMark Time Spy Score | 5133 points | |
Help | ||
| 3DMark - 1920x1080 Fire Strike Graphics | |
| Alienware 15 R3 | |
| MSI GT62VR 7RE-223 | |
| Acer Predator 15 G9-593-765Q | |
| Acer Predator 15 G9-593-751X | |
| Asus Strix GL502VS-FY032T | |
| Gigabyte Aero 15 | |
| Lenovo Legion Y720 80VR002XGE | |
| 3DMark 11 - 1280x720 Performance GPU | |
| Alienware 15 R3 | |
| MSI GT62VR 7RE-223 | |
| Acer Predator 15 G9-593-765Q | |
| Asus Strix GL502VS-FY032T | |
| Acer Predator 15 G9-593-751X | |
| Gigabyte Aero 15 | |
| Lenovo Legion Y720 80VR002XGE | |
Gaming Performance
The hardware of the Predator 15 is powerful enough to bring all the titles represented in our database smoothly to the display. You can always select the Full HD resolution and high to maximum quality settings. The graphics core still offers enough reserves for 4K gaming, but you would have to connect the corresponding external monitor.
With the help of the game The Witcher 3, we evaluate whether the frame rates remain constant to a large extent. To do this we let the game run for about 60 minutes in Full HD resolution and the maximum quality settings. The character that embodies the player is not moved for the whole time. The frame rates remain mostly constant (54 to 61 FPS). With increasing duration, a slight drop is noticeable, since the Turbo drops off slightly.
| The Witcher 3 - 1920x1080 Ultra Graphics & Postprocessing (HBAO+) | |
| Acer Predator 15 G9-593-765Q | |
| Acer Predator 15 G9-593-751X | |
| Asus Strix GL502VS-FY032T | |
| Gigabyte Aero 15 | |
| Lenovo Legion Y720 80VR002XGE | |
| Battlefield 1 - 1920x1080 Ultra Preset AA:T | |
| Acer Predator 15 G9-593-751X | |
| Alienware 15 R3 | |
| MSI GT62VR 7RE-223 | |
| BioShock Infinite - 1920x1080 Ultra Preset, DX11 (DDOF) | |
| Acer Predator 15 G9-593-751X | |
| MSI GT62VR 7RE-223 | |
| Lenovo Legion Y720 80VR002XGE | |
| low | med. | high | ultra | |
|---|---|---|---|---|
| Tomb Raider (2013) | 456.5 | 446.2 | 408.4 | 207.3 |
| BioShock Infinite (2013) | 270 | 230.1 | 213.6 | 138.4 |
| The Witcher 3 (2015) | 236.2 | 178 | 110.1 | 59.6 |
| Battlefield 1 (2016) | 184.6 | 159.7 | 123.6 | 112.5 |
| For Honor (2017) | 245.3 | 150.6 | 143.3 | 105.6 |
| Ghost Recon Wildlands (2017) | 127.9 | 95.3 | 84.1 | 51.6 |
| Warhammer 40.000: Dawn of War III (2017) | 151.3 | 89.5 | 64.2 | 55.1 |
| Prey (2017) | 142.5 | 139.3 | 134.5 | 131.6 |
Emissions
Noise Emissions
When idle, the fans are constantly running at low speeds. However, they are not really audible, since the whirring of the 2.5-inch hard drive is louder than the fans. During load, the fans speed up noticeably. During our stress test, the noise level rises to 50 dB(A). While running the Witcher 3 test, the noise level varies between 38 and 45 dB(A).
An electronic hum can be heard from inside the computer, when large amounts of data are moved on the SSD.
Noise level
| Idle |
| 34 / 36 / 38 dB(A) |
| HDD |
| 36 dB(A) |
| Load |
| 41 / 50 dB(A) |
 | ||
30 dB silent 40 dB(A) audible 50 dB(A) loud |
||
min: | ||
| Acer Predator 15 G9-593-751X i7-7700HQ, GeForce GTX 1070 Mobile | Acer Predator 15 G9-593-765Q 6700HQ, GeForce GTX 1070 Mobile | Alienware 15 R3 i7-7700HQ, GeForce GTX 1070 Mobile | MSI GT62VR 7RE-223 i7-7700HQ, GeForce GTX 1070 Mobile | Asus Strix GL502VS-FY032T 6700HQ, GeForce GTX 1070 Mobile | |
|---|---|---|---|---|---|
| Noise | 3% | -1% | 4% | 6% | |
| off / environment * (dB) | 32 | 30 6% | 30 6% | 30 6% | 30 6% |
| Idle Minimum * (dB) | 34 | 31 9% | 31 9% | 34 -0% | 32 6% |
| Idle Average * (dB) | 36 | 35 3% | 32 11% | 35 3% | 33 8% |
| Idle Maximum * (dB) | 38 | 38 -0% | 42 -11% | 36 5% | 34 11% |
| Load Average * (dB) | 41 | 43 -5% | 49 -20% | 40 2% | 39 5% |
| Witcher 3 ultra * (dB) | 42 | ||||
| Load Maximum * (dB) | 50 | 49 2% | 50 -0% | 46 8% | 51 -2% |
* ... smaller is better
Temperature
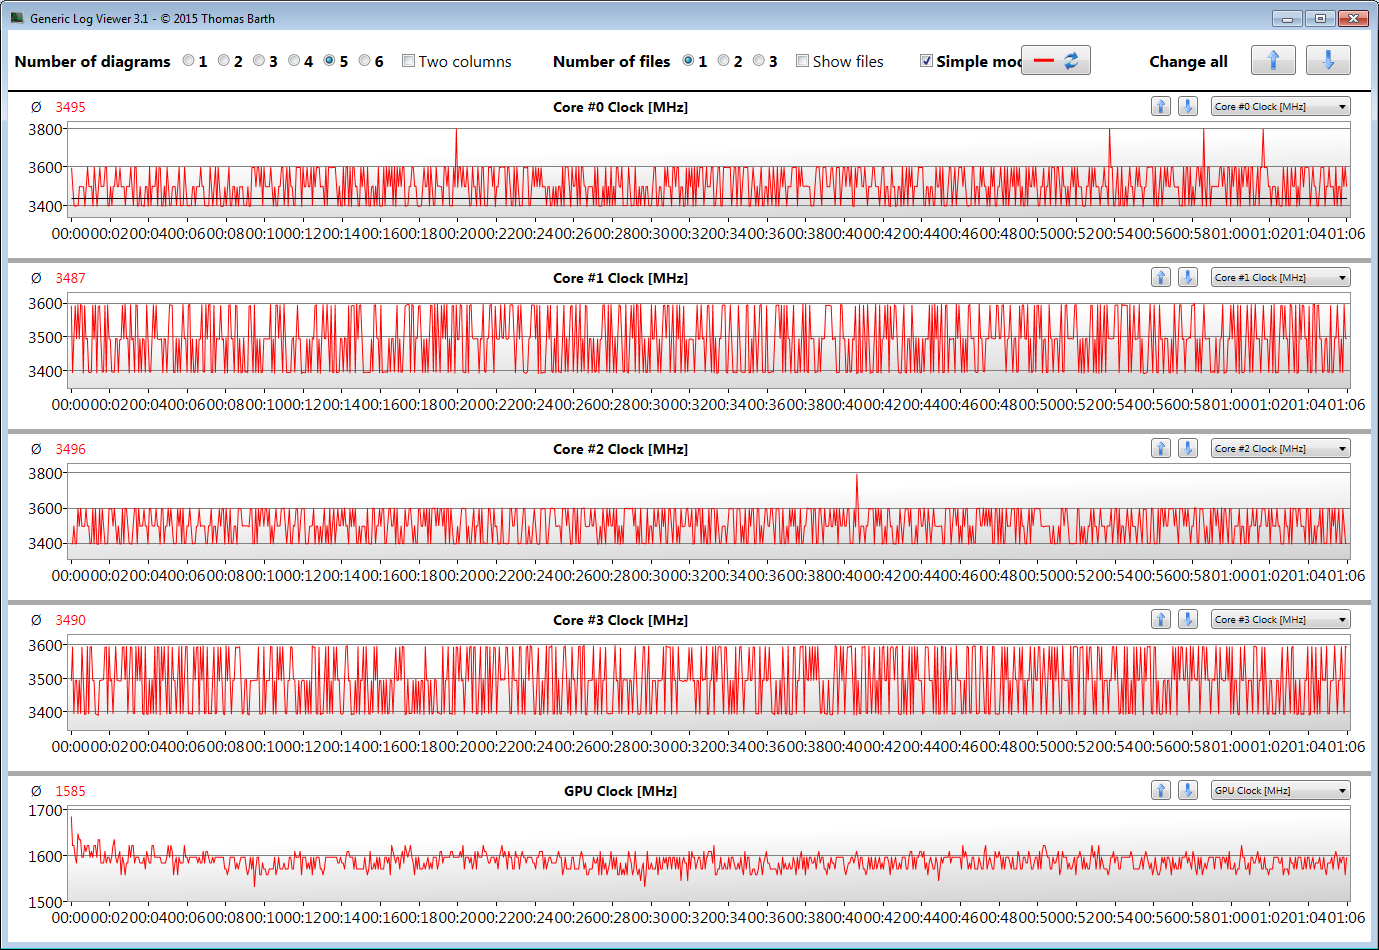
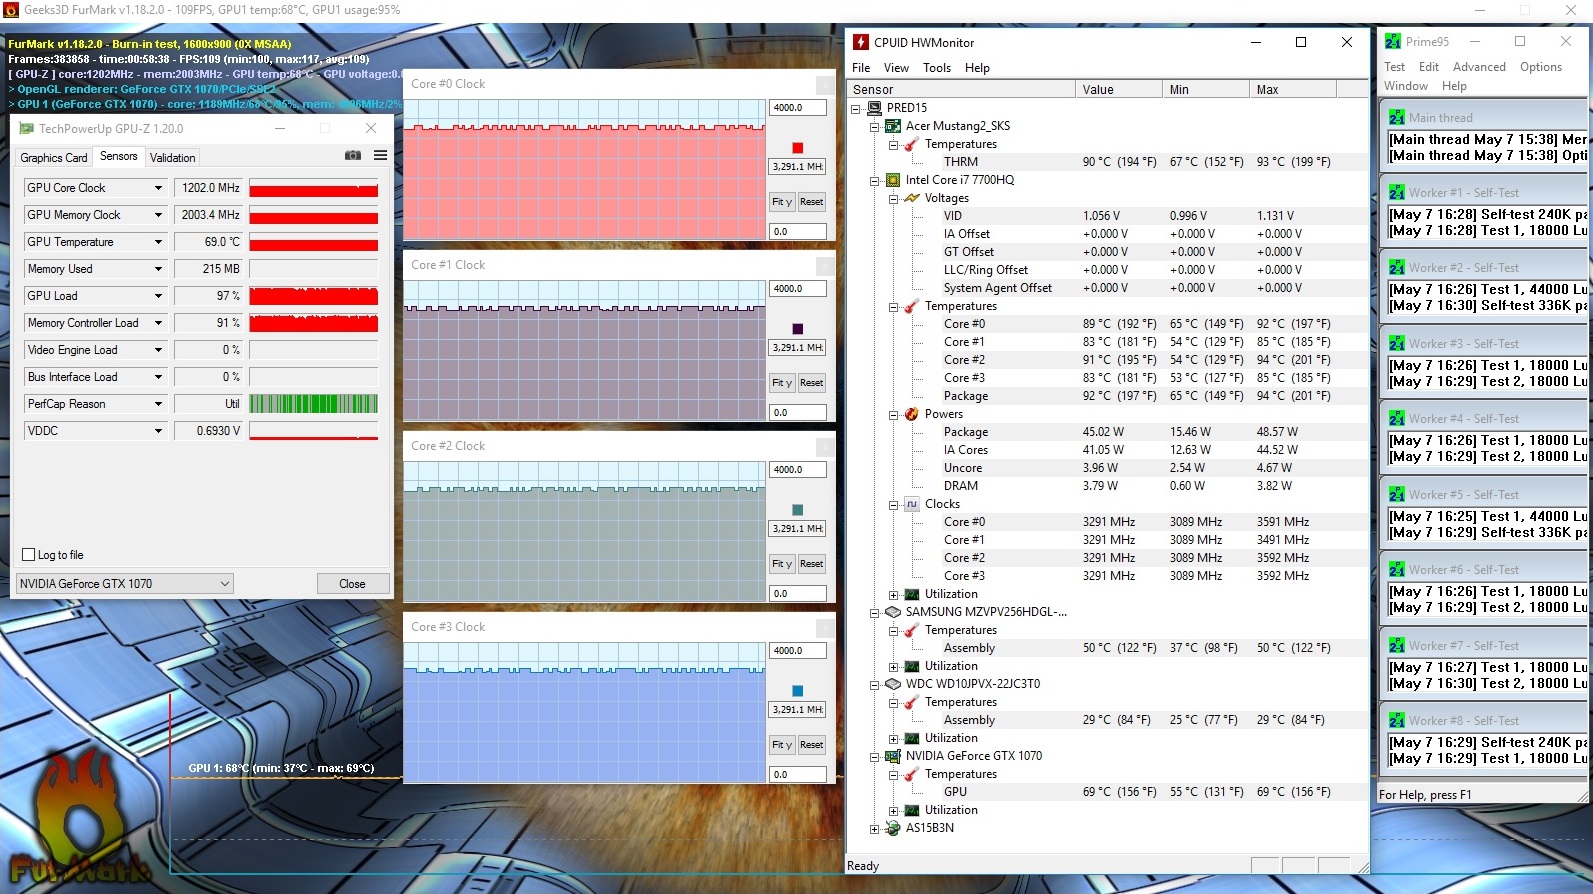
The Predator runs through our stress test (Prime95 and FurMark run for at least one hour) in different ways in mains and battery operation. In mains operation, the processor runs at 2.8 to 3.5 GHz and the graphics core runs at about 1200 MHz. With this, the operating speed remains below the basis clock speed. This should not give reason for worry. During normal gaming operation, the GPU speed is not throttled. When the stress test is run in battery operation, the speeds drop to between 2.3 and 2.4 GHz (CPU) and between 750 and 760 MHz (GPU).
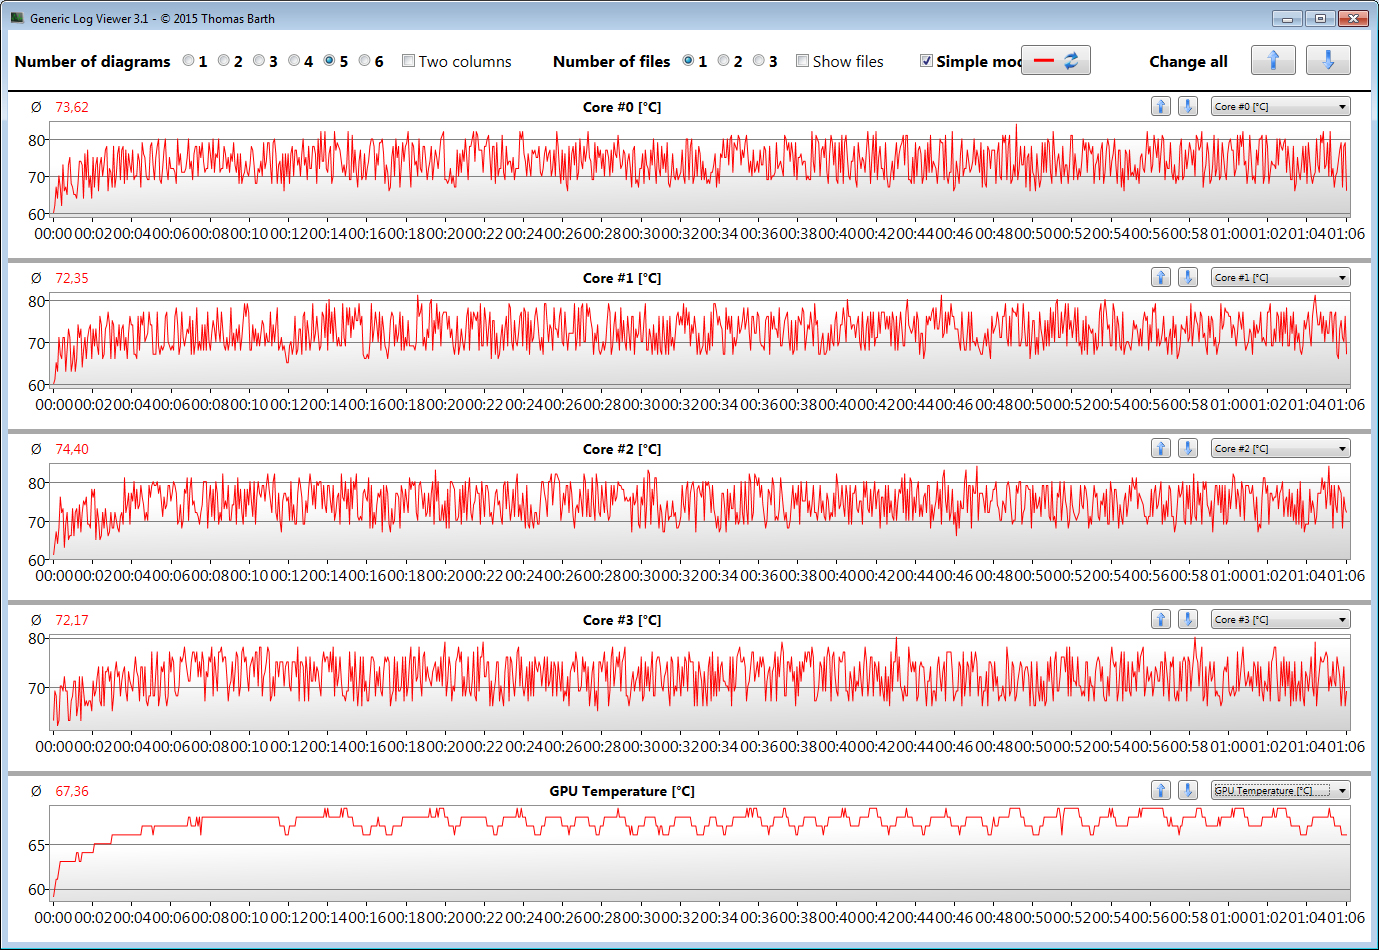
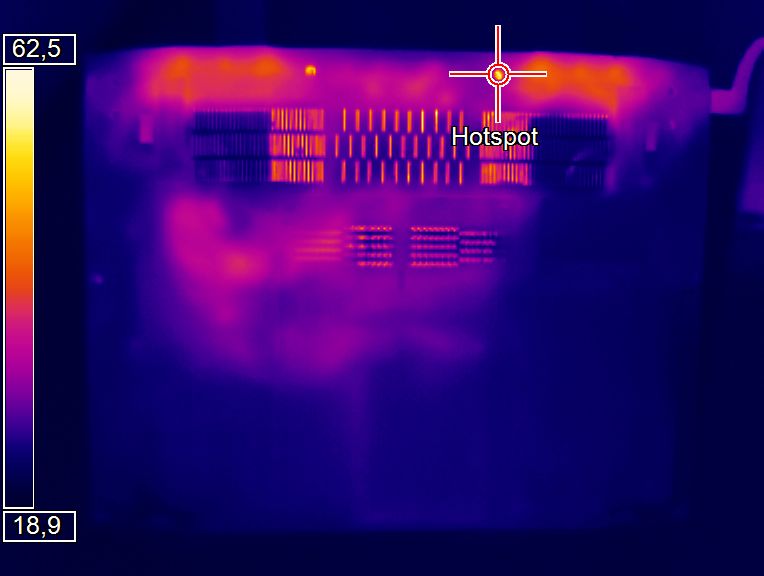
The computer heats up only very moderately. During the stress test, it exceeds the 40-degree-Celsius mark (104 °F) only at a few measuring points. During the Witcher 3 test (the game runs for one hour in Full HD resolution at maximum quality settings), it warms up a tad less.
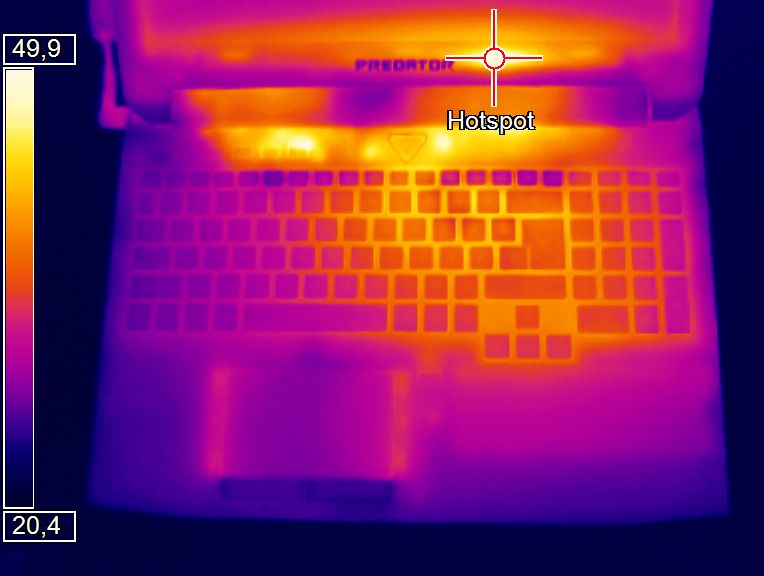
(±) The maximum temperature on the upper side is 42.3 °C / 108 F, compared to the average of 40.4 °C / 105 F, ranging from 21.2 to 68.8 °C for the class Gaming.
(±) The bottom heats up to a maximum of 40.9 °C / 106 F, compared to the average of 43.2 °C / 110 F
(+) In idle usage, the average temperature for the upper side is 26.3 °C / 79 F, compared to the device average of 33.9 °C / 93 F.
(±) Playing The Witcher 3, the average temperature for the upper side is 34.8 °C / 95 F, compared to the device average of 33.9 °C / 93 F.
(+) The palmrests and touchpad are reaching skin temperature as a maximum (32.1 °C / 89.8 F) and are therefore not hot.
(-) The average temperature of the palmrest area of similar devices was 28.8 °C / 83.8 F (-3.3 °C / -6 F).
| Acer Predator 15 G9-593-751X i7-7700HQ, GeForce GTX 1070 Mobile | Acer Predator 15 G9-593-765Q 6700HQ, GeForce GTX 1070 Mobile | Alienware 15 R3 i7-7700HQ, GeForce GTX 1070 Mobile | MSI GT62VR 7RE-223 i7-7700HQ, GeForce GTX 1070 Mobile | Asus Strix GL502VS-FY032T 6700HQ, GeForce GTX 1070 Mobile | |
|---|---|---|---|---|---|
| Heat | 2% | -29% | -3% | -17% | |
| Maximum Upper Side * (°C) | 42.3 | 40.5 4% | 46 -9% | 40.6 4% | 48 -13% |
| Maximum Bottom * (°C) | 40.9 | 42 -3% | 51.8 -27% | 48.4 -18% | 46.8 -14% |
| Idle Upper Side * (°C) | 28.4 | 28.2 1% | 36.5 -29% | 26.8 6% | 33.7 -19% |
| Idle Bottom * (°C) | 25.2 | 24.3 4% | 38.2 -52% | 26.4 -5% | 30.5 -21% |
* ... smaller is better
Speakers
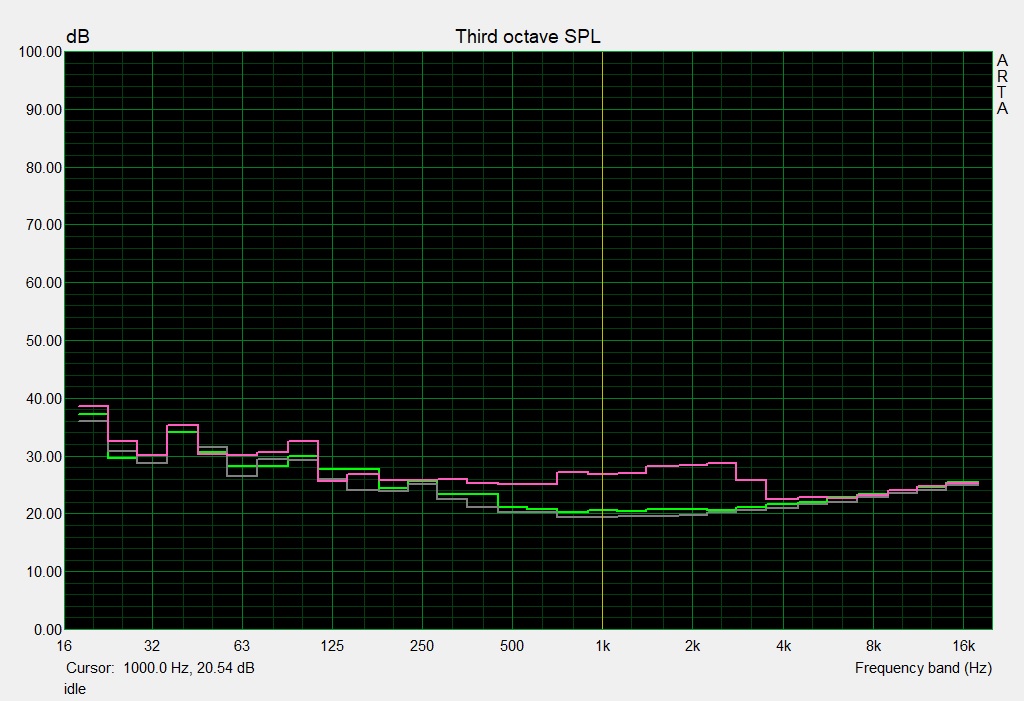
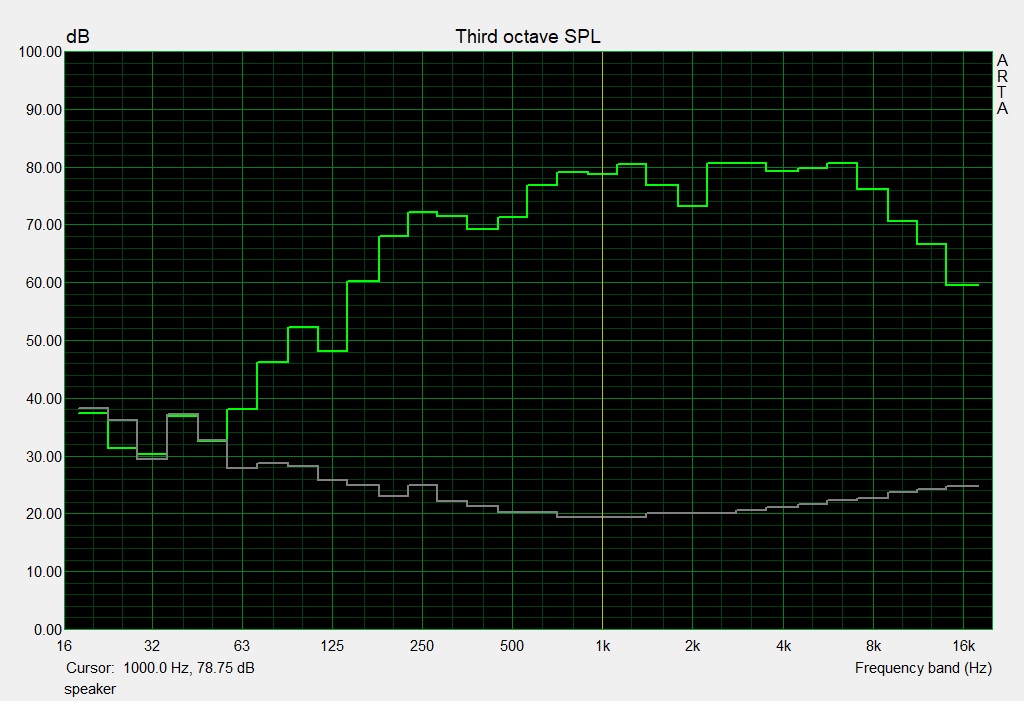
Acer Predator 15 G9-593-751X audio analysis
(+) | speakers can play relatively loud (91 dB)
Bass 100 - 315 Hz
(±) | reduced bass - on average 14.1% lower than median
(±) | linearity of bass is average (10.6% delta to prev. frequency)
Mids 400 - 2000 Hz
(+) | balanced mids - only 3.2% away from median
(+) | mids are linear (4.9% delta to prev. frequency)
Highs 2 - 16 kHz
(+) | balanced highs - only 3.7% away from median
(+) | highs are linear (5.3% delta to prev. frequency)
Overall 100 - 16.000 Hz
(+) | overall sound is linear (14.1% difference to median)
Compared to same class
» 24% of all tested devices in this class were better, 8% similar, 68% worse
» The best had a delta of 6%, average was 18%, worst was 132%
Compared to all devices tested
» 17% of all tested devices were better, 4% similar, 80% worse
» The best had a delta of 4%, average was 24%, worst was 134%
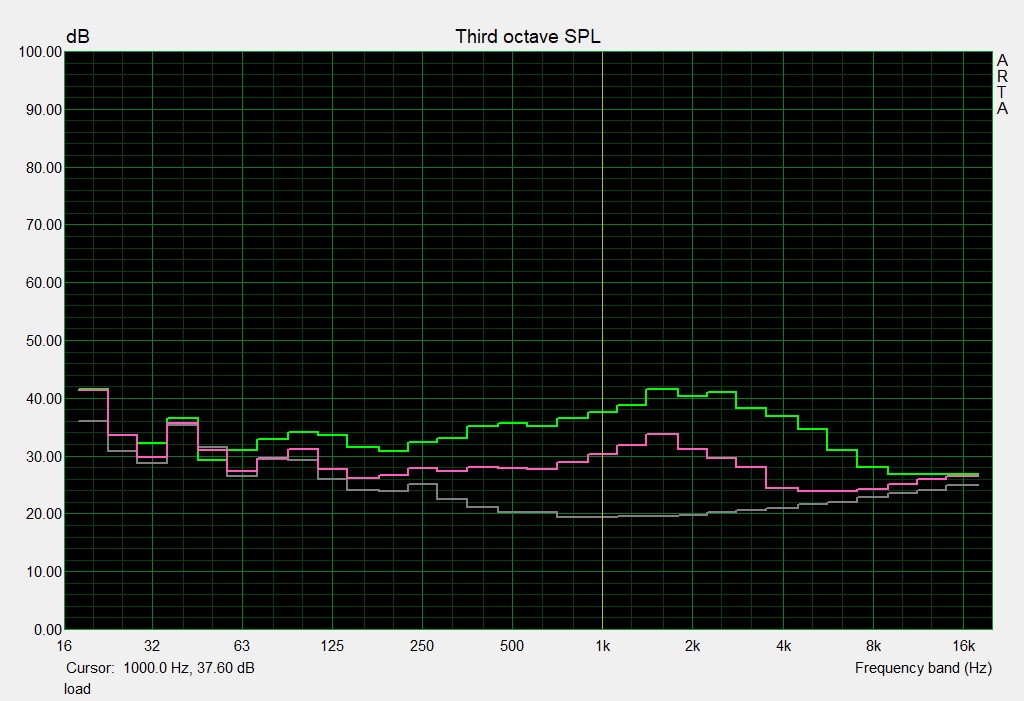
Alienware 15 R3 audio analysis
(+) | speakers can play relatively loud (82 dB)
Bass 100 - 315 Hz
(-) | nearly no bass - on average 19.1% lower than median
(±) | linearity of bass is average (10.4% delta to prev. frequency)
Mids 400 - 2000 Hz
(±) | higher mids - on average 6.7% higher than median
(±) | linearity of mids is average (7.5% delta to prev. frequency)
Highs 2 - 16 kHz
(+) | balanced highs - only 3.6% away from median
(+) | highs are linear (5.2% delta to prev. frequency)
Overall 100 - 16.000 Hz
(±) | linearity of overall sound is average (21.6% difference to median)
Compared to same class
» 77% of all tested devices in this class were better, 5% similar, 18% worse
» The best had a delta of 6%, average was 18%, worst was 132%
Compared to all devices tested
» 61% of all tested devices were better, 7% similar, 32% worse
» The best had a delta of 4%, average was 24%, worst was 134%
Frequency diagram in comparison (checkboxes above can be checked/un-checked!)
Power Management
Power Consumption
When idle, the deactivation of the integrated GPU has a noticeable negative effect. The power consumption rises up to 30 watts. During load, the power consumption is at a normal level for the hardware used here, and the consumption rises to 213 watts during the stress test. While running the Witcher 3 test, we measure a value of 168 watts. The included power supply is rated at 230 watts.
| Off / Standby | |
| Idle | |
| Load |
|
Key:
min: | |
| Acer Predator 15 G9-593-751X i7-7700HQ, GeForce GTX 1070 Mobile | Acer Predator 15 G9-593-765Q 6700HQ, GeForce GTX 1070 Mobile | Alienware 15 R3 i7-7700HQ, GeForce GTX 1070 Mobile | MSI GT62VR 7RE-223 i7-7700HQ, GeForce GTX 1070 Mobile | Asus Strix GL502VS-FY032T 6700HQ, GeForce GTX 1070 Mobile | |
|---|---|---|---|---|---|
| Power Consumption | 2% | 2% | 1% | 1% | |
| Idle Minimum * (Watt) | 18 | 18 -0% | 19 -6% | 20 -11% | 20 -11% |
| Idle Average * (Watt) | 23 | 24 -4% | 23 -0% | 24 -4% | 24 -4% |
| Idle Maximum * (Watt) | 30 | 29 3% | 29 3% | 29 3% | 29 3% |
| Load Average * (Watt) | 89 | 86 3% | 85 4% | 82 8% | 86 3% |
| Witcher 3 ultra * (Watt) | 168 | ||||
| Load Maximum * (Watt) | 213 | 201 6% | 192 10% | 193 9% | 183 14% |
* ... smaller is better
Battery Life
In our practically relevant WLAN test, the Predator achieves a runtime of 5:32 hours. We simulate the load when calling up websites with a script. The "Balanced" profile is active, energy-saving functions are deactivated, and the display brightness is adjusted to about 150 cd/m². One battery charge keeps our video test running for 4:55 hours. Here we run the short film Big Buck Bunny (H.264 coding, 1920x1080 pixels) in a constant loop. The wireless module and the energy-saving functions are deactivated and the display brightness is lowered to 150 cd/m².
| Acer Predator 15 G9-593-751X i7-7700HQ, GeForce GTX 1070 Mobile, 90 Wh | Acer Predator 15 G9-593-765Q 6700HQ, GeForce GTX 1070 Mobile, Wh | Alienware 15 R3 i7-7700HQ, GeForce GTX 1070 Mobile, 99 Wh | MSI GT62VR 7RE-223 i7-7700HQ, GeForce GTX 1070 Mobile, 75 Wh | Asus Strix GL502VS-FY032T 6700HQ, GeForce GTX 1070 Mobile, 62 Wh | |
|---|---|---|---|---|---|
| Battery runtime | -5% | -17% | -21% | -47% | |
| Reader / Idle (h) | 8.4 | 6.4 -24% | 6.3 -25% | 4.1 -51% | |
| H.264 (h) | 4.9 | 5 2% | 4.4 -10% | 4.2 -14% | |
| WiFi v1.3 (h) | 5.5 | 4.8 -13% | 4.4 -20% | 4.1 -25% | 3.3 -40% |
| Load (h) | 2 | 1.9 -5% | 1.7 -15% | 1.6 -20% | 1 -50% |
Verdict
Pros
Cons
The Acer Predator 15 G9-593-751X mainly represents a Kaby Lake upgrade. The Core-i7-7700HQ four-core processor offers only a slight performance advantage against the Skylake predecessor. The built-in hardware brings all the current titles to the screen fluidly in Full HD resolution with high to maximum quality settings. Nvidia's G-Sync technology assures a fluid presentation of the images on the 60-Hz display. The matte IPS Full HD screen appeals with good contrast and stable viewing angles. The brightness value is okay, but could have been higher.
With the Predator 15, Acer delivers a rounded gaming notebook.
The noise development of the computer is on a normal level for a high-end laptop. The heat development of the computer turns out relatively low, however. A fast NVMe SSD assures a quickly running system. A 2.5-inch hard drive that is also present provides for the necessary storage space with 1 TB capacity. Exchanging both drives would not be a problem since the computer has a maintenance flap.
Acer Predator 15 G9-593-751X
- 05/28/2017 v6 (old)
Sascha Mölck
Price comparison
