MSI GF62VR 7RF (7700HQ, GTX 1060, FHD 60 Hz) Laptop Review
Most gamers should be familiar with MSI; the Taiwanese-based company is known for its expansive library of gaming notebooks. While some users may find the vast amount of choices overwhelming, others appreciate the fact that MSI offers a gaming laptop for just about every user at every price point. The GF62VR is yet another mid-tier gaming notebook from MSI. Using the same design language as the GP and GE lines, there's are quite a number of familiar elements in the GF62VR.
The GF62VR looks very capable on paper, and thanks to its aggressive price point, it offers great "bang for the buck". Equipped with an Intel Core i7-7700HQ and an Nvidia GeForce GTX 1060, the GF72VR is capable of handling high-level workloads and the latest AAA titles at Full HD and high settings. However, MSI did make some sacrifices to price the device at the lower end of the market (about USD $1300 MSRP). In this review, we'll take a close look at the features (or lack thereof) of the GF62VR to help potential buyers weigh the pros and cons and see if the shortcomings are worth the incredibly competitive price. Our review unit is equipped with an optional PCIe NVMe SSD, which raises the total price to USD $1410. In addition, there are a few other SKUs available from MSI and other retailers. The GF62VR is also available with a GTX 1050 Ti (MSRP $1100). A variant with a higher 120 Hz display has been advertised MSI's site but doesn't seem to be available at this time. Gamers wanting a faster refresh rate should look at the GF72VR, which is equipped with a 120 Hz panel.
We will compare similarly specced notebooks to our review unit. Keep in mind that most of these other devices are more expensive than the GF62VR, some by several hundred dollars. As such, prospective purchasers will be able to see what a higher budget can net them and what they'll have to consider when trying to save some cash. Some competitors we'll use for a comparison include the HP Omen 15, the Schenker XMG A517, Gigabyte's Aero 15 and P55W v7, and Asus' Strix GL502VM, all of which are 15.6" notebooks equipped with the GTX 1060. We'll also compare MSI's own GE62VR, on which the newer GF62VR is based; the main difference lies in the latter's lack of an optical drive and some very minor design tweaks. Let's get started.
Case
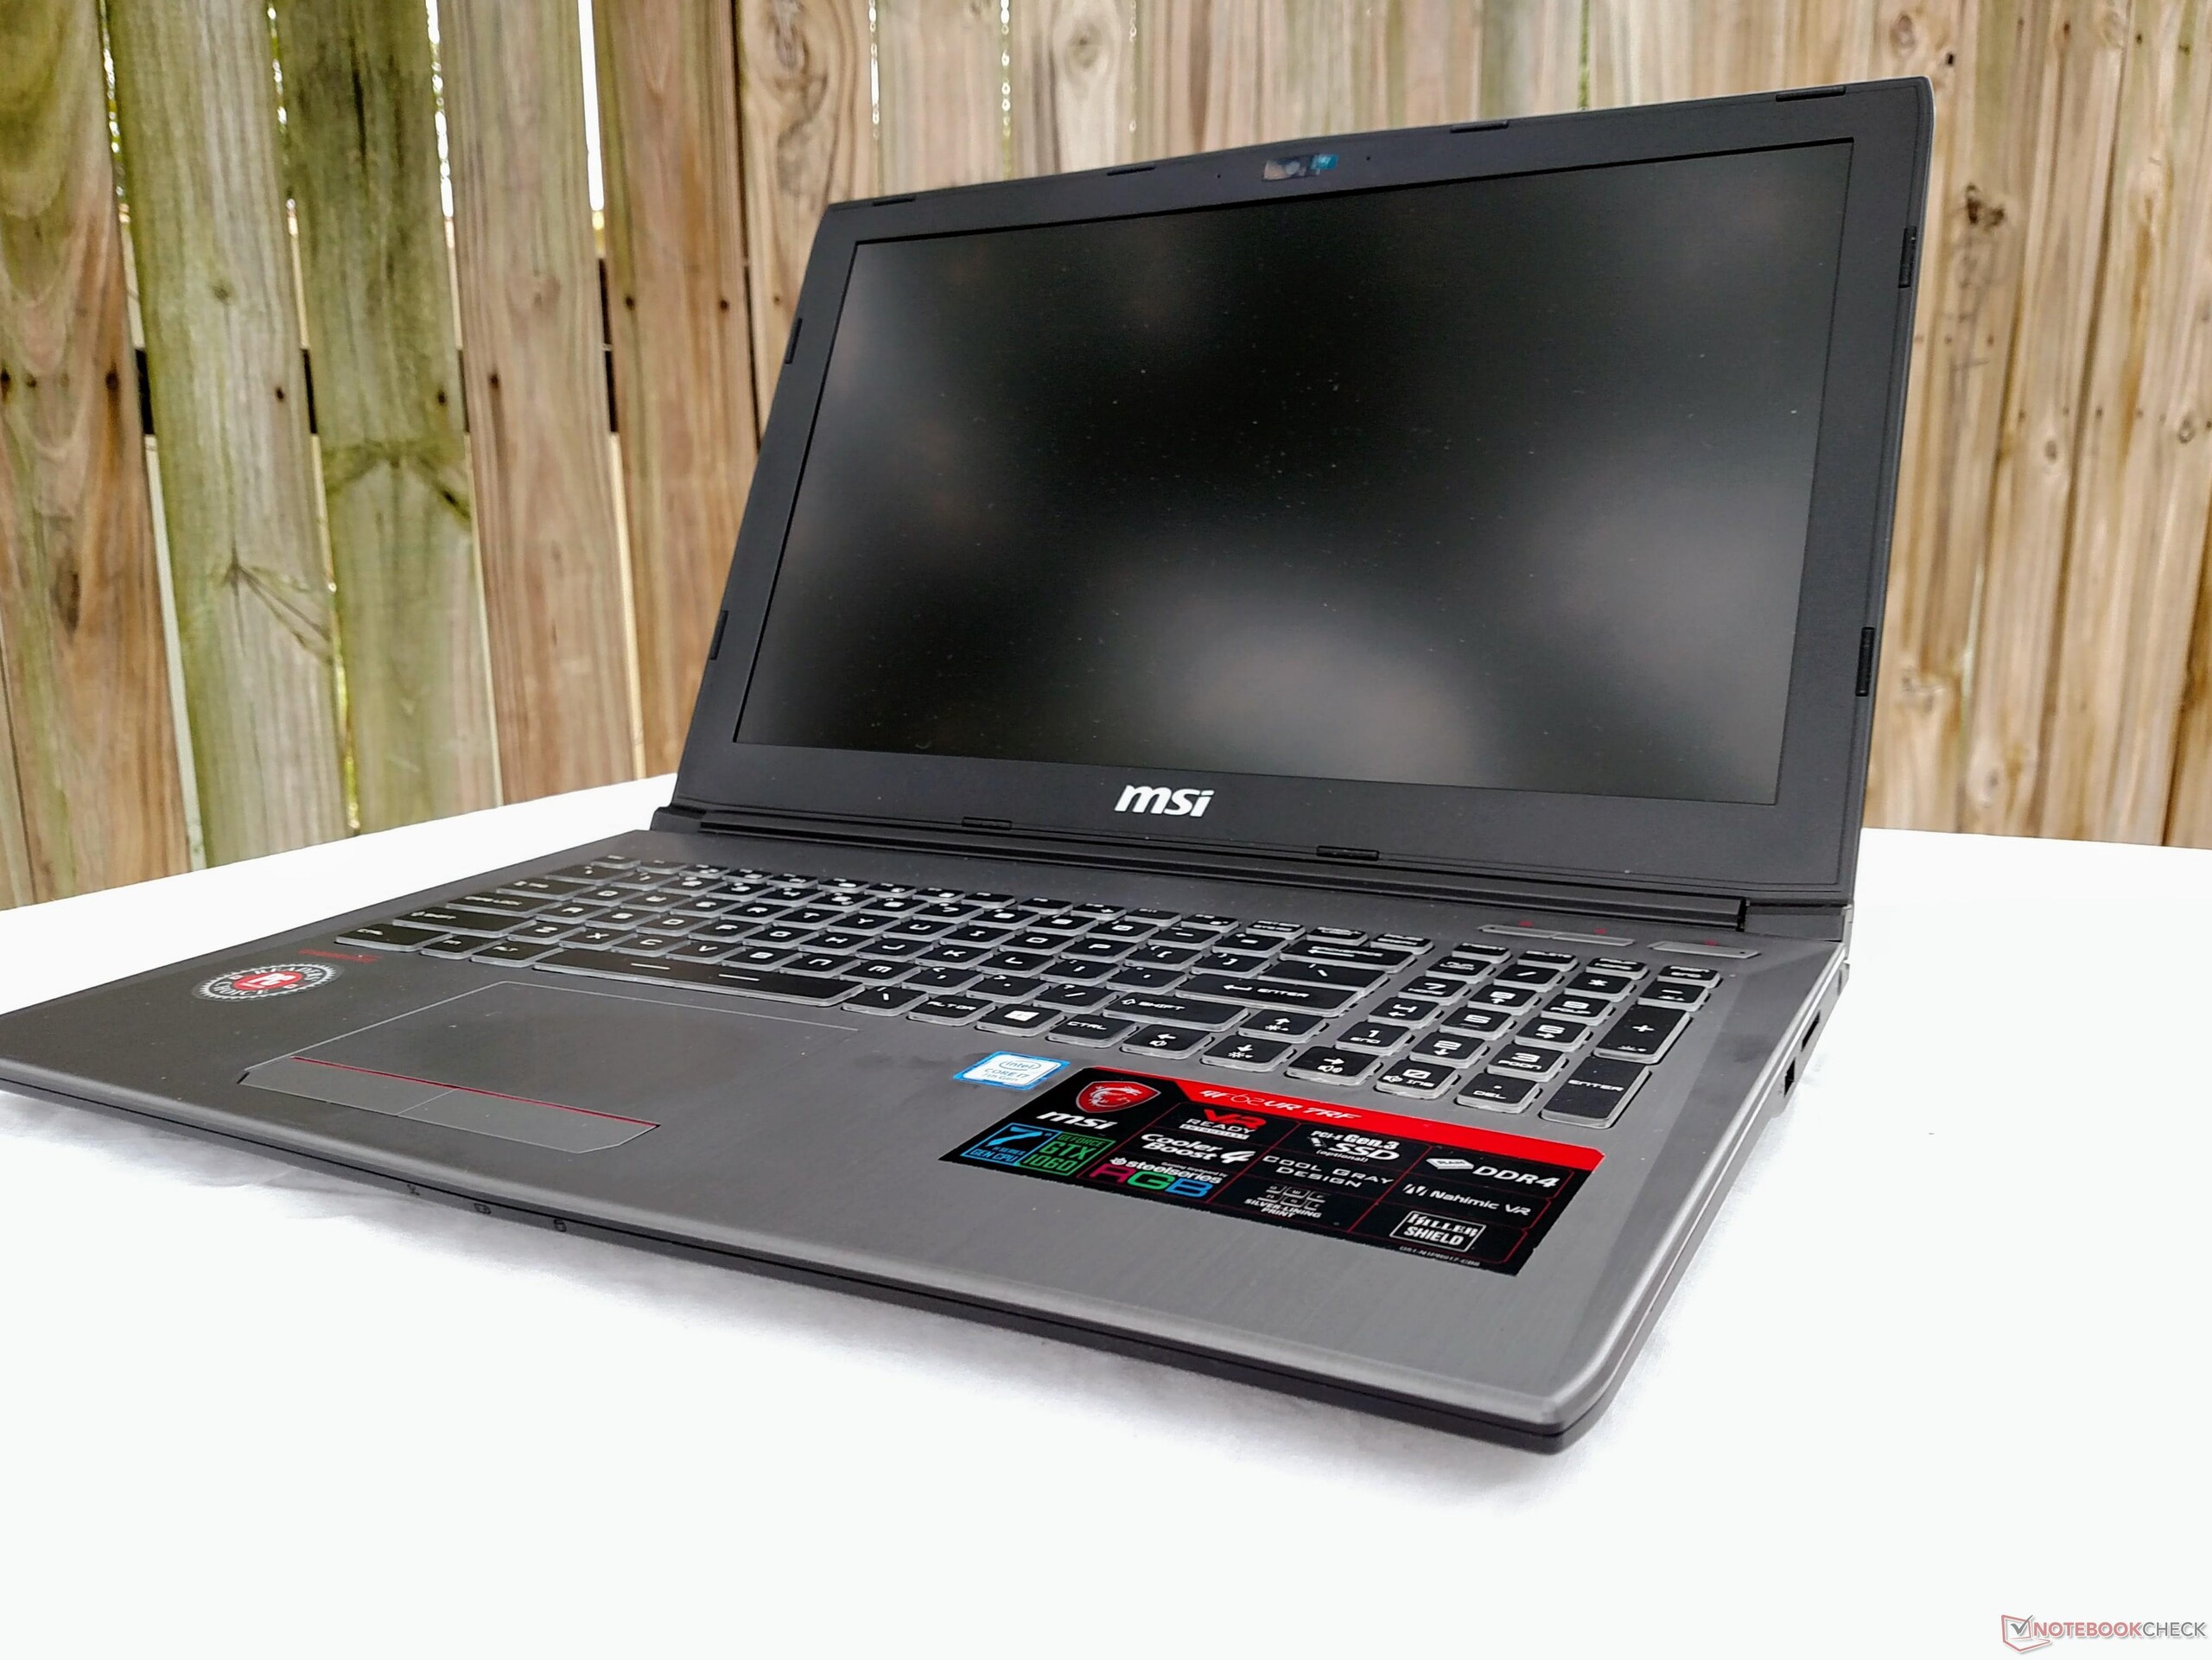
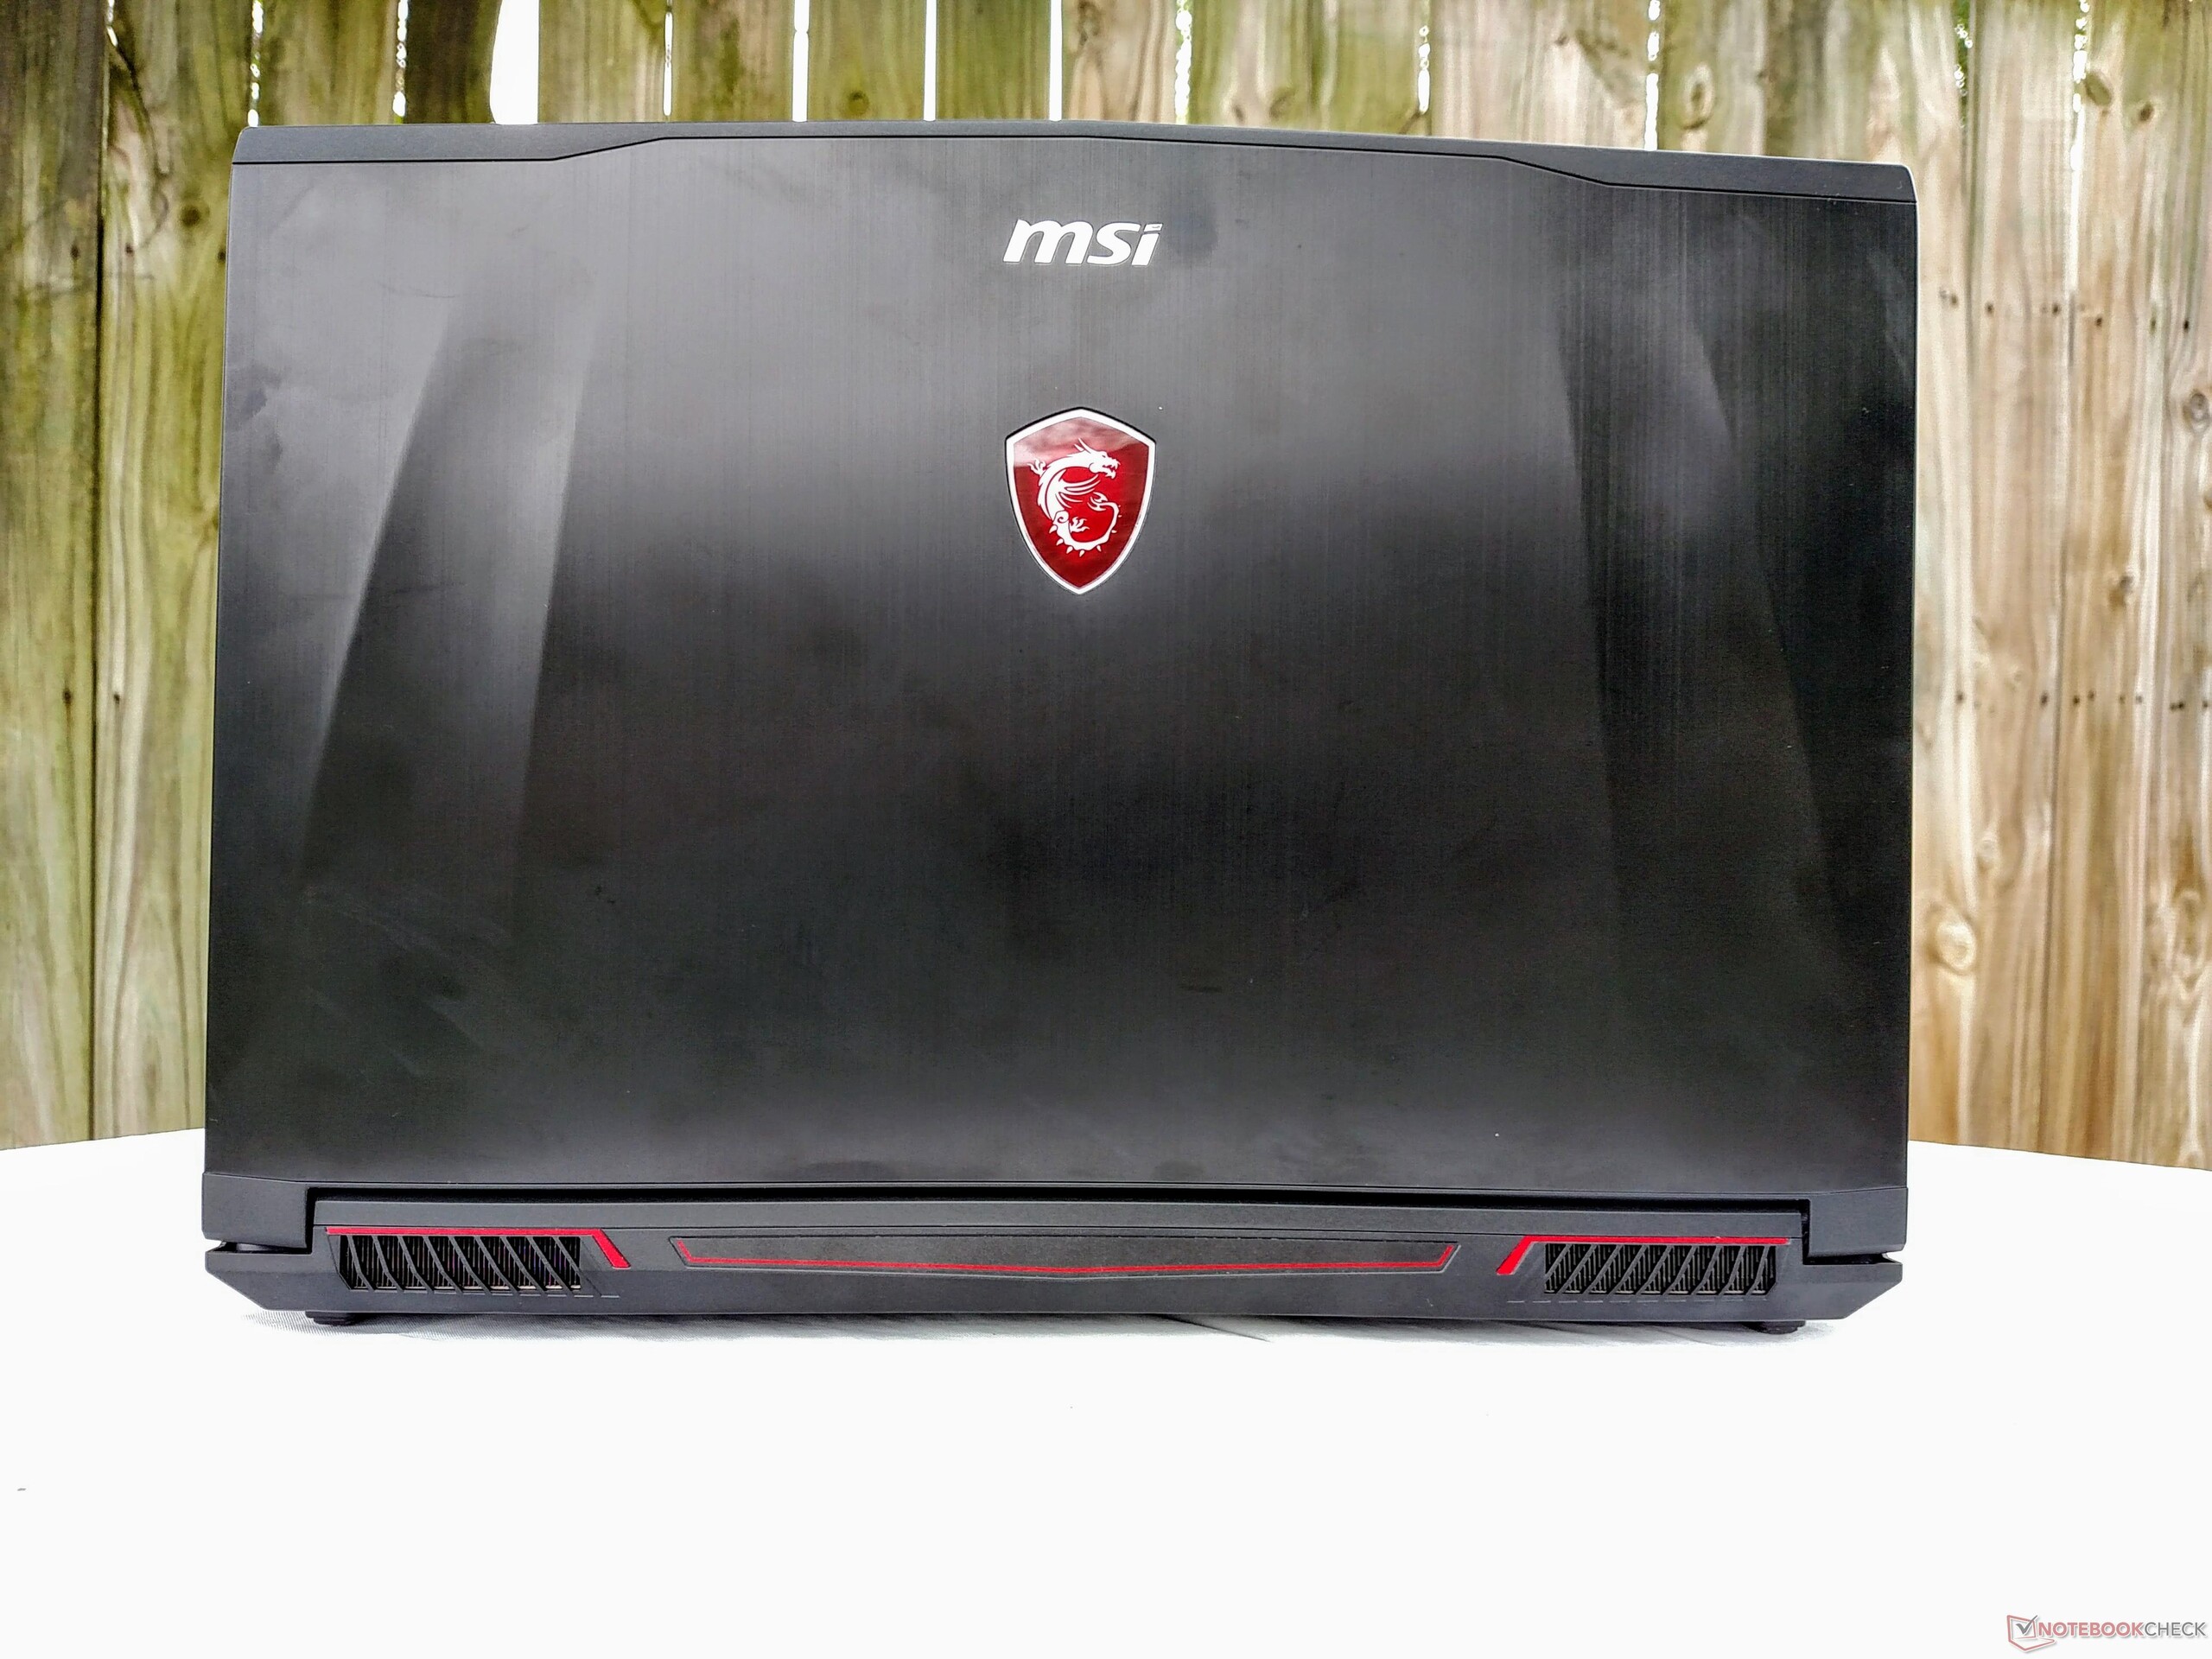
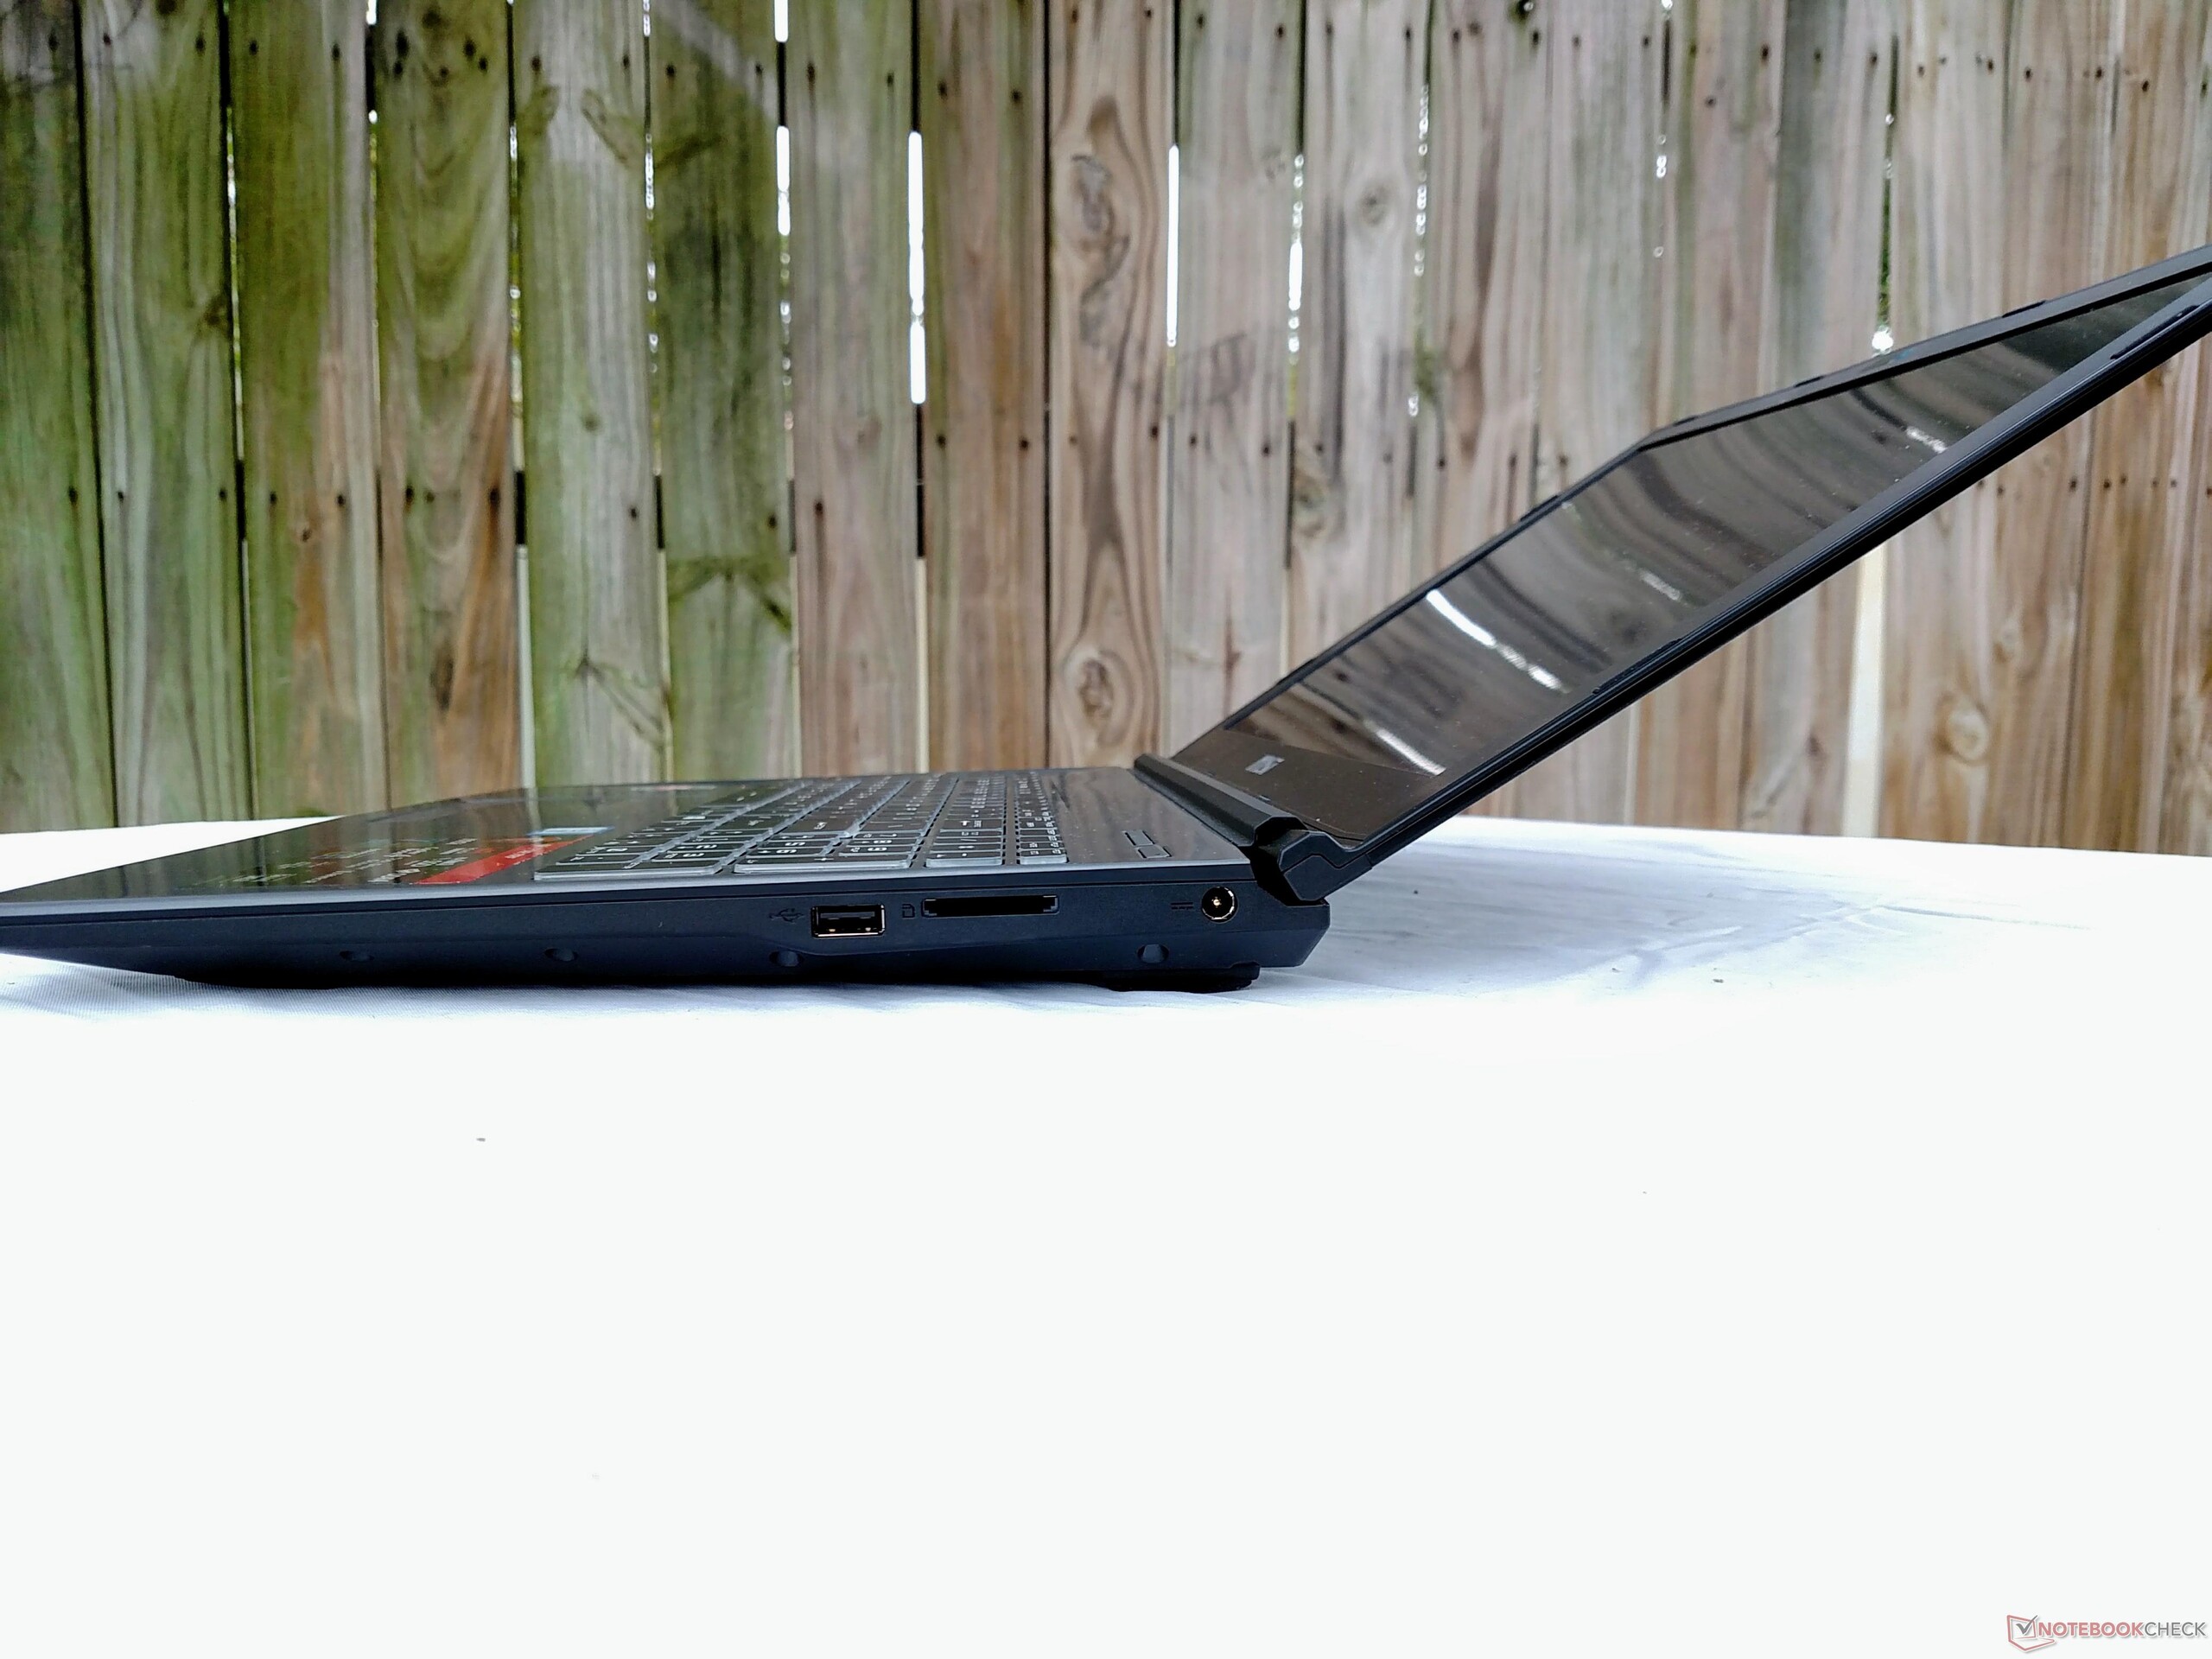
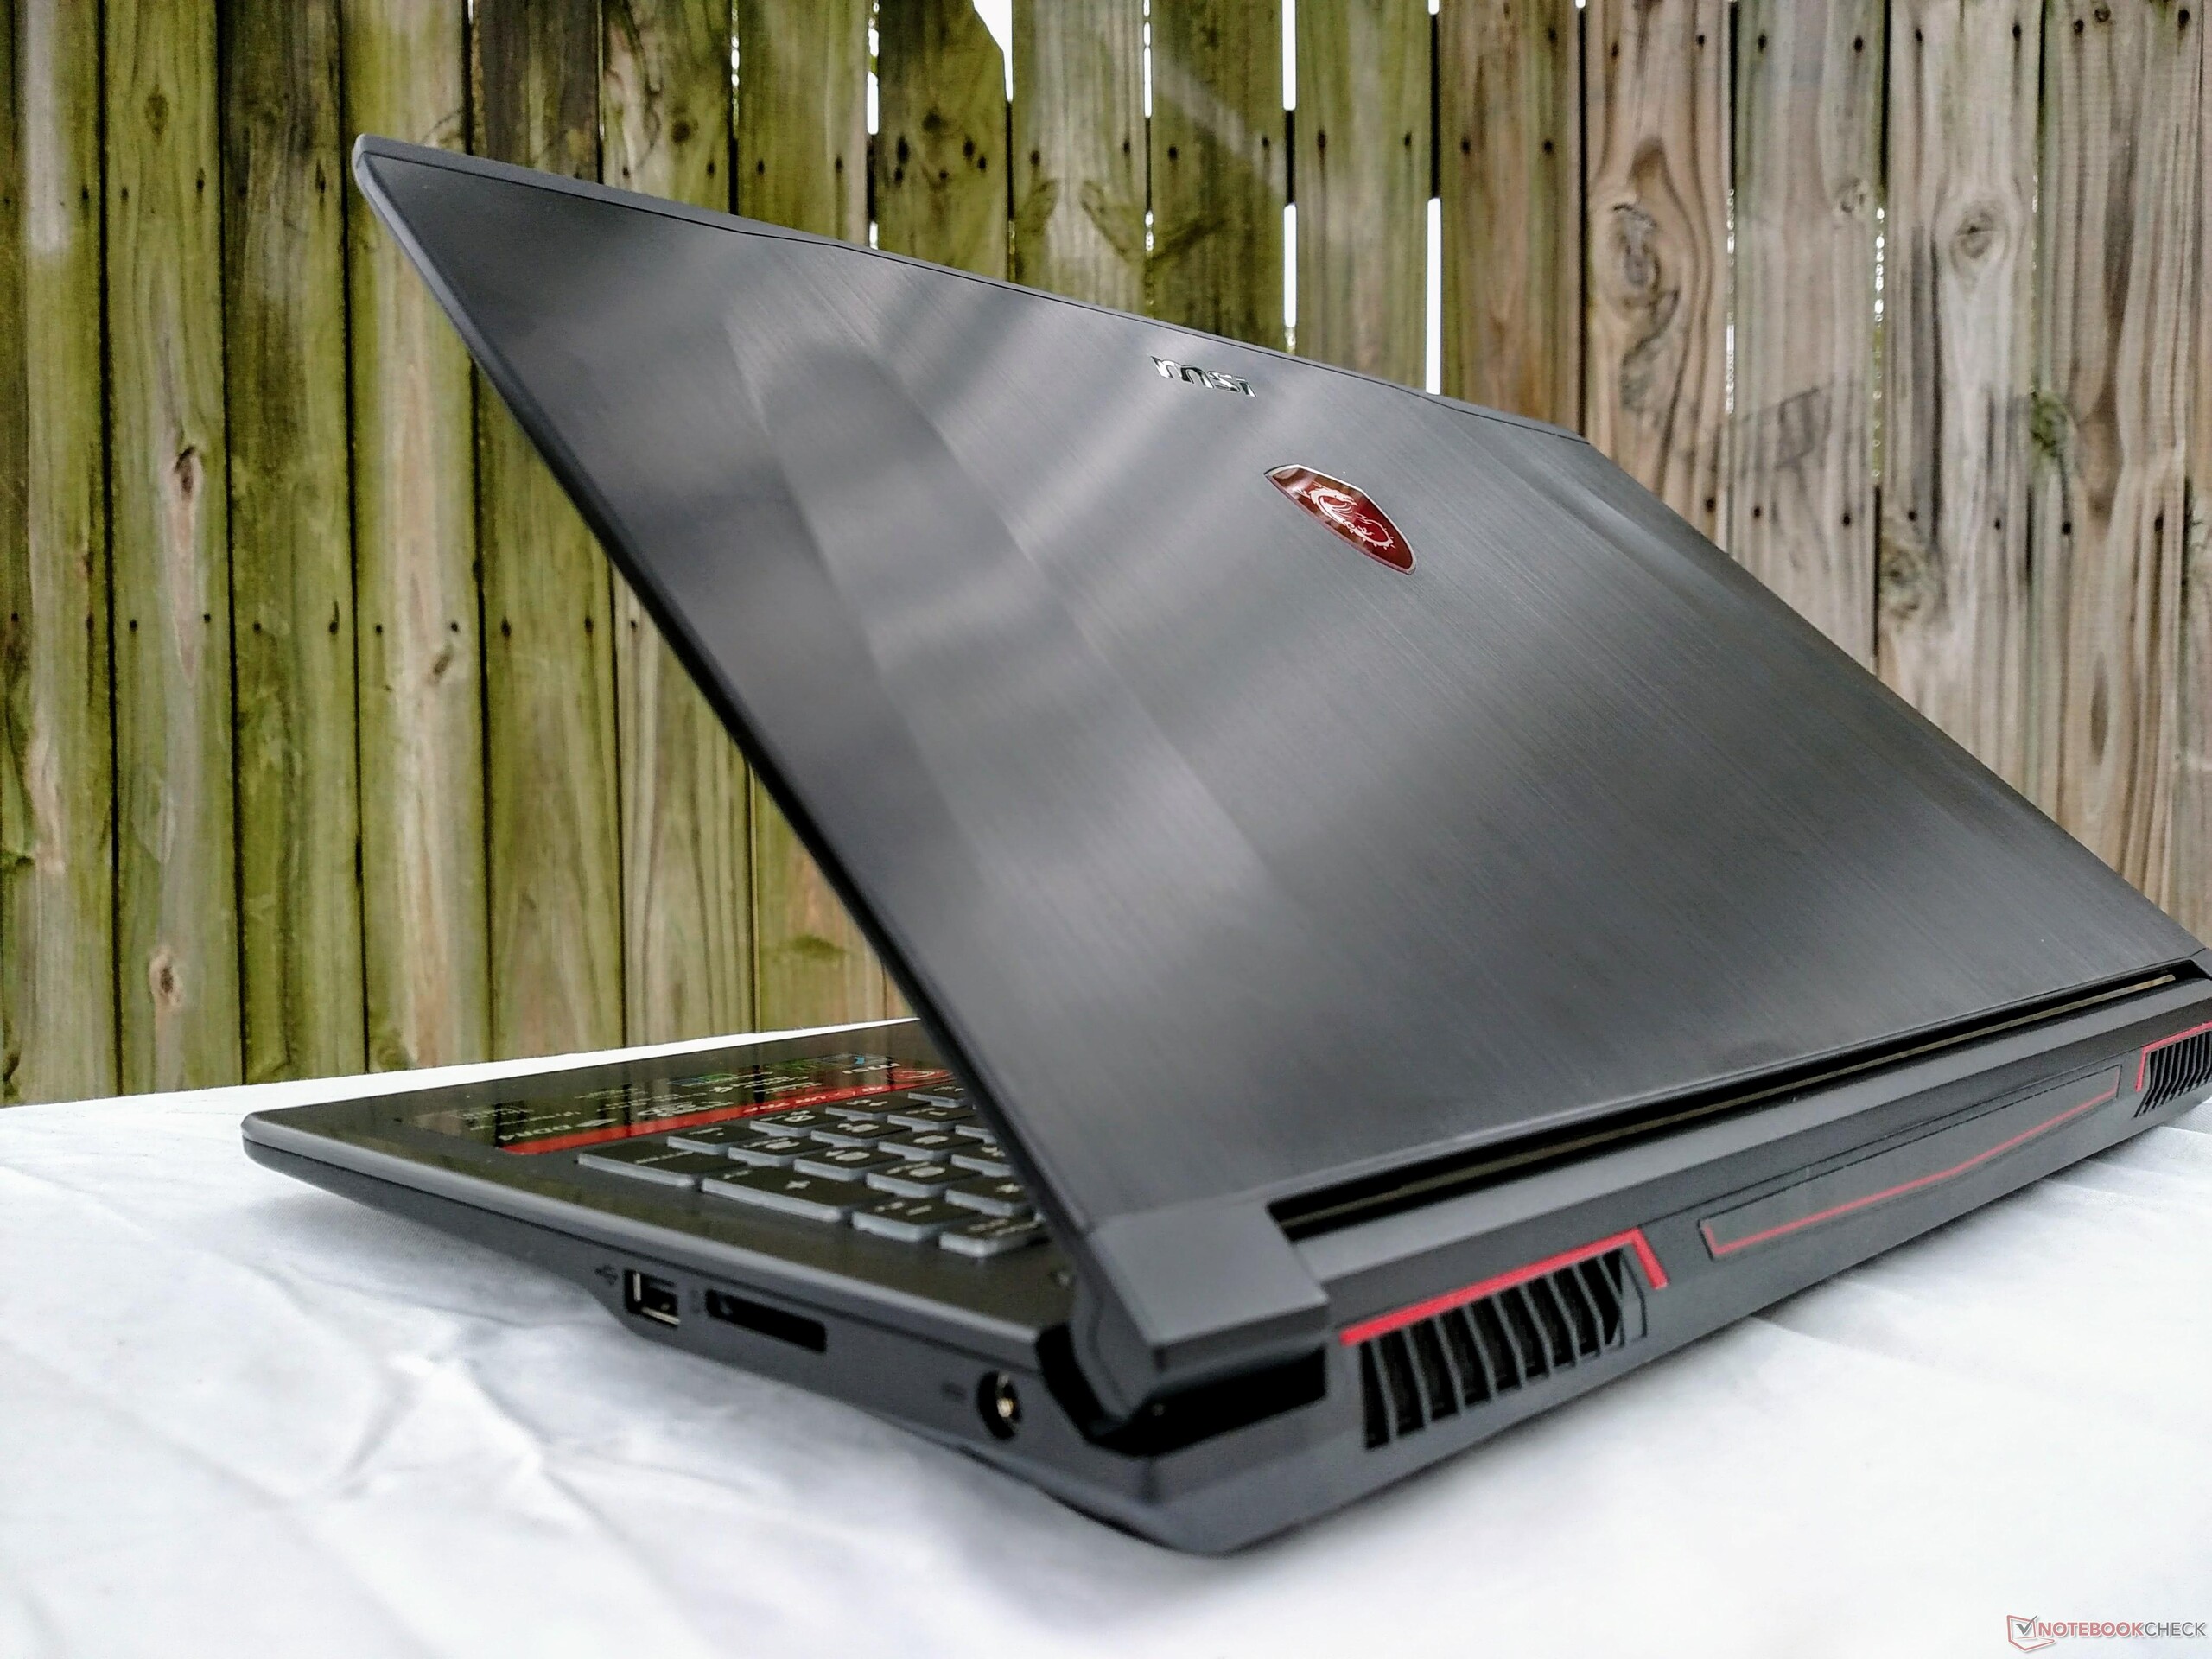
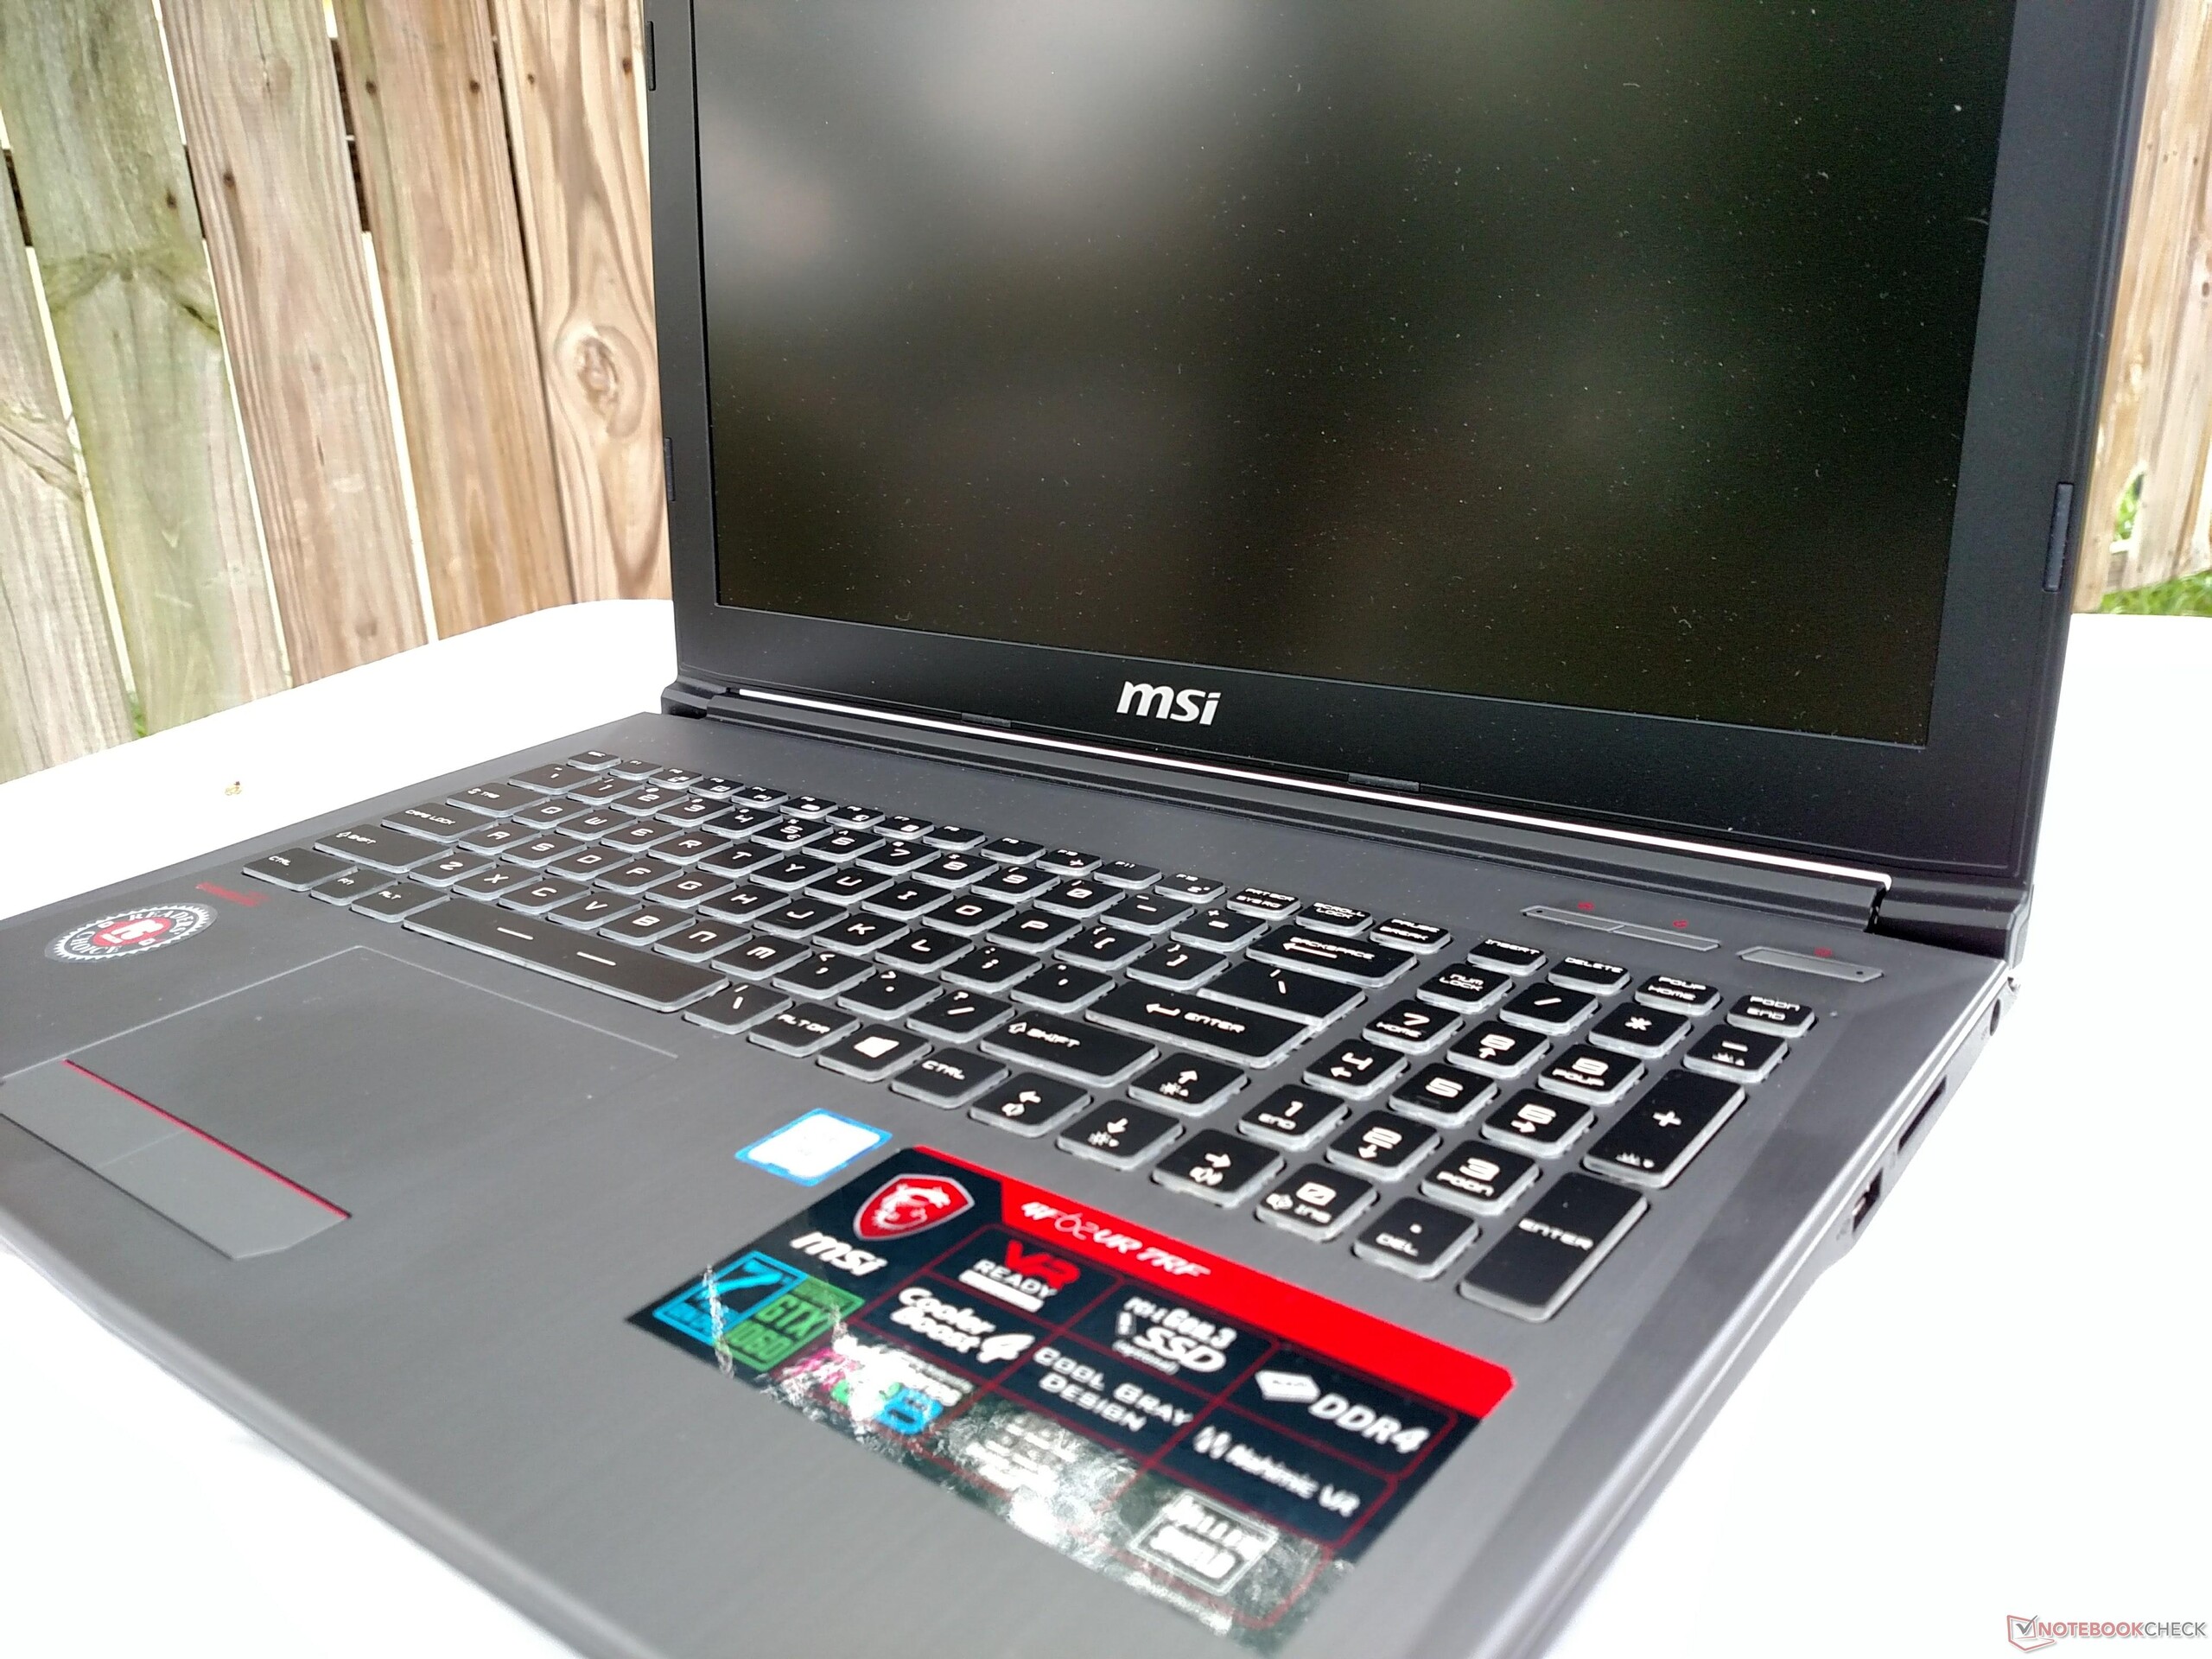
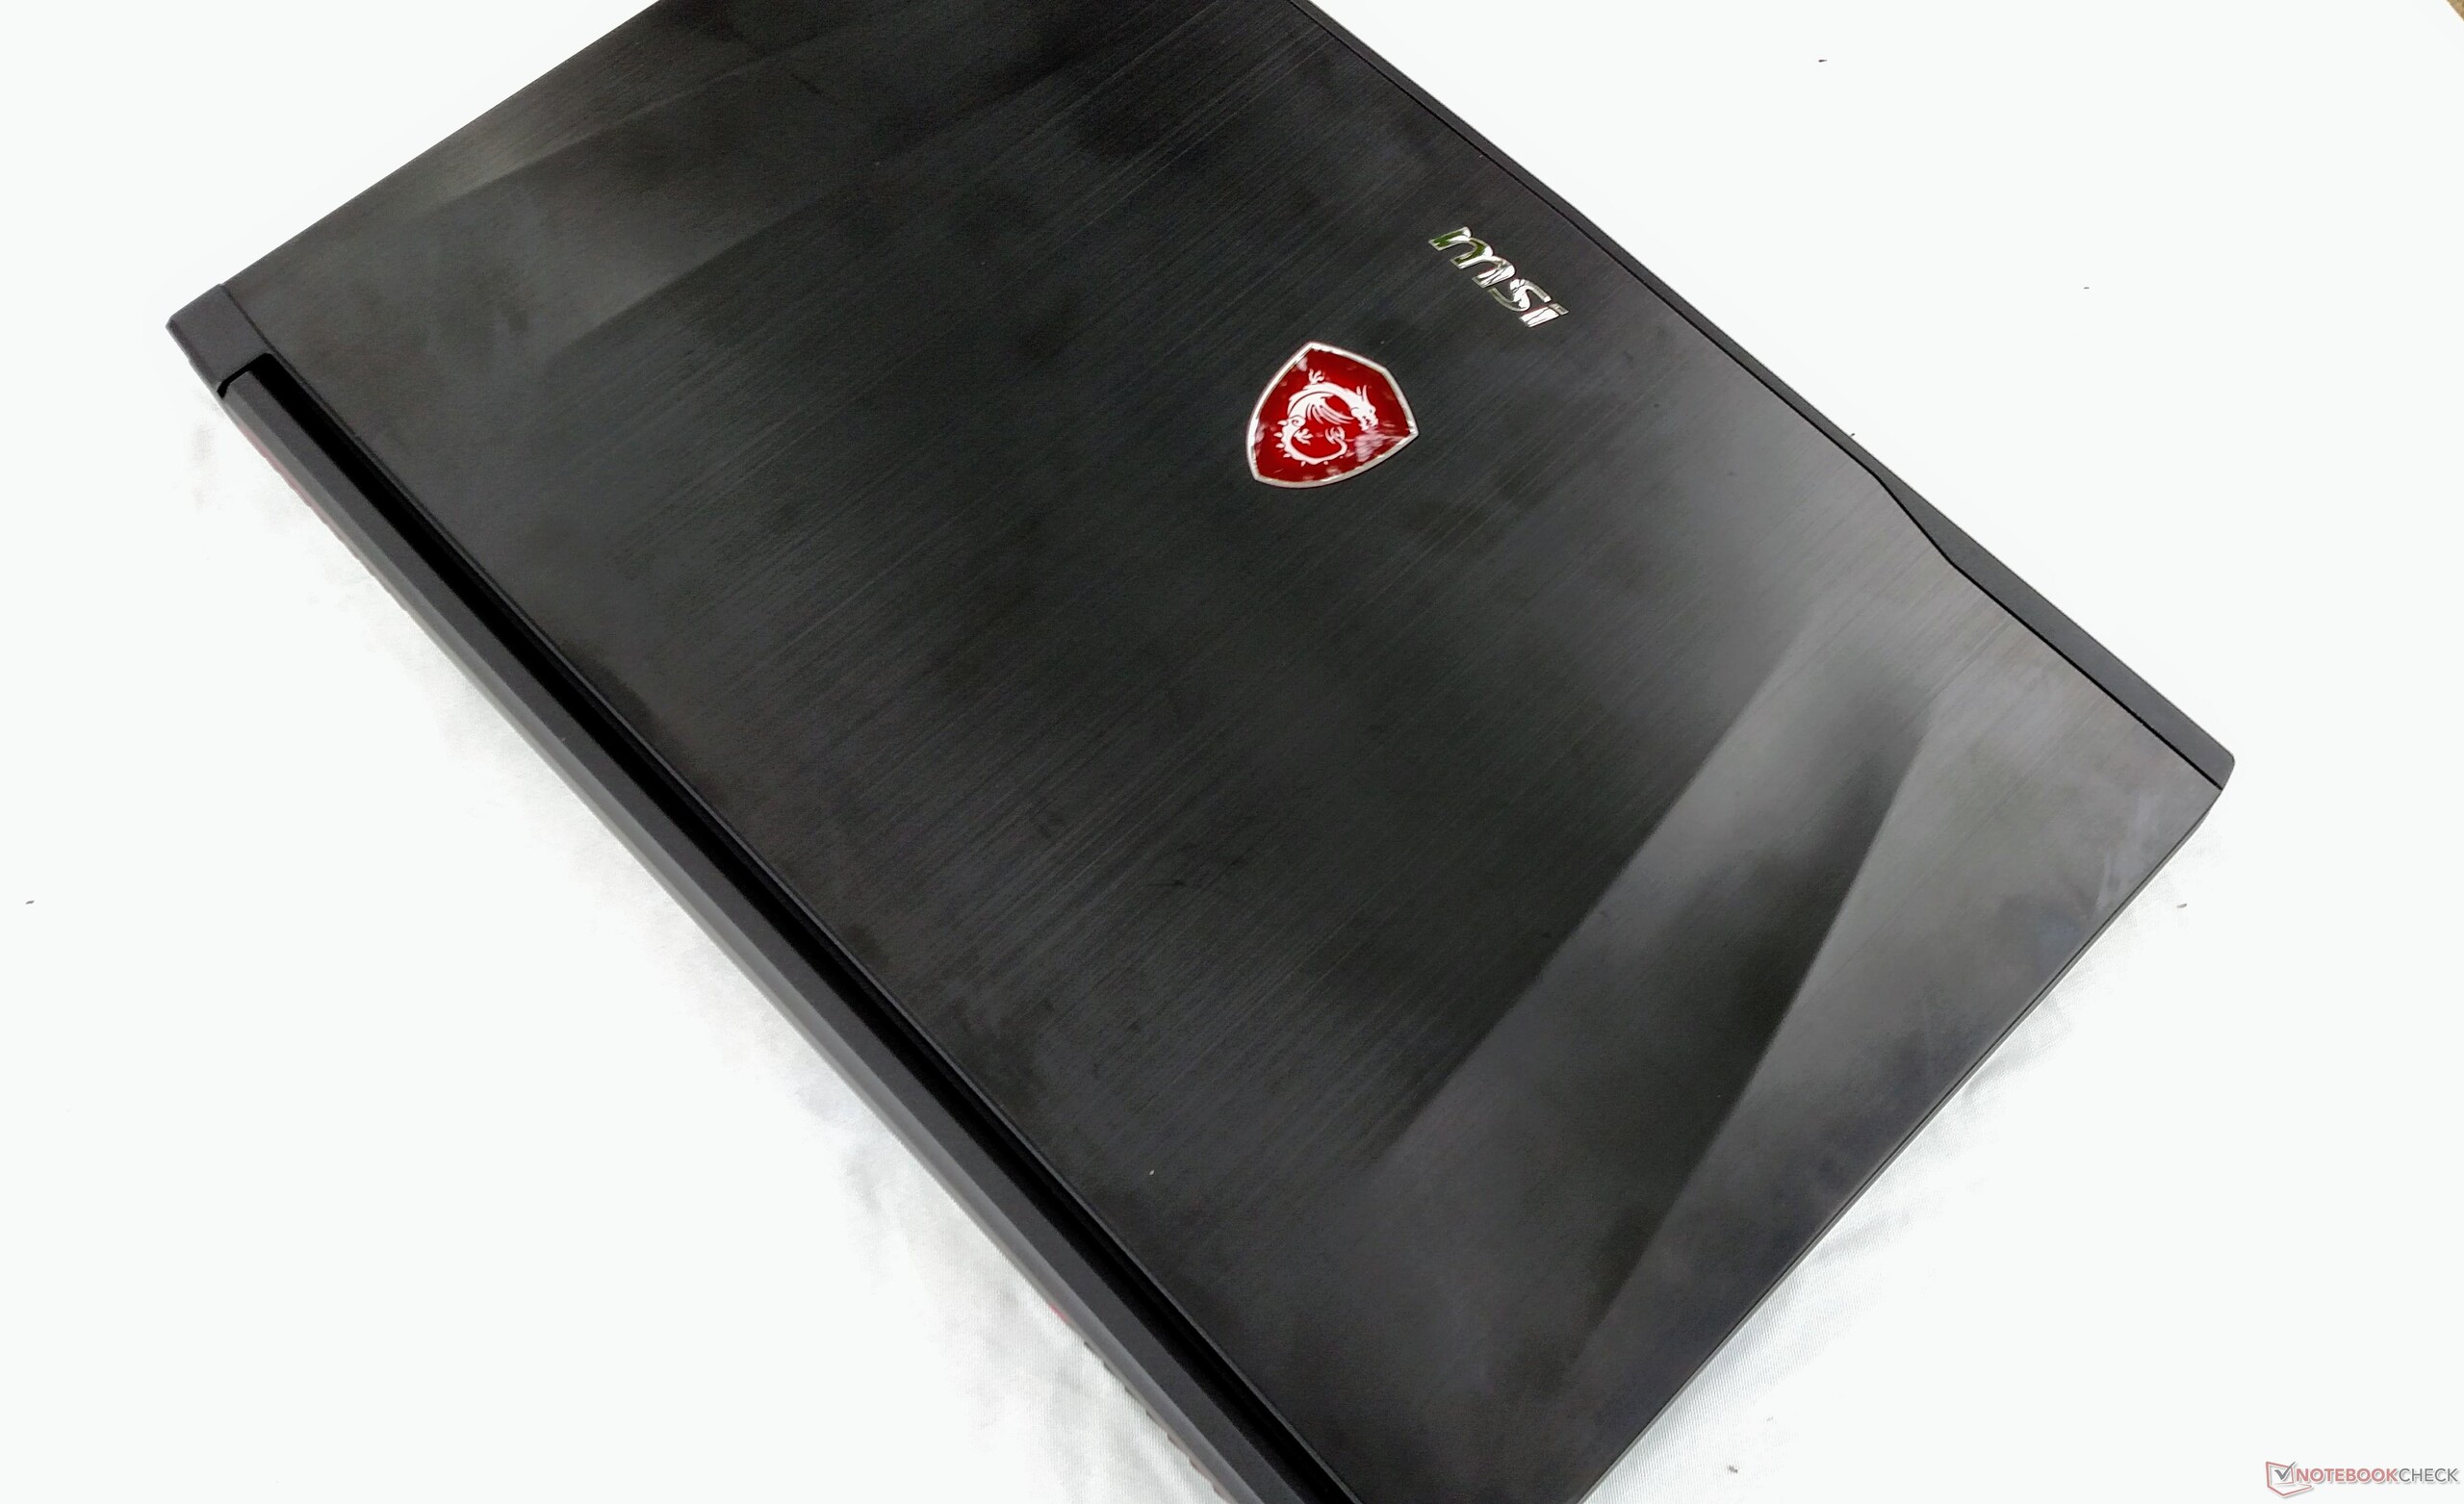
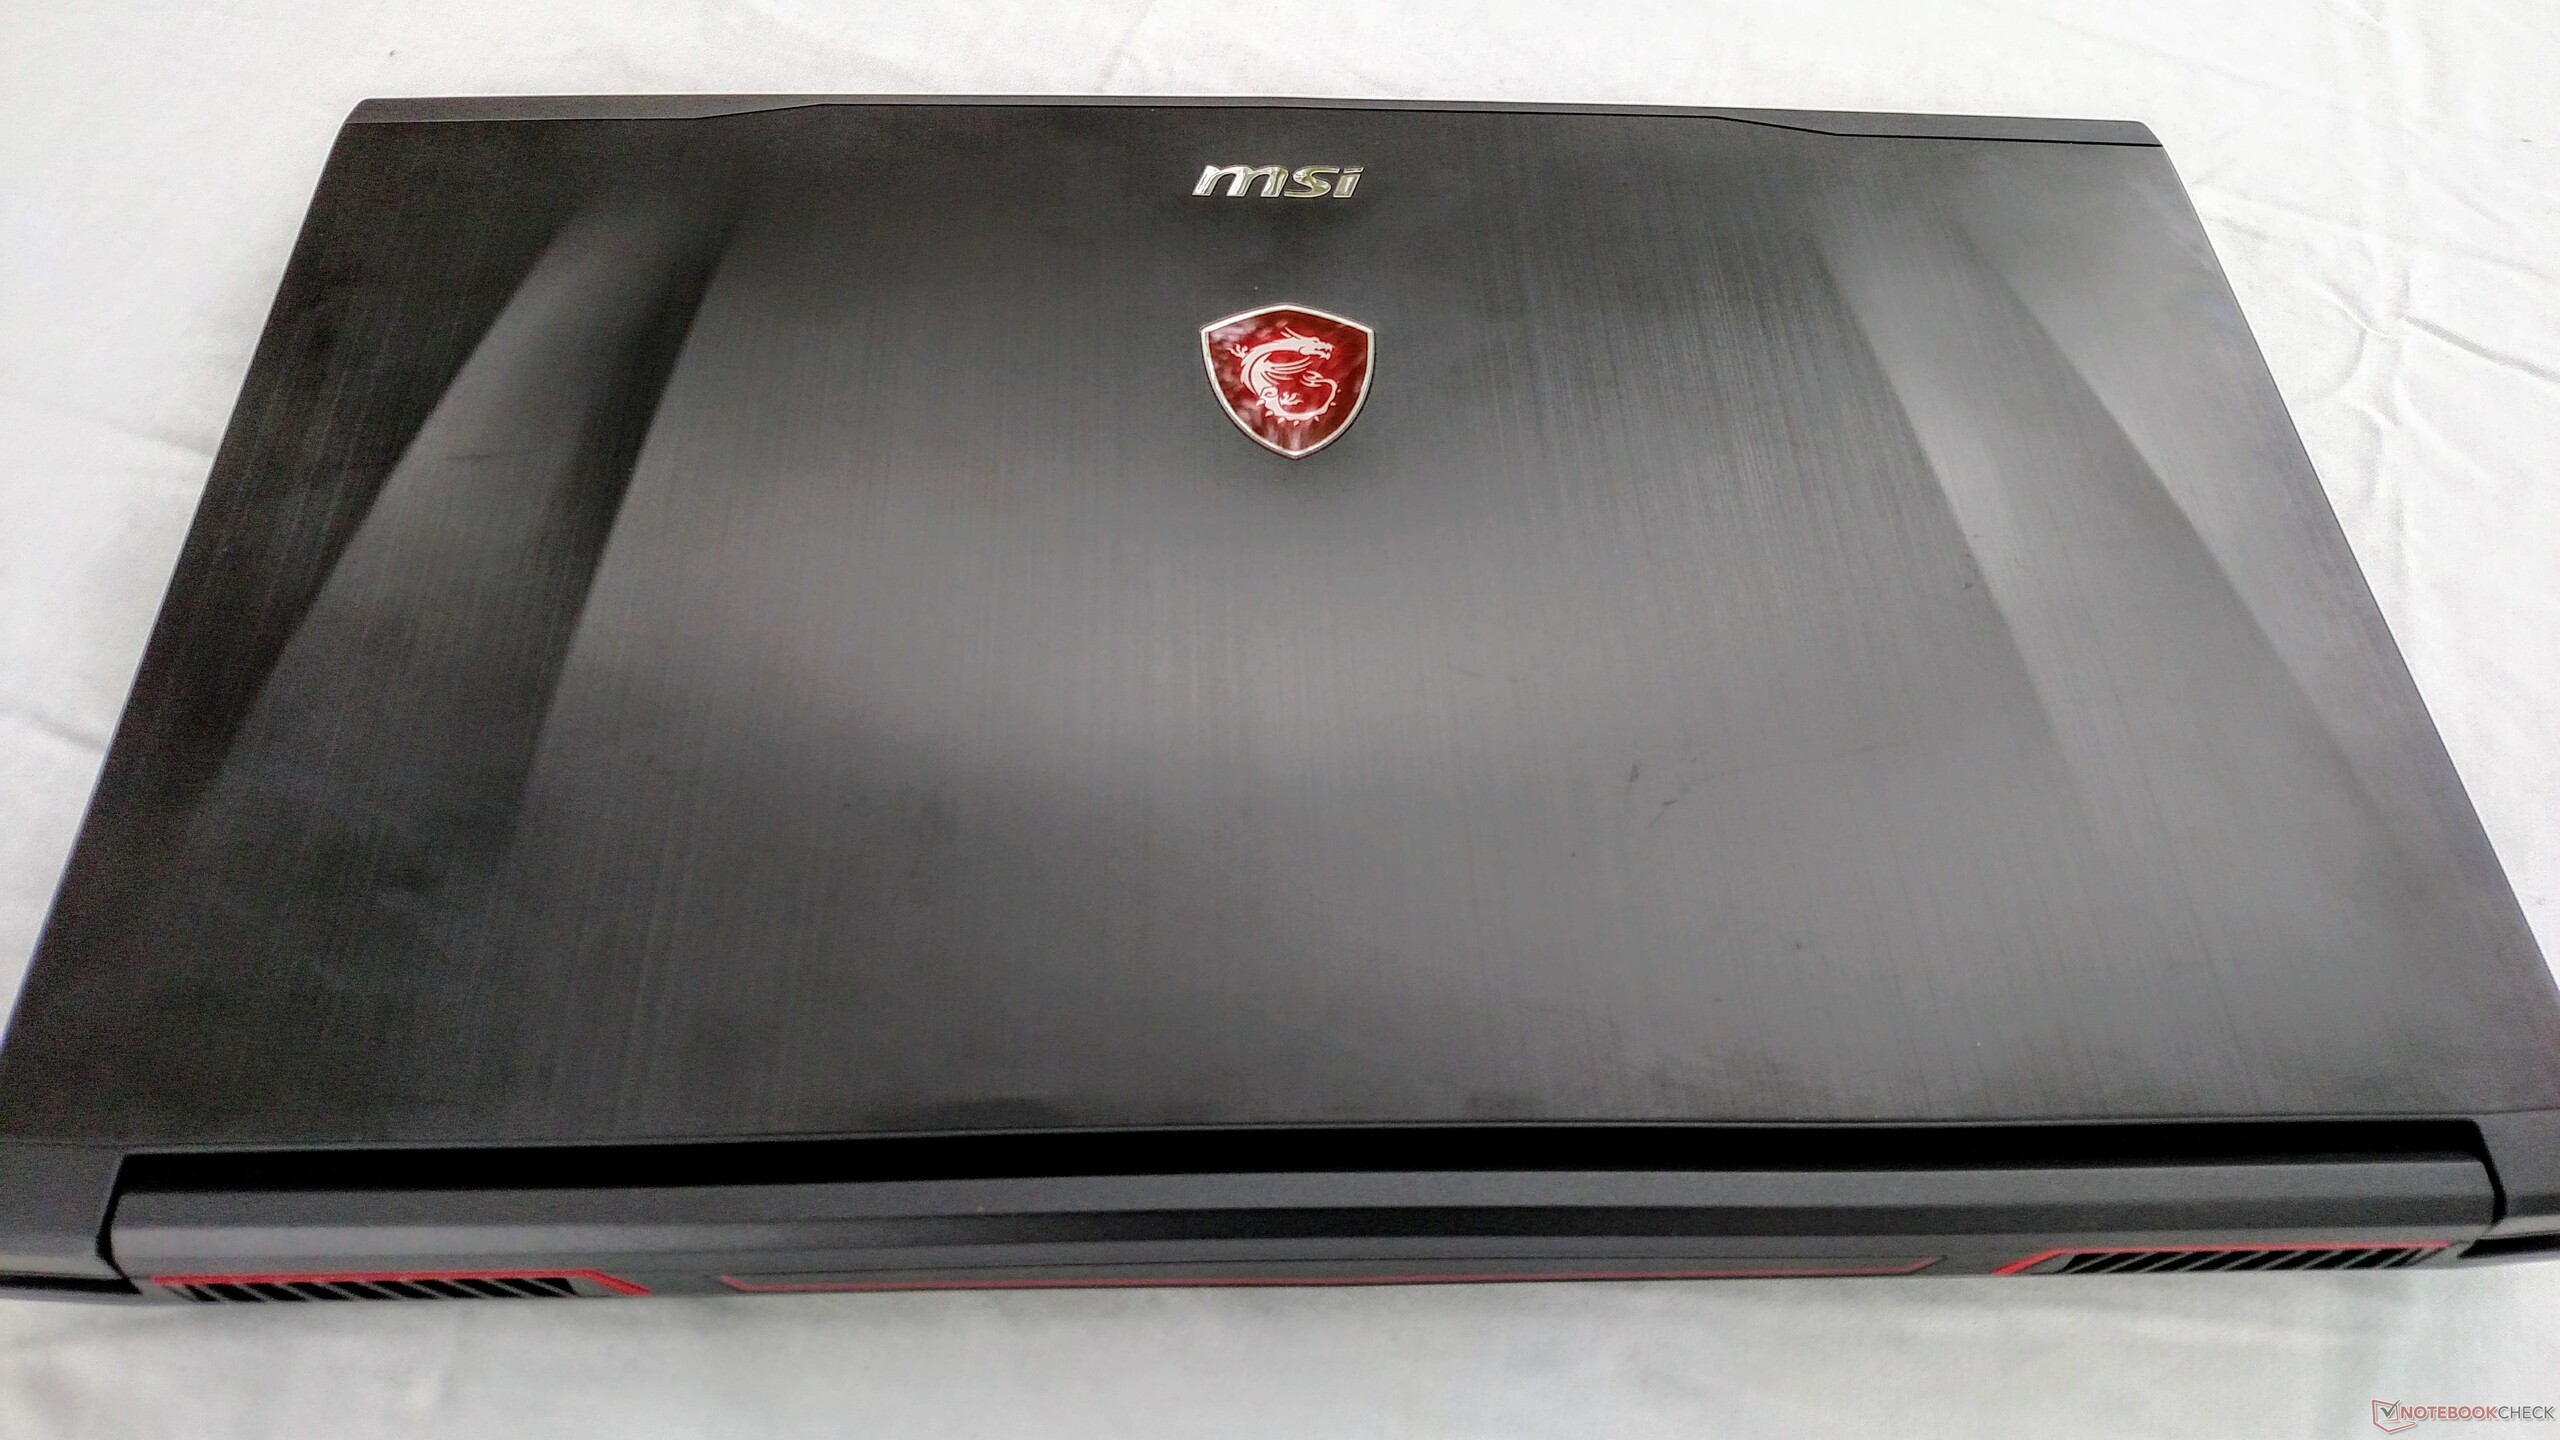
The case is a mix of high- and low-end materials. The lid is brushed aluminum, which feels cool and premium underhand. Adornment is relatively simple with some aggressive lines down either side and a backlit MSI logo front and center. Unfortunately, the lid is a fingerprint magnet and smudges will quickly tarnish the otherwise clean aesthetic. The lid case is also very thin and can be easily twisted or warped, even under light pressure. The display hinge is too stiff for one-handed opening but holds the screen firmly in place up to about 135-140°. There is some unwarranted creaking when opening the lid from the right side. We must also note that the lid will open slightly when the device is held vertically.
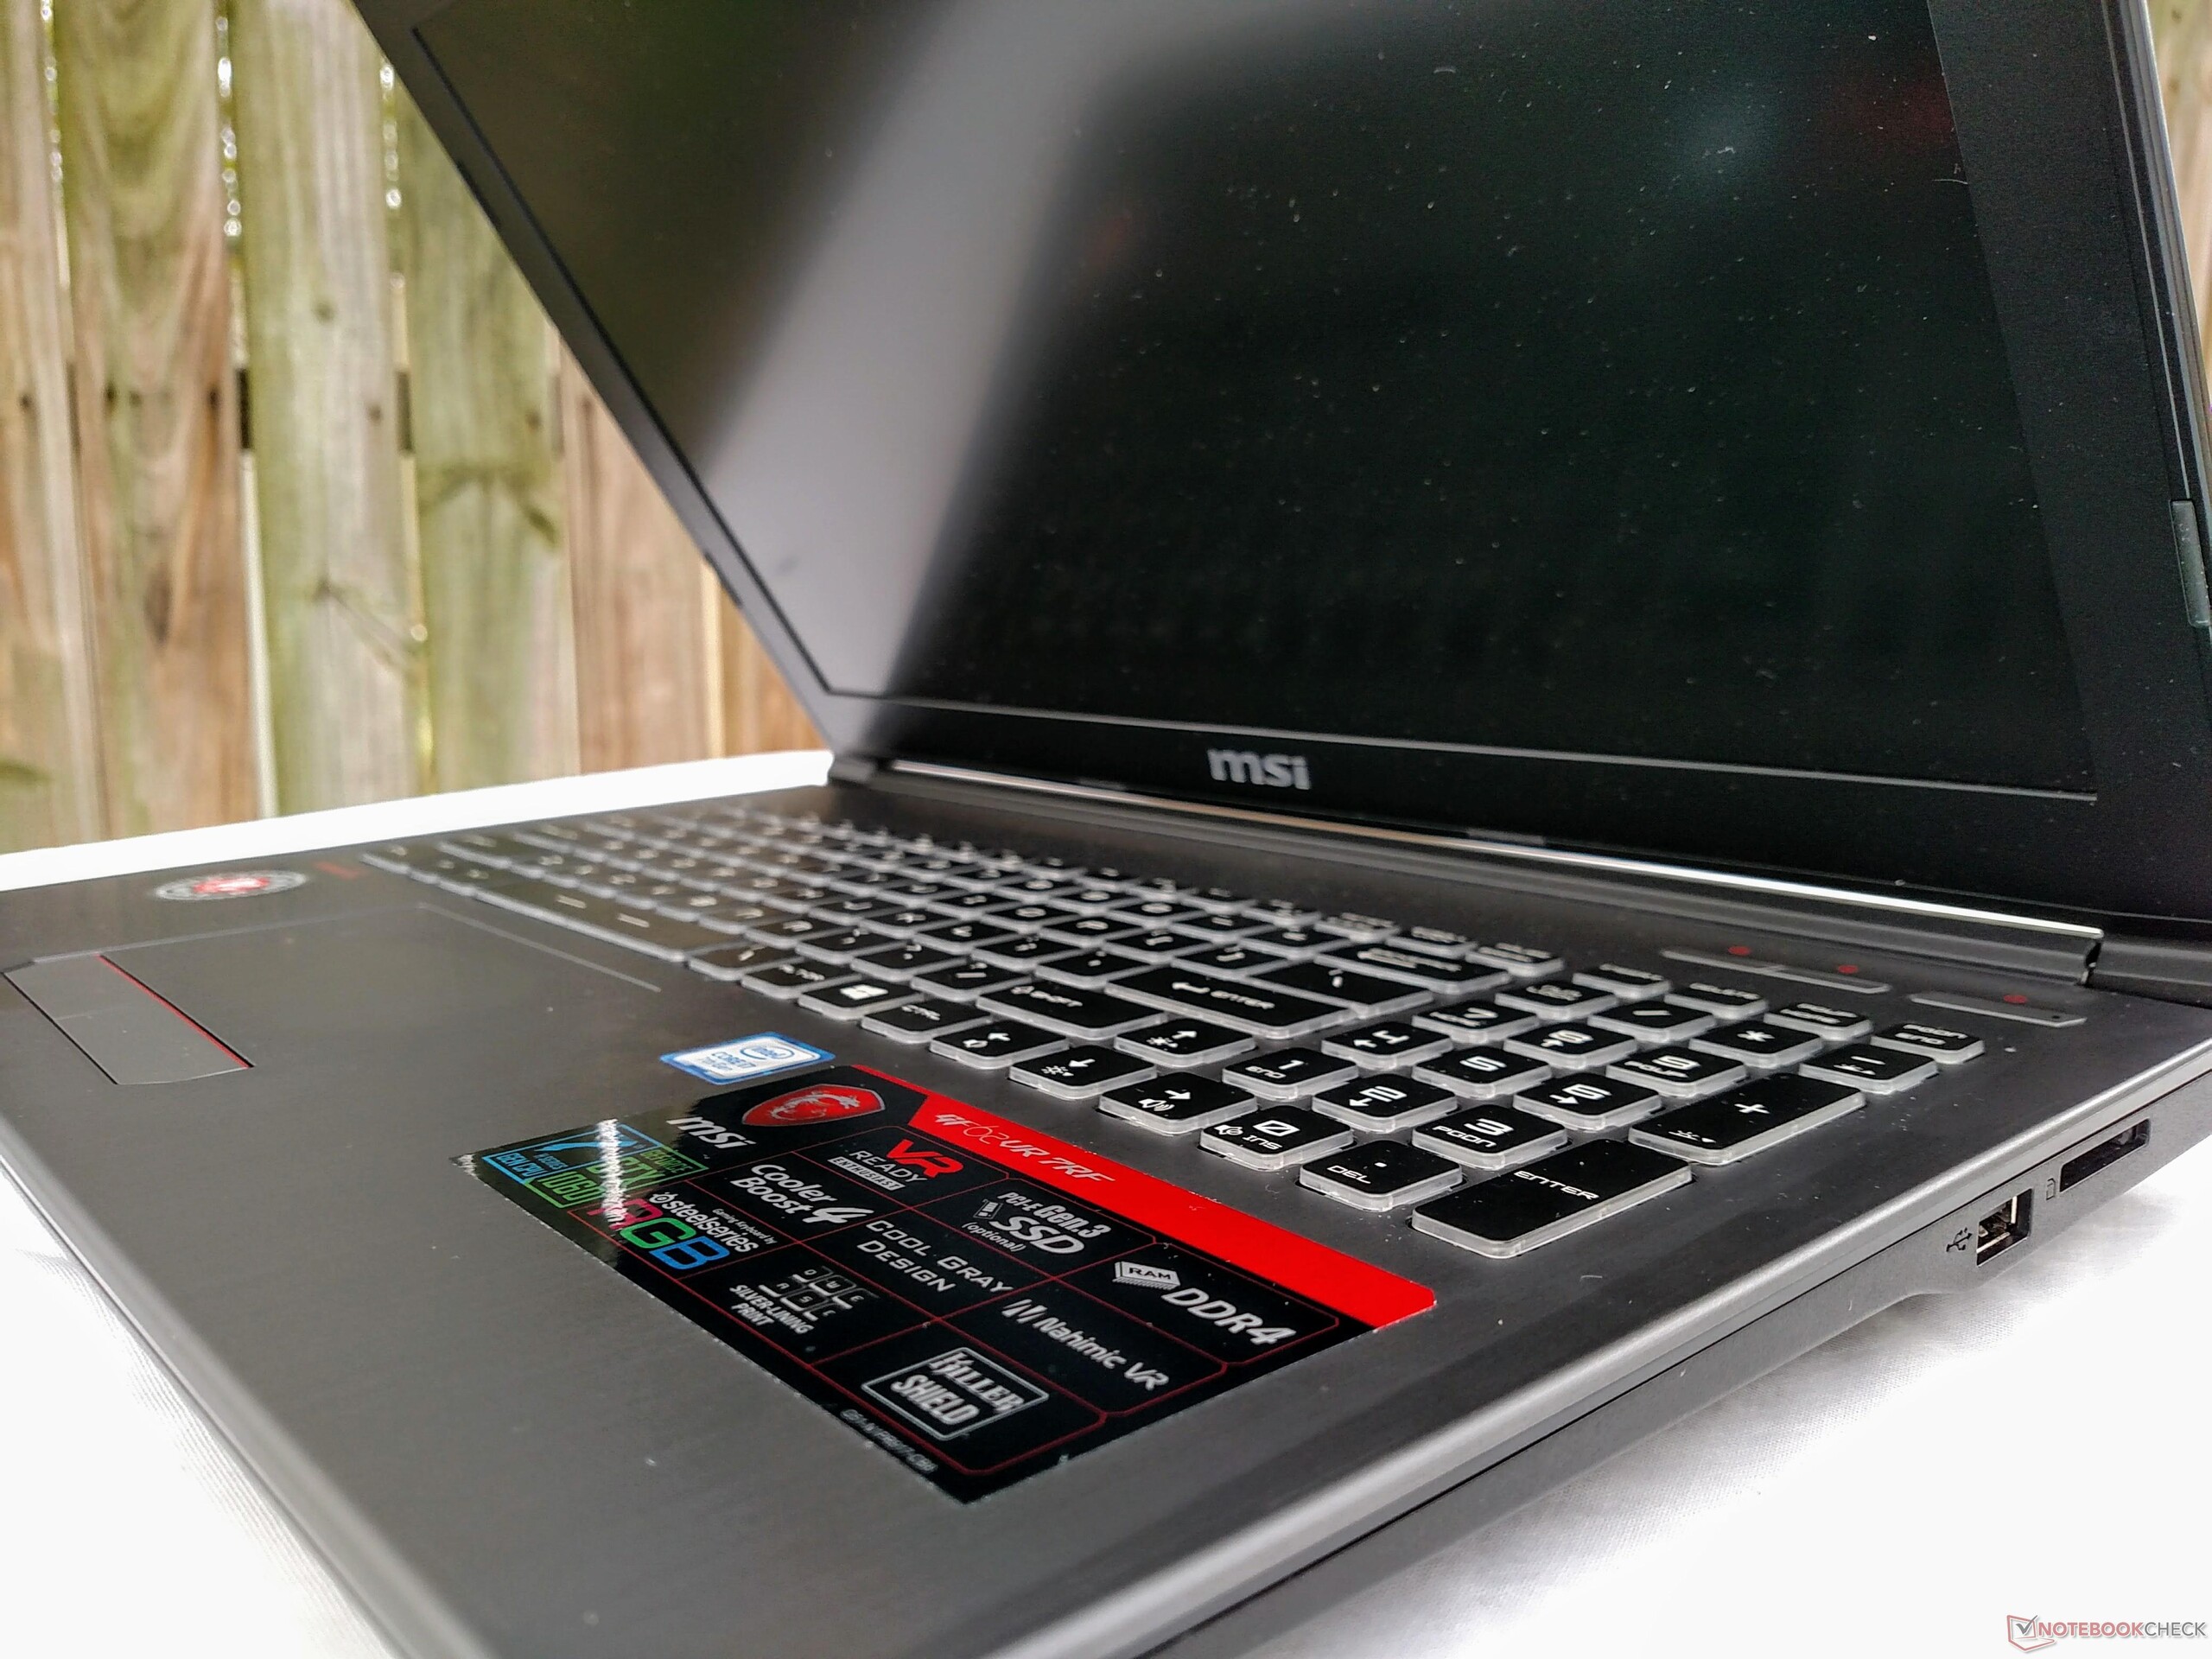
The keyboard deck is unapologetically plastic. MSI offers the device in both black and "Cool Gray," which is an almost charcoal shade of silver. The matte case does well in keeping fingerprints off the faux-brushed metal finish, keeping the deck looking clean. The deck and palm rests can be flexed under heavy directed pressure but remain stable while typing and during normal use. The underside continues the plastic story but is very firm and rigid. There is some creaking when the bottom panel is pushed, particularly around the vents. Gaps are tight and even around the device, although there is a small lip along the front edge caused by the palm rests overshooting their juncture with the bottom case. This creates a slight edge that may catch.
All said, the lid looks nice but feels weak, while the keyboard deck and bottom panel look cheap but feel solid. As stated, the design language exactly mimics MSI's other mid-tier options, the GE and GP lines. The overall aesthetic is an ineffective juncture between premium and budget materials but is largely unoffensive. It's a far cry from the Asus GL503VD, which successfully pairs a metal lid with a plastic body to striking effect.
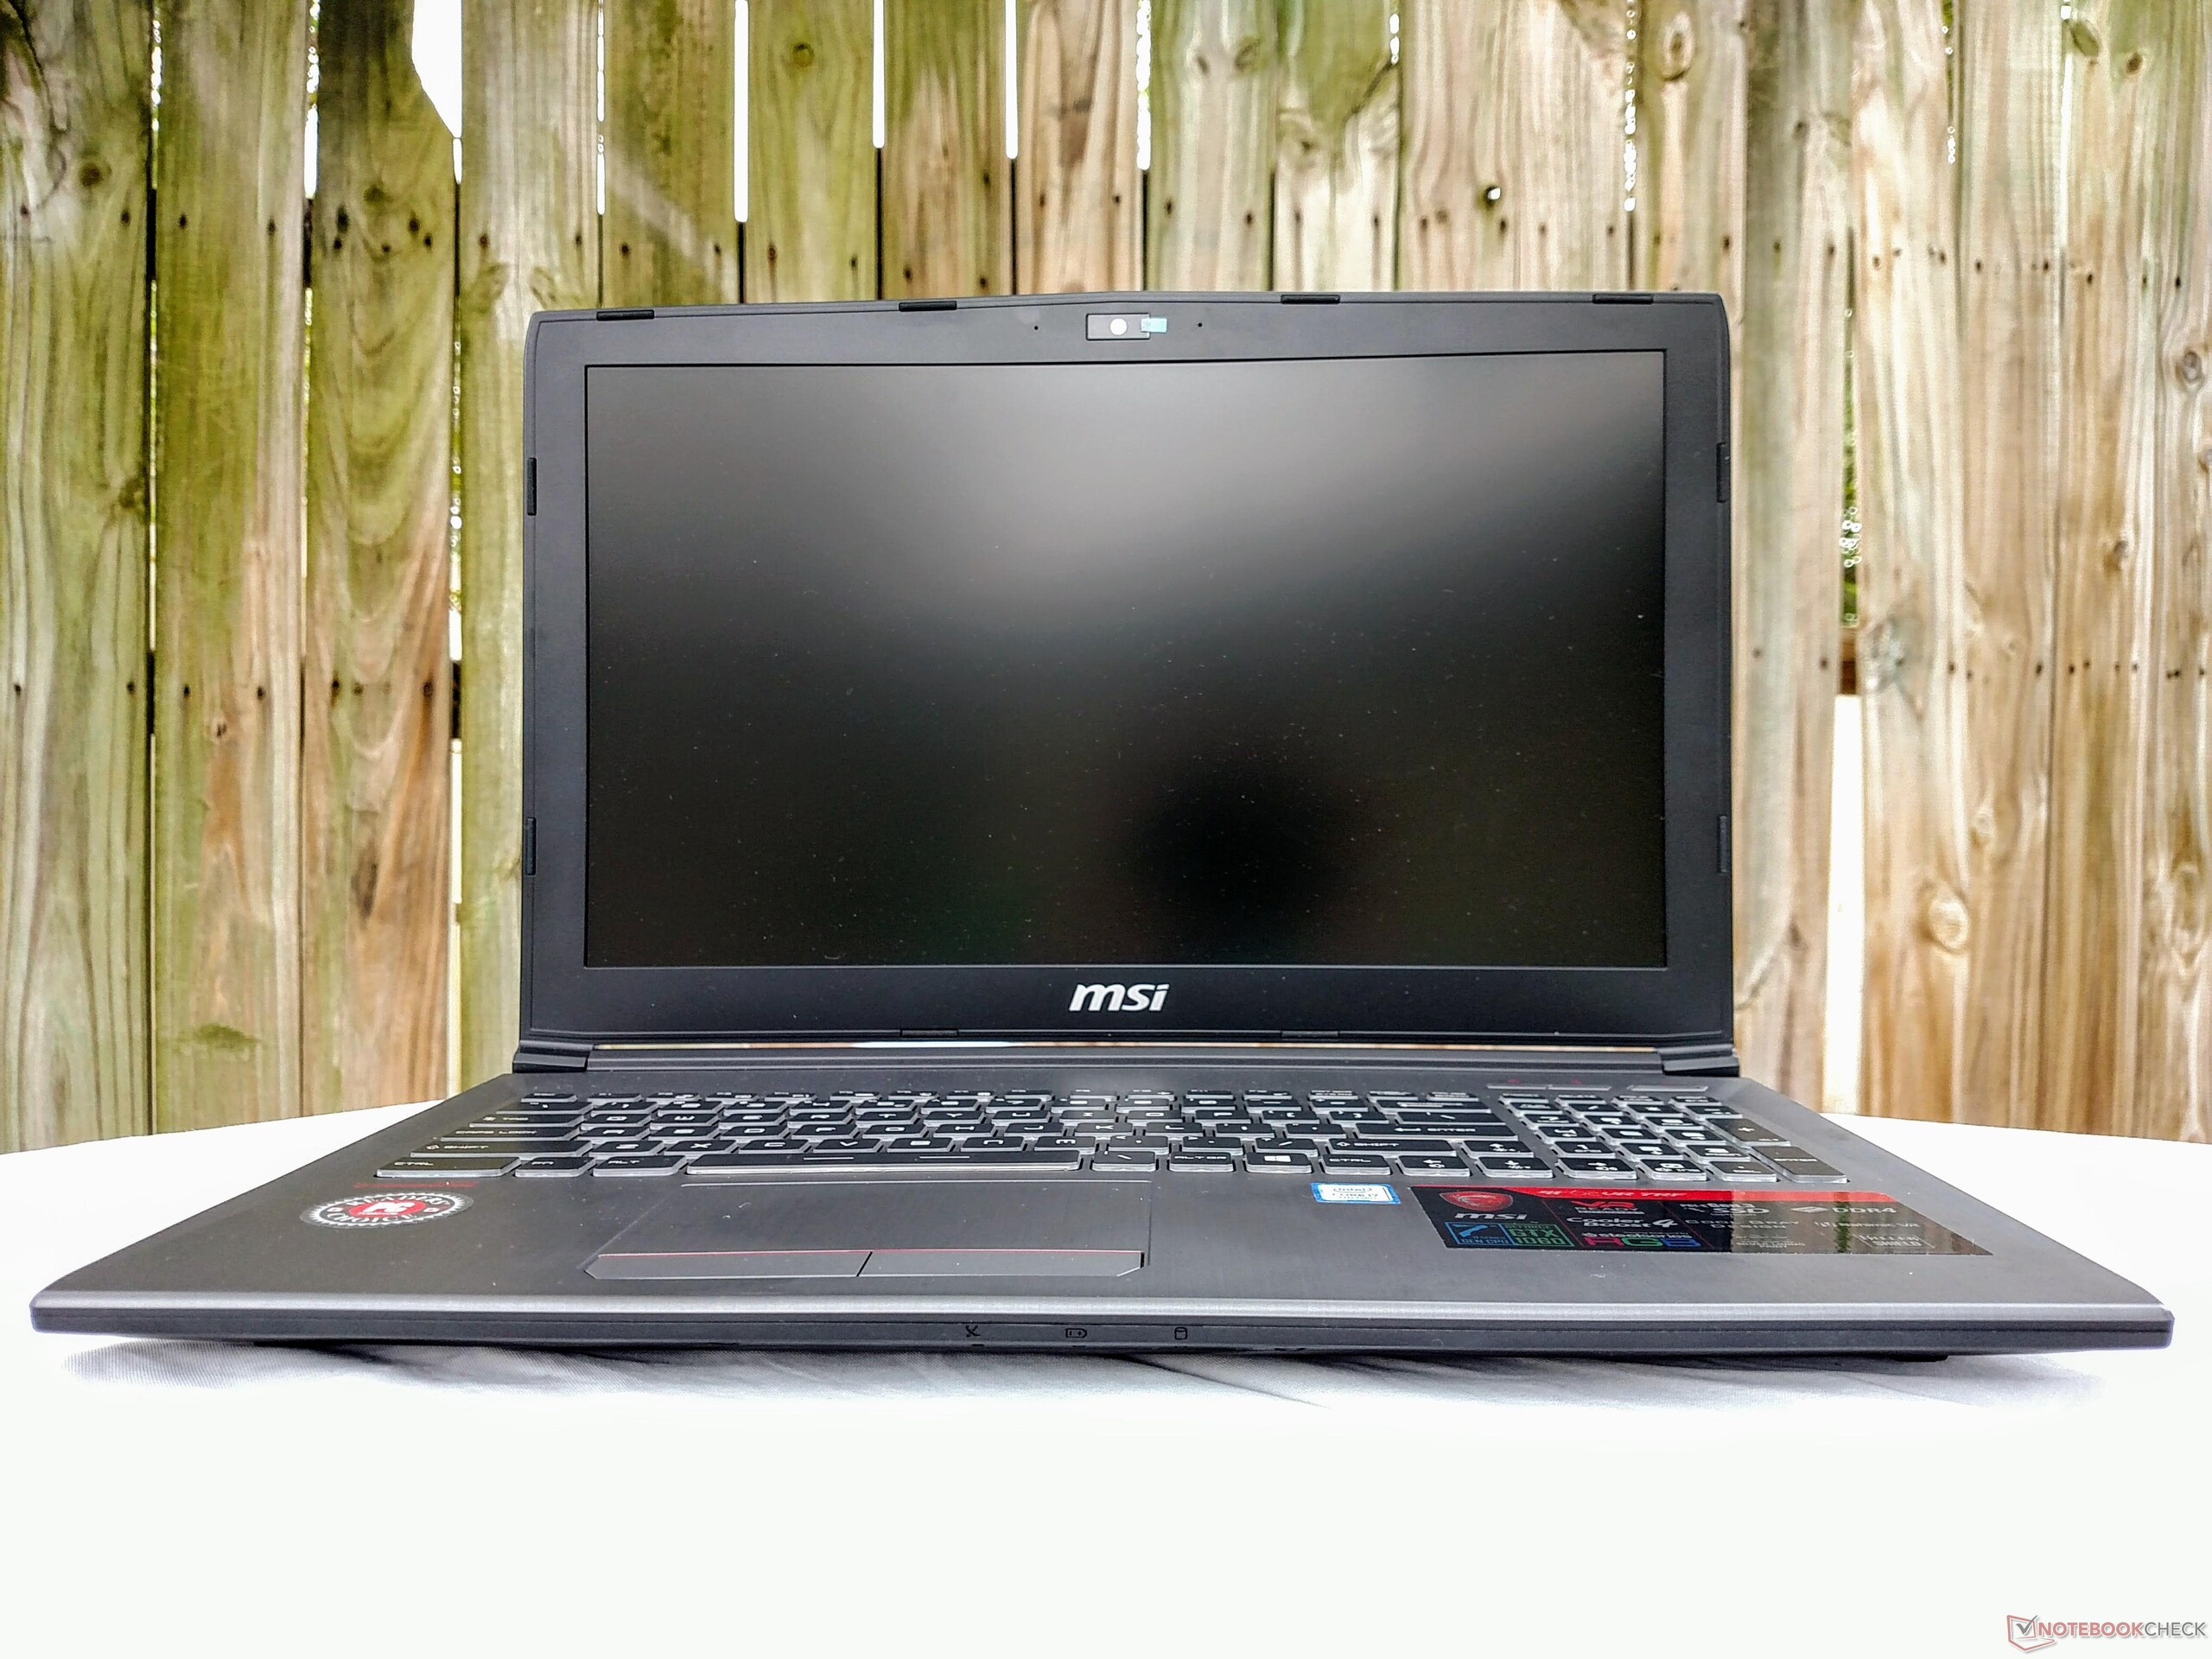
In terms of size, the GF62VR is about average. Unsurprisingly, the dimensions are the exact same as the GE62VR, although the newer GF62VR is about 300 grams lighter (likely due to the absence of the optical drive). In fact, the GF62VR is lighter than many other competitors (save the compact Aero 15 and MSI GS63VR), making it one of the better options for gamers on the go.
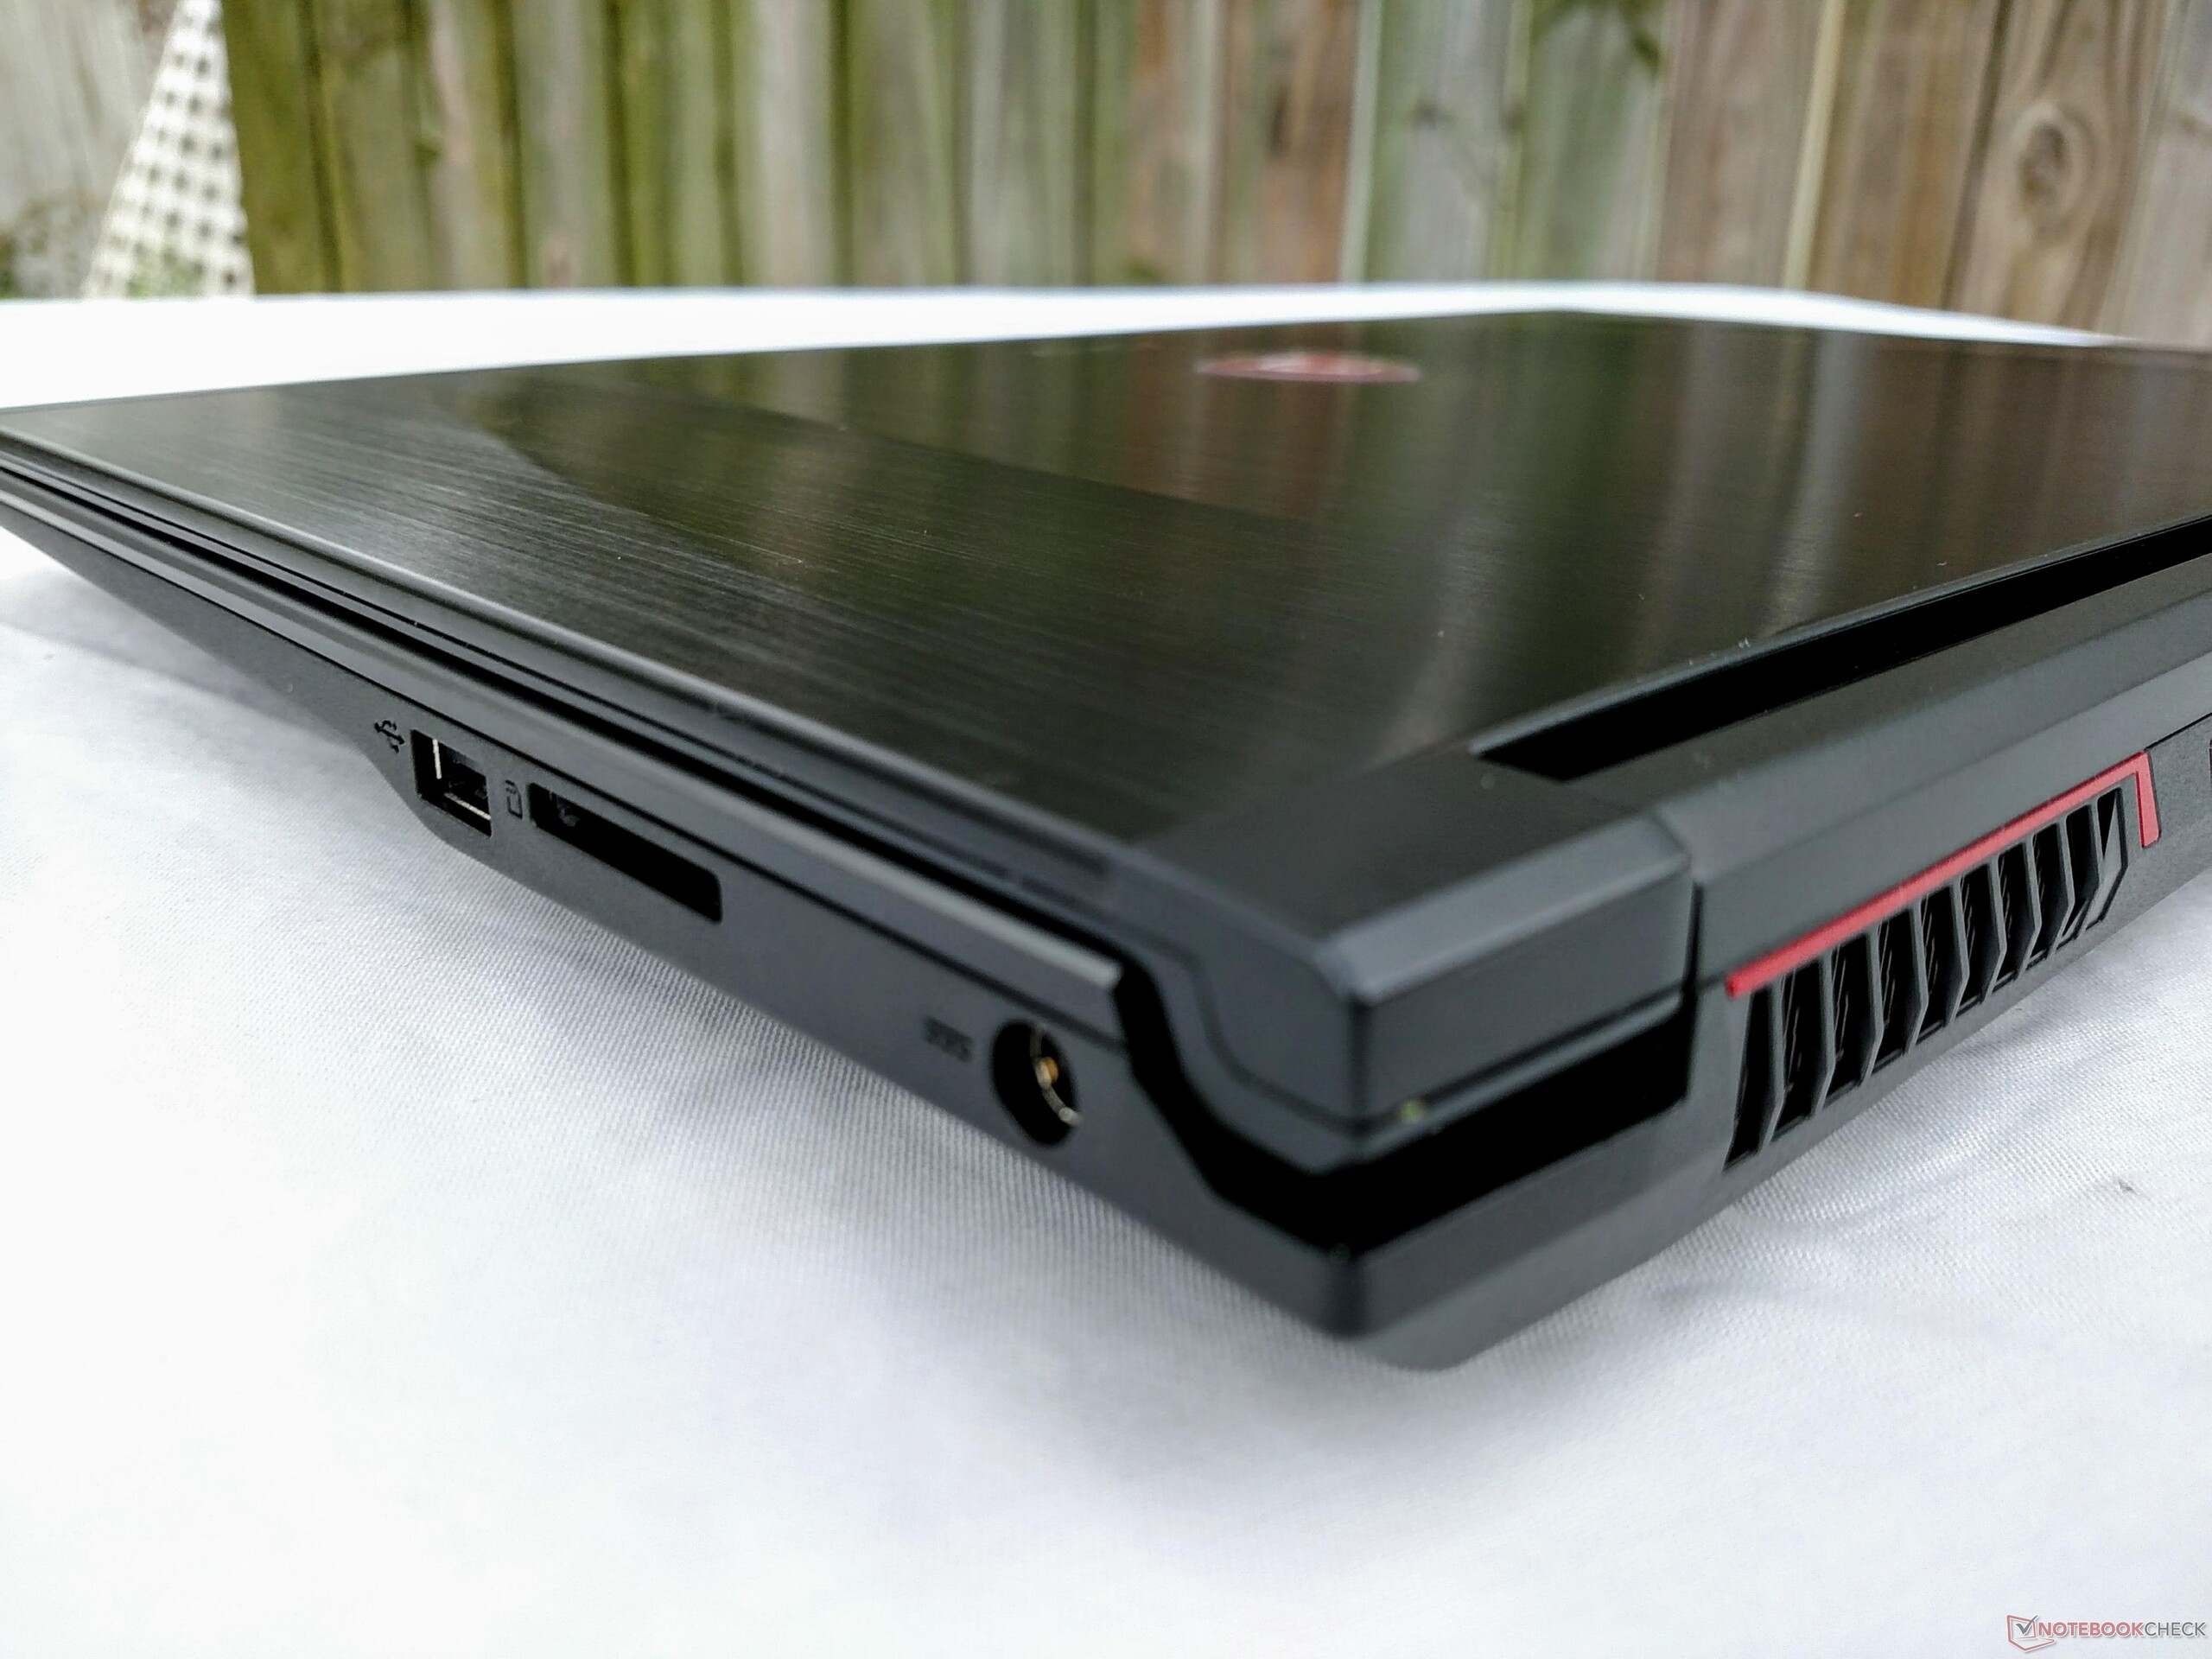
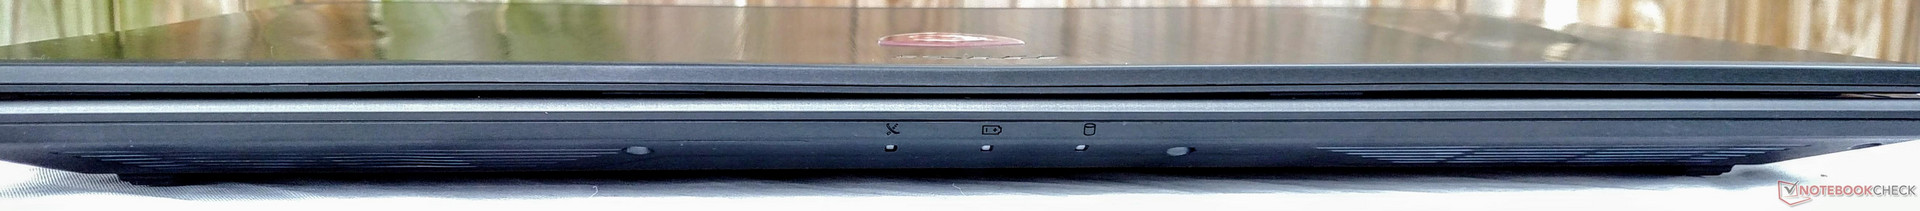
Connectivity
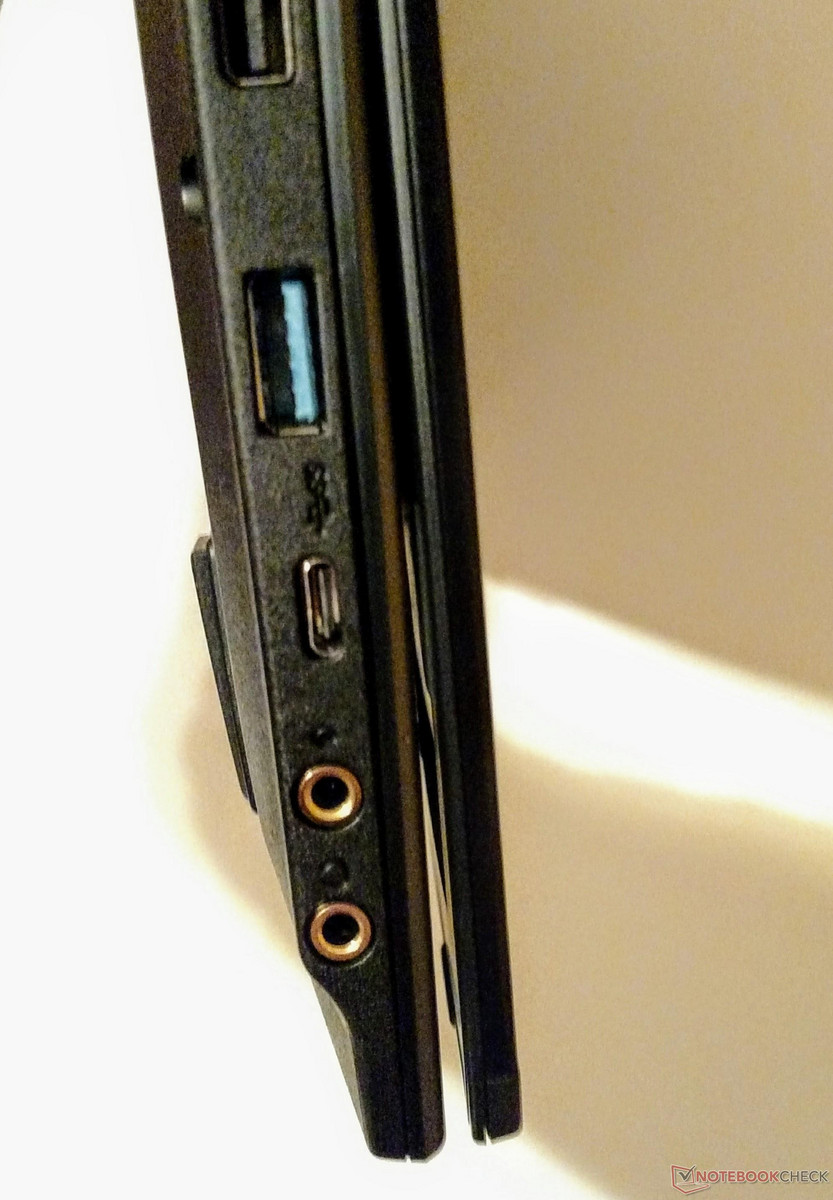
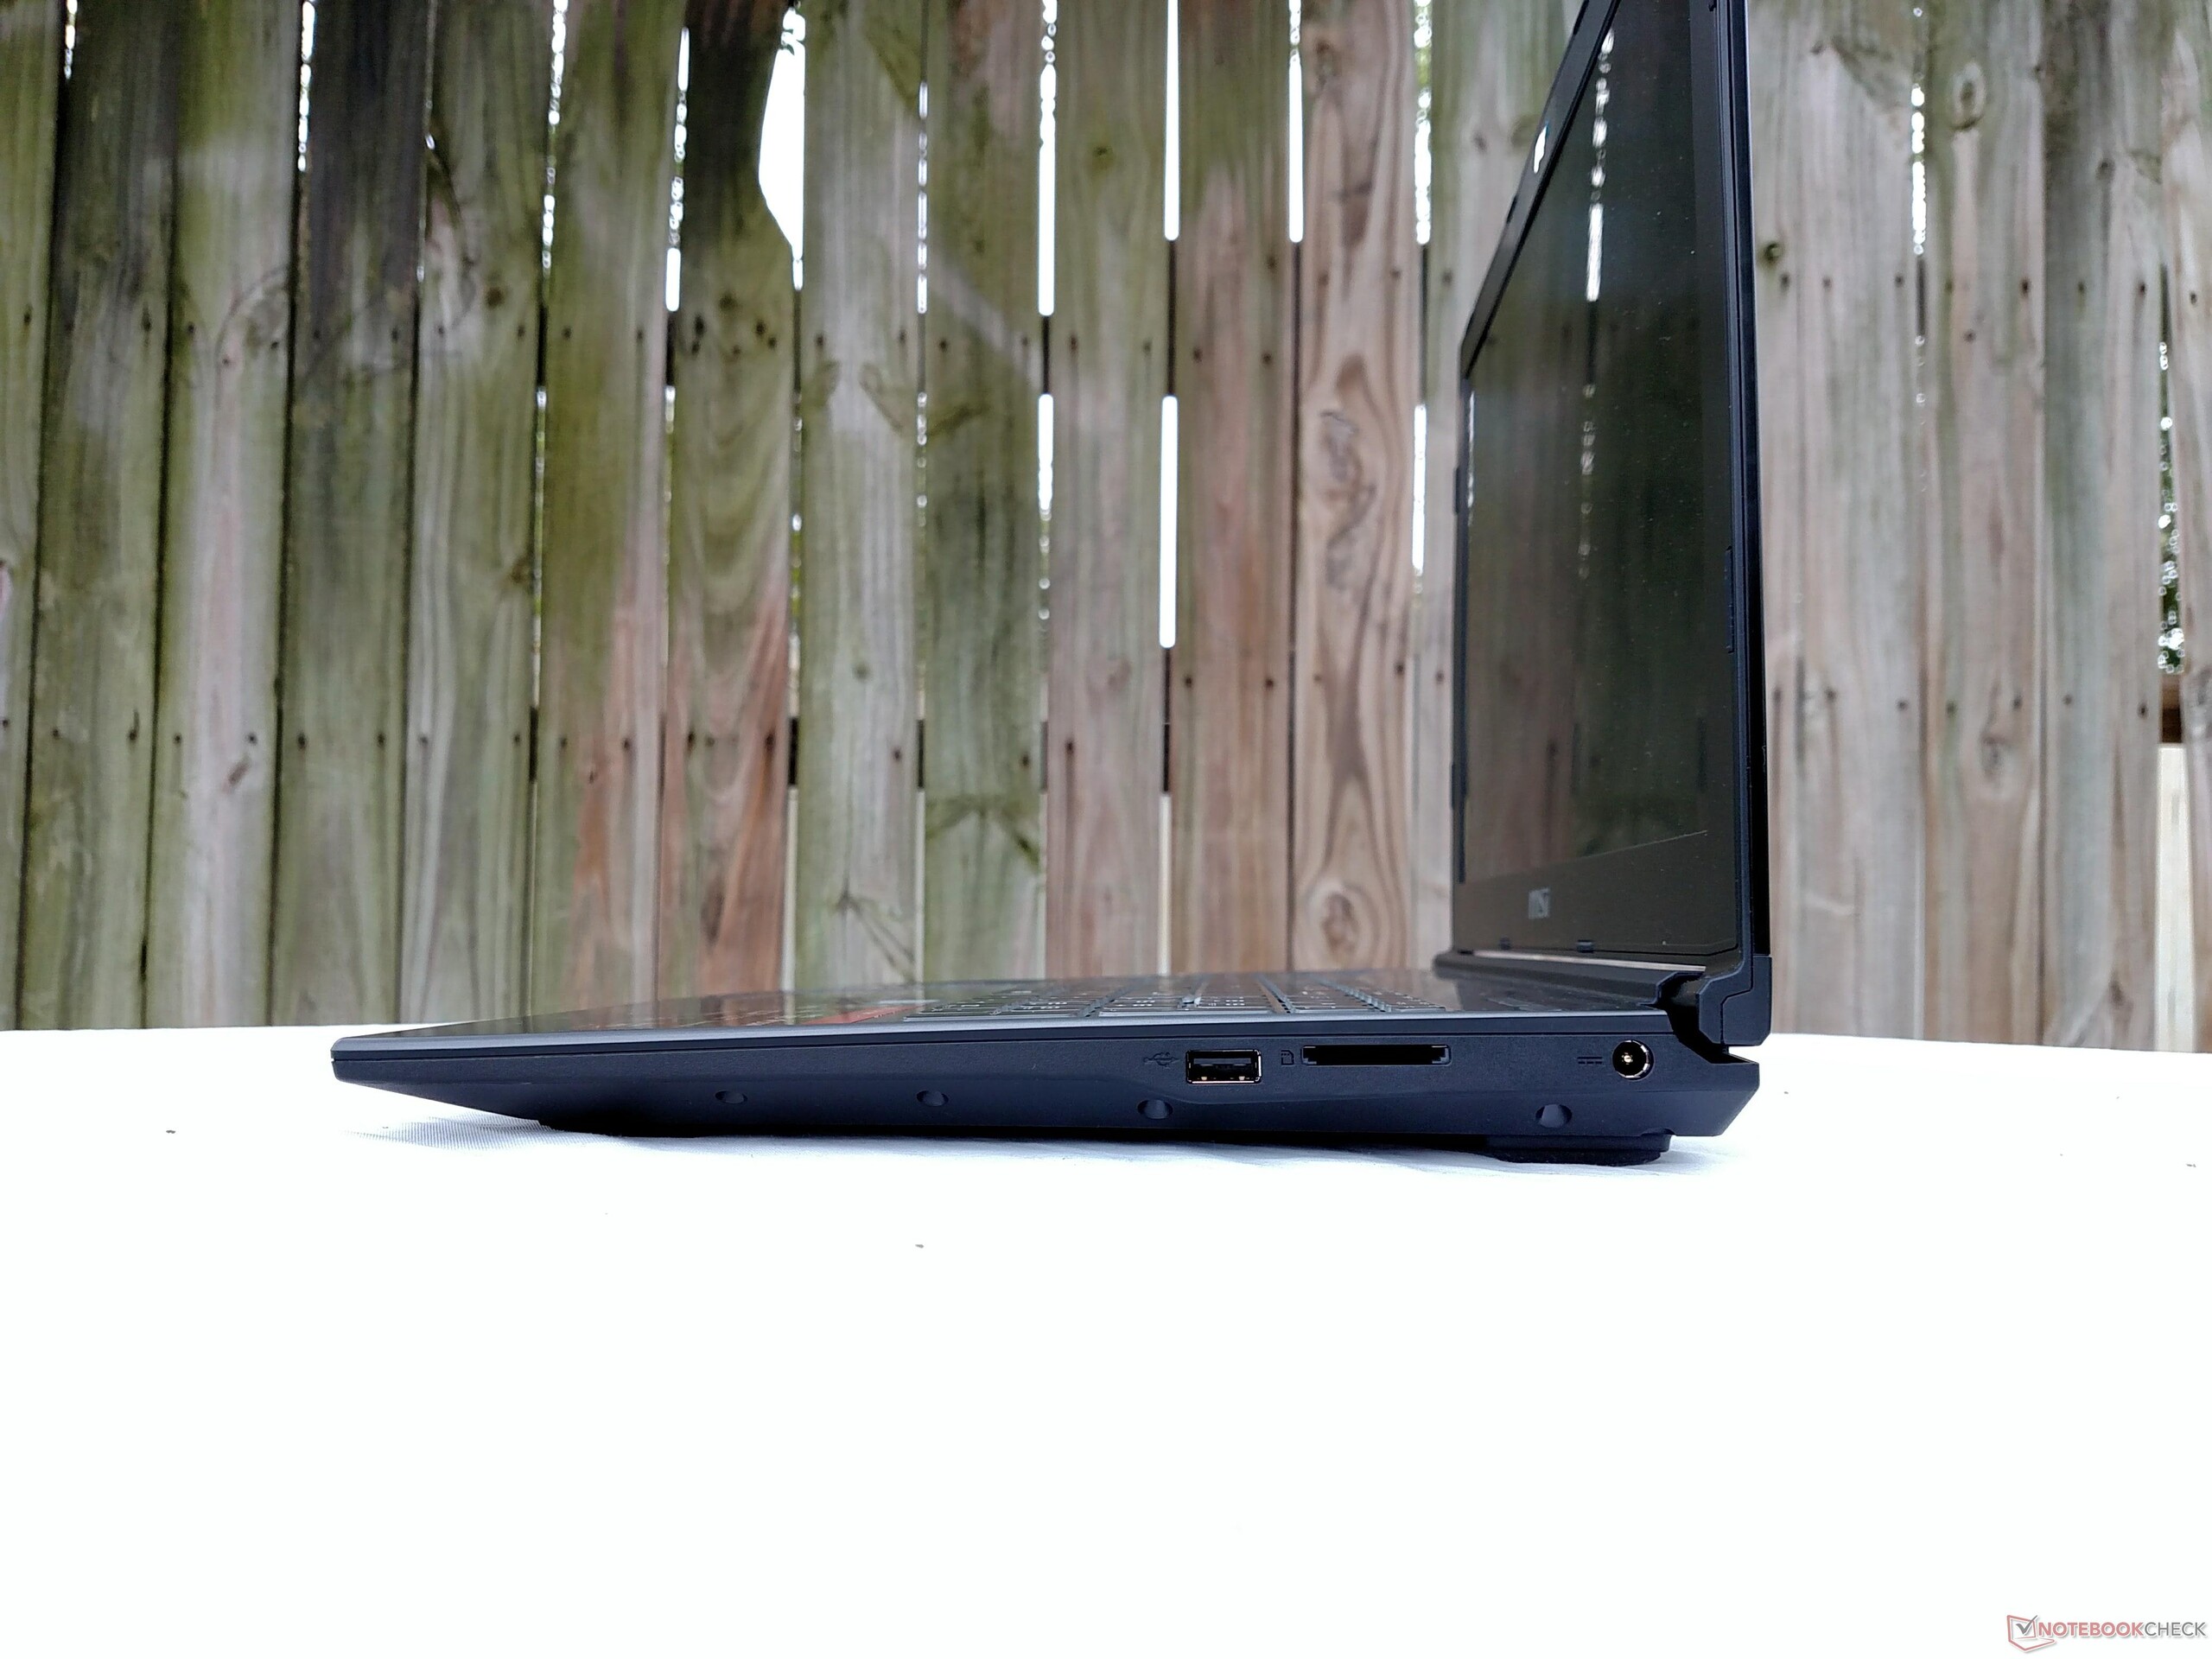
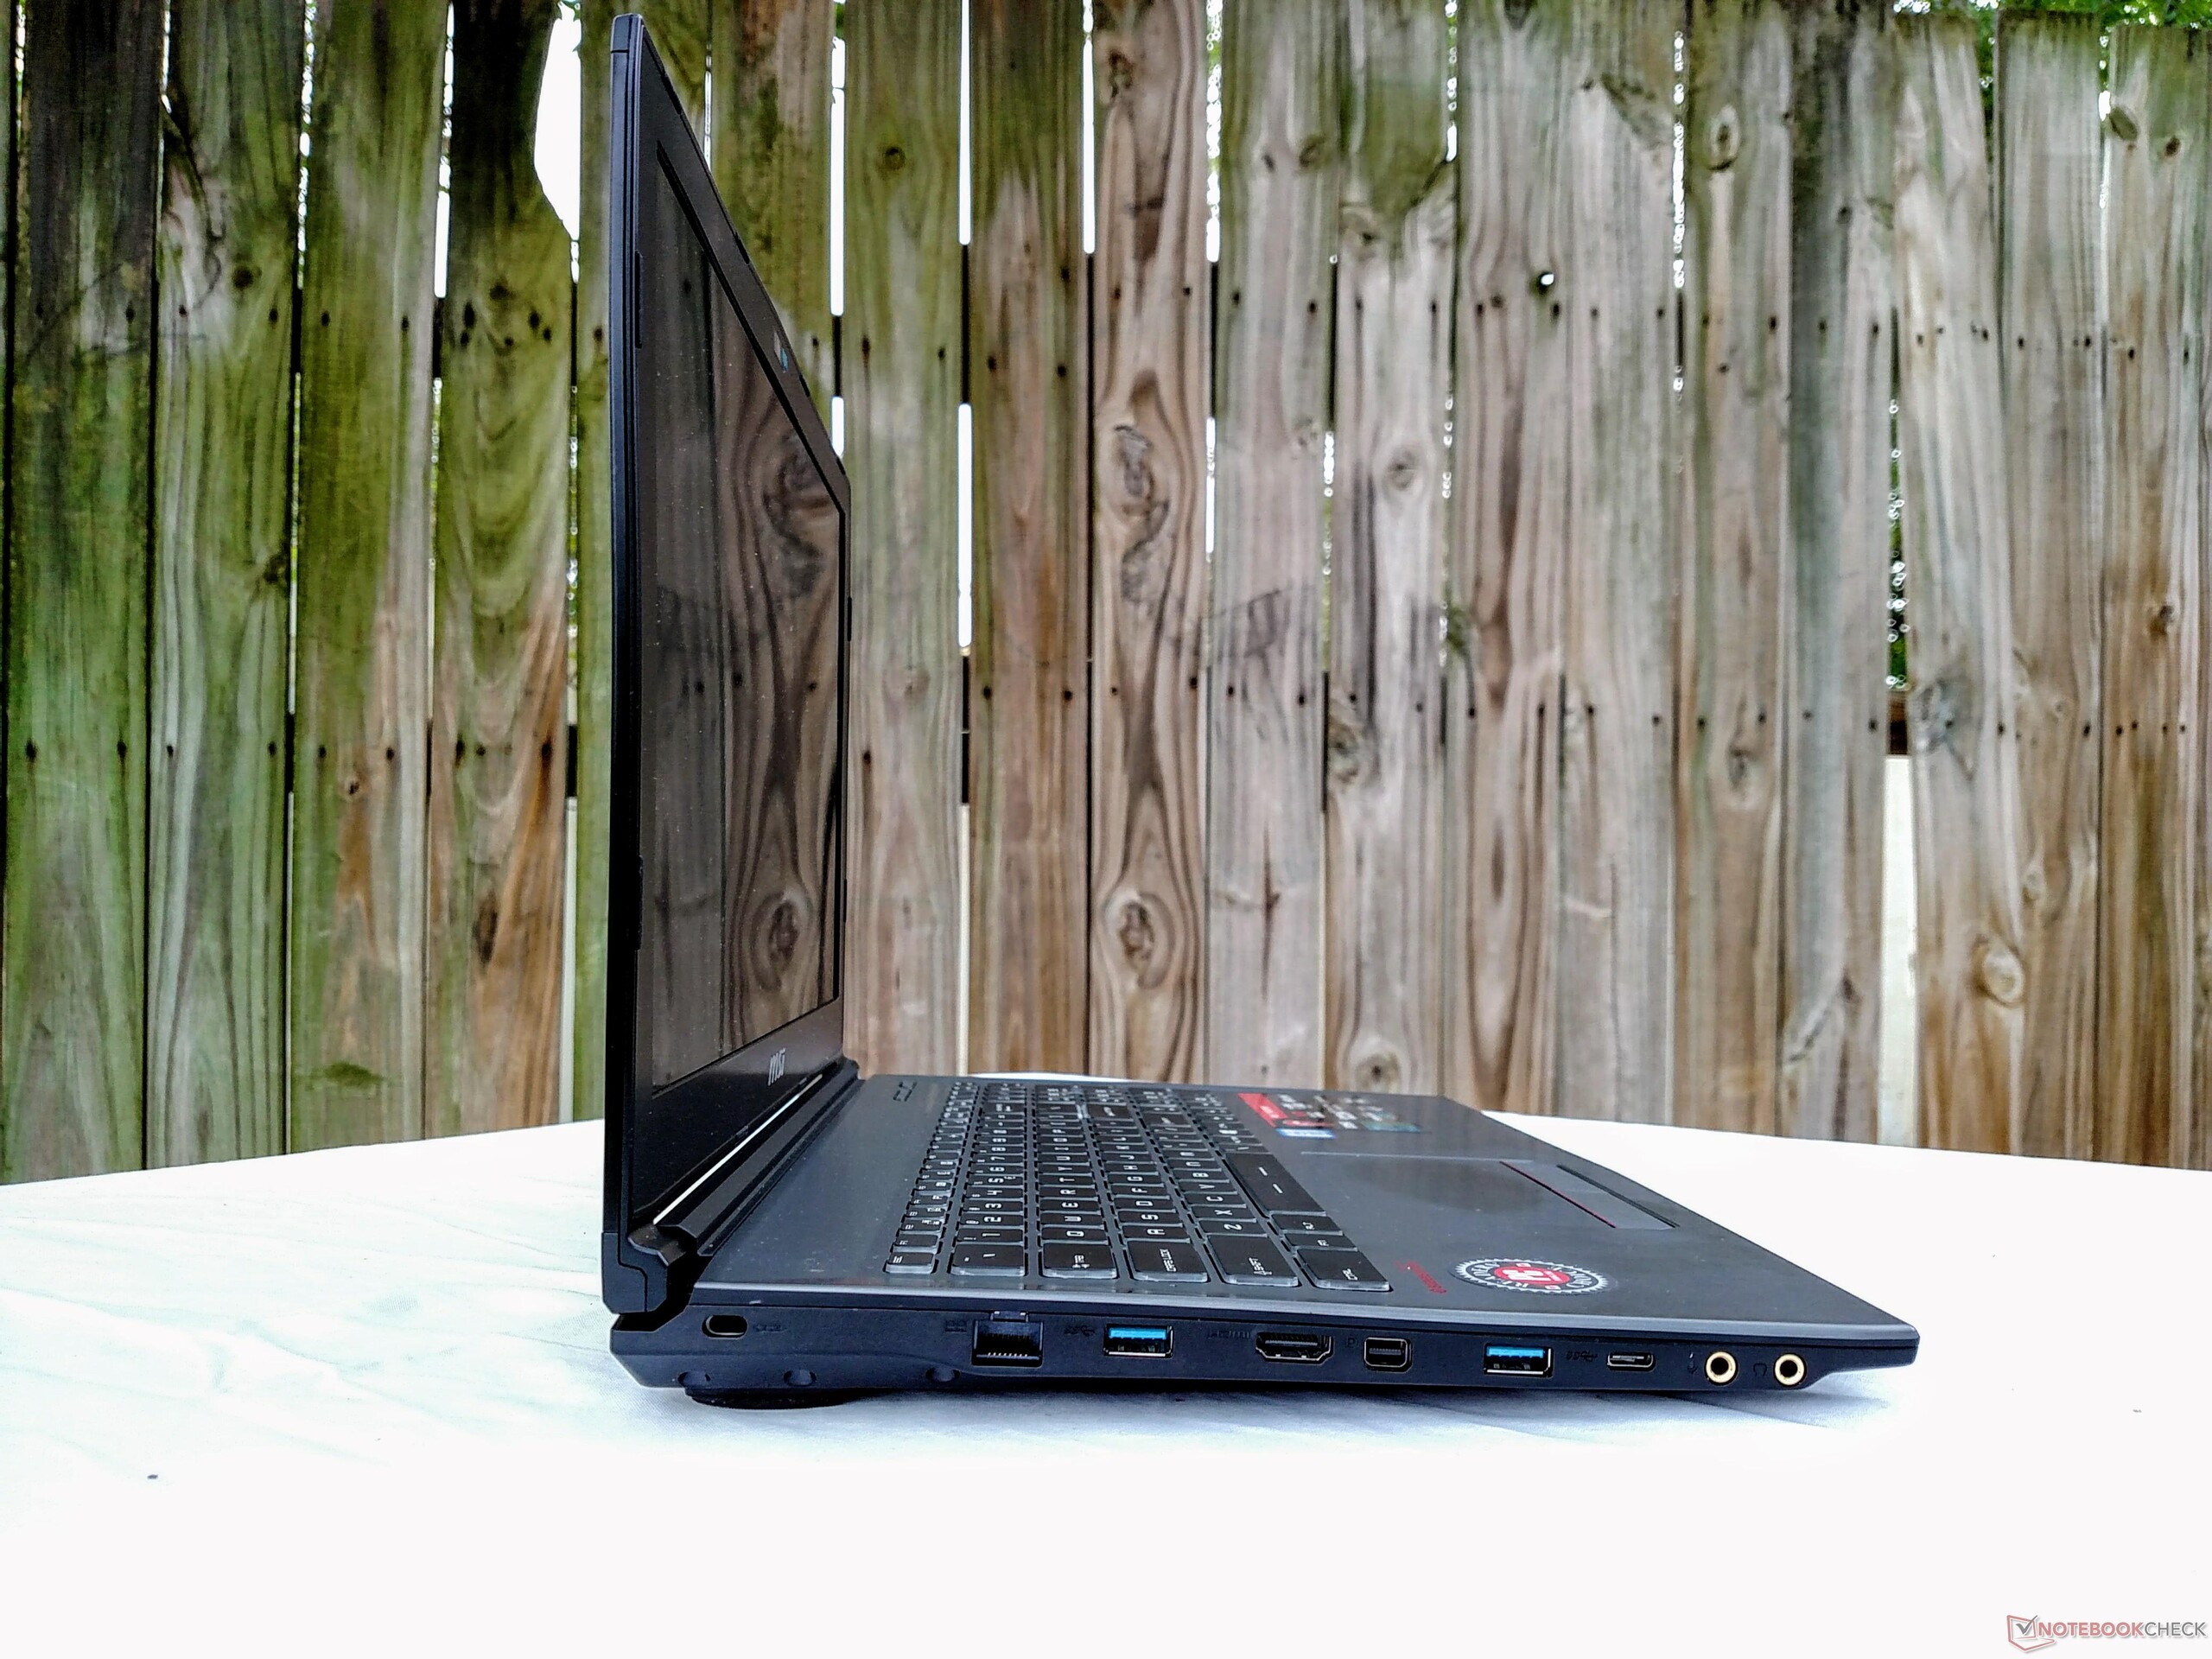
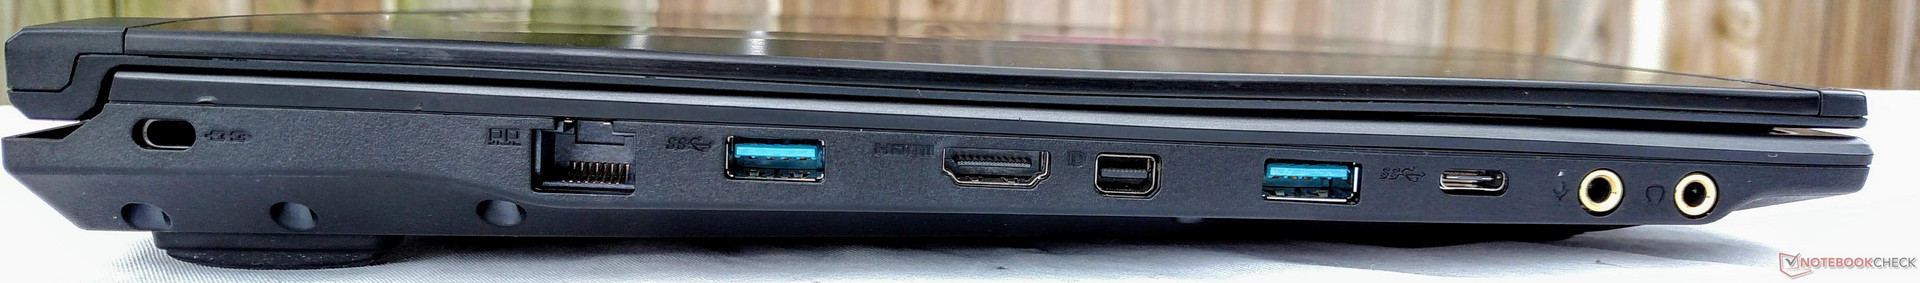
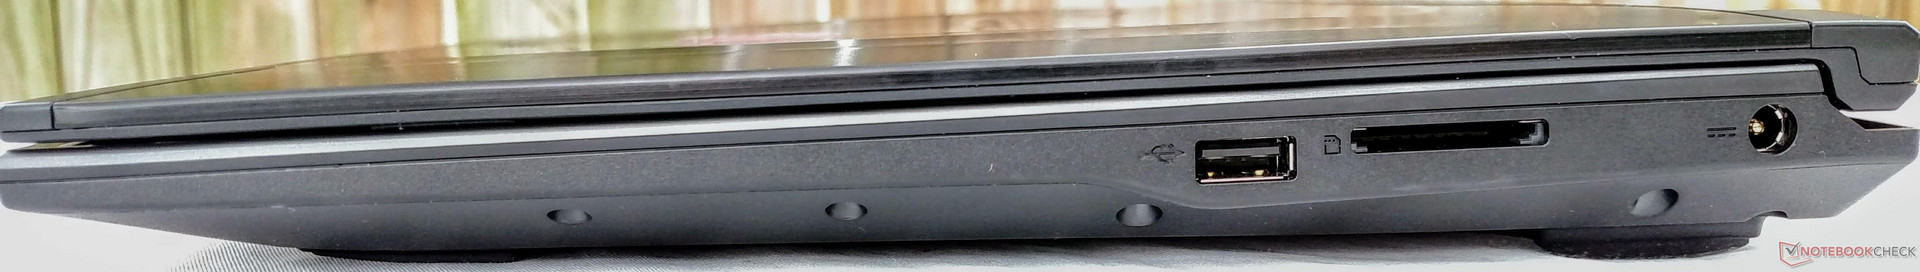
The GF62VR features a good mix of ports that should satisfy most gamers' peripheral needs. There are two USB 3.0 ports, a single USB 2.0 port, HDMI 1.4, and mini DisplayPort 1.2. A single USB 3.1 Type-C port is present, but it sadly lacks Thunderbolt 3 support. While not unexpected given the price point, Thunderbolt connectivity could have gone a long way in setting the device apart, but would inevitably add to the cost. On the plus side, the dedicated 3.5 mm audio out jack support HiFi headsets via an integrated DAC, which is good news for audiophiles.
SD Card Reader
Using our Toshiba Exceria Pro SDXC 64 GB UHS-II Reference-Card, we measure disappointing SD Card speeds. The reader transfers files at about 26.2 MB/s, which is far below the industry average (roughly 75-85 MB/s). Unfortunately, these slow speeds aren't entirely unexpected from a mid-tier MSI device; the company has become somewhat infamous for poor SD card reader performance over the past few years.
| SD Card Reader | |
| average JPG Copy Test (av. of 3 runs) | |
| Asus Strix GL502VM-DS74 | |
| Gigabyte Aero 15 | |
| Schenker XMG A517 | |
| HP Omen 15-ce002ng | |
| Gigabyte P55W v7 | |
| MSI GF62VR 7RF-877 | |
| MSI GE62VR 6RF-001US | |
| maximum AS SSD Seq Read Test (1GB) | |
| Asus Strix GL502VM-DS74 | |
| Gigabyte Aero 15 | |
| Gigabyte P55W v7 | |
| Schenker XMG A517 | |
| HP Omen 15-ce002ng | |
| MSI GF62VR 7RF-877 | |
| MSI GE62VR 6RF-001US | |
Communication
WiFi speeds are respectable and connections are solid and reliable. Transmit and receive speeds sit at 559 and 657 MBit/s, respectively, which is in line with the competition. During our testing period, we experience rock steady connections with no dropped signals.
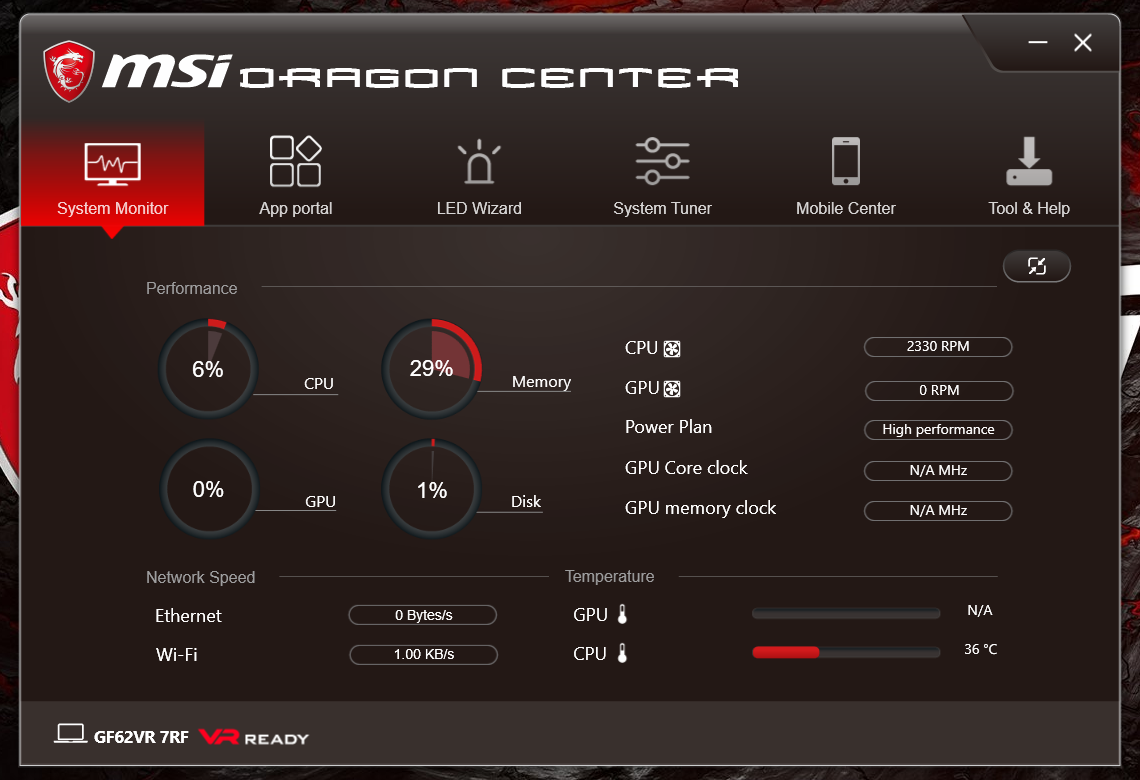
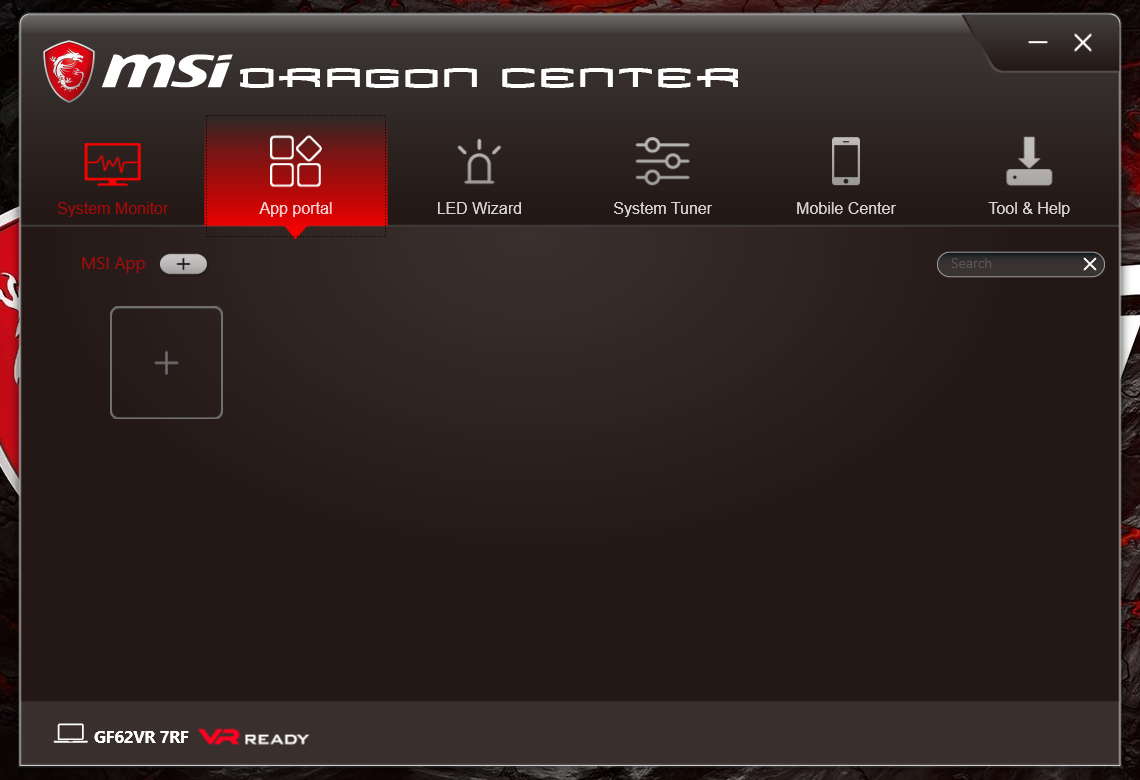
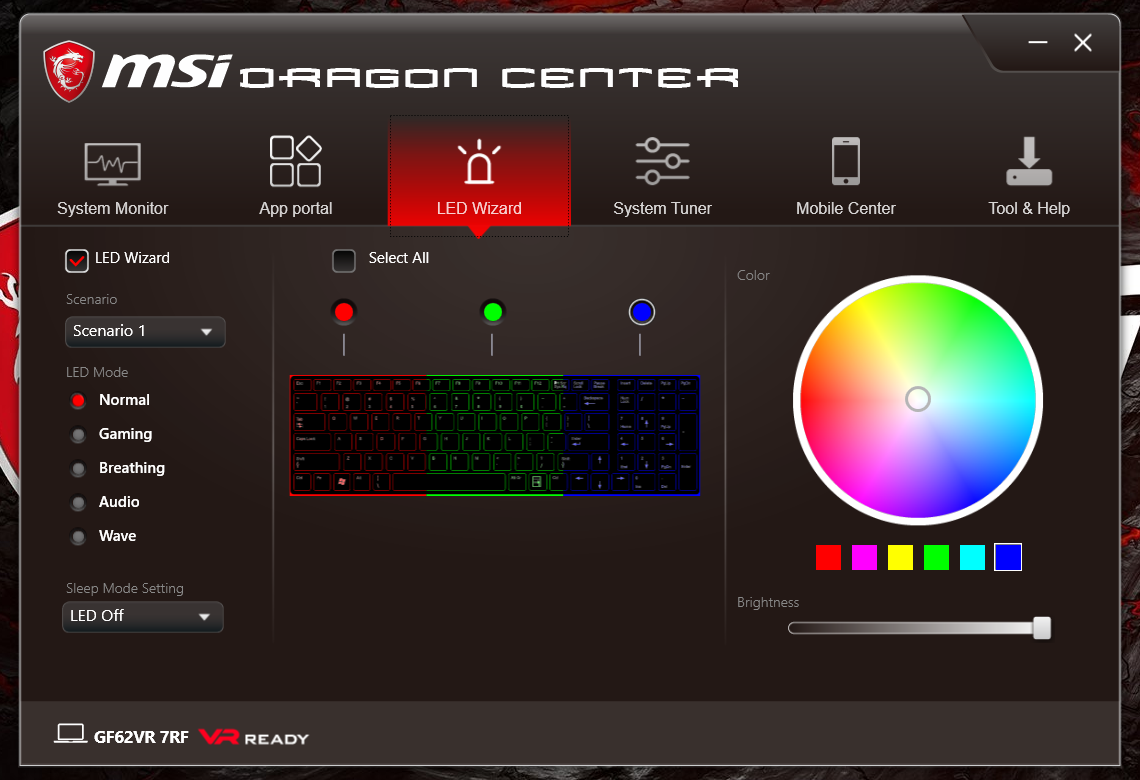
Software
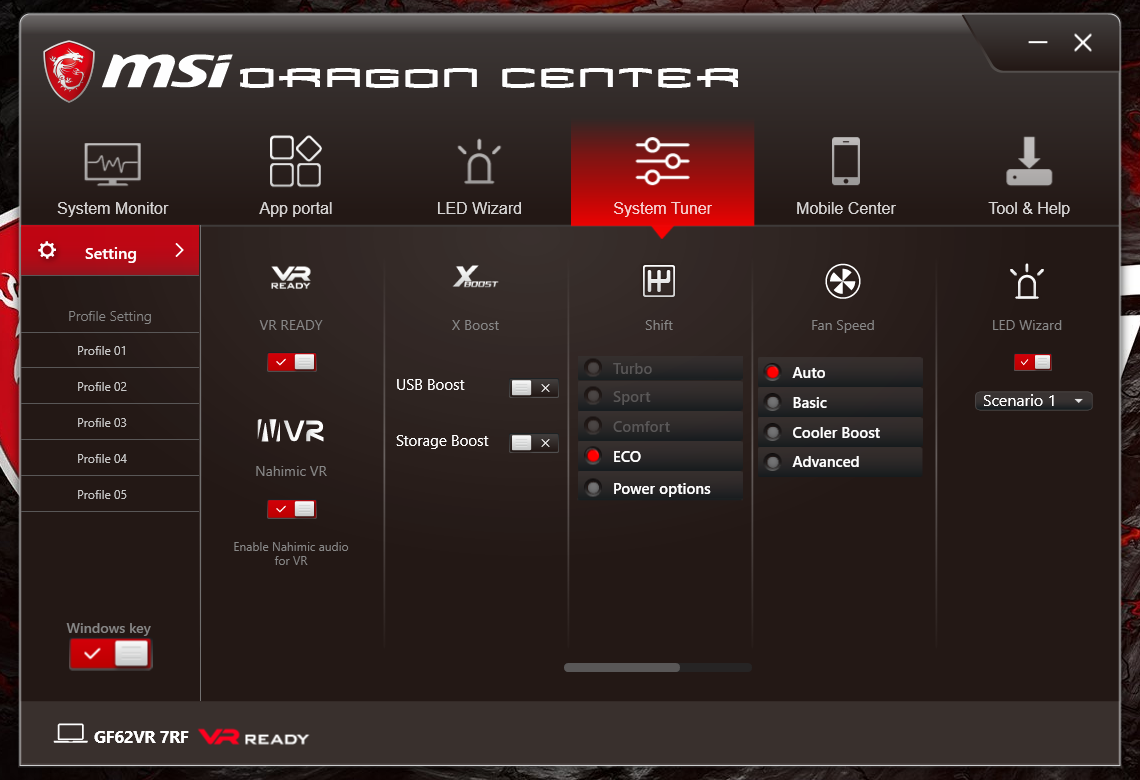
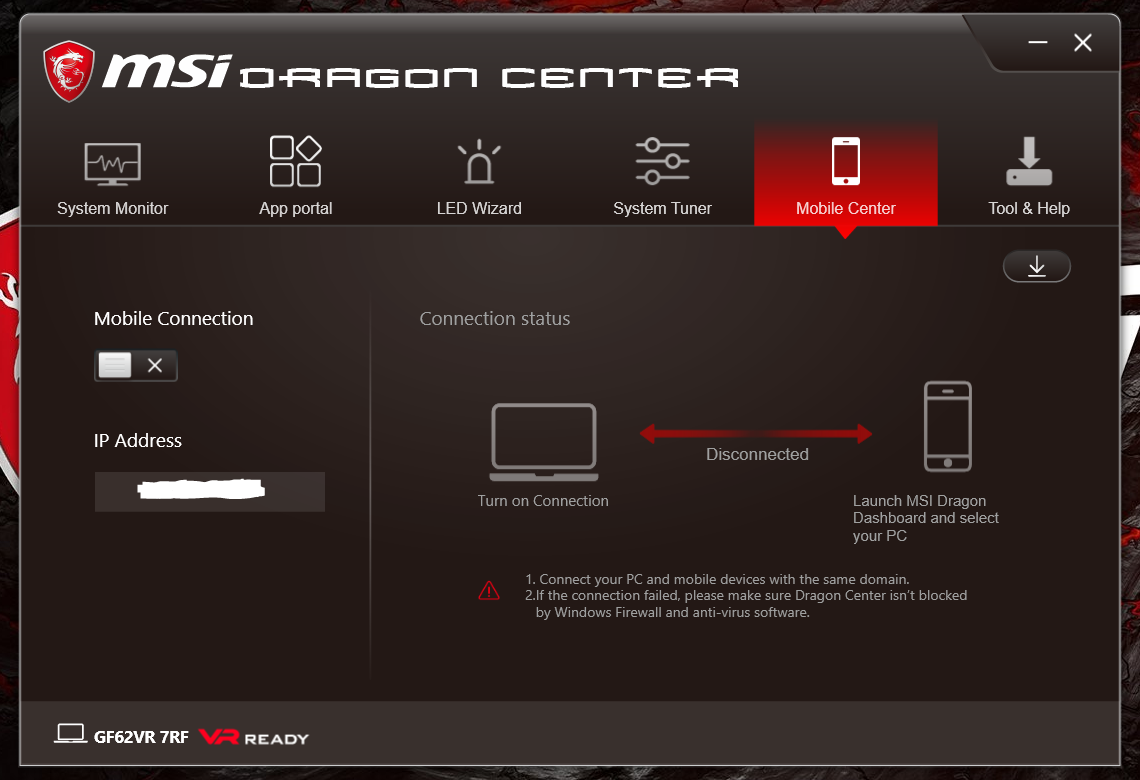
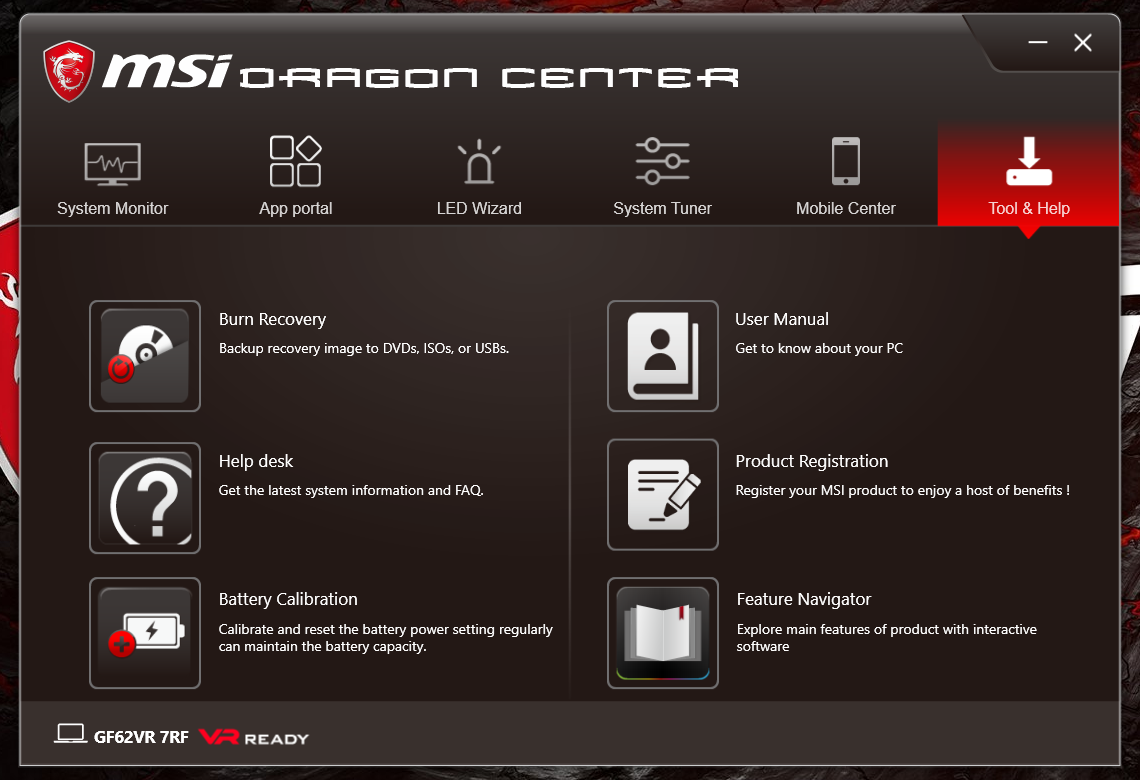
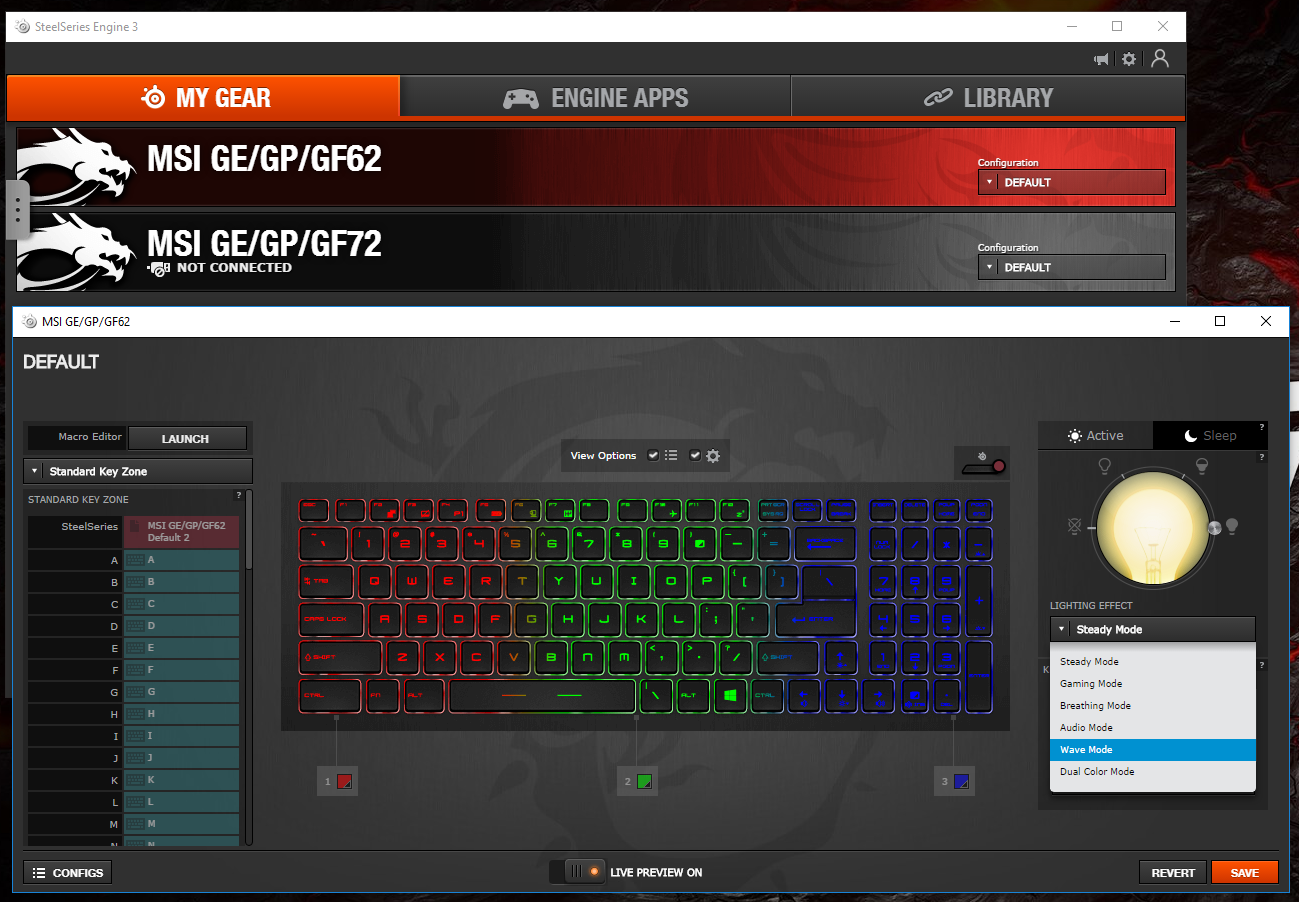
MSI's Dragon Center makes a return, and with it comes a slew of pre-installed software. Most of these are dedicated applications to tweak various pieces of the system, such as the Nahimic suite for fine-tuning sound profiles. Unfortunately, most of this software is redundant. For example, both the LED Wizard and SteelSeries Engine 3 applications can be used to set the color and effects of the three RGB-backlit zones in the keyboard. Less is usually more, and this is, unfortunately, a lesson MSI has yet to learn.
Maintenance
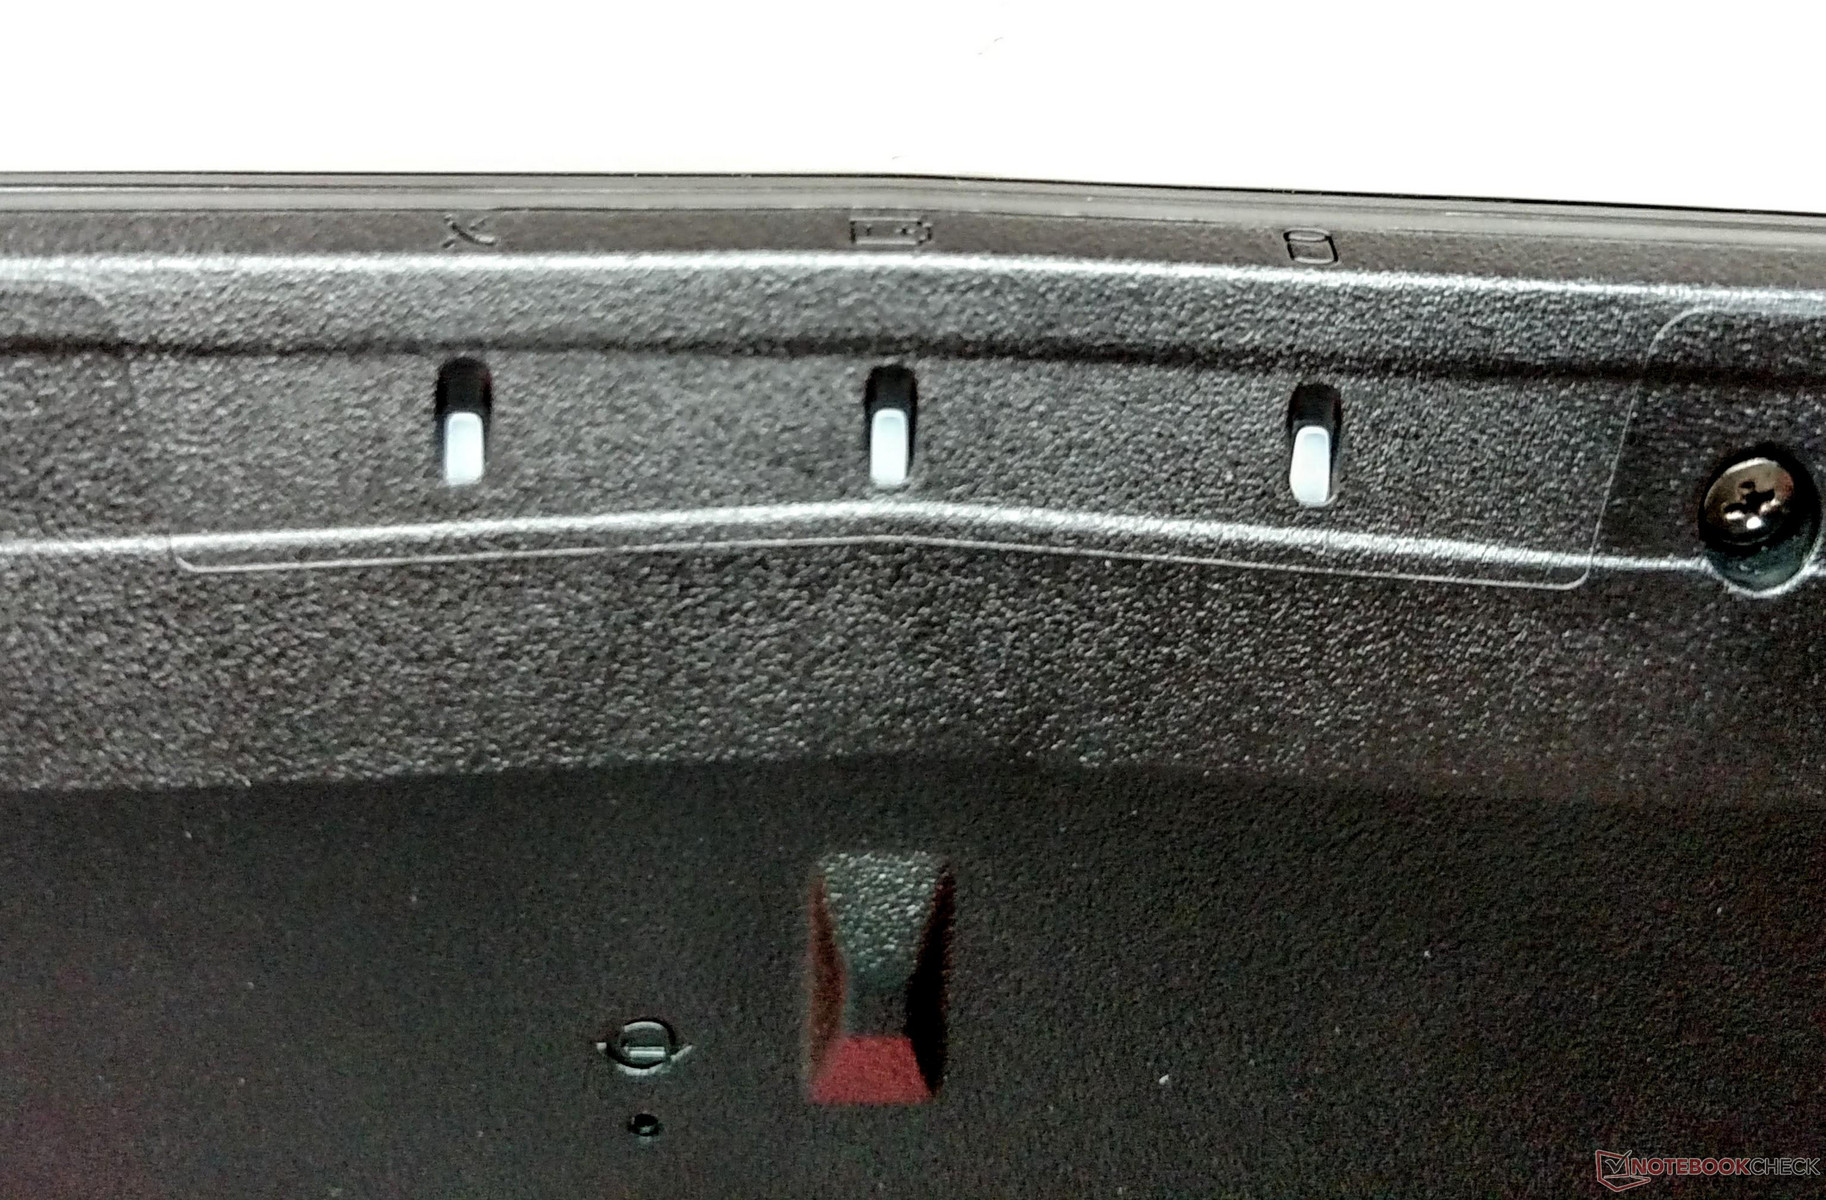
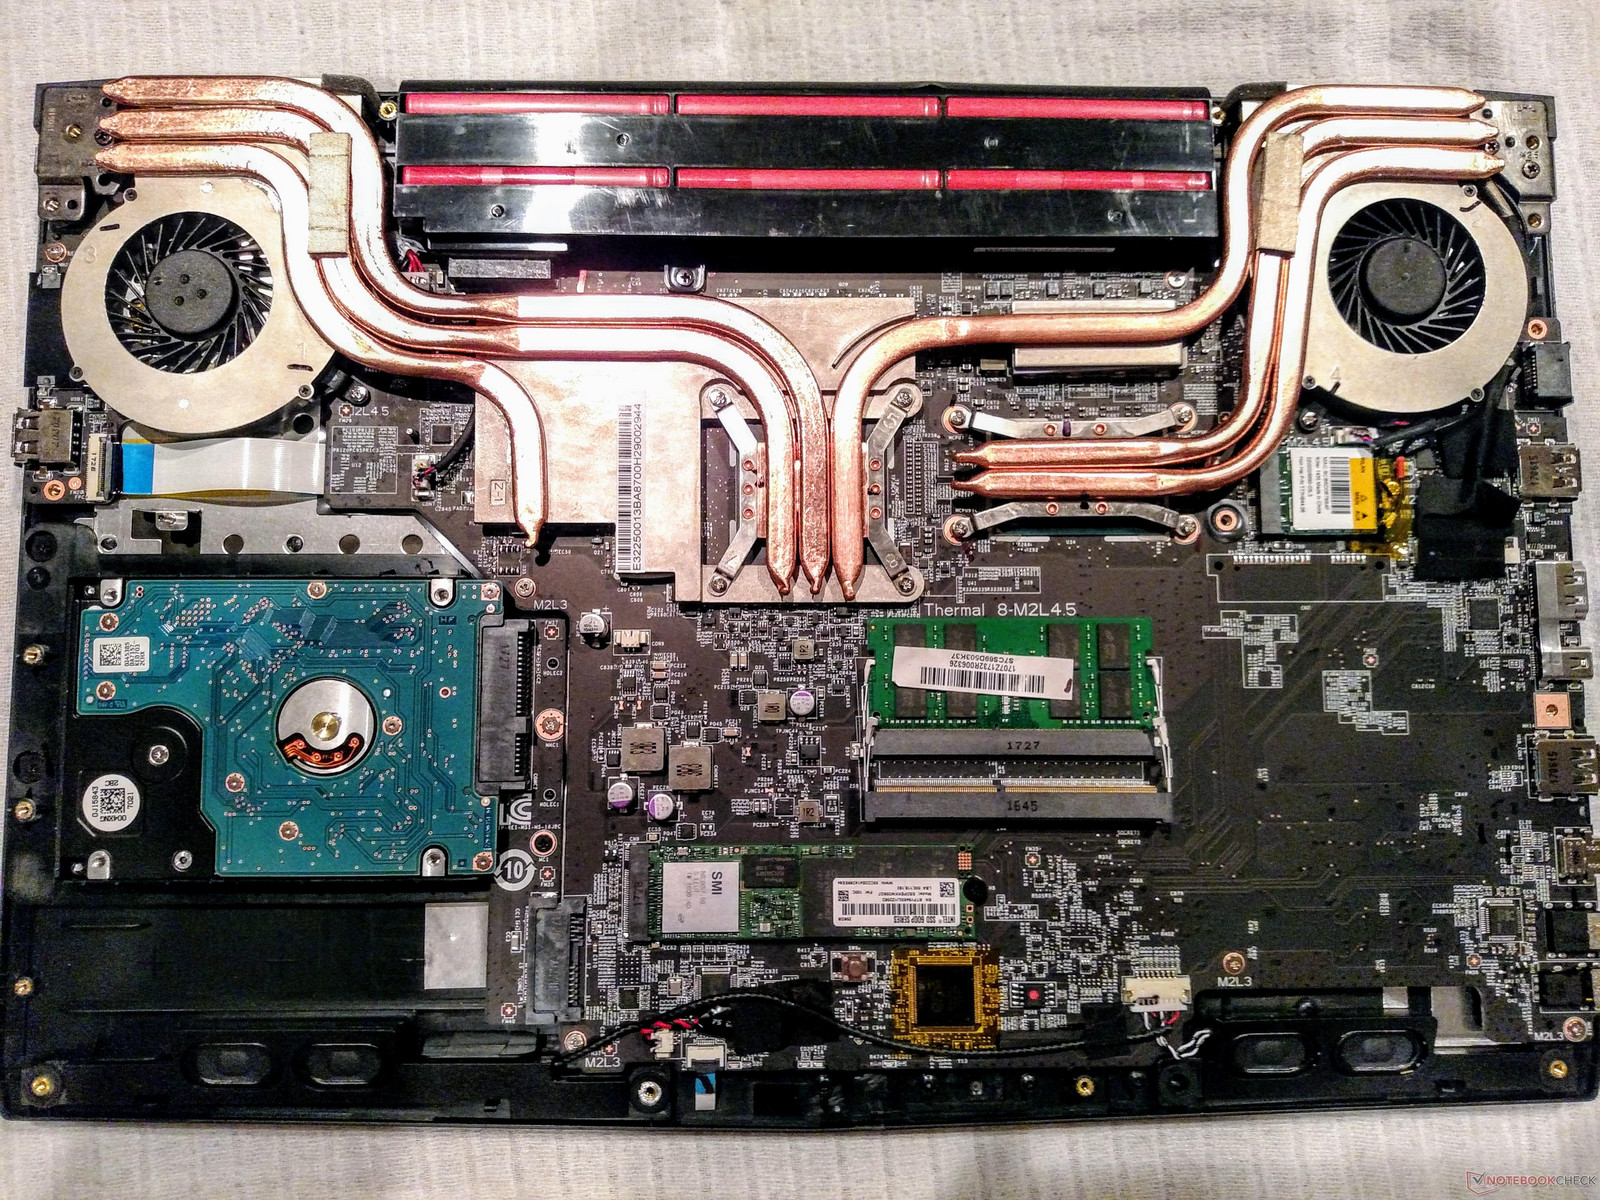
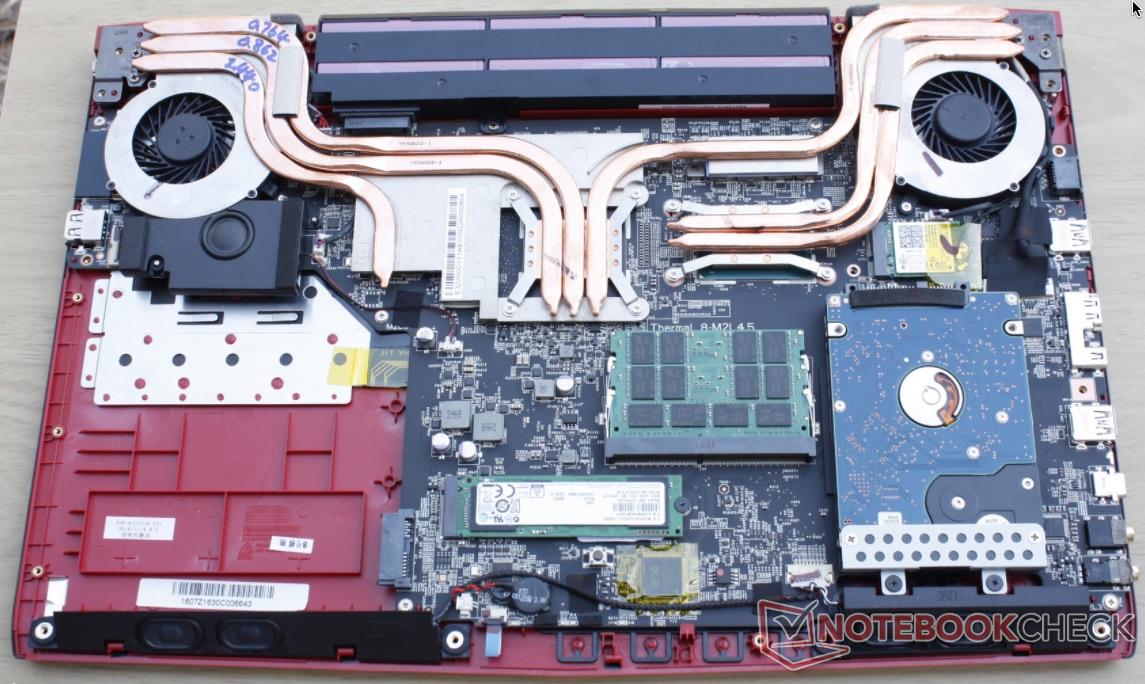
Accessing the internals of the GF62VR is a straightforward but time-consuming process. The bottom panel is secured by 16 #00 Phillips Head screws (one of which is hidden under a "warranty void if broken" sticker) and stubborn plastic clips. The screws are the same size, which makes sorting easy, but the plastic clips will require some work to disengage, so caution should be exercised.
Once inside, users will have ready access to two RAM slots, the 2.5" HDD (which can be swapped for another 7 mm SATA drive), the M.2 PCIe drive, the battery, and the cooling system for the CPU and GPU. The fans and heat pipes can be removed with a bit of extra work should users want to apply new thermal compound. Interestingly, the removal of the optical drive isn't the only design change to the internals; the 2.5" drive has been moved to the right side of the device (left side when accessing the internals). This likely explains why the center of balance of the machine is shifted to the right. We also note the absence of the subwoofer present in the GE62VR.
Warranty
MSI offers a 12-month limited warranty on the GF72VR. This can be voided if the sticker covering one of the screws on the bottom panel is broken. Third-party sellers, such as Computer Upgrade King, typically offer extended warranties of up to 3 years (36 months) for a nominal fee.
Input Devices
Keyboard
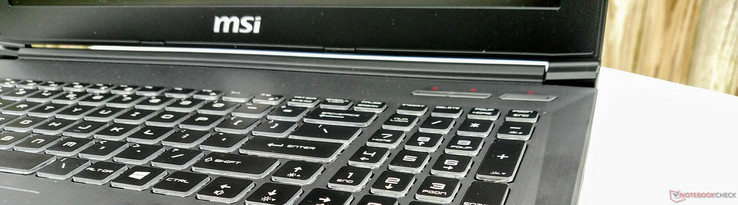
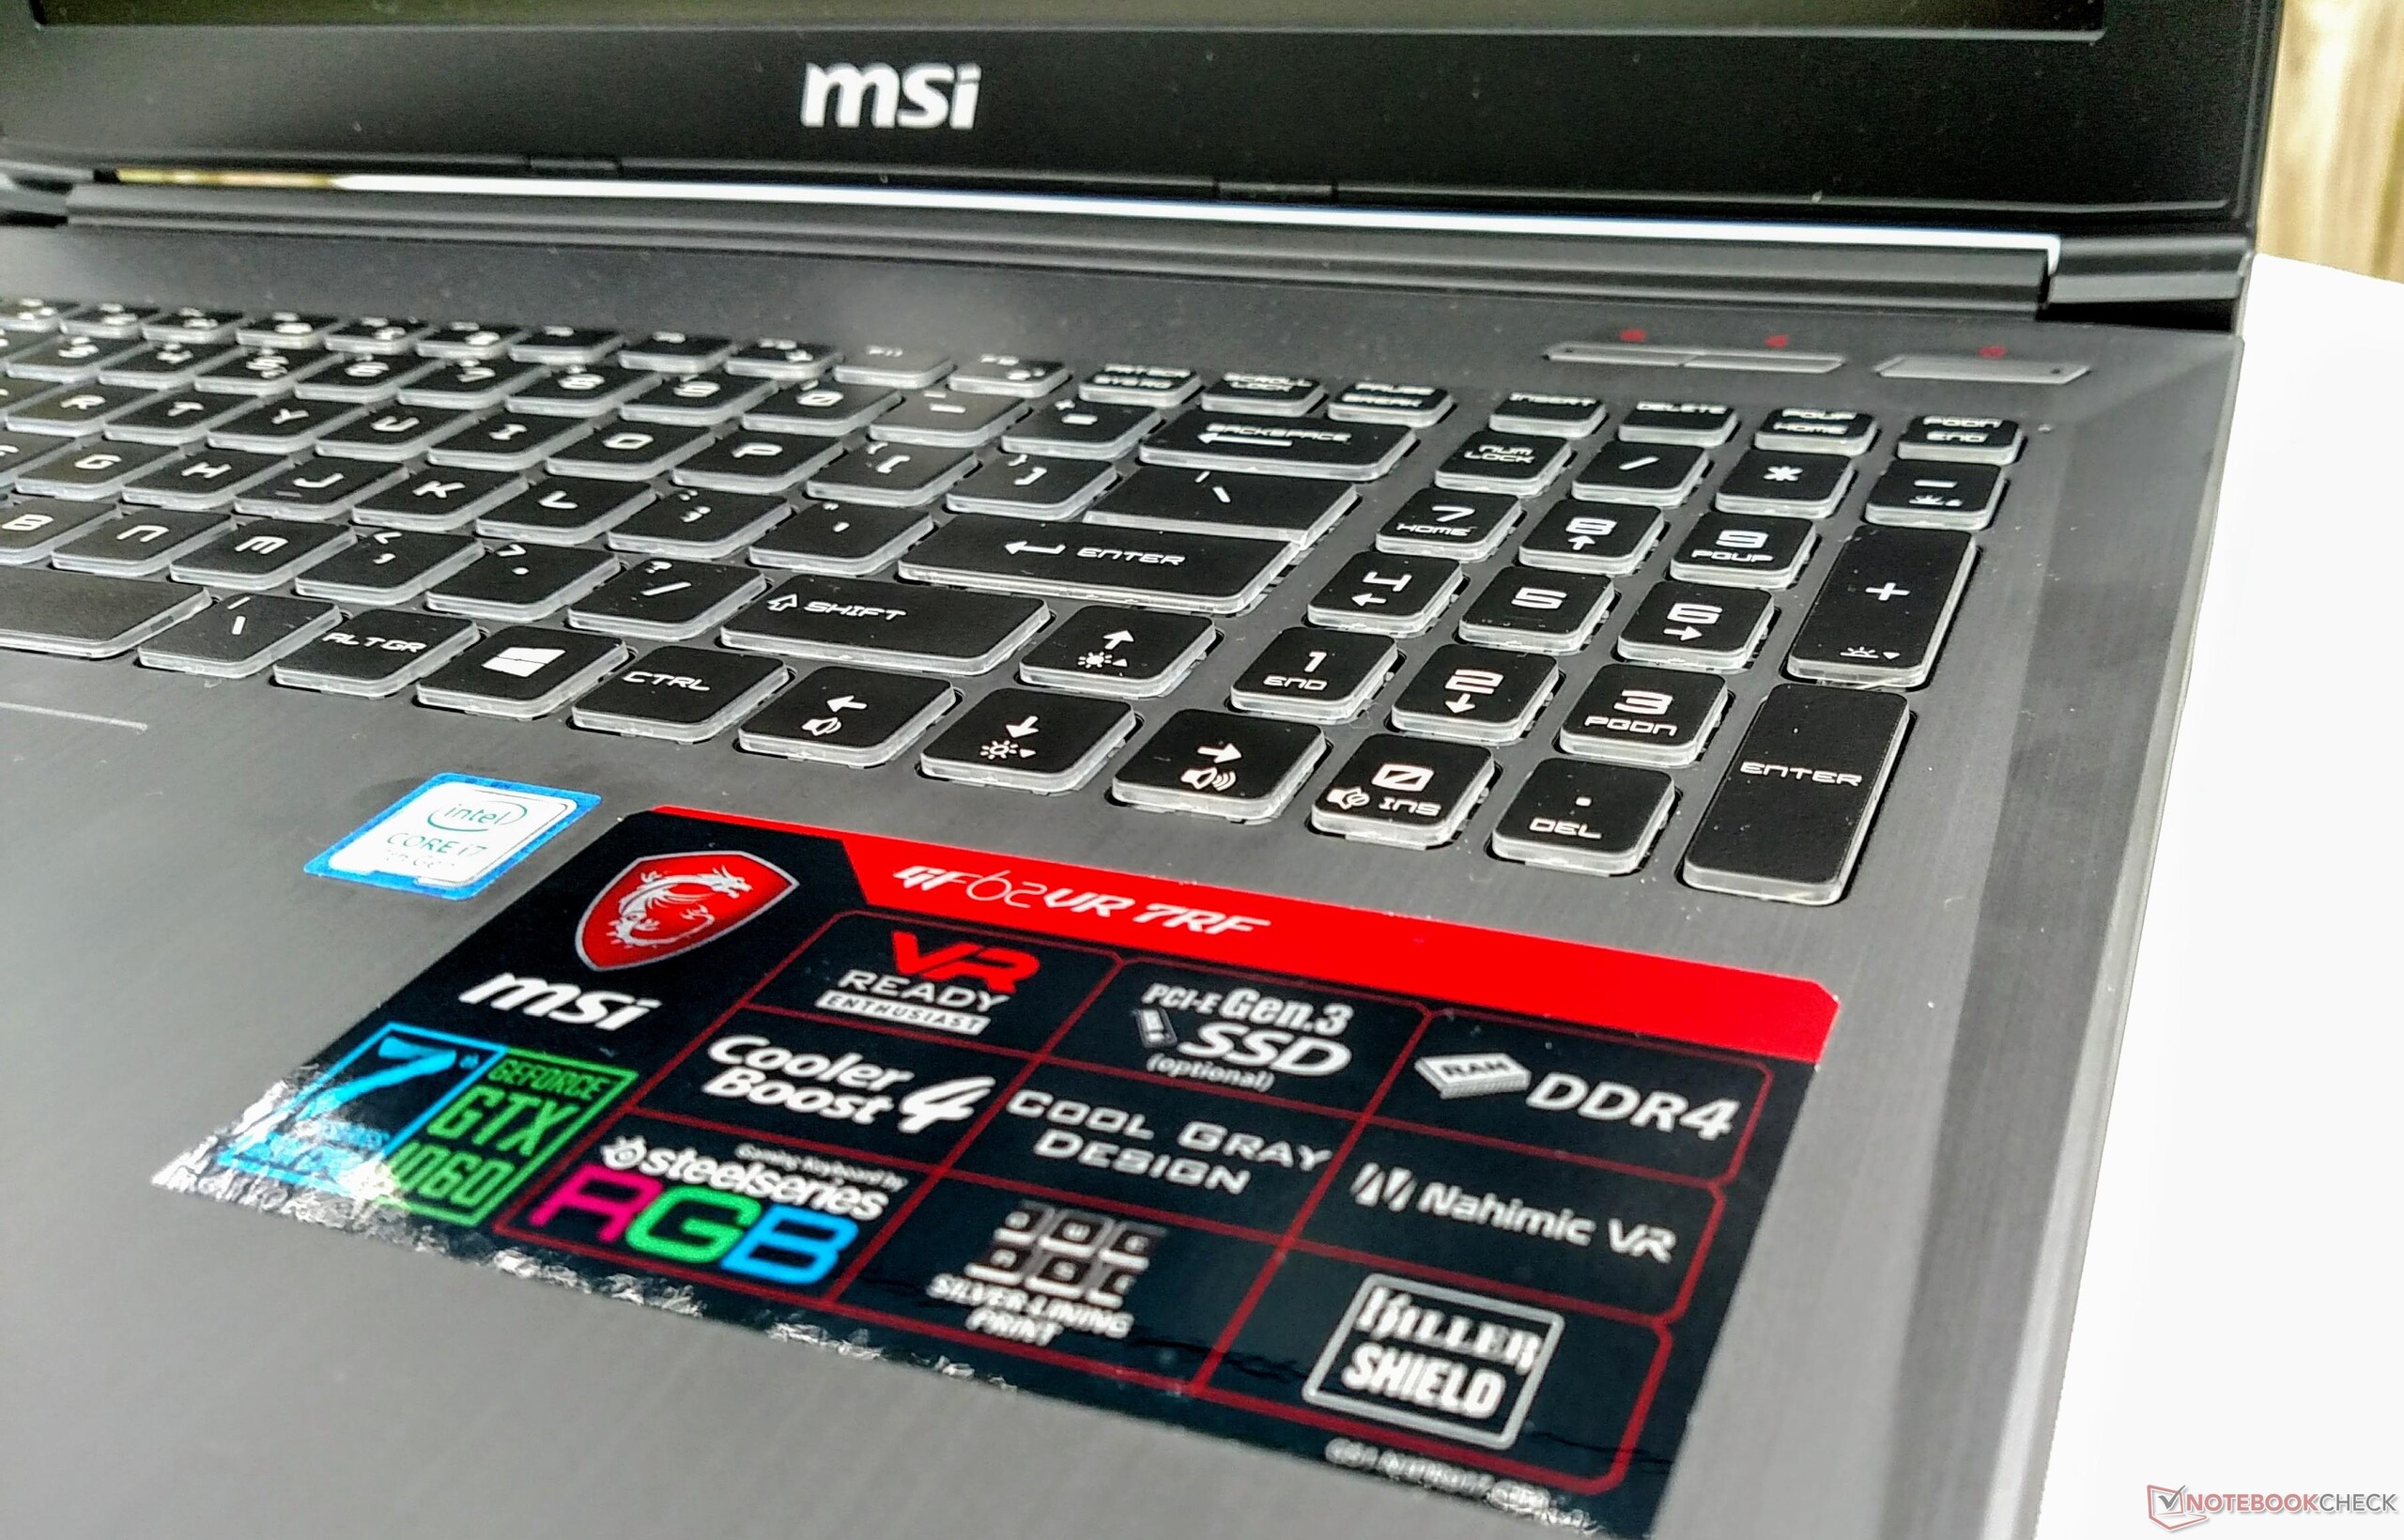
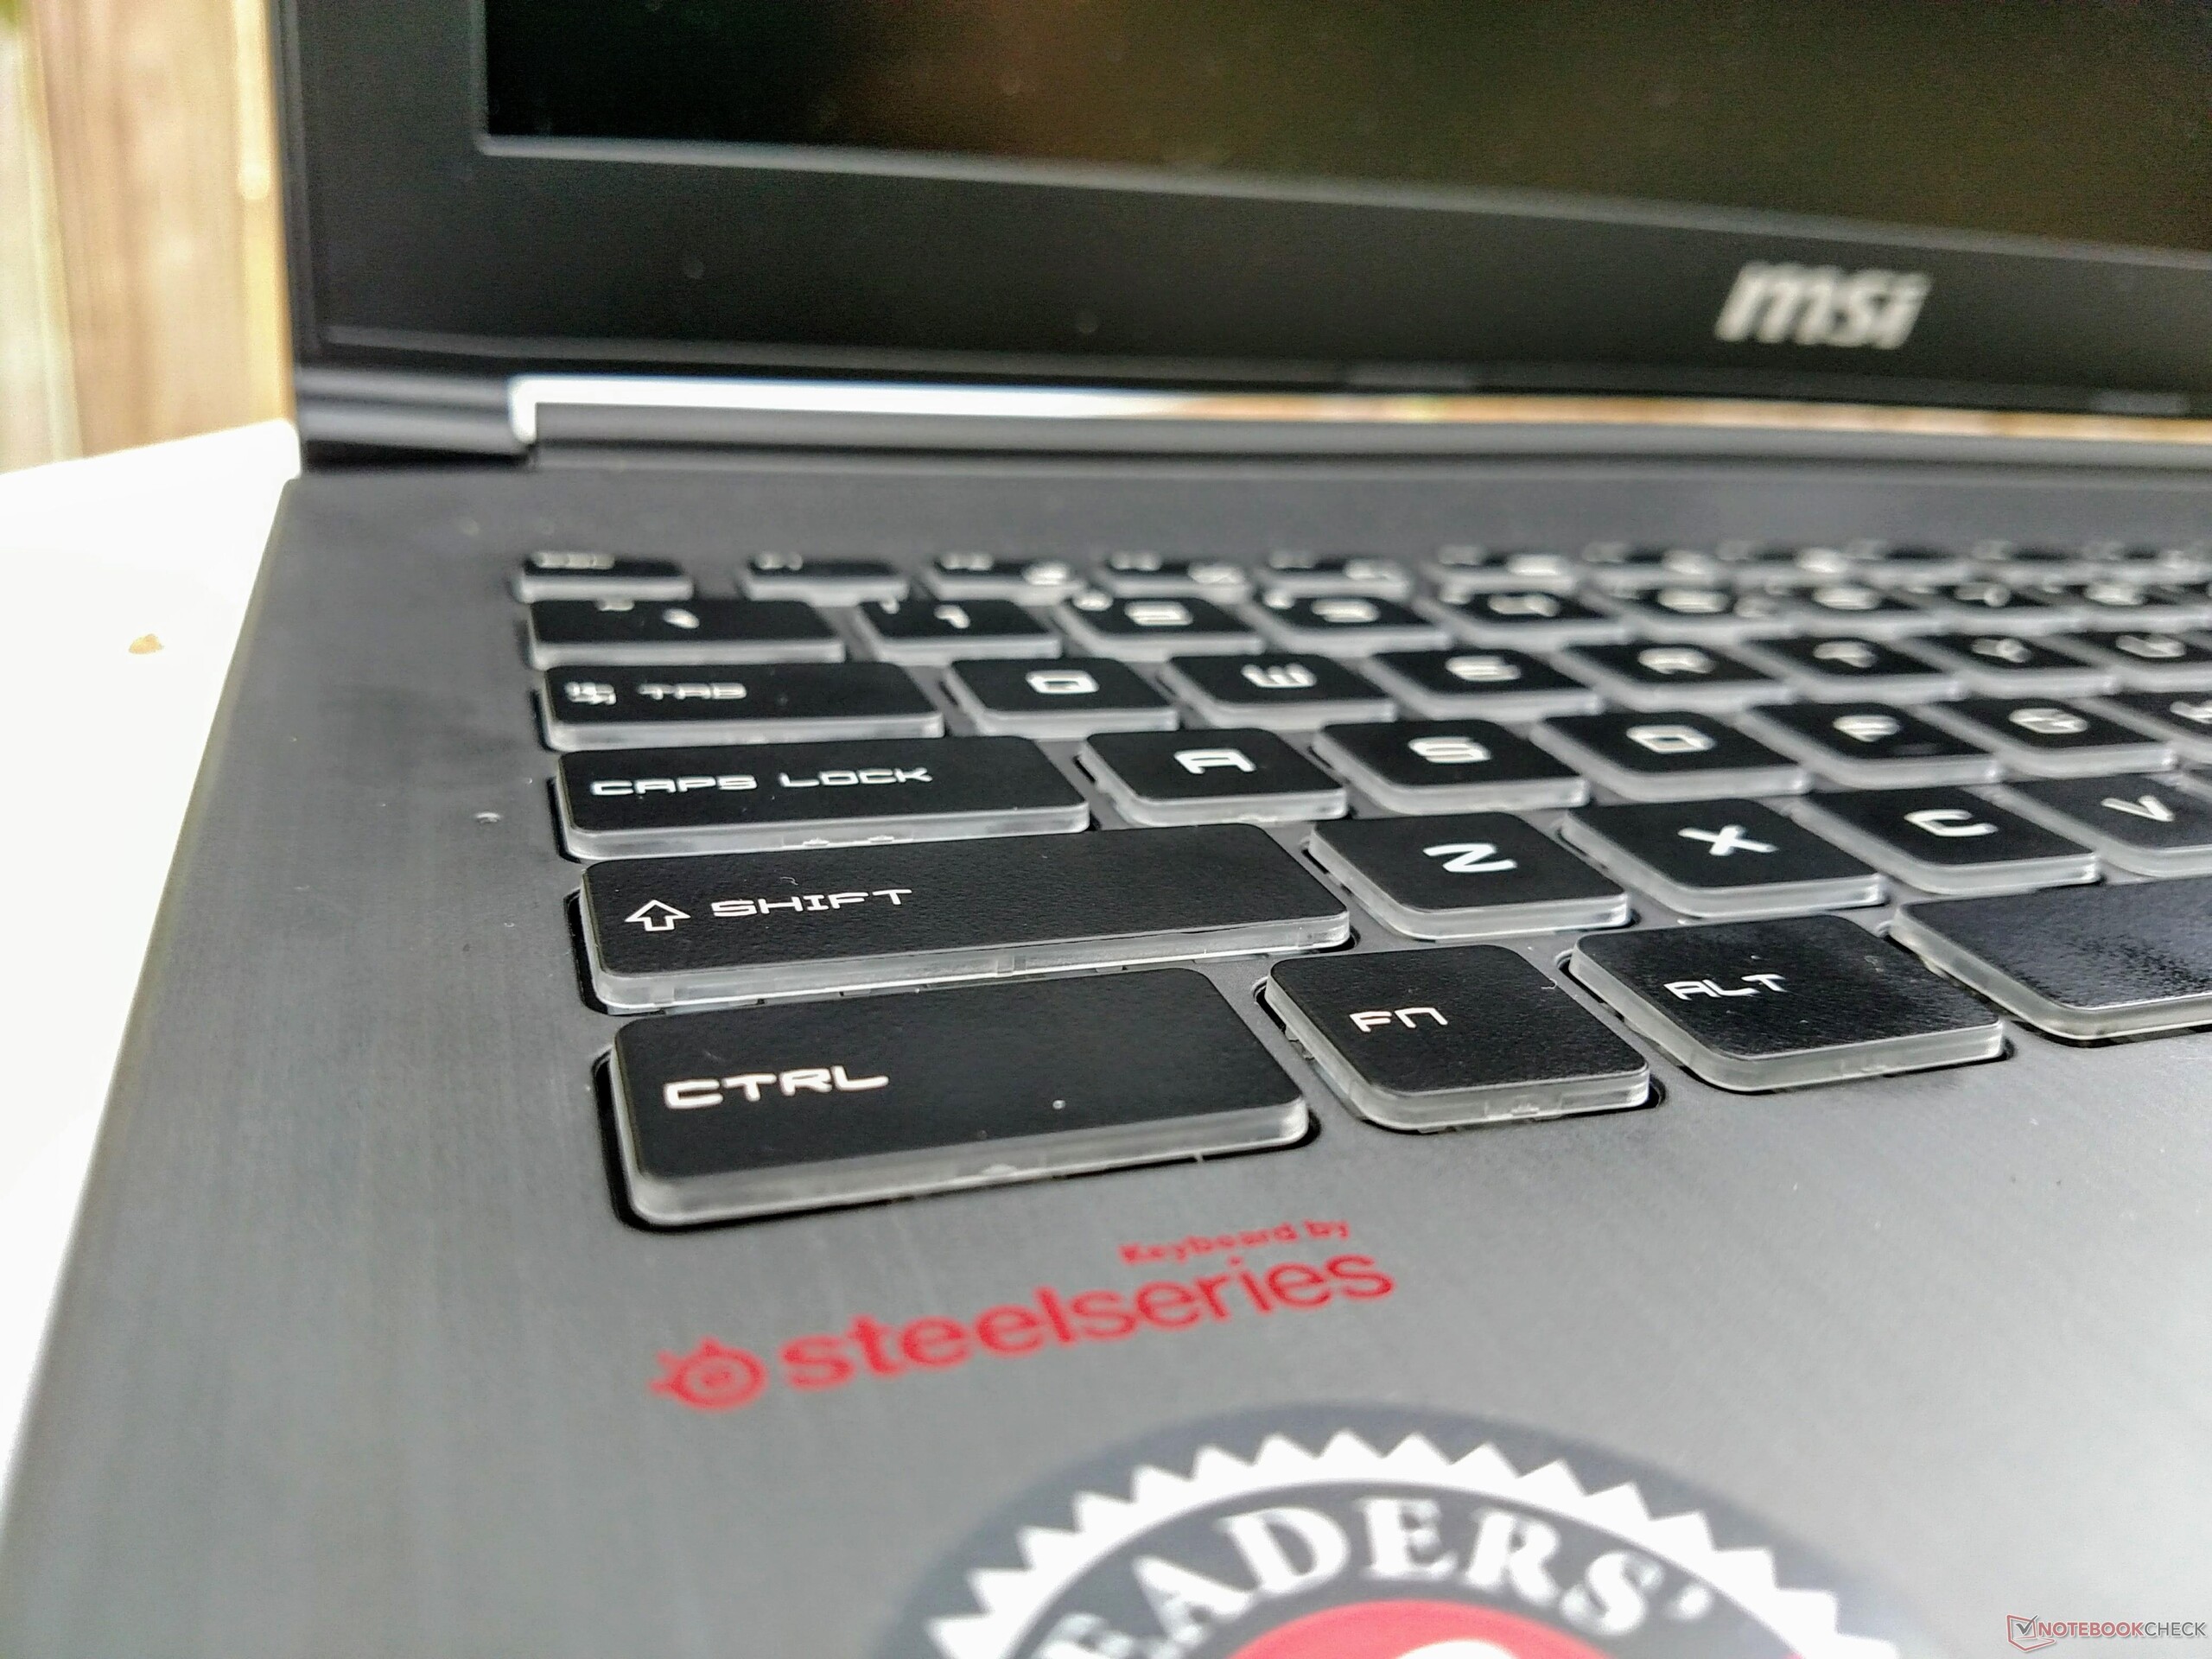
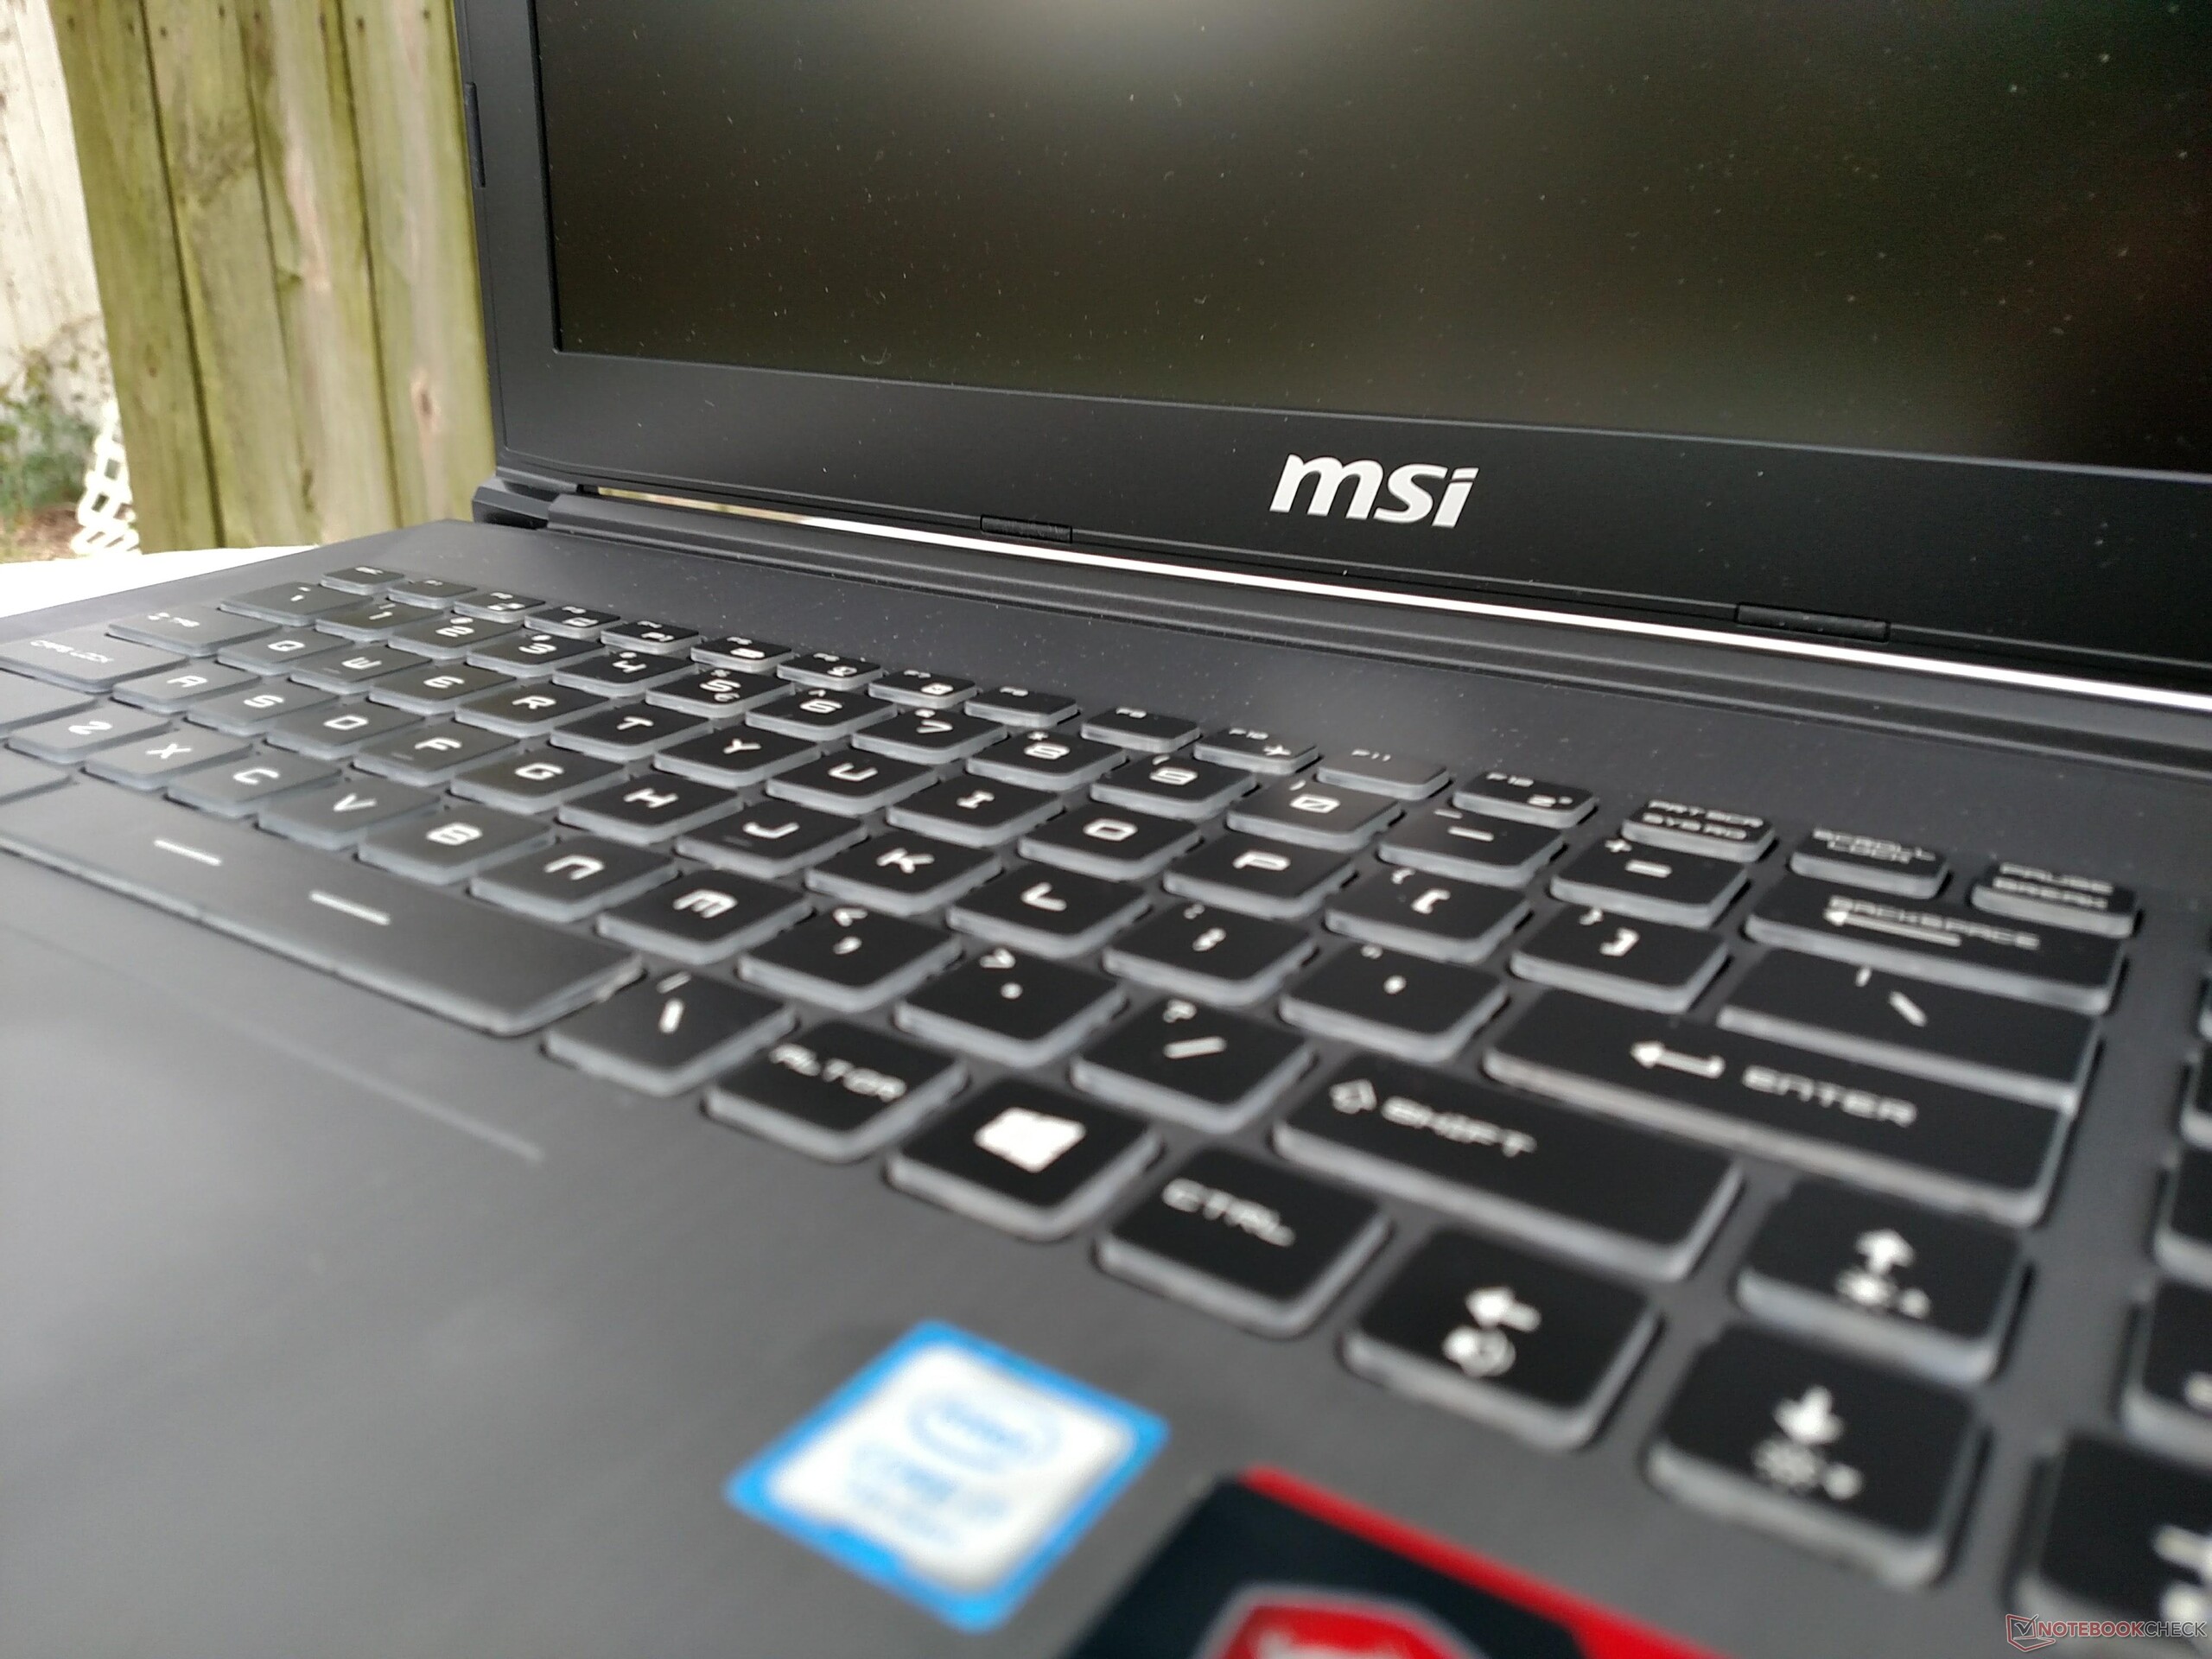
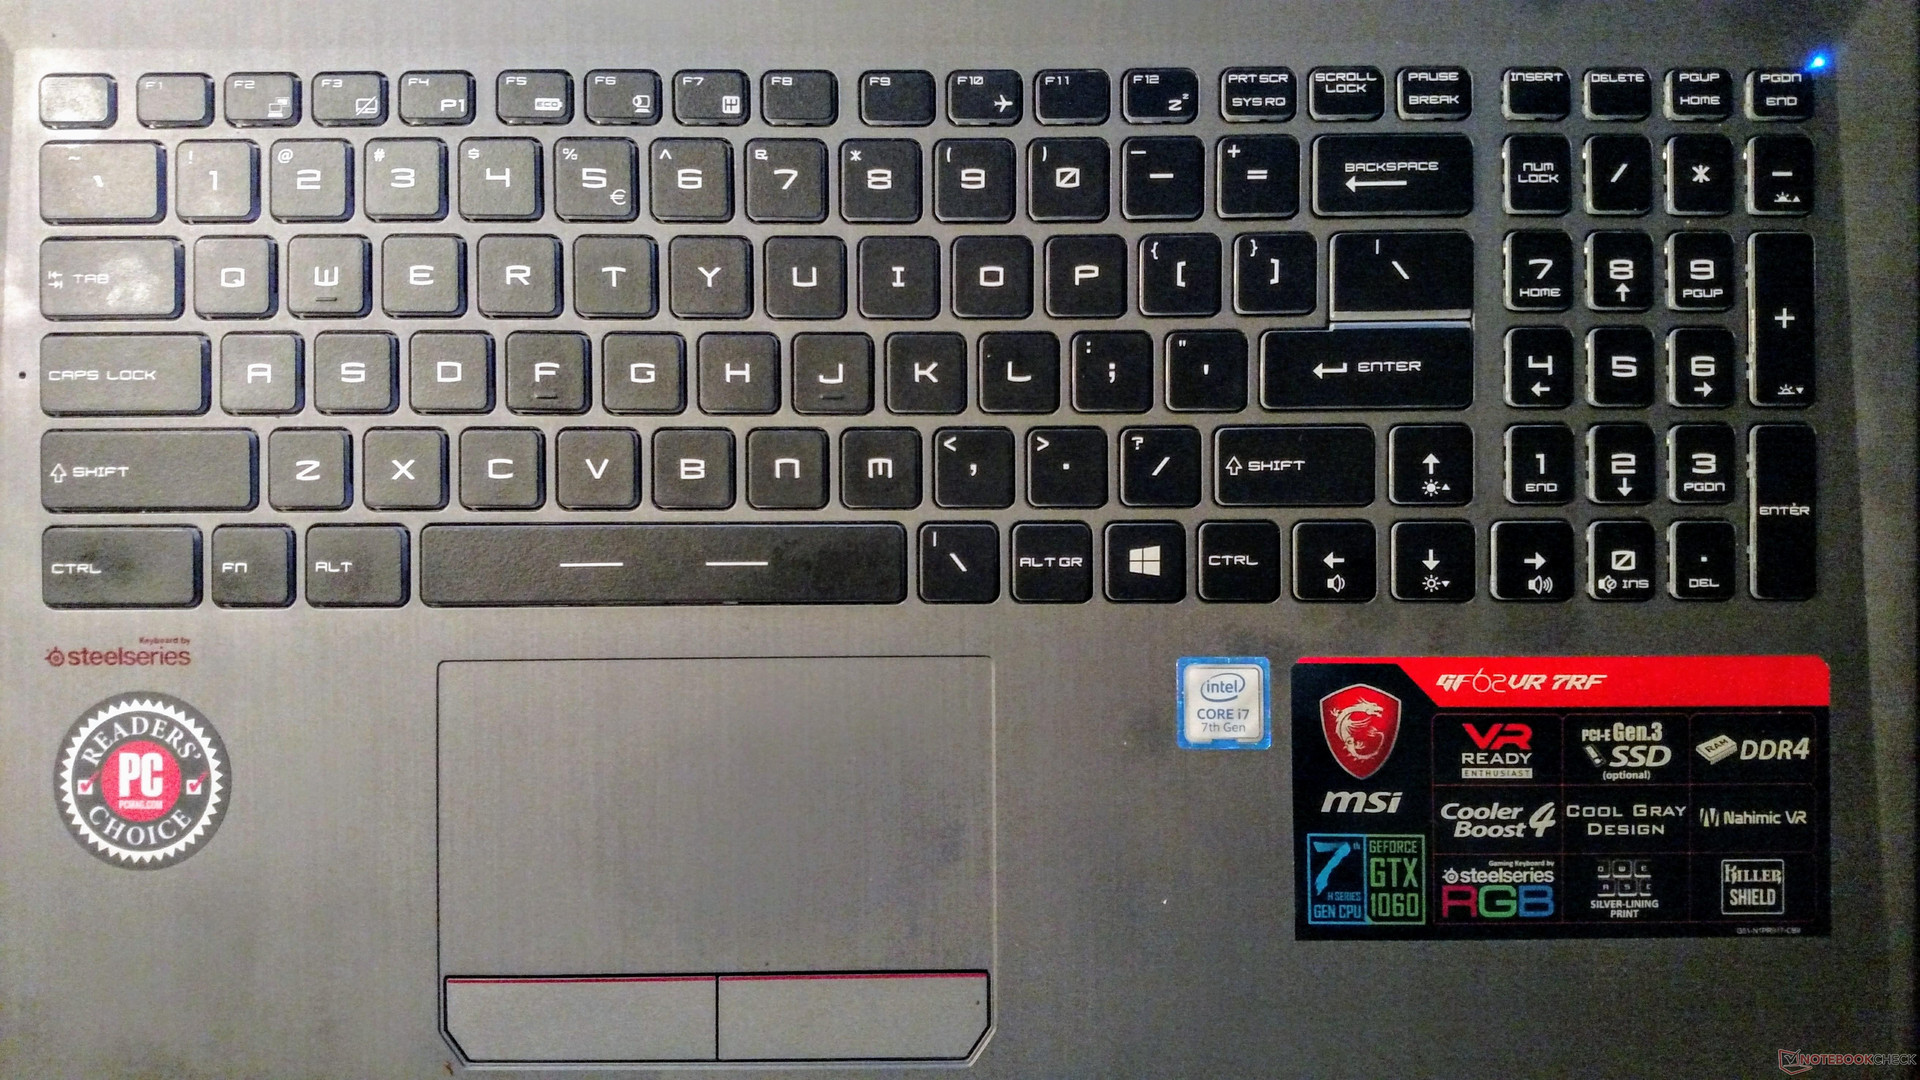
The SteelSeries keyboard is a staple of MSI notebooks and with good reason. MSI keyboards are more often than not among the best in the business, and the GF62VR is no exception. Drop is well defined with firm, crisp feedback that is a much better than many other devices, like the Asus GL503VD (which had a spongy feel). There is also a good amount of travel. The responsive keys are well-sized and well-spaced and make for an accurate and fast typing experience. Noise is also minimal and well suited to a quiet office or room; the keyboard is quiet with none of the clackiness found in other gaming laptops such as the Auros X3 Plus v7. Touch typists and novices alike will find plenty to like about the keyboard.
The keyboard also features anti-ghosting, and macros can be defined via the SteelSeries 3 Engine software utility. There are the usual special keys for things like display brightness and volume as well as dedicated keys for performance modes, launching MSI's Dragon Center software, and a user-programmable macro. The absence of a dedicated row of macro keys, like those found in the aforementioned Aorus X3 or Gigabyte's Aero 14, may be disappointing for some gamers.
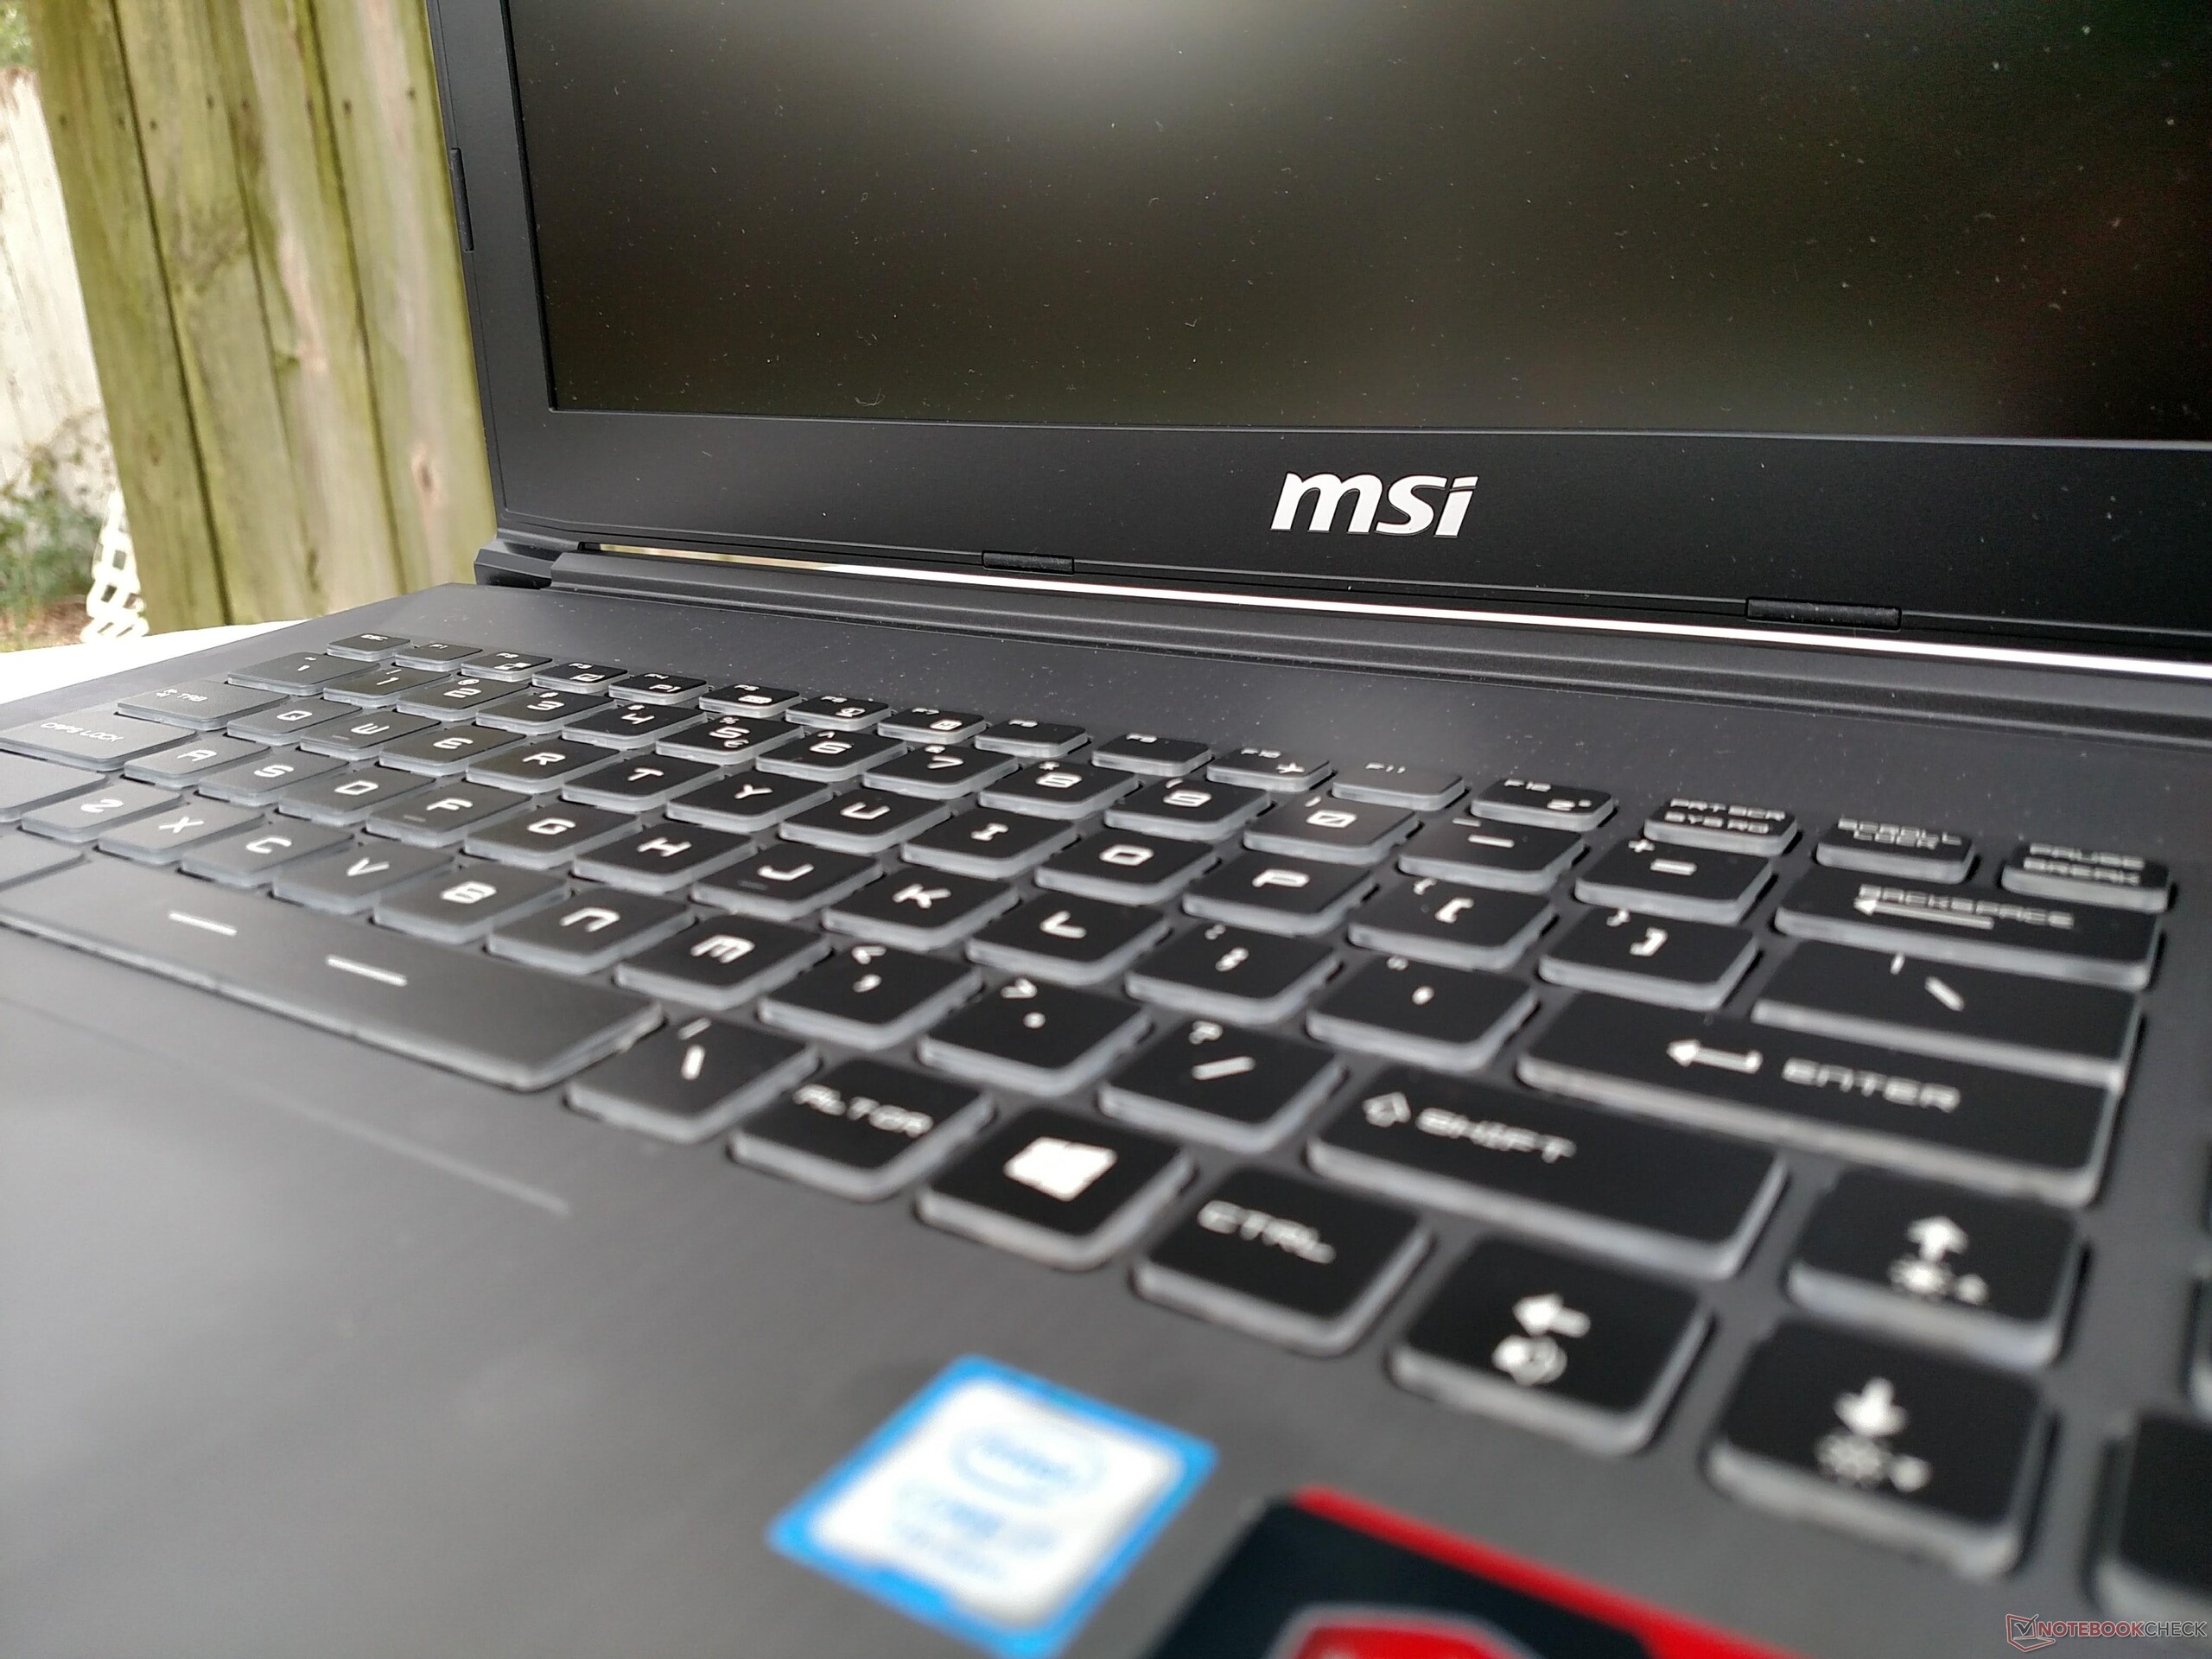
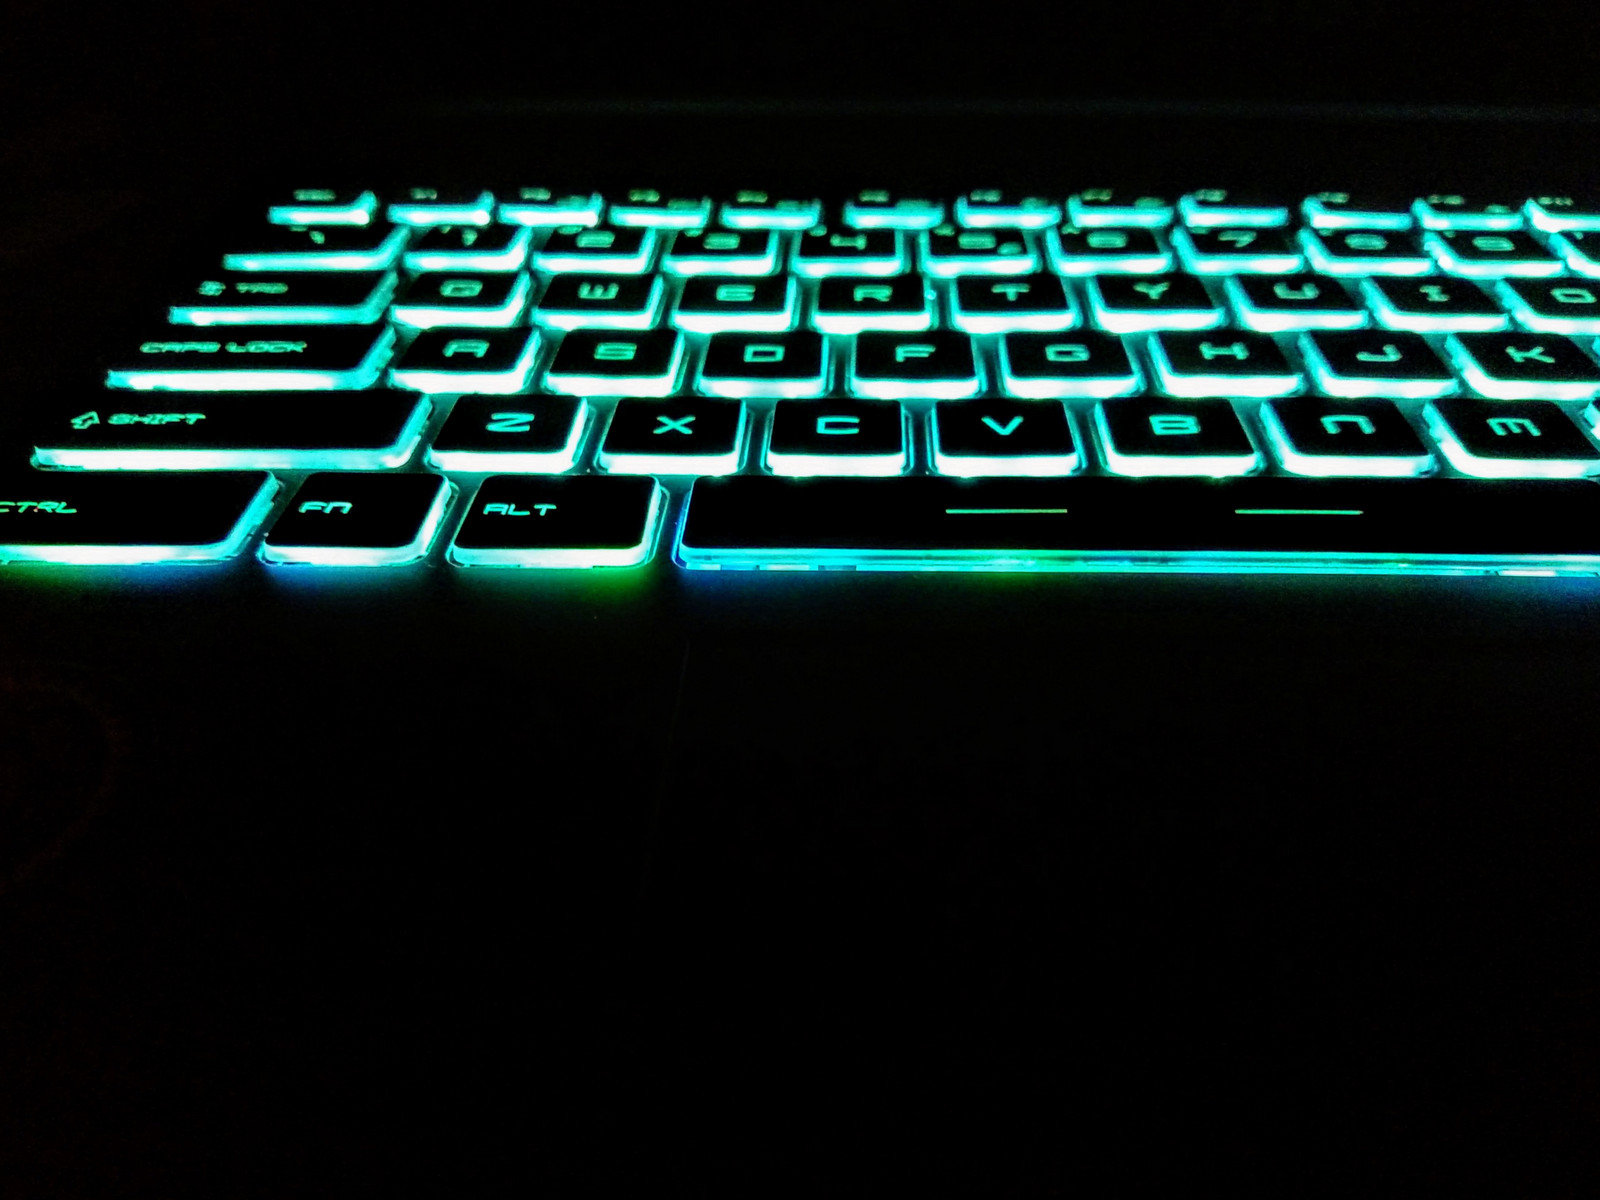
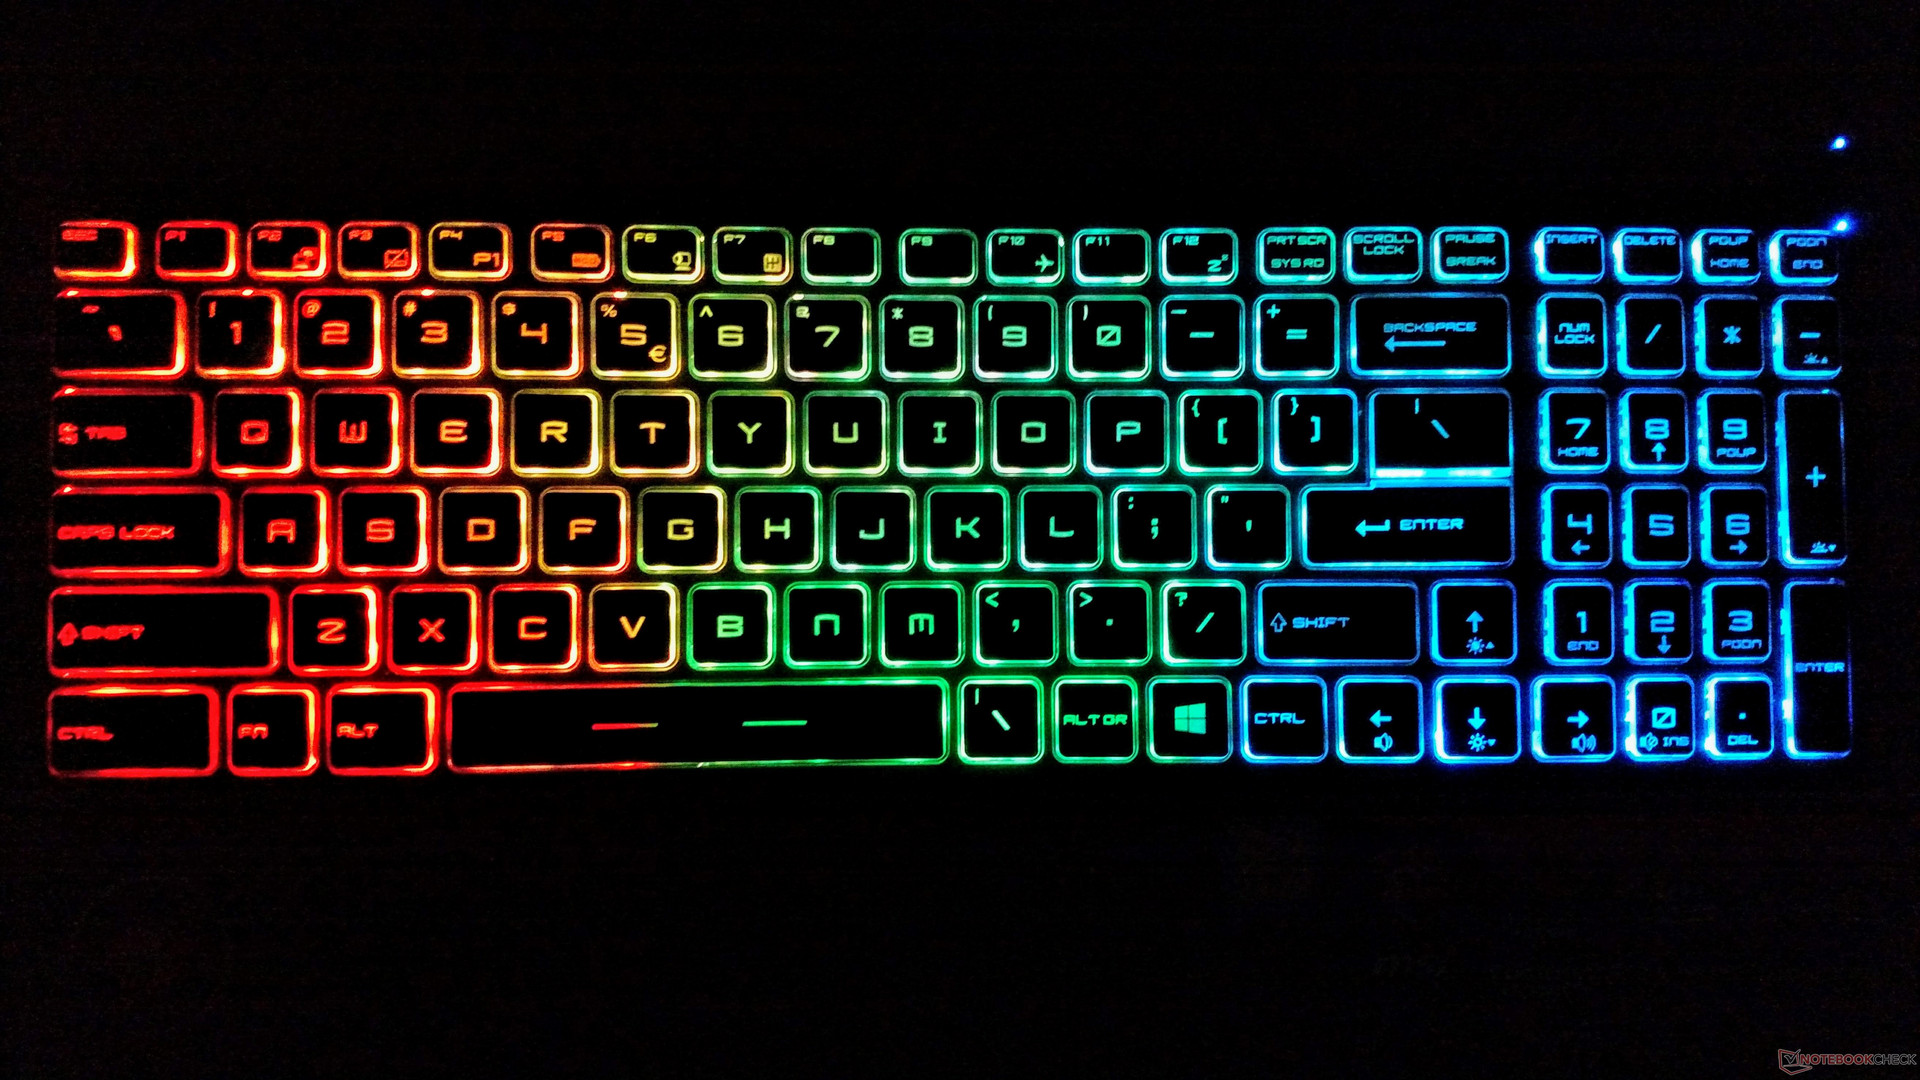
The keyboard offers three zones of RGB lighting with various effects like breathing or an "audio mode" that makes the backlight react to music or sound being played through the notebook. The backlight has three levels of brightness. The backlight does suffer from some color bleed when mixed colors are selected (e.g., aqua, pink, etc.). This is noticeable along the bottom row of keys and the space bar, especially in dark environments.
Touchpad
The touchpad is a bit on the small side (~10.8 cm x 6.0 cm) and may feel a bit too cramped for some users. The plastic finish is made from the same material as the palm rests and feels smooth but thin underhand. Tracking is fluid and responsive with a silky glide. The dedicated mouse buttons underneath are firm, if a bit stiff, and have a tactile and responsive click. The mechanism has a hollow sound, but the overall feel is satisfying.
Display
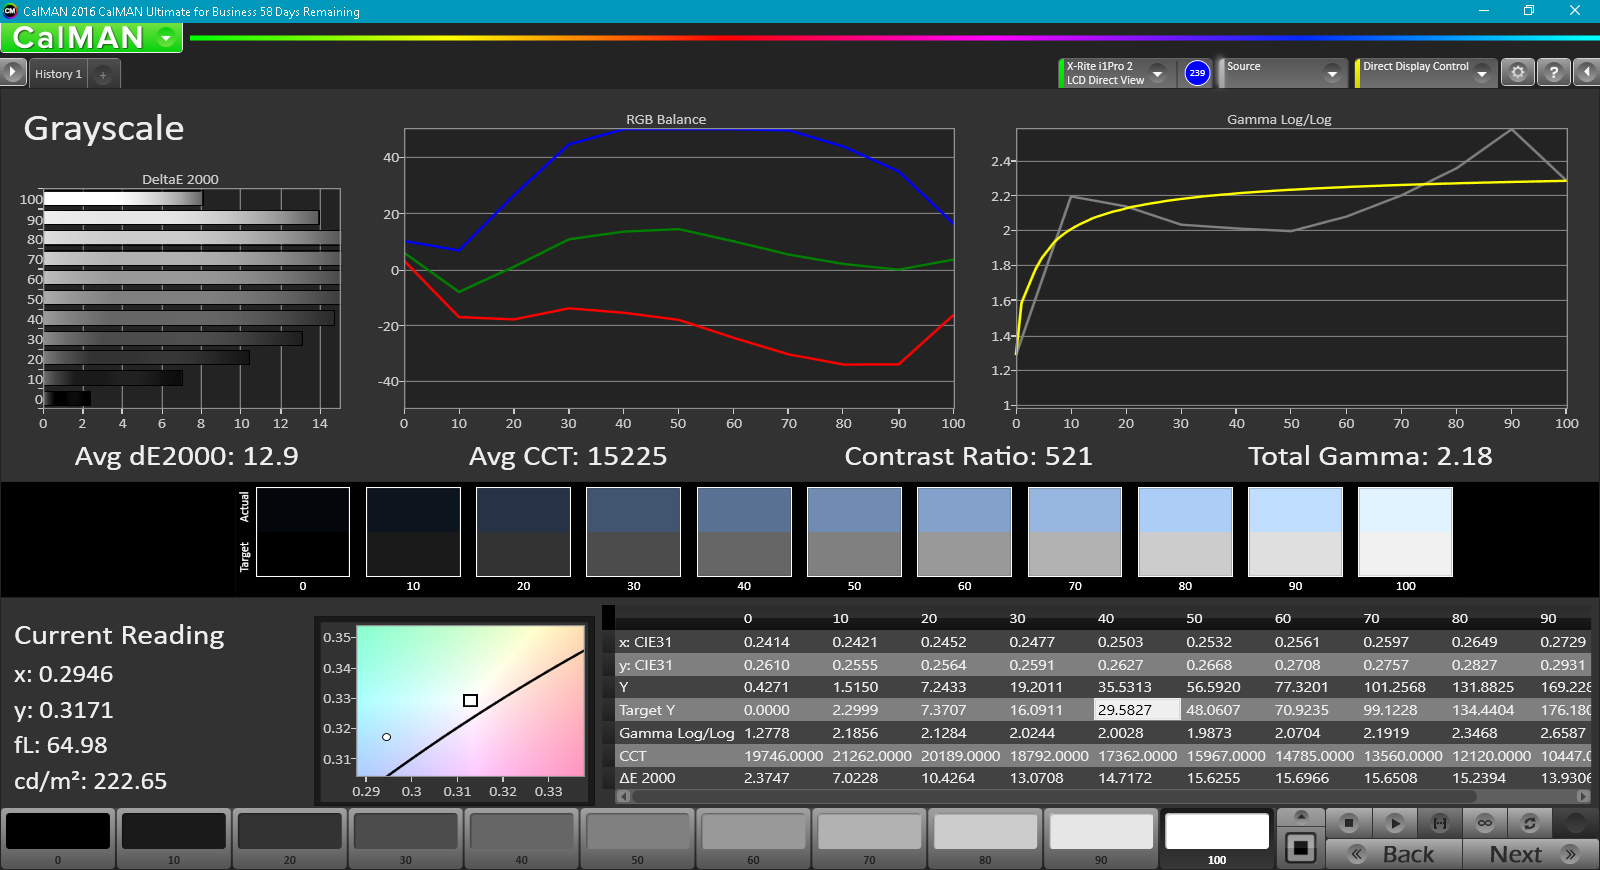
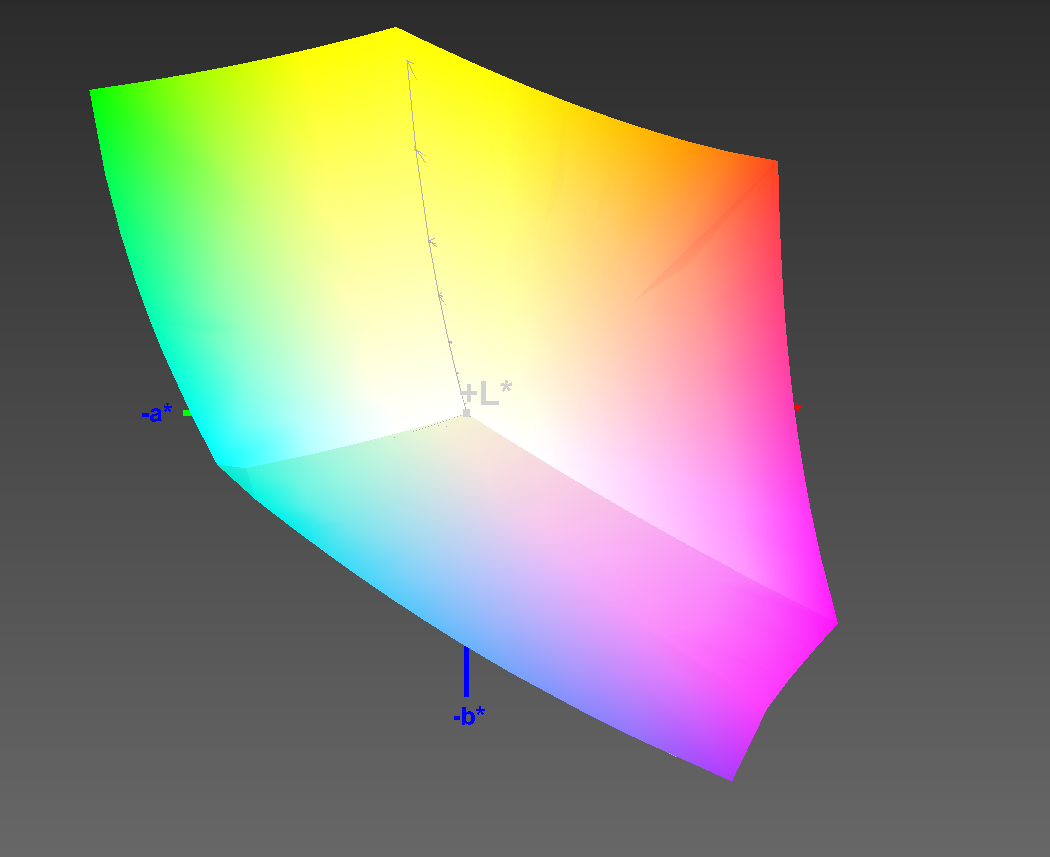
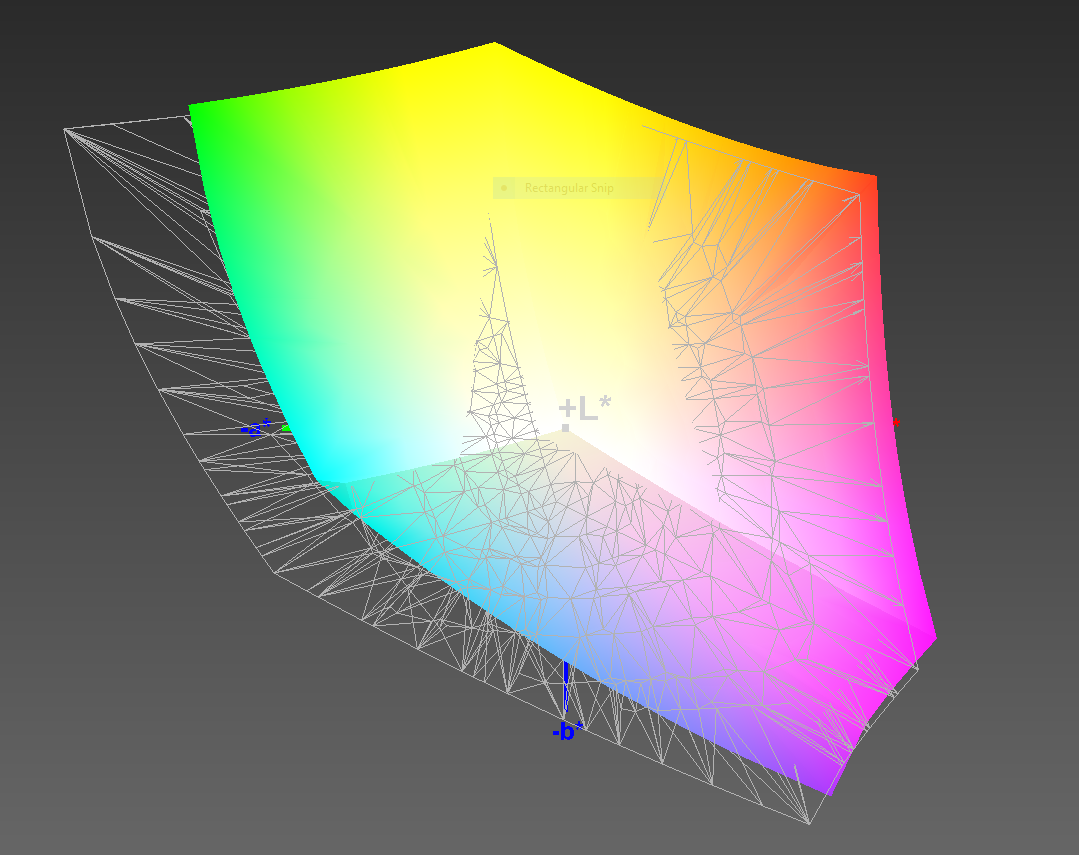
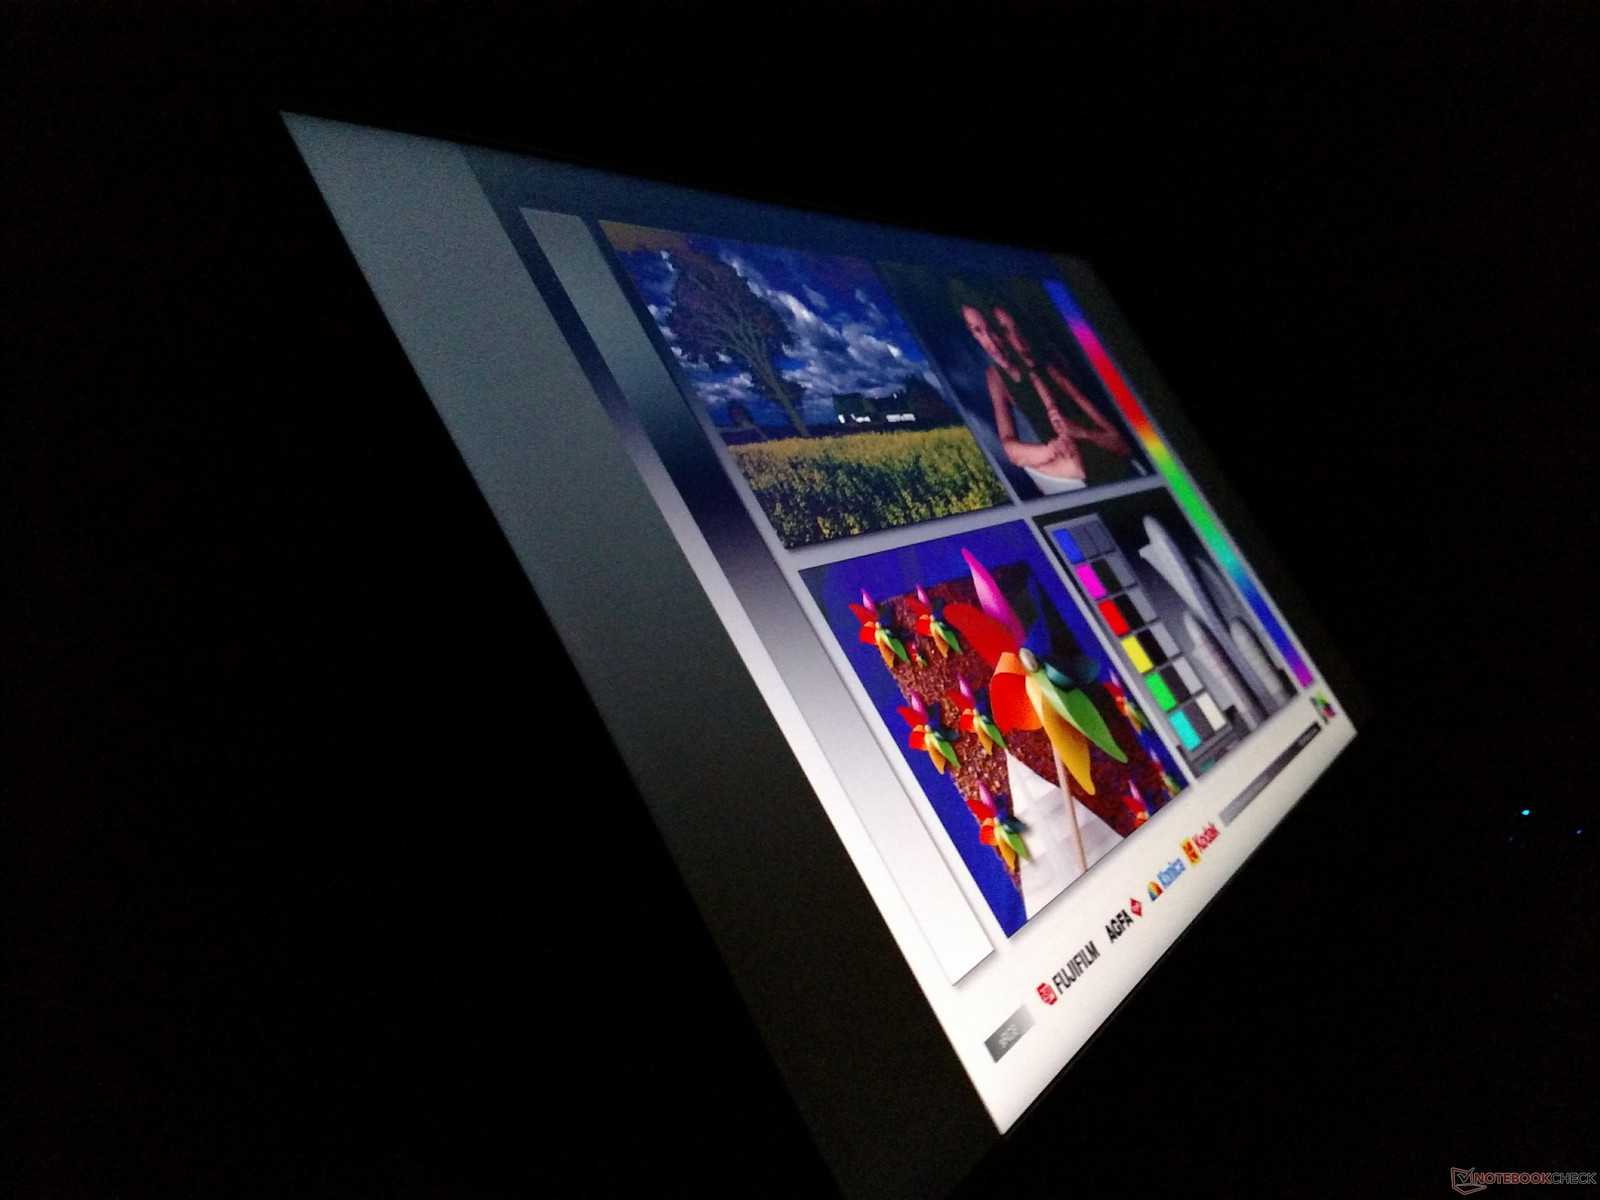
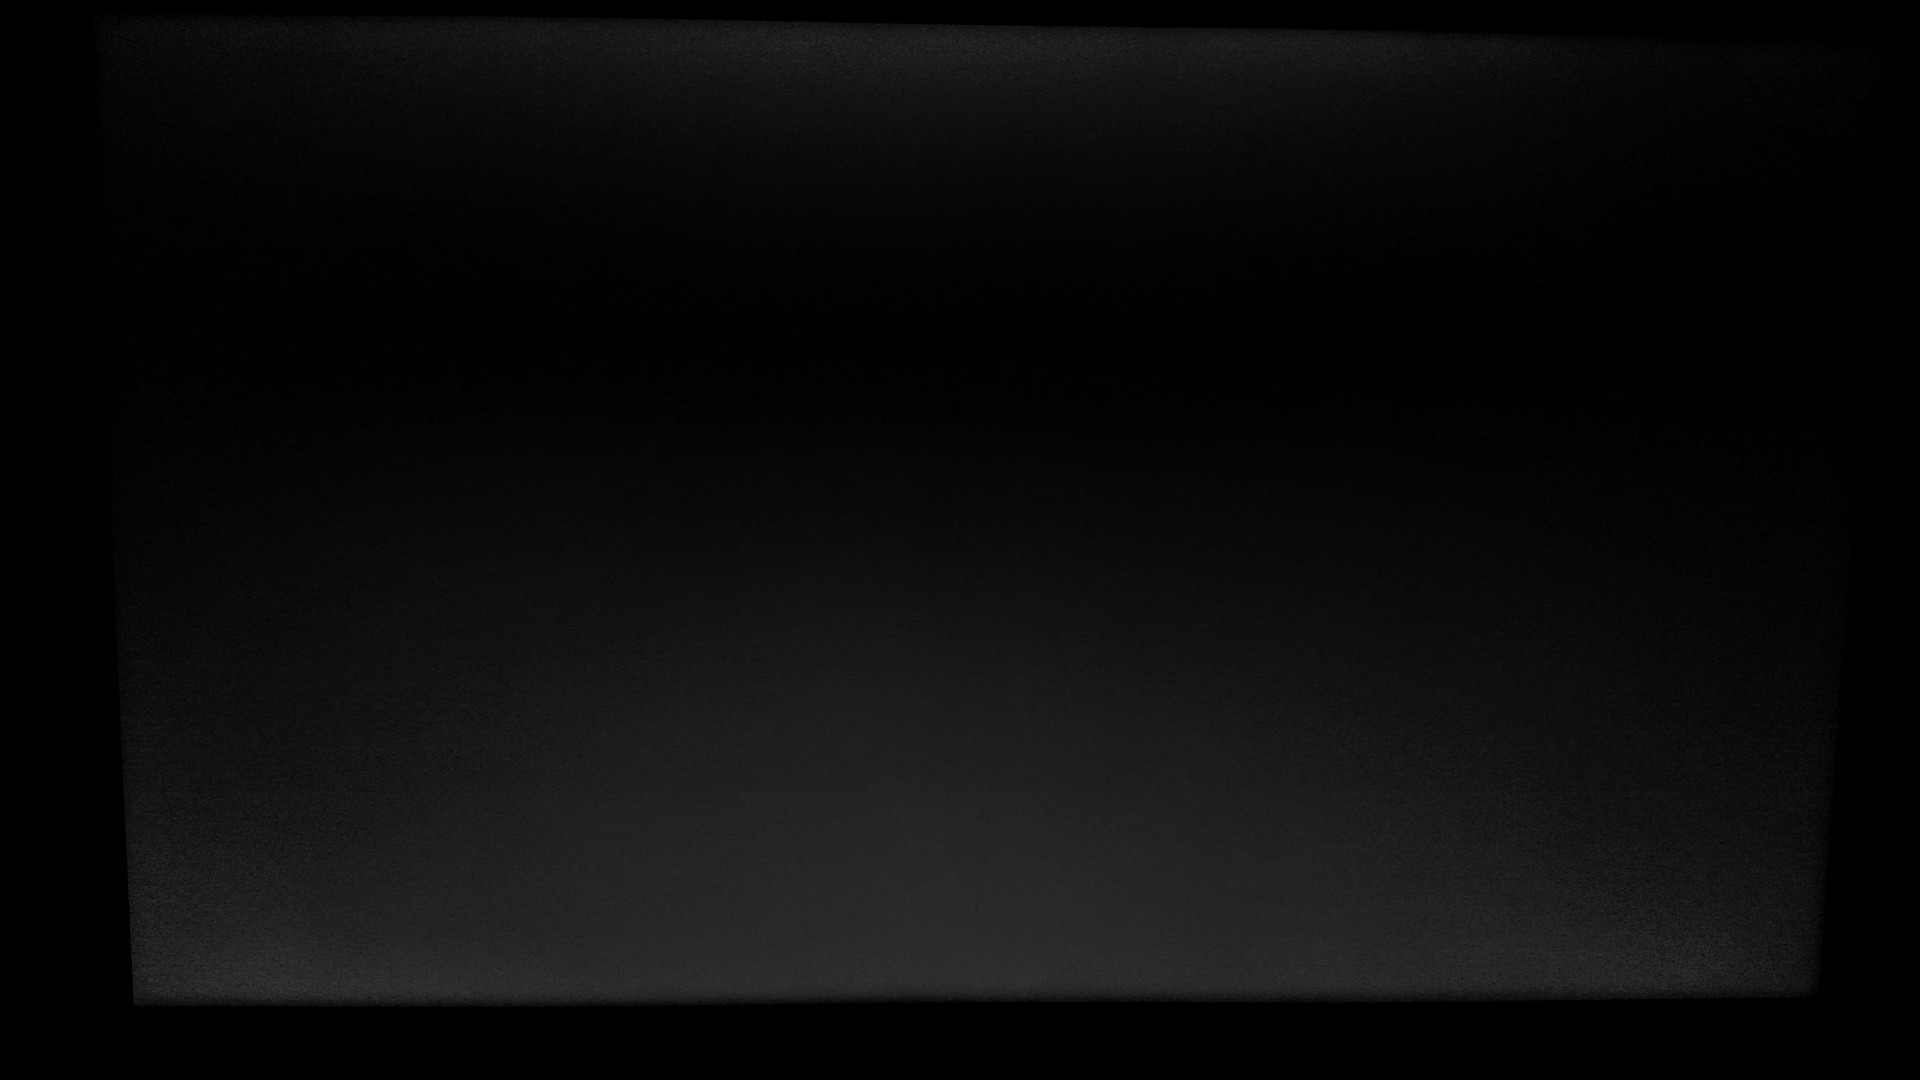
The 15.6-inch Full HD panel from Chi Mei is a missed opportunity. MSI advertises its wide color space coverage, claiming the "Vivid Color" screen hits 94% of the NTSC gamut. While colors are good, the TN panel has poor viewing angles and even worse black levels. As a result, contrast is abysmal; images look washed out unless viewed from a straight angle and colors look pallid and desaturated. Response times are good; black/white and grey 50%/grey 80% response times are quick, as expected of a TN panel. (Our graph of the 50% grey/80% grey erroneously miscalculated the fall time.) The screen is dim and doesn't get very bright, capping out at an average of 208 nits. The backlight is fairly even and in line with the competition. There is also no noticeable backlight bleed along the edge.
| |||||||||||||||||||||||||
Brightness Distribution: 88 %
Center on Battery: 223.9 cd/m²
Contrast: 400:1 (Black: 0.56 cd/m²)
ΔE ColorChecker Calman: 9.7 | ∀{0.5-29.43 Ø4.75}
ΔE Greyscale Calman: 12.9 | ∀{0.09-98 Ø5}
100% sRGB (Argyll 1.6.3 3D)
75% AdobeRGB 1998 (Argyll 1.6.3 3D)
83.9% AdobeRGB 1998 (Argyll 3D)
99.9% sRGB (Argyll 3D)
85.6% Display P3 (Argyll 3D)
Gamma: 2.18
CCT: 15225 K
| MSI GF62VR 7RF-877 Chi Mei N156HGA-EAL, TN LED, 15.6", 1920x1080 | MSI GE62VR 6RF-001US IPS, 15.6", 1920x1080 | Schenker XMG A517 LG Philips LP156WF6 (LGD046F), IPS, 15.6", 1920x1080 | Gigabyte Aero 15 N156HCA-EA1 (CMN15D7), IPS, 15.6", 1920x1080 | Gigabyte P55W v7 LG Philips LP156WF6 (LGD046F), IPS, 15.6", 1920x1080 | Asus Strix GL502VM-DS74 IPS, 15.6", 1920x1080 | HP Omen 15-ce002ng AUO42ED, IPS, 15.6", 1920x1080 | Samsung Odyssey NP800G5M-X01US IPS, 15.6", 1920x1080 | |
|---|---|---|---|---|---|---|---|---|
| Display | -22% | -22% | -17% | -24% | -22% | -18% | -39% | |
| Display P3 Coverage (%) | 85.6 | 65.6 -23% | 65 -24% | 65.2 -24% | 63.5 -26% | 64.8 -24% | 65.8 -23% | 47.11 -45% |
| sRGB Coverage (%) | 99.9 | 84.3 -16% | 85.1 -15% | 92.5 -7% | 82 -18% | 84.9 -15% | 90.9 -9% | 70.4 -30% |
| AdobeRGB 1998 Coverage (%) | 83.9 | 61.7 -26% | 62.2 -26% | 66.5 -21% | 59.9 -29% | 62 -26% | 66.5 -21% | 48.71 -42% |
| Response Times | 9% | 15% | -9% | 12% | -10% | -8% | -8% | |
| Response Time Grey 50% / Grey 80% * (ms) | 49.6 ? | 36.8 ? 26% | 36 ? 27% | 42.8 ? 14% | 37 ? 25% | 42 ? 15% | 43.2 ? 13% | 38.8 ? 22% |
| Response Time Black / White * (ms) | 24.4 ? | 26.4 ? -8% | 24 ? 2% | 32 ? -31% | 25 ? -2% | 32.8 ? -34% | 31.2 ? -28% | 33.6 ? -38% |
| PWM Frequency (Hz) | 25510 ? | 21000 ? | 26000 ? | 19230 ? | ||||
| Screen | 63% | 38% | 38% | 38% | 40% | 50% | 11% | |
| Brightness middle (cd/m²) | 223.9 | 302 35% | 320 43% | 320 43% | 287 28% | 307.8 37% | 304 36% | 255.9 14% |
| Brightness (cd/m²) | 208 | 303 46% | 311 50% | 316 52% | 289 39% | 301 45% | 289 39% | 249 20% |
| Brightness Distribution (%) | 88 | 87 -1% | 90 2% | 90 2% | 87 -1% | 88 0% | 86 -2% | 90 2% |
| Black Level * (cd/m²) | 0.56 | 0.169 70% | 0.36 36% | 0.36 36% | 0.29 48% | 0.33 41% | 0.26 54% | 0.48 14% |
| Contrast (:1) | 400 | 1787 347% | 889 122% | 889 122% | 990 148% | 933 133% | 1169 192% | 533 33% |
| Colorchecker dE 2000 * | 9.7 | 4.61 52% | 5.08 48% | 4.62 52% | 4.92 49% | 4.5 54% | 3.46 64% | 5.9 39% |
| Colorchecker dE 2000 max. * | 19.7 | 9.98 49% | 10.73 46% | 9.75 51% | 11 44% | 10 49% | 7.72 61% | 18.9 4% |
| Greyscale dE 2000 * | 12.9 | 3.32 74% | 4.04 69% | 6 53% | 3.66 72% | 2.9 78% | 2.46 81% | 5.6 57% |
| Gamma | 2.18 101% | 2.24 98% | 2.34 94% | 2.46 89% | 2.32 95% | 2.22 99% | 2.38 92% | 2.21 100% |
| CCT | 15225 43% | 6358 102% | 7029 92% | 6761 96% | 6482 100% | 1136 572% | 6915 94% | 7250 90% |
| Color Space (Percent of AdobeRGB 1998) (%) | 75 | 55.4 -26% | 56 -25% | 60 -20% | 54 -28% | 55.4 -26% | 59 -21% | 44.8 -40% |
| Color Space (Percent of sRGB) (%) | 100 | 84.4 -16% | 85 -15% | 92 -8% | 82 -18% | 84.8 -15% | 91 -9% | 70.1 -30% |
| Total Average (Program / Settings) | 17% /
39% | 10% /
23% | 4% /
21% | 9% /
22% | 3% /
21% | 8% /
28% | -12% /
-1% |
* ... smaller is better
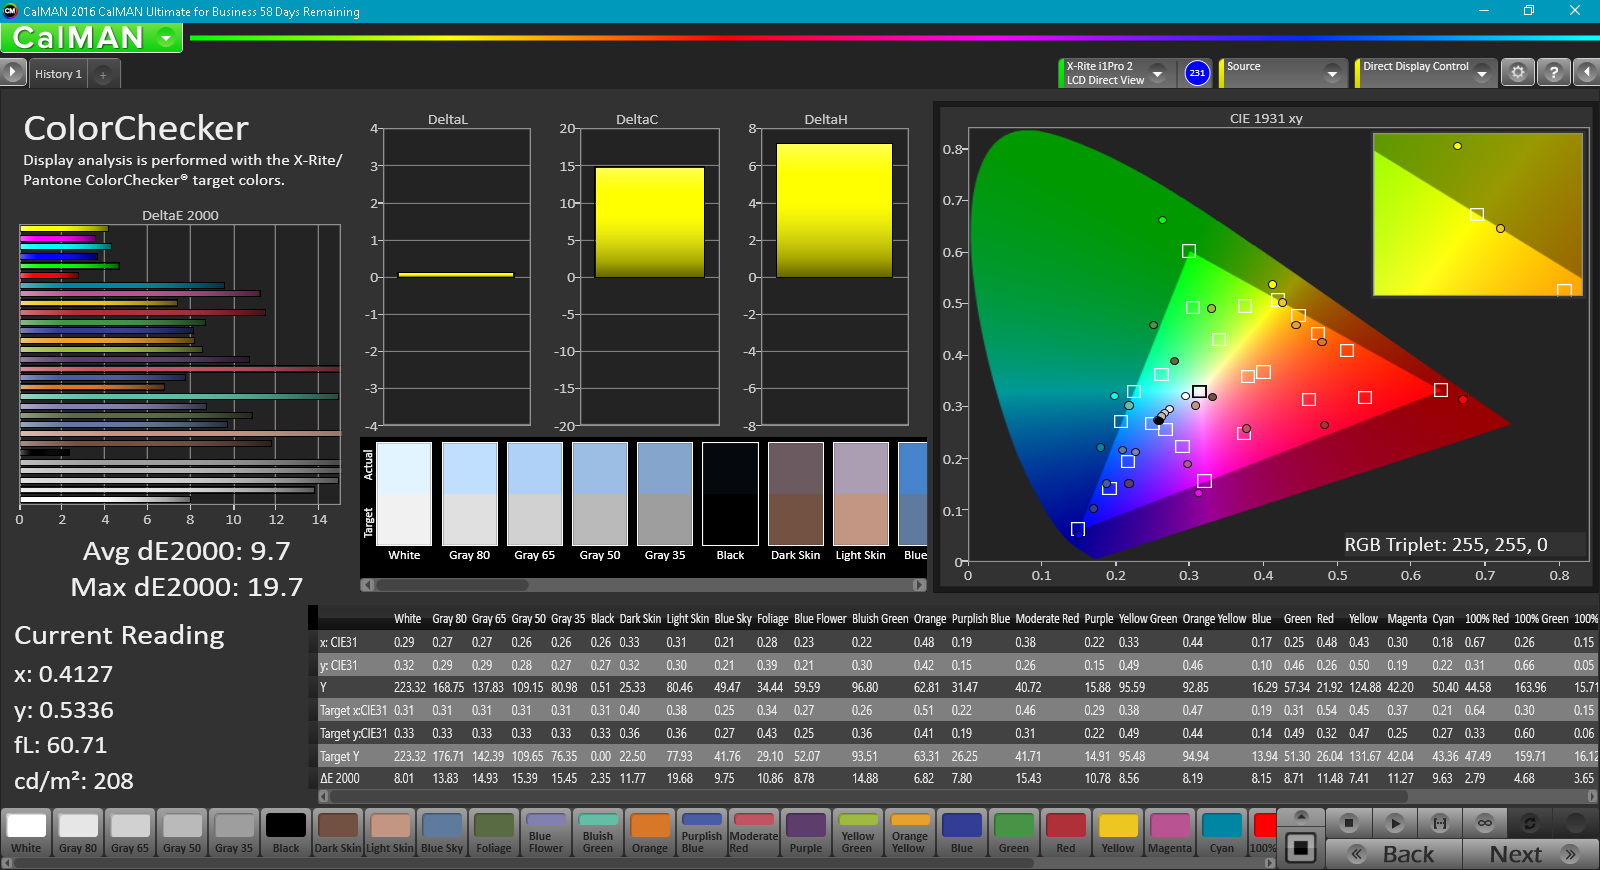
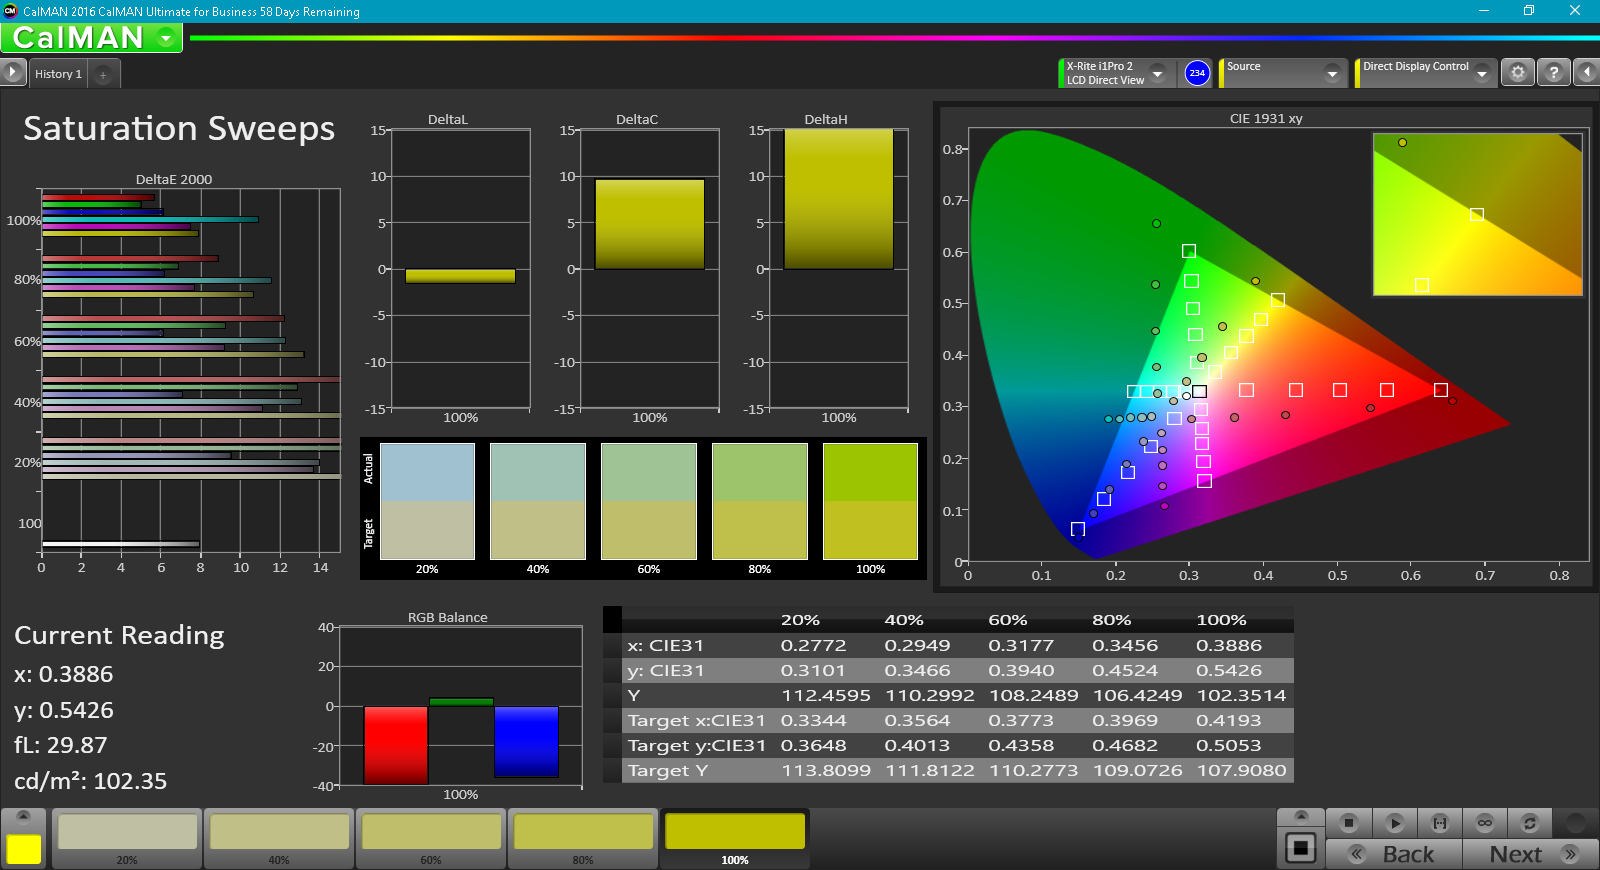
The displays saving grace lies in its wide color space. The screen covers 100% of the sRGB and 75% of the AdobeRGB color gamuts, which is impressive. However, while the display covers a wide range of colors, it isn't able to accurately reproduce them. The average DeltaE sits at 9.7 for colors and 12.9 for grays. (As a reference, a DeltaE at or below 3 is considered acceptable for professional use, and the DeltaE of most gaming notebooks typically ranges from 3-6.) In addition to the weak color accuracy, color temperature is over 15,000, giving whites a blue tint.
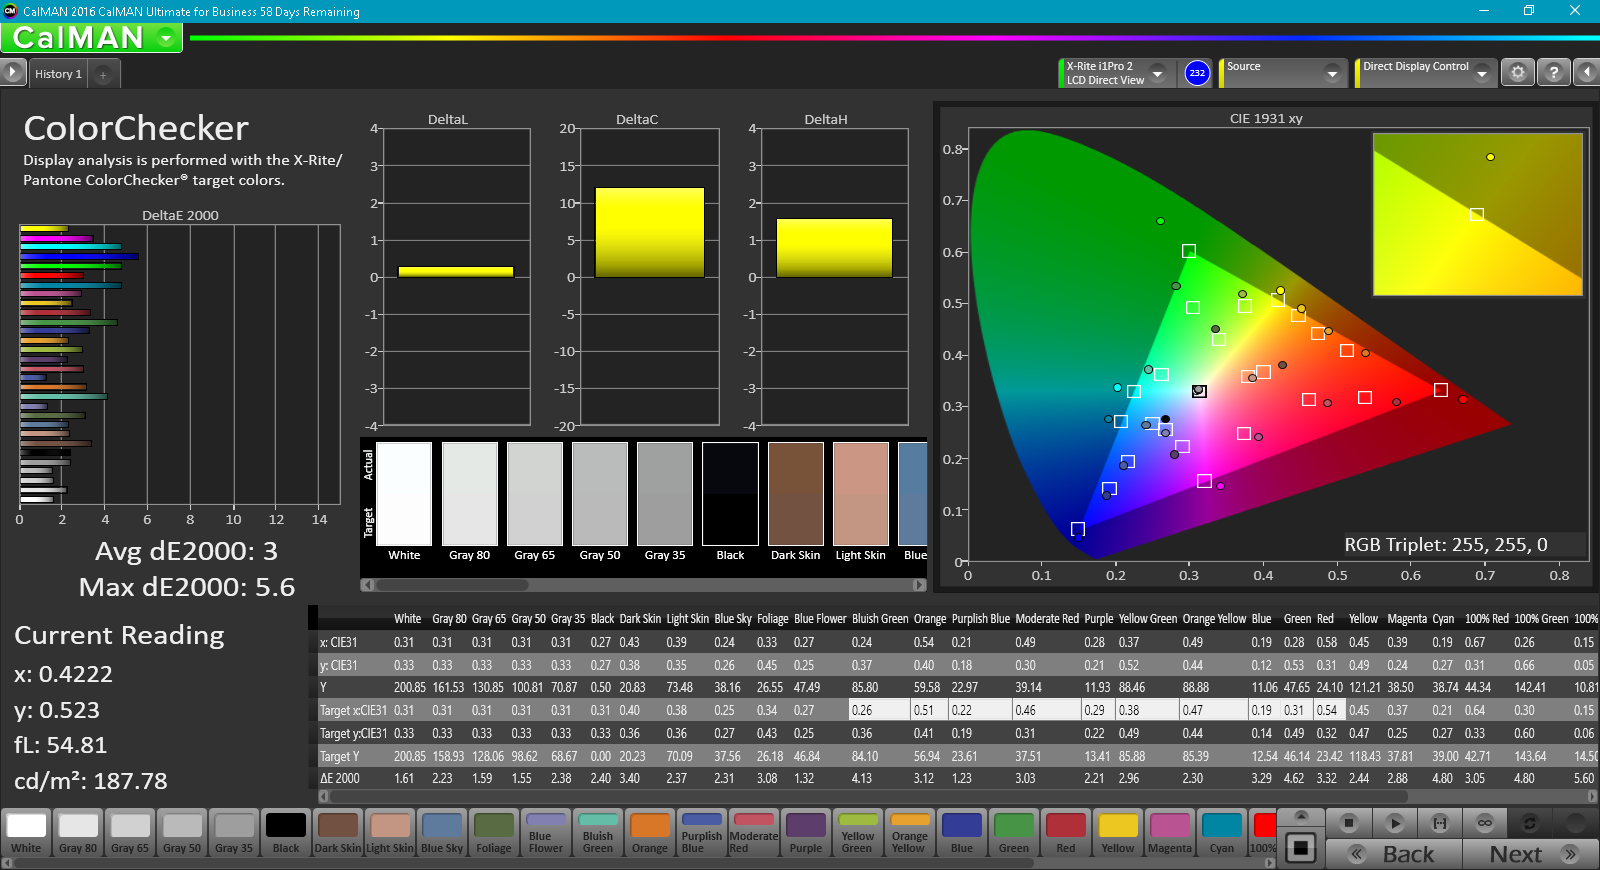
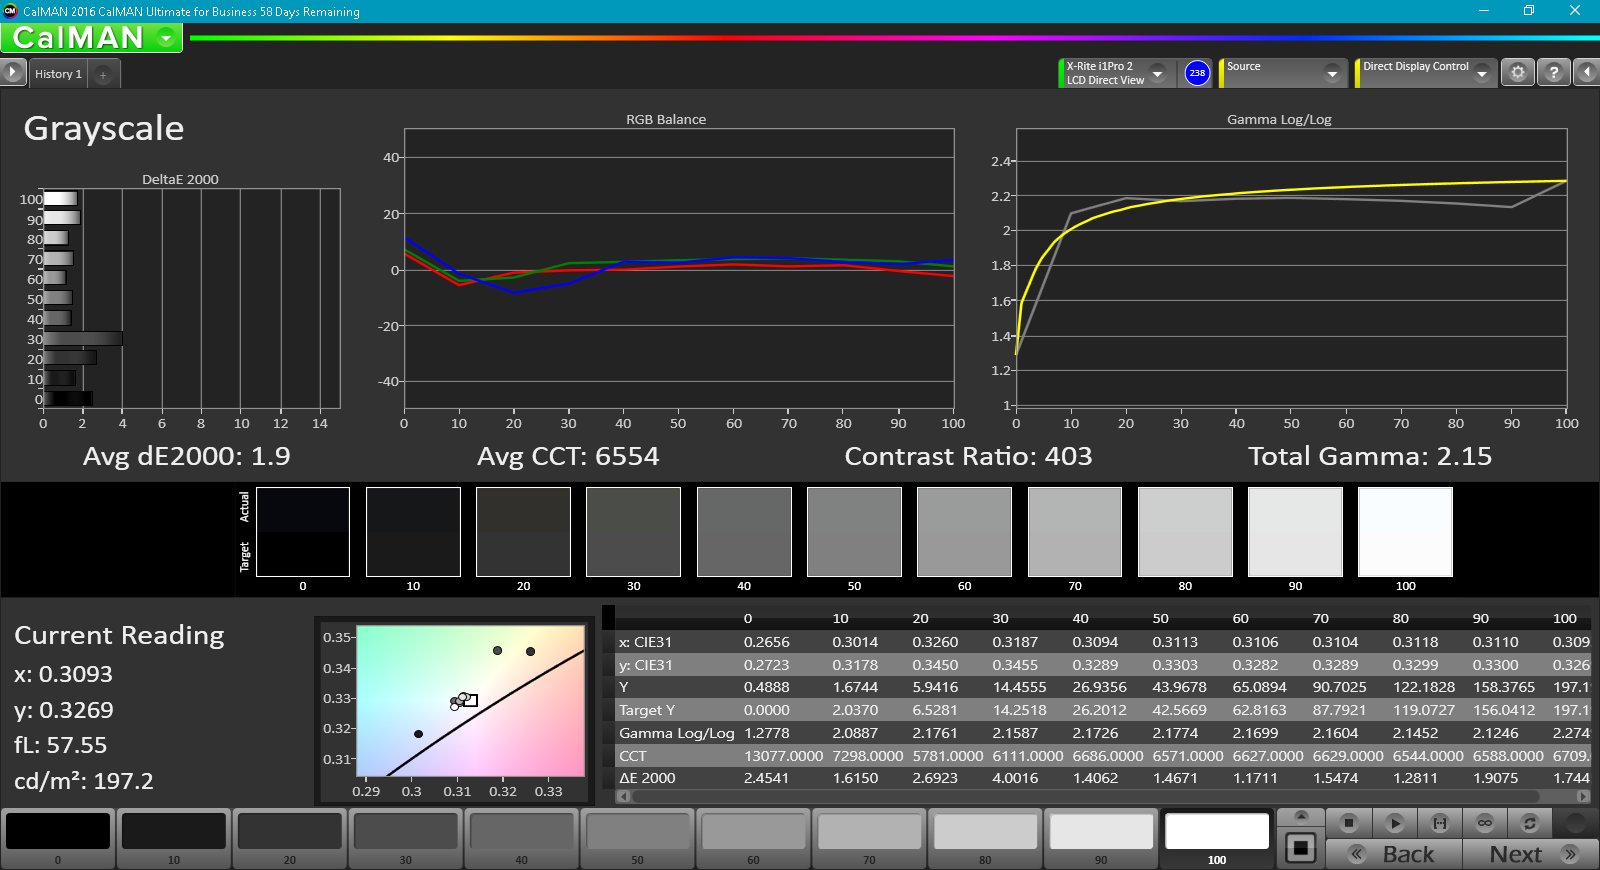
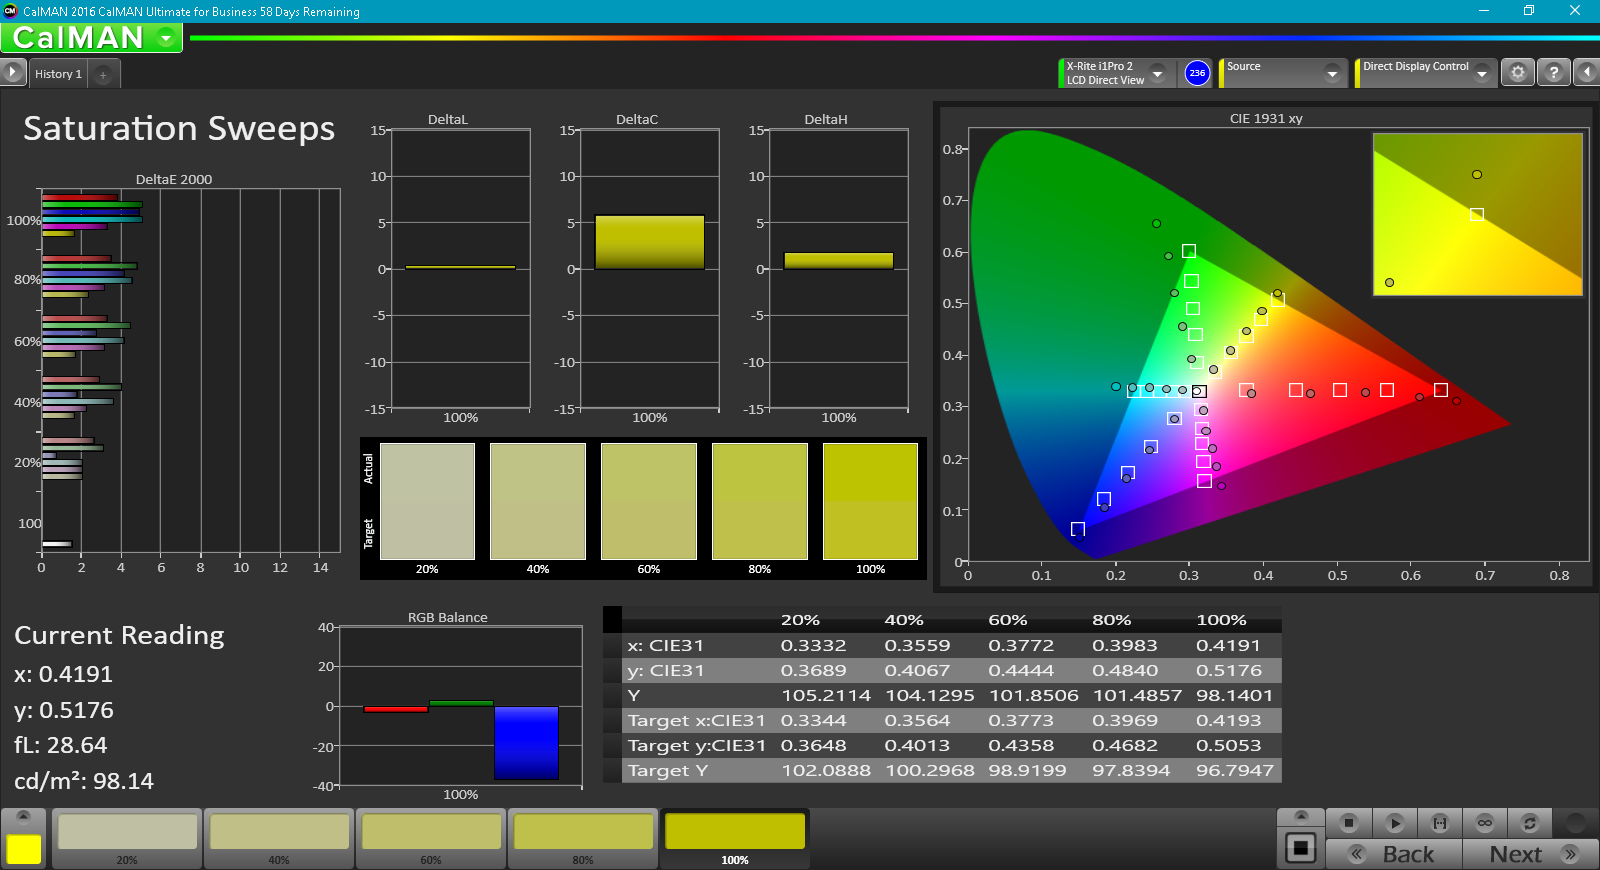
Calibration greatly improves the picture. After using our calibration tools, the DeltaE for color falls to 3, while the grayscale DeltaE hits an impressive 1.9. Color temperature also evens out around 6500; as a result, whites more neutral and better balanced. Out of the box, the screen is disappointing, so (if possible) calibration should be among the first thing new owners do.
As mentioned, viewing angles are poor. When viewed off center, colors start to fade. Along the vertical axis, colors invert entirely when viewed past about 15-20°. The screen looks vibrant when viewed directly but desaturated and milky when viewed off-angle.
The lackluster brightness means that the screen is unusable in sunlight. However, the matte finish works to heavily reduce glare; under shade or indoors, text is legible and images are clear.


Display Response Times
| ↔ Response Time Black to White | ||
|---|---|---|
| 24.4 ms ... rise ↗ and fall ↘ combined | ↗ 20 ms rise | 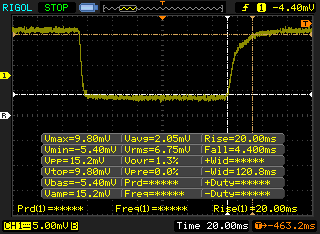 |
| ↘ 4.4 ms fall | ||
| The screen shows good response rates in our tests, but may be too slow for competitive gamers. In comparison, all tested devices range from 0.1 (minimum) to 240 (maximum) ms. » 57 % of all devices are better. This means that the measured response time is worse than the average of all tested devices (20.1 ms). | ||
| ↔ Response Time 50% Grey to 80% Grey | ||
| 49.6 ms ... rise ↗ and fall ↘ combined | ↗ 24.8 ms rise | 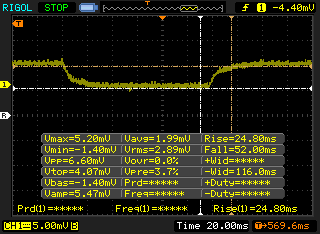 |
| ↘ 24.8 ms fall | ||
| The screen shows slow response rates in our tests and will be unsatisfactory for gamers. In comparison, all tested devices range from 0.165 (minimum) to 636 (maximum) ms. » 85 % of all devices are better. This means that the measured response time is worse than the average of all tested devices (31.4 ms). | ||
Screen Flickering / PWM (Pulse-Width Modulation)
| Screen flickering / PWM detected | 25510 Hz | ≤ 20 % brightness setting | 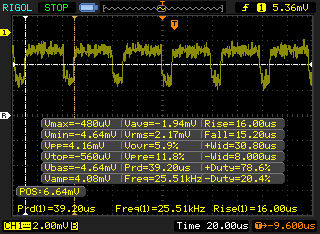 |
The display backlight flickers at 25510 Hz (worst case, e.g., utilizing PWM) Flickering detected at a brightness setting of 20 % and below. There should be no flickering or PWM above this brightness setting. The frequency of 25510 Hz is quite high, so most users sensitive to PWM should not notice any flickering. In comparison: 53 % of all tested devices do not use PWM to dim the display. If PWM was detected, an average of 7996 (minimum: 5 - maximum: 343500) Hz was measured. | |||
Performance
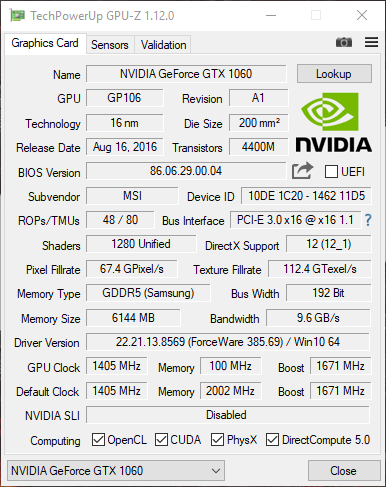
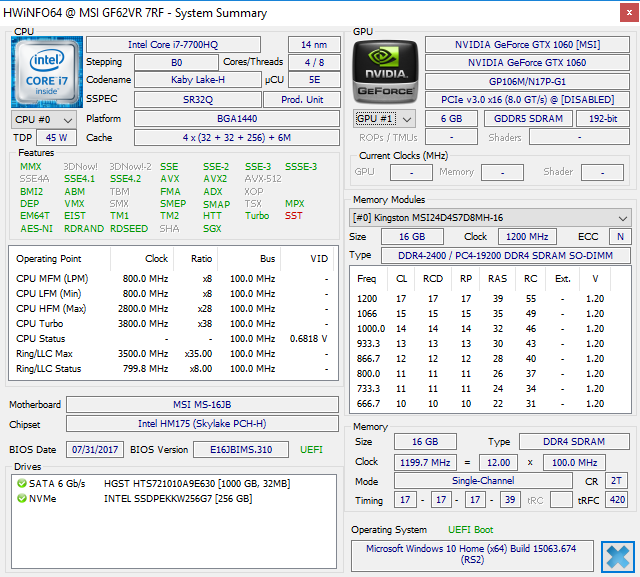
The GF62VR opts for a very familiar setup, using Intel's Core i7-7700HQ and an Nvidia GeForce GTX 1060. These components make for an excellent pairing and are well suited for gaming and other demanding tasks. This, combined with the optional PCIe NVMe SSD, makes for a responsive system well suited to heavier workloads. The included "Cooler Boost" mode pushes the fans to their maximum speeds, which results in a slight performance bump, which we'll look at in the section below.
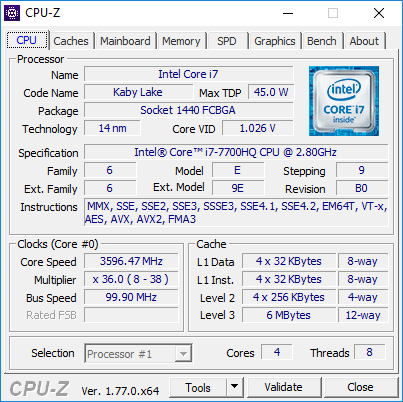
Processor
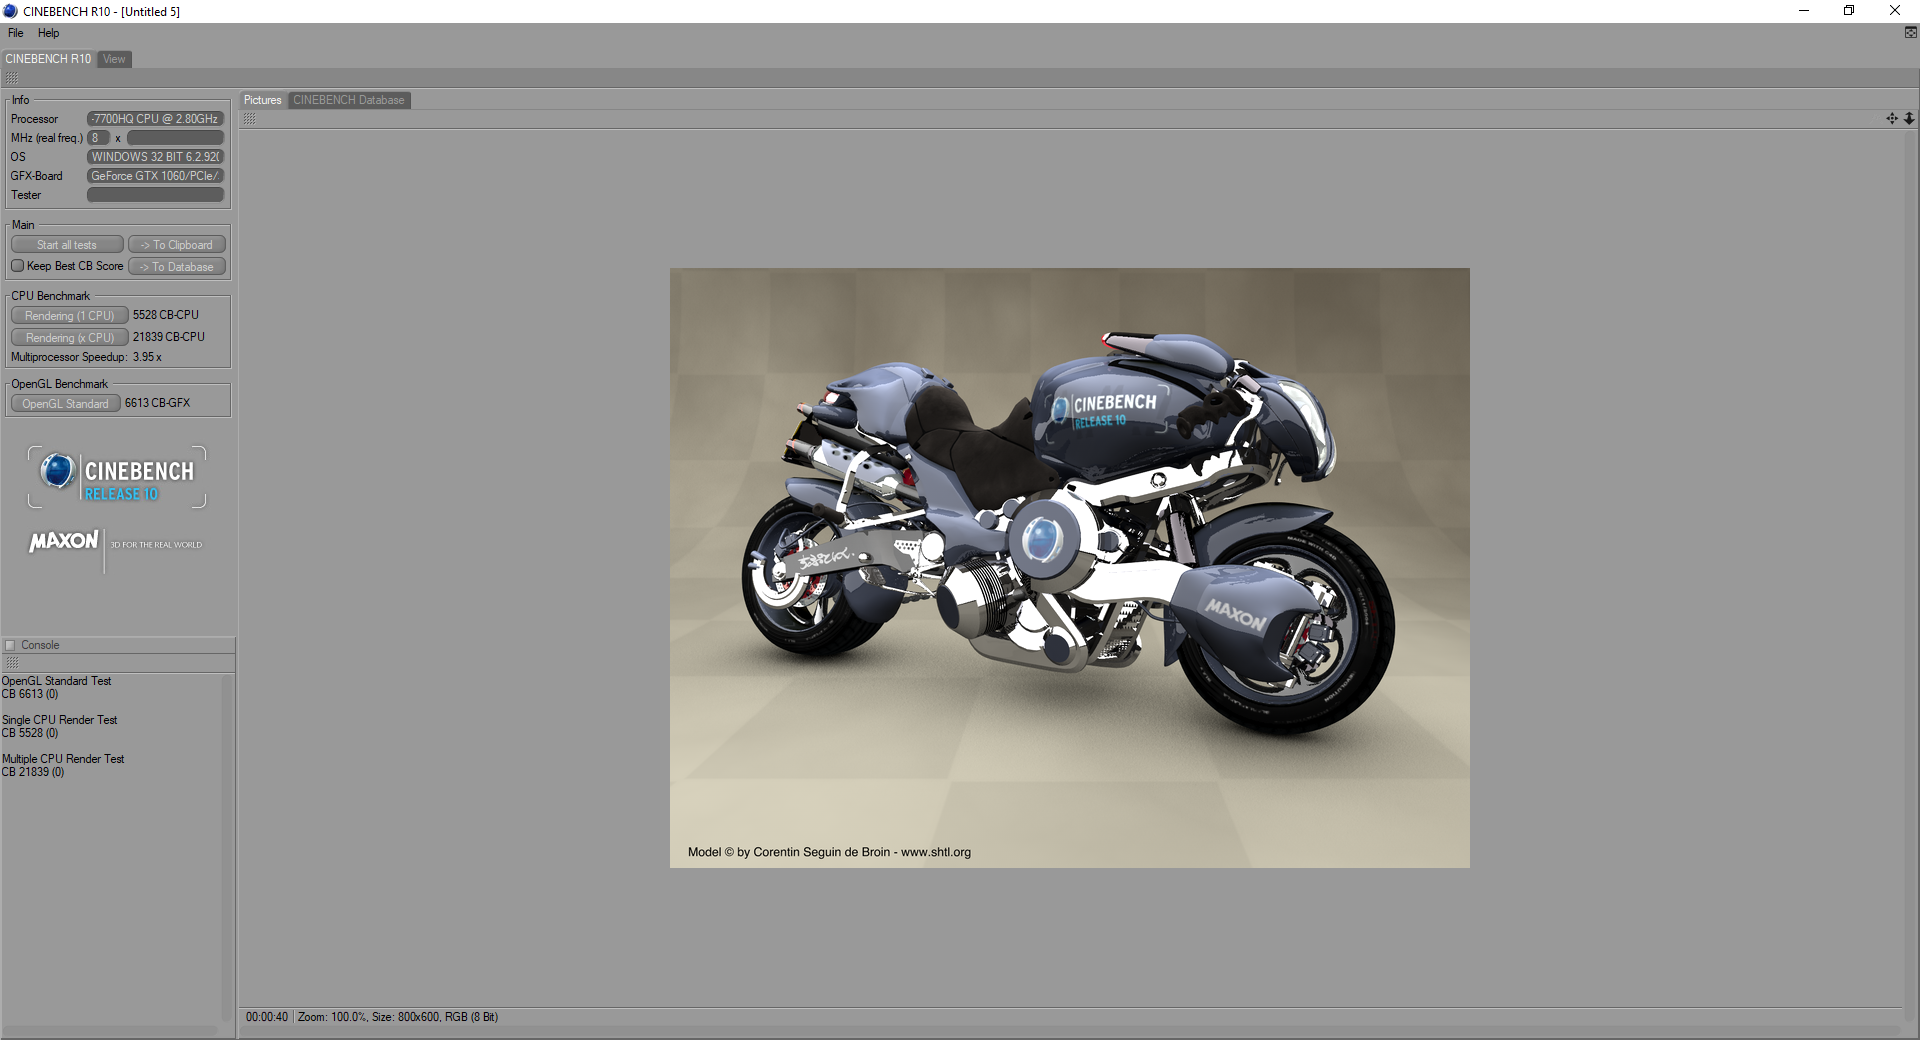
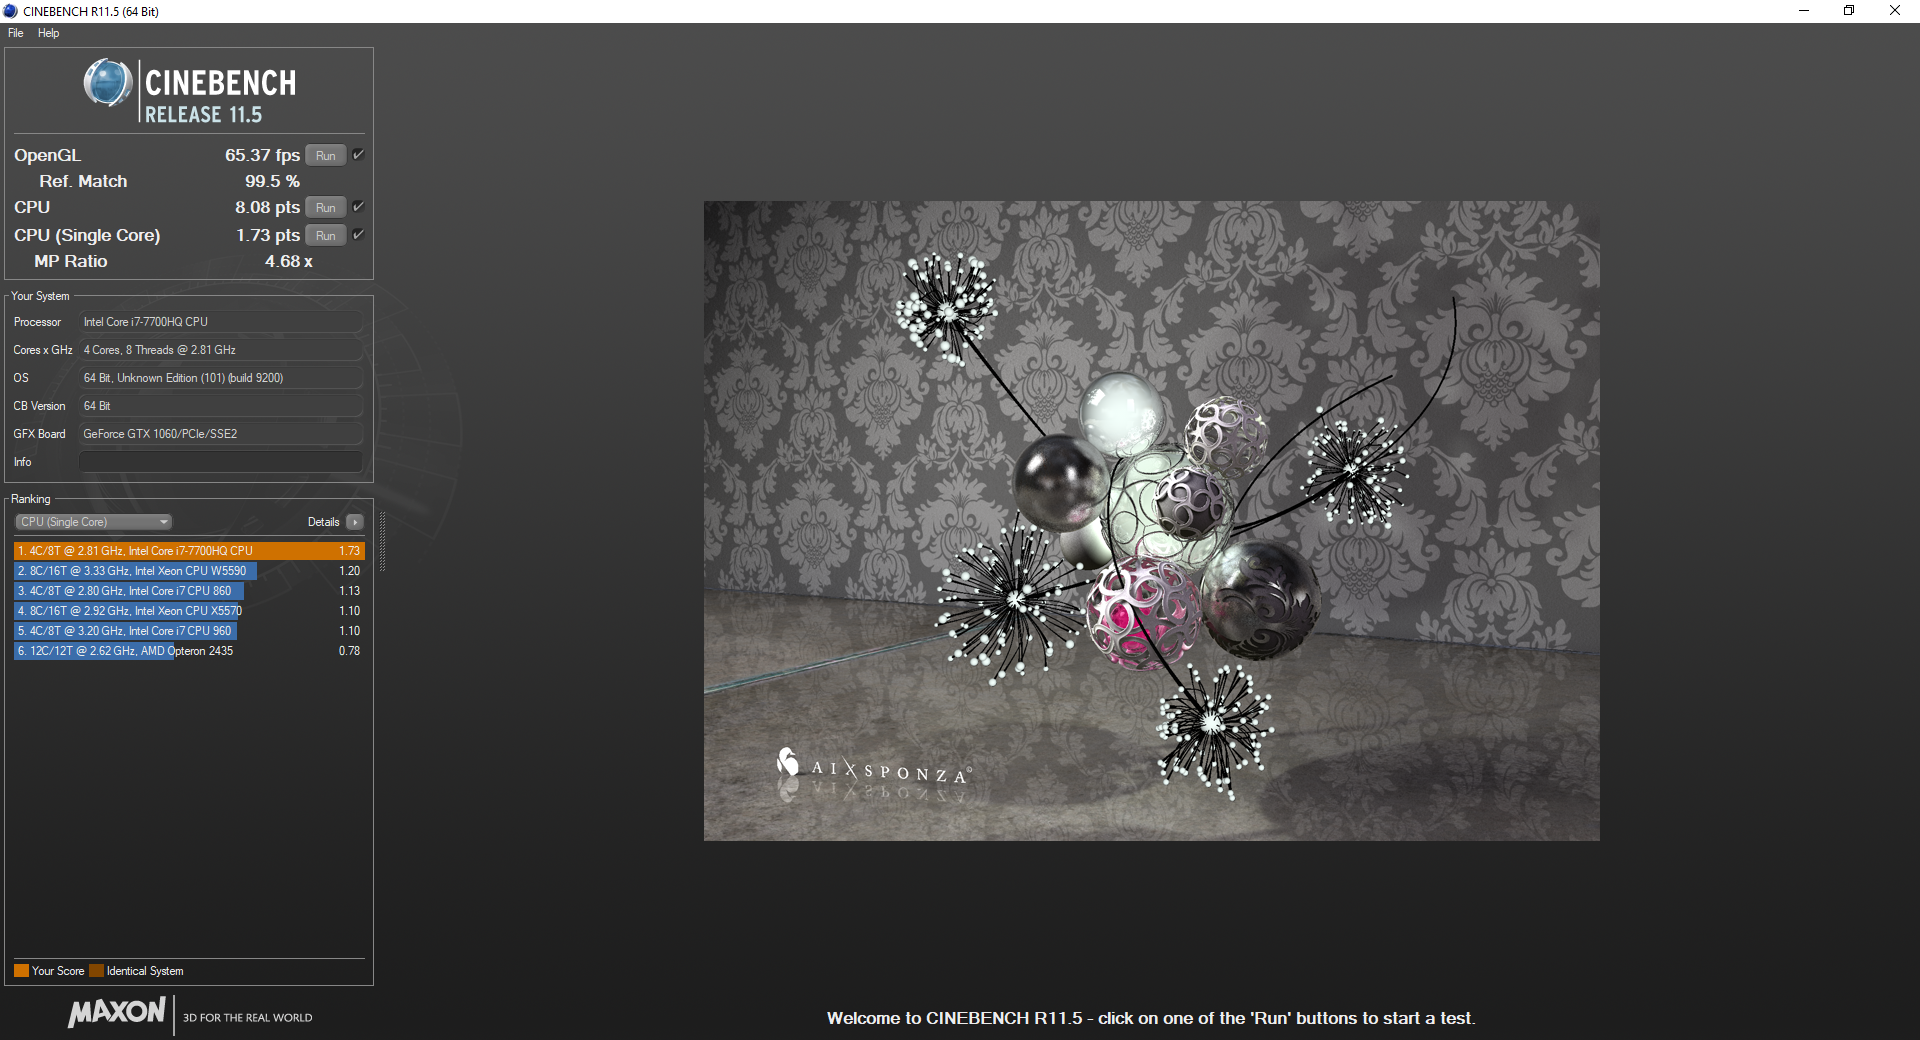
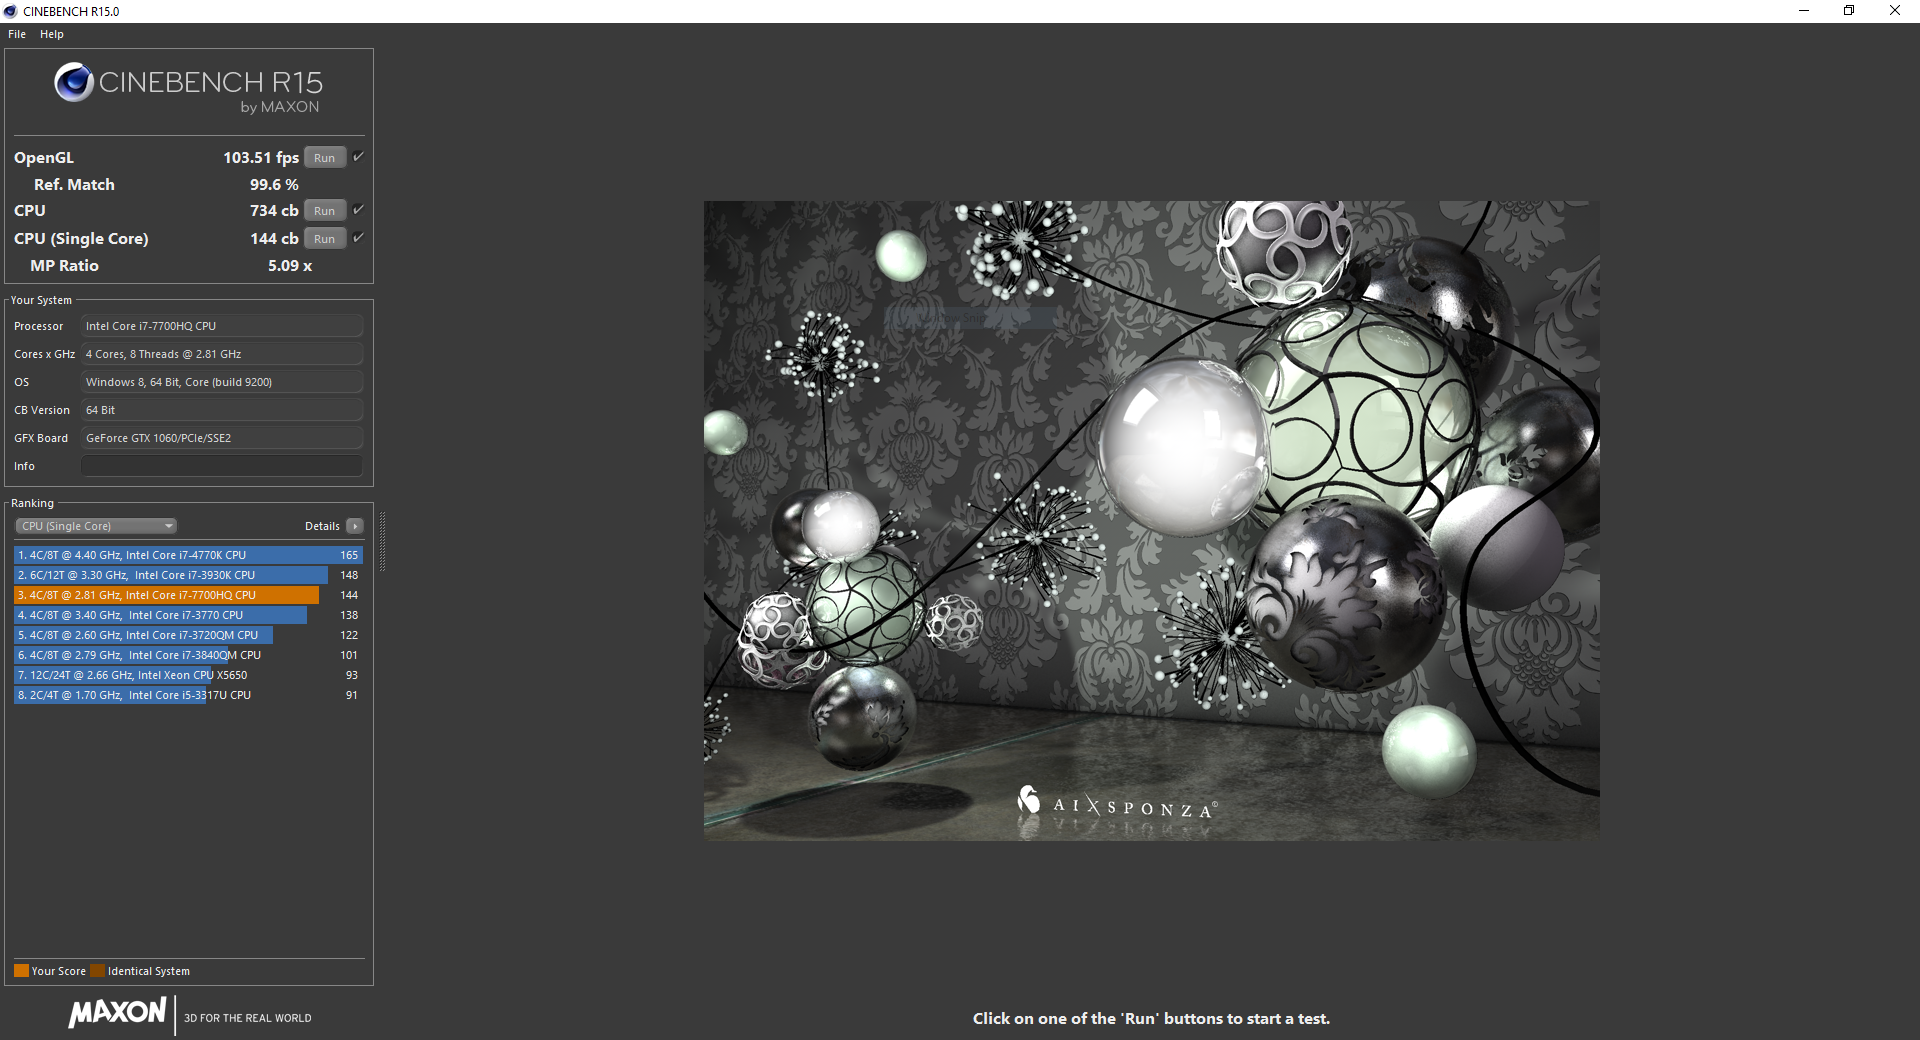
The quad-core Intel Core i7-7700HQ has been an incredibly popular choice for gaming notebooks. The Kaby Lake-based CPU has a base clock of 2.8 GHz (with a boost up to 3.8) and hyperthreading, making it a good choice for heavy multi-threaded workloads. We've seen a number of devices equipped with this processor, and each puts up some impressive performance that should be more than adequate for most users. Compared to the slower Core i5-7300HQ, the 7700HQ performs about 40-45% better in Cinebench R15's multicore test, which is a sizeable improvement. However, as most games still lack multi-threaded optimization, this will be more useful in processor-oriented tasks, such as video rendering and intense number crunching. The 7700HQ sits near the top of Intel's pack; the powerful i7-7820HK performs only about 7-14% better.
The GF62VR offers a 10% bump in multicore performance over the older GE62VR, which is equipped with a Core i7-6700HQ. Single core performance is even closer, with the 7700HQ scoring about 3-4% higher. As such, CPU-intensive tasks should behave very similarly between the two devices. Users concerned with processor speeds might want to opt for the older GE62VR to save on some cash.
Long-term performance is consistent; running the Cinebench R15 multi-core test 50 times in a row yields scores between 720 and 730.
| Cinebench R15 | |
| CPU Single 64Bit | |
| Aorus X9 | |
| Alienware 15 R3 Max-Q | |
| Lenovo Legion Y920-17IKB | |
| HP Omen 15-ce002ng | |
| Asus Strix GL502VM-DS74 | |
| Gigabyte P55W v7 | |
| Samsung Odyssey NP800G5M-X01US | |
| Lenovo Legion Y520-15IKBM 80YY001APB | |
| Acer Aspire VX15 VX5-591G-589S | |
| MSI GF62VR 7RF-877 | |
| Dell Inspiron 15 7566 PL | |
| MSI GE62VR 6RF-001US | |
| CPU Multi 64Bit | |
| Aorus X9 | |
| Lenovo Legion Y920-17IKB | |
| Lenovo Legion Y920-17IKB | |
| Alienware 15 R3 Max-Q | |
| Asus Strix GL502VM-DS74 | |
| HP Omen 15-ce002ng | |
| Samsung Odyssey NP800G5M-X01US | |
| MSI GF62VR 7RF-877 | |
| Gigabyte P55W v7 | |
| Dell Inspiron 15 7566 PL | |
| MSI GE62VR 6RF-001US | |
| Lenovo Legion Y520-15IKBM 80YY001APB | |
| Acer Aspire VX15 VX5-591G-589S | |
| wPrime 2.10 - 1024m | |
| Lenovo Legion Y520-15IKBM 80YY001APB | |
| Lenovo Legion Y920-17IKB | |
| Dell Inspiron 15 7566 PL | |
| MSI GE62VR 6RF-001US | |
| MSI GF62VR 7RF-877 | |
| Asus Strix GL502VM-DS74 | |
| Samsung Odyssey NP800G5M-X01US | |
* ... smaller is better
System Performance
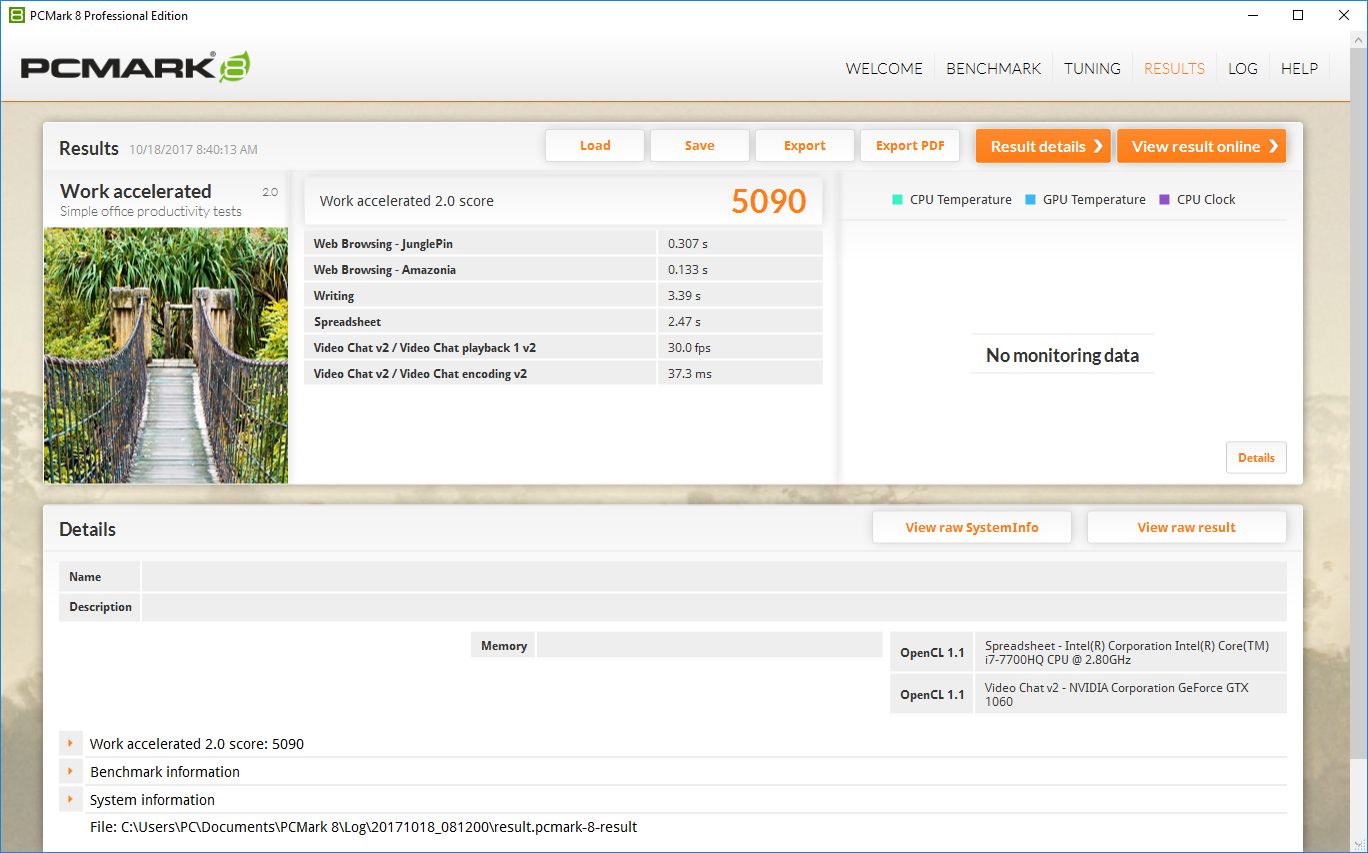
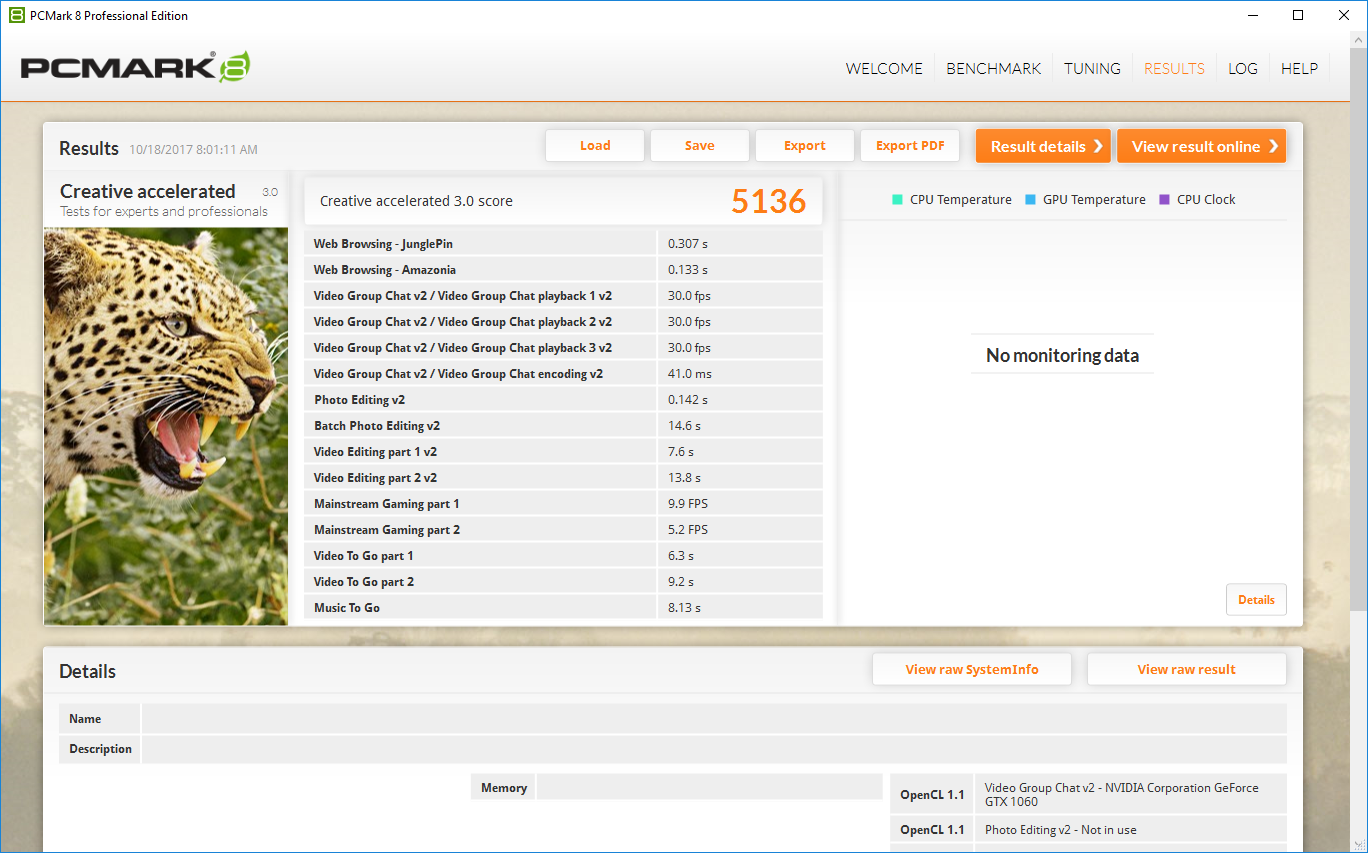
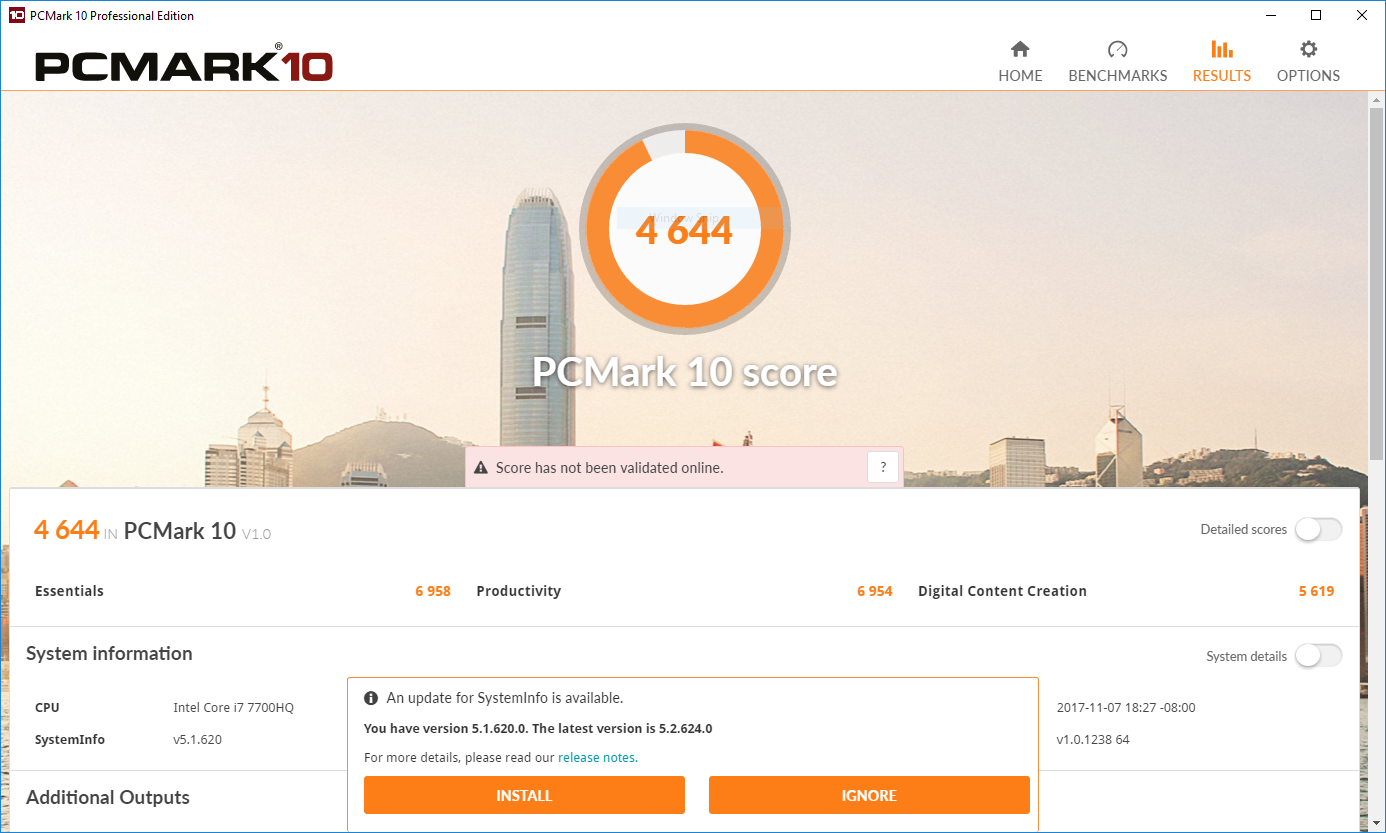
Overall system performance is responsive and quick. Using PCMark 8 to test the entire system, we see the GF62VR fall toward the tail end of its competition. However, this rating belies the overall snappiness of the machine; rarely were we left waiting on the system to respond. System performance is almost identical to the GE62VR with PCMark scores from both machines coming within a percentage point or less to each other. Users in need of more power should take a look at higher end machines like the Lenovo Legion Y920, which bests the GF62VR in every PCMark test by a significant margin.
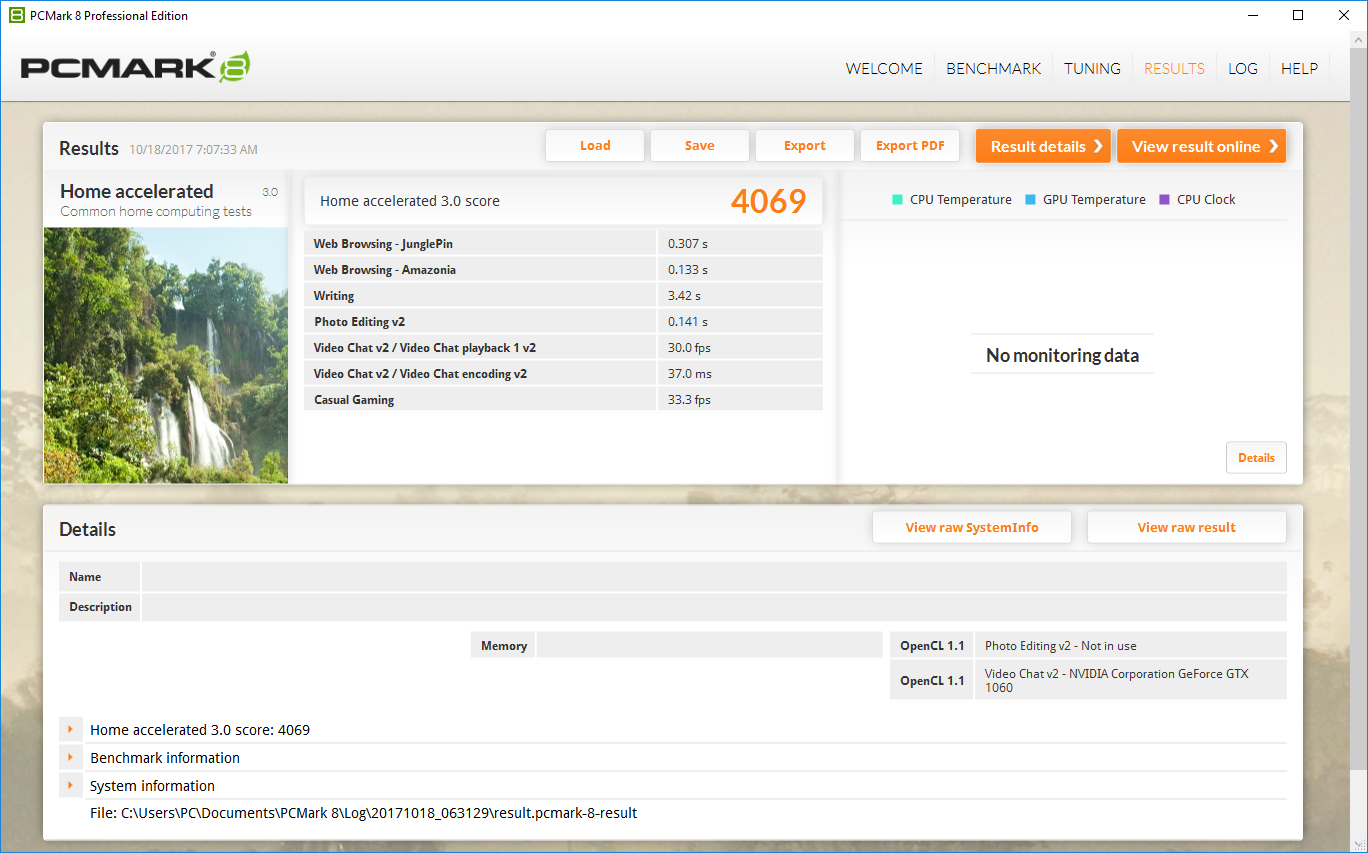
| PCMark 8 Home Score Accelerated v2 | 4069 points | |
| PCMark 8 Creative Score Accelerated v2 | 5136 points | |
| PCMark 8 Work Score Accelerated v2 | 5090 points | |
| PCMark 10 Score | 4644 points | |
Help | ||
Storage Devices
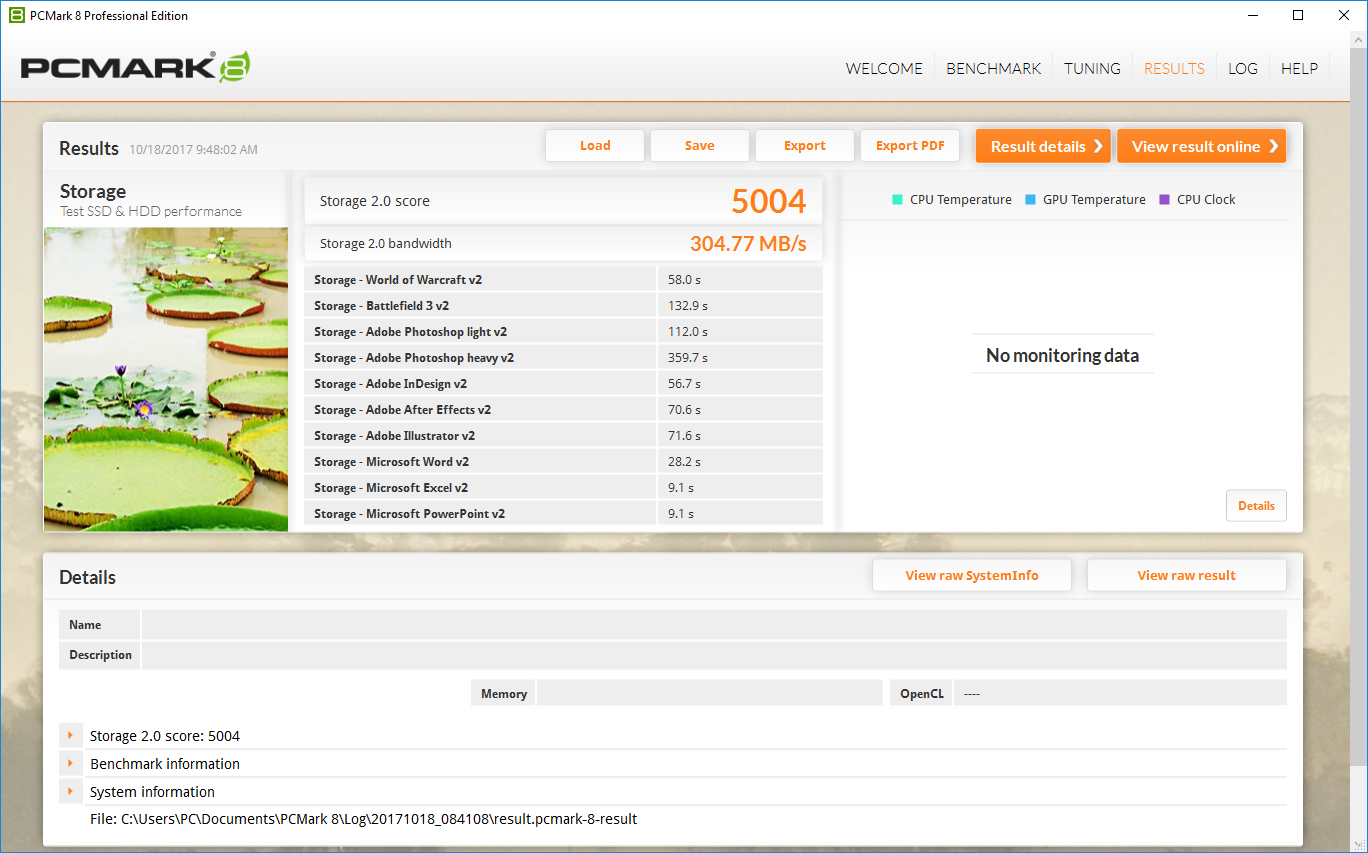
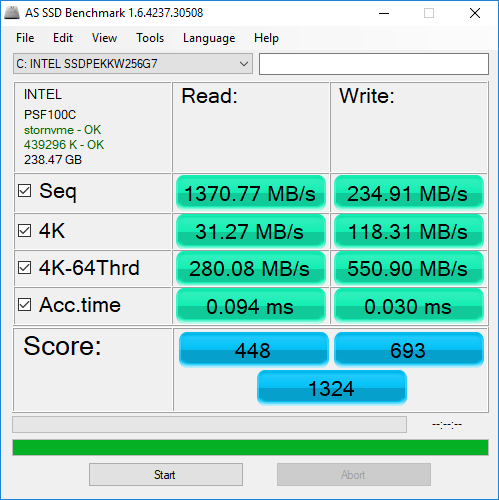
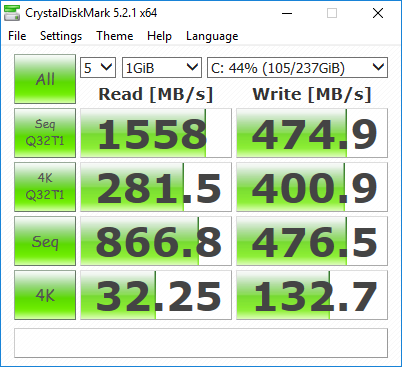
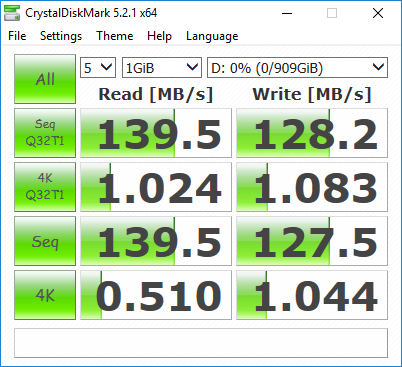
The combination of a fast NVMe SSD and a large 1 TB HDD tries to bring the best of both storage worlds. The operating system and frequently used programs load quickly off the main SSD, while media, older games, and other large files can be stored on the secondary HDD. The SSD comes from Intel and allows for fast access times and read speeds, but falls behind the speedier Samsung drives found in competitors. In fact, the Intel SSD's write speeds are more in line with SATA SSDs, which routinely average between 300-500 MB/s. The end result is a fairly disappointing drive.
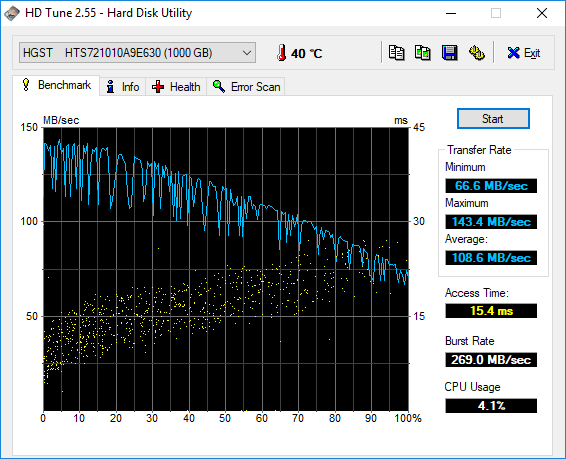
The 7200 RPM HDD is relatively quick for a mechanical drive, hitting read and write speeds of about 130-140 MB/s. Both drives can be easily swapped out should one fail or users wish to install their own. Most retailers also offer various options for both the NVMe and SATA drives.
| MSI GF62VR 7RF-877 Intel SSD 600p SSDPEKKW256G7 | MSI GE62VR 6RF-001US Samsung SM951 MZVPV512HDGL m.2 PCI-e | Lenovo Legion Y520-15IKBM 80YY001APB ADATA SX7000NP 256 GB | Schenker XMG A517 Samsung SSD 960 Evo 500GB m.2 NVMe | Gigabyte P55W v7 Liteonit CV3-8D256 | Asus Strix GL502VM-DS74 Samsung SSD 960 Evo 250GB m.2 NVMe | Samsung Odyssey NP800G5M-X01US Samsung PM961 NVMe MZVLW128HEGR | Dell Inspiron 15 7566 PL Toshiba SG5 THNSNK128GVN8 | Acer Aspire VX15 VX5-591G-589S Hynix HFS128G39TND | |
|---|---|---|---|---|---|---|---|---|---|
| AS SSD | 93% | 4% | 180% | -41% | 39% | 33% | -50% | -89% | |
| Copy Game MB/s (MB/s) | 471.7 | 898 90% | 1100 133% | 240.5 -49% | 157.6 -67% | ||||
| Copy Program MB/s (MB/s) | 286.5 | 403.5 41% | 483.6 69% | 299.5 5% | 111.1 -61% | ||||
| Copy ISO MB/s (MB/s) | 1069 | 1225 15% | 1599 50% | 1560 46% | 195 -82% | ||||
| Score Total (Points) | 1324 | 2572 94% | 898 -32% | 4063 207% | 840 -37% | 3501 164% | 1592 20% | 710 -46% | 882 -33% |
| Score Write (Points) | 693 | 581 -16% | 291 -58% | 1575 127% | 248 -64% | 1028 48% | 376 -46% | 218 -69% | 218 -69% |
| Score Read (Points) | 448 | 1327 196% | 409 -9% | 1677 274% | 393 -12% | 1670 273% | 852 90% | 332 -26% | 444 -1% |
| Access Time Write * (ms) | 0.03 | 0.038 -27% | 0.033 -10% | 0.026 13% | 0.083 -177% | 0.3 -900% | 0.031 -3% | 0.08 -167% | 0.261 -770% |
| Access Time Read * (ms) | 0.09 | 0.039 57% | 0.069 23% | 0.036 60% | 0.088 2% | 0.41 -356% | 0.066 27% | 0.099 -10% | 0.077 14% |
| 4K-64 Write (MB/s) | 551 | 329.8 -40% | 100.7 -82% | 1263 129% | 166.6 -70% | 768 39% | 176.4 -68% | 111.8 -80% | 113.9 -79% |
| 4K-64 Read (MB/s) | 280.1 | 1092 290% | 255.9 -9% | 1359 385% | 318.3 14% | 1375 391% | 564 101% | 256.9 -8% | 361.4 29% |
| 4K Write (MB/s) | 118.3 | 103 -13% | 110.6 -7% | 147 24% | 48.47 -59% | 118 0% | 124.1 5% | 92.6 -22% | 90.8 -23% |
| 4K Read (MB/s) | 31.27 | 44.04 41% | 30.9 -1% | 48 54% | 23.34 -25% | 44.55 42% | 44.75 43% | 25.39 -19% | 32.29 3% |
| Seq Write (MB/s) | 234.9 | 1480 530% | 795 238% | 1662 608% | 328.1 40% | 1424 506% | 752 220% | 134.1 -43% | 130.2 -45% |
| Seq Read (MB/s) | 1371 | 1912 39% | 1221 -11% | 2694 96% | 514 -63% | 2505 83% | 2433 77% | 493.2 -64% | 507 -63% |
* ... smaller is better

GPU Performance
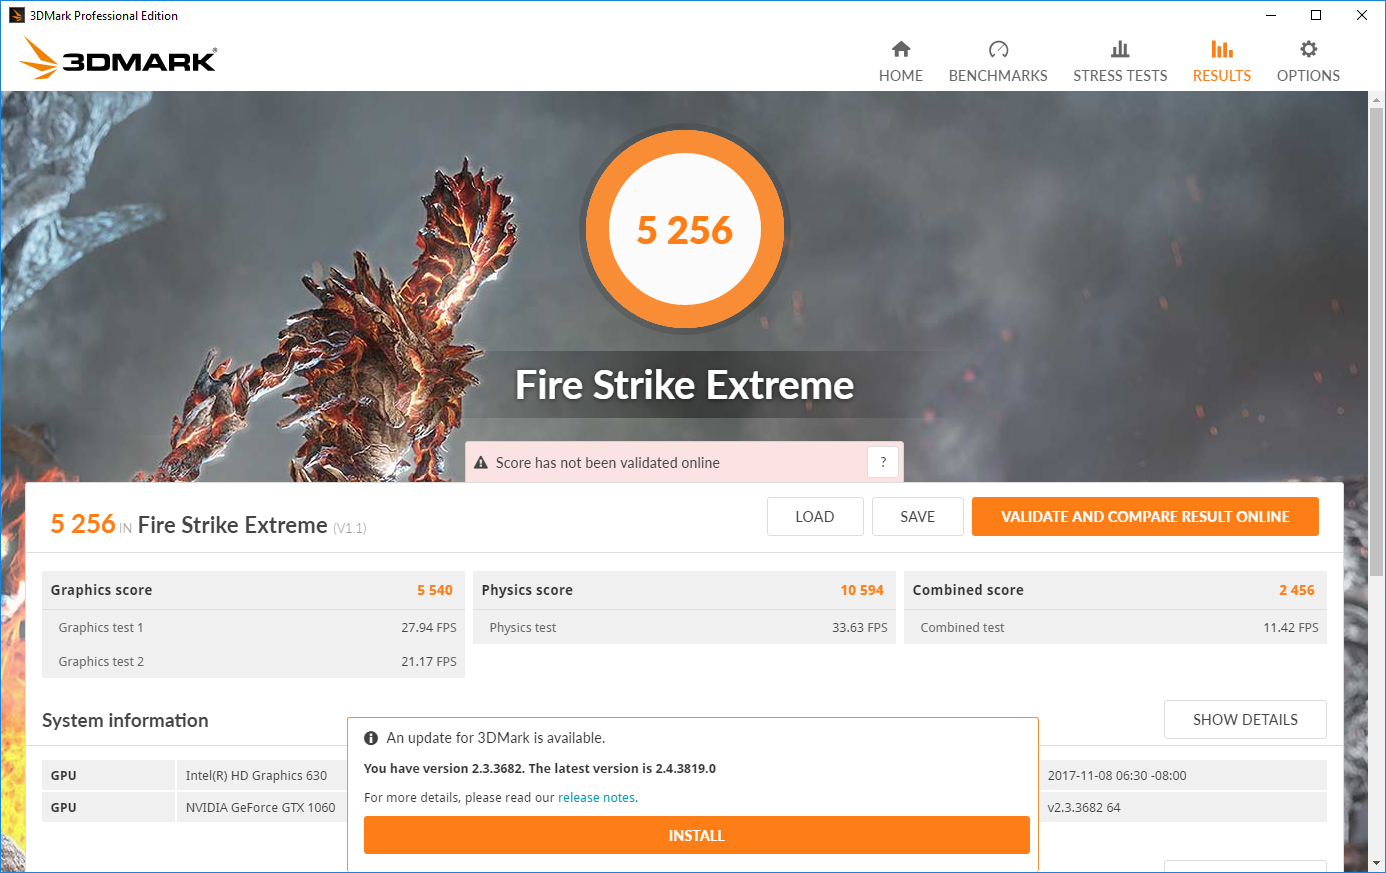
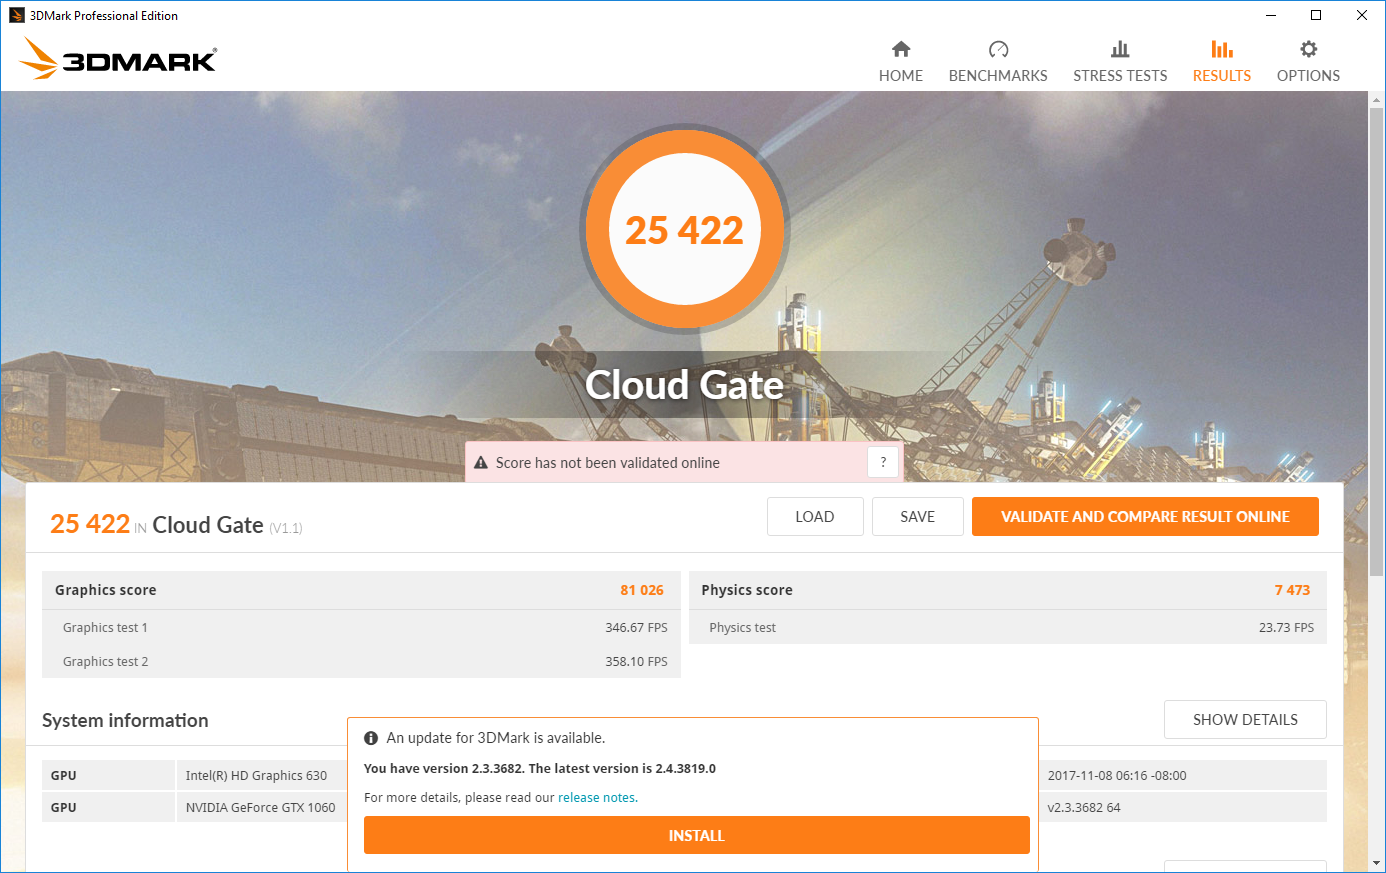
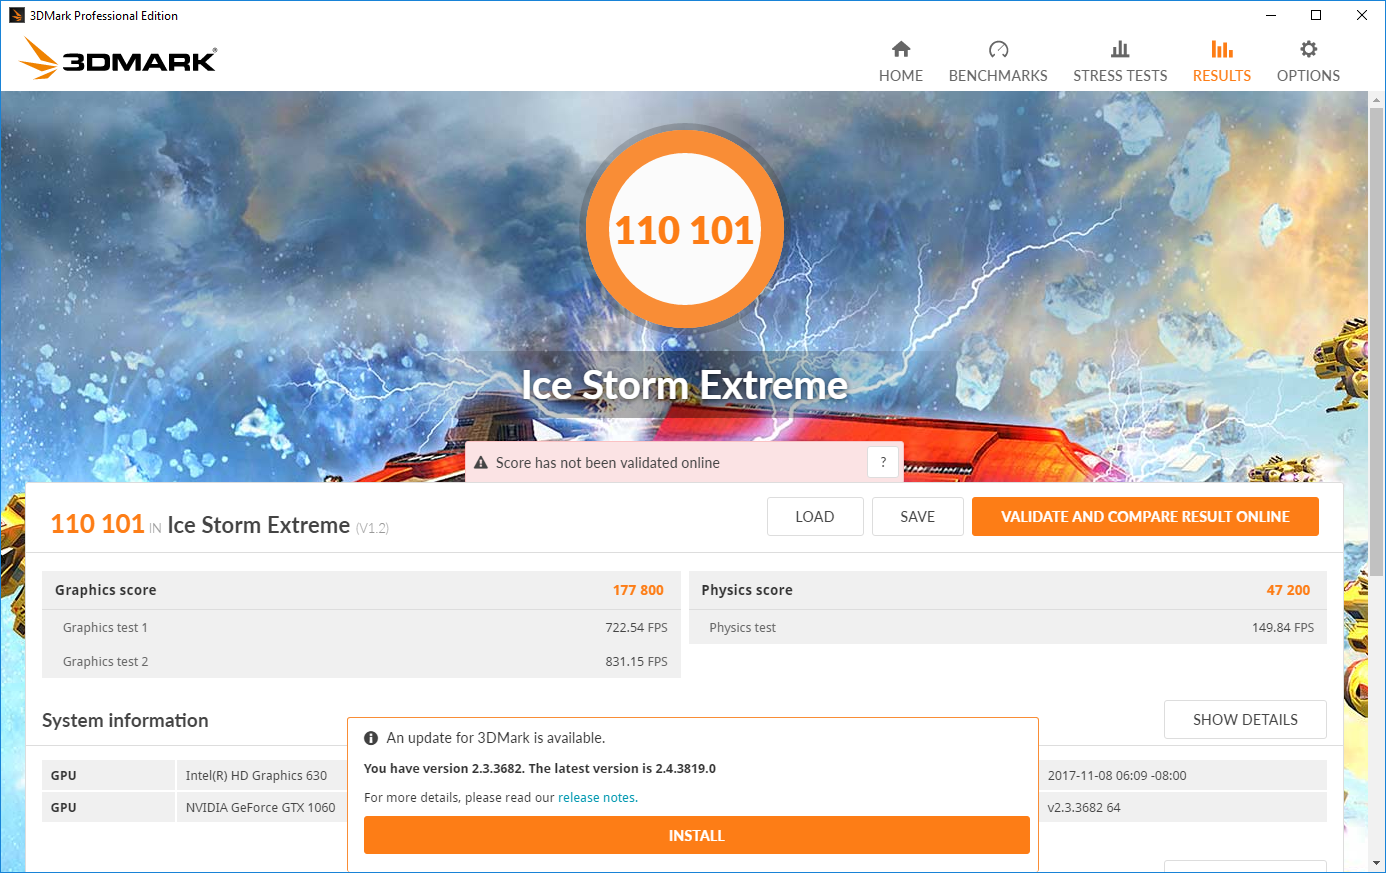
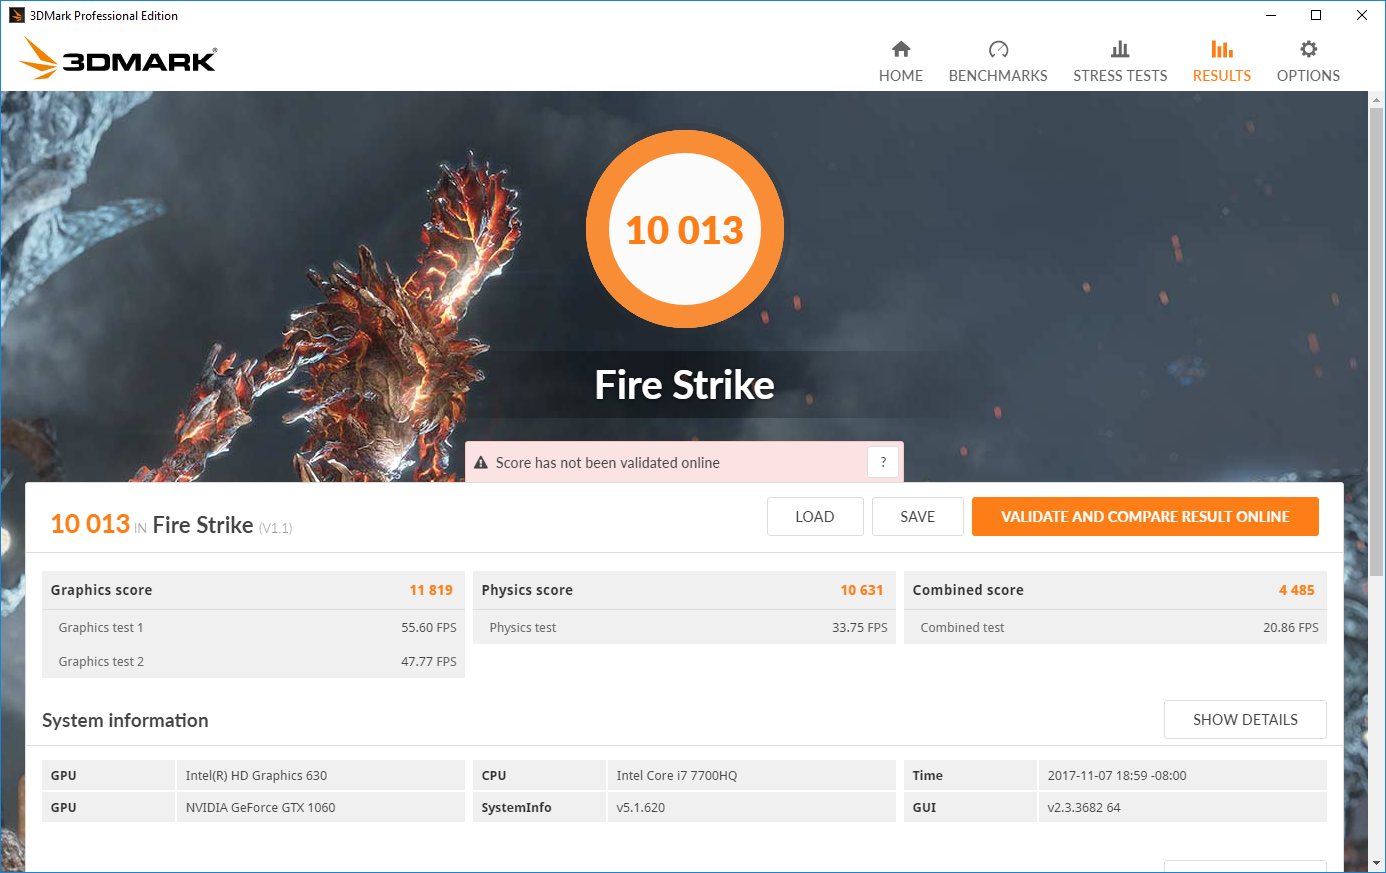
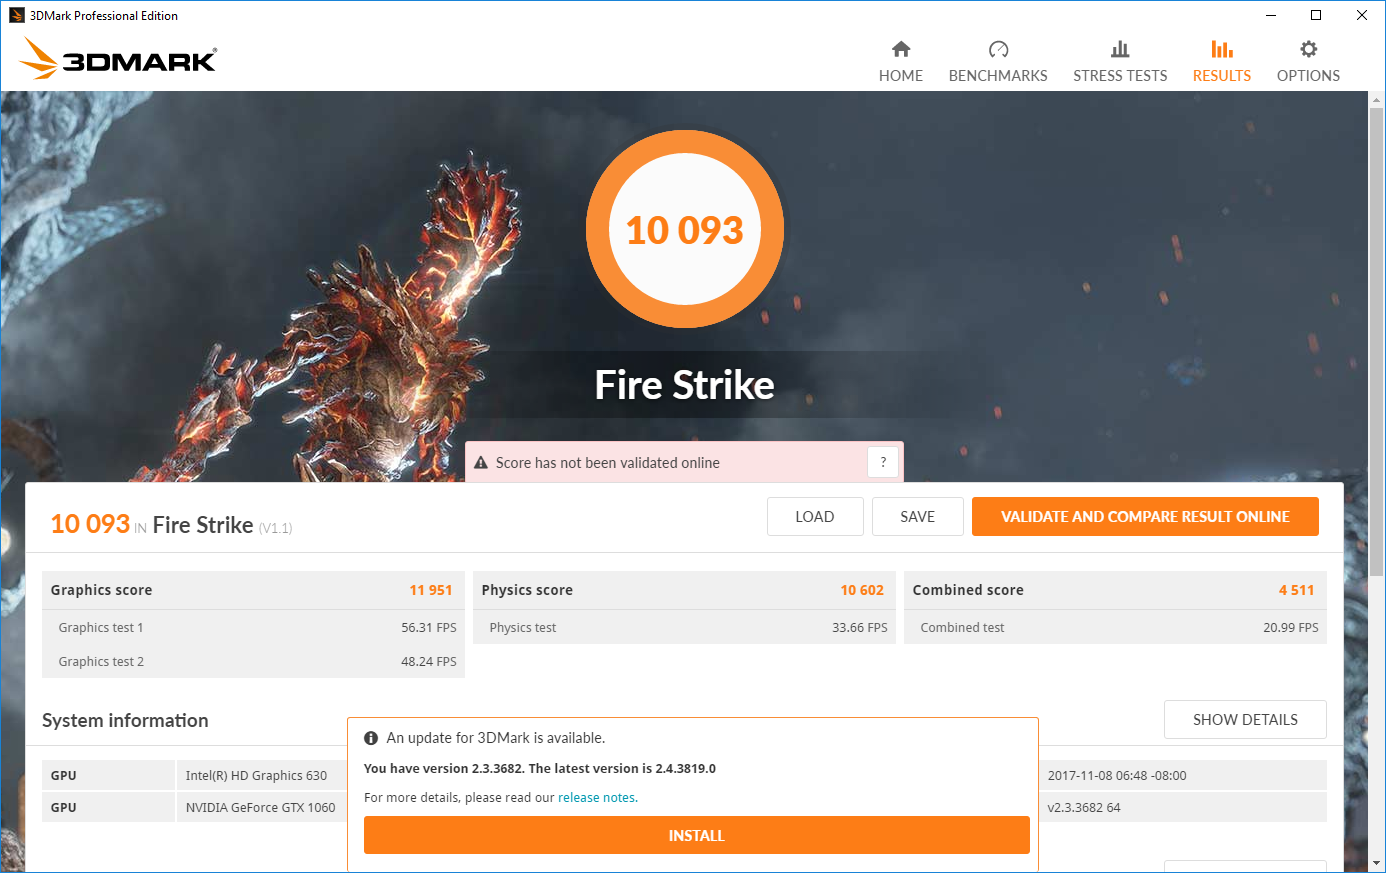
Nvidia's GeForce GTX 1060 has proven time and again to be a very capable mid-range GPU. 3D oriented tasks are no problem for the card, as shown by 3DMark. The GF62VR's variant of the GTX 1060 features 6 GB of GDDR5 VRAM and a boost clock up to 1671 MHz, which is tuned a bit higher than some other 1060-equipped notebooks. As a result, the device performs well in 3DMark, leading its competitors by as much as 7% in Fire Strike. (It should be noted that the GE62VR also scores higher than rivals and falls only 1% behind the newer GF62VR). This score was achieved with the fan boost enabled, but the device still performs admirably with the fans running under their normal profile, hitting 11819 in the Fire Strike Graphics test. This is still among the best scores we've seen from the GTX 1060. Gamers and professionals that need more from their graphics card should look at notebooks equipped with the GTX 1070 or GTX 1080NVIDIA GeForce GTX 1080 (Laptop), which perform about 40% and 80% better, respectively.
For more information about the Nvidia GeForce GTX 1060, please visit our dedicated page here.
| 3DMark | |
| 1280x720 Cloud Gate Standard Graphics | |
| Aorus X9 | |
| MSI GT75VR 7RF-012 Titan Pro | |
| Alienware 15 R3 Max-Q | |
| MSI GF62VR 7RF-877 | |
| Asus Strix GL502VM-DS74 | |
| Lenovo Legion Y920-17IKB | |
| MSI GE62VR 6RF-001US | |
| Lenovo Legion Y520-15IKBM 80YY001APB | |
| Gigabyte P55W v7 | |
| Acer Predator 15 G9-592-7925 | |
| Acer Aspire Nitro BE VN7-793G-5811 | |
| Asus Strix GL502VT-DS74 | |
| Samsung Odyssey NP800G5M-X01US | |
| 1920x1080 Fire Strike Graphics | |
| Aorus X9 | |
| MSI GT75VR 7RF-012 Titan Pro | |
| Alienware 15 R3 Max-Q | |
| Lenovo Legion Y920-17IKB | |
| MSI GF62VR 7RF-877 | |
| MSI GE62VR 6RF-001US | |
| Gigabyte P55W v7 | |
| Asus Strix GL502VM-DS74 | |
| Lenovo Legion Y520-15IKBM 80YY001APB | |
| Acer Aspire Nitro BE VN7-793G-5811 | |
| Acer Predator 15 G9-592-7925 | |
| Asus Strix GL502VT-DS74 | |
| Samsung Odyssey NP800G5M-X01US | |
| 1920x1080 Ice Storm Extreme Graphics | |
| Alienware 15 R3 Max-Q | |
| Asus Strix GL502VM-DS74 | |
| Acer Aspire Nitro BE VN7-793G-5811 | |
| MSI GF62VR 7RF-877 | |
| Asus Strix GL502VT-DS74 | |
| Samsung Odyssey NP800G5M-X01US | |
| MSI GE62VR 6RF-001US | |
| Lenovo Legion Y520-15IKBM 80YY001APB | |
| 3DMark Ice Storm Standard Score | 116682 points | |
| 3DMark Cloud Gate Standard Score | 25422 points | |
| 3DMark Fire Strike Score | 10093 points | |
| 3DMark Fire Strike Extreme Score | 5256 points | |
Help | ||
Gaming Performance
It should be no surprise, based on the stellar GPU performance, that gaming is no challenge for the GF62VR. Most AAA titles can be played at the display's native resolution (1920 x 1080) at High or Ultra settings without breaking a sweat. Popular games, like DOOM, Rise of the Tomb Raider, and Fallout 4 will be smooth. Lighter titles, like Rocket League, can even be played at 4K and still maintain high framerates. Demanding or poorly optimized games will need settings turned down to High or Medium to hit the 60 fps threshold.
Long gameplay sessions should yield fairly steady framerates. Running The Witcher 3 for an hour sees the FPS counter hover between 36-40, which is consistent. There are no noticeable or jarring dips in the framerate.
| BioShock Infinite - 1920x1080 Ultra Preset, DX11 (DDOF) | |
| Alienware 15 R3 Max-Q | |
| Lenovo Legion Y920-17IKB | |
| MSI GF62VR 7RF-877 | |
| Asus FX502VM-AS73 | |
| MSI GS63VR 7RF-228US | |
| Hyperbook N85-7300-8-12-1060 | |
| MSI GE72VR-6RF16H21 | |
| MSI GE62VR 6RF-001US | |
| Lenovo Legion Y520-15IKBM 80YY001APB | |
| Acer Aspire Nitro BE VN7-793G-5811 | |
| Acer Aspire VX15 VX5-591G-589S | |
| Dell Inspiron 15 7566 PL | |
| Metro: Last Light - 1920x1080 Very High (DX11) AF:16x | |
| Lenovo Legion Y920-17IKB | |
| Asus FX502VM-AS73 | |
| MSI GS63VR 7RF-228US | |
| MSI GF62VR 7RF-877 | |
| MSI GE62VR 6RF-001US | |
| Thief - 1920x1080 Very High Preset AA:FXAA & High SS AF:8x | |
| Lenovo Legion Y920-17IKB | |
| Asus FX502VM-AS73 | |
| MSI GS63VR 7RF-228US | |
| MSI GF62VR 7RF-877 | |
| MSI GE62VR 6RF-001US | |
| Hyperbook N85-7300-8-12-1060 | |
| Lenovo Legion Y520-15IKBM 80YY001APB | |
| Dell Inspiron 15 7566 PL | |
| The Witcher 3 | |
| 1920x1080 Ultra Graphics & Postprocessing (HBAO+) | |
| Aorus X9 | |
| Alienware 15 R3 Max-Q | |
| Lenovo Legion Y920-17IKB | |
| Lenovo Legion Y920-17IKB | |
| MSI GS63VR 7RF-228US | |
| Hyperbook N85-7300-8-12-1060 | |
| MSI GF62VR 7RF-877 | |
| Gigabyte P55W v7 | |
| Gigabyte Aero 15 | |
| MSI GE72VR-6RF16H21 | |
| Lenovo Legion Y520-15IKBM 80YY001APB | |
| HP Omen 15-ce002ng | |
| Acer Aspire Nitro BE VN7-793G-5811 | |
| Dell Inspiron 15 7566 PL | |
| 1920x1080 High Graphics & Postprocessing (Nvidia HairWorks Off) | |
| Aorus X9 | |
| Alienware 15 R3 Max-Q | |
| MSI GS63VR 7RF-228US | |
| Gigabyte P55W v7 | |
| Gigabyte Aero 15 | |
| MSI GF62VR 7RF-877 | |
| MSI GE72VR-6RF16H21 | |
| HP Omen 15-ce002ng | |
| Hyperbook N85-7300-8-12-1060 | |
| Lenovo Legion Y520-15IKBM 80YY001APB | |
| Acer Aspire Nitro BE VN7-793G-5811 | |
| Dell Inspiron 15 7566 PL | |
| Fallout 4 | |
| 1920x1080 Ultra Preset AA:T AF:16x | |
| Asus FX502VM-AS73 | |
| MSI GF62VR 7RF-877 | |
| MSI GS63VR 7RF-228US | |
| MSI GE62VR 6RF-001US | |
| 1920x1080 High Preset AA:T AF:16x | |
| MSI GF62VR 7RF-877 | |
| Rise of the Tomb Raider | |
| 1920x1080 Very High Preset AA:FX AF:16x | |
| Lenovo Legion Y920-17IKB | |
| MSI GS63VR 7RF-228US | |
| Gigabyte P55W v7 | |
| Asus FX502VM-AS73 | |
| MSI GF62VR 7RF-877 | |
| MSI GE72VR-6RF16H21 | |
| MSI GE62VR 6RF-001US | |
| HP Omen 15-ce002ng | |
| 1920x1080 High Preset AA:FX AF:4x | |
| MSI GF62VR 7RF-877 | |
| Gigabyte P55W v7 | |
| MSI GE72VR-6RF16H21 | |
| HP Omen 15-ce002ng | |
| Hitman 2016 | |
| 1920x1080 Ultra / On AA:SM AF:16x | |
| MSI GF62VR 7RF-877 | |
| 1920x1080 High / On AA:FX AF:8x | |
| MSI GF62VR 7RF-877 | |
| Doom | |
| 1920x1080 Ultra Preset AA:SM | |
| Asus FX502VM-AS73 | |
| MSI GF62VR 7RF-877 | |
| MSI GS63VR 7RF-228US | |
| HP Omen 15-ce002ng | |
| MSI GE62VR 6RF-001US | |
| 1920x1080 High Preset AA:FX | |
| MSI GF62VR 7RF-877 | |
| HP Omen 15-ce002ng | |
| Rocket League | |
| 1920x1080 High Quality AA:High FX | |
| Aorus X9 | |
| MSI GF62VR 7RF-877 | |
| HP Omen 15-ce002ng | |
| 3840x2160 High Quality AA:High FX | |
| Aorus X9 | |
| MSI GF62VR 7RF-877 | |
| HP Omen 15-ce002ng | |
| 1920x1080 Quality AA:Medium FX | |
| MSI GF62VR 7RF-877 | |
| HP Omen 15-ce002ng | |
| Dirt 4 | |
| 3840x2160 Ultra Preset AF:16x | |
| MSI GF62VR 7RF-877 | |
| 1920x1080 Ultra Preset AA:4xMS AF:16x | |
| Aorus X9 | |
| MSI GF62VR 7RF-877 | |
| HP Omen 15-ce002ng | |
| 1920x1080 High Preset AA:2xMS AF:8x | |
| Aorus X9 | |
| MSI GF62VR 7RF-877 | |
| HP Omen 15-ce002ng | |
| Playerunknown's Battlegrounds (PUBG) | |
| 1920x1080 Ultra Preset | |
| Aorus X9 | |
| MSI GF62VR 7RF-877 | |
| 1920x1080 High Preset | |
| Aorus X9 | |
| MSI GF62VR 7RF-877 | |
| low | med. | high | ultra | 4K | |
|---|---|---|---|---|---|
| BioShock Infinite (2013) | 108 | ||||
| Metro: Last Light (2013) | 75 | ||||
| Thief (2014) | 71 | ||||
| The Witcher 3 (2015) | 68 | 39 | |||
| Batman: Arkham Knight (2015) | 86 | 61 | |||
| Metal Gear Solid V (2015) | 60 | 60 | |||
| Fallout 4 (2015) | 83 | 69 | |||
| Just Cause 3 (2015) | 79 | 70 | |||
| Rise of the Tomb Raider (2016) | 73 | 60 | |||
| Hitman 2016 (2016) | 58 | 51 | |||
| Ashes of the Singularity (2016) | 45 | ||||
| Doom (2016) | 99 | 93 | |||
| Mafia 3 (2016) | 48 | 40 | |||
| Farming Simulator 17 (2016) | 162 | 150 | |||
| Resident Evil 7 (2017) | 104 | 83 | |||
| Rocket League (2017) | 238 | 171 | 64 | ||
| Dirt 4 (2017) | 98 | 58 | 31 | ||
| Playerunknown's Battlegrounds (PUBG) (2017) | 69 | 53 |
Stress Test
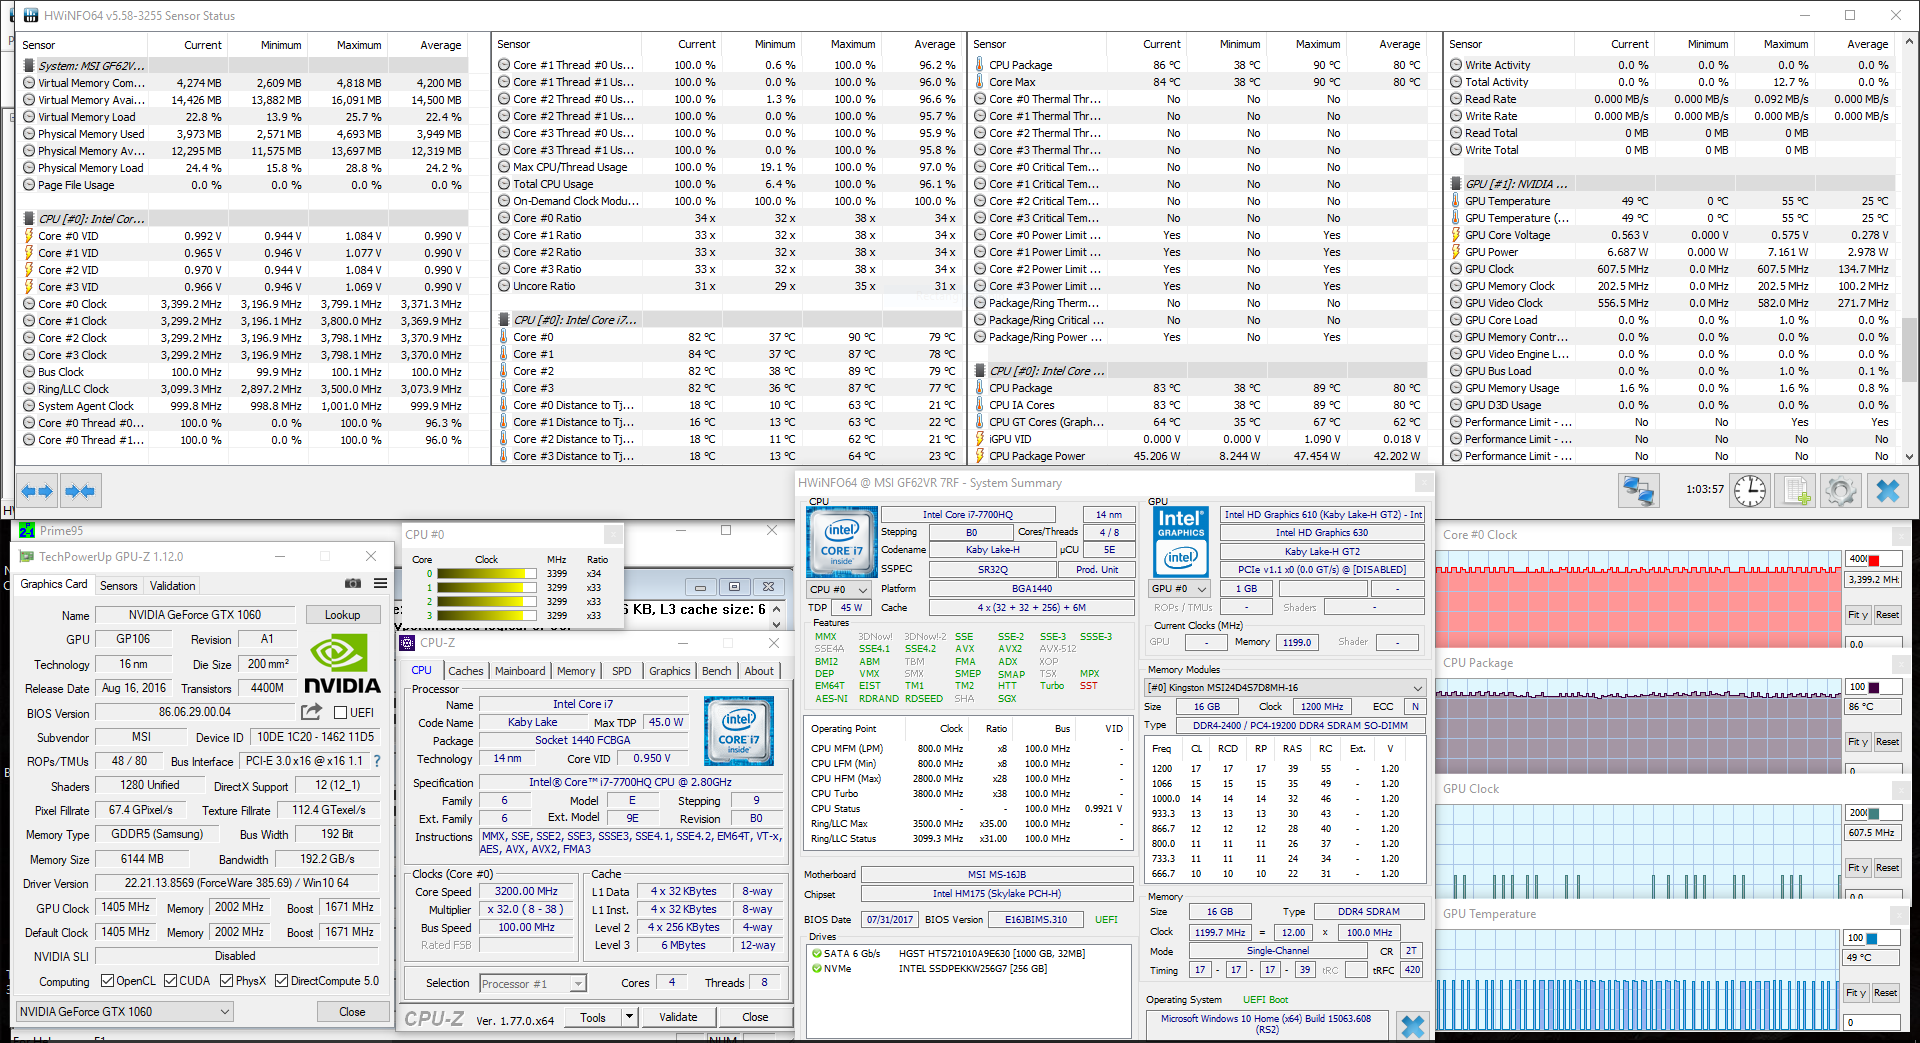
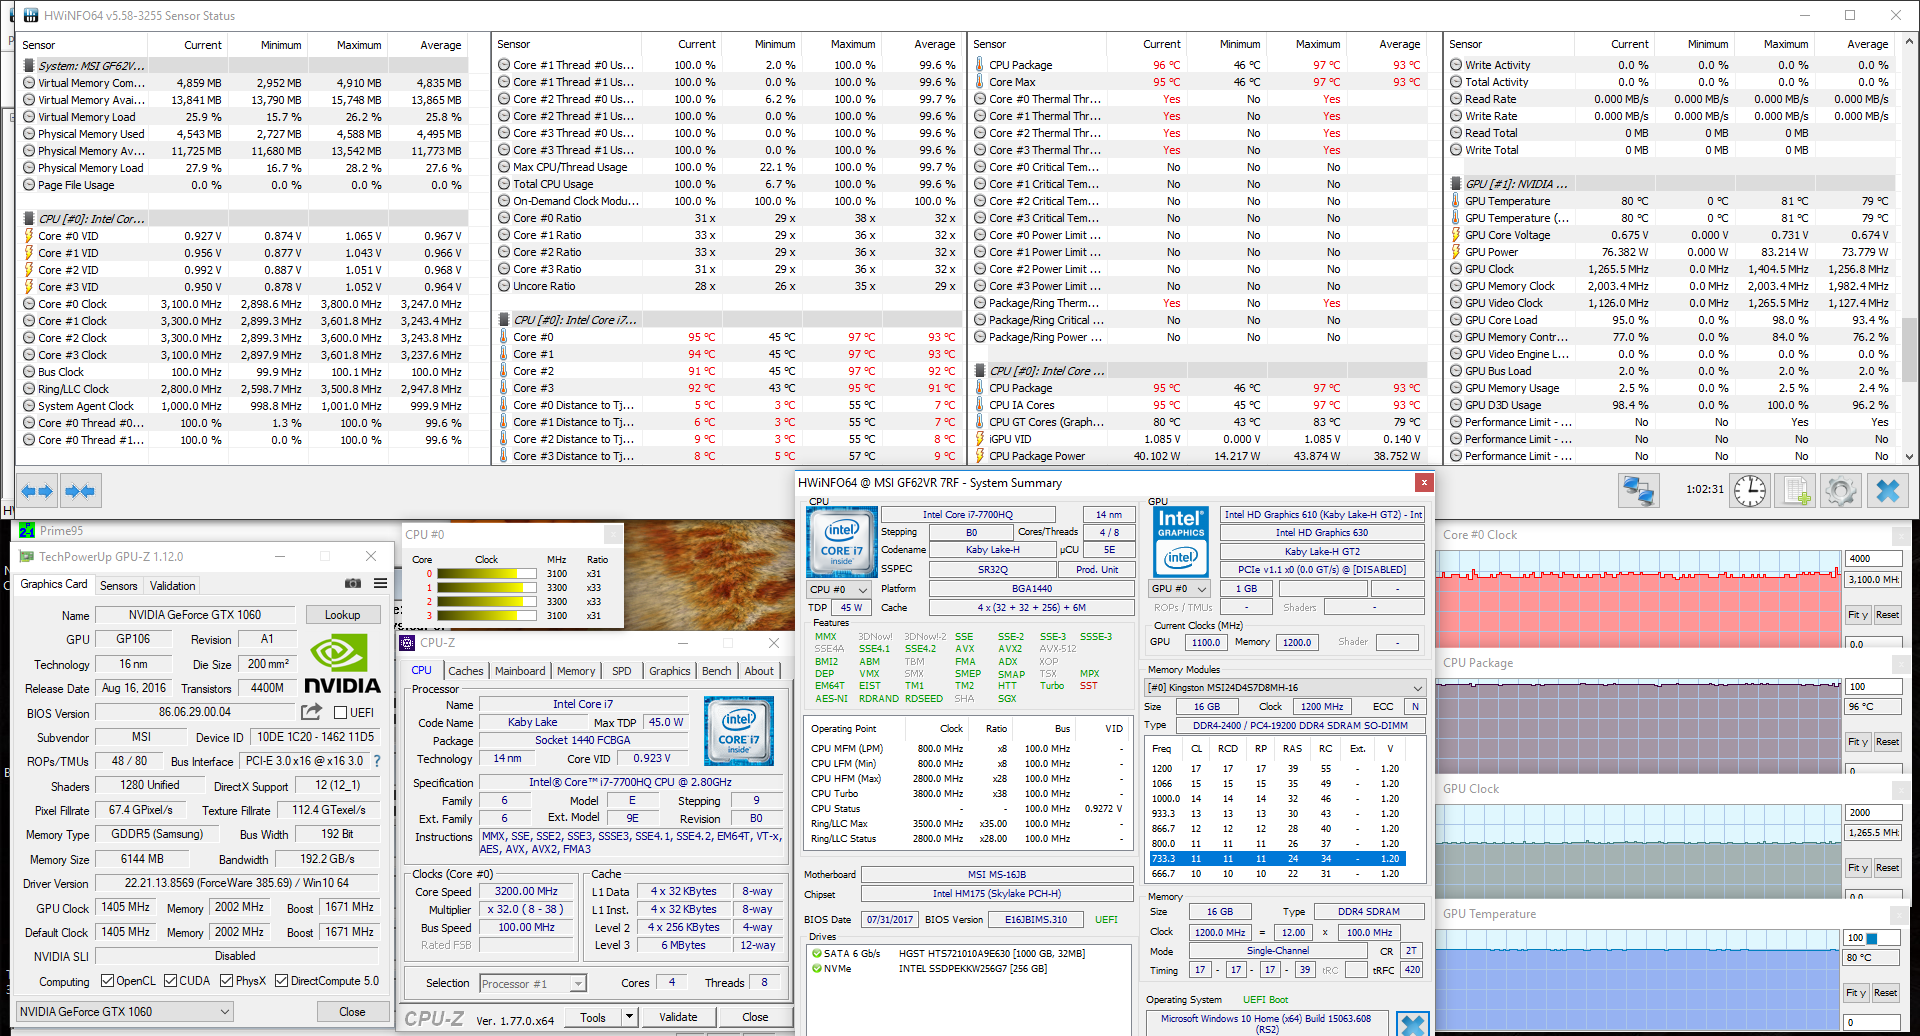
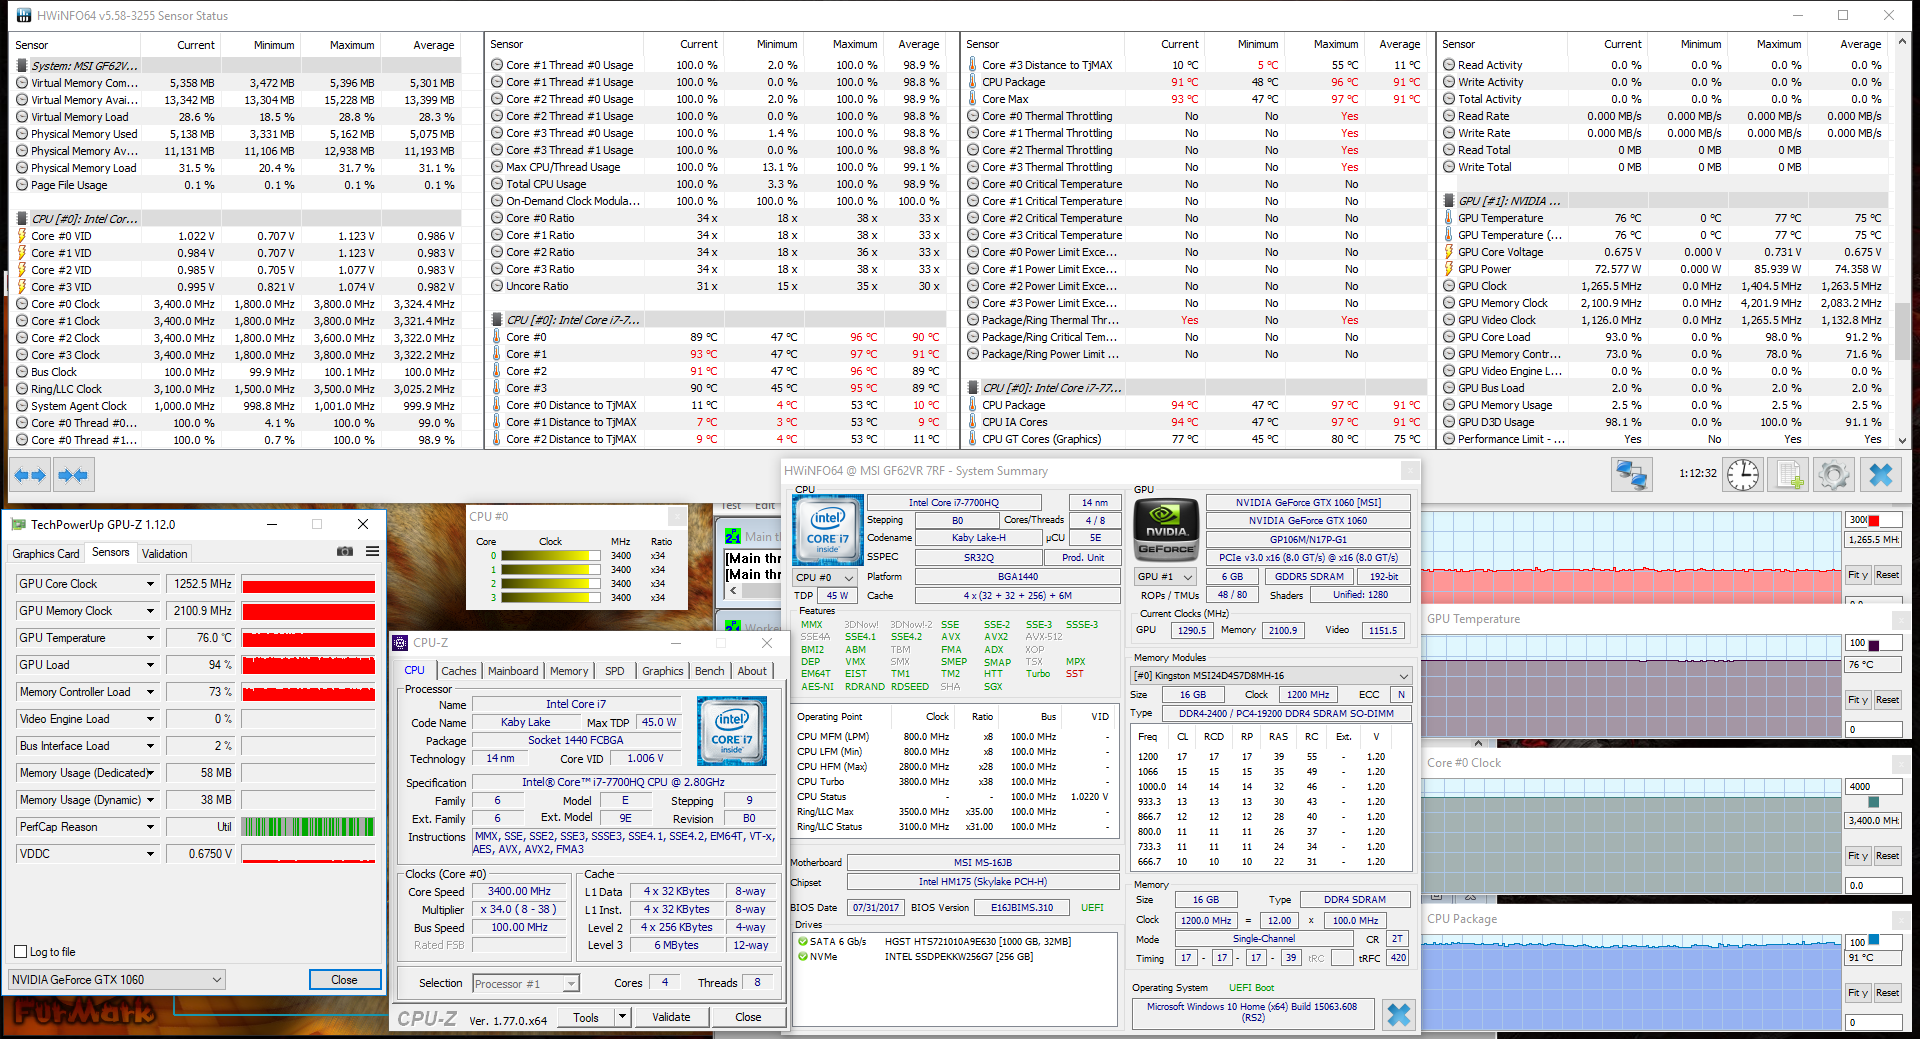
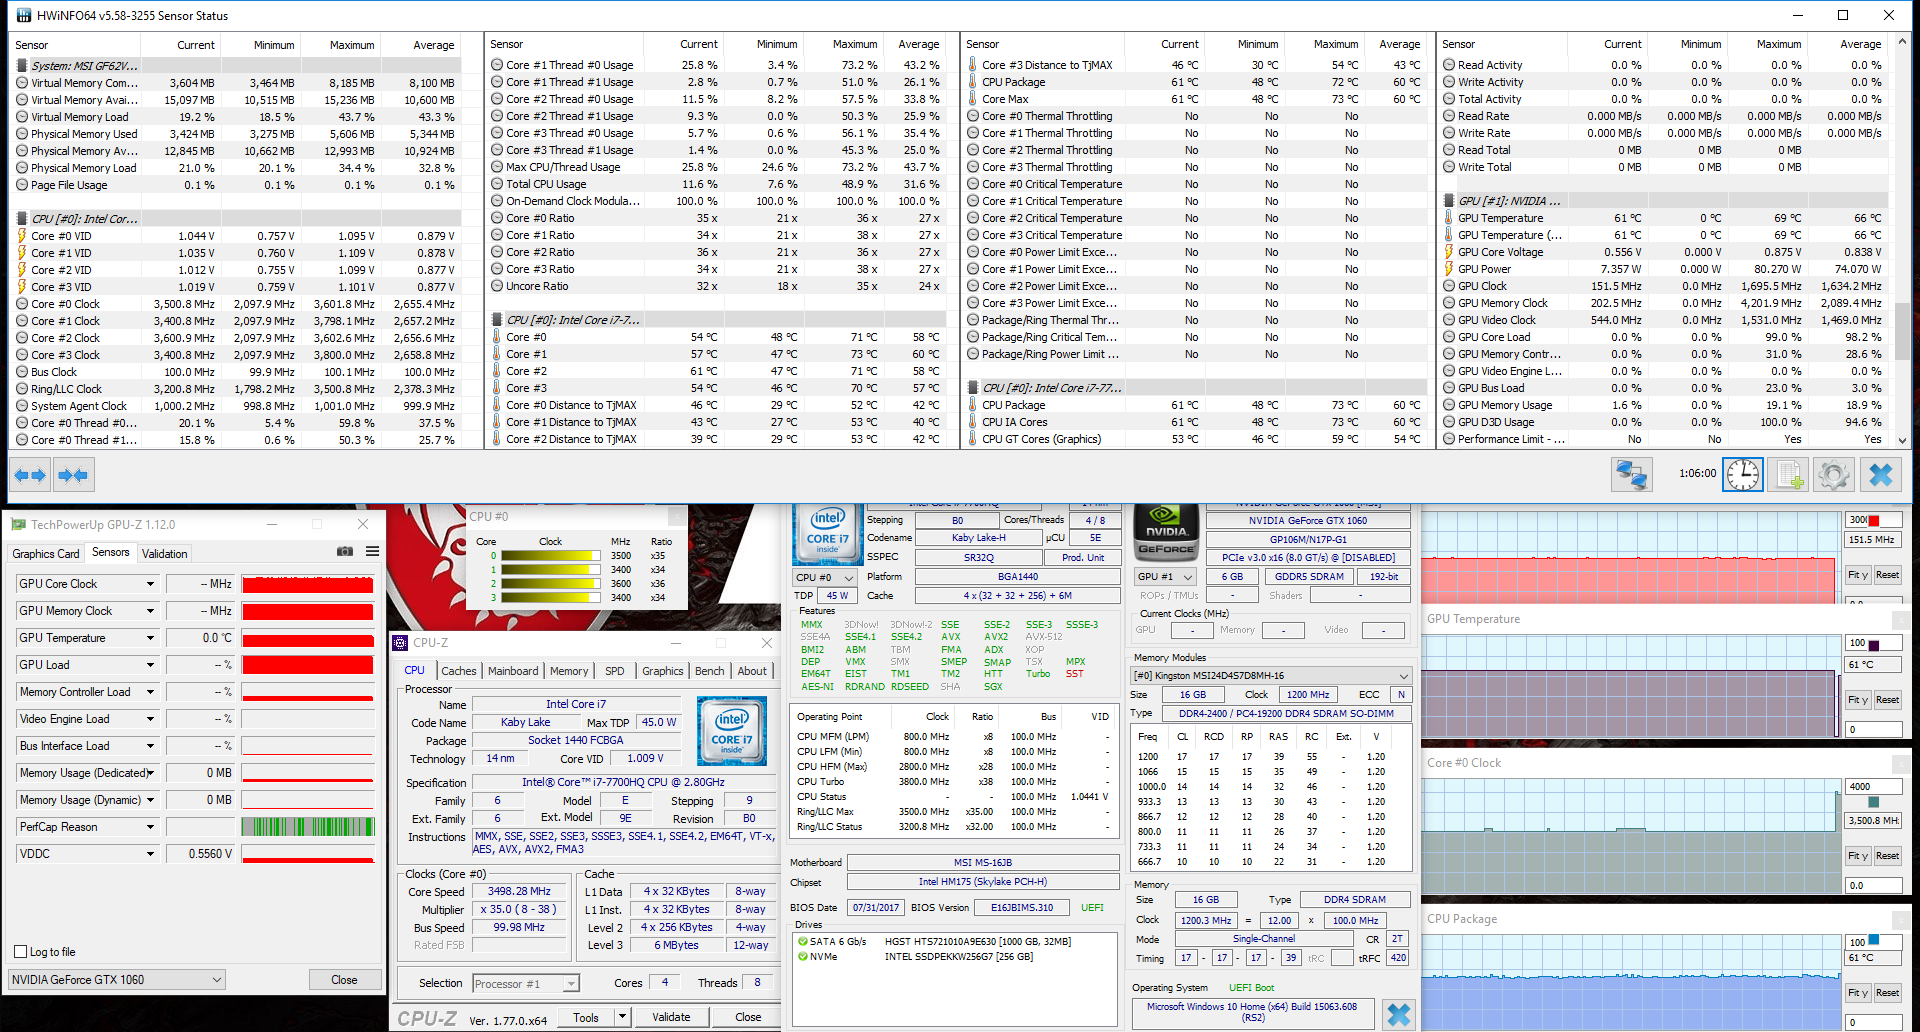
Stress testing with synthetic and real-world benchmarks gives us a good idea of what to expect from prolonged workloads that place a high demand on the system. Using Prime95 to fully tax the CPU, we see each core of the 7700HQ boost up to 3.8 GHz intermittently with an average of 3.4 GHz across the CPU. Temperatures remain reasonable at about 80° C. Running FurMark sees the GPU stay near its base clock speed of just under 1300 MHz. Temperatures across the GPU die remain steady at 71° C, which is well within acceptable limits.
Running FurMark and Prime95 together sees more of the same; the CPU maintains an average clock speed of about 3.2 GHz, while the GPU holds at an average of 1260 MHz. However, temperatures across the CPU package climb to a toasty 93° C. Intel rates their CPUs as able to safely operate under 100° C, but these temps are encroaching upon that limit. GPU heat averages 79° C. Enabling the "Cooler Boost" mode runs the fans at full speed through indefinitely, and re-running our dual stress test in this mode sees a slight bump in performance with a small reduction in temperatures.
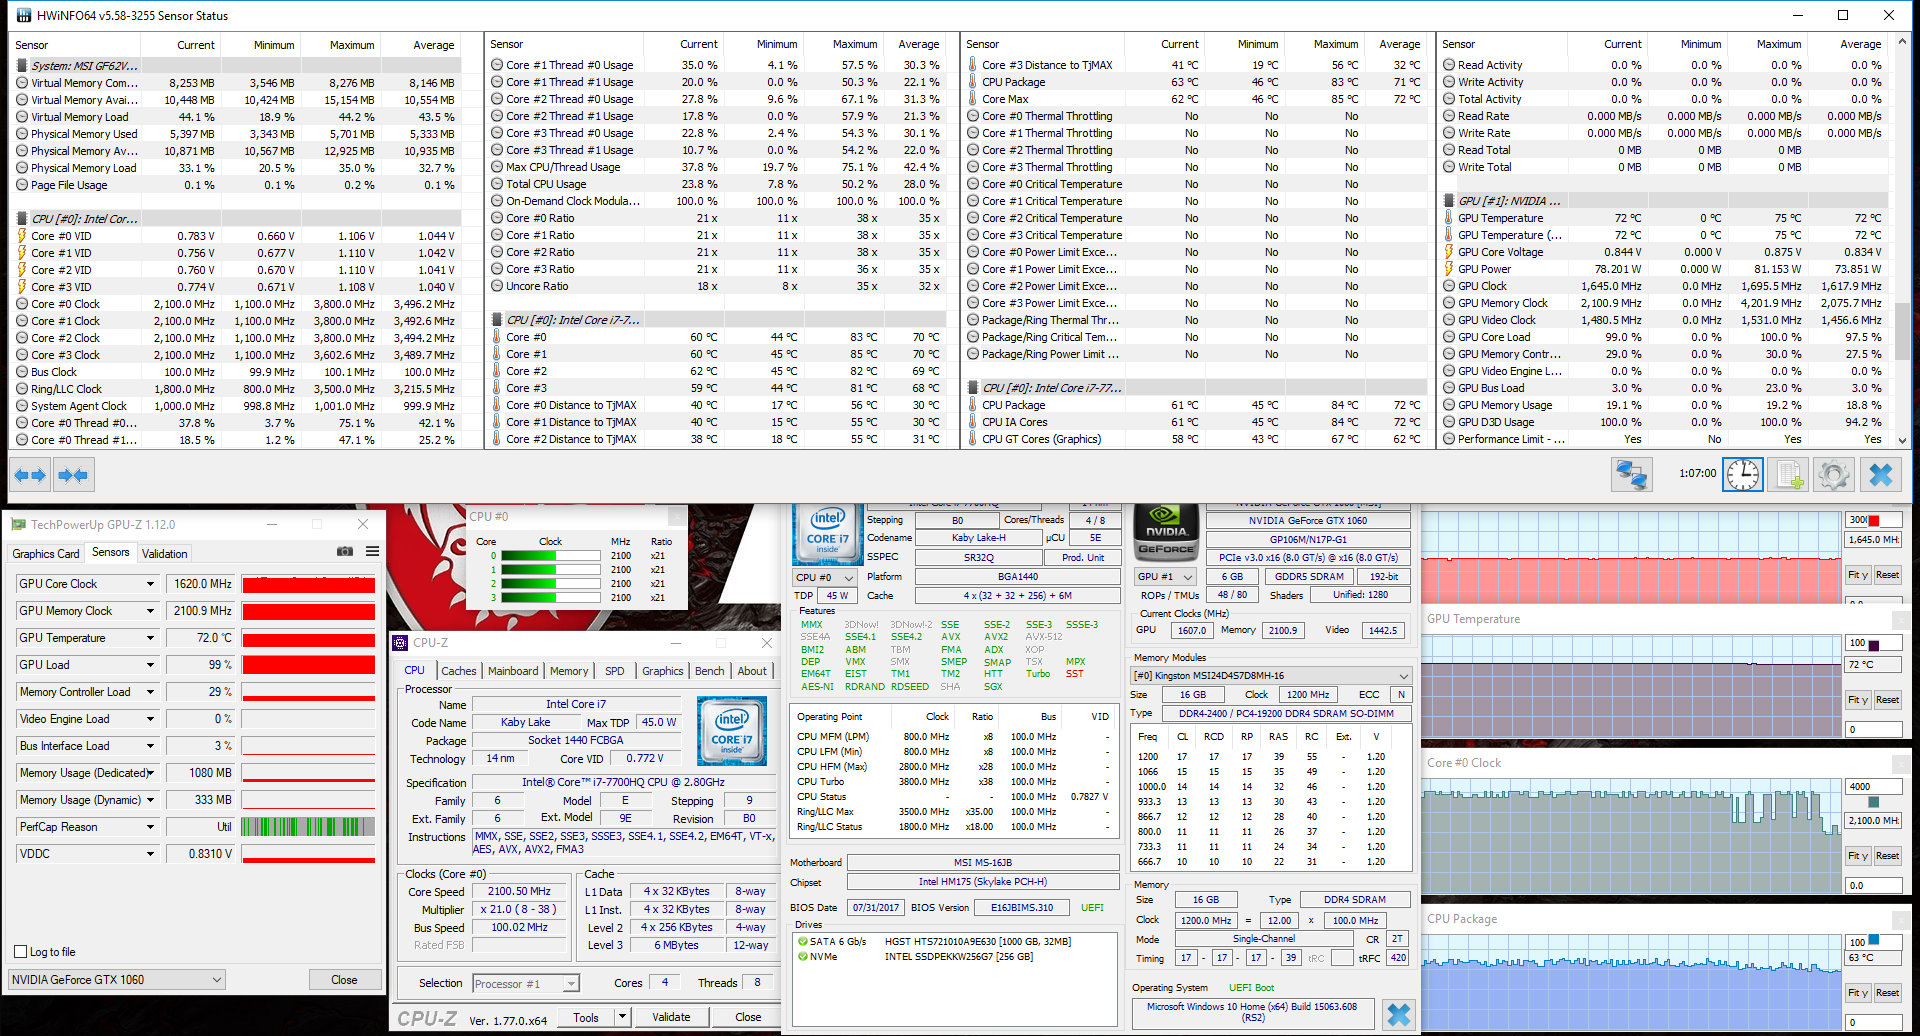
While synthetic testing creates a worst case scenario, running The Witcher 3 gives us a better idea of how the system operates under real-world testing. The GF62VR doesn't disappoint. Both the CPU and GPU are able to run strong throughout the test (3.5 GHz and 1618 MHz, respectively), and temperatures are very well managed, hovering in the low 70s. Running the game for an hour with Cooler Boost enabled reduces these temperatures even further, with the CPU settling in at 60° C and the GPU averaging 66° C. While Cooler Boost greatly increases the noise level, it may be a worthy tradeoff for the reduction in heat output and the small bump in performance.
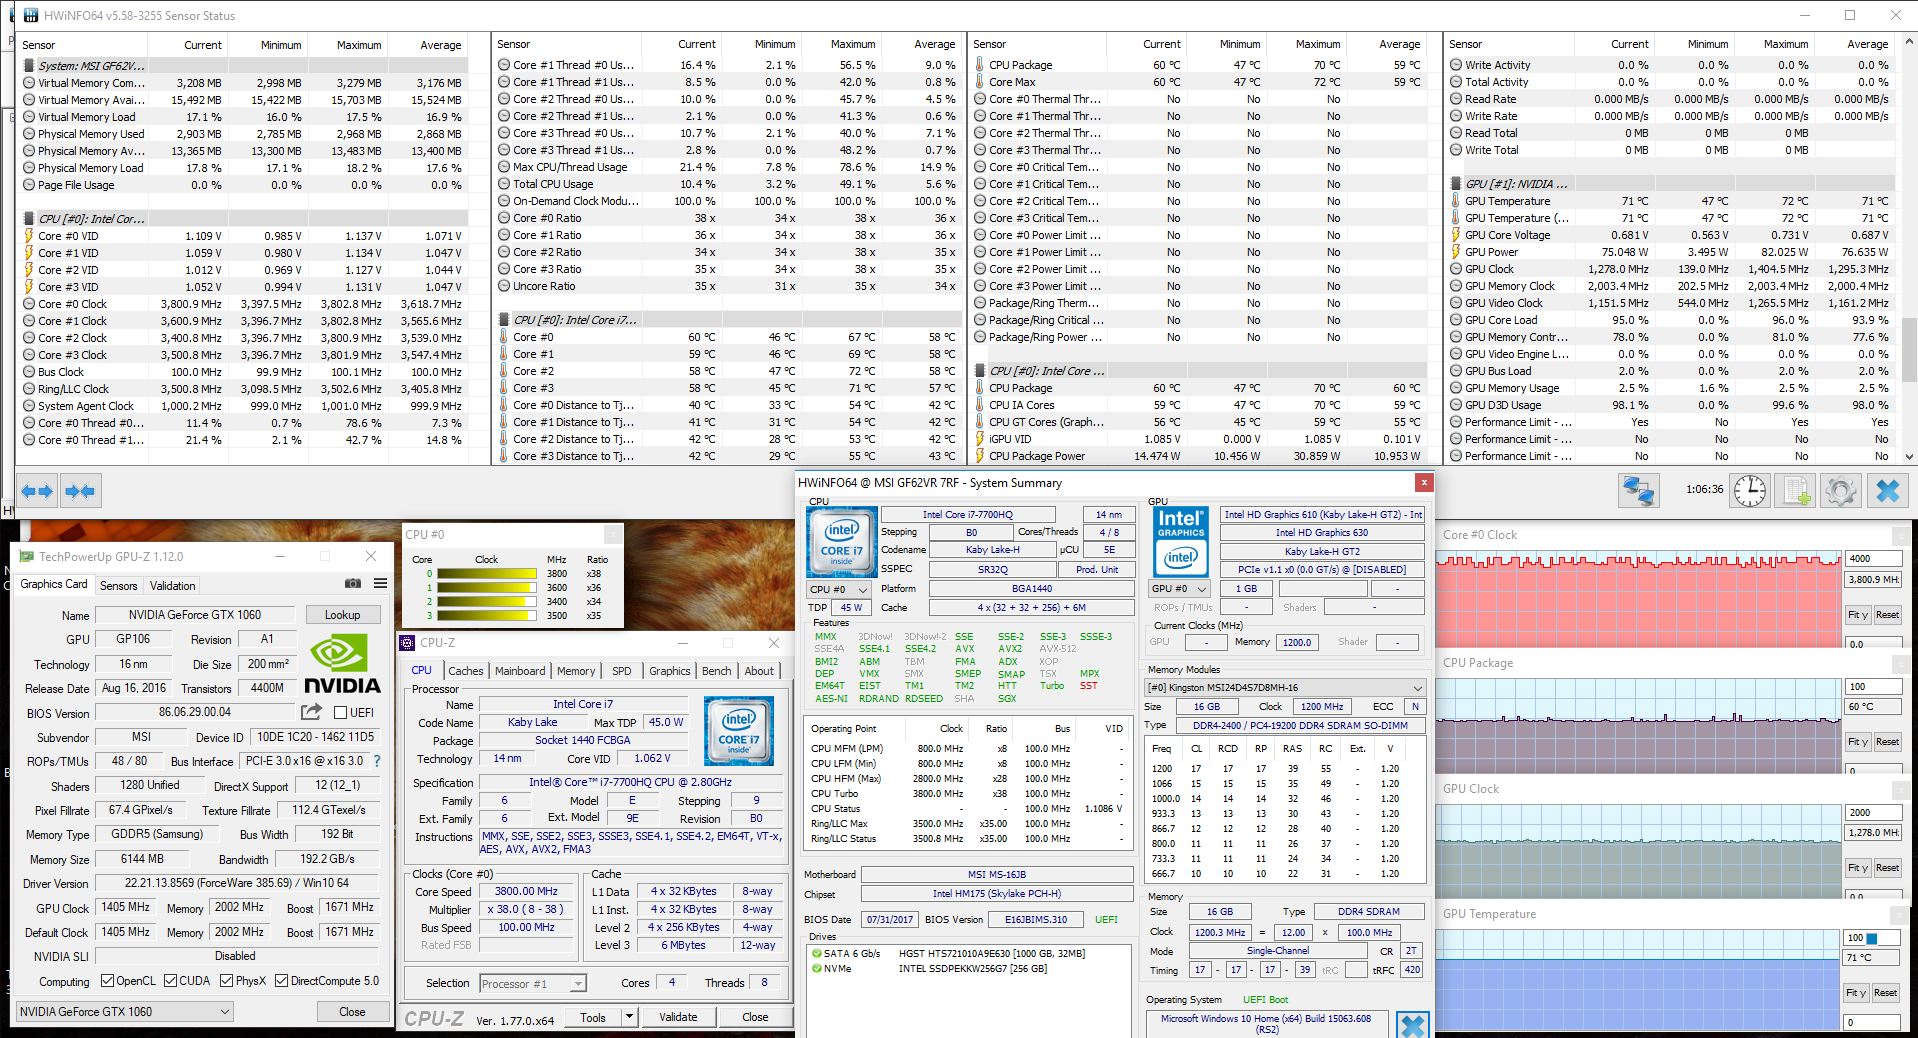
| CPU Clock (GHz) | GPU Clock (MHz) | Average CPU Temperature (°C) | Average GPU Temperature (°C) | |
| Prime95 Stress | 3.4 | - | 80 | - |
| FurMark Stress | 3.6 | 1295 | 59 | 71 |
| Prime95 + FurMark Stress | 3.24 | 1256 | 93 | 79 |
| Prime95 + FurMark Stress (Cooler Boost) | 3.32 | 1263 | 91 | 75 |
| Witcher 3 Stress | 3.5 | 1618 | 71 | 72 |
| Witcher 3 Stress (Cooler Boost) | 2.7 | 1634 | 60 | 66 |
Emissions
System Noise
While the fans do a good job in keeping the GF62VR cool, they are fairly noisy. Under light load, the fans are barely audible. Heavier tasks cause the fans to ramp fairly aggressively. Without Cooler Boost enabled, the fans aren't unbearable; they average about 41 dB(A) under load and peak at about 49 dB(A) while gaming. This is a bit louder than rival devices, but the high pitch makes the fan noise stand out even more. The whiny timbre can cut through ambient noise and can be heard across an office or room. Enabling Cooler Boost pushes the fans even further, hitting 53.5 dB(A). On the positive side, there is no coil whine present in the device.
Noise level
| Idle |
| 33.5 / 33.5 / 33.5 dB(A) |
| Load |
| 41.3 / 53.5 dB(A) |
 | ||
30 dB silent 40 dB(A) audible 50 dB(A) loud |
||
min: | ||
| MSI GF62VR 7RF-877 GeForce GTX 1060 Mobile, i7-7700HQ, Intel SSD 600p SSDPEKKW256G7 | MSI GE62VR 6RF-001US GeForce GTX 1060 Mobile, 6700HQ, Samsung SM951 MZVPV512HDGL m.2 PCI-e | Gigabyte P55W v7 GeForce GTX 1060 Mobile, i7-7700HQ, Liteonit CV3-8D256 | Lenovo Legion Y520-15IKBM 80YY001APB GeForce GTX 1060 Max-Q, i5-7300HQ, ADATA SX7000NP 256 GB | Schenker XMG A517 GeForce GTX 1060 Mobile, i7-7700HQ, Samsung SSD 960 Evo 500GB m.2 NVMe | Gigabyte Aero 15 GeForce GTX 1060 Mobile, i7-7700HQ, Lite-On CX2-8B512-Q11 | Asus Strix GL502VM-DS74 GeForce GTX 1060 Mobile, i7-7700HQ, Samsung SSD 960 Evo 250GB m.2 NVMe | HP Omen 15-ce002ng GeForce GTX 1060 Max-Q, i7-7700HQ, Samsung PM961 MZVLW256HEHP | Samsung Odyssey NP800G5M-X01US GeForce GTX 1050 Mobile, i7-7700HQ, Samsung PM961 NVMe MZVLW128HEGR | |
|---|---|---|---|---|---|---|---|---|---|
| Noise | 0% | 0% | 6% | -1% | 3% | -2% | 2% | 5% | |
| off / environment * (dB) | 28.1 | 28.2 -0% | 30 -7% | 30 -7% | 31 -10% | 30.8 -10% | 30 -7% | 28.1 -0% | |
| Idle Minimum * (dB) | 33.5 | 32.8 2% | 33 1% | 30.5 9% | 30 10% | 32 4% | 32 4% | 30 10% | 28.1 16% |
| Idle Average * (dB) | 33.5 | 32.9 2% | 34 -1% | 33 1% | 35 -4% | 33 1% | 32 4% | 33 1% | 29.1 13% |
| Idle Maximum * (dB) | 33.5 | 32.9 2% | 35 -4% | 36.1 -8% | 40 -19% | 34 -1% | 32 4% | 37 -10% | 29.1 13% |
| Load Average * (dB) | 41.3 | 41.6 -1% | 39 6% | 39.4 5% | 43 -4% | 39 6% | 48.3 -17% | 41 1% | 49.2 -19% |
| Witcher 3 ultra * (dB) | 48.5 | 43 11% | 43 11% | 42 13% | |||||
| Load Maximum * (dB) | 53.5 | 55 -3% | 50 7% | 41.5 22% | 49 8% | 50 7% | 51.2 4% | 50 7% | 49.2 8% |
* ... smaller is better
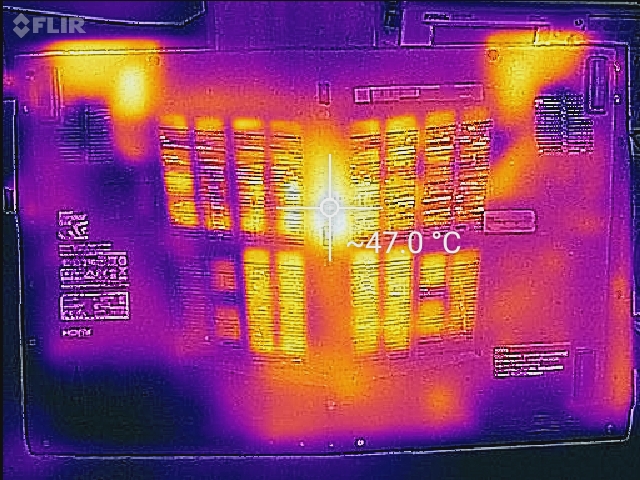
Temperature
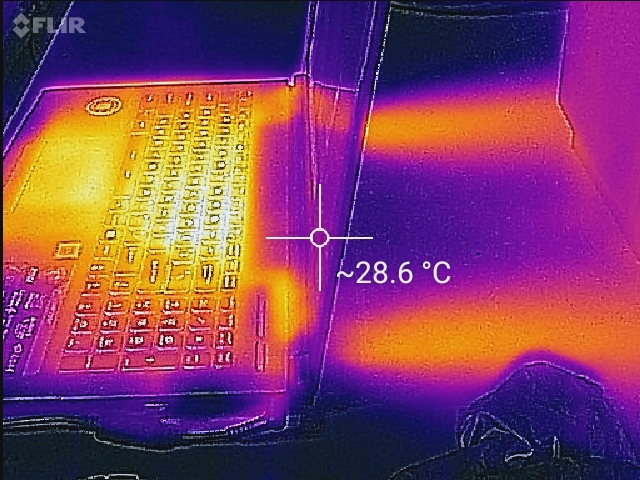
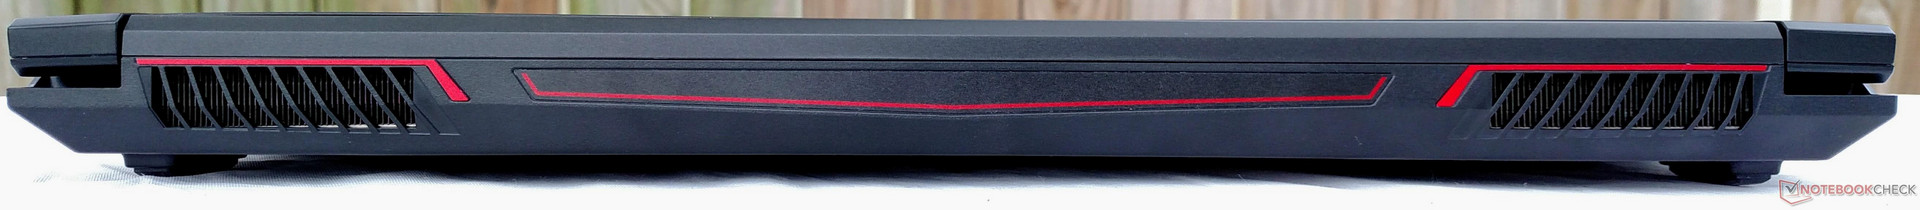
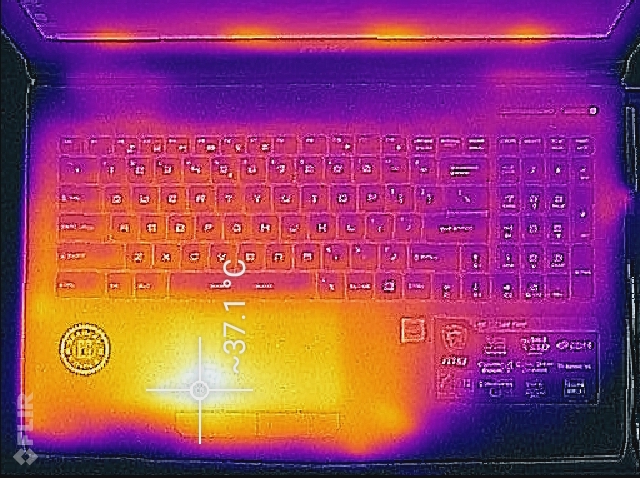
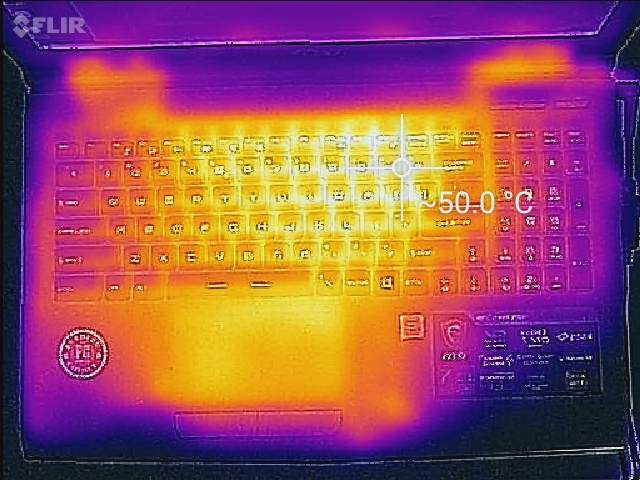
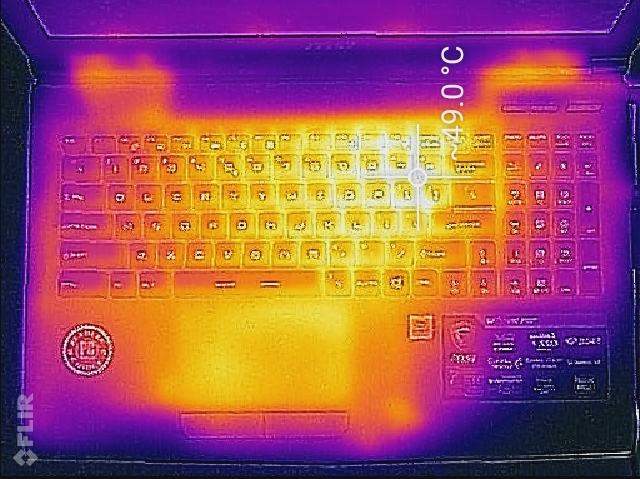
Thanks to its beefy six heat pipes and efficient (if noisy) fans, the GF62VR remains fairly cool to the touch, even under load. Temperatures across the keyboard average in the 37-45° C range under full synthetic load and while gaming. There is a hot spot in the upper right of the keyboard (around the "9" and "0" keys) that hits about 50° C, which is a bit warm to the touch. However, the WASD keys remain relatively cool. Even under load, typing never gets uncomfortable. The touchpad does get warm to the touch (even when the system is idle), most likely because it sits directly over the NVMe drive. It should be noted that other manufacturers are starting to encase installed NVMe drives in heatsink-like enclosures, as these drives can run very hot.
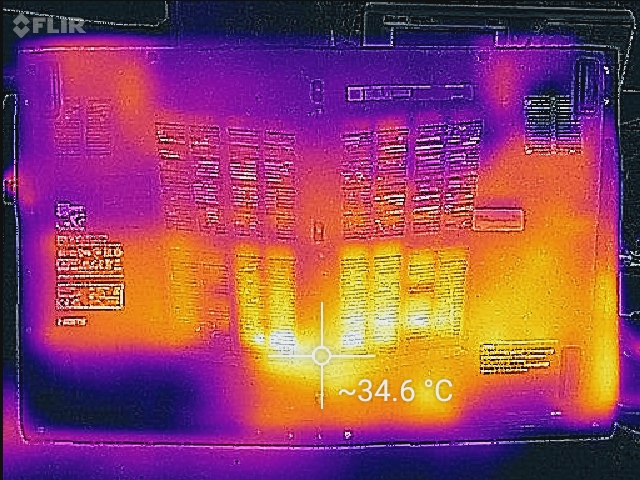
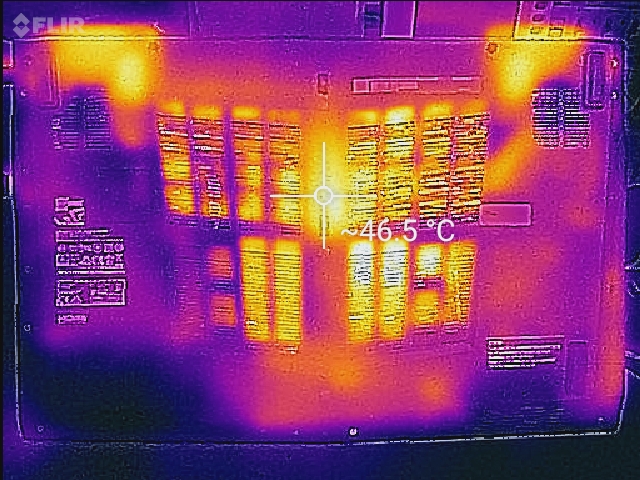
As a note, most of the hot air is exhausted through the vents at the back corners of the device. This area can get hot to the touch, so it is advised to use the GF62VR on a flat, hard surface with nothing blocking these rear vents.
(-) The maximum temperature on the upper side is 48.2 °C / 119 F, compared to the average of 40.4 °C / 105 F, ranging from 21.2 to 68.8 °C for the class Gaming.
(-) The bottom heats up to a maximum of 46 °C / 115 F, compared to the average of 43.3 °C / 110 F
(+) In idle usage, the average temperature for the upper side is 29.8 °C / 86 F, compared to the device average of 33.9 °C / 93 F.
(±) Playing The Witcher 3, the average temperature for the upper side is 37.9 °C / 100 F, compared to the device average of 33.9 °C / 93 F.
(-) The palmrests and touchpad can get very hot to the touch with a maximum of 44.2 °C / 111.6 F.
(-) The average temperature of the palmrest area of similar devices was 28.8 °C / 83.8 F (-15.4 °C / -27.8 F).
Speakers

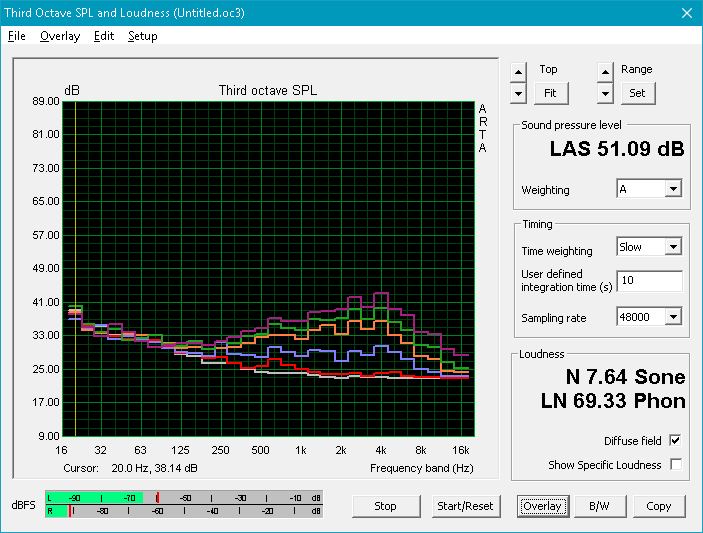
The speakers are loud but lack body. Music sounds thin, and highs easily overpower mids. The removal of the GE62VR's subwoofer results in a complete absence of bass. The overall sound profile heavily favors the upper end, resulting in a very tinny timbre. MSI has kept the dedicated HiFi audio jack; users with a pair of higher-end headphones will be able to take full advantage of the integrated DAC.
MSI GF62VR 7RF-877 audio analysis
(+) | speakers can play relatively loud (84.9 dB)
Bass 100 - 315 Hz
(-) | nearly no bass - on average 27.4% lower than median
(±) | linearity of bass is average (10.4% delta to prev. frequency)
Mids 400 - 2000 Hz
(±) | higher mids - on average 8.5% higher than median
(±) | linearity of mids is average (9.5% delta to prev. frequency)
Highs 2 - 16 kHz
(±) | higher highs - on average 8% higher than median
(±) | linearity of highs is average (8% delta to prev. frequency)
Overall 100 - 16.000 Hz
(-) | overall sound is not linear (31.8% difference to median)
Compared to same class
» 97% of all tested devices in this class were better, 1% similar, 2% worse
» The best had a delta of 6%, average was 18%, worst was 132%
Compared to all devices tested
» 91% of all tested devices were better, 2% similar, 8% worse
» The best had a delta of 4%, average was 24%, worst was 134%
MSI GE62VR 6RF-001US audio analysis
(±) | speaker loudness is average but good (76.9 dB)
Bass 100 - 315 Hz
(±) | reduced bass - on average 13.1% lower than median
(±) | linearity of bass is average (12% delta to prev. frequency)
Mids 400 - 2000 Hz
(+) | balanced mids - only 3% away from median
(±) | linearity of mids is average (12% delta to prev. frequency)
Highs 2 - 16 kHz
(+) | balanced highs - only 4.4% away from median
(±) | linearity of highs is average (10.1% delta to prev. frequency)
Overall 100 - 16.000 Hz
(±) | linearity of overall sound is average (18.6% difference to median)
Compared to same class
» 60% of all tested devices in this class were better, 9% similar, 31% worse
» The best had a delta of 6%, average was 18%, worst was 132%
Compared to all devices tested
» 42% of all tested devices were better, 8% similar, 51% worse
» The best had a delta of 4%, average was 24%, worst was 134%
Frequency Comparison (Checkbox selectable!)
Graph 1: Pink Noise 100% Vol.; Graph 2: Audio off
Energy Management
Power Consumption
Power consumption is largely similar to other notebooks with similar specs. Idle draw is curiously high, averaging about 18.2 Watts; most other systems pull between 10 and 15 W when idle. Under full load, the machine pulls about 162 W from the wall, which is about 90% of the 180 W adapter. While gaming (which is more realistic), the GF62VR only needs 125 W. This is more than other devices (which average between 95-110 W) but well within expectation and the limits of the power supply.
| Off / Standby | |
| Idle | |
| Load |
|
Key:
min: | |
| MSI GF62VR 7RF-877 i7-7700HQ, GeForce GTX 1060 Mobile, Intel SSD 600p SSDPEKKW256G7, TN LED, 1920x1080, 15.6" | MSI GE62VR 6RF-001US 6700HQ, GeForce GTX 1060 Mobile, Samsung SM951 MZVPV512HDGL m.2 PCI-e, IPS, 1920x1080, 15.6" | Gigabyte P55W v7 i7-7700HQ, GeForce GTX 1060 Mobile, Liteonit CV3-8D256, IPS, 1920x1080, 15.6" | Lenovo Legion Y520-15IKBM 80YY001APB i5-7300HQ, GeForce GTX 1060 Max-Q, ADATA SX7000NP 256 GB, IPS, 1920x1080, 15.6" | Schenker XMG A517 i7-7700HQ, GeForce GTX 1060 Mobile, Samsung SSD 960 Evo 500GB m.2 NVMe, IPS, 1920x1080, 15.6" | Gigabyte Aero 15 i7-7700HQ, GeForce GTX 1060 Mobile, Lite-On CX2-8B512-Q11, IPS, 1920x1080, 15.6" | Asus Strix GL502VM-DS74 i7-7700HQ, GeForce GTX 1060 Mobile, Samsung SSD 960 Evo 250GB m.2 NVMe, IPS, 1920x1080, 15.6" | HP Omen 15-ce002ng i7-7700HQ, GeForce GTX 1060 Max-Q, Samsung PM961 MZVLW256HEHP, IPS, 1920x1080, 15.6" | Samsung Odyssey NP800G5M-X01US i7-7700HQ, GeForce GTX 1050 Mobile, Samsung PM961 NVMe MZVLW128HEGR, IPS, 1920x1080, 15.6" | |
|---|---|---|---|---|---|---|---|---|---|
| Power Consumption | -45% | 21% | 30% | 9% | 9% | -82% | -12% | 34% | |
| Idle Minimum * (Watt) | 16.2 | 25.4 -57% | 8 51% | 3.9 76% | 8 51% | 12 26% | 38.3 -136% | 18 -11% | 6.7 59% |
| Idle Average * (Watt) | 18.2 | 30.3 -66% | 13 29% | 10.7 41% | 12 34% | 15 18% | 40.5 -123% | 23 -26% | 8.9 51% |
| Idle Maximum * (Watt) | 18.9 | 31.5 -67% | 18 5% | 11.2 41% | 25 -32% | 20 -6% | 42.2 -123% | 30 -59% | 10.8 43% |
| Load Average * (Watt) | 82.7 | 111.8 -35% | 76 8% | 111.5 -35% | 85 -3% | 82 1% | 110.4 -33% | 85 -3% | 81.8 1% |
| Witcher 3 ultra * (Watt) | 125.7 | 110 12% | 111 12% | 96 24% | 92.2 27% | ||||
| Load Maximum * (Watt) | 162.3 | 163.2 -1% | 143 12% | 115.5 29% | 180 -11% | 161 1% | 155.7 4% | 158 3% | 122.7 24% |
* ... smaller is better
Battery Life
Battery life is pretty disappointing. While about 17% better than the GE62VR overall, the GF62VR falls short of the two hour mark in our WiFi v1.3 test (Balanced power setting, screen set to 150 cd/m2, loading a new webpage every 30-40 seconds). Even in Battery Eater's Reader test, which is a best-case scenario, the device only lasts 2 hours 45 minutes. This is partly due to the anemic 41 Wh battery, which is significantly smaller than competitors'. Bring the power adapter along when working away from home.
| MSI GF62VR 7RF-877 i7-7700HQ, GeForce GTX 1060 Mobile, 41 Wh | MSI GE62VR 6RF-001US 6700HQ, GeForce GTX 1060 Mobile, 51 Wh | Gigabyte P55W v7 i7-7700HQ, GeForce GTX 1060 Mobile, 63 Wh | Lenovo Legion Y520-15IKBM 80YY001APB i5-7300HQ, GeForce GTX 1060 Max-Q, 45 Wh | Schenker XMG A517 i7-7700HQ, GeForce GTX 1060 Mobile, 62 Wh | Gigabyte Aero 15 i7-7700HQ, GeForce GTX 1060 Mobile, 94.24 Wh | Asus Strix GL502VM-DS74 i7-7700HQ, GeForce GTX 1060 Mobile, 64 Wh | HP Omen 15-ce002ng i7-7700HQ, GeForce GTX 1060 Max-Q, 70 Wh | Samsung Odyssey NP800G5M-X01US i7-7700HQ, GeForce GTX 1050 Mobile, 43 Wh | |
|---|---|---|---|---|---|---|---|---|---|
| Battery runtime | -14% | 235% | 300% | 158% | 239% | -6% | 71% | 161% | |
| Reader / Idle (h) | 2.8 | 2.3 -18% | 13.2 371% | 11.2 300% | 7.5 168% | 10.6 279% | 1.7 -39% | 4.3 54% | 10.2 264% |
| WiFi v1.3 (h) | 1.9 | 1.7 -11% | 5.8 205% | 5 163% | 7 268% | 1.5 -21% | 3.3 74% | 4.4 132% | |
| Load (h) | 0.7 | 0.6 -14% | 1.6 129% | 1.7 143% | 1.9 171% | 1 43% | 1.3 86% | 1.3 86% | |
| WiFi (h) | 4 |
Pros
Cons
Verdict

On paper, there's nothing very special about the MSI GF62VR. While it offers good, consistent performance and a color-rich display, these are offset by a poor quality TN screen with terrible color accuracy and annoyingly high-pitched fans. The story of the GF62VR is one of compromise; for every positive, there is a negative. The end result is a great gaming laptop that falls short in some critical areas (mainly display quality, fan noise, and build quality).
However, when considering the current price point, the notebook becomes much more attractive. Starting at USD $1300, the GF62VR falls into the price range for notebooks sporting the GTX 1050 Ti. Most laptops with similar components start about $200-300 more. Add in the fact that gaming performance tends to topple competitors and the GF62VR suddenly becomes one of the better "bang for your buck" gaming laptops on the market now.
There's a major tradeoff to consider here. For that great price/performance ratio, users are going to have to put up with a (frankly) awful screen that demands calibration, whiny and loud fans, and a plastic shell that tries and fails to imitate a more premium chassis. But the tradeoff may be worth it to some consumers.
For gamers that don't care much about aesthetics and just want to play while on the go, it's hard to beat the GF62VR right now. The GF62VR's main competitor is actually the older GE62VR it's replacing. If you can find a GE62VR on the used market with an IPS display, it would likely be the better buy. However, if you have to have a new gaming notebook with a GTX 1060 that offers the best value, the GF62VR should be at or near the top of your list.
MSI GF62VR 7RF-877
- 11/10/2017 v6 (old)
Sam Medley
Price comparison
