Lenovo Legion Y920-17IKB (i7-7820HK, GTX 1070) Laptop Review
Nearly a year ago, we evaluated Lenovo’s Y900 gaming notebook, which was a bit of an adventure into uncharted territory for the manufacturer; that is to say, it was the first device truly positioned to compete with the likes of the highest-end 17-inch Alienware, MSI, and ASUS ROG gaming notebooks—and it was priced accordingly. Suffice it to say that it made a statement, too, as we were impressed by a number of its achievements: namely, reasonable temperatures, strong build quality, storage configuration options, connectivity, lack of throttling, and G-Sync capability. However, we also found plenty of room for improvement, as we were disappointed by the lackluster “Turbo Mode” feature, high CPU temperatures under load, unique mechanical keyboard, loud fan, and price (among other items).
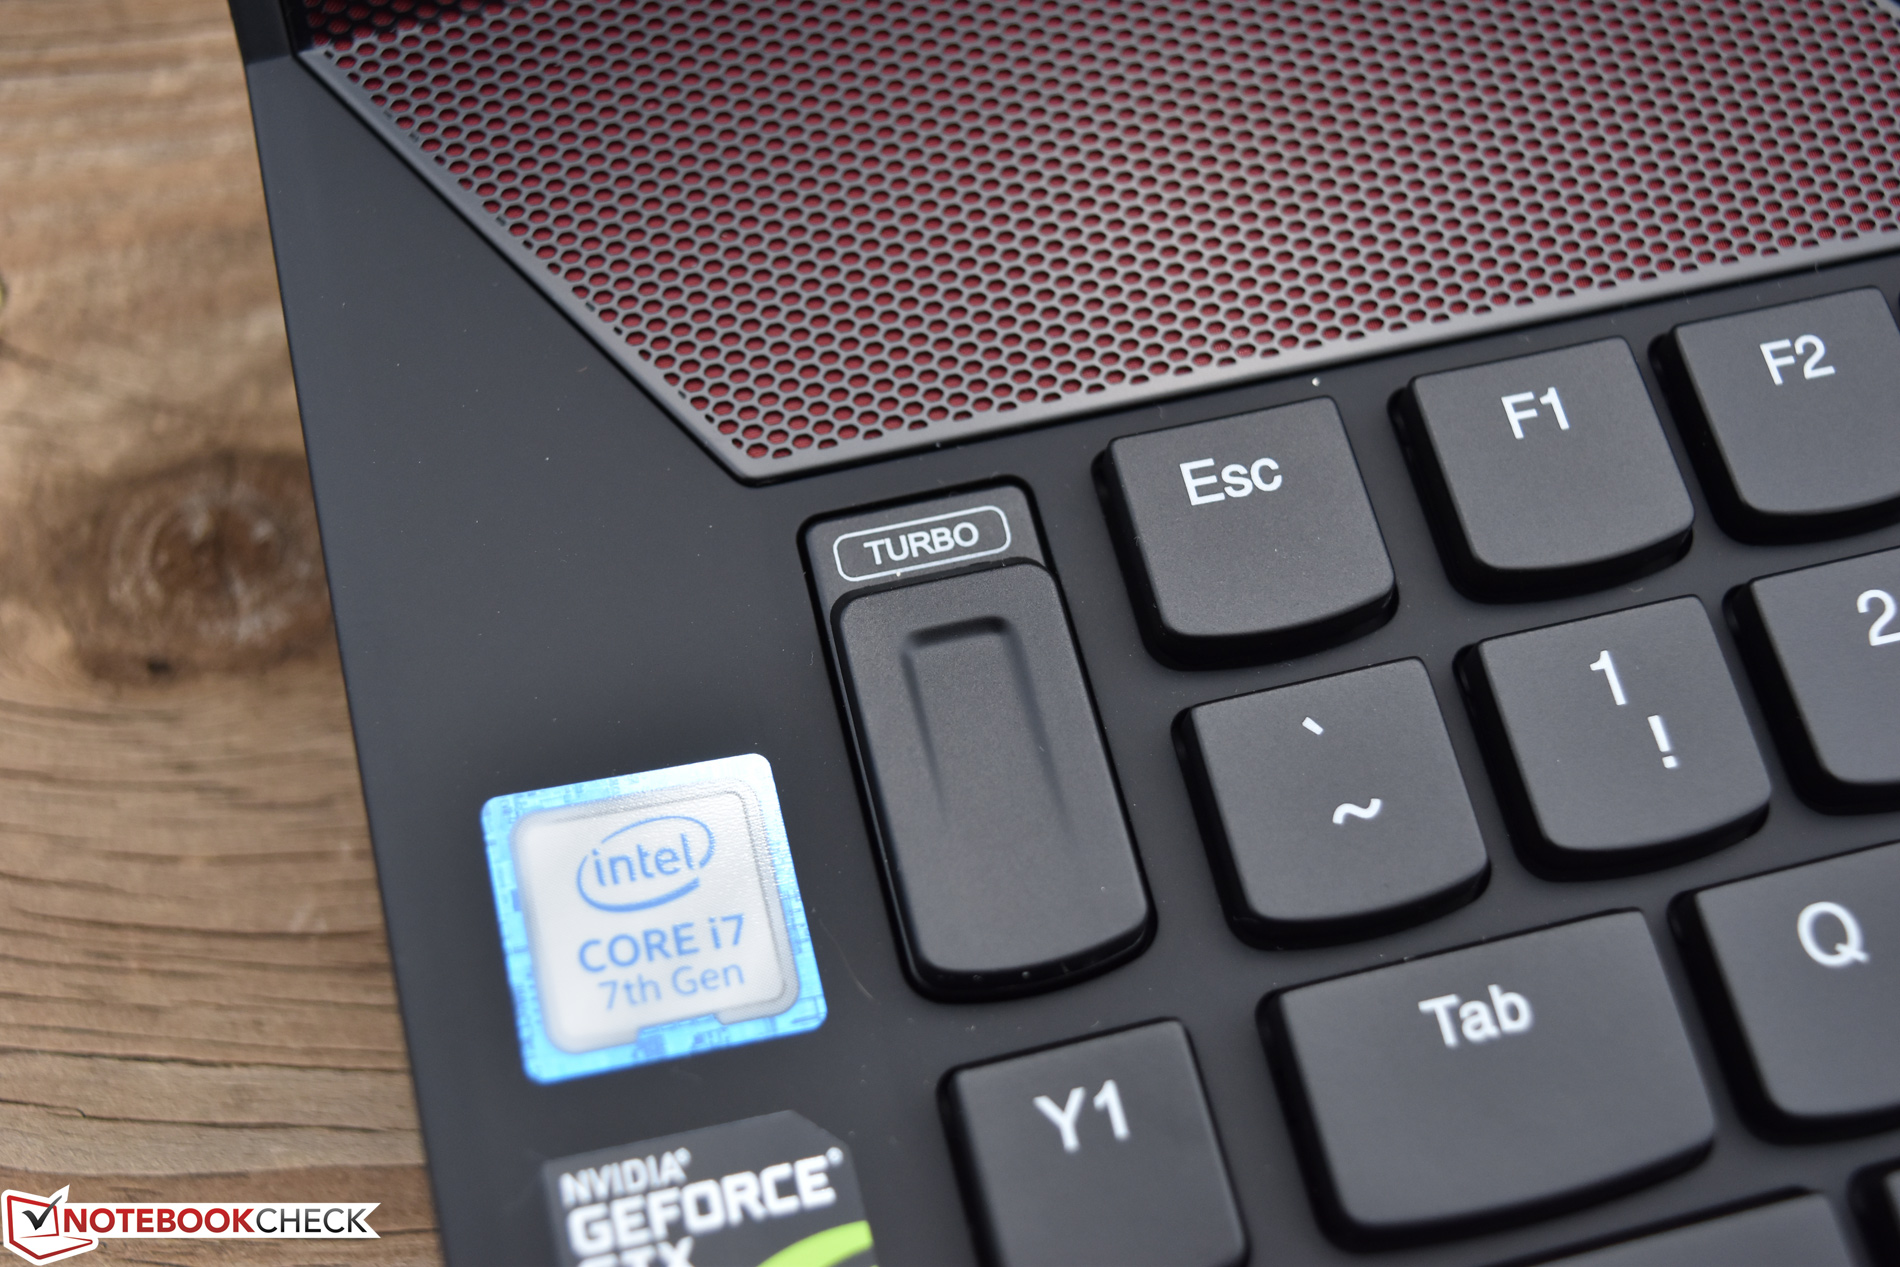
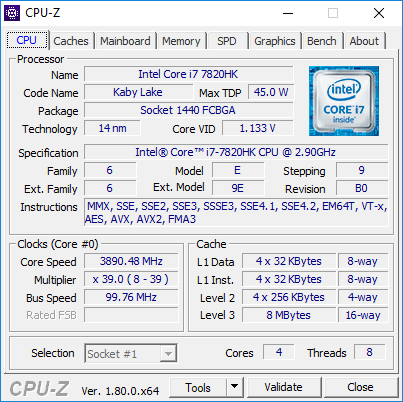
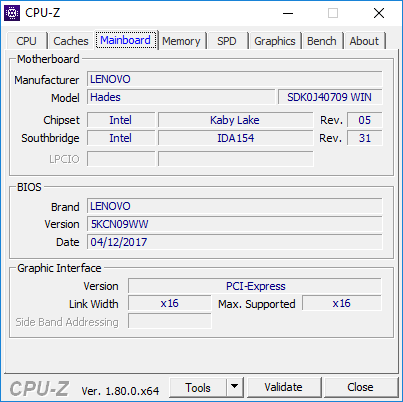
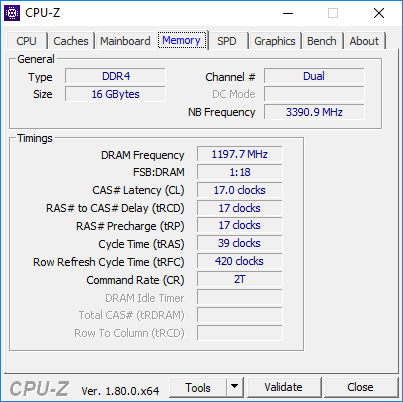
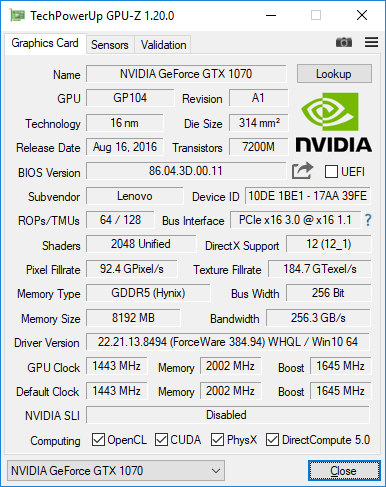
Today, we put the Y920 under our microscopes. Although it’s part of Lenovo’s new Legion series, it’s a direct successor to the Y900, with nearly identical design and build, similar features, and above all else, an upgraded Kaby Lake chipset with a Pascal architecture GPU. Our review configuration is equipped with an Intel Core i7-7820HK CPU, NVIDIA GeForce GTX 1070 GPU, 16 GB of DDR4 RAM, a 512 GB NVMe SSD, and an FHD 1080p display (retail cost is around $2,299 currently as configured). With most of the revisions having taken place under the hood, it will be interesting to see whether the Legion Y920 has addressed our biggest criticisms. Let’s get started!
Case
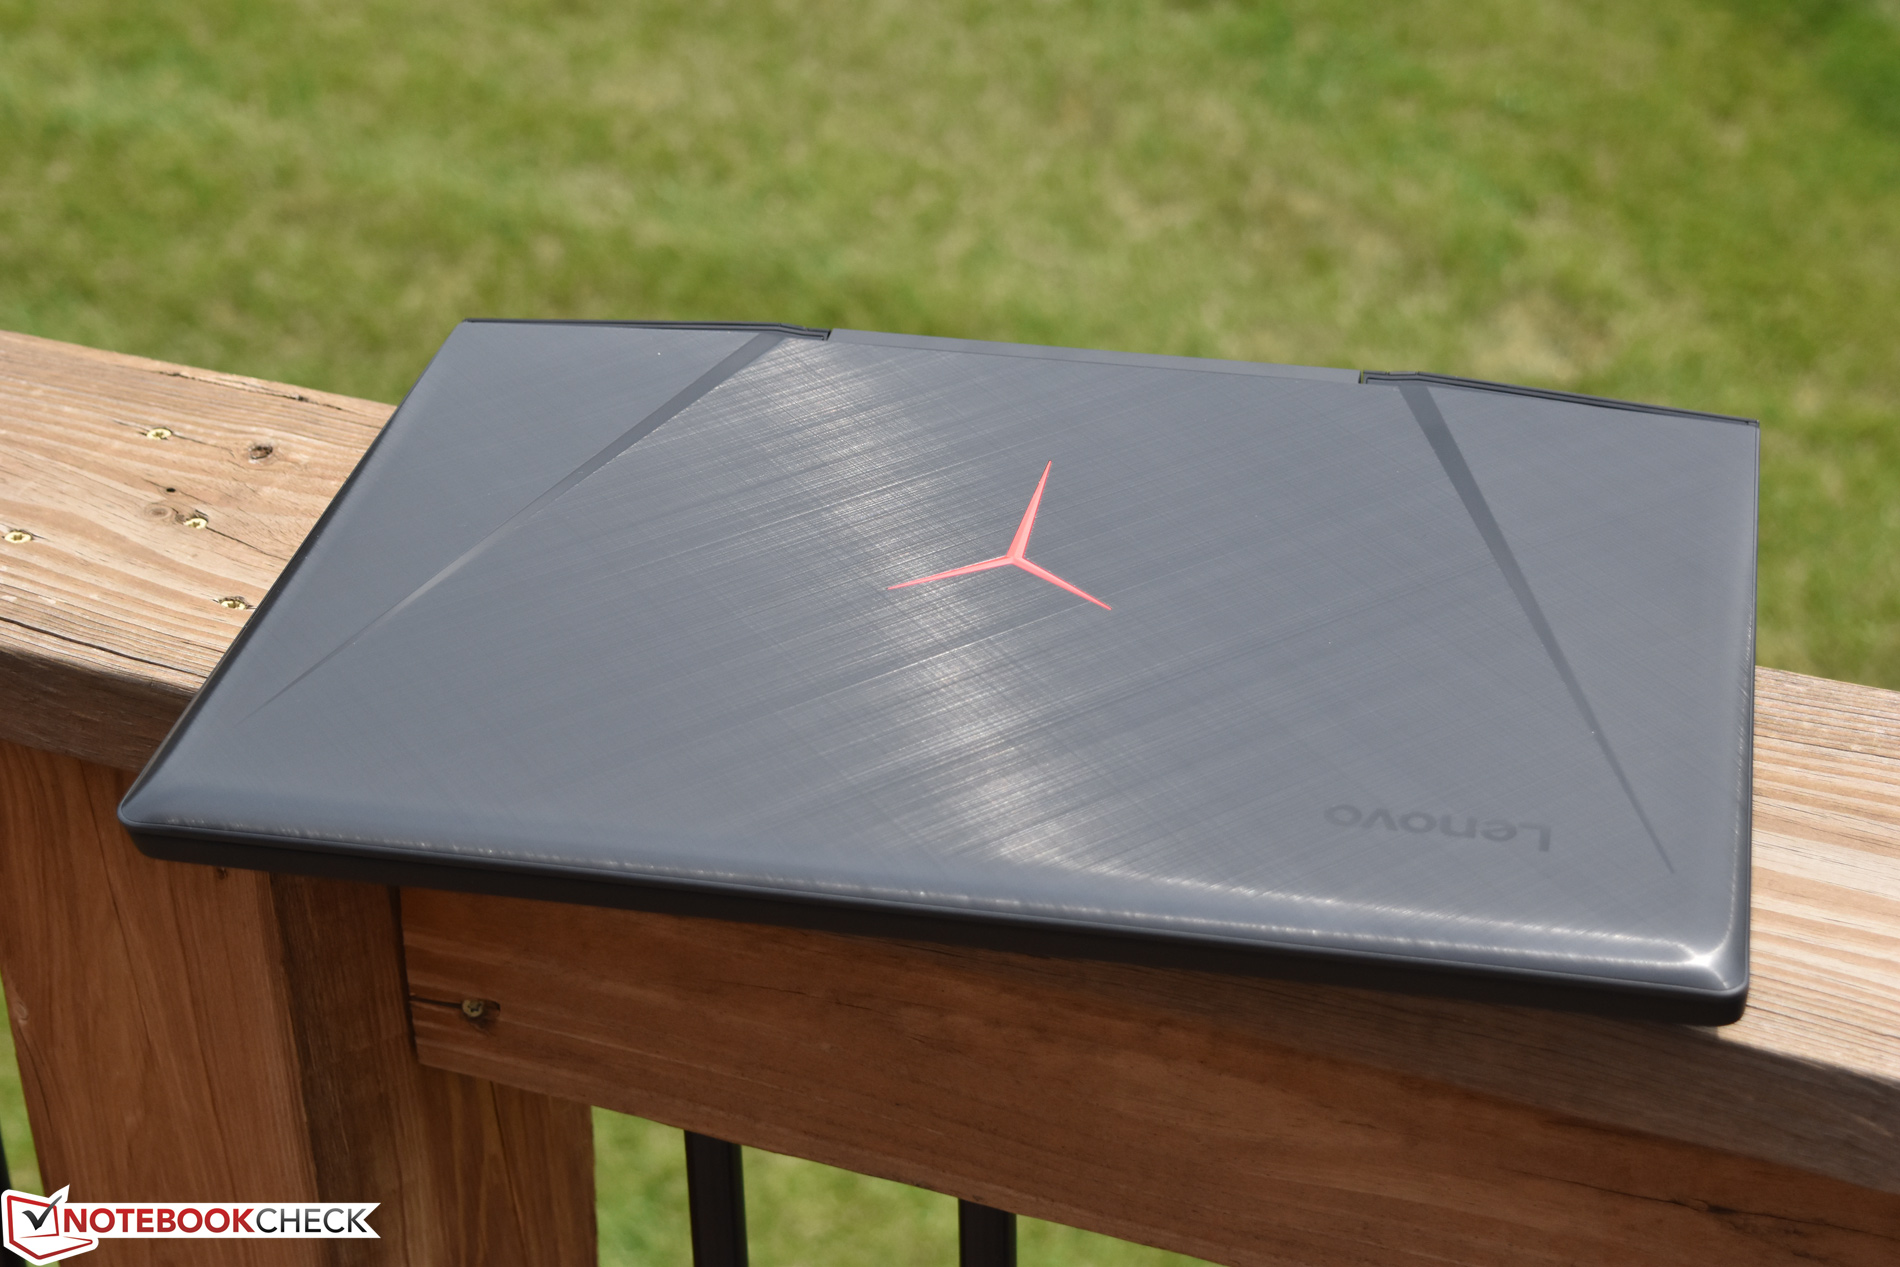
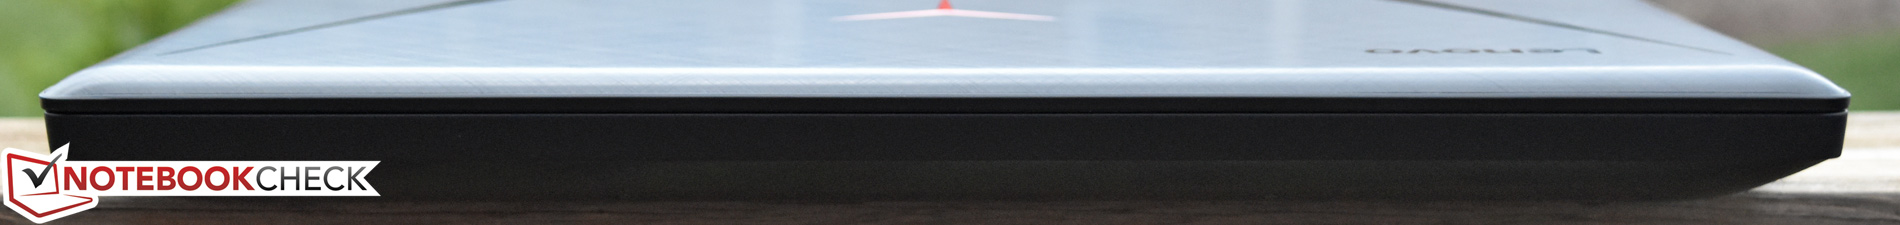
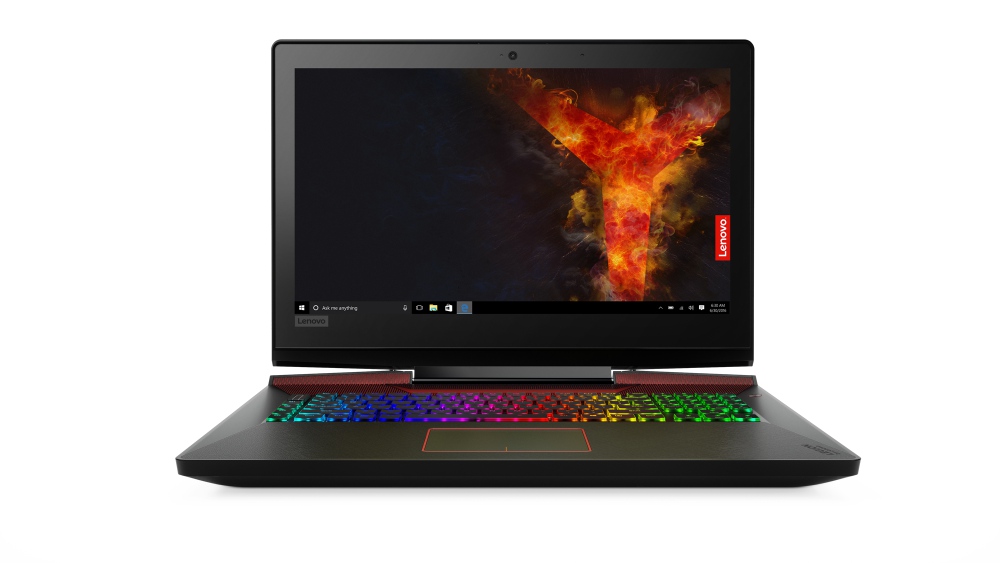
The Lenovo Legion Y920 looks nearly identical to its predecessor. The construction is a hybrid of aluminum and ABS plastic which lends significant stability to the machine. Very little flex is present when pressure is applied to the base unit apart from some minimal visible movement in the center above the touchpad, and the only noticeable creaking is provoked by pressure under the right side of the keyboard. The flip side of all this stability is, naturally, weight: the Y920 tips the scales at a significant 4.426 kg, which is roughly the same as the 17-inch Alienware 17 R4, as well as the Asus ROG G752VS.

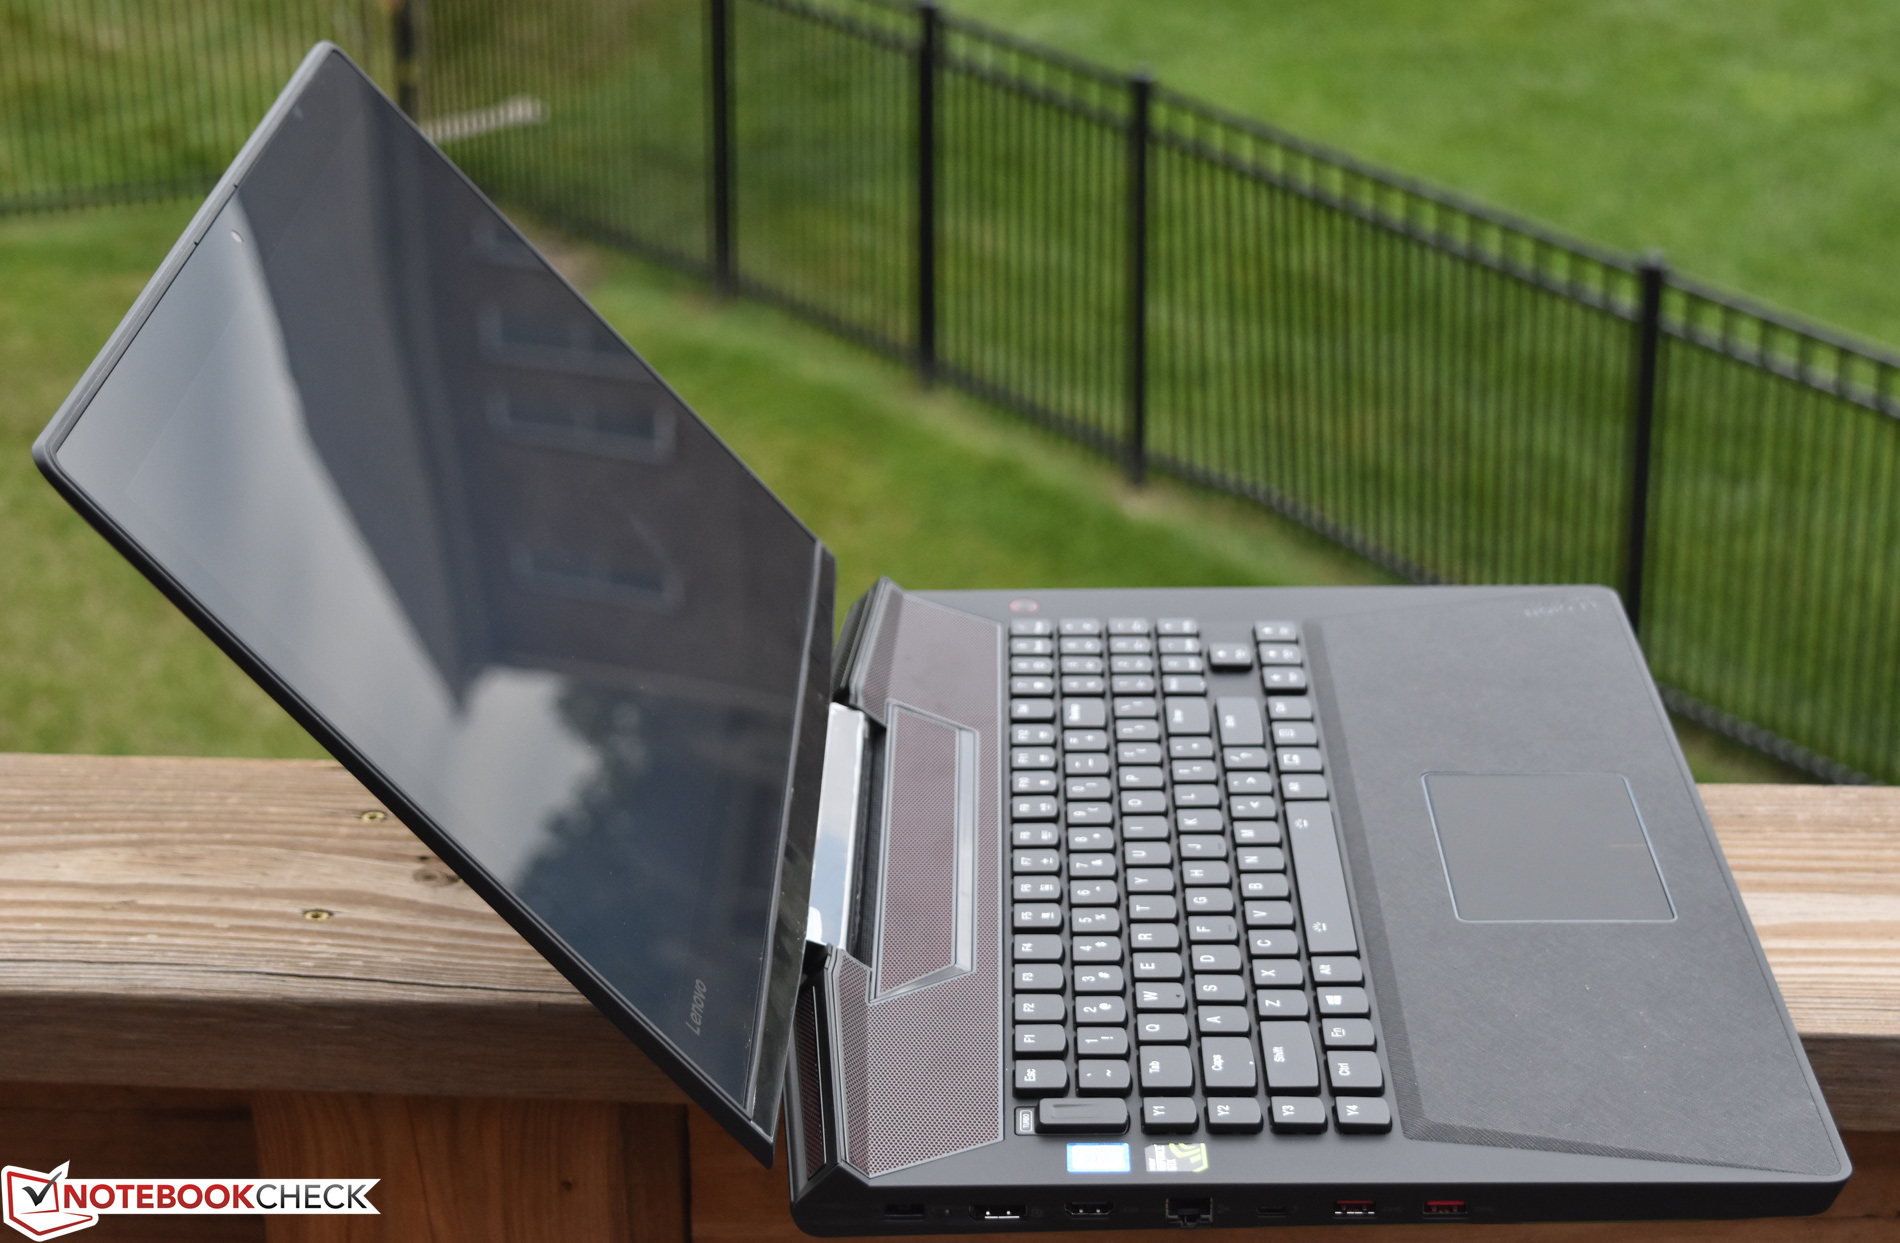

Although the display lid is large, the effects of twisting are minimal and torsion resistance is quite good considering the size. Pressure applied to the back of the lid produces no visible artifacts on the LCD. The center hinge supporting the display, meanwhile, is a bit bouncier than we would like to see, especially when taken in conjunction with the semi-gloss finish on the screen. However, the base unit grabs onto the surface well enough thanks to the four large rubber feet on the underside—so bounce is really only noticeable if the surface itself on which the notebook is resting happens to move (such as while in transit).
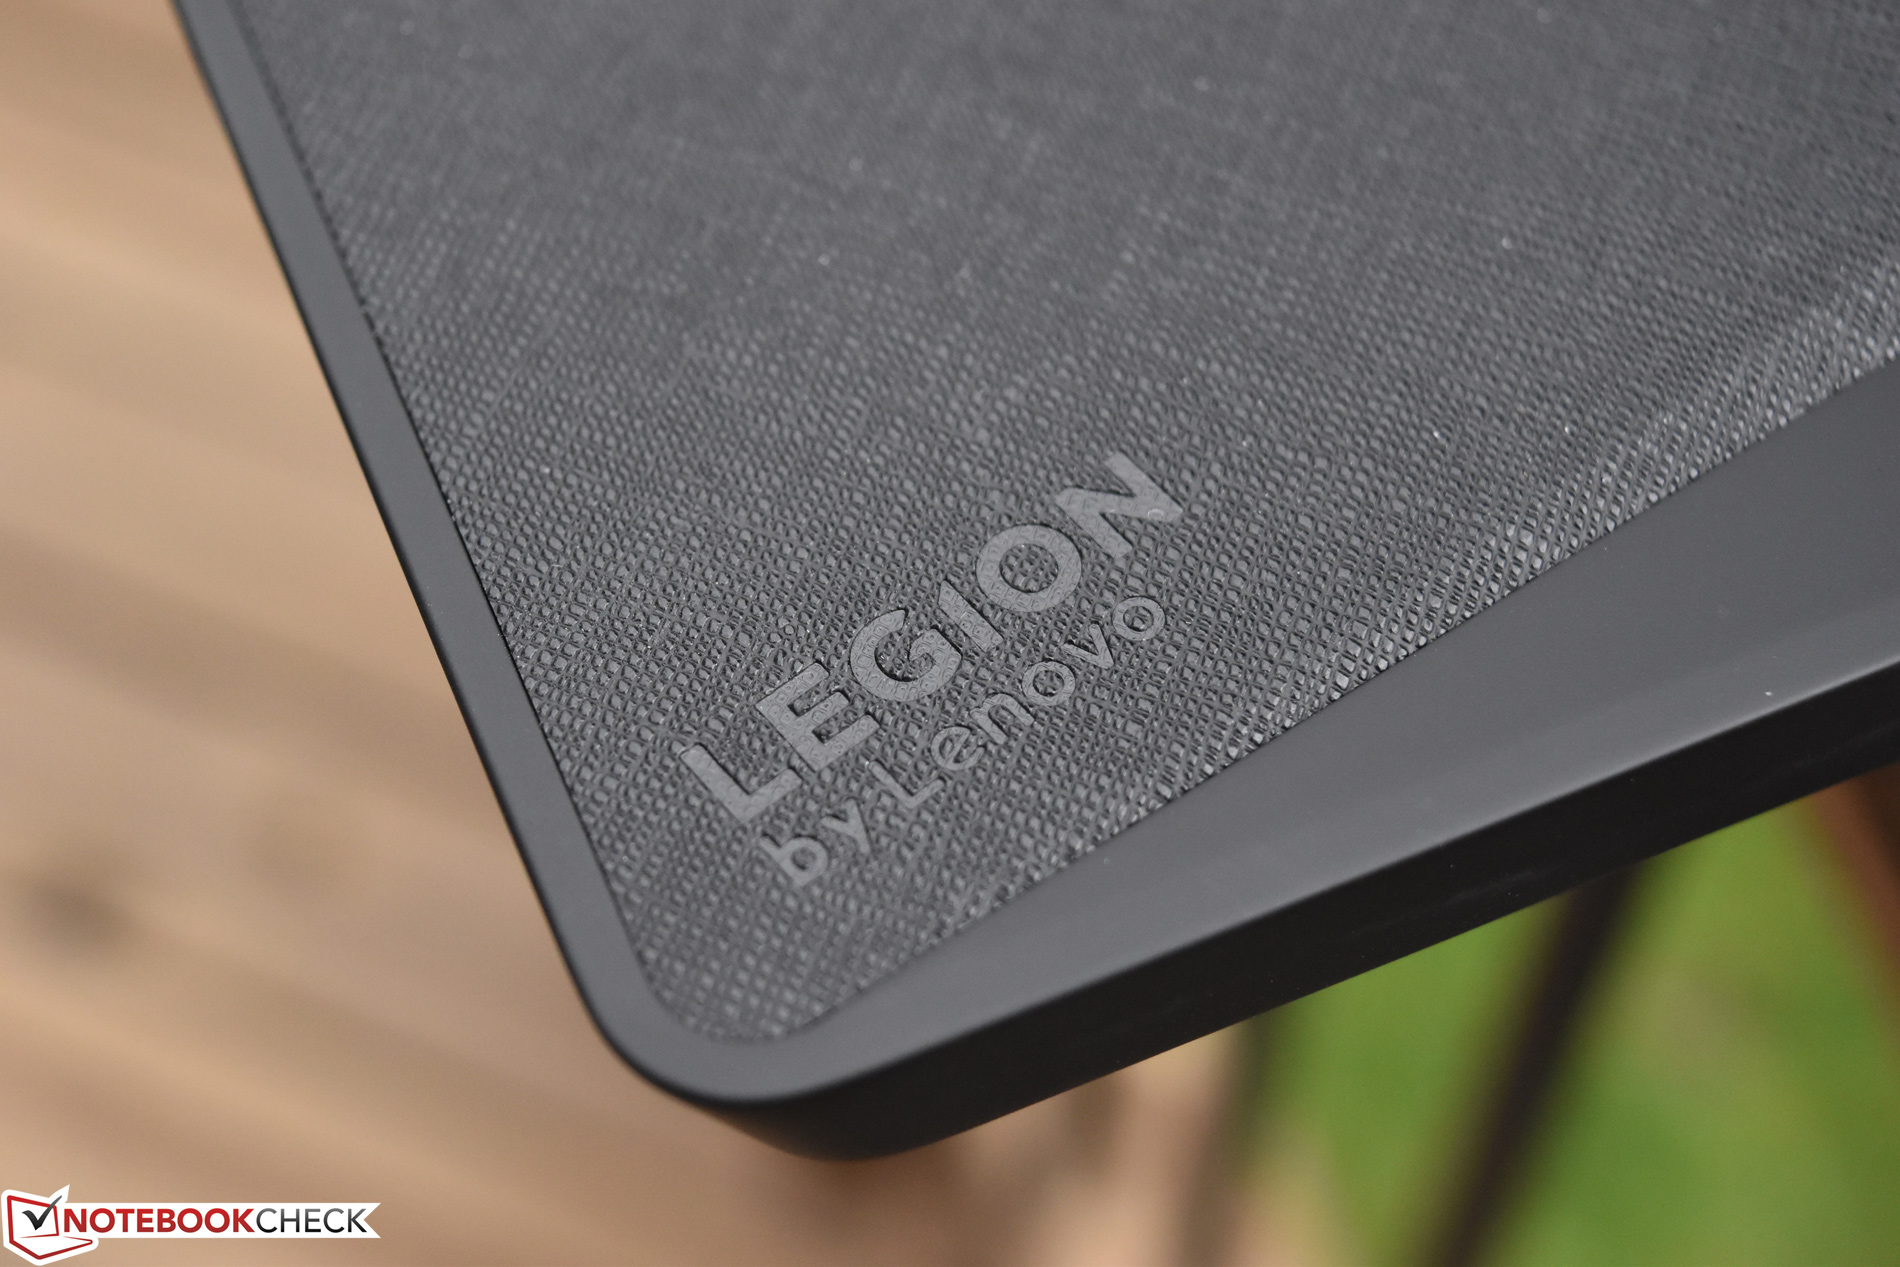
Haptically speaking, the textured rubber-lined palm rest insulates the user’s hands from any internal heat during gaming and is pleasant to the touch. It also helps prevent palm slippage and it looks nice, to boot—but it’s worth mentioning that it is more difficult to clean thanks to the tiny ridges that are part of the texture.
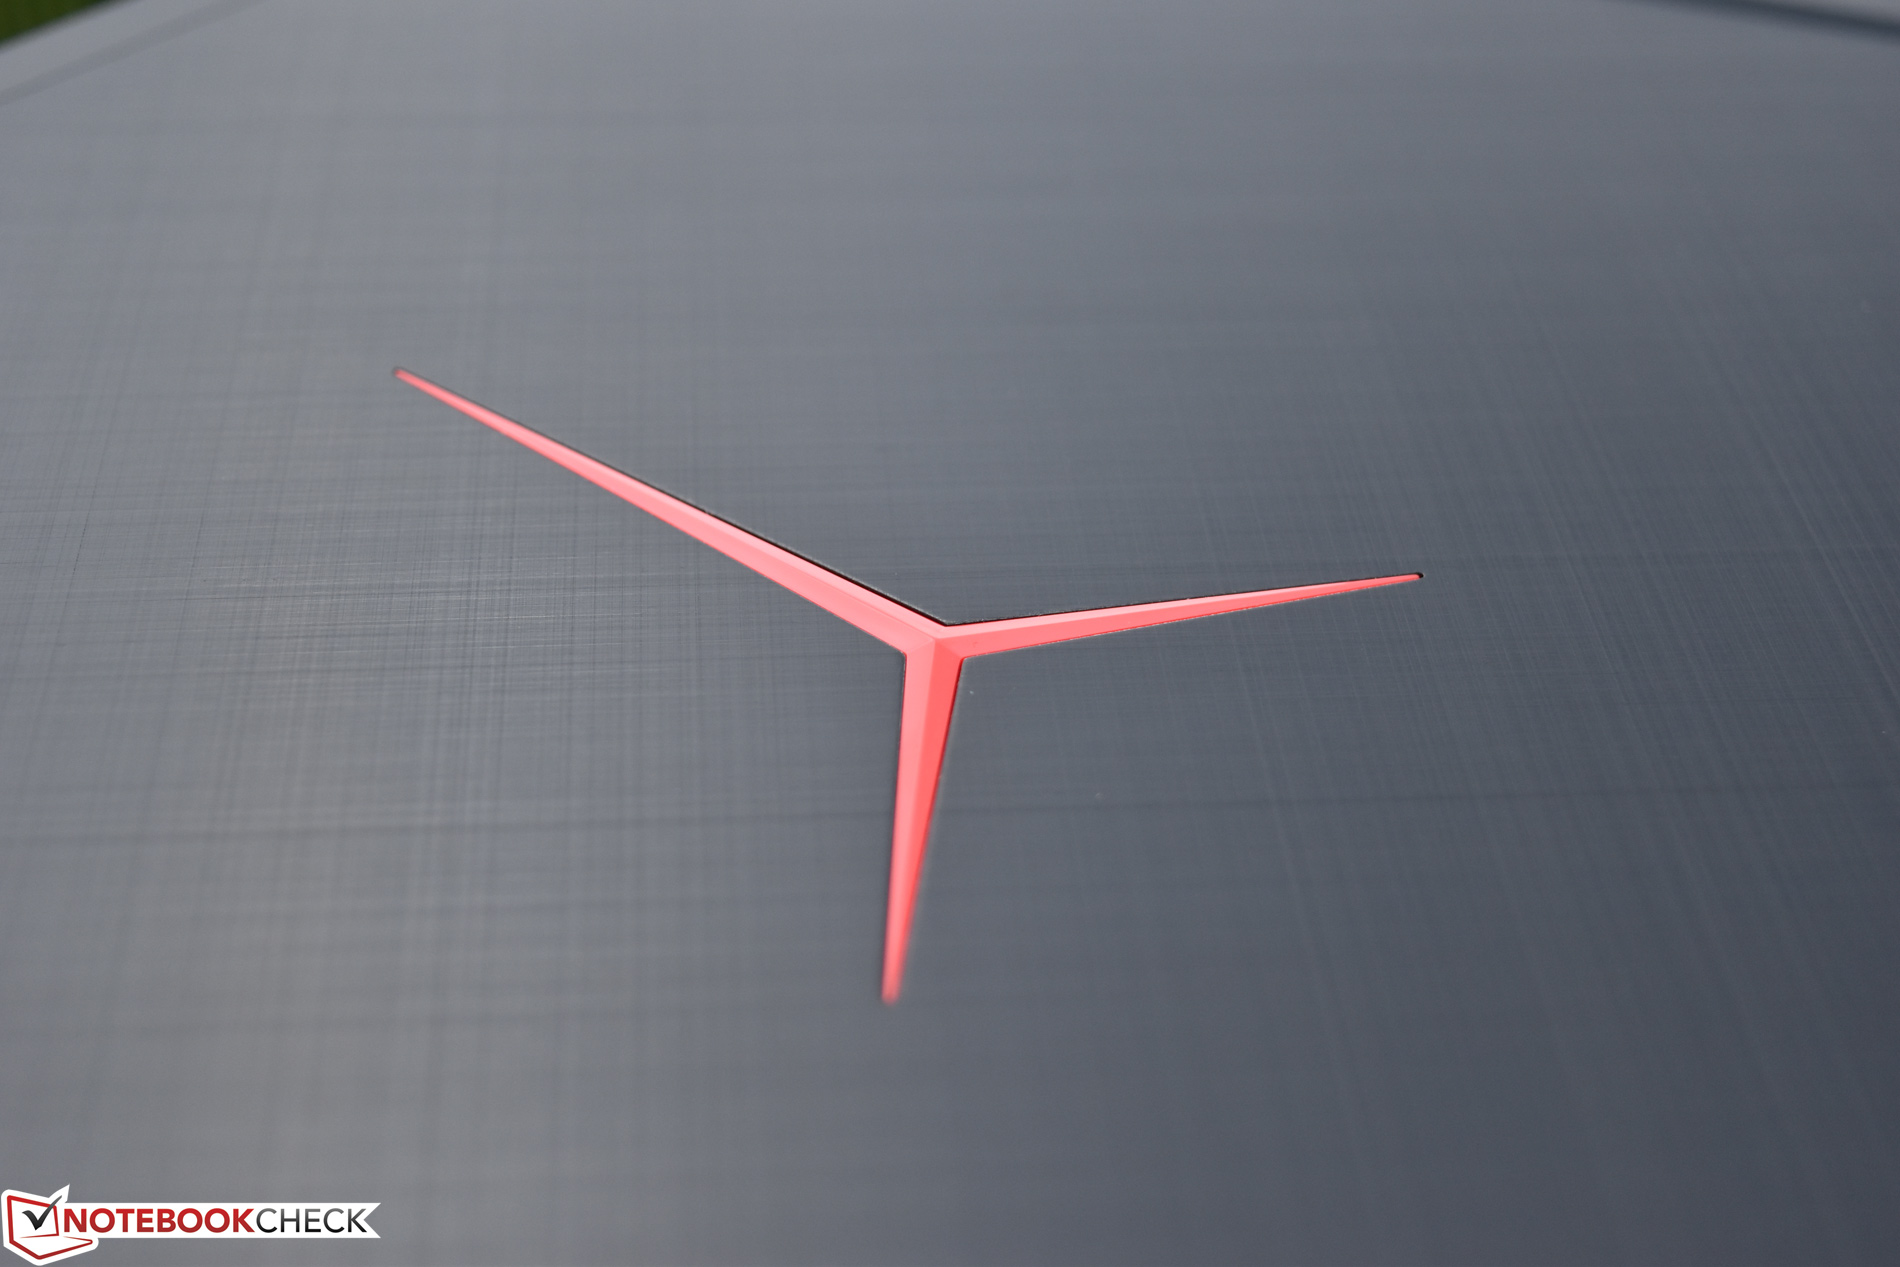
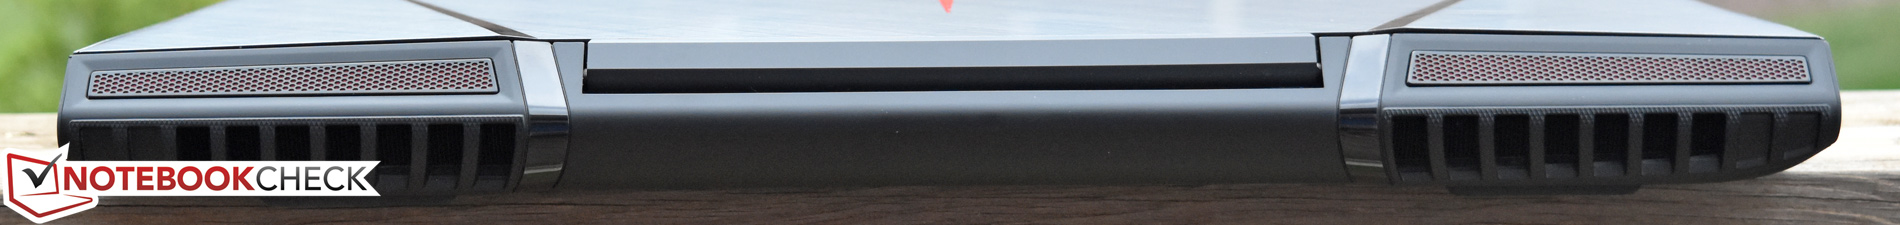
Speaking of appearances, the cross-hatch aluminum lid pattern and lighted Legion logo are still intact, spilling over a red accent color from the otherwise black lid to the speaker grill on the base unit, where the only other hint of color is the RGB-backlit keyboard (which we’ll get to in a bit). It’s a thoroughly gaming-like appearance, and it fits in perfectly well with its peers in the segment.
Connectivity
As before, the Legion Y920 features plenty of ports, conveniently spaced. There are now four USB 3.0 ports (up from 2 x USB 3.0 + 2 x USB 2.0 on the Y900) along with the USB Type-C/Thunderbolt 3 port. The latter can also be used to drive up to two 4K external monitors simultaneously, or the user can leverage one of the other two video output options—HDMI or DisplayPort. This is one area in which the Y920 absolutely does not lack.

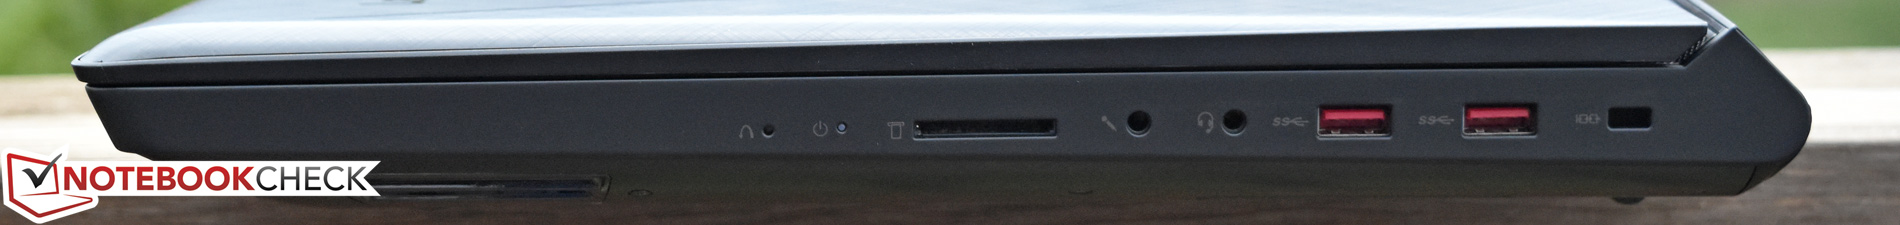
SD Card Reader
SD card performance when measured in conjunction with our standard Toshiba UHS-II SDXC card is roughly on par with that of most rivals. Some machines are much faster (such as the Dell XPS 15-9560), but these are acceptable speeds regardless.
| SD Card Reader | |
| average JPG Copy Test (av. of 3 runs) | |
| Asus G752VS-BA338T | |
| HP Omen 15-ce002ng | |
| Gigabyte P56XT | |
| Lenovo Legion Y920-17IKB | |
| maximum AS SSD Seq Read Test (1GB) | |
| Gigabyte P56XT | |
| Lenovo Legion Y920-17IKB | |
| Asus G752VS-BA338T | |
| HP Omen 15-ce002ng | |
Communication
The Y920 features a Killer E2500 Gigabit Ethernet adapter (versus the Qualcomm/Atheros e2400 adapter from the Y900—both are essentially equivalent regardless of branding discrepancies) as well as a Killer Wireless-n/a/ac 1535 WLAN adapter. This is the same wireless adapter as the Y900 and its transmission speeds are more than adequate.
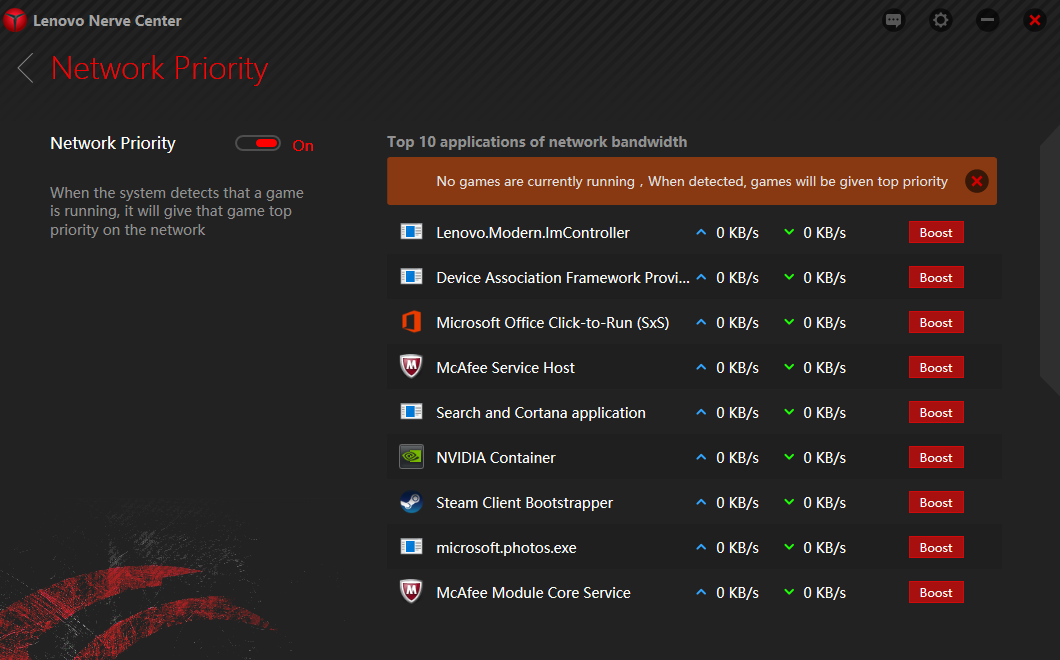
Lenovo’s Nerve Center application also includes a Network Priority option which essentially is QOS at the machine level. When the feature is enabled and a game is detected, the system automatically grants that application top network priority.
| Networking | |
| iperf3 transmit AX12 | |
| Lenovo Legion Y720 80VR002XGE | |
| Lenovo Legion Y920-17IKB | |
| Alienware 17 R4 | |
| HP Omen 15-ce002ng | |
| Gigabyte P56XT | |
| iperf3 receive AX12 | |
| HP Omen 15-ce002ng | |
| Gigabyte P56XT | |
| Lenovo Legion Y920-17IKB | |
| Alienware 17 R4 | |
| Lenovo Legion Y720 80VR002XGE | |
Software
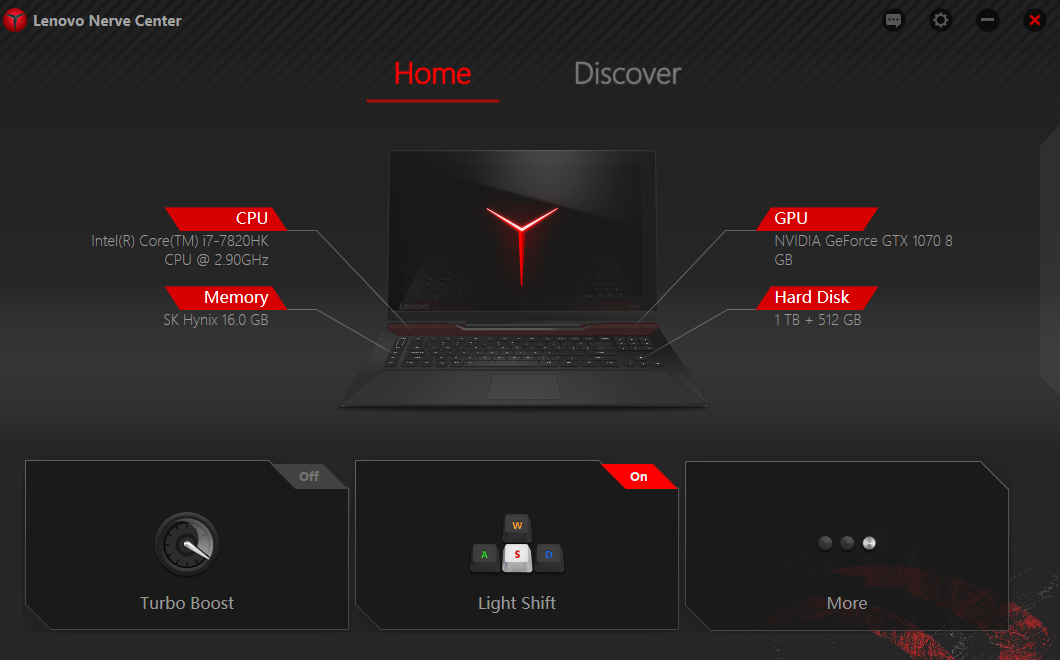
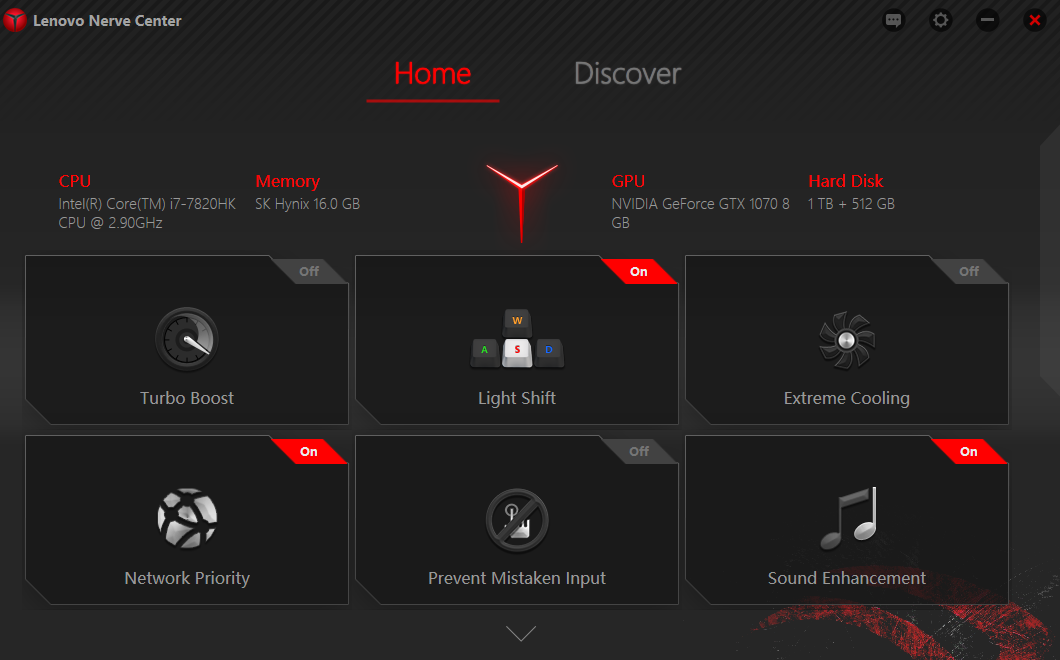
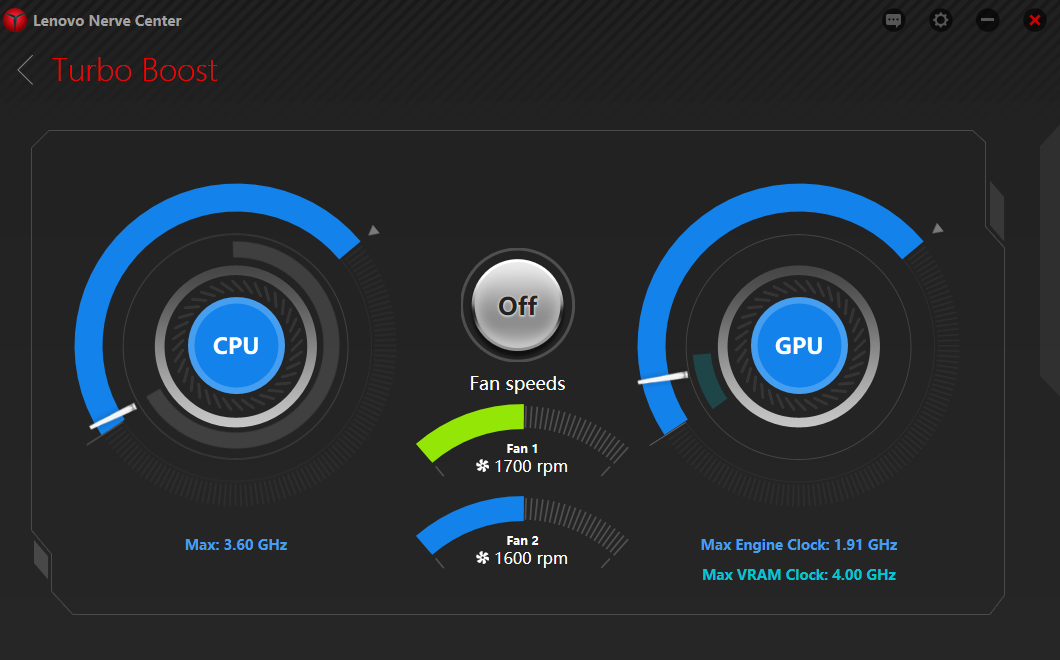
Lenovo includes their Nerve Center software package with the Y920 (it’s standard on all Legion machines). We’ve covered this software before, though it has been continually updated and continues to improve. It’s intended as a one-stop solution for all gamer-type customizations of the machine’s functions, and it specifically provides options for the following items:
- CPU/GPU/fan speed Turbo Boost
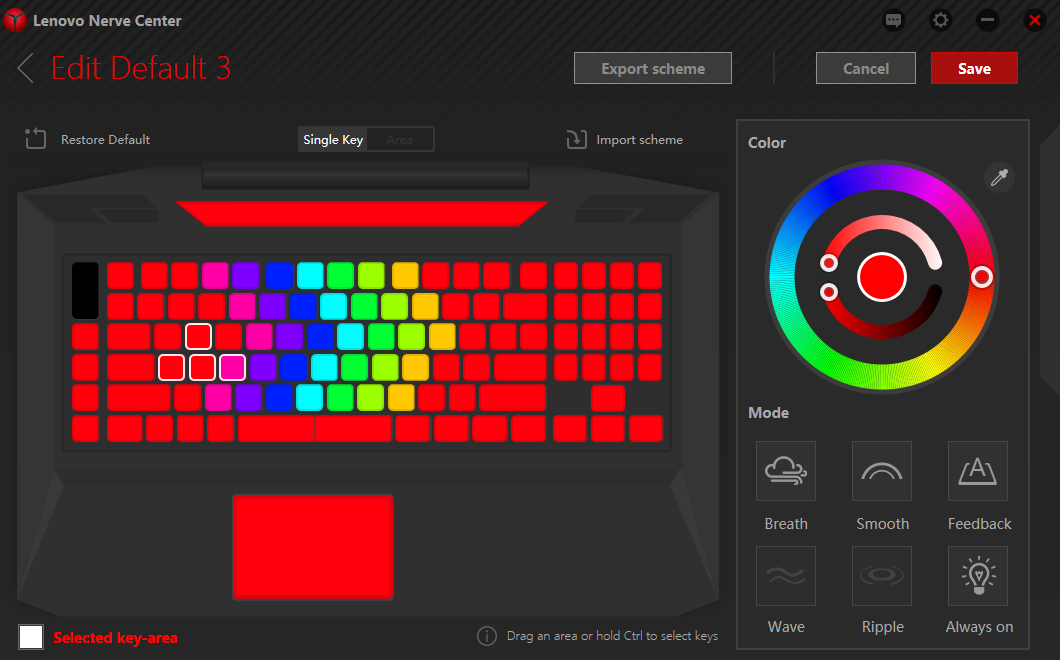
- Light Shift RGB keyboard backlighting options/schemes
- Extreme Cooling On/Off switch
- Network Priority / QOS functionality (mentioned previously)
- Prevent Mistaken Input to disable the Windows key and touchpad while games are running
- Sound Enhancement to auto-launch Dolby audio post-processing software when a game starts
It’s an easy-to-use and relatively helpful program that is quite similar to offerings from competitors such as Dell and ASUS. During our time with the machine, we didn’t experience any problems with it.
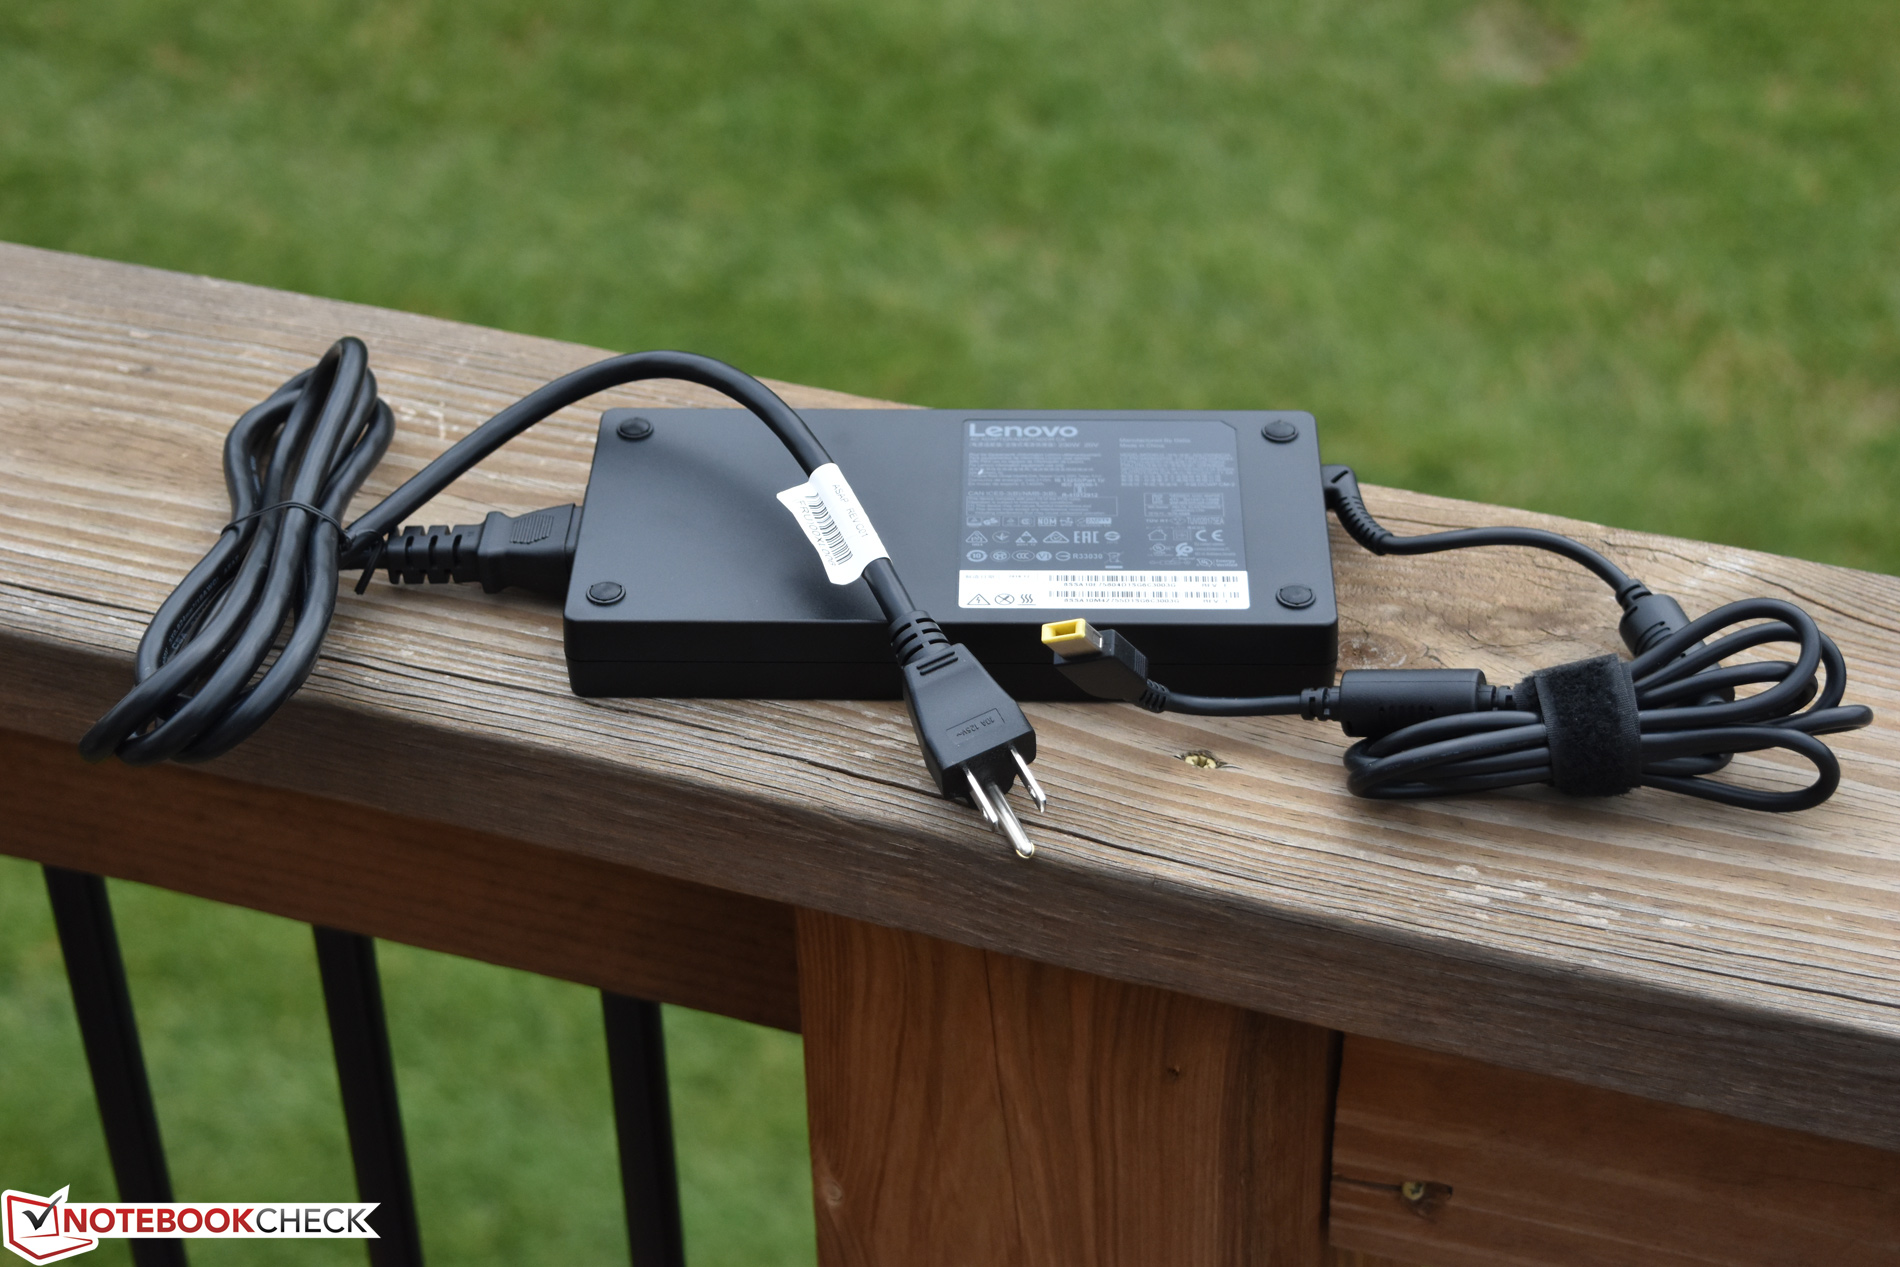
Accessories
The only accessory included with the Legion Y920 is the 230W AC adapter, which—while certainly and inevitably large—is thoughtfully designed in a flat form factor with rubber feet for easy positioning on any surface.
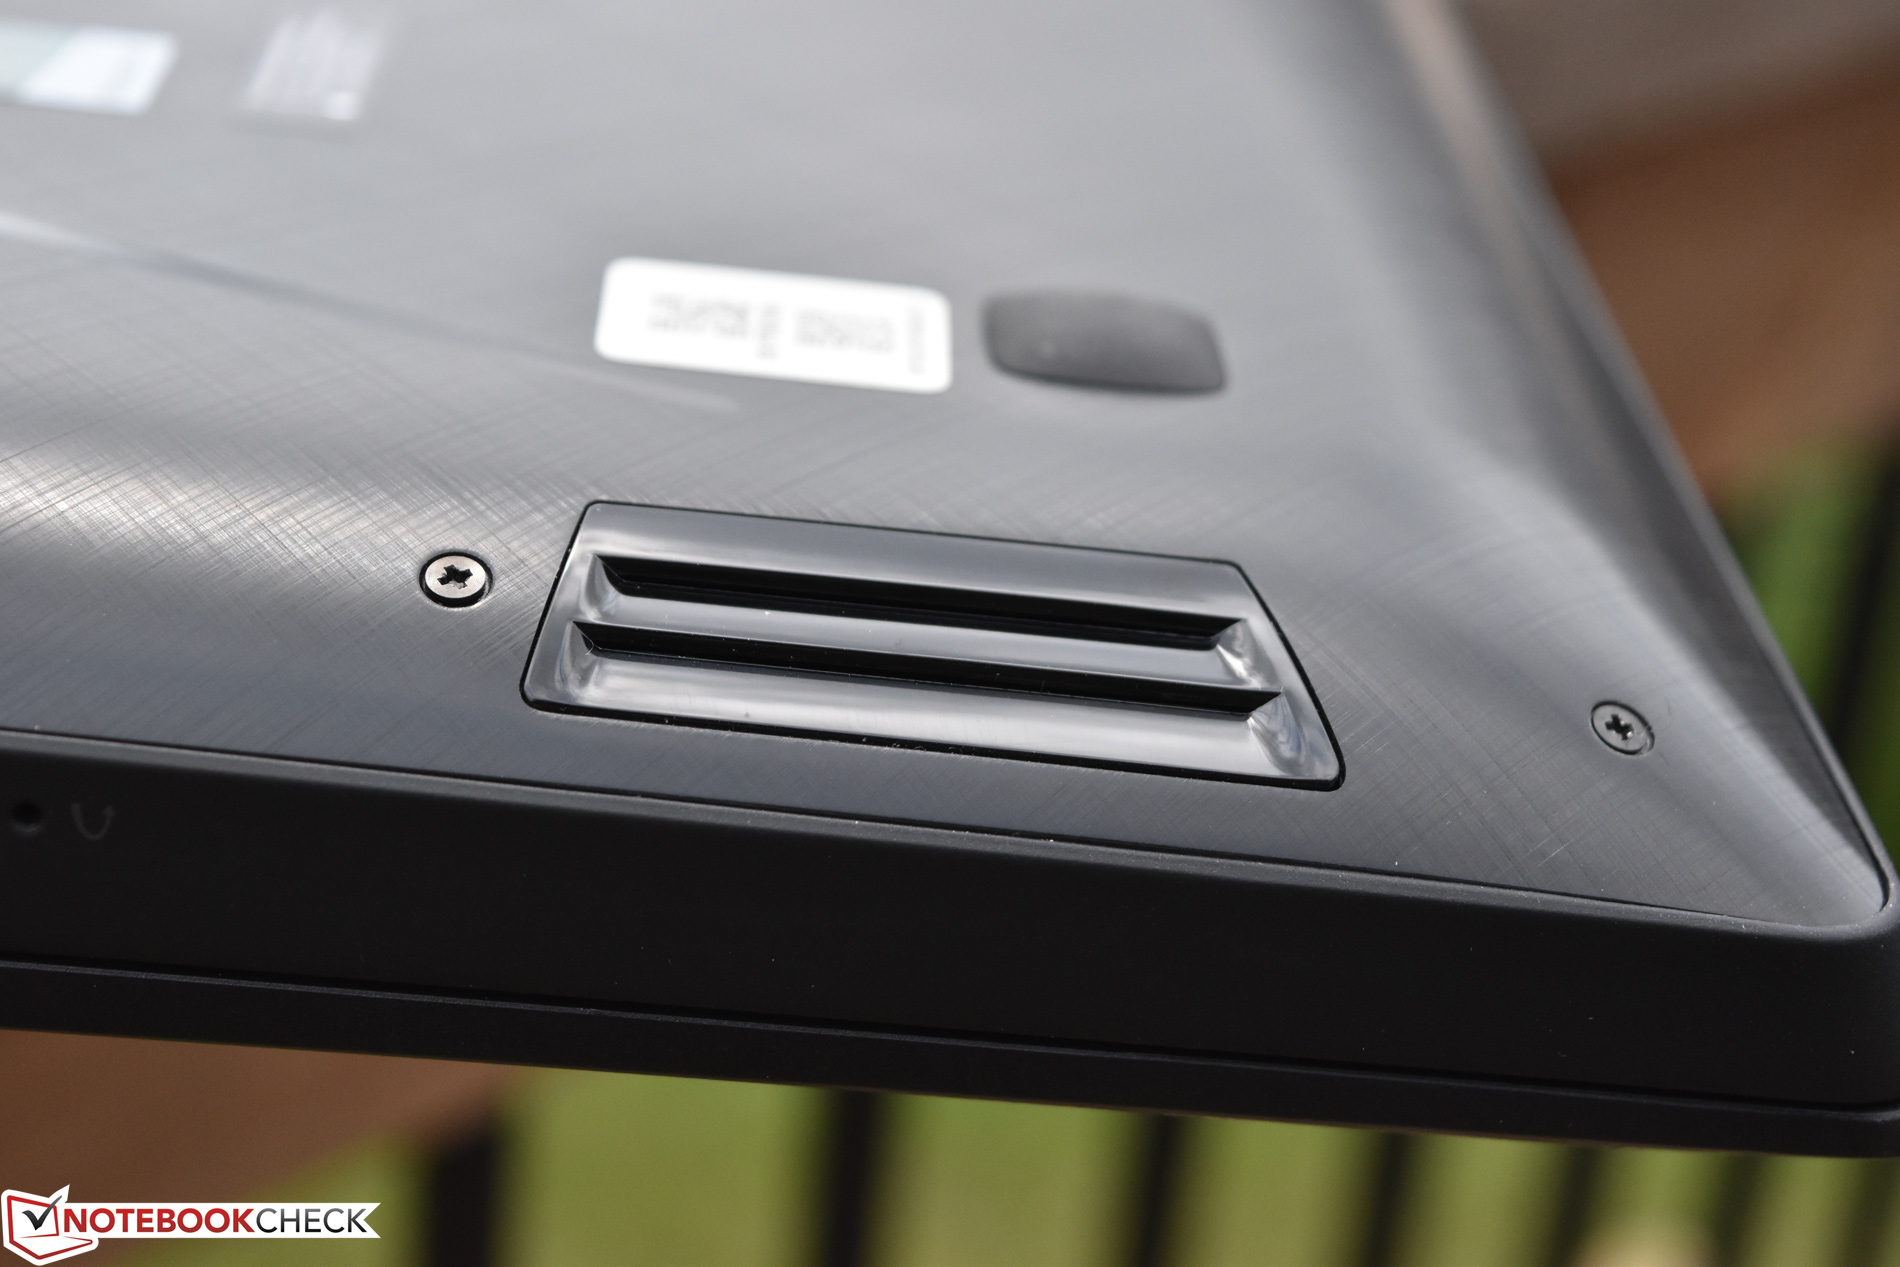
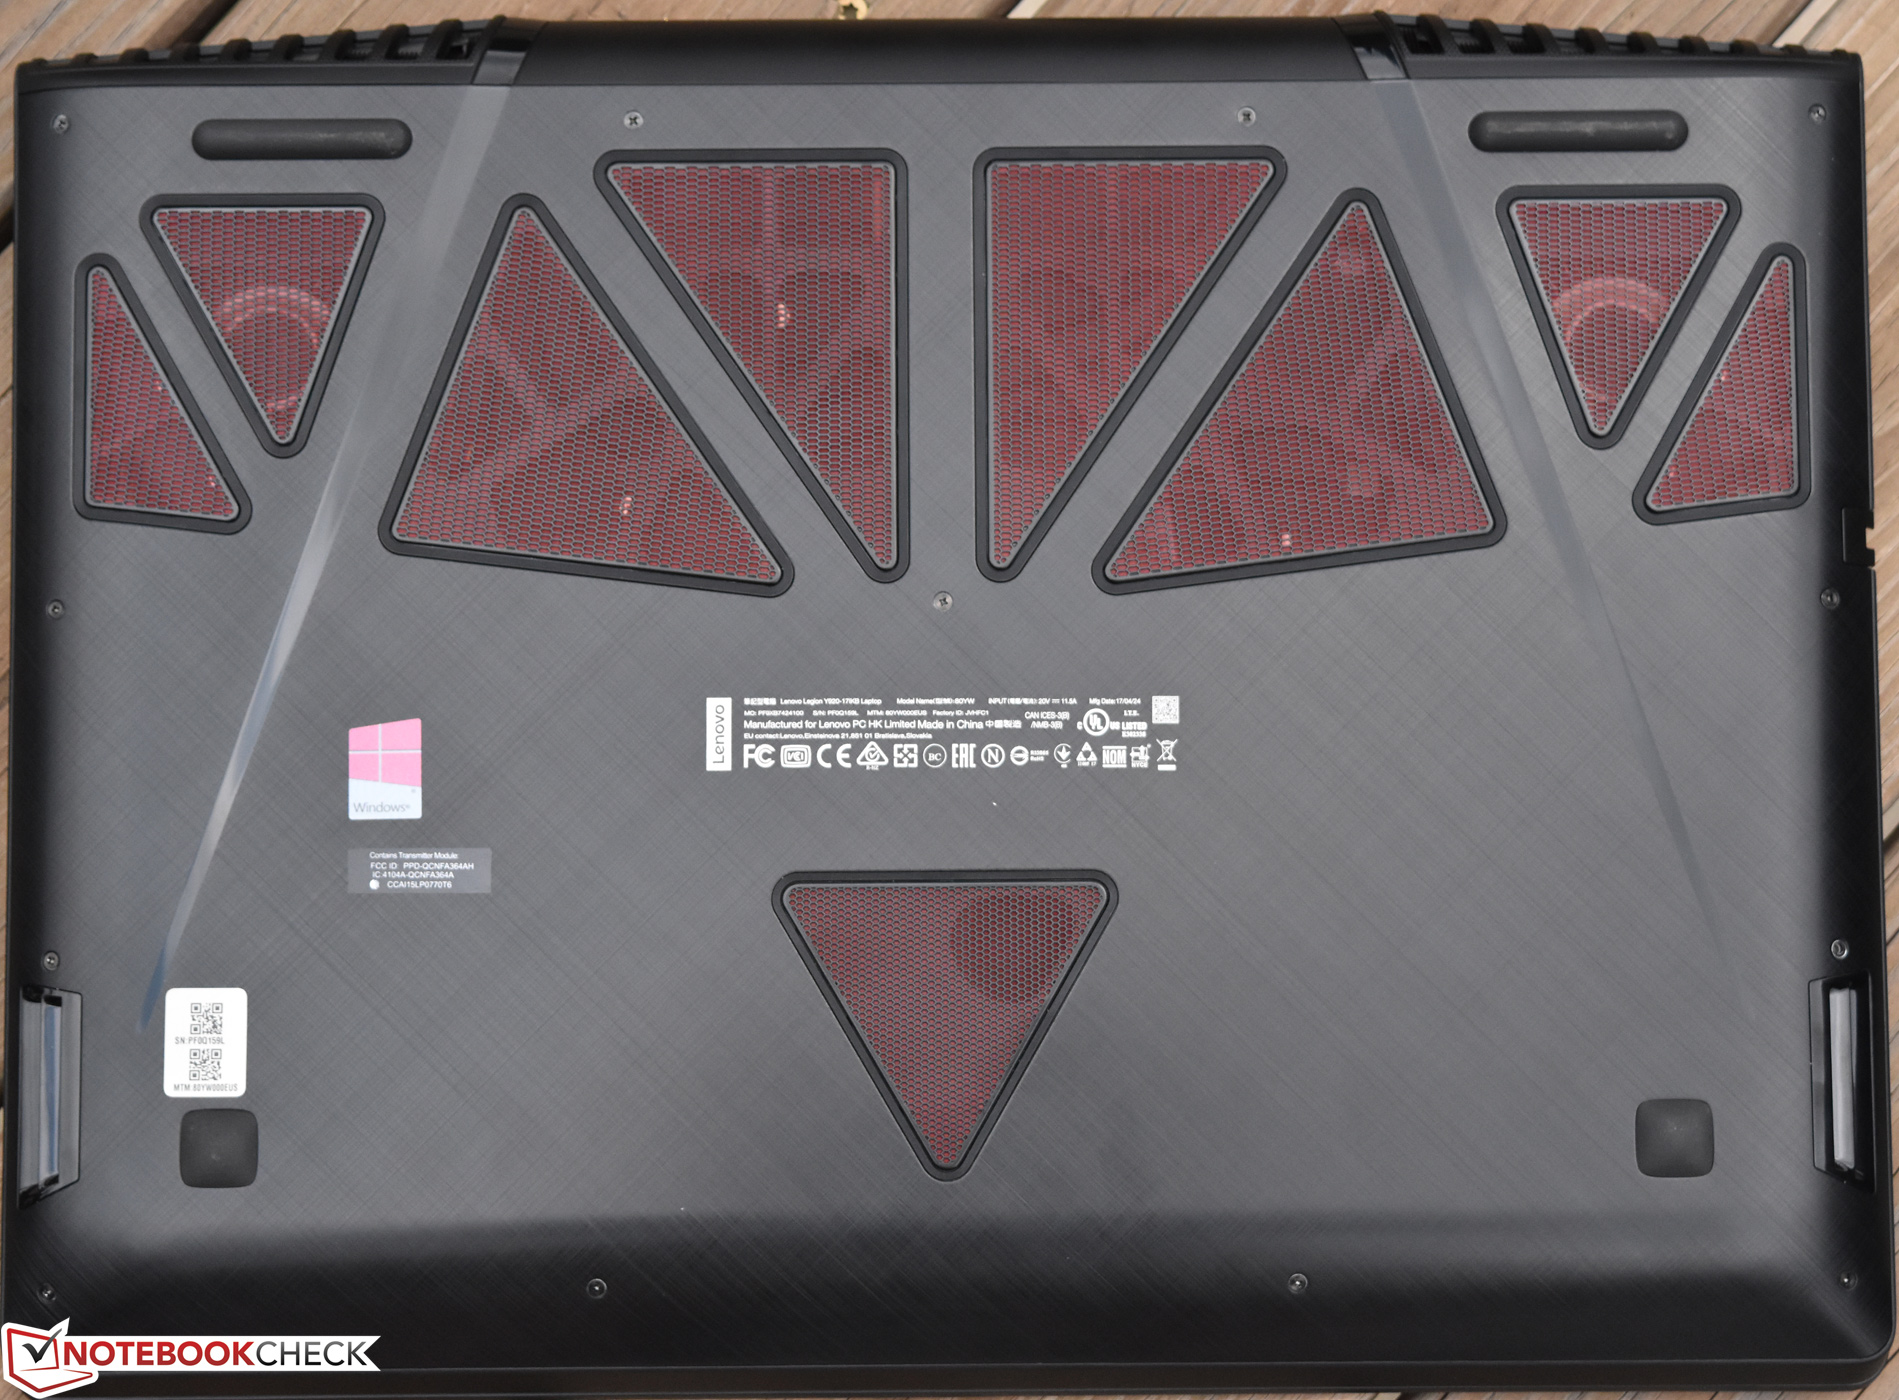
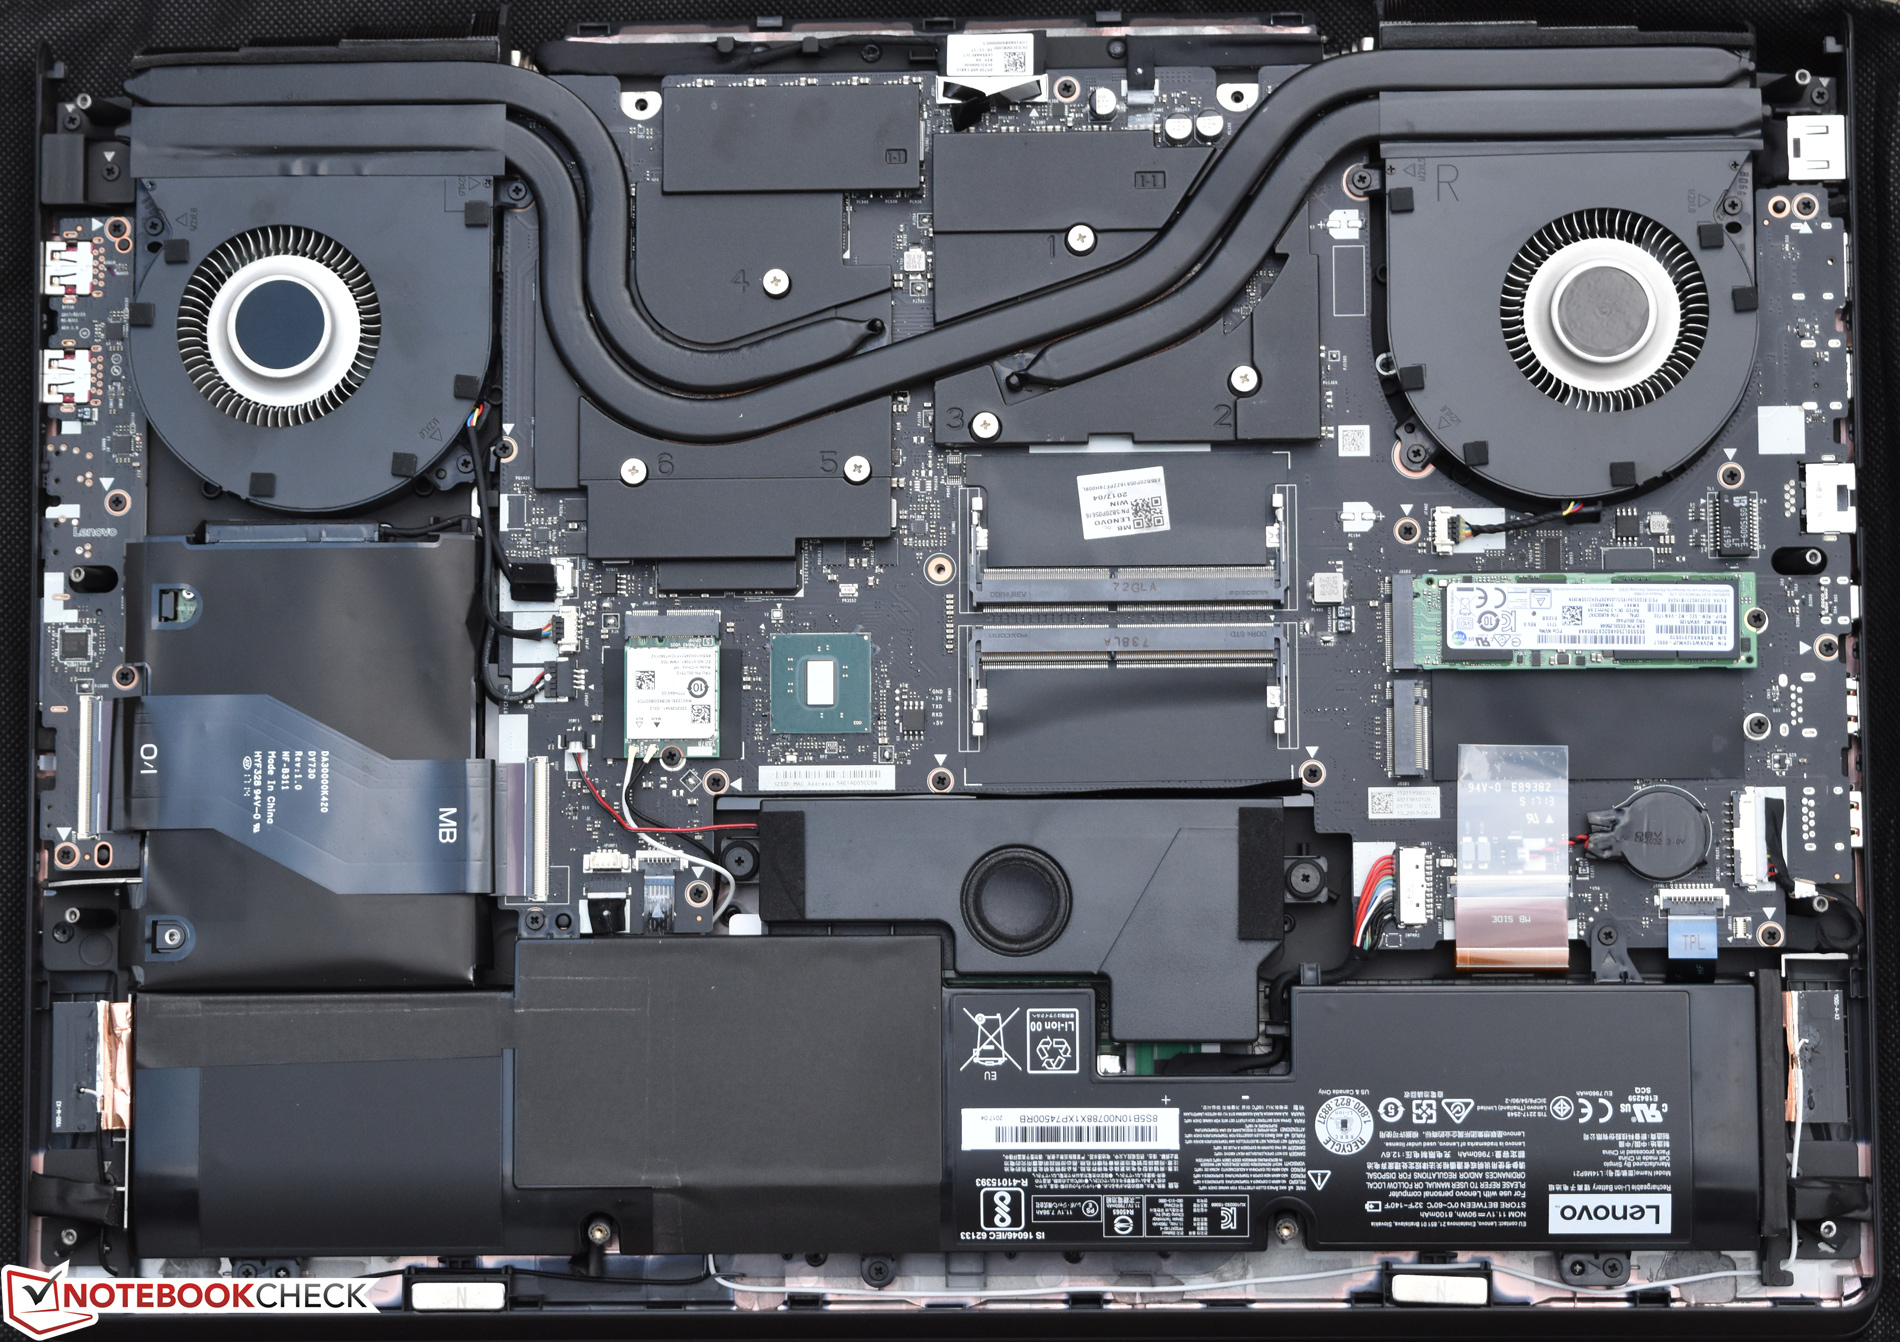
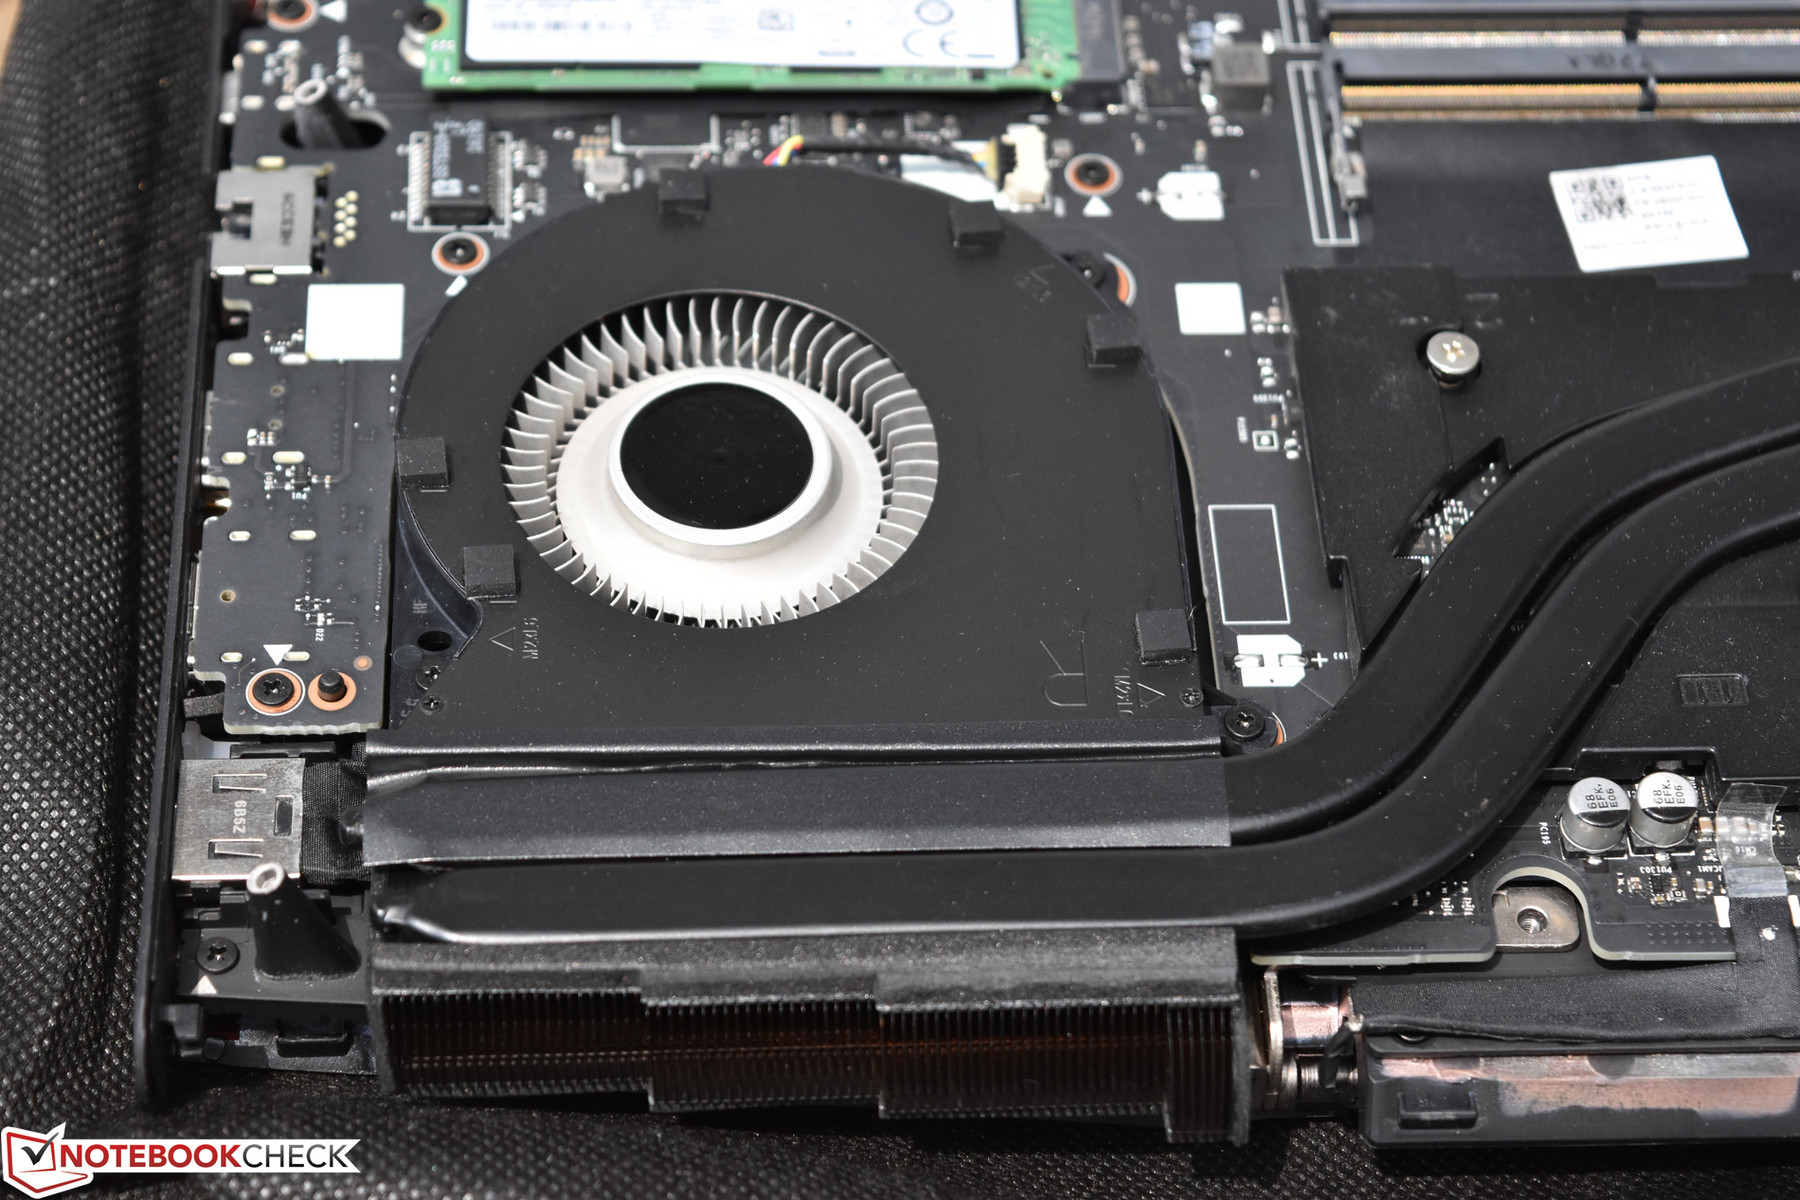
Maintenance
Thirteen Phillips-head screws secure the bottom cover to the Y920, after which nearly every major part is accessible/replaceable. However, some reports indicate that this could void your warranty. Before planning any upgrades, it would be wise to check first with the manufacturer.
Warranty
The Y920 includes a 1-year limited depot warranty. Please see our Guarantees, Return policies and Warranties FAQ for country-specific information.
Input Devices
Keyboard
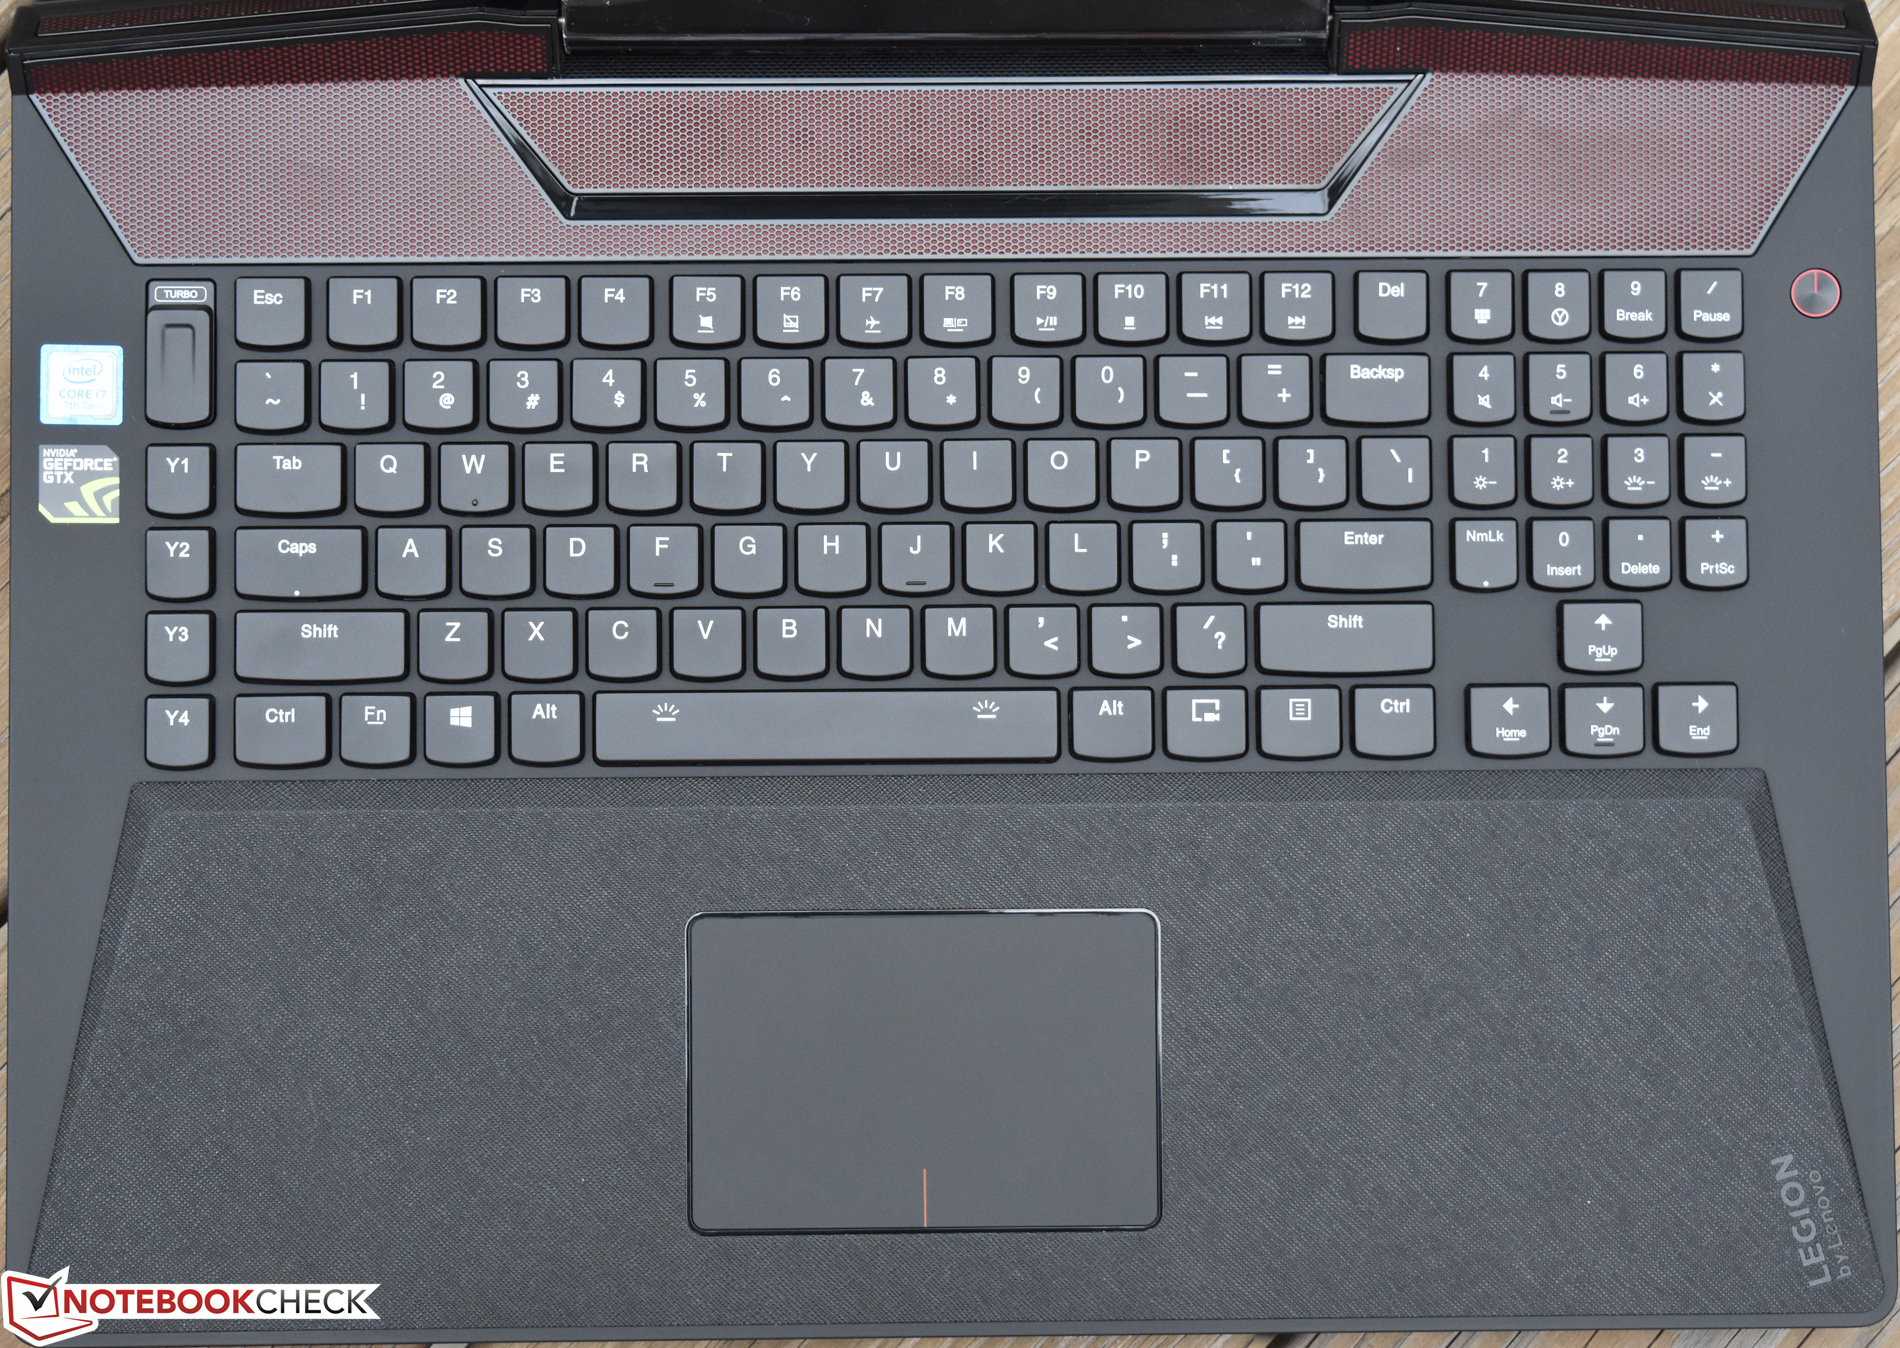
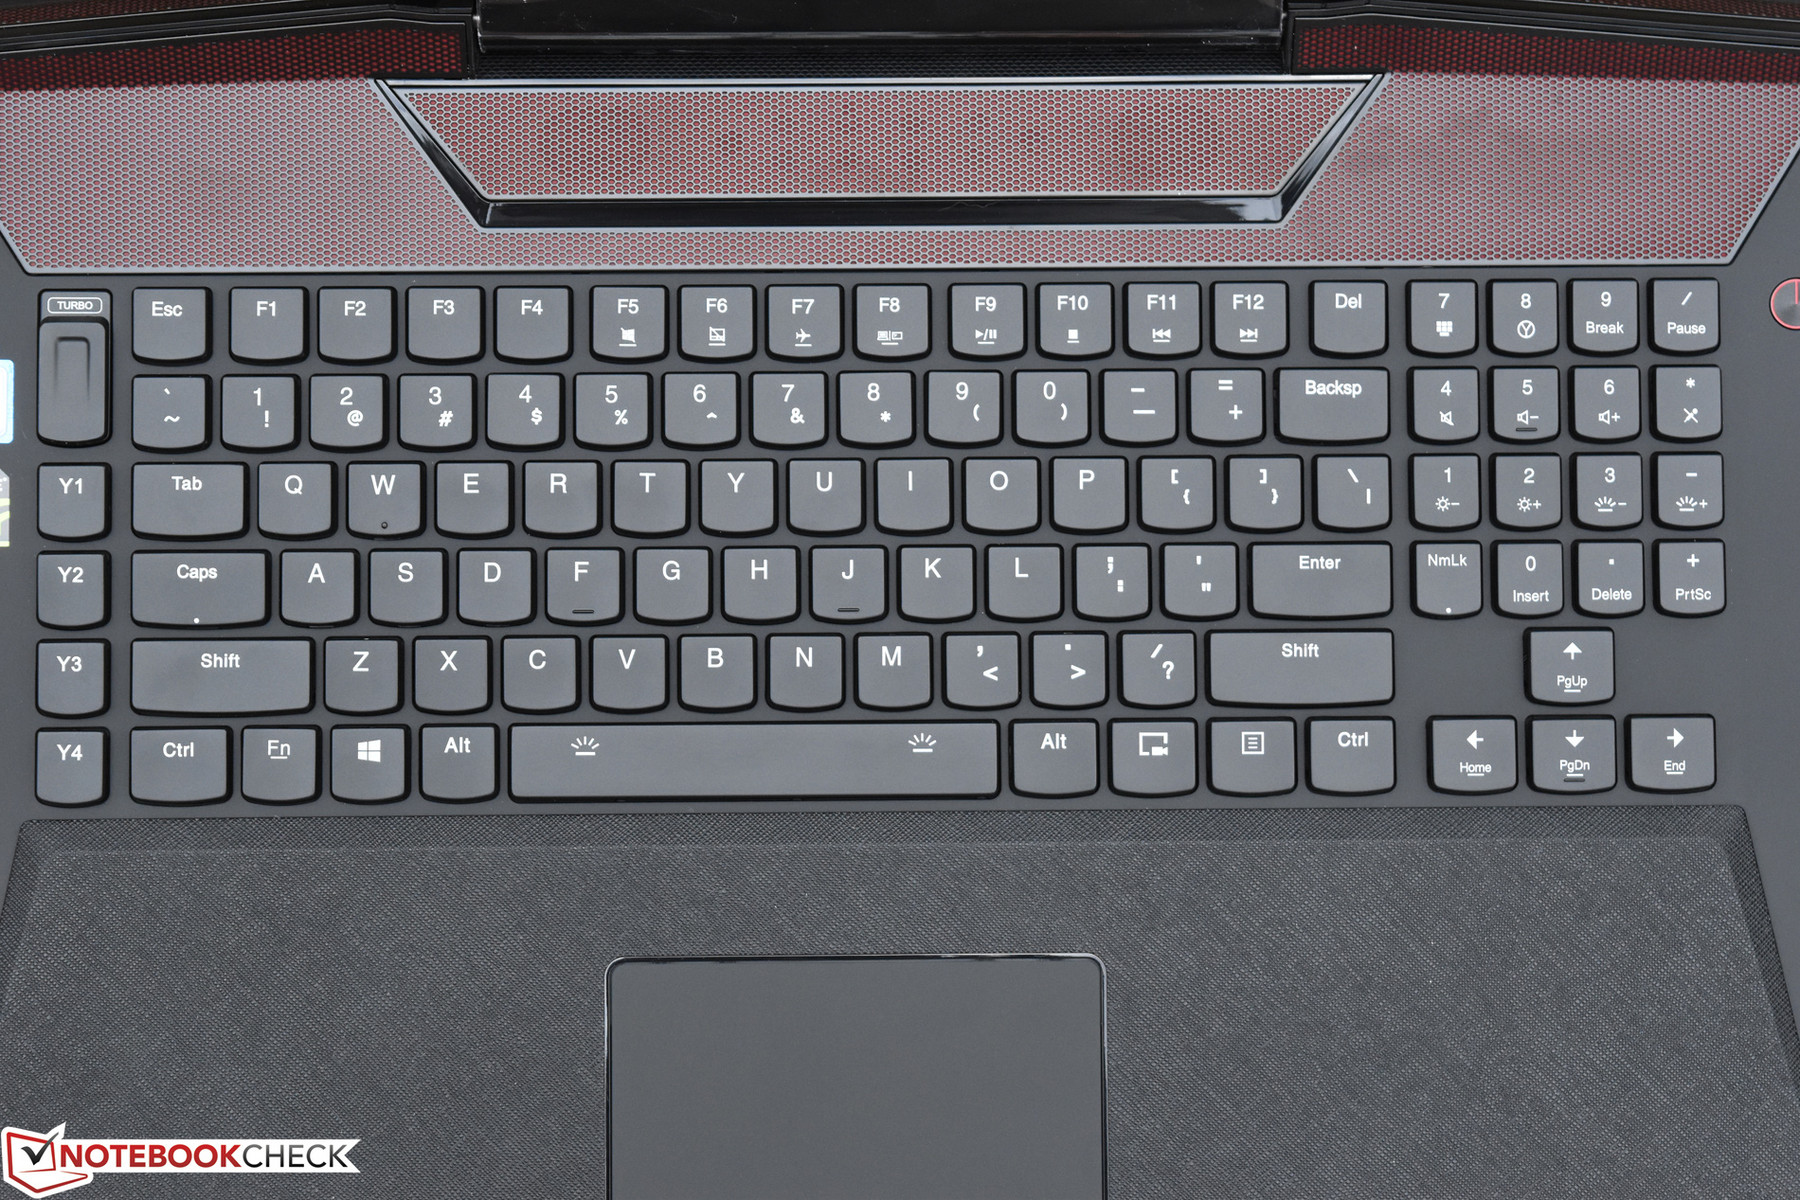
The Lenovo Legion Y920, like its predecessor, also features a mechanical keyboard—something which has long been hailed the holy grail of gaming peripherals. The difference is immediately noticeable, as every key features an identical level of feedback and exudes a rather loud “click” when depressed—a characteristic common to all mechanical keyboards. Unfortunately, regardless of this undeniably premium aspiration, the result is less than perfect: thanks to an uncommonly light actuation force and keys which are rather wobbly (they literally pivot under the finger until pressed), typing takes some serious adjustment on the Y920 keyboard. Overall, we feel that the vanilla Lenovo AccuType keyboard is fundamentally superior.
The keyboard is RGB backlit and (mostly) customizable. The Nerve Center software package allows for assigning different colors to different keys individually as well as even to the lighting surrounding the touchpad and top speaker grille, but it doesn’t go so far as to allow notification- and event-based lighting changes like (for instance) the Alienware software does. However, it is easy to activate one of a few different preconfigured animation styles with whatever color scheme you choose.
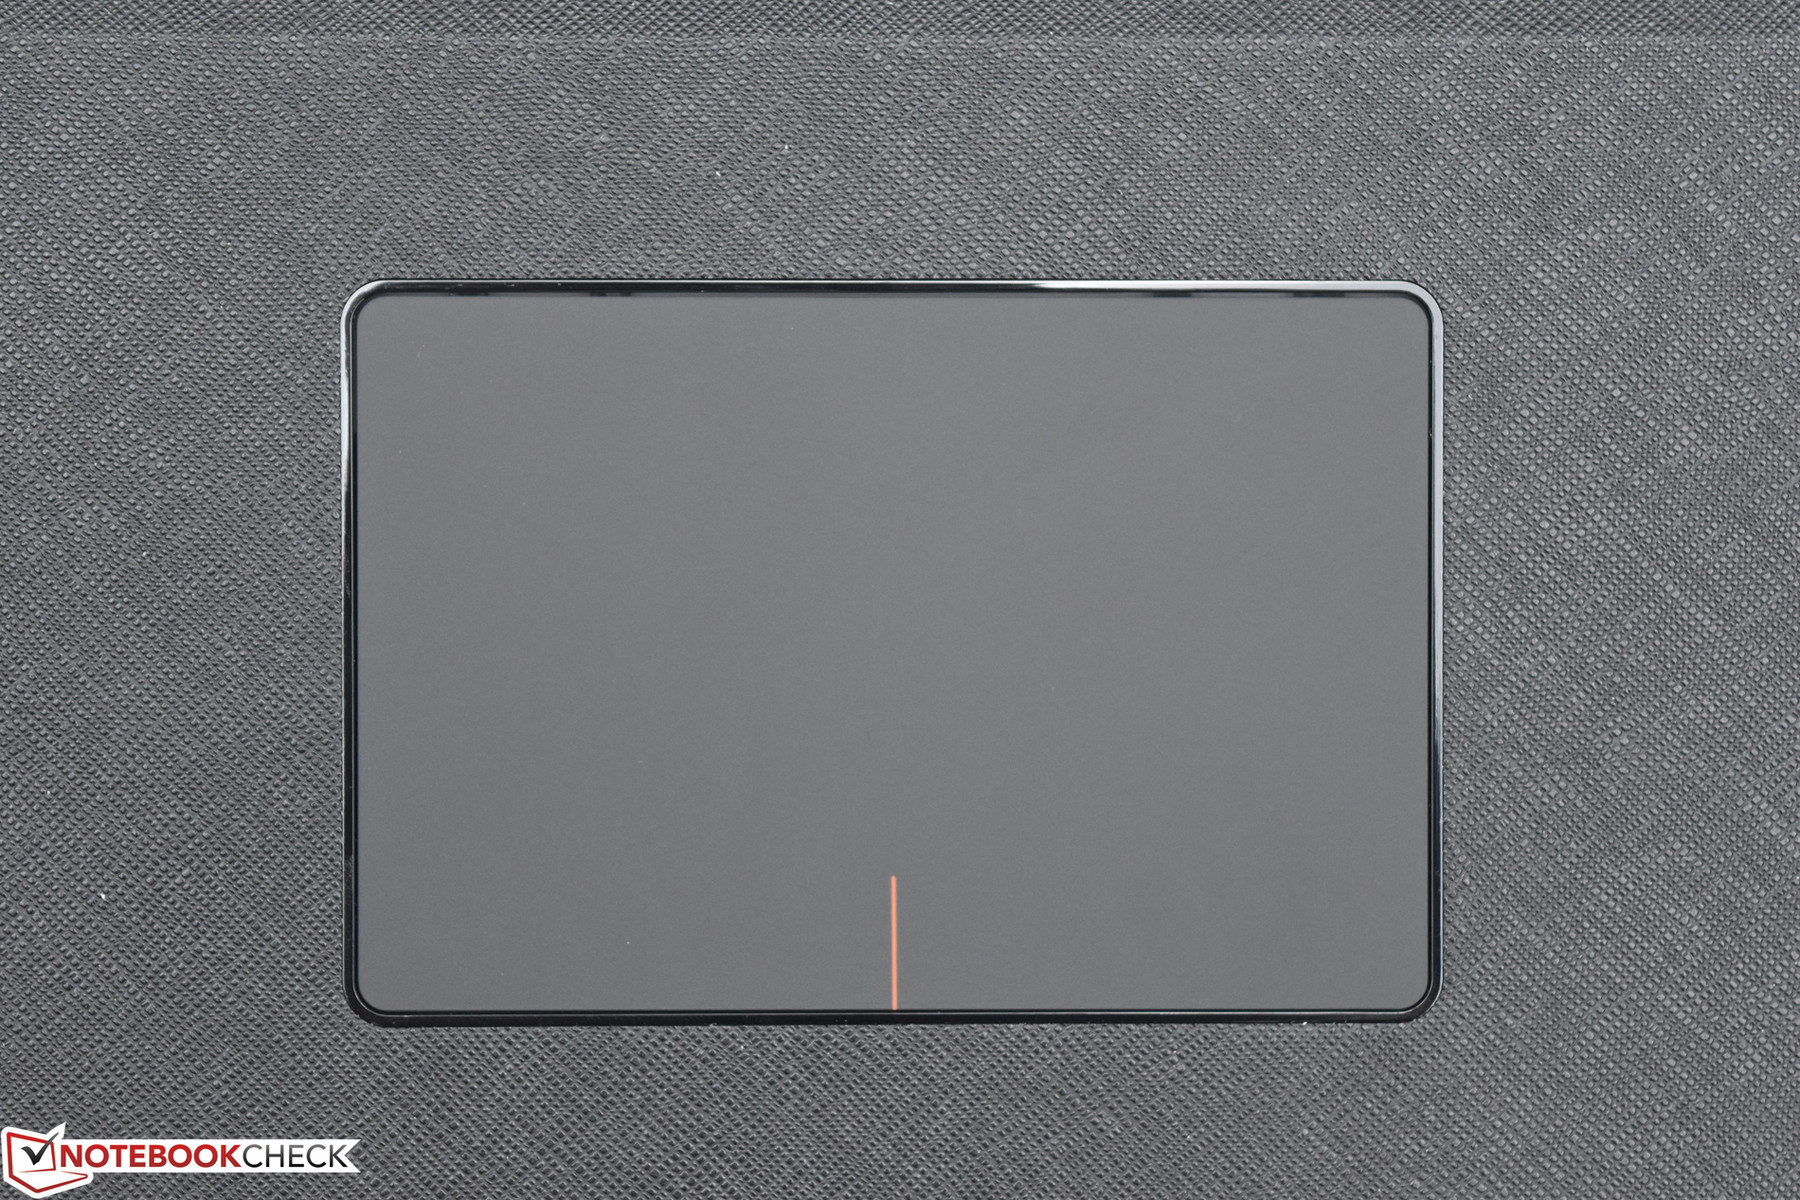
Touchpad
The Synaptics touchpad is fairly large and provides accurate pointer translation with a pleasantly smooth surface finish. The integrated buttons aren’t nearly as pleasant, however; the feedback is a bit mushier than ideal and it’s difficult to tell whether you’re right- or left-clicking. Drag-and-drop is, as usual, a challenge with the clickpad as well. Gestures are accurately and quickly interpreted.
Display
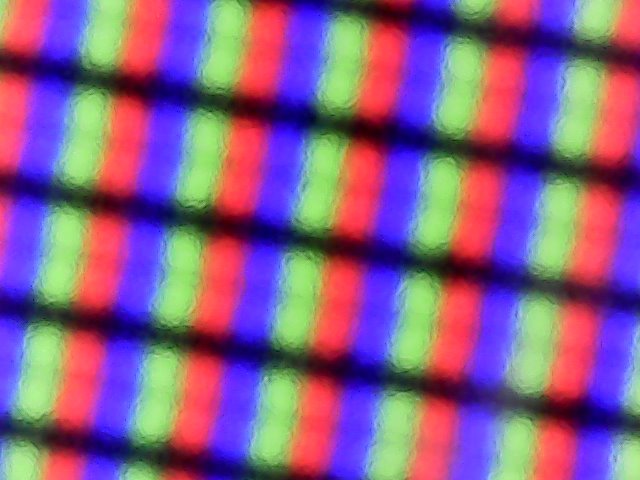
The Y920’s 17.3-inch FHD 1920x1080 display features what Lenovo refers to as an “AntiGlare” finish—though really, it’s just glossy with a little less reflectivity than the average high-gloss edge-to-edge glass display. Regardless, the 127 PPI derived from the panel size and resolution should be enough for satisfactory gaming presentation, and—of equivalent importance—NVIDIA G-Sync technology is on board, which synchronizes display refresh rates with those of the GPU for a smoother gaming experience overall.
Subjectively speaking, the display appears bright with reasonably good color reproduction. It doesn’t have too warm or cool a tint to it, and the contrast levels also seem acceptable.
| |||||||||||||||||||||||||
Brightness Distribution: 81 %
Center on Battery: 422.3 cd/m²
Contrast: 880:1 (Black: 0.48 cd/m²)
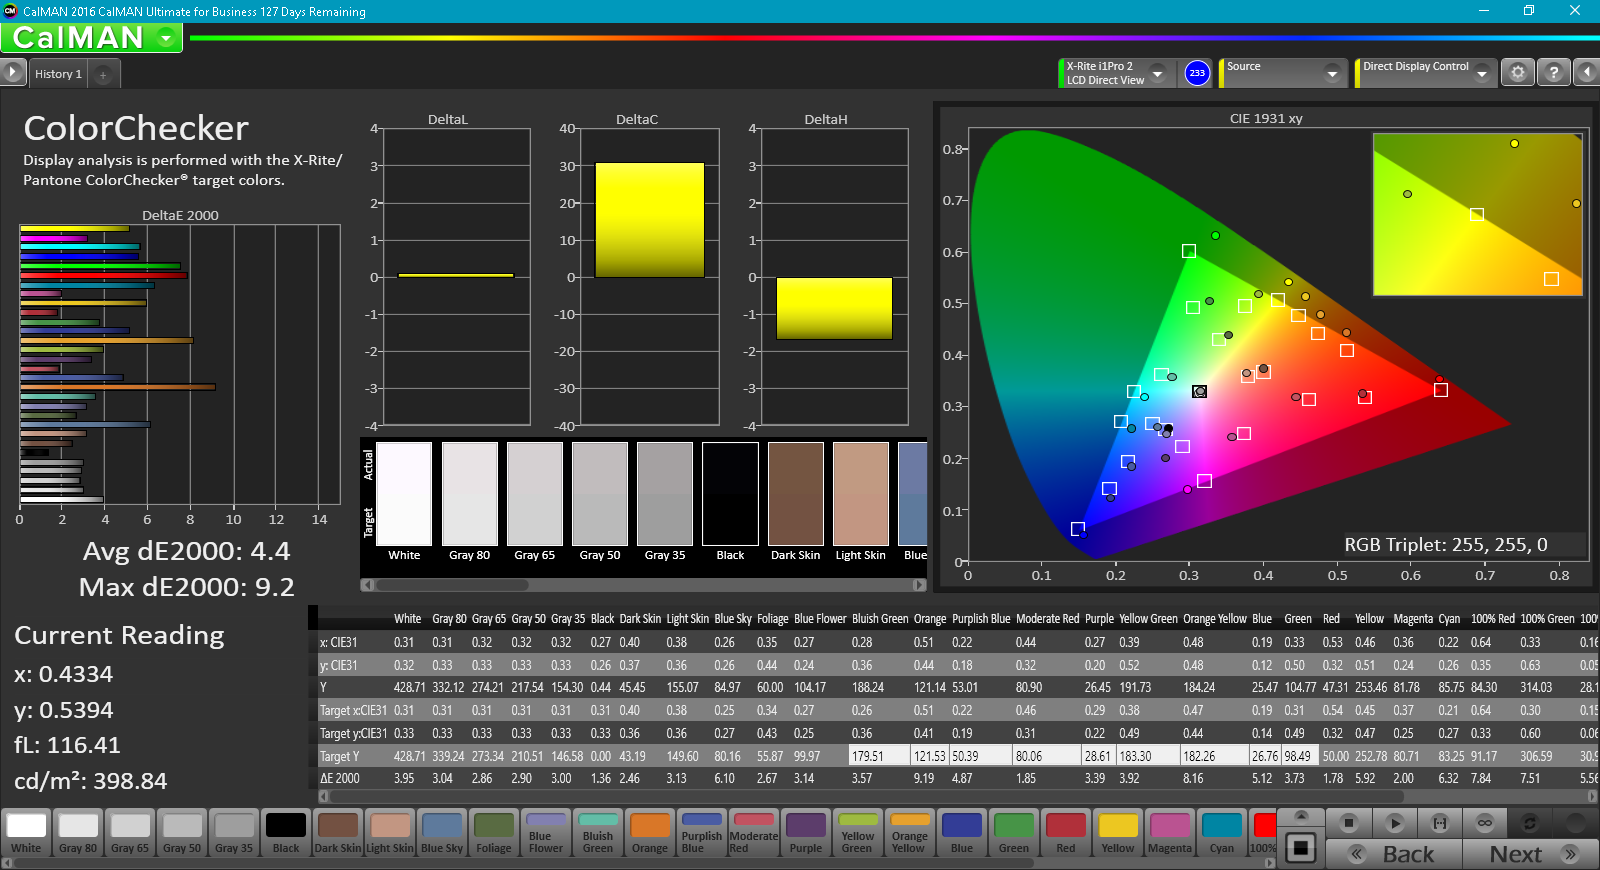
ΔE ColorChecker Calman: 4.4 | ∀{0.5-29.43 Ø4.71}
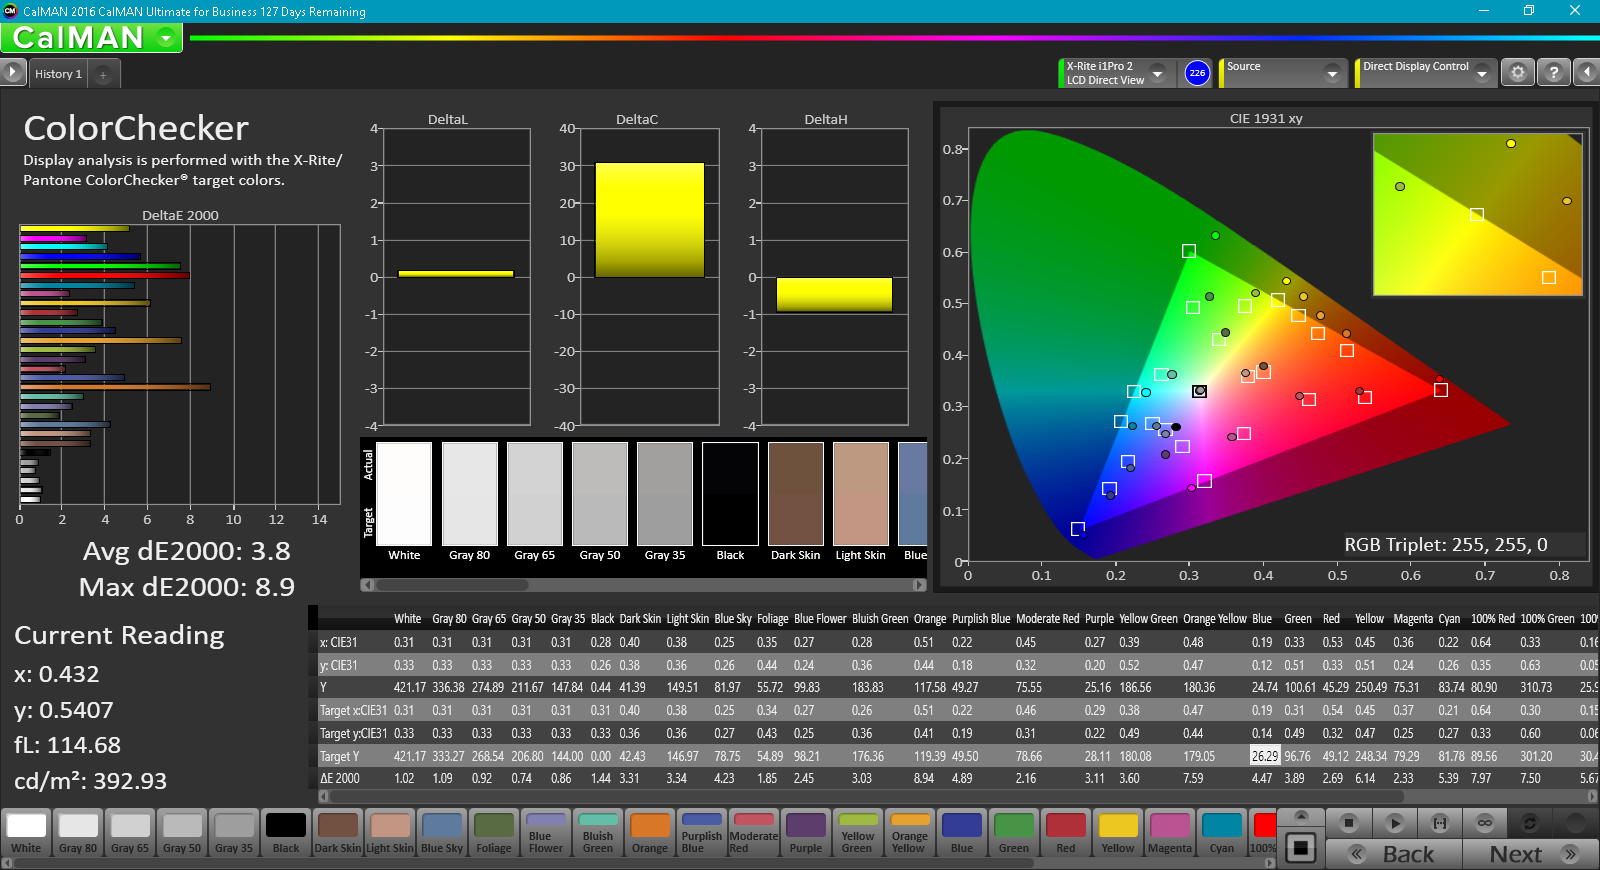
ΔE Greyscale Calman: 2.8 | ∀{0.09-98 Ø4.96}
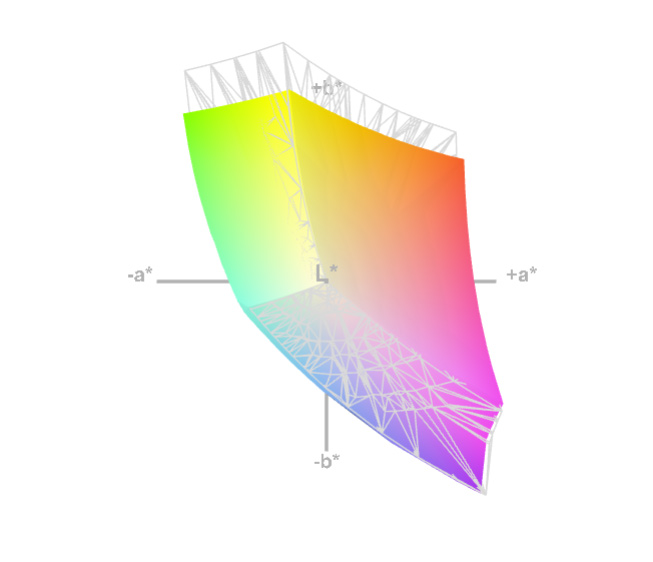
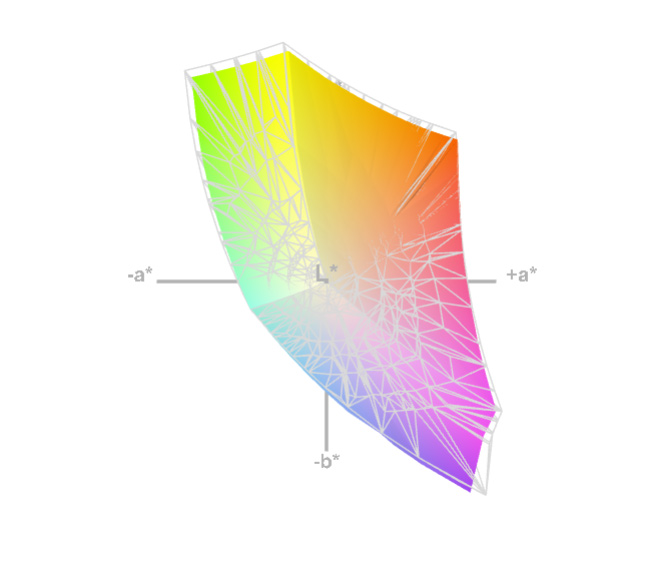
84% sRGB (Argyll 1.6.3 3D)
55% AdobeRGB 1998 (Argyll 1.6.3 3D)
61.4% AdobeRGB 1998 (Argyll 3D)
84% sRGB (Argyll 3D)
66.4% Display P3 (Argyll 3D)
Gamma: 2.22
CCT: 6403 K
| Lenovo Legion Y920-17IKB LP173WF4-SPF5, IPS, 17.3", 1920x1080 | Asus G752VS-BA338T AU Optronics B173HAN01.1 (AUO119D), IPS, 17.3", 1920x1080 | Gigabyte P56XT LG Philips LP156WF6 (LGD046F), IPS, 15.6", 1920x1080 | HP Omen 15-ce002ng AUO42ED, IPS, 15.6", 1920x1080 | Alienware 17 R4 TN LED, 17.3", 2560x1440 | Lenovo Legion Y720 80VR002XGE LG Philips LGD0533 LP156WF6-SPK3, IPS, 15.6", 1920x1080 | Lenovo IdeaPad Y900 17.3", 1920x1080 | |
|---|---|---|---|---|---|---|---|
| Display | 1% | 0% | 5% | -3% | -36% | 3% | |
| Display P3 Coverage (%) | 66.4 | 61.6 -7% | 64.8 -2% | 65.8 -1% | 61.2 -8% | 38.43 -42% | 67.4 2% |
| sRGB Coverage (%) | 84 | 90.3 8% | 84.6 1% | 90.9 8% | 82.9 -1% | 57.5 -32% | 86.3 3% |
| AdobeRGB 1998 Coverage (%) | 61.4 | 62.8 2% | 61.8 1% | 66.5 8% | 60.5 -1% | 39.75 -35% | 63.2 3% |
| Response Times | -19% | -18% | -42% | 21% | -26% | -16% | |
| Response Time Grey 50% / Grey 80% * (ms) | 28.8 ? | 36 ? -25% | 37.2 ? -29% | 43.2 ? -50% | 30 ? -4% | 43 ? -49% | 34.8 ? -21% |
| Response Time Black / White * (ms) | 23.2 ? | 26 ? -12% | 24.8 ? -7% | 31.2 ? -34% | 12.8 ? 45% | 24 ? -3% | 25.6 ? -10% |
| PWM Frequency (Hz) | 20000 | 20000 ? | 21000 ? | ||||
| Screen | -19% | -18% | 10% | -16% | -19% | -4% | |
| Brightness middle (cd/m²) | 422.3 | 307 -27% | 301 -29% | 304 -28% | 402.3 -5% | 288 -32% | 344.9 -18% |
| Brightness (cd/m²) | 378 | 300 -21% | 280 -26% | 289 -24% | 372 -2% | 275 -27% | 329 -13% |
| Brightness Distribution (%) | 81 | 88 9% | 87 7% | 86 6% | 86 6% | 86 6% | 86 6% |
| Black Level * (cd/m²) | 0.48 | 0.32 33% | 0.32 33% | 0.26 46% | 0.62 -29% | 0.36 25% | 0.349 27% |
| Contrast (:1) | 880 | 959 9% | 941 7% | 1169 33% | 649 -26% | 800 -9% | 988 12% |
| Colorchecker dE 2000 * | 4.4 | 5.53 -26% | 6.21 -41% | 3.46 21% | 5.6 -27% | 5.29 -20% | 4.49 -2% |
| Colorchecker dE 2000 max. * | 9.2 | 11.54 -25% | 10.78 -17% | 7.72 16% | 9.8 -7% | 9.97 -8% | 8.72 5% |
| Greyscale dE 2000 * | 2.8 | 7 -150% | 6.08 -117% | 2.46 12% | 4.7 -68% | 4.5 -61% | 4.63 -65% |
| Gamma | 2.22 99% | 2.48 89% | 2.31 95% | 2.38 92% | 2.14 103% | 2.39 92% | 2.11 104% |
| CCT | 6403 102% | 8103 80% | 7375 88% | 6915 94% | 7519 86% | 6839 95% | 6905 94% |
| Color Space (Percent of AdobeRGB 1998) (%) | 55 | 58 5% | 55 0% | 59 7% | 53.7 -2% | 37 -33% | 56.7 3% |
| Color Space (Percent of sRGB) (%) | 84 | 90 7% | 84 0% | 91 8% | 82.2 -2% | 57 -32% | 86.4 3% |
| Total Average (Program / Settings) | -12% /
-15% | -12% /
-15% | -9% /
2% | 1% /
-9% | -27% /
-23% | -6% /
-4% |
* ... smaller is better
We measured an average brightness of 378 cd/m² with a significantly higher brightness in the center quadrant of 422.3 cd/m². The rest of the screen is fairly consistent in its luminosity, however, so brightness distribution still isn’t all that bad at 81%. Contrast, as we previously predicted, was measured at 880:1, which is pretty good but not stellar. Compared with its closest modern competitor, the Asus ROG G752VS, the Legion Y920 handles the basics better (21% brighter, roughly the same contrast, better color accuracy).
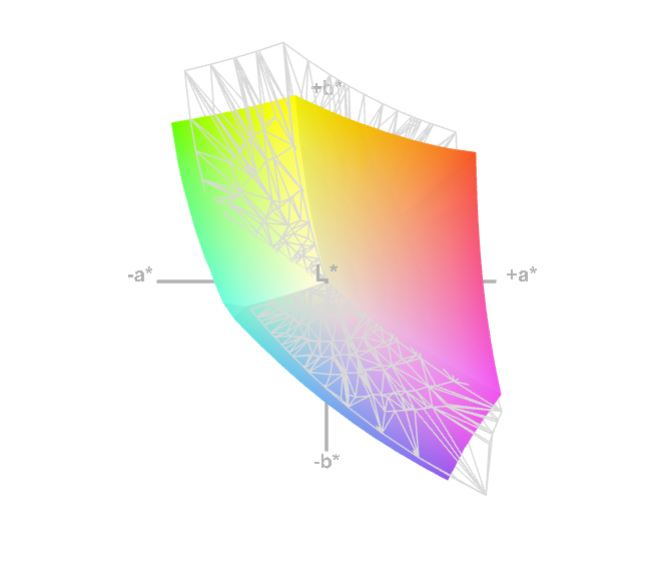
The display is not particularly unique in its color coverage, producing (per our measurements) 84% of sRGB and 55% of AdobeRGB. That’s roughly in line with the rest of our comparison field, with only the Legion Y720 coming in behind with a much more disappointing 57% of sRGB.
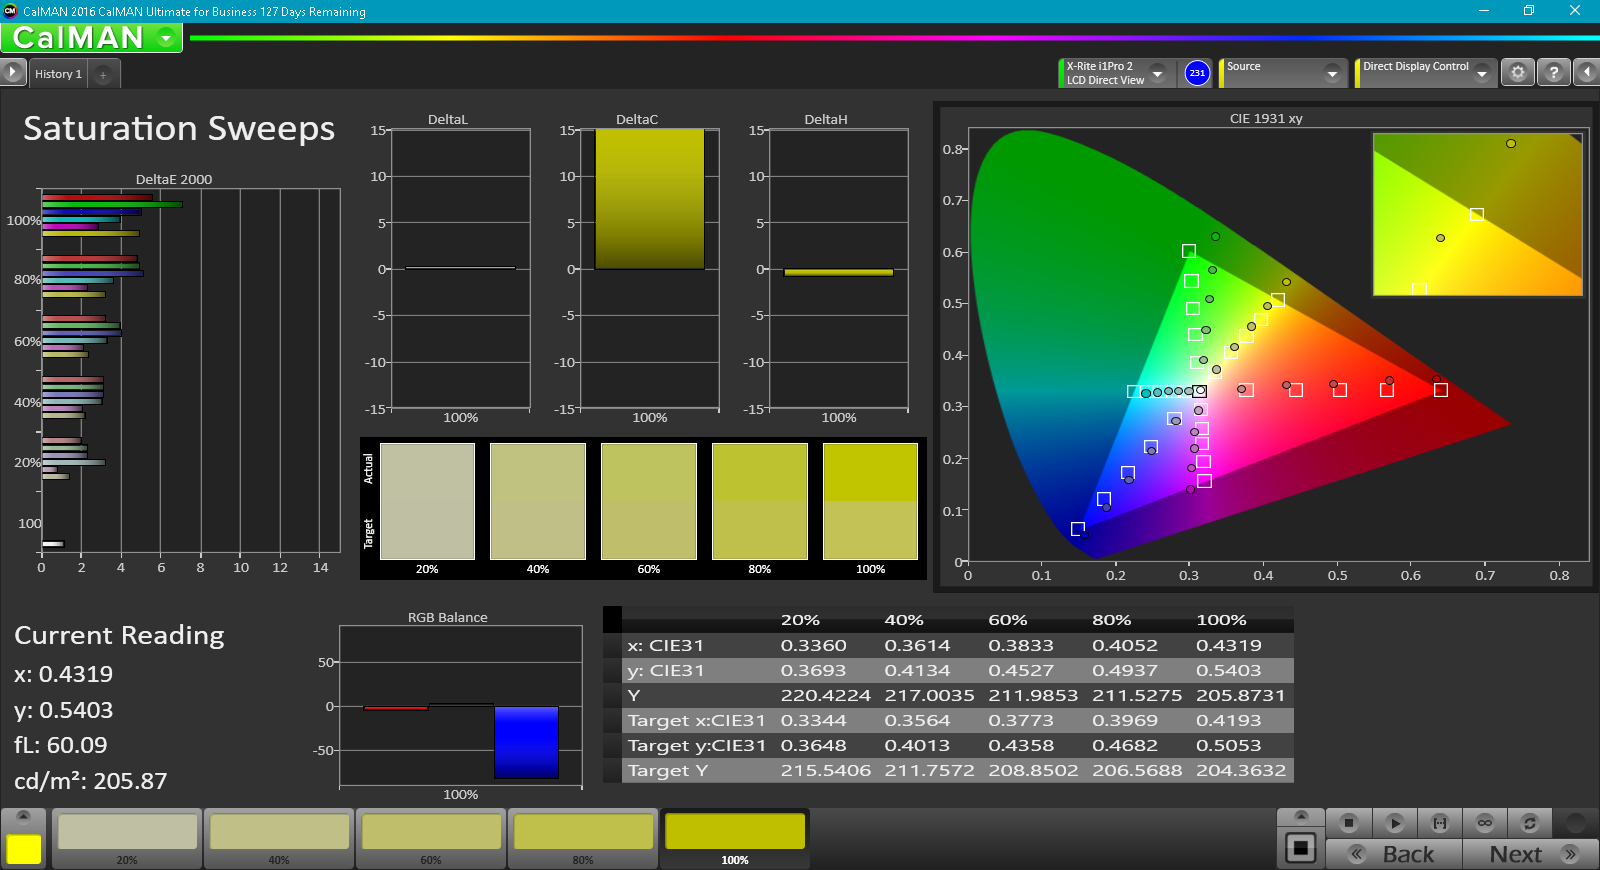
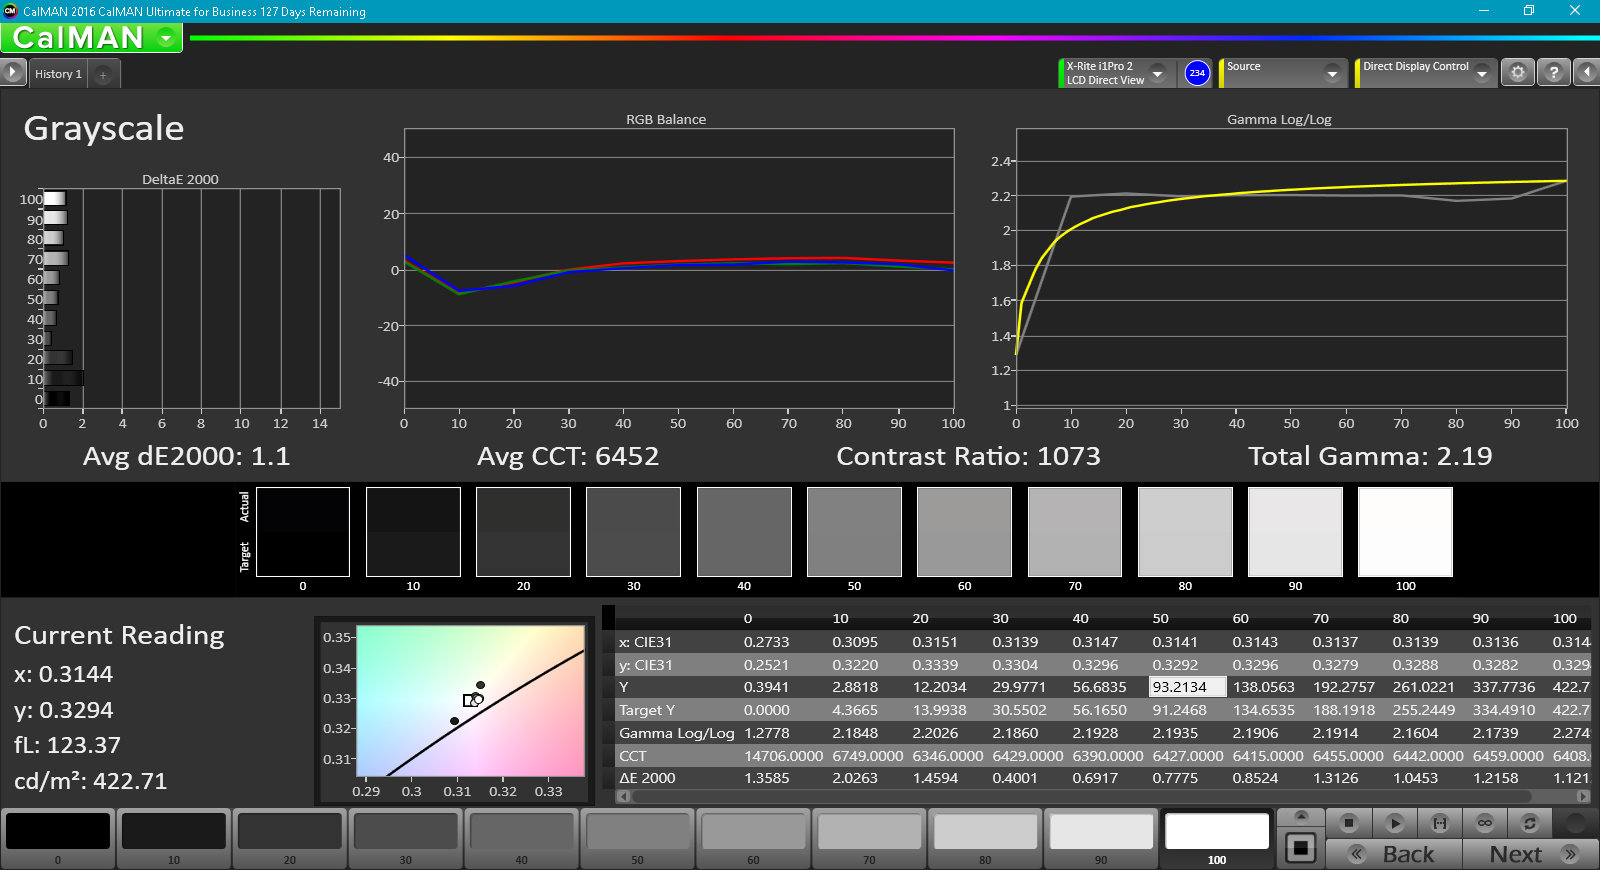
The Y920 also does a good job with color accuracy out of the box. Our CalMAN 5 measurements suggested DeltaE values of 4.4 and 2.8 for Colorchecker and Greyscale respectively (ideal: 0), and the CCT Average was 6403K—very close to the 6500K ideal value. The Total Gamma reading of 2.22 also isn’t too far off the ideal mark of 2.4.


Display Response Times
| ↔ Response Time Black to White | ||
|---|---|---|
| 23.2 ms ... rise ↗ and fall ↘ combined | ↗ 13.6 ms rise | 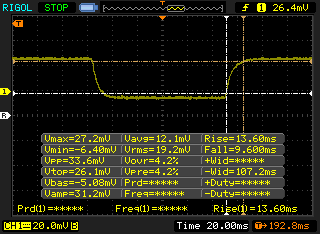 |
| ↘ 9.6 ms fall | ||
| The screen shows good response rates in our tests, but may be too slow for competitive gamers. In comparison, all tested devices range from 0.1 (minimum) to 240 (maximum) ms. » 53 % of all devices are better. This means that the measured response time is worse than the average of all tested devices (19.8 ms). | ||
| ↔ Response Time 50% Grey to 80% Grey | ||
| 28.8 ms ... rise ↗ and fall ↘ combined | ↗ 14 ms rise | 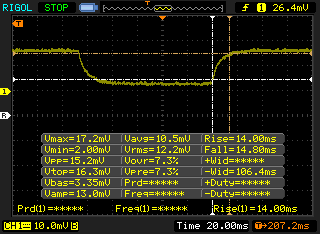 |
| ↘ 14.8 ms fall | ||
| The screen shows relatively slow response rates in our tests and may be too slow for gamers. In comparison, all tested devices range from 0.165 (minimum) to 636 (maximum) ms. » 39 % of all devices are better. This means that the measured response time is similar to the average of all tested devices (30.9 ms). | ||
Screen Flickering / PWM (Pulse-Width Modulation)
| Screen flickering / PWM detected | 20000 Hz | 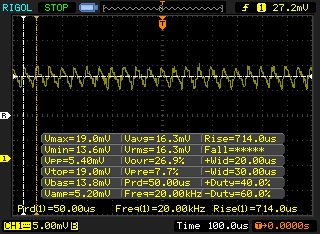 | |
The display backlight flickers at 20000 Hz (worst case, e.g., utilizing PWM) . The frequency of 20000 Hz is quite high, so most users sensitive to PWM should not notice any flickering. In comparison: 52 % of all tested devices do not use PWM to dim the display. If PWM was detected, an average of 7748 (minimum: 5 - maximum: 343500) Hz was measured. | |||
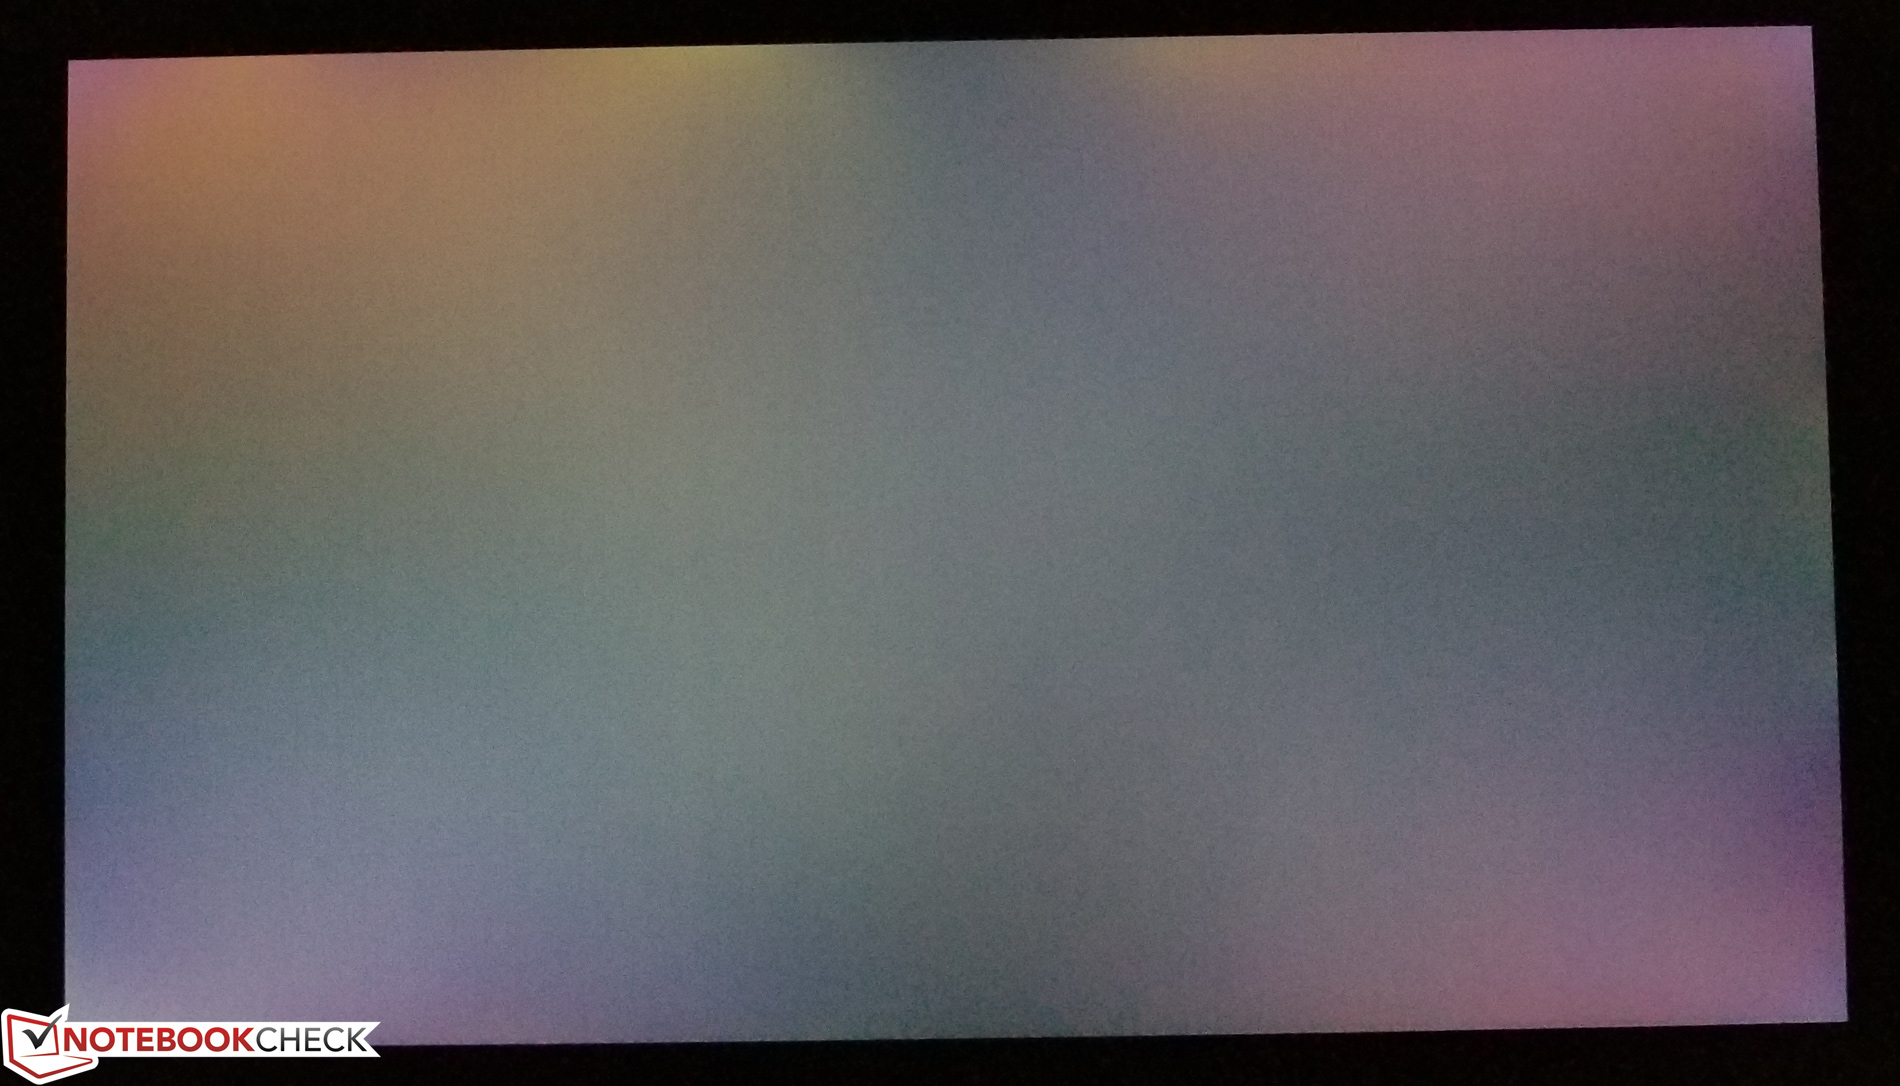
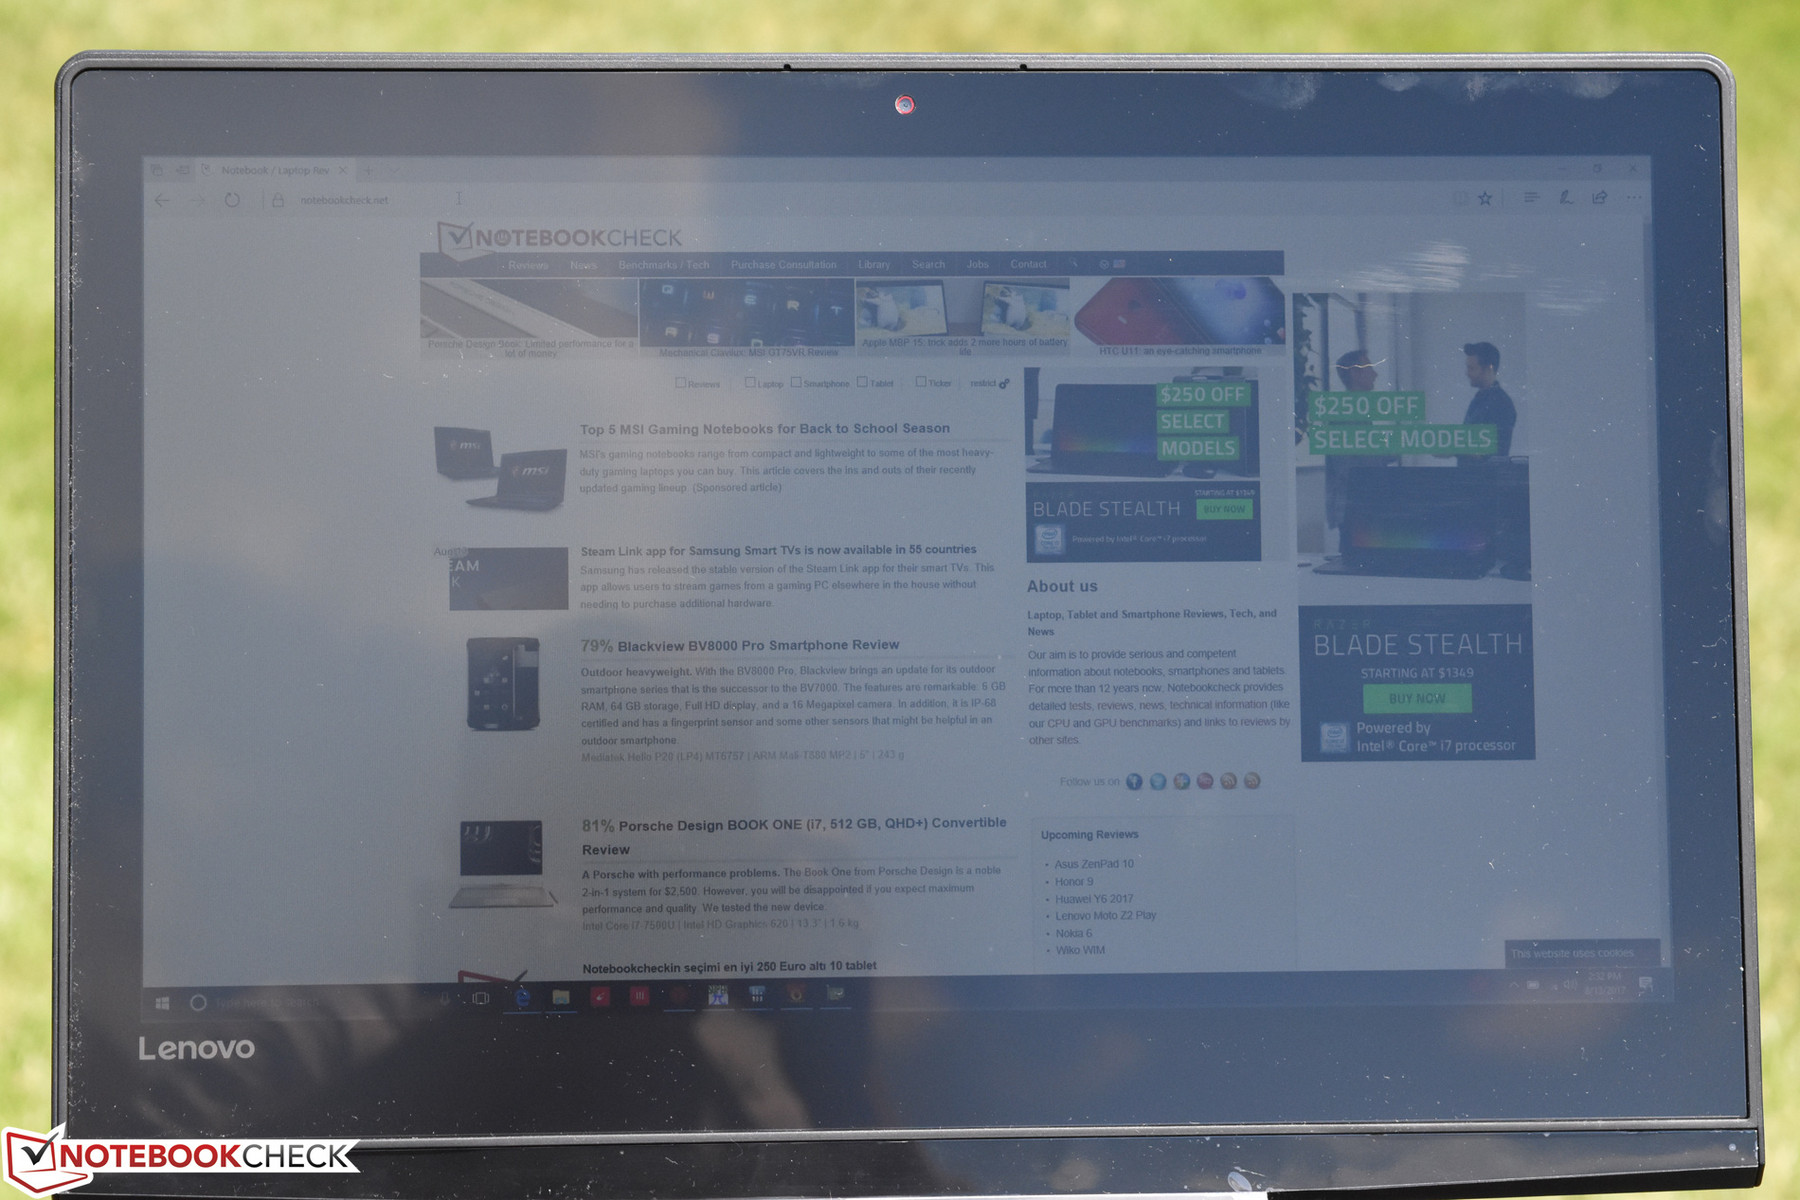
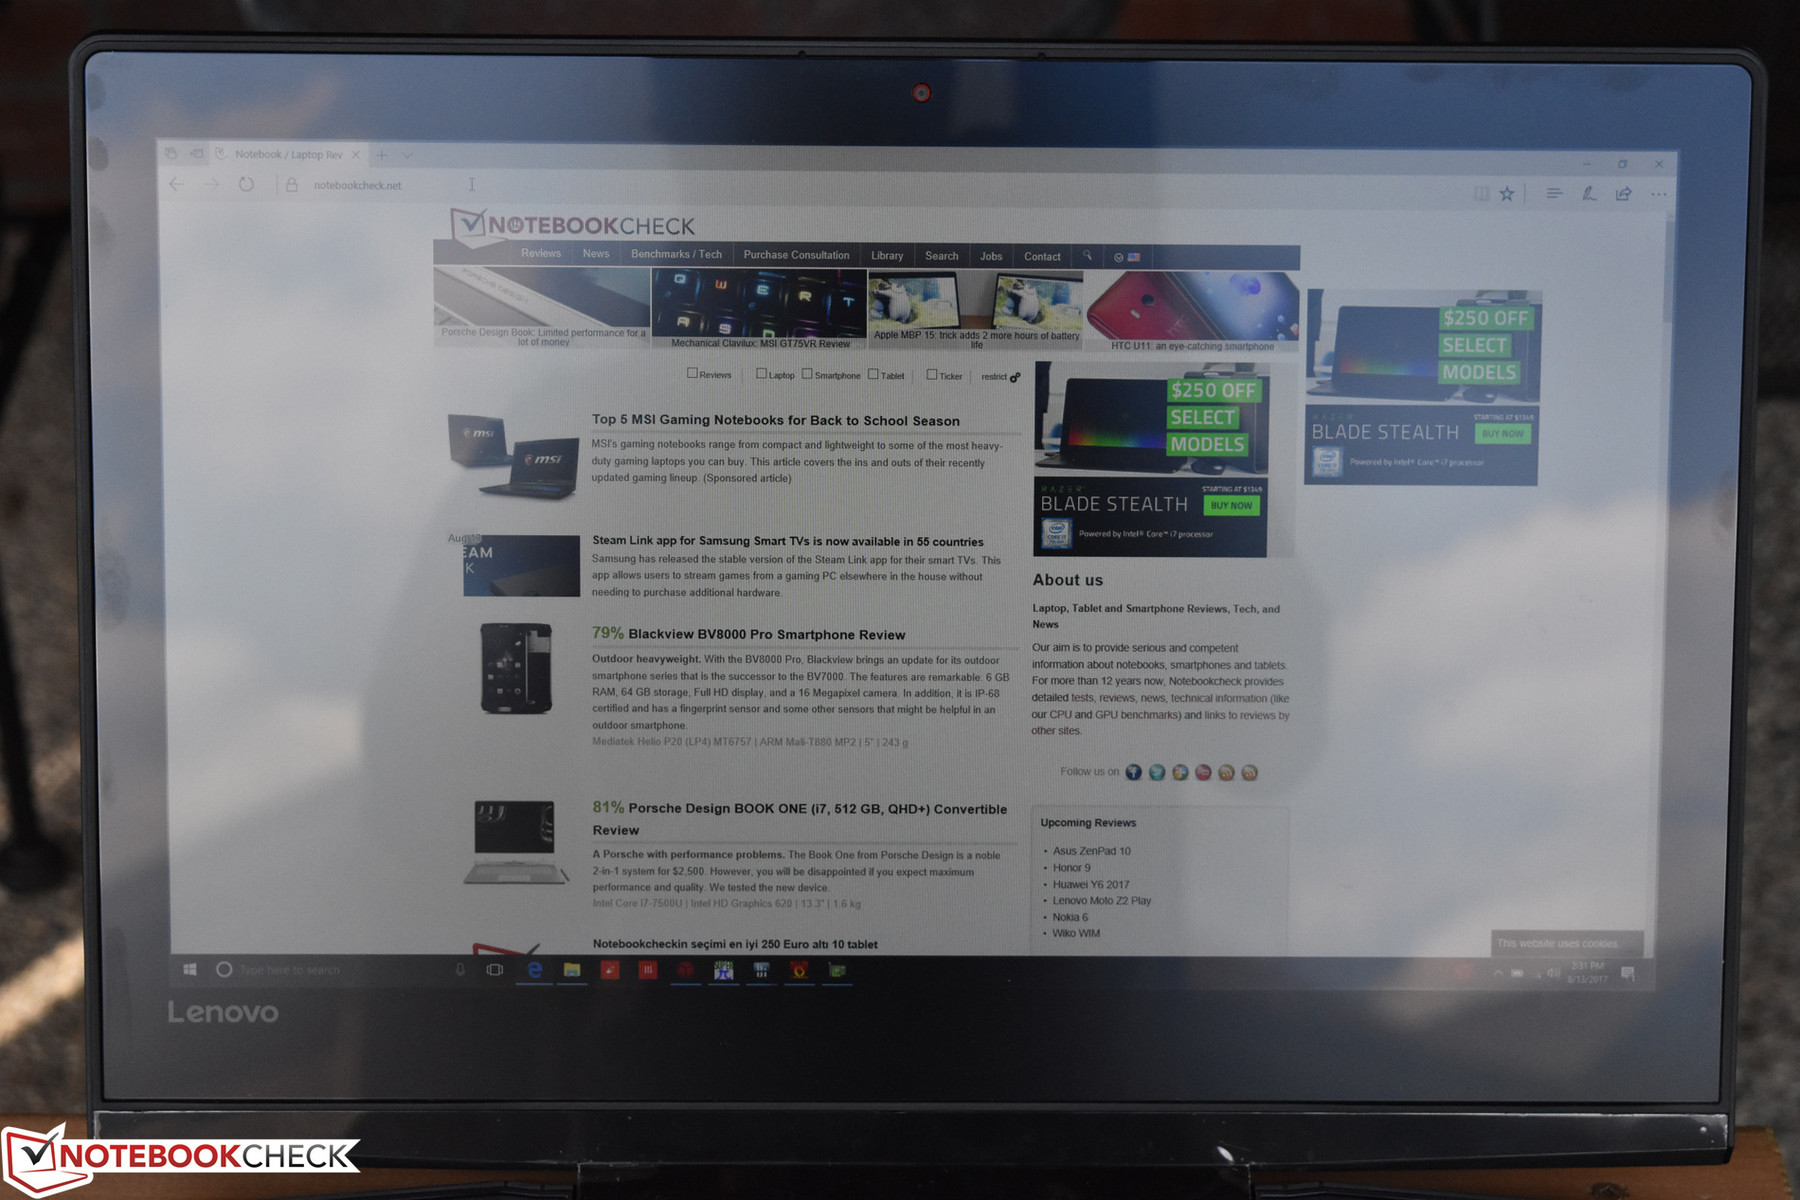
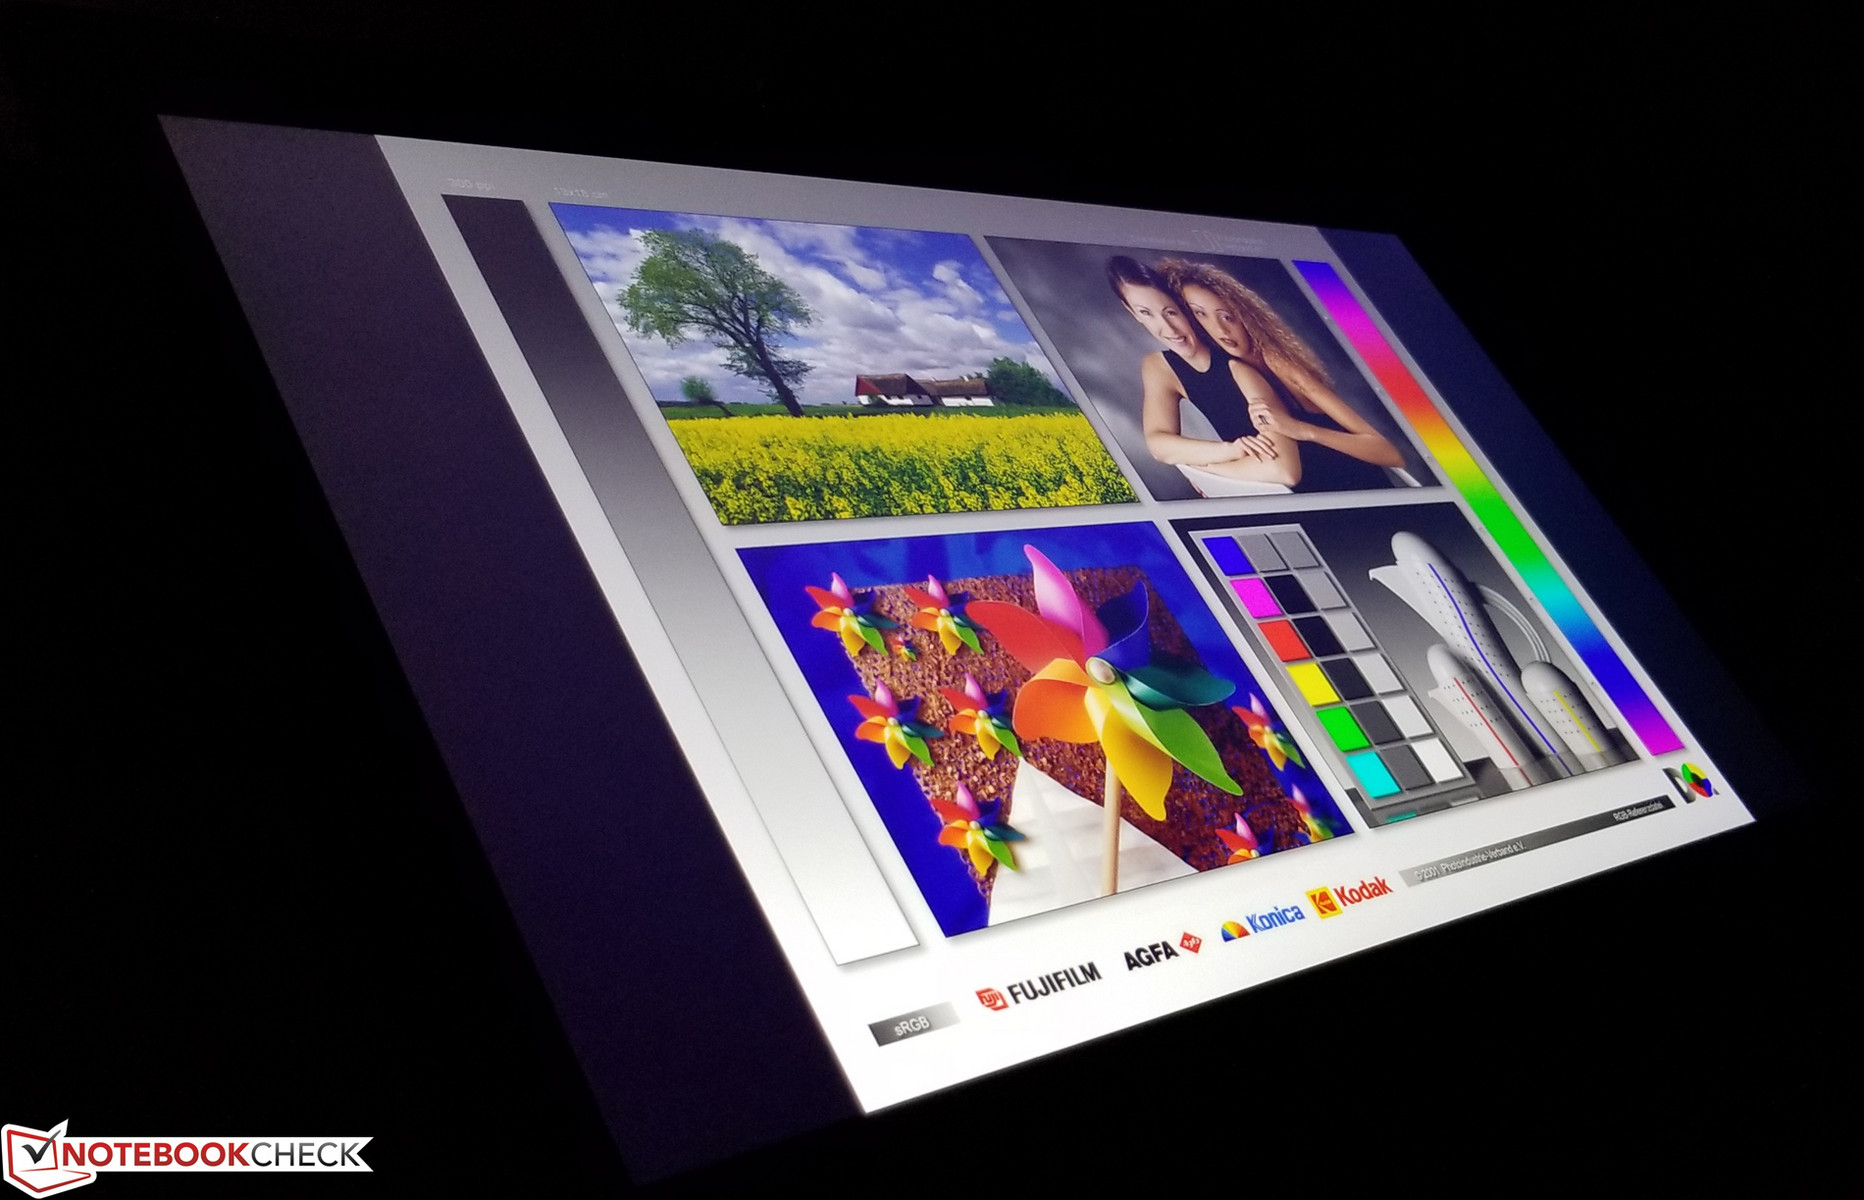
Outdoors, the Y920 is just fine in shaded areas. Introduce any sunlight, however, and the so-called “AntiGlare” finish that Lenovo refers to quickly succumbs to obstructive reflections. It isn’t nearly as bad as it is in many other notebooks with glossy panels, but it’s certainly not as resistant as true anti-glare panels. Viewing angles, on the other hand, are excellent thanks to the IPS panel.
Performance
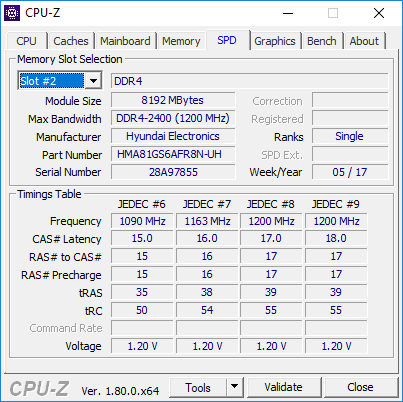
The Y920 is only offered with two different CPU choices: an Intel Core i7-7700HQ and an i7-7820HK. Our review unit features the latter option, which is the more expensive of the two and the second-fastest consumer-level CPU from Intel currently available. The preinstalled memory, on the other hand, is standard regardless of CPU choice: 16 GB of dual-channel DDR4-2400 RAM, which should be sufficient for most any task. As we’ll see later, storage options are quite a bit more varied, but solid-state is the name of the game as usual, and Lenovo provides a number of NVMe options for additional performance.
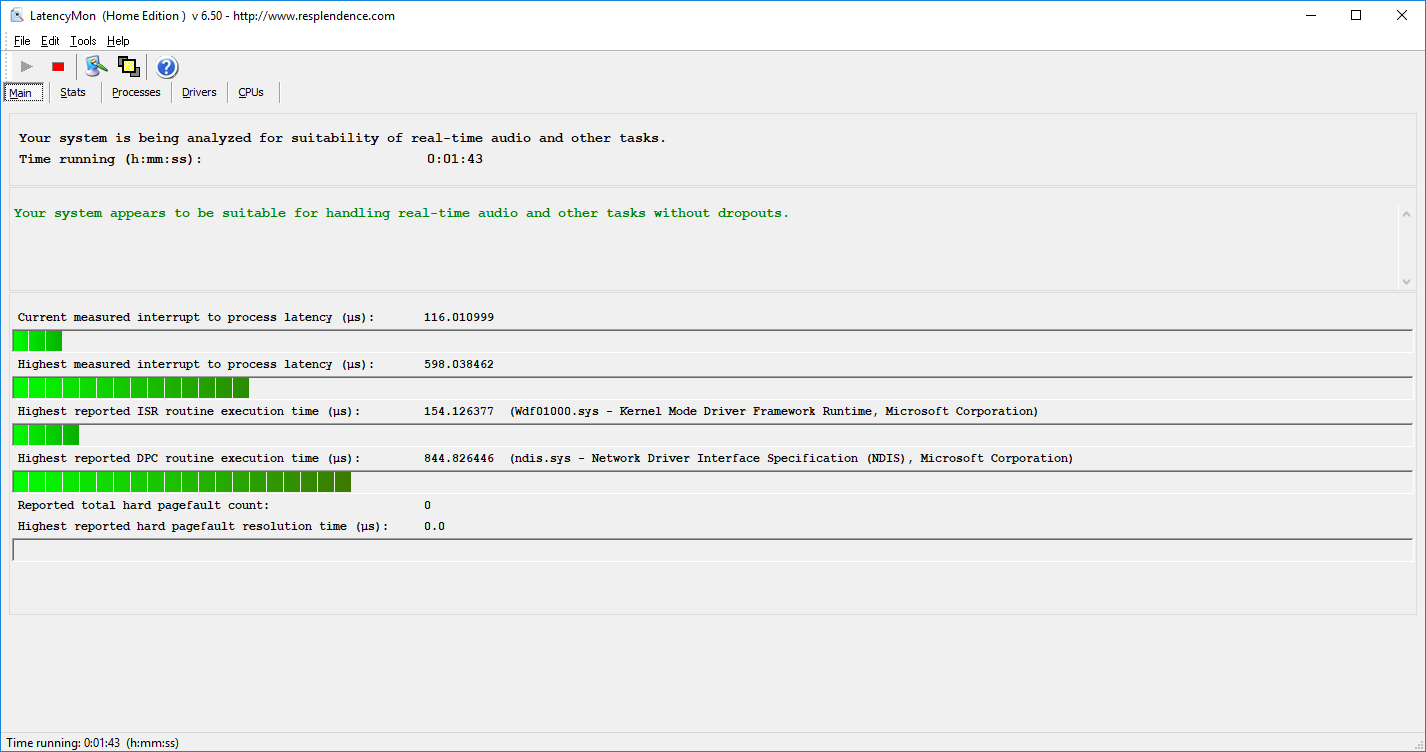
A secondary run of 3DMark 11 while unplugged produced a much lower score of just 6620, but that’s normal for these power-hungry gaming machines. Meanwhile, LatencyMon detected no DPC latency issues which could affect the smooth streaming of real-time audio and video content on the Y920.
Processor
The Intel Core i7-7820HK’s four cores (plus Hyper-Threading) are clocked at 2.9 – 3.9 GHz (2 cores: 3.7 GHz; 4 cores: 3.5 GHz), so it’s more than capable of handling any gaming endeavor. Plus, it’s unlocked, and Lenovo’s default “Turbo” settings overclock to 4.1 GHz—though (and this is the critical point) that’s provided thermal headroom exists to accommodate it. We’ll examine that second point in a moment, but the bottom line is that the CPU is not likely to age as quickly as the GPU in this machine regardless of choice. Yes, the Core i7-7820HK is technically a bit quicker, and its potential for overclocking renders it more future proof, but even if performance pans out ideally, it’s unlikely that in three or four years the CPU will be the primary bottleneck during gaming sessions on the Legion Y920. By then, it’ll be time to consider planning for a replacement if serious gaming is still on the table. And besides, overclocking the CPU is far less likely to positively affect gaming performance versus overclocking the GPU, and the additional thermal constraints posed by the higher clock rates (as we witness later in our testing) could lead to less consistent performance overall.
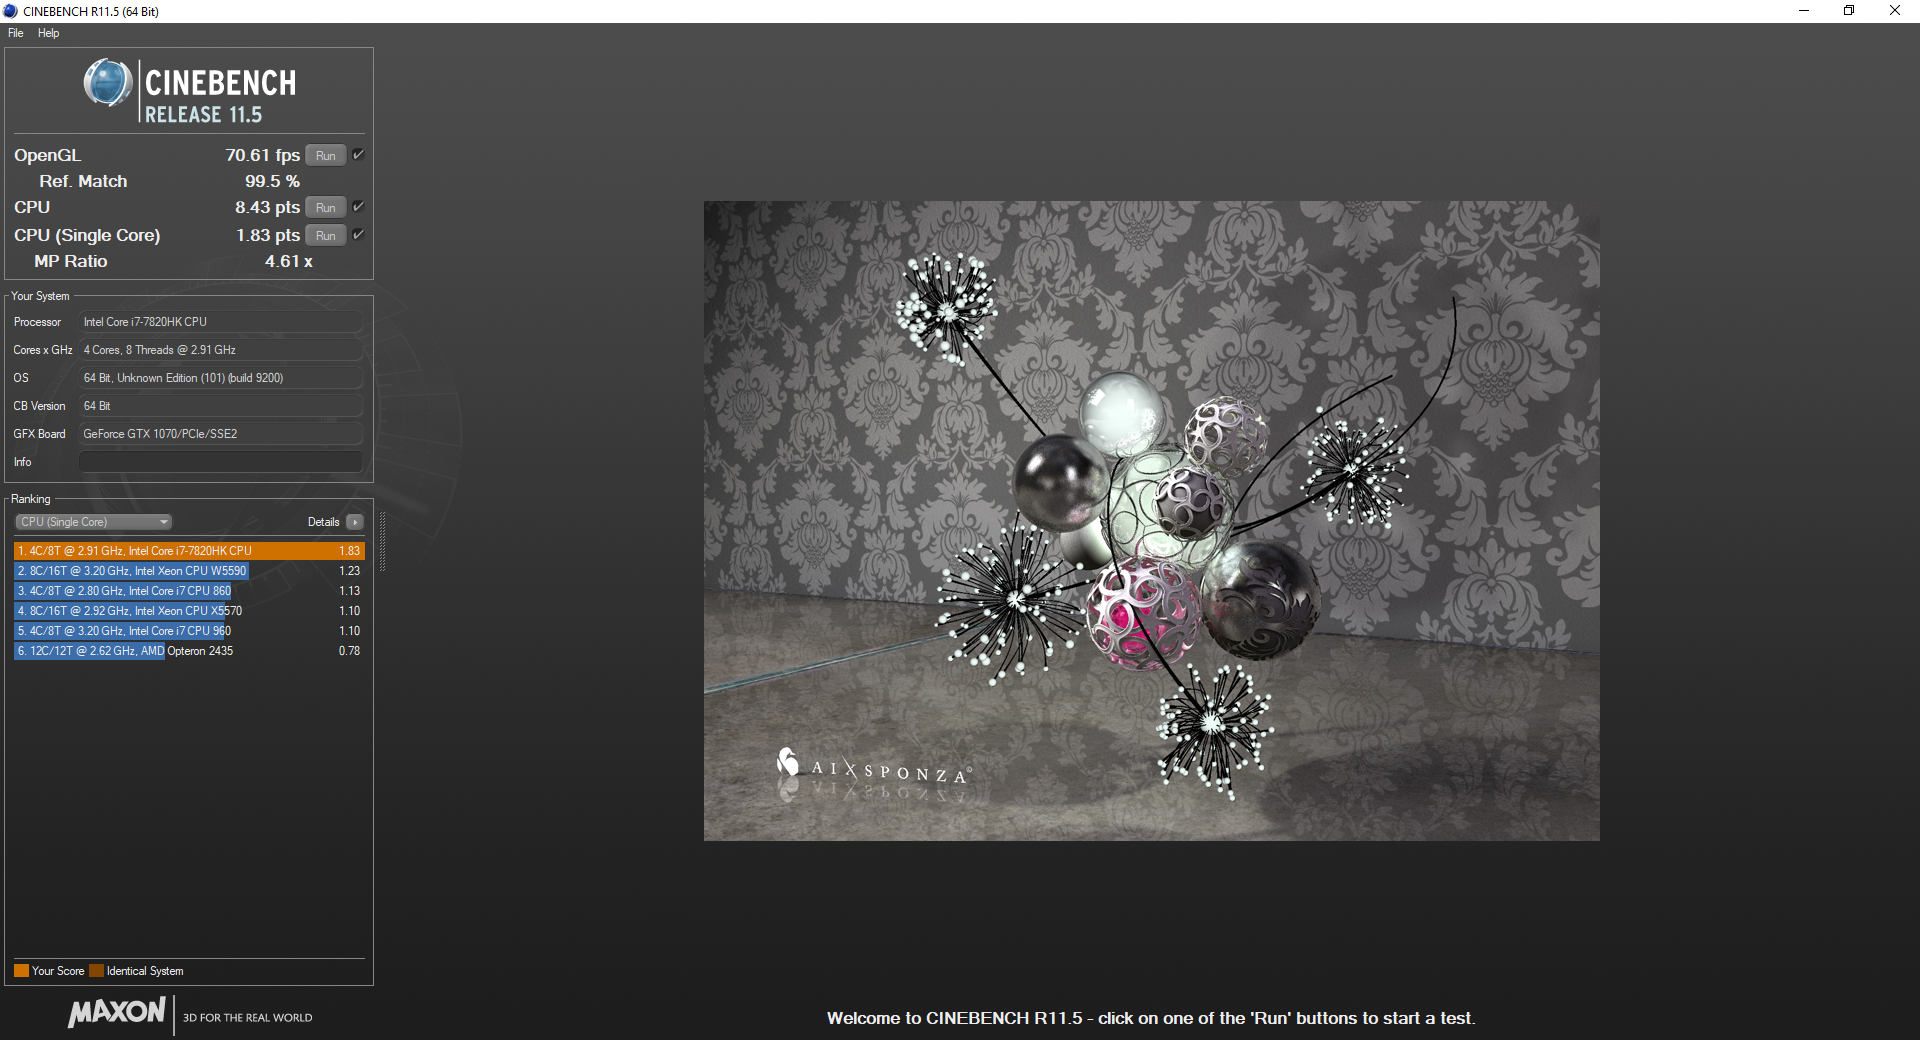
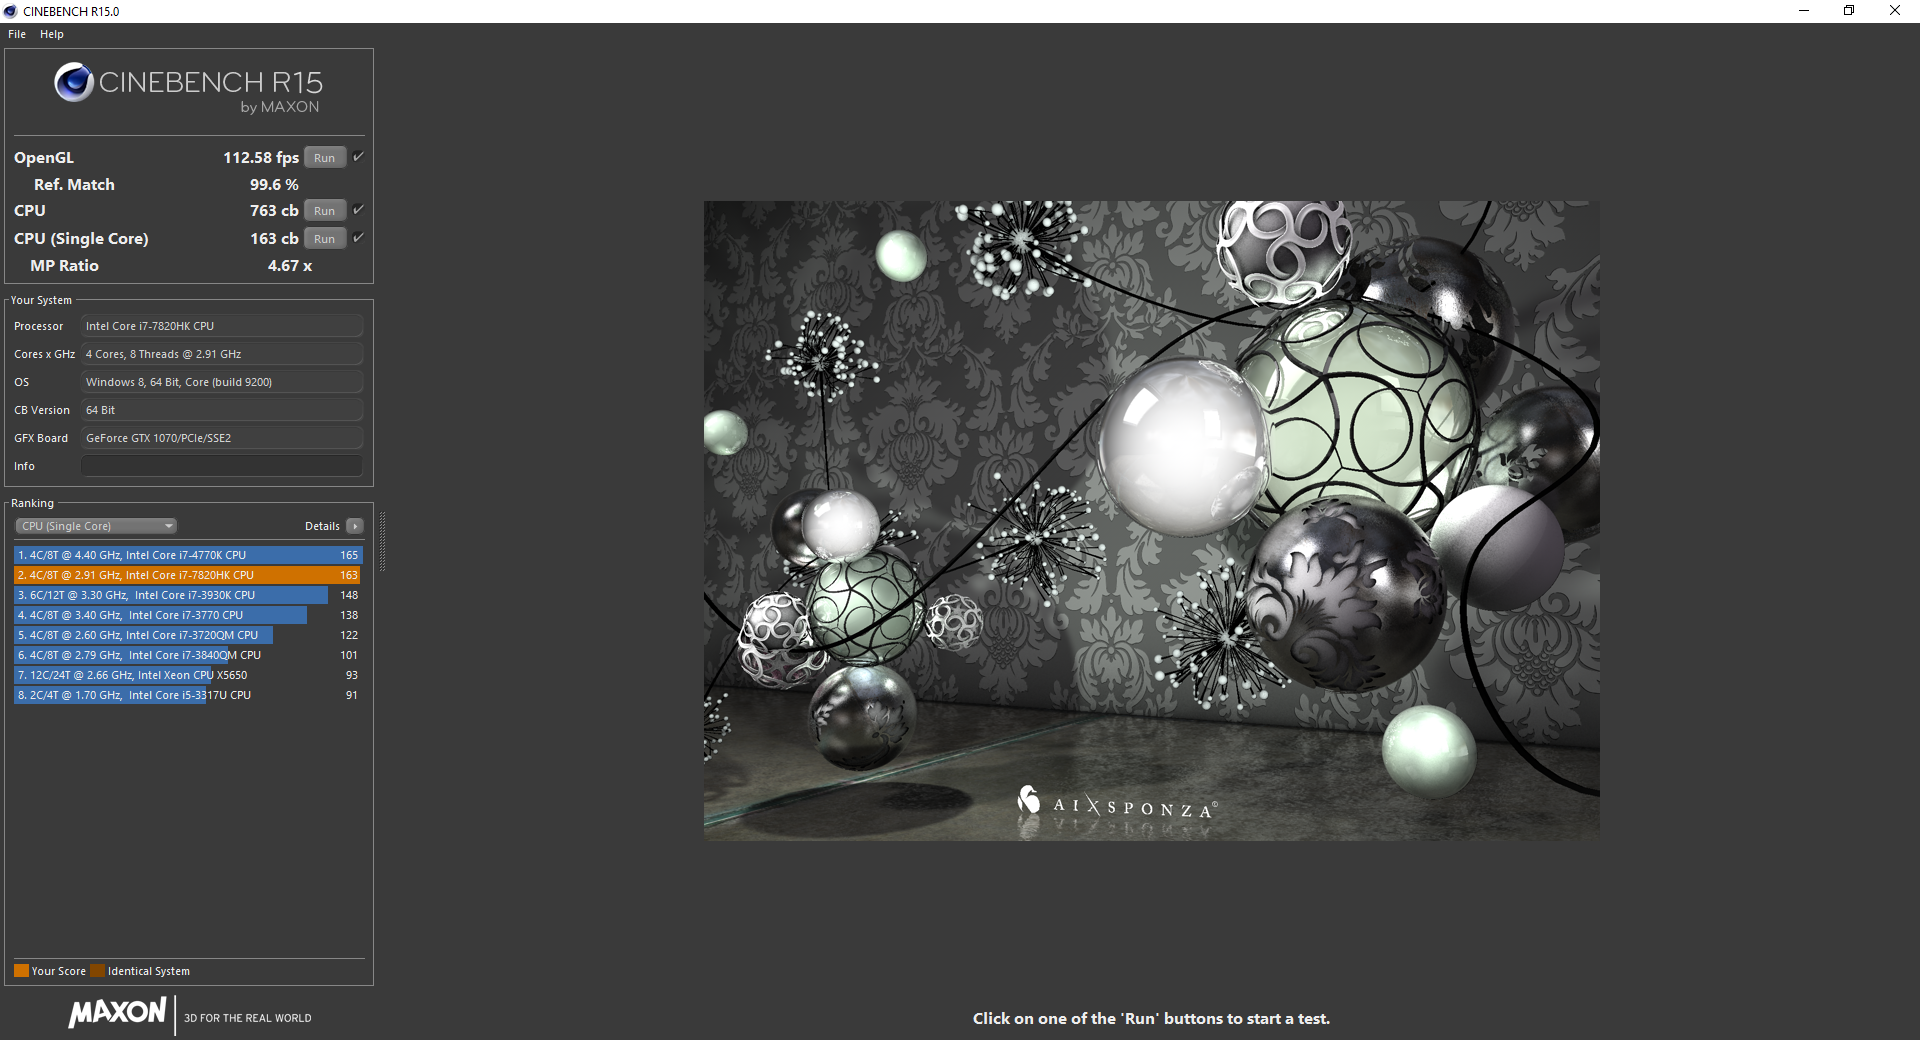
We’ll come back to this point in a moment, but first, let’s take a look at CPU performance as compared to competing notebooks. The only other machine in our comparison field today which shares the same processor is the Alienware 17 R4, and it manages higher scores overall than the Lenovo Legion Y920—even when the Y920 is running in its so-called Turbo Mode. Apart from the Cinebench R15 Multi-CPU benchmark (where two sets of data are shown for the Y920, one with Turbo Mode on and the other off), the rest of our benchmarks below are recorded with Turbo Mode off. However, our testing revealed that a performance bump of around 2 to 5 percent on average is possible with Turbo Mode on, so keep that in mind while digesting the data.
So then, why does the Alienware still manage higher scores even when up against the Y920 with Turbo Mode enabled? Because of its more manageable internal temperatures (as we’ll see in just a bit). The Alienware 17 R4 is able to maintain a full 4.0 GHz (1.1 Ghz above base clock rate) for the duration of a CPU stress test, whereas we most commonly witnessed frequencies of the Legion Y920’s CPU hovering in the 3.5 to 3.6 GHz range. The difference is particularly evident in multi-core benchmarks thanks to the additional thermal challenges imposed by such intensive tests.
| wPrime 2.10 - 1024m | |
| Lenovo Legion Y920-17IKB | |
| Lenovo IdeaPad Y900 | |
| MSI GS43VR 7RE-069US | |
| Alienware 17 R4 | |
* ... smaller is better
You can see this embodied in our data, where single-core Cinebench tests show little to no performance difference (after adjusted slightly upward to account for Turbo Mode settings) but multi-core tests reveal something closer to a 10% discrepancy when compared to the Alienware. The same applies to super Pi (single-threaded) versus wPrime (multi-threaded), where the Y920 holds its own in the former and lags by an enormous margin in the latter (84%/71% slower in wPrime with Turbo Mode Off/On, just 7% slower in super Pi). It might be tempting to think that the separate Extreme Cooling mode might help to lower temperatures and alleviate this shortfall, but these two settings (Turbo Mode and Extreme Cooling) are mutually exclusive; enabling one will automatically disable the other. For the record, we also extensively tested CPU performance with Extreme Cooling enabled, and it’s strangely below both other scenarios (Turbo Mode on and off)—for instance, in wPrime, we received a score of 355 seconds with Extreme Cooling enabled (vs. 331s disabled and 306s with Turbo Boost enabled).
Compared with the Asus ROG G752VS, which leverages an i7-7700HQ, the Y920 is only slightly faster (a few percentage points on average). Scores of 763/782 (Turbo Mode Off/On) in Cinebench R15 multi-CPU versus the Asus’ score of 742 are not particularly convincing that the i7-7820HK option is worth the extra cost.
The bottom line is that it’s probably not worth stressing over the CPU selection in the Y920. Either choice is going to be sufficiently fast for most gaming needs, and neither is likely to stand in the way of gaming before the GPU drifts into obsolescence first. For most people, the Core i7-7700HQ is going to be just fine, especially considering the fact that the i7-7820HK configuration doesn’t take full advantage of the overclocking capabilities—and that the GPU remains overclockable no matter which CPU is on board. It also may result in more consistent performance overall due to what would presumably be lower chip temperatures under sustained load.
One other quick note before we move onto the next section: our Cinebench R15 real-world sustained performance testing showed few kinks in the Y920’s armor with Turbo Mode enabled, with very consistent scores from start to finish. But with Turbo Mode disabled, the initial value (already lower, just 755) immediately gives way to scores in the 730 range, along with occasional dips below (one as low as 716). The average scores only differ by 6 – 7 percent between Turbo Mode states, but this does illustrate the differences in performance pretty clearly.
System Performance
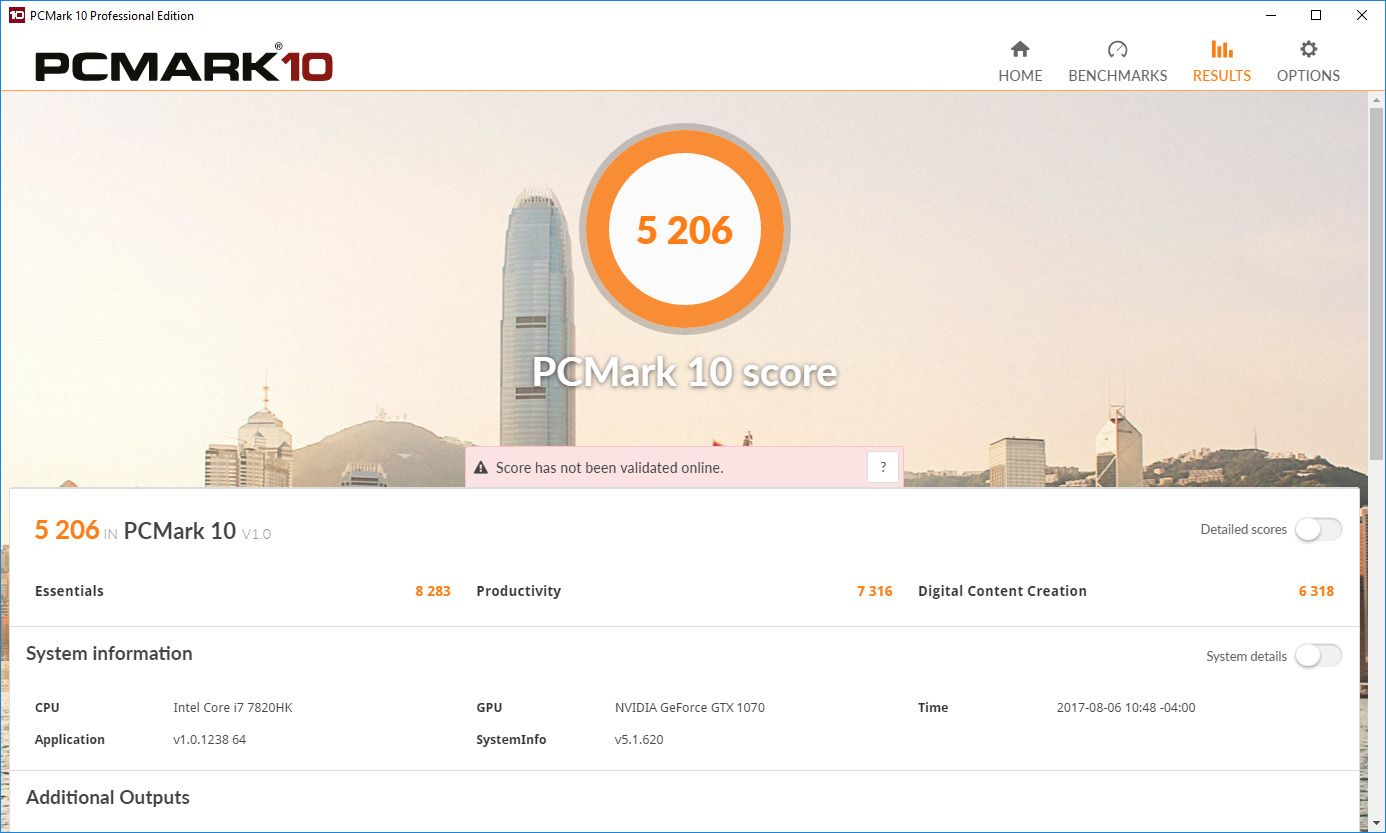
In spite of its somewhat disappointing CPU capabilities, we’re happy to report that our tests of the Y920’s general system performance using PCMark left us with few concerns in that department. Here, the Y920 dominated the charts with a 5206 in PCMark 10 and equally impressive scores across all PCMark 8 tests which either topped or closely matched all other competitors in our comparison field. As before, the Alienware 17 R4 was once again the primary competitor in most of these tests, but both machines post such impressive results that it’d be splitting hairs to try and meaningfully compare the two.
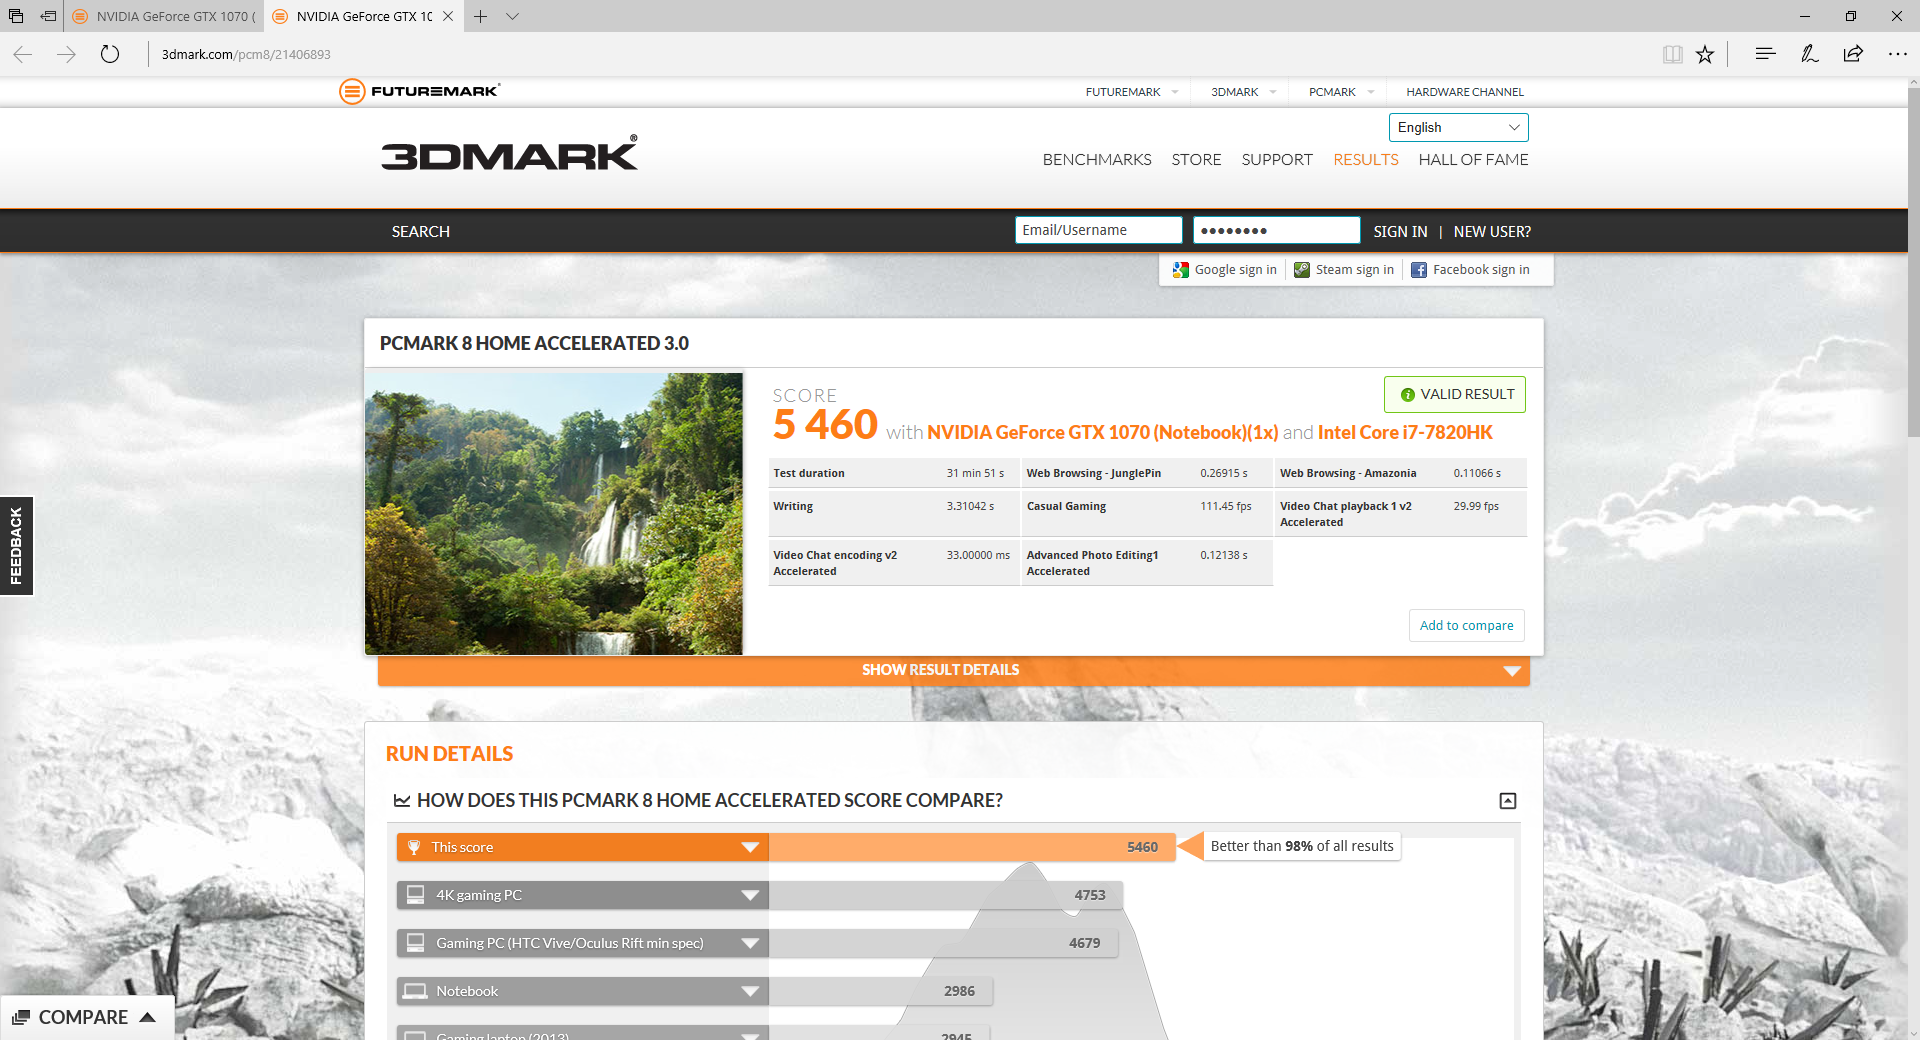
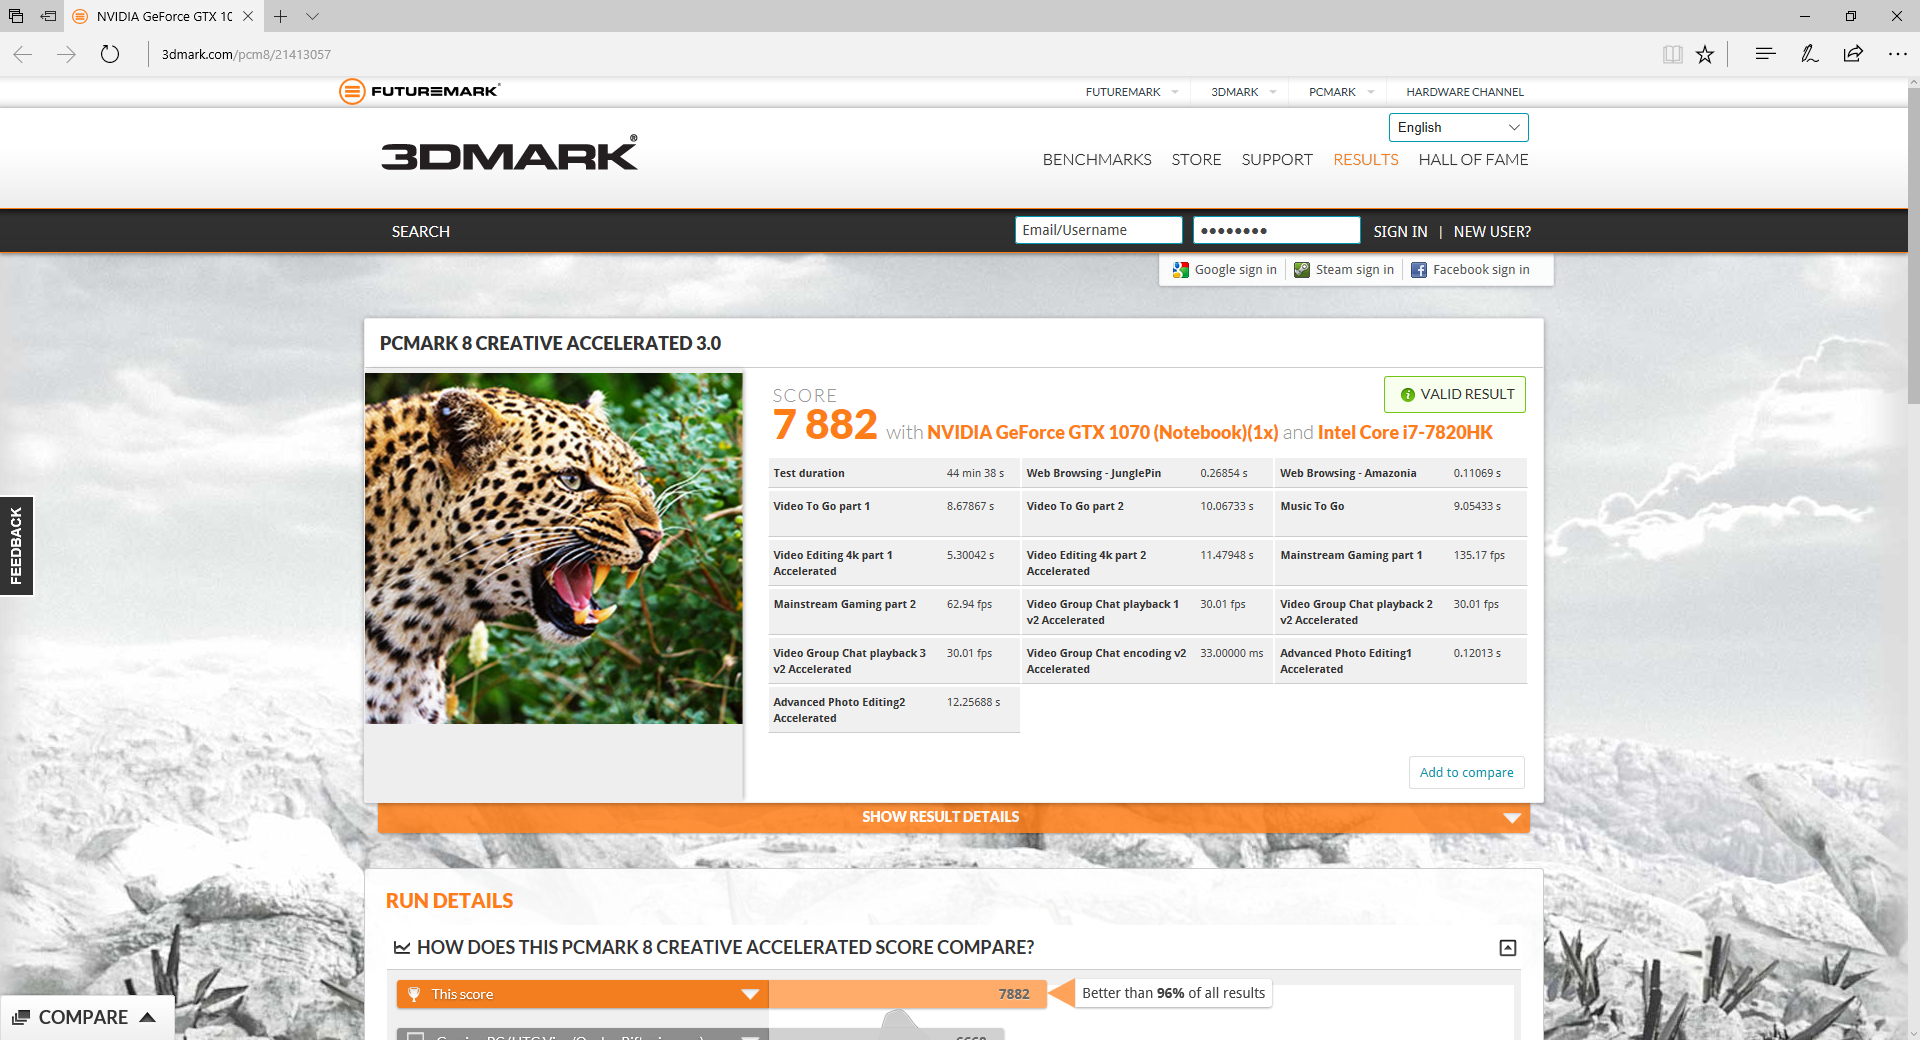
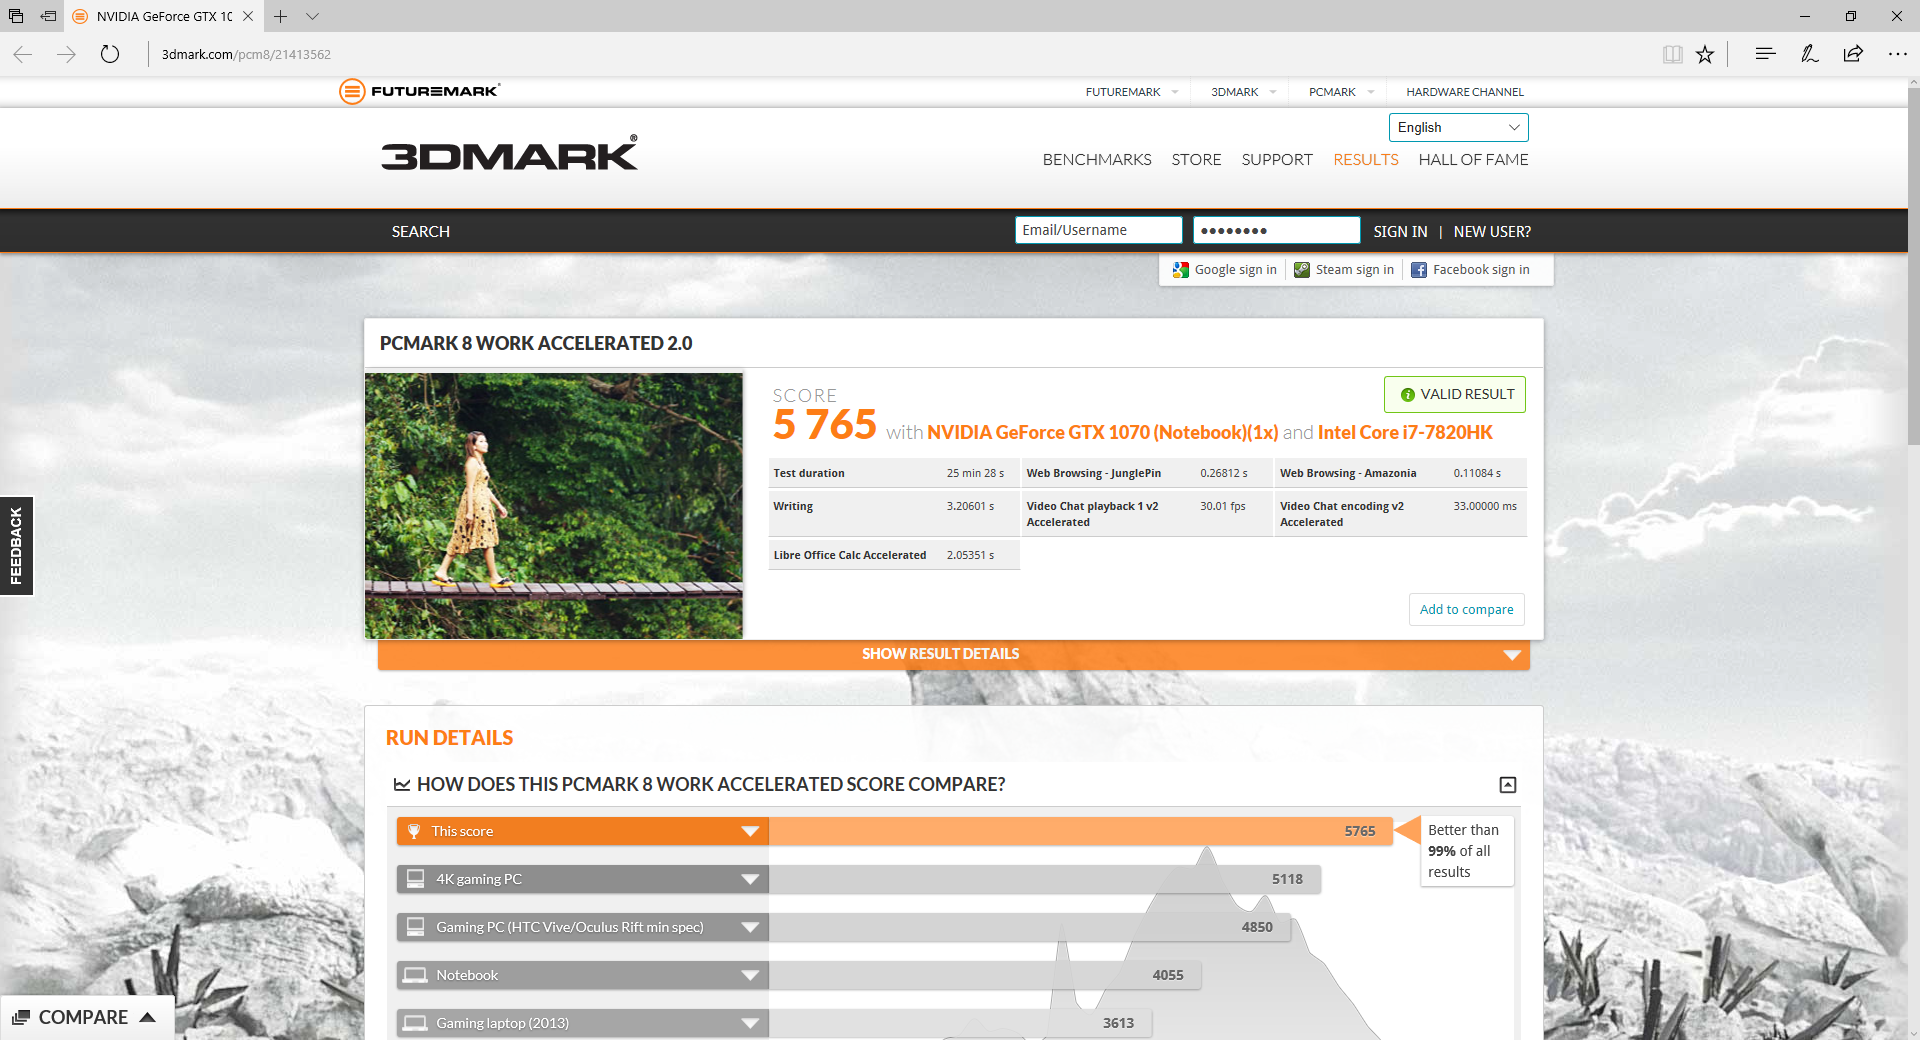
| PCMark 8 Home Score Accelerated v2 | 5460 points | |
| PCMark 8 Creative Score Accelerated v2 | 7882 points | |
| PCMark 8 Work Score Accelerated v2 | 5765 points | |
| PCMark 10 Score | 5206 points | |
Help | ||
Storage Devices
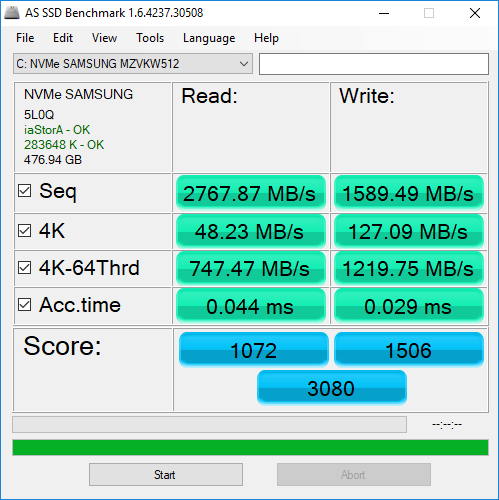
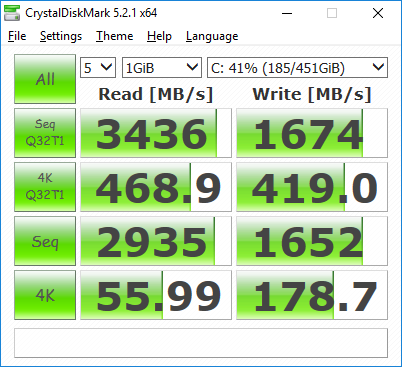
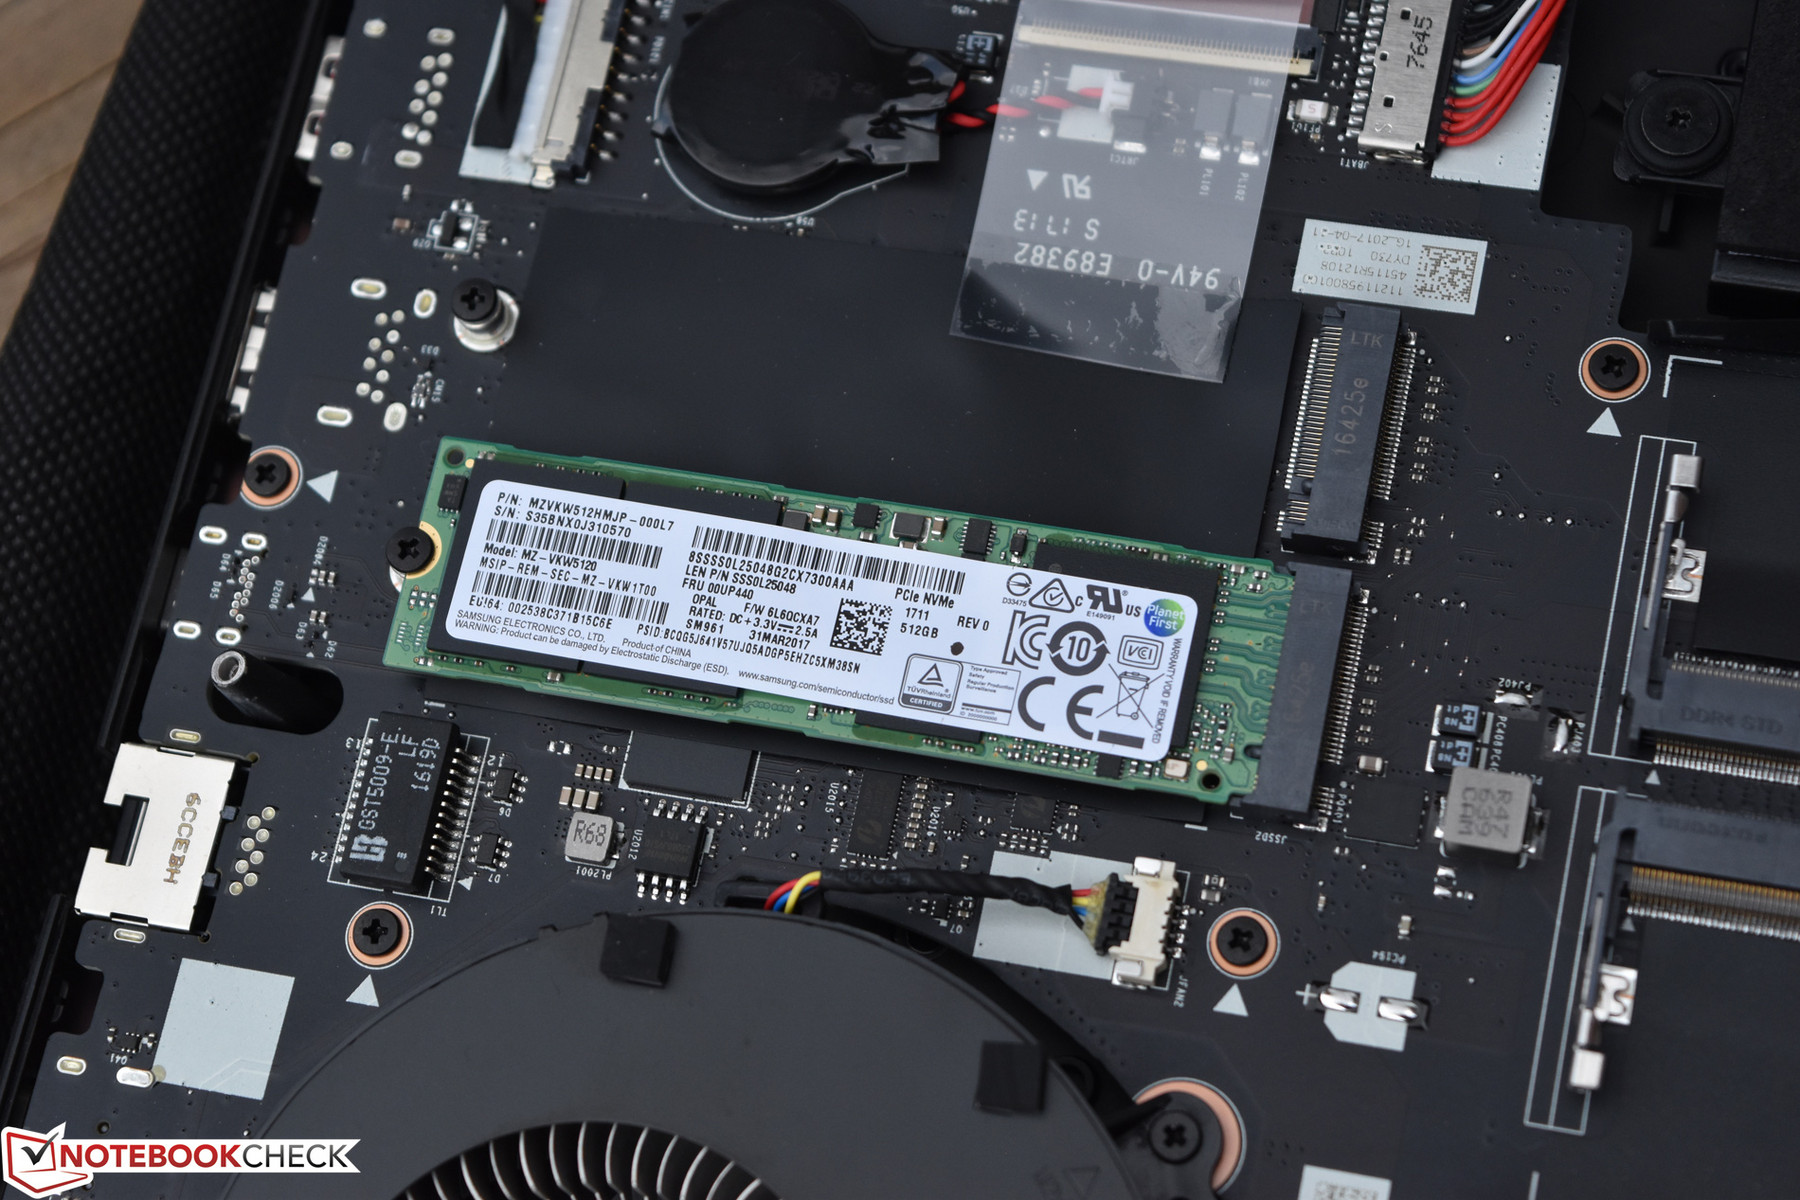
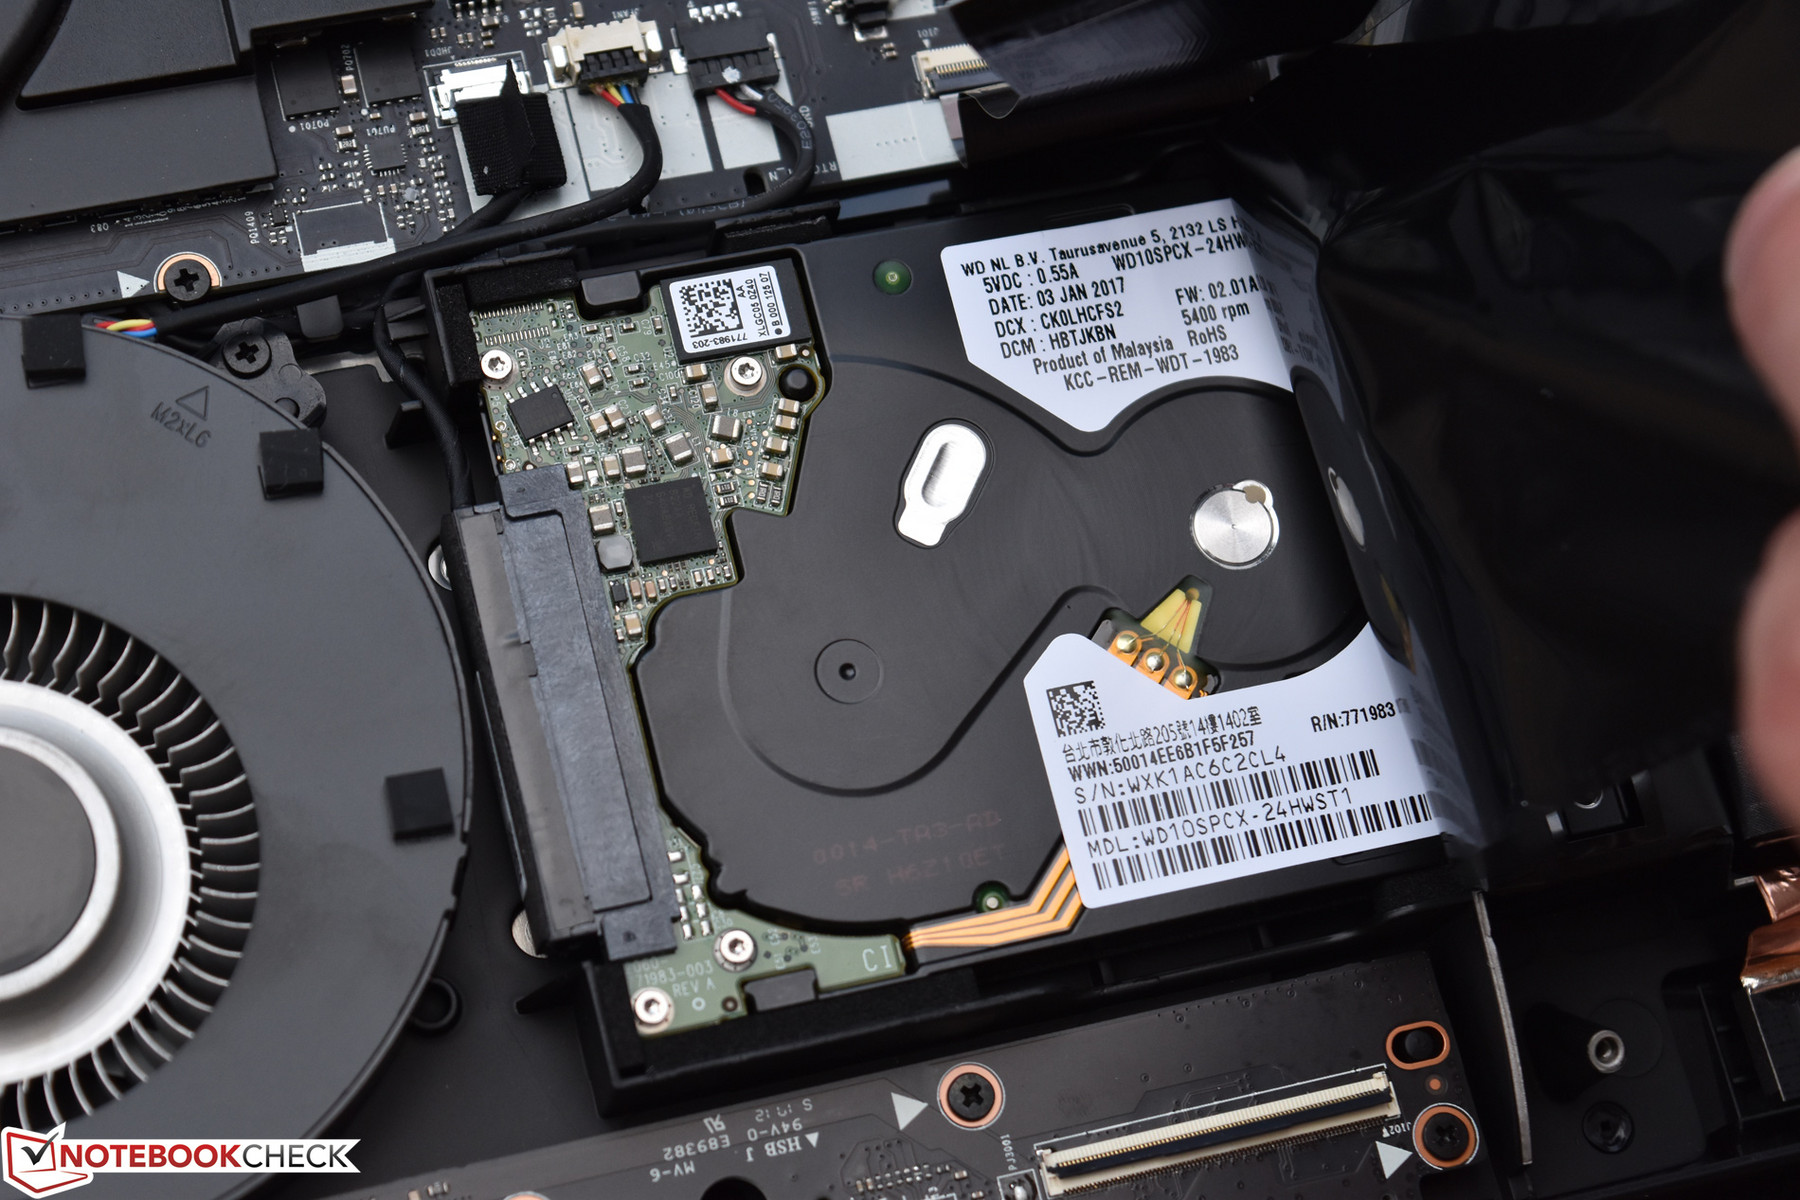
One major reason for these stellar results is evident as we turn to our storage benchmarks. The Y920’s Samsung SM961 NVMe SSD is one of the current best storage drives around, and its sequential and 4K-64 read/write results of 2768/1589 and 747/1220 MB/s are evidence of that. Our machine also came equipped with a secondary mechanical storage drive—a 1 TB Western Digital 5400 RPM model—but there’s actually still a third bay available as well (another M.2 / NVMe bay). As you might have guessed, the two M.2 slots can be used in conjunction for RAID operation.
| Lenovo Legion Y920-17IKB Samsung SM961 MZVKW512HMJP m.2 PCI-e | Asus G752VS-BA338T Samsung SM961 MZVKW512HMJP m.2 PCI-e | MSI GS43VR 7RE-069US SK Hynix HFS128G39MNC-3510A | Alienware 17 R4 SK Hynix PC300 NVMe 512 GB | Lenovo IdeaPad Y900 Samsung SM951 MZVPV256 m.2 | |
|---|---|---|---|---|---|
| AS SSD | 1% | -84% | -49% | -20% | |
| Copy Game MB/s (MB/s) | 1117 | 1217 9% | 332.1 -70% | 574 -49% | 618 -45% |
| Copy Program MB/s (MB/s) | 407.8 | 445.1 9% | 225.4 -45% | 446.1 9% | 484.4 19% |
| Copy ISO MB/s (MB/s) | 1975 | 2145 9% | 382.1 -81% | 1227 -38% | 1237 -37% |
| Score Total (Points) | 3080 | 3056 -1% | 1126 -63% | 2072 -33% | 2402 -22% |
| Score Write (Points) | 1506 | 1480 -2% | 435 -71% | 858 -43% | 526 -65% |
| Score Read (Points) | 1072 | 1077 0% | 455 -58% | 831 -22% | 1261 18% |
| Access Time Write * (ms) | 0.029 | 0.027 7% | 0.115 -297% | 0.123 -324% | 0.033 -14% |
| Access Time Read * (ms) | 0.044 | 0.058 -32% | 0.106 -141% | 0.042 5% | 0.051 -16% |
| 4K-64 Write (MB/s) | 1220 | 1185 -3% | 312.5 -74% | 671 -45% | 305.4 -75% |
| 4K-64 Read (MB/s) | 747 | 744 0% | 373.9 -50% | 620 -17% | 1030 38% |
| 4K Write (MB/s) | 127.1 | 138.9 9% | 86.2 -32% | 113.4 -11% | 112.8 -11% |
| 4K Read (MB/s) | 48.23 | 49.71 3% | 30.35 -37% | 35.61 -26% | 45.51 -6% |
| Seq Write (MB/s) | 1589 | 1554 -2% | 366.6 -77% | 735 -54% | 1080 -32% |
| Seq Read (MB/s) | 2768 | 2824 2% | 509 -82% | 1752 -37% | 1860 -33% |
* ... smaller is better

GPU Performance
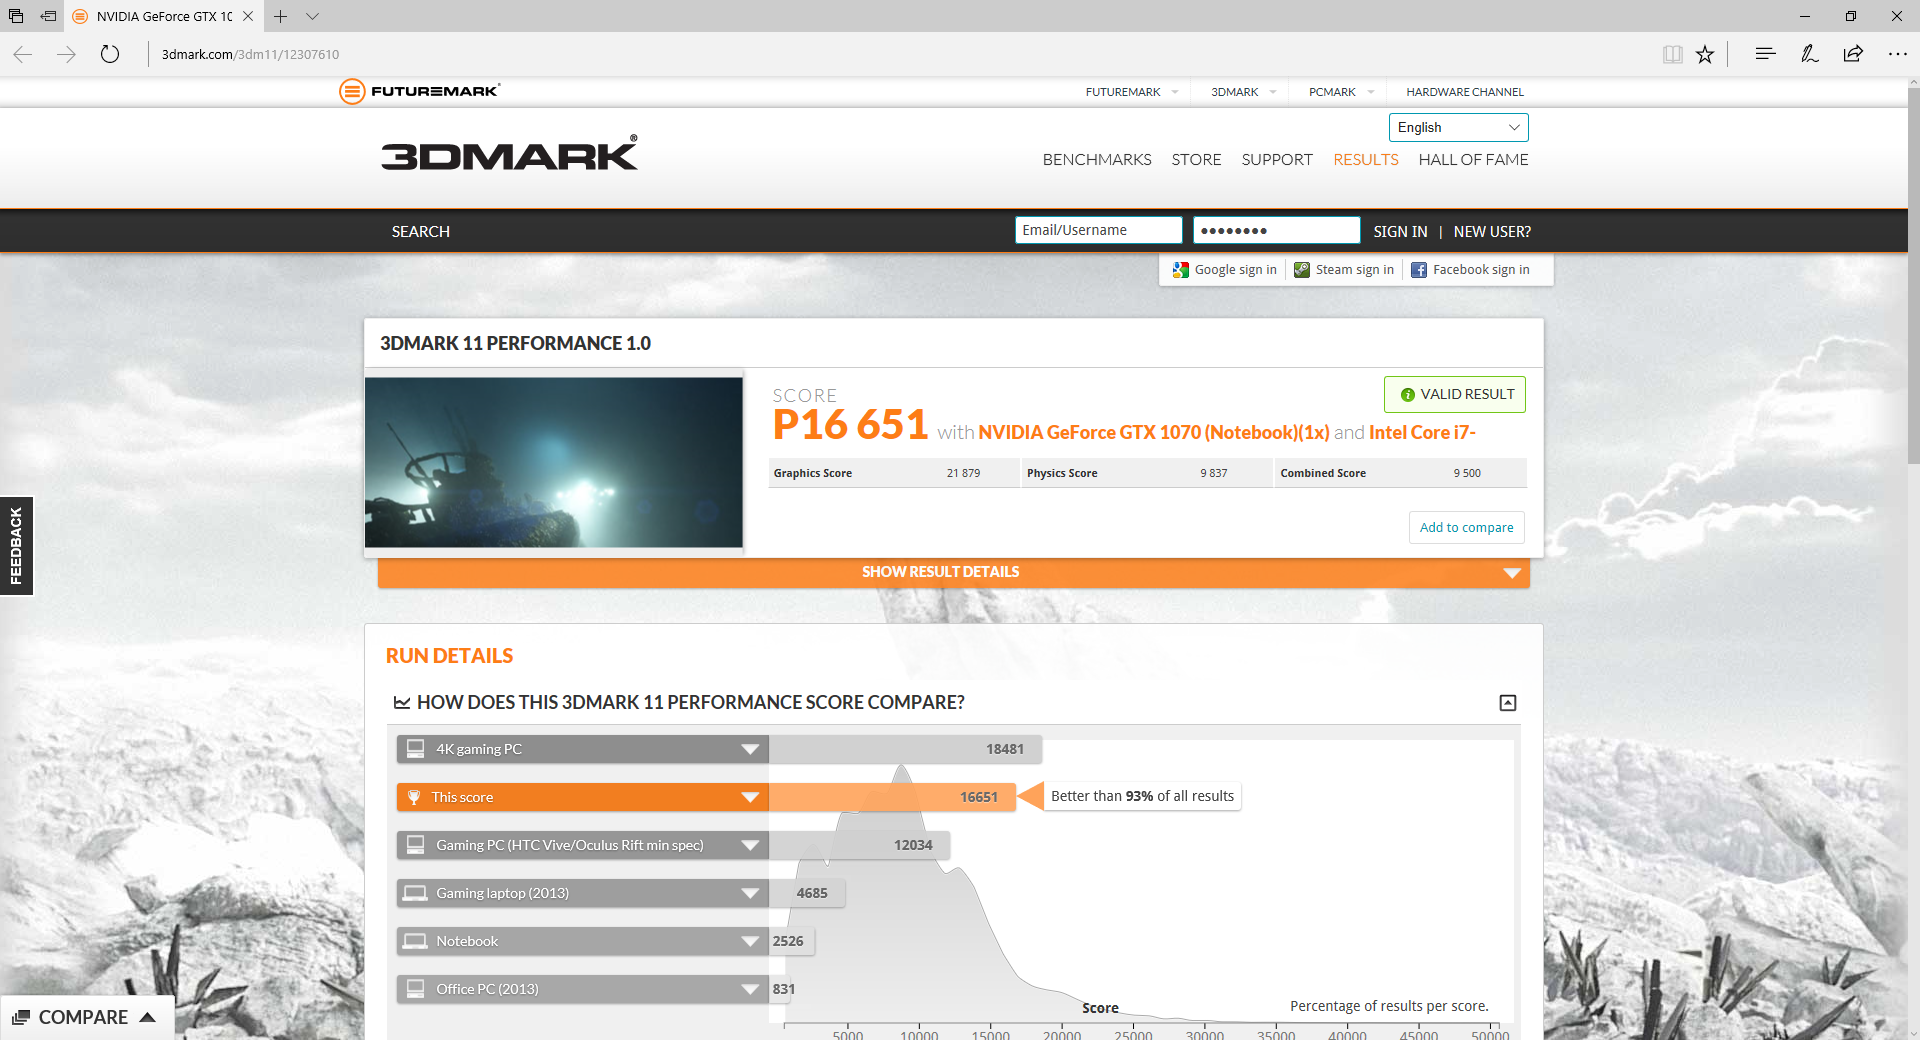
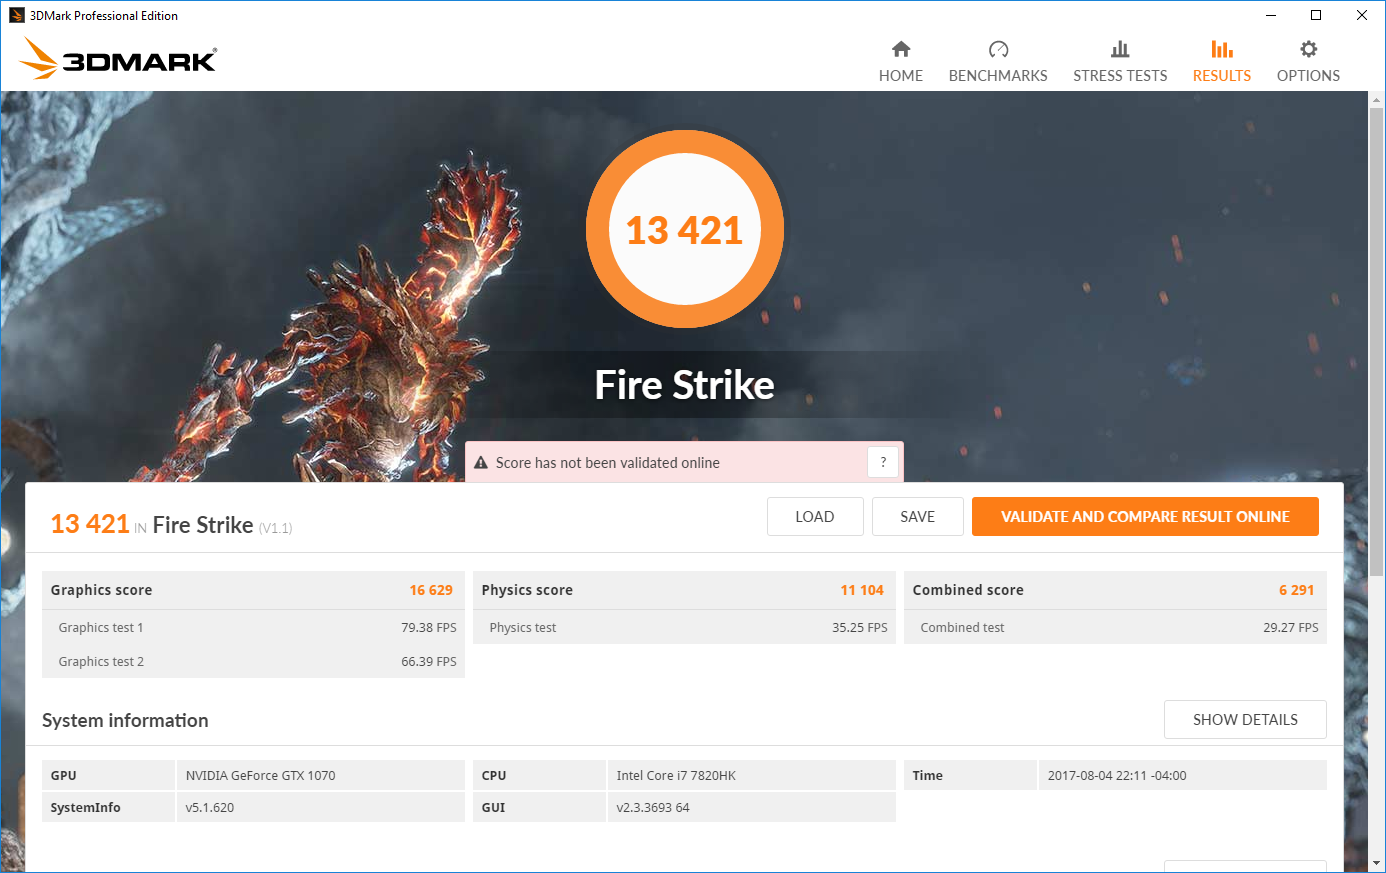
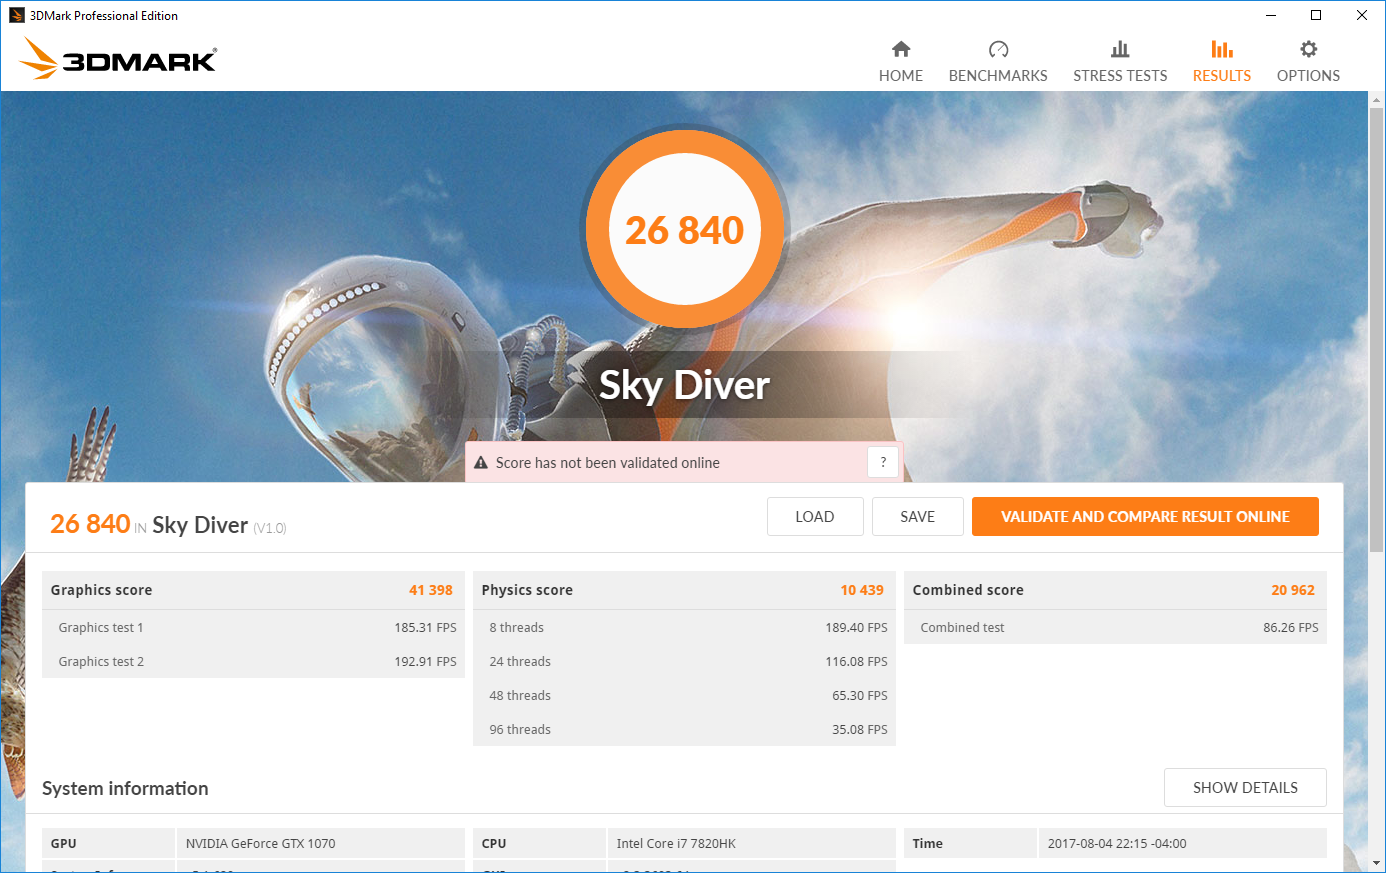
CPU performance is adequate, storage performance is excellent… but what about the GPU? Clearly the single most important item in a gaming machine, let’s hope it isn’t subject to the same thermal constraints that plagued the processor. Although faster GTX 1070 notebooks exist, the Legion Y920 turns in a decent performance for its hardware: we recorded a 3DMark Fire Strike Graphics score of 16629 (slightly higher than the Gigabyte P56XT’s 16410, though below the Asus G752VS score of 18346) and a 3DMark 11 Performance GPU score of 21879 (once again besting the Gigabyte’s score of 20576 but succumbing to the Asus G752VS’ 24349). The latter score is roughly 2% below the median for all 40 benchmarks (currently) in our database for the GTX 1070 (score: 22354), so it’s not ideal, but it’s not far off the mark, either. It’s overall around 20 to 30 percent below the performance of the Alienware 17 R4 and its GTX 1080.
Keep in mind that these benchmarks were performed using the laptop’s default settings, meaning that Turbo Mode was off; with it on, users should be able to eke out another percentage point or two of performance according to our tests—but the differences are minor to say the least. For instance, with Turbo Mode enabled, 3DMark 11 scores jump slightly to 16869 (1.3% higher) and 21933 (0.3% higher) for overall/Performance GPU. That’s still below the Asus ROG G752VS’ scores of 17222 and 24349, but for the most part (as we see in our actual gaming tests below) performance will likely only be around 3 to 4 percent different between the two models during actual gaming.
In terms of sustained performance, we turn to our Witcher 3 benchmark as always for a real-world estimation of how well the device holds up. Like our earlier Cinebench R15 sustained CPU test, we ran our Witcher benchmark twice—with Turbo Mode both on and off—and recorded and analyzed all the data for both states. To quickly summarize, we found that performance without Turbo Mode enabled was mostly consistent, but we did witness frame drops into the middle and low 50s (frames per second) for probably around a third of our test duration (which is 60 minutes in total). Meanwhile, enabling Turbo Mode basically eradicates the problem, with only some extremely minor and infrequent fluctuation down just a couple of frames per second. The bottom line is that there’s really no good reason not to have Turbo Mode enabled during gaming sessions unless the noise level simply bothers you too much. We didn’t even notice any significant difference in case surface temperatures between the two scenarios; CPU temperatures reached 93°C on average, while GPU temperatures climbed to a consistent 73 °C.
| 3DMark | |
| 1280x720 Cloud Gate Standard Graphics | |
| Alienware 17 R4 | |
| Asus G752VS-BA338T | |
| Gigabyte P56XT | |
| HP Omen 15-ce002ng | |
| Lenovo Legion Y920-17IKB | |
| MSI GS43VR 7RE-069US | |
| Lenovo IdeaPad Y900 | |
| Lenovo Legion Y720 80VR002XGE | |
| 1920x1080 Fire Strike Graphics | |
| Alienware 17 R4 | |
| Asus G752VS-BA338T | |
| Lenovo Legion Y920-17IKB | |
| Gigabyte P56XT | |
| MSI GS43VR 7RE-069US | |
| Lenovo Legion Y720 80VR002XGE | |
| HP Omen 15-ce002ng | |
| Lenovo IdeaPad Y900 | |
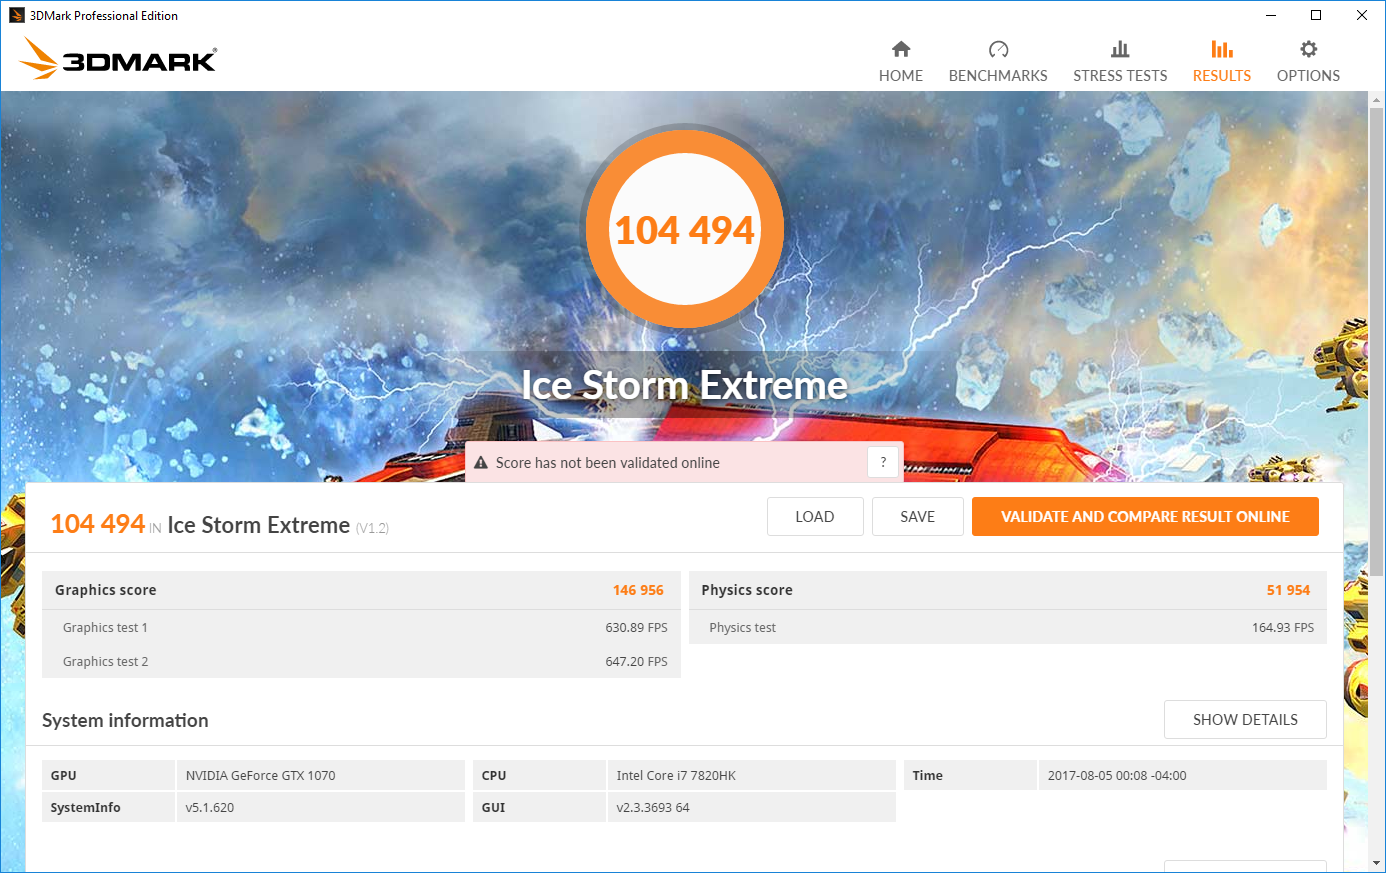
| 1920x1080 Ice Storm Extreme Graphics | |
| Alienware 17 R4 | |
| Lenovo IdeaPad Y900 | |
| Asus G752VS-BA338T | |
| MSI GS43VR 7RE-069US | |
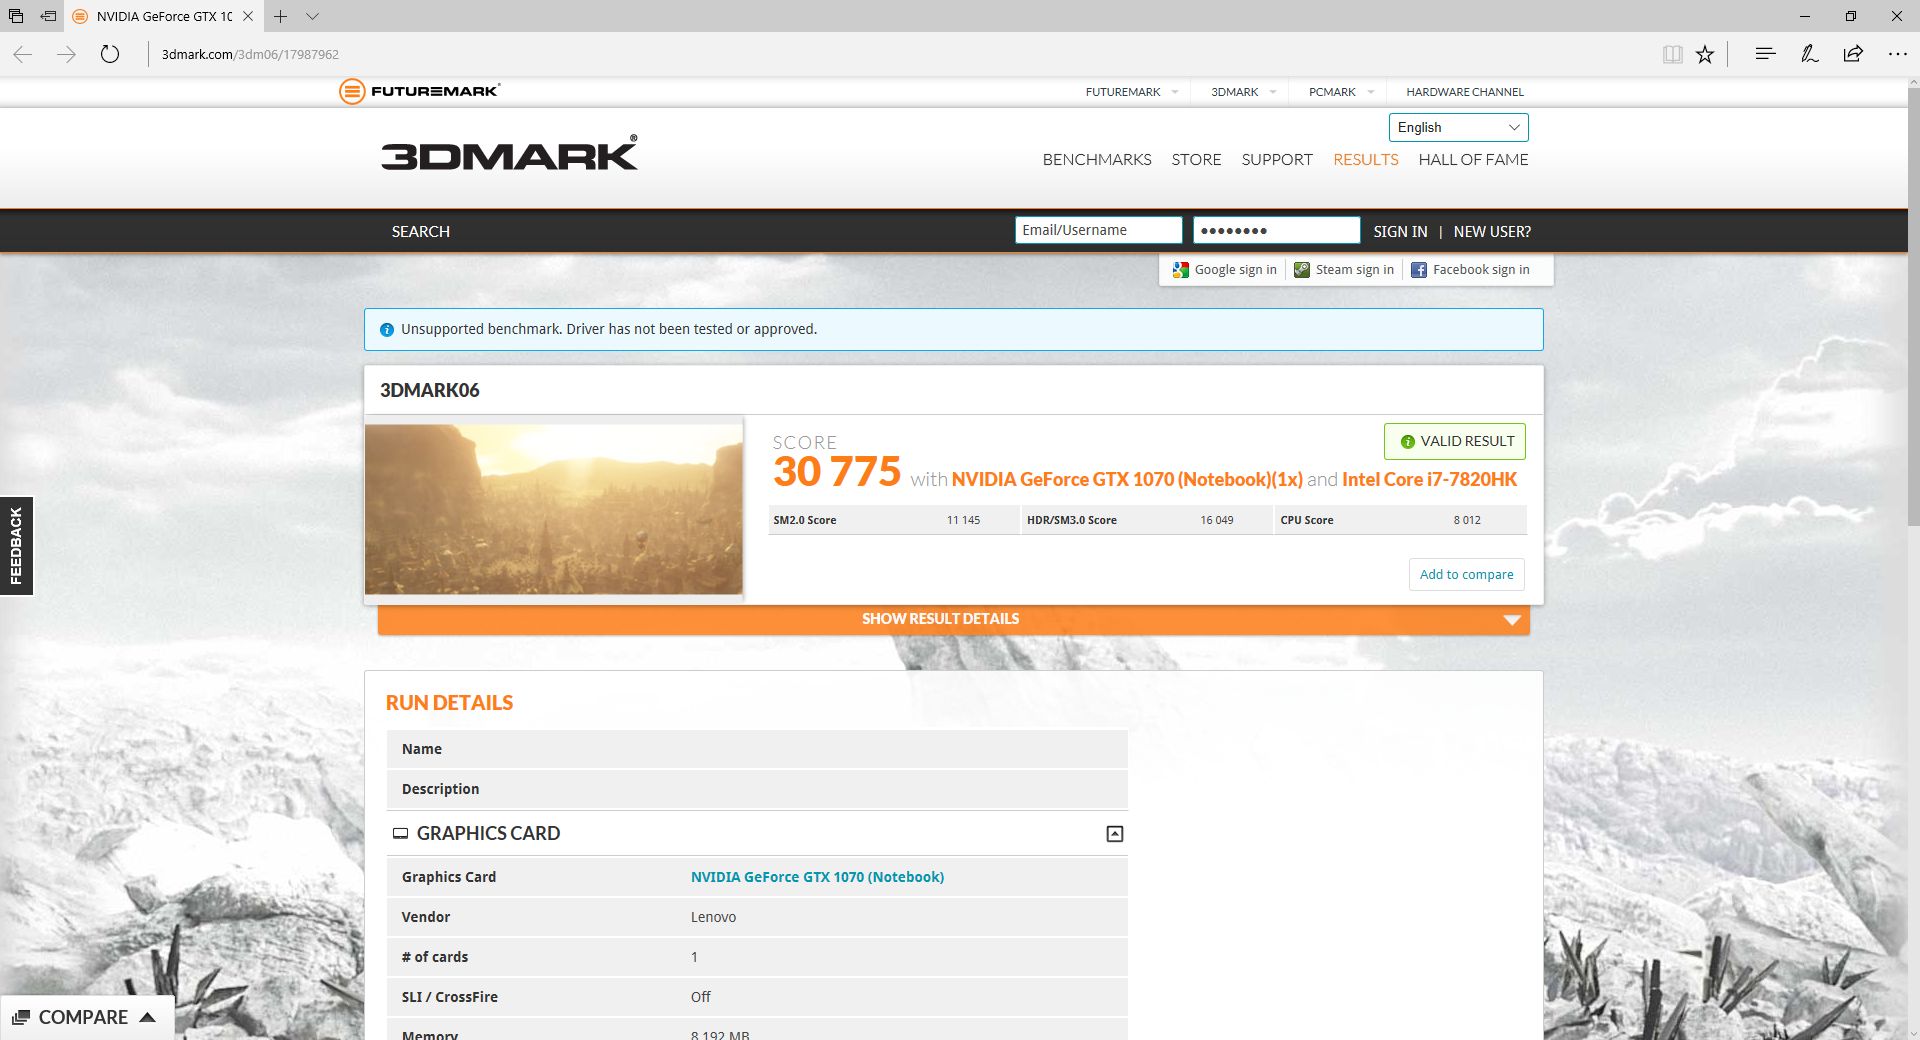
| 3DMark 06 Standard Score | 30775 points | |
| 3DMark 11 Performance | 16651 points | |
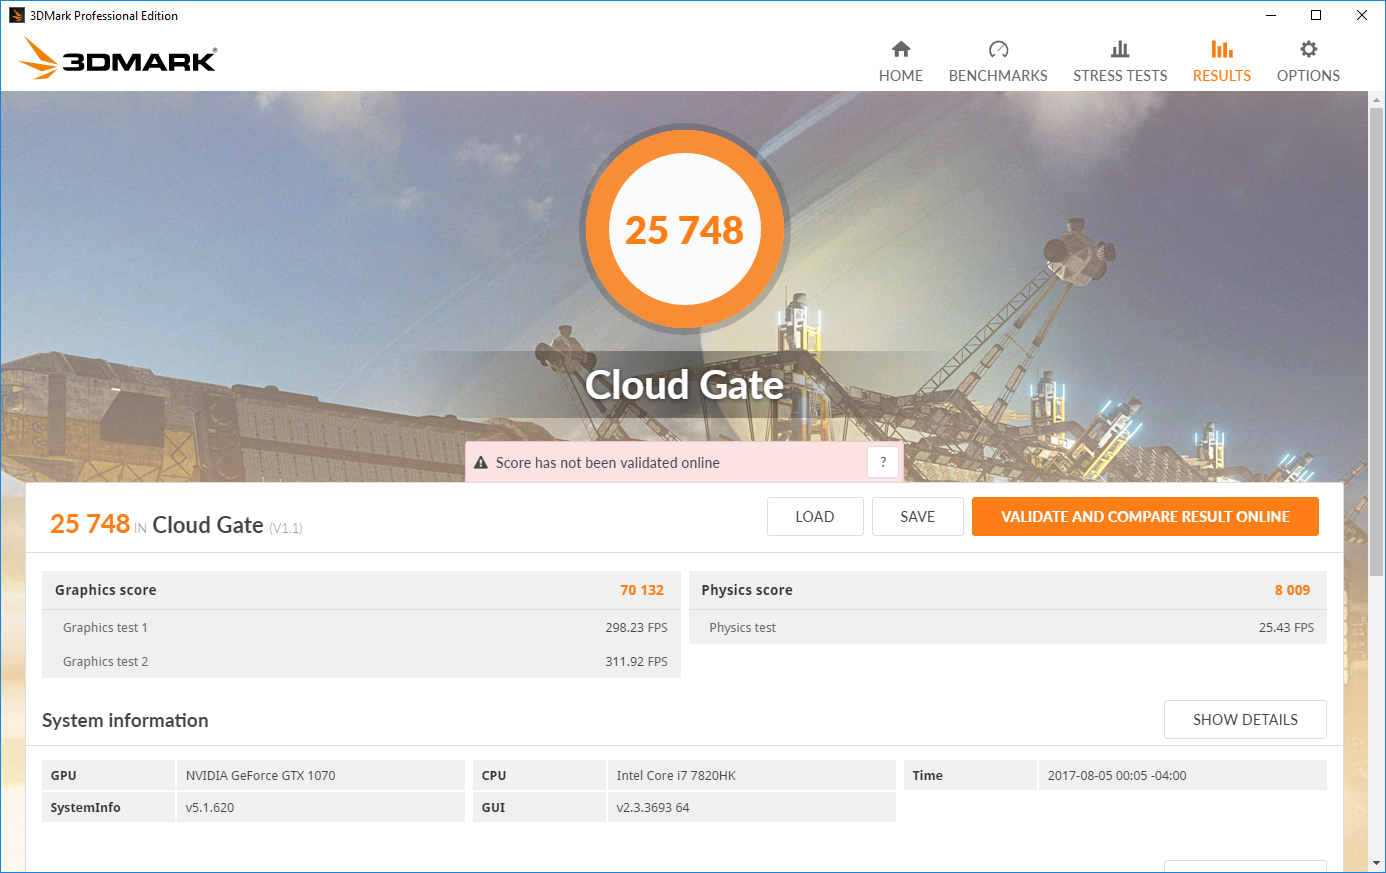
| 3DMark Cloud Gate Standard Score | 25748 points | |
| 3DMark Fire Strike Score | 13421 points | |
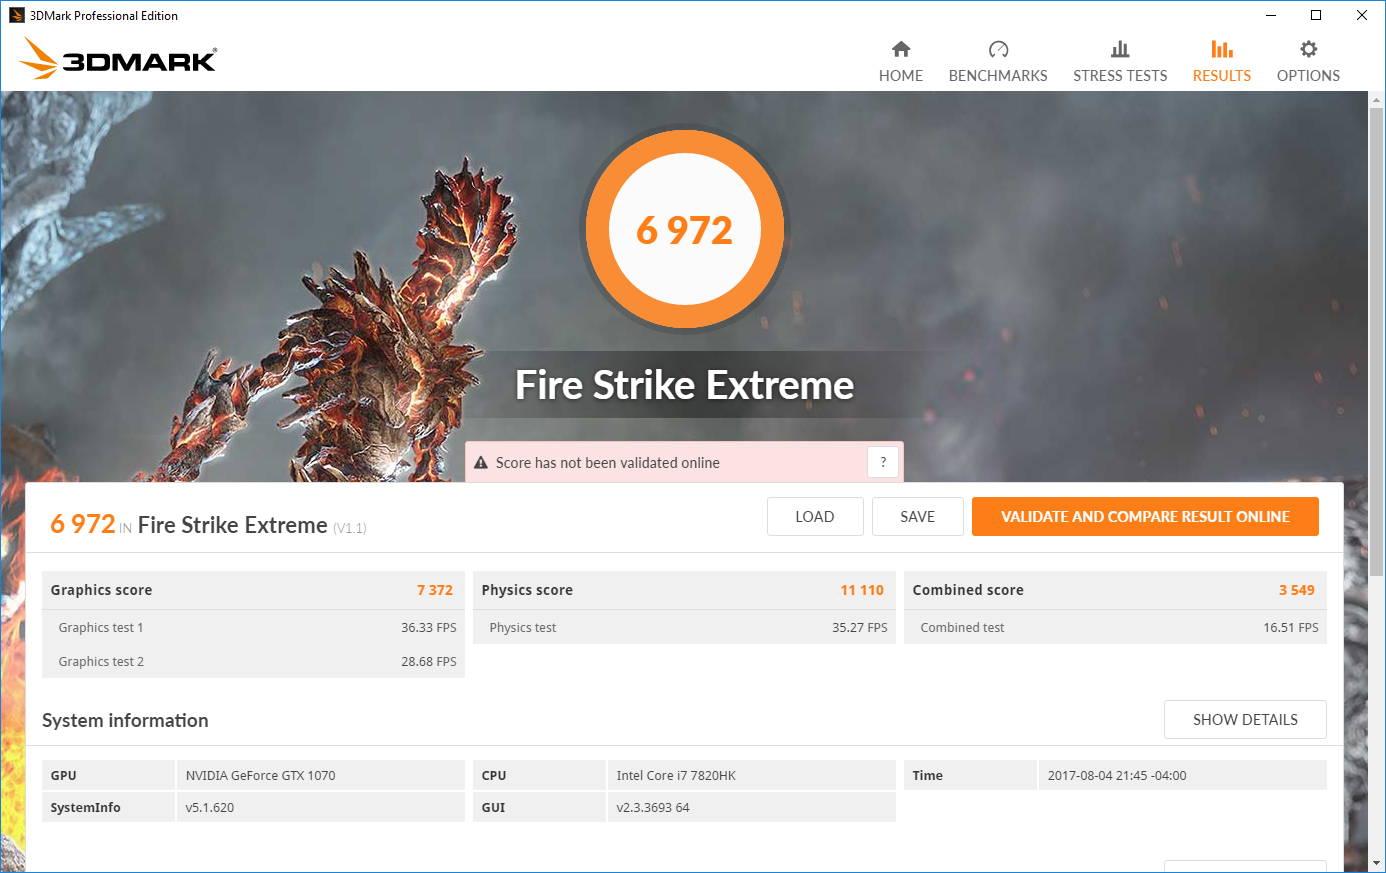
| 3DMark Fire Strike Extreme Score | 6972 points | |
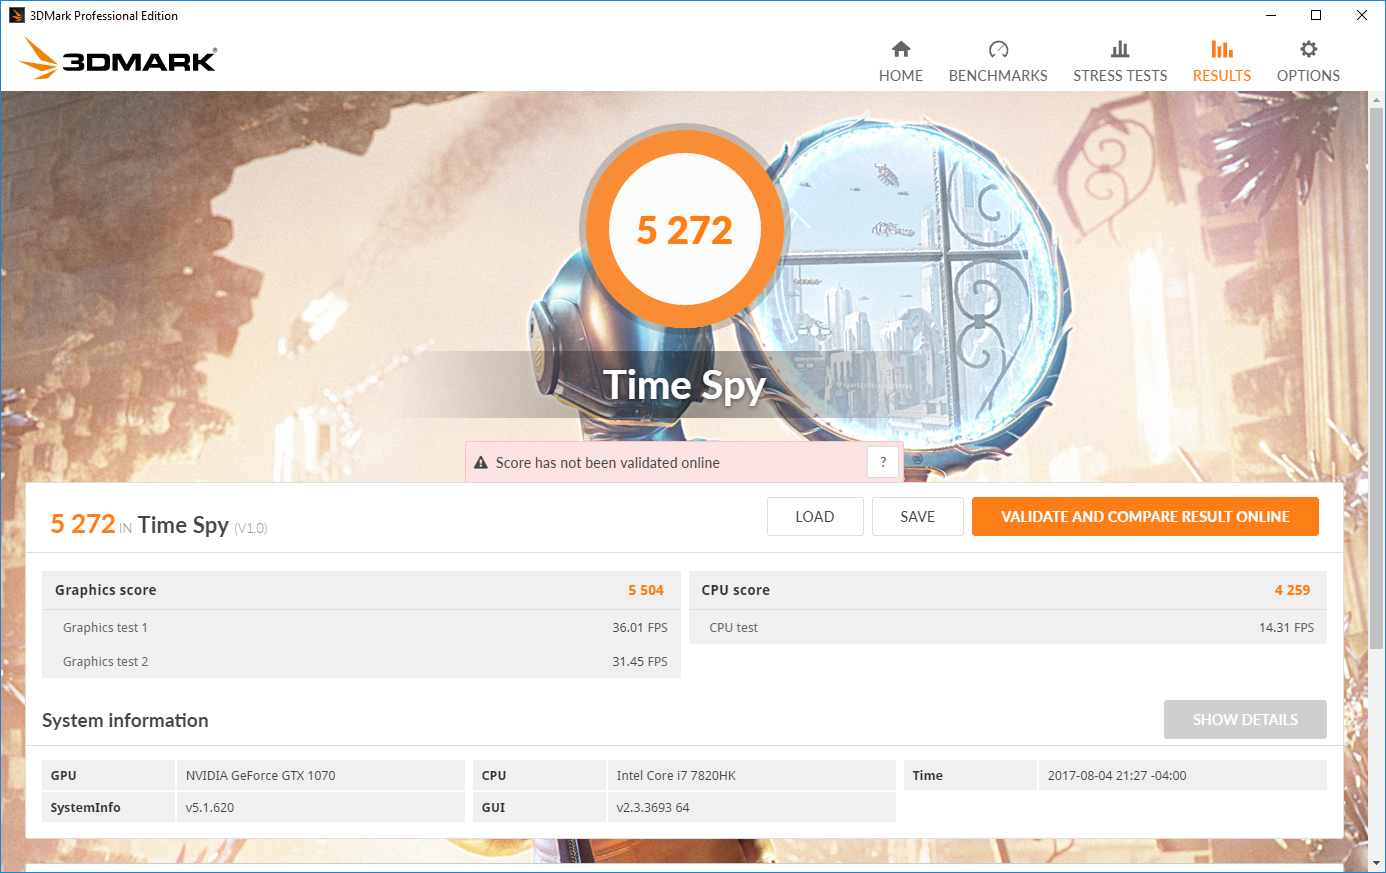
| 3DMark Time Spy Score | 5272 points | |
Help | ||
Gaming Performance
It’s no surprise that the Y920 was able to handle any game we threw at it without missing a beat, even on high settings. It’s helpful perhaps that display resolution is limited to 1080p, as the GTX 1070 can easily tackle serious loads at that setting as we’ve seen before.
| Thief - 1920x1080 Very High Preset AA:FXAA & High SS AF:8x (sort by value) | |
| Lenovo Legion Y920-17IKB | |
| MSI GS43VR 7RE-069US | |
| Alienware 17 R4 | |
| Lenovo IdeaPad Y900 | |
| BioShock Infinite - 1920x1080 Ultra Preset, DX11 (DDOF) (sort by value) | |
| Lenovo Legion Y920-17IKB | |
| Asus G752VS-BA338T | |
| MSI GS43VR 7RE-069US | |
| Alienware 17 R4 | |
| Lenovo Legion Y720 80VR002XGE | |
| Lenovo IdeaPad Y900 | |
| Rise of the Tomb Raider - 1920x1080 Very High Preset AA:FX AF:16x (sort by value) | |
| Lenovo Legion Y920-17IKB | |
| Asus G752VS-BA338T | |
| MSI GS43VR 7RE-069US | |
| HP Omen 15-ce002ng | |
| Alienware 17 R4 | |
| Lenovo IdeaPad Y900 | |
| Metro: Last Light - 1920x1080 Very High (DX11) AF:16x (sort by value) | |
| Lenovo Legion Y920-17IKB | |
| MSI GS43VR 7RE-069US | |
| Alienware 17 R4 | |
| Lenovo IdeaPad Y900 | |
| The Witcher 3 - 1920x1080 Ultra Graphics & Postprocessing (HBAO+) (sort by value) | |
| Lenovo Legion Y920-17IKB | |
| Lenovo Legion Y920-17IKB | |
| Asus G752VS-BA338T | |
| MSI GS43VR 7RE-069US | |
| Gigabyte P56XT | |
| HP Omen 15-ce002ng | |
| Alienware 17 R4 | |
| Lenovo Legion Y720 80VR002XGE | |
| Batman: Arkham Knight - 1920x1080 High / On AA:SM AF:16x (sort by value) | |
| Lenovo Legion Y920-17IKB | |
| MSI GS43VR 7RE-069US | |
| HP Omen 15-ce002ng | |
| Alienware 17 R4 | |
| Lenovo IdeaPad Y900 | |
| low | med. | high | ultra | |
|---|---|---|---|---|
| BioShock Infinite (2013) | 133 | |||
| Metro: Last Light (2013) | 117 | |||
| Thief (2014) | 107 | |||
| The Witcher 3 (2015) | 60 | |||
| Batman: Arkham Knight (2015) | 85 | |||
| Rise of the Tomb Raider (2016) | 95 |
Stress Test
We stress test machines using a combination of Prime95 and FurMark to discern their theoretical maximum potential under the heaviest synthetic loads. For most machines, this may be merely an exercise in superfluity, but for gaming devices and workstations, it can provide valuable insight as to the top-level capabilities of a machine that could eventually encounter similar conditions—however rarely.
As we alluded to earlier, our stress tests of the Legion Y920 were particularly illuminating. Before we get started, it’s important to explain how we approached these tests. We performed each exercise with Turbo Mode off, allowed the machine to cool, and then repeated it a second time with Turbo Mode on. We recorded the results in each scenario separately to allow for comparison and perhaps a better idea of how well the Turbo Mode feature actually works.
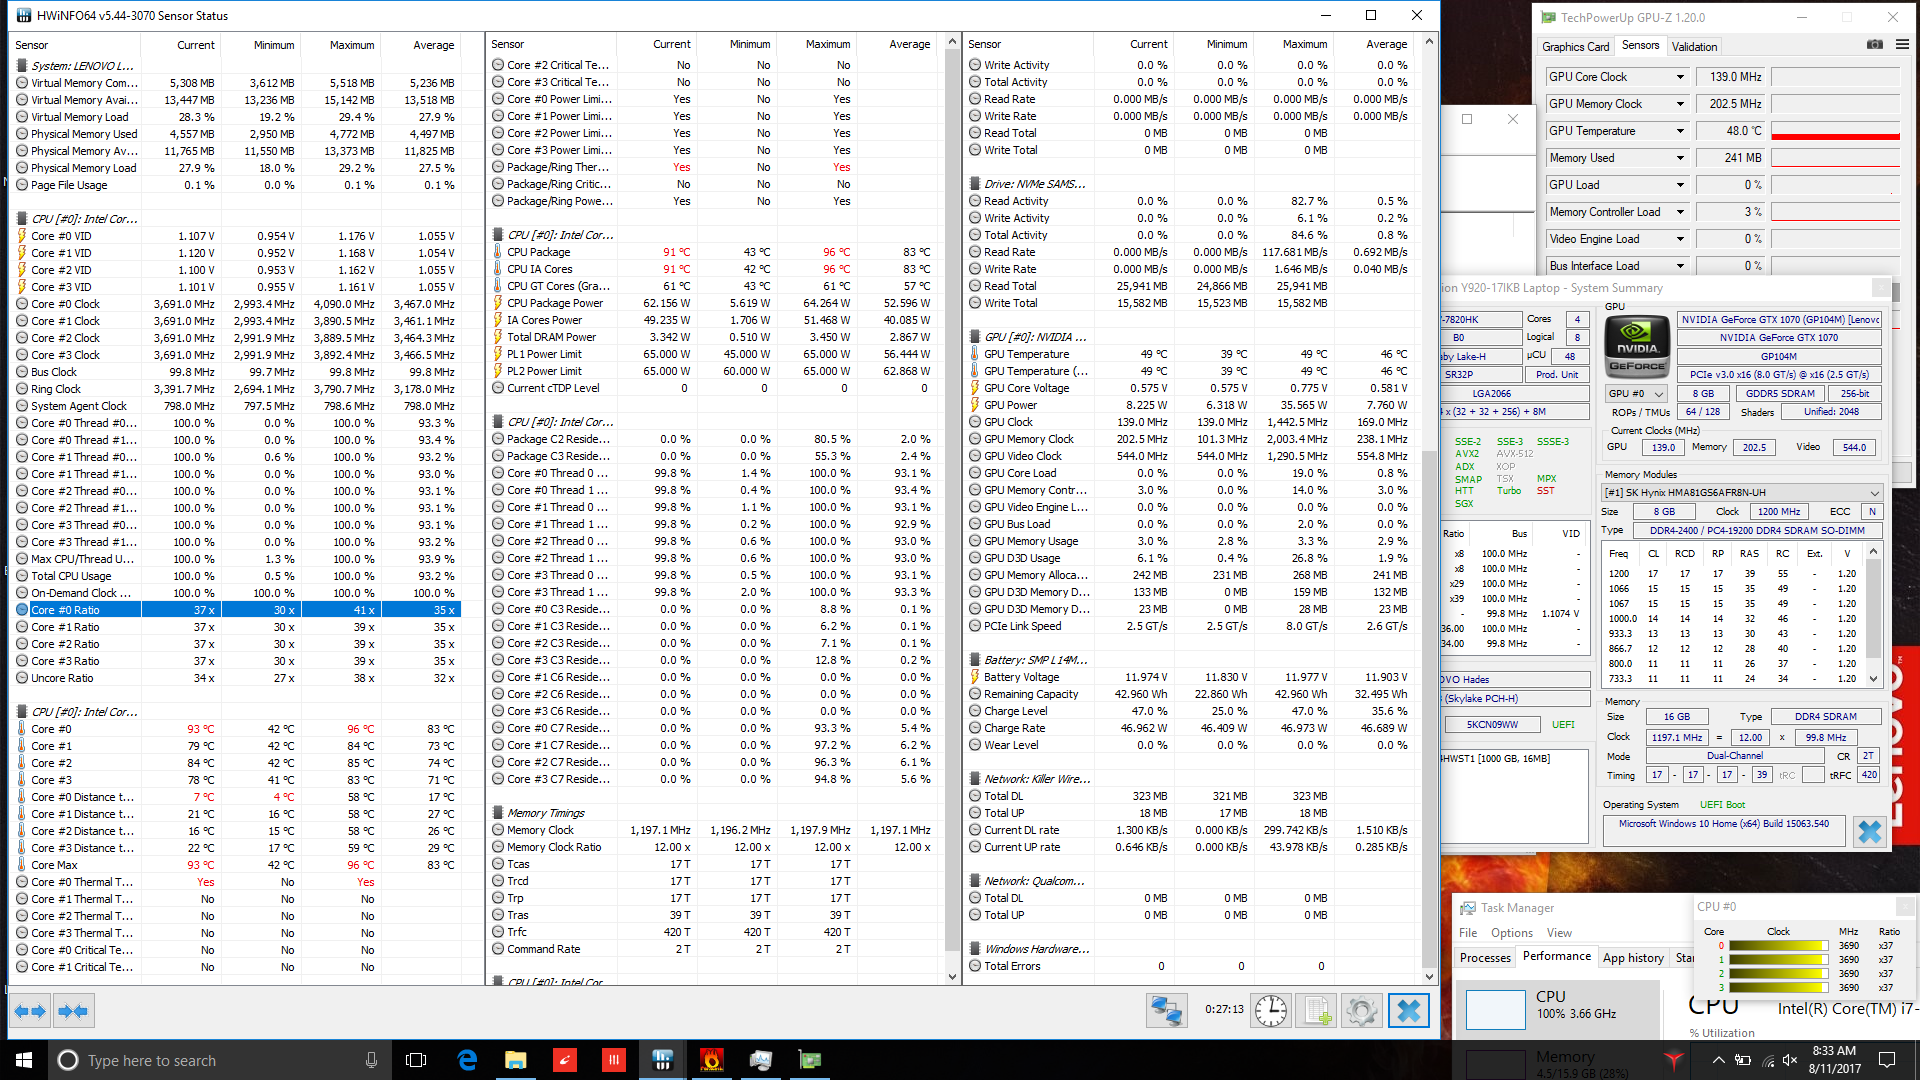
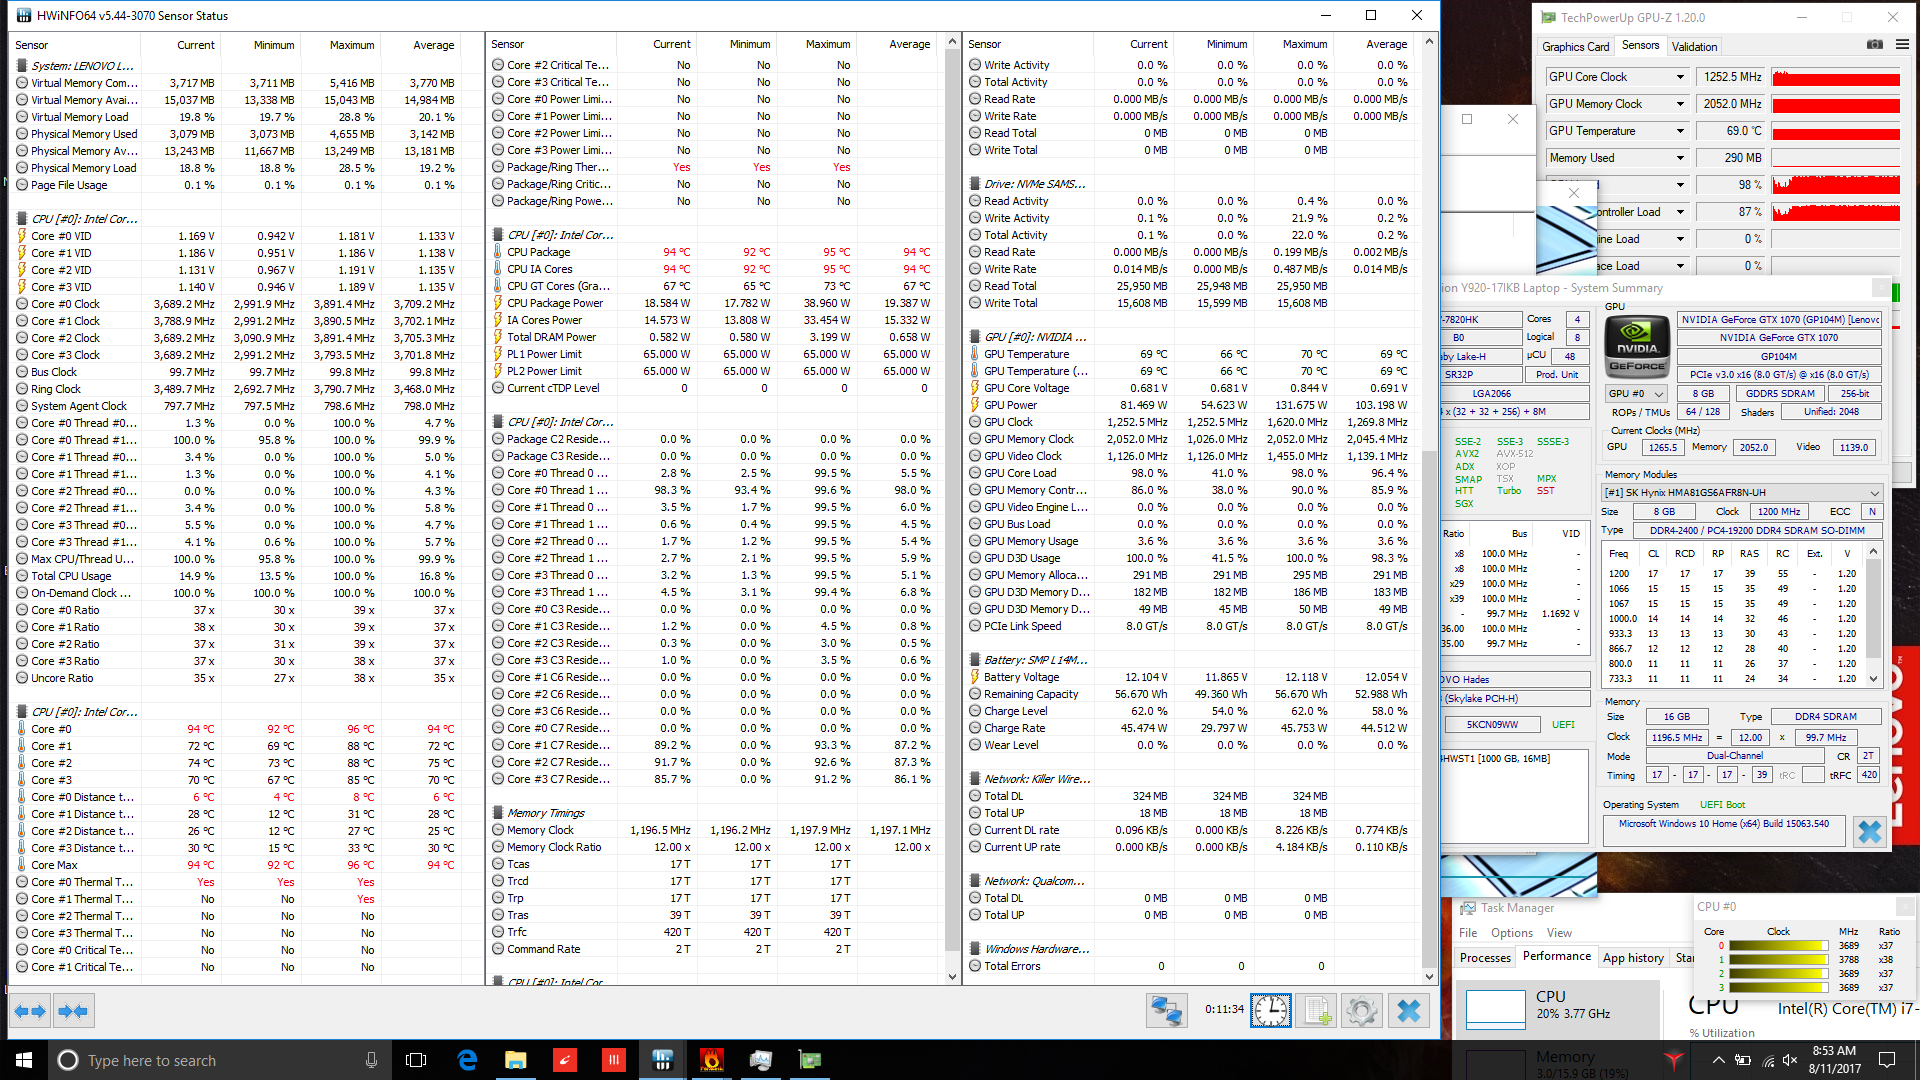
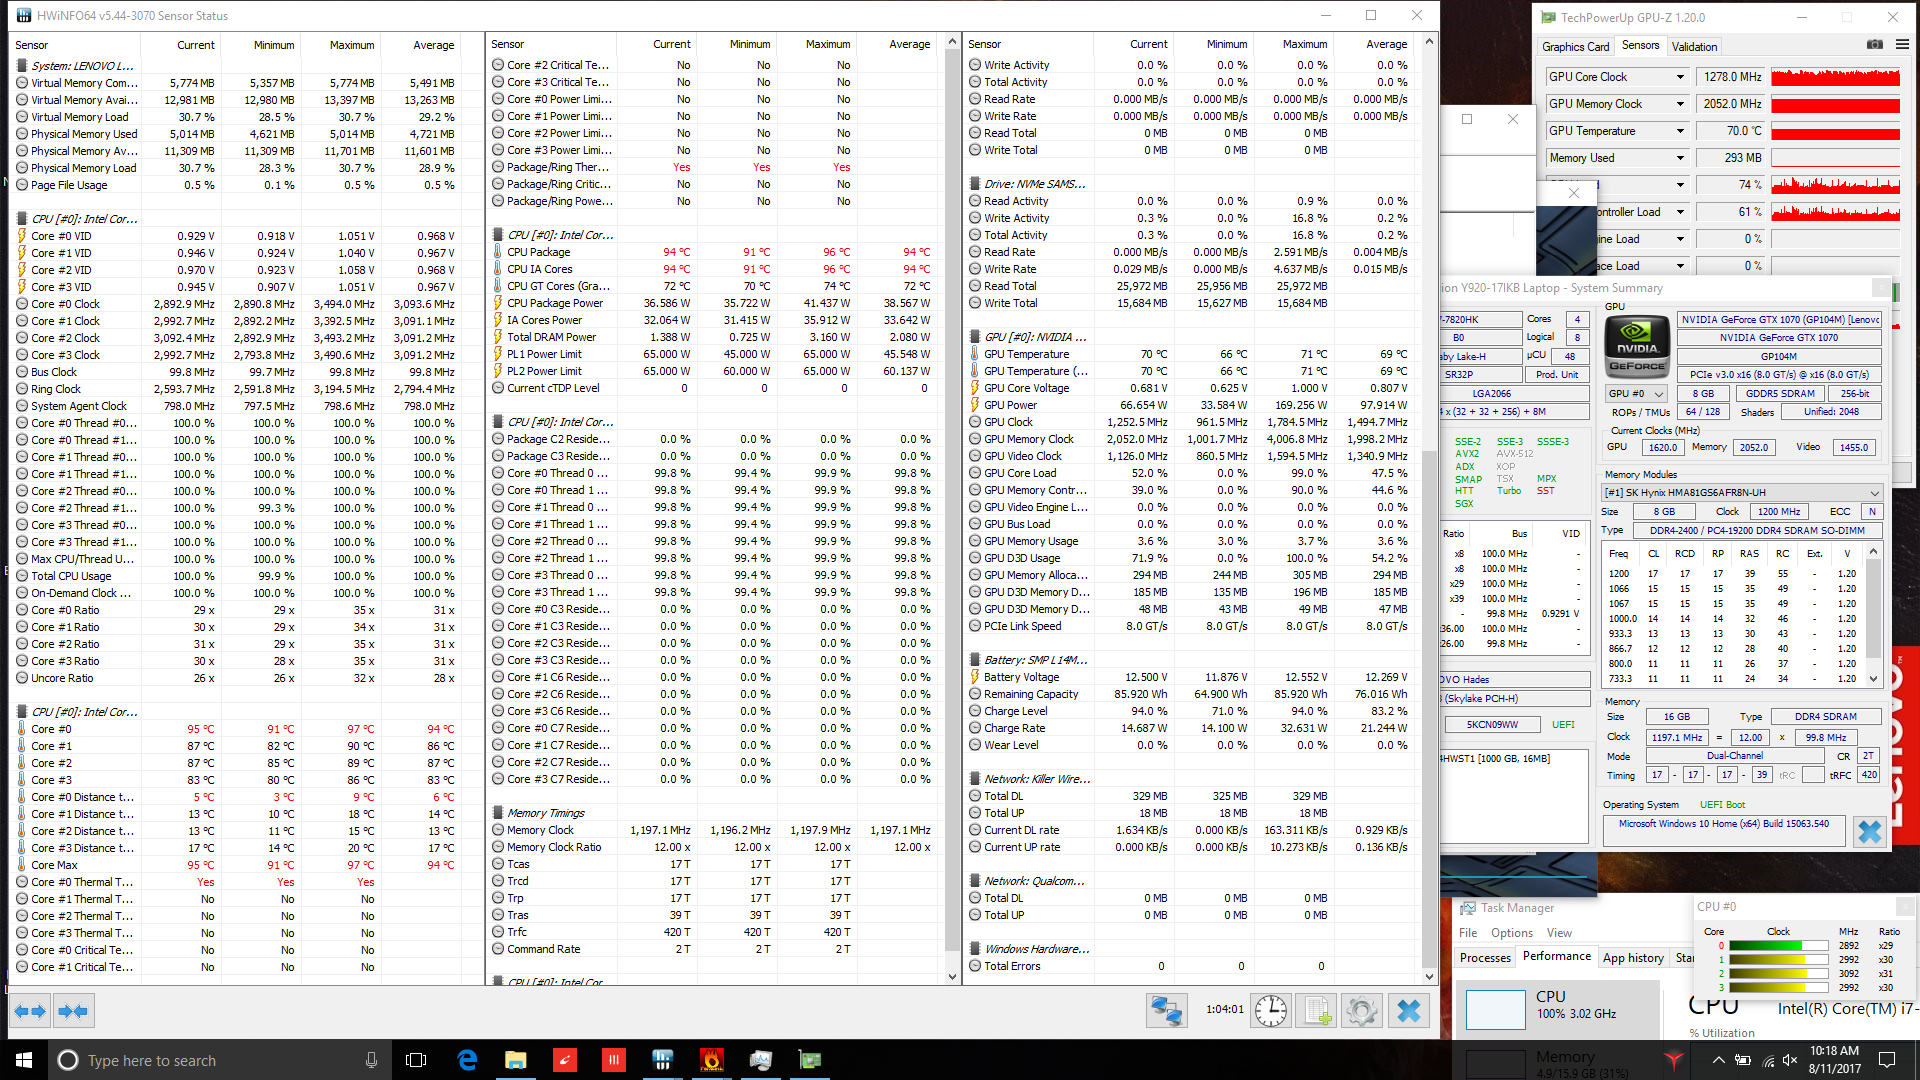
First, under CPU stress using Prime95, we witnessed an initial clock rate of 3.5 GHz until around 30 seconds into stress, at which point it drops to around 3.1 – 3.2 GHz (after reaching a max of 82 degrees). We then switched Turbo Mode on and repeated the test. The results were similar, but the clock rates were (predictably) just a bit higher: initially 3.7 GHz and eventually down to 3.5 – 3.6 GHz (after reaching 95 degrees). This result is significant because it explains why we never see performance matching that of the Alienware 17 R4 even with Turbo Mode enabled: the Alienware is able to maintain a permanent turbo clock rate of 4.0 GHz, a full 1.1 GHz above the base frequency of the CPU and roughly 400 – 500 MHz faster than the Legion Y920 on average (roughly 10 – 12 percent faster, which is exactly what we found in our Cinebench R15 benchmarks).
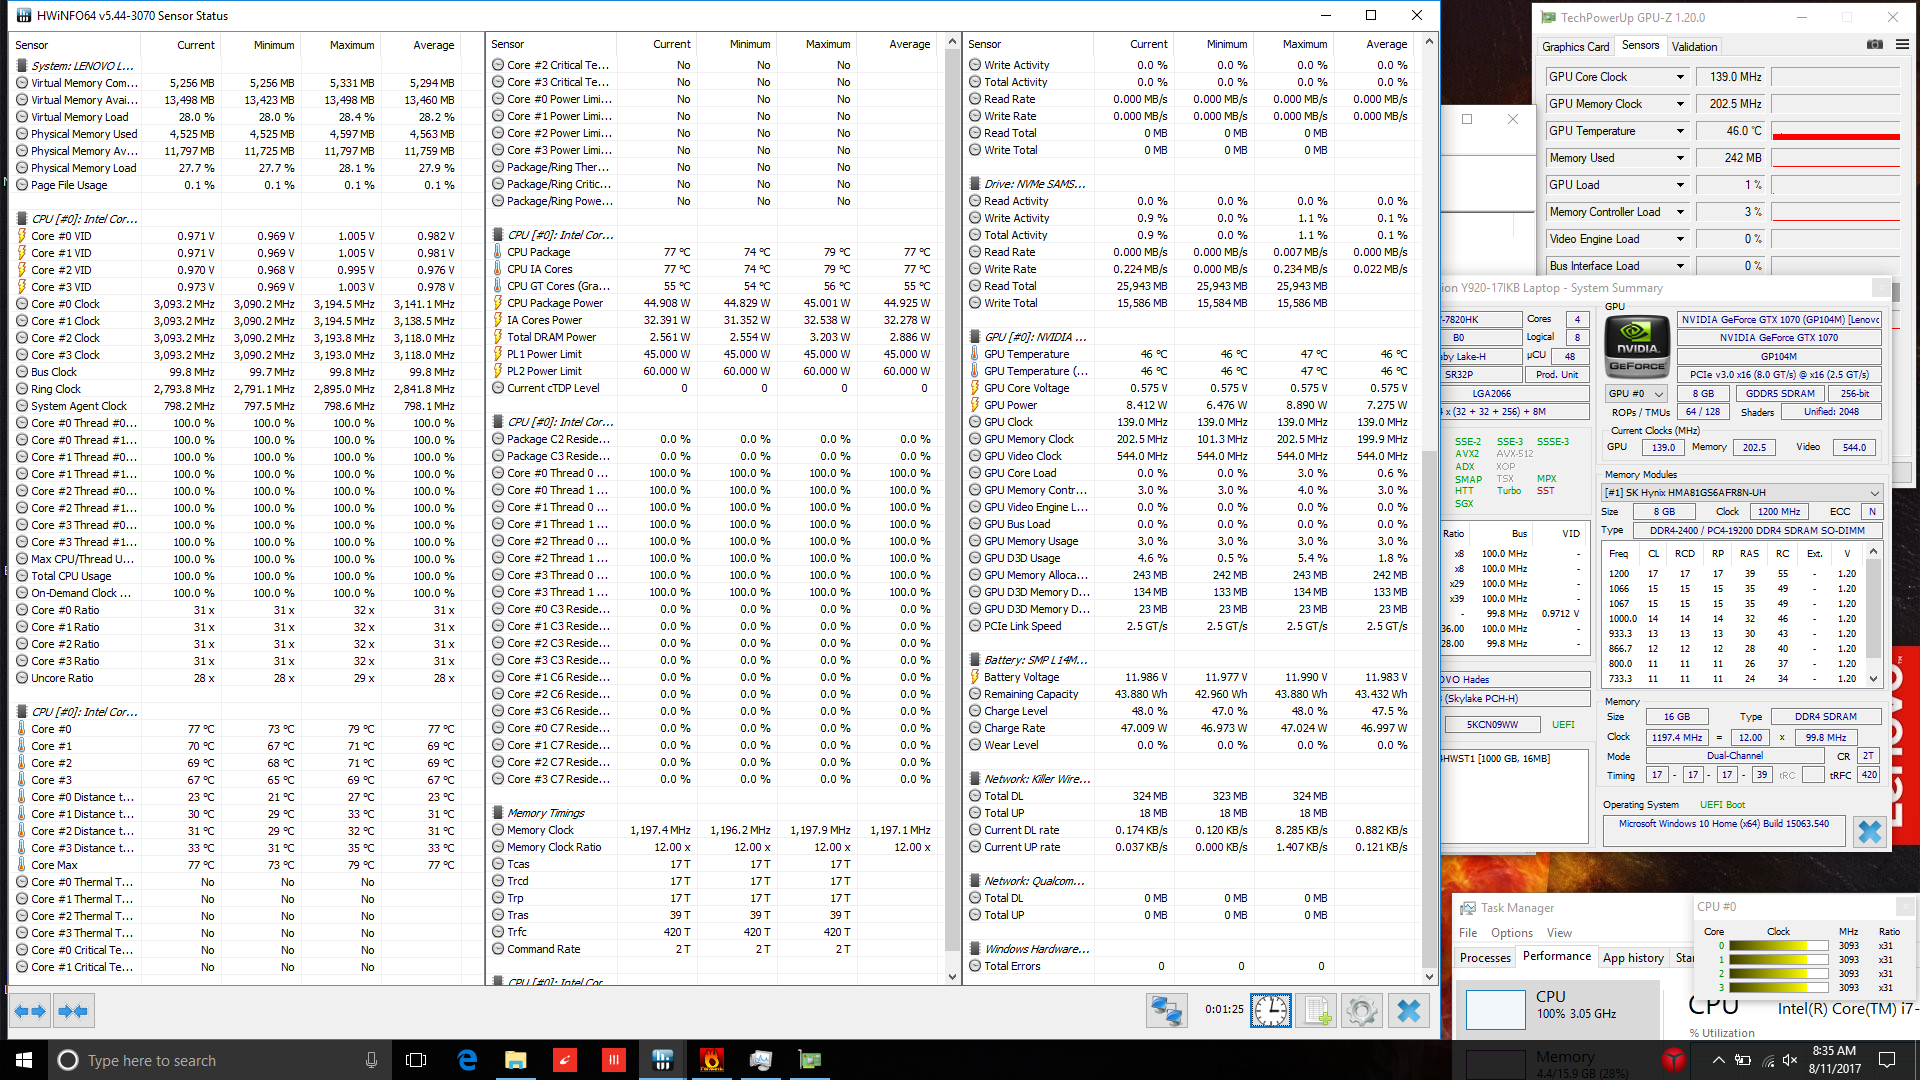
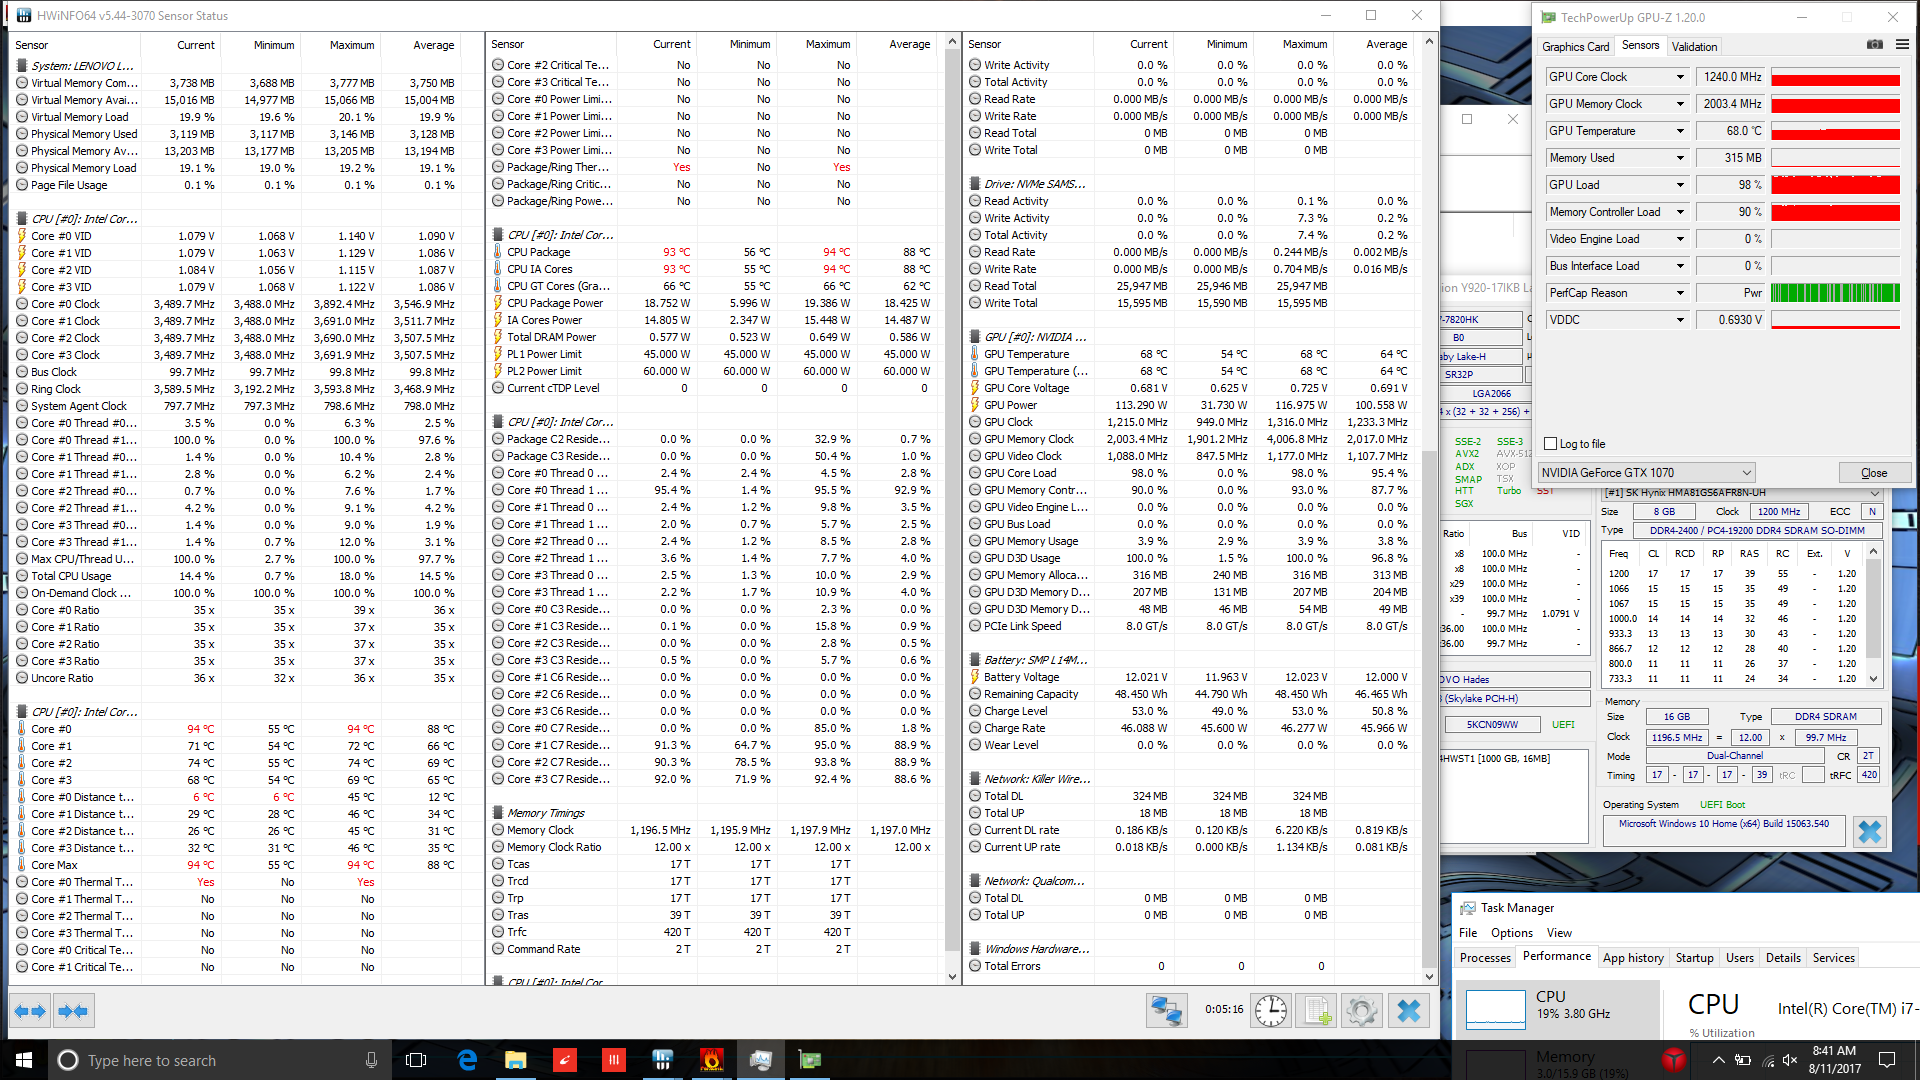
GPU performance thankfully isn’t a major issue on the Y920, but stress testing still provided some interesting data points. Under FurMark synthetic GPU stress, initially, the GPU frequency hovers around 1230 MHz on average with a temperature of 68 °C. With Turbo Mode enabled, the frequency increases to roughly 1280 MHz and the average temperature is slightly higher at 69 °C. As our earlier benchmarks showed, GPU performance is adequate overall, so we’re really more concerned about consistency and GPU temperatures—both areas of proficiency for the Y920.
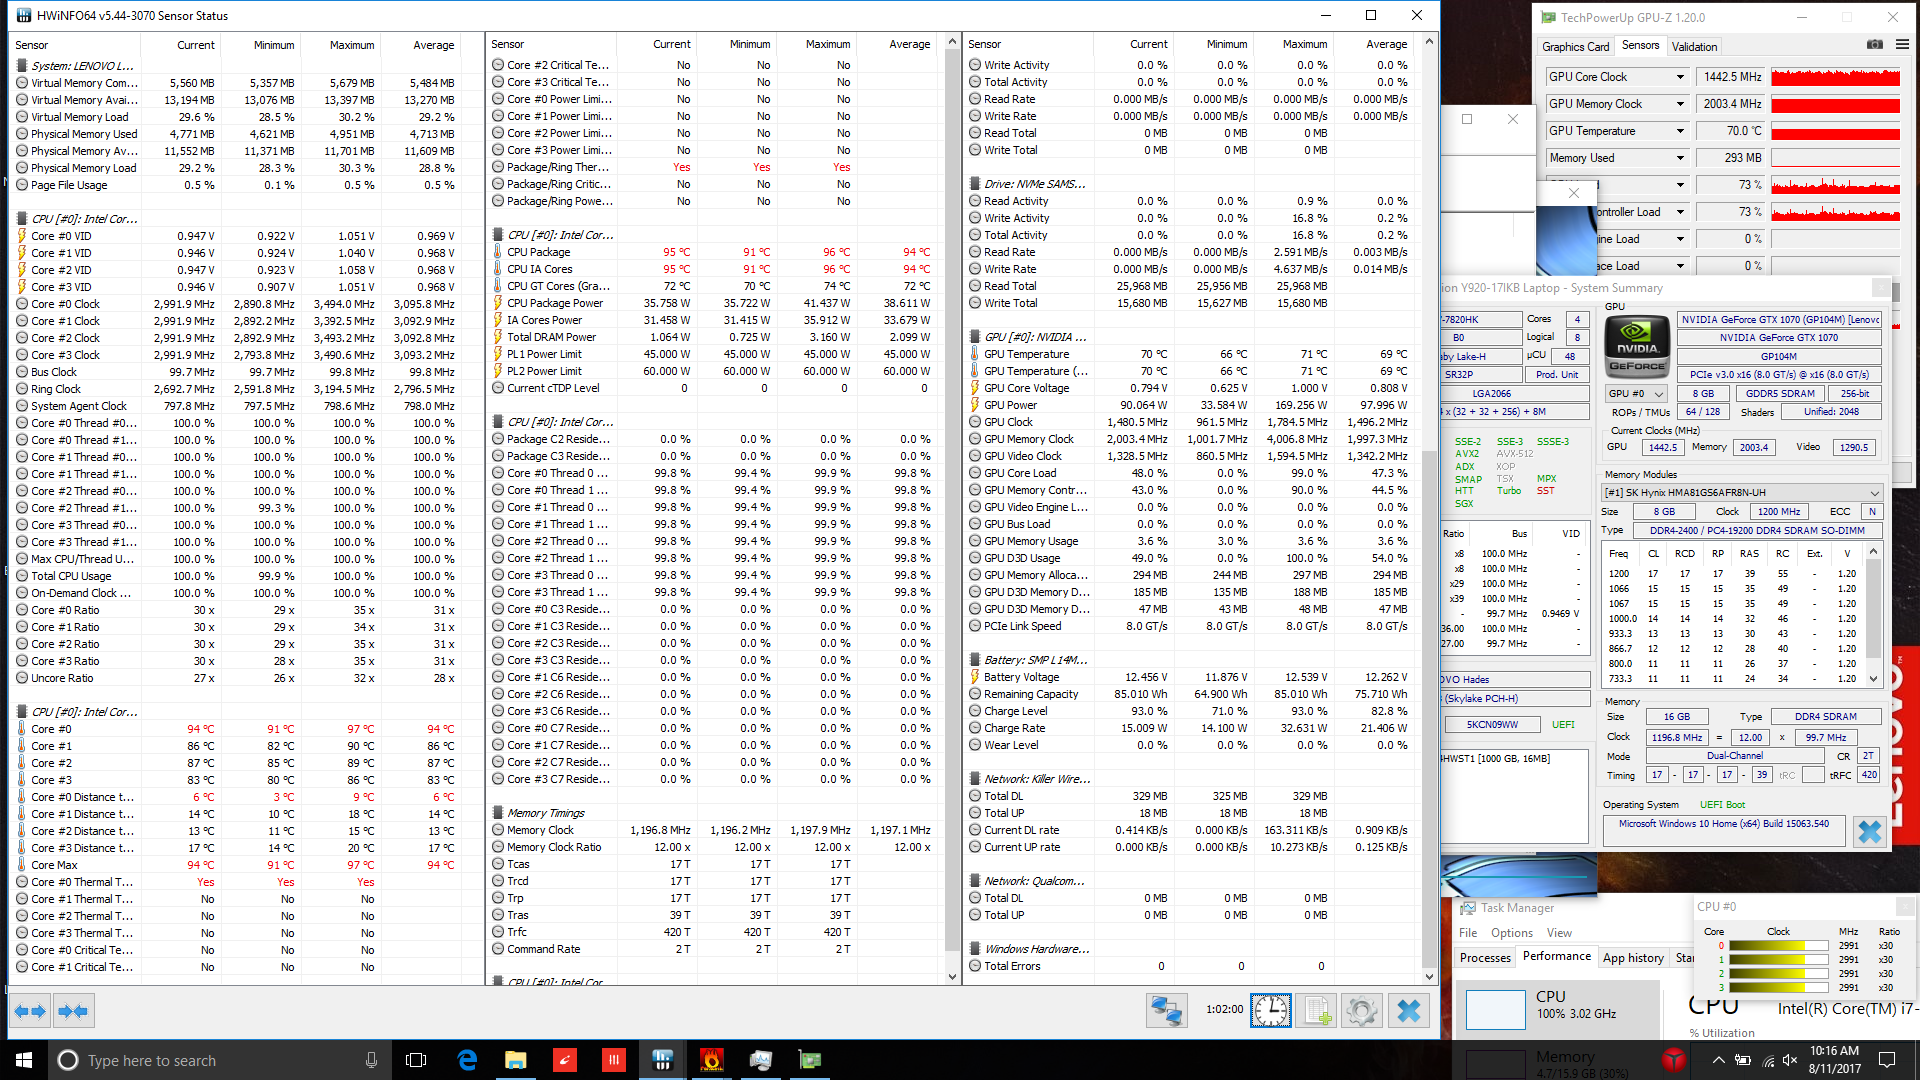
Combined CPU and GPU stress, meanwhile, saw GPU frequencies fluctuating between 1290 MHz and 1650 MHz and CPU frequencies confined to the 3.0 – 3.1 GHz range. The maximum GPU temperature we recorded was 70 °C (average: 69 °C) and the maximum CPU temperature was a very hot 95 °C (average: 94 °C). Switching Turbo Mode on slightly increases nearly all of these values, with GPU frequencies reaching 1300 – 1750 MHz (and temperatures remaining the same) and CPU frequencies notching upward to 3.1 – 3.2 GHz. CPU temperatures in any situation are far more bothersome to the Y920 than GPU temperatures, the latter of which never see anything above the 70s C.
In summation, enabling Turbo Mode increases both possible top-end clock rates and temperatures/fan speeds. Thermal tolerances/limits appear to remain the same though temperatures are obviously affected. The performance difference is marginal at best, but as we explained earlier during our sustained performance testing of both the CPU and GPU, there really is no good reason not to enable it unless noise levels are a prime concern.
Stress Test Results, Turbo Mode OFF
| CPU Clock (GHz) | GPU Clock (MHz) | Average CPU Temperature (°C) | Average GPU Temperature (°C) | |
| Prime95 Stress | 3.1 - 3.2 | - | 82 | - |
| FurMark Stress | - | 1230 | - | 68 |
| Prime95 + FurMark Stress | 3.0 - 3.1 | 1290 - 1650 | 94 | 69 |
Stress Test Results, Turbo Mode ON
| CPU Clock (GHz) | GPU Clock (MHz) | Average CPU Temperature (°C) | Average GPU Temperature (°C) | |
| Prime95 Stress | 3.5 - 3.6 | - | 95 | - |
| FurMark Stress | - | 1280 | - | 69 |
| Prime95 + FurMark Stress | 3.1 - 3.2 | 1300 - 1750 | 94 | 69 |
Emissions
System Noise
The Legion Y920 fares quite well for a gaming notebook in the realm of system noise. While idle, the device is mostly silent, registering just 31.5 dB(A) on average against an environmental background noise level of 28.1 dB(A). Even under typical loads, with Turbo Mode off, the machine records an average of 33.2 dB(A), with a maximum of 46.5 dB(A)—obviously louder, but not terribly obtrusive. Enabling Turbo Mode does bump this up again to around 47.2 dB(A), but that’s still below basically all of its competitors (as you can see detailed in the chart below). The fan’s noise profile does border on more of an irritating “whir” while running at very high RPMs (as compared to the more favorable, lower-frequency “whoosh” of some competitors), but at worst, it’s par for the course for a machine of this size and power.
Noise level
| Idle |
| 29.9 / 31.5 / 31.5 dB(A) |
| Load |
| 33.2 / 46.5 dB(A) |
 | ||
30 dB silent 40 dB(A) audible 50 dB(A) loud |
||
min: | ||
| Lenovo Legion Y920-17IKB GeForce GTX 1070 Mobile, i7-7820HK, Samsung SM961 MZVKW512HMJP m.2 PCI-e | Asus G752VS-BA338T GeForce GTX 1070 Mobile, i7-7700HQ, Samsung SM961 MZVKW512HMJP m.2 PCI-e | Gigabyte P56XT GeForce GTX 1070 Mobile, i7-7700HQ, LiteOn CX2-8B256 | Alienware 17 R4 GeForce GTX 1080 Mobile, i7-7820HK, SK Hynix PC300 NVMe 512 GB | Lenovo Legion Y720 80VR002XGE GeForce GTX 1060 Mobile, i7-7700HQ, Samsung PM961 MZVLW256HEHP | Lenovo IdeaPad Y900 GeForce GTX 980M, 6820HK, Samsung SM951 MZVPV256 m.2 | |
|---|---|---|---|---|---|---|
| Noise | -7% | -12% | -16% | -1% | -15% | |
| off / environment * (dB) | 28.1 | 30 -7% | 30 -7% | 28.2 -0% | 30.3 -8% | 28.8 -2% |
| Idle Minimum * (dB) | 29.9 | 30 -0% | 34 -14% | 35.6 -19% | 31 -4% | 29.4 2% |
| Idle Average * (dB) | 31.5 | 32 -2% | 35 -11% | 35.6 -13% | 30.9 2% | 32.4 -3% |
| Idle Maximum * (dB) | 31.5 | 36 -14% | 39 -24% | 35.7 -13% | 31.5 -0% | 48 -52% |
| Load Average * (dB) | 33.2 | 43 -30% | 39 -17% | 50.2 -51% | 38.7 -17% | 42.5 -28% |
| Witcher 3 ultra * (dB) | 46.5 | 43 8% | 48 -3% | 50.2 -8% | 42 10% | |
| Load Maximum * (dB) | 46.5 | 49 -5% | 49 -5% | 50.2 -8% | 41.9 10% | 48.5 -4% |
* ... smaller is better
Temperature
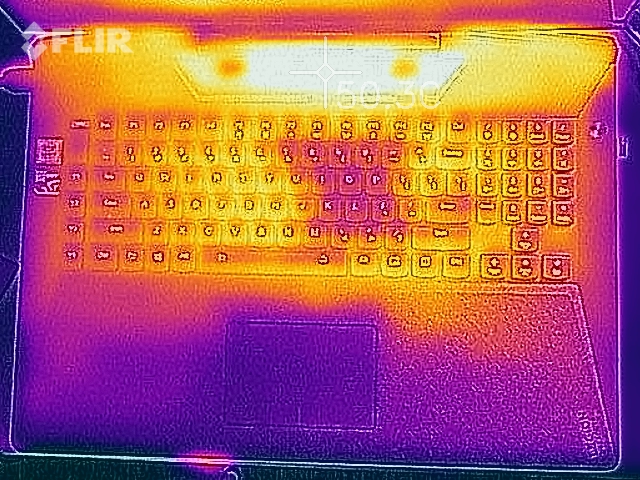
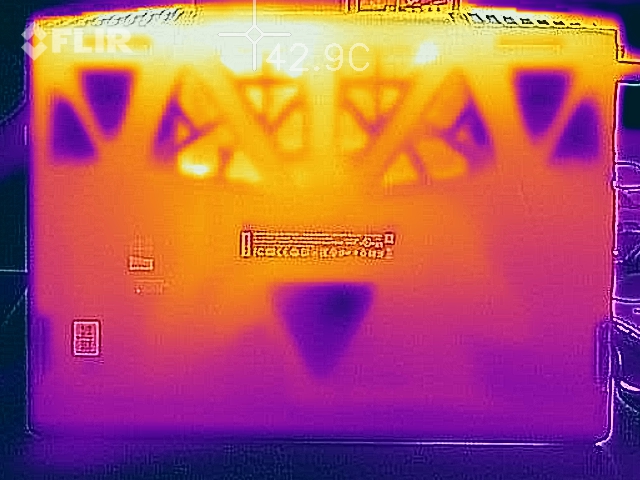
Although chip temperatures have proven themselves problematic, surface temperatures are not much of an issue for the Legion Y920. While idling, the machine is only marginally warmer than the surrounding ambient temperature; we recorded 26.3 °C and 25.8 °C on average from the top cover and underside of the machine, respectively.
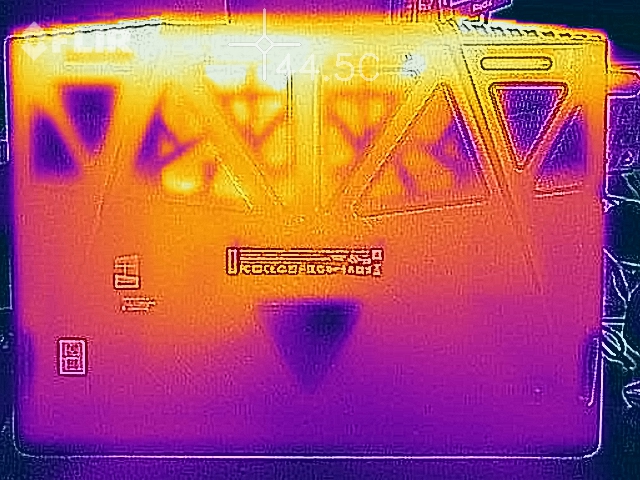
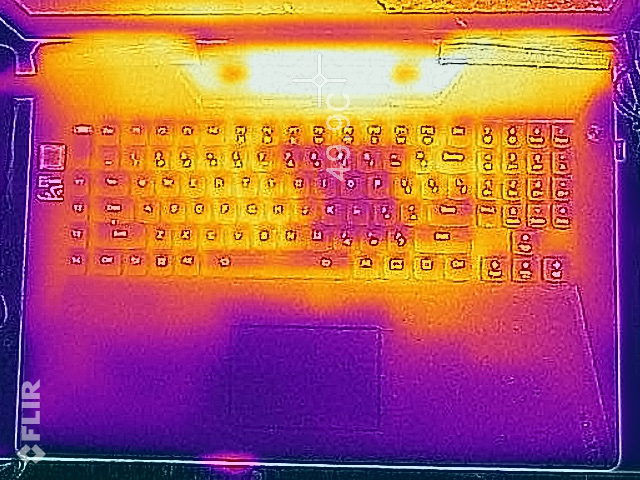
Synthetic stress and Witcher 3 stress both push the machine in to the upper 30s °C on average across the board (38 °C / 36.2 °C respectively during Witcher 3 Ultra stress). That’s still more than reasonable, however, and even the hotspot of 50 °C (upper-middle quadrant of the top cover) isn’t much of a bother seeing as it doesn’t affect the keyboard or palmrest. The latter two areas stay relatively cool even under load, with the highest keyboard temperature we measured in the center (40.6 °C) and the highest palmrest temperature on the right side of the touchpad (33.2 °C) still proving nothing worrisome. The hottest area on the bottom of the machine is the rear (“top”) three quadrants, which average around 43 °C—still hardly anything to be concerned about.
(-) The maximum temperature on the upper side is 50.8 °C / 123 F, compared to the average of 40.4 °C / 105 F, ranging from 21.2 to 68.8 °C for the class Gaming.
(±) The bottom heats up to a maximum of 42.8 °C / 109 F, compared to the average of 43.2 °C / 110 F
(+) In idle usage, the average temperature for the upper side is 26.3 °C / 79 F, compared to the device average of 33.9 °C / 93 F.
(±) Playing The Witcher 3, the average temperature for the upper side is 38 °C / 100 F, compared to the device average of 33.9 °C / 93 F.
(+) The palmrests and touchpad are reaching skin temperature as a maximum (33.2 °C / 91.8 F) and are therefore not hot.
(-) The average temperature of the palmrest area of similar devices was 28.8 °C / 83.8 F (-4.4 °C / -8 F).
Speakers
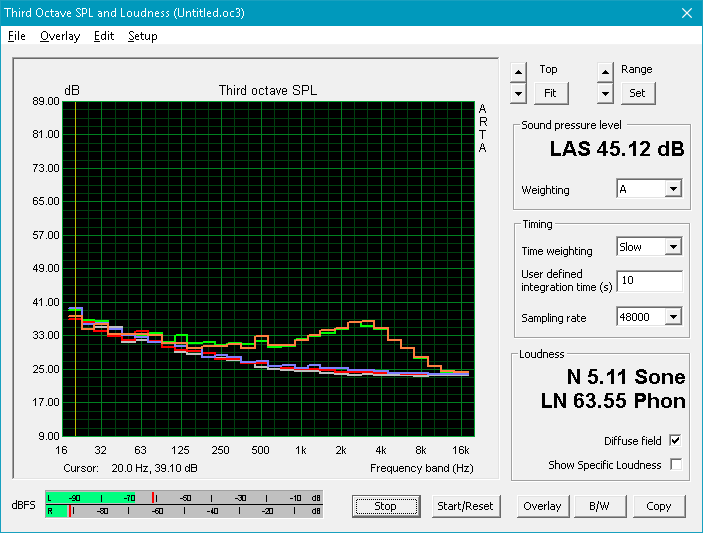
The Y920’s speakers are a pleasant surprise—though when coming from a nearly 10 lb. notebook, perhaps it’s not as much of a shock. You’ll find two 2 W speakers accompanied by a 3 W subwoofer, and that results in better bass reproduction and—happily—relatively balanced mids and highs according to our measurements. Volume levels are not particularly loud (69.67 dB on average), though some adjustment/tweaking is possible via the Dolby Atmos post-processing software.
Speaking of which, this post-processing can be automatically invoked (in the background) via the Lenovo Nerve Center application when games are detected in the foreground. This feature is enabled by default, but in case the post-processing effects prove irritating to the user, disabling it is as easy as launching Nerve Center and switching the Sound Enhancement feature off.


Lenovo Legion Y920-17IKB audio analysis
(-) | not very loud speakers (69.7 dB)
Bass 100 - 315 Hz
(±) | reduced bass - on average 5.3% lower than median
(-) | bass is not linear (15.2% delta to prev. frequency)
Mids 400 - 2000 Hz
(+) | balanced mids - only 2.4% away from median
(+) | mids are linear (5.1% delta to prev. frequency)
Highs 2 - 16 kHz
(+) | balanced highs - only 3.9% away from median
(+) | highs are linear (5.8% delta to prev. frequency)
Overall 100 - 16.000 Hz
(±) | linearity of overall sound is average (17.8% difference to median)
Compared to same class
» 53% of all tested devices in this class were better, 10% similar, 37% worse
» The best had a delta of 6%, average was 18%, worst was 132%
Compared to all devices tested
» 36% of all tested devices were better, 8% similar, 56% worse
» The best had a delta of 4%, average was 23%, worst was 134%
Lenovo Legion Y720 80VR002XGE audio analysis
(-) | not very loud speakers (70 dB)
Bass 100 - 315 Hz
(±) | reduced bass - on average 12.6% lower than median
(±) | linearity of bass is average (12.6% delta to prev. frequency)
Mids 400 - 2000 Hz
(+) | balanced mids - only 2.8% away from median
(±) | linearity of mids is average (8.9% delta to prev. frequency)
Highs 2 - 16 kHz
(+) | balanced highs - only 3.5% away from median
(+) | highs are linear (4.5% delta to prev. frequency)
Overall 100 - 16.000 Hz
(+) | overall sound is linear (13.9% difference to median)
Compared to same class
» 22% of all tested devices in this class were better, 7% similar, 71% worse
» The best had a delta of 6%, average was 18%, worst was 132%
Compared to all devices tested
» 16% of all tested devices were better, 4% similar, 80% worse
» The best had a delta of 4%, average was 23%, worst was 134%
Frequency Comparison (Checkbox selectable!)
Graph 1: Pink Noise 100% Vol.; Graph 2: Audio off
Energy Management
Power Consumption
The Y920 is a fairly power-hungry machine thanks to its 17.3-inch IPS G-Sync display and high-end CPU and GPU. We measured an idle average of 30.9 W, which is nearly 3 times the 10.9 W of the Legion Y720 and higher than all other competitors apart from the GTX 1080-equipped, WQHD-rocking Alienware 17 R4 (37.6 W). Under load, we measured an average of 87.4 W and a maximum of 201.5 W; Witcher 3 stress brought the average up to around 182.02 W, which is probably indicative of what we’d see during a typical heavy gaming session.
| Off / Standby | |
| Idle | |
| Load |
|
Key:
min: | |
| Lenovo Legion Y920-17IKB i7-7820HK, GeForce GTX 1070 Mobile, Samsung SM961 MZVKW512HMJP m.2 PCI-e, IPS, 1920x1080, 17.3" | Asus G752VS-BA338T i7-7700HQ, GeForce GTX 1070 Mobile, Samsung SM961 MZVKW512HMJP m.2 PCI-e, IPS, 1920x1080, 17.3" | Alienware 17 R4 i7-7820HK, GeForce GTX 1080 Mobile, SK Hynix PC300 NVMe 512 GB, TN LED, 2560x1440, 17.3" | Lenovo Legion Y720 80VR002XGE i7-7700HQ, GeForce GTX 1060 Mobile, Samsung PM961 MZVLW256HEHP, IPS, 1920x1080, 15.6" | Lenovo IdeaPad Y900 6820HK, GeForce GTX 980M, Samsung SM951 MZVPV256 m.2, , 1920x1080, 17.3" | |
|---|---|---|---|---|---|
| Power Consumption | 9% | -24% | 49% | 3% | |
| Idle Minimum * (Watt) | 29.4 | 21 29% | 37.5 -28% | 8 73% | 24.3 17% |
| Idle Average * (Watt) | 30.9 | 27 13% | 37.6 -22% | 10.9 65% | 29.6 4% |
| Idle Maximum * (Watt) | 31.9 | 32 -0% | 37.6 -18% | 11.8 63% | 29.9 6% |
| Load Average * (Watt) | 87.4 | 86 2% | 122.4 -40% | 70 20% | 110.1 -26% |
| Witcher 3 ultra * (Watt) | 182 | 165 9% | 180.3 1% | 102 44% | |
| Load Maximum * (Watt) | 201.5 | 206 -2% | 277.4 -38% | 148 27% | 171.4 15% |
* ... smaller is better
Battery Life
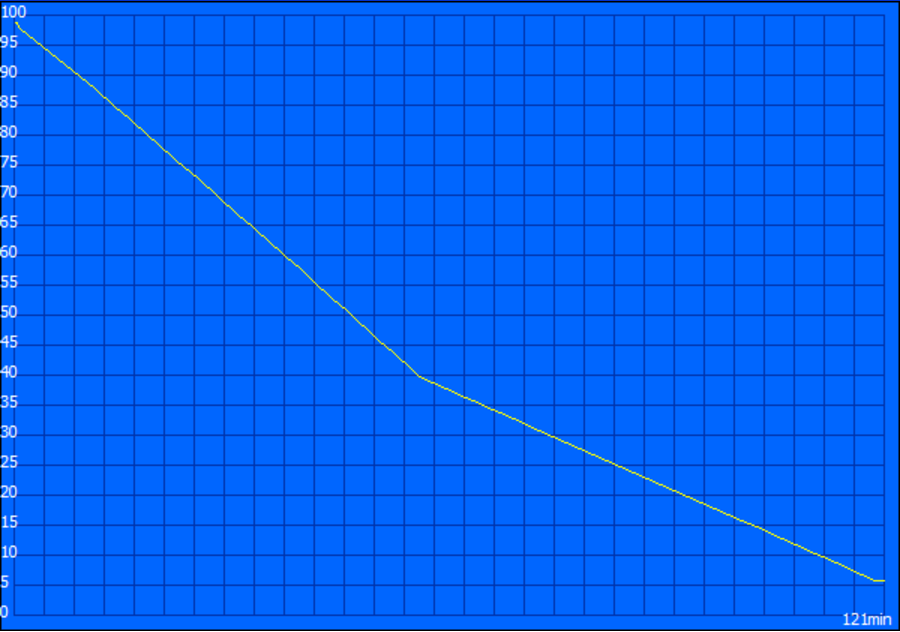
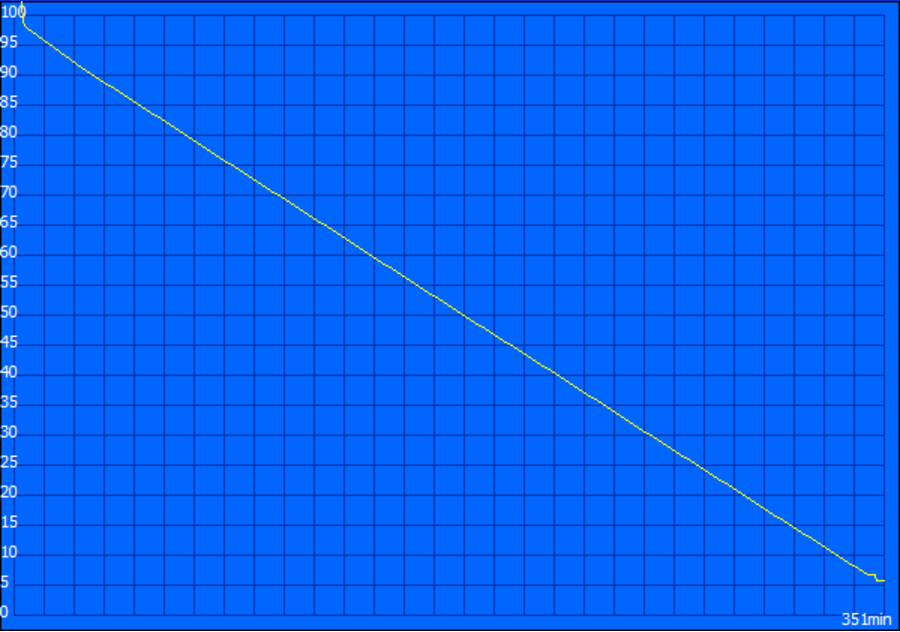
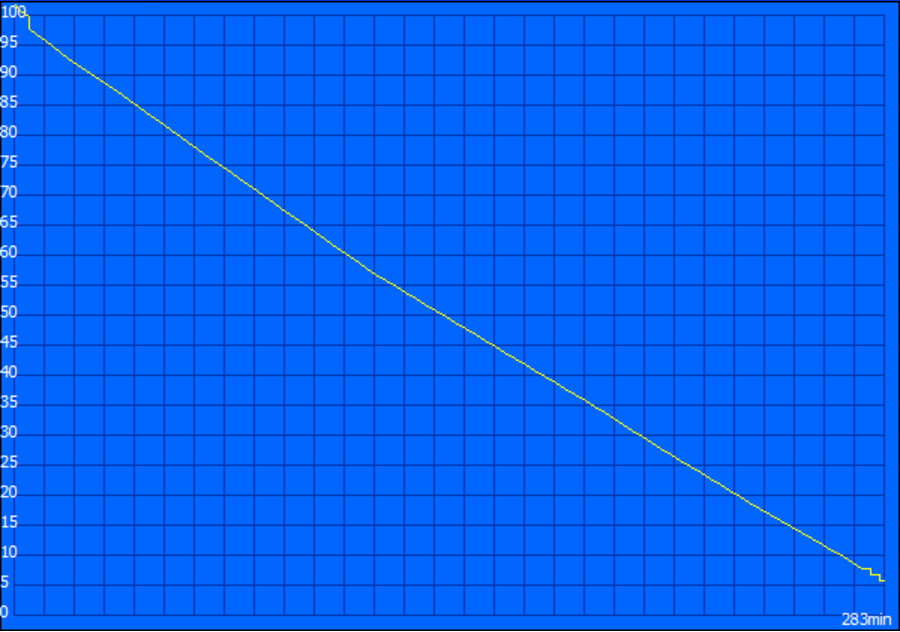
It shouldn’t come as much of a surprise that the Legion Y920 isn’t meant for long runtimes while operating unplugged, but then again, that really isn’t what most gamers care about. Under load, the laptop lasted for just over two hours, while web surfing at around 150 cd/m² lasted for 4 hours and 43 minutes total. That’s not terrible for a high-end gaming PC, but again, the likelihood of this thing making frequent trips out of the house is not very high given its unwieldy size and weight and its need for AC power for true gaming performance. Compared with its peers, this is right around what we’d expect to see from a 90 Wh battery paired with these components.
Please also note the odd change in slope in the Classic Test graph. Because of this, we actually ran this battery test twice, but the result was exactly the same both times, so it ought to be accurate regardless of the cause.
| Lenovo Legion Y920-17IKB i7-7820HK, GeForce GTX 1070 Mobile, 90 Wh | Asus G752VS-BA338T i7-7700HQ, GeForce GTX 1070 Mobile, 90 Wh | MSI GS43VR 7RE-069US i7-7700HQ, GeForce GTX 1060 Mobile, 61 Wh | Gigabyte P56XT i7-7700HQ, GeForce GTX 1070 Mobile, 91.2 Wh | HP Omen 15-ce002ng i7-7700HQ, GeForce GTX 1060 Max-Q, 70 Wh | Alienware 17 R4 i7-7820HK, GeForce GTX 1080 Mobile, 99 Wh | Lenovo Legion Y720 80VR002XGE i7-7700HQ, GeForce GTX 1060 Mobile, 60 Wh | Lenovo IdeaPad Y900 6820HK, GeForce GTX 980M, 90 Wh | |
|---|---|---|---|---|---|---|---|---|
| Battery runtime | 3% | -7% | 32% | -31% | -33% | 31% | 0% | |
| Reader / Idle (h) | 5.9 | 7.4 25% | 9 53% | 9.5 61% | 4.3 -27% | 4.6 -22% | 11.8 100% | 5.8 -2% |
| WiFi v1.3 (h) | 4.7 | 4.9 4% | 2.9 -38% | 6.4 36% | 3.3 -30% | 3 -36% | 6.3 34% | 4.1 -13% |
| Load (h) | 2 | 1.6 -20% | 1.3 -35% | 2 0% | 1.3 -35% | 1.2 -40% | 1.2 -40% | 2.3 15% |
Pros
Cons
Verdict
The $2,299 MSRP Lenovo Legion Y920 is a bonafide desktop replacement, meant for serious gaming and equipped correspondingly. Everything from the overclockable Core i7-7820HK CPU and GTX 1070 GPU to the blazing Samsung NVMe SSD and 17.3-inch IPS G-SYNC display panel fit the profile and position the Y920 for direct competition with some of the biggest behemoths of the market.
To that end, we find high-level GPU performance which—while below the median slightly for the GTX 1070—is still incredibly fast overall, along with excellent general system performance. Noise levels are noticeable yet never terribly bothersome, case temperatures are surprisingly comfortable, and the included Lenovo Nerve Center software package allows for easy tweaking of related parameters such as fan speeds and automatic overclocking. Finally, build quality is top-notch, with the combination of ABS plastic and aluminum fitting together very nicely and forming both an attractive and haptically-pleasing package.
The Legion Y920’s primary shortfalls, meanwhile, are found in the categories of sustained CPU performance (thanks to extremely high chip temperatures under multi-core load) and input devices. With regard to the former, while the Core i7-7820HK impresses on paper, the Y920 was unable to match the level of turbo performance in our testing that the Alienware 17 R4 achieved (4.0 GHz permanently under load) thanks to unchecked temperatures that quickly extended into the 90s C. This suggests that a configuration equipped with the Core i7-7700HQ would represent both a better value and a more stable performer in multi-core applications. As for the input devices, the clickpad’s integrated buttons can be a bother, and the mechanical keyboard—while certainly a defining feature—possesses a unique and unorthodox sort of feedback (as well as loose, clattery keys) that absolutely will require a trial period and some serious adjustment. It may even be a deal-breaker for some users; we personally prefer the conventional Lenovo AccuType keyboard.
Forgiving the disappointing CPU performance and the unconventional mechanical keyboard, there really isn’t much else major to criticize about the Y920. It’s huge, heavy, and self-assured in its styling, but it’s exactly what we’d expect to see from a modern 17.3-inch gaming machine.
As for the Turbo Mode slider, we found few reasons ever to leave it disabled, and we discovered that performance while enabled, though marginally higher, was still not necessarily any better than that of similarly-equipped competitors. It seems somewhat gimmicky in that regard, but we suppose having the option is always superior to the alternative.
So, forgiving the disappointing CPU performance and the unconventional mechanical keyboard, there really isn’t much else major to criticize about the Y920. It’s huge, heavy, and self-assured in its styling, but it’s exactly what we’d expect to see from a modern 17.3-inch gaming machine. It’s fundamentally superior to the Y900 that precedes it, and it resides in the company of the Alienware 17 R4 and Asus ROG GL752VS with similar performance and pricing. Those in the market for a solid GTX 1070-equipped desktop replacement should at least give it a serious look (and play around with the keyboard if possible) before settling on a purchase.
Lenovo Legion Y920-17IKB
- 08/16/2017 v6 (old)
Steve Schardein
Price comparison
