MSI GS43VR 7RE (i7-7700HQ, GTX 1060) Laptop Review
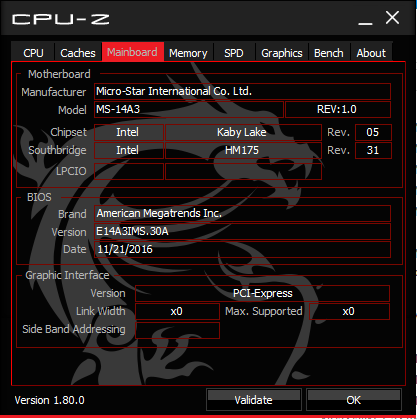
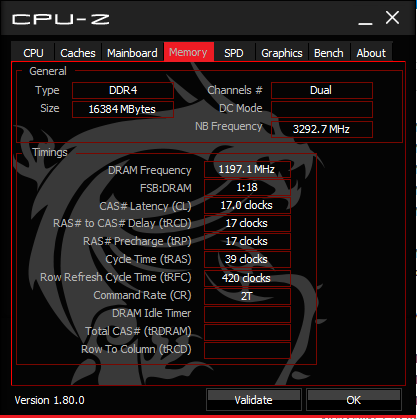
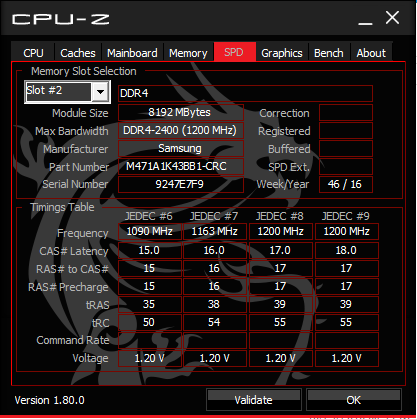
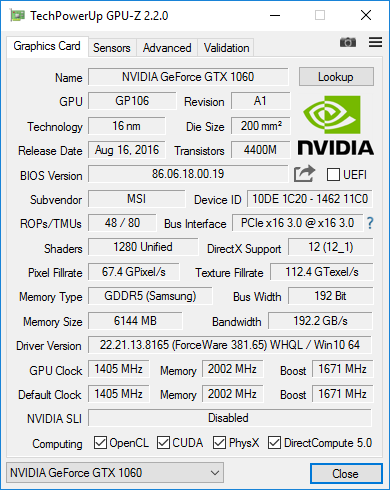
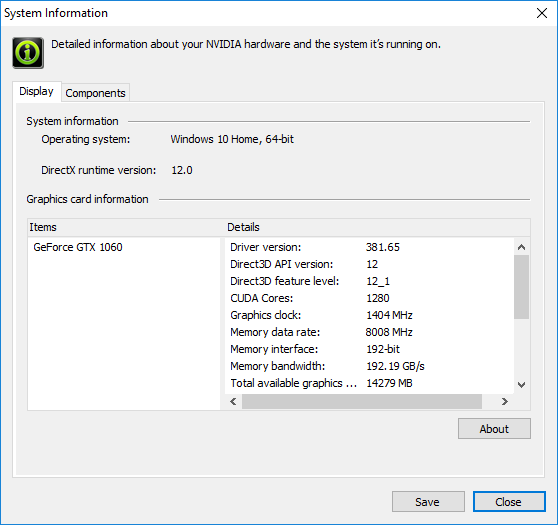
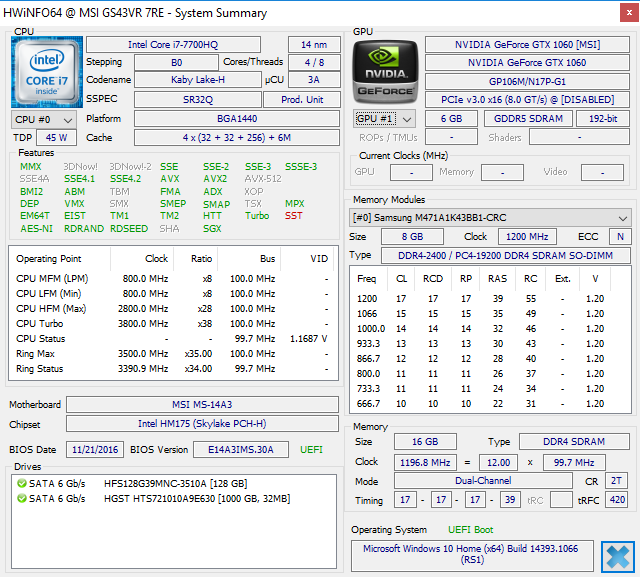
MSI has silently updated last year's Skylake GS43VR 6RE to the newer Kaby Lake GS43VR 7RE without much of a fanfare. Aside from the CPU (i7-6700HQ to i7-7700HQ) and motherboard chipset (HM170 to HM175) changes, the GS43VR 7RE is exactly the same chassis and notebook as last year's model. Users can expect a GTX 1060 GPU (with either 3 GB or 6 GB of GDDR5 VRAM), 16 GB to 32 GB of DDR4 RAM, matte 1080p IPS display, and dual storage bays without any other major configuration options.
This update review will focus more on the performance side and what benefits, if any, the Kaby Lake update has brought to the table. We recommend checking out our existing review on the GS43VR 6RE for more information on chassis quality, display, keyboard, and other hardware features as they all still apply here. The super-small and high-performance GS43VR series has only a few direct competitors in this size category including the new Razer Blade, Gigabyte Aero 14, Aorus X3 Plus, Alienware 13, and the Clevo P641HK.
Case
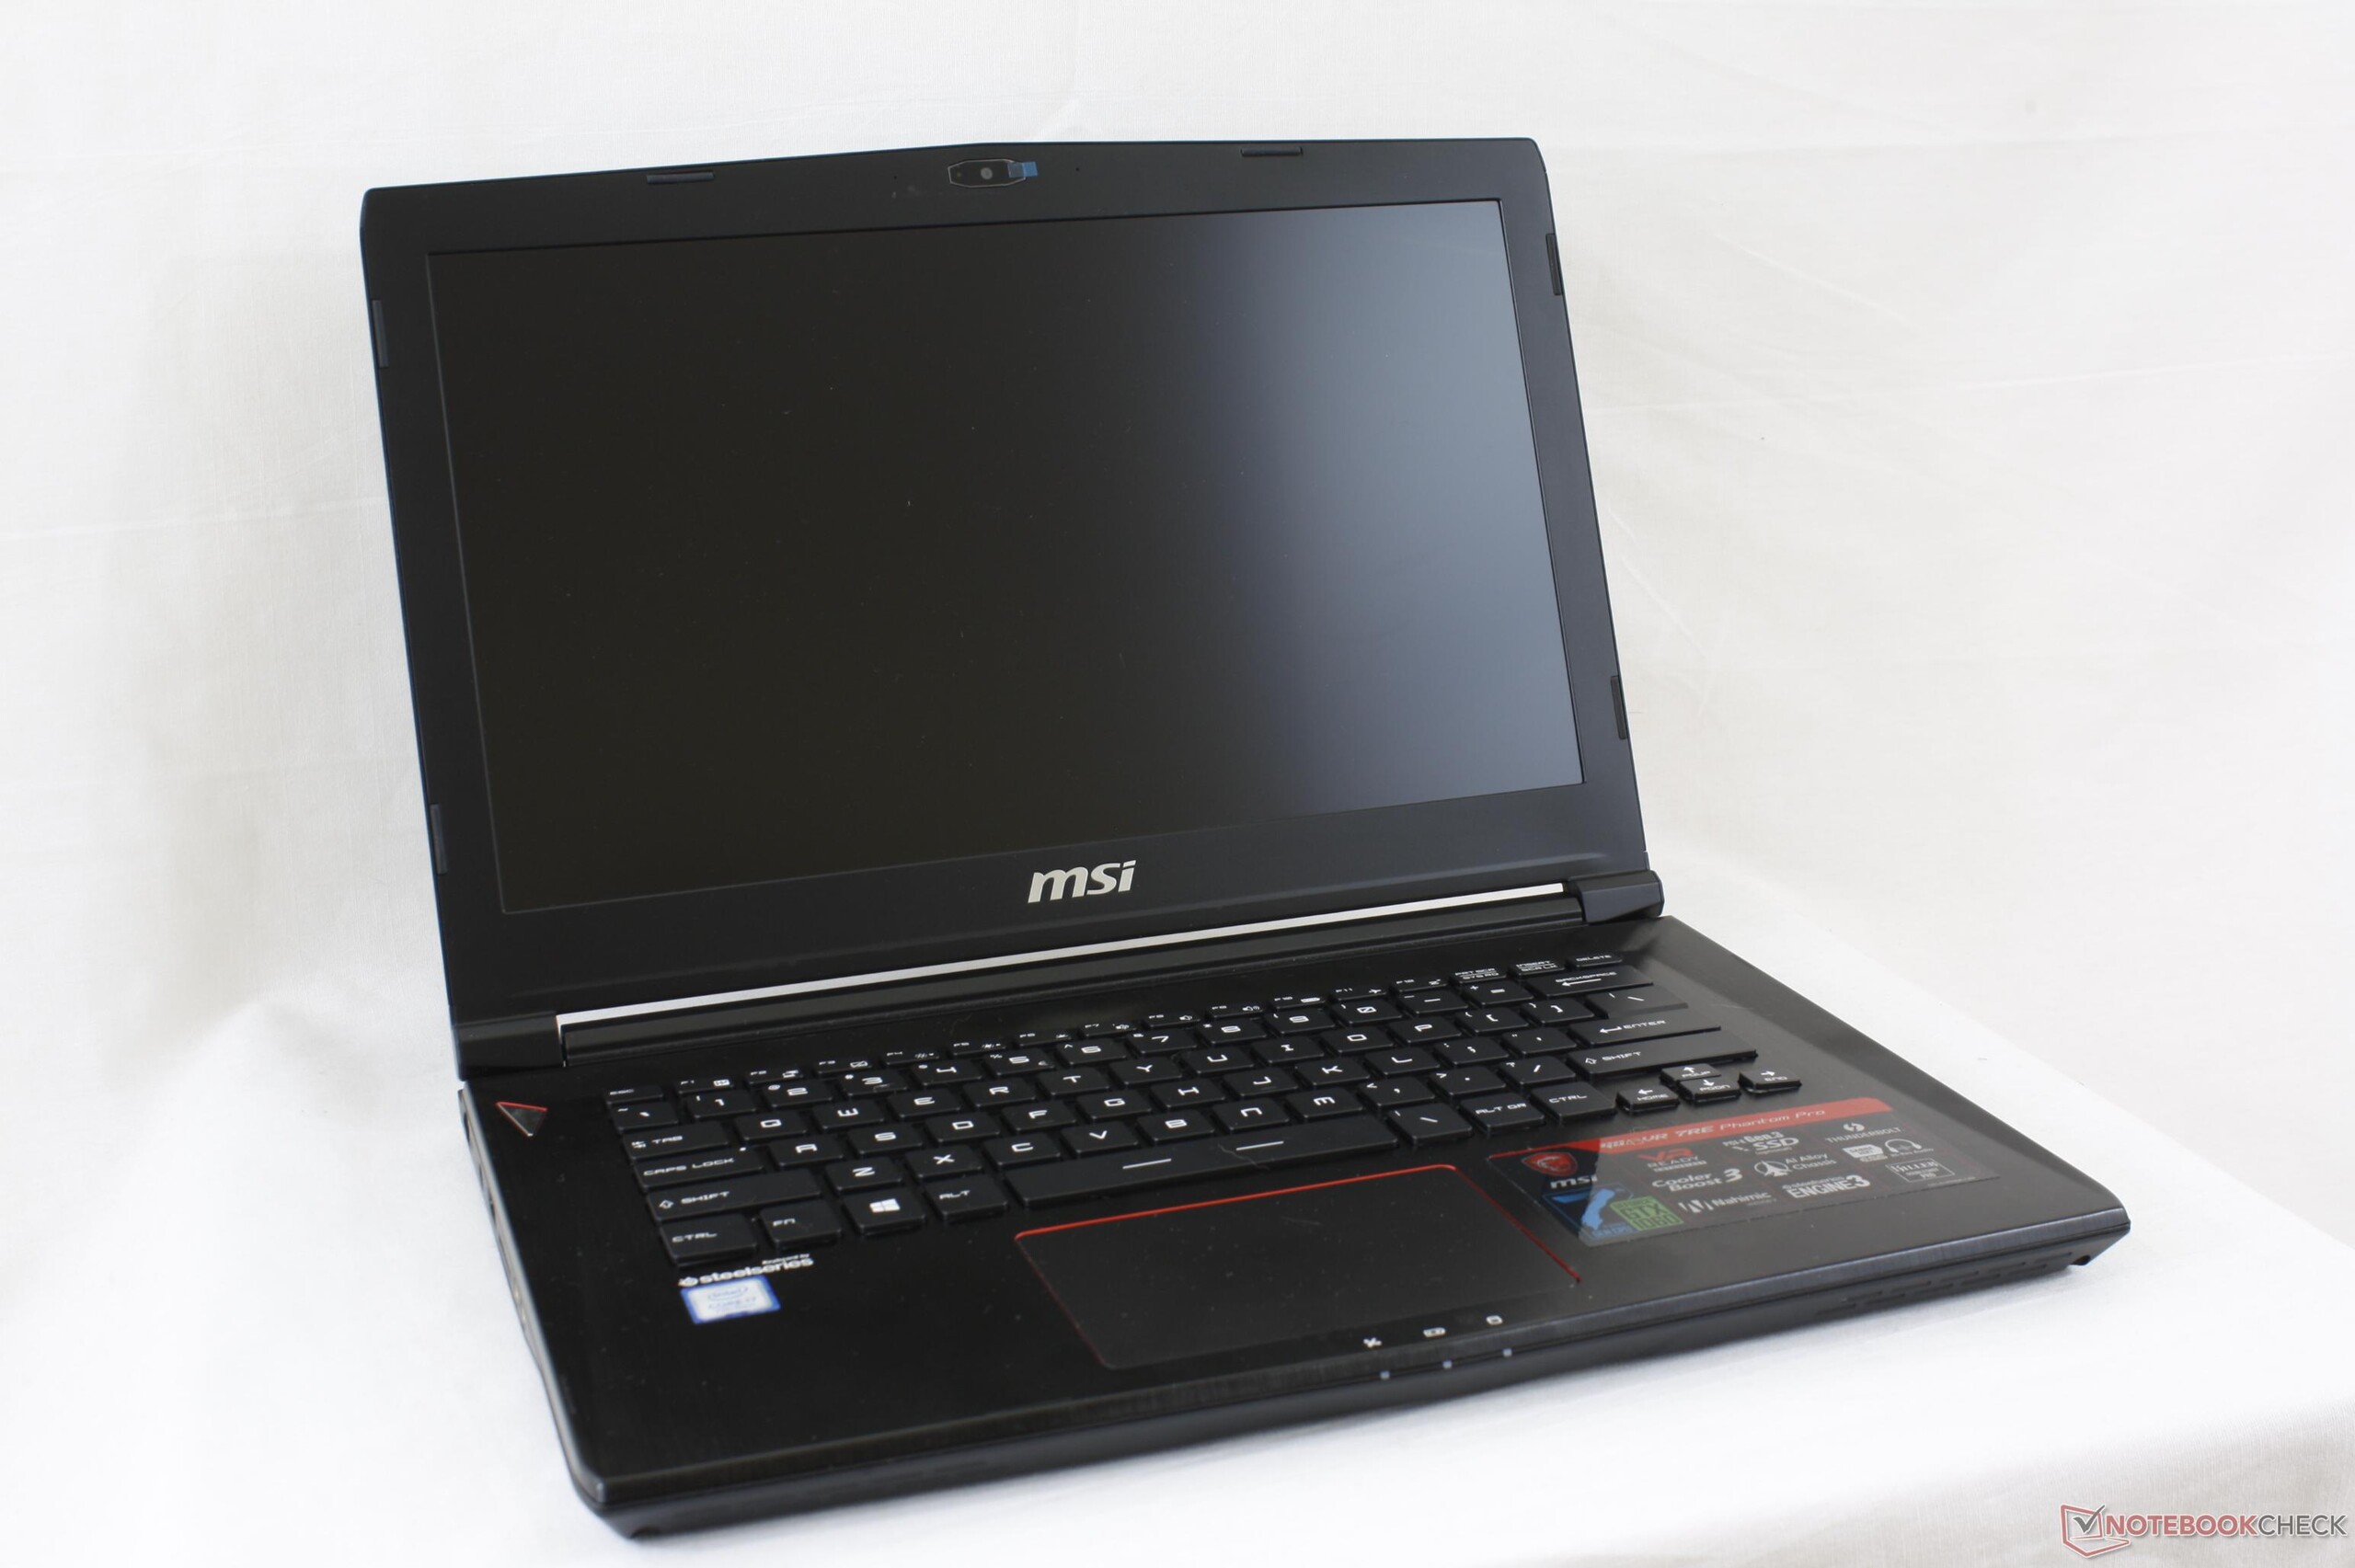
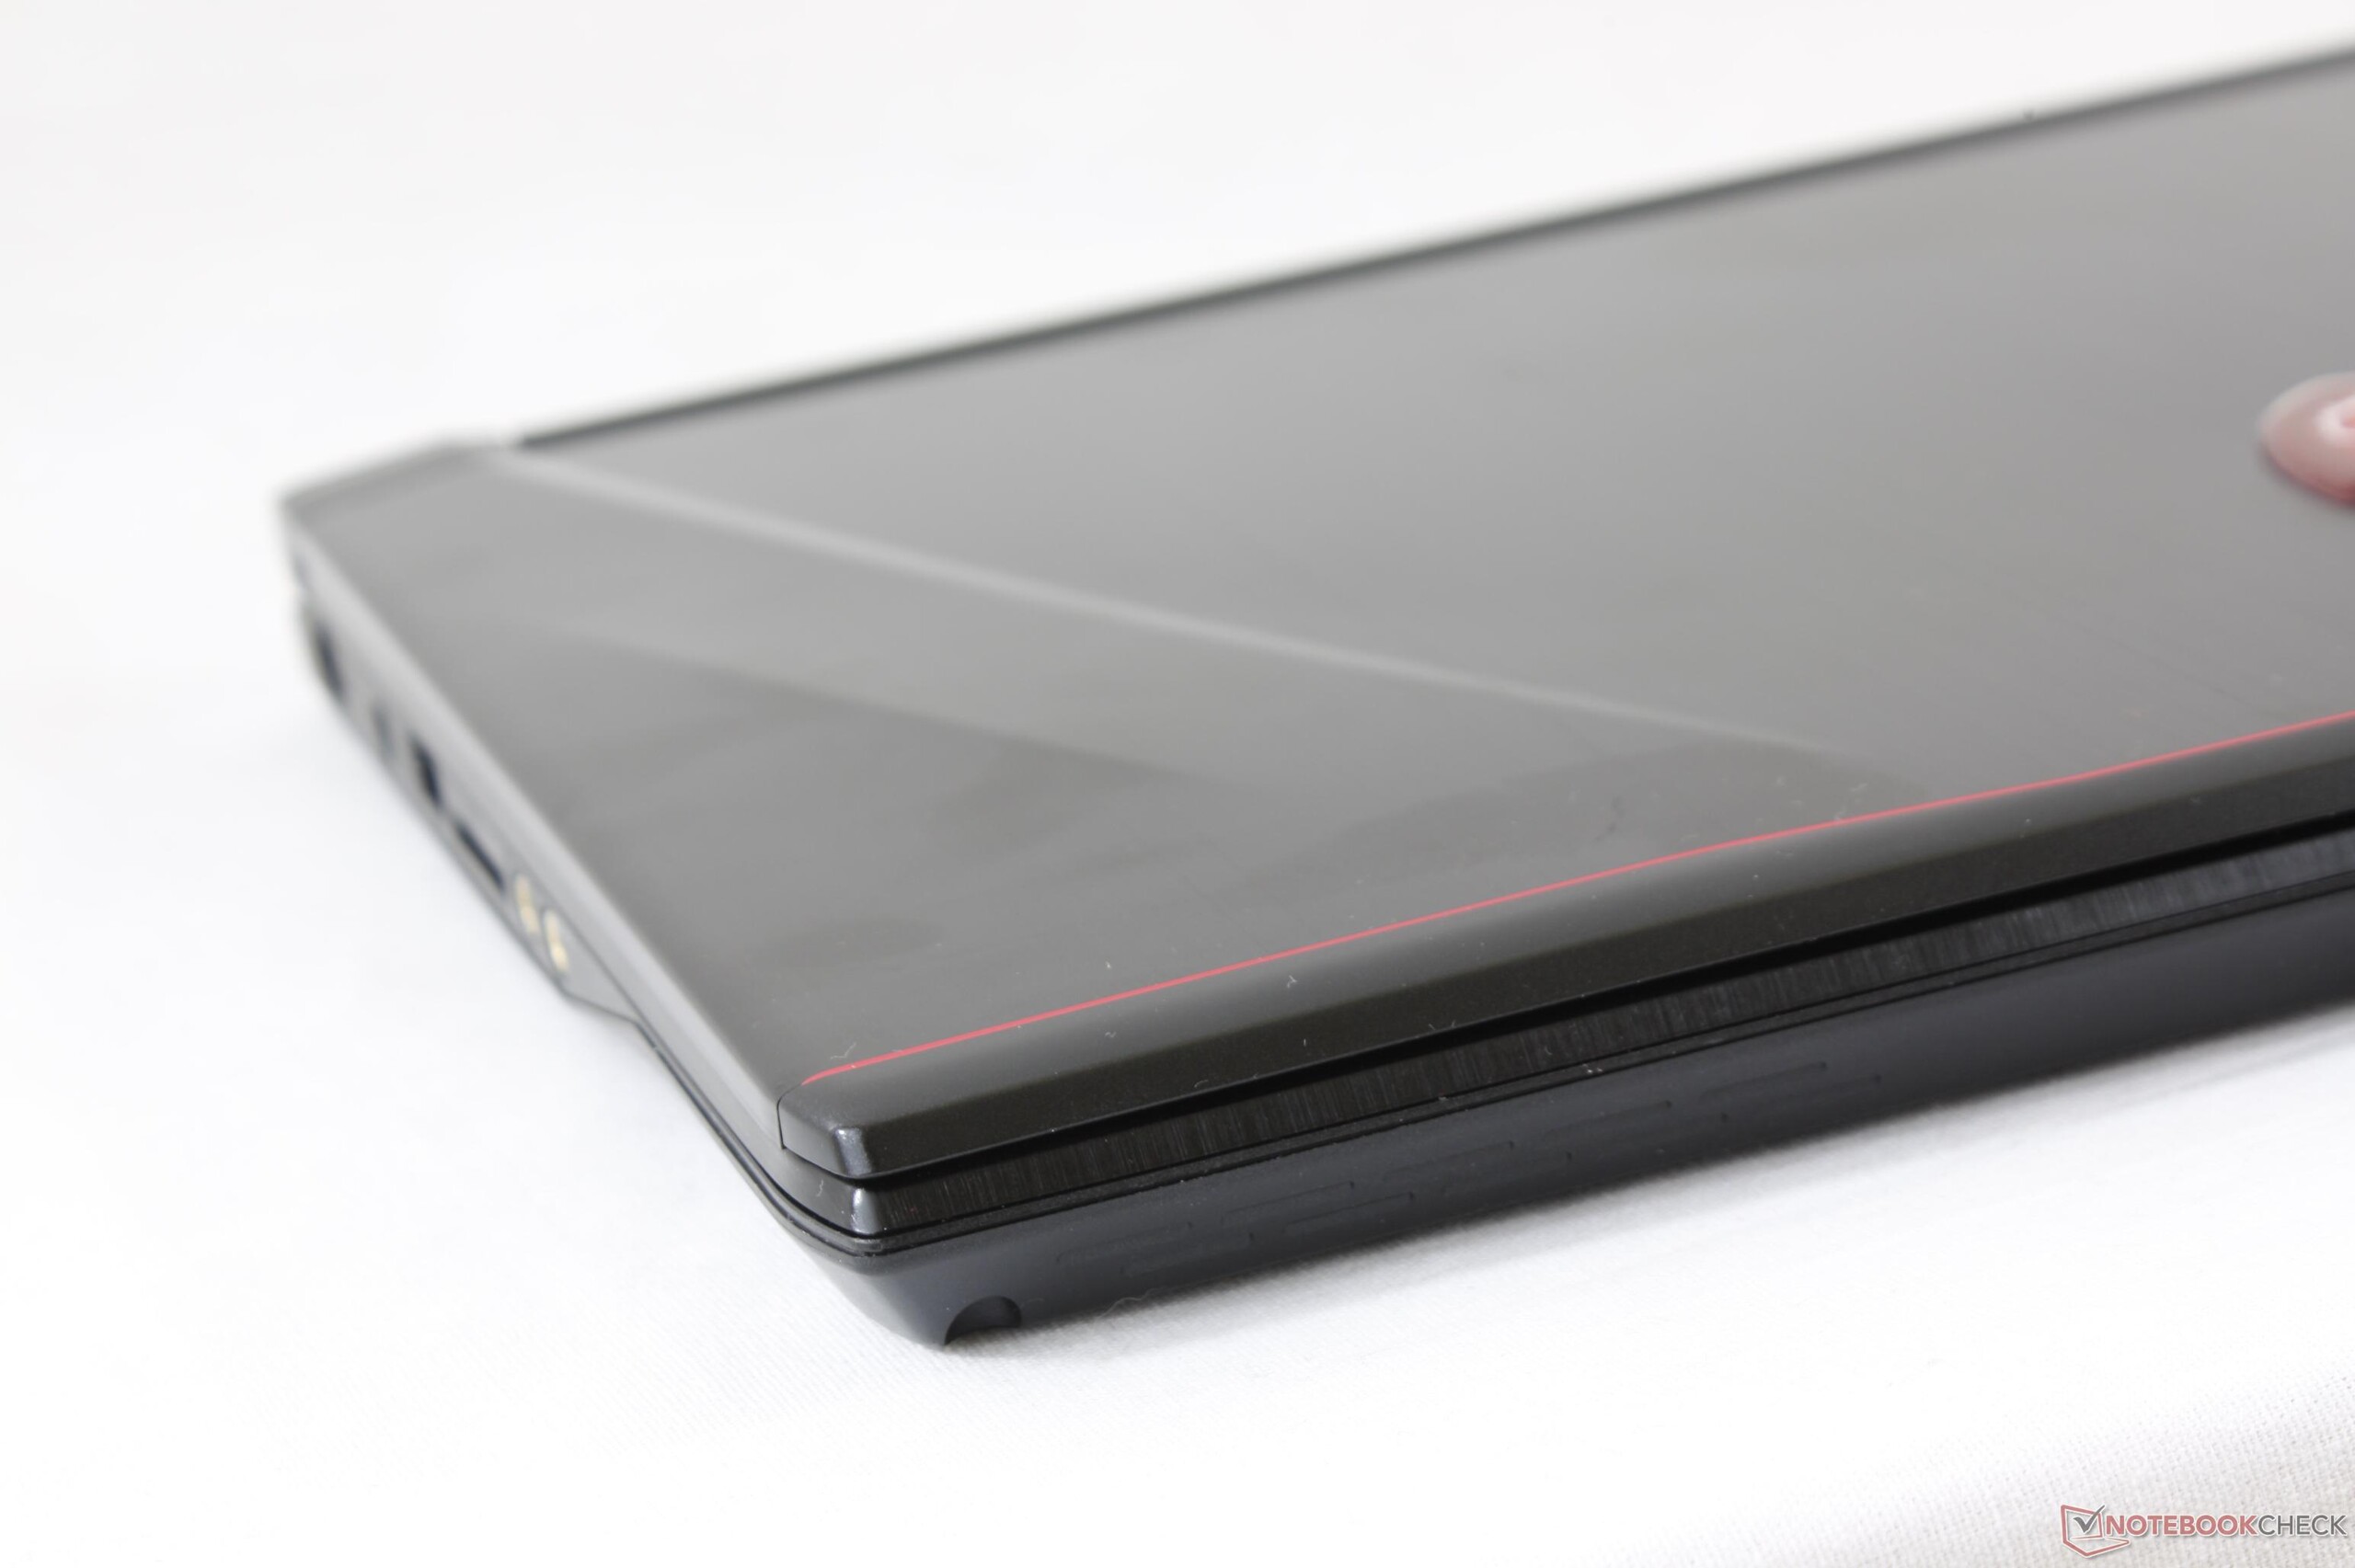
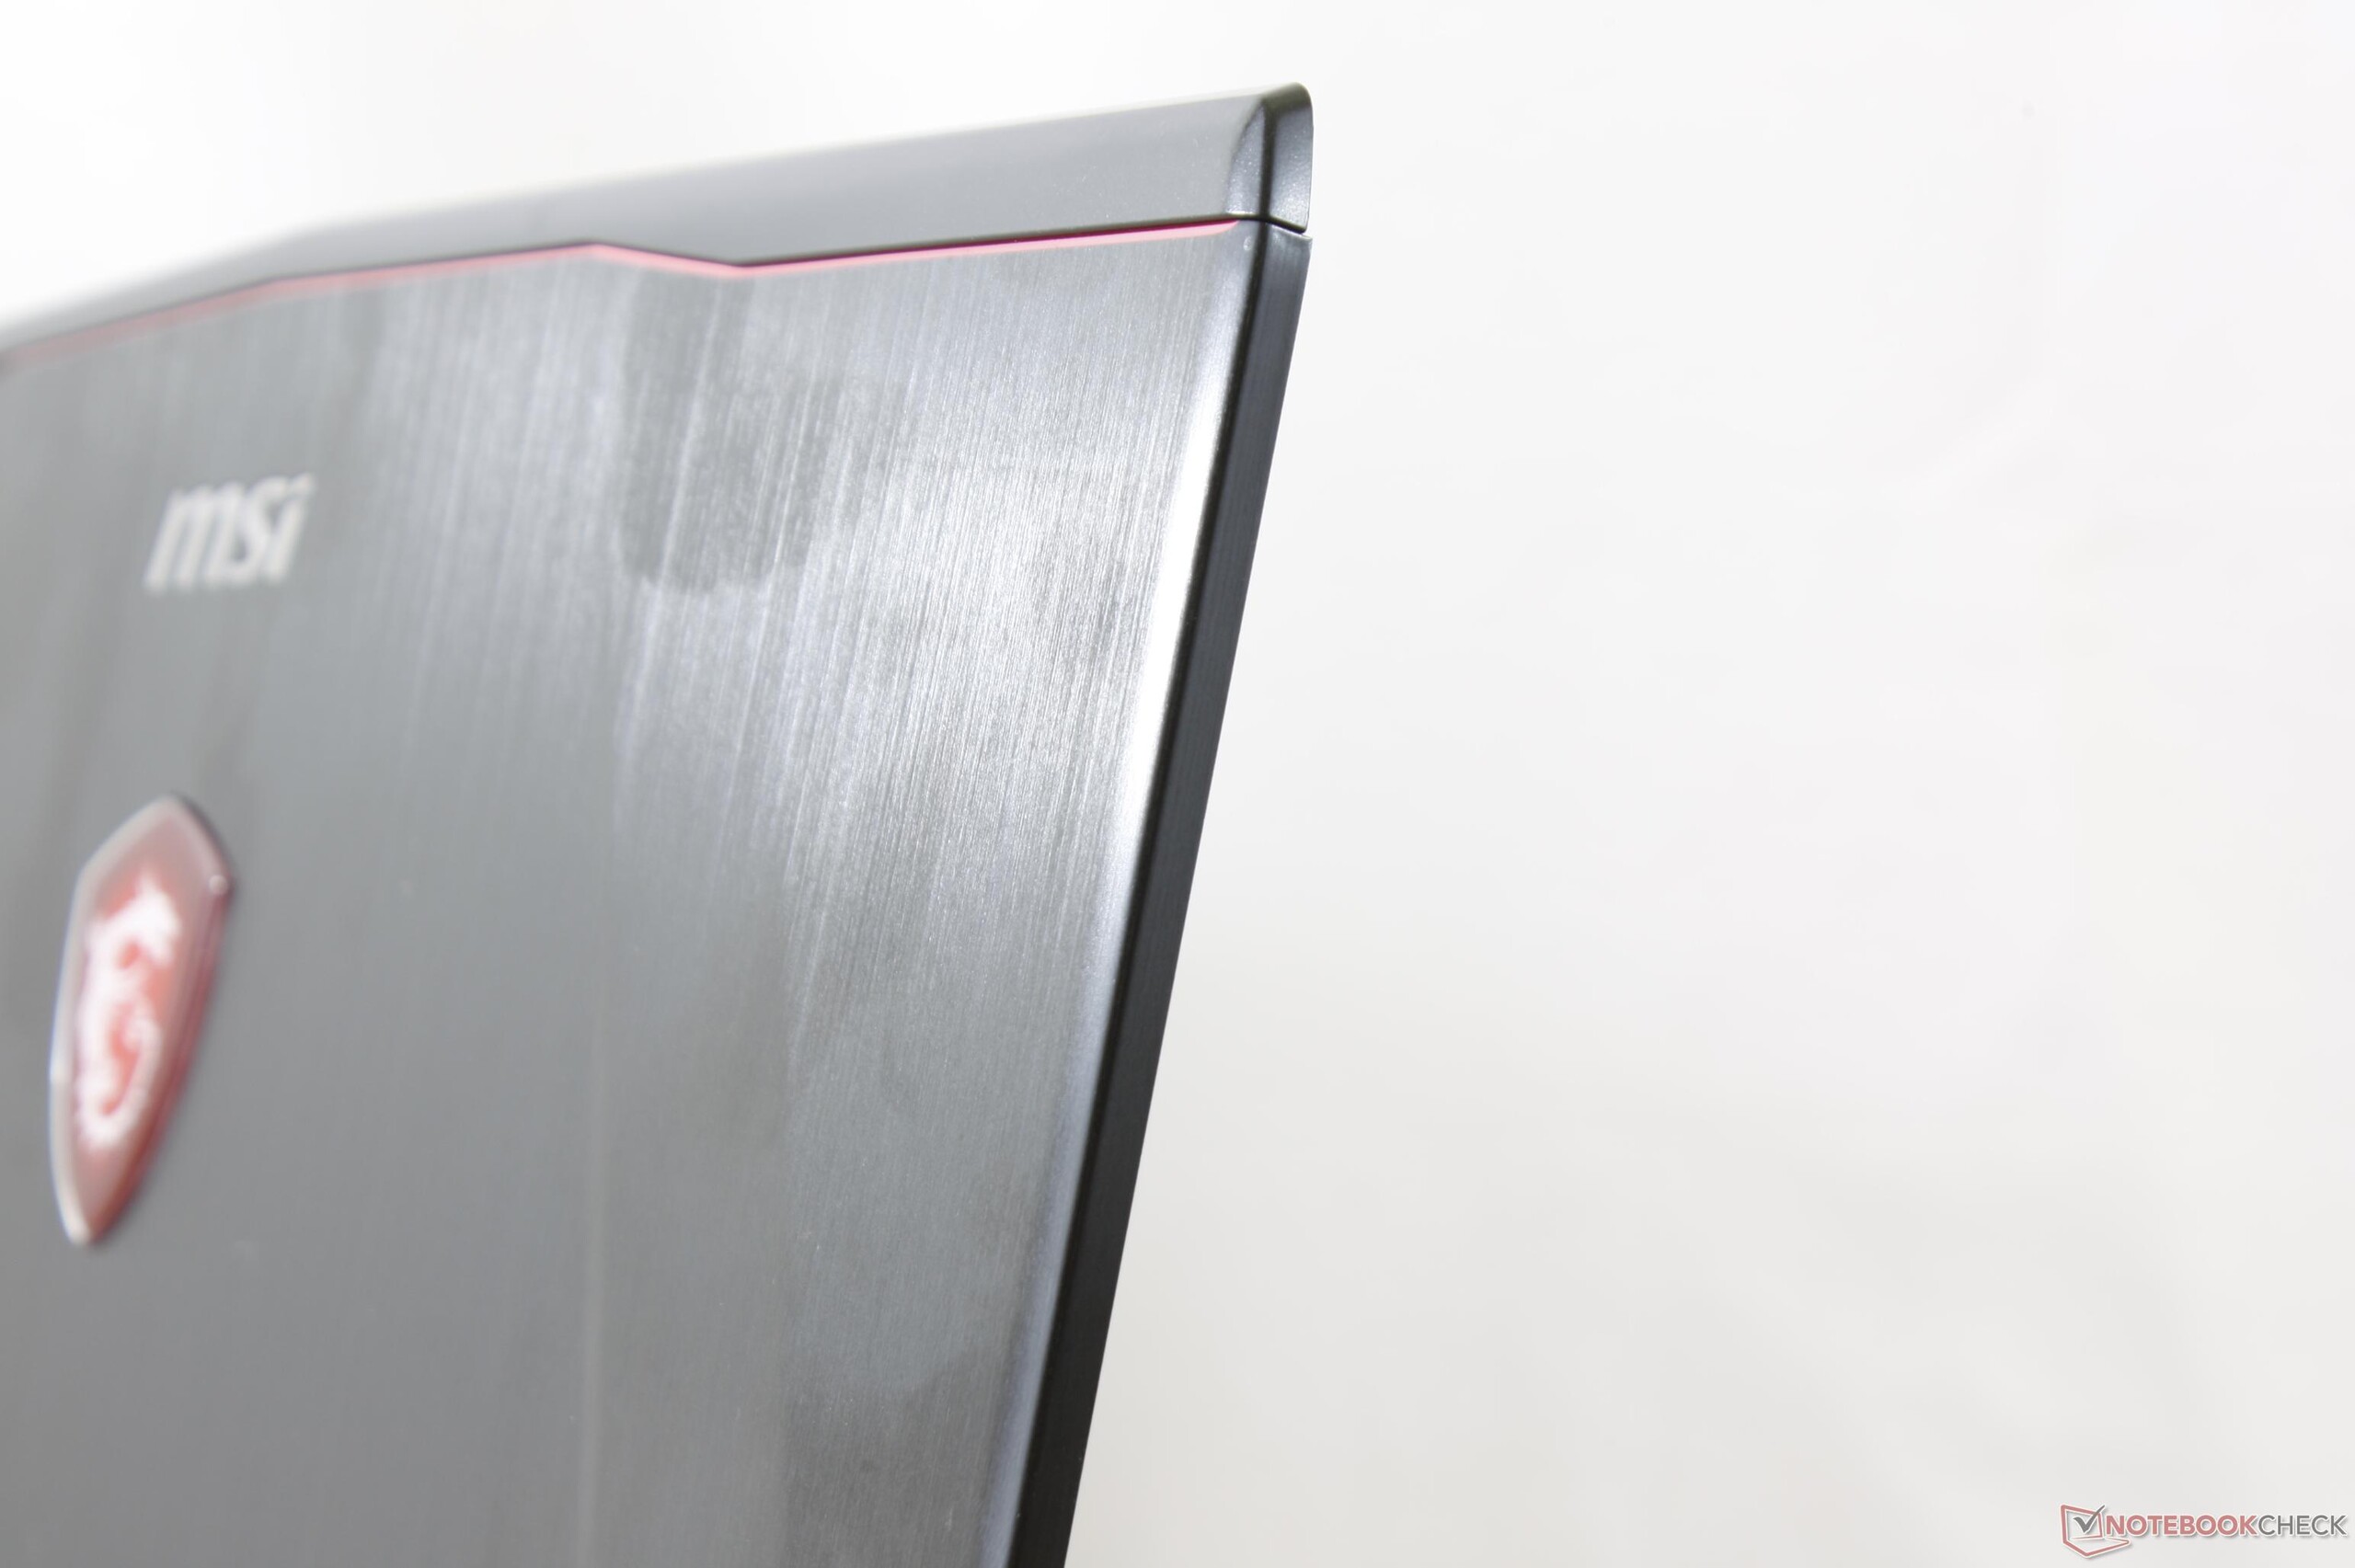
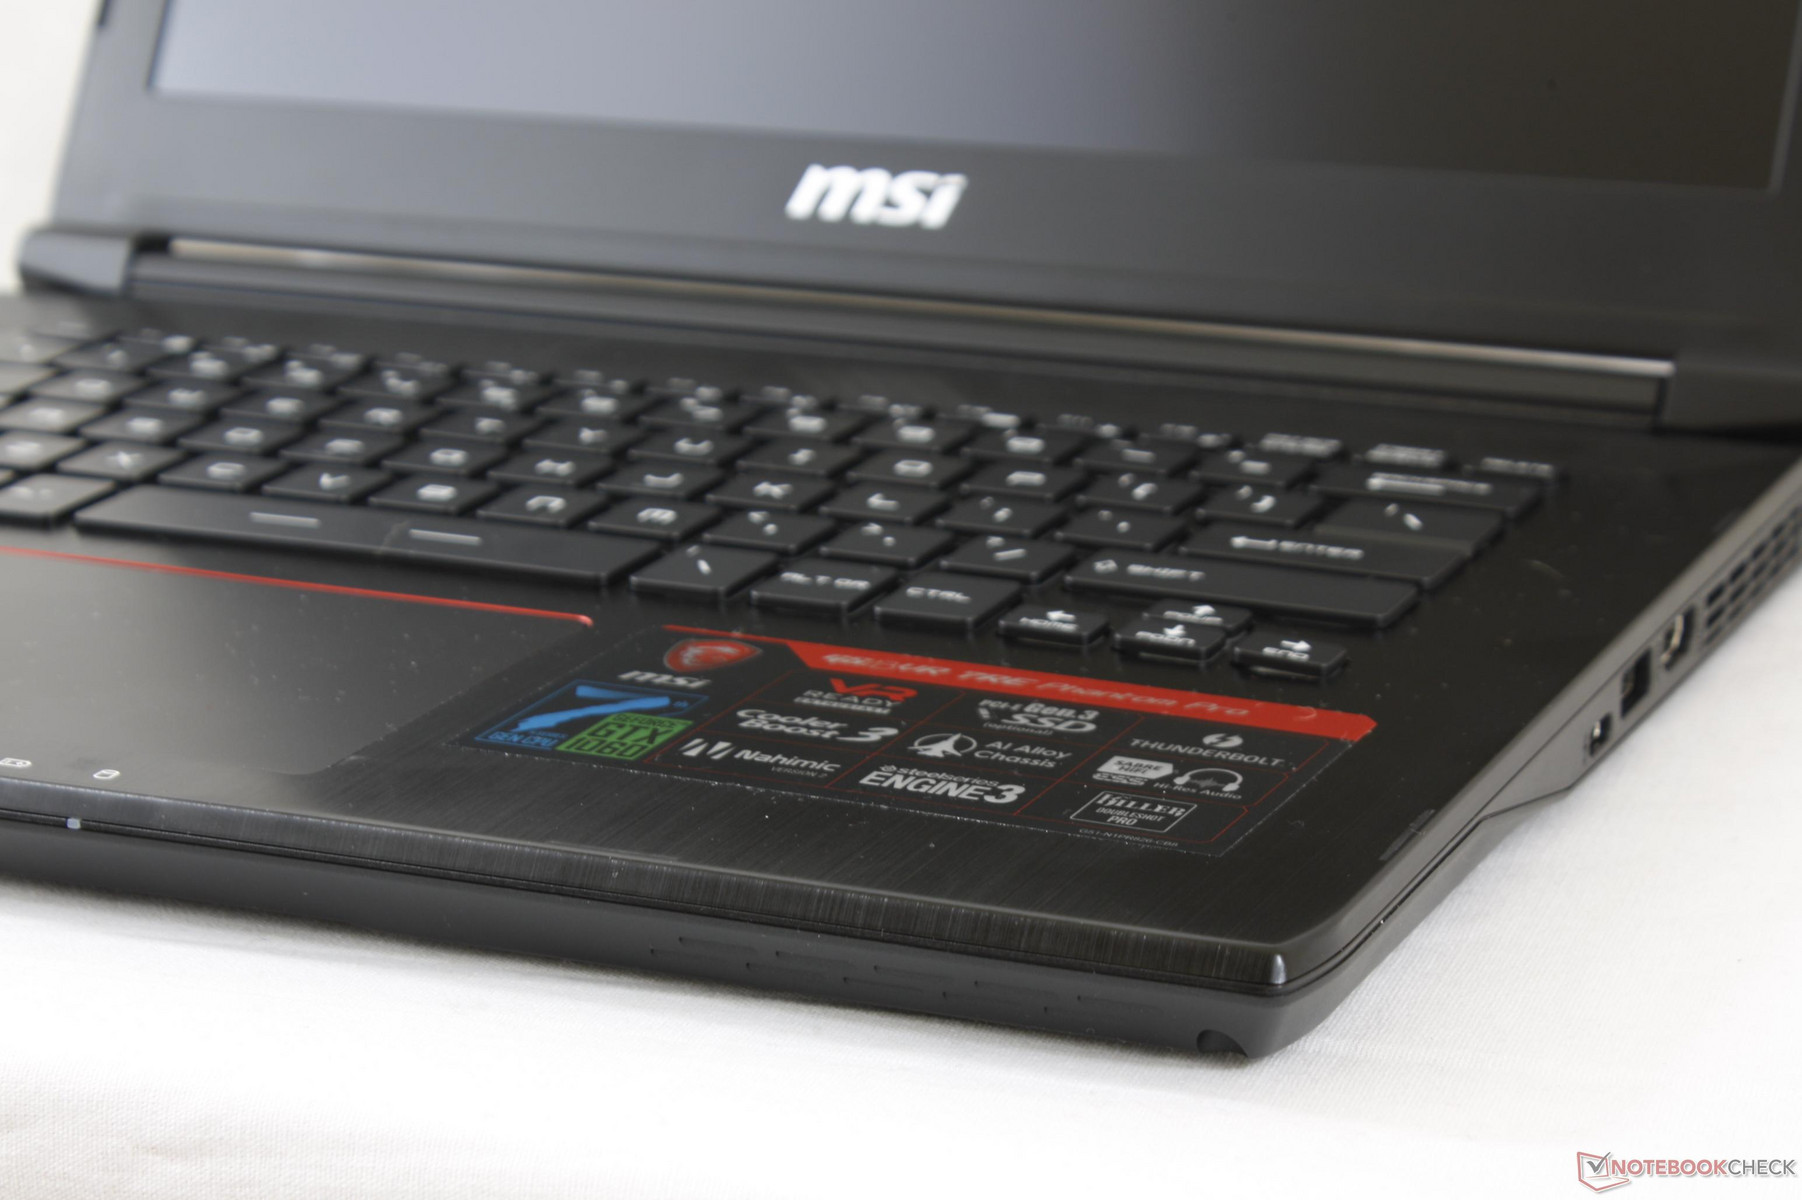
The brushed aluminum alloy chassis mimics the style of the larger GT series with a subdued design that's a comfortable middle-ground between the minimalist Razer Blade and showy Aorus X3. While the system looks great, it's not nearly as rigid or unyielding as the Razer equivalent. There is noticeably more flexing around the lid, keyboard, and palm rests with minor creaking when attempting to twist the base. The hinges, while satisfactory, are not as firm and feel slightly weaker when opened close to the maximum angle. This isn't to say that overall quality is bad, but the manufacturer still has a long way to go before matching the tougher and more solid feel of the Razer or Alienware. To MSI's credit, the lid is at least better than on the very flexible Aorus X3.
Construction quality is excellent from top to bottom with no unintended gaps between materials on our test unit. The GS43VR is far from being a unibody design and so checking for imperfections around the edges and ventilation grilles is a must.


Perhaps coincidentally, all the well-known 14-inch gaming notebooks weigh about the same in the 1.8 to 1.9 kg range including the GS43VR, Razer Blade, Aero 14, and Aorus X3. The MSI is about 2 mm and 4 mm thicker than the Aero 14 and Razer Blade, respectively, and with a slightly larger footprint than both as well for a less denser feel. Even so, there's no denying the extreme portability and performance-per-pound of a 14-inch notebook with GTX 1060 graphics.
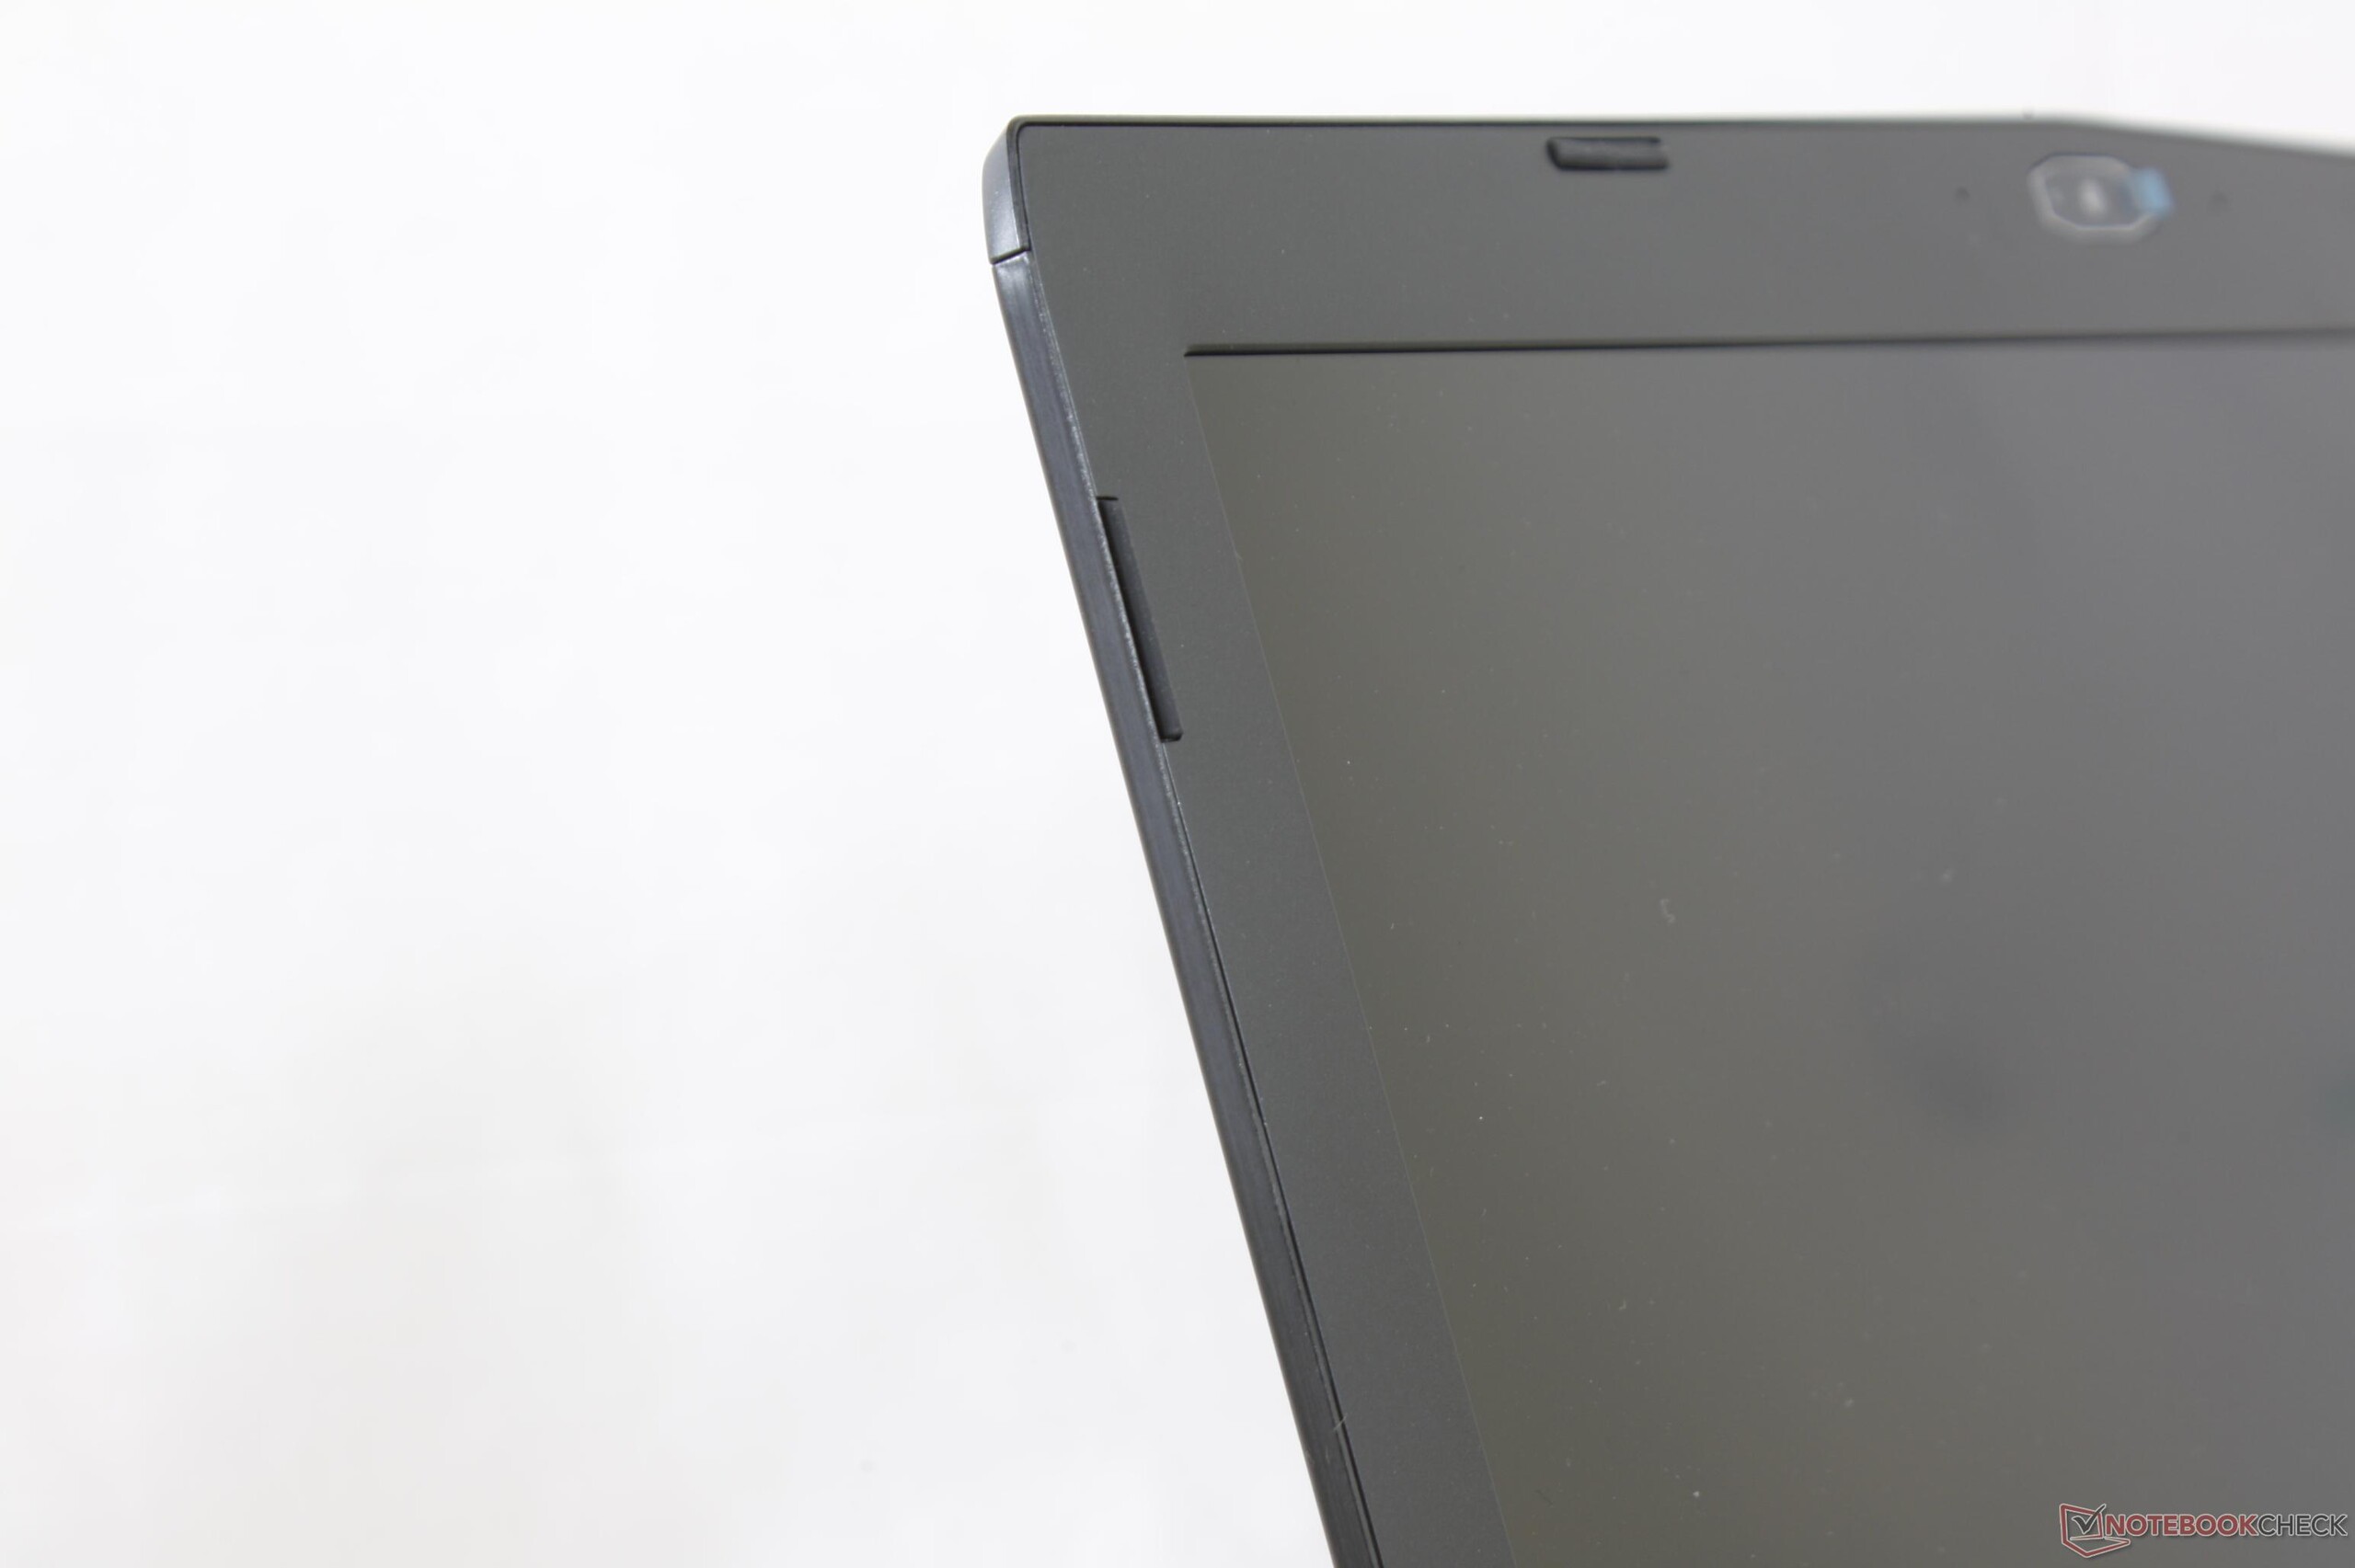
It's worth mentioning that the display bezels of the GS43VR are quite thick. For example, the length and width of the MSI are almost identical to the MacBook Pro 15 even though the latter incorporates a larger 15.4-inch screen.
Connectivity

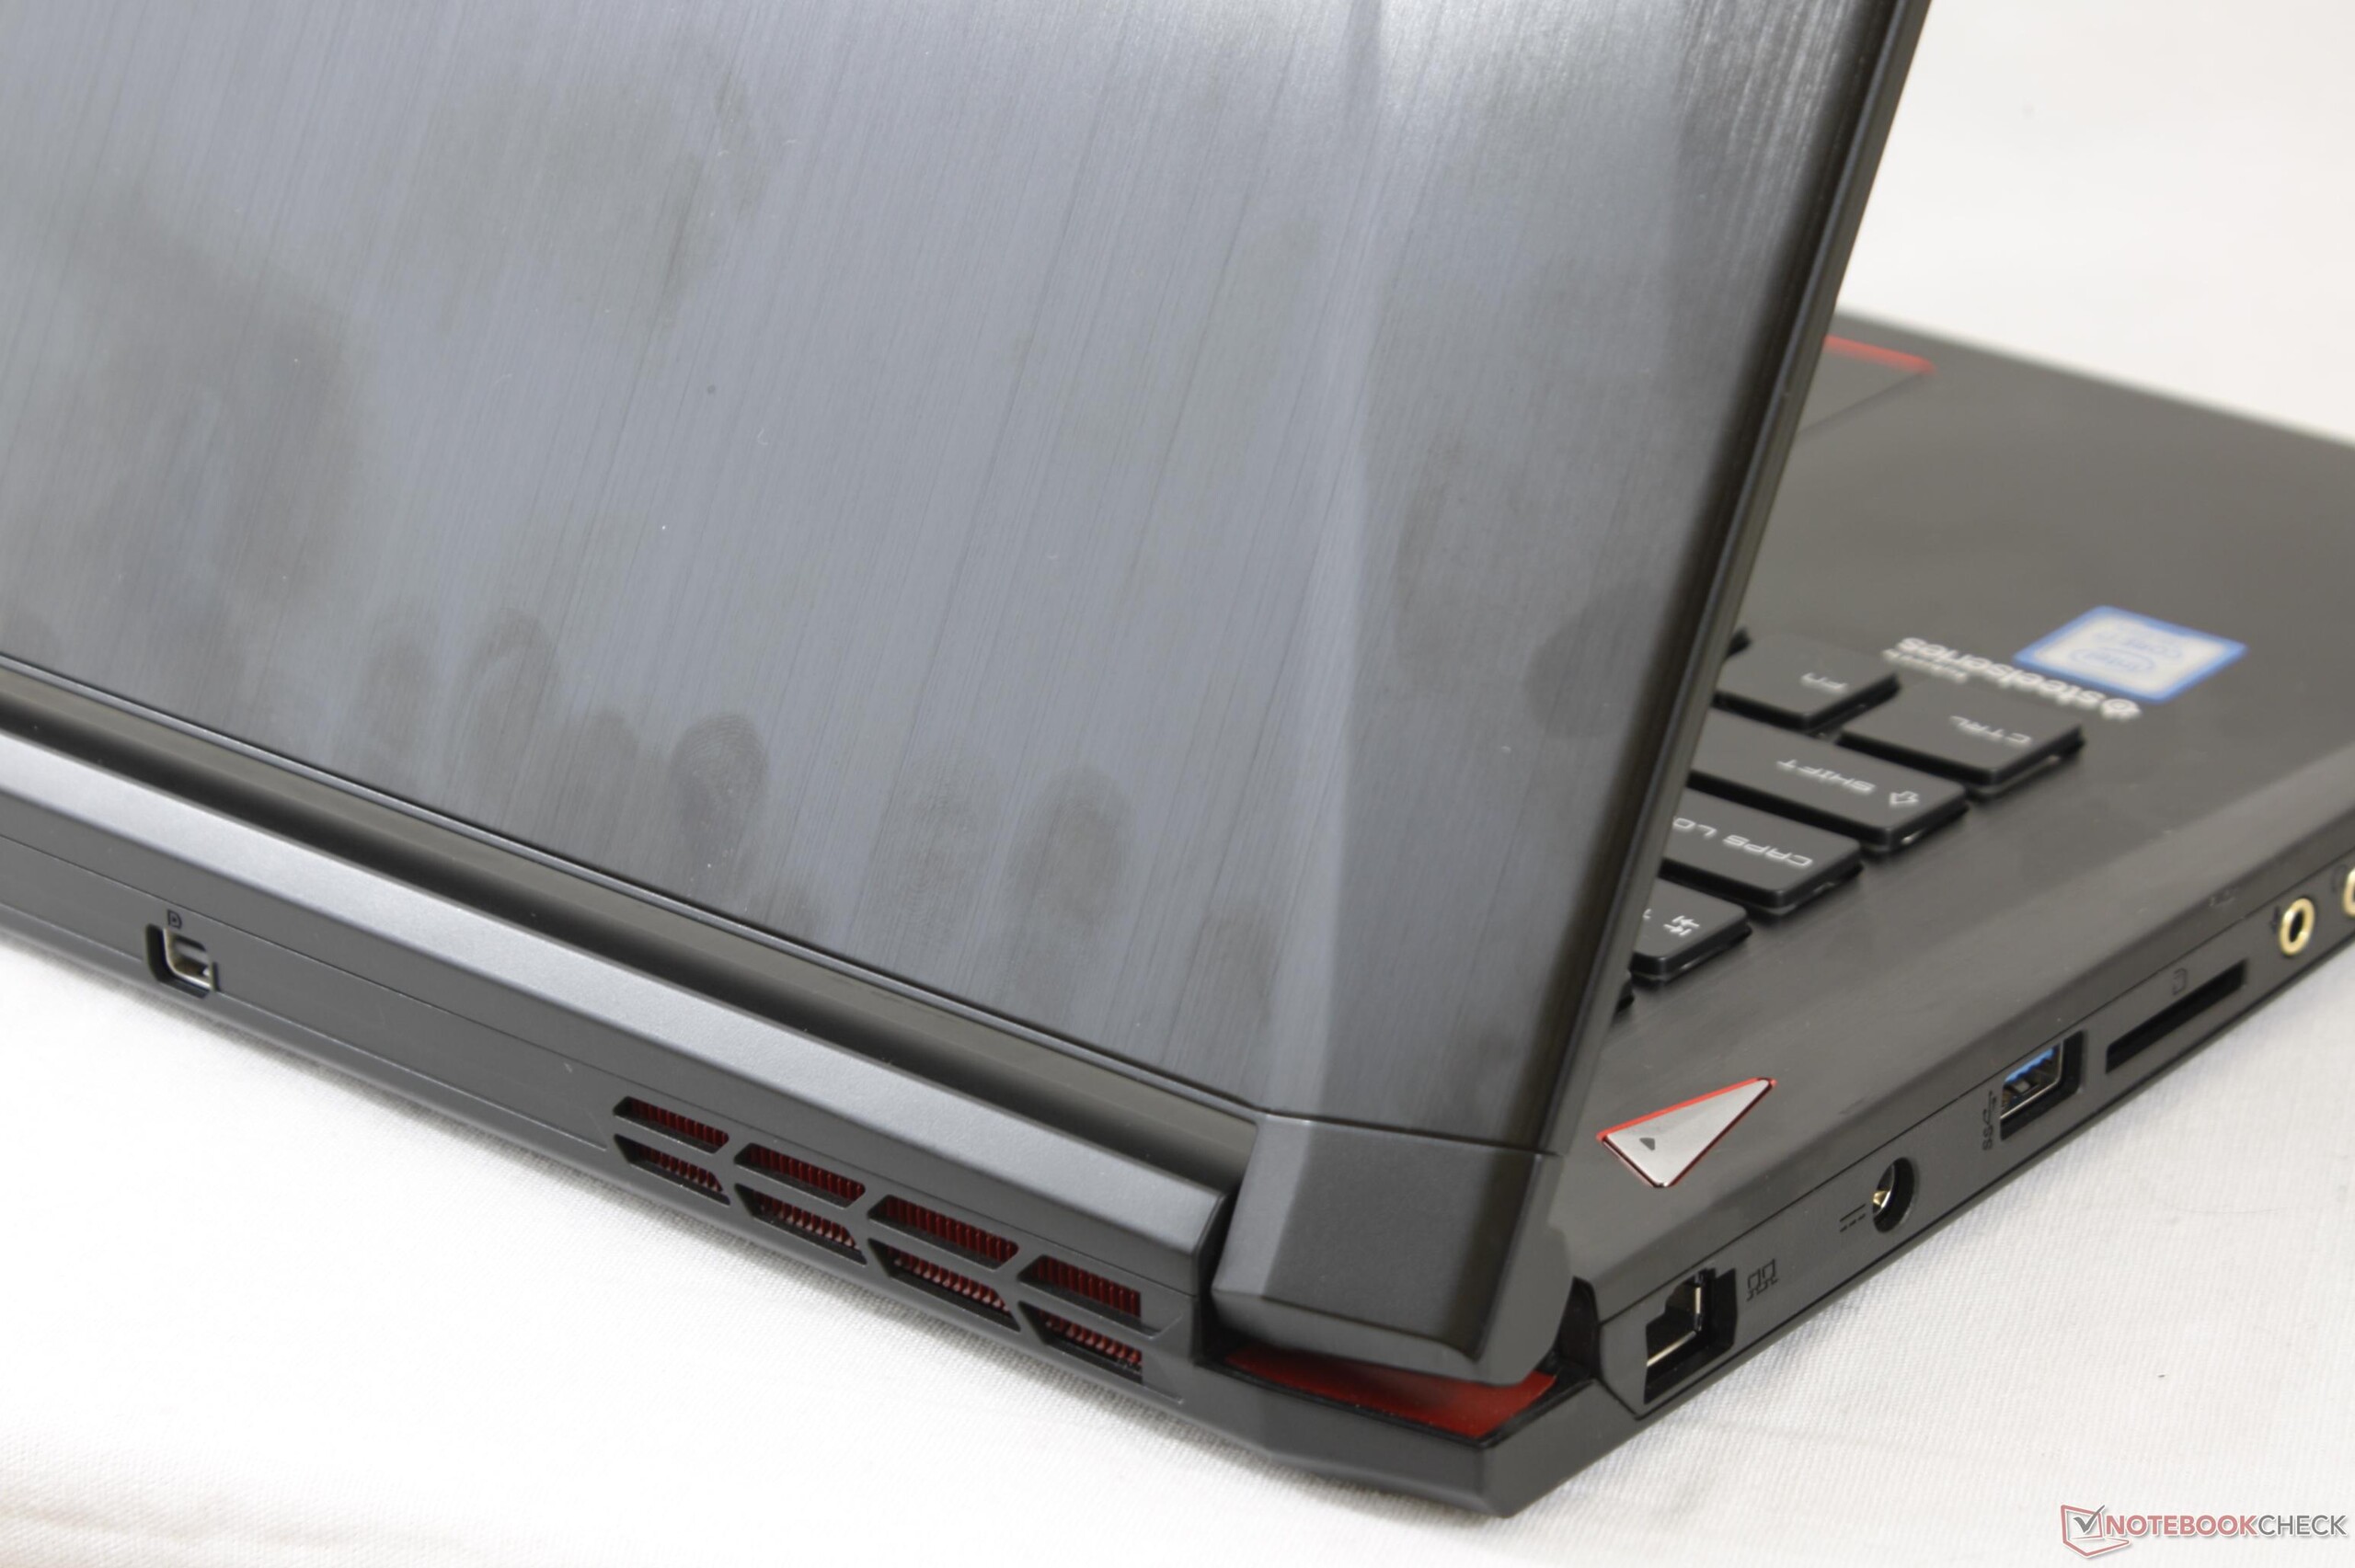
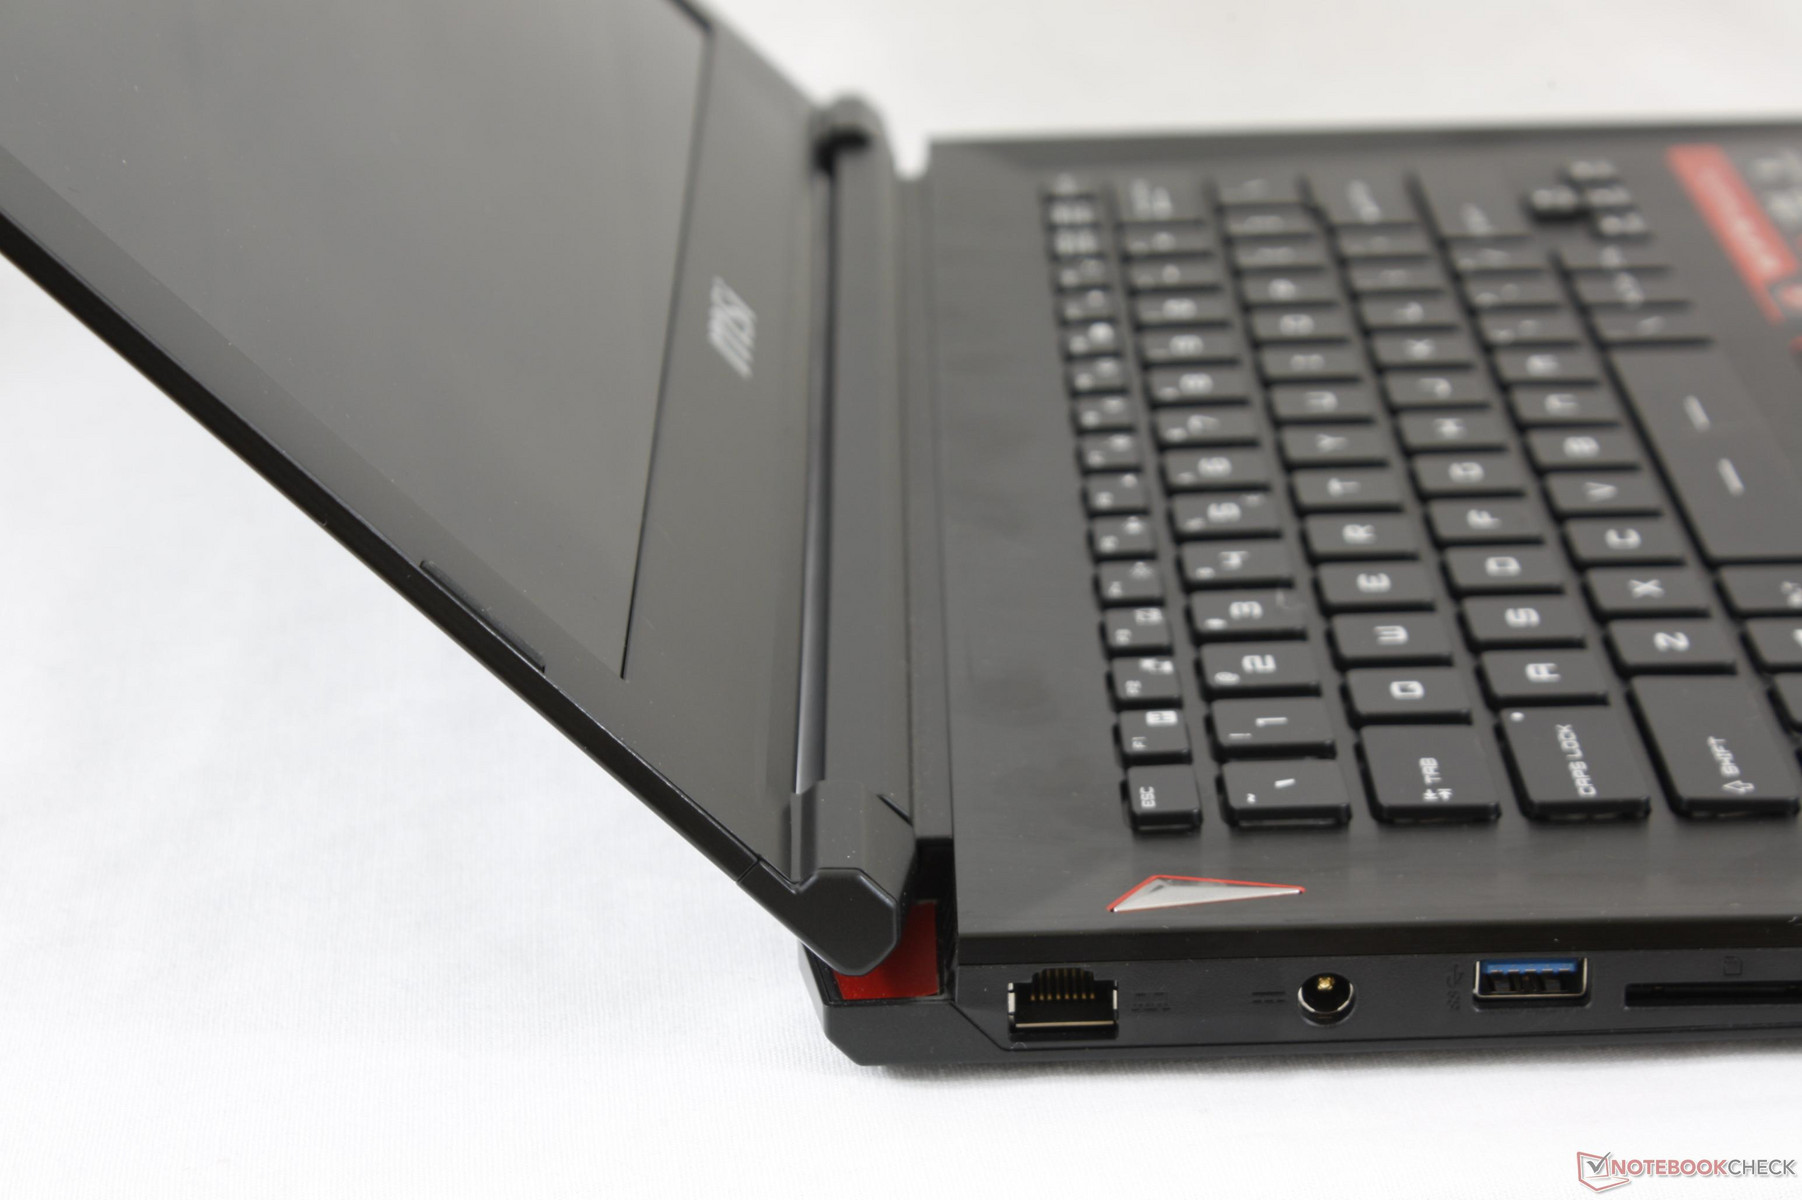
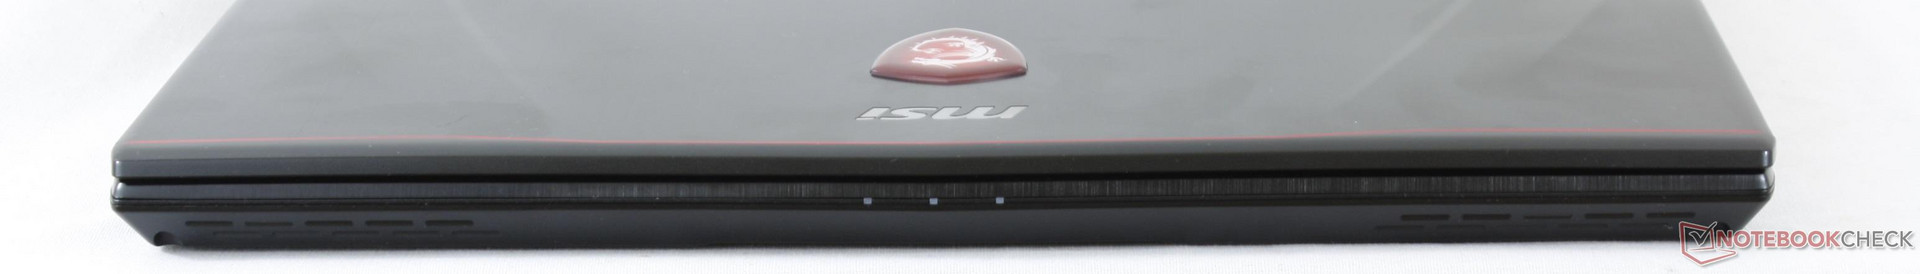
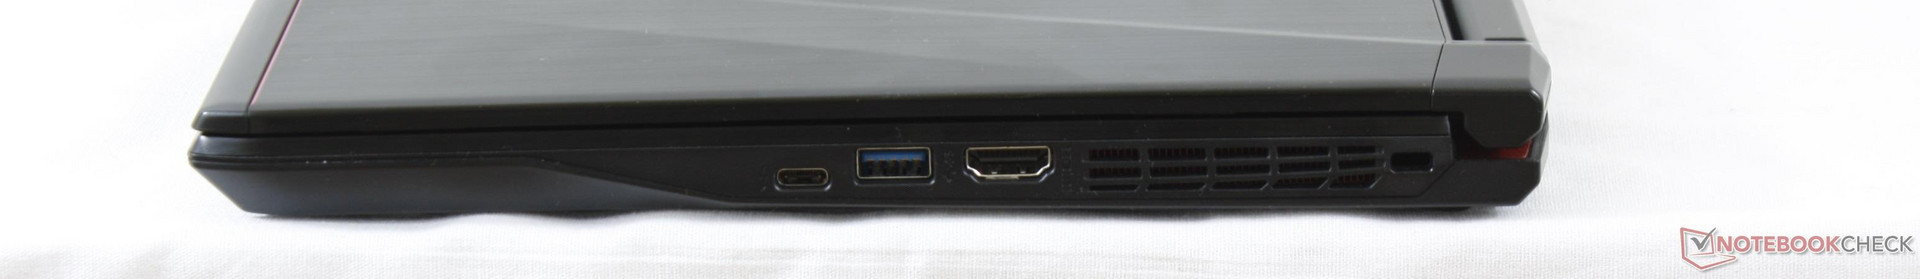
No changes have been made to port selection. This isn't necessarily an issue as the GS43VR has always included a healthy number of connectivity options for its size class, but the manufacturer could have at least updated its mDP 1.2 and HDMI 1.4 ports to 1.4 and 2.0, respectively, in the year since the GS43VR 6RE launch.
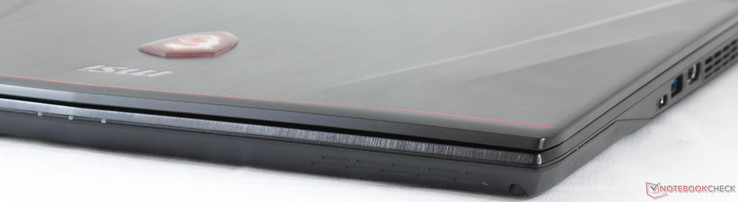
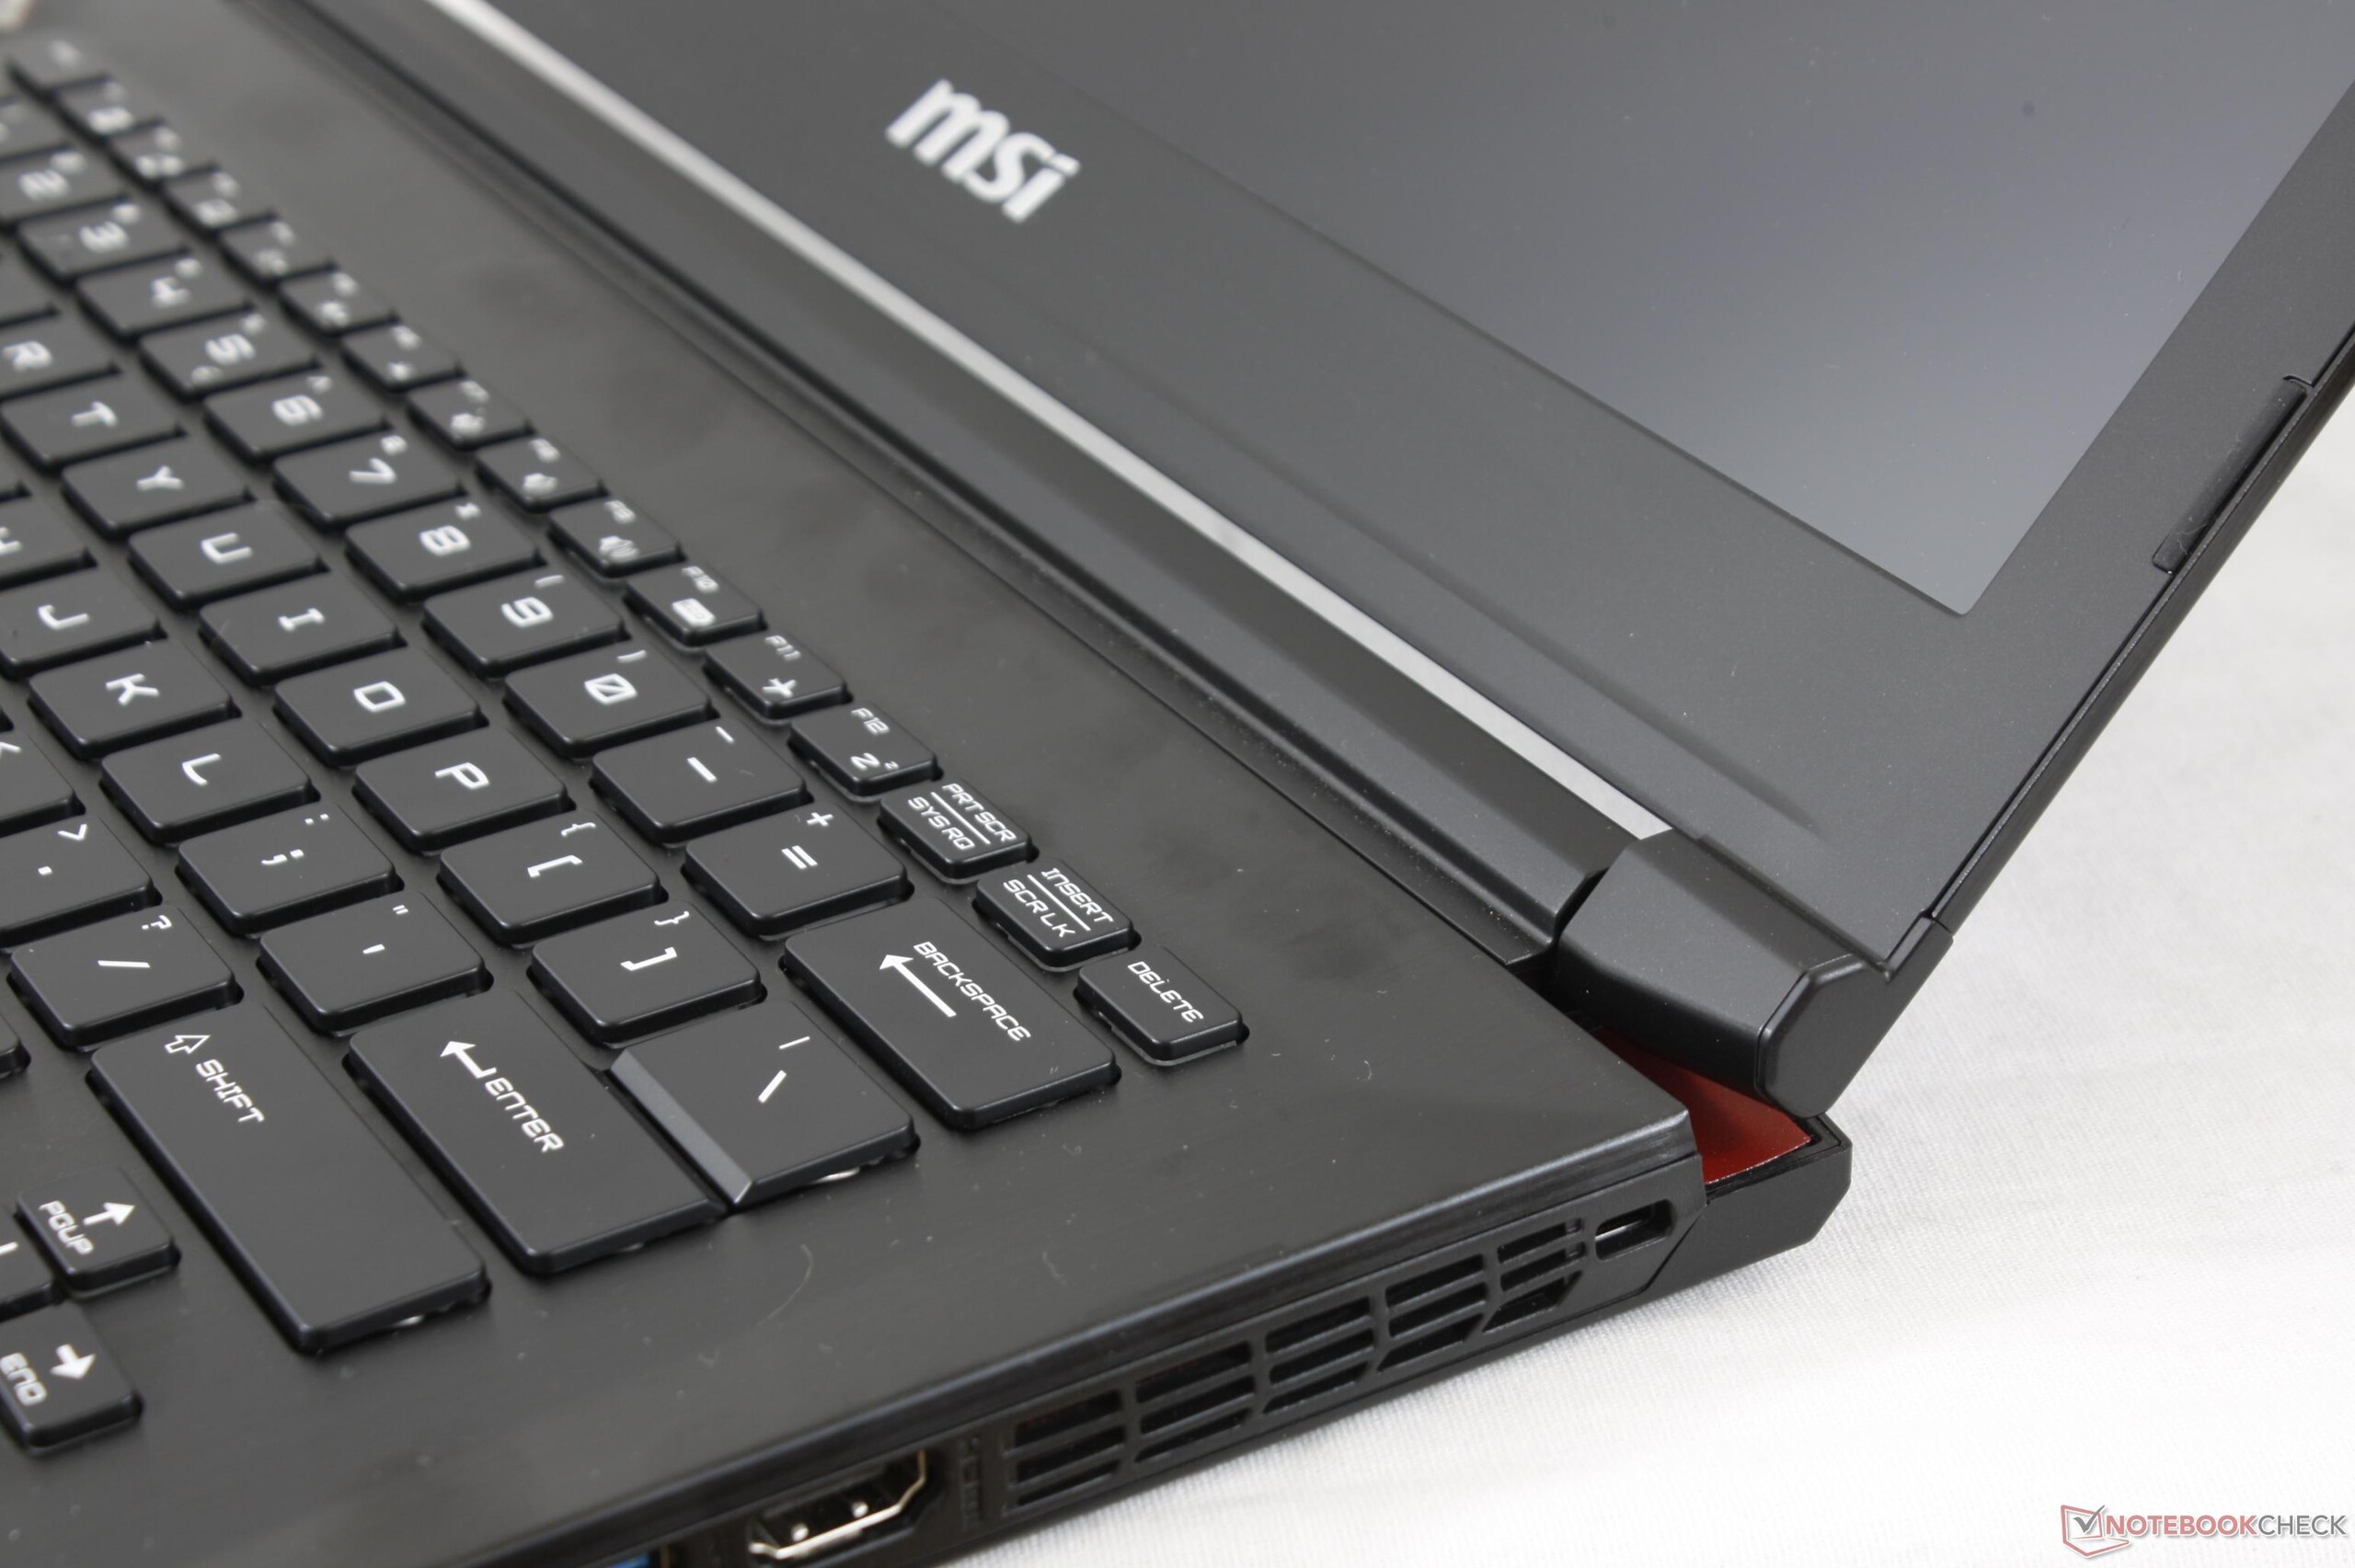
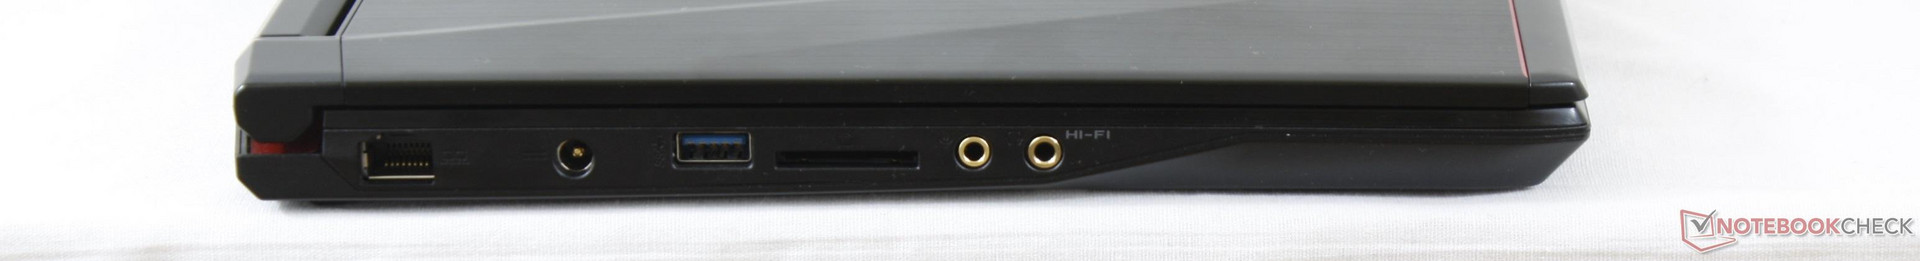
Port positioning can feel tight if too many cables are connected at once. The three ports on the right edge, for example, are quite close to one another while the angled power adapter plug on the left edge will have to sit over or under the USB or Ethernet cable (as shown in the picture to the right). Still, these are just very minor annoyances.

Software
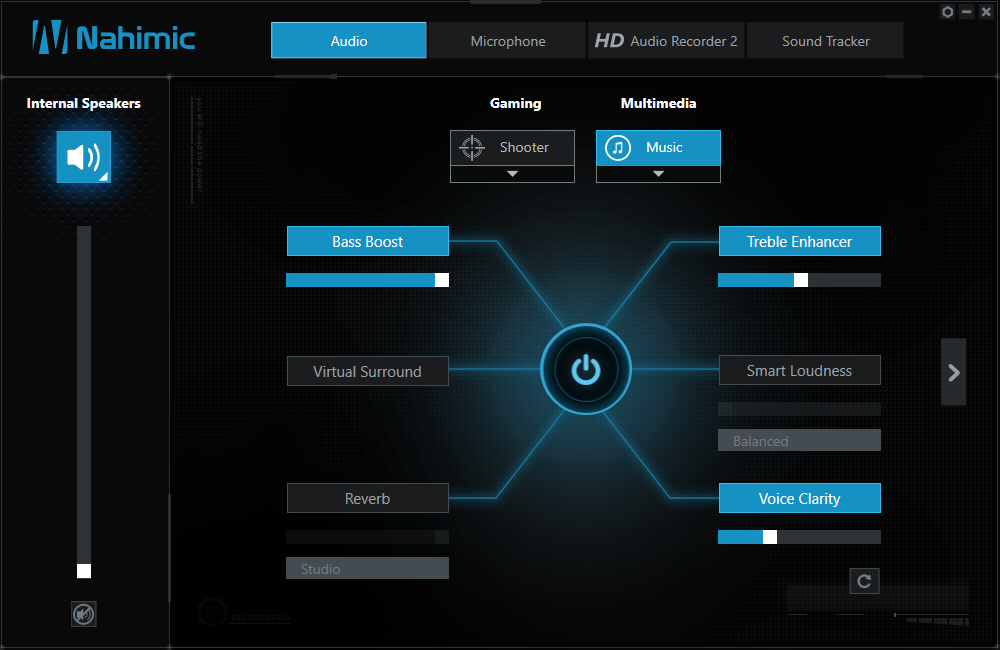
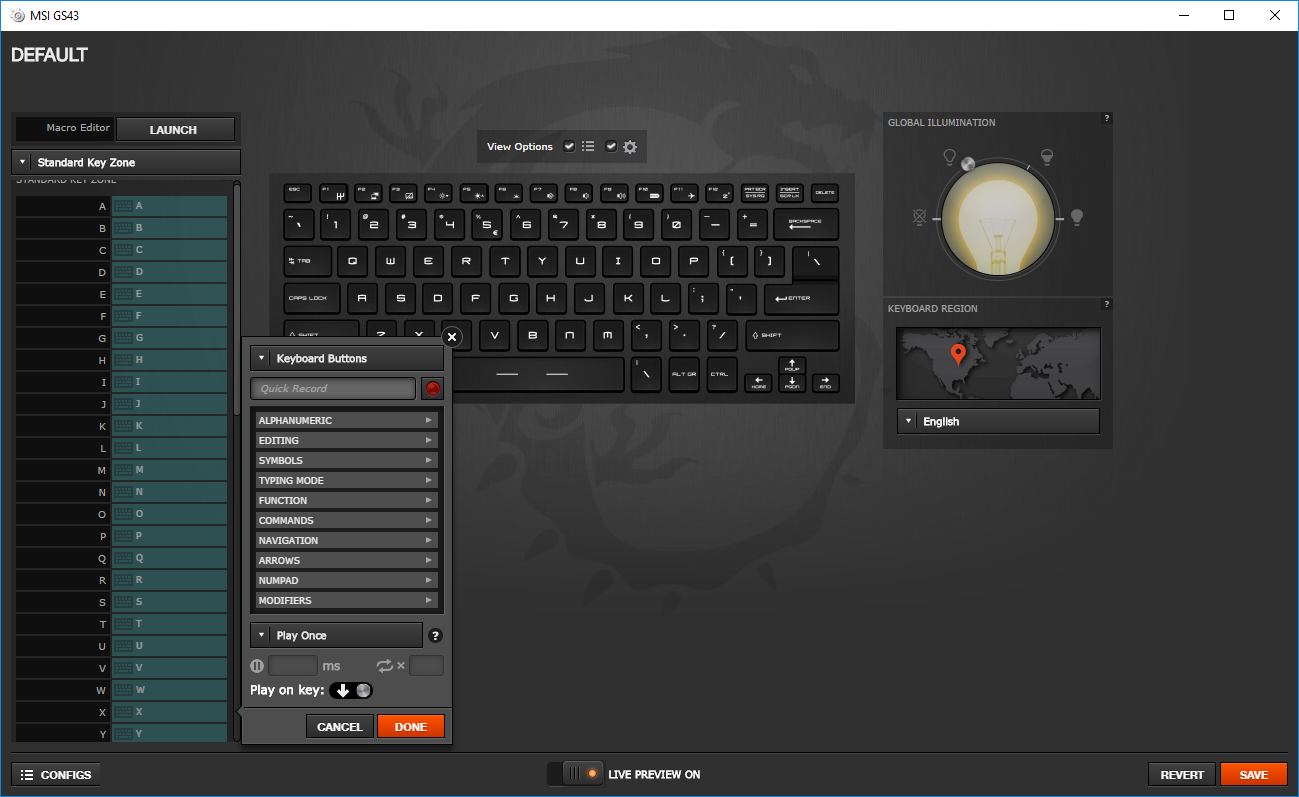
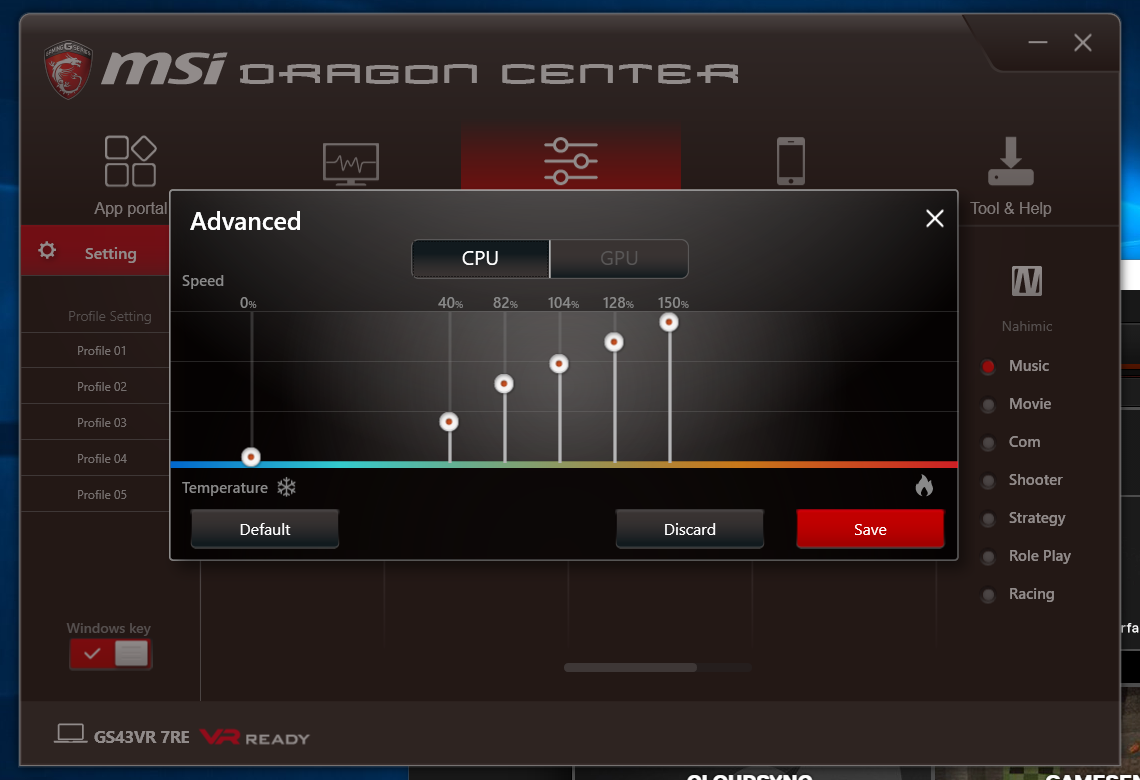
The familiar System Control Manager (SCM), Killer Control Center, Dragon Center, and Nahimic applications come pre-installed onto the system. Dragon Center in particular is easy to use with its large icons, multiple profile settings, individual CPU and GPU fan controls, and the ever useful system monitor. The fan settings aren't as precise as on the EVGA SC15 and there is no system monitor overlay or recording option when gaming. A year of XSplit streaming comes free as with most MSI G series and Aorus notebooks.
SD Card Reader
Card reader performance continues to be very slow on the entire GS series. Transferring 1 GB worth of images from our Toshiba UHS-II SDXC test card to desktop takes about 52 seconds compared to less than 10 seconds on the XPS 15 9560. We find this unacceptable for a gaming notebook retailing for $1500 USD, but we can at least appreciate that a spring-loaded card reader is even included at all unlike on the Razer.
A fully inserted SD card will protrude by just 1 to 2 mm for safe transporting.
| SD Card Reader | |
| average JPG Copy Test (av. of 3 runs) | |
| Dell XPS 15 9560 (i7-7700HQ, UHD) | |
| Eurocom Sky MX5 R3 | |
| MSI GS63VR 7RF-228US | |
| MSI GS43VR 7RE-069US | |
| maximum AS SSD Seq Read Test (1GB) | |
| Dell XPS 15 9560 (i7-7700HQ, UHD) | |
| Eurocom Sky MX5 R3 | |
| MSI GS63VR 7RF-228US | |
| MSI GS43VR 7RE-069US | |
Communication
The familiar Killer 1535 with integrated Bluetooth 4.2 is back as the standard option for the GS43VR. A real-world test standing one meter away from our Linksys EA8500 router returns an average transfer rate of 582 Mbps against its theoretical maximum of 867 Mbps. See our review on the Killer 1535 for more information on its features and performance. We never experienced any connectivity issues during our time with the MSI test unit.
| Networking | |
| iperf3 transmit AX12 | |
| MSI GS63VR 7RF-228US | |
| MSI GS43VR 7RE-069US | |
| Razer Blade (2016) FHD | |
| iperf3 receive AX12 | |
| MSI GS63VR 7RF-228US | |
| MSI GS43VR 7RE-069US | |
| Razer Blade (2016) FHD | |
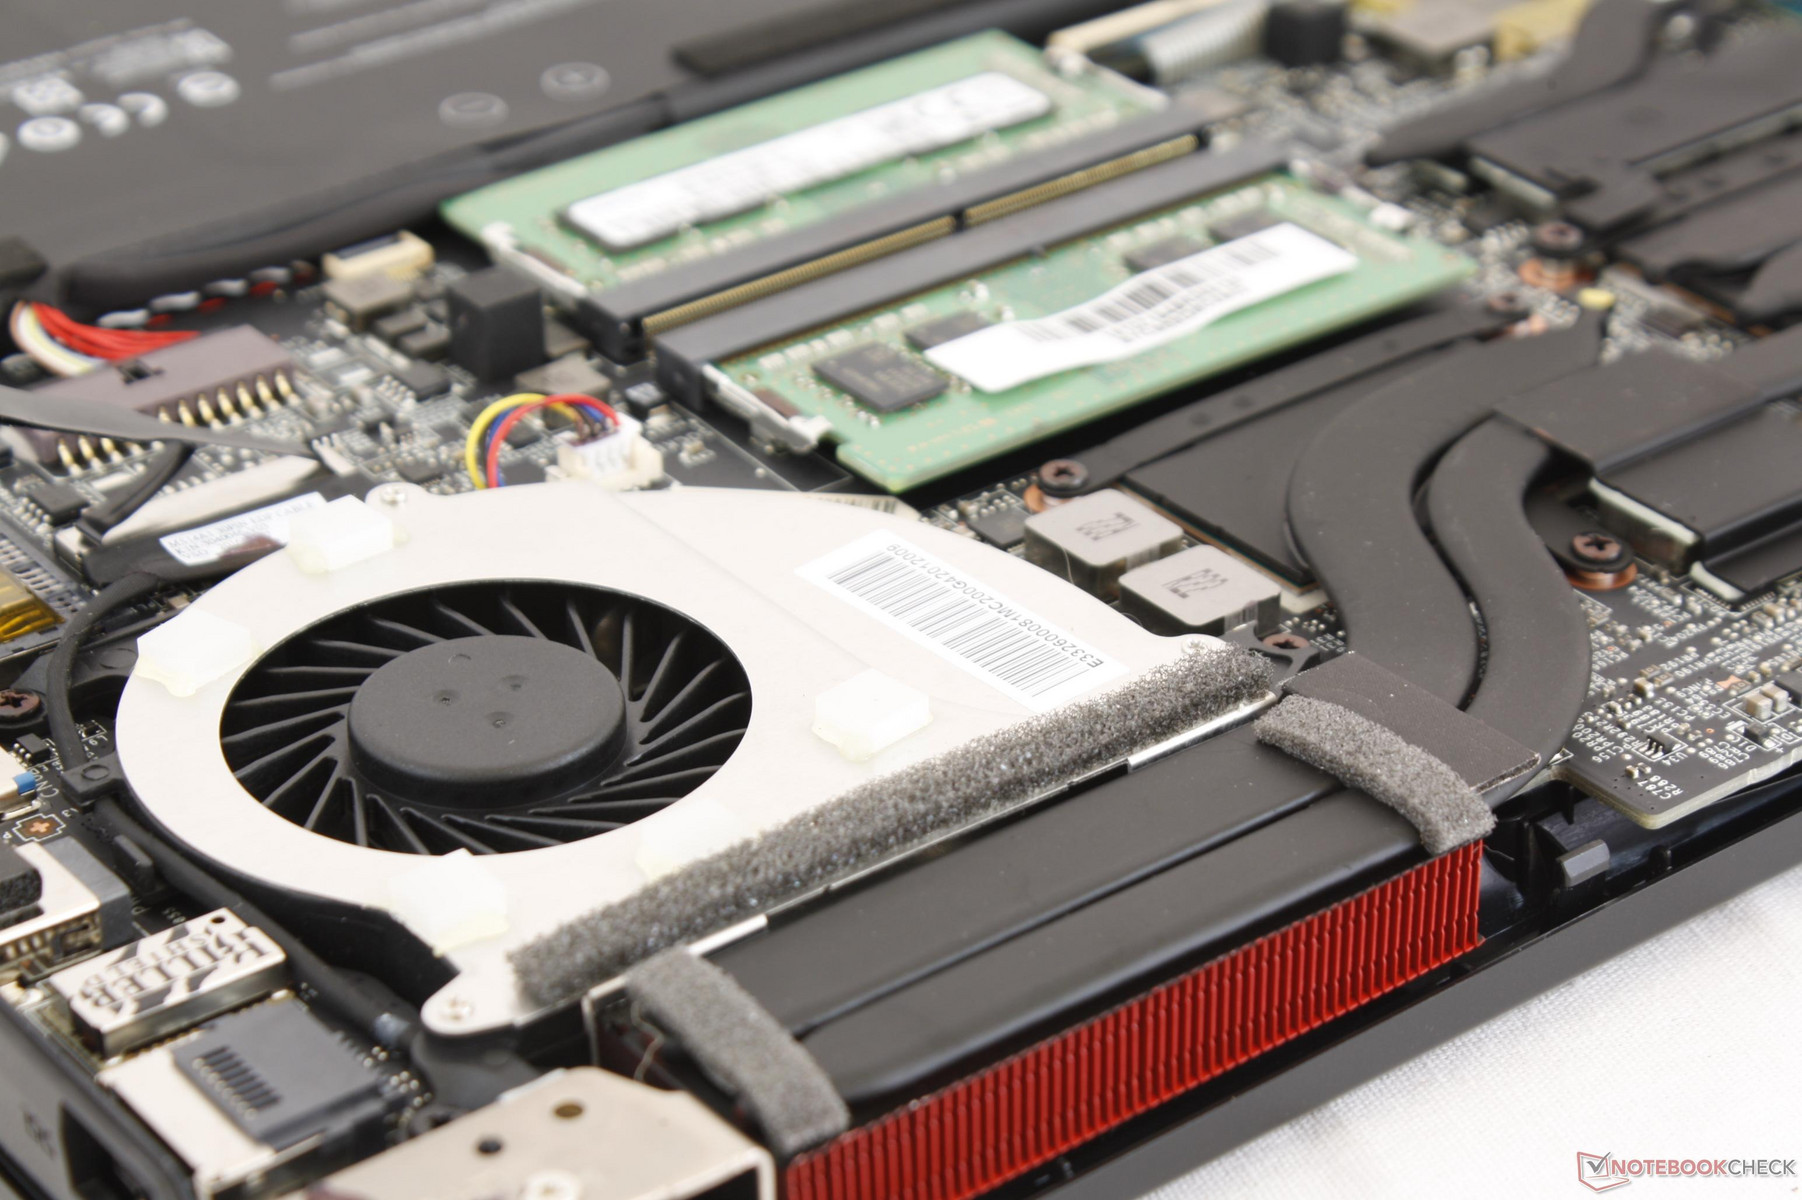
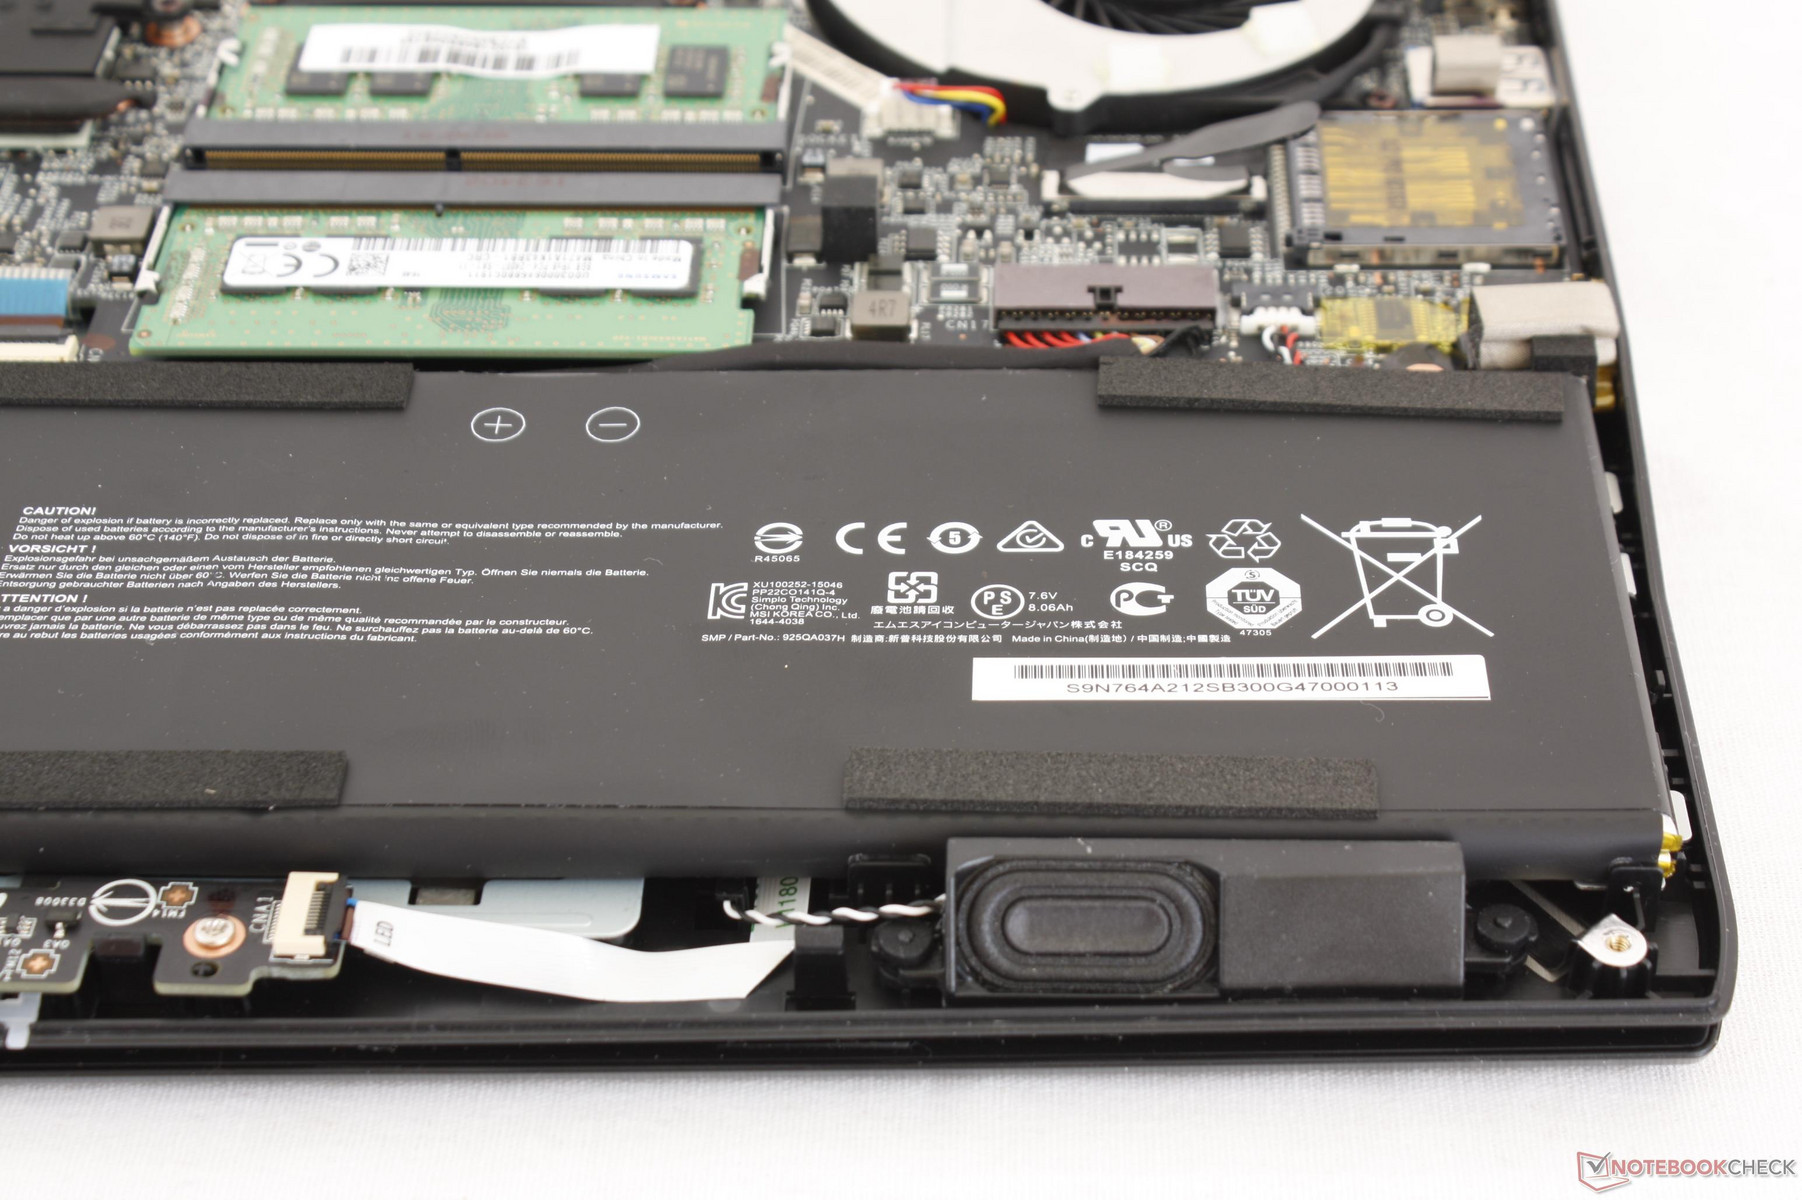
Maintenance
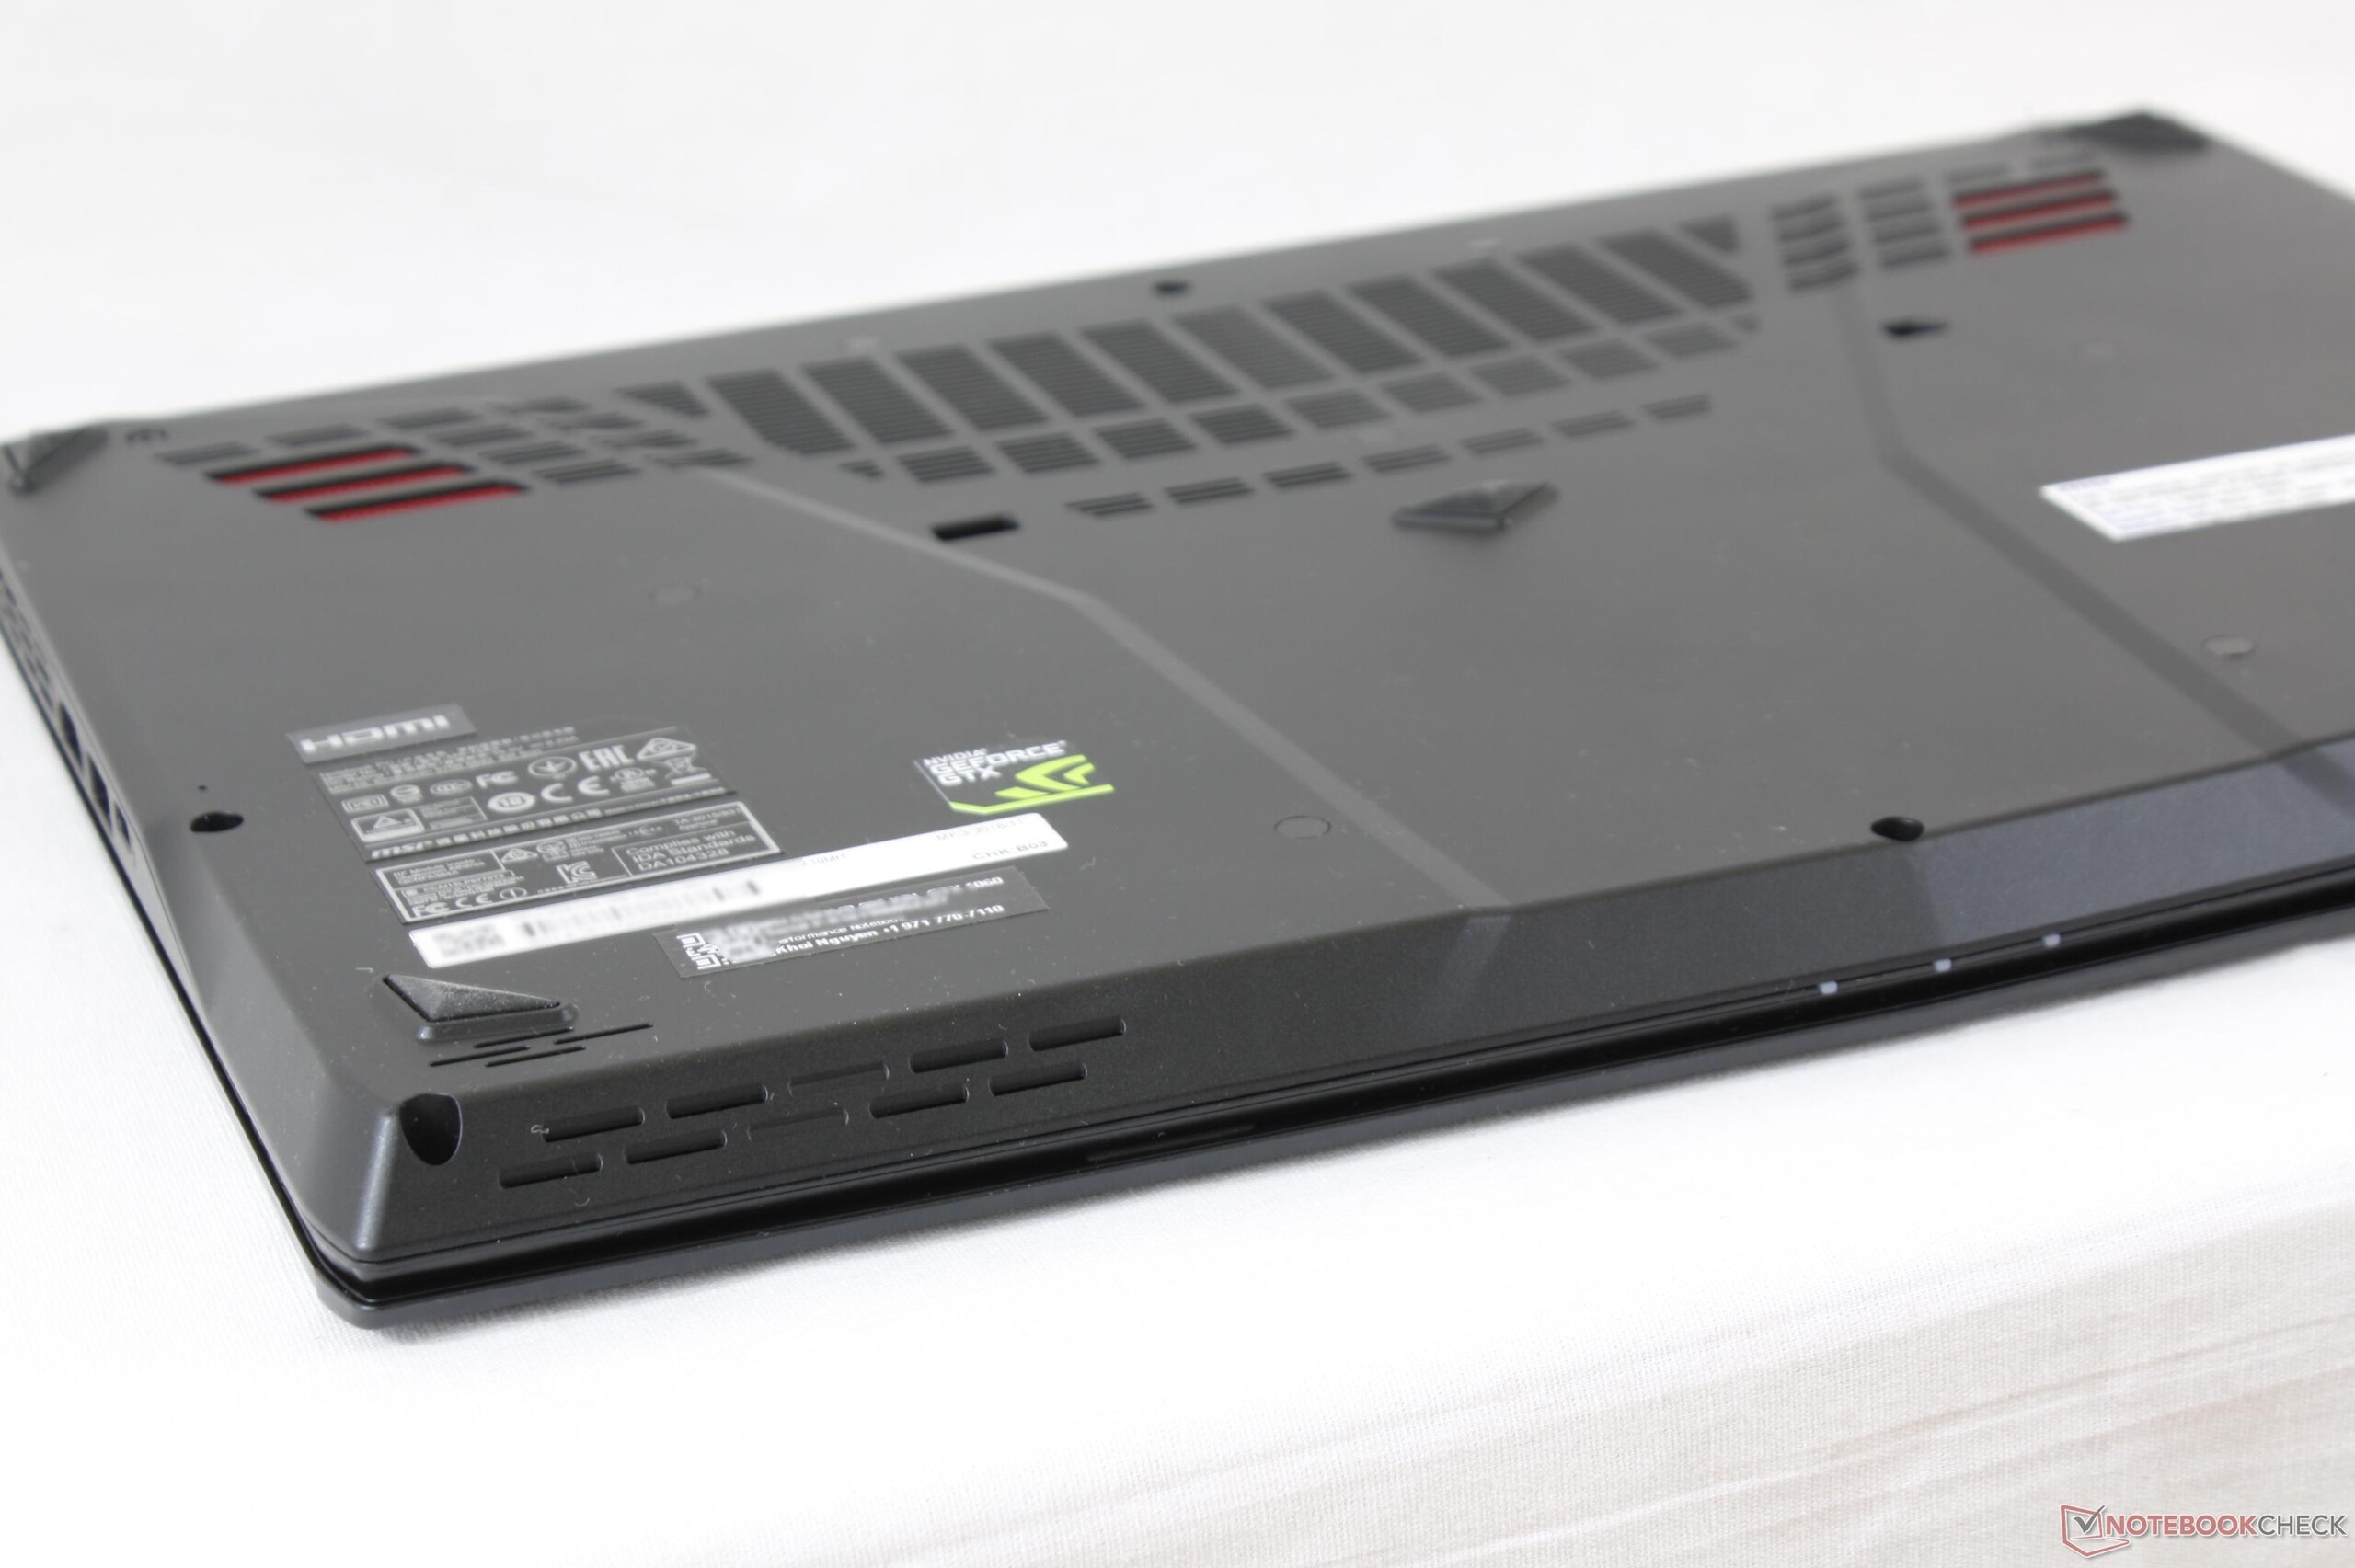
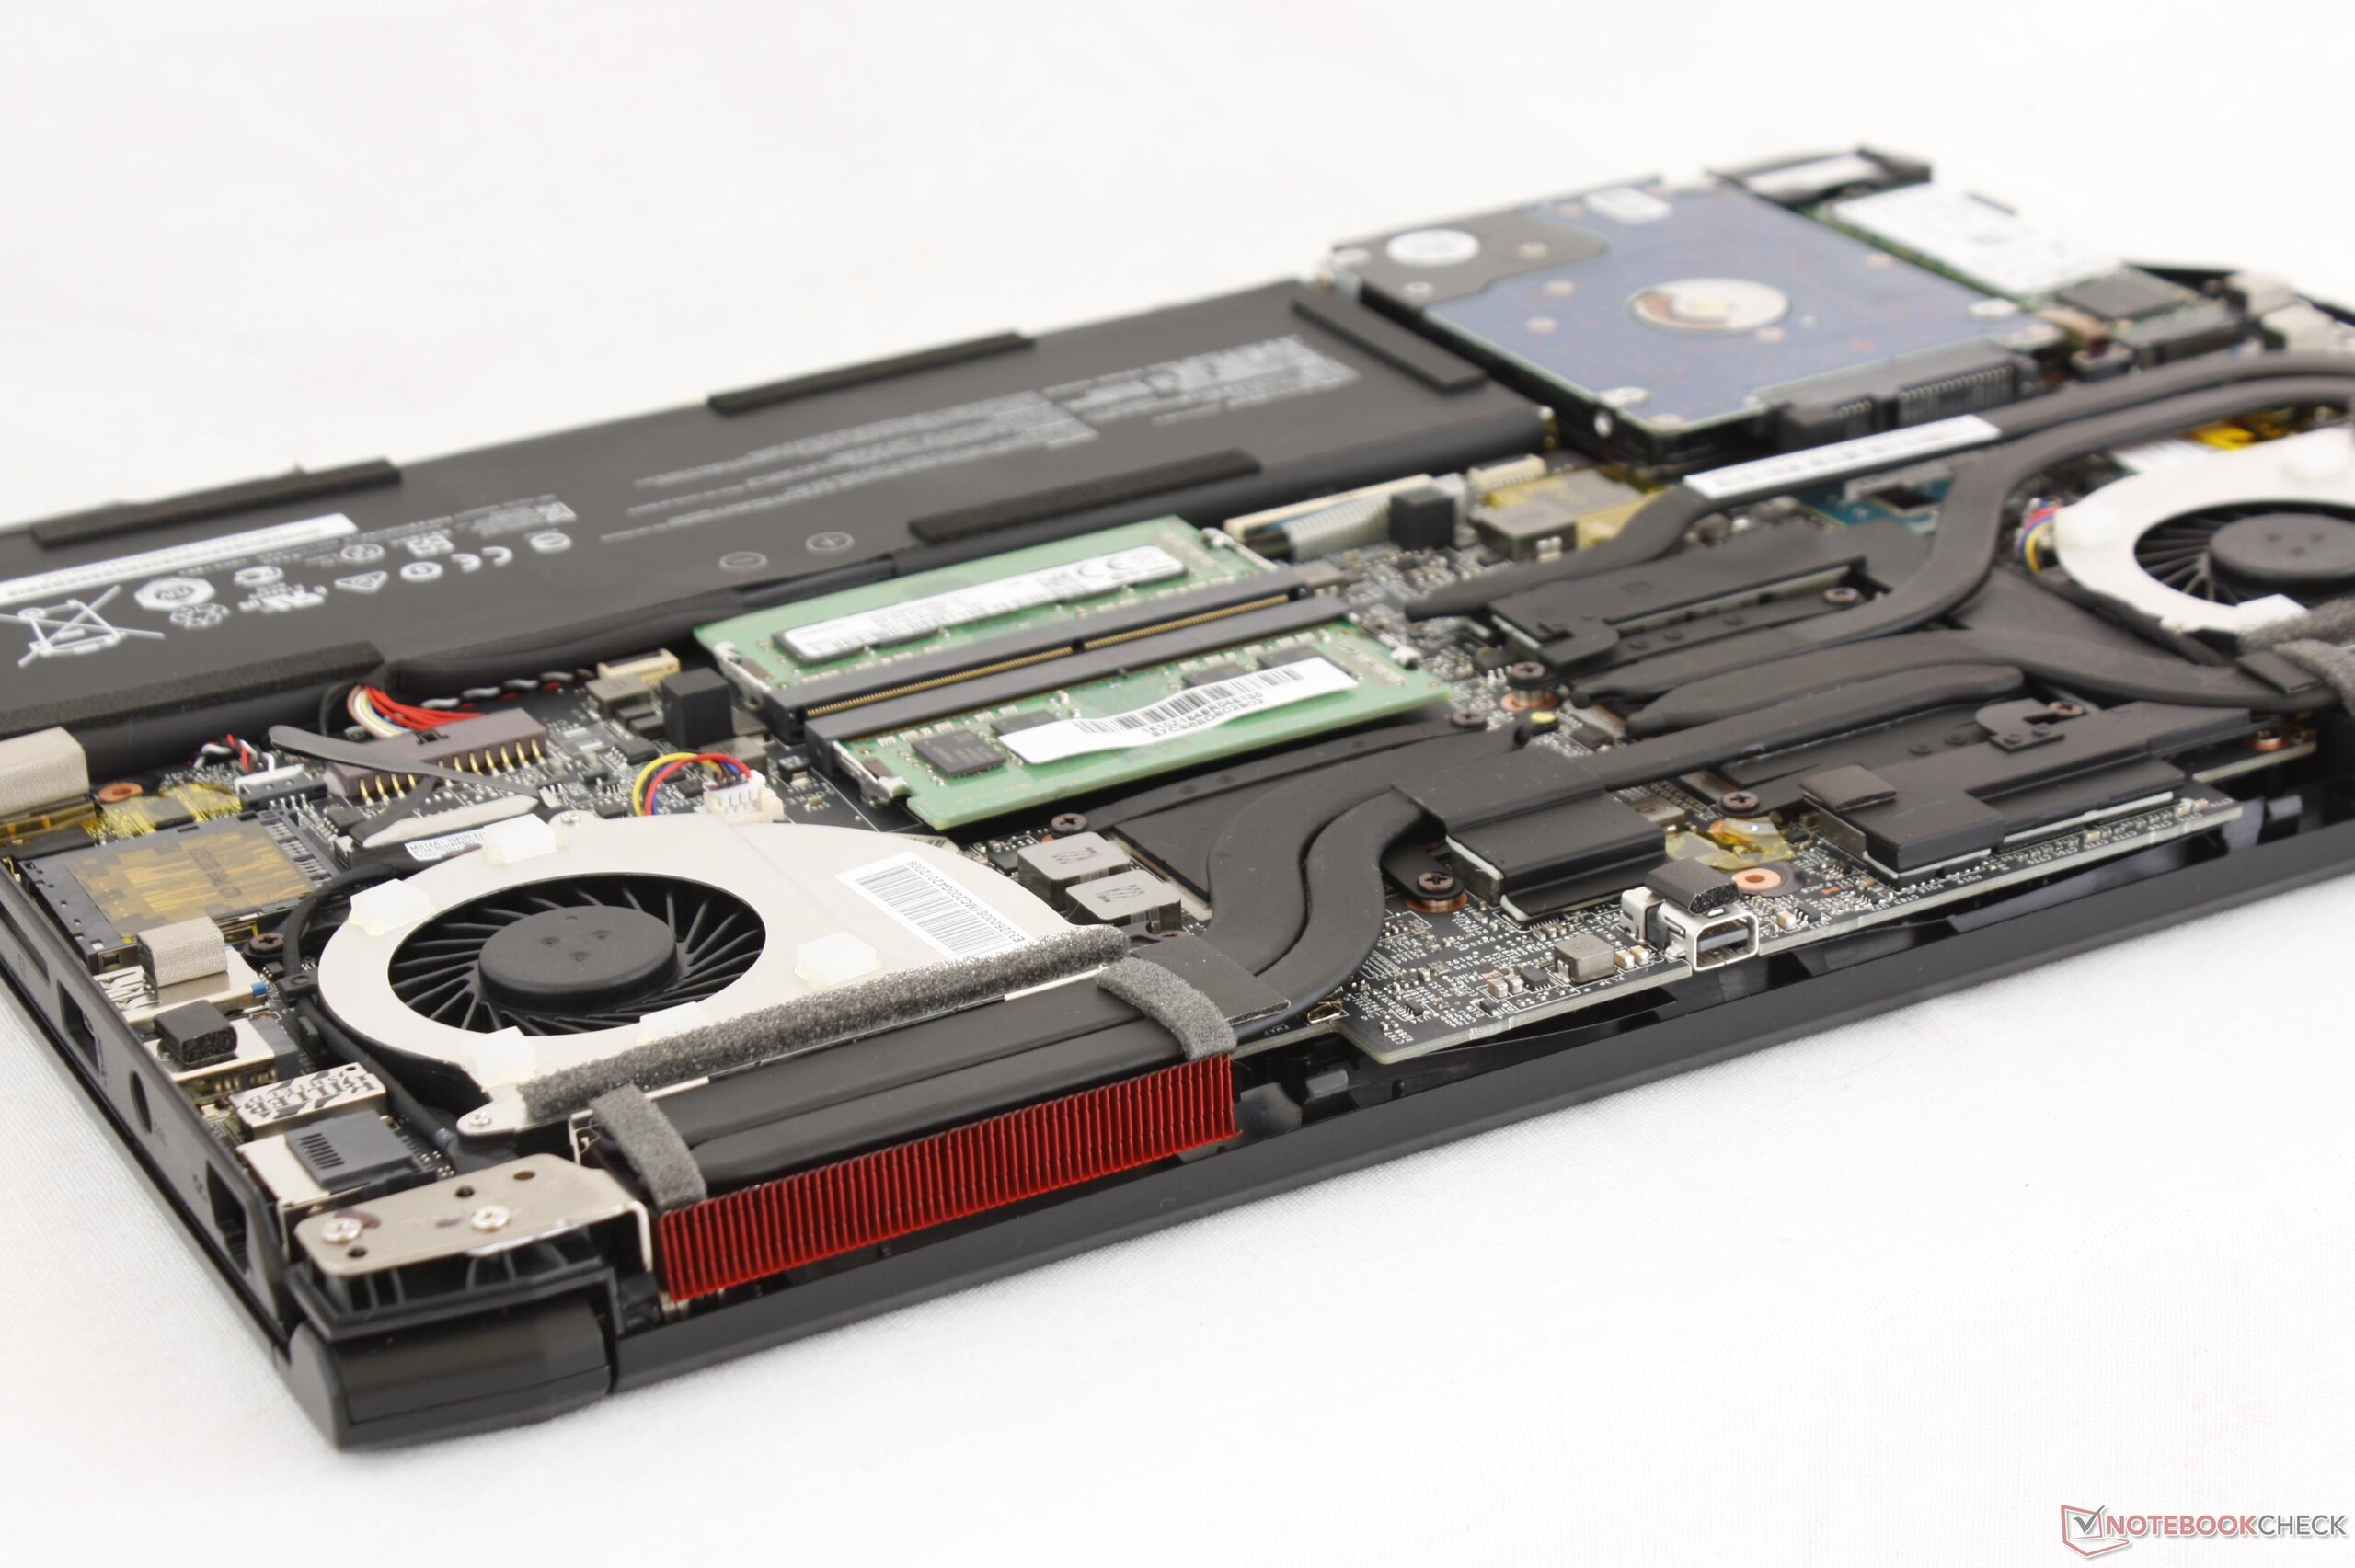
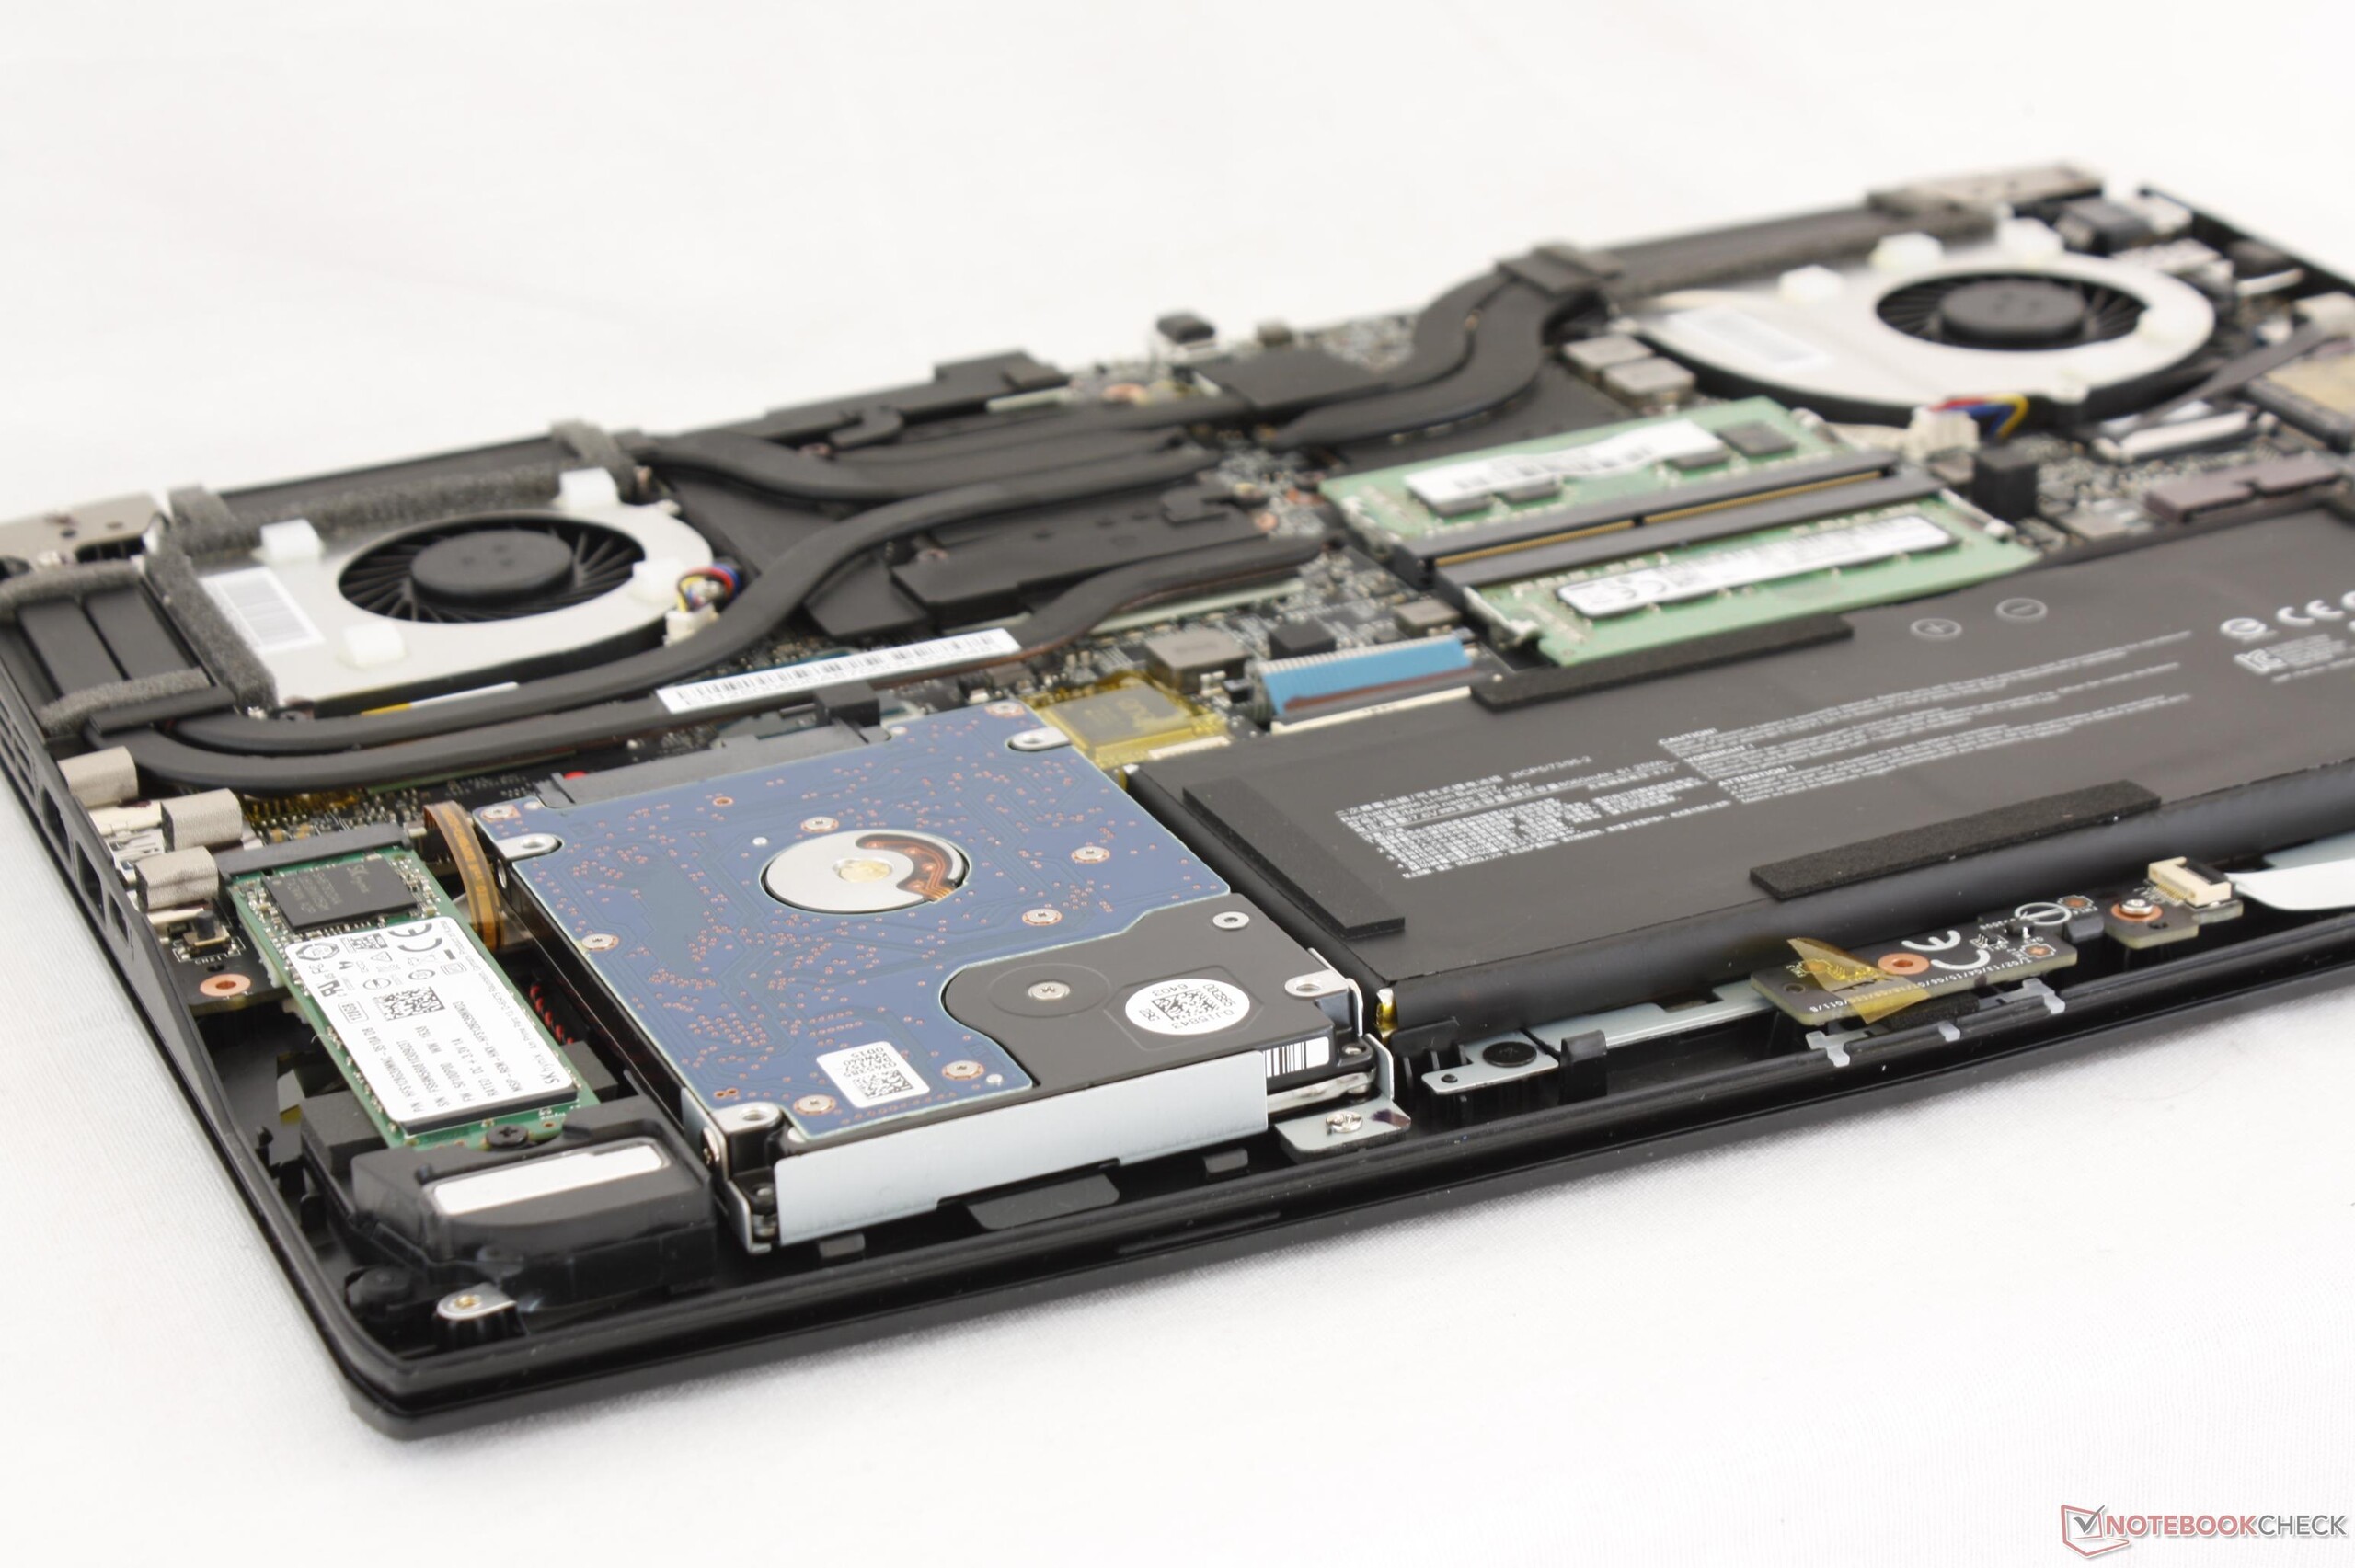
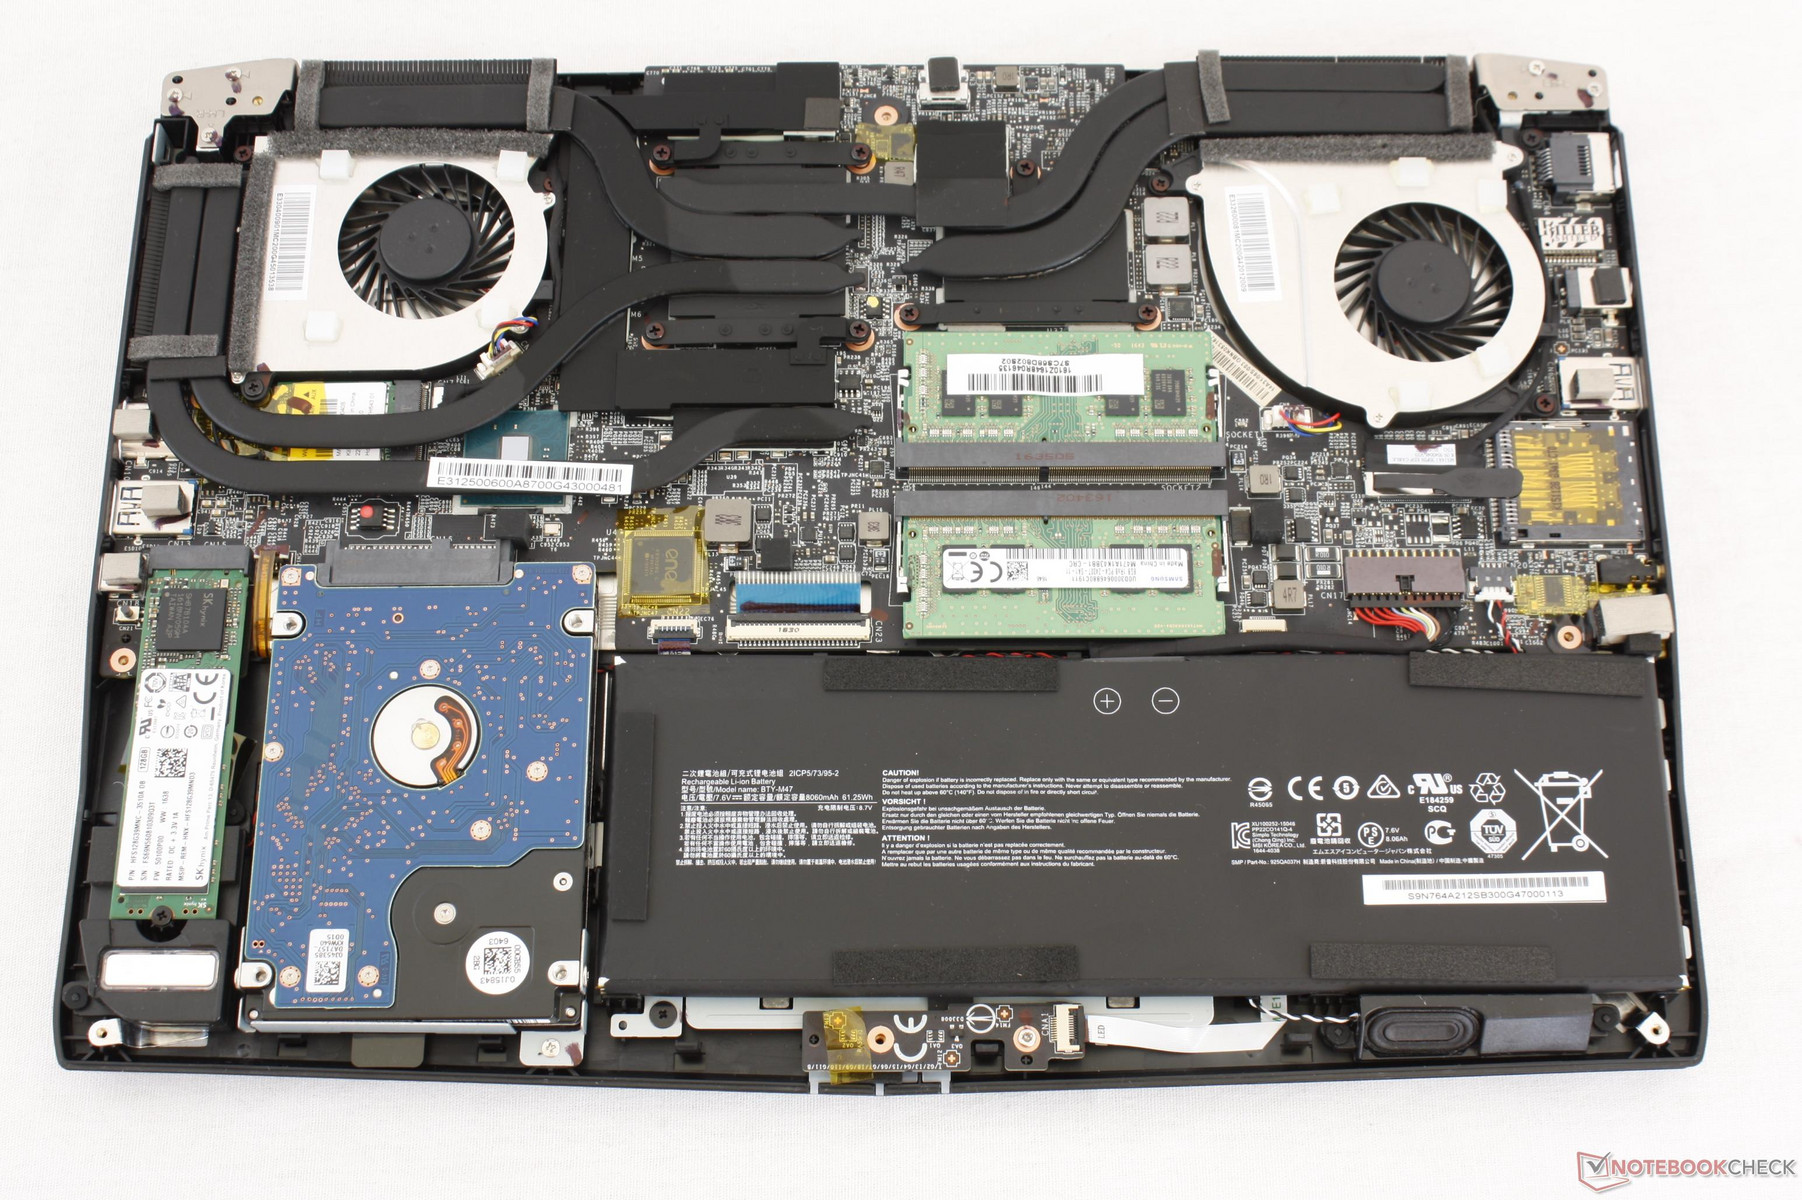
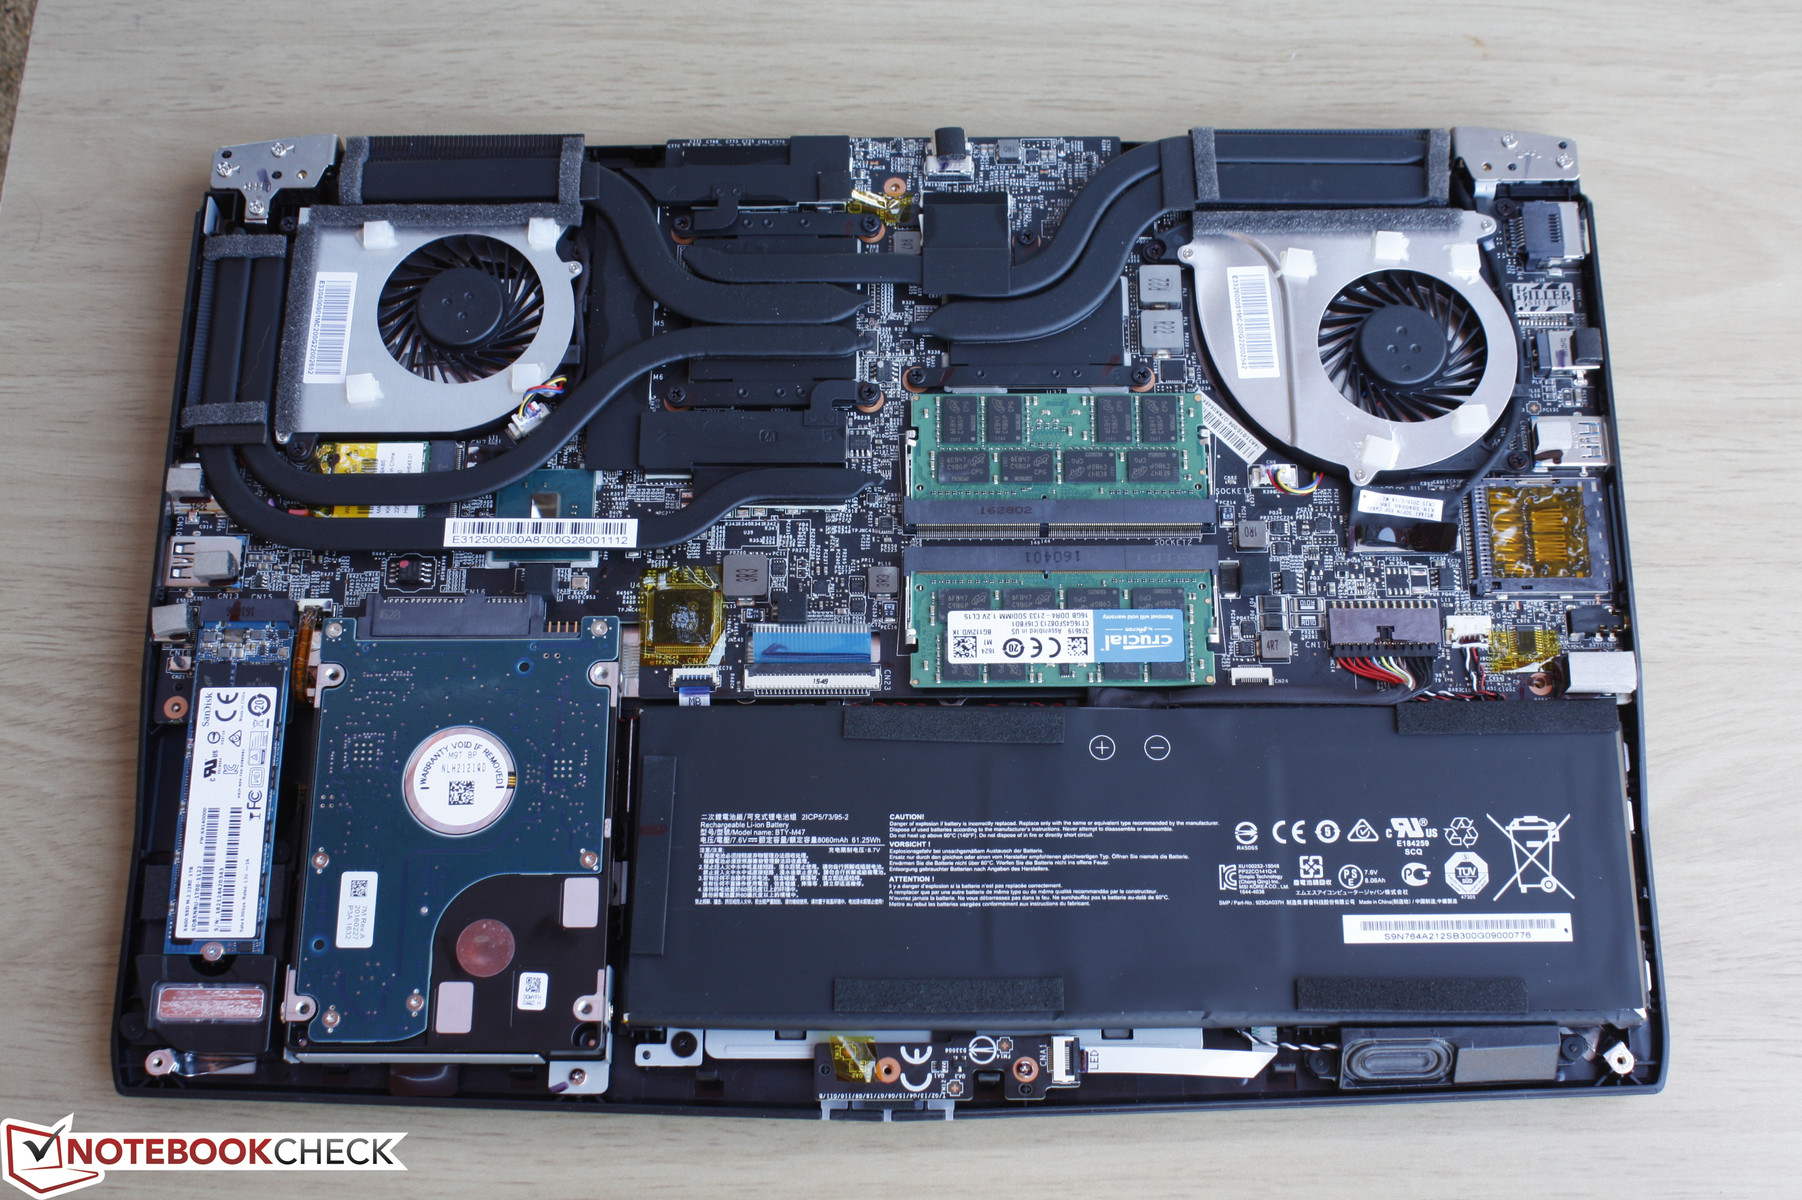
The bottom panel is secured by eight screws and can be easily removed with just a Philips screwdriver. Unlike the upside-down motherboard design of the larger GS63VR and GS73VR, the core components of the GS43VR are immediately accessible including both DDR4 SODIMM slots, both storage bays, both system fans, and the internal battery.The M.2 WLAN module is a bit more difficult to get to since it is underneath the GPU heat pipes.
Annoyingly, simply unscrewing the maintenance panel from the bottom of the notebook will automatically void the manufacturer warranty. We're unsure why MSI insists on advocating this unfavorable practice especially when many other gaming notebooks have no qualms about end-user upgrades.
Warranty
The standard one-year limited warranty applies. New products must be registered through MSI.com in order to take advantage of the warranty services. Please see our Guarantees, Return policies and Warranties FAQ for country-specific information.
Input Devices
Keyboard
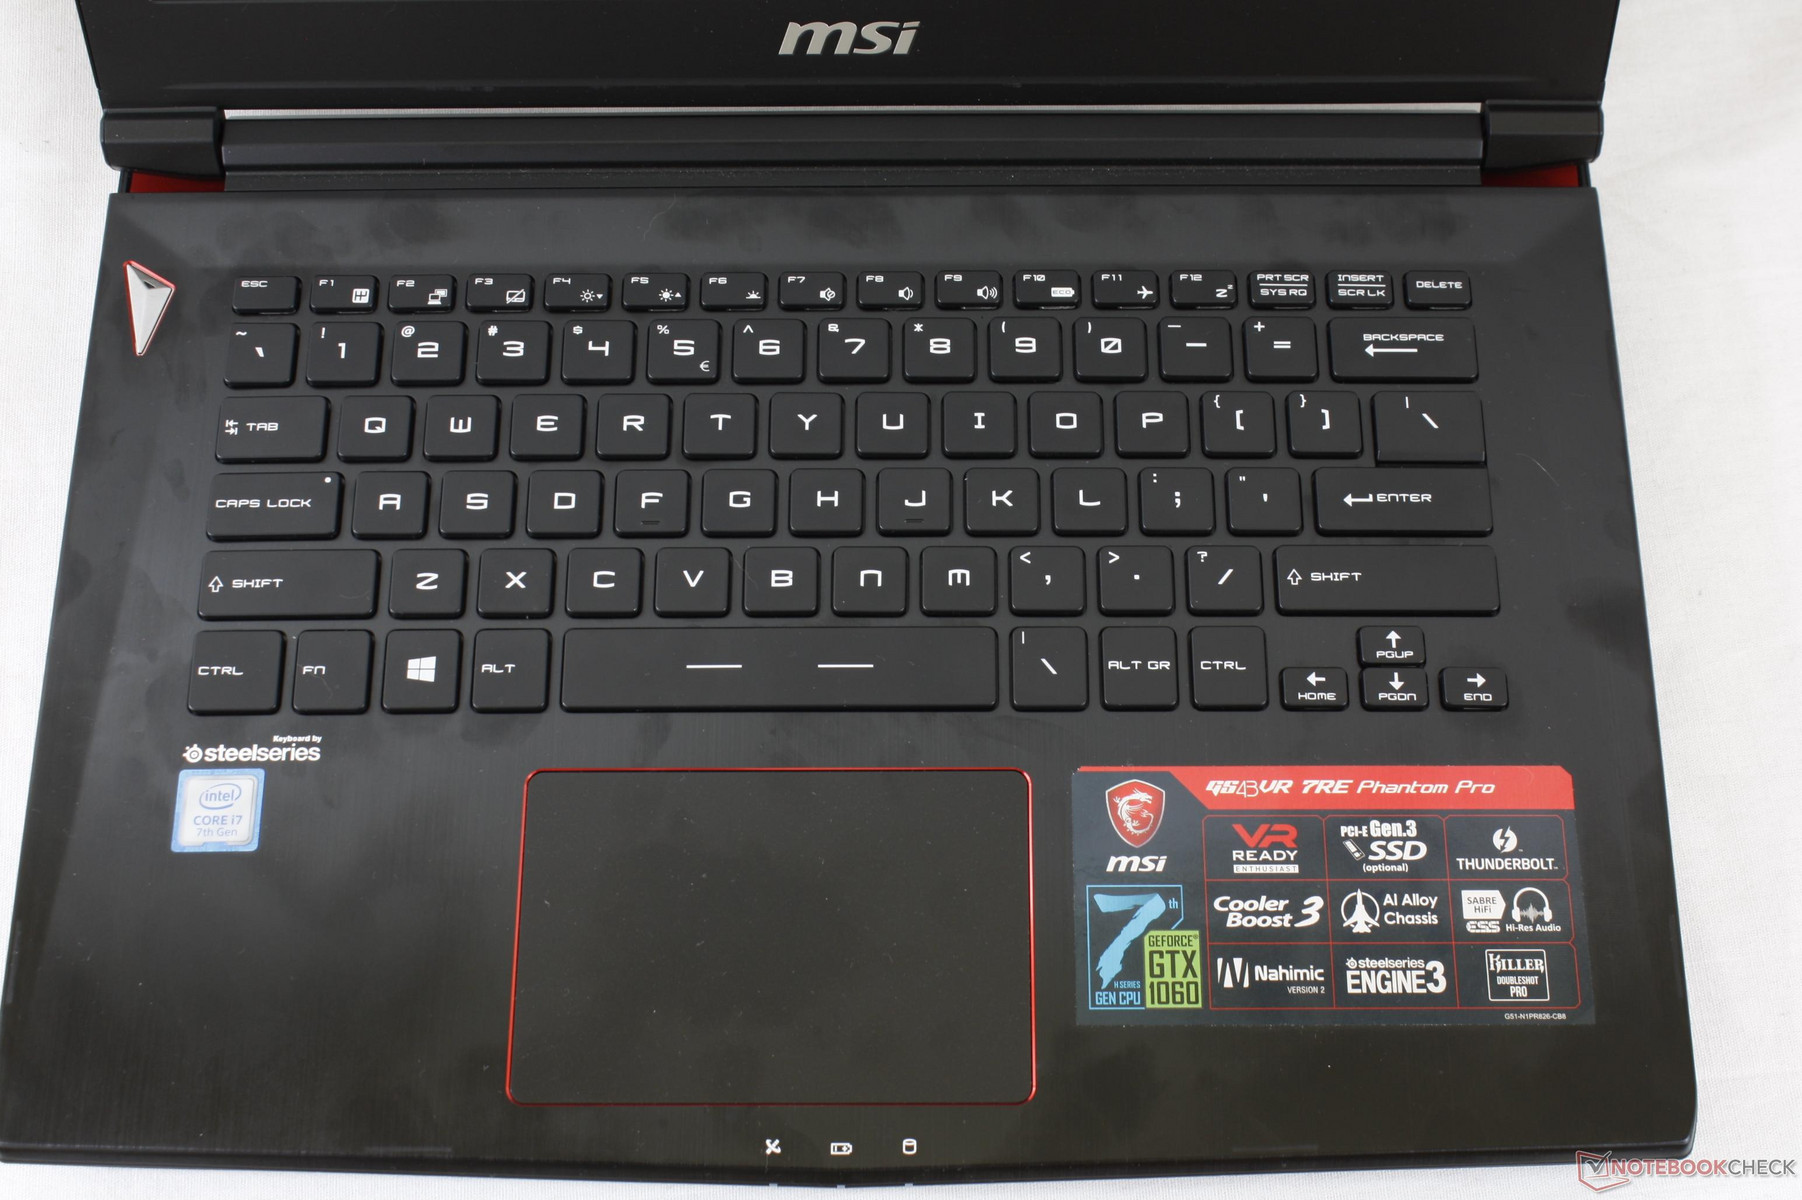
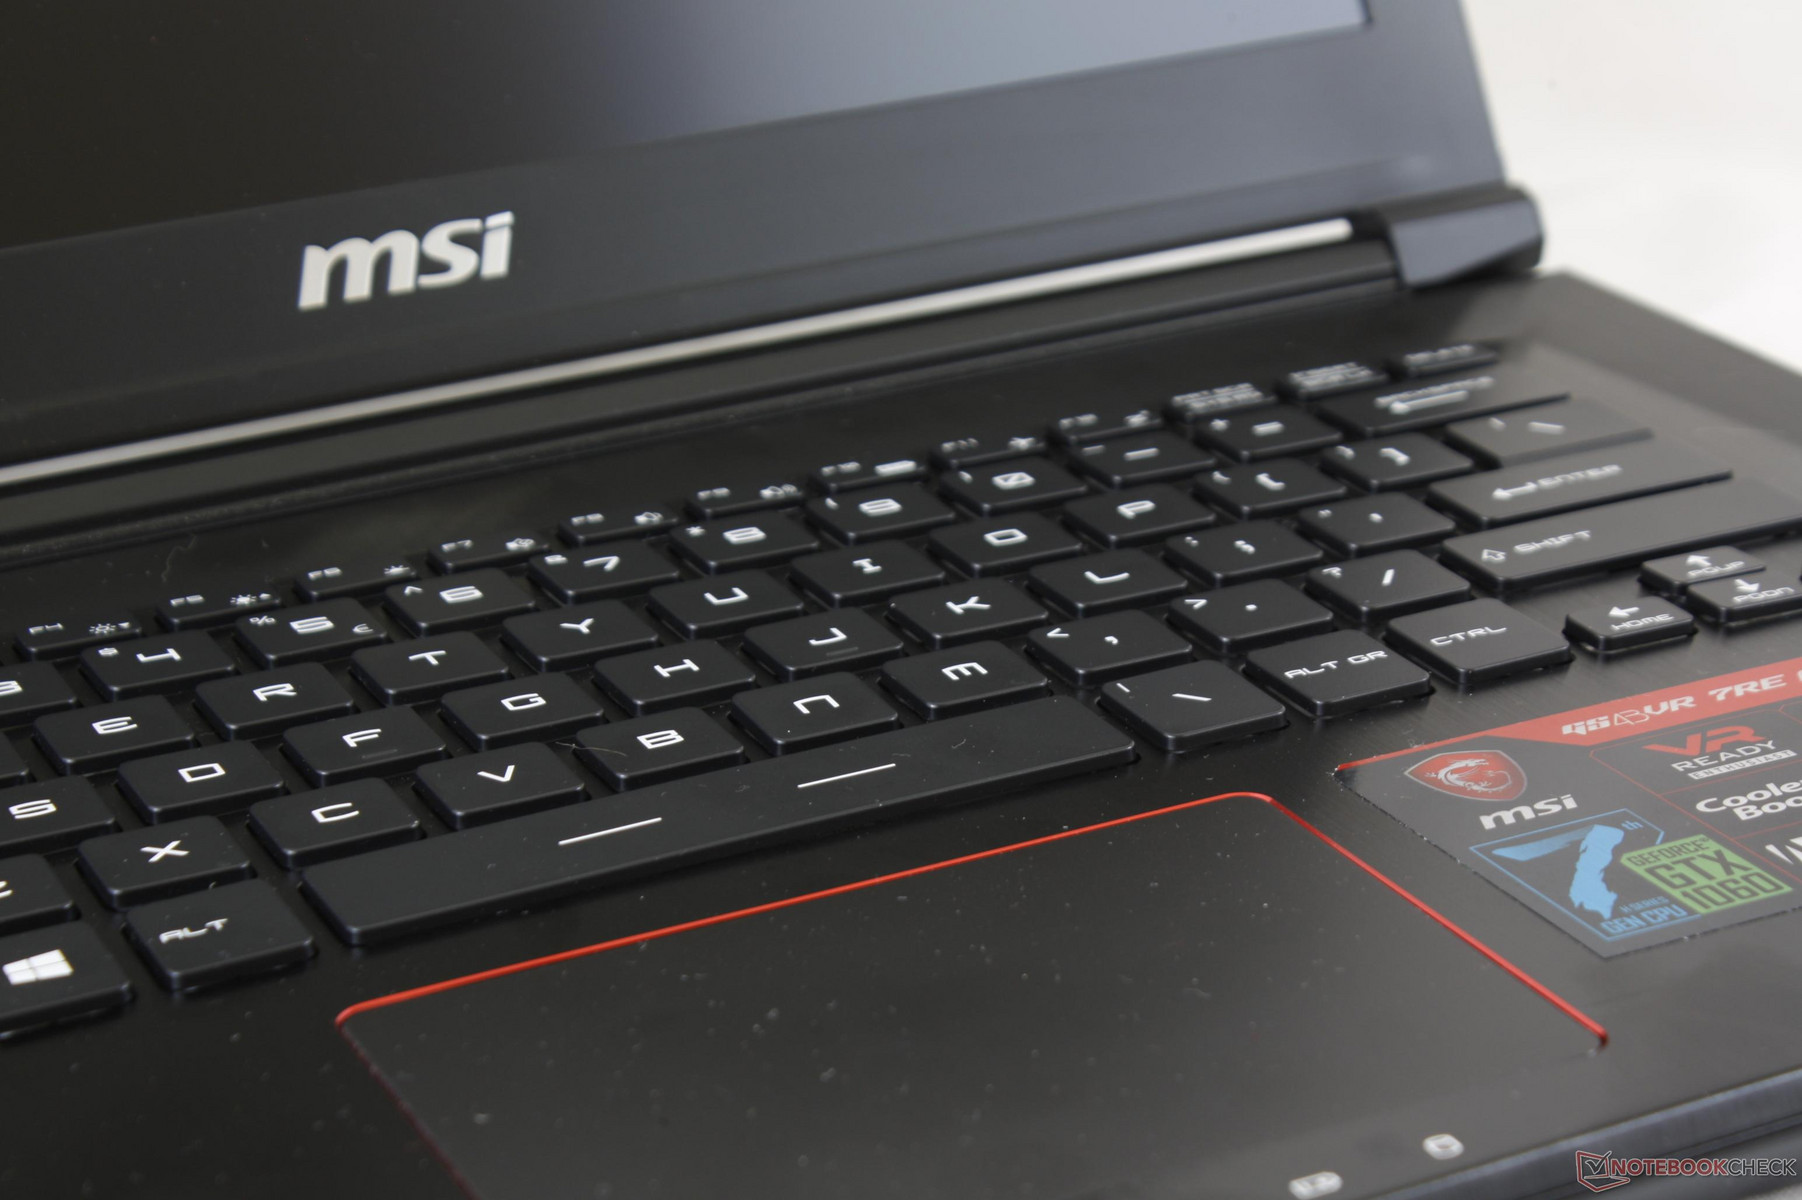
It's immediately apparent that the keyboard keys on the GS43VR offer deeper travel than on the Razer Blade simply because of how much more raised the individual keys are on the MSI. In practice, the keys feel spongier than on the Razer since the base of the MSI flexes more easily when the keys are pressed. The typing experience is a tad quieter and with less clatter as a result.
The two-level red backlight returns unchanged. The rest of MSI's GS, GE, and GT families have been refreshed with multi-zone RGB lights while the GS43VR series has yet to receive the same treatment.
Touchpad
The integrated clickpad (10.5 x 7.0 cm) is smaller than the one on the XPS 15 (10.5 x 8.5 cm) but larger than on the Aorus X3 Plus v7 (10.0 x 7.0 cm). Glide is smooth across the texture-less surface with no cursor jitters or other odd behavior. The Elan software has palm detection automatically enabled and can recognize up to three-finger inputs.
The relatively large surface area is made possible by the use of integrated mouse keys. Clicking on the trackpad surface is shallow in travel and slightly soft in feedback for an adequate feel. Perhaps a more unyielding base would have made for a firmer clickpad as applying pressure on the surface will also warp it slightly. We find it easier to gently tap on the trackpad to input a click instead of forcibly pushing down on the surface each and every time.
Display
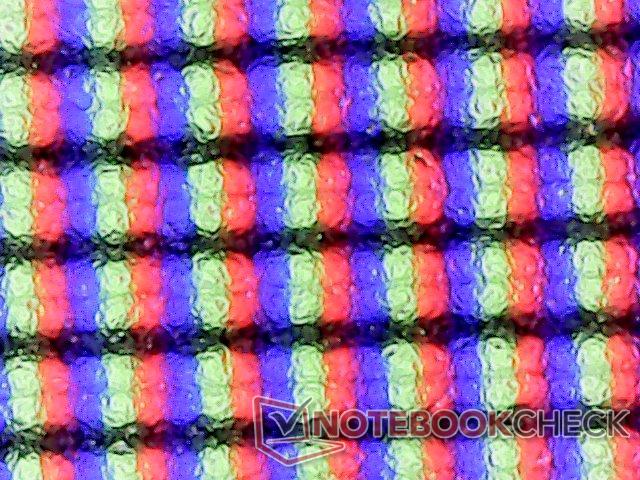
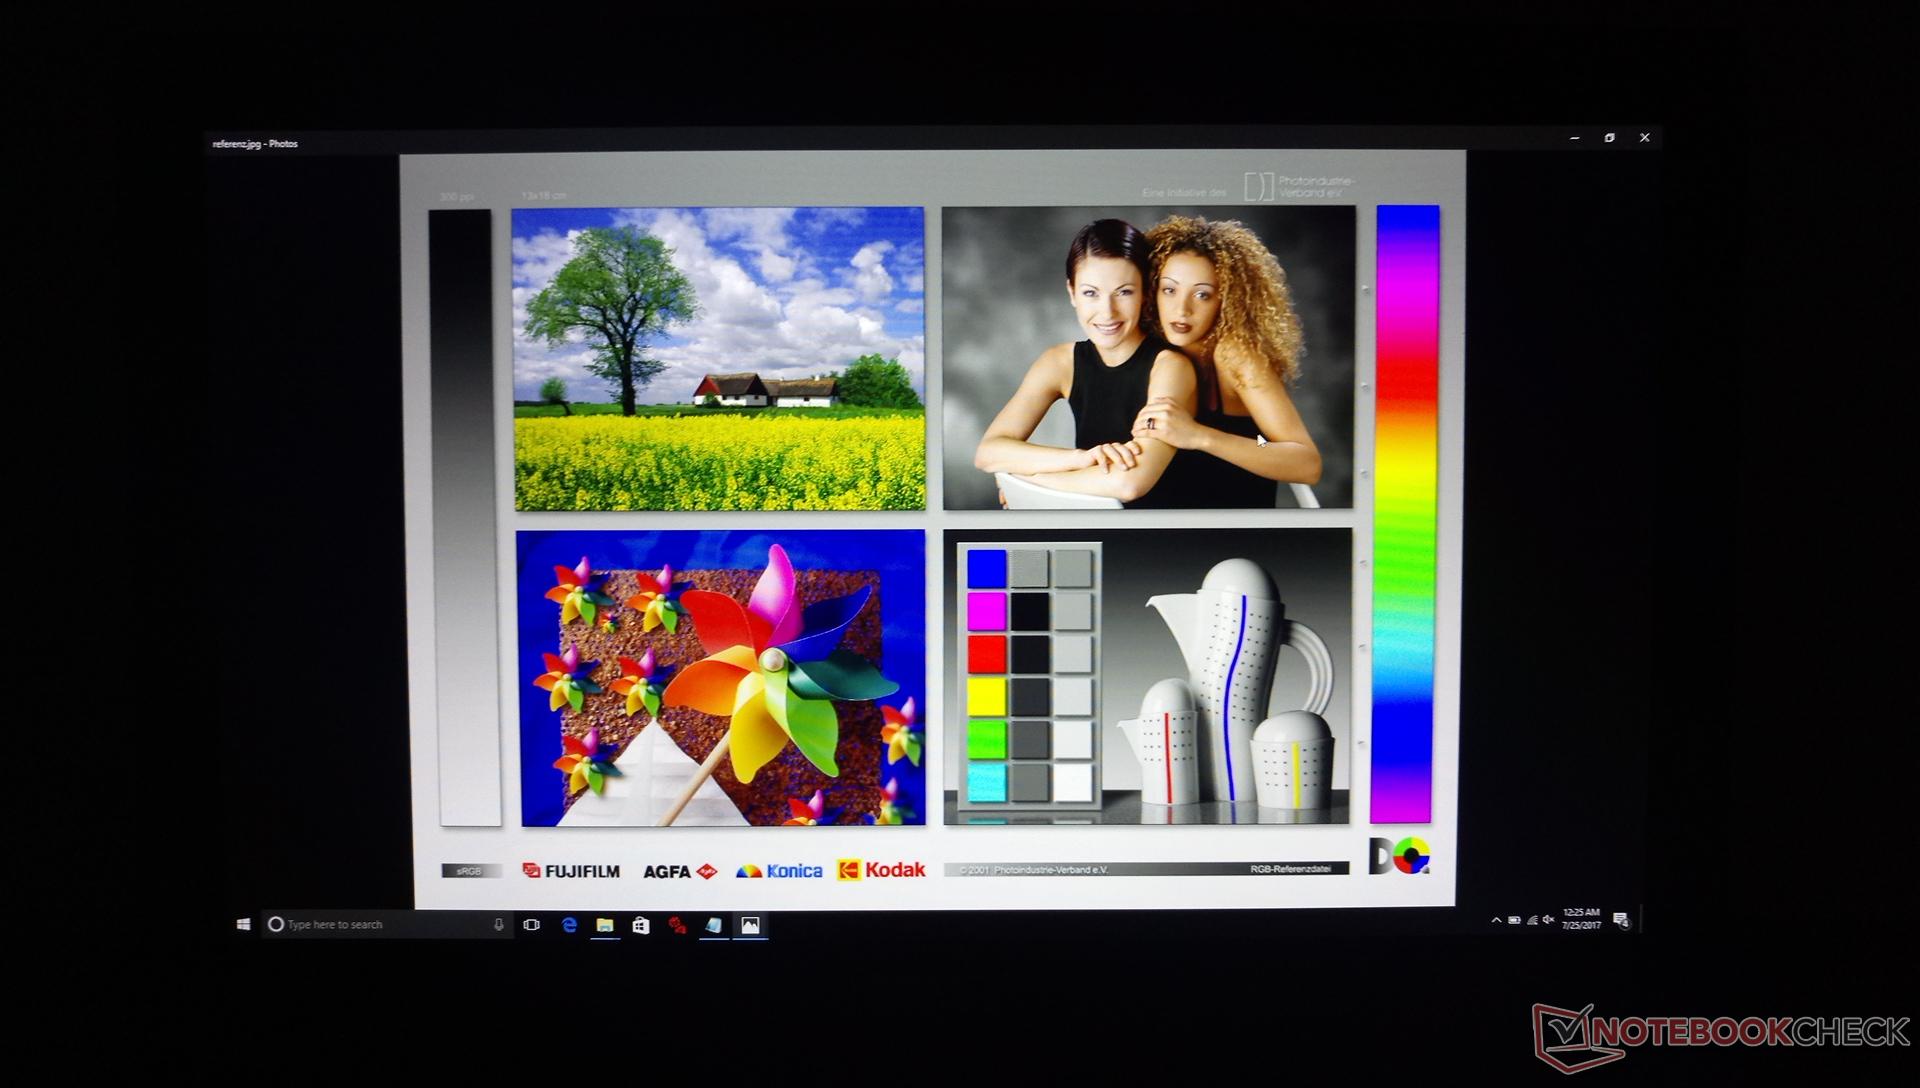
The GS43VR 7RE uses the same matte LG Philips LP140WF3-SPD1 IPS panel as on the Razer Blade 2016 and the older GS43VR 6RE. Colors, contrast, and display quality are all subsequently nearly the same between these three notebooks. Display response times are still different owing to the fact that we have since upgraded our photodiodes and oscilloscope in the past year. Subjectively, the screen is crisp and suffers from no major graininess issues that can sometimes plague matte displays like on the Pavilion 17z or EVGA SC15.
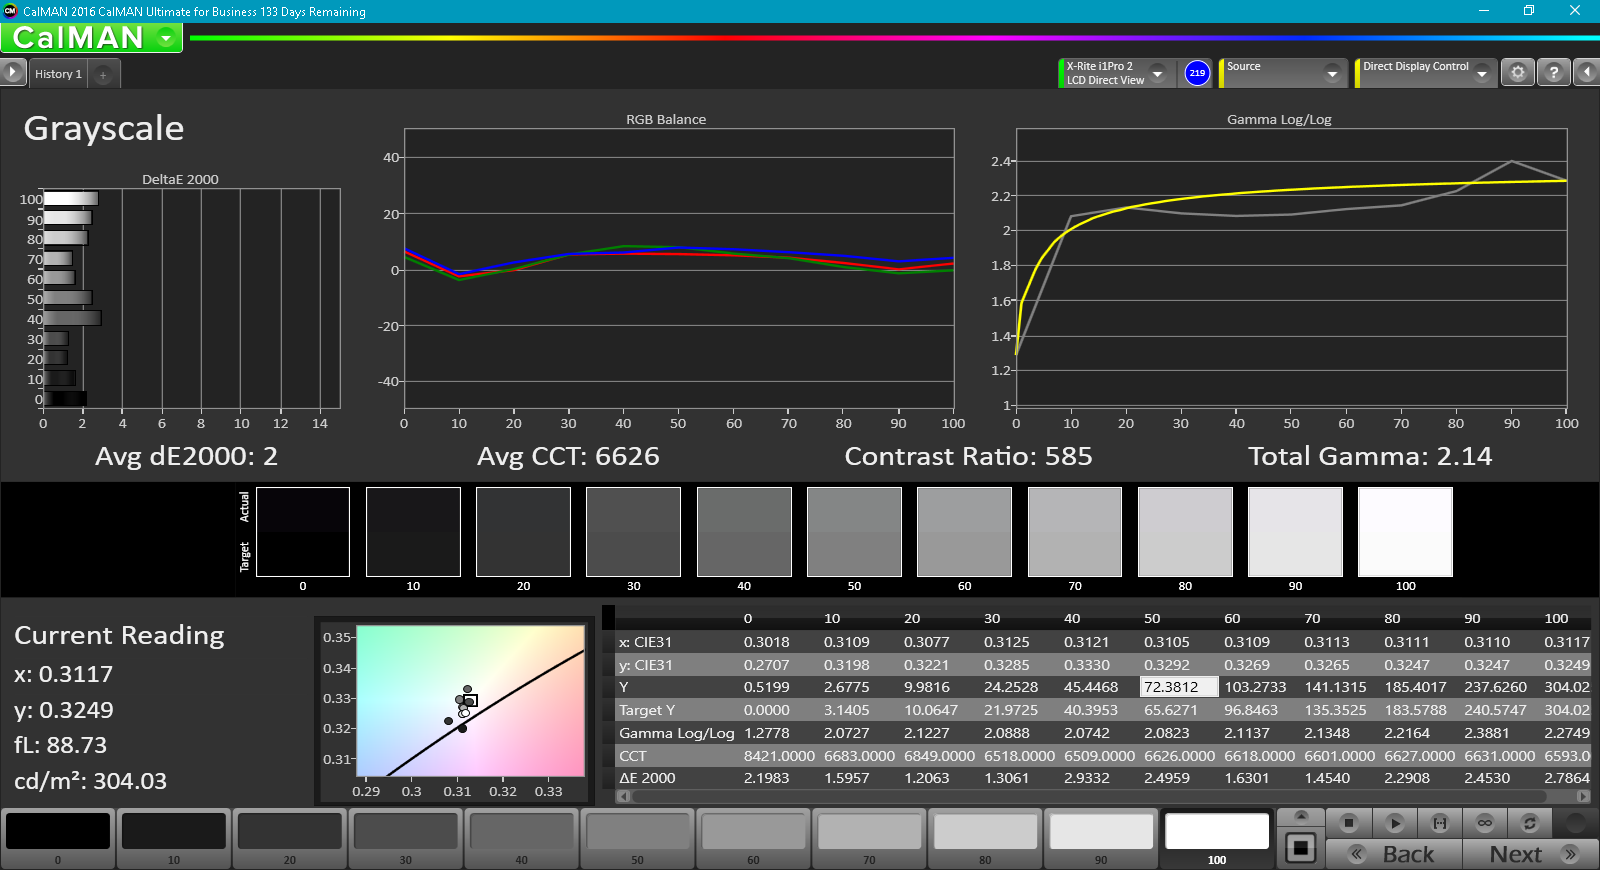
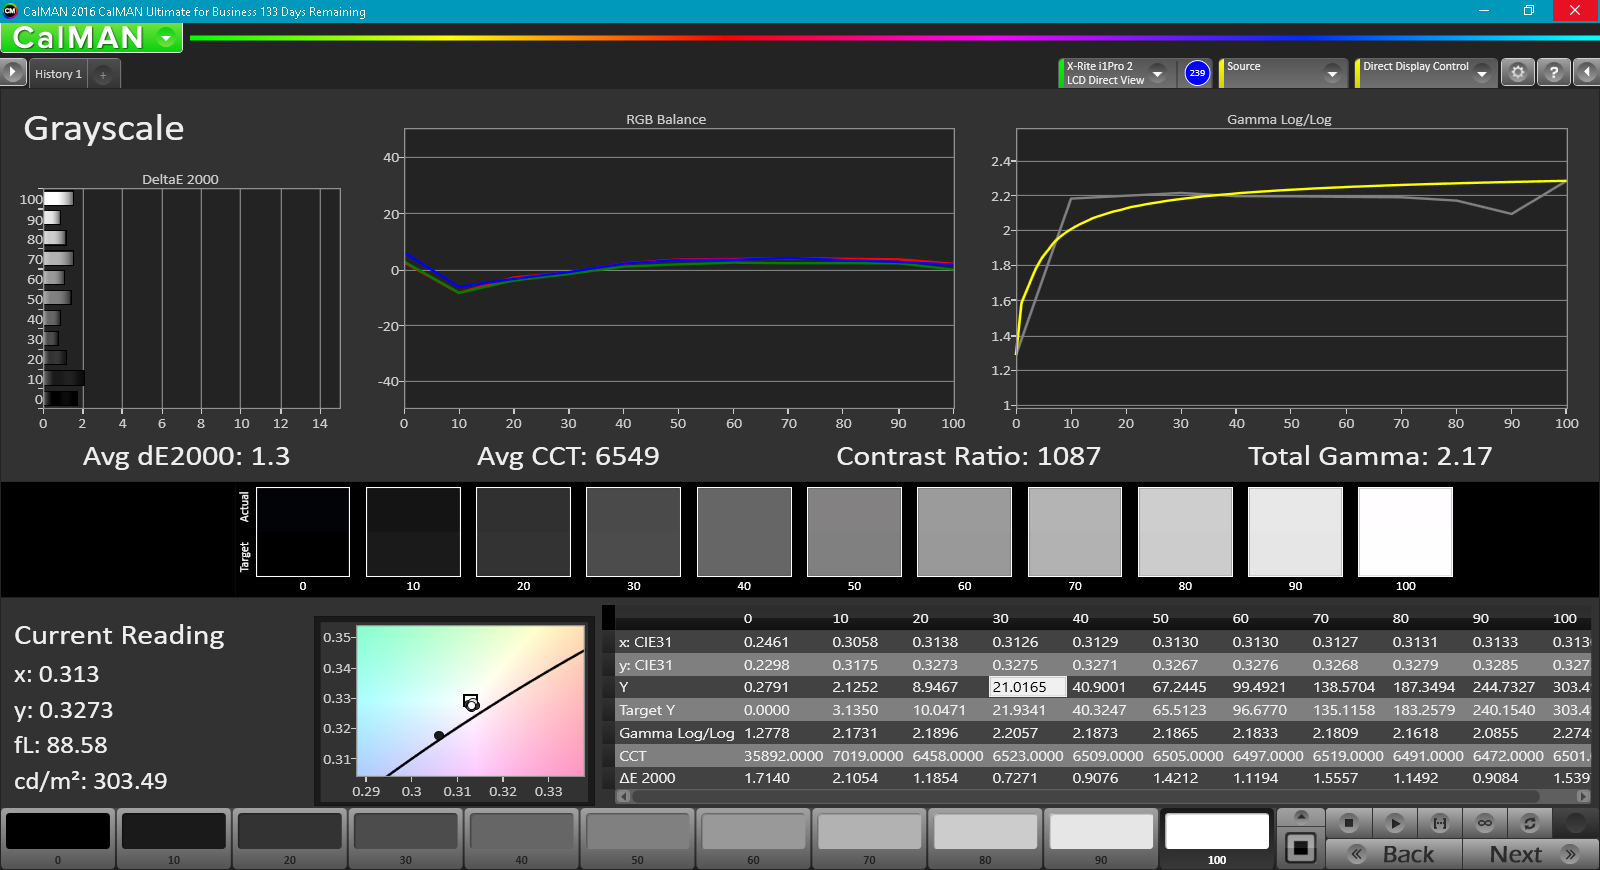
An interesting observation is that the contrast ratio of the GS43VR seems to change significantly before and after a calibration. We reported a contrast ratio of about 800:1 on the GS43VR 6RE and we initially recorded a lower result of 585:1 on the GS43VR 7RE. After calibration, however, contrast ratio jumped to 1095:1 to be very close to the Razer Blade 2016 display. Small contrast ratio changes before and after calibration are common, but a doubling as recorded here very strange. We performed the test twice just to double check and the results were repeatable.
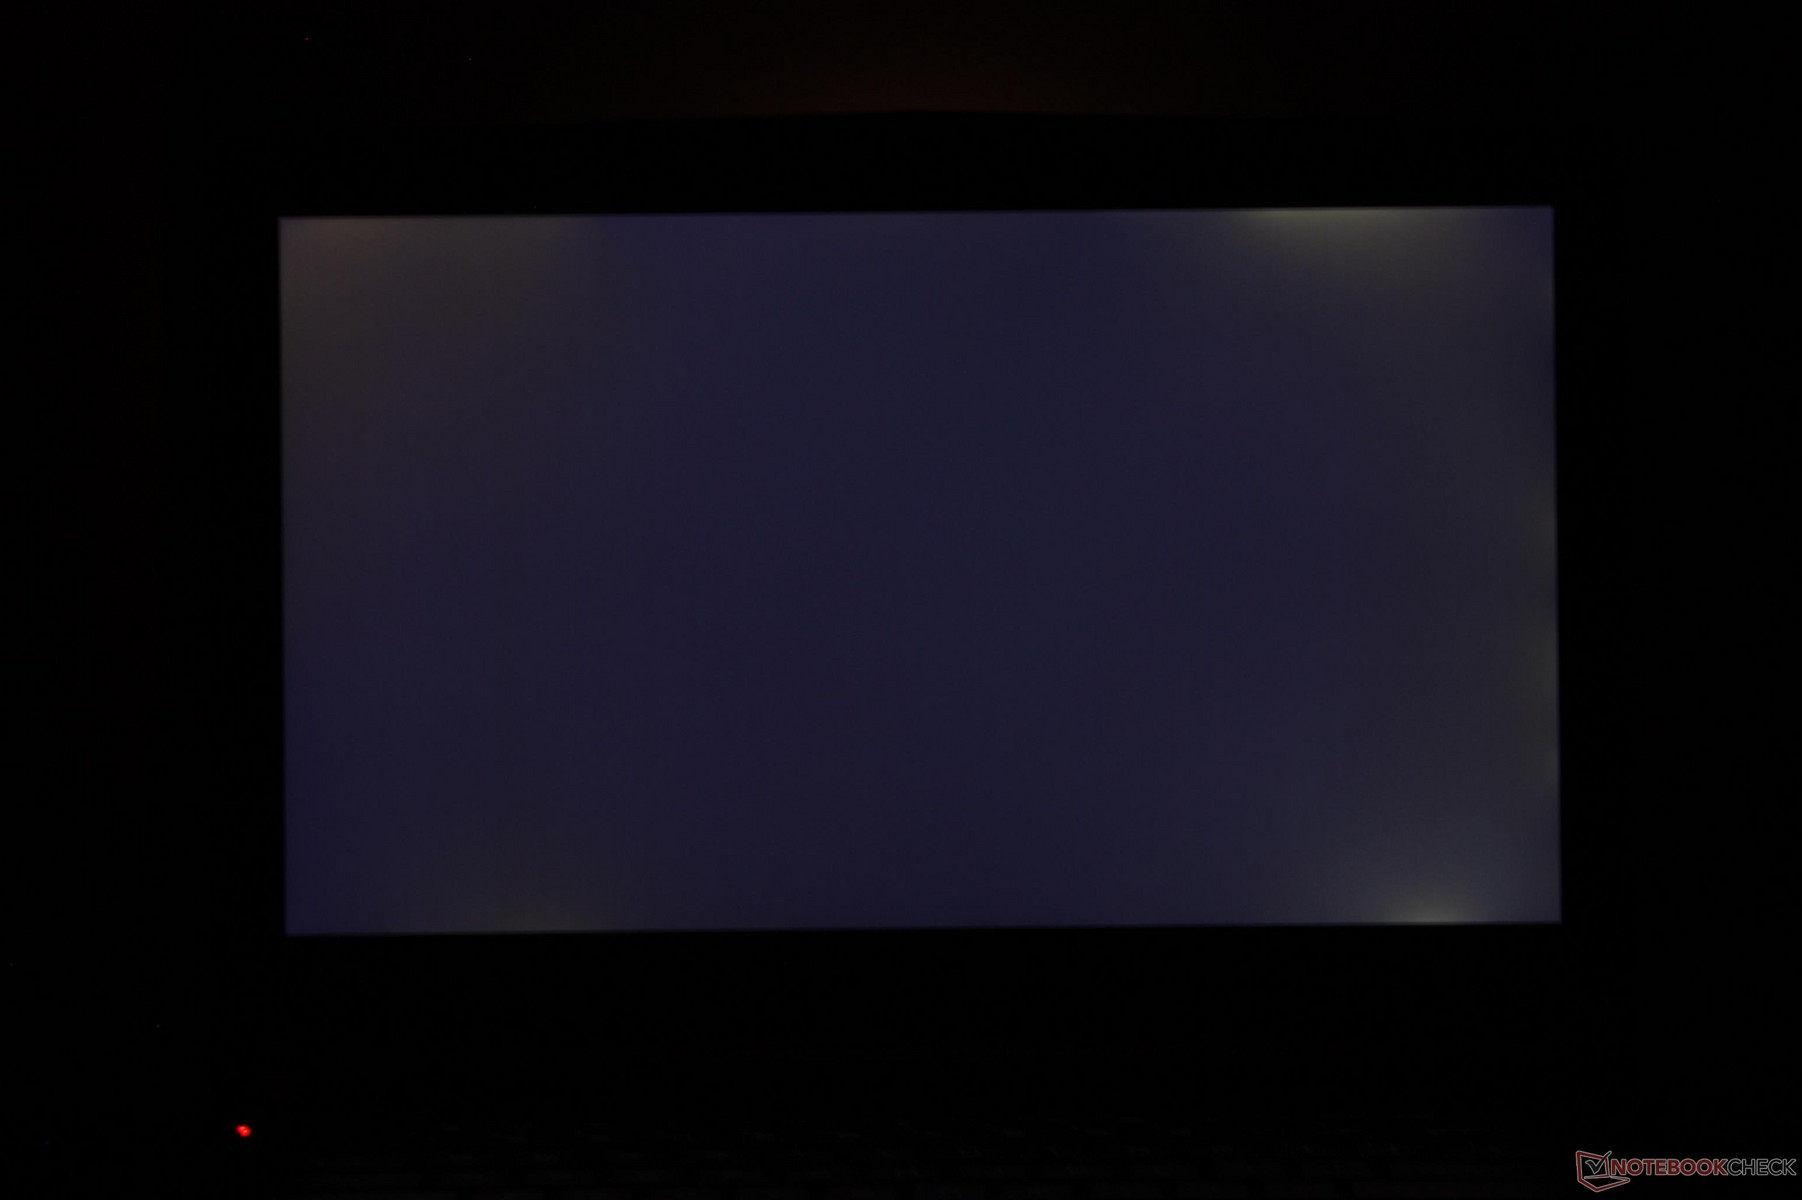
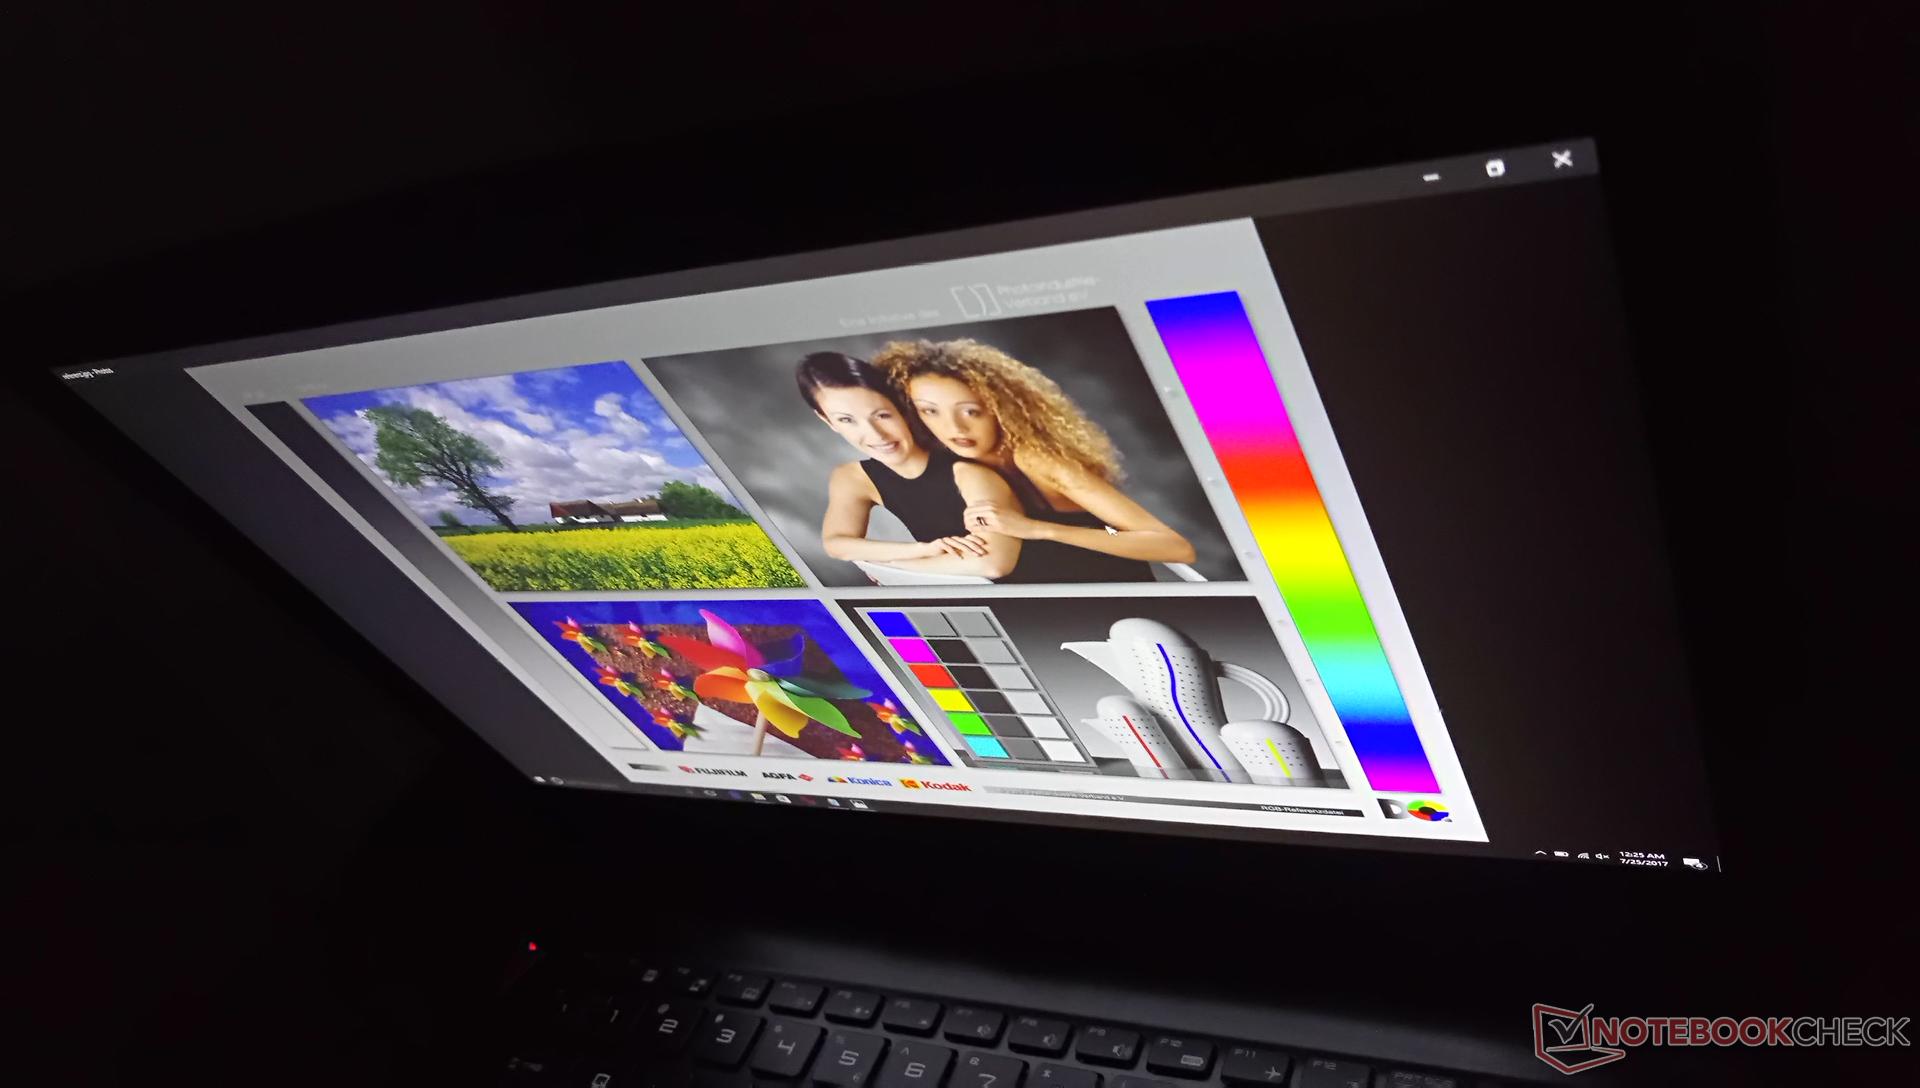
Uneven backlight bleeding is unfortunately more prominent on our GS43VR 7RE unit than our GS43VR 6RE. The light is most apparent when playing movies with black borders or games with darkened scenes but is otherwise trivial when web browsing or word processing.
Interesting, the GS43VR 7RE exhibits PWM on all brightness levels up to 99 percent while our GS43VR 6RE unit did not. The frequency is nonetheless very high and so most users are not likely to be bothered by it.
| |||||||||||||||||||||||||
Brightness Distribution: 86 %
Center on Battery: 306.6 cd/m²
Contrast: 1095:1 (Black: 0.28 cd/m²)
ΔE ColorChecker Calman: 3.9 | ∀{0.5-29.43 Ø4.71}
ΔE Greyscale Calman: 2 | ∀{0.09-98 Ø4.96}
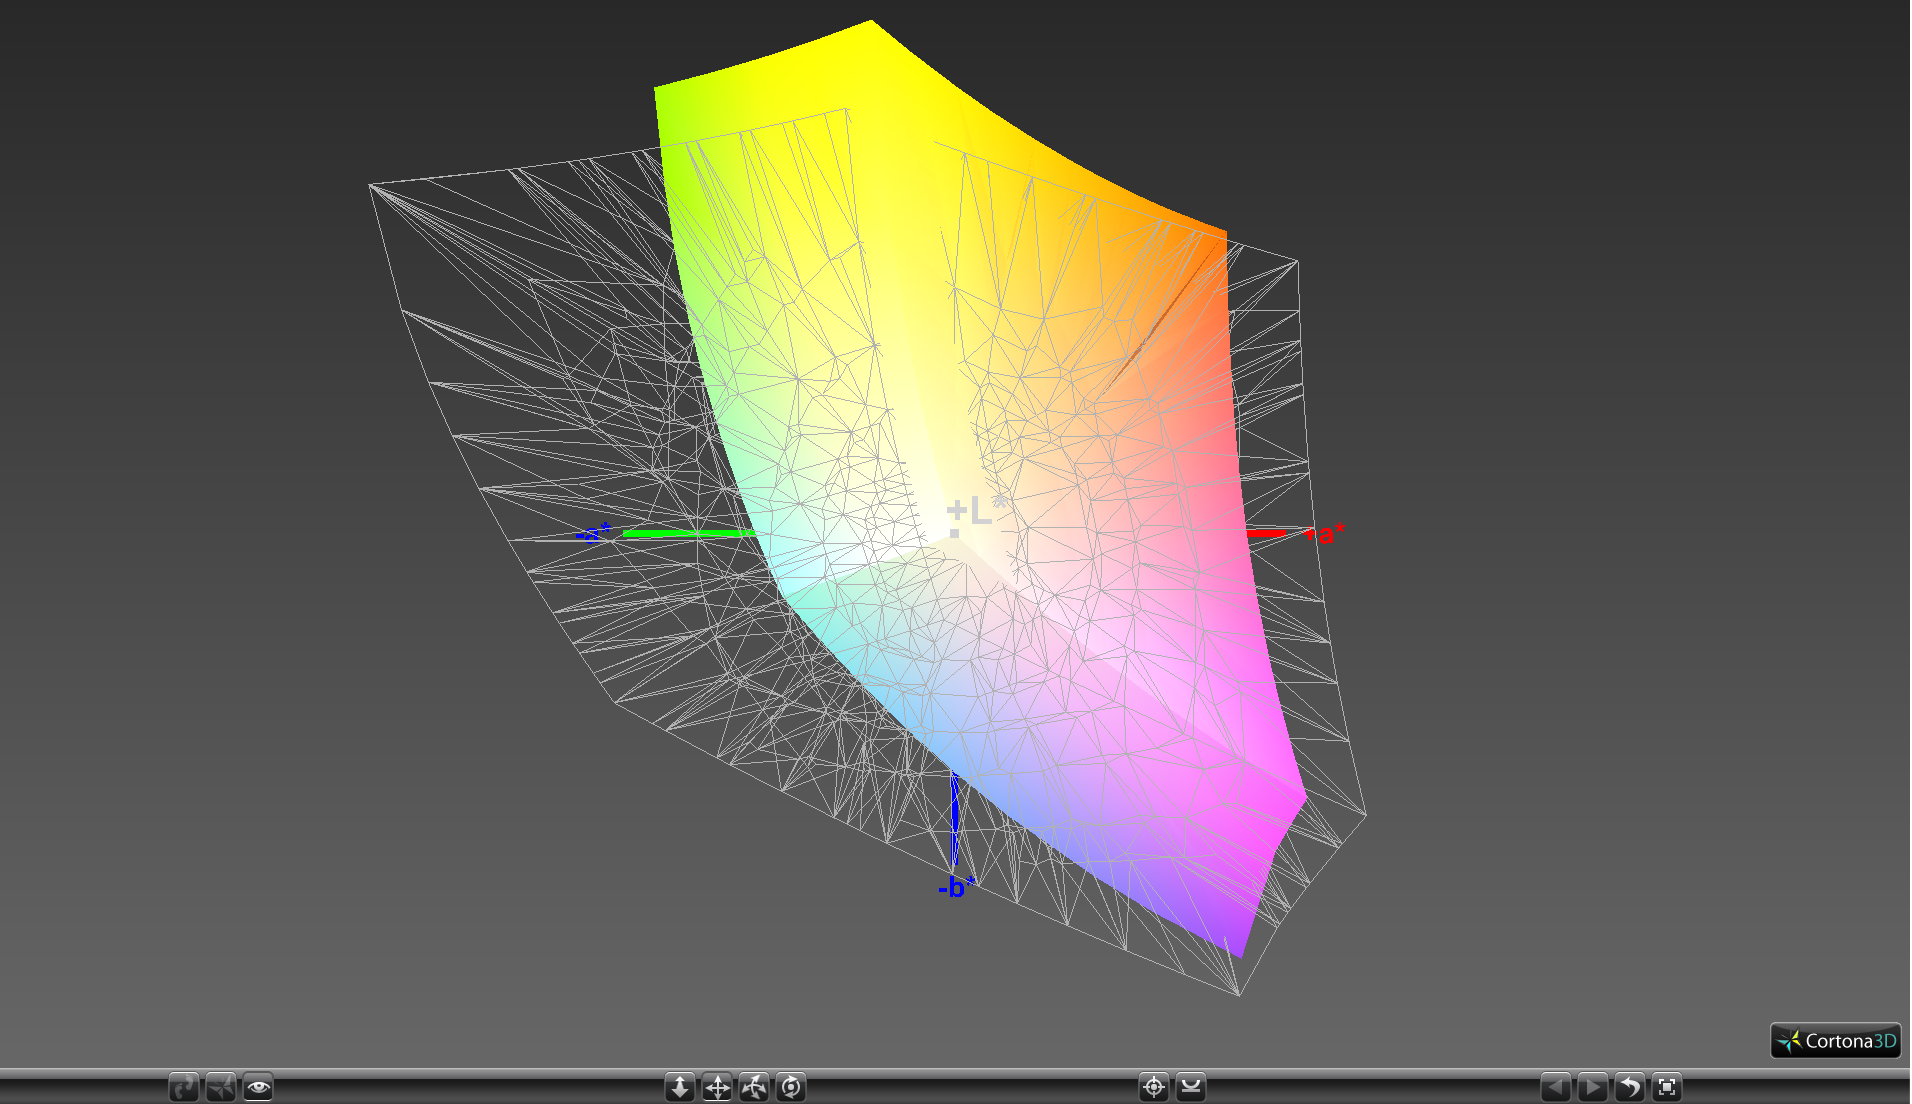
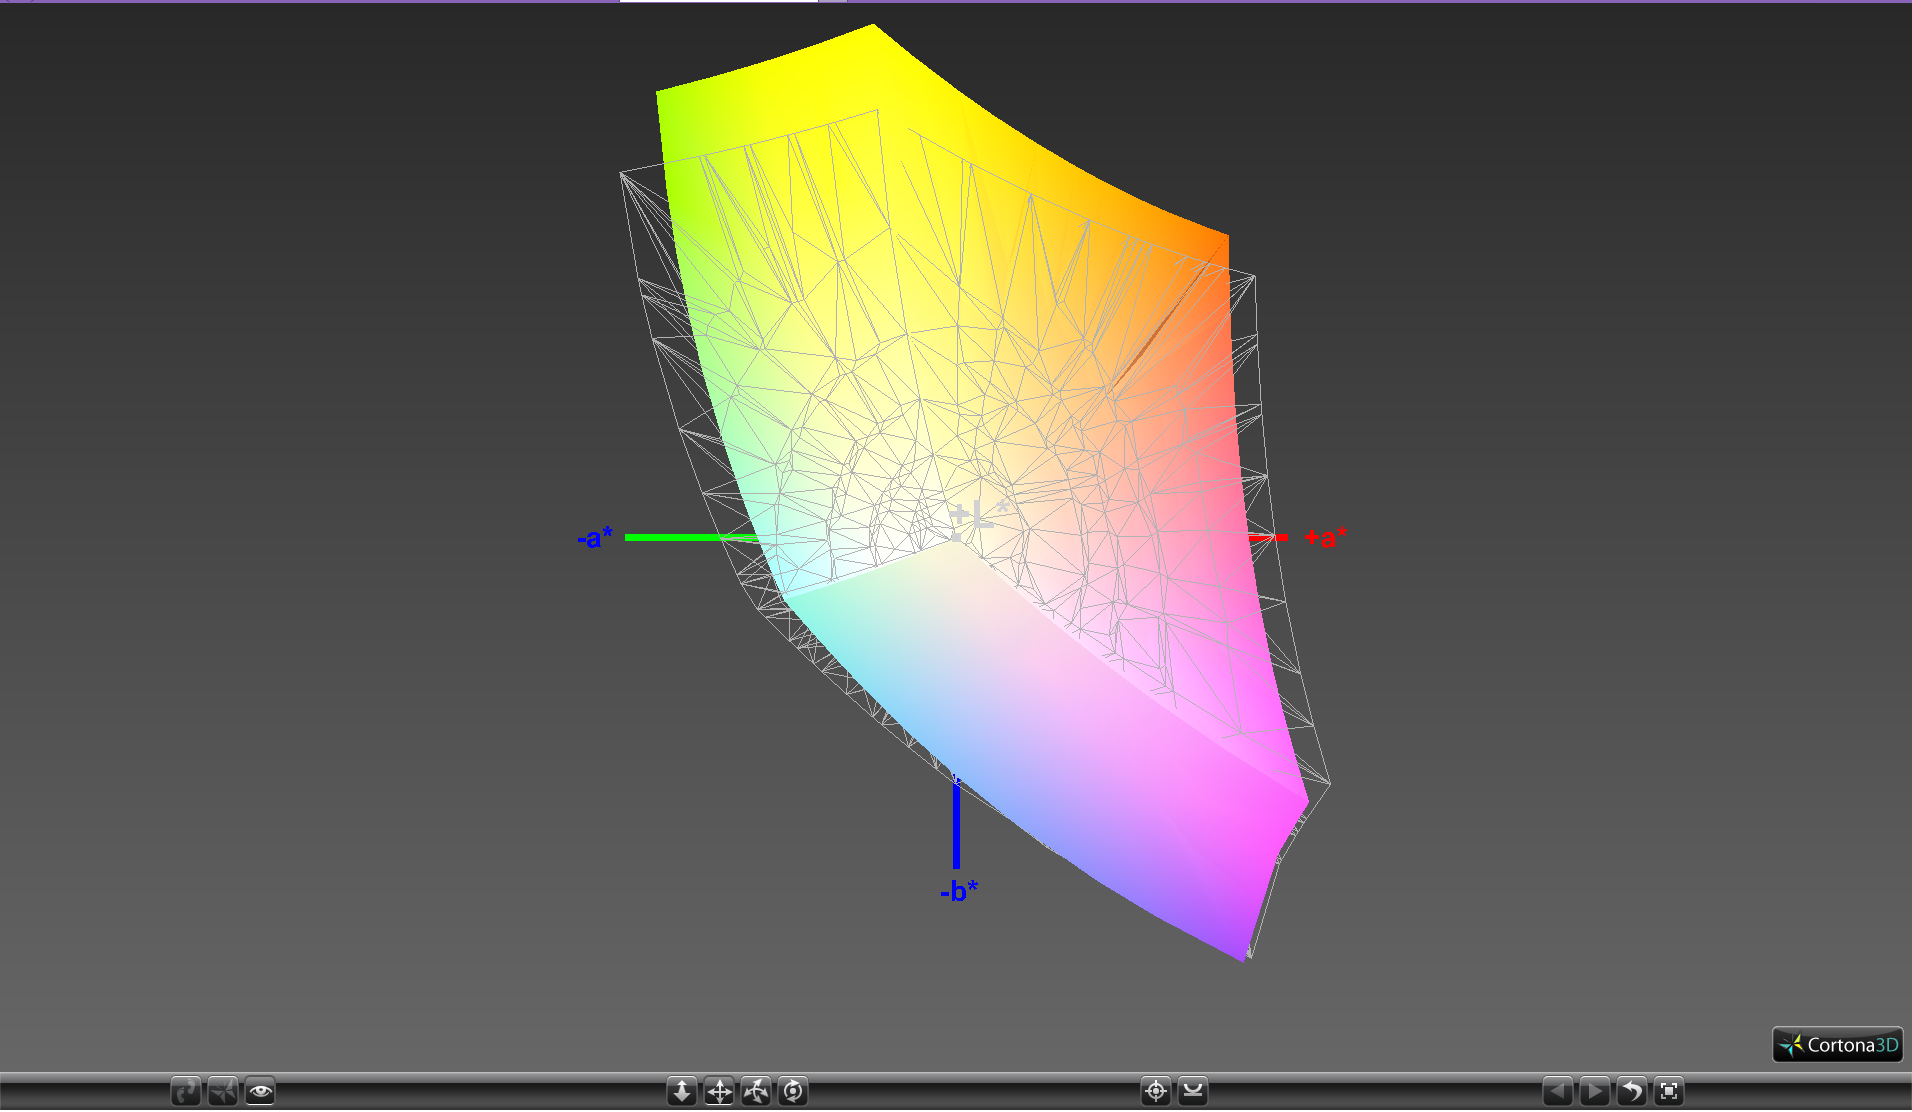
86.1% sRGB (Argyll 1.6.3 3D)
56.1% AdobeRGB 1998 (Argyll 1.6.3 3D)
62.8% AdobeRGB 1998 (Argyll 3D)
85.9% sRGB (Argyll 3D)
66.3% Display P3 (Argyll 3D)
Gamma: 2.14
CCT: 6626 K
| MSI GS43VR 7RE-069US ID: LGD046D, Name: LG Philips LP140WF3-SPD1, IPS, 14", 1920x1080 | MSI GS43VR 6RE-006US Name: LG Philips LP140WF3-SPD1, ID: LGD046D, IPS, 14", 1920x1080 | Razer Blade (2016) FHD LG Philips LP140WF3-SPD1 (LGD046D), IPS, 14", 1920x1080 | Aorus x3 Plus v7 Sharp SHP1401, IGZO TFT, 13.9", 3200x1800 | Apple MacBook Pro 15 2016 (2.6 GHz, 450) IPS, 15.4", 2880x1800 | Asus Zephyrus GX501 AUO B156HAN04.2 (AUO42ED), IPS, 15.6", 1920x1080 | |
|---|---|---|---|---|---|---|
| Display | 0% | -3% | 6% | 3% | ||
| Display P3 Coverage (%) | 66.3 | 65.5 -1% | 65.2 -2% | 66.1 0% | 64.8 -2% | |
| sRGB Coverage (%) | 85.9 | 86.4 1% | 83.4 -3% | 96.5 12% | 91.8 7% | |
| AdobeRGB 1998 Coverage (%) | 62.8 | 63.1 0% | 60.9 -3% | 67.5 7% | 65.9 5% | |
| Response Times | -14% | -42% | -24% | -57% | -27% | |
| Response Time Grey 50% / Grey 80% * (ms) | 31.6 ? | 31.6 ? -0% | 47 ? -49% | 38 ? -20% | 47.3 ? -50% | 40.4 ? -28% |
| Response Time Black / White * (ms) | 19.2 ? | 24.4 ? -27% | 26 ? -35% | 24.4 ? -27% | 31.2 ? -63% | 24 ? -25% |
| PWM Frequency (Hz) | 21190 ? | 201.6 ? | 117000 ? | |||
| Screen | 3% | -15% | 12% | 37% | -23% | |
| Brightness middle (cd/m²) | 306.6 | 288.4 -6% | 272 -11% | 348 14% | 483 58% | 328 7% |
| Brightness (cd/m²) | 291 | 282 -3% | 277 -5% | 359 23% | 465 60% | 305 5% |
| Brightness Distribution (%) | 86 | 83 -3% | 84 -2% | 73 -15% | 92 7% | 83 -3% |
| Black Level * (cd/m²) | 0.28 | 0.35 -25% | 0.26 7% | 0.29 -4% | 0.33 -18% | 0.25 11% |
| Contrast (:1) | 1095 | 824 -25% | 1046 -4% | 1200 10% | 1464 34% | 1312 20% |
| Colorchecker dE 2000 * | 3.9 | 2.61 33% | 4.59 -18% | 2.4 38% | 1.4 64% | 6.02 -54% |
| Colorchecker dE 2000 max. * | 9 | 7.34 18% | 8.49 6% | 5.1 43% | 3 67% | 10.14 -13% |
| Greyscale dE 2000 * | 2 | 1.18 41% | 4.28 -114% | 2.3 -15% | 1.5 25% | 6.32 -216% |
| Gamma | 2.14 103% | 2.24 98% | 2.23 99% | 2.21 100% | 2.34 94% | 2.28 96% |
| CCT | 6626 98% | 6506 100% | 6848 95% | 6206 105% | 6650 98% | 8194 79% |
| Color Space (Percent of AdobeRGB 1998) (%) | 56.1 | 56.4 1% | 55 -2% | 62 11% | 60 7% | |
| Color Space (Percent of sRGB) (%) | 86.1 | 86.4 0% | 83 -4% | 96 11% | 92 7% | |
| Total Average (Program / Settings) | -4% /
0% | -20% /
-16% | -2% /
6% | -10% /
18% | -16% /
-18% |
* ... smaller is better
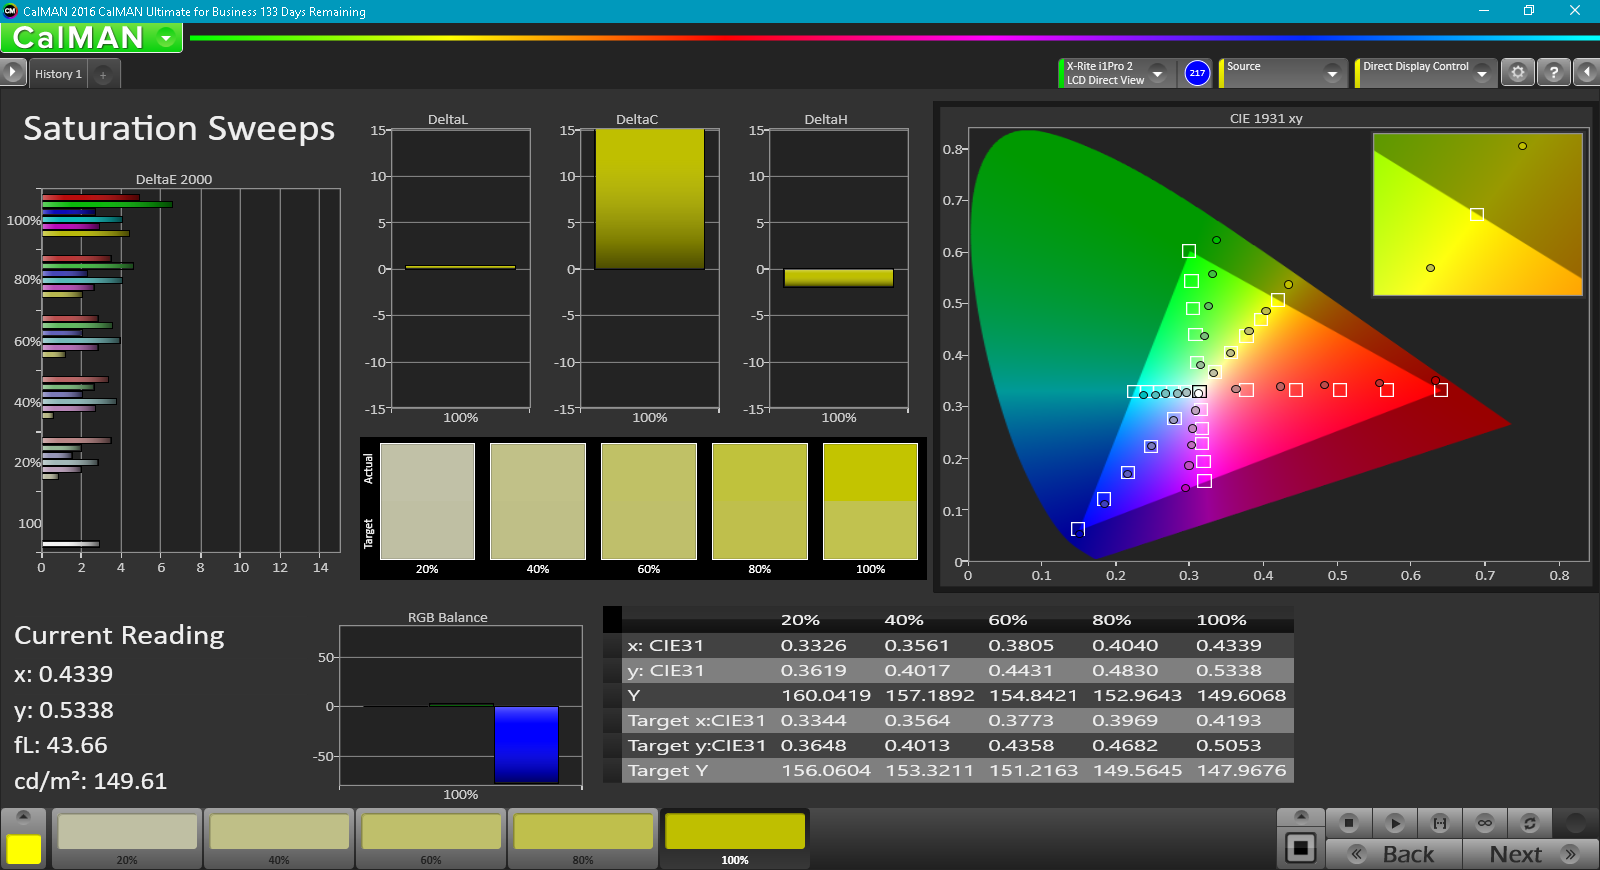
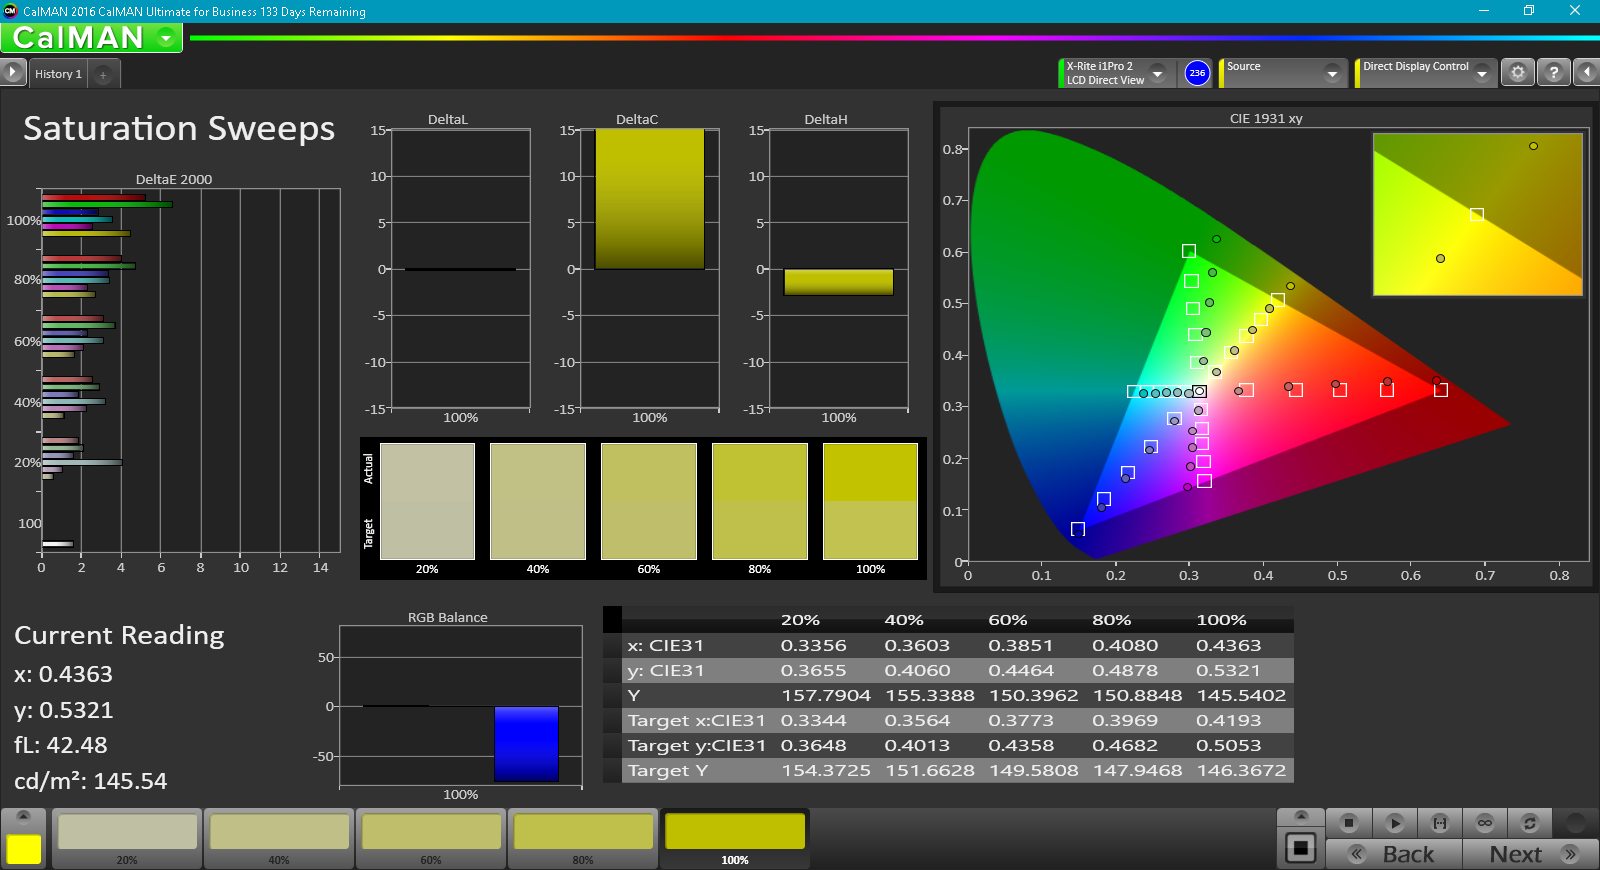
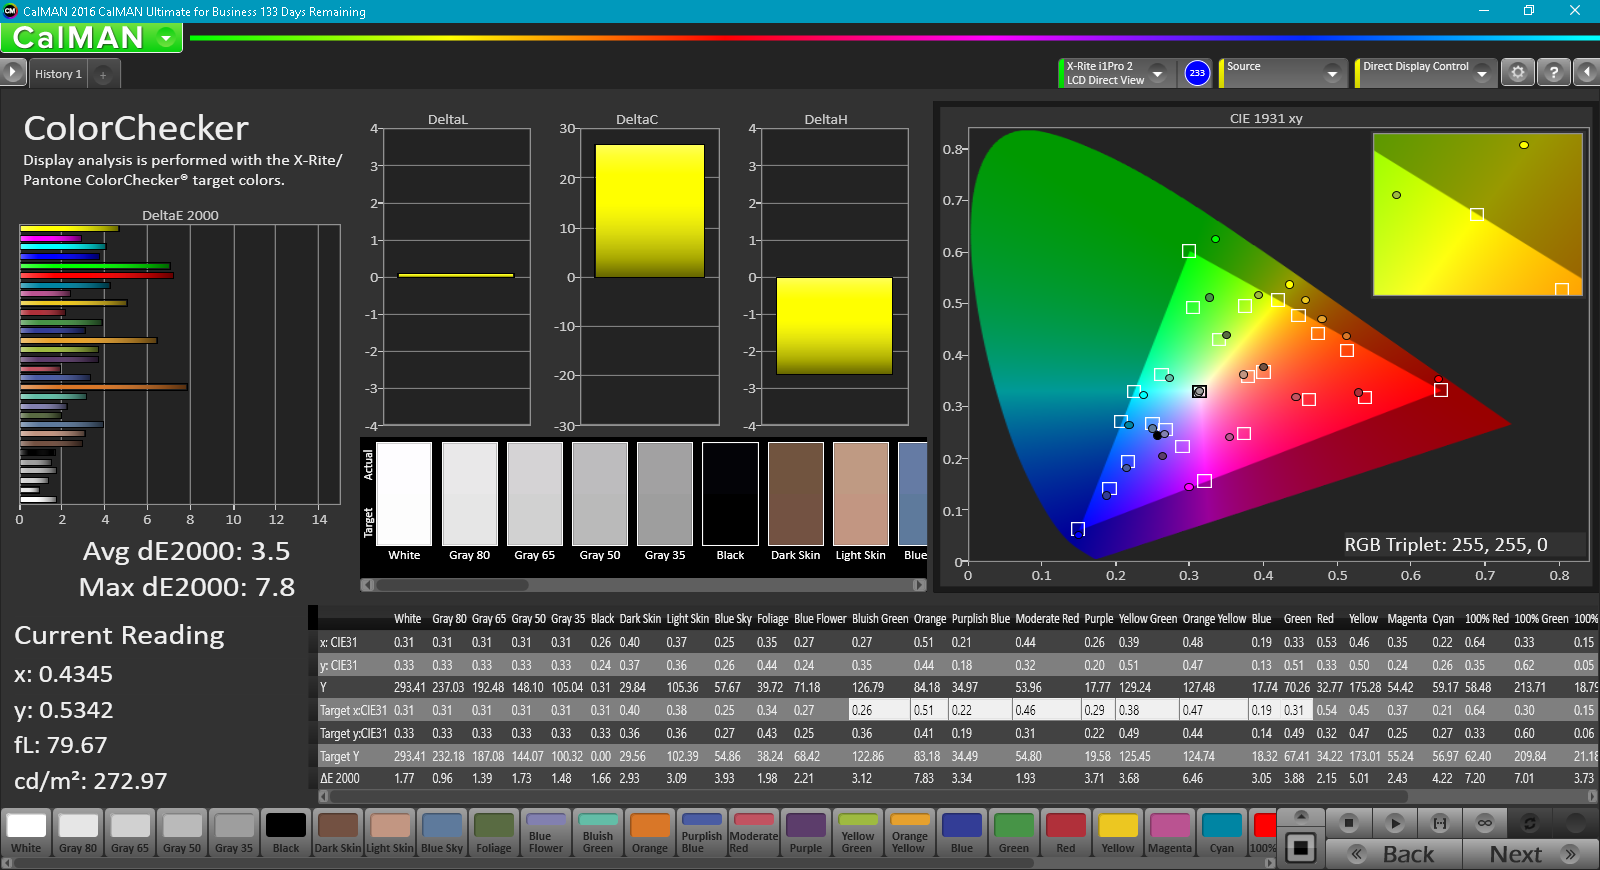
MSI advertises "exceptional color fidelity of close to 100% sRGB" and our own independent measurement shows an actual sRGB coverage of around 86 percent. Whether or not this is "close" enough for professional graphics work will depend on the user, but there are plenty of other notebooks available with wider sRGB coverage like the XPS 13, Toshiba P50T, or Aorus X3 with Sharp IGZO panels if color accuracy is truly a concern.

Further measurements with an X-Rite spectrophotometer reveal generally accurate grayscale and colors out of the box. Though a calibration will only improve DeltaE values just slightly, we recommend it regardless because of the increase in contrast ratio it brings.

Display Response Times
| ↔ Response Time Black to White | ||
|---|---|---|
| 19.2 ms ... rise ↗ and fall ↘ combined | ↗ 10 ms rise |  |
| ↘ 9.2 ms fall | ||
| The screen shows good response rates in our tests, but may be too slow for competitive gamers. In comparison, all tested devices range from 0.1 (minimum) to 240 (maximum) ms. » 43 % of all devices are better. This means that the measured response time is similar to the average of all tested devices (19.8 ms). | ||
| ↔ Response Time 50% Grey to 80% Grey | ||
| 31.6 ms ... rise ↗ and fall ↘ combined | ↗ 15.6 ms rise | 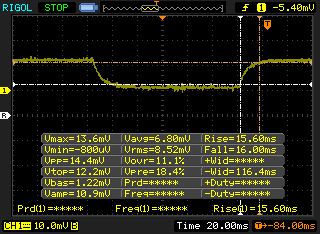 |
| ↘ 16 ms fall | ||
| The screen shows slow response rates in our tests and will be unsatisfactory for gamers. In comparison, all tested devices range from 0.165 (minimum) to 636 (maximum) ms. » 43 % of all devices are better. This means that the measured response time is similar to the average of all tested devices (30.9 ms). | ||
Screen Flickering / PWM (Pulse-Width Modulation)
| Screen flickering / PWM detected | 21190 Hz | ≤ 99 % brightness setting | 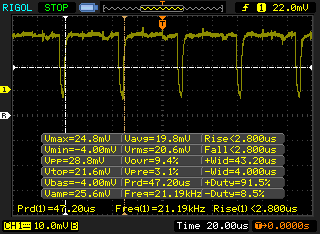 |
The display backlight flickers at 21190 Hz (worst case, e.g., utilizing PWM) Flickering detected at a brightness setting of 99 % and below. There should be no flickering or PWM above this brightness setting. The frequency of 21190 Hz is quite high, so most users sensitive to PWM should not notice any flickering. In comparison: 52 % of all tested devices do not use PWM to dim the display. If PWM was detected, an average of 7748 (minimum: 5 - maximum: 343500) Hz was measured. | |||
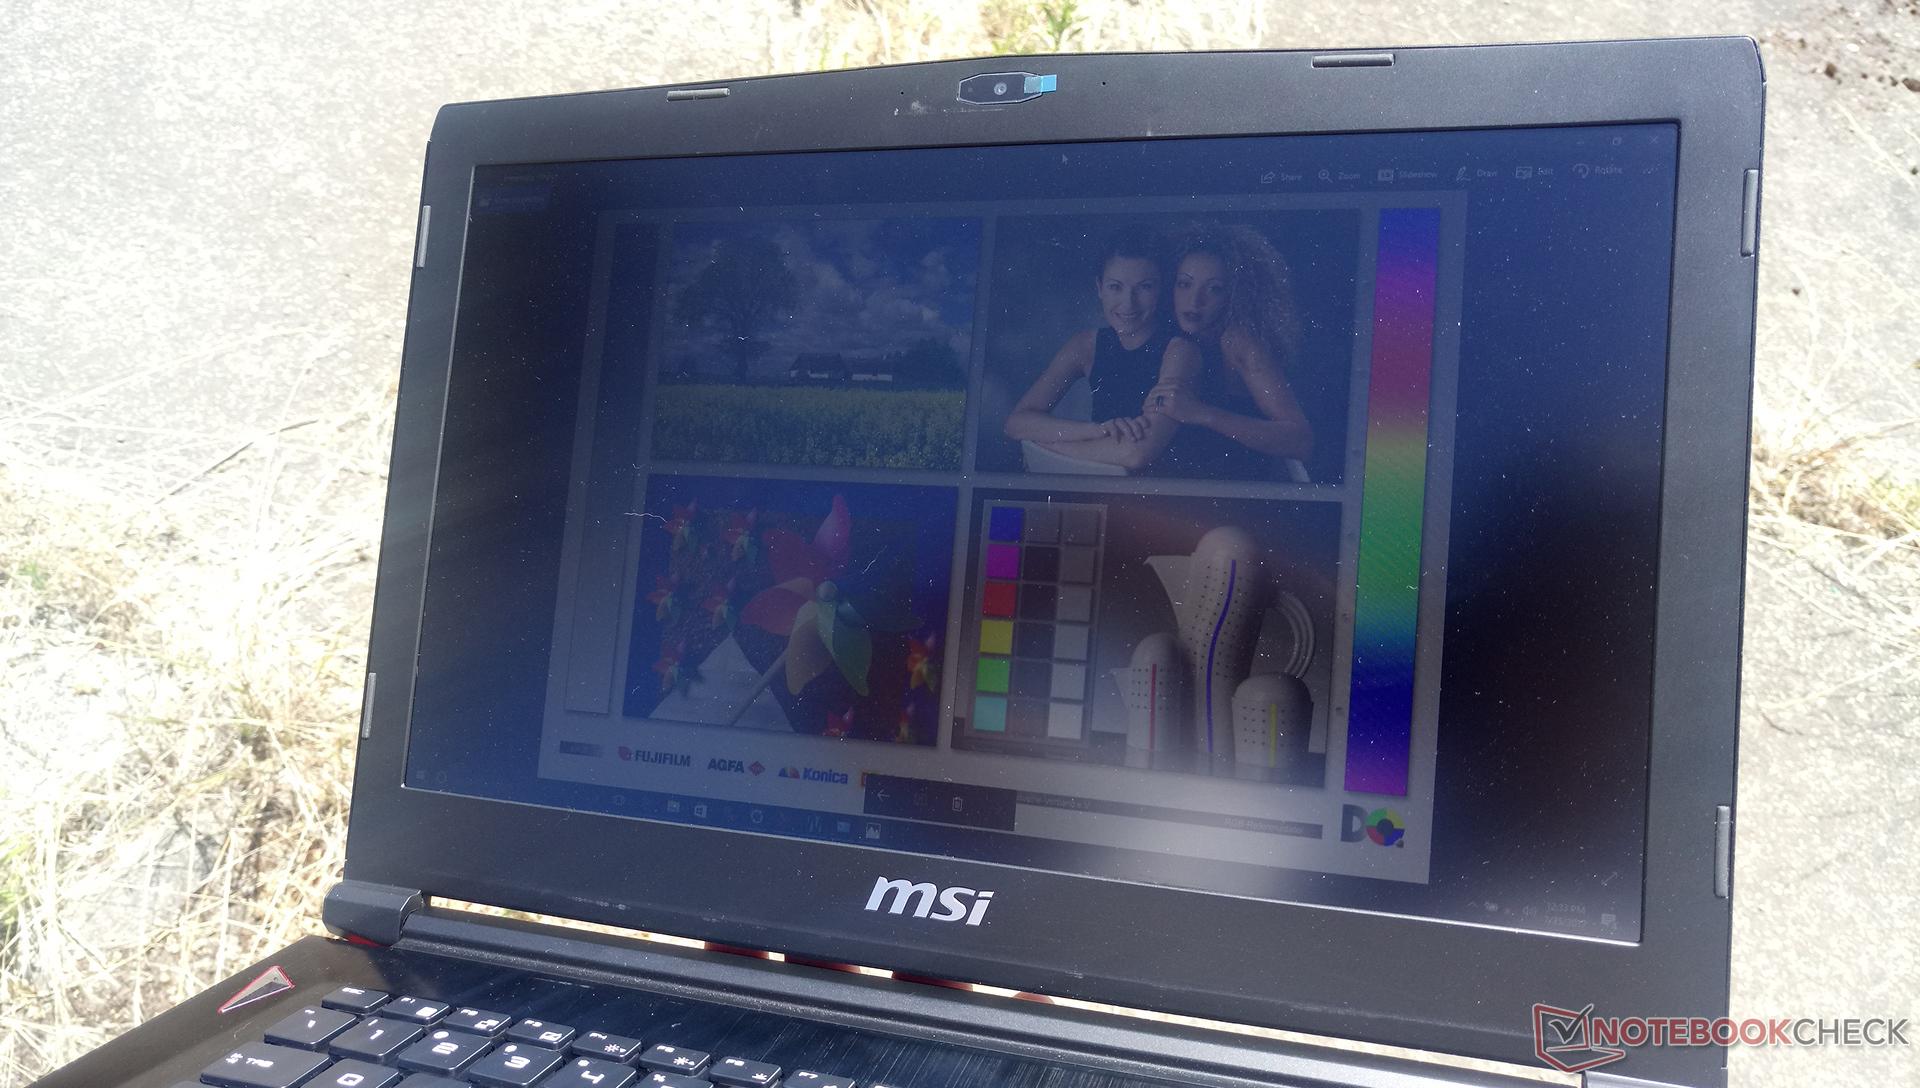
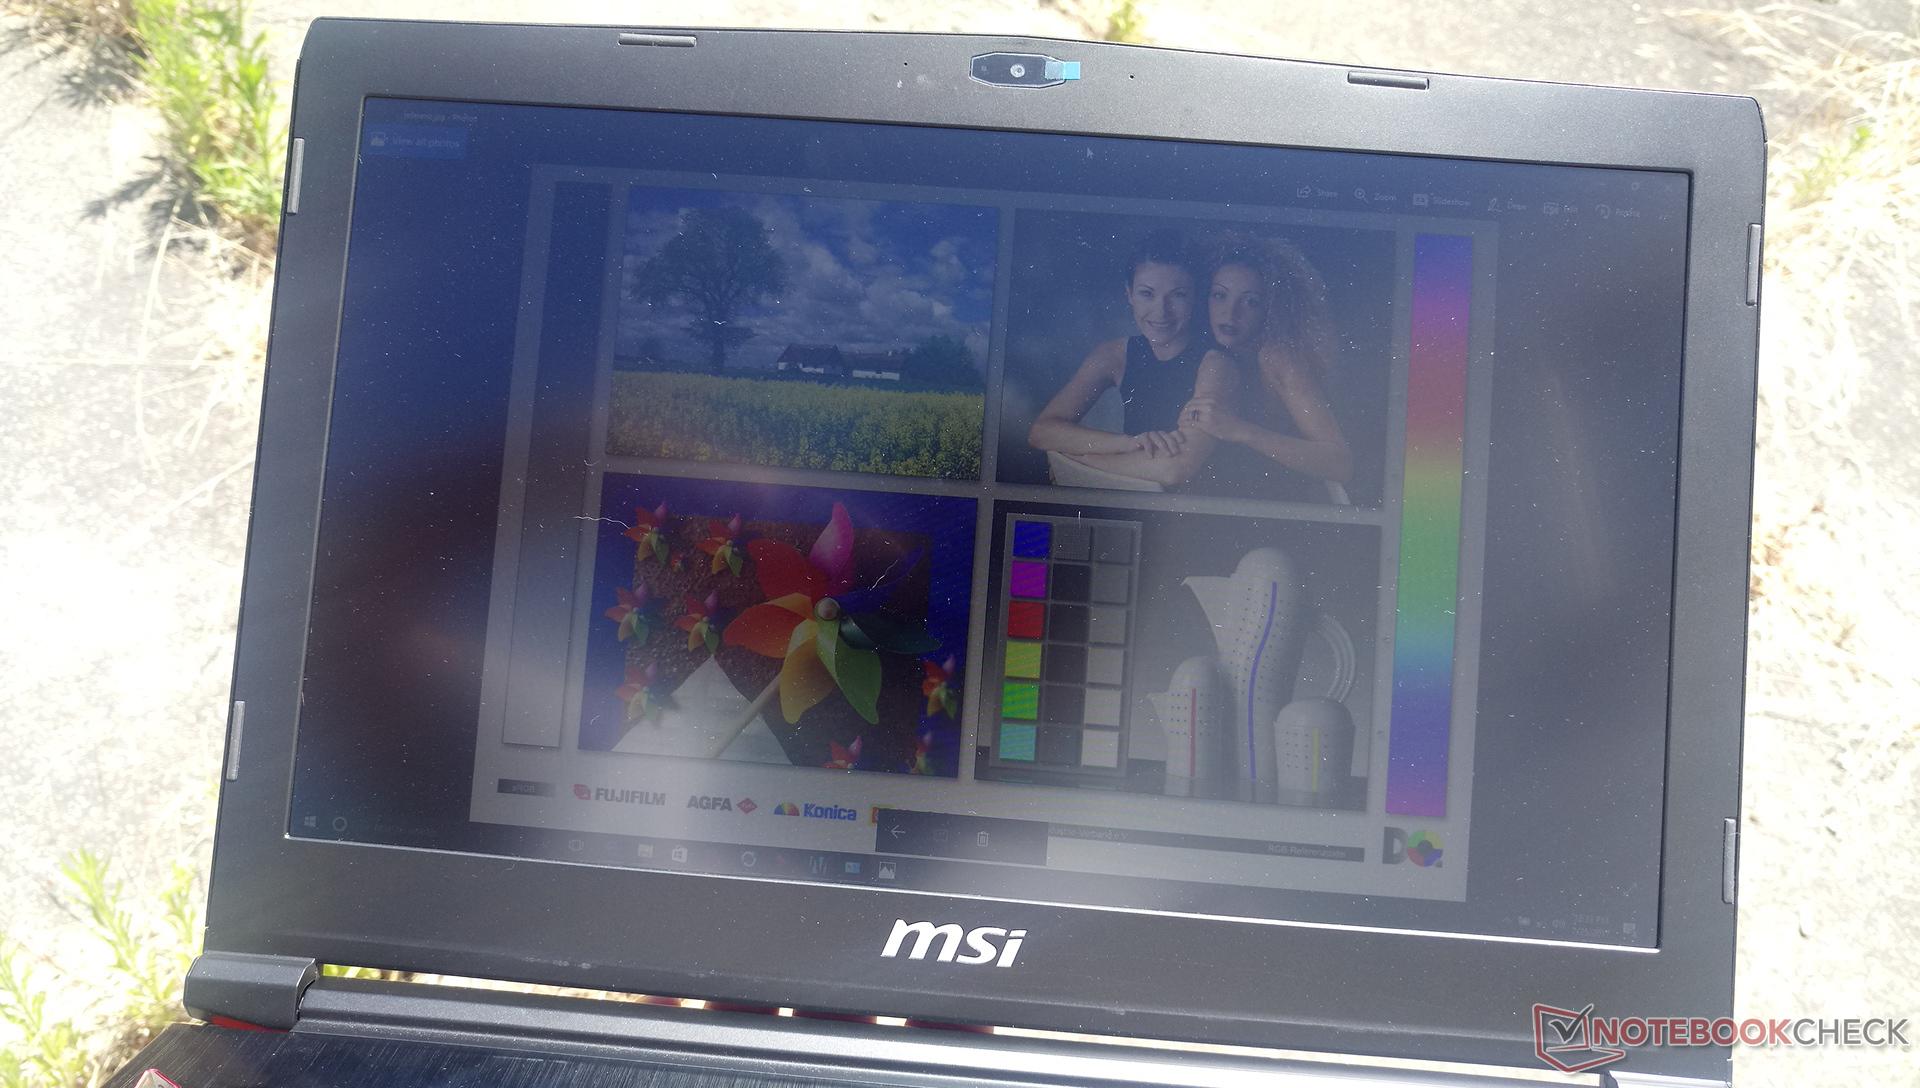
Outdoor visibility is average under shade and poor when under direct sunlight. The backlight is not sufficiently bright to overcome sunlight and onscreen content will look washed out as a result. While glare isn't too big of an issue due to the matte IPS panel, it's still recommended to increase font size because of the small display and pixel size.

Performance
The Core i7-7700HQ CPU and GTX 1060 GPU are a common pairing for high-end gaming notebooks. The current GS43VR 7RE series offers no other CPU, GPU, or even display options at this time. A second SKU with a 3 GB GTX 1060 exists instead of our 6 GB GTX 1060 configuration, but nearly all retailers have only the 6 GB version in stock as of this writing. It's very likely that future GS43 revisions will incorporate Max-Q options because of the higher efficiency levels.
Optimus comes standard with no options for G-Sync. Given this uncommonly small screen size for a gaming notebook, the tight supply for 14-inch G-Sync panels was probably enough of an an issue to omit the option completely for buyers.
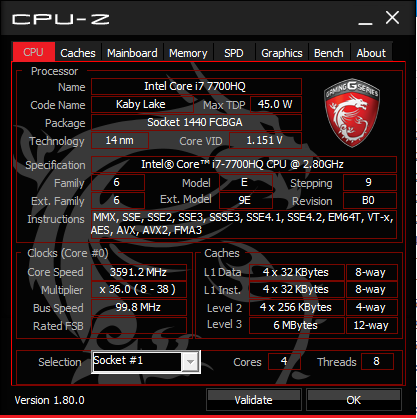
Processor
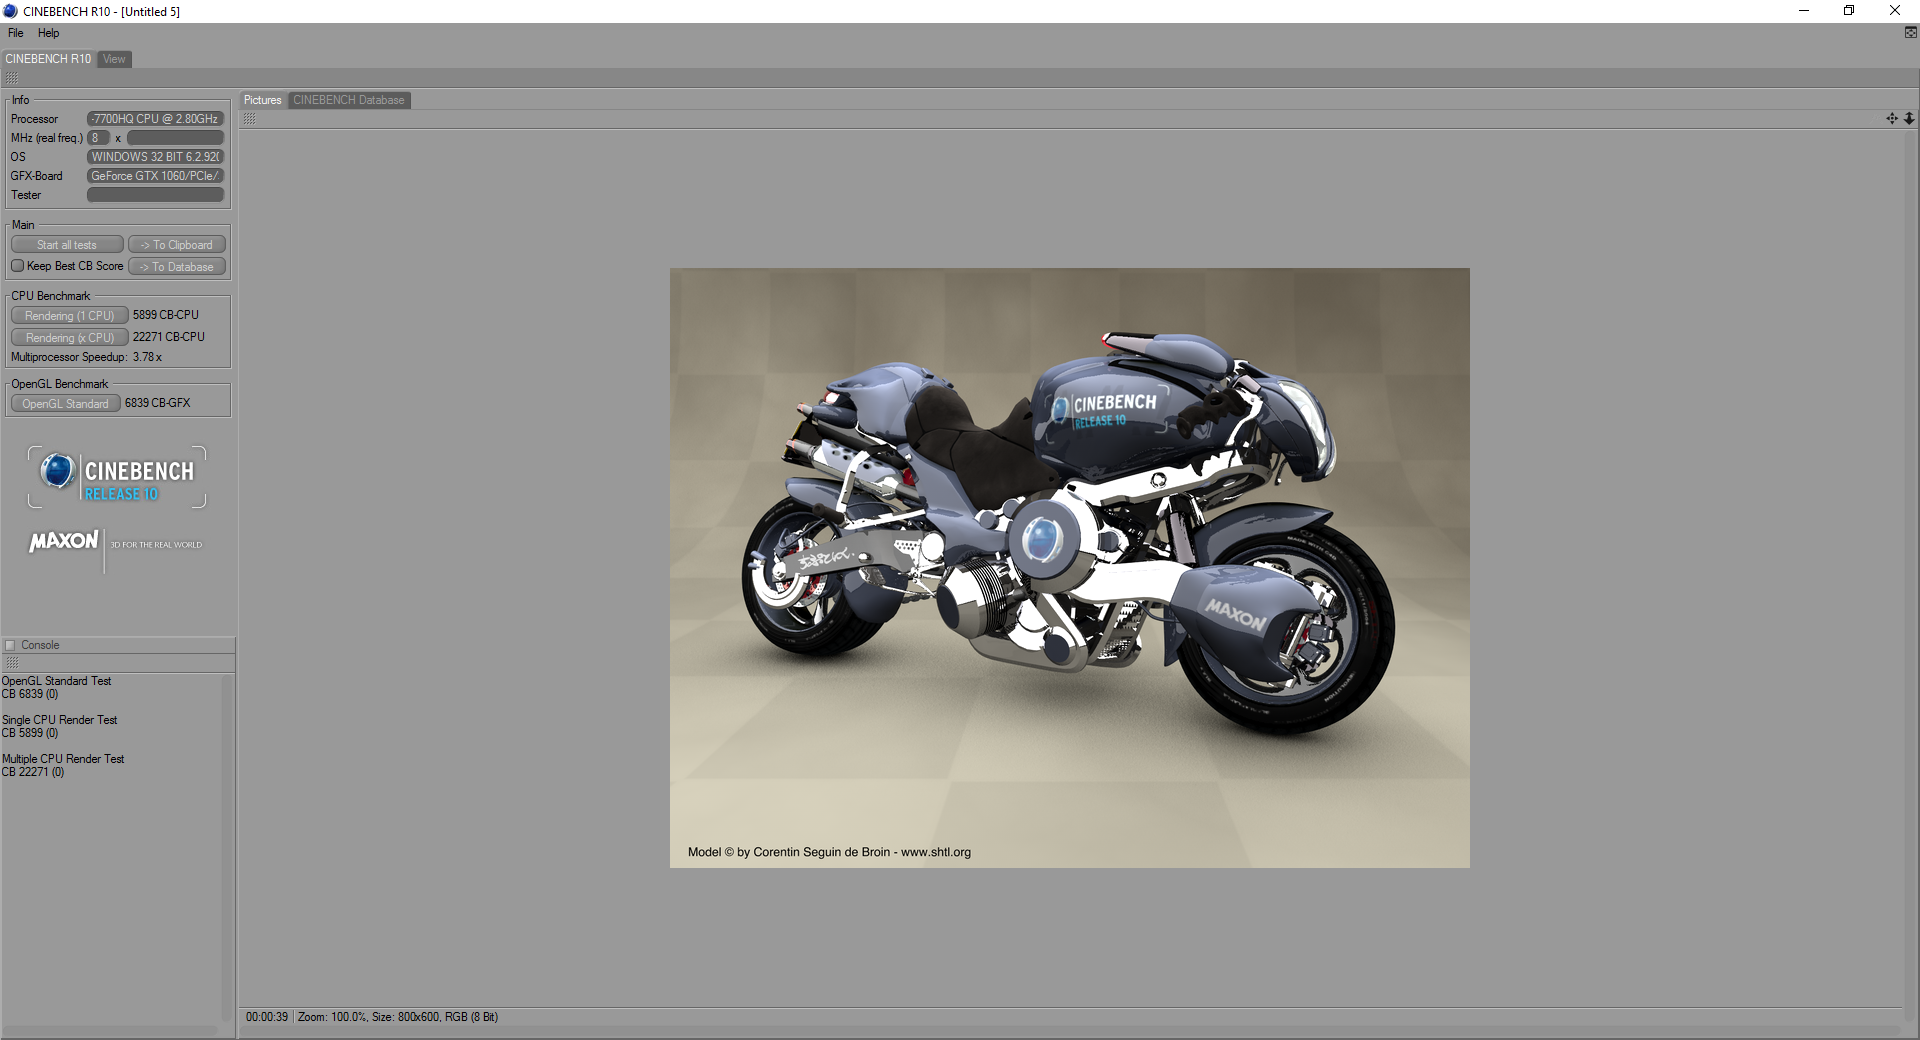
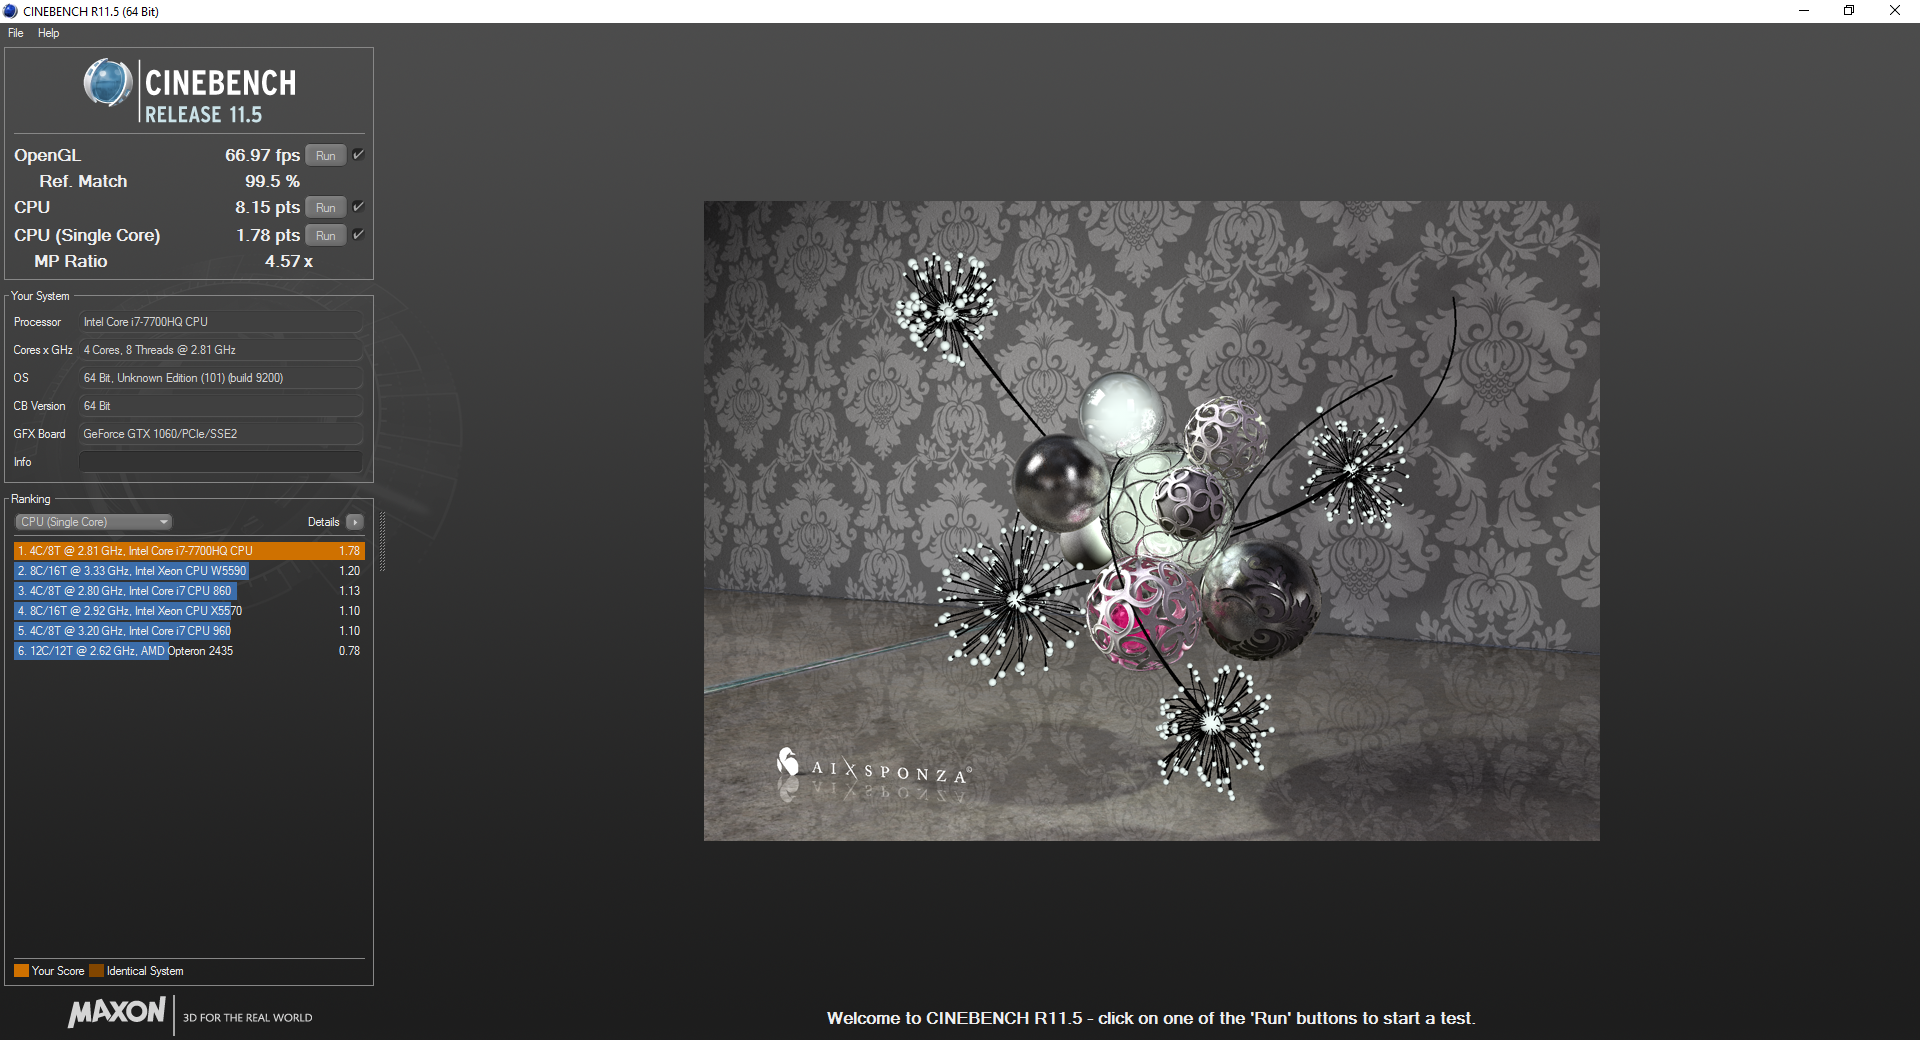
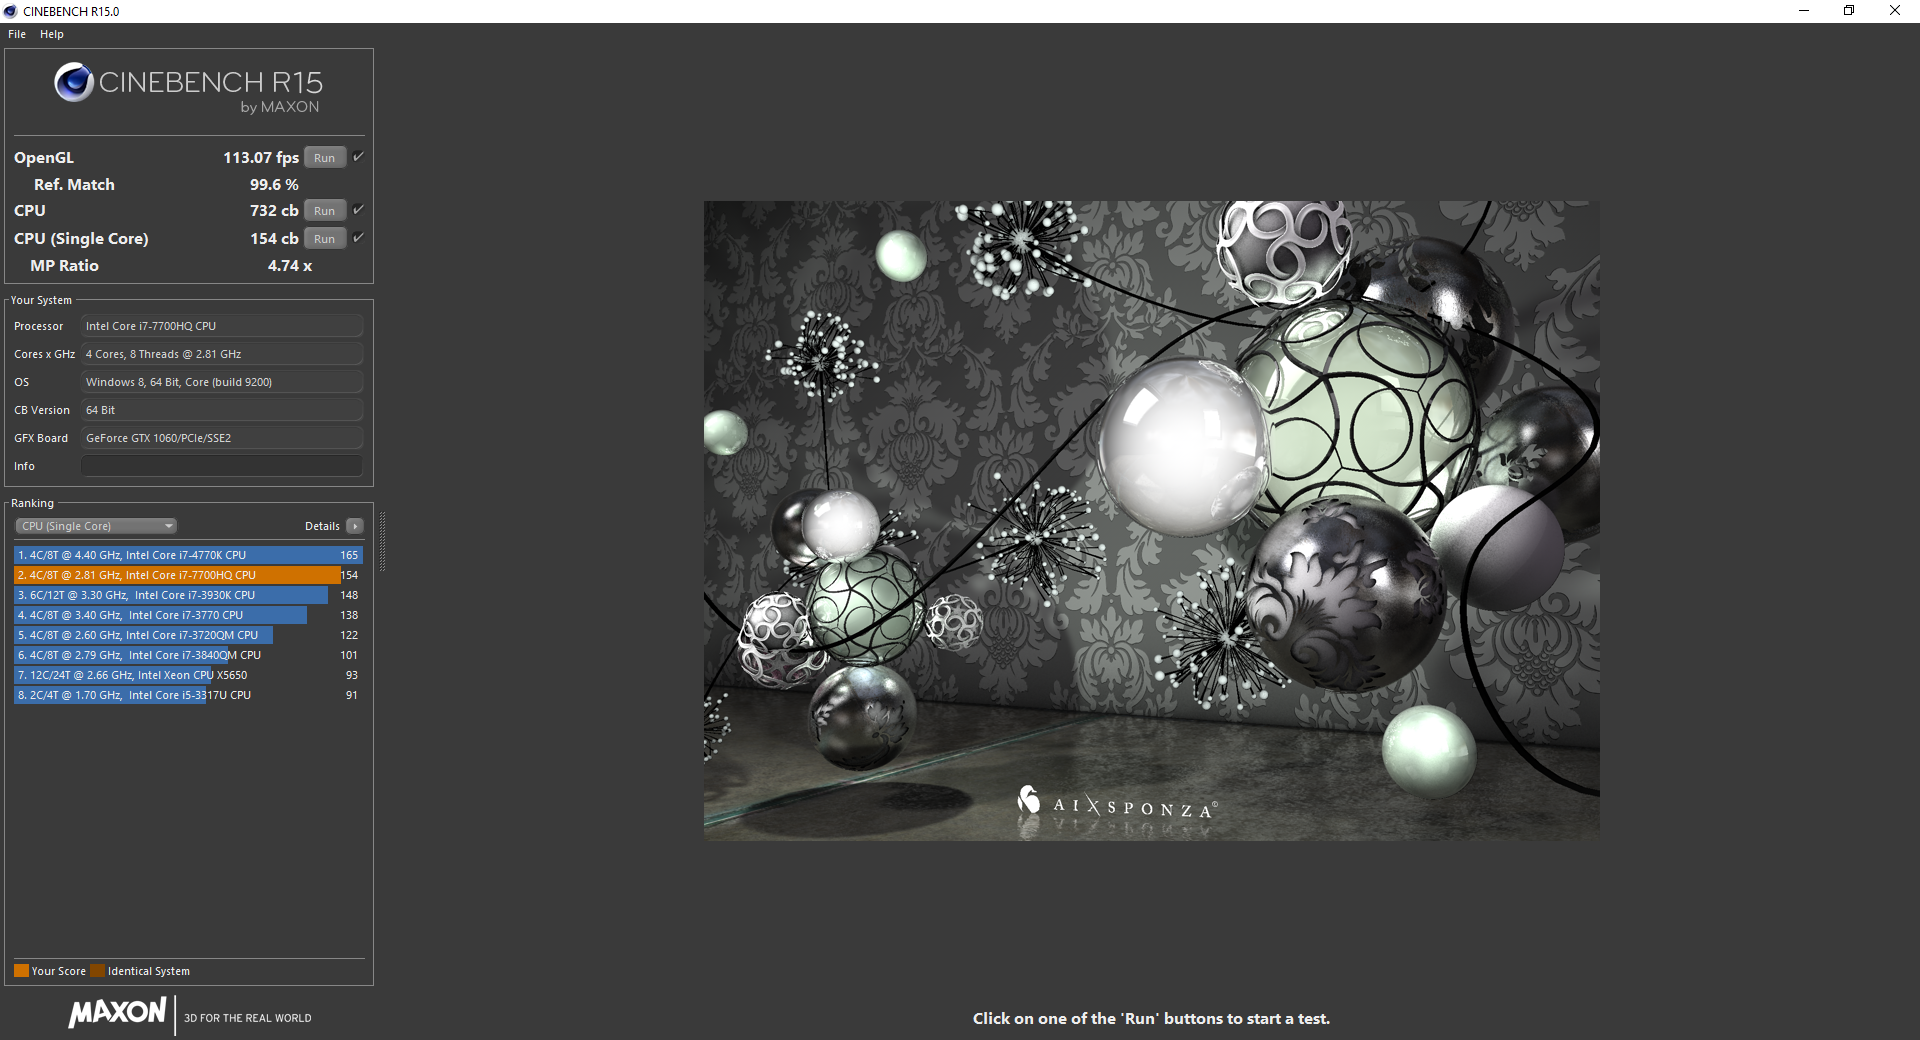
The i7-7700HQ in the MSI performs similarly to other notebooks sporting the same CPU and is even a step up from the i7-6700HQ in last year's GS43VR. A looping CineBench Multi-Thread test, however, shows it to be unable to sustain maximum Turbo Boost clock rates for very long as our graph below shows CineBench scores dropping by about 9 percent after the sixth or seventh loop. This is definitely not as bad as on the MSI GS63VR and gamers are unlikely to notice the dip during use. Overall CPU power is only marginally better than the outgoing Skylake i7-6700HQ and older Broadwell i7-5700HQ in multi-thread workloads.
See our CPU page on the Core i7-7700HQ for more technical information and benchmarks.
| wPrime 2.10 - 1024m | |
| Lenovo IdeaPad Y50 | |
| Eurocom Shark 4 | |
| MSI GS43VR 6RE-006US | |
| MSI GS43VR 7RE-069US | |
| EVGA SC15 | |
| MSI GP62-2QEi781FD | |
| Eurocom Tornado F5 | |
* ... smaller is better
System Performance
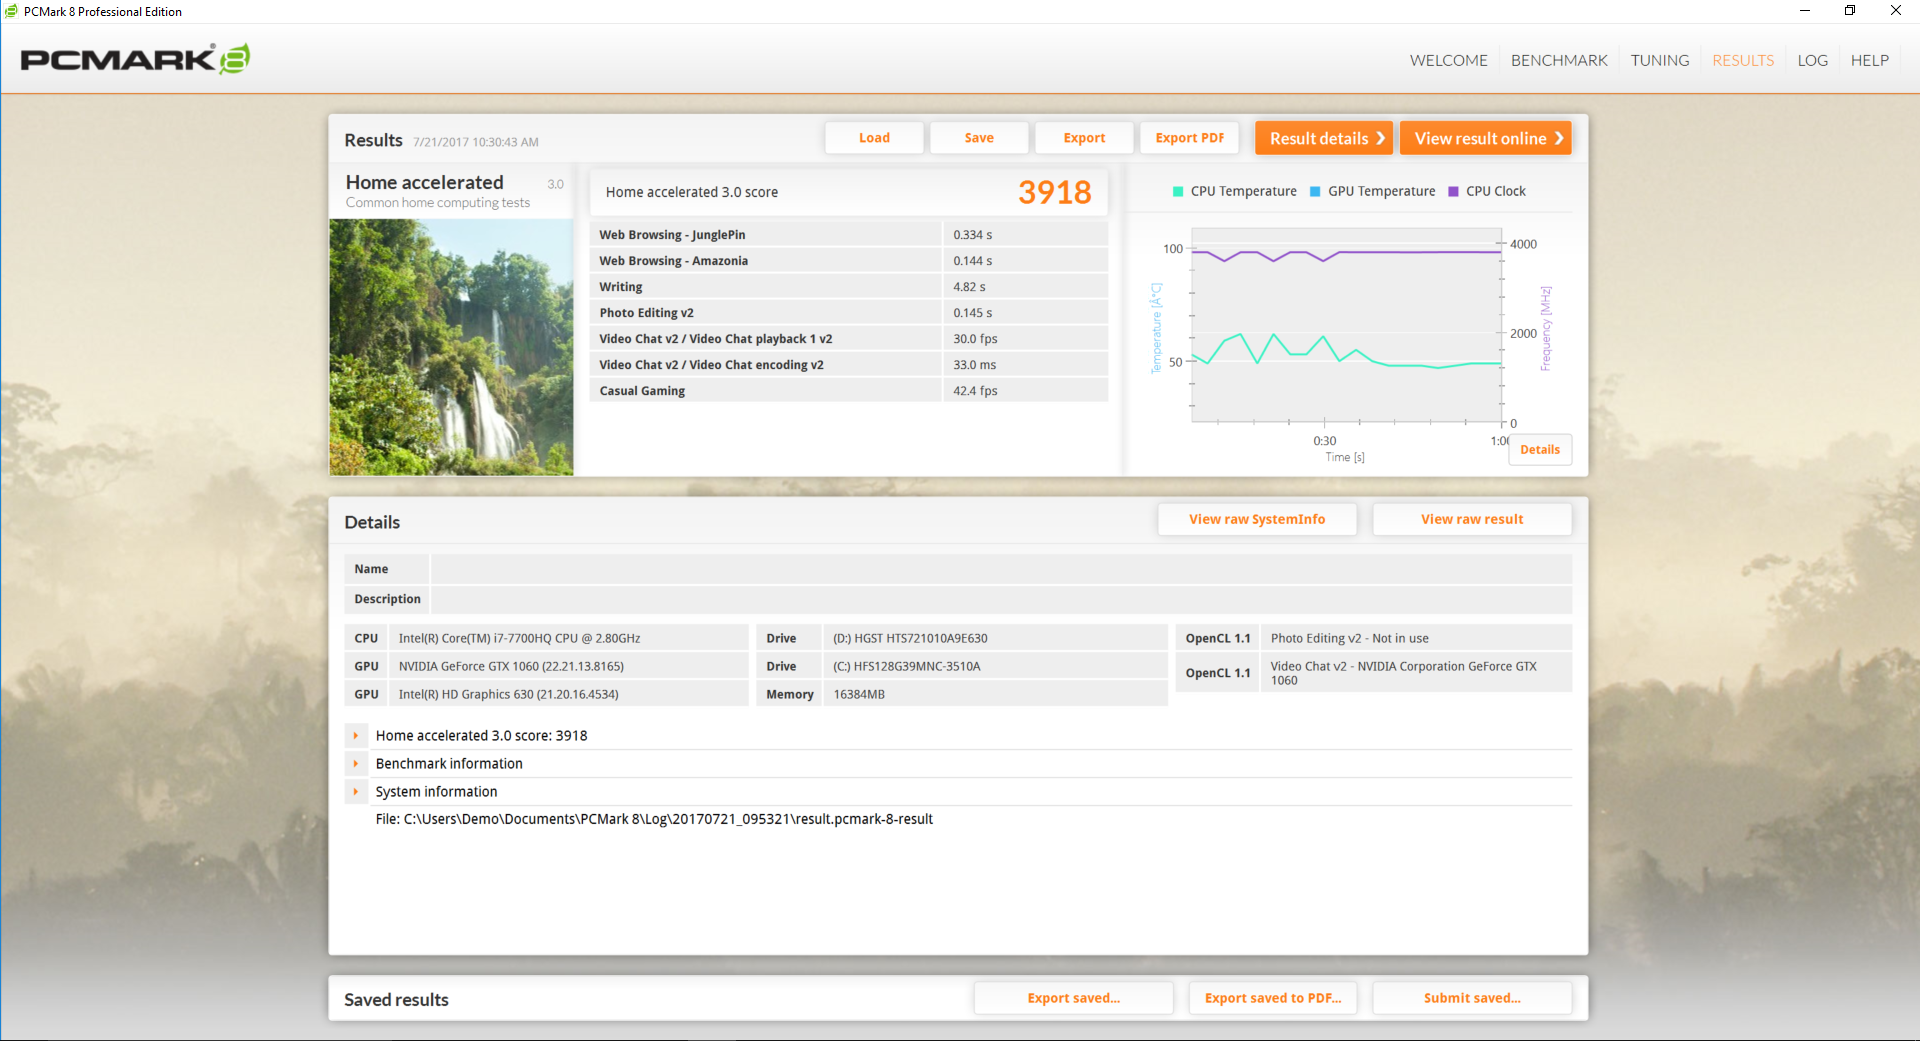
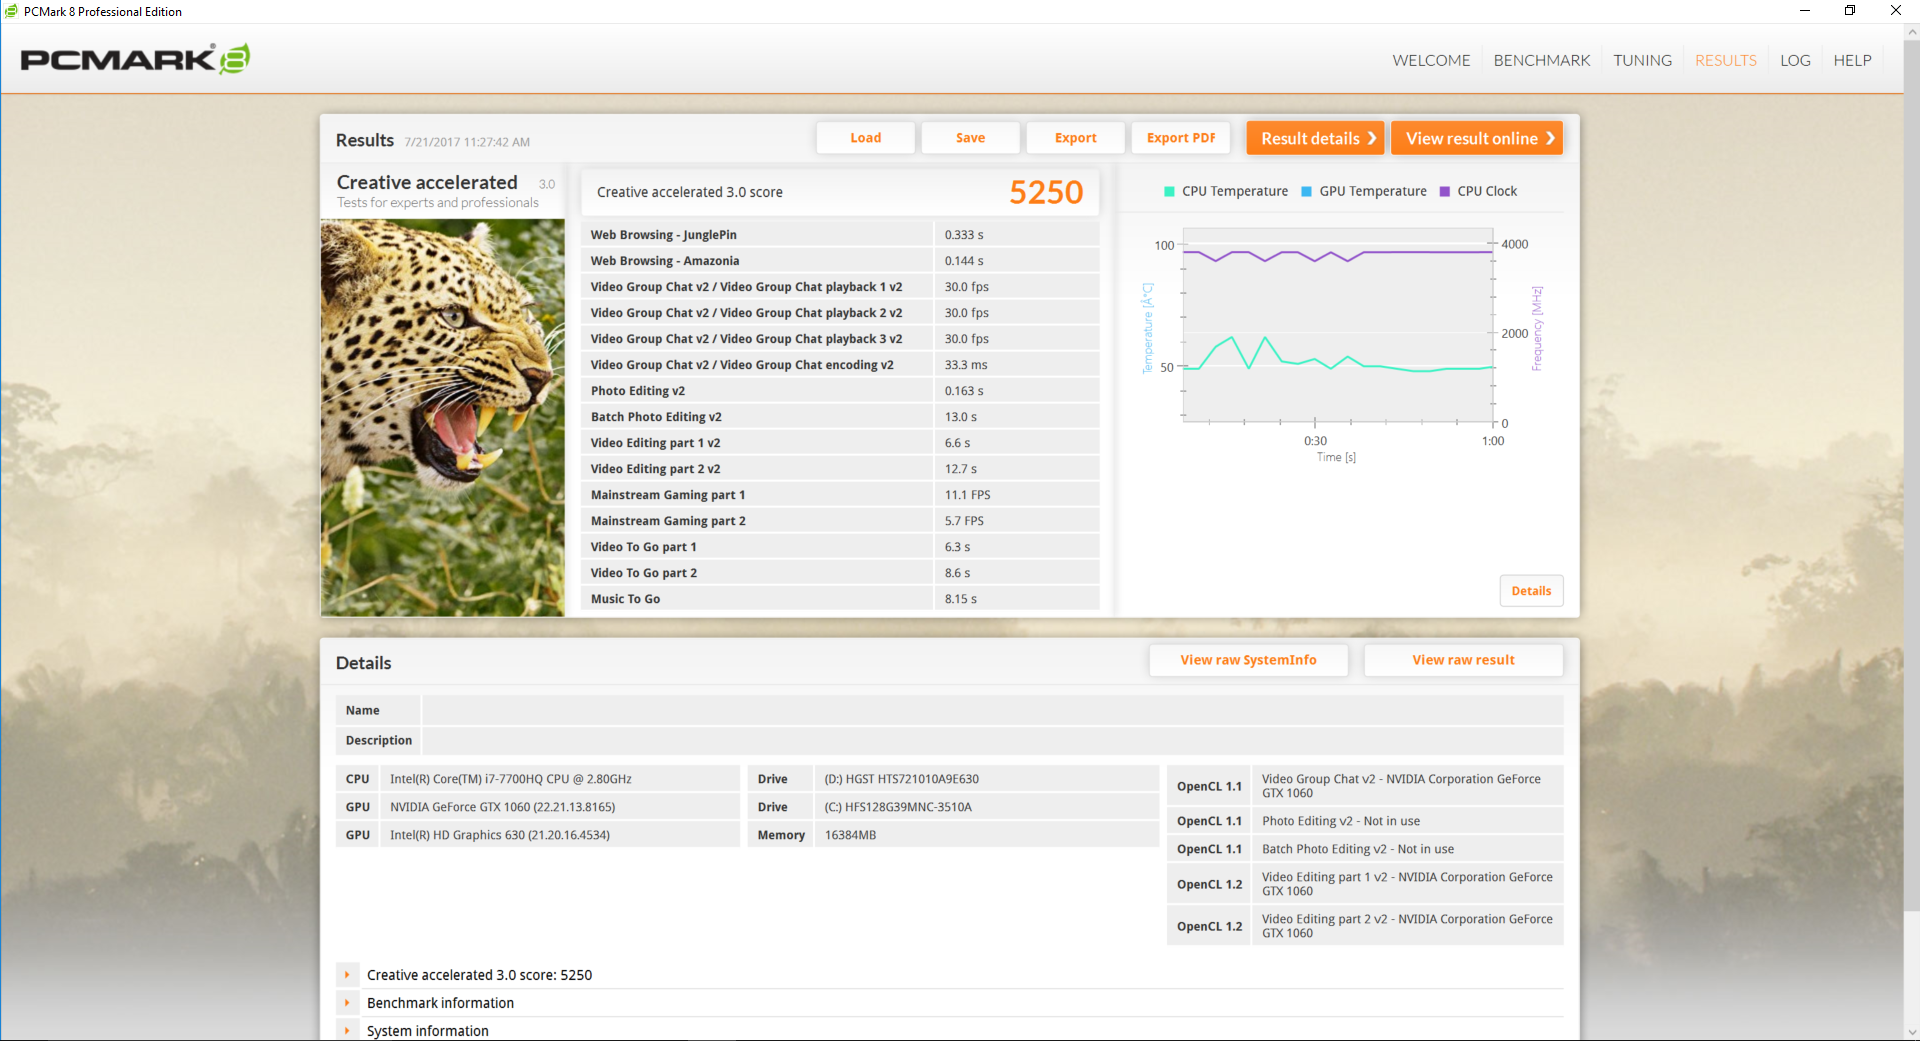
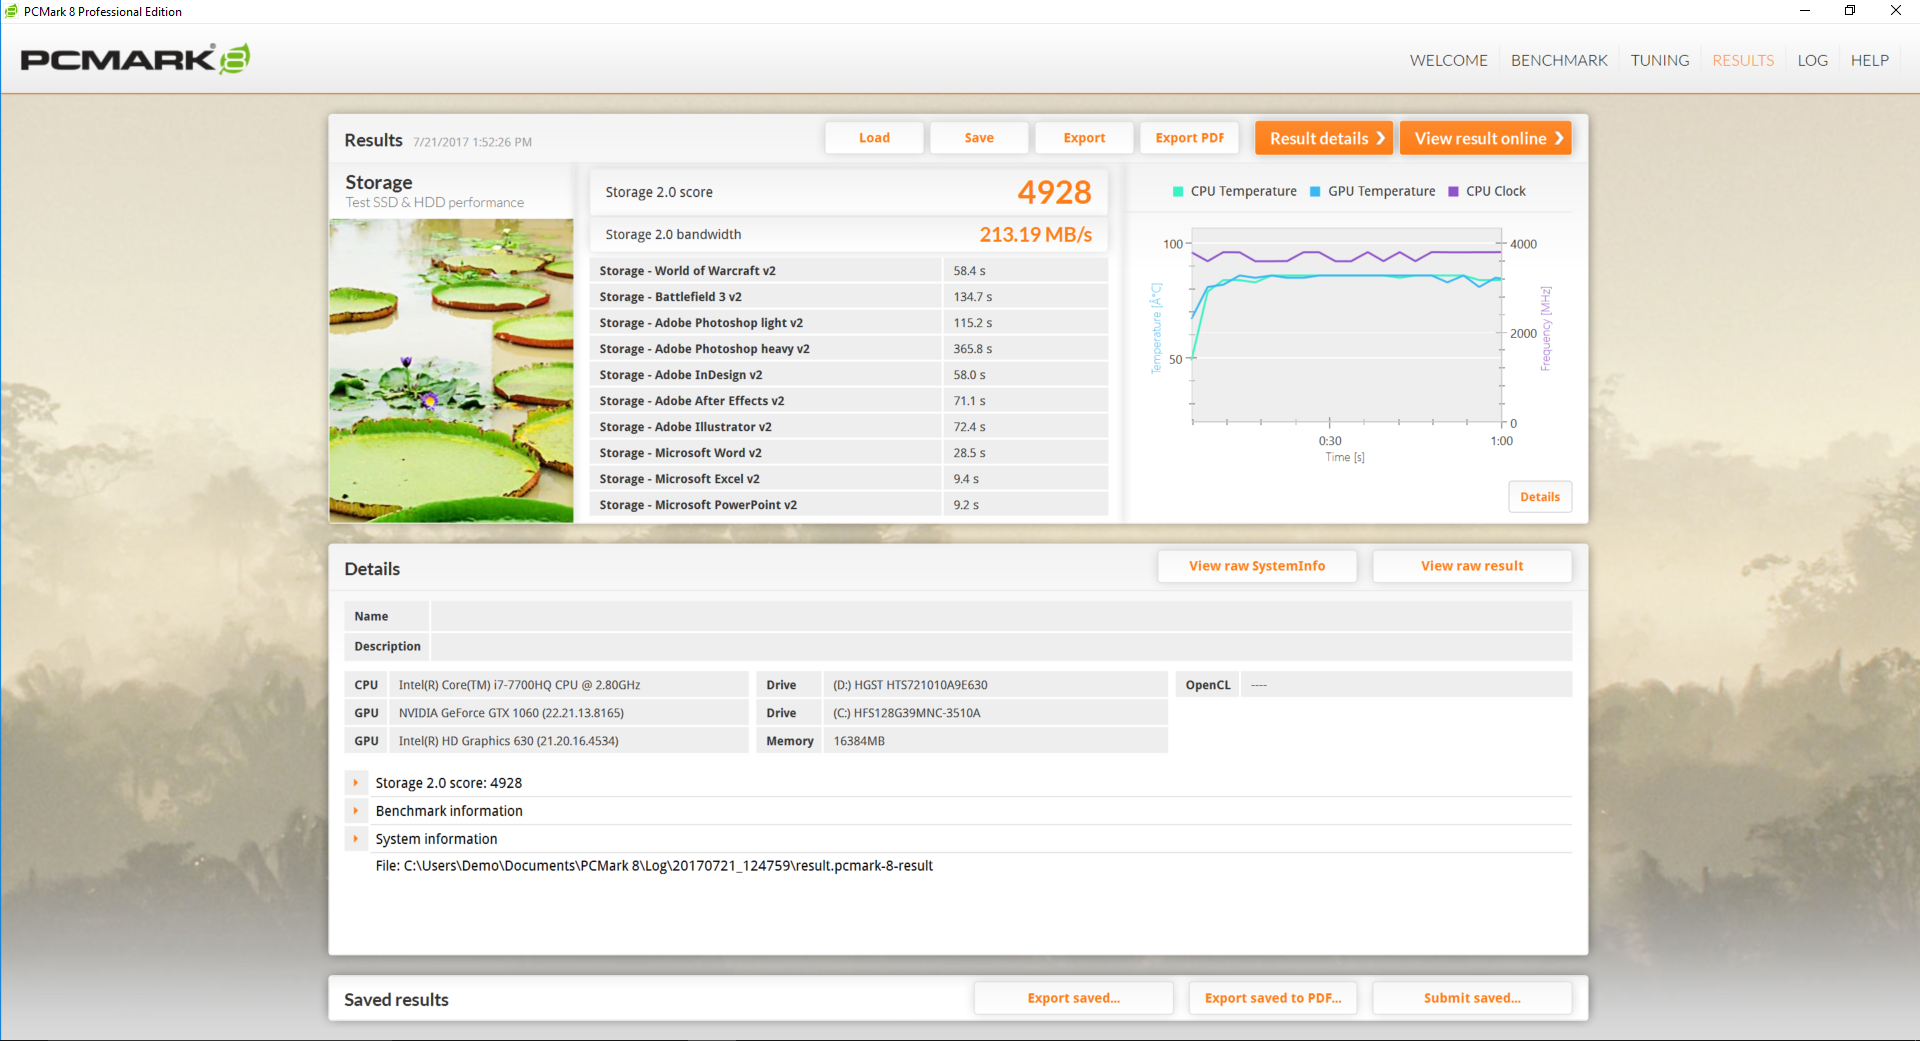
PCMark scores are below other notebooks that are equipped with both a GTX 1060 and primary NVMe SSD. Otherwise, the MSI is subjectively snappy and speedy as one would expect from a high-power gaming notebook. We never experienced any crashes, but the mouse cursor would very infrequently stop and become unresponsive for up to a couple of seconds possibly due to background activity. The Dragon Center software, for example, is automatically set to download updates without user consent.


| PCMark 8 | |
| Home Score Accelerated v2 | |
| Eurocom Tornado F5 | |
| EVGA SC15 | |
| MSI GS43VR 7RE-069US | |
| Lenovo IdeaPad Y50 | |
| Work Score Accelerated v2 | |
| Eurocom Tornado F5 | |
| EVGA SC15 | |
| MSI GS43VR 7RE-069US | |
| Lenovo IdeaPad Y50 | |
| Creative Score Accelerated v2 | |
| Eurocom Tornado F5 | |
| EVGA SC15 | |
| MSI GS43VR 7RE-069US | |
| Lenovo IdeaPad Y50 | |
| PCMark 8 Home Score Accelerated v2 | 3918 points | |
| PCMark 8 Creative Score Accelerated v2 | 5250 points | |
| PCMark 8 Work Score Accelerated v2 | 4672 points | |
| PCMark 10 Score | 4807 points | |
Help | ||
Storage Devices
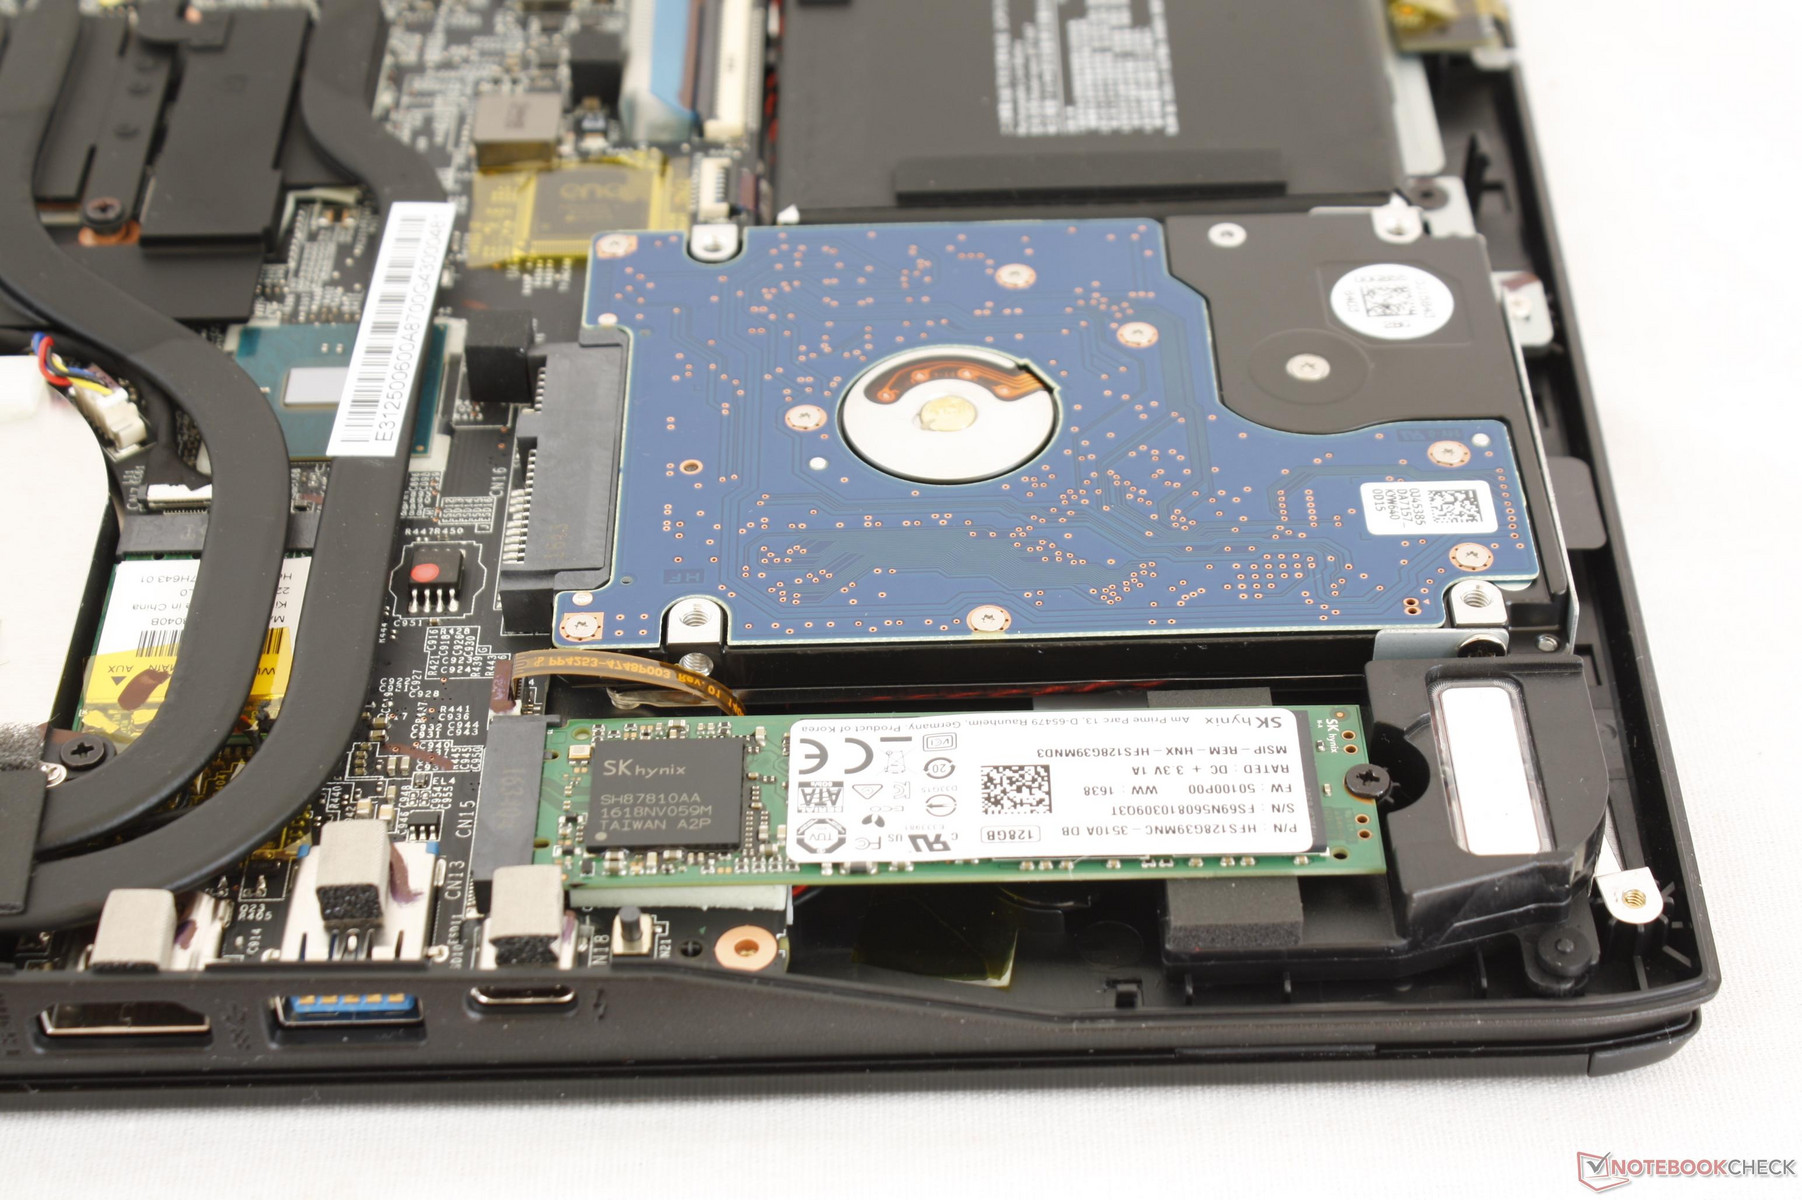
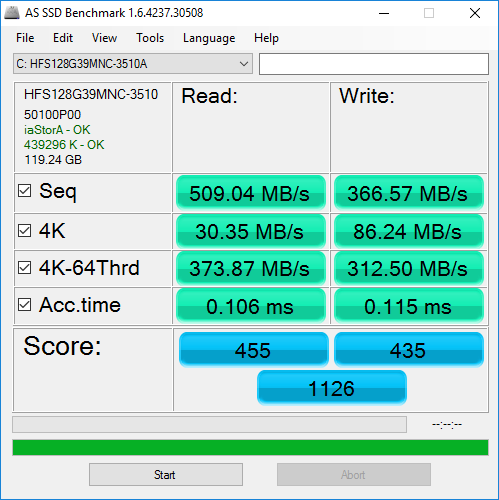
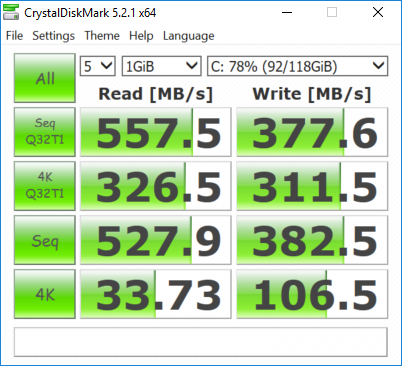
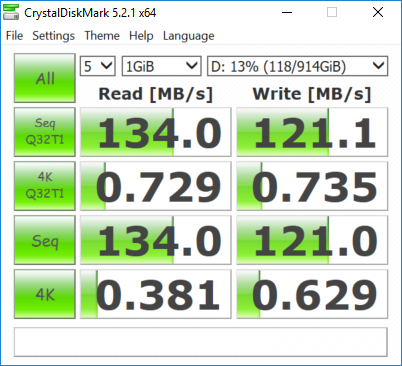
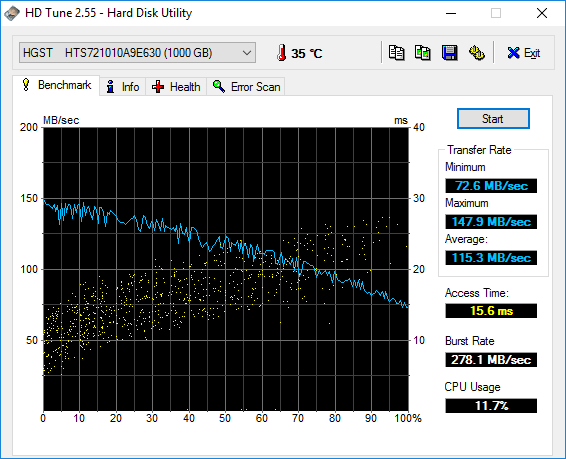
Our test unit houses a primary 128 GB SK Hynix M.2 SSD and secondary 1 TB Hitachi HGST 7200 RPM HDD. NVMe M.2 drives are supported here even if our configuration is not equipped with one. Transfer rates for both the SSD and HDD are excellent considering that they are limited by the SATA III standard. Upgrading to NVMe will bring massive gains across the board in terms of read and write rates as shown by the comparison table below.
See our table of SSDs and HDDs for more benchmark comparisons.
| MSI GS43VR 7RE-069US SK Hynix HFS128G39MNC-3510A | MSI GS63VR 7RF-228US Samsung SM961 MZVKW512HMJP m.2 PCI-e | Razer Blade (2016) FHD | Gigabyte Aero 14 GA-K106Q416-PL-B02 Liteonit CV3-8D256 | Aorus x3 Plus v7 Toshiba NVMe THNSN5512GPU7 | |
|---|---|---|---|---|---|
| AS SSD | 204% | 209% | -11% | 118% | |
| Copy Game MB/s (MB/s) | 332.1 | 1082 226% | 1014 205% | ||
| Copy Program MB/s (MB/s) | 225.4 | 401.9 78% | 399.4 77% | ||
| Copy ISO MB/s (MB/s) | 382.1 | 1666 336% | 1459 282% | ||
| Score Total (Points) | 1126 | 3756 234% | 4067 261% | 917 -19% | 2570 128% |
| Score Write (Points) | 435 | 1468 237% | 1522 250% | 298 -31% | 933 114% |
| Score Read (Points) | 455 | 1549 240% | 1710 276% | 411 -10% | 1112 144% |
| Access Time Write * (ms) | 0.115 | 0.029 75% | 0.032 72% | 0.074 36% | 0.05 57% |
| Access Time Read * (ms) | 0.106 | 0.041 61% | 0.036 66% | 0.089 16% | 0.11 -4% |
| 4K-64 Write (MB/s) | 312.5 | 1185 279% | 1234 295% | 218.9 -30% | 692 121% |
| 4K-64 Read (MB/s) | 373.9 | 1229 229% | 1403 275% | 333 -11% | 857 129% |
| 4K Write (MB/s) | 86.2 | 127.6 48% | 116.6 35% | 50 -42% | 128.6 49% |
| 4K Read (MB/s) | 30.35 | 48.01 58% | 47.65 57% | 26.32 -13% | 41.4 36% |
| Seq Write (MB/s) | 366.6 | 1550 323% | 1715 368% | 291.4 -21% | 1117 205% |
| Seq Read (MB/s) | 509 | 2719 434% | 2594 410% | 517 2% | 2131 319% |
* ... smaller is better

GPU Performance
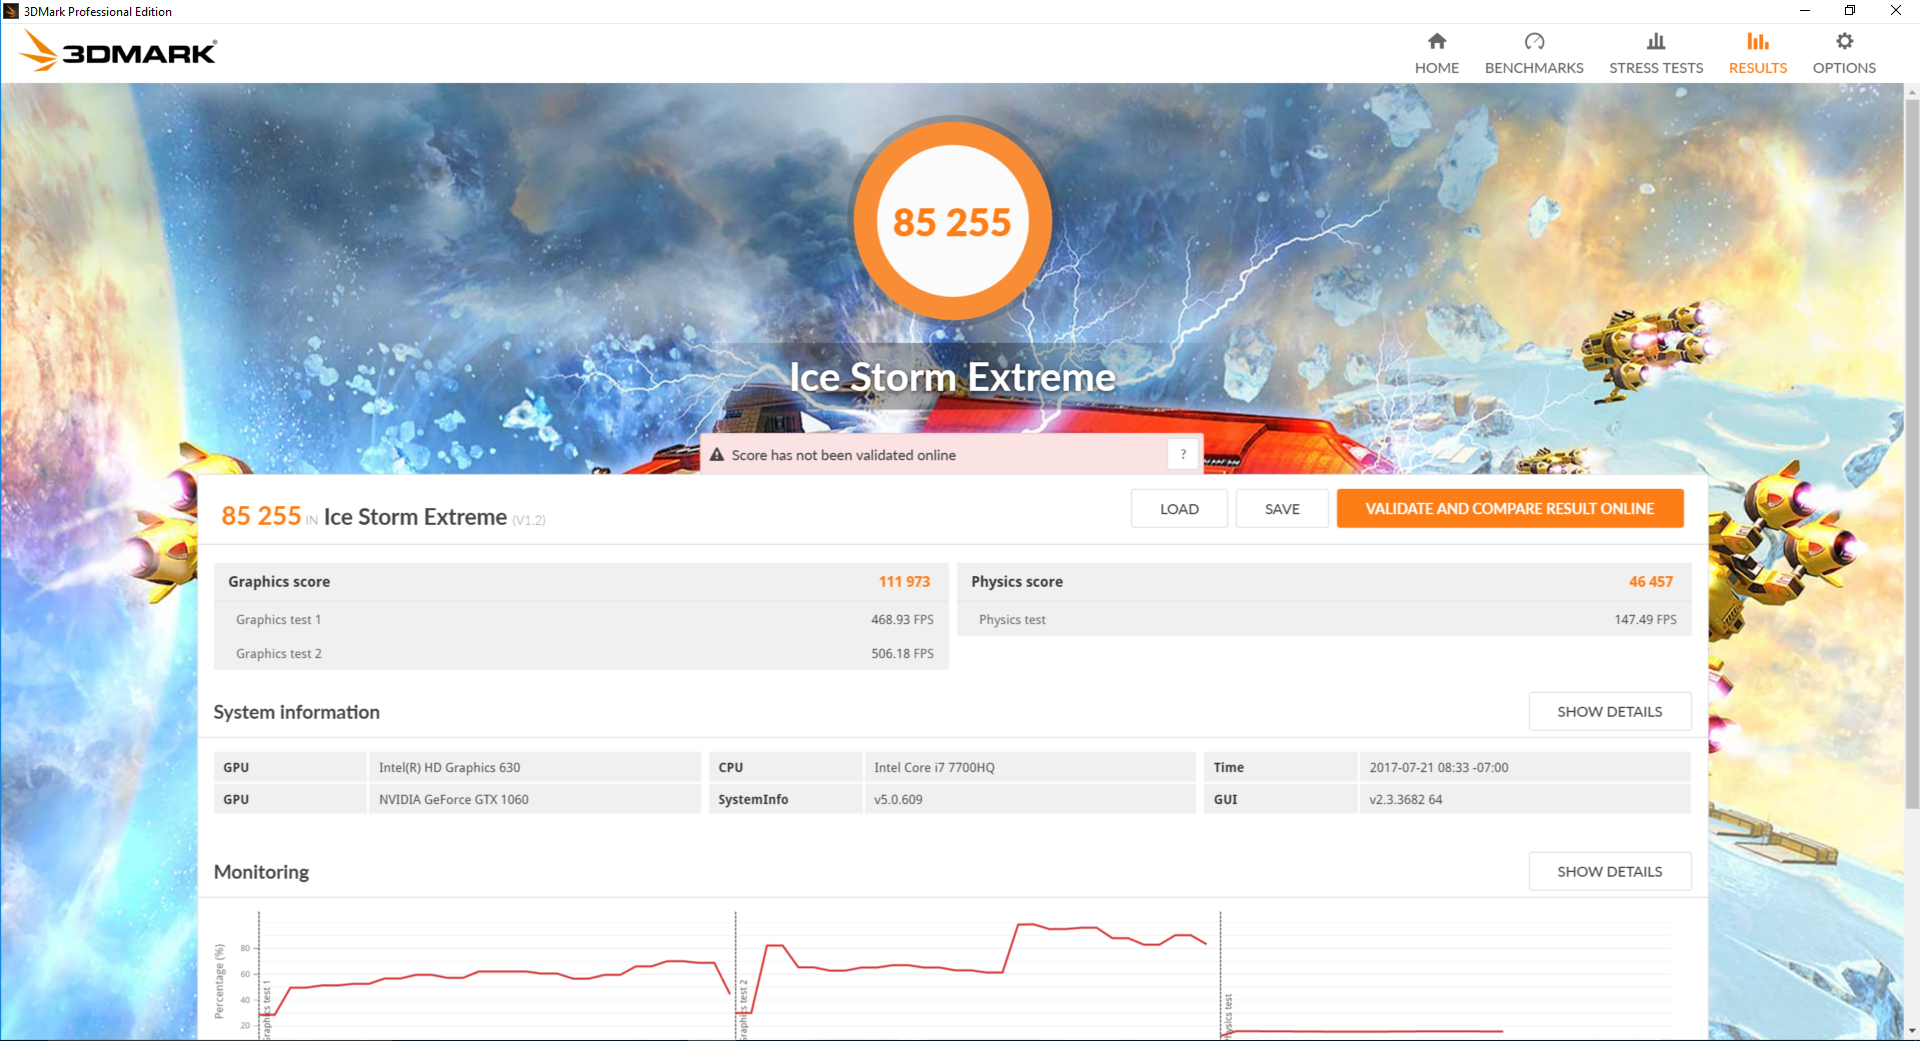
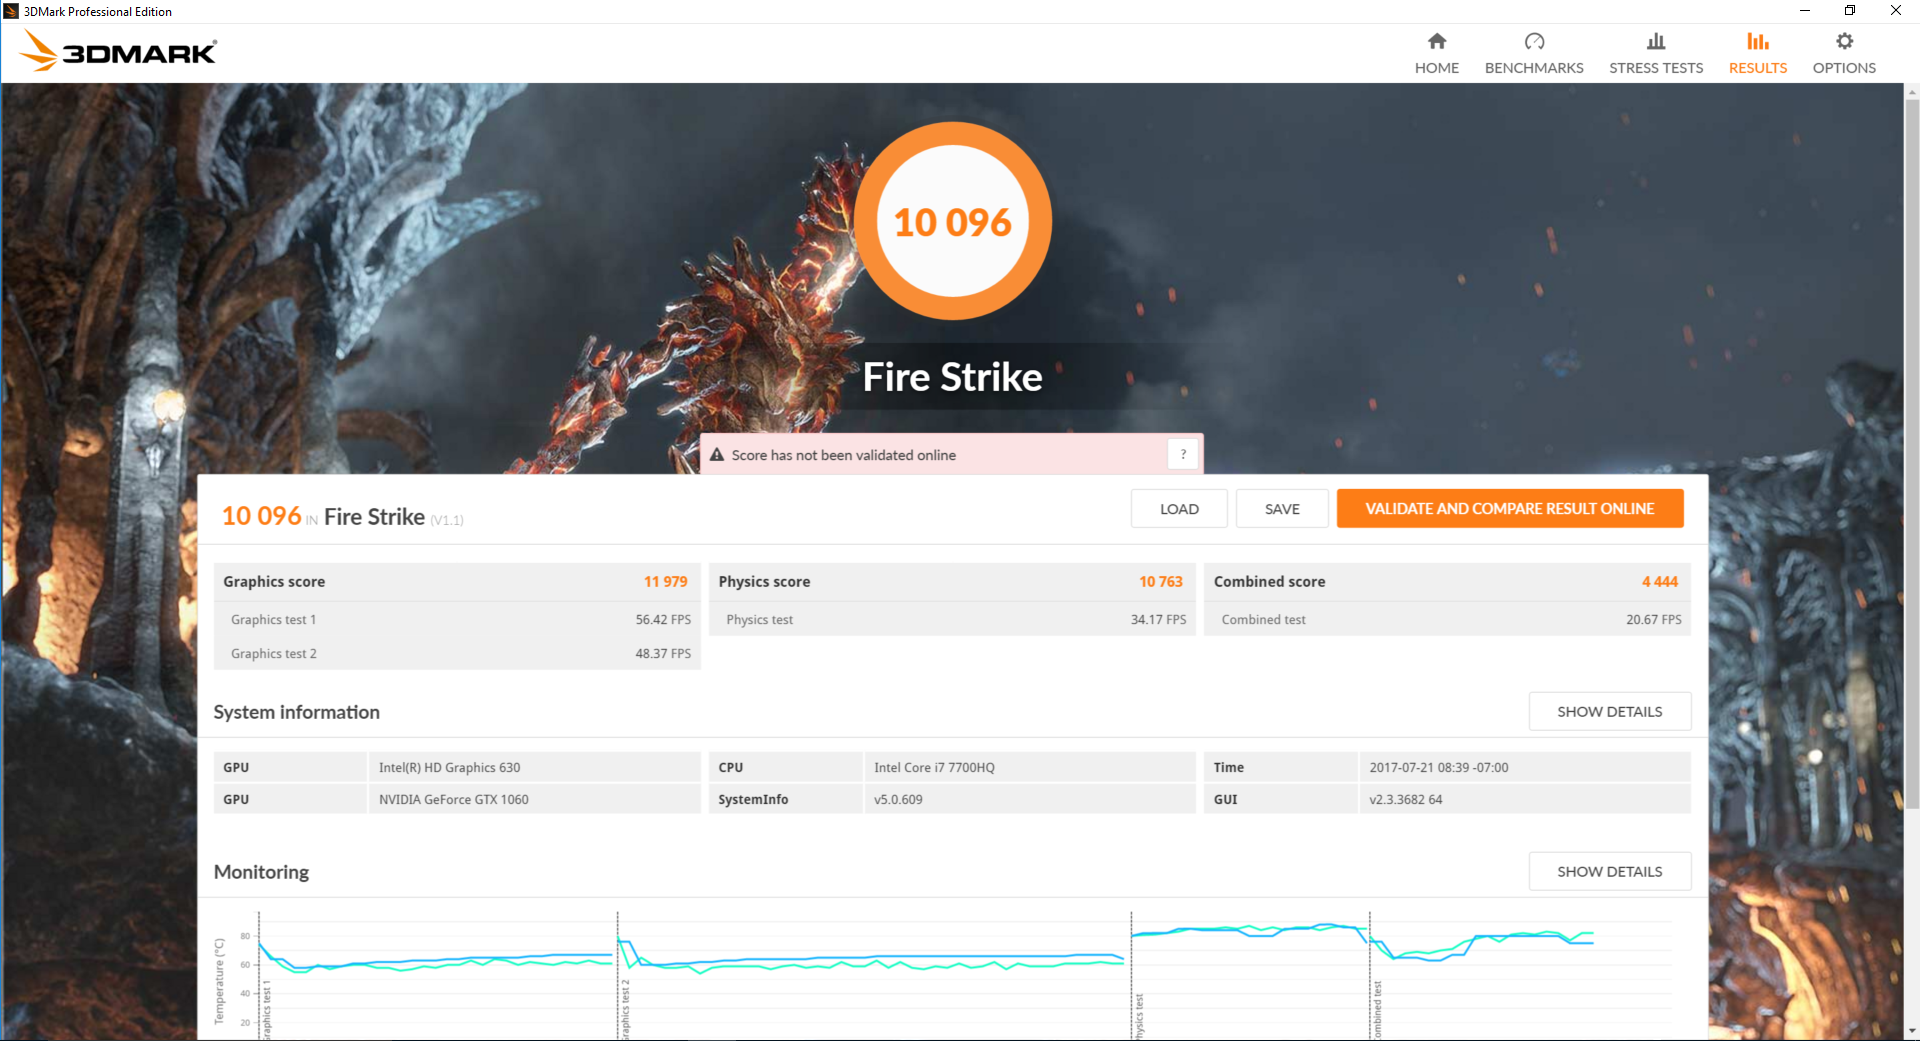
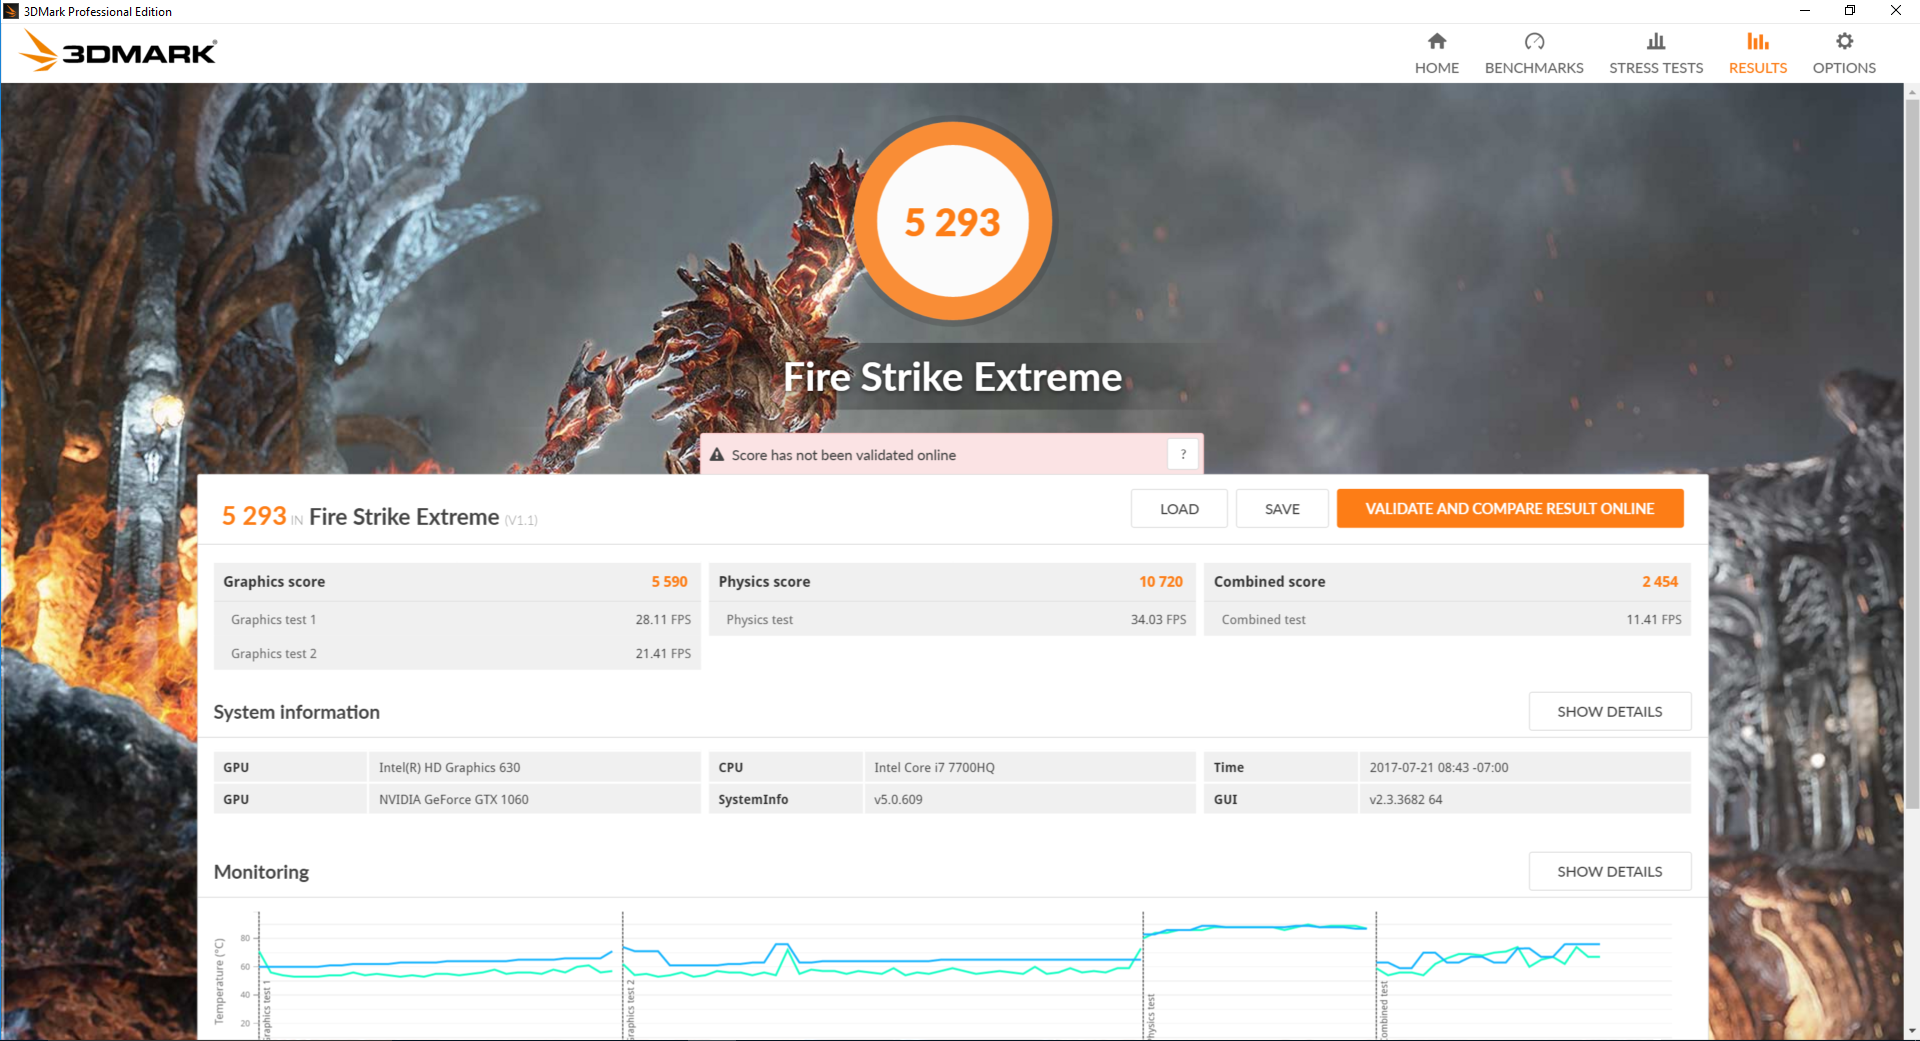
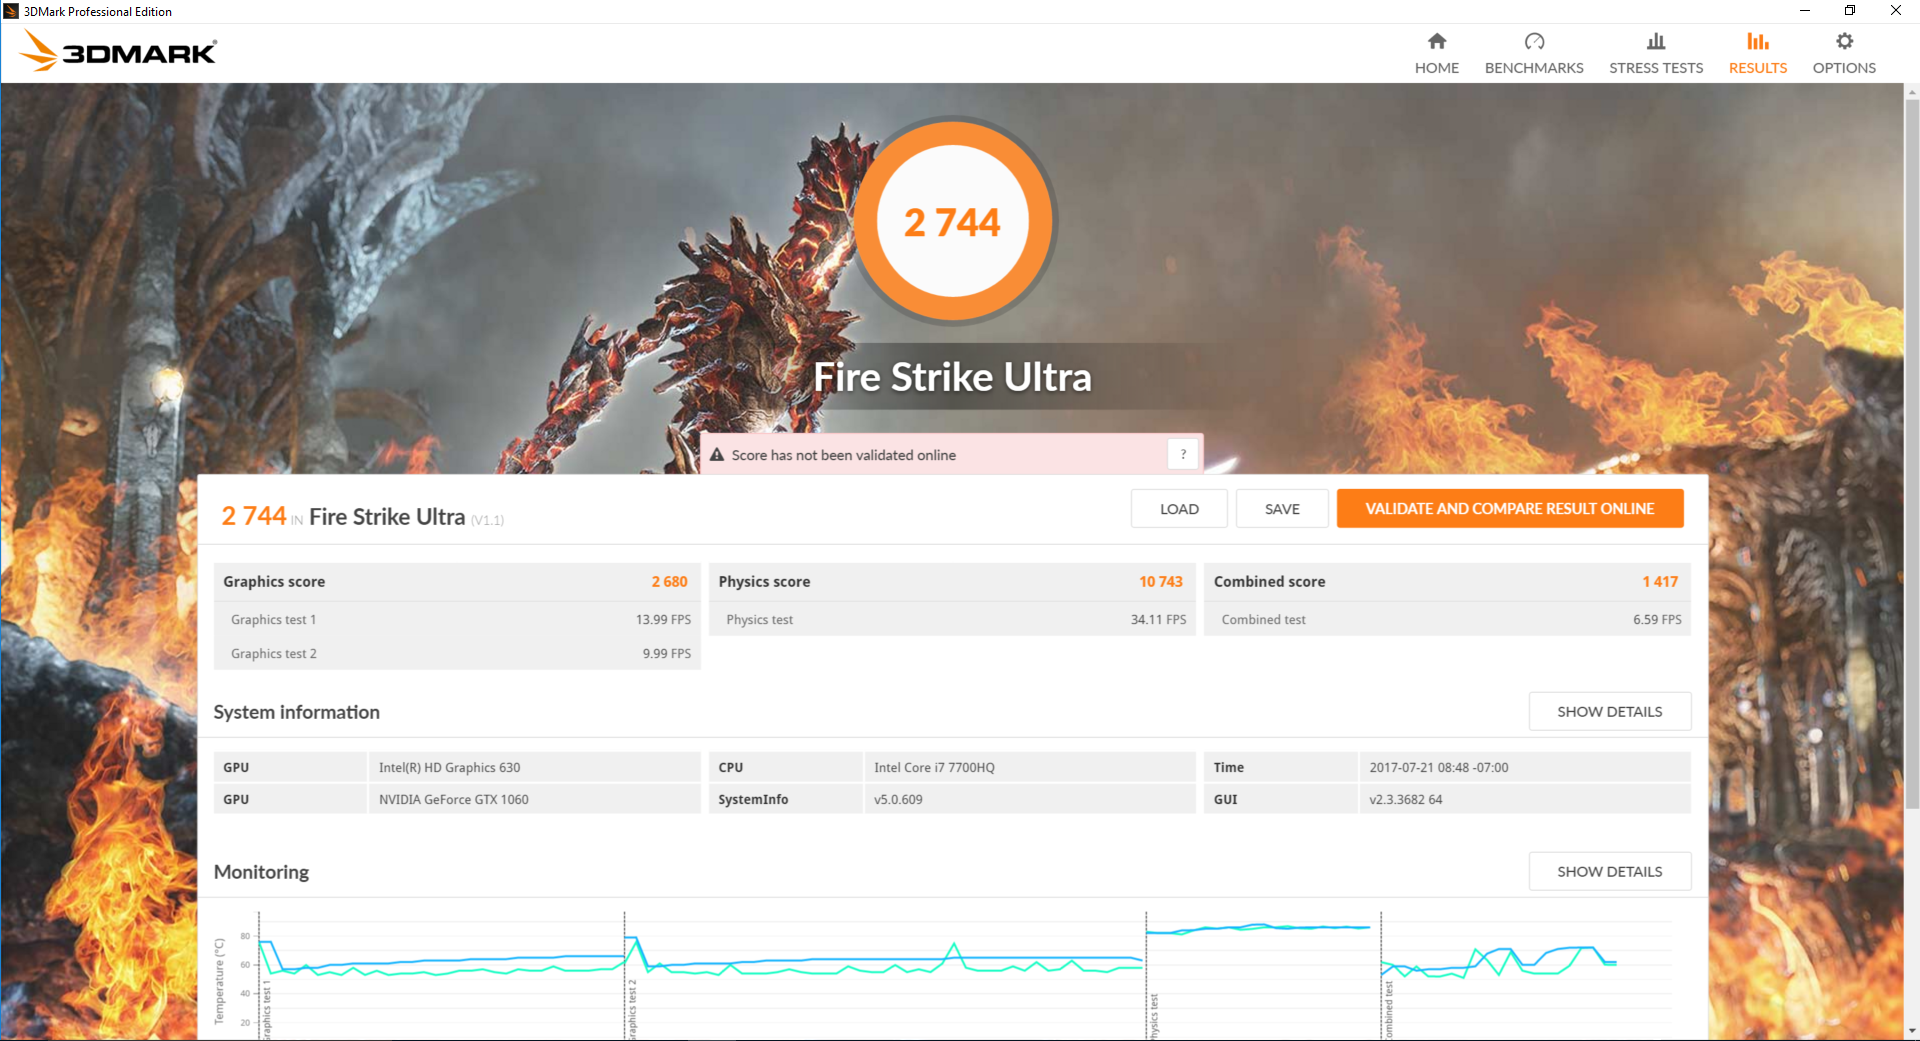
The mobile GTX 1060 in the GS43VR is within just single-digit percentages from our reference desktop GTX 1060 Founder's Edition according to 3DMark benchmarks. Users are quite literally getting the power of a desktop GTX 1060 at stock speeds in a laptop that is nearly the size of an Ultrabook. Its raw graphical capabilities are about 15 to 20 percent higher than both the GTX 980M and new GTX 1060 Max-Q.
See our reviews on the GTX 1060 and Pascal architecture for more technical information on the series.
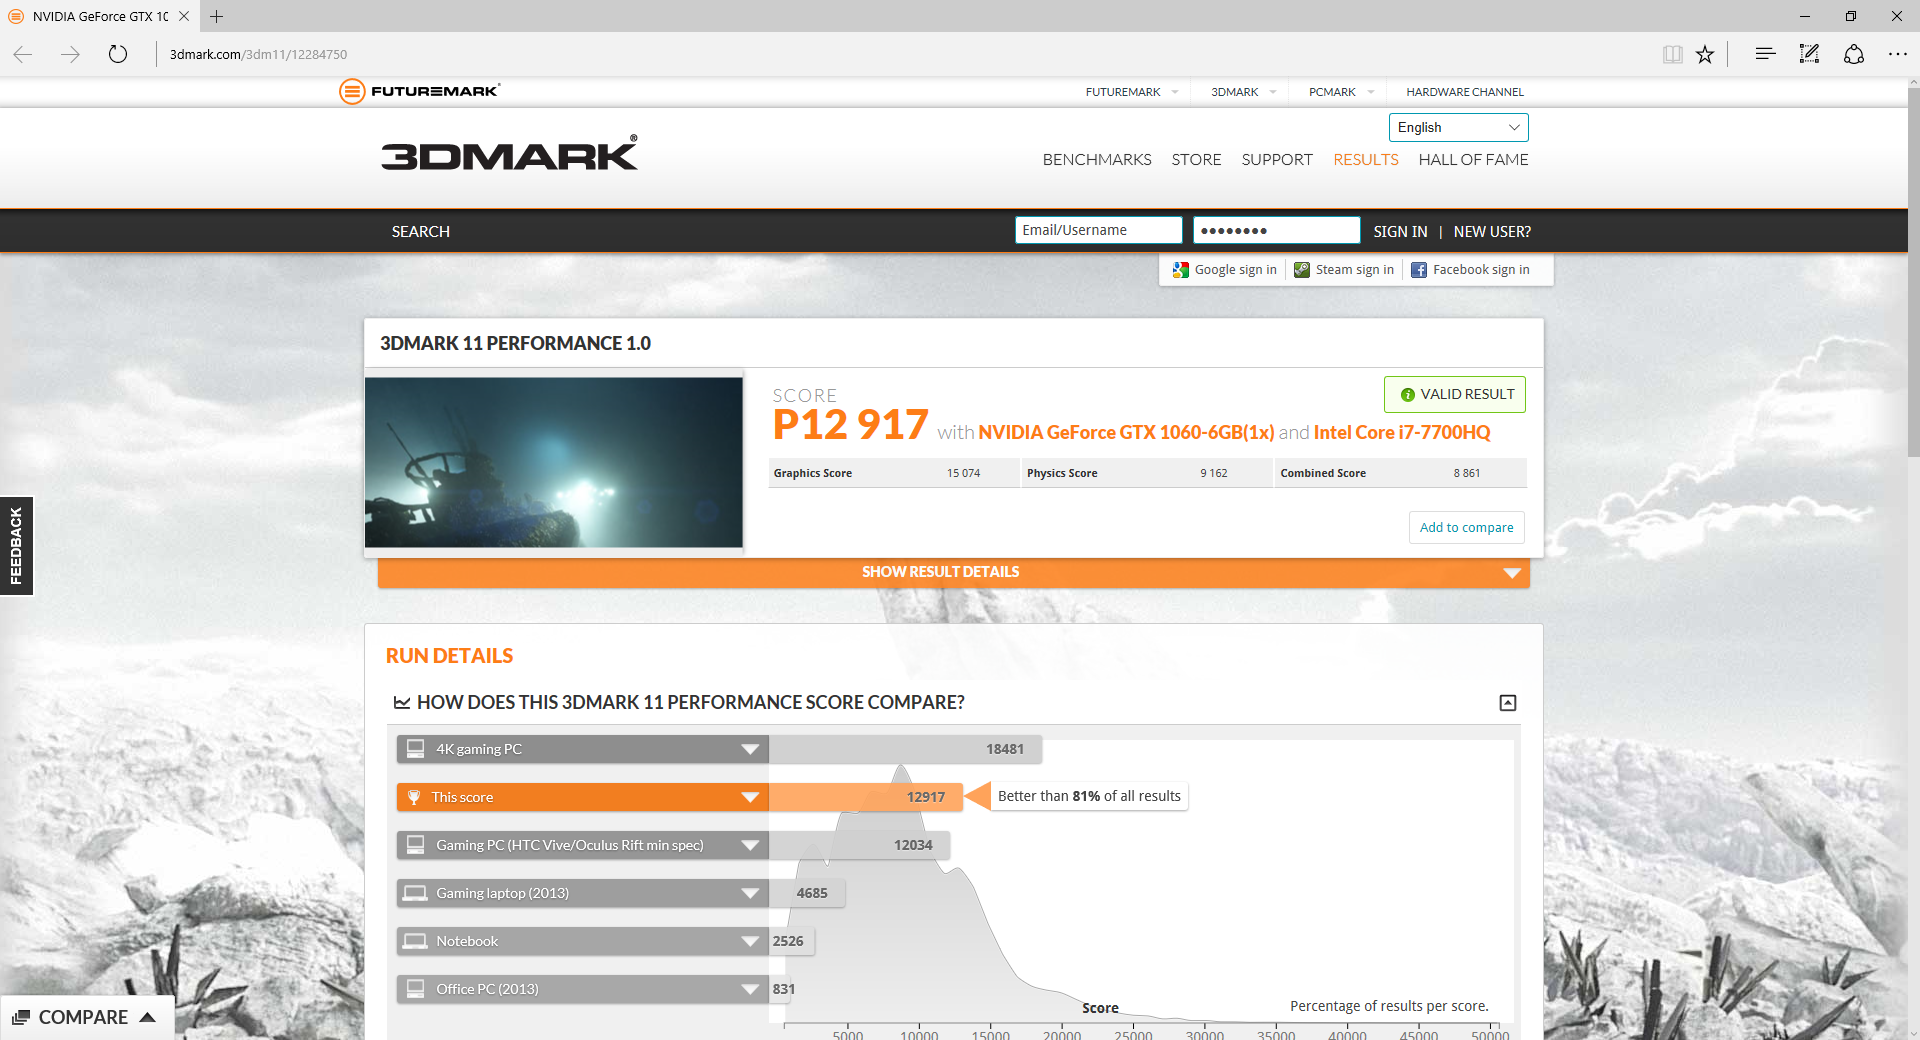

| 3DMark 11 Performance | 12917 points | |
| 3DMark Ice Storm Standard Score | 85006 points | |
| 3DMark Cloud Gate Standard Score | 24792 points | |
| 3DMark Fire Strike Score | 10096 points | |
| 3DMark Fire Strike Extreme Score | 5293 points | |
Help | ||
Gaming Performance
The GTX 1060 in the MSI performs as fast as the same GTX 1060 in the much larger GT72VR when gaming. Users will be able to play most if not all of today's titles at native 1080p on High to Extreme settings. Moving up to the GTX 1080 Max-Q or GTX 1070 will bring a 40 to 60 percent boost in frame rate depending on the title.
See our dedicated page on the GTX 1060 GPU for more gaming benchmark comparisons.
| Rise of the Tomb Raider - 1920x1080 Very High Preset AA:FX AF:16x | |
| Alienware 17 R4 | |
| Asus Zephyrus GX501 | |
| Eurocom Sky MX5 R3 | |
| MSI GS43VR 7RE-069US | |
| Nvidia GeForce GTX 1060 Founders Edition 6 GB | |
| Nvidia GeForce GTX 1060 Founders Edition 6 GB | |
| MSI GT72VR 6RD-063US | |
| Aorus X5S v5 | |
| Lenovo Legion Y520-15IKBN-80WK001KUS | |
| The Witcher 3 - 1920x1080 Ultra Graphics & Postprocessing (HBAO+) | |
| Alienware 17 R4 | |
| Eurocom Sky MX5 R3 | |
| Asus Zephyrus GX501 | |
| Nvidia GeForce GTX 1060 Founders Edition 6 GB | |
| MSI GS43VR 7RE-069US | |
| Lenovo Legion Y520-15IKBN-80WK001KUS | |
| BioShock Infinite - 1920x1080 Ultra Preset, DX11 (DDOF) | |
| Alienware 17 R4 | |
| Eurocom Sky MX5 R3 | |
| MSI GS43VR 7RE-069US | |
| MSI GT72VR 6RD-063US | |
| Aorus X5S v5 | |
| Lenovo Legion Y520-15IKBN-80WK001KUS | |
| low | med. | high | ultra | |
|---|---|---|---|---|
| BioShock Infinite (2013) | 105.6 | |||
| Metro: Last Light (2013) | 80.2 | |||
| Thief (2014) | 77.1 | |||
| The Witcher 3 (2015) | 79 | 41 | ||
| Batman: Arkham Knight (2015) | 88 | 60 | ||
| Metal Gear Solid V (2015) | 60 | |||
| Fallout 4 (2015) | 71.5 | |||
| Rise of the Tomb Raider (2016) | 68.8 | |||
| Ashes of the Singularity (2016) | 58.1 | |||
| Overwatch (2016) | 106 | |||
| Mafia 3 (2016) | 42 | |||
| Prey (2017) | 106.7 |
Stress Test
We subject the notebook to extremely stressful processing conditions to identify for any potential throttling or stability issues. When under Prime95 load, the CPU can be observed maintaining a core clock rate in the 3.0 to 3.2 GHz range or about 200 MHz to 400 MHz above the base clock rate of the i7-7700HQ. The CPU can indeed attain higher clock rates in the 3.4 to 3.8 GHz range until core temperatures hit an imposed 95 C ceiling where Turbo Boost will then throttle for safer operating temperatures. Even so, the stable core temperature of about 80 to 84 C is still very warm for any processor.
Running both Prime95 and FurMark simultaneously will strip the CPU from any Turbo Boost benefits and will even throttle it slightly to as low as 2.4 GHz with a steady core temperature of 95 C. The alarmingly hot >90 C range is unfortunately a common sight on super-thin or small gaming notebooks like those from Razer or Aorus.
Witcher 3 stress is more representative of real-world gaming load. CPU and GPU performances remain steady at 3.6 GHz and 1658 MHz, respectively, with core temperatures hovering in the low 70 C range each. These thermals would be considered very warm for a desktop build but are just about average for a gaming notebook. The real drawback, of course, will be the fan noise as our next section will detail.
Running on batteries will throttle GPU performance more heavily than the CPU. A Fire Strike run on battery power returns Physics and Graphics scores of 9454 and 3903 points, respectively, compared to 10763 and 11979 points when on mains. Setting the Nvidia Power Management mode to "Prefer maximum performance" did not improve our benchmark scores.
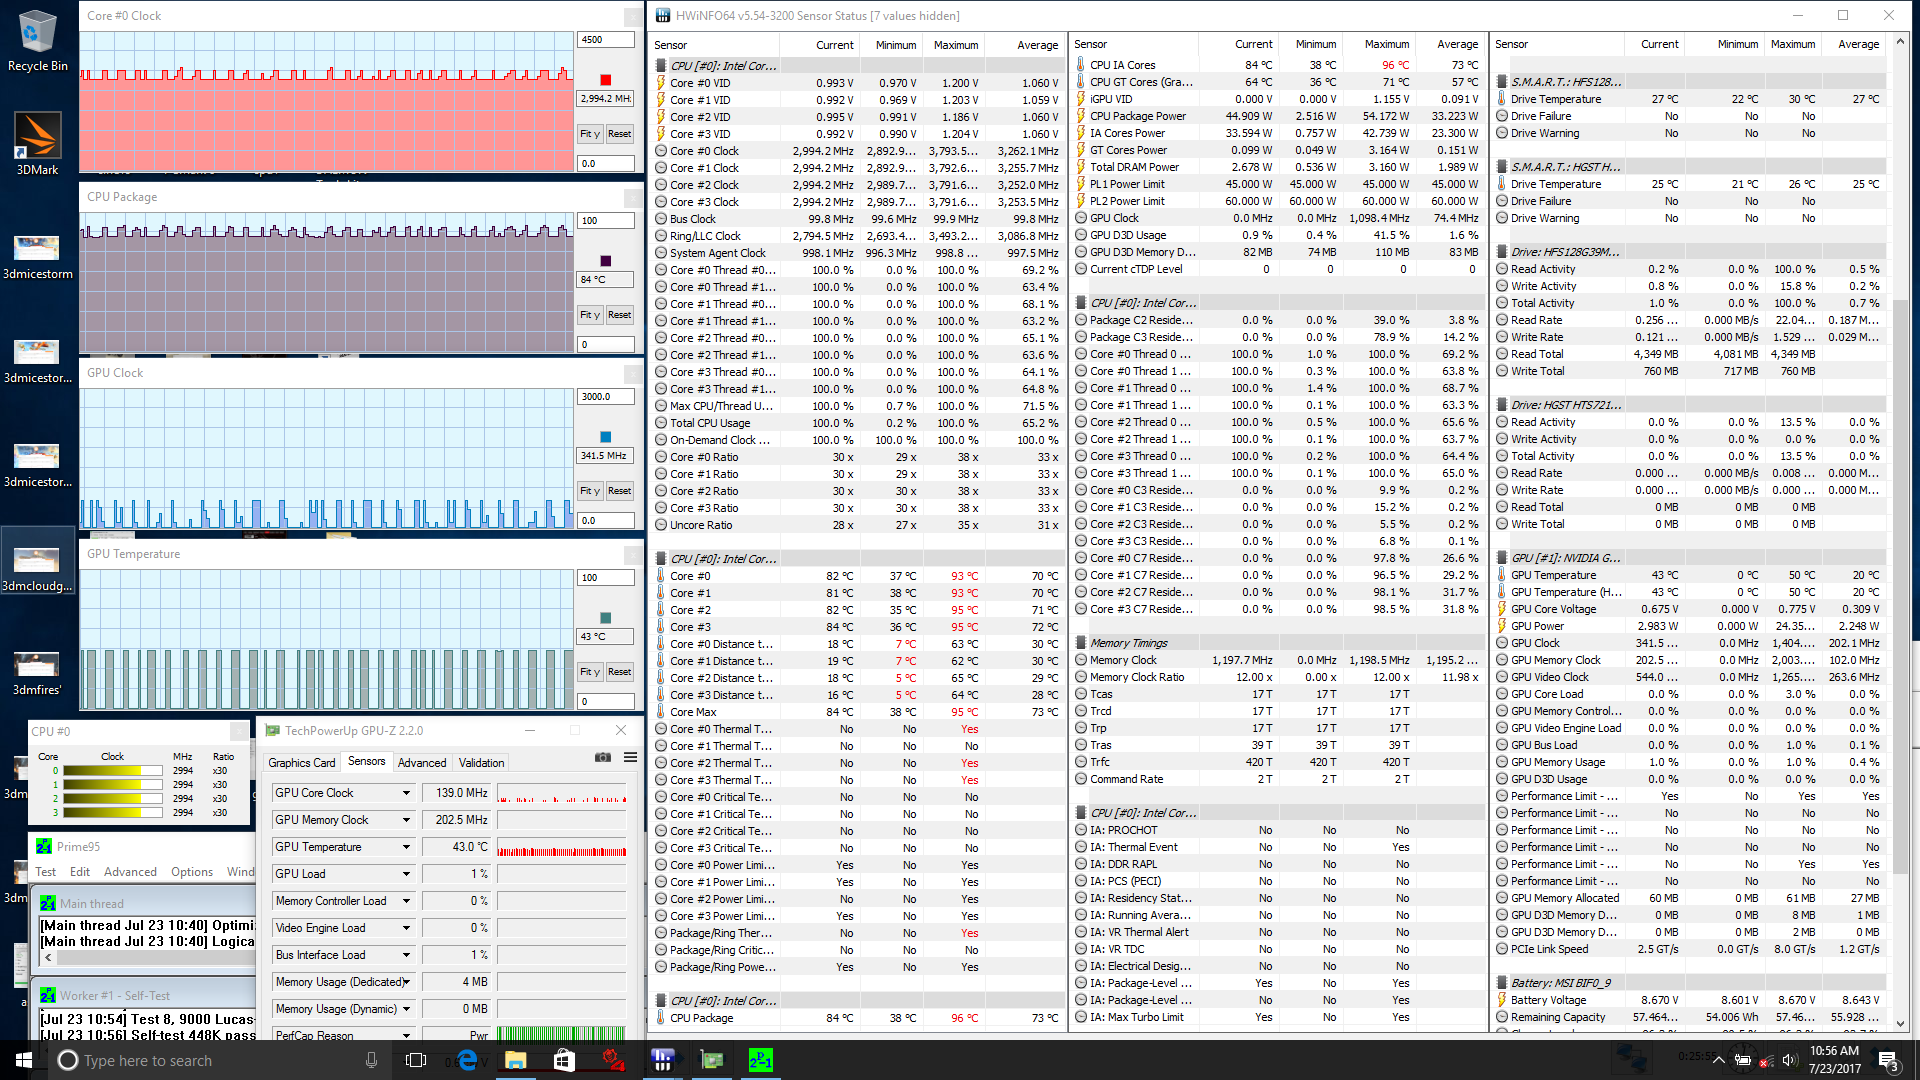
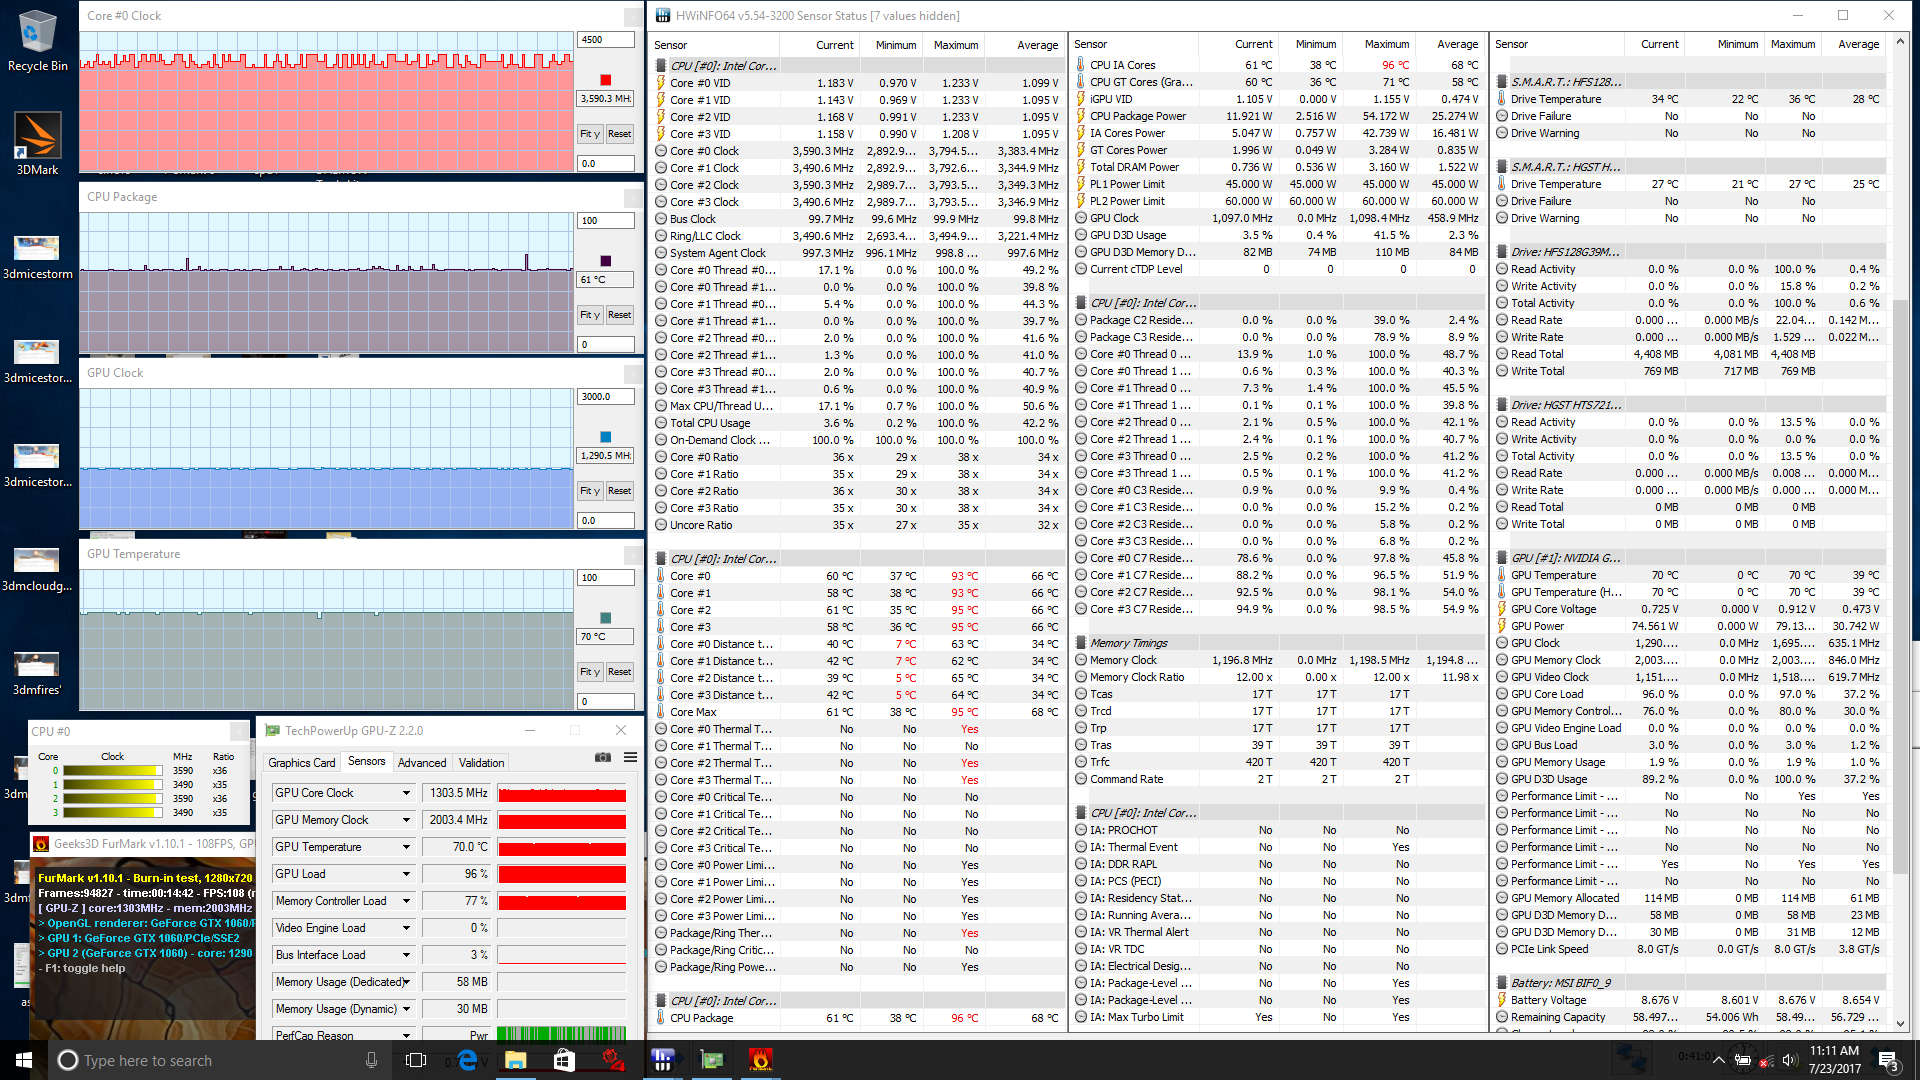
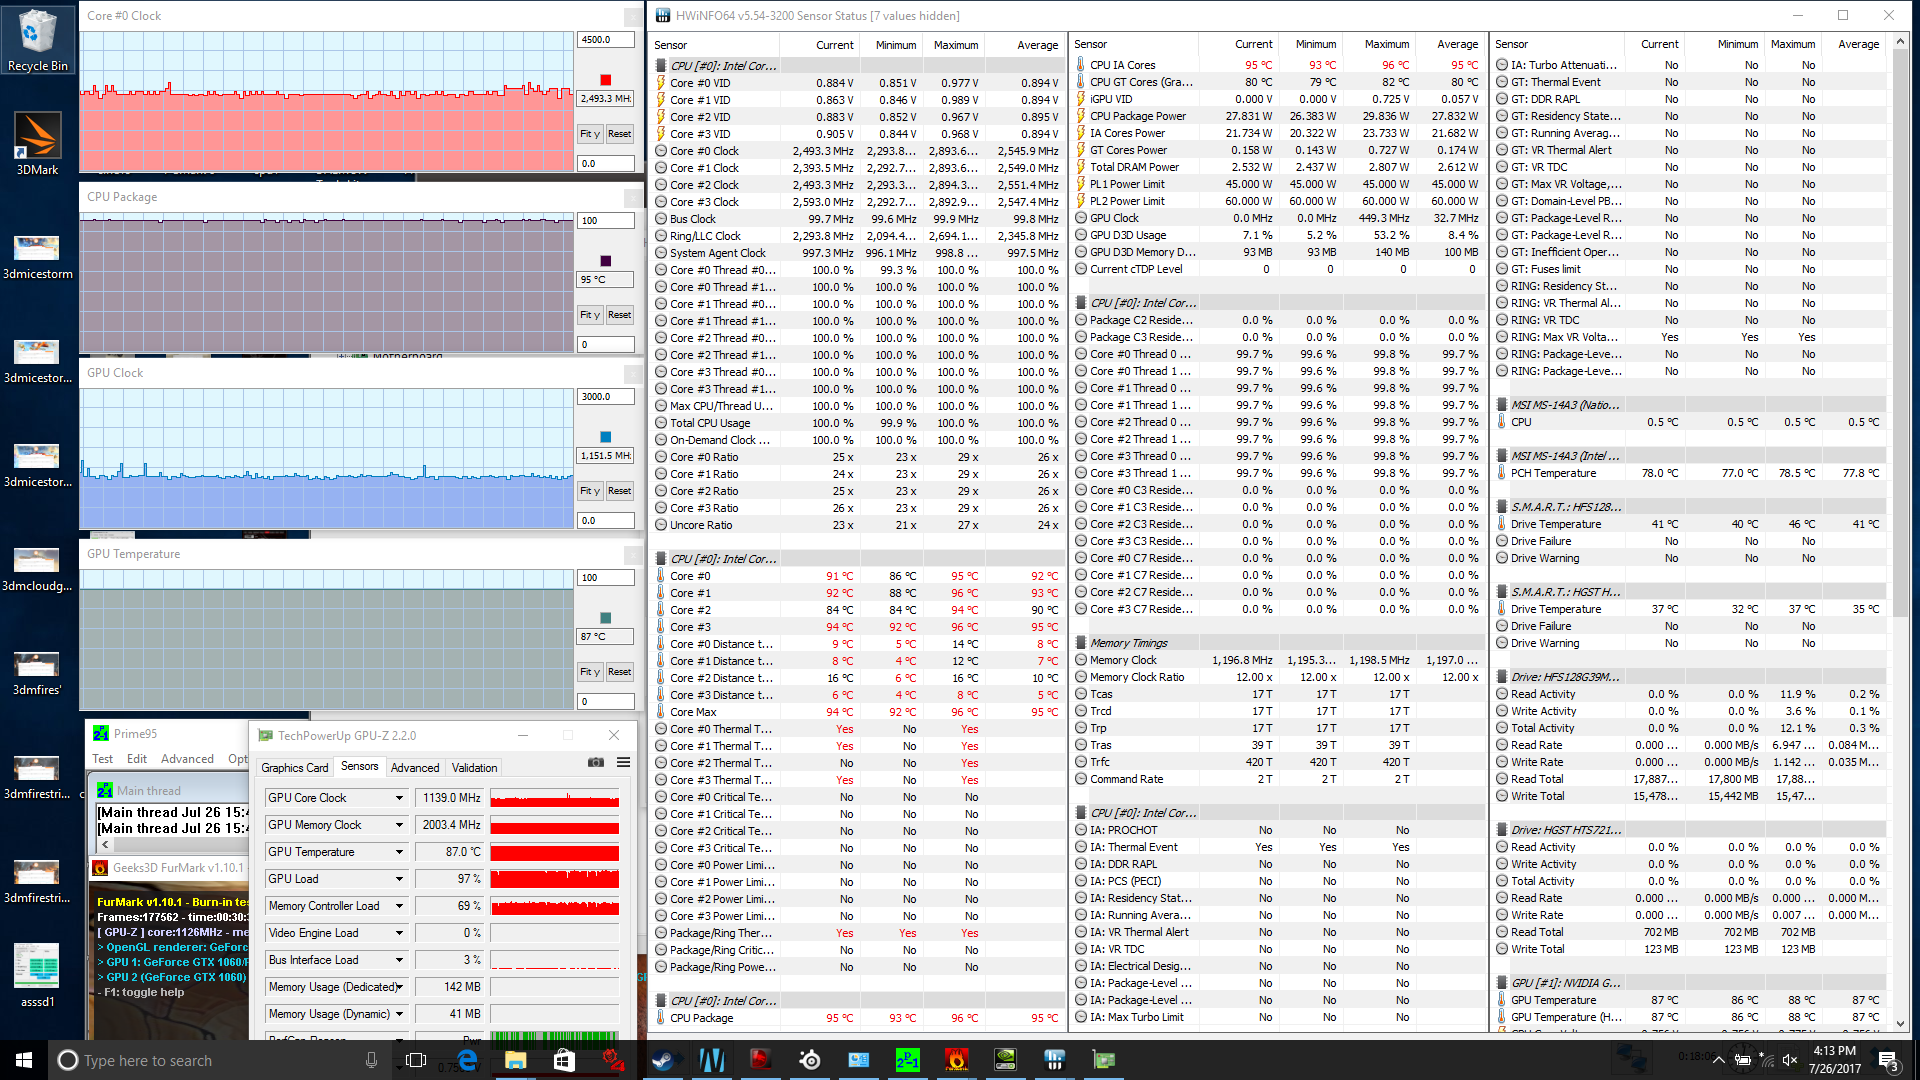
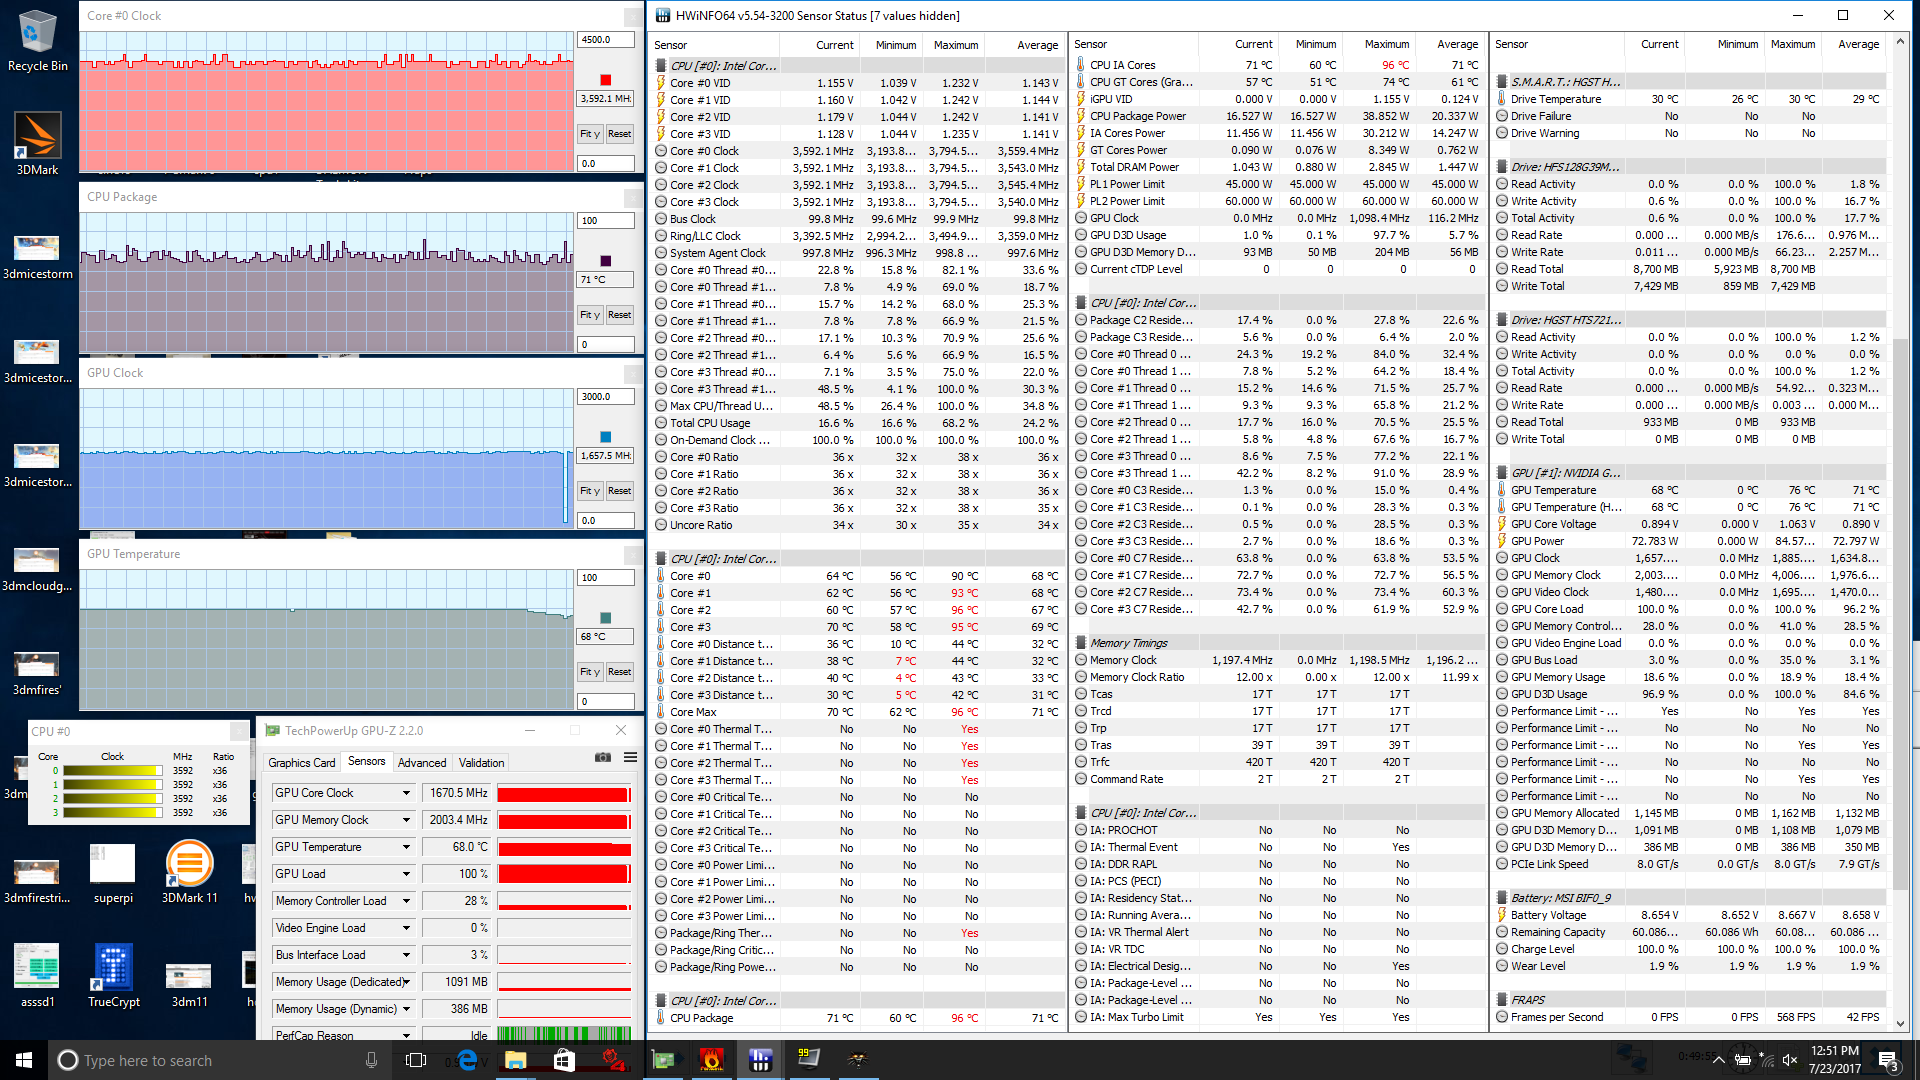
| CPU Clock (GHz) | GPU Clock (MHz) | Average CPU Temperature (°C) | Average GPU Temperature (°C) | |
| Prime95 Stress | 3.0 - 3.2 | -- | 80 - 84 | 43 |
| FurMark Stress | -- | 1291 | 61 | 70 |
| Prime95 + FurMark Stress | 2.4 - 2.6 | 1152 | 95 | 87 |
| Witcher 3 Stress | 3.6 | 1658 | 71 | 70 |
Emissions
System Noise
Unsurprisingly, cramming a 45 W HQ-class CPU and an ~80 W GTX 1060 in a 14-inch form factor has resulted in some extreme fan noise readings. The fans are always active at around 33 dB(A) at their quietest when idling on the Power Saver Profile and with integrated graphics active. A few minutes of browsing or regular use is already enough to cause the fans to pulsate between 33 and 35 dB(A) whereas the latest U-class Ultrabooks are essentially silent under similar loads.
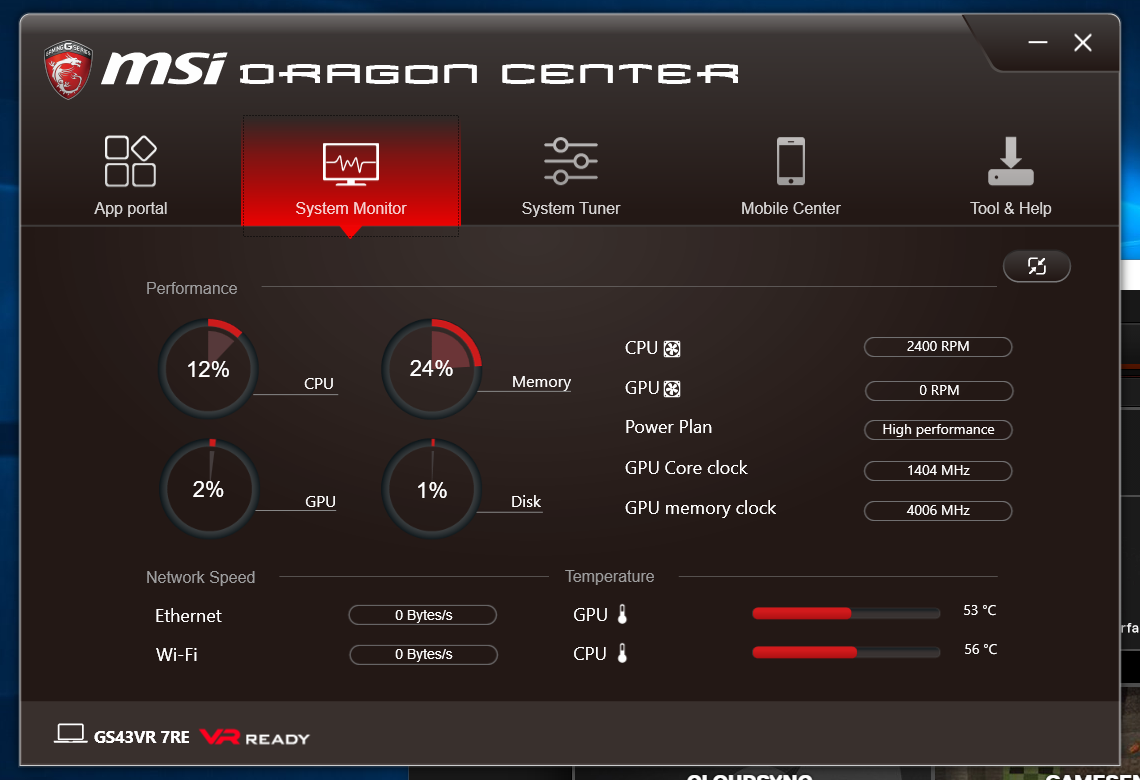
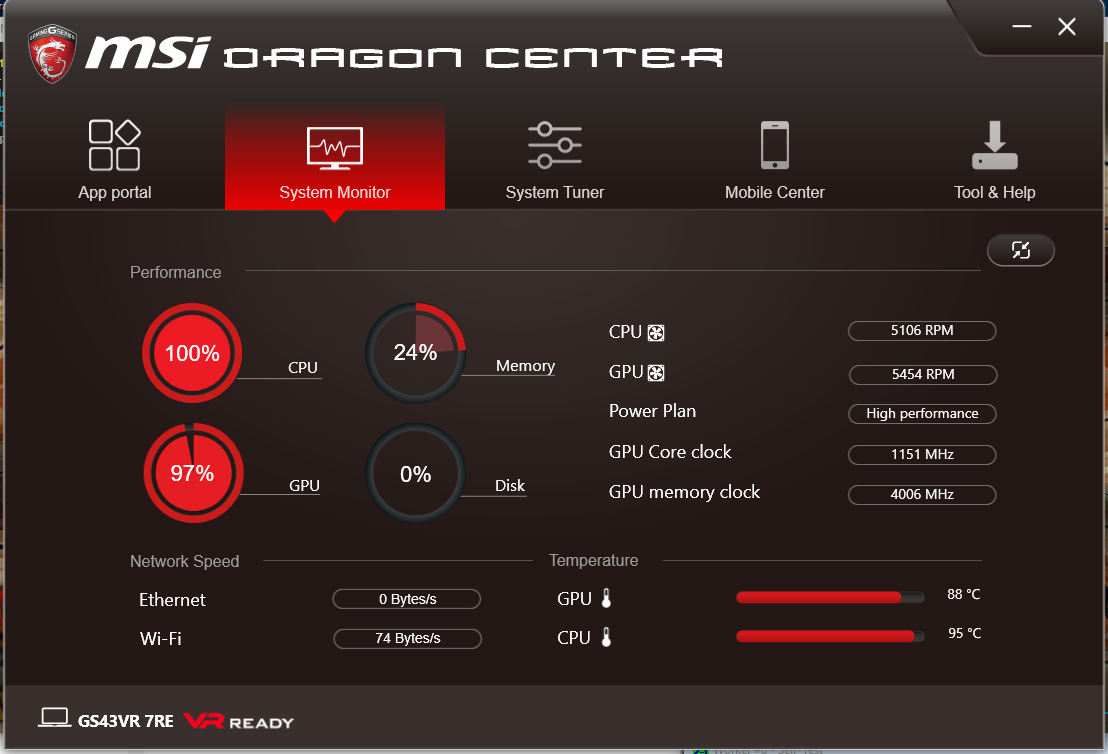
Fan noise only gets worse from here. Idling on the High Performance profile with the Nvidia GPU active will bump fan noise to the low 40 dB(A) range without even needing to run any applications. In other words, an idling GS43VR has the potential to be as loud as an Ultrabook under extreme processing loads. This pulsing and high idling fan noise can fortunately be mitigated by playing around with the Dragon Center fan controls, but we find it faster to simply turn on Power Saver mode with the iGPU instead. Running Witcher 3 will cause the fans to run as loudly as 56.7 dB(A) to be one of the loudest gaming notebooks we've recorded alongside the Razer Blade 14 and Alienware 13. The System Monitor window shows both fans running in the 5100 to 5400 RPM range each when at their maximum.
Very slight electronic noise or coil whine is audible on our test unit seemingly at random intervals.

Noise level
| Idle |
| 33 / 34.5 / 35 dB(A) |
| Load |
| 54.2 / 54.2 dB(A) |
 | ||
30 dB silent 40 dB(A) audible 50 dB(A) loud |
||
min: | ||
| MSI GS43VR 7RE-069US GeForce GTX 1060 Mobile, i7-7700HQ, SK Hynix HFS128G39MNC-3510A | MSI GS63VR 7RF-228US GeForce GTX 1060 Mobile, i7-7700HQ, Samsung SM961 MZVKW512HMJP m.2 PCI-e | Razer Blade (2016) FHD GeForce GTX 1060 Mobile, 6700HQ | Gigabyte Aero 14 GA-K106Q416-PL-B02 GeForce GTX 1060 Mobile, i7-7700HQ, Liteonit CV3-8D256 | Aorus x3 Plus v7 GeForce GTX 1060 Mobile, i7-7820HK, Toshiba NVMe THNSN5512GPU7 | Apple MacBook Pro 15 2016 (2.6 GHz, 450) Radeon Pro 450, 6700HQ, Apple SSD SM0256L | |
|---|---|---|---|---|---|---|
| Noise | 10% | -2% | 7% | -1% | 12% | |
| off / environment * (dB) | 28 | 28.8 -3% | 31 -11% | 29.1 -4% | 30.4 -9% | |
| Idle Minimum * (dB) | 33 | 33.1 -0% | 35 -6% | 31.3 5% | 31.4 5% | 30.6 7% |
| Idle Average * (dB) | 34.5 | 33.1 4% | 36 -4% | 31.3 9% | 37 -7% | 30.6 11% |
| Idle Maximum * (dB) | 35 | 34 3% | 37 -6% | 31.3 11% | 40.8 -17% | 30.6 13% |
| Load Average * (dB) | 54.2 | 37.2 31% | 43 21% | 50.3 7% | 50 8% | 34.7 36% |
| Witcher 3 ultra * (dB) | 56.7 | 46.1 19% | 53.6 5% | |||
| Load Maximum * (dB) | 54.2 | 47.1 13% | 57 -5% | 53.4 1% | 53.6 1% | 46.3 15% |
* ... smaller is better
Temperature
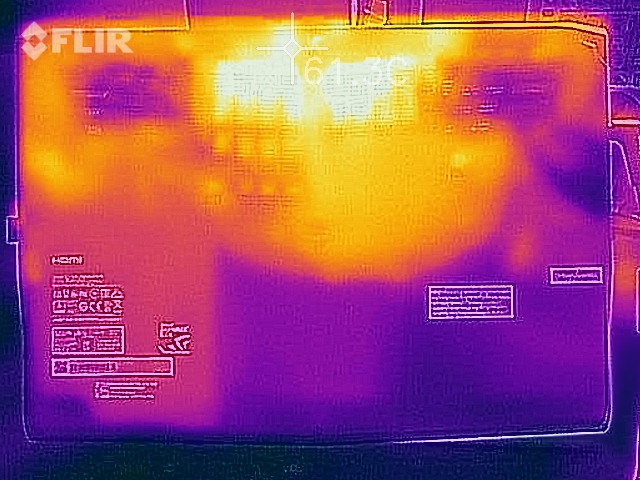
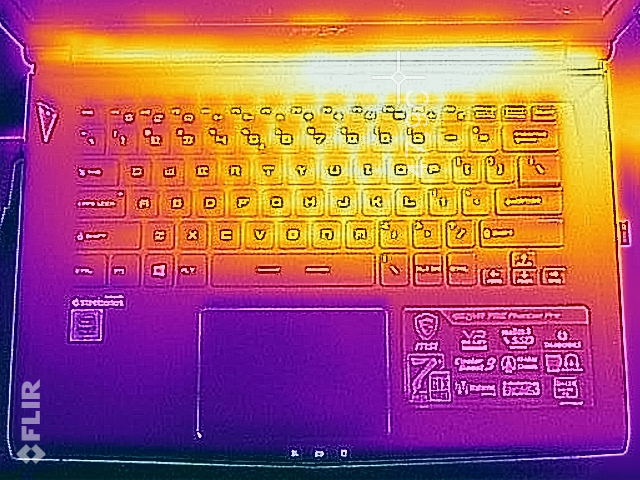
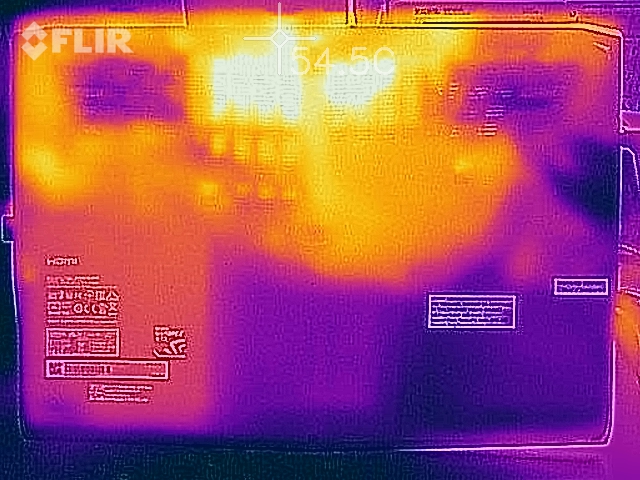
Warmer areas can always be felt on the right palm rest and above the first row of keyboard keys where the processors and HDD are located, respectively. Surfaces near the processors can be as warm as 63 C during extreme loads compared to just 54 C on the larger but similarly equipped GT72VR. If gaming, this same hot spot on the GS43VR will only be slightly cooler at 54 C. It's interesting to note that the fans are running so loudly under load and drawing air from the speaker grilles that the palm rests become noticeably cooler than if the system were idling at lower fan RPMs. Fortunately, the WASD keys never become uncomfortably warm no matter the load which is quite surprising for a 14-inch gaming notebook.
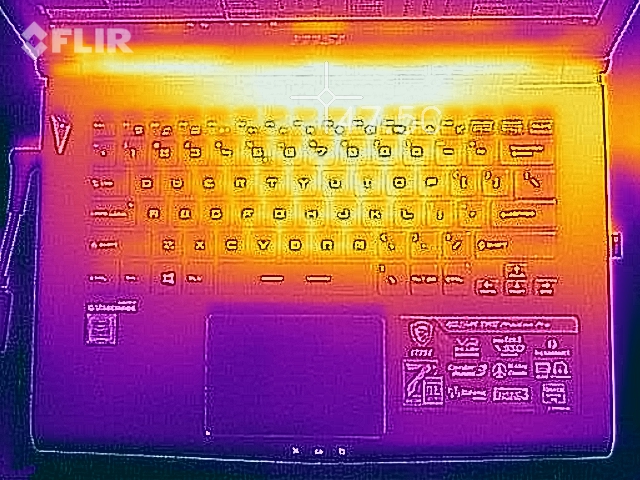
(-) The maximum temperature on the upper side is 47.8 °C / 118 F, compared to the average of 40.4 °C / 105 F, ranging from 21.2 to 68.8 °C for the class Gaming.
(-) The bottom heats up to a maximum of 63.2 °C / 146 F, compared to the average of 43.2 °C / 110 F
(+) In idle usage, the average temperature for the upper side is 28.6 °C / 83 F, compared to the device average of 33.9 °C / 93 F.
(±) Playing The Witcher 3, the average temperature for the upper side is 36.4 °C / 98 F, compared to the device average of 33.9 °C / 93 F.
(+) The palmrests and touchpad are reaching skin temperature as a maximum (32 °C / 89.6 F) and are therefore not hot.
(-) The average temperature of the palmrest area of similar devices was 28.8 °C / 83.8 F (-3.2 °C / -5.8 F).
Speakers
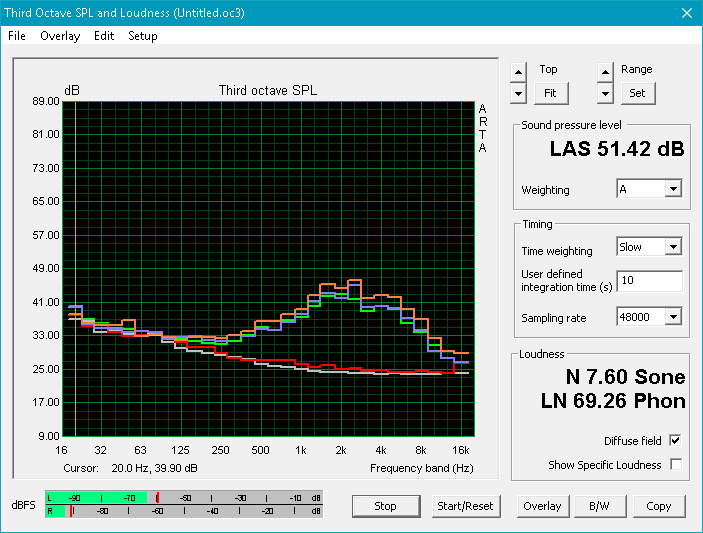
The integrated 2 W stereo speakers are average at best. Our microphone measurements below show poor bass reproduction and an overemphasis on treble frequencies that we find unsatisfactory for music and video playback. A flatter curve like the one for the Eurocom X7E2 is preferable for a balanced sound experience as opposed to the bell curve of the MSI. Adjusting the sound settings through Nahimic do not appear to improve quality by any noticeable margin. Earphones are definitely recommended whenever possible especially for gaming.
The GS43VR utilizes the same ESS Sabre DAC as the larger GS63/GS73 and GT72/GT73 series for supporting hi-res audio output (24 bit/192 kHz) and professional headphones. While most users are not likely to take full advantage of this, it's still a unique feature in the small 14-inch gaming space.
")


MSI GS43VR 7RE-069US audio analysis
(±) | speaker loudness is average but good (72 dB)
Bass 100 - 315 Hz
(-) | nearly no bass - on average 21.9% lower than median
(±) | linearity of bass is average (7.2% delta to prev. frequency)
Mids 400 - 2000 Hz
(+) | balanced mids - only 3.5% away from median
(±) | linearity of mids is average (7.6% delta to prev. frequency)
Highs 2 - 16 kHz
(±) | higher highs - on average 5.7% higher than median
(±) | linearity of highs is average (11% delta to prev. frequency)
Overall 100 - 16.000 Hz
(±) | linearity of overall sound is average (27.5% difference to median)
Compared to same class
» 93% of all tested devices in this class were better, 1% similar, 5% worse
» The best had a delta of 6%, average was 18%, worst was 132%
Compared to all devices tested
» 84% of all tested devices were better, 3% similar, 13% worse
» The best had a delta of 4%, average was 23%, worst was 134%
Apple MacBook 12 (Early 2016) 1.1 GHz audio analysis
(+) | speakers can play relatively loud (83.6 dB)
Bass 100 - 315 Hz
(±) | reduced bass - on average 11.3% lower than median
(±) | linearity of bass is average (14.2% delta to prev. frequency)
Mids 400 - 2000 Hz
(+) | balanced mids - only 2.4% away from median
(+) | mids are linear (5.5% delta to prev. frequency)
Highs 2 - 16 kHz
(+) | balanced highs - only 2% away from median
(+) | highs are linear (4.5% delta to prev. frequency)
Overall 100 - 16.000 Hz
(+) | overall sound is linear (10.2% difference to median)
Compared to same class
» 7% of all tested devices in this class were better, 2% similar, 90% worse
» The best had a delta of 5%, average was 18%, worst was 53%
Compared to all devices tested
» 5% of all tested devices were better, 1% similar, 94% worse
» The best had a delta of 4%, average was 23%, worst was 134%
Frequency Comparison (Checkbox selectable!)
Graph 1: Pink Noise 100% Vol.; Graph 2: Audio off
Energy Management
Power Consumption
The system will draw anywhere between 9 W and 12 W when idling on desktop depending on the power profile setting and screen brightness level compared to 19 W on our Skylake GS43VR likely due to differences in background activity. Average load with 3DMark06 will draw about 77 W while the Skylake GS43VR will draw as much as 107 W when running 3DMark 11.
Maximum load with Prime95 and FurMark running simultaneously will demand 153 W from a power adapter (~16 x 7.5 x 3 cm) rated for up to 180 W.
| Off / Standby | |
| Idle | |
| Load |
|
Key:
min: | |
| MSI GS43VR 7RE-069US i7-7700HQ, GeForce GTX 1060 Mobile, SK Hynix HFS128G39MNC-3510A, IPS, 1920x1080, 14" | Alienware 13 R3 i7-7700HQ, GeForce GTX 1060 Mobile, Toshiba NVMe THNSN5256GPUK, OLED, 2560x1440, 13.3" | Razer Blade (2016) FHD 6700HQ, GeForce GTX 1060 Mobile, , IPS, 1920x1080, 14" | Gigabyte Aero 14 GA-K106Q416-PL-B02 i7-7700HQ, GeForce GTX 1060 Mobile, Liteonit CV3-8D256, , 2560x1440, 14" | Aorus x3 Plus v7 i7-7820HK, GeForce GTX 1060 Mobile, Toshiba NVMe THNSN5512GPU7, IGZO TFT, 3200x1800, 13.9" | Apple MacBook Pro 15 2016 (2.6 GHz, 450) 6700HQ, Radeon Pro 450, Apple SSD SM0256L, IPS, 2880x1800, 15.4" | |
|---|---|---|---|---|---|---|
| Power Consumption | -6% | -33% | -44% | -33% | 32% | |
| Idle Minimum * (Watt) | 9.1 | 7 23% | 14 -54% | 12 -32% | 15.1 -66% | 2.9 68% |
| Idle Average * (Watt) | 11.9 | 12 -1% | 18 -51% | 18.1 -52% | 15.8 -33% | 9.7 18% |
| Idle Maximum * (Watt) | 12.2 | 18 -48% | 21 -72% | 21.3 -75% | 16.7 -37% | 10.1 17% |
| Load Average * (Watt) | 77 | 76 1% | 70 9% | 127.2 -65% | 110.9 -44% | 65 16% |
| Witcher 3 ultra * (Watt) | 126.4 | 135 -7% | ||||
| Load Maximum * (Watt) | 153 | 161 -5% | 146 5% | 149.4 2% | 170.4 -11% | 89.5 42% |
* ... smaller is better
Battery Life
The non-removable 61 Wh battery is of adequate capacity considering the small size of the system. Nonetheless, real-world runtimes are rather poor at just under 3 hours during our WLAN stress test (Balanced profile, Auto-Select graphics). Perhaps notably, the system can last for almost 9 full hours when idling on desktop at the lowest possible brightness setting with the Power Saver profile and iGPU active. Battery life appears to be very dependent on system settings and we absolutely recommend enabling all power-saving features to extend battery life if using the notebook for word processing, browsing, or streaming purposes. Our Skylake GS43VR unit, for example, was able to last for almost 4.5 ours when under similar WLAN loads.
Charging from near empty to full capacity will take longer than on most other notebooks at around 2.5 hours.
| MSI GS43VR 7RE-069US i7-7700HQ, GeForce GTX 1060 Mobile, 61 Wh | MSI GS63VR 7RF-228US i7-7700HQ, GeForce GTX 1060 Mobile, 65 Wh | Razer Blade (2016) FHD 6700HQ, GeForce GTX 1060 Mobile, 70 Wh | Gigabyte Aero 14 GA-K106Q416-PL-B02 i7-7700HQ, GeForce GTX 1060 Mobile, 94.24 Wh | Aorus x3 Plus v7 i7-7820HK, GeForce GTX 1060 Mobile, 74 Wh | Apple MacBook Pro 15 2016 (2.6 GHz, 450) 6700HQ, Radeon Pro 450, 76 Wh | |
|---|---|---|---|---|---|---|
| Battery runtime | 2% | 54% | -13% | 30% | 107% | |
| Reader / Idle (h) | 9 | 6.4 -29% | 12.7 41% | 7.8 -13% | 8 -11% | |
| WiFi v1.3 (h) | 2.9 | 3.9 34% | 7.1 145% | 4.9 69% | 10 245% | |
| Load (h) | 1.3 | 1.3 0% | 1 -23% | 1.7 31% | 0.9 -31% | |
| WiFi (h) | 5.2 |
Pros
Cons
Verdict
The GS43VR 7RE can barely be considered an update over the GS43VR 6RE. CPU performance is a little better, but Turbo Boost potential still throttles and so users can't even take full advantage of the Kaby Lake upgrade. Since the core experience remains the same, the most important part of this Kaby Lake GS43VR launch is that the older Skylake GS43VR will be cheaper to find.
MSI could have made a few more changes to better justify purchasing the Kaby Lake GS43VR over last year's model. Multi-zone RGB keys, HDMI 2.0, faster SD card reader, more display options (G-Sync, 3 or 5 ms response times), and perhaps even less bloatware could have all gone a long way. It's clear that the current GS43 iteration could benefit from a full design refresh to catch up with the new looks of the more well-known GE63VR and GT series. The large step up should make all the aforementioned missing features possible and hopefully improve chassis rigidity and fan noise along the way. In this case, the Alienware 13 and Razer Blade feel stronger and sturdier than what MSI has to offer in this size category as of today.
At a screen size of just 14-inches, the GS43VR is only recommended for gamers who are constantly on-the-go and want the performance of a gaming PC in as portable of a package as possible. Otherwise, the GT72 or GT73 make significantly better gaming machines in terms of fan noise, chassis quality, connectivity, and the sheer number of options for the price. We suggest that new GS43VR owners become familiar with the fan controls and uninstall the bloatware that seem to be hindering battery life.
The GS43VR doesn't quite match the feel or quality of a 13-inch Alienware 13 or 14-inch Razer Blade and is overdue for a design overhaul. At $1500 USD, the MSI costs about the same as the $1550 USD Dell and is cheaper than the $1900 USD Razer. If the MSI is a must, then investing in the older Skylake GS43VR will save a few hundred Dollars without sacrificing gaming performance.
MSI GS43VR 7RE-069US
- 07/27/2017 v6 (old)
Allen Ngo
Price comparison
