EVGA SC15 (i7-7700HQ, GTX 1060) Laptop Review
The EVGA SC series is just over a year old and has now expanded to include the 15.6-inch SC15 to accompany the existing 17.3-inch SC17. It would be easy to excuse the SC15 as a scaled down version of its bigger brother, but the notebook utilizes yet another brand new chassis design that makes it more than just a "mini SC17".
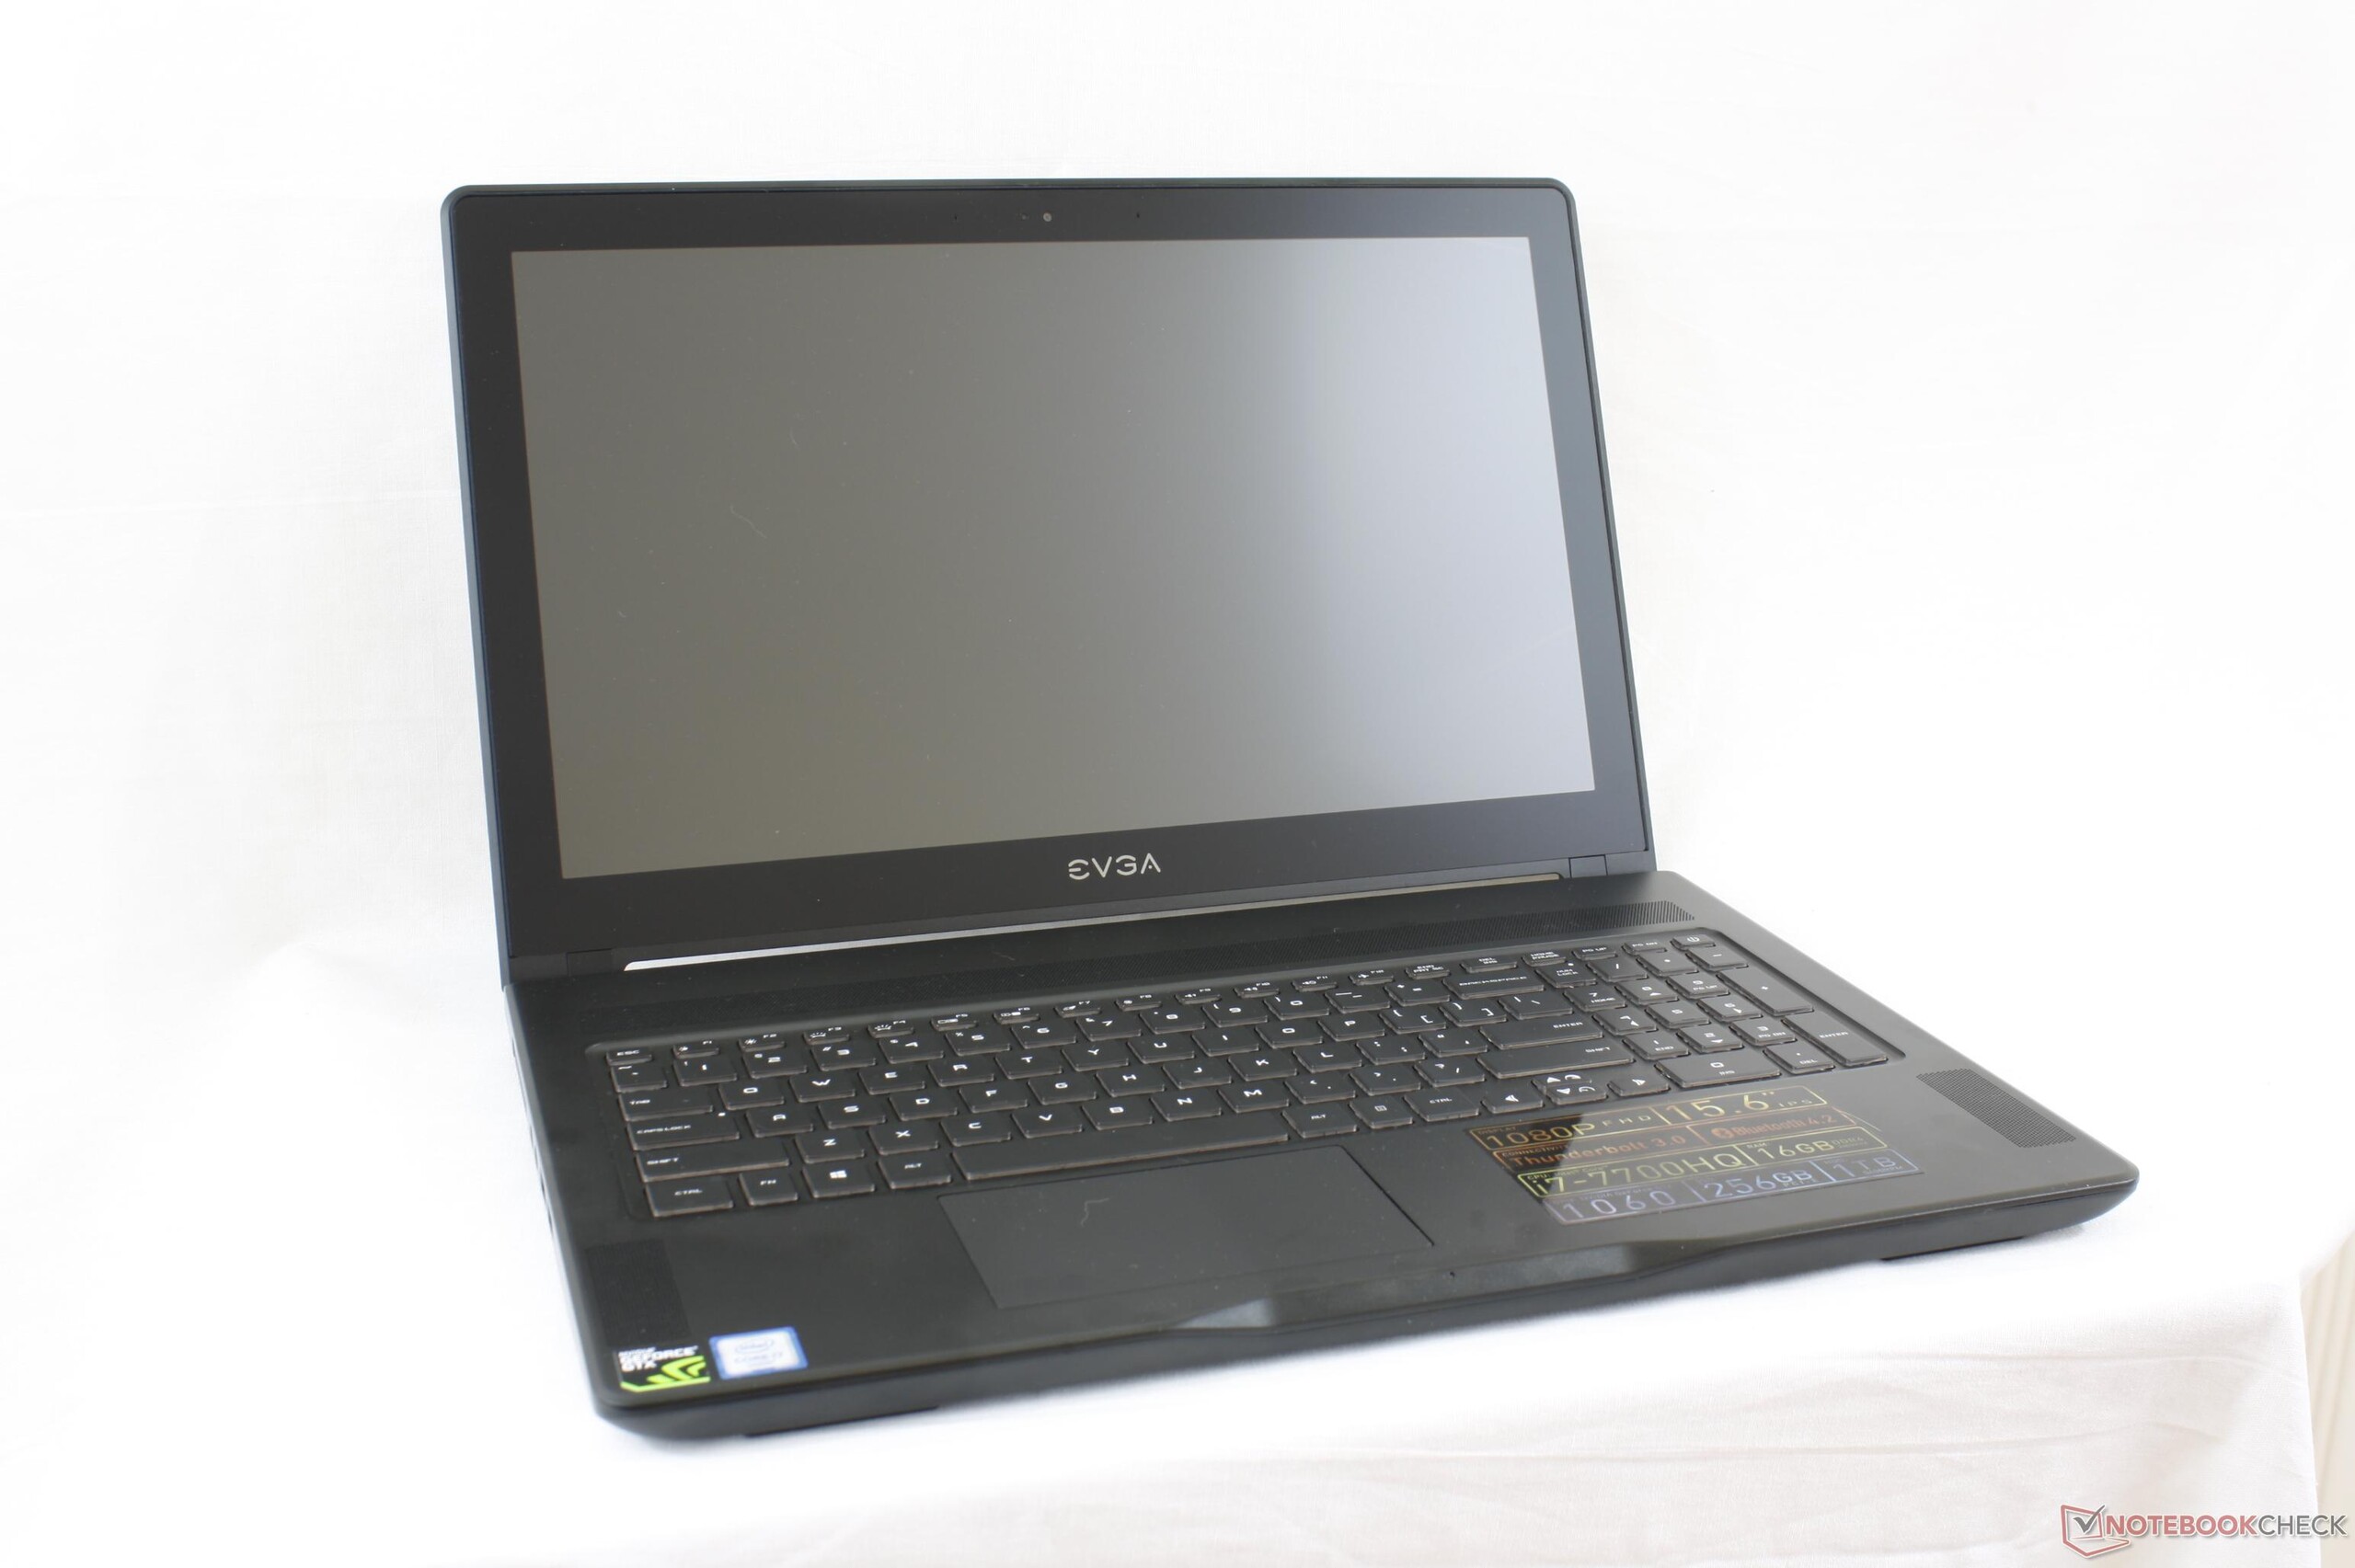
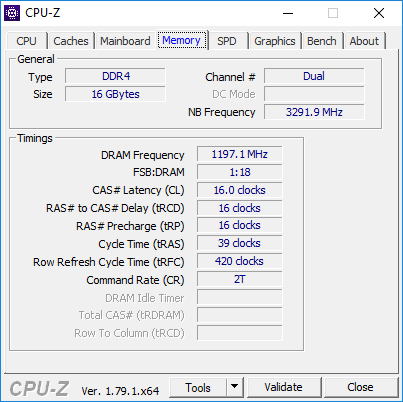
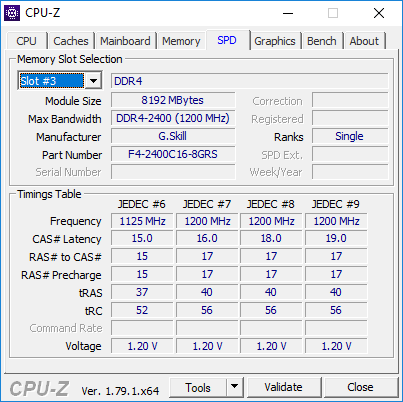
The manufacturer currently offers the SC15 in only one configuration sporting an i7-7700HQ CPU, GTX 1060 GPU, 16 GB of RAM, and FHD 120 Hz G-Sync display in contrast to the HK-class processor, GTX 1070/1080 GPU, and 4K UHD display of the SC17. When also considering its slim size, the SC15 is in direct competition against some heavy hitters in the market including the Gigabyte Aero 15, Acer Aspire V15, MSI GS63VR, Asus FX502VM/GL502VM, Gigabyte P55W, and the Lenovo Legion Y720.
Price is certainly not a distinct advantage as the $1900 USD MSRP is slightly more than what many of the above alternatives are now selling for. For this review, we'll find out exactly what the SC15 brings to the table to justify the higher price point.
Case
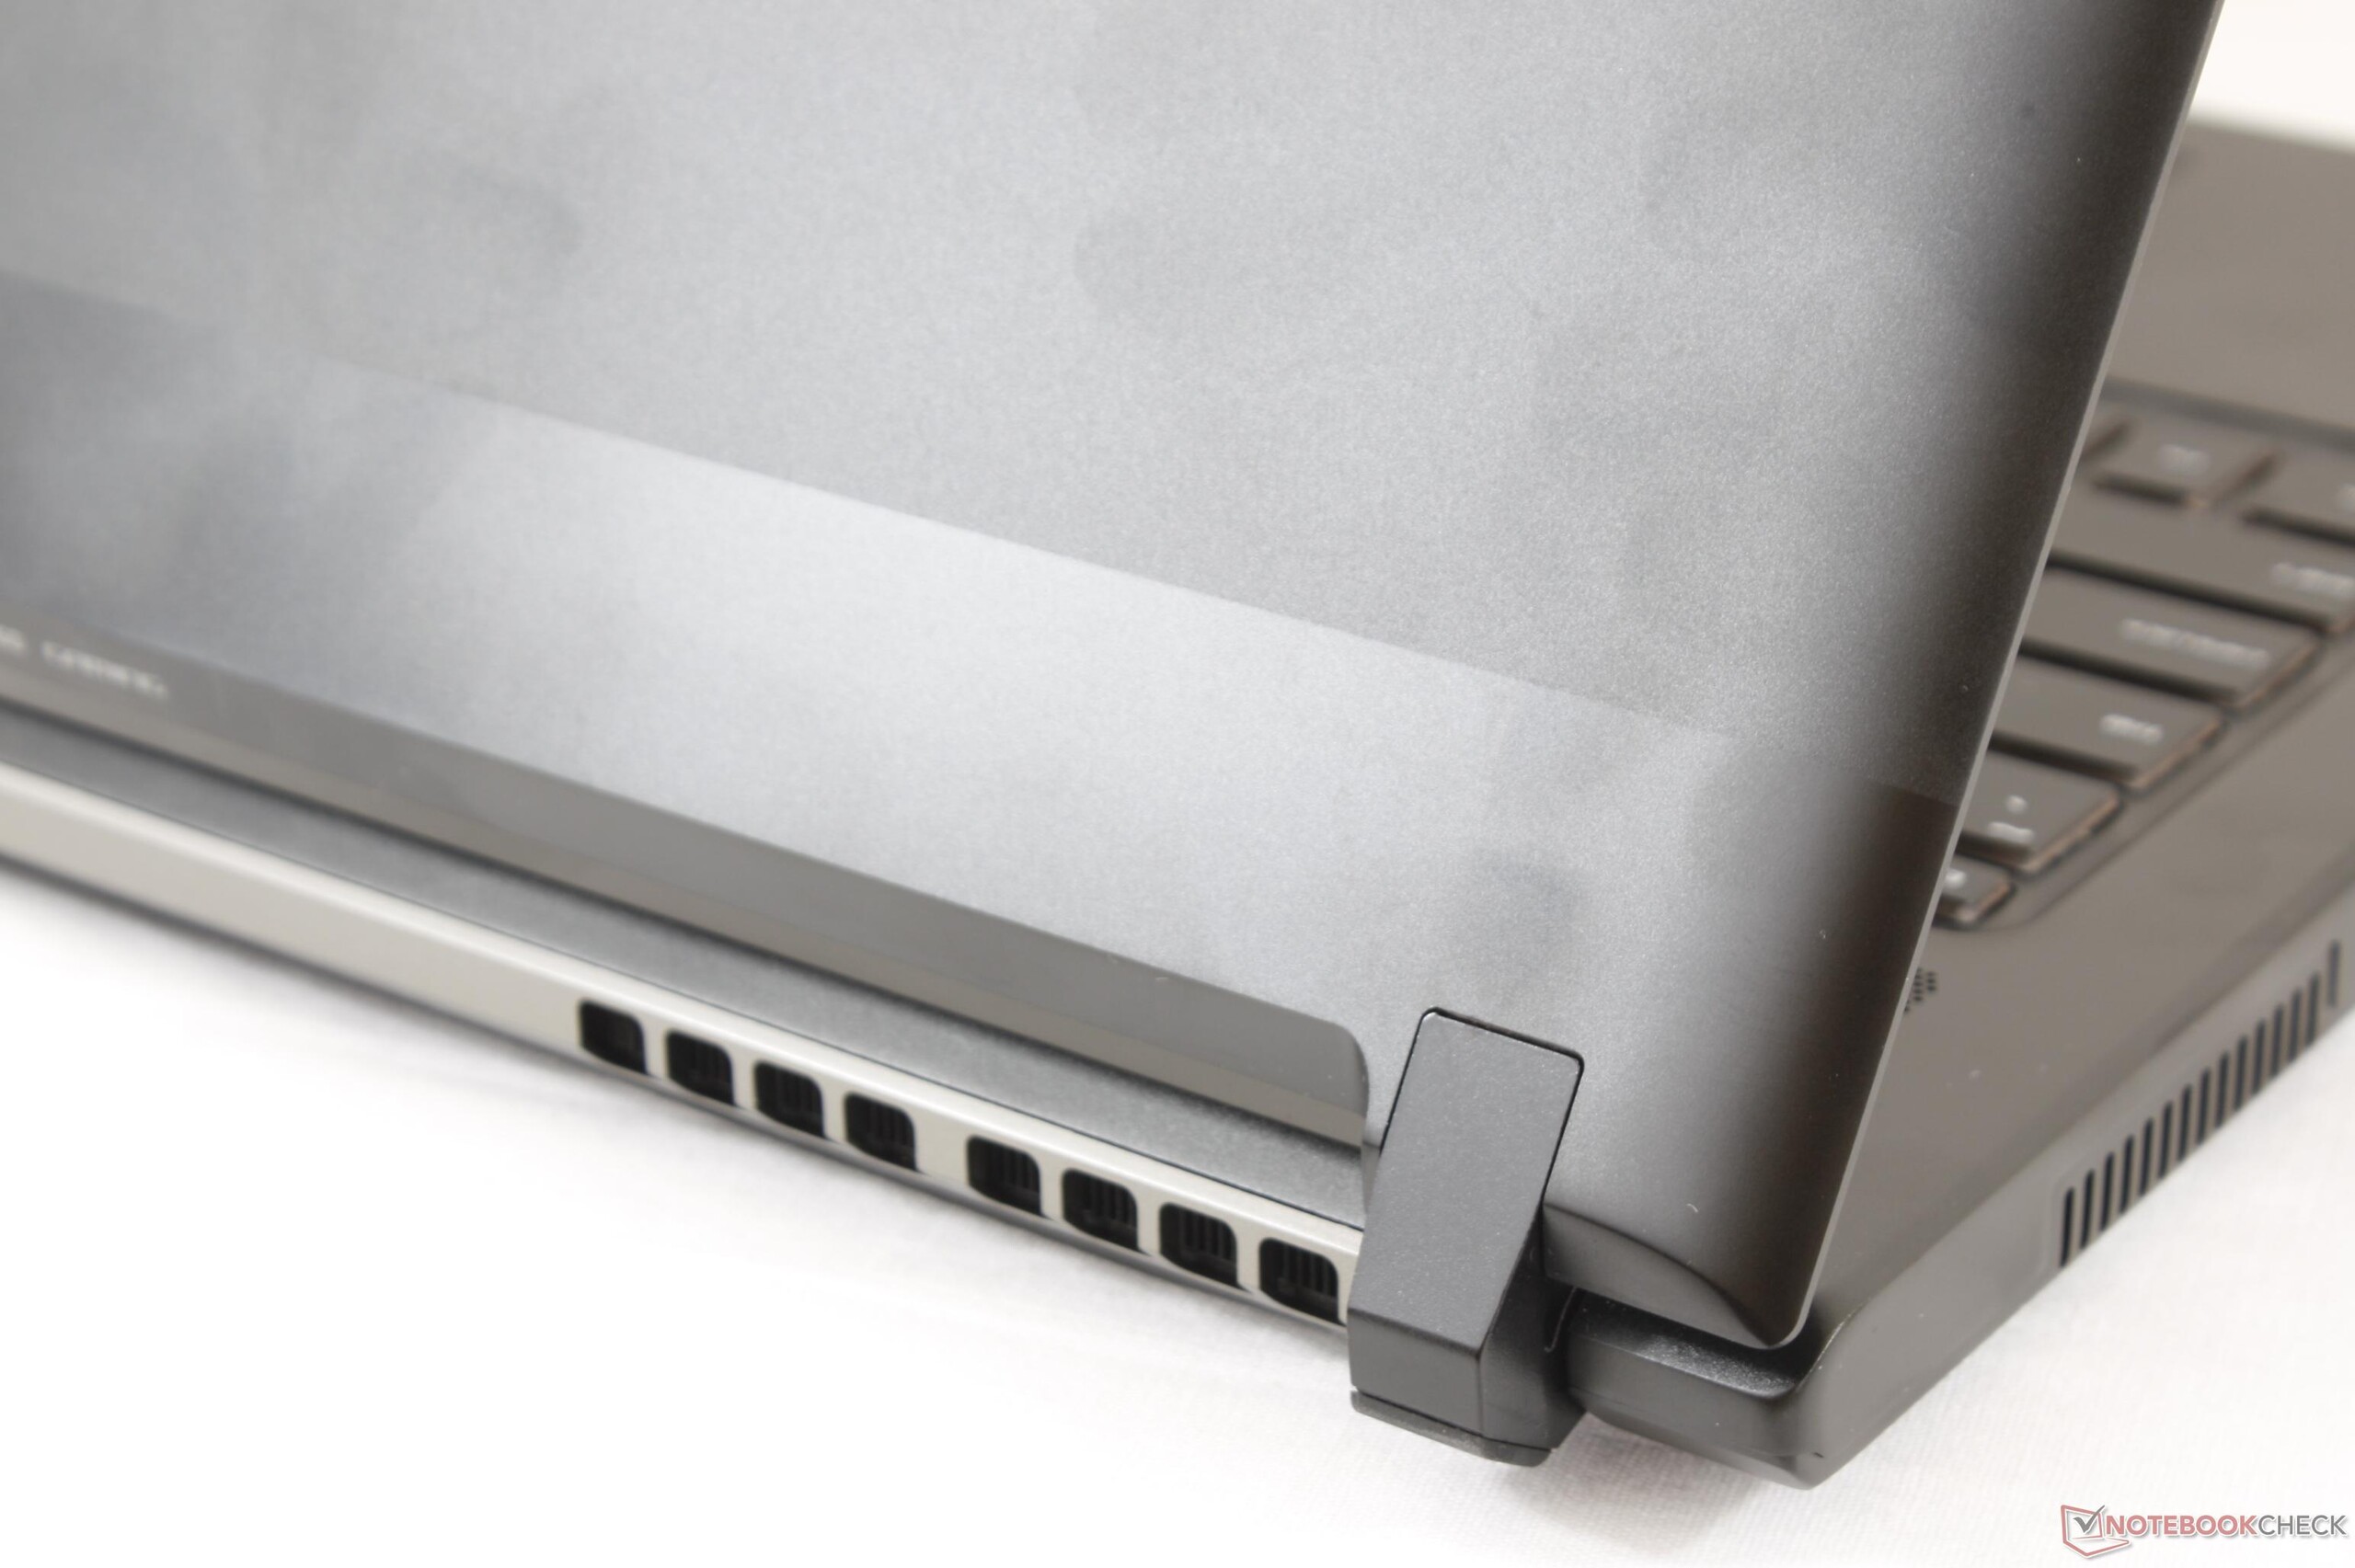
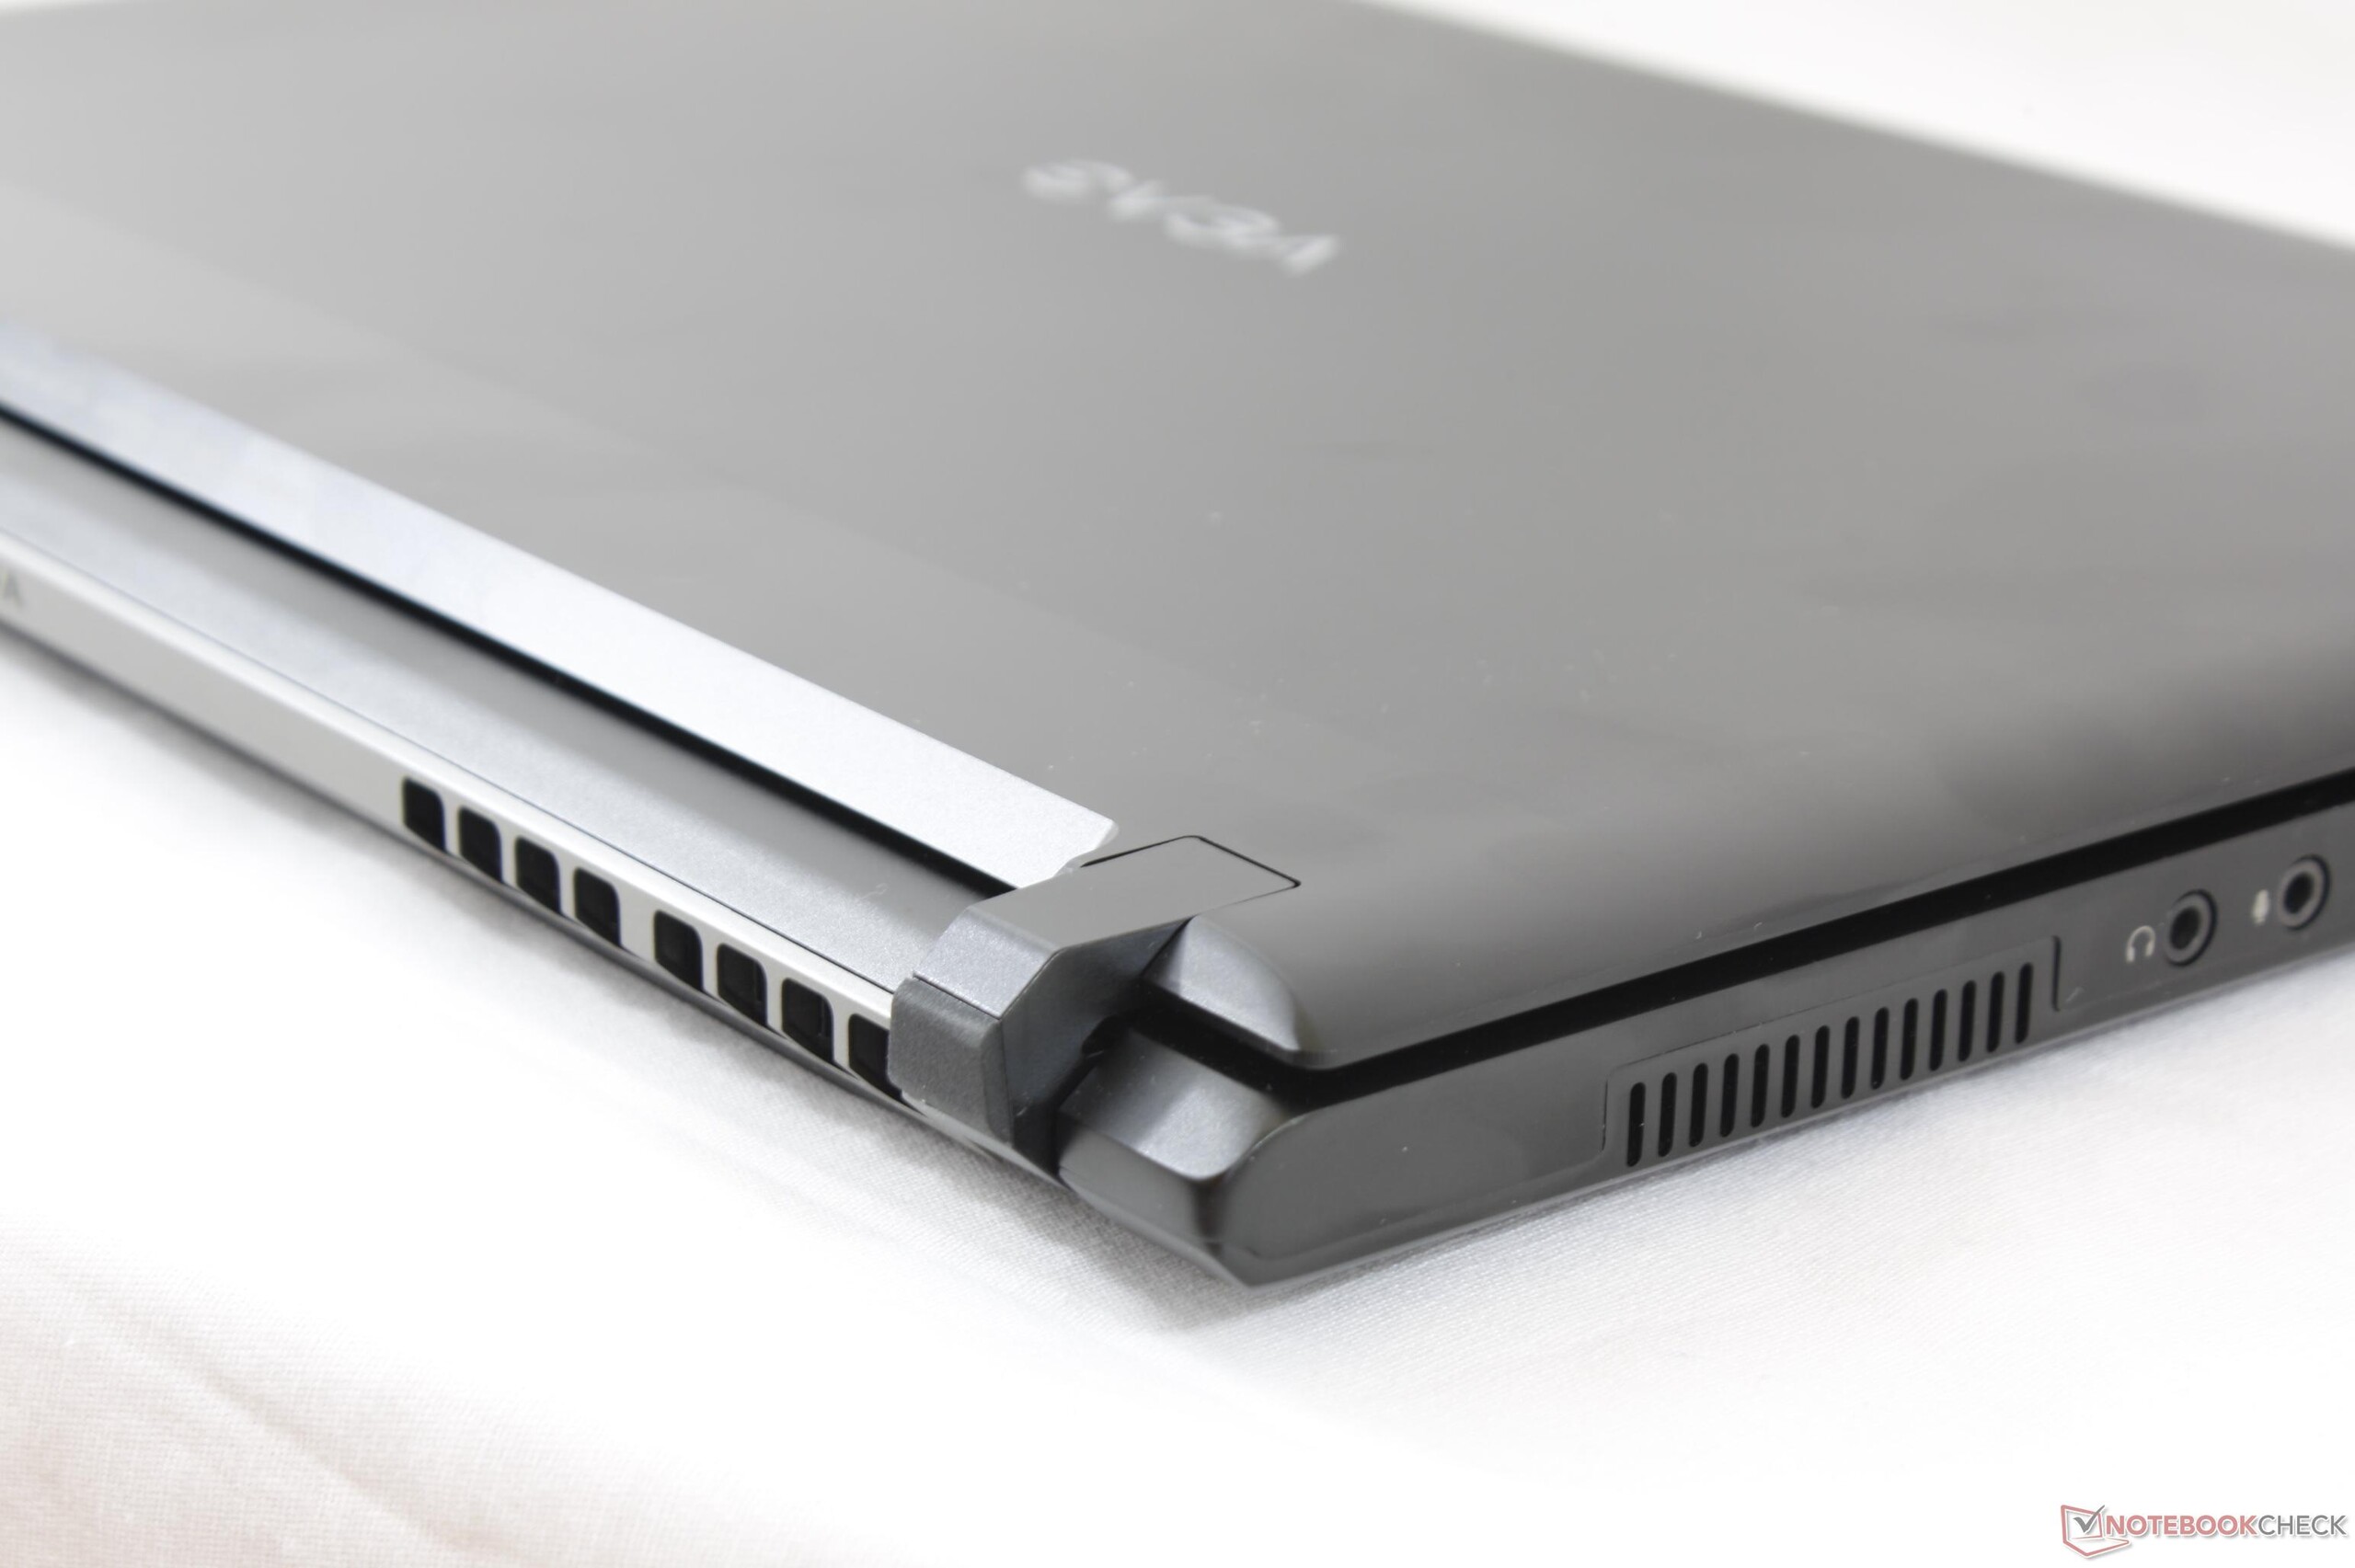
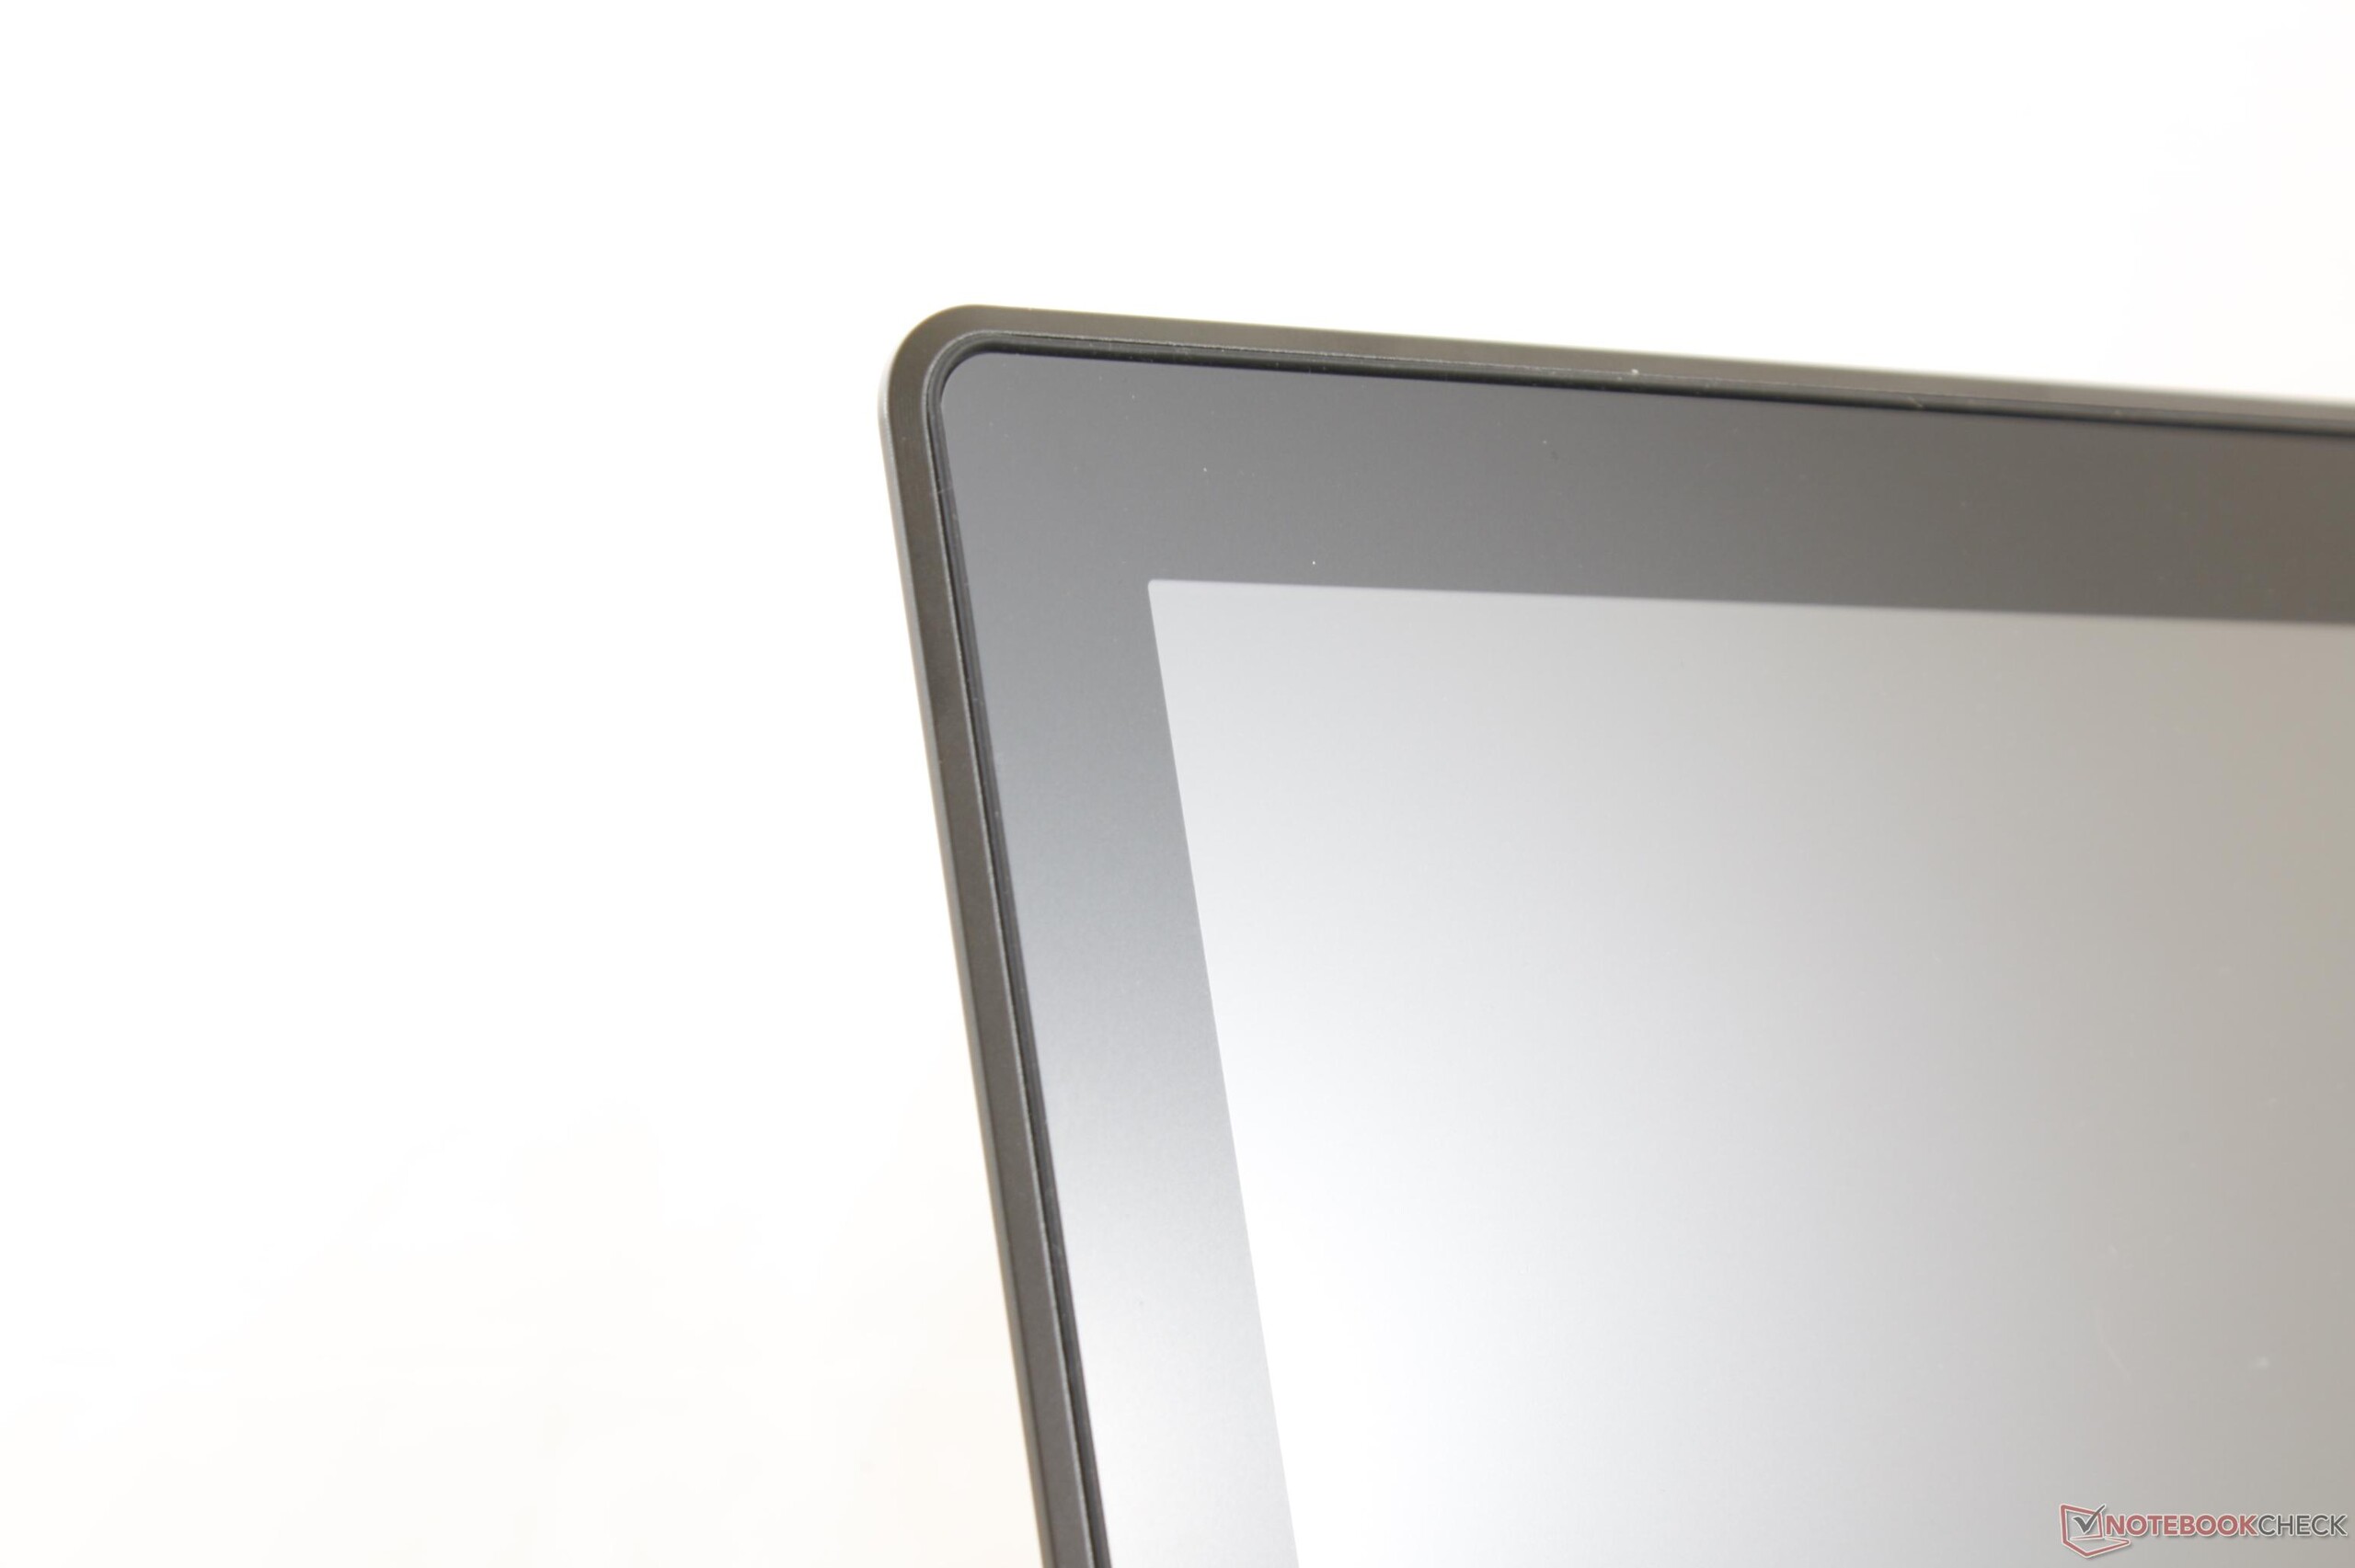
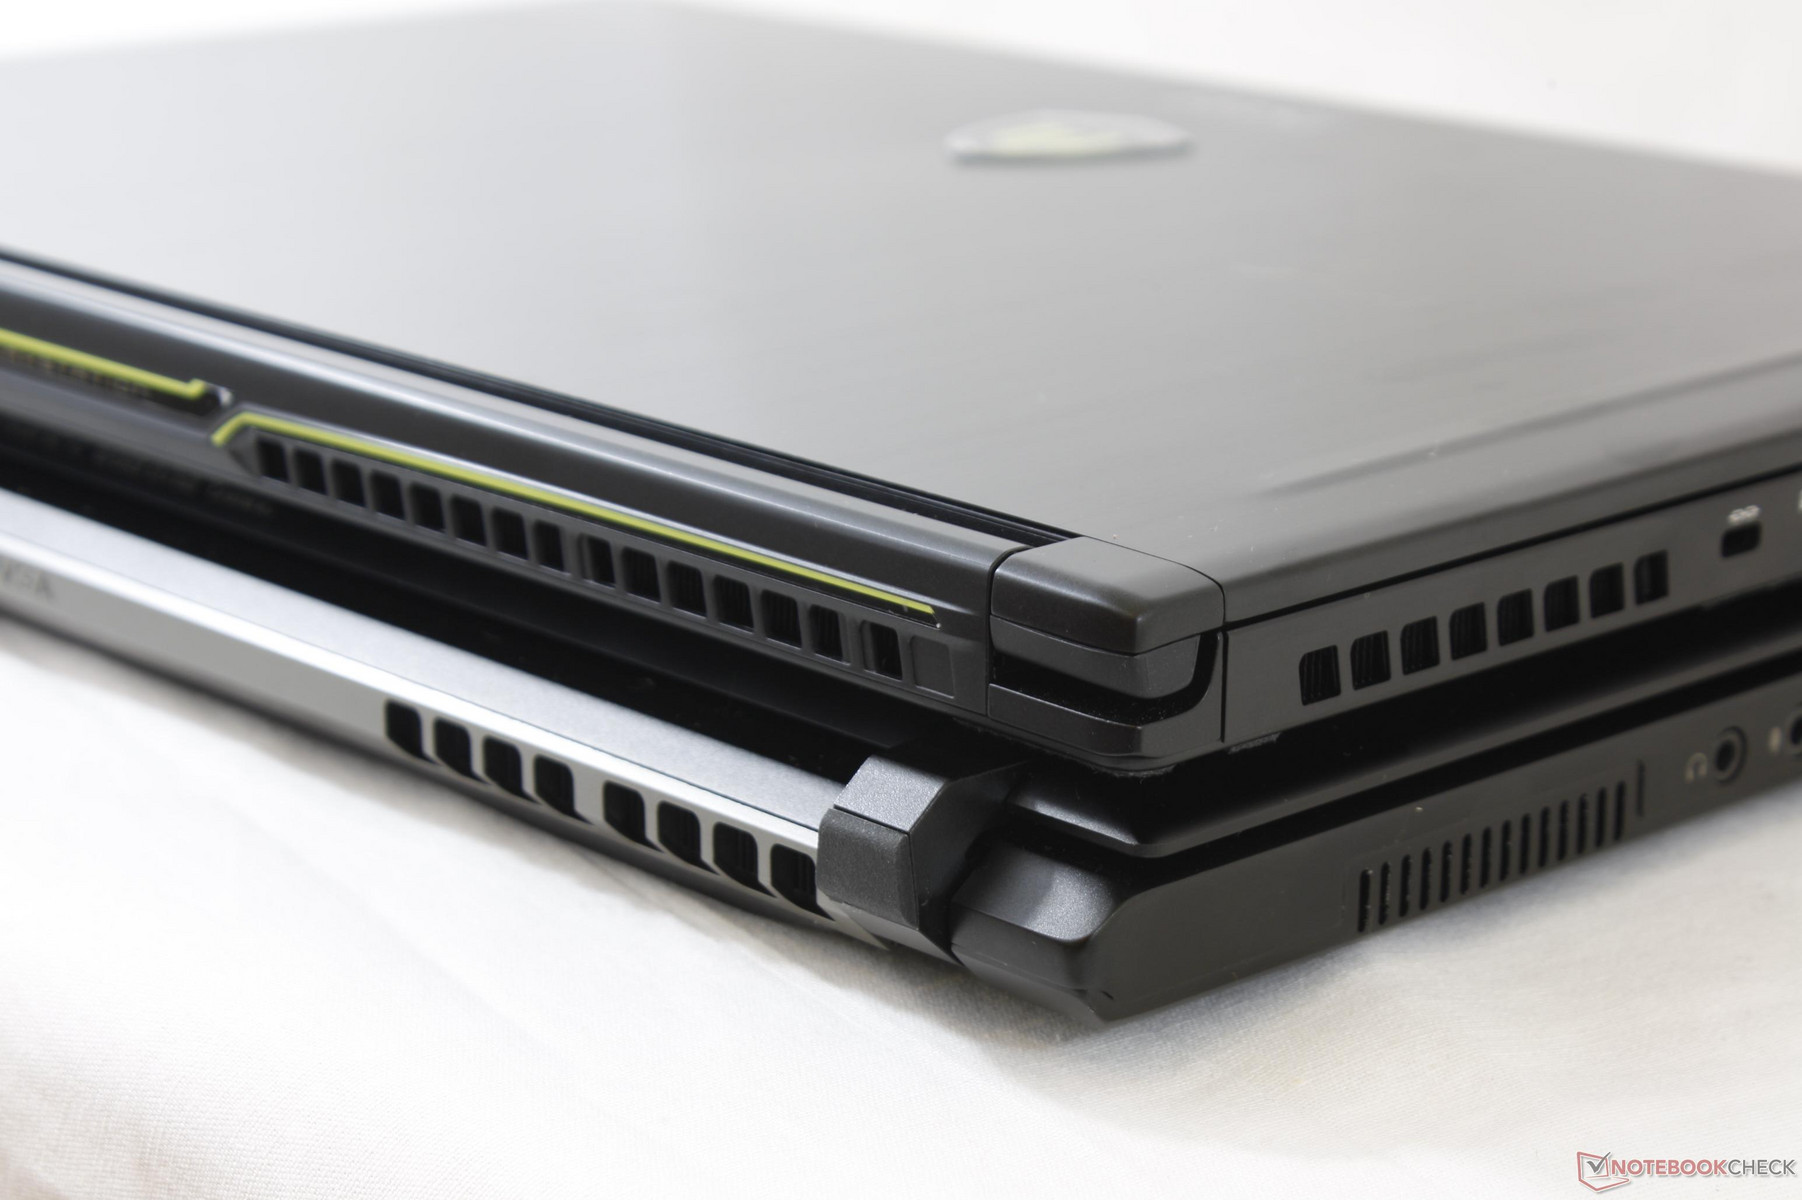
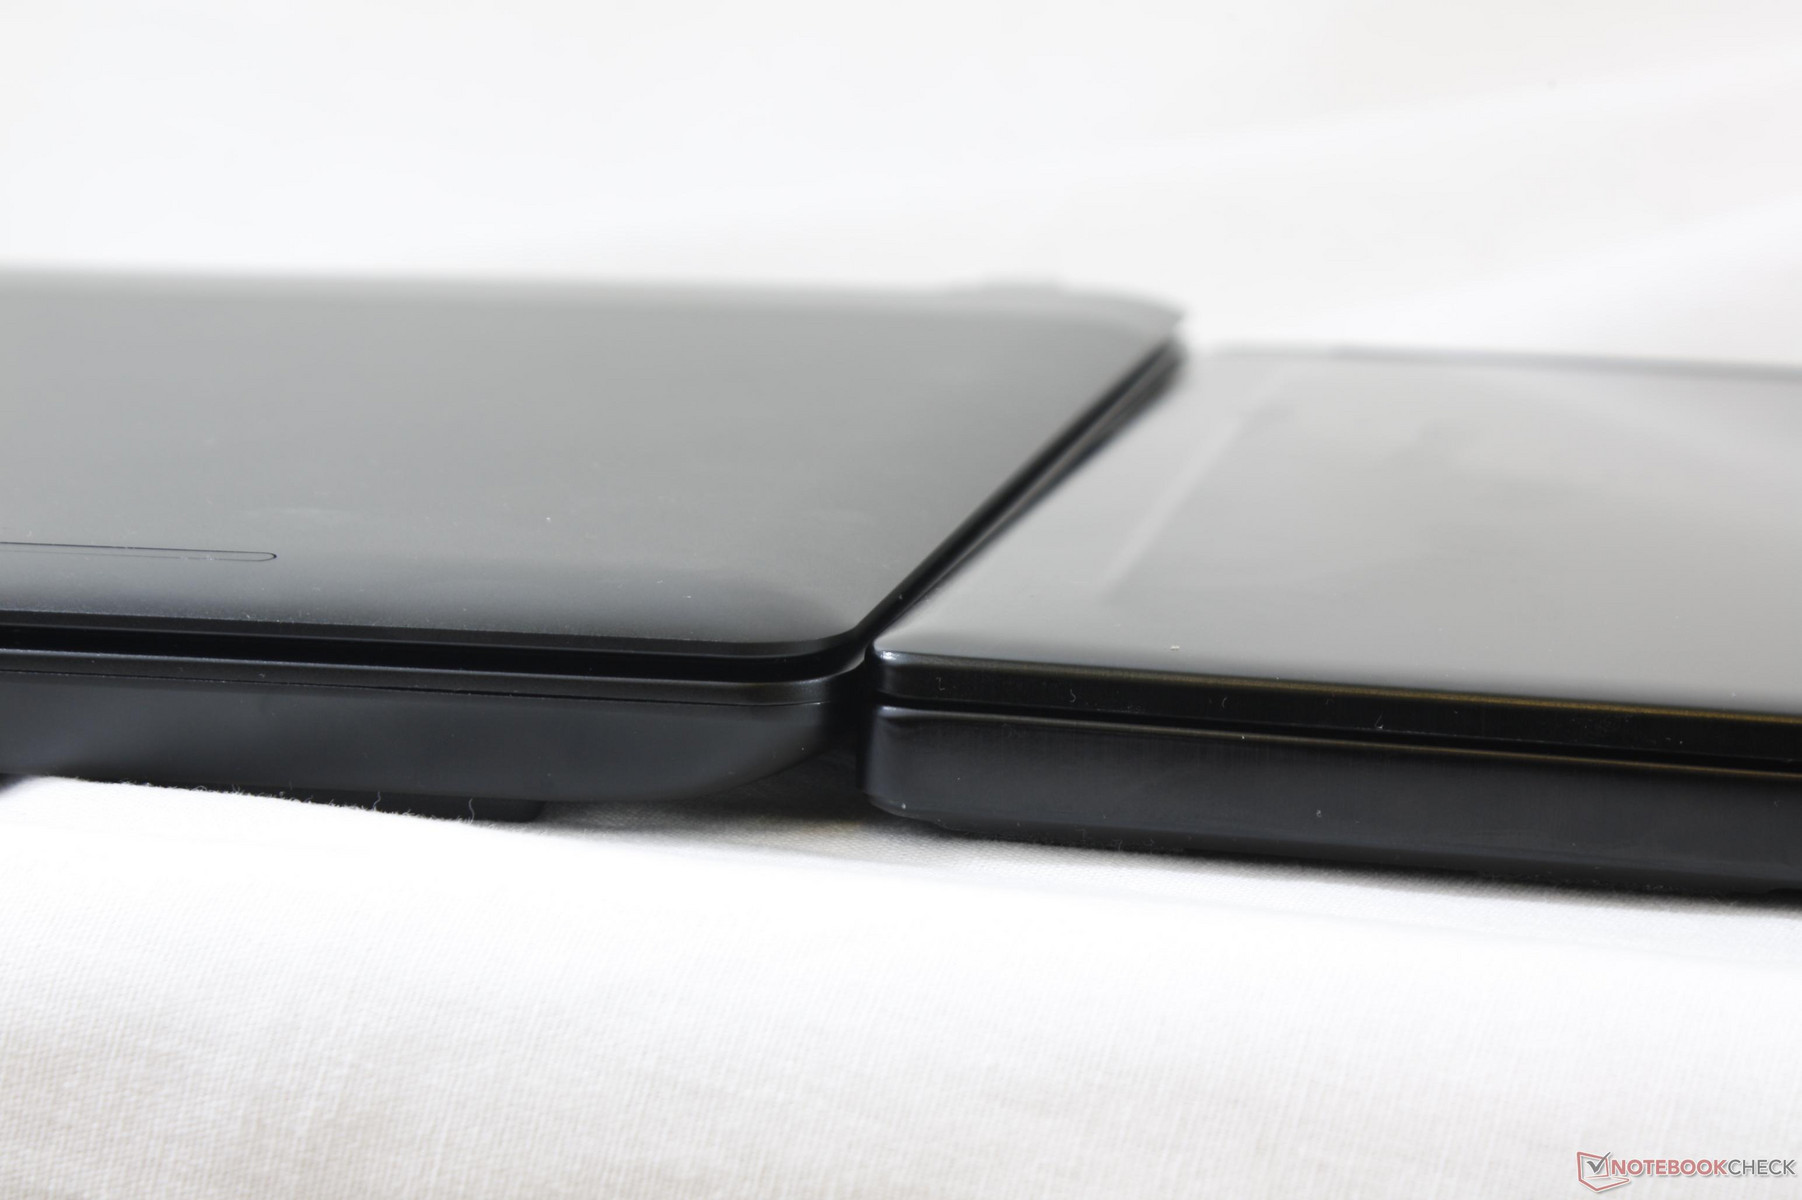
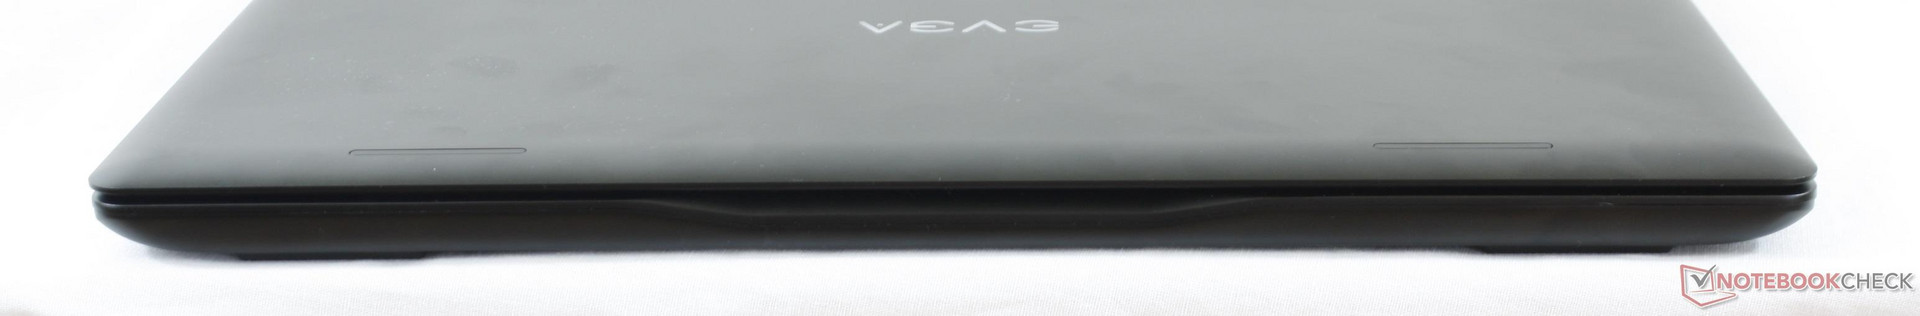
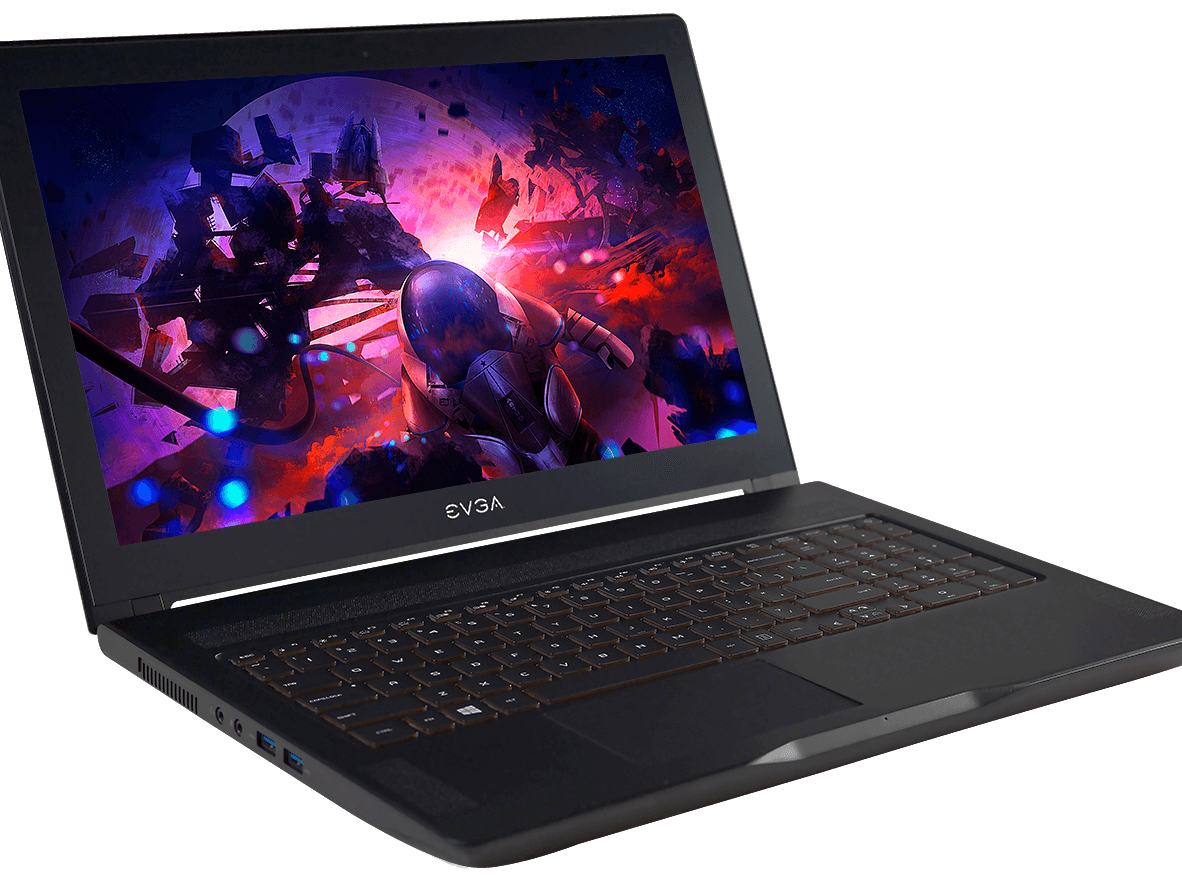
We've processed a plethora of gaming notebooks through our conveyor belt of tests, but the SC15 is something special. It's the first slim 15-inch gaming notebook to feel as rigid, thick, and inflexible as the large 17-inch Alienware 17, MSI GT73VR, or Asus G752VS while having thin dimensions similar to that of the MSI GS63VR, Gigabyte P55, or Asus FX502. The display of the SC15 is by far the most unyielding of any 15-inch gaming notebook and rivals that of the XPS 15 9560. Its base exhibits absolutely no flexing, warping, or creaking when attempting to twist its corners or depress the keyboard center. The dual hinges appear small, but are deceivingly firm with no teetering when typing. Workmanship is second to none where the word "premium" couldn't couldn't be a more appropriate description.
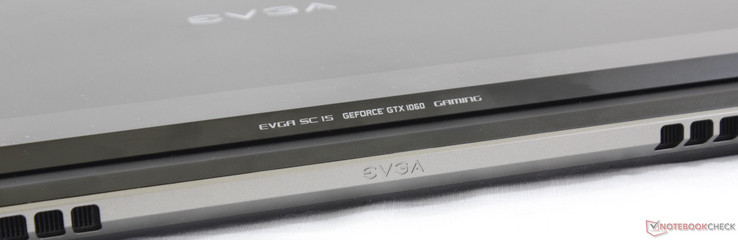
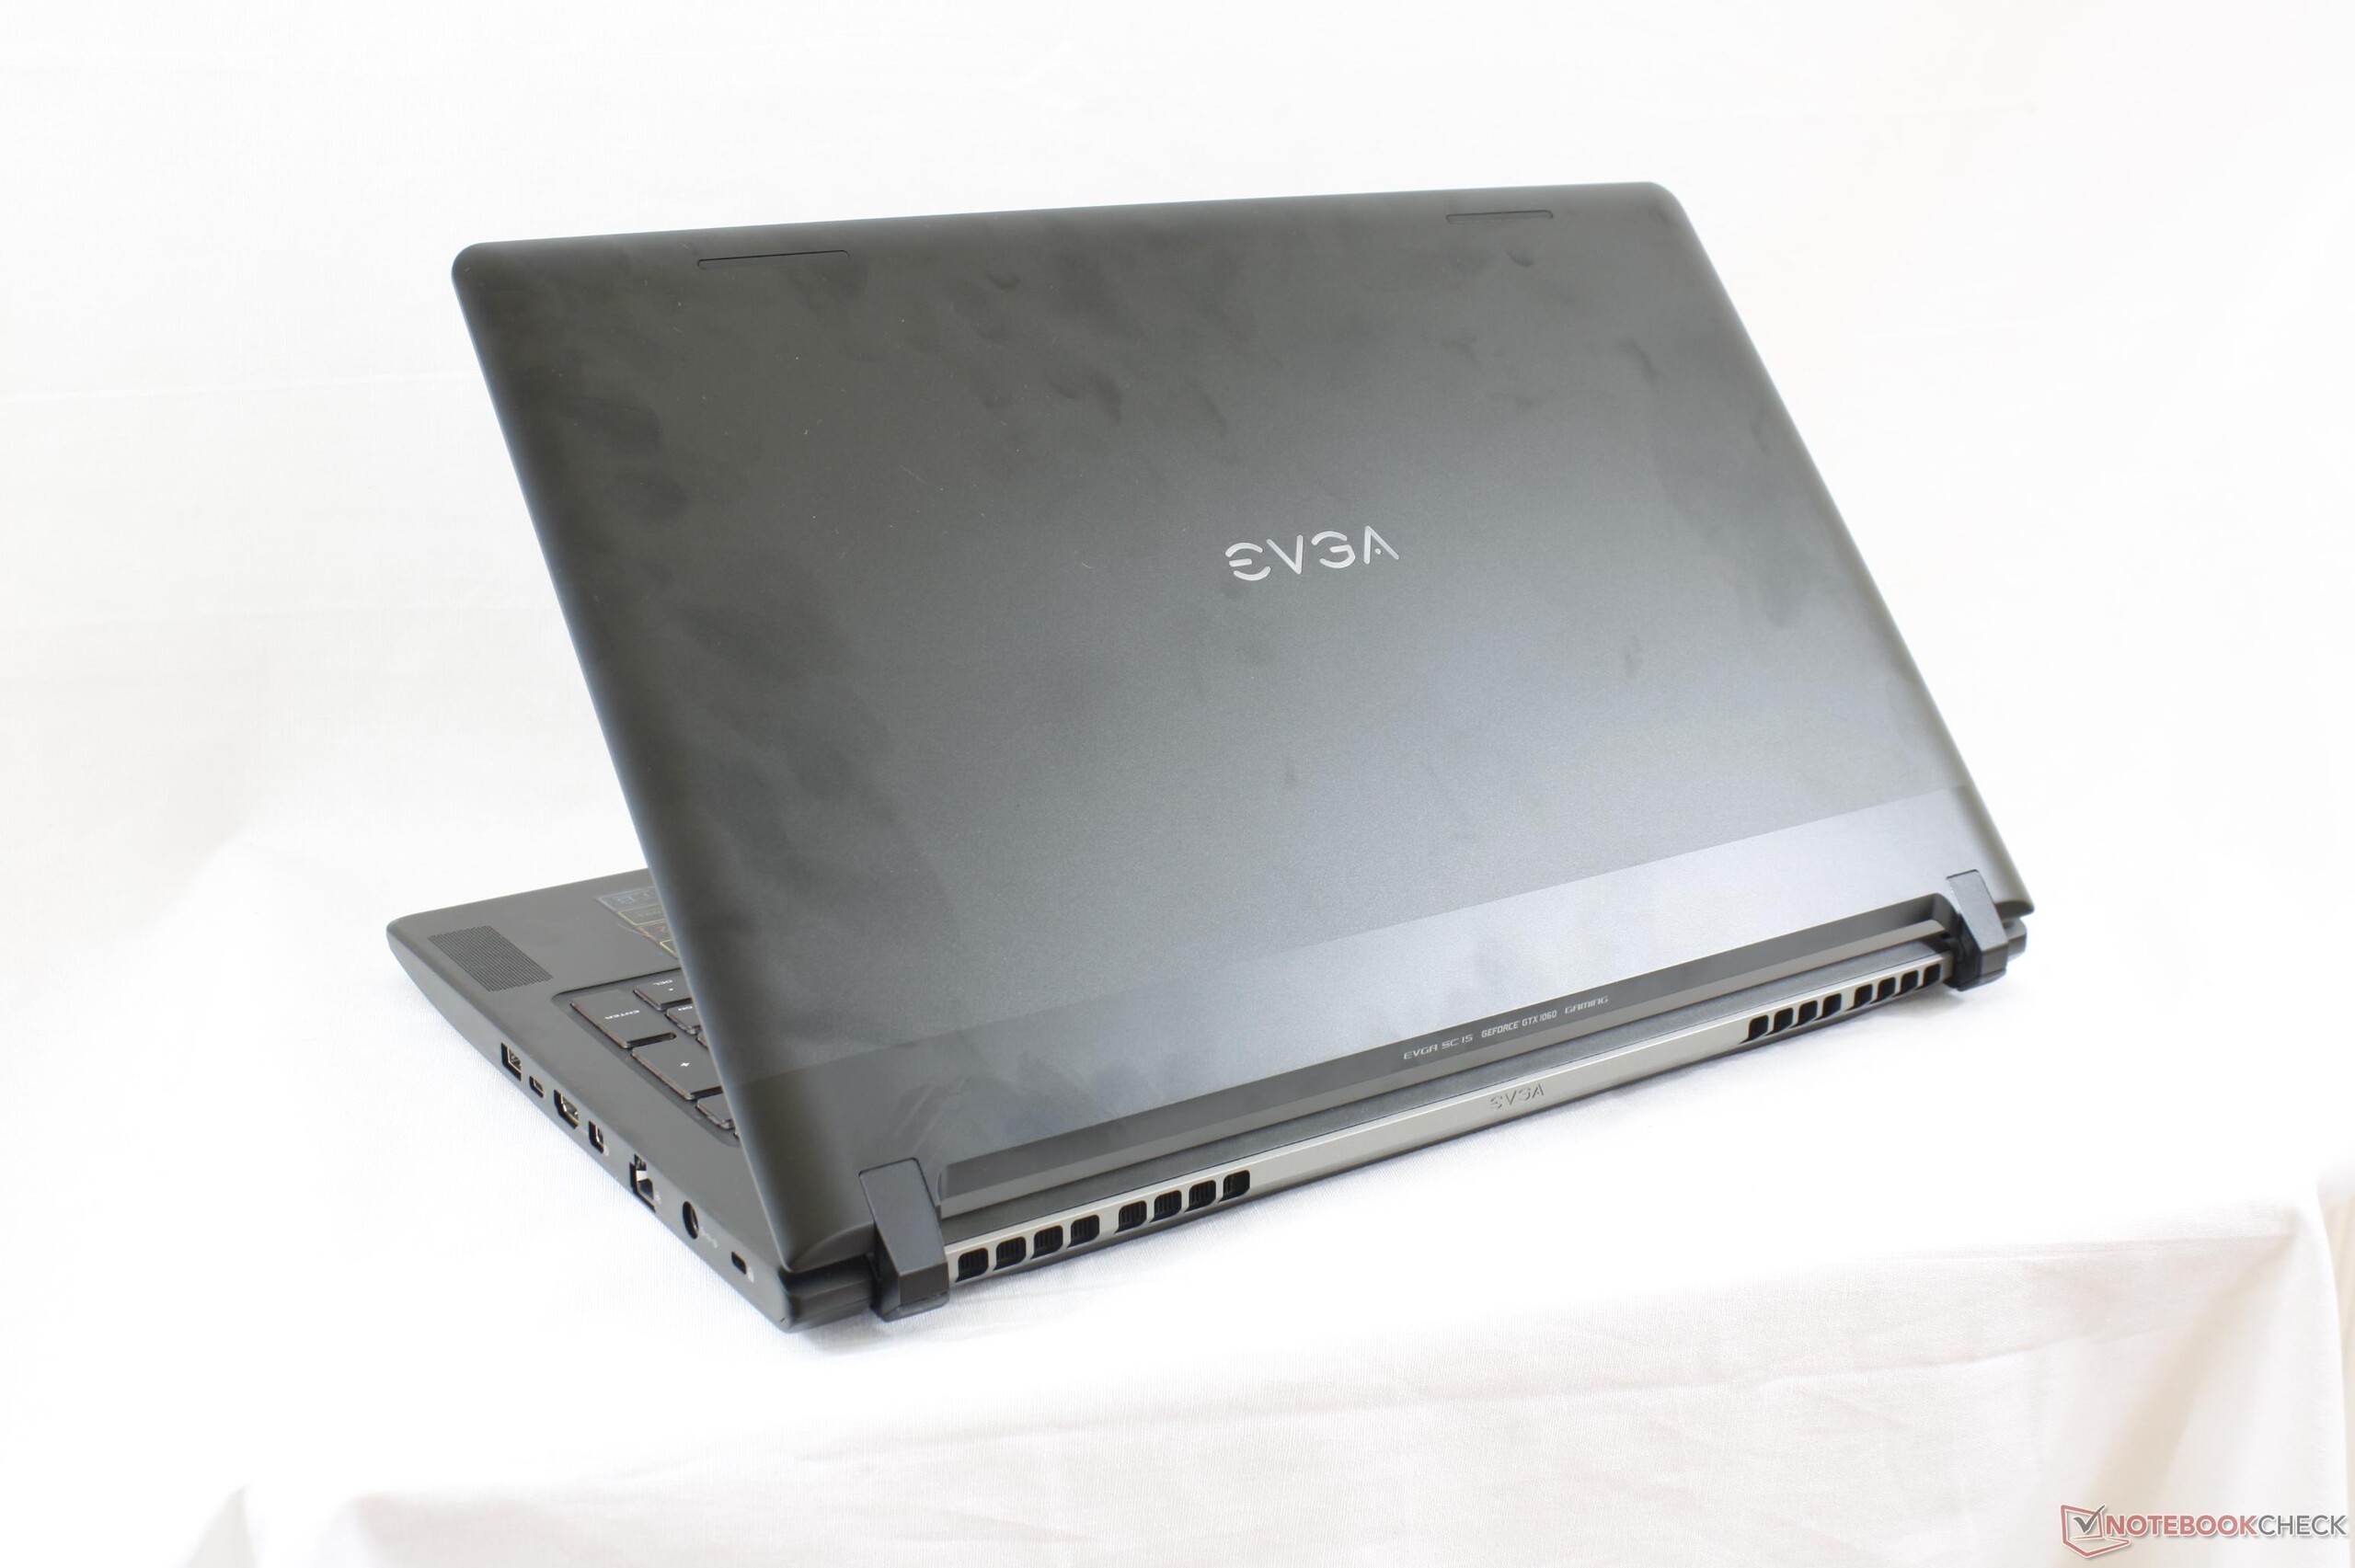
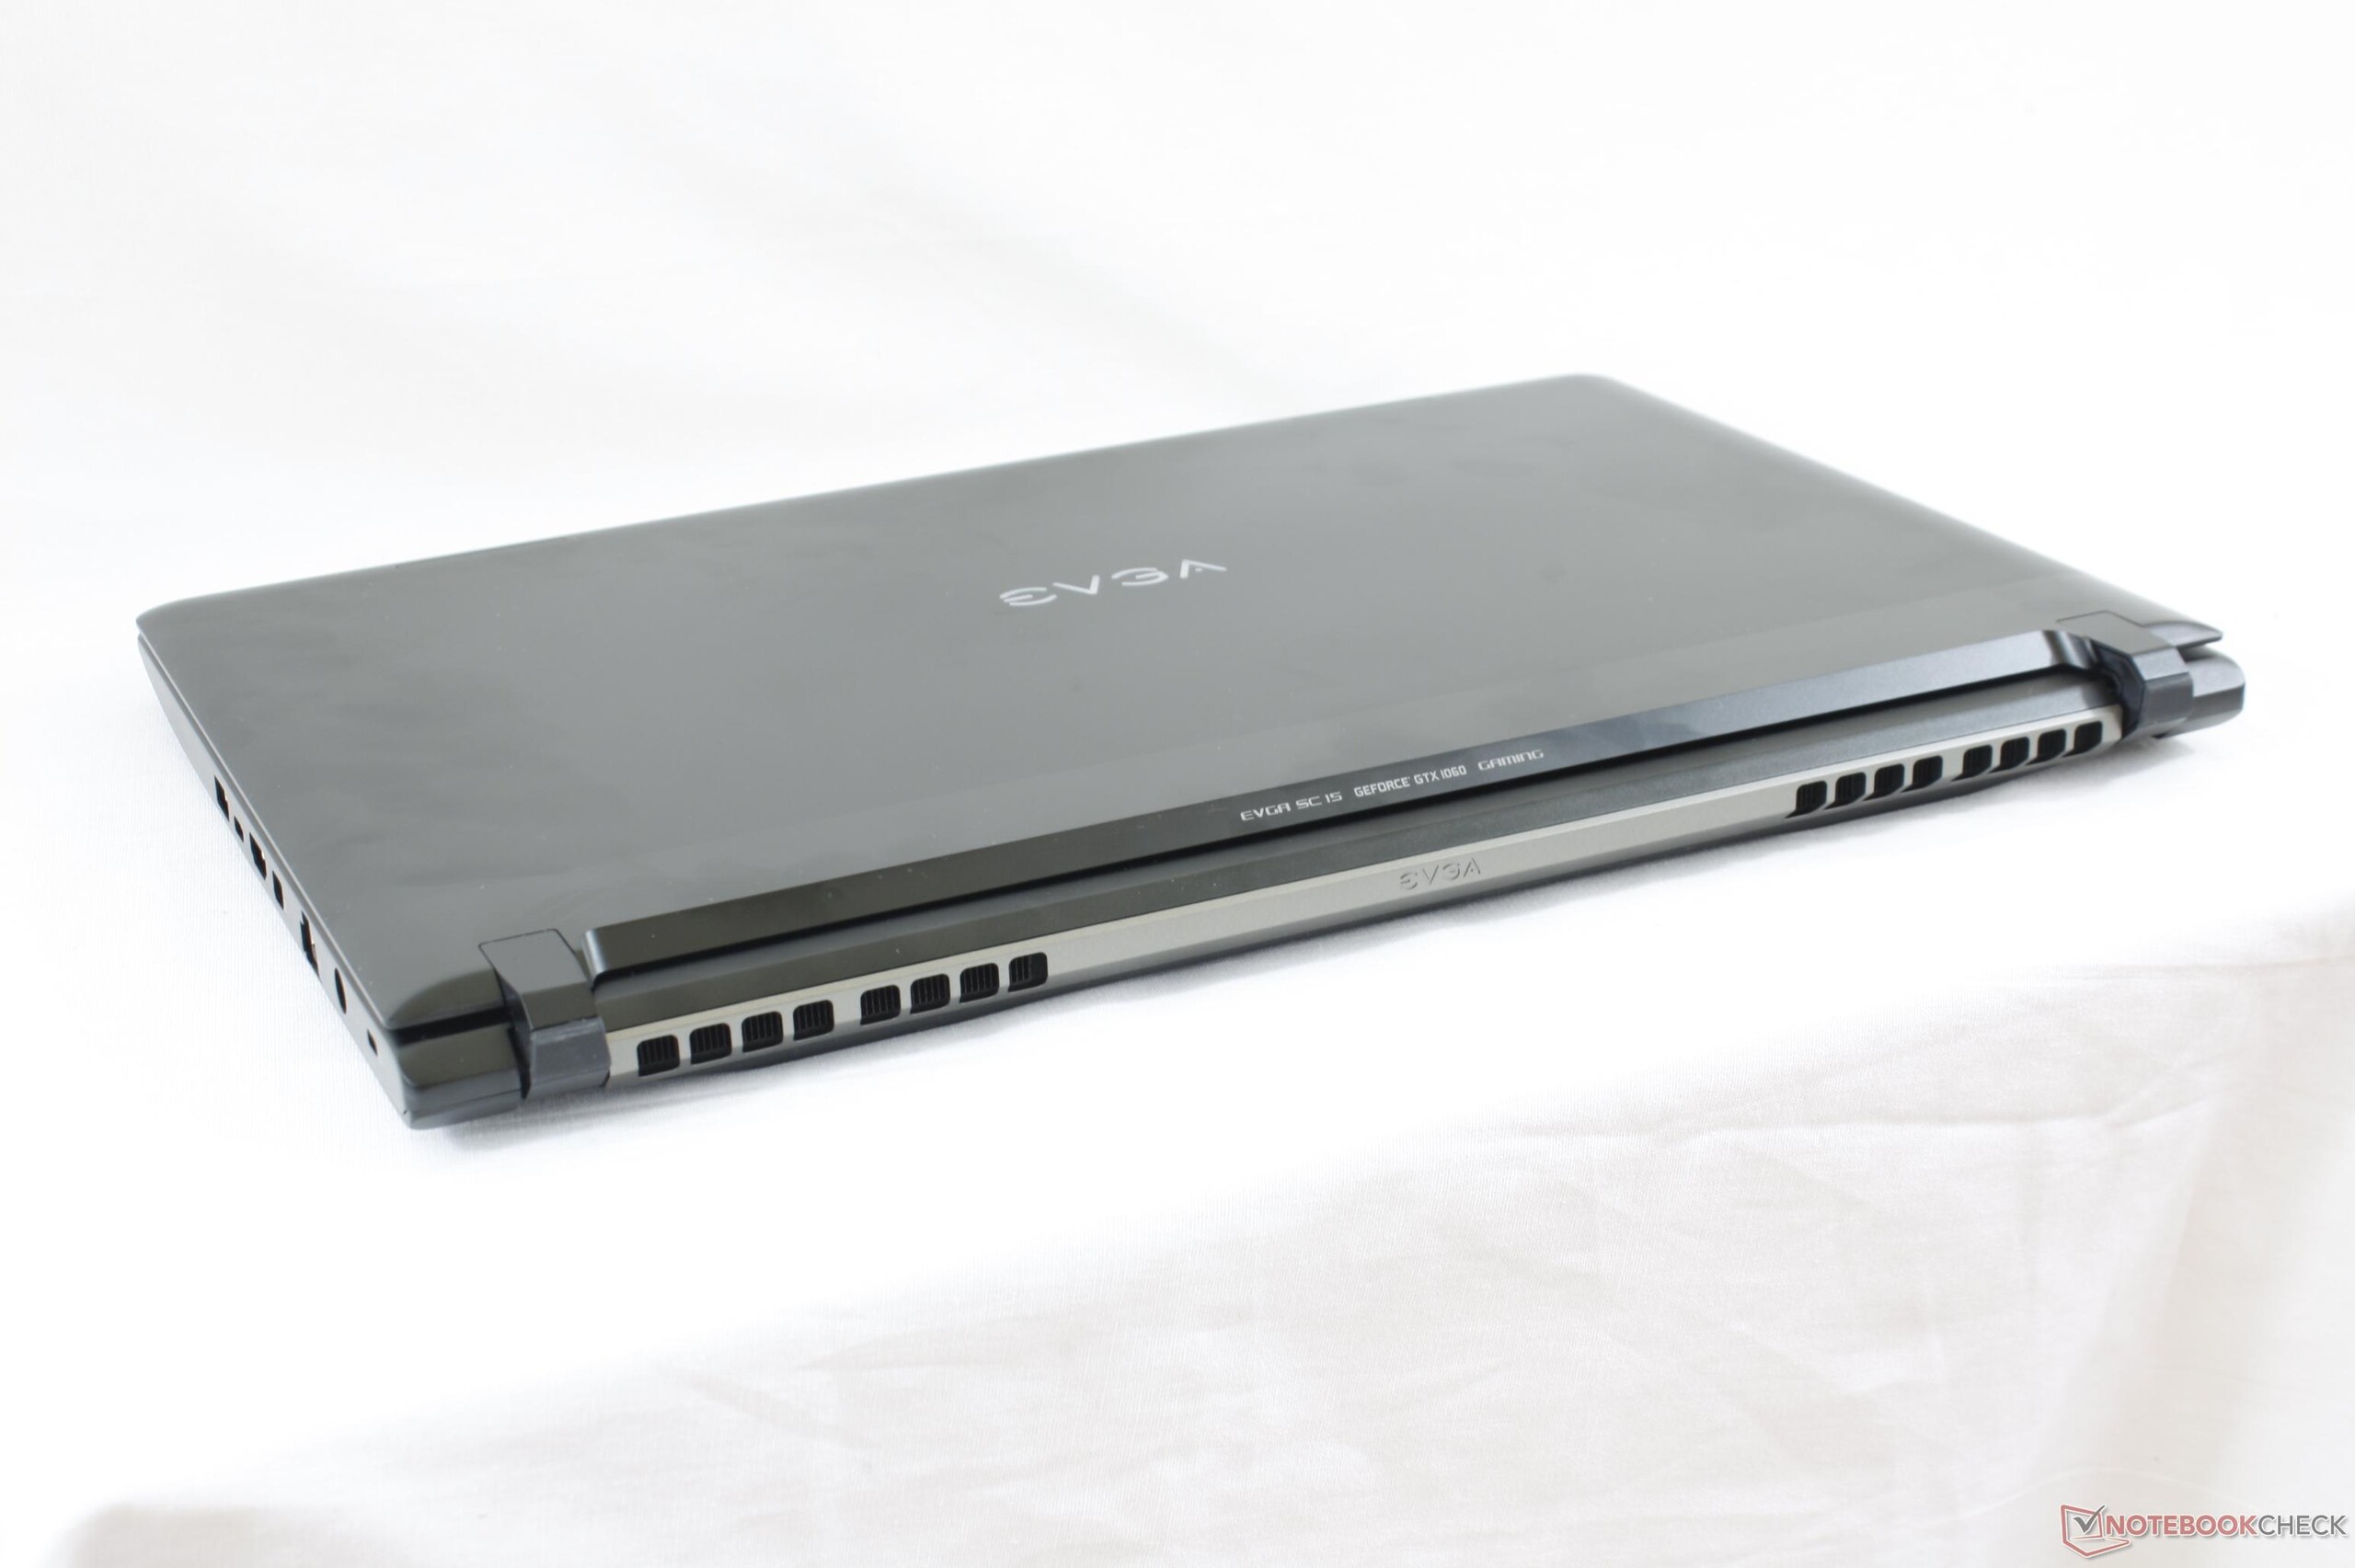
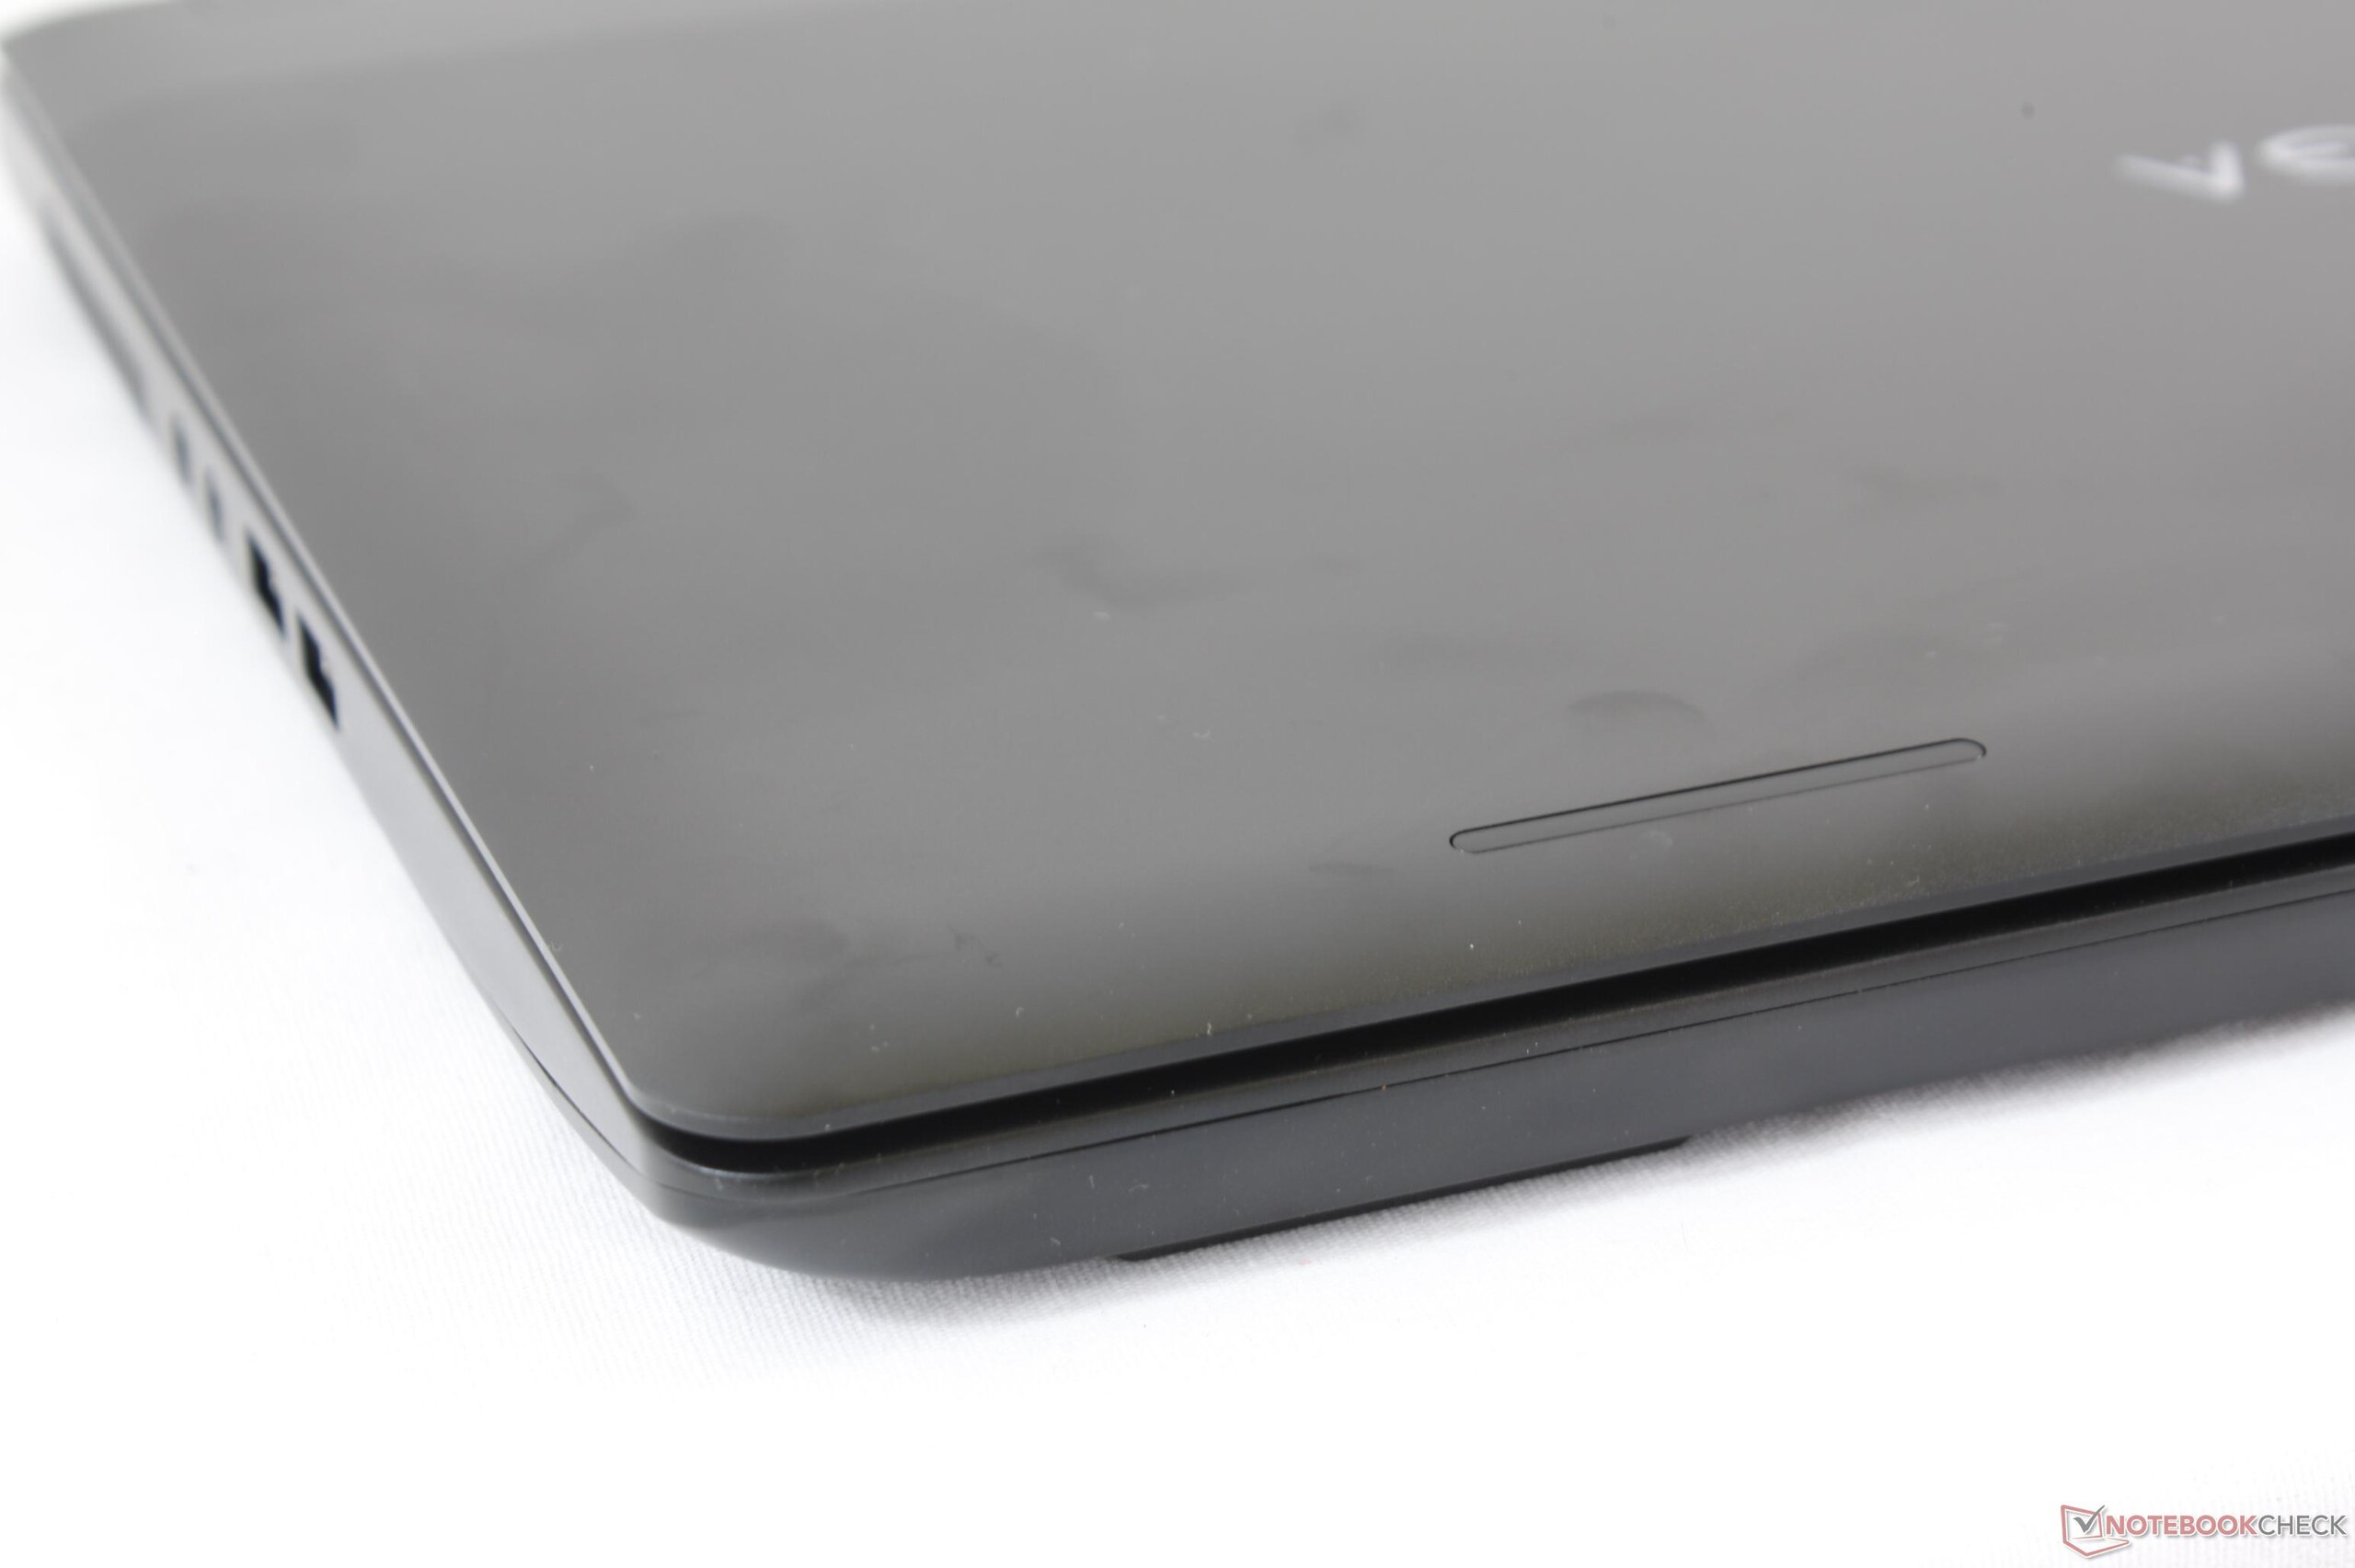
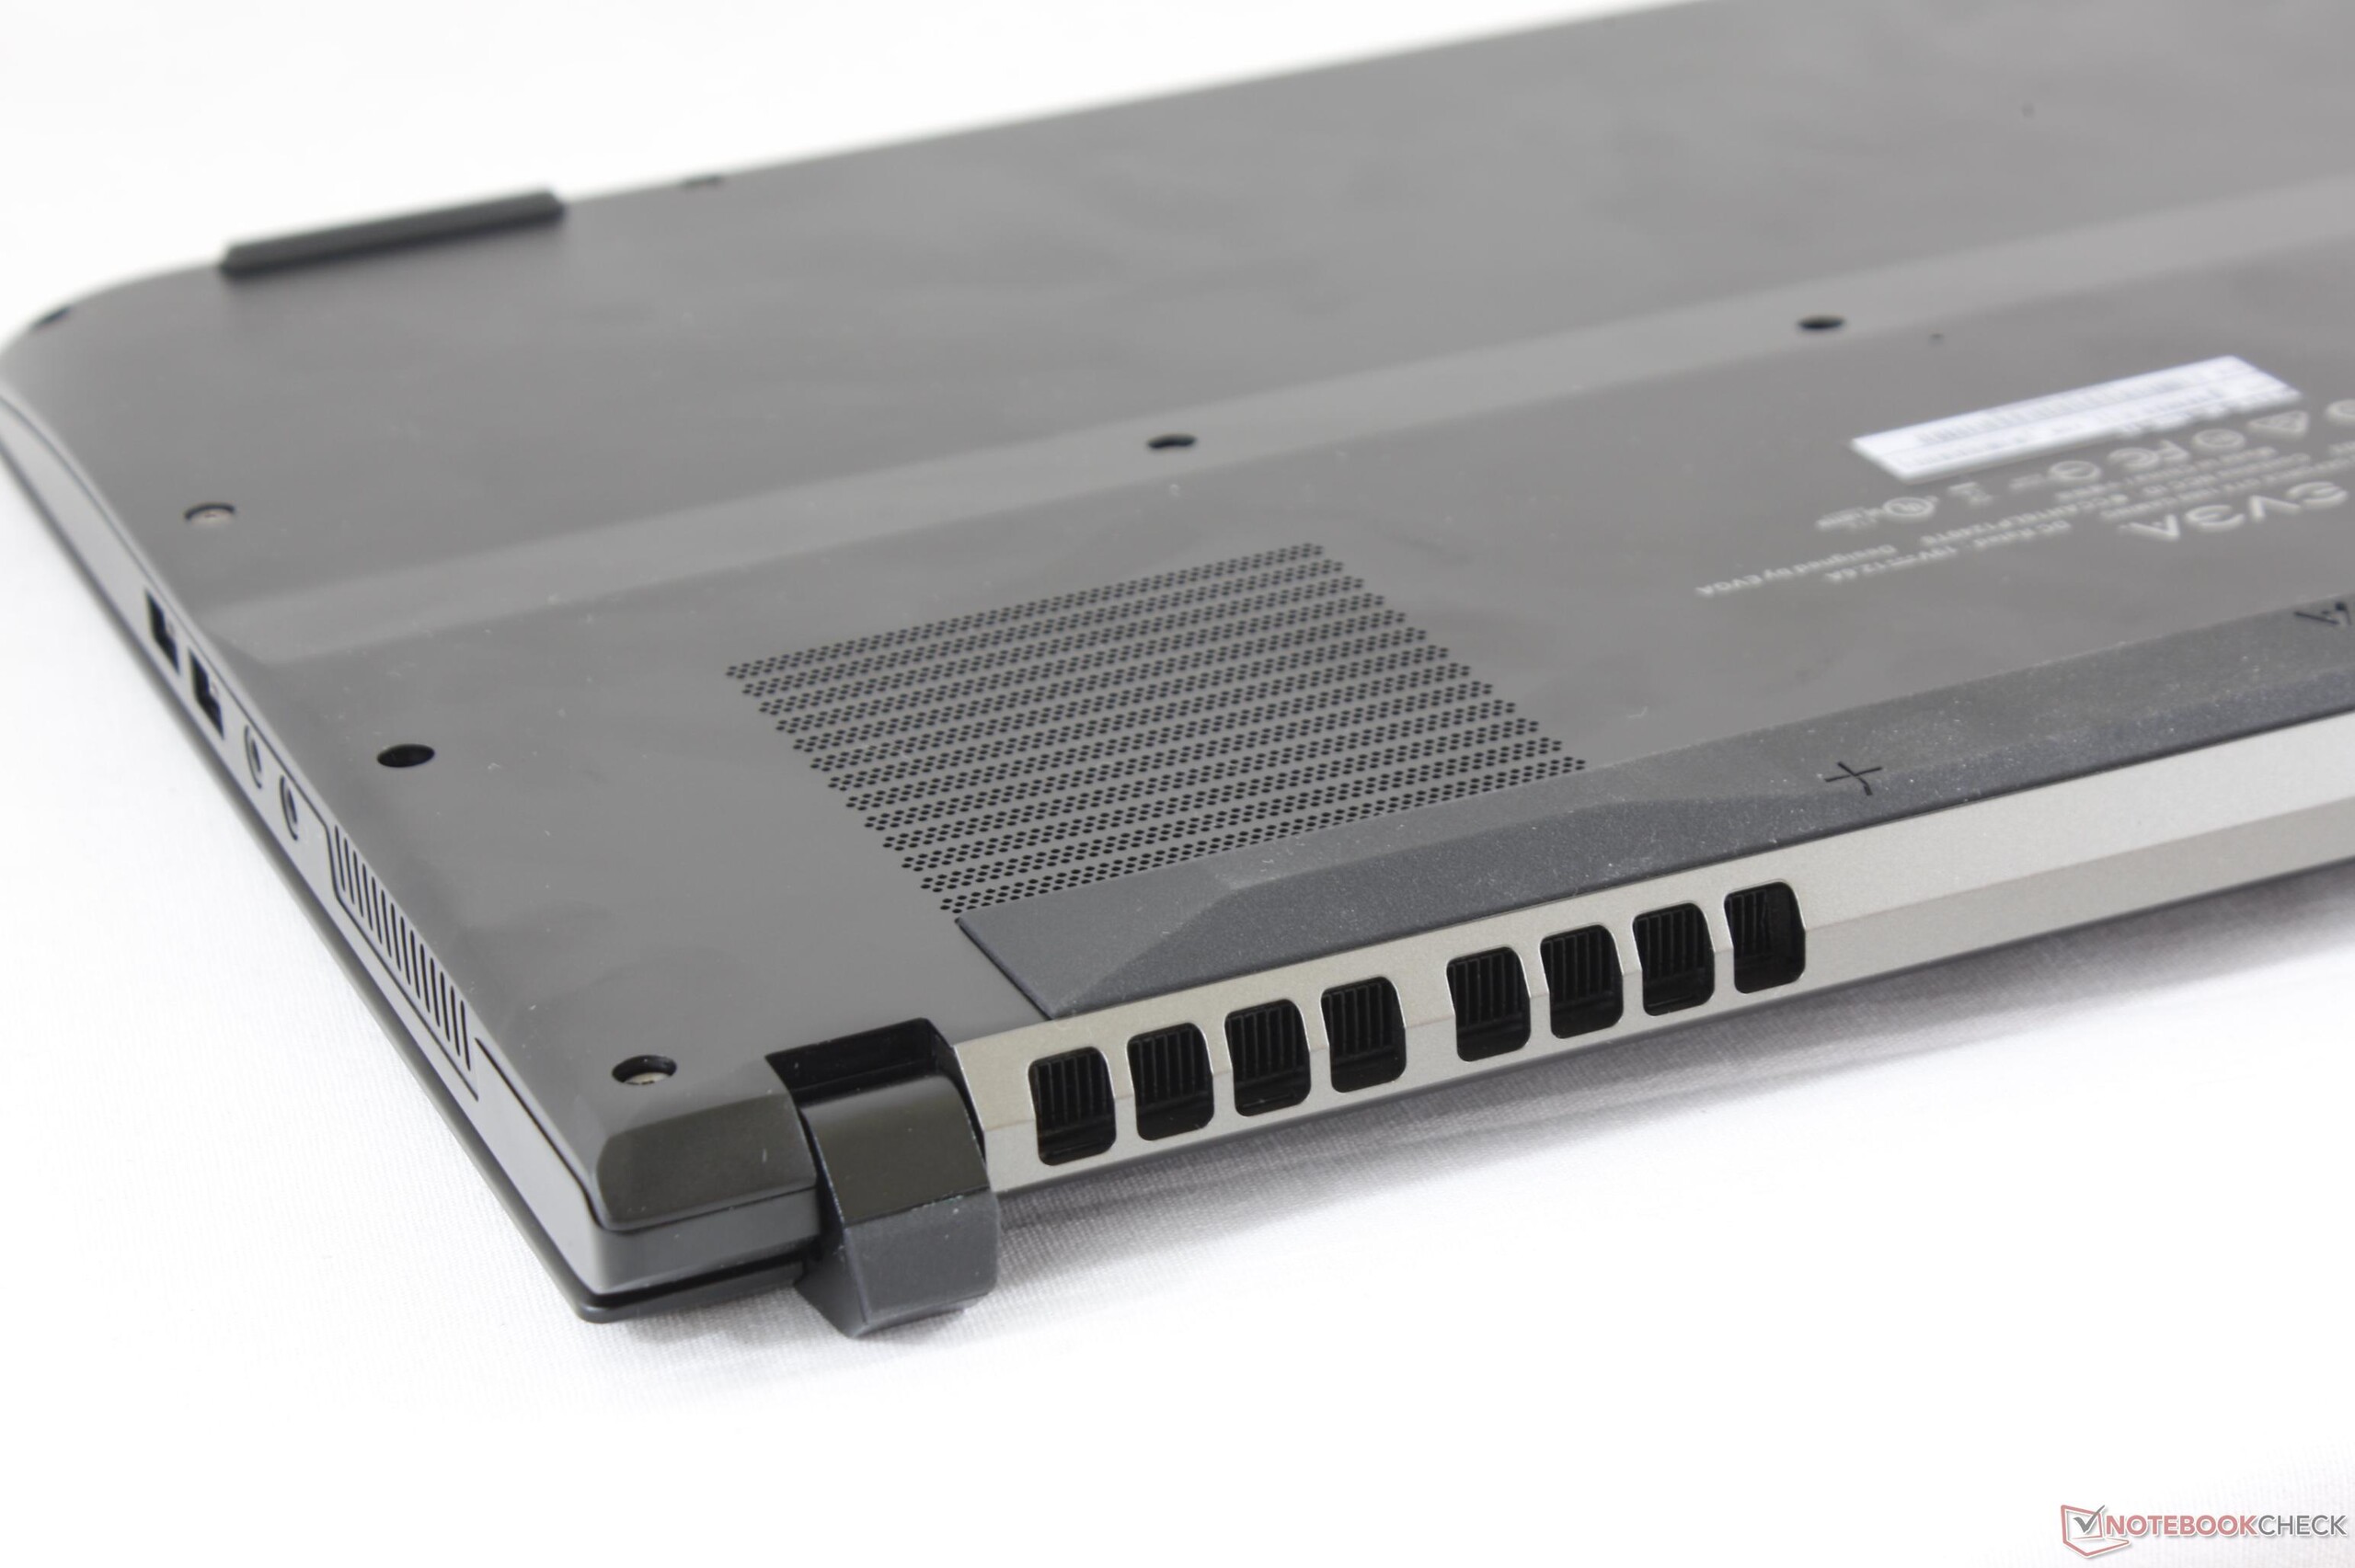
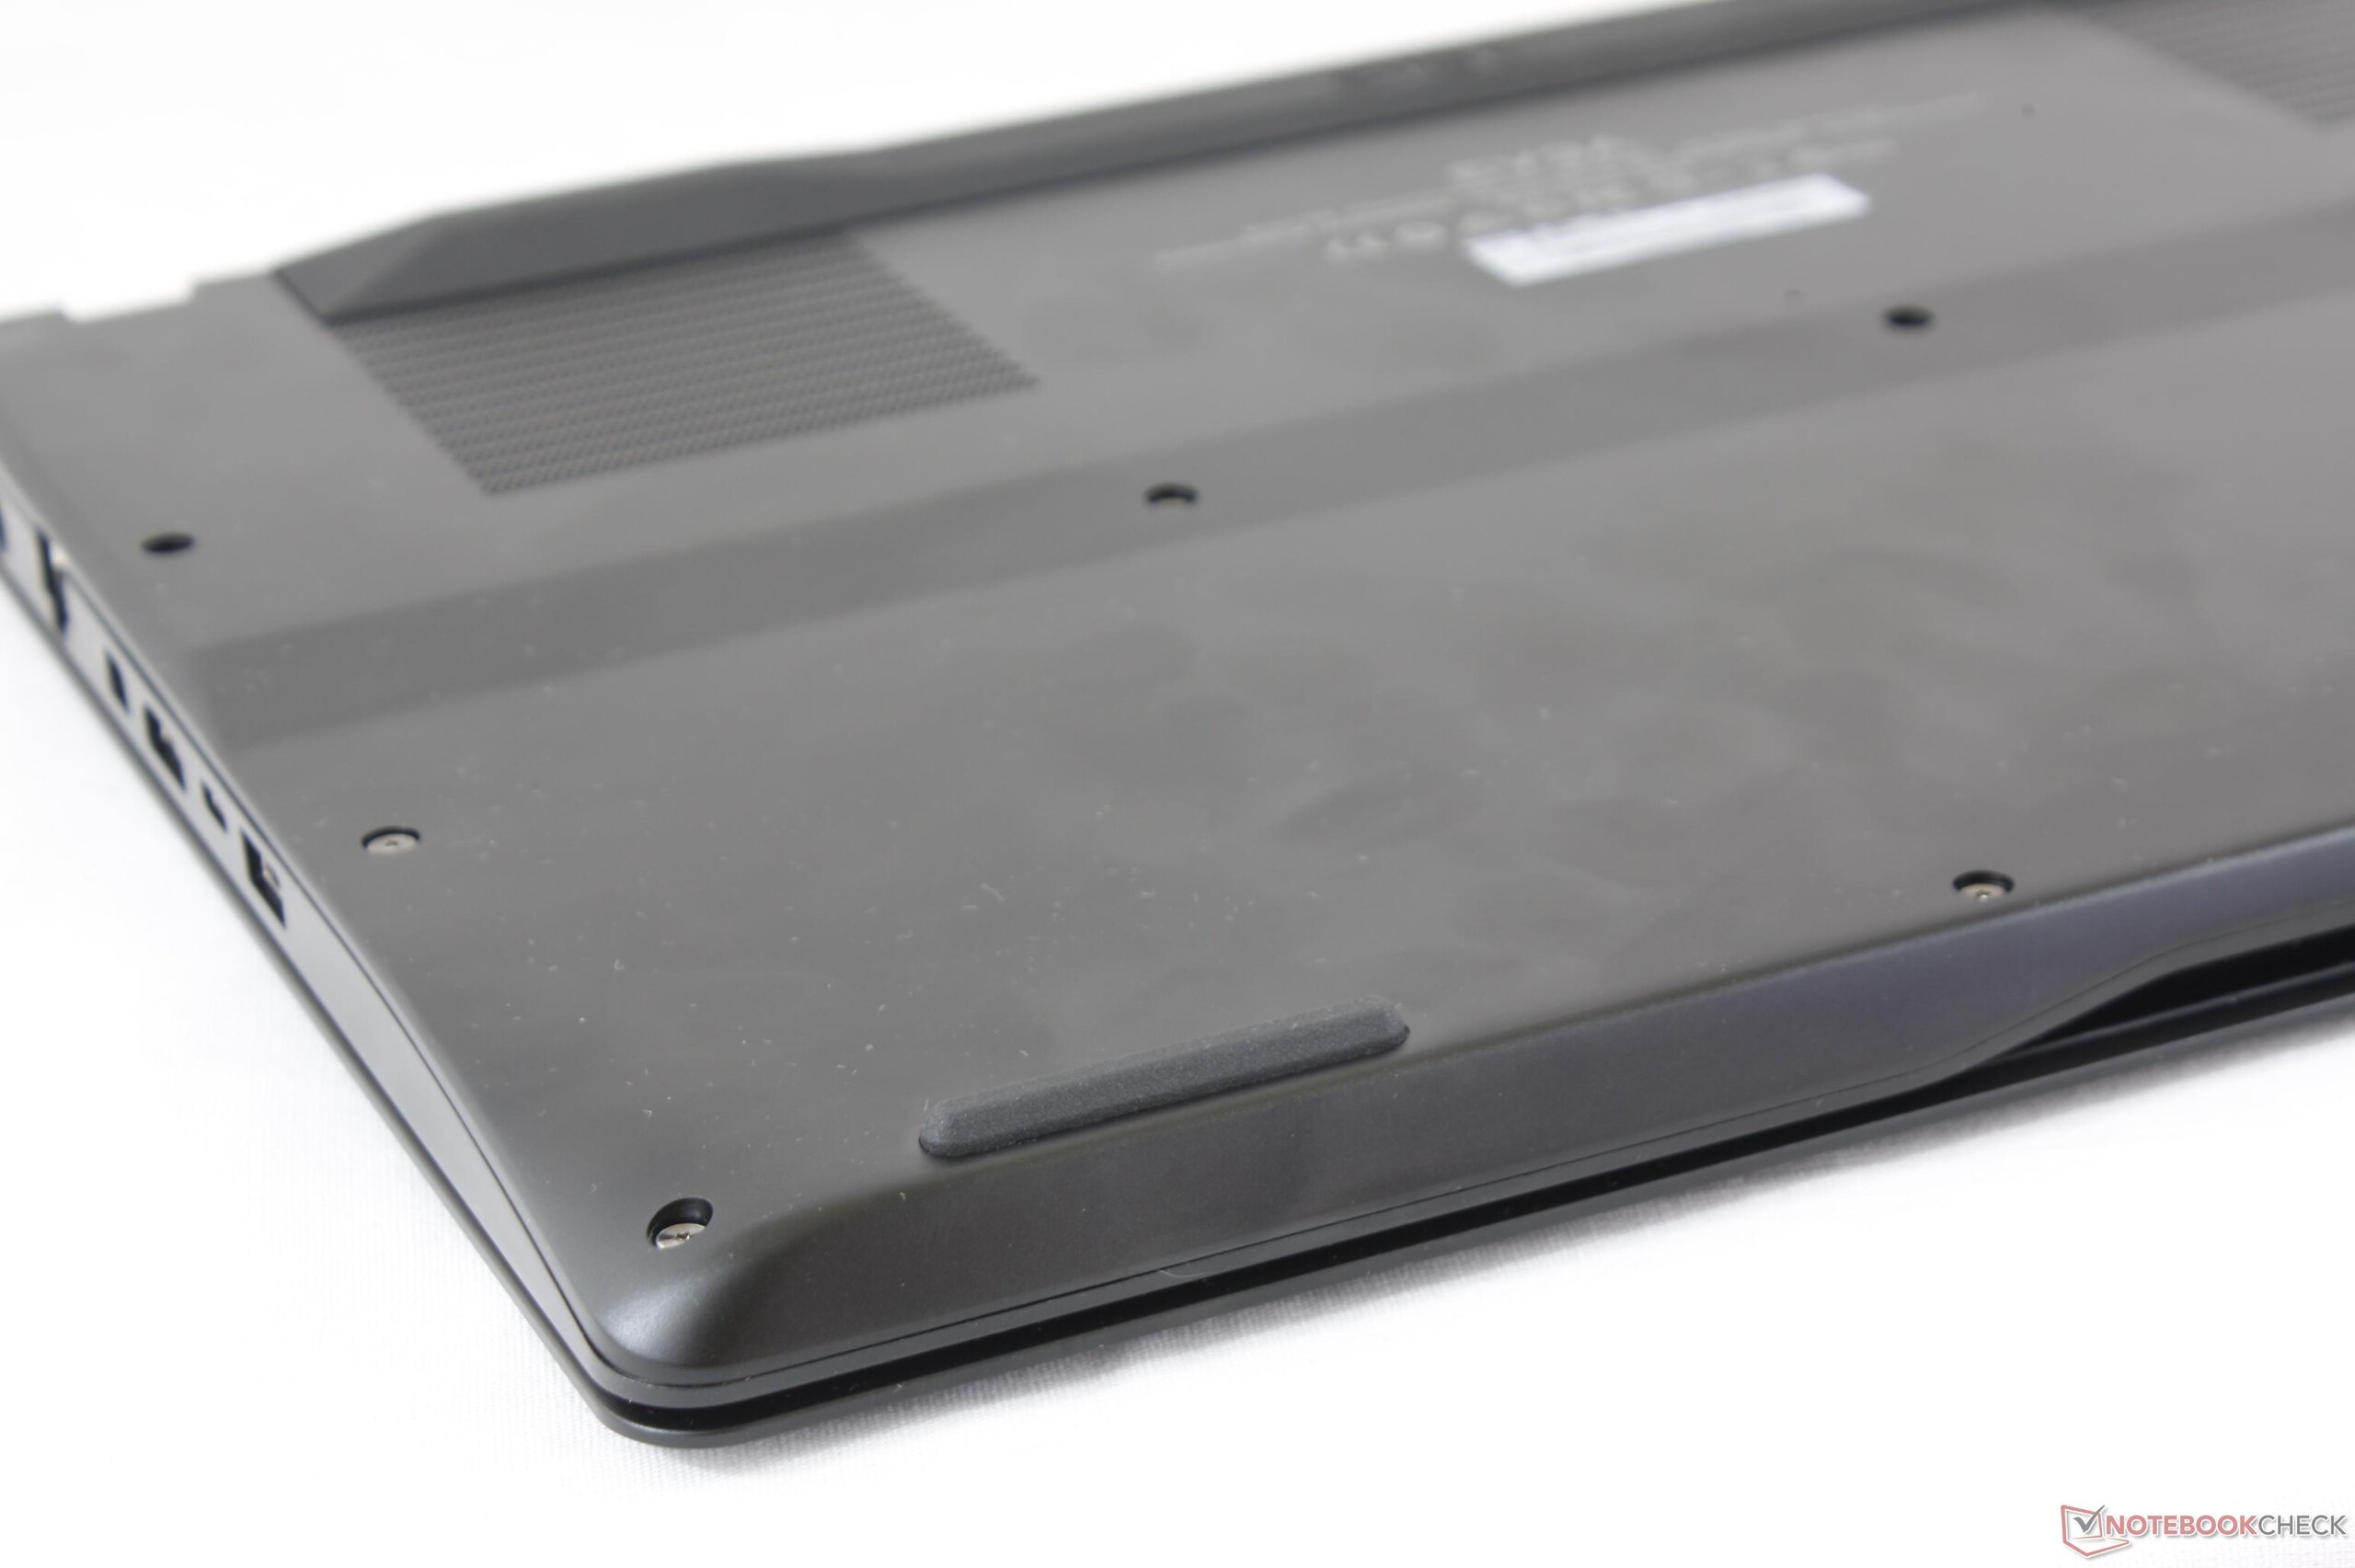
As for the understated non-unibody design, the aluminum chassis is completely smooth and uniform from top to bottom save for the rubber footing. Its matte surfaces are very slightly textured and sit perfectly flushed around the edges of corners. Until Razer unveils an actual 15-inch Blade, the EVGA SC15 is probably the closest we can get in terms of feel and quality.
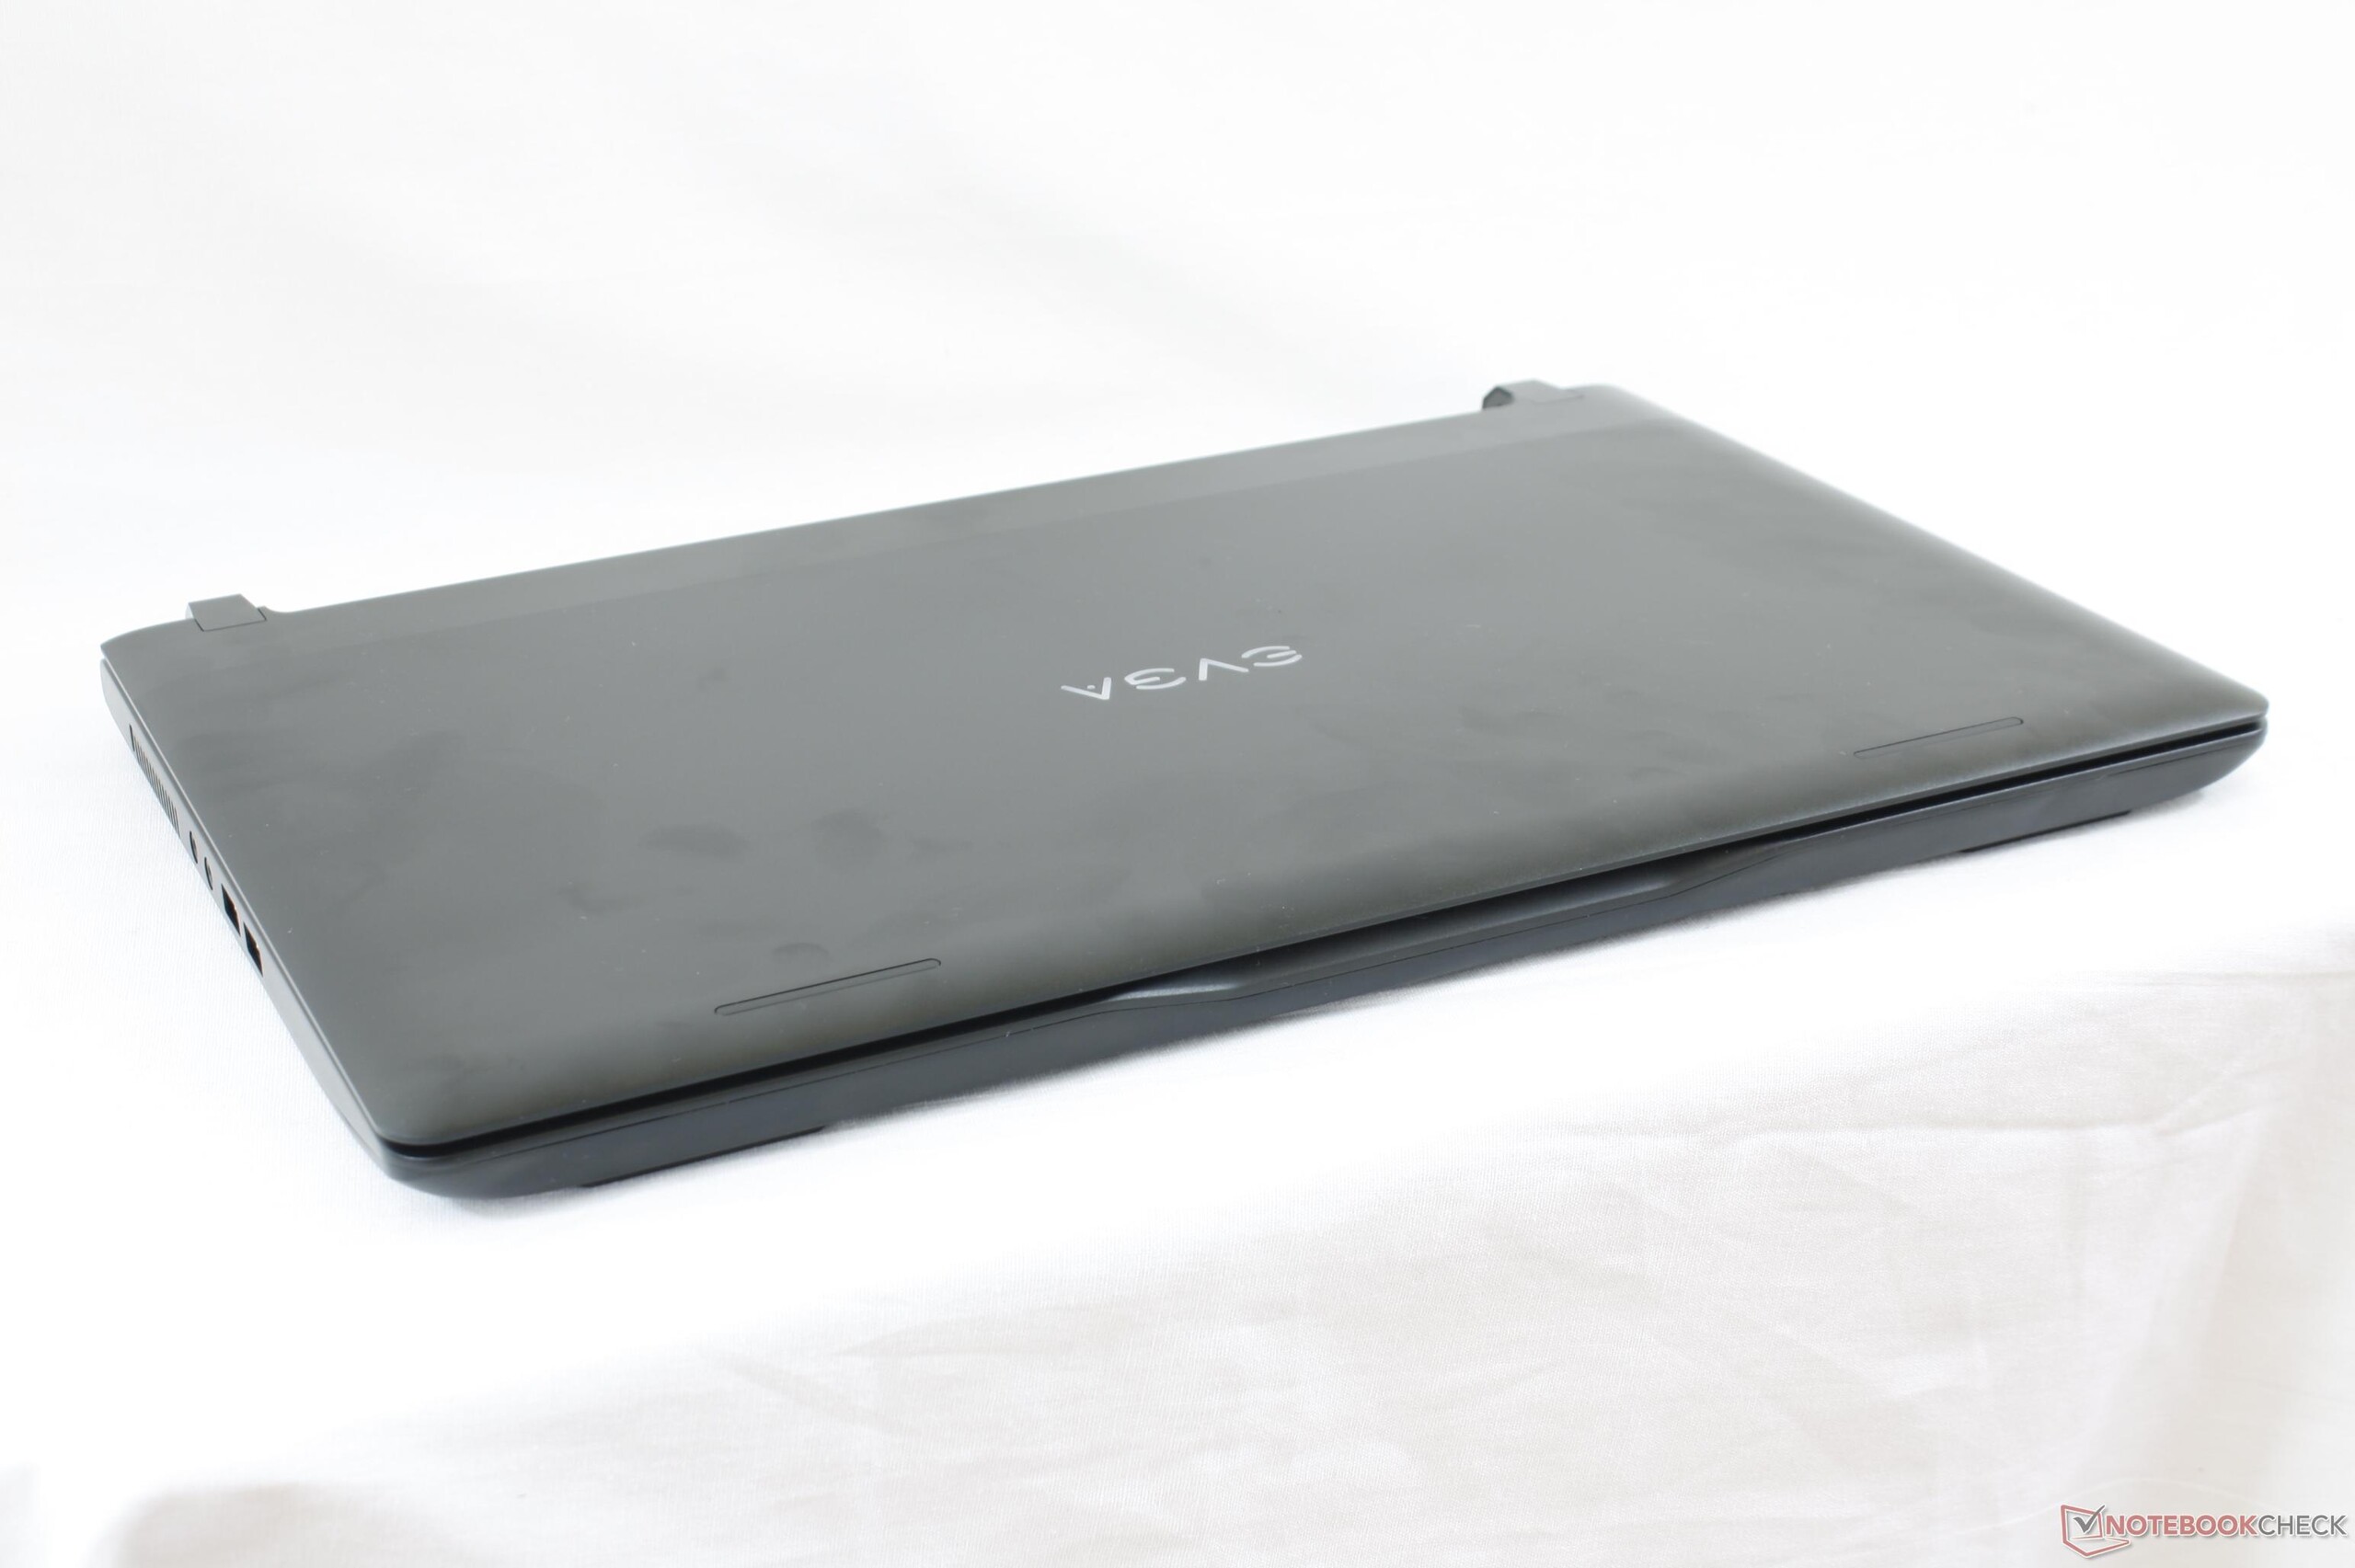
We can't stress how incredibly dense the SC15 is for a notebook this size. At 2.9 kg, the EVGA weighs as much as the MSI GT62VR that comes in nearly twice as thick. The MSI GS63VR, which is only 4 to 5 mm thinner than the SC15, is a full kilogram lighter. The weighty chassis is no doubt a very tangible price to pay for the sound framework of the SC15. Users can expect the EVGA to be noticeably heavier than other thin-and-light gaming notebooks without the imposing girth of larger 15-inch notebooks like the Predator 15, Alienware 15, or Lenovo Legion series.
Connectivity
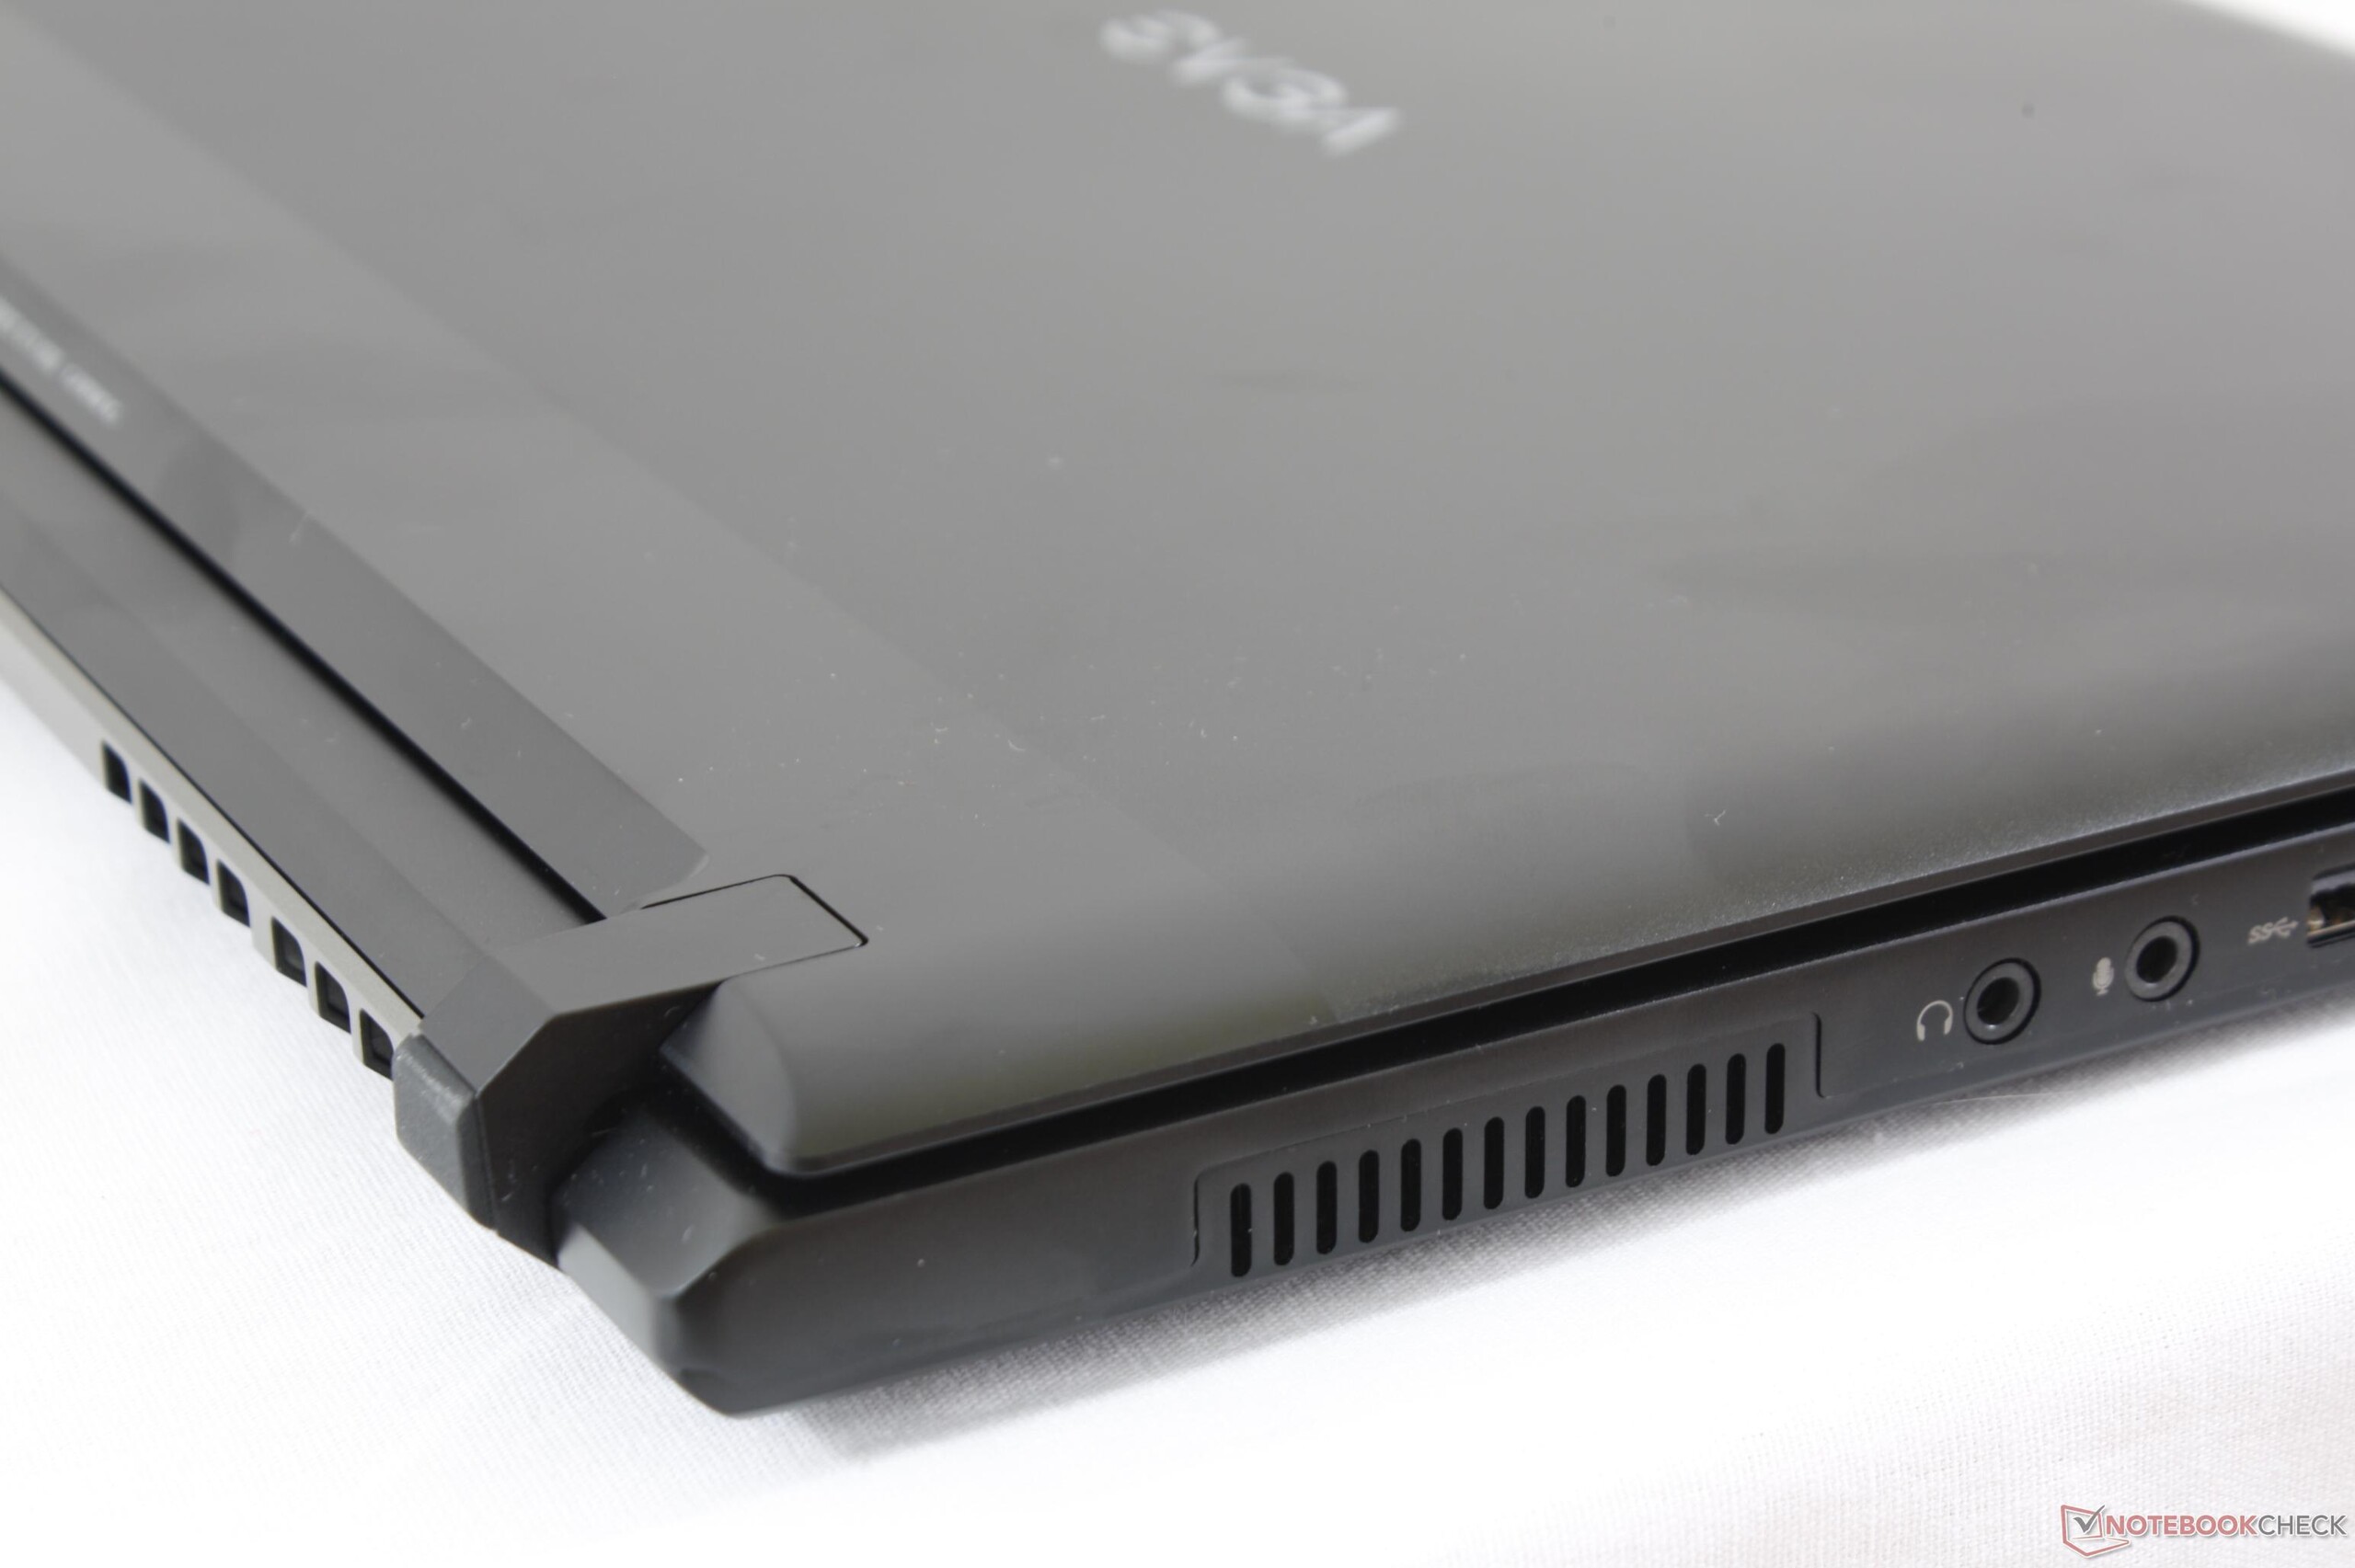
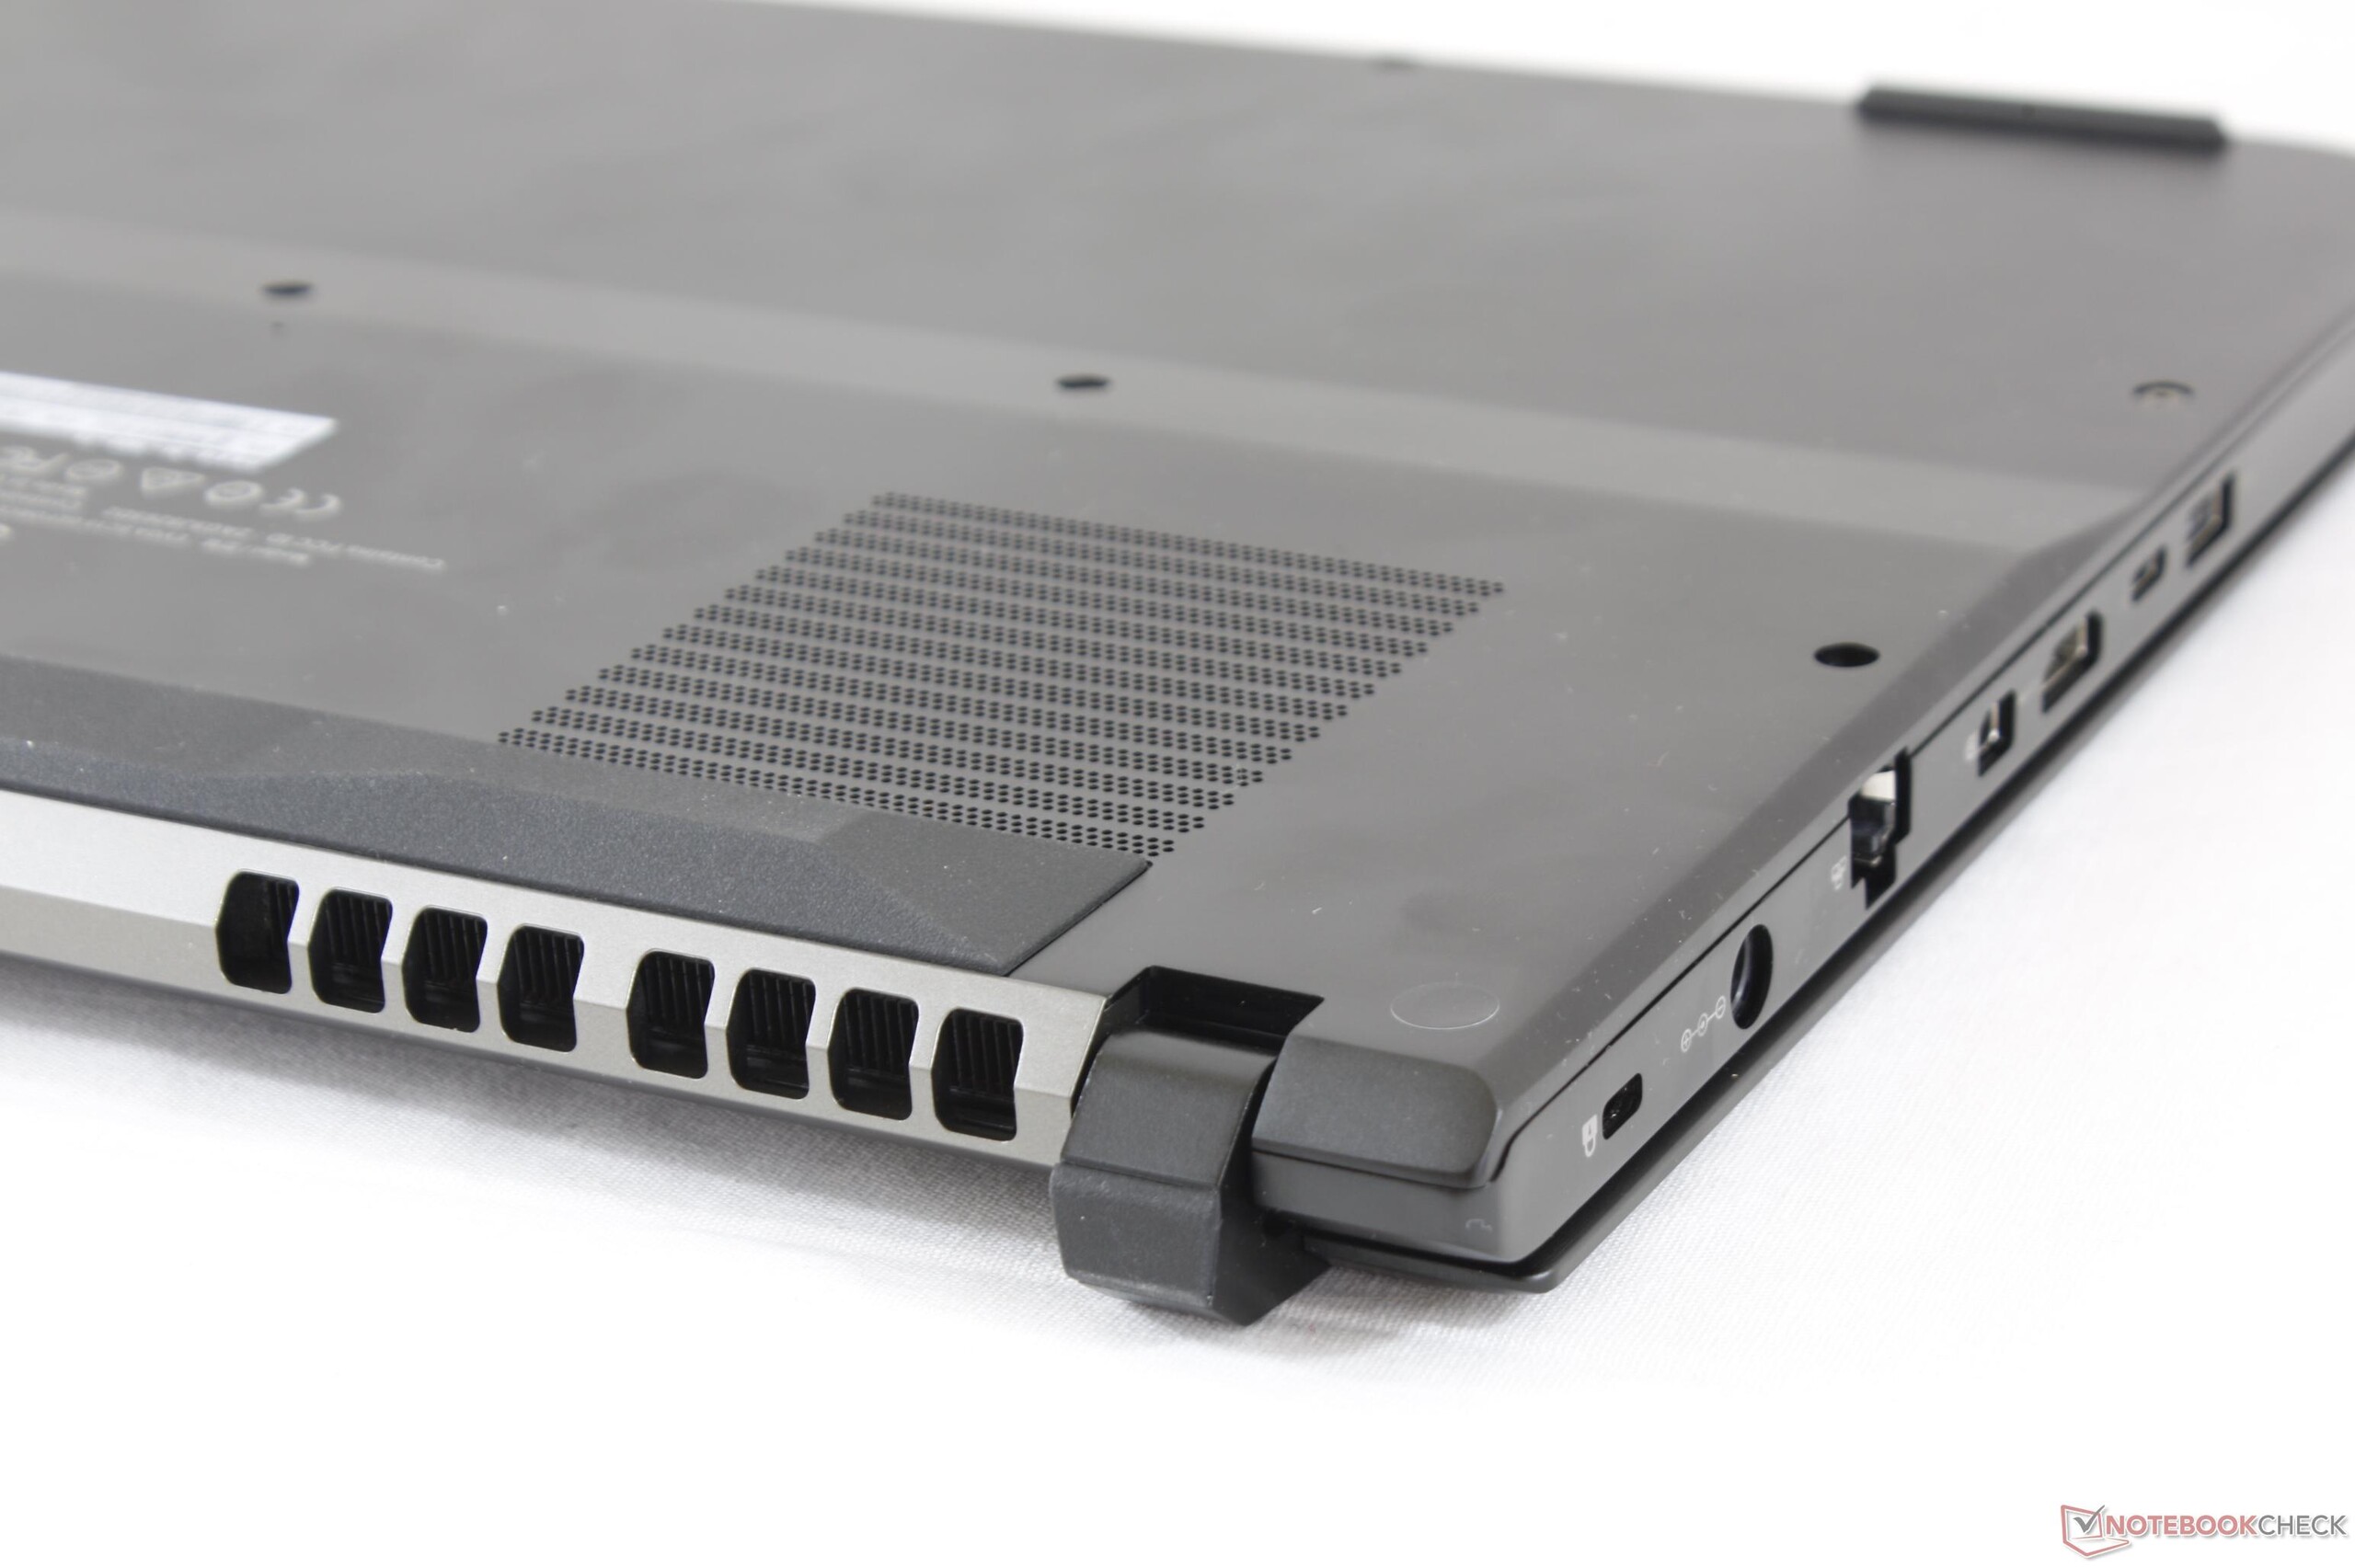
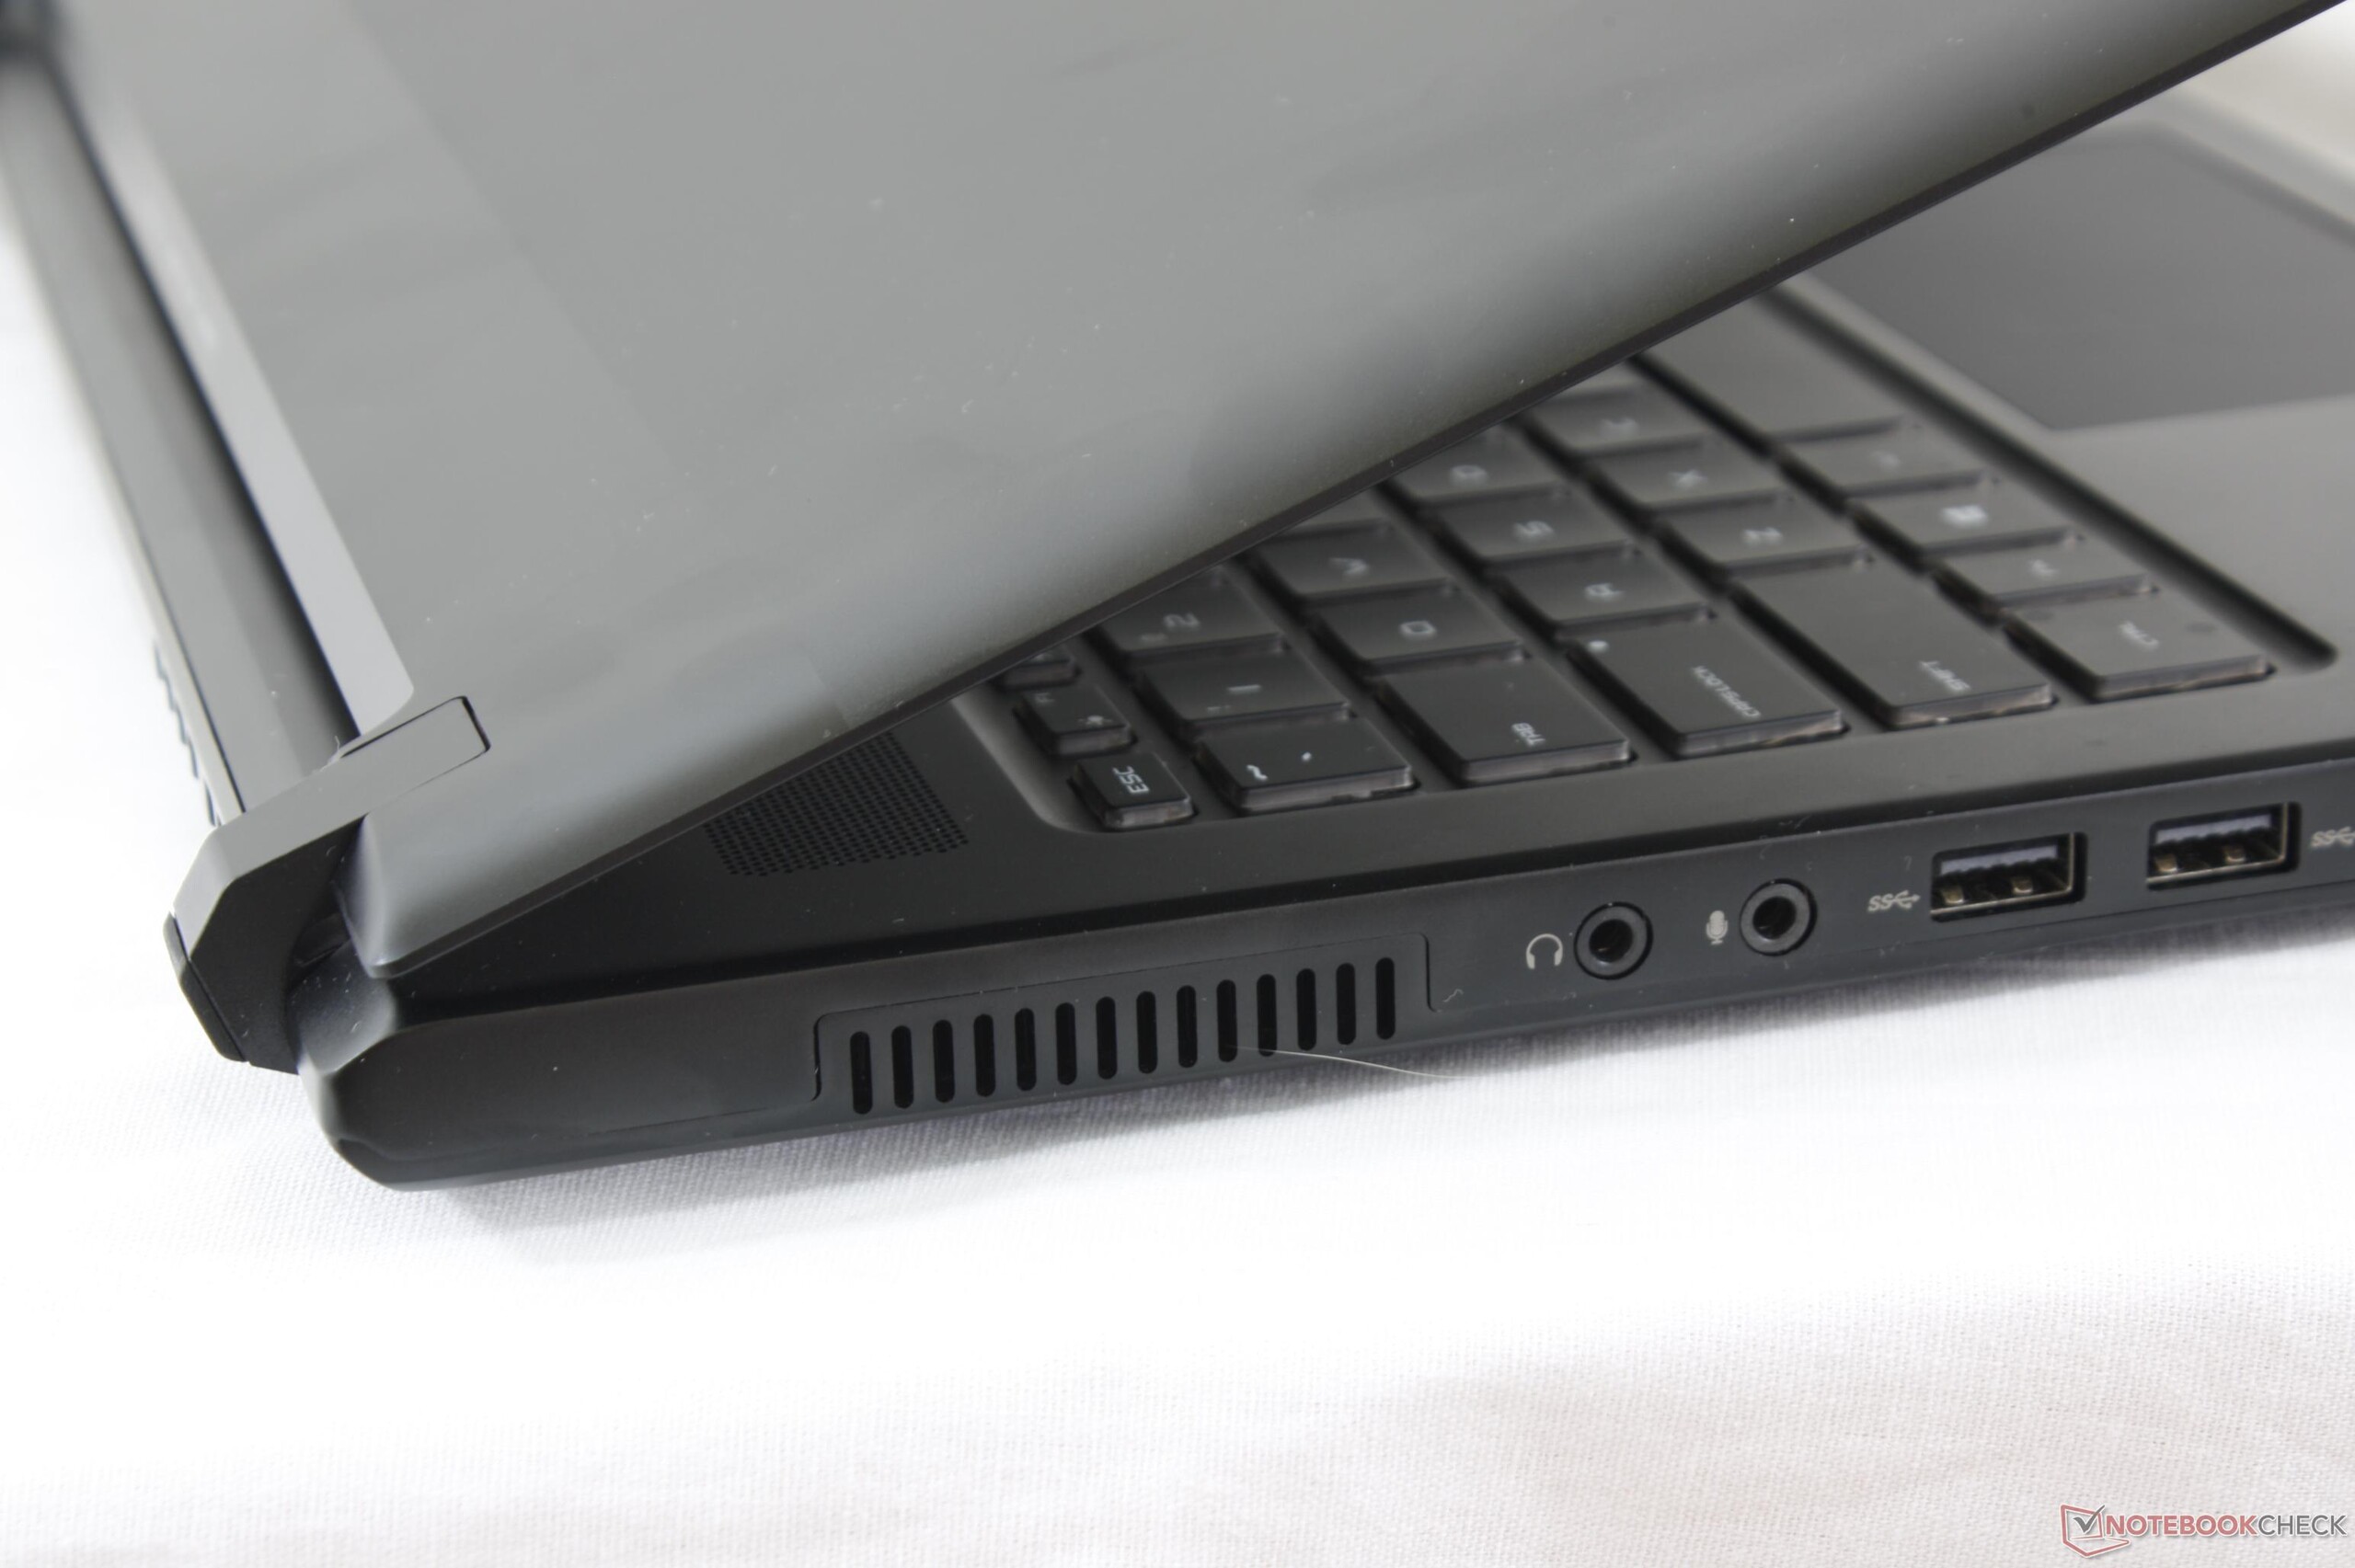
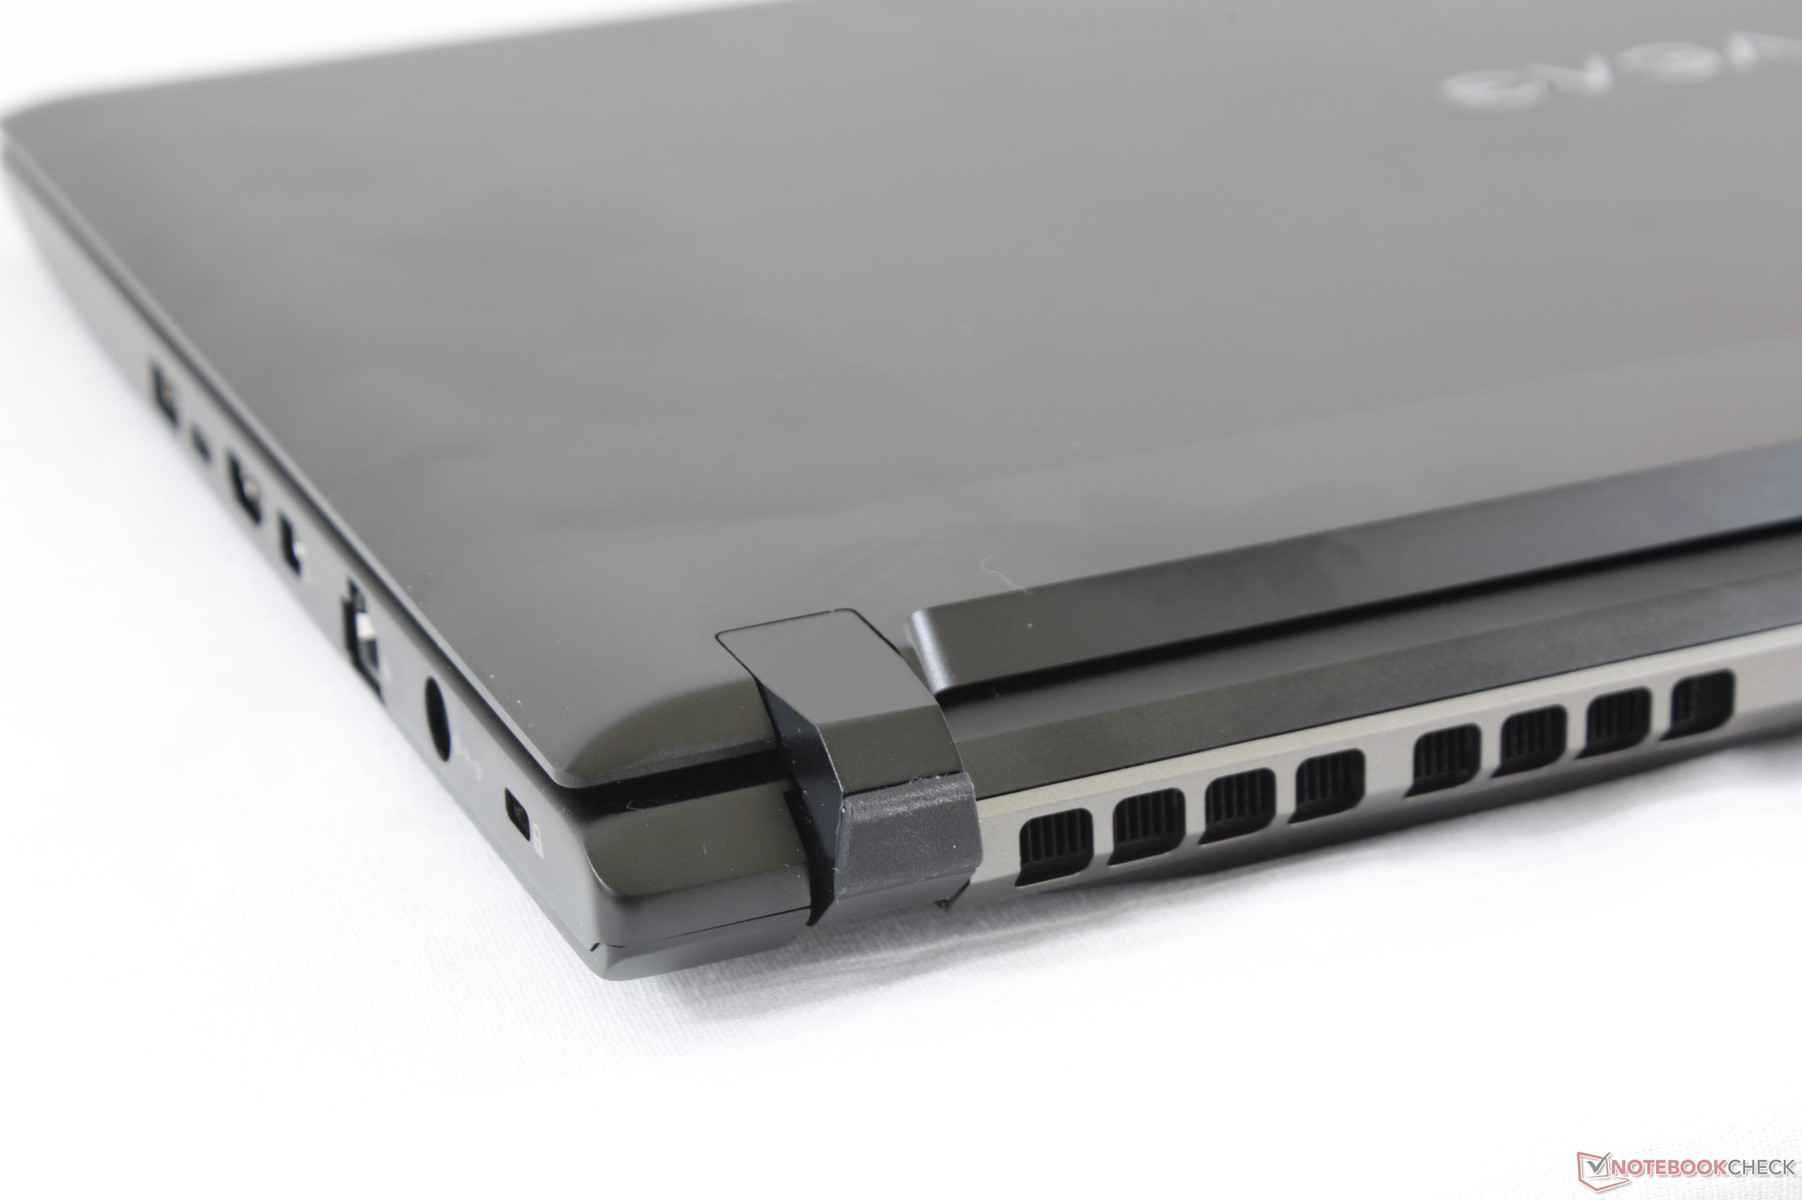
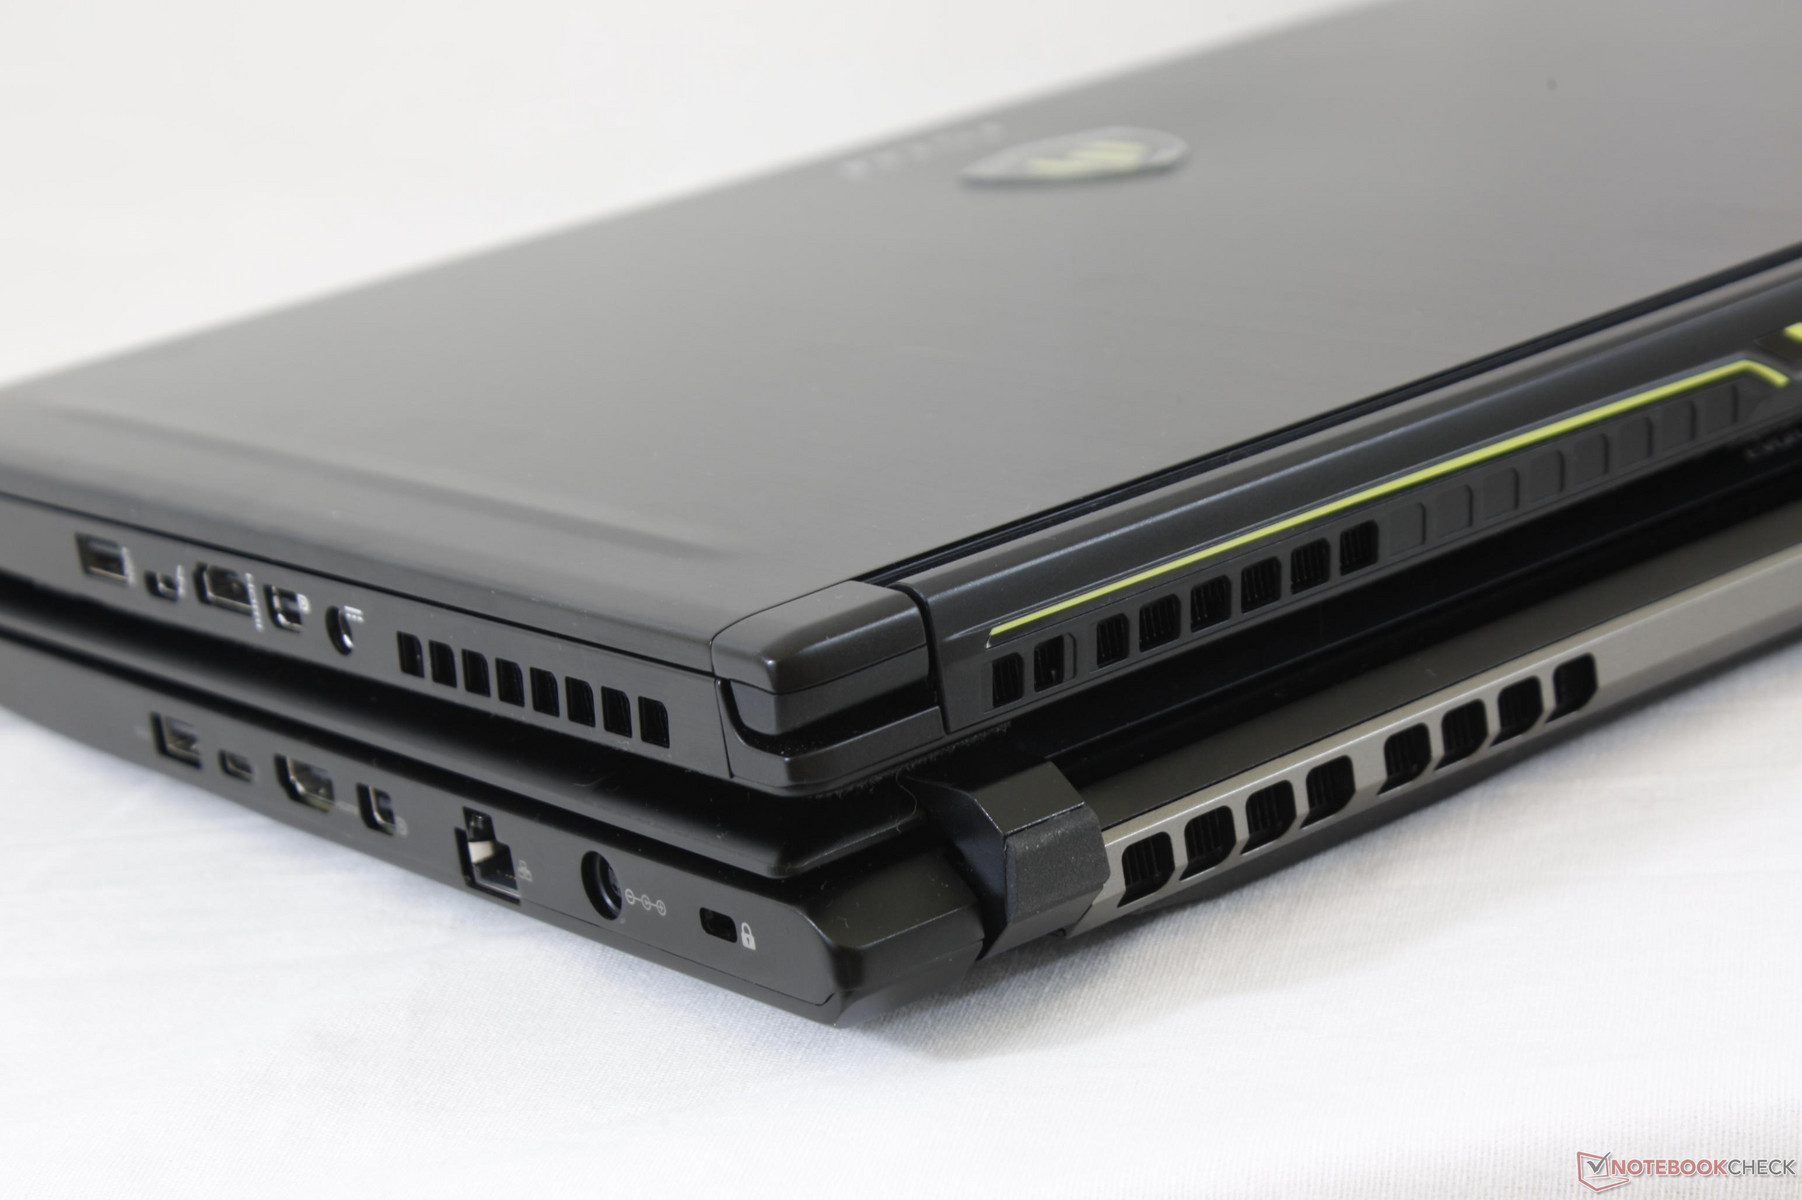
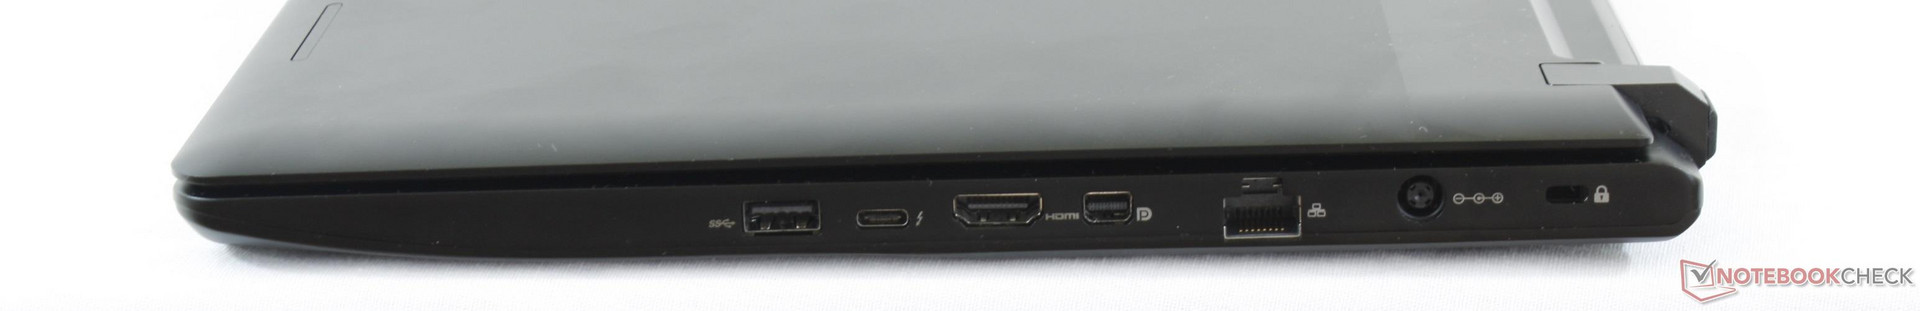
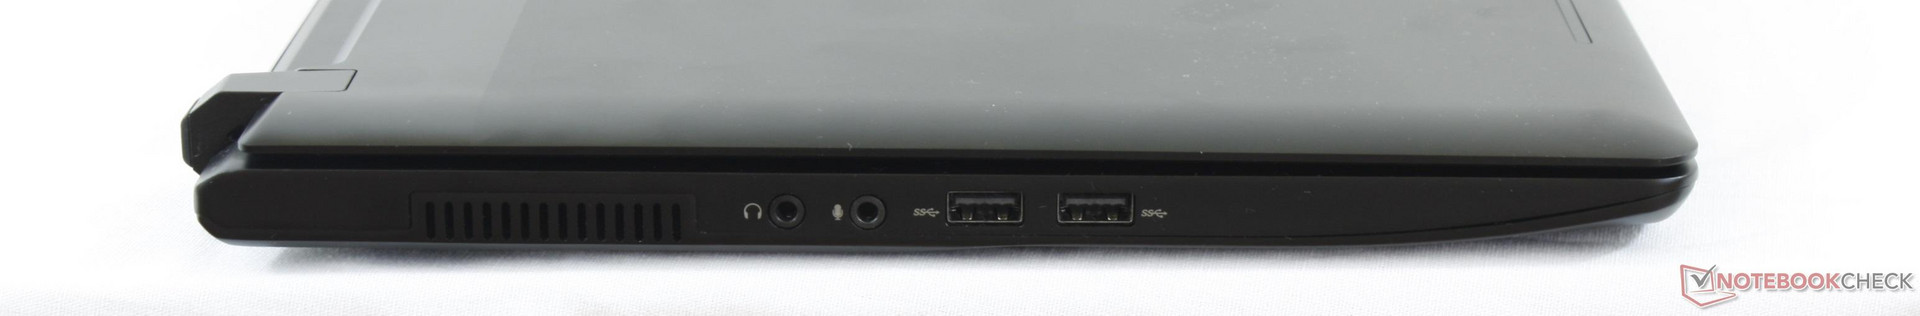
A healthy number of ports are available including 3x USB 3.0 Type-A and multiple video-out ports. While the MSI GS63VR includes one more USB Type-A port, it uses the older HDMI 1.4 and mDP 1.2 standards compared to HDMI 2.0b and mDP 1.4 on the SC15. This has little significance to most users, but SC15 owners will have the ability to output to compatible 4K monitors at up to 60 Hz and 120 Hz without needing to resort to Thunderbolt 3.
All ports are easy to reach on the left- and right-hand edges of the notebook. Most of the ports are along the right edge and so right-handed mouse users may have to deal with a cluttered desk of cables. Perhaps the most disappointing aspect, however, is the complete lack of an integrated SD card reader unlike on most other gaming notebooks.
Communication
The Intel 8265 module with integrated Bluetooth 4.2 comes standard with no options for the gaming-centric Killer 1535. Real-world transfer rates average 657 Mbps against the theoretical maximum of 867 Mbps when standing one meter away from our EA8500 test router, but transmit speed is strangely slower at an average of 361 Mbps even after multiple retests. Beyond this, we experienced no connectivity or latency issues during our time with the unit. There is no WWAN or SIM support unlike on the recent Eurocom Sky MX5 R3.
| Networking | |
| iperf3 transmit AX12 | |
| MSI GS63VR 7RF-228US | |
| Dell XPS 15 9560 (i7-7700HQ, UHD) | |
| EVGA SC15 | |
| iperf3 receive AX12 | |
| MSI GS63VR 7RF-228US | |
| EVGA SC15 | |
| Dell XPS 15 9560 (i7-7700HQ, UHD) | |
Accessories
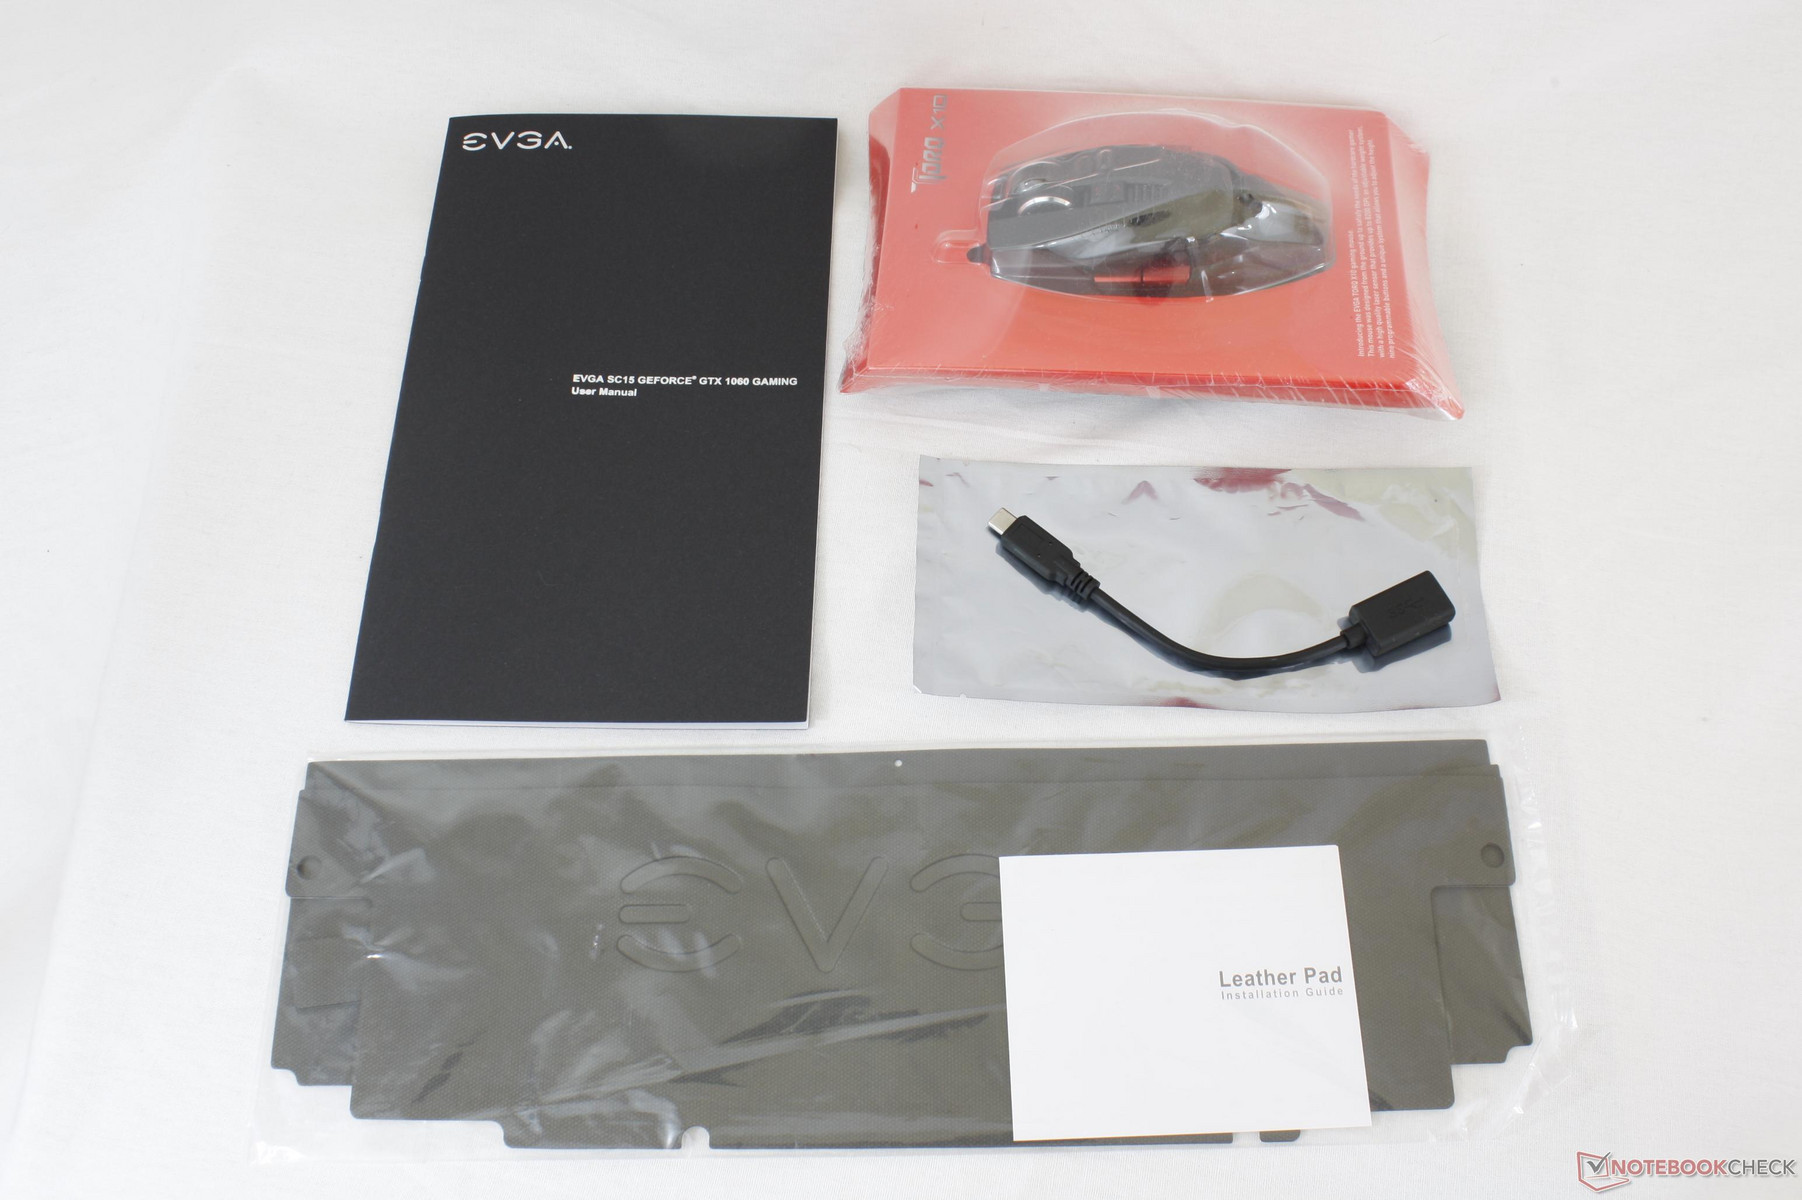
Included extras are a wired Torq X10 gaming mouse (similar to the one included with each SC17), USB Type-C to USB 3.0 Type-A adapter, leather palm rest pad, and a user guide. A velvet cleaning cloth would have been a neat addition, though EVGA is already throwing in more than what other gaming manufacturers include for free. Generic Thunderbolt 3 docking stations should be compatible with the system as well.
Maintenance
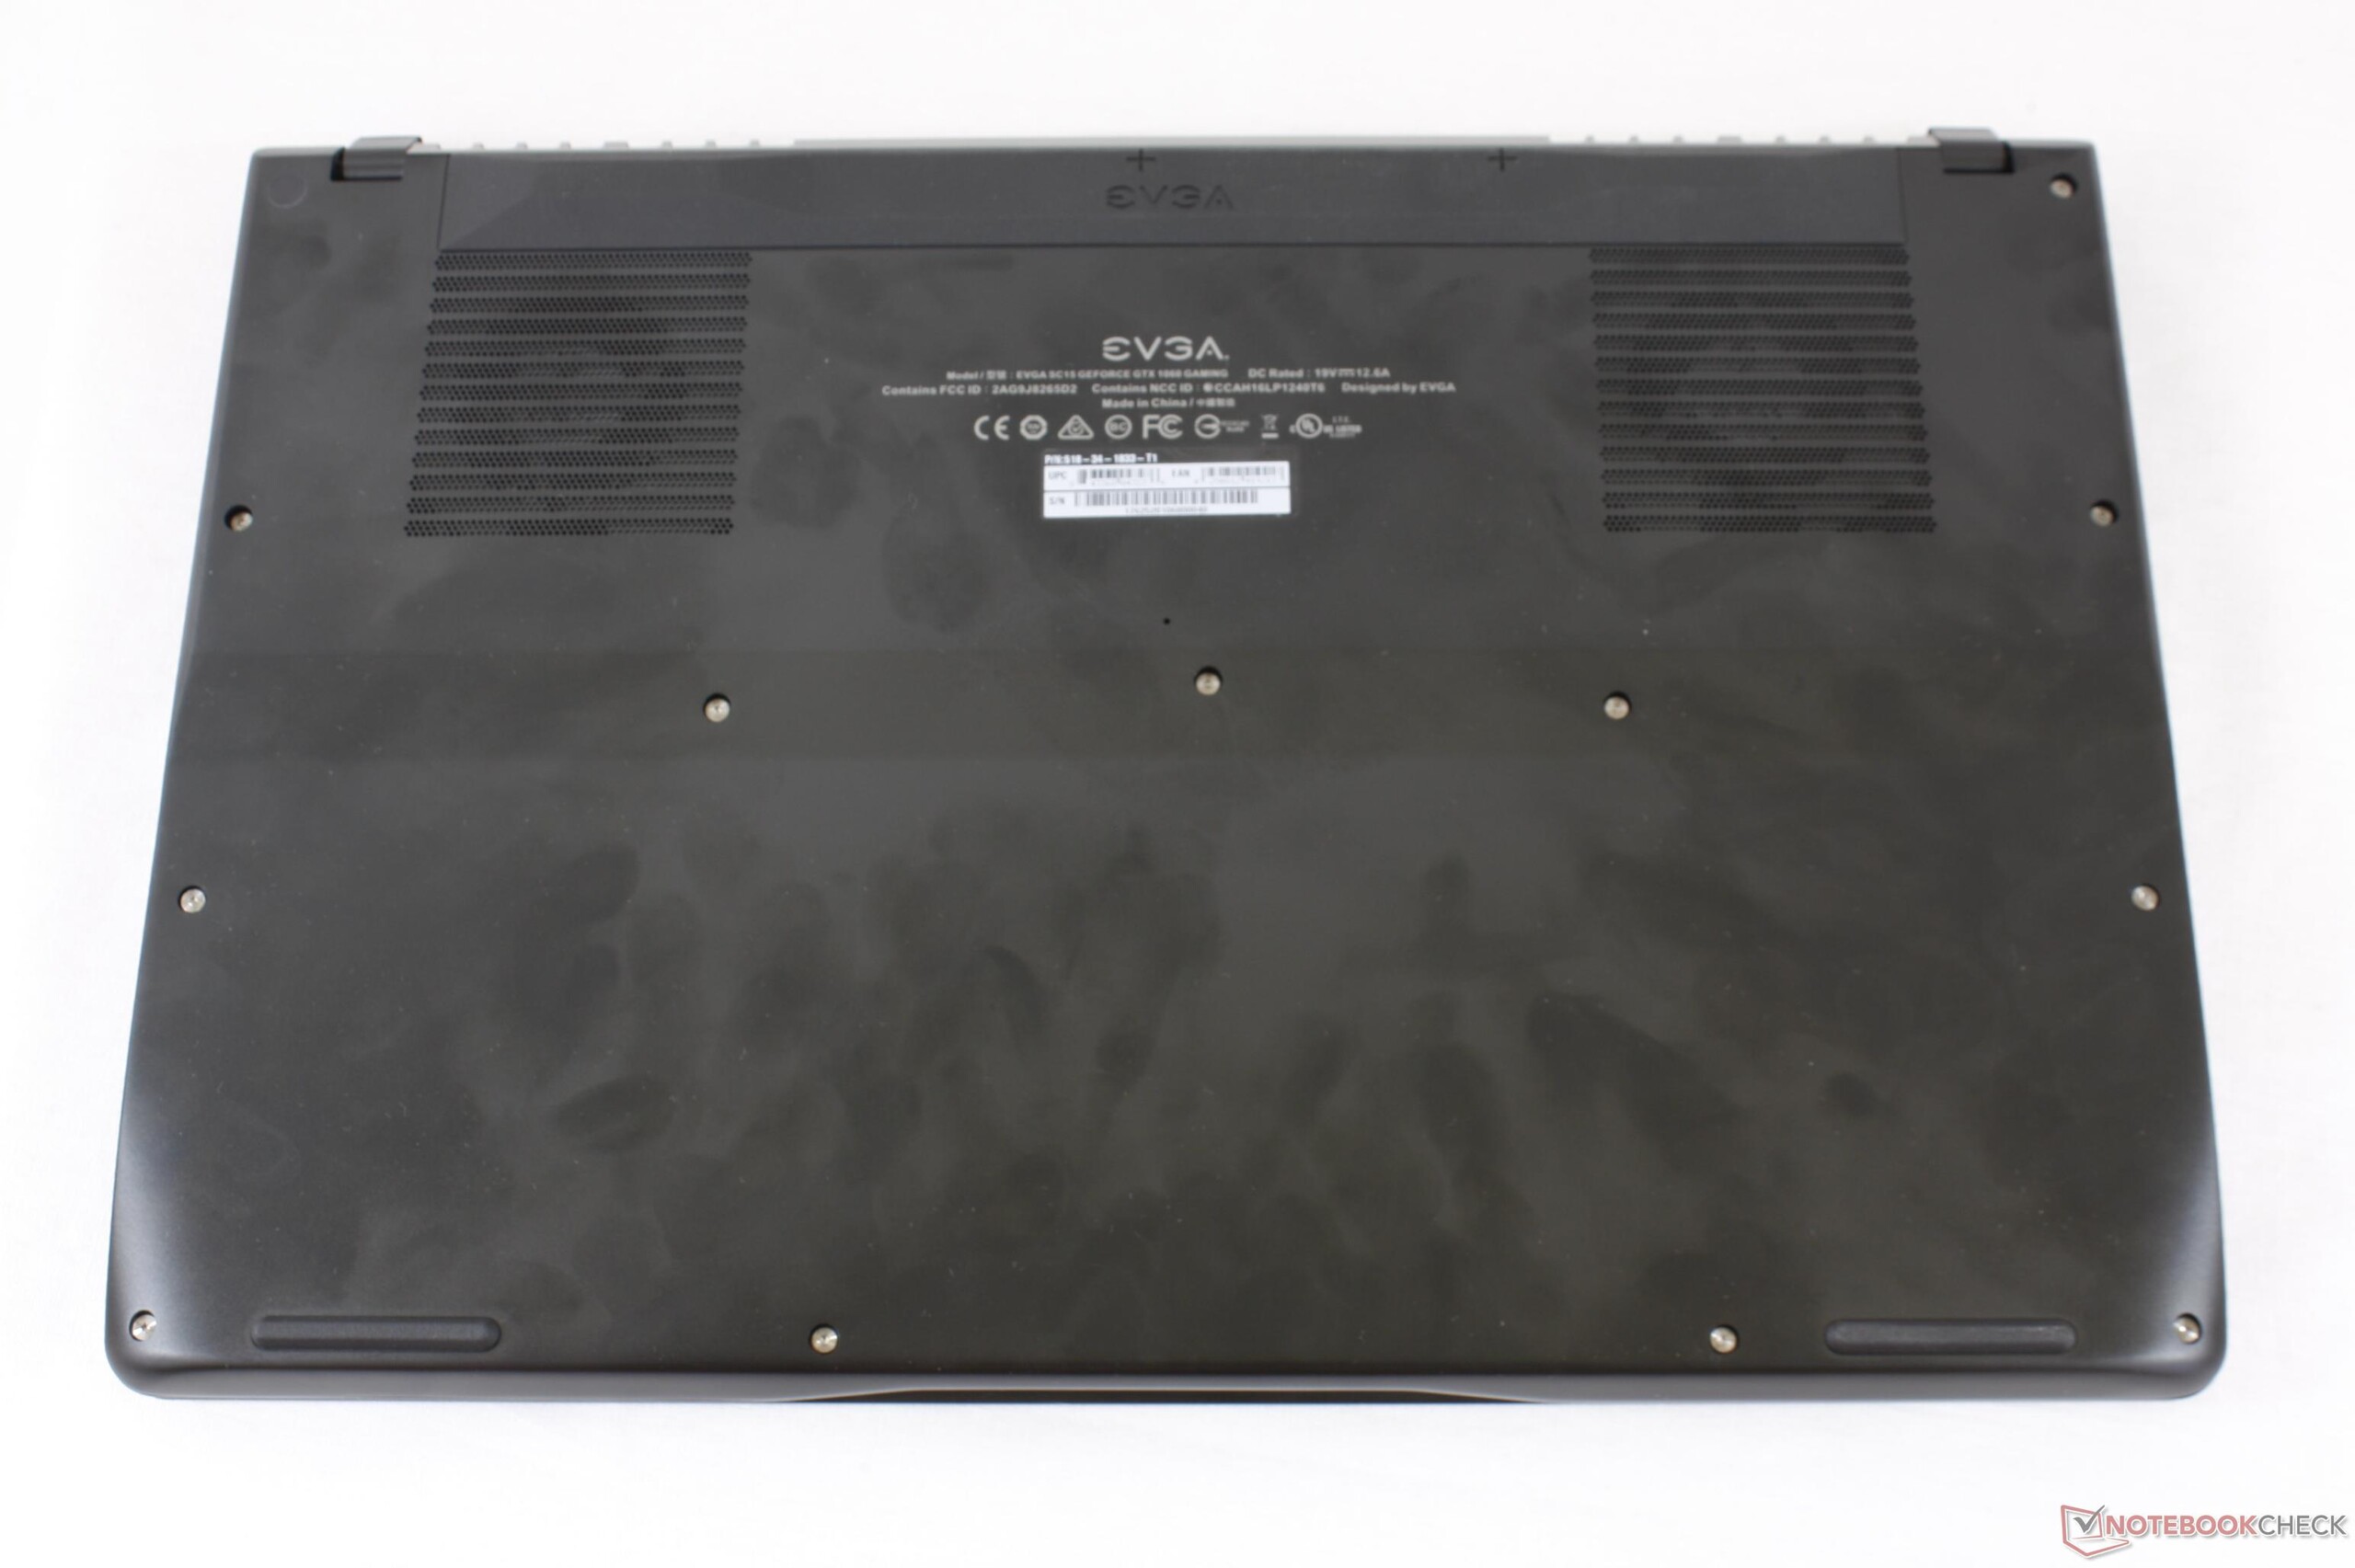
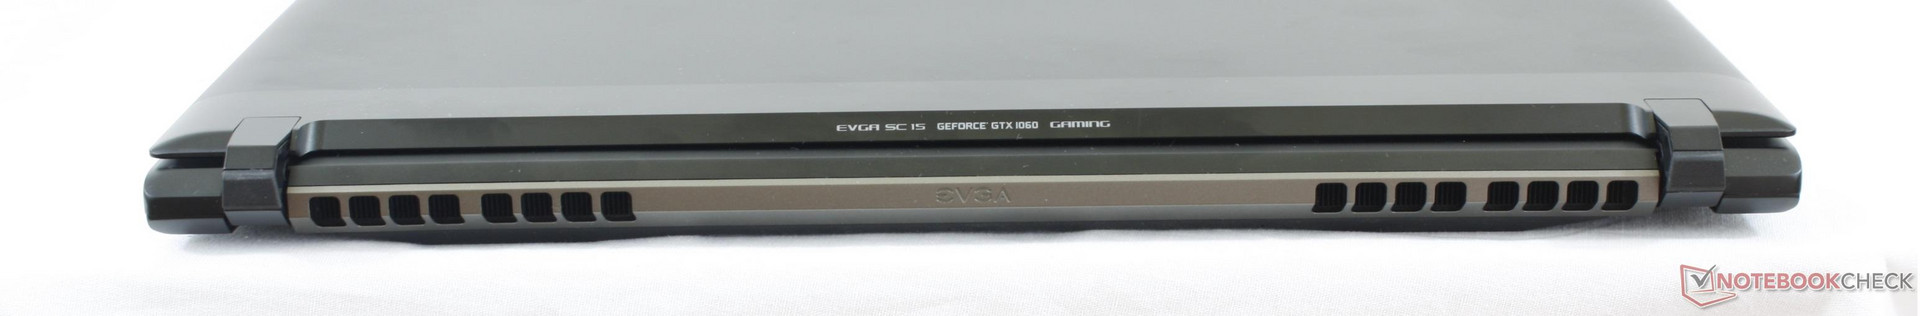
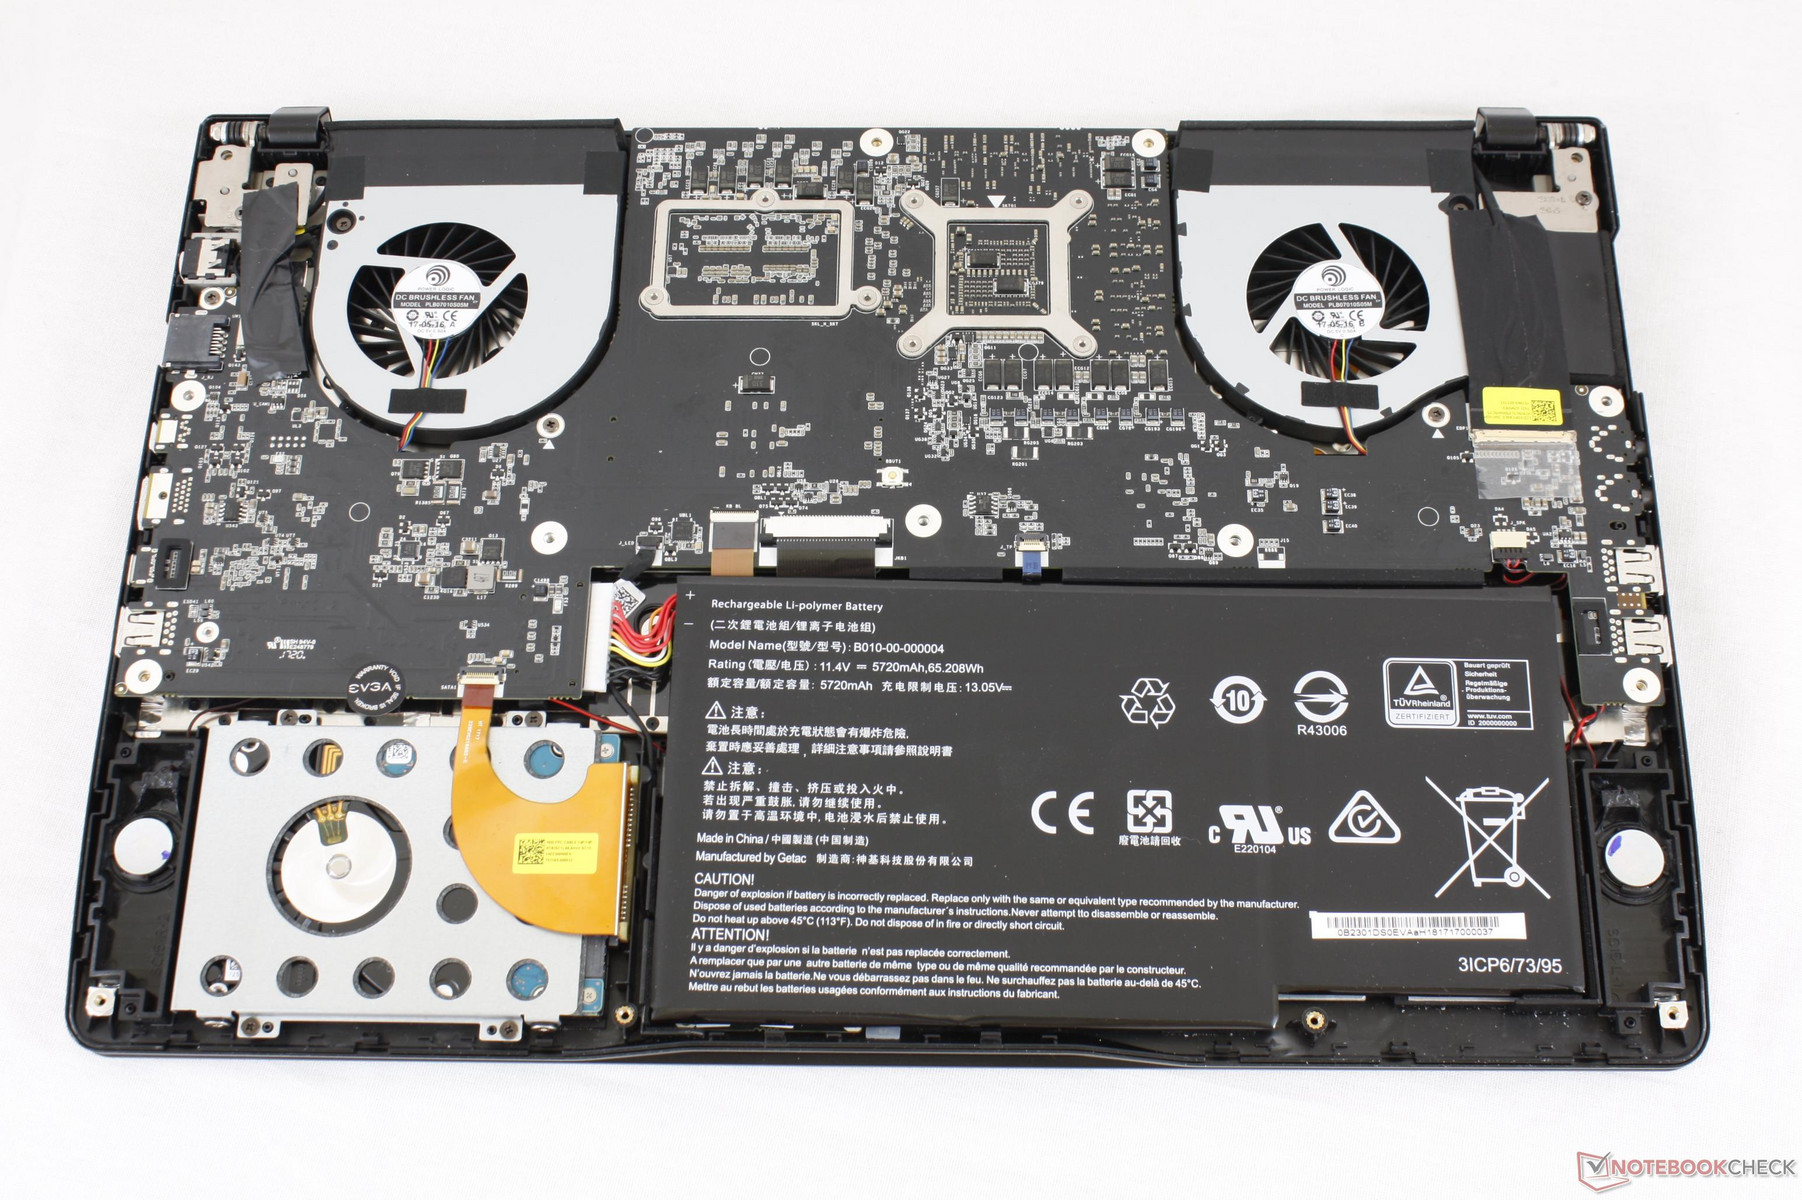
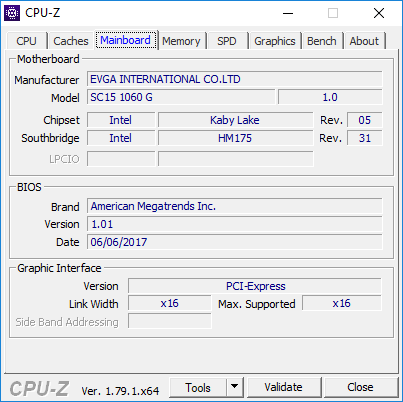
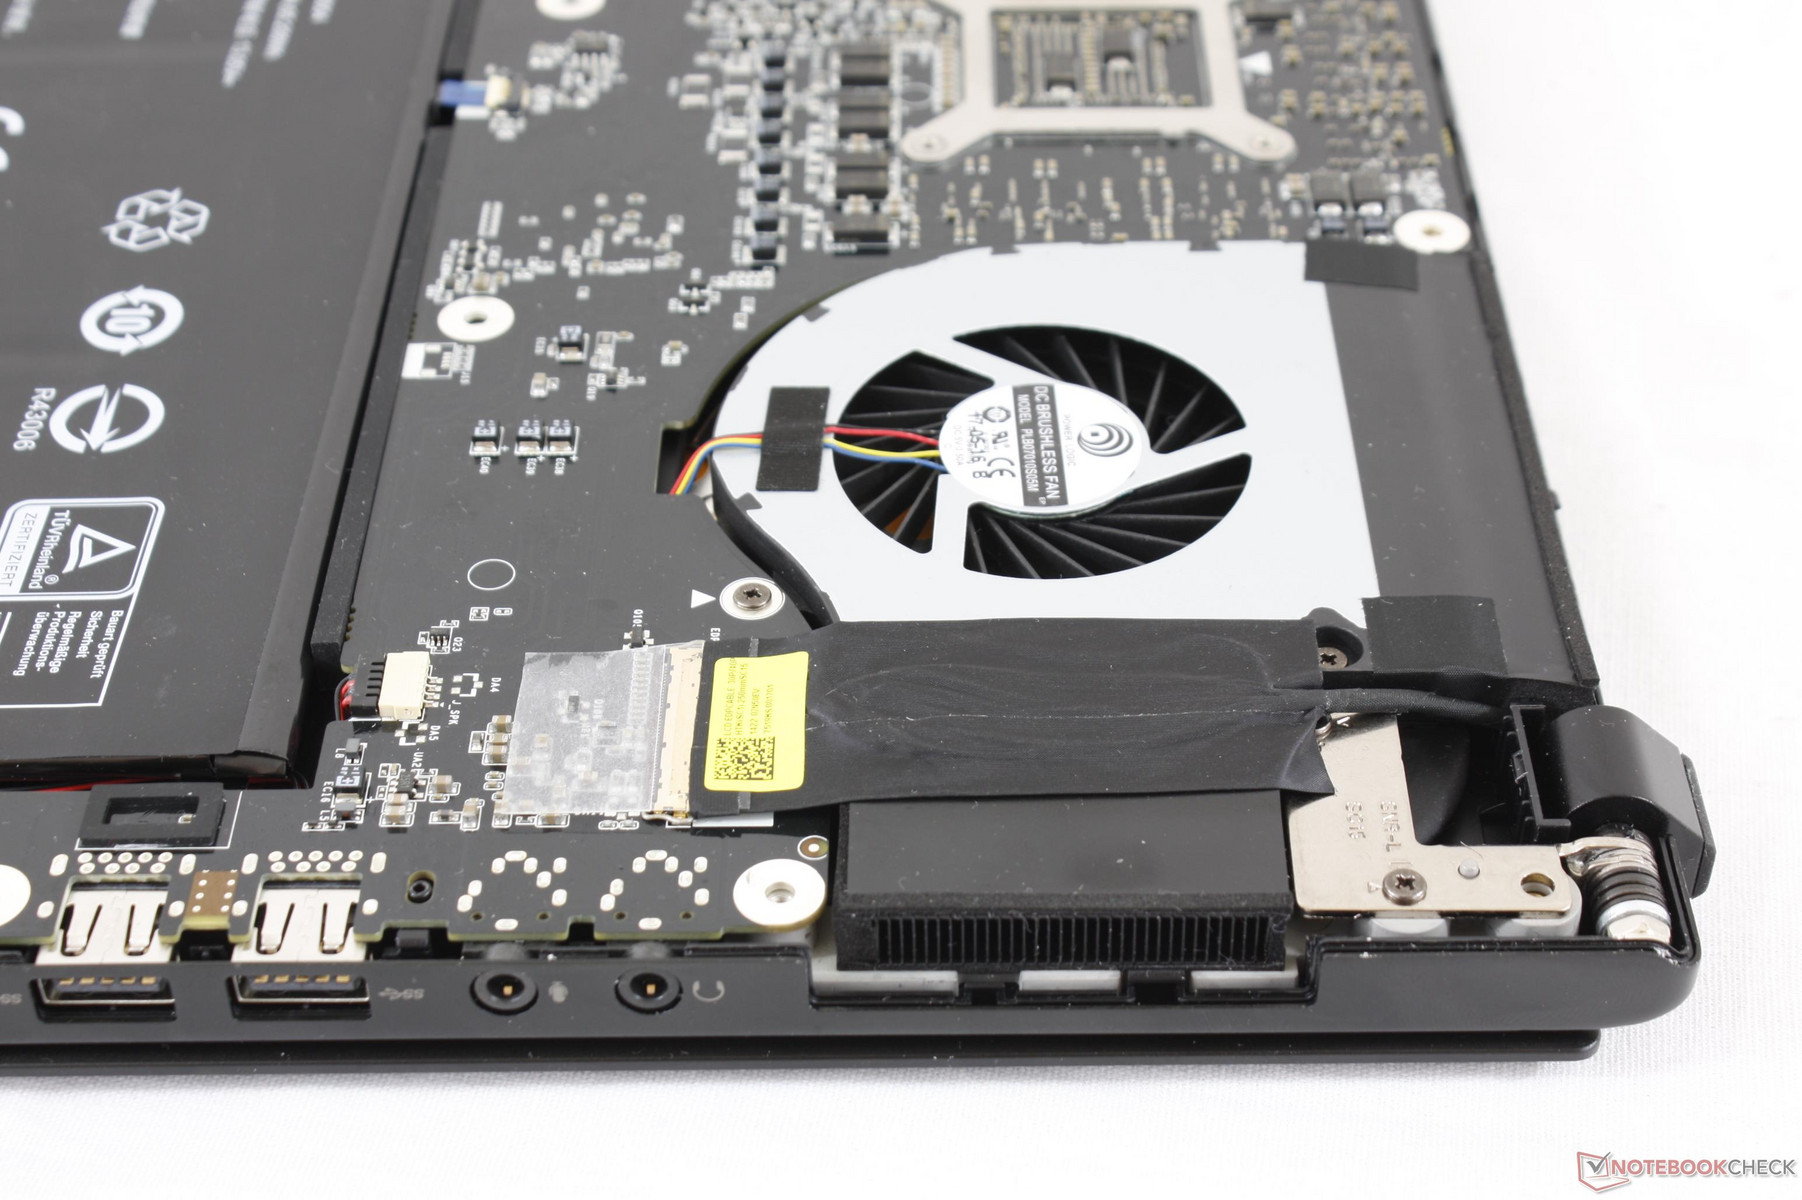
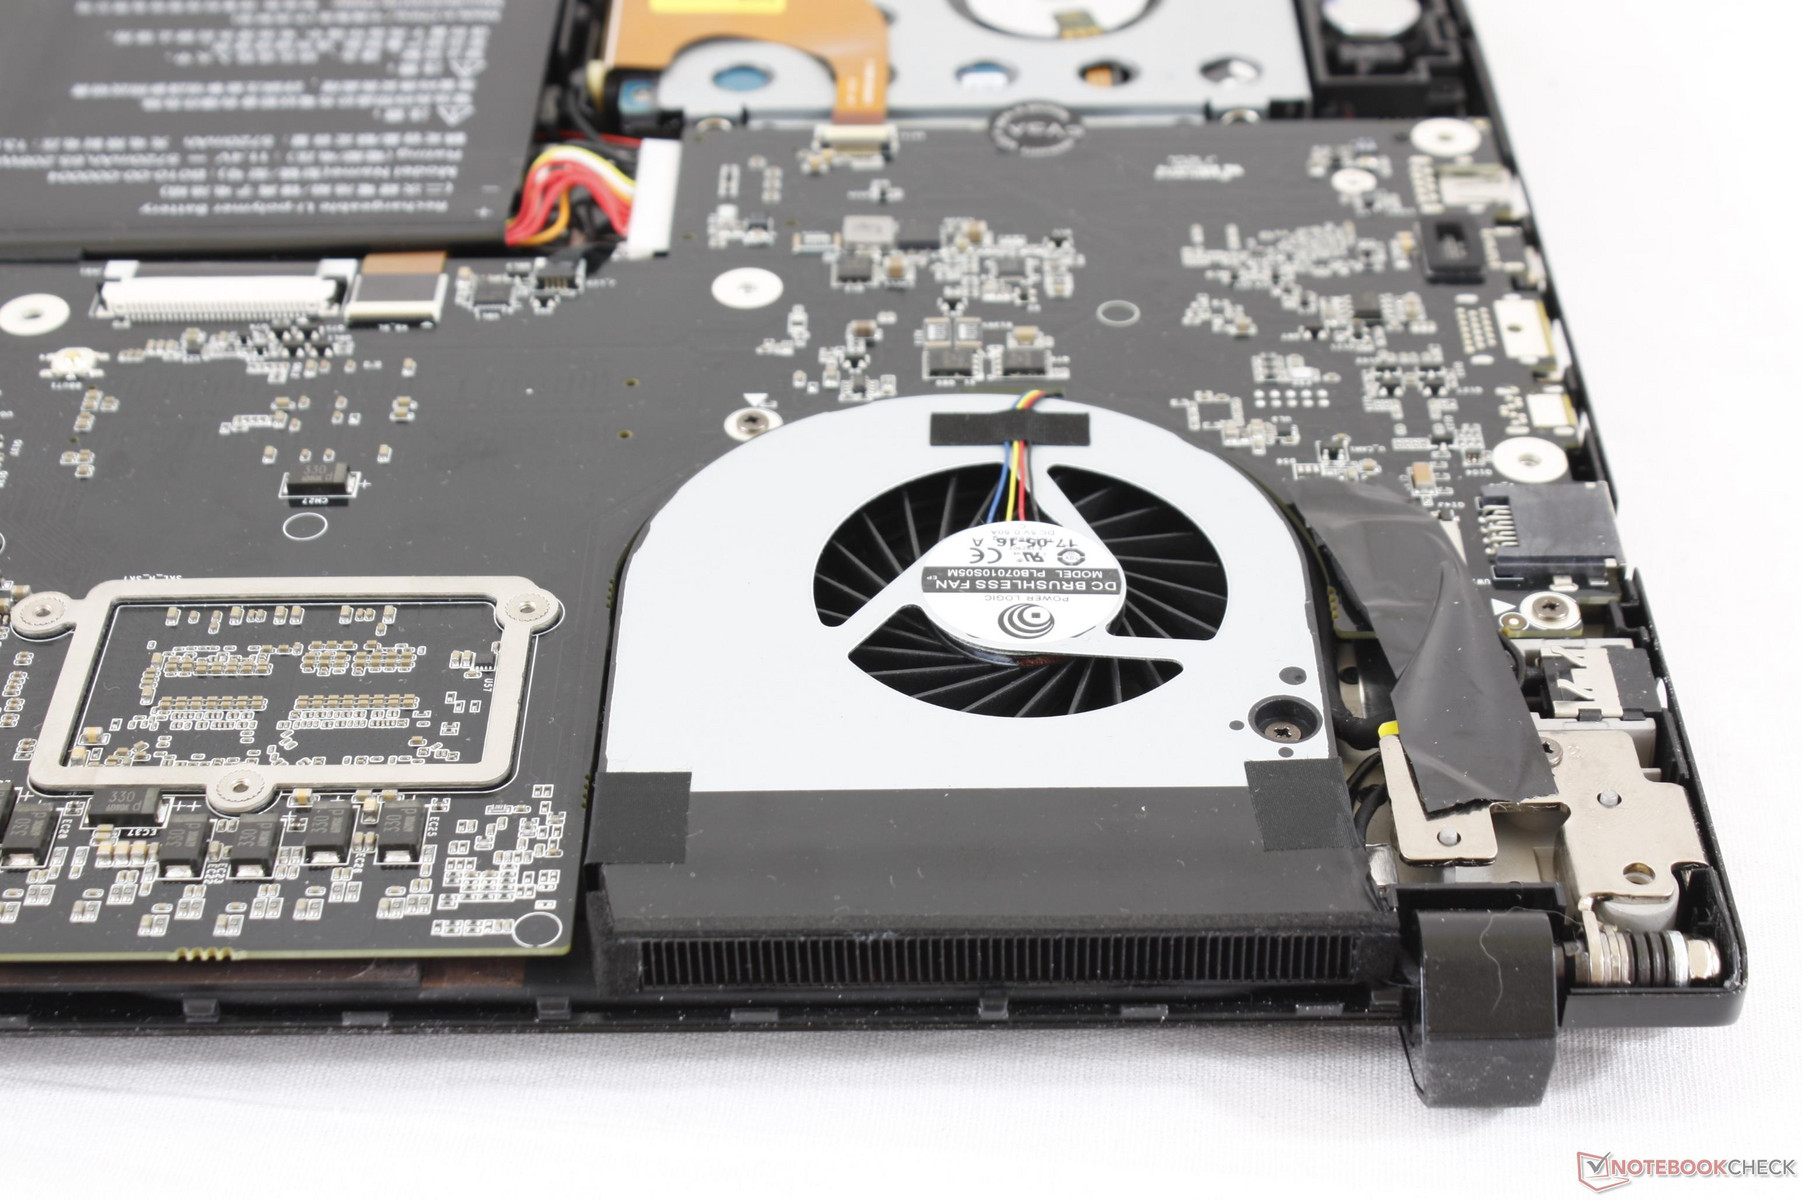
The bottom panel is secured by 13 screws (plus 2 more underneath the rear rubber footing) and is relatively easy to remove so long as users are careful of the rear latches surrounding the ventilation grilles. An uncommon T6 Torx wrench is required whereas most notebooks have standard Philips screws or T5 Torx screws like the Razer Blade or Gigabyte series. Removing the bottom panel will not void the manufacturer warranty.
Unfortunately for tinkerers, the SC15 motherboard is upside-down and so most of its components are not easily serviceable without further disassembly. The MSI GS63VR/GS73VR series takes a similar approach for better or worse.
Warranty
Like Gigabyte and Aorus, EVGA offers a base two-year warranty as standard. Please see our Guarantees, Return policies and Warranties FAQ for country-specific information.
Input Devices
Keyboard
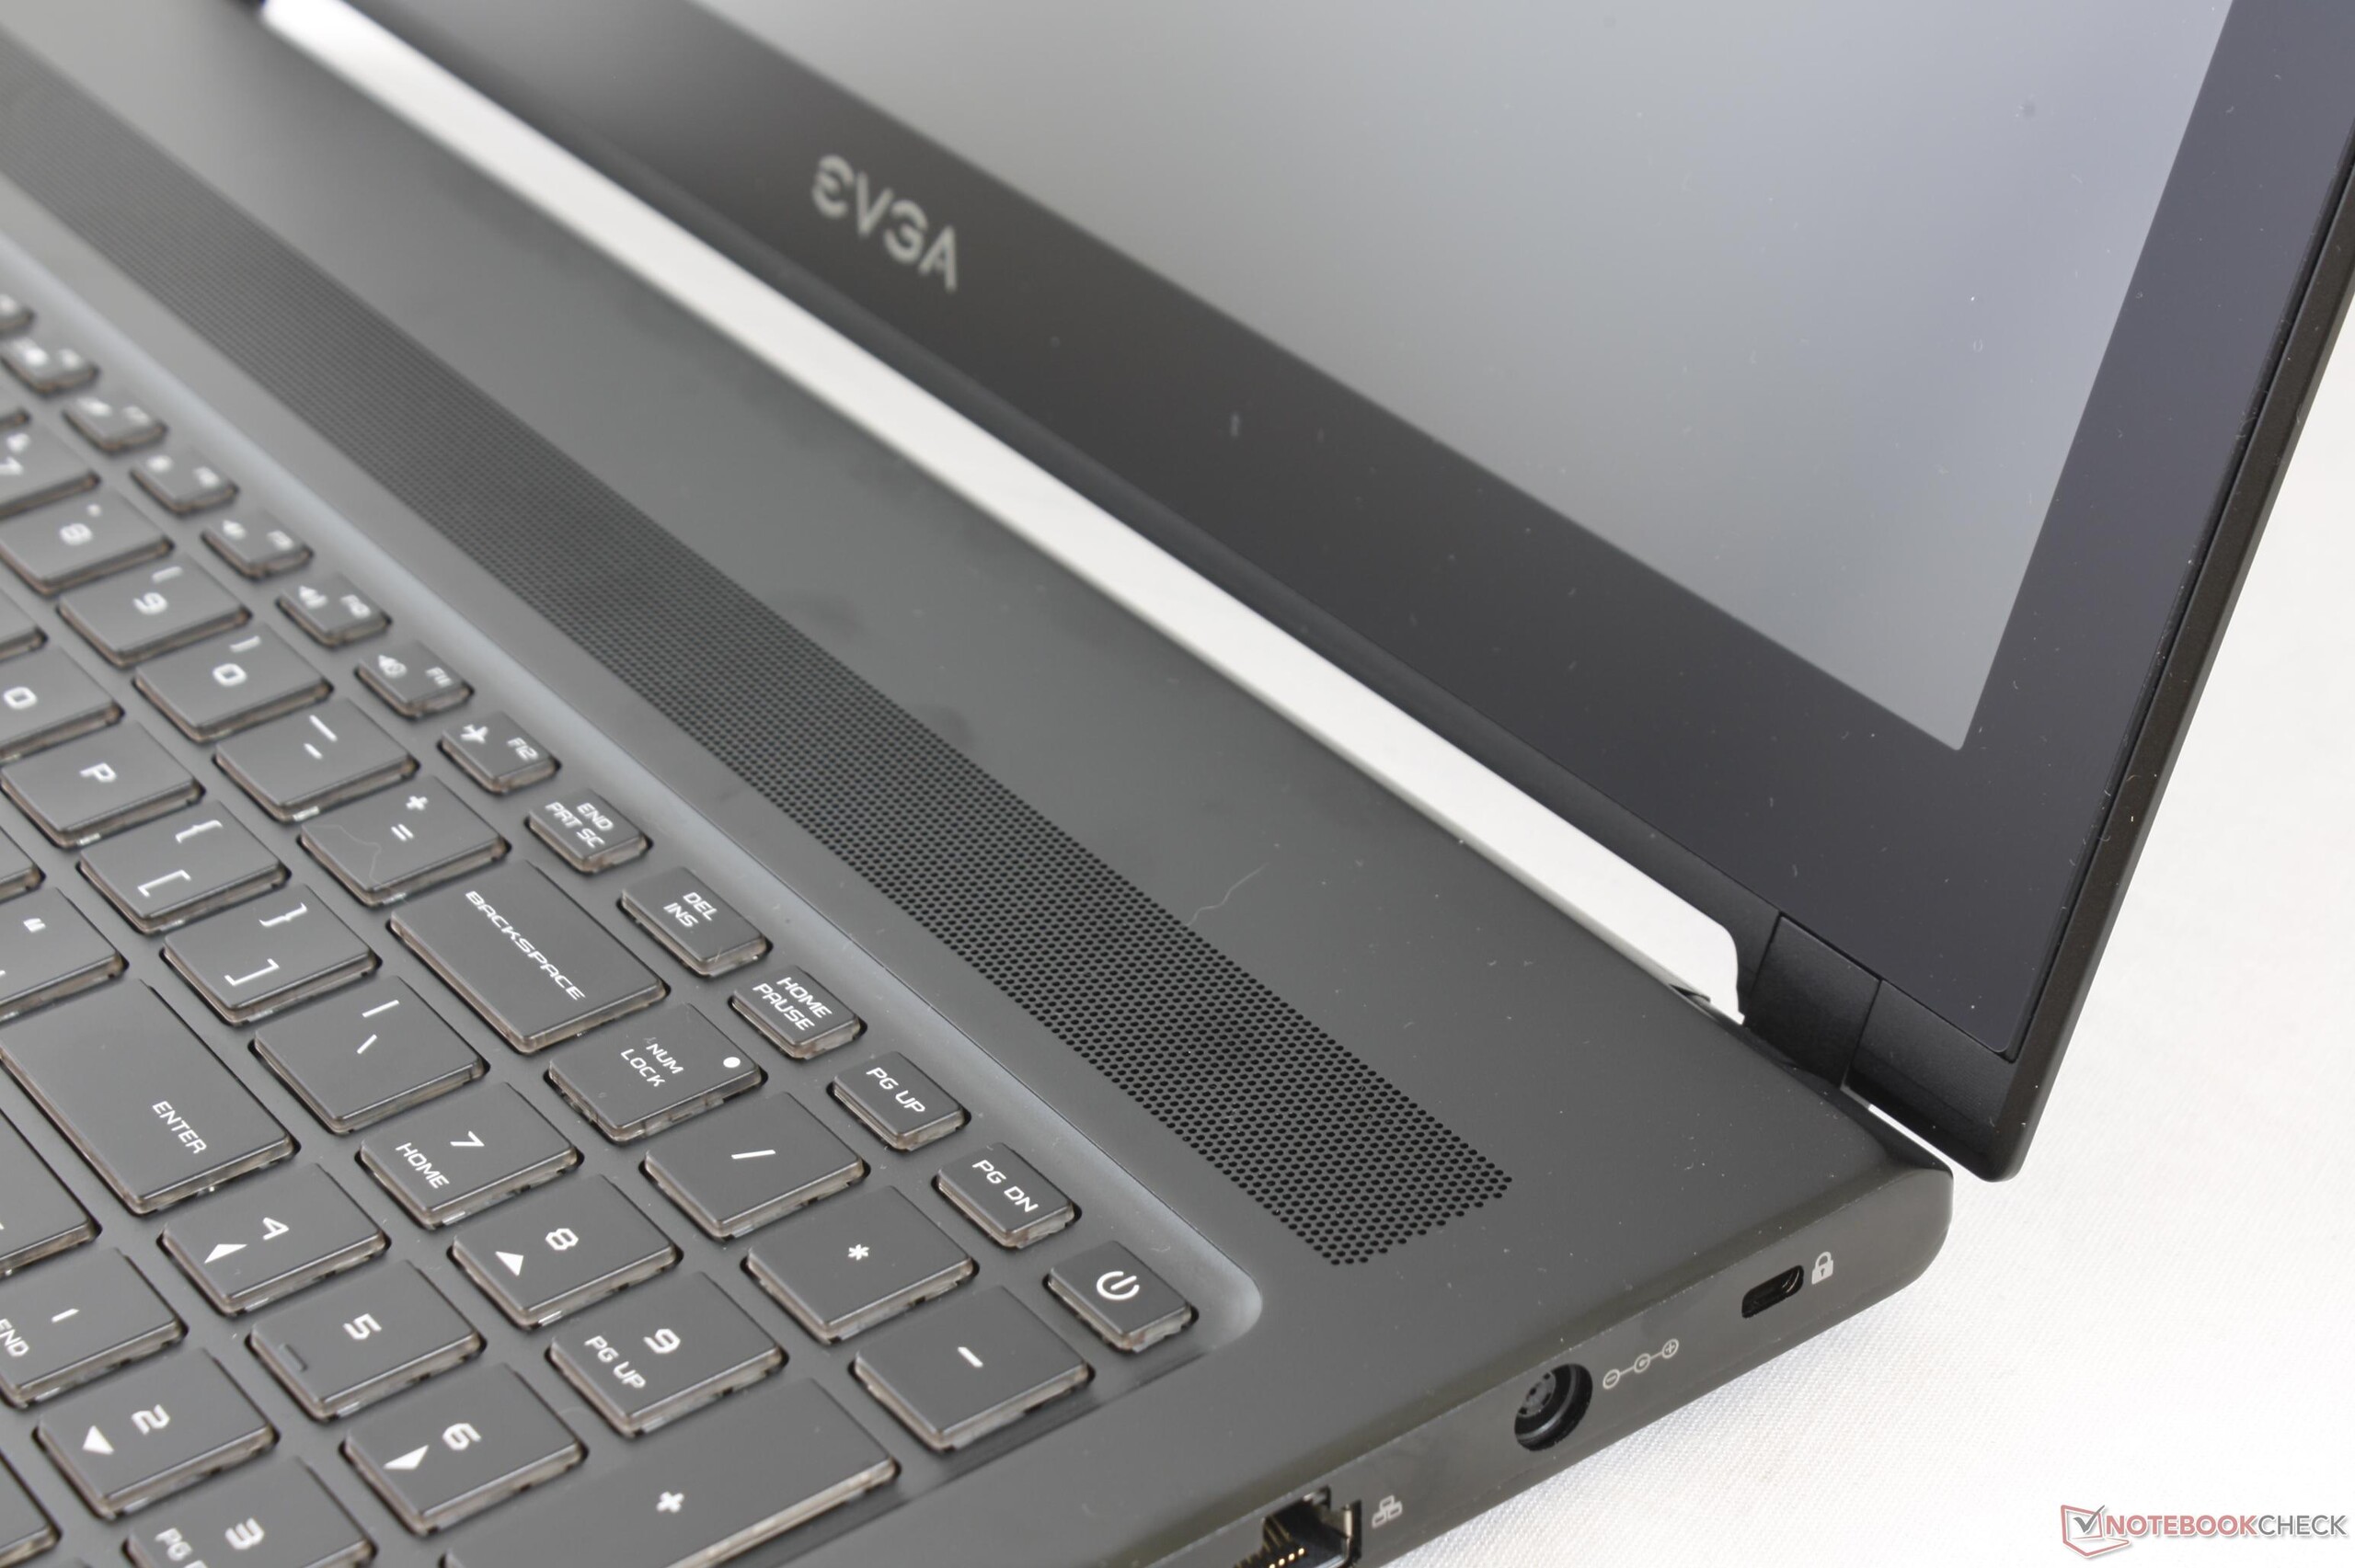
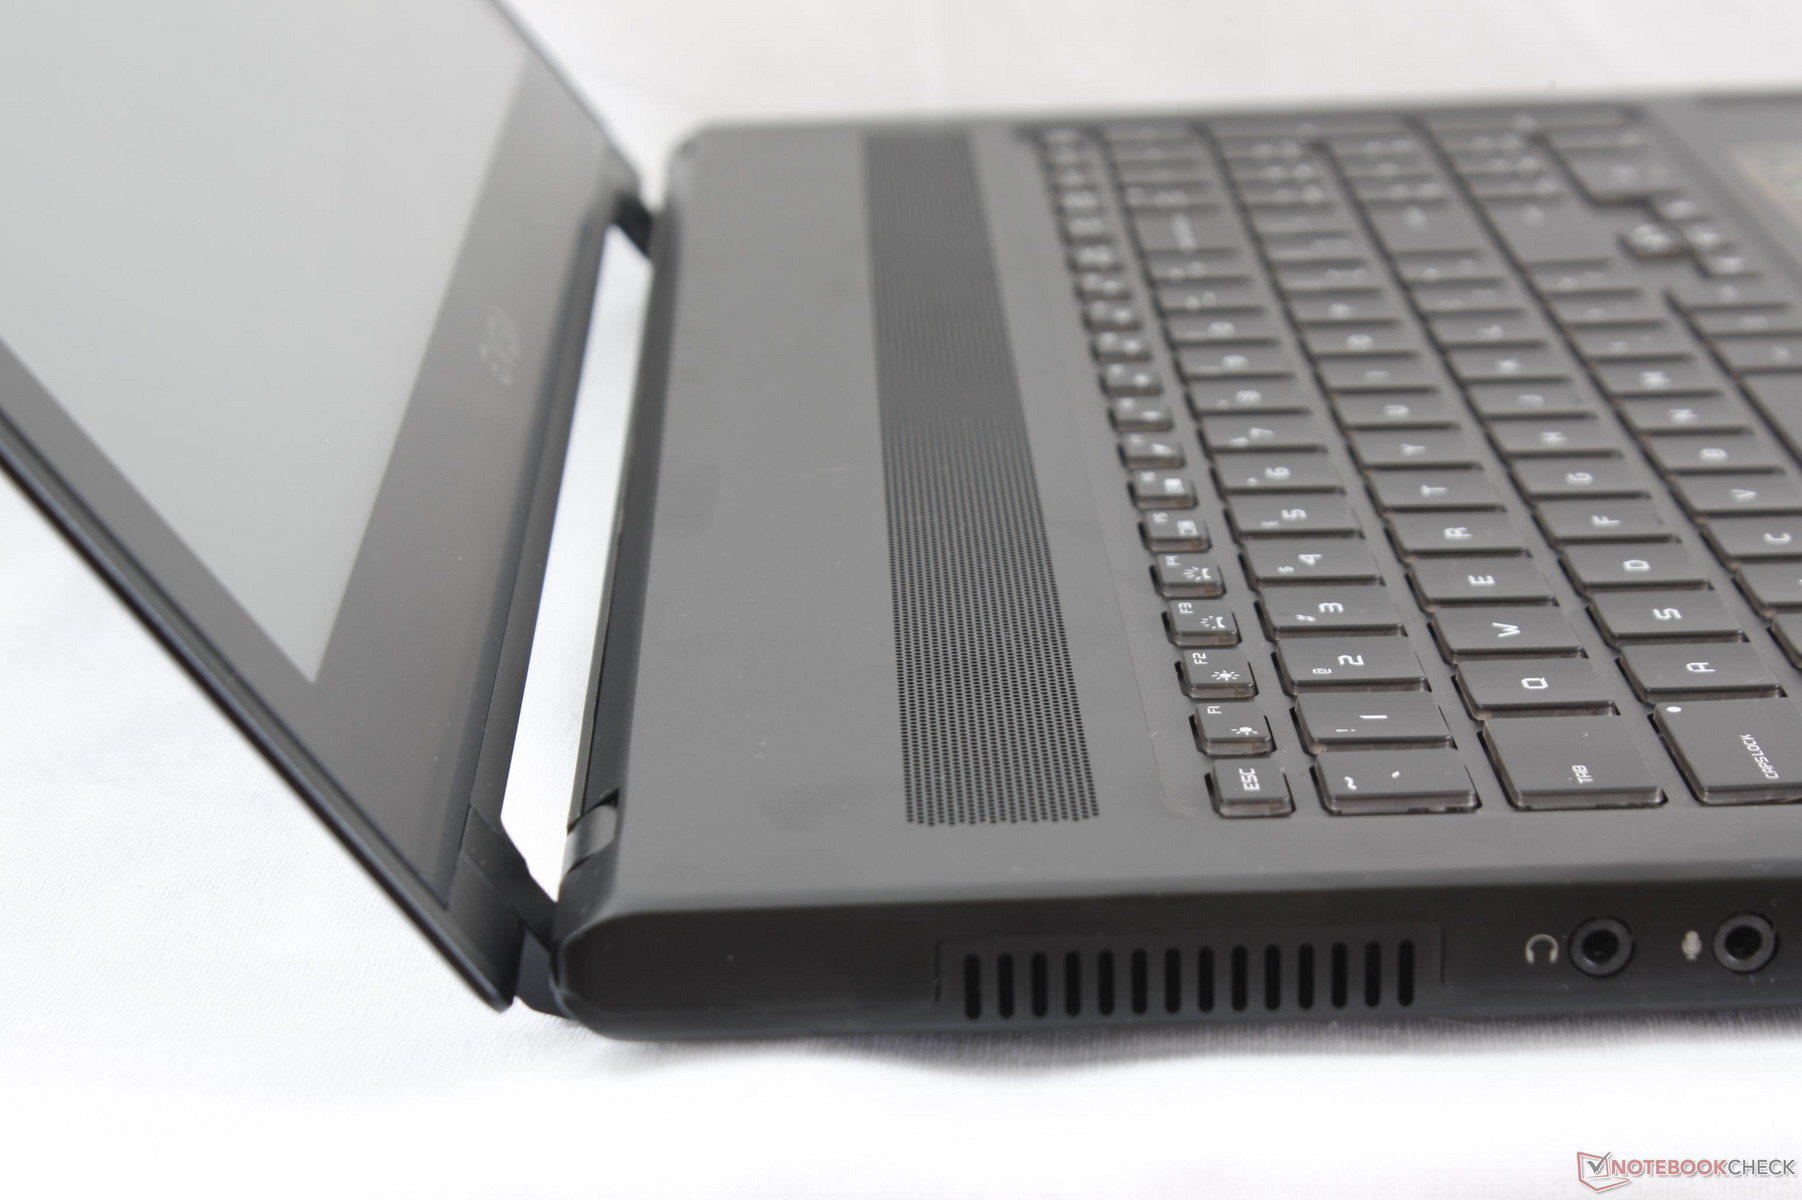
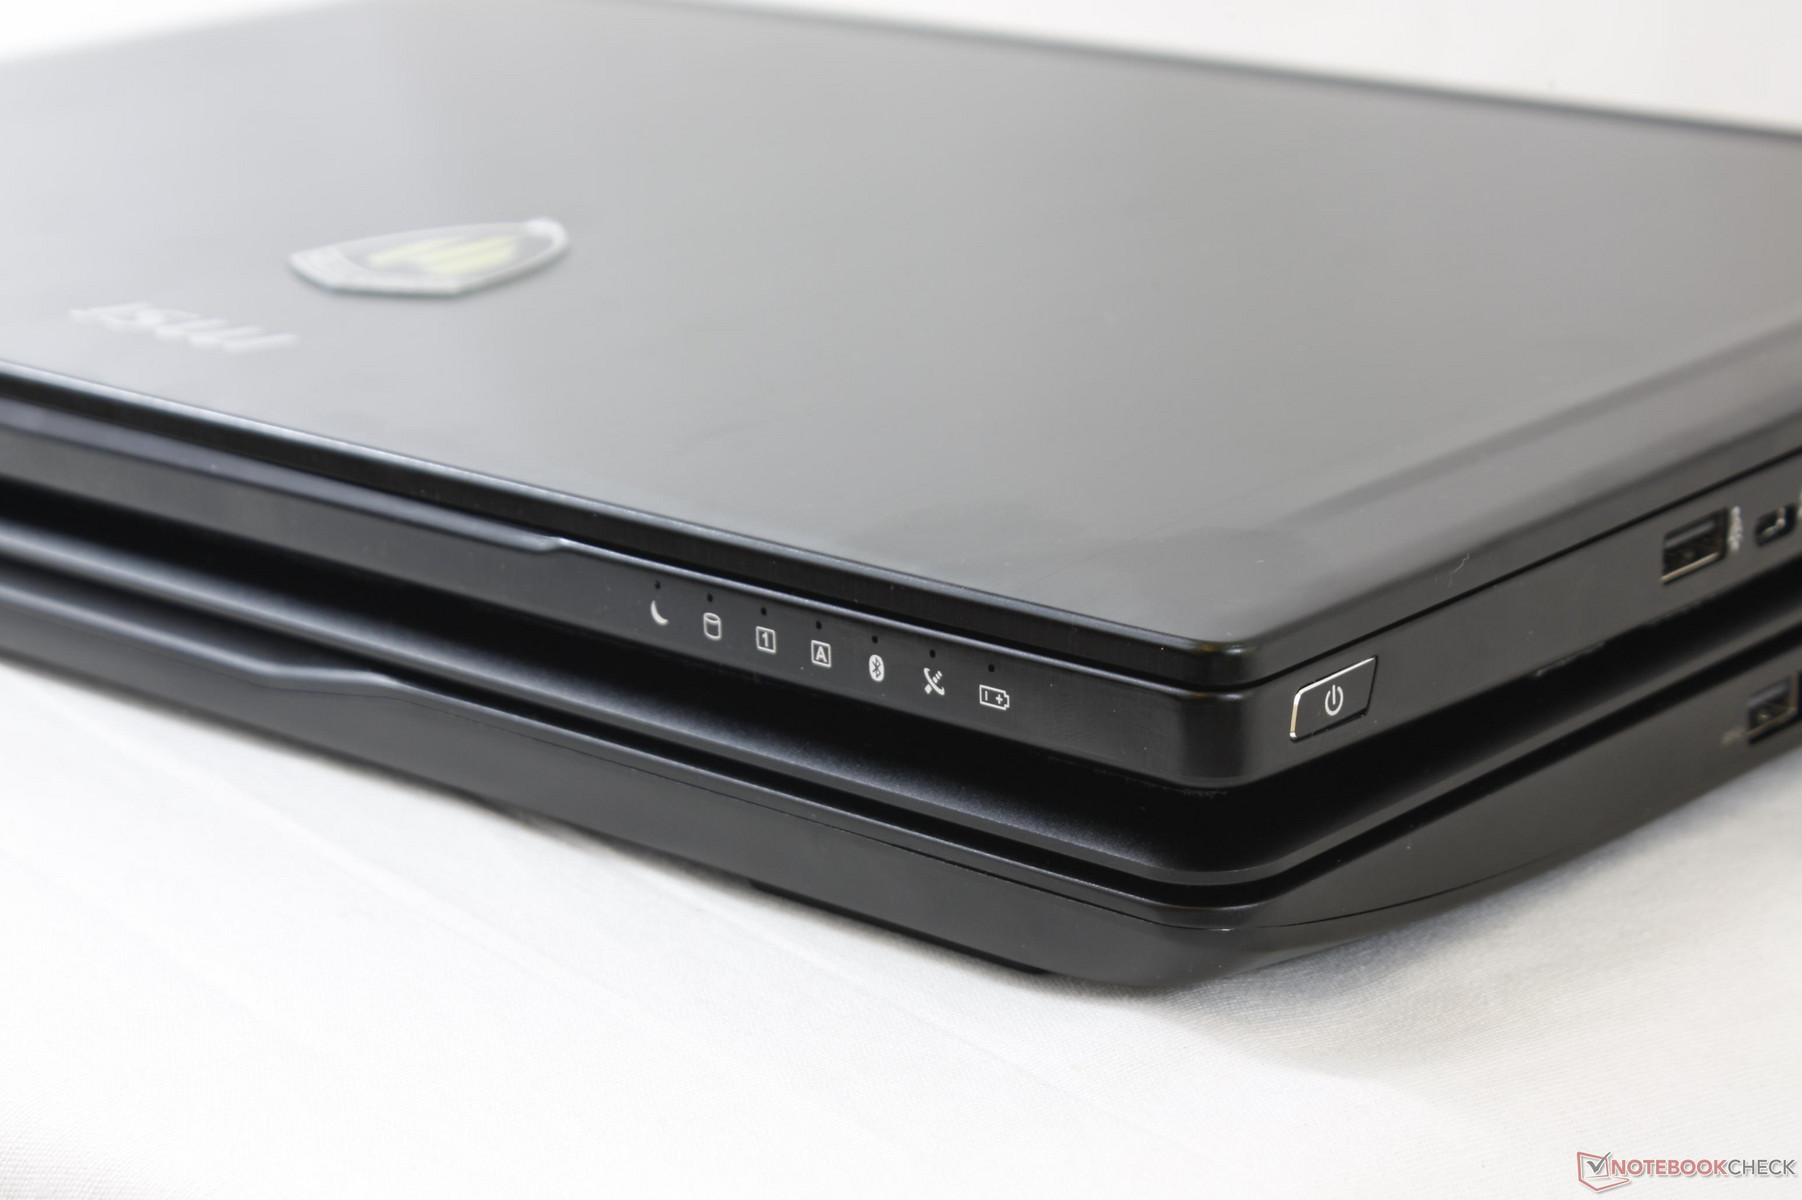
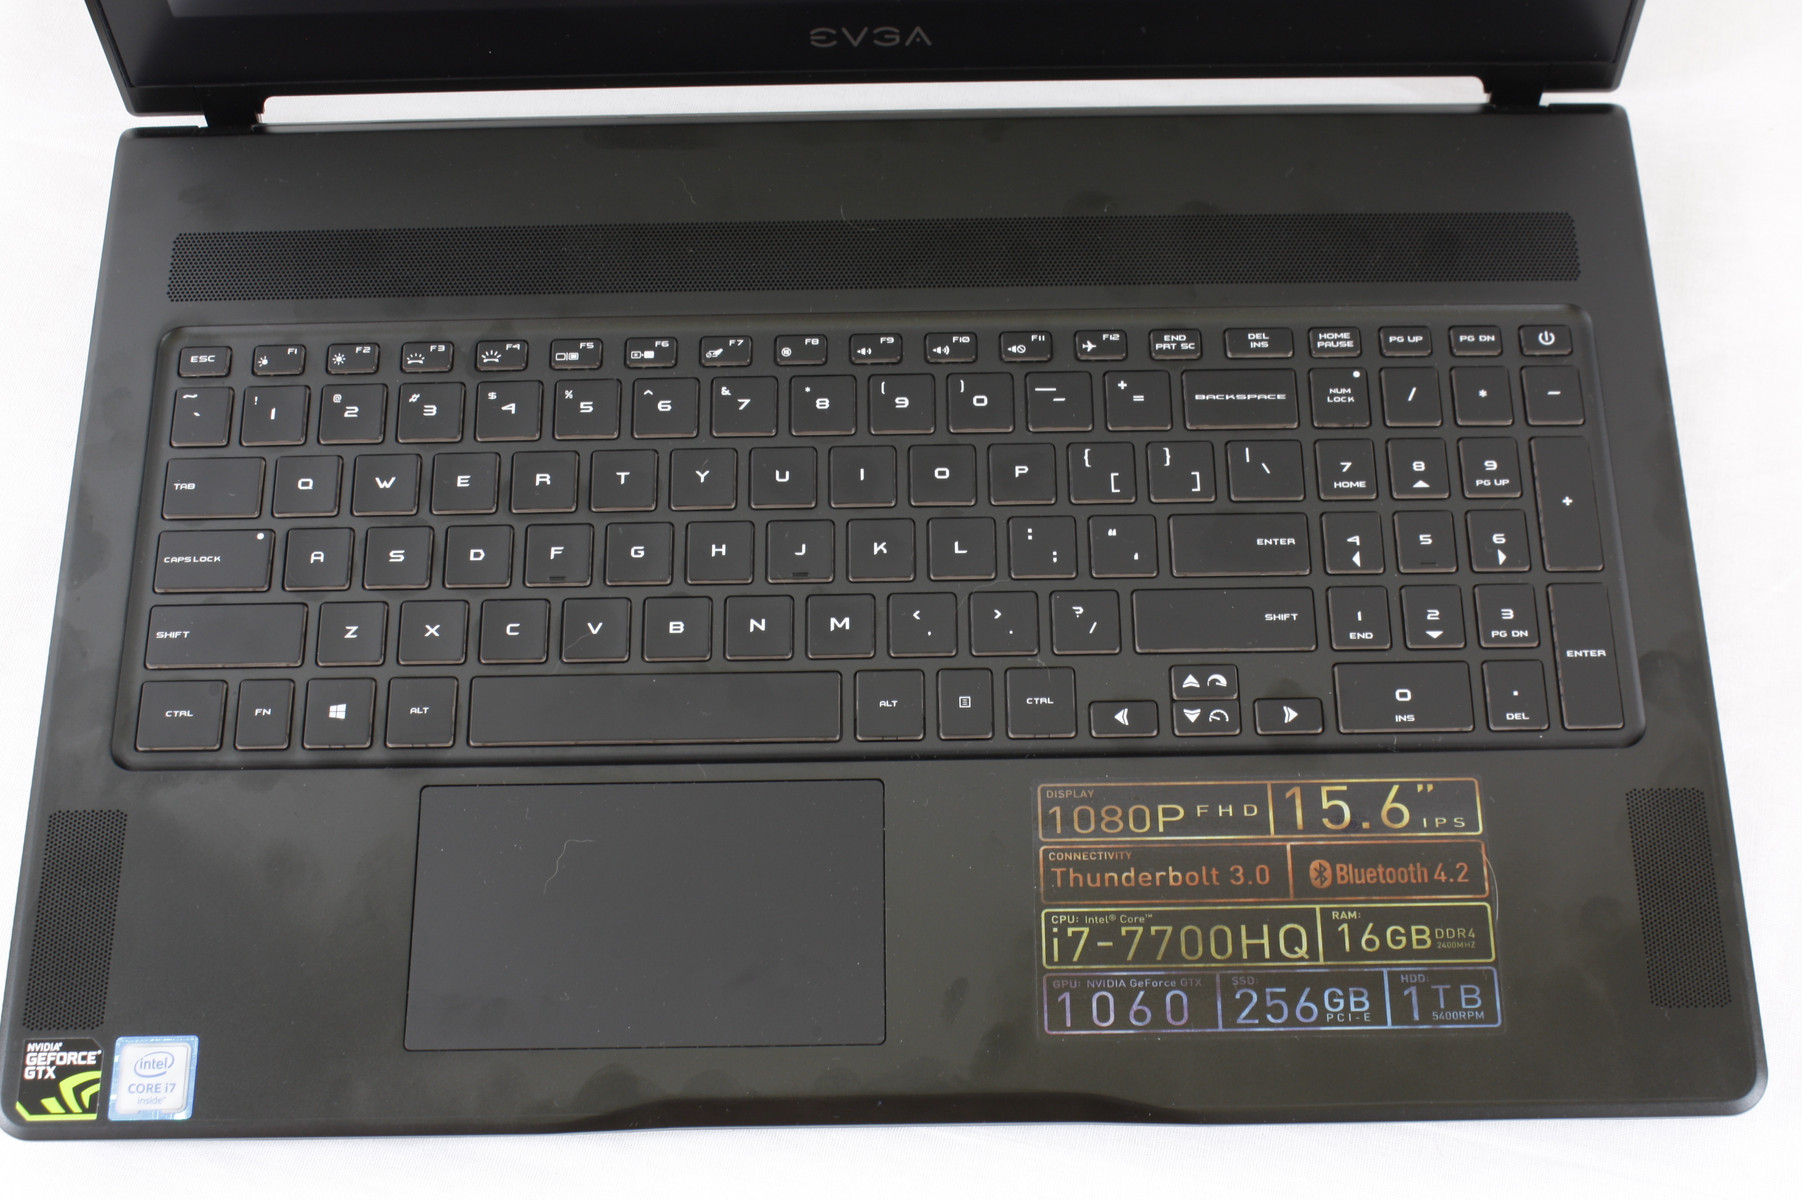
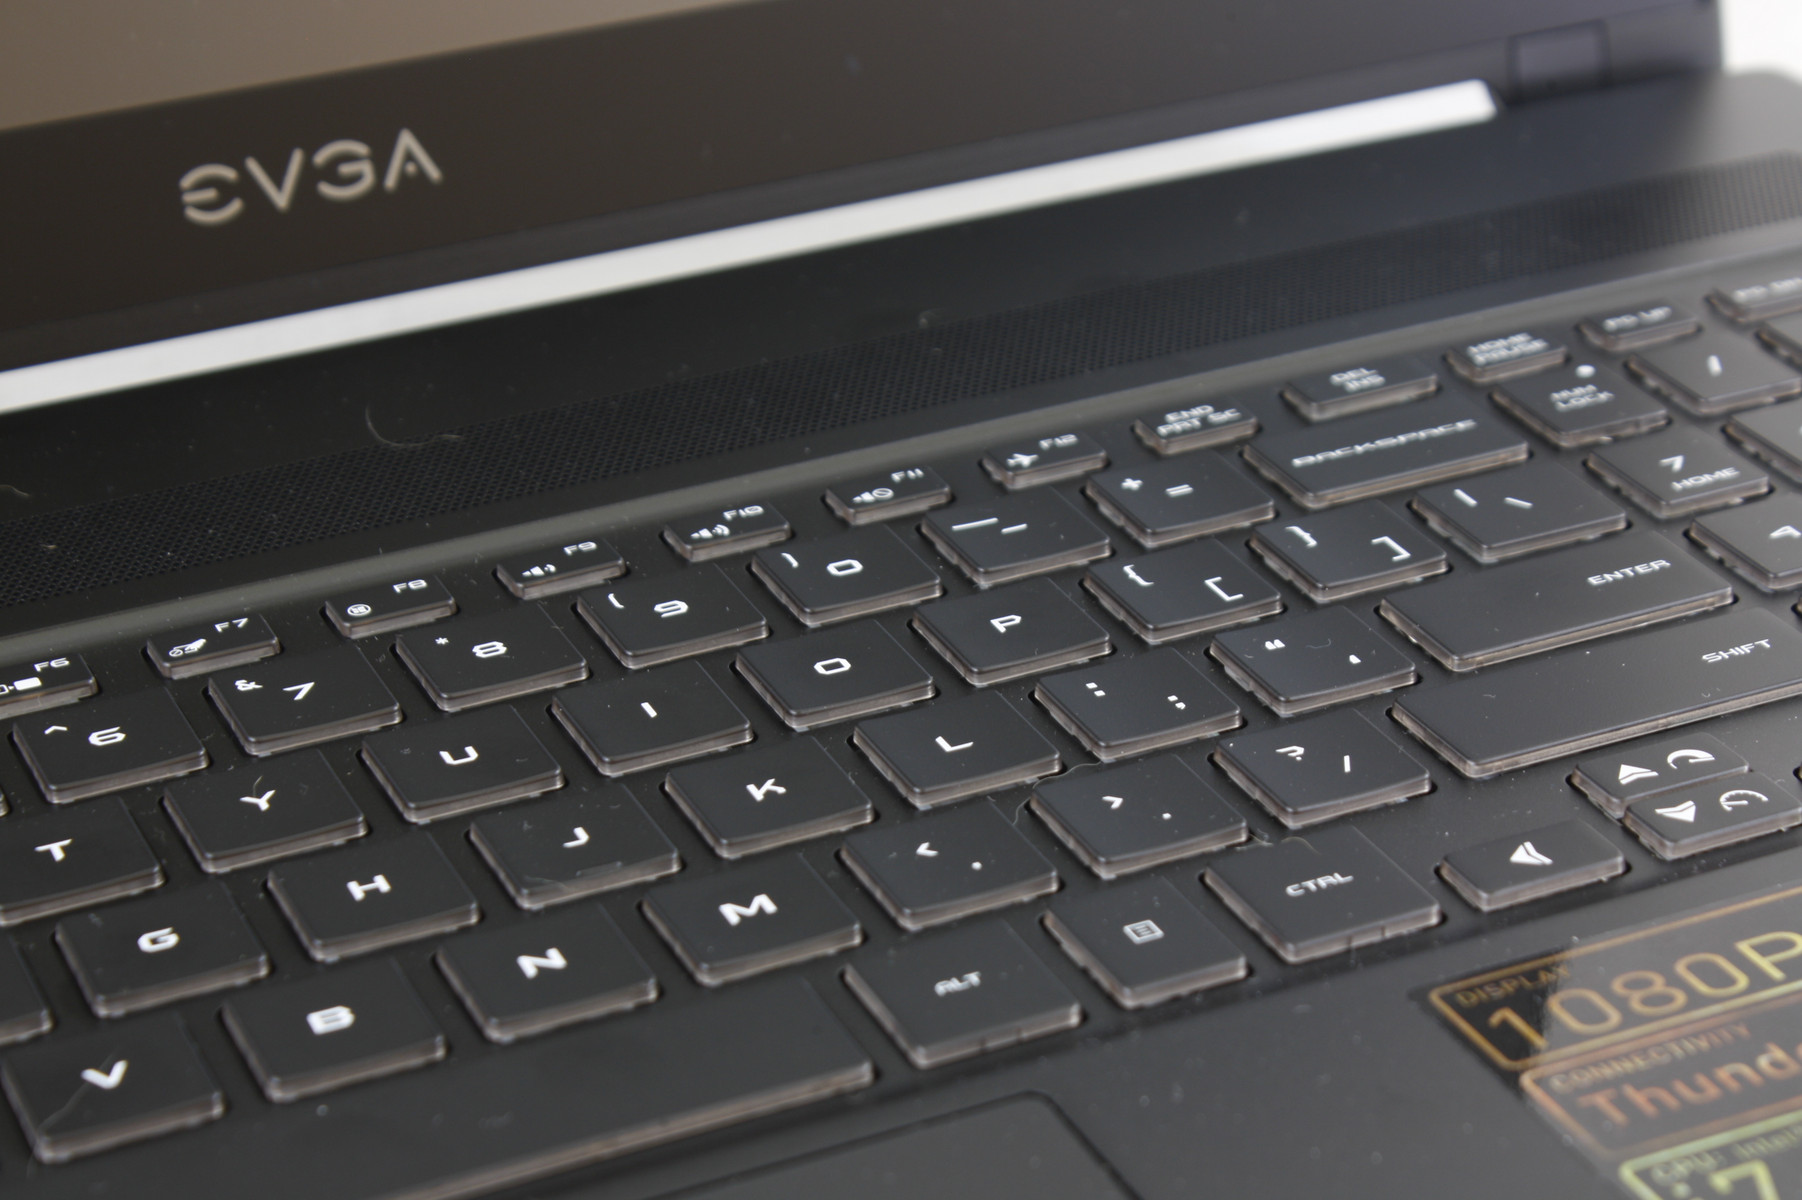
The chiclet (~34.25 x 10.5 cm) keyboard keys are shorter in travel than on the GS63VR but are louder and firmer with stronger tactile feedback when pressed. As a result, the keys feel rather light not unlike on an Ultrabook and may take some time to become accustomed to. The Arrow keys and first row of F keys are a bit too small and are unfortunately spongier than the larger QWERTY and NumPad keys as a result. The positioning of the Power button adjacent to the PgDn key may potentially lead to some accidental shutdowns during use.
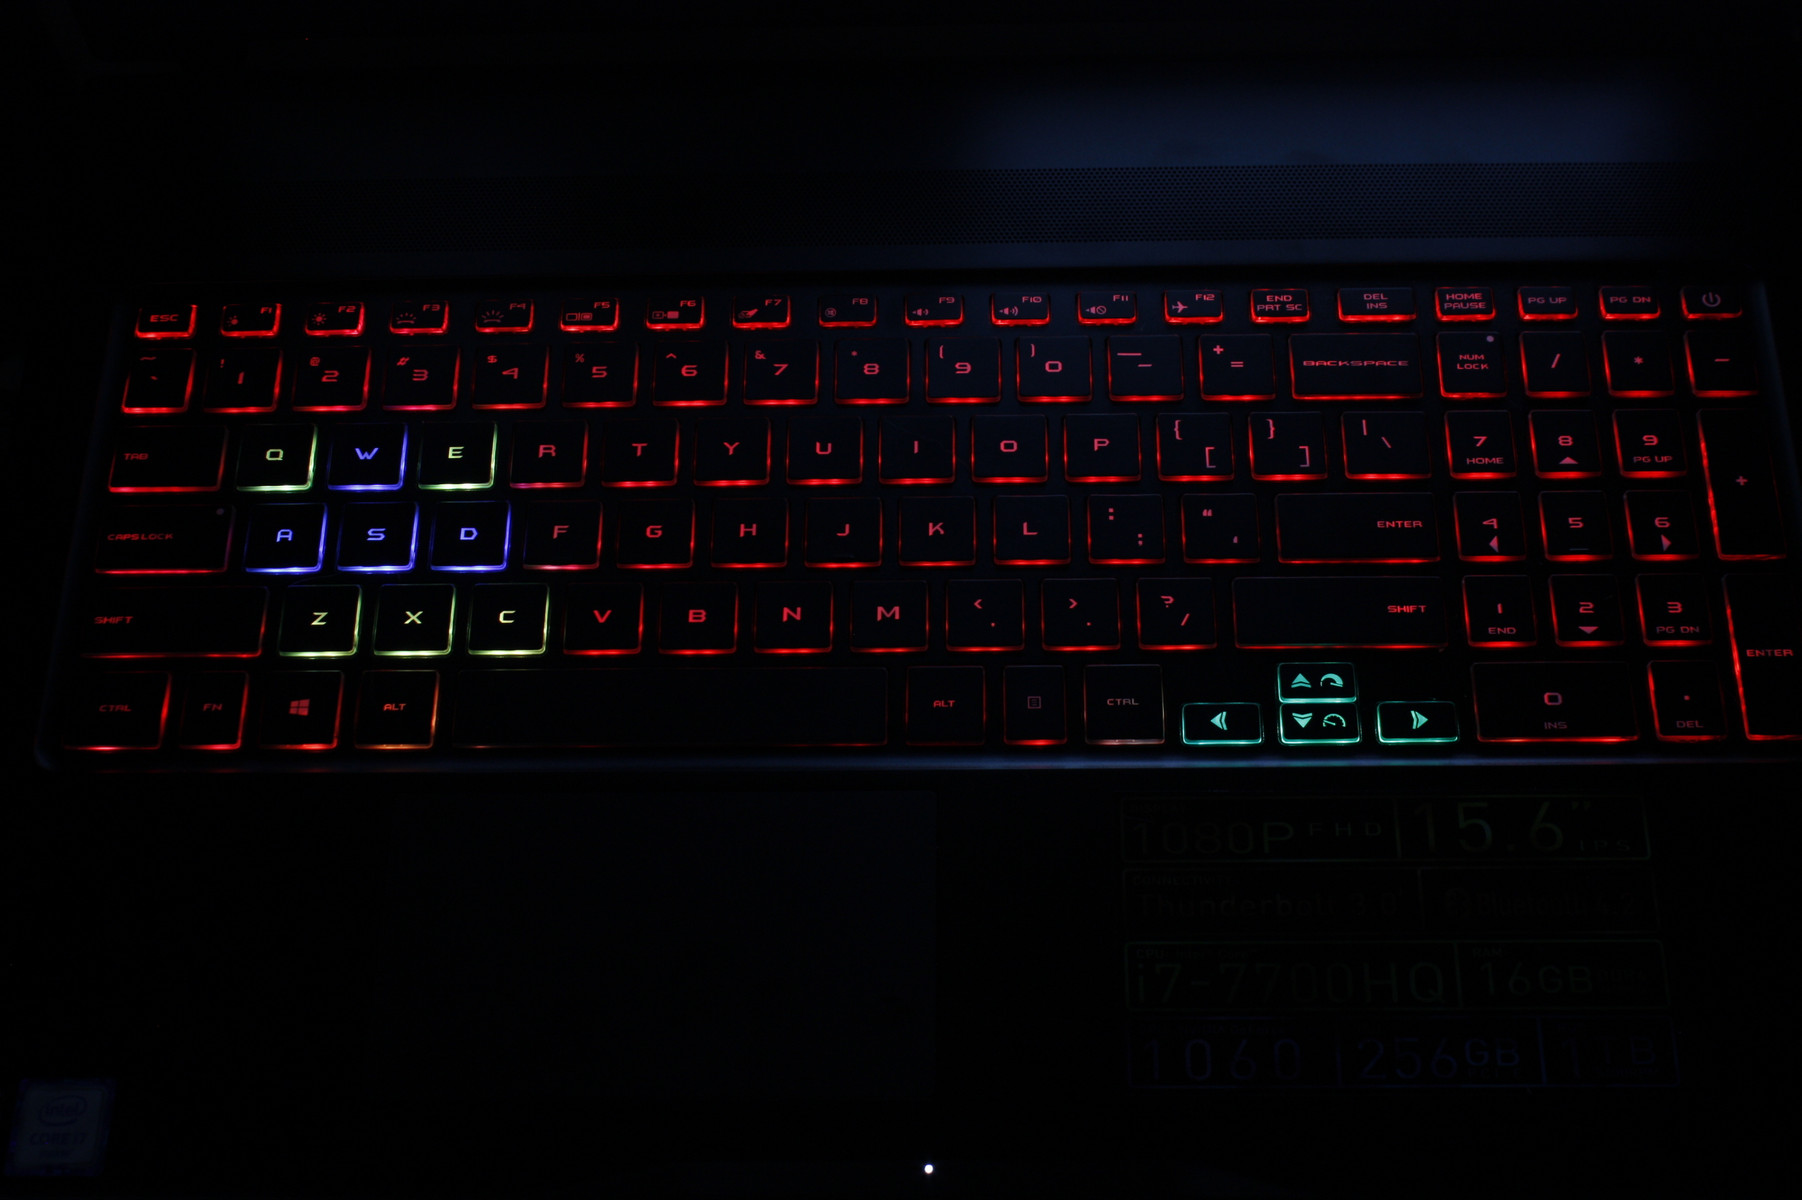
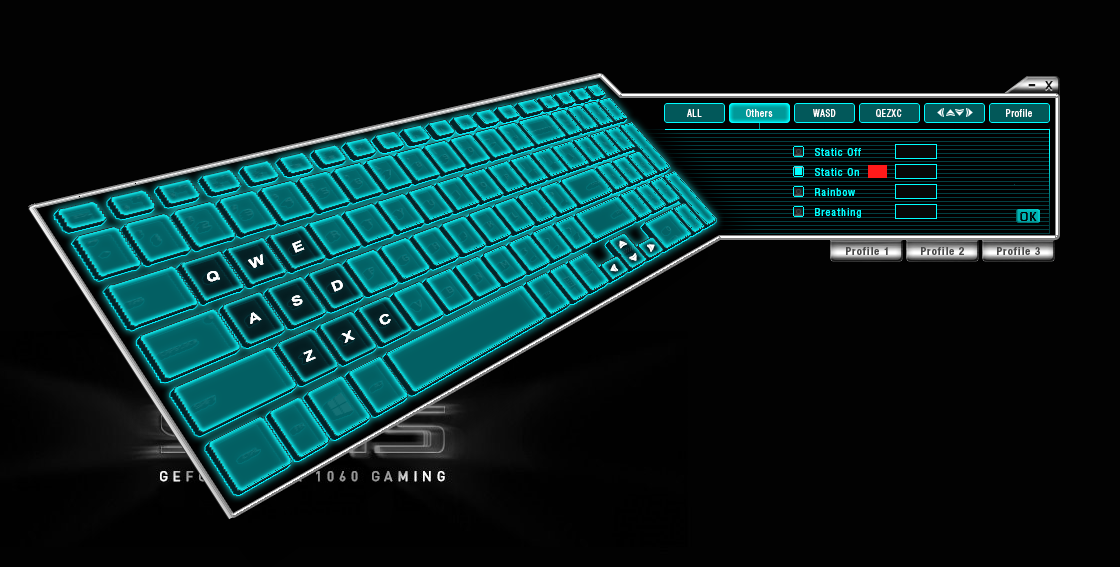
The 4-zone RGB backlight includes five brightness settings and a few preset actions. Unfortunately, the options here pale in comparison to the per-key RGB options of most newer gaming notebooks and even the 7-zone keyboard backlight of the Lenovo Y900. The pre-installed software has no built-in macro customization or the ability to assign different commands, either. For a gaming notebook, the lighting features feel barebones and come out short of the competition.
Touchpad
The trackpad (10.5 x 6 cm) is smaller in surface area than the ones on the GS63VR (10.5 x 7 cm) and original SC17. Functionally, however, the smooth surface exhibits excellent gliding properties and responsiveness is very fast due to the 120 Hz panel. Applying a strong force on the very center of the trackpad surface will warp it only slightly.
The integrated mouse clicks are shallow in travel and somewhat on the soft side in terms of feedback. While this isn't uncommon, we're disappointed to see that feedback is uneven depending on where you click with a finger. Inputting a click on the very bottom left of the trackpad, for example, feels much softer and weaker than if inputting a click nearer the bottom right or even bottom edge. This is unexpected considering that the rest of the chassis is visually very well designed.
Display
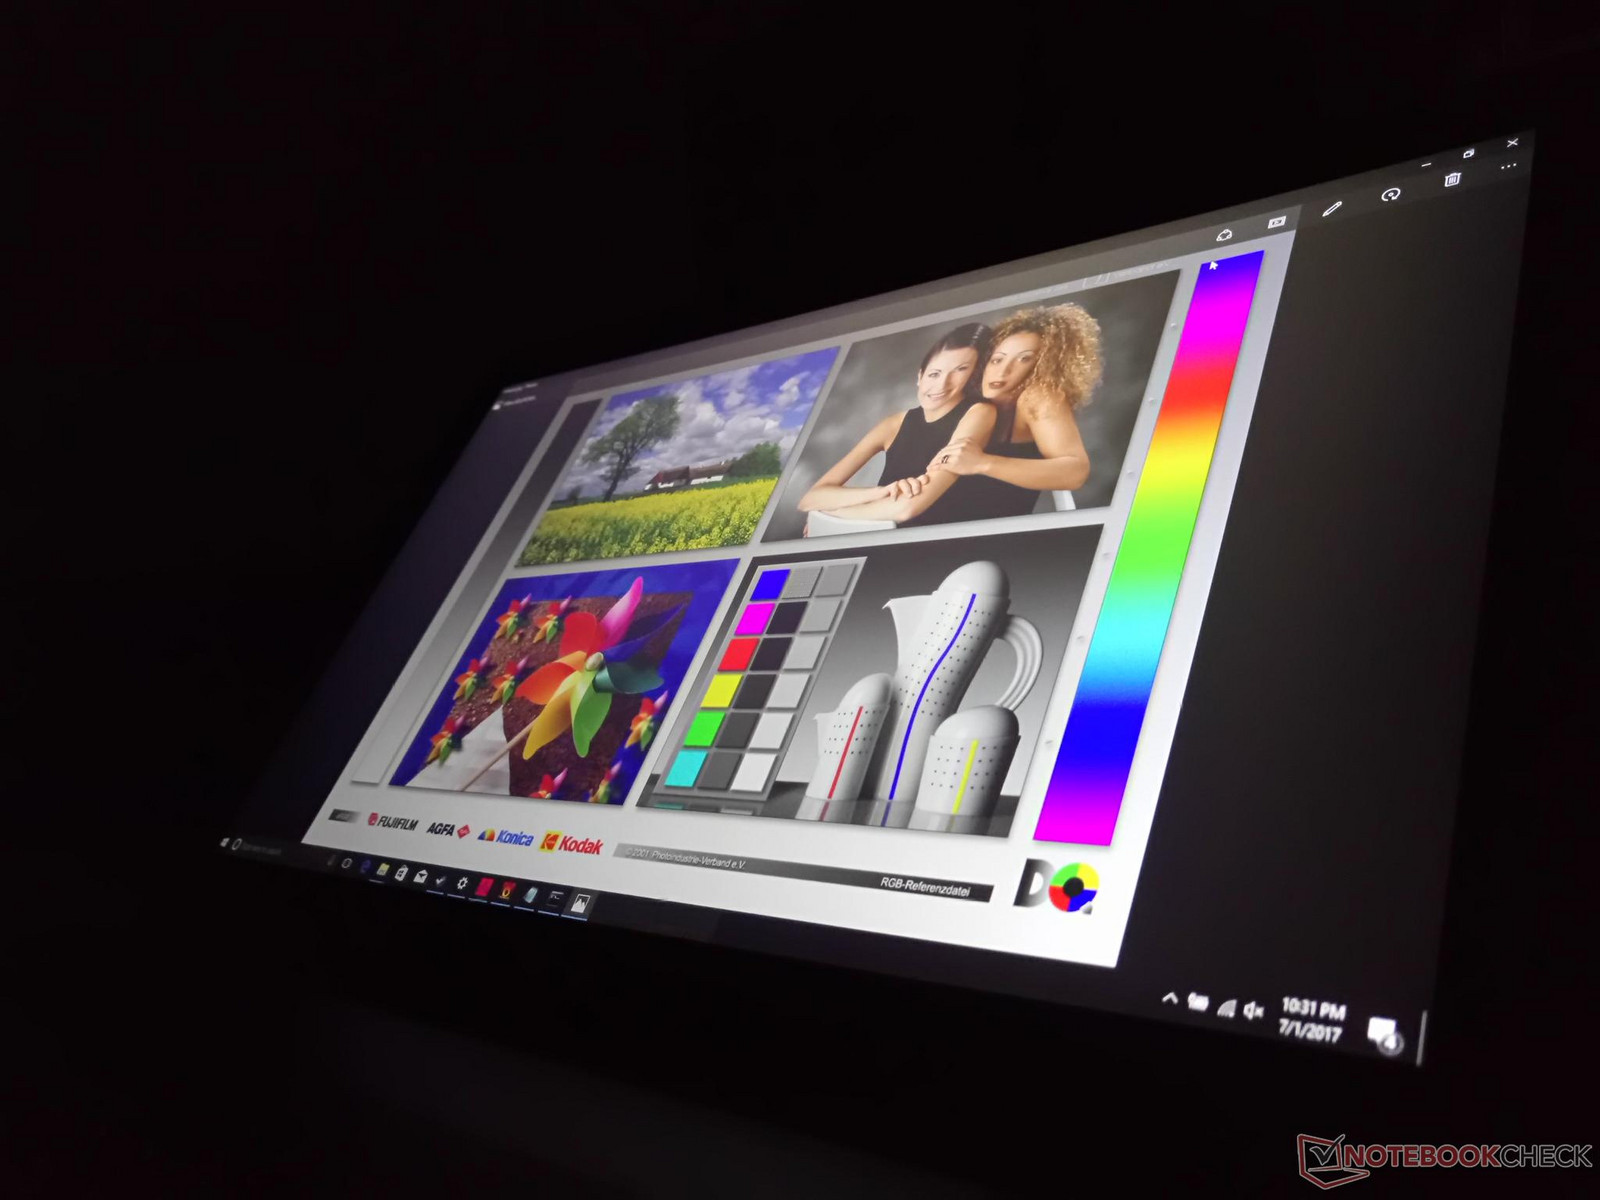
The only display option available at the time of writing is an edge-to-edge matte 1080p G-Sync panel with a 120 Hz refresh rate. This AU Optronics B156HAN04.2 panel can also be found on the new Asus Zephyrus and both share similar color reproduction and black levels as a result. Backlight brightness distribution, however, is poorer on the EVGA as the left side of the screen is slightly dimmer than the right.
Two notable display drawbacks plague the SC15: The average response times and thick matte panel. Fast response times of less than 8.3 ms (1 second/120 FPS) are required to take full advantage of a native 120 Hz panel, but the disappointing black-white response times result in more ghosting than we would have liked. Secondly, the overlying edge-to-edge matte surface is thicker than on most other notebooks and display quality subsequently suffers. Colors do not "pop" as much as on an Apple MacBook and the screen is far grainier than any glossy panel and even most other matte displays. Our microscope image below shows just how rough the matte overlay can be when compared to our usual crisp subpixel shots.
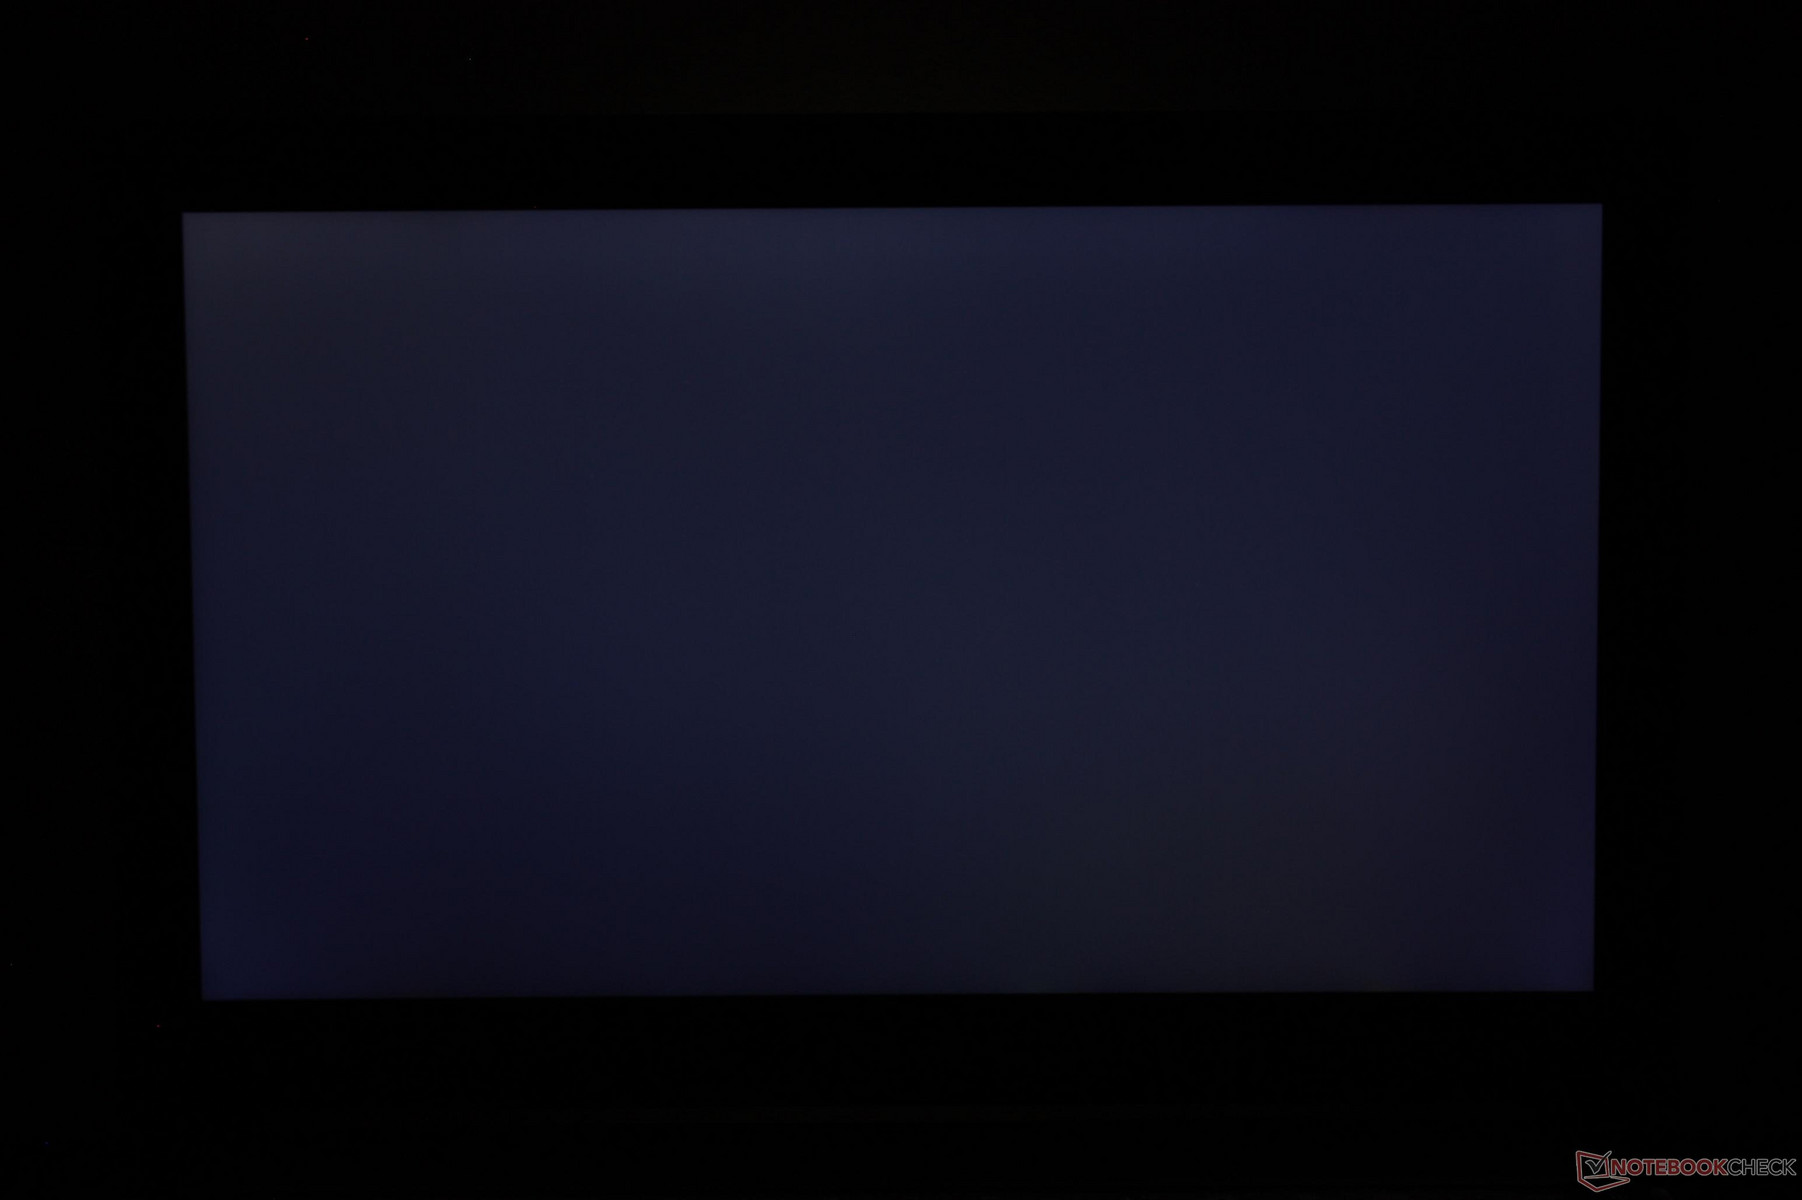
Uneven backlight bleeding is very minimal around the top two corners and right edge on our unit and is essentially unnoticeable when gaming or during normal use.

| |||||||||||||||||||||||||
Brightness Distribution: 73 %
Center on Battery: 281.5 cd/m²
Contrast: 1043:1 (Black: 0.27 cd/m²)
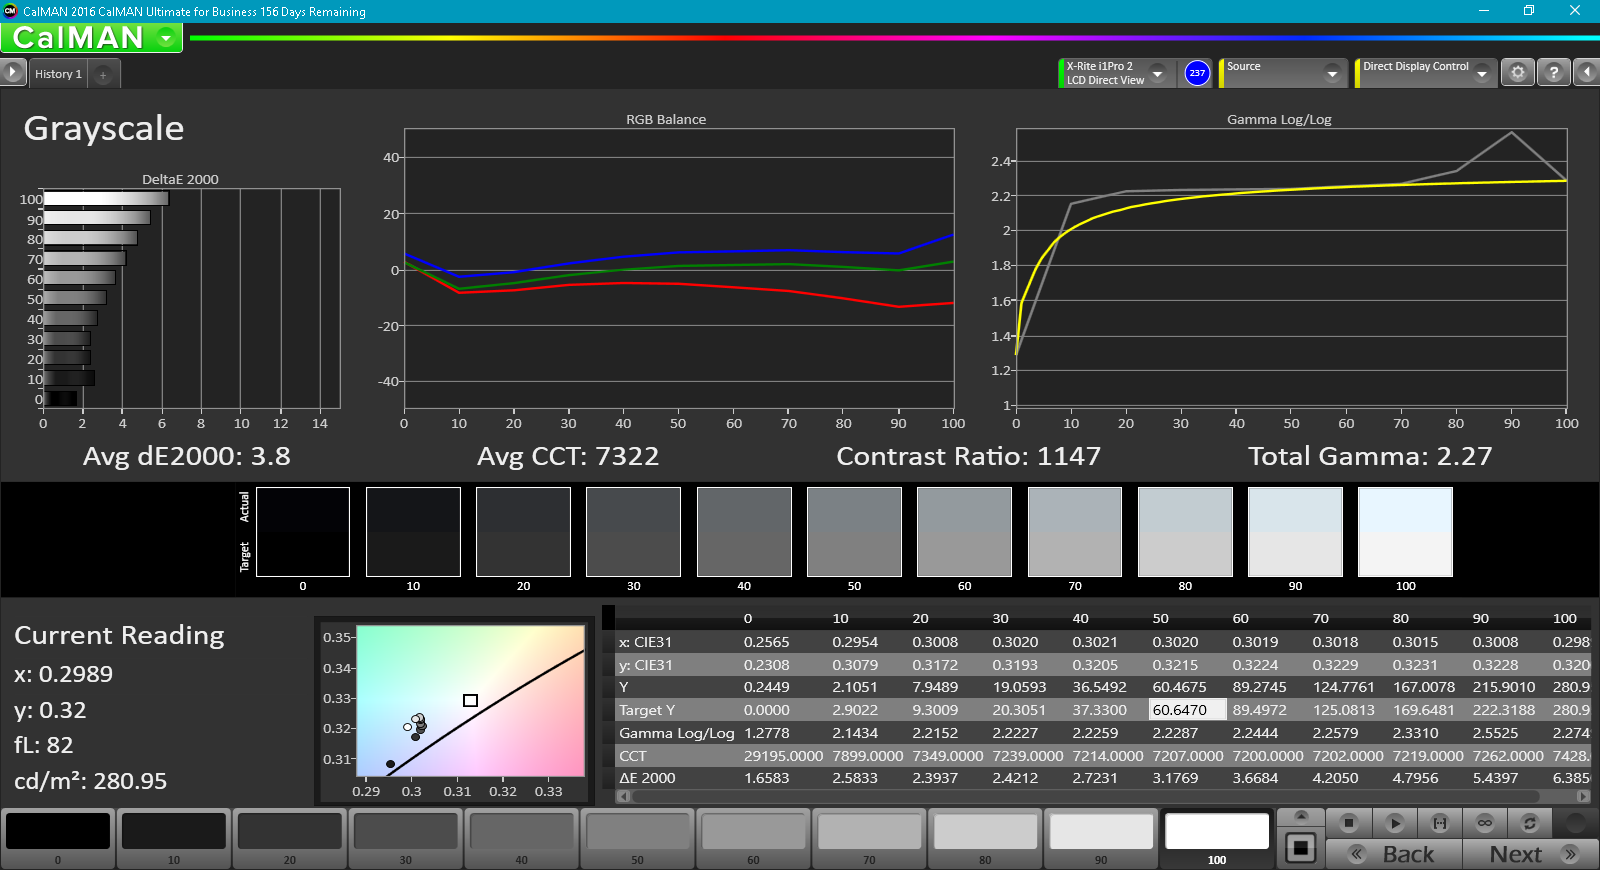
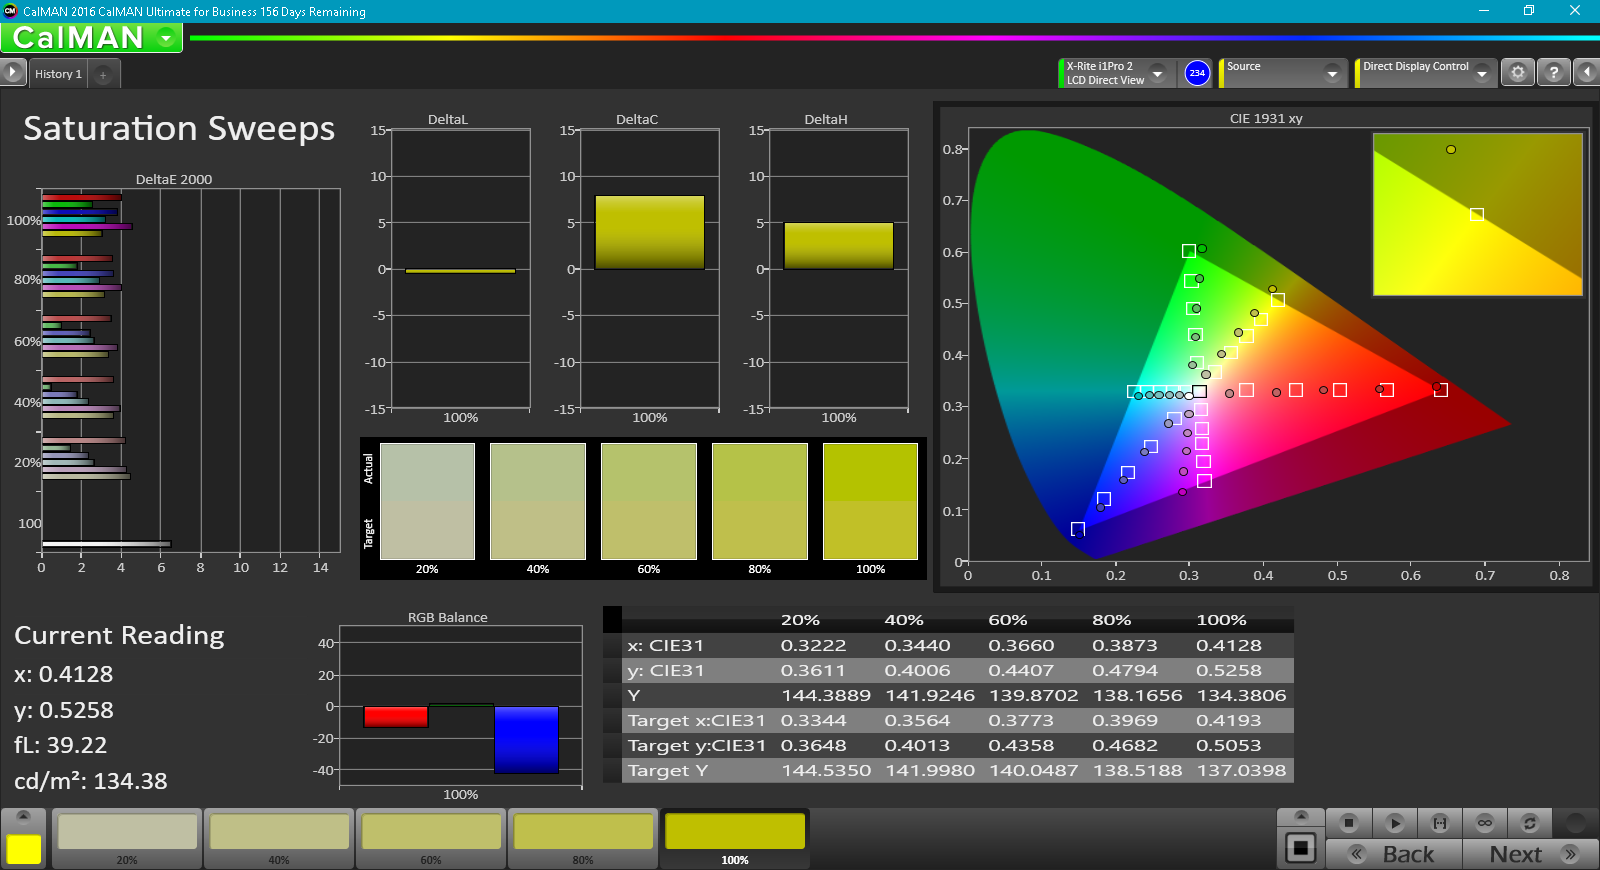
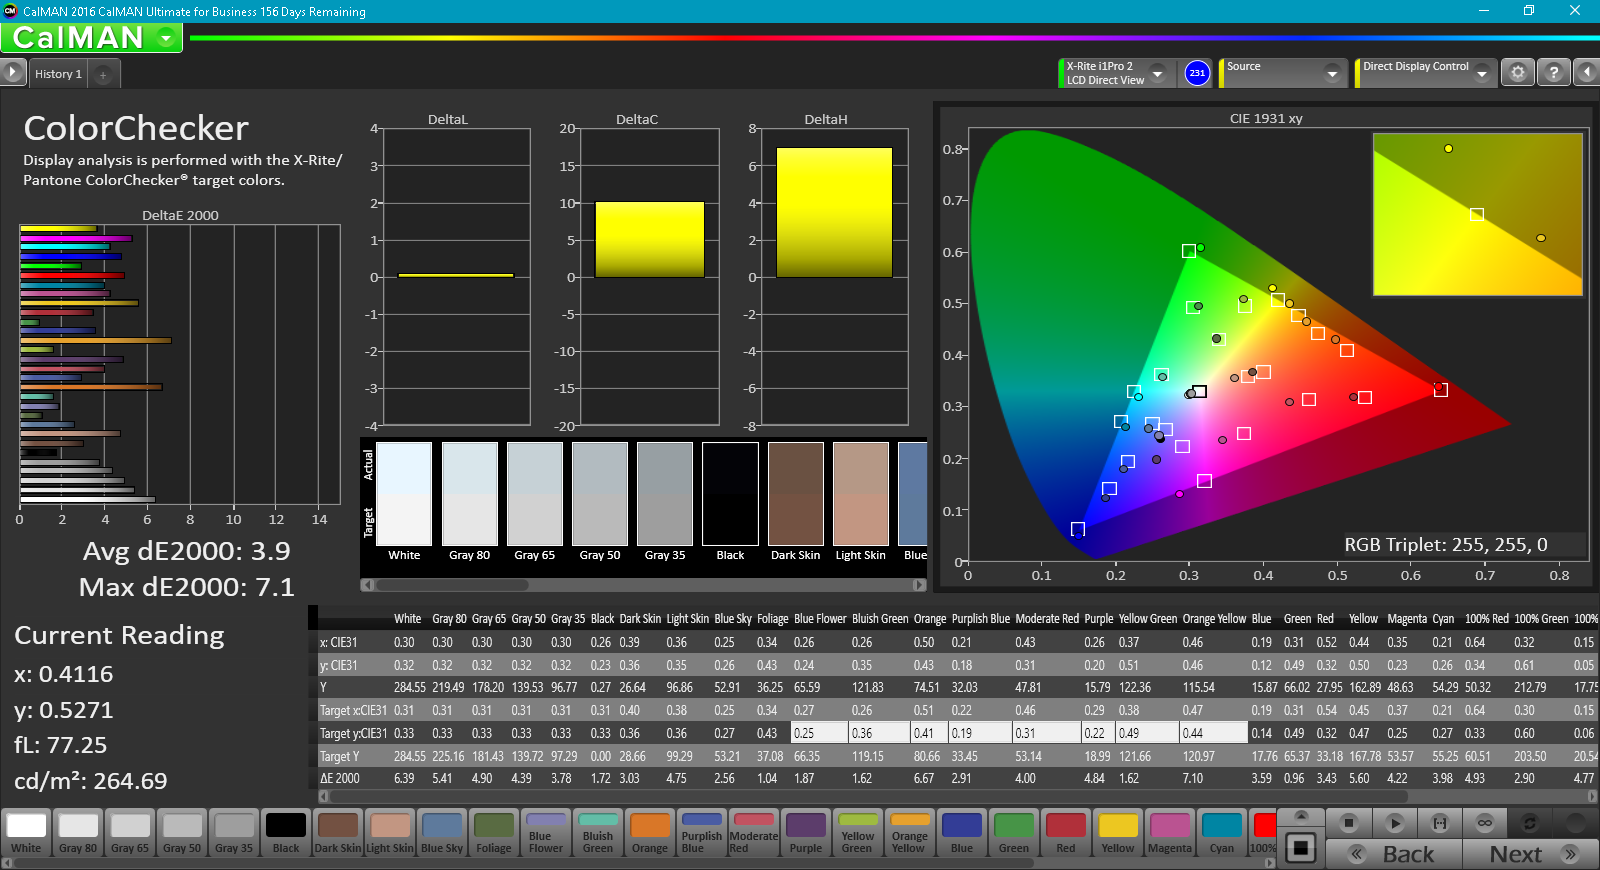
ΔE ColorChecker Calman: 3.9 | ∀{0.5-29.43 Ø4.71}
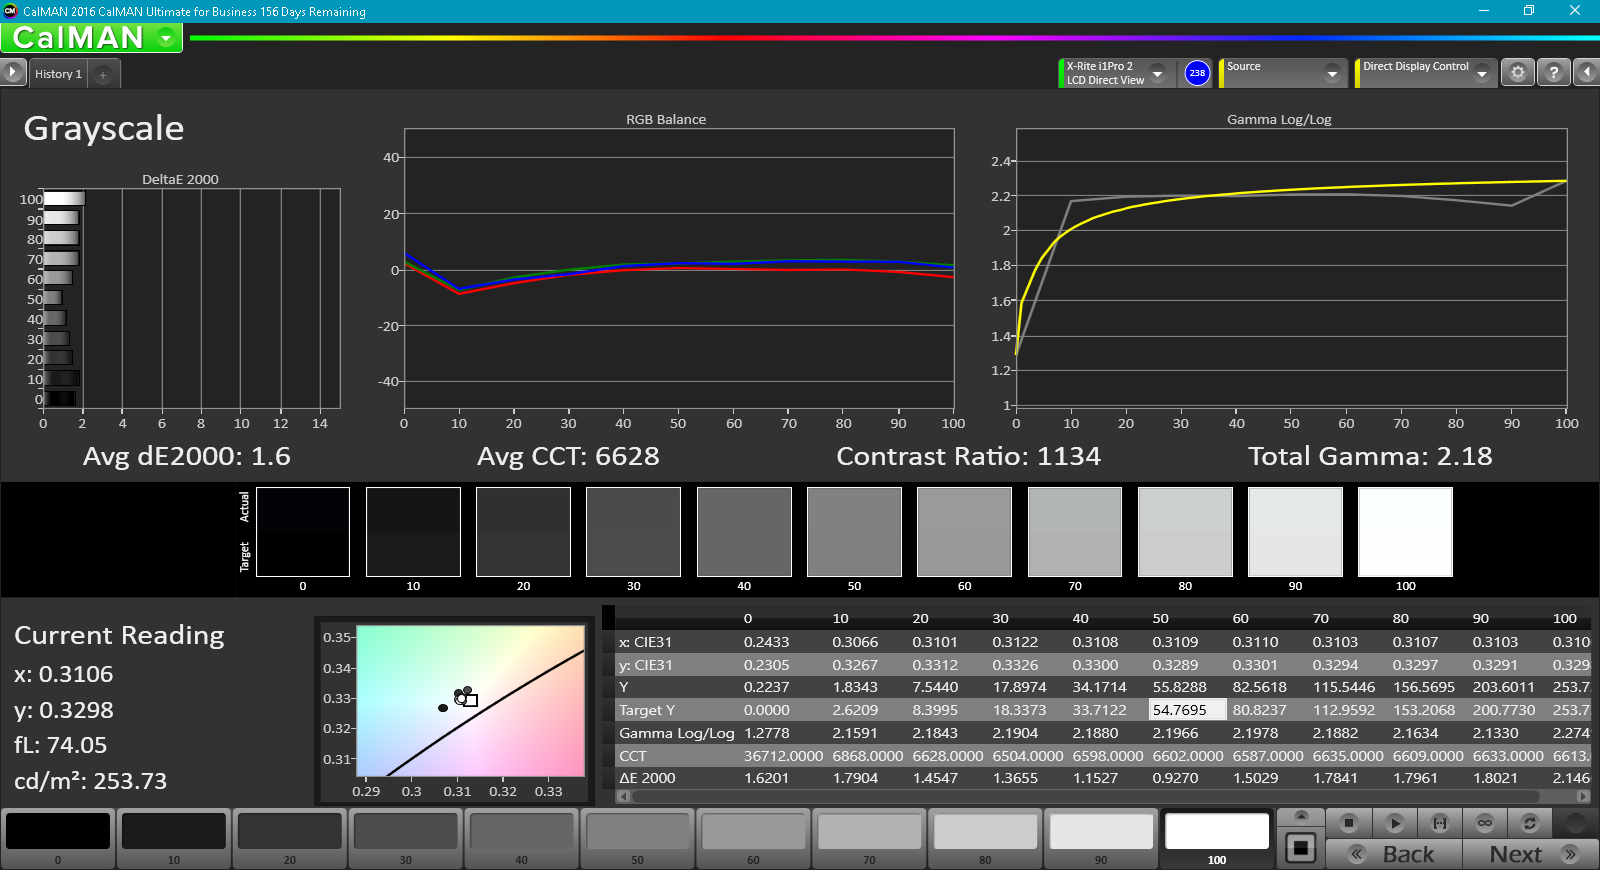
ΔE Greyscale Calman: 3.8 | ∀{0.09-98 Ø4.96}
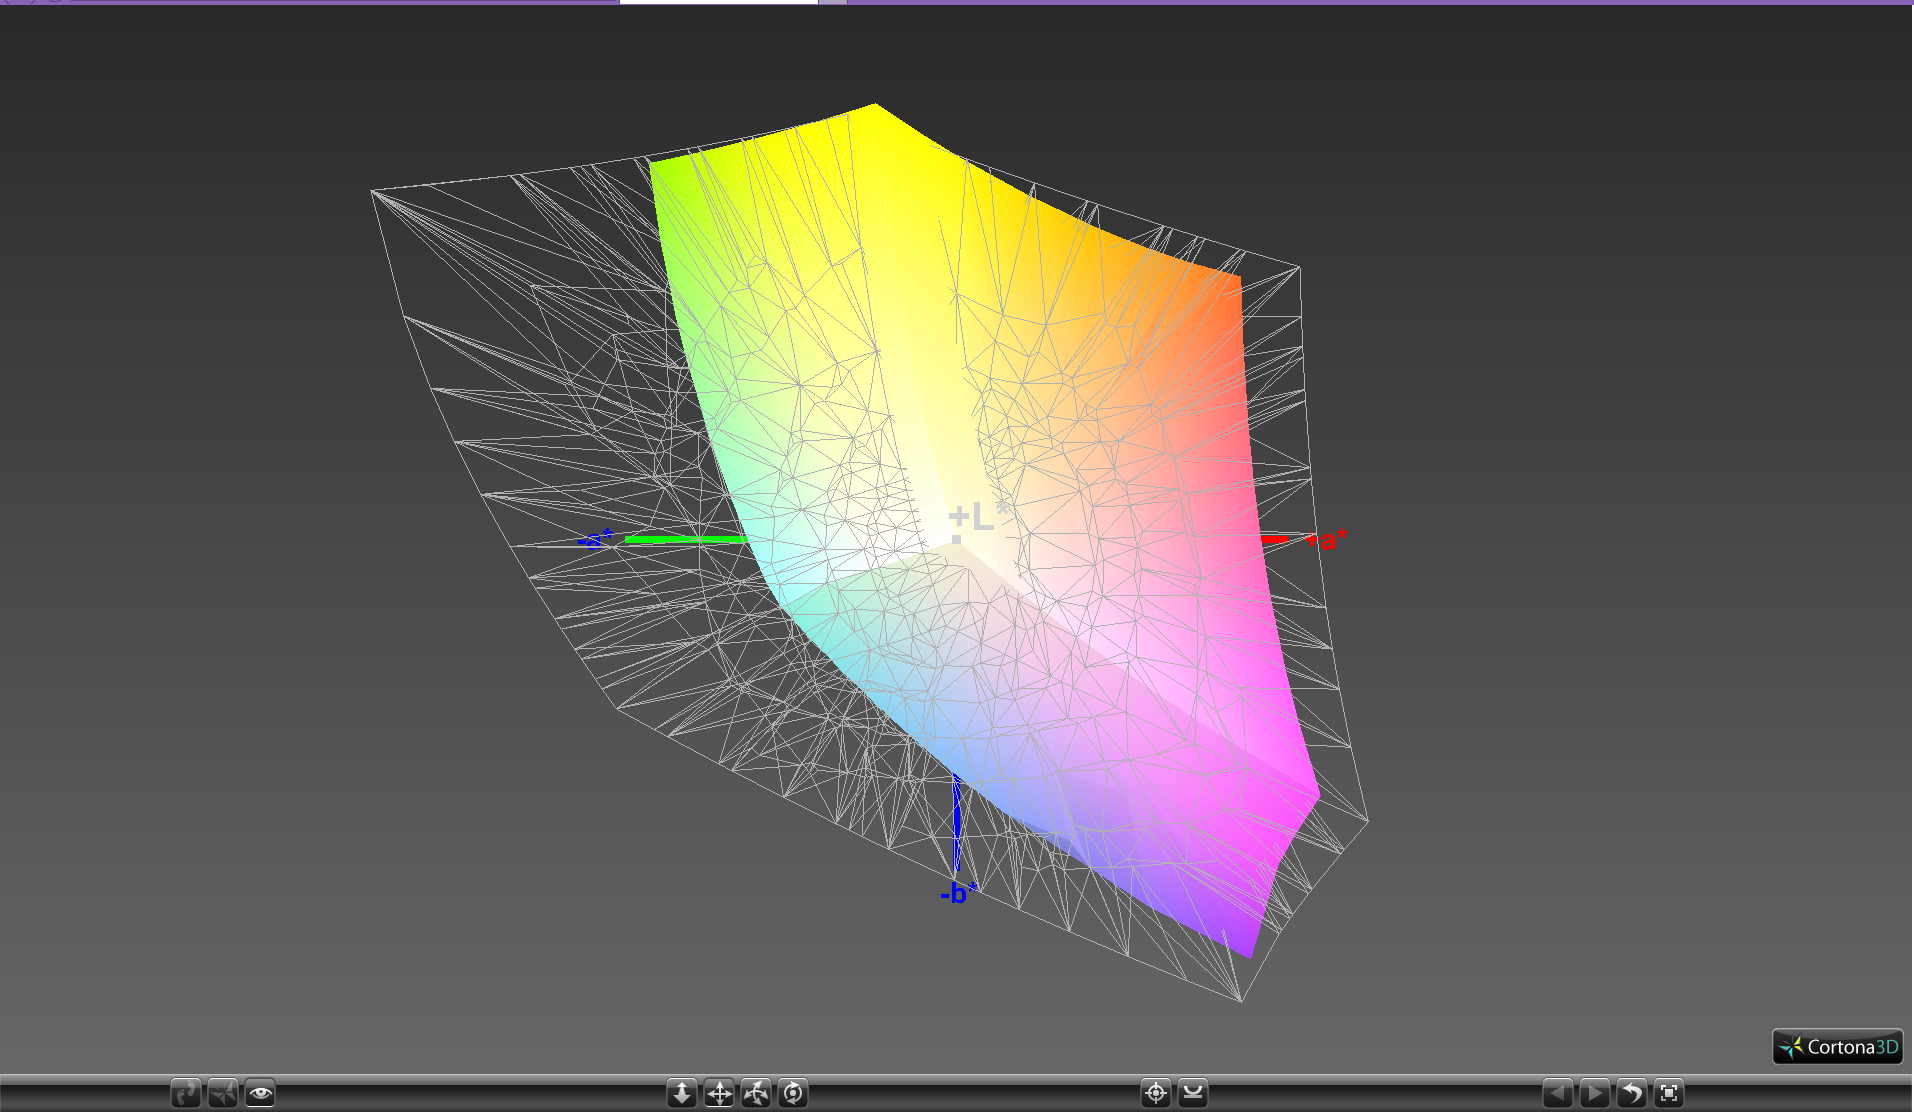
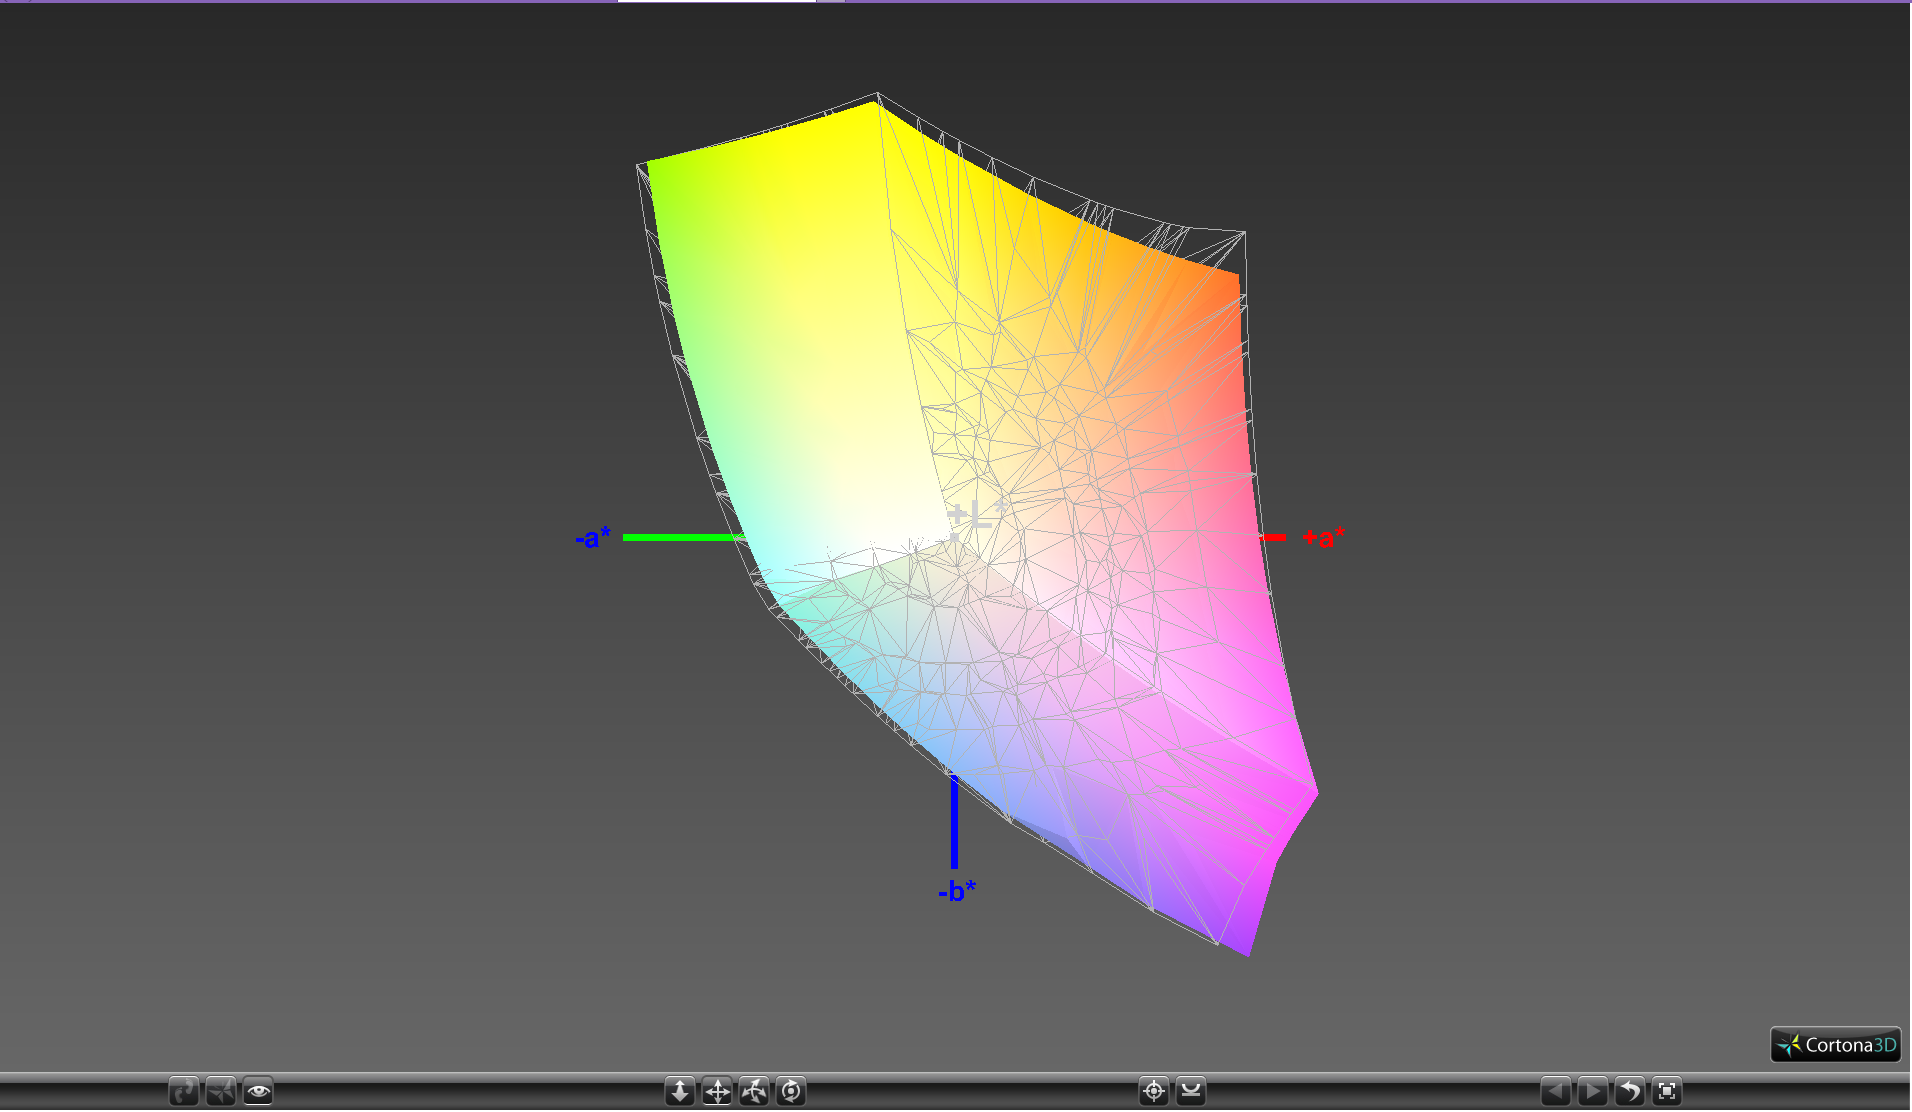
89.3% sRGB (Argyll 1.6.3 3D)
57.8% AdobeRGB 1998 (Argyll 1.6.3 3D)
63.6% AdobeRGB 1998 (Argyll 3D)
89.6% sRGB (Argyll 3D)
62.3% Display P3 (Argyll 3D)
Gamma: 2.27
CCT: 7322 K
| EVGA SC15 ID: AUO42ED, Name: AU Optronics B156HAN04.2, , 15.6", 1920x1080 | Asus Zephyrus GX501 AUO B156HAN04.2 (AUO42ED), IPS, 15.6", 1920x1080 | Apple MacBook Pro 15 2017 (2.8 GHz, 555) APPA031, IPS, 15.4", 2880x1800 | Gigabyte Aero 15 N156HCA-EA1 (CMN15D7), IPS, 15.6", 1920x1080 | Aorus X5 v6 IPS, 15.6", 2880x1620 | MSI GS63VR 7RF-228US IPS, 15.6", 3840x2160 | |
|---|---|---|---|---|---|---|
| Display | 3% | 34% | 4% | -2% | -21% | |
| Display P3 Coverage (%) | 62.3 | 64.8 4% | 97.9 57% | 65.2 5% | 62.5 0% | 48.21 -23% |
| sRGB Coverage (%) | 89.6 | 91.8 2% | 99.9 11% | 92.5 3% | 86.2 -4% | 72.6 -19% |
| AdobeRGB 1998 Coverage (%) | 63.6 | 65.9 4% | 85.9 35% | 66.5 5% | 62.5 -2% | 49.81 -22% |
| Response Times | 13% | -13% | -4% | 7% | 28% | |
| Response Time Grey 50% / Grey 80% * (ms) | 41.6 ? | 40.4 ? 3% | 48 ? -15% | 42.8 ? -3% | 34 ? 18% | 28 ? 33% |
| Response Time Black / White * (ms) | 30.8 ? | 24 ? 22% | 33.8 ? -10% | 32 ? -4% | 32 ? -4% | 23.6 ? 23% |
| PWM Frequency (Hz) | 119000 ? | 26000 ? | 198.4 | 1351 ? | ||
| Screen | -7% | 41% | -9% | -5% | -47% | |
| Brightness middle (cd/m²) | 281.5 | 328 17% | 545 94% | 320 14% | 280.4 0% | 274.2 -3% |
| Brightness (cd/m²) | 253 | 305 21% | 523 107% | 316 25% | 271 7% | 263 4% |
| Brightness Distribution (%) | 73 | 83 14% | 86 18% | 90 23% | 83 14% | 92 26% |
| Black Level * (cd/m²) | 0.27 | 0.25 7% | 0.44 -63% | 0.36 -33% | 0.249 8% | 0.44 -63% |
| Contrast (:1) | 1043 | 1312 26% | 1239 19% | 889 -15% | 1126 8% | 623 -40% |
| Colorchecker dE 2000 * | 3.9 | 6.02 -54% | 1.6 59% | 4.62 -18% | 4.94 -27% | 8 -105% |
| Colorchecker dE 2000 max. * | 7.1 | 10.14 -43% | 3.8 46% | 9.75 -37% | 8.13 -15% | 14.6 -106% |
| Greyscale dE 2000 * | 3.8 | 6.32 -66% | 1.9 50% | 6 -58% | 5.13 -35% | 9.1 -139% |
| Gamma | 2.27 97% | 2.28 96% | 2.26 97% | 2.46 89% | 2.26 97% | 2.24 98% |
| CCT | 7322 89% | 8194 79% | 6834 95% | 6761 96% | 7433 87% | 5020 129% |
| Color Space (Percent of AdobeRGB 1998) (%) | 57.8 | 60 4% | 60 4% | 55.9 -3% | 45.7 -21% | |
| Color Space (Percent of sRGB) (%) | 89.3 | 92 3% | 92 3% | 85.9 -4% | 72.1 -19% | |
| Total Average (Program / Settings) | 3% /
-2% | 21% /
31% | -3% /
-6% | 0% /
-3% | -13% /
-32% |
* ... smaller is better
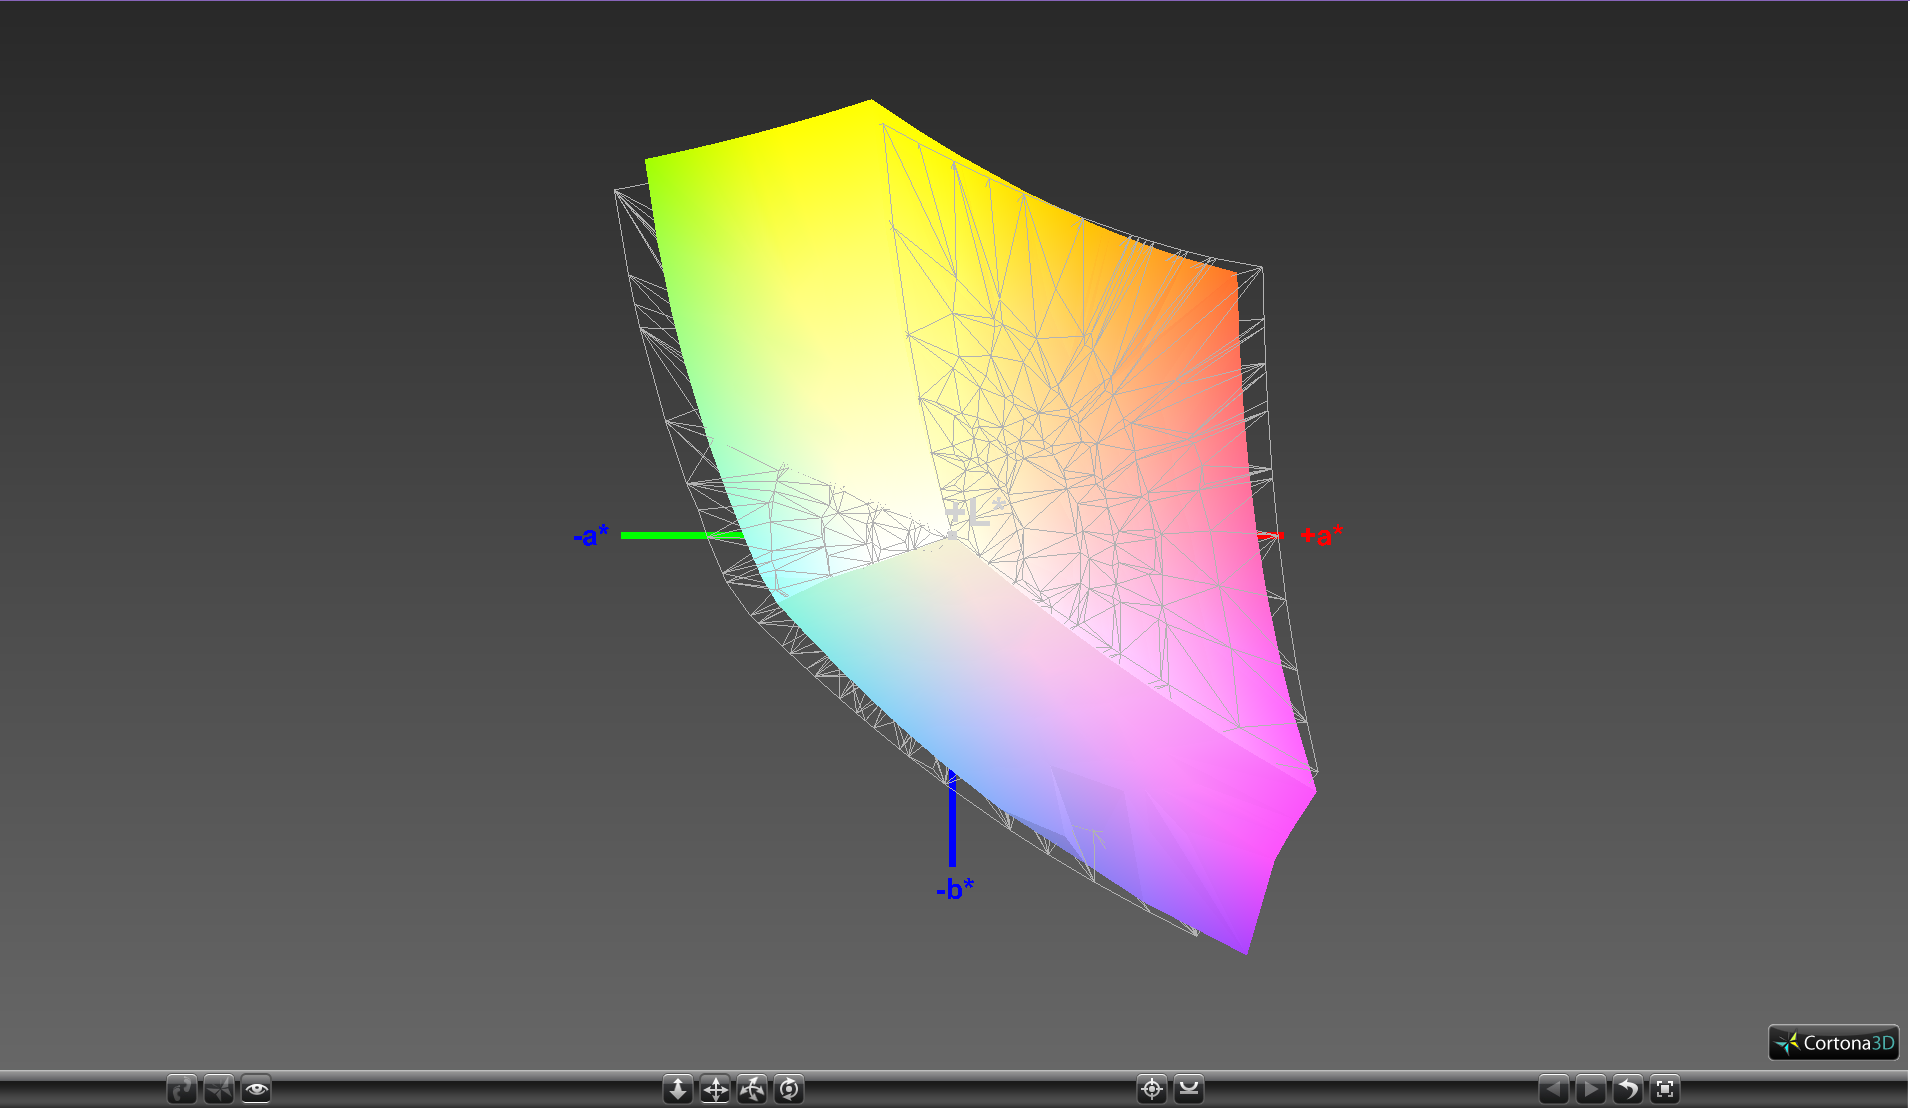
Color space is approximately 58 percent and 89 percent of the AdobeRGB and sRGB standards, respectively. Less expensive panels may cover only 60 percent of sRGB while some gaming notebooks like the Razer Blade offer full sRGB coverage and more to better appeal to digital artists. For gaming purposes, however, color accuracy will usually take a backseat to response times and contrast.
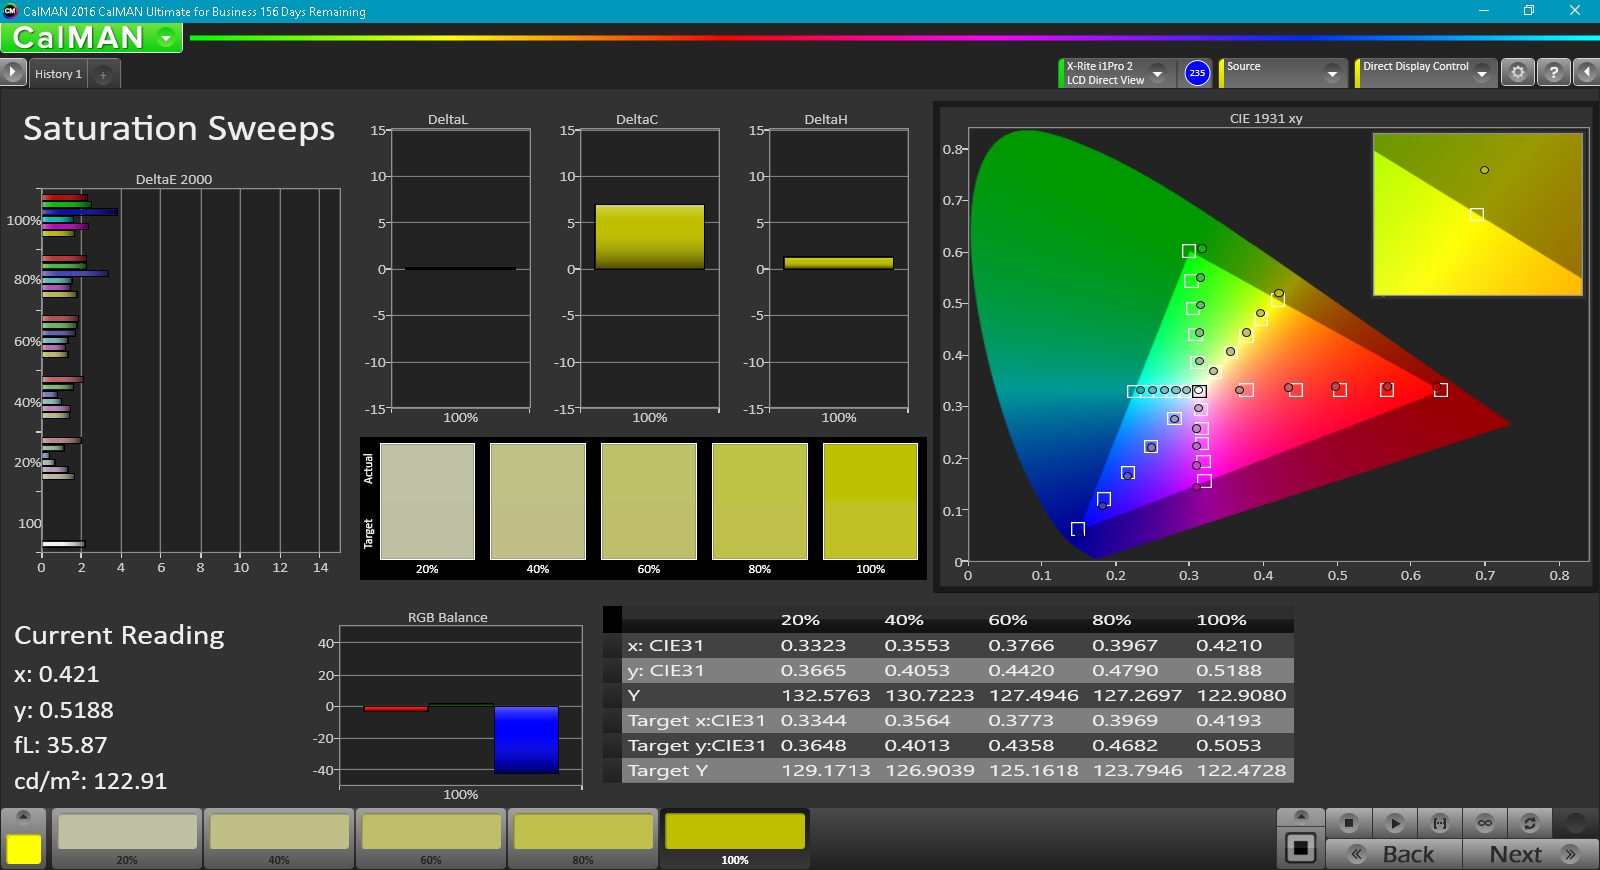
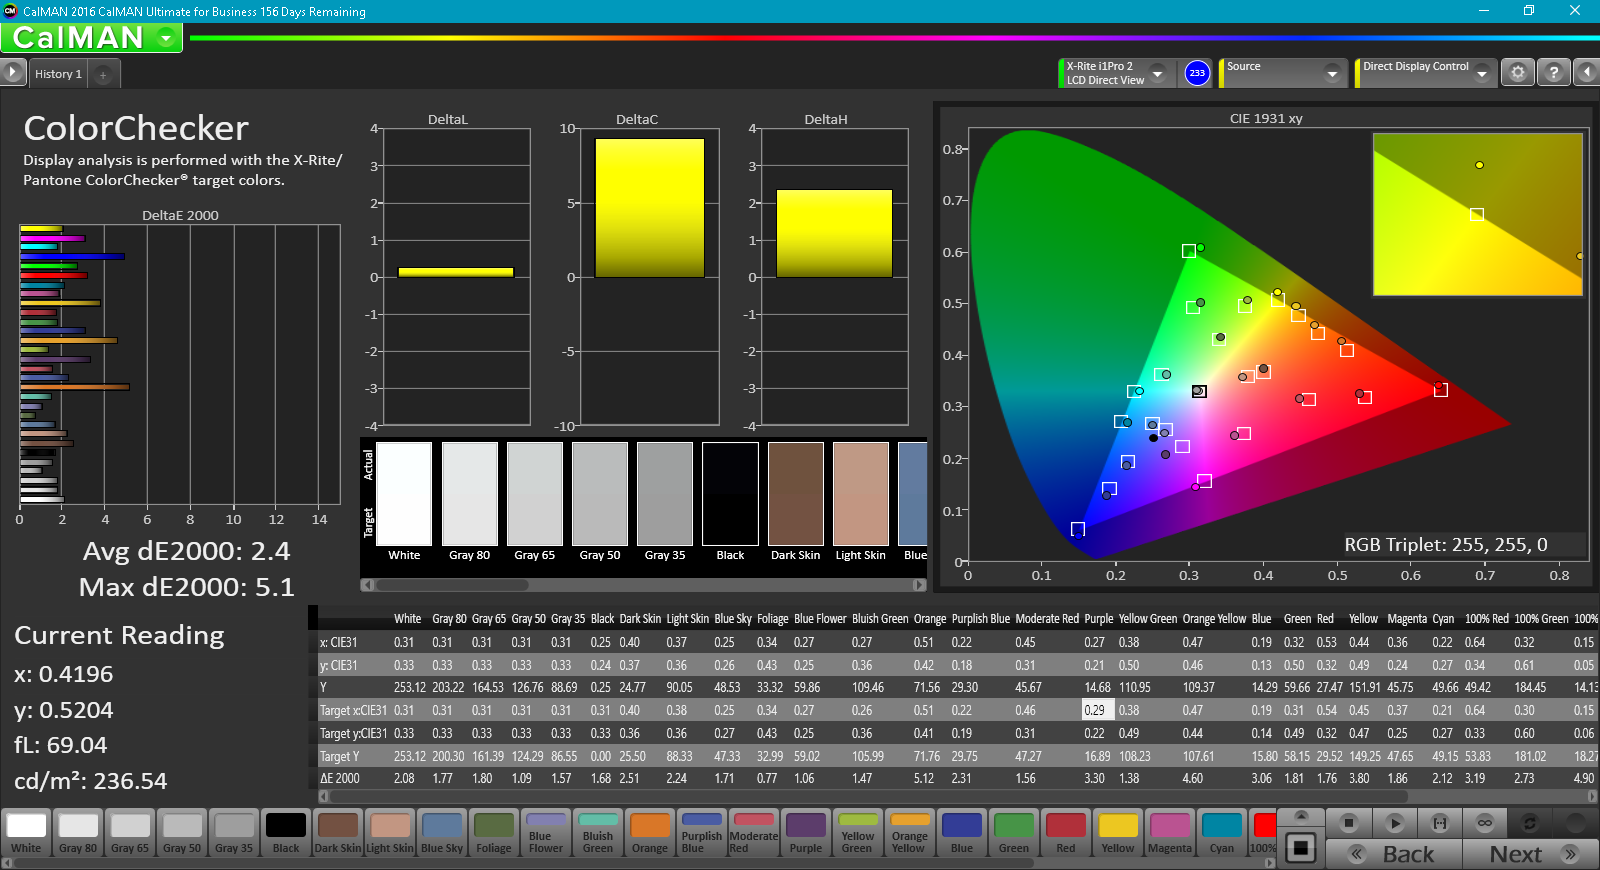
Further display measurements with a X-Rite spectrophotometer reveal good colors and grayscale out of the box. A calibration is still recommended to achieve even greater color and grayscale accuracy as shown by our before and after measurements below.
Display Response Times
| ↔ Response Time Black to White | ||
|---|---|---|
| 30.8 ms ... rise ↗ and fall ↘ combined | ↗ 17.6 ms rise | 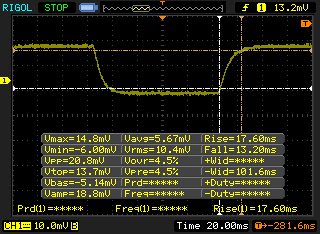 |
| ↘ 13.2 ms fall | ||
| The screen shows slow response rates in our tests and will be unsatisfactory for gamers. In comparison, all tested devices range from 0.1 (minimum) to 240 (maximum) ms. » 83 % of all devices are better. This means that the measured response time is worse than the average of all tested devices (19.8 ms). | ||
| ↔ Response Time 50% Grey to 80% Grey | ||
| 41.6 ms ... rise ↗ and fall ↘ combined | ↗ 21.6 ms rise | 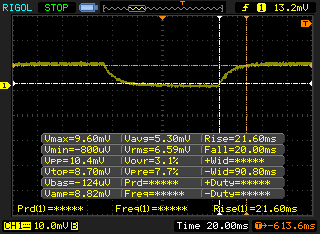 |
| ↘ 20 ms fall | ||
| The screen shows slow response rates in our tests and will be unsatisfactory for gamers. In comparison, all tested devices range from 0.165 (minimum) to 636 (maximum) ms. » 67 % of all devices are better. This means that the measured response time is worse than the average of all tested devices (30.9 ms). | ||
Screen Flickering / PWM (Pulse-Width Modulation)
| Screen flickering / PWM not detected | 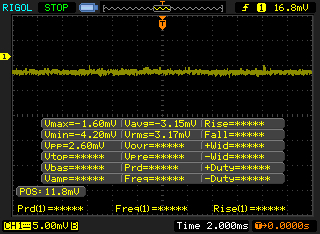 | ||
In comparison: 52 % of all tested devices do not use PWM to dim the display. If PWM was detected, an average of 7748 (minimum: 5 - maximum: 343500) Hz was measured. | |||
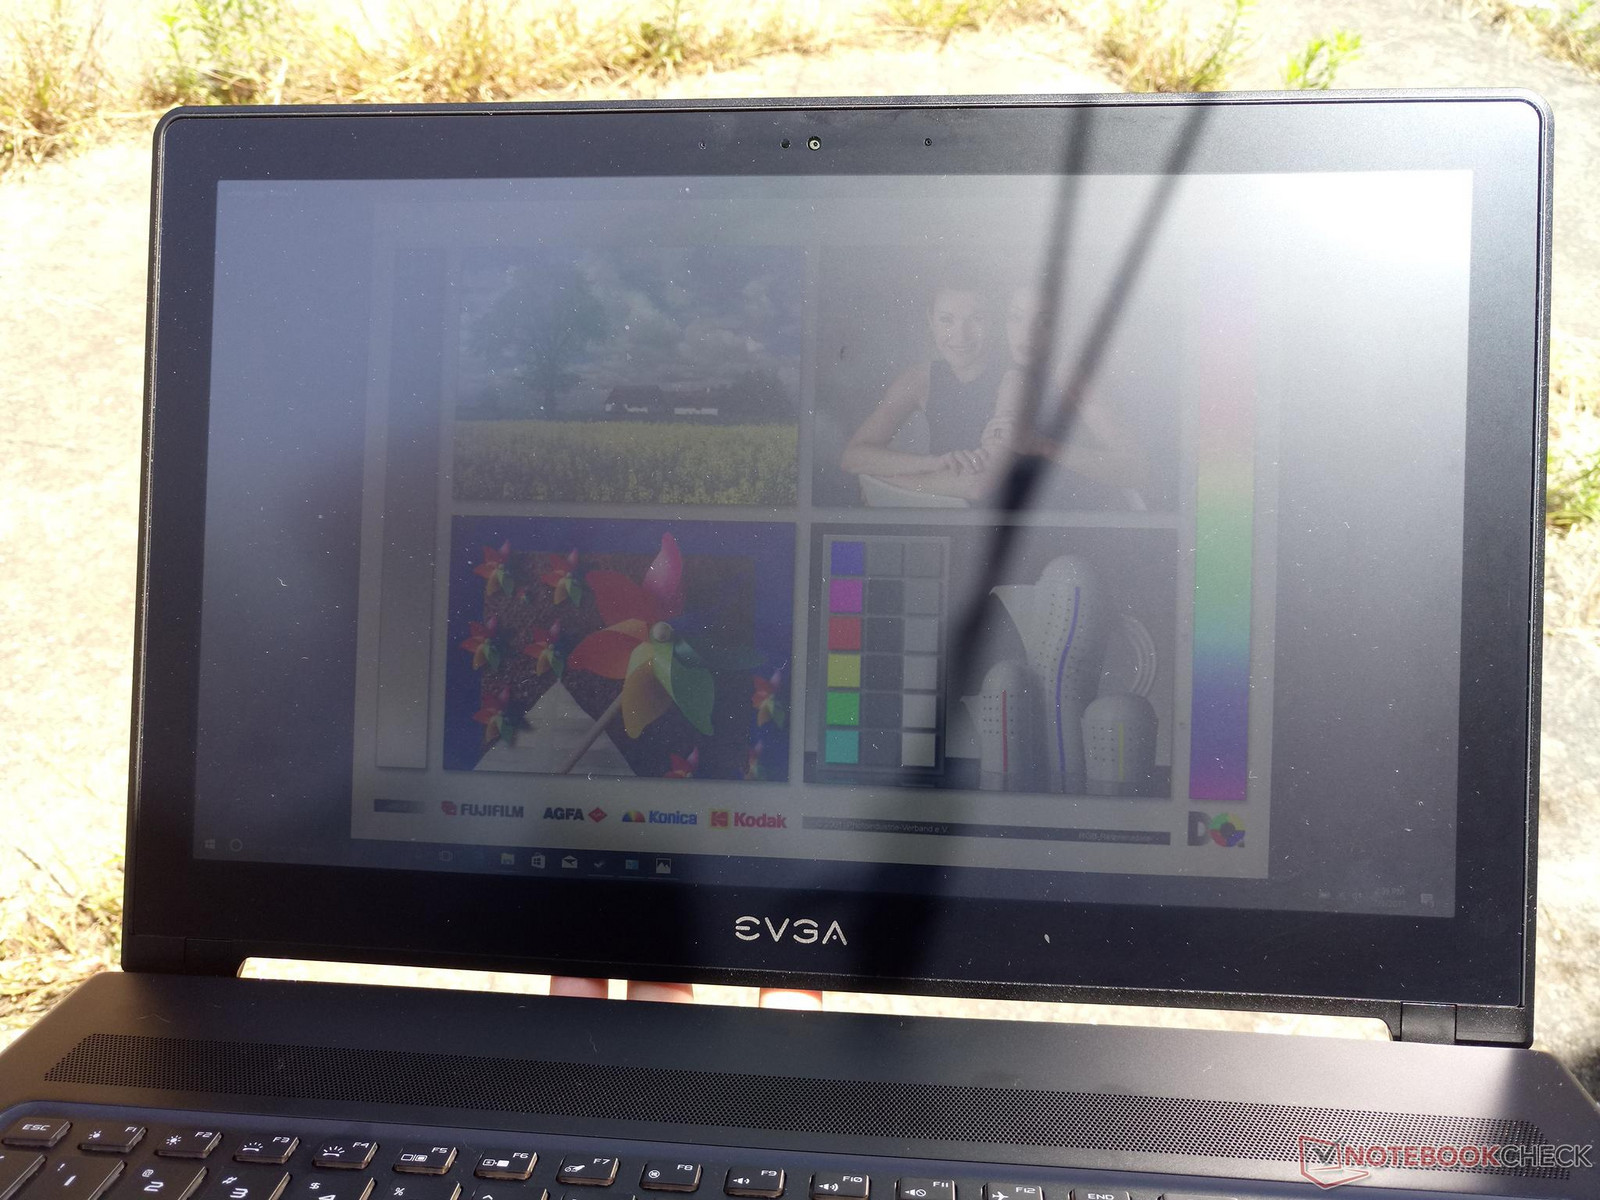
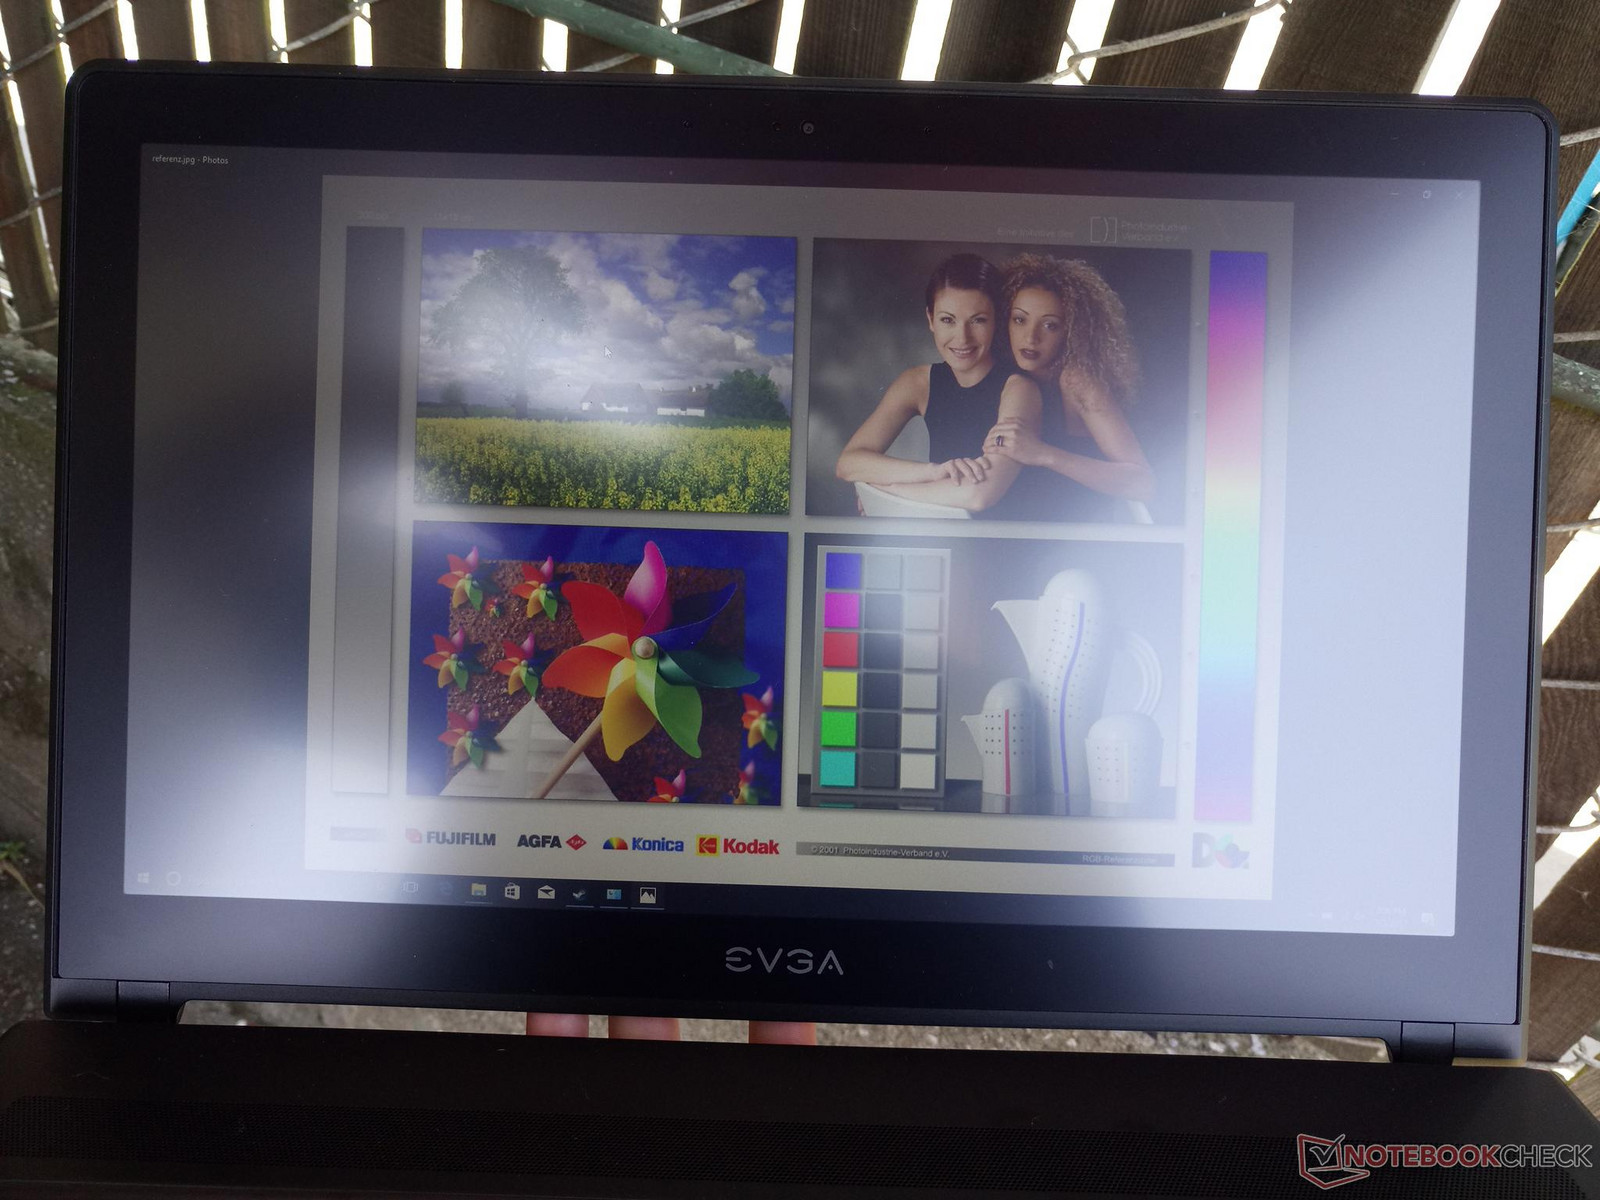
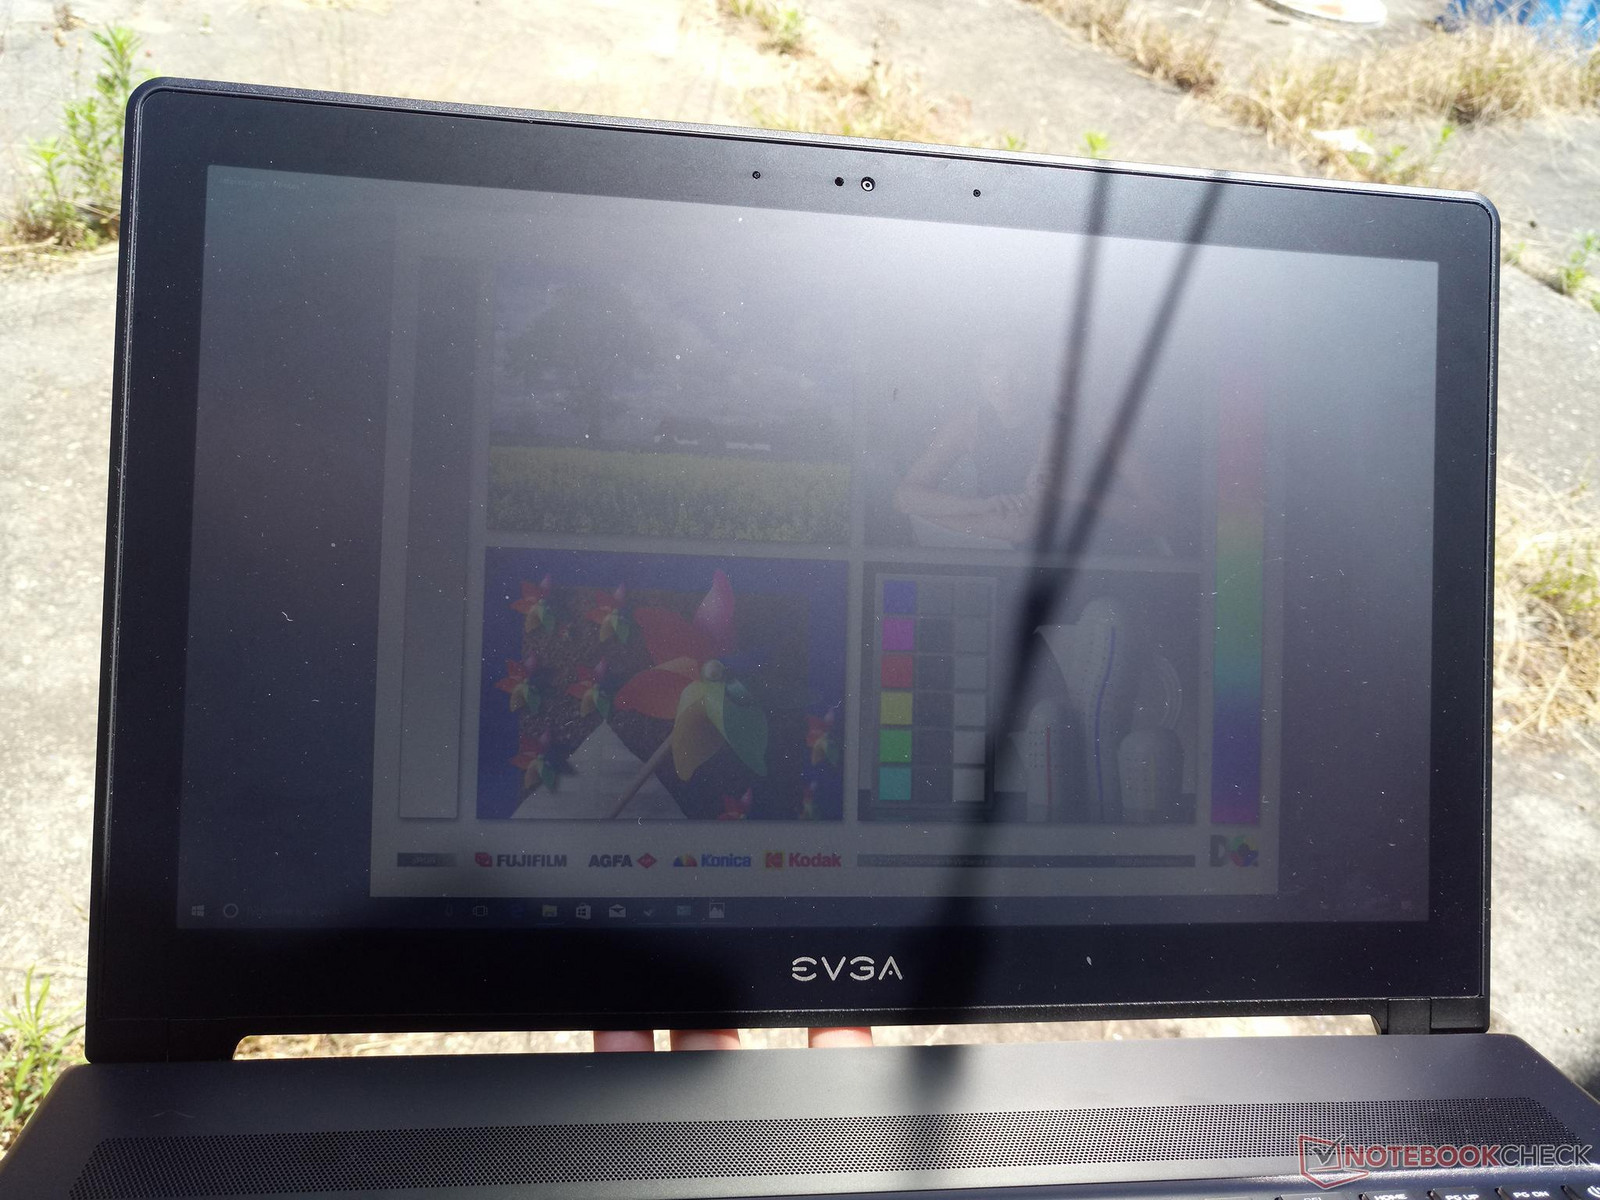
Outdoor visibility is below average as sunlight and ambient lighting will easily overpower the display backlight. Texts and images appear washed out and muted even if glare can be avoided. The wide IPS viewing angles do little to improve the screen since the insufficient backlight is the main bottleneck. Users who want better outdoor visibility may want to consider the Aero 15 instead.
Performance
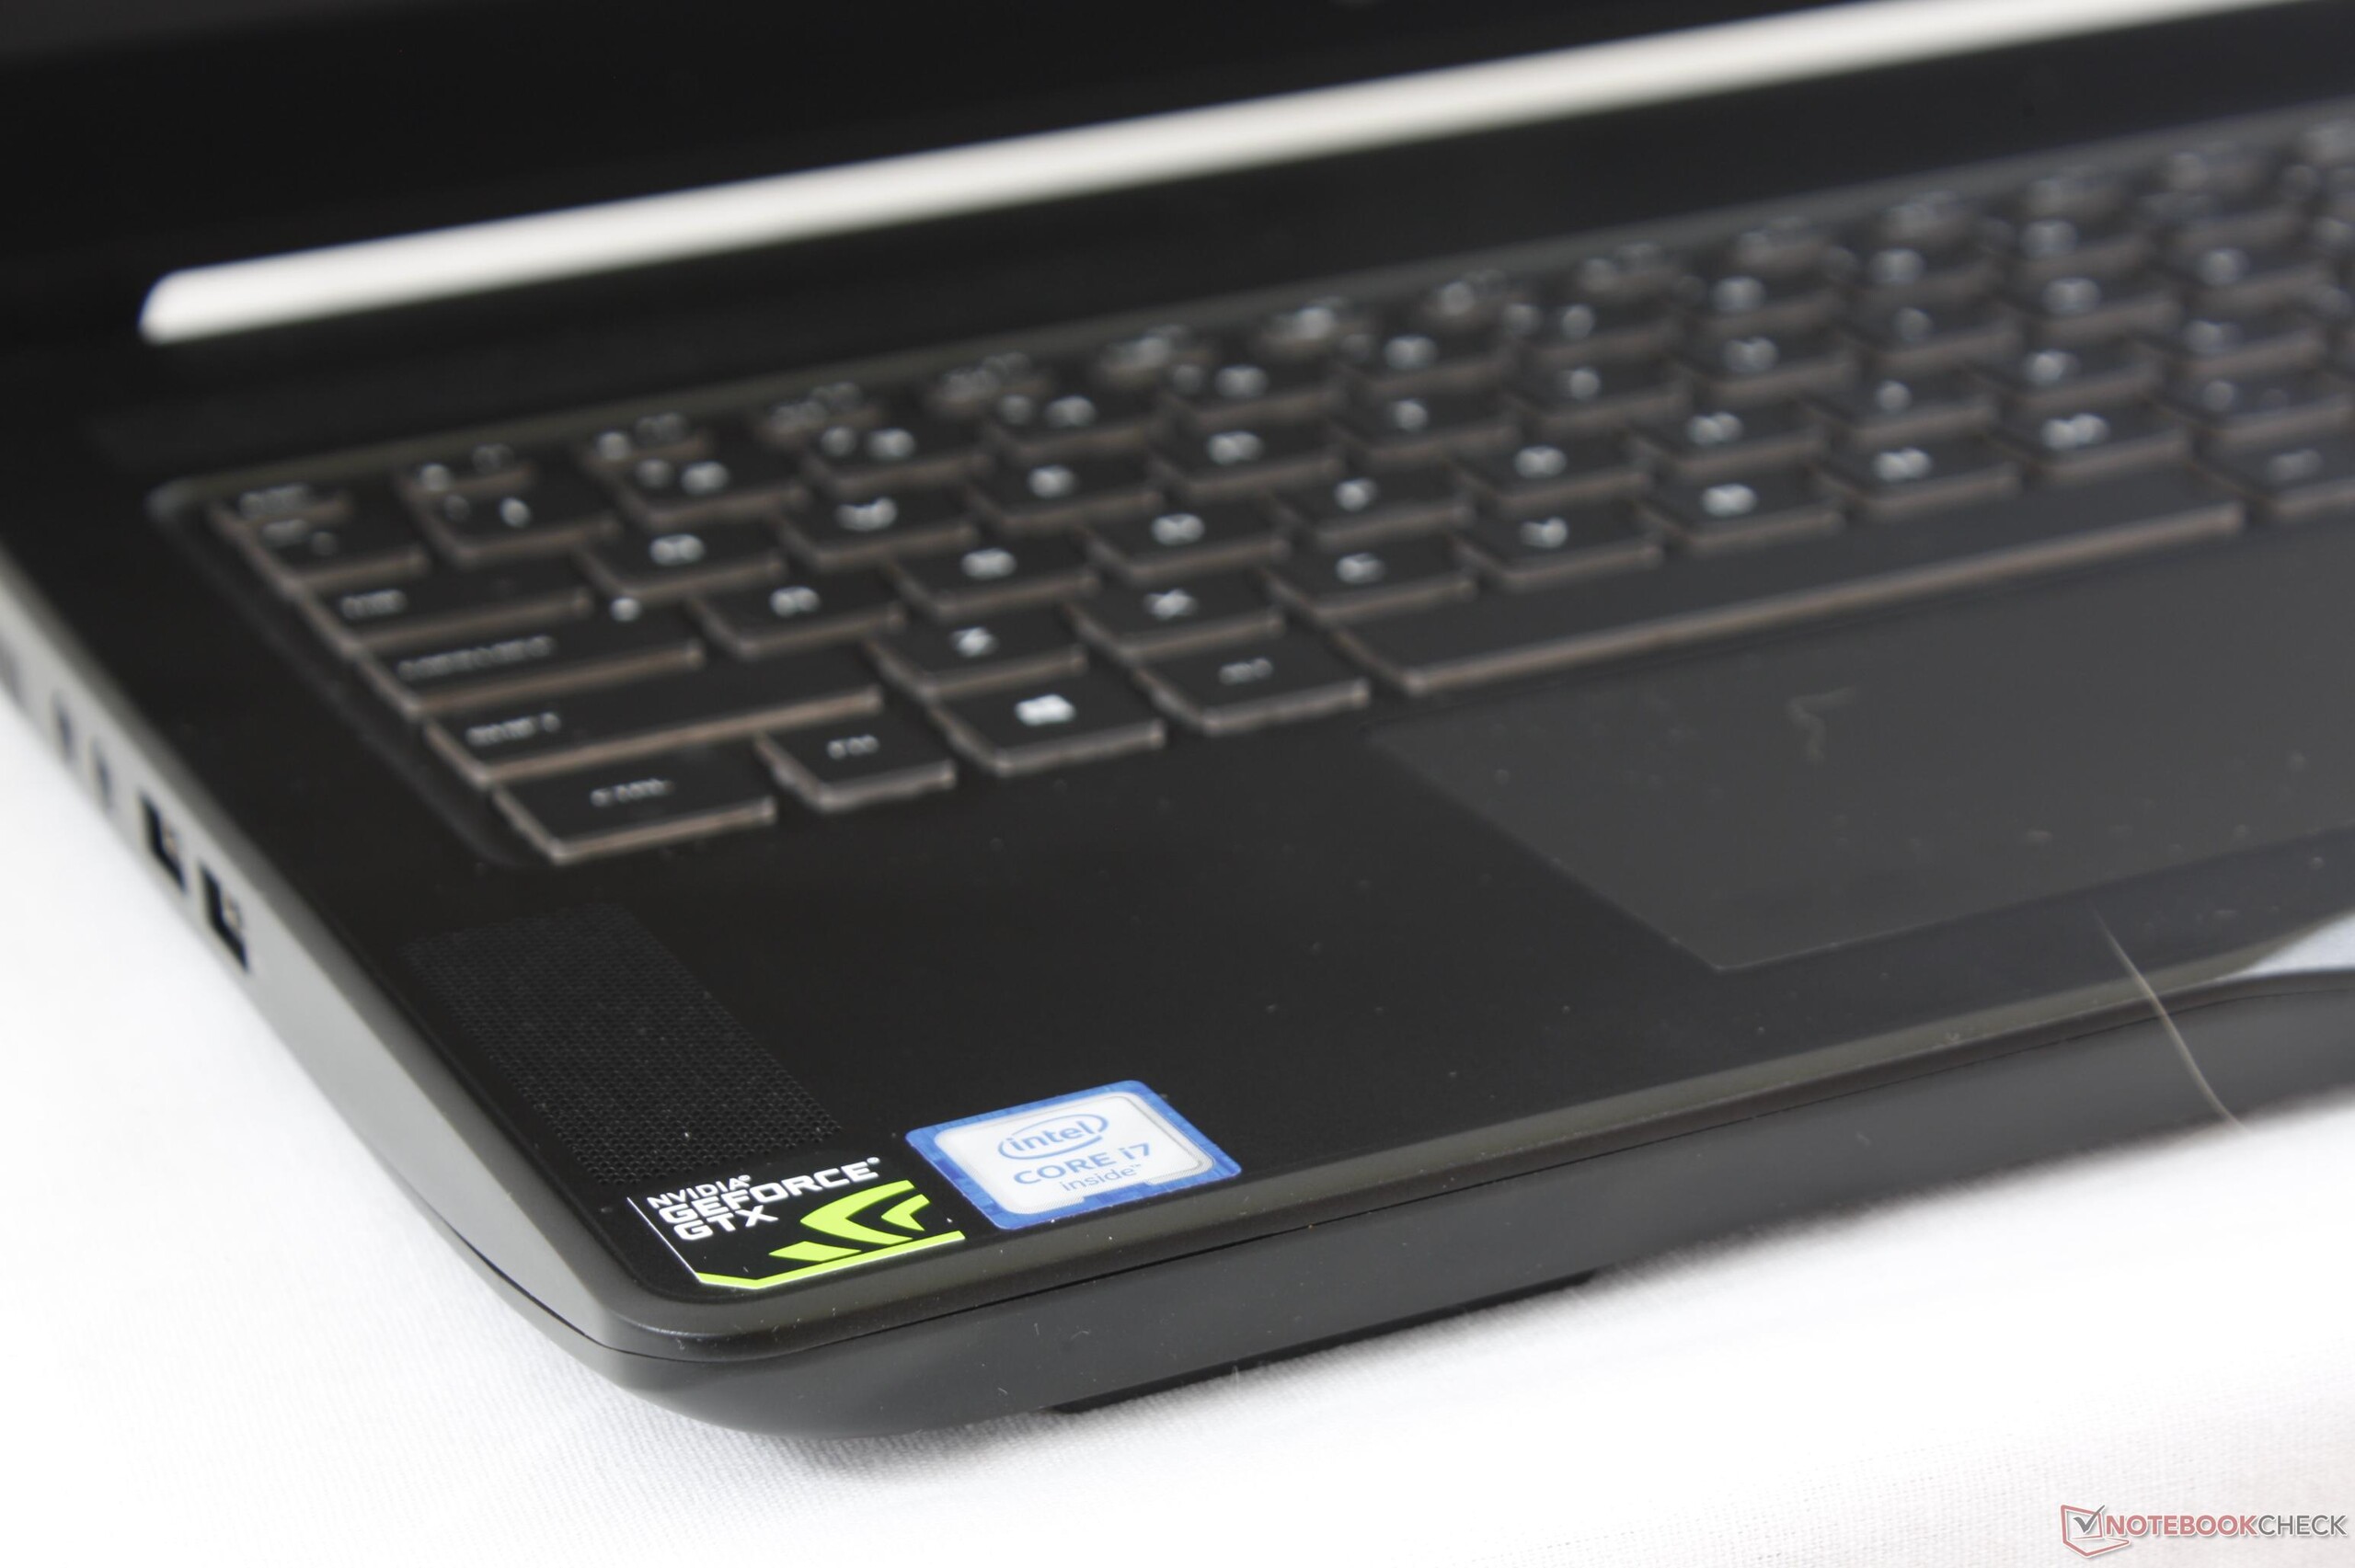
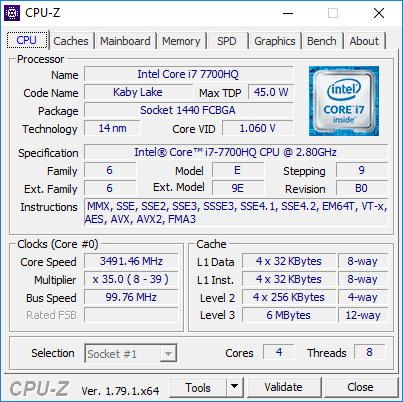
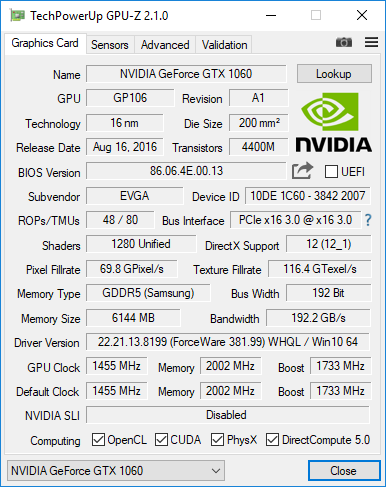
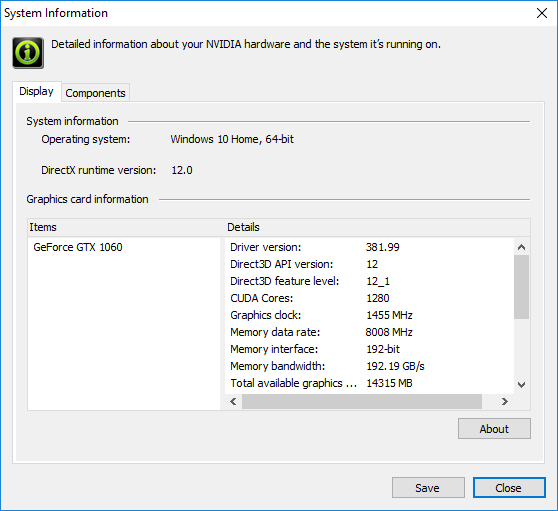
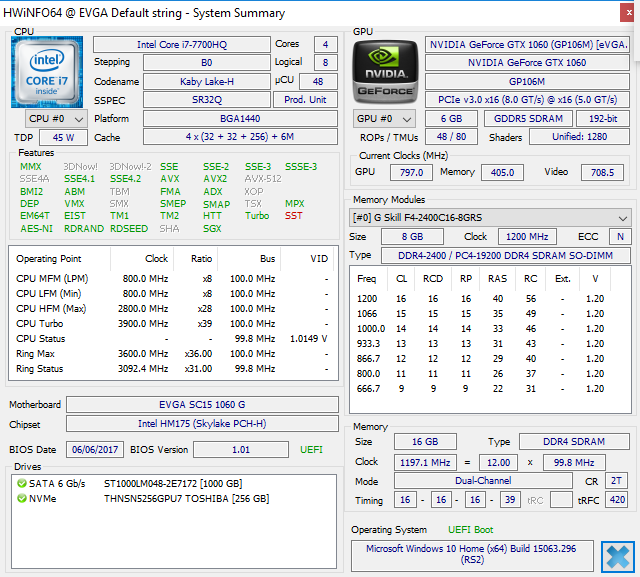
EVGA appears to be shipping the SC15 with only the i7-7700HQ CPU and GTX 1060 GPU for now. In contrast, the larger SC17 ships with unlocked HK-class processors for potentially faster CPU performance. The switch to the much more common and less expensive i7-7700HQ is likely for the best as the i7-6820HK and i7-7820HK at stock clock rates perform essentially the same as the i7-7700HQ as our next section will show.
Optimus is not included since G-Sync comes standard and both continue to be mutually exclusive. The integrated HD Graphics 630 is disabled as a result with no manual graphics switching options.
Processor
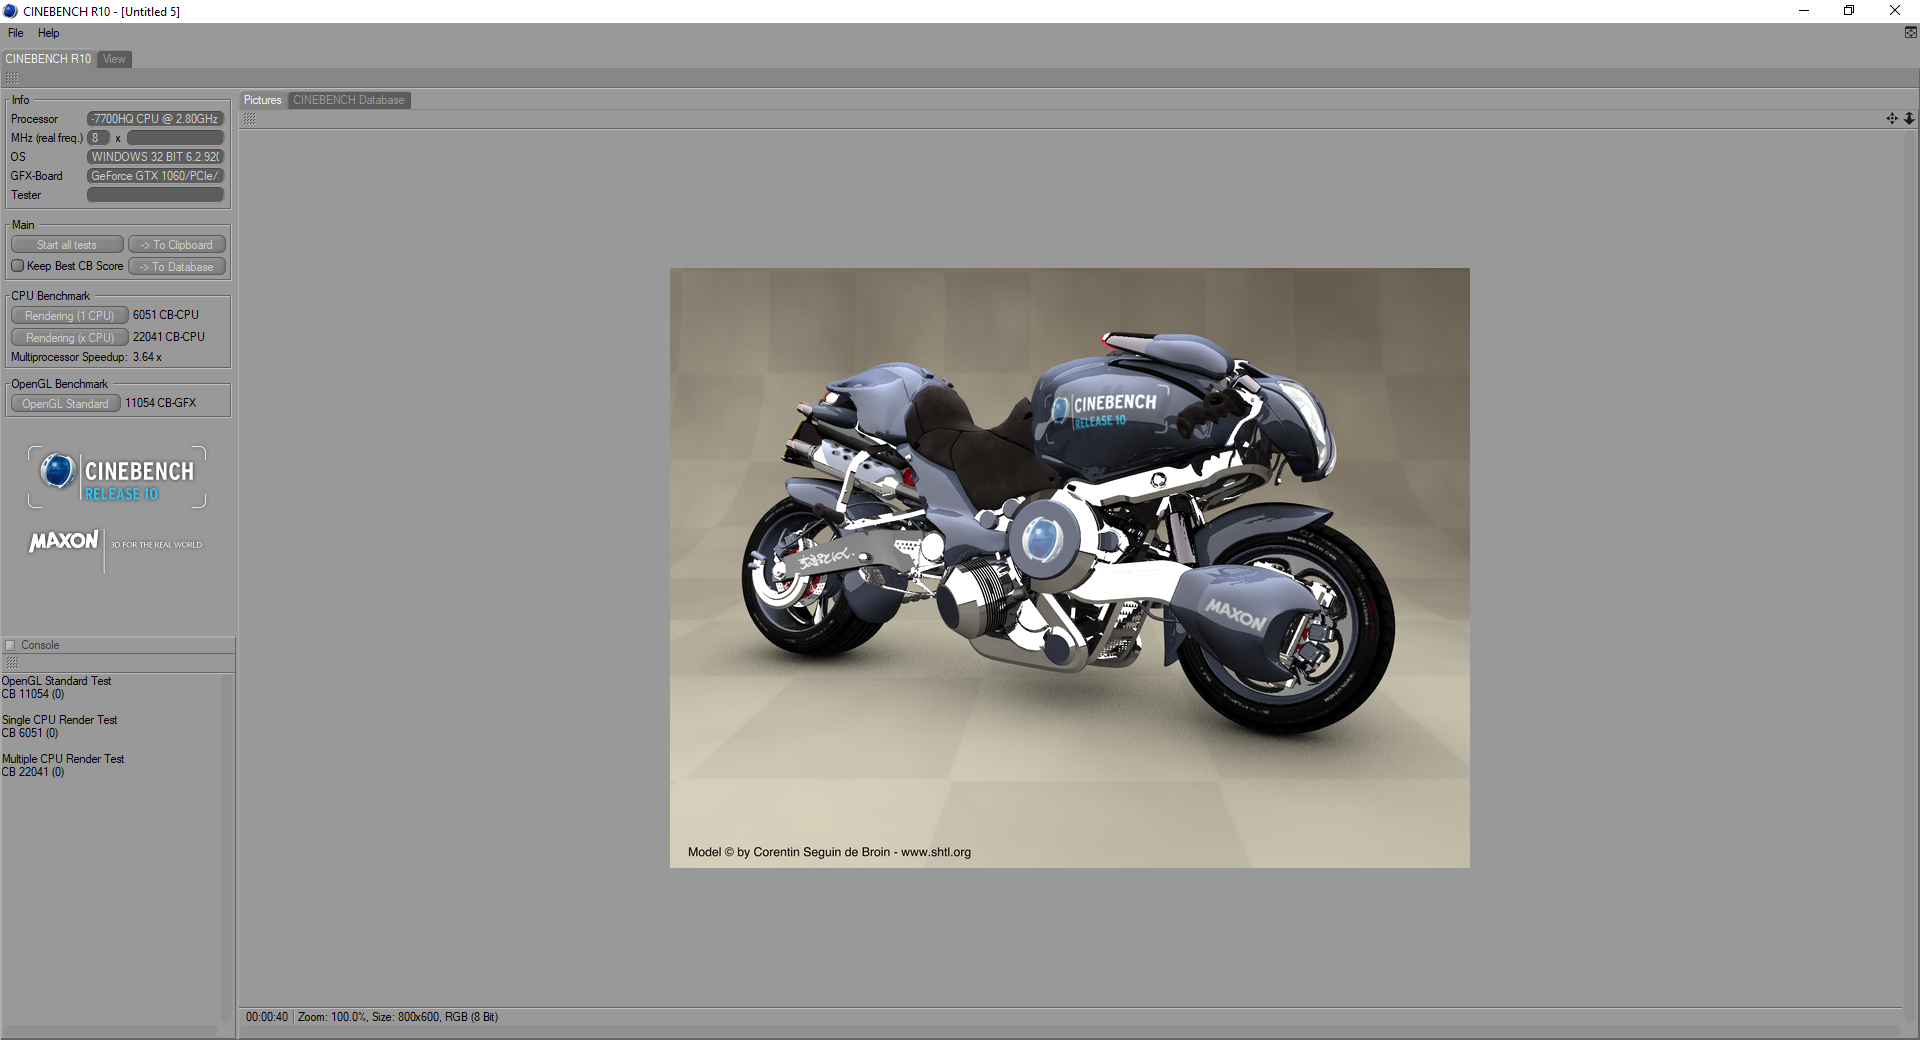
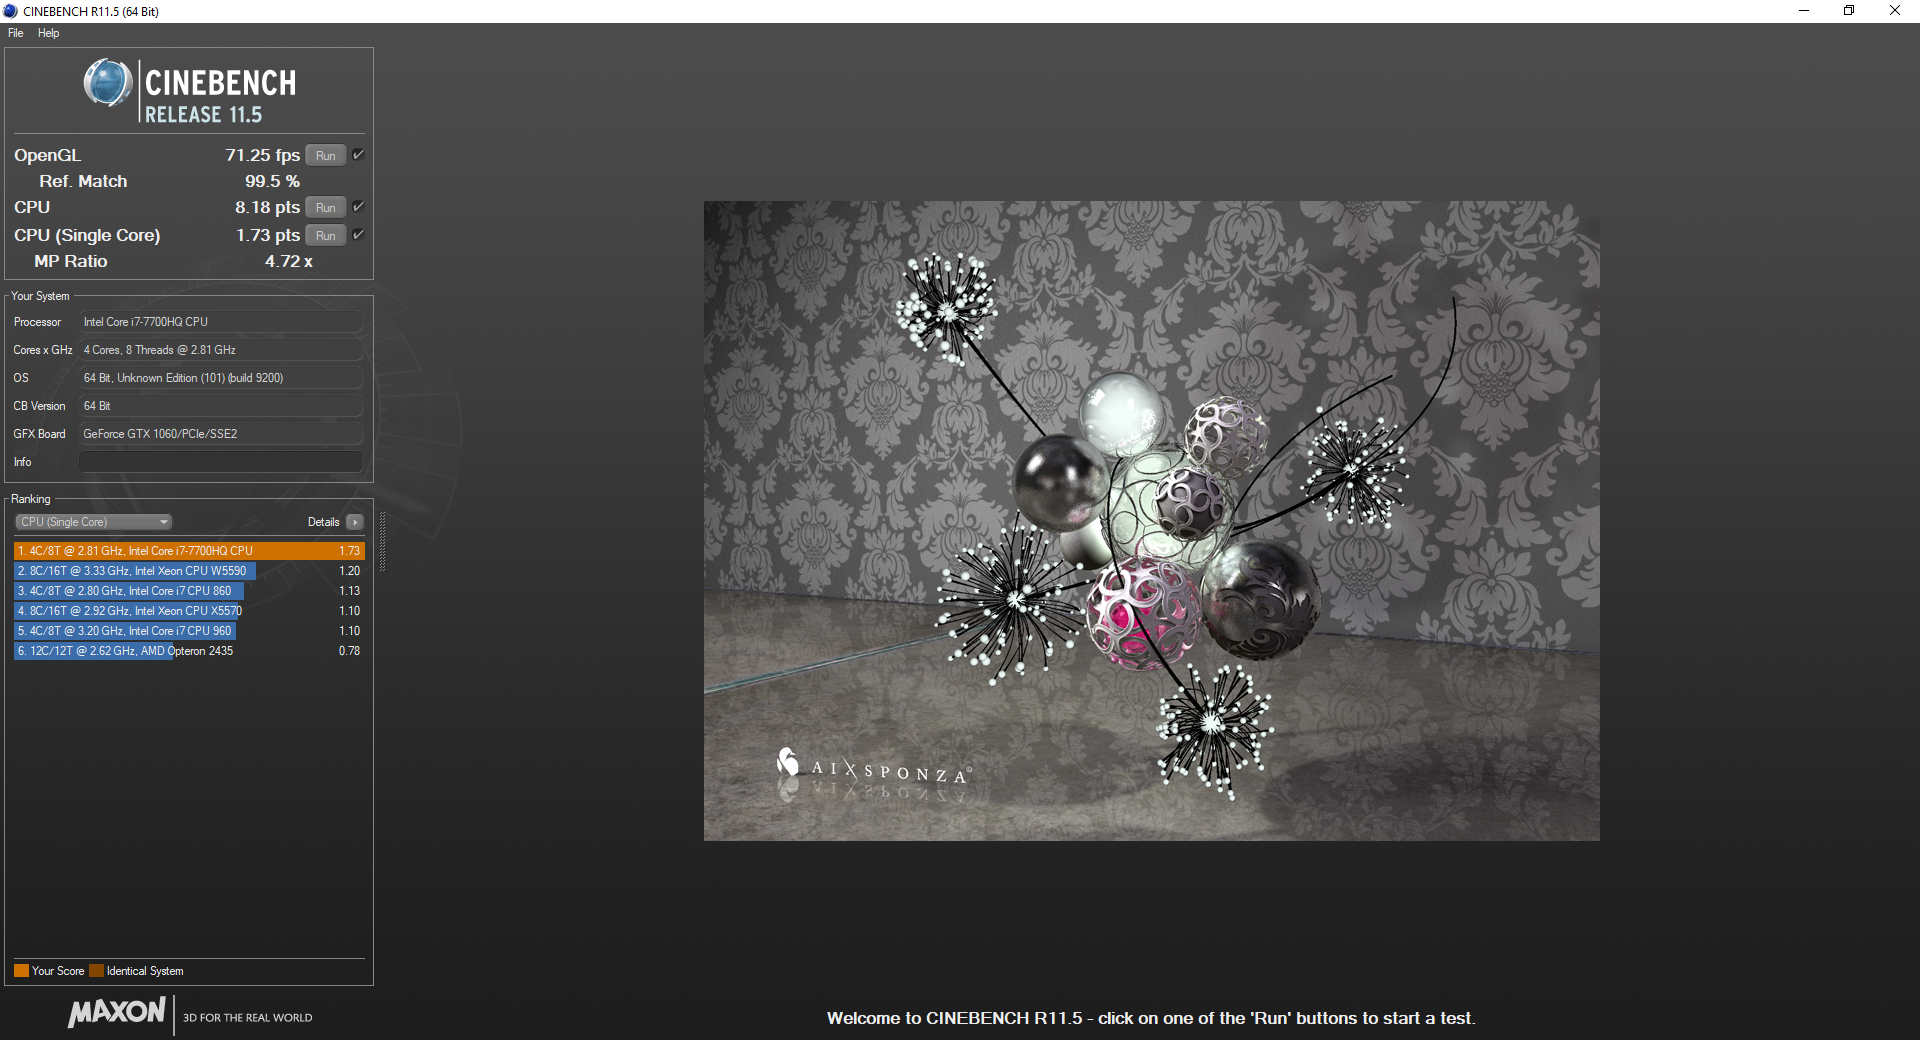
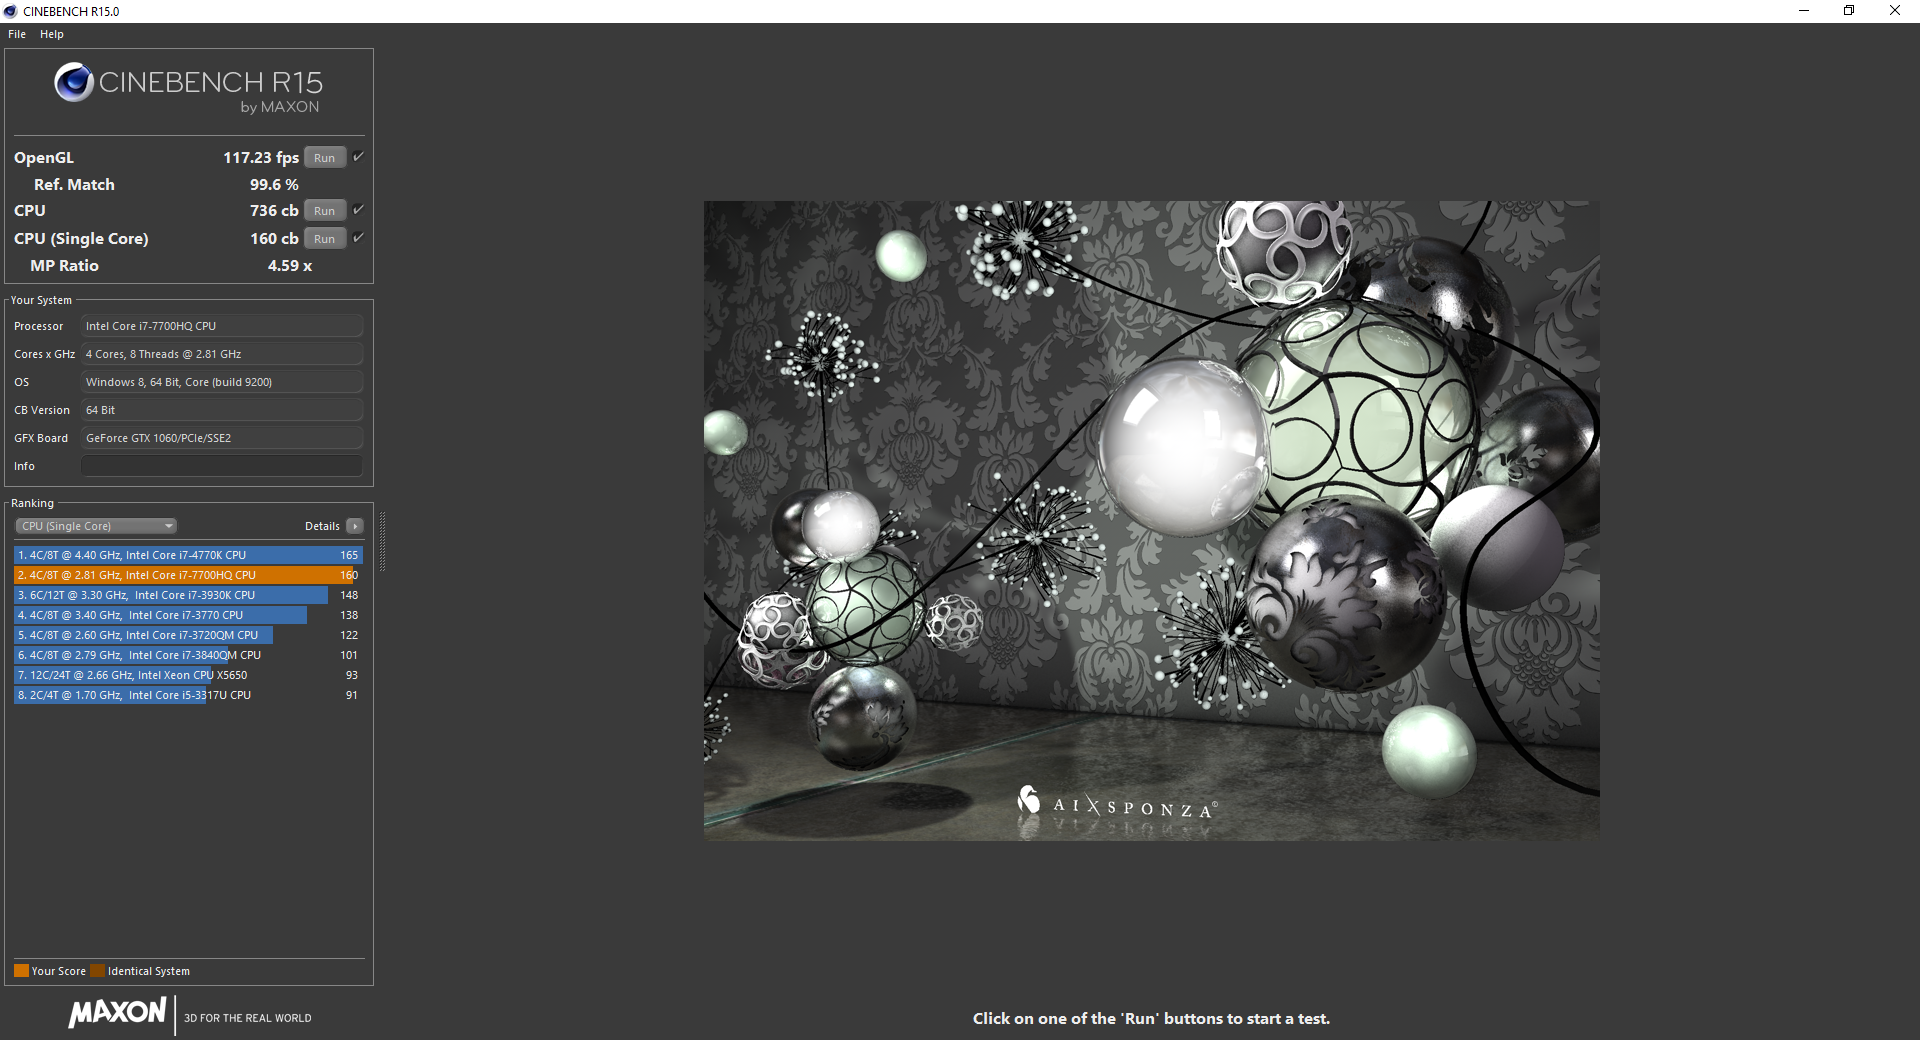
CPU performance is similar to other notebooks sporting the same i7-7700HQ CPU like the Samsung Odyssey according to CineBench benchmarks. Users upgrading from the Broadwell i7-5700HQ or Skylake i7-6700HQ will see very marginal improvements, but older gaming notebooks equipped with the Haswell i7-4700HQ will see much larger gains. The i7-7820HK at stock speeds performs about the same as the i7-7700HQ while the desktop i7-7700K in certain Clevo systems can be about 20 percent faster. Running CineBench R15 Multi-Thread in a loop results in very steady scores from start to finish whereas certain competing systems may slowly throttle the CPU over time.
See our dedicated CPU page on the Core i7-7700HQ for more technical information and benchmark comparisons.
| wPrime 2.10 - 1024m | |
| EVGA SC17 GTX 1070 | |
| Eurocom Sky MX5 R3 | |
| EVGA SC15 | |
| Samsung Odyssey NP800G5M-X01US | |
| MSI GP62-2QEi781FD | |
| Eurocom Tornado F5 | |
* ... smaller is better
System Performance
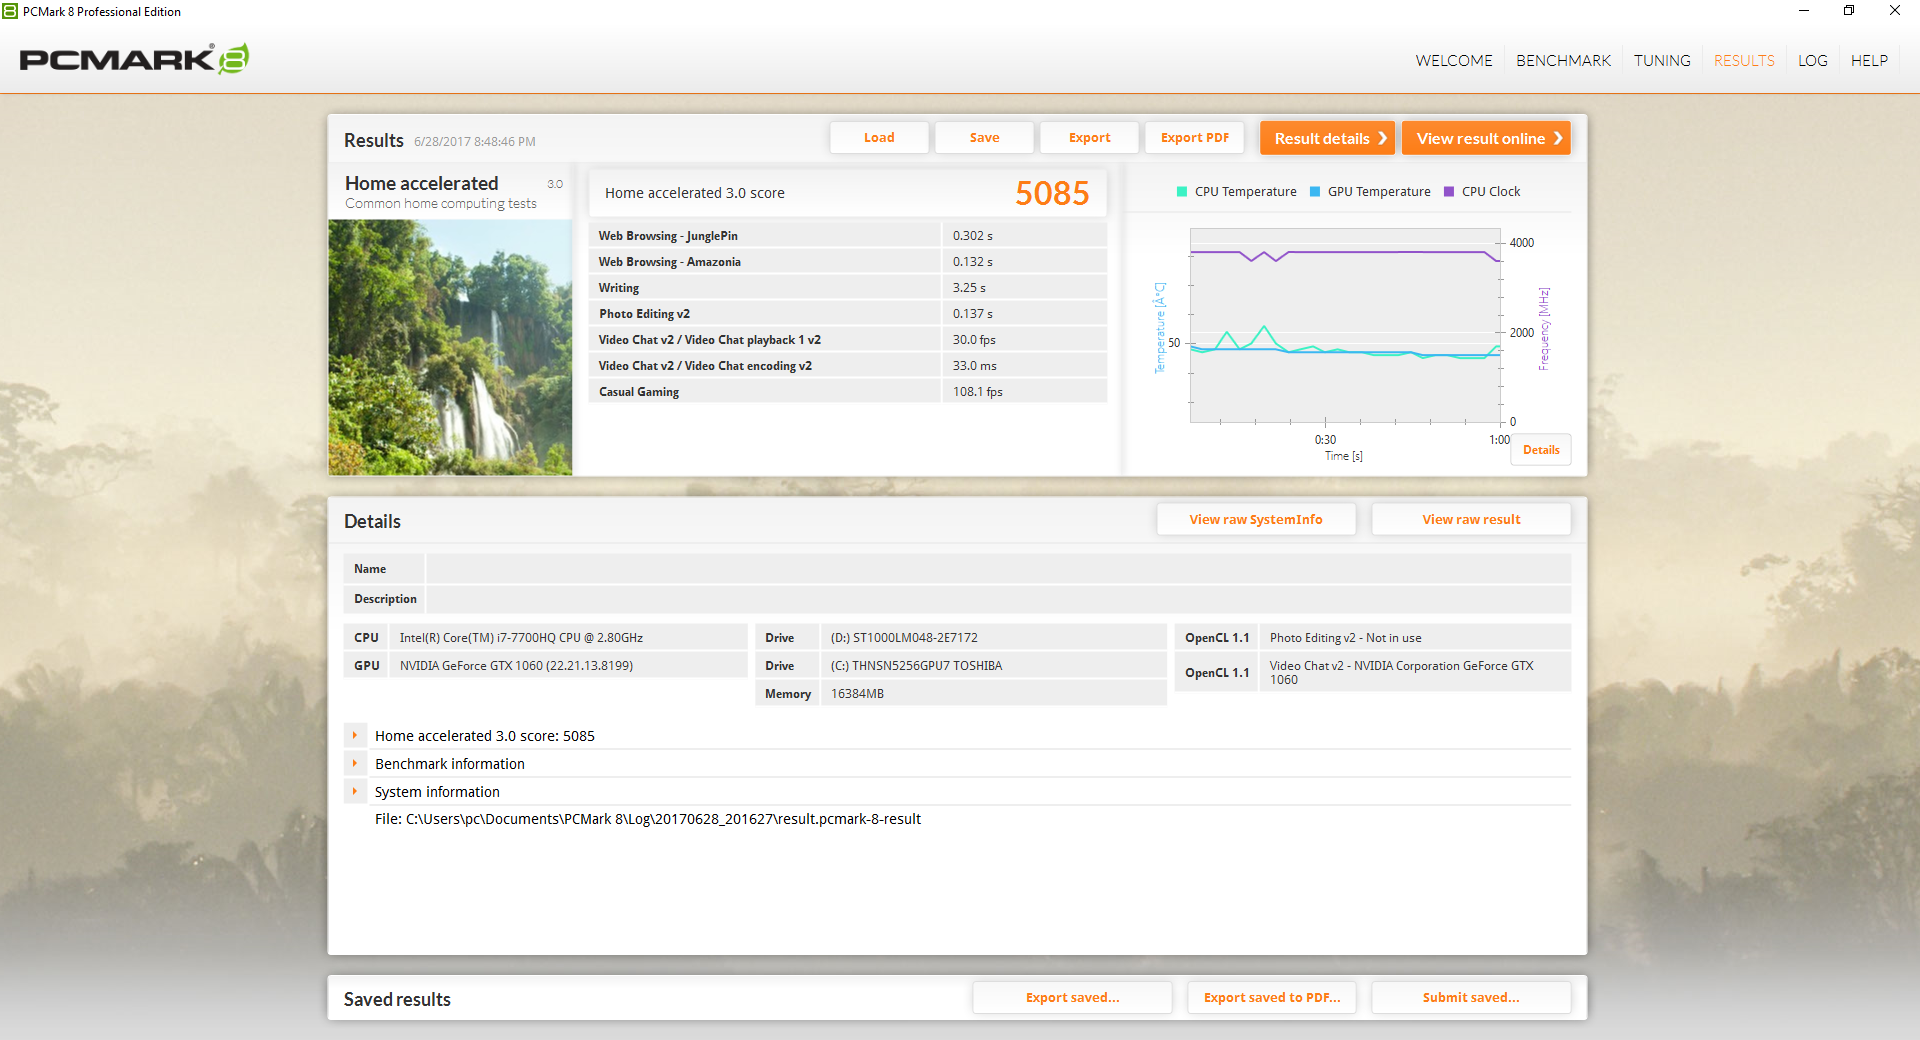
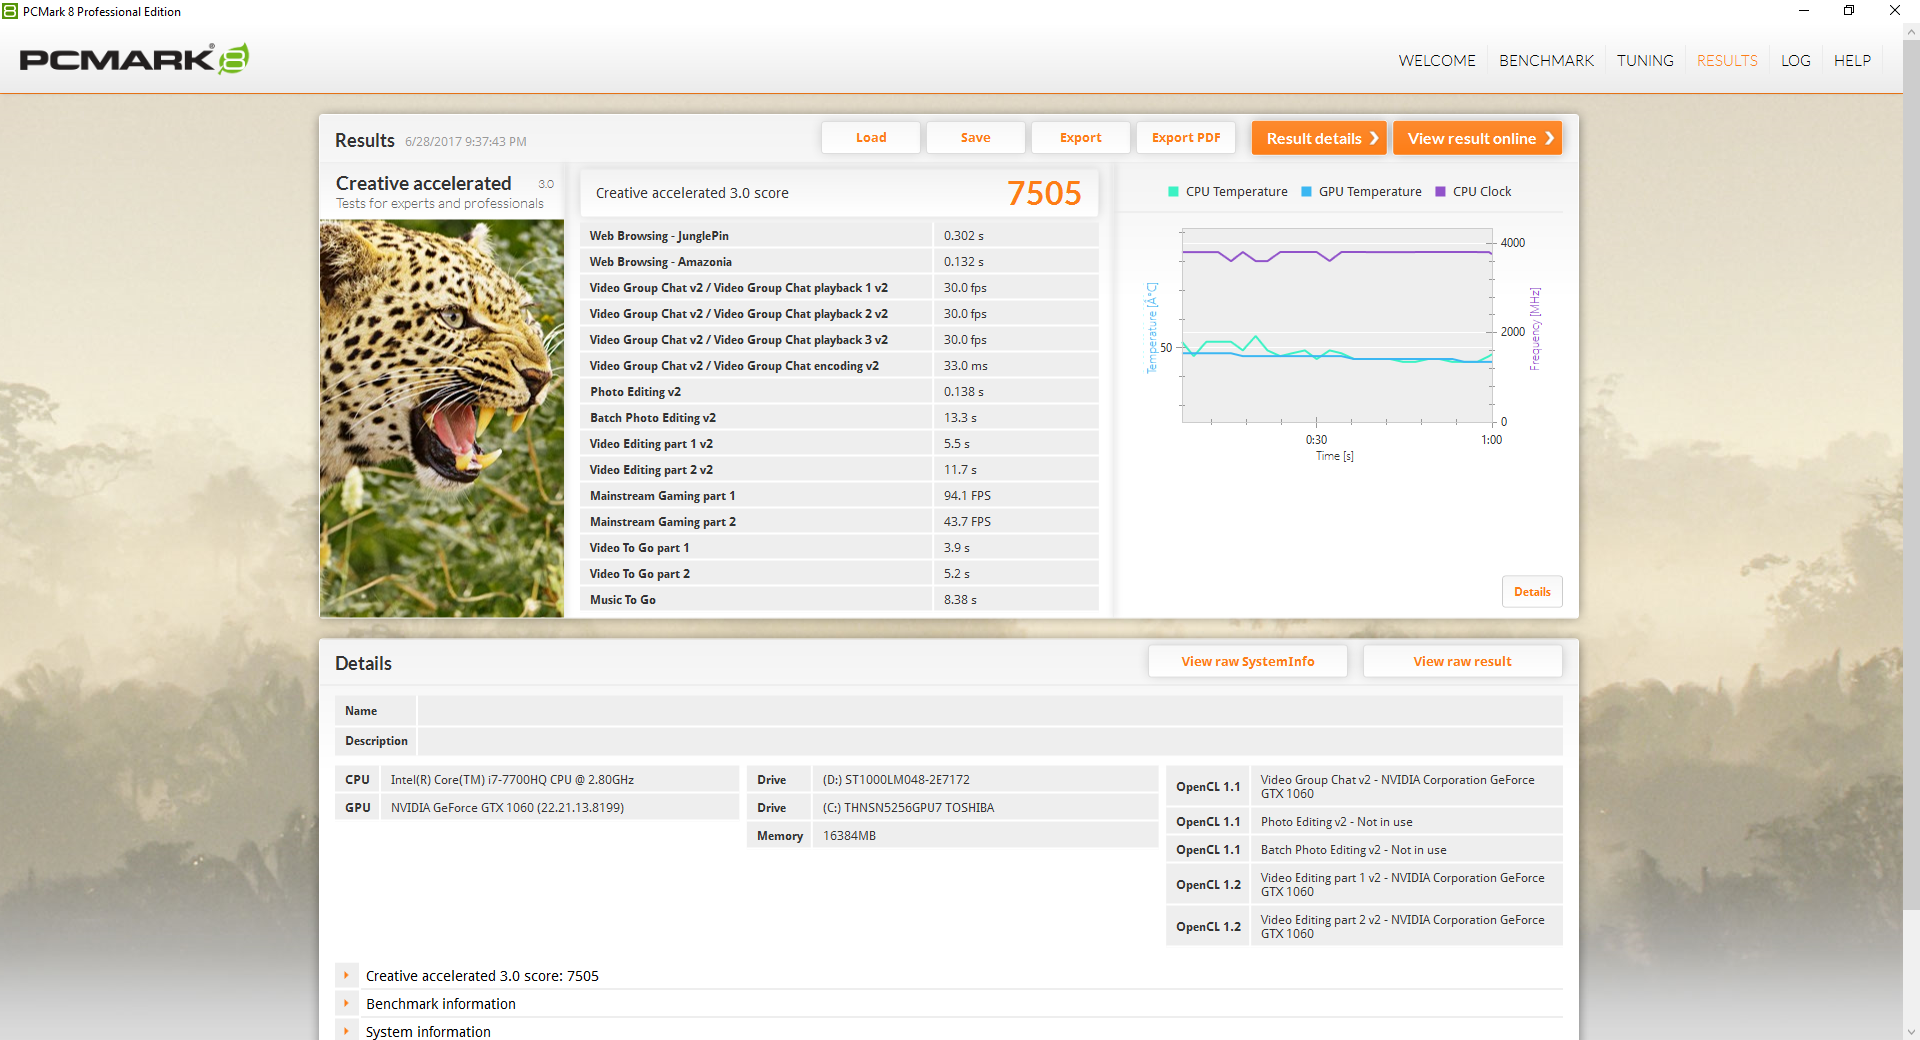
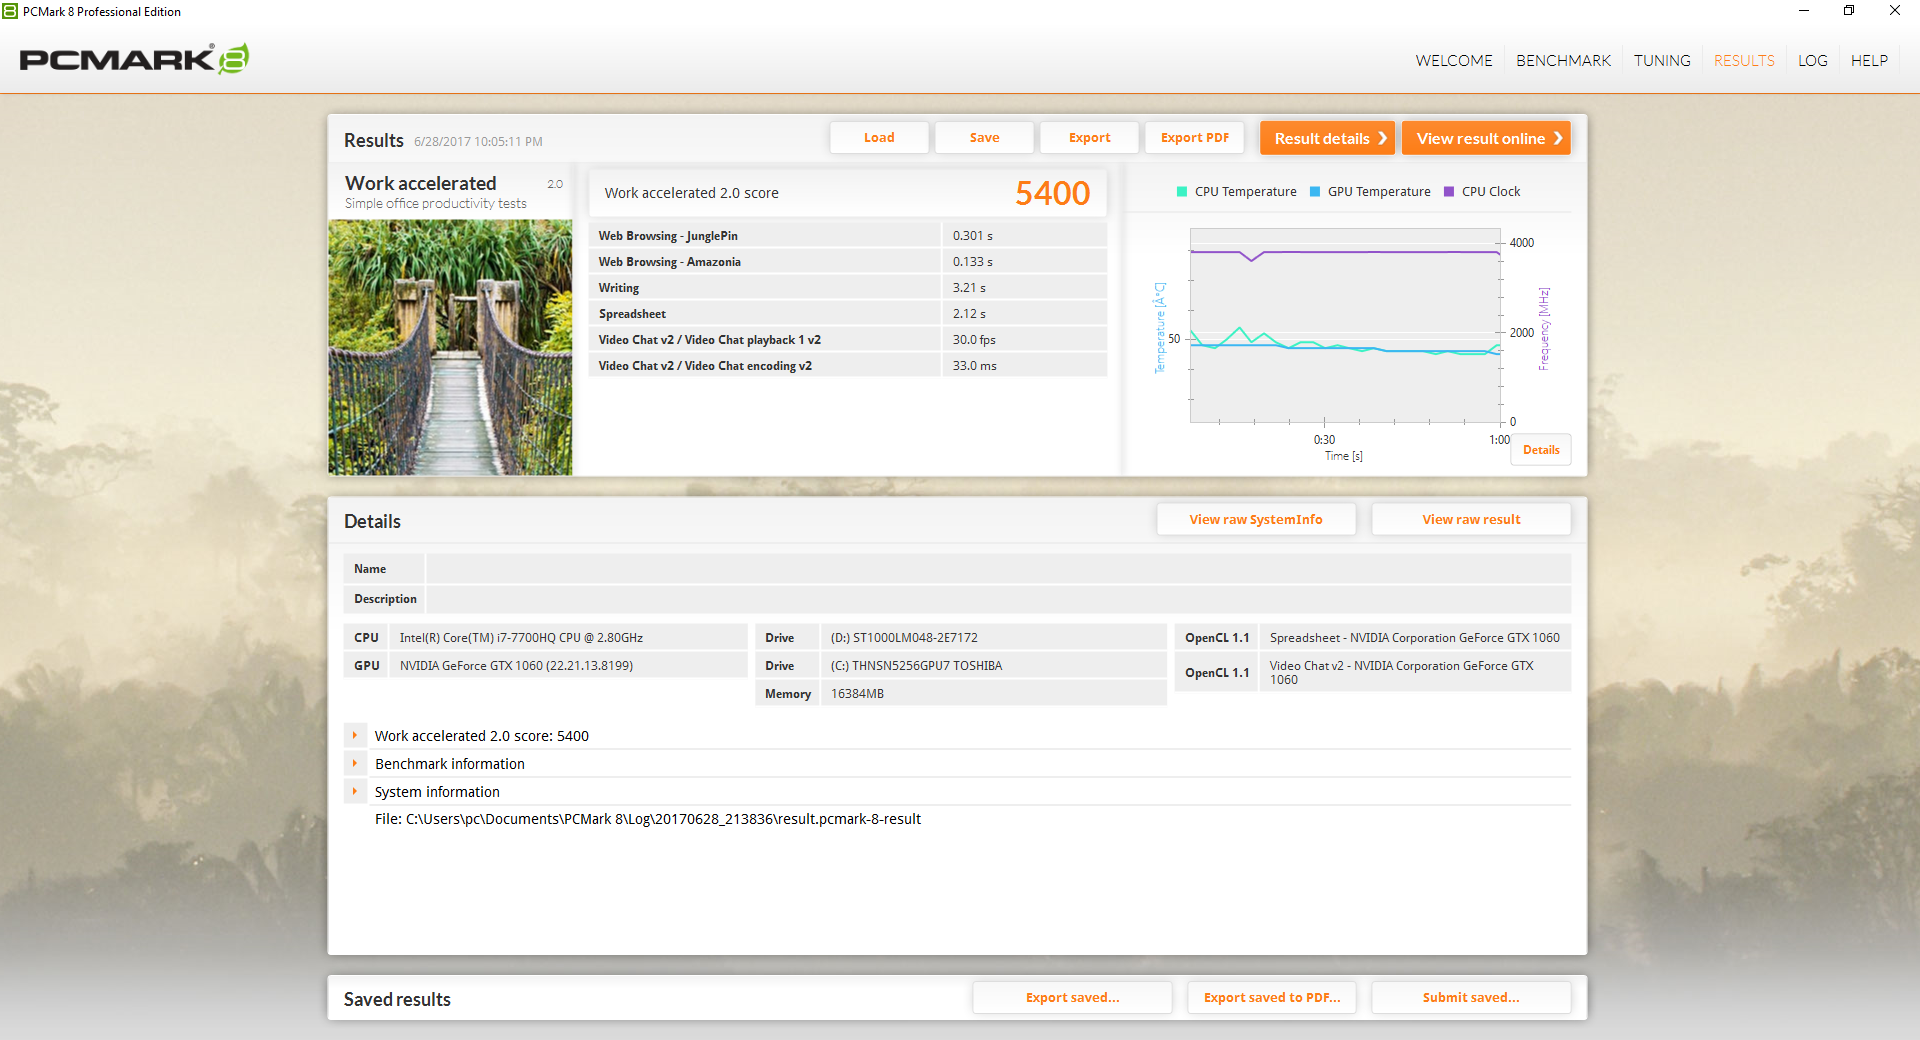
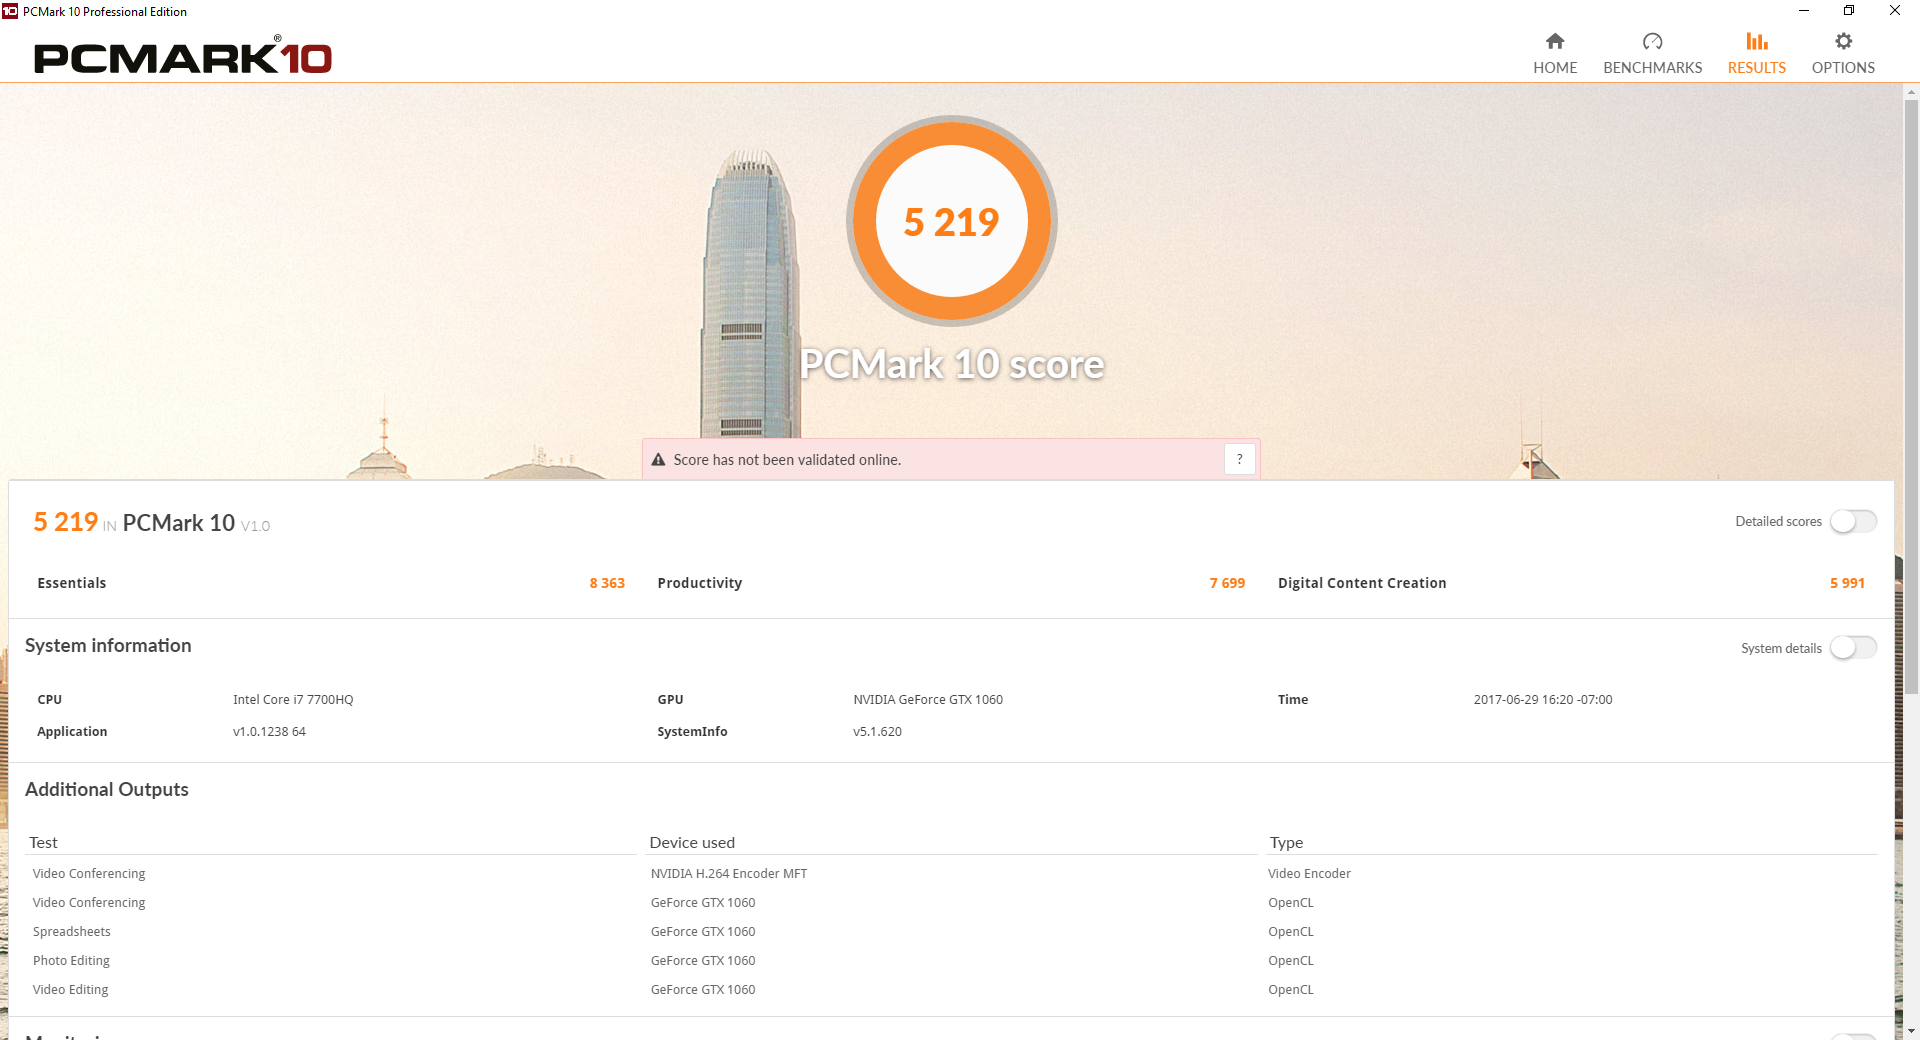
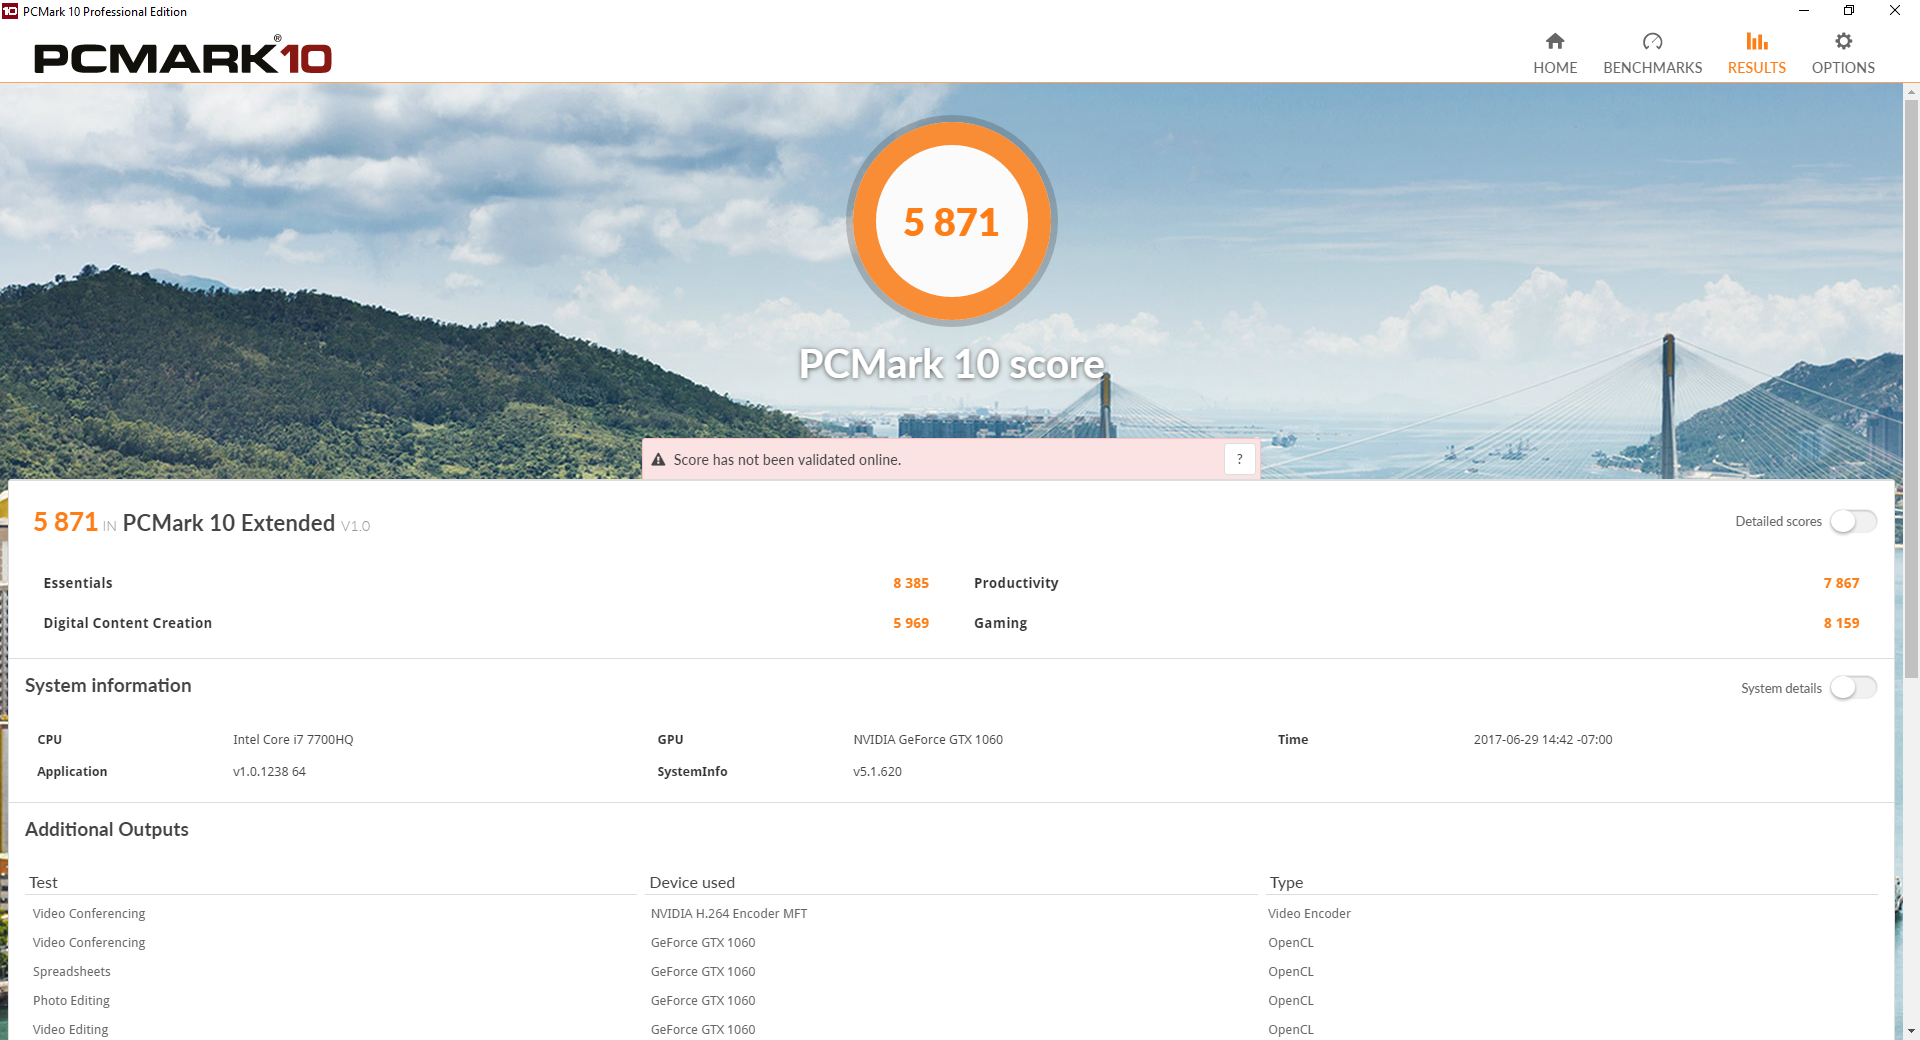
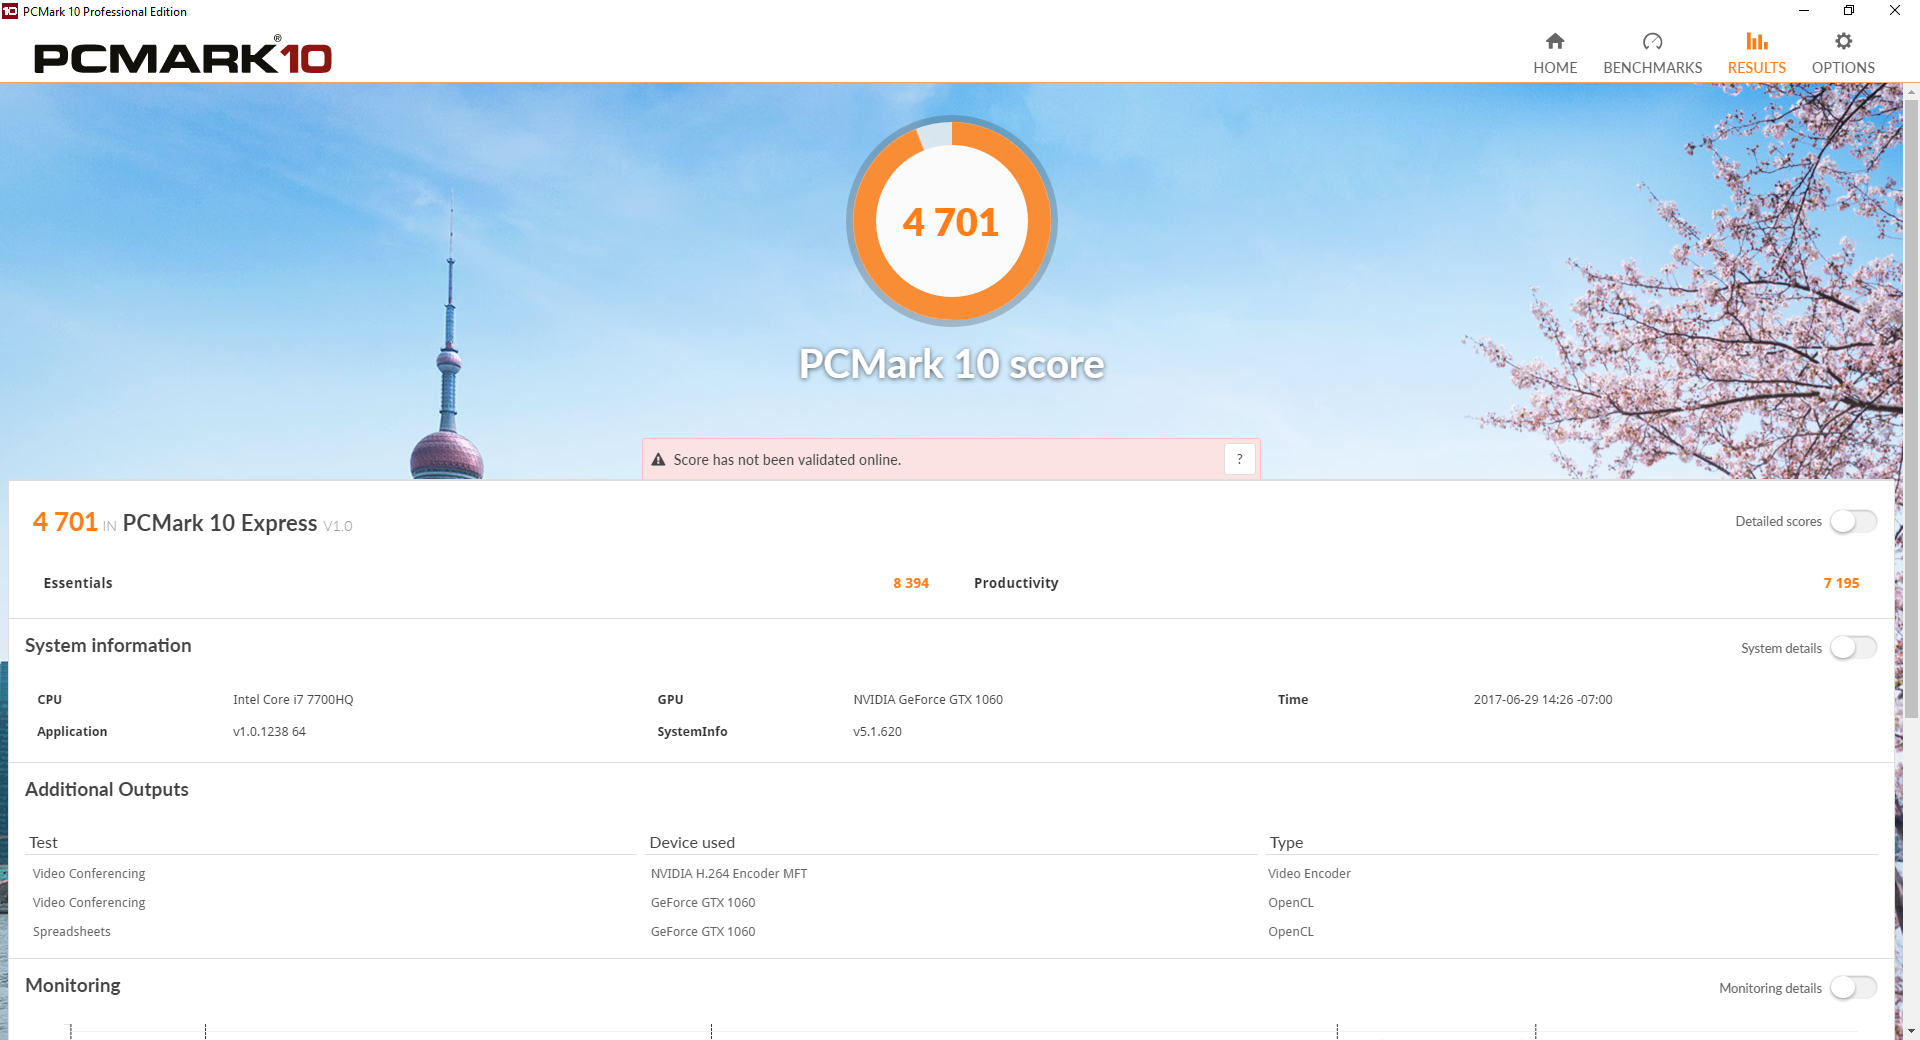
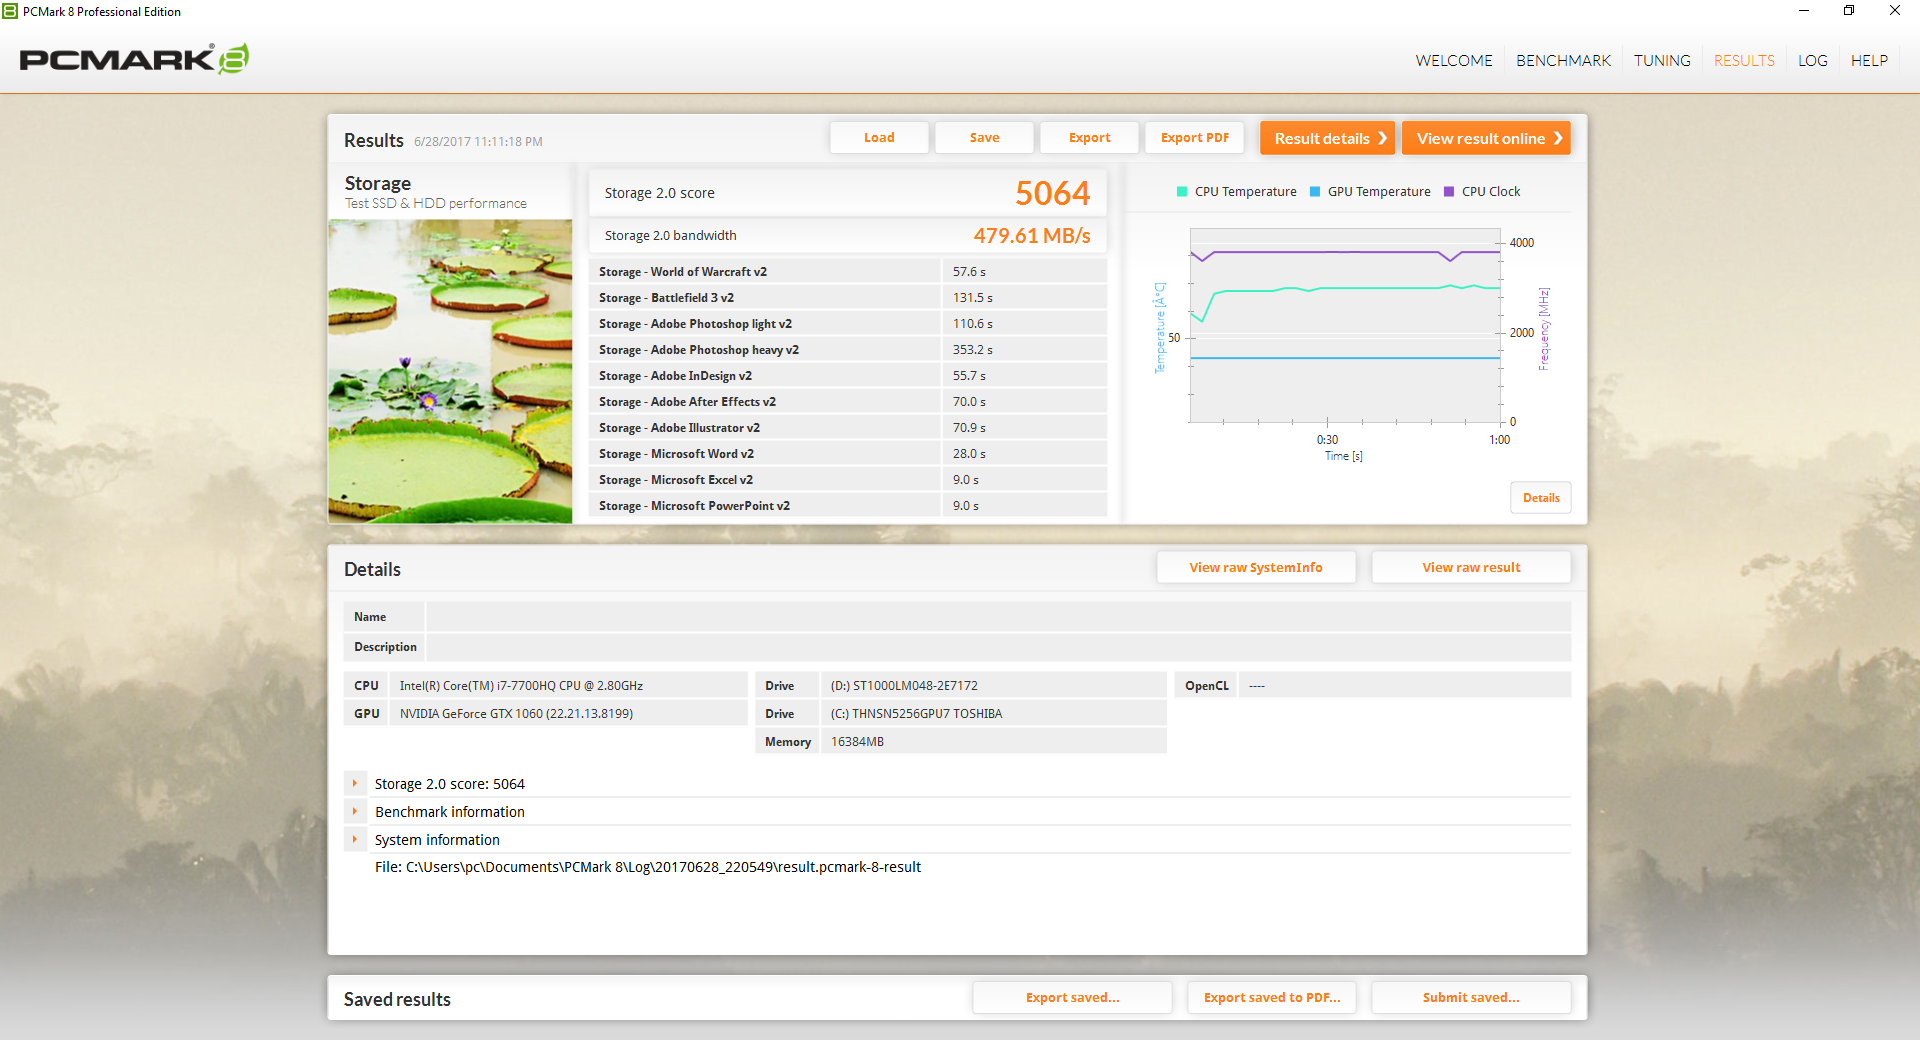
PCMark 8 ranks the EVGA within single-digit percentages from the Aorus X5 v6 and significantly higher than the new MacBook Pro 15. Subjectively, the system runs smoothly with no notable software hitches.
| PCMark 8 | |
| Home Score Accelerated v2 | |
| EVGA SC15 | |
| Aorus X5 v6 | |
| Apple MacBook Pro 15 2017 (2.8 GHz, 555) | |
| Work Score Accelerated v2 | |
| EVGA SC15 | |
| Aorus X5 v6 | |
| Apple MacBook Pro 15 2017 (2.8 GHz, 555) | |
| Creative Score Accelerated v2 | |
| Aorus X5 v6 | |
| EVGA SC15 | |
| Apple MacBook Pro 15 2017 (2.8 GHz, 555) | |
| PCMark 8 Home Score Accelerated v2 | 5085 points | |
| PCMark 8 Creative Score Accelerated v2 | 7505 points | |
| PCMark 8 Work Score Accelerated v2 | 5400 points | |
Help | ||
Storage Devices
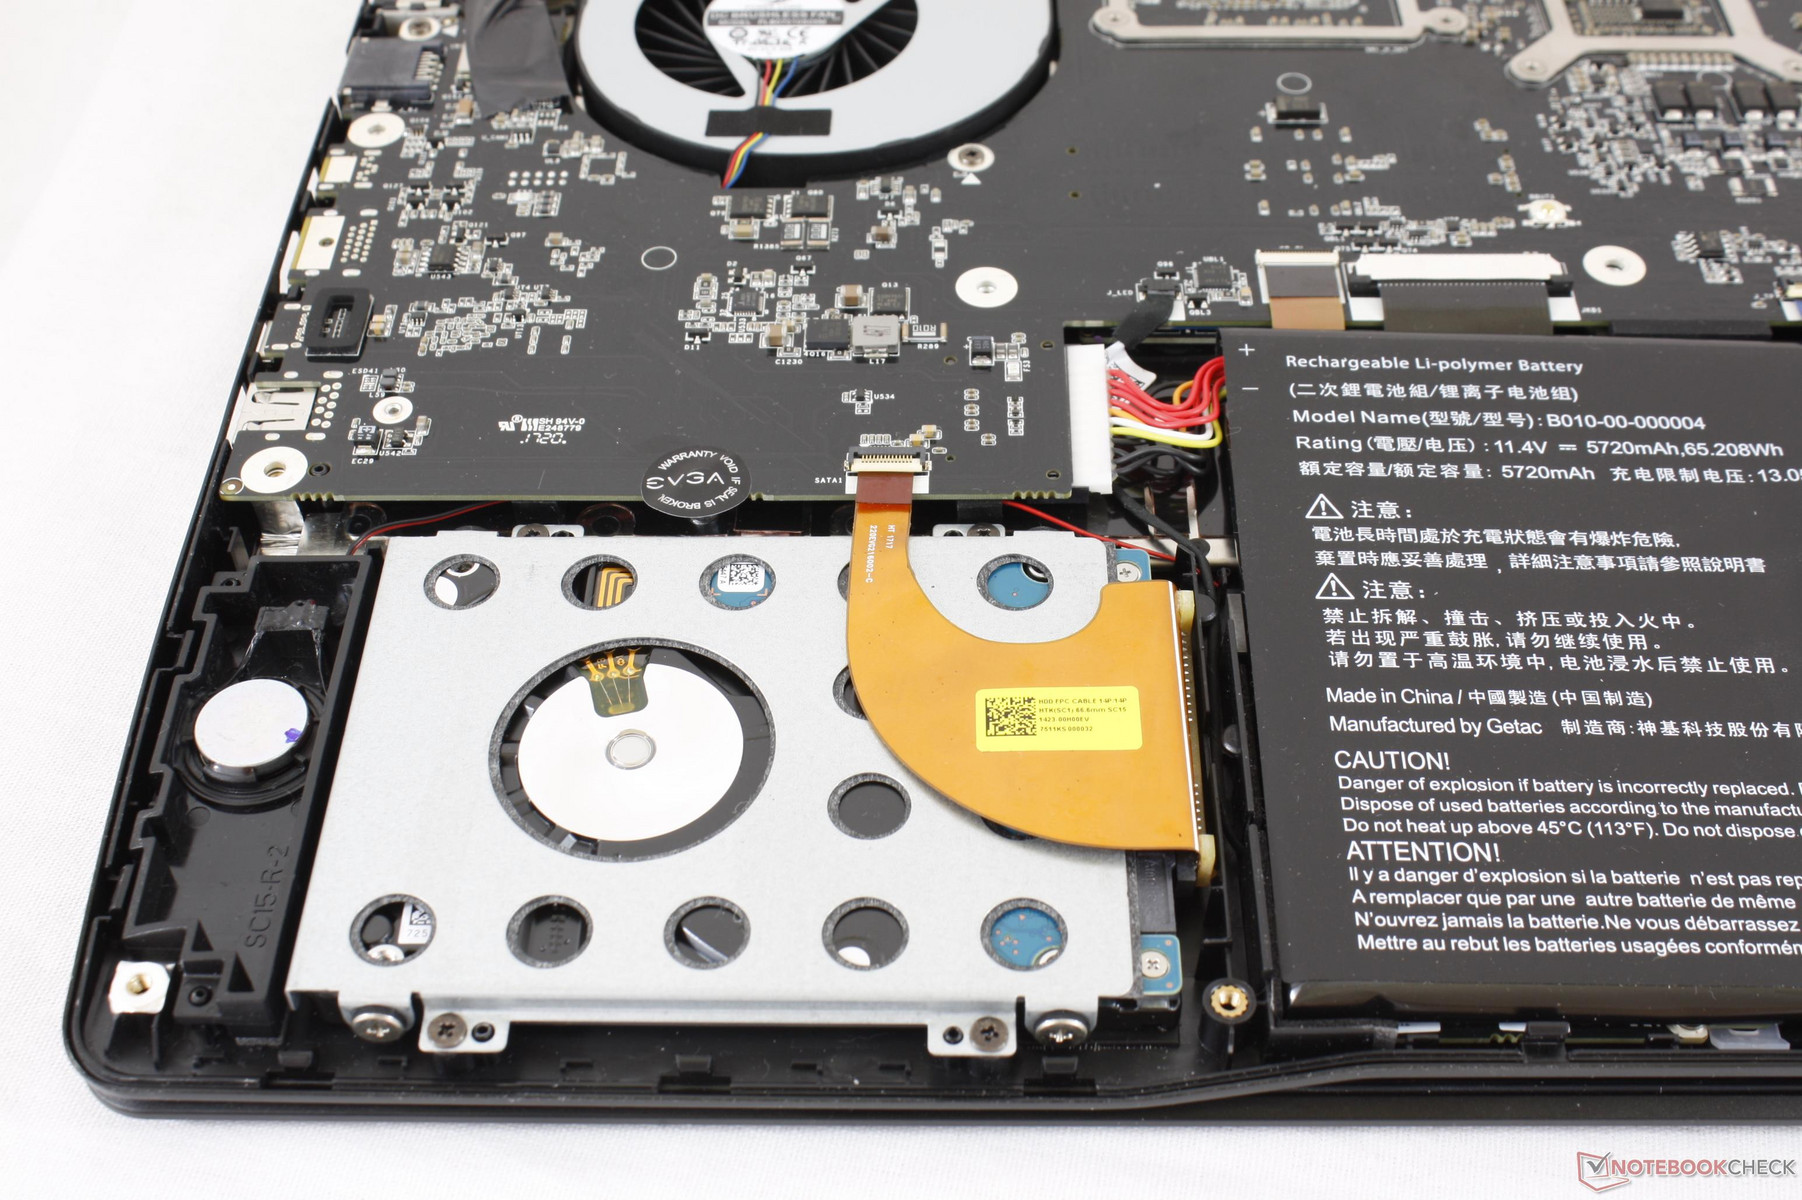
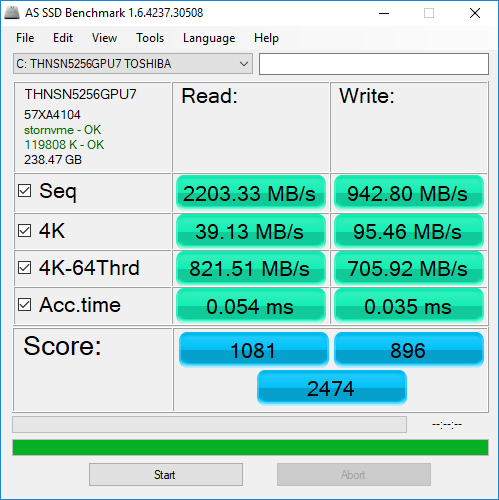
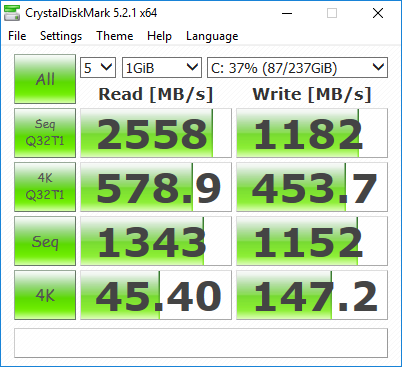
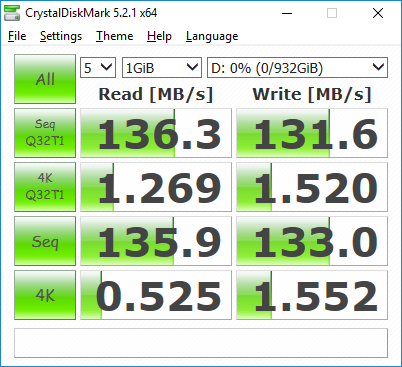
Our test system is equipped with a primary 256 GB Toshiba THNSN5256GPU7 NVMe SSD and a secondary 1 TB Seagate ST1000LM048 HDD. Only the secondary 2.5-inch SATA slot is immediately accessible while the primary M.2 SSD will require further disassembly. We recommend using 7 mm drives if replacing or upgrading as 9.5 mm drives may be too tight of a fit. Users who want more than two internal storage bays may want to consider the Eurocom Sky MX5 or Alienware 15 instead.
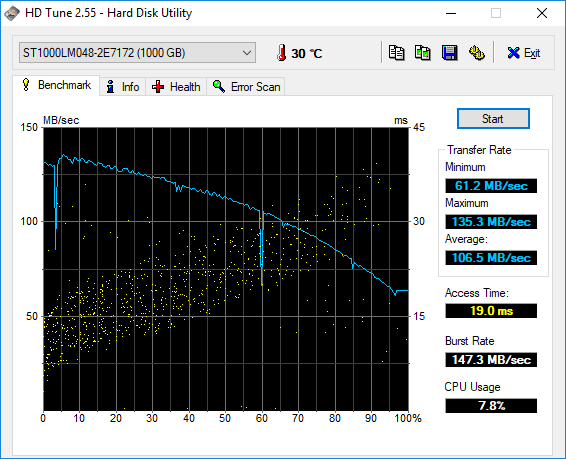
Read and write rates from the Toshiba SSD are significantly faster than any SATA III SSD or HDD as expected. Its average sequential write rate of 943 MB/s, however, is noticeably slower than the Samsung SM951 found on many other gaming notebooks and flagship Ultrabooks. Meanwhile, the Seagate HDD returns an average transfer rate of 106.5 MB/s according to HD Tune, which is above average for a 5400 RPM drive.
See our table of HDDs and SSDs for more benchmark comparisons.
| EVGA SC15 Toshiba NVMe THNSN5256GPU7 | MSI GS63VR 7RF-228US Samsung SM961 MZVKW512HMJP m.2 PCI-e | Aorus X5 v6 Samsung SM951 MZVPV256 m.2 | Dell XPS 15 9560 (i7-7700HQ, UHD) Lite-On CX2-8B512-Q11 | Aorus X7 DT v6 Samsung SM951 MZVPV512HDGL m.2 PCI-e | |
|---|---|---|---|---|---|
| AS SSD | 37% | -56% | 9% | 17% | |
| Copy Game MB/s (MB/s) | 977 | 1082 11% | 1073 10% | 540 -45% | 1134 16% |
| Copy Program MB/s (MB/s) | 442.3 | 401.9 -9% | 351.5 -21% | 411.5 -7% | 502 13% |
| Copy ISO MB/s (MB/s) | 1071 | 1666 56% | 351.1 -67% | 1272 19% | 1482 38% |
| Score Total (Points) | 2474 | 3756 52% | 1630 -34% | 2810 14% | 2695 9% |
| Score Write (Points) | 896 | 1468 64% | 514 -43% | 1022 14% | 665 -26% |
| Score Read (Points) | 1081 | 1549 43% | 756 -30% | 1206 12% | 1353 25% |
| Access Time Write * (ms) | 0.035 | 0.029 17% | 0.025 29% | 0.034 3% | 0.025 29% |
| Access Time Read * (ms) | 0.054 | 0.041 24% | 0.367 -580% | 0.034 37% | 0.047 13% |
| 4K-64 Write (MB/s) | 706 | 1185 68% | 272.5 -61% | 789 12% | 366.9 -48% |
| 4K-64 Read (MB/s) | 822 | 1229 50% | 521 -37% | 962 17% | 1107 35% |
| 4K Write (MB/s) | 95.5 | 127.6 34% | 131.3 37% | 112.2 17% | 149.1 56% |
| 4K Read (MB/s) | 39.13 | 48.01 23% | 44.6 14% | 41.34 6% | 48.93 25% |
| Seq Write (MB/s) | 943 | 1550 64% | 1099 17% | 1207 28% | 1494 58% |
| Seq Read (MB/s) | 2203 | 2719 23% | 1904 -14% | 2026 -8% | 1971 -11% |
* ... smaller is better

GPU Performance
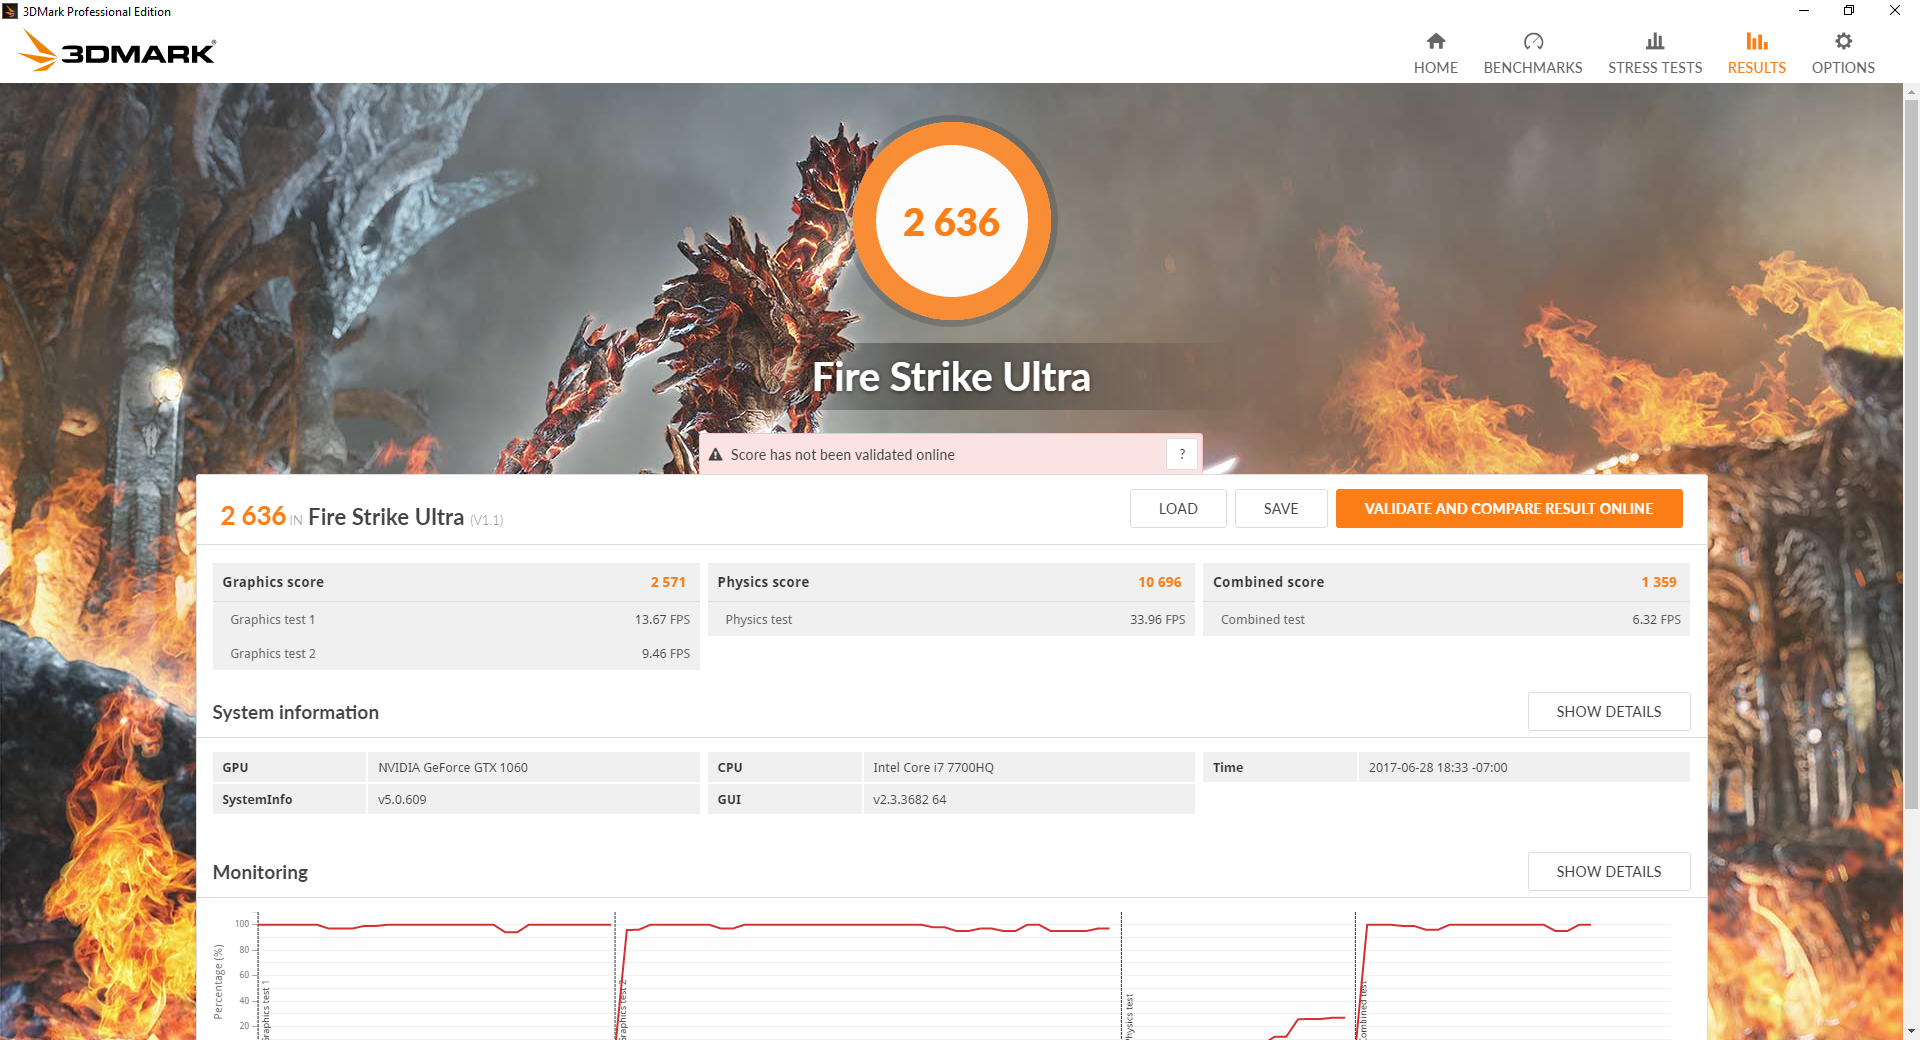
The GTX 1060 in the SC15 performs about the same as the Lenovo Legion Y520 according to 3DMark benchmarks and is around 12 percent slower than our reference desktop GTX 1060. Jumping to the GTX 1080 Max-Q or GTX 1070 will bring a performance boost of about 60 percent each over the GTX 1060. Users upgrading from older mid-range notebooks equipped with Maxwell GPUs will experience even greater performance boosts with the SC15.
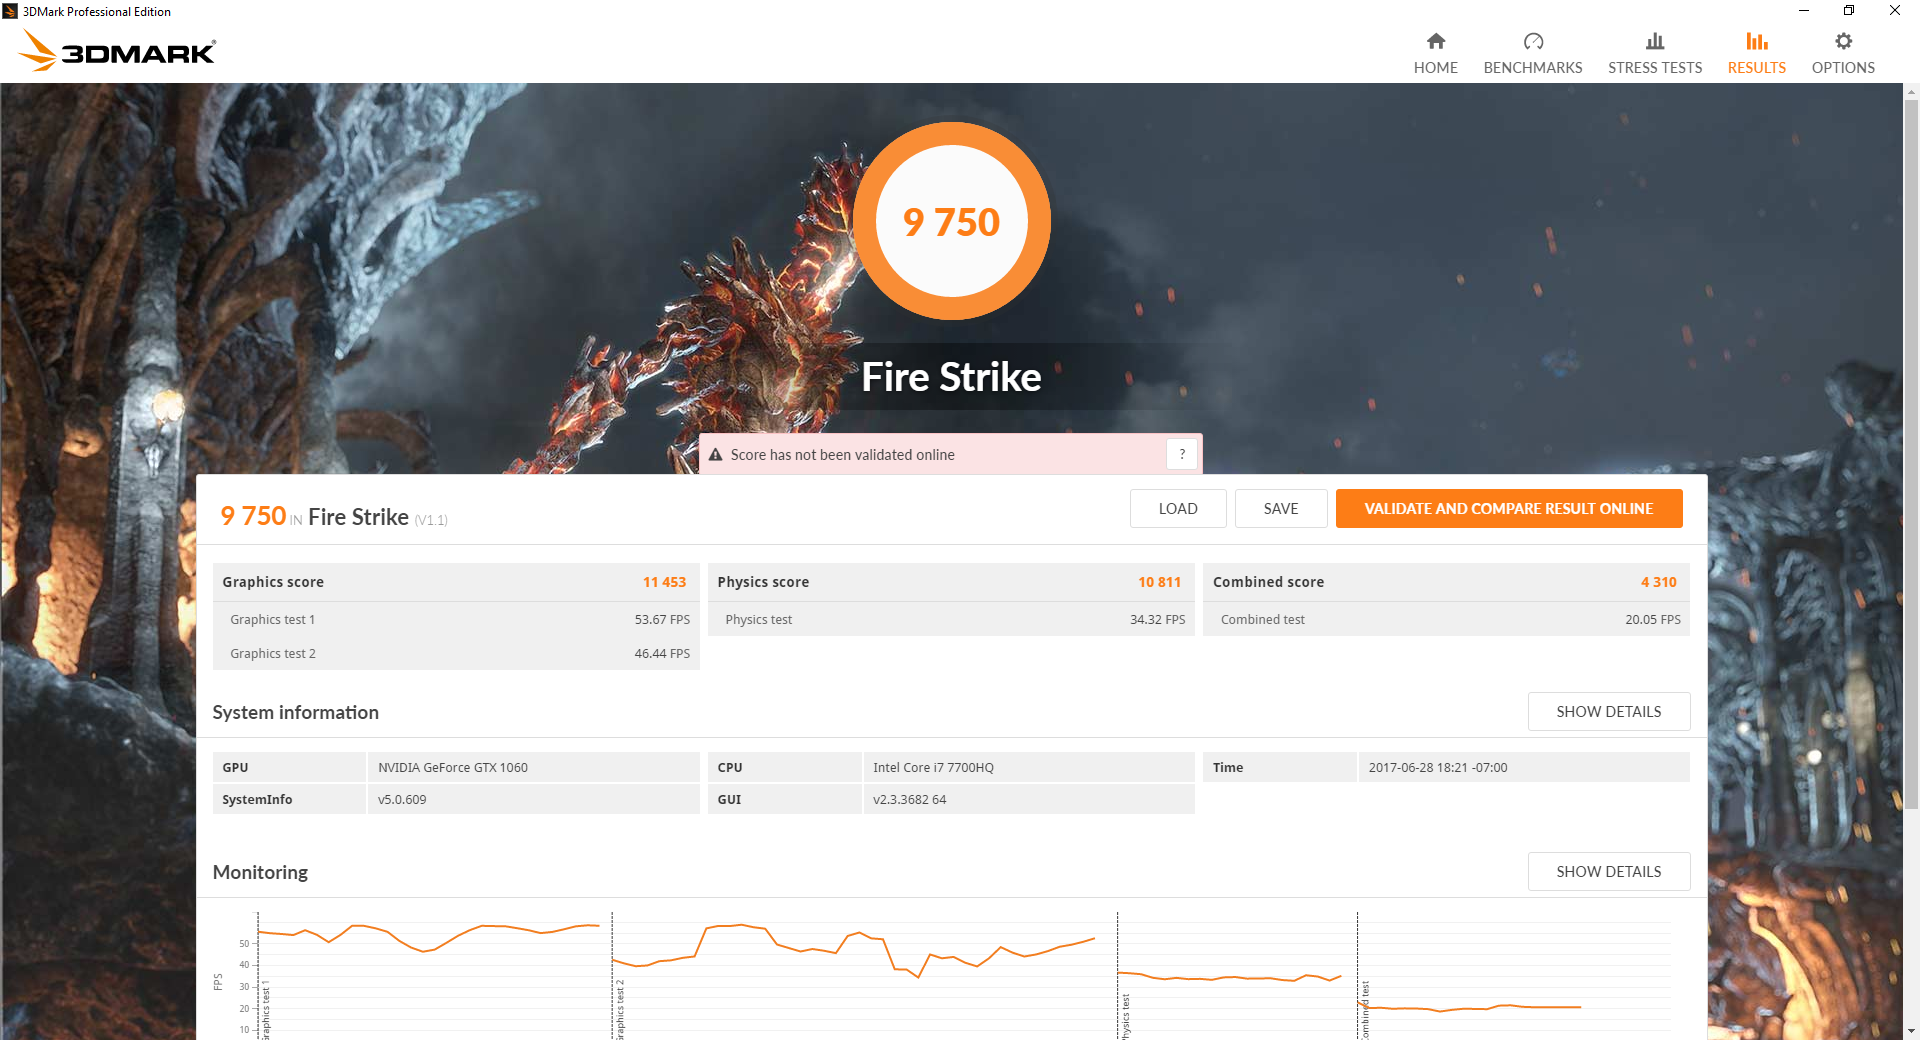
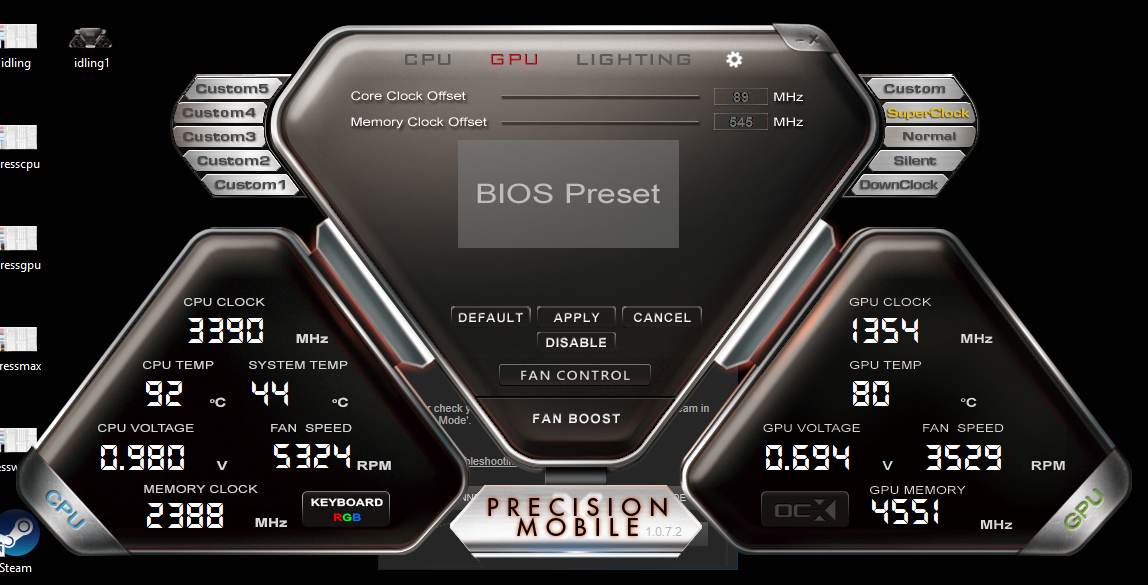
Activating the preset "Superclock" feature to automatically overclock the GPU by 89/545 MHz (core/memory) will boost the Fire Strike Graphics score from 11453 points to 12019 points. It's quite the modest uptick at just under 5 percent, but users can of course overclock further if desired.
See our dedicated review of the GTX 1060 for more information of the Pascal series.
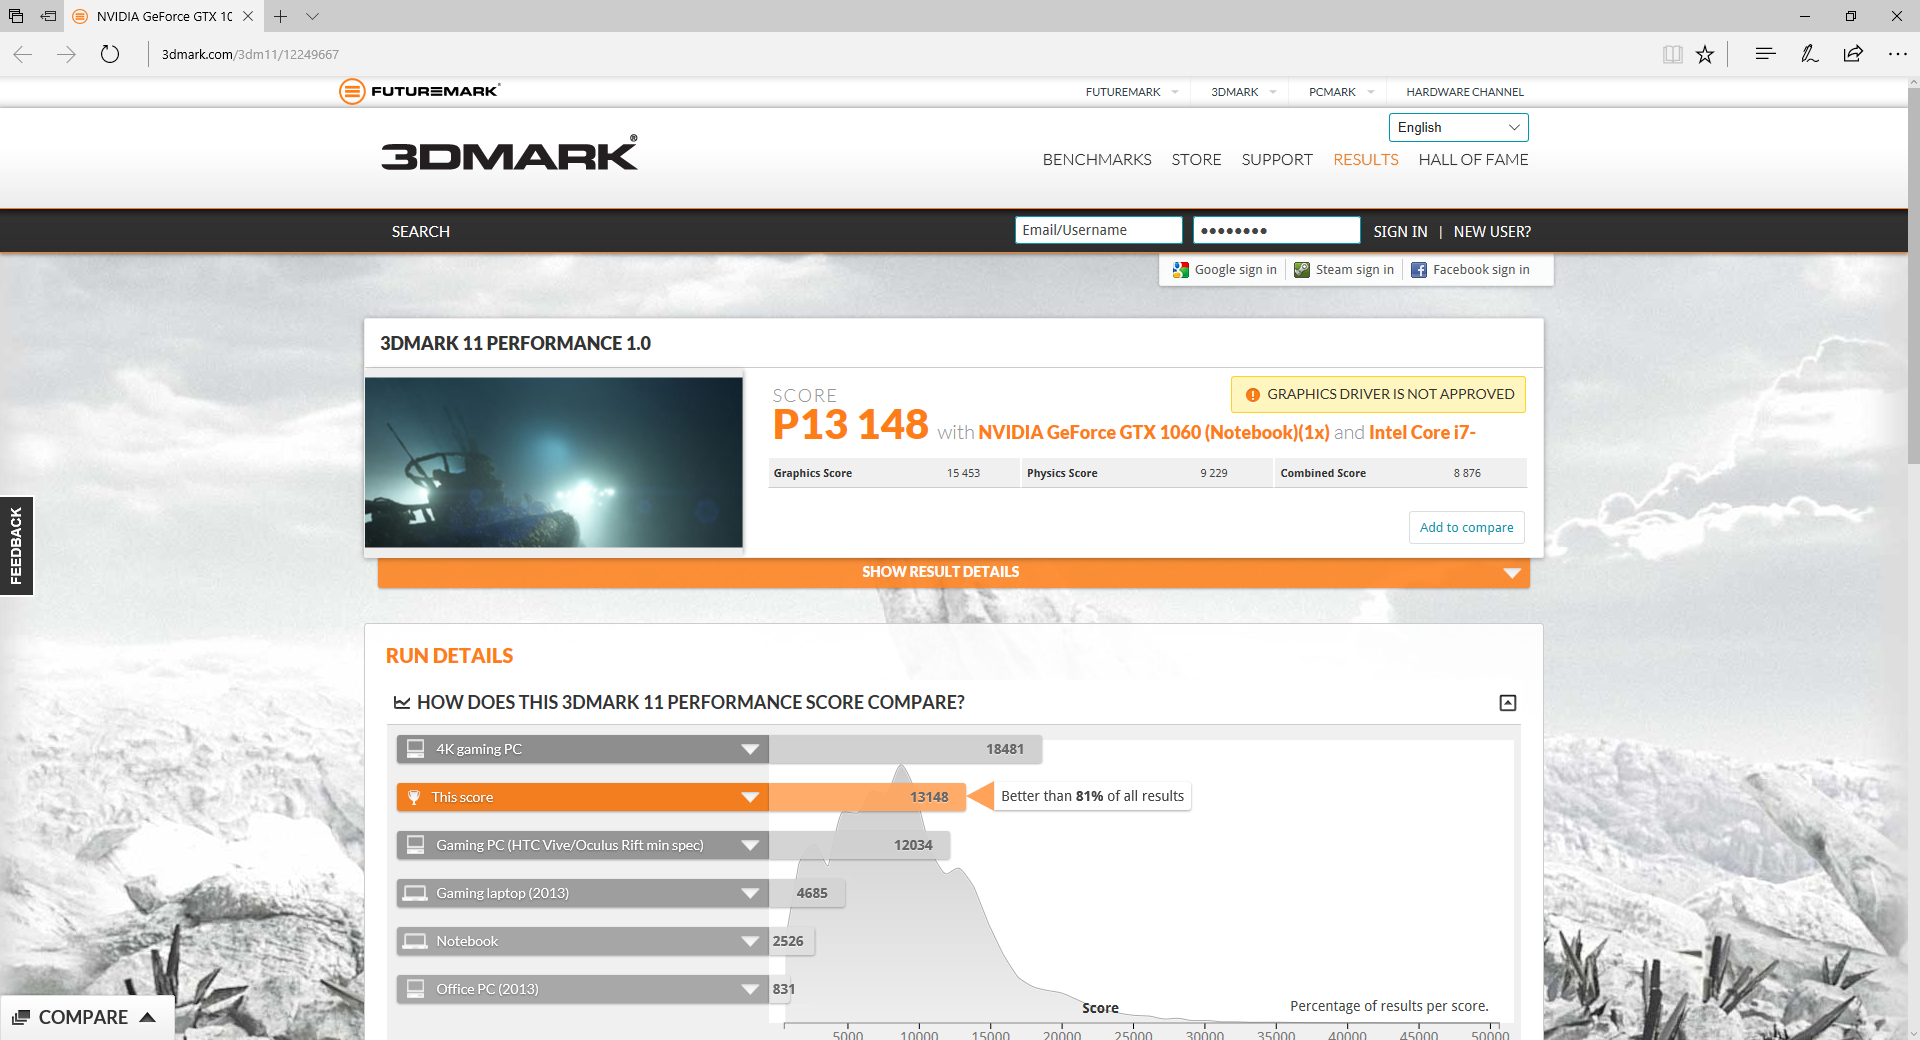
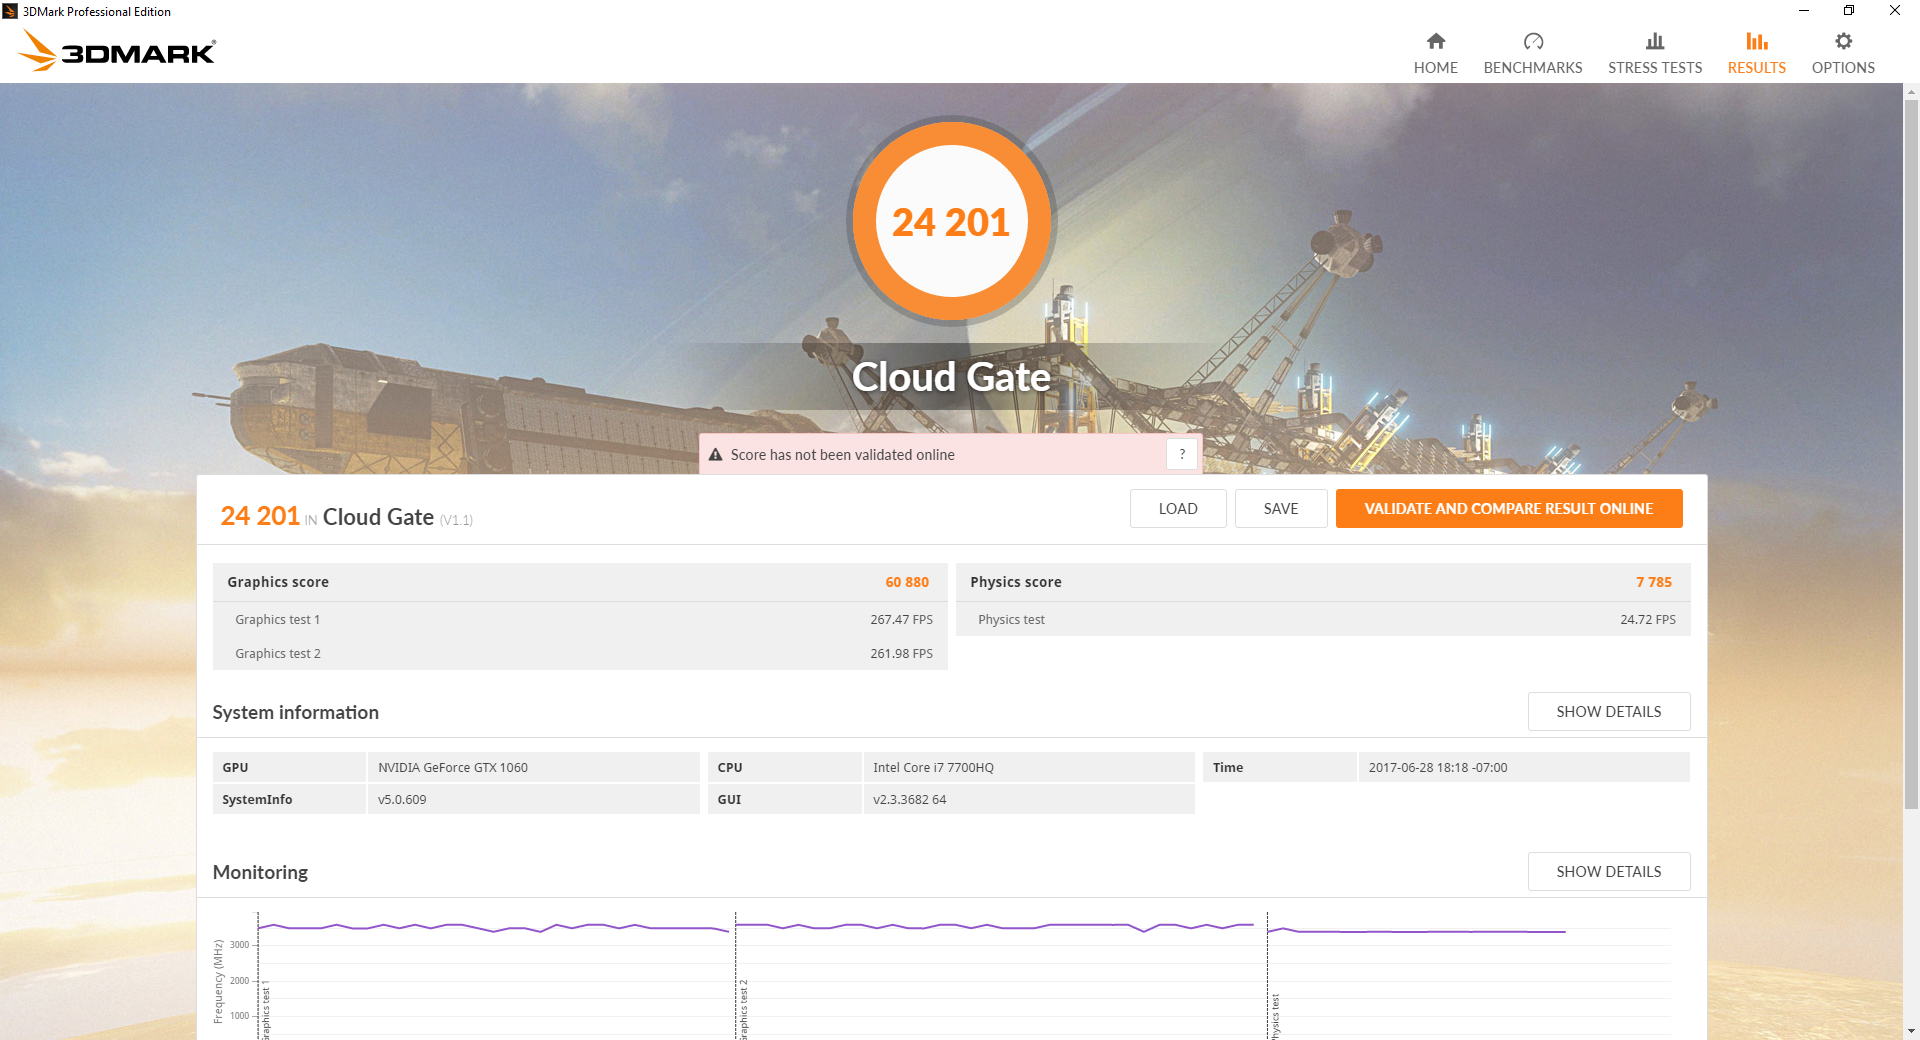

| 3DMark 11 Performance | 13148 points | |
| 3DMark Ice Storm Standard Score | 110194 points | |
| 3DMark Cloud Gate Standard Score | 24201 points | |
| 3DMark Fire Strike Score | 9750 points | |
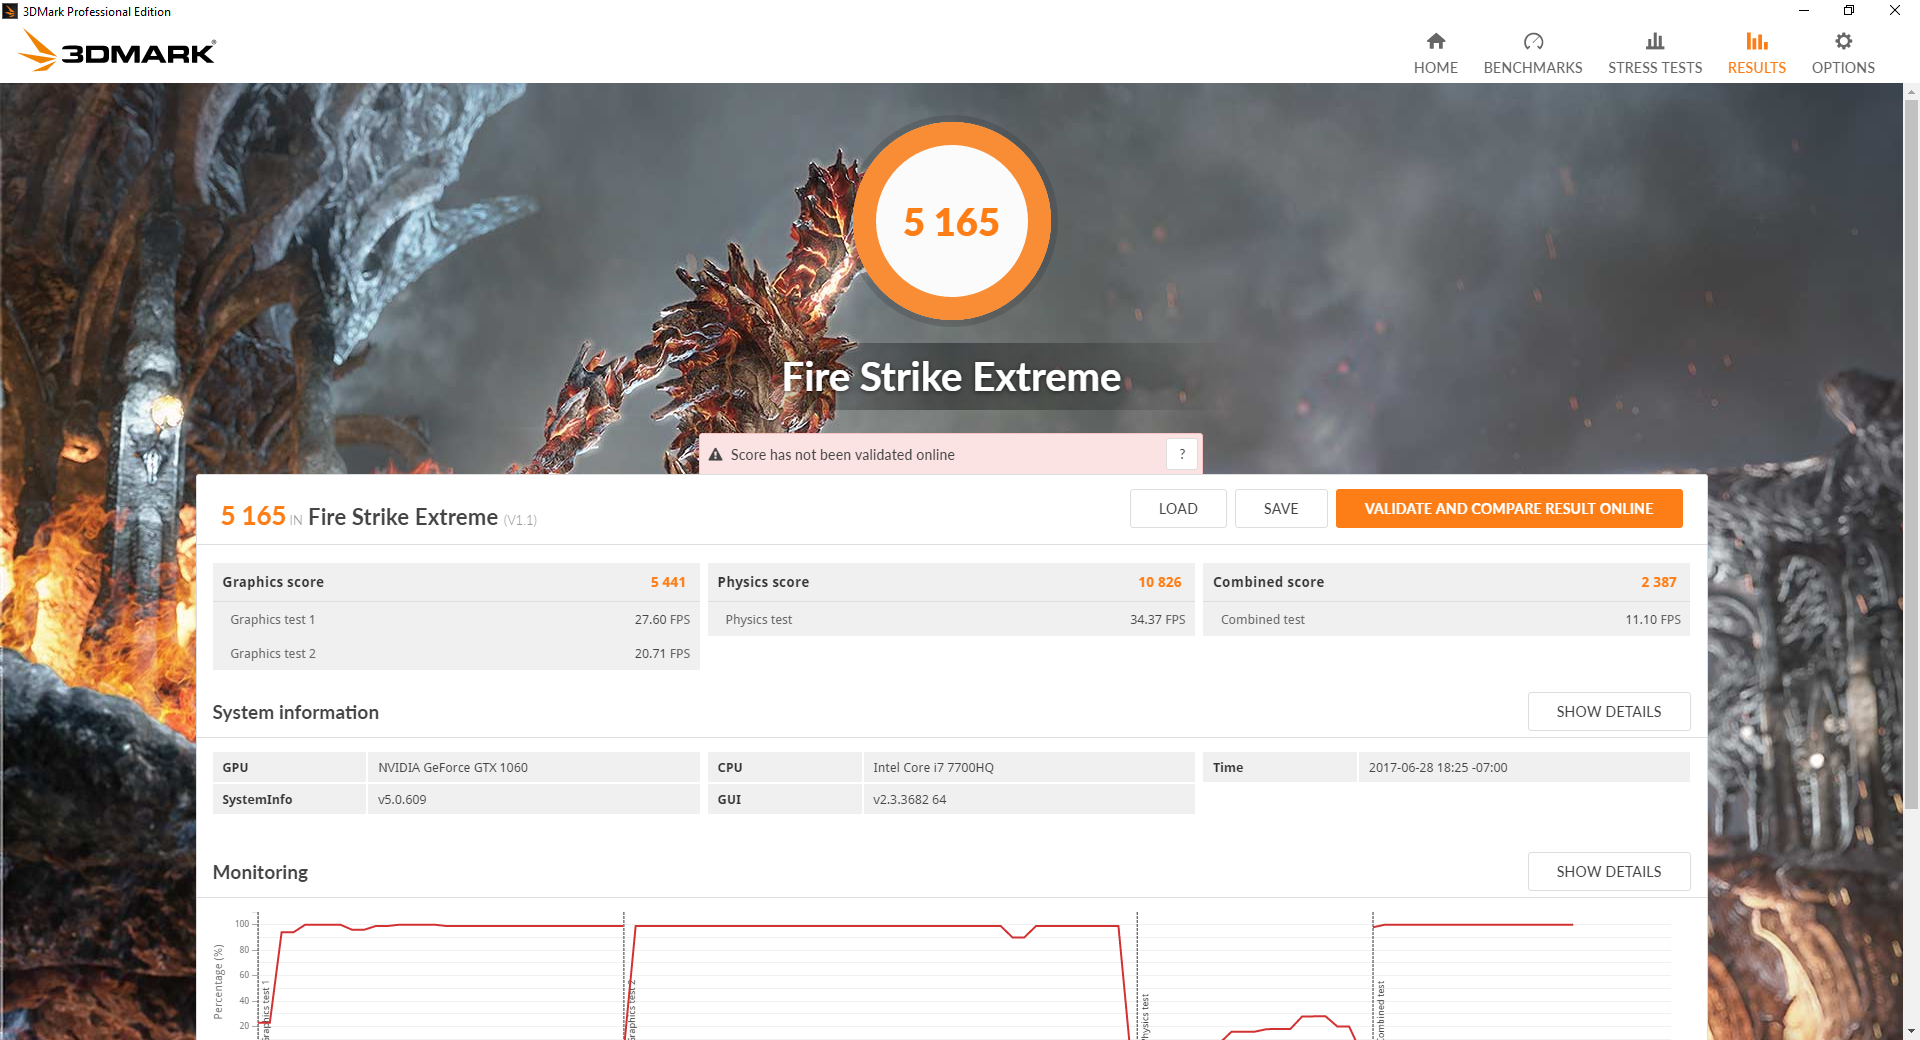
| 3DMark Fire Strike Extreme Score | 5165 points | |
Help | ||
Gaming Performance
The mobile GTX 1060 in the SC15 performs on the same level as our desktop GTX 1060 and the Aorus X3 Plus v7 equipped with the same GPU in Rise of the Tomb Raider despite the >10 percent difference in 3DMark scores between the SC15 and desktop GTX 1060. Most titles will run at 1080p60 on maximum settings without any issues while a select few like The Witcher 3 or Mafia 3 will have to dial back certain settings to achieve a smooth 60 FPS. Even so, frame drops in the 40 to 50 FPS range will not result in heavy screen tears due to both G-Sync and the native 120 Hz panel.
See our GTX 1060 GPU page for more technical information and benchmark comparisons.
| low | med. | high | ultra | |
|---|---|---|---|---|
| BioShock Infinite (2013) | 110 | |||
| Metro: Last Light (2013) | 82.7 | |||
| Thief (2014) | 79 | |||
| The Witcher 3 (2015) | 66 | 39.6 | ||
| Batman: Arkham Knight (2015) | 89 | 62 | ||
| Metal Gear Solid V (2015) | 60 | |||
| Dota 2 Reborn (2015) | 117.9 | |||
| Fallout 4 (2015) | 70.8 | |||
| Rise of the Tomb Raider (2016) | 66.8 | |||
| Ashes of the Singularity (2016) | 63.7 | 59.2 | ||
| Doom (2016) | 98.4 | |||
| Overwatch (2016) | 103.9 | |||
| Mafia 3 (2016) | 41 | |||
| Prey (2017) | 110.3 |
| Rise of the Tomb Raider - 1920x1080 Very High Preset AA:FX AF:16x | |
| EVGA SC17 GTX 1070 | |
| Nvidia GeForce GTX 1060 Founders Edition 6 GB | |
| Nvidia GeForce GTX 1060 Founders Edition 6 GB | |
| EVGA SC15 | |
| Aorus x3 Plus v7 | |
| EVGA SC17 | |
| Asus Strix GL502VT-DS74 | |
| HP Omen 15-ax213ng | |
| HP Pavilion 17 FHD V3A33AV | |
Stress Test
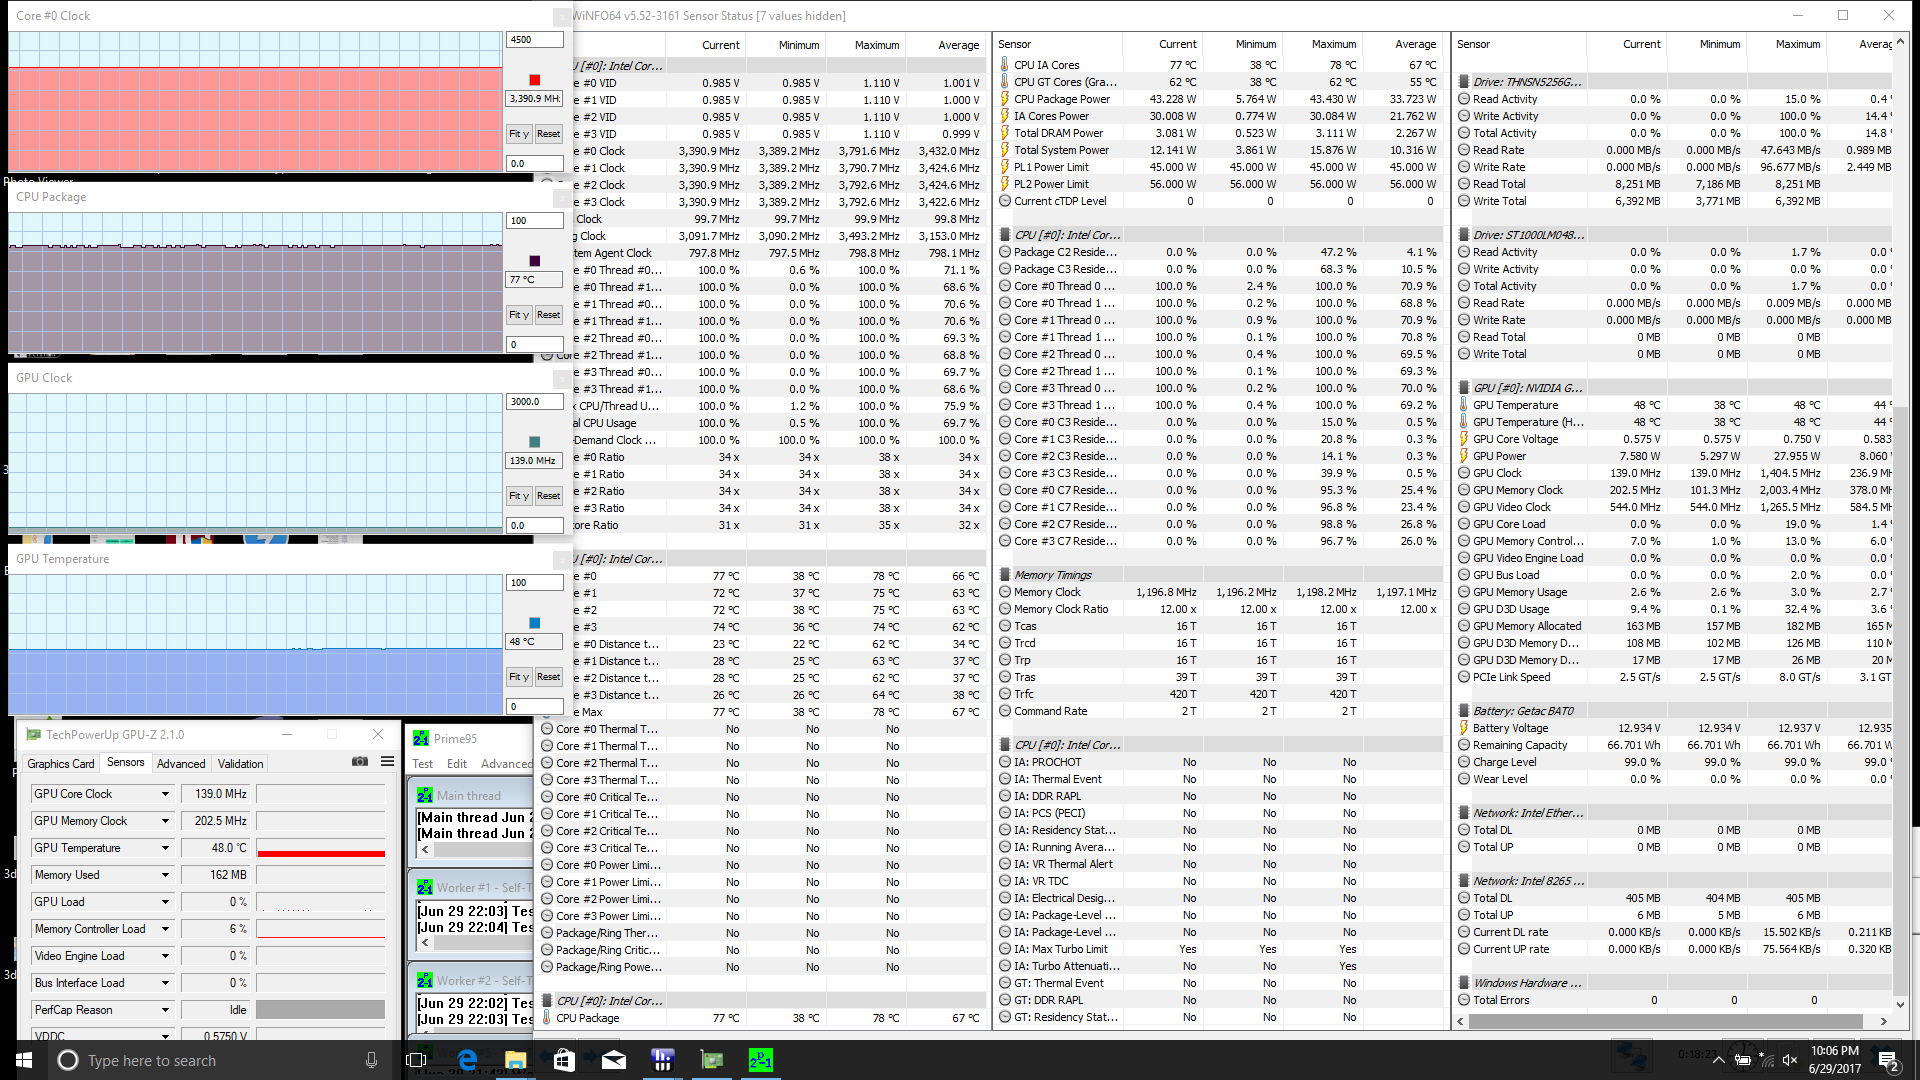
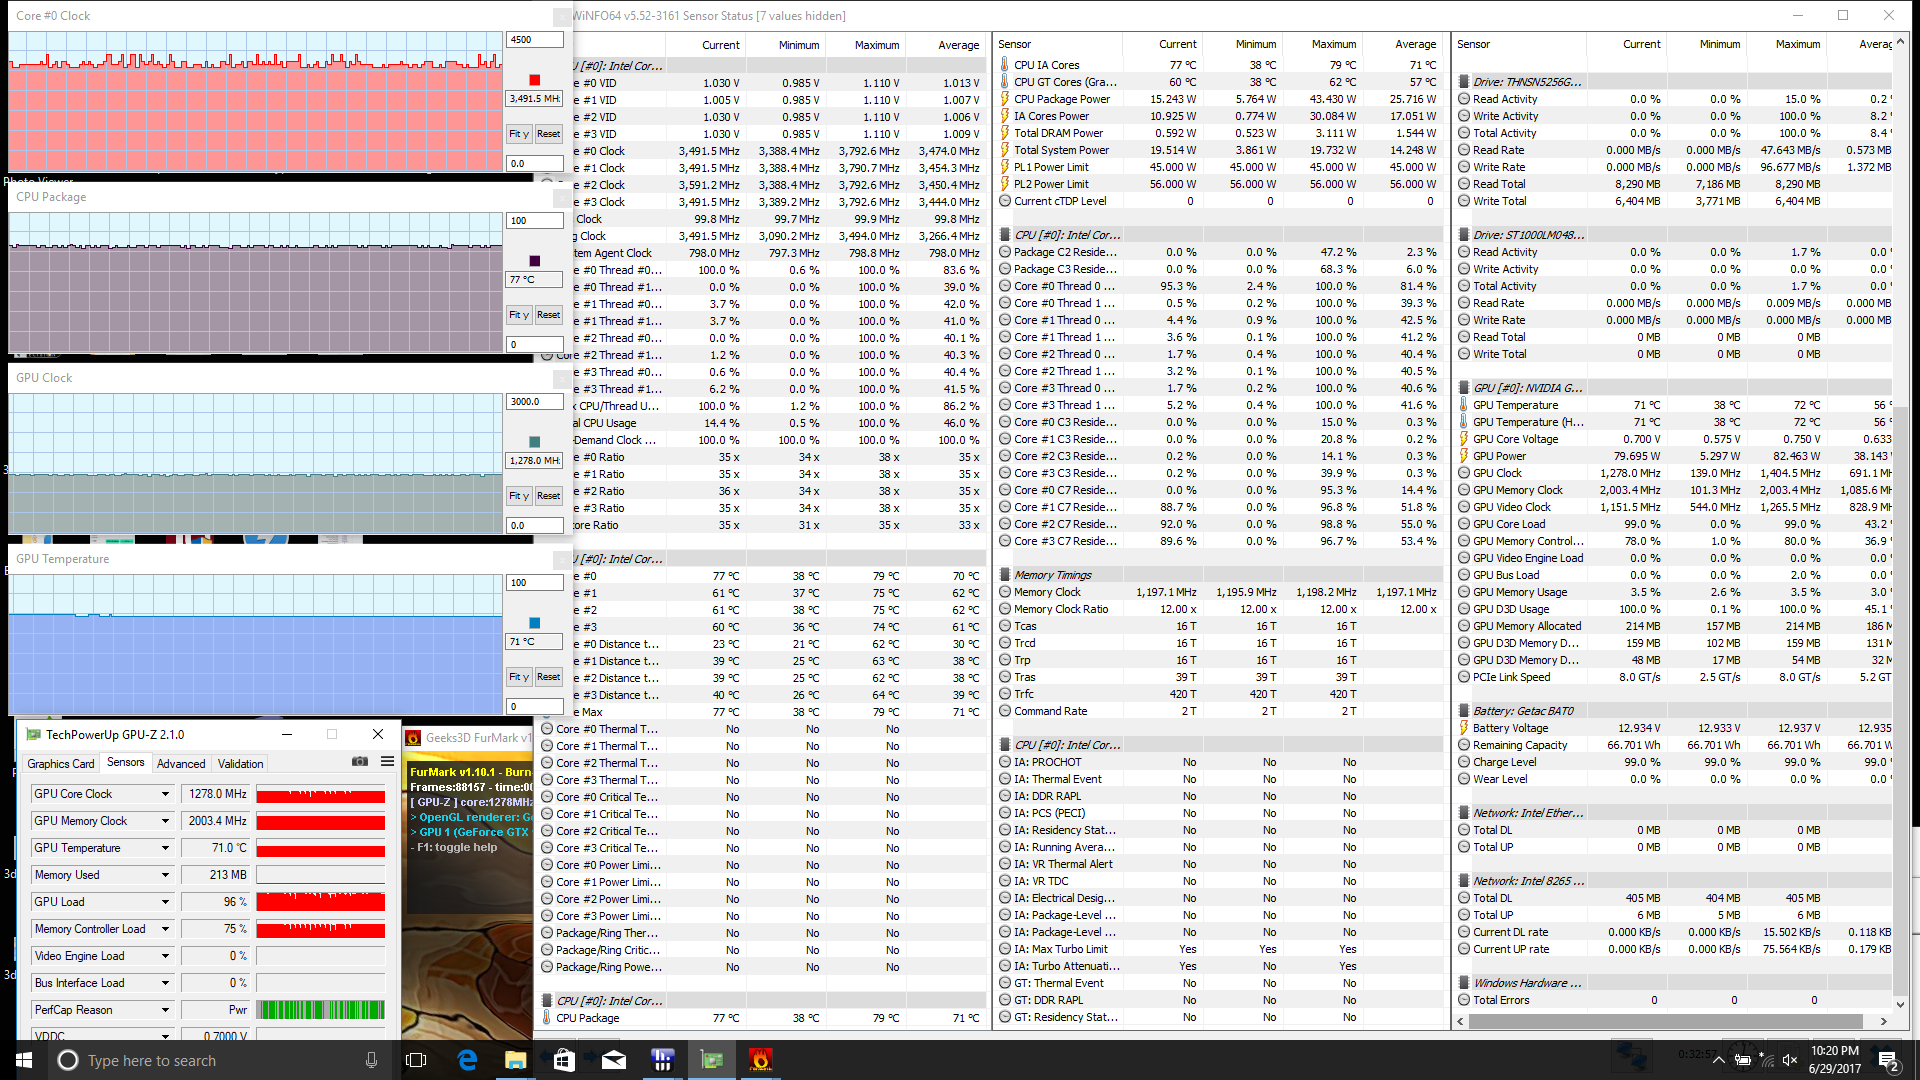
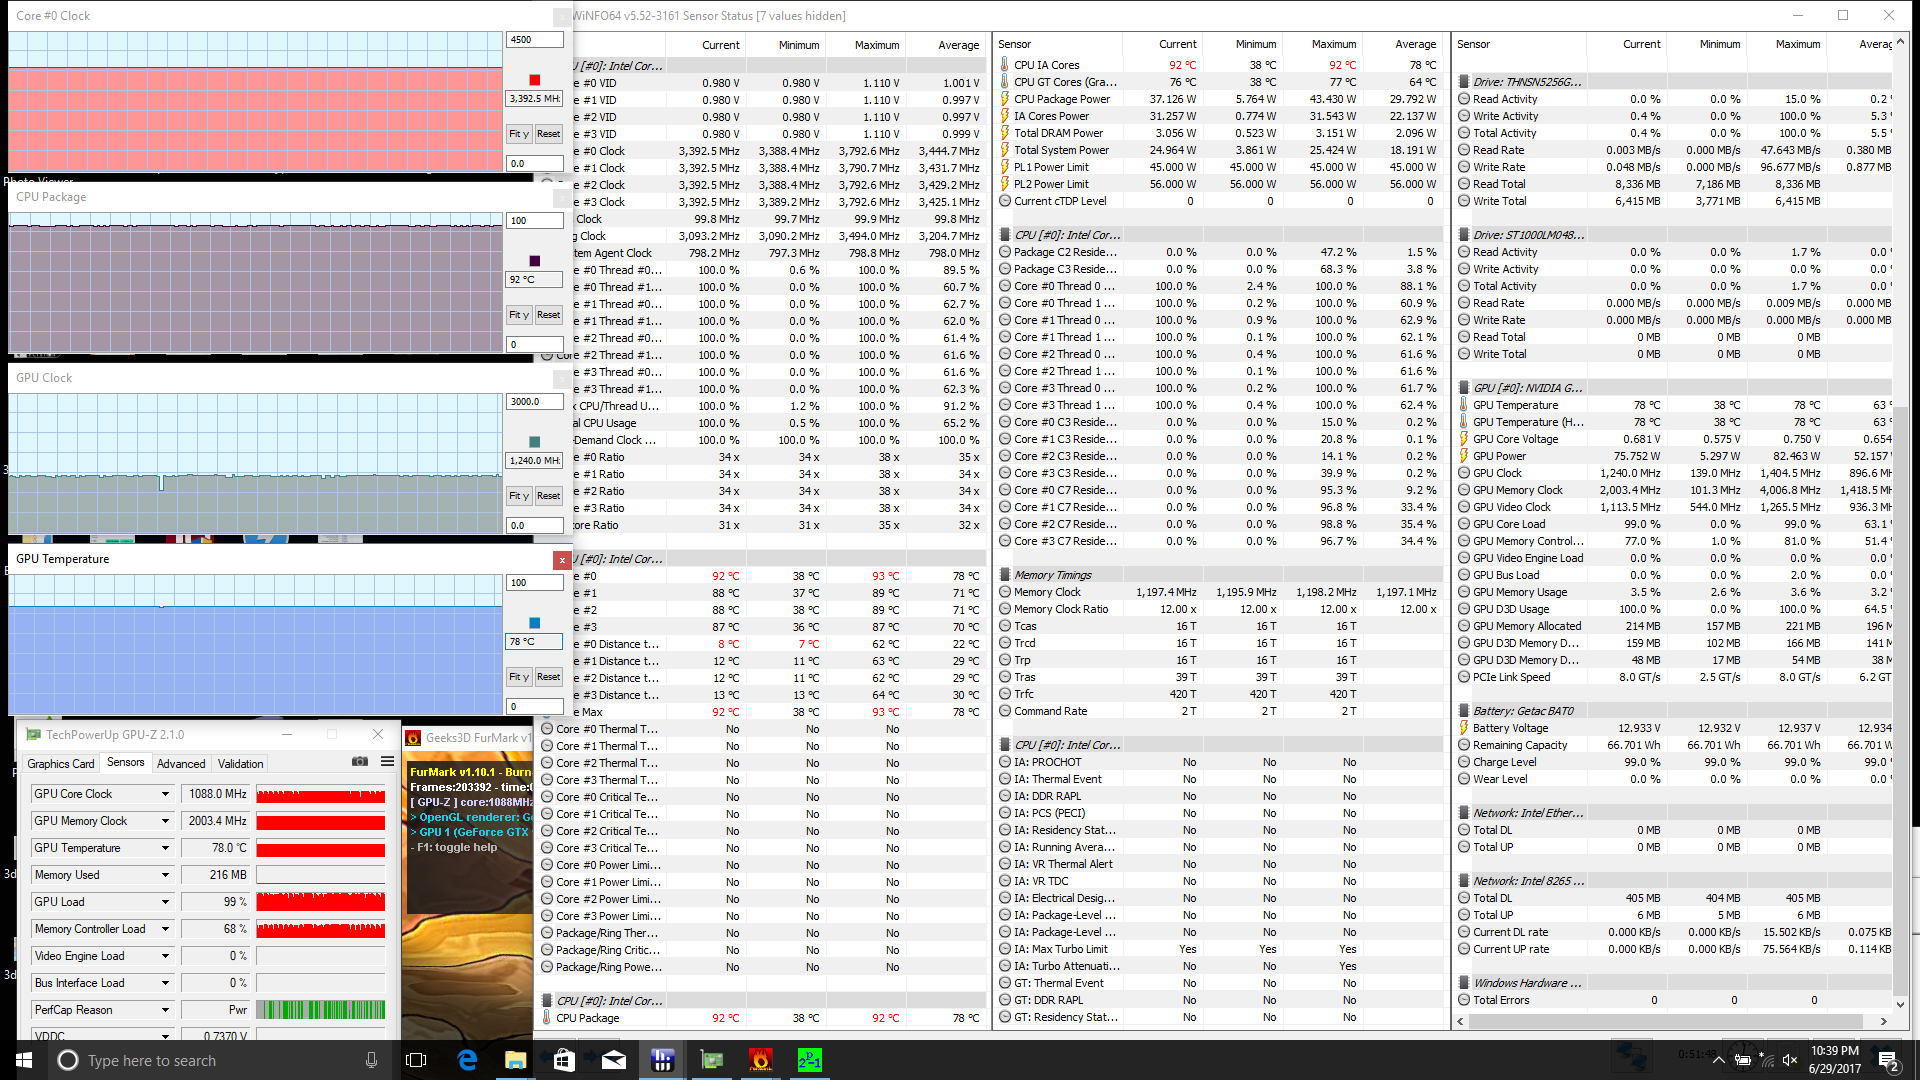
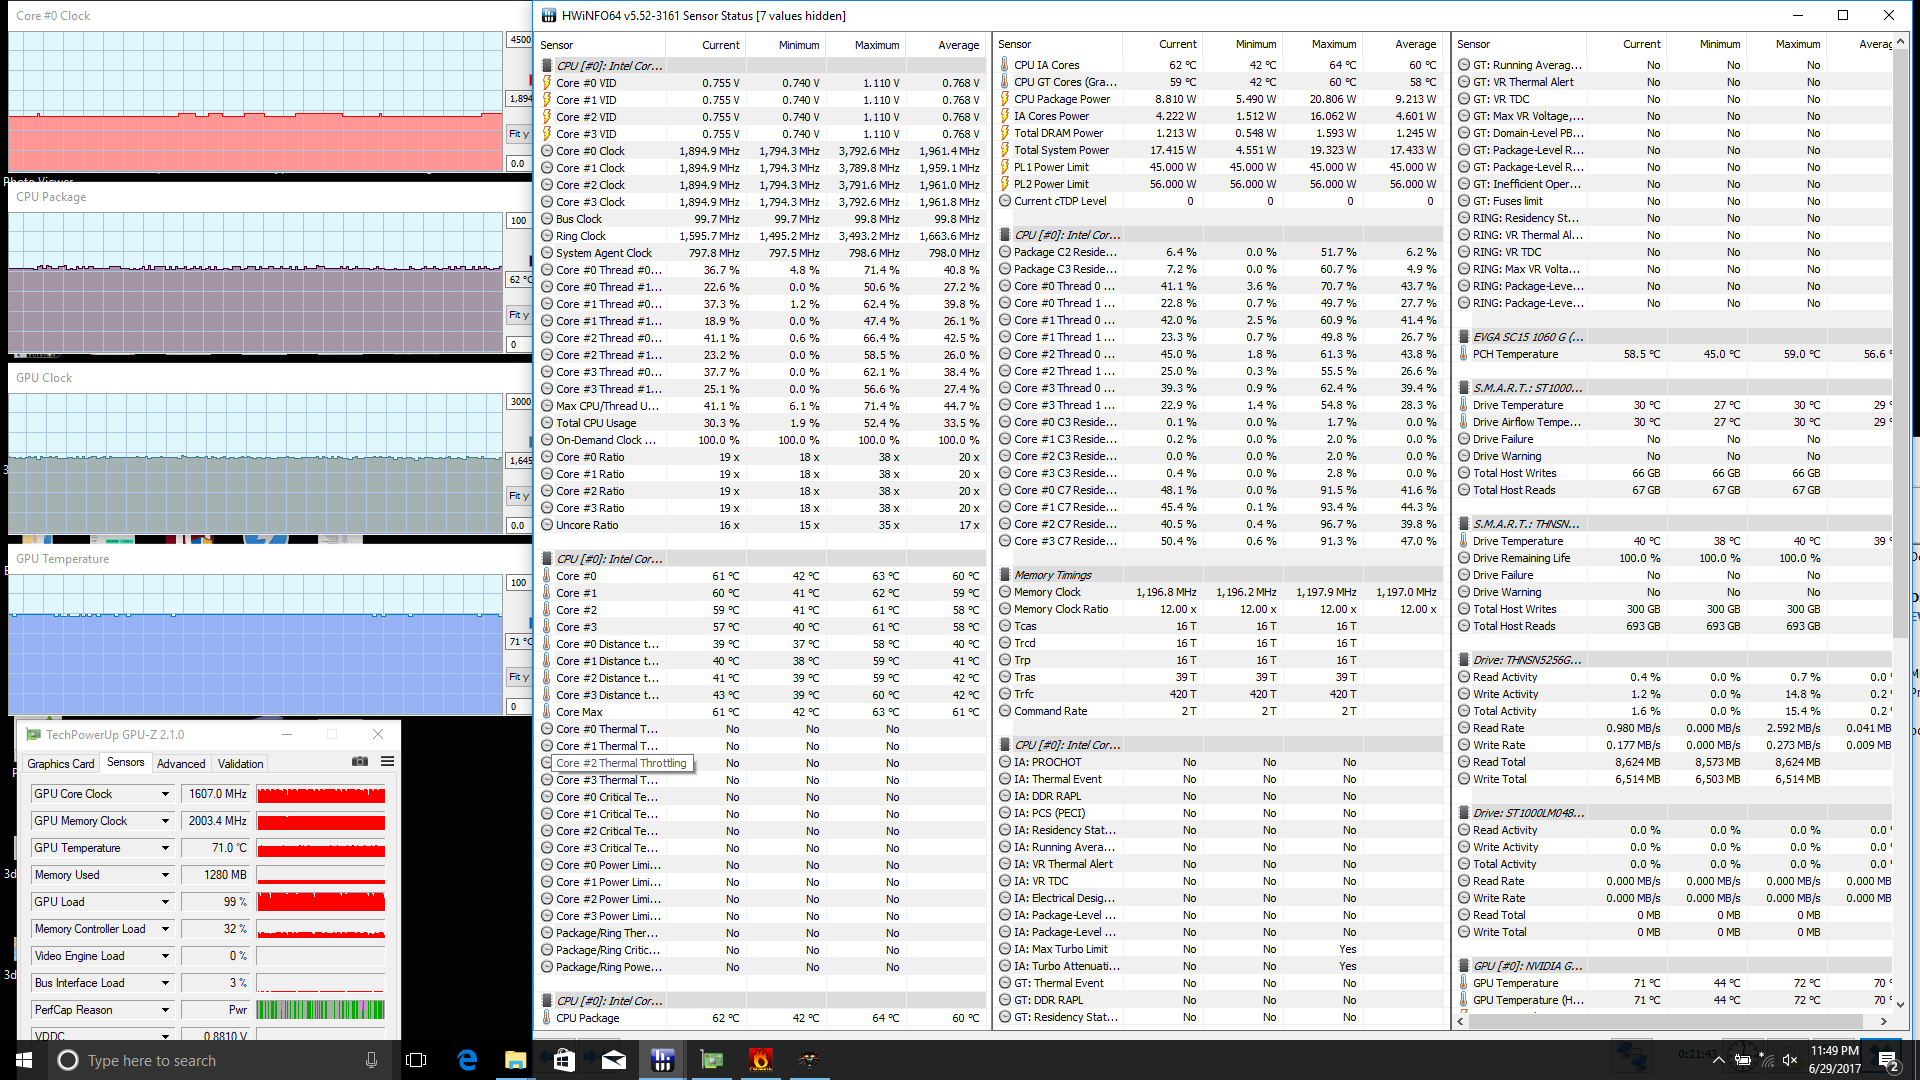
We stress the notebook to identify for any potential throttling or hardware issues. The CPU runs stably at its maximum multi-core Turbo Boost of 3.4 GHz when Prime95 is active and even when both Prime95 and FurMark are running simultaneously. Core temperature can be as warm as 92 C when under such unrealistic loads while the GPU remains under 80 C. Note that this is without "SuperClock" activated and so the GPU can potentially run warmer than 80 C should users choose to overclock it.
Witcher 3 is more representative of real-world gaming stress compared to FurMark or Unigine Valley. The CPU can be observed running at just 1.9 GHz and a cool stable core temperature of only 62 C compared to over 90 C on the Alienware 17 R4 under the same conditions. Unfortunately, our test shows periodic drops in frame rates to 32 or 33 FPS every few minutes or so as represented by the graph below. The regular consistency of this behavior suggests interference from pre-installed software activity that may be running in the background. Most other gaming notebooks we've tested under these same Witcher 3 conditions do not exhibit this phenomenon.
Running on batteries will heavily throttle both the CPU and GPU. A 3DMark Fire Strike run on battery power returns Physics and Graphics scores of 9450 and 3586 points, respectively, compared to 10811 and 11453 points when on mains.
| CPU Clock (GHz) | GPU Clock (MHz) | Average CPU Temperature (°C) | Average GPU Temperature (°C) | |
| Prime95 Stress | 3.4 | -- | 77 | 48 |
| FurMark Stress | -- | 1278 | 77 | 71 |
| Prime95 + FurMark Stress | 3.4 | 1088 - 1240 | 92 | 78 |
| Witcher 3 Stress | 1.9+ | 1607 - 1645 | 62 | 71 |
Emissions
System Noise
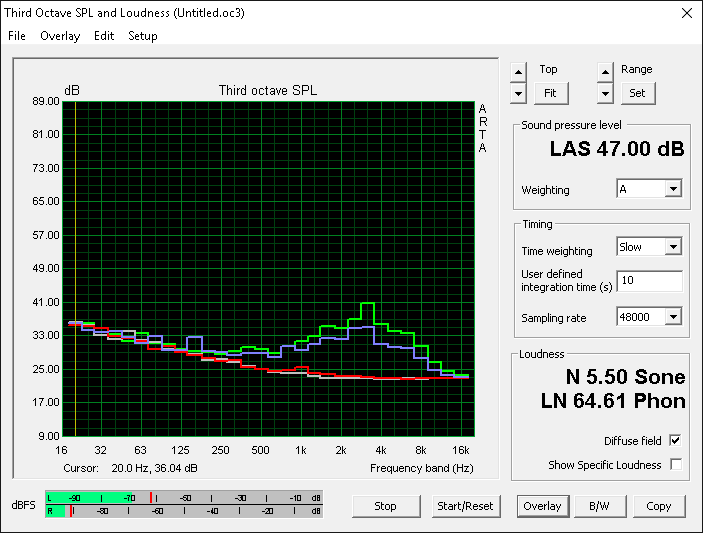
Both system fans are always active and audible at around 32 dB(A) during very low processing loads not unlike most high-end gaming notebooks. While complete silence is always more desirable, the fans here are thankfully lethargic and not very sensitive to low-medium processing loads. Thus, users can multi-task and stream video without constantly pulsing fan noises.
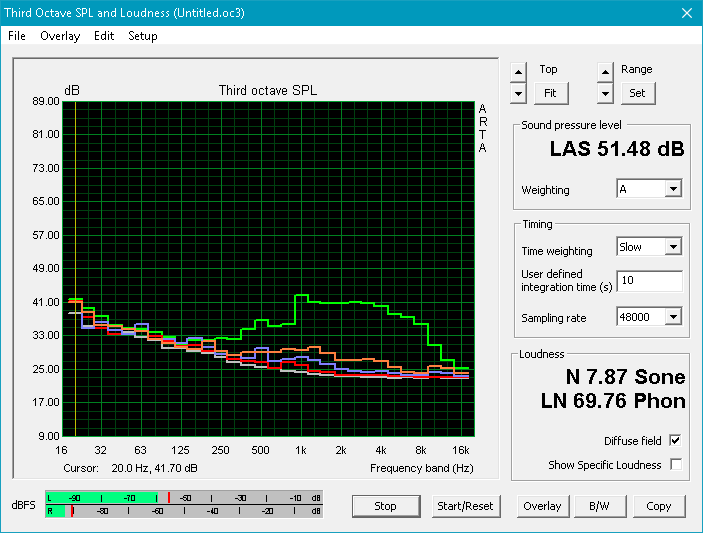
Medium load as represented by 3DMark06 will bump fan noise up to 36.5 dB(A) to be noticeably quieter than the Zephyrus, MacBook Pro 15, GS63VR, and Aorus X5 v6. In fact, the SC15 is one the quietest 15-inch gaming notebooks we've tested. Running Witcher 3 will bump fan noise up to 40.3 dB(A) and 41.6 dB(A) compared to the mid-to-high 40 dB(A) range on other thin and medium-sized gaming notebooks. To our surprise, the SC15 is quieter than the larger MSI GT73VR. Its fans are also not as high-pitched as the GS63VR or GS73VR as shown by the broad fan noise graph below.
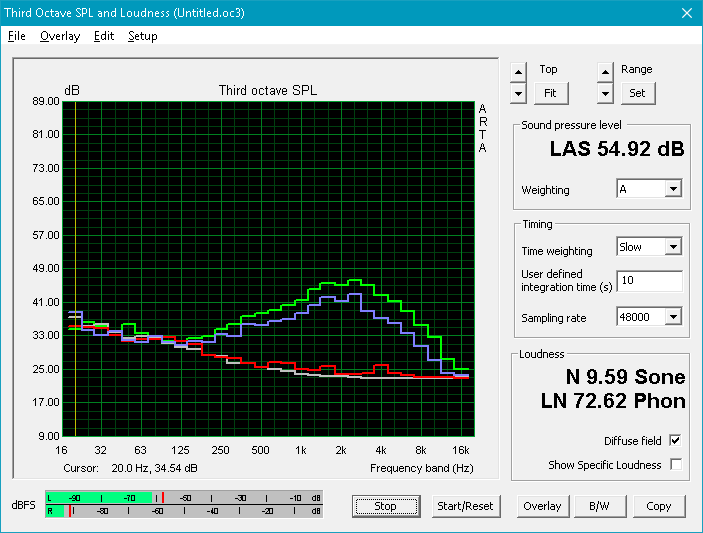
Maximum load with both Prime95 and FurMark on the preset "SuperClock" overclock will automatically bump fan noise up to a steady 53.4 dB(A). This maximum is very loud and intolerable without a set of headphones, but users will never reach such high RPMs if simply gaming on the stock clock rate settings.
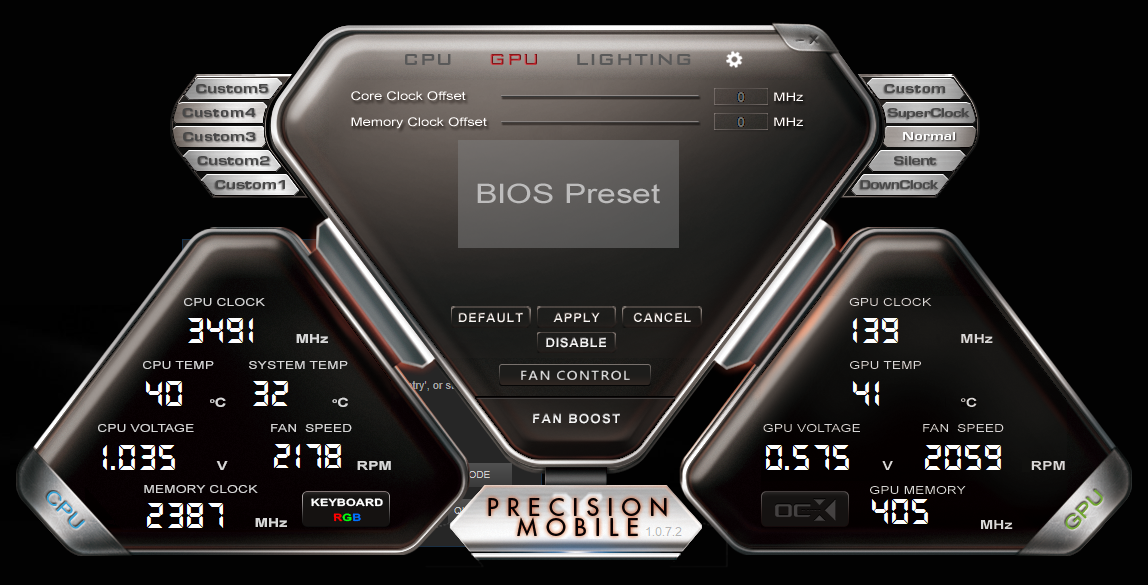
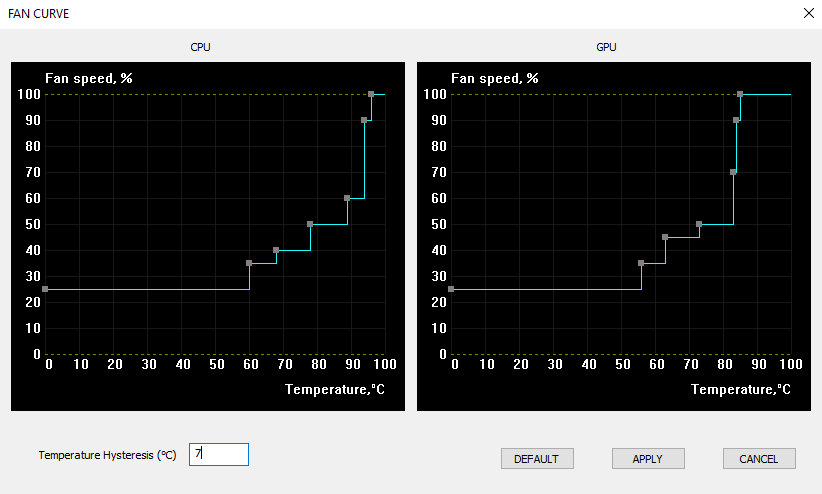
The fan control software is the simplest and best we've seen on a gaming notebook. Users can manually tune individual fans down to single-digit temperature and speed settings with hysteresis (trigger latency) options. The MSI Dragon software offers something similar, but with far fewer preset temperature and fan ranges.
Our unit exhibited no electronic noise or coil whine during testing.
Noise level
| Idle |
| 31.9 / 32 / 32 dB(A) |
| Load |
| 36.5 / 53.4 dB(A) |
 | ||
30 dB silent 40 dB(A) audible 50 dB(A) loud |
||
min: | ||
| EVGA SC15 GeForce GTX 1060 Mobile, i7-7700HQ, Toshiba NVMe THNSN5256GPU7 | Asus Zephyrus GX501 GeForce GTX 1080 Max-Q, i7-7700HQ, Samsung SSD SM961 1TB M.2 MZVKW1T0HMLH | Apple MacBook Pro 15 2017 (2.8 GHz, 555) Radeon Pro 555, i7-7700HQ, Apple SSD SM0256L | MSI GS63VR 7RF-228US GeForce GTX 1060 Mobile, i7-7700HQ, Samsung SM961 MZVKW512HMJP m.2 PCI-e | Gigabyte Aero 15 GeForce GTX 1060 Mobile, i7-7700HQ, Lite-On CX2-8B512-Q11 | Aorus X5 v6 GeForce GTX 1070 Mobile, 6820HK, Samsung SM951 MZVPV256 m.2 | |
|---|---|---|---|---|---|---|
| Noise | -2% | 1% | -3% | -4% | -14% | |
| off / environment * (dB) | 28 | 31 -11% | 30.9 -10% | 28.8 -3% | 31 -11% | 29.3 -5% |
| Idle Minimum * (dB) | 31.9 | 32 -0% | 31.3 2% | 33.1 -4% | 32 -0% | 33.4 -5% |
| Idle Average * (dB) | 32 | 33 -3% | 31.3 2% | 33.1 -3% | 33 -3% | 35.2 -10% |
| Idle Maximum * (dB) | 32 | 34 -6% | 31.7 1% | 34 -6% | 34 -6% | 35.2 -10% |
| Load Average * (dB) | 36.5 | 39 -7% | 39.7 -9% | 37.2 -2% | 39 -7% | 53.3 -46% |
| Witcher 3 ultra * (dB) | 40.3 | 42 -4% | 35.5 12% | 46.1 -14% | 43 -7% | |
| Load Maximum * (dB) | 53.4 | 46 14% | 48.6 9% | 47.1 12% | 50 6% | 57.6 -8% |
* ... smaller is better
Temperature
Surface temperatures are flat and slightly warm on both sides of the notebook during very low loads. If on maximum (Prime95 + FurMark) processing load, the quadrant above the first row of keyboard keys can be as warm as 49 C as shown by our heat maps below.
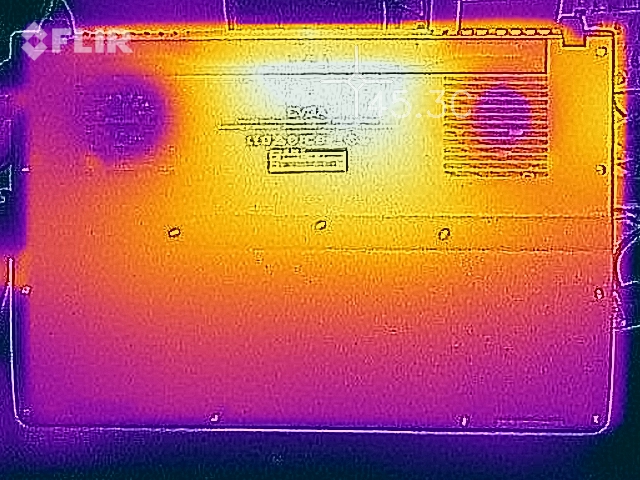
Temperature development is quite symmetrical due to the positioning of the CPU and GPU and the dual system fans especially when compared to notebooks like the Pavilion 15 Power or Asus VivoBook S15. The warm surfaces of the SC15 never become bothersome since the hot spots are generally away from the keyboard keys and palm rests. Super-thin alternatives like the Aero 15, GS63VR, and Asus Zephyrus all run significantly warmer than the EVGA when gaming or under extreme loads.
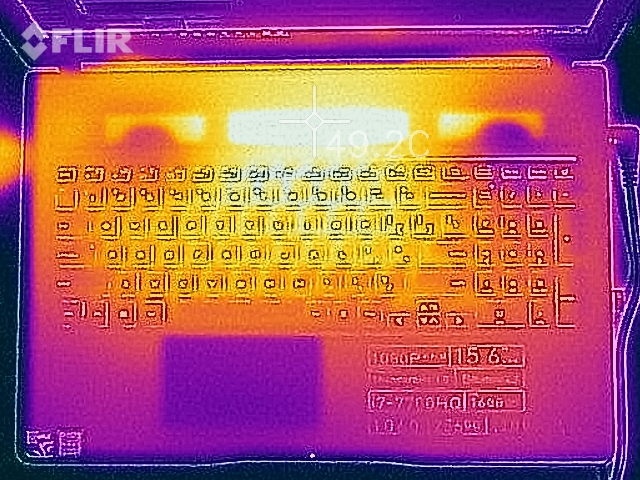
(-) The maximum temperature on the upper side is 49.2 °C / 121 F, compared to the average of 40.4 °C / 105 F, ranging from 21.2 to 68.8 °C for the class Gaming.
(-) The bottom heats up to a maximum of 45.2 °C / 113 F, compared to the average of 43.2 °C / 110 F
(+) In idle usage, the average temperature for the upper side is 26.8 °C / 80 F, compared to the device average of 33.9 °C / 93 F.
(±) Playing The Witcher 3, the average temperature for the upper side is 32 °C / 90 F, compared to the device average of 33.9 °C / 93 F.
(+) The palmrests and touchpad are cooler than skin temperature with a maximum of 29.8 °C / 85.6 F and are therefore cool to the touch.
(±) The average temperature of the palmrest area of similar devices was 28.8 °C / 83.8 F (-1 °C / -1.8 F).
Speakers
The integrated stereo speakers are disappointing for a gaming notebook. Not only is maximum volume below average compared to competitors, but bass is exceptionally poor as shown by our pink noise microphone measurements below. Lower frequencies are not well reproduced and treble feels overemphasized. Additionally, the positioning of the speakers directly on the palm rests is suboptimal as it is far too easy to completely cover the speaker grilles with the palms of your hands during use. Fortunately, maximum volume will not reverberate the chassis or introduce any static.
Headphones are still recommended for a better experience. A handful of other gaming notebooks like the MSI GS series or the Eurocom MX5 have special Hi-Fi audio DACs not found on the SC15 to support studio-grade headphones and microphones.
")


EVGA SC15 audio analysis
(-) | not very loud speakers (61.2 dB)
Bass 100 - 315 Hz
(-) | nearly no bass - on average 15.8% lower than median
(±) | linearity of bass is average (7.3% delta to prev. frequency)
Mids 400 - 2000 Hz
(±) | higher mids - on average 6.8% higher than median
(±) | linearity of mids is average (14.5% delta to prev. frequency)
Highs 2 - 16 kHz
(+) | balanced highs - only 2.5% away from median
(±) | linearity of highs is average (8% delta to prev. frequency)
Overall 100 - 16.000 Hz
(-) | overall sound is not linear (34.7% difference to median)
Compared to same class
» 99% of all tested devices in this class were better, 1% similar, 1% worse
» The best had a delta of 6%, average was 18%, worst was 132%
Compared to all devices tested
» 93% of all tested devices were better, 1% similar, 6% worse
» The best had a delta of 4%, average was 23%, worst was 134%
Apple MacBook 12 (Early 2016) 1.1 GHz audio analysis
(+) | speakers can play relatively loud (83.6 dB)
Bass 100 - 315 Hz
(±) | reduced bass - on average 11.3% lower than median
(±) | linearity of bass is average (14.2% delta to prev. frequency)
Mids 400 - 2000 Hz
(+) | balanced mids - only 2.4% away from median
(+) | mids are linear (5.5% delta to prev. frequency)
Highs 2 - 16 kHz
(+) | balanced highs - only 2% away from median
(+) | highs are linear (4.5% delta to prev. frequency)
Overall 100 - 16.000 Hz
(+) | overall sound is linear (10.2% difference to median)
Compared to same class
» 7% of all tested devices in this class were better, 2% similar, 90% worse
» The best had a delta of 5%, average was 18%, worst was 53%
Compared to all devices tested
» 5% of all tested devices were better, 1% similar, 94% worse
» The best had a delta of 4%, average was 23%, worst was 134%
Frequency Comparison (Checkbox selectable!)
Graph 1: Pink Noise 100% Vol.; Graph 2: Audio off
Energy Management
Power Consumption
The SC15 is noticeably more demanding than other gaming systems when idling on desktop. When compared to the Aero 15, for example, the Gigabyte system can be over two times more efficient during very low loads. The relatively high power consumption of the EVGA also impacts battery life as shown by our next section.
The higher power consumption during low loads fortunately does not scale up to gaming loads. Running 3DMark06 and Witcher 3 will draw about 80 W and 121 W, respectively, not unlike the Aero 15. Maximum load with both Prime95 and FurMark will draw 159 W from a slim power adapter (~15 x 15 x 2 cm) rated for up to 240 W. The ample power overhead isn't necessarily bad, but a smaller 200 W power adapter would have been just as efficient.
| Off / Standby | |
| Idle | |
| Load |
|
Key:
min: | |
| EVGA SC15 i7-7700HQ, GeForce GTX 1060 Mobile, Toshiba NVMe THNSN5256GPU7, , 1920x1080, 15.6" | Asus Zephyrus GX501 i7-7700HQ, GeForce GTX 1080 Max-Q, Samsung SSD SM961 1TB M.2 MZVKW1T0HMLH, IPS, 1920x1080, 15.6" | Apple MacBook Pro 15 2017 (2.8 GHz, 555) i7-7700HQ, Radeon Pro 555, Apple SSD SM0256L, IPS, 2880x1800, 15.4" | Gigabyte Aero 15 i7-7700HQ, GeForce GTX 1060 Mobile, Lite-On CX2-8B512-Q11, IPS, 1920x1080, 15.6" | Aorus X5 v6 6820HK, GeForce GTX 1070 Mobile, Samsung SM951 MZVPV256 m.2, IPS, 2880x1620, 15.6" | |
|---|---|---|---|---|---|
| Power Consumption | -3% | 46% | 21% | -33% | |
| Idle Minimum * (Watt) | 25.8 | 18 30% | 3.4 87% | 12 53% | 25 3% |
| Idle Average * (Watt) | 26.6 | 23 14% | 13.9 48% | 15 44% | 28.9 -9% |
| Idle Maximum * (Watt) | 26.7 | 31 -16% | 17.6 34% | 20 25% | 30.1 -13% |
| Load Average * (Watt) | 80.3 | 79 2% | 71.1 11% | 82 -2% | 167.3 -108% |
| Witcher 3 ultra * (Watt) | 121.2 | 148 -22% | 57.9 52% | 111 8% | |
| Load Maximum * (Watt) | 159.3 | 196 -23% | 88.5 44% | 161 -1% | 222.6 -40% |
* ... smaller is better
Battery Life
Runtimes from the internal 62 Wh battery are very short at just under 3 hours of WLAN use. This is quite low even for a gaming notebook as the GS63VR and Aero 15 can easily outlast the EVGA under all tested scenarios. The poor battery life can be partly attributed to the average battery capacity and lack of Optimus support.
Charging from near empty to full capacity will take just over 2 hours.
| EVGA SC15 i7-7700HQ, GeForce GTX 1060 Mobile, 62 Wh | Asus Zephyrus GX501 i7-7700HQ, GeForce GTX 1080 Max-Q, 50 Wh | Apple MacBook Pro 15 2017 (2.8 GHz, 555) i7-7700HQ, Radeon Pro 555, 76 Wh | MSI GS63VR 7RF-228US i7-7700HQ, GeForce GTX 1060 Mobile, 65 Wh | Gigabyte Aero 15 i7-7700HQ, GeForce GTX 1060 Mobile, 94.24 Wh | Aorus X5 v6 6820HK, GeForce GTX 1070 Mobile, 94.24 Wh | |
|---|---|---|---|---|---|---|
| Battery runtime | -29% | 127% | 35% | 124% | 14% | |
| Reader / Idle (h) | 3.7 | 3.1 -16% | 6.4 73% | 10.6 186% | 4.2 14% | |
| WiFi v1.3 (h) | 2.8 | 2.2 -21% | 10.7 282% | 3.9 39% | 7 150% | 3 7% |
| Load (h) | 1.4 | 0.7 -50% | 1 -29% | 1.3 -7% | 1.9 36% | 1.7 21% |
| Witcher 3 ultra (h) | 1.5 |
Pros
Cons
Verdict
The SC15 is almost everything we could want out of a balanced GTX 1060 gaming notebook. The chassis is of very high quality, fan noise is not screeching loud, CPU performance is consistent, and both G-Sync and 120 Hz refresh rate come standard. Anyone considering the GS63VR, Omen 15, Gigabyte P55, Asus GL552/FX502, Aorus X5, or any other slim 15-inch gaming notebook will find the EVGA to not only be physically sturdier and more robust, but also generally quieter with lower core temperatures as well. There is really no other slim alternative if longevity, temperature, and noise are of utmost concerns.
There are a few major disadvantages preventing the SC15 from being the 15-inch GTX 1060 gaming notebook to own. Perhaps its biggest drawback is the lack of any other display options. MSI and Aorus offer panels with 5 ms and 3 ms response times for dramatically reduced ghosting compared to 18 ms (black-white) on the EVGA. The high 120 Hz refresh rate is nice, but its advantages are muddled by slow response times and the fact that a more powerful GPU is required to reach such high frame rates for the fast input latency. A speculative 120 Hz/5 ms SKU would be the best thing to happen for the SC15 even if it means sacrificing IPS viewing angles for TN.
The display complaints don't end there either as the overlying edge-to-edge matte panel is quite thick. While this has the advantage of a stronger and more inflexible lid, onscreen content suffers from additional graininess as a result.
Some other drawbacks are small in comparison, though they do add up. The poor speakers, lack of an integrated SD reader, poor battery life, high idling power consumption, and heavy weight may irk a few gamers. Like most Apple notebooks, the price premium isn't necessarily for the fancy features, but for the exceptional quality of the overall build.
The SC15 is sturdier, quieter, and cooler than any other gaming notebook currently available in its size class and configuration. Its slow display response times and lack of SKUs bring down an otherwise very high quality offering.
EVGA SC15
- 07/05/2017 v6 (old)
Allen Ngo
Price comparison
