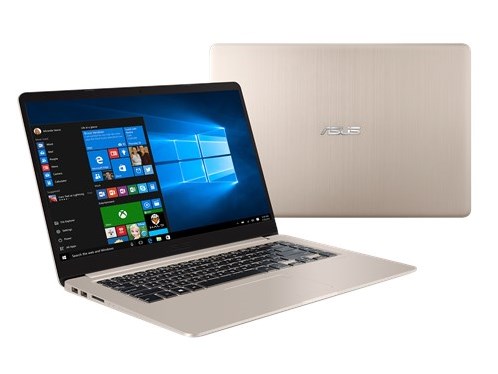
Asus VivoBook S15 S510UA (i5-7200U, FHD) Laptop Review
The VivoBook S15 series is defined by its narrow "NanoEdge" display bezel popularized by the successful Dell XPS 13 and XPS 15 series of notebooks. Unlike these latter alternatives, however, the VivoBook S15 costs significantly less and is thus an easier point of entry for more mainstream users. Options range from a Core i3-7100U CPU with 768p TN display (S510UA) up to the Core i7-7500U CPU with 1080p IPS display and dedicated GeForce 940MX graphics (S510UQ). Prices range wildly from as low as $500 USD up to $1100 USD as a result. Our test unit today is the S510UA with mid-range upgrades including a backlit keyboard, fingerprint reader, i5-7200U CPU, and FHD panel for approximately $800 USD, which is still noticeably less than flagship alternatives.
CUKUSA currently offers a version of the S510UA with the higher-end i7-7500U, FHD display, 128 GB M.2 SSD + 1 TB HDD, and 8 GB of system RAM for $799 USD. Buyers can use the coupon code "NBC50Off" to being the price down to $749 USD.
The last 15-inch VivoBook unit we checked out was the F556UQ/X556UQ earlier this year. The newer VivoBook S15 series, however, has been significantly improved from the bottom up to be thinner and much more stylish while dropping legacy features such as the optical drive and VGA port. The result is a system that looks like a direct competitor to the expensive XPS 15 9560 but is actually a more portable alternative to the thicker HP Pavilion 15, Acer Aspire E5, Lenovo IdeaPad 510, and upcoming Flex 15 refresh when considering its price and performance level.
Case
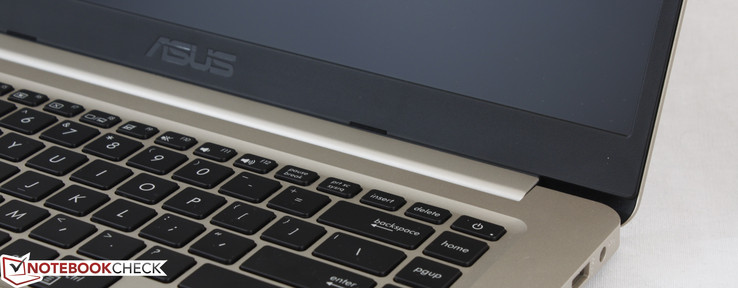
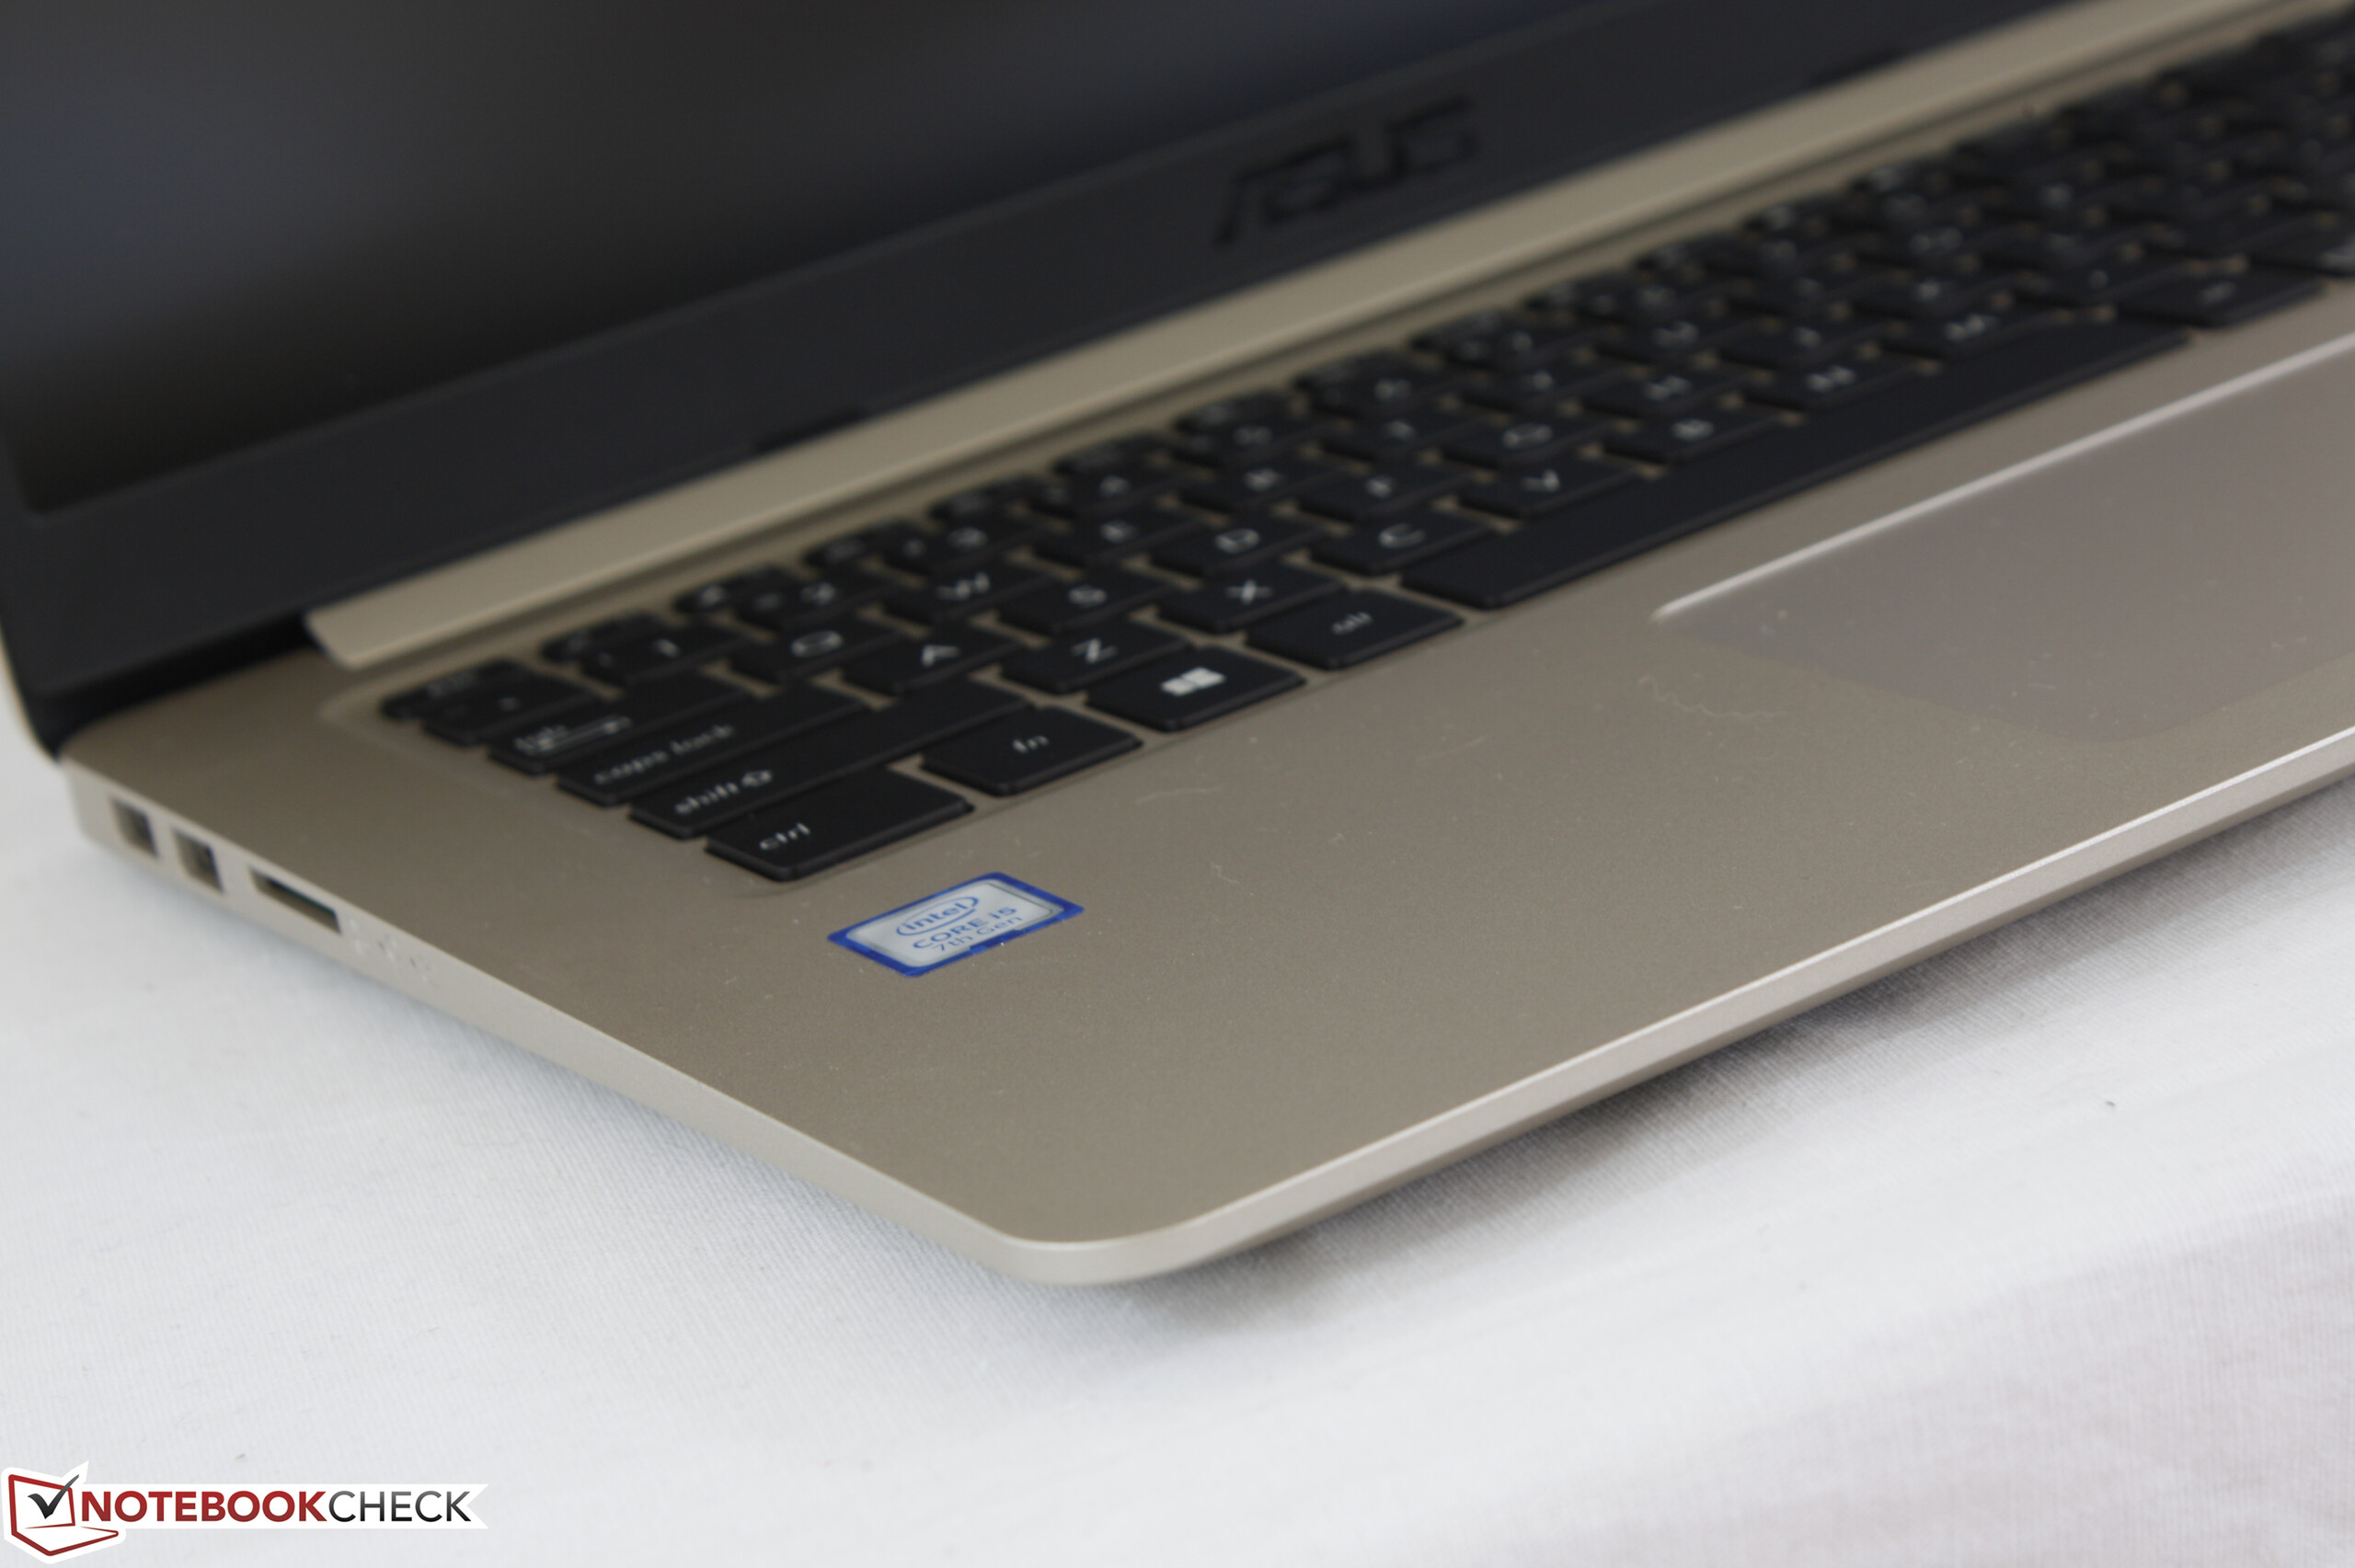
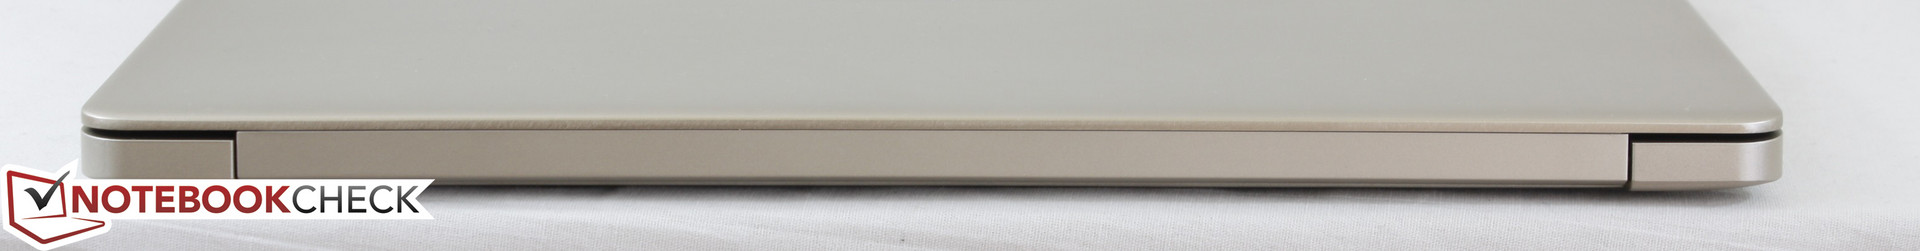
This is easily the best-looking VivoBook yet with its new slimmer form factor and narrower bezels that make it nearly 700 g lighter and 37 percent smaller than the VivoBook F556UQ. The soft gold color finish and brushed aluminum outer lid accentuate the sleek design no matter the positioning or angle of the notebook. Surfaces are smooth while the matte plastic base is just slightly roughened for added texture. For a notebook series starting at $500 USD, the VivoBook S15 is making a solid first impression in a price range where stale and mundane designs are far too common.
Look beyond the attractive design and portability of the notebook, however, and what's left is a base that doesn't feel as good as it looks. While side-to-side twisting is minimal and within normal limits, we find that the palm rests and keyboard surfaces warp and bend too easily with slight audible creaking. This in turn causes repercussions to the typing experience since the keys will feel softer than they really are. The lid has just average resistance to twisting and can be easily depressed down its center with a slight push of a finger. The bar hinge is thankfully very wide for better stability and with minimal teetering while typing on a flat desk, but this alone doesn't make up for the mediocre rigidity of the overall system.
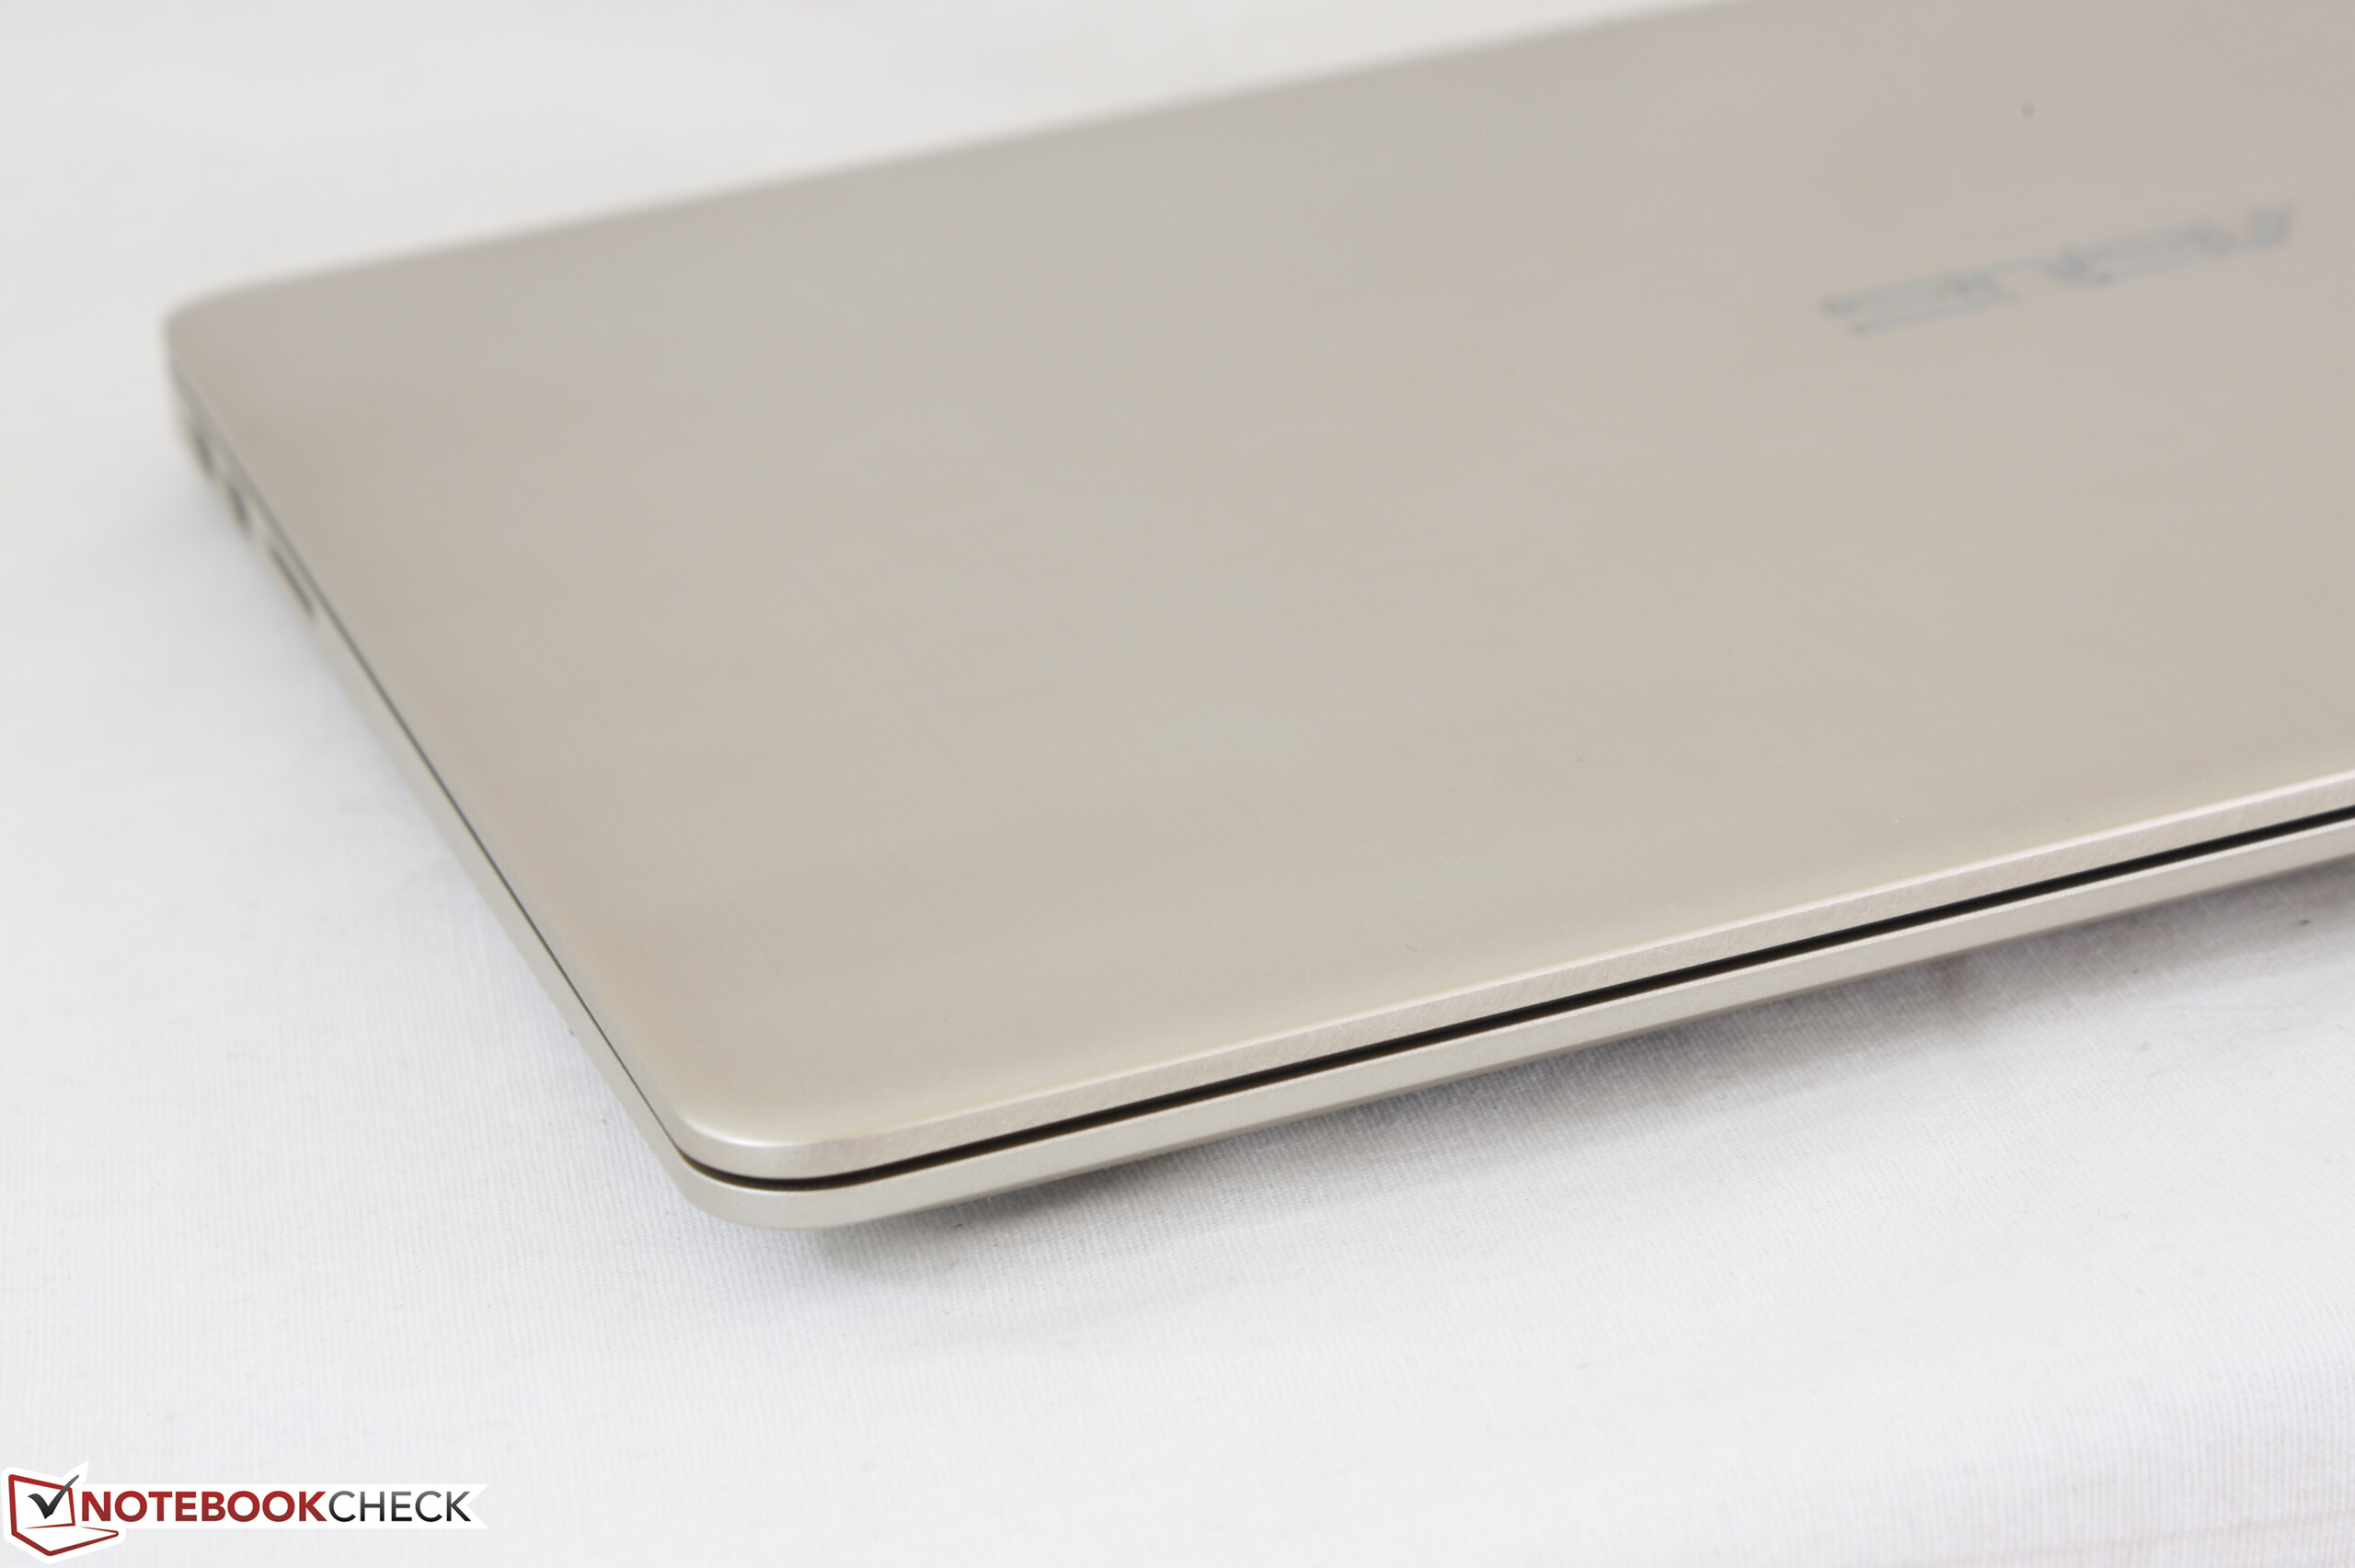
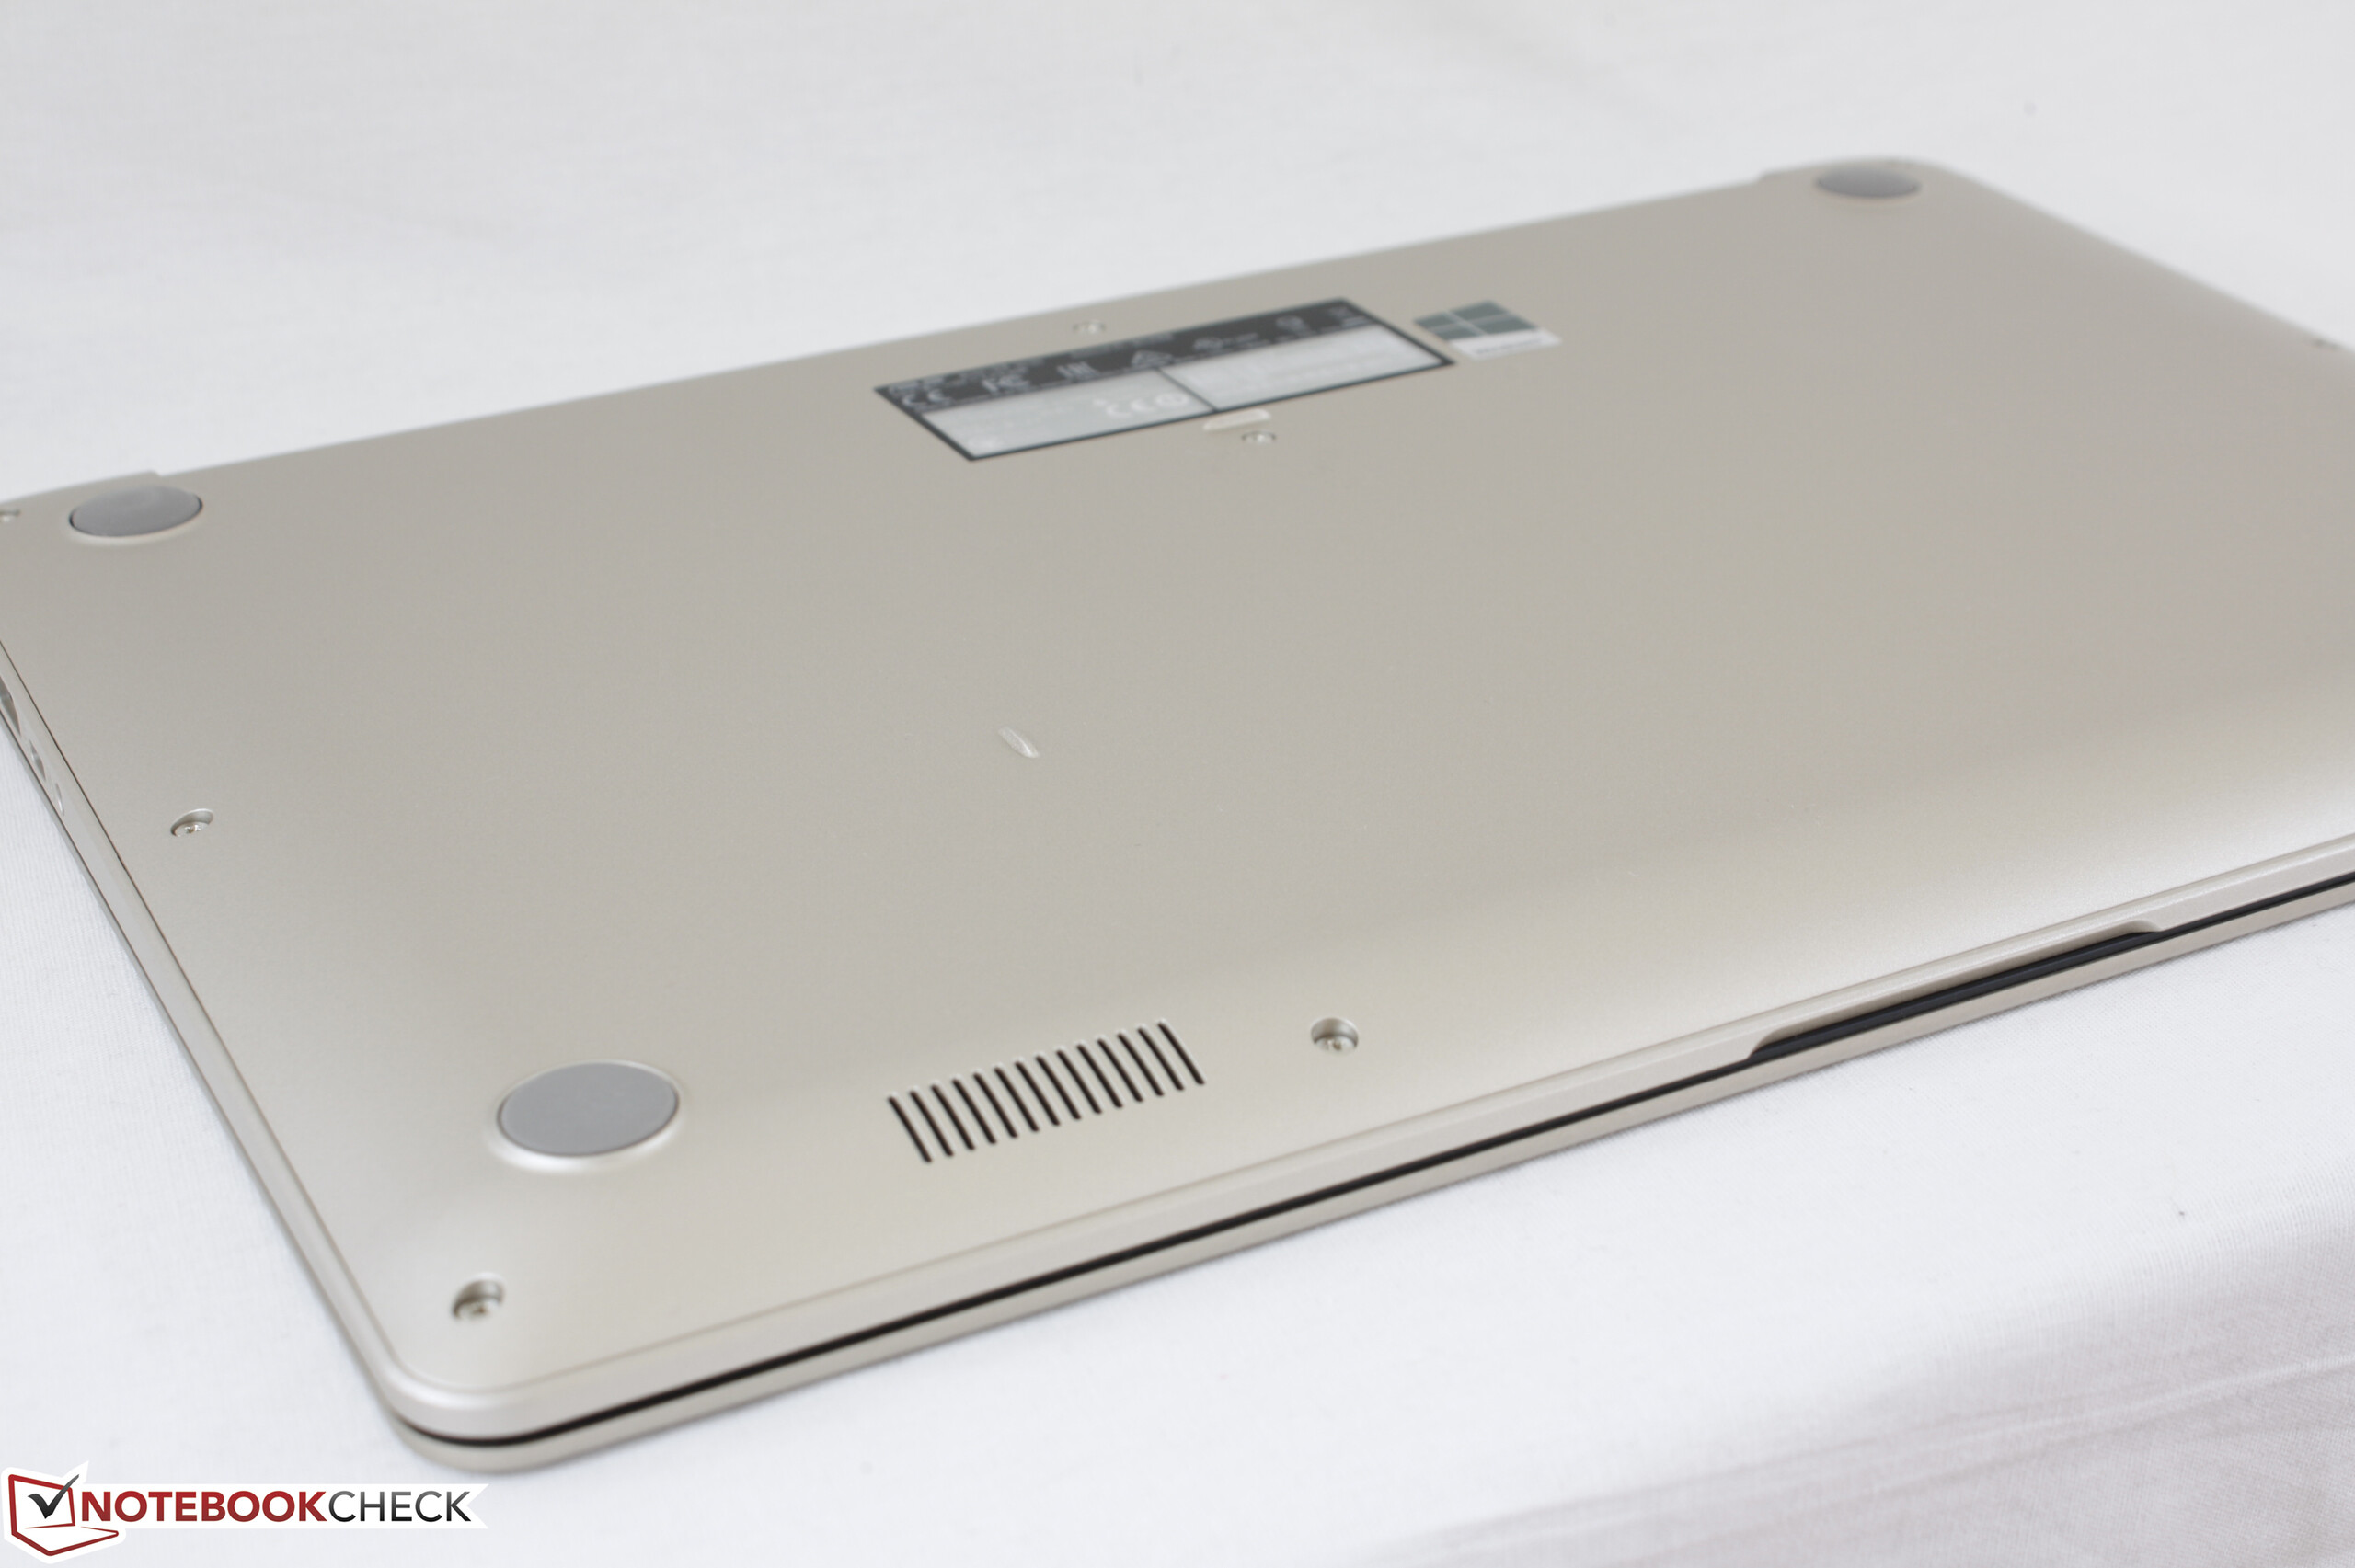
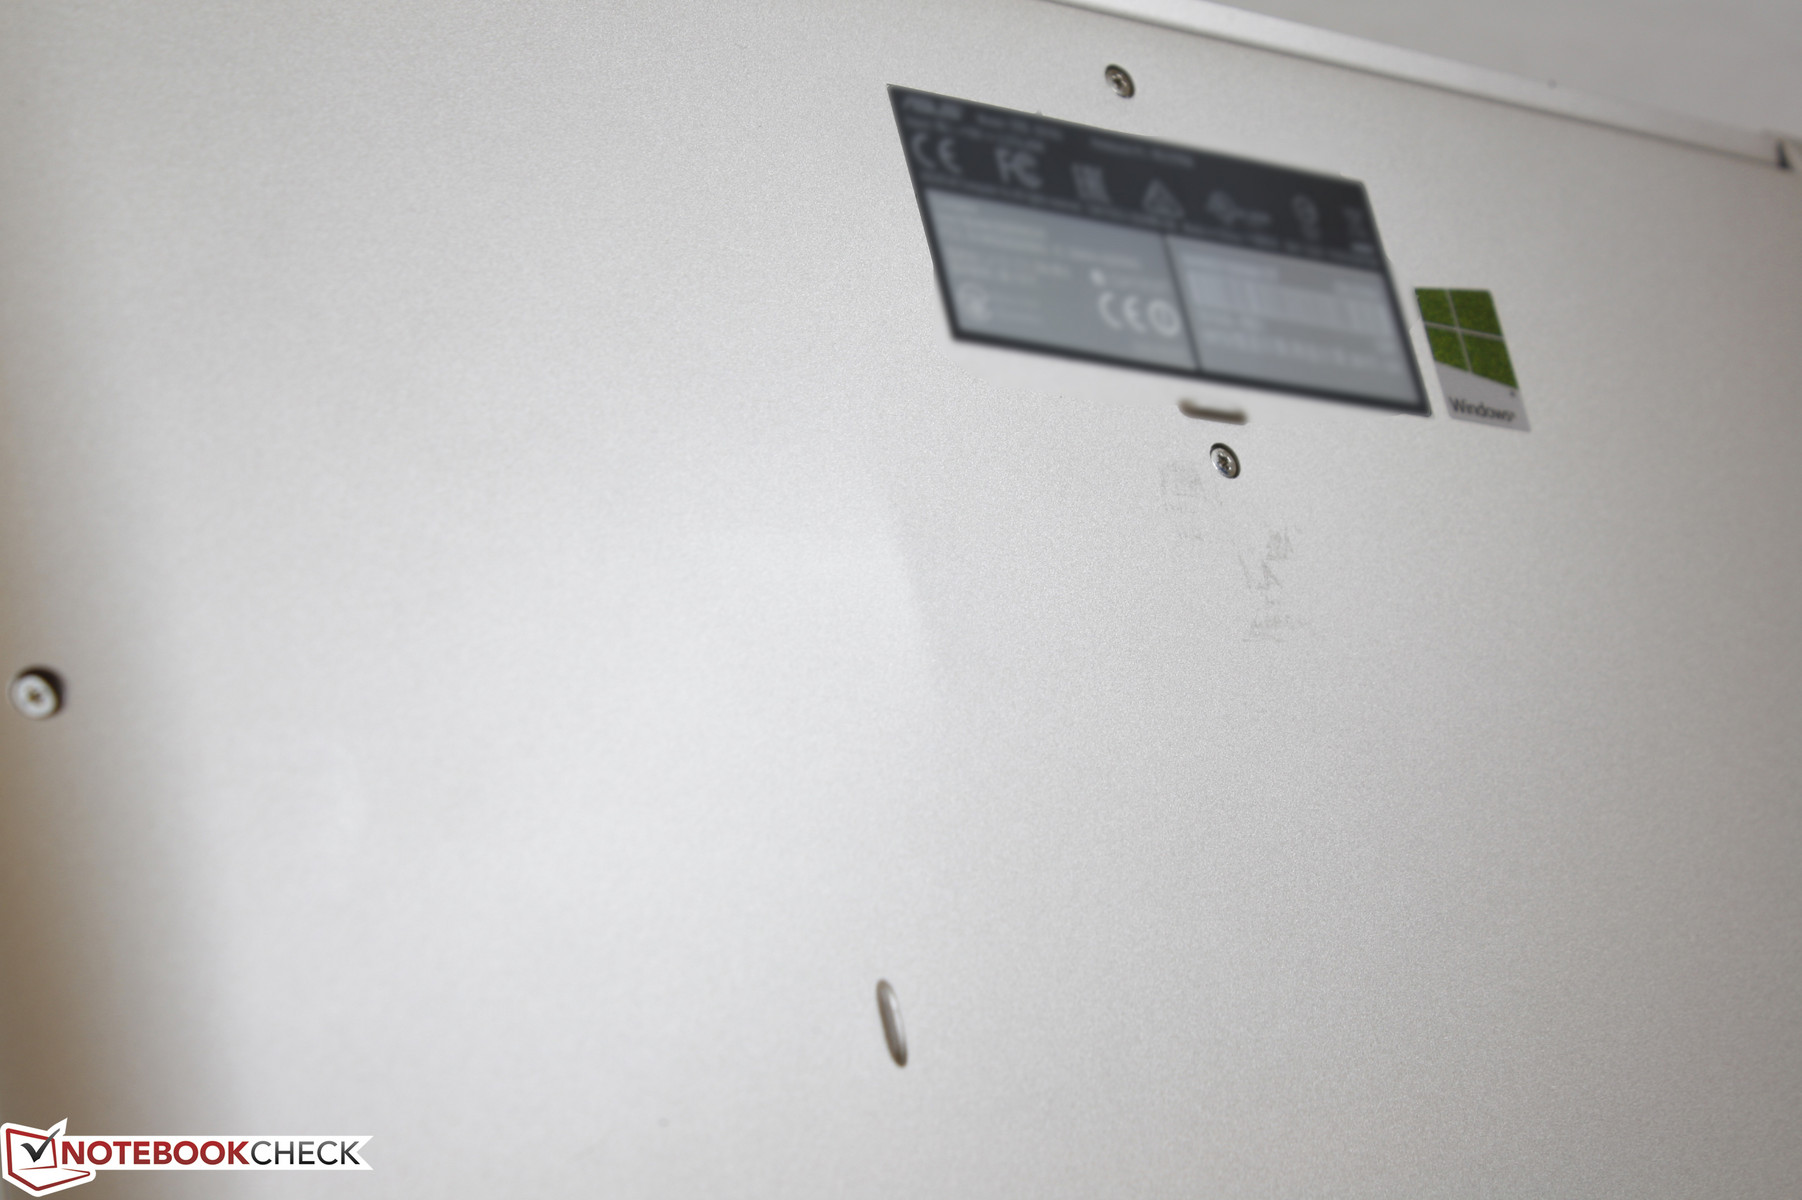
Build quality is uniform from top to bottom as we can observe no unintended gaps between materials or unevenness surrounding the thin inner bezel. With that said, the bottom panel of our test unit exhibits slight superficial warping as noted on our System Noise section below, so quality is not as consistent as it could have been.
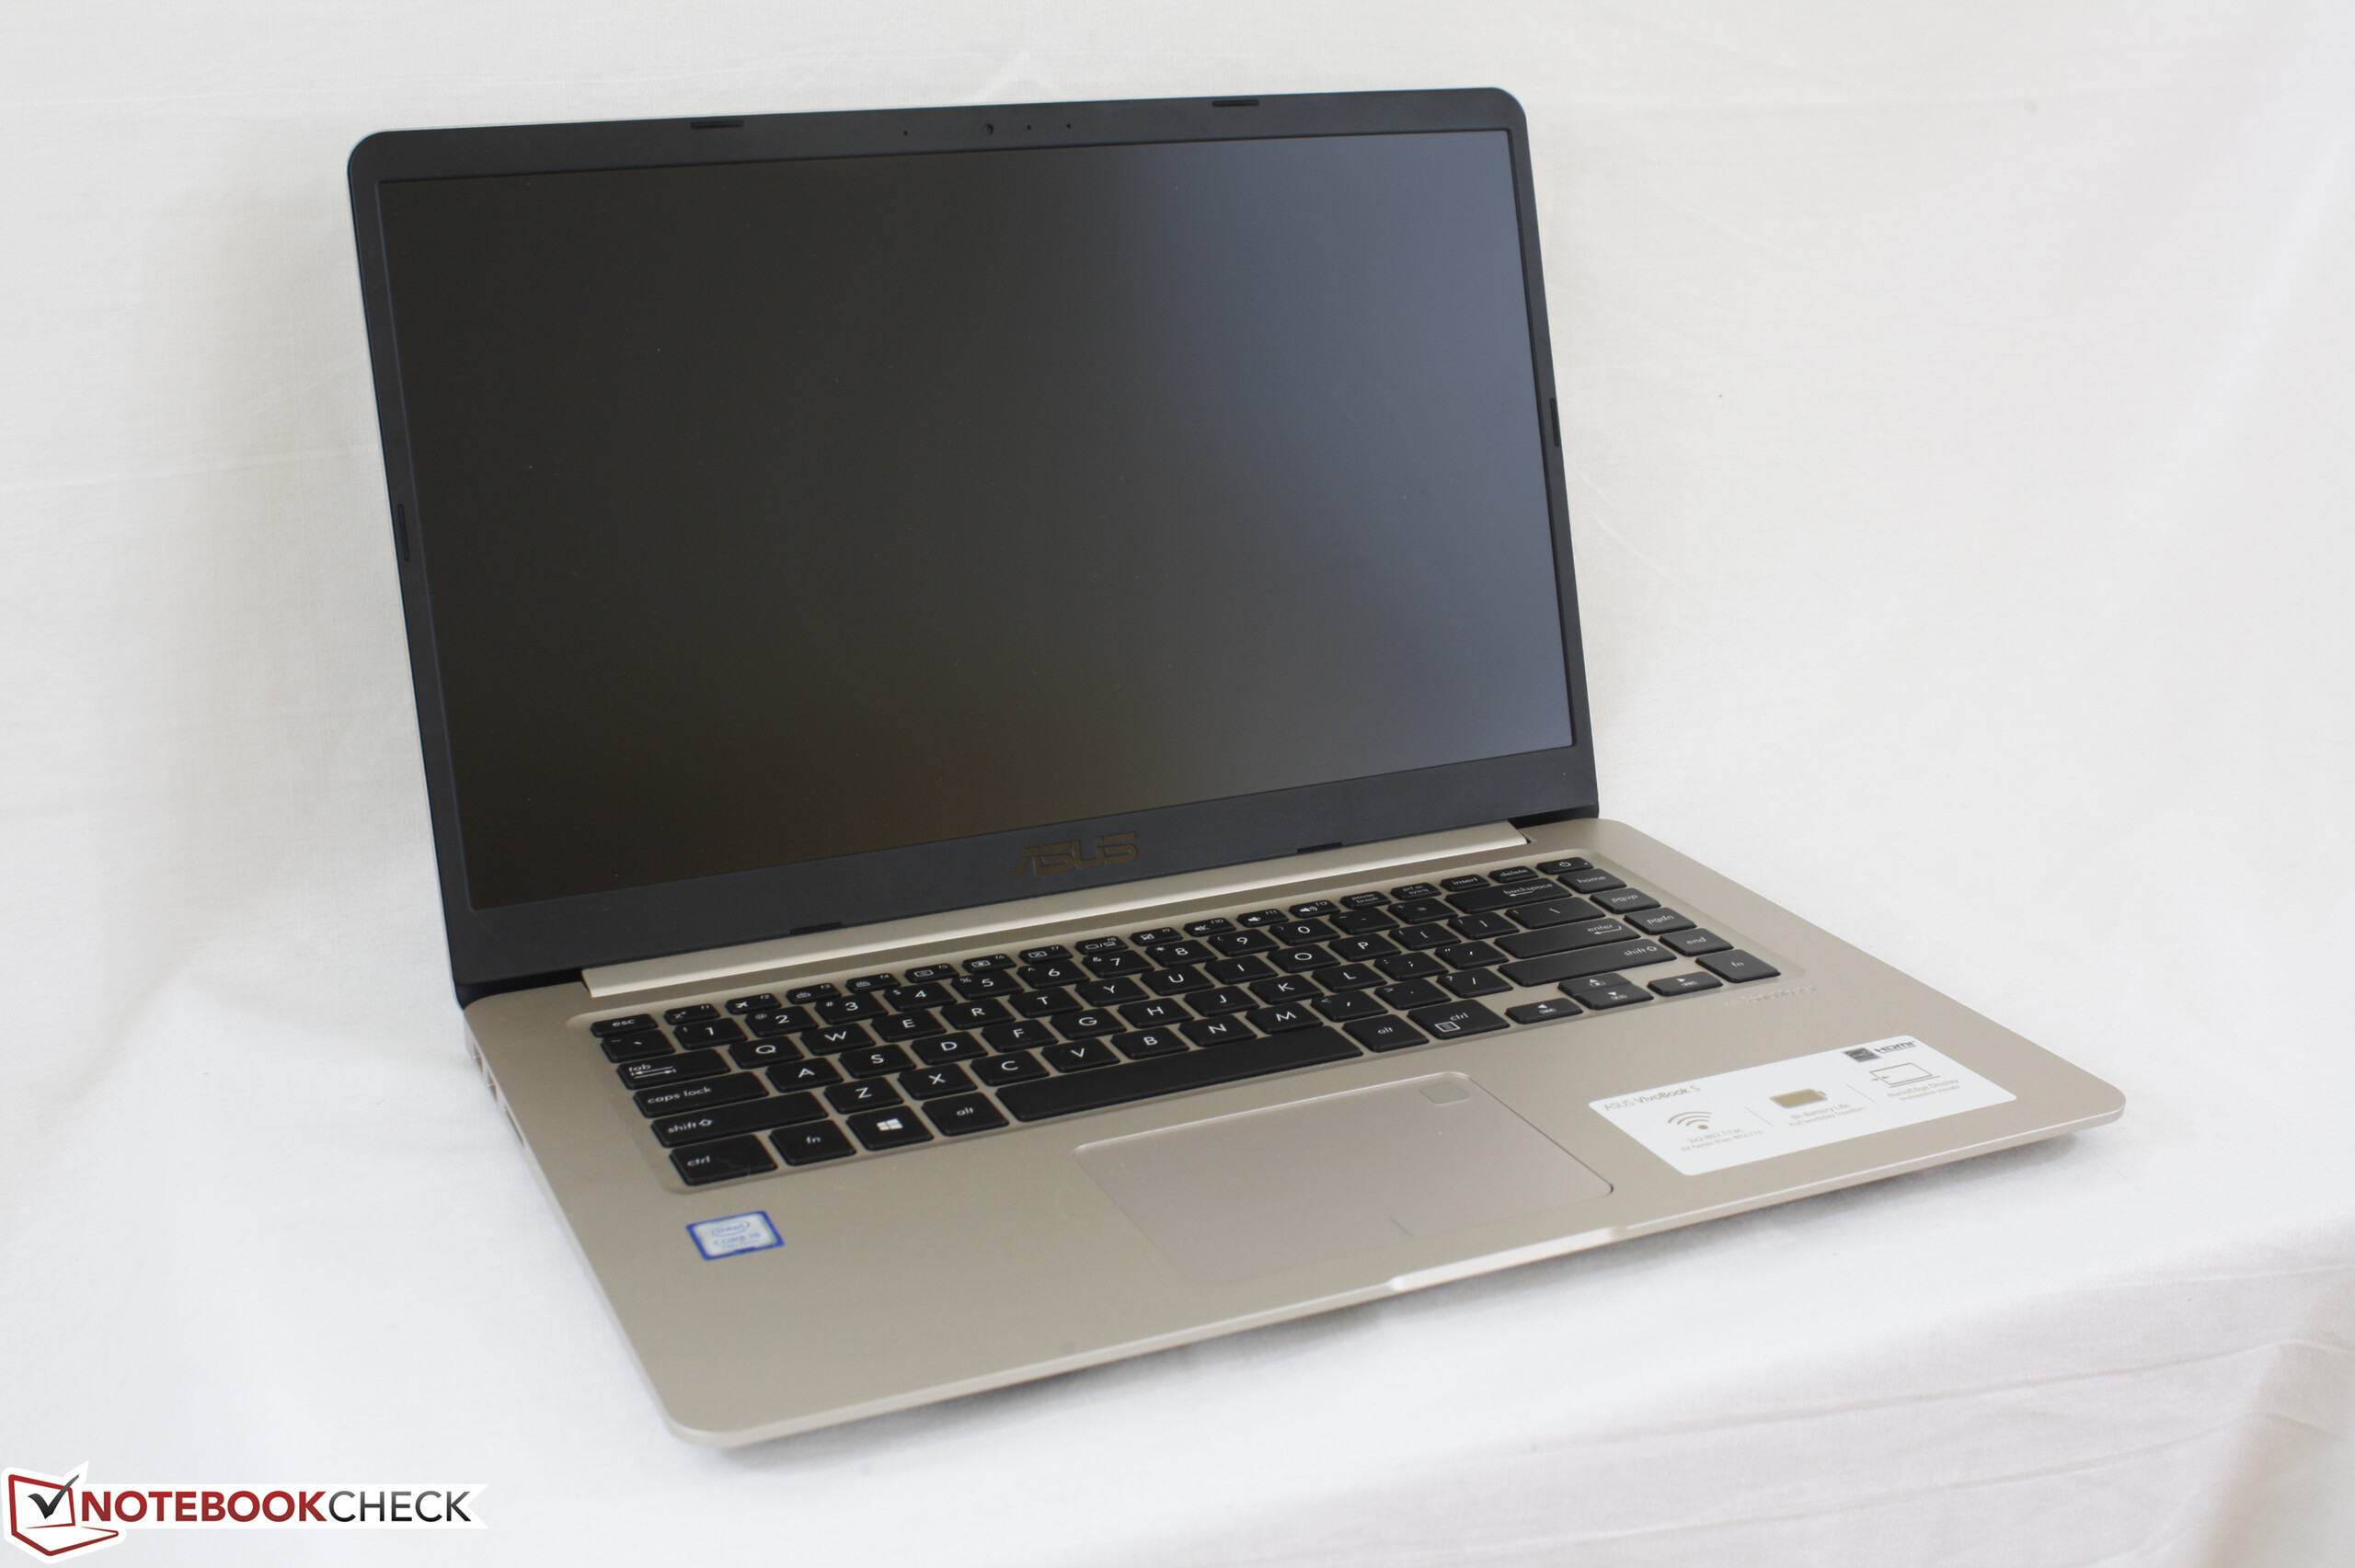
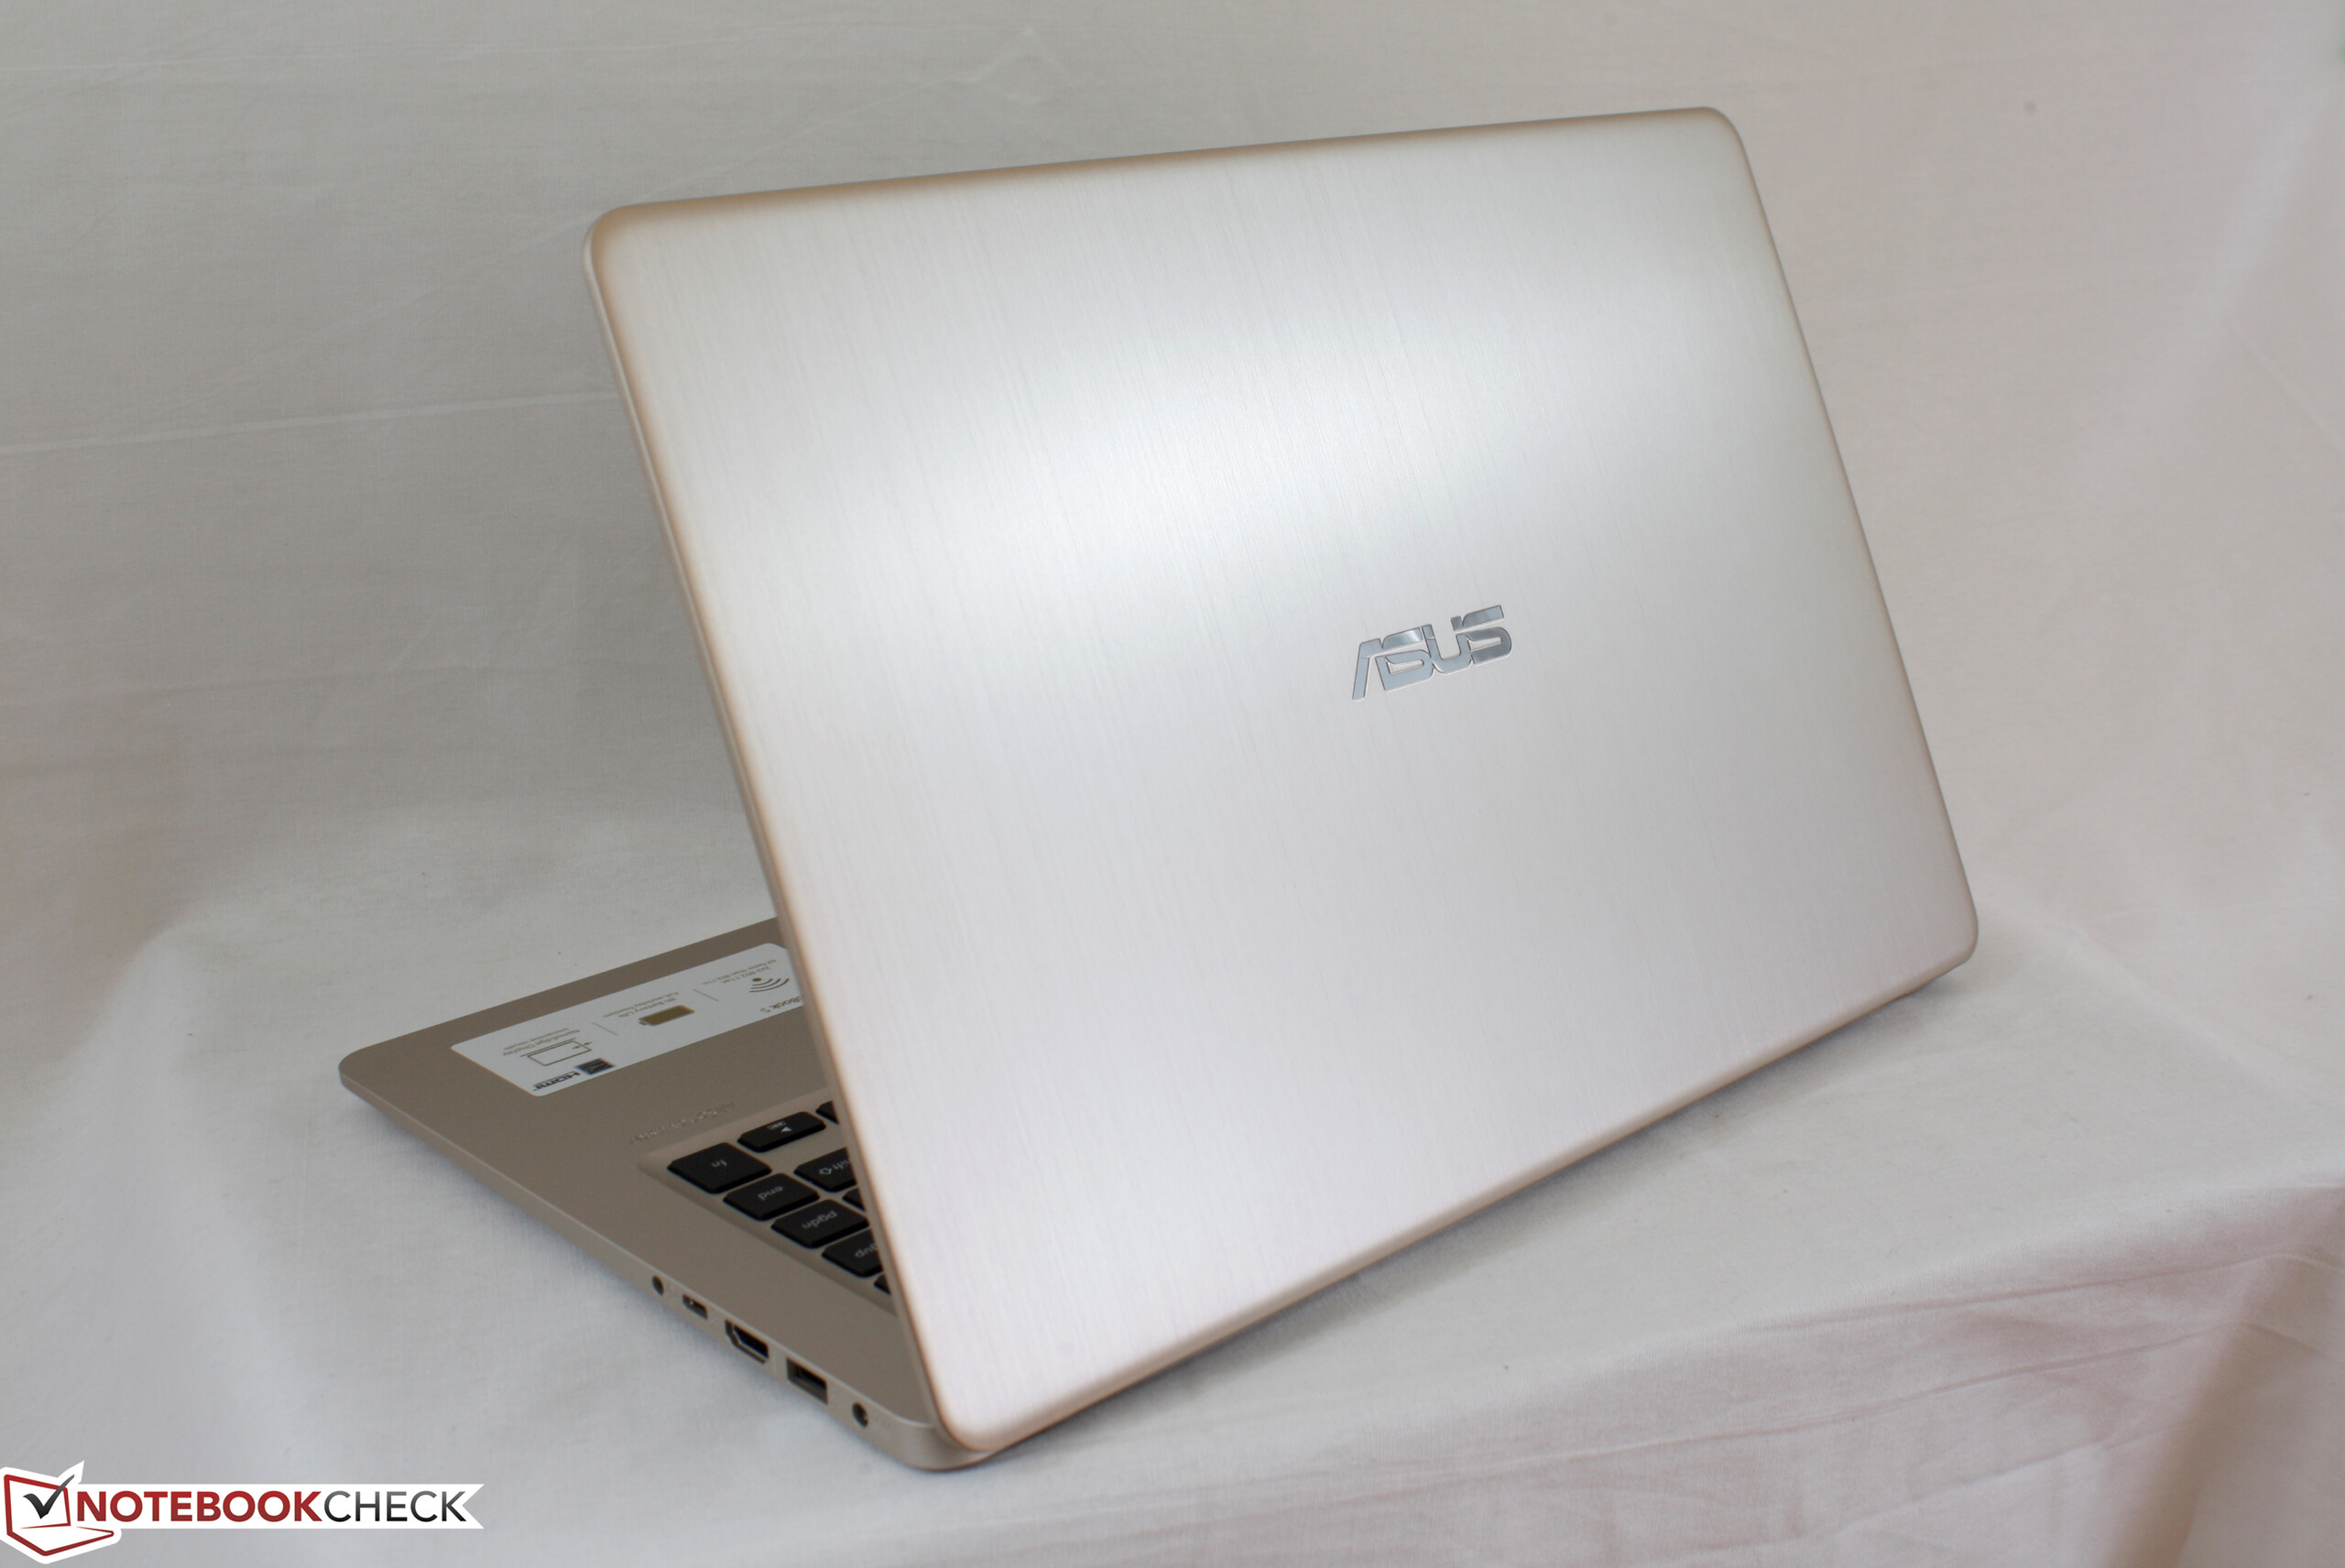

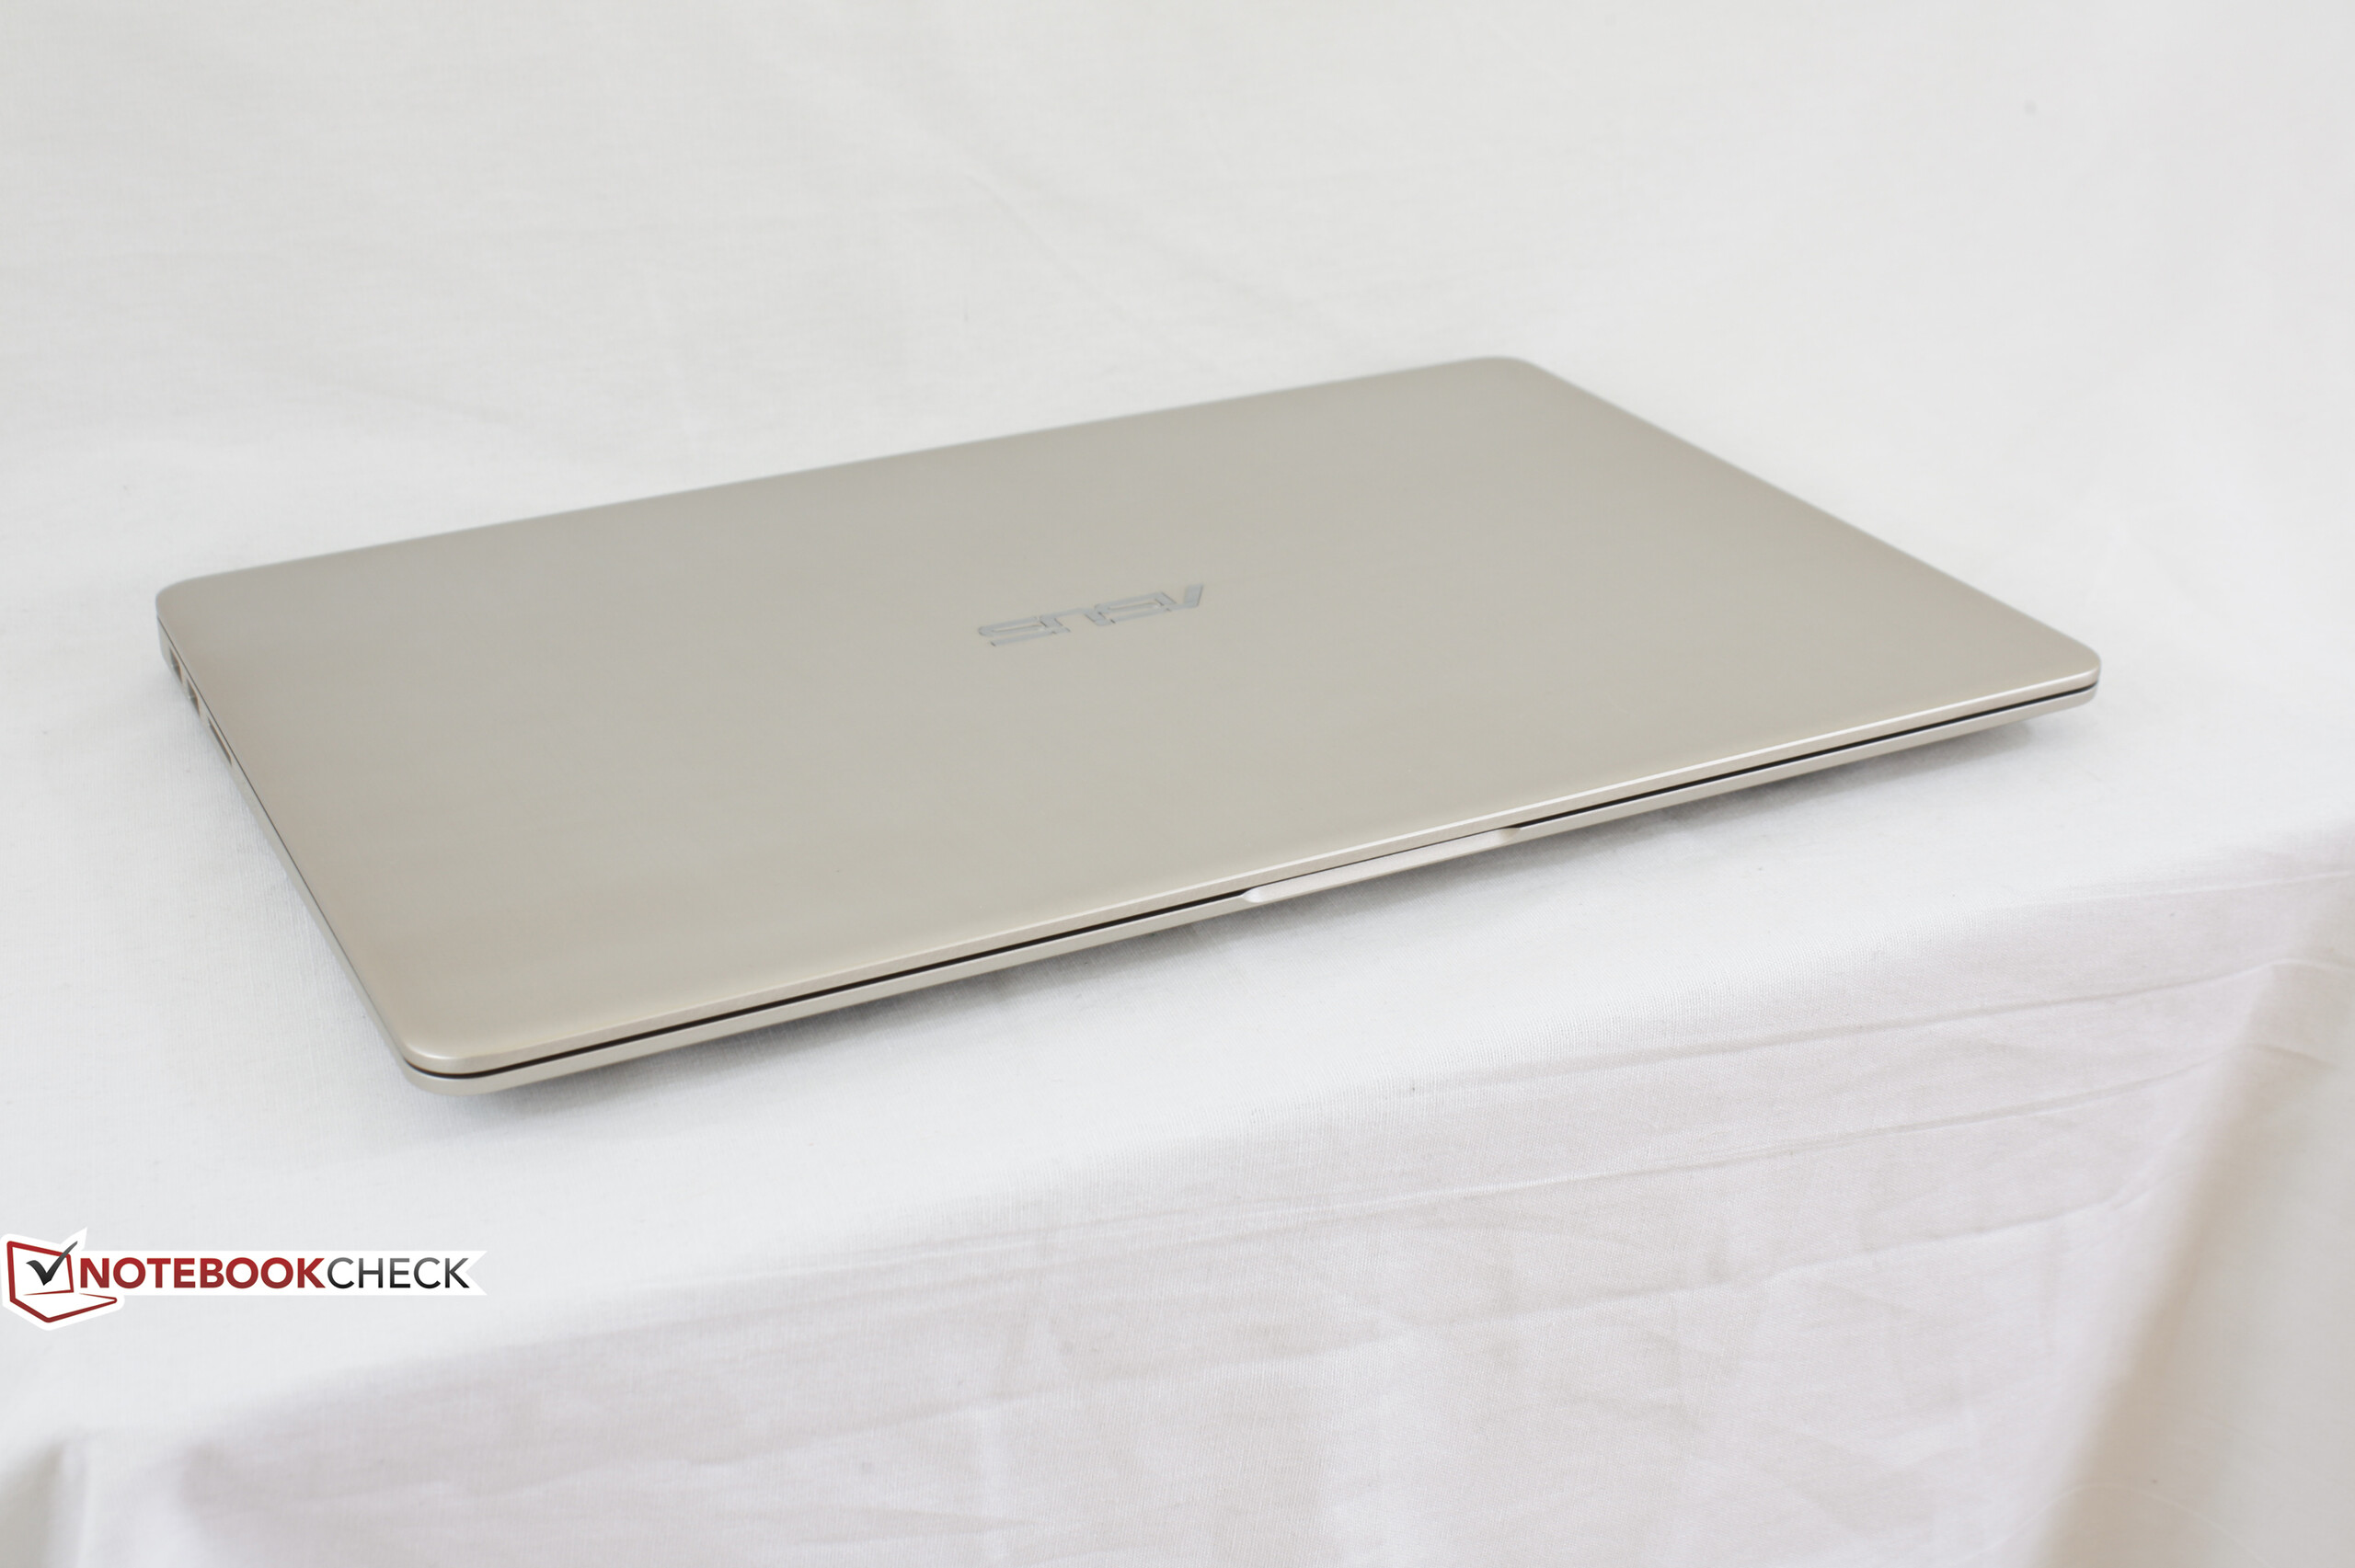
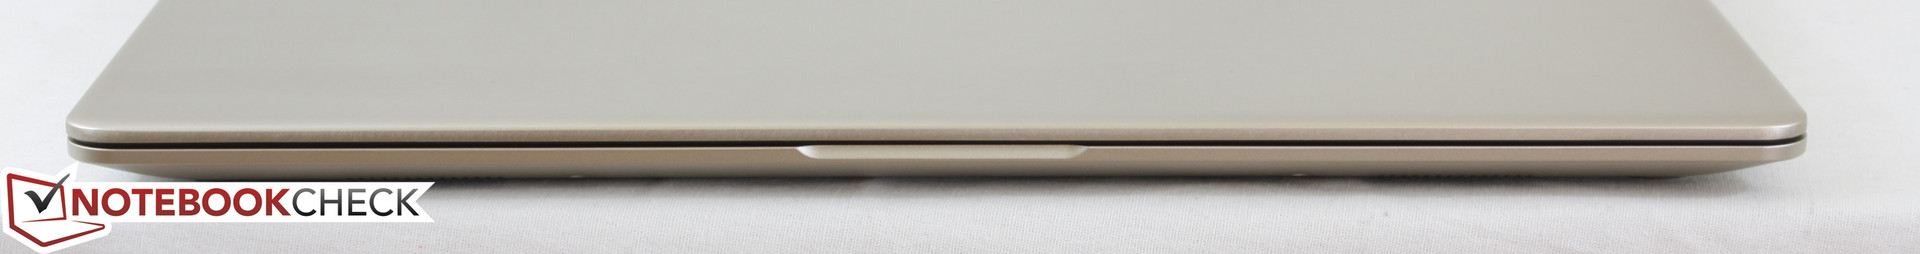
The VivoBook S15 is very light for a 15-inch notebook at just 1.6 kg compared to over 2 kg each for the Pavilion 15t or Envy 15. Its dimensions are also nearly as small and thin as the XPS 15 while being substantially lighter by about 500 grams. The Asus is certainly not as dense as its more powerful Dell counterpart, but the small size and weight shouldn't be understated at this price point.
Connectivity
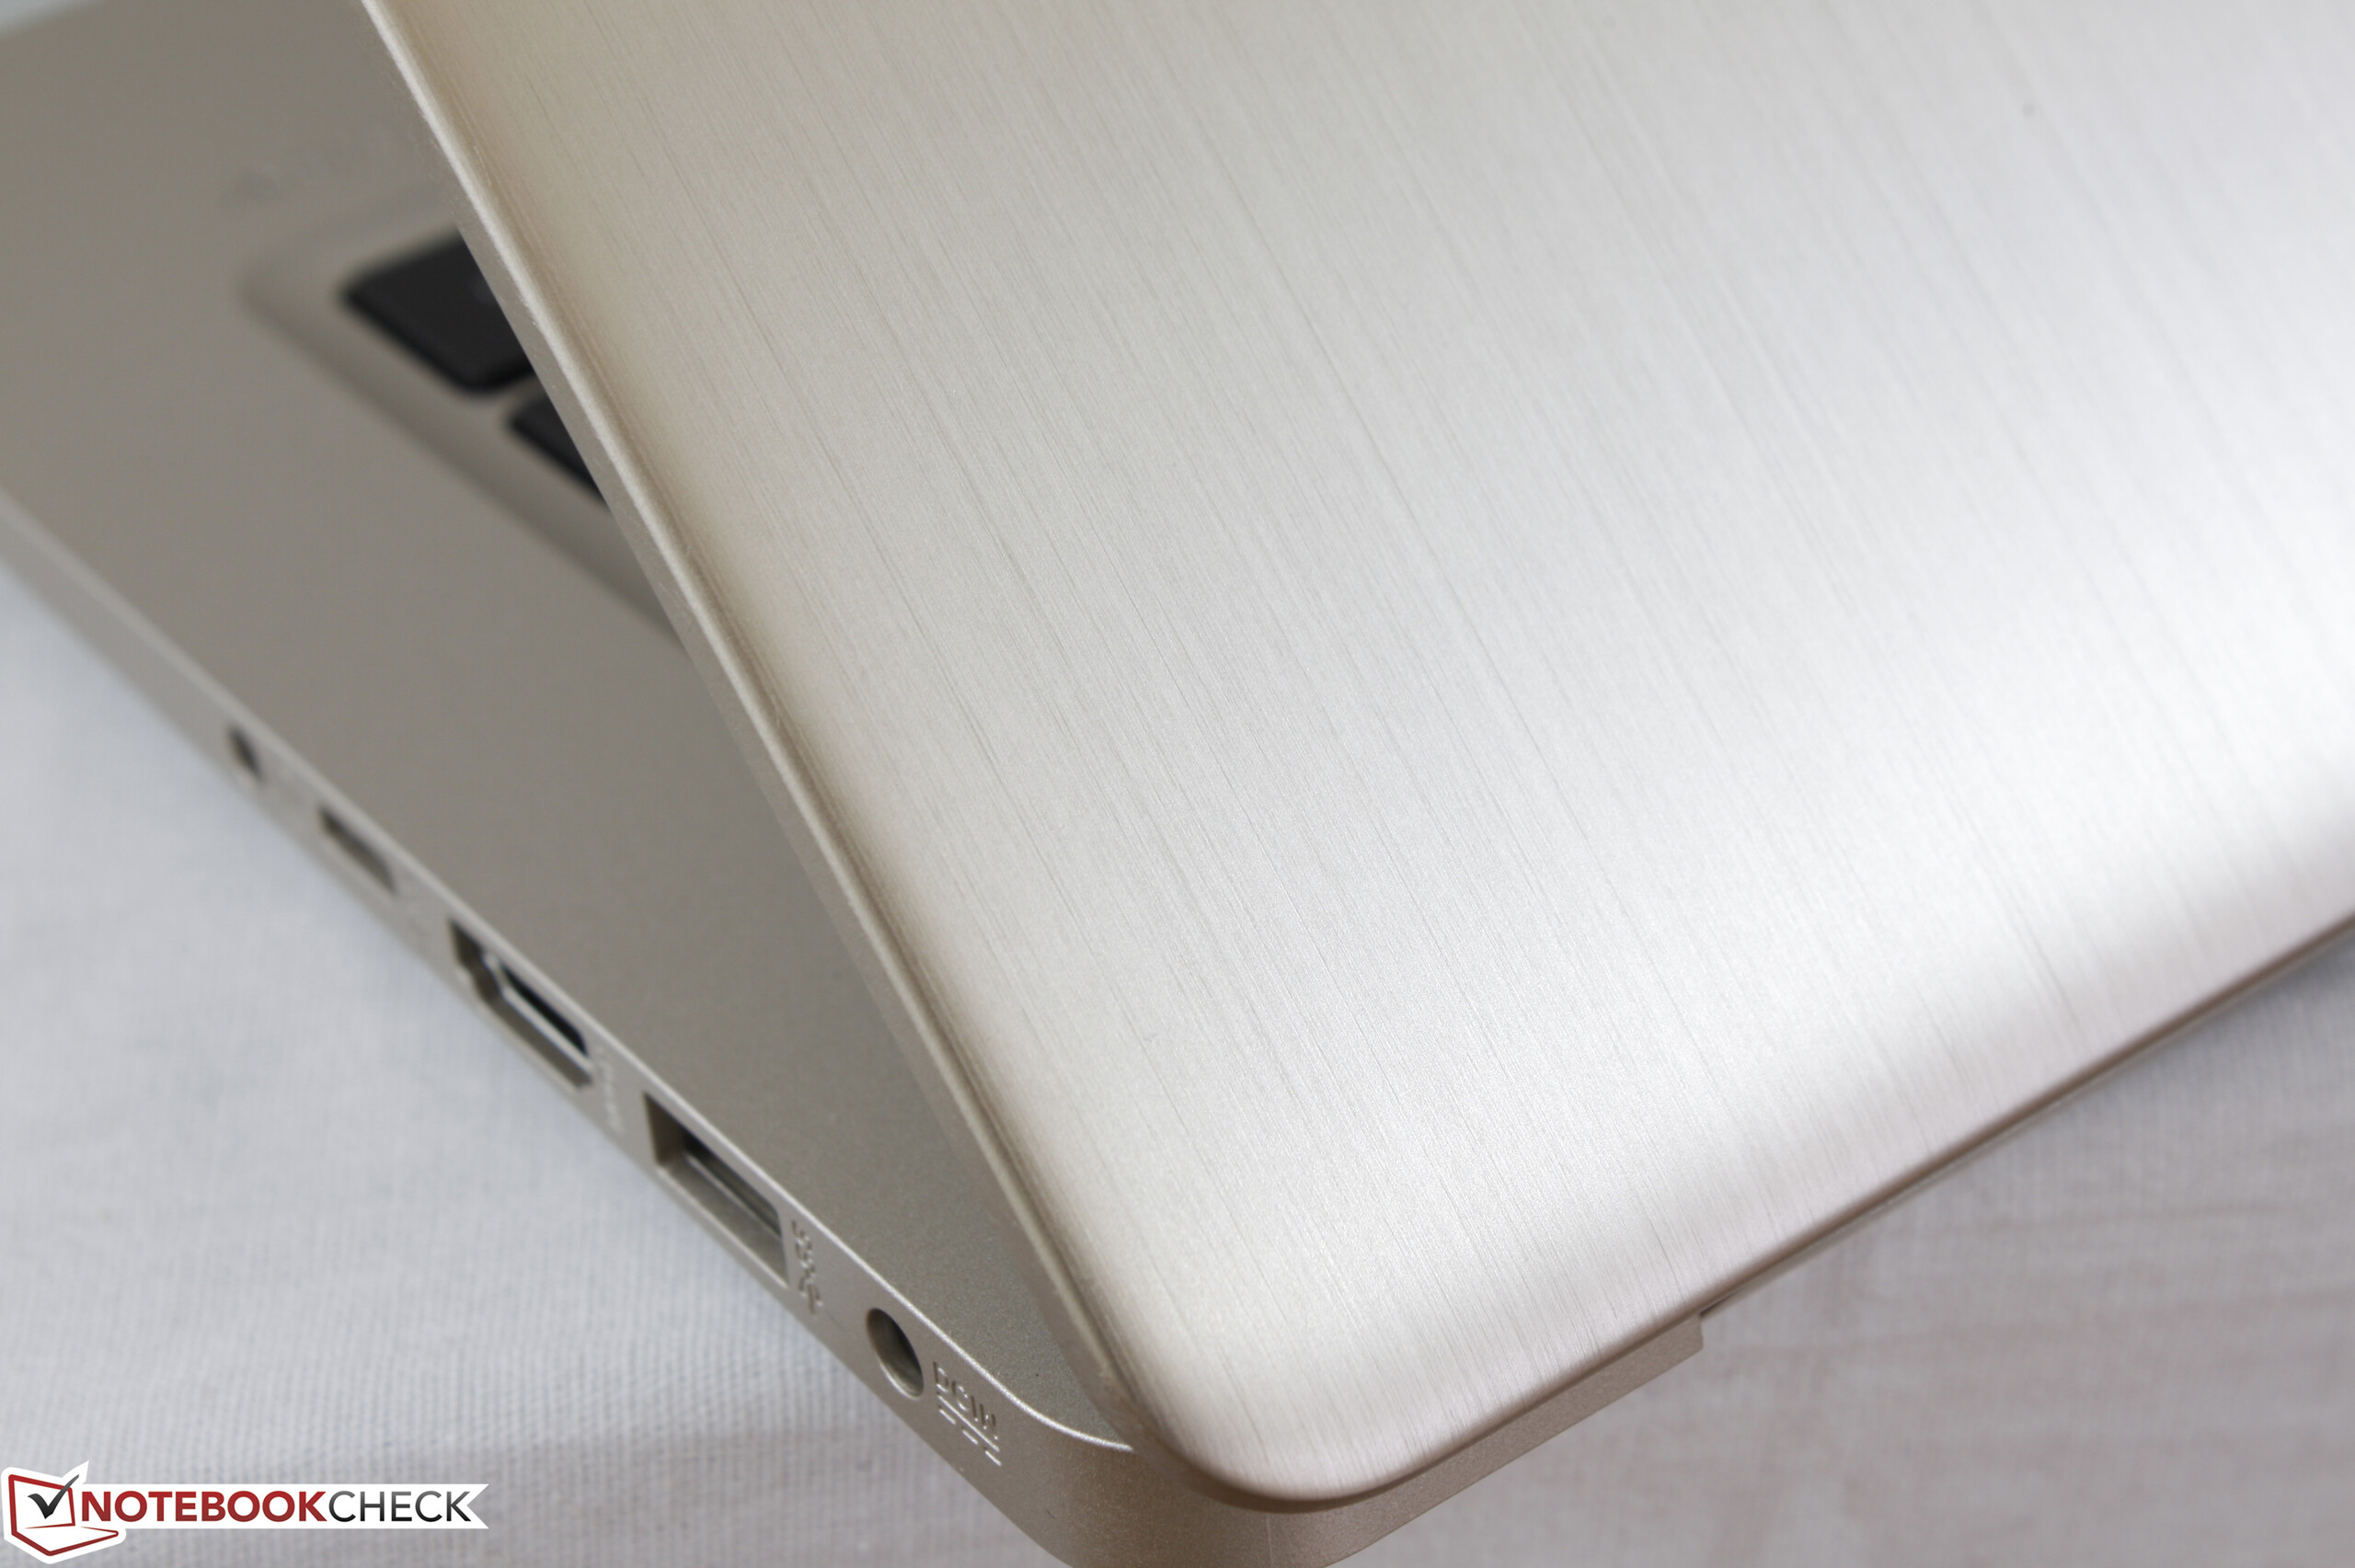
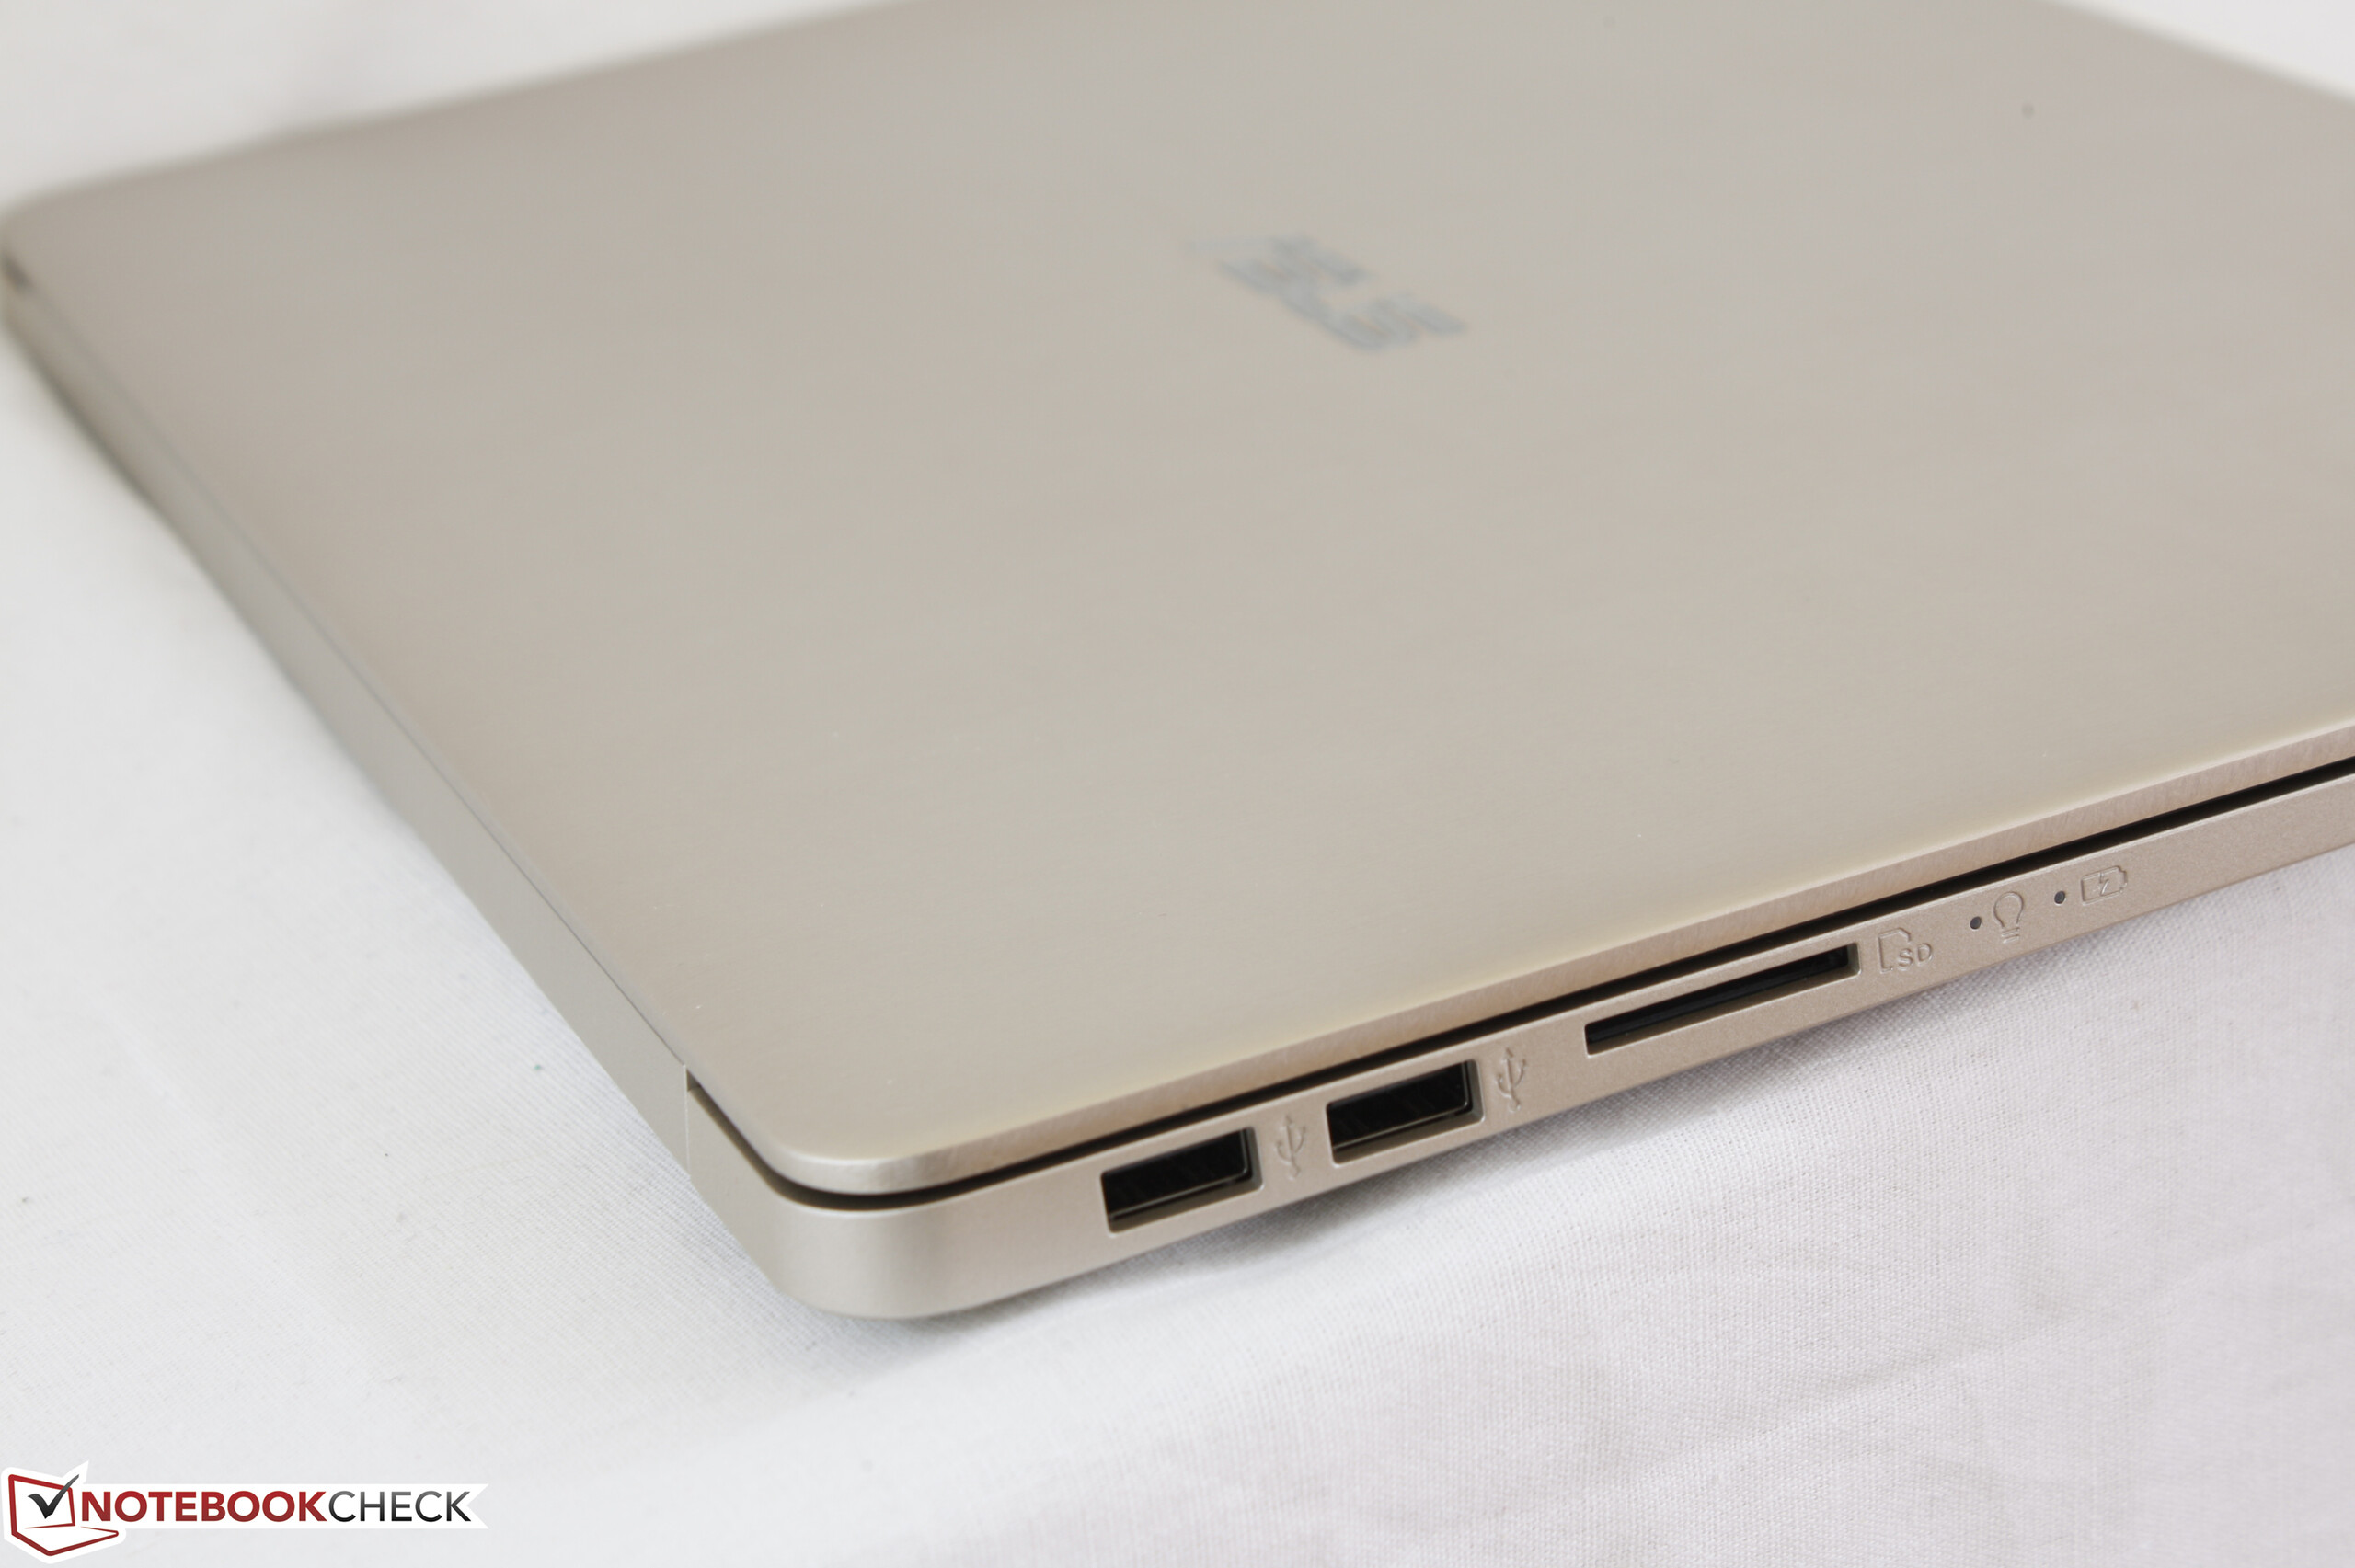
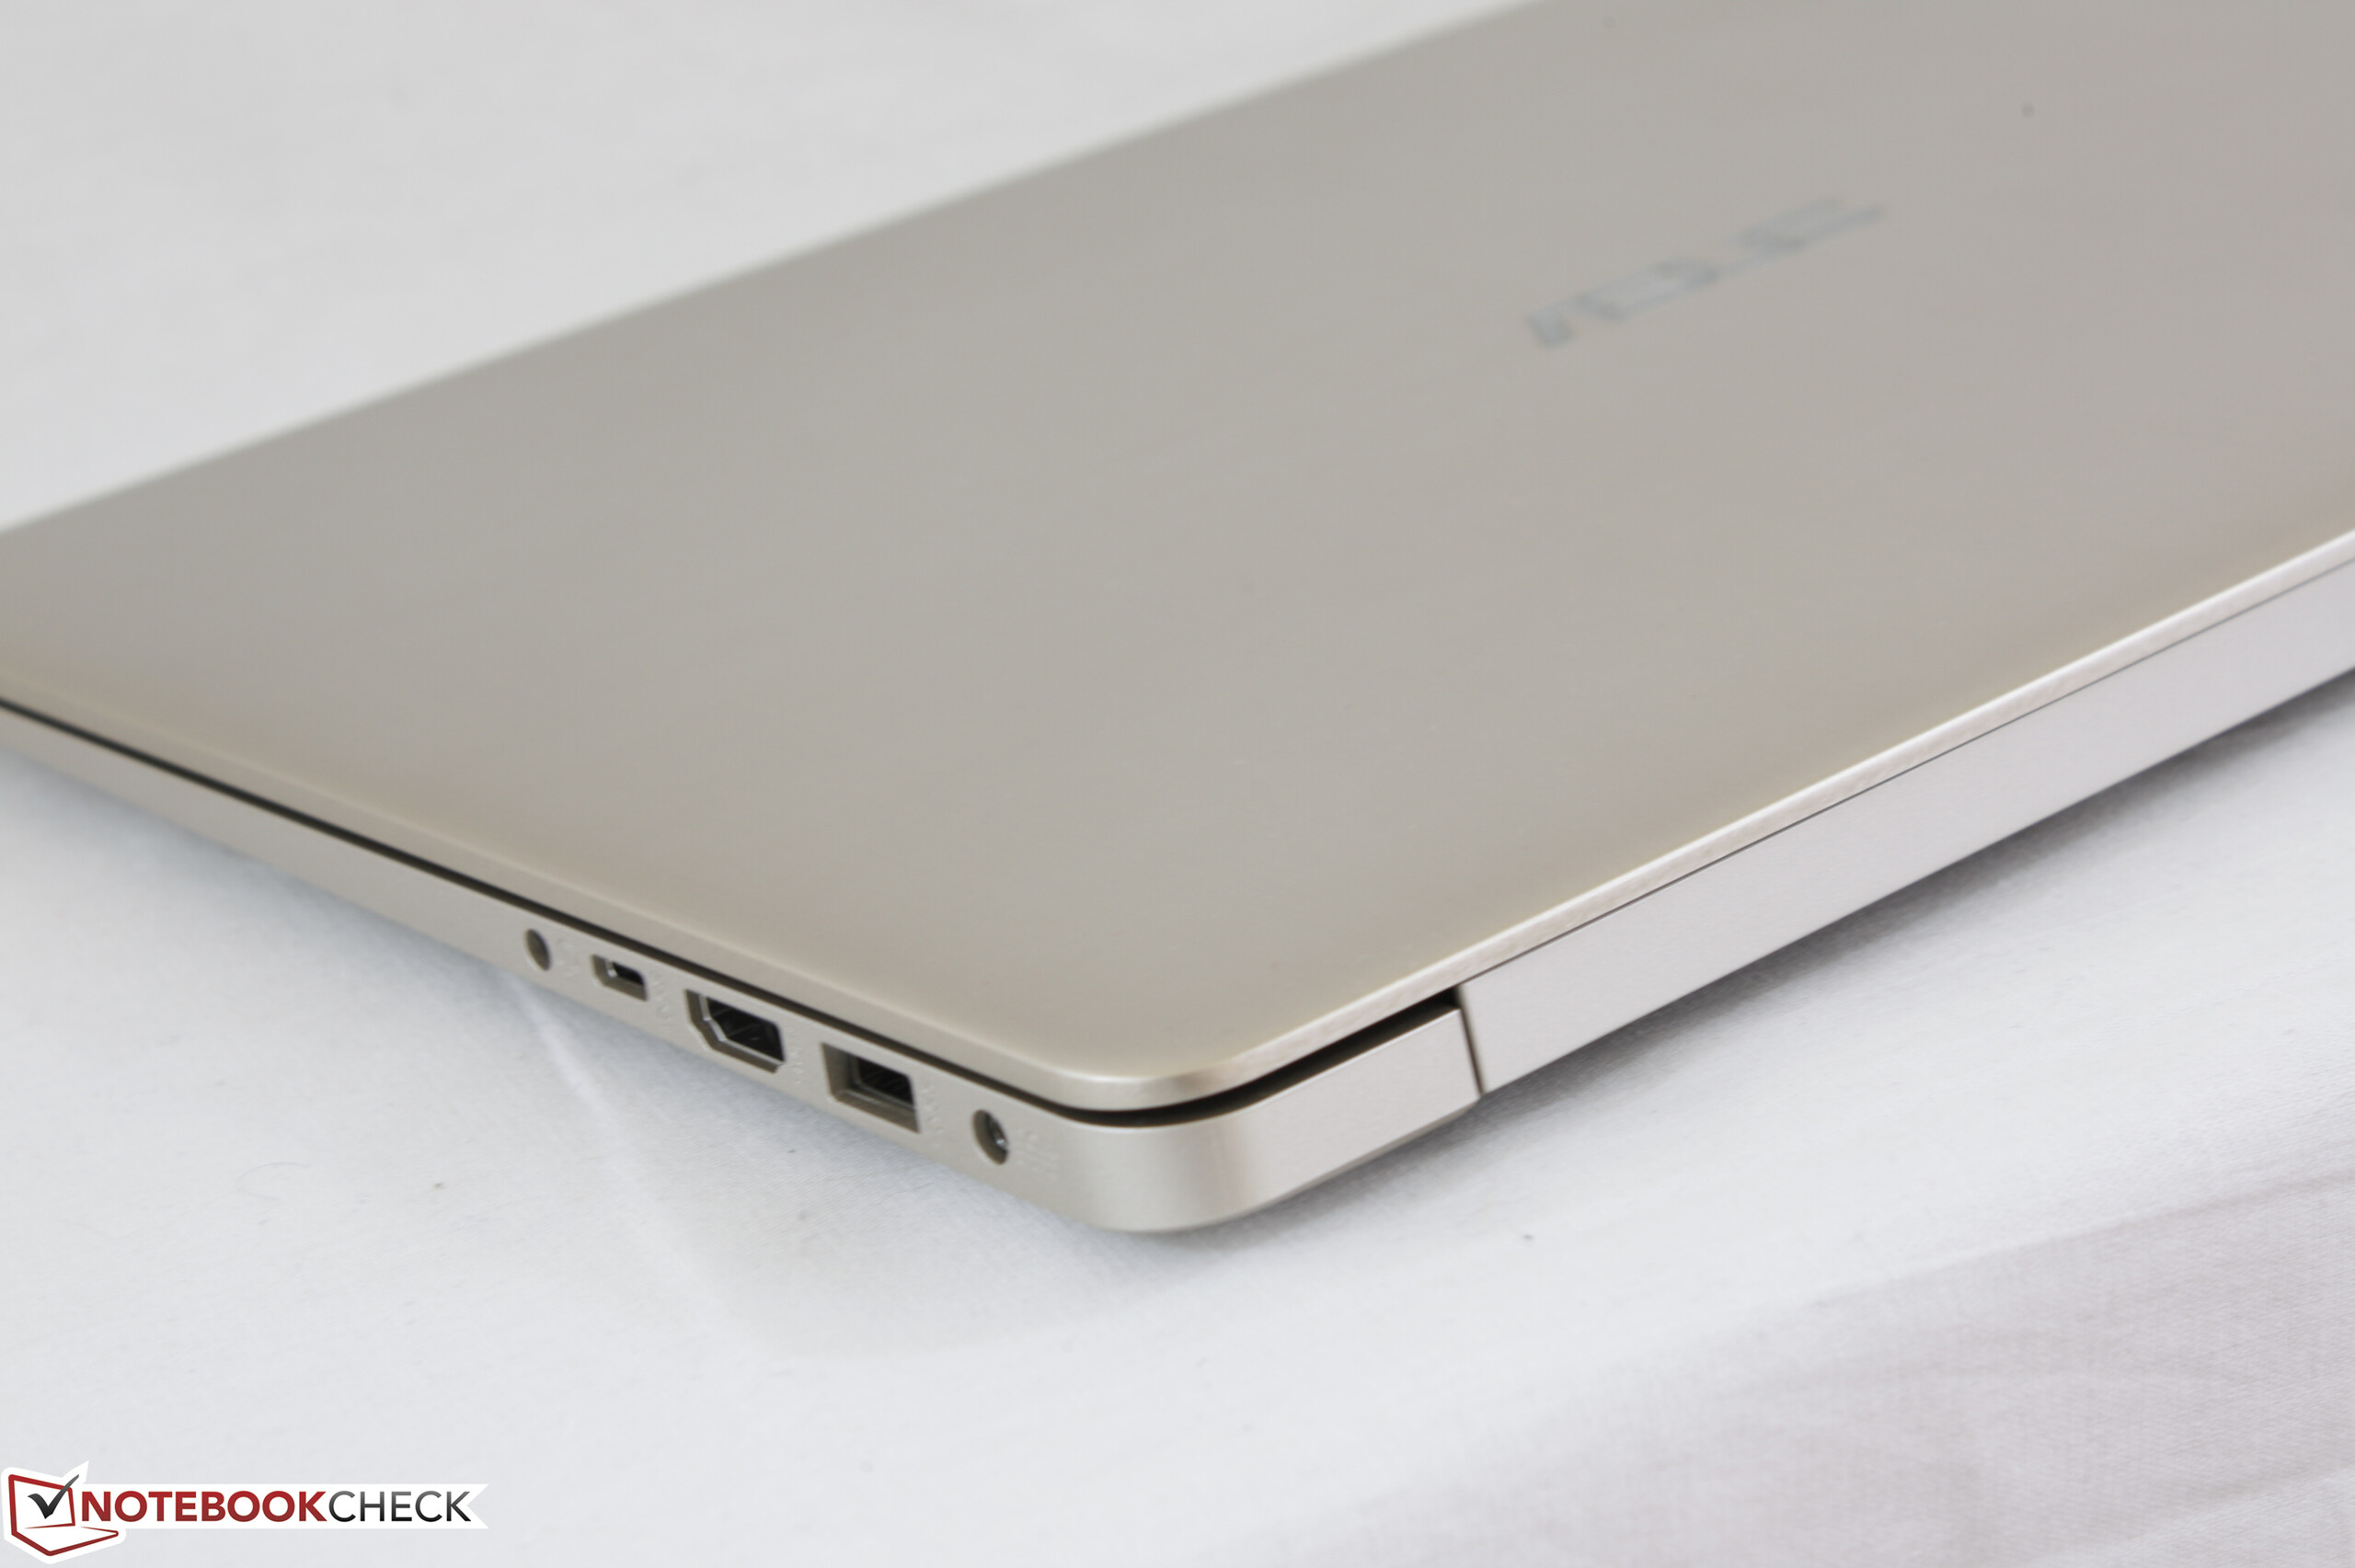
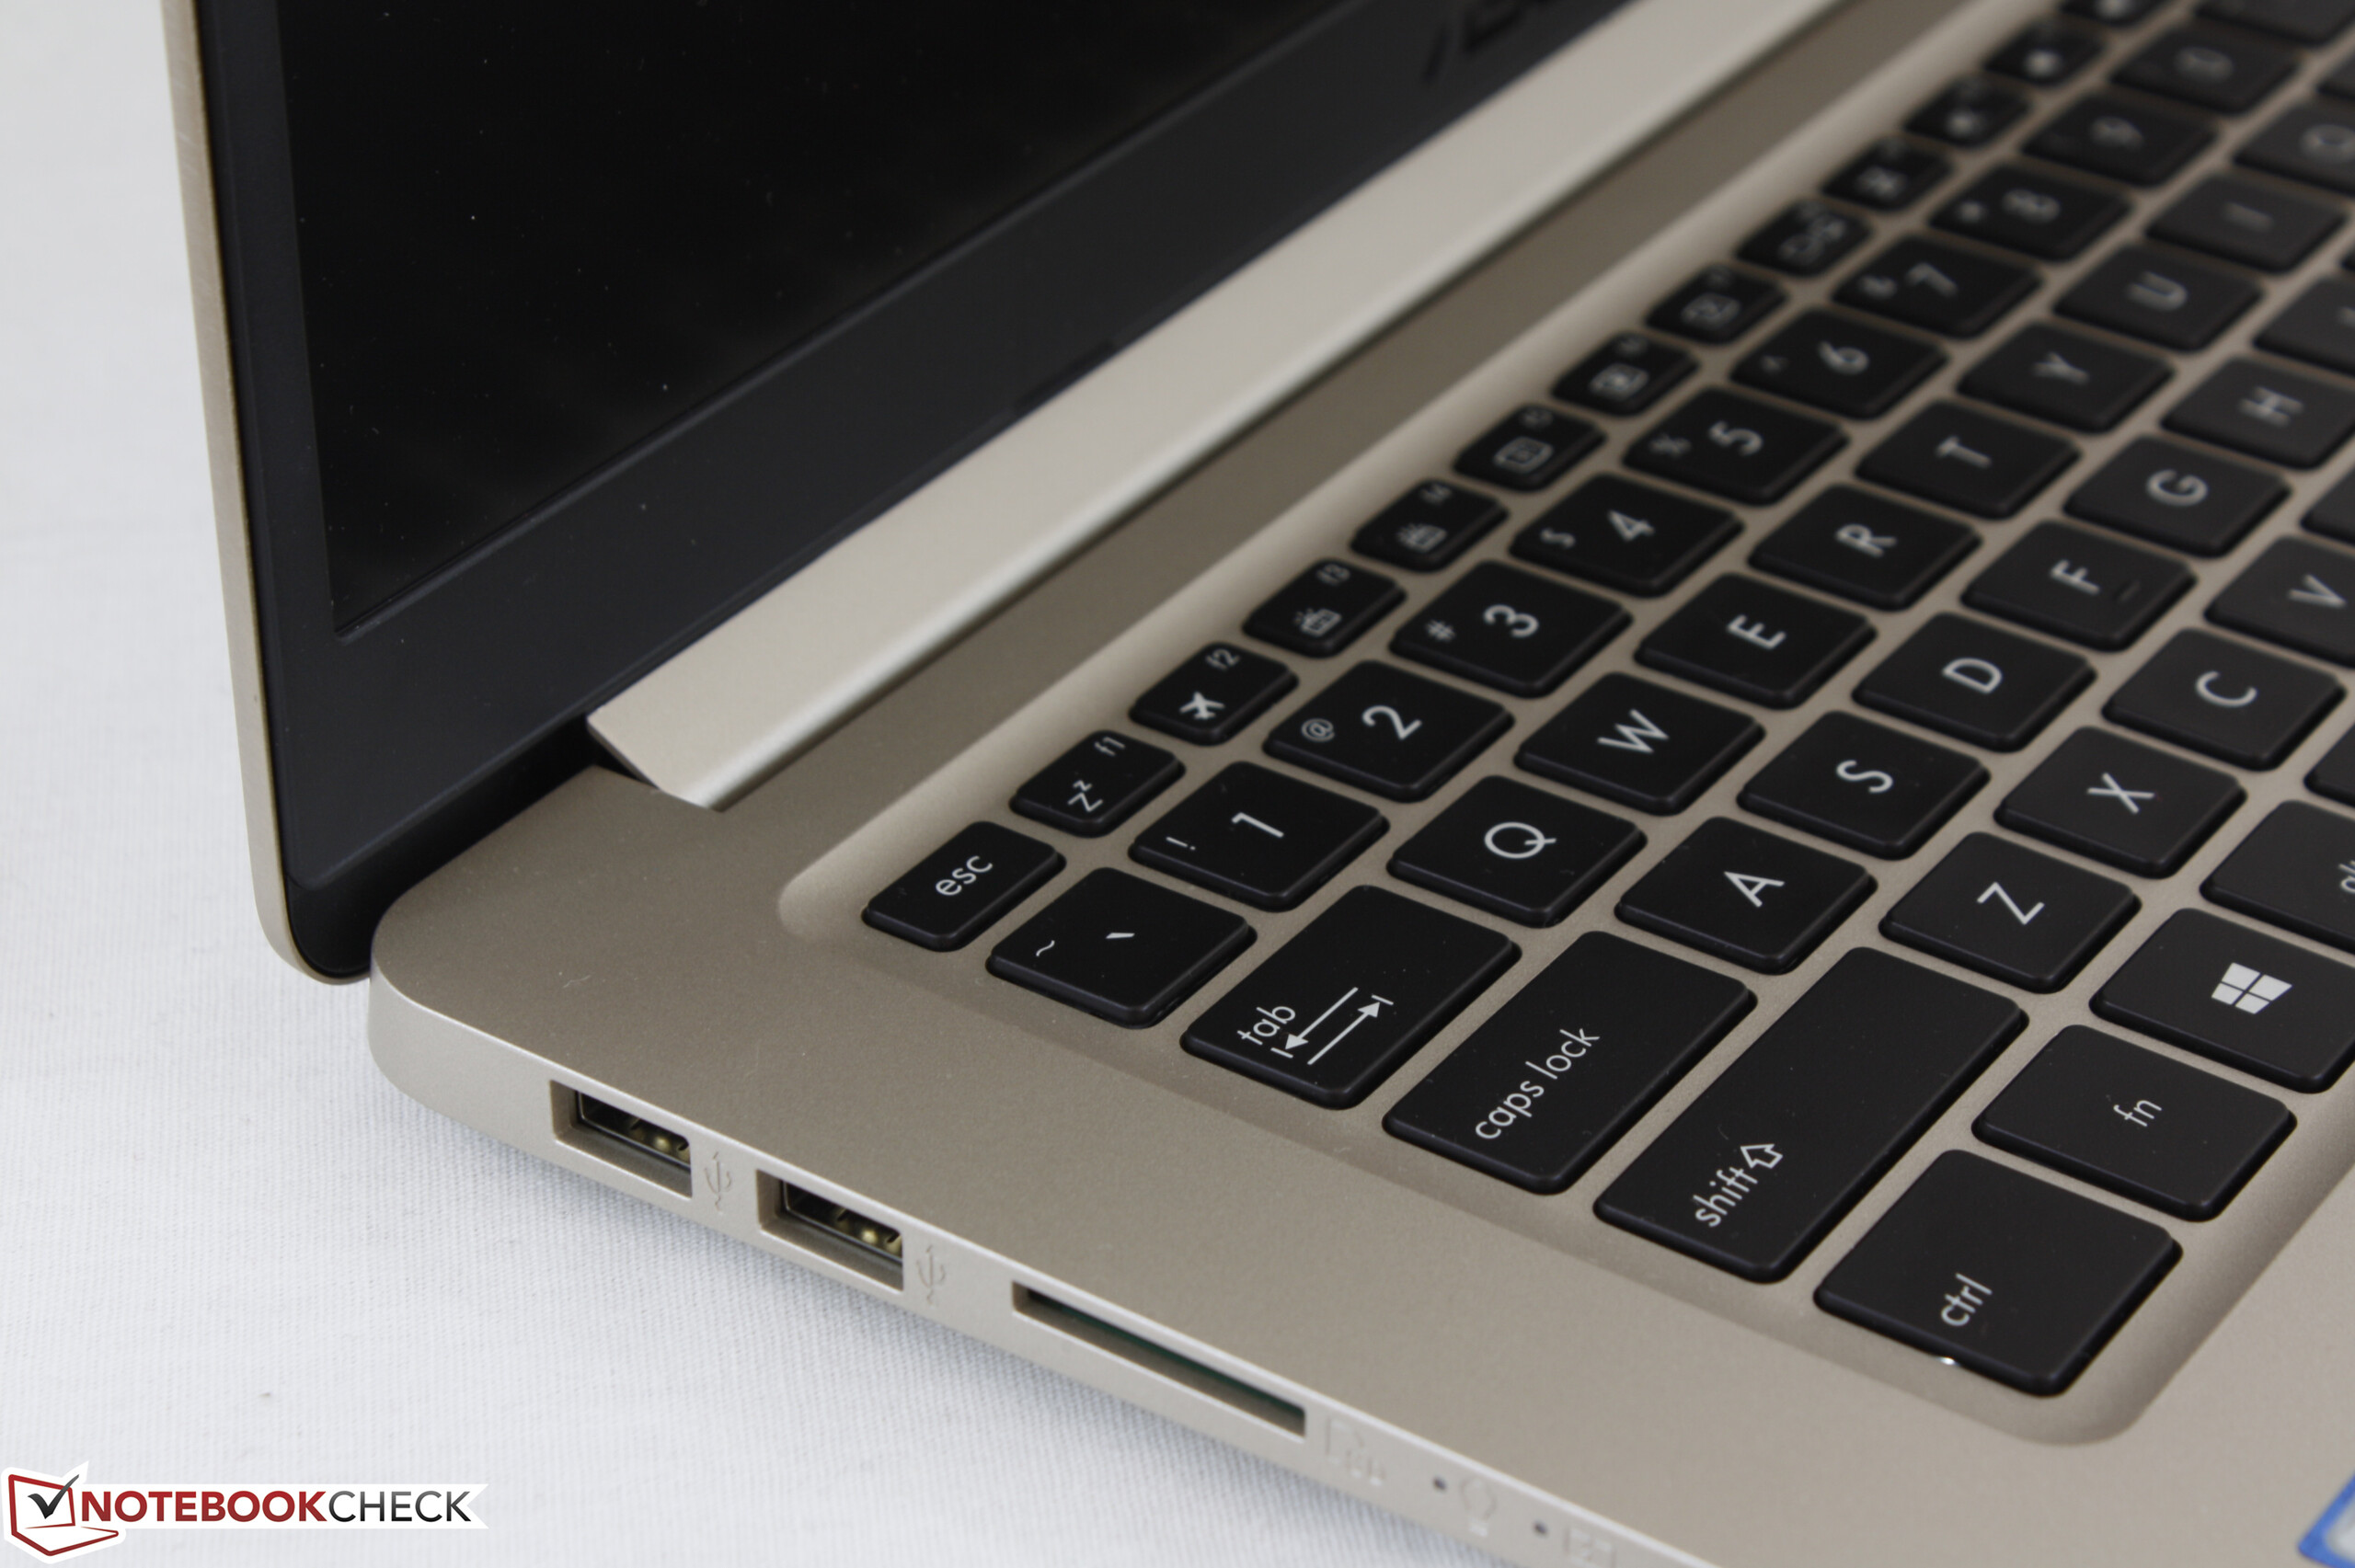
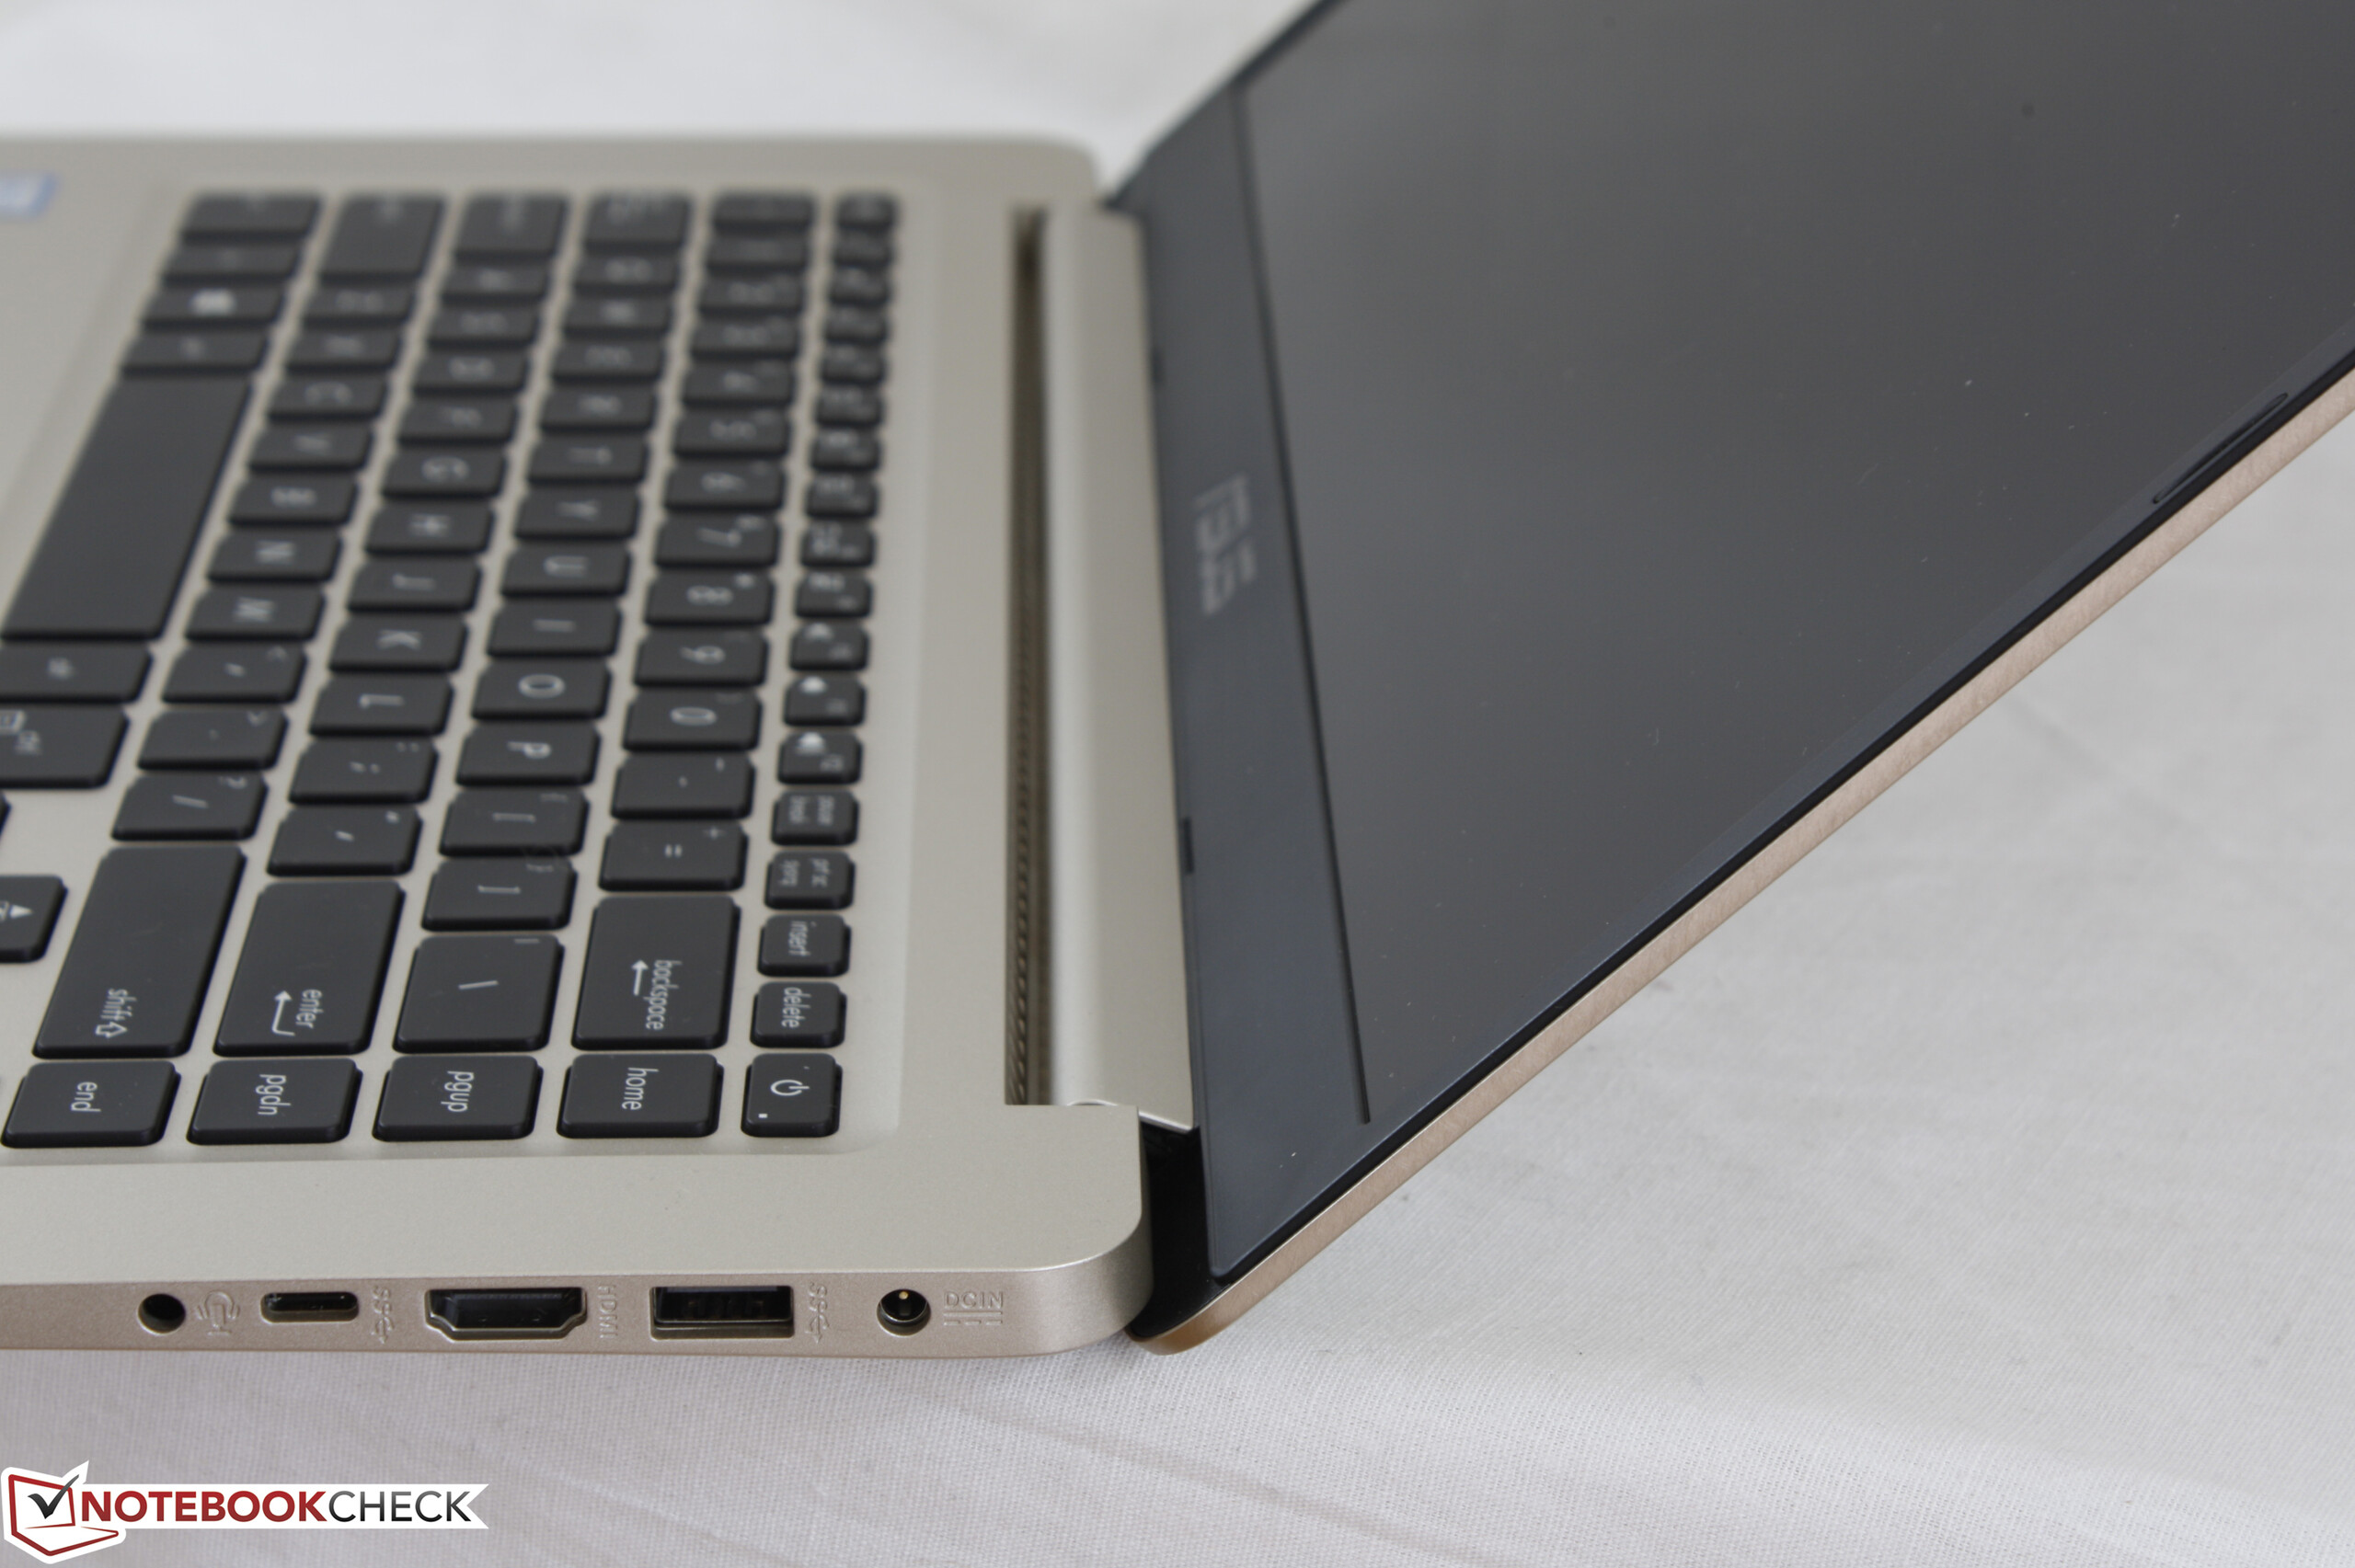
Available ports are the basic fare including HDMI, USB Type-A, and USB Type-C Gen. 1 (5 Gbps). Gone are the RJ-45 ports, VGA ports, and optical bays on older VivoBook models. Two of the three USB Type-A ports are still version 2.0 whereas some competitors are beginning to drop 2.0 altogether. The HP Envy 15, for example, houses essentially the same port selection as our Asus except with full USB 3.0 ports. Beyond this small nitpick, all ports are easy to reach and positioned closer to the rear of the system where cables are less likely to interfere.


SD Card Reader
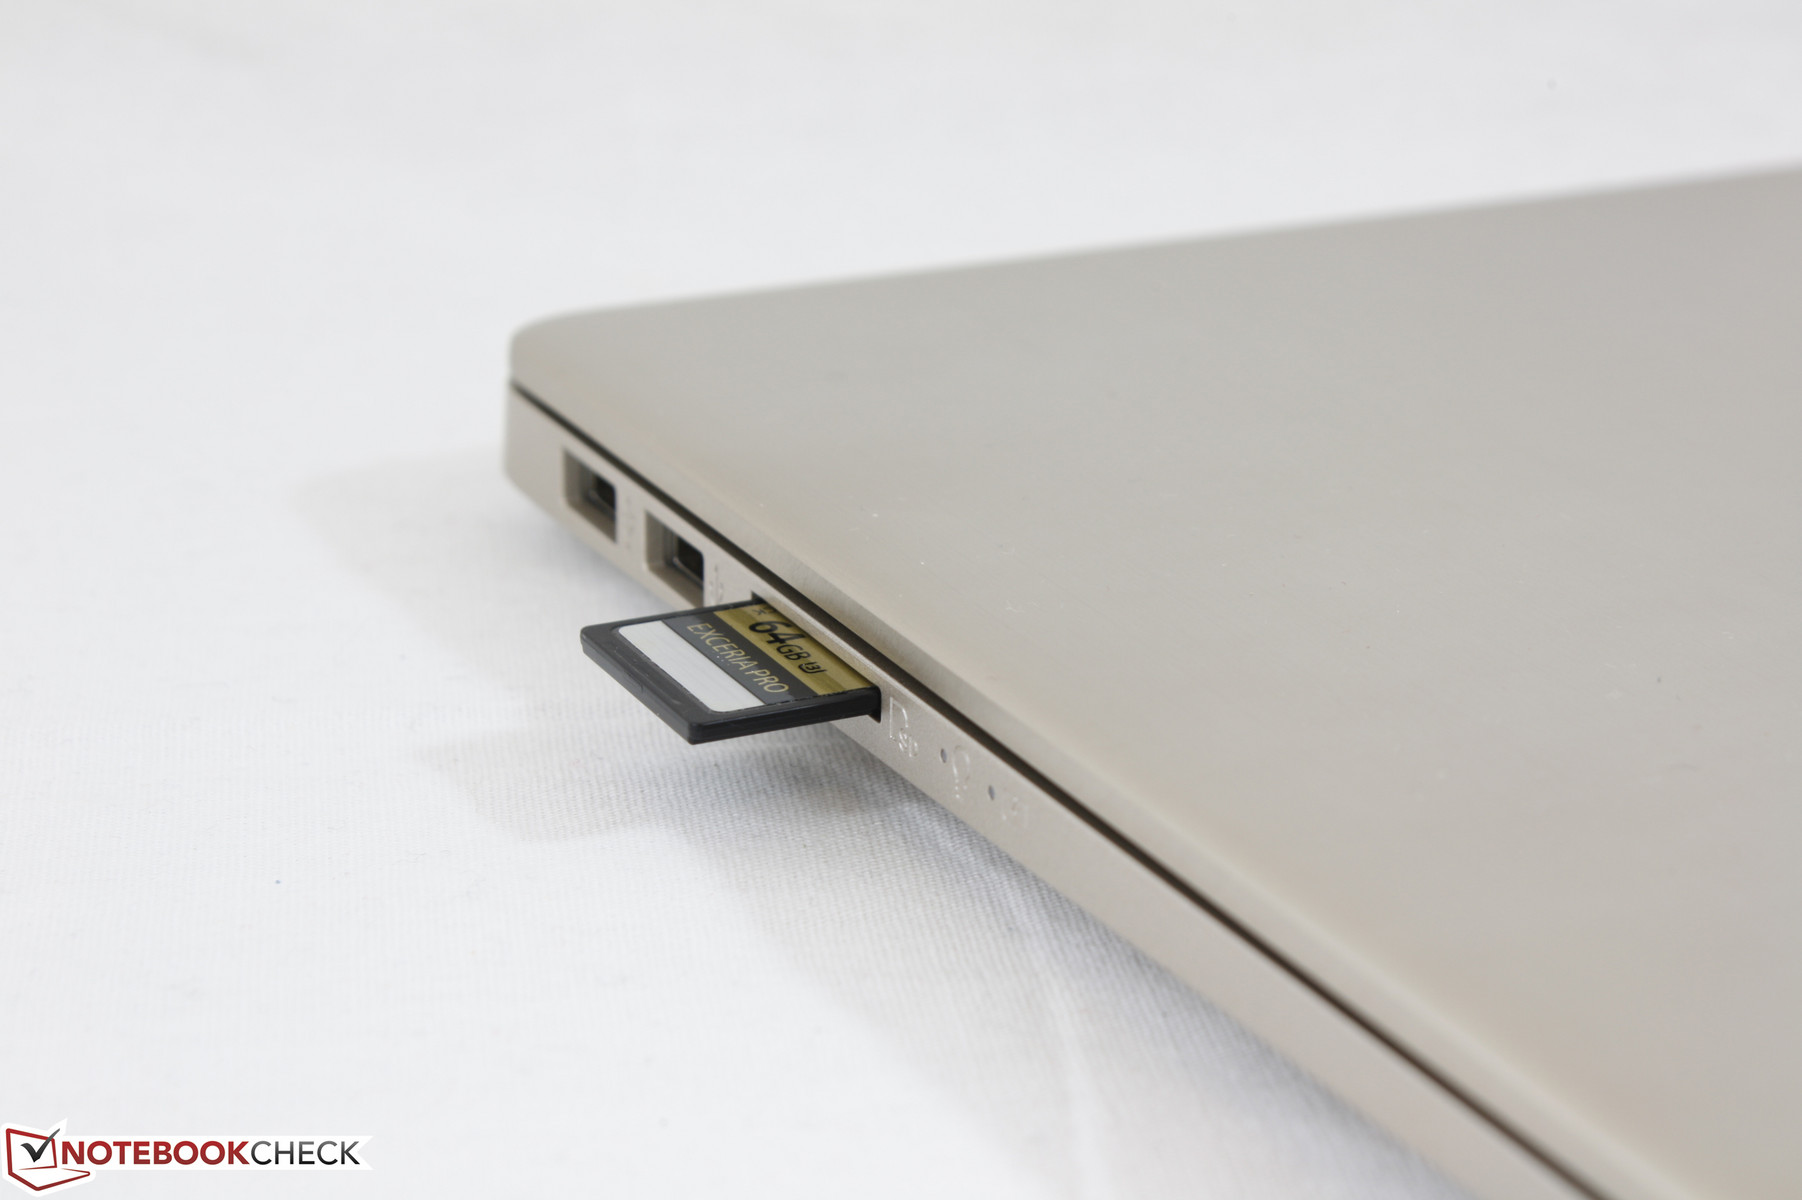
The integrated card reader is slow with average transfer rates in the low 30 MB/s range compared to 90 MB/s or 150+ MB/s on the HP Pavilion 15t and XPS 15 9560, respectively.
The reader is not spring loaded and an inserted SD card will protrude by over half its length compared to many other notebooks where the inserted card can sit flush against the edge for safe transporting.
| SD Card Reader | |
| average JPG Copy Test (av. of 3 runs) | |
| HP Pavilion 15t-au100 CTO (W0P31AV) | |
| Asus VivoBook S15 S510UA | |
| Dell Inspiron 15 7000 7567 | |
| maximum AS SSD Seq Read Test (1GB) | |
| HP Pavilion 15t-au100 CTO (W0P31AV) | |
| Asus VivoBook S15 S510UA | |
| Dell Inspiron 15 7000 7567 | |
Communication
The dual-band 2x2 Intel 8265 integrates both MU-MIMO and Bluetooth 4.2 but without WiDi functionality. A real-world WLAN test standing one meter away from our Linksys EA8500 test router returns an average transfer rate of 639 Mbps against a theoretical maximum of 867 Mbps. We otherwise experienced no connectivity or dropout issues during our time with the test unit.
| Networking | |
| iperf3 transmit AX12 | |
| Asus VivoBook S15 S510UA | |
| Lenovo V510-15IKB 80WQ0002GE | |
| Dell Inspiron 15 7000 7567 (jseb) | |
| iperf3 receive AX12 | |
| Asus VivoBook S15 S510UA | |
| Lenovo V510-15IKB 80WQ0002GE | |
| Dell Inspiron 15 7000 7567 (jseb) | |
Accessories
There are no included extras outside of the AC adapter and Quick Start guide. A USB-to-RJ45 adapter or carrying sleeve like for new ZenBook purchases would have been nifty additions.
Maintenance
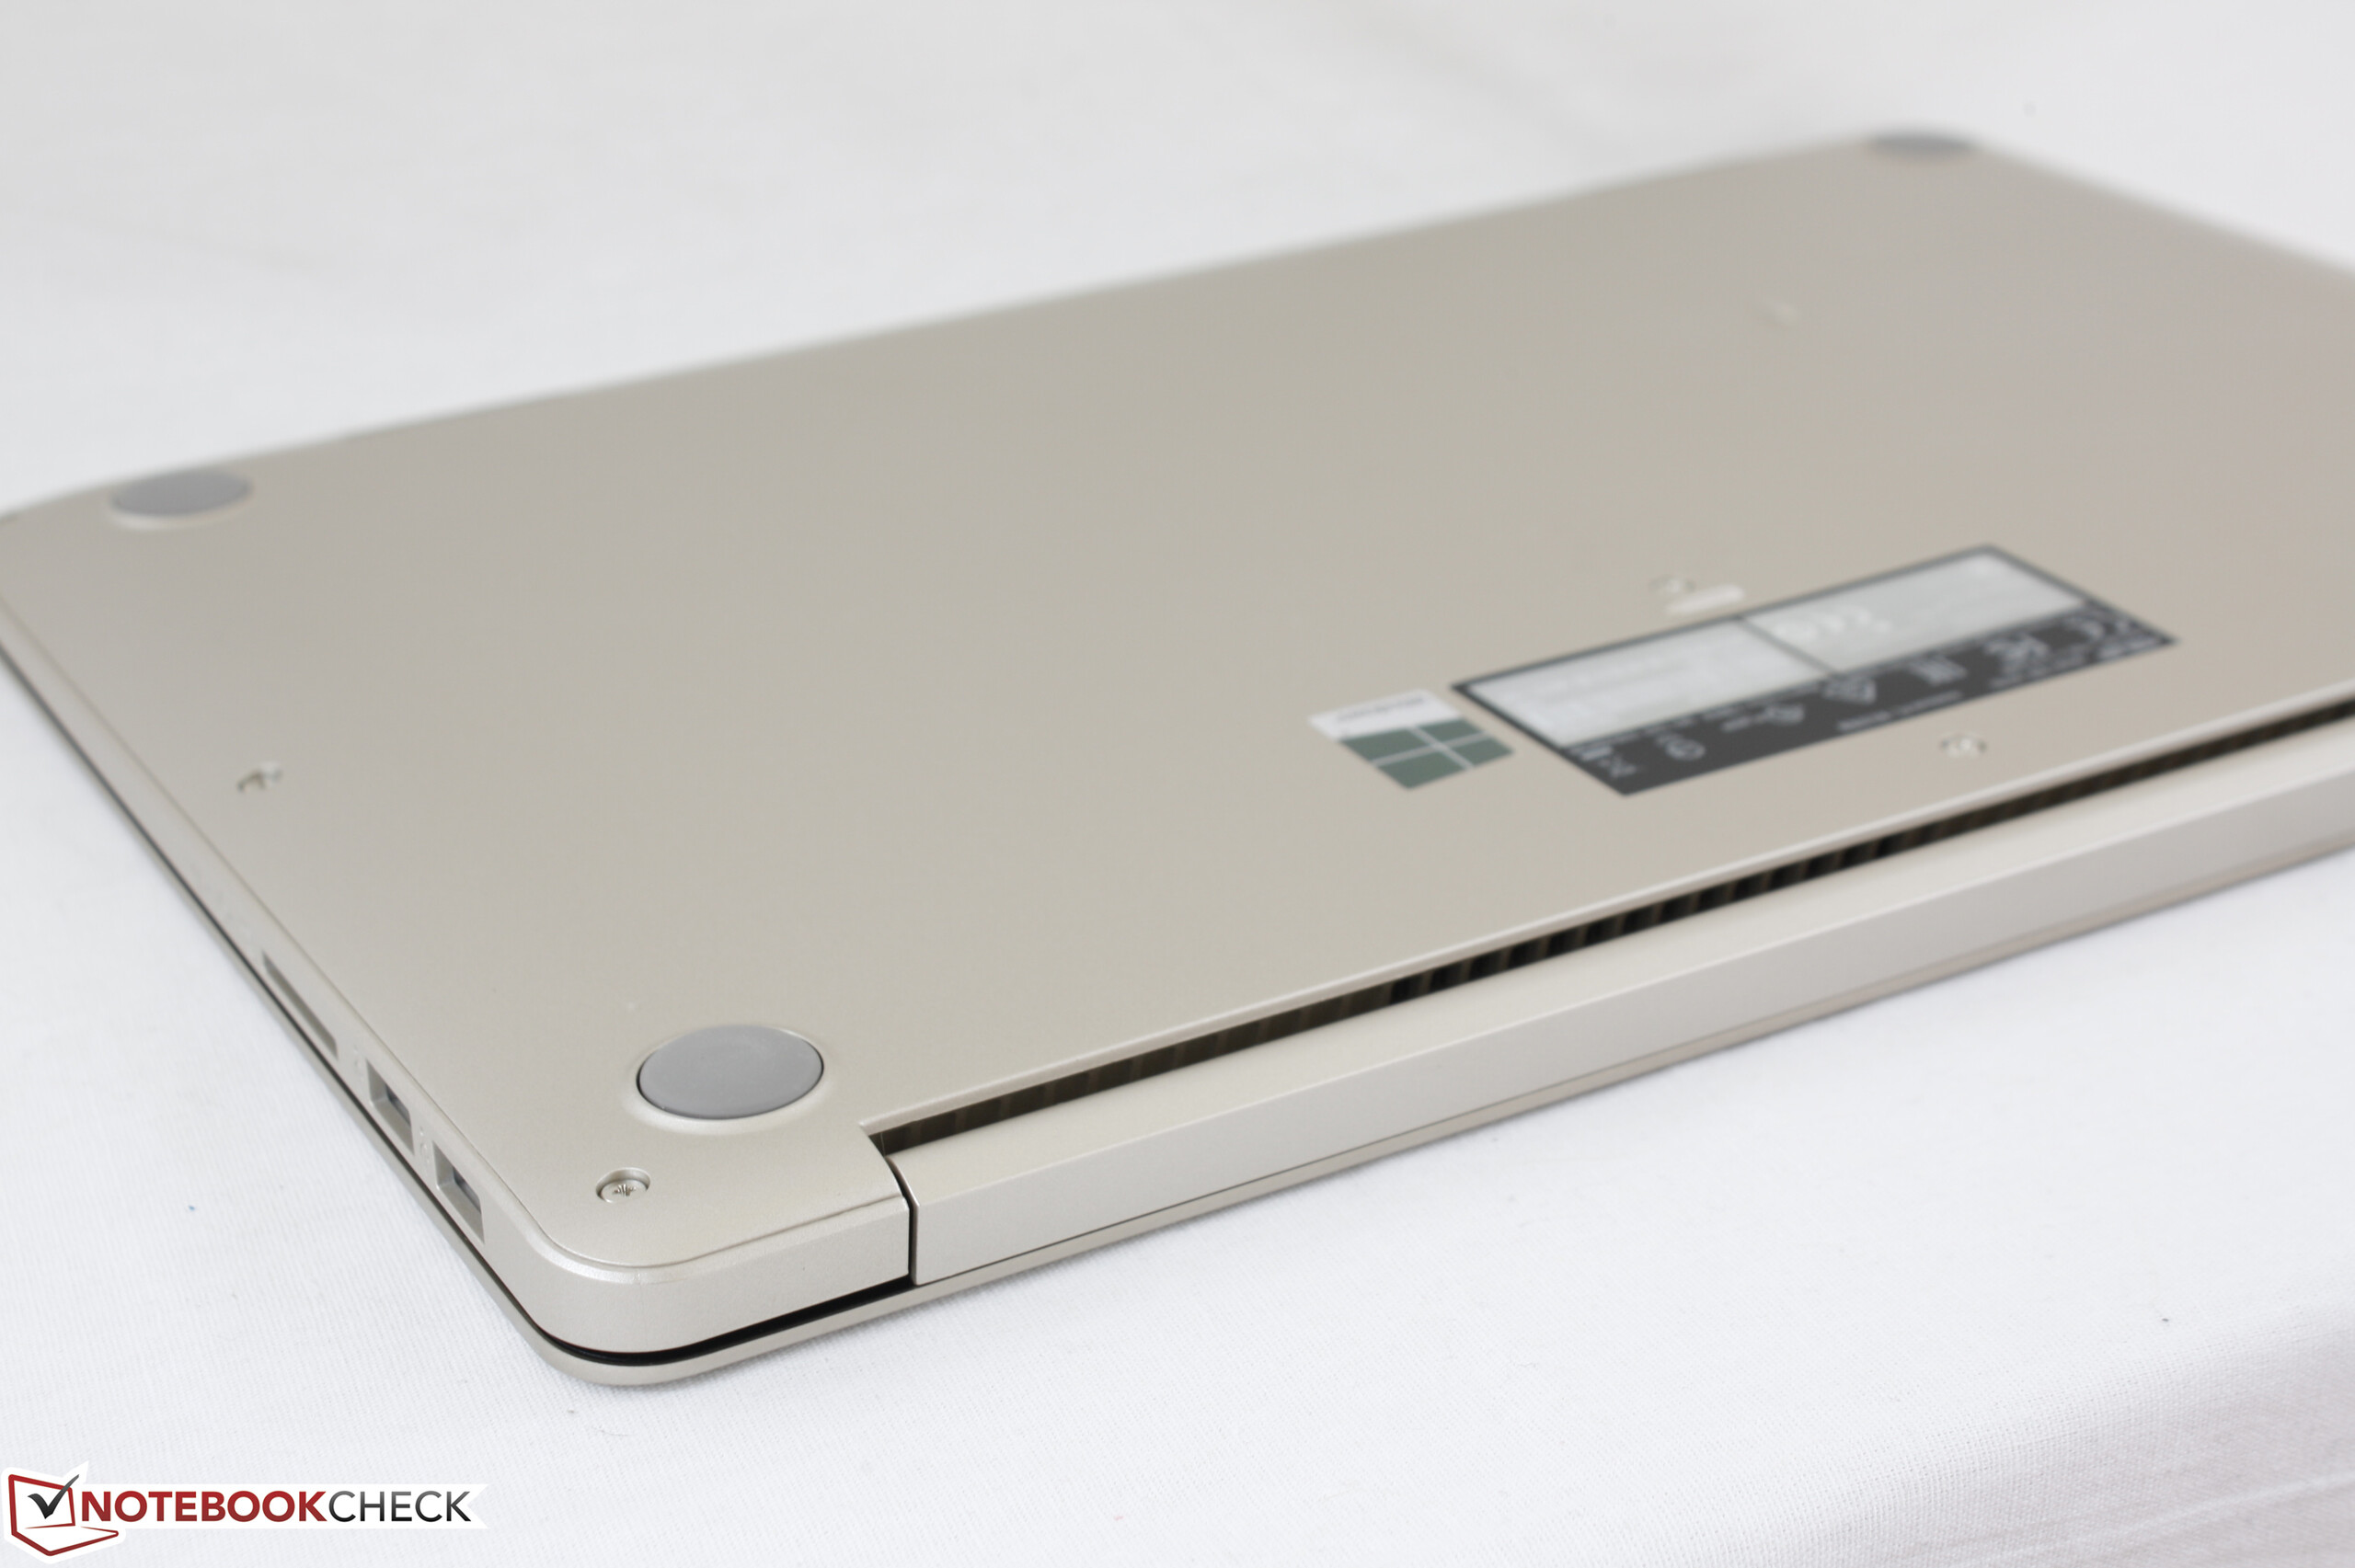
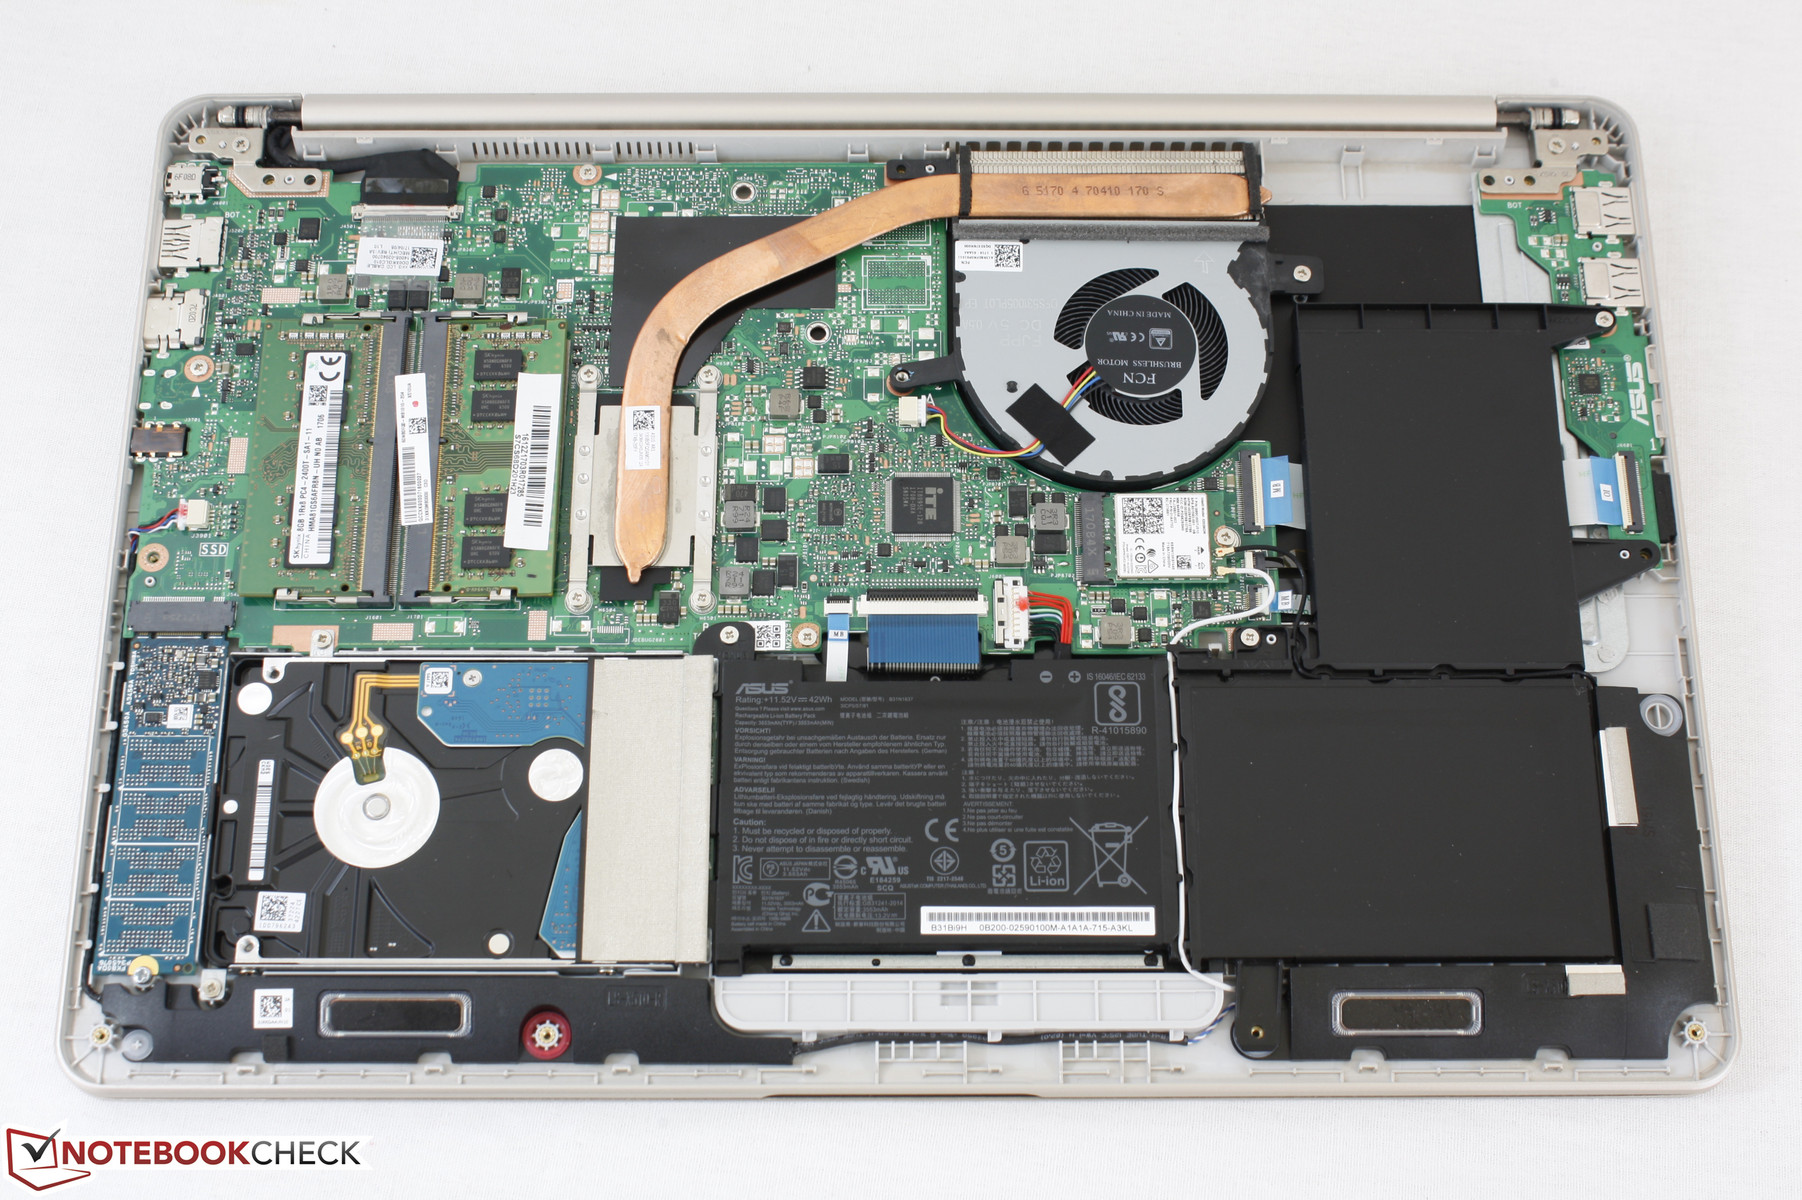
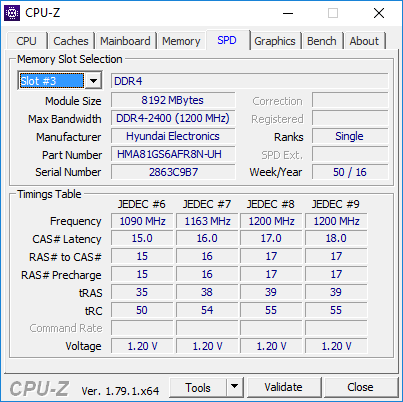
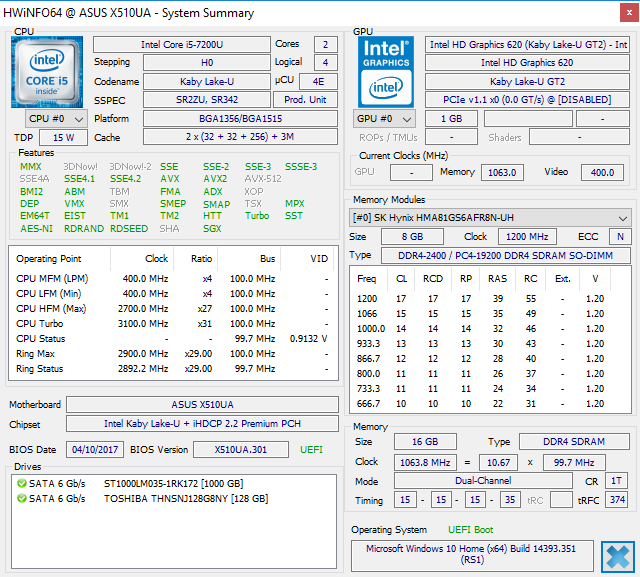
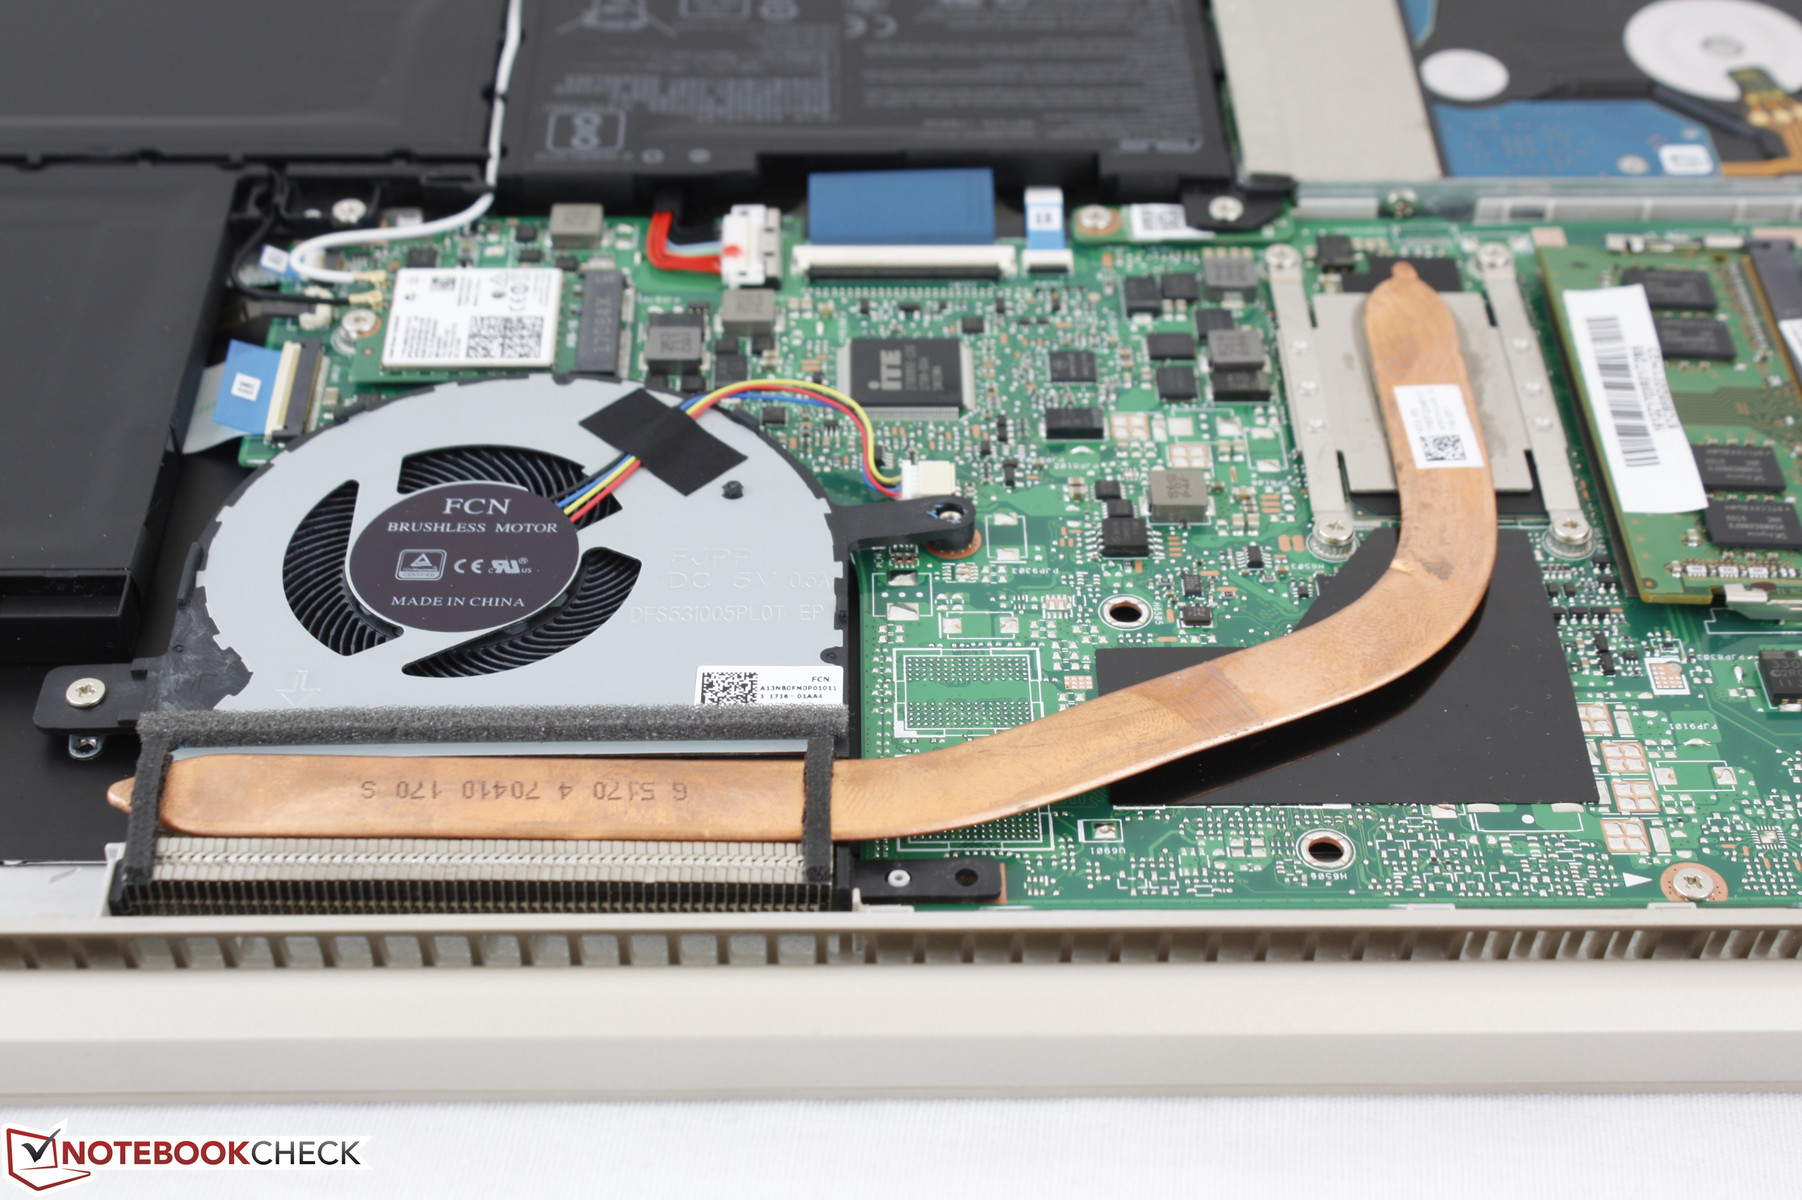
Serviceability requires a Philips screwdriver and sharp edge to remove the bottom panel. Note that there are two screws hidden underneath the rear rubber feet in addition to the ten securing the edges and corners. Once the panel is removed, users will have direct access to the battery, WLAN module, 2x DDR4 SODIMM slots, and both storage bays. The emptied space on the motherboard underneath the midsection of the heat pipe shows where the dedicated Nvidia GPU would have been located had this been the Vivobook S15 S510UR/S510UQ SKU.
Warranty
The standard one-year limited manufacturer warranty applies with onsite service available if buyers happen to be within 40 km of an Asus service center. CUKUSA covers any pre-configured components added by the reseller for up to three years. Please see our Guarantees, Return policies and Warranties FAQ for country-specific information.
Input Devices
Keyboard
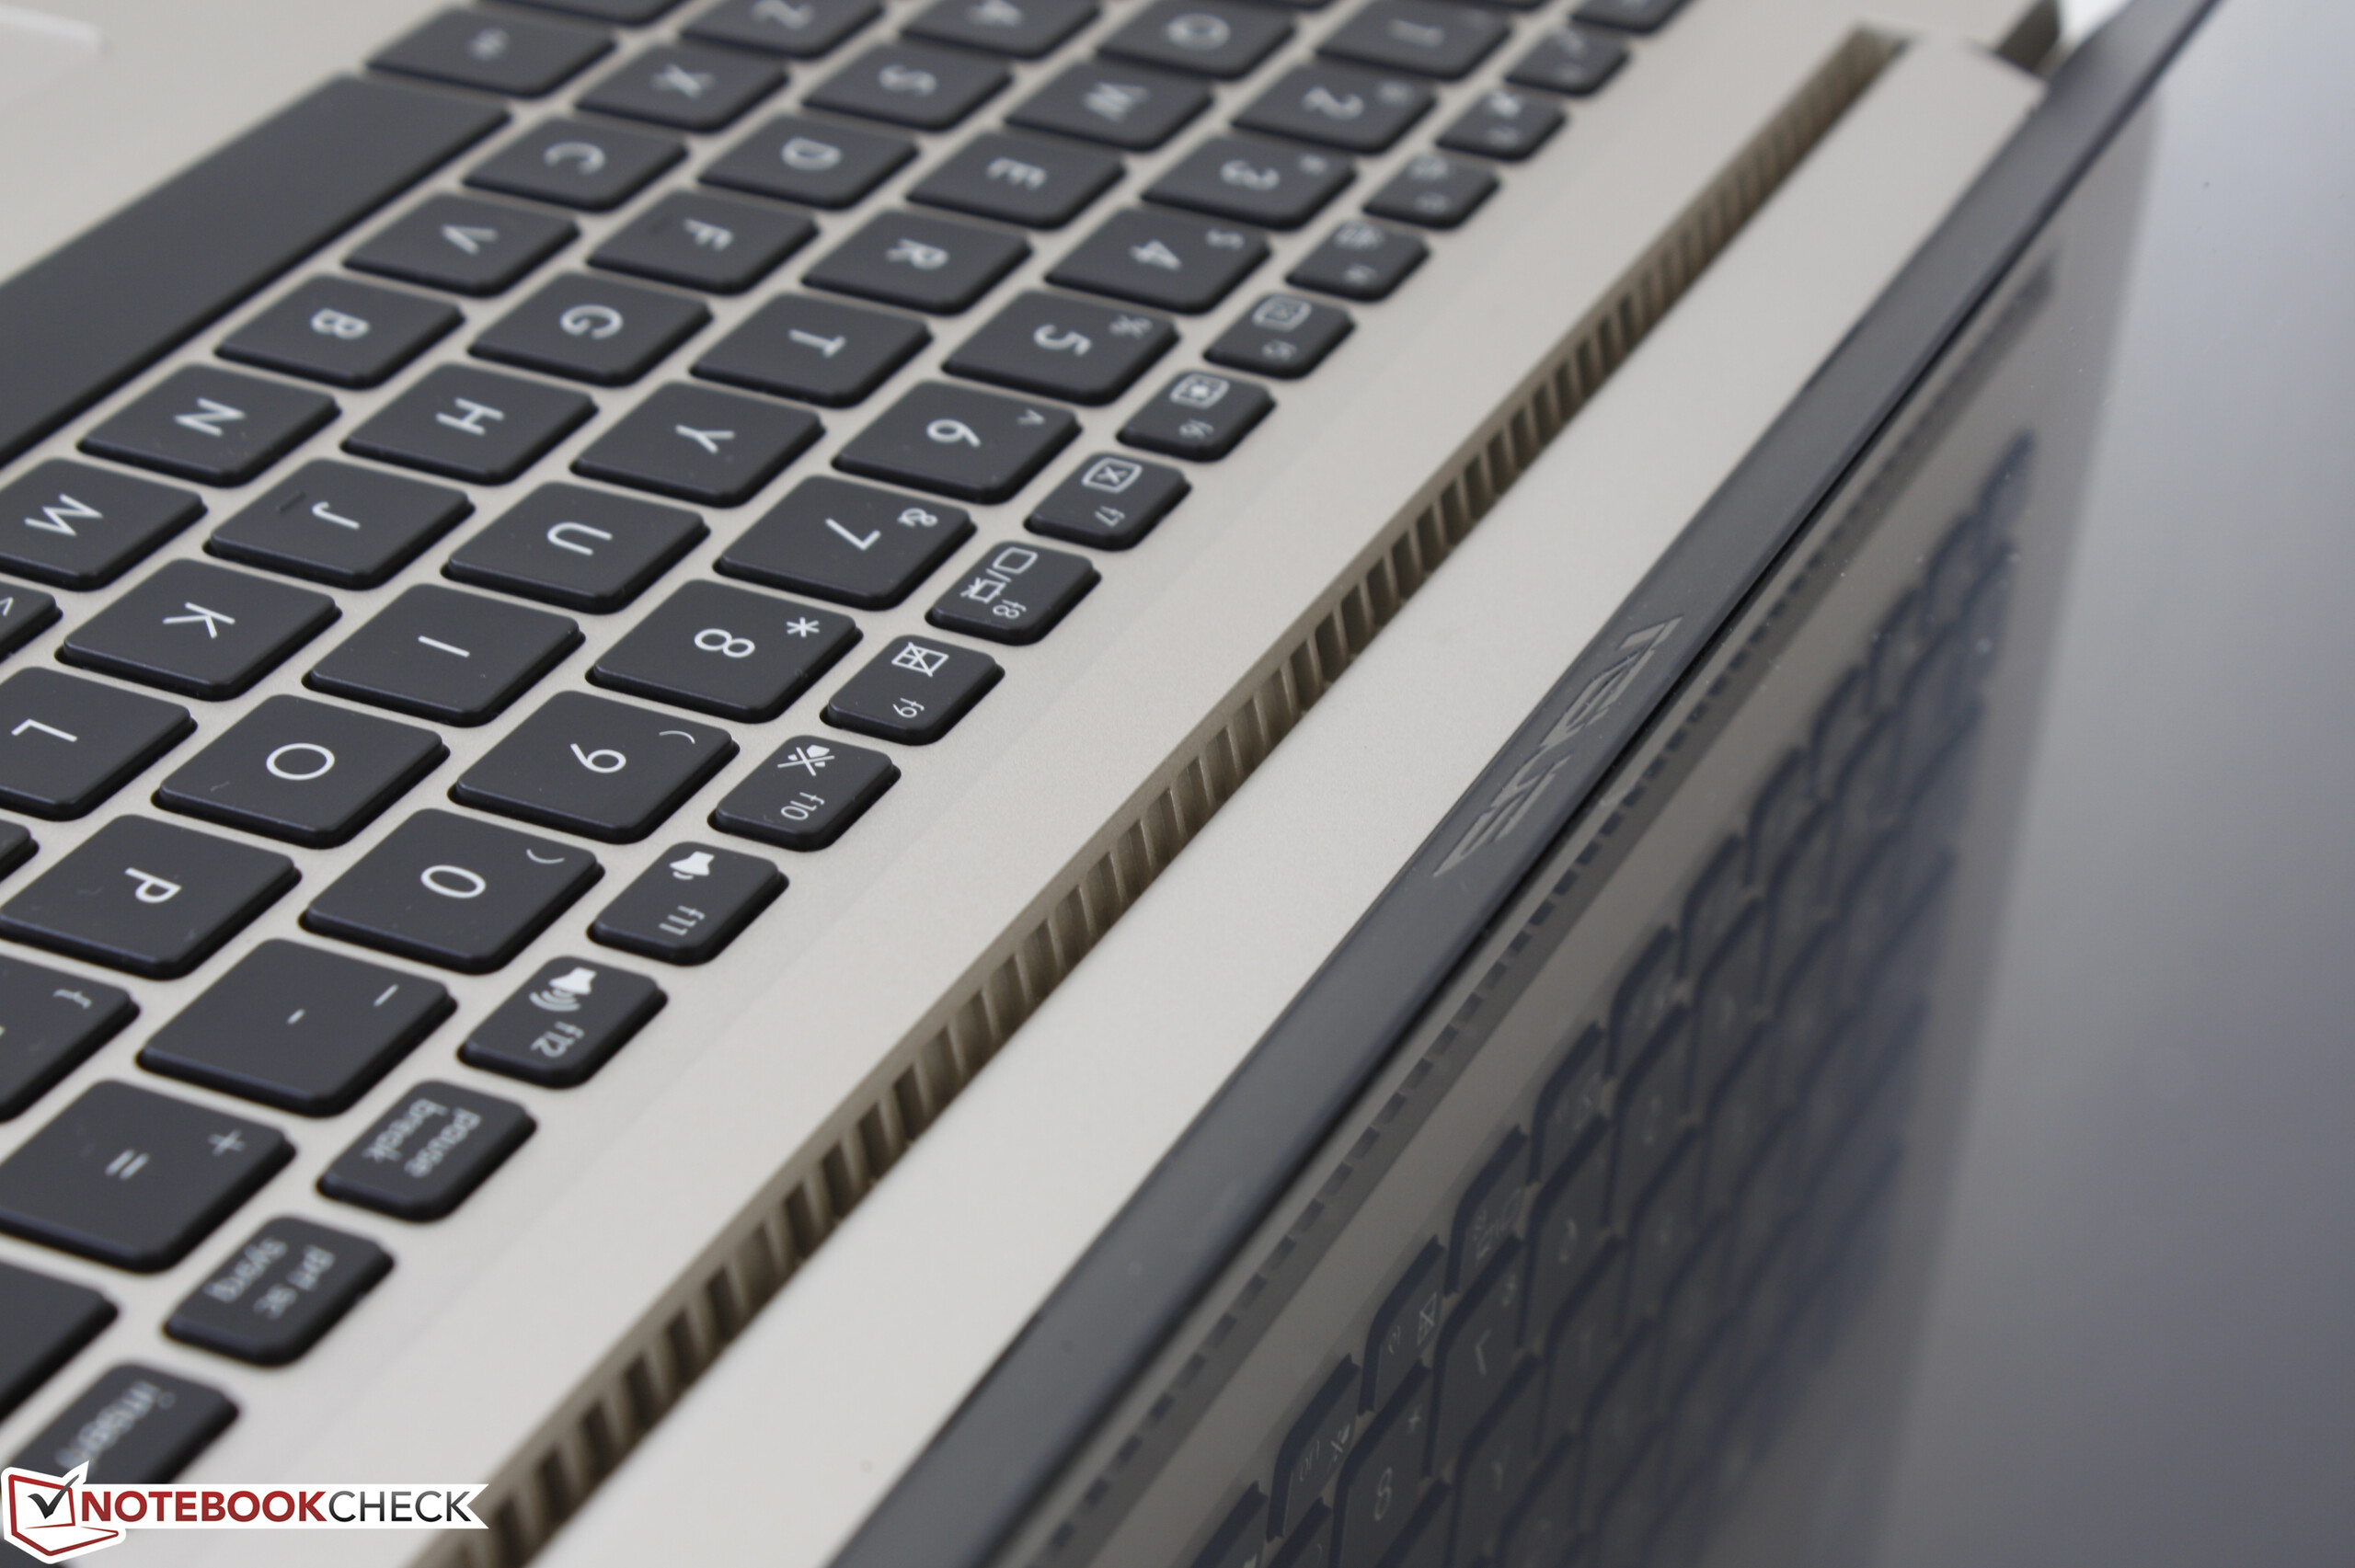
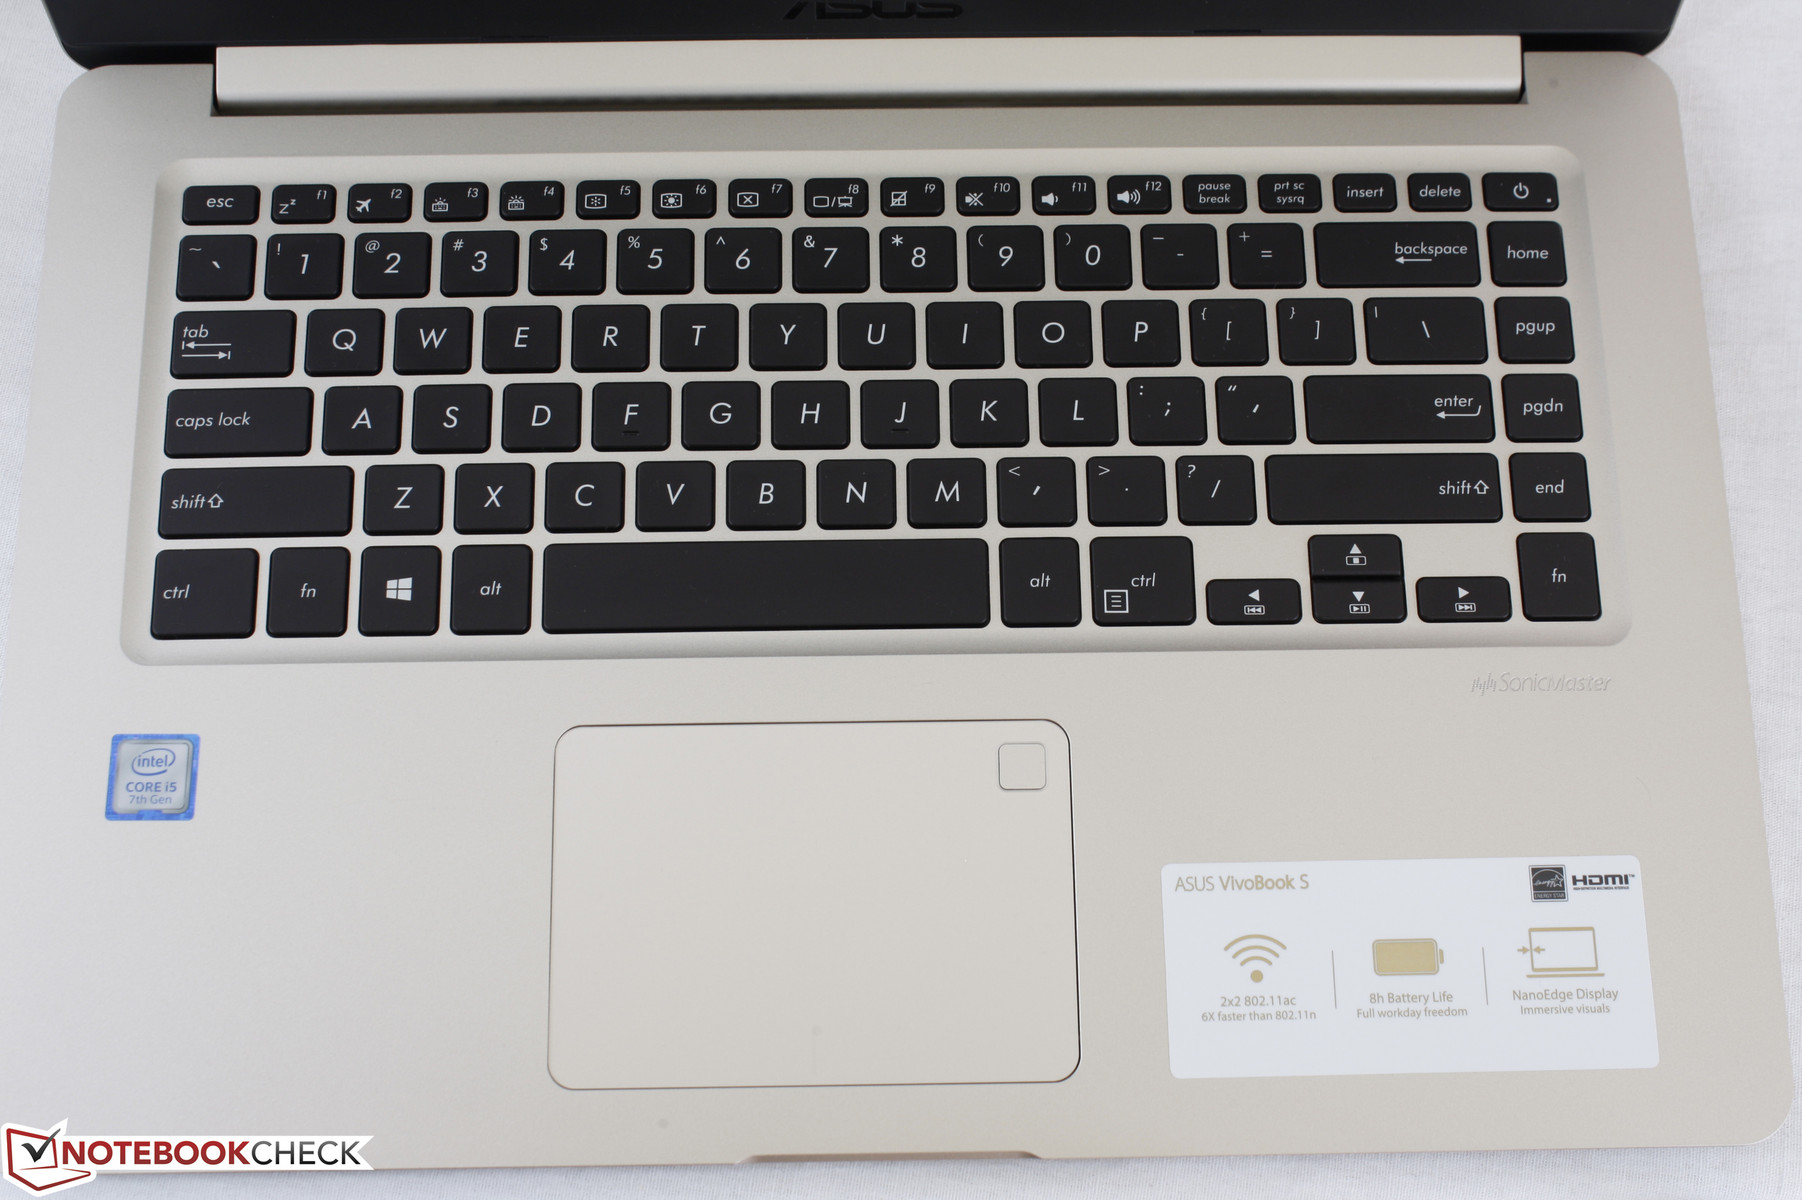
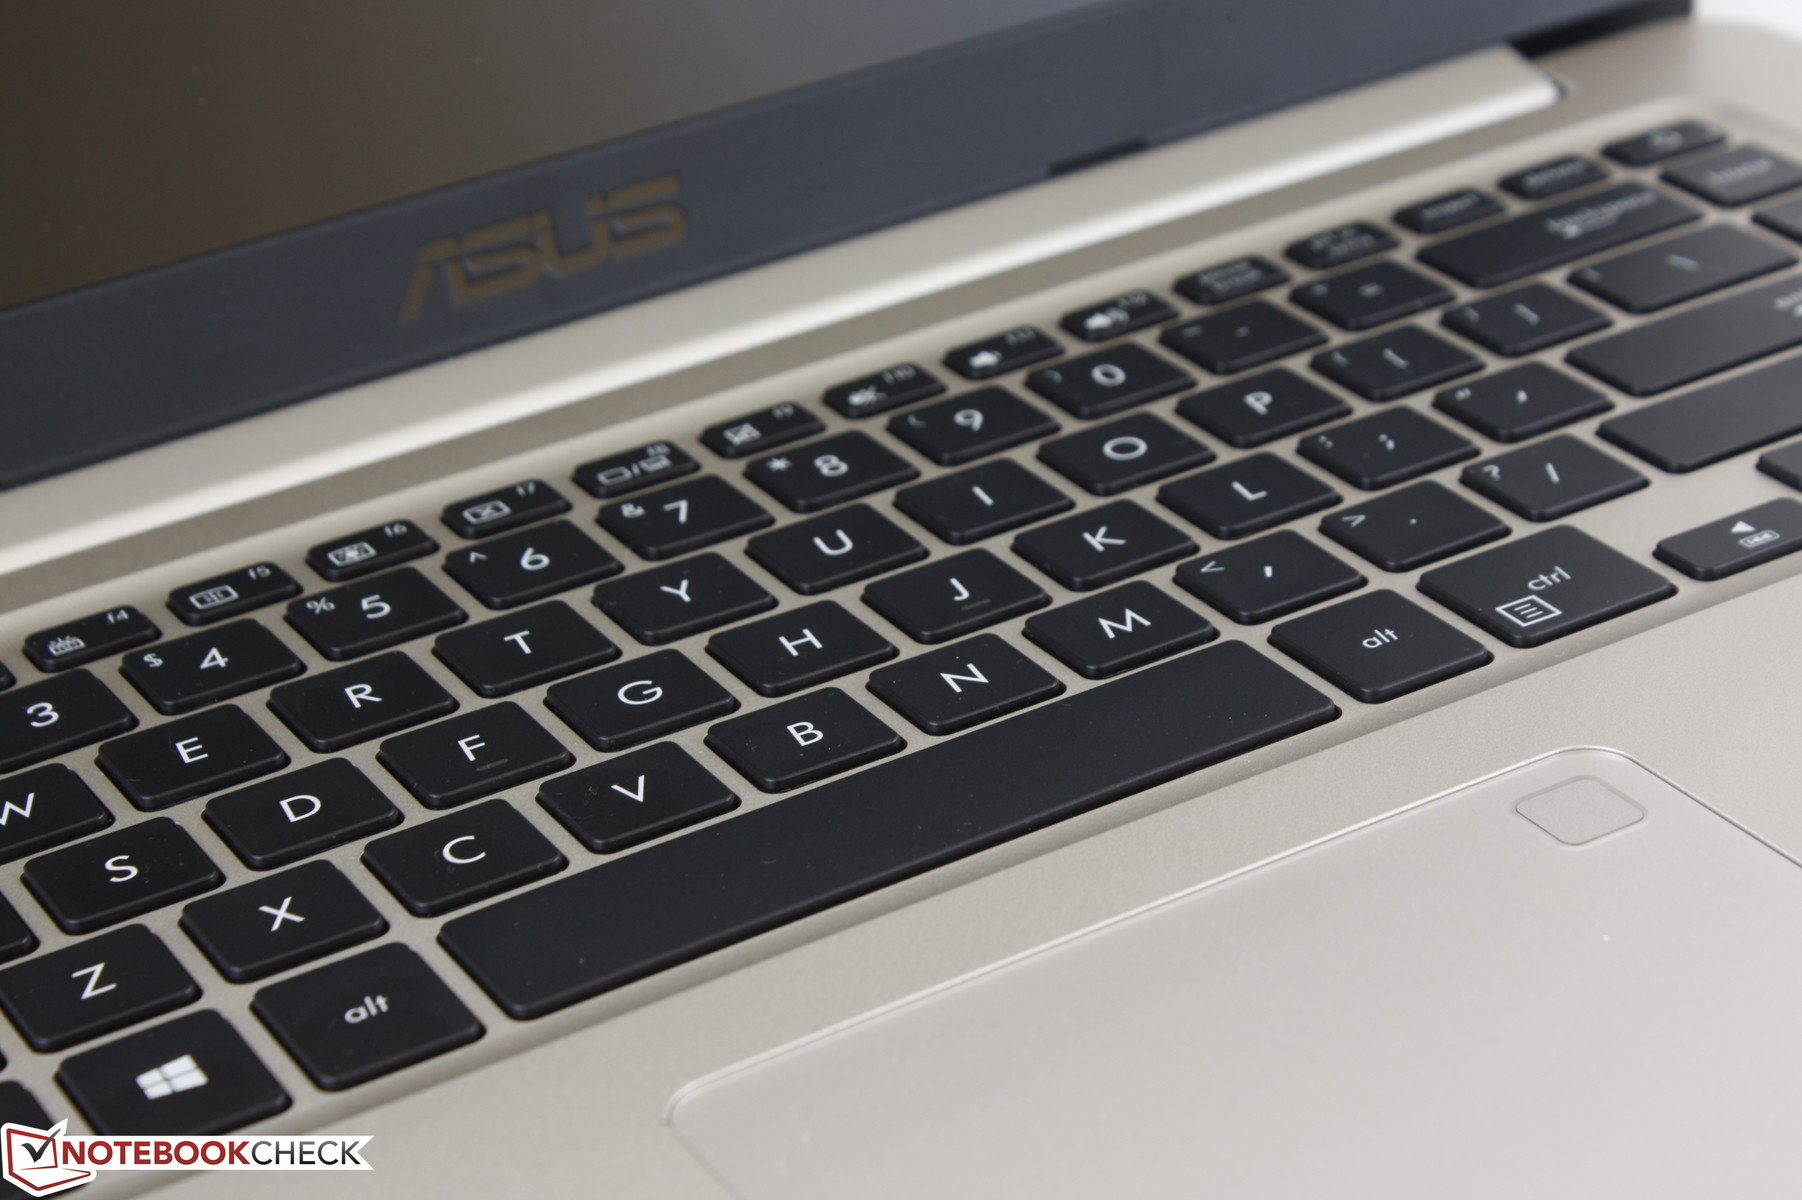
The keyboard (30.5 x 10.5 cm) keys are soft in feedback and have a shallow 1.4 mm travel. The spongy feel is partly due to the weak foundation of the surrounding base as applying pressure on the center of the keyboard will visibly warp much of the surface. Clatter is relatively quiet as a result and the individual keys fortunately do not wiggle in place. Overall, however, the keys are too light even for an Ultrabook and could have been a lot firmer for a more satisfying typing experience.
The system includes an optional three-level white backlight. The lighting clearly bleeds through a set of ventilation grilles near the rear of the notebook, which is a rather strange design decision. The backlight would have probably been slightly brighter had this light leak been addressed.
Touchpad
The integrated trackpad is decently sized (10.5 x 7.5 cm) and responsive for standard cursor control with no jittering. Glide can be sticky on the smooth surface, however, and the top right corner will not track movement since this space is occupied by the optional fingerprint reader.
The integrated mouse keys are poor and feel uneven from corner to corner. Clicking on the bottom left corner to input a left click will depress the surface as it should, but the surface will sometimes remain depressed and not immediately retract back to its original position. Meanwhile, the bottom right corner of the trackpad appears to function normally for right clicks. Travel is nonetheless shallow and feedback is weak. We find that lightly tapping on the trackpad surface is instead much easier for dragging items or inputting left clicks.
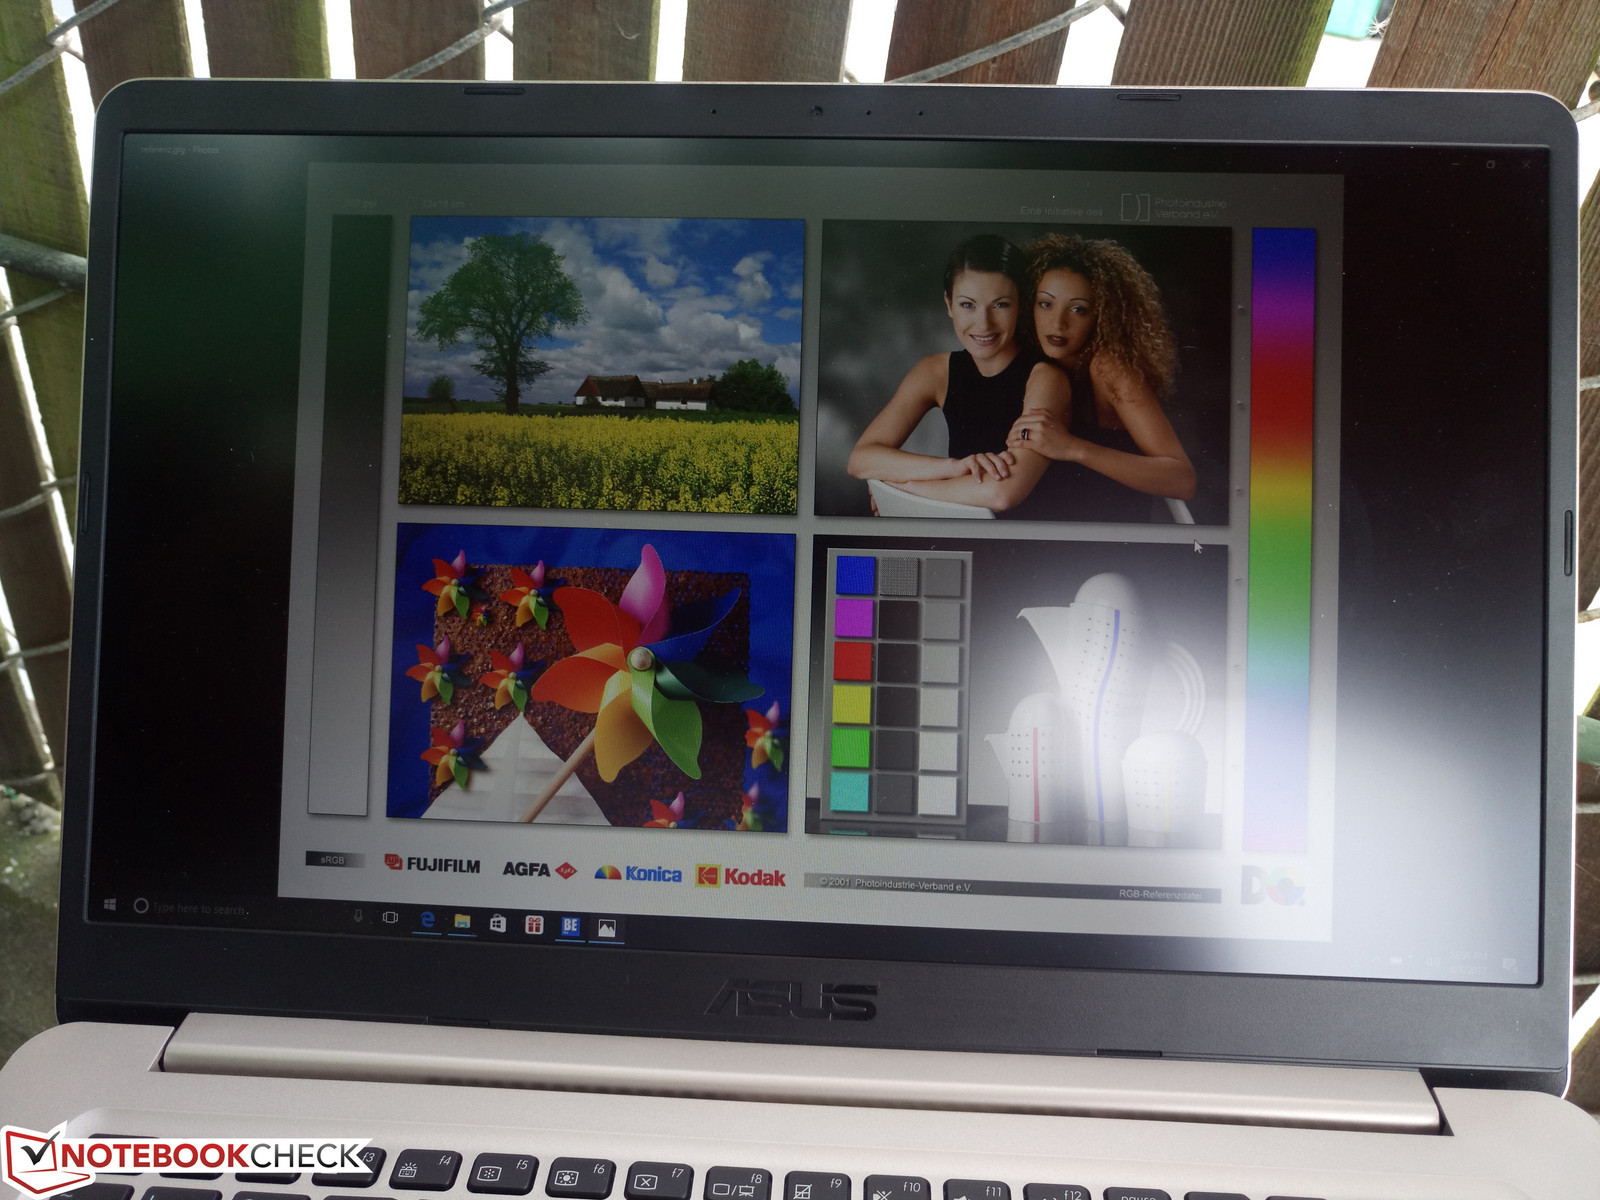
Display
Our configuration comes equipped with a matte 1080p IPS panel that has become standard on mainstream notebooks. While the X510UA offers no 4K UHD or touchscreen options, a lower-end S510UA SKU is available with a TN 768p display to shave off costs. Native resolutions that are 900p or lower are difficult to recommend as these panels often suffer from poorer colors and black levels is addition to the lower PPI.
The Lenovo V510 uses an IPS panel from the same LG Philips series as our Asus and the two share similar display qualities as a result. Contrast, brightness, and response times are all typical of what we expect from a mainstream 1080p display. In this case, the display on the Asus is holding no surprises.
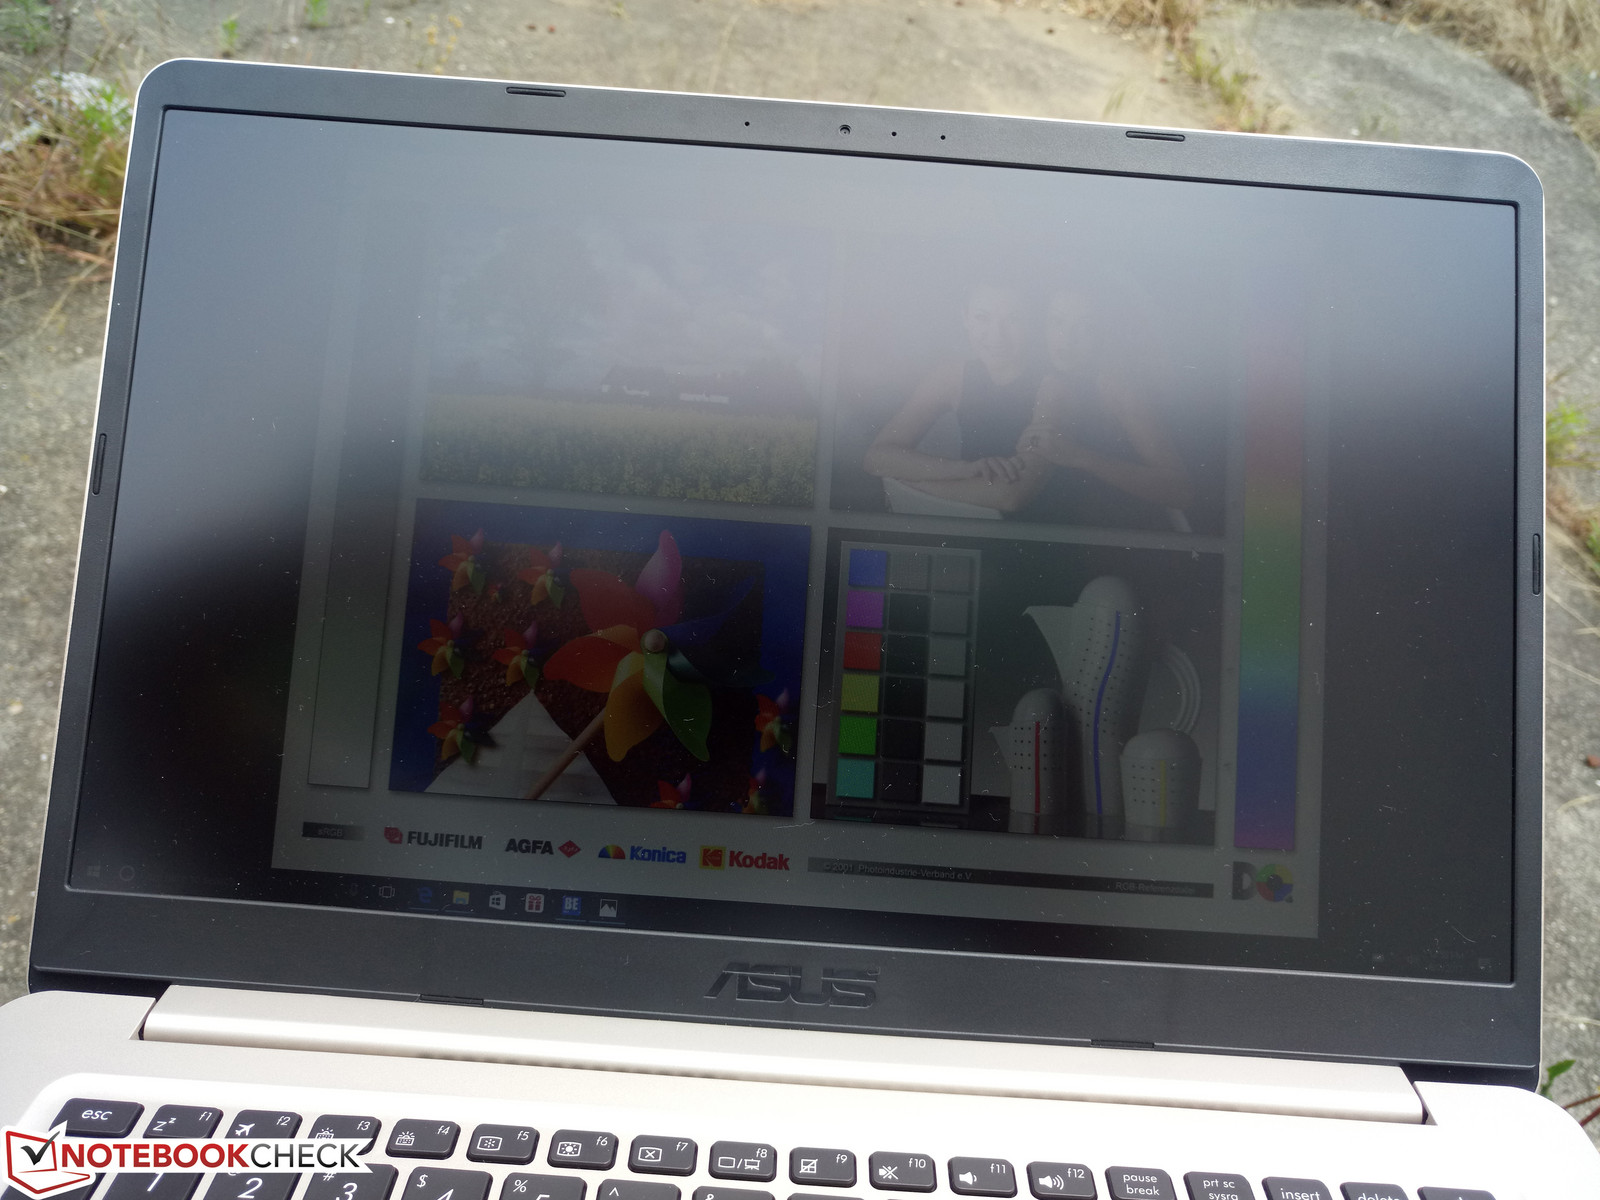
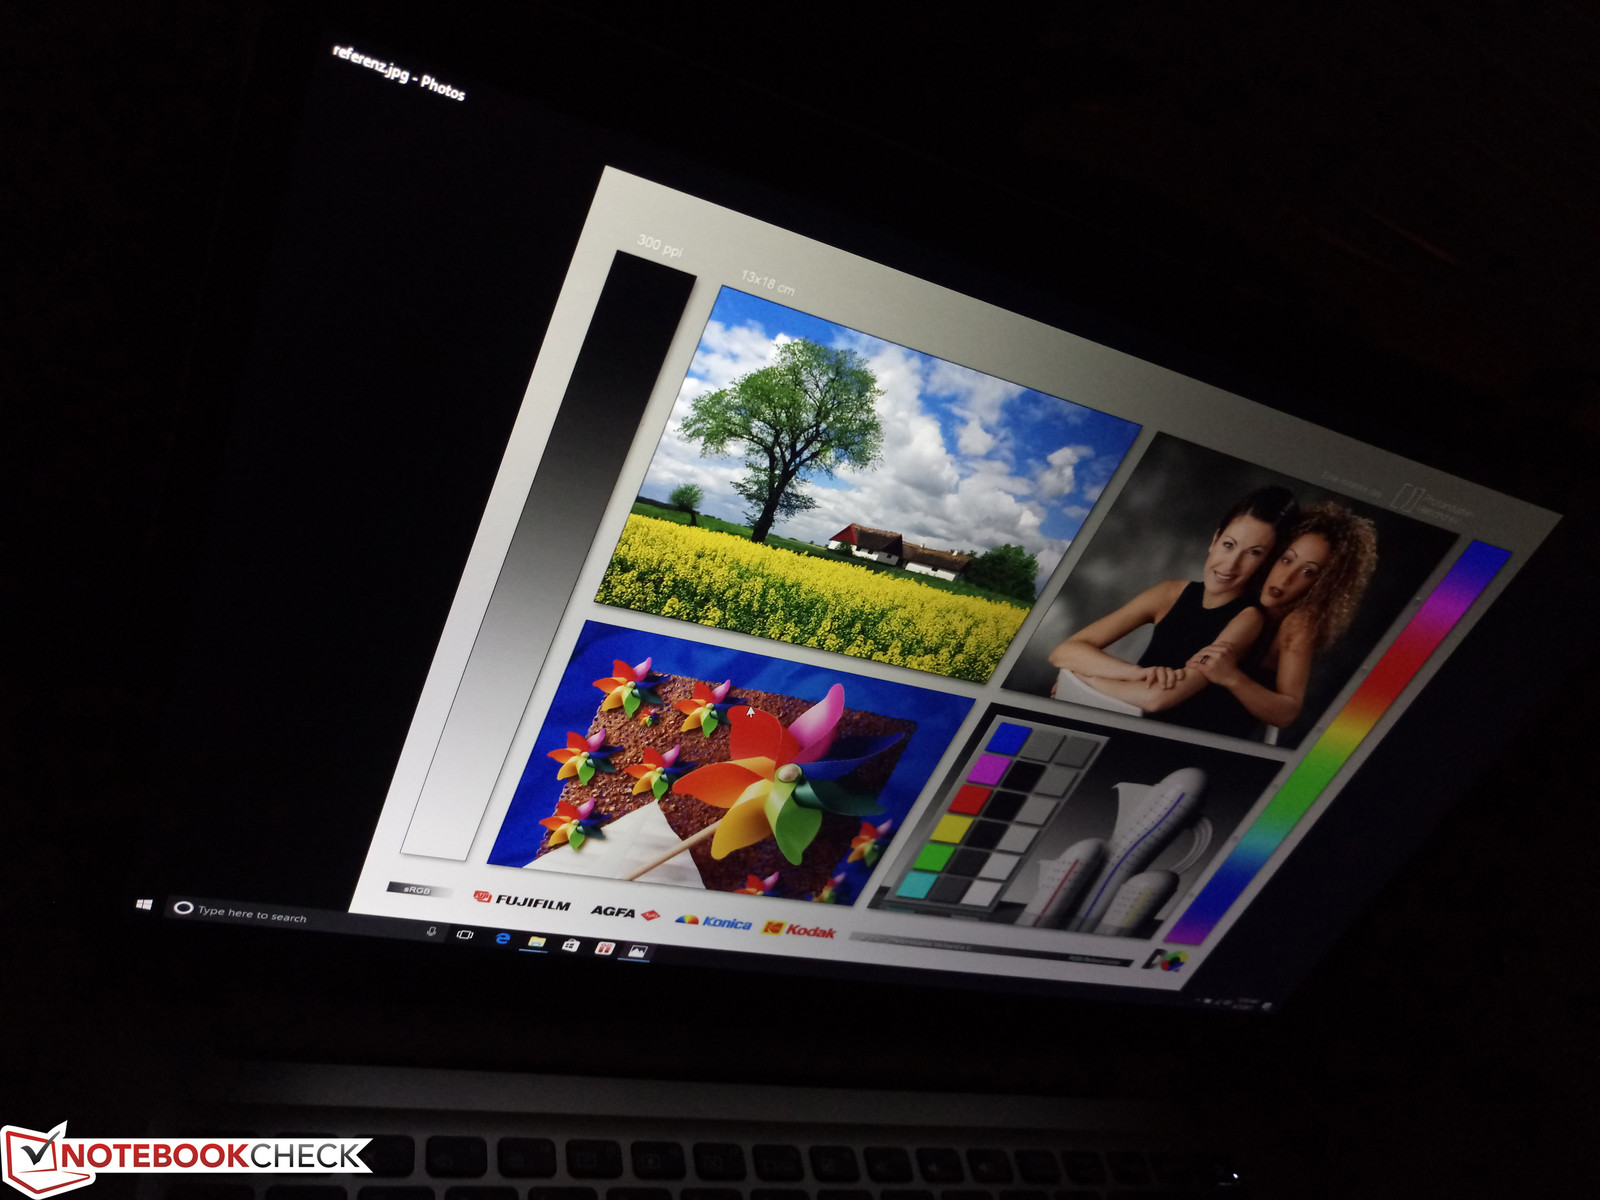
Uneven backlight bleeding is minimal with only the slightest of clouding on the top left corner. Subjectively, texts and images are very clean with almost no hints of graininess despite not using a glossy panel.
| |||||||||||||||||||||||||
Brightness Distribution: 89 %
Center on Battery: 277.5 cd/m²
Contrast: 793:1 (Black: 0.35 cd/m²)
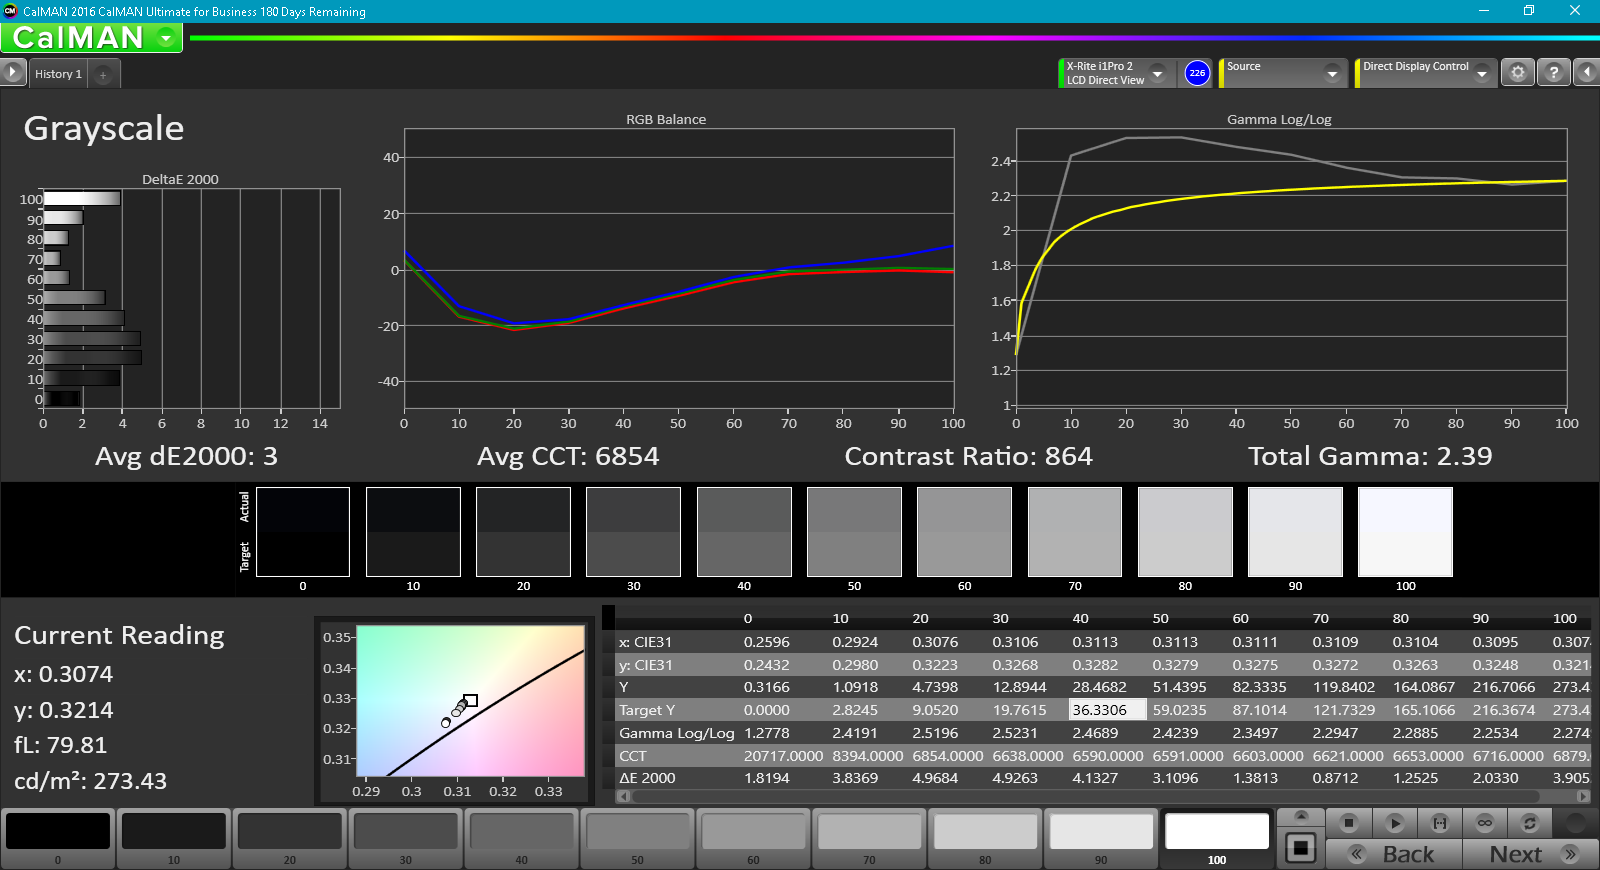
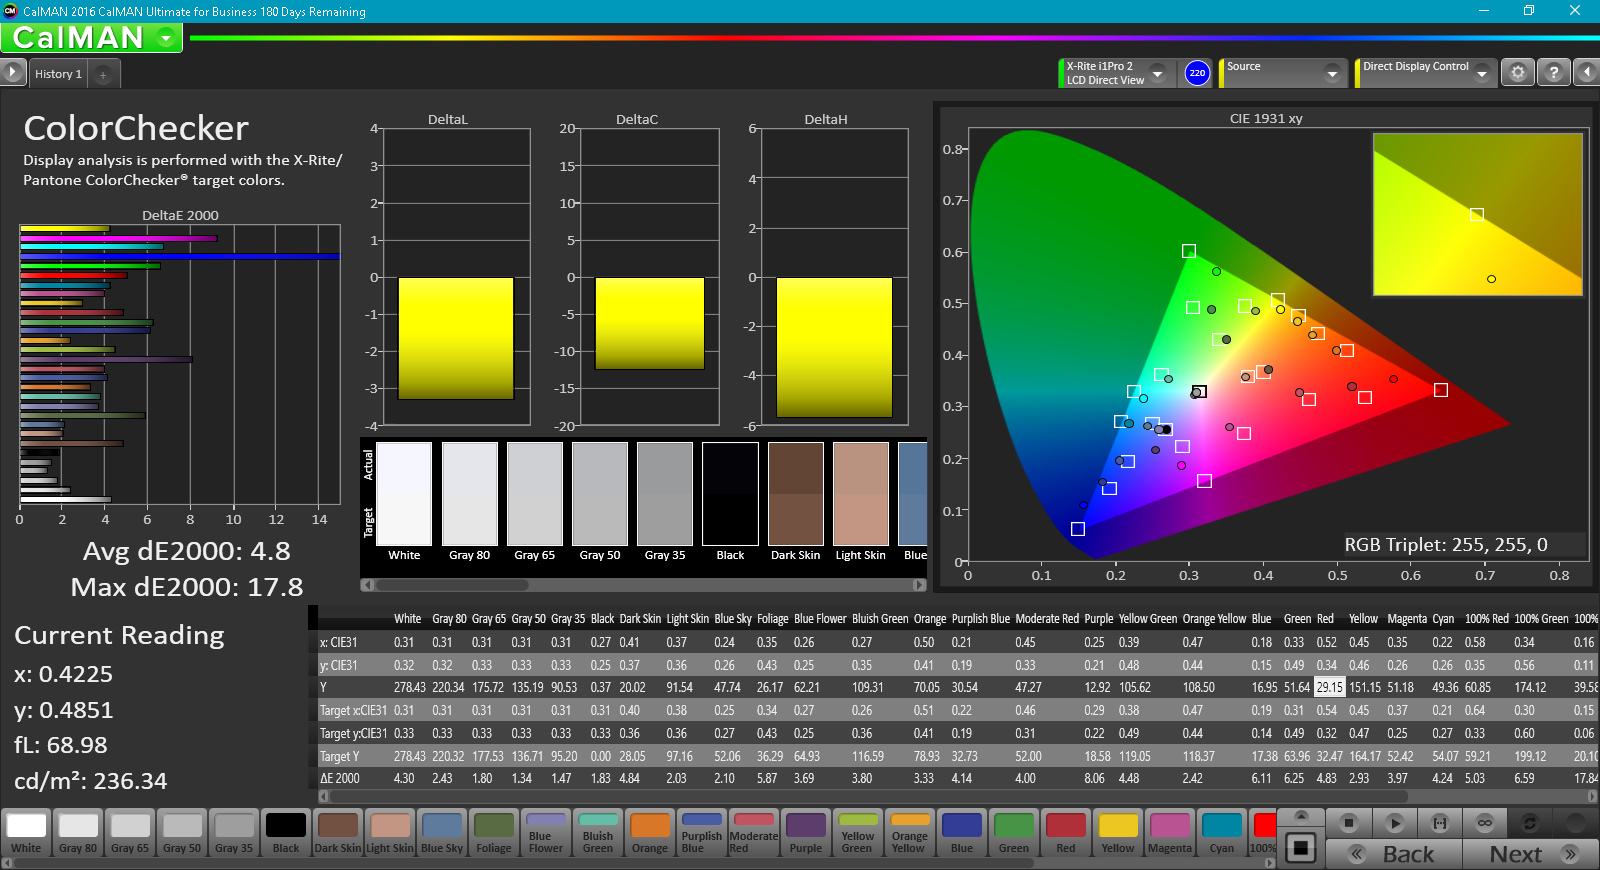
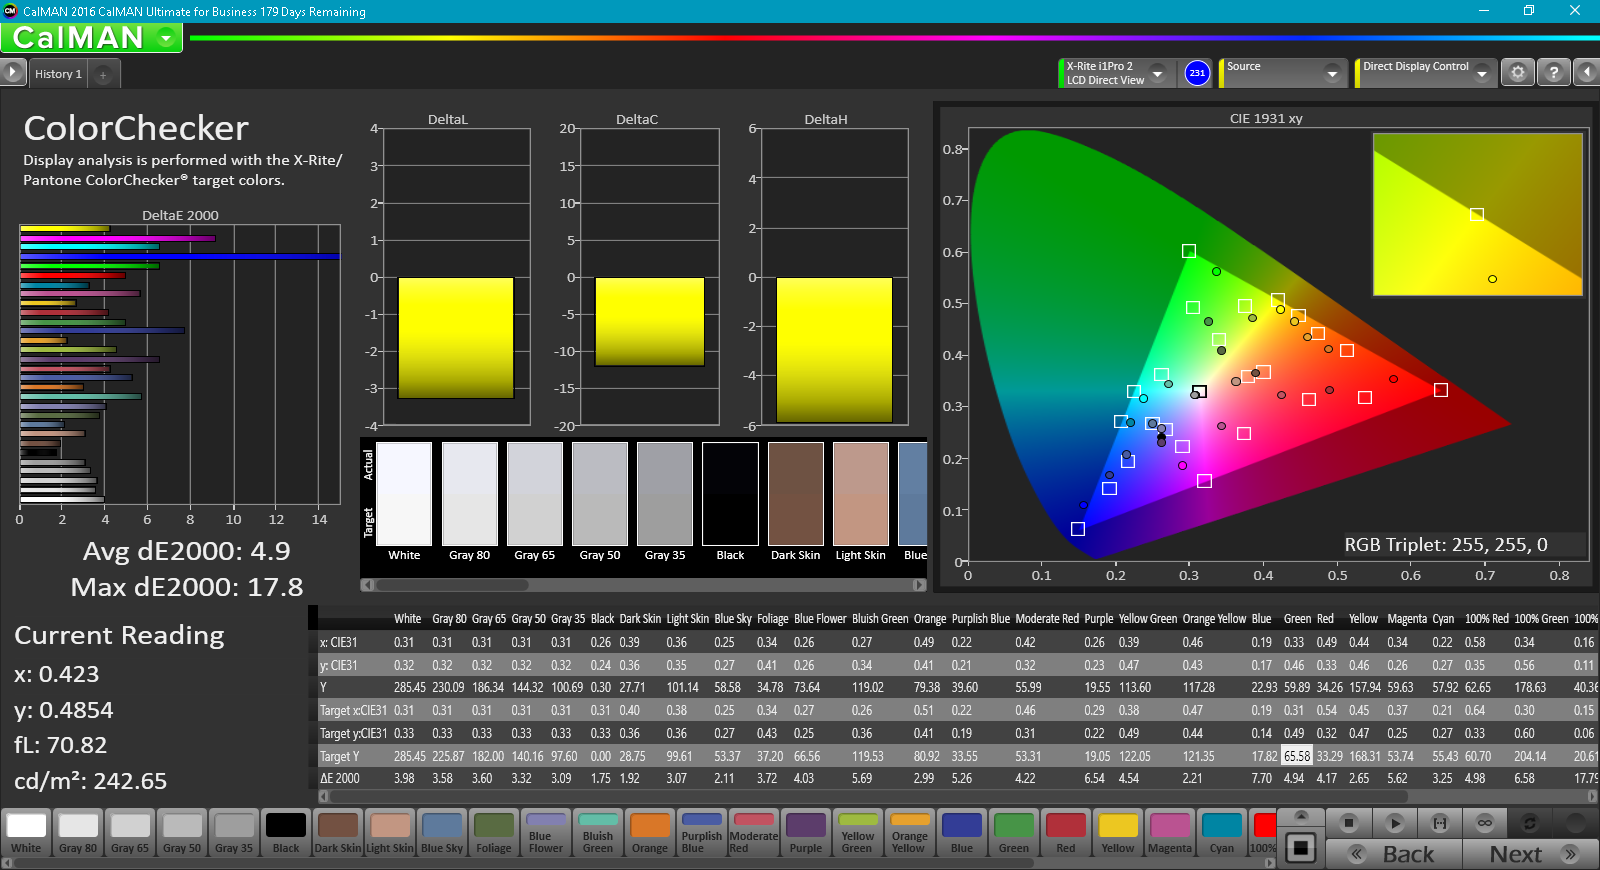
ΔE ColorChecker Calman: 4.8 | ∀{0.5-29.43 Ø4.72}
ΔE Greyscale Calman: 3 | ∀{0.09-98 Ø4.97}
69.3% sRGB (Argyll 1.6.3 3D)
37.7% AdobeRGB 1998 (Argyll 1.6.3 3D)
41.11% AdobeRGB 1998 (Argyll 3D)
59.5% sRGB (Argyll 3D)
39.9% Display P3 (Argyll 3D)
Gamma: 2.39
CCT: 6854 K
| Asus VivoBook S15 S510UA ID: LGD0573, Name: LG Display LP156WF9-SPK2, IPS, 15.6", 1920x1080 | Lenovo V510-15IKB 80WQ0002GE LG Philips LP156WF6-SPK3, IPS, 15.6", 1920x1080 | HP Pavilion 15t-au100 CTO (W0P31AV) BOE0693, IPS, 15.6", 1920x1080 | Apple MacBook Pro 15 2016 (2.9 GHz, 460) Apple APPA030, IPS, 15.4", 2880x1800 | HP Envy 15-as133cl Chi Mei CMN15D8, IPS, 15.6", 1920x1080 | Dell Inspiron 15 7000 7567 AU Optronics AUO38ED B156HTN 28H80, TN, 15.6", 1920x1080 | |
|---|---|---|---|---|---|---|
| Display | -2% | 9% | 109% | 8% | -8% | |
| Display P3 Coverage (%) | 39.9 | 38.8 -3% | 43.27 8% | 99 148% | 42.95 8% | 36.42 -9% |
| sRGB Coverage (%) | 59.5 | 58.1 -2% | 64.9 9% | 100 68% | 64.3 8% | 54.9 -8% |
| AdobeRGB 1998 Coverage (%) | 41.11 | 40.12 -2% | 44.71 9% | 87.3 112% | 44.41 8% | 37.62 -8% |
| Response Times | -8% | -18% | -66% | -15% | -15% | |
| Response Time Grey 50% / Grey 80% * (ms) | 38.4 ? | 39 ? -2% | 42 ? -9% | 46 ? -20% | 44.4 ? -16% | 36 ? 6% |
| Response Time Black / White * (ms) | 26.4 ? | 30 ? -14% | 33.6 ? -27% | 56 ? -112% | 30 ? -14% | 36 ? -36% |
| PWM Frequency (Hz) | 20000 ? | 198.4 | 119000 ? | 1000 ? | ||
| Screen | -6% | -9% | 46% | 2% | -75% | |
| Brightness middle (cd/m²) | 277.5 | 256 -8% | 186.5 -33% | 420 51% | 262.3 -5% | 246 -11% |
| Brightness (cd/m²) | 265 | 252 -5% | 174 -34% | 401 51% | 240 -9% | 235 -11% |
| Brightness Distribution (%) | 89 | 87 -2% | 69 -22% | 90 1% | 83 -7% | 75 -16% |
| Black Level * (cd/m²) | 0.35 | 0.3 14% | 0.18 49% | 0.3 14% | 0.24 31% | 0.55 -57% |
| Contrast (:1) | 793 | 853 8% | 1036 31% | 1400 77% | 1093 38% | 447 -44% |
| Colorchecker dE 2000 * | 4.8 | 5.4 -13% | 5.7 -19% | 3.33 31% | 5 -4% | 10.97 -129% |
| Colorchecker dE 2000 max. * | 17.8 | 9.36 47% | 22.5 -26% | 5.11 71% | 20.6 -16% | |
| Greyscale dE 2000 * | 3 | 5.37 -79% | 4.4 -47% | 2.73 9% | 3.2 -7% | 14.25 -375% |
| Gamma | 2.39 92% | 2.58 85% | 2.35 94% | 2.48 89% | 2.45 90% | 1.83 120% |
| CCT | 6854 95% | 6795 96% | 6963 93% | 6457 101% | 6817 95% | 11200 58% |
| Color Space (Percent of AdobeRGB 1998) (%) | 37.7 | 37 -2% | 44.71 19% | 78.09 107% | 40.5 7% | 35 -7% |
| Color Space (Percent of sRGB) (%) | 69.3 | 58 -16% | 64.95 -6% | 99.97 44% | 63.5 -8% | 55 -21% |
| Total Average (Program / Settings) | -5% /
-5% | -6% /
-7% | 30% /
43% | -2% /
1% | -33% /
-52% |
* ... smaller is better
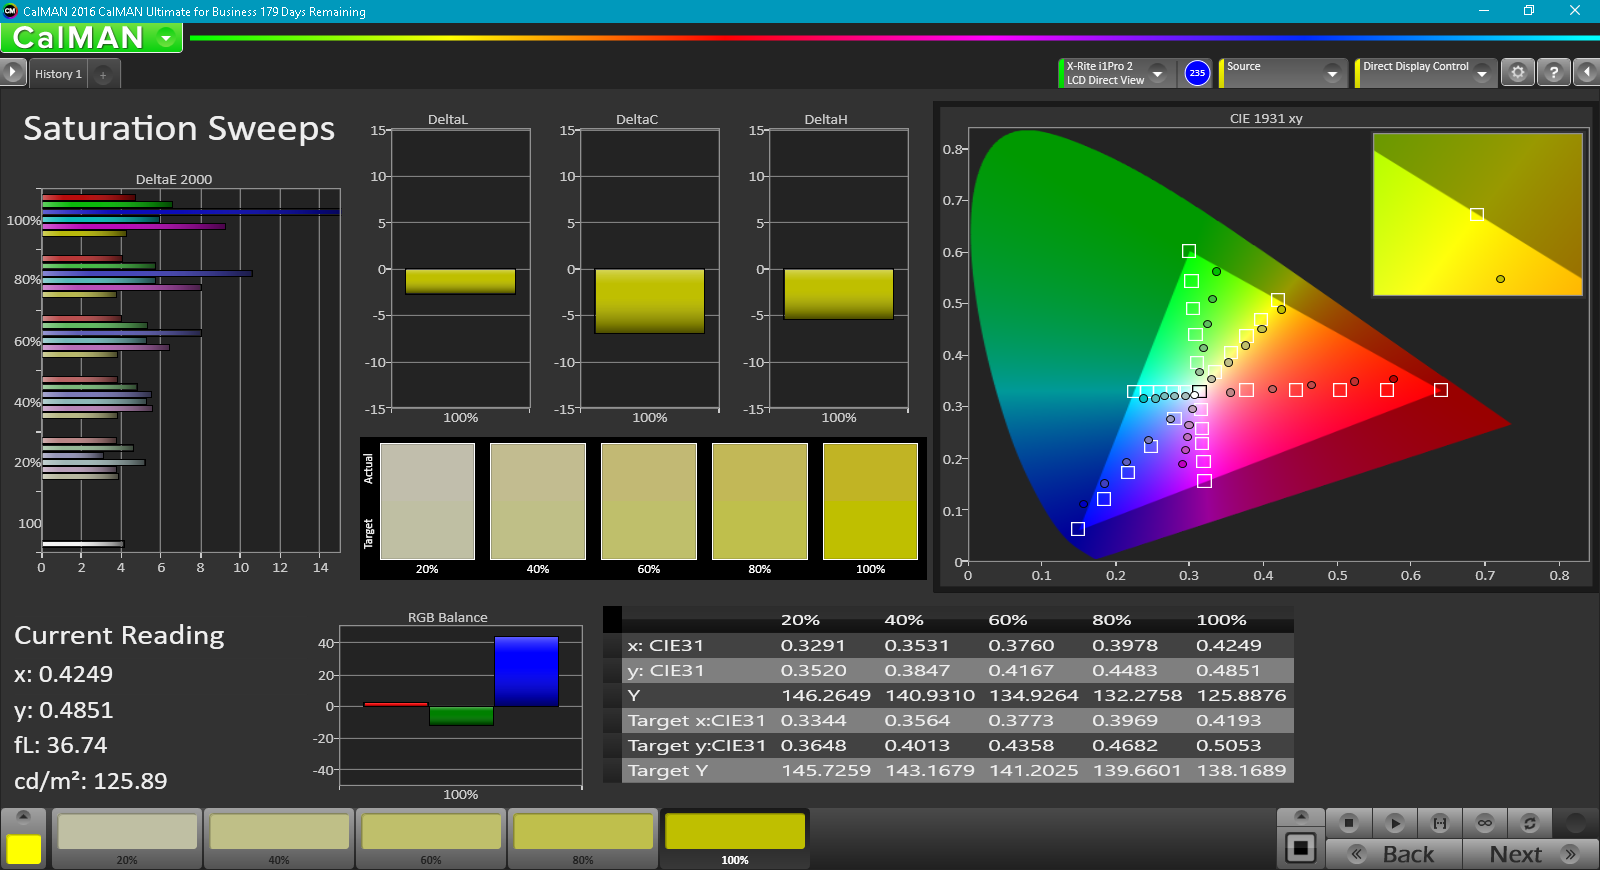
Color coverage is approximately 38 percent and 70 percent of the AdobeRGB and sRGB standards, respectively. Meanwhile, Asus advertises 45 percent NTSC coverage compared to 72 percent NTSC on pricier alternatives. This is about average for a consumer Ultrabook IPS panel, though models exist with complete sRGB coverage such as the Spectre x360 13 or MacBook Pro 15 if color accuracy is a high priority. For word processing, browsing, and streaming, however, a wider gamut is relatively unimportant.
Further measurements with a X-Rite spectrophotometer reveal generally accurate colors and grayscale out of the box. A calibration improves both RGB balance and grayscale especially for darker grays, but it's interesting to note that color accuracy will not necessarily increase. Blue and purple colors in particular appear to be more inaccurate than others. All colors become more inaccurate the higher the saturation level due the imperfect sRGB coverage of the panel.


Display Response Times
| ↔ Response Time Black to White | ||
|---|---|---|
| 26.4 ms ... rise ↗ and fall ↘ combined | ↗ 15.6 ms rise | 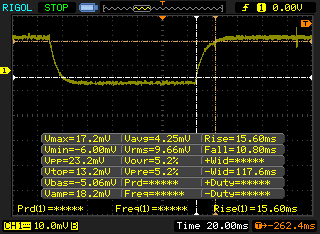 |
| ↘ 10.8 ms fall | ||
| The screen shows relatively slow response rates in our tests and may be too slow for gamers. In comparison, all tested devices range from 0.1 (minimum) to 240 (maximum) ms. » 66 % of all devices are better. This means that the measured response time is worse than the average of all tested devices (19.8 ms). | ||
| ↔ Response Time 50% Grey to 80% Grey | ||
| 38.4 ms ... rise ↗ and fall ↘ combined | ↗ 19.2 ms rise | 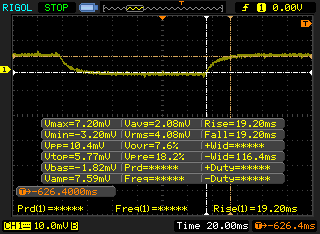 |
| ↘ 19.2 ms fall | ||
| The screen shows slow response rates in our tests and will be unsatisfactory for gamers. In comparison, all tested devices range from 0.165 (minimum) to 636 (maximum) ms. » 57 % of all devices are better. This means that the measured response time is worse than the average of all tested devices (31 ms). | ||
Screen Flickering / PWM (Pulse-Width Modulation)
| Screen flickering / PWM not detected | 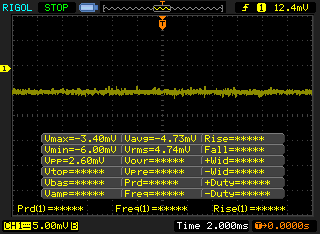 | ||
In comparison: 52 % of all tested devices do not use PWM to dim the display. If PWM was detected, an average of 7753 (minimum: 5 - maximum: 343500) Hz was measured. | |||
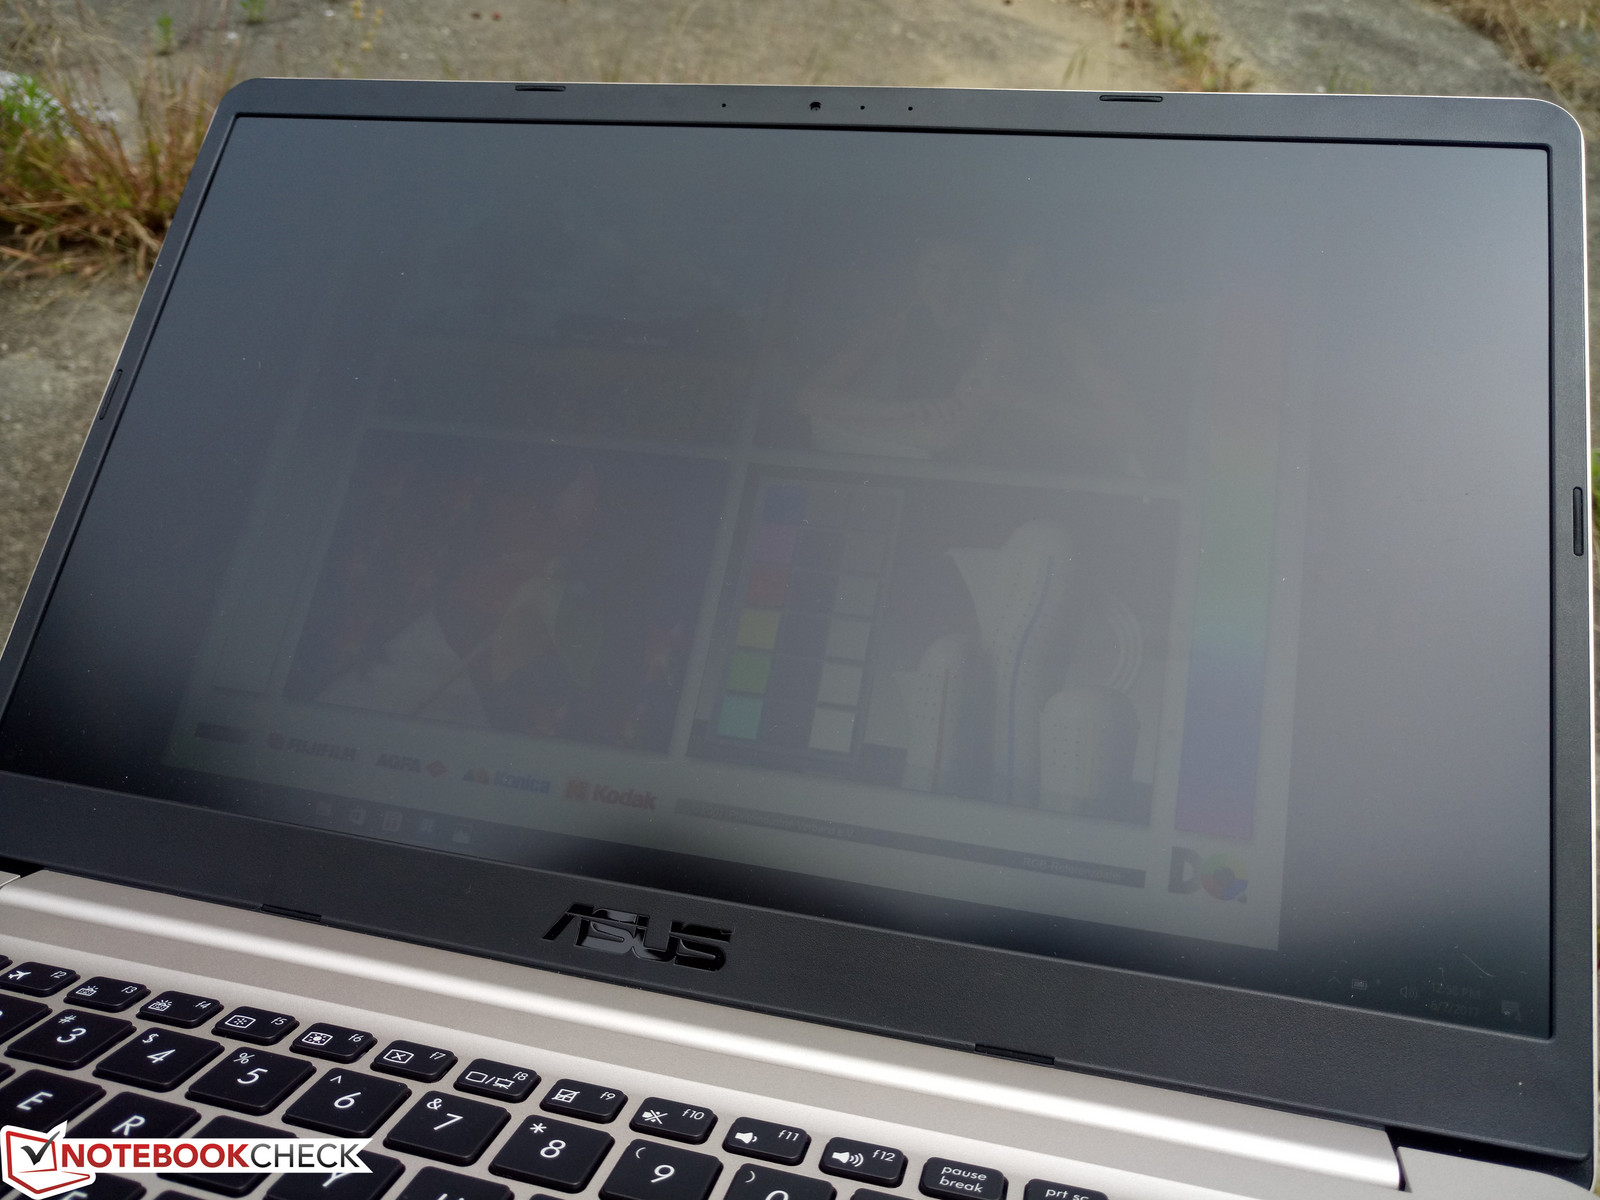
Outdoor visibility is decent under shade and poor if under direct sunlight or overcast. The display backlight is not bright enough to overcome ambient lighting and onscreen content will appear washed out as a result. Glare isn't too annoying of an issue due to the matte panel and wide IPS viewing angles, though a wider hinge angle greater than 140 degrees would have been appreciated.
Performance
The VivoBook S15 S510 series currently consists of three models distinguished primarily by the choice of GPU. The S510UR and S510UQ are equipped with the dedicated GeForce 930MX and 940MX plus Optimus, respectively, whereas the S510UA is limited to the integrated HD Graphics 620. Otherwise, it appears that users can freely configure between the i3-7100U, i5-7200U, or i7-7500U CPU, 8 GB or 16 GB of RAM, 768p or 1080p display, or backlit/non-backlit keyboard on any model. We're a bit disappointed to not see any higher GPU options as the older VivoBook X556/F556 series was also limited to the GeForce 940MX.
Processor
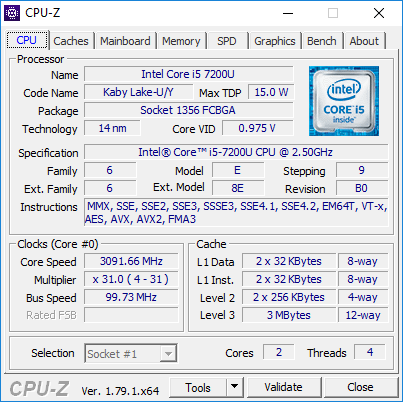
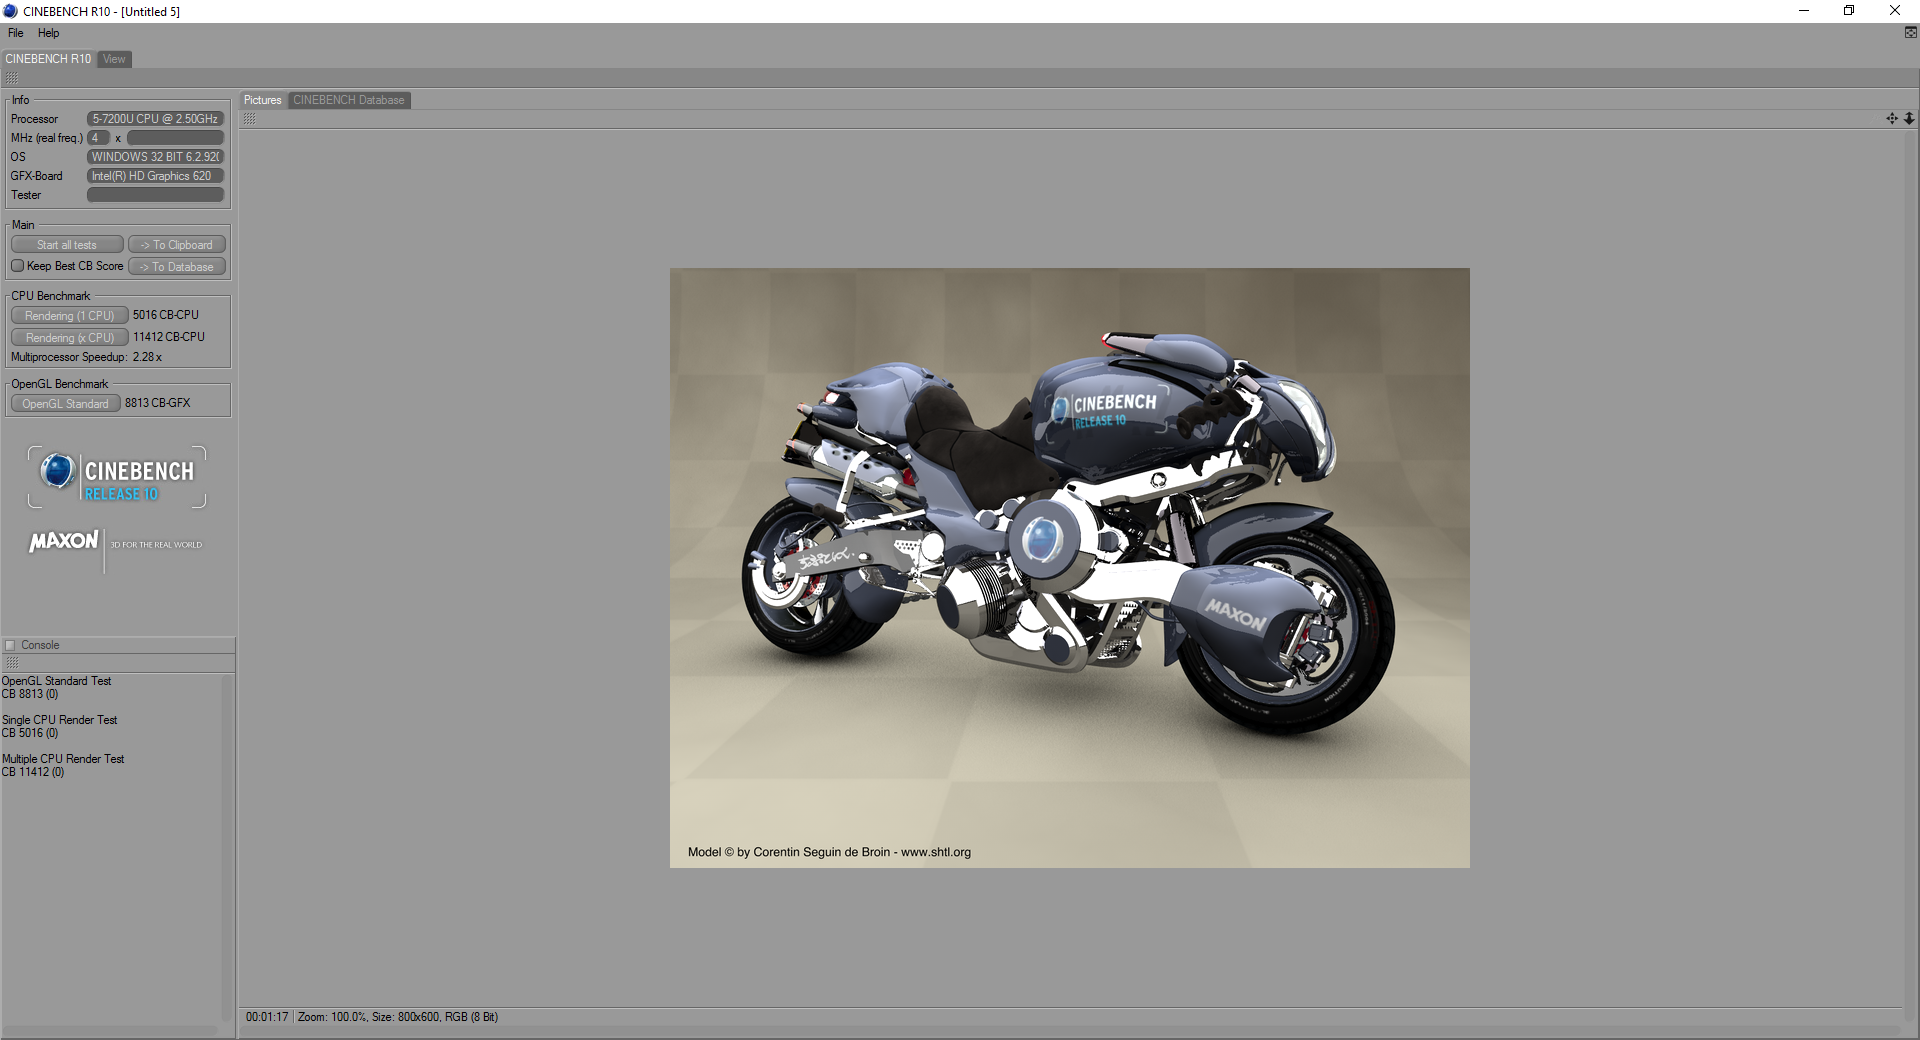
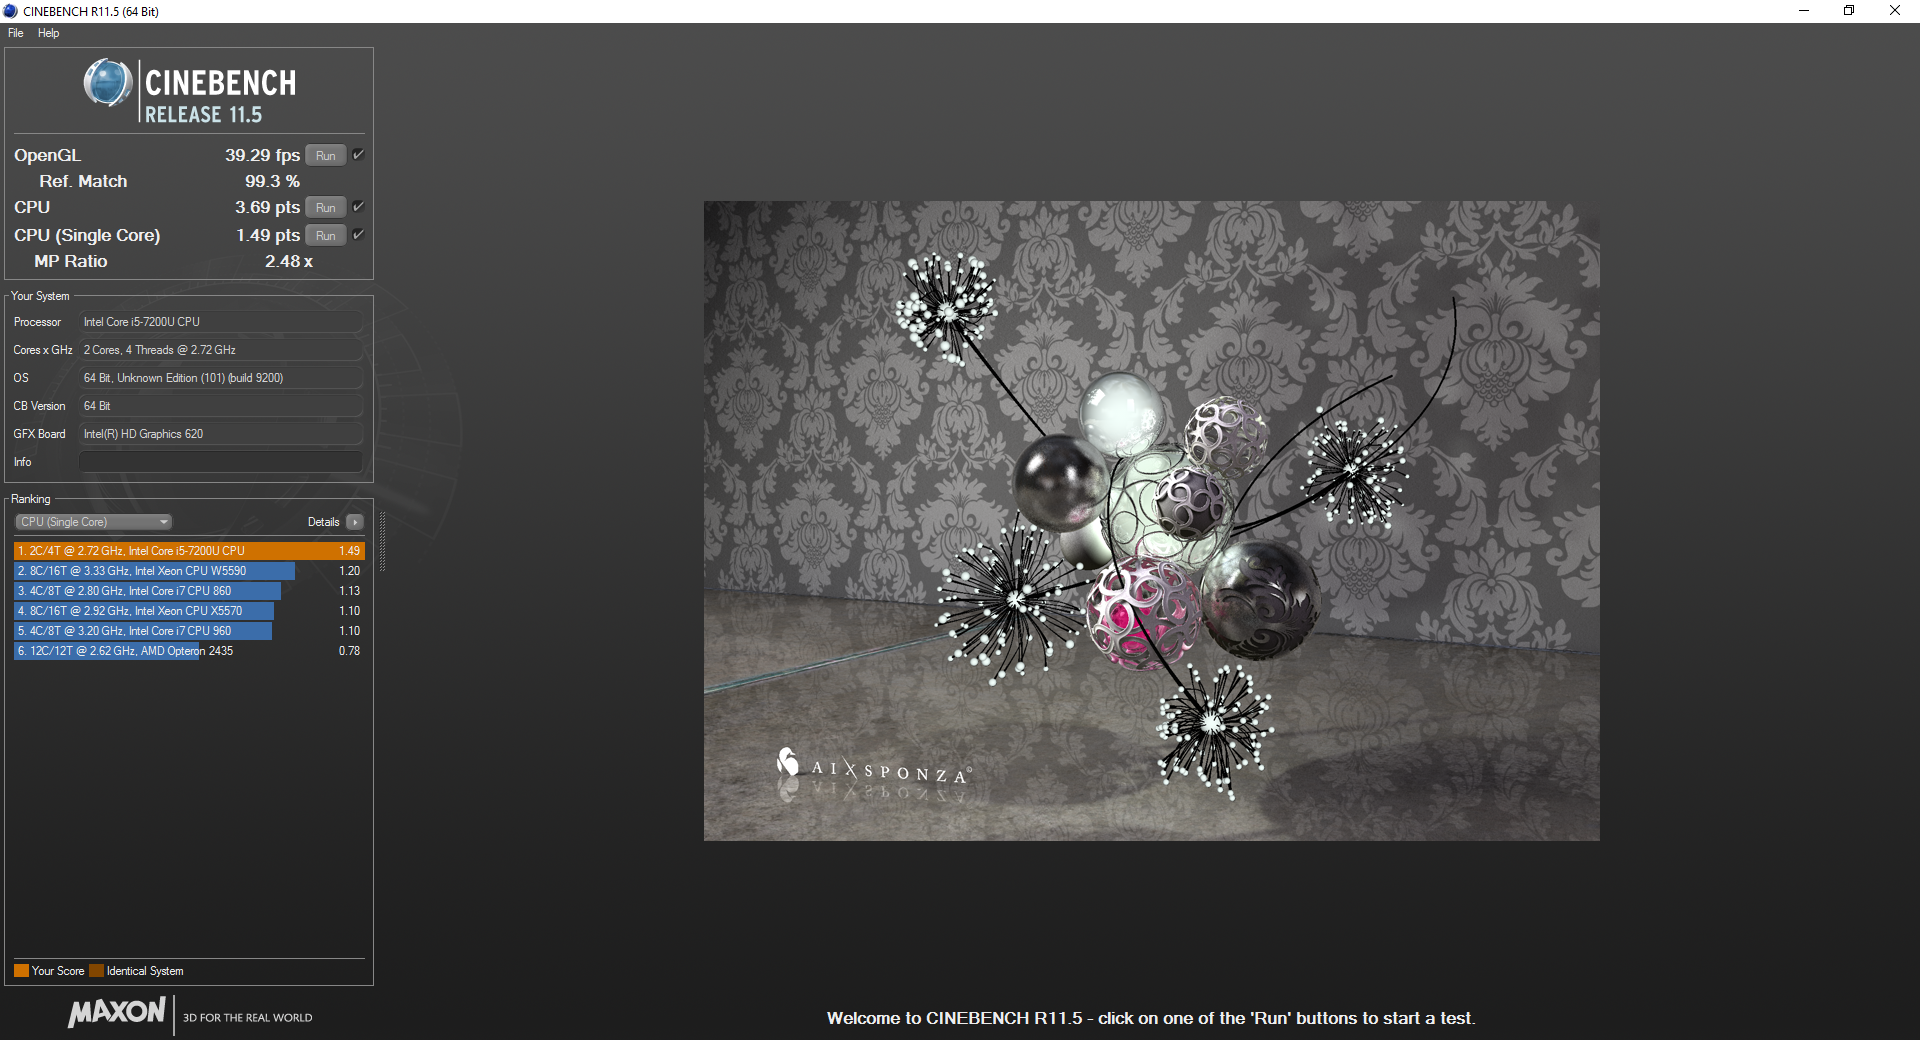
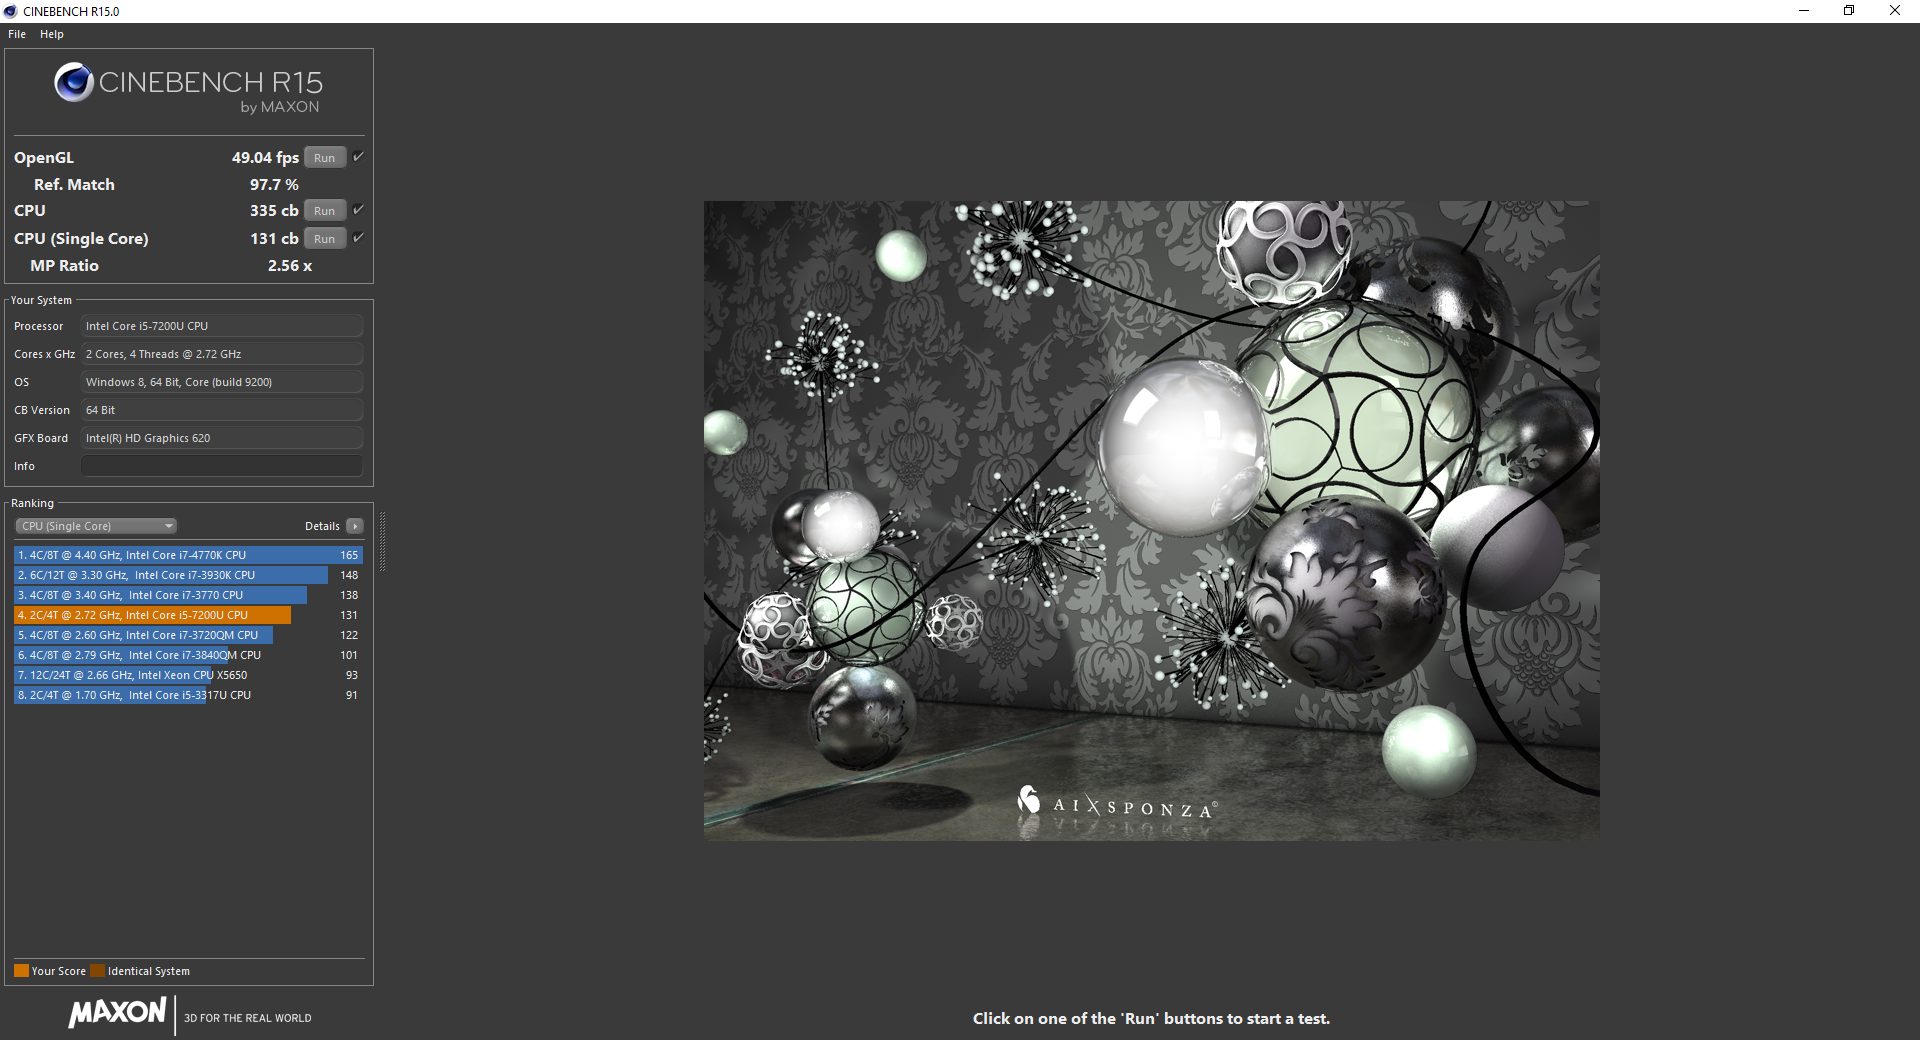
CPU performance from the i5-7200U is about 16 percent and 30 percent ahead of the Skylake i5-6200U and Broadwell i5-5200U, respectively, in multi-threaded workloads. The processor is also neck-to-neck with the i5-6267U in the 2016 Macbook Pro 13 even though the Apple integrates a much faster GPU. Users who opt in for the faster VivoBook S15 SKU with the i7-7500U CPU should see minimal performance gains of about 5 to 10 percent according to CineBench benchmarks. Jumping from the i3-7100U to the i5-7200U, however, will provide a massive boost in processor performance as shown by our comparison chart below since the i3 series is lacking Hyper-Threading. Running CineBench Multi-Thread in a loop results in no significant performance drops to ensure steady processing performance when under high loads.
See our dedicated CPU page on the Core i5-7200U for more technical information and benchmark comparisons.
| wPrime 2.10 - 1024m | |
| Lenovo IdeaPad Z40-59422614 | |
| Lenovo Thinkpad 13-20J1001BUS | |
| HP EliteBook 725 G4 | |
| Dell Latitude 5280 | |
| Asus VivoBook S15 S510UA | |
| Lenovo ThinkPad T470s-20HF0012US | |
* ... smaller is better
System Performance
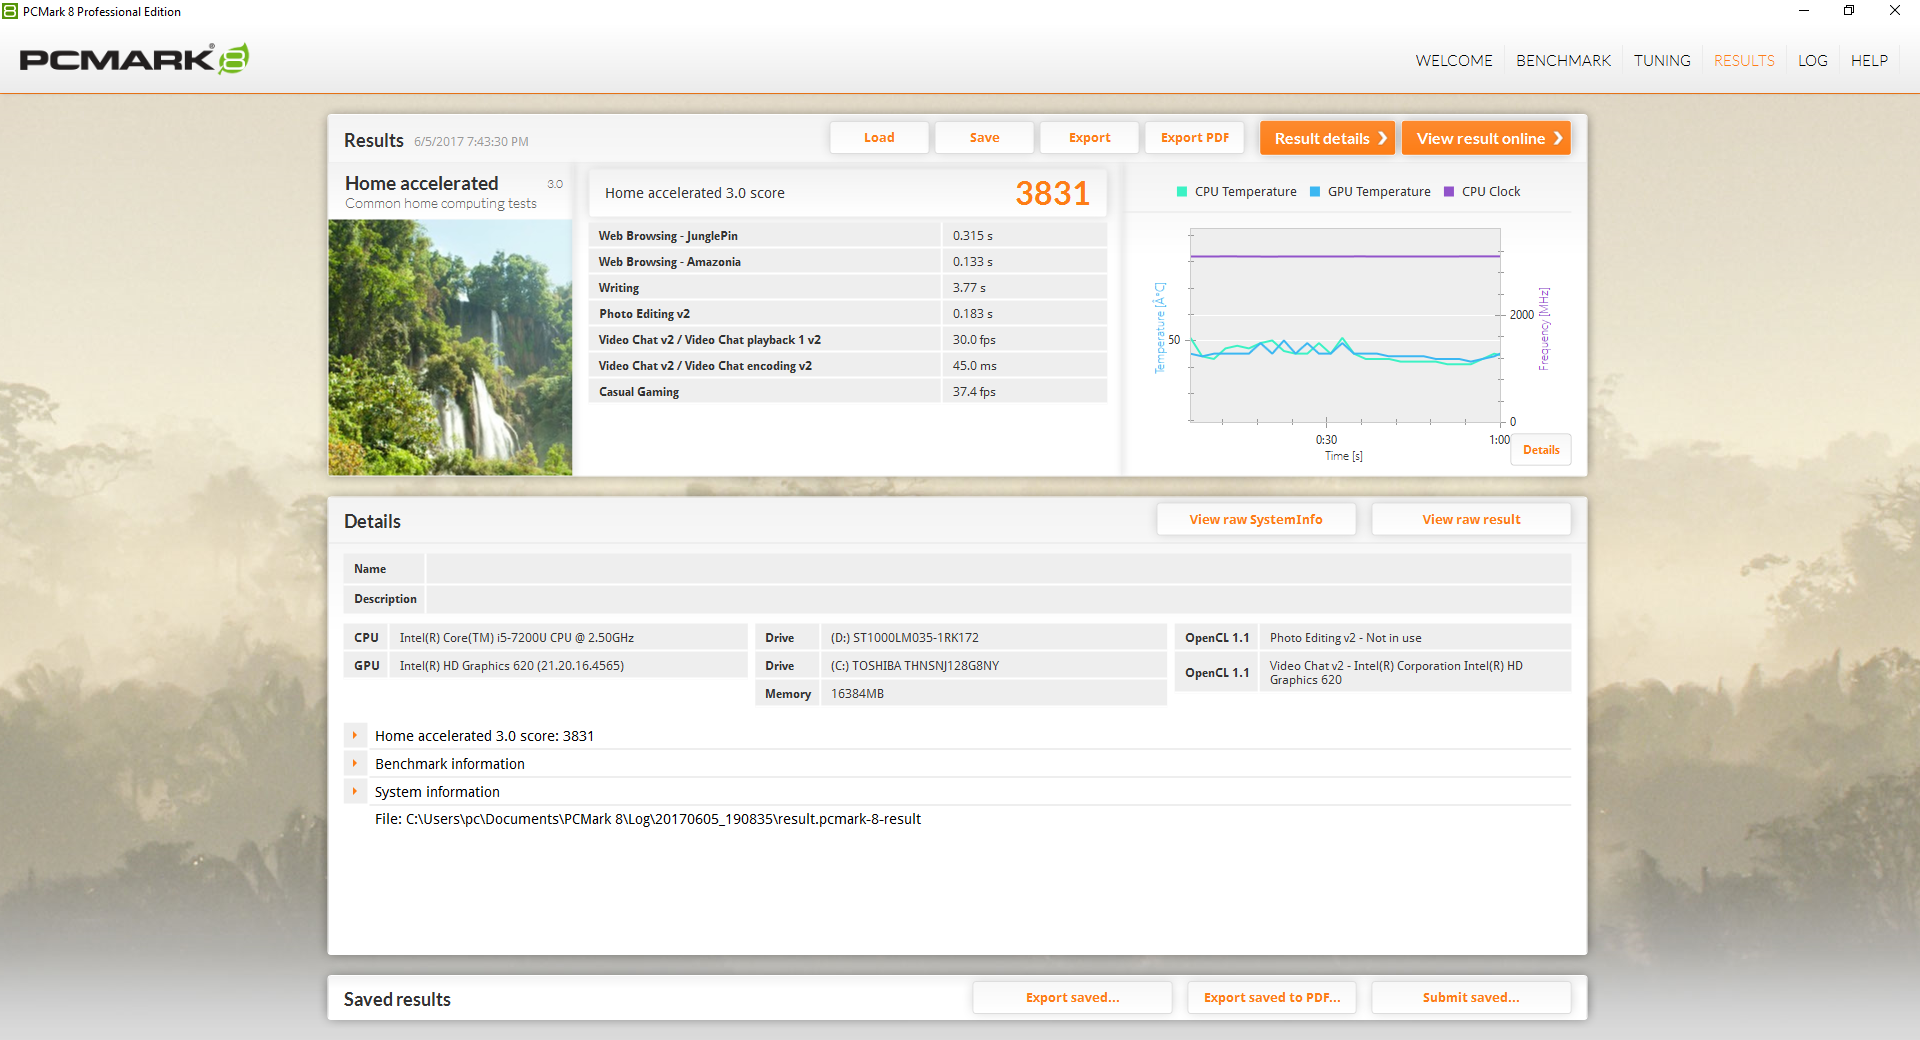
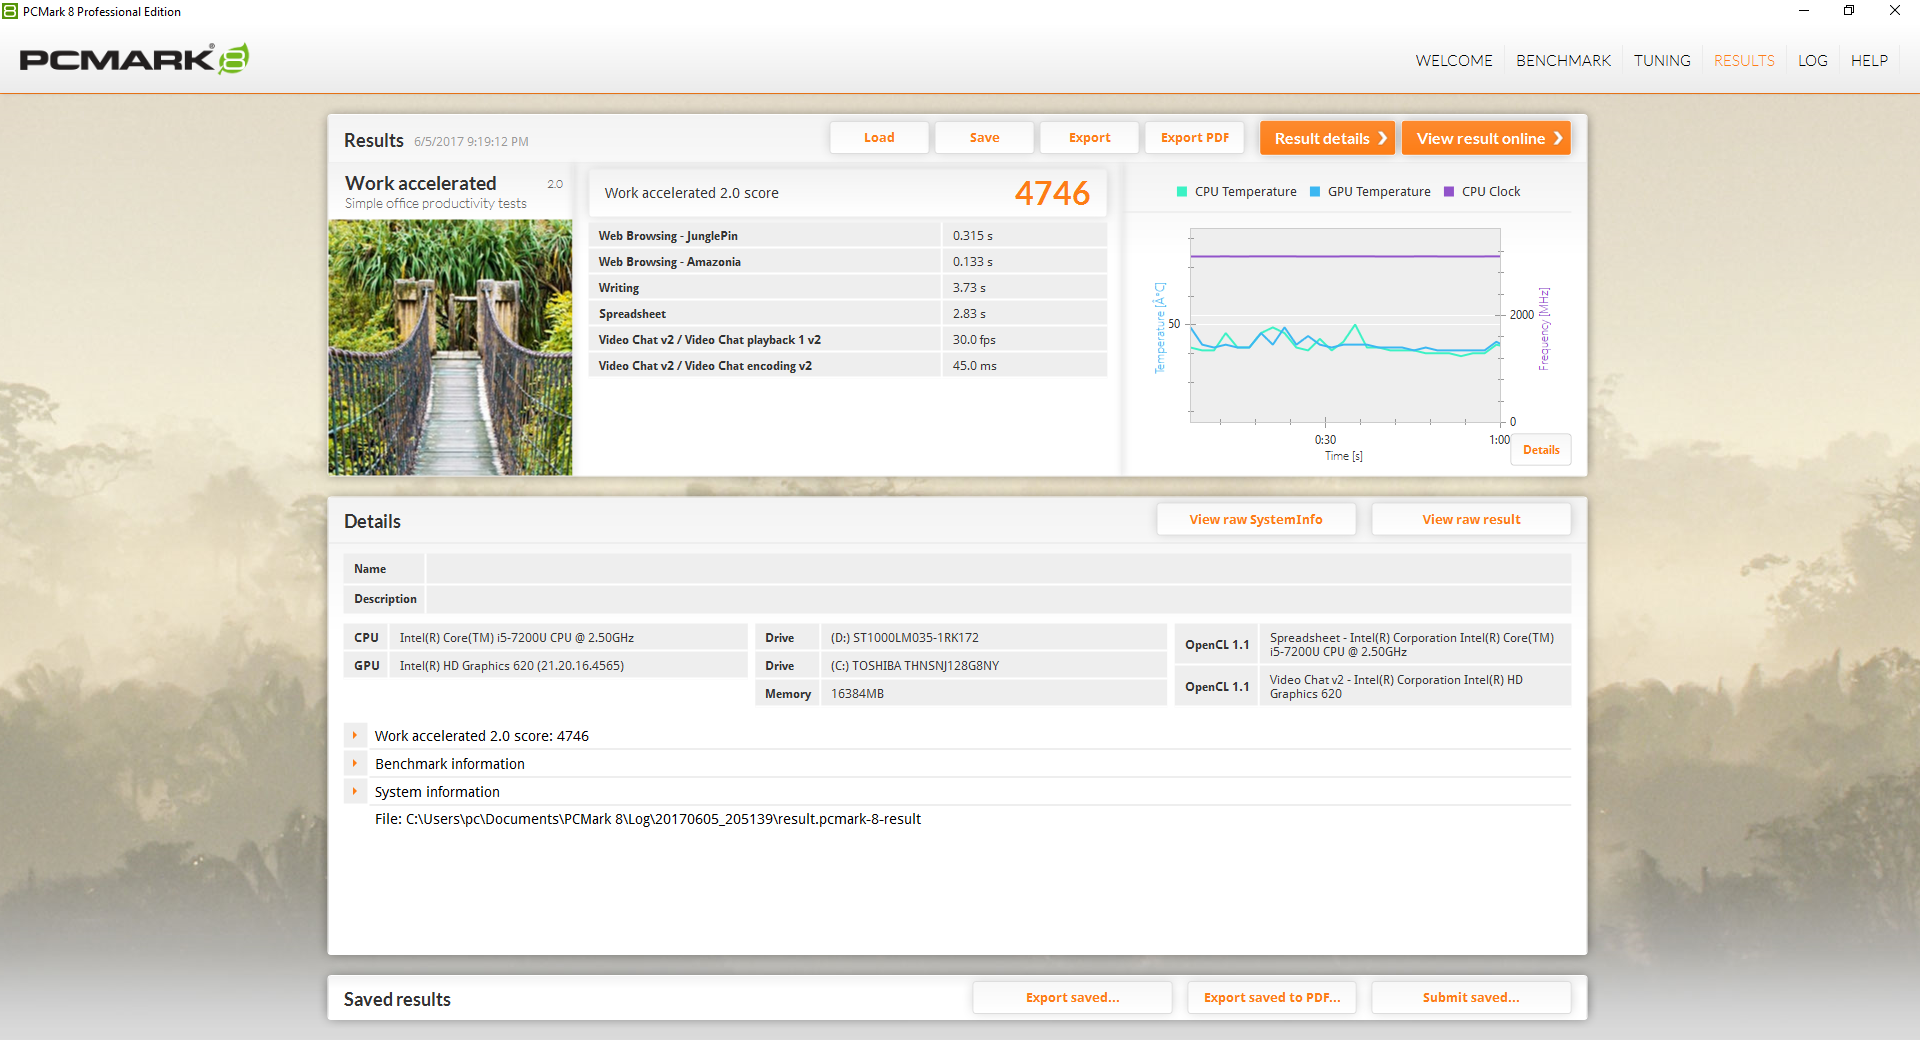
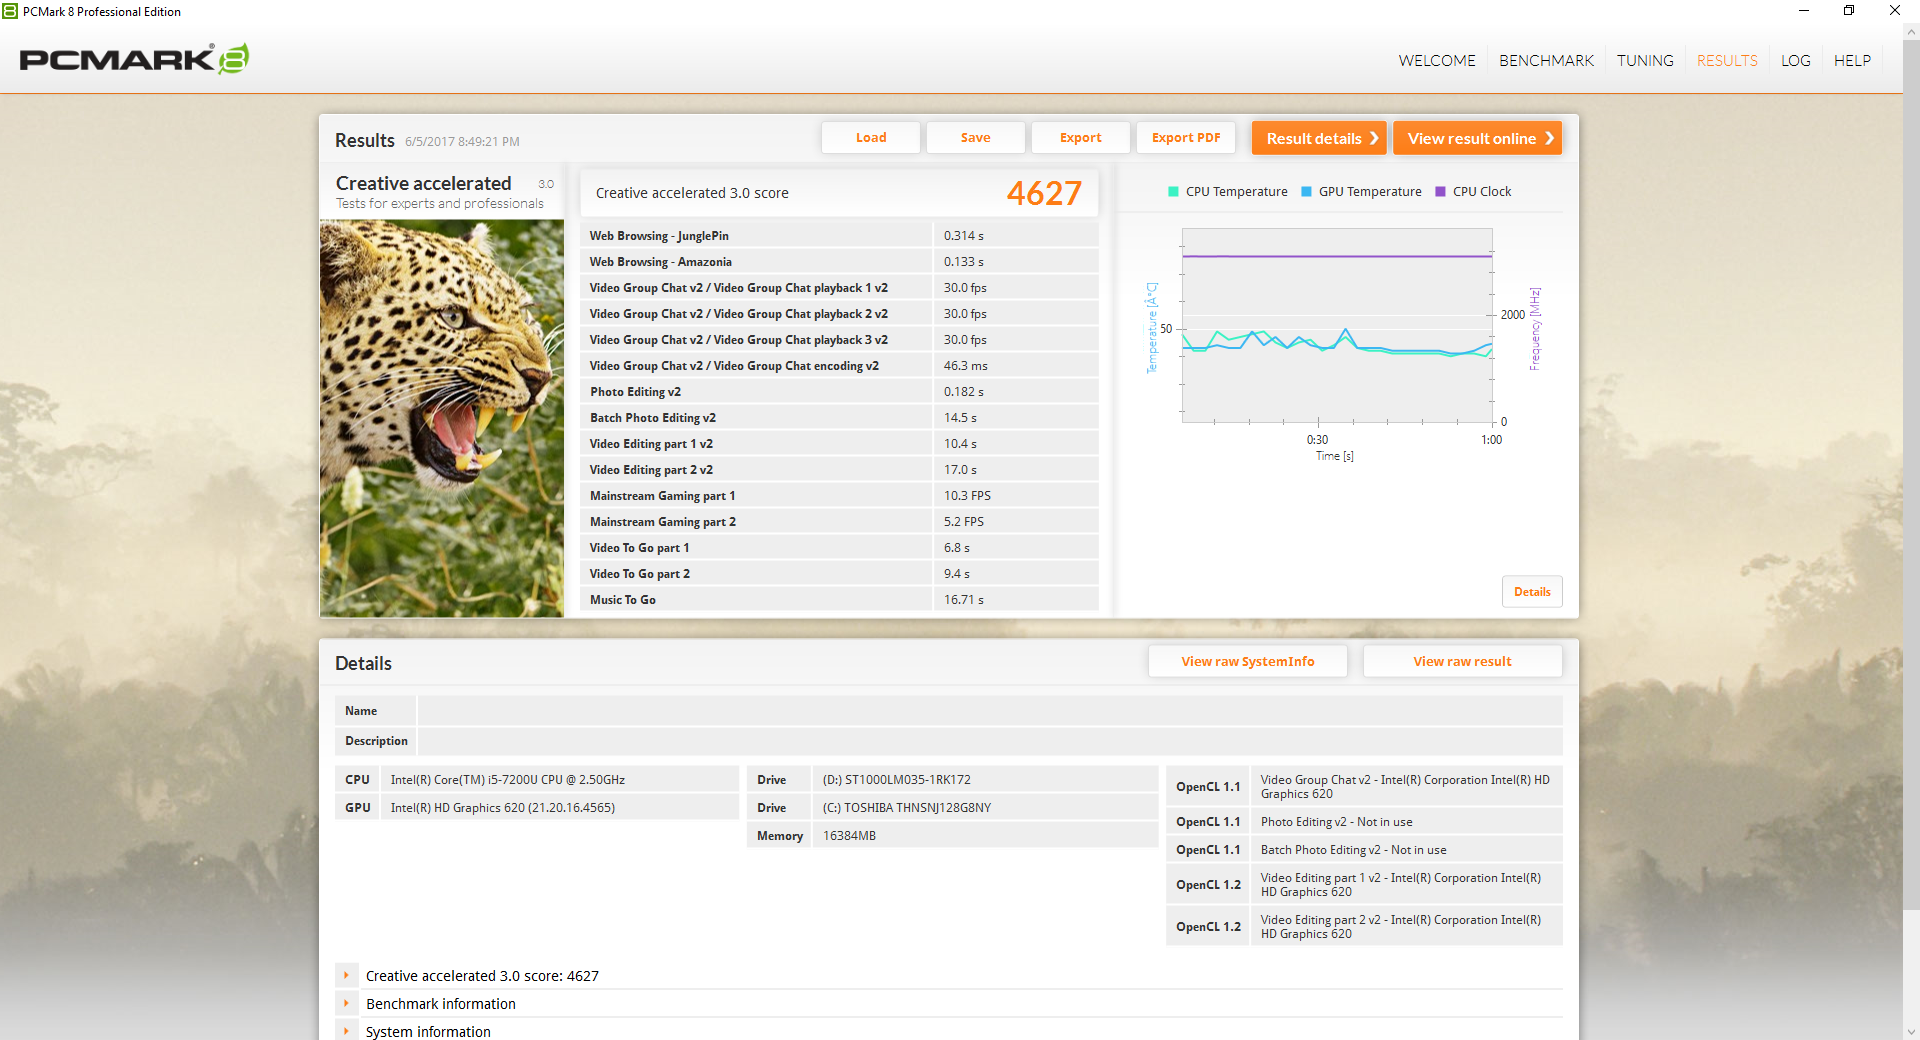
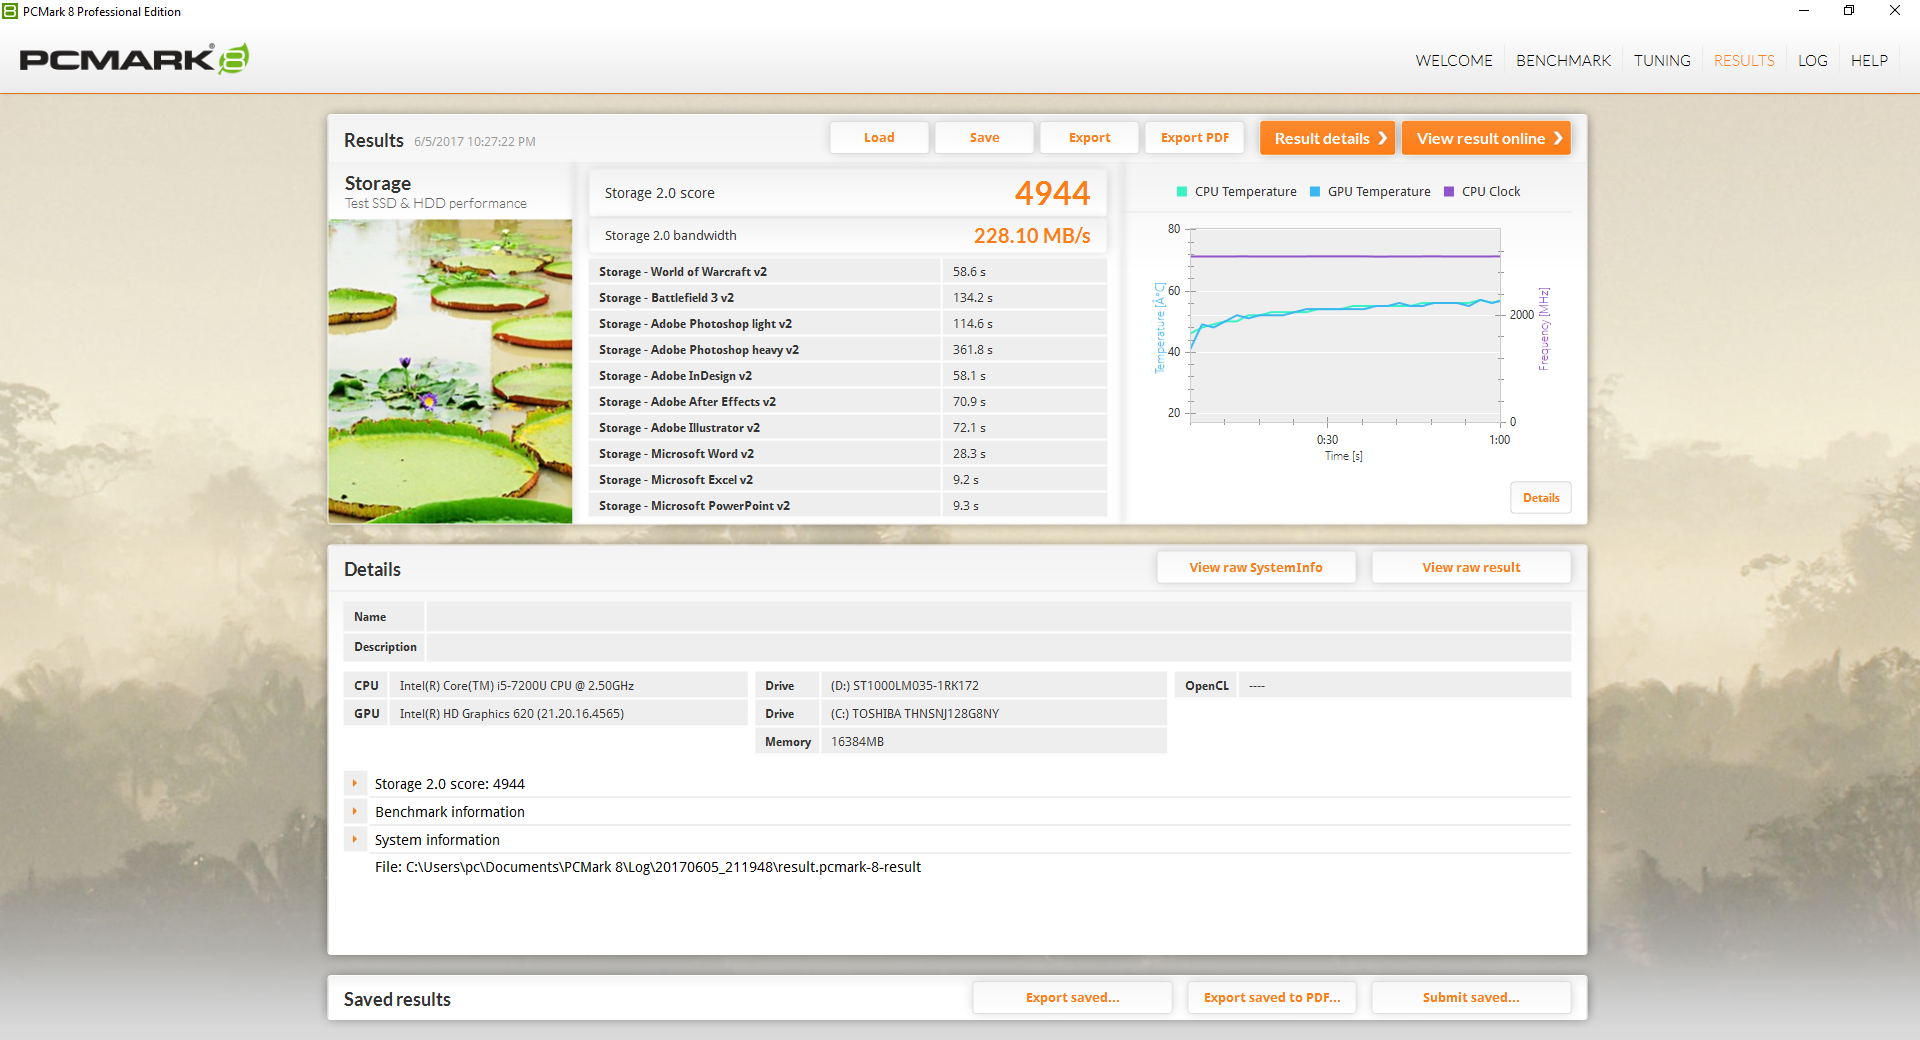
PCmark 8 ranks the Asus just slightly below the MacBook Pro 15. Subjectively, we experienced no software or hardware glitches during our time with the test unit. Applications launch swiftly as one would expect from a SSD-based notebook.
| PCMark 8 | |
| Home Score Accelerated v2 | |
| Apple MacBook Pro 15 2016 (2.9 GHz, 460) | |
| Asus VivoBook S15 S510UA | |
| HP Pavilion 15t-au100 CTO (W0P31AV) | |
| Work Score Accelerated v2 | |
| Apple MacBook Pro 15 2016 (2.9 GHz, 460) | |
| Asus VivoBook S15 S510UA | |
| HP Pavilion 15t-au100 CTO (W0P31AV) | |
| Creative Score Accelerated v2 | |
| Apple MacBook Pro 15 2016 (2.9 GHz, 460) | |
| Asus VivoBook S15 S510UA | |
| HP Pavilion 15t-au100 CTO (W0P31AV) | |
| PCMark 8 Home Score Accelerated v2 | 3831 points | |
| PCMark 8 Creative Score Accelerated v2 | 4627 points | |
| PCMark 8 Work Score Accelerated v2 | 4746 points | |
Help | ||
Storage Devices
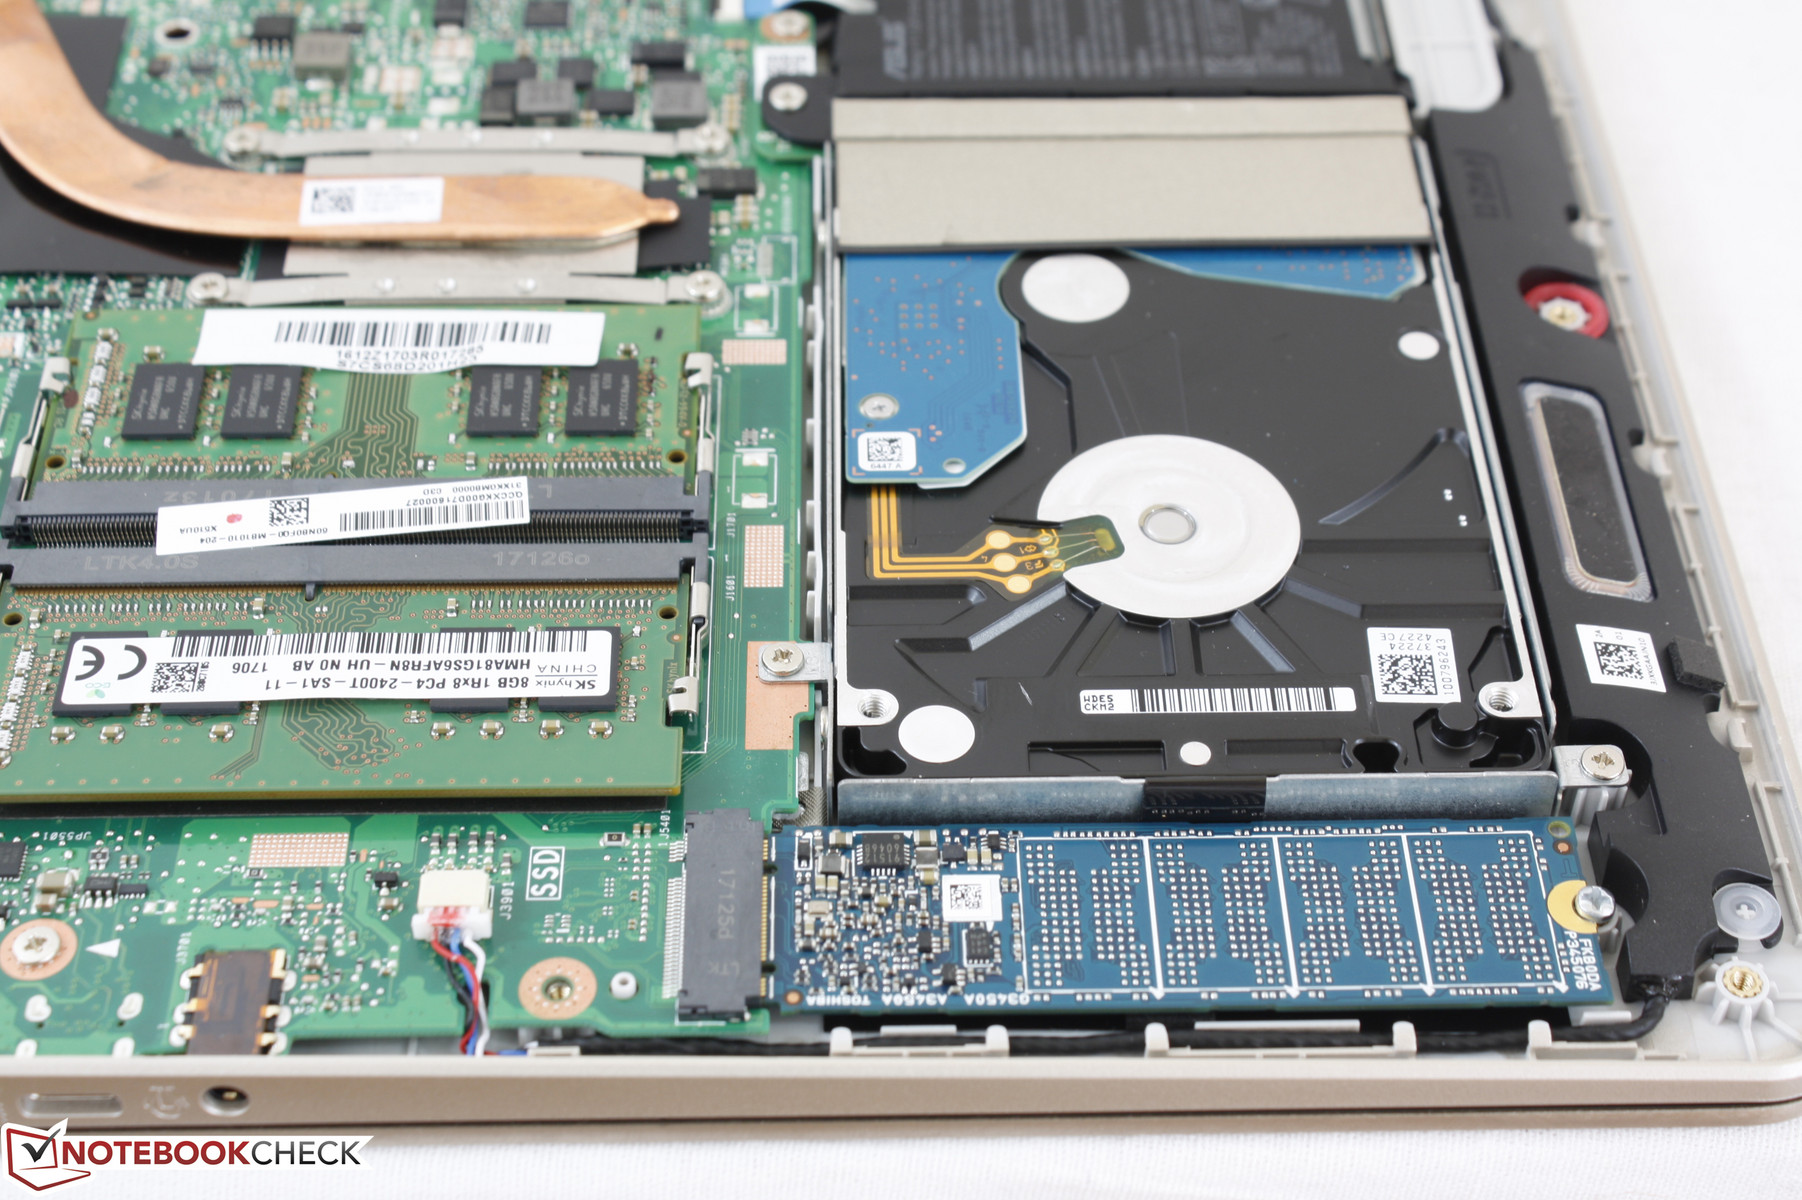
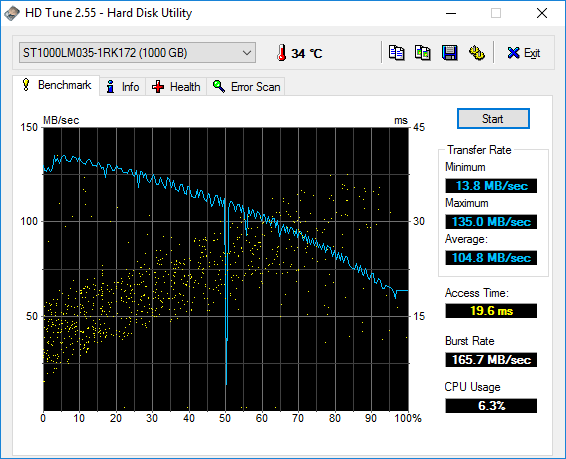
Two internal storage bays are available in the form of M.2 and 2.5-inch SATA III. NVMe is not supported and so users will be limited to the standard 6 Gbps bandwidth. Our particular test unit has been configured with a primary 128 GB Toshiba HG6 THNSNJ128G8NY SSD and secondary 1 TB Seagate ST1000LM035 HDD. We recommend sticking to 7 mm drives instead of thicker 9.5 mm alternatives.
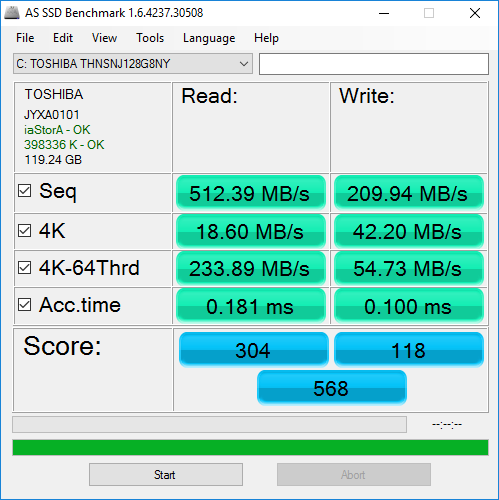
Performance from the supplied Toshiba SSD is typical of a SATA III SSD with read rates maxing out at about 500 MB/s. Its read and write rates of smaller 4K blocks, however, are much slower than some Intel and Samsung SSDs as shown by our comparison table below. Meanwhile, the secondary Seagate drive is quite fast for a 5400 RPM HDD with an average transfer rate of almost 105 MB/s according to HD Tune.
See our growing table of HDDs and SSDs for more performance comparisons.
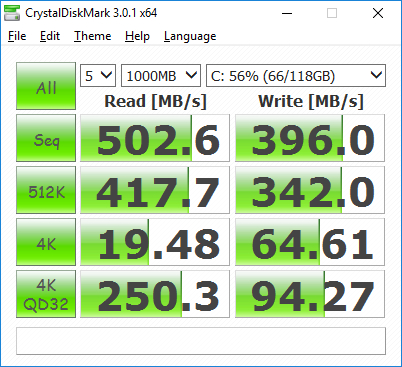
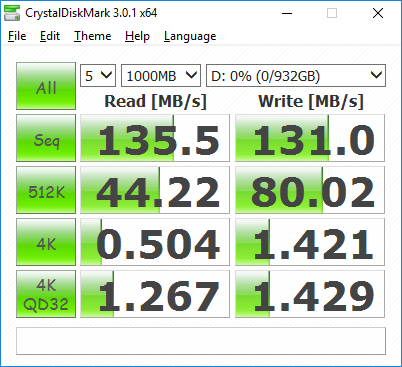
| Asus VivoBook S15 S510UA Toshiba HG6 THNSNJ128G8NY | Lenovo V510-15IKB 80WQ0002GE Samsung CM871a MZNTY256HDHP | HP Pavilion 15t-au100 CTO (W0P31AV) Toshiba MQ01ABD100 | Apple MacBook Pro 15 2016 (2.9 GHz, 460) Apple SSD SM1024L | Dell Inspiron 15 7000 7567 Intel SSDSCKKF256H6 | |
|---|---|---|---|---|---|
| CrystalDiskMark 3.0 | 51% | -91% | 165% | 29% | |
| Read Seq (MB/s) | 503 | 532 6% | 109.5 -78% | 1458 190% | 485.8 -3% |
| Write Seq (MB/s) | 396 | 511 29% | 105.2 -73% | 1440 264% | 422.8 7% |
| Read 512 (MB/s) | 417.7 | 414.8 -1% | 34.08 -92% | 914 119% | 338.9 -19% |
| Write 512 (MB/s) | 342 | 307.7 -10% | 40.02 -88% | 1058 209% | 304 -11% |
| Read 4k (MB/s) | 19.48 | 39.51 103% | 0.429 -98% | 9.786 -50% | 27.11 39% |
| Write 4k (MB/s) | 64.6 | 108.1 67% | 1.008 -98% | 10.9 -83% | 85.4 32% |
| Read 4k QD32 (MB/s) | 250.3 | 361.6 44% | 0.81 -100% | 679 171% | 279.6 12% |
| Write 4k QD32 (MB/s) | 94.3 | 253 168% | 0.893 -99% | 562 496% | 255.1 171% |

GPU Performance
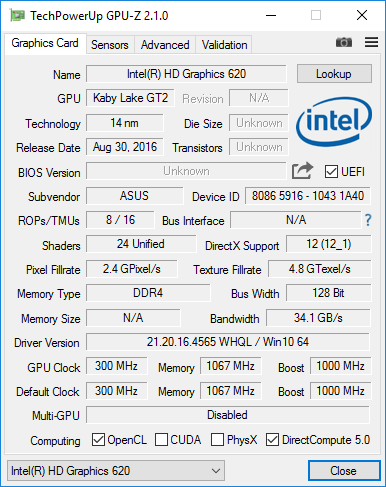
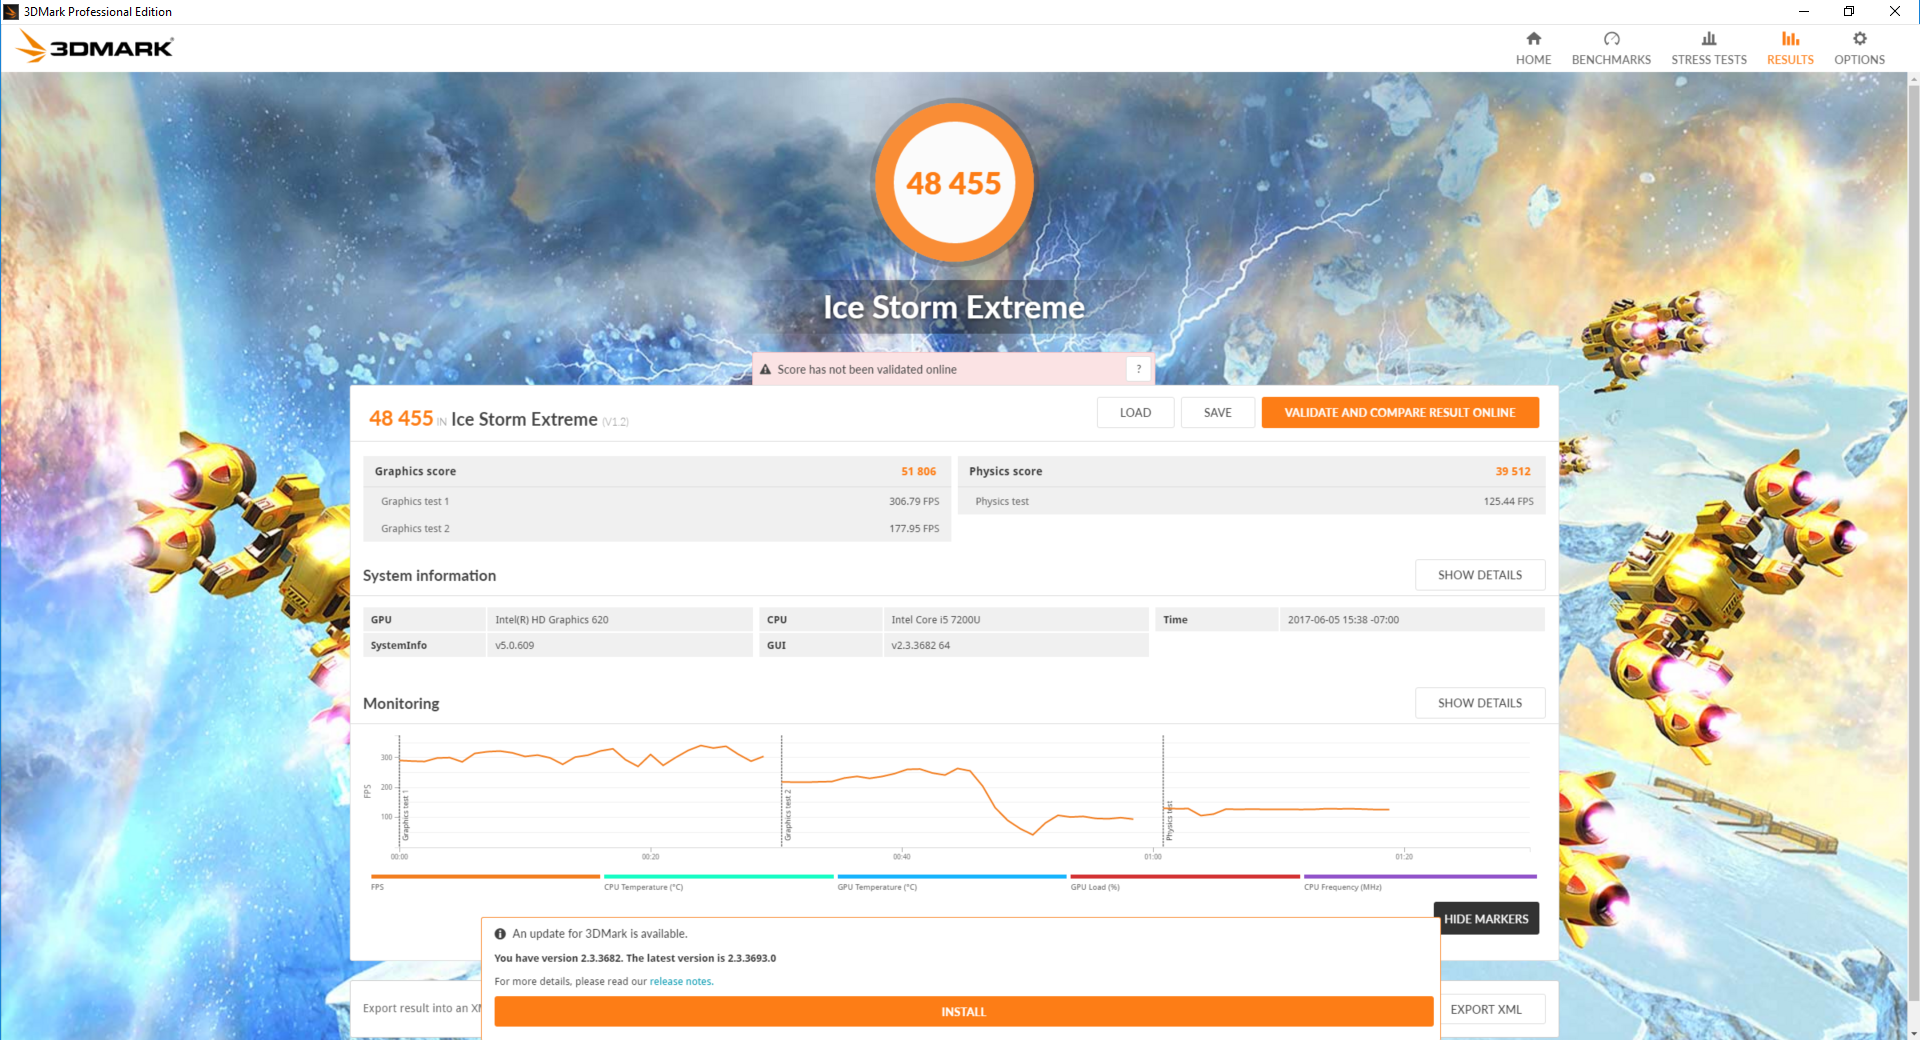
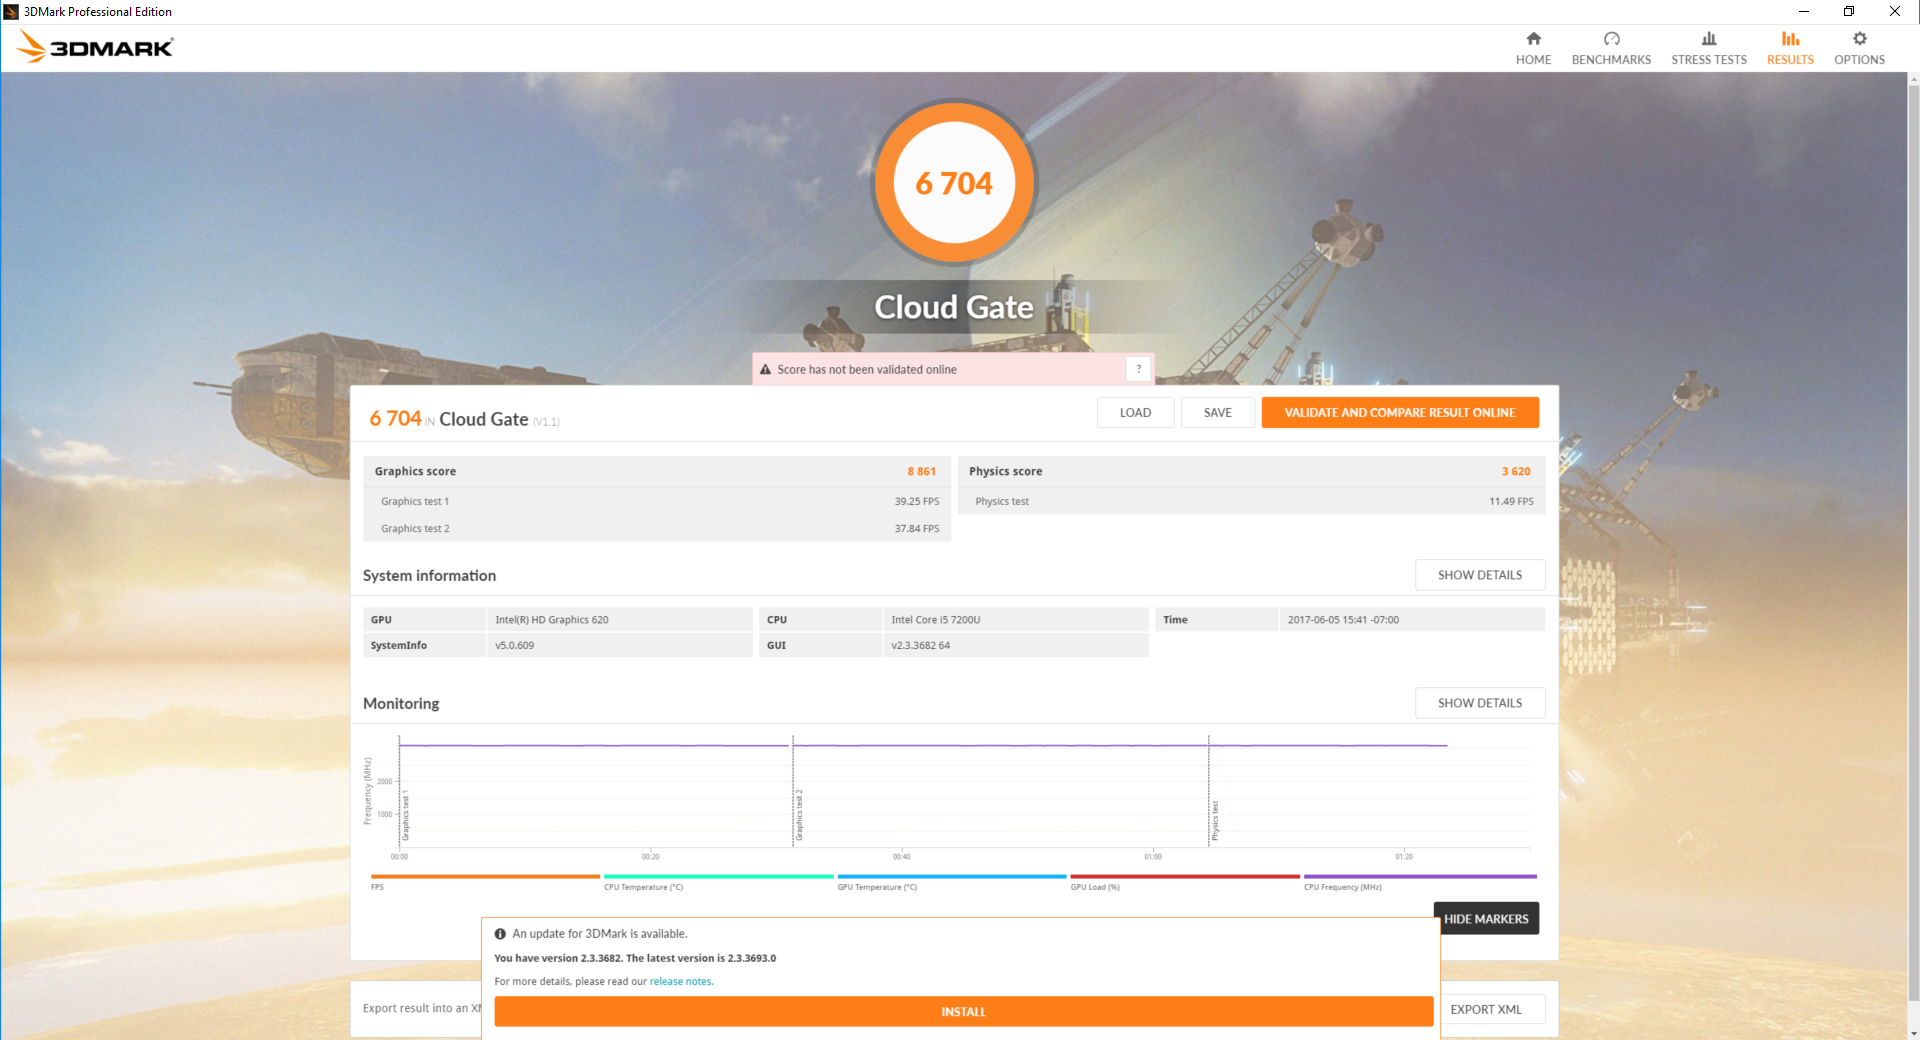
Graphics performance from the integrated HD Graphics 620 is about 20 percent faster than the Latitude 5280 with the same i5-7200U CPU according to 3DMark 11. Wide performance deltas are common amongst integrated HD Graphics GPUs due to the variable GPU clock rates or the speed of the shared RAM. Gaming performance is still subpar and users are unlikely to notice any significant advantages over the older HD Graphics 520 in practice. Dota 2, for example, is unable to maintain 60 FPS even on medium 768p settings. Users who prefer the VivoBook S15 S510UQ SKU with the dedicated GeForce 940MX will get a rough 60 percent boost in graphics power over the HD Graphics 620 to be comparable to the Iris Graphics 550 GPU in the 2016 MacBook Pro 13.
See our dedicated GPU page on the HD Graphics 620 for more technical details and benchmark comparisons.
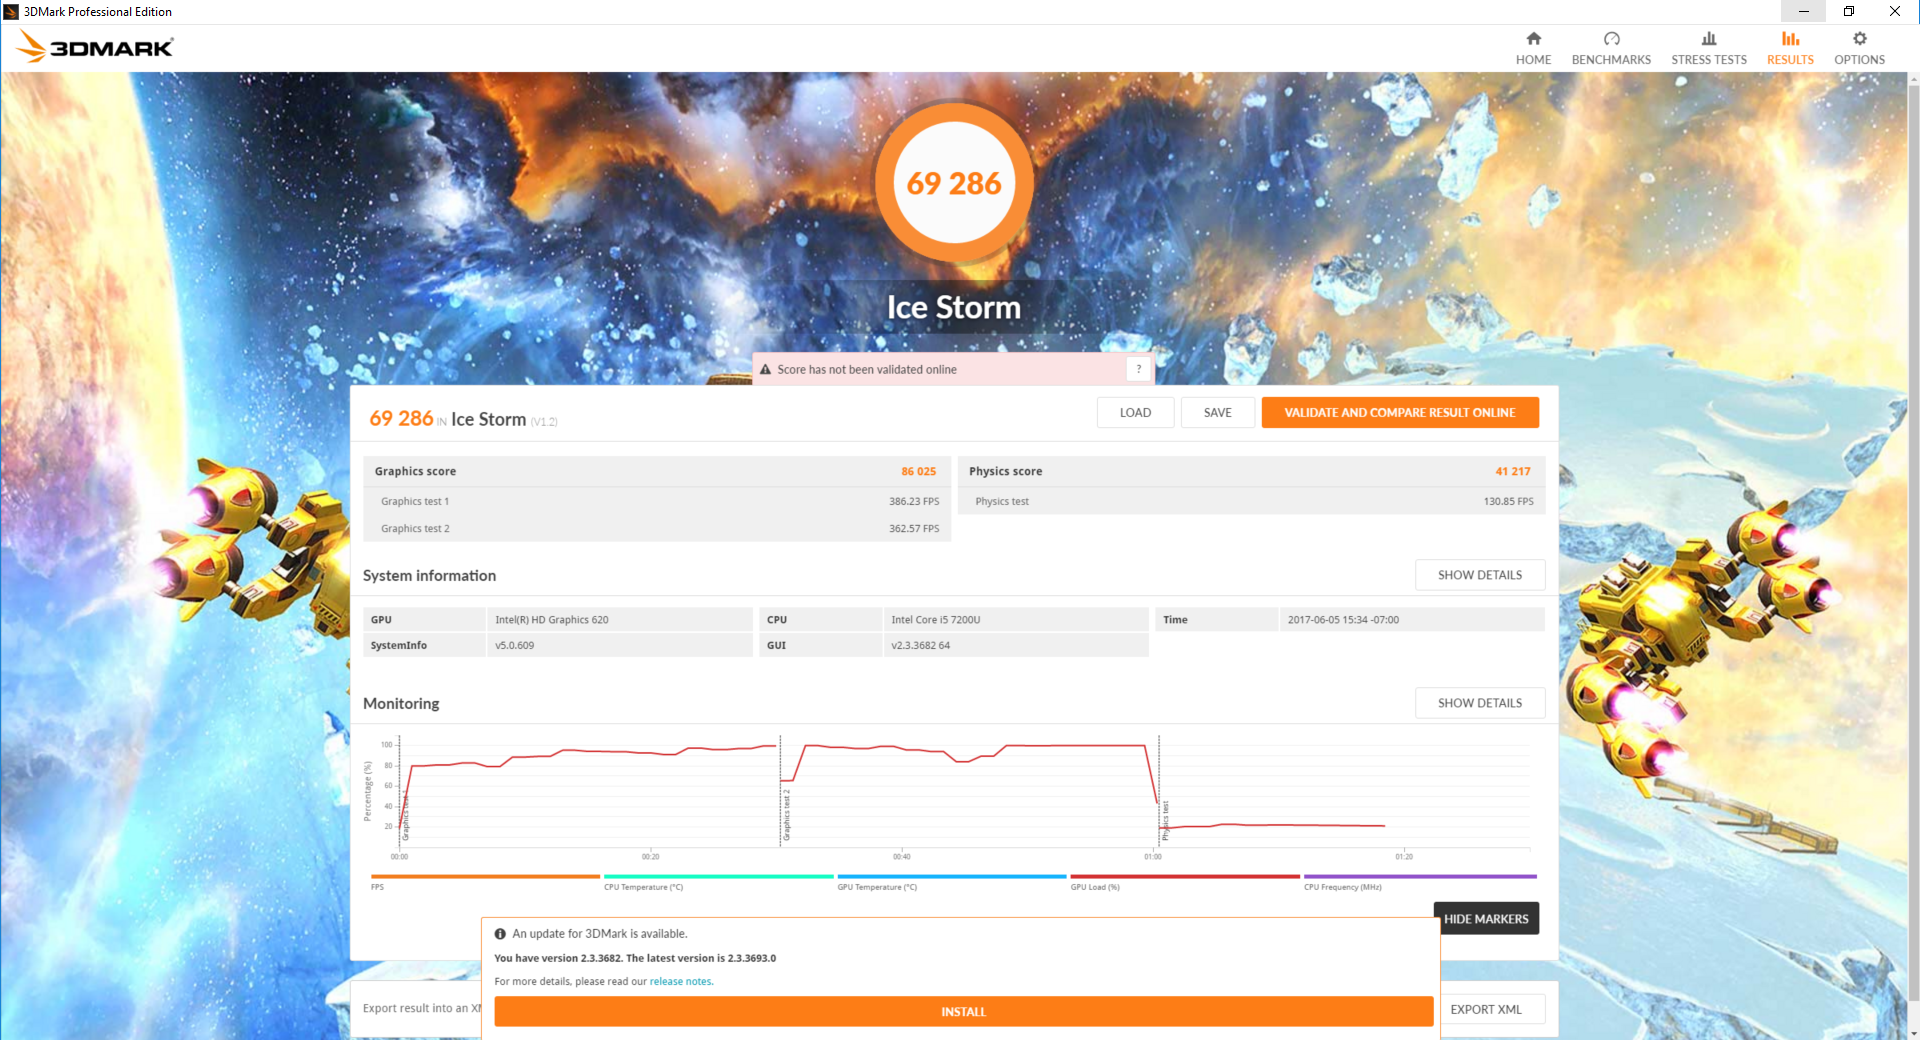
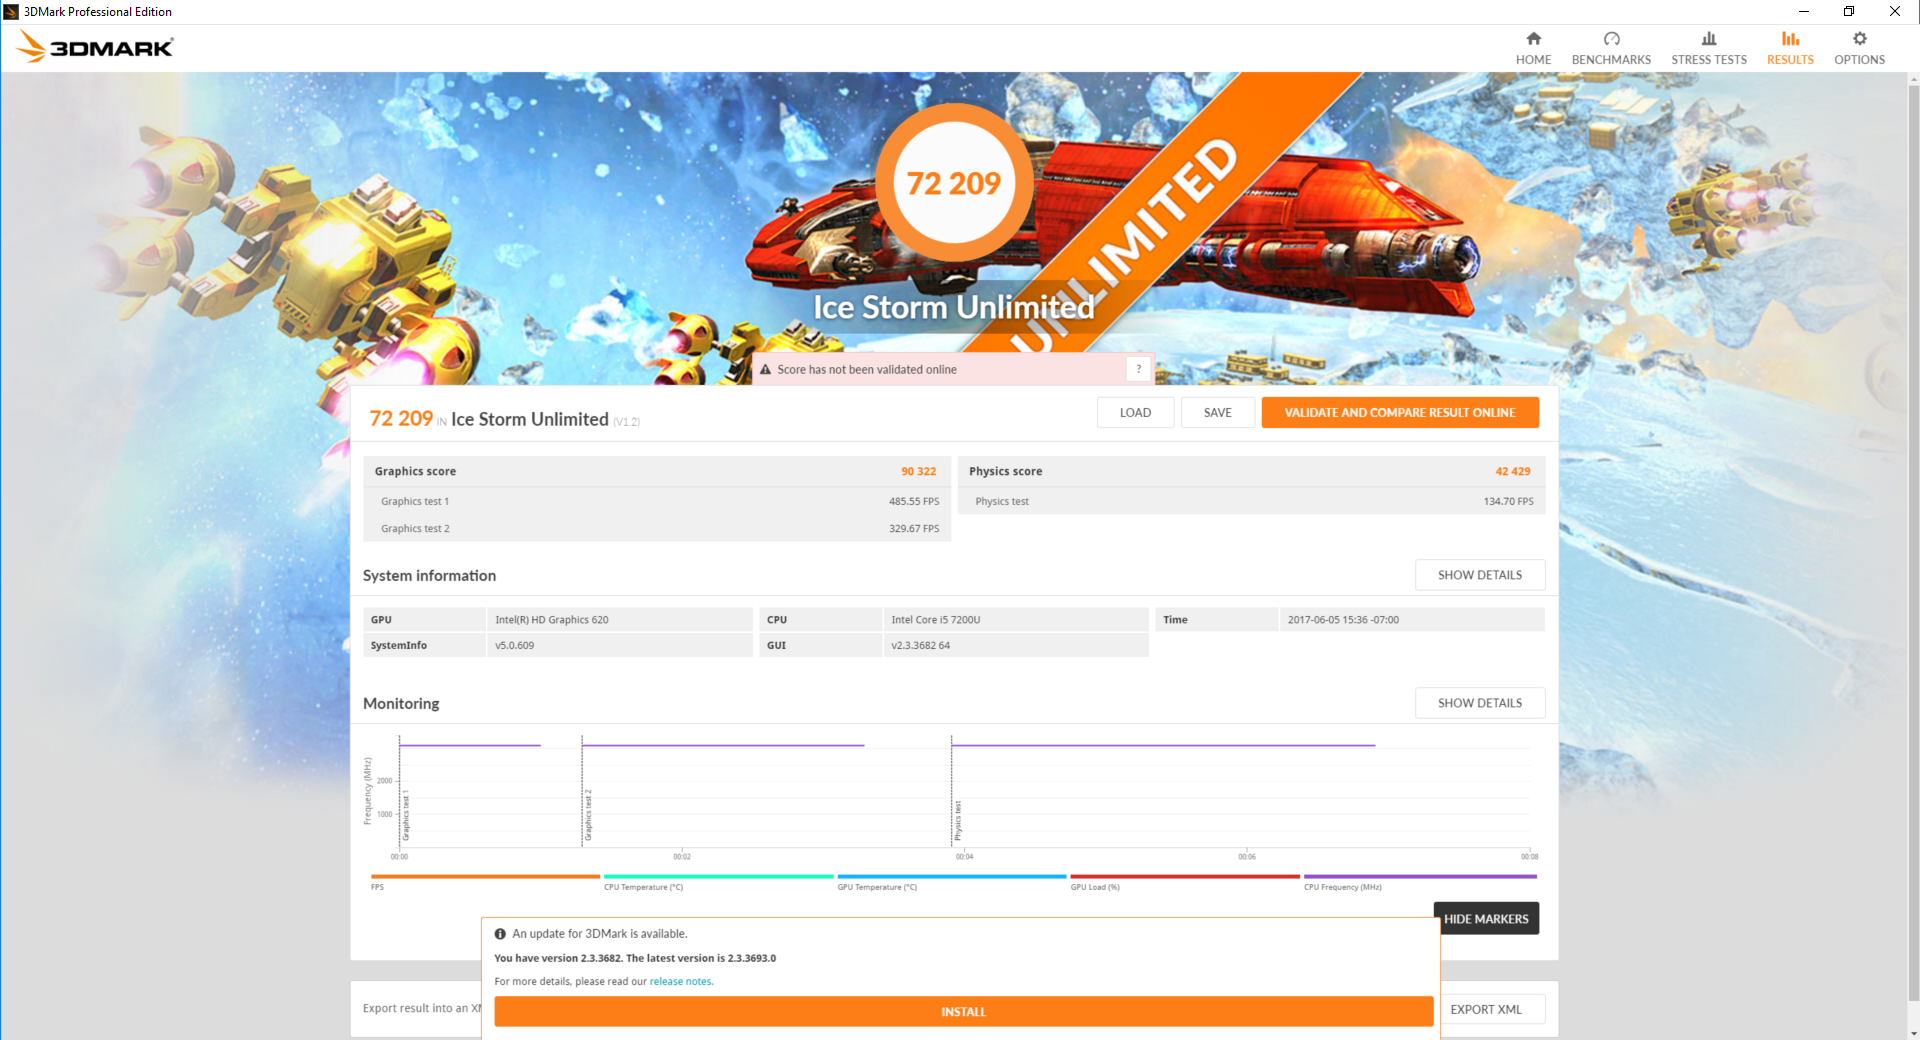
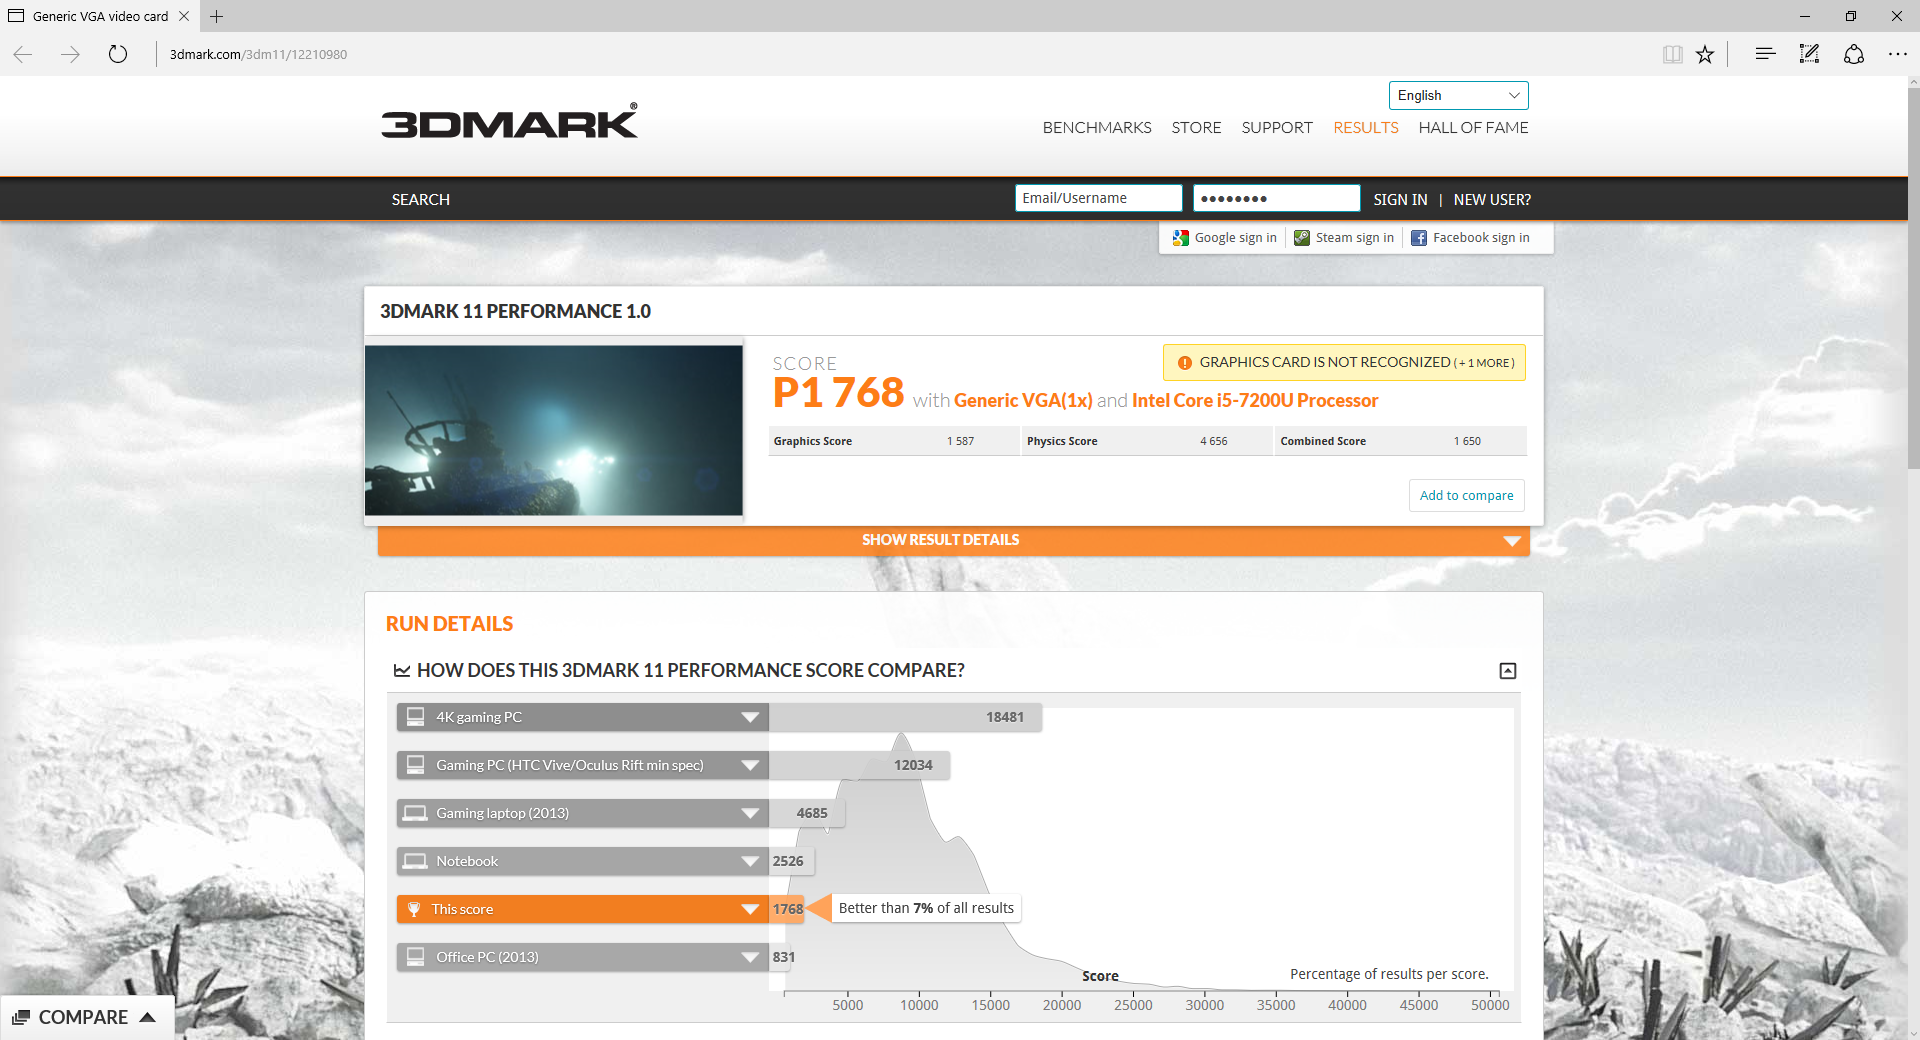
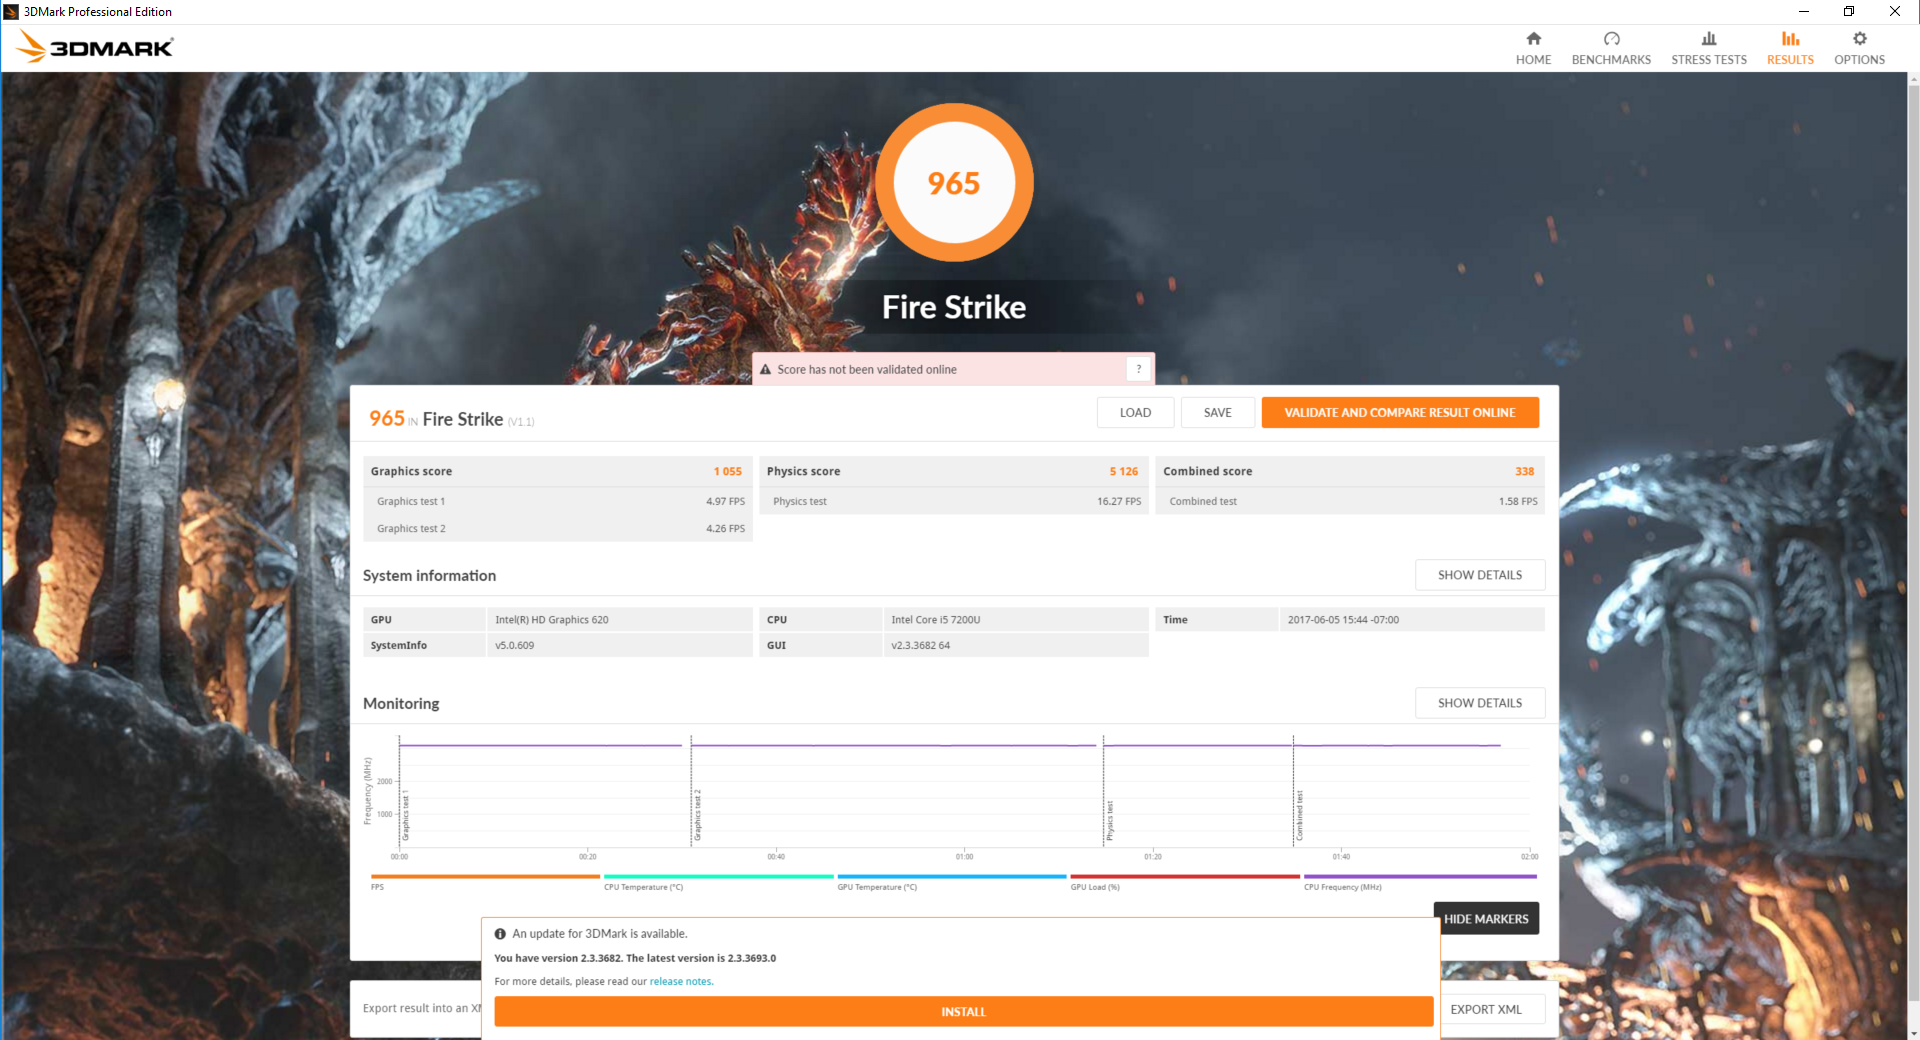
| 3DMark 11 Performance | 1768 points | |
| 3DMark Ice Storm Standard Score | 69286 points | |
| 3DMark Cloud Gate Standard Score | 6704 points | |
| 3DMark Fire Strike Score | 965 points | |
| 3DMark Fire Strike Extreme Score | 449 points | |
Help | ||
| low | med. | high | ultra | |
|---|---|---|---|---|
| BioShock Infinite (2013) | 62.7 | 33.9 | 28.6 | 8.8 |
| Dota 2 Reborn (2015) | 82 | 56 | 20 |
Stress Test
We stress the system with synthetic benchmarks in order to identify for any throttling or stability issues. When under Prime95 stress, the Asus can be observed maintaining a clock rate of 3.1 GHz compared to its base clock rate of 2.5 GHz. This is the processor's maximum rated Turbo Boost and it's always impressive to see an Ultrabook running stably at its highest speeds without fluctuating frequencies. Running both Prime95 and FurMark simultaneously will throttle the CPU down to just 1.4 GHz in order to maintain a core temperature of about 71 C as is common on many Ultrabooks. In this case, the integrated GPU takes priority over the CPU as the GPU never runs slower than 848 MHz.
Running on battery power will not throttle CPU or GPU performance. A 3DMark 11 run on batteries returns Physics and Graphics scores of 4424 and 1514 points, respectively, compared to 4656 and 1587 points when on mains.
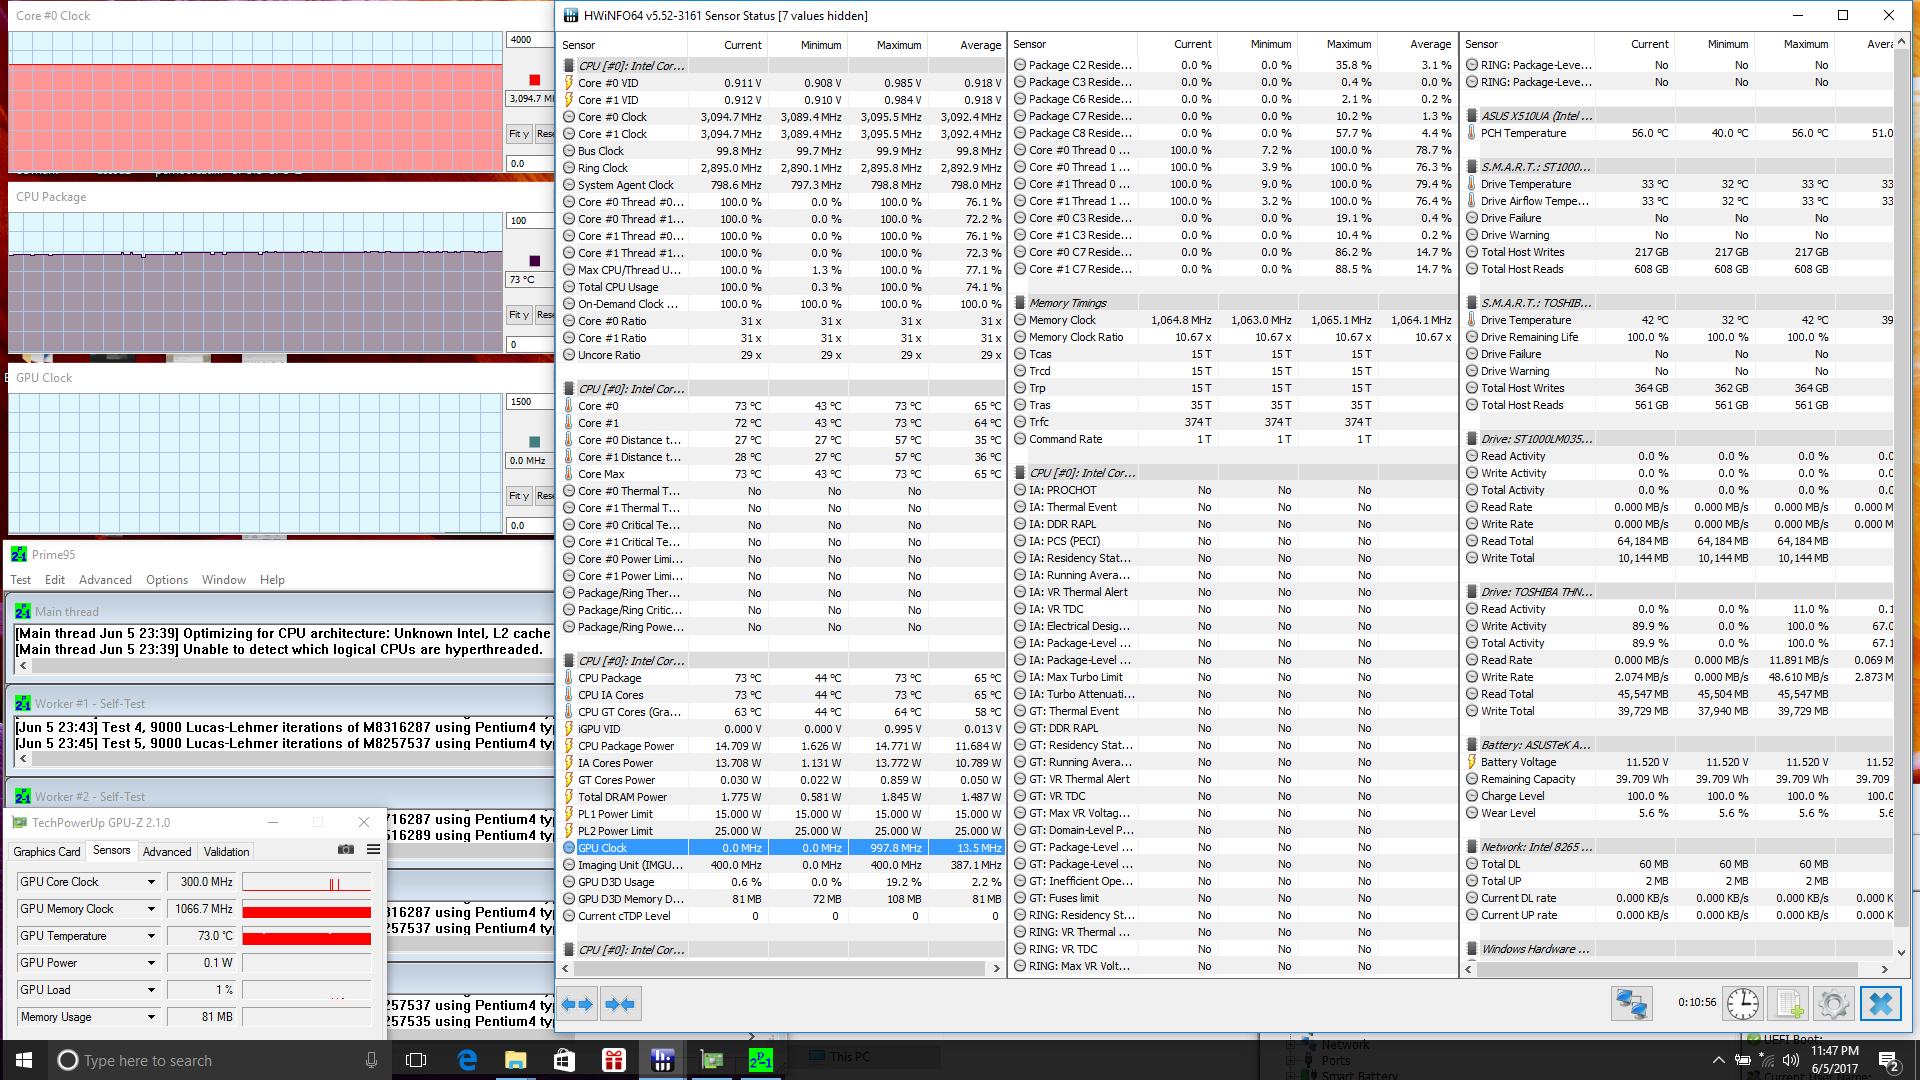
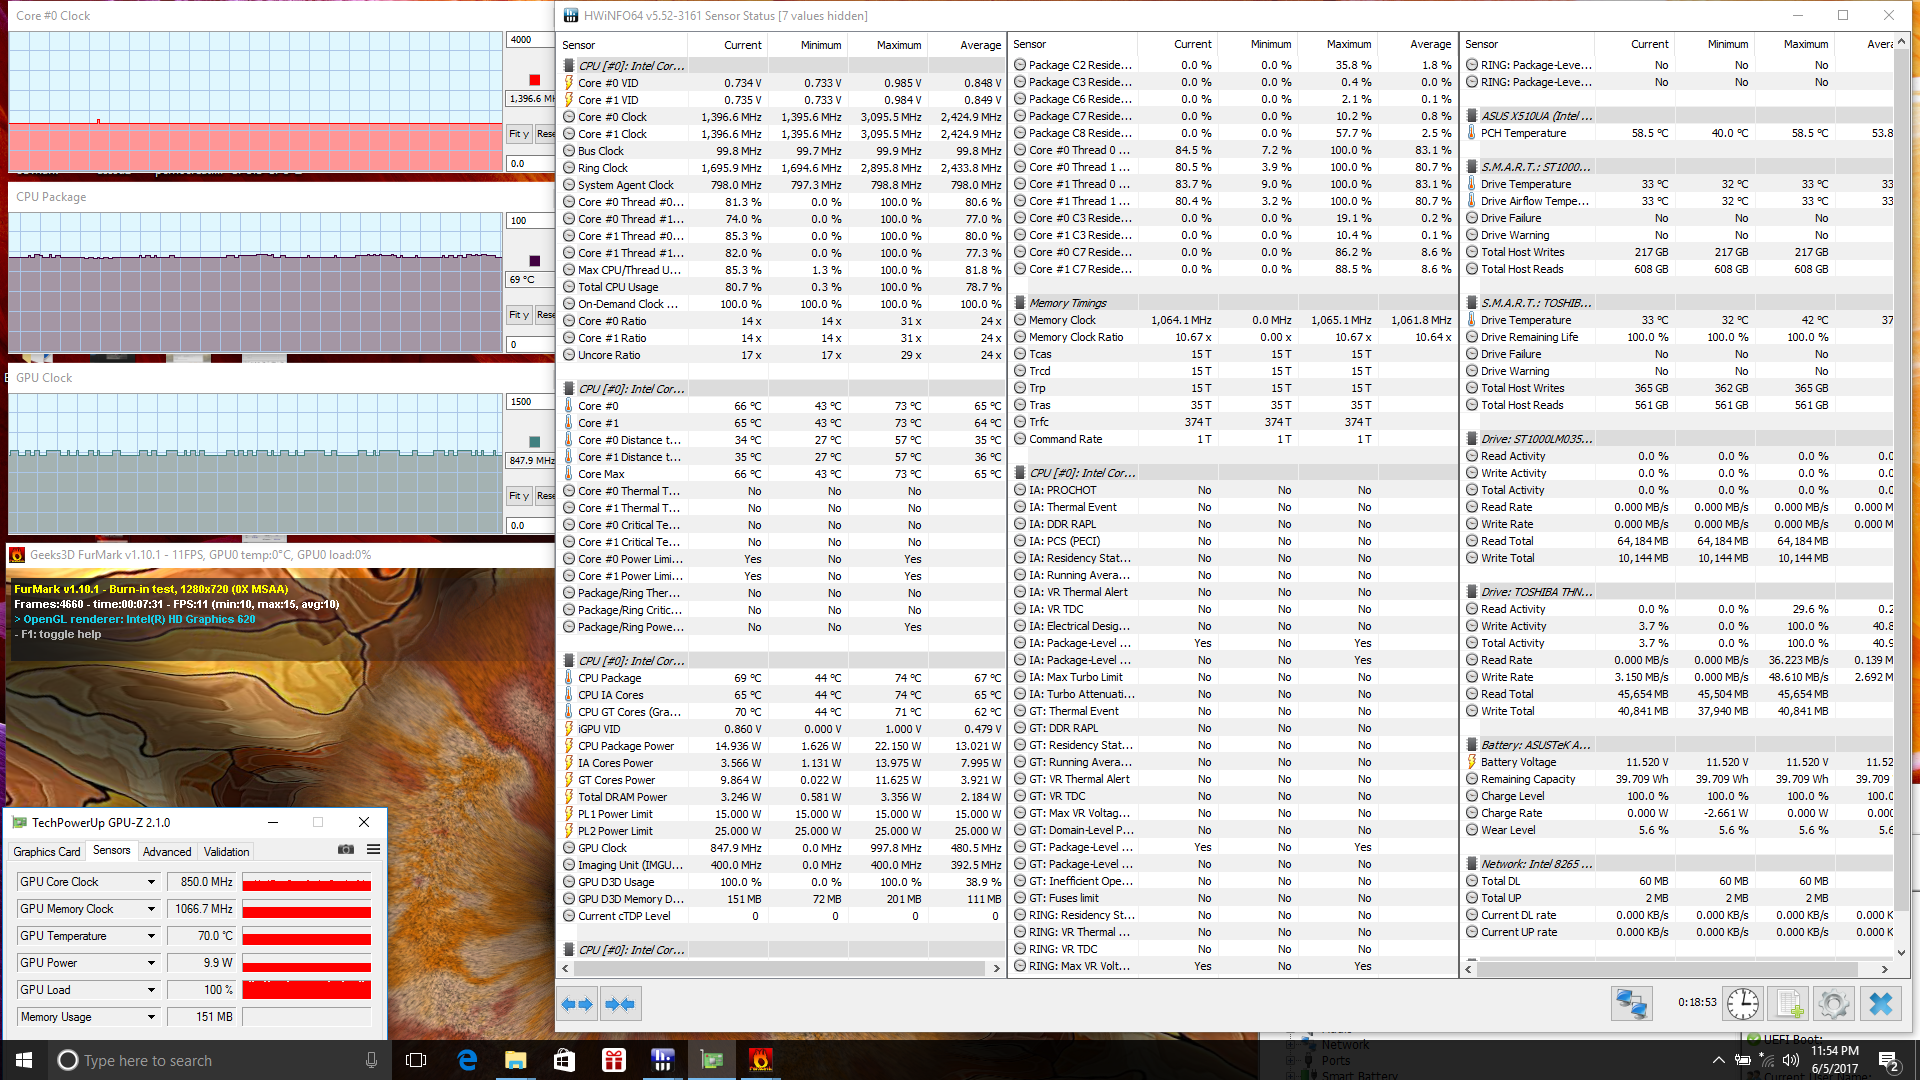
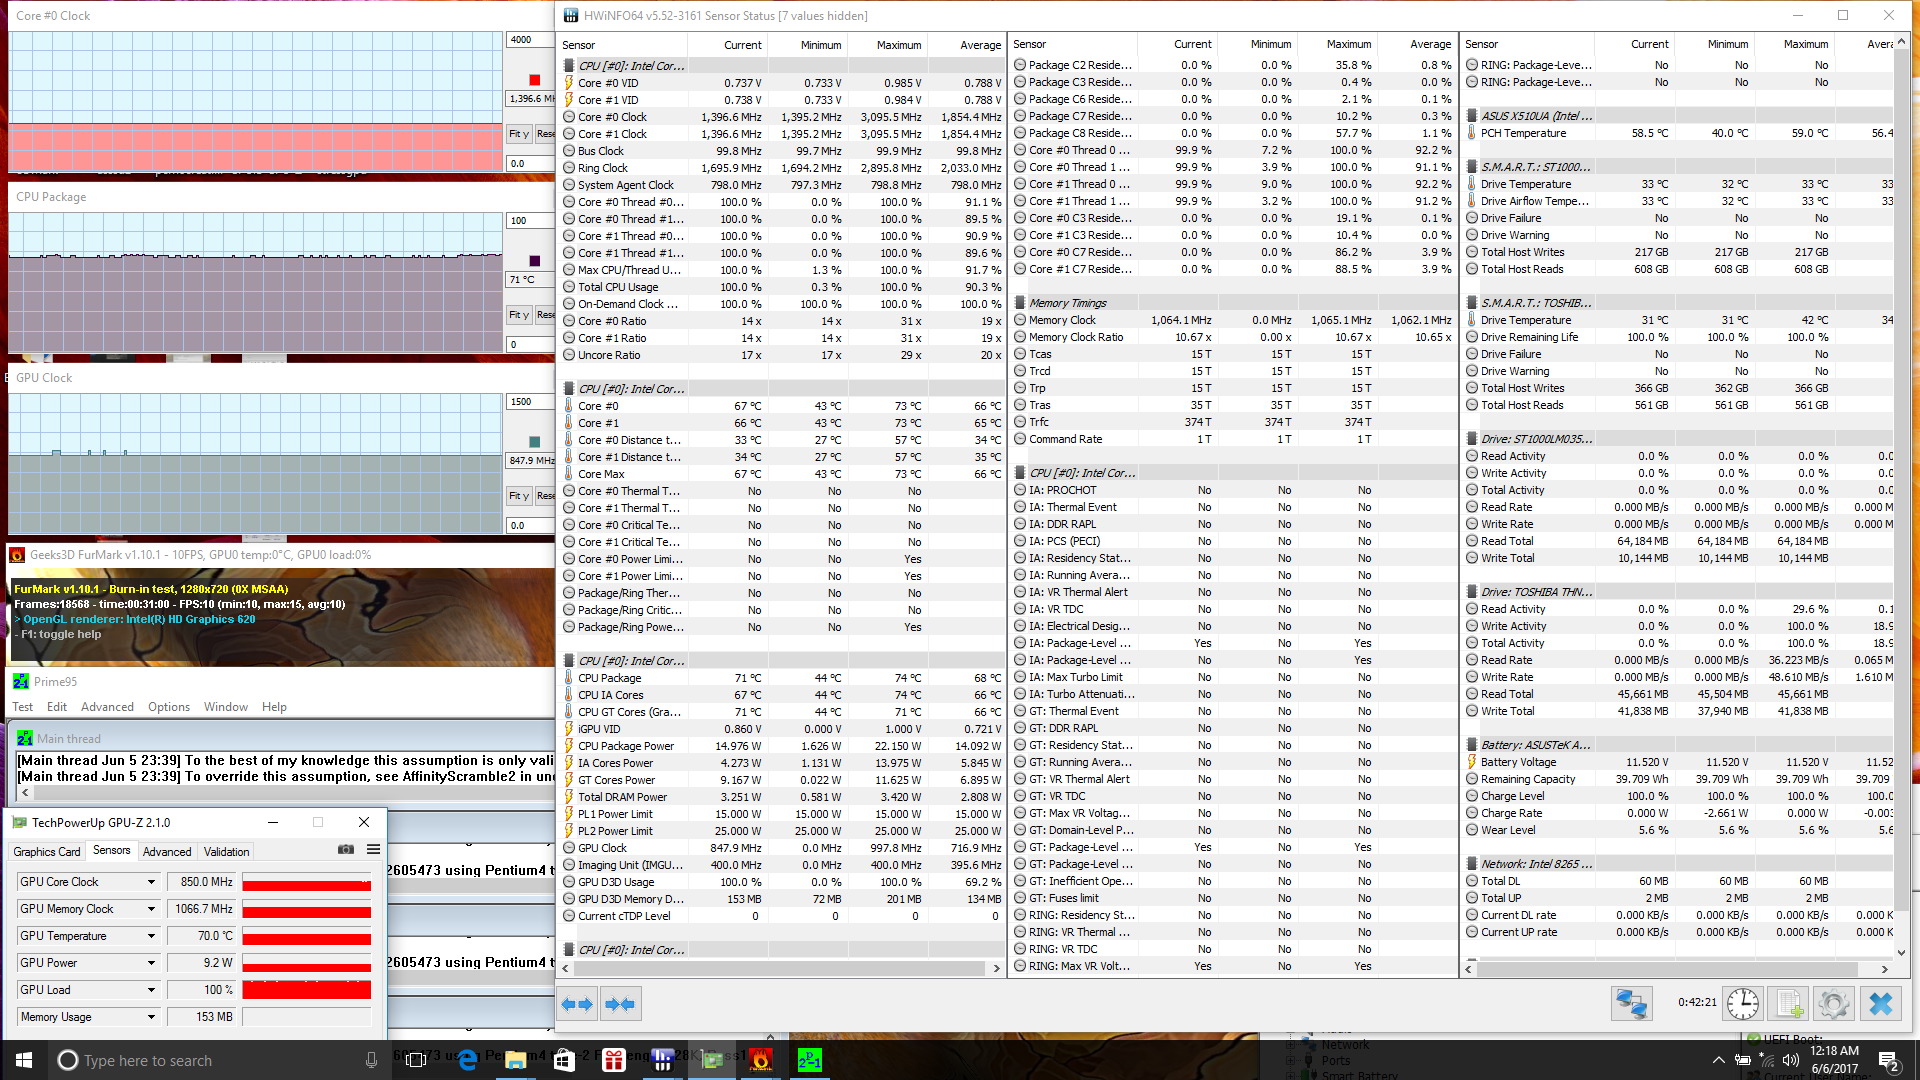
| CPU Clock (GHz) | GPU Clock (MHz) | Average CPU Temperature (°C) | |
| Prime95 Stress | 3.1 | -- | 73 |
| FurMark Stress | -- | 848 | 69 |
| Prime95 + FurMark Stress | 1.4 | 848 | 71 |
Emissions
System Noise
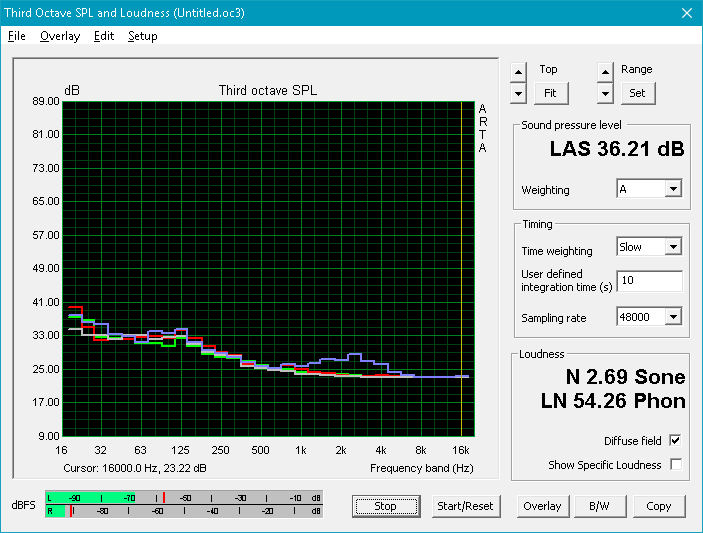
The cooling solution consists of a single fan and heat pipe whereas other 15-inch notebooks with similar ULV CPUs may utilize two fans instead. The fan in the Asus is always active no matter the system load, but it is thankfully very quiet and hardly noticeable in a typical home or office environment. Fan noise remains low and will not pulsate when browsing or streaming video. Of course, the S510UR/S510UR SKUs with the dedicated Nvidia GPU may be more likely to run louder than our iGPU-only configuration.
Medium loads, such as with 3DMark06, will slowly bump fan noise to a steady 36.9 dB(A). Maximum load with Prime95 and FurMark will not increase fan RPM any further and so users can expect to reach the maximum fan noise of the system when gaming or running intensive processing loads. The low 37 dB(A) range is still tolerable and quieter than most Ultrabooks where the low 40 dB(A) range is the norm when under similar extreme loads.
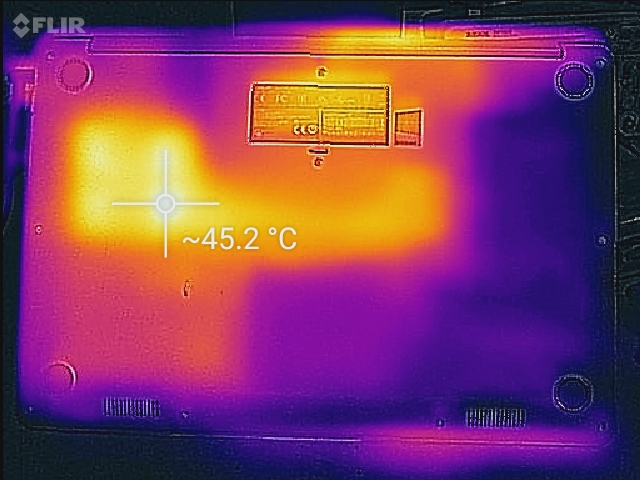
Warping of the chassis may occur during very high processing loads. As shown by the picture below, the bottom maintenance panel of our test unit exhibits a dent on the region immediately over the processor. We're unsure if this is due to the heat of the processor or the pressure from the heat pipe underneath, but this is likely not intentional by the manufacturer as the bottom surface is supposed to be completely flat from edge to edge.
Noise level
| Idle |
| 30.2 / 30.2 / 30.2 dB(A) |
| HDD |
| 30.2 dB(A) |
| Load |
| 36.9 / 37 dB(A) |
 | ||
30 dB silent 40 dB(A) audible 50 dB(A) loud |
||
min: | ||
| Asus VivoBook S15 S510UA HD Graphics 620, i5-7200U, Toshiba HG6 THNSNJ128G8NY | Lenovo V510-15IKB 80WQ0002GE HD Graphics 620, i5-7200U, Samsung CM871a MZNTY256HDHP | HP Pavilion 15t-au100 CTO (W0P31AV) GeForce 940MX, i7-7500U, Toshiba MQ01ABD100 | Apple MacBook Pro 15 2016 (2.9 GHz, 460) Radeon Pro 460, 6920HQ, Apple SSD SM1024L | Dell Inspiron 15 7000 7567 GeForce GTX 1050 Ti Mobile, i7-7700HQ, Intel SSDSCKKF256H6 | |
|---|---|---|---|---|---|
| Noise | 0% | -9% | -4% | -11% | |
| off / environment * (dB) | 28.2 | 30.2 -7% | 29 -3% | 30.3 -7% | |
| Idle Minimum * (dB) | 30.2 | 30.2 -0% | 32.2 -7% | 30.3 -0% | 30.9 -2% |
| Idle Average * (dB) | 30.2 | 30.2 -0% | 32.2 -7% | 30.3 -0% | 30.9 -2% |
| Idle Maximum * (dB) | 30.2 | 32 -6% | 33.7 -12% | 30.3 -0% | 31 -3% |
| Load Average * (dB) | 36.9 | 34.7 6% | 39.4 -7% | 35.1 5% | 46.5 -26% |
| Load Maximum * (dB) | 37 | 33.9 8% | 42.2 -14% | 46 -24% | 46.8 -26% |
* ... smaller is better
Temperature
Surface temperature development is unusual because of the positioning of the processor near the center of the notebook and the angled heat pipe. A hot spot of 46 C can be observed directly on the Alt key whereas most other Ultrabooks are warmest nearer the rear in order to keep frontal quadrants cooler for hands and fingers. The right half of the notebook is also significantly warmer than the left, so one hand will become warmer than the other after extended typing sessions. The S510UR/S510UQ will likely run hotter since the same cooling solution must dissipate heat from two discrete processors instead of one. The temperature gradient is otherwise flat on both sides of the VivoBook during very low processing loads.
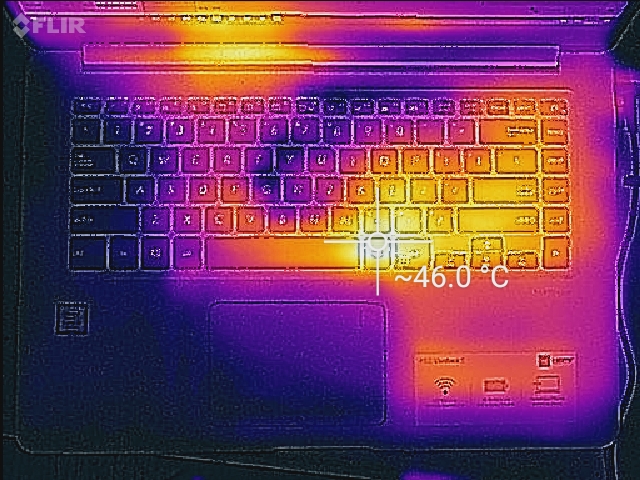
(-) The maximum temperature on the upper side is 46 °C / 115 F, compared to the average of 36.8 °C / 98 F, ranging from 21 to 71 °C for the class Multimedia.
(±) The bottom heats up to a maximum of 45 °C / 113 F, compared to the average of 39.1 °C / 102 F
(+) In idle usage, the average temperature for the upper side is 23.5 °C / 74 F, compared to the device average of 31.3 °C / 88 F.
(+) The palmrests and touchpad are reaching skin temperature as a maximum (32.4 °C / 90.3 F) and are therefore not hot.
(-) The average temperature of the palmrest area of similar devices was 28.7 °C / 83.7 F (-3.7 °C / -6.6 F).
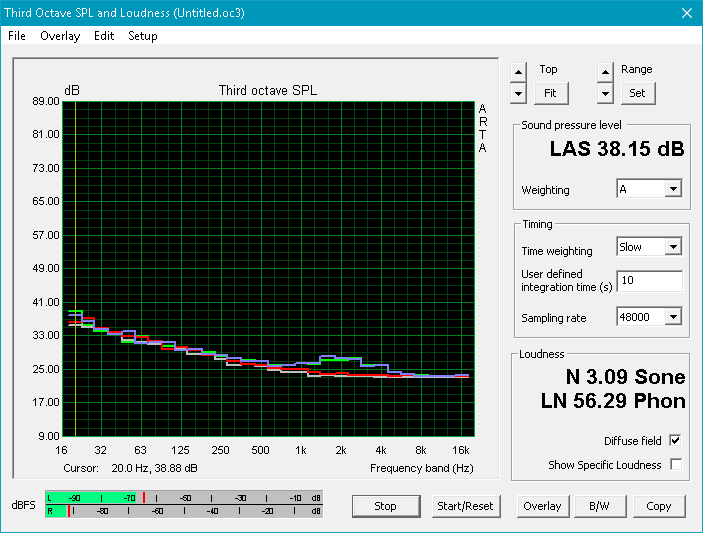
Speakers

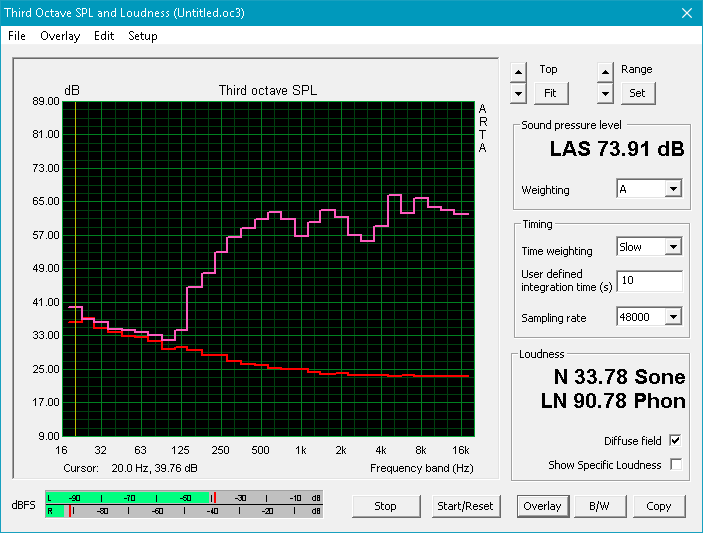
The integrated 2 W stereo speakers sound better than expected. Bass is still underrepresented, but the Asus can at least reproduce lower frequencies better than the thicker Pavilion 15t and also with superior balance between bass and treble frequencies as shown by the pink noise measurements below. Maximum volume is sufficiently loud to fill a small room and will not introduce any static or heavy imbalances. The palm rests will reverberate quite noticeably, however, since the speakers are located directly underneath the front corners.
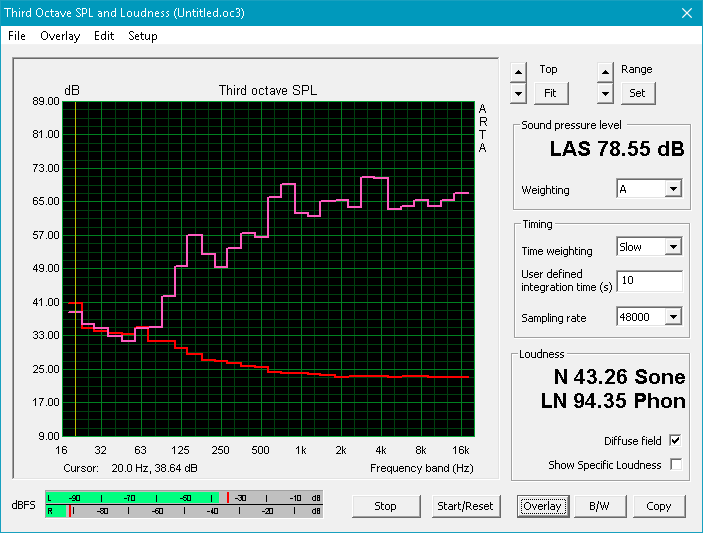
Asus VivoBook S15 S510UA audio analysis
(-) | not very loud speakers (66.4 dB)
Bass 100 - 315 Hz
(-) | nearly no bass - on average 15.3% lower than median
(±) | linearity of bass is average (12.2% delta to prev. frequency)
Mids 400 - 2000 Hz
(+) | balanced mids - only 1.6% away from median
(+) | mids are linear (6.8% delta to prev. frequency)
Highs 2 - 16 kHz
(+) | balanced highs - only 3.8% away from median
(±) | linearity of highs is average (10.6% delta to prev. frequency)
Overall 100 - 16.000 Hz
(±) | linearity of overall sound is average (19.8% difference to median)
Compared to same class
» 65% of all tested devices in this class were better, 6% similar, 28% worse
» The best had a delta of 5%, average was 17%, worst was 45%
Compared to all devices tested
» 50% of all tested devices were better, 7% similar, 42% worse
» The best had a delta of 4%, average was 23%, worst was 134%
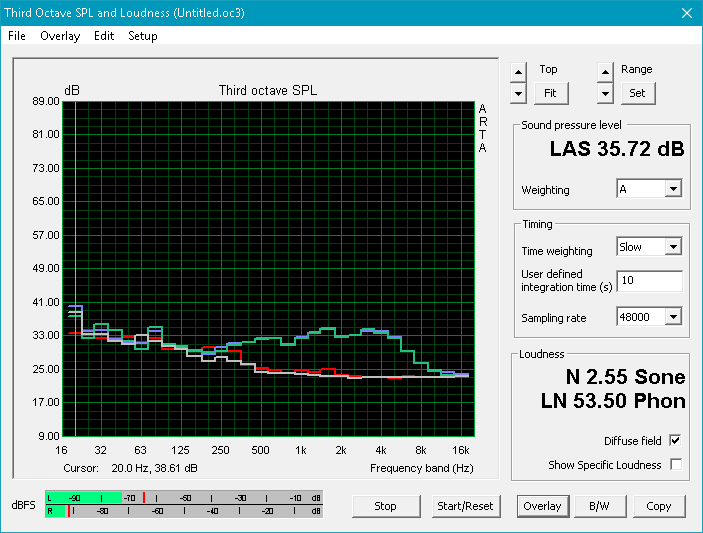
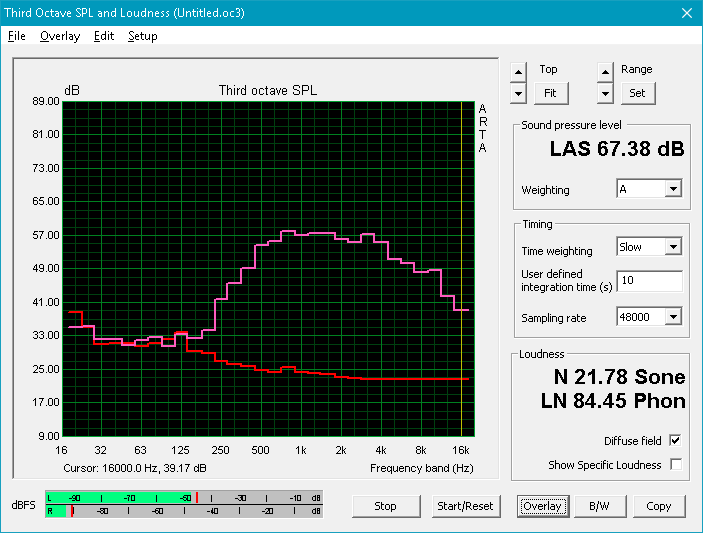
Apple MacBook 12 (Early 2016) 1.1 GHz audio analysis
(+) | speakers can play relatively loud (83.6 dB)
Bass 100 - 315 Hz
(±) | reduced bass - on average 11.3% lower than median
(±) | linearity of bass is average (14.2% delta to prev. frequency)
Mids 400 - 2000 Hz
(+) | balanced mids - only 2.4% away from median
(+) | mids are linear (5.5% delta to prev. frequency)
Highs 2 - 16 kHz
(+) | balanced highs - only 2% away from median
(+) | highs are linear (4.5% delta to prev. frequency)
Overall 100 - 16.000 Hz
(+) | overall sound is linear (10.2% difference to median)
Compared to same class
» 7% of all tested devices in this class were better, 2% similar, 91% worse
» The best had a delta of 5%, average was 18%, worst was 53%
Compared to all devices tested
» 5% of all tested devices were better, 1% similar, 94% worse
» The best had a delta of 4%, average was 23%, worst was 134%
Frequency Comparison (Checkbox selectable!)
Graph 1: Pink Noise 100% Vol.; Graph 2: Audio off
Energy Management
Power Consumption
At around 4 W to 8 W when under idling loads, the Asus is about as efficient as the Lenovo V510 and the HP Envy 15. The Apple notebook demands notably more power when idling simply due to its faster CPU, higher resolution display, and significantly brighter display backlight. Running 3DMark06 will draw slightly more than the aforementioned Lenovo and HP under similar conditions.
Extreme processing loads with Prime95 and FurMark will draw 36 W from the small (6.5 x 6.5 x 3 cm) power adapter rated for up to 45 W.
| Off / Standby | |
| Idle | |
| Load |
|
Key:
min: | |
| Asus VivoBook S15 S510UA i5-7200U, HD Graphics 620, Toshiba HG6 THNSNJ128G8NY, IPS, 1920x1080, 15.6" | Lenovo V510-15IKB 80WQ0002GE i5-7200U, HD Graphics 620, Samsung CM871a MZNTY256HDHP, IPS, 1920x1080, 15.6" | HP Pavilion 15t-au100 CTO (W0P31AV) i7-7500U, GeForce 940MX, Toshiba MQ01ABD100, IPS, 1920x1080, 15.6" | Apple MacBook Pro 15 2016 (2.9 GHz, 460) 6920HQ, Radeon Pro 460, Apple SSD SM1024L, IPS, 2880x1800, 15.4" | HP Envy 15-as133cl i7-7500U, HD Graphics 620, HGST Travelstar 5K1000 HTS541010A7E630, IPS, 1920x1080, 15.6" | |
|---|---|---|---|---|---|
| Power Consumption | -5% | -33% | -62% | 10% | |
| Idle Minimum * (Watt) | 4.6 | 4 13% | 6.16 -34% | 3 35% | 4.6 -0% |
| Idle Average * (Watt) | 7.6 | 9.6 -26% | 8.48 -12% | 9.9 -30% | 7.7 -1% |
| Idle Maximum * (Watt) | 7.7 | 9.7 -26% | 9.62 -25% | 12.5 -62% | 7.8 -1% |
| Load Average * (Watt) | 35.1 | 27.7 21% | 41.63 -19% | 70.6 -101% | 30.5 13% |
| Load Maximum * (Watt) | 36.2 | 38.4 -6% | 63.22 -75% | 90.8 -151% | 22.7 37% |
* ... smaller is better
Battery Life
The 42 Wh battery is just slightly larger than the batteries in the VivoBook F556/X556 series. Unfortunately, runtimes are below average at just under 4.5 hours of real-world WLAN use compared to nearly 7 hours on the Envy 15 under similar conditions. Users who prefer to run on more reserved system settings may be able to squeeze out much longer runtimes as idling on Power Saver and on the lowest brightness setting will last for just over 10 hours.
Charging from near empty to full capacity will take about one hour and forty-five minutes. This is slightly faster than many 15-inch notebooks due in part to the smaller battery capacity.
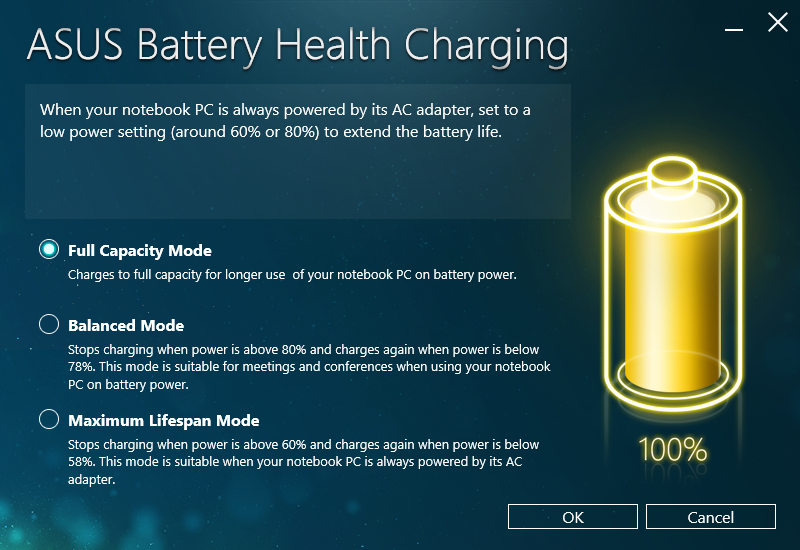
It's worth noting that the Asus will automatically enter Sleep mode when the battery reaches 35 percent and has been idling for long periods. This appears to occur only in the Balanced profile setting and cannot be disabled even after disabling Sleep through the Windows Power Profile menu. This occurred multiple times during our battery life tests and we suspect that it is due to overlying Asus bloatware as we've never encountered such behavior on other notebooks. This battery-saving "feature" shouldn't be an issue during day-to-day use since it only kicks in under rare circumstances.
| Asus VivoBook S15 S510UA i5-7200U, HD Graphics 620, 42 Wh | Lenovo V510-15IKB 80WQ0002GE i5-7200U, HD Graphics 620, 32 Wh | HP Pavilion 15t-au100 CTO (W0P31AV) i7-7500U, GeForce 940MX, 41 Wh | Apple MacBook Pro 15 2016 (2.9 GHz, 460) 6920HQ, Radeon Pro 460, 76 Wh | HP Envy 15-as133cl i7-7500U, HD Graphics 620, 52 Wh | |
|---|---|---|---|---|---|
| Battery runtime | -12% | 3% | 58% | 17% | |
| Reader / Idle (h) | 10.2 | 7.3 -28% | 9.6 -6% | ||
| WiFi v1.3 (h) | 4.3 | 3.8 -12% | 3.7 -14% | 10.3 140% | 6.8 58% |
| Load (h) | 1.2 | 1.8 50% | 0.9 -25% | 1.2 0% |
Pros
Cons
Verdict

The VivoBook S510 series was designed to be more affordable than the ZenBook, XPS, or Spectre series without being any heavier or less attractive. It is, an essence, a budget-mainstream notebook wrapped in a super-thin flagship design. Asus has succeeded in this regard as the S510UA starts for far less than $1000 USD and its narrow bezels naturally lead to a smaller footprint when compared to more typical budget-mainstream notebooks in the Pavilion, Inspiron, or IdeaPad families. We're especially relieved to see no cut corners on display quality or core performance as the processor can sustain Turbo Boost speeds without much of an issue. The relatively low fan noise is another high note especially when compared to the more energetic fans of the XPS 15.
Where the S510UA falters, however, is hard to ignore. The case is not very rigid and both the keyboard and trackpad do not feel as firm as they could have been. Its chassis may look like a flagship offering, but it doesn't feel anywhere near as solid as one. Battery life is short and the superficial dent on the bottom of the notebook around the processor is telling of a more budget or economical design. Hopefully these strange hardware flaws on our test unit are not indicative of a wider problem with the new VivoBook S15 series as a whole, so we'll likely check out more SKUs in the future for a better perspective.
We can absolutely recommend the VivoBook S15 S510 over an older HP Pavilion 15 or Asus F series if affordability and portability are of top concerns. Otherwise, users who want to invest about $200 or $300 USD more on an introductory ZenBook, XPS, or Spectre SKU will find a vastly superior experience.
The lightweight S510UA looks sleek, performs wonderfully, and carries a respectable 1080p IPS matte display. The spongy keyboard, below average battery life, and odd hardware hitches on our test unit suggest that buyers should tread carefully before investing in the new VivoBook S15 series.
Asus VivoBook S15 S510UA
- 06/11/2017 v6 (old)
Allen Ngo
Price comparison
