HP Envy 15 as133cl Notebook Review
Go one step up from the budget Pavilion series and one step down from the flagship Spectre series and you have yourself the mainstream Envy series of notebooks. Envy models tend to stray away from the plastic that make up Pavilion models for a more elegant metal design and come with far superior display options as well. As for the costlier Spectre series, Envy notebooks are still generally thicker and heavier and lacking in high-end features such as Thunderbolt 3 and super-narrow bezels.
The Envy 15 returns with Kaby Lake and a refreshed look. It brings new features to the 15.6-inch family including USB Type-C and M.2 NVMe, but drops a number of features from the older Envy 15 models including the optical drive, GeForce MX graphics, and matte panel options. How do these changes compare to competing notebooks in the same size category?
Our existing reviews on older Envy 15 models will give a good idea of the series and what differences exist between each successive generation.
Case
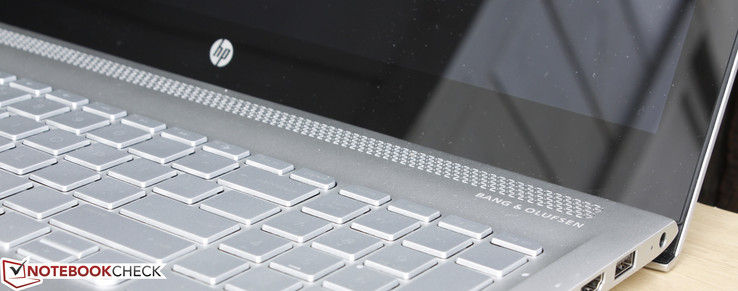
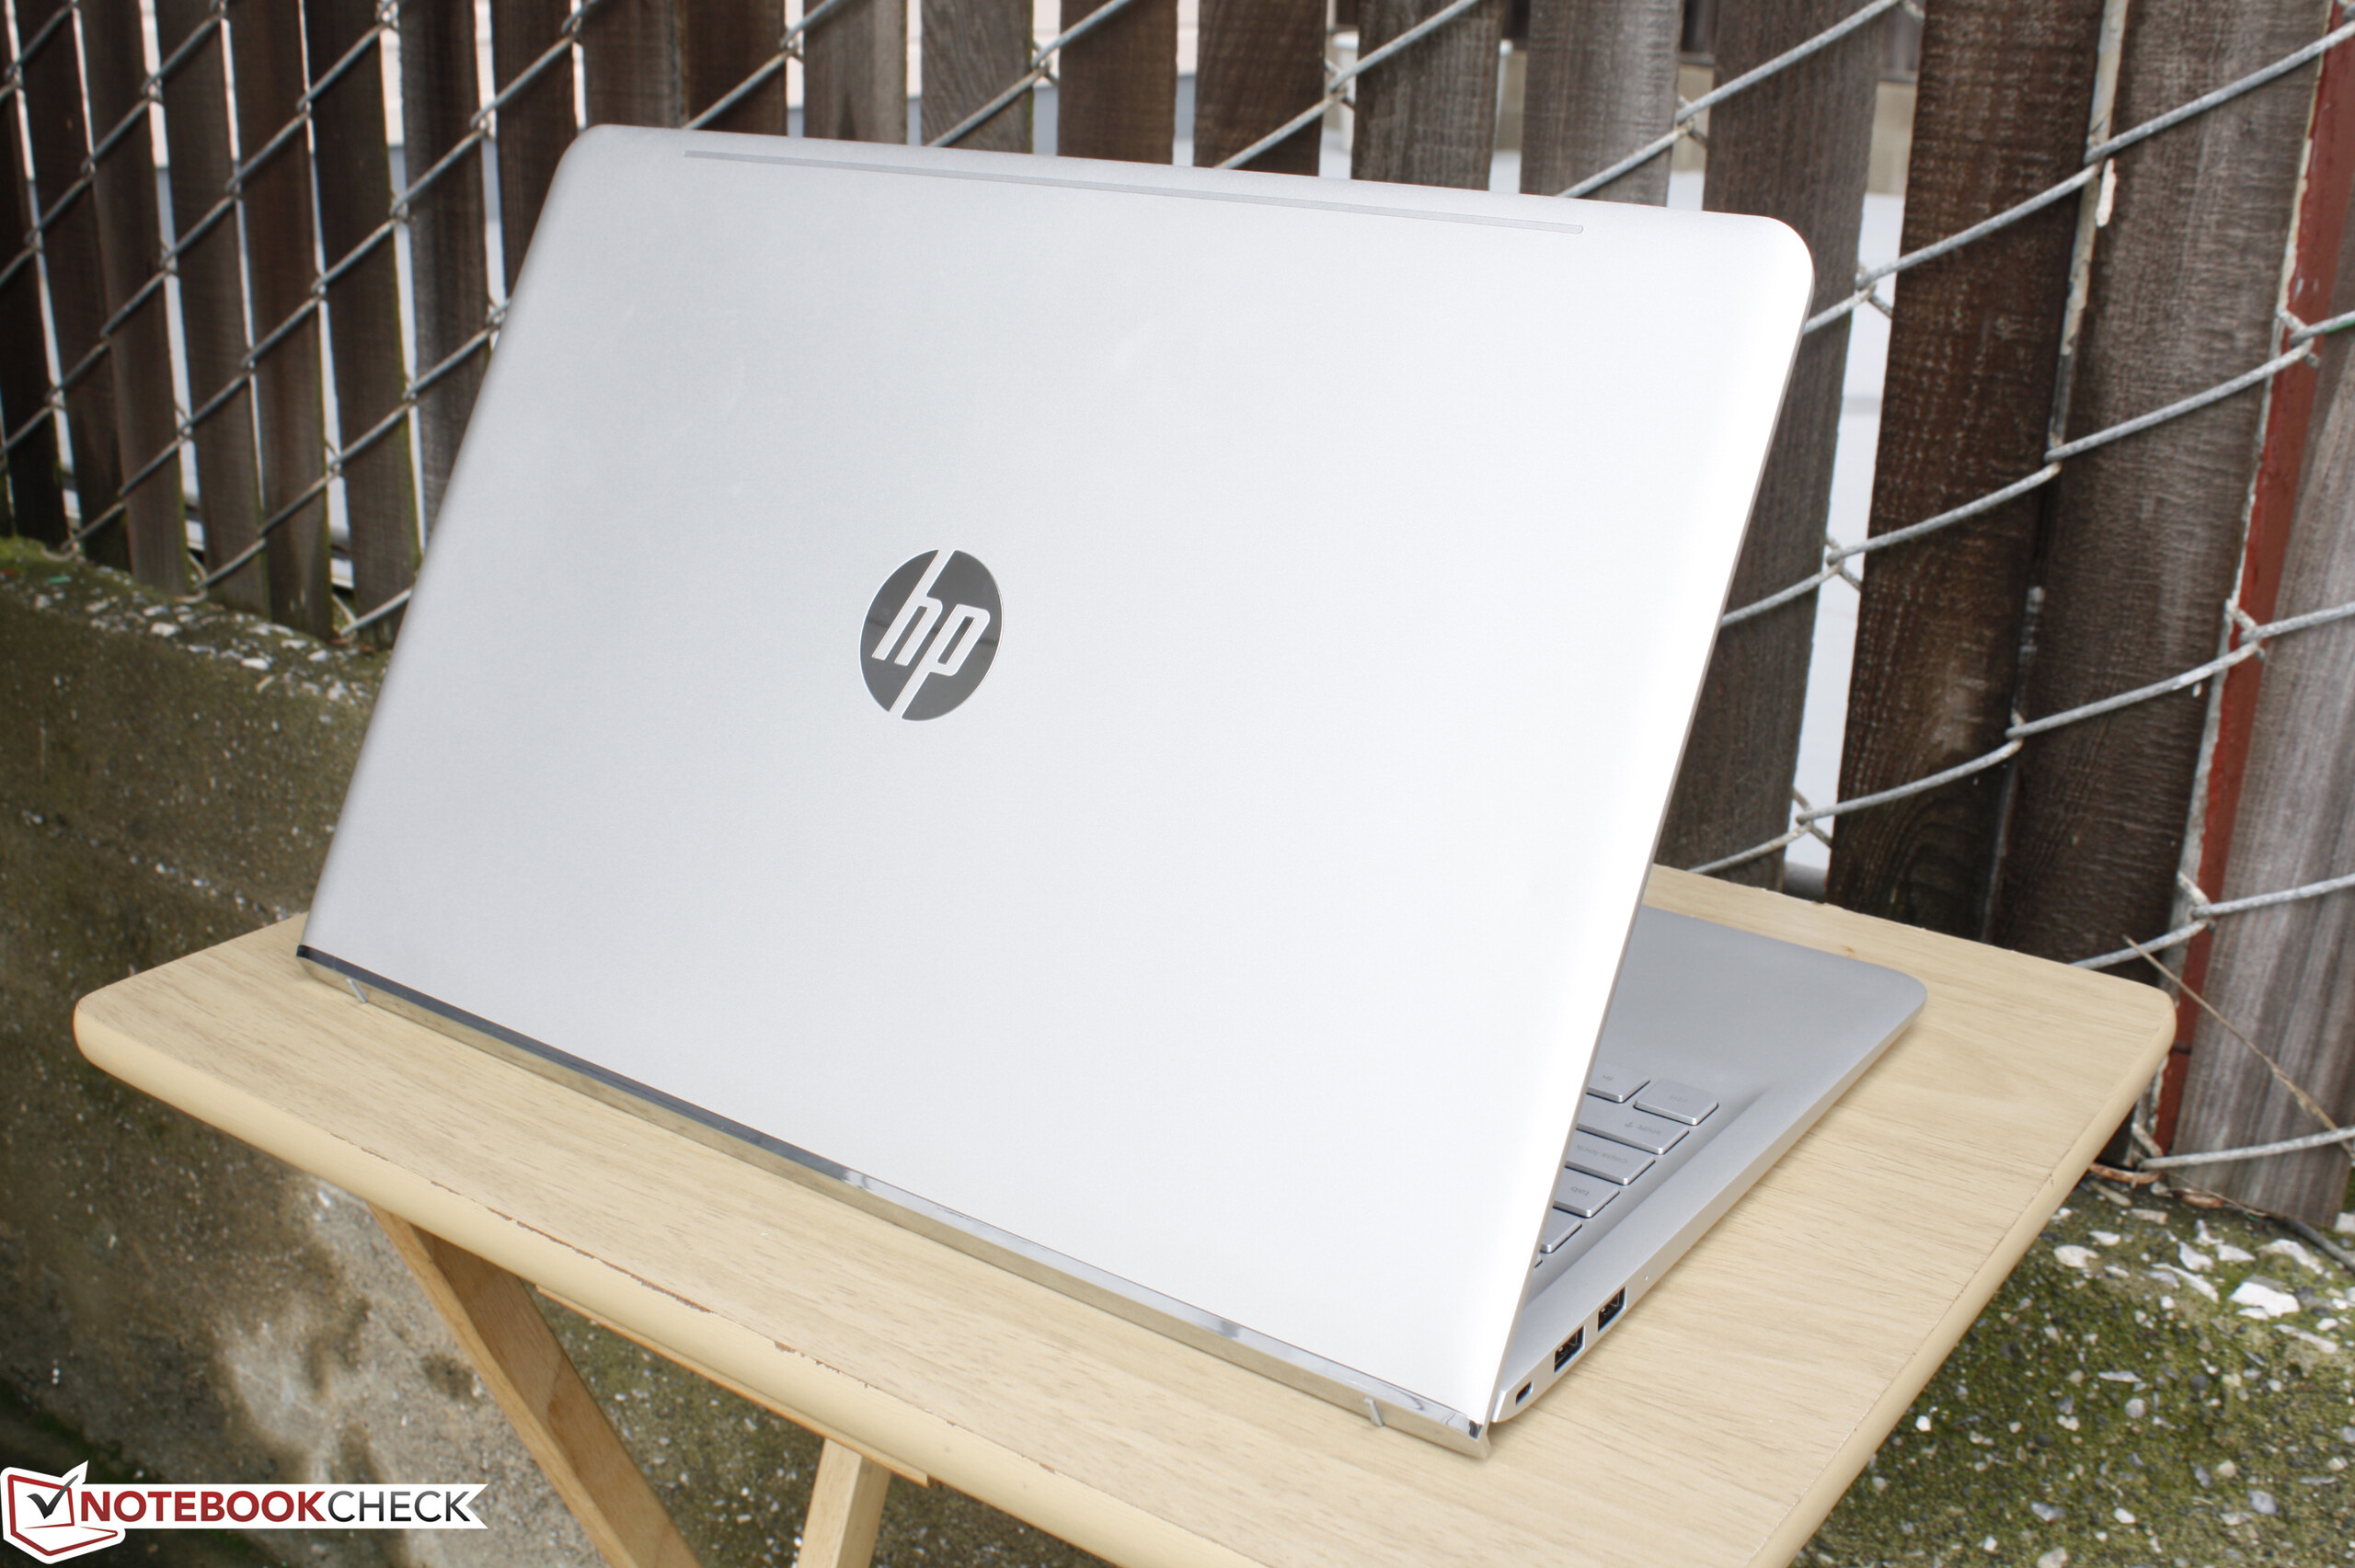
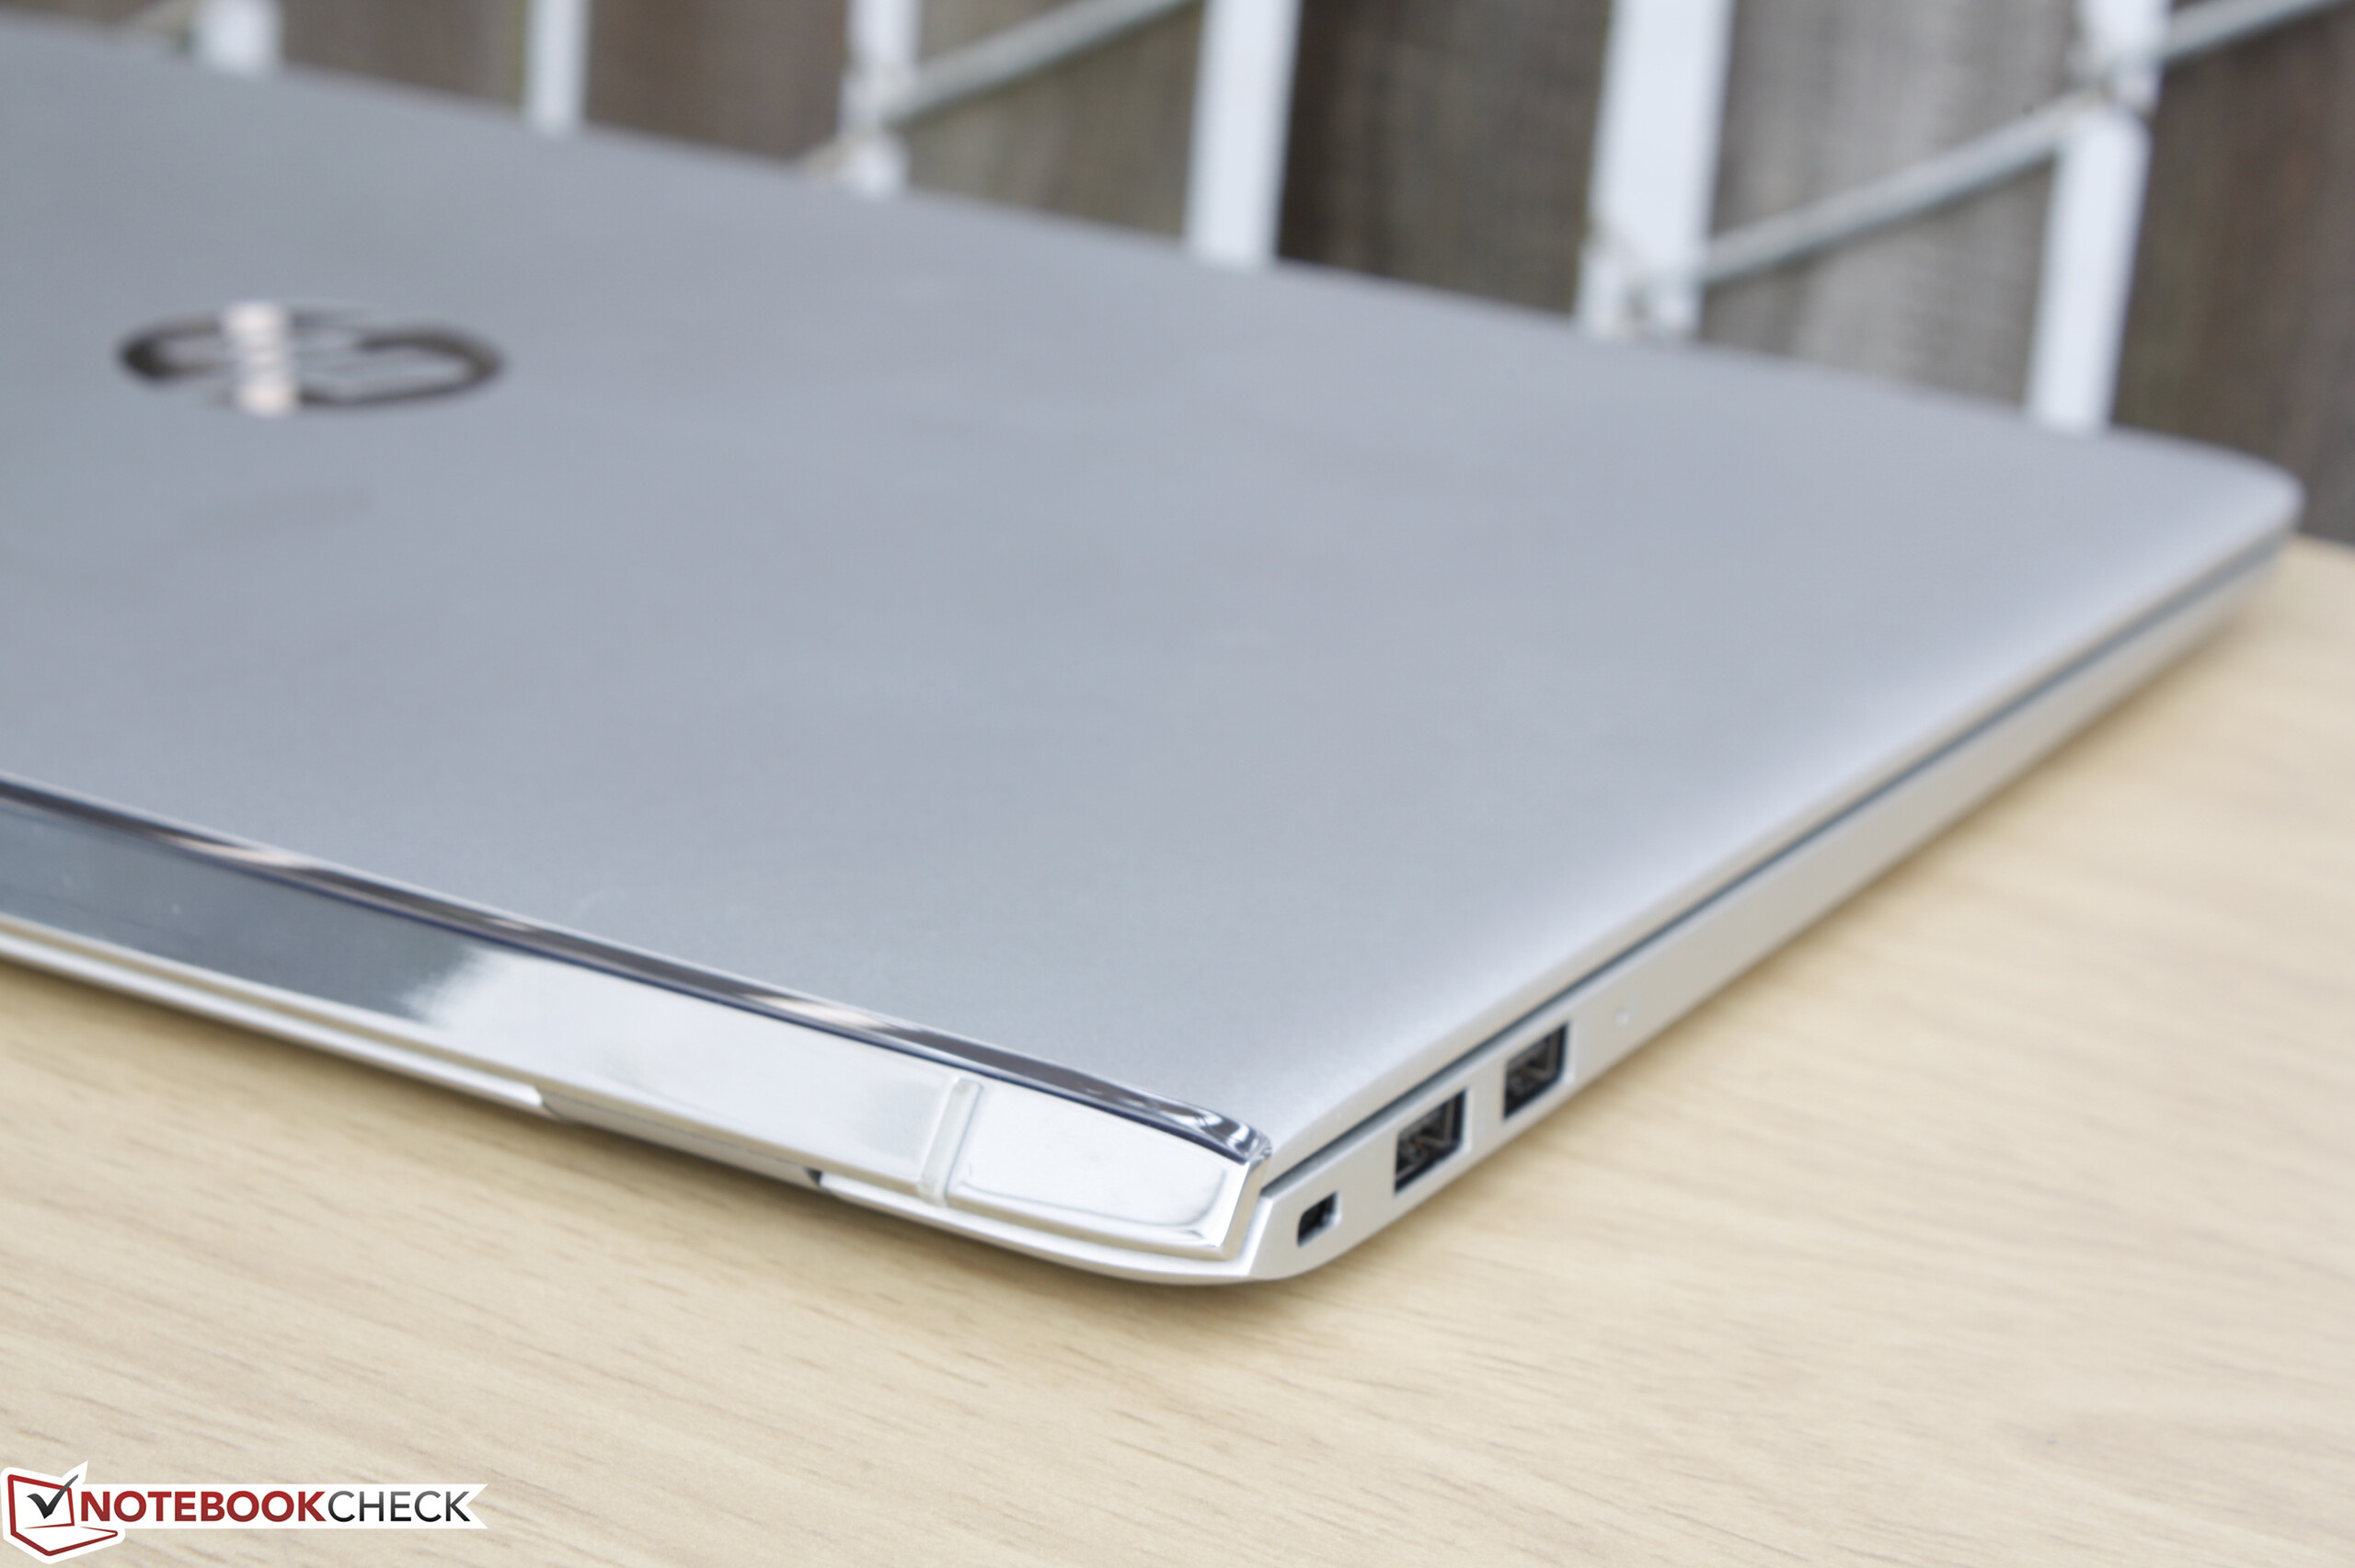
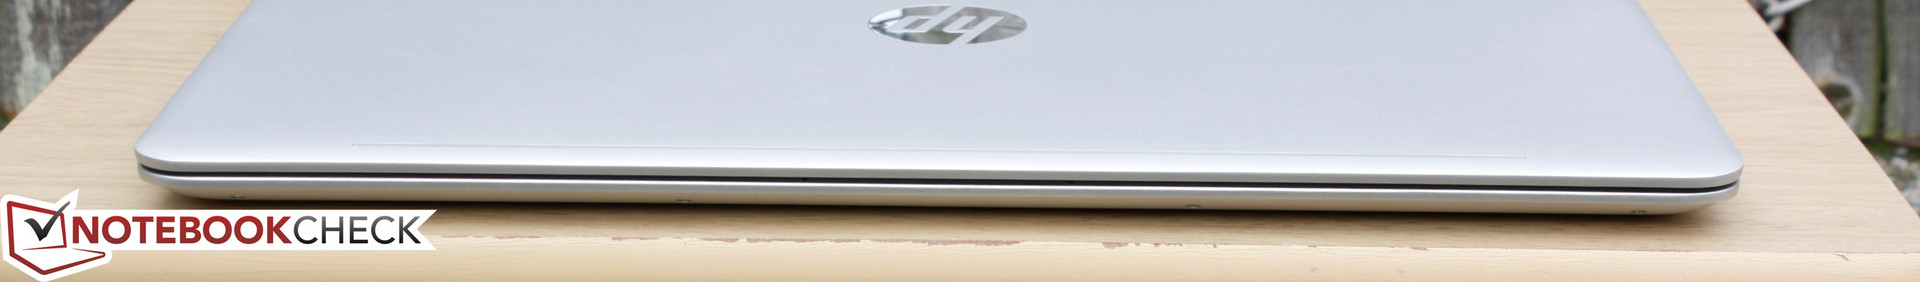
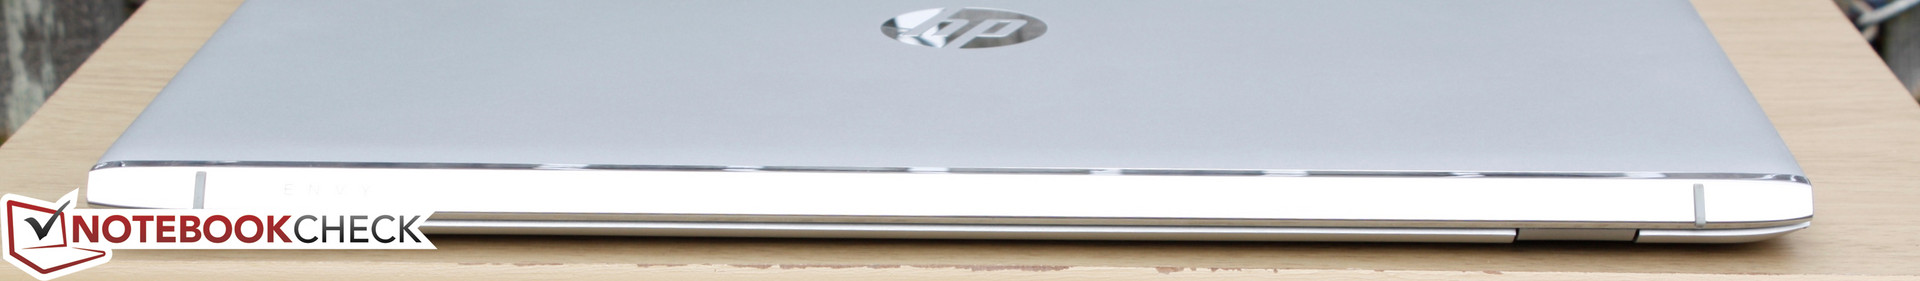
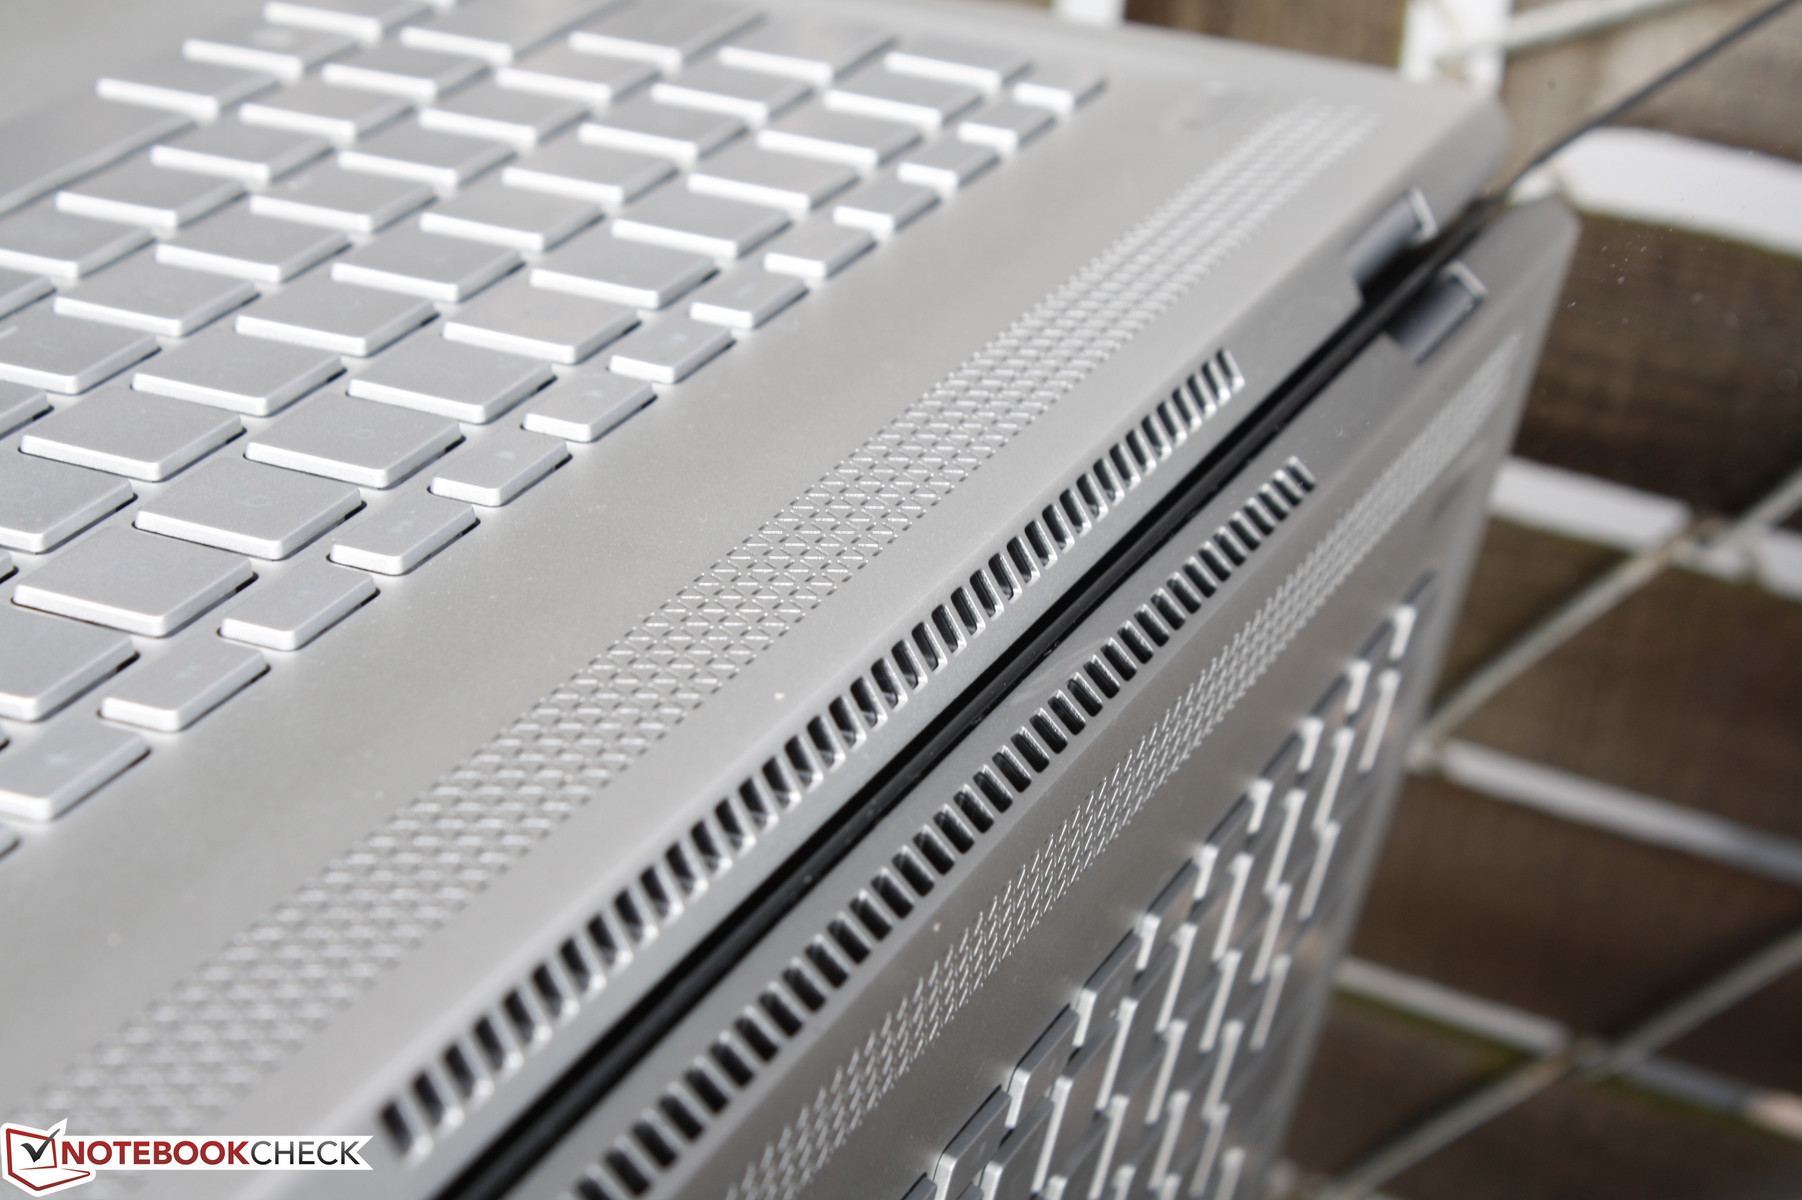
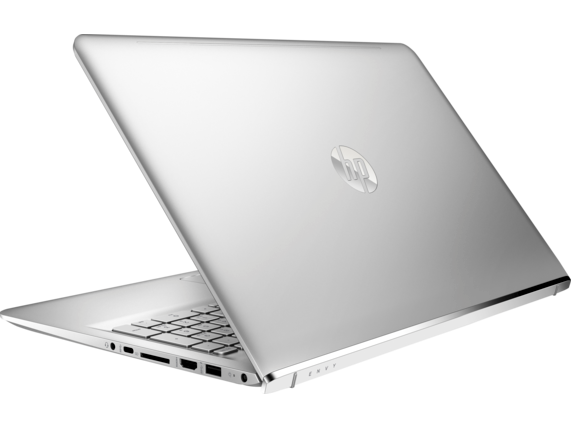
The redesigned all-metal body utilizes the familiar curved lid approach introduced two years ago but in a more attractive and sharper chassis. A glossy strip on the back of the lid adds visual flare to the otherwise typical matte gray lid and base that nearly all mainstream and flagship HP devices seem to share. Build quality is excellent from top to bottom with no unintended gaps or crevices between materials as this is not a unibody design. The base is rigid and attempting to twist its palm rests or depress the keyboard will result in only minimal warping and creaking.
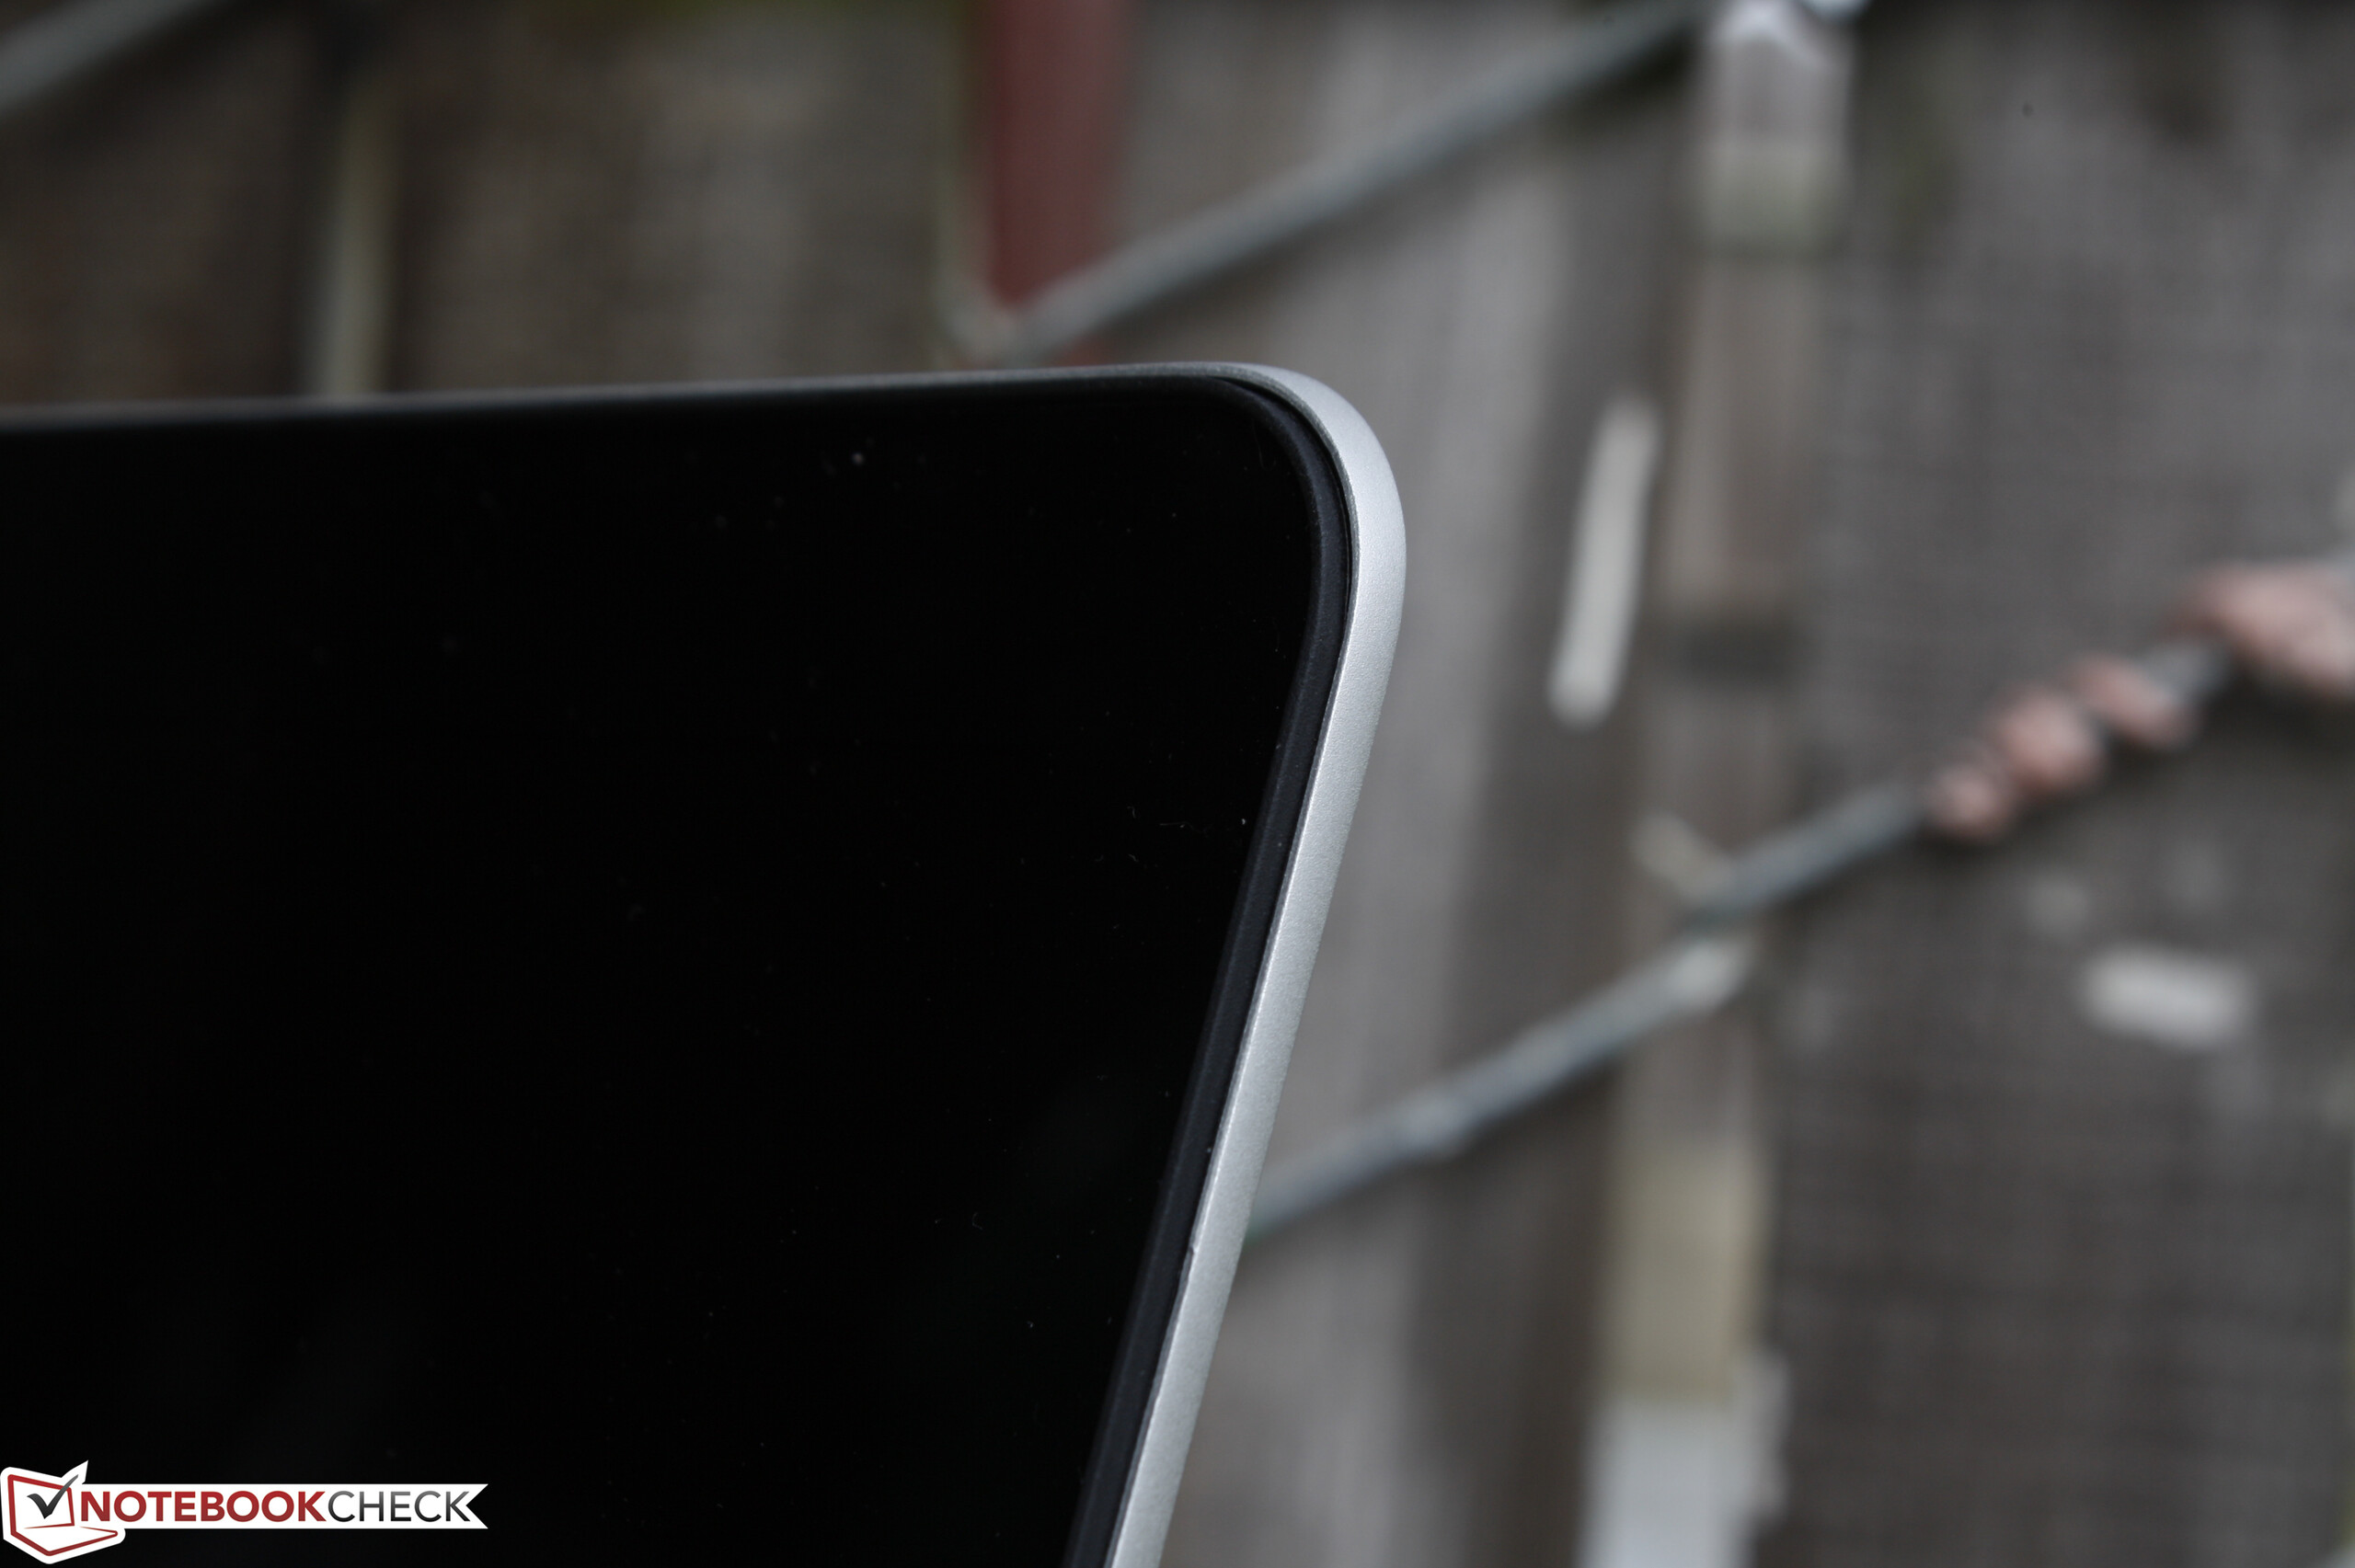
Perhaps the more disappointing aspect of the chassis is the lid itself. When opened, the lid will almost always teeter and will even continue to move slightly when typing. It's more prone to side-to-side twisting and warping down the center with some audible creaking as well. The displays on the latest Spectre units feel stiffer than what is offered here on the Envy.
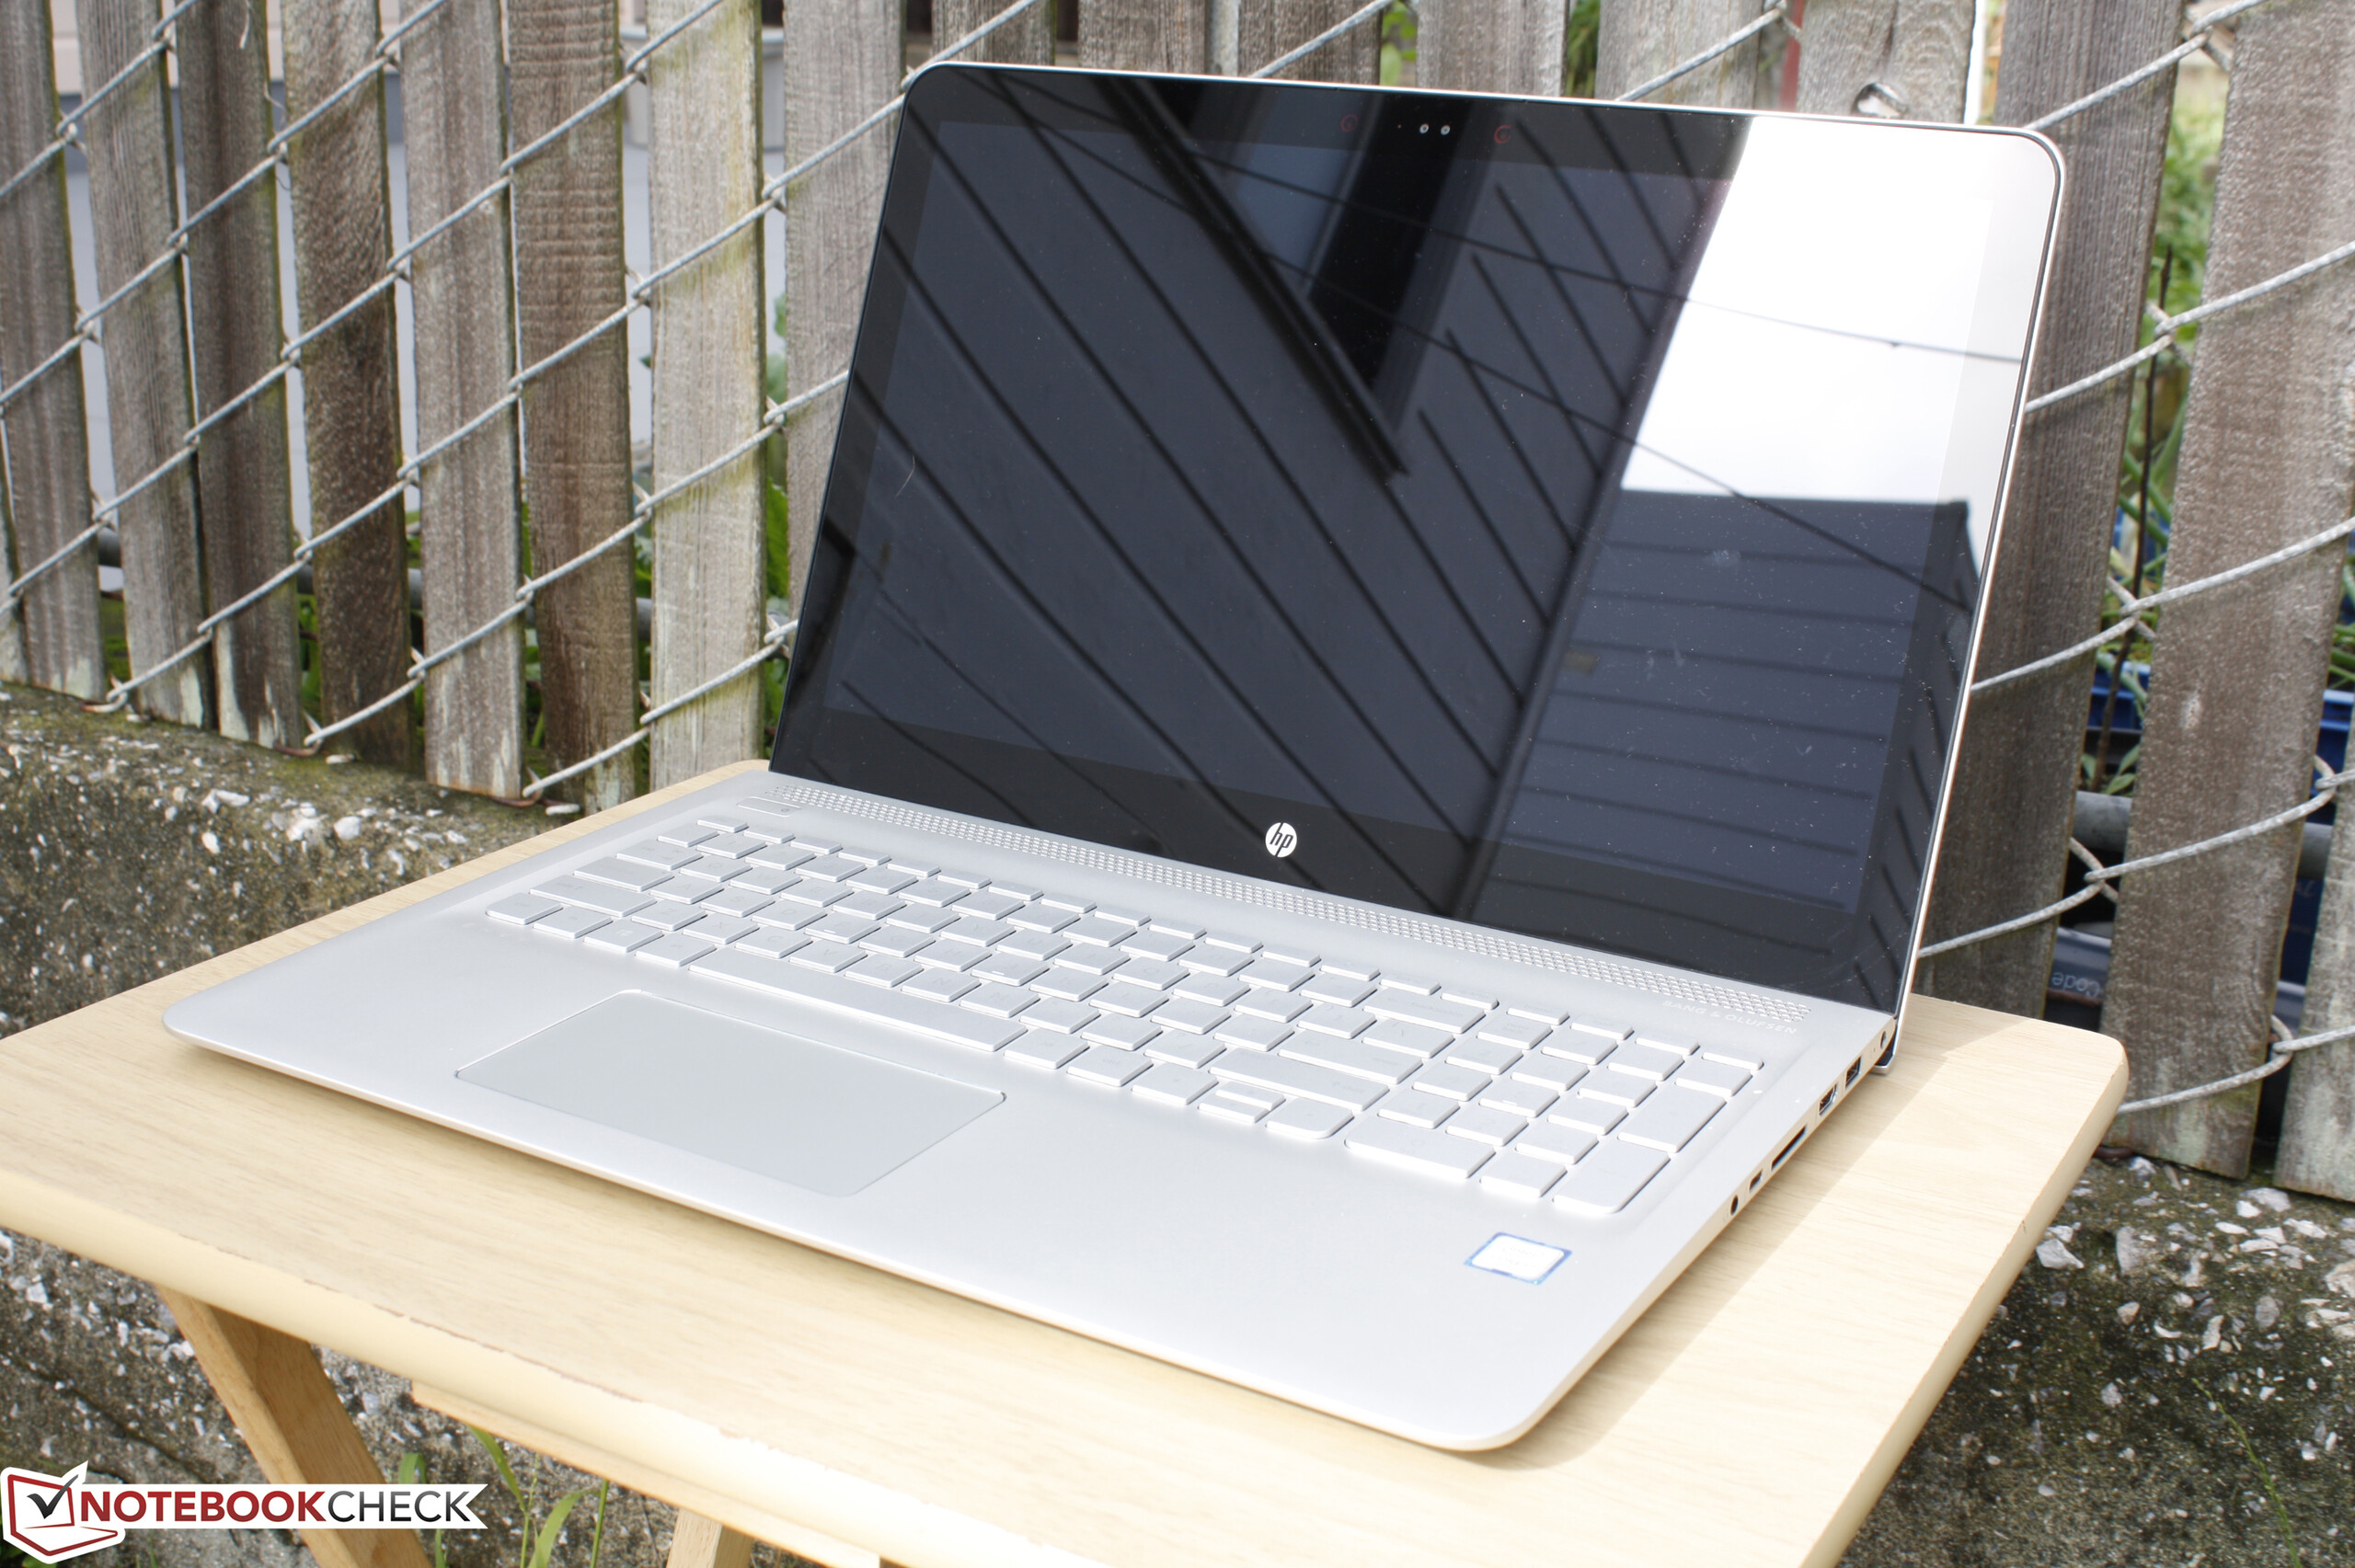
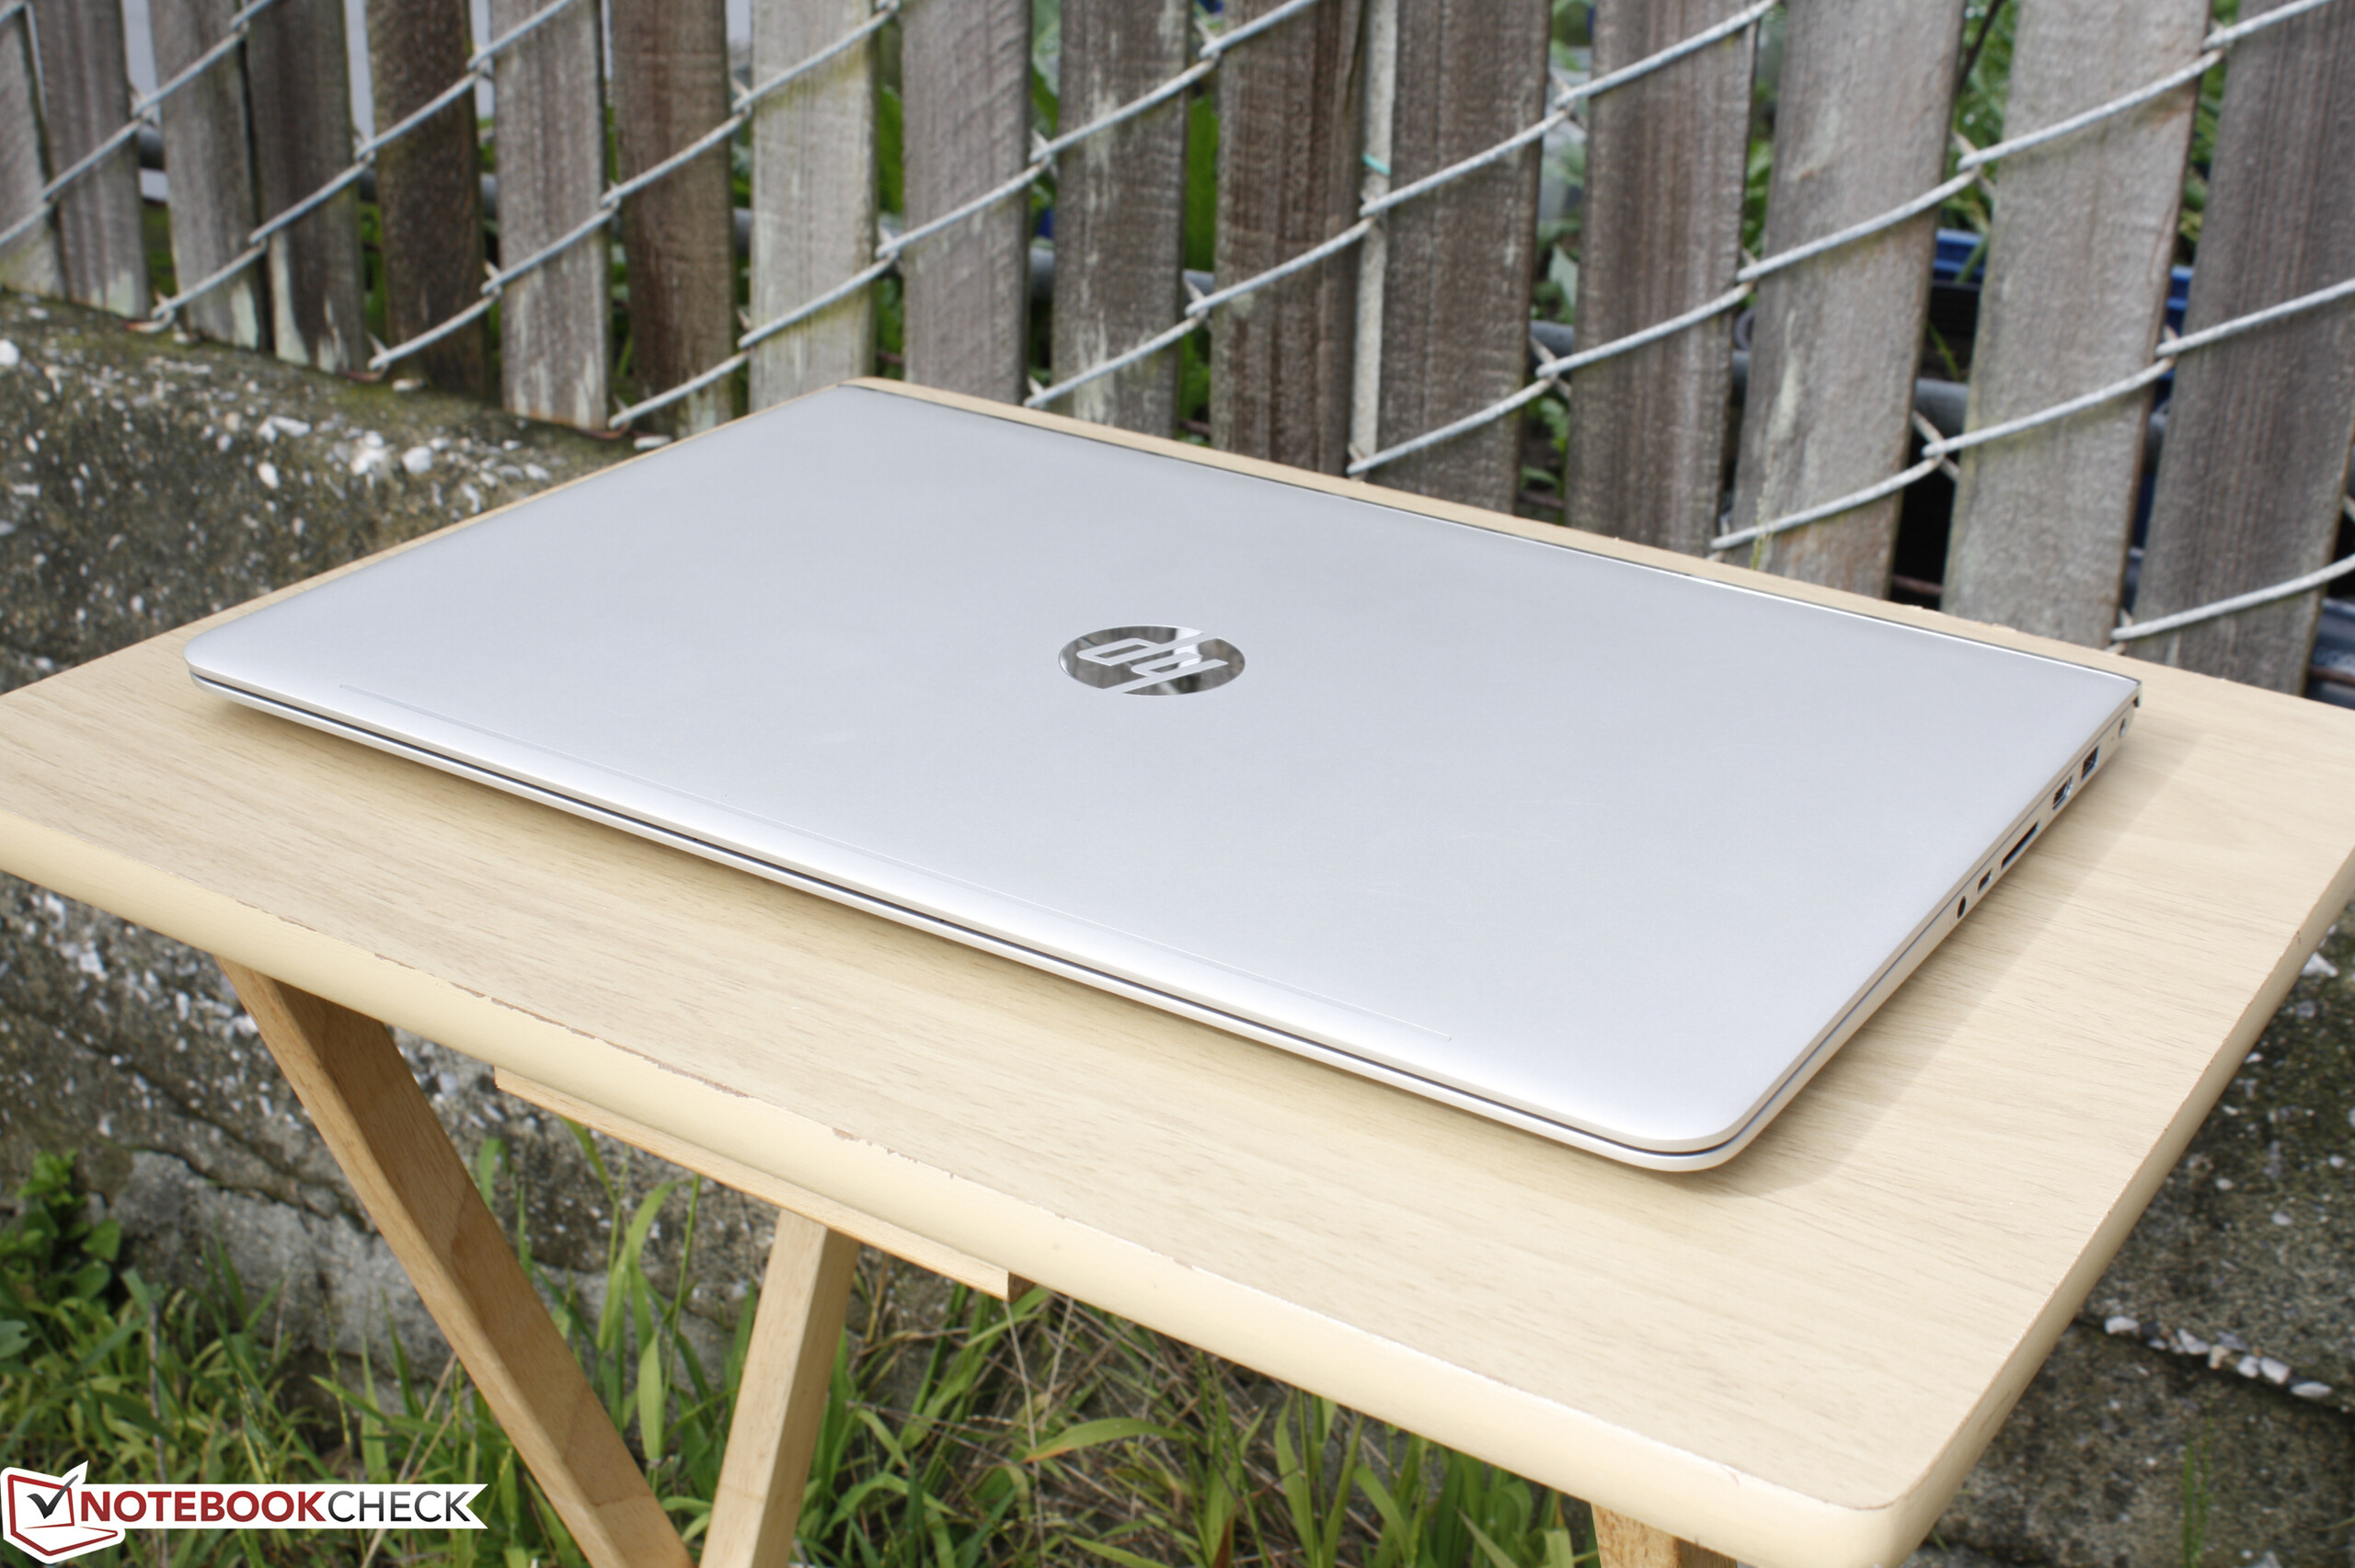
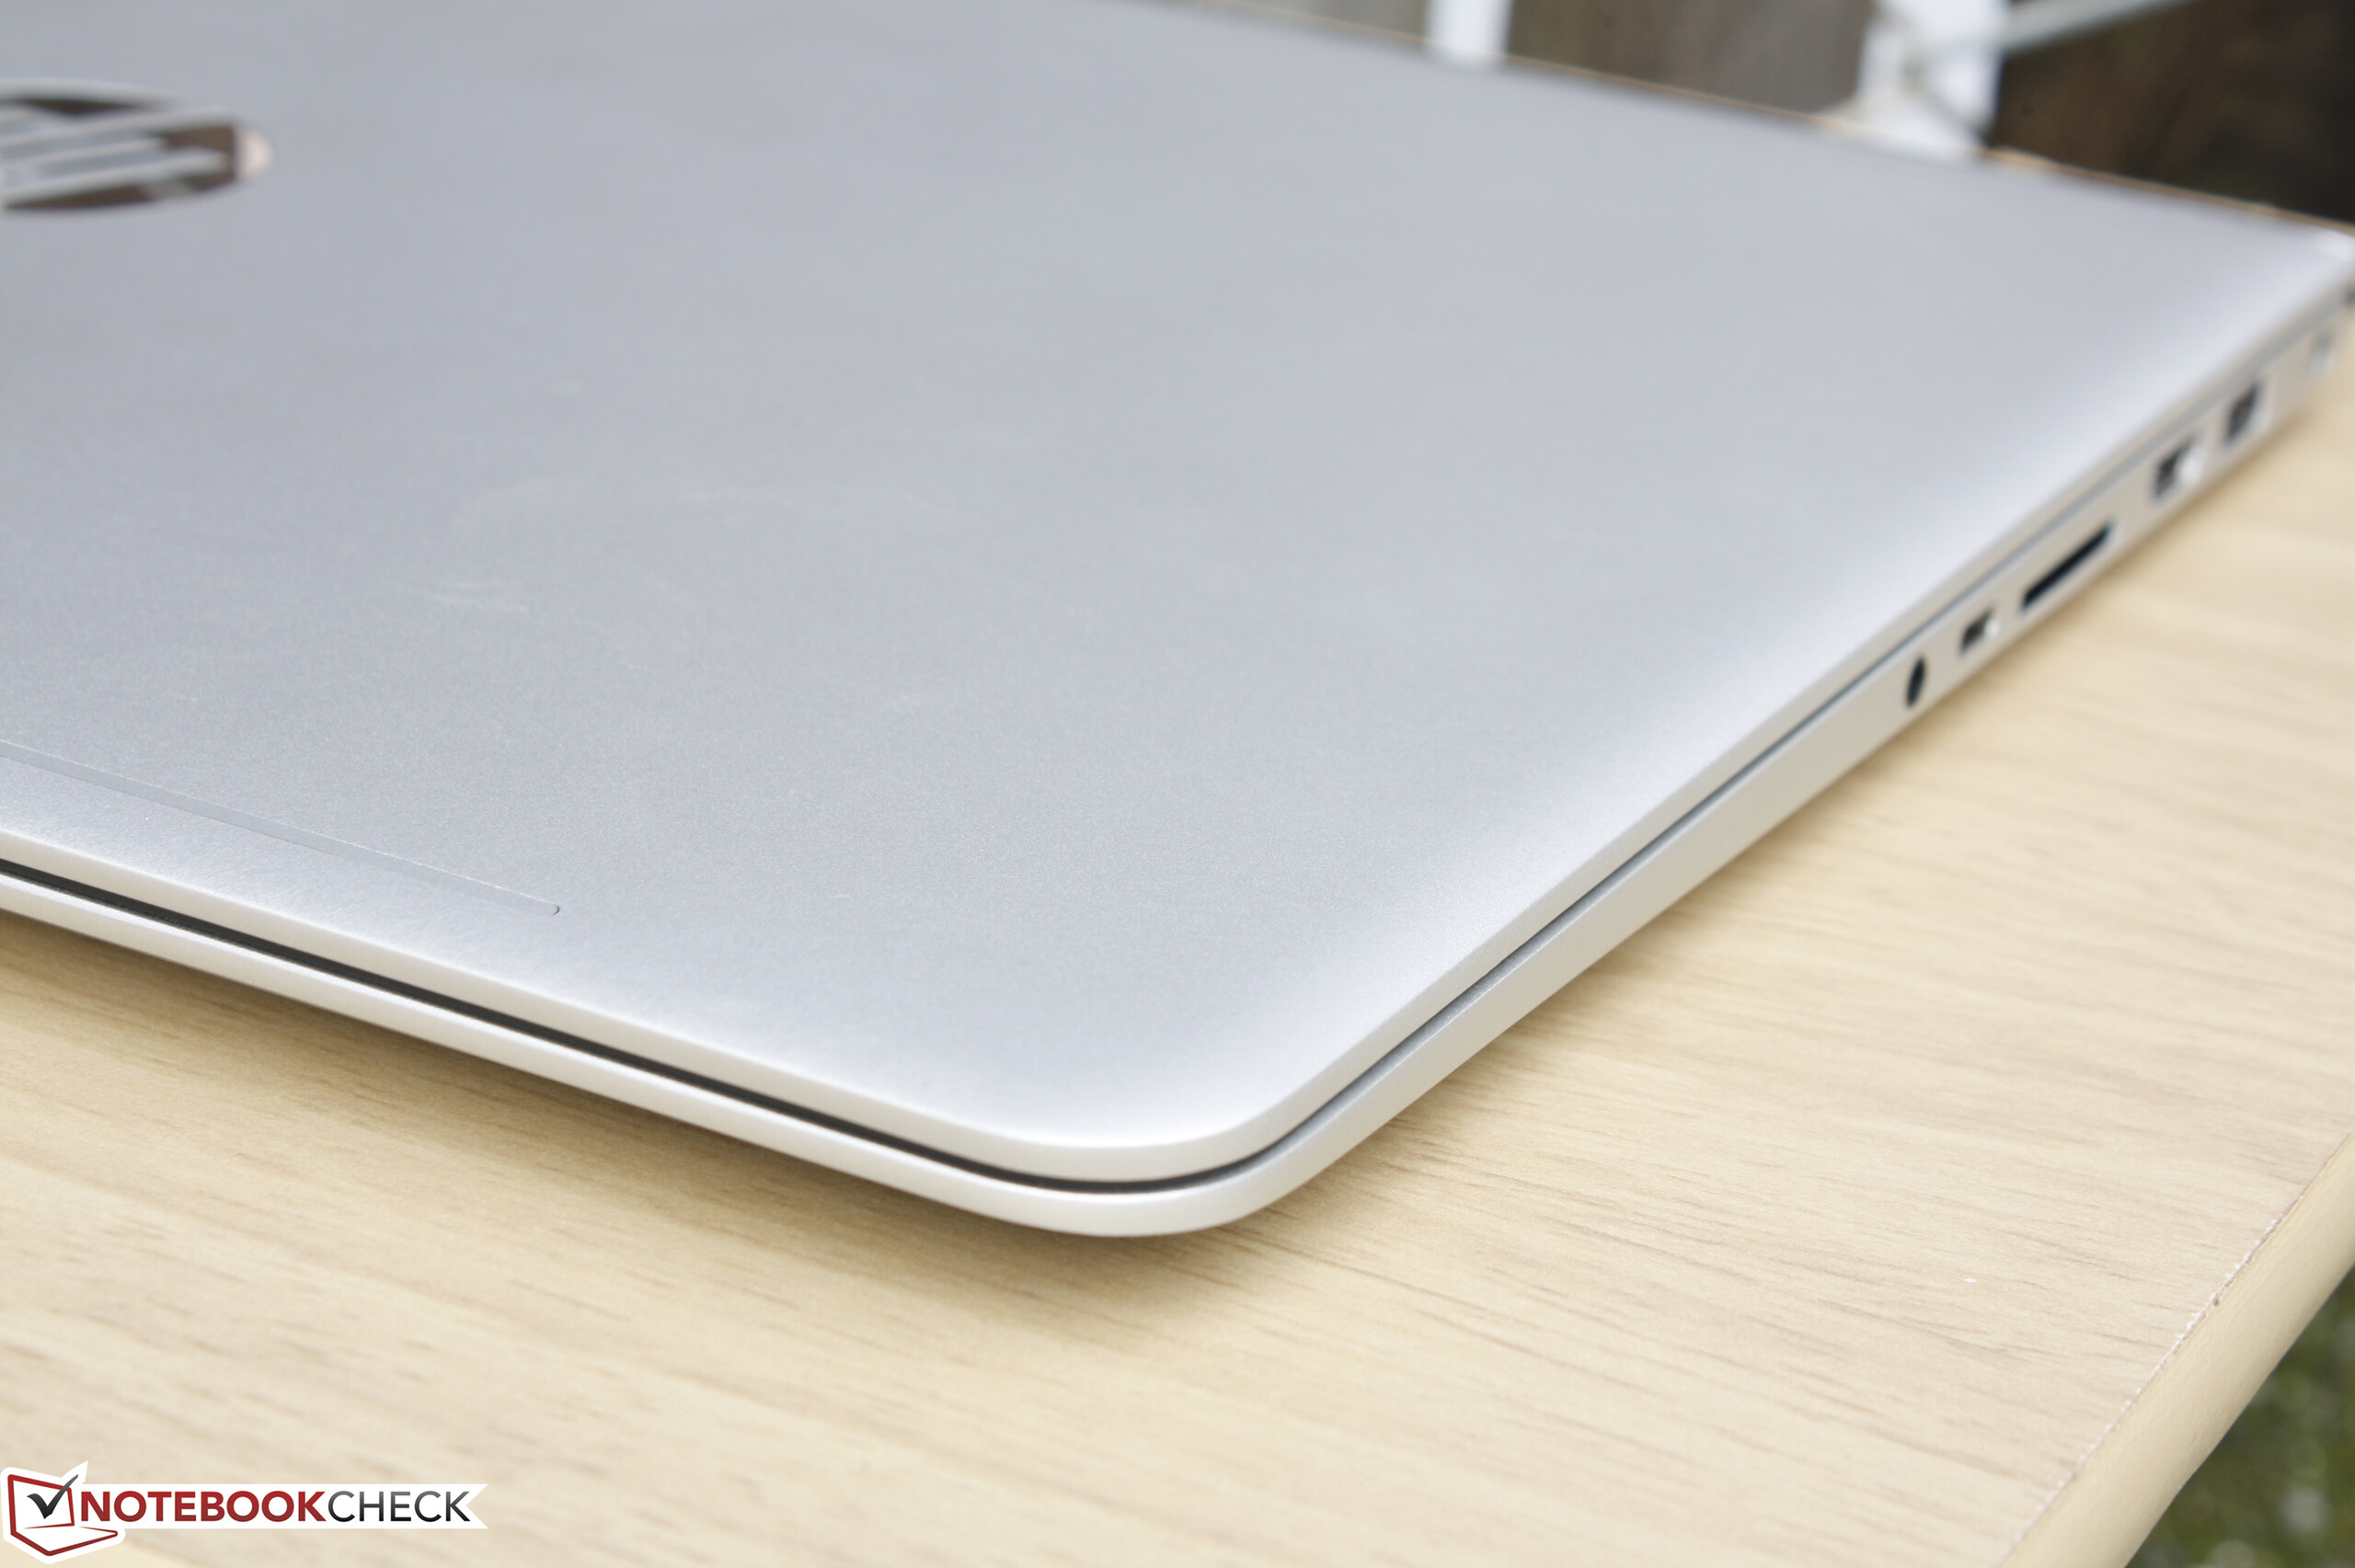
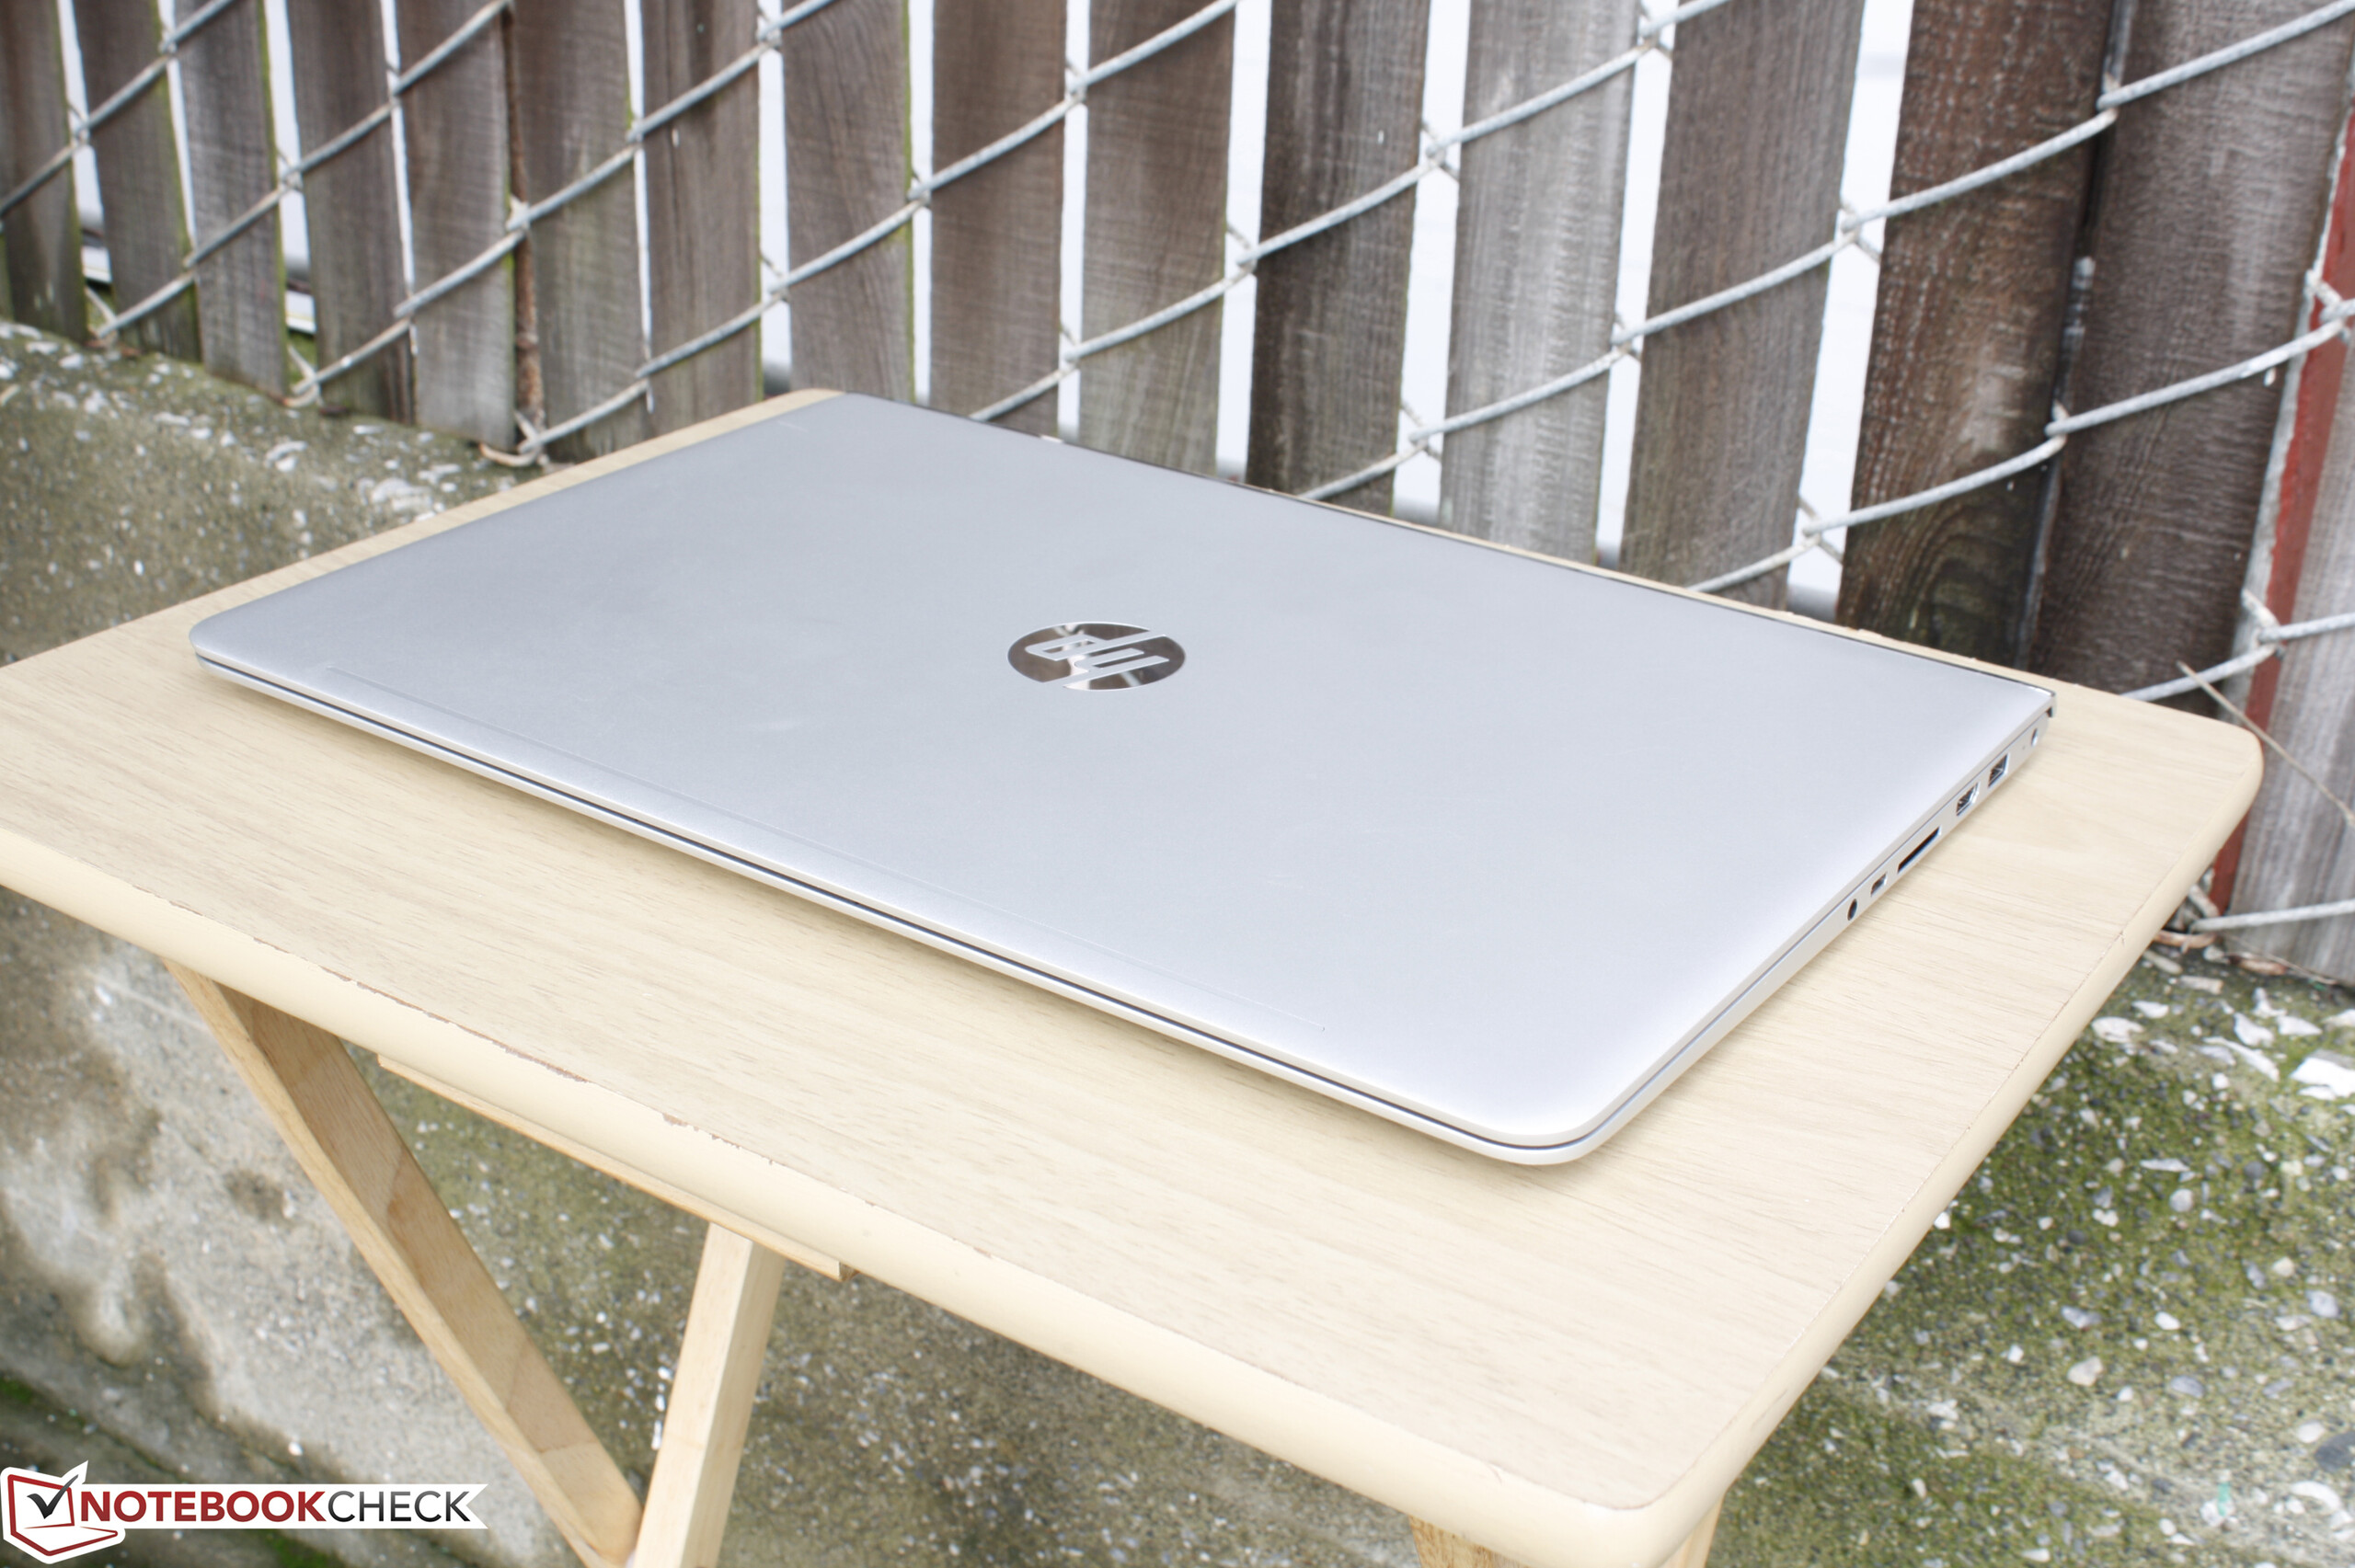
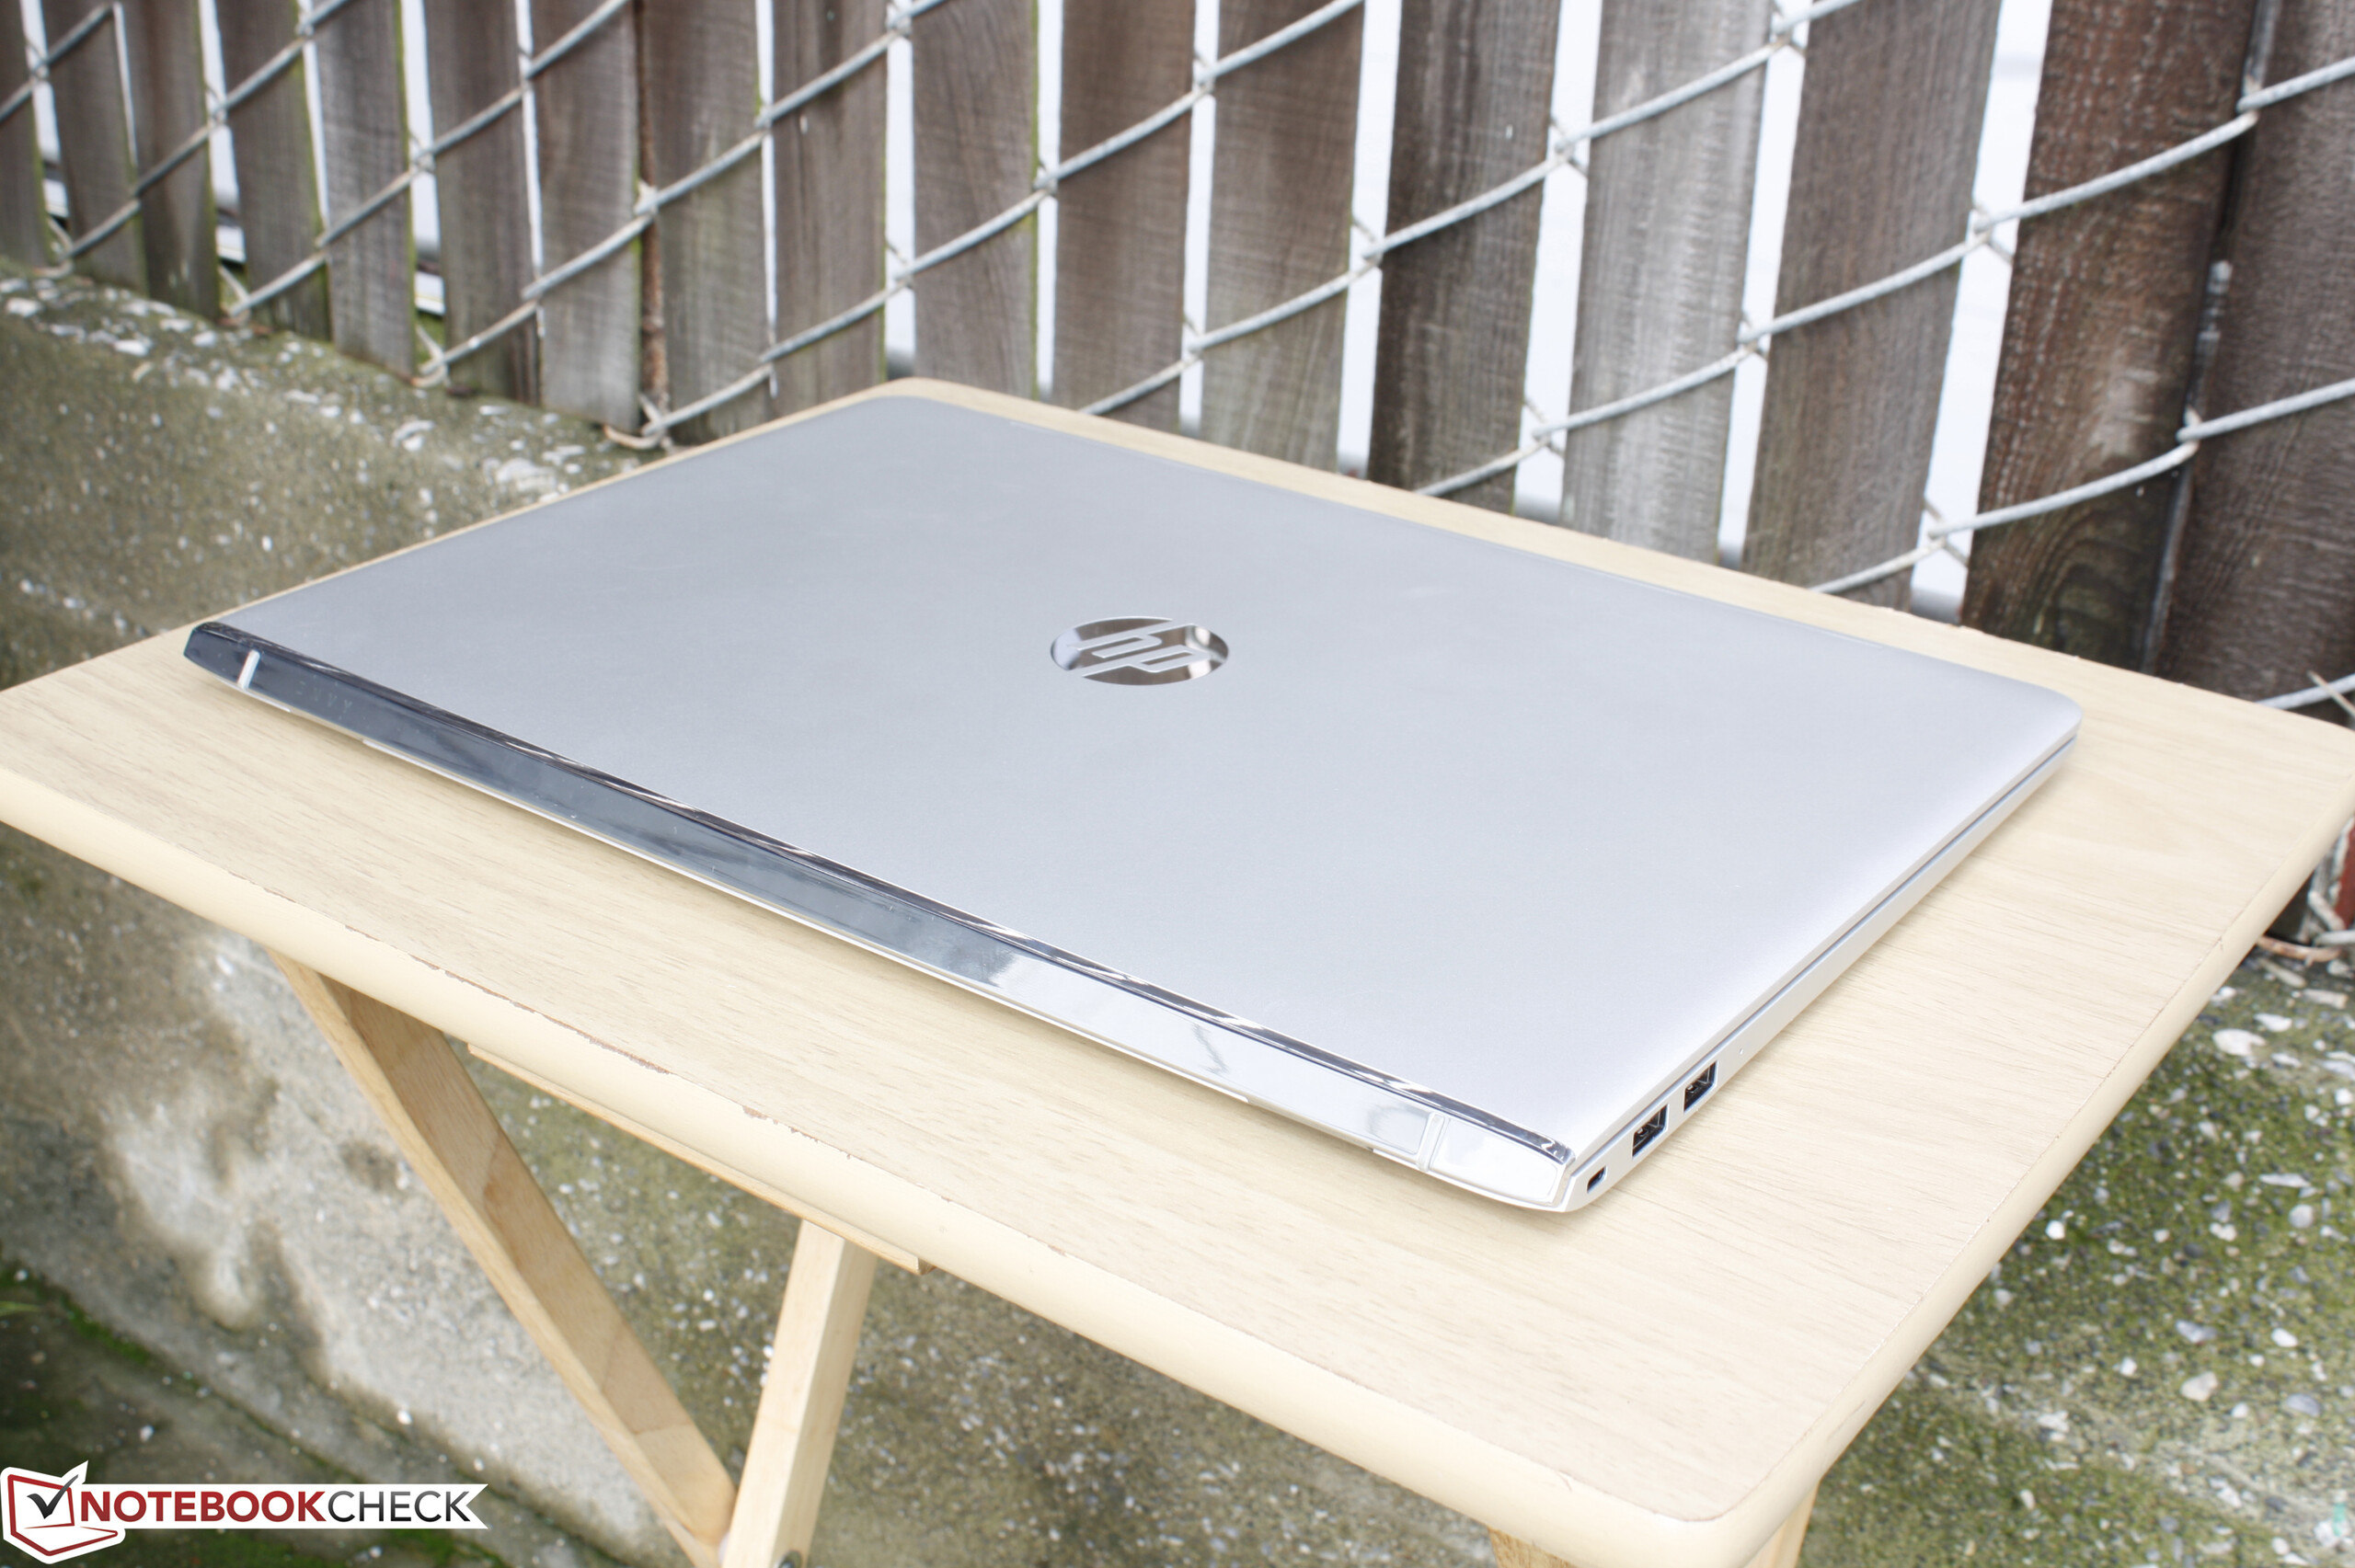
In terms of size and weight, the new Envy 15 chassis is 5 mm thinner than the outgoing Envy 15 design and is about 200 g lighter as well. In fact, the new design is thinner than most competitors save for the pricier XPS 15 9560 that is significantly smaller, lighter, and more powerful than our HP in review. The new Spectre 15 x360 and its super-narrow bezels is HP's direct answer to the Dell InfinityEdge design, but mainstream users on a budget should still be content with the overall compact dimensions of the Envy system.
Connectivity
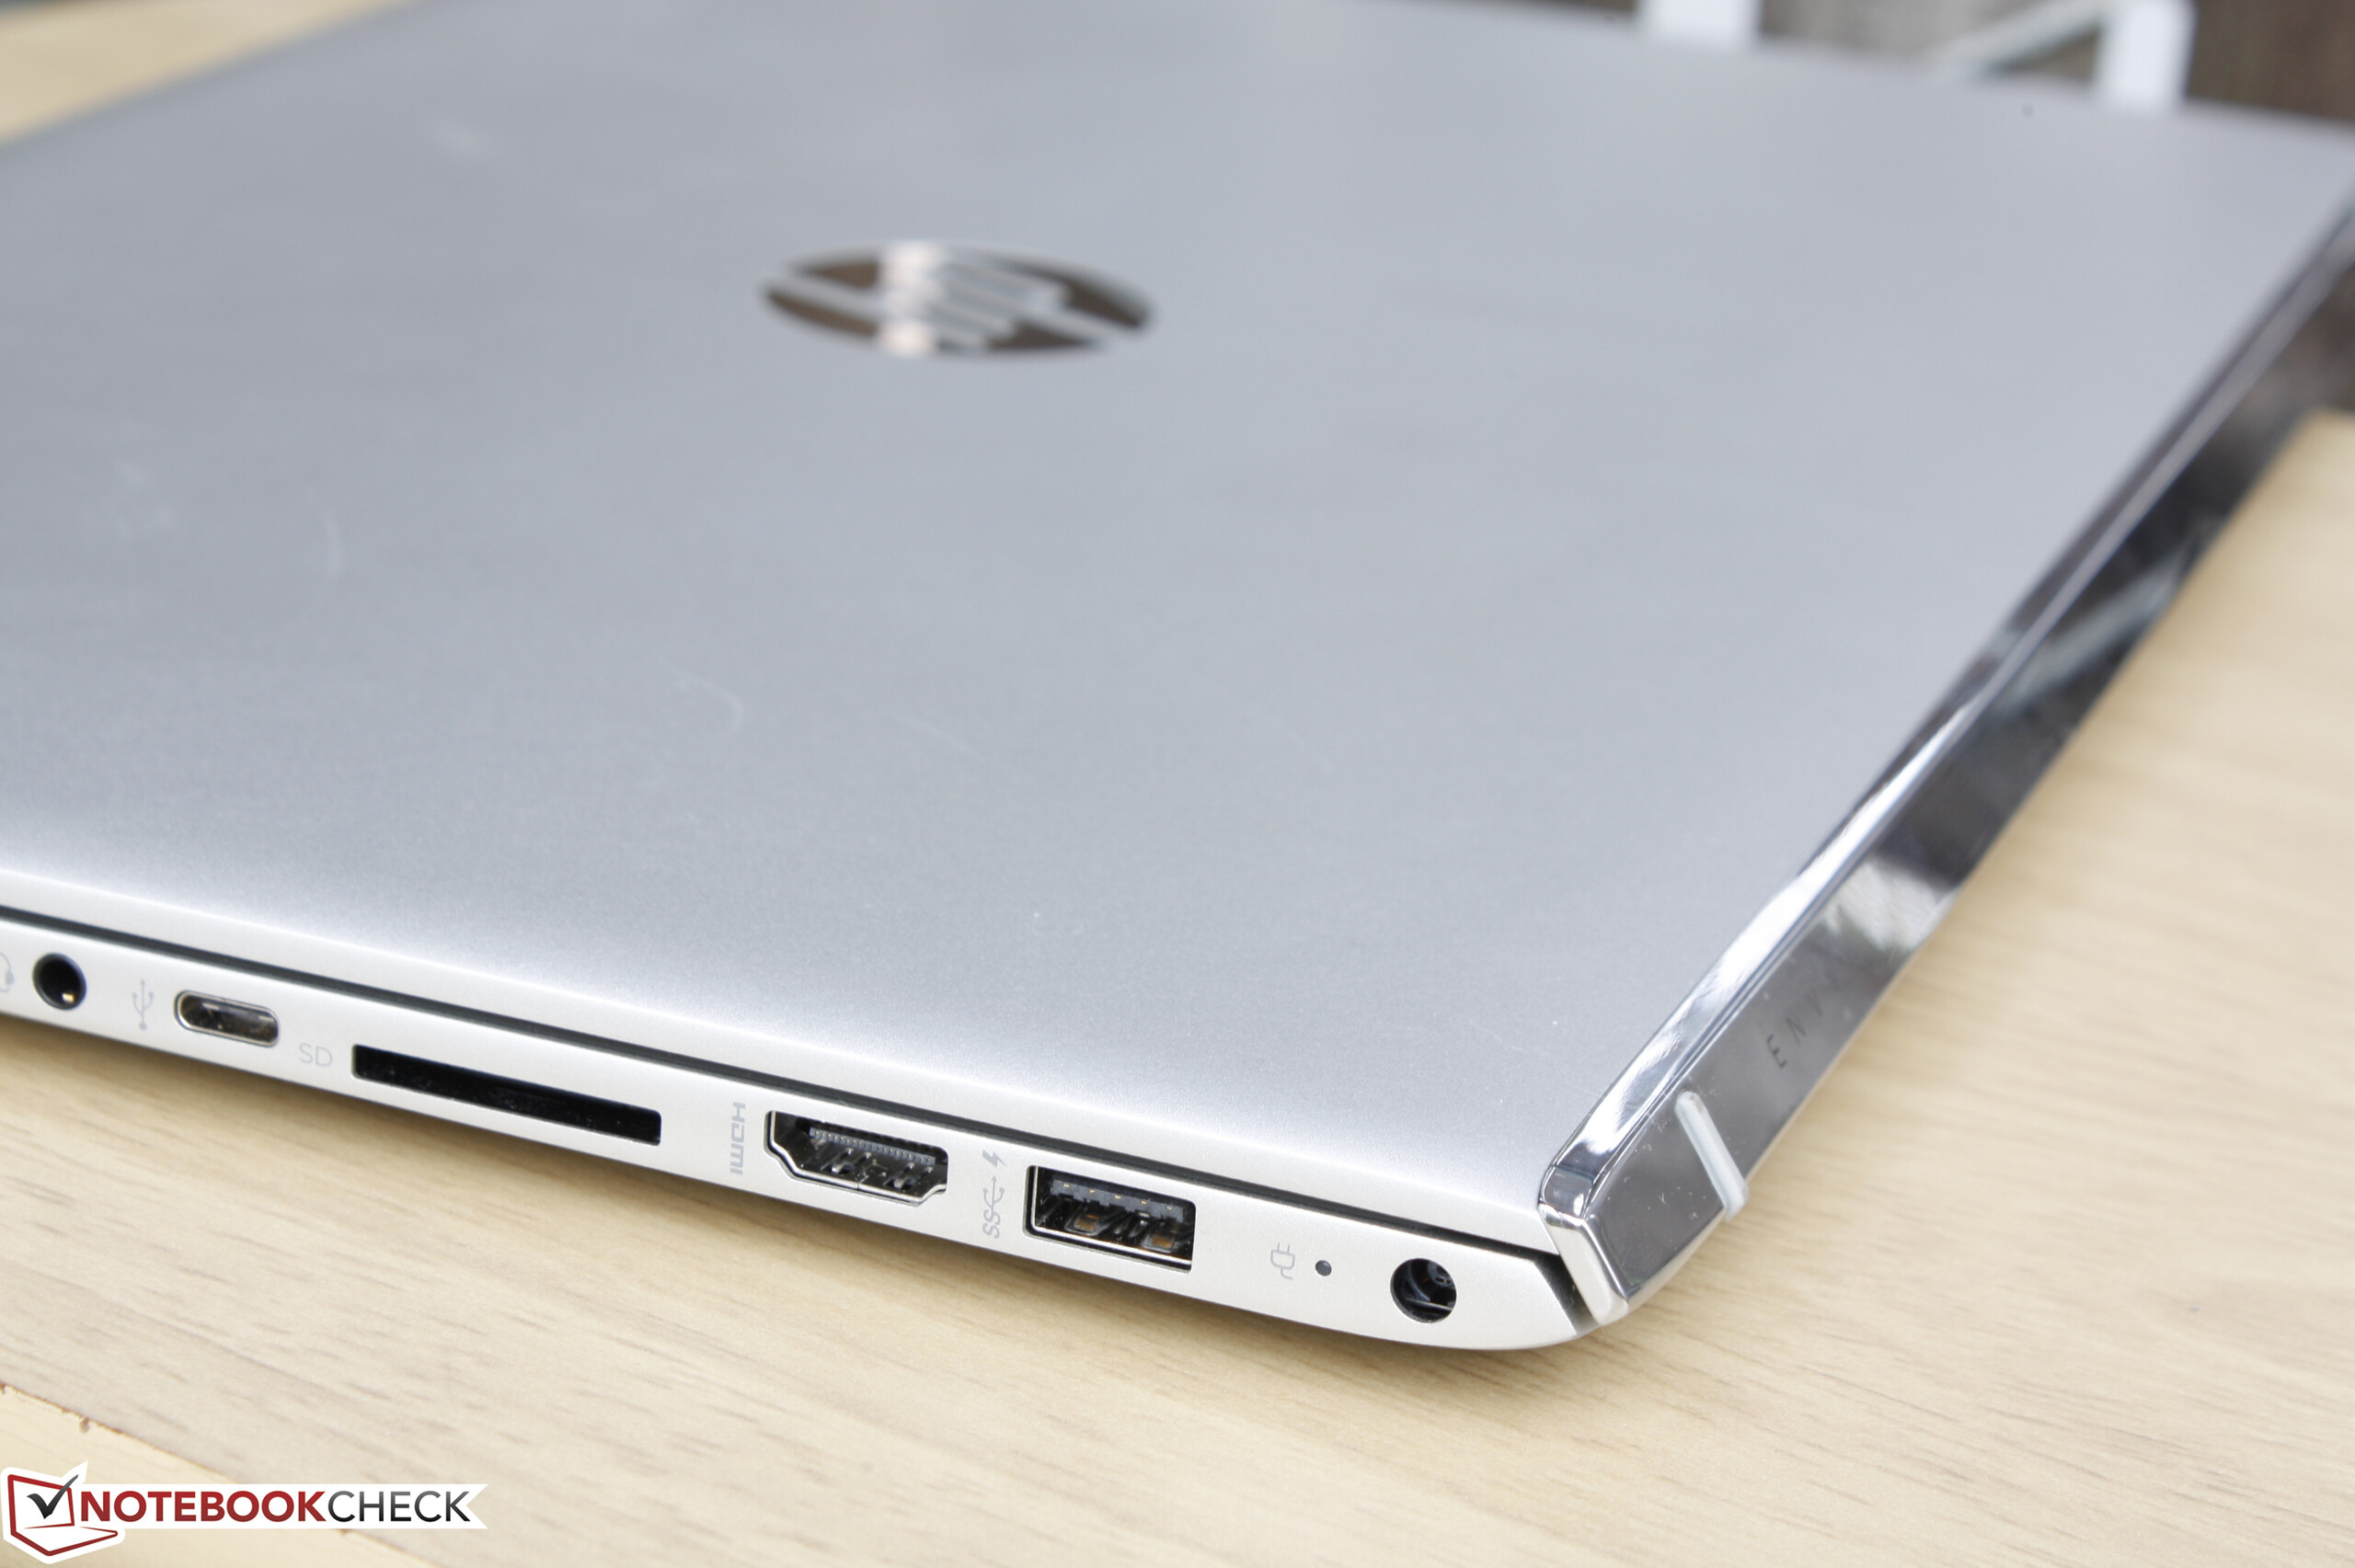
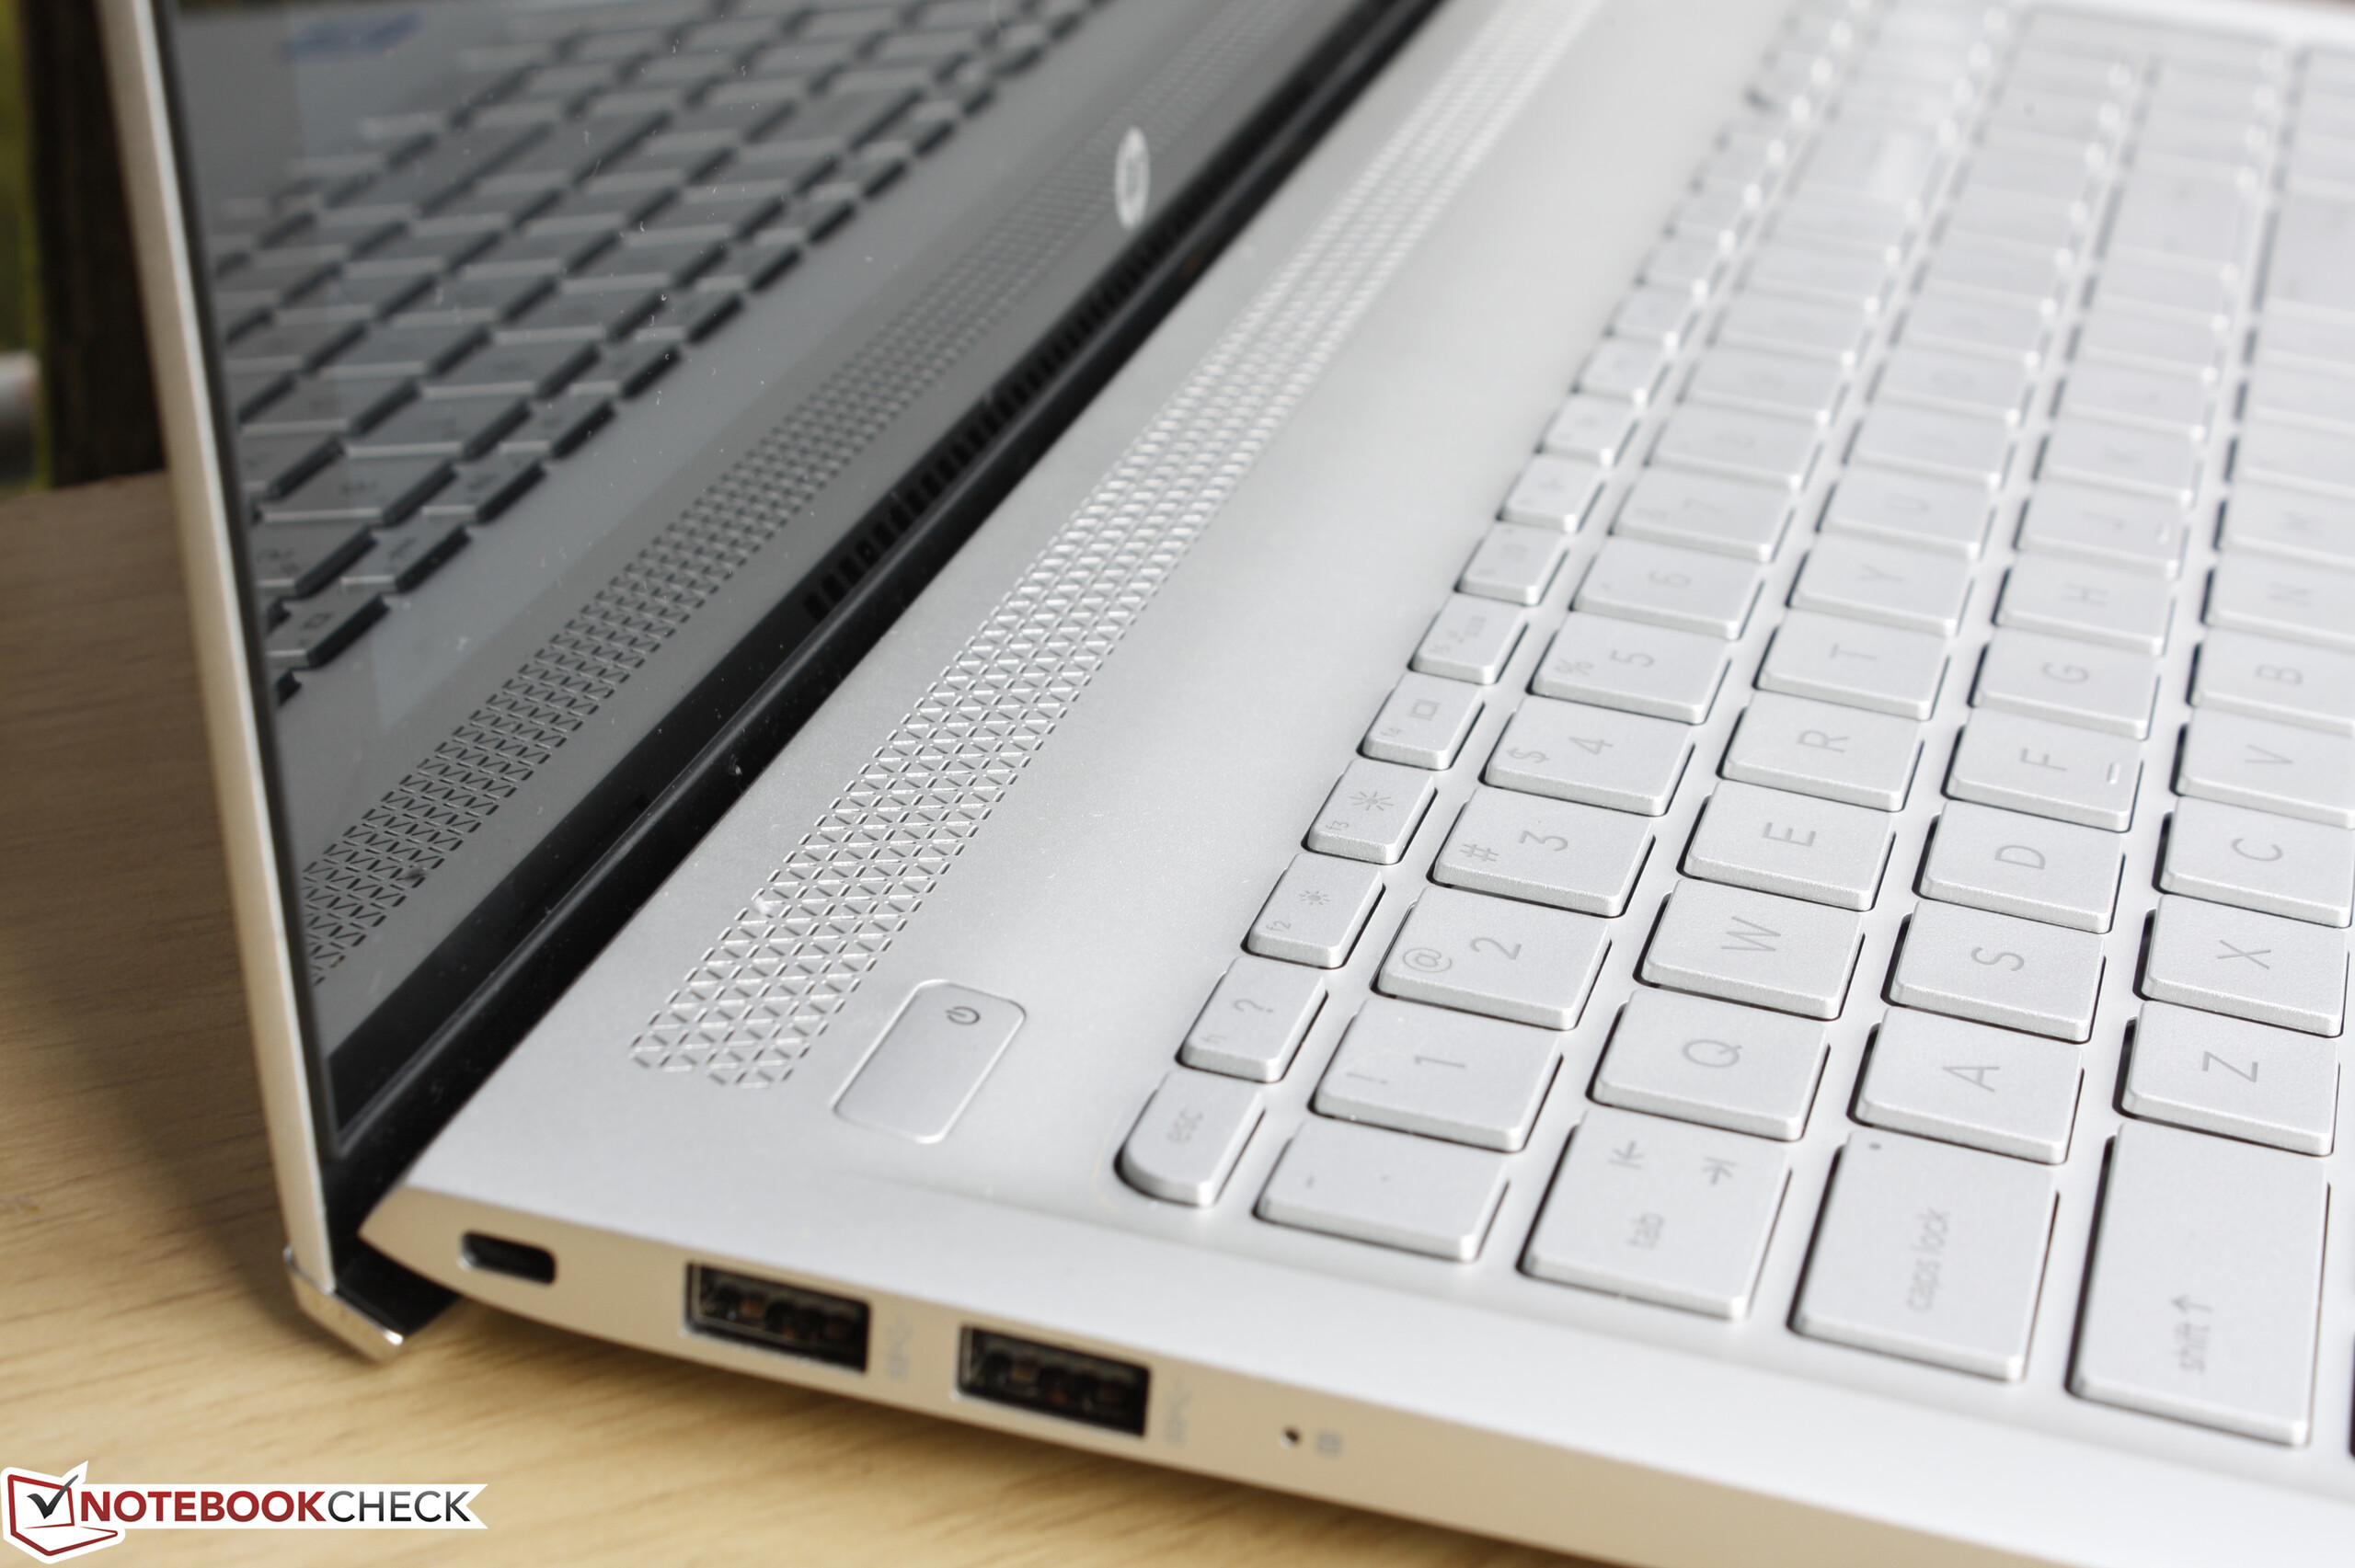
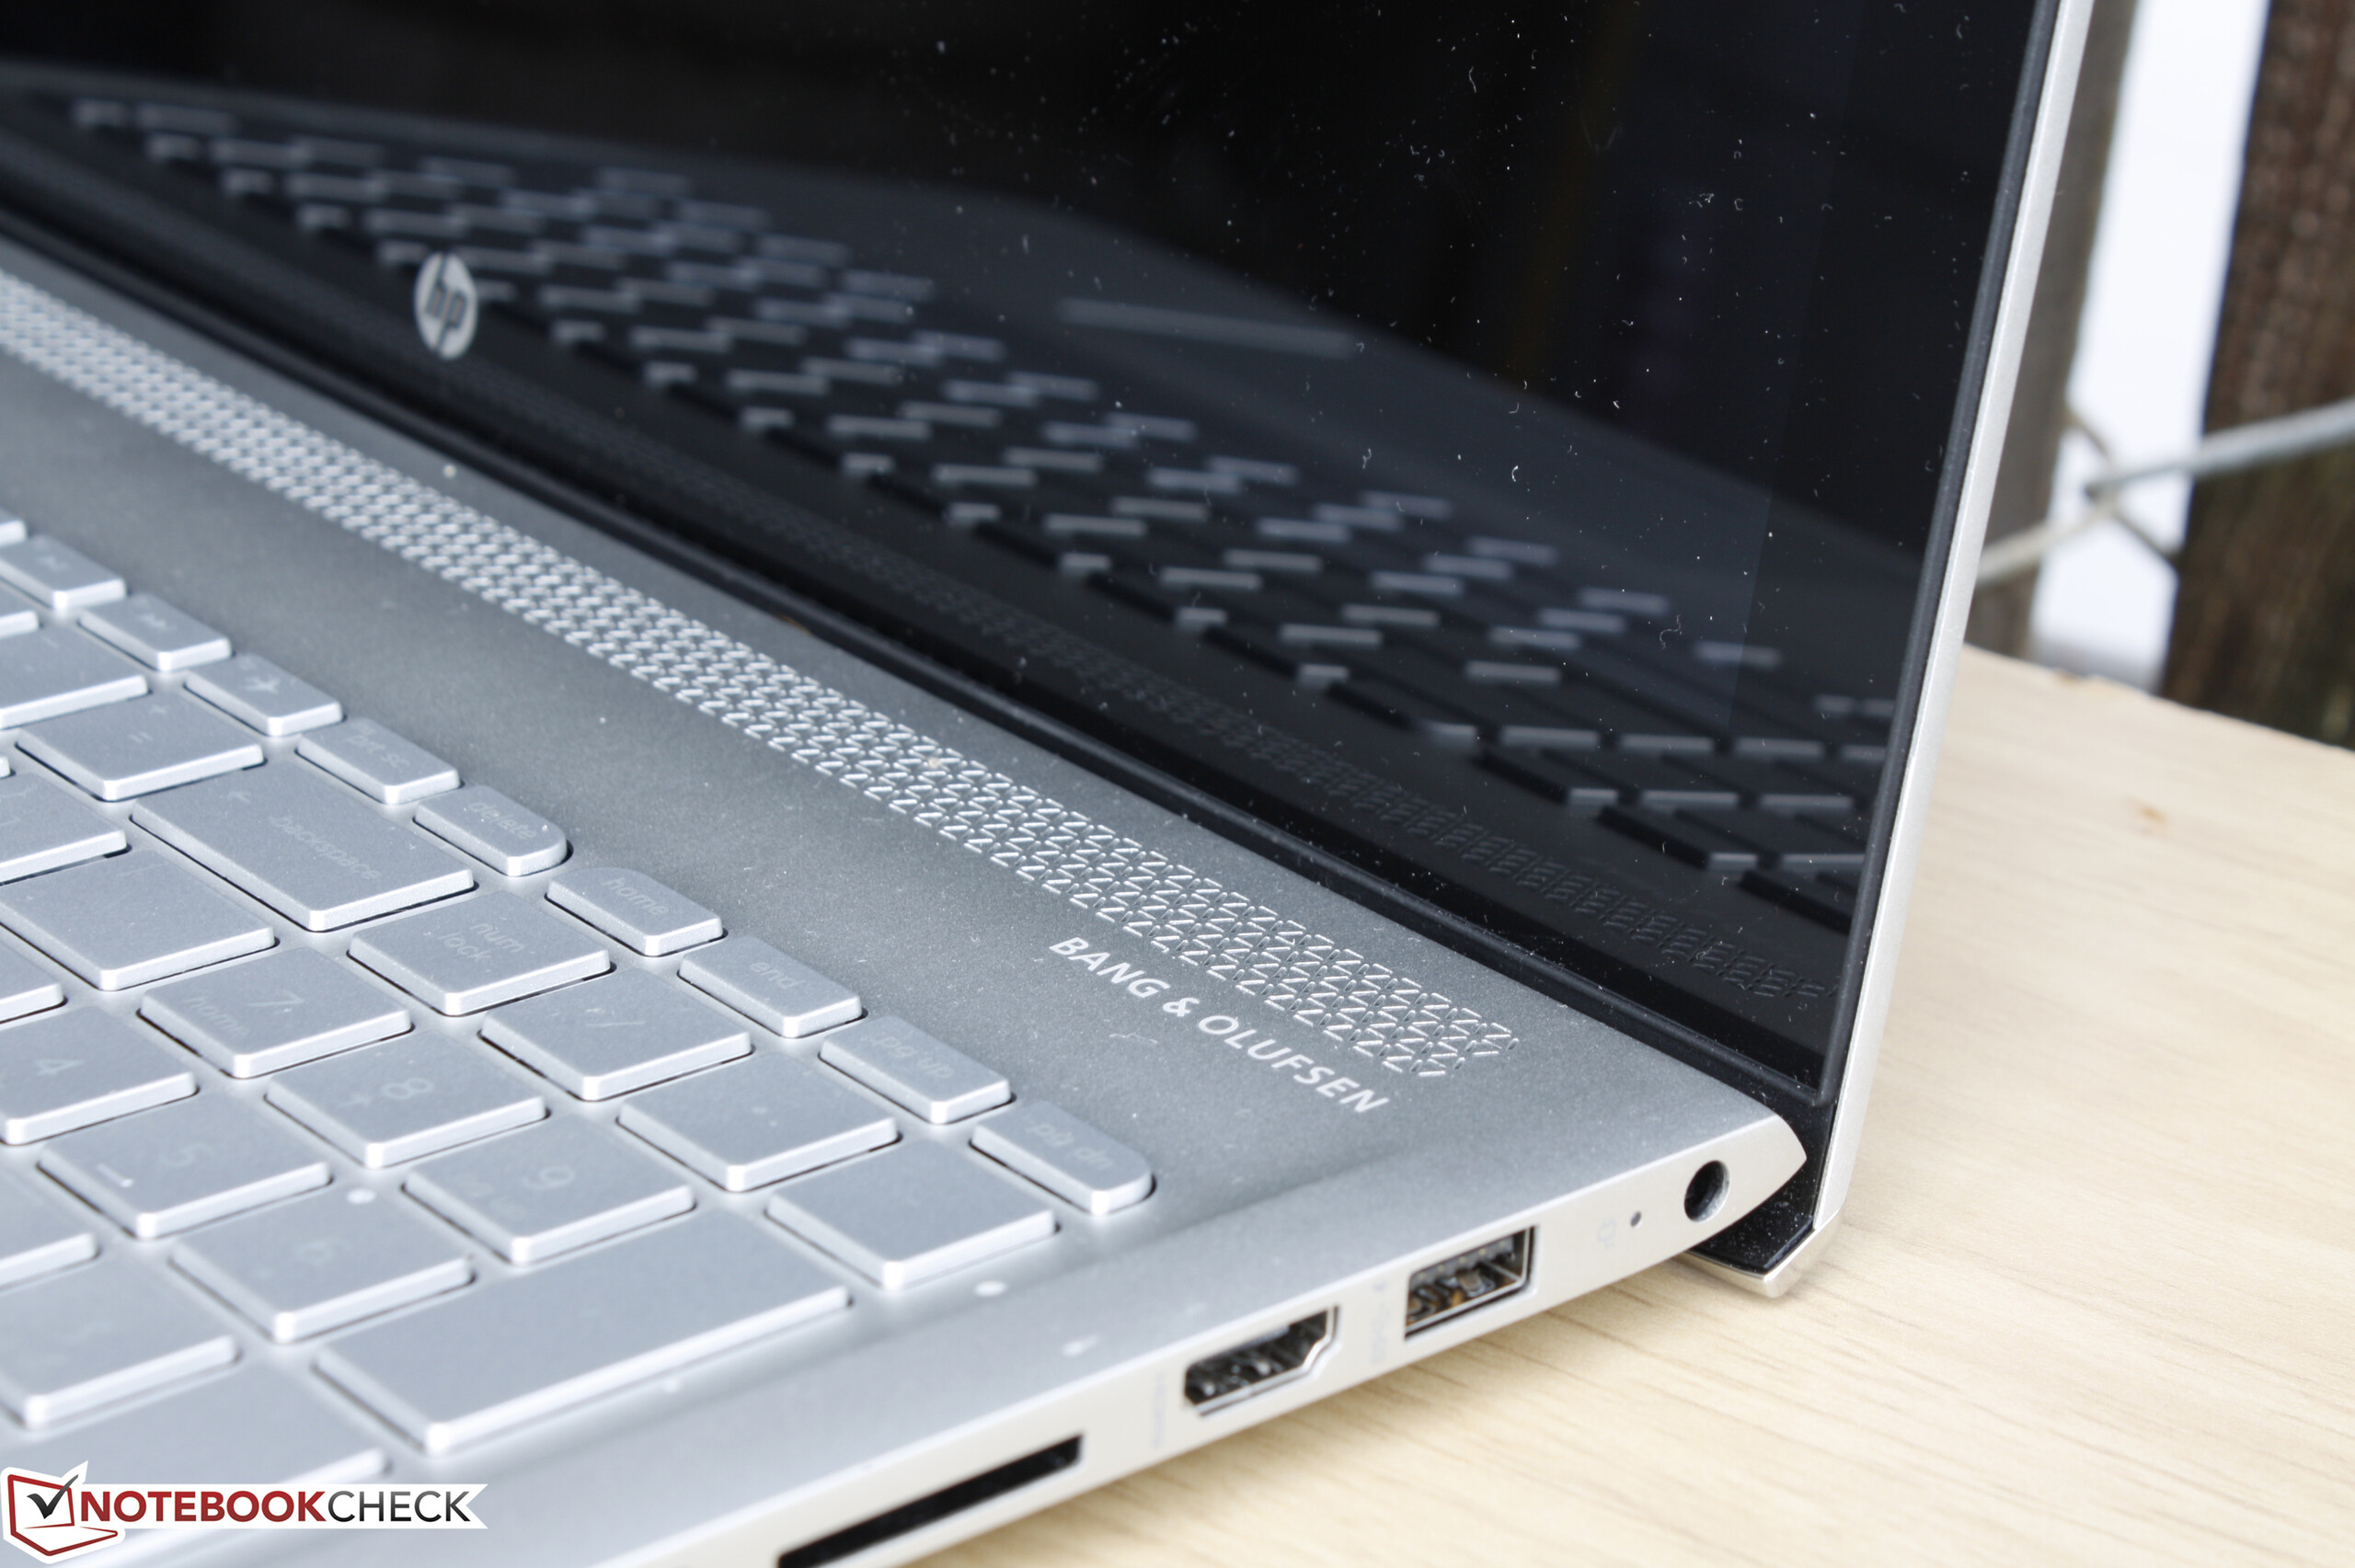
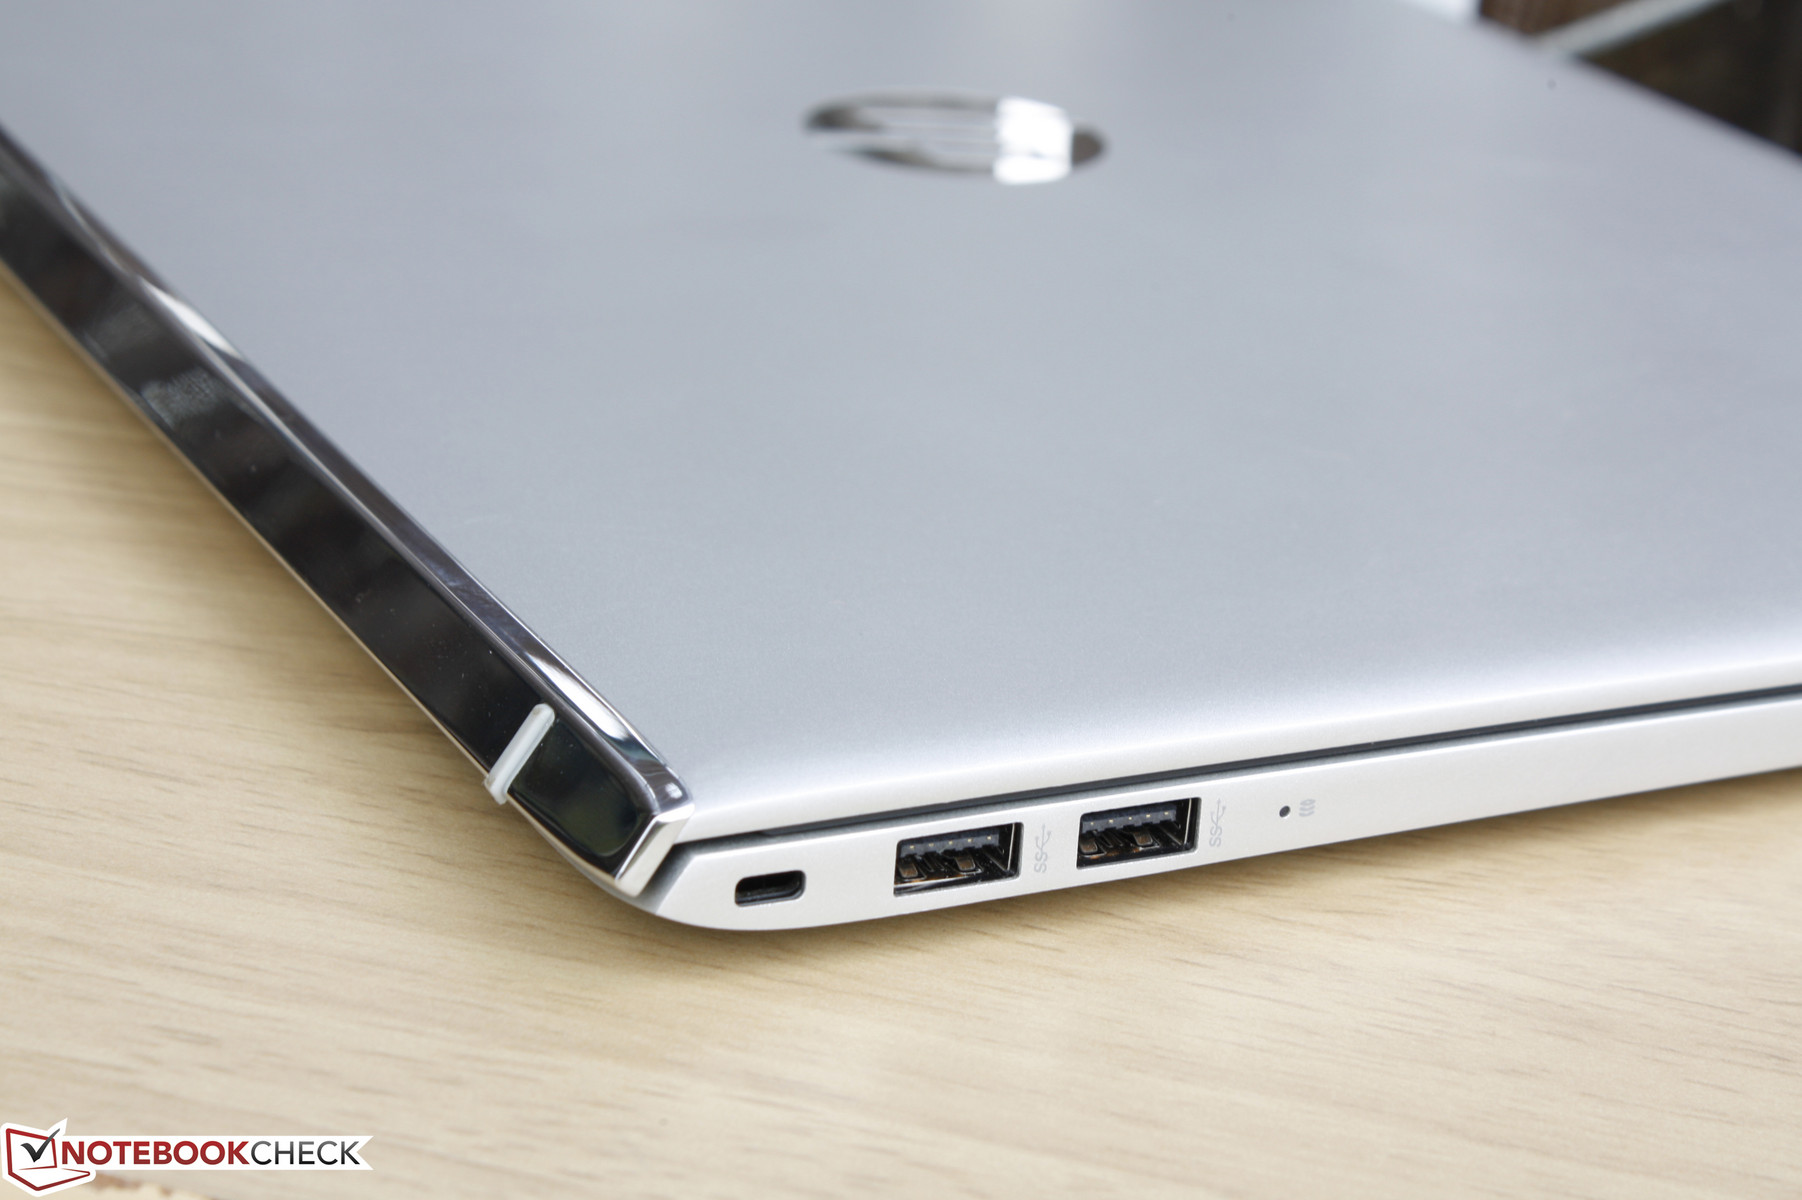
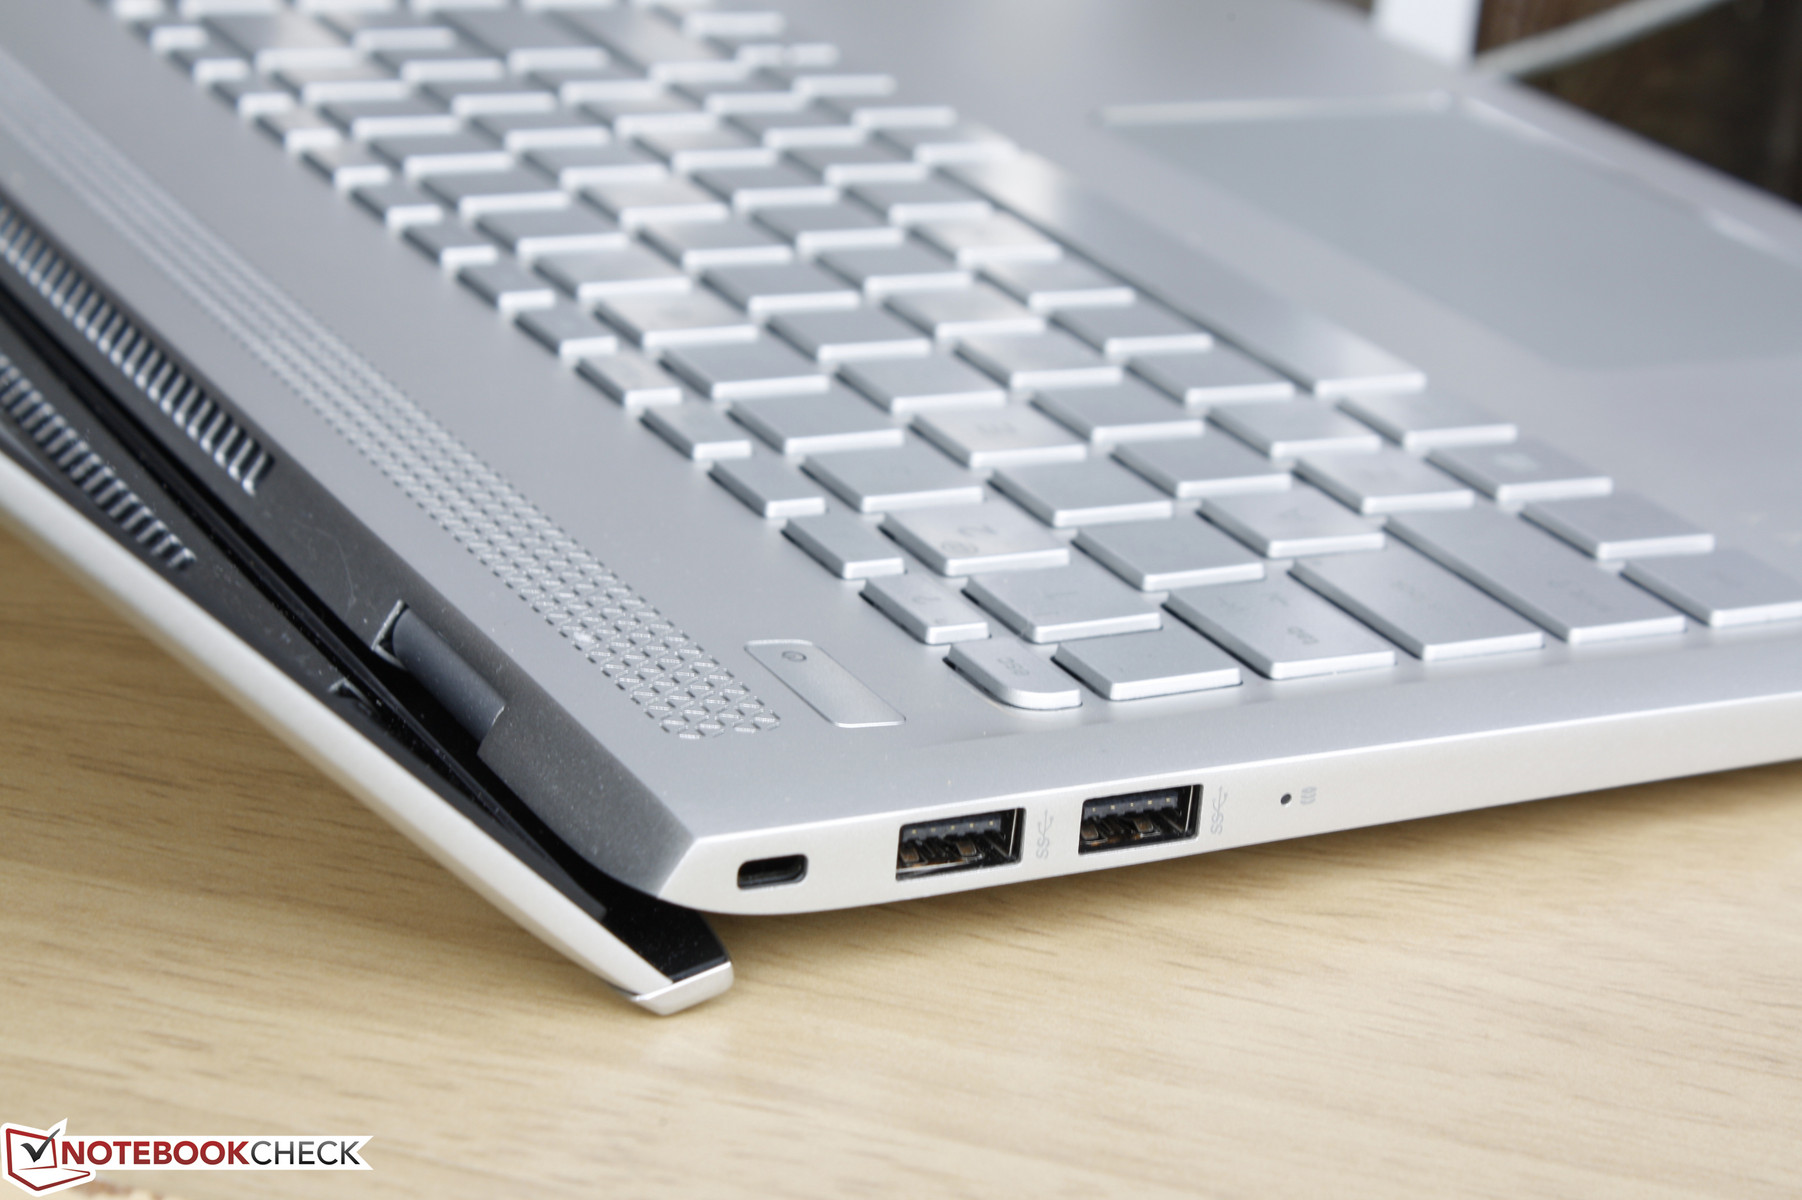
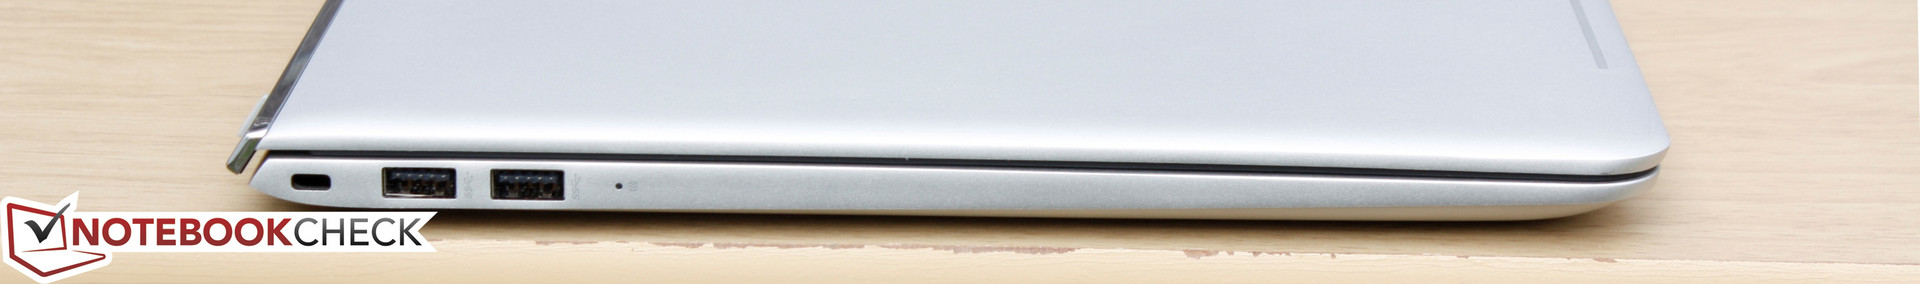
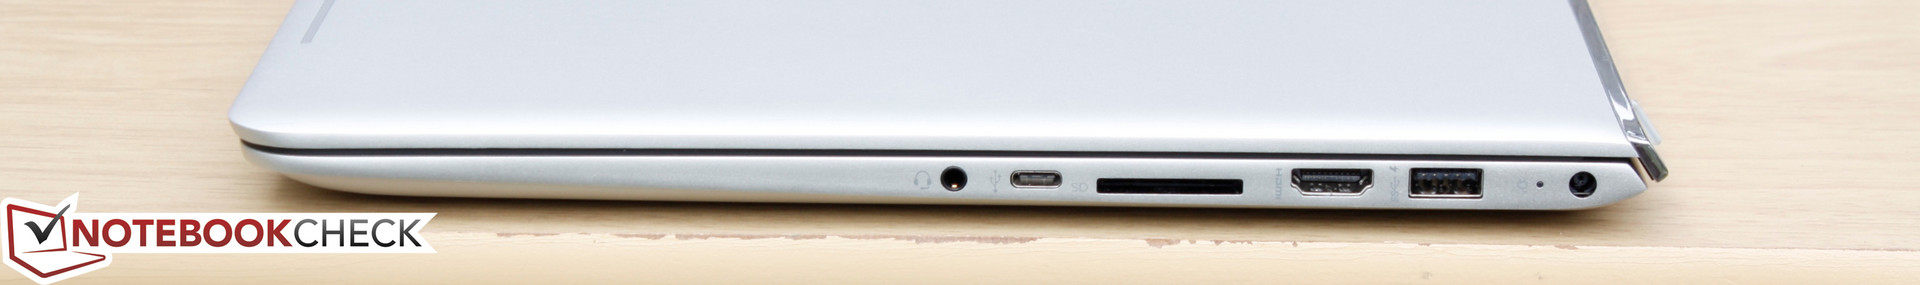
Port options are standard with easily accessible USB 3.0, HDMI, and USB Type-C ports. Missing features include RJ-45 and VGA, both of which are far less common on consumer-oriented notebooks compared to business-centric offerings. The USB Type-C port here does not appear to offer Gen. 2 speeds or DisplayPort compatibility. The design of the lid also prohibits any ports from being placed on the rear of the unit.
SD Card Reader
The spring-loaded integrated card reader provides average transfer rates of about 91 MB/s with our Toshiba SDXC UHS-II test card. Transferring 1 GB worth of images from the card to desktop will take roughly 16 seconds. The inserted SD card sits flush against the edge of the notebook and remains safe to carry at all times.
| SD Card Reader | |
| average JPG Copy Test (av. of 3 runs) | |
| Dell XPS 13 9360 FHD i5 | |
| HP Envy 15-as133cl | |
| HP 17-y044ng | |
| maximum AS SSD Seq Read Test (1GB) | |
| Dell XPS 13 9360 FHD i5 | |
| HP Envy 15-as133cl | |
| HP 17-y044ng | |
Communication
The 2x2 dual-band Intel wireless-ac 7265 module offers a theoretical transfer rate of 867 Mbps and integrates both vPro and Bluetooth 4.1. Real-world results when connected to our Linksys EA8500 test router standing one meter away returns an average transfer rate of 657 Mbps. We experienced no notable connectivity issues during our time with the unit.
WWAN and GPS options are not available on the Envy 15.
| Networking | |
| iperf3 transmit AX12 | |
| Dell XPS 13 9360 FHD i5 | |
| HP Envy 15-as133cl | |
| HP 15-ba077ng | |
| iperf3 receive AX12 | |
| HP Envy 15-as133cl | |
| Dell XPS 13 9360 FHD i5 | |
| HP 15-ba077ng | |
Accessories
There are no included extras other than the AC adapter and setup guide. HP sells branded accessories like mice and keyboards that work generically through USB.
Maintenance
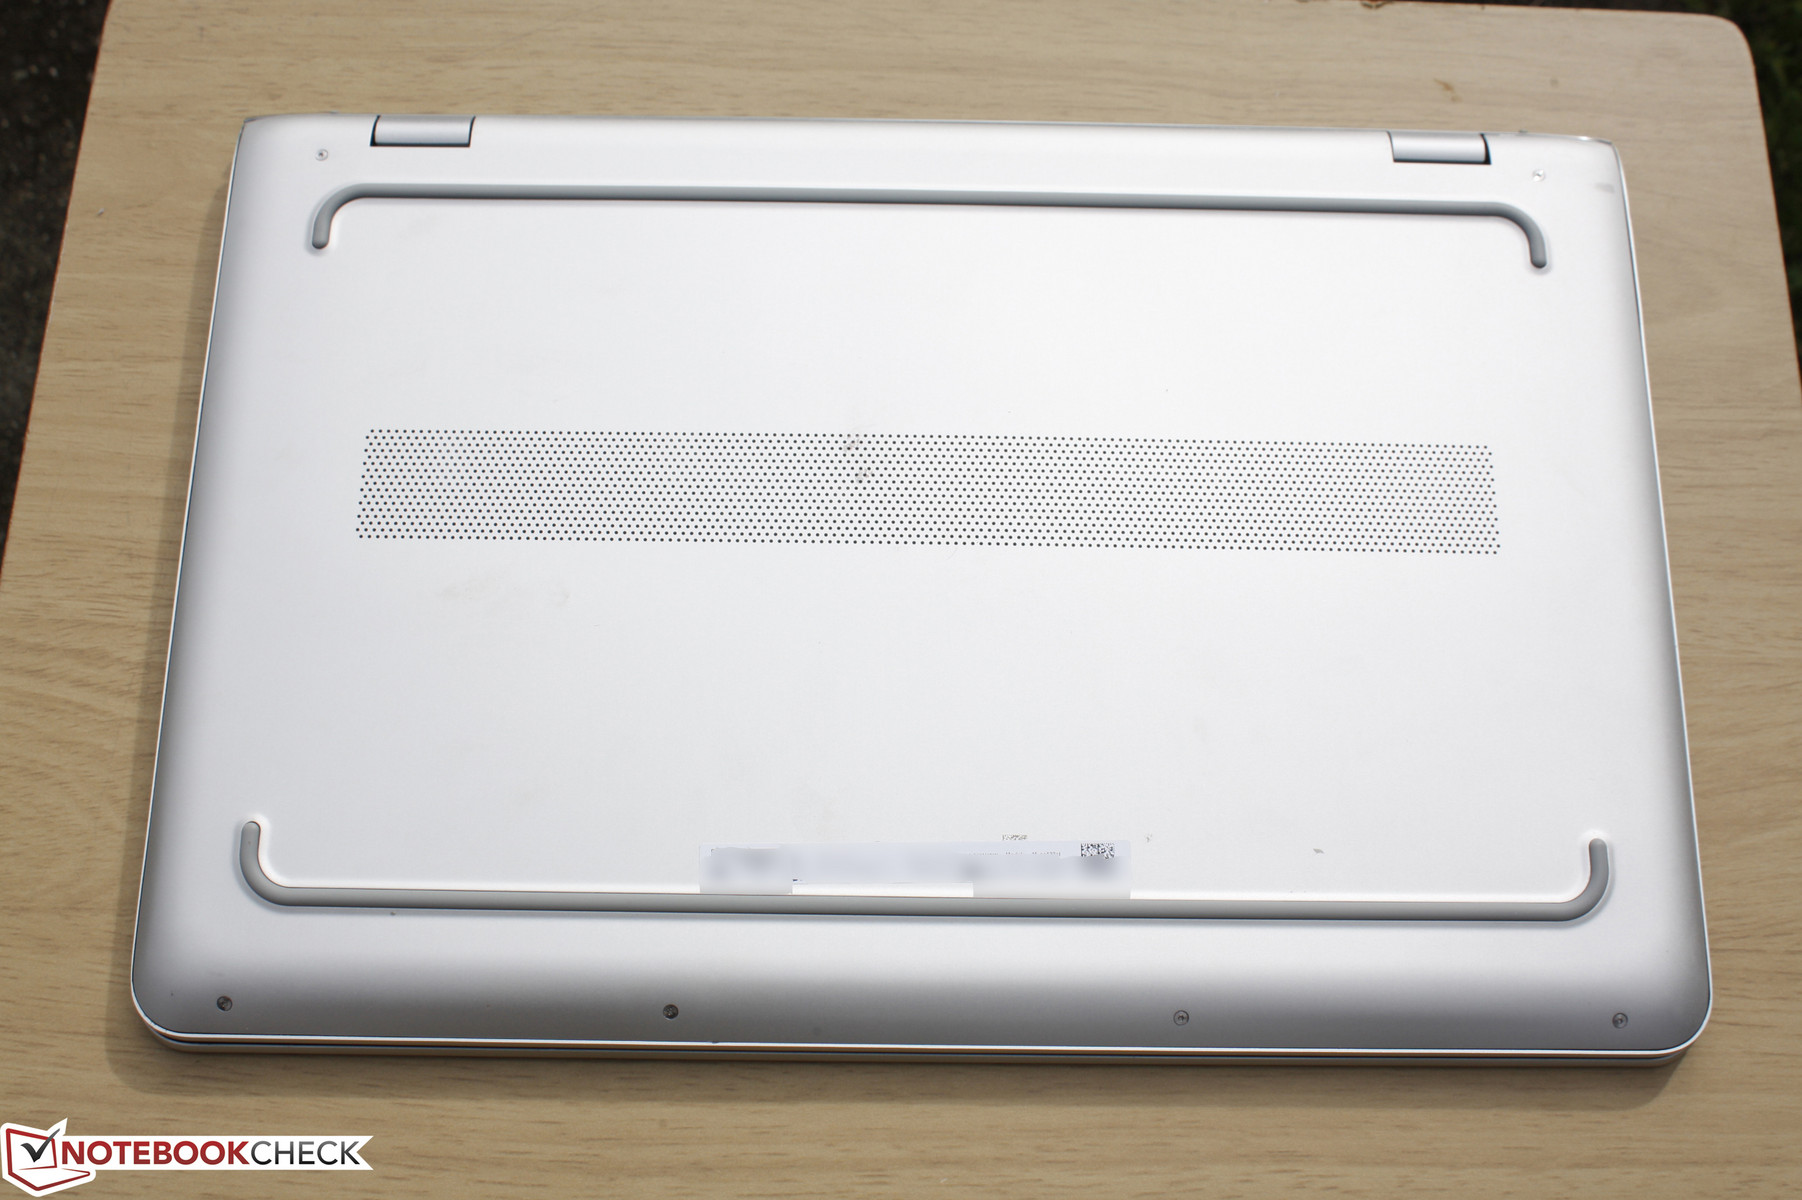
The bottom panel is secured by six hex screws requiring a T5 wrench to remove. Unfortunately, the panel itself is latched very tightly to the base and its sharp edges make safe removal very difficult. End-user servicing is clearly discouraged on the Envy 15.
Users should find 2x storage bays and 2x SODIMM slots underneath the bottom panel if removed.
Warranty
The standard one-year limited warranty applies for all new purchases of the notebook. Extended warranty options include Accidental Damage, LoJack, and Pickup and Support for up to three years.
Please see our Guarantees, Return Policies and Warranties FAQ for country-specific information.
Input Devices
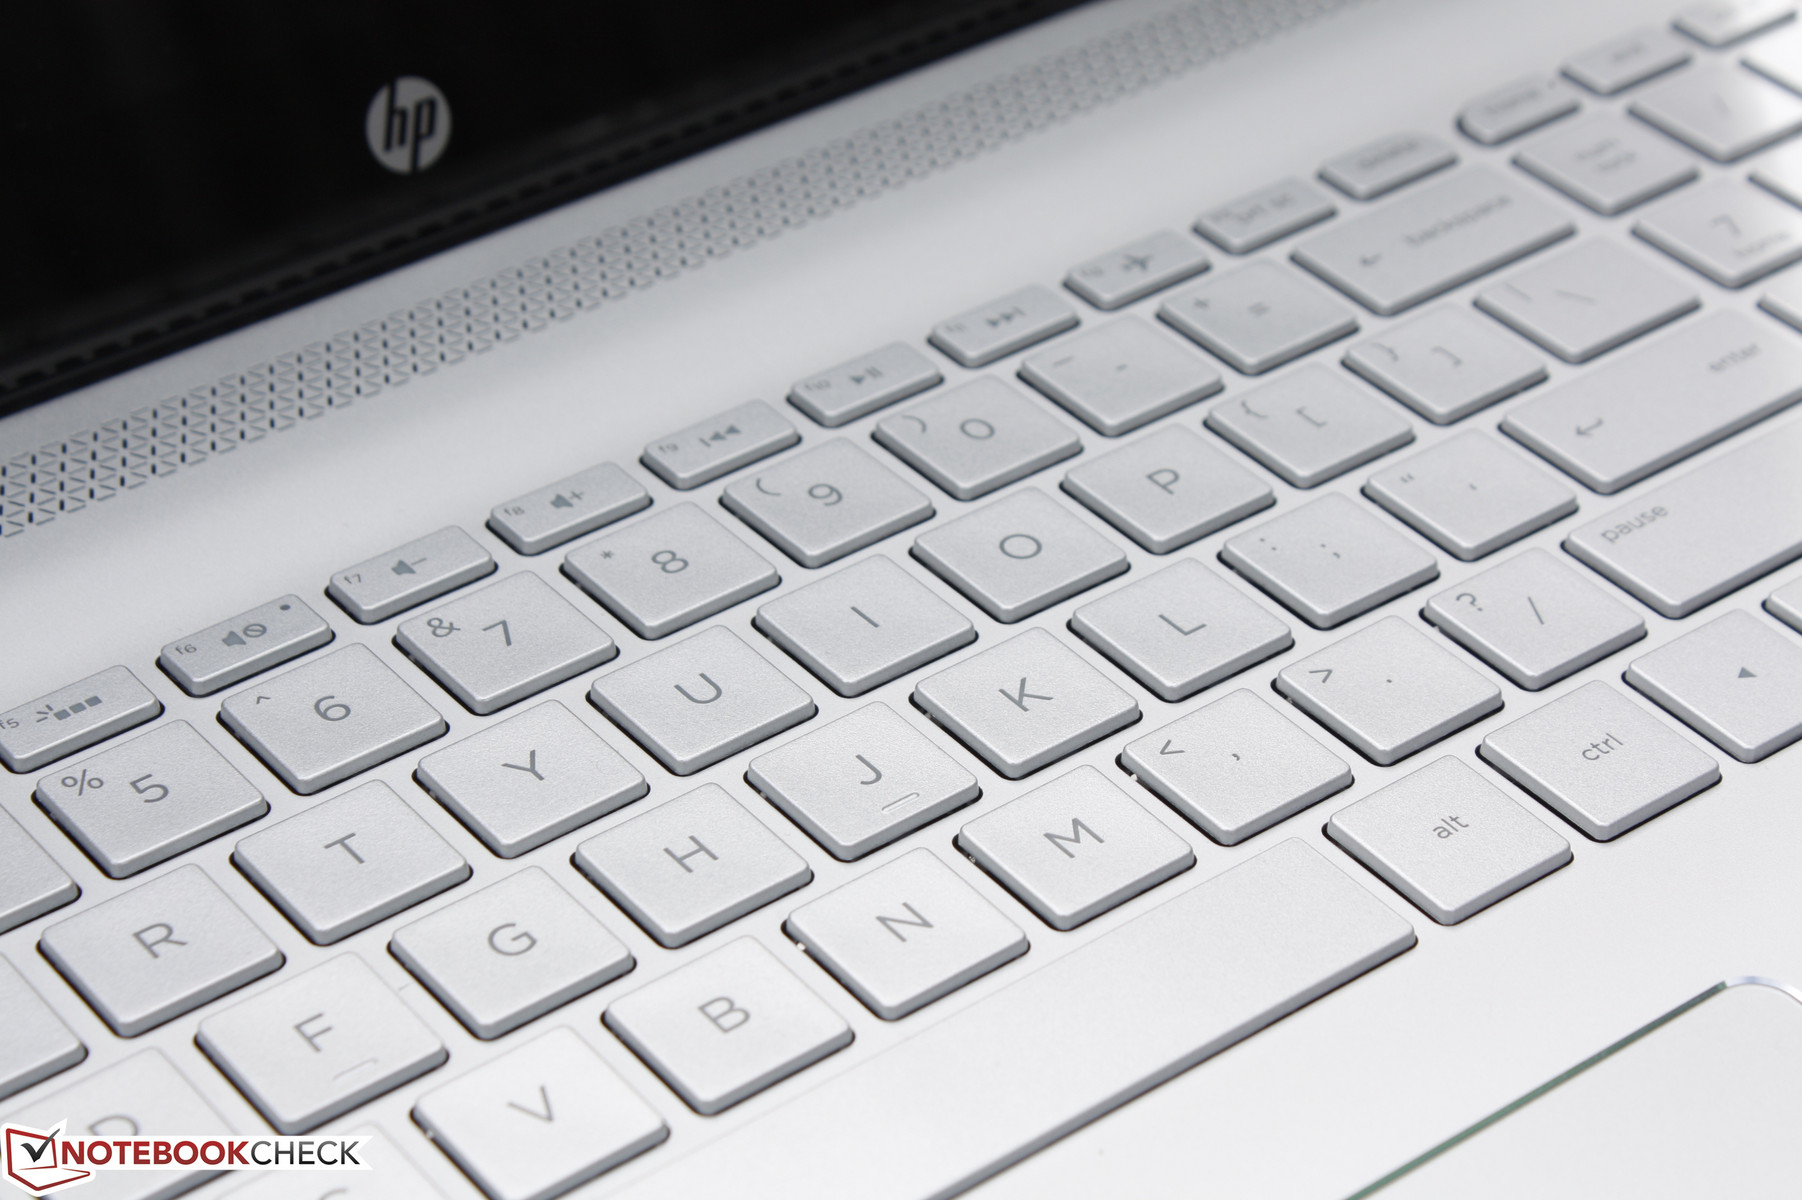
Keyboard
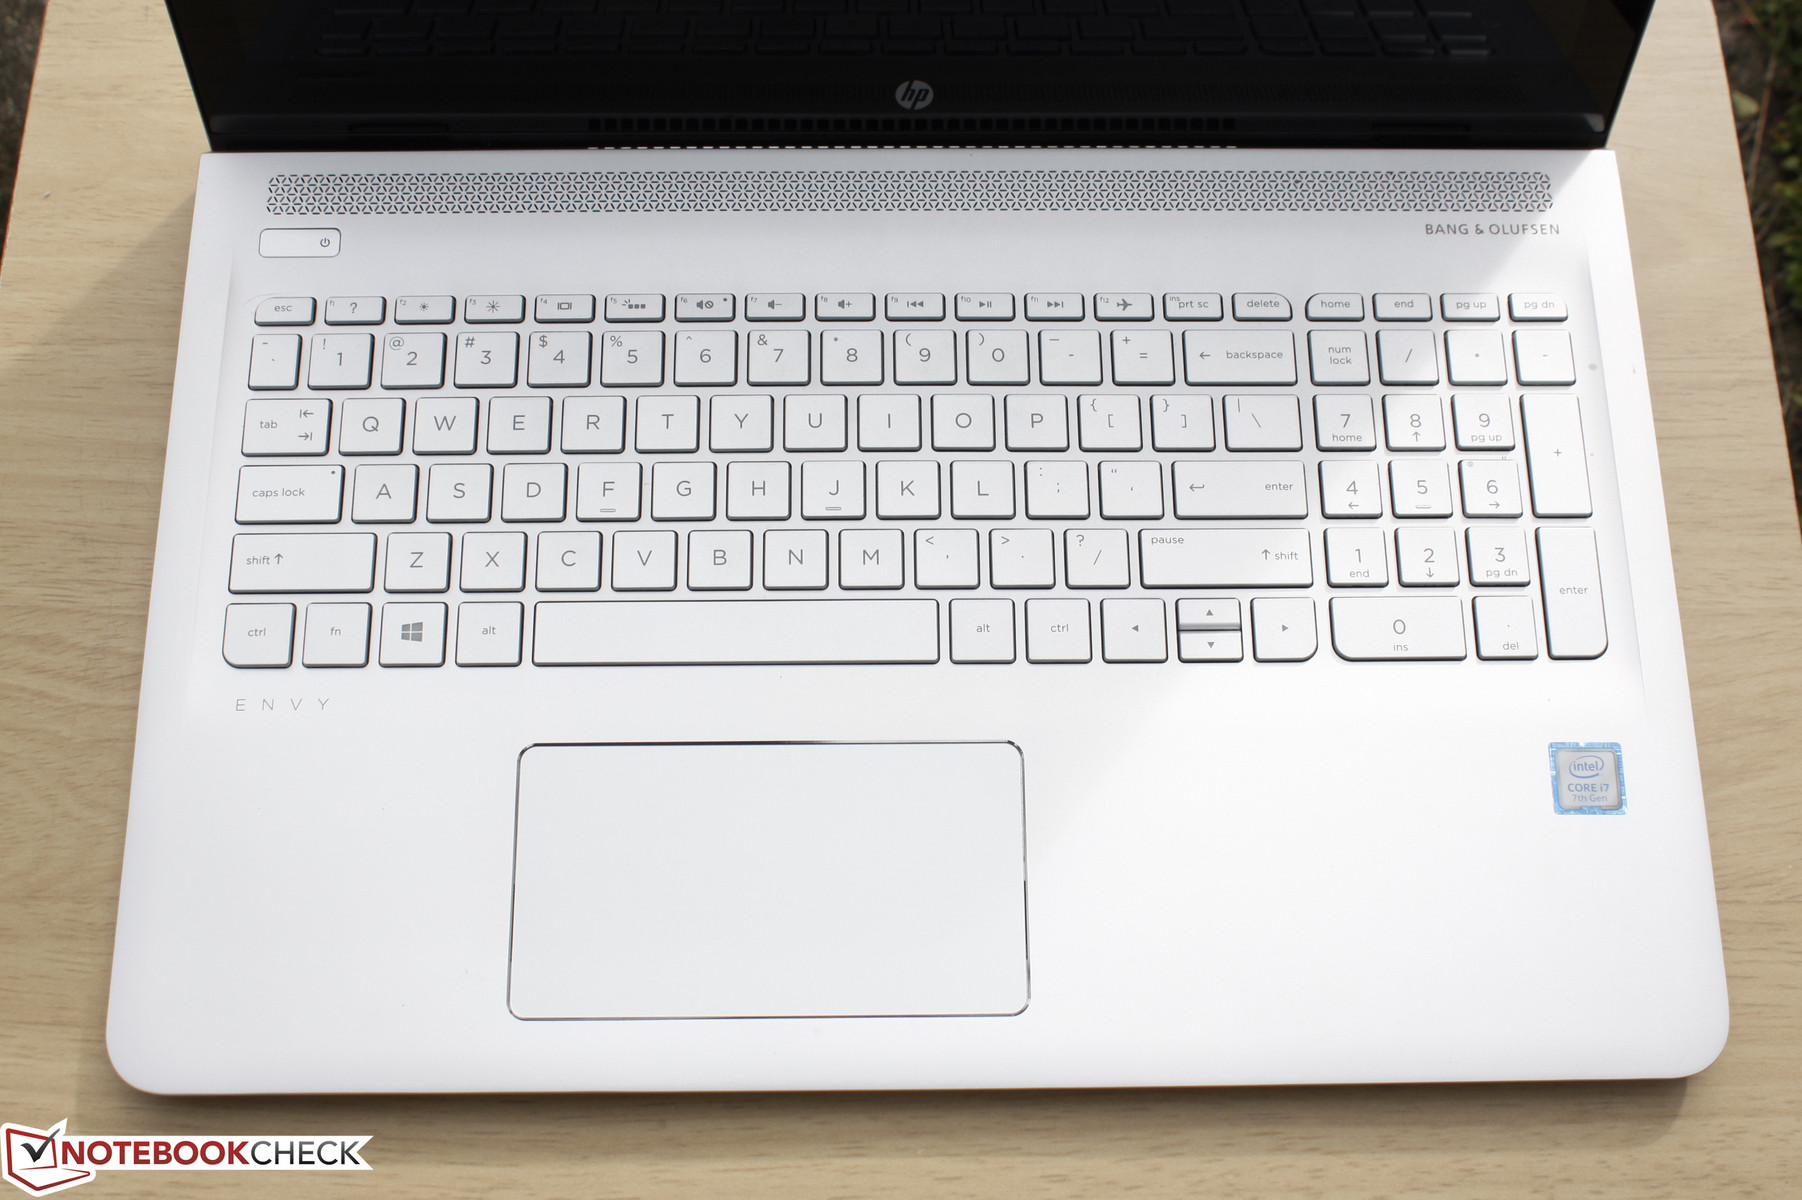
The typing experience on the Envy 15 feels similar to the Spectre 15 x360. Unlike its more expensive sibling, however, the Envy carries a dedicated NumPad that both students and office workers will likely appreciate. Feedback from the keys could have been more firm to make up for the shallow travel. When compared to the AccuType keyboard on newer Lenovo systems, for example, the keys on the HP feel spongier and lighter.
The dark gray lettering contrasts rather poorly against the gray keys unlike on most other notebooks where black keys and white lettering are much more common. The white backlight becomes more of a necessity if working under dimly lit environments as a result.
Touchpad
The wide integrated clickpad (~12 x 6.5 cm) is slightly shorter than on the older Spectre 15 x360. Fortunately, it retains its smooth gliding characteristics and accurate cursor control with no cursor jumping or dead zones.
The clickpad falters in its integrated mouse keys as travel is very shallow and feedback is much too soft. Clicking repeatedly in quick succession is difficult because of how poor the tactile feedback is. The auditory feedback is quiet and unsatisfactory as well, so users may find it easier to simply tap on the clickpad or the touchscreen itself for inputting mouse clicks.
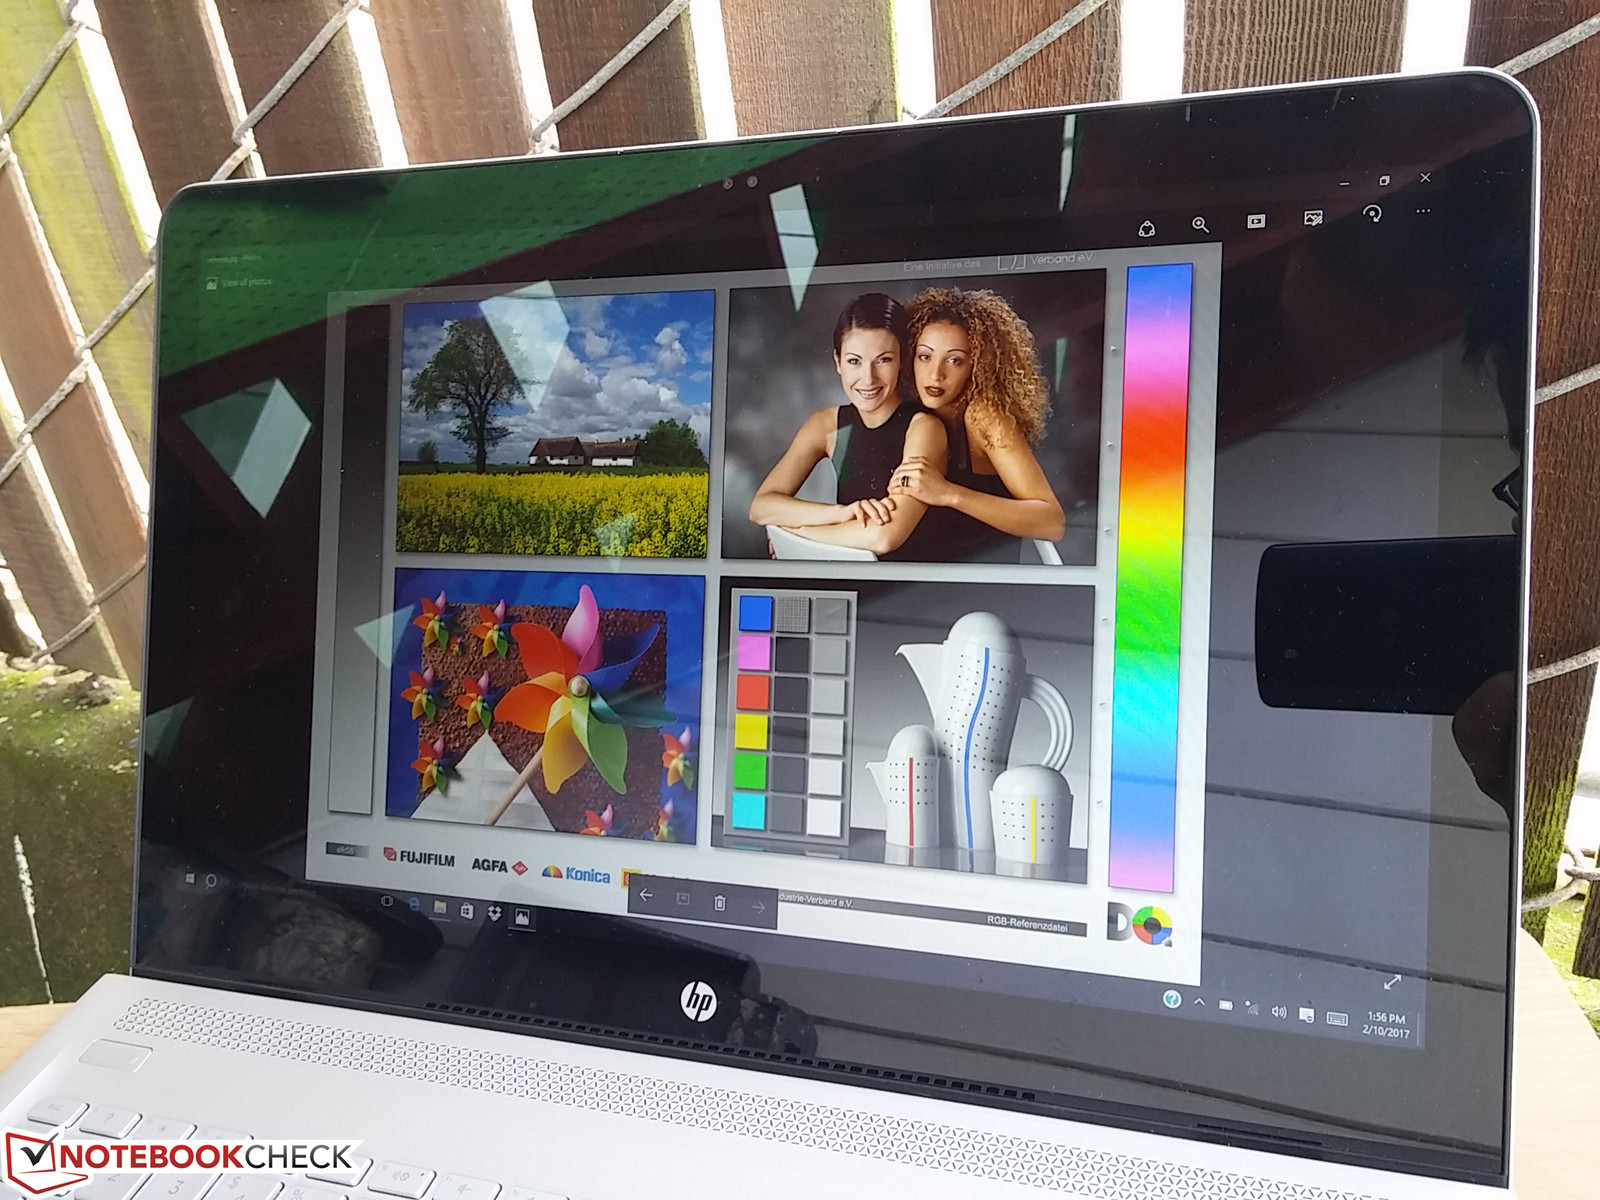
Display
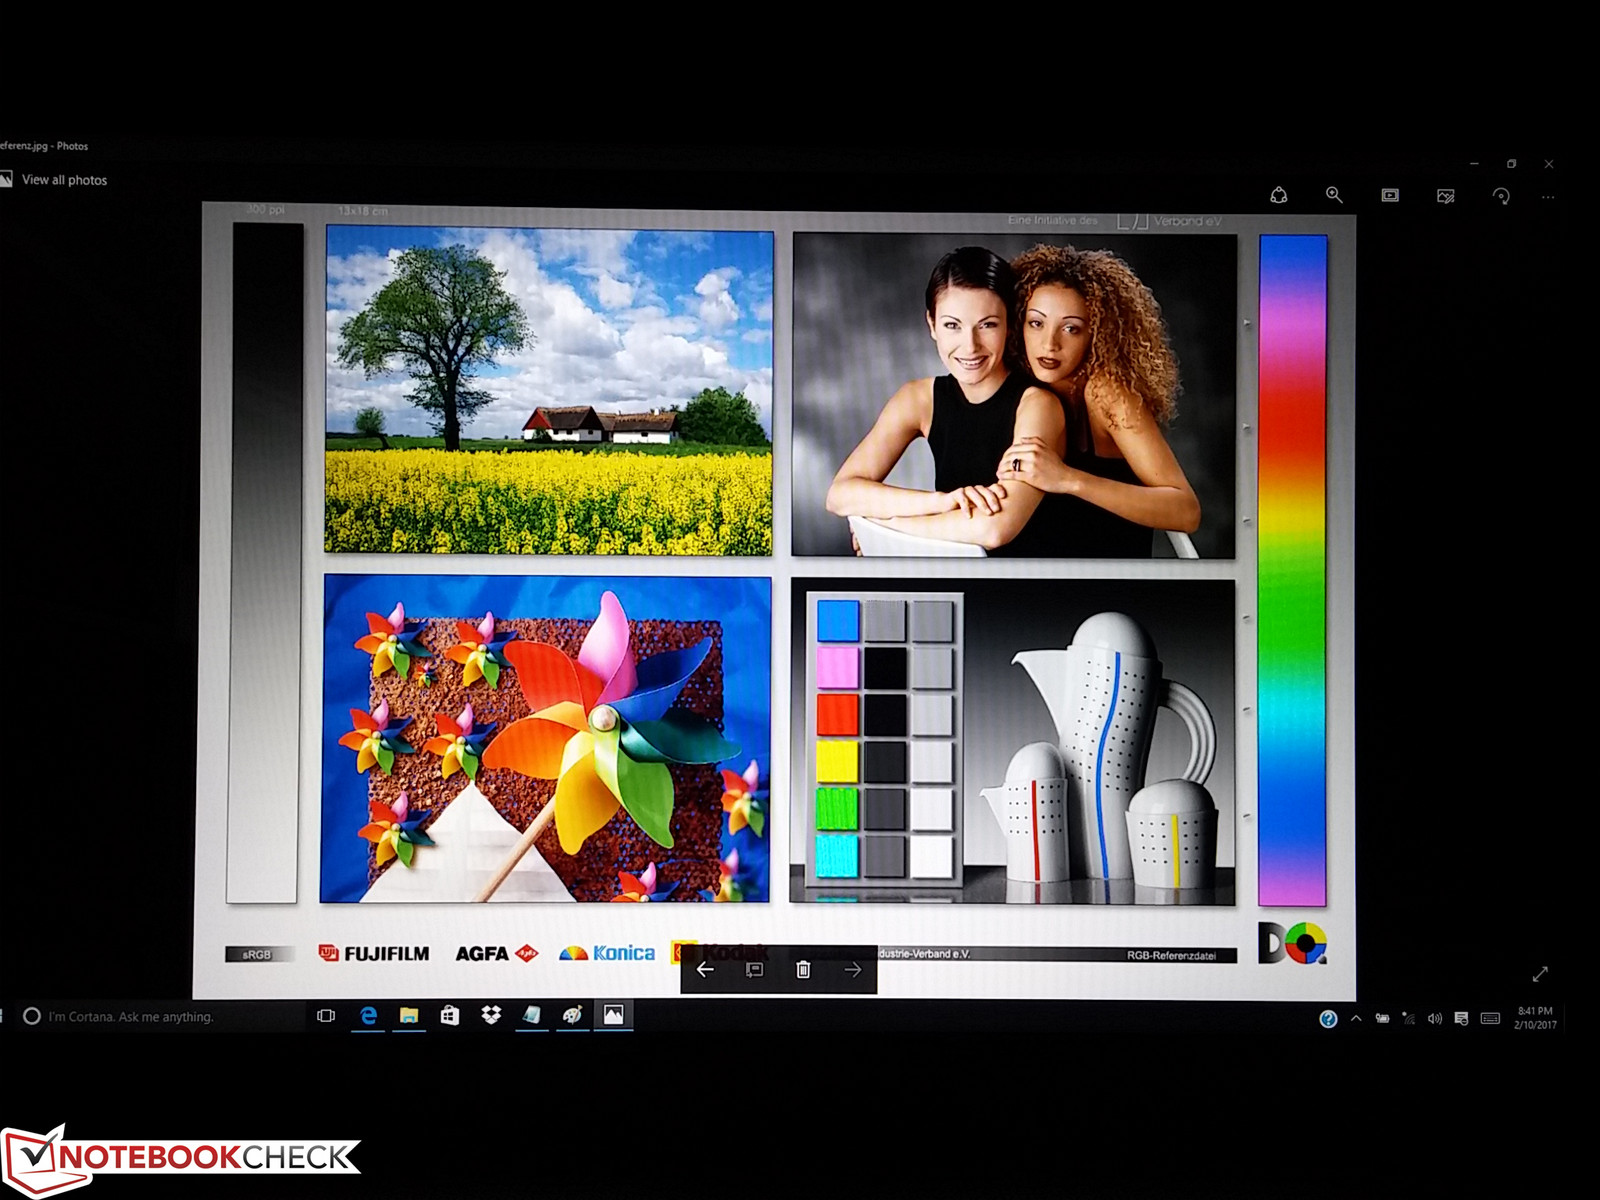
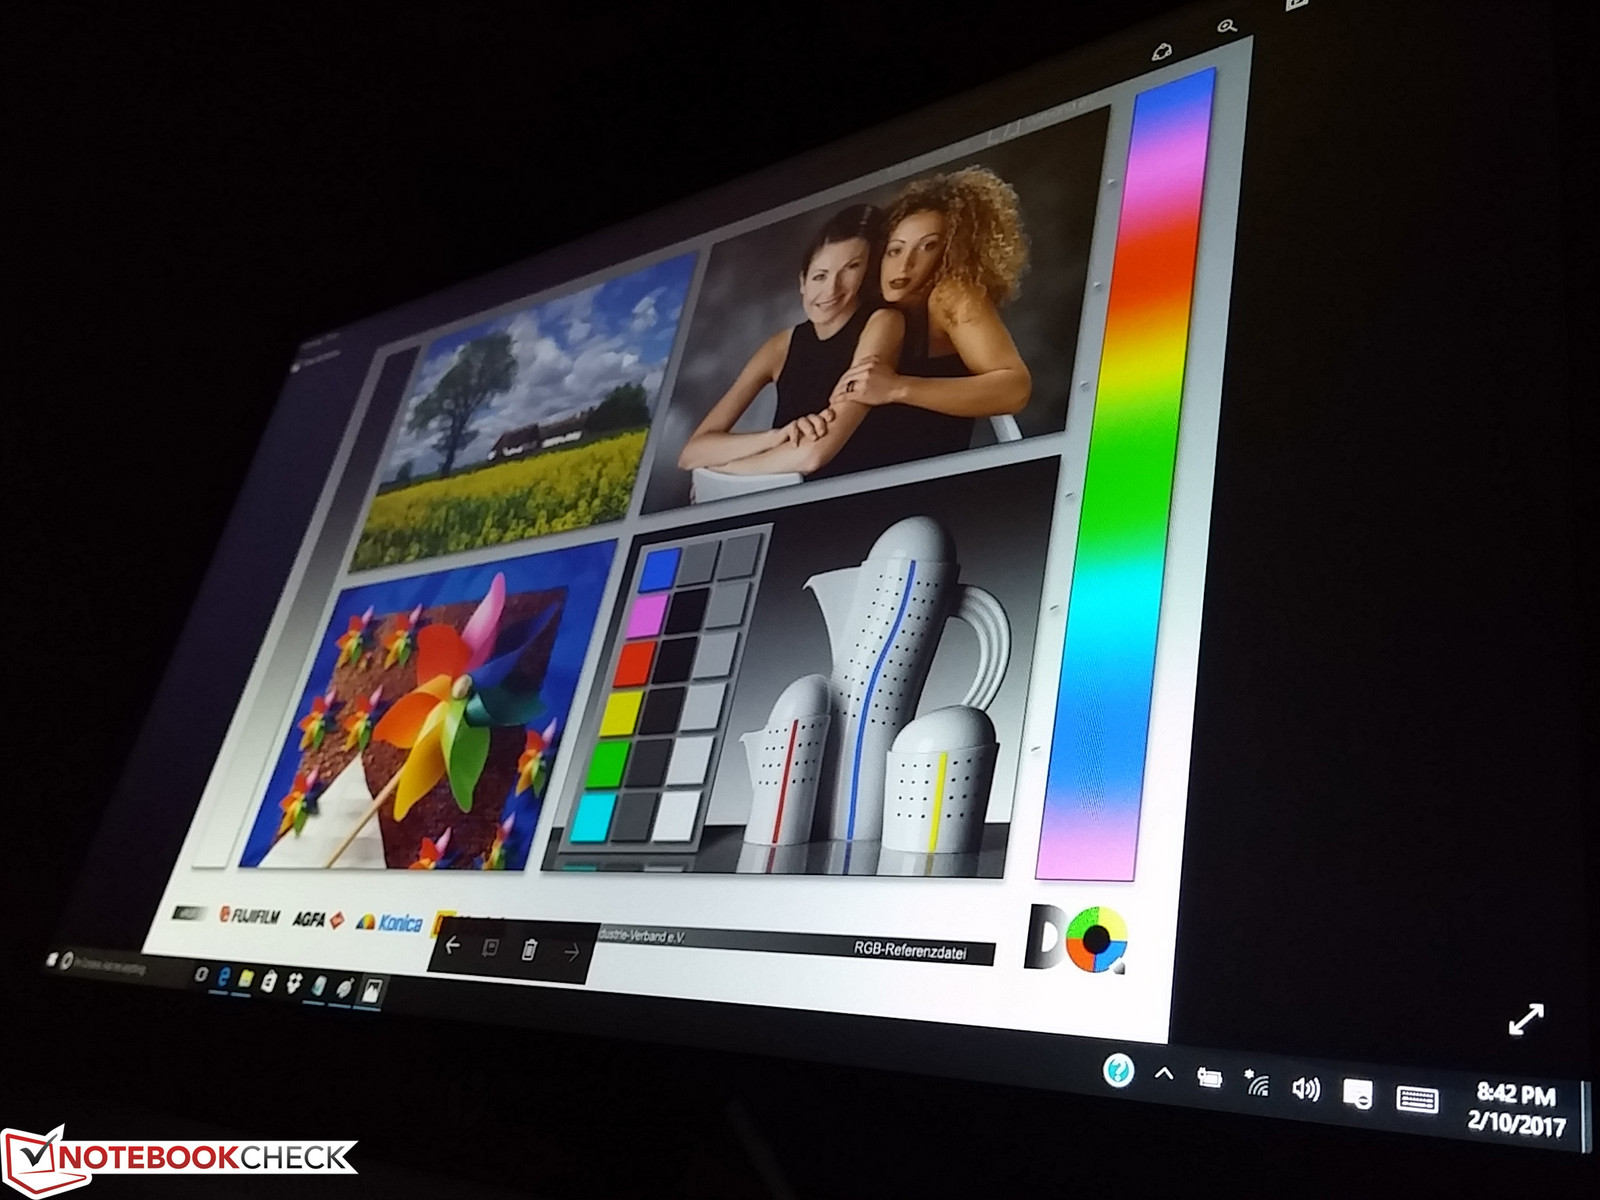
The glossy 1080p touchscreen on our test unit is sharp with no noticeable grains or unusual artifacts. Its Chi Mei CMN15D8 IPS panel can be found on no other notebooks in our database thus far and measurements show it to offer excellent contrast levels and a slightly brighter backlight than many other mainstream 15.6-inch notebooks. The 4K UHD Envy 15 SKU likely offers different brightness, contrast, and color accuracy results than our FHD model, so the measurements below reflect only the FHD SKU on hand.
Backlight bleeding is moderate around the top corners and it extends slightly towards the center of the screen. This only becomes noticeable if displaying a completely black background or during movie playback with black borders and is otherwise not an issue when browsing or word processing.


| |||||||||||||||||||||||||
Brightness Distribution: 83 %
Center on Battery: 262.3 cd/m²
Contrast: 1093:1 (Black: 0.24 cd/m²)
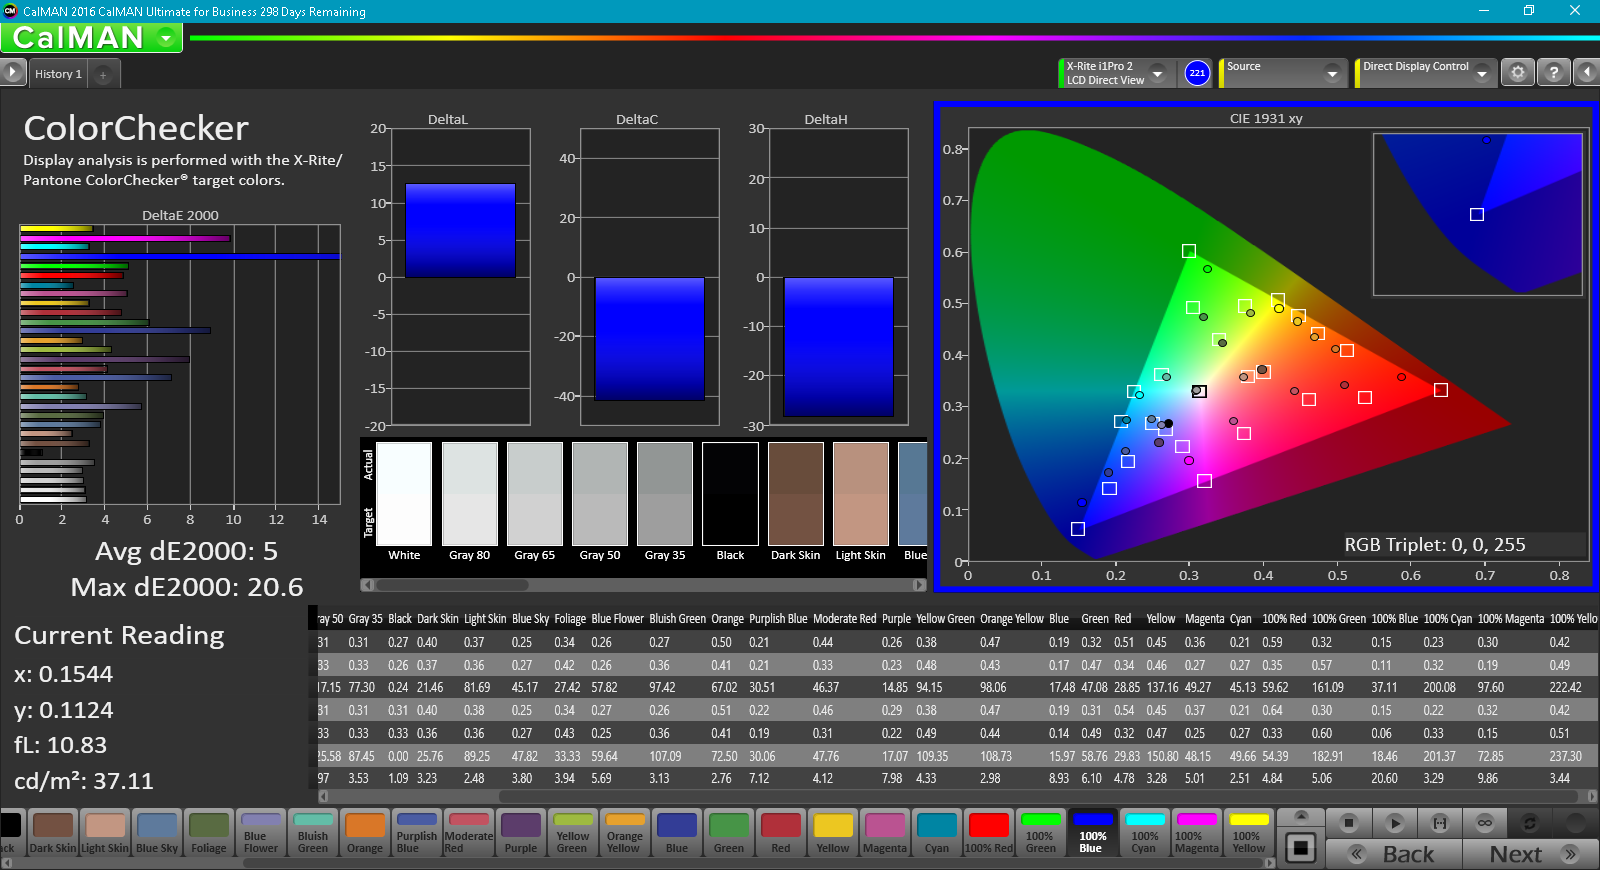
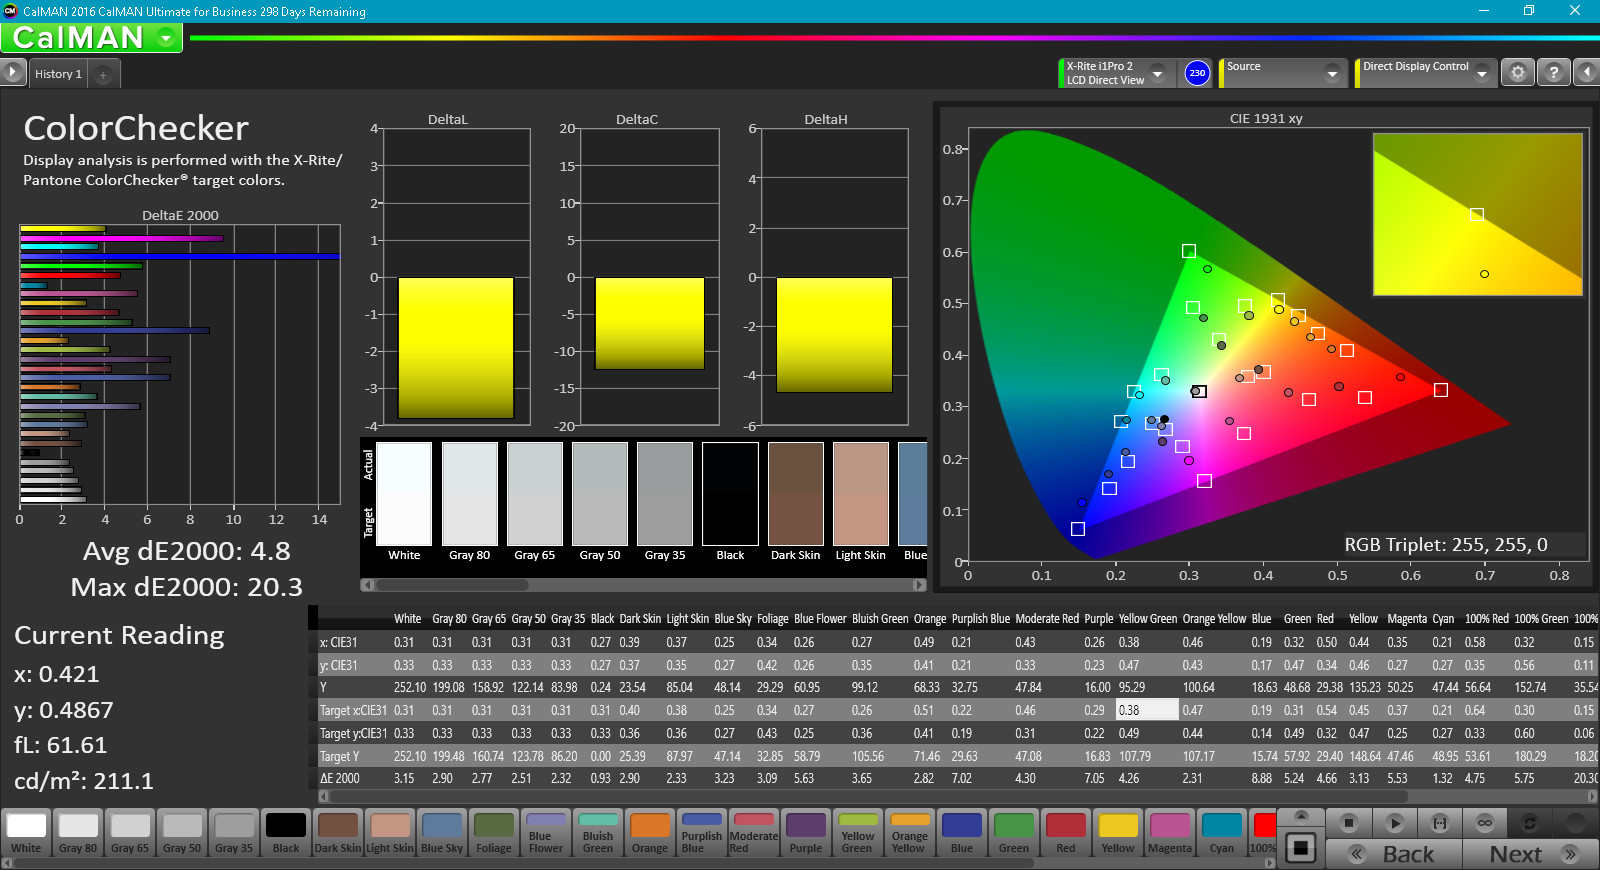
ΔE ColorChecker Calman: 5 | ∀{0.5-29.43 Ø4.71}
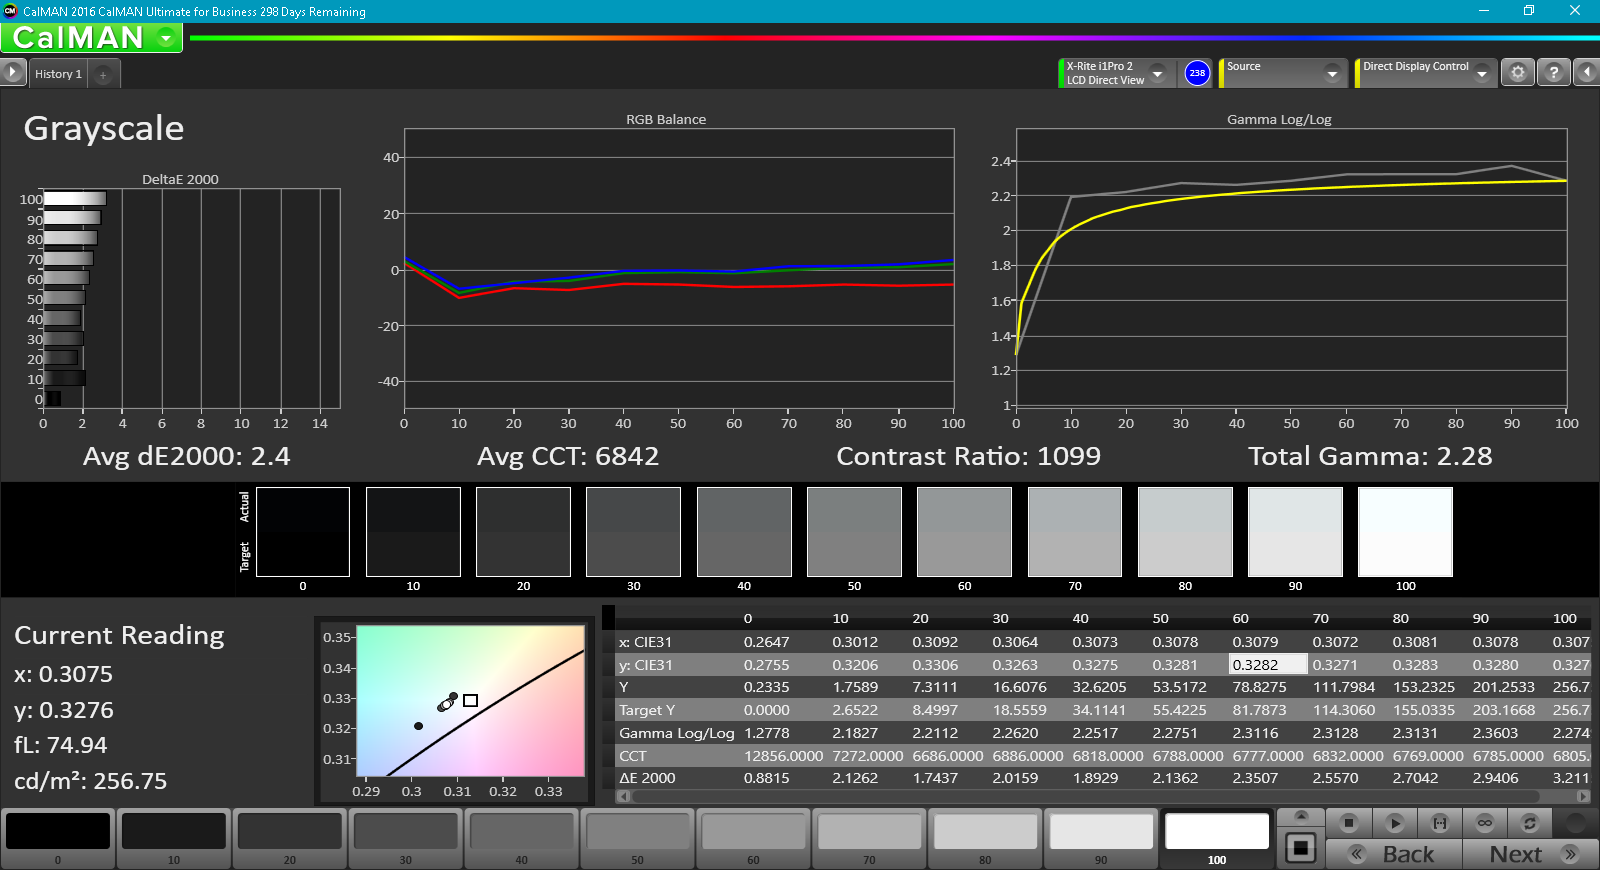
ΔE Greyscale Calman: 3.2 | ∀{0.09-98 Ø4.96}
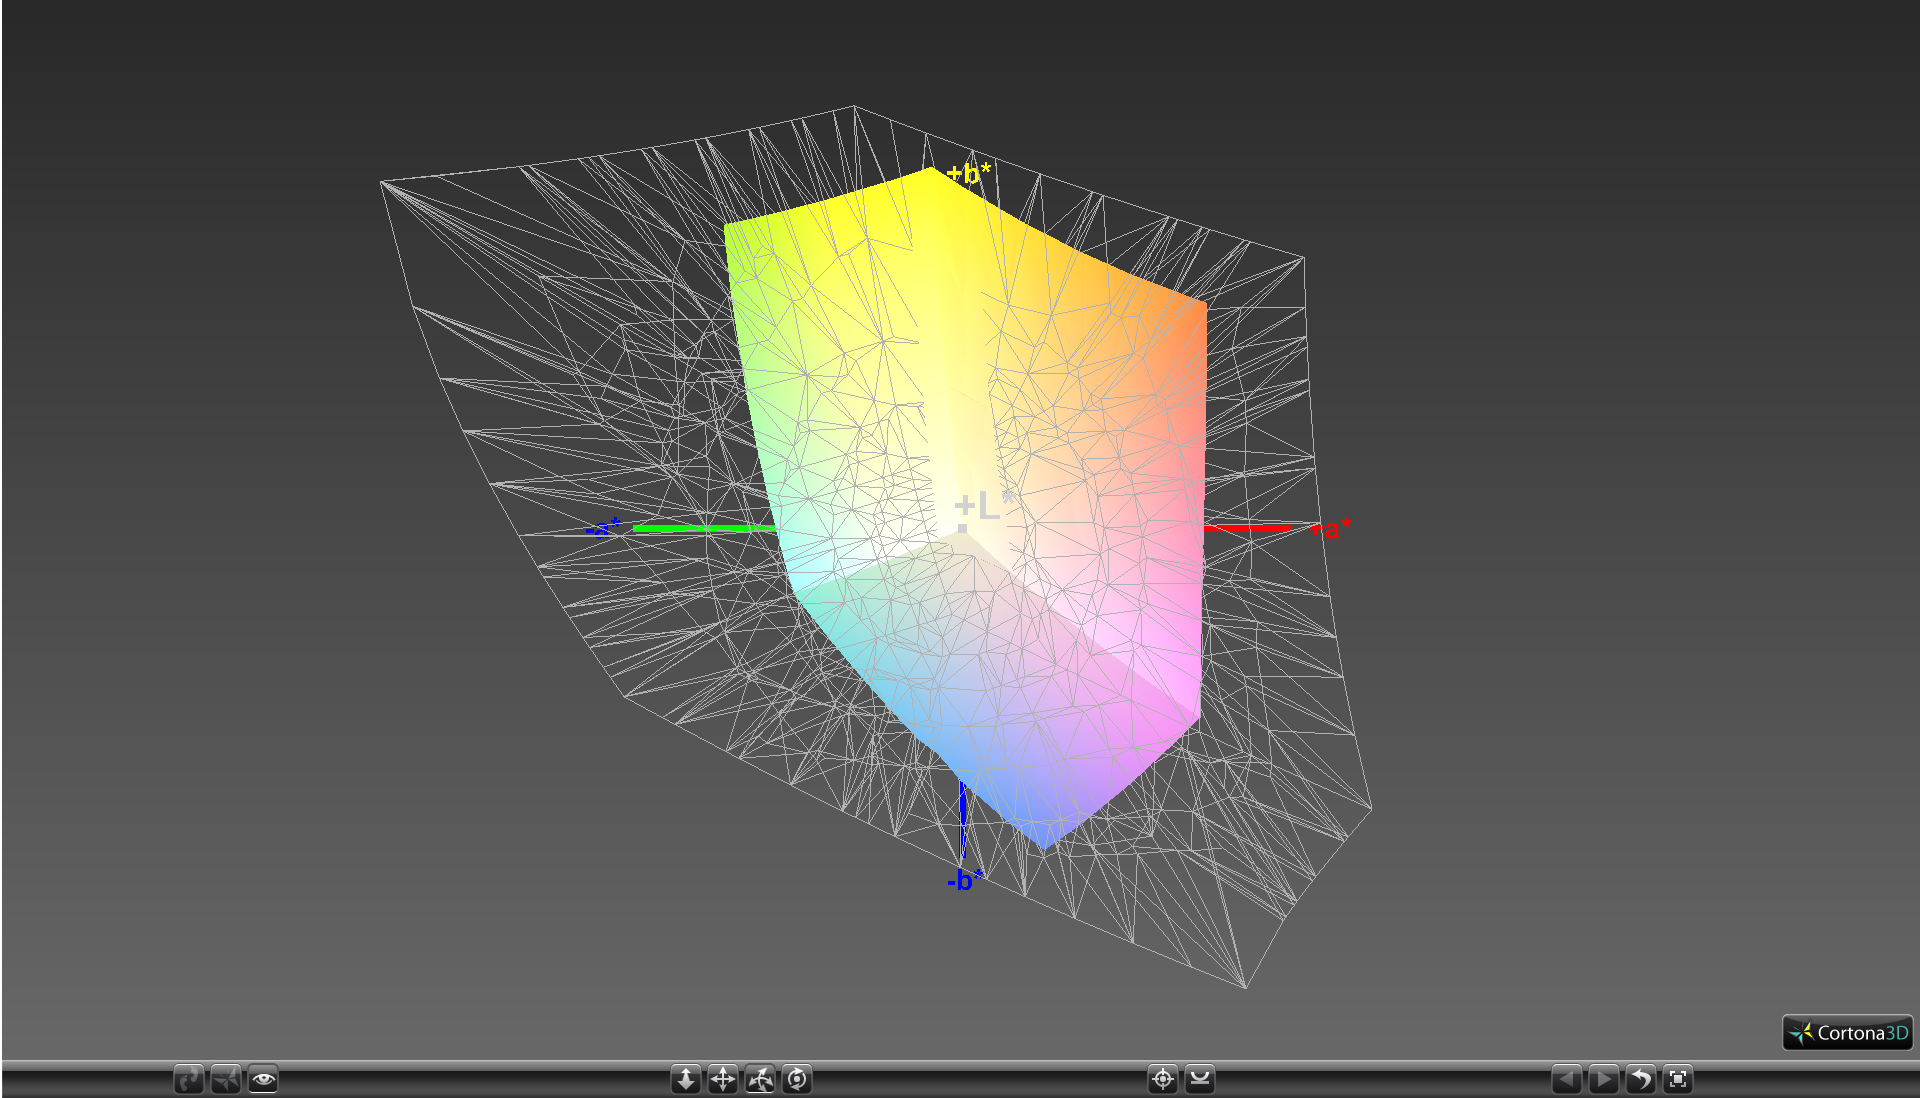
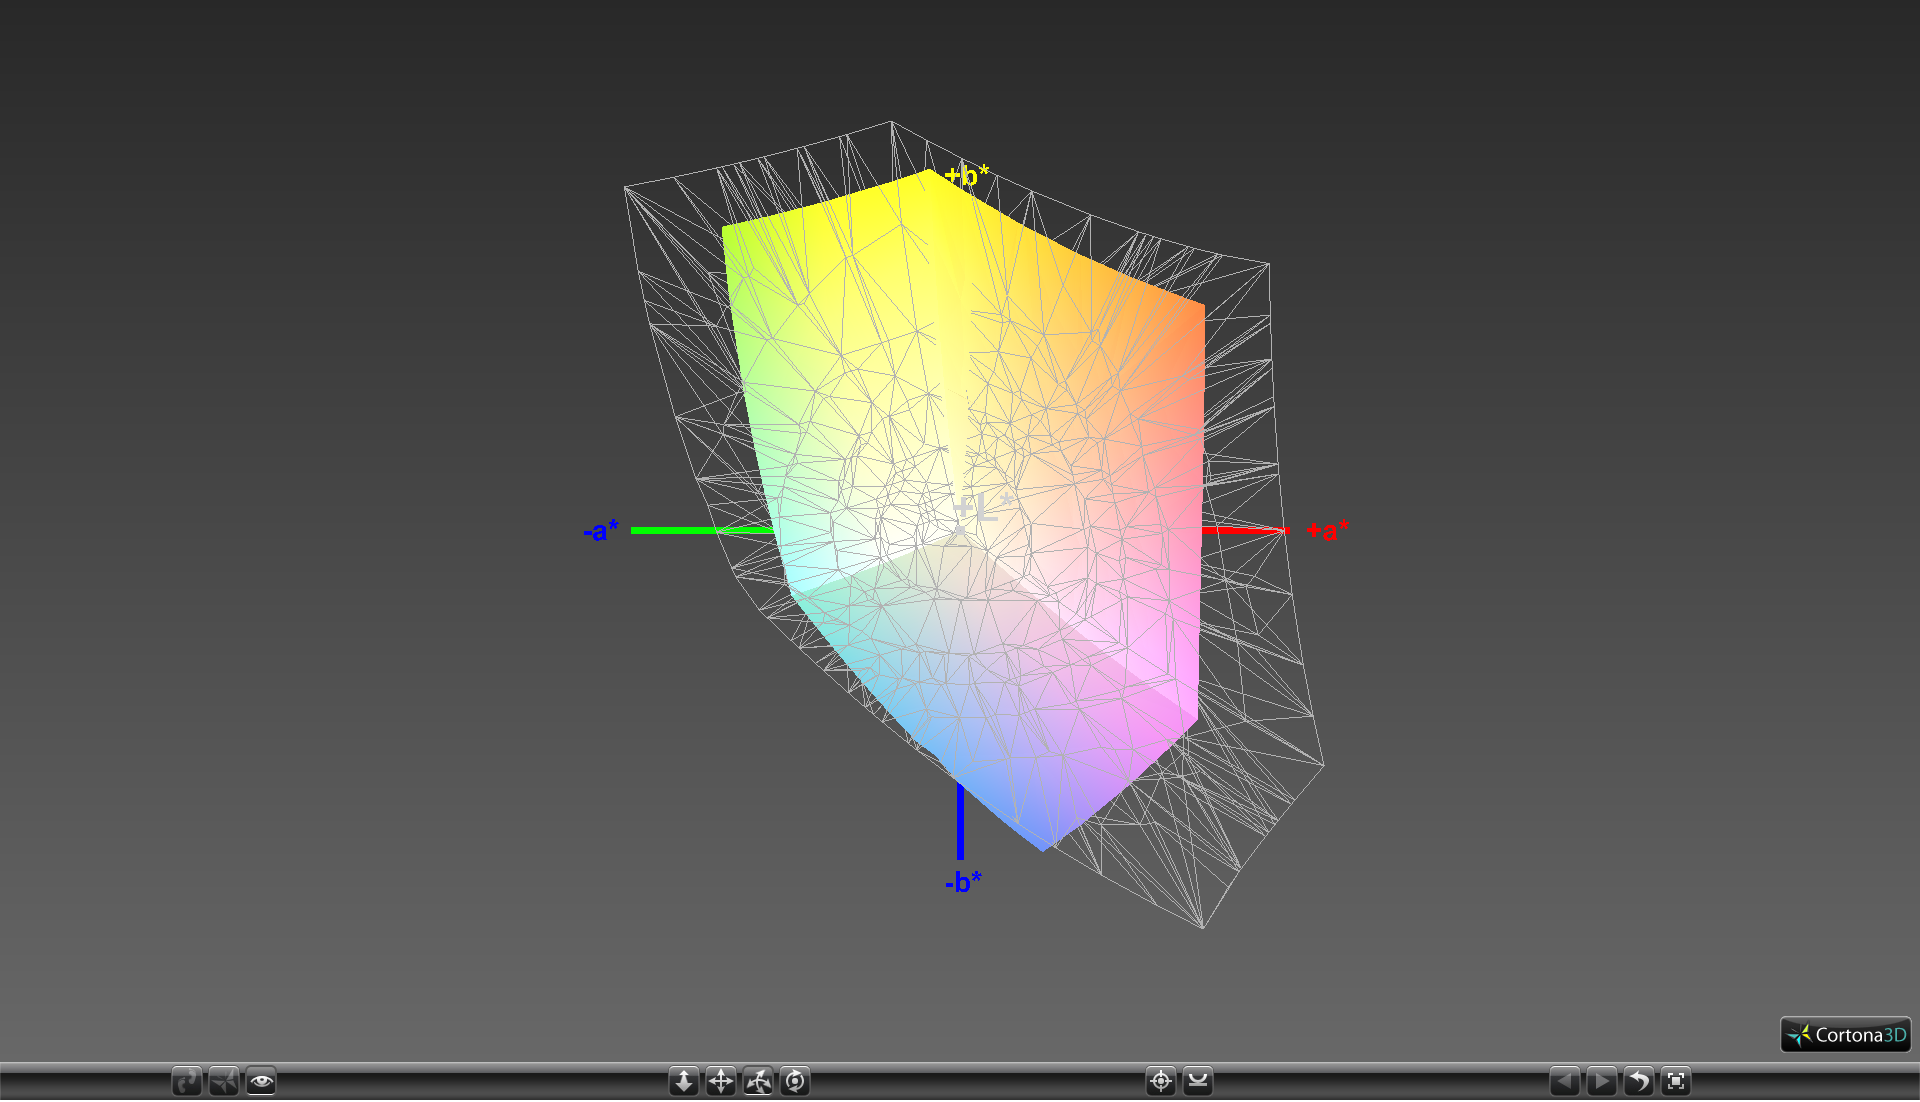
63.5% sRGB (Argyll 1.6.3 3D)
40.5% AdobeRGB 1998 (Argyll 1.6.3 3D)
44.41% AdobeRGB 1998 (Argyll 3D)
64.3% sRGB (Argyll 3D)
42.95% Display P3 (Argyll 3D)
Gamma: 2.45
CCT: 6817 K
| HP Envy 15-as133cl Chi Mei CMN15D8, IPS, 15.6", 1920x1080 | Dell XPS 15 2017 9560 (7300HQ, Full-HD) Sharp SHP1453 LQ156M1, LED IGZO IPS InfinityEdge, 15.6", 1920x1080 | HP 15-ba077ng BOE, TN LED, 15.6", 1920x1080 | Acer Aspire E15 E5-553G-109A Chi Mei CMN15C4 / N156HGE-EAB, TN LED, 15.6", 1920x1080 | HP Pavilion 15t-au100 CTO (W0P31AV) BOE0693, IPS, 15.6", 1920x1080 | Lenovo Ideapad 310-15IKB BOE NT156FHM-N31, TN LED, 15.6", 1920x1080 | |
|---|---|---|---|---|---|---|
| Display | 58% | -7% | -8% | 1% | -11% | |
| Display P3 Coverage (%) | 42.95 | 68.9 60% | 39.98 -7% | 39.72 -8% | 43.27 1% | 38.07 -11% |
| sRGB Coverage (%) | 64.3 | 98.9 54% | 60.2 -6% | 59.2 -8% | 64.9 1% | 57.3 -11% |
| AdobeRGB 1998 Coverage (%) | 44.41 | 70.9 60% | 41.31 -7% | 41.07 -8% | 44.71 1% | 39.34 -11% |
| Response Times | -49% | 16% | 28% | -4% | 17% | |
| Response Time Grey 50% / Grey 80% * (ms) | 44.4 ? | 54 ? -22% | 42 ? 5% | 42.4 ? 5% | 42 ? 5% | 43 ? 3% |
| Response Time Black / White * (ms) | 30 ? | 52.4 ? -75% | 22 ? 27% | 14.6 ? 51% | 33.6 ? -12% | 21 ? 30% |
| PWM Frequency (Hz) | 1000 ? | 50 ? | 28740 | 198.4 | ||
| Screen | 19% | -71% | -54% | -10% | -33% | |
| Brightness middle (cd/m²) | 262.3 | 400 52% | 209 -20% | 224 -15% | 186.5 -29% | 185 -29% |
| Brightness (cd/m²) | 240 | 392 63% | 200 -17% | 201 -16% | 174 -27% | 184 -23% |
| Brightness Distribution (%) | 83 | 89 7% | 88 6% | 75 -10% | 69 -17% | 95 14% |
| Black Level * (cd/m²) | 0.24 | 0.26 -8% | 0.56 -133% | 0.46 -92% | 0.18 25% | 0.28 -17% |
| Contrast (:1) | 1093 | 1538 41% | 373 -66% | 487 -55% | 1036 -5% | 661 -40% |
| Colorchecker dE 2000 * | 5 | 4.9 2% | 12.21 -144% | 10.5 -110% | 5.7 -14% | 8.07 -61% |
| Colorchecker dE 2000 max. * | 20.6 | 11 47% | 20.66 -0% | 16.8 18% | 22.5 -9% | 14.83 28% |
| Greyscale dE 2000 * | 3.2 | 7.2 -125% | 13.48 -321% | 11.23 -251% | 4.4 -38% | 8.83 -176% |
| Gamma | 2.45 90% | 2.11 104% | 2.34 94% | 2.12 104% | 2.35 94% | 2.47 89% |
| CCT | 6817 95% | 6911 94% | 15364 42% | 11096 59% | 6963 93% | 10628 61% |
| Color Space (Percent of AdobeRGB 1998) (%) | 40.5 | 64.2 59% | 38 -6% | 38 -6% | 44.71 10% | 36.2 -11% |
| Color Space (Percent of sRGB) (%) | 63.5 | 98.9 56% | 60 -6% | 59 -7% | 64.95 2% | 57 -10% |
| Total Average (Program / Settings) | 9% /
18% | -21% /
-46% | -11% /
-34% | -4% /
-7% | -9% /
-22% |
* ... smaller is better
Color space is approximately 41 percent and 64 percent of the sRGB and AdobeRGB standards, respectively. This is similar to the displays of the HP 15, HP Pavilion 15t, and Lenovo Ideapad 310 even though these three make use of TN panels instead. IPS panels on certain Ultrabooks and pricier alternatives can offer deeper and more accurate colors to appeal to graphics artists such as on the new Dell XPS 15 9560.

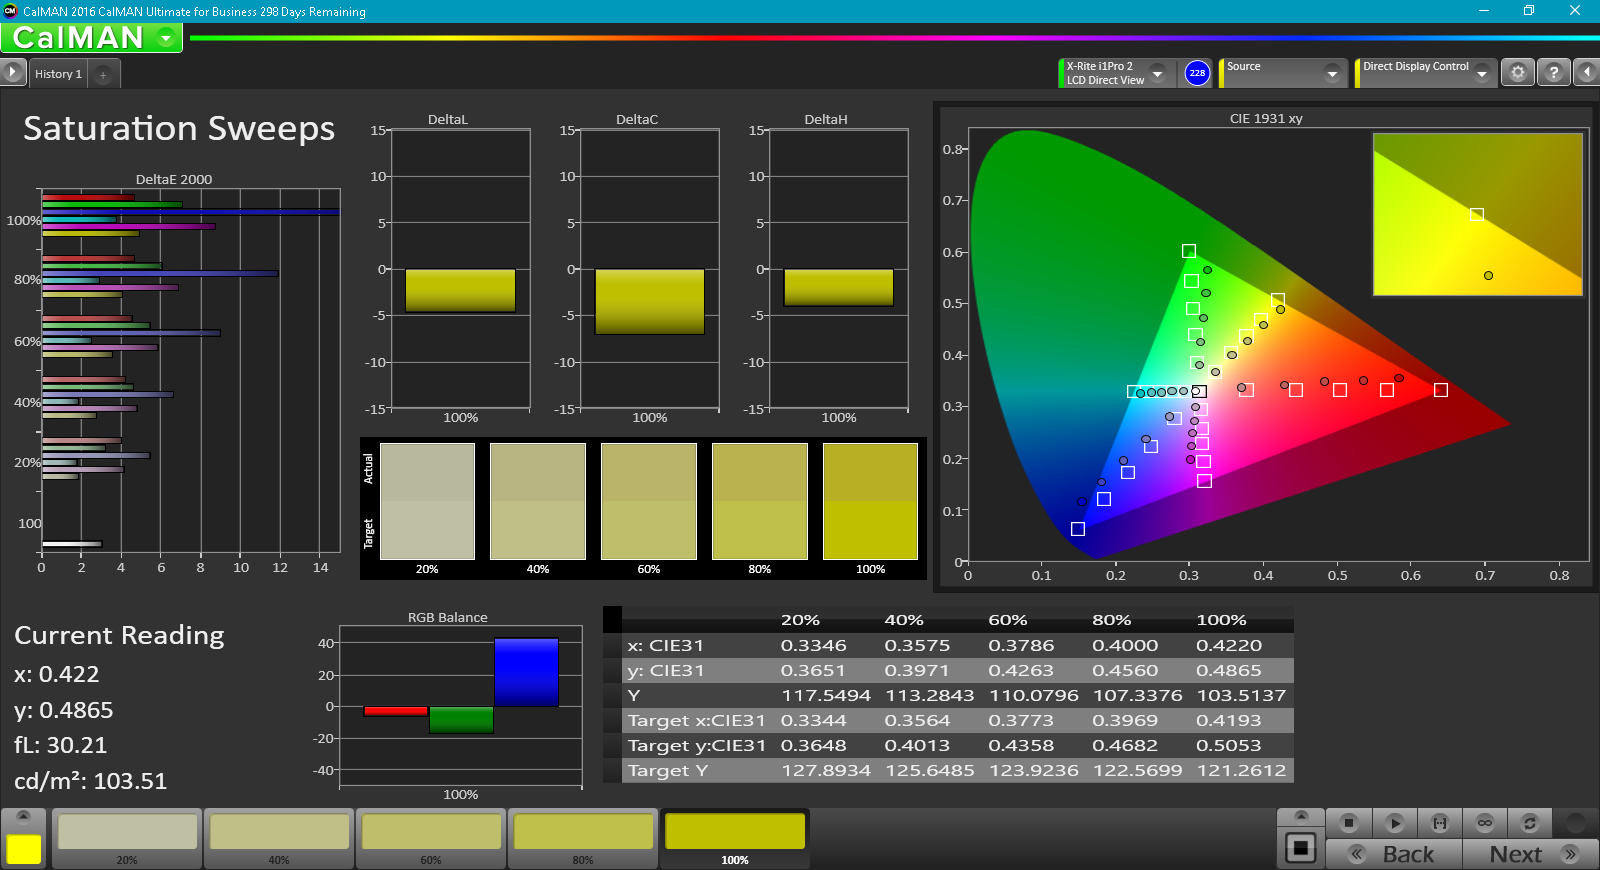
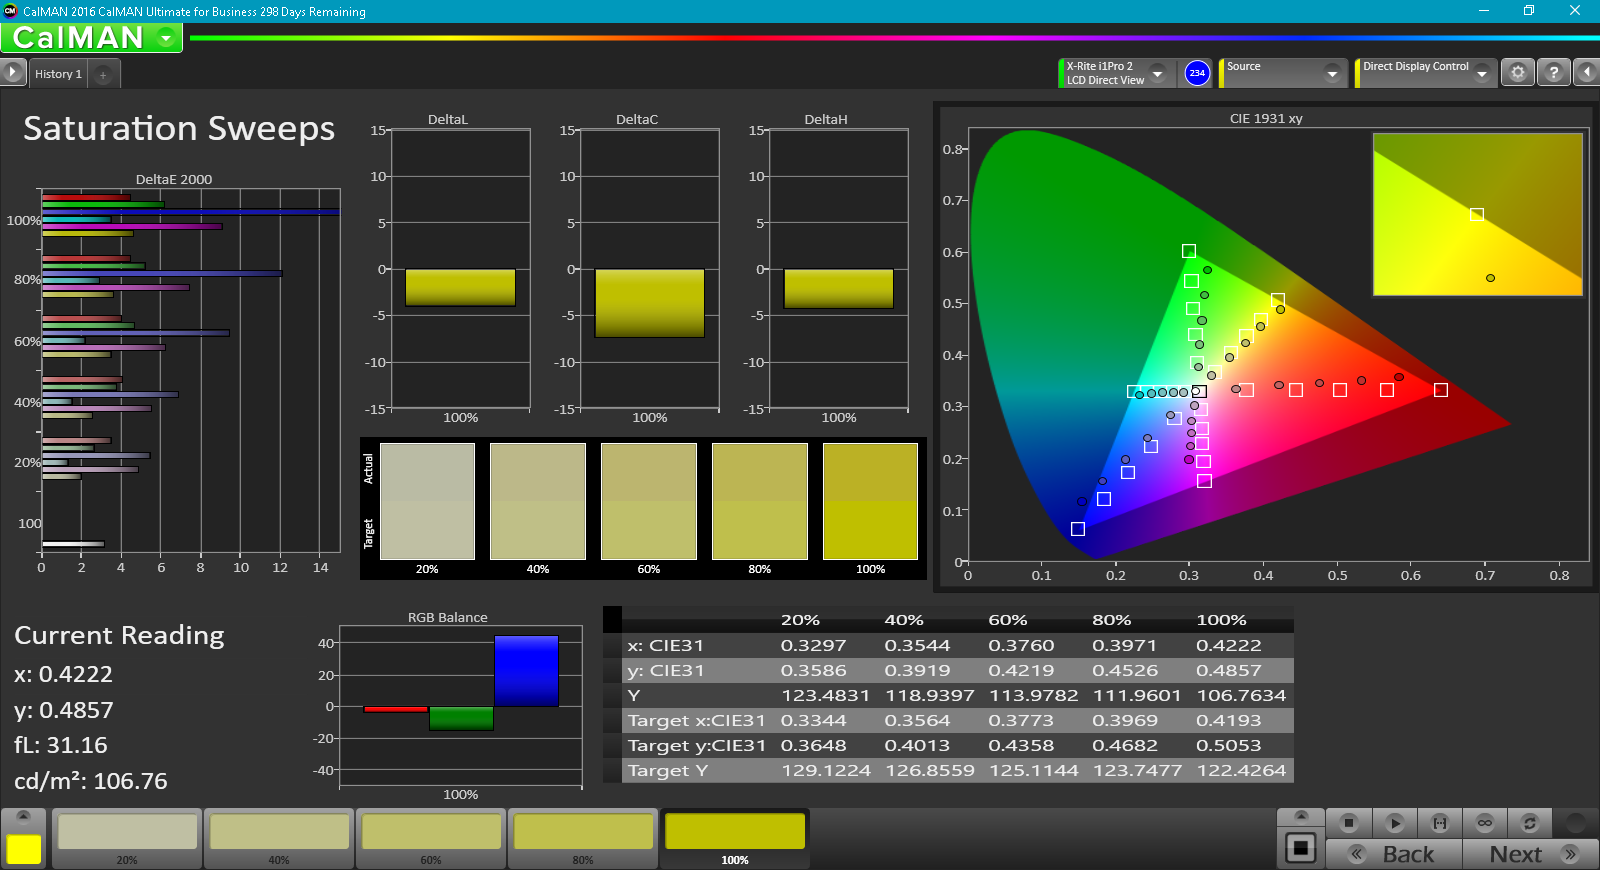
Colors and grayscale are generally accurate out of the box with an acceptable color temperature that's not too warm or cool. A calibration with a X-Rite spectrophotometer will still improve grayscale and RGB balance, but one noticeable problem remains: Pure blue appears to be more blue-violet and more inaccurate than other colors according to our saturation and color test results below. All colors on the Envy 15 become more inaccurate the higher the saturation level due to the panel's low sRGB coverage.

Display Response Times
| ↔ Response Time Black to White | ||
|---|---|---|
| 30 ms ... rise ↗ and fall ↘ combined | ↗ 6.4 ms rise | 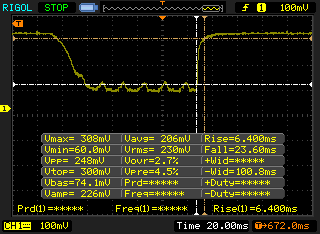 |
| ↘ 23.6 ms fall | ||
| The screen shows slow response rates in our tests and will be unsatisfactory for gamers. In comparison, all tested devices range from 0.1 (minimum) to 240 (maximum) ms. » 80 % of all devices are better. This means that the measured response time is worse than the average of all tested devices (19.8 ms). | ||
| ↔ Response Time 50% Grey to 80% Grey | ||
| 44.4 ms ... rise ↗ and fall ↘ combined | ↗ 16 ms rise | 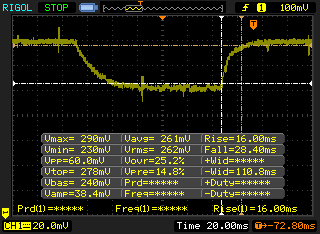 |
| ↘ 28.4 ms fall | ||
| The screen shows slow response rates in our tests and will be unsatisfactory for gamers. In comparison, all tested devices range from 0.165 (minimum) to 636 (maximum) ms. » 76 % of all devices are better. This means that the measured response time is worse than the average of all tested devices (31 ms). | ||
Screen Flickering / PWM (Pulse-Width Modulation)
| Screen flickering / PWM detected | 1000 Hz | ≤ 99 % brightness setting | 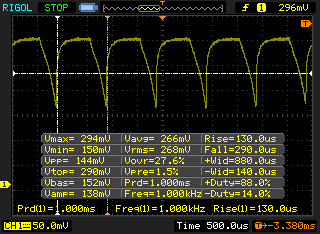 |
The display backlight flickers at 1000 Hz (worst case, e.g., utilizing PWM) Flickering detected at a brightness setting of 99 % and below. There should be no flickering or PWM above this brightness setting. The frequency of 1000 Hz is quite high, so most users sensitive to PWM should not notice any flickering. In comparison: 52 % of all tested devices do not use PWM to dim the display. If PWM was detected, an average of 7754 (minimum: 5 - maximum: 343500) Hz was measured. | |||
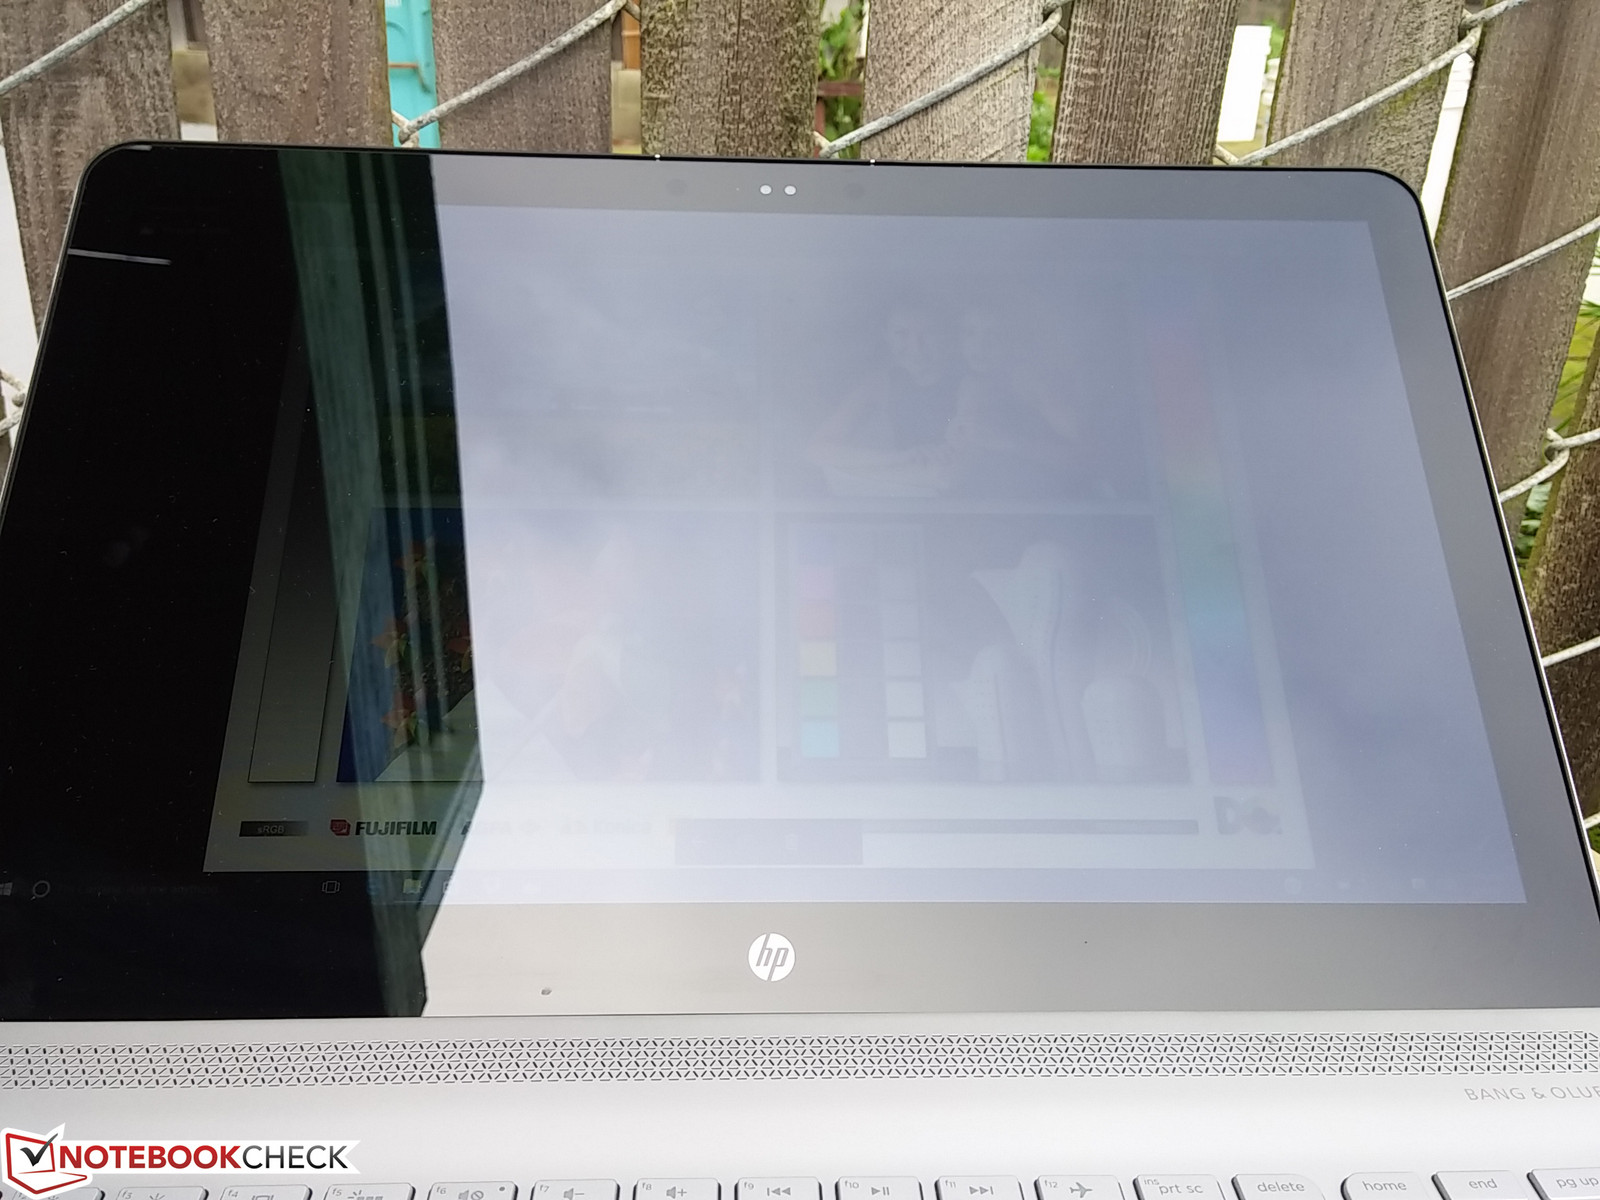
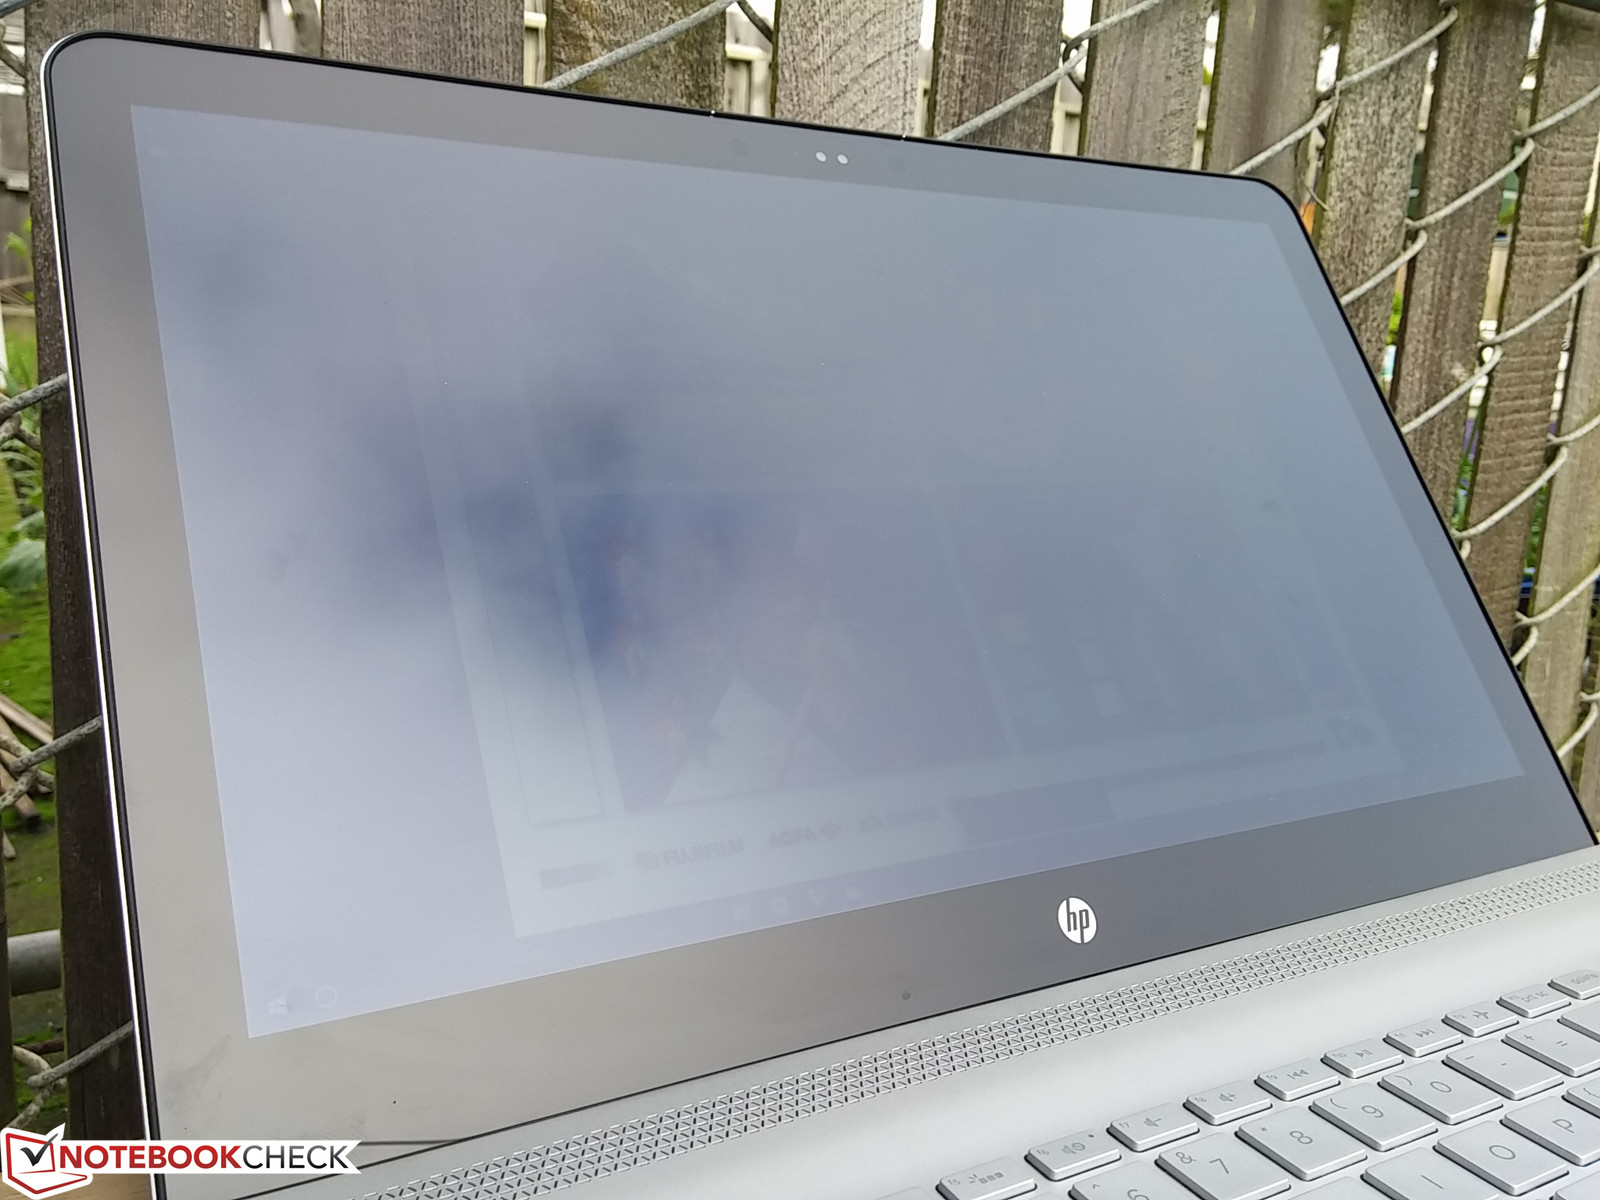
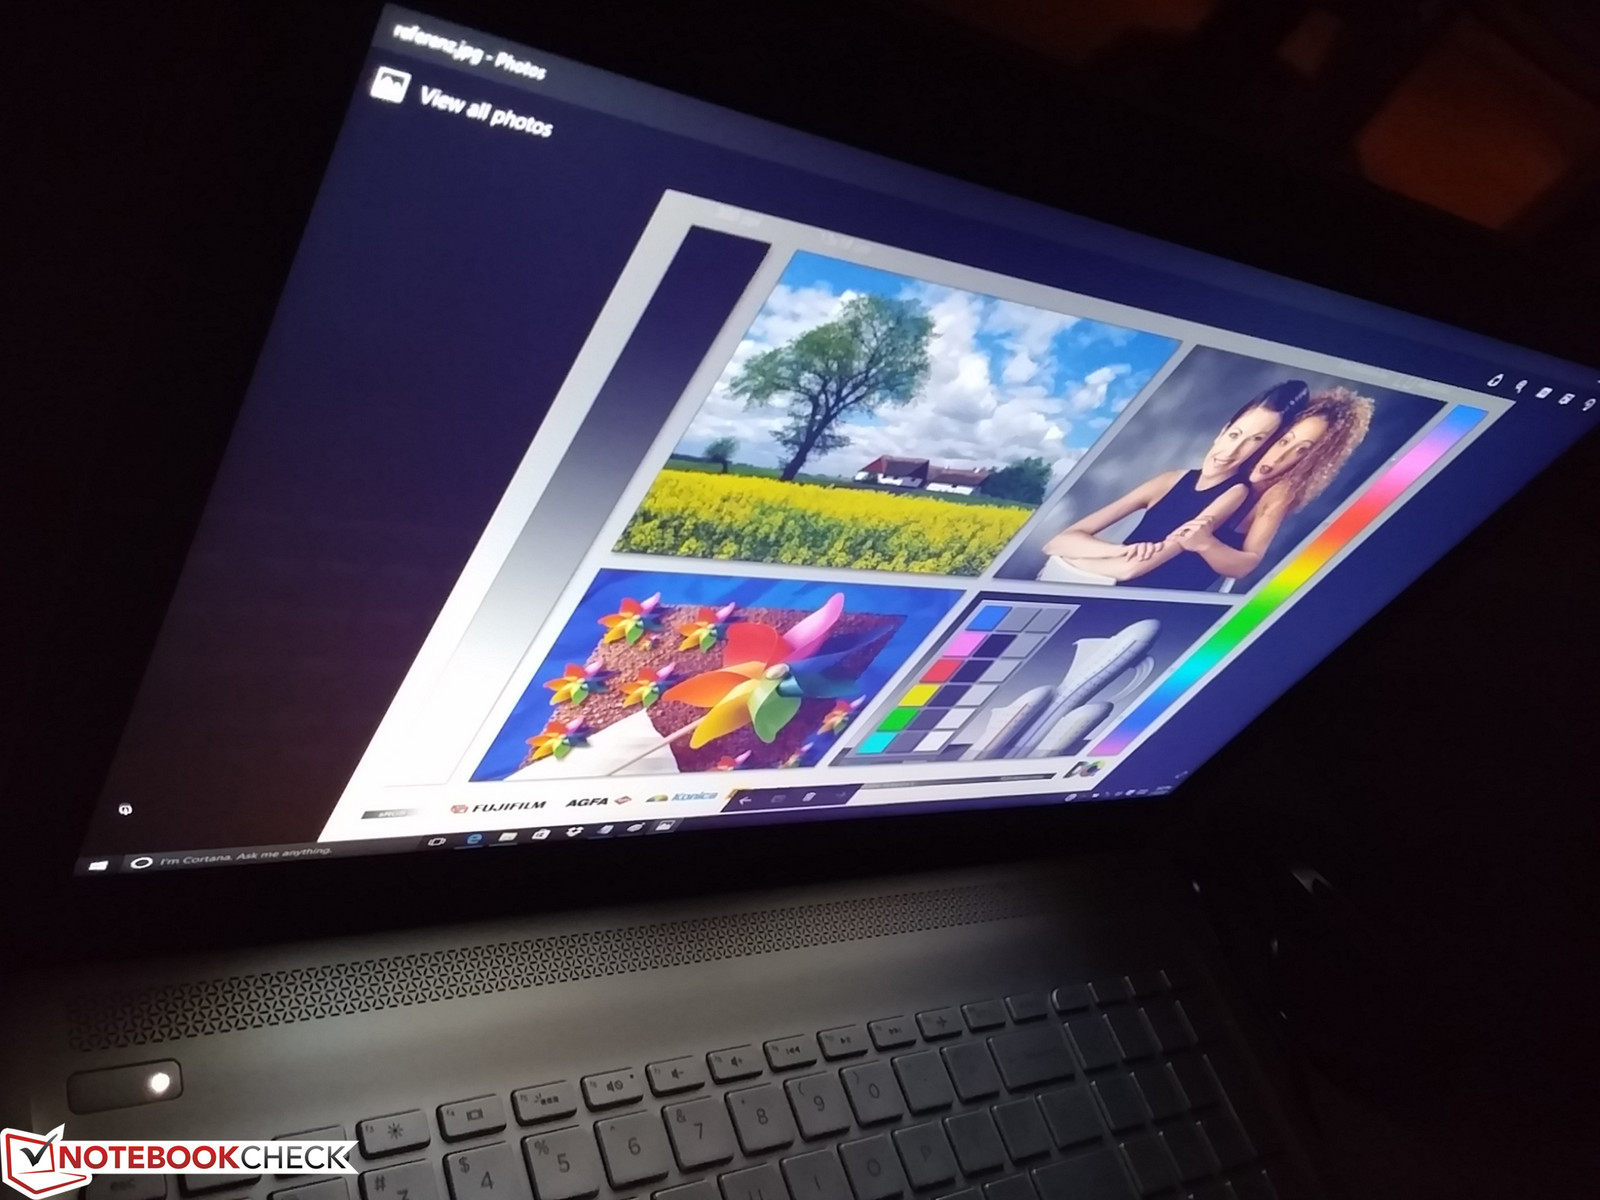
Outdoor visibility is limited to areas under shade as even a cloudy day is enough to overcome the backlight and cause distracting glare. The glossy panel works against the notebook when under these conditions, so users will be forced to exploit the wide viewing angles to reduce glare as much as possible. Apparent brightness drops if viewing too far off angle and darker areas of the screen can appear slightly purple.
Performance
Configurable options for the Envy 15 are wide including two Kaby Lake CPUs (i7-7500U or i7-7560U), FHD or 4K UHD, 8 GB to 12 GB of RAM, and multiple storage options from 256 GB NVMe SSDs to dual HDD+SSD combinations. The i7-7500U in our test unit can run up to its maximum 3.5 GHz clock rate for very short periods.
All current SKUs make use of a touchscreen with no non-touch matte options, which is somewhat aggravating given that the Envy 15 offers no specialized 360-degree hinges to maximize the usefulness of a touchscreen.
Processor
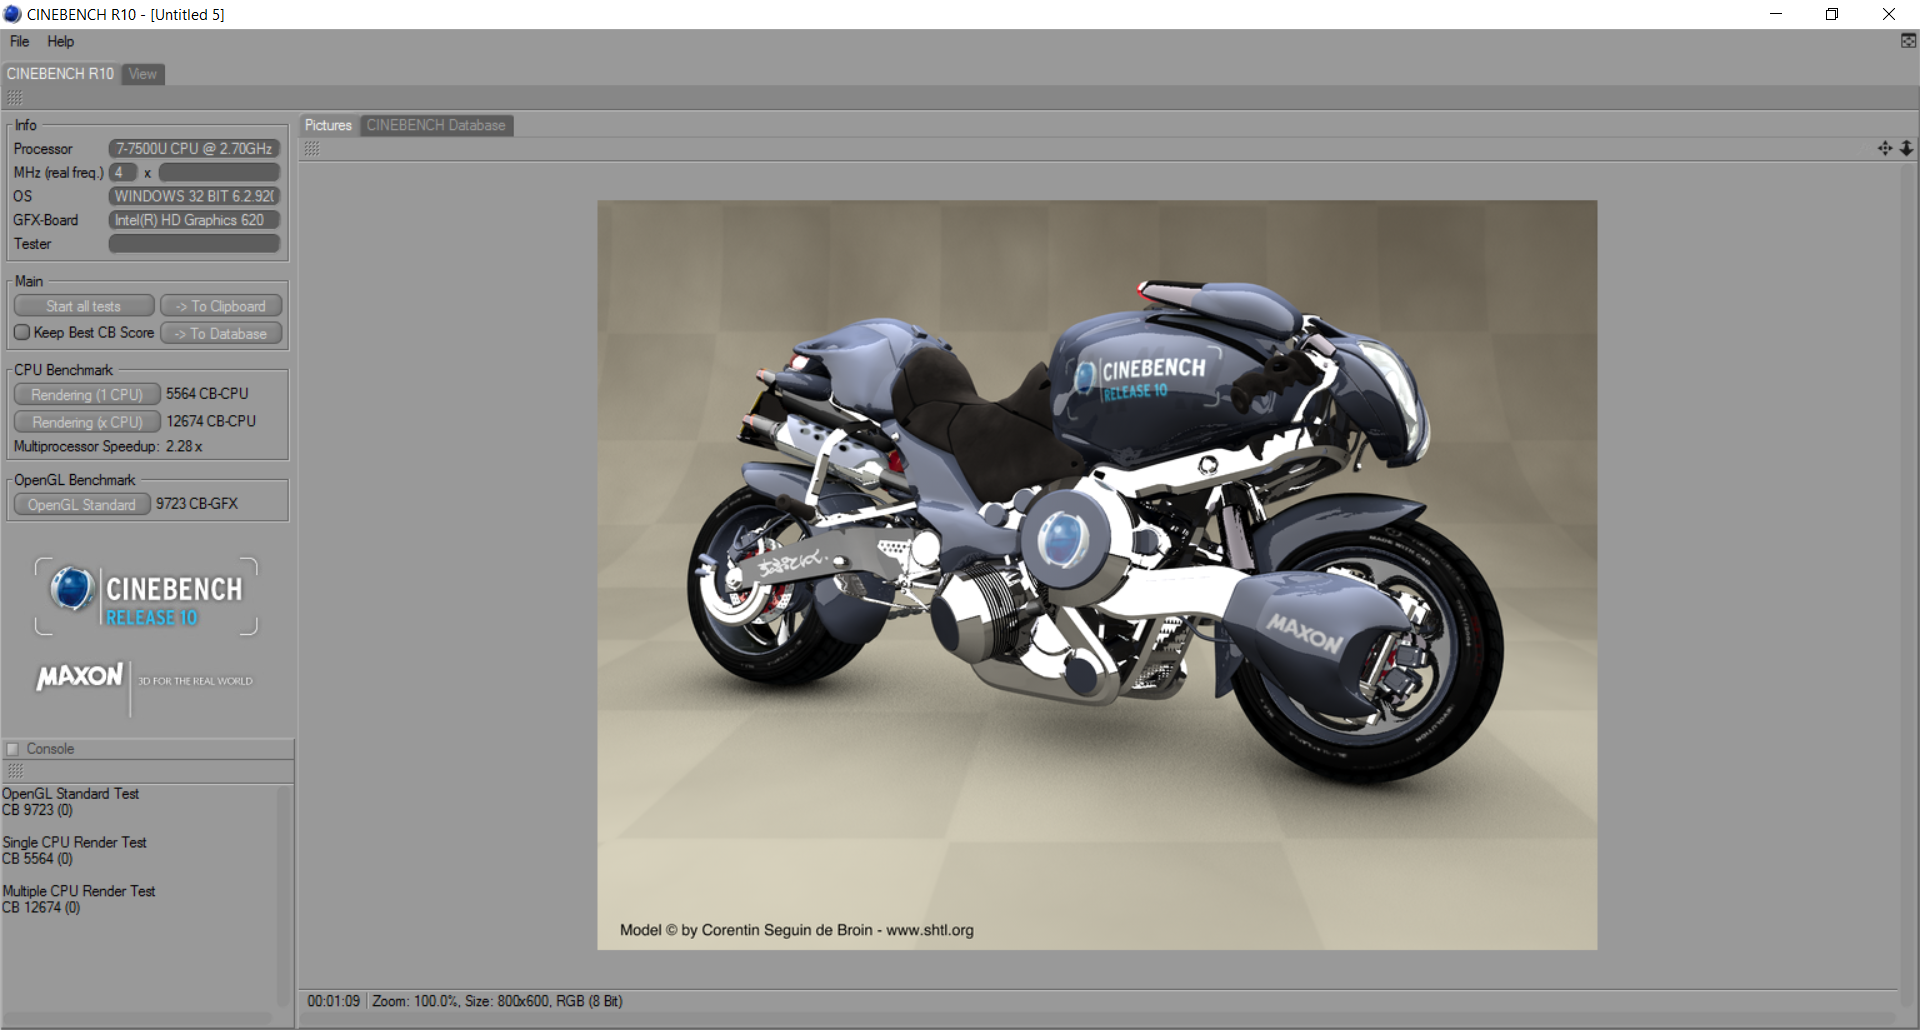
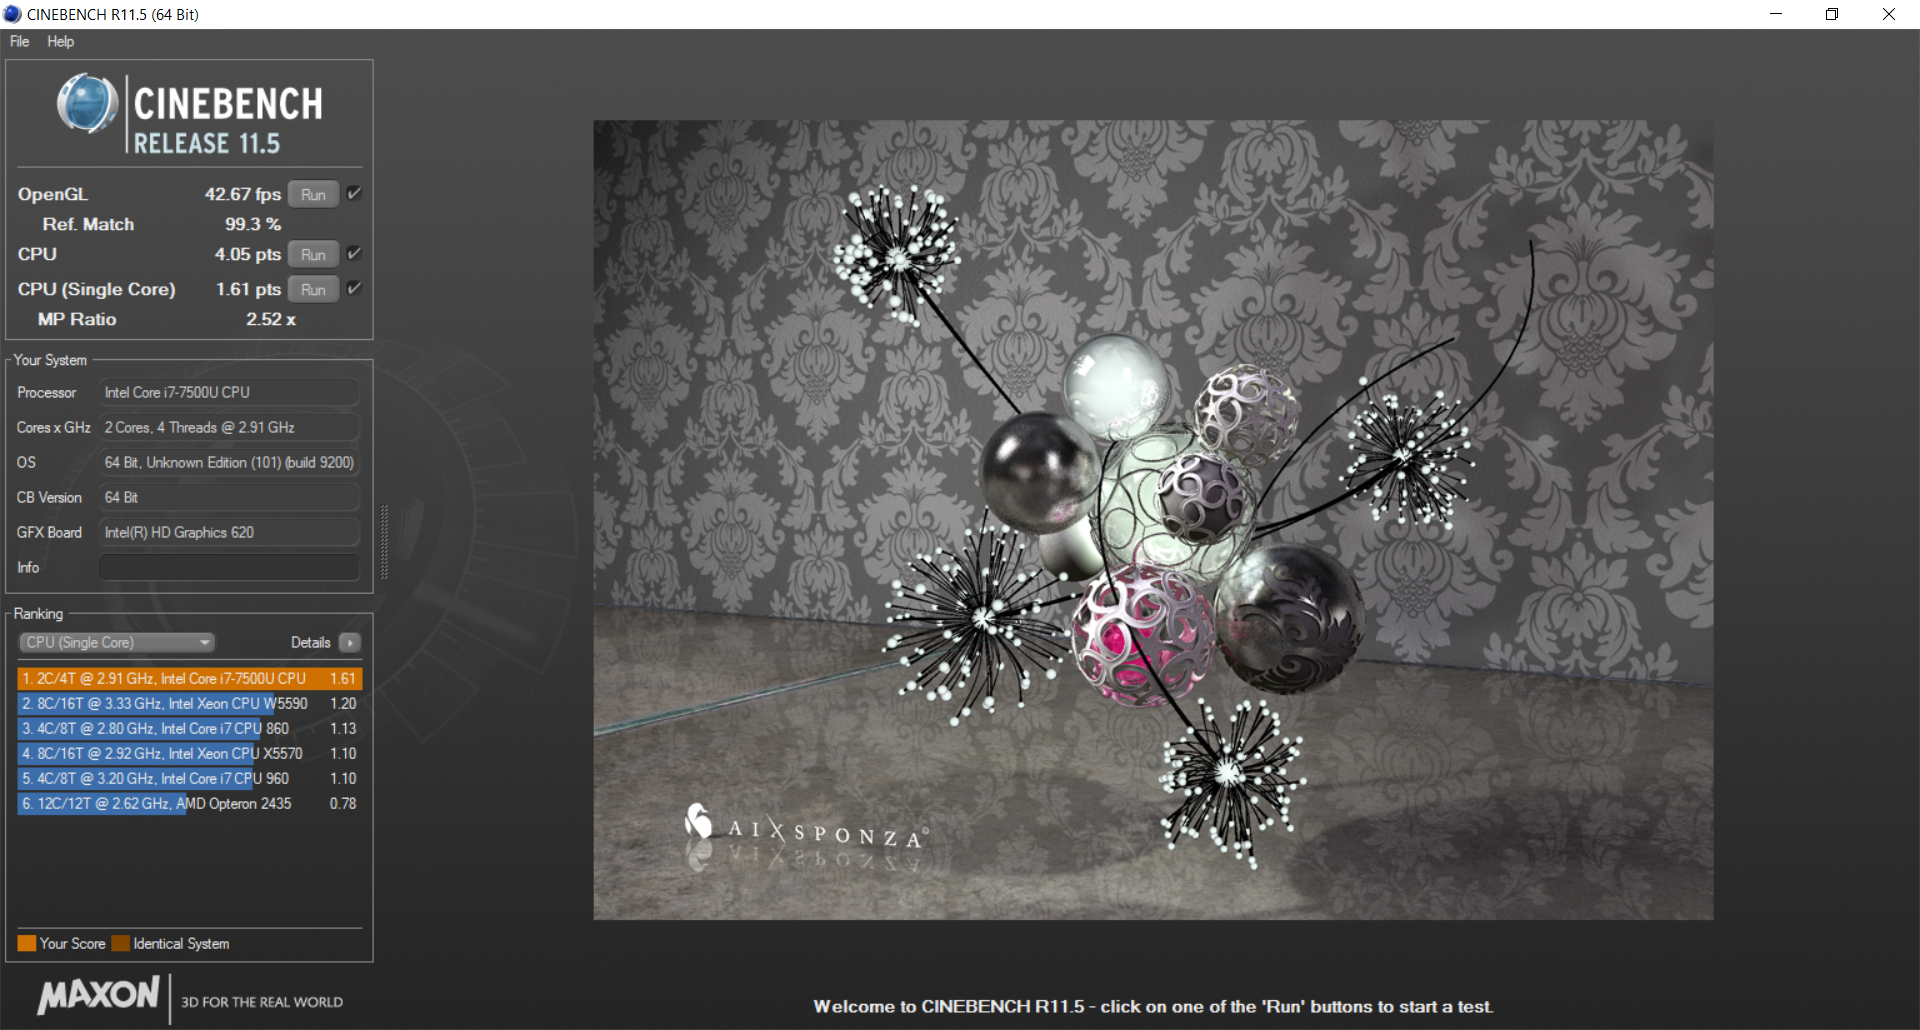
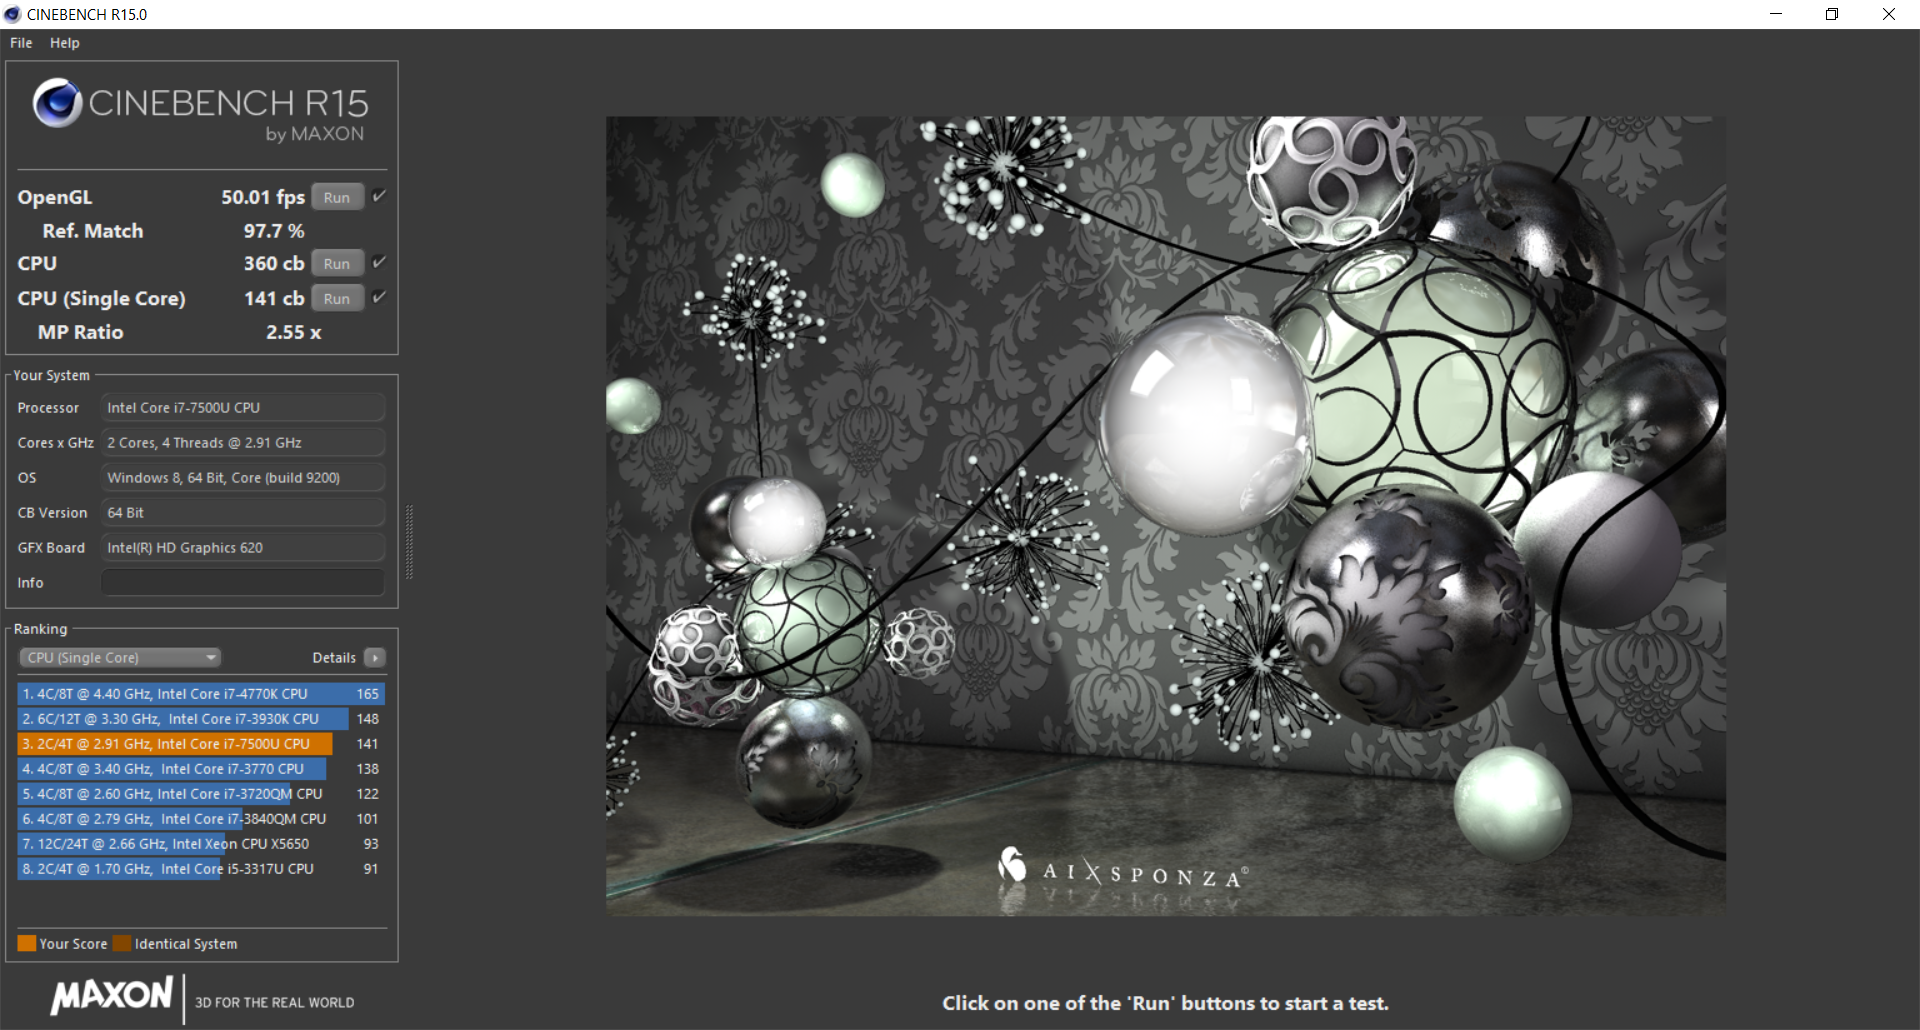
The i7-7500U is a common processor of choice on newer Ultrabooks and it performs where we expect it to be on the Envy 15 at about 8 to 10 percent ahead of the outgoing i7-6500U according to CineBench benchmarks. The raw CPU performance benefits have been very incremental and steady between each successive Core generation despite the jumps to smaller fabrication methods over the years. When compared to the much older Haswell i5-4200U, for example, users can expect a performance jump of about 50 percent for both single- and multi-threaded loads. Proper HQ-class quad-core processors of previous generations can easily outperform the latest ULV Kaby Lake CPU especially in multi-threaded workloads.
See our dedicated CPU page on the Core i7-7500U for more technical information and benchmark comparisons.
| wPrime 2.10 - 1024m | |
| Lenovo Y40-59423035 | |
| Fujitsu LifeBook A557 PL | |
| HP Envy 15-as133cl | |
| Super Pi Mod 1.5 XS 32M - 32M | |
| Lenovo Y40-59423035 | |
| Fujitsu LifeBook A557 PL | |
| HP Envy 15-as133cl | |
* ... smaller is better
System Performance
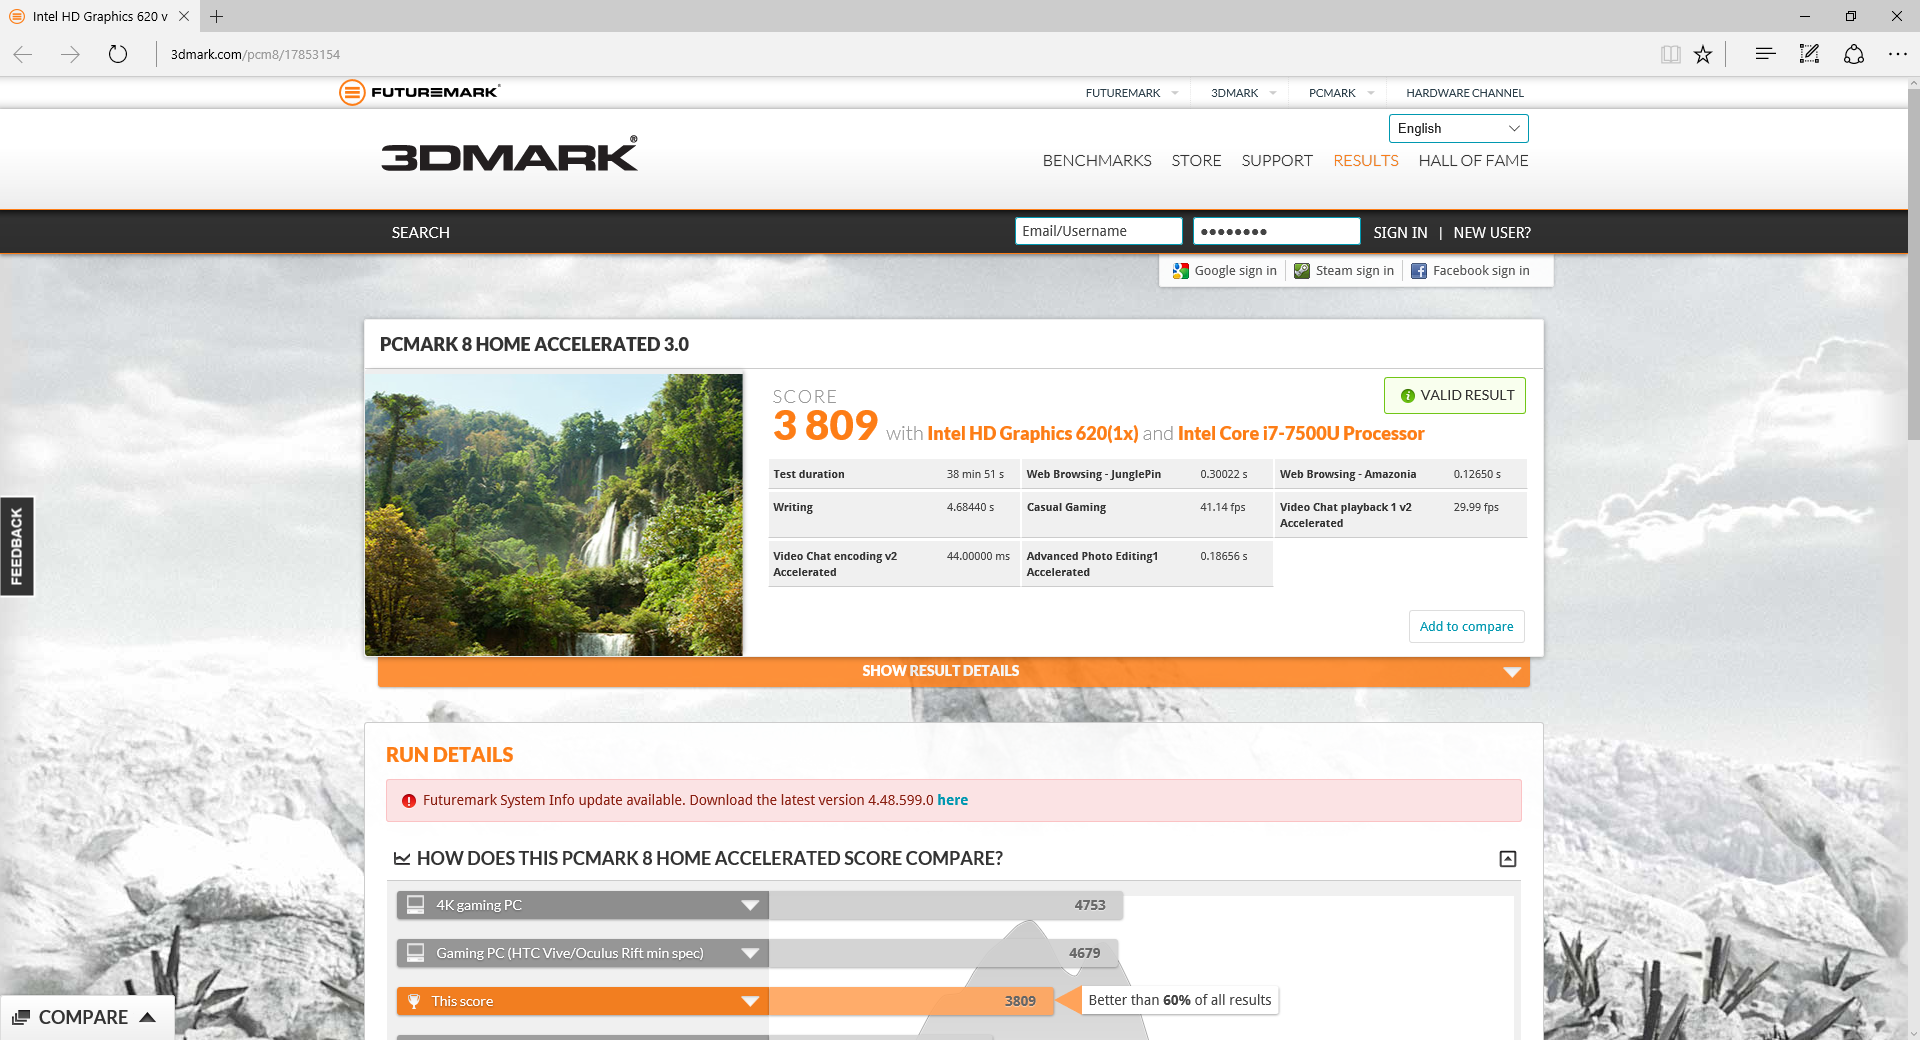
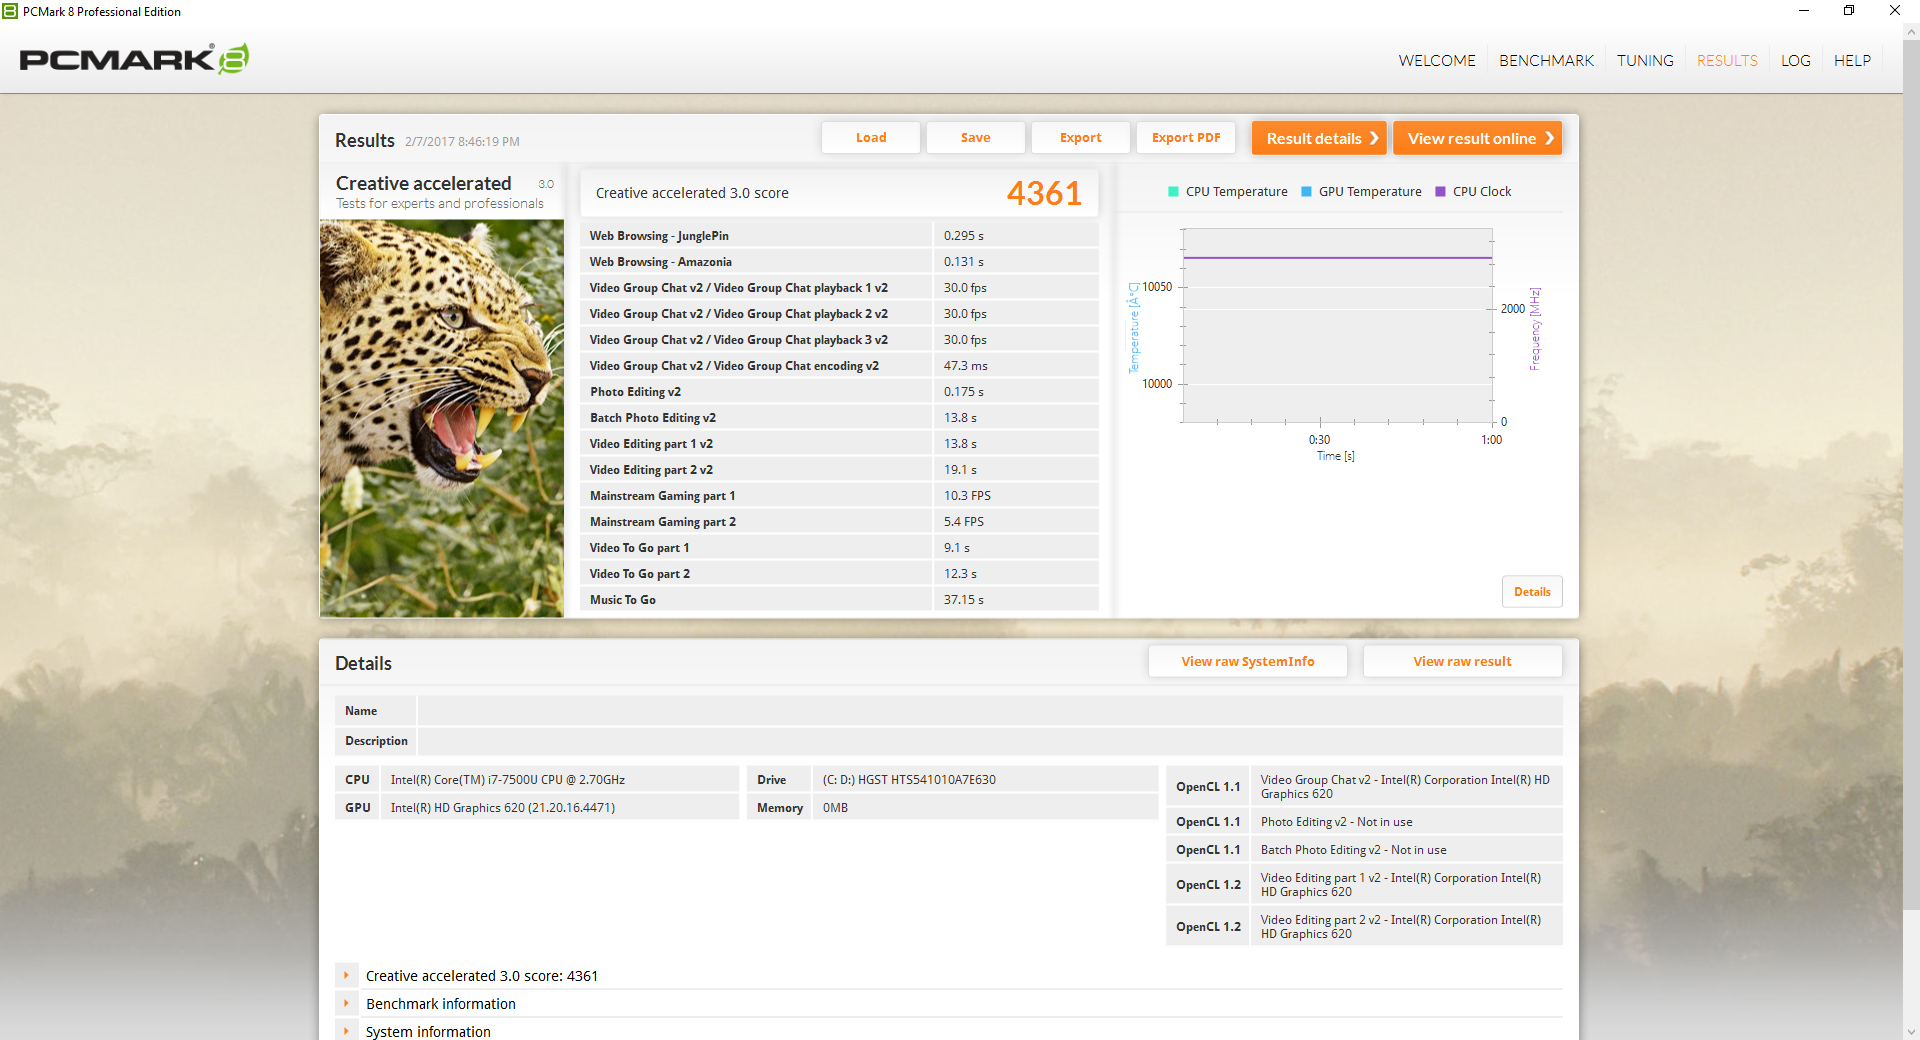
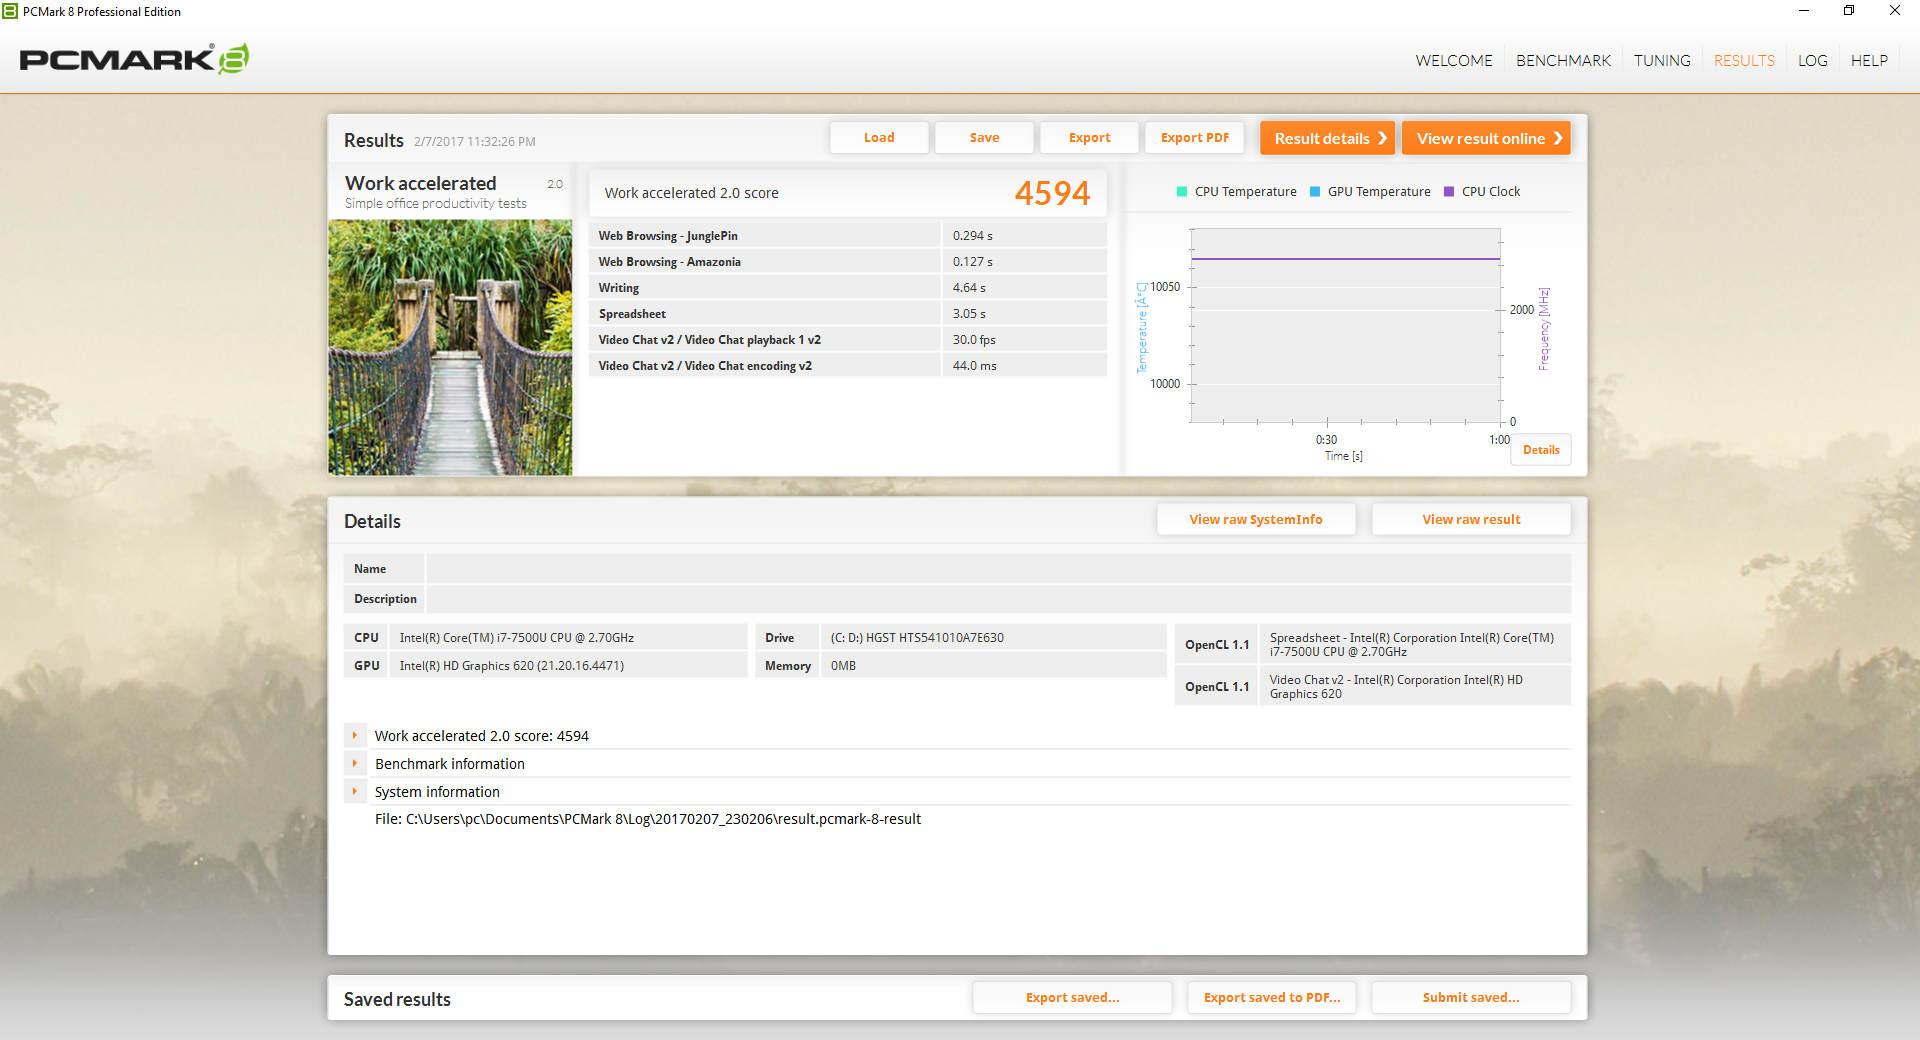
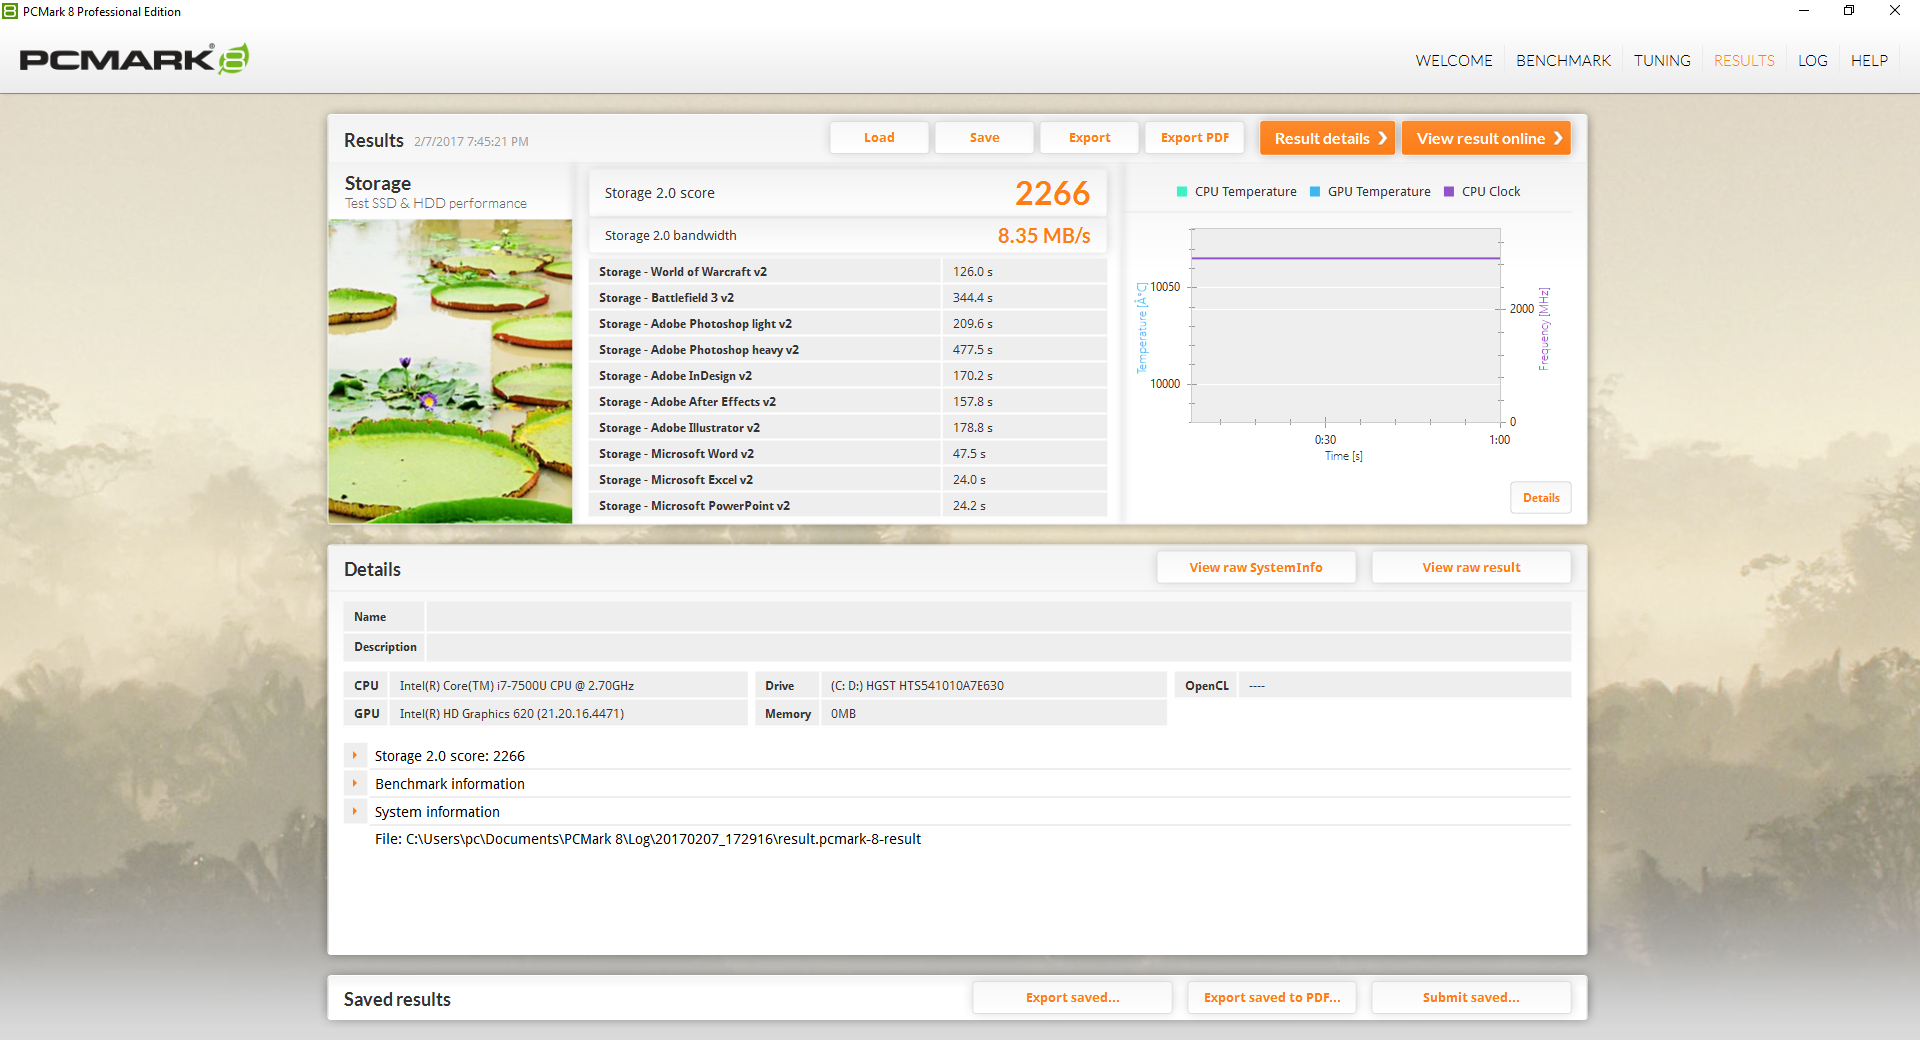
PCMark 8 ranks our Envy 15 in the same ballpark as other systems with ULV Skylake or Kaby Lake CPUs like the Zenbook UX310UQ or the Acer TravelMate P249. Subjectively, system performance is fast when navigating through the OS, but launching applications is somewhat slow and limited by the mechanical drive. The drive can frequently be heard operating and seeking when opening programs. Otherwise, we experienced no other software or hardware issues on our test unit.
| PCMark 8 | |
| Home Score Accelerated v2 | |
| Dell Inspiron 15 5000 5567-1753 | |
| HP Envy 15-as133cl | |
| Asus Zenbook UX310UQ-GL011T | |
| Acer TravelMate P249-M-5452 | |
| Work Score Accelerated v2 | |
| Dell Inspiron 15 5000 5567-1753 | |
| Asus Zenbook UX310UQ-GL011T | |
| HP Envy 15-as133cl | |
| Acer TravelMate P249-M-5452 | |
| Creative Score Accelerated v2 | |
| Dell Inspiron 15 5000 5567-1753 | |
| Asus Zenbook UX310UQ-GL011T | |
| HP Envy 15-as133cl | |
| Acer TravelMate P249-M-5452 | |
| PCMark 8 Home Score Accelerated v2 | 3809 points | |
| PCMark 8 Creative Score Accelerated v2 | 4361 points | |
| PCMark 8 Work Score Accelerated v2 | 4594 points | |
Help | ||
Storage Devices
Internal storage options include one M.2 NVMe SSD slot and one 2.5-inch SATA III bay. Our configuration holds just a single 2.5-inch Western Digital mechanical drive.
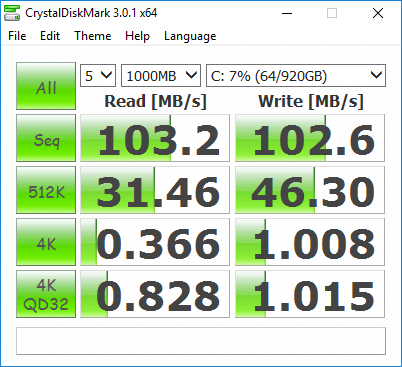
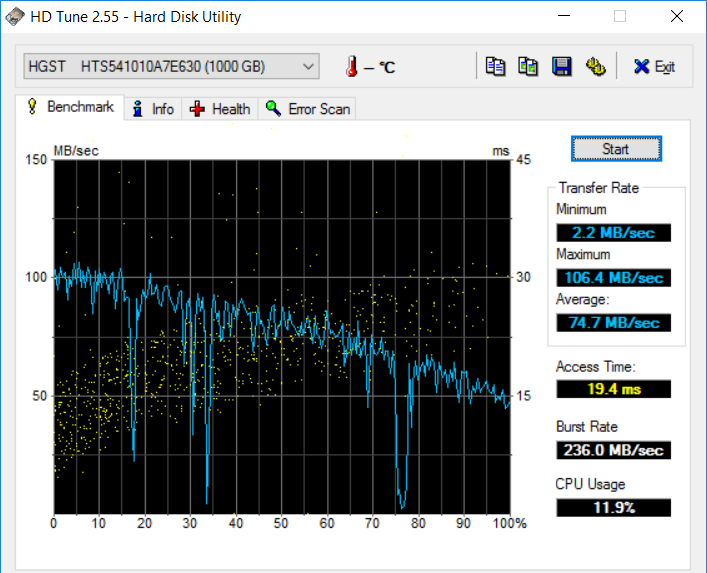
Transfer rates are very poor from our primary drive even by 5400 RPM HDD standards. Average transfer rates are just under 75 MB/s according to HD Tune compared to 90 to 100+ MB/s from 7200 RPM alternatives. Additionally, the drive has unusually low minimum transfer rates that make it significantly slower than competing notebooks with primary SSDs. Nonetheless, average performance is on par with the Toshiba HDD in our Pavilion 15t test model according to CrystalDiskMark.
See our growing table of SSDs and HDDs for more benchmark comparisons.
| HP Envy 15-as133cl HGST Travelstar 5K1000 HTS541010A7E630 | Dell XPS 15 2017 9560 (7300HQ, Full-HD) WDC WD10SPCX-75KHST0 + SanDisk Z400s M.2 2242 32 GB Cache | HP 15-ba077ng SanDisk Z400s SD8SNAT-256G | Acer Aspire E15 E5-553G-109A Liteonit CV3-8D128 | HP Pavilion 15t-au100 CTO (W0P31AV) Toshiba MQ01ABD100 | |
|---|---|---|---|---|---|
| CrystalDiskMark 3.0 | 1425% | 5547% | 5871% | 1% | |
| Read Seq (MB/s) | 103.2 | 123 19% | 447.4 334% | 348.6 238% | 109.5 6% |
| Write Seq (MB/s) | 102.6 | 74.2 -28% | 243.3 137% | 311.8 204% | 105.2 3% |
| Read 512 (MB/s) | 31.46 | 101.7 223% | 333.4 960% | 295.9 841% | 34.08 8% |
| Write 512 (MB/s) | 46.3 | 42.51 -8% | 283.1 511% | 185.8 301% | 40.02 -14% |
| Read 4k (MB/s) | 0.366 | 10.84 2862% | 20.99 5635% | 23.76 6392% | 0.429 17% |
| Write 4k (MB/s) | 1.008 | 1.021 1% | 62.7 6120% | 44.94 4358% | 1.008 0% |
| Read 4k QD32 (MB/s) | 0.828 | 69.8 8330% | 143.1 17183% | 171.6 20625% | 0.81 -2% |
| Write 4k QD32 (MB/s) | 1.015 | 1.057 4% | 138 13496% | 143.2 14008% | 0.893 -12% |

GPU Performance
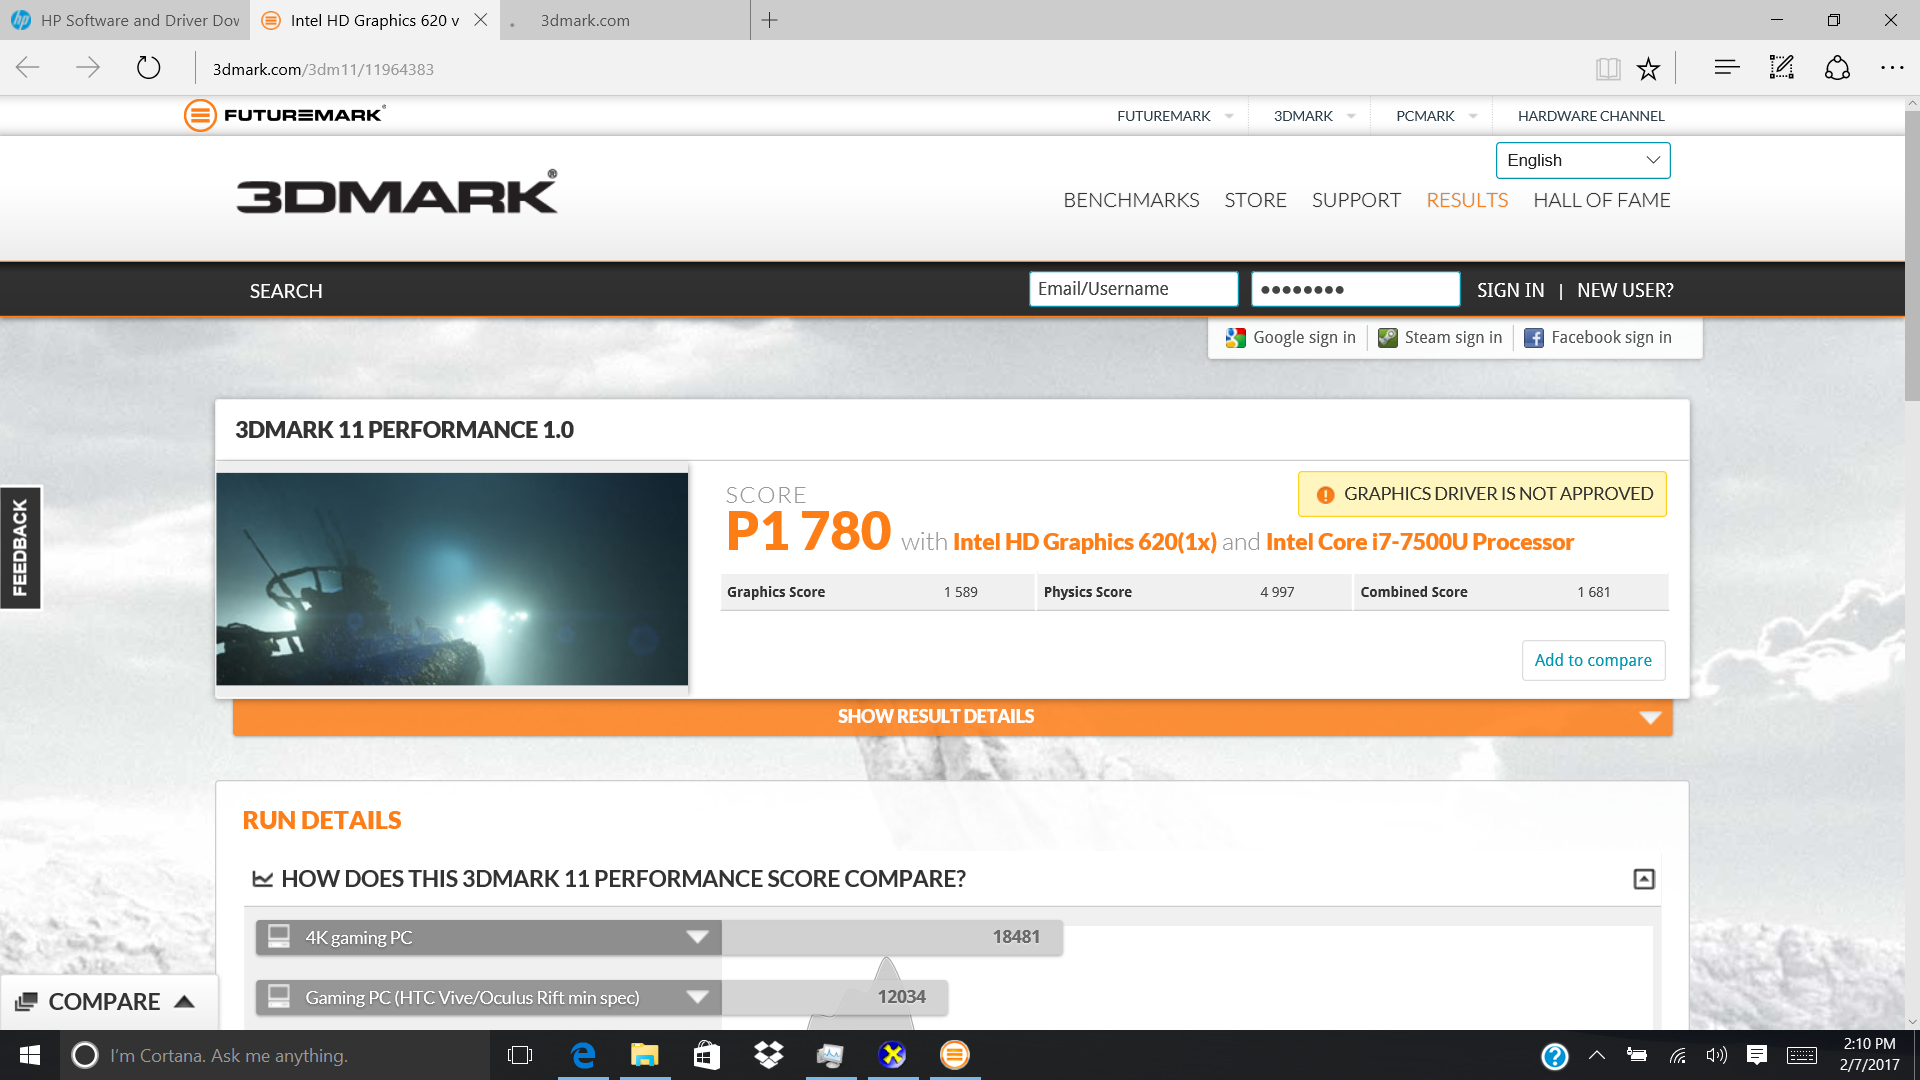
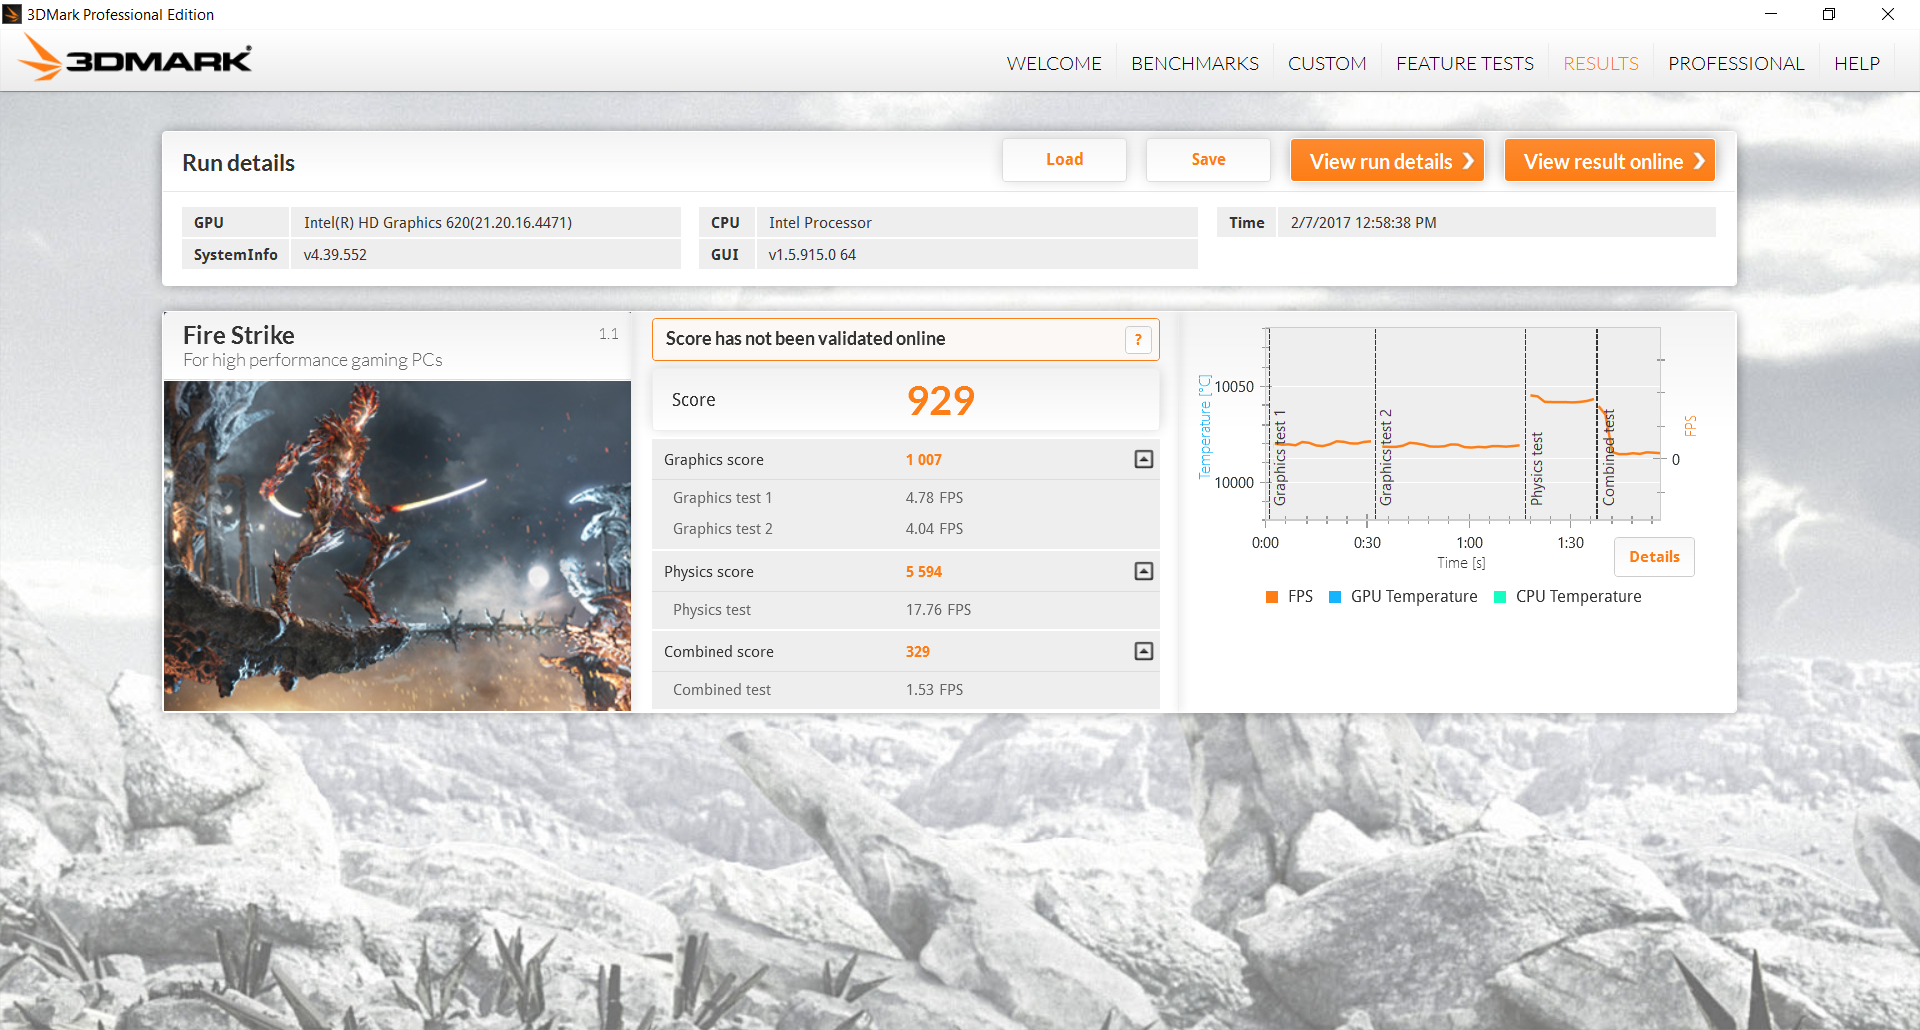
Raw graphics performance from the integrated HD Graphics 620 is about 20 percent faster than the HD Graphics 520 in the i5-6200U and 10 percent faster than the HD Graphics 620 in the i5-7200U according to 3DMark 11. While a slight improvement from Intel's older HD Graphics GPUs, the HD Graphics 620 still falls behind Nvidia's weakest discrete GPUs. The entry-level GeForce 920M, for example, outperforms our HP by almost 20 percent according to 3DMark Fire Strike.
Performance in games continues to be extremely limited. Undemanding titles like DOTA 2 or League of Legends should run well on native 1080p and low settings while more strenuous titles like Rise of the Tomb Raider can be unplayable even on the lowest of settings and resolutions.
See our dedicated GPU page on the HD Graphics 620 for more technical information and benchmark comparisons.
| 3DMark 11 | |
| 1280x720 Performance GPU | |
| Acer Aspire V3-572PG-604M | |
| Asus Zenbook UX310UQ-GL011T | |
| Dell Inspiron 15 5000 5567-1753 | |
| HP 250 G4 T6P08ES | |
| Lenovo U31-70 80M5003EGE | |
| HP Envy 15-as133cl | |
| Fujitsu LifeBook A557 PL | |
| Acer TravelMate P249-M-5452 | |
| 1280x720 Performance Combined | |
| Dell Inspiron 15 5000 5567-1753 | |
| Asus Zenbook UX310UQ-GL011T | |
| Acer Aspire V3-572PG-604M | |
| HP Envy 15-as133cl | |
| HP 250 G4 T6P08ES | |
| Lenovo U31-70 80M5003EGE | |
| Acer TravelMate P249-M-5452 | |
| Fujitsu LifeBook A557 PL | |
| 3DMark | |
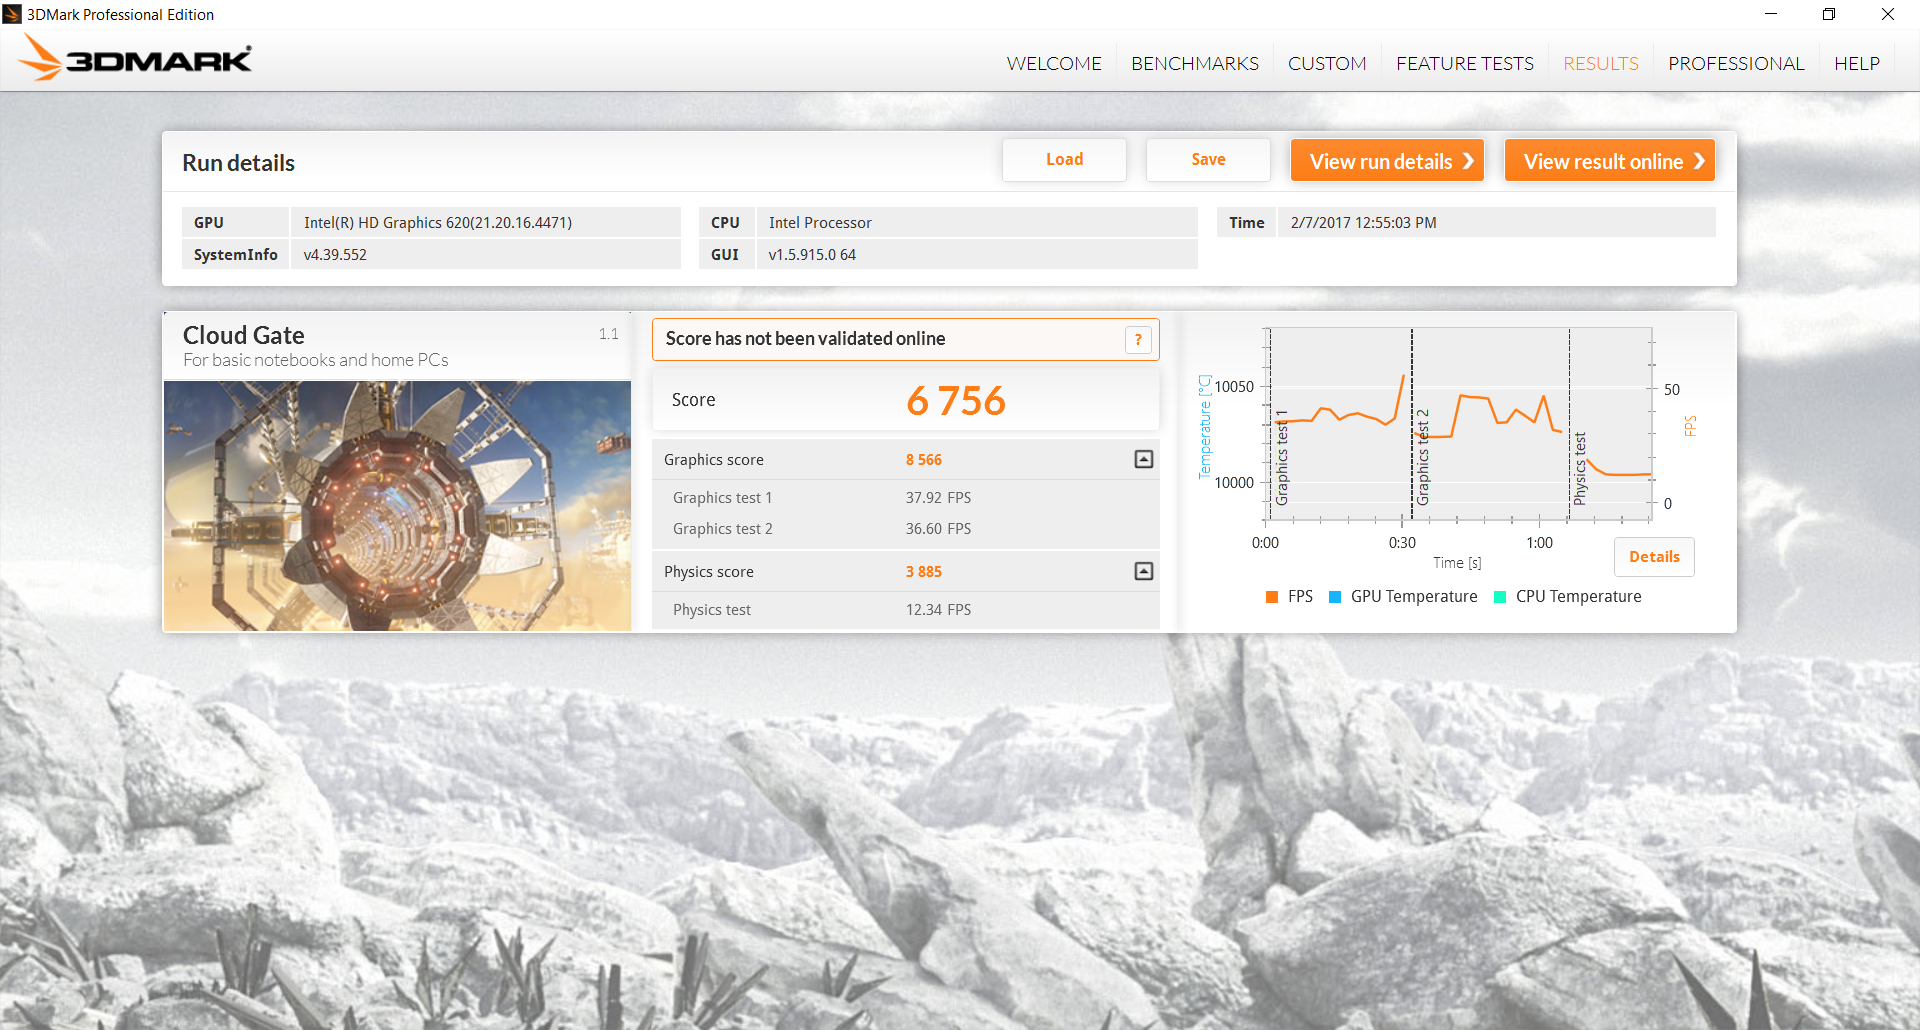
| 1280x720 Cloud Gate Standard Graphics | |
| Dell Inspiron 15 5000 5567-1753 | |
| Acer Aspire V3-572PG-604M | |
| HP Envy 15-as133cl | |
| Asus Zenbook UX310UQ-GL011T | |
| Lenovo U31-70 80M5003EGE | |
| Fujitsu LifeBook A557 PL | |
| Acer TravelMate P249-M-5452 | |
| HP 250 G4 T6P08ES | |
| 1920x1080 Fire Strike Graphics | |
| Acer Aspire V3-572PG-604M | |
| Asus Zenbook UX310UQ-GL011T | |
| Dell Inspiron 15 5000 5567-1753 | |
| Lenovo U31-70 80M5003EGE | |
| HP 250 G4 T6P08ES | |
| HP Envy 15-as133cl | |
| Fujitsu LifeBook A557 PL | |
| Acer TravelMate P249-M-5452 | |
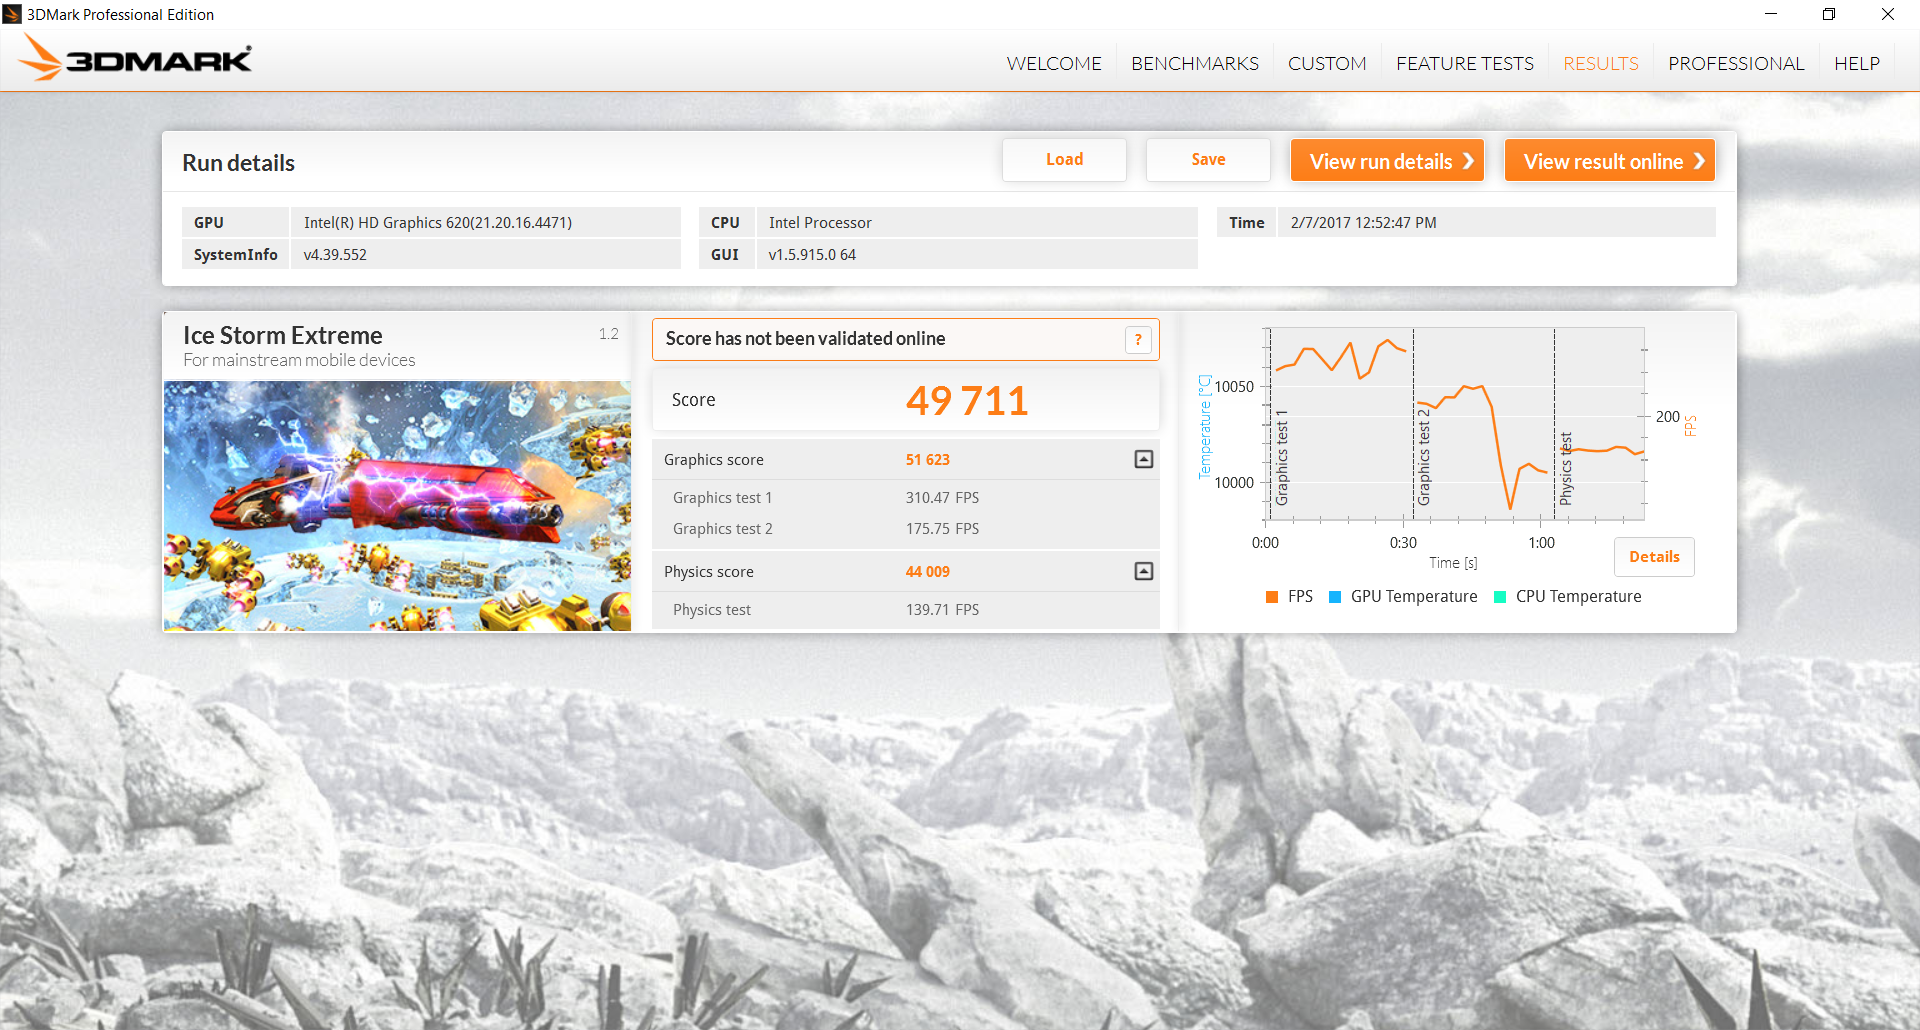
| 1920x1080 Ice Storm Extreme Graphics | |
| HP Envy 15-as133cl | |
| Asus Zenbook UX310UQ-GL011T | |
| Dell Inspiron 15 5000 5567-1753 | |
| Acer TravelMate P249-M-5452 | |
| 3DMark 11 Performance | 1780 points | |
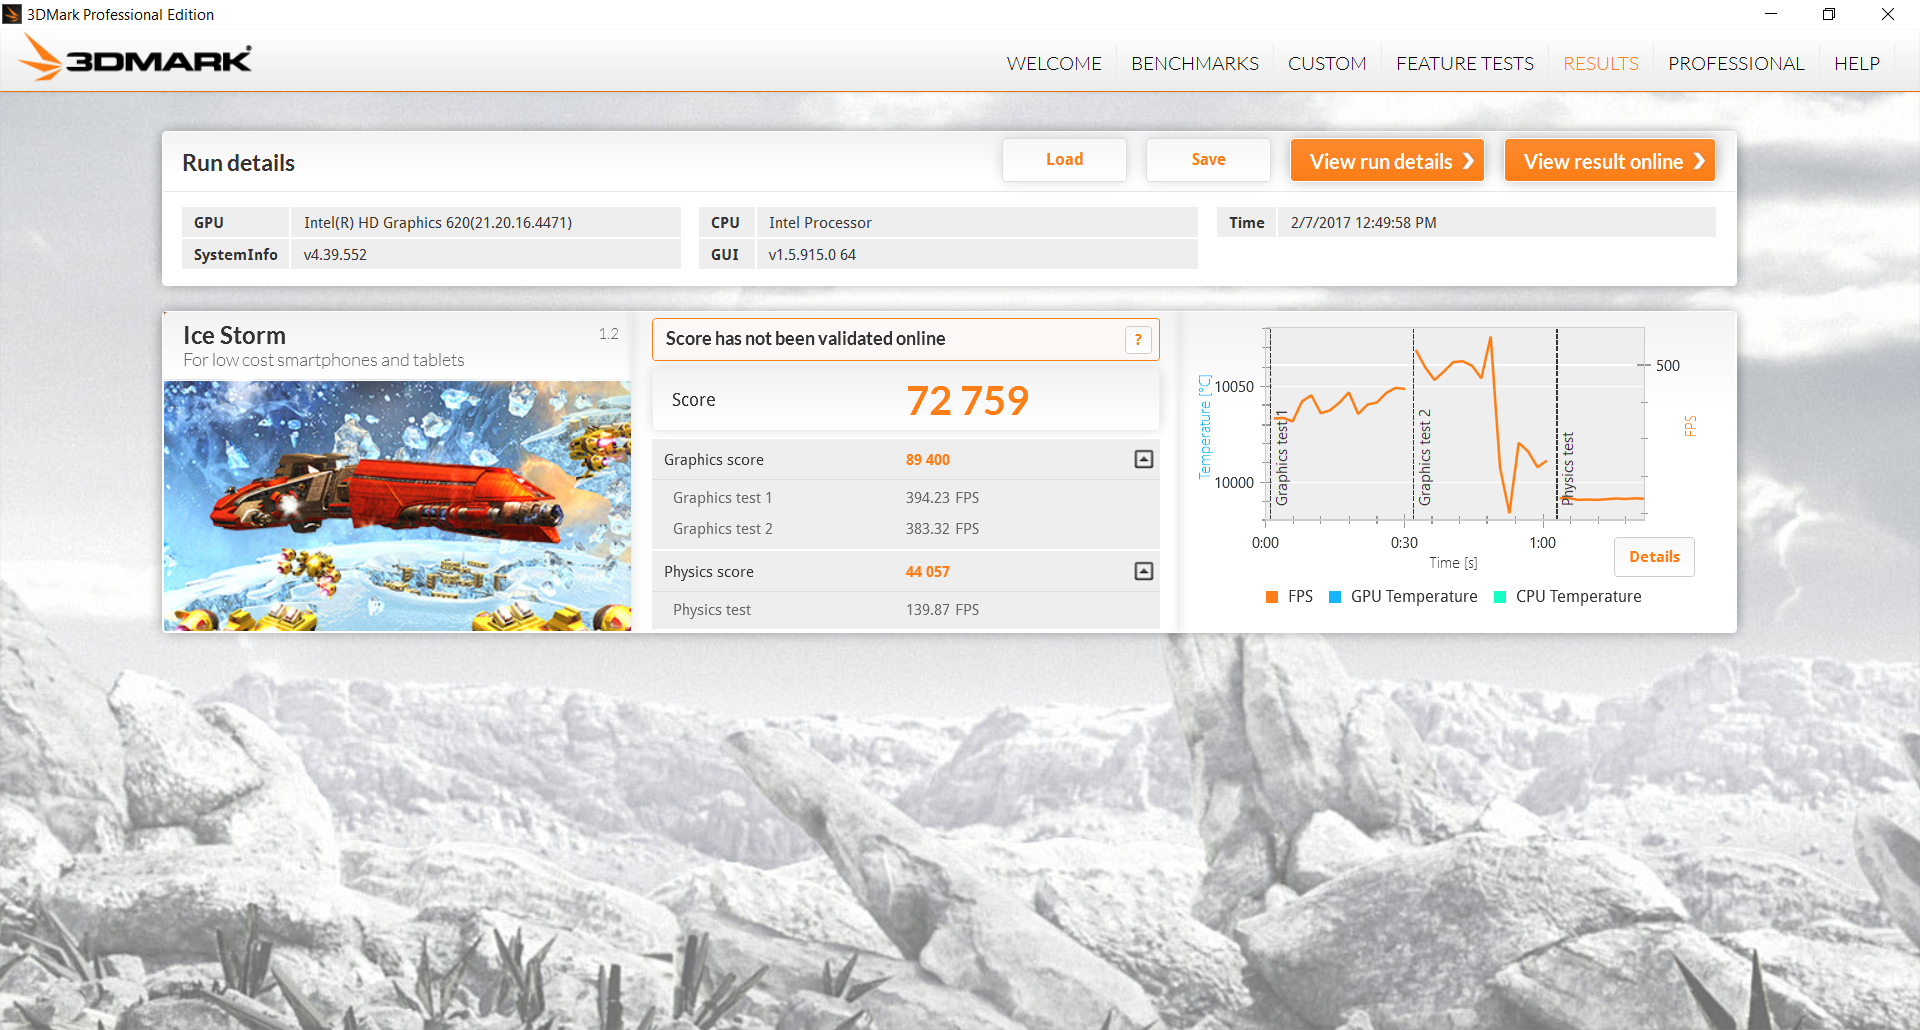
| 3DMark Ice Storm Standard Score | 72759 points | |
| 3DMark Cloud Gate Standard Score | 6756 points | |
| 3DMark Fire Strike Score | 929 points | |
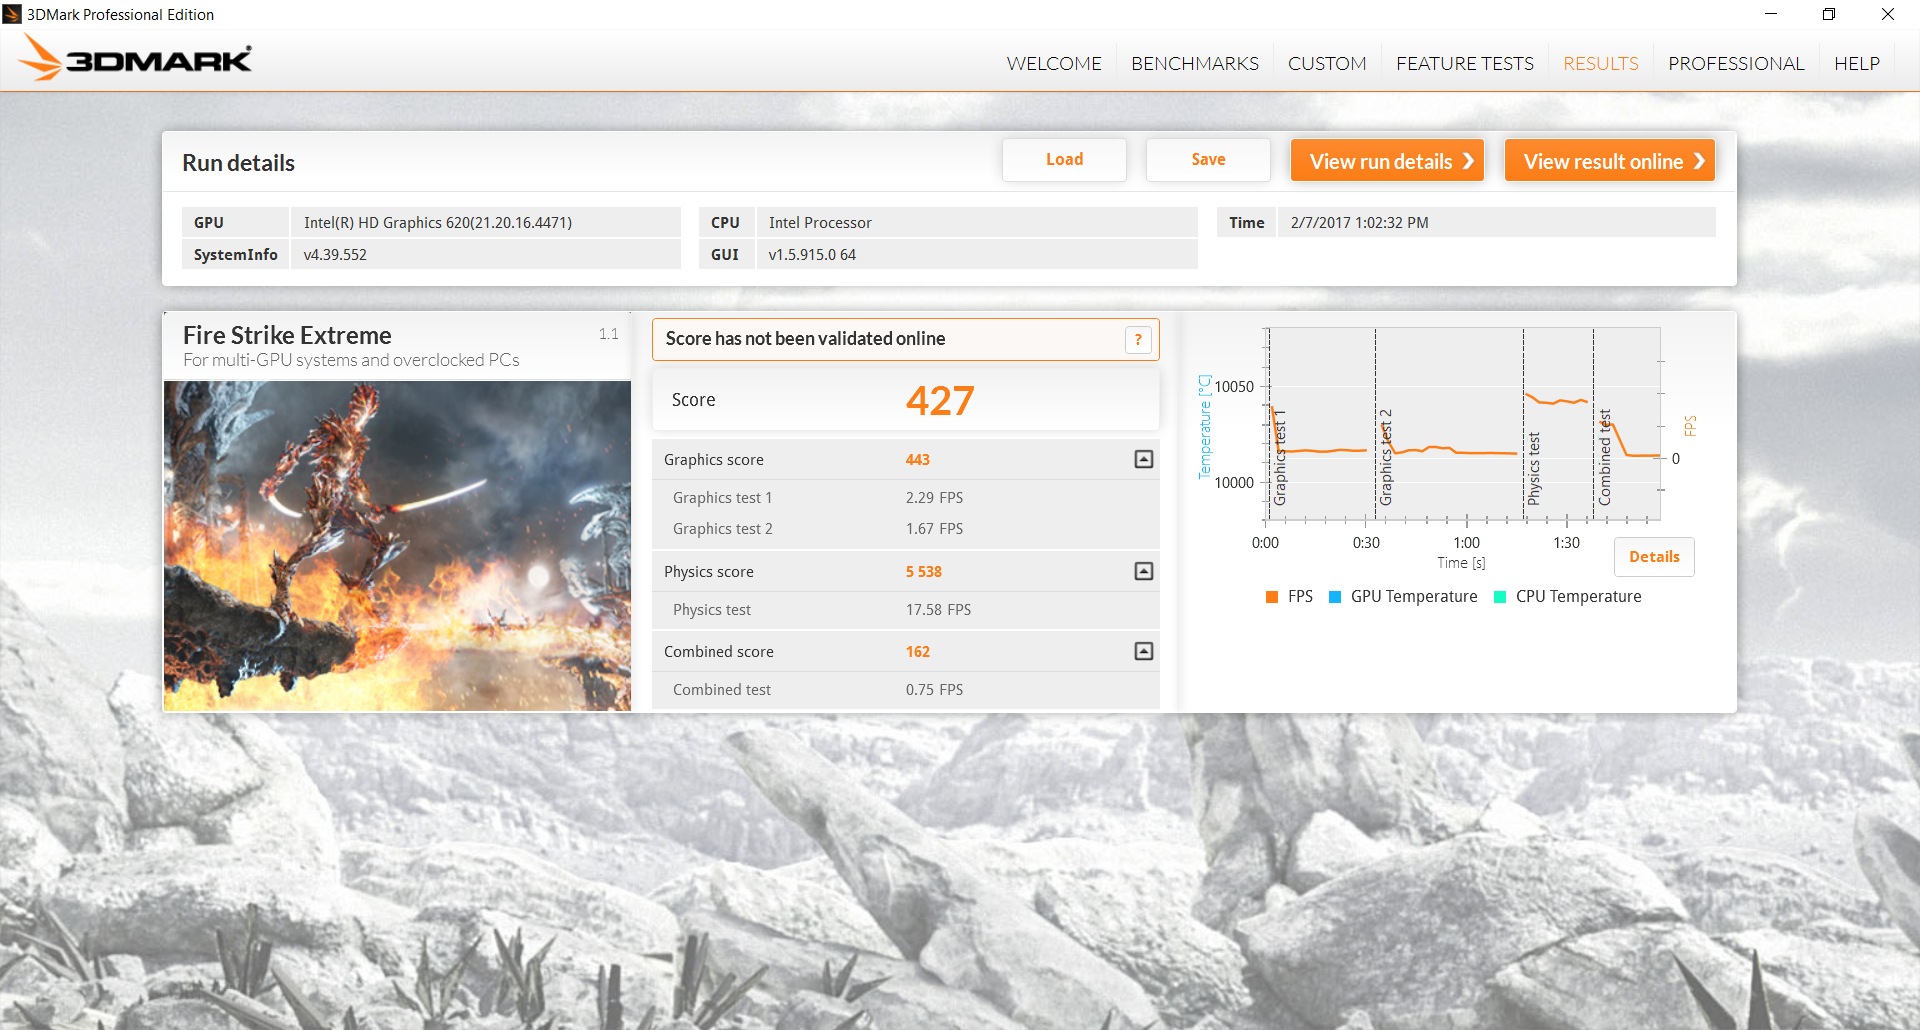
| 3DMark Fire Strike Extreme Score | 427 points | |
Help | ||
| low | med. | high | ultra | |
|---|---|---|---|---|
| BioShock Infinite (2013) | 52.7 | 30.7 | 26.4 | 8.3 |
| Rise of the Tomb Raider (2016) | 20.2 | 12.1 | ||
| Overwatch (2016) | 49.5 | 35.1 |
Stress Test
We stress the notebook with intensive benchmarks to test for any potential throttling or stability issues. When under Prime95 load to stress the CPU, the Envy 15 is able to maintain a core clock rate of 3.4 GHz against a base clock rate of 2.7 GHz and a maximum Turbo Boost potential of 3.5 GHz. This is impressive for an ULV U-class CPU, but the drawback here is a high core temperature of 83 C. Similarly, running FurMark will result in a steady GPU clock rate of 1000 MHz and a slightly cooler core temperature of 77 C.
Running both Prime95 and FurMark simultaneously will heavily throttle the CPU down to 1.5 GHz while the GPU remains in the healthier 900 to 950 MHz range. The drop in performance is considerable enough that both fan noise and power consumption will actually fall to lower levels, which is the complete opposite of what we expect from a system when under extremely demanding processing loads.
Fortunately, users are unlikely to run into major throttling issues when under gaming loads. Unigine Valley stress, for example, sees both the CPU and integrated GPU maintaining high Turbo Boost clock rates at a reasonable core temperature of 72 C. In comparison, the smaller 13.3-inch XPS 13 9360 with the same i7-7500U CPU will run a little warmer at 76 C when under the same Unigine Valley stress conditions.
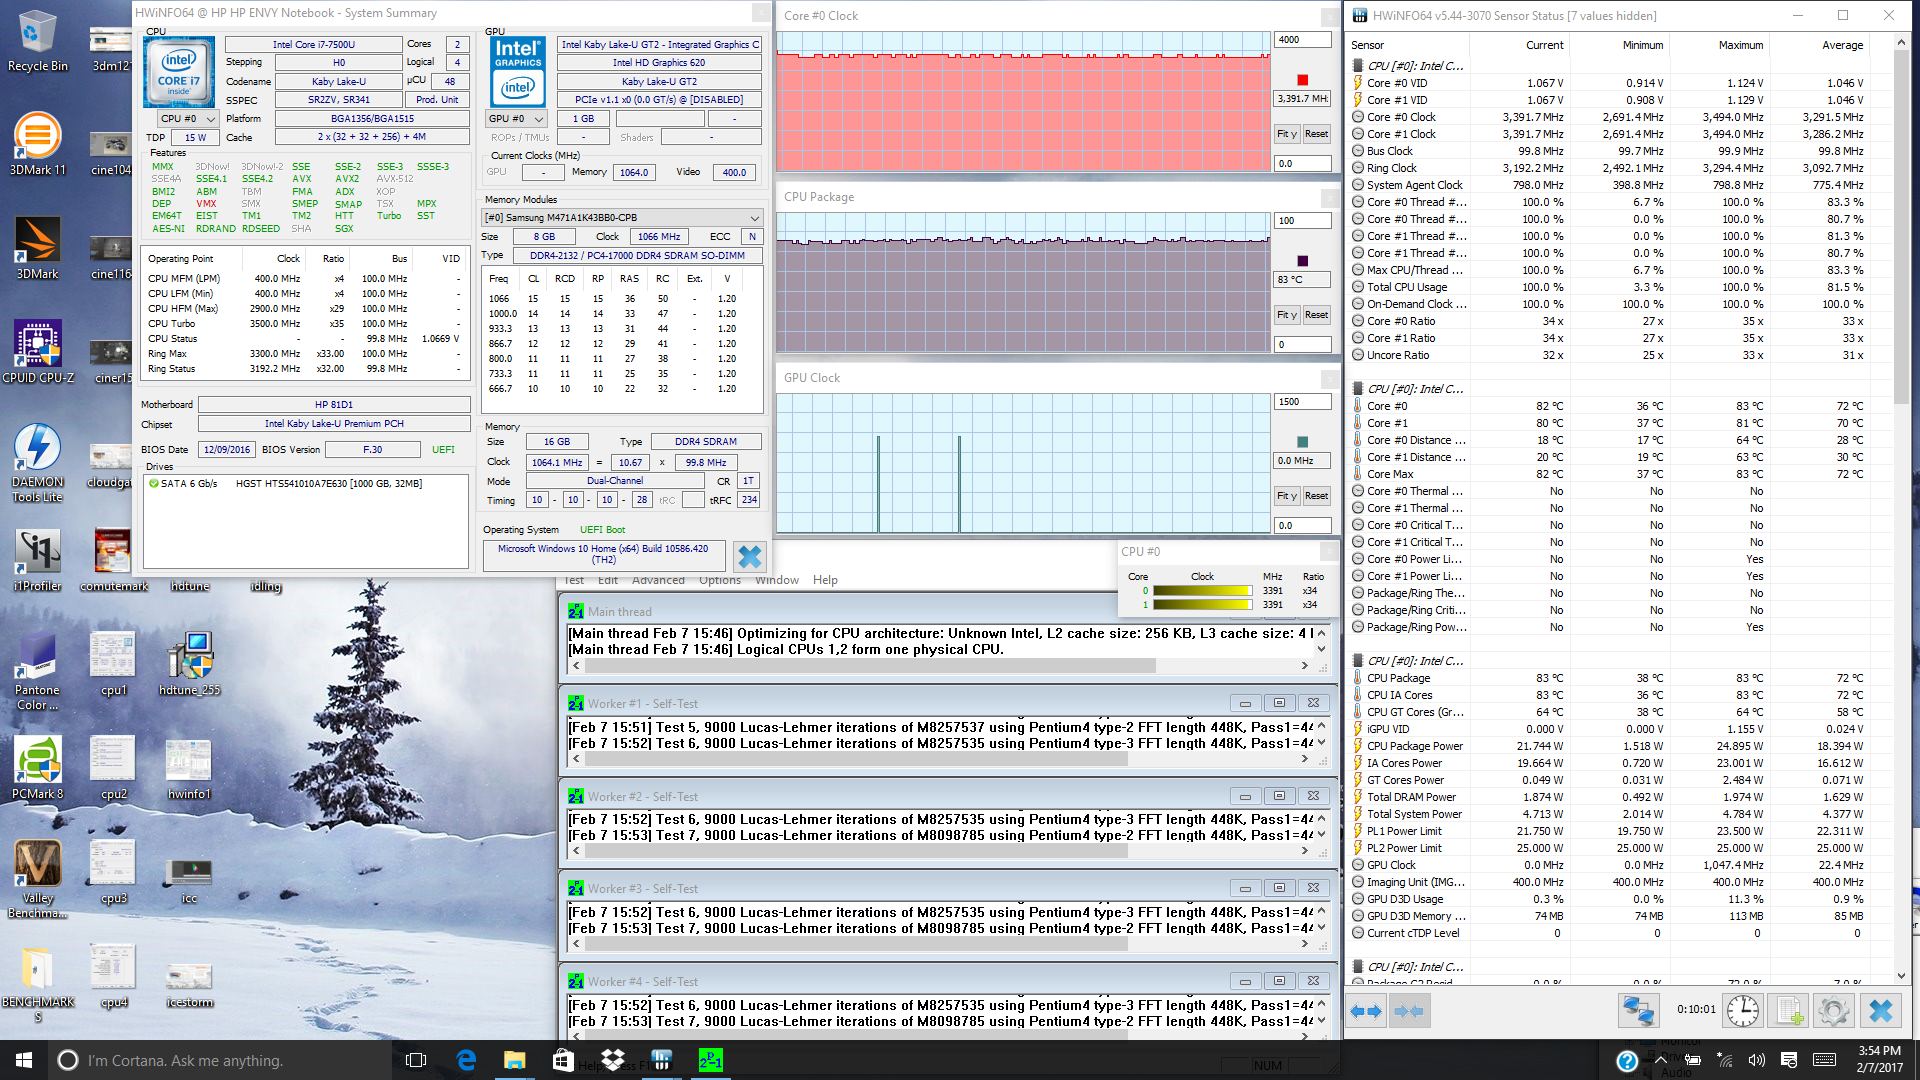
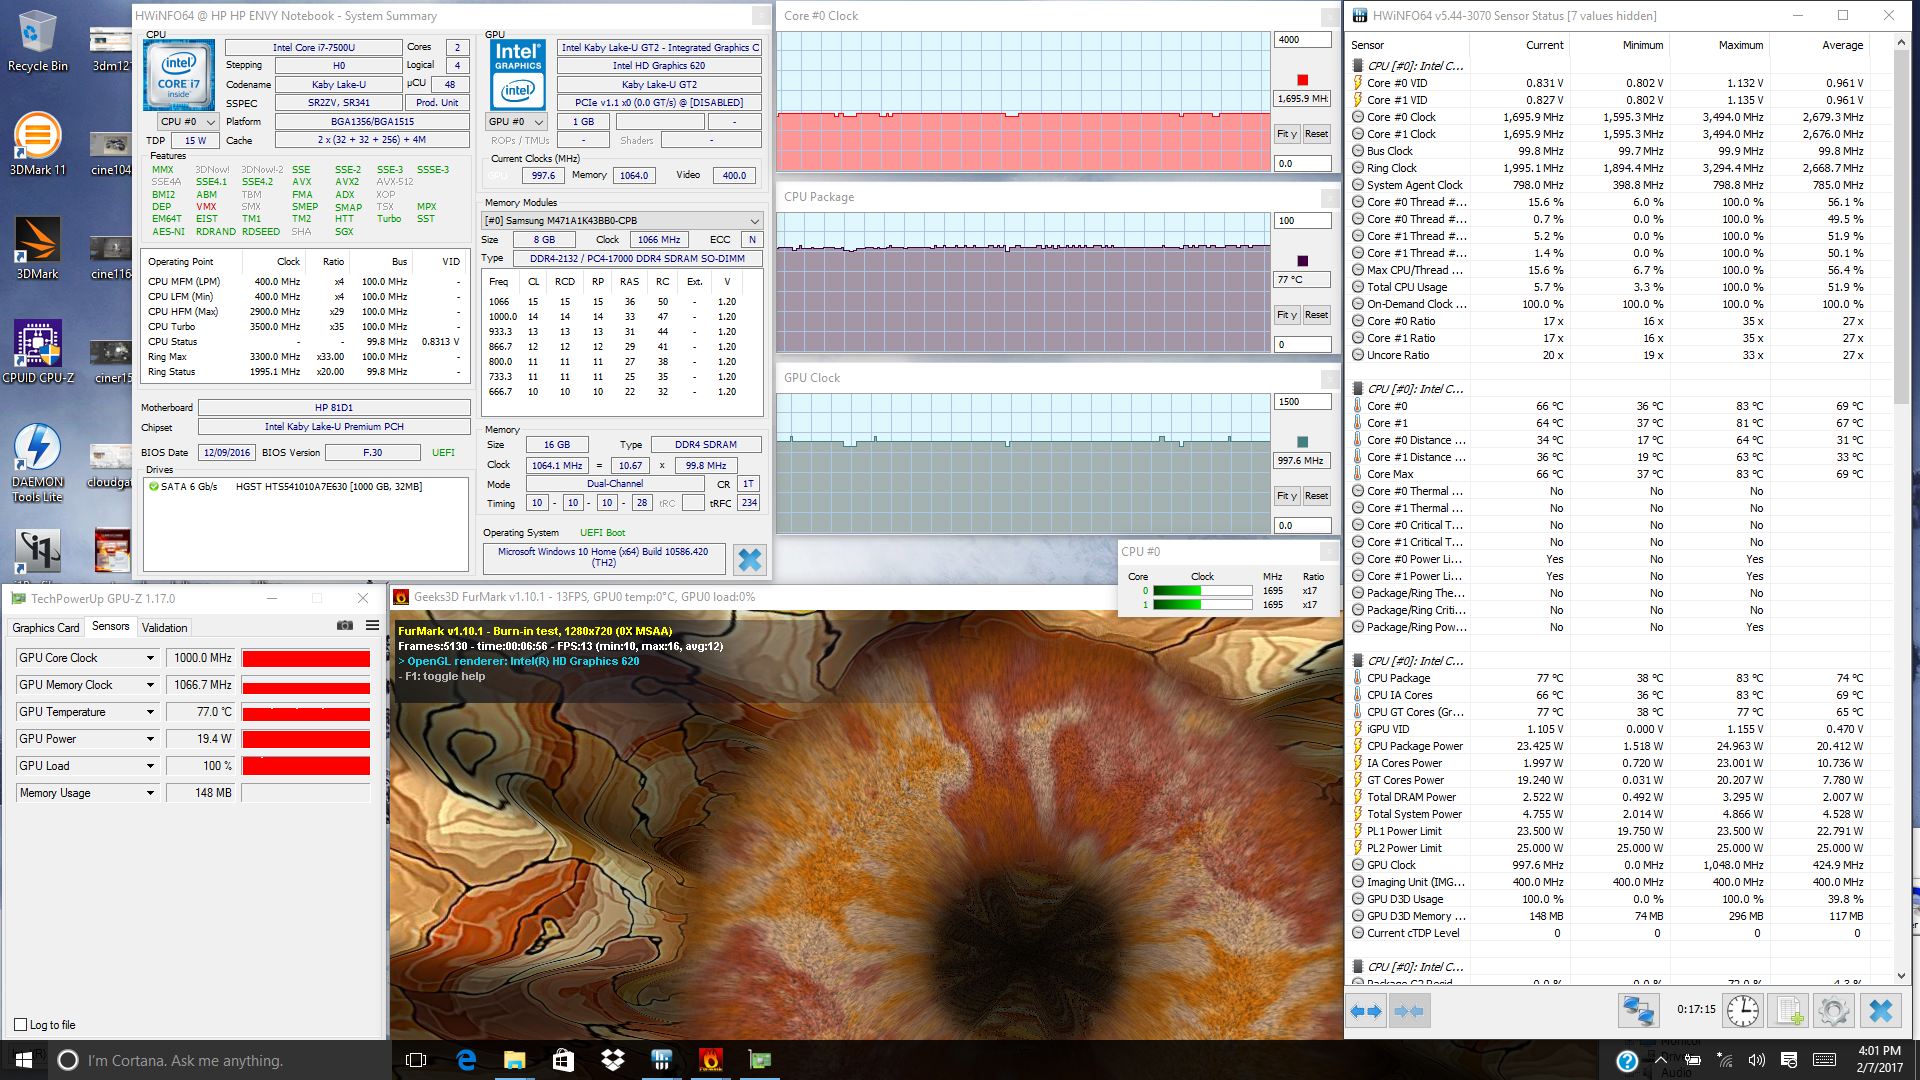
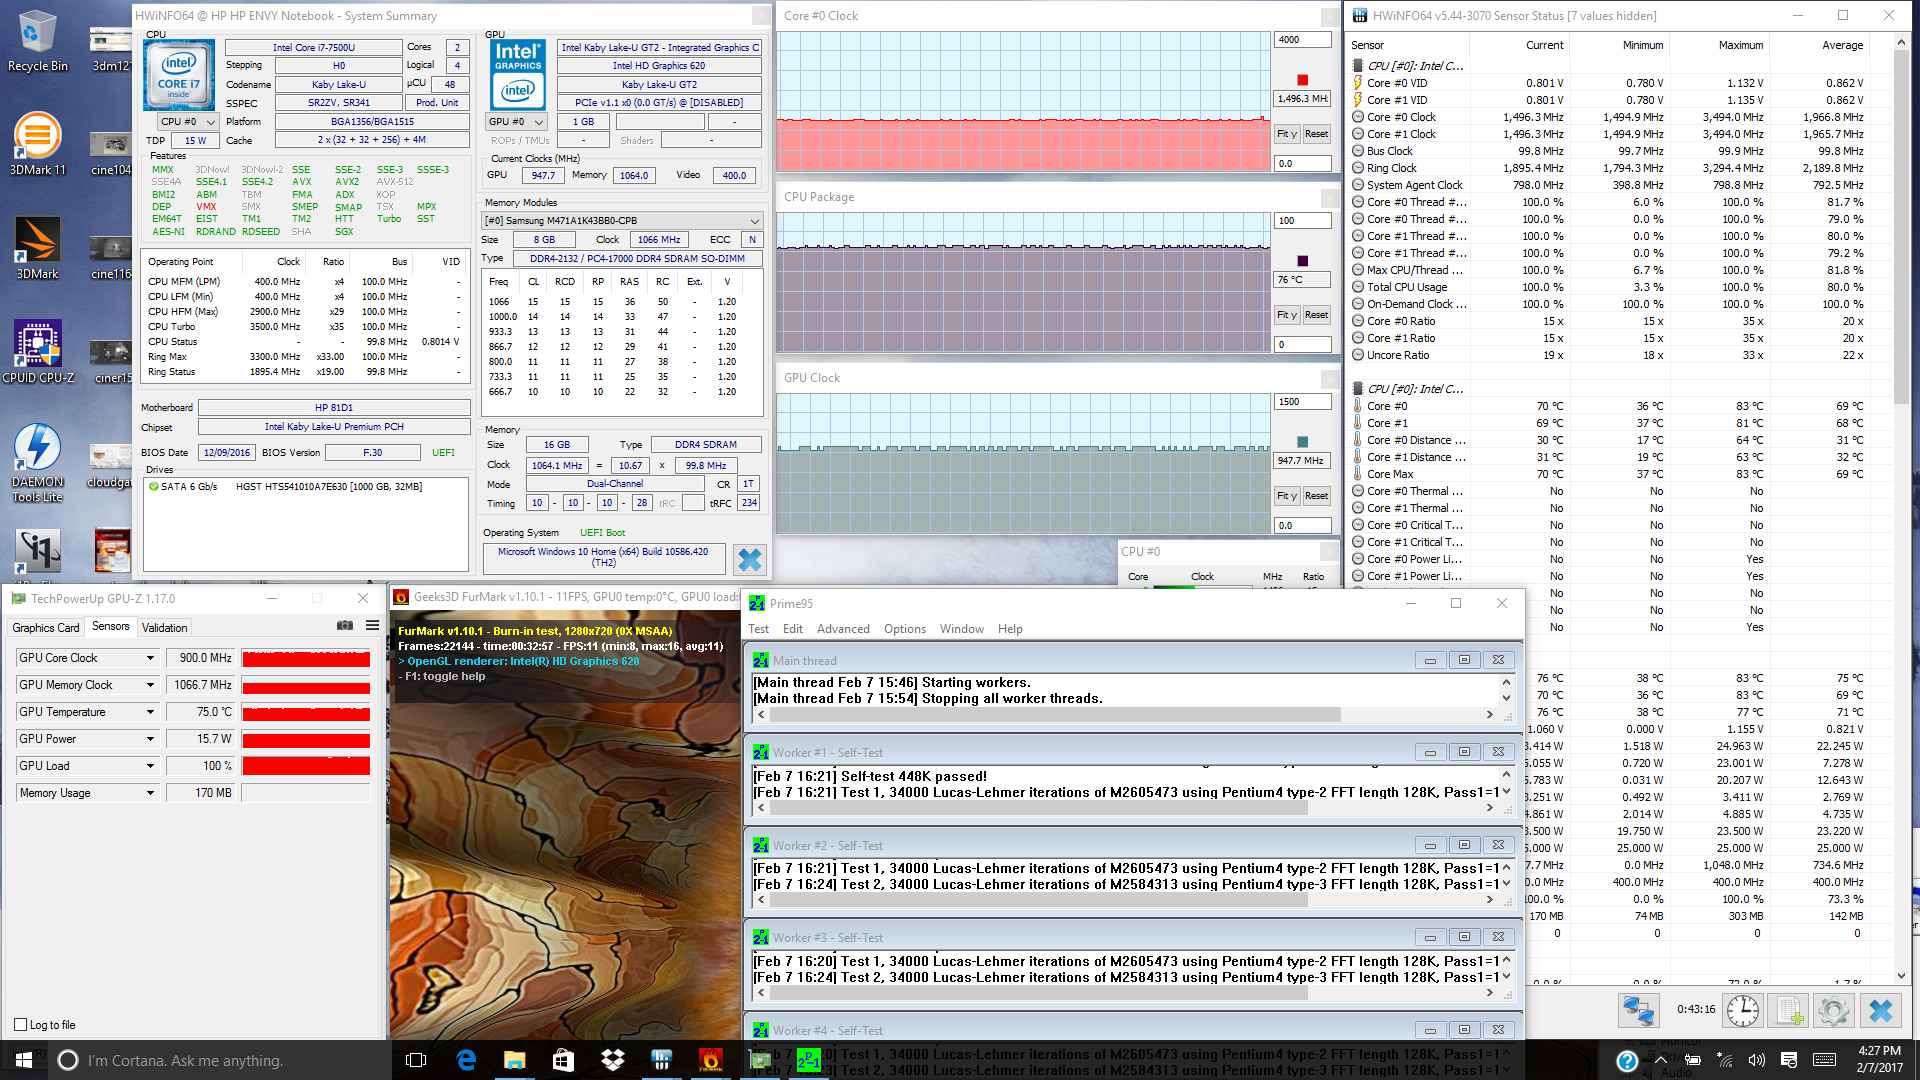
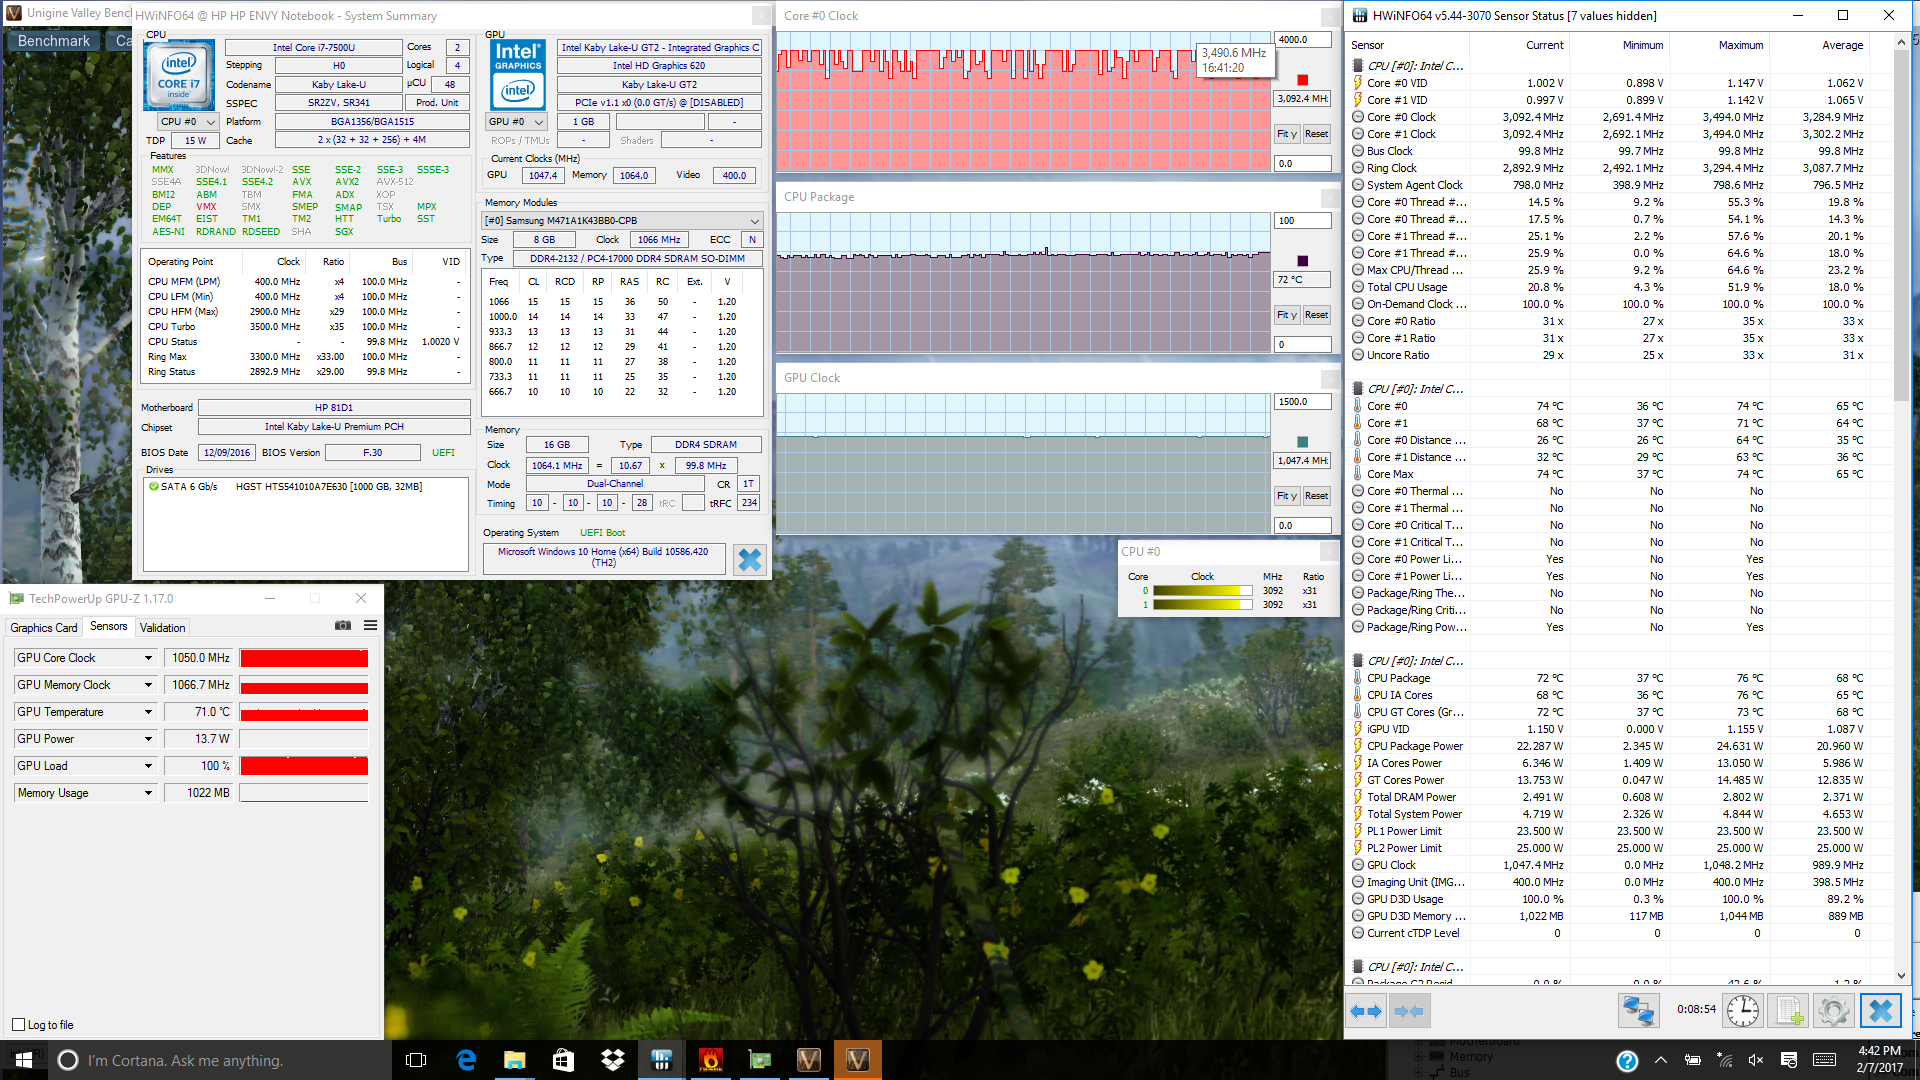
| CPU Clock (GHz) | GPU Clock (MHz) | Average CPU Temperature (°C) | |
| Prime95 Stress | 3.4 | -- | 83 |
| FurMark Stress | -- | 1000 | 77 |
| Prime95 + FurMark Stress | 1.5 | 900 - 947 | 76 |
| Unigine Valley Stress | 3.1 - 3.5 | 1050 | 72 |
Emissions
System Noise
Fan noise is present no matter the onscreen load or power settings at about 32.5 dB(A) minimum. The hard drive, however, is audibly louder at 33.8 dB(A) when it is active and seeking data. Though still relatively quiet, the noise is subjectively much more noticeable compared to other notebooks with mechanical drives. This is yet another huge incentive to opt for an Envy 15 SKU with a primary SSD instead.
Gaming loads will bump fan noise up to just under 39 dB(A). Unfortunately, the system fan will periodically drop back to 32.5 dB(A) only to be bumped back up to 39 dB(A) again, so this pulsing behavior can be unfavorable and annoying. Most notebooks under gaming loads will maintain a fixed fan speed as best as possible to avoid frequent jumps in fan noise.
Note that fan noise will drop back down permanently to its minimum when under extreme stress (Prime95+FurMark) due to heavy throttling.
Noise level
| Idle |
| 32.5 / 32.5 / 32.5 dB(A) |
| HDD |
| 33.8 dB(A) |
| Load |
| 38.7 / 32.5 dB(A) |
 | ||
30 dB silent 40 dB(A) audible 50 dB(A) loud |
||
min: | ||
| HP Envy 15-as133cl HD Graphics 620, i7-7500U, HGST Travelstar 5K1000 HTS541010A7E630 | Dell XPS 15 2017 9560 (7300HQ, Full-HD) GeForce GTX 1050 Mobile, i5-7300HQ, WDC WD10SPCX-75KHST0 + SanDisk Z400s M.2 2242 32 GB Cache | HP 15-ba077ng Radeon R7 (Bristol Ridge), A12-9700P, SanDisk Z400s SD8SNAT-256G | Acer Aspire E15 E5-553G-109A Radeon R8 M445DX, A12-9700P, Liteonit CV3-8D128 | HP Pavilion 15t-au100 CTO (W0P31AV) GeForce 940MX, i7-7500U, Toshiba MQ01ABD100 | Lenovo Ideapad 310-15IKB HD Graphics 620, i5-7200U, Hynix HFS128G3MND | |
|---|---|---|---|---|---|---|
| Noise | -12% | 4% | 3% | -7% | 1% | |
| off / environment * (dB) | 30 | 30.3 -1% | 30.6 -2% | 30.5 -2% | 29 3% | |
| Idle Minimum * (dB) | 32.5 | 31.6 3% | 31.5 3% | 31.4 3% | 32.2 1% | 30.6 6% |
| Idle Average * (dB) | 32.5 | 31.6 3% | 31.8 2% | 31.4 3% | 32.2 1% | 30.6 6% |
| Idle Maximum * (dB) | 32.5 | 33.4 -3% | 31.8 2% | 31.9 2% | 33.7 -4% | 30.6 6% |
| Load Average * (dB) | 38.7 | 47.8 -24% | 31.4 19% | 33.7 13% | 39.4 -2% | 36.8 5% |
| Load Maximum * (dB) | 32.5 | 47.8 -47% | 33.4 -3% | 33.8 -4% | 42.2 -30% | 38.2 -18% |
| Witcher 3 ultra * (dB) | 40.6 |
* ... smaller is better
Temperature
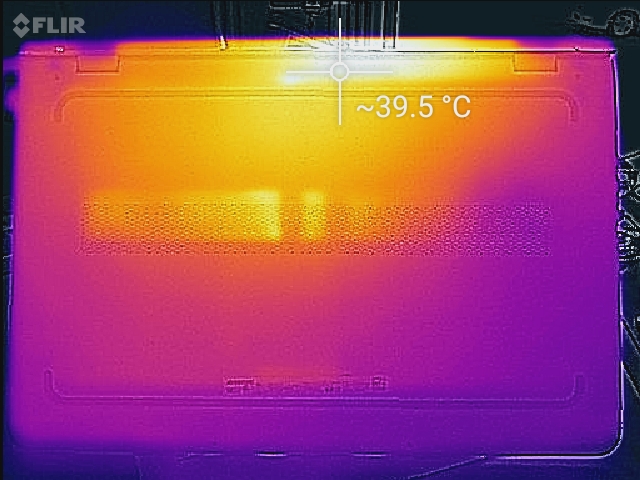
Surface temperatures when idling are flat across the board on both sides of the notebook with no discernible hot spots. When under extreme processing loads, we can measure surfaces as warm as 39 C on the bottom rear of the notebook and 35 C on the top surface above the first row of keyboard keys as shown by the thermographs below. Both hot spots are thankfully away from the palm rests and keyboard, so the notebook will never become uncomfortable to use no matter the onscreen load.
It's worth noting that due to the aforementioned throttling when under Prime95+FurMark load, the Envy 15 will actually run slightly warmer when subjected to Prime95 stress only. Surface temperatures are still warmer on average compared to the Ideapad 310 but significantly cooler than the AMD-powered Acer Aspire E5 553G.
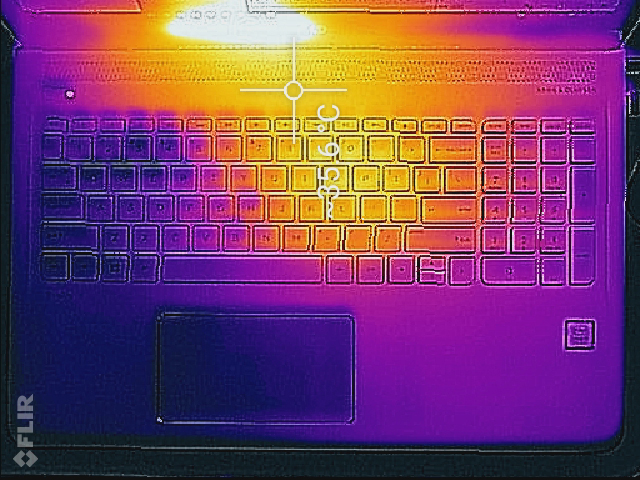
(+) The maximum temperature on the upper side is 35.6 °C / 96 F, compared to the average of 36.8 °C / 98 F, ranging from 21 to 71 °C for the class Multimedia.
(+) The bottom heats up to a maximum of 39.4 °C / 103 F, compared to the average of 39.1 °C / 102 F
(+) In idle usage, the average temperature for the upper side is 23 °C / 73 F, compared to the device average of 31.3 °C / 88 F.
(+) The palmrests and touchpad are cooler than skin temperature with a maximum of 24.6 °C / 76.3 F and are therefore cool to the touch.
(+) The average temperature of the palmrest area of similar devices was 28.7 °C / 83.7 F (+4.1 °C / 7.4 F).
Speakers
Sound quality from the B&O dual speakers is much more balanced compared to the smaller and thinner Spectre 13 according to our pink noise measurements. Sounds are represented much more evenly on the Envy 15 across a wider range of frequencies, though bass is still rather poor as shown by the sharp drop off at the 200 Hz mark. Maximum volume is sufficiently loud to fill a small conference room and will reverberate the chassis just slightly. We can notice no static or audible vibrations when at high volume settings.
")


HP Envy 15-as133cl audio analysis
(±) | speaker loudness is average but good (77.2 dB)
Bass 100 - 315 Hz
(-) | nearly no bass - on average 16.6% lower than median
(±) | linearity of bass is average (13.8% delta to prev. frequency)
Mids 400 - 2000 Hz
(+) | balanced mids - only 1.9% away from median
(+) | mids are linear (4.3% delta to prev. frequency)
Highs 2 - 16 kHz
(+) | balanced highs - only 2.6% away from median
(±) | linearity of highs is average (9.8% delta to prev. frequency)
Overall 100 - 16.000 Hz
(±) | linearity of overall sound is average (20% difference to median)
Compared to same class
» 66% of all tested devices in this class were better, 8% similar, 26% worse
» The best had a delta of 5%, average was 17%, worst was 45%
Compared to all devices tested
» 51% of all tested devices were better, 8% similar, 41% worse
» The best had a delta of 4%, average was 23%, worst was 134%
Apple MacBook 12 (Early 2016) 1.1 GHz audio analysis
(+) | speakers can play relatively loud (83.6 dB)
Bass 100 - 315 Hz
(±) | reduced bass - on average 11.3% lower than median
(±) | linearity of bass is average (14.2% delta to prev. frequency)
Mids 400 - 2000 Hz
(+) | balanced mids - only 2.4% away from median
(+) | mids are linear (5.5% delta to prev. frequency)
Highs 2 - 16 kHz
(+) | balanced highs - only 2% away from median
(+) | highs are linear (4.5% delta to prev. frequency)
Overall 100 - 16.000 Hz
(+) | overall sound is linear (10.2% difference to median)
Compared to same class
» 7% of all tested devices in this class were better, 2% similar, 90% worse
» The best had a delta of 5%, average was 18%, worst was 53%
Compared to all devices tested
» 5% of all tested devices were better, 1% similar, 94% worse
» The best had a delta of 4%, average was 23%, worst was 134%
Frequency Comparison (Checkbox selectable!)
Graph 1: Pink Noise 100% Vol.; Graph 2: Audio off
Energy Management
Power Consumption
The HP is generally more power efficient than similarly sized competitors including the Acer Aspire E15 with the AMD A12-9700P APU. Gaming loads will draw just over 30 W of power to be on par with the Lenovo Ideapad 310 and its slightly slower Kaby Lake i7-7200U CPU. Due to the heavy throttling, the Envy 15 actually draws less power when under extreme processing stress compared to when under typical gaming loads.
The small power adapter (~6 x 6 x 2.75 cm) is rated for an output of up to 45 W and so there is ample overhead no matter the system load.
| Off / Standby | |
| Idle | |
| Load |
|
Key:
min: | |
| HP Envy 15-as133cl | Dell XPS 15 2017 9560 (7300HQ, Full-HD) | HP 15-ba077ng | Acer Aspire E15 E5-553G-109A | HP Pavilion 15t-au100 CTO (W0P31AV) | Lenovo Ideapad 310-15IKB | |
|---|---|---|---|---|---|---|
| Power Consumption | -145% | -7% | -76% | -56% | -7% | |
| Idle Minimum * (Watt) | 4.6 | 6.6 -43% | 4.4 4% | 7.2 -57% | 6.16 -34% | 3.5 24% |
| Idle Average * (Watt) | 7.7 | 9 -17% | 6.8 12% | 10.3 -34% | 8.48 -10% | 6.1 21% |
| Idle Maximum * (Watt) | 7.8 | 10.7 -37% | 8.9 -14% | 11.9 -53% | 9.62 -23% | 7 10% |
| Load Average * (Watt) | 30.5 | 77.5 -154% | 30.9 -1% | 48.2 -58% | 41.63 -36% | 31.2 -2% |
| Load Maximum * (Watt) | 22.7 | 130 -473% | 31 -37% | 63 -178% | 63.22 -179% | 42.9 -89% |
| Witcher 3 ultra * (Watt) | 51.8 |
* ... smaller is better
Battery Life
The 52 Wh internal battery is larger in capacity than many other budget-mainstream notebooks in this size class. Users can expect around 6 to 7 hours of real-world WLAN use out of the Envy 15 compared to less than 4 hours each on both the Ideapad 310 and HP Pavilion 15t when under similar testing conditions.
Charging the battery from near empty to full capacity will take around 2 hours.
| HP Envy 15-as133cl i7-7500U, HD Graphics 620, 52 Wh | Dell XPS 15 2017 9560 (7300HQ, Full-HD) i5-7300HQ, GeForce GTX 1050 Mobile, 56 Wh | HP 15-ba077ng A12-9700P, Radeon R7 (Bristol Ridge), 41 Wh | Acer Aspire E15 E5-553G-109A A12-9700P, Radeon R8 M445DX, 40 Wh | HP Pavilion 15t-au100 CTO (W0P31AV) i7-7500U, GeForce 940MX, 41 Wh | Lenovo Ideapad 310-15IKB i5-7200U, HD Graphics 620, 30 Wh | |
|---|---|---|---|---|---|---|
| Battery runtime | -1% | 14% | -33% | -7% | -7% | |
| Reader / Idle (h) | 9.6 | 9.4 -2% | 12.4 29% | 6 -37% | 7.3 -24% | 10.2 6% |
| WiFi v1.3 (h) | 6.8 | 5.6 -18% | 4.9 -28% | 4.3 -37% | 3.7 -46% | 3.8 -44% |
| Load (h) | 1.2 | 1.4 17% | 1.7 42% | 0.9 -25% | 1.8 50% | 1.4 17% |
Pros
Cons
Verdict
Nothing particularly stands out on the Envy 15. Its chassis and thin design make it more attractive than competing notebooks from Acer or Lenovo in the sub $900 USD price range and battery life is pretty good as well, but overall performance is somewhat disappointing. The system fan is always active, the keyboard keys and clickpad are too soft, sRGB coverage is limited, touchscreen functionality is forced on all SKUs, and the lid could have been more firm and less wobbly. We recommend avoiding SKUs with the primary HDD and to instead invest in one with a NVMe SSD for much faster system performance since end-user servicing is difficult.
If competing notebooks can be considered, then users will find more value out of the outgoing XPS 15 9550. Configuring the base Envy 15 with a 256 GB SSD will bring up the price to nearly 4 digits where even the entry-level SKUs of the XPS 15 9550, Spectre 15 x360, or Asus Zenbook series are within reach.
HP Envy 15-as133cl
- 02/13/2017 v6 (old)
Allen Ngo
Price comparison
