HP Spectre x360 15-ap012dx Convertible Review
Multimedia notebooks and Ultrabooks are increasingly becoming available with QHD or UHD options in addition to the standard 1080p SKUs. These higher resolution displays always come with higher price tags, but users must be aware that the higher resolutions may come with sacrifices to battery life and other potential drawbacks related to the display.
We published on the 1080p version of the Spectre x360 15 not too long ago and walked away impressed by its quality and usability considering the large 15.6-inch screen size. We recommend checking out our previous review page for more information on chassis quality and features. Is this 4K UHD version worth the added costs?
Display
A quick glance at the 4K UHD screen reveals crisper texts and images than its FHD counterpart, of course. The higher resolution naturally allows for better multi-tasking and more screen real-estate for multiple windows. Our measurements show brightness levels to be essentially equal to the less expensive FHD SKU at just under 300 nits.
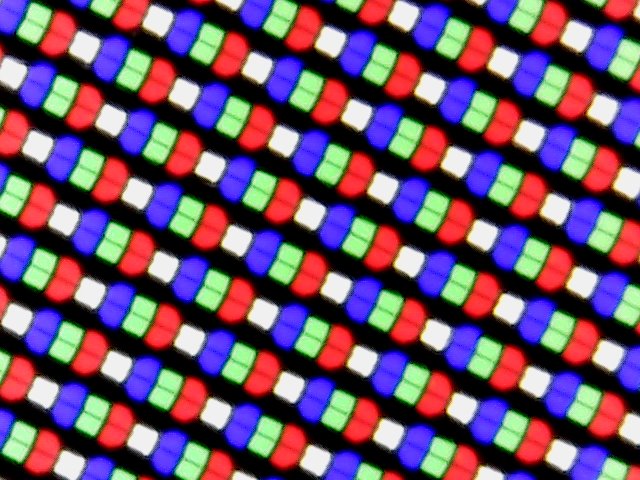
The underlying panel is the LG Philips LGD04E0 compared to the LG Philips LP156WF6 on the FHD version. Perhaps more interestingly, the 4K UHD SKU utilizes a RGBW subpixel matrix instead of the standard RGB matrix as found on the FHD SKU. In theory, this should give the 4K UHD panel more accurate colors out-of-the-box compared to its FHD counterpart, which our measurements show to a slight degree. Contrast, however, is essentially halved as a result.
Uneven backlight bleeding is minimal and difficult to notice. Playing a movie with black borders on top and bottom will probably be the most common way to see the slight bleeding around the edges.

| |||||||||||||||||||||||||
Brightness Distribution: 88 %
Center on Battery: 298 cd/m²
Contrast: 523:1 (Black: 0.57 cd/m²)
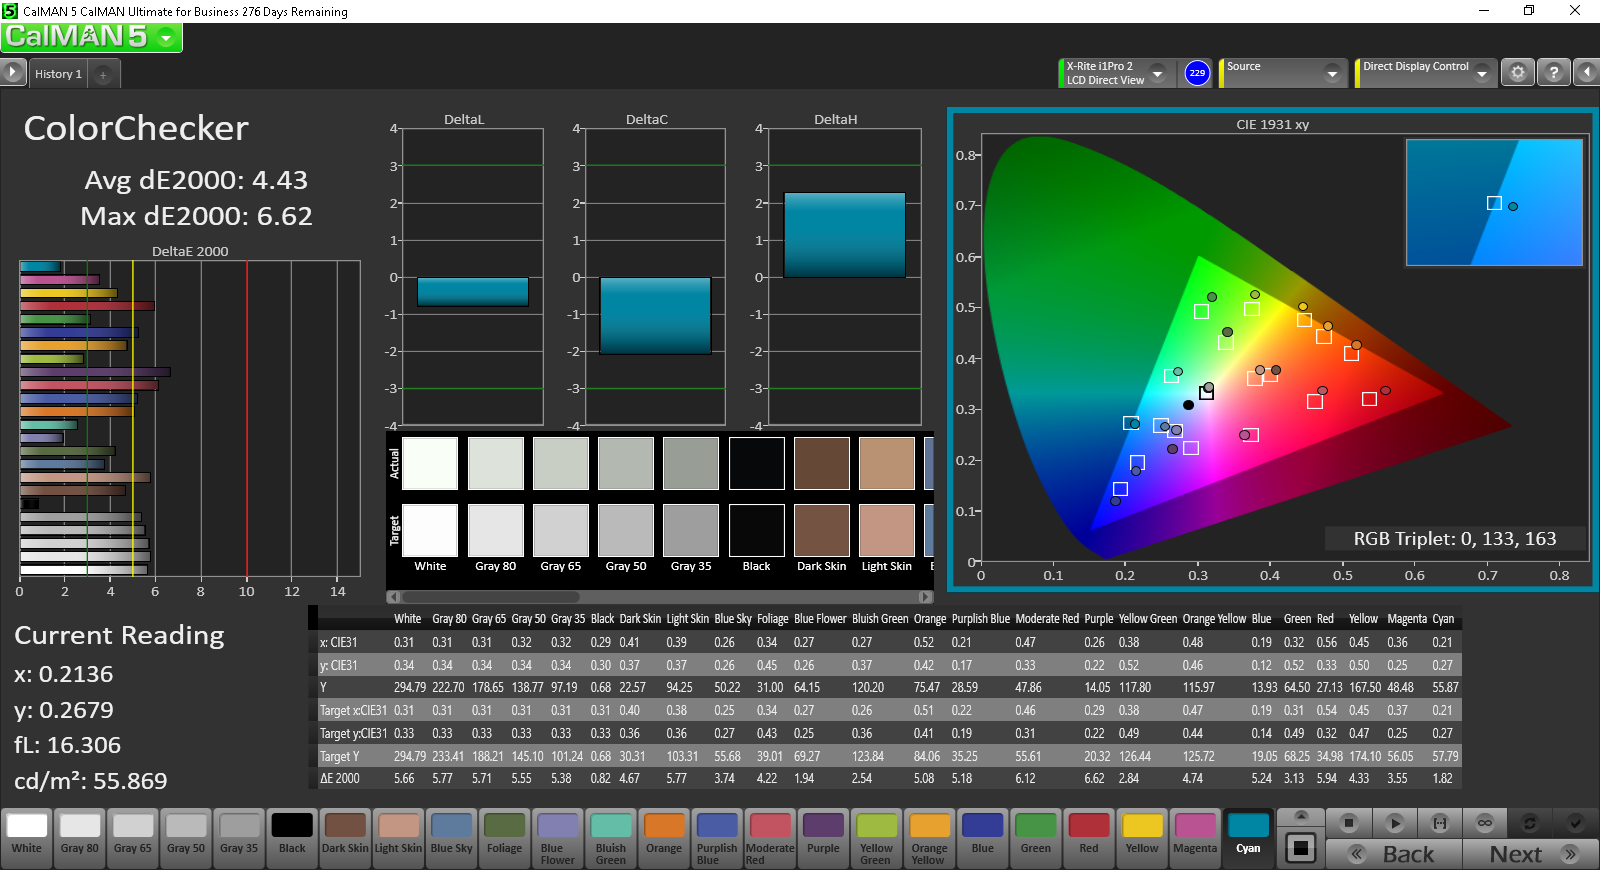
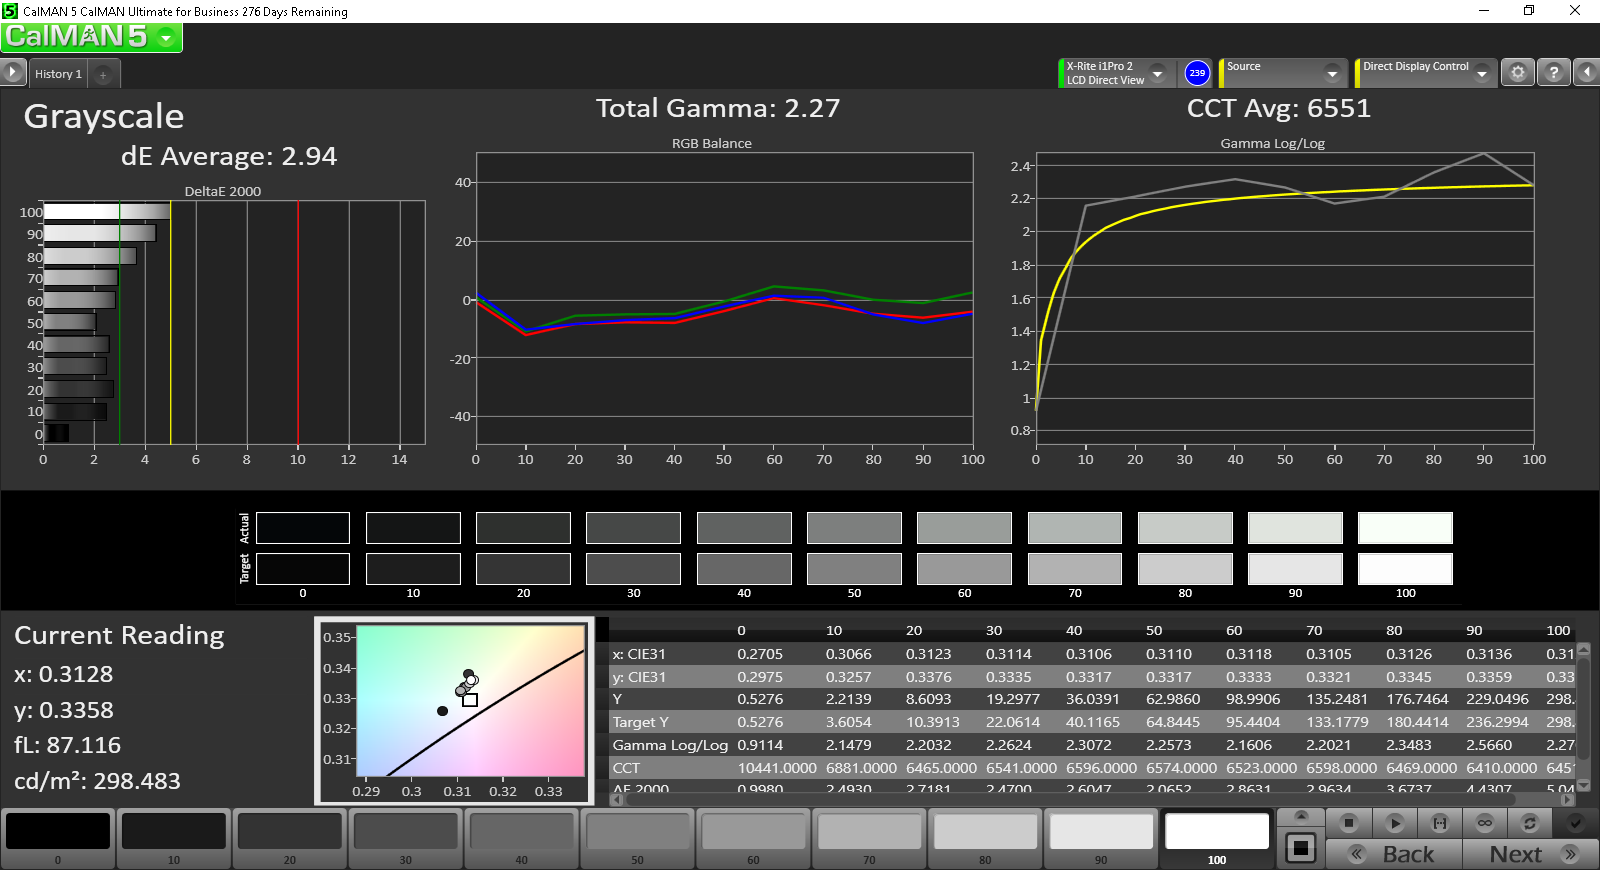
ΔE ColorChecker Calman: 4.43 | ∀{0.5-29.43 Ø4.71}
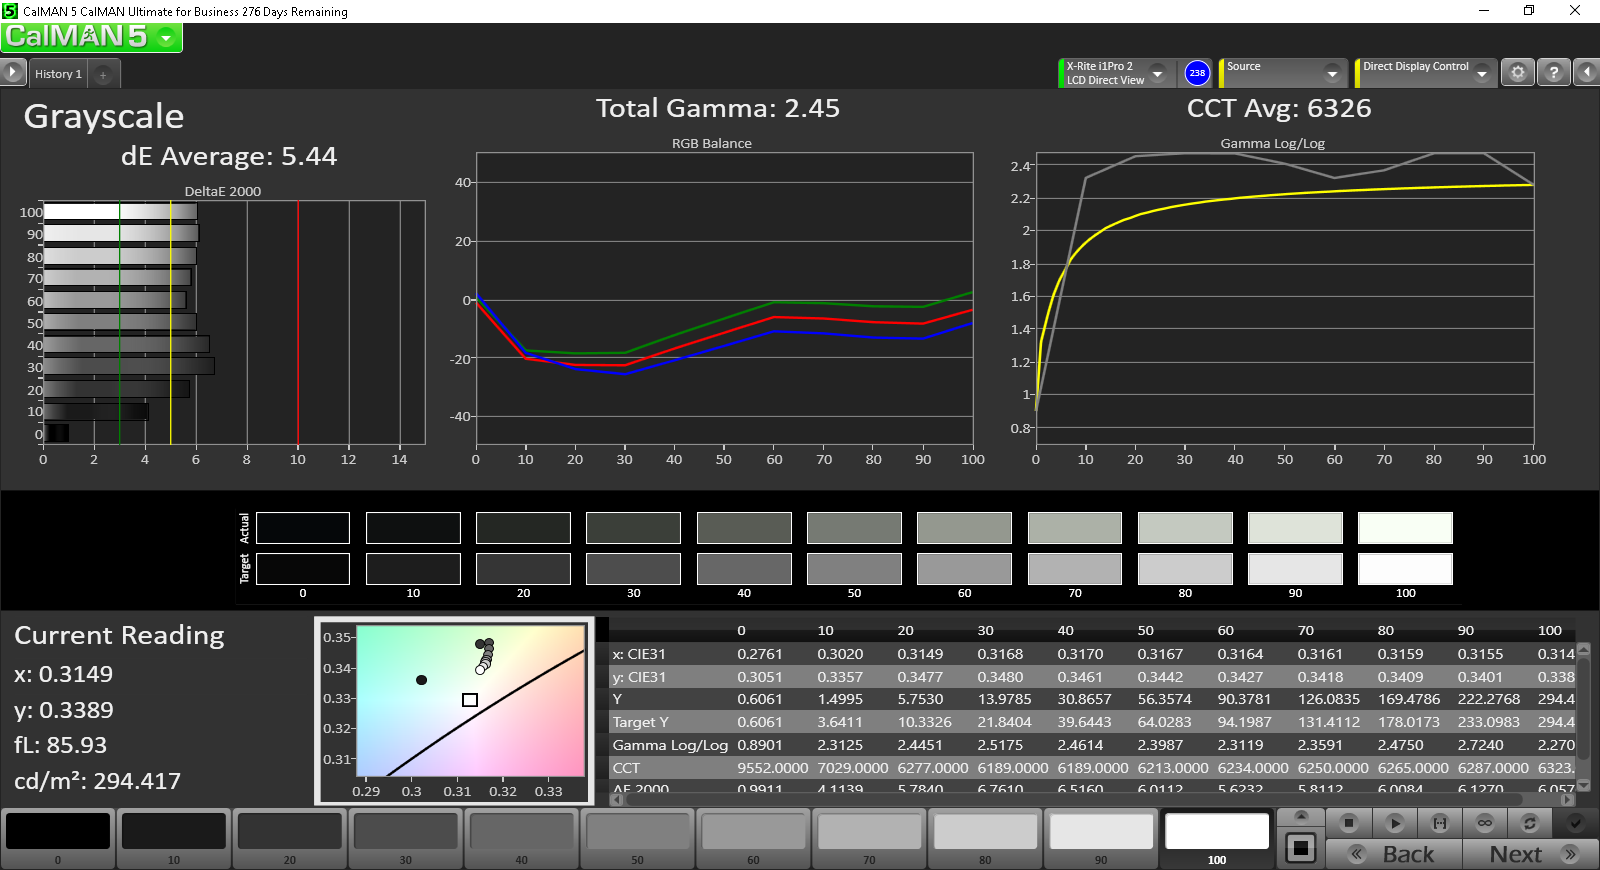
ΔE Greyscale Calman: 2.45 | ∀{0.09-98 Ø4.96}
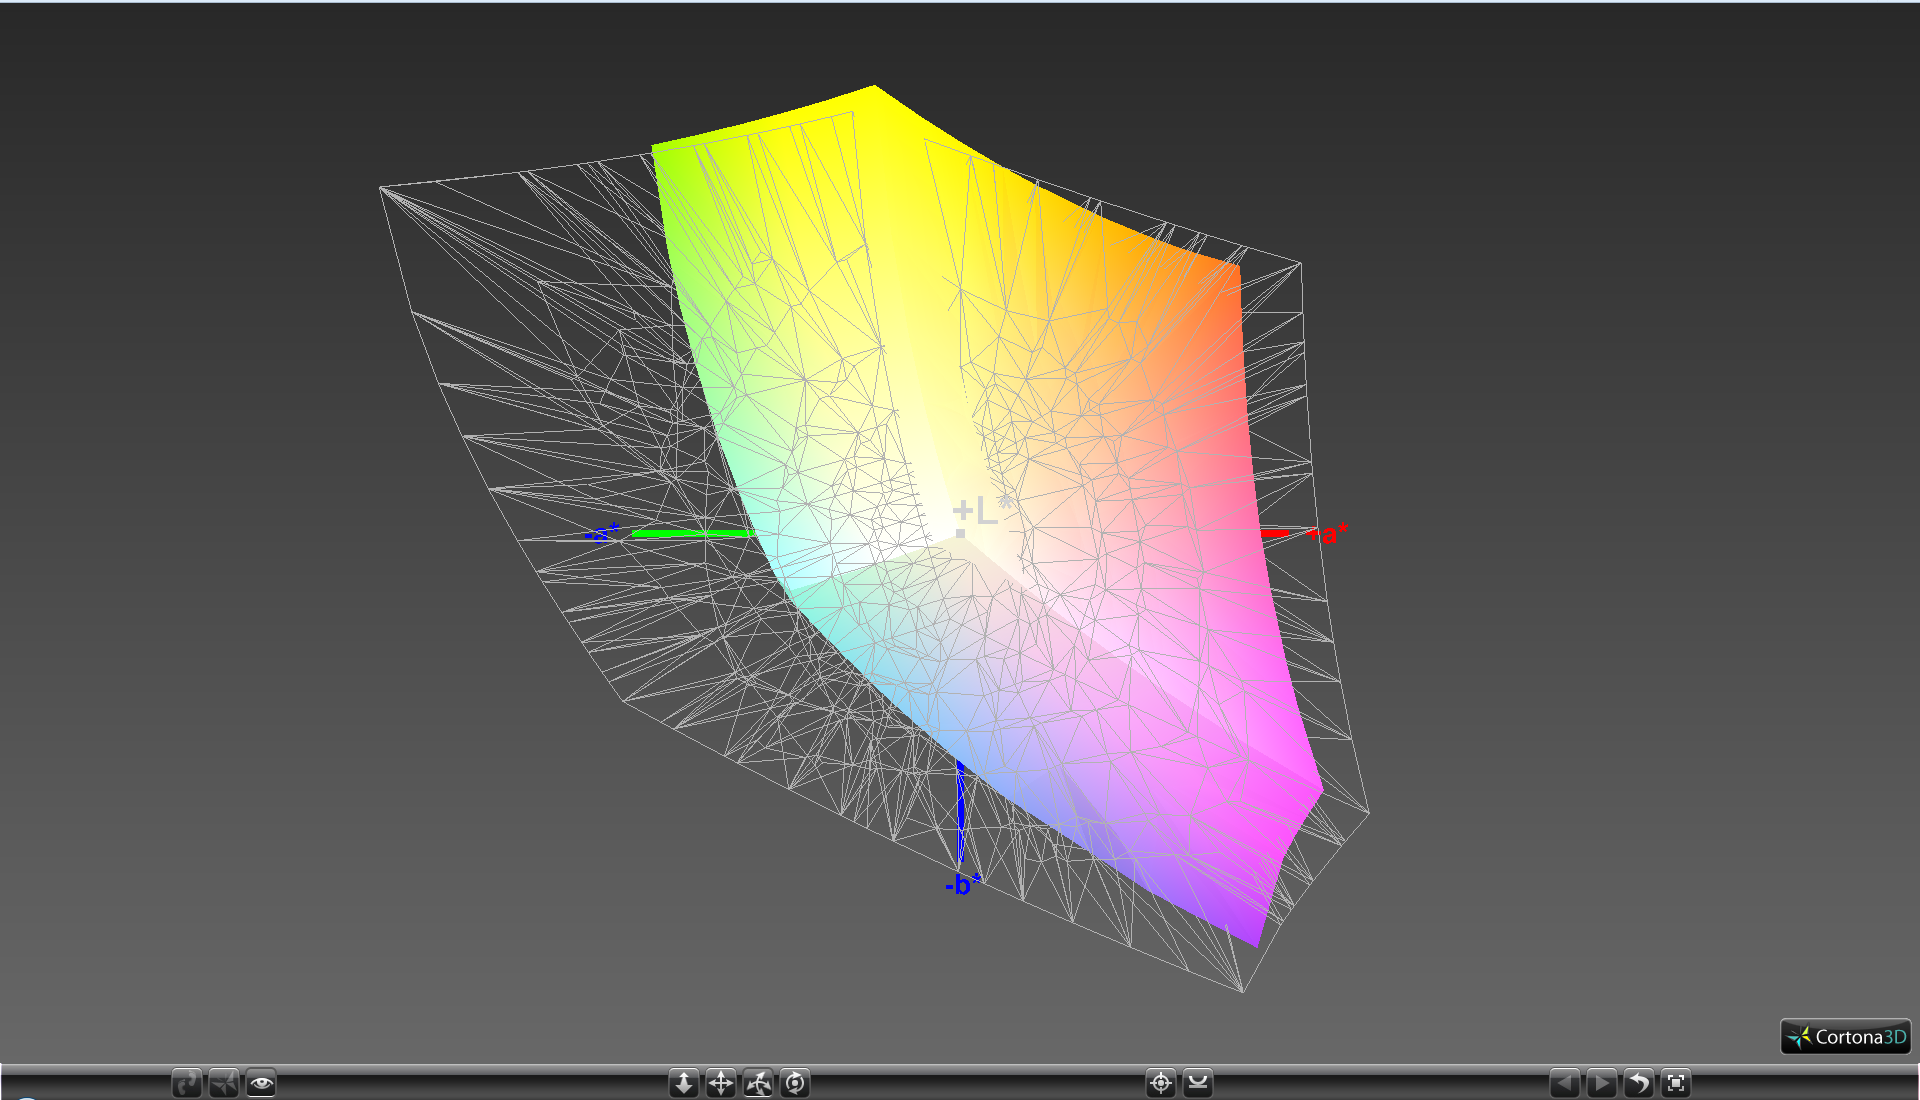
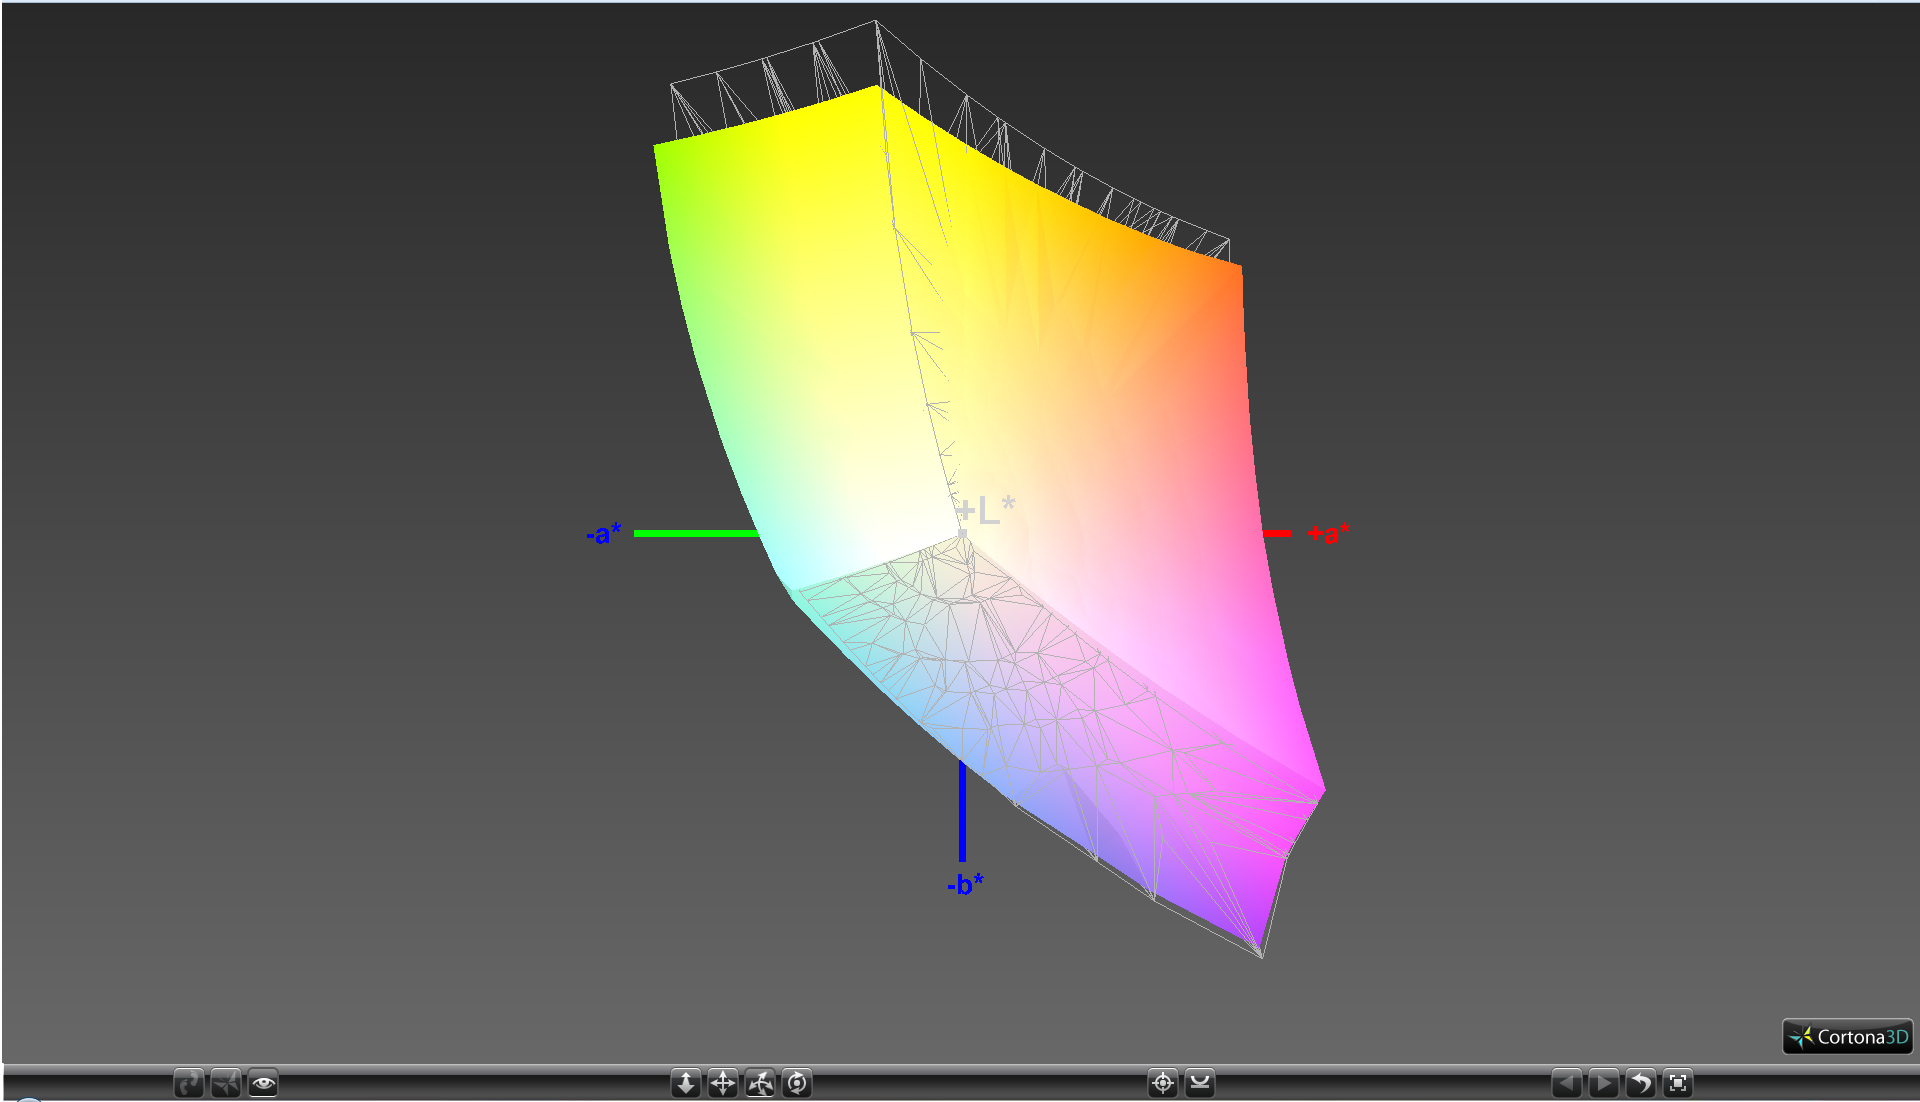
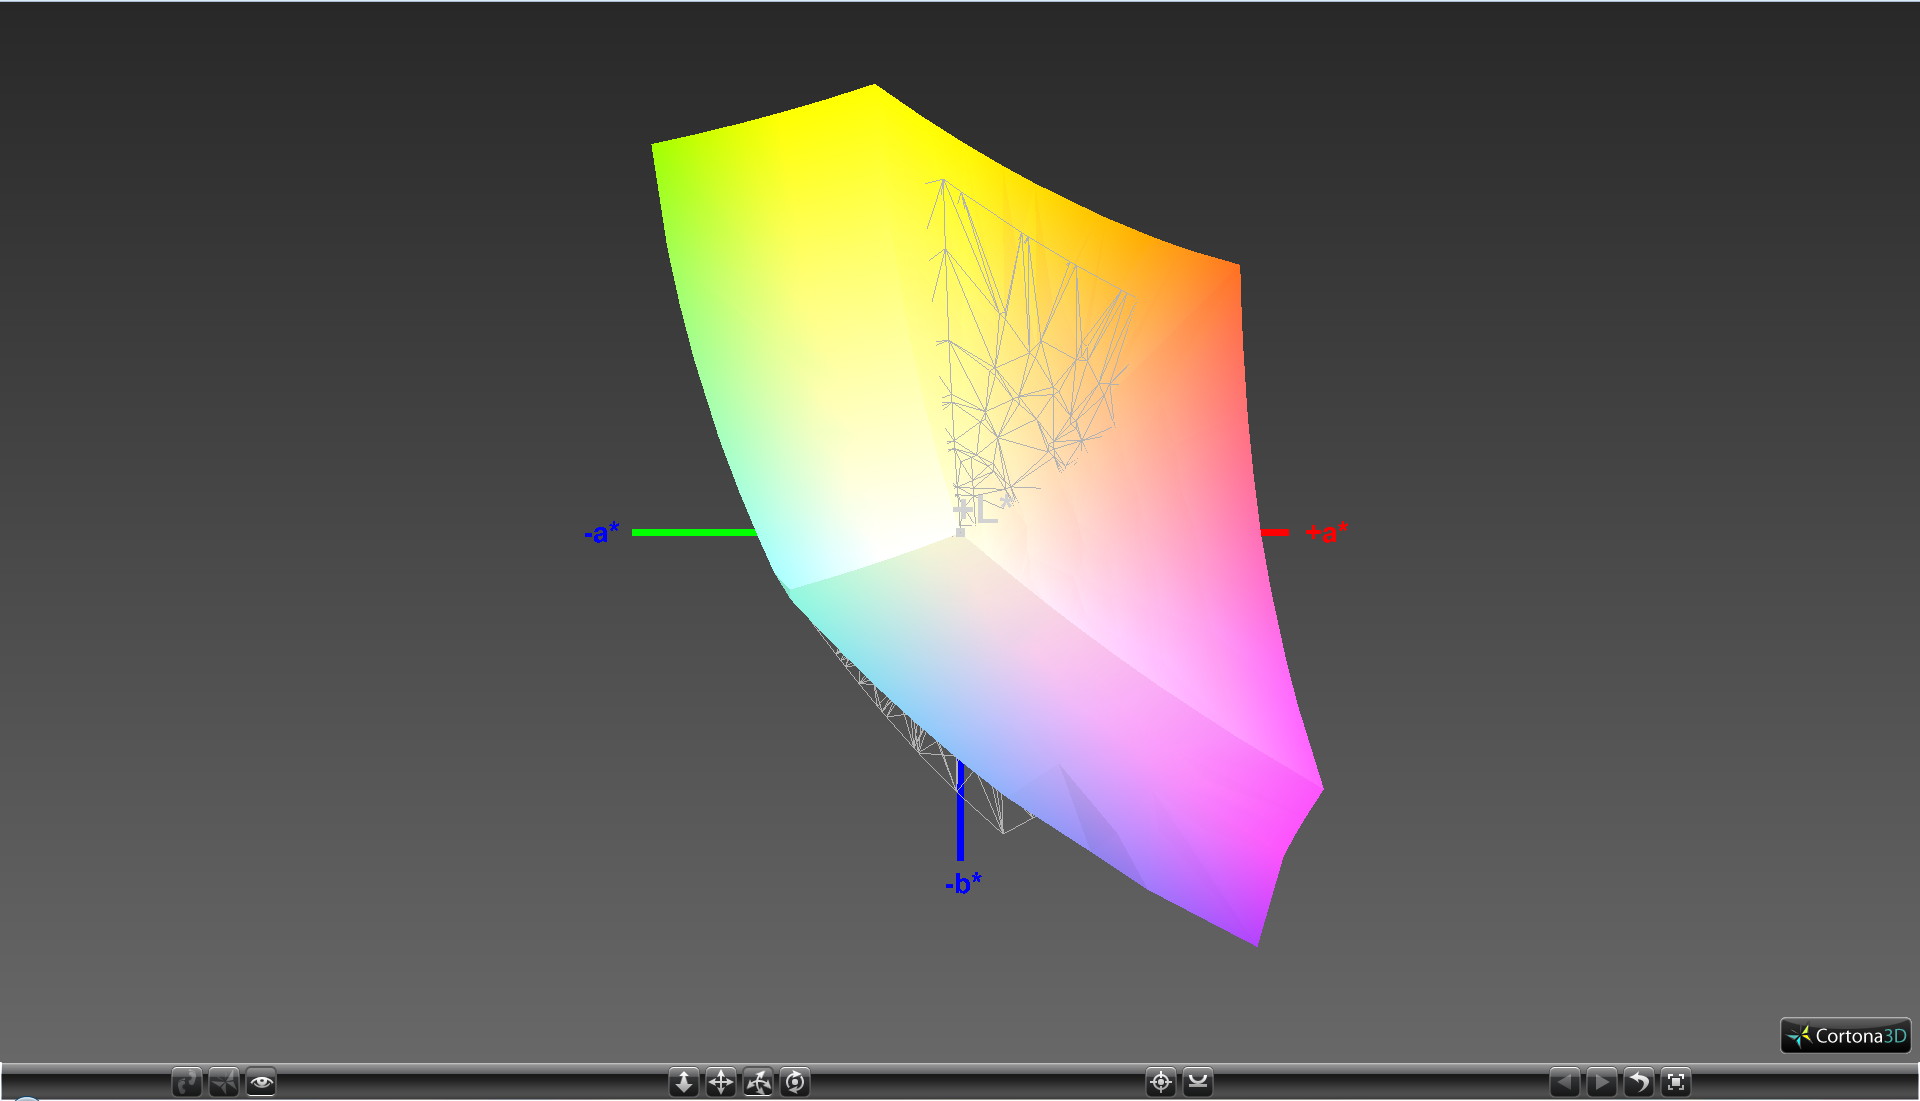
87.8% sRGB (Argyll 1.6.3 3D)
57.2% AdobeRGB 1998 (Argyll 1.6.3 3D)
63.9% AdobeRGB 1998 (Argyll 3D)
88.2% sRGB (Argyll 3D)
62.8% Display P3 (Argyll 3D)
Gamma: 2.45
CCT: 6326 K
| HP Spectre x360 15-ap012dx 15.6", 3840x2160 | HP Spectre x360 15-ap011dx 15.6", 1920x1080 | Toshiba Satellite L50-C-275 15.6", 1920x1080 | Dell XPS 15 9550 i7 FHD 15.6", 1920x1080 | HP Envy 15-w103ng x360 15.6", 1920x1080 | Lenovo Ideapad 500s-14ISK 14", 1920x1080 | |
|---|---|---|---|---|---|---|
| Display | -2% | -3% | 10% | -34% | -33% | |
| Display P3 Coverage (%) | 62.8 | 64.8 3% | 64.1 2% | 68.5 9% | 39.97 -36% | 40.74 -35% |
| sRGB Coverage (%) | 88.2 | 83.5 -5% | 82.9 -6% | 97.2 10% | 59.8 -32% | 60.6 -31% |
| AdobeRGB 1998 Coverage (%) | 63.9 | 61 -5% | 60.6 -5% | 70.4 10% | 41.32 -35% | 42.15 -34% |
| Response Times | -16% | 26% | -87% | -7% | -7% | |
| Response Time Grey 50% / Grey 80% * (ms) | 32.8 ? | 40 ? -22% | 24 ? 27% | 64 ? -95% | 37 ? -13% | 43 ? -31% |
| Response Time Black / White * (ms) | 28 ? | 30.4 ? -9% | 21 ? 25% | 50 ? -79% | 28 ? -0% | 23 ? 18% |
| PWM Frequency (Hz) | 50 ? | |||||
| Screen | -2% | 2% | 3% | -32% | -64% | |
| Brightness middle (cd/m²) | 298 | 289.9 -3% | 294 -1% | 371.5 25% | 208 -30% | 249 -16% |
| Brightness (cd/m²) | 295 | 275 -7% | 285 -3% | 356 21% | 205 -31% | 235 -20% |
| Brightness Distribution (%) | 88 | 88 0% | 83 -6% | 92 5% | 80 -9% | 87 -1% |
| Black Level * (cd/m²) | 0.57 | 0.289 49% | 0.26 54% | 0.252 56% | 0.26 54% | 0.44 23% |
| Contrast (:1) | 523 | 1003 92% | 1131 116% | 1474 182% | 800 53% | 566 8% |
| Colorchecker dE 2000 * | 4.43 | 5.24 -18% | 5.07 -14% | 5.55 -25% | 6.97 -57% | 9.47 -114% |
| Colorchecker dE 2000 max. * | 6.62 | 9.55 -44% | 9.33 -41% | 10.95 -65% | 15.41 -133% | |
| Greyscale dE 2000 * | 2.45 | 4.46 -82% | 4.25 -73% | 7.1 -190% | 7.37 -201% | 10.22 -317% |
| Gamma | 2.45 90% | 2.31 95% | 2.49 88% | 2.1 105% | 2.34 94% | 2.34 94% |
| CCT | 6326 103% | 6818 95% | 6597 99% | 6823 95% | 11451 57% | |
| Color Space (Percent of AdobeRGB 1998) (%) | 57.2 | 54.7 -4% | 54 -6% | 63.4 11% | 38 -34% | 39 -32% |
| Color Space (Percent of sRGB) (%) | 87.8 | 83.3 -5% | 83 -5% | 97.9 12% | 59 -33% | 57 -35% |
| Total Average (Program / Settings) | -7% /
-4% | 8% /
4% | -25% /
-8% | -24% /
-29% | -35% /
-50% |
* ... smaller is better
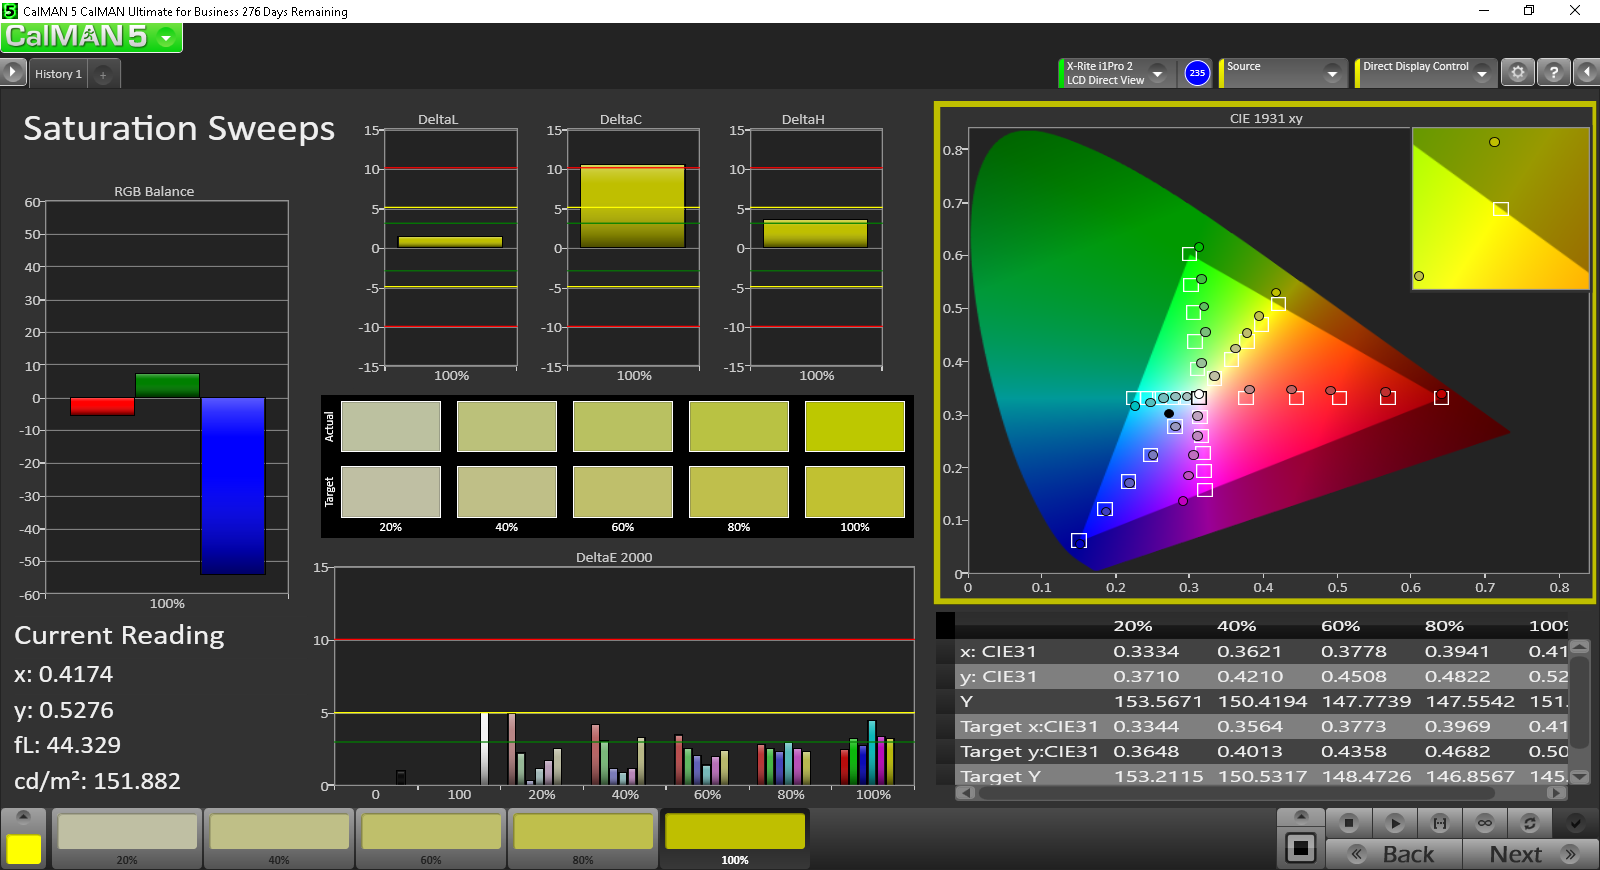
Color coverage is approximately 57 percent and 88 percent of AdobeRGB and sRGB standards, respectively. The denser panel does not offer tangible color gains over its FHD counterpart. It is, however, still a massive improvement over the panel on the Envy 15 x360.

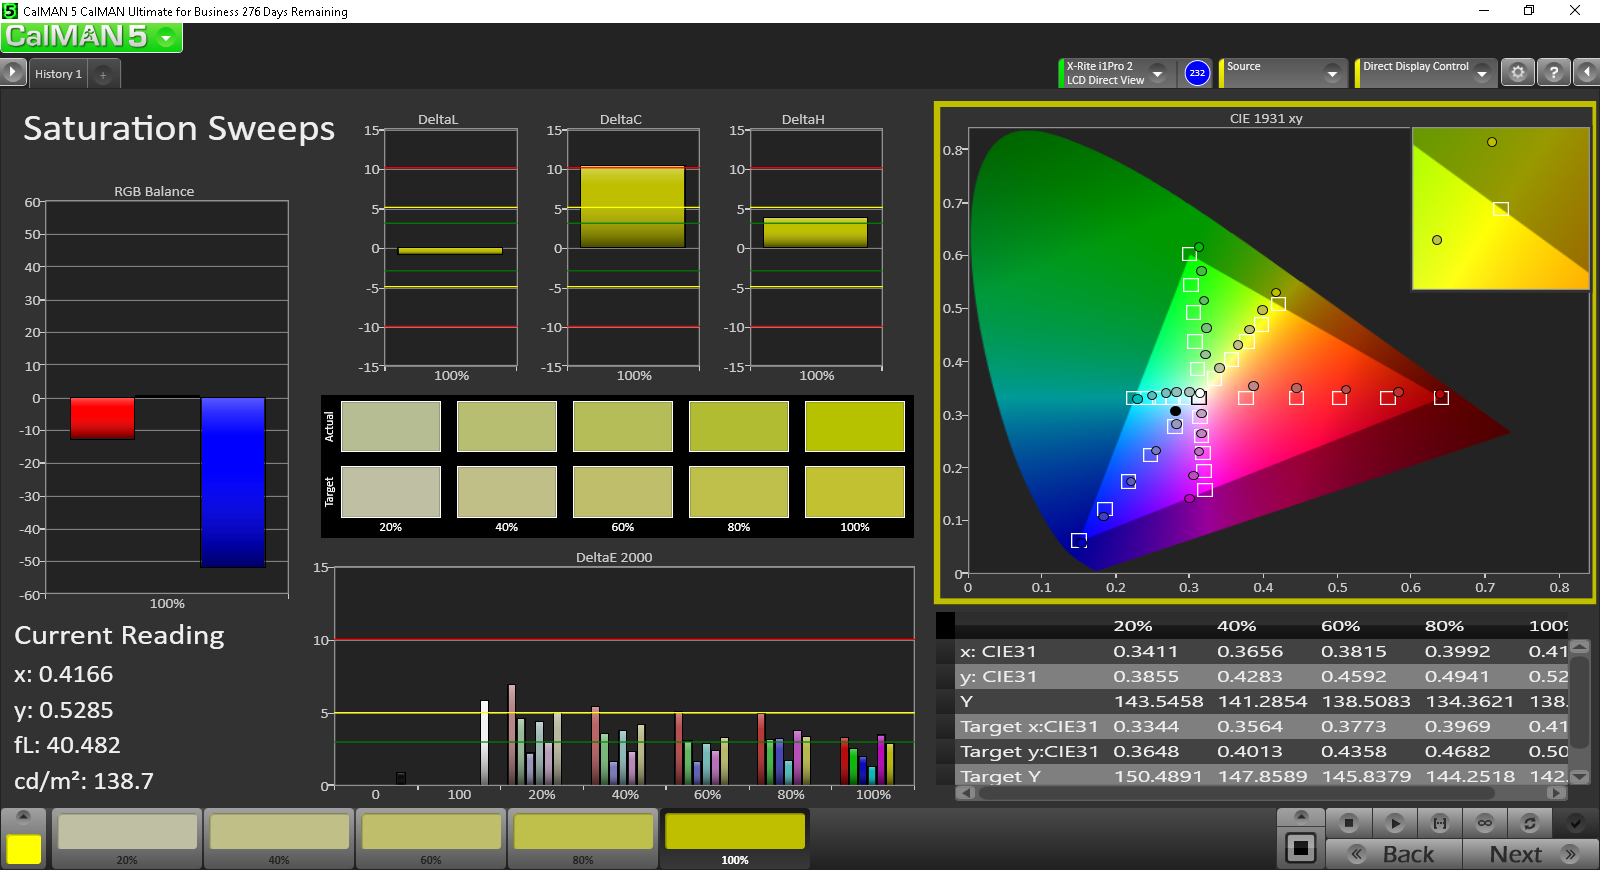
Further display measurements reveal an average grayscale with better color accuracy than the FHD counterpart. A quick calibration improves grayscale noticeably and colors just slightly. Colors become less accurate at higher saturation levels due to imperfect sRGB coverage.
It's worth noting that the grayscale on the FHD SKU can be even better than the 4K UHD SKU after calibration as shown by our measurements.

Display Response Times
| ↔ Response Time Black to White | ||
|---|---|---|
| 28 ms ... rise ↗ and fall ↘ combined | ↗ 4.8 ms rise | 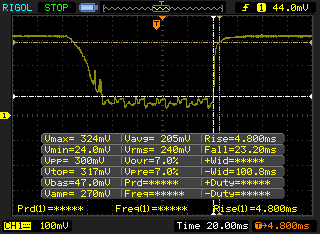 |
| ↘ 23.2 ms fall | ||
| The screen shows relatively slow response rates in our tests and may be too slow for gamers. In comparison, all tested devices range from 0.1 (minimum) to 240 (maximum) ms. » 71 % of all devices are better. This means that the measured response time is worse than the average of all tested devices (19.8 ms). | ||
| ↔ Response Time 50% Grey to 80% Grey | ||
| 32.8 ms ... rise ↗ and fall ↘ combined | ↗ 14.8 ms rise | 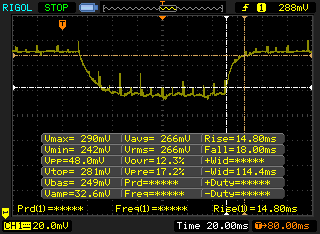 |
| ↘ 18 ms fall | ||
| The screen shows slow response rates in our tests and will be unsatisfactory for gamers. In comparison, all tested devices range from 0.165 (minimum) to 636 (maximum) ms. » 45 % of all devices are better. This means that the measured response time is similar to the average of all tested devices (30.9 ms). | ||
Screen Flickering / PWM (Pulse-Width Modulation)
| Screen flickering / PWM not detected | 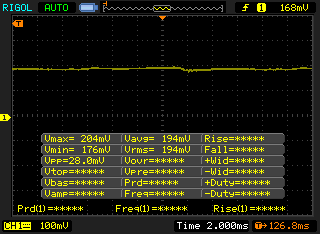 | ||
In comparison: 52 % of all tested devices do not use PWM to dim the display. If PWM was detected, an average of 7741 (minimum: 5 - maximum: 343500) Hz was measured. | |||
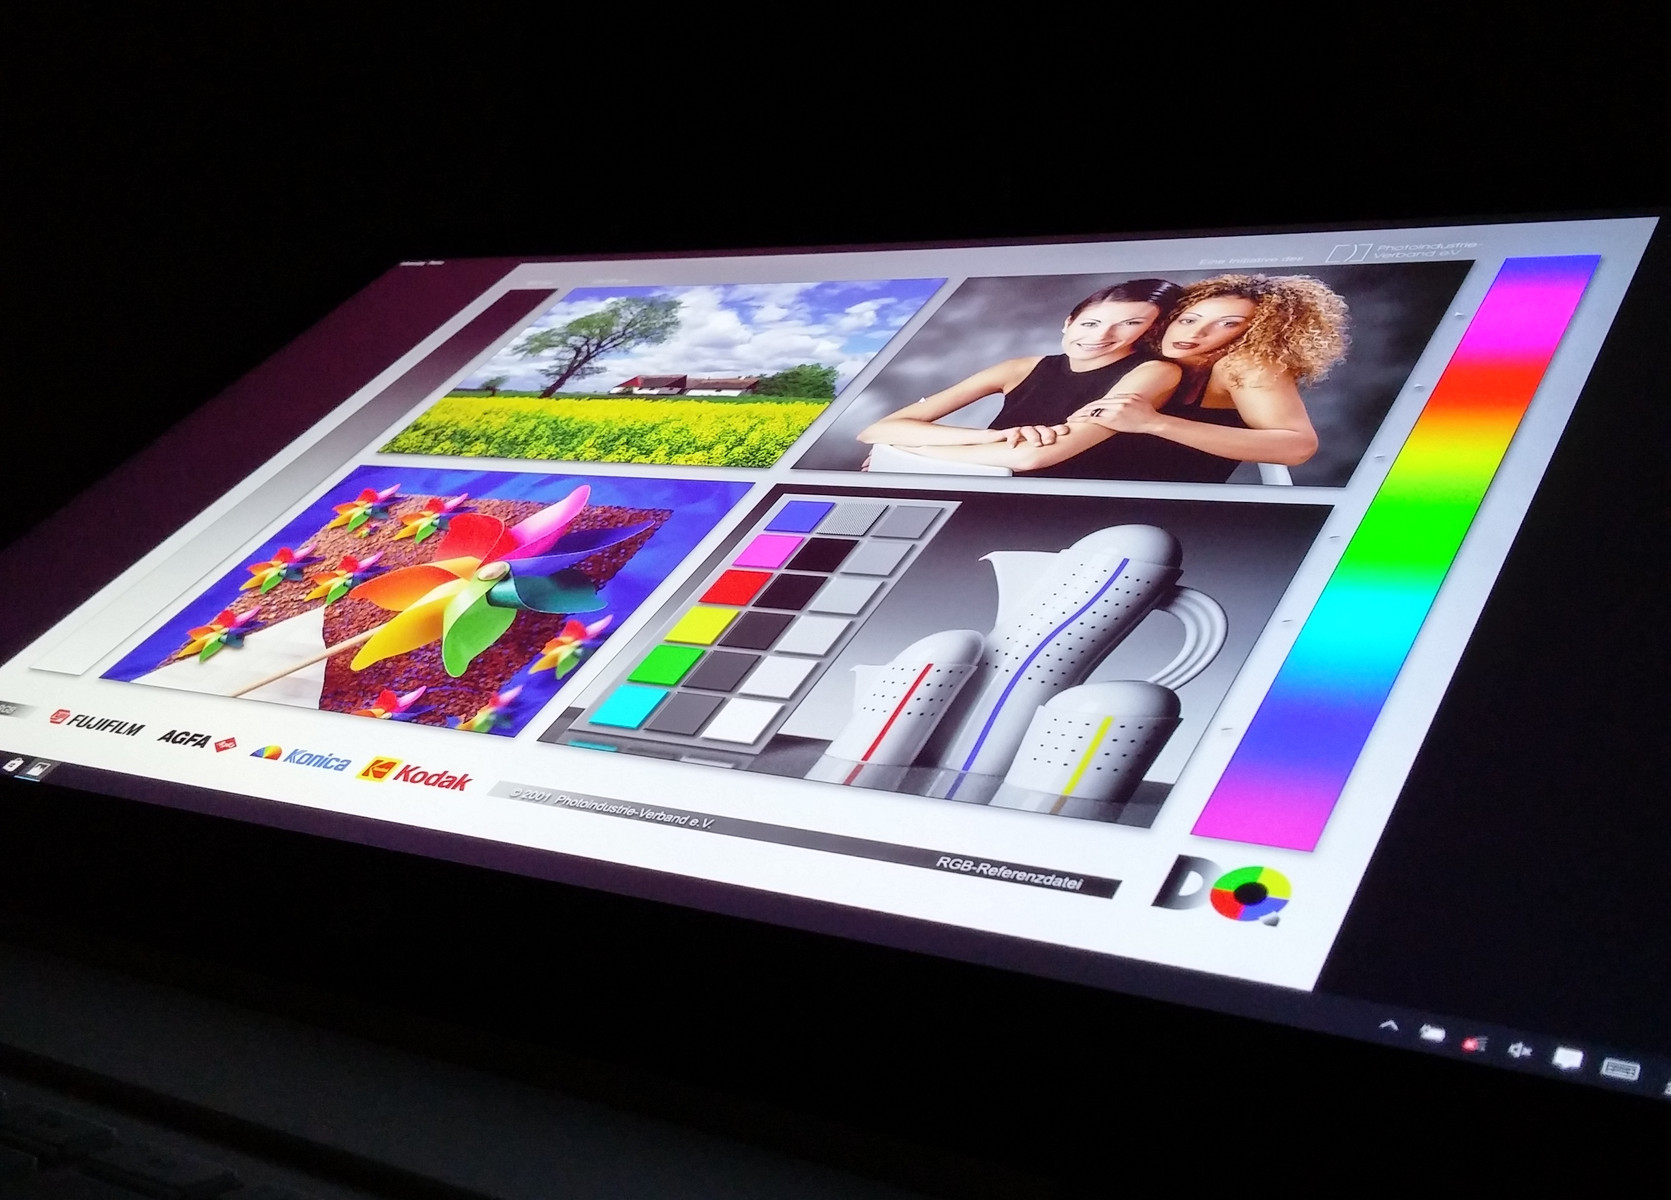
Outdoor usability is the same as on the FHD panel. The lower contrast, however, can cause the screen to look slightly more washed out. The difference is otherwise subjectively insignificant when outdoors under shade or sunlight.
Viewing angles are very wide as expected due to the IPS panel. Extremely shallow angles can cause colors to gray or redden as seen on the top left side of the display on our example screenshot. This is a common occurrence on most panels.
Performance
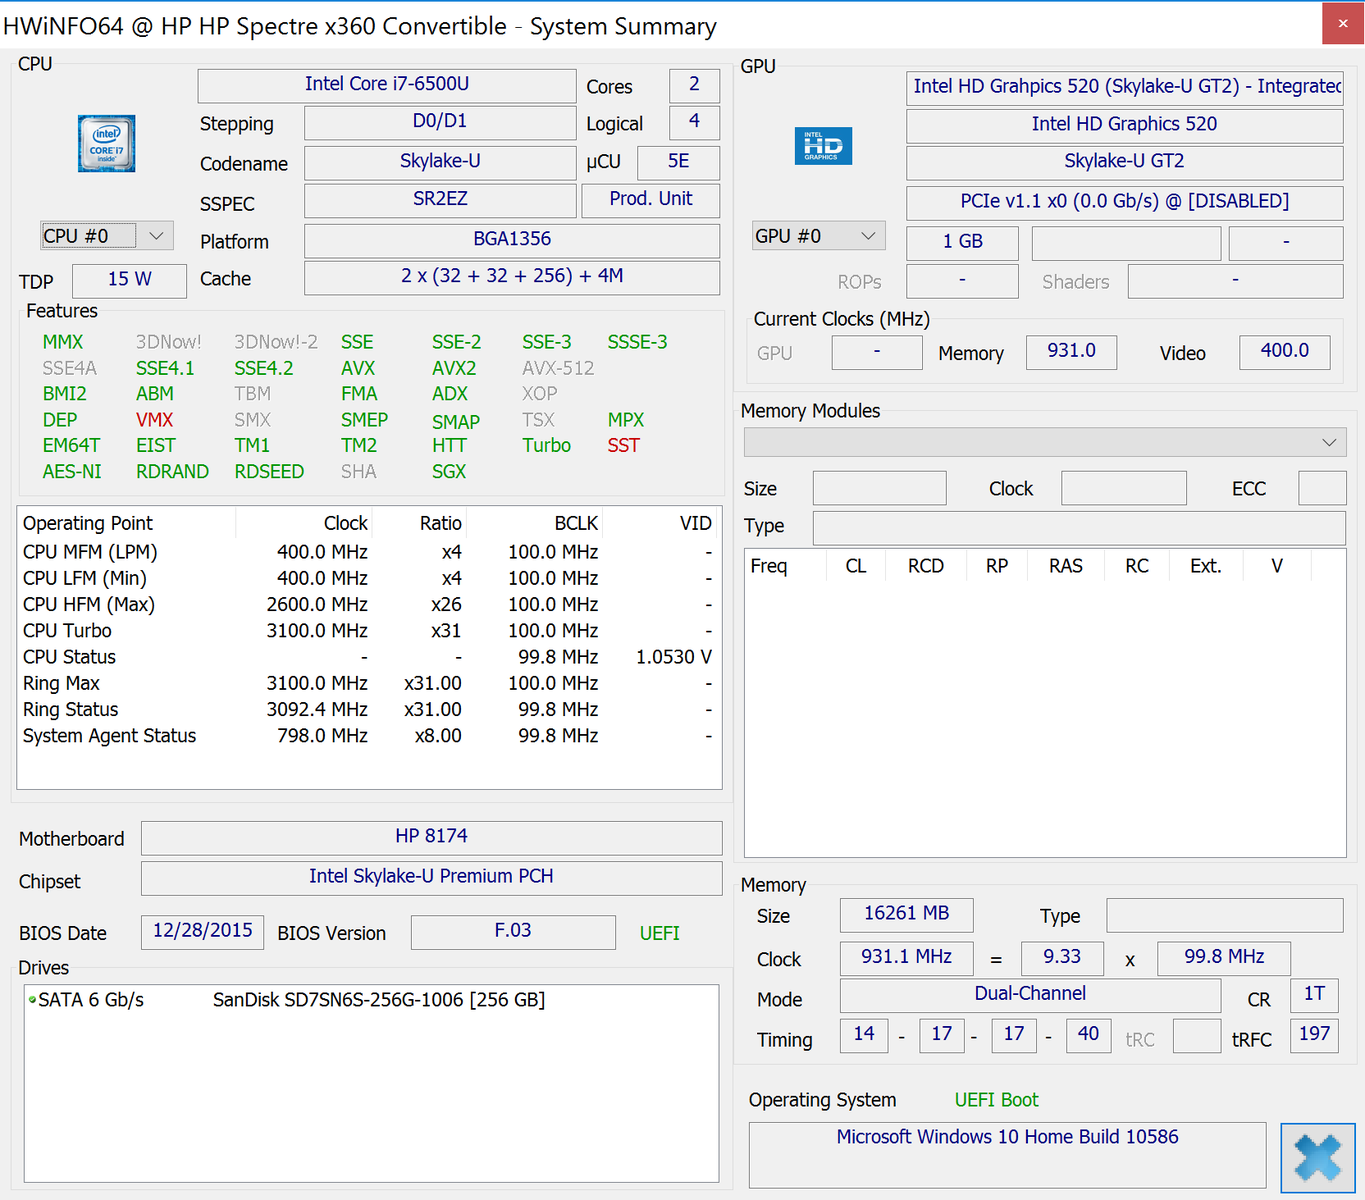
While the Spectre x360 15 4K UHD includes options for the faster Core i7-6500U and i7-6560U, our particular unit uses the same Core i5-5200U CPU as our previous FHD test unit. Thus, performance results are essentially the same as on our previous review page. Onboard RAM has been doubled from 8 GB to 16 GB with all else remaining identical save for the SSD manufacturer.
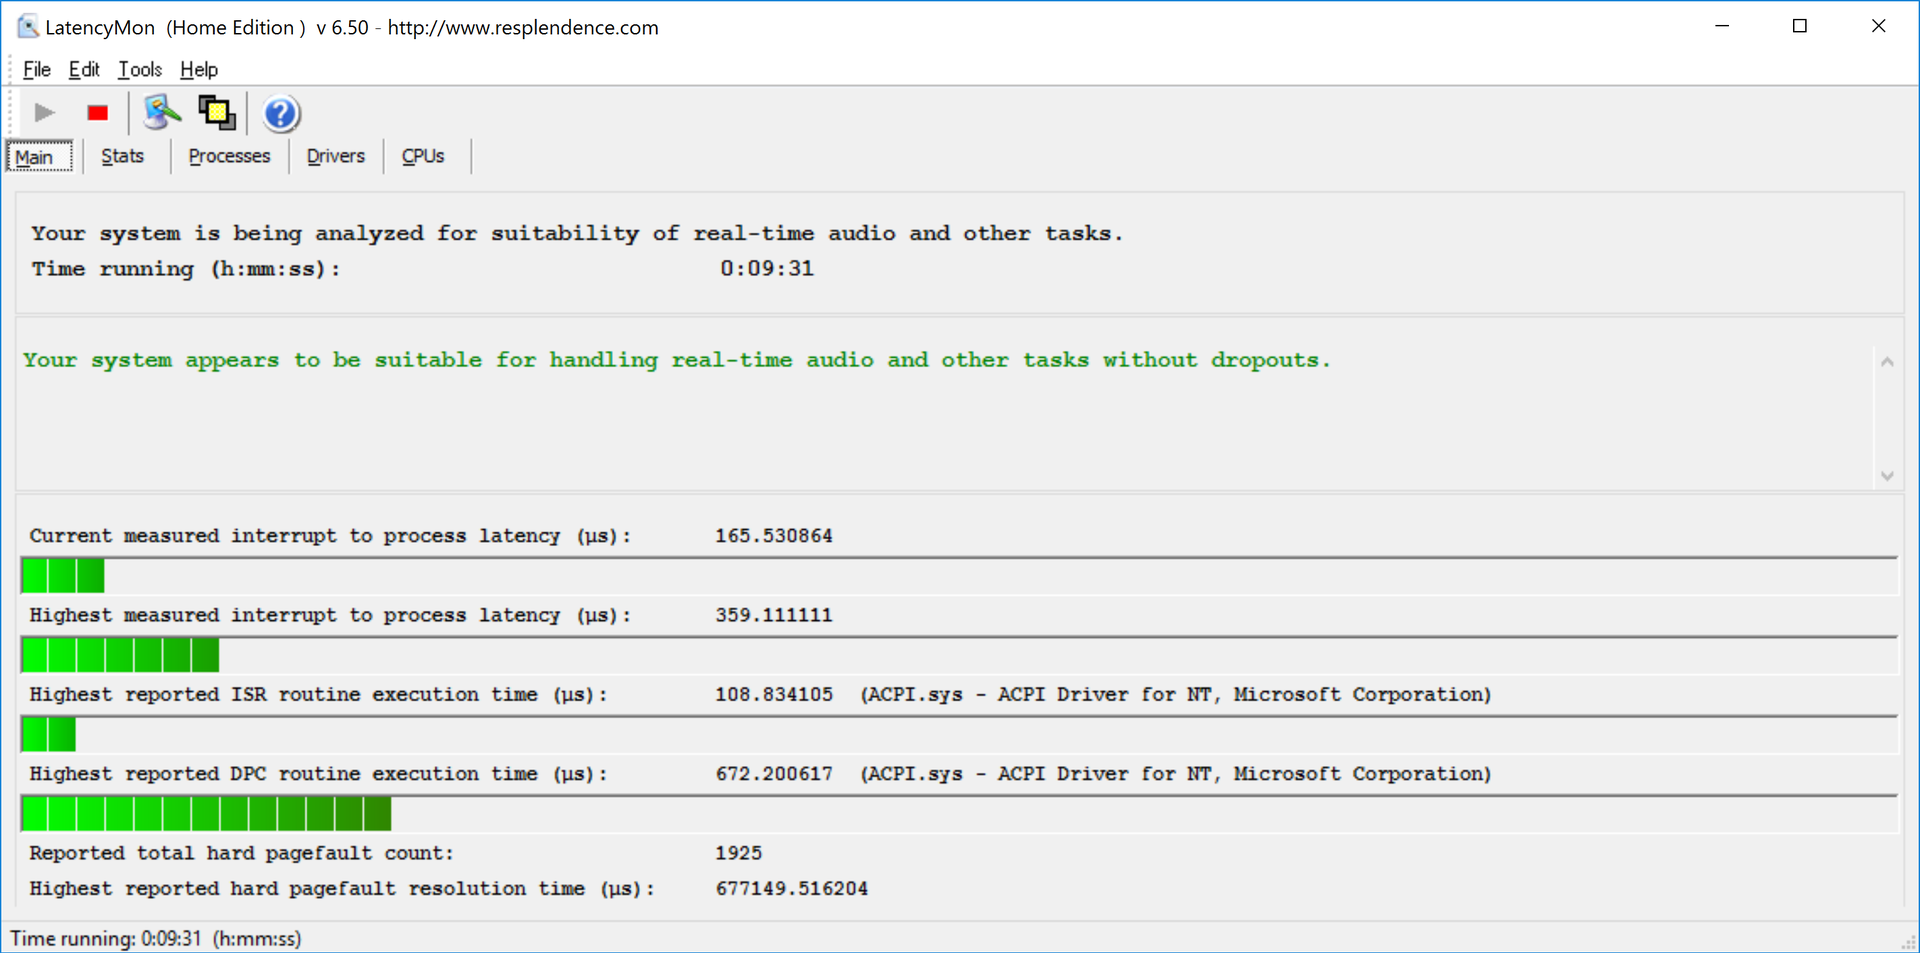
LatencyMon shows no hard page faults after uninstalling the pre-installed McAfee software.
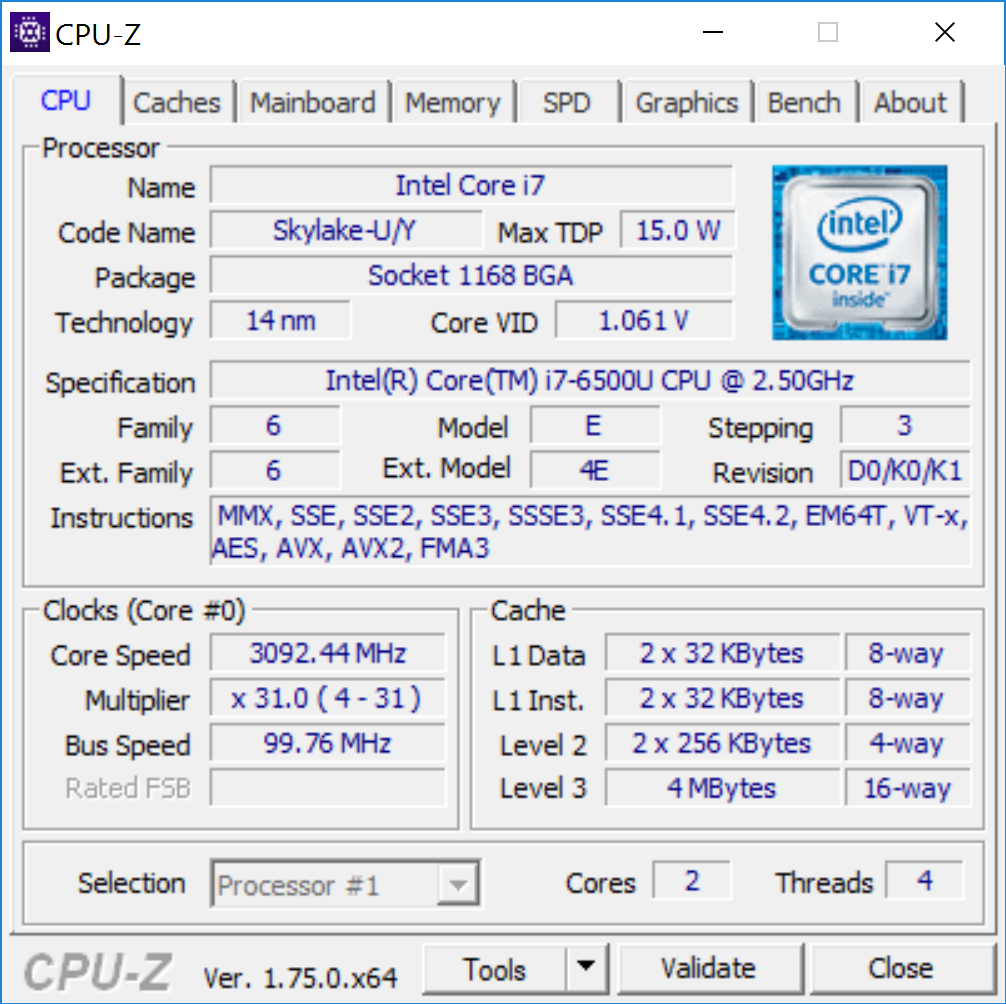
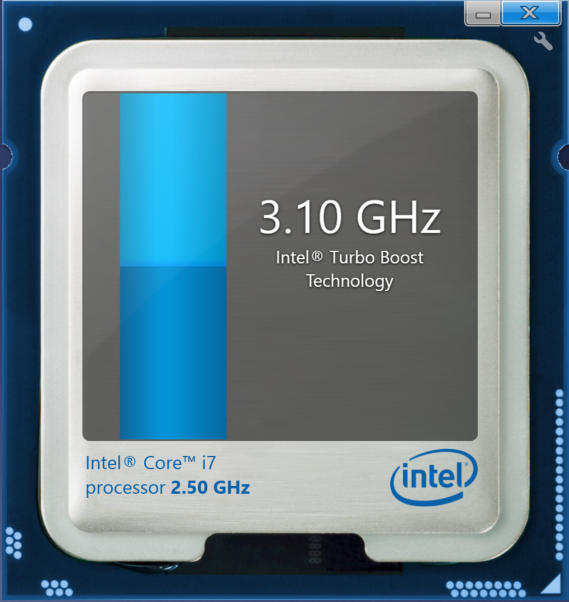
Processor
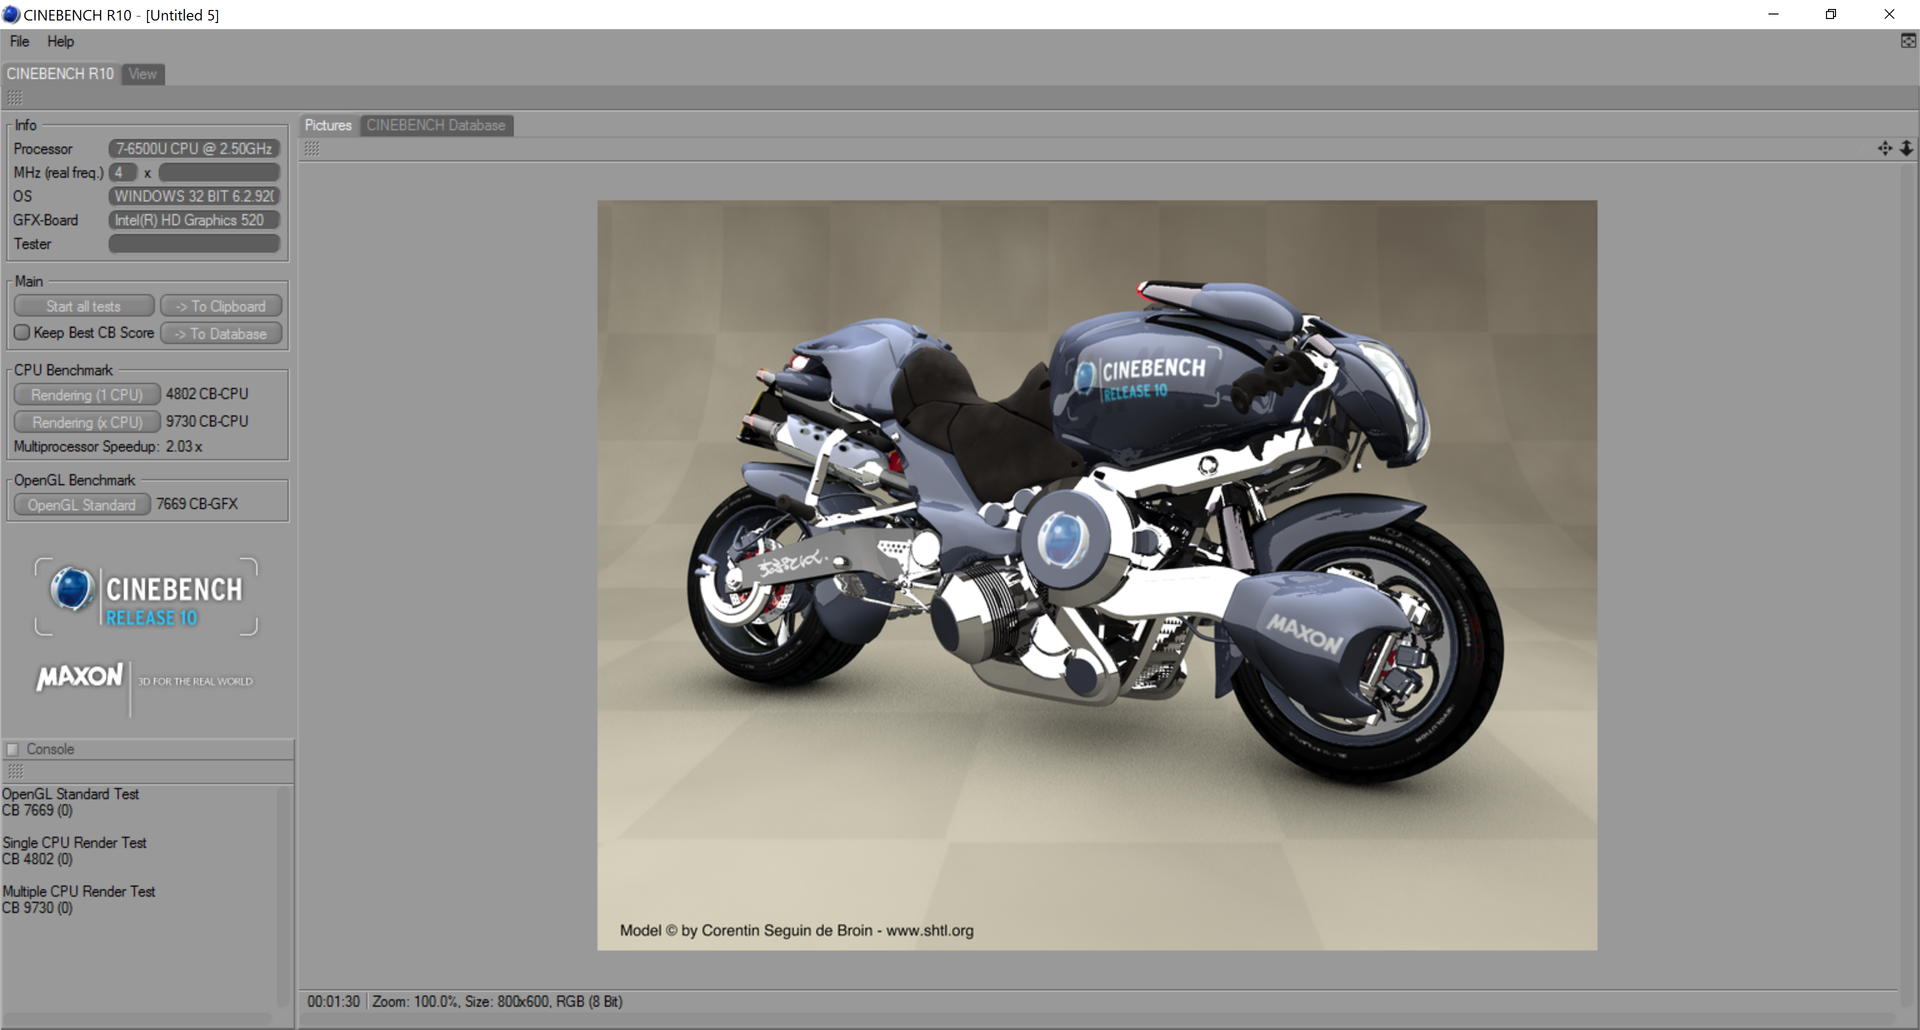
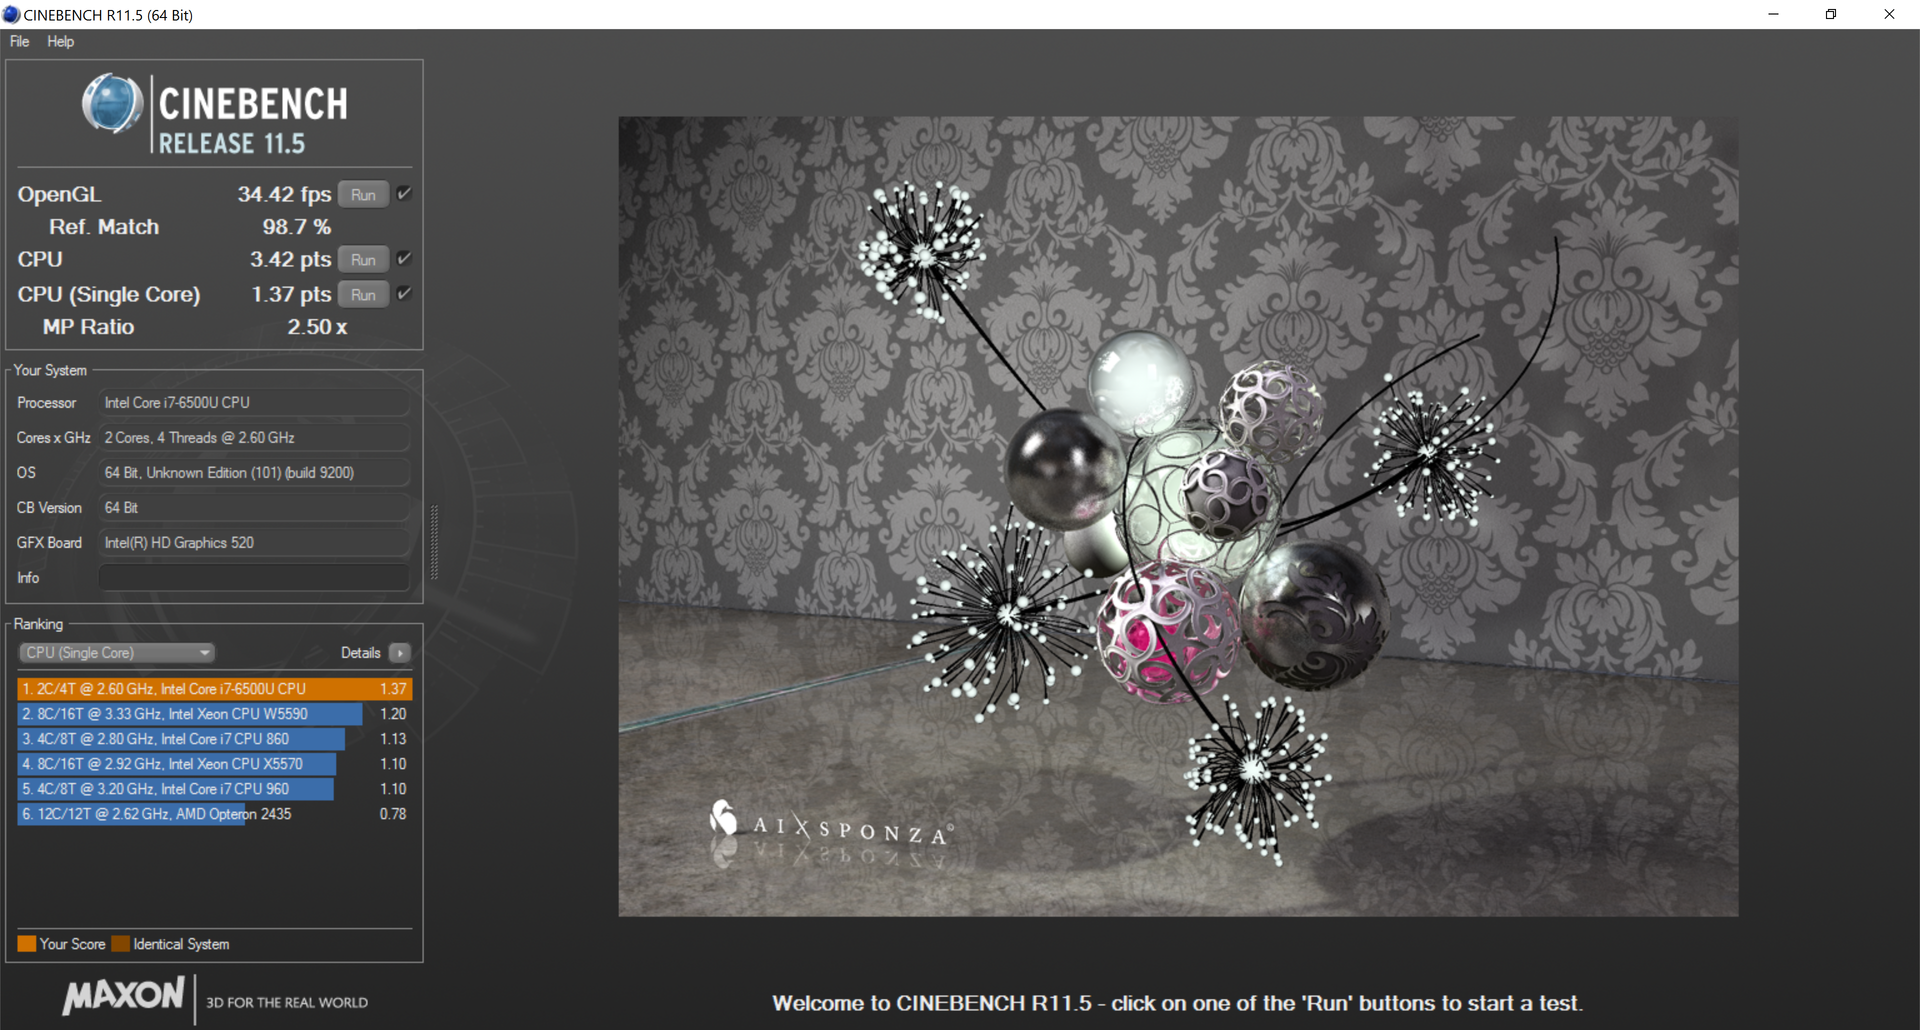
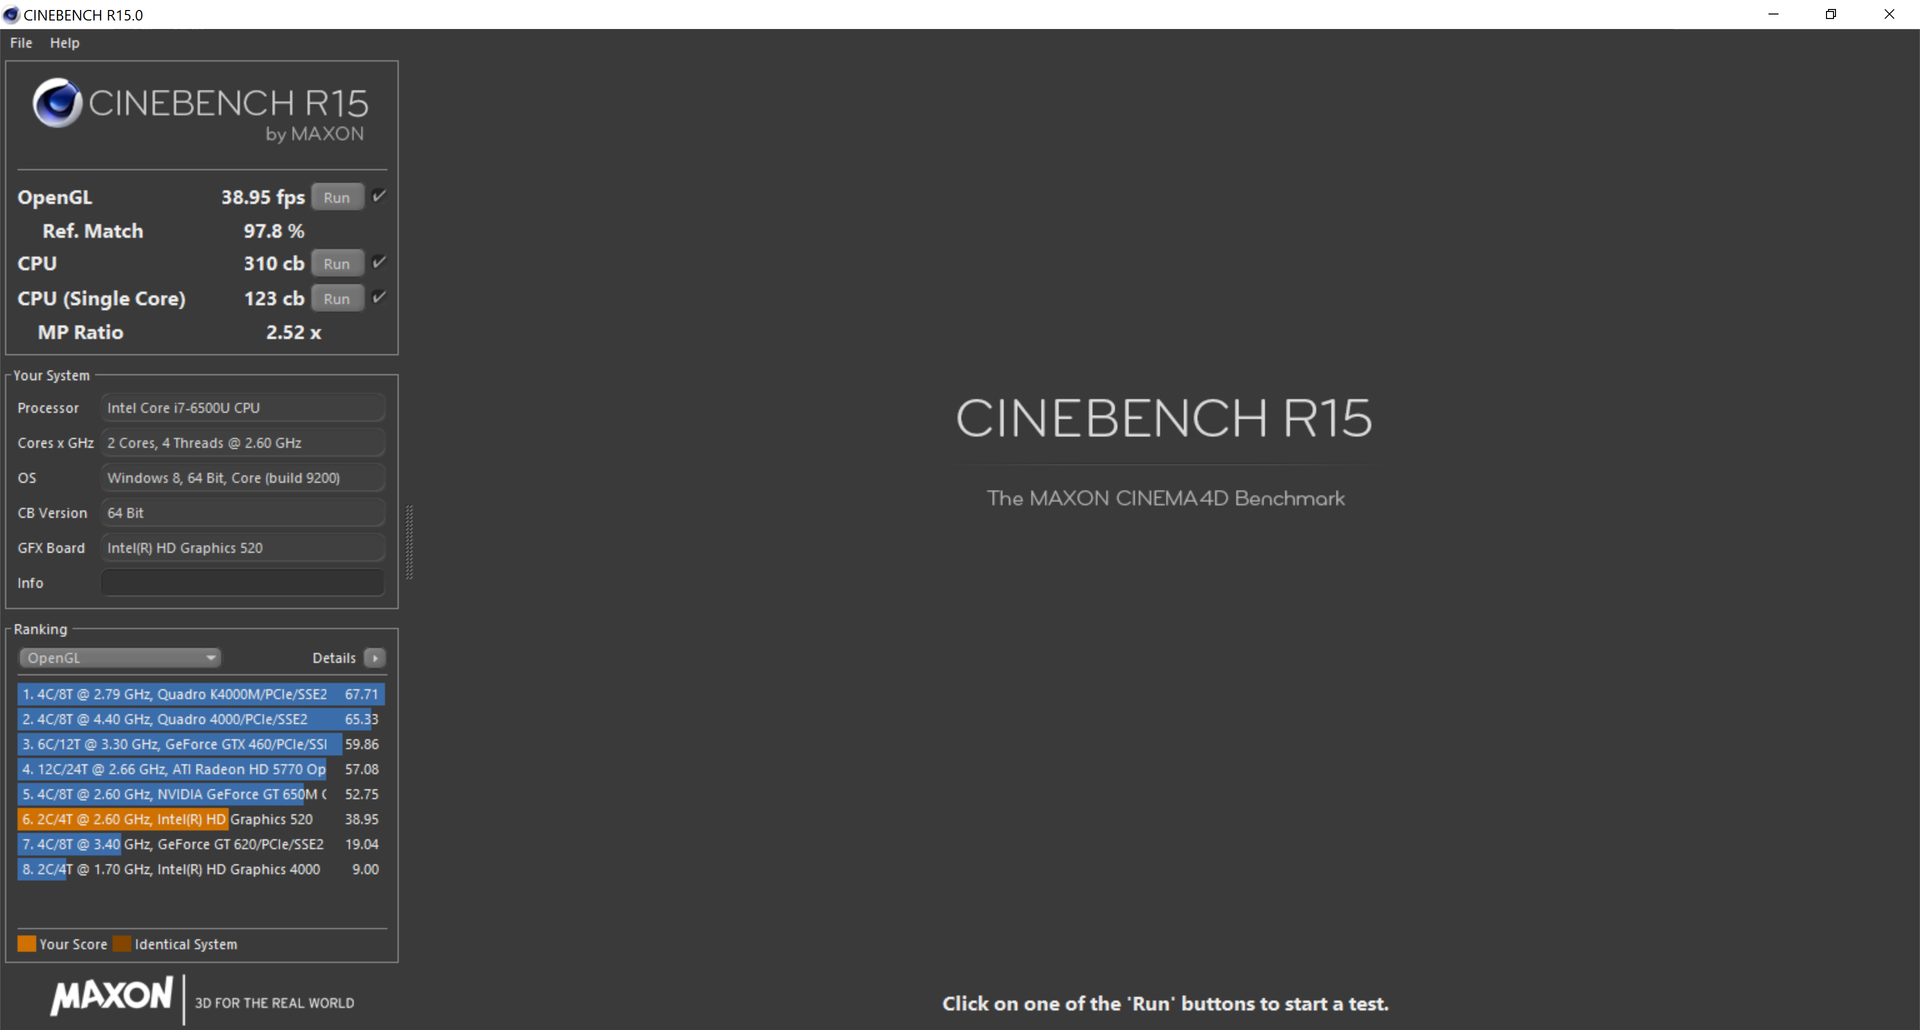
Raw performance is only a few percentage points within most other ULV models down to even the Haswell generation. The gap widens when compared to the Core i7-6650U, but the differences are still barely in the double digits. More power-hungry quad-core processors like the older Core i7-4700HQ will still handily outperform the ULV Skylake core in multi-core processes.
See our dedicated CPU page on the Core i5-6200U for more technical information and benchmarks.
| Cinebench R10 | |
| Rendering Single CPUs 64Bit (sort by value) | |
| Lenovo IdeaPad Y50 | |
| Microsoft Surface Pro 4 Core i7 | |
| Lenovo ThinkPad T440s 20AQ006BGE | |
| Rendering Multiple CPUs 64Bit (sort by value) | |
| Lenovo IdeaPad Y50 | |
| Microsoft Surface Pro 4 Core i7 | |
| Lenovo ThinkPad T440s 20AQ006BGE | |
| wPrime 2.10 - 1024m (sort by value) | |
| HP Spectre x360 15-ap012dx | |
| Lenovo IdeaPad Y50 | |
| Microsoft Surface Pro 4 Core i7 | |
| Razer Blade Stealth UHD i7-6500U | |
| Super Pi Mod 1.5 XS 32M - 32M (sort by value) | |
| HP Spectre x360 15-ap012dx | |
| Lenovo IdeaPad Y50 | |
| Microsoft Surface Pro 4 Core i7 | |
| Razer Blade Stealth UHD i7-6500U | |
* ... smaller is better
System Performance
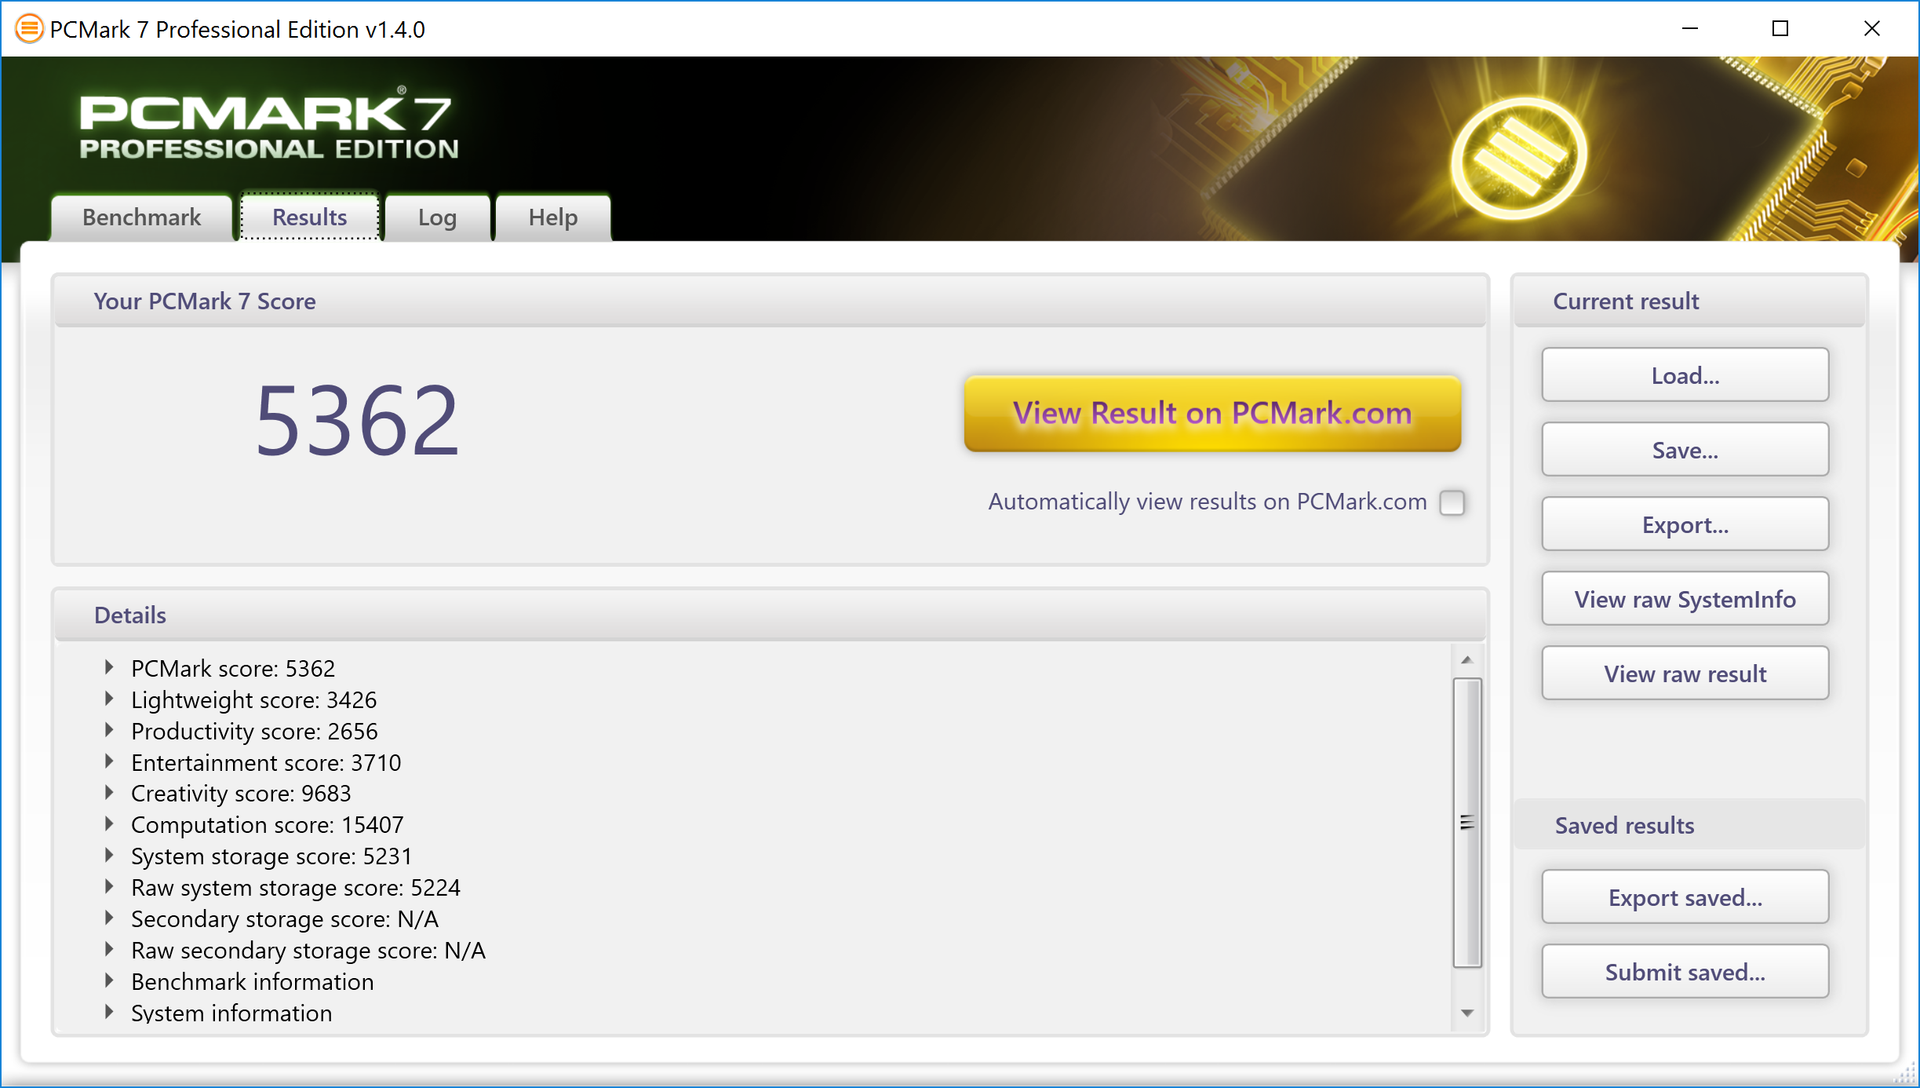
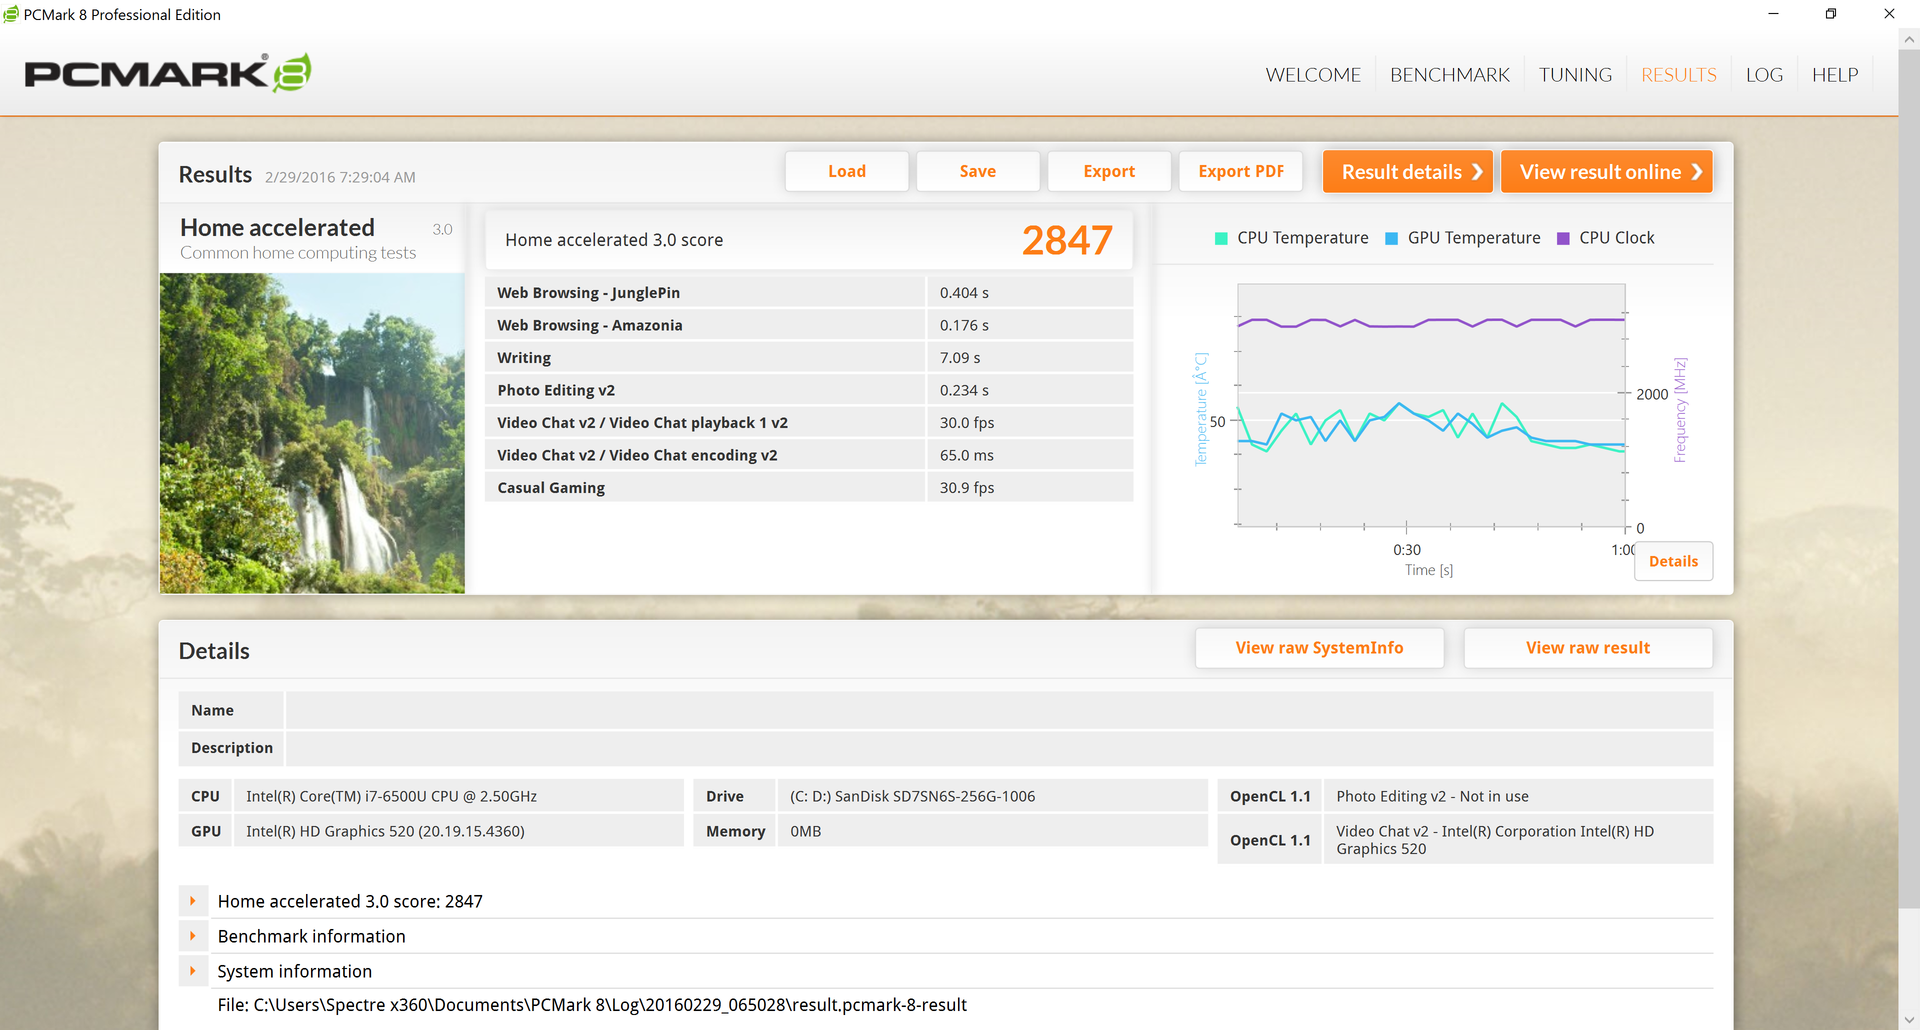
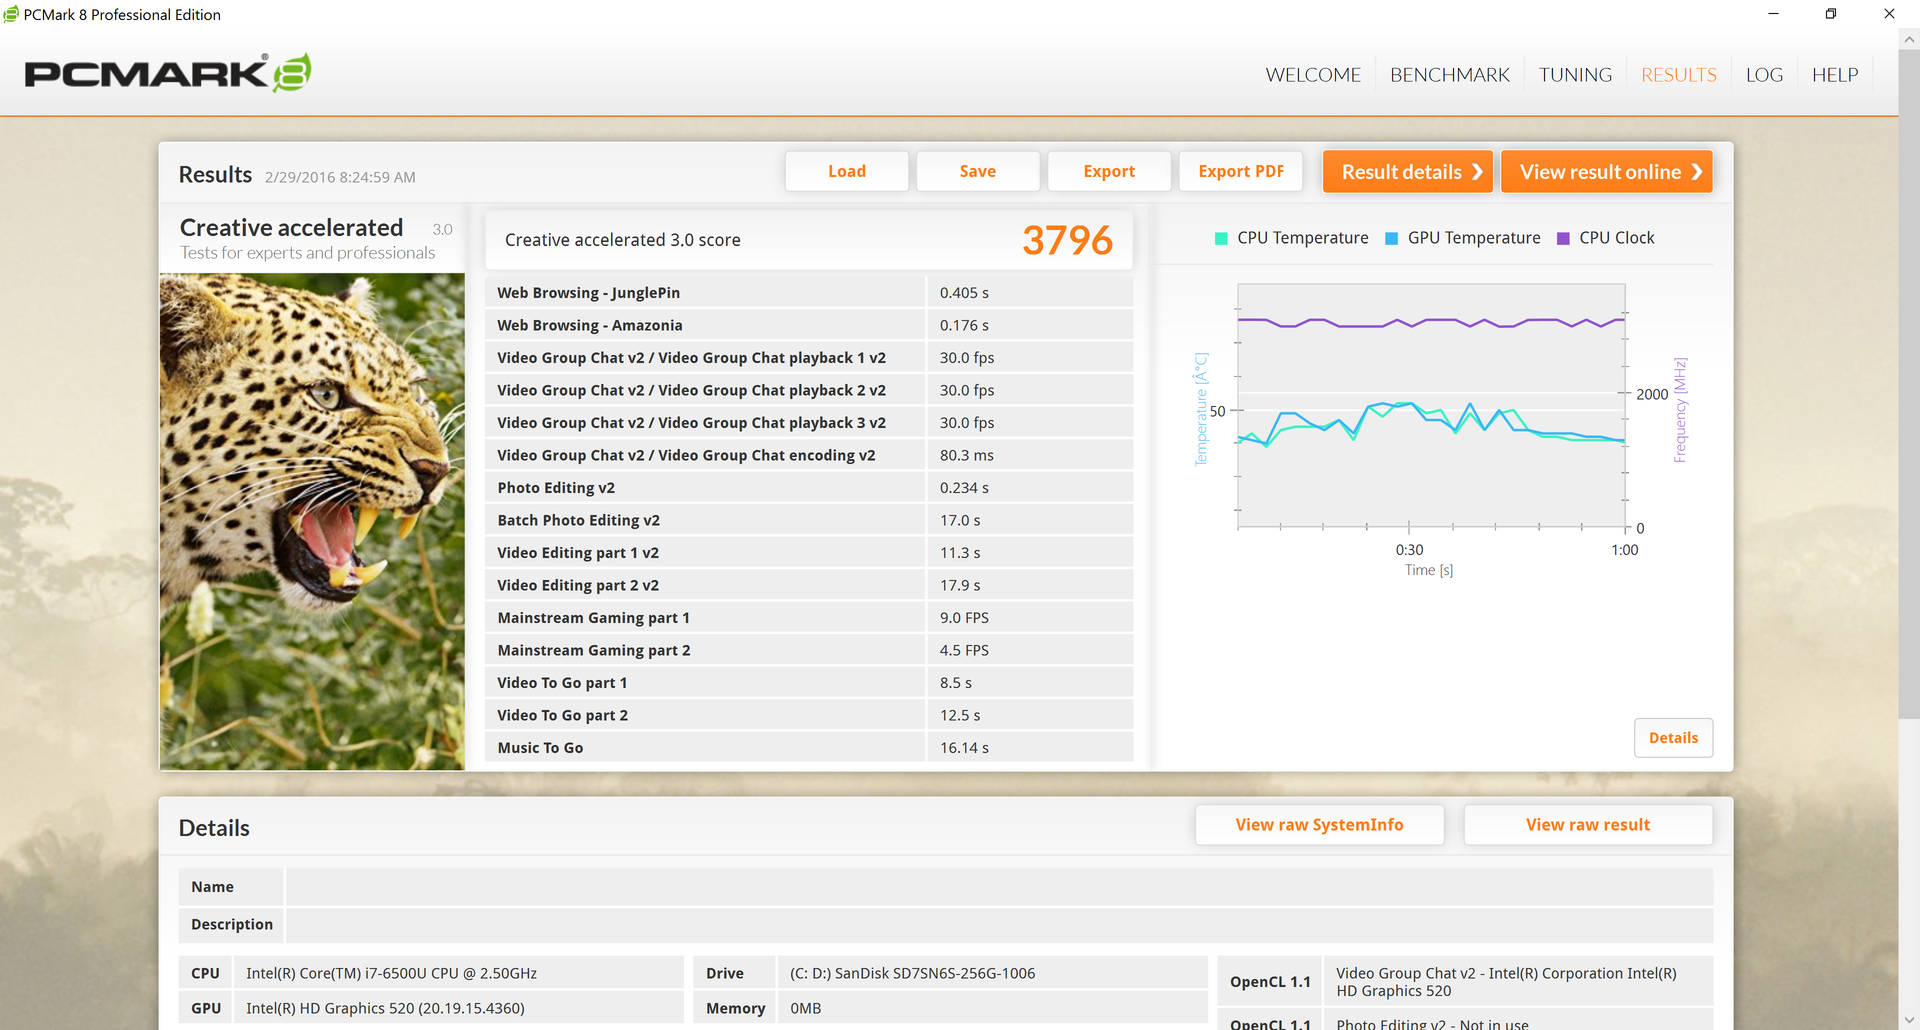
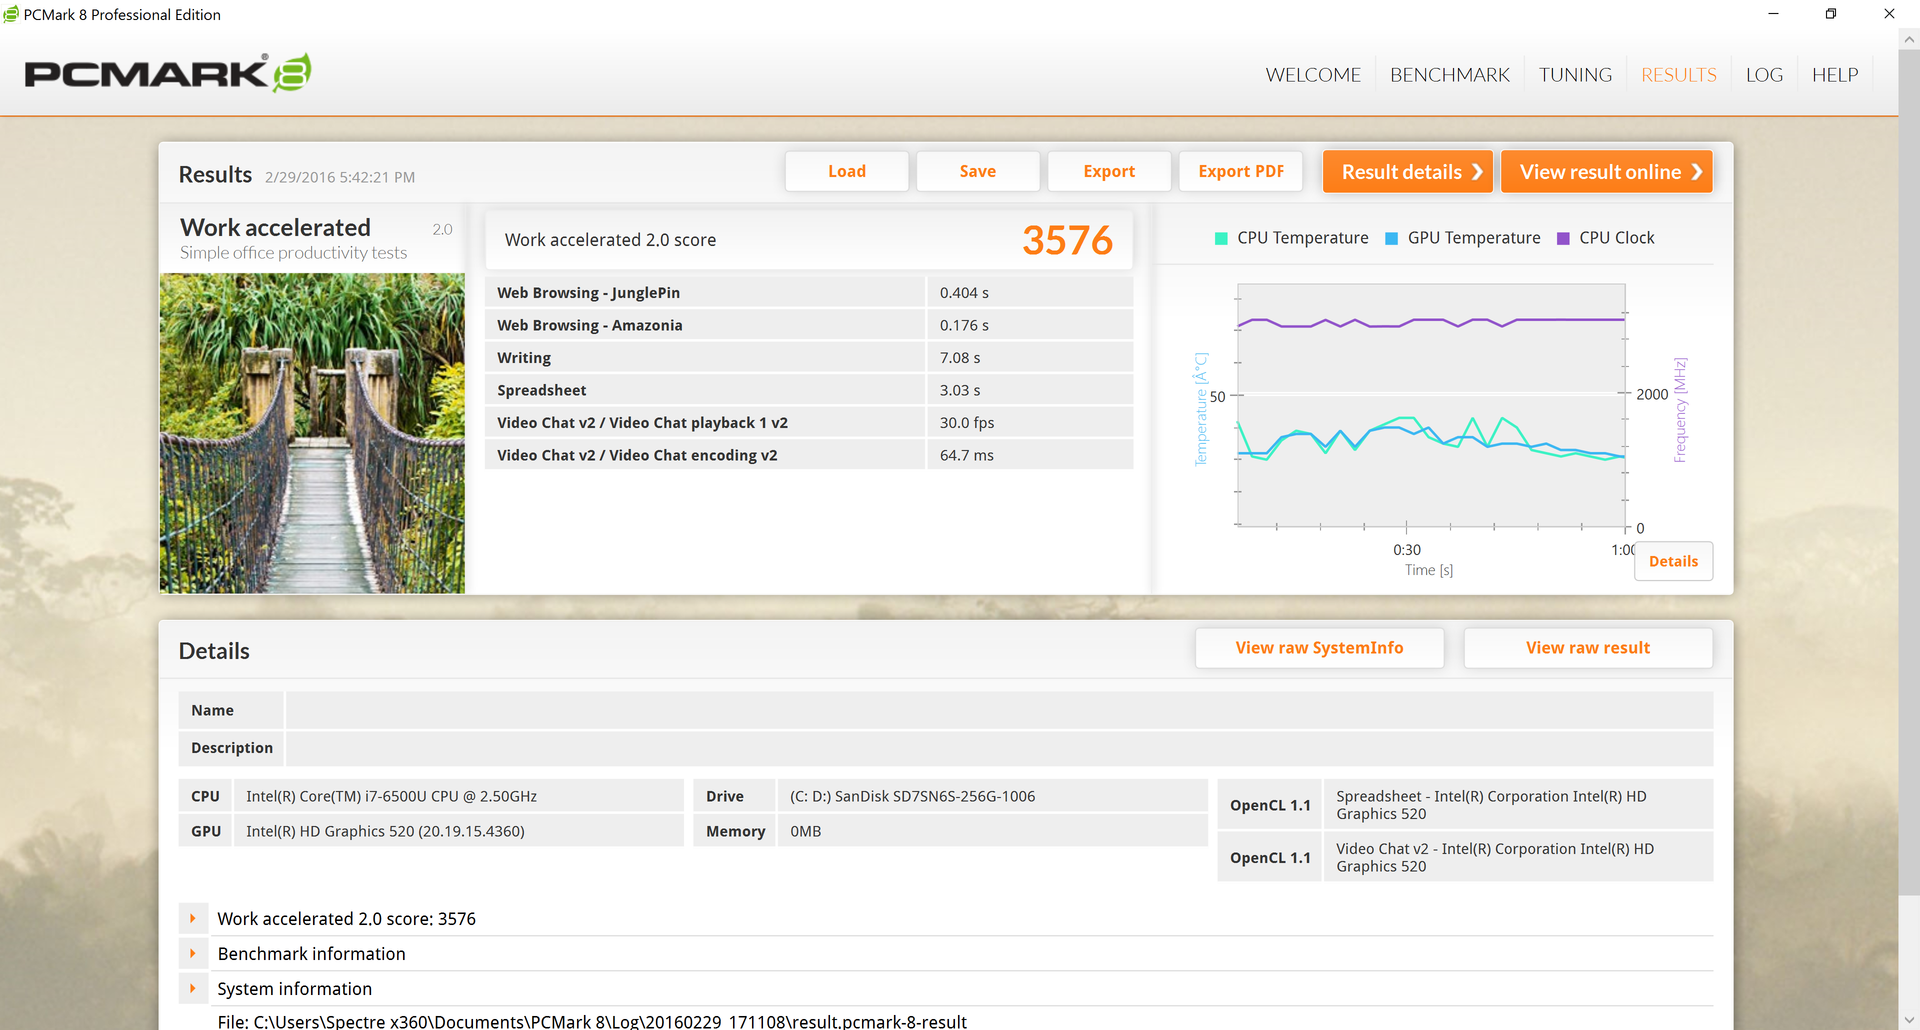
PCMark benchmarks place the HP convertible in line with other 15.6-inch multimedia notebooks. Both the XPS 15 and Surface Pro 4 Core i7 consistently rank slightly higher than the HP due to their faster CPU and integrated GPU.
| PCMark 7 - Score (sort by value) | |
| HP Spectre x360 15-ap012dx | |
| Microsoft Surface Pro 4 Core i7 | |
| Dell XPS 15 9550 i7 FHD | |
| Lenovo IdeaPad Y50-70-59441231 | |
| HP Envy 15-w000ng x360 | |
| PCMark 7 Score | 5326 points | |
| PCMark 8 Home Score Accelerated v2 | 2847 points | |
| PCMark 8 Creative Score Accelerated v2 | 3796 points | |
| PCMark 8 Work Score Accelerated v2 | 3576 points | |
Help | ||
Storage Devices
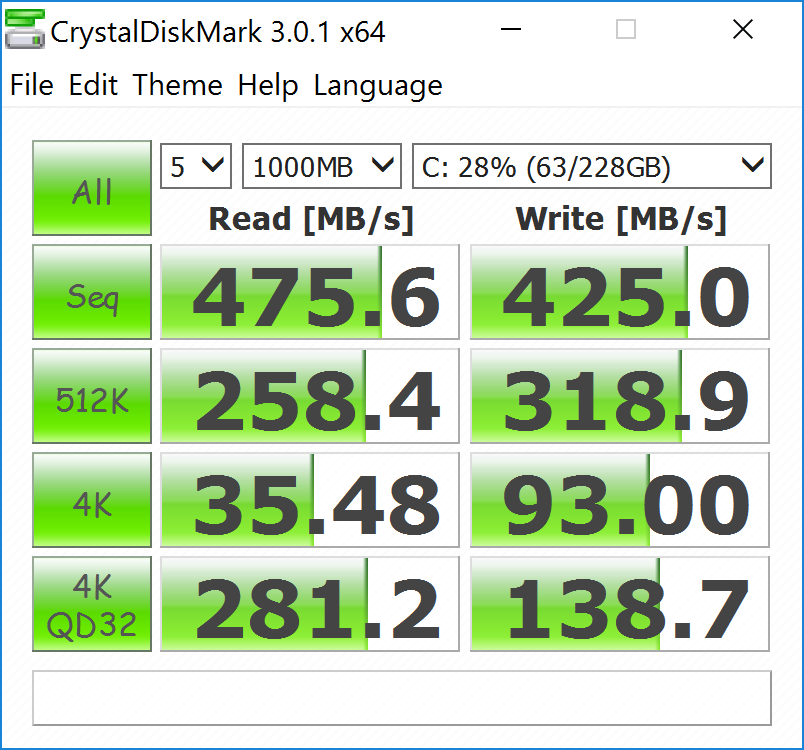
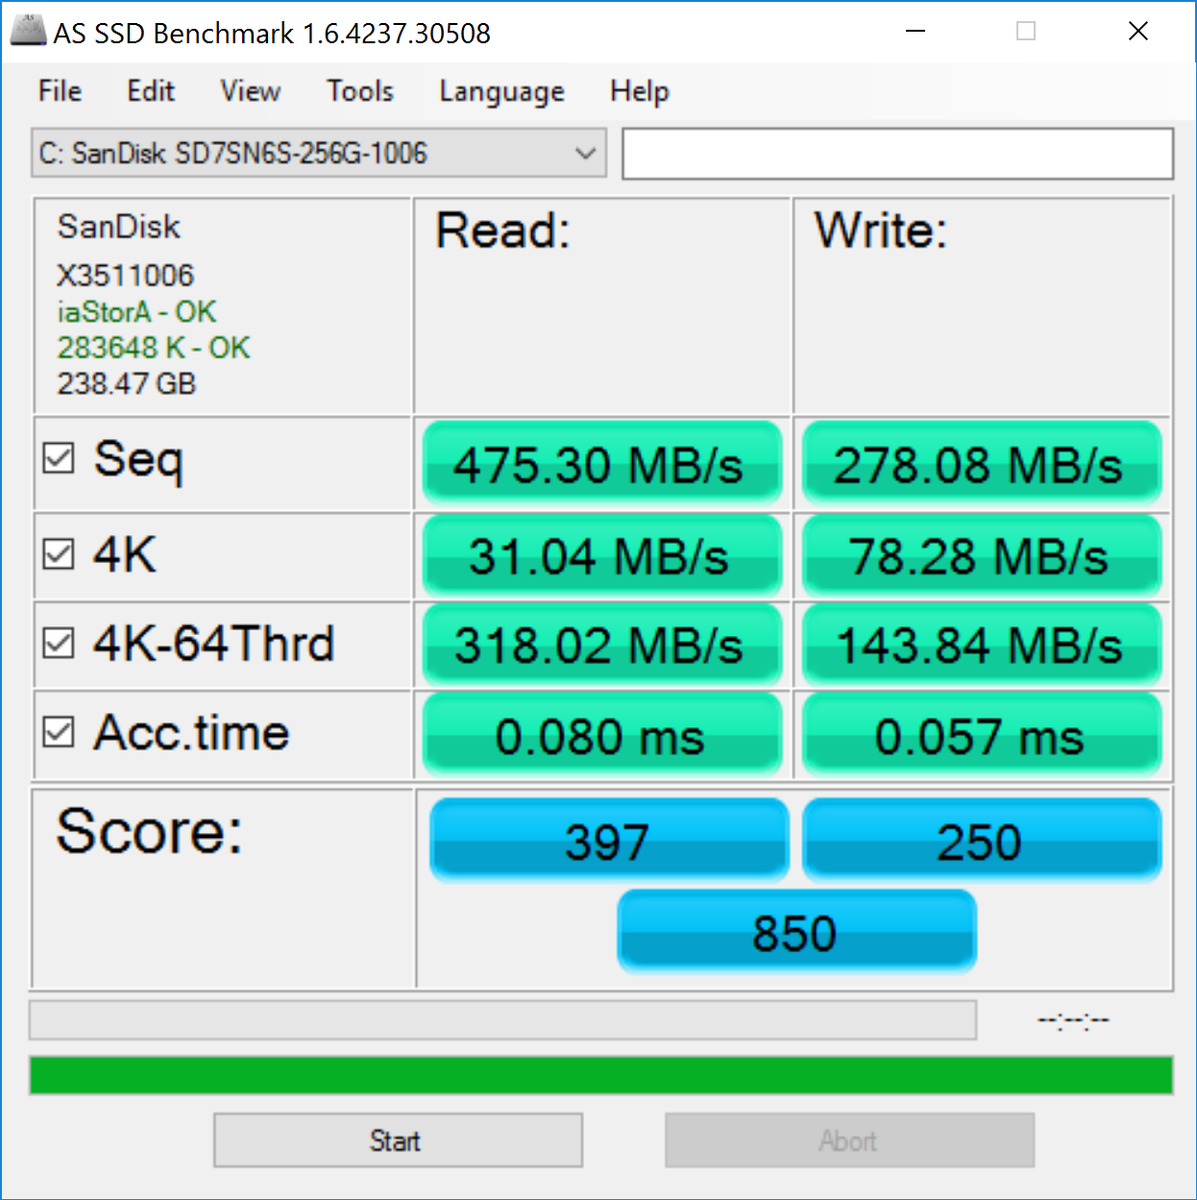
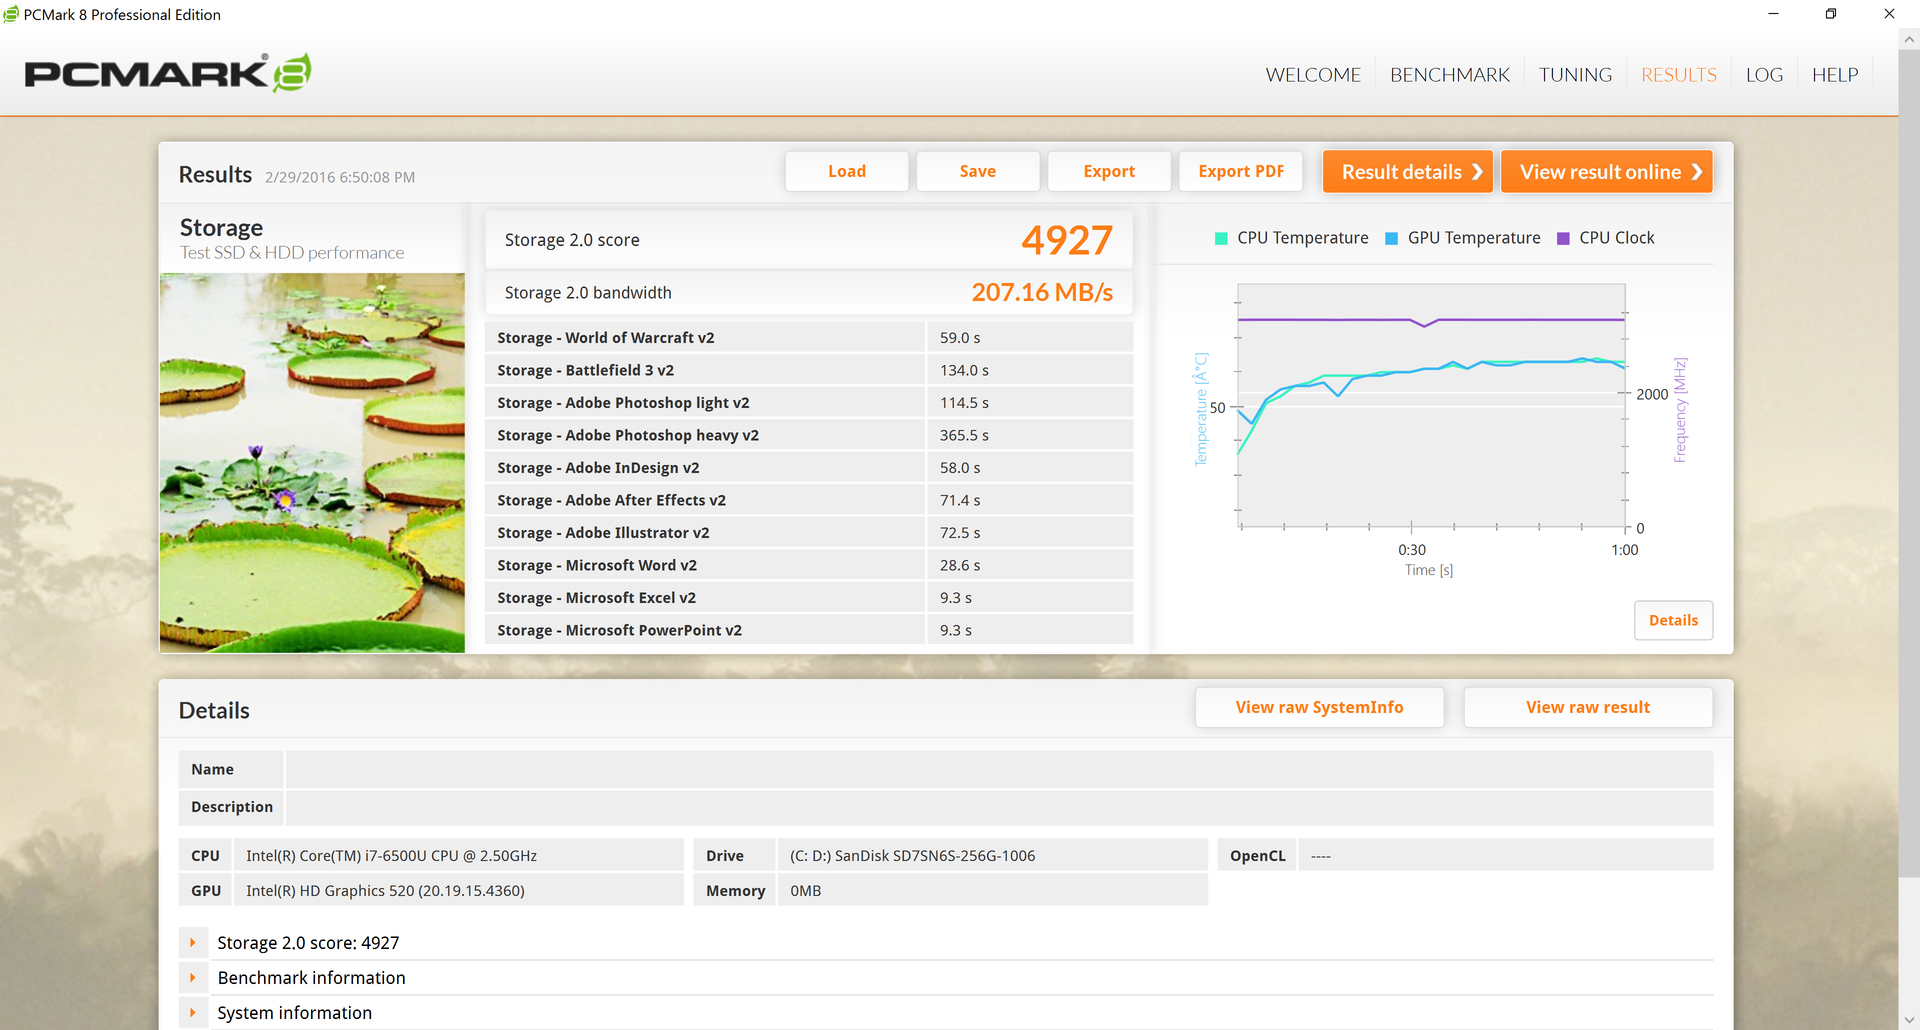
The 256 GB SanDisk M.2 SSD offers very similar performance levels as the Lite-On SSD in our FHD test unit according to AS SSD. Other SATA III-based systems are also quite similar including the Envy 15 x360 and Satellite L50-C. Systems with NVMe SSDs like the recent XPS 15 will easily outperform the HP Spectre x360 15.
See our growing table of SSDs and HDDs for more comparisons and benchmarks.

| HP Spectre x360 15-ap012dx HD Graphics 520, 6200U, Sandisk X300 SD7SN6S-256G-1006 | HP Spectre x360 15-ap011dx HD Graphics 520, 6200U, Liteon L8H-256V2G | Toshiba Satellite L50-C-275 GeForce 930M, 6200U, Samsung SSD PM871 MZNLN256HCHP | Dell XPS 15 9550 i7 FHD GeForce GTX 960M, 6700HQ, Samsung PM951 NVMe 512 GB | HP Envy 15-w103ng x360 GeForce 930M, 6200U, Samsung SSD PM851 256 GB MZNTE256HMHP | Lenovo Ideapad 500s-14ISK GeForce 940M, 6500U, Samsung PM871 MZYLN256HCHP | |
|---|---|---|---|---|---|---|
| AS SSD | 1% | 6% | 134% | -3% | 8% | |
| Copy Game MB/s (MB/s) | 307.7 | 208.1 -32% | 178.3 -42% | 805 162% | 196.1 -36% | 197.6 -36% |
| Copy Program MB/s (MB/s) | 215.3 | 185.6 -14% | 105.3 -51% | 325.3 51% | 137.9 -36% | 168.7 -22% |
| Copy ISO MB/s (MB/s) | 403.4 | 224.2 -44% | 244.1 -39% | 1127 179% | 436.8 8% | 236 -41% |
| Score Total (Points) | 850 | 882 4% | 1080 27% | 2410 184% | 950 12% | 1032 21% |
| Score Write (Points) | 250 | 353 41% | 381 52% | 675 170% | 303 21% | 336 34% |
| Score Read (Points) | 397 | 352 -11% | 463 17% | 1180 197% | 432 9% | 460 16% |
| Access Time Write * (ms) | 0.057 | 0.05 12% | 0.041 28% | 0.035 39% | 0.044 23% | 0.041 28% |
| Access Time Read * (ms) | 0.08 | 0.067 16% | 0.102 -27% | 0.038 52% | 0.131 -64% | 0.067 16% |
| 4K-64 Write (MB/s) | 143.8 | 252.9 76% | 271.8 89% | 513 257% | 201.8 40% | 223 55% |
| 4K-64 Read (MB/s) | 318 | 274.8 -14% | 380.8 20% | 990 211% | 356.5 12% | 376.6 18% |
| 4K Write (MB/s) | 78.3 | 74.1 -5% | 81.8 4% | 105.4 35% | 78.3 0% | 82.8 6% |
| 4K Read (MB/s) | 31.04 | 26 -16% | 32.34 4% | 31.86 3% | 25.25 -19% | 33.12 7% |
| Seq Write (MB/s) | 278.1 | 263.2 -5% | 273.9 -2% | 570 105% | 226.4 -19% | 298.7 7% |
| Seq Read (MB/s) | 475.3 | 513 8% | 498 5% | 1579 232% | 507 7% | 500 5% |
* ... smaller is better
GPU Performance
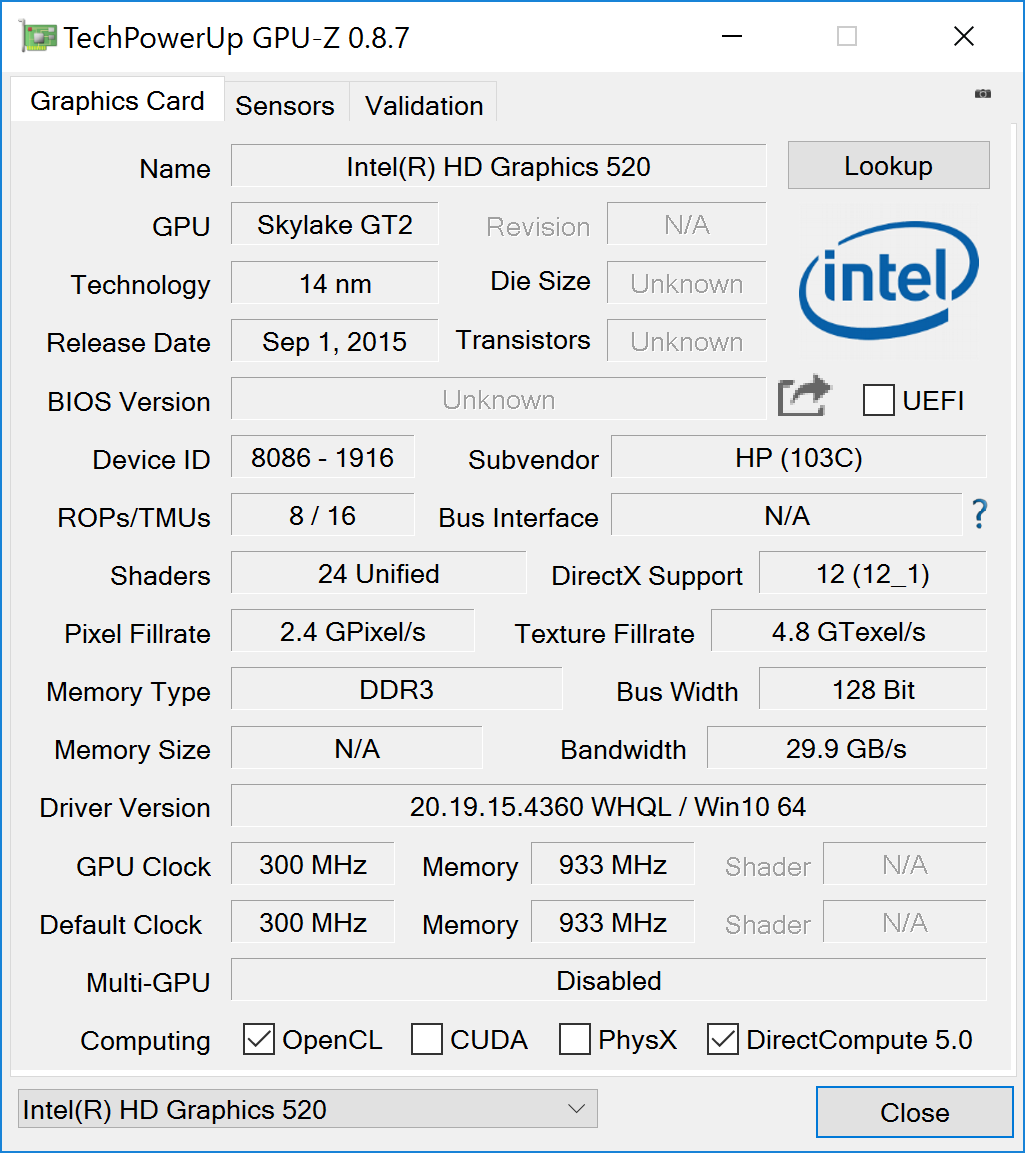
The integrated HD Graphics 520 shows healthy leads over the HD Graphics 5500 and HD Graphics 4400 from the two previous generations with comparatively wider gaps in performance over raw CPU power. Users who demand even more GPU power may want the higher-end SKU with the Core i7-6560U and integrated Iris Graphics 540, which should provide performance levels close to the Core i7-6650U according to our benchmarks from the XPS 13.
See our dedicated GPU page on the HD Graphics 520 for more technical details and benchmarks.
| 3DMark 11 | |
| 1280x720 Performance (sort by value) | |
| HP Spectre x360 15-ap012dx | |
| Microsoft Surface Pro 4 Core i7 | |
| Razer Blade Stealth UHD i7-6500U | |
| Lenovo IdeaPad 100-15IBD | |
| Dell Vostro 3546 JAN15HSW1601_1K9_Win | |
| 1280x720 Performance GPU (sort by value) | |
| HP Spectre x360 15-ap012dx | |
| Microsoft Surface Pro 4 Core i7 | |
| Razer Blade Stealth UHD i7-6500U | |
| Lenovo IdeaPad 100-15IBD | |
| Dell Vostro 3546 JAN15HSW1601_1K9_Win | |
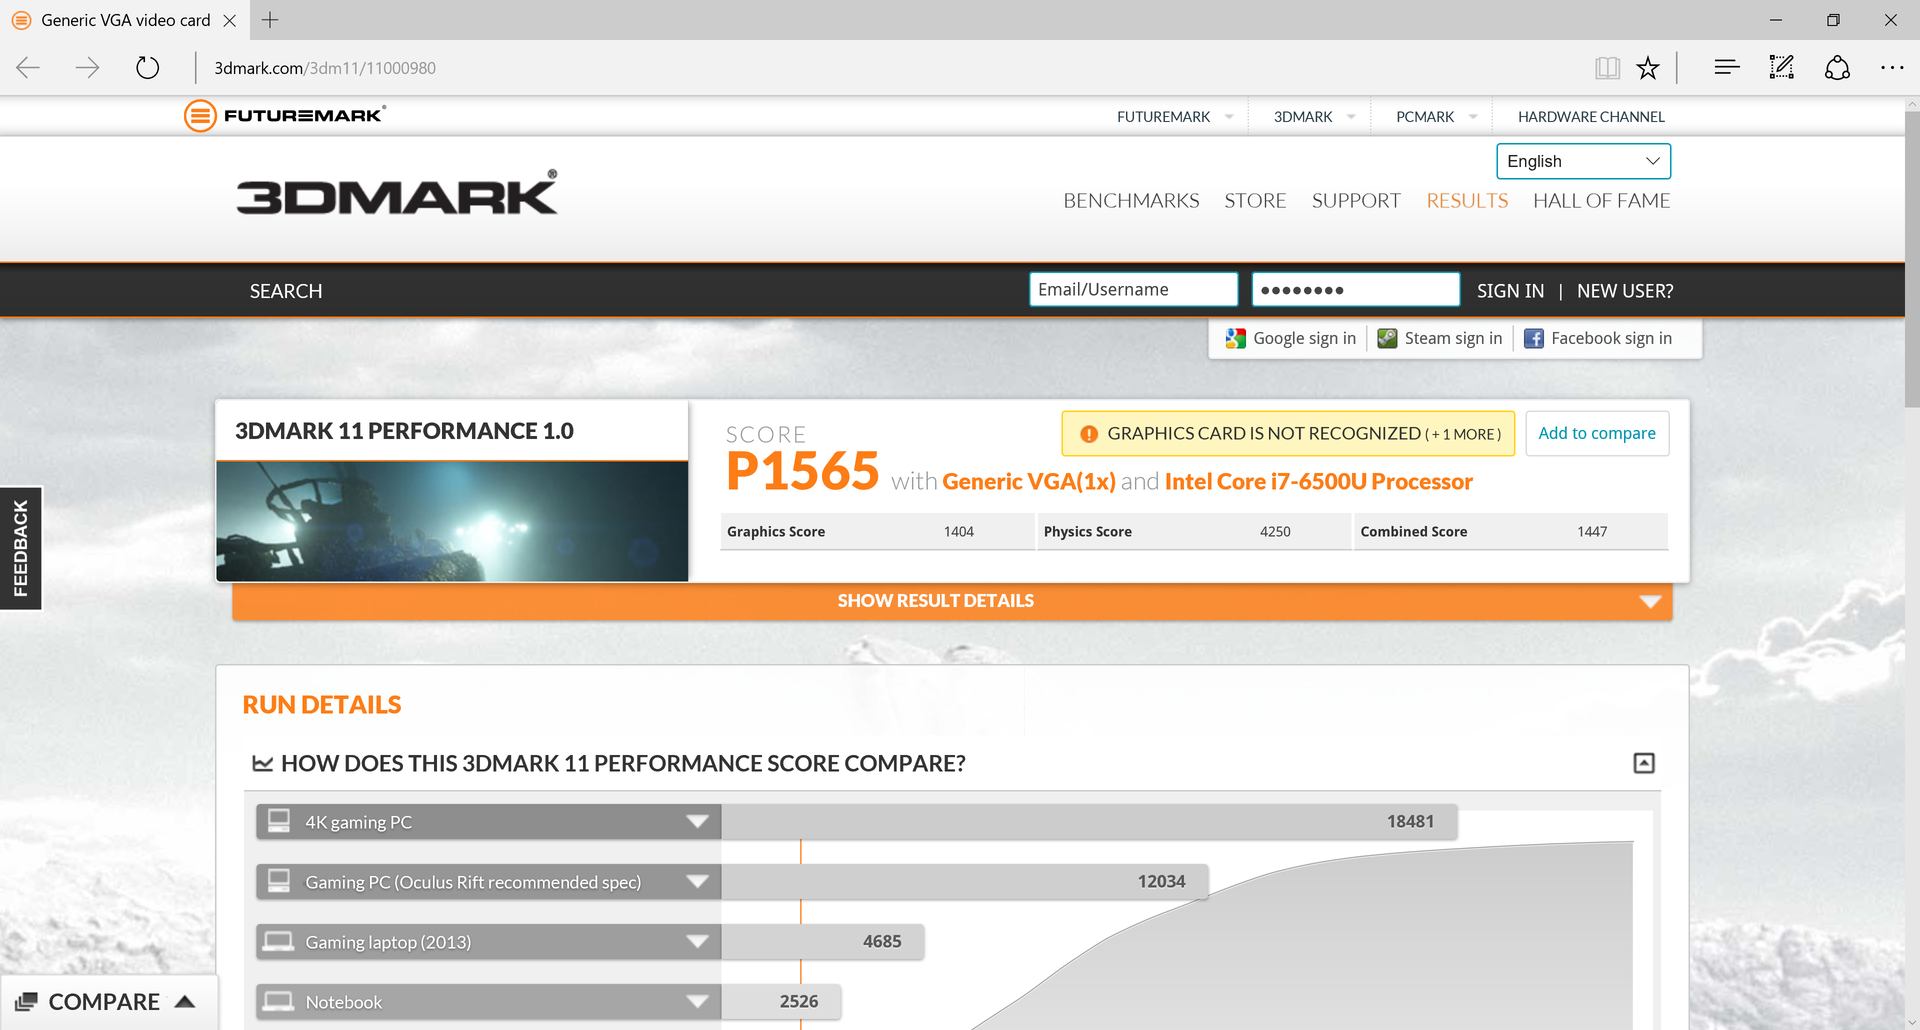
| 3DMark 11 Performance | 1565 points | |
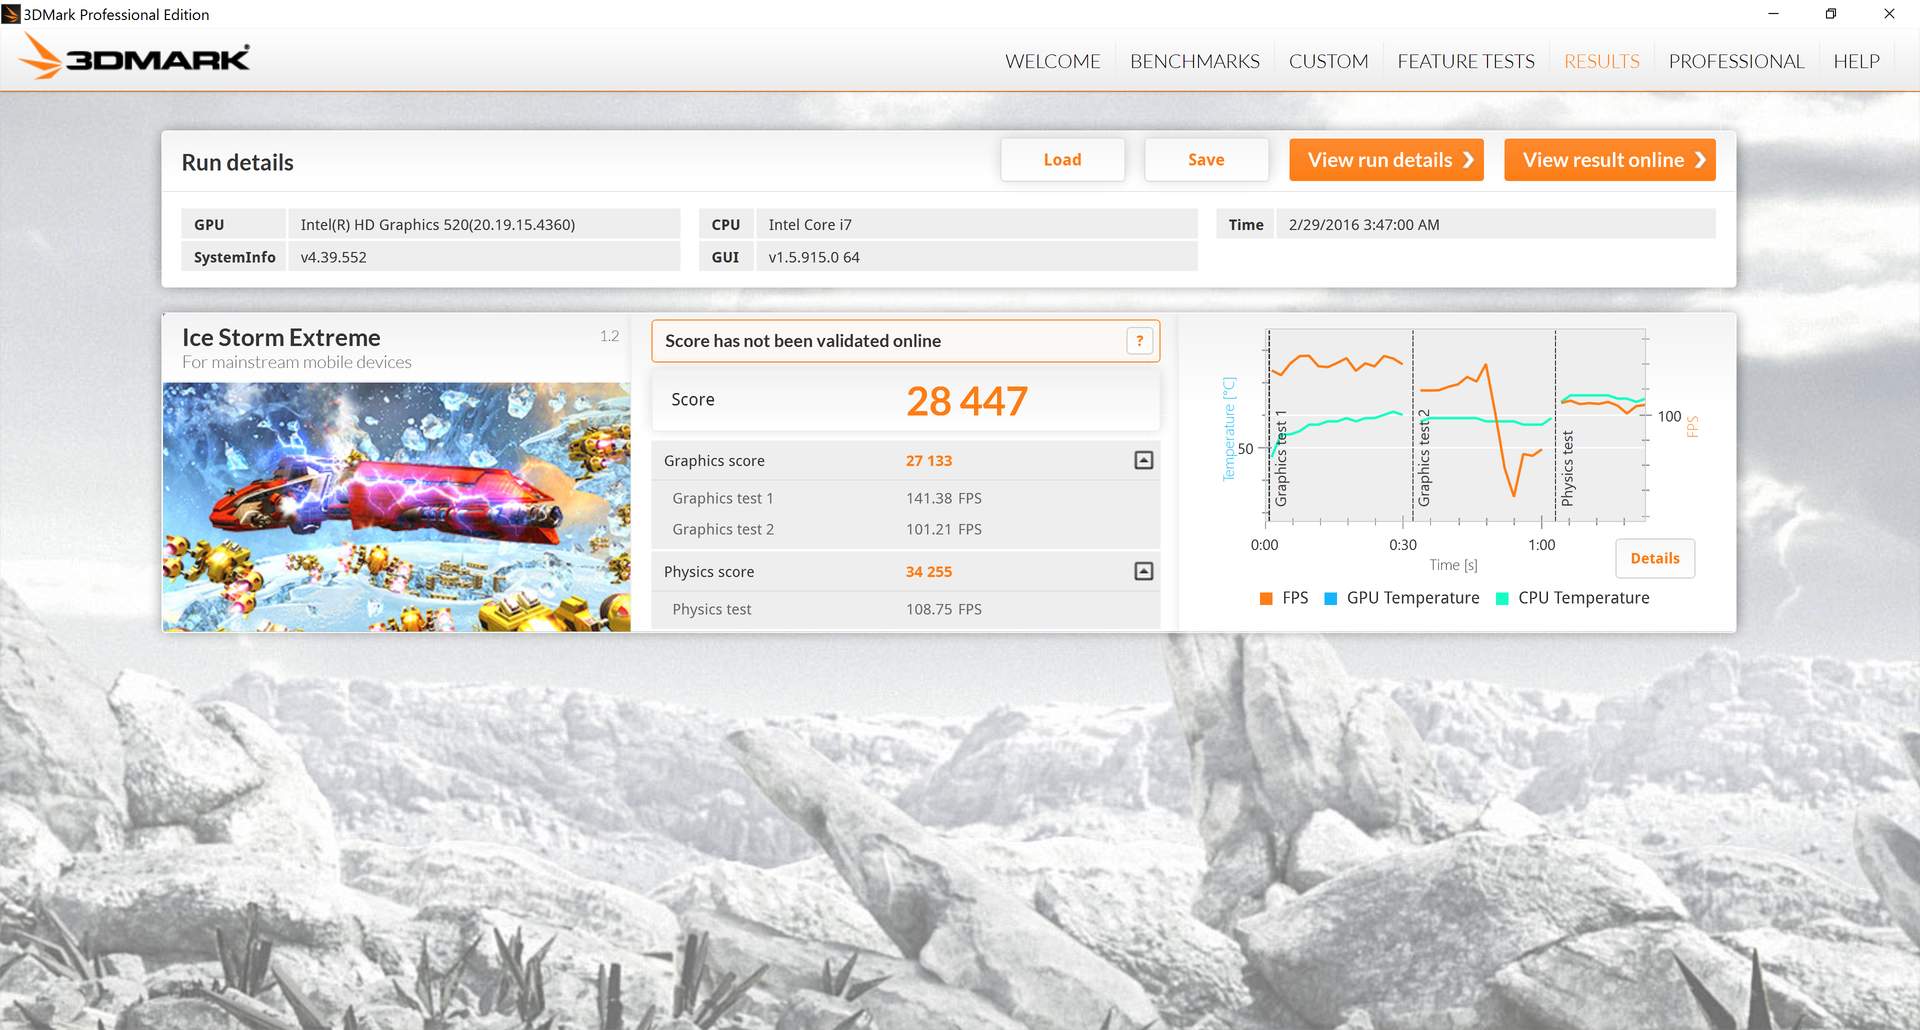
| 3DMark Ice Storm Standard Score | 41767 points | |
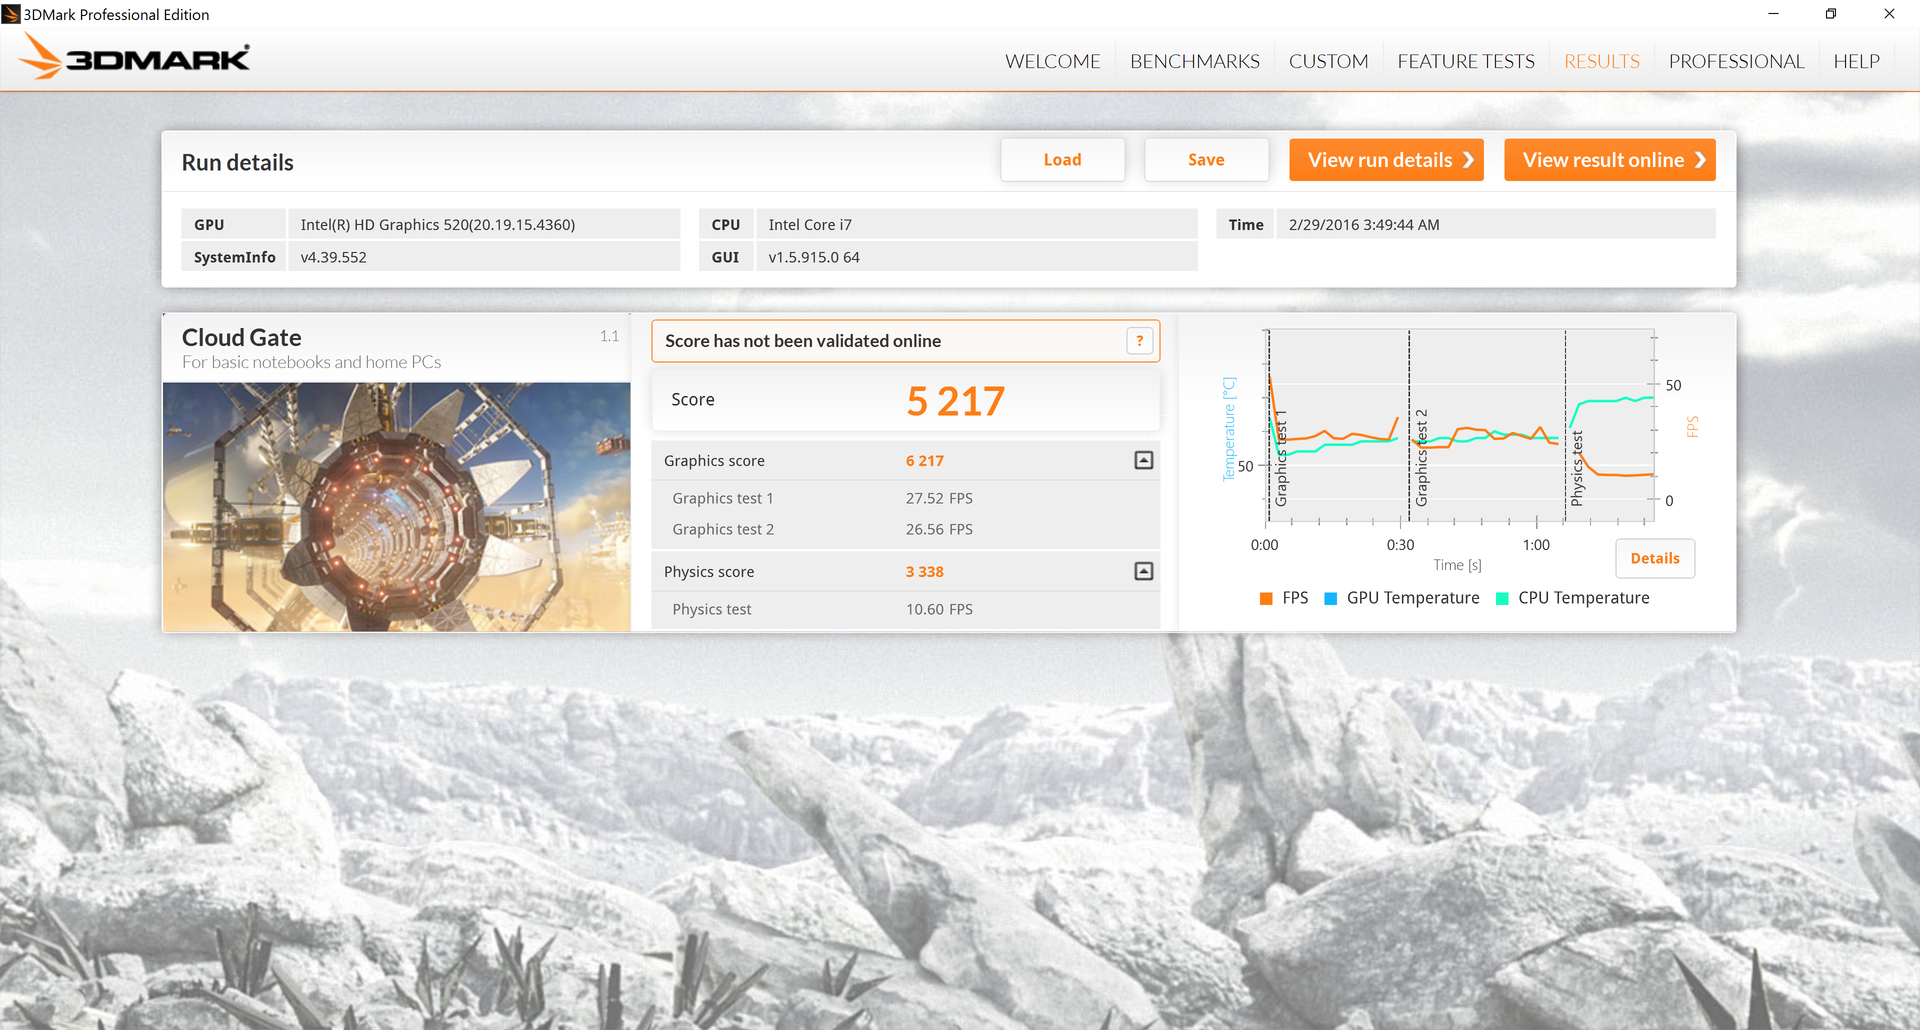
| 3DMark Cloud Gate Standard Score | 5217 points | |
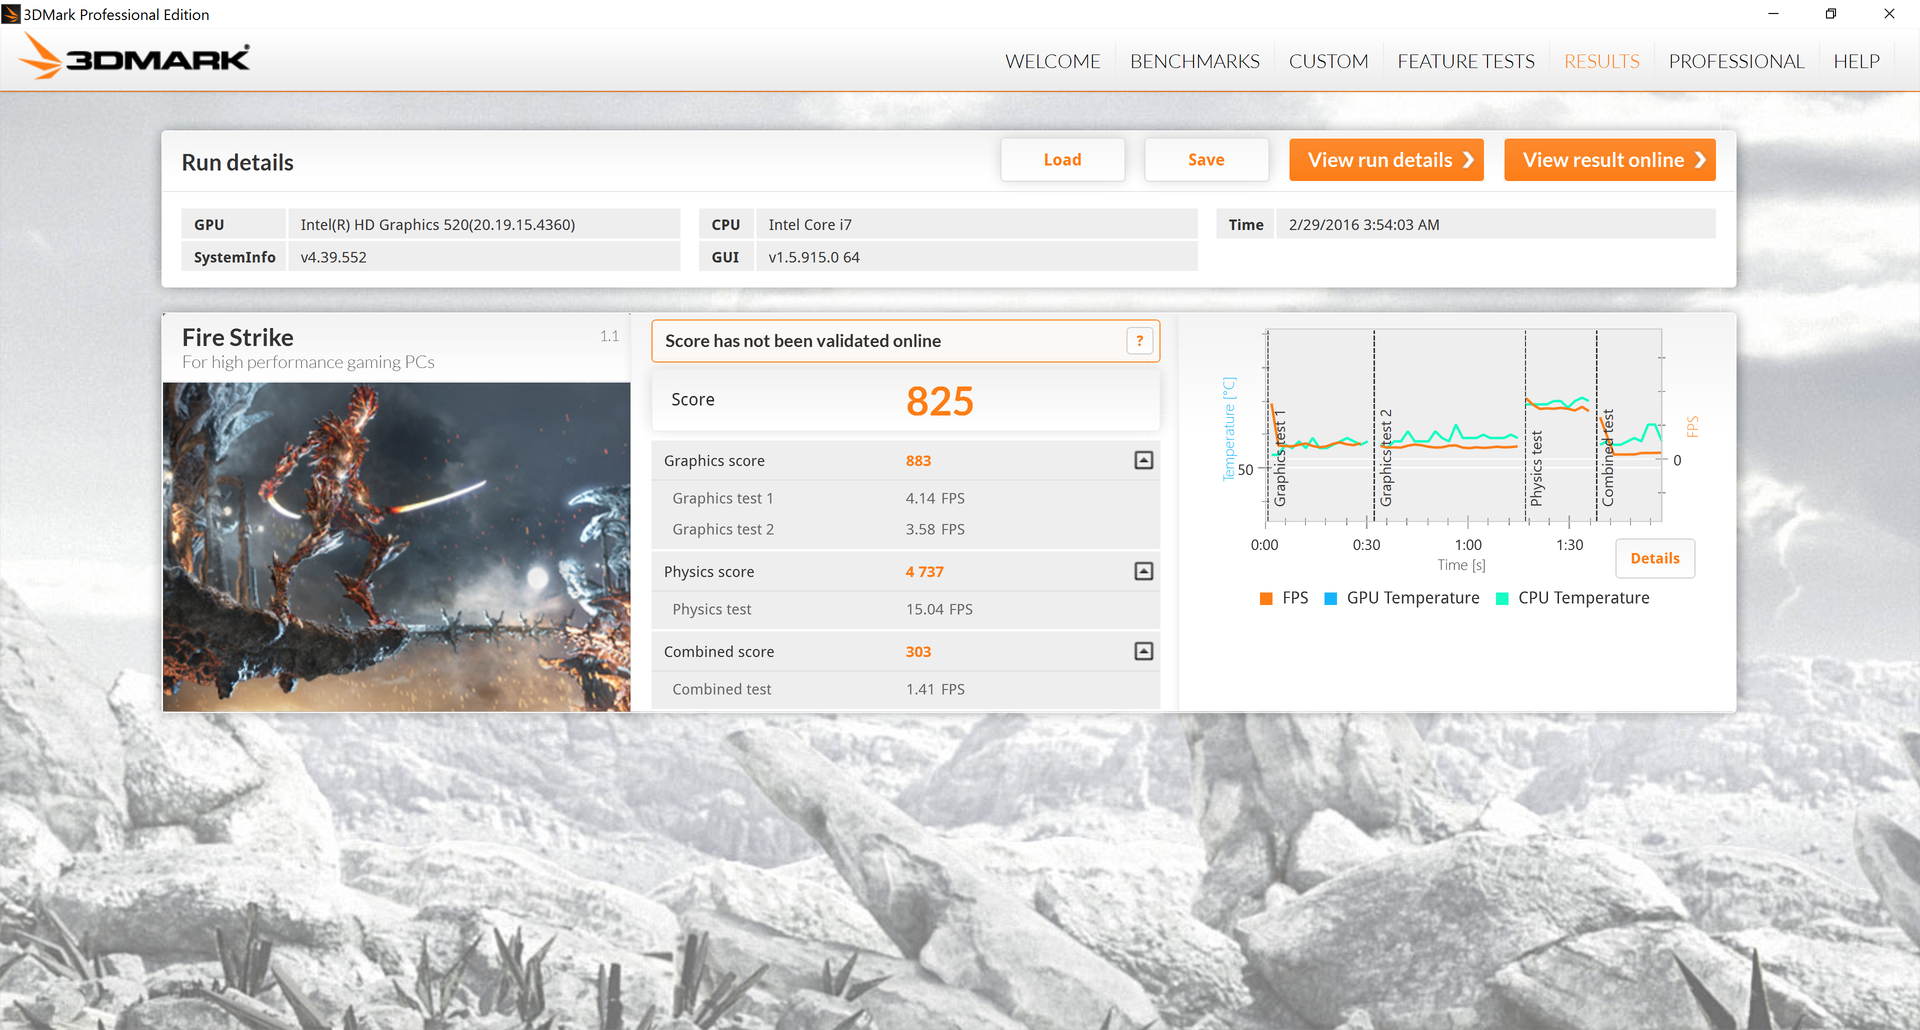
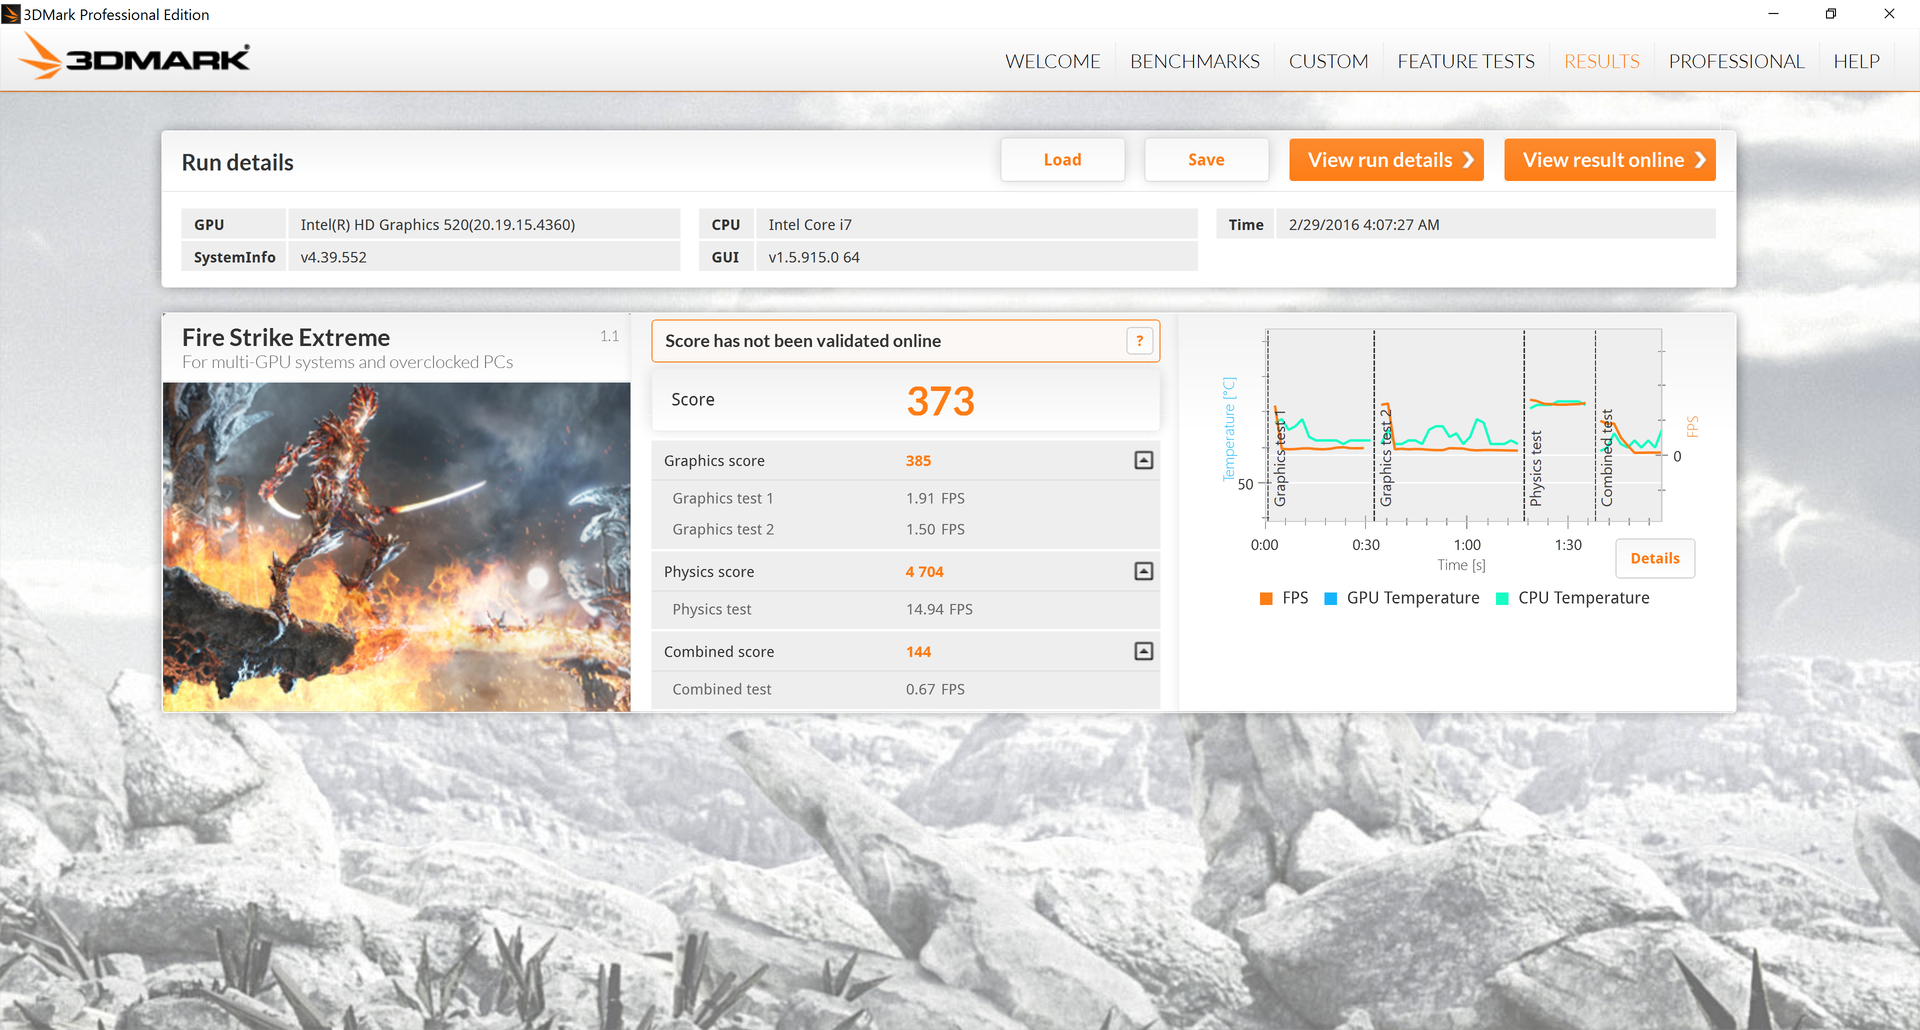
| 3DMark Fire Strike Score | 825 points | |
| 3DMark Fire Strike Extreme Score | 373 points | |
Help | ||
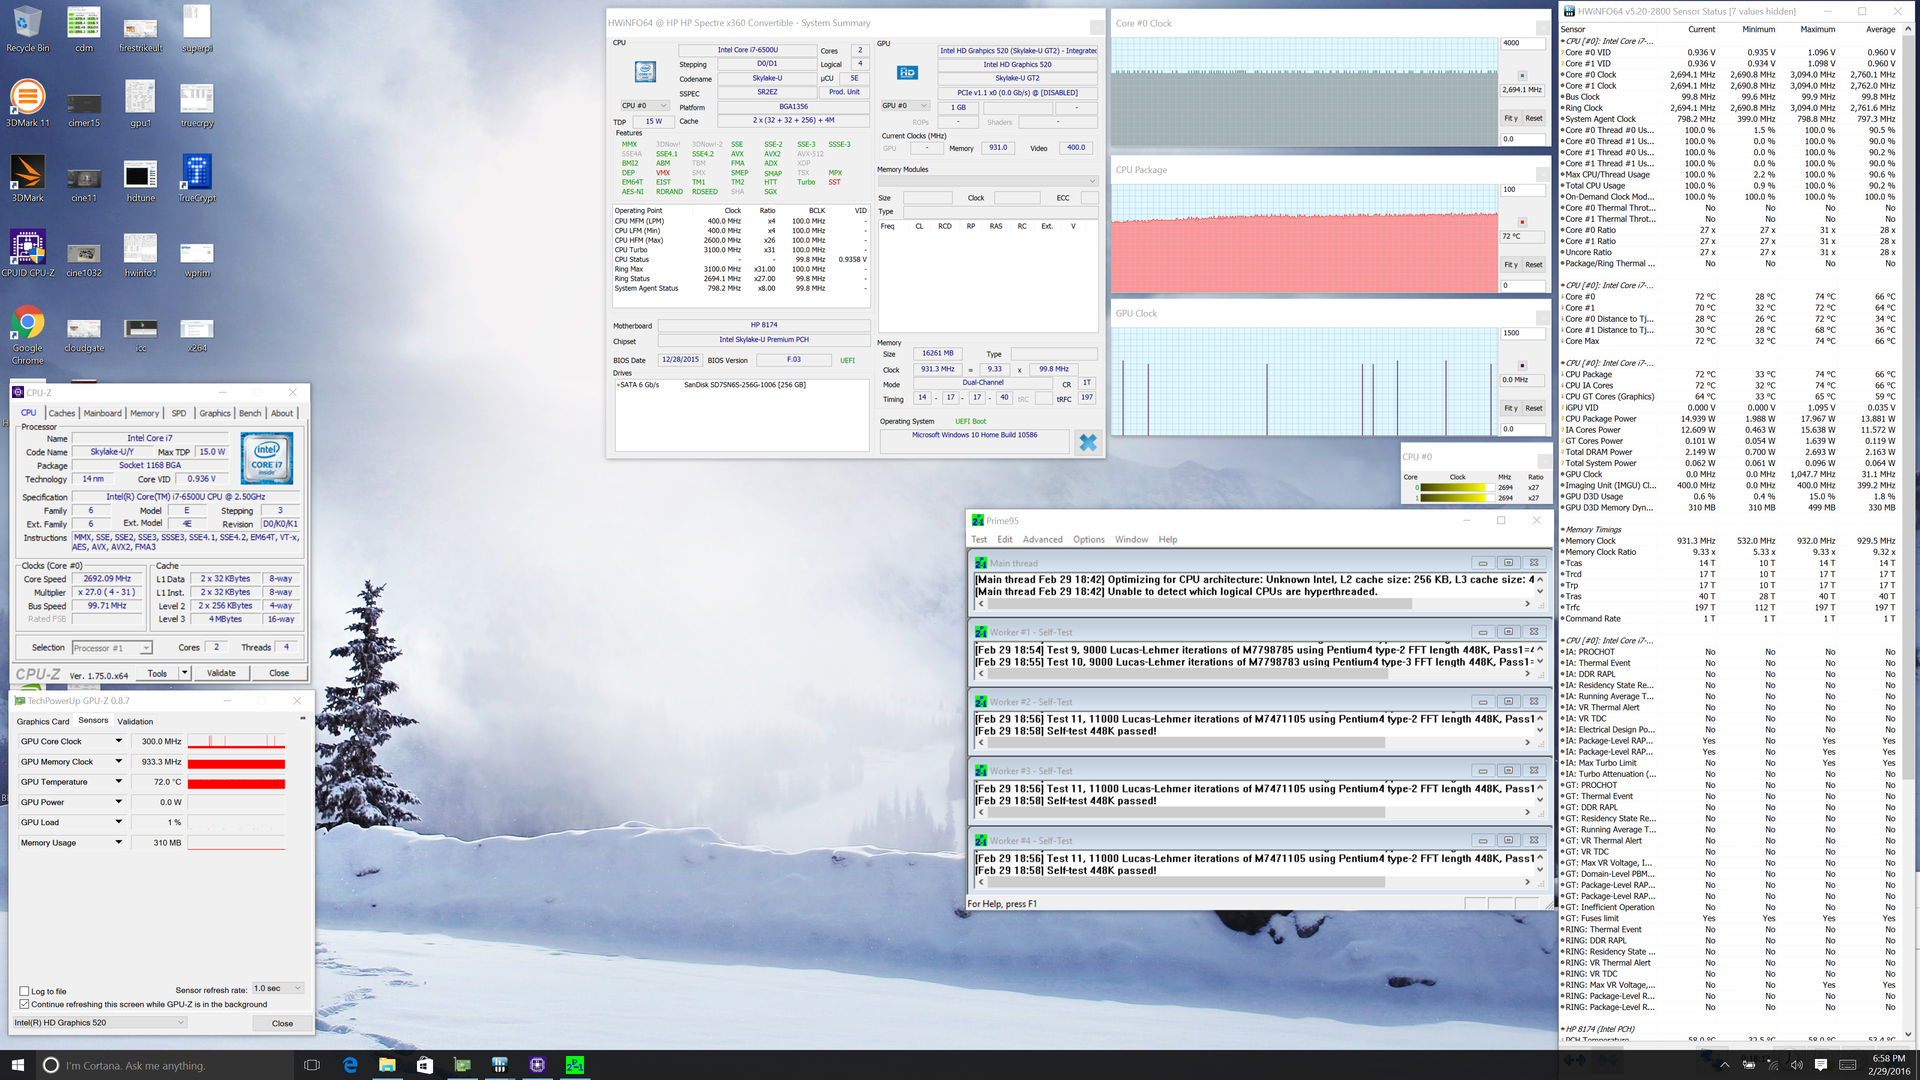
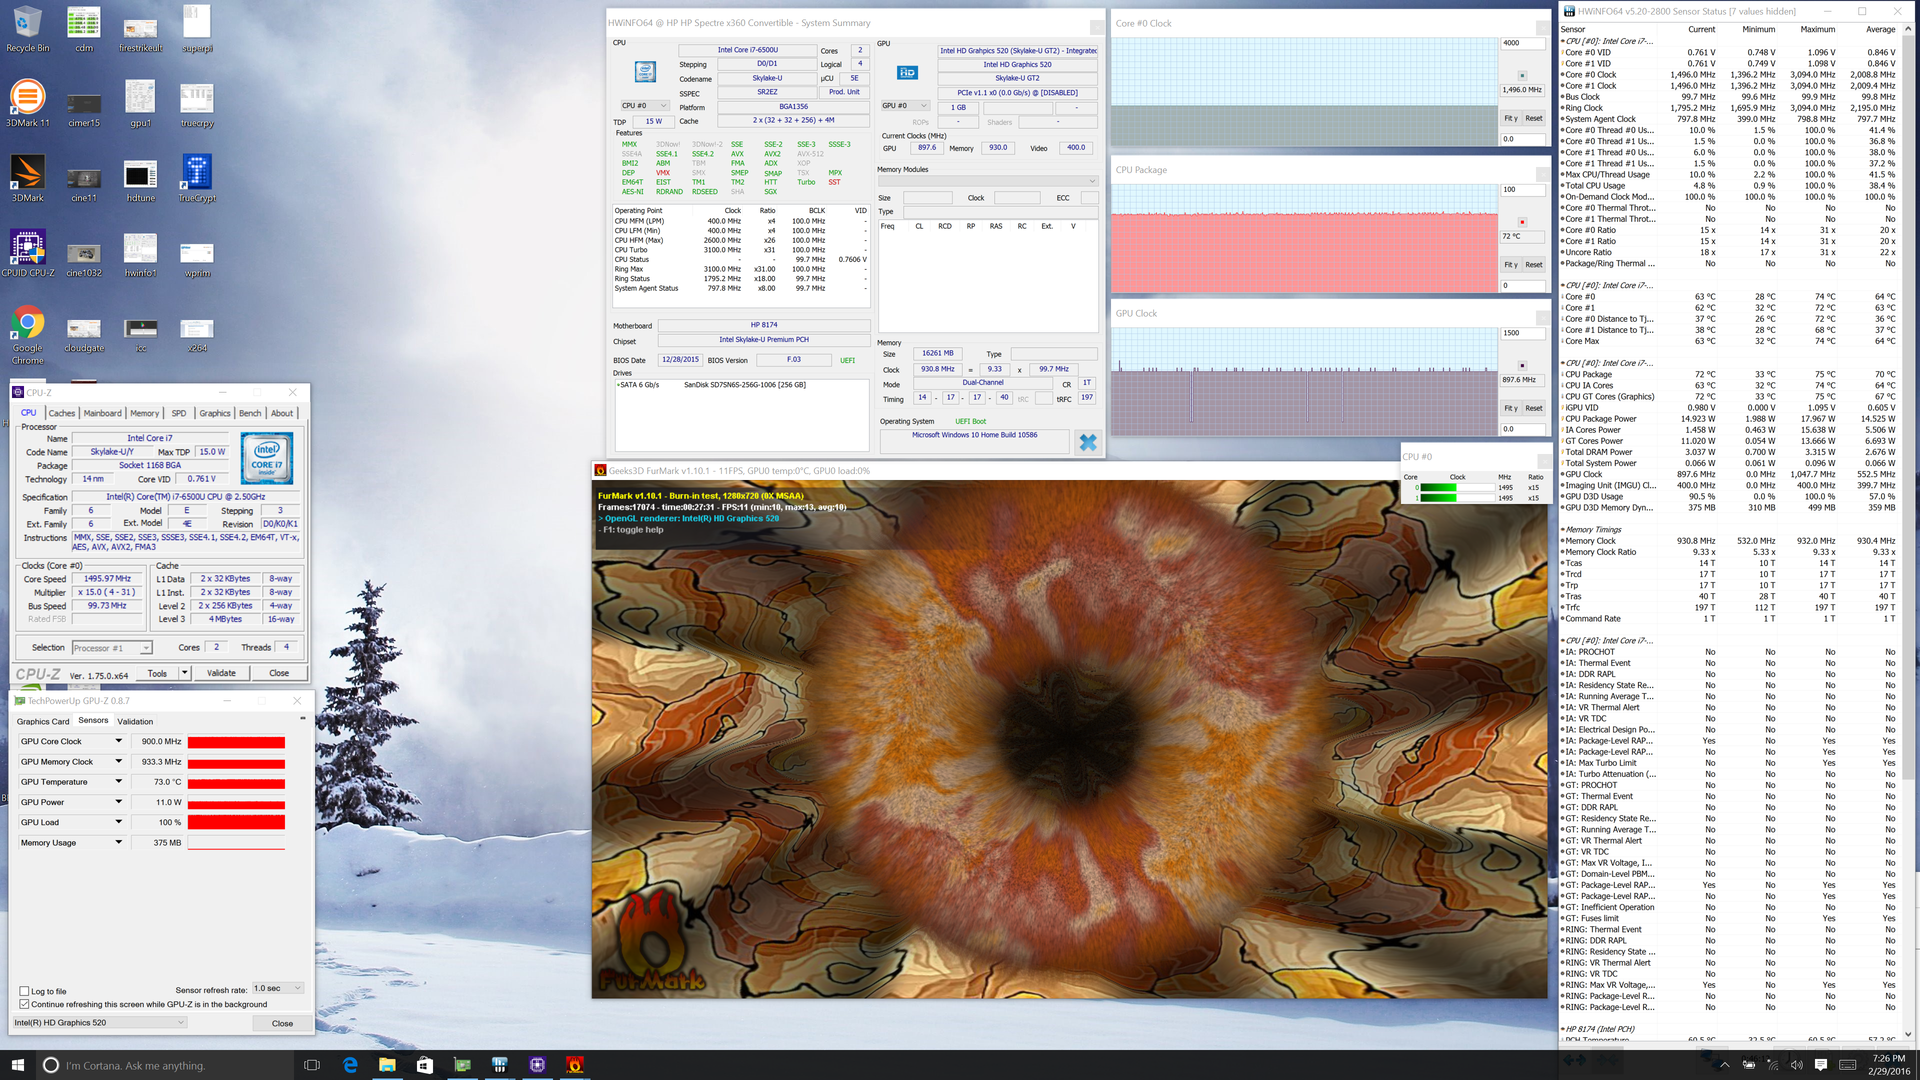
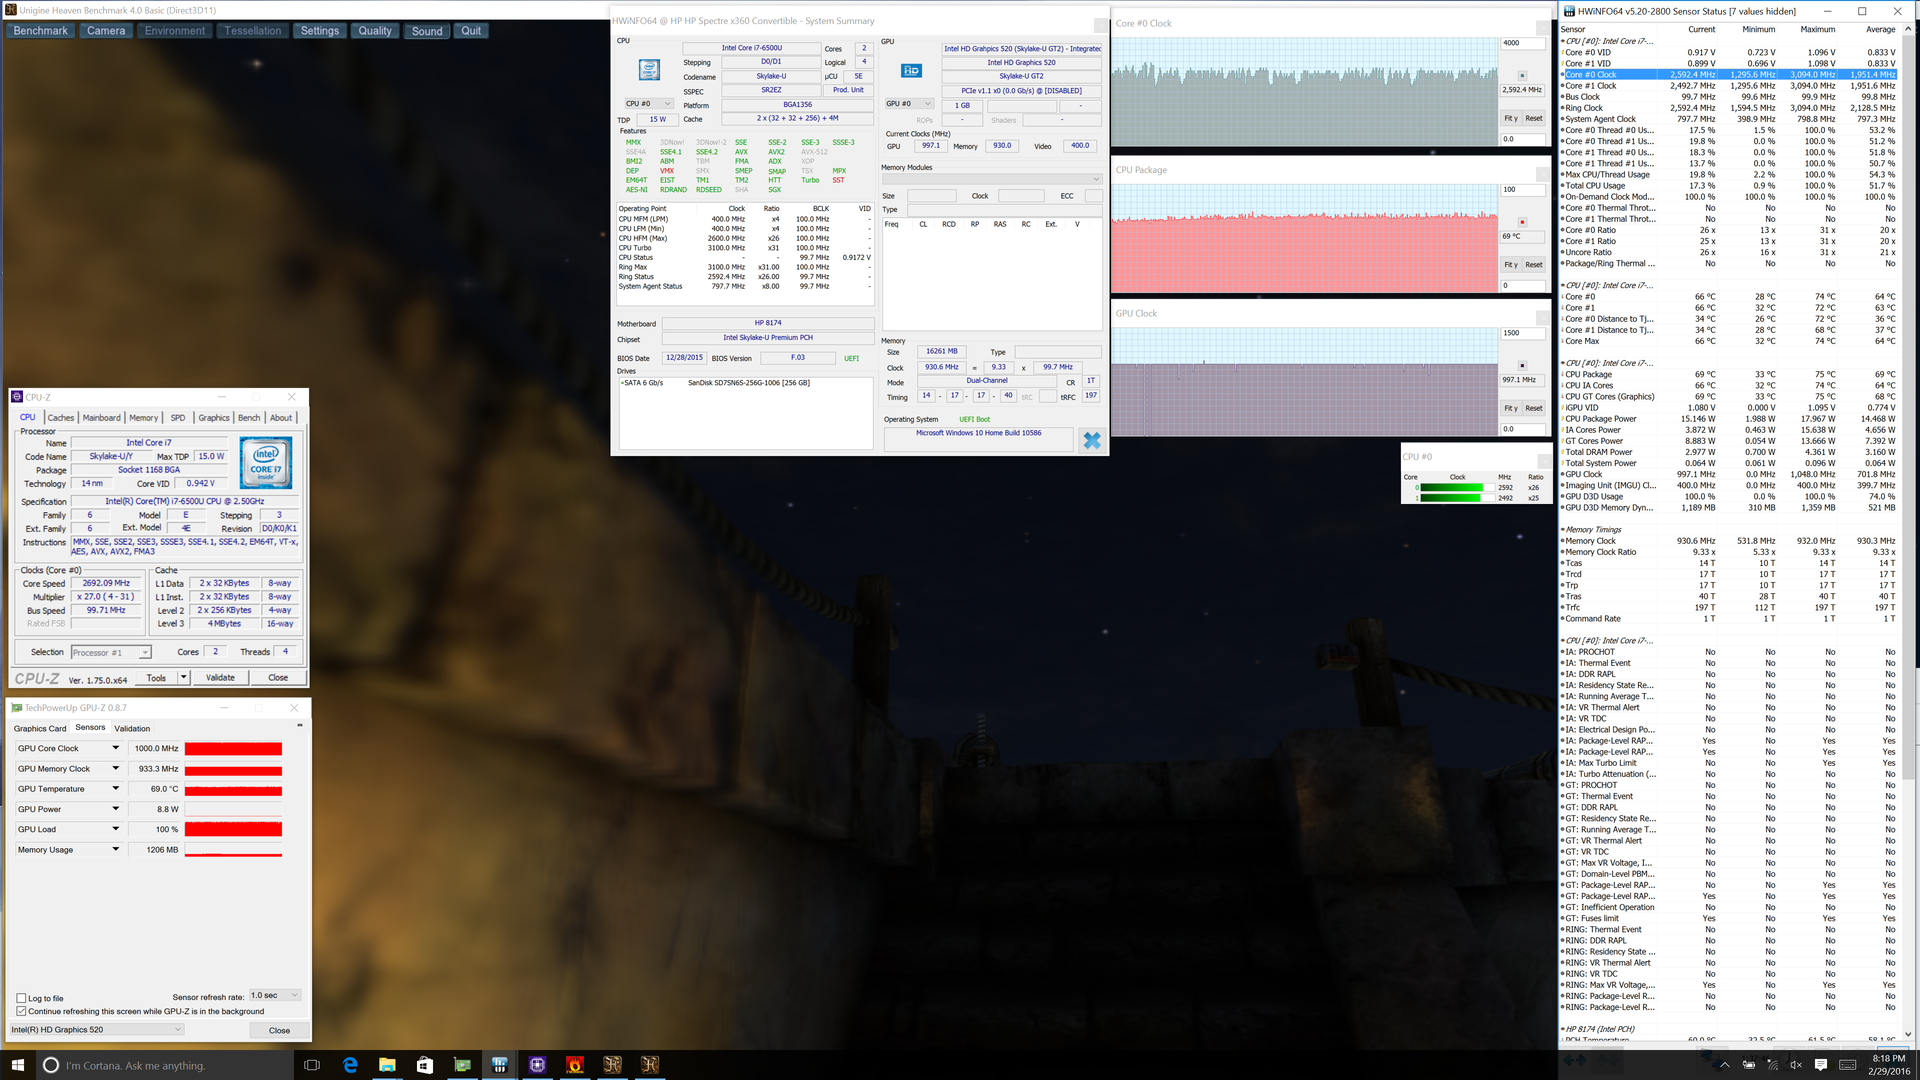
Stress Test
We stress the system again to more or less confirm our results from our previous test unit. Core temperatures are slightly higher this time around, but stable clock rates remain essentially identical.
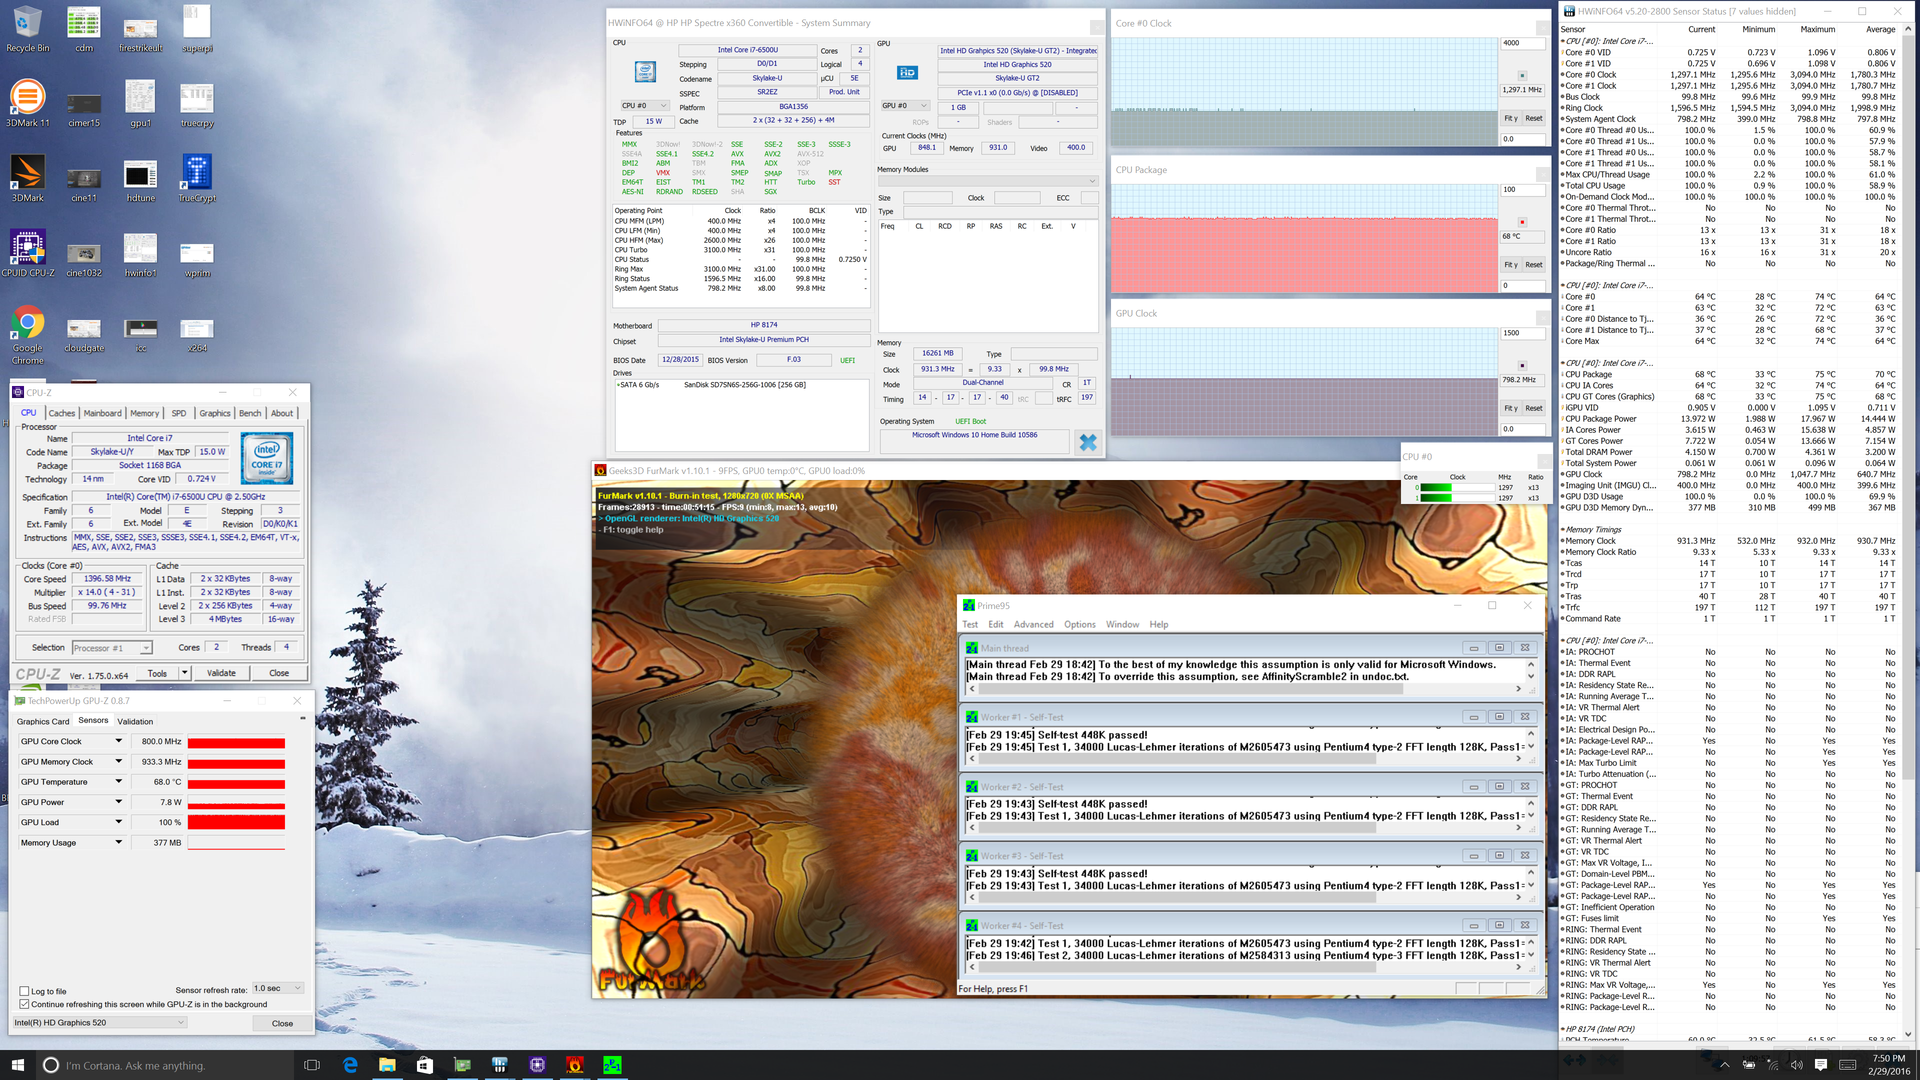
| CPU Clock (GHz) | GPU Clock (MHz) | Average Core Temperature (C) | |
| Prime95 Stress | 2.7 | -- | 72 |
| FurMark Stress | -- | 900 | 73 |
| Prime95 + FurMark Stress | 1.3 | 800 | 64 - 68 |
| Unigine Heaven Stress | 2.7 - 2.8 | 950 - 1000 | 66 - 69 |
Emissions
System Noise
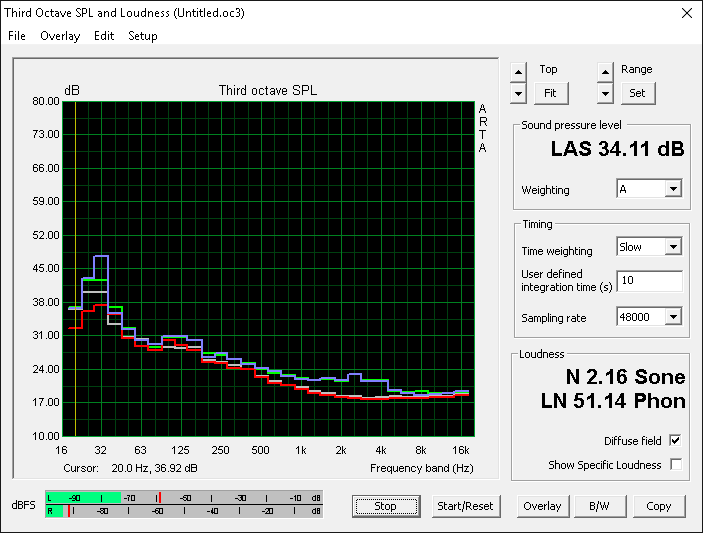
Fan behavior mimics the FHD SKU both when idling and when under load. The system is silent under low loads and will jump to a steady 38 dB(A) when running Unigine Heaven or other very demanding applications. This means that the fan rarely pulsates during regular use.
| HP Spectre x360 15-ap012dx HD Graphics 520, 6200U, Sandisk X300 SD7SN6S-256G-1006 | Toshiba Satellite L50-C-275 GeForce 930M, 6200U, Samsung SSD PM871 MZNLN256HCHP | HP Envy 15-w103ng x360 GeForce 930M, 6200U, Samsung SSD PM851 256 GB MZNTE256HMHP | Dell XPS 15 9550 i7 FHD GeForce GTX 960M, 6700HQ, Samsung PM951 NVMe 512 GB | Lenovo IdeaPad Y50-70-59441231 GeForce GTX 960M, 4710HQ, Samsung SSD PM851 512 GB MZ7TE512HMHP | Lenovo Yoga 500-14ISK GeForce 920M, 6200U, WDC Slim WD10SPCX-24HWST1 | |
|---|---|---|---|---|---|---|
| Noise | 2% | -10% | -4% | -14% | -8% | |
| off / environment * (dB) | 29.5 | 22 25% | 31.3 -6% | |||
| Idle Minimum * (dB) | 29.5 | 31.3 -6% | 32.9 -12% | 29.2 1% | 29.6 -0% | 32.8 -11% |
| Idle Average * (dB) | 29.5 | 31.3 -6% | 32.9 -12% | 29.3 1% | 31.1 -5% | 32.8 -11% |
| Idle Maximum * (dB) | 29.6 | 32.2 -9% | 32.9 -11% | 29.5 -0% | 34.3 -16% | 32.8 -11% |
| Load Average * (dB) | 38.1 | 36.4 4% | 37 3% | 36.5 4% | 45 -18% | 39.4 -3% |
| Load Maximum * (dB) | 38.2 | 36.6 4% | 46 -20% | 47.7 -25% | 49.2 -29% | 39.2 -3% |
* ... smaller is better
Noise level
| Idle |
| 29.5 / 29.5 / 29.6 dB(A) |
| Load |
| 38.1 / 38.2 dB(A) |
 | ||
30 dB silent 40 dB(A) audible 50 dB(A) loud |
||
min: | ||
Temperature
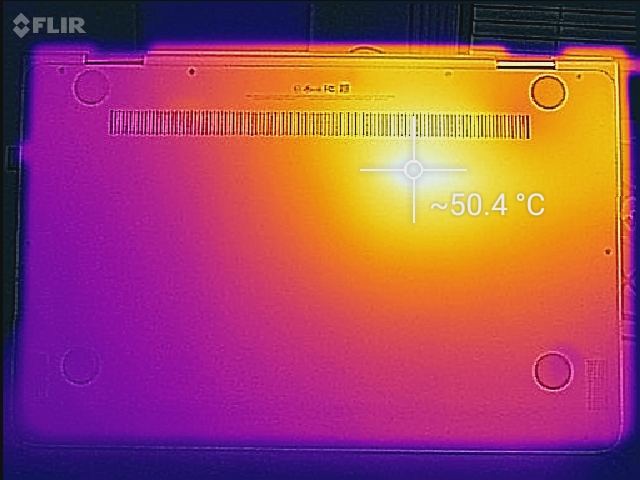
Surface temperatures are flat when idling with the warmest spot on the bottom of the notebook closest to the CPU. This same spot can be as warm as 50 C when under Prime95+FurMark load. Our measurements are again warmer than our FHD SKU due in part to the differing ambient temperatures during the tests.
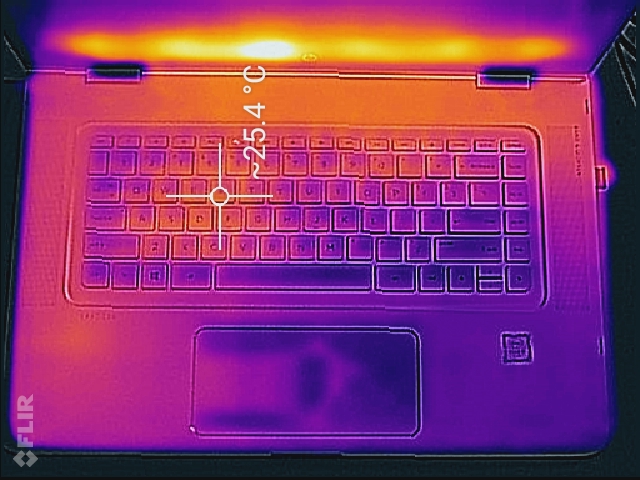
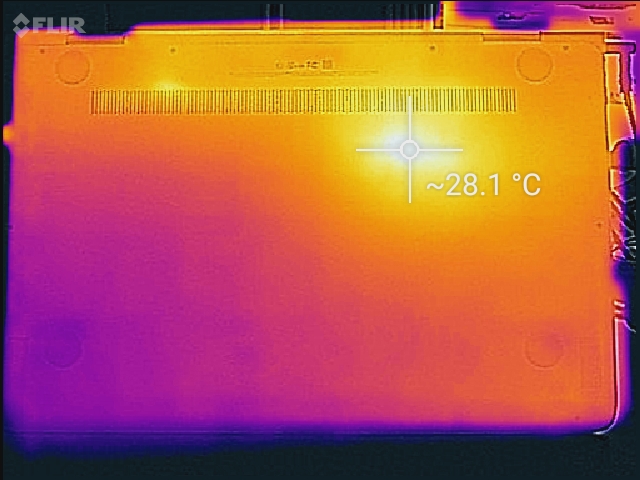
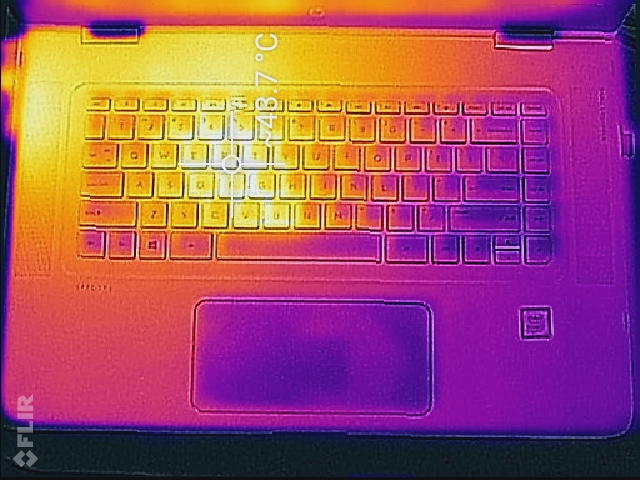
(+) The maximum temperature on the upper side is 39.9 °C / 104 F, compared to the average of 35.4 °C / 96 F, ranging from 19.6 to 60 °C for the class Convertible.
(±) The bottom heats up to a maximum of 41 °C / 106 F, compared to the average of 36.9 °C / 98 F
(+) In idle usage, the average temperature for the upper side is 24.1 °C / 75 F, compared to the device average of 30.3 °C / 87 F.
(+) The palmrests and touchpad are reaching skin temperature as a maximum (34.2 °C / 93.6 F) and are therefore not hot.
(-) The average temperature of the palmrest area of similar devices was 28 °C / 82.4 F (-6.2 °C / -11.2 F).
Energy Management
Power Consumption
Power draw is measurably higher on the 4K UHD model compared to the FHD model. The differences are more noticeable when idling, of course, at about a 3 W to 4 W delta when on the maximum brightness setting. Though small, this translates into shorter runtimes as shown in the next section.
| HP Spectre x360 15-ap012dx HD Graphics 520, 6200U, Sandisk X300 SD7SN6S-256G-1006 | HP Spectre x360 15-ap011dx HD Graphics 520, 6200U, Liteon L8H-256V2G | Toshiba Satellite L50-C-275 GeForce 930M, 6200U, Samsung SSD PM871 MZNLN256HCHP | HP Envy 15-w103ng x360 GeForce 930M, 6200U, Samsung SSD PM851 256 GB MZNTE256HMHP | Lenovo IdeaPad Y50-70-59441229 GeForce GTX 960M, 4710HQ, Samsung SSD PM851 256 GB MZ7TE256HMHP | Dell XPS 15-9550 i7 GeForce GTX 960M, 6700HQ, Samsung PM951 NVMe 512 GB | |
|---|---|---|---|---|---|---|
| Power Consumption | 14% | 8% | 17% | -62% | -120% | |
| Idle Minimum * (Watt) | 6.5 | 5.8 11% | 4.7 28% | 4.15 36% | 4.3 34% | 12.5 -92% |
| Idle Average * (Watt) | 13.3 | 9.9 26% | 9.9 26% | 8.2 38% | 7.8 41% | 19.6 -47% |
| Idle Maximum * (Watt) | 15.1 | 11.1 26% | 10.1 33% | 8.2 46% | 10.6 30% | 22.8 -51% |
| Load Average * (Watt) | 30.8 | 30.6 1% | 36 -17% | 34.6 -12% | 99.7 -224% | 102 -231% |
| Load Maximum * (Watt) | 38.5 | 36.2 6% | 51 -32% | 48 -25% | 112.3 -192% | 107 -178% |
* ... smaller is better
| Off / Standby | |
| Idle | |
| Load |
|
Key:
min: | |
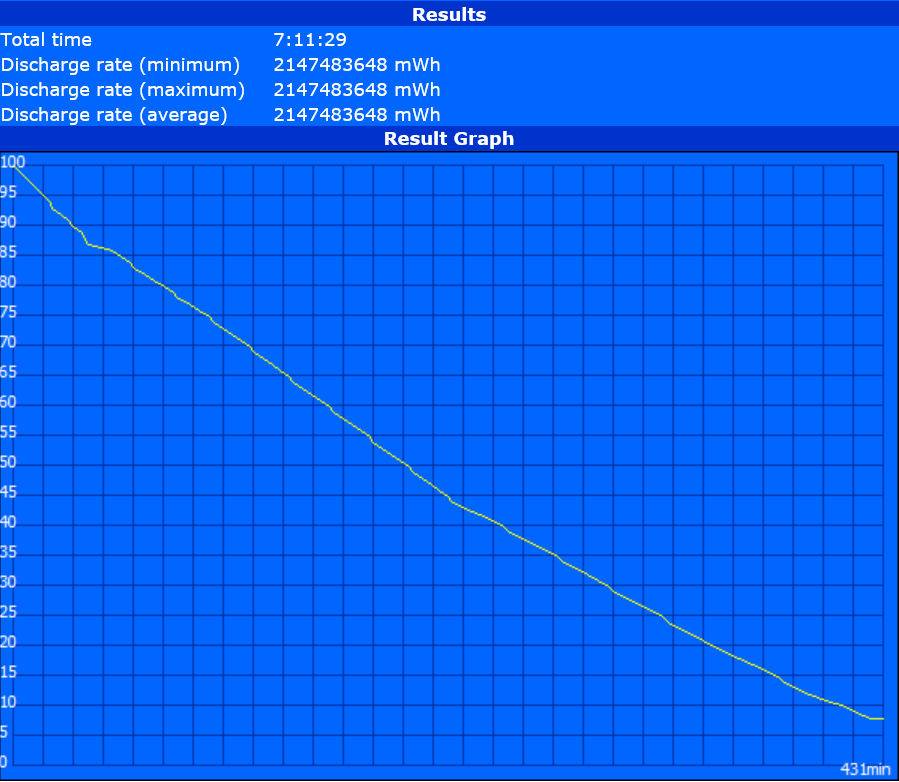
Battery Life
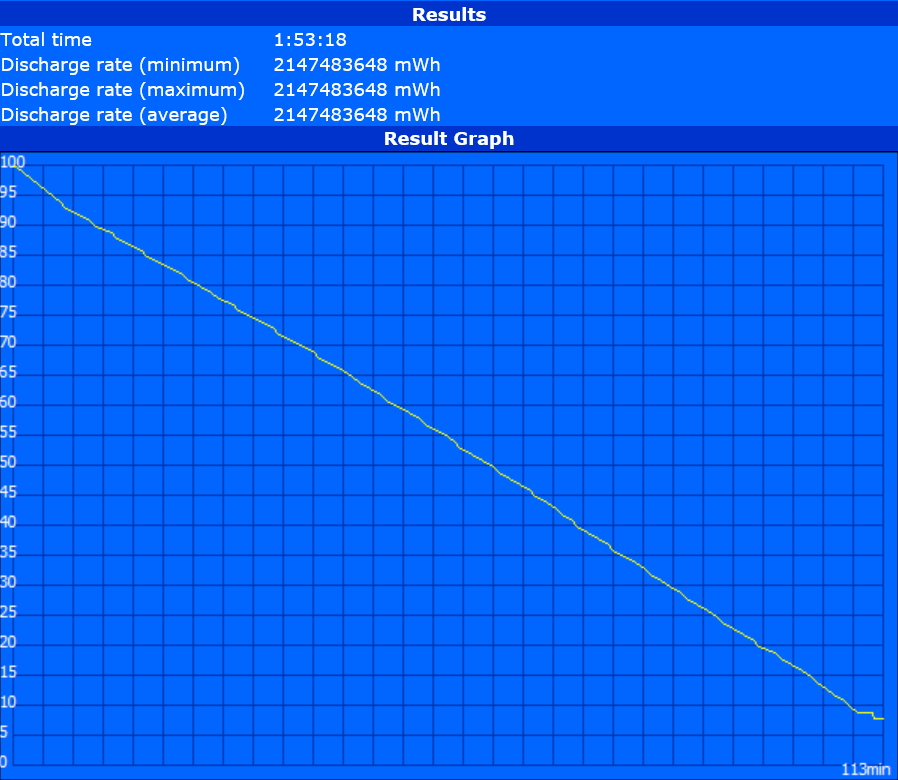
Whereas we were able to run our FHD test unit for almost nine hours of constant WLAN use, the exact same conditions for our 4K UHD SKU lasted for just over 7 hours instead. Nonetheless, this should be more than sufficient for most users. The XPS 15 carries an even denser battery pack than the HP with discrete Nvidia GPU graphics and can still outlast our HP on a single charge.

| HP Spectre x360 15-ap012dx 65 Wh | HP Spectre x360 15-ap011dx 65 Wh | Toshiba Satellite L50-C-275 45 Wh | Dell XPS 15 9550 i7 FHD 84 Wh | HP Envy 15-w103ng x360 48 Wh | Lenovo IdeaPad Y50-70-59441229 56 Wh | |
|---|---|---|---|---|---|---|
| Battery runtime | 24% | -19% | 20% | -8% | -42% | |
| Reader / Idle (h) | 11.8 | 13.7 16% | 16.3 38% | |||
| WiFi v1.3 (h) | 7.2 | 9 25% | 5.8 -19% | 9.1 26% | 6.6 -8% | 4.2 -42% |
| Load (h) | 1.9 | 2.5 32% | 1.8 -5% |
Pros
Cons
Verdict
Should you purchase the costlier 4K UHD SKU over the less expensive FHD SKU? The advantages are obvious including sharper texts and images for potentially better multi-tasking. We're also relieved to see no major reductions in backlight brightness due to the denser pixel count.
While the move to a RGBW matrix has resulted in slightly more accurate colors before calibration, contrast has suffered and grayscale is worse than on FHD counterpart. Battery life has taken a notable hit by up to two hours during WLAN use. We can only assume that the higher-end SKU with the more powerful Core i7-6560U and Iris Graphics 540 would reduce battery life even further. Still, seven hours of real-world use is very good for a 15.6-inch system.
The small handful of drawbacks aren't significant enough to dissuade potential buyers. They should, however, be made more clear to users as specifications like backlight brightness, contrast, or color accuracy aren't always explicitly stated by the manufacturer for each display option. This applies to all manufacturers and not just HP as we have recorded different levels of brightness, contrasts, and gamuts between XPS 13 SKUs, Zenbook UX303 SKUs, and others due to resolution differences.
The Spectre x360 15 4K UHD SKU offers an even more gorgeous touchscreen as expected. Battery life and contrast both take sizable hits, but this is otherwise still one of the best 15-inch convertibles currently available.
HP Spectre x360 15-ap012dx
- 02/27/2017 v6 (old)
Allen Ngo
Price comparison
