Notebook reviews with Intel HD Graphics 4400 graphics card
Lenovo B50-70 MCC2GGE Notebook Review
Low-cost Office. Lenovo charges just under 350 Euro for a Core i3 notebook with Windows 8.1. Those looking for an inexpensive computer for home use, can hardly go wrong with this computer - despite several weaknesses (dark display, poor battery life, only one year warranty).
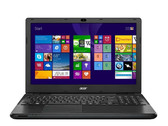
Intel Core i3-4030U, HD Graphics 4400, 15.6", 2.3 kgFujitsu LifeBook A514 Notebook Review
Inconsistent office turbo. The LifeBook A514 wants to stand out from the typical budget office notebooks with an i3 CPU as well as an SSD. This works pretty well in terms of general performance, but other areas – starting with the display up to the temperature development – leave mixed impressions: Some results are great, some reveal serious drawbacks.
Intel Core i3-4005U, HD Graphics 4400, 15.6", 2.2 kgAsus Q302LA Convertible Review
The affordable convertible. For about $500, this Asus is both a decent tablet and notebook. Unfortunately, a lot of important corners had to be cut to bring this transformer to such an inexpensive level.
Intel Core i3-4030U, HD Graphics 4400, 13.3", 1.8 kgAcer TravelMate P246-M-598B Notebook Review
Simple. Are 15.6-inch devices too big, and do you need a portable machine for outings? If you are not a perfectionist, Acer's 14-inch laptop with eight hours of battery life could be the ideal TravelMate for you.
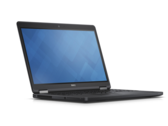
Intel Core i5-4210U, HD Graphics 4400, 14", 2.1 kgDell Latitude 12 E5250 Notebook Review
Little business partner. Following the positive rating of Dell's Latitude E5450 product line, we tested the 12.5-inch Latitude E5250. However, it did not completely fulfill the high expectations.
Intel Core i5-4310U, HD Graphics 4400, 12.5", 1.7 kgHP Probook 430 G2: Intel Core i5-4210U, 13.30", 1.5 kg
Review » HP ProBook 430 G2 Notebook Review Update
Fujitsu Lifebook U574: Intel Core i5-4200U, 13.30", 1.6 kg
Review » Fujitsu Lifebook U574 Ultrabook Review
Acer Aspire R13 R7-371T-779K: Intel Core i7-4510U, 13.30", 1.5 kg
Review » Acer Aspire R13 R7-371T-779K Convertible Review
Dell Latitude 14 Rugged - 5404: Intel Core i5-4310U, 14.00", 3.1 kg
Review » Dell Latitude 14 Rugged 5404 Notebook Review
Acer TravelMate P256-M-39NG: Intel Core i3-4005U, 15.60", 2.5 kg
Review » Acer TravelMate P256-M-39NG Notebook Review
Lenovo Edge 15-80H10004US: Intel Core i5-4210U, 15.60", 2.4 kg
Review » Lenovo Edge 15-80H10004US Notebook Review
Dell Latitude E5550: Intel Core i5-4310U, 15.60", 2.1 kg
Review » Dell Latitude E5550 Notebook Review
Asus ASUSPRO Advanced BU201LA-DT036G: Intel Core i5-4210U, 12.50", 1.4 kg
Review » Asus ASUSPRO Advanced BU201LA-DT036G Ultrabook Review
Lenovo Horizon 2s-F0AT0003US: Intel Core i5-4210U, 19.50", 2.5 kg
Review » Lenovo Horizon 2s-F0AT0003US AIO Review
Dell Latitude 14 E5450: Intel Core i5-4310U, 14.00", 2 kg
Review » Dell Latitude 14 E5450 Notebook Review
Toshiba Satellite Radius P50W-BST2N01: Intel Core i5-4210U, 15.60", 2.2 kg
Review » Toshiba Satellite Radius P50W-BST2N01 Convertible Review
Lenovo Horizon 2e-F0AS0014US: Intel Core i3-4030U, 21.50", 4.6 kg
Review » Lenovo Horizon 2e-F0AS0014US AIO Review
Dell Inspiron 13 7347: Intel Core i5-4210U, 13.30", 1.7 kg
Review » Dell Inspiron 13 7347 Convertible Review
Acer Aspire V3-371-55GS: Intel Core i5-4210U, 13.30", 1.5 kg
Review » Acer Aspire V3-371-55GS Subnotebook Review
HP Pavilion 13-a000ng x360: Intel Core i3-4030U, 13.30", 1.8 kg
Review » HP Pavilion 13-a000ng x360 Convertible Review
Toshiba Satellite P30W-B-104: Intel Core i5-4210U, 13.30", 2 kg
Review » Toshiba Satellite Click 2 Pro P30W-B-104 Convertible Review
Asus Transformer Book Flip TP550LA-CJ070P: Intel Core i5-4210U, 15.60", 2.3 kg
Review » Asus Transformer Book Flip TP550LA-CJ070P Convertible Review
Toshiba Satellite Pro R50-B-112: Intel Core i5-4210U, 15.60", 2.3 kg
Review » Toshiba Satellite Pro R50-B-112 Notebook Review
Toshiba Tecra Z40t-A1410: Intel Core i5-4310U, 14.00", 1.6 kg
Review » Toshiba Tecra Z40T-A1410 Notebook Review
Dell Inspiron 14-7437 (FHD): Intel Core i7-4510U, 14.00", 2 kg
Review » Dell Inspiron 14-7437 FHD Ultrabook Review Update
HP Envy 15-u001ng x360: Intel Core i5-4210U, 15.60", 2.4 kg
Review » HP Envy x360-15t Touch Convertible Review
Dell Latitude 12 Rugged Extreme: Intel Core i5-4300U, 11.60", 2.7 kg
Review » Dell Latitude 12 Rugged Extreme Convertible Review
Acer Extensa 2510-34Z4: Intel Core i3-4030U, 15.60", 2.5 kg
Review » Acer Extensa 2510-34Z4 Notebook Review
Lenovo IdeaPad Flex 2 15: Intel Core i5-4210U, 15.60", 2.6 kg
Review » Lenovo IdeaPad Flex 2 15 Notebook Review
Toshiba Portege Z30t-A-10X: Intel Core i7-4500U, 13.30", 1.4 kg
Review » Toshiba Portégé Z30t-A-10X Ultrabook Review Update
Fujitsu Stylistic Q704: Intel Core i5-4300U, 12.50", 2.1 kg
Review » Fujitsu Stylistic Q704 Convertible Review
Dell Latitude 14 7414 Rugged Extreme: Intel Core i5-4300U, 14.00", 3.7 kg
Review » Dell Latitude 14 Rugged Extreme Notebook Review
Acer Aspire V3-371-36M2: Intel Core i3-4030U, 13.30", 1.5 kg
Review » Acer Aspire V3-371-36M2 Notebook Review
Dell Inspiron 17-5748: Intel Core i7-4510U, 17.30", 3.2 kg
Review » Dell Inspiron 17-5748 Notebook Review
HP EliteBook Revolve 810 G2: Intel Core i5-4300U, 11.60", 1.3 kg
Review » HP EliteBook Revolve 810 G2 Notebook Review Update
Microsoft Surface Pro 3: Intel Core i5-4300U, 12.00", 0.8 kg
Review » Microsoft Surface Pro 3 Tablet Review
Lenovo Yoga 2 13: Intel Core i3-4010U, 13.30", 1.6 kg
Review » Lenovo Yoga 2 13 Convertible Review
Lenovo M30-70: Intel Core i3-4010U, 13.30", 1.5 kg
Review » Lenovo M30-70 Notebook Review
Asus Transformer Book T300LA-C4006H: Intel Core i5-4200U, 13.30", 1.9 kg
Review » Asus Transformer Book T300LA-C4006H Convertible Review
Toshiba Tecra Z50 A-12K: Intel Core i7-4600U, 15.60", 1.8 kg
Review » Toshiba Tecra Z50 A-12K Notebook Review
Toshiba Tecra Z40 A-147: Intel Core i5-4200U, 14.00", 1.5 kg
Review » Toshiba Tecra Z40 A-147 Notebook Review
Asus UX32LA-R3025H: Intel Core i5-4200U, 13.30", 1.5 kg
Review » Asus Zenbook UX32LA-R3025H Ultrabook Review
Lenovo ThinkPad X240: Intel Core i7-4600U, 12.50", 1.5 kg
Review » Lenovo ThinkPad X240 Full HD Notebook Review
Samsung ATIV Book 9 2014 (NP930X5J-K02DE): Intel Core i5-4200U, 15.60", 1.8 kg
Review » Samsung ATIV Book 9 2014 (NP930X5J-K02DE) Ultrabook Review
Sony Vaio SVF14N13CXB: Intel Core i5-4200U, 14.00", 2 kg
Review » Sony Vaio Flip 14A SVF14N13CXB Convertible Review
Toshiba Kirabook 2014: Intel Core i7-4500U, 13.30", 1.3 kg
Review » Toshiba KIRAbook (KIRA-101) Ultrabook Review
Asus ASUSPRO Essential PU301LA-RO064G: Intel Core i7-4500U, 13.30", 1.9 kg
Review » Asus AsusPro Essential PU301LA-RO064G Notebook Review
Dell Latitude 13 3340 Education Series: Intel Core i5-4200U, 13.30", 1.8 kg
Review » Review Dell Latitude 3340 Notebook
Dell Latitude E5440-4668: Intel Core i5-4300U, 14.00", 2.3 kg
Review » Review Dell Latitude E5440-4668 Notebook
Dell Latitude E5540: Intel Core i5-4300U, 15.60", 2.4 kg
Review » Review Dell Latitude E5540 Notebook
Fujitsu Lifebook T904: Intel Core i7-4600U, 13.30", 1.6 kg
Review » Review Fujitsu Lifebook T904 Convertible
Samsung ATIV Book 9 900X3G-K01: Intel Core i5-4200U, 13.30", 1.1 kg
Review » Review Samsung ATIV Book 9 900X3G-K01DE Notebook
Fujitsu LifeBook U904-0M75A1DE: Intel Core i5-4200U, 14.00", 1.4 kg
Review » Review Update Fujitsu LifeBook U904-0M75A1DE Ultrabook
Lenovo ThinkPad T440 20B6005YGE: Intel Core i7-4600U, 14.00", 1.7 kg
Review » Review Lenovo ThinkPad T440 20B6005YGE Notebook
HP EliteBook 840 G1: Intel Core i7-4600U, 14.00", 1.8 kg
Review » Review HP EliteBook 840 G1-H5G28ET Ultrabook
Fujitsu LifeBook S904: Intel Core i7-4600U, 13.30", 1.5 kg
Review » Review Fujitsu LifeBook S904 Notebook
Asus VivoBook S301LA-C1073H: Intel Core i5-4200U, 13.30", 1.8 kg
Review » Review Asus VivoBook S301LA-C1073H Ultrabook
HP EliteBook Folio 1040 G1 (H5F62ET): Intel Core i5-4200U, 14.00", 1.5 kg
Review » Review HP EliteBook Folio 1040 G1 (H5F62ET) Ultrabook
Dell XPS 13-9333: Intel Core i5-4200U, 13.30", 1.4 kg
Review » Review Update Dell XPS 13-9333 Touchscreen Ultrabook
HP EliteBook 820 G1: Intel Core i7-4600U, 12.50", 1.5 kg
Review » Review HP EliteBook 820 G1-H5G14ET Subnotebook
HP EliteBook 850 G1-H5G34ET: Intel Core i5-4200U, 15.60", 2 kg
Review » Review HP EliteBook 850 G1-H5G34ET Notebook
Acer TravelMate P255-M-54204G50Mnss: Intel Core i5-4200U, 15.60", 2.4 kg
Review » Review Acer TravelMate P255-M-54204G50Mnss Notebook
Lenovo ThinkPad X1 Carbon Touch 20A8-003UGE: Intel Core i7-4600U, 14.00", 1.4 kg
Review » Review Lenovo ThinkPad X1 Carbon Touch 20A8-003UGE Ultrabook
Acer TravelMate P455-M-54204G50Makk: Intel Core i5-4200U, 15.60", 2.4 kg
Review » Review Acer TravelMate P455-M-54204G50Makk Notebook
Lenovo Thinkpad T440s 20AQ0069GE: Intel Core i7-4600U, 14.00", 1.7 kg
Review » Review Update Lenovo ThinkPad T440s 20AQ0069GE Notebook
HP Spectre 13-3010eg: Intel Core i7-4500U, 13.30", 1.5 kg
Review » Review HP Spectre 13-3010eg Ultrabook
Fujitsu Lifebook U904: Intel Core i7-4600U, 14.00", 1.4 kg
Review » Review Fujitsu LifeBook U904 Ultrabook
Asus Transformer Book Trio TX201LA: Intel Core i7-4500U, 11.60", 1.7 kg
Review » Review Asus Transformer Book Trio TX201LA Convertible
Toshiba Portege Z30-A-12U: Intel Core i7-4500U, 13.30", 1.2 kg
Review » Review Toshiba Portégé Z30-A-12U Notebook
Asus Zenbook UX302LA-C4003H: Intel Core i5-4200U, 13.30", 1.5 kg
Review » Review Asus Zenbook UX302LA-C4003H Ultrabook
Sony Vaio Fit multi-flip SV-F13N1L2E/S : Intel Core i5-4200U, 13.30", 1.3 kg
Review » Review Sony Vaio Fit 13A SV-F13N1L2E/S Convertible
Lenovo ThinkPad Yoga: Intel Core i5-4200U, 12.50", 1.6 kg
Review » Review Lenovo ThinkPad Yoga Convertible
Dell Inspiron 14-7437: Intel Core i7-4500U, 14.00", 1.7 kg
Review » Review Dell Inspiron 14-7437 Notebook
Lenovo Yoga 2 Pro: Intel Core i5-4200U, 13.30", 1.4 kg
Review » Review Lenovo Yoga 2 Pro Convertible
Dell Latitude E7240 Touch: Intel Core i5-4300U, 12.50", 1.4 kg
Review » Review Update Dell Latitude E7240 Touch Notebook
Acer Aspire S7-392: Intel Core i7-4500U, 13.30", 1.3 kg
Review » Review Acer Aspire S7-392 Ultrabook
Lenovo ThinkPad X240: Intel Core i7-4600U, 12.50", 1.5 kg
Review » Review Lenovo ThinkPad X240 Ultrabook
Dell Latitude E7440: Intel Core i5-4200U, 14.00", 1.6 kg
Review » Review Dell Latitude E7440 Notebook
Microsoft Surface Pro 2: Intel Core i5-4200U, 10.60", 0.9 kg
Review » Review Microsoft Surface Pro 2 Tablet
Fujitsu Lifebook U554: Intel Core i5-4200U, 13.30", 1.5 kg
Review » Review Fujitsu Lifebook U554 Notebook
Nexoc B401 Ultra (W840SU-T): Intel Core i7-4500U, 14.00", 2.2 kg
Review » Review Nexoc B401 Ultra (Clevo W840SU-T) Notebook
HP Pavilion 15-n005sg: Intel Core i5-4200U, 15.60", 2.3 kg
Review » Review HP Pavilion 15-n005sg Notebook
Lenovo IdeaPad Flex 14-59395501: Intel Core i5-4200U, 14.00", 1.9 kg
Review » Review Lenovo IdeaPad Flex 14 Notebook
HP ProBook 430-G1: Intel Core i5-4200U, 13.30", 1.6 kg
Review » Review HP ProBook 430-G1 Notebook
Toshiba Satellite U50t-A-100: Intel Core i5-4200U, 15.60", 2.4 kg
Review » Review Toshiba Satellite U50t-A-100 Notebook
Samsung ATIV Book 9 Plus: Intel Core i5-4200U, 13.30", 1.4 kg
Review » Review Samsung ATIV Book 9 Plus 940X3G Ultrabook
Lenovo ThinkPad T440s 20AQ-S00500: Intel Core i5-4200U, 14.00", 1.6 kg
Review » Review Lenovo ThinkPad T440s 20AQ-S00500 Notebook
Dell Latitude E7240: Intel Core i5-4200U, 12.50", 1.3 kg
Review » Review Dell Latitude E7240 Notebook
Acer Aspire E1-572-34014G50Dnkk: Intel Core i3-4010U, 15.60", 2.1 kg
Review » Review Update Acer Aspire E1-572-34014G50Dnkk Notebook
Dell XPS 12-9Q33: Intel Core i5-4200U, 12.50", 1.5 kg
Review » Review Update Dell XPS 12-9Q33 Convertible
Lenovo IdeaPad U330p: Intel Core i5-4200U, 13.30", 1.5 kg
Review » Review Lenovo IdeaPad U330p Notebook
Acer Aspire V7-582P-6673: Intel Core i5-4200U, 15.60", 2.2 kg
Review » Review Acer Aspire V7-582P-6673 Ultrabook
Dell Inspiron 15R-5537: Intel Core i7-4500U, 15.60", 2.3 kg
Review » Review Dell Inspiron 15R-5537 Notebook
Sony Vaio Pro 13 SVP-1321C5ER: Intel Core i7-4500U, 13.30", 1.1 kg
Review » Review Sony Vaio Pro 13 SVP-1321C5ER Ultrabook
Sony Vaio Pro 11 SVP121M2EB.G4: Intel Core i5-4200U, 11.60", 0.9 kg
Review » Review Sony Vaio Pro 11 SVP121M2EB.G4 Ultrabook
Sony Vaio Duo 13 SVD1321M2E: Intel Core i5-4200U, 13.30", 1.3 kg
Review » Review Sony Vaio Duo 13 SVD1321M2E Convertible Ultrabook
HP Pavilion 13-a000ng x360: Intel Core i3-4030U, 13.30", 1.8 kg
External Review » HP Pavilion 13-a000ng x360
Acer Aspire ES1-571-50VH: Intel Core i5-4200U, 15.60", 2.4 kg
External Review » Acer Aspire ES1-571-50VH
Acer TravelMate P246-M-598B: Intel Core i5-4210U, 14.00", 2.1 kg
External Review » Acer TravelMate P246-M-598B
Dell Vostro 3558-9427: Intel Core i3-4005U, 15.60", 2.2 kg
External Review » Dell Vostro 3558-9427
Acer Aspire E5-571-38NJ: Intel Core i3-4005U, 15.60", 2.3 kg
External Review » Acer Aspire E5-571-38NJ
Acer Aspire E5-571-316T: Intel Core i3-4005U, 15.60", 2.5 kg
External Review » Acer Aspire E5-571-316T
Toshiba Satellite C55-C-11G: Intel Core i3-4005U, 15.60", 2.2 kg
External Review » Toshiba Satellite C55-C-11G
Toshiba Satellite C70-C-10l: Intel Core i3-4005U, 17.30", 2.6 kg
External Review » Toshiba Satellite C70-C-10l
Asus ASUSPRO Advanced BU401LA-CZ180G: Intel Core i5-4210U, 14.00", 1.7 kg
External Review » Asus ASUSPRO Advanced BU401LA-CZ180G
Toshiba Satellite C55-C-142: Intel Core i3-4005U, 15.60", 2.2 kg
External Review » Toshiba Satellite C55-C-142
Fujitsu Lifebook A514: Intel Core i3-4005U, 15.60", 2.2 kg
External Review » Fujitsu Lifebook A514
Acer Aspire E5-573-3870: Intel Core i3-4005U, 15.60", 2.4 kg
External Review » Acer Aspire E5-573-3870
Asus X555LA-XX290H: Intel Core i3-4030U, 15.60", 2.3 kg
External Review » Asus X555LA-XX290H
Acer Aspire R7-371T-72WX: Intel Core i7-4510U, 13.30", 1.5 kg
External Review » Acer Aspire R7-371T-72WX
Acer TravelMate P256-M-55EG: Intel Core i5-4210U, 15.60", 2.5 kg
External Review » Acer TravelMate P256-M-55EG
Asus X555LA-XX053D: Intel Core i3-4030U, 15.60", 2.3 kg
External Review » Asus X555LA-XX053D
Toshiba Portege Z30-A-1E1: Intel Core i7-4510U, 13.30", 1.2 kg
External Review » Toshiba Portege Z30-A-1E1
Medion Akoya S6413T-MD98842: Intel Core i5-4210U, 15.60", 1.4 kg
External Review » Medion Akoya S6413T-MD98842
HP Envy 15-u050sr x360: Intel Core i5-4210U, 15.60", 2.4 kg
External Review » HP Envy 15-u050sr x360
Acer Aspire R3-471T-394N: Intel Core i3-4030U, 14.00", 2.2 kg
External Review » Acer Aspire R3-471T-394N
Dell Latitude 14 Rugged Extreme-7404: Intel Core i5-4300U, 14.00", 3.5 kg
External Review » Dell Latitude 14 Rugged Extreme-7404
Acer TravelMate P256-M-385Y: Intel Core i3-4030U, 15.60", 2.5 kg
External Review » Acer TravelMate P256-M-385Y
Asus X555MA: Intel Core i5-4210U, 15.60", 2.3 kg
External Review » Asus X555MA
Acer Aspire E5-571-5552: Intel Core i5-4210U, 15.60", 2.5 kg
External Review » Acer Aspire E5-571-5552
HP Probook 430 G2: Intel Core i5-4210U, 13.30", 1.5 kg
External Review » HP Probook 430 G2
Acer Aspire R7-371T-77FF: Intel Core i7-4510U, 13.30", 1.5 kg
External Review » Acer Aspire R7-371T-77FF
Acer Aspire V3-371-33LX: Intel Core i3-4005U, 13.30", 1.5 kg
External Review » Acer Aspire V3-371-33LX
Dell Latitude 14 E5450: Intel Core i5-4310U, 14.00", 2 kg
External Review » Dell Latitude 14 E5450
Lenovo G50-70-59440028: Intel Core i3-4005U, 15.60", 2.5 kg
External Review » Lenovo G50-70-59440028
Asus ASUSPRO Advanced B551LA-CN169G: Intel Core i5-4210U, 15.60", 2.5 kg
External Review » Asus ASUSPRO Advanced B551LA-CN169G
Asus ASUSPRO Advanced BU201LA-DT036G: Intel Core i5-4210U, 12.50", 1.4 kg
External Review » Asus ASUSPRO Advanced BU201LA-DT036G
Lenovo IdeaPad U330p: Intel Core i5-4200U, 13.30", 1.5 kg
External Review » Lenovo IdeaPad U330p
Acer Aspire R7-371T-72TC: Intel Core i7-4510U, 13.30", 1.5 kg
External Review » Acer Aspire R7-371T-72TC
Acer Aspire E5-571-3205: Intel Core i3-4030U, 15.60", 2.5 kg
External Review » Acer Aspire E5-571-3205
Toshiba Portege Z30-A-189: Intel Core i5-4210U, 13.30", 1.2 kg
External Review » Toshiba Portege Z30-A-189
Dell Latitude 12 E5250: Intel Core i5-4310U, 12.50", 1.7 kg
External Review » Dell Latitude 12 E5250
Acer Aspire R7-371T-55DQ: Intel Core i5-4210U, 13.30", 1.5 kg
External Review » Acer Aspire R7-371T-55DQ
Fujitsu Lifebook U554: Intel Core i5-4200U, 13.30", 1.5 kg
External Review » Fujitsu Lifebook U554
HP Pavilion 13-b102TU: Intel Core i3-4030U, 13.30", 1.7 kg
External Review » HP Pavilion 13-b102TU
Acer Travelmate P645-MG-54208G1.02ttkk: Intel Core i5-4200U, 14.00", 1.5 kg
External Review » Acer Travelmate P645-MG-54208G1.02ttkk
Toshiba Satellite Click 2 Pro P30W-B-104: Intel Core i5-4210U, 13.30", 1 kg
External Review » Toshiba Satellite Click 2 Pro P30W-B-104
Acer Aspire R13 R7-371T-779K: Intel Core i7-4510U, 13.30", 1.5 kg
External Review » Acer Aspire R13 R7-371T-779K
Toshiba Tecra C50-B1503: Intel Core i5-4210U, 15.60", 2.3 kg
External Review » Toshiba Tecra C50-B1503
Toshiba Satellite Z30T-A-111: Intel Core i5-4200U, 13.30", 1.4 kg
External Review » Toshiba Satellite Z30T-A-111
Lenovo Edge 15-80H10004US: Intel Core i5-4210U, 15.60", 2.4 kg
External Review » Lenovo Edge 15-80H10004US
Acer Aspire R7-371T-55DJ: Intel Core i5-4210U, 13.30", 1.5 kg
External Review » Acer Aspire R7-371T-55DJ
Dell Inspiron 15-7537-3290: Intel Core i7-4510U, 15.60", 2.6 kg
External Review » Dell Inspiron 15-7537-3290
Samsung 940X3G-K07DE: Intel Core i5-4200U, 13.30", 1.4 kg
External Review » Samsung 940X3G-K07DE
Asus Transformer Book Flip TP300LA-C4034H: Intel Core i5-4210U, 13.30", 1.8 kg
External Review » Asus Transformer Book Flip TP300LA-C4034H
Toshiba Satellite L50-B-177: Intel Core i3-4005U, 15.60", 2.2 kg
External Review » Toshiba Satellite L50-B-177
HP G1 EliteBook Folio 1040 (H5F66EA): Intel Core i7-4600U, 14.00", 1.5 kg
External Review » HP G1 EliteBook Folio 1040 (H5F66EA)
HP Pavilion 13-a051sr: Intel Core i5-4210U, 13.30", 2 kg
External Review » HP Pavilion 13-a051sr
Asus Zenbook UX303LA-R5094H: Intel Core i5-4210U, 13.30", 1.5 kg
External Review » Asus Zenbook UX303LA-R5094H
HP Envy 15-u000na x360: Intel Core i5-4210U, 15.60", 2.4 kg
External Review » HP Envy 15-u000na x360
Lenovo IdeaPad U330-59427487: Intel Core i5-4200U, 13.30", 1.7 kg
External Review » Lenovo IdeaPad U330-59427487
Toshiba Satellite Pro R50-B-12U: Intel Core i5-4210U, 15.60", 2.3 kg
External Review » Toshiba Satellite Pro R50-B-12U
Lenovo IdeaPad S510р-59-394781: Intel Core i3-4010U, 15.60", 2.4 kg
External Review » Lenovo IdeaPad S510р-59-394781
Toshiba Satellite L50-B-17C: Intel Core i3-4005U, 15.60", 2.2 kg
External Review » Toshiba Satellite L50-B-17C
Toshiba Satellite Pro R50-B-11C: Intel Core i3-4005U, 15.60", 2.2 kg
External Review » Toshiba Satellite Pro R50-B-11C
Acer Aspire V3-371-52VR: Intel Core i5-4210U, 13.30", 1.5 kg
External Review » Acer Aspire V3-371-52VR
Asus Chromebox CN60: Intel Core i3-4010U, 0.00", 0.6 kg
External Review » Asus Chromebox CN60
Lenovo IdeaPad Yoga2 13-59427516: Intel Core i3-4030U, 13.30", 1.6 kg
External Review » Lenovo IdeaPad Yoga2 13-59427516
Asus ASUSPRO BU201: Intel Core i5-4210U, 12.50", 1.3 kg
External Review » Asus ASUSPRO BU201
Asus Transformer Book Flip TP300LA-DW106H: Intel Core i3-4010U, 13.30", 1.8 kg
External Review » Asus Transformer Book Flip TP300LA-DW106H
Acer Aspire V3-371-77NK: Intel Core i7-4510U, 13.00", 1.6 kg
External Review » Acer Aspire V3-371-77NK
Fujitsu Stylistic Q704: Intel Core i5-4300U, 12.50", 2.1 kg
External Review » Fujitsu Stylistic Q704
Dell Latitude E5440-4668: Intel Core i5-4300U, 14.00", 2.3 kg
External Review » Dell Latitude E5440-4668
HP Envy 15-u100ng x360: Intel Core i5-4210U, 15.60", 2.4 kg
External Review » HP Envy 15-u100ng x360
HP Pavilion 13-a000nc x360: Intel Core i3-4030U, 13.00", 1.8 kg
External Review » HP Pavilion 13-a000nc x360
Asus Zenbook UX303LA-R5097H: Intel Core i7-4510U, 13.30", 1.5 kg
External Review » Asus Zenbook UX303LA-R5097H
Toshiba Satellite L70-B-11C: Intel Core i5-4200U, 17.30", 2.7 kg
External Review » Toshiba Satellite L70-B-11C
Dell Latitude 12 Rugged Extreme: Intel Core i5-4300U, 11.60", 2.7 kg
External Review » Dell Latitude 12 Rugged Extreme
Dell Inspiron 13 7347: Intel Core i5-4210U, 13.30", 1.7 kg
External Review » Dell Inspiron 13 7347
Acer Aspire R13: Intel Core i5-4210U, 13.30", 1.8 kg
External Review » Acer Aspire R13
Toshiba Satellite Click 2 Pro P35W-B3226: Intel Core i7-4510U, 13.30", 2.3 kg
External Review » Toshiba Satellite Click 2 Pro P35W-B3226
Dell Inspiron 13-7347-3276: Intel Core i3-4010U, 13.30", 1.7 kg
External Review » Dell Inspiron 13-7347-3276
Toshiba Satellite Pro R50-B-112: Intel Core i5-4210U, 15.60", 2.3 kg
External Review » Toshiba Satellite Pro R50-B-112
Lenovo M30-70: Intel Core i3-4010U, 13.30", 1.5 kg
External Review » Lenovo M30-70
Lenovo IdeaPad U430p-59428492: Intel Core i5-4210U, 14.00", 1.7 kg
External Review » Lenovo IdeaPad U430p-59428492
Toshiba KIRA-102: Intel Core i7-4510U, 13.30", 1.4 kg
External Review » Toshiba KIRA-102
Toshiba Satellite Z30-A-1D2: Intel Core i7-4510U, 13.30", 1.2 kg
External Review » Toshiba Satellite Z30-A-1D2
Acer Aspire E5-471-64WR: Intel Core i3-4030U, 14.00", 2 kg
External Review » Acer Aspire E5-471-64WR
Asus Transformer Book Flip TP300LA-C4032H: Intel Core i5-4210U, 13.30", 1.8 kg
External Review » Asus Transformer Book Flip TP300LA-C4032H
Toshiba Satellite Radius P50W-BST2N22: Intel Core i5-4210U, 15.60", 2.2 kg
External Review » Toshiba Satellite Radius P50W-BST2N22
Asus ASUSPRO Advanced BU401LA-CZ040G: Intel Core i5-4200U, 14.00", 1.7 kg
External Review » Asus ASUSPRO Advanced BU401LA-CZ040G
Toshiba Satellite Click 2 Pro P30W-BST2N22: Intel Core i7-4510U, 13.30", 2.3 kg
External Review » Toshiba Satellite Click 2 Pro P30W-BST2N22
Asus Transformer Book Flip TP300LA-DW063H: Intel Core i3-4030U, 13.30", 1.8 kg
External Review » Asus Transformer Book Flip TP300LA-DW063H
Acer Extensa 2510-34Z4: Intel Core i3-4030U, 15.60", 2.5 kg
External Review » Acer Extensa 2510-34Z4
Acer Aspire E5-471-59RT: Intel Core i5-4210U, 14.00", 2.3 kg
External Review » Acer Aspire E5-471-59RT
Toshiba Satellite Radius P55W-B5224: Intel Core i7-4510U, 15.60", 2.2 kg
External Review » Toshiba Satellite Radius P55W-B5224
Dell Inspiron 17-5748: Intel Core i7-4510U, 17.30", 3.2 kg
External Review » Dell Inspiron 17-5748
HP Envy 15-U002NF: Intel Core i5-4210U, 15.60", 2.4 kg
External Review » HP Envy 15-U002NF
Lenovo ThinkPad Yoga S1: Intel Core i7-4500U, 12.50", 1.6 kg
External Review » Lenovo ThinkPad Yoga S1
Acer C720-3404 Chromebook: Intel Core i3-4005U, 11.60", 1.2 kg
External Review » Acer C720-3404 Chromebook
Acer C720-3605 Chromebook: Intel Core i3-4005U, 11.60", 1.2 kg
External Review » Acer C720-3605 Chromebook
Lenovo Yoga 2 13: Intel Core i3-4010U, 13.30", 1.6 kg
External Review » Lenovo Yoga 2 13
Lenovo IdeaPad Flex 2 15: Intel Core i5-4210U, 15.60", 2.6 kg
External Review » Lenovo IdeaPad Flex 2 15
Acer Aspire S7-392: Intel Core i7-4500U, 13.30", 1.3 kg
External Review » Acer Aspire S7-392
Acer Aspire V7-482P: Intel Core i5-4200U, 14.00", 1.9 kg
External Review » Acer Aspire V7-482P
Acer Aspire E5-571P-363N: Intel Core i3-4030U, 15.60", 2.5 kg
External Review » Acer Aspire E5-571P-363N
Dell Latitude 14 7414 Rugged Extreme: Intel Core i5-4300U, 14.00", 3.7 kg
External Review » Dell Latitude 14 Rugged Extreme
Acer Aspire S7-392-5410: Intel Core i5-4210U, 13.30", 1.3 kg
External Review » Acer Aspire S7-392-5410
Acer Aspire S3-392G-54206G50tws: Intel Core i5-4200U, 13.30", 1.7 kg
External Review » Acer Aspire S3-392G-54206G50tws
Asus VivoBook S301LA-C1073H: Intel Core i5-4200U, 13.30", 1.8 kg
External Review » Asus VivoBook S301LA-C1073H
Toshiba Satellite Z30-A-12R: Intel Core i5-4200U, 13.30", 1.2 kg
External Review » Toshiba Satellite Z30-A-12R
Asus Zenbook UX302LA-C4004H: Intel Core i5-4200U, 13.30", 1.5 kg
External Review » Asus Zenbook UX302LA-C4004H
Toshiba Portege Z30T-A-11C: Intel Core i5-4200U, 13.30", 1.4 kg
External Review » Toshiba Portege Z30T-A-11C
Acer Aspire M5-583P-6637: Intel Core i5-4200U, 15.60", 2.4 kg
External Review » Acer Aspire M5-583P-6637
Dell Inspiron 14-5447: Intel Core i5-4210U, 14.00", 2.2 kg
External Review » Dell Inspiron 14-544
Asus X751L: Intel Core i7-4500U, 17.30", 2.8 kg
External Review » Asus X751L
Asus Transformer Book T300LA 90NB02W1-M01450: Intel Core i7-4500U, 13.30", 1.9 kg
External Review » Asus Transformer Book T300LA 90NB02W1-M01450
Panasonic Toughbook CF-AX3: Intel Core i5-4300U, 11.60", 1.2 kg
External Review » Panasonic Toughbook CF-AX3
Dell Latitude E7240-SM008LE72408GER: Intel Core i5-4300U, 12.50", 1.4 kg
External Review » Dell Latitude E7240-SM008LE72408GER
HP Envy 15-u001ng x360: Intel Core i5-4210U, 15.60", 2.4 kg
External Review » HP Envy 15-u001ng x360
Asus K511LA: Intel Core i7-4500U, 15.60", 2.2 kg
External Review » Asus K511LA
Asus VivoBook S451LA-CA045H: Intel Core i5-4200U, 14.00", 2.2 kg
External Review » Asus VivoBook S451LA-CA045H
Toshiba Tecra Z50-A-11H: Intel Core i5-4200U, 15.60", 1.8 kg
External Review » Toshiba Tecra Z50-A-11H
HP Spectre 13-3010ea: Intel Core i5-4200U, 13.30", 1.5 kg
External Review » HP Spectre 13-3010ea
Asus Transformer Book T300LA-C4001H: Intel Core i5-4200U, 13.30", 1.9 kg
External Review » Asus Transformer Book T300LA-C4001H
Fujitsu Lifebook U574: Intel Core i5-4200U, 13.30", 1.6 kg
External Review » Fujitsu Lifebook U574
Toshiba Satellite L50-B-1DV: Intel Core i5-4200U, 15.60", 2.2 kg
External Review » Toshiba Satellite L50-B-1DV
Toshiba Tecra Z40-A-121: Intel Core i7-4600U, 14.00", 1.5 kg
External Review » Toshiba Tecra Z40-A-121
Asus B551LA-CN018G: Intel Core i5-4200U, 15.60", 2.5 kg
External Review » Asus B551LA-CN018G
Toshiba Kirabook 2014: Intel Core i7-4500U, 13.30", 1.3 kg
External Review » Toshiba Kirabook 2014
Microsoft Surface Pro 3: Intel Core i5-4300U, 12.00", 0.8 kg
External Review » Microsoft Surface Pro 3
Toshiba Satellite L50-B-1DJ: Intel Core i3-4005U, 15.60", 2.2 kg
External Review » Toshiba Satellite L50-B-1DJ
Sony Vaio Fit Multi-Flip SV-F13N1J2R: Intel Core i3-4005U, 13.30", 1.3 kg
External Review » Sony Vaio Fit Multi-Flip SV-F13N1J2R
HP EliteBook 820 G1-F1R78AW: Intel Core i5-4300U, 12.50", 1.5 kg
External Review » HP EliteBook 820 G1-F1R78AW
Fujitsu Lifebook T904: Intel Core i7-4600U, 13.30", 1.6 kg
External Review » Fujitsu Lifebook T904
Samsung ATIV Book 9 900X3G-K01: Intel Core i5-4200U, 13.30", 1.1 kg
External Review » Samsung ATIV Book 9 900X3G-K01
Acer Aspire V5-561-6607: Intel Core i5-4200U, 15.60", 2.5 kg
External Review » Acer Aspire V5-561-6607
Dell Latitude 13 3340 Education Series: Intel Core i5-4200U, 13.30", 1.8 kg
External Review » Dell Latitude 3340 i5
Toshiba Tecra Z50-A1503: Intel Core i7-4600U, 15.60", 1.5 kg
External Review » Toshiba Tecra Z50-A1503
Fujitsu LifeBook U904-0M75A1DE: Intel Core i5-4200U, 14.00", 1.4 kg
External Review » Fujitsu LifeBook U904-0M75A1DE
Acer TravelMate P645-M-5420G12Tkk: Intel Core i5-4200U, 14.00", 1.5 kg
External Review » Acer TravelMate P645-M-5420G12Tkk
Toshiba Portege Z30-A-M5S: Intel Core i5-4200U, 13.30", 1.2 kg
External Review » Toshiba Portege Z30-A-M5S
Lenovo IdeaPad Yoga 2 13-59402183: Intel Core i3-4010U, 13.30", 1.6 kg
External Review » Lenovo IdeaPad Yoga 2 13-59402183
Toshiba Tecra Z50-A-11C: Intel Core i7-4600U, 15.60", 1.7 kg
External Review » Toshiba Tecra Z50-A-11C
Lenovo ThinkPad X1 Carbon Touch 20A8-003UGE: Intel Core i7-4600U, 14.00", 1.4 kg
External Review » Lenovo ThinkPad X1 Carbon Touch 20A8-003UGE
Lenovo IdeaPad Yoga 2 13 inch-59402636: Intel Core i5-4200U, 13.30", 1.6 kg
External Review » Lenovo IdeaPad Yoga 2 13 inch-59402636
Eurocom Armadillo 14 inch: Intel Core i7-4500U, 14.00", 2 kg
External Review » Eurocom Armadillo 14 inch
Asus Transformer Book Trio TX201LA-CQ026H: Intel Core i5-4200U, 11.60", 1.7 kg
External Review » Asus Transformer Book Trio TX201LA-CQ026H
HP Spectre 13 Pro: Intel Core i5-4200U, 13.00", 1.5 kg
External Review » HP Spectre 13 Pro
HP EliteBook Revolve 810 G2: Intel Core i5-4300U, 11.60", 1.3 kg
External Review » HP EliteBook Revolve 810 G2
Dell Latitude E5540: Intel Core i5-4300U, 15.60", 2.4 kg
External Review » Dell Latitude E5540
Acer Aspire S7-392-6807: Intel Core i5-4200U, 13.30", 1.3 kg
External Review » Acer Aspire S7-392-6807
Asus VivoBook V451LA-DS51T: Intel Core i5-4200U, 14.00", 2.2 kg
External Review » Asus VivoBook V451LA-DS51T
Asus UX301LA-DH51T: Intel Core i5-4200U, 13.30", 1.2 kg
External Review » Asus UX301LA-DH51T
Asus UX32L : Intel Core i5-4200U, 13.30", 1.5 kg
External Review » Asus UX32L
HP Spectre 13-3000eo: Intel Core i5-4200U, 13.30", 1.5 kg
External Review » HP Spectre 13-3000eo
Toshiba Portege Z30-A-12U: Intel Core i7-4500U, 13.30", 1.2 kg
External Review » Toshiba Portege Z30-A-12U
Sony Vaio Flip 15 SV-F15N1L2ES: Intel Core i5-4200U, 15.60", 2.3 kg
External Review » Sony Vaio Flip 15 SV-F15N1L2ES
Acer Aspire R7-572-6423: Intel Core i5-4200U, 15.60", 2.4 kg
External Review » Acer Aspire R7-572-6423
Toshiba Satellite Z30-A-134: Intel Core i5-4200U, 13.30", 1.2 kg
External Review » Toshiba Satellite Z30-A-134
Fujitsu LifeBook S904: Intel Core i7-4600U, 13.30", 1.5 kg
External Review » Fujitsu LifeBook S904
Fujitsu LifeBook U904-0M0006PL: Intel Core i5-4300U, 14.00", 1.4 kg
External Review » Fujitsu LifeBook U904-0M0006PL
Asus Transformer Book Trio TX201LA-CQ003H: Intel Core i7-4500U, 11.60", 1.7 kg
External Review » Asus Transformer Book Trio TX201LA-CQ003H
HP EliteBook Folio 1040 G1: Intel Core i5-4300U, 14.00", 1.6 kg
External Review » HP EliteBook Folio 1040 G1
HP Spectre 13-3090EF: Intel Core i5-4200U, 13.30", 1.5 kg
External Review » HP Spectre 13-3090EF
Sony VAIO 13 SV-F13N1A4E: Intel Core i5-4200U, 13.30", 1.3 kg
External Review » Sony VAIO 13 SV-F13N1A4E
Toshiba Portege Z30-A-12N: Intel Core i5-4200U, 13.00", 1.2 kg
External Review » Toshiba Portege Z30-A-12N
Asus UX301LA-DH71T: Intel Core i7-4558U, 13.30", 1.2 kg
External Review » Asus UX301LA-DH71T
Lenovo ThinkPad X1 Carbon 2014: Intel Core i5-4200U, 14.00", 1.4 kg
External Review » Lenovo ThinkPad X1 Carbon 2014
Sony Vaio Tap 21 SV-T21227CXB: Intel Core i7-4500U, 21.50", 3.9 kg
External Review » Sony Vaio Tap 21 SV-T21227CXB
Toshiba Portege Z30-A-12T: Intel Core i5-4200U, 13.30", 1.2 kg
External Review » Toshiba Portege Z30-A-12T
Lenovo ThinkPad T440s 20AQ-0069GE: Intel Core i7-4600U, 14.00", 1.6 kg
External Review » Lenovo ThinkPad T440s 20AQ-0069GE
Toshiba Satellite M50-A-11Q: Intel Core i3-4005U, 15.60", 2.2 kg
External Review » Toshiba Satellite M50-A-11Q
Lenovo ThinkPad X240-20AL007YGE: Intel Core i5-4200U, 12.50", 1.4 kg
External Review » Lenovo ThinkPad X240-20AL007YGE
Asus Transformer Book Trio TX201LA-CQ004: Intel Core i5-4200U, 11.60", 1.7 kg
External Review » Asus Transformer Book Trio TX201LA-CQ004
Sony Vaio Fit multi-flip SV-F13N1X2E/S: Intel Core i7-4500U, 13.00", 1.4 kg
External Review » Sony Vaio Fit multi-flip SV-F13N1X2E/S
Dell XPS 13-9333: Intel Core i5-4200U, 13.30", 1.4 kg
External Review » Dell XPS 13-9333
Toshiba Satellite U50t-A-10F: Intel Core i5-4200U, 15.60", 2.4 kg
External Review » Toshiba Satellite U50t-A-10F
HP Spectre 13-3010eg: Intel Core i7-4500U, 13.30", 1.5 kg
External Review » HP Spectre 13-3010eg
Toshiba Portege Z30-A1302: Intel Core i7-4600U, 13.30", 1.2 kg
External Review » Toshiba Portege Z30-A1302
Fujitsu Lifebook U904: Intel Core i7-4600U, 14.00", 1.4 kg
External Review » Fujitsu Lifebook U904
Toshiba Kirabook 2014: Intel Core i5-4200U, 13.30", 1.4 kg
External Review » Toshiba Kirabook 2014
Sony Vaio Pro SVP1321M2E: Intel Core i5-4200U, 13.30", 1 kg
External Review » Sony Vaio Pro SVP1321M2E
Dell Latitude E7240 Touch: Intel Core i5-4300U, 12.50", 1.4 kg
External Review » Dell Latitude E7240 Touch
Acer Aspire S7-392-9460: Intel Core i7-4500U, 13.30", 1.3 kg
External Review » Acer Aspire S7-392-9460
Asus Transformer Book T300LA-C4002H: Intel Core i3-4010U, 13.30", 2 kg
External Review » Asus Transformer Book T300LA-C4002H
Acer Aspire S7-392-54208G12tws: Intel Core i5-4200U, 13.30", 1.3 kg
External Review » Acer Aspire S7-392-54208G12tws
Toshiba Satellite U50t-A-10H: Intel Core i5-4200U, 15.60", 2.2 kg
External Review » Toshiba Satellite U50t-A-10H
Toshiba Satellite E45t-A4300: Intel Core i5-4200U, 14.00", 2 kg
External Review » Toshiba Satellite E45t-A4300
Toshiba Portege Z30-A1301: Intel Core i5-4300U, 13.30", 1.2 kg
External Review » Toshiba Portege Z30-A1301
Acer Aspire E1-572-34014G50Mnkk: Intel Core i3-4010U, 15.60", 2.2 kg
External Review » Acer Aspire E1-572-34014G50Mnkk
Sony Vaio Flip 14 SV-F14N16CXB: Intel Core i7-4500U, 14.00", 1.9 kg
External Review » Sony Vaio Flip 14 SV-F14N16CXB
Asus Transformer Book Trio TX201LA: Intel Core i7-4500U, 11.60", 1.7 kg
External Review » Asus Transformer Book Trio TX201LA
Lenovo ThinkPad Yoga: Intel Core i5-4200U, 12.50", 1.6 kg
External Review » Lenovo ThinkPad Yoga
Asus UX301LA-C4006H: Intel Core i7-4500U, 13.30", 1.2 kg
External Review » Asus UX301LA-C4006H
Lenovo IdeaPad Flex 15-59393845: Intel Core i5-4200U, 15.60", 2.2 kg
External Review » Lenovo IdeaPad Flex 15-59393845
Sony Vaio Fit multi-flip SV-F13N1L2E/S : Intel Core i5-4200U, 13.30", 1.3 kg
External Review » Sony Vaio Fit multi-flip SV-F13N1L2E/S
Samsung ATIV 940X3G-K01NL: Intel Core i5-4200U, 13.30", 2.4 kg
External Review » Samsung ATIV 940X3G-K01NL
Samsung ATIV 940X3G-K01PL: Intel Core i5-4200U, 13.30", 1.3 kg
External Review » Samsung ATIV 940X3G-K01PL
HP EliteBook 820 G1: Intel Core i5-4200U, 12.50", 1.3 kg
External Review » HP EliteBook 820 G1
Dell Latitude E7440: Intel Core i5-4300U, 14.00"
External Review » Dell Latitude E7440
Sony Vaio Flip 13 SV-F13N17PXB: Intel Core i7-4500U, 13.30", 1.3 kg
External Review » Sony Vaio Flip 13 SV-F13N17PXB
Lenovo ThinkPad X240: Intel Core i7-4600U, 12.50", 1.5 kg
External Review » Lenovo ThinkPad X240
Sony Vaio SV-F13N1Y9E/S: Intel Core i7-4500U, 13.30", 1.2 kg
External Review » Sony Vaio SV-F13N1Y9E/S
Toshiba Tecra Z40-A1401: Intel Core i5-4300U, 14.00", 1.5 kg
External Review » Toshiba Tecra Z40-A1401
Toshiba Tecra Z40-A1402: Intel Core i7-4600U, 14.00", 1.5 kg
External Review » Toshiba Tecra Z40-A1402
Sony Vaio Flip 13 SV-F13N13CXB: Intel Core i5-4200U, 13.30", 1.3 kg
External Review » Sony Vaio Flip 13 SV-F13N13CXB
Samsung ATIV 940X3G-K01HU: Intel Core i5-4200U, 13.30", 1.3 kg
External Review » Samsung ATIV 940X3G-K01HU
Sony Vaio Duo 13 SVD1321M2E: Intel Core i5-4200U, 13.30", 1.3 kg
External Review » Sony Vaio Duo 13 SVD1321M2E
Samsung ATIV 940X3G-K01SE: Intel Core i5-4200U, 13.30", 1.4 kg
External Review » Samsung ATIV 940X3G-K01SE
Dell Latitude E7240: Intel Core i5-4200U, 12.50", 1.3 kg
External Review » Dell Latitude E7240
Asus UX301LA-C4019H: Intel Core i5-4200U, 13.30", 1.2 kg
External Review » Asus UX301LA-C4019H
Lenovo IdeaPad U330-59372367: Intel Core i5-4200U, 13.30", 1.7 kg
External Review » Lenovo IdeaPad U330-59372367
Dell Inspiron 14-7437: Intel Core i7-4500U, 14.00", 1.7 kg
External Review » Dell Inspiron 14-7437
Acer Aspire S7-392-6832: Intel Core i5-4200U, 13.30", 1.3 kg
External Review » Acer Aspire S7-392-6832
Medion Akoya S6212T: Intel Core i3-4010U, 15.60", 2.6 kg
External Review » Medion Akoya S6212T
Sony Vaio Flip 14 SV-F14N13CXB: Intel Core i5-4200U, 14.10", 1.9 kg
External Review » Sony Vaio Flip 14 SV-F14N13CXB
Samsung 940X3G-K01DE: Intel Core i5-4200U, 13.30", 1.3 kg
External Review » Samsung 940X3G-K01DE
Sony Vaio Flip 15 SV-F15N190X: Intel Core i7-4500U, 15.60", 2.3 kg
External Review » Sony Vaio Flip 15 SV-F15N190X
Toshiba Satellite L50T-A-130: Intel Core i5-4200U, 15.60", 2.6 kg
External Review » Toshiba Satellite L50T-A-130
Asus VivoBook S551LA-CJ022H: Intel Core i3-4010U, 15.60", 2.4 kg
External Review » Asus VivoBook S551LA-CJ022H
Acer Aspire E1-572-34016G75Dnkk: Intel Core i3-4010U, 15.60", 2.4 kg
External Review » Acer Aspire E1-572-34016G75Dnkk
Samsung ATIV Book 9 Plus: Intel Core i5-4200U, 13.30", 1.4 kg
External Review » Samsung ATIV Book 9 Plus
Lenovo IdeaPad Flex 14-59395501: Intel Core i5-4200U, 14.00", 1.9 kg
External Review » Lenovo IdeaPad Flex 14-59395501
Sony Vaio SV-P1321SCXS: Intel Core i7-4500U, 13.30", 1.1 kg
External Review » Sony Vaio SV-P1321SCXS
Samsung ATIV 940X3G-K01FR: Intel Core i5-4200U, 13.30", 1.4 kg
External Review » Samsung ATIV 940X3G-K01FR
Toshiba Satellite U50t-A-100: Intel Core i5-4200U, 15.60", 2.4 kg
External Review » Toshiba Satellite U50t-A-100
Lenovo ThinkPad T440s 20AQ-S00500: Intel Core i5-4200U, 14.00", 1.6 kg
External Review » Lenovo ThinkPad T440s 20AQ-S00500
Dell Inspiron 15R-5537: Intel Core i7-4500U, 15.60", 2.3 kg
External Review » Dell Inspiron 15R-5537
Lenovo ThinkPad X240s: Intel Core i5-4200U, 12.50", 1.3 kg
External Review » Lenovo ThinkPad X240s
HP ProBook 430-G1: Intel Core i5-4200U, 13.30", 1.6 kg
External Review » HP ProBook 430-G1
Acer Aspire V7-582P-6673: Intel Core i5-4200U, 15.60", 2.2 kg
External Review » Acer Aspire V7-582P-6673
Microsoft Surface Pro 2: Intel Core i5-4200U, 10.60", 0.9 kg
External Review » Microsoft Surface Pro 2
HP Envy Rove 20: Intel Core i3-4010U, 20.00", 5.4 kg
External Review » HP Envy Rove 20
Sony Vaio SV-P1321WSNB: Intel Core i5-4200U, 13.30", 1.1 kg
External Review » Sony Vaio SV-P1321WSNB
Toshiba Satellite E45t-A4200: Intel Core i5-4200U, 14.00", 2 kg
External Review » Toshiba Satellite E45t-A4200
Sony Vaio Duo 13 SV-D1321L2EW: Intel Core i5-4200U, 13.30", 1.3 kg
External Review » Sony Vaio Duo 13 SV-D1321L2EW
Samsung ATIV 940X3G-K01US: Intel Core i5-4200U, 13.30", 1.4 kg
External Review » Samsung ATIV 940X3G-K01US
HP Envy TouchSmart 14t-k000: Intel Core i5-4200U, 14.00", 2 kg
External Review » HP Envy TouchSmart 14t-k000
Lenovo Yoga 2 Pro: Intel Core i5-4200U, 13.30", 1.4 kg
External Review » Lenovo IdeaPad Yoga 2 Pro
Sony Vaio Pro SVP1321M9RB: Intel Core i5-4200U, 13.30", 1.1 kg
External Review » Sony Vaio Pro SVP1321M9RB
Acer Aspire S7-392-74508G25tws: Intel Core i7-4500U, 13.30", 1.3 kg
External Review » Acer Aspire S7-392-74508G25tws
Asus UX31LA: Intel Core i7-4500U, 13.30", 1.5 kg
External Review » Asus UX31LA
Sony Vaio Duo 13 SV-D1321M2R: Intel Core i5-4200U, 13.30", 1.4 kg
External Review » Sony Vaio Duo 13 SV-D1321M2R
Samsung ATIV 940X3G-K03DE: Intel Core i5-4200U, 13.30", 1.3 kg
External Review » Samsung ATIV 940X3G-K03DE
Sony Vaio Duo 13 SV-D1321Z9R: Intel Core i7-4500U, 13.30", 1.4 kg
External Review » Sony Vaio Duo 13 SV-D1321Z9R
Sony Vaio SV-P132A1CM: Intel Core i7-4500U, 13.30", 1.1 kg
External Review » Sony Vaio SV-P132A1CM
Sony Vaio Pro 13 SVP-1321C5ER: Intel Core i7-4500U, 13.30", 1.1 kg
External Review » Sony Vaio Pro 13 SVP-1321C5ER
Acer Aspire M5-583P-6428: Intel Core i5-4200U, 15.60", 2.4 kg
External Review » Acer Aspire M5-583P-6428
Acer Aspire E1-572-6870: Intel Core i5-4200U, 15.60", 2.3 kg
External Review » Acer Aspire E1-572-6870
Sony Vaio SV-P1121C5ER2: Intel Core i7-4500U, 11.60", 0.9 kg
External Review » Sony Vaio SV-P1121C5ER2
Sony Vaio Pro SVP1321L1EBI.G4: Intel Core i5-4200U, 13.30", 1 kg
External Review » Sony Vaio Pro SVP1321L1EBI.G4
Sony Vaio Pro 11 SVP121M2EB.G4: Intel Core i5-4200U, 11.60", 0.9 kg
External Review » Sony Vaio Pro 11 SVP121M2EB.G4
Dell XPS 12-9Q33: Intel Core i5-4200U, 12.50", 1.5 kg
External Review » Dell XPS 12-9Q33
Sony Vaio SV-P1121M2E: Intel Core i5-4200U, 11.60", 0.9 kg
External Review » Sony Vaio SV-P1121M2E
Sony Vaio Pro SVP1321X9EB: Intel Core i7-4500U, 13.30", 0.9 kg
External Review » Sony Vaio Pro SVP1321X9EB
Sony Vaio Duo 13 SV-D1321Z9EB: Intel Core i7-4500U, 13.30", 1.3 kg
External Review » Sony Vaio Duo 13 SV-D1321Z9EB
Sony Vaio SV-P13213CGB: Intel Core i5-4200U, 13.30", 1.1 kg
External Review » Sony Vaio SV-P13213CGB
Sony Vaio SV-P13213CXB: Intel Core i5-4200U, 13.30", 1.1 kg
External Review » Sony Vaio SV-P13213CXB
Sony Vaio SV-P1321Z9EB: Intel Core i7-4500U, 13.30", 1.1 kg
External Review » Sony Vaio SV-P1321Z9EB
Acer Aspire S7-392-6411: Intel Core i5-4200U, 13.30", 1.3 kg
External Review » Acer Aspire S7-392-6411
Samsung ATIV Q: unknown, 13.30", 1.3 kg
External Review » Samsung ATIV Q
Sony Vaio SV-P1321BPXB: Intel Core i7-4500U, 13.30", 1.1 kg
External Review » Sony Vaio SV-P1321BPXB
Sony Vaio Duo 13 SV-D13213CXB: Intel Core i5-4200U, 13.30", 1.4 kg
External Review » Sony Vaio Duo 13 SV-D13213CXB
Sony Vaio SV-P11215PXB: Intel Core i7-4500U, 11.60", 0.9 kg
External Review » Sony Vaio SV-P11215PXB
Microsoft Surface Pro 3: Intel Core i5-4300U, 12.00", 0.8 kg
» Opinion: Surface Pro 3 - Quality Tablet PC but not mainstream