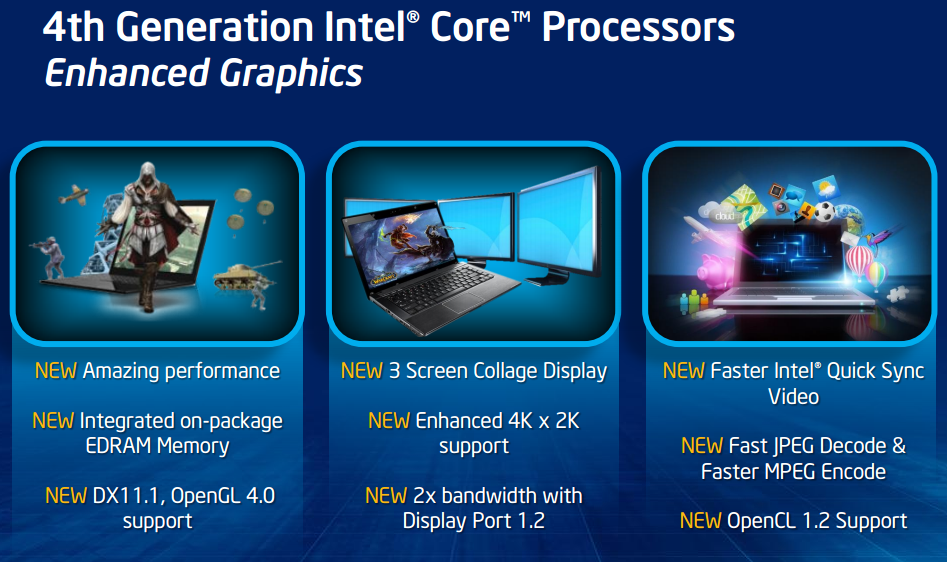
Notebook reviews with Intel HD Graphics (Haswell) graphics card
HP 350 G1 (2015) Notebook Review
Low-cost Office. With the 350 G1, HP offers a simple Office notebook with Haswell Pentium. You only need to put 290 Euros (~$320) on the table to own this 15.6-inch model.
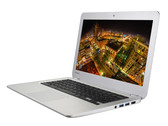
Intel Pentium 3558U, HD Graphics (Haswell), 15.6", 2.3 kgHP Chromebook 14 G1 Notebook Review
Cute. HP adroitly shows us just how much laptop a Chromebook must have. We get solid build and power wrapped up in a classy design for approximately 375 Euros (~$406). Of course, some compromises will have to be made for this price.
Intel Celeron 2955U, HD Graphics (Haswell), 14", 1.8 kgAcer Aspire V3-331-P982 Notebook Review Update
Enduring. Despite the low price of around 450 Euros (~$597), Acer's 13.3-inch laptop can boast with very good battery runtimes. Read in our report whether that is the only thing the computer has to offer.
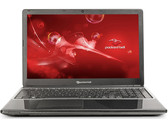
Intel Pentium 3556U, HD Graphics (Haswell), 13.3", 1.5 kgPackard Bell EasyNote TE69HW-29574G50Mnsk Notebook Review
Haswell bargain. The search for a quiet, efficient and inexpensive home office notebook with decent battery life is over. The Packard Bell Easynote TE69HW-29574G50Mnsk, which sells for 299 Euro ($410), fits the bill exactly. An added bonus: the system is equipped with a Haswell Celeron CPU instead of a weaker Bay Trail processor.
Intel Celeron 2957U, HD Graphics (Haswell), 15.6", 2.3 kgReview Toshiba Chromebook CB30-102 Notebook
For grandpa. Not interested in Windows? Chrome OS is the alternative offered on this laptop. No complicated hardware settings; just open it up and start surfing. Does Toshiba do a good job with this non-Windows concept?
Intel Celeron 2955U, HD Graphics (Haswell), 13.3", 1.5 kgLenovo IdeaPad Flex 15: Intel Pentium 3556U, 15.60", 2.3 kg
Review » Review Lenovo IdeaPad Flex 15 Notebook
Acer Aspire E1-532: Intel Celeron 2955U, 15.60", 2.4 kg
Review » Review Acer Aspire E1-532 Notebook
Acer C720-2800 Chromebook: Intel Celeron 2955U, 11.60", 1.2 kg
Review » Review Acer C720-2800 Chromebook
Acer Aspire ES1-571-P4KB: Intel Pentium 3556U, 15.60", 2.4 kg
External Review » Acer Aspire ES1-571-P4KB
Acer Extensa 2530-P86Y: Intel Pentium 3558U, 15.60", 2.4 kg
External Review » Acer Extensa 2530-P86Y
Acer Aspire E15 E5-573-P62E: Intel Pentium 3556U, 15.60", 2.4 kg
External Review » Acer Aspire E15 E5-573-P62E
Lenovo G70-70-80HW0069GE: Intel Pentium 3558U, 17.30", 2.9 kg
External Review » Lenovo G70-70-80HW0069GE
Lenovo IdeaPad S4070: Intel Pentium 3558U, 14.00", 1.8 kg
External Review » Lenovo IdeaPad S4070
Acer Aspire V3-331-P982: Intel Pentium 3556U, 13.30", 1.5 kg
External Review » Acer Aspire V3-331-P982
MSI S20-4M341: Intel Pentium 3556U, 11.60", 1.1 kg
External Review » MSI S20-4M341
Lenovo G50-70-59424801: Intel Celeron 2957U, 15.60", 2.5 kg
External Review » Lenovo G50-70-59424801
HP Chromebook 14-q014sa: Intel Celeron 2955U, 14.00", 1.8 kg
External Review » HP Chromebook 14-q014sa
Lenovo IdeaPad S510P-59-405720: Intel Pentium 3556U, 15.60", 2.4 kg
External Review » Lenovo IdeaPad S510P-59-405720
Dell Inspiron 3537: Intel Celeron 2955U, 15.60", 2.3 kg
External Review » Dell Inspiron 3537
HP Chromebook 14-Q000Er: Intel Celeron 2955U, 14.00", 1.9 kg
External Review » HP Chromebook 14-Q000Er
HP Pavilion 11-n008tu x360: Intel Celeron N2820, 11.60", 1.4 kg
External Review » HP Pavilion 11-n008tu x360
HP Pavilion 14-q030sg: Intel Celeron 2955U, 14.00", 1.9 kg
External Review » HP Pavilion 14-q030sg
Acer C720-29552G01Aii: Intel Celeron 2955U, 11.60", 1.3 kg
External Review » Acer C720-29552G01Aii
Dell Inspiron 11-3137: Intel Pentium 3556U, 11.60", 1.4 kg
External Review » Dell Inspiron 11-3137
HP Pavilion 11-N000eo X360: Intel Celeron N2820, 11.60", 1.4 kg
External Review » HP Pavilion 11-N000eo X360
HP Spectre 13-H200EF: Intel Core i7-4500U, 13.30", 1.5 kg
External Review » HP Spectre 13-H200EF
Toshiba Chromebook CB30-102: Intel Celeron 2955U, 13.30", 1.5 kg
External Review » Toshiba Chromebook CB30-102
Acer C720P-29552G01aww Chromebook: Intel Celeron 2955U, 11.60", 1.4 kg
External Review » Acer C720P-29552G01aww Chromebook
Acer C720P-29554G01aww Chromebook: Intel Celeron 2955U, 11.60", 1.2 kg
External Review » Acer C720P-29554G01aww Chromebook
Dell Chromebook 11: Intel Celeron 2955U, 11.60", 1.3 kg
External Review » Dell Chromebook 11
Toshiba Satellite NB10t-A-103: Intel Celeron N2810, 11.60", 1.3 kg
External Review » Toshiba Satellite NB10t-A-103
Toshiba CB30-A3120: Intel Celeron 2955U, 13.30", 1.5 kg
External Review » Toshiba CB30-A3120
Toshiba CB30-102: Intel Celeron 2955U, 13.30", 1.5 kg
External Review » Toshiba CB30-102
Toshiba CB35-A3120 Chromebook: Intel Celeron 2955U, 13.30", 1.5 kg
External Review » Toshiba CB30-A3120
Acer C720P-2666 Chromebook: Intel Celeron 2955U, 11.60", 1.2 kg
External Review » Acer C720P-2666 Chromebook
Acer C720-2802 Chromebook: Intel Celeron 2955U, 11.60", 1.2 kg
External Review » Acer C720-2802 Chromebook
Sony Vaio Tap 11 SV-T1121C5E: Intel Pentium 3560Y, 11.60", 0.8 kg
External Review » Sony Vaio Tap 11 SV-T1121C5E
Acer C720P-2600 Chromebook: Intel Celeron 2955U, 11.60", 1.2 kg
External Review » Acer C720P-2600 Chromebook
Acer C720-2955G01aii: Intel Celeron 2955U, 11.60", 1.3 kg
External Review » Acer C720-2955G01aii
HP Chromebook 14-q001tu: Intel Celeron 2955U, 14.00", 1.8 kg
External Review » HP Chromebook 14-q001tu
HP Chromebook 14-q029wm: Intel Celeron 2955U, 14.00", 1.8 kg
External Review » HP Chromebook 14-q029wm
Acer C720-2800 Chromebook: Intel Celeron 2955U, 11.60", 1.2 kg
External Review » Acer Aspire C720 Chromebook